Washington, D.C. 20549
Nuveen New Jersey Premium Income Municipal Fund, Inc.
Kevin J. McCarthy
Form N-CSR is to be used by management investment companies to file reports with the Commission not later than 10 days after the transmission to stockholders of any report that is required to be transmitted to stockholders under Rule 30e-1 under the Investment Company Act of 1940 (17 CFR 270.30e-1). The Commission may use the information provided on Form N-CSR in its regulatory, disclosure review, inspection, and policymaking roles.
A registrant is required to disclose the information specified by Form N-CSR, and the Commission will make this information public. A registrant is not required to respond to the collection of information contained in Form N-CSR unless the Form displays a currently valid Office of Management and Budget ("OMB") control number. Please direct comments concerning the accuracy of the information collection burden estimate and any suggestions for reducing the burden to Secretary, Securities and Exchange Commission, 450 Fifth Street, NW, Washington, DC 20549-0609. The OMB has reviewed this collection of information under the clearance requirements of 44 U.S.C. ss. 3507.
ITEM 1. REPORTS TO STOCKHOLDERS.
LIFE IS COMPLEX.
Nuveen makes things e-simple.
It only takes a minute to sign up for e-Reports. Once enrolled, you’ll receive an e-mail as soon as your Nuveen Fund information is ready. No more waiting for delivery by regular mail. Just click on the link within the e-mail to see the report and save it on your computer if you wish.
Free e-Reports right to your e-mail!
www.investordelivery.com
If you receive your Nuveen Fund distributions and statements from your financial advisor or brokerage account.
OR
www.nuveen.com/accountaccess
If you receive your Nuveen Fund distributions and statements directly from Nuveen.
Table of Contents
| Chairman’s Letter to Shareholders | 4 |
| | |
| Portfolio Manager’s Comments | 5 |
| | |
| Fund Leverage and Other Information | 11 |
| | |
| Common Share Dividend and Price Information | 13 |
| | |
| Performance Overviews | 15 |
| | |
| Portfolios of Investments | 25 |
| | |
| Statement of Assets and Liabilities | 88 |
| | |
| Statement of Operations | 90 |
| | |
| Statement of Changes in Net Assets | 92 |
| | |
| Statement of Cash Flows | 96 |
| | |
| Financial Highlights | 100 |
| | |
| Notes to Financial Statements | 112 |
| | |
| Annual Investment Management Agreement Approval Process | 125 |
| | |
| Reinvest Automatically, Easily and Conveniently | 136 |
| | |
| Glossary of Terms Used in this Report | 138 |
| | |
| Additional Fund Information | 143 |
Chairman’s
Letter to Shareholders
Dear Shareholders,
Investors have many reasons to remain cautious. The challenges in the Euro area continue to cast a shadow over global economies and financial markets. The political support for addressing fiscal issues is eroding as the economic and social impacts become more visible. Despite strong action by the European Central Bank, member nations appear unwilling to surrender sufficient sovereignty to unify the Euro area financial system or strengthen its banks. The gains made in reducing deficits, and the hard-won progress on winning popular acceptance of the need for economic austerity, are at risk. To their credit, European political leaders press on to find compromise solutions, but there is increasing concern that time is running out.
In the U.S., the extended period of increasing corporate earnings that enabled the equity markets to withstand the downward pressures coming from weakening job creation and slower economic growth appears to be coming to an end. The Fed remains committed to low interest rates and announced a third phase of quantitative easing (QE3) scheduled to continue until mid-2015. The recent election results have removed a major element of uncertainty in the U.S. political picture, but it remains to be seen whether the outcome will reduce the highly partisan atmosphere in Congress and enable progress on the many pressing fiscal and budgetary issues that must be resolved in the coming months.
During the last twelve months, U.S. investors have experienced a solid recovery in the domestic equity markets with increasing volatility as the “fiscal cliff” approaches. The experienced investment teams at Nuveen keep their eye on a longer time horizon and use their practiced investment disciplines to negotiate through market peaks and valleys to achieve long-term goals for investors. Experienced professionals pursue investments that will weather short-term volatility and at the same time, seek opportunities that are created by markets that overreact to negative developments. Monitoring this process is an important consideration for the Fund Board as it oversees your Nuveen Fund on your behalf.
As always, I encourage you to contact your financial consultant if you have any questions about your investment in a Nuveen Fund. On behalf of the other members of your Fund Board, we look forward to continuing to earn your trust in the months and years ahead.
Sincerely,
Robert P. Bremner
Chairman of the Board
December 20, 2012
Portfolio Manager’s Comments
Nuveen New Jersey Investment Quality Municipal Fund, Inc. (NQJ)
Nuveen New Jersey Premium Income Municipal Fund, Inc. (NNJ)
Nuveen New Jersey Dividend Advantage Municipal Fund (NXJ)
Nuveen New Jersey Dividend Advantage Municipal Fund 2 (NUJ)
Nuveen New Jersey Municipal Value Fund (NJV)
Nuveen Pennsylvania Investment Quality Municipal Fund (NQP)
Nuveen Pennsylvania Premium Income Municipal Fund 2 (NPY)
Nuveen Pennsylvania Dividend Advantage Municipal Fund (NXM)
Nuveen Pennsylvania Dividend Advantage Municipal Fund 2 (NVY)
Nuveen Pennsylvania Municipal Value Fund (NPN)
Portfolio manager Paul Brennan discusses key investment strategies and the six-month performance of the Nuveen New Jersey and Pennsylvania Funds. Paul assumed portfolio management responsibility for these ten Funds in 2011.
What key strategies were used to manage the Nuveen New Jersey and Pennsylvania Funds during the six-month reporting period ended October 31, 2012?
During this reporting period, municipal bond prices generally rallied, as strong demand and tight supply combined to create favorable market conditions for municipal bonds. Although the total volume of tax-exempt supply improved over that of the same six-month period a year earlier, the issuance pattern remained light compared with long-term historical trends. This supply/demand dynamic served as a key driver of performance. Concurrent with rising prices, yields continued to decline across most maturities, especially at the longer end of the municipal yield curve and the curve flattened. During this period, we saw an increased number of borrowers come to market seeking to take advantage of the low rate environment through refunding activity, with approximately 60% of new municipal paper issued by borrowers that were calling existing debt and refinancing at lower rates.
In this environment, we continued to take a bottom-up approach to discovering sectors that appeared undervalued as well as individual credits that we believe had the potential
Certain statements in this report are forward-looking statements. Discussions of specific investments are for illustration only and are not intended as recommendations of individual investments. The forward-looking statements and other views expressed herein are those of the portfolio manager as of the date of this report. Actual future results or occurrences may differ significantly from those anticipated in any forward-looking statements, and the views expressed herein are subject to change at any time, due to numerous market and other factors. The Funds disclaim any obligation to update publicly or revise any forward-looking statements or views expressed herein.
Ratings shown are the highest rating given by one of the following national rating agencies: Standard & Poor’s, Moody’s Investors Service, Inc., or Fitch, Inc. Credit ratings are subject to change. AAA, AA, A, and BBB are investment grade ratings; BB, B, CCC, CC, C and D are below investment grade ratings. Certain bonds backed by U.S. Government or agency securities are regarded as having an implied rating equal to the rating of such securities. Holdings designated N/R are not rated by these national rating agencies.
to perform well over the long term. During this period, the New Jersey Funds found value in several areas of the market, including health care, toll roads, higher education and tax-supported bonds. The additions to our health care holdings were generally replacements for health care bonds that had been refunded or redeemed, rather than an increase in exposure to this sector. Overall, allocations to health care in the New Jersey Funds were slightly lower at the end of this period than they were six months earlier.
In the Pennsylvania Funds, we added to our positions in hospital bonds, higher education and local general obligation (GO) bonds and other tax-supported issues. In particular, Pennsylvania’s hospital sector offered attractive opportunities from a number of issuers across the state, with credit quality ranging from AA to BB.
In general during this period, we emphasized bonds with longer maturities, particularly in the New Jersey Funds, where extending duration was a major focus. These Funds, with the exception of NJV, tended to be at the shorter end of their targeted duration range. The purchase of longer maturity bonds helped to extend the Funds’ durations, provided additional protection for their duration and yield curve positioning and enabled us to take advantage of more attractive yields at the longer end of the municipal yield curve. We also continued to add bonds with longer maturities to the Pennsylvania Funds, although these Funds were generally better positioned in terms of duration than the New Jersey Funds, with durations at the higher end of their targeted range. We also purchased lower rated bonds when we found attractive opportunities, as we believed these bonds continued to offer relative value. On the whole, the municipal market environment in New Jersey during this period tended to be more challenging than in Pennsylvania, as in-state demand remained exceptionally strong and longer term issuance often was insufficient to meet that demand.
During this period, we also took advantage of short-term market opportunities created by supply/demand dynamics in the municipal market. While demand for tax-exempt paper remained consistently strong throughout the period, supply fluctuated widely. We found that periods of substantial supply provided good short-term buying opportunities not only because of the increased number of issues available, but also because some investors became more hesitant in their buying as supply grew, causing spreads to widen temporarily. At times when supply was more plentiful, we focused on anticipating cashflows from bond calls and maturing bonds and closely monitored opportunities for reinvestment.
Cash for new purchases during this period was generated primarily by the proceeds from an increased number of bond calls resulting from the growth in refinancings. During this period, we worked to redeploy these proceeds as well as those from maturing bonds to keep the Funds as fully invested as possible. Overall, selling was minimal because the bonds in our portfolios generally offered higher yields than those available in the current marketplace.
As of October 31, 2012, all of these Funds continued to use inverse floating rate securities. We employ inverse floaters for a variety of reasons, including duration management, income enhancement and total return enhancement.
How did the Funds perform during the six-month reporting period ended October 31, 2012?
Individual results for the Nuveen New Jersey and Pennsylvania Funds, as well as relevant index and peer group information, are presented in the accompanying table.
Average Annual Total Returns on Common Share Net Asset Value*
For periods ended 10/31/12
| | 6-Month | 1-Year | 5-Year | 10-Year |
| New Jersey Funds | | | | |
| NQJ | 5.76% | 15.57% | 7.35% | 6.53% |
| NNJ | 5.64% | 15.00% | 7.38% | 6.26% |
| NXJ | 7.87% | 17.61% | 7.63% | 7.07% |
| NUJ | 5.70% | 15.50% | 7.20% | 6.90% |
| NJV** | 4.79% | 14.89% | N/A | N/A |
| | | | | |
| S&P New Jersey Municipal Bond Index*** | 4.09% | 11.07% | 6.08% | 5.63% |
| S&P Municipal Bond Index*** | 3.65% | 9.56% | 5.83% | 5.35% |
| Lipper Other States Municipal Debt Funds Classification Average*** | 5.41% | 14.35% | 6.96% | 6.41% |
| | | | | |
| Pennsylvania Funds | | | | |
| NQP | 6.20% | 16.14% | 7.81% | 6.51% |
| NPY | 5.53% | 14.76% | 7.44% | 6.32% |
| NXM | 5.78% | 14.69% | 7.26% | 6.76% |
| NVY | 5.90% | 14.54% | 7.02% | 6.49% |
| NPN** | 4.79% | 12.16% | N/A | N/A |
| | | | | |
| S&P Pennsylvania Municipal Bond Index*** | 3.39% | 9.01% | 5.80% | 5.30% |
| S&P Municipal Bond Index*** | 3.65% | 9.56% | 5.83% | 5.35% |
| Lipper Other States Municipal Debt Funds Classification Average*** | 5.41% | 14.35% | 6.96% | 6.41% |
| | Past performance is not predictive of future results. Current performance may be higher or lower than the data shown. Returns do not reflect the deduction of taxes that shareholders may have to pay on Fund distributions or upon the sale of Fund shares. |
| | |
| | For additional information, see the Performance Overview page for your Fund in this report. |
| | |
| * | Six-month returns are cumulative; all other returns are annualized. |
| | |
| ** | Unlike the other eight Funds in this report, NJV and NPN do not use regulatory leverage. |
| | |
| *** | Refer to the Glossary of Terms Used in this Report for definitions. Indexes and Lipper averages are not available for direct investment. |
For the six months ended October 31, 2012, the cumulative returns on common share net asset value (NAV) for all of the Nuveen New Jersey and Pennsylvania Funds exceeded the returns for their respective S&P Municipal Bond Index. For the same period, all of the Funds except NJV and NPN outperformed the average return for the Lipper Other States Municipal Debt Funds Classification Average.
One of the reasons behind the underperformance of NJV and NPN relative to their Lipper averages was the fact that these Funds do not use regulatory leverage (however, they may use effective leverage).
Key management factors that influenced the Funds’ returns during this period included duration and yield curve positioning, credit exposure and sector allocation. In addition, the use of regulatory leverage was an important positive factor affecting the performance of NQJ, NNJ, NXJ, NUJ, NQP, NPY, NXM and NVY.
In an environment of declining rates and flattening yield curve, municipal bonds with longer maturities generally outperformed those with shorter maturities during this period. Overall, credits at the longest end of the municipal yield curve posted the strongest returns, while bonds at the shortest end produced the weakest results. Among these Funds, NXJ, NQP and NVY were the most advantageously positioned in terms of duration and yield curve, with better exposure to the segments of the municipal curve that performed best. In general during this period, the greater a Fund’s exposure to the outperforming longer parts of the curve, the greater the positive impact on the Fund’s return. In particular, the Funds benefited from their holdings of long duration bonds, many of which had zero percent coupons, which generally outperformed the market during this period.
Credit exposure was another important factor in the Funds’ performance during these six months, as lower quality bonds generally outperformed higher quality bonds. This outperformance was due in part to the greater demand for lower-rated bonds as investors looked for investment vehicles offering higher yields. As investors became more comfortable taking on additional investment risk, credit spreads, or the difference in yield spreads between U.S. Treasury securities and comparable investments such as municipal bonds, narrowed through a variety of rating categories. As a result of this
spread compression, the Funds generally benefited from their holdings of lower rated credits, with good weightings of bonds rated A and lower across the board.
During this period, revenue bonds as a whole outperformed the general municipal market. Holdings that generally made positive contributions to the Funds’ returns included health care (together with hospitals), education, water and sewer, and transportation bonds. In general, these Funds tended to have strong weightings in the health care, transportation and education sectors, which was positive for performance. Tobacco credits backed by the 1998 master tobacco settlement agreement also performed well, helped in part by their longer effective durations. These bonds also benefited from market developments, including increased demand for higher yielding investments by investors who had become less risk averse. In addition, based on recent data showing that cigarette sales had fallen less steeply than anticipated, the 46 states participating in the agreement, including New Jersey and Pennsylvania, stand to receive increased payments from the tobacco companies. During this period, the New Jersey Funds had good weightings of tobacco credits, which benefited their performance as tobacco bonds rallied. The Pennsylvania Funds, with the exception of NPN, did not hold tobacco bonds, primarily due to the fact that Pennsylvania has not issued any tobacco settlement credits. NPN invested in tobacco bonds issued by the District of Columbia.
Individual security selection also contributed to the Funds’ performance, with the most significant example being NXJ’s large holding of non-callable, zero coupon bonds issued by North Hudson Sewerage Authority. These bonds were advance refunded during this period, with the proceeds of the refunding issue escrowed to maturity in 2023. This provided a meaningful boost to NXJ’s performance.
In contrast, bonds that previously had been pre-refunded, which are often backed by U.S. Treasury securities, were the poorest performing market segment during this period. The underperformance of these bonds can be attributed primarily to their shorter effective maturities and higher credit quality. Throughout this period, NXJ, NNJ, and NPY had the heaviest weightings of pre-refunded bonds, with NXJ’s allocation augmented by the previously mentioned recent refunding. In addition, GO bonds and utilities and housing credits slightly lagged the performance of the general municipal market for this period.
In late October 2012, near the end of this reporting period, areas of the Mid-Atlantic and Northeastern United States, including New Jersey and Pennsylvania, were devastated by Hurricane Sandy. Although the full extent of economic loss from this superstorm was still being assessed at the time this report was prepared, the storm did not result in any disruption of the municipal bond market and we believe this event will not have any negative impact on municipal credit quality, performance or debt service payments in the region.
Fund Leverage and
Other Information
IMPACT OF THE FUNDS’ LEVERAGE STRATEGIES ON PERFORMANCE
One important factor impacting the returns of all these Funds relative to the comparative indexes was the Funds’ use of leverage. As mentioned previously, NJV and NPN do not use regulatory leverage. The Funds use leverage because their managers believe that, over time, leveraging provides opportunities for additional income and total return for common shareholders. However, use of leverage also can expose common shareholders to additional volatility. For example, as the prices of securities held by a Fund decline, the negative impact of these valuation changes on common share net asset value and common shareholder total return is magnified by the use of leverage. Conversely, leverage may enhance common share returns during periods when the prices of securities held by a Fund generally are rising. Leverage made a positive contribution to the performance of these Funds over this reporting period.
THE FUNDS’ REGULATORY LEVERAGE
As of October 31, 2012, the Funds have issued and outstanding MuniFund Term Preferred (MTP) Shares and Variable Rate Demand Preferred (VRDP) Shares as shown in the accompanying table. As mentioned previously, NJV and NPN do not use regulatory leverage.
MTP Shares
| | | | | | MTP Shares Issued | | | Annual | | NYSE |
| Fund | | | Series | | at Liquidation Value | | | Interest Rate | | Ticker |
| NXJ | | | 2014 | | $ | 44,861,000 | | | 2.30 | % | | NXJ PrA |
| NUJ | | | 2015 | | $ | 35,050,000 | | | 2.00 | % | | NUJ PrC |
| NXM | | | 2015 | | $ | 23,190,000 | | | 2.10 | % | | NXM PrC |
| NVY | | | 2015 | | $ | 24,550,000 | | | 2.15 | % | | NVY PrC |
VRDP Shares
| | VRDP Shares Issued |
| Fund | at Liquidation Value |
| NQJ | | $ | 144,300,000 |
| NNJ | | $ | 88,600,000 |
| NQP | | $ | 112,500,000 |
| NPY | | $ | 100,000,000 |
(Refer to Notes to Financial Statements, Footnote 1 – General Information and Significant Accounting Policies for further details on MTP Shares and VRDP Shares.)
RISK CONSIDERATIONS
Fund shares are not guaranteed or endorsed by any bank or other insured depository institution, and are not federally insured by the Federal Deposit Insurance Corporation. Past performance is no guarantee of future results. Fund common shares are subject to a variety of risks, including:
Investment and Market Risk. An investment in common shares is subject to investment risk, including the possible loss of the entire principal amount that you invest. Your investment in common shares represents an indirect investment in the municipal securities owned by the Fund, which generally trade in the over-the-counter markets. Your common shares at any point in time may be worth less than your original investment, even after taking into account the reinvestment of Fund dividends and distributions.
Price Risk. Shares of closed-end investment companies like these Funds frequently trade at a discount to their NAV. Your common shares at any point in time may be worth less than your original investment, even after taking into account the reinvestment of Fund dividends and distributions.
Tax Risk. The tax treatment of Fund distributions may be affected by new IRS interpretations of the Internal Revenue Code and future changes in tax laws and regulations.
Issuer Credit Risk. This is the risk that a security in a Fund’s portfolio will fail to make dividend or interest payments when due.
Interest Rate Risk. Fixed-income securities such as bonds, preferred, convertible and other debt securities will decline in value if market interest rates rise.
Reinvestment Risk. If market interest rates decline, income earned from a Fund’s portfolio may be reinvested at rates below that of the original bond that generated the income.
Call Risk or Prepayment Risk. Issuers may exercise their option to prepay principal earlier than scheduled, forcing a Fund to reinvest in lower-yielding securities.
Inverse Floater Risk. The Funds may invest in inverse floaters. Due to their leveraged nature, these investments can greatly increase a Fund’s exposure to interest rate risk and credit risk. In addition, investments in inverse floaters involve the risk that the Fund could lose more than its original principal investment.
Leverage Risk. Each Fund’s use of leverage creates the possibility of higher volatility for the Fund’s per share NAV, market price, distributions and returns. There is no assurance that a Fund’s leveraging strategy will be successful.
Common Share Dividend
and Price Information
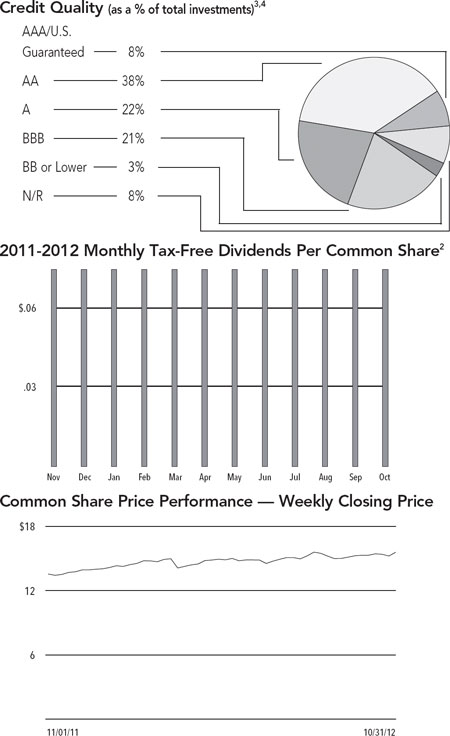
DIVIDEND INFORMATION
The monthly dividends of NQJ, NNJ, NQP, NPY, NVY and NPN remained stable throughout the six-month reporting period ended October 31, 2012, while the dividends of NXJ, NUJ, NJV and NXM were each reduced once during the period.
All of the Funds in this report seek to pay stable dividends at rates that reflect each Fund’s past results and projected future performance. During certain periods, each Fund may pay dividends at a rate that may be more or less than the amount of net investment income actually earned by the Fund during the period. If a Fund has cumulatively earned more than it has paid in dividends, it holds the excess in reserve as undistributed net investment income (UNII) as part of the Fund’s NAV. Conversely, if a Fund has cumulatively paid dividends in excess of its earnings, the excess constitutes negative UNII that is likewise reflected in the Fund’s NAV. Each Fund will, over time, pay all of its net investment income as dividends to shareholders. As of October 31, 2012, all of the Funds had positive UNII balances, based upon our best estimate, for tax purposes and positive UNII balances for financial reporting purposes.
COMMON SHARE REPURCHASES AND PRICE INFORMATION
As of October 31, 2012, and since the inception of the Funds’ repurchase programs, the following Funds have cumulatively repurchased and retired common shares as shown in the accompanying table. Since the inception of the Funds’ repurchase programs, NJV, NVY and NPN have not repurchased any of their outstanding common shares.
| | Common Shares | % of Outstanding |
| Fund | Repurchased and Retired | Common Shares |
| NQJ | 30,600 | 0.1% |
| NNJ | 12,900 | 0.1% |
| NXJ | 7,200 | 0.1% |
| NUJ | 2,800 | 0.1% |
| NQP | 220,600 | 1.4% |
| NPY | 231,200 | 1.5% |
| NXM | 10,600 | 0.3% |
During the six-month reporting period, the Funds did not repurchase any of their outstanding common shares.
As of October 31, 2012, and during the six-month reporting period, the Funds’ common share prices were trading at (+) premiums and/or (-) discounts to their common share NAVs as shown in the accompanying table.
| | 10/31/12 | Six-Month Average |
| Fund | (+)Premium/(-) Discount | (-) Discount |
| NQJ | (+)1.46% | (+)0.22% |
| NNJ | (+)4.17% | (+)1.83% |
| NXJ | (+)2.61% | (-)1.57% |
| NUJ | (+)5.30% | (+)4.79% |
| NJV | (+)0.59% | (-)1.01% |
| NQP | (+)1.17% | (-)0.74% |
| NPY | (-)2.44% | (-)3.62% |
| NXM | (-)2.20% | (-)4.79% |
| NVY | (-)0.13% | (-)2.21% |
| NPN | (-)4.76% | (-)5.56% |
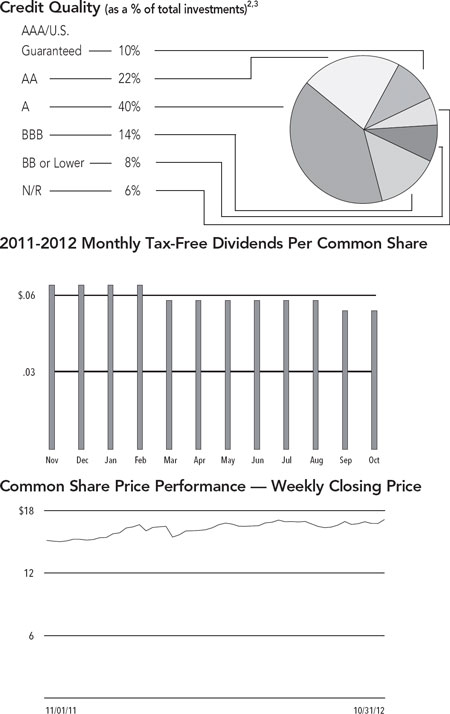
| NQJ | | Nuveen New Jersey |
| Performance | | Investment Quality |
| OVERVIEW | | Municipal Fund, Inc. |
| | | as of October 31, 2012 |
| Fund Snapshot | | | | |
| Common Share Price | | $ | 15.99 | |
| Common Share Net Asset Value (NAV) | | $ | 15.76 | |
| Premium/(Discount) to NAV | | | 1.46 | % |
| Market Yield | | | 5.29 | % |
Taxable-Equivalent Yield1 | | | 7.85 | % |
| Net Assets Applicable to Common Shares ($000) | | $ | 322,714 | |
| | | | | |
| Leverage | | | | |
| Regulatory Leverage | | | 30.90 | % |
| Effective Leverage | | | 33.23 | % |
| Average Annual Total Returns | | | | | | | |
| (Inception 2/21/91) | | | | | | | |
| | | On Share Price | | On NAV |
| 6-Month (Cumulative) | | | 10.04 | % | | 5.76 | % |
| 1-Year | | | 23.78 | % | | 15.57 | % |
| 5-Year | | | 10.34 | % | | 7.35 | % |
| 10-Year | | | 7.19 | % | | 6.53 | % |
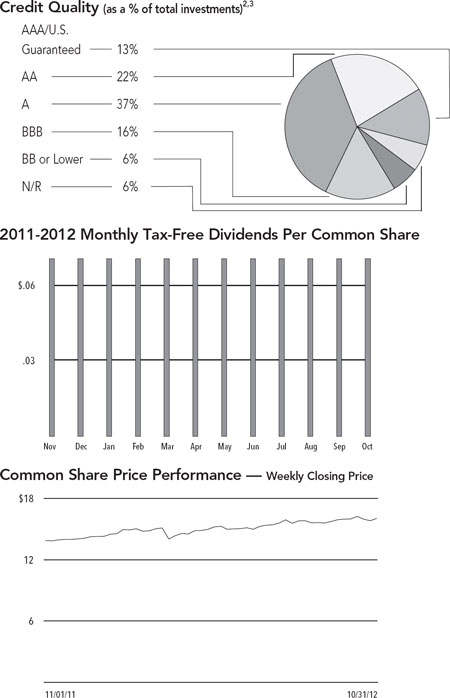
Portfolio Composition3 | | | | |
| (as a % of total investments) | | | | |
| Tax Obligation/Limited | | | 27.0 | % |
| Transportation | | | 17.3 | % |
| Health Care | | | 15.0 | % |
| Education and Civic Organizations | | | 10.9 | % |
| U.S. Guaranteed | | | 9.6 | % |
| Consumer Staples | | | 3.8 | % |
| Tax Obligation/General | | | 3.8 | % |
| Other | | | 12.6 | % |
| | Refer to the Glossary of Terms Used in this Report for further definition of the terms used within this Fund’s Performance Overview page. |
| 1 | Taxable-Equivalent Yield represents the yield that must be earned on a fully taxable investment in order to equal the yield of the Fund on an after-tax basis. It is based on a combined federal and state income tax rate of 32.6%. When comparing this Fund to investments that generate qualified dividend income, the Taxable-Equivalent Yield is lower. |
| 2 | Ratings shown are the highest rating given by one of the following national rating agencies: Standard & Poor’s, Moody’s Investors Service, Inc. or Fitch, Inc. Credit ratings are subject to change. AAA, AA, A, and BBB are investment grade ratings; BB, B, CCC, CC, C and D are below-investment grade ratings. Certain bonds backed by U.S. Government or agency securities are regarded as having an implied rating equal to the rating of such securities. Holdings designated N/R are not rated by these national rating agencies. |
| 3 | Holdings are subject to change. |
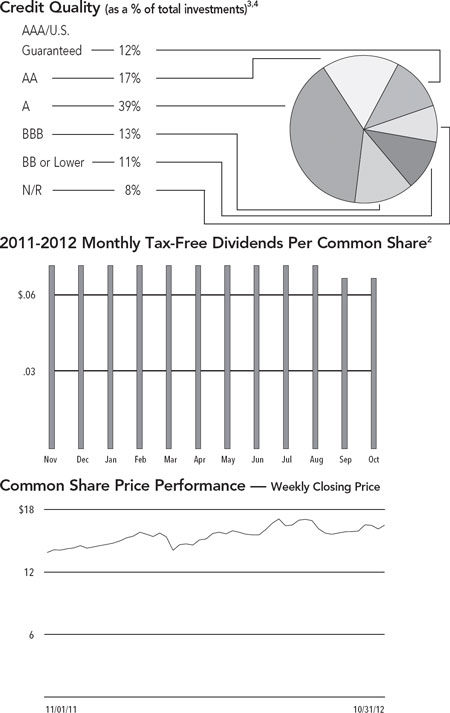
| NNJ | | Nuveen New Jersey |
| Performance | | Premium Income |
| OVERVIEW | | Municipal Fund, Inc. |
| | | as of October 31, 2012 |
| Fund Snapshot | | | | |
| Common Share Price | | $ | 16.99 | |
| Common Share Net Asset Value (NAV) | | $ | 16.31 | |
| Premium/(Discount) to NAV | | | 4.17 | % |
| Market Yield | | | 5.12 | % |
Taxable-Equivalent Yield1 | | | 7.60 | % |
| Net Assets Applicable to Common Shares ($000) | | $ | 196,812 | |
| | | | | |
| Leverage | | | | |
| Regulatory Leverage | | | 31.04 | % |
| Effective Leverage | | | 33.36 | % |
| Average Annual Total Returns | | | | | | | |
| (Inception 12/17/92) | | | | | | | |
| | | On Share Price | | On NAV |
| 6-Month (Cumulative) | | | 12.72 | % | | 5.64 | % |
| 1-Year | | | 22.82 | % | | 15.00 | % |
| 5-Year | | | 10.85 | % | | 7.38 | % |
| 10-Year | | | 7.45 | % | | 6.26 | % |
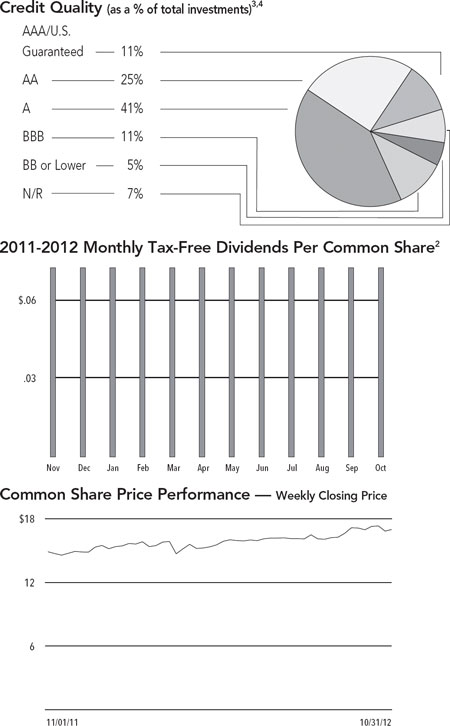
Portfolio Composition4 | | | | |
| (as a % of total investments) | | | | |
| Tax Obligation/Limited | | | 31.1 | % |
| Transportation | | | 15.7 | % |
| U.S. Guaranteed | | | 12.5 | % |
| Health Care | | | 11.9 | % |
| Education and Civic Organizations | | | 10.8 | % |
| Water and Sewer | | | 4.6 | % |
| Other | | | 13.4 | % |
| | Refer to the Glossary of Terms Used in this Report for further definition of the terms used within this Fund’s Performance Overview page. |
| 1 | Taxable-Equivalent Yield represents the yield that must be earned on a fully taxable investment in order to equal the yield of the Fund on an after-tax basis. It is based on a combined federal and state income tax rate of 32.6%. When comparing this Fund to investments that generate qualified dividend income, the Taxable-Equivalent Yield is lower. |
| 2 | The Fund paid shareholders a capital gains distribution in December 2011 of $0.0105 per share. |
| 3 | Ratings shown are the highest rating given by one of the following national rating agencies: Standard & Poor’s, Moody’s Investors Service, Inc. or Fitch, Inc. Credit ratings are subject to change. AAA, AA, A, and BBB are investment grade ratings; BB, B, CCC, CC, C and D are below-investment grade ratings. Certain bonds backed by U.S. Government or agency securities are regarded as having an implied rating equal to the rating of such securities. Holdings designated N/R are not rated by these national rating agencies. |
| 4 | Holdings are subject to change. |
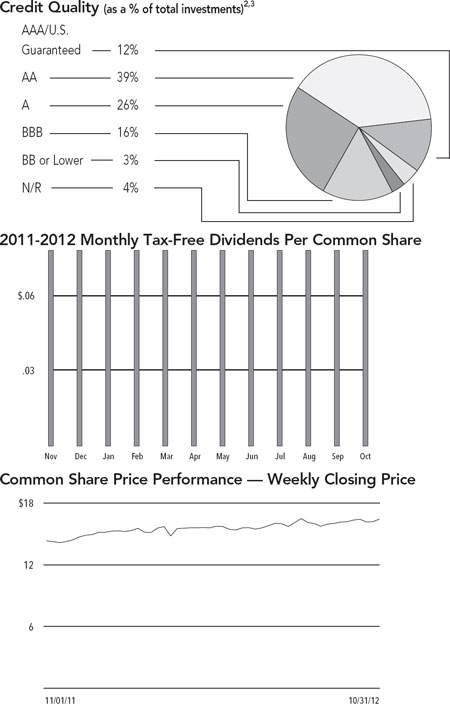
| NXJ | | Nuveen New Jersey |
| Performance | | Dividend Advantage |
| OVERVIEW | | Municipal Fund |
| | | as of October 31, 2012 |
| Fund Snapshot | | | | |
| Common Share Price | | $ | 16.53 | |
| Common Share Net Asset Value (NAV) | | $ | 16.11 | |
| Premium/(Discount) to NAV | | | 2.61 | % |
| Market Yield | | | 4.75 | % |
Taxable-Equivalent Yield1 | | | 7.05 | % |
| Net Assets Applicable to Common Shares ($000) | | $ | 105,838 | |
| | | | | |
| Leverage | | | | |
| Regulatory Leverage | | | 29.77 | % |
| Effective Leverage | | | 32.11 | % |
| Average Annual Total Returns | | | | | | | |
| (Inception 3/27/01) | | | | | | | |
| | | On Share Price | | On NAV |
| 6-Month (Cumulative) | | | 13.62 | % | | 7.87 | % |
| 1-Year | | | 32.09 | % | | 17.61 | % |
| 5-Year | | | 10.54 | % | | 7.63 | % |
| 10-Year | | | 8.18 | % | | 7.07 | % |
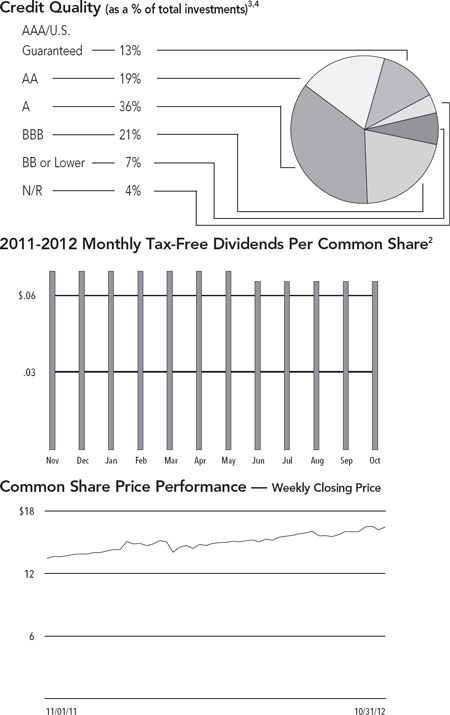
Portfolio Composition4 | | | | |
| (as a % of total investments) | | | | |
| Tax Obligation/Limited | | | 26.3 | % |
| U.S. Guaranteed | | | 18.1 | % |
| Transportation | | | 13.2 | % |
| Health Care | | | 10.6 | % |
| Water and Sewer | | | 8.3 | % |
| Education and Civic Organizations | | | 7.4 | % |
| Consumer Staples | | | 4.0 | % |
| Other | | | 12.1 | % |
| | Refer to the Glossary of Terms Used in this Report for further definition of the terms used within this Fund’s Performance Overview page. |
| 1 | Taxable-Equivalent Yield represents the yield that must be earned on a fully taxable investment in order to equal the yield of the Fund on an after-tax basis. It is based on a combined federal and state income tax rate of 32.6%. When comparing this Fund to investments that generate qualified dividend income, the Taxable-Equivalent Yield is lower. |
| 2 | The Fund paid shareholders a capital gains distribution in December 2011 of $0.0054 per share. |
| 3 | Ratings shown are the highest rating given by one of the following national rating agencies: Standard & Poor’s, Moody’s Investors Service, Inc. or Fitch, Inc. Credit ratings are subject to change. AAA, AA, A, and BBB are investment grade ratings; BB, B, CCC, CC, C and D are below-investment grade ratings. Certain bonds backed by U.S. Government or agency securities are regarded as having an implied rating equal to the rating of such securities. Holdings designated N/R are not rated by these national rating agencies. |
| 4 | Holdings are subject to change. |
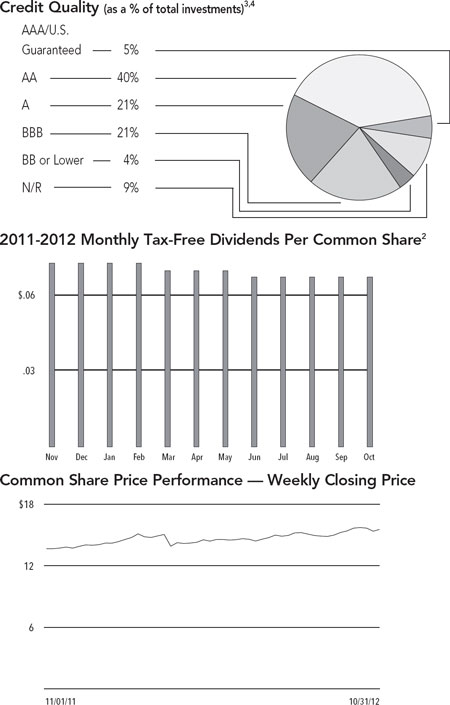
| NUJ | | Nuveen New Jersey |
| Performance | | Dividend Advantage |
| OVERVIEW | | Municipal Fund 2 |
| | | as of October 31, 2012 |
| Fund Snapshot | | | | |
| Common Share Price | | $ | 16.50 | |
| Common Share Net Asset Value (NAV) | | $ | 15.67 | |
| Premium/(Discount) to NAV | | | 5.30 | % |
| Market Yield | | | 4.84 | % |
Taxable-Equivalent Yield1 | | | 7.18 | % |
| Net Assets Applicable to Common Shares ($000) | | $ | 70,925 | |
| | | | | |
| Leverage | | | | |
| Regulatory Leverage | | | 33.07 | % |
| Effective Leverage | | | 34.74 | % |
| Average Annual Total Returns | | | | | | | |
| (Inception 3/25/02) | | | | | | | |
| | | On Share Price | | On NAV |
| 6-Month (Cumulative) | | | 7.62 | % | | 5.70 | % |
| 1-Year | | | 26.78 | % | | 15.50 | % |
| 5-Year | | | 9.94 | % | | 7.20 | % |
| 10-Year | | | 7.96 | % | | 6.90 | % |
Portfolio Composition4 | | | | |
| (as a % of total investments) | | | | |
| Tax Obligation/Limited | | | 25.2 | % |
| Health Care | | | 18.8 | % |
| Transportation | | | 14.2 | % |
| U.S. Guaranteed | | | 10.7 | % |
| Education and Civic Organizations | | | 7.5 | % |
| Long-Term Care | | | 5.7 | % |
| Consumer Staples | | | 4.1 | % |
| Other | | | 13.8 | % |
| | Refer to the Glossary of Terms Used in this Report for further definition of the terms used within this Fund’s Performance Overview page. |
| 1 | Taxable-Equivalent Yield represents the yield that must be earned on a fully taxable investment in order to equal the yield of the Fund on an after-tax basis. It is based on a combined federal and state income tax rate of 32.6%. When comparing this Fund to investments that generate qualified dividend income, the Taxable-Equivalent Yield is lower. |
| 2 | The Fund paid shareholders a capital gains distribution in December 2011 of $0.0087 per share. |
| 3 | Ratings shown are the highest rating given by one of the following national rating agencies: Standard & Poor’s, Moody’s Investors Service, Inc. or Fitch, Inc. Credit ratings are subject to change. AAA, AA, A, and BBB are investment grade ratings; BB, B, CCC, CC, C and D are below-investment grade ratings. Certain bonds backed by U.S. Government or agency securities are regarded as having an implied rating equal to the rating of such securities. Holdings designated N/R are not rated by these national rating agencies. |
| 4 | Holdings are subject to change. |
| NJV | | Nuveen New Jersey |
| Performance | | Municipal Value |
| OVERVIEW | | Fund |
| | | as of October 31, 2012 |
| Fund Snapshot | | | | |
| Common Share Price | | $ | 17.17 | |
| Common Share Net Asset Value (NAV) | | $ | 17.07 | |
| Premium/(Discount) to NAV | | | 0.59 | % |
| Market Yield | | | 3.77 | % |
Taxable-Equivalent Yield1 | | | 5.59 | % |
| Net Assets Applicable to Common Shares ($000) | | $ | 26,673 | |
| | | | | |
| Leverage | | | | |
| Regulatory Leverage | | | N/A | |
| Effective Leverage | | | 5.32 | % |
| Average Annual Total Returns | | | | | | | |
| (Inception 4/28/09) | | | | | | | |
| | | On Share Price | | On NAV |
| 6-Month (Cumulative) | | | 7.23 | % | | 4.79 | % |
| 1-Year | | | 19.87 | % | | 14.89 | % |
| Since Inception | | | 9.11 | % | | 10.18 | % |
Portfolio Composition3 | | | | |
| (as a % of total investments) | | | | |
| Tax Obligation/Limited | | | 30.1 | % |
| Health Care | | | 24.1 | % |
| Tax Obligation/General | | | 9.0 | % |
| Education and Civic Organizations | | | 8.5 | % |
| U.S. Guaranteed | | | 8.2 | % |
| Consumer Staples | | | 6.1 | % |
| Transportation | | | 5.6 | % |
| Other | | | 8.4 | % |
| | Refer to the Glossary of Terms Used in this Report for further definition of the terms used within this Fund’s Performance Overview page. |
| 1 | Taxable-Equivalent Yield represents the yield that must be earned on a fully taxable investment in order to equal the yield of the Fund on an after-tax basis. It is based on a combined federal and state income tax rate of 32.6%. When comparing this Fund to investments that generate qualified dividend income, the Taxable-Equivalent Yield is lower. |
| 2 | Ratings shown are the highest rating given by one of the following national rating agencies: Standard & Poor’s, Moody’s Investors Service, Inc. or Fitch, Inc. Credit ratings are subject to change. AAA, AA, A, and BBB are investment grade ratings; BB, B, CCC, CC, C and D are below-investment grade ratings. Certain bonds backed by U.S. Government or agency securities are regarded as having an implied rating equal to the rating of such securities. Holdings designated N/R are not rated by these national rating agencies. |
| 3 | Holdings are subject to change. |
| N/A | The Fund does not use regulatory leverage. |
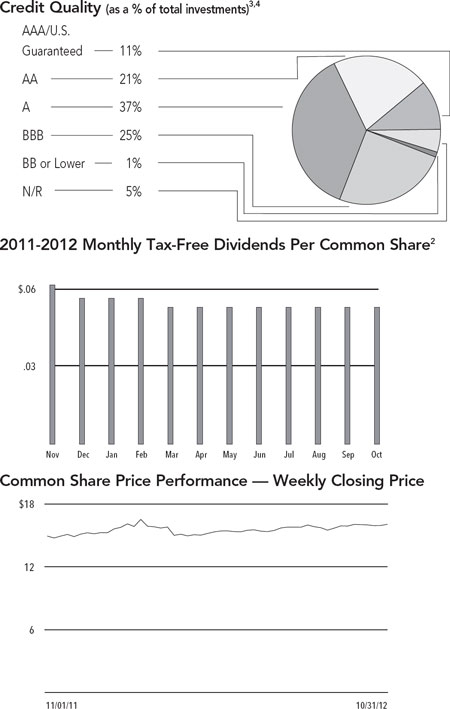
| NQP | | Nuveen Pennsylvania |
| Performance | | Investment Quality |
| OVERVIEW | | Municipal Fund |
| | | as of October 31, 2012 |
| Fund Snapshot | | | | |
| Common Share Price | | $ | 16.47 | |
| Common Share Net Asset Value (NAV) | | $ | 16.28 | |
| Premium/(Discount) to NAV | | | 1.17 | % |
| Market Yield | | | 5.68 | % |
Taxable-Equivalent Yield1 | | | 8.14 | % |
| Net Assets Applicable to Common Shares ($000) | | $ | 262,091 | |
| | | | | |
| Leverage | | | | |
| Regulatory Leverage | | | 30.03 | % |
| Effective Leverage | | | 37.11 | % |
| Average Annual Total Returns | | | | | | | |
| (Inception 2/21/91) | | | | | | | |
| | | On Share Price | | On NAV |
| 6-Month (Cumulative) | | | 8.21 | % | | 6.20 | % |
| 1-Year | | | 22.61 | % | | 16.14 | % |
| 5-Year | | | 10.61 | % | | 7.81 | % |
| 10-Year | | | 7.61 | % | | 6.51 | % |
Portfolio Composition3 | | | | |
| (as a % of total investments) | | | | |
| Tax Obligation/General | | | 24.1 | % |
| Health Care | | | 16.9 | % |
| Education and Civic Organizations | | | 15.4 | % |
| Transportation | | | 8.5 | % |
| U.S. Guaranteed | | | 6.9 | % |
| Utilities | | | 5.5 | % |
| Housing/Single Family | | | 5.4 | % |
| Water and Sewer | | | 4.9 | % |
| Other | | | 12.4 | % |
| | Refer to the Glossary of Terms Used in this Report for further definition of the terms used within this Fund’s Performance Overview page. |
| 1 | Taxable-Equivalent Yield represents the yield that must be earned on a fully taxable investment in order to equal the yield of the Fund on an after-tax basis. It is based on a combined federal and state income tax rate of 30.2%. When comparing this Fund to investments that generate qualified dividend income, the Taxable-Equivalent Yield is lower. |
| 2 | Ratings shown are the highest rating given by one of the following national rating agencies: Standard & Poor’s, Moody’s Investors Service, Inc. or Fitch, Inc. Credit ratings are subject to change. AAA, AA, A, and BBB are investment grade ratings; BB, B, CCC, CC, C and D are below-investment grade ratings. Certain bonds backed by U.S. Government or agency securities are regarded as having an implied rating equal to the rating of such securities. Holdings designated N/R are not rated by these national rating agencies. |
| 3 | Holdings are subject to change. |
| NPY | | Nuveen Pennsylvania |
| Performance | | Premium Income |
| OVERVIEW | | Municipal Fund 2 |
| | | as of October 31, 2012 |
| Fund Snapshot | | | | |
| Common Share Price | | $ | 15.17 | |
| Common Share Net Asset Value (NAV) | | $ | 15.55 | |
| Premium/(Discount) to NAV | | | -2.44 | % |
| Market Yield | | | 5.54 | % |
Taxable-Equivalent Yield1 | | | 7.94 | % |
| Net Assets Applicable to Common Shares ($000) | | $ | 242,547 | |
| | | | | |
| Leverage | | | | |
| Regulatory Leverage | | | 29.19 | % |
| Effective Leverage | | | 35.10 | % |
| Average Annual Total Returns | | | | | | | |
| (Inception 3/18/93) | | | | | | | |
| | | On Share Price | | On NAV |
| 6-Month (Cumulative) | | | 7.51 | % | | 5.53 | % |
| 1-Year | | | 20.70 | % | | 14.76 | % |
| 5-Year | | | 10.22 | % | | 7.44 | % |
| 10-Year | | | 7.25 | % | | 6.32 | % |
Portfolio Composition3 | | | | |
| (as a % of total investments) | | | | |
| Health Care | | | 18.3 | % |
| Education and Civic Organizations | | | 17.4 | % |
| Tax Obligation/General | | | 16.8 | % |
| U.S. Guaranteed | | | 10.2 | % |
| Water and Sewer | | | 8.7 | % |
| Transportation | | | 7.7 | % |
| Long-Term Care | | | 4.5 | % |
| Tax Obligation/Limited | | | 4.5 | % |
| Other | | | 11.9 | % |
| | Refer to the Glossary of Terms Used in this Report for further definition of the terms used within this Fund’s Performance Overview page. |
| 1 | Taxable-Equivalent Yield represents the yield that must be earned on a fully taxable investment in order to equal the yield of the Fund on an after-tax basis. It is based on a combined federal and state income tax rate of 30.2%. When comparing this Fund to investments that generate qualified dividend income, the Taxable-Equivalent Yield is lower. |
| 2 | Ratings shown are the highest rating given by one of the following national rating agencies: Standard & Poor’s, Moody’s Investors Service, Inc. or Fitch, Inc. Credit ratings are subject to change. AAA, AA, A, and BBB are investment grade ratings; BB, B, CCC, CC, C and D are below-investment grade ratings. Certain bonds backed by U.S. Government or agency securities are regarded as having an implied rating equal to the rating of such securities. Holdings designated N/R are not rated by these national rating agencies. |
| 3 | Holdings are subject to change. |
| NXM | | Nuveen Pennsylvania |
| Performance | | Dividend Advantage |
| OVERVIEW | | Municipal Fund |
| | | as of October 31, 2012 |
| Fund Snapshot | | | | |
| Common Share Price | | $ | 15.57 | |
| Common Share Net Asset Value (NAV) | | $ | 15.92 | |
| Premium/(Discount) to NAV | | | -2.20 | % |
| Market Yield | | | 5.16 | % |
Taxable-Equivalent Yield1 | | | 7.39 | % |
| Net Assets Applicable to Common Shares ($000) | | $ | 52,874 | |
| | | | | |
| Leverage | | | | |
| Regulatory Leverage | | | 30.49 | % |
| Effective Leverage | | | 33.85 | % |
| Average Annual Total Returns | | | | | | | |
| (Inception 3/27/01) | | | | | | | |
| | | On Share Price | | On NAV |
| 6-Month (Cumulative) | | | 10.90 | % | | 5.78 | % |
| 1-Year | | | 23.51 | % | | 14.69 | % |
| 5-Year | | | 9.38 | % | | 7.26 | % |
| 10-Year | | | 7.40 | % | | 6.76 | % |
Portfolio Composition4 | | | | |
| (as a % of total investments) | | | | |
| Health Care | | | 18.8 | % |
| Tax Obligation/General | | | 16.5 | % |
| Education and Civic Organizations | | | 16.3 | % |
| Long-Term Care | | | 11.0 | % |
| Tax Obligation/Limited | | | 8.7 | % |
| Transportation | | | 6.1 | % |
| Water and Sewer | | | 4.9 | % |
| U.S. Guaranteed | | | 4.6 | % |
| Other | | | 13.1 | % |
| | Refer to the Glossary of Terms Used in this Report for further definition of the terms used within this Fund’s Performance Overview page. |
| 1 | Taxable-Equivalent Yield represents the yield that must be earned on a fully taxable investment in order to equal the yield of the Fund on an after-tax basis. It is based on a combined federal and state income tax rate of 30.2%. When comparing this Fund to investments that generate qualified dividend income, the Taxable-Equivalent Yield is lower. |
| 2 | The Fund paid shareholders a capital gains distribution in December 2011 of $0.0645 per share. |
| 3 | Ratings shown are the highest rating given by one of the following national rating agencies: Standard & Poor’s, Moody’s Investors Service, Inc. or Fitch, Inc. Credit ratings are subject to change. AAA, AA, A, and BBB are investment grade ratings; BB, B, CCC, CC, C and D are below-investment grade ratings. Certain bonds backed by U.S. Government or agency securities are regarded as having an implied rating equal to the rating of such securities. Holdings designated N/R are not rated by these national rating agencies. |
| 4 | Holdings are subject to change. |
| NVY | | Nuveen Pennsylvania |
| Performance | | Dividend Advantage |
| OVERVIEW | | Municipal Fund 2 |
| | | as of October 31, 2012 |
| Fund Snapshot | | | | |
| Common Share Price | | $ | 15.60 | |
| Common Share Net Asset Value (NAV) | | $ | 15.62 | |
| Premium/(Discount) to NAV | | | -0.13 | % |
| Market Yield | | | 5.73 | % |
Taxable-Equivalent Yield1 | | | 8.21 | % |
| Net Assets Applicable to Common Shares ($000) | | $ | 58,195 | |
| | | | | |
| Leverage | | | | |
| Regulatory Leverage | | | 29.67 | % |
| Effective Leverage | | | 35.53 | % |
| Average Annual Total Returns | | | | | | | |
| (Inception 3/25/02) | | | | | | | |
| | | On Share Price | | On NAV |
| 6-Month (Cumulative) | | | 7.81 | % | | 5.90 | % |
| 1-Year | | | 23.45 | % | | 14.54 | % |
| 5-Year | | | 9.52 | % | | 7.02 | % |
| 10-Year | | | 6.88 | % | | 6.49 | % |
Portfolio Composition4 | | | | |
| (as a % of total investments) | | | | |
| Education and Civic Organizations | | | 17.6 | % |
| Health Care | | | 16.3 | % |
| Tax Obligation/General | | | 16.1 | % |
| Tax Obligation/Limited | | | 13.1 | % |
| Water and Sewer | | | 8.7 | % |
| Transportation | | | 7.2 | % |
| Long-Term Care | | | 6.6 | % |
| Other | | | 14.4 | % |
| | Refer to the Glossary of Terms Used in this Report for further definition of the terms used within this Fund’s Performance Overview page. |
| 1 | Taxable-Equivalent Yield represents the yield that must be earned on a fully taxable investment in order to equal the yield of the Fund on an after-tax basis. It is based on a combined federal and state income tax rate of 30.2%. When comparing this Fund to investments that generate qualified dividend income, the Taxable-Equivalent Yield is lower. |
| 2 | The Fund paid shareholders a capital gains distribution in December 2011 of $0.0619 per share. |
| 3 | Ratings shown are the highest rating given by one of the following national rating agencies: Standard & Poor’s, Moody’s Investors Service, Inc. or Fitch, Inc. Credit ratings are subject to change. AAA, AA, A, and BBB are investment grade ratings; BB, B, CCC, CC, C and D are below-investment grade ratings. Certain bonds backed by U.S. Government or agency securities are regarded as having an implied rating equal to the rating of such securities. Holdings designated N/R are not rated by these national rating agencies. |
| 4 | Holdings are subject to change. |
| NPN | | Nuveen Pennsylvania |
| Performance | | Municipal Value Fund |
| OVERVIEW | | |
| | | as of October 31, 2012 |
| Fund Snapshot | | | | |
| Common Share Price | | $ | 16.02 | |
| Common Share Net Asset Value (NAV) | | $ | 16.82 | |
| Premium/(Discount) to NAV | | | -4.76 | % |
| Market Yield | | | 3.97 | % |
Taxable-Equivalent Yield1 | | | 5.69 | % |
| Net Assets Applicable to Common Shares ($000) | | $ | 20,510 | |
| | | | | |
| Leverage | | | | |
| Regulatory Leverage | | | N/A | |
| Effective Leverage | | | 1.65 | % |
| Average Annual Total Returns | | | | | | | |
| (Inception 4/28/09) | | | | | | | |
| | | On Share Price | | On NAV |
| 6-Month (Cumulative) | | | 6.28 | % | | 4.79 | % |
| 1-Year | | | 13.28 | % | | 12.16 | % |
| Since Inception | | | 6.88 | % | | 9.65 | % |
Portfolio Composition4 | | | | |
| (as a % of total investments) | | | | |
| Health Care | | | 22.7 | % |
| Tax Obligation/Limited | | | 19.7 | % |
| Water and Sewer | | | 12.3 | % |
| Education and Civic Organizations | | | 10.8 | % |
| Tax Obligation/General | | | 8.2 | % |
| Transportation | | | 6.1 | % |
| Housing/Multifamily | | | 4.6 | % |
| Long-Term Care | | | 4.4 | % |
| Other | | | 11.2 | % |
| | Refer to the Glossary of Terms Used in this Report for further definition of the terms used within this Fund’s Performance Overview page. |
| 1 | Taxable-Equivalent Yield represents the yield that must be earned on a fully taxable investment in order to equal the yield of the Fund on an after-tax basis. It is based on a combined federal and state income tax rate of 30.2%. When comparing this Fund to investments that generate qualified dividend income, the Taxable-Equivalent Yield is lower. |
| 2 | The Fund paid shareholders a capital gains distribution in December 2011 of $0.0229 per share. |
| 3 | Ratings shown are the highest rating given by one of the following national rating agencies: Standard & Poor’s, Moody’s Investors Service, Inc. or Fitch, Inc. Credit ratings are subject to change. AAA, AA, A, and BBB are investment grade ratings; BB, B, CCC, CC, C and D are below-investment grade ratings. Certain bonds backed by U.S. Government or agency securities are regarded as having an implied rating equal to the rating of such securities. Holdings designated N/R are not rated by these national rating agencies. |
| 4 | Holdings are subject to change. |
| N/A | The Fund does not use regulatory leverage. |
| | | Nuveen New Jersey Investment Quality Municipal Fund, Inc. |
| NQJ | | Portfolio of Investments |
| | | October 31, 2012 (Unaudited) |
| | Principal | | | Optional Call | | | | |
| | Amount (000) | | Description (1) | Provisions (2) | Ratings (3) | | Value | |
| | | | Consumer Discretionary – 0.3% (0.2% of Total Investments) | | | | | |
| | | | Middlesex County Improvement Authority, New Jersey, Senior Revenue Bonds, Heldrich Center Hotel/Conference Center Project, Series 2005A: | | | | | |
| $ | 800 | | 5.000%, 1/01/32 | 1/15 at 100.00 | B3 | $ | 519,088 | |
| | 690 | | 5.125%, 1/01/37 | 1/15 at 100.00 | B3 | | 447,748 | |
| | 1,490 | | Total Consumer Discretionary | | | | 966,836 | |
| | | | Consumer Staples – 5.4% (3.8% of Total Investments) | | | | | |
| | | | Tobacco Settlement Financing Corporation, New Jersey, Tobacco Settlement Asset-Backed Bonds, Series 2007-1A: | | | | | |
| | 2,900 | | 4.500%, 6/01/23 | 6/17 at 100.00 | B1 | | 2,837,766 | |
| | 12,105 | | 4.750%, 6/01/34 | 6/17 at 100.00 | B2 | | 10,497,333 | |
| | 4,820 | | 5.000%, 6/01/41 | 6/17 at 100.00 | B2 | | 4,218,030 | |
| | 19,825 | | Total Consumer Staples | | | | 17,553,129 | |
| | | | Education and Civic Organizations – 15.5% (10.9% of Total Investments) | | | | | |
| | 1,000 | | New Jersey Economic Development Authority, Revenue Bonds, The Seeing Eye Inc., Series 2005, 5.000%, 12/01/24 – AMBAC Insured | 6/15 at 100.00 | N/R | | 1,060,130 | |
| | 2,000 | | New Jersey Educational Facilities Authority, Revenue Bonds, Fairleigh Dickinson University, Series 2002D, 5.250%, 7/01/32 – ACA Insured | 7/13 at 100.00 | BBB | | 2,015,640 | |
| | 500 | | New Jersey Educational Facilities Authority, Revenue Bonds, Fairleigh Dickinson University, Series 2004C, 5.500%, 7/01/23 | 7/14 at 100.00 | BBB | | 516,685 | |
| | 1,000 | | New Jersey Educational Facilities Authority, Revenue Bonds, Georgian Court University, Series 2007D, 5.000%, 7/01/27 | 7/17 at 100.00 | BBB | | 1,066,020 | |
| | | | New Jersey Educational Facilities Authority, Revenue Bonds, Kean University, Series 2007D: | | | | | |
| | 3,555 | | 5.000%, 7/01/32 – FGIC Insured | 7/17 at 100.00 | A2 | | 3,827,811 | |
| | 2,295 | | 5.000%, 7/01/39 – FGIC Insured | 7/17 at 100.00 | A2 | | 2,464,945 | |
| | 120 | | New Jersey Educational Facilities Authority, Revenue Bonds, Montclair State University, Series 2004L, 5.125%, 7/01/22 – NPFG Insured | 7/14 at 100.00 | AA– | | 128,512 | |
| | 1,225 | | New Jersey Educational Facilities Authority, Revenue Bonds, Montclair State University, Series 2005F, 5.000%, 7/01/16 – FGIC Insured | 7/15 at 100.00 | A1 | | 1,352,584 | |
| | 2,770 | | New Jersey Educational Facilities Authority, Revenue Bonds, Montclair State University, Series 2006A, 5.000%, 7/01/36 – AMBAC Insured | 7/16 at 100.00 | AA– | | 2,927,807 | |
| | 1,500 | | New Jersey Educational Facilities Authority, Revenue Bonds, Passaic County Community College, Series 2010C, 5.250%, 7/01/32 | 7/20 at 100.00 | A2 | | 1,717,950 | |
| | 2,000 | | New Jersey Educational Facilities Authority, Revenue Bonds, Princeton University, Tender Option Bond Trust 3922, 13.401%, 7/01/19 (IF) | No Opt Call | AAA | | 3,056,840 | |
| | 1,495 | | New Jersey Educational Facilities Authority, Revenue Bonds, Ramapo College, Series 2004H, 5.000%, 7/01/16 – FGIC Insured | 7/14 at 100.00 | A | | 1,589,723 | |
| | 750 | | New Jersey Educational Facilities Authority, Revenue Bonds, Ramapo College, Series 2012B, 5.000%, 7/01/42 | 7/22 at 100.00 | A | | 853,763 | |
| | | | New Jersey Educational Facilities Authority, Revenue Bonds, Rider University, Series 2012A: | | | | | |
| | 430 | | 5.000%, 7/01/32 | 7/21 at 100.00 | BBB+ | | 475,636 | |
| | 285 | | 5.000%, 7/01/37 | 7/21 at 100.00 | BBB+ | | 310,807 | |
| | | | New Jersey Educational Facilities Authority, Revenue Refunding Bonds, College of New Jersey, Series 2012A: | | | | | |
| | 200 | | 5.000%, 7/01/18 | No Opt. Call | AA | | 240,600 | |
| | 400 | | 5.000%, 7/01/19 | No Opt. Call | AA | | 487,644 | |
| | 2,000 | | New Jersey Higher Education Assistance Authority, Student Loan Revenue Bonds, Series 2000A, 6.125%, 6/01/17 – NPFG Insured (Alternative Minimum Tax) | 12/12 at 100.00 | Aaa | | 2,006,740 | |
| | 2,000 | | New Jersey Higher Education Assistance Authority, Student Loan Revenue Bonds, Series 2008A, 6.125%, 6/01/30 – AGC Insured (Alternative Minimum Tax) | 6/18 at 100.00 | AA– | | 2,232,420 | |
| | 720 | | New Jersey Higher Education Assistance Authority, Student Loan Revenue Bonds, Series 2010-1A, 5.000%, 12/01/25 | 12/19 at 100.00 | AA | | 793,246 | |
| | 450 | | New Jersey Higher Education Assistance Authority, Student Loan Revenue Bonds, Series 2010-2, 5.000%, 12/01/30 | 12/20 at 100.00 | Aa3 | | 500,670 | |
| | | Nuveen New Jersey Investment Quality Municipal Fund, Inc. (continued) |
| NQJ | | Portfolio of Investments |
October 31, 2012 (Unaudited)
| | Principal | | | Optional Call | | | | |
| | Amount (000) | | Description (1) | Provisions (2) | Ratings (3) | | Value | |
| | | | Education and Civic Organizations (continued) | | | | | |
| $ | 875 | | New Jersey Higher Education Assistance Authority, Student Loan Revenue Bonds, Series 2011-1, 5.750%, 12/01/27 (Alternative Minimum Tax) | 12/21 at 100.00 | Aa3 | $ | 1,023,094 | |
| | 3,370 | | New Jersey Higher Education Assistance Authority, Student Loan Revenue Bonds, Series 2012-1A, 4.250%, 12/01/25 (Alternative Minimum Tax) | 12/22 at 100.00 | AA | | 3,508,878 | |
| | 950 | | New Jersey Higher Education Assistance Authority, Student Loan Revenue Bonds, Tender Option Bond Trust PA-4643, 19.767%, 6/01/30 (IF) (4) | 6/19 at 100.00 | AA | | 1,460,416 | |
| | 200 | | Puerto Rico Industrial, Tourist, Educational, Medical and Environmental Control Facilities Financing Authority, Higher Education Revenue Bonds, Inter-American University of Puerto Rico Project, Refunding Series 2012, 5.000%, 10/01/31 | 10/22 at 100.00 | A– | | 220,278 | |
| | 4,235 | | Puerto Rico Industrial, Tourist, Educational, Medical and Environmental Control Facilities Financing Authority, Higher Education Revenue Bonds, University of the Sacred Heart, Series 2001, 5.250%, 9/01/21 | 3/13 at 100.00 | BBB | | 4,242,200 | |
| | | | University of Medicine and Dentistry of New Jersey, Certificates of Participation, Child Health Institute, LLC, Series 2003: | | | | | |
| | 1,945 | | 5.000%, 4/15/20 – AMBAC Insured | 4/13 at 100.00 | BBB+ | | 1,966,687 | |
| | 1,370 | | 5.000%, 4/15/22 – AMBAC Insured | 4/13 at 100.00 | BBB+ | | 1,382,645 | |
| | | | University of Medicine and Dentistry of New Jersey, Revenue Bonds, Series 2002A: | | | | | |
| | 2,100 | | 5.000%, 12/01/24 – AMBAC Insured | 12/12 at 100.00 | A– | | 2,106,636 | |
| | 4,000 | | 5.500%, 12/01/27 – AMBAC Insured | 12/12 at 100.00 | A– | | 4,013,800 | |
| | 290 | | 5.000%, 12/01/31 – AMBAC Insured | 12/12 at 100.00 | A– | | 290,687 | |
| | 46,030 | | Total Education and Civic Organizations | | | | 49,841,494 | |
| | | | Financials – 1.7% (1.2% of Total Investments) | | | | | |
| | 5,000 | | New Jersey Economic Development Authority, Revenue Refunding Bonds, Kapkowski Road Landfill Project, Series 2002, 5.750%, 10/01/21 | No Opt. Call | Ba2 | | 5,563,400 | |
| | | | Health Care – 21.3% (15.0% of Total Investments) | | | | | |
| | 1,000 | | Camden County Improvement Authority, New Jersey, Revenue Bonds, Cooper Health System, Series 2004A, 5.750%, 2/15/34 | 8/14 at 100.00 | BBB | | 1,035,020 | |
| | 2,090 | | Camden County Improvement Authority, New Jersey, Revenue Bonds, Cooper Health System, Series 2005A, 5.000%, 2/15/25 | 2/15 at 100.00 | BBB | | 2,170,089 | |
| | 2,320 | | New Jersey Health Care Facilities Finance Authority, Revenue Bonds, AHS Hospital Corporation, Series 2008A, 5.000%, 7/01/27 | 7/18 at 100.00 | A1 | | 2,533,510 | |
| | 5,750 | | New Jersey Health Care Facilities Financing Authority, FHA-Insured Mortgage Revenue Bonds, Jersey City Medical Center, Series 2001, 5.000%, 8/01/41 – AMBAC Insured | 2/13 at 100.00 | N/R | | 5,754,945 | |
| | 1,175 | | New Jersey Health Care Facilities Financing Authority, Hospital Revenue Bonds, Virtua Health, Tender Option Bond Trust 3018, 19.251%, 7/01/38 – AGC Insured (IF) (4) | 7/19 at 100.00 | AA– | | 1,727,908 | |
| | 1,000 | | New Jersey Health Care Facilities Financing Authority, New Jersey, Revenue Bonds, Saint Peters University Hospital, Refunding Series 2011, 6.250%, 7/01/35 | 7/21 at 100.00 | BBB– | | 1,131,650 | |
| | 2,000 | | New Jersey Health Care Facilities Financing Authority, New Jersey, Revenue Bonds, Saint Peters University Hospital, Series 2007, 5.750%, 7/01/37 | 7/18 at 100.00 | BBB– | | 2,128,320 | |
| | 3,750 | | New Jersey Health Care Facilities Financing Authority, Revenue Bonds, Atlanticare Regional Medical Center, Series 2007, 5.000%, 7/01/37 | 7/17 at 100.00 | A+ | | 3,964,425 | |
| | 1,265 | | New Jersey Health Care Facilities Financing Authority, Revenue Bonds, CentraState Medical Center, Series 2006A, 5.000%, 7/01/30 – AGC Insured | 7/17 at 100.00 | Aa3 | | 1,357,535 | |
| | 400 | | New Jersey Health Care Facilities Financing Authority, Revenue Bonds, Children’s Specialized Hospital, Series 2005A, 5.500%, 7/01/36 | 7/15 at 100.00 | BBB | | 411,896 | |
| | 695 | | New Jersey Health Care Facilities Financing Authority, Revenue Bonds, Hunterdon Medical Center, Series 2006B, 5.000%, 7/01/36 | 7/16 at 100.00 | A | | 718,088 | |
| | 615 | | New Jersey Health Care Facilities Financing Authority, Revenue Bonds, Hunterdon Medical Center, Series 2006, 5.125%, 7/01/35 | 7/16 at 100.00 | A | | 639,090 | |
| | Principal | | | Optional Call | | | | |
| | Amount (000) | | Description (1) | Provisions (2) | Ratings (3) | | Value | |
| | | | Health Care (continued) | | | | | |
| | | | New Jersey Health Care Facilities Financing Authority, Revenue Bonds, Kennedy Health System Obligated Group Issue, Refunding Series 2012: | | | | | |
| $ | 500 | | 3.750%, 7/01/27 | No Opt. Call | A3 | $ | 506,190 | |
| | 1,375 | | 5.000%, 7/01/31 | 7/22 at 100.00 | A3 | | 1,519,678 | |
| | 1,500 | | 5.000%, 7/01/37 | 7/22 at 100.00 | A3 | | 1,641,240 | |
| | | | New Jersey Health Care Facilities Financing Authority, Revenue Bonds, Meridian Health System Obligated Group, Refunding Series 2011: | | | | | |
| | 3,000 | | 5.000%, 7/01/25 | 7/18 at 100.00 | A | | 3,463,350 | |
| | 1,760 | | 5.000%, 7/01/26 | 7/22 at 100.00 | A | | 2,014,461 | |
| | 3,545 | | New Jersey Health Care Facilities Financing Authority, Revenue Bonds, Meridian Health, Series 2007-I, 5.000%, 7/01/38 – AGC Insured | 7/18 at 100.00 | AA– | | 3,811,300 | |
| | | | New Jersey Health Care Facilities Financing Authority, Revenue Bonds, RWJ Health Care Corporation, Series 2005B: | | | | | |
| | 1,495 | | 5.000%, 7/01/25 – RAAI Insured | 7/15 at 100.00 | N/R | | 1,515,183 | |
| | 1,585 | | 5.000%, 7/01/35 – RAAI Insured | 7/15 at 100.00 | N/R | | 1,598,853 | |
| | 3,160 | | New Jersey Health Care Facilities Financing Authority, Revenue Bonds, Saint Barnabas Health Care System, Refunding Series 2011A, 5.625%, 7/01/37 | 7/21 at 100.00 | BBB+ | | 3,558,666 | |
| | 1,885 | | New Jersey Health Care Facilities Financing Authority, Revenue Bonds, Saint Barnabas Health Care System, Series 2006A, 5.000%, 7/01/29 | 1/17 at 100.00 | BBB+ | | 1,948,543 | |
| | 2,300 | | New Jersey Health Care Facilities Financing Authority, Revenue Bonds, Saint Joseph’s Healthcare System Obligated Group Issue, Series 2008, 6.625%, 7/01/38 | 7/18 at 100.00 | BBB– | | 2,670,898 | |
| | 2,850 | | New Jersey Health Care Facilities Financing Authority, Revenue Bonds, Shore Memorial Health System, Series 2003, 5.000%, 7/01/23 – RAAI Insured | 7/13 at 100.00 | N/R | | 2,862,056 | |
| | 3,300 | | New Jersey Health Care Facilities Financing Authority, Revenue Bonds, Somerset Medical Center, Series 2003, 5.500%, 7/01/33 | 7/13 at 100.00 | Ba2 | | 3,315,609 | |
| | | | New Jersey Health Care Facilities Financing Authority, Revenue Bonds, South Jersey Hospital System, Refunding Series 2006: | | | | | |
| | 670 | | 5.000%, 7/01/25 | 7/16 at 100.00 | A2 | | 709,121 | |
| | 4,410 | | 5.000%, 7/01/36 | 7/16 at 100.00 | A2 | | 4,588,561 | |
| | 1,295 | | 5.000%, 7/01/46 | 7/16 at 100.00 | A2 | | 1,342,889 | |
| | 3,135 | | New Jersey Health Care Facilities Financing Authority, Revenue Refunding Bonds, Bayshore Community Hospital, Series 2002, 5.125%, 7/01/32 – RAAI Insured | 11/12 at 100.00 | N/R | | 3,135,752 | |
| | 1,425 | | New Jersey Health Care Facilities Financing Authority, Revenue Refunding Bonds, St. Barnabas Healthcare System - West Hudson Hospital Obligated Group, Series 1998A, 5.000%, 7/01/23 – NPFG Insured | 1/13 at 100.00 | BBB+ | | 1,426,297 | |
| | 3,425 | | Newark, New Jersey, GNMA Collateralized Healthcare Facility Revenue Bonds, New Community Urban Renewal Corporation, Series 2001A, 5.200%, 6/01/30 | 6/14 at 100.00 | Aaa | | 3,500,384 | |
| | 64,675 | | Total Health Care | | | | 68,701,507 | |
| | | | Housing/Multifamily – 1.9% (1.3% of Total Investments) | | | | | |
| | | | New Jersey Economic Development Authority, Student Housing Revenue Bonds, Provident Group-Montclair Properties LLC, Montclair State University Student Housing Project, Series 2010A: | | | | | |
| | 1,830 | | 5.750%, 6/01/31 | 6/20 at 100.00 | Baa3 | | 2,068,284 | |
| | 1,050 | | 5.875%, 6/01/42 | 6/20 at 100.00 | Baa3 | | 1,174,730 | |
| | 2,743 | | Newark Housing Authority, New Jersey, GNMA Collateralized Housing Revenue Bonds, Fairview Apartments Project, Series 2000A, 6.400%, 10/20/34 (Alternative Minimum Tax) | 4/13 at 100.00 | Aaa | | 2,748,277 | |
| | 5,623 | | Total Housing/Multifamily | | | | 5,991,291 | |
| | | | Housing/Single Family – 4.9% (3.4% of Total Investments) | | | | | |
| | 10,000 | | New Jersey Housing & Mortgage Finance Agency, Single Family Home Mortgage Revenue Bonds, Series 2011A, 4.450%, 10/01/25 | 10/21 at 100.00 | Aa1 | | 11,081,498 | |
| | 335 | | New Jersey Housing and Mortgage Finance Agency, Single Family Housing Revenue Bonds, Series 2007T, 4.700%, 10/01/37 (Alternative Minimum Tax) | 4/17 at 100.00 | AA | | 344,574 | |
| | 2,160 | | Puerto Rico Housing Finance Corporation, Mortgage-Backed Securities Home Mortgage Revenue Bonds, Series 2001A, 5.200%, 12/01/33 | 12/12 at 100.00 | Aaa | | 2,163,326 | |
| | 2,155 | | Puerto Rico Housing Finance Corporation, Mortgage-Backed Securities Home Mortgage Revenue Bonds, Series 2001B, 5.300%, 12/01/28 (Alternative Minimum Tax) | 12/12 at 100.00 | Aaa | | 2,157,758 | |
| | 14,650 | | Total Housing/Single Family | | | | 15,747,156 | |
| | | Nuveen New Jersey Investment Quality Municipal Fund, Inc. (continued) |
| NQJ | | Portfolio of Investments |
October 31, 2012 (Unaudited)
| | Principal | | | Optional Call | | | | |
| | Amount (000) | | Description (1) | Provisions (2) | Ratings (3) | | Value | |
| | | | Long-Term Care – 2.3% (1.6% of Total Investments) | | | | | |
| $ | 1,660 | | Burlington County Bridge Commission, New Jersey, Economic Development Revenue Bonds, The Evergreens Project, Series 2007, 5.625%, 1/01/38 | 1/18 at 100.00 | N/R | $ | 1,725,736 | |
| | 1,125 | | New Jersey Economic Development Authority, First Mortgage Revenue Bonds, Winchester Gardens at Wards Homestead, Series 2004A, 5.750%, 11/01/24 | 11/14 at 100.00 | BBB– | | 1,157,074 | |
| | 2,625 | | New Jersey Economic Development Authority, GNMA Collateralized Mortgage Revenue Bonds, Victoria Health Corporation, Series 2001A, 5.200%, 12/20/36 | 12/14 at 100.00 | Aaa | | 2,706,979 | |
| | 595 | | New Jersey Economic Development Authority, Revenue Bonds, Masonic Charity Foundation of New Jersey, Series 2001, 5.875%, 6/01/18 | 6/13 at 100.00 | A– | | 602,539 | |
| | 1,100 | | New Jersey Economic Development Authority, Revenue Bonds, Masonic Charity Foundation of New Jersey, Series 2002, 5.250%, 6/01/32 | 6/13 at 102.00 | A– | | 1,130,118 | |
| | 7,105 | | Total Long-Term Care | | | | 7,322,446 | |
| | | | Tax Obligation/General – 5.4% (3.8% of Total Investments) | | | | | |
| | 690 | | Haddon Heights School District, Camden County, New Jersey, General Obligation Bonds, Refunding Series 2012, 3.250%, 1/01/30 (WI/DD, Settling 11/09/12) | 1/23 at 100.00 | AA– | | 702,875 | |
| | 4,300 | | Jersey City, New Jersey, General Obligation Bonds, Series 2006A, 5.000%,
9/01/22 – AMBAC Insured | 9/16 at 100.00 | A2 | | 4,867,815 | |
| | 930 | | Middletown Township Board of Education, Monmouth County, New Jersey, Refunding Series 2010, 5.000%, 8/01/27 | 8/20 at 100.00 | AA | | 1,095,363 | |
| | 1,400 | | Newark Housing Authority, New Jersey, City-Secured Police Facility Revenue Bonds, South Ward Police Facility, Series 2009A, 6.750%, 12/01/38 – AGC Insured | 12/19 at 100.00 | Aa3 | | 1,764,322 | |
| | 2,210 | | Union County Utilities Authority, New Jersey, Resource Recovery Facility Lease Revenue Refunding Bonds, Covantan Union Inc. Lessee, Series 2011B, 5.250%, 12/01/31 (Alternative Minimum Tax) | 12/21 at 100.00 | AA+ | | 2,473,056 | |
| | 2,515 | | Union County Utilities Authority, New Jersey, Solid Waste System County Deficiency Revenue Bonds, Series 2011, 5.000%, 6/15/41 | 6/21 at 100.00 | AA+ | | 2,897,657 | |
| | | | West Deptford Township, New Jersey, General Obligation Bonds, Series 2004: | | | | | |
| | 1,690 | | 5.000%, 9/01/16 – AMBAC Insured | 9/14 at 100.00 | A– | | 1,785,012 | |
| | 1,865 | | 4.750%, 9/01/18 – AMBAC Insured | 9/14 at 100.00 | A– | | 1,955,508 | |
| | 15,600 | | Total Tax Obligation/General | | | | 17,541,608 | |
| | | | Tax Obligation/Limited – 38.3% (27.0% of Total Investments) | | | | | |
| | 1,775 | | Bergen County Improvement Authority, New Jersey, Guaranteed Lease Revenue Bonds, County Administration Complex Project, Series 2005, 5.000%, 11/15/26 | No Opt. Call | Aaa | | 2,374,737 | |
| | 1,965 | | Essex County Improvement Authority, New Jersey, Project Consolidation Revenue Bonds, Series 2007, 5.250%, 12/15/22 – AMBAC Insured | No Opt. Call | Aa2 | | 2,465,368 | |
| | 1,145 | | Garden State Preservation Trust, New Jersey, Open Space and Farmland Preservation Bonds, Series 2005A, 5.750%, 11/01/28 – AGM Insured | No Opt. Call | AAA | | 1,533,063 | |
| | 2,650 | | Garden State Preservation Trust, New Jersey, Open Space and Farmland Preservation Bonds, Series 2005C, 5.125%, 11/01/18 – AGM Insured | No Opt. Call | AAA | | 3,289,419 | |
| | | | Gloucester County Improvement Authority, New Jersey, Lease Revenue Bonds, Series 2005A: | | | | | |
| | 1,000 | | 5.000%, 9/01/21 – NPFG Insured | 9/15 at 100.00 | AA+ | | 1,113,300 | |
| | 1,420 | | 5.000%, 9/01/22 – NPFG Insured | 9/15 at 100.00 | AA+ | | 1,580,886 | |
| | | | Government of Guam, Business Privilege Tax Bonds, Series 2011A: | | | | | |
| | 2,585 | | 5.250%, 1/01/36 | 1/22 at 100.00 | A | | 2,916,449 | |
| | 1,570 | | 5.125%, 1/01/42 | 1/22 at 100.00 | A | | 1,749,608 | |
| | | | Hudson County Improvement Authority, New Jersey, County Secured Lease Revenue Bonds, County Services Building Project, Series 2005: | | | | | |
| | 1,090 | | 5.000%, 4/01/25 – AMBAC Insured | 4/15 at 100.00 | AA– | | 1,187,893 | |
| | 2,525 | | 5.000%, 4/01/35 – AMBAC Insured | 4/15 at 100.00 | AA– | | 2,701,245 | |
| | 1,445 | | Lower Township Municipal Utilities Authority, Cape May County, New Jersey, Revenue Bonds, Series 2003D, 5.000%, 12/01/16 – FGIC Insured | 12/13 at 100.00 | N/R | | 1,492,497 | |
| | 5,700 | | New Jersey Building Authority, State Building Revenue Bonds, Series 2007A, 5.000%, 6/15/26 | 6/16 at 100.00 | A+ | | 6,089,538 | |
| | Principal | | | Optional Call | | | | |
| | Amount (000) | | Description (1) | Provisions (2) | Ratings (3) | | Value | |
| | | | Tax Obligation/Limited (continued) | | | | | |
| | | | New Jersey Economic Development Authority, Cigarette Tax Revenue Refunding Bonds, Series 2012: | | | | | |
| $ | 1,800 | | 5.000%, 6/15/19 | No Opt. Call | BBB+ | $ | 2,082,528 | |
| | 1,100 | | 5.000%, 6/15/21 | No Opt. Call | BBB+ | | 1,280,730 | |
| | 1,900 | | 5.000%, 6/15/25 | 6/22 at 100.00 | BBB+ | | 2,154,467 | |
| | 4,675 | | New Jersey Economic Development Authority, Lease Revenue Bonds, Liberty State Park Project, Series 2005C, 5.000%, 3/01/27 – AGM Insured | 3/15 at 100.00 | AA– | | 4,897,483 | |
| | 5,000 | | New Jersey Economic Development Authority, Revenue Bonds, Motor Vehicle Surcharge, Series 2004A, 5.250%, 7/01/15 – NPFG Insured | 7/14 at 100.00 | A | | 5,390,200 | |
| | | | New Jersey Economic Development Authority, Revenue Bonds, Newark Downtown District Management Corporation Project, Series 2007: | | | | | |
| | 205 | | 5.125%, 6/15/27 | 6/17 at 100.00 | Baa3 | | 216,673 | |
| | 345 | | 5.125%, 6/15/37 | 6/17 at 100.00 | Baa3 | | 358,852 | |
| | | | New Jersey Economic Development Authority, School Facilities Construction Financing Program Bonds, Series 2007U: | | | | | |
| | 1,965 | | 5.000%, 9/01/37 – AMBAC Insured | 9/17 at 100.00 | A+ | | 2,126,268 | |
| | 3,930 | | 5.000%, 9/01/37 | 9/17 at 100.00 | A+ | | 4,252,535 | |
| | 1,925 | | New Jersey Educational Facilities Authority, Revenue Bonds, Higher Education Capital Improvement Fund, Refunding Series 2005A, 5.000%, 9/01/15 – AGM Insured | No Opt. Call | AA– | | 2,148,435 | |
| | 2,500 | | New Jersey Health Care Facilities Financing Authority, Lease Revenue Bonds, Department of Human Services - Greystone Park Psychiatric Hospital, Series 2003, 5.000%, 9/15/25 | 9/13 at 100.00 | A+ | | 2,583,925 | |
| | | | New Jersey Health Care Facilities Financing Authority, Lease Revenue Bonds, Department of Human Services - Greystone Park Psychiatric Hospital, Series 2005: | | | | | |
| | 2,885 | | 5.000%, 9/15/18 – AMBAC Insured | 9/15 at 100.00 | A+ | | 3,169,490 | |
| | 4,455 | | 5.000%, 9/15/24 – AMBAC Insured | 9/15 at 100.00 | A+ | | 4,800,263 | |
| | 850 | | New Jersey Health Care Facilities Financing Authority, State Contract Bonds, Hospital Asset Transformation Program, Series 2008A, 5.250%, 10/01/38 | 10/18 at 100.00 | A+ | | 930,988 | |
| | | | New Jersey Transportation Trust Fund Authority, Federal Highway Aid Grant Anticipation Bonds, Series 2006: | | | | | |
| | 1,075 | | 5.000%, 6/15/17 – FGIC Insured | 6/16 at 100.00 | Aa3 | | 1,230,477 | |
| | 1,900 | | 5.000%, 6/15/18 – FGIC Insured | 6/16 at 100.00 | Aa3 | | 2,165,316 | |
| | 12,000 | | New Jersey Transportation Trust Fund Authority, Transportation System Bonds, Capital Appreciation Series 2010A, 0.000%, 12/15/30 | No Opt. Call | A+ | | 5,625,000 | |
| | 4,300 | | New Jersey Transportation Trust Fund Authority, Transportation System Bonds, Refunding Series 2006A, 5.500%, 12/15/22 | No Opt. Call | A+ | | 5,491,014 | |
| | 4,200 | | New Jersey Transportation Trust Fund Authority, Transportation System Bonds, Series 2004B, 5.500%, 12/15/16 – NPFG Insured | No Opt. Call | A+ | | 4,972,170 | |
| | 3,890 | | New Jersey Transportation Trust Fund Authority, Transportation System Bonds, Series 2005D, 5.000%, 6/15/19 – AGM Insured | 6/15 at 100.00 | AA– | | 4,291,876 | |
| | | | New Jersey Transportation Trust Fund Authority, Transportation System Bonds, Series 2006C: | | | | | |
| | 10,000 | | 0.000%, 12/15/32 – AGM Insured | No Opt. Call | AA– | | 4,188,400 | |
| | 15,355 | | 0.000%, 12/15/33 – AGM Insured | No Opt. Call | AA– | | 6,097,010 | |
| | 15,310 | | 0.000%, 12/15/34 – AGM Insured | No Opt. Call | AA– | | 5,736,504 | |
| | 2,500 | | New Jersey Transportation Trust Fund Authority, Transportation System Bonds, Series 2007A, 5.000%, 12/15/26 – AMBAC Insured | 12/17 at 100.00 | A+ | | 2,890,925 | |
| | 4,100 | | New Jersey Transportation Trust Fund Authority, Transportation System Bonds, Series 2010D, 5.000%, 12/15/24 | No Opt. Call | A+ | | 4,996,629 | |
| | 1,820 | | Passaic County Improvement Authority, New Jersey, Lease Revenue Bonds, Preakness Healthcare Center Expansion Project, Series 2012, 3.500%, 5/01/35 | 5/22 at 100.00 | Aa3 | | 1,822,184 | |
| | 1,315 | | Puerto Rico Convention Center District Authority, Hotel Occupancy Tax Revenue Bonds, Series 2006A, 4.500%, 7/01/36 – CIFG Insured | 7/16 at 100.00 | BBB+ | | 1,310,187 | |
| | 2,000 | | Puerto Rico Sales Tax Financing Corporation, Sales Tax Revenue Bonds, First Subordinate Series 2010C, 6.000%, 8/01/39 | 8/20 at 100.00 | A+ | | 2,242,220 | |
| | 3,750 | | Puerto Rico Sales Tax Financing Corporation, Sales Tax Revenue Bonds, First Subordinate Series 2011A-1, 5.000%, 8/01/43 | 8/21 at 100.00 | A+ | | 3,913,088 | |
| | 1,650 | | Virgin Islands Public Finance Authority, Matching Fund Loan Notes Revenue Bonds, Subordinate Lien Series 2010B, 5.250%, 10/01/29 | 10/20 at 100.00 | Baa2 | | 1,800,992 | |
| | 143,570 | | Total Tax Obligation/Limited | | | | 123,660,832 | |
| | | Nuveen New Jersey Investment Quality Municipal Fund, Inc. (continued) |
| NQJ | | Portfolio of Investments |
October 31, 2012 (Unaudited)
| | Principal | | | Optional Call | | | | |
| | Amount (000) | | Description (1) | Provisions (2) | Ratings (3) | | Value | |
| | | | Transportation – 24.6% (17.3% of Total Investments) | | | | | |
| $ | 2,250 | | Casino Reinvestment Development Authority, New Jersey, Parking Revenue Bonds, Series 2005A, 5.250%, 6/01/20 – NPFG Insured | 6/15 at 100.00 | A– | $ | 2,381,603 | |
| | | | Delaware River and Bay Authority, Delaware and New Jersey, Revenue Bonds, Series 2005: | | | | | |
| | 2,000 | | 5.000%, 1/01/25 – NPFG Insured | 1/15 at 100.00 | A1 | | 2,165,400 | |
| | 4,050 | | 5.000%, 1/01/26 – NPFG Insured | 1/15 at 100.00 | A1 | | 4,344,233 | |
| | 1,500 | | 5.000%, 1/01/27 – NPFG Insured | 1/15 at 100.00 | A1 | | 1,605,990 | |
| | | | Delaware River Joint Toll Bridge Commission, Pennsylvania, Revenue Bonds, Refunding Series 2012A: | | | | | |
| | 1,115 | | 5.000%, 7/01/24 | 7/22 at 100.00 | A2 | | 1,343,988 | |
| | 650 | | 4.000%, 7/01/26 | 7/22 at 100.00 | A2 | | 711,601 | |
| | | | Delaware River Port Authority, New Jersey and Pennsylvania, Revenue Bonds, Series 2010E: | | | | | |
| | 1,000 | | 5.000%, 1/01/40 – AGM Insured | 1/20 at 100.00 | AA– | | 1,120,200 | |
| | 3,300 | | 5.000%, 1/01/40 | 1/20 at 100.00 | A– | | 3,696,660 | |
| | 2,960 | | Delaware River Port Authority, Pennsylvania and New Jersey, Revenue Refunding Bonds, Port District Project, Series 2001A, 5.200%, 1/01/27 – AGM Insured | 11/12 at 100.00 | AA– | | 2,966,009 | |
| | | | New Brunswick Parking Authority, Middlesex County, New Jersey, Guaranteed Parking Revenue Bonds, Refunding Series 2012: | | | | | |
| | 240 | | 5.000%, 9/01/28 | 9/22 at 100.00 | A+ | | 280,939 | |
| | 610 | | 5.000%, 9/01/29 | 9/22 at 100.00 | A+ | | 711,785 | |
| | 3,000 | | New Jersey Economic Development Authority, Revenue Bonds, American Airlines Inc., Series 1991, 7.100%, 11/01/31 (Alternative Minimum Tax) (5) | 5/13 at 100.00 | N/R | | 1,384,110 | |
| | | | New Jersey Economic Development Authority, Special Facilities Revenue Bonds, Continental Airlines Inc., Series 1999: | | | | | |
| | 650 | | 5.125%, 9/15/23 (Alternative Minimum Tax) | 3/13 at 100.00 | B | | 664,099 | |
| | 1,250 | | 5.250%, 9/15/29 (Alternative Minimum Tax) | 3/13 at 100.00 | B | | 1,284,138 | |
| | 3,405 | | New Jersey Transit Corporation, Certificates of Participation, Federal Transit Administration Grants, Series 2005A, 5.000%, 9/15/18 – FGIC Insured | 9/15 at 100.00 | A1 | | 3,730,688 | |
| | 1,265 | | New Jersey Turnpike Authority, Revenue Bonds, Series 2005A, 5.250%, 1/01/29 – AGM Insured | No Opt. Call | AA– | | 1,635,961 | |
| | 4,000 | | New Jersey Turnpike Authority, Revenue Bonds, Series 2009I, 5.000%, 1/01/35 | 1/20 at 100.00 | A+ | | 4,510,920 | |
| | 2,380 | | New Jersey Turnpike Authority, Revenue Bonds, Series 2012B, 5.000%, 1/01/28 | 1/23 at 100.00 | A+ | | 2,832,271 | |
| | 1,260 | | Passaic County Improvement Authority, New Jersey, County Guaranteed Parking Revenue Bonds, 200 Hospital Plaza Project, Series 2010, 5.000%, 5/01/42 | 5/20 at 100.00 | Aa3 | | 1,418,659 | |
| | | | Port Authority of New York and New Jersey, Consolidated Revenue Bonds, One Hundred Fortieth Series 2005: | | | | | |
| | 7,000 | | 5.000%, 12/01/28 – SYNCORA GTY Insured | 6/15 at 101.00 | AA– | | 7,696,148 | |
| | 3,000 | | 5.000%, 12/01/34 | 6/15 at 101.00 | AA– | | 3,283,860 | |
| | 1,000 | | Port Authority of New York and New Jersey, Consolidated Revenue Bonds, One Hundred Forty Eighth Series 2008, Trust 2920, 17.154%, 8/15/32 – AGM Insured (IF) | 8/17 at 100.00 | AA– | | 1,518,920 | |
| | 2,000 | | Port Authority of New York and New Jersey, Consolidated Revenue Bonds, One Hundred Thirty-Fourth Series 2004, 5.000%, 7/15/34 | 1/14 at 101.00 | AA– | | 2,108,660 | |
| | | | Port Authority of New York and New Jersey, Special Project Bonds, JFK International Air Terminal LLC, Sixth Series 1997: | | | | | |
| | 3,500 | | 7.000%, 12/01/12 – NPFG Insured (Alternative Minimum Tax) | No Opt. Call | BBB | | 3,509,940 | |
| | 6,605 | | 5.750%, 12/01/22 – NPFG Insured (Alternative Minimum Tax) | 12/12 at 100.00 | BBB | | 6,607,376 | |
| | 12,130 | | 5.750%, 12/01/25 – NPFG Insured (Alternative Minimum Tax) | 12/12 at 100.00 | BBB | | 12,133,151 | |
| | | | South Jersey Transportation Authority, New Jersey, Transportation System Revenue Bonds, Series 2012.: | | | | | |
| | 2,000 | | 5.000%, 11/01/20 | No Opt. Call | A– | | 2,406,460 | |
| | 1,000 | | 5.000%, 11/01/22 | No Opt. Call | A– | | 1,205,250 | |
| | 75,120 | | Total Transportation | | | | 79,259,019 | |
| | | | U.S. Guaranteed – 13.6% (9.6% of Total Investments) (6) | | | | | |
| | | | New Jersey Economic Development Authority, Cigarette Tax Revenue Bonds, Series 2004: | | | | | |
| | 2,500 | | 5.750%, 6/15/29 (Pre-refunded 6/15/14) | 6/14 at 100.00 | Aaa | | 2,720,700 | |
| | 5,750 | | 5.750%, 6/15/34 (Pre-refunded 6/15/14) | 6/14 at 100.00 | Aaa | | 6,257,610 | |
| | Principal | | | Optional Call | | | | |
| | Amount (000) | | Description (1) | Provisions (2) | Ratings (3) | | Value | |
| | | | U.S. Guaranteed (6) (continued) | | | | | |
| $ | 1,500 | | New Jersey Educational Facilities Authority, Revenue Bonds, Kean University, Series 2003D, 5.250%, 7/01/20 (Pre-refunded 7/01/13) – FGIC Insured | 7/13 at 100.00 | A2 (6) | $ | 1,549,455 | |
| | 1,925 | | New Jersey Educational Facilities Authority, Revenue Bonds, Kean University, Series 2005B, 5.000%, 7/01/30 (Pre-refunded 7/01/16) – NPFG Insured | 7/16 at 100.00 | A– (6) | | 2,243,530 | |
| | 1,380 | | New Jersey Educational Facilities Authority, Revenue Bonds, Montclair State University, Series 2004L, 5.125%, 7/01/22 (Pre-refunded 7/01/14) – NPFG Insured | 7/14 at 100.00 | BBB (6) | | 1,490,731 | |
| | | | New Jersey Educational Facilities Authority, Revenue Bonds, Montclair State University, Series 2005F: | | | | | |
| | 2,000 | | 5.000%, 7/01/18 (Pre-refunded 7/01/15) – FGIC Insured | 7/15 at 100.00 | A1 (6) | | 2,245,760 | |
| | 1,175 | | 5.000%, 7/01/32 (Pre-refunded 7/01/15) – FGIC Insured | 7/15 at 100.00 | A1 (6) | | 1,319,384 | |
| | | | New Jersey Educational Facilities Authority, Revenue Bonds, New Jersey Institute of Technology, Series 2004B: | | | | | |
| | 1,260 | | 5.000%, 7/01/19 (Pre-refunded 1/01/14) – AMBAC Insured | 1/14 at 100.00 | A+ (6) | | 1,329,602 | |
| | 2,510 | | 4.750%, 7/01/20 (Pre-refunded 1/01/14) – AMBAC Insured | 1/14 at 100.00 | A+ (6) | | 2,641,348 | |
| | 185 | | 4.250%, 7/01/24 (Pre-refunded 1/01/14) – AMBAC Insured | 1/14 at 100.00 | A+ (6) | | 193,604 | |
| | 610 | | New Jersey Educational Facilities Authority, Revenue Bonds, Rider University, Series 2004A, 5.500%, 7/01/23 (Pre-refunded 7/01/14) – RAAI Insured | 7/14 at 100.00 | BBB+ (6) | | 662,747 | |
| | 1,300 | | New Jersey Educational Facilities Authority, Revenue Bonds, Rowan University, Series 2003I, 5.125%, 7/01/21 (Pre-refunded 7/01/13) – FGIC Insured | 7/13 at 100.00 | A+ (6) | | 1,341,782 | |
| | | | New Jersey Educational Facilities Authority, Revenue Bonds, Rowan University, Series 2004C: | | | | | |
| | 1,195 | | 5.000%, 7/01/20 (Pre-refunded 7/01/14) – NPFG Insured | 7/14 at 100.00 | A+ (6) | | 1,288,401 | |
| | 1,875 | | 5.000%, 7/01/24 (Pre-refunded 7/01/14) – NPFG Insured | 7/14 at 100.00 | A+ (6) | | 2,021,550 | |
| | 1,430 | | New Jersey Educational Facilities Authority, Revenue Bonds, William Paterson University, Series 2004A, 5.125%, 7/01/21 (Pre-refunded 7/01/14) – FGIC Insured | 7/14 at 100.00 | AA– (6) | | 1,541,497 | |
| | 2,840 | | New Jersey Health Care Facilities Financing Authority, Revenue Bonds, Capital Health System Obligated Group, Series 2003A, 5.375%, 7/01/33 (Pre-refunded 7/01/13) | 7/13 at 100.00 | N/R (6) | | 2,934,061 | |
| | 1,690 | | New Jersey Health Care Facilities Financing Authority, Revenue Bonds, St. Clare’s Hospital, Series 2004A, 5.250%, 7/01/20 – RAAI Insured (ETM) | No Opt. Call | N/R (6) | | 2,122,961 | |
| | | | New Jersey Turnpike Authority, Revenue Bonds, Series 1991C: | | | | | |
| | 170 | | 6.500%, 1/01/16 (ETM) | No Opt. Call | AA+ (6) | | 202,569 | |
| | 55 | | 6.500%, 1/01/16 – NPFG Insured (ETM) | No Opt. Call | A+ (6) | | 65,537 | |
| | 160 | | 6.500%, 1/01/16 – NPFG Insured (ETM) | No Opt. Call | A+ (6) | | 186,896 | |
| | 1,930 | | 6.500%, 1/01/16 (ETM) | No Opt. Call | AA+ (6) | | 2,097,717 | |
| | 1,250 | | Newark Housing Authority, New Jersey, Port Authority Terminal Revenue Bonds, Series 2004, 5.250%, 1/01/21 (Pre-refunded 1/01/14) – NPFG Insured | 1/14 at 100.00 | BBB (6) | | 1,322,225 | |
| | 1,625 | | Passaic County Improvement Authority, New Jersey, Lease Revenue Bonds, Preakness Healthcare Center Project, Series 2005, 5.000%, 5/01/30 (Pre-refunded 5/01/15) – AMBAC Insured | 5/15 at 100.00 | Aa3 (6) | | 1,810,851 | |
| | 2,000 | | South Jersey Port Corporation, New Jersey, Marine Terminal Revenue Refunding Bonds, Series 2002K, 5.100%, 1/01/33 (Pre-refunded 1/01/13) | 1/13 at 100.00 | A– (6) | | 2,016,100 | |
| | 2,245 | | Tobacco Settlement Financing Corporation, New Jersey, Tobacco Settlement Asset-Backed Bonds, Series 2003, 6.375%, 6/01/32 (Pre-refunded 6/01/13) | 6/13 at 100.00 | Aaa | | 2,320,836 | |
| | 40,560 | | Total U.S. Guaranteed | | | | 43,927,454 | |
| | | | Utilities – 1.6% (1.1% of Total Investments) | | | | | |
| | 395 | | Guam Power Authority, Revenue Bonds, Series 2012A, 5.000%, 10/01/34 | 10/22 at 100.00 | BBB | | 428,508 | |
| | 2,055 | | Mercer County Improvement Authority, New Jersey, Solid Waste Revenue Bonds, Regional Sludge Project, Series 2003, 5.000%, 12/15/14 – FGIC Insured | 12/13 at 100.00 | AA+ | | 2,160,422 | |
| | 2,500 | | Salem County Pollution Control Financing Authority, New Jersey, Pollution Control Revenue Refunding Bonds, PSEG Power LLC Project, Series 2001A, 5.750%, 4/01/31 (Alternative Minimum Tax) | 4/13 at 100.50 | Baa1 | | 2,528,425 | |
| | 4,950 | | Total Utilities | | | | 5,117,355 | |
| | | Nuveen New Jersey Investment Quality Municipal Fund, Inc. (continued) |
| NQJ | | Portfolio of Investments |
October 31, 2012 (Unaudited)
| | Principal | | | Optional Call | | | | |
| | Amount (000) | | Description (1) | Provisions (2) | Ratings (3) | | Value | |
| | | | Water and Sewer – 5.3% (3.8% of Total Investments) | | | | | |
| | | | Lacey Municipal Utilities Authority, Ocean County, New Jersey, Water Revenue Bonds, Series 2003B: | | | | | |
| $ | 1,750 | | 5.000%, 12/01/17 – FGIC Insured | 12/13 at 100.00 | N/R | $ | 1,803,603 | |
| | 1,835 | | 5.000%, 12/01/18 – FGIC Insured | 12/13 at 100.00 | N/R | | 1,886,820 | |
| | 1,000 | | 5.000%, 12/01/19 – FGIC Insured | 12/13 at 100.00 | N/R | | 1,026,570 | |
| | 3,000 | | New Jersey Economic Development Authority, Water Facilities Revenue Bonds, New Jersey-American Water Company Inc. Project, Refunding Series 2010B, 5.600%, 11/01/34 (Alternative Minimum Tax) | 5/20 at 100.00 | A | | 3,426,240 | |
| | 1,080 | | New Jersey Economic Development Authority, Water Facilities Revenue Bonds, New Jersey-American Water Company Inc. Project, Refunding Series 2010D, 4.875%, 11/01/29 (Alternative Minimum Tax) | 11/20 at 100.00 | A | | 1,184,814 | |
| | 2,905 | | New Jersey Environmental Infrastructure Trust, Environmental Infrastructure Bonds, Tender Option Bond Trust 4729, 7.185%, 9/01/21 (IF) (4) | No Opt. Call | AAA | | 4,032,721 | |
| | | | North Hudson Sewerage Authority, Gross Revenue Senior Lien Lease Certificates, Series 2012A: | | | | | |
| | 1,650 | | 5.000%, 6/01/27 – NPFG Insured | 6/22 at 100.00 | A | | 1,927,085 | |
| | 1,725 | | 5.000%, 6/01/42 – NPFG Insured | 6/22 at 100.00 | A | | 1,942,316 | |
| | 14,945 | | Total Water and Sewer | | | | 17,230,169 | |
| $ | 459,143 | | Total Investments (cost $426,817,472) – 142.1% | | | | 458,423,696 | |
| | | | Variable Rate Demand Preferred Shares, at Liquidation Value – (44.7)% (7) | | | | (144,300,000 | ) |
| | | | Other Assets Less Liabilities – 2.6% | | | | 8,589,944 | |
| | | | Net Assets Applicable to Common Shares – 100% | | | $ | 322,713,640 | |
| (1) | | All percentages shown in the Portfolio of Investments are based on net assets applicable to Common shares unless otherwise noted. |
| (2) | | Optional Call Provisions: Dates (month and year) and prices of the earliest optional call or redemption. There may be other call provisions at varying prices at later dates. Certain mortgage-backed securities may be subject to periodic principal paydowns. |
| (3) | | Ratings: Using the highest of Standard & Poor’s Group (“Standard & Poor’s”), Moody’s Investors Service, Inc. (“Moody’s”) or Fitch, Inc. (“Fitch”) rating. Ratings below BBB by Standard & Poor’s, Baa by Moody’s or BBB by Fitch are considered to be below investment grade. Holdings designated N/R are not rated by any of these national rating agencies. |
| (4) | | Investment, or portion of investment, has been pledged to collateralize the net payment obligations for investments in inverse floating rate transactions. |
| (5) | | At or subsequent to the end of the reporting period, this security is non-income producing. Non-income producing security, in the case of a bond, generally denotes that the issuer has (1) defaulted on the payment of principal or interest, (2) is under the protection of the Federal Bankruptcy Court or (3) the Fund’s Adviser has concluded that the issue is not likely to meet its future interest payment obligations and has directed the Fund’s custodian to cease accruing additional income on the Fund’s records. |
| (6) | | Backed by an escrow or trust containing sufficient U.S. Government or U.S. Government agency securities, which ensure the timely payment of principal and interest. Certain bonds backed by U.S. Government or agency securities are regarded as having an implied rating equal to the rating of such securities. |
| (7) | | Variable Rate Demand Preferred Shares, at Liquidation Value as a percentage of Total Investments is 31.5%. |
| N/R | | Not rated. |
| WI/DD | | Investment, or portion of investment, purchased on a when-issued or delayed delivery basis. |
| (ETM) | | Escrowed to maturity. |
| (IF) | | Inverse floating rate investment. |
See accompanying notes to financial statements.
| | | Nuveen New Jersey Premium Income Municipal Fund, Inc. |
| NNJ | | Portfolio of Investments |
| | | October 31, 2012 (Unaudited) |
| | Principal | | | Optional Call | | | | |
| | Amount (000) | | Description (1) | Provisions (2) | Ratings (3) | | Value | |
| | | | Consumer Discretionary – 0.3% (0.2% of Total Investments) | | | | | |
| | | | Middlesex County Improvement Authority, New Jersey, Senior Revenue Bonds, Heldrich Center Hotel/Conference Center Project, Series 2005A: | | | | | |
| $ | 480 | | 5.000%, 1/01/32 | 1/15 at 100.00 | B3 | $ | 311,453 | |
| | 415 | | 5.125%, 1/01/37 | 1/15 at 100.00 | B3 | | 269,298 | |
| | 895 | | Total Consumer Discretionary | | | | 580,751 | |
| | | | Consumer Staples – 4.8% (3.3% of Total Investments) | | | | | |
| | | | Tobacco Settlement Financing Corporation, New Jersey, Tobacco Settlement Asset-Backed Bonds, Series 2007-1A: | | | | | |
| | 755 | | 4.500%, 6/01/23 | 6/17 at 100.00 | B1 | | 738,798 | |
| | 7,620 | | 4.750%, 6/01/34 | 6/17 at 100.00 | B2 | | 6,607,985 | |
| | 2,345 | | 5.000%, 6/01/41 | 6/17 at 100.00 | B2 | | 2,052,133 | |
| | 10,720 | | Total Consumer Staples | | | | 9,398,916 | |
| | | | Education and Civic Organizations – 15.6% (10.8% of Total Investments) | | | | | |
| | 1,125 | | New Jersey Economic Development Authority, Revenue Bonds, The Seeing Eye Inc., Series 2005, 5.000%, 12/01/24 – AMBAC Insured | 6/15 at 100.00 | N/R | | 1,192,646 | |
| | 500 | | New Jersey Educational Facilities Authority, Revenue Bonds, Fairleigh Dickinson University, Series 2002D, 5.250%, 7/01/32 – ACA Insured | 7/13 at 100.00 | BBB | | 503,910 | |
| | 300 | | New Jersey Educational Facilities Authority, Revenue Bonds, Fairleigh Dickinson University, Series 2004C, 5.500%, 7/01/23 | 7/14 at 100.00 | BBB | | 310,011 | |
| | | | New Jersey Educational Facilities Authority, Revenue Bonds, Kean University, Series 2007D: | | | | | |
| | 2,090 | | 5.000%, 7/01/32 – FGIC Insured | 7/17 at 100.00 | A2 | | 2,250,387 | |
| | 3,350 | | 5.000%, 7/01/39 – FGIC Insured | 7/17 at 100.00 | A2 | | 3,598,068 | |
| | 100 | | New Jersey Educational Facilities Authority, Revenue Bonds, Montclair State University, Series 2004L, 5.125%, 7/01/19 – NPFG Insured | 7/14 at 100.00 | AA– | | 107,266 | |
| | 970 | | New Jersey Educational Facilities Authority, Revenue Bonds, Montclair State University, Series 2006A, 5.000%, 7/01/36 – AMBAC Insured | 7/16 at 100.00 | AA– | | 1,025,261 | |
| | 1,000 | | New Jersey Educational Facilities Authority, Revenue Bonds, Passaic County Community College, Series 2010C, 5.375%, 7/01/41 | 7/20 at 100.00 | A2 | | 1,131,180 | |
| | 1,335 | | New Jersey Educational Facilities Authority, Revenue Bonds, Princeton University, Tender Option Bond Trust 3922, 13.401%, 7/01/19 (IF) | No Opt. Call | AAA | | 2,040,441 | |
| | | | New Jersey Educational Facilities Authority, Revenue Bonds, Ramapo College, Series 2004H: | | | | | |
| | 1,640 | | 5.000%, 7/01/18 – FGIC Insured | 7/14 at 100.00 | A | | 1,748,699 | |
| | 1,040 | | 5.000%, 7/01/23 – FGIC Insured | 7/14 at 100.00 | A | | 1,106,071 | |
| | 275 | | New Jersey Educational Facilities Authority, Revenue Bonds, Ramapo College, Series 2012B, 5.000%, 7/01/37 | 7/22 at 100.00 | A | | 311,828 | |
| | | | New Jersey Educational Facilities Authority, Revenue Bonds, Rider University, Series 2012A: | | | | | |
| | 260 | | 5.000%, 7/01/32 | 7/21 at 100.00 | BBB+ | | 287,594 | |
| | 170 | | 5.000%, 7/01/37 | 7/21 at 100.00 | BBB+ | | 185,394 | |
| | 300 | | New Jersey Educational Facilities Authority, Revenue Refunding Bonds, College of New Jersey, Series 2012A, 5.000%, 7/01/19 | No Opt. Call | AA | | 365,733 | |
| | 1,405 | | New Jersey Higher Education Assistance Authority, Student Loan Revenue Bonds, Series 1999A, 5.250%, 6/01/18 – NPFG Insured (Alternative Minimum Tax) | 12/12 at 100.00 | A | | 1,407,796 | |
| | 985 | | New Jersey Higher Education Assistance Authority, Student Loan Revenue Bonds, Series 2000A, 6.000%, 6/01/15 – NPFG Insured (Alternative Minimum Tax) | 12/12 at 100.00 | Aaa | | 988,585 | |
| | 2,000 | | New Jersey Higher Education Assistance Authority, Student Loan Revenue Bonds, Series 2008A, 6.125%, 6/01/30 – AGC Insured (Alternative Minimum Tax) | 6/18 at 100.00 | AA– | | 2,232,420 | |
| | 450 | | New Jersey Higher Education Assistance Authority, Student Loan Revenue Bonds, Series 2010-1A, 5.000%, 12/01/25 | 12/19 at 100.00 | AA | | 495,779 | |
| | 270 | | New Jersey Higher Education Assistance Authority, Student Loan Revenue Bonds, Series 2010-2, 5.000%, 12/01/30 | 12/20 at 100.00 | Aa3 | | 300,402 | |
| | | Nuveen New Jersey Premium Income Municipal Fund, Inc. (continued) |
| NNJ | | Portfolio of Investments |
October 31, 2012 (Unaudited)
| | Principal | | | Optional Call | | | | |
| | Amount (000) | | Description (1) | Provisions (2) | Ratings (3) | | Value | |
| | | | Education and Civic Organizations (continued) | | | | | |
| $ | 350 | | New Jersey Higher Education Assistance Authority, Student Loan Revenue Bonds, Series 2011-1, 5.750%, 12/01/27 (Alternative Minimum Tax) | 12/21 at 100.00 | Aa3 | $ | 409,238 | |
| | 1,925 | | New Jersey Higher Education Assistance Authority, Student Loan Revenue Bonds, Series 2012-1A, 4.375%, 12/01/26 (Alternative Minimum Tax) | 12/22 at 100.00 | AA | | 2,005,138 | |
| | 550 | | New Jersey Higher Education Assistance Authority, Student Loan Revenue Bonds, Tender Option Bond Trust PA-4643, 19.767%, 6/01/30 (IF) (4) | 6/19 at 100.00 | AA | | 845,504 | |
| | 2,025 | | University of Medicine and Dentistry of New Jersey, Certificates of Participation, Child Health Institute, LLC, Series 2003, 5.000%, 4/15/21 – AMBAC Insured | 4/13 at 100.00 | BBB+ | | 2,045,493 | |
| | 1,000 | | University of Medicine and Dentistry of New Jersey, Certificates of Participation, University Housing Associates, LLC, Series 2004, 5.000%, 6/15/29 – NPFG Insured | 6/14 at 100.00 | BBB+ | | 1,023,970 | |
| | 2,750 | | University of Medicine and Dentistry of New Jersey, Revenue Bonds, Series 2002A, 5.000%, 12/01/31 – AMBAC Insured | 12/12 at 100.00 | A– | | 2,756,518 | |
| | 28,165 | | Total Education and Civic Organizations | | | | 30,675,332 | |
| | | | Financials – 0.9% (0.6% of Total Investments) | | | | | |
| | 1,500 | | New Jersey Economic Development Authority, Revenue Refunding Bonds, Kapkowski Road Landfill Project, Series 2002, 5.750%, 10/01/21 | No Opt. Call | Ba2 | | 1,669,020 | |
| | | | Health Care – 17.2% (11.9% of Total Investments) | | | | | |
| | 25 | | Camden County Improvement Authority, New Jersey, Healthcare Revenue Bonds, Cooper Health System, Series 2005B, 5.250%, 2/15/27 | 2/15 at 100.00 | BBB | | 26,124 | |
| | 620 | | Camden County Improvement Authority, New Jersey, Revenue Bonds, Cooper Health System, Series 2004A, 5.750%, 2/15/34 | 8/14 at 100.00 | BBB | | 641,712 | |
| | 690 | | Camden County Improvement Authority, New Jersey, Revenue Bonds, Cooper Health System, Series 2005A, 5.000%, 2/15/25 | 2/15 at 100.00 | BBB | | 716,441 | |
| | 1,375 | | New Jersey Health Care Facilities Finance Authority, Revenue Bonds, AHS Hospital Corporation, Series 2008A, 5.000%, 7/01/27 | 7/18 at 100.00 | A1 | | 1,501,541 | |
| | 695 | | New Jersey Health Care Facilities Financing Authority, Hospital Revenue Bonds, Virtua Health, Tender Option Bond Trust 3018, 19.251%, 7/01/38 – AGC Insured (IF) (4) | 7/19 at 100.00 | AA– | | 1,022,039 | |
| | | | New Jersey Health Care Facilities Financing Authority, New Jersey, Revenue Bonds, Saint Peters University Hospital, Refunding Series 2011: | | | | | |
| | 1,150 | | 6.000%, 7/01/26 | 7/21 at 100.00 | BBB– | | 1,321,074 | |
| | 1,000 | | 6.250%, 7/01/35 | 7/21 at 100.00 | BBB– | | 1,131,650 | |
| | 1,615 | | New Jersey Health Care Facilities Financing Authority, Revenue Bonds, Atlanticare Regional Medical Center, Series 2007, 5.000%, 7/01/37 | 7/17 at 100.00 | A+ | | 1,707,346 | |
| | 240 | | New Jersey Health Care Facilities Financing Authority, Revenue Bonds, Children’s Specialized Hospital, Series 2005A, 5.500%, 7/01/36 | 7/15 at 100.00 | BBB | | 247,138 | |
| | 700 | | New Jersey Health Care Facilities Financing Authority, Revenue Bonds, Hunterdon Medical Center, Series 2006B, 5.000%, 7/01/36 | 7/16 at 100.00 | A | | 723,254 | |
| | 375 | | New Jersey Health Care Facilities Financing Authority, Revenue Bonds, Hunterdon Medical Center, Series 2006, 5.125%, 7/01/35 | 7/16 at 100.00 | A | | 389,689 | |
| | 1,800 | | New Jersey Health Care Facilities Financing Authority, Revenue Bonds, Kennedy Health System Obligated Group Issue, Refunding Series 2012, 3.750%, 7/01/27 | No Opt. Call | A3 | | 1,822,284 | |
| | | | New Jersey Health Care Facilities Financing Authority, Revenue Bonds, Meridian Health System Obligated Group, Refunding Series 2011: | | | | | |
| | 220 | | 5.000%, 7/01/26 | 7/22 at 100.00 | A | | 251,808 | |
| | 2,500 | | 5.000%, 7/01/27 | 7/22 at 100.00 | A | | 2,849,200 | |
| | 2,125 | | New Jersey Health Care Facilities Financing Authority, Revenue Bonds, Meridian Health, Series 2007-I, 5.000%, 7/01/38 – AGC Insured | 7/18 at 100.00 | AA– | | 2,284,630 | |
| | 465 | | New Jersey Health Care Facilities Financing Authority, Revenue Bonds, Palisades Medical Center of New York Presbyterian Healthcare System, Series 2002, 6.625%, 7/01/31 | 7/13 at 100.00 | BB+ | | 468,939 | |
| | 1,165 | | New Jersey Health Care Facilities Financing Authority, Revenue Bonds, RWJ Health Care Corporation, Series 2005B, 5.000%, 7/01/35 – RAAI Insured | 7/15 at 100.00 | N/R | | 1,175,182 | |
| | Principal | | | Optional Call | | | | |
| | Amount (000) | | Description (1) | Provisions (2) | Ratings (3) | | Value | |
| | | | Health Care (continued) | | | | | |
| $ | 1,790 | | New Jersey Health Care Facilities Financing Authority, Revenue Bonds, Saint Barnabas Health Care System, Refunding Series 2011A, 5.625%, 7/01/37 | 7/21 at 100.00 | BBB+ | $ | 2,015,826 | |
| | 1,160 | | New Jersey Health Care Facilities Financing Authority, Revenue Bonds, Saint Barnabas Health Care System, Series 2006A, 5.000%, 7/01/29 | 1/17 at 100.00 | BBB+ | | 1,199,104 | |
| | 1,500 | | New Jersey Health Care Facilities Financing Authority, Revenue Bonds, Saint Joseph’s Healthcare System Obligated Group Issue, Series 2008, 6.625%, 7/01/38 | 7/18 at 100.00 | BBB– | | 1,741,890 | |
| | 1,675 | | New Jersey Health Care Facilities Financing Authority, Revenue Bonds, Shore Memorial Health System, Series 2003, 5.000%, 7/01/23 – RAAI Insured | 7/13 at 100.00 | N/R | | 1,682,085 | |
| | 2,010 | | New Jersey Health Care Facilities Financing Authority, Revenue Bonds, Somerset Medical Center, Series 2003, 5.500%, 7/01/33 | 7/13 at 100.00 | Ba2 | | 2,019,507 | |
| | | | New Jersey Health Care Facilities Financing Authority, Revenue Bonds, South Jersey Hospital System, Refunding Series 2006: | | | | | |
| | 1,250 | | 5.000%, 7/01/36 | 7/16 at 100.00 | A2 | | 1,300,613 | |
| | 1,155 | | 5.000%, 7/01/46 | 7/16 at 100.00 | A2 | | 1,197,712 | |
| | 1,710 | | New Jersey Health Care Facilities Financing Authority, Revenue Refunding Bonds, Bayshore Community Hospital, Series 2002, 5.000%, 7/01/22 – RAAI Insured | 11/12 at 100.00 | N/R | | 1,710,530 | |
| | 2,650 | | Puerto Rico Industrial, Tourist, Educational, Medical and Environmental Control Facilities Financing Authority, Adjustable Rate Industrial Revenue Bonds, American Home Products Corporation, Series 1983A, 5.100%, 12/01/18 | 12/12 at 100.00 | A1 | | 2,660,680 | |
| | 31,660 | | Total Health Care | | | | 33,807,998 | |
| | | | Housing/Multifamily – 3.4% (2.3% of Total Investments) | | | | | |
| | 340 | | Essex County Improvement Authority, New Jersey, FNMA Enhanced Multifamily Revenue Bonds, Mount Carmel Towers, Series 2002, 4.750%, 11/01/22 (Alternative Minimum Tax) | 11/22 at 100.00 | Aa1 | | 340,449 | |
| | | | New Jersey Economic Development Authority, Student Housing Revenue Bonds, Provident Group-Montclair Properties LLC, Montclair State University Student Housing Project, Series 2010A: | | | | | |
| | 1,100 | | 5.750%, 6/01/31 | 6/20 at 100.00 | Baa3 | | 1,243,231 | |
| | 550 | | 5.875%, 6/01/42 | 6/20 at 100.00 | Baa3 | | 615,335 | |
| | 4,445 | | New Jersey Housing and Mortgage Finance Agency, Multifamily Housing Revenue Bonds, Series 1997A, 5.550%, 5/01/27 – AMBAC Insured (Alternative Minimum Tax) | 5/13 at 100.00 | A+ | | 4,452,868 | |
| | 6,435 | | Total Housing/Multifamily | | | | 6,651,883 | |
| | | | Housing/Single Family – 2.5% (1.8% of Total Investments) | | | | | |
| | 4,000 | | New Jersey Housing & Mortgage Finance Agency, Single Family Home Mortgage Revenue Bonds, Series 2011A, 4.650%, 10/01/29 | 10/21 at 100.00 | Aa1 | | 4,406,280 | |
| | 575 | | New Jersey Housing and Mortgage Finance Agency, Single Family Housing Revenue Bonds, Series 2007T, 4.700%, 10/01/37 (Alternative Minimum Tax) | 4/17 at 100.00 | AA | | 591,434 | |
| | 4,575 | | Total Housing/Single Family | | | | 4,997,714 | |
| | | | Long-Term Care – 1.4% (1.0% of Total Investments) | | | | | |
| | 970 | | Burlington County Bridge Commission, New Jersey, Economic Development Revenue Bonds, The Evergreens Project, Series 2007, 5.625%, 1/01/38 | 1/18 at 100.00 | N/R | | 1,008,412 | |
| | 750 | | New Jersey Economic Development Authority, First Mortgage Revenue Bonds, Winchester Gardens at Wards Homestead, Series 2004A, 5.800%, 11/01/31 | 11/14 at 100.00 | BBB– | | 770,895 | |
| | 1,000 | | New Jersey Economic Development Authority, Revenue Bonds, Masonic Charity Foundation of New Jersey, Series 2001, 5.500%, 6/01/21 | 6/13 at 100.00 | A– | | 1,011,720 | |
| | 2,720 | | Total Long-Term Care | | | | 2,791,027 | |
| | | Nuveen New Jersey Premium Income Municipal Fund, Inc. (continued) |
| NNJ | | Portfolio of Investments |
October 31, 2012 (Unaudited)
| | Principal | | | Optional Call | | | | |
| | Amount (000) | | Description (1) | Provisions (2) | Ratings (3) | | Value | |
| | | | Tax Obligation/General – 5.9% (4.1% of Total Investments) | | | | | |
| $ | 2,250 | | Freehold Regional High School District, Monmouth County Board of Education, New Jersey, School District Refunding Bonds, Series 2001, 5.000%, 3/01/17 – FGIC Insured | No Opt. Call | AA | $ | 2,640,128 | |
| | 2,500 | | Jersey City, New Jersey, General Obligation Bonds, Series 2006A, 5.000%,
9/01/22 – AMBAC Insured | 9/16 at 100.00 | A2 | | 2,830,125 | |
| | 555 | | Middletown Township Board of Education, Monmouth County, New Jersey, Refunding Series 2010, 5.000%, 8/01/27 | 8/20 at 100.00 | AA | | 653,685 | |
| | 1,475 | | Union County Utilities Authority, New Jersey, Resource Recovery Facility Lease Revenue Refunding Bonds, Covantan Union Inc. Lessee, Series 2011B, 5.250%, 12/01/31 (Alternative Minimum Tax) | 12/21 at 100.00 | AA+ | | 1,650,569 | |
| | 1,485 | | Washington Township Board of Education, Mercer County, New Jersey, General Obligation Bonds, Series 2005, 5.250%, 1/01/27 – AGM Insured | No Opt. Call | Aa3 | | 1,962,294 | |
| | 1,780 | | West Deptford Township, New Jersey, General Obligation Bonds, Series 2004, 4.750%, 9/01/17 – AMBAC Insured | 9/14 at 100.00 | A– | | 1,872,524 | |
| | 10,045 | | Total Tax Obligation/General | | | | 11,609,325 | |
| | | | Tax Obligation/Limited – 44.7% (31.1% of Total Investments) | | | | | |
| | 1,000 | | Bergen County Improvement Authority, New Jersey, Guaranteed Lease Revenue Bonds, County Administration Complex Project, Series 2005, 5.000%, 11/15/26 | No Opt. Call | Aaa | | 1,337,880 | |
| | 5,385 | | Essex County Improvement Authority, New Jersey, Lease Revenue Bonds, Series 2003, 5.125%, 12/15/19 – AGM Insured | 12/13 at 100.00 | Aa2 | | 5,656,293 | |
| | 1,155 | | Essex County Improvement Authority, New Jersey, Project Consolidation Revenue Bonds, Series 2007, 5.250%, 12/15/22 – AMBAC Insured | No Opt. Call | Aa2 | | 1,449,109 | |
| | 3,000 | | Garden State Preservation Trust, New Jersey, Open Space and Farmland Preservation Bonds, Series 2003B, 0.000%, 11/01/25 – AGM Insured | No Opt. Call | AAA | | 2,029,260 | |
| | 1,000 | | Garden State Preservation Trust, New Jersey, Open Space and Farmland Preservation Bonds, Series 2005A, 5.750%, 11/01/28 – AGM Insured | No Opt. Call | AAA | | 1,338,920 | |
| | 1,225 | | Garden State Preservation Trust, New Jersey, Open Space and Farmland Preservation Bonds, Series 2005C, 5.125%, 11/01/18 – AGM Insured | No Opt. Call | AAA | | 1,520,580 | |
| | | | Government of Guam, Business Privilege Tax Bonds, Series 2011A: | | | | | |
| | 1,835 | | 5.250%, 1/01/36 | 1/22 at 100.00 | A | | 2,070,284 | |
| | 1,185 | | 5.125%, 1/01/42 | 1/22 at 100.00 | A | | 1,320,564 | |
| | | | Hudson County Improvement Authority, New Jersey, County Secured Lease Revenue Bonds, County Services Building Project, Series 2005: | | | | | |
| | 1,185 | | 5.000%, 4/01/25 – AMBAC Insured | 4/15 at 100.00 | AA– | | 1,291,425 | |
| | 2,755 | | 5.000%, 4/01/35 – AMBAC Insured | 4/15 at 100.00 | AA– | | 2,947,299 | |
| | 3,450 | | New Jersey Building Authority, State Building Revenue Bonds, Series 2007A, 5.000%, 6/15/25 | 6/16 at 100.00 | A+ | | 3,694,985 | |
| | | | New Jersey Economic Development Authority, Cigarette Tax Revenue Refunding Bonds, Series 2012: | | | | | |
| | 1,050 | | 5.000%, 6/15/19 | No Opt. Call | BBB+ | | 1,214,808 | |
| | 1,100 | | 5.000%, 6/15/26 | 6/22 at 100.00 | BBB+ | | 1,241,152 | |
| | 3,200 | | New Jersey Economic Development Authority, Revenue Bonds, Motor Vehicle Surcharge, Series 2004A, 5.250%, 7/01/15 – NPFG Insured | 7/14 at 100.00 | A | | 3,449,728 | |
| | | | New Jersey Economic Development Authority, Revenue Bonds, Newark Downtown District Management Corporation Project, Series 2007: | | | | | |
| | 120 | | 5.125%, 6/15/27 | 6/17 at 100.00 | Baa3 | | 126,833 | |
| | 205 | | 5.125%, 6/15/37 | 6/17 at 100.00 | Baa3 | | 213,231 | |
| | | | New Jersey Economic Development Authority, School Facilities Construction Financing Program Bonds, Series 2007U: | | | | | |
| | 1,155 | | 5.000%, 9/01/37 – AMBAC Insured | 9/17 at 100.00 | A+ | | 1,249,791 | |
| | 2,310 | | 5.000%, 9/01/37 | 9/17 at 100.00 | A+ | | 2,499,582 | |
| | 2,720 | | New Jersey Health Care Facilities Financing Authority, Lease Revenue Bonds, Department of Human Services - Greystone Park Psychiatric Hospital, Series 2003, 5.000%, 9/15/25 | 9/13 at 100.00 | A+ | | 2,811,310 | |
| | | | New Jersey Health Care Facilities Financing Authority, Lease Revenue Bonds, Department of Human Services - Greystone Park Psychiatric Hospital, Series 2005: | | | | | |
| | 2,615 | | 5.000%, 9/15/24 – AMBAC Insured | 9/15 at 100.00 | A+ | | 2,817,663 | |
| | 3,000 | | 5.000%, 9/15/28 – AMBAC Insured | 9/15 at 100.00 | A+ | | 3,188,340 | |
| | Principal | | | Optional Call | | | | |
| | Amount (000) | | Description (1) | Provisions (2) | Ratings (3) | | Value | |
| | | | Tax Obligation/Limited (continued) | | | | | |
| $ | 505 | | New Jersey Health Care Facilities Financing Authority, State Contract Bonds, Hospital Asset Transformation Program, Series 2008A, 5.250%, 10/01/38 | 10/18 at 100.00 | A+ | $ | 553,116 | |
| | 1,500 | | New Jersey Sports and Exposition Authority, Convention Center Luxury Tax Bonds, Series 2004, 5.500%, 3/01/22 – NPFG Insured | No Opt. Call | BBB | | 1,808,655 | |
| | | | New Jersey Transportation Trust Fund Authority, Federal Highway Aid Grant Anticipation Bonds, Series 2006: | | | | | |
| | 400 | | 5.000%, 6/15/17 – FGIC Insured | 6/16 at 100.00 | Aa3 | | 457,852 | |
| | 715 | | 5.000%, 6/15/18 – FGIC Insured | 6/16 at 100.00 | Aa3 | | 814,843 | |
| | 12,000 | | New Jersey Transportation Trust Fund Authority, Transportation System Bonds, Capital Appreciation Series 2010A, 0.000%, 12/15/30 | No Opt. Call | A+ | | 5,624,997 | |
| | 1,700 | | New Jersey Transportation Trust Fund Authority, Transportation System Bonds, Refunding Series 2006A, 5.500%, 12/15/22 | No Opt. Call | A+ | | 2,170,866 | |
| | 2,600 | | New Jersey Transportation Trust Fund Authority, Transportation System Bonds, Series 2004B, 5.500%, 12/15/16 – NPFG Insured | No Opt. Call | A+ | | 3,078,010 | |
| | 2,000 | | New Jersey Transportation Trust Fund Authority, Transportation System Bonds, Series 2005B, 5.250%, 12/15/18 – FGIC Insured | 12/15 at 100.00 | A+ | | 2,268,360 | |
| | 1,110 | | New Jersey Transportation Trust Fund Authority, Transportation System Bonds, Series 2005D, 5.000%, 6/15/19 – AGM Insured | 6/15 at 100.00 | AA– | | 1,224,674 | |
| | | | New Jersey Transportation Trust Fund Authority, Transportation System Bonds, Series 2006C: | | | | | |
| | 6,000 | | 0.000%, 12/15/32 – AGM Insured | No Opt. Call | AA– | | 2,513,040 | |
| | 12,000 | | 0.000%, 12/15/33 – AGM Insured | No Opt. Call | AA– | | 4,764,840 | |
| | 4,000 | | 0.000%, 12/15/34 – AGM Insured | No Opt. Call | AA– | | 1,498,760 | |
| | 4,000 | | New Jersey Transportation Trust Fund Authority, Transportation System Bonds, Series 2007A, 5.000%, 12/15/26 – AMBAC Insured | 12/17 at 100.00 | A+ | | 4,625,480 | |
| | 800 | | New Jersey Transportation Trust Fund Authority, Transportation System Bonds, Series 2010D, 5.000%, 12/15/24 | No Opt. Call | A+ | | 974,952 | |
| | 1,130 | | Passaic County Improvement Authority, New Jersey, Lease Revenue Bonds, Preakness Healthcare Center Expansion Project, Series 2012, 3.500%, 5/01/35 | 5/22 at 100.00 | Aa3 | | 1,131,356 | |
| | 780 | | Puerto Rico Convention Center District Authority, Hotel Occupancy Tax Revenue Bonds, Series 2006A, 4.500%, 7/01/36 – CIFG Insured | 7/16 at 100.00 | BBB+ | | 777,145 | |
| | 3,750 | | Puerto Rico Sales Tax Financing Corporation, Sales Tax Revenue Bonds, First Subordinate Series 2011A-1, 5.000%, 8/01/43 | 8/21 at 100.00 | A+ | | 3,913,088 | |
| | 2,745 | | Union County Improvement Authority, New Jersey, General Obligation Lease Revenue Bonds, Plainfield Park Madison Redevelopment Project, Series 2003, 5.000%, 3/01/34 – AGM Insured | 3/13 at 100.00 | Aa1 | | 2,781,701 | |
| | 2,445 | | Union County Improvement Authority, New Jersey, General Obligation Lease Revenue Bonds, Series 2003, 5.000%, 6/15/23 | 6/13 at 100.00 | Aa1 | | 2,515,000 | |
| | 1,000 | | Virgin Islands Public Finance Authority, Matching Fund Loan Notes Revenue Bonds, Subordinate Lien Series 2010B, 5.250%, 10/01/29 | 10/20 at 100.00 | Baa2 | | 1,091,510 | |
| | 101,830 | | Total Tax Obligation/Limited | | | | 88,057,282 | |
| | | | Transportation – 22.5% (15.7% of Total Investments) | | | | | |
| | 2,750 | | Casino Reinvestment Development Authority, New Jersey, Parking Revenue Bonds, Series 2005A, 5.250%, 6/01/20 – NPFG Insured | 6/15 at 100.00 | A– | | 2,910,848 | |
| | 2,500 | | Delaware River and Bay Authority, Delaware and New Jersey, Revenue Bonds, Series 2005, 5.000%, 1/01/27 – NPFG Insured | 1/15 at 100.00 | A1 | | 2,676,650 | |
| | 1,600 | | Delaware River and Bay Authority, Delaware and New Jersey, Revenue Bonds, Series 2012A, 5.000%, 1/01/42 (WI/DD, Settling 11/06/12) | 1/23 at 100.00 | A1 | | 1,848,944 | |
| | 1,105 | | Delaware River Joint Toll Bridge Commission, Pennsylvania, Revenue Bonds, Refunding Series 2012A, 5.000%, 7/01/25 | 7/22 at 100.00 | A2 | | 1,324,088 | |
| | 500 | | Delaware River Port Authority, New Jersey and Pennsylvania, Revenue Bonds, Series 2010E, 5.000%, 1/01/40 | 1/20 at 100.00 | A– | | 560,100 | |
| | | Nuveen New Jersey Premium Income Municipal Fund, Inc. (continued) |
| NNJ | | Portfolio of Investments |
October 31, 2012 (Unaudited)
| | Principal | | | Optional Call | | | | |
| | Amount (000) | | Description (1) | Provisions (2) | Ratings (3) | | Value | |
| | | | Transportation (continued) | | | | | |
| | | | New Jersey Economic Development Authority, Special Facilities Revenue Bonds, Continental Airlines Inc., Series 1999: | | | | | |
| $ | 350 | | 5.125%, 9/15/23 (Alternative Minimum Tax) | 3/13 at 100.00 | B | $ | 357,592 | |
| | 750 | | 5.250%, 9/15/29 (Alternative Minimum Tax) | 3/13 at 100.00 | B | | 770,483 | |
| | 3,000 | | New Jersey Transit Corporation, Certificates of Participation, Federal Transit Administration Grants, Series 2002A, 5.500%, 9/15/14 – AMBAC Insured | No Opt. Call | Aa3 | | 3,257,880 | |
| | 1,875 | | New Jersey Transit Corporation, Certificates of Participation, Federal Transit Administration Grants, Series 2005A, 5.000%, 9/15/18 – FGIC Insured | 9/15 at 100.00 | A1 | | 2,054,344 | |
| | 225 | | New Jersey Turnpike Authority, Revenue Bonds, Series 1991C, 6.500%, 1/01/16 – AMBAC Insured | No Opt. Call | A3 | | 262,823 | |
| | 2,500 | | New Jersey Turnpike Authority, Revenue Bonds, Series 2009I, 5.000%, 1/01/35 | 1/20 at 100.00 | A+ | | 2,819,325 | |
| | 2,380 | | New Jersey Turnpike Authority, Revenue Bonds, Series 2012B, 5.000%, 1/01/28 | 1/23 at 100.00 | A+ | | 2,832,271 | |
| | 240 | | Passaic County Improvement Authority, New Jersey, County Guaranteed Parking Revenue Bonds, 200 Hospital Plaza Project, Series 2010, 5.000%, 5/01/42 | 5/20 at 100.00 | Aa3 | | 270,221 | |
| | 2,750 | | Passaic County Improvement Authority, New Jersey, Revenue Bonds, Paterson Parking Deck Facility, Series 2005, 5.000%, 4/15/35 – AGM Insured | 4/15 at 100.00 | Aa3 | | 2,945,003 | |
| | | | Port Authority of New York and New Jersey, Consolidated Revenue Bonds, One Hundred Fortieth Series 2005: | | | | | |
| | 4,000 | | 5.000%, 12/01/28 – SYNCORA GTY Insured | 6/15 at 101.00 | AA– | | 4,397,800 | |
| | 3,000 | | 5.000%, 12/01/34 | 6/15 at 101.00 | AA– | | 3,283,860 | |
| | 585 | | Port Authority of New York and New Jersey, Consolidated Revenue Bonds, One Hundred Forty Eighth Series 2008, Trust 2920, 17.154%, 8/15/32 – AGM Insured (IF) | 8/17 at 100.00 | AA– | | 888,568 | |
| | 1,000 | | Port Authority of New York and New Jersey, Consolidated Revenue Bonds, One Hundred Thirty-Fourth Series 2004, 5.000%, 7/15/34 | 1/14 at 101.00 | AA– | | 1,054,330 | |
| | 8,000 | | Port Authority of New York and New Jersey, Special Project Bonds, JFK International Air Terminal LLC, Sixth Series 1997, 5.750%, 12/01/22 – NPFG Insured (Alternative Minimum Tax) | 12/12 at 100.00 | BBB | | 8,002,877 | |
| | 790 | | South Jersey Transportation Authority, New Jersey, Transportation System Revenue Bonds, Series 2012, 5.000%, 11/01/22 | No Opt. Call | A– | | 952,148 | |
| | 850 | | Trenton Parking Authority, Mercer County, New Jersey, Guaranteed Parking System Revenue Bonds, Series 2003, 5.000%, 10/01/24 – FGIC Insured | 10/13 at 100.00 | AA | | 864,518 | |
| | 40,750 | | Total Transportation | | | | 44,334,673 | |
| | | | U.S. Guaranteed – 18.0% (12.5% of Total Investments) (5) | | | | | |
| | 2,075 | | Egg Harbor Township School District, Atlantic County, New Jersey, General Obligation Bonds, Series 2005, 5.000%, 4/01/27 (Pre-refunded 4/01/15) – NPFG Insured | 4/15 at 100.00 | N/R (5) | | 2,307,794 | |
| | 1,000 | | Manalapan-Englishtown Regional Board of Education, New Jersey, General Obligation Bonds, Series 2003, 5.000%, 10/01/27 (Pre-refunded 10/01/13) – NPFG Insured | 10/13 at 100.00 | AA (5) | | 1,043,420 | |
| | | | New Jersey Economic Development Authority, Cigarette Tax Revenue Bonds, Series 2004: | | | | | |
| | 500 | | 5.750%, 6/15/29 (Pre-refunded 6/15/14) | 6/14 at 100.00 | Aaa | | 544,140 | |
| | 1,600 | | 5.500%, 6/15/31 (Pre-refunded 6/15/14) | 6/14 at 100.00 | Aaa | | 1,734,784 | |
| | 2,540 | | 5.750%, 6/15/34 (Pre-refunded 6/15/14) | 6/14 at 100.00 | Aaa | | 2,764,231 | |
| | 1,660 | | New Jersey Economic Development Authority, Revenue Bonds, Yeshiva Ktana of Passaic, Series 1993, 8.000%, 9/15/18 (ETM) | No Opt. Call | N/R (5) | | 2,040,738 | |
| | 595 | | New Jersey Educational Facilities Authority, Revenue Bonds, Kean University, Series 2005B, 5.000%, 7/01/30 (Pre-refunded 7/01/16) – NPFG Insured | 7/16 at 100.00 | A– (5) | | 693,455 | |
| | 1,145 | | New Jersey Educational Facilities Authority, Revenue Bonds, Montclair State University, Series 2004L, 5.125%, 7/01/19 (Pre-refunded 7/01/14) – NPFG Insured | 7/14 at 100.00 | BBB (5) | | 1,236,875 | |
| | | | New Jersey Educational Facilities Authority, Revenue Bonds, New Jersey Institute of Technology, Series 2004B: | | | | | |
| | 1,375 | | 5.000%, 7/01/18 (Pre-refunded 1/01/14) – AMBAC Insured | 1/14 at 100.00 | A+ (5) | | 1,450,955 | |
| | 725 | | 5.000%, 7/01/19 (Pre-refunded 1/01/14) – AMBAC Insured | 1/14 at 100.00 | A+ (5) | | 765,049 | |
| | 1,530 | | 4.750%, 7/01/20 (Pre-refunded 1/01/14) – AMBAC Insured | 1/14 at 100.00 | A+ (5) | | 1,610,065 | |
| | Principal | | | Optional Call | | | | |
| | Amount (000) | | Description (1) | Provisions (2) | Ratings (3) | | Value | |
| | | | U.S. Guaranteed (5) (continued) | | | | | |
| $ | 300 | | New Jersey Educational Facilities Authority, Revenue Bonds, Rider University, Series 2004A, 5.500%, 7/01/23 (Pre-refunded 7/01/14) – RAAI Insured | 7/14 at 100.00 | BBB+ (5) | $ | 325,941 | |
| | 400 | | New Jersey Educational Facilities Authority, Revenue Bonds, Rowan University, Series 2004C, 5.000%, 7/01/20 (Pre-refunded 7/01/14) – NPFG Insured | 7/14 at 100.00 | A+ (5) | | 431,264 | |
| | | | New Jersey Health Care Facilities Financing Authority, Revenue Bonds, Capital Health System Obligated Group, Series 2003A: | | | | | |
| | 750 | | 5.000%, 7/01/26 (Pre-refunded 7/01/13) | 7/13 at 100.00 | N/R (5) | | 772,965 | |
| | 1,670 | | 5.375%, 7/01/33 (Pre-refunded 7/01/13) | 7/13 at 100.00 | N/R (5) | | 1,725,310 | |
| | 1,270 | | New Jersey Health Care Facilities Financing Authority, Revenue Bonds, St. Clare’s Hospital, Series 2004A, 5.250%, 7/01/20 – RAAI Insured (ETM) | 7/14 at 100.00 | N/R (5) | | 1,595,361 | |
| | | | New Jersey Turnpike Authority, Revenue Bonds, Series 1991C: | | | | | |
| | 125 | | 6.500%, 1/01/16 – AMBAC Insured (ETM) | 1/16 at 100.00 | A3 (5) | | 148,250 | |
| | 470 | | 6.500%, 1/01/16 (ETM) | No Opt. Call | AA+ (5) | | 560,043 | |
| | 195 | | 6.500%, 1/01/16 – NPFG Insured (ETM) | No Opt. Call | A+ (5) | | 232,358 | |
| | 565 | | 6.500%, 1/01/16 – NPFG Insured (ETM) | No Opt. Call | A+ (5) | | 659,977 | |
| | 120 | | 6.500%, 1/01/16 – AMBAC Insured (ETM) | No Opt. Call | A3 (5) | | 142,990 | |
| | 5,090 | | 6.500%, 1/01/16 (ETM) | No Opt. Call | AA+ (5) | | 5,532,318 | |
| | 1,365 | | 6.500%, 1/01/16 – AMBAC Insured (ETM) | No Opt. Call | AA+ (5) | | 1,483,619 | |
| | 750 | | Newark Housing Authority, New Jersey, Port Authority Terminal Revenue Bonds, Series 2004, 5.250%, 1/01/21 (Pre-refunded 1/01/14) – NPFG Insured | 1/14 at 100.00 | BBB (5) | | 793,335 | |
| | 2,125 | | Puerto Rico Electric Power Authority, Power Revenue Bonds, Series 2005RR, 5.000%, 7/01/35 (Pre-refunded 7/01/15) – FGIC Insured | 7/15 at 100.00 | AA+ (5) | | 2,383,103 | |
| | 1,925 | | Tobacco Settlement Financing Corporation, New Jersey, Tobacco Settlement Asset-Backed Bonds, Series 2003, 6.375%, 6/01/32 (Pre-refunded 6/01/13) | 6/13 at 100.00 | Aaa | | 1,990,027 | |
| | 350 | | Trenton Parking Authority, Mercer County, New Jersey, Guaranteed Parking System Revenue Bonds, Series 2003, 5.000%, 10/01/24 (Pre-refunded
10/01/13) – FGIC Insured | 10/13 at 100.00 | A3 (5) | | 365,362 | |
| | 32,215 | | Total U.S. Guaranteed | | | | 35,333,729 | |
| | | | Utilities – 0.1% (0.1% of Total Investments) | | | | | |
| | 245 | | Guam Power Authority, Revenue Bonds, Series 2012A, 5.000%, 10/01/34 | 10/22 at 100.00 | BBB | | 265,783 | |
| | | | Water and Sewer – 6.6% (4.6% of Total Investments) | | | | | |
| | | | Bayonne Municipal Utilities Authority, New Jersey, Water System Revenue Refunding Bonds, Series 2003A: | | | | | |
| | 1,450 | | 5.000%, 4/01/19 – SYNCORA GTY Insured | 4/13 at 100.00 | N/R | | 1,460,005 | |
| | 1,250 | | 5.000%, 4/01/24 – SYNCORA GTY Insured | 4/13 at 100.00 | N/R | | 1,254,213 | |
| | 515 | | Jersey City Sewer Authority, Hudson County, New Jersey, Sewer Revenue Refunding Bonds, Series 1993, 6.250%, 1/01/14 – AMBAC Insured | No Opt. Call | N/R | | 528,292 | |
| | 1,250 | | New Jersey Economic Development Authority, Water Facilities Revenue Bonds, New Jersey-American Water Company Inc. Project, Refunding Series 2010B, 5.600%, 11/01/34 (Alternative Minimum Tax) | 5/20 at 100.00 | A | | 1,427,600 | |
| | 420 | | New Jersey Economic Development Authority, Water Facilities Revenue Bonds, New Jersey-American Water Company Inc. Project, Refunding Series 2010D, 4.875%, 11/01/29 (Alternative Minimum Tax) | 11/20 at 100.00 | A | | 460,761 | |
| | 1,780 | | New Jersey Environmental Infrastructure Trust, Environmental Infrastructure Bonds, Tender Option Bond Trust 4729, 7.185%, 9/01/21 (IF) (4) | No Opt. Call | AAA | | 2,470,996 | |
| | 1,650 | | New Jersey Water Supply Authority, Water Supply Authority Bonds, Manasquan Reservoir, Series 2005, 5.000%, 8/01/31 – NPFG Insured | 8/15 at 100.00 | AA | | 1,784,294 | |
| | | | North Hudson Sewerage Authority, Gross Revenue Senior Lien Lease Certificates, Series 2012A: | | | | | |
| | 1,000 | | 5.000%, 6/01/27 – NPFG Insured | 6/22 at 100.00 | A | | 1,167,930 | |
| | 1,100 | | 5.000%, 6/01/42 – NPFG Insured | 6/22 at 100.00 | A | | 1,238,578 | |
| | | Nuveen New Jersey Premium Income Municipal Fund, Inc. (continued) |
| NNJ | | Portfolio of Investments |
October 31, 2012 (Unaudited)
| | Principal | | | Optional Call | | | | |
| | Amount (000) | | Description (1) | Provisions (2) | Ratings (3) | | Value | |
| | | | Water and Sewer (continued) | | | | | |
| $ | 1,070 | | Wanaque Valley Regional Sewer Authority, Passaic County, New Jersey, Sewer Revenue Refunding Bonds, Series 1993B, 5.750%, 9/01/18 – AMBAC Insured | No Opt. Call | A1 | $ | 1,179,065 | |
| | 11,485 | | Total Water and Sewer | | | | 12,971,734 | |
| $ | 283,240 | | Total Investments (cost $260,494,351) – 143.9% | | | | 283,145,167 | |
| | | | Variable Rate Demand Preferred Shares, at Liquidation Value – (45.0)% (6) | | | | (88,600,000 | ) |
| | | | Other Assets Less Liabilities – 1.1% | | | | 2,267,109 | |
| | | | Net Assets Applicable to Common Shares – 100% | | | $ | 196,812,276 | |
| (1) | | All percentages shown in the Portfolio of Investments are based on net assets applicable to Common shares unless otherwise noted. |
| (2) | | Optional Call Provisions: Dates (month and year) and prices of the earliest optional call or redemption. There may be other call provisions at varying prices at later dates. Certain mortgage-backed securities may be subject to periodic principal paydowns. |
| (3) | | Ratings: Using the highest of Standard & Poor’s Group (“Standard & Poor’s”), Moody’s Investors Service, Inc. (“Moody’s”) or Fitch, Inc. (“Fitch”) rating. Ratings below BBB by Standard & Poor’s, Baa by Moody’s or BBB by Fitch are considered to be below investment grade. Holdings designated N/R are not rated by any of these national rating agencies. |
| (4) | | Investment, or portion of investment, has been pledged to collateralize the net payment obligations for investments in inverse floating rate transactions. |
| (5) | | Backed by an escrow or trust containing sufficient U.S. Government or U.S. Government agency securities, which ensure the timely payment of principal and interest. Certain bonds backed by U.S. Government or agency securities are regarded as having an implied rating equal to the rating of such securities. |
| (6) | | Variable Rate Demand Preferred Shares, at Liquidation Value as a percentage of Total Investments is 31.3%. |
| N/R | | Not rated. |
| WI/DD | | Investment, or portion of investment, purchased on a when-issued or delayed delivery basis. |
| (ETM) | | Escrowed to maturity. |
| (IF) | | Inverse floating rate investment. |
See accompanying notes to financial statements.
| | | Nuveen New Jersey Dividend Advantage Municipal Fund |
| NXJ | | Portfolio of Investments |
| | | October 31, 2012 (Unaudited) |
| | Principal | | | Optional Call | | | | |
| | Amount (000) | | Description (1) | Provisions (2) | Ratings (3) | | Value | |
| | | | Consumer Discretionary – 0.3% (0.2% of Total Investments) | | | | | |
| | | | Middlesex County Improvement Authority, New Jersey, Senior Revenue Bonds, Heldrich Center Hotel/Conference Center Project, Series 2005A: | | | | | |
| $ | 260 | | 5.000%, 1/01/32 | 1/15 at 100.00 | B3 | $ | 168,704 | |
| | 230 | | 5.125%, 1/01/37 | 1/15 at 100.00 | B3 | | 149,249 | |
| | 490 | | Total Consumer Discretionary | | | | 317,953 | |
| | | | Consumer Staples – 5.7% (4.0% of Total Investments) | | | | | |
| | | | Tobacco Settlement Financing Corporation, New Jersey, Tobacco Settlement Asset-Backed Bonds, Series 2007-1A: | | | | | |
| | 895 | | 4.500%, 6/01/23 | 6/17 at 100.00 | B1 | | 875,793 | |
| | 4,525 | | 4.750%, 6/01/34 | 6/17 at 100.00 | B2 | | 3,924,034 | |
| | 1,385 | | 5.000%, 6/01/41 | 6/17 at 100.00 | B2 | | 1,212,027 | |
| | 6,805 | | Total Consumer Staples | | | | 6,011,854 | |
| | | | Education and Civic Organizations – 10.5% (7.4% of Total Investments) | | | | | |
| | 250 | | New Jersey Educational Facilities Authority, Revenue Bonds, Fairleigh Dickinson University, Series 2004C, 5.500%, 7/01/23 | 7/14 at 100.00 | BBB | | 258,343 | |
| | | | New Jersey Educational Facilities Authority, Revenue Bonds, Kean University, Series 2007D: | | | | | |
| | 1,115 | | 5.000%, 7/01/32 – FGIC Insured | 7/17 at 100.00 | A2 | | 1,200,565 | |
| | 735 | | 5.000%, 7/01/39 – FGIC Insured | 7/17 at 100.00 | A2 | | 789,427 | |
| | 60 | | New Jersey Educational Facilities Authority, Revenue Bonds, Montclair State University, Series 2004L, 5.125%, 7/01/21 – NPFG Insured | 7/14 at 100.00 | AA– | | 64,308 | |
| | 970 | | New Jersey Educational Facilities Authority, Revenue Bonds, Montclair State University, Series 2006A, 5.000%, 7/01/36 – AMBAC Insured | 7/16 at 100.00 | AA– | | 1,025,261 | |
| | 665 | | New Jersey Educational Facilities Authority, Revenue Bonds, Princeton University, Tender Option Bond Trust 3922, 13.401%, 7/01/19 (IF) | No Opt. Call | AAA | | 1,016,399 | |
| | 300 | | New Jersey Educational Facilities Authority, Revenue Bonds, Ramapo College, Series 2012B, 5.000%, 7/01/42 | 7/22 at 100.00 | A | | 341,505 | |
| | | | New Jersey Educational Facilities Authority, Revenue Bonds, Rider University, Series 2012A: | | | | | |
| | 260 | | 5.000%, 7/01/32 | 7/21 at 100.00 | BBB+ | | 287,594 | |
| | 170 | | 5.000%, 7/01/37 | 7/21 at 100.00 | BBB+ | | 185,394 | |
| | 270 | | New Jersey Higher Education Assistance Authority, Student Loan Revenue Bonds, Series 2010-1A, 5.000%, 12/01/25 | 12/19 at 100.00 | AA | | 297,467 | |
| | 135 | | New Jersey Higher Education Assistance Authority, Student Loan Revenue Bonds, Series 2010-2, 5.000%, 12/01/30 | 12/20 at 100.00 | Aa3 | | 150,201 | |
| | 350 | | New Jersey Higher Education Assistance Authority, Student Loan Revenue Bonds, Series 2011-1, 5.750%, 12/01/27 (Alternative Minimum Tax) | 12/21 at 100.00 | Aa3 | | 409,238 | |
| | 1,185 | | New Jersey Higher Education Assistance Authority, Student Loan Revenue Bonds, Series 2012-1A, 4.250%, 12/01/25 (Alternative Minimum Tax) | 12/22 at 100.00 | AA | | 1,233,834 | |
| | 300 | | New Jersey Higher Education Assistance Authority, Student Loan Revenue Bonds, Tender Option Bond Trust PA-4643, 19.767%, 6/01/30 (IF) (4) | 6/19 at 100.00 | AA | | 461,184 | |
| | 250 | | Puerto Rico Industrial, Tourist, Educational, Medical and Environmental Control Facilities Financing Authority, Higher Education Revenue Bonds, Ana G. Mendez University System Project, Refunding Series 2012, 5.125%, 4/01/32 | 4/22 at 100.00 | BBB– | | 254,193 | |
| | 75 | | Puerto Rico Industrial, Tourist, Educational, Medical and Environmental Control Facilities Financing Authority, Higher Education Revenue Bonds, Inter-American University of Puerto Rico Project, Refunding Series 2012, 5.000%, 10/01/31 | 10/22 at 100.00 | A– | | 82,604 | |
| | | | Puerto Rico Industrial, Tourist, Educational, Medical and Environmental Control Facilities Financing Authority, Higher Education Revenue Bonds, University of the Sacred Heart, Series 2001: | | | | | |
| | 2,000 | | 5.250%, 9/01/21 | 3/13 at 100.00 | BBB | | 2,003,400 | |
| | 500 | | 5.250%, 9/01/31 | 3/13 at 100.00 | BBB | | 500,455 | |
| | 500 | | Puerto Rico Industrial, Tourist, Educational, Medical and Environmental Control Facilities Financing Authority, Higher Education Revenue Refunding Bonds, Ana G. Mendez University System, Series 2002, 5.500%, 12/01/31 | 12/12 at 101.00 | BBB– | | 503,260 | |
| | 10,090 | | Total Education and Civic Organizations | | | | 11,064,632 | |
| | | Nuveen New Jersey Dividend Advantage Municipal Fund (continued) |
| NXJ | | Portfolio of Investments |
October 31, 2012 (Unaudited)
| | Principal | | | Optional Call | | | | |
| | Amount (000) | | Description (1) | Provisions (2) | Ratings (3) | | Value | |
| | | | Financials – 1.8% (1.3% of Total Investments) | | | | | |
| $ | 850 | | New Jersey Economic Development Authority, Economic Development Revenue Bonds, Glimcher Properties LP, Series 1998, 6.000%, 11/01/28 (Alternative Minimum Tax) | 11/12 at 100.00 | N/R | $ | 849,898 | |
| | 250 | | New Jersey Economic Development Authority, Industrial Development Revenue Refunding Bonds, Newark Airport Marriott Hotel, Series 1996, 7.000%, 10/01/14 | 11/12 at 100.00 | Ba1 | | 251,238 | |
| | 750 | | New Jersey Economic Development Authority, Revenue Refunding Bonds, Kapkowski Road Landfill Project, Series 2002, 5.750%, 10/01/21 | No Opt. Call | Ba2 | | 834,510 | |
| | 1,850 | | Total Financials | | | | 1,935,646 | |
| | | | Health Care – 14.9% (10.6% of Total Investments) | | | | | |
| | 310 | | Camden County Improvement Authority, New Jersey, Revenue Bonds, Cooper Health System, Series 2004A, 5.750%, 2/15/34 | 8/14 at 100.00 | BBB | | 320,856 | |
| | 710 | | New Jersey Health Care Facilities Finance Authority, Revenue Bonds, AHS Hospital Corporation, Series 2008A, 5.000%, 7/01/27 | 7/18 at 100.00 | A1 | | 775,341 | |
| | 370 | | New Jersey Health Care Facilities Financing Authority, Hospital Revenue Bonds, Virtua Health, Tender Option Bond Trust 3018, 19.251%, 7/01/38 – AGC Insured (IF) (4) | 7/19 at 100.00 | AA– | | 544,107 | |
| | 850 | | New Jersey Health Care Facilities Financing Authority, New Jersey, Revenue Bonds, Saint Peters University Hospital, Refunding Series 2011, 6.000%, 7/01/26 | 7/21 at 100.00 | BBB– | | 976,446 | |
| | 865 | | New Jersey Health Care Facilities Financing Authority, Revenue Bonds, Atlanticare Regional Medical Center, Series 2007, 5.000%, 7/01/37 | 7/17 at 100.00 | A+ | | 914,461 | |
| | 1,500 | | New Jersey Health Care Facilities Financing Authority, Revenue Bonds, CentraState Medical Center, Series 2006A, 5.000%, 7/01/30 – AGC Insured | 7/17 at 100.00 | Aa3 | | 1,609,725 | |
| | 130 | | New Jersey Health Care Facilities Financing Authority, Revenue Bonds, Children’s Specialized Hospital, Series 2005A, 5.500%, 7/01/36 | 7/15 at 100.00 | BBB | | 133,866 | |
| | 440 | | New Jersey Health Care Facilities Financing Authority, Revenue Bonds, Hunterdon Medical Center, Series 2006B, 5.000%, 7/01/36 | 7/16 at 100.00 | A | | 454,617 | |
| | 180 | | New Jersey Health Care Facilities Financing Authority, Revenue Bonds, Hunterdon Medical Center, Series 2006, 5.125%, 7/01/35 | 7/16 at 100.00 | A | | 187,051 | |
| | 1,040 | | New Jersey Health Care Facilities Financing Authority, Revenue Bonds, Kennedy Health System Obligated Group Issue, Refunding Series 2012, 3.750%, 7/01/27 | No Opt. Call | A3 | | 1,052,875 | |
| | 1,255 | | New Jersey Health Care Facilities Financing Authority, Revenue Bonds, Meridian Health, Series 2007-I, 5.000%, 7/01/38 – AGC Insured | 7/18 at 100.00 | AA– | | 1,349,276 | |
| | 125 | | New Jersey Health Care Facilities Financing Authority, Revenue Bonds, RWJ Health Care Corporation, Series 2005B, 5.000%, 7/01/25 – RAAI Insured | 7/15 at 100.00 | N/R | | 126,688 | |
| | 1,555 | | New Jersey Health Care Facilities Financing Authority, Revenue Bonds, Saint Barnabas Health Care System, Refunding Series 2011A, 5.625%, 7/01/37 | 7/21 at 100.00 | BBB+ | | 1,751,179 | |
| | 445 | | New Jersey Health Care Facilities Financing Authority, Revenue Bonds, Saint Barnabas Health Care System, Series 2006A, 5.000%, 7/01/29 | 1/17 at 100.00 | BBB+ | | 460,001 | |
| | 700 | | New Jersey Health Care Facilities Financing Authority, Revenue Bonds, Saint Joseph’s Healthcare System Obligated Group Issue, Series 2008, 6.625%, 7/01/38 | 7/18 at 100.00 | BBB– | | 812,882 | |
| | 895 | | New Jersey Health Care Facilities Financing Authority, Revenue Bonds, Shore Memorial Health System, Series 2003, 5.000%, 7/01/23 – RAAI Insured | 7/13 at 100.00 | N/R | | 898,786 | |
| | 2,000 | | New Jersey Health Care Facilities Financing Authority, Revenue Bonds, Somerset Medical Center, Series 2003, 5.500%, 7/01/33 | 7/13 at 100.00 | Ba2 | | 2,009,460 | |
| | | | New Jersey Health Care Facilities Financing Authority, Revenue Bonds, South Jersey Hospital System, Refunding Series 2006: | | | | | |
| | 665 | | 5.000%, 7/01/36 | 7/16 at 100.00 | A2 | | 691,926 | |
| | 615 | | 5.000%, 7/01/46 | 7/16 at 100.00 | A2 | | 637,743 | |
| | 14,650 | | Total Health Care | | | | 15,707,286 | |
| | | | Housing/Multifamily – 0.9% (0.7% of Total Investments) | | | | | |
| | | | New Jersey Economic Development Authority, Student Housing Revenue Bonds, Provident Group-Montclair Properties LLC, Montclair State University Student Housing Project, Series 2010A: | | | | | |
| | 560 | | 5.750%, 6/01/31 | 6/20 at 100.00 | Baa3 | | 632,918 | |
| | 300 | | 5.875%, 6/01/42 | 6/20 at 100.00 | Baa3 | | 335,637 | |
| | 860 | | Total Housing/Multifamily | | | | 968,555 | |
| | Principal | | | Optional Call | | | | |
| | Amount (000) | | Description (1) | Provisions (2) | Ratings (3) | | Value | |
| | | | Housing/Single Family – 5.2% (3.7% of Total Investments) | | | | | |
| $ | 5,000 | | New Jersey Housing & Mortgage Finance Agency, Single Family Home Mortgage Revenue Bonds, Series 2011A, 4.650%, 10/01/29 | 10/21 at 100.00 | Aa1 | $ | 5,507,849 | |
| | | | Long-Term Care – 2.5% (1.8% of Total Investments) | | | | | |
| | 520 | | Burlington County Bridge Commission, New Jersey, Economic Development Revenue Bonds, The Evergreens Project, Series 2007, 5.625%, 1/01/38 | 1/18 at 100.00 | N/R | | 540,592 | |
| | 250 | | New Jersey Economic Development Authority, First Mortgage Revenue Bonds, Winchester Gardens at Wards Homestead, Series 2004A, 5.800%, 11/01/31 | 11/14 at 100.00 | BBB– | | 256,965 | |
| | | | New Jersey Economic Development Authority, Revenue Bonds, Masonic Charity Foundation of New Jersey, Series 2001: | | | | | |
| | 1,000 | | 6.000%, 6/01/25 | 12/12 at 101.00 | A– | | 1,011,950 | |
| | 335 | | 5.500%, 6/01/31 | 12/12 at 101.00 | A– | | 338,796 | |
| | 500 | | New Jersey Economic Development Authority, Revenue Bonds, United Methodist Homes of New Jersey Obligated Group, Series 1998, 5.125%, 7/01/25 | 1/13 at 100.00 | BB+ | | 500,105 | |
| | 2,605 | | Total Long-Term Care | | | | 2,648,408 | |
| | | | Tax Obligation/General – 3.6% (2.6% of Total Investments) | | | | | |
| | 1,000 | | Jersey City, New Jersey, General Obligation Bonds, Series 2006A, 5.000%,
9/01/22 – AMBAC Insured | 9/16 at 100.00 | A2 | | 1,132,050 | |
| | 1,100 | | Linden, New Jersey, General Obligation Bonds, Refunding Series 2011, 4.000%, 5/01/23 | 5/21 at 100.00 | AA– | | 1,223,772 | |
| | 300 | | Middletown Township Board of Education, Monmouth County, New Jersey, Refunding Series 2010, 5.000%, 8/01/27 | 8/20 at 100.00 | AA | | 353,343 | |
| | 250 | | Newark Housing Authority, New Jersey, City-Secured Police Facility Revenue Bonds, South Ward Police Facility, Series 2009A, 6.750%, 12/01/38 – AGC Insured | 12/19 at 100.00 | Aa3 | | 315,058 | |
| | 740 | | Union County Utilities Authority, New Jersey, Resource Recovery Facility Lease Revenue Refunding Bonds, Covantan Union Inc. Lessee, Series 2011B, 5.250%, 12/01/31 (Alternative Minimum Tax) | 12/21 at 100.00 | AA+ | | 828,082 | |
| | 3,390 | | Total Tax Obligation/General | | | | 3,852,305 | |
| | | | Tax Obligation/Limited – 37.0% (26.3% of Total Investments) | | | | | |
| | 600 | | Bergen County Improvement Authority, New Jersey, Guaranteed Lease Revenue Bonds, County Administration Complex Project, Series 2005, 5.000%, 11/15/26 | No Opt. Call | Aaa | | 802,728 | |
| | 1,745 | | Burlington County Bridge Commission, New Jersey, Guaranteed Pooled Loan Bonds, Series 2003, 5.000%, 12/01/18 – NPFG Insured | 12/13 at 100.00 | AA | | 1,829,894 | |
| | 1,000 | | Camden County Improvement Authority, New Jersey, County Guaranteed Lease Revenue Bonds, Series 2005A, 5.000%, 9/01/16 – AGM Insured | 9/15 at 100.00 | Aa2 | | 1,117,180 | |
| | 1,100 | | Casino Reinvestment Development Authority, New Jersey, Hotel Room Fee Revenue Bonds, Series 2004, 5.250%, 1/01/16 – AMBAC Insured | 1/15 at 102.00 | A– | | 1,179,728 | |
| | 620 | | Essex County Improvement Authority, New Jersey, Project Consolidation Revenue Bonds, Series 2007, 5.250%, 12/15/22 – AMBAC Insured | No Opt. Call | Aa2 | | 777,877 | |
| | 3,000 | | Garden State Preservation Trust, New Jersey, Open Space and Farmland Preservation Bonds, Refunding Series 2012A, 5.000%, 11/01/20 | No Opt. Call | AAA | | 3,793,950 | |
| | 500 | | Garden State Preservation Trust, New Jersey, Open Space and Farmland Preservation Bonds, Series 2005A, 5.750%, 11/01/28 – AGM Insured | No Opt. Call | AAA | | 669,460 | |
| | 815 | | Garden State Preservation Trust, New Jersey, Open Space and Farmland Preservation Bonds, Series 2005C, 5.125%, 11/01/18 – AGM Insured | No Opt. Call | AAA | | 1,011,651 | |
| | 1,785 | | New Jersey Building Authority, State Building Revenue Bonds, Series 2007A, 5.000%, 6/15/27 | 6/16 at 100.00 | A+ | | 1,901,239 | |
| | | | New Jersey Economic Development Authority, Cigarette Tax Revenue Refunding Bonds, Series 2012: | | | | | |
| | 600 | | 5.000%, 6/15/19 | No Opt. Call | BBB+ | | 694,176 | |
| | 360 | | 5.000%, 6/15/21 | No Opt. Call | BBB+ | | 419,148 | |
| | 600 | | 5.000%, 6/15/26 | 6/22 at 100.00 | BBB+ | | 676,992 | |
| | 1,200 | | New Jersey Economic Development Authority, Revenue Bonds, Motor Vehicle Surcharge, Series 2004A, 5.250%, 7/01/15 – NPFG Insured | 7/14 at 100.00 | A | | 1,293,648 | |
| | | | New Jersey Economic Development Authority, Revenue Bonds, Newark Downtown District Management Corporation Project, Series 2007: | | | | | |
| | 65 | | 5.125%, 6/15/27 | 6/17 at 100.00 | Baa3 | | 68,701 | |
| | 115 | | 5.125%, 6/15/37 | 6/17 at 100.00 | Baa3 | | 119,617 | |
| | | Nuveen New Jersey Dividend Advantage Municipal Fund (continued) |
| NXJ | | Portfolio of Investments |
October 31, 2012 (Unaudited)
| | Principal | | | Optional Call | | | | |
| | Amount (000) | | Description (1) | Provisions (2) | Ratings (3) | | Value | |
| | | | Tax Obligation/Limited (continued) | | | | | |
| | | | New Jersey Economic Development Authority, School Facilities Construction Financing Program Bonds, Series 2007U: | | | | | |
| $ | 615 | | 5.000%, 9/01/37 – AMBAC Insured | 9/17 at 100.00 | A+ | $ | 665,473 | |
| | 1,235 | | 5.000%, 9/01/37 | 9/17 at 100.00 | A+ | | 1,336,356 | |
| | 470 | | New Jersey Educational Facilities Authority, Revenue Bonds, Higher Education Capital Improvement Fund, Refunding Series 2005A, 5.000%, 9/01/15 – AGM Insured | No Opt. Call | AA– | | 524,553 | |
| | | | New Jersey Health Care Facilities Financing Authority, Lease Revenue Bonds, Department of Human Services - Greystone Park Psychiatric Hospital, Series 2005: | | | | | |
| | 925 | | 5.000%, 9/15/18 – AMBAC Insured | 9/15 at 100.00 | A+ | | 1,016,214 | |
| | 1,400 | | 5.000%, 9/15/24 – AMBAC Insured | 9/15 at 100.00 | A+ | | 1,508,500 | |
| | 250 | | New Jersey Health Care Facilities Financing Authority, State Contract Bonds, Hospital Asset Transformation Program, Series 2008A, 5.250%, 10/01/38 | 10/18 at 100.00 | A+ | | 273,820 | |
| | | | New Jersey Transportation Trust Fund Authority, Federal Highway Aid Grant Anticipation Bonds, Series 2006: | | | | | |
| | 350 | | 5.000%, 6/15/17 – FGIC Insured | 6/16 at 100.00 | Aa3 | | 400,621 | |
| | 610 | | 5.000%, 6/15/18 – FGIC Insured | 6/16 at 100.00 | Aa3 | | 695,180 | |
| | 6,000 | | New Jersey Transportation Trust Fund Authority, Transportation System Bonds, Capital Appreciation Series 2010A, 0.000%, 12/15/30 | No Opt. Call | A+ | | 2,812,500 | |
| | 1,300 | | New Jersey Transportation Trust Fund Authority, Transportation System Bonds, Refunding Series 2006A, 5.500%, 12/15/22 | No Opt. Call | A+ | | 1,660,074 | |
| | 1,300 | | New Jersey Transportation Trust Fund Authority, Transportation System Bonds, Series 2004B, 5.500%, 12/15/16 – NPFG Insured | No Opt. Call | A+ | | 1,539,005 | |
| | 1,280 | | New Jersey Transportation Trust Fund Authority, Transportation System Bonds, Series 2005D, 5.000%, 6/15/19 – AGM Insured | 6/15 at 100.00 | AA– | | 1,412,237 | |
| | | | New Jersey Transportation Trust Fund Authority, Transportation System Bonds, Series 2006C: | | | | | |
| | 3,000 | | 0.000%, 12/15/32 – AGM Insured | No Opt. Call | AA– | | 1,256,520 | |
| | 3,500 | | 0.000%, 12/15/33 – AGM Insured | No Opt. Call | AA– | | 1,389,745 | |
| | 6,000 | | 0.000%, 12/15/34 – AGM Insured | No Opt. Call | AA– | | 2,248,140 | |
| | 1,000 | | New Jersey Transportation Trust Fund Authority, Transportation System Bonds, Series 2007A, 5.000%, 12/15/26 – AMBAC Insured | 12/17 at 100.00 | A+ | | 1,156,370 | |
| | 800 | | New Jersey Transportation Trust Fund Authority, Transportation System Bonds, Series 2010D, 5.000%, 12/15/24 | No Opt. Call | A+ | | 974,952 | |
| | 915 | | Passaic County Improvement Authority, New Jersey, Lease Revenue Bonds, Preakness Healthcare Center Expansion Project, Series 2012, 3.500%, 5/01/35 | 5/22 at 100.00 | Aa3 | | 916,098 | |
| | 405 | | Puerto Rico Convention Center District Authority, Hotel Occupancy Tax Revenue Bonds, Series 2006A, 4.500%, 7/01/36 – CIFG Insured | 7/16 at 100.00 | BBB+ | | 403,518 | |
| | 550 | | Virgin Islands Public Finance Authority, Matching Fund Loan Notes Revenue Bonds, Subordinate Lien Series 2010B, 5.250%, 10/01/29 | 10/20 at 100.00 | Baa2 | | 600,331 | |
| | 46,010 | | Total Tax Obligation/Limited | | | | 39,146,196 | |
| | | | Transportation – 18.5% (13.2% of Total Investments) | | | | | |
| | | | Delaware River and Bay Authority, Delaware and New Jersey, Revenue Bonds, Series 2005: | | | | | |
| | 1,000 | | 5.000%, 1/01/25 – NPFG Insured | 1/15 at 100.00 | A1 | | 1,082,700 | |
| | 1,000 | | 5.000%, 1/01/26 – NPFG Insured | 1/15 at 100.00 | A1 | | 1,072,650 | |
| | 500 | | 5.000%, 1/01/27 – NPFG Insured | 1/15 at 100.00 | A1 | | 535,330 | |
| | 350 | | Delaware River Joint Toll Bridge Commission, Pennsylvania, Revenue Bonds, Refunding Series 2012A, 4.000%, 7/01/27 | 7/22 at 100.00 | A2 | | 377,493 | |
| | 500 | | Delaware River Port Authority, New Jersey and Pennsylvania, Revenue Bonds, Series 2010E, 5.000%, 1/01/40 | 1/20 at 100.00 | A– | | 560,100 | |
| | 300 | | New Brunswick Parking Authority, Middlesex County, New Jersey, Guaranteed Parking Revenue Bonds, Refunding Series 2012, 5.000%, 9/01/31 | 9/22 at 100.00 | A+ | | 347,019 | |
| | 900 | | New Jersey Economic Development Authority, Special Facilities Revenue Bonds, Continental Airlines Inc., Series 2000, 7.000%, 11/15/30 (Alternative Minimum Tax) | 11/12 at 100.00 | B | | 903,375 | |
| | 1,000 | | New Jersey Transit Corporation, Certificates of Participation, Federal Transit Administration Grants, Series 2002A, 5.500%, 9/15/14 – AMBAC Insured | No Opt. Call | Aa3 | | 1,085,960 | |
| | 1,000 | | New Jersey Transit Corporation, Certificates of Participation, Federal Transit Administration Grants, Series 2005A, 5.000%, 9/15/18 – FGIC Insured | 9/15 at 100.00 | A1 | | 1,095,650 | |
| | Principal | | | Optional Call | | | | |
| | Amount (000) | | Description (1) | Provisions (2) | Ratings (3) | | Value | |
| | | | Transportation (continued) | | | | | |
| $ | 300 | | New Jersey Turnpike Authority, Revenue Bonds, Series 2005A, 5.250%, 1/01/29 – AGM Insured | No Opt. Call | AA– | $ | 387,975 | |
| | 1,000 | | New Jersey Turnpike Authority, Revenue Bonds, Series 2009I, 5.000%, 1/01/35 | 1/20 at 100.00 | A+ | | 1,127,730 | |
| | 1,660 | | New Jersey Turnpike Authority, Revenue Bonds, Series 2012B, 5.000%, 1/01/28 | 1/23 at 100.00 | A+ | | 1,975,450 | |
| | 240 | | Passaic County Improvement Authority, New Jersey, County Guaranteed Parking Revenue Bonds, 200 Hospital Plaza Project, Series 2010, 5.000%, 5/01/42 | 5/20 at 100.00 | Aa3 | | 270,221 | |
| | 1,500 | | Port Authority of New York and New Jersey, Consolidated Revenue Bonds, One Hundred Fortieth Series 2005, 5.000%, 12/01/34 | 6/15 at 101.00 | AA– | | 1,641,930 | |
| | 310 | | Port Authority of New York and New Jersey, Consolidated Revenue Bonds, One Hundred Forty Eighth Series 2008, Trust 2920, 17.154%, 8/15/32 – AGM Insured (IF) | 8/17 at 100.00 | AA– | | 470,865 | |
| | 500 | | Port Authority of New York and New Jersey, Consolidated Revenue Bonds, One Hundred Thirty-Fourth Series 2004, 5.000%, 7/15/34 | 1/14 at 101.00 | AA– | | 527,165 | |
| | 5,000 | | Port Authority of New York and New Jersey, Special Project Bonds, JFK International Air Terminal LLC, Sixth Series 1997, 5.750%, 12/01/22 – NPFG Insured (Alternative Minimum Tax) | 12/12 at 100.00 | BBB | | 5,001,799 | |
| | 950 | | South Jersey Transportation Authority, New Jersey, Transportation System Revenue Bonds, Series 2012, 5.000%, 11/01/22 | No Opt. Call | A– | | 1,144,988 | |
| | 18,010 | | Total Transportation | | | | 19,608,400 | |
| | | | U.S. Guaranteed – 25.4% (18.1% of Total Investments) (5) | | | | | |
| | | | New Jersey Economic Development Authority, Cigarette Tax Revenue Bonds, Series 2004: | | | | | |
| | 600 | | 5.750%, 6/15/29 (Pre-refunded 6/15/14) | 6/14 at 100.00 | Aaa | | 652,968 | |
| | 1,200 | | 5.750%, 6/15/34 (Pre-refunded 6/15/14) | 6/14 at 100.00 | Aaa | | 1,305,936 | |
| | 385 | | New Jersey Educational Facilities Authority, Revenue Bonds, Kean University, Series 2005B, 5.000%, 7/01/30 (Pre-refunded 7/01/16) – NPFG Insured | 7/16 at 100.00 | A– (5) | | 448,706 | |
| | 690 | | New Jersey Educational Facilities Authority, Revenue Bonds, Montclair State University, Series 2004L, 5.125%, 7/01/21 (Pre-refunded 7/01/14) – NPFG Insured | 7/14 at 100.00 | BBB (5) | | 745,366 | |
| | | | New Jersey Educational Facilities Authority, Revenue Bonds, Montclair State University, Series 2005F: | | | | | |
| | 700 | | 5.000%, 7/01/17 (Pre-refunded 7/01/15) – FGIC Insured | 7/15 at 100.00 | A1 (5) | | 786,016 | |
| | 1,000 | | 5.000%, 7/01/24 (Pre-refunded 7/01/15) – FGIC Insured | 7/15 at 100.00 | A1 (5) | | 1,122,880 | |
| | 520 | | 5.000%, 7/01/32 (Pre-refunded 7/01/15) – FGIC Insured | 7/15 at 100.00 | A1 (5) | | 583,898 | |
| | 1,000 | | New Jersey Educational Facilities Authority, Revenue Bonds, New Jersey Institute of Technology, Series 2004B, 5.000%, 7/01/21 (Pre-refunded 1/01/14) – AMBAC Insured | 1/14 at 100.00 | A+ (5) | | 1,055,240 | |
| | 625 | | New Jersey Educational Facilities Authority, Revenue Bonds, Rowan University, Series 2004C, 5.000%, 7/01/24 (Pre-refunded 7/01/14) – NPFG Insured | 7/14 at 100.00 | A+ (5) | | 673,850 | |
| | 630 | | New Jersey Educational Facilities Authority, Revenue Bonds, William Paterson University, Series 2004A, 5.125%, 7/01/19 (Pre-refunded 7/01/14) – FGIC Insured | 7/14 at 100.00 | AA– (5) | | 679,121 | |
| | 890 | | New Jersey Health Care Facilities Financing Authority, Revenue Bonds, Capital Health System Obligated Group, Series 2003A, 5.375%, 7/01/33 (Pre-refunded 7/01/13) | 7/13 at 100.00 | N/R (5) | | 919,477 | |
| | 845 | | New Jersey Health Care Facilities Financing Authority, Revenue Bonds, St. Clare’s Hospital, Series 2004A, 5.250%, 7/01/20 – RAAI Insured (ETM) | 7/14 at 100.00 | N/R (5) | | 1,061,481 | |
| | | | New Jersey Turnpike Authority, Revenue Bonds, Series 1991C: | | | | | |
| | 130 | | 6.500%, 1/01/16 (ETM) | No Opt. Call | AA+ (5) | | 154,905 | |
| | 25 | | 6.500%, 1/01/16 – NPFG Insured (ETM) | No Opt. Call | A+ (5) | | 29,790 | |
| | 50 | | 6.500%, 1/01/16 – NPFG Insured (ETM) | No Opt. Call | A+ (5) | | 58,405 | |
| | 710 | | 6.500%, 1/01/16 (ETM) | No Opt. Call | AA+ (5) | | 771,699 | |
| | 2,000 | | New Jersey Turnpike Authority, Revenue Bonds, Series 2003A, 5.000%, 1/01/19 (Pre-refunded 7/01/13) – FGIC Insured | 7/13 at 100.00 | A+ (5) | | 2,064,120 | |
| | 375 | | Newark Housing Authority, New Jersey, Port Authority Terminal Revenue Bonds, Series 2004, 5.250%, 1/01/21 (Pre-refunded 1/01/14) – NPFG Insured | 1/14 at 100.00 | BBB (5) | | 396,668 | |
| | 15,840 | | North Hudson Sewerage Authority, New Jersey, Sewerage Revenue Refunding Bonds, Series 2001A, 0.000%, 8/01/23 – NPFG Insured (ETM) | No Opt. Call | Baa2 (5) | | 12,327,160 | |
| | 965 | | Tobacco Settlement Financing Corporation, New Jersey, Tobacco Settlement Asset-Backed Bonds, Series 2003, 6.375%, 6/01/32 (Pre-refunded 6/01/13) | 6/13 at 100.00 | Aaa | | 997,598 | |
| | 29,180 | | Total U.S. Guaranteed | | | | 26,835,284 | |
| | | Nuveen New Jersey Dividend Advantage Municipal Fund (continued) |
| NXJ | | Portfolio of Investments |
October 31, 2012 (Unaudited)
| | Principal | | | Optional Call | | | | |
| | Amount (000) | | Description (1) | Provisions (2) | Ratings (3) | | Value | |
| | | | Utilities – 2.5% (1.8% of Total Investments) | | | | | |
| $ | 1,510 | | Industrial Pollution Control Financing Authority of Cape May County (New Jersey), Pollution Control Revenue Refunding Bonds, 1991 Series A (Atlantic City Electric Company Project), 6.800%, 3/01/21 – NPFG Insured | No Opt. Call | A | $ | 2,002,336 | |
| | 635 | | New Jersey Economic Development Authority, Energy Facilities Revenue Bonds, UMM Energy Partners, LLC Project, Series 2012A, 5.125%, 6/15/43 (Alternative Minimum Tax) | 6/22 at 100.00 | Baa3 | | 649,738 | |
| | 2,145 | | Total Utilities | | | | 2,652,074 | |
| | | | Water and Sewer – 11.7% (8.3% of Total Investments) | | | | | |
| | 225 | | Guam Government Waterworks Authority, Water and Wastewater System Revenue Bonds, Series 2005, 6.000%, 7/01/25 | 7/15 at 100.00 | Ba2 | | 234,929 | |
| | 7,000 | | New Jersey Economic Development Authority, Water Facilities Revenue Bonds, Middlesex Water Company, Series 1998, 5.350%, 2/01/38 – NPFG Insured (Alternative Minimum Tax) | 2/13 at 100.00 | A | | 7,006,579 | |
| | 250 | | New Jersey Economic Development Authority, Water Facilities Revenue Bonds, New Jersey-American Water Company Inc. Project, Refunding Series 2010B, 5.600%, 11/01/34 (Alternative Minimum Tax) | 5/20 at 100.00 | A | | 285,520 | |
| | 320 | | New Jersey Economic Development Authority, Water Facilities Revenue Bonds, New Jersey-American Water Company Inc. Project, Refunding Series 2010D, 4.875%, 11/01/29 (Alternative Minimum Tax) | 11/20 at 100.00 | A | | 351,056 | |
| | 1,680 | | New Jersey Environmental Infrastructure Trust, Environmental Infrastructure Bonds, Series 2012A, 3.250%, 9/01/31 | 9/21 at 100.00 | AAA | | 1,738,766 | |
| | 925 | | New Jersey Environmental Infrastructure Trust, Environmental Infrastructure Bonds, Tender Option Bond Trust 4729, 7.185%, 9/01/21 (IF) (4) | No Opt. Call | AAA | | 1,284,085 | |
| | | | North Hudson Sewerage Authority, Gross Revenue Senior Lien Lease Certificates, Series 2012A: | | | | | |
| | 670 | | 5.000%, 6/01/27 – NPFG Insured | 6/22 at 100.00 | A | | 782,513 | |
| | 640 | | 5.000%, 6/01/42 – NPFG Insured | 6/22 at 100.00 | A | | 720,627 | |
| | 11,710 | | Total Water and Sewer | | | | 12,404,075 | |
| $ | 152,795 | | Total Investments (cost $135,397,704) – 140.5% | | | | 148,660,517 | |
| | | | MuniFund Term Prefered Shares, at Liquidation Value – (42.4)% (6) | | | | (44,861,000 | ) |
| | | | Other Assets Less Liabilities – 1.9% | | | | 2,038,388 | |
| | | | Net Assets Applicable to Common Shares – 100% | | | $ | 105,837,905 | |
| (1) | | All percentages shown in the Portfolio of Investments are based on net assets applicable to Common shares unless otherwise noted. |
| (2) | | Optional Call Provisions: Dates (month and year) and prices of the earliest optional call or redemption. There may be other call provisions at varying prices at later dates. Certain mortgage-backed securities may be subject to periodic principal paydowns. |
| (3) | | Ratings: Using the highest of Standard & Poor’s Group (“Standard & Poor’s”), Moody’s Investors Service, Inc. (“Moody’s”) or Fitch, Inc. (“Fitch”) rating. Ratings below BBB by Standard & Poor’s, Baa by Moody’s or BBB by Fitch are considered to be below investment grade. Holdings designated N/R are not rated by any of these national rating agencies. |
| (4) | | Investment, or portion of investment, has been pledged to collateralize the net payment obligations for investments in inverse floating rate transactions. |
| (5) | | Backed by an escrow or trust containing sufficient U.S. Government or U.S. Government agency securities, which ensure the timely payment of principal and interest. Certain bonds backed by U.S. Government or agency securities are regarded as having an implied rating equal to the rating of such securities. |
| (6) | | MuniFund Term Preferred Shares, at Liquidation Value as a percentage of Total Investments is 30.2%. |
| N/R | | Not rated. |
| (ETM) | | Escrowed to maturity. |
| (IF) | | Inverse floating rate investment. |
See accompanying notes to financial statements.
| | | Nuveen New Jersey Dividend Advantage Municipal Fund 2 |
| NUJ | | Portfolio of Investments |
| | | October 31, 2012 (Unaudited) |
| | Principal | | | Optional Call | | | | |
| | Amount (000) | | Description (1) | Provisions (2) | Ratings (3) | | Value | |
| | | | Consumer Discretionary – 0.3% (0.2% of Total Investments) | | | | | |
| | | | Middlesex County Improvement Authority, New Jersey, Senior Revenue Bonds, Heldrich Center Hotel/Conference Center Project, Series 2005A: | | | | | |
| $ | 180 | | 5.000%, 1/01/32 | 1/15 at 100.00 | B3 | $ | 116,795 | |
| | 150 | | 5.125%, 1/01/37 | 1/15 at 100.00 | B3 | | 97,337 | |
| | 330 | | Total Consumer Discretionary | | | | 214,132 | |
| | | | Consumer Staples – 5.9% (4.1% of Total Investments) | | | | | |
| | | | Tobacco Settlement Financing Corporation, New Jersey, Tobacco Settlement Asset-Backed Bonds, Series 2007-1A: | | | | | |
| | 605 | | 4.500%, 6/01/23 | 6/17 at 100.00 | B1 | | 592,017 | |
| | 3,275 | | 4.750%, 6/01/34 | 6/17 at 100.00 | B2 | | 2,840,046 | |
| | 885 | | 5.000%, 6/01/41 | 6/17 at 100.00 | B2 | | 774,472 | |
| | 4,765 | | Total Consumer Staples | | | | 4,206,535 | |
| | | | Education and Civic Organizations – 11.0% (7.5% of Total Investments) | | | | | |
| | 200 | | New Jersey Educational Facilities Authority, Revenue Bonds, Fairleigh Dickinson University, Series 2004C, 5.500%, 7/01/23 | 7/14 at 100.00 | BBB | | 206,674 | |
| | | | New Jersey Educational Facilities Authority, Revenue Bonds, Kean University, Series 2007D: | | | | | |
| | 790 | | 5.000%, 7/01/32 – FGIC Insured | 7/17 at 100.00 | A2 | | 850,625 | |
| | 495 | | 5.000%, 7/01/39 – FGIC Insured | 7/17 at 100.00 | A2 | | 531,655 | |
| | 335 | | New Jersey Educational Facilities Authority, Revenue Bonds, Princeton University, Tender Option Bond Trust 3922, 13.401%, 7/01/19 (IF) | 7/21 at 100.00 | AAA | | 512,021 | |
| | 275 | | New Jersey Educational Facilities Authority, Revenue Bonds, Ramapo College, Series 2012B, 5.000%, 7/01/37 | 7/22 at 100.00 | A | | 311,828 | |
| | | | New Jersey Educational Facilities Authority, Revenue Bonds, Rider University, Series 2012A: | | | | | |
| | 170 | | 5.000%, 7/01/32 | 7/21 at 100.00 | BBB+ | | 188,042 | |
| | 115 | | 5.000%, 7/01/37 | 7/21 at 100.00 | BBB+ | | 125,413 | |
| | 300 | | New Jersey Educational Facilities Authority, Revenue Refunding Bonds, College of New Jersey, Series 2012A, 5.000%, 7/01/19 | No Opt. Call | AA | | 365,733 | |
| | 180 | | New Jersey Higher Education Assistance Authority, Student Loan Revenue Bonds, Series 2010-1A, 5.000%, 12/01/25 | 12/19 at 100.00 | AA | | 198,311 | |
| | 105 | | New Jersey Higher Education Assistance Authority, Student Loan Revenue Bonds, Series 2010-2, 5.000%, 12/01/30 | 12/20 at 100.00 | Aa3 | | 116,823 | |
| | 175 | | New Jersey Higher Education Assistance Authority, Student Loan Revenue Bonds, Series 2011-1, 5.750%, 12/01/27 (Alternative Minimum Tax) | 12/21 at 100.00 | Aa3 | | 204,619 | |
| | 1,100 | | New Jersey Higher Education Assistance Authority, Student Loan Revenue Bonds, Series 2012-1A, 4.250%, 12/01/25 (Alternative Minimum Tax) | 12/22 at 100.00 | AA | | 1,145,331 | |
| | 200 | | New Jersey Higher Education Assistance Authority, Student Loan Revenue Bonds, Tender Option Bond Trust PA-4643, 19.767%, 6/01/30 (IF) (4) | 6/19 at 100.00 | AA | | 307,456 | |
| | 575 | | New Jersey Institute of Technology, New Jersey, General Obligation Bonds, Series 2012A, 5.000%, 7/01/42 | 7/22 at 100.00 | A+ | | 658,134 | |
| | 200 | | Puerto Rico Industrial, Tourist, Educational, Medical and Environmental Control Facilities Financing Authority, Higher Education Revenue Bonds, Ana G. Mendez University System Project, Refunding Series 2012, 5.125%, 4/01/32 | 4/22 at 100.00 | BBB– | | 203,354 | |
| | 75 | | Puerto Rico Industrial, Tourist, Educational, Medical and Environmental Control Facilities Financing Authority, Higher Education Revenue Bonds, Inter-American University of Puerto Rico Project, Refunding Series 2012, 5.000%, 10/01/31 | 10/22 at 100.00 | A– | | 82,604 | |
| | 1,790 | | University of Medicine and Dentistry of New Jersey, Revenue Bonds, Series 2002A, 5.000%, 12/01/31 – AMBAC Insured | 12/12 at 100.00 | A– | | 1,794,242 | |
| | 7,080 | | Total Education and Civic Organizations | | | | 7,802,865 | |
| | | | Financials – 4.9% (3.3% of Total Investments) | | | | | |
| | 600 | | New Jersey Economic Development Authority, Economic Development Revenue Bonds, Glimcher Properties LP, Series 1998, 6.000%, 11/01/28 (Alternative Minimum Tax) | 11/12 at 100.00 | N/R | | 599,928 | |
| | | Nuveen New Jersey Dividend Advantage Municipal Fund 2 (continued) |
| NUJ | | Portfolio of Investments |
October 31, 2012 (Unaudited)
| | Principal | | | Optional Call | | | | |
| | Amount (000) | | Description (1) | Provisions (2) | Ratings (3) | | Value | |
| | | | Financials (continued) | | | | | |
| $ | 1,250 | | New Jersey Economic Development Authority, Industrial Development Revenue Refunding Bonds, Newark Airport Marriott Hotel, Series 1996, 7.000%, 10/01/14 | 11/12 at 100.00 | Ba1 | $ | 1,256,188 | |
| | 1,450 | | New Jersey Economic Development Authority, Revenue Refunding Bonds, Kapkowski Road Landfill Project, Series 2002, 5.750%, 10/01/21 | No Opt. Call | Ba2 | | 1,613,386 | |
| | 3,300 | | Total Financials | | | | 3,469,502 | |
| | | | Health Care – 27.5% (18.8% of Total Investments) | | | | | |
| | 220 | | Camden County Improvement Authority, New Jersey, Revenue Bonds, Cooper Health System, Series 2004A, 5.750%, 2/15/34 | 8/14 at 100.00 | BBB | | 227,704 | |
| | 400 | | New Jersey Health Care Facilities Finance Authority, Revenue Bonds, AHS Hospital Corporation, Series 2008A, 5.000%, 7/01/27 | 7/18 at 100.00 | A1 | | 436,812 | |
| | | | New Jersey Health Care Facilities Financing Authority, FHA-Insured Mortgage Revenue Bonds, Jersey City Medical Center, Series 2001: | | | | | |
| | 355 | | 5.000%, 8/01/31 – AMBAC Insured | 2/13 at 100.00 | N/R | | 355,380 | |
| | 1,925 | | 5.000%, 8/01/41 – AMBAC Insured | 2/13 at 100.00 | N/R | | 1,926,656 | |
| | 260 | | New Jersey Health Care Facilities Financing Authority, Hospital Revenue Bonds, Virtua Health, Tender Option Bond Trust 3018, 19.251%, 7/01/38 – AGC Insured (IF) (4) | 7/19 at 100.00 | AA– | | 382,346 | |
| | 500 | | New Jersey Health Care Facilities Financing Authority, New Jersey, Revenue Bonds, Saint Peters University Hospital, Refunding Series 2011, 6.250%, 7/01/35 | 7/21 at 100.00 | BBB– | | 565,825 | |
| | 610 | | New Jersey Health Care Facilities Financing Authority, Revenue Bonds, Atlanticare Regional Medical Center, Series 2007, 5.000%, 7/01/37 | 7/17 at 100.00 | A+ | | 644,880 | |
| | 1,000 | | New Jersey Health Care Facilities Financing Authority, Revenue Bonds, CentraState Medical Center, Series 2006A, 5.000%, 7/01/30 – AGC Insured | 7/17 at 100.00 | Aa3 | | 1,073,150 | |
| | 90 | | New Jersey Health Care Facilities Financing Authority, Revenue Bonds, Children’s Specialized Hospital, Series 2005A, 5.500%, 7/01/36 | 7/15 at 100.00 | BBB | | 92,677 | |
| | 170 | | New Jersey Health Care Facilities Financing Authority, Revenue Bonds, Hunterdon Medical Center, Series 2006, 5.125%, 7/01/35 | 7/16 at 100.00 | A | | 176,659 | |
| | 800 | | New Jersey Health Care Facilities Financing Authority, Revenue Bonds, Kennedy Health System Obligated Group Issue, Refunding Series 2012, 3.750%, 7/01/27 | No Opt. Call | A3 | | 809,904 | |
| | 1,020 | | New Jersey Health Care Facilities Financing Authority, Revenue Bonds, Meridian Health System Obligated Group, Refunding Series 2011, 5.000%, 7/01/26 | 7/22 at 100.00 | A | | 1,167,472 | |
| | 945 | | New Jersey Health Care Facilities Financing Authority, Revenue Bonds, Meridian Health, Series 2007-I, 5.000%, 7/01/38 – AGC Insured | 7/18 at 100.00 | AA– | | 1,015,988 | |
| | 1,185 | | New Jersey Health Care Facilities Financing Authority, Revenue Bonds, Palisades Medical Center of New York Presbyterian Healthcare System, Series 2002, 6.625%, 7/01/31 | 7/13 at 100.00 | BB+ | | 1,195,037 | |
| | 135 | | New Jersey Health Care Facilities Financing Authority, Revenue Bonds, RWJ Health Care Corporation, Series 2005B, 5.000%, 7/01/35 – RAAI Insured | 7/15 at 100.00 | N/R | | 136,180 | |
| | 1,165 | | New Jersey Health Care Facilities Financing Authority, Revenue Bonds, Saint Barnabas Health Care System, Refunding Series 2011A, 5.625%, 7/01/37 | 7/21 at 100.00 | BBB+ | | 1,311,976 | |
| | 500 | | New Jersey Health Care Facilities Financing Authority, Revenue Bonds, Saint Joseph’s Healthcare System Obligated Group Issue, Series 2008, 6.625%, 7/01/38 | 7/18 at 100.00 | BBB– | | 580,630 | |
| | 630 | | New Jersey Health Care Facilities Financing Authority, Revenue Bonds, Shore Memorial Health System, Series 2003, 5.000%, 7/01/23 – RAAI Insured | 7/13 at 100.00 | N/R | | 632,665 | |
| | 1,520 | | New Jersey Health Care Facilities Financing Authority, Revenue Bonds, Somerset Medical Center, Series 2003, 5.500%, 7/01/33 | 7/13 at 100.00 | Ba2 | | 1,527,190 | |
| | | | New Jersey Health Care Facilities Financing Authority, Revenue Bonds, South Jersey Hospital System, Refunding Series 2006: | | | | | |
| | 2,455 | | 5.000%, 7/01/36 | 7/16 at 100.00 | A2 | | 2,554,402 | |
| | 435 | | 5.000%, 7/01/46 | 7/16 at 100.00 | A2 | | 451,086 | |
| | 1,150 | | New Jersey Health Care Facilities Financing Authority, Revenue Refunding Bonds, Bayshore Community Hospital, Series 2002, 5.125%, 7/01/32 – RAAI Insured | 11/12 at 100.00 | N/R | | 1,150,276 | |
| | 1,100 | | Puerto Rico Industrial, Tourist, Educational, Medical and Environmental Control Facilities Financing Authority, Adjustable Rate Industrial Revenue Bonds, American Home Products Corporation, Series 1983A, 5.100%, 12/01/18 | 12/12 at 100.00 | A1 | | 1,104,433 | |
| | 18,570 | | Total Health Care | | | | 19,519,328 | |
| | Principal | | | Optional Call | | | | |
| | Amount (000) | | Description (1) | Provisions (2) | Ratings (3) | | Value | |
| | | | Housing/Multifamily – 3.6% (2.5% of Total Investments) | | | | | |
| | | | New Jersey Economic Development Authority, Student Housing Revenue Bonds, Provident Group-Montclair Properties LLC, Montclair State University Student Housing Project, Series 2010A: | | | | | |
| $ | 380 | | 5.750%, 6/01/31 | 6/20 at 100.00 | Baa3 | $ | 429,480 | |
| | 200 | | 5.875%, 6/01/42 | 6/20 at 100.00 | Baa3 | | 223,758 | |
| | 1,920 | | New Jersey Housing and Mortgage Finance Agency, Multifamily Housing Revenue Bonds, Series 1997A, 5.650%, 5/01/40 – AMBAC Insured (Alternative Minimum Tax) | 5/13 at 100.00 | A+ | | 1,921,997 | |
| | 2,500 | | Total Housing/Multifamily | | | | 2,575,235 | |
| | | | Housing/Single Family – 1.9% (1.3% of Total Investments) | | | | | |
| | 1,000 | | New Jersey Housing & Mortgage Finance Agency, Single Family Home Mortgage Revenue Bonds, Series 2011A, 4.650%, 10/01/29 | 10/21 at 100.00 | Aa1 | | 1,101,570 | |
| | 215 | | New Jersey Housing and Mortgage Finance Agency, Single Family Housing Revenue Bonds, Series 2007T, 4.700%, 10/01/37 (Alternative Minimum Tax) | 4/17 at 100.00 | AA | | 221,145 | |
| | 1,215 | | Total Housing/Single Family | | | | 1,322,715 | |
| | | | Long-Term Care – 8.4% (5.7% of Total Investments) | | | | | |
| | 365 | | Burlington County Bridge Commission, New Jersey, Economic Development Revenue Bonds, The Evergreens Project, Series 2007, 5.625%, 1/01/38 | 1/18 at 100.00 | N/R | | 379,454 | |
| | | | New Jersey Economic Development Authority, Revenue Bonds, Masonic Charity Foundation of New Jersey, Series 2001: | | | | | |
| | 1,000 | | 5.500%, 6/01/21 | 6/13 at 100.00 | A– | | 1,011,720 | |
| | 4,000 | | 5.500%, 6/01/31 | 12/12 at 101.00 | A– | | 4,045,317 | |
| | 520 | | New Jersey Economic Development Authority, Revenue Bonds, United Methodist Homes of New Jersey Obligated Group, Series 1998, 5.125%, 7/01/25 | 1/13 at 100.00 | BB+ | | 520,109 | |
| | 5,885 | | Total Long-Term Care | | | | 5,956,600 | |
| | | | Tax Obligation/General – 3.8% (2.6% of Total Investments) | | | | | |
| | 700 | | Jersey City, New Jersey, General Obligation Bonds, Series 2006A, 5.000%,
9/01/22 – AMBAC Insured | 9/16 at 100.00 | A2 | | 792,435 | |
| | 190 | | Middletown Township Board of Education, Monmouth County, New Jersey, Refunding Series 2010, 5.000%, 8/01/27 | 8/20 at 100.00 | AA | | 223,784 | |
| | 740 | | Union County Utilities Authority, New Jersey, Resource Recovery Facility Lease Revenue Refunding Bonds, Covantan Union Inc. Lessee, Series 2011B, 5.250%, 12/01/31 (Alternative Minimum Tax) | 12/21 at 100.00 | AA+ | | 828,082 | |
| | 635 | | West Deptford, New Jersey, General Obligation Bonds, Series 2005, 5.000%, 7/01/27 – AGM Insured | 7/17 at 100.00 | AA– | | 716,979 | |
| | 100 | | Woodbridge Township, Middlesex County, New Jersey, General Obligation Bonds,, 5.000%, 7/15/19 | No Opt. Call | AA– | | 121,364 | |
| | 2,365 | | Total Tax Obligation/General | | | | 2,682,644 | |
| | | | Tax Obligation/Limited – 36.9% (25.2% of Total Investments) | | | | | |
| | 400 | | Bergen County Improvement Authority, New Jersey, Guaranteed Lease Revenue Bonds, County Administration Complex Project, Series 2005, 5.000%, 11/15/26 | No Opt. Call | Aaa | | 535,152 | |
| | 1,000 | | Burlington County Bridge Commission, New Jersey, Guaranteed Pooled Loan Bonds, Series 2003, 5.000%, 12/01/18 – NPFG Insured | 12/13 at 100.00 | AA | | 1,048,650 | |
| | 750 | | Casino Reinvestment Development Authority, New Jersey, Hotel Room Fee Revenue Bonds, Series 2004, 5.250%, 1/01/16 – AMBAC Insured | 1/15 at 102.00 | A– | | 804,360 | |
| | 435 | | Essex County Improvement Authority, New Jersey, Project Consolidation Revenue Bonds, Series 2007, 5.250%, 12/15/22 – AMBAC Insured | No Opt. Call | Aa2 | | 545,768 | |
| | 500 | | Garden State Preservation Trust, New Jersey, Open Space and Farmland Preservation Bonds, Series 2005A, 5.750%, 11/01/28 – AGM Insured | No Opt. Call | AAA | | 669,460 | |
| | 530 | | Garden State Preservation Trust, New Jersey, Open Space and Farmland Preservation Bonds, Series 2005C, 5.125%, 11/01/18 – AGM Insured | No Opt. Call | AAA | | 657,884 | |
| | | | Government of Guam, Business Privilege Tax Bonds, Series 2011A: | | | | | |
| | 670 | | 5.250%, 1/01/36 | 1/22 at 100.00 | A | | 755,907 | |
| | 265 | | 5.125%, 1/01/42 | 1/22 at 100.00 | A | | 295,316 | |
| | 500 | | Government of Guam, Business Privilege Tax Bonds, Series 2012B-1, 5.000%, 1/01/29 | 1/22 at 100.00 | A | | 566,530 | |
| | 1,305 | | New Jersey Building Authority, State Building Revenue Bonds, Series 2007A, 5.000%, 6/15/26 | 6/16 at 100.00 | A+ | | 1,394,184 | |
| | | Nuveen New Jersey Dividend Advantage Municipal Fund 2 (continued) |
| NUJ | | Portfolio of Investments |
October 31, 2012 (Unaudited)
| | Principal | | | Optional Call | | | | |
| | Amount (000) | | Description (1) | Provisions (2) | Ratings (3) | | Value | |
| | | | Tax Obligation/Limited (continued) | | | | | |
| | | | New Jersey Economic Development Authority, Cigarette Tax Revenue Refunding Bonds, Series 2012: | | | | | |
| $ | 700 | | 5.000%, 6/15/19 | No Opt. Call | BBB+ | $ | 809,872 | |
| | 250 | | 5.000%, 6/15/21 | No Opt. Call | BBB+ | | 291,075 | |
| | 300 | | 5.000%, 6/15/26 | 6/22 at 100.00 | BBB+ | | 338,496 | |
| | | | New Jersey Economic Development Authority, Revenue Bonds, Newark Downtown District Management Corporation Project, Series 2007: | | | | | |
| | 50 | | 5.125%, 6/15/27 | 6/17 at 100.00 | Baa3 | | 52,847 | |
| | 75 | | 5.125%, 6/15/37 | 6/17 at 100.00 | Baa3 | | 78,011 | |
| | | | New Jersey Economic Development Authority, School Facilities Construction Financing Program Bonds, Series 2007U: | | | | | |
| | 435 | | 5.000%, 9/01/37 – AMBAC Insured | 9/17 at 100.00 | A+ | | 470,700 | |
| | 870 | | 5.000%, 9/01/37 | 9/17 at 100.00 | A+ | | 941,401 | |
| | | | New Jersey Health Care Facilities Financing Authority, Lease Revenue Bonds, Department of Human Services - Greystone Park Psychiatric Hospital, Series 2005: | | | | | |
| | 655 | | 5.000%, 9/15/18 – AMBAC Insured | 9/15 at 100.00 | A+ | | 719,590 | |
| | 985 | | 5.000%, 9/15/24 – AMBAC Insured | 9/15 at 100.00 | A+ | | 1,061,338 | |
| | 200 | | New Jersey Health Care Facilities Financing Authority, State Contract Bonds, Hospital Asset Transformation Program, Series 2008A, 5.250%, 10/01/38 | 10/18 at 100.00 | A+ | | 219,056 | |
| | | | New Jersey Transportation Trust Fund Authority, Federal Highway Aid Grant Anticipation Bonds, Series 2006: | | | | | |
| | 295 | | 5.000%, 6/15/17 – FGIC Insured | 6/16 at 100.00 | Aa3 | | 337,666 | |
| | 525 | | 5.000%, 6/15/18 – FGIC Insured | 6/16 at 100.00 | Aa3 | | 598,311 | |
| | 4,000 | | New Jersey Transportation Trust Fund Authority, Transportation System Bonds, Capital Appreciation Series 2010A, 0.000%, 12/15/30 | No Opt. Call | A+ | | 1,875,000 | |
| | 800 | | New Jersey Transportation Trust Fund Authority, Transportation System Bonds, Refunding Series 2006A, 5.500%, 12/15/22 | No Opt. Call | A+ | | 1,021,584 | |
| | 900 | | New Jersey Transportation Trust Fund Authority, Transportation System Bonds, Series 2004B, 5.500%, 12/15/16 – NPFG Insured | No Opt. Call | A+ | | 1,065,465 | |
| | 665 | | New Jersey Transportation Trust Fund Authority, Transportation System Bonds, Series 2005D, 5.000%, 6/15/19 – AGM Insured | 6/15 at 100.00 | AA– | | 733,701 | |
| | | | New Jersey Transportation Trust Fund Authority, Transportation System Bonds, Series 2006C: | | | | | |
| | 2,000 | | 0.000%, 12/15/32 – AGM Insured | No Opt. Call | AA– | | 837,680 | |
| | 4,000 | | 0.000%, 12/15/33 – AGM Insured | No Opt. Call | AA– | | 1,588,280 | |
| | 5,000 | | 0.000%, 12/15/34 – AGM Insured | No Opt. Call | AA– | | 1,873,450 | |
| | 1,300 | | New Jersey Transportation Trust Fund Authority, Transportation System Bonds, Series 2010D, 5.000%, 12/15/24 | No Opt. Call | A+ | | 1,584,297 | |
| | | | Passaic County Improvement Authority, New Jersey, Lease Revenue Bonds, Preakness Healthcare Center Expansion Project, Series 2012: | | | | | |
| | 865 | | 5.000%, 5/01/21 | No Opt. Call | Aa3 | | 1,029,307 | |
| | 695 | | 3.500%, 5/01/35 | 5/22 at 100.00 | Aa3 | | 695,834 | |
| | 290 | | Puerto Rico Convention Center District Authority, Hotel Occupancy Tax Revenue Bonds, Series 2006A, 4.500%, 7/01/36 – CIFG Insured | 7/16 at 100.00 | BBB+ | | 288,939 | |
| | 350 | | Virgin Islands Public Finance Authority, Matching Fund Loan Notes Revenue Bonds, Subordinate Lien Series 2010B, 5.250%, 10/01/29 | 10/20 at 100.00 | Baa2 | | 382,029 | |
| | 32,560 | | Total Tax Obligation/Limited | | | | 26,167,140 | |
| | | | Transportation – 20.9% (14.2% of Total Investments) | | | | | |
| | 500 | | Delaware River and Bay Authority, Delaware and New Jersey, Revenue Bonds, Series 2005, 5.000%, 1/01/27 – NPFG Insured | 1/15 at 100.00 | A1 | | 535,330 | |
| | 800 | | Delaware River and Bay Authority, Delaware and New Jersey, Revenue Bonds, Series 2012A, 5.000%, 1/01/42 (WI/DD, Settling 11/06/12) | 1/23 at 100.00 | A1 | | 924,472 | |
| | 300 | | Delaware River Joint Toll Bridge Commission, Pennsylvania, Revenue Bonds, Refunding Series 2012A, 4.000%, 7/01/27 | 7/22 at 100.00 | A2 | | 323,565 | |
| | 700 | | Delaware River Port Authority, New Jersey and Pennsylvania, Revenue Bonds, Series 2010E, 5.000%, 1/01/40 | 1/20 at 100.00 | A– | | 784,140 | |
| | Principal | | | Optional Call | | | | |
| | Amount (000) | | Description (1) | Provisions (2) | Ratings (3) | | Value | |
| | | | Transportation (continued) | | | | | |
| | | | New Brunswick Parking Authority, Middlesex County, New Jersey, Guaranteed Parking Revenue Bonds, Refunding Series 2012: | | | | | |
| $ | 225 | | 5.000%, 9/01/28 | 9/22 at 100.00 | A+ | $ | 263,381 | |
| | 250 | | 3.625%, 9/01/34 | 9/22 at 100.00 | A+ | | 251,868 | |
| | 600 | | New Jersey Economic Development Authority, Special Facilities Revenue Bonds, Continental Airlines Inc., Series 2000, 7.000%, 11/15/30 (Alternative Minimum Tax) | 11/12 at 100.00 | B | | 602,250 | |
| | 1,000 | | New Jersey Transit Corporation, Certificates of Participation, Federal Transit Administration Grants, Series 2002A, 5.500%, 9/15/14 – AMBAC Insured | No Opt. Call | Aa3 | | 1,085,960 | |
| | 765 | | New Jersey Transit Corporation, Certificates of Participation, Federal Transit Administration Grants, Series 2005A, 5.000%, 9/15/18 – FGIC Insured | 9/15 at 100.00 | A1 | | 838,172 | |
| | 30 | | New Jersey Turnpike Authority, Revenue Bonds, Series 1991C, 6.500%, 1/01/16 | No Opt. Call | A3 | | 35,043 | |
| | 1,500 | | New Jersey Turnpike Authority, Revenue Bonds, Series 2005A, 5.250%, 1/01/29 – AGM Insured | No Opt. Call | AA– | | 1,939,875 | |
| | 1,200 | | New Jersey Turnpike Authority, Revenue Bonds, Series 2012B, 5.000%, 1/01/28 | 1/23 at 100.00 | A+ | | 1,428,036 | |
| | 360 | | Passaic County Improvement Authority, New Jersey, County Guaranteed Parking Revenue Bonds, 200 Hospital Plaza Project, Series 2010, 5.000%, 5/01/42 | 5/20 at 100.00 | Aa3 | | 405,331 | |
| | 500 | | Port Authority of New York and New Jersey, Consolidated Revenue Bonds, One Hundred Thirty-Fourth Series 2004, 5.000%, 7/15/34 | 1/14 at 101.00 | AA– | | 527,165 | |
| | | | Port Authority of New York and New Jersey, Special Project Bonds, JFK International Air Terminal LLC, Sixth Series 1997: | | | | | |
| | 4,000 | | 7.000%, 12/01/12 – NPFG Insured (Alternative Minimum Tax) | No Opt. Call | BBB | | 4,011,359 | |
| | 50 | | 5.750%, 12/01/22 – NPFG Insured (Alternative Minimum Tax) | 12/12 at 100.00 | BBB | | 50,018 | |
| | 650 | | South Jersey Transportation Authority, New Jersey, Transportation System Revenue Bonds, Series 2012, 5.000%, 11/01/22 | No Opt. Call | A– | | 783,413 | |
| | 13,430 | | Total Transportation | | | | 14,789,378 | |
| | | | U.S. Guaranteed – 15.6% (10.7% of Total Investments) (5) | | | | | |
| | 2,300 | | Guam Power Authority, Revenue Bonds, Series 1999A, 5.250%, 10/01/34 (Pre-refunded 11/19/12) – NPFG Insured | 11/12 at 100.00 | BBB (5) | | 2,305,772 | |
| | 65 | | New Jersey Economic Development Authority, Cigarette Tax Revenue Bonds, Series 2004, 5.500%, 6/15/16 (ETM) | No Opt. Call | Aaa | | 76,798 | |
| | | | New Jersey Economic Development Authority, Cigarette Tax Revenue Bonds, Series 2004: | | | | | |
| | 400 | | 5.750%, 6/15/29 (Pre-refunded 6/15/14) | 6/14 at 100.00 | Aaa | | 435,312 | |
| | 400 | | 5.500%, 6/15/31 (Pre-refunded 6/15/14) | 6/14 at 100.00 | Aaa | | 433,696 | |
| | 700 | | 5.750%, 6/15/34 (Pre-refunded 6/15/14) | 6/14 at 100.00 | Aaa | | 761,796 | |
| | 175 | | New Jersey Educational Facilities Authority, Revenue Bonds, Kean University, Series 2005B, 5.000%, 7/01/30 (Pre-refunded 7/01/16) – NPFG Insured | 7/16 at 100.00 | A– (5) | | 203,957 | |
| | 575 | | New Jersey Educational Facilities Authority, Revenue Bonds, New Jersey Institute of Technology, Series 2004B, 5.000%, 7/01/21 (Pre-refunded 1/01/14) – AMBAC Insured | 1/14 at 100.00 | A+ (5) | | 606,763 | |
| | 500 | | New Jersey Educational Facilities Authority, Revenue Bonds, William Paterson University, Series 2004A, 5.125%, 7/01/19 (Pre-refunded 7/01/14) – FGIC Insured | 7/14 at 100.00 | AA– (5) | | 538,985 | |
| | | | New Jersey Health Care Facilities Financing Authority, Revenue Bonds, Capital Health System Obligated Group, Series 2003A: | | | | | |
| | 750 | | 5.000%, 7/01/26 (Pre-refunded 7/01/13) | 7/13 at 100.00 | N/R (5) | | 772,965 | |
| | 630 | | 5.375%, 7/01/33 (Pre-refunded 7/01/13) | 7/13 at 100.00 | N/R (5) | | 650,866 | |
| | 500 | | New Jersey State, General Obligation Bonds, Series 2004, 5.000%, 4/01/13 (ETM) | No Opt. Call | AA– (5) | | 510,045 | |
| | | | New Jersey Turnpike Authority, Revenue Bonds, Series 1991C: | | | | | |
| | 15 | | 6.500%, 1/01/16 (ETM) | No Opt. Call | A3 (5) | | 17,874 | |
| | 185 | | 6.500%, 1/01/16 (ETM) | No Opt. Call | AA+ (5) | | 220,442 | |
| | 1,970 | | 6.500%, 1/01/16 (ETM) | No Opt. Call | AA+ (5) | | 2,141,193 | |
| | 25 | | 6.500%, 1/01/16 – NPFG Insured (ETM) | No Opt. Call | A+ (5) | | 27,173 | |
| | 250 | | Newark Housing Authority, New Jersey, Port Authority Terminal Revenue Bonds, Series 2004, 5.250%, 1/01/21 (Pre-refunded 1/01/14) – NPFG Insured | 1/14 at 100.00 | BBB (5) | | 264,445 | |
| | 1,070 | | Tobacco Settlement Financing Corporation, New Jersey, Tobacco Settlement Asset-Backed Bonds, Series 2003, 6.375%, 6/01/32 (Pre-refunded 6/01/13) | 6/13 at 100.00 | Aaa | | 1,106,145 | |
| | 10,510 | | Total U.S. Guaranteed | | | | 11,074,227 | |
| | | Nuveen New Jersey Dividend Advantage Municipal Fund 2 (continued) |
| NUJ | | Portfolio of Investments |
October 31, 2012 (Unaudited)
| | Principal | | | Optional Call | | | | |
| | Amount (000) | | Description (1) | Provisions (2) | Ratings (3) | | Value | |
| | | | Utilities – 1.3% (0.9% of Total Investments) | | | | | |
| $ | 895 | | New Jersey Economic Development Authority, Energy Facilities Revenue Bonds, UMM Energy Partners, LLC Project, Series 2012A, 5.125%, 6/15/43 (Alternative Minimum Tax) | 6/22 at 100.00 | Baa3 | $ | 915,773 | |
| | | | Water and Sewer – 4.3% (3.0% of Total Investments) | | | | | |
| | 150 | | Guam Government Waterworks Authority, Water and Wastewater System Revenue Bonds, Series 2005, 6.000%, 7/01/25 | 7/15 at 100.00 | Ba2 | | 156,620 | |
| | 500 | | New Jersey Economic Development Authority, Water Facilities Revenue Bonds, New Jersey-American Water Company Inc. Project, Refunding Series 2010B, 5.600%, 11/01/34 (Alternative Minimum Tax) | 5/20 at 100.00 | A | | 571,040 | |
| | 220 | | New Jersey Economic Development Authority, Water Facilities Revenue Bonds, New Jersey-American Water Company Inc. Project, Refunding Series 2010D, 4.875%, 11/01/29 (Alternative Minimum Tax) | 11/20 at 100.00 | A | | 241,351 | |
| | 660 | | New Jersey Environmental Infrastructure Trust, Environmental Infrastructure Bonds, Tender Option Bond Trust 4729, 7.185%, 9/01/21 (IF) (4) | No Opt. Call | AAA | | 916,212 | |
| | | | North Hudson Sewerage Authority, Gross Revenue Senior Lien Lease Certificates, Series 2012A: | | | | | |
| | 500 | | 5.000%, 6/01/27 – NPFG Insured | 6/22 at 100.00 | A | | 583,965 | |
| | 535 | | 5.000%, 6/01/42 – NPFG Insured | 6/22 at 100.00 | A | | 602,399 | |
| | 2,565 | | Total Water and Sewer | | | | 3,071,587 | |
| $ | 105,970 | | Total Investments (cost $96,848,290) – 146.3% | | | | 103,767,661 | |
| | | | MuniFund Term Preferred Shares, at Liquidation Value – (49.4)% (6) | | | | (35,050,000 | ) |
| | | | Other Assets Less Liabilities – 3.1% | | | | 2,207,278 | |
| | | | Net Assets Applicable to Common Shares – 100% | | | $ | 70,924,939 | |
| (1) | | All percentages shown in the Portfolio of Investments are based on net assets applicable to Common shares unless otherwise noted. |
| (2) | | Optional Call Provisions: Dates (month and year) and prices of the earliest optional call or redemption. There may be other call provisions at varying prices at later dates. Certain mortgage-backed securities may be subject to periodic principal paydowns. |
| (3) | | Ratings: Using the highest of Standard & Poor’s Group (“Standard & Poor’s”), Moody’s Investors Service, Inc. (“Moody’s”) or Fitch, Inc. (“Fitch”) rating. Ratings below BBB by Standard & Poor’s, Baa by Moody’s or BBB by Fitch are considered to be below investment grade. Holdings designated N/R are not rated by any of these national rating agencies. |
| (4) | | Investment, or portion of investment, has been pledged to collateralize the net payment obligations for investments in inverse floating rate transactions. |
| (5) | | Backed by an escrow or trust containing sufficient U.S. Government or U.S. Government agency securities, which ensure the timely payment of principal and interest. Certain bonds backed by U.S. Government or agency securities are regarded as having an implied rating equal to the rating of such securities. |
| (6) | | MuniFund Term Preferred Shares, at Liquidation Value as a percentage of Total Investments is 33.8%. |
| N/R | | Not rated. |
| WI/DD | | Investment, or portion of investment, purchased on a when-issued or delayed delivery basis. |
| (ETM) | | Escrowed to maturity. |
| (IF) | | Inverse floating rate investment. |
See accompanying notes to financial statements.
| | | Nuveen New Jersey Municipal Value Fund |
| NJV | | Portfolio of Investments |
| | | October 31, 2012 (Unaudited) |
| | Principal | | | Optional Call | | | | |
| | Amount (000) | | Description (1) | Provisions (2) | Ratings (3) | | Value | |
| | | | Consumer Staples – 6.2% (6.1% of Total Investments) | | | | | |
| | | | Tobacco Settlement Financing Corporation, New Jersey, Tobacco Settlement Asset-Backed Bonds, Series 2007-1A: | | | | | |
| $ | 150 | | 4.750%, 6/01/34 | 6/17 at 100.00 | B2 | $ | 130,079 | |
| | 1,750 | | 5.000%, 6/01/41 | 6/17 at 100.00 | B2 | | 1,531,442 | |
| | 1,900 | | Total Consumer Staples | | | | 1,661,521 | |
| | | | Education and Civic Organizations – 8.7% (8.5% of Total Investments) | | | | | |
| | | | New Jersey Educational Facilities Authority, Revenue Bonds, Rider University, Series 2012A: | | | | | |
| | 50 | | 5.000%, 7/01/32 | 7/21 at 100.00 | BBB+ | | 55,307 | |
| | 30 | | 5.000%, 7/01/37 | 7/21 at 100.00 | BBB+ | | 32,717 | |
| | 40 | | New Jersey Educational Facilities Authority, Revenue Bonds, William Paterson University, Series 2005E, 3.750%, 7/01/13 – AGM Insured | No Opt. Call | AA– | | 40,765 | |
| | 900 | | New Jersey Educational Facilities Authority, Revenue Refunding Bonds, Kean University, Series 2009A, 5.500%, 9/01/36 | 9/19 at 100.00 | A2 | | 1,032,948 | |
| | 1,000 | | New Jersey Higher Education Assistance Authority, Student Loan Revenue Bonds, Series 2009A, 5.625%, 6/01/30 | 6/19 at 100.00 | AA | | 1,134,319 | |
| | 30 | | New Jersey Higher Education Assistance Authority, Student Loan Revenue Bonds, Series 2010-2, 5.000%, 12/01/30 | 12/20 at 100.00 | Aa3 | | 33,378 | |
| | 2,050 | | Total Education and Civic Organizations | | | | 2,329,434 | |
| | | | Health Care – 24.7% (24.1% of Total Investments) | | | | | |
| | 500 | | Camden County Improvement Authority, New Jersey, Revenue Bonds, Cooper Health System, Series 2005A, 5.000%, 2/15/25 | 2/15 at 100.00 | BBB | | 519,160 | |
| | 105 | | Illinois Finance Authority, Revenue Bonds, OSF Healthcare System, Series 2007A, 5.750%, 11/15/37 | 11/17 at 100.00 | A | | 115,545 | |
| | 2,000 | | New Jersey Health Care Facilities Financing Authority, Hospital Revenue Bonds, Virtua Health Series 2009A, 5.500%, 7/01/38 – AGC Insured (UB) (4) | 7/19 at 100.00 | AA– | | 2,235,280 | |
| | 1,000 | | New Jersey Health Care Facilities Financing Authority, Revenue Bonds, Hunterdon Medical Center, Series 2006B, 5.000%, 7/01/36 | 7/16 at 100.00 | A | | 1,033,220 | |
| | 70 | | New Jersey Health Care Facilities Financing Authority, Revenue Bonds, Saint Barnabas Health Care System, Refunding Series 2011A, 5.625%, 7/01/37 | 7/21 at 100.00 | BBB+ | | 78,831 | |
| | 750 | | New Jersey Health Care Facilities Financing Authority, Revenue Bonds, Saint Joseph’s Healthcare System Obligated Group Issue, Series 2008, 6.000%, 7/01/18 | No Opt. Call | BBB– | | 877,275 | |
| | 705 | | New Jersey Health Care Facilities Financing Authority, Revenue Bonds, South Jersey Hospital System, Refunding Series 2006, 5.000%, 7/01/36 | 7/16 at 100.00 | A2 | | 733,545 | |
| | 1,000 | | New Jersey Health Care Facilities Financing Authority, Revenue Refunding Bonds, Bayshore Community Hospital, Series 2002, 5.125%, 7/01/32 – RAAI Insured | 11/12 at 100.00 | N/R | | 1,000,240 | |
| | 6,130 | | Total Health Care | | | | 6,593,096 | |
| | | | Housing/Multifamily – 4.7% (4.5% of Total Investments) | | | | | |
| | | | New Jersey Economic Development Authority, Student Housing Revenue Bonds, Provident Group-Montclair Properties LLC, Montclair State University Student Housing Project, Series 2010A: | | | | | |
| | 100 | | 5.750%, 6/01/31 | 6/20 at 100.00 | Baa3 | | 113,021 | |
| | 50 | | 5.875%, 6/01/42 | 6/20 at 100.00 | Baa3 | | 55,940 | |
| | 1,000 | | New Jersey Housing and Mortgage Finance Agency, Multifamily Housing Revenue Bonds, Series 2009A, 4.950%, 5/01/41 | 11/19 at 100.00 | A+ | | 1,073,920 | |
| | 1,150 | | Total Housing/Multifamily | | | | 1,242,881 | |
| | | Nuveen New Jersey Municipal Value Fund (continued) |
| NJV | | Portfolio of Investments |
October 31, 2012 (Unaudited)
| | Principal | | | Optional Call | | | | |
| | Amount (000) | | Description (1) | Provisions (2) | Ratings (3) | | Value | |
| | | | Housing/Single Family – 2.1% (2.0% of Total Investments) | | | | | |
| | | | New Jersey Housing & Mortgage Finance Agency, Single Family Home Mortgage Revenue Bonds, Series 2011A: | | | | | |
| $ | 100 | | 1.250%, 10/01/13 | No Opt. Call | Aa1 | $ | 100,568 | |
| | 440 | | 4.500%, 10/01/29 | 10/21 at 100.00 | Aa1 | | 457,142 | |
| | 540 | | Total Housing/Single Family | | | | 557,710 | |
| | | | Tax Obligation/General – 9.2% (9.0% of Total Investments) | | | | | |
| | 100 | | Bloomfield Township Board of Education, Essex County, New Jersey, General Obligation Bonds, Series 2011, 3.000%, 9/01/16 | No Opt. Call | AA– | | 106,599 | |
| | 75 | | Clark Township Board of Education, Union County, New Jersey, General Obligation Bonds, School Series 2005, 4.000%, 6/01/13 – AGM Insured | No Opt. Call | Aa3 | | 76,652 | |
| | 55 | | Essex County, New Jersey, General Obligation Bonds, Series 2005A, 5.000%, 6/01/13 – AGM Insured | No Opt. Call | Aa2 | | 56,496 | |
| | 40 | | Gloucester Township Board of Education, Camden County, New Jersey, General Obligation Bonds, Series 2004, 5.000%, 8/01/13 – NPFG Insured | No Opt. Call | AA– | | 41,428 | |
| | 25 | | Greater Egg Harbor Regional High School District, Alantic County, New Jersey, General Obligation Bonds, Series 2007, 3.750%, 2/01/13 – AGM Insured | No Opt. Call | Aa3 | | 25,224 | |
| | 10 | | Hillsborough Township School District, Somerset County, New Jersey, General Obligation School Bonds, Series 2001, 5.375%, 10/01/16 – AGM Insured | No Opt. Call | AA– | | 11,848 | |
| | 255 | | Millville, New Jersey, General Obligation Bonds, Improvement Series 2011, 5.000%, 11/01/14 – AGM Insured | No Opt. Call | AA– | | 276,978 | |
| | 50 | | Monmouth County Improvement Authority, New Jersey, Governmental Loan Revenue Bonds, Series 2005, 5.000%, 12/01/14 – AMBAC Insured | No Opt. Call | N/R | | 53,220 | |
| | 150 | | Monmouth County Improvement Authority, New Jersey, Governmental Loan Revenue Bonds, Series 2006, 5.000%, 12/01/15 – AMBAC Insured | No Opt. Call | N/R | | 163,445 | |
| | 150 | | Monmouth County Improvement Authority, New Jersey, Governmental Loan Revenue Bonds, Series 2007, 5.000%, 12/01/16 – AMBAC Insured | No Opt. Call | N/R | | 166,637 | |
| | 500 | | Newark Housing Authority, New Jersey, City-Secured Police Facility Revenue Bonds, South Ward Police Facility, Series 2009A, 6.750%, 12/01/38 – AGC Insured | 12/19 at 100.00 | Aa3 | | 630,115 | |
| | 30 | | North Bergen Township, New Jersey, General Obligation Bonds, General Improvement Series 2009, 4.000%, 2/01/17 | No Opt. Call | AA– | | 33,749 | |
| | 75 | | Passaic County, New Jersey, General Obligation Bonds, Refunding Series 2009, 3.000%, 9/01/14 – AGC Insured | No Opt. Call | Aa3 | | 78,143 | |
| | 50 | | Passaic County, New Jersey, General Obligation Bonds, Series 2004, 3.500%, 3/15/15 – NPFG Insured | No Opt. Call | Aa3 | | 53,136 | |
| | 100 | | Readington Township, New Jersey, General Obligation Bonds, General Improvement Series 2011, 4.000%, 1/15/13 | No Opt. Call | AA | | 100,753 | |
| | 100 | | Swedesboro Woolwich Consolidated School District, Gloucester County, New Jersey, General Obligation Bonds, Series 2006, 4.500%, 1/15/14 – AGM Insured | No Opt. Call | Aa3 | | 104,260 | |
| | 150 | | Union County Utilities Authority, New Jersey, Resource Recovery Facility Lease Revenue Refunding Bonds, Covantan Union Inc. Lessee, Series 2011B, 5.250%, 12/01/31 (Alternative Minimum Tax) | 12/21 at 100.00 | AA+ | | 167,855 | |
| | 170 | | Union County Utilities Authority, New Jersey, Solid Waste System County Deficiency Revenue Bonds, Series 2011, 5.000%, 6/15/41 | 6/21 at 100.00 | AA+ | | 195,866 | |
| | 100 | | Upper Freehold Township, New Jersey, General Obligation Bonds, Series 2012, 3.000%, 12/15/14 | No Opt. Call | AA | | 104,313 | |
| | 2,185 | | Total Tax Obligation/General | | | | 2,446,717 | |
| | Principal | | | Optional Call | | | | |
| | Amount (000) | | Description (1) | Provisions (2) | Ratings (3) | | Value | |
| | | | Tax Obligation/Limited – 30.8% (30.1% of Total Investments) | | | | | |
| $ | 25 | | Essex County Improvement Authority, New Jersey, Lease Revenue Bonds, Series 2003, 5.000%, 12/15/13 – AGM Insured | No Opt. Call | Aa2 | $ | 26,268 | |
| | 200 | | Garden State Preservation Trust, New Jersey, Open Space and Farmland Preservation Bonds, Series 2005A, 5.750%, 11/01/28 – AGM Insured | No Opt. Call | AAA | | 267,784 | |
| | 630 | | Guam Government, Limited Obligation Section 30 Revenue Bonds, Series 2009A, 5.750%, 12/01/34 | 12/19 at 100.00 | BBB+ | | 707,931 | |
| | 100 | | New Jersey Economic Development Authority, Cigarette Tax Revenue Refunding Bonds, Series 2012, 5.000%, 6/15/14 | No Opt. Call | BBB+ | | 106,458 | |
| | 700 | | New Jersey Health Care Facilities Financing Authority, State Contract Bonds, Hospital Asset Transformation Program, Series 2008A, 5.250%, 10/01/38 | 10/18 at 100.00 | A+ | | 766,696 | |
| | 2,000 | | New Jersey Health Care Facilities Financing Authority, State Contract Bonds, Hospital Asset Transformation Program, Series 2009A, 5.750%, 10/01/31 | 10/19 at 100.00 | A+ | | 2,348,676 | |
| | 5,425 | | New Jersey Transportation Trust Fund Authority, Transportation System Bonds, Series 2009A, 0.000%, 12/15/39 | No Opt. Call | A+ | | 1,478,474 | |
| | 1,000 | | Puerto Rico Sales Tax Financing Corporation, Sales Tax Revenue Bonds, First Subordinate Series 2009A, 6.000%, 8/01/42 | 8/19 at 100.00 | A+ | | 1,107,559 | |
| | 250 | | The Camden County Improvement Authority (Camden County, New Jersey) County Guaranteed Loan Revenue Bonds (County Capital Program) Series 2011, 2.000%, 1/15/13 | No Opt. Call | Aa2 | | 250,760 | |
| | 105 | | Virgin Islands Public Finance Authority, Matching Fund Loan Notes Revenue Bonds, Senior Lien Series 2010A, 5.000%, 10/01/29 | 10/20 at 100.00 | BBB+ | | 116,227 | |
| | 1,000 | | Virgin Islands Public Finance Authority, Revenue Bonds, Senior Lien Matching Fund Loan Notes, Series 2009A-1, 5.000%, 10/01/39 | 10/19 at 100.00 | BBB+ | | 1,038,730 | |
| | 11,435 | | Total Tax Obligation/Limited | | | | 8,215,563 | |
| | | | Transportation – 5.7% (5.6% of Total Investments) | | | | | |
| | 500 | | New Jersey Economic Development Authority, Revenue Bonds, American Airlines Inc., Series 1991, 7.100%, 11/01/31 (Alternative Minimum Tax) (5) | 5/13 at 100.00 | N/R | | 230,685 | |
| | 400 | | New Jersey Economic Development Authority, Special Facilities Revenue Bonds, Continental Airlines Inc., Series 2003, 9.000%, 6/01/33 (Mandatory put 6/01/13) (Alternative Minimum Tax) | 6/15 at 100.00 | B | | 415,916 | |
| | | | New Jersey Turnpike Authority, Revenue Bonds, Series 1991C: | | | | | |
| | 15 | | 6.500%, 1/01/16 | No Opt. Call | A3 | | 17,522 | |
| | 5 | | 6.500%, 1/01/16 – AMBAC Insured | No Opt. Call | A3 | | 5,841 | |
| | 765 | | New Jersey Turnpike Authority, Revenue Bonds, Series 2009E, 5.250%, 1/01/40 | 1/19 at 100.00 | A+ | | 862,362 | |
| | 1,685 | | Total Transportation | | | | 1,532,326 | |
| | | | U.S. Guaranteed – 8.5% (8.2% of Total Investments) (6) | | | | | |
| | 50 | | New Jersey Economic Development Authority, Cigarette Tax Revenue Bonds, Series 2004, 5.500%, 6/15/16 – RAAI Insured (ETM) | No Opt. Call | Aaa | | 59,076 | |
| | 1,000 | | New Jersey Economic Development Authority, Cigarette Tax Revenue Bonds, Series 2004, 5.750%, 6/15/34 (Pre-refunded 6/15/14) | 6/14 at 100.00 | Aaa | | 1,088,280 | |
| | 250 | | New Jersey Environmental Infrastructure Trust, Environmental Infrastructure Bonds, Series 2004A, 5.000%, 9/01/22 (Pre-refunded 9/01/13) | 9/13 at 100.00 | AAA | | 259,938 | |
| | | | New Jersey Turnpike Authority, Revenue Bonds, Series 1991C: | | | | | |
| | 10 | | 6.500%, 1/01/16 (ETM) | No Opt. Call | A3 (6) | | 11,916 | |
| | 55 | | 6.500%, 1/01/16 (ETM) | No Opt. Call | AA+ (6) | | 65,537 | |
| | 365 | | 6.500%, 1/01/16 (ETM) | No Opt. Call | AA+ (6) | | 396,719 | |
| | 115 | | 6.500%, 1/01/16 – NPFG Insured (ETM) | No Opt. Call | A+ (6) | | 124,994 | |
| | 10 | | Tobacco Settlement Financing Corporation, New Jersey, Tobacco Settlement Asset-Backed Bonds, Series 2003, 6.375%, 6/01/32 (Pre-refunded 6/01/13) | 6/13 at 100.00 | Aaa | | 10,338 | |
| | 220 | | Wisconsin Health and Educational Facilities Authority, Revenue Bonds, ProHealth Care, Inc. Obligated Group, Series 2009, 6.625%, 2/15/32 (Pre-refunded 2/18/14) | 2/14 at 100.00 | A+ (6) | | 237,833 | |
| | 2,075 | | Total U.S. Guaranteed | | | | 2,254,631 | |
| | | Nuveen New Jersey Municipal Value Fund (continued) |
| NJV | | Portfolio of Investments |
October 31, 2012 (Unaudited)
| | Principal | | | Optional Call | | | | |
| | Amount (000) | | Description (1) | Provisions (2) | Ratings (3) | | Value | |
| | | | Utilities – 1.5% (1.5% of Total Investments) | | | | | |
| $ | 300 | | Industrial Pollution Control Financing Authority of Cape May County (New Jersey), Pollution Control Revenue Refunding Bonds, 1991 Series A (Atlantic City Electric Company Project), 6.800%, 3/01/21 – NPFG Insured | No Opt. Call | A | $ | 397,815 | |
| | | | Water and Sewer – 0.4% (0.4% of Total Investments) | | | | | |
| | 100 | | Cape May County Municipal Utilities Authority, New Jersey, Revenue Bonds, Refunding Series 2002A, 5.750%, 1/01/13 – AGM Insured | No Opt. Call | Aa1 | | 100,918 | |
| $ | 29,550 | | Total Investments (cost $23,463,155) – 102.5% | | | | 27,332,612 | |
| | | | Floating Rate Obligations – (5.6)% | | | | (1,500,000 | ) |
| | | | Other Assets Less Liabilities – 3.1% | | | | 840,118 | |
| | | | Net Assets Applicable to Common Shares – 100% | | | $ | 26,672,730 | |
| (1) | | All percentages shown in the Portfolio of Investments are based on net assets applicable to Common shares unless otherwise noted. |
| (2) | | Optional Call Provisions: Dates (month and year) and prices of the earliest optional call or redemption. There may be other call provisions at varying prices at later dates. Certain mortgage-backed securities may be subject to periodic principal paydowns. |
| (3) | | Ratings: Using the highest of Standard & Poor’s Group (“Standard & Poor’s”), Moody’s Investors Service, Inc. (“Moody’s”) or Fitch, Inc. (“Fitch”) rating. Ratings below BBB by Standard & Poor’s, Baa by Moody’s or BBB by Fitch are considered to be below investment grade. Holdings designated N/R are not rated by any of these national rating agencies. |
| (4) | | Investment, or portion of investment, has been pledged to collateralize the net payment obligations for investments in inverse floating rate transactions. |
| (5) | | At or subsequent to the end of the reporting period, this security is non-income producing. Non-income producing security, in the case of a bond, generally denotes that the issuer has (1) defaulted on the payment of principal or interest, (2) is under the protection of the Federal Bankruptcy Court or (3) the Fund’s Adviser has concluded that the issue is not likely to meet its future interest payment obligations and has directed the Fund’s custodian to cease accruing additional income on the Fund’s records. |
| (6) | | Backed by an escrow or trust containing sufficient U.S. Government or U.S. Government agency securities, which ensure the timely payment of principal and interest. Certain bonds backed by U.S. Government or agency securities are regarded as having an implied rating equal to the rating of such securities. |
| N/R | | Not rated. |
| (ETM) | | Escrowed to maturity. |
| (UB) | | Underlying bond of an inverse floating rate trust reflected as a financing transaction. See Notes to Financial Statements, Footnote 1 – General Information and Significant Accounting Policies, Inverse Floating Rate Securities for more information. |
See accompanying notes to financial statements.
| | | Nuveen Pennsylvania Investment Quality Municipal Fund |
| NQP | | Portfolio of Investments |
| | | October 31, 2012 (Unaudited) |
| | Principal | | | Optional Call | | | | |
| | Amount (000) | | Description (1) | Provisions (2) | Ratings (3) | | Value | |
| | | | Consumer Staples – 0.5% (0.3% of Total Investments) | | | | | |
| $ | 1,000 | | Pennsylvania Economic Development Financing Authority, Solid Waste Disposal Revenue Bonds, Procter & Gamble Paper Project, Series 2001, 5.375%, 3/01/31 (Alternative Minimum Tax) | No Opt. Call | AA– | $ | 1,280,470 | |
| | | | Education and Civic Organizations – 22.0% (15.4% of Total Investments) | | | | | |
| | 200 | | Allegheny County Higher Education Building Authority, Pennsylvania, College Revenue Refunding Bonds, Robert Morris College, Series 1998A, 6.000%, 5/01/28 | No Opt. Call | Baa3 | | 234,694 | |
| | 700 | | Allegheny County Higher Education Building Authority, Pennsylvania, Revenue Bonds, Carnegie Mellon University, Series 2012A, 5.000%, 3/01/24 | 3/22 at 100.00 | AA– | | 862,414 | |
| | 1,235 | | Allegheny County Higher Education Building Authority, Pennsylvania, Revenue Bonds, Robert Morris University, Series 2006A, 4.750%, 2/15/26 | 2/16 at 100.00 | Baa3 | | 1,249,906 | |
| | | | Delaware County Authority, Pennsylvania, Revenue Bonds, Villanova University, Series 2006: | | | | | |
| | 1,710 | | 5.000%, 8/01/23 – AMBAC Insured | 8/16 at 100.00 | A+ | | 1,872,211 | |
| | 840 | | 5.000%, 8/01/24 – AMBAC Insured | 8/16 at 100.00 | A+ | | 915,701 | |
| | | | Erie Higher Education Building Authority, Pennsylvania, College Revenue Bonds, Gannon University, Series 2007-GG3: | | | | | |
| | 790 | | 5.000%, 5/01/32 – RAAI Insured | 5/17 at 100.00 | N/R | | 806,574 | |
| | 250 | | 5.000%, 5/01/35 – RAAI Insured | 5/17 at 100.00 | N/R | | 254,023 | |
| | | | Indiana County Industrial Development Authority, Pennsylvania, Revenue Bonds, Student Cooperative Association Inc./Indiana University of Pennsylvania - Student Union Project, Series 1999B: | | | | | |
| | 815 | | 0.000%, 11/01/15 – AMBAC Insured | No Opt. Call | N/R | | 751,552 | |
| | 815 | | 0.000%, 11/01/16 – AMBAC Insured | No Opt. Call | N/R | | 728,064 | |
| | 815 | | 0.000%, 11/01/17 – AMBAC Insured | No Opt. Call | N/R | | 697,950 | |
| | 815 | | 0.000%, 11/01/18 – AMBAC Insured | No Opt. Call | N/R | | 669,205 | |
| | 815 | | 0.000%, 11/01/19 – AMBAC Insured | No Opt. Call | N/R | | 638,732 | |
| | 1,985 | | Lycoming County Authority, Pennsylvania, Revenue Bonds, Pennsylvania College of Technology, Series 2012, 5.000%, 5/01/32 | 5/22 at 100.00 | A | | 2,208,948 | |
| | 1,515 | | Montgomery County Higher Education and Health Authority, Pennsylvania, Revenue Bonds, Arcadia University, Series 2006, 4.500%, 4/01/30 – RAAI Insured | 4/16 at 100.00 | BBB+ | | 1,542,800 | |
| | 900 | | Montgomery County Higher Education and Health Authority, Pennsylvania, Revenue Bonds, Arcadia University, Series 2010, 5.625%, 4/01/40 | 4/20 at 100.00 | BBB+ | | 990,909 | |
| | 355 | | New Wilmington, Pennsylvania, Revenue, Westminster College, Series 2007G, 5.125%, 5/01/33 – RAAI Insured | 5/17 at 100.00 | N/R | | 367,308 | |
| | 1,235 | | Pennsylvania Higher Education Assistance Agency, Capital Acquisition Revenue Refunding Bonds, Series 2001, 5.000%, 12/15/30 – NPFG Insured | 5/13 at 100.00 | BBB | | 1,237,421 | |
| | 2,175 | | Pennsylvania Higher Educational Facilities Authority, General Revenue Bonds, State System of Higher Education, Refunding Series 2012AN, 5.000%, 6/15/21 | No Opt. Call | AA | | 2,724,971 | |
| | 4,600 | | Pennsylvania Higher Educational Facilities Authority, General Revenue Bonds, State System of Higher Education, Series 2008AH, 5.000%, 6/15/33 | 6/18 at 100.00 | AA | | 5,310,700 | |
| | 1,900 | | Pennsylvania Higher Educational Facilities Authority, Revenue Bonds, AICUP Financing Program-Mount Aloysius College Project, Series 2011R-1, 5.000%, 11/01/35 | 11/21 at 100.00 | A– | | 2,058,099 | |
| | 1,435 | | Pennsylvania Higher Educational Facilities Authority, Revenue Bonds, Allegheny College, Series 2006, 4.750%, 5/01/31 | 5/16 at 100.00 | A– | | 1,503,005 | |
| | 2,650 | | Pennsylvania Higher Educational Facilities Authority, Revenue Bonds, Drexel University, Series 2007A, 5.000%, 5/01/37 – NPFG Insured | 11/17 at 100.00 | A | | 2,856,727 | |
| | 750 | | Pennsylvania Higher Educational Facilities Authority, Revenue Bonds, Drexel University, Series 2011A, 5.250%, 5/01/41 | 5/21 at 100.00 | A | | 852,570 | |
| | 3,870 | | Pennsylvania Higher Educational Facilities Authority, Revenue Bonds, Temple University, First Series of 2006, 5.000%, 4/01/21 – NPFG Insured | 4/16 at 100.00 | Aa3 | | 4,392,295 | |
| | 320 | | Pennsylvania Higher Educational Facilities Authority, Revenue Bonds, Thomas Jefferson University, Series 2002, 5.000%, 1/01/20 | 1/13 at 100.00 | A1 | | 321,706 | |
| | 1,000 | | Pennsylvania Higher Educational Facilities Authority, Revenue Bonds, Thomas Jefferson University, Series 2010, 5.000%, 3/01/40 | 3/20 at 100.00 | A+ | | 1,112,980 | |
| | 300 | | Pennsylvania Higher Educational Facilities Authority, Revenue Bonds, Thomas Jefferson University, Series 2012, 5.000%, 3/01/42 | 9/22 at 100.00 | A+ | | 337,284 | |
| | | Nuveen Pennsylvania Investment Quality Municipal Fund (continued) |
| NQP | | Portfolio of Investments |
October 31, 2012 (Unaudited)
| | Principal | | | Optional Call | | | | |
| | Amount (000) | | Description (1) | Provisions (2) | Ratings (3) | | Value | |
| | | | Education and Civic Organizations (continued) | | | | | |
| $ | 2,000 | | Pennsylvania Higher Educational Facilities Authority, Revenue Bonds, University of Pennsylvania, Series 2005C, 5.000%, 7/15/38 | 7/15 at 100.00 | AA+ | $ | 2,180,140 | |
| | | | Pennsylvania Higher Educational Facilities Authority, Revenue Bonds, University of the Sciences in Philadelphia, Series 2012: | | | | | |
| | 285 | | 4.000%, 11/01/39 | 11/22 at 100.00 | A3 | | 289,683 | |
| | 910 | | 5.000%, 11/01/42 | 11/22 at 100.00 | A3 | | 1,006,933 | |
| | 1,320 | | Pennsylvania Higher Educational Facilities Authority, Revenue Bonds, Ursinus College, Series 2003, 5.375%, 1/01/20 – RAAI Insured | 7/13 at 100.00 | A– | | 1,356,366 | |
| | 785 | | Pennsylvania Higher Educational Facilities Authority, Revenue Bonds, York College Project, Series 2005EE1, 5.250%, 11/01/27 – SYNCORA GTY Insured | 11/15 at 100.00 | A | | 834,502 | |
| | 6,500 | | Pennsylvania State University, General Revenue Bonds, Series 2005, 5.000%, 9/01/29 (UB) | 9/15 at 100.00 | Aa2 | | 7,160,075 | |
| | 600 | | Philadelphia Authority for Industrial Development, Pennsylvania, Revenue Bonds, MaST Charter School Project, Series 2010, 6.000%, 8/01/35 | 8/20 at 100.00 | BBB+ | | 679,890 | |
| | 3,650 | | State Public School Building Authority, Pennsylvania, College Revenue Bonds, Northampton County Area Community College, Series 2011, 5.500%, 3/01/31 | 3/21 at 100.00 | A1 | | 4,255,280 | |
| | 1,665 | | Union County, Higher Education Facilities Financing Authority, Pennsylvania, Revenue Bonds, Bucknell University, Series 2002A, 5.250%, 4/01/18 | 4/13 at 100.00 | Aa2 | | 1,699,882 | |
| | 600 | | Wilkes-Barre Finance Authority, Pennsylvania, Revenue Bonds, University of Scranton, Series 2010, 5.000%, 11/01/40 | 11/20 at 100.00 | A | | 667,860 | |
| | 53,105 | | Total Education and Civic Organizations | | | | 57,629,360 | |
| | | | Health Care – 24.2% (16.9% of Total Investments) | | | | | |
| | | | Allegheny County Hospital Development Authority, Pennsylvania, Revenue Bonds, Ohio Valley General Hospital, Series 2005A: | | | | | |
| | 1,150 | | 5.000%, 4/01/25 | 4/15 at 100.00 | Ba2 | | 1,149,954 | |
| | 1,555 | | 5.125%, 4/01/35 | 4/15 at 100.00 | Ba2 | | 1,503,638 | |
| | 3,360 | | Beaver County Hospital Authority, Pennsylvania, Revenue Bonds, Heritage Valley Health System, Inc., Series 2012, 5.000%, 5/15/26 | 5/21 at 100.00 | AA– | | 3,841,387 | |
| | 1,400 | | Berks County Municipal Authority, Pennsylvania, Revenue Bonds, Reading Hospital and Medical Center Project, Series 2012A, 5.000%, 11/01/44 | 5/22 at 100.00 | AA | | 1,549,982 | |
| | 890 | | Central Bradford Progress Authority, Pennsylvania, Revenue Bonds, Guthrie Health, Series 2011, 5.375%, 12/01/41 | 12/21 at 100.00 | AA– | | 1,012,553 | |
| | 2,460 | | Centre County Hospital Authority, Pennsylvania, Hospital Revenue Bonds, Mount Nittany Medical Center Project, Series 2011, 7.000%, 11/15/46 | 11/21 at 100.00 | A– | | 3,184,421 | |
| | 595 | | Chester County Health and Educational Facilities Authority, Pennsylvania, Health System Revenue Bonds, Jefferson Health System, Series 2010A, 5.000%, 5/15/40 | 5/20 at 100.00 | AA | | 663,068 | |
| | 900 | | Dauphin County General Authority, Pennsylvania, Health System Revenue Bonds, Pinnacle Health System Project, Series 2012A, 5.000%, 6/01/42 | 6/22 at 100.00 | A | | 972,891 | |
| | 1,300 | | Erie County Hospital Authority, Pennsylvania, Hospital Revenue Bonds, Saint Vincent Health Center Project, Series 2010A, 7.000%, 7/01/27 | 7/20 at 100.00 | Ba2 | | 1,435,902 | |
| | 280 | | Erie County Hospital Authority, Pennsylvania, Revenue Bonds, Hamot Health Foundation, Series 2007, 5.000%, 11/01/37 – CIFG Insured | 11/17 at 100.00 | Aa3 | | 299,841 | |
| | 3,335 | | Franklin County Industrial Development Authority, Pennsylvania, Revenue Bonds, Chambersburg Hospital Project, Series 2010, 5.375%, 7/01/42 | 7/20 at 100.00 | A+ | | 3,661,563 | |
| | 1,190 | | Lancaster County Hospital Authority, Pennsylvania, Health System Revenue Bonds, Lancaster General Hospital Project, Tender Option Bond 4234, 13.400%, 1/01/36 (IF) | 1/22 at 100.00 | AA– | | 1,566,659 | |
| | 1,890 | | Lancaster County Hospital Authority, Pennsylvania, Hospital Revenue Bonds, The Lancaster General Hospital Project, Series 2007A, 5.000%, 3/15/26 | 3/17 at 100.00 | AA– | | 2,094,914 | |
| | | | Lebanon County Health Facilities Authority, Pennsylvania, Revenue Bonds, Good Samaritan Hospital Project, Series 2002: | | | | | |
| | 250 | | 5.800%, 11/15/22 | 11/12 at 101.00 | BB+ | | 252,798 | |
| | 2,800 | | 5.900%, 11/15/28 | 11/12 at 101.00 | BB+ | | 2,830,632 | |
| | Principal | | | Optional Call | | | | |
| | Amount (000) | | Description (1) | Provisions (2) | Ratings (3) | | Value | |
| | | | Health Care (continued) | | | | | |
| $ | 3,280 | | Lehigh County General Purpose Authority, Pennsylvania, Hospital Revenue Bonds, Lehigh Valley Health Network, Series 2008A, 5.000%, 7/01/33 – AGM Insured | 7/18 at 100.00 | AA– | $ | 3,531,642 | |
| | 1,250 | | Lehigh County General Purpose Authority, Pennsylvania, Revenue Bonds, Good Shepherd Group, Series 2004A, 5.500%, 11/01/24 | 11/14 at 100.00 | A | | 1,294,513 | |
| | 5,345 | | Lehigh County General Purpose Authority, Pennsylvania, Revenue Bonds, Good Shepherd Group, Series 2007, 5.000%, 11/01/30 – AGC Insured | 11/17 at 100.00 | AA– | | 5,828,829 | |
| | | | Lycoming County Authority, Pennsylvania, Health System Revenue Bonds, Susquehanna Health System Project, Series 2009: | | | | | |
| | 3,000 | | 5.500%, 7/01/28 | 7/19 at 100.00 | A– | | 3,311,640 | |
| | 1,000 | | 5.750%, 7/01/39 | 7/19 at 100.00 | A– | | 1,112,900 | |
| | | | Monroe County Hospital Authority, Hospital Revenue Bonds, Pocono Medical Center, Series 2012A: | | | | | |
| | 290 | | 4.000%, 1/01/25 | 1/22 at 100.00 | A | | 300,930 | |
| | 740 | | 5.000%, 1/01/41 | 1/22 at 100.00 | A | | 793,643 | |
| | 710 | | Monroe County Hospital Authority, Pennsylvania, Hospital Revenue Bonds, Pocono Medical Center, Series 2007, 5.125%, 1/01/37 | 1/17 at 100.00 | A | | 737,988 | |
| | 1,600 | | Montgomery County Higher Education and Health Authority, Pennsylvania, Hospital Revenue Bonds, Abington Memorial Hospital Obligated Group, Series 2012A, 5.000%, 6/01/31 | 6/22 at 100.00 | A | | 1,815,536 | |
| | 215 | | Montgomery County Industrial Development Authority, Pennsylvania, FHA Insured Mortgage Revenue Bonds, New Regional Medical Center Project, Series 2010, 5.375%, 8/01/38 | 8/20 at 100.00 | AA | | 247,738 | |
| | 1,000 | | Northampton County General Purpose Authority, Pennsylvania, Hospital Revenue Bonds, Saint Lukes Hospital Project, Series 2008A, 5.500%, 8/15/35 | 8/18 at 100.00 | A3 | | 1,085,100 | |
| | 335 | | Pennsylvania Economic Development Financing Authority, Health System Revenue Bonds , Albert Einstein Healthcare, Series 2009A, 6.250%, 10/15/23 | 10/19 at 100.00 | BBB+ | | 394,965 | |
| | 1,240 | | Pennsylvania Higher Educational Facilities Authority, Revenue Bonds, University of Pennsylvania Health System, Series 2012A, 5.000%, 8/15/42 | 8/22 at 100.00 | AA– | | 1,384,795 | |
| | 1,800 | | Philadelphia Hospitals and Higher Education Facilities Authority, Pennsylvania, Hospital Revenue Bonds, Temple University Health System Obligated Group, Series 2012A, 5.625%, 7/01/42 | 7/22 at 100.00 | BBB– | | 1,915,074 | |
| | 1,795 | | Philadelphia Hospitals and Higher Education Facilities Authority, Pennsylvania, Health System Revenue Bonds, Jefferson Health System, Series 2010B, 5.000%, 5/15/40 | 5/20 at 100.00 | AA | | 1,967,679 | |
| | 1,165 | | Philadelphia Hospitals and Higher Education Facilities Authority, Pennsylvania, Hospital Revenue Bonds, Children’s Hospital of Philadelphia, Tender Option Bond Trust 3975, 13.391%, 7/01/19 (IF) | No Opt. Call | AA | | 1,562,999 | |
| | 1,613 | | South Fork Municipal Authority, Pennsylvania, Hospital Revenue Bonds, Conemaugh Valley Memorial Hospital,, 5.500%, 7/01/29 | 7/20 at 100.00 | BBB+ | | 1,797,205 | |
| | | | Southcentral Pennsylvania General Authority, Revenue Bonds, Hanover Hospital Inc., Series 2005: | | | | | |
| | 525 | | 5.000%, 12/01/27 – RAAI Insured | 12/15 at 100.00 | BBB– | | 537,863 | |
| | 370 | | 5.000%, 12/01/29 – RAAI Insured | 12/15 at 100.00 | BBB– | | 377,670 | |
| | | | Union County Hospital Authority, Pennsylvania, Hospital Revenue Bonds, Evangelical Community Hospital Project, Refunding and Improvement Series 2011: | | | | | |
| | 1,635 | | 6.875%, 8/01/31 | 8/21 at 100.00 | BBB+ | | 1,993,212 | |
| | 1,365 | | 7.000%, 8/01/41 | 8/21 at 100.00 | BBB+ | | 1,642,887 | |
| | 1,875 | | West Shore Area Authority, Cumberland County, Pennsylvania, Hospital Revenue Bonds, Holy Spirit Hospital of the Sisters of Christian Charity Project, Series 2011, 6.500%, 1/01/36 | 1/21 at 100.00 | BBB+ | | 2,239,819 | |
| | 1,280 | | West Shore Area Authority, Cumberland County, Pennsylvania, Hospital Revenue Bonds, Holy Spirit Hospital of the Sisters of Christian Charity, Series 2011B, 5.625%, 1/01/32 | 1/22 at 100.00 | BBB+ | | 1,443,994 | |
| | 56,783 | | Total Health Care | | | | 63,338,824 | |
| | | | Housing/Multifamily – 4.2% (2.9% of Total Investments) | | | | | |
| | 200 | | Pennsylvania Higher Educational Facilities Authority, Revenue Bonds, Edinboro University Foundation Student Housing Project, Series 2010, 6.000%, 7/01/43 | 7/20 at 100.00 | BBB– | | 226,598 | |
| | | | Pennsylvania Higher Educational Facilities Authority, Revenue Bonds, Foundation for Student Housing at Indiana University, Project Series 2012A: | | | | | |
| | 1,000 | | 5.000%, 7/01/27 | 7/22 at 100.00 | BBB+ | | 1,114,690 | |
| | 400 | | 5.000%, 7/01/32 | 7/22 at 100.00 | BBB+ | | 435,300 | |
| | | Nuveen Pennsylvania Investment Quality Municipal Fund (continued) |
| NQP | | Portfolio of Investments |
October 31, 2012 (Unaudited)
| | Principal | | | Optional Call | | | | |
| | Amount (000) | | Description (1) | Provisions (2) | Ratings (3) | | Value | |
| | | | Housing/Multifamily (continued) | | | | | |
| $ | 5,000 | | Pennsylvania Higher Educational Facilities Authority, Revenue Bonds, Slippery Rock University Foundation Inc., Series 2007A, 5.000%, 7/01/39 – SYNCORA GTY Insured | 7/17 at 100.00 | BBB+ | $ | 5,164,400 | |
| | 3,300 | | Pennsylvania Higher Educational Facilities Authority, Revenue Bonds, Slippery Rock University Foundation Inc., Student Housing Project, Series 2005A, 5.000%, 7/01/37 – SYNCORA GTY Insured | 7/15 at 100.00 | BBB+ | | 3,366,594 | |
| | 800 | | Philadelphia Authority for Industrial Development, Pennsylvania, Multifamily Housing Revenue Bonds, Presbyterian Homes Germantown - Morrisville Project, Series 2005A, 5.625%, 7/01/35 | 5/15 at 102.00 | Baa3 | | 811,216 | |
| | 10,700 | | Total Housing/Multifamily | | | | 11,118,798 | |
| | | | Housing/Single Family – 7.7% (5.4% of Total Investments) | | | | | |
| | 8,675 | | Pennsylvania Housing Finance Agency, Single Family Mortgage Revenue Bonds, Series 1995A, 4.900%, 10/01/37 (Alternative Minimum Tax) | 10/15 at 100.00 | AA+ | | 8,854,831 | |
| | 605 | | Pennsylvania Housing Finance Agency, Single Family Mortgage Revenue Bonds, Series 2006-93A, 4.950%, 10/01/26 (Alternative Minimum Tax) | 4/15 at 100.00 | AA+ | | 624,402 | |
| | 1,185 | | Pennsylvania Housing Finance Agency, Single Family Mortgage Revenue Bonds, Series 2006-96B, 3.950%, 4/01/16 | No Opt. Call | AA+ | | 1,288,154 | |
| | 1,355 | | Pennsylvania Housing Finance Agency, Single Family Mortgage Revenue Bonds, Series 2007-97A, 4.600%, 10/01/27 (Alternative Minimum Tax) | 10/16 at 100.00 | AA+ | | 1,405,813 | |
| | 1,540 | | Pennsylvania Housing Finance Agency, Single Family Mortgage Revenue Bonds, Series 2007-98A, 4.850%, 10/01/31 (Alternative Minimum Tax) | 10/16 at 100.00 | AA+ | | 1,596,641 | |
| | 2,800 | | Pennsylvania Housing Finance Agency, Single Family Mortgage Revenue Bonds, Series 2011-112, 5.000%, 10/01/25 | 10/20 at 100.00 | AA+ | | 3,083,052 | |
| | 1,000 | | Pennsylvania Housing Finance Agency, Single Family Mortgage Revenue Bonds, Tender Option Bonds Trust 3950, 12.451%, 4/01/27 (IF) | 4/21 at 100.00 | AA+ | | 1,265,080 | |
| | 2,015 | | Pittsburgh Urban Redevelopment Authority, Pennsylvania, Mortgage Revenue Bonds, Series 2001B, 5.450%, 10/01/32 (Alternative Minimum Tax) | 4/13 at 100.00 | Aa1 | | 2,017,519 | |
| | 19,175 | | Total Housing/Single Family | | | | 20,135,492 | |
| | | | Industrials – 1.4% (1.0% of Total Investments) | | | | | |
| | | | Pennsylvania Economic Development Financing Authority, Exempt Facilities Revenue Refunding Bonds, Amtrak Project, Series 2012A: | | | | | |
| | 1,275 | | 5.000%, 11/01/23 (Alternative Minimum Tax) | 11/22 at 100.00 | A1 | | 1,451,932 | |
| | 2,000 | | 5.000%, 11/01/41 (Alternative Minimum Tax) | 11/22 at 100.00 | A1 | | 2,186,800 | |
| | 3,275 | | Total Industrials | | | | 3,638,732 | |
| | | | Long-Term Care – 4.0% (2.8% of Total Investments) | | | | | |
| | 1,500 | | Cumberland County Municipal Authority Revenue Bonds, Pennsylvania, Diakon Lutheran Social Ministries Project, Series 2009, 6.375%, 1/01/39 | 1/19 at 100.00 | BBB+ | | 1,674,660 | |
| | 1,330 | | Cumberland County Municipal Authority, Pennsylvania, Revenue Bonds, Diakon Lutheran Social Ministries, Series 2007, 5.000%, 1/01/36 | 1/17 at 100.00 | BBB+ | | 1,371,749 | |
| | 1,500 | | Cumberland County Municipal Authority, Pennsylvania, Revenue Bonds, Presbyterian Homes Inc., Series 2003A, 5.000%, 12/01/26 – RAAI Insured | 12/12 at 100.00 | BBB+ | | 1,500,960 | |
| | 1,000 | | Delaware County Authority, Revenue Bonds, Elwyn, Inc. Project, Series 2010, 5.000%, 6/01/21 | 6/17 at 100.00 | BBB | | 1,052,160 | |
| | | | Lancaster County Hospital Authority, Pennsylvania, Health Center Revenue Bonds, Masonic Homes Project, Series 2006: | | | | | |
| | 1,550 | | 5.000%, 11/01/26 | 11/16 at 100.00 | A | | 1,636,382 | |
| | 415 | | 5.000%, 11/01/36 | 11/16 at 100.00 | A | | 432,928 | |
| | 220 | | Lancaster County Hospital Authority, Pennsylvania, Health Center Revenue Bonds, Saint Anne’s Retirement Community, Inc. , Series 2012, 5.000%, 4/01/33 (WI/DD, Settling 11/01/12) | 4/22 at 100.00 | BB+ | | 221,470 | |
| | 900 | | Montgomery Count Industrial Development Authority, Pennsylvania, Revenue Refunding Bonds, ACTS Retirement-Life Communities, Inc. , Series 2012, 5.000%, 11/15/26 | 5/22 at 100.00 | A– | | 995,976 | |
| | 1,500 | | Philadelphia Authority for Industrial Development, Pennsylvania, Revenue Bonds, Philadelphia Corporation for the Aging Project, Series 2001B, 5.250%, 7/01/26 – AMBAC Insured | 1/13 at 100.50 | Baa1 | | 1,509,060 | |
| | 9,915 | | Total Long-Term Care | | | | 10,395,345 | |
| | Principal | | | Optional Call | | | | |
| | Amount (000) | | Description (1) | Provisions (2) | Ratings (3) | | Value | |
| | | | Materials – 1.2% (0.8% of Total Investments) | | | | | |
| $ | 1,260 | | Bradford County Industrial Development Authority, Pennsylvania, Solid Waste Disposal Revenue Bonds, International Paper Company, Series 2005B, 5.200%, 12/01/19 (Alternative Minimum Tax) | 12/15 at 100.00 | BBB | $ | 1,351,791 | |
| | 1,750 | | Pennsylvania Economic Development Financing Authority, Exempt Facilities Revenue Bonds, National Gypsum Company, Series 1997B, 6.125%, 11/01/27 (Alternative Minimum Tax) | 5/13 at 100.00 | N/R | | 1,723,890 | |
| | 3,010 | | Total Materials | | | | 3,075,681 | |
| | | | Tax Obligation/General – 34.4% (24.1% of Total Investments) | | | | | |
| | 3,430 | | Allegheny County, Pennsylvania, General Obligation Bonds, Series 2011C-65, 5.375%, 5/01/31 | 5/21 at 100.00 | A+ | | 3,931,912 | |
| | 3,000 | | Bethel Park School District, Allegheny County, Pennsylvania, General Obligation Bonds, Series 2009, 5.000%, 8/01/29 | 8/19 at 100.00 | Aa2 | | 3,681,300 | |
| | | | Centre County, Pennsylvania, General Obligation Bonds, Series 2012B: | | | | | |
| | 310 | | 4.000%, 7/01/24 | 7/20 at 100.00 | AA | | 345,802 | |
| | 1,430 | | 4.000%, 7/01/25 | 7/20 at 100.00 | AA | | 1,584,025 | |
| | 915 | | 4.000%, 7/01/26 | 7/20 at 100.00 | AA | | 1,007,845 | |
| | 6,000 | | Delaware Valley Regional Finance Authority, Pennsylvania, Local Government Revenue Bonds, Series 2002, 5.750%, 7/01/17 (UB) | No Opt. Call | A+ | | 6,990,240 | |
| | 7,350 | | Erie City School District, Erie County, Pennsylvania, General Obligation Bonds, Series 2000, 0.000%, 9/01/30 – AMBAC Insured | No Opt. Call | N/R | | 3,385,190 | |
| | 4,715 | | Gateway School District, Allegheny County, Pennsylvania, General Obligation Bonds, Refunding Series 2012, 4.000%, 10/15/32 | 10/22 at 100.00 | A1 | | 4,970,506 | |
| | 1,260 | | Luzerne County, Pennsylvania, General Obligation Bonds, Series 2003C, 5.250%, 12/15/16 – FGIC Insured | No Opt. Call | N/R | | 1,393,270 | |
| | 5,000 | | Pennsylvania Public School Building Authority, Lease Revenue Bonds, School District of Philadelphia, Series 2006B, 5.000%, 6/01/33 – AGM Insured (UB) | 12/16 at 100.00 | Aa3 | | 5,323,100 | |
| | 4,830 | | Pennsylvania State, General Obligation Bonds, Series 2007, Residuals 1986, 12.835%, 3/01/15 (IF) | No Opt. Call | AA+ | | 6,677,717 | |
| | 1,675 | | Philadelphia School District, Pennsylvania, General Obligation Bonds, Series 2007A, 5.000%, 6/01/34 – FGIC Insured | No Opt. Call | AA | | 2,043,282 | |
| | 2,620 | | Philadelphia, Pennsylvania, General Obligation Bonds, Refunding Series 2011, 6.500%, 8/01/41 | 8/20 at 100.00 | A2 | | 3,208,111 | |
| | 4,135 | | Pine-Richland School District, Pennsylvania, General Obligation Bonds, School Improvement Series 2005, 5.000%, 7/15/35 – AGM Insured | 7/15 at 100.00 | AA– | | 4,393,148 | |
| | 3,000 | | Pittsburgh School District, Allegheny County, Pennsylvania, General Obligation Refunding Bonds, Series 2002A, 5.500%, 9/01/15 – AGM Insured | No Opt. Call | AA– | | 3,373,920 | |
| | | | Pittsburgh, Pennsylvania, General Obligation Bonds, Series 2012B: | | | | | |
| | 2,590 | | 5.000%, 9/01/25 | 9/22 at 100.00 | A1 | | 3,041,437 | |
| | 1,280 | | 5.000%, 9/01/26 | 9/22 at 100.00 | A1 | | 1,492,762 | |
| | 1,900 | | Radnor Township School District, Delaware County, Pennsylvania, General Obligation Bonds, Series 2012, 3.000%, 2/15/34 | 2/18 at 100.00 | Aa2 | | 1,855,977 | |
| | 1,130 | | Radnor Township, Pennsylvania, General Obligation Bonds, Series 2012, 4.000%, 11/01/37 | 11/22 at 100.00 | Aa1 | | 1,191,483 | |
| | 1,070 | | Schuylkill Valley School District, Berks County, Pennsylvania, General Obligation Bonds, Series 2006A, 5.000%, 4/01/22 – FGIC Insured | 4/16 at 100.00 | Aa3 | | 1,209,004 | |
| | 800 | | Scranton Parking Authority, Pennsylvania, Guaranteed Parking Revenue Bonds, Series 2004, 5.000%, 9/15/33 – FGIC Insured | 9/13 at 100.00 | BBB | | 748,768 | |
| | 630 | | Scranton, Pennsylvania, General Obligation Bonds, Series 2012A, 8.500%, 9/01/22 | No Opt. Call | N/R | | 615,592 | |
| | 21,000 | | State Public School Building Authority, Pennsylvania, School Revenue Bonds, Philadelphia School District Project, Series 2003, 5.500%, 6/01/28 – AGM Insured (UB) (4) | No Opt. Call | AA– | | 27,728,190 | |
| | 80,070 | | Total Tax Obligation/General | | | | 90,192,581 | |
| | | Nuveen Pennsylvania Investment Quality Municipal Fund (continued) |
| NQP | | Portfolio of Investments |
October 31, 2012 (Unaudited)
| | Principal | | | Optional Call | | | | |
| | Amount (000) | | Description (1) | Provisions (2) | Ratings (3) | | Value | |
| | | | Tax Obligation/Limited – 6.5% (4.6% of Total Investments) | | | | | |
| $ | 500 | | Allentown Neighborhood Improvement Zone Development Authority, Pennsylvania, Tax Revenue Bonds, Series 2012A, 5.000%, 5/01/35 | 5/22 at 100.00 | Baa2 | $ | 535,115 | |
| | | | Government of Guam, Business Privilege Tax Bonds, Series 2011A: | | | | | |
| | 1,670 | | 5.250%, 1/01/36 | 1/22 at 100.00 | A | | 1,884,127 | |
| | 655 | | 5.125%, 1/01/42 | 1/22 at 100.00 | A | | 729,932 | |
| | 2,140 | | Pennsylvania Turnpike Commission, Oil Franchise Tax Revenue Bonds, Senior Lien Series 2003A, 5.000%, 12/01/32 – NPFG Insured | 12/18 at 100.00 | AA | | 2,380,729 | |
| | 2,700 | | Philadelphia Municipal Authority, Pennsylvania, Lease Revenue Bonds, Series 2003B, 5.250%, 11/15/17 – AGM Insured | 11/13 at 100.00 | AA– | | 2,831,868 | |
| | 3,140 | | Puerto Rico Infrastructure Financing Authority, Special Tax Revenue Bonds, Series 2005A, 0.000%, 7/01/32 – FGIC Insured | No Opt. Call | BBB+ | | 955,690 | |
| | 2,500 | | Puerto Rico Sales Tax Financing Corporation, Sales Tax Revenue Bonds, First Subordinate Series 2009A, 6.500%, 8/01/44 | 8/19 at 100.00 | A+ | | 2,936,575 | |
| | 1,625 | | Puerto Rico Sales Tax Financing Corporation, Sales Tax Revenue Bonds, First Subordinate Series 2010A, 5.500%, 8/01/42 | 2/20 at 100.00 | A+ | | 1,736,378 | |
| | 3,000 | | Puerto Rico Sales Tax Financing Corporation, Sales Tax Revenue Bonds, First Subordinate Series 2011A-1, 5.000%, 8/01/43 | 8/21 at 100.00 | A+ | | 3,130,470 | |
| | 17,930 | | Total Tax Obligation/Limited | | | | 17,120,884 | |
| | | | Transportation – 12.1% (8.5% of Total Investments) | | | | | |
| | 400 | | Delaware River Port Authority, New Jersey and Pennsylvania, Revenue Bonds, Series 2010E, 5.000%, 1/01/40 | 1/20 at 100.00 | A– | | 448,080 | |
| | 2,035 | | Lehigh-Northampton Airport Authority, Pennsylvania, Airport Revenue Bonds, Lehigh Valley Airport System, Series 2000A, 6.000%, 5/15/30 – NPFG Insured (Alternative Minimum Tax) | 11/12 at 100.00 | Baa2 | | 2,036,770 | |
| | 1,200 | | Pennsylvania Turnpike Commission, Motor License Fund-Enhanced Subordinate Special Revenue Bonds, Series 2010A, 5.000%, 12/01/38 | 12/19 at 100.00 | AA | | 1,334,688 | |
| | 2,500 | | Pennsylvania Turnpike Commission, Motor License Fund-Enhanced Subordinate Special Revenue Bonds, Series 2012A, 5.000%, 12/01/31 | 12/21 at 100.00 | AA | | 2,902,450 | |
| | 3,000 | | Pennsylvania Turnpike Commission, Motor License Fund-Enhanced Turnpike Subordinate Special Revenue, Series 2011B, 5.000%, 12/01/41 | 12/21 at 100.00 | AA | | 3,388,590 | |
| | 6,600 | | Pennsylvania Turnpike Commission, Turnpike Revenue Bonds, Capital Appreciation Series 2009E, 0.000%, 12/01/38 | 12/27 at 100.00 | A– | | 6,556,174 | |
| | | | Pennsylvania Turnpike Commission, Turnpike Revenue Bonds, Series 2006A: | | | | | |
| | 3,820 | | 5.000%, 12/01/22 – AMBAC Insured | 6/16 at 100.00 | Aa3 | | 4,338,107 | |
| | 2,930 | | 5.000%, 12/01/24 – AMBAC Insured | 6/16 at 100.00 | Aa3 | | 3,319,661 | |
| | 750 | | Pennsylvania Turnpike Commission, Turnpike Revenue Bonds, Subordinate Lien, Refunding Series 2010B-1, 5.000%, 12/01/37 | 12/19 at 100.00 | A– | | 814,868 | |
| | 3,600 | | Philadelphia Airport System, Pennsylvania, Revenue Bonds, Series 2005A, 4.750%, 6/15/35 – NPFG Insured (Alternative Minimum Tax) | 6/15 at 100.00 | A+ | | 3,643,596 | |
| | 2,985 | | Susquehanna Area Regional Airport Authority, Pennsylvania, Airport System Revenue Bonds, Subordinate Lien Series 2003D, 5.375%, 1/01/18 | 1/13 at 100.00 | Ba1 | | 2,991,776 | |
| | 29,820 | | Total Transportation | | | | 31,774,760 | |
| | | | U.S. Guaranteed – 9.8% (6.9% of Total Investments) (5) | | | | | |
| | 1,400 | | Delaware County Regional Water Quality Control Authority, Pennsylvania, Sewerage Revenue Bonds, Series 2004, 5.250%, 5/01/20 (Pre-refunded 5/01/14) – NPFG Insured | 5/14 at 100.00 | N/R (5) | | 1,503,376 | |
| | 630 | | Delaware River Joint Toll Bridge Commission, New Jersey and Pennsylvania, Revenue Bonds, Series 2003, 5.250%, 7/01/17 (Pre–refunded 7/01/13) | 7/13 at 100.00 | A2 (5) | | 650,771 | |
| | 5,525 | | Hazleton Area School District, Luzerne County, Pennsylvania, General Obligation Bonds, Series 2004, 5.125%, 3/01/28 (Pre-refunded 9/01/14) – AGM Insured | 9/14 at 100.00 | Aa3 (5) | | 6,011,032 | |
| | 1,125 | | Lehigh County General Purpose Authority, Pennsylvania, Hospital Revenue Bonds, St. Luke’s Hospital of Bethlehem, Series 2003, 5.375%, 8/15/33 (Pre-refunded 8/15/13) | 8/13 at 100.00 | AA+ (5) | | 1,169,494 | |
| | Principal | | | Optional Call | | | | |
| | Amount (000) | | Description (1) | Provisions (2) | Ratings (3) | | Value | |
| | | | U.S. Guaranteed (5) (continued) | | | | | |
| | | | Pennsylvania Higher Educational Facilities Authority, Revenue Bonds, Thomas Jefferson University, Series 2002: | | | | | |
| $ | 680 | | 5.000%, 1/01/20 (Pre-refunded 1/01/13) | 1/13 at 100.00 | A1 (5) | $ | 685,420 | |
| | 2,405 | | 5.000%, 1/01/32 (Pre-refunded 1/01/13) (WI/DD, Settling 11/01/12) | 1/13 at 100.00 | A1 (5) | | 2,424,168 | |
| | 1,625 | | Pennsylvania Higher Educational Facilities Authority, Revenue Bonds, Ursinus College, Series 2003, 5.375%, 1/01/20 (Pre-refunded 7/01/13) – RAAI Insured | 7/13 at 100.00 | N/R (5) | | 1,679,373 | |
| | 1,535 | | Pennsylvania, General Obligation Bonds, First Series 2006, 5.000%, 10/01/18 (Pre-refunded 10/01/16) | 10/16 at 100.00 | Aa1 (5) | | 1,804,868 | |
| | 500 | | Pennsylvania, General Obligation Bonds, Second Series 2005, 5.000%, 1/01/18 (Pre-refunded 1/01/16) | 1/16 at 100.00 | Aa1 (5) | | 571,875 | |
| | | | Philadelphia Authority for Industrial Development, Pennsylvania, Revenue Bonds, Franklin Towne Charter High School, Series 2006A: | | | | | |
| | 510 | | 5.250%, 1/01/27 (Pre-refunded 1/01/17) | 1/17 at 100.00 | Baa1 (5) | | 600,403 | |
| | 860 | | 5.375%, 1/01/32 (Pre-refunded 1/01/17) | 1/17 at 100.00 | Baa1 (5) | | 1,016,830 | |
| | 515 | | Philadelphia Gas Works, Pennsylvania, Revenue Bonds, Twelfth Series 1990B, 7.000%, 5/15/20 – NPFG Insured (ETM) | No Opt. Call | BBB (5) | | 637,297 | |
| | 960 | | St. Mary Hospital Authority, Pennsylvania, Health System Revenue Bonds, Catholic Health East, Series 2004B, 5.375%, 11/15/34 (Pre-refunded 11/15/14) | 11/14 at 100.00 | A+ (5) | | 1,055,741 | |
| | 445 | | State Public School Building Authority, Pennsylvania, School Revenue Bonds, Conneaut School District, Series 2003, 5.250%, 11/01/21 (Pre-refunded
11/01/13) – FGIC Insured | 11/13 at 100.00 | A (5) | | 467,183 | |
| | 2,655 | | Warrington Township Municipal Authority, Bucks County, Pennsylvania, Water and Sewer Revenue Bonds, Series 1991, 7.100%, 12/01/21 (Pre-refunded 11/15/15) – FGIC Insured | 11/15 at 100.00 | N/R (5) | | 3,066,047 | |
| | 2,170 | | West View Borough Municipal Authority, Allegheny County, Pennsylvania, Special Obligation Bonds, Series 1985A, 9.500%, 11/15/14 (ETM) | No Opt. Call | Aaa | | 2,452,252 | |
| | 23,540 | | Total U.S. Guaranteed | | | | 25,796,130 | |
| | | | Utilities – 7.8% (5.5% of Total Investments) | | | | | |
| | 1,250 | | Allegheny County Industrial Development Authority, Pennsylvania, Pollution Control Revenue Refunding Bonds, Duquesne Light Company, Series 1999A, 4.350%, 12/01/13 – AMBAC Insured | No Opt. Call | BBB+ | | 1,288,288 | |
| | 5,475 | | Beaver County Industrial Development Authority, Pennsylvania, Pollution Control Revenue Refunding Bonds, First Energy Nuclear Generation Project, Series 2008A, 2.700%, 4/01/35 (Mandatory put 4/02/18) | No Opt. Call | BBB– | | 5,491,699 | |
| | 1,430 | | Lehigh County Industrial Development Authority, Pennsylvania, Pollution Control Revenue Bonds, Pennsylvania Power and Light Company, Series 2005, 4.750%, 2/15/27 – FGIC Insured | 2/15 at 100.00 | A– | | 1,471,556 | |
| | 700 | | Philadelphia Gas Works, Pennsylvania, Revenue Bonds, General Ordinance, Fifth Series 2004A-1, 5.000%, 9/01/26 – AGM Insured | 9/14 at 100.00 | AA– | | 738,836 | |
| | 2,000 | | Philadelphia Gas Works, Pennsylvania, Revenue Bonds, General Ordinance, Seventeenth Series 2003, 5.375%, 7/01/19 – AGM Insured | 7/13 at 100.00 | AA– | | 2,049,420 | |
| | 5,490 | | Philadelphia Gas Works, Pennsylvania, Revenue Bonds, Seventh Series, 2007, 5.000%, 10/01/37 – AMBAC Insured | 10/17 at 100.00 | BBB+ | | 5,721,458 | |
| | 3,700 | | York County Industrial Development Authority, Pennsylvania, Pollution Control Revenue Refunding Bonds, PSEG Power Project, Series 2001A, 5.500%, 9/01/20 | 3/13 at 100.50 | Baa1 | | 3,744,289 | |
| | 20,045 | | Total Utilities | | | | 20,505,546 | |
| | | Nuveen Pennsylvania Investment Quality Municipal Fund (continued) |
| NQP | | Portfolio of Investments |
October 31, 2012 (Unaudited)
| | Principal | | | Optional Call | | | | |
| | Amount (000) | | Description (1) | Provisions (2) | Ratings (3) | | Value | |
| | | | Water and Sewer – 7.0% (4.9% of Total Investments) | | | | | |
| $ | 2,100 | | Allegheny County Sanitary Authority, Pennsylvania, Sewerage Revenue Bonds, Series 2005A, 5.000%, 12/01/21 – NPFG Insured | 12/15 at 100.00 | A1 | $ | 2,337,384 | |
| | 2,205 | | Bethlehem Authority, Northampton and Lehigh Counties, Pennsylvania, Guaranteed Water Revenue Bonds, Series 2004, 5.000%, 11/15/20 – AGM Insured | 11/14 at 100.00 | AA– | | 2,319,241 | |
| | 2,000 | | Harrisburg Authority, Dauphin County, Pennsylvania, Water Revenue Refunding Bonds, Series 2004, 5.000%, 7/15/22 – AGM Insured | 7/14 at 100.00 | AA– | | 2,007,460 | |
| | 1,600 | | Luzerne County Industrial Development Authority, Pennsylvania, Water Facility Revenue Refunding Bonds, Pennsylvania-American Water Company, Series 2009, 5.500%, 12/01/39 | 12/19 at 100.00 | A | | 1,806,128 | |
| | 500 | | Pennsylvania Economic Development Financing Authority, Sewage Sludge Disposal Revenue Bonds, Philadelphia Biosolids Facility Project, Series 2009, 6.250%, 1/01/32 | 1/20 at 100.00 | BBB+ | | 572,985 | |
| | 3,500 | | Pennsylvania Economic Development Financing Authority, Water Facilities Revenue Bonds, Aqua Pennsylvania, Inc. Project, Series 2009A, 5.000%, 10/01/39 | 10/19 at 100.00 | AA– | | 3,909,883 | |
| | 2,150 | | Philadelphia, Pennsylvania, Water and Wastewater Revenue Bonds, Series 2005A, 5.000%, 7/01/23 – AGM Insured | 7/15 at 100.00 | AA– | | 2,347,712 | |
| | 2,620 | | Philadelphia, Pennsylvania, Water and Wastewater Revenue Bonds, Series 2011A, 5.000%, 1/01/41 | 1/21 at 100.00 | A1 | | 2,949,437 | |
| | 16,675 | | Total Water and Sewer | | | | 18,250,230 | |
| $ | 345,043 | | Total Investments (cost $342,604,525) – 142.8% | | | | 374,252,833 | |
| | | | Floating Rate Obligations – (9.8)% | | | | (25,810,000 | ) |
| | | | Variable Rate Demand Preferred Shares, at Liquidation Value – (42.9)% (6) | | | | (112,500,000 | ) |
| | | | Other Assets Less Liabilities – 9.9% | | | | 26,147,742 | |
| | | | Net Assets Applicable to Common Shares – 100% | | | $ | 262,090,575 | |
| (1) | | All percentages shown in the Portfolio of Investments are based on net assets applicable to Common shares unless otherwise noted. |
| (2) | | Optional Call Provisions: Dates (month and year) and prices of the earliest optional call or redemption. There may be other call provisions at varying prices at later dates. Certain mortgage-backed securities may be subject to periodic principal paydowns. |
| (3) | | Ratings: Using the highest of Standard & Poor’s Group (“Standard & Poor’s”), Moody’s Investors Service, Inc. (“Moody’s”) or Fitch, Inc. (“Fitch”) rating. Ratings below BBB by Standard & Poor’s, Baa by Moody’s or BBB by Fitch are considered to be below investment grade. Holdings designated N/R are not rated by any of these national rating agencies. |
| (4) | | Investment, or portion of investment, has been pledged to collateralize the net payment obligations for investments in inverse floating rate transactions. |
| (5) | | Backed by an escrow or trust containing sufficient U.S. Government or U.S. Government agency securities, which ensure the timely payment of principal and interest. Certain bonds backed by U.S. Government or agency securities are regarded as having an implied rating equal to the rating of such securities. |
| (6) | | Variable Rate Demand Preferred Shares, at Liquidation Value as a percentage of Total Investments is 30.1%. |
| N/R | | Not rated. |
| WI/DD | | Investment, or portion of investment, purchased on a when-issued or delayed delivery basis. |
| (ETM) | | Escrowed to maturity. |
| (IF) | | Inverse floating rate investment. |
| (UB) | | Underlying bond of an inverse floating rate trust reflected as a financing transaction. See Notes to Financial Statements, Footnote 1 – General Information and Significant Accounting Policies, Inverse Floating Rate Securities for more information. |
See accompanying notes to financial statements.
| | | Nuveen Pennsylvania Premium Income Municipal Fund 2 |
| NPY | | Portfolio of Investments |
| | | October 31, 2012 (Unaudited) |
| | Principal | | | Optional Call | | | | |
| | Amount (000) | | Description (1) | Provisions (2) | Ratings (3) | | Value | |
| | | | Education and Civic Organizations – 24.6% (17.4% of Total Investments) | | | | | |
| $ | 200 | | Allegheny County Higher Education Building Authority, Pennsylvania, College Revenue Refunding Bonds, Robert Morris College, Series 1998A, 6.000%, 5/01/28 | No Opt. Call | Baa3 | $ | 234,694 | |
| | 445 | | Allegheny County Higher Education Building Authority, Pennsylvania, Revenue Bonds, Carnegie Mellon University, Series 2012A, 5.000%, 3/01/24 | 3/22 at 100.00 | AA– | | 548,249 | |
| | 1,245 | | Allegheny County Higher Education Building Authority, Pennsylvania, Revenue Bonds, Duquesne University, Series 2004A, 5.000%, 3/01/19 – FGIC Insured | 3/14 at 100.00 | A– | | 1,302,357 | |
| | 1,140 | | Allegheny County Higher Education Building Authority, Pennsylvania, Revenue Bonds, Robert Morris University, Series 2006A, 4.750%, 2/15/26 | 2/16 at 100.00 | Baa3 | | 1,153,760 | |
| | | | Delaware County Authority, Pennsylvania, Revenue Bonds, Villanova University, Series 2006: | | | | | |
| | 1,565 | | 5.000%, 8/01/23 – AMBAC Insured | 8/16 at 100.00 | A+ | | 1,713,456 | |
| | 770 | | 5.000%, 8/01/24 – AMBAC Insured | 8/16 at 100.00 | A+ | | 839,392 | |
| | | | Delaware County Authority, Pennsylvania, Revenue Refunding Bonds, Villanova University, Series 2003: | | | | | |
| | 1,705 | | 5.250%, 8/01/19 – FGIC Insured | 8/13 at 100.00 | A1 | | 1,757,497 | |
| | 1,350 | | 5.250%, 8/01/20 – FGIC Insured | 8/13 at 100.00 | A1 | | 1,390,527 | |
| | 1,000 | | 5.250%, 8/01/21 – FGIC Insured | 8/13 at 100.00 | A1 | | 1,029,110 | |
| | | | Erie Higher Education Building Authority, Pennsylvania, College Revenue Bonds, Gannon University, Series 2007-GG3: | | | | | |
| | 725 | | 5.000%, 5/01/32 – RAAI Insured | 5/17 at 100.00 | N/R | | 740,211 | |
| | 250 | | 5.000%, 5/01/35 – RAAI Insured | 5/17 at 100.00 | N/R | | 254,023 | |
| | 3,060 | | Indiana County Industrial Development Authority, Pennsylvania, Revenue Bonds, Student Cooperative Association Inc./Indiana University of Pennsylvania - Student Union Project, Series 2004, 5.000%, 11/01/24 – AMBAC Insured | 11/14 at 100.00 | N/R | | 3,096,536 | |
| | 1,985 | | Lycoming County Authority, Pennsylvania, Revenue Bonds, Pennsylvania College of Technology, Series 2012, 5.000%, 5/01/32 | 5/22 at 100.00 | A | | 2,208,948 | |
| | 1,575 | | Montgomery County Higher Education and Health Authority, Pennsylvania, Revenue Bonds, Arcadia University, Series 2006, 4.500%, 4/01/30 – RAAI Insured | 4/16 at 100.00 | BBB+ | | 1,603,901 | |
| | 855 | | Montgomery County Higher Education and Health Authority, Pennsylvania, Revenue Bonds, Arcadia University, Series 2010, 5.625%, 4/01/40 | 4/20 at 100.00 | BBB+ | | 941,364 | |
| | 325 | | New Wilmington, Pennsylvania, Revenue, Westminster College, Series 2007G, 5.125%, 5/01/33 – RAAI Insured | 5/17 at 100.00 | N/R | | 336,268 | |
| | 4,200 | | Pennsylvania Higher Educational Facilities Authority, General Revenue Bonds, State System of Higher Education, Series 2008AH, 5.000%, 6/15/33 | 6/18 at 100.00 | AA | | 4,848,900 | |
| | 1,285 | | Pennsylvania Higher Educational Facilities Authority, Revenue Bonds, Allegheny College, Series 2006, 4.750%, 5/01/31 | 5/16 at 100.00 | A– | | 1,345,896 | |
| | 2,420 | | Pennsylvania Higher Educational Facilities Authority, Revenue Bonds, Drexel University, Series 2007A, 5.000%, 5/01/37 – NPFG Insured | 11/17 at 100.00 | A | | 2,608,784 | |
| | 750 | | Pennsylvania Higher Educational Facilities Authority, Revenue Bonds, Drexel University, Series 2011A, 5.250%, 5/01/41 | 5/21 at 100.00 | A | | 852,570 | |
| | 450 | | Pennsylvania Higher Educational Facilities Authority, Revenue Bonds, LaSalle University, Series 2012, 4.000%, 5/01/32 | 11/22 at 100.00 | BBB+ | | 453,141 | |
| | 3,000 | | Pennsylvania Higher Educational Facilities Authority, Revenue Bonds, Temple University, First Series of 2006, 5.000%, 4/01/21 – NPFG Insured | 4/16 at 100.00 | Aa3 | | 3,404,880 | |
| | 1,845 | | Pennsylvania Higher Educational Facilities Authority, Revenue Bonds, Thomas Jefferson University, Series 2002, 5.000%, 1/01/32 | 1/13 at 100.00 | A1 | | 1,850,553 | |
| | 1,000 | | Pennsylvania Higher Educational Facilities Authority, Revenue Bonds, Thomas Jefferson University, Series 2010, 5.000%, 3/01/40 | 3/20 at 100.00 | A+ | | 1,112,980 | |
| | 300 | | Pennsylvania Higher Educational Facilities Authority, Revenue Bonds, Thomas Jefferson University, Series 2012, 5.000%, 3/01/42 | 9/22 at 100.00 | A+ | | 337,284 | |
| | 2,000 | | Pennsylvania Higher Educational Facilities Authority, Revenue Bonds, University of Pennsylvania, Series 2005C, 5.000%, 7/15/38 | 7/15 at 100.00 | AA+ | | 2,180,140 | |
| | | Nuveen Pennsylvania Premium Income Municipal Fund 2 (continued) |
| NPY | | Portfolio of Investments |
October 31, 2012 (Unaudited)
| | Principal | | | Optional Call | | | | |
| | Amount (000) | | Description (1) | Provisions (2) | Ratings (3) | | Value | |
| | | | Education and Civic Organizations (continued) | | | | | |
| | | | Pennsylvania Higher Educational Facilities Authority, Revenue Bonds, University of the Sciences in Philadelphia, Series 2012: | | | | | |
| $ | 485 | | 4.000%, 11/01/39 | 11/22 at 100.00 | A3 | $ | 492,969 | |
| | 910 | | 5.000%, 11/01/42 | 11/22 at 100.00 | A3 | | 1,006,933 | |
| | 590 | | Pennsylvania Higher Educational Facilities Authority, Revenue Bonds, Ursinus College, Series 2003, 5.500%, 1/01/24 – RAAI Insured | 7/13 at 100.00 | A– | | 605,063 | |
| | 700 | | Pennsylvania Higher Educational Facilities Authority, Revenue Bonds, Widener University, Series 2003, 5.400%, 7/15/36 | 7/13 at 100.00 | A– | | 718,704 | |
| | 800 | | Pennsylvania Higher Educational Facilities Authority, Revenue Bonds, York College Project, Series 2005EE1, 5.250%, 11/01/27 – SYNCORA GTY Insured | 11/15 at 100.00 | A | | 850,448 | |
| | 1,000 | | Pennsylvania Higher Educational Facilities Authority, University of the Sciences in Philadelphia Revenue Bonds, Series 2005, 4.750%, 11/01/33 – SYNCORA GTY Insured | 5/15 at 100.00 | A3 | | 1,035,620 | |
| | 2,000 | | Pennsylvania State University, General Revenue Bonds, Series 2010, 5.000%, 3/01/35 | 3/20 at 100.00 | AA | | 2,283,380 | |
| | 10,600 | | Pennsylvania State University, General Revenue Bonds, Series 2007A, 4.500%, 8/15/36 (UB) | 8/16 at 100.00 | AA | | 11,054,846 | |
| | 530 | | Philadelphia Authority for Industrial Development, Pennsylvania, Revenue Bonds, MaST Charter School Project, Series 2010, 6.000%, 8/01/35 | 8/20 at 100.00 | BBB+ | | 600,570 | |
| | 1,545 | | State Public School Building Authority, Pennsylvania, College Revenue Bonds, Montgomery County Community College, Series 2005, 5.000%, 5/01/18 – AMBAC Insured | 5/15 at 100.00 | Aa2 | | 1,694,757 | |
| | 750 | | Union County, Higher Education Facilities Financing Authority, Pennsylvania, Revenue Bonds, Bucknell University, Series 2002A, 5.250%, 4/01/19 | 4/13 at 100.00 | Aa2 | | 765,713 | |
| | 300 | | Wilkes-Barre Finance Authority, Pennsylvania, Revenue Bonds, University of Scranton, Series 2010, 5.000%, 11/01/40 | 11/20 at 100.00 | A | | 333,930 | |
| | 55,655 | | Total Education and Civic Organizations | | | | 59,588,354 | |
| | | | Health Care – 25.8% (18.3% of Total Investments) | | | | | |
| | | | Allegheny County Hospital Development Authority, Pennsylvania, Revenue Bonds, Ohio Valley General Hospital, Series 2005A: | | | | | |
| | 1,150 | | 5.000%, 4/01/25 | 4/15 at 100.00 | Ba2 | | 1,149,954 | |
| | 1,455 | | 5.125%, 4/01/35 | 4/15 at 100.00 | Ba2 | | 1,406,941 | |
| | | | Beaver County Hospital Authority, Pennsylvania, Revenue Bonds, Heritage Valley Health System, Inc., Series 2012: | | | | | |
| | 1,210 | | 5.000%, 5/15/27 | 5/21 at 100.00 | AA– | | 1,374,984 | |
| | 2,000 | | 5.000%, 5/15/28 | 5/21 at 100.00 | AA– | | 2,263,100 | |
| | 2,070 | | Central Bradford Progress Authority, Pennsylvania, Revenue Bonds, Guthrie Health, Series 2011, 5.375%, 12/01/41 | 12/21 at 100.00 | AA– | | 2,355,039 | |
| | 1,640 | | Centre County Hospital Authority, Pennsylvania, Hospital Revenue Bonds, Mount Nittany Medical Center Project, Series 2011, 7.000%, 11/15/46 | 11/21 at 100.00 | A– | | 2,122,947 | |
| | 825 | | Dauphin County General Authority, Pennsylvania, Health System Revenue Bonds, Pinnacle Health System Project, Series 2012A, 5.000%, 6/01/42 | 6/22 at 100.00 | A | | 891,817 | |
| | 1,200 | | Erie County Hospital Authority, Pennsylvania, Hospital Revenue Bonds, Saint Vincent Health Center Project, Series 2010A, 7.000%, 7/01/27 | 7/20 at 100.00 | Ba2 | | 1,325,448 | |
| | 395 | | Erie County Hospital Authority, Pennsylvania, Revenue Bonds, Hamot Health Foundation, Series 2007, 5.000%, 11/01/37 – CIFG Insured | 11/17 at 100.00 | Aa3 | | 422,990 | |
| | 1,835 | | Franklin County Industrial Development Authority, Pennsylvania, Revenue Bonds, Chambersburg Hospital Project, Series 2010, 5.375%, 7/01/42 | 7/20 at 100.00 | A+ | | 2,014,683 | |
| | 1,320 | | Lancaster County Hospital Authority, Pennsylvania, Health System Revenue Bonds, Lancaster General Hospital Project, Tender Option Bond 4234, 13.400%, 1/01/36 (IF) | 1/22 at 100.00 | AA– | | 1,737,806 | |
| | 1,885 | | Lancaster County Hospital Authority, Pennsylvania, Hospital Revenue Bonds, The Lancaster General Hospital Project, Series 2007A, 5.000%, 3/15/26 | 3/17 at 100.00 | AA– | | 2,089,372 | |
| | 5,000 | | Lebanon County Health Facilities Authority, Pennsylvania, Revenue Bonds, Good Samaritan Hospital Project, Series 2002, 5.900%, 11/15/28 | 11/12 at 101.00 | BB+ | | 5,054,700 | |
| | 2,990 | | Lehigh County General Purpose Authority, Pennsylvania, Hospital Revenue Bonds, Lehigh Valley Health Network, Series 2008A, 5.000%, 7/01/33 – AGM Insured | 7/18 at 100.00 | AA– | | 3,219,393 | |
| | 1,250 | | Lehigh County General Purpose Authority, Pennsylvania, Revenue Bonds, Good Shepherd Group, Series 2004A, 5.500%, 11/01/24 | 11/14 at 100.00 | A | | 1,294,513 | |
| | Principal | | | Optional Call | | | | |
| | Amount (000) | | Description (1) | Provisions (2) | Ratings (3) | | Value | |
| | | | Health Care (continued) | | | | | |
| $ | 4,505 | | Lehigh County General Purpose Authority, Pennsylvania, Revenue Bonds, Good Shepherd Group, Series 2007, 5.000%, 11/01/30 – AGC Insured | 11/17 at 100.00 | AA– | $ | 4,912,793 | |
| | | | Lycoming County Authority, Pennsylvania, Health System Revenue Bonds, Susquehanna Health System Project, Series 2009: | | | | | |
| | 3,000 | | 5.500%, 7/01/28 | 7/19 at 100.00 | A– | | 3,311,640 | |
| | 1,000 | | 5.750%, 7/01/39 | 7/19 at 100.00 | A– | | 1,112,900 | |
| | 600 | | Monroe County Hospital Authority, Hospital Revenue Bonds, Pocono Medical Center, Series 2012A, 5.000%, 1/01/41 | 1/22 at 100.00 | A | | 643,494 | |
| | 650 | | Monroe County Hospital Authority, Pennsylvania, Hospital Revenue Bonds, Pocono Medical Center, Series 2007, 5.125%, 1/01/37 | 1/17 at 100.00 | A | | 675,623 | |
| | 1,450 | | Montgomery County Higher Education and Health Authority, Pennsylvania, Hospital Revenue Bonds, Abington Memorial Hospital Obligated Group, Series 2012A, 5.000%, 6/01/31 | 6/22 at 100.00 | A | | 1,645,330 | |
| | 565 | | Montgomery County Industrial Development Authority, Pennsylvania, FHA Insured Mortgage Revenue Bonds, New Regional Medical Center Project, Series 2010, 5.375%, 8/01/38 | 8/20 at 100.00 | AA | | 651,033 | |
| | | | Northampton County General Purpose Authority, Pennsylvania, Hospital Revenue Bonds, Saint Lukes Hospital Project, Series 2008A: | | | | | |
| | 1,235 | | 5.250%, 8/15/23 | 8/18 at 100.00 | A3 | | 1,358,438 | |
| | 1,000 | | 5.500%, 8/15/35 | 8/18 at 100.00 | A3 | | 1,085,100 | |
| | 650 | | Pennsylvania Economic Development Financing Authority, Health System Revenue Bonds , Albert Einstein Healthcare, Series 2009A, 6.250%, 10/15/23 | 10/19 at 100.00 | BBB+ | | 766,350 | |
| | 930 | | Pennsylvania Higher Educational Facilities Authority, Revenue Bonds, University of Pennsylvania Health System, Series 2012A, 5.000%, 8/15/42 | 8/22 at 100.00 | AA– | | 1,038,596 | |
| | 1,750 | | Philadelphia Hospitals and Higher Education Facilities Authority, Pennsylvania, Hospital Revenue Bonds, Temple University Health System Obligated Group, Series 2012A, 5.625%, 7/01/42 | 7/22 at 100.00 | BBB– | | 1,861,878 | |
| | 3,575 | | Philadelphia Hospitals and Higher Education Facilities Authority, Pennsylvania, Health System Revenue Bonds, Jefferson Health System, Series 2010B, 5.000%, 5/15/40 | 5/20 at 100.00 | AA | | 3,918,915 | |
| | 695 | | Philadelphia Hospitals and Higher Education Facilities Authority, Pennsylvania, Hospital Revenue Bonds, Children’s Hospital of Philadelphia, Tender Option Bond Trust 3975, 13.391%, 7/01/19 (IF) | No Opt. Call | AA | | 932,433 | |
| | 2,000 | | Pottsville Hospital Authority, Pennsylvania, Hospital Revenue Bonds, Pottsville Hospital and Warne Clinic, Series 1998, 5.625%, 7/01/24 | 1/13 at 100.00 | N/R | | 2,000,380 | |
| | | | Southcentral Pennsylvania General Authority, Revenue Bonds, Hanover Hospital Inc., Series 2005: | | | | | |
| | 475 | | 5.000%, 12/01/27 – RAAI Insured | 12/15 at 100.00 | BBB– | | 486,638 | |
| | 330 | | 5.000%, 12/01/29 – RAAI Insured | 12/15 at 100.00 | BBB– | | 336,841 | |
| | | | Union County Hospital Authority, Pennsylvania, Hospital Revenue Bonds, Evangelical Community Hospital Project, Refunding and Improvement Series 2011: | | | | | |
| | 1,365 | | 6.875%, 8/01/31 | 8/21 at 100.00 | BBB+ | | 1,664,058 | |
| | 1,135 | | 7.000%, 8/01/41 | 8/21 at 100.00 | BBB+ | | 1,366,063 | |
| | 1,720 | | West Shore Area Authority, Cumberland County, Pennsylvania, Hospital Revenue Bonds, Holy Spirit Hospital of the Sisters of Christian Charity Project, Series 2011, 6.500%, 1/01/36 | 1/21 at 100.00 | BBB+ | | 2,054,660 | |
| | 1,300 | | West Shore Area Authority, Cumberland County, Pennsylvania, Hospital Revenue Bonds, Holy Spirit Hospital of the Sisters of Christian Charity, Series 2011B, 5.750%, 1/01/41 | 1/22 at 100.00 | BBB+ | | 1,494,064 | |
| | 575 | | Westmoreland County Industrial Development Authority, Pennsylvania, Health System Revenue Bonds, Excela Health Project, Series 2010A, 5.125%, 7/01/30 | 7/20 at 100.00 | A3 | | 621,063 | |
| | 56,730 | | Total Health Care | | | | 62,661,977 | |
| | | | Housing/Multifamily – 3.8% (2.7% of Total Investments) | | | | | |
| | 1,965 | | Delaware County Industrial Development Authority, Pennsylvania, Multifamily Housing Revenue Bonds, Darby Townhouses Project, Series 2002A, 5.500%, 4/01/32 (Mandatory put 4/01/22) (Alternative Minimum Tax) | 4/13 at 100.00 | AA+ | | 1,987,617 | |
| | 750 | | Pennsylvania Higher Educational Facilities Authority, Revenue Bonds, Edinboro University Foundation Student Housing Project, Series 2010, 6.000%, 7/01/43 | 7/20 at 100.00 | BBB– | | 849,743 | |
| | | | Pennsylvania Higher Educational Facilities Authority, Revenue Bonds, Slippery Rock University Foundation Inc., Student Housing Project, Series 2005A: | | | | | |
| | 2,035 | | 5.000%, 7/01/19 – SYNCORA GTY Insured | 7/15 at 100.00 | BBB+ | | 2,155,655 | |
| | 3,400 | | 5.000%, 7/01/37 – SYNCORA GTY Insured | 7/15 at 100.00 | BBB+ | | 3,468,612 | |
| | | Nuveen Pennsylvania Premium Income Municipal Fund 2 (continued) |
| NPY | | Portfolio of Investments |
| | | October 31, 2012 (Unaudited) |
| | Principal | | | Optional Call | | | | |
| | Amount (000) | | Description (1) | Provisions (2) | Ratings (3) | | Value | |
| | | | Housing/Multifamily (continued) | | | | | |
| $ | 740 | | Philadelphia Authority for Industrial Development, Pennsylvania, Multifamily Housing Revenue Bonds, Presbyterian Homes Germantown - Morrisville Project, Series 2005A, 5.625%, 7/01/35 | 5/15 at 102.00 | Baa3 | $ | 750,375 | |
| | 8,890 | | Total Housing/Multifamily | | | | 9,212,002 | |
| | | | Housing/Single Family – 5.0% (3.5% of Total Investments) | | | | | |
| | 3,885 | | Pennsylvania Housing Finance Agency, Single Family Mortgage Revenue Bonds, Series 2006-95A, 4.900%, 10/01/37 (Alternative Minimum Tax) (UB) | 10/15 at 100.00 | AA+ | | 3,965,536 | |
| | 295 | | Pennsylvania Housing Finance Agency, Single Family Mortgage Revenue Bonds, Series 2006-93A, 4.950%, 10/01/26 (Alternative Minimum Tax) (UB) | 4/15 at 100.00 | AA+ | | 304,461 | |
| | 1,355 | | Pennsylvania Housing Finance Agency, Single Family Mortgage Revenue Bonds, Series 2007-97A, 4.600%, 10/01/27 (Alternative Minimum Tax) (UB) | 10/16 at 100.00 | AA+ | | 1,405,813 | |
| | 1,215 | | Pennsylvania Housing Finance Agency, Single Family Mortgage Revenue Bonds, Series 2007-98A, 4.850%, 10/01/31 (Alternative Minimum Tax) (UB) | 10/16 at 100.00 | AA+ | | 1,259,688 | |
| | 2,400 | | Pennsylvania Housing Finance Agency, Single Family Mortgage Revenue Bonds, Series 2011-112, 5.000%, 10/01/25 | 10/20 at 100.00 | AA+ | | 2,642,616 | |
| | 1,820 | | Pennsylvania Housing Finance Agency, Single Family Mortgage Revenue Bonds, Tender Option Bonds Trust 3950, 12.451%, 4/01/27 (IF) | 4/21 at 100.00 | AA+ | | 2,302,446 | |
| | 140 | | Pittsburgh Urban Redevelopment Authority, Pennsylvania, Mortgage Revenue Bonds, Series 1997A, 6.200%, 10/01/21 (Alternative Minimum Tax) | 4/13 at 100.00 | Aa1 | | 140,357 | |
| | 11,110 | | Total Housing/Single Family | | | | 12,020,917 | |
| | | | Industrials – 0.6% (0.4% of Total Investments) | | | | | |
| | 1,220 | | Pennsylvania Economic Development Financing Authority, Exempt Facilities Revenue Refunding Bonds, Amtrak Project, Series 2012A, 5.000%, 11/01/23 (Alternative Minimum Tax) | 11/22 at 100.00 | A1 | | 1,389,299 | |
| | | | Long-Term Care – 6.4% (4.5% of Total Investments) | | | | | |
| | 1,500 | | Cumberland County Municipal Authority Revenue Bonds, Pennsylvania, Diakon Lutheran Social Ministries Project, Series 2009, 6.375%, 1/01/39 | 1/19 at 100.00 | BBB+ | | 1,674,660 | |
| | 4,905 | | Cumberland County Municipal Authority, Pennsylvania, Revenue Bonds, Diakon Lutheran Social Ministries, Series 2007, 5.000%, 1/01/36 | 1/17 at 100.00 | BBB+ | | 5,058,968 | |
| | 1,000 | | Cumberland County Municipal Authority, Pennsylvania, Revenue Bonds, Presbyterian Homes Inc., Series 2003A, 5.000%, 12/01/22 – RAAI Insured | 12/12 at 100.00 | BBB+ | | 1,000,980 | |
| | 500 | | Delaware County Authority, Revenue Bonds, Elwyn, Inc. Project, Series 2010, 5.000%, 6/01/21 | 6/17 at 100.00 | BBB | | 526,080 | |
| | | | Lancaster County Hospital Authority, Pennsylvania, Health Center Revenue Bonds, Masonic Homes Project, Series 2006: | | | | | |
| | 1,565 | | 5.000%, 11/01/31 | 11/16 at 100.00 | A | | 1,640,292 | |
| | 230 | | 5.000%, 11/01/36 | 11/16 at 100.00 | A | | 239,936 | |
| | 210 | | Lancaster County Hospital Authority, Pennsylvania, Health Center Revenue Bonds, Saint Anne’s Retirement Community, Inc. , Series 2012, 5.000%, 4/01/33 (WI/DD, Settling 11/01/12) | 4/22 at 100.00 | BB+ | | 211,403 | |
| | 825 | | Montgomery Count Industrial Development Authority, Pennsylvania, Revenue Refunding Bonds, ACTS Retirement-Life Communities, Inc. , Series 2012, 5.000%, 11/15/26 | 5/22 at 100.00 | A– | | 912,978 | |
| | | | Pennsylvania Economic Development Financing Authority, Revenue Bonds, Dr. Gertrude A. Barber Center Inc., Series 2000: | | | | | |
| | 1,000 | | 6.150%, 12/01/20 – RAAI Insured | 2/13 at 100.00 | BBB | | 1,002,490 | |
| | 2,000 | | 5.900%, 12/01/30 – RAAI Insured | 12/12 at 100.00 | BBB | | 2,002,800 | |
| | 1,230 | | Pennsylvania Economic Development Financing Authority, Revenue Bonds, Northwestern Human Services Inc., Series 1998A, 5.250%, 6/01/28 | 12/12 at 100.00 | BB | | 1,213,211 | |
| | 14,965 | | Total Long-Term Care | | | | 15,483,798 | |
| | | | Materials – 2.3% (1.7% of Total Investments) | | | | | |
| | 1,190 | | Bradford County Industrial Development Authority, Pennsylvania, Solid Waste Disposal Revenue Bonds, International Paper Company, Series 2005B, 5.200%, 12/01/19 (Alternative Minimum Tax) | 12/15 at 100.00 | BBB | | 1,276,692 | |
| | 4,500 | | Pennsylvania Economic Development Financing Authority, Exempt Facilities Revenue Bonds, National Gypsum Company, Series 1997B, 6.125%, 11/01/27 (Alternative Minimum Tax) | 5/13 at 100.00 | N/R | | 4,432,860 | |
| | 5,690 | | Total Materials | | | | 5,709,552 | |
| | Principal | | | Optional Call | | | | |
| | Amount (000) | | Description (1) | Provisions (2) | Ratings (3) | | Value | |
| | | | Tax Obligation/General – 23.6% (16.8% of Total Investments) | | | | | |
| $ | 3,965 | | Allegheny County, Pennsylvania, General Obligation Bonds, Series C69-C70 of 2012, 5.000%, 12/01/37 | 12/22 at 100.00 | A+ | $ | 4,421,927 | |
| | 3,000 | | Bethel Park School District, Allegheny County, Pennsylvania, General Obligation Bonds, Series 2009, 5.000%, 8/01/29 | 8/19 at 100.00 | Aa2 | | 3,681,300 | |
| | | | Harrisburg Redevelopment Authority, Dauphin County, Pennsylvania, Guaranteed Revenue Bonds, Series 1998B: | | | | | |
| | 1,750 | | 0.000%, 5/01/22 – AGM Insured | 5/16 at 75.56 | AA– | | 1,028,860 | |
| | 2,750 | | 0.000%, 11/01/22 – AGM Insured | 5/16 at 73.64 | AA– | | 1,572,230 | |
| | 2,750 | | 0.000%, 5/01/23 – AGM Insured | 5/16 at 71.71 | AA– | | 1,521,080 | |
| | 260 | | Lower Merion School District, Montgomery County, Pennsylvania, General Obligation Bonds, Series 2007, 5.000%, 9/01/23 | 9/17 at 100.00 | Aaa | | 308,233 | |
| | 2,115 | | Owen J. Roberts School District, Chester County, Pennsylvania, General Obligation Bonds, Series 2006, 5.000%, 5/15/24 – AGM Insured | 5/16 at 100.00 | Aa2 | | 2,419,306 | |
| | 4,835 | | Pennsylvania State, General Obligation Bonds, Series 2007, Residuals 1986, 12.835%, 3/01/15 (IF) | No Opt. Call | Aa2 | | 6,684,629 | |
| | 1,500 | | Philadelphia School District, Pennsylvania, General Obligation Bonds, Series 2007A, 5.000%, 6/01/34 – FGIC Insured | No Opt. Call | AA | | 1,829,805 | |
| | | | Philadelphia School District, Pennsylvania, General Obligation Bonds, Series 2011C: | | | | | |
| | 1,000 | | 5.000%, 9/01/14 | No Opt. Call | AA | | 1,078,910 | |
| | 1,400 | | 5.000%, 9/01/15 | No Opt. Call | AA | | 1,557,206 | |
| | 1,555 | | Philadelphia School District, Pennsylvania, General Obligation Bonds, Series 2011D, 4.000%, 9/01/15 | No Opt. Call | AA | | 1,686,258 | |
| | 3,775 | | Pine-Richland School District, Pennsylvania, General Obligation Bonds, School Improvement Series 2005, 5.000%, 7/15/35 – AGM Insured | 7/15 at 100.00 | AA– | | 4,010,673 | |
| | 1,950 | | Pittsburgh, Pennsylvania, General Obligation Bonds, Series 2012B, 5.000%, 9/01/26 | 9/22 at 100.00 | A1 | | 2,274,129 | |
| | 2,700 | | Pittsburgh, Pennsylvania, General Obligation Bonds, Series 2006B, 5.250%, 9/01/16 – AGM Insured | No Opt. Call | AA– | | 3,109,320 | |
| | 6,000 | | Puerto Rico Highway and Transportation Authority, Highway Revenue Bonds, Series 2007N, 5.500%, 7/01/29 – AMBAC Insured | No Opt. Call | Baa1 | | 6,679,140 | |
| | 1,600 | | Radnor Township School District, Delaware County, Pennsylvania, General Obligation Bonds, Series 2012, 3.000%, 2/15/34 | 2/18 at 100.00 | Aa2 | | 1,562,928 | |
| | 6,710 | | Reading School District, Berks County, Pennsylvania, General Obligation Bonds, Series 2003B, 0.000%, 1/15/32 – FGIC Insured | No Opt. Call | A | | 3,107,267 | |
| | 2,250 | | Scranton Parking Authority, Pennsylvania , Guaranteed Revenue Bonds, Series 2007, 5.250%, 6/01/39 – RAAI Insured | 6/17 at 100.00 | N/R | | 2,028,420 | |
| | 940 | | Scranton Parking Authority, Pennsylvania, Guaranteed Parking Revenue Bonds, Series 2004, 5.000%, 9/15/33 – FGIC Insured | 9/13 at 100.00 | BBB | | 879,802 | |
| | 585 | | Scranton, Pennsylvania, General Obligation Bonds, Series 2012A, 8.500%, 9/01/22 | No Opt. Call | N/R | | 571,621 | |
| | 980 | | State Public School Building Authority, Pennsylvania, School Revenue Bonds, York City School District, Series 2003, 4.000%, 5/01/21 – AGM Insured | 5/13 at 100.00 | Aa3 | | 995,964 | |
| | 1,400 | | Woodland Hills School District, Allegheny County, Pennsylvania, General Obligation Bonds, Series 2005D, 5.000%, 9/01/17 – AGM Insured | 9/15 at 100.00 | AA– | | 1,566,572 | |
| | 2,400 | | York County, Pennsylvania, General Obligation Bonds, Series 2006, 5.000%, 6/01/33 – NPFG Insured | 12/15 at 100.00 | AA | | 2,668,656 | |
| | 58,170 | | Total Tax Obligation/General | | | | 57,244,236 | |
| | | | Tax Obligation/Limited – 6.3% (4.5% of Total Investments) | | | | | |
| | 500 | | Allentown Neighborhood Improvement Zone Development Authority, Pennsylvania, Tax Revenue Bonds, Series 2012A, 5.000%, 5/01/35 | 5/22 at 100.00 | Baa2 | | 535,115 | |
| | 1,500 | | Erie County Convention Center Authority, Pennsylvania, Convention Center Revenue Bonds, Series 2005, 5.000%, 1/15/36 – FGIC Insured | 1/15 at 100.00 | Aa2 | | 1,602,450 | |
| | 1,950 | | Pennsylvania Turnpike Commission, Oil Franchise Tax Revenue Bonds, Senior Lien Series 2003A, 5.000%, 12/01/32 – NPFG Insured | 12/18 at 100.00 | AA | | 2,169,356 | |
| | 5,015 | | Philadelphia Municipal Authority, Pennsylvania, Lease Revenue Bonds, Series 2003B, 5.250%, 11/15/17 – AGM Insured | 11/13 at 100.00 | AA– | | 5,259,933 | |
| | 2,550 | | Pittsburgh and Allegheny County Sports and Exhibition Authority, Pennsylvania, Hotel Room Excise Tax Revenue Bonds, Refunding Series 2012, 5.000%,
2/01/26 – AGC Insured | 8/22 at 100.00 | AA– | | 2,969,348 | |
| | | Nuveen Pennsylvania Premium Income Municipal Fund 2 (continued) |
| NPY | | Portfolio of Investments |
October 31, 2012 (Unaudited)
| | Principal | | | Optional Call | | | | |
| | Amount (000) | | Description (1) | Provisions (2) | Ratings (3) | | Value | |
| | | | Tax Obligation/Limited (continued) | | | | | |
| $ | 2,880 | | Puerto Rico Infrastructure Financing Authority, Special Tax Revenue Bonds, Series 2005A, 0.000%, 7/01/32 – FGIC Insured | No Opt. Call | BBB+ | $ | 876,557 | |
| | 5,670 | | Puerto Rico Sales Tax Financing Corporation, Sales Tax Revenue Bonds, Senior Series 2011C, 0.000%, 8/01/39 | No Opt. Call | AA– | | 1,354,393 | |
| | 435 | | Puerto Rico, Highway Revenue Bonds, Highway and Transportation Authority, Series 2003AA, 5.500%, 7/01/19 – NPFG Insured | No Opt. Call | A3 | | 496,187 | |
| | 20,500 | | Total Tax Obligation/Limited | | | | 15,263,339 | |
| | | | Transportation – 10.8% (7.7% of Total Investments) | | | | | |
| | 1,480 | | Delaware River Port Authority, New Jersey and Pennsylvania, Revenue Bonds, Series 2010E, 5.000%, 1/01/40 | 1/20 at 100.00 | A– | | 1,657,896 | |
| | 2,200 | | Pennsylvania Turnpike Commission, Motor License Fund-Enhanced Subordinate Special Revenue Bonds, Series 2010A, 5.000%, 12/01/38 | 12/19 at 100.00 | AA | | 2,446,928 | |
| | 5,500 | | Pennsylvania Turnpike Commission, Turnpike Revenue Bonds, Capital Appreciation Series 2009E, 0.000%, 12/01/38 | 12/27 at 100.00 | A– | | 5,463,480 | |
| | 2,680 | | Pennsylvania Turnpike Commission, Turnpike Revenue Bonds, Series 2006A, 5.000%, 12/01/24 – AMBAC Insured | 6/16 at 100.00 | Aa3 | | 3,036,413 | |
| | 1,400 | | Pennsylvania Turnpike Commission, Turnpike Revenue Bonds, Subordinate Lien, Refunding Series 2010B-1, 5.000%, 12/01/37 | 12/19 at 100.00 | A– | | 1,521,086 | |
| | 3,250 | | Philadelphia Airport System, Pennsylvania, Revenue Bonds, Series 2005A, 4.750%, 6/15/35 – NPFG Insured (Alternative Minimum Tax) | 6/15 at 100.00 | A+ | | 3,289,358 | |
| | 2,000 | | Pittsburgh Public Parking Authority, Pennsylvania, Parking Revenue Bonds, Series 2005B, 5.000%, 12/01/23 – FGIC Insured | 12/15 at 100.00 | BBB | | 2,095,260 | |
| | 6,700 | | Susquehanna Area Regional Airport Authority, Pennsylvania, Airport System Revenue Bonds, Series 2003B, 5.000%, 1/01/33 – AMBAC Insured | 1/13 at 100.00 | Baa3 | | 6,700,603 | |
| | 25,210 | | Total Transportation | | | | 26,211,024 | |
| | | | U.S. Guaranteed – 14.4% (10.2% of Total Investments) (4) | | | | | |
| | 1,615 | | Delaware County Regional Water Quality Control Authority, Pennsylvania, Sewerage Revenue Bonds, Series 2004, 5.250%, 5/01/23 (Pre-refunded 5/01/14) – NPFG Insured | 5/14 at 100.00 | N/R (4) | | 1,734,252 | |
| | 650 | | Delaware River Joint Toll Bridge Commission, New Jersey and Pennsylvania, Revenue Bonds, Series 2003, 5.250%, 7/01/17 (Pre-refunded 7/01/13) | 7/13 at 100.00 | A2 (4) | | 671,431 | |
| | 3,500 | | Hazleton Area School District, Luzerne County, Pennsylvania, General Obligation Bonds, Series 2004, 5.125%, 3/01/28 (Pre-refunded 9/01/14) – AGM Insured | 9/14 at 100.00 | Aa3 (4) | | 3,807,895 | |
| | 2,600 | | Norristown Area School District, Montgomery County, Pennsylvania, General Obligation Bonds, Series 2003, 5.000%, 9/01/24 (Pre-refunded 3/01/13) – FGIC Insured | 3/13 at 100.00 | N/R (4) | | 2,641,418 | |
| | 475 | | Pennsylvania Higher Educational Facilities Authority, College Revenue Bonds, Ninth Series 1976, 7.625%, 7/01/15 (ETM) | 11/12 at 100.00 | Aaa | | 525,678 | |
| | 720 | | Pennsylvania Higher Educational Facilities Authority, Revenue Bonds, Ursinus College, Series 2003, 5.500%, 1/01/24 (Pre-refunded 7/01/13) – RAAI Insured | 7/13 at 100.00 | N/R (4) | | 744,689 | |
| | 3,200 | | Pennsylvania, General Obligation Bonds, First Series 2006, 5.000%, 10/01/18 (Pre-refunded 10/01/16) | 10/16 at 100.00 | Aa1 (4) | | 3,762,592 | |
| | 1,000 | | Pennsylvania, General Obligation Bonds, Second Series 2005, 5.000%, 1/01/18 (Pre-refunded 1/01/16) | 1/16 at 100.00 | Aa1 (4) | | 1,143,750 | |
| | | | Philadelphia Authority for Industrial Development, Pennsylvania, Revenue Bonds, Franklin Towne Charter High School, Series 2006A: | | | | | |
| | 470 | | 5.250%, 1/01/27 (Pre-refunded 1/01/17) | 1/17 at 100.00 | Baa1 (4) | | 553,312 | |
| | 790 | | 5.375%, 1/01/32 (Pre-refunded 1/01/17) | 1/17 at 100.00 | Baa1 (4) | | 934,064 | |
| | 3,740 | | Philadelphia Hospitals and Higher Education Facilities Authority, Pennsylvania, Hospital Revenue Bonds, Presbyterian Medical Center of Philadelphia, Series 1993, 6.650%, 12/01/19 (ETM) | No Opt. Call | AA+ (4) | | 4,525,250 | |
| | 1,970 | | Puerto Rico, Highway Revenue Bonds, Highway and Transportation Authority, Series 2003AA, 5.500%, 7/01/19 – NPFG Insured (ETM) | No Opt. Call | A3 (4) | | 2,511,139 | |
| | Principal | | | Optional Call | | | | |
| | Amount (000) | | Description (1) | Provisions (2) | Ratings (3) | | Value | |
| | | | U.S. Guaranteed (4) (continued) | | | | | |
| $ | 1,015 | | St. Mary Hospital Authority, Pennsylvania, Health System Revenue Bonds, Catholic Health East, Series 2004B, 5.375%, 11/15/34 (Pre-refunded 11/15/14) | 11/14 at 100.00 | A+ (4) | $ | 1,116,226 | |
| | | | State Public School Building Authority, Berkes County, Pennsylvania, School Revenue Bonds, Brandywine Heights Area School District, Series 2003: | | | | | |
| | 1,930 | | 5.000%, 2/01/20 (Pre-refunded 2/01/13) – FGIC Insured | 2/13 at 100.00 | A1 (4) | | 1,953,064 | |
| | 1,955 | | 5.000%, 2/01/21 (Pre-refunded 2/01/13) – FGIC Insured | 2/13 at 100.00 | A1 (4) | | 1,978,362 | |
| | 4,060 | | State Public School Building Authority, Pennsylvania, Lease Revenue Bonds, Philadelphia School District, Series 2003, 5.000%, 6/01/33 (Pre-refunded
6/01/13) – AGM Insured | 6/13 at 100.00 | AA+ (4) | | 4,172,706 | |
| | | | State Public School Building Authority, Pennsylvania, School Revenue Bonds, Conneaut School District, Series 2003: | | | | | |
| | 360 | | 5.250%, 11/01/21 (Pre-refunded 11/01/13) – FGIC Insured | 11/13 at 100.00 | A (4) | | 377,946 | |
| | 490 | | 5.250%, 11/01/22 (Pre-refunded 11/01/13) – FGIC Insured | 11/13 at 100.00 | A (4) | | 514,427 | |
| | 520 | | State Public School Building Authority, Pennsylvania, School Revenue Bonds, York City School District, Series 2003, 4.000%, 5/01/21 (Pre-refunded 5/01/13) – AGM Insured | 5/13 at 100.00 | Aa3 (4) | | 529,802 | |
| | 665 | | West View Borough Municipal Authority, Allegheny County, Pennsylvania, Special Obligation Bonds, Series 1985A, 9.500%, 11/15/14 (ETM) | No Opt. Call | Aaa | | 751,497 | |
| | 31,725 | | Total U.S. Guaranteed | | | | 34,949,500 | |
| | | | Utilities – 5.1% (3.6% of Total Investments) | | | | | |
| | 1,125 | | Allegheny County Industrial Development Authority, Pennsylvania, Pollution Control Revenue Refunding Bonds, Duquesne Light Company, Series 1999A, 4.350%, 12/01/13 – AMBAC Insured | No Opt. Call | BBB+ | | 1,159,459 | |
| | 2,000 | | Indiana County Industrial Development Authority, Pennsylvania, Pollution Control Revenue Refunding Bonds, PSEG Power LLC, Series 2001A, 5.850%, 6/01/27 (Alternative Minimum Tax) | 12/12 at 101.00 | Baa1 | | 2,022,600 | |
| | 2,150 | | Lehigh County Industrial Development Authority, Pennsylvania, Pollution Control Revenue Bonds, Pennsylvania Power and Light Company, Series 2005, 4.750%, 2/15/27 – FGIC Insured | 2/15 at 100.00 | A– | | 2,212,479 | |
| | 700 | | Philadelphia Gas Works, Pennsylvania, Revenue Bonds, General Ordinance, Fifth Series 2004A-1, 5.000%, 9/01/26 – AGM Insured | 9/14 at 100.00 | AA– | | 738,836 | |
| | 1,000 | | Philadelphia Gas Works, Pennsylvania, Revenue Bonds, General Ordinance, Seventeenth Series 2003, 5.375%, 7/01/19 – AGM Insured | 7/13 at 100.00 | AA– | | 1,024,710 | |
| | 5,050 | | Philadelphia Gas Works, Pennsylvania, Revenue Bonds, Seventh Series, 2007, 5.000%, 10/01/37 – AMBAC Insured | 10/17 at 100.00 | BBB+ | | 5,262,908 | |
| | 12,025 | | Total Utilities | | | | 12,420,992 | |
| | | | Water and Sewer – 12.3% (8.7% of Total Investments) | | | | | |
| | | | Allegheny County Sanitary Authority, Pennsylvania, Sewerage Revenue Bonds, Series 2005A: | | | | | |
| | 1,900 | | 5.000%, 12/01/21 – NPFG Insured | 12/15 at 100.00 | A1 | | 2,114,776 | |
| | 2,120 | | 5.000%, 12/01/23 – NPFG Insured | 12/15 at 100.00 | A1 | | 2,348,748 | |
| | 545 | | 5.000%, 12/01/30 – NPFG Insured | 12/15 at 100.00 | A1 | | 599,228 | |
| | 2,500 | | Bethlehem Authority, Northampton and Lehigh Counties, Pennsylvania, Guaranteed Water Revenue Bonds, Series 2004, 5.000%, 11/15/20 – AGM Insured | 11/14 at 100.00 | AA– | | 2,629,525 | |
| | 4,000 | | Bucks County Industrial Development Authority, Pennsylvania, Water Facility Revenue Bonds, Pennsylvania Suburban Water Company, Series 2002, 5.550%, 9/01/32 – NPFG Insured (Alternative Minimum Tax) | 11/12 at 100.00 | AA– | | 4,007,040 | |
| | | | Bucks County Water and Sewer Authority, Pennsylvania, Revenue Bonds, Tender Option Bond Trust 4015: | | | | | |
| | 1,665 | | 13.114%, 12/01/19 (IF) (5) | No Opt. Call | AA– | | 2,543,887 | |
| | 205 | | 13.102%, 12/01/19 (IF) (5) | No Opt. Call | AA– | | 305,602 | |
| | 2,000 | | Harrisburg Authority, Dauphin County, Pennsylvania, Water Revenue Refunding Bonds, Series 2004, 5.000%, 7/15/22 – AGM Insured | 7/14 at 100.00 | AA– | | 2,007,460 | |
| | 1,600 | | Luzerne County Industrial Development Authority, Pennsylvania, Water Facility Revenue Refunding Bonds, Pennsylvania-American Water Company, Series 2009, 5.500%, 12/01/39 | 12/19 at 100.00 | A | | 1,806,128 | |
| | | Nuveen Pennsylvania Premium Income Municipal Fund 2 (continued) |
| NPY | | Portfolio of Investments |
October 31, 2012 (Unaudited)
| | Principal | | | Optional Call | | | | |
| | Amount (000) | | Description (1) | Provisions (2) | Ratings (3) | | Value | |
| | | | Water and Sewer (continued) | | | | | |
| | | | Norristown Municipal Waste Authority, Pennsylvania, Sewer Revenue Bonds, Series 2003: | | | | | |
| $ | 1,140 | | 5.125%, 11/15/22 – FGIC Insured | 11/13 at 100.00 | N/R | $ | 1,163,450 | |
| | 2,535 | | 5.125%, 11/15/23 – FGIC Insured | 11/13 at 100.00 | N/R | | 2,584,002 | |
| | 500 | | Pennsylvania Economic Development Financing Authority, Sewage Sludge Disposal Revenue Bonds, Philadelphia Biosolids Facility Project, Series 2009, 6.250%, 1/01/32 | 1/20 at 100.00 | BBB+ | | 572,985 | |
| | 2,000 | | Philadelphia, Pennsylvania, Water and Wastewater Revenue Bonds, Series 2005A, 5.000%, 7/01/23 – AGM Insured | 7/15 at 100.00 | AA– | | 2,183,915 | |
| | 2,440 | | Philadelphia, Pennsylvania, Water and Wastewater Revenue Bonds, Series 2011A, 5.000%, 1/01/41 | 1/21 at 100.00 | A1 | | 2,746,805 | |
| | 2,000 | | Unity Township Municipal Authority, Pennsylvania, Sewerage Revenue Bonds, Series 2004, 5.000%, 12/01/34 – AGM Insured | 12/14 at 100.00 | AA– | | 2,111,155 | |
| | 27,150 | | Total Water and Sewer | | | | 29,724,706 | |
| $ | 329,040 | | Total Investments (cost $312,972,813) – 141.0% | | | | 341,879,696 | |
| | | | Floating Rate Obligations – (4.2)% | | | | (10,115,000 | ) |
| | | | Variable Rate Demand Preferred Shares, at Liquidation Value – (41.2)% (6) | | | | (100,000,000 | ) |
| | | | Other Assets Less Liabilities – 4.4% | | | | 10,781,988 | |
| | | | Net Assets Applicable to Common Shares – 100% | | | $ | 242,546,684 | |
| (1) | | All percentages shown in the Portfolio of Investments are based on net assets applicable to Common shares unless otherwise noted. |
| (2) | | Optional Call Provisions: Dates (month and year) and prices of the earliest optional call or redemption. There may be other call provisions at varying prices at later dates. Certain mortgage-backed securities may be subject to periodic principal paydowns. |
| (3) | | Ratings: Using the highest of Standard & Poor’s Group (“Standard & Poor’s”), Moody’s Investors Service, Inc. (“Moody’s”) or Fitch, Inc. (“Fitch”) rating. Ratings below BBB by Standard & Poor’s, Baa by Moody’s or BBB by Fitch are considered to be below investment grade. Holdings designated N/R are not rated by any of these national rating agencies. |
| (4) | | Backed by an escrow or trust containing sufficient U.S. Government or U.S. Government agency securities, which ensure the timely payment of principal and interest. Certain bonds backed by U.S. Government or agency securities are regarded as having an implied rating equal to the rating of such securities. |
| (5) | | Investment, or portion of investment, has been pledged to collateralize the net payment obligations for investments in inverse floating rate transaction |
| (6) | | Variable Rate Demand Preferred Shares, at Liquidation Value as a percentage of Total Investments is 29.3%. |
| N/R | | Not rated. |
| WI/DD | | Investment, or portion of investment, purchased on a when-issued or delayed delivery basis. |
| (ETM) | | Escrowed to maturity. |
| (IF) | | Inverse floating rate investment. |
| (UB) | | Underlying bond of an inverse floating rate trust reflected as a financing transaction. See Notes to Financial Statements, Footnote 1 – General Information and Significant Accounting Policies, Inverse Floating Rate Securities for more information. |
See accompanying notes to financial statements.
| | | Nuveen Pennsylvania Dividend Advantage Municipal Fund |
| NXM | | Portfolio of Investments |
| | | October 31, 2012 (Unaudited) |
| | Principal | | | Optional Call | | | | |
| | Amount (000) | | Description (1) | Provisions (2) | Ratings (3) | | Value | |
| | | | Consumer Staples – 2.4% (1.7% of Total Investments) | | | | | |
| $ | 1,000 | | Pennsylvania Economic Development Financing Authority, Solid Waste Disposal Revenue Bonds, Procter & Gamble Paper Project, Series 2001, 5.375%, 3/01/31 (Alternative Minimum Tax) | No Opt. Call | AA– | $ | 1,280,469 | |
| | | | Education and Civic Organizations – 22.8% (16.3% of Total Investments) | | | | | |
| | 100 | | Allegheny County Higher Education Building Authority, Pennsylvania, College Revenue Refunding Bonds, Robert Morris College, Series 1998A, 6.000%, 5/01/28 | No Opt. Call | Baa3 | | 117,347 | |
| | 235 | | Allegheny County Higher Education Building Authority, Pennsylvania, Revenue Bonds, Robert Morris University, Series 2006A, 4.750%, 2/15/26 | 2/16 at 100.00 | Baa3 | | 237,836 | |
| | 700 | | Chester County Health and Education Facilities Authority, Pennsylvania, Revenue Bonds, Immaculata University, Series 2005, 5.500%, 10/15/25 | 10/15 at 102.00 | N/R | | 726,362 | |
| | 720 | | Chester County Industrial Development Authority, Pennsylvania, Avon Grove Charter School Revenue Bonds, Series 2007A, 6.375%, 12/15/37 | 12/17 at 100.00 | BBB– | | 756,410 | |
| | 300 | | Delaware County Authority, Pennsylvania, General Revenue Bonds, Eastern University, Series 2006, 4.500%, 10/01/27 – RAAI Insured | 10/16 at 100.00 | N/R | | 295,821 | |
| | | | Delaware County Authority, Pennsylvania, Revenue Bonds, Villanova University, Series 2006: | | | | | |
| | 295 | | 5.000%, 8/01/23 – AMBAC Insured | 8/16 at 100.00 | A+ | | 322,984 | |
| | 145 | | 5.000%, 8/01/24 – AMBAC Insured | 8/16 at 100.00 | A+ | | 158,067 | |
| | 160 | | Erie Higher Education Building Authority, Pennsylvania, College Revenue Bonds, Gannon University, Series 2007-GG3, 5.000%, 5/01/32 – RAAI Insured | 5/17 at 100.00 | N/R | | 163,357 | |
| | 200 | | Montgomery County Higher Education and Health Authority, Pennsylvania, Revenue Bonds, Arcadia University, Series 2010, 5.625%, 4/01/40 | 4/20 at 100.00 | BBB+ | | 220,202 | |
| | 1,000 | | Montgomery County Industrial Development Authority, Pennsylvania, Revenue Bonds, Hill School, Series 2005, 5.000%, 8/15/27 – NPFG Insured | 8/15 at 100.00 | A1 | | 1,090,490 | |
| | 75 | | New Wilmington, Pennsylvania, Revenue, Westminster College, Series 2007G, 5.125%, 5/01/33 – RAAI Insured | 5/17 at 100.00 | N/R | | 77,600 | |
| | 500 | | Pennsylvania Higher Educational Facilities Authority, General Revenue Bonds, State System of Higher Education, Refunding Series 2012AN, 5.000%, 6/15/21 | No Opt. Call | AA | | 626,430 | |
| | 900 | | Pennsylvania Higher Educational Facilities Authority, General Revenue Bonds, State System of Higher Education, Series 2008AH, 5.000%, 6/15/33 | 6/18 at 100.00 | AA | | 1,039,050 | |
| | 500 | | Pennsylvania Higher Educational Facilities Authority, Revenue Bonds, AICUP Financing Program-Mount Aloysius College Project, Series 2011R-1, 5.000%, 11/01/35 | 11/21 at 100.00 | A– | | 541,605 | |
| | 220 | | Pennsylvania Higher Educational Facilities Authority, Revenue Bonds, Allegheny College, Series 2006, 4.750%, 5/01/31 | 5/16 at 100.00 | A– | | 230,426 | |
| | 540 | | Pennsylvania Higher Educational Facilities Authority, Revenue Bonds, Drexel University, Series 2007A, 5.000%, 5/01/37 – NPFG Insured | 11/17 at 100.00 | A | | 582,125 | |
| | 400 | | Pennsylvania Higher Educational Facilities Authority, Revenue Bonds, Gwynedd Mercy College, Series 2012-KK1, 5.375%, 5/01/42 | 5/22 at 100.00 | BBB– | | 421,440 | |
| | 700 | | Pennsylvania Higher Educational Facilities Authority, Revenue Bonds, Temple University, First Series of 2006, 5.000%, 4/01/21 – NPFG Insured | 4/16 at 100.00 | Aa3 | | 794,472 | |
| | 350 | | Pennsylvania Higher Educational Facilities Authority, Revenue Bonds, Thomas Jefferson University, Series 2002, 5.500%, 1/01/16 | 1/13 at 100.00 | A1 | | 352,870 | |
| | 70 | | Pennsylvania Higher Educational Facilities Authority, Revenue Bonds, Thomas Jefferson University, Series 2012, 5.000%, 3/01/42 | 9/22 at 100.00 | A+ | | 78,700 | |
| | | | Pennsylvania Higher Educational Facilities Authority, Revenue Bonds, University of the Sciences in Philadelphia, Series 2012: | | | | | |
| | 120 | | 4.000%, 11/01/39 | 11/22 at 100.00 | A3 | | 121,972 | |
| | 215 | | 5.000%, 11/01/42 | 11/22 at 100.00 | A3 | | 237,902 | |
| | 1,000 | | Pennsylvania State University, General Revenue Bonds, Series 2010, 5.000%, 3/01/35 | 3/20 at 100.00 | AA | | 1,141,690 | |
| | 470 | | Philadelphia Authority for Industrial Development, Pennsylvania, Revenue Bonds, Leadership Learning Partners, Series 2005A, 5.375%, 7/01/36 | 1/13 at 102.00 | N/R | | 339,819 | |
| | 110 | | Philadelphia Authority for Industrial Development, Pennsylvania, Revenue Bonds, MaST Charter School Project, Series 2010, 6.000%, 8/01/35 | 8/20 at 100.00 | BBB+ | | 124,647 | |
| | | Nuveen Pennsylvania Dividend Advantage Municipal Fund (continued) |
| NXM | | Portfolio of Investments |
October 31, 2012 (Unaudited)
| | Principal | | | Optional Call | | | | |
| | Amount (000) | | Description (1) | Provisions (2) | Ratings (3) | | Value | |
| | | | Education and Civic Organizations (continued) | | | | | |
| $ | 230 | | Philadelphia Authority for Industrial Development, Pennsylvania, Revenue Bonds, Richard Allen Preparatory Charter School, Series 2006, 6.250%, 5/01/33 | 5/16 at 100.00 | BBB– | $ | 239,276 | |
| | 750 | | State Public School Building Authority, Pennsylvania, College Revenue Bonds, Northampton County Area Community College, Series 2011, 5.500%, 3/01/31 | 3/21 at 100.00 | A1 | | 874,373 | |
| | 150 | | Wilkes-Barre Finance Authority, Pennsylvania, Revenue Bonds, University of Scranton, Series 2010, 5.000%, 11/01/40 | 11/20 at 100.00 | A | | 166,965 | |
| | 11,155 | | Total Education and Civic Organizations | | | | 12,080,238 | |
| | | | Health Care – 26.3% (18.8% of Total Investments) | | | | | |
| | 550 | | Allegheny County Hospital Development Authority, Pennsylvania, Revenue Bonds, Ohio Valley General Hospital, Series 2005A, 5.125%, 4/01/35 | 4/15 at 100.00 | Ba2 | | 531,834 | |
| | 385 | | Allentown Area Hospital Authority, Pennsylvania, Revenue Bonds, Sacred Heart Hospital, Series 2005, 6.000%, 11/15/16 | No Opt. Call | N/R | | 391,322 | |
| | 700 | | Beaver County Hospital Authority, Pennsylvania, Revenue Bonds, Heritage Valley Health System, Inc., Series 2012, 5.000%, 5/15/27 | 5/21 at 100.00 | AA– | | 795,445 | |
| | 765 | | Berks County Municipal Authority, Pennsylvania, Revenue Bonds, Reading Hospital and Medical Center Project, Series 2012A, 5.000%, 11/01/44 | 5/22 at 100.00 | AA | | 846,954 | |
| | 445 | | Central Bradford Progress Authority, Pennsylvania, Revenue Bonds, Guthrie Health, Series 2011, 5.375%, 12/01/41 | 12/21 at 100.00 | AA– | | 506,277 | |
| | 175 | | Dauphin County General Authority, Pennsylvania, Health System Revenue Bonds, Pinnacle Health System Project, Series 2012A, 5.000%, 6/01/42 | 6/22 at 100.00 | A | | 189,173 | |
| | 200 | | Erie County Hospital Authority, Pennsylvania, Hospital Revenue Bonds, Saint Vincent Health Center Project, Series 2010A, 7.000%, 7/01/27 | 7/20 at 100.00 | Ba2 | | 220,908 | |
| | 80 | | Erie County Hospital Authority, Pennsylvania, Revenue Bonds, Hamot Health Foundation, Series 2007, 5.000%, 11/01/37 – CIFG Insured | 11/17 at 100.00 | Aa3 | | 85,669 | |
| | 835 | | Franklin County Industrial Development Authority, Pennsylvania, Revenue Bonds, Chambersburg Hospital Project, Series 2010, 5.375%, 7/01/42 | 7/20 at 100.00 | A+ | | 916,763 | |
| | 230 | | Fulton County, Pennsylvania, Industrial Development Authority Hospital Revenue Bonds, Fulton County Medical Center Project, Series 2006, 5.900%, 7/01/40 | 7/16 at 100.00 | N/R | | 234,954 | |
| | 400 | | Lancaster County Hospital Authority, Pennsylvania, Health System Revenue Bonds, Lancaster General Hospital Project, Tender Option Bond 4234, 13.400%, 01/01/36 (IF) | 1/22 at 100.00 | AA– | | 526,608 | |
| | 600 | | Lebanon County Health Facilities Authority, Pennsylvania, Revenue Bonds, Good Samaritan Hospital Project, Series 2002, 5.900%, 11/15/28 | 11/12 at 101.00 | BB+ | | 606,564 | |
| | 650 | | Lehigh County General Purpose Authority, Pennsylvania, Hospital Revenue Bonds, Lehigh Valley Health Network, Series 2008A, 5.000%, 7/01/33 – AGM Insured | 7/18 at 100.00 | AA– | | 699,868 | |
| | 250 | | Lehigh County General Purpose Authority, Pennsylvania, Revenue Bonds, Good Shepherd Group, Series 2004A, 5.500%, 11/01/24 | 11/14 at 100.00 | A | | 258,903 | |
| | 1,025 | | Lehigh County General Purpose Authority, Pennsylvania, Revenue Bonds, Good Shepherd Group, Series 2007, 5.000%, 11/01/37 – AGC Insured | 11/17 at 100.00 | AA– | | 1,101,045 | |
| | 700 | | Lycoming County Authority, Pennsylvania, Health System Revenue Bonds, Susquehanna Health System Project, Series 2009, 5.750%, 7/01/39 | 7/19 at 100.00 | A– | | 779,030 | |
| | | | Monroe County Hospital Authority, Hospital Revenue Bonds, Pocono Medical Center, Series 2012A: | | | | | |
| | 75 | | 4.000%, 1/01/25 | 1/22 at 100.00 | A | | 77,827 | |
| | 170 | | 5.000%, 1/01/41 | 1/22 at 100.00 | A | | 182,323 | |
| | 140 | | Monroe County Hospital Authority, Pennsylvania, Hospital Revenue Bonds, Pocono Medical Center, Series 2007, 5.125%, 1/01/37 | 1/17 at 100.00 | A | | 145,519 | |
| | 330 | | Montgomery County Higher Education and Health Authority, Pennsylvania, Hospital Revenue Bonds, Abington Memorial Hospital Obligated Group, Series 2012A, 5.000%, 6/01/31 | 6/22 at 100.00 | A | | 374,454 | |
| | 165 | | Montgomery County Industrial Development Authority, Pennsylvania, FHA Insured Mortgage Revenue Bonds, New Regional Medical Center Project, Series 2010, 5.375%, 8/01/38 | 8/20 at 100.00 | AA | | 190,125 | |
| | 310 | | Pennsylvania Higher Educational Facilities Authority, Revenue Bonds, University of Pennsylvania Health System, Series 2012A, 5.000%, 8/15/42 | 8/22 at 100.00 | AA– | | 346,199 | |
| | 400 | | Philadelphia Hospitals and Higher Education Facilities Authority, Pennsylvania, Hospital Revenue Bonds, Temple University Health System Obligated Group, Series 2012A, 5.625%, 7/01/42 | 7/22 at 100.00 | BBB– | | 425,572 | |
| | Principal | | | Optional Call | | | | |
| | Amount (000) | | Description (1) | Provisions (2) | Ratings (3) | | Value | |
| | | | Health Care (continued) | | | | | |
| $ | 1,495 | | Philadelphia Hospitals and Higher Education Facilities Authority, Pennsylvania, Health System Revenue Bonds, Jefferson Health System, Series 2010B, 5.000%, 5/15/40 | 5/20 at 100.00 | AA | $ | 1,638,818 | |
| | 230 | | Philadelphia Hospitals and Higher Education Facilities Authority, Pennsylvania, Hospital Revenue Bonds, Children’s Hospital of Philadelphia, Tender Option Bond Trust 3975, 13.391%, 7/01/19 (IF) | No Opt. Call | AA | | 308,575 | |
| | 25 | | Pottsville Hospital Authority, Pennsylvania, Hospital Revenue Bonds, Pottsville Hospital and Warne Clinic, Series 1998, 5.625%, 7/01/24 | 1/13 at 100.00 | N/R | | 25,005 | |
| | 240 | | Southcentral Pennsylvania General Authority, Revenue Bonds, Hanover Hospital Inc., Series 2005, 5.000%, 12/01/25 (WI/DD, Settling 11/01/12) – RAAI Insured | 12/15 at 100.00 | BBB– | | 246,869 | |
| | 625 | | West Shore Area Authority, Cumberland County, Pennsylvania, Hospital Revenue Bonds, Holy Spirit Hospital of the Sisters of Christian Charity Project, Series 2011, 6.500%, 1/01/36 | 1/21 at 100.00 | BBB+ | | 746,606 | |
| | 420 | | West Shore Area Authority, Cumberland County, Pennsylvania, Hospital Revenue Bonds, Holy Spirit Hospital of the Sisters of Christian Charity, Series 2011B, 5.750%, 1/01/41 | 1/22 at 100.00 | BBB+ | | 482,698 | |
| | 12,615 | | Total Health Care | | | | 13,881,907 | |
| | | | Housing/Multifamily – 2.6% (1.9% of Total Investments) | | | | | |
| | 150 | | Pennsylvania Higher Educational Facilities Authority, Revenue Bonds, Edinboro University Foundation Student Housing Project, Series 2010, 6.000%, 7/01/43 | 7/20 at 100.00 | BBB– | | 169,949 | |
| | 350 | | Pennsylvania Higher Educational Facilities Authority, Revenue Bonds, Foundation for Student Housing at Indiana University, Project Series 2012A, 5.000%, 7/01/32 | 7/22 at 100.00 | BBB+ | | 380,888 | |
| | 700 | | Pennsylvania Higher Educational Facilities Authority, Revenue Bonds, Slippery Rock University Foundation Inc., Student Housing Project, Series 2005A, 5.000%, 7/01/37 – SYNCORA GTY Insured | 7/15 at 100.00 | BBB+ | | 714,126 | |
| | 100 | | Philadelphia Authority for Industrial Development, Pennsylvania, Multifamily Housing Revenue Bonds, Presbyterian Homes Germantown - Morrisville Project, Series 2005A, 5.625%, 7/01/35 | 5/15 at 102.00 | Baa3 | | 101,402 | |
| | 1,300 | | Total Housing/Multifamily | | | | 1,366,365 | |
| | | | Housing/Single Family – 4.7% (3.3% of Total Investments) | | | | | |
| | 240 | | Pennsylvania Housing Finance Agency, Single Family Mortgage Revenue Bonds, Series 2006-96B, 3.950%, 4/01/16 | No Opt. Call | AA+ | | 260,892 | |
| | 475 | | Pennsylvania Housing Finance Agency, Single Family Mortgage Revenue Bonds, Series 2006-95A, 4.900%, 10/01/37 (Alternative Minimum Tax) (UB) | 10/15 at 100.00 | AA+ | | 484,847 | |
| | 110 | | Pennsylvania Housing Finance Agency, Single Family Mortgage Revenue Bonds, Series 2006-93A, 4.950%, 10/01/26 (Alternative Minimum Tax) (UB) | 4/15 at 100.00 | AA+ | | 113,527 | |
| | 315 | | Pennsylvania Housing Finance Agency, Single Family Mortgage Revenue Bonds, Series 2007-98A, 4.850%, 10/01/31 (Alternative Minimum Tax) (UB) | 10/16 at 100.00 | AA+ | | 326,584 | |
| | 400 | | Pennsylvania Housing Finance Agency, Single Family Mortgage Revenue Bonds, Series 2011-112, 5.000%, 10/01/25 | 10/20 at 100.00 | AA+ | | 440,436 | |
| | 665 | | Pennsylvania Housing Finance Agency, Single Family Mortgage Revenue Bonds, Tender Option Bonds Trust 3950, 12.451%, 4/01/27 (IF) | 4/21 at 100.00 | AA+ | | 841,278 | |
| | 2,205 | | Total Housing/Single Family | | | | 2,467,564 | |
| | | | Industrials – 0.6% (0.4% of Total Investments) | | | | | |
| | 290 | | Pennsylvania Economic Development Financing Authority, Exempt Facilities Revenue Refunding Bonds, Amtrak Project, Series 2012A, 5.000%, 11/01/27 (Alternative Minimum Tax) | 11/22 at 100.00 | A1 | | 326,125 | |
| | | | Long-Term Care – 15.3% (11.0% of Total Investments) | | | | | |
| | | | Bucks County Industrial Development Authority, Pennsylvania, Revenue Bonds, Lutheran Community at Telford Center, Series 2007: | | | | | |
| | 220 | | 5.750%, 1/01/27 | 1/17 at 100.00 | N/R | | 225,911 | |
| | 360 | | 5.750%, 1/01/37 | 1/17 at 100.00 | N/R | | 364,882 | |
| | 1,000 | | Cumberland County Municipal Authority Revenue Bonds, Pennsylvania, Diakon Lutheran Social Ministries Project, Series 2009, 6.375%, 1/01/39 | 1/19 at 100.00 | BBB+ | | 1,116,440 | |
| | 220 | | Cumberland County Municipal Authority, Pennsylvania, Revenue Bonds, Diakon Lutheran Social Ministries, Series 2007, 5.000%, 1/01/36 | 1/17 at 100.00 | BBB+ | | 226,906 | |
| | 230 | | Delaware County Authority, Revenue Bonds, Elwyn, Inc. Project, Series 2010, 5.000%, 6/01/21 | 6/17 at 100.00 | BBB | | 241,997 | |
| | 200 | | Lancaster County Hospital Authority, Pennsylvania, Health Center Revenue Bonds, Masonic Homes Project, Series 2006, 5.000%, 11/01/36 | 11/16 at 100.00 | A | | 208,640 | |
| | | Nuveen Pennsylvania Dividend Advantage Municipal Fund (continued) |
| NXM | | Portfolio of Investments |
October 31, 2012 (Unaudited)
| | Principal | | | Optional Call | | | | |
| | Amount (000) | | Description (1) | Provisions (2) | Ratings (3) | | Value | |
| | | | Long-Term Care (continued) | | | | | |
| $ | 50 | | Lancaster County Hospital Authority, Pennsylvania, Health Center Revenue Bonds, Saint Anne’s Retirement Community, Inc. , Series 2012, 5.000%, 4/01/33 (WI/DD, Settling 11/01/12) | 4/22 at 100.00 | BB+ | $ | 50,334 | |
| | 185 | | Lancaster County Hospital Authority, Pennsylvania, Revenue Bonds, Brethren Village Project, Series 2008A, 6.375%, 7/01/30 | 7/17 at 100.00 | N/R | | 199,545 | |
| | 785 | | Lebanon County Health Facilities Authority, Pennsylvania, Health Center Revenue Bonds, Pleasant View Retirement Community, Series 2005A, 5.300%, 12/15/26 | 12/14 at 100.00 | N/R | | 797,309 | |
| | 190 | | Montgomery Count Industrial Development Authority, Pennsylvania, Revenue Refunding Bonds, ACTS Retirement-Life Communities, Inc. , Series 2012, 5.000%, 11/15/26 | 5/22 at 100.00 | A– | | 210,262 | |
| | | | Pennsylvania Economic Development Financing Authority, Revenue Bonds, Northwestern Human Services Inc., Series 1998A: | | | | | |
| | 855 | | 5.250%, 6/01/14 | 11/12 at 100.00 | BB | | 856,094 | |
| | 50 | | 5.125%, 6/01/18 | 11/12 at 100.00 | BB | | 50,023 | |
| | | | Philadelphia Authority for Industrial Development, Pennsylvania, Revenue Bonds, Philadelphia Corporation for the Aging Project, Series 2001B: | | | | | |
| | 670 | | 5.250%, 7/01/23 – AMBAC Insured | 7/13 at 100.00 | Baa1 | | 674,241 | |
| | 2,875 | | 5.250%, 7/01/31 – AMBAC Insured | 1/13 at 100.50 | Baa1 | | 2,891,588 | |
| | 7,890 | | Total Long-Term Care | | | | 8,114,172 | |
| | | | Materials – 2.5% (1.8% of Total Investments) | | | | | |
| | 350 | | Allegheny County Industrial Development Authority, Pennsylvania, Revenue Bonds, United States Steel Corporation, Series 2005, 5.500%, 11/01/16 | No Opt. Call | BB | | 367,647 | |
| | 210 | | Bradford County Industrial Development Authority, Pennsylvania, Solid Waste Disposal Revenue Bonds, International Paper Company, Series 2005B, 5.200%, 12/01/19 (Alternative Minimum Tax) | 12/15 at 100.00 | BBB | | 225,299 | |
| | 750 | | Pennsylvania Economic Development Financing Authority, Exempt Facilities Revenue Bonds, National Gypsum Company, Series 1997B, 6.125%, 11/01/27 (Alternative Minimum Tax) | 5/13 at 100.00 | N/R | | 738,810 | |
| | 1,310 | | Total Materials | | | | 1,331,756 | |
| | | | Tax Obligation/General – 23.2% (16.5% of Total Investments) | | | | | |
| | 500 | | Allegheny County, Pennsylvania, General Obligation Bonds, Series 2011C-65, 5.375%, 5/01/31 | 5/21 at 100.00 | A+ | | 573,165 | |
| | 1,965 | | Gateway School District, Allegheny County, Pennsylvania, General Obligation Bonds, Refunding Series 2012, 4.000%, 10/15/32 | 10/22 at 100.00 | A1 | | 2,071,482 | |
| | 500 | | Heidelberg, Lebanon County, Pennsylvania, Guaranteed Sewer Revenue Bonds, Series 2011, 5.125%, 12/01/46 | 12/16 at 100.00 | A | | 528,760 | |
| | 1,000 | | Luzerne County, Pennsylvania, General Obligation Bonds, Series 2008B, 5.000%, 12/15/27 – AGM Insured | 6/18 at 100.00 | AA– | | 1,048,110 | |
| | 375 | | Philadelphia School District, Pennsylvania, General Obligation Bonds, Series 2007A, 5.000%, 6/01/34 – FGIC Insured | No Opt. Call | AA | | 457,451 | |
| | 840 | | Pine-Richland School District, Pennsylvania, General Obligation Bonds, School Improvement Series 2005, 5.000%, 7/15/35 – AGM Insured | 7/15 at 100.00 | AA– | | 892,441 | |
| | 3,000 | | Pittsburgh School District, Allegheny County, Pennsylvania, General Obligation Refunding Bonds, Series 2002A, 5.500%, 9/01/14 – AGM Insured | No Opt. Call | AA– | | 3,252,146 | |
| | 480 | | Pittsburgh, Pennsylvania, General Obligation Bonds, Series 2012B, 5.000%, 9/01/26 | 9/22 at 100.00 | A1 | | 559,786 | |
| | 370 | | Radnor Township School District, Delaware County, Pennsylvania, General Obligation Bonds, Series 2012, 3.000%, 2/15/34 | 2/18 at 100.00 | Aa2 | | 361,427 | |
| | 505 | | Radnor Township, Pennsylvania, General Obligation Bonds, Series 2012, 4.000%, 11/01/37 | 11/22 at 100.00 | Aa1 | | 532,477 | |
| | 2,220 | | Reading School District, Berks County, Pennsylvania, General Obligation Bonds, Series 2003B, 0.000%, 1/15/32 – FGIC Insured | No Opt. Call | A | | 1,028,038 | |
| | 160 | | Scranton Parking Authority, Pennsylvania, Guaranteed Parking Revenue Bonds, Series 2004, 5.000%, 9/15/33 – FGIC Insured | 9/13 at 100.00 | BBB | | 149,754 | |
| | 125 | | Scranton, Pennsylvania, General Obligation Bonds, Series 2012A, 8.500%, 9/01/22 | No Opt. Call | N/R | | 122,141 | |
| | 600 | | York County, Pennsylvania, General Obligation Bonds, Series 2006, 5.000%, 6/01/33 – NPFG Insured | 12/15 at 100.00 | AA | | 667,164 | |
| | 12,640 | | Total Tax Obligation/General | | | | 12,244,342 | |
| | Principal | | | Optional Call | | | | |
| | Amount (000) | | Description (1) | Provisions (2) | Ratings (3) | | Value | |
| | | | Tax Obligation/Limited – 12.2% (8.7% of Total Investments) | | | | | |
| $ | 1,000 | | Allegheny County Redevelopment Authority, Pennsylvania, TIF Revenue Bonds, Pittsburg Mills Project, Series 2004, 5.600%, 7/01/23 | 7/15 at 101.00 | N/R | $ | 1,033,320 | |
| | 225 | | Allentown Neighborhood Improvement Zone Development Authority, Pennsylvania, Tax Revenue Bonds, Series 2012A, 5.000%, 5/01/35 | 5/22 at 100.00 | Baa2 | | 240,802 | |
| | 450 | | Erie County Convention Center Authority, Pennsylvania, Convention Center Revenue Bonds, Series 2005, 5.000%, 1/15/36 – FGIC Insured | 1/15 at 100.00 | Aa2 | | 480,735 | |
| | 425 | | Pennsylvania Turnpike Commission, Oil Franchise Tax Revenue Bonds, Senior Lien Series 2003A, 5.000%, 12/01/32 – NPFG Insured | 12/18 at 100.00 | AA | | 472,808 | |
| | 1,000 | | Pennsylvania Turnpike Commission, Registration Fee Revenue Bonds, Series 2005A, 5.250%, 7/15/18 – AGM Insured | No Opt. Call | AA– | | 1,219,280 | |
| | 1,000 | | Philadelphia Municipal Authority, Pennsylvania, Lease Revenue Bonds, Series 2003B, 5.250%, 11/15/17 – AGM Insured | 11/13 at 100.00 | AA– | | 1,048,840 | |
| | 610 | | Pittsburgh and Allegheny County Sports and Exhibition Authority, Pennsylvania, Hotel Room Excise Tax Revenue Bonds, Refunding Series 2012, 5.000%,
2/01/26 – AGC Insured | 8/22 at 100.00 | AA– | | 710,315 | |
| | 750 | | Puerto Rico Highway and Transportation Authority, Highway Revenue Bonds, Series 2007N, 5.250%, 7/01/33 – NPFG Insured | No Opt. Call | Baa1 | | 803,595 | |
| | 630 | | Puerto Rico Infrastructure Financing Authority, Special Tax Revenue Bonds, Series 2005A, 0.000%, 7/01/32 – FGIC Insured | No Opt. Call | BBB+ | | 191,747 | |
| | 240 | | Washington County Redevelopment Authority, Pennsylvania, Tanger Outlet Victory Center Tax Increment Bonds, Series 2006A, 5.450%, 7/01/35 | 7/17 at 100.00 | N/R | | 246,638 | |
| | 6,330 | | Total Tax Obligation/Limited | | | | 6,448,080 | |
| | | | Transportation – 8.6% (6.1% of Total Investments) | | | | | |
| | 680 | | Delaware River Port Authority, New Jersey and Pennsylvania, Revenue Bonds, Series 2010E, 5.000%, 1/01/40 | 1/20 at 100.00 | A– | | 761,736 | |
| | | | Pennsylvania Turnpike Commission, Motor License Fund-Enhanced Subordinate Special Revenue Bonds, Series 2010A: | | | | | |
| | 880 | | 0.000%, 12/01/34 | 12/20 at 100.00 | AA | | 855,114 | |
| | 250 | | 5.000%, 12/01/38 | 12/19 at 100.00 | AA | | 278,060 | |
| | 680 | | Pennsylvania Turnpike Commission, Motor License Fund-Enhanced Subordinate Special Revenue Bonds, Series 2012A, 5.000%, 12/01/31 | 12/21 at 100.00 | AA | | 789,466 | |
| | 420 | | Pennsylvania Turnpike Commission, Turnpike Revenue Bonds, Series 2006A, 5.000%, 12/01/24 – AMBAC Insured | 6/16 at 100.00 | Aa3 | | 475,856 | |
| | 150 | | Pennsylvania Turnpike Commission, Turnpike Revenue Bonds, Subordinate Lien, Refunding Series 2010B-1, 5.000%, 12/01/37 | 12/19 at 100.00 | A– | | 162,974 | |
| | 1,000 | | Pennsylvania Turnpike Commission, Turnpike Subordinate Revenue Bonds, Series 2009C, 0.000%, 6/01/33 – AGM Insured | 6/26 at 100.00 | AA | | 1,069,140 | |
| | 140 | | Susquehanna Area Regional Airport Authority, Pennsylvania, Airport System Revenue Bonds, Subordinate Lien Series 2003D, 5.375%, 1/01/18 | 1/13 at 100.00 | Ba1 | | 140,318 | |
| | 4,200 | | Total Transportation | | | | 4,532,664 | |
| | | | U.S. Guaranteed – 6.4% (4.6% of Total Investments) (4) | | | | | |
| | 1,000 | | Cumberland County Municipal Authority, Pennsylvania, Retirement Community Revenue Bonds, Wesley Affiliated Services Inc., Series 2002A, 7.125%, 1/01/25 (Pre-refunded 1/01/13) | 1/13 at 101.00 | N/R (4) | | 1,021,390 | |
| | 130 | | Delaware River Joint Toll Bridge Commission, New Jersey and Pennsylvania, Revenue Bonds, Series 2003, 5.250%, 7/01/17 (Pre-refunded 7/01/13) | 7/13 at 100.00 | A2 (4) | | 134,286 | |
| | 800 | | Hazleton Area School District, Luzerne County, Pennsylvania, General Obligation Bonds, Series 2004, 5.125%, 3/01/28 (Pre-refunded 9/01/14) – AGM Insured | 9/14 at 100.00 | Aa3 (4) | | 870,376 | |
| | 300 | | Pennsylvania, General Obligation Bonds, First Series 2006, 5.000%, 10/01/18 (Pre-refunded 10/01/16) | 10/16 at 100.00 | Aa1 (4) | | 352,743 | |
| | 255 | | Philadelphia Authority for Industrial Development, Pennsylvania, Revenue Bonds, Franklin Towne Charter High School, Series 2006A, 5.250%, 1/01/27 (Pre-refunded 1/01/17) | 1/17 at 100.00 | Baa1 (4) | | 300,201 | |
| | 350 | | Philadelphia Gas Works, Pennsylvania, Revenue Bonds, General Ordinance, Fourth Series 1998, 5.250%, 8/01/18 (Pre-refunded 8/01/13) – AGM Insured | 8/13 at 100.00 | AA– (4) | | 363,108 | |
| | 120 | | Philadelphia Gas Works, Pennsylvania, Revenue Bonds, Twelfth Series 1990B, 7.000%, 5/15/20 – NPFG Insured (ETM) | No Opt. Call | BBB (4) | | 148,496 | |
| | 170 | | St. Mary Hospital Authority, Pennsylvania, Health System Revenue Bonds, Catholic Health East, Series 2004B, 5.375%, 11/15/34 (Pre-refunded 11/15/14) | 11/14 at 100.00 | A+ (4) | | 186,954 | |
| | 3,125 | | Total U.S. Guaranteed | | | | 3,377,554 | |
| | | Nuveen Pennsylvania Dividend Advantage Municipal Fund (continued) |
| NXM | | Portfolio of Investments |
October 31, 2012 (Unaudited)
| | Principal | | | Optional Call | | | | |
| | Amount (000) | | Description (1) | Provisions (2) | Ratings (3) | | Value | |
| | | | Utilities – 5.6% (4.0% of Total Investments) | | | | | |
| $ | 500 | | Allegheny County Industrial Development Authority, Pennsylvania, Pollution Control Revenue Refunding Bonds, Duquesne Light Company, Series 1999A, 4.350%, 12/01/13 – AMBAC Insured | No Opt. Call | BBB+ | $ | 515,315 | |
| | 1,125 | | Beaver County Industrial Development Authority, Pennsylvania, Pollution Control Revenue Refunding Bonds, FirstEnergy Nuclear Generation Project, Series 2008A, 2.700%, 4/01/35 (Mandatory put 4/02/18) | No Opt. Call | BBB– | | 1,128,431 | |
| | 140 | | Philadelphia Gas Works, Pennsylvania, Revenue Bonds, General Ordinance, Fifth Series 2004A-1, 5.000%, 9/01/26 – AGM Insured | 9/14 at 100.00 | AA– | | 147,767 | |
| | 1,105 | | Philadelphia Gas Works, Pennsylvania, Revenue Bonds, Seventh Series, 2007, 5.000%, 10/01/37 – AMBAC Insured | 10/17 at 100.00 | BBB+ | | 1,151,587 | |
| | 2,870 | | Total Utilities | | | | 2,943,100 | |
| | | | Water and Sewer – 6.9% (4.9% of Total Investments) | | | | | |
| | 500 | | Bethlehem Authority, Northampton and Lehigh Counties, Pennsylvania, Guaranteed Water Revenue Bonds, Series 2004, 5.000%, 11/15/20 – AGM Insured | 11/14 at 100.00 | AA– | | 525,905 | |
| | 375 | | Bucks County Water and Sewer Authority, Pennsylvania, Revenue Bonds, Tender Option Bond Trust 4015, 13.102%, 12/01/19 (IF) (5) | No Opt. Call | AA– | | 559,028 | |
| | 600 | | Harrisburg Authority, Dauphin County, Pennsylvania, Water Revenue Refunding Bonds, Series 2004, 5.000%, 7/15/22 – AGM Insured | 7/14 at 100.00 | AA– | | 602,238 | |
| | 400 | | Luzerne County Industrial Development Authority, Pennsylvania, Water Facility Revenue Refunding Bonds, Pennsylvania-American Water Company, Series 2009, 5.500%, 12/01/39 | 12/19 at 100.00 | A | | 451,532 | |
| | 100 | | Pennsylvania Economic Development Financing Authority, Sewage Sludge Disposal Revenue Bonds, Philadelphia Biosolids Facility Project, Series 2009, 6.250%, 1/01/32 | 1/20 at 100.00 | BBB+ | | 114,597 | |
| | 500 | | Pennsylvania Economic Development Financing Authority, Water Facilities Revenue Bonds, Aqua Pennsylvania, Inc. Project, Series 2009A, 5.000%, 10/01/39 | 10/19 at 100.00 | AA– | | 558,555 | |
| | 750 | | Philadelphia, Pennsylvania, Water and Wastewater Revenue Bonds, Series 2011A, 5.000%, 1/01/41 | 1/21 at 100.00 | A1 | | 844,306 | |
| | 3,225 | | Total Water and Sewer | | | | 3,656,161 | |
| $ | 70,155 | | Total Investments (cost $68,396,927) – 140.1% | | | | 74,050,497 | |
| | | | Floating Rate Obligations – (1.0)% | | | | (530,000 | ) |
| | | | MuniFund Term Preferred Shares, at Liquidation Value – (43.9)% (6) | | | | (23,190,000 | ) |
| | | | Other Assets Less Liabilities – 4.8% | | | | 2,543,641 | |
| | | | Net Assets Applicable to Common Shares – 100% | | | $ | 52,874,138 | |
| (1) | | All percentages shown in the Portfolio of Investments are based on net assets applicable to Common shares unless otherwise noted. |
| (2) | | Optional Call Provisions: Dates (month and year) and prices of the earliest optional call or redemption. There may be other call provisions at varying prices at later dates. Certain mortgage-backed securities may be subject to periodic principal paydowns. |
| (3) | | Ratings: Using the highest of Standard & Poor’s Group (“Standard & Poor’s”), Moody’s Investors Service, Inc. (“Moody’s”) or Fitch, Inc. (“Fitch”) rating. Ratings below BBB by Standard & Poor’s, Baa by Moody’s or BBB by Fitch are considered to be below investment grade. Holdings designated N/R are not rated by any of these national rating agencies. |
| (4) | | Backed by an escrow or trust containing sufficient U.S. Government or U.S. Government agency securities, which ensure the timely payment of principal and interest. Certain bonds backed by U.S. Government or agency securities are regarded as having an implied rating equal to the rating of such securities. |
| (5) | | Investment, or portion of investment, has been pledged to collateralize the net payment obligations for investments in inverse floating rate transactions. |
| (6) | | MuniFund Term Preferred Shares, at Liquidation Value as a percentage of Total Investments is 31.3%. |
| N/R | | Not rated. |
| WI/DD | | Investment, or portion of investment, purchased on a when-issued or delayed delivery basis. |
| (ETM) | | Escrowed to maturity. |
| (IF) | | Inverse floating rate investment. |
| (UB) | | Underlying bond of an inverse floating rate trust reflected as a financing transaction. See Notes to Financial Statements, Footnote 1 – General Information and Significant Accounting Policies, Inverse Floating Rate Securities for more information. |
See accompanying notes to financial statements.
| | | Nuveen Pennsylvania Dividend Advantage Municipal Fund 2 |
| NVY | | Portfolio of Investments |
| | | October 31, 2012 (Unaudited) |
| | Principal | | | Optional Call | | | | |
| | Amount (000) | | Description (1) | Provisions (2) | Ratings (3) | | Value | |
| | | | Education and Civic Organizations – 25.5% (17.6% of Total Investments) | | | | | |
| $ | 1,000 | | Allegheny County Higher Education Building Authority, Pennsylvania, College Revenue Refunding Bonds, Robert Morris College, Series 1998A, 6.000%, 5/01/28 | No Opt. Call | Baa3 | $ | 1,173,470 | |
| | 100 | | Allegheny County Higher Education Building Authority, Pennsylvania, Revenue Bonds, Carnegie Mellon University, Series 2012A, 5.000%, 3/01/24 | 3/22 at 100.00 | AA– | | 123,202 | |
| | 800 | | Chester County Health and Education Facilities Authority, Pennsylvania, Revenue Bonds, Immaculata University, Series 2005, 5.500%, 10/15/25 | 10/15 at 102.00 | N/R | | 830,128 | |
| | 720 | | Chester County Industrial Development Authority, Pennsylvania, Avon Grove Charter School Revenue Bonds, Series 2007A, 6.375%, 12/15/37 | 12/17 at 100.00 | BBB– | | 756,410 | |
| | 450 | | Delaware County Authority, Pennsylvania, General Revenue Bonds, Eastern University, Series 2006, 4.500%, 10/01/27 – RAAI Insured | 10/16 at 100.00 | N/R | | 443,732 | |
| | | | Delaware County Authority, Pennsylvania, Revenue Bonds, Villanova University, Series 2006: | | | | | |
| | 340 | | 5.000%, 8/01/23 – AMBAC Insured | 8/16 at 100.00 | A+ | | 372,252 | |
| | 165 | | 5.000%, 8/01/24 – AMBAC Insured | 8/16 at 100.00 | A+ | | 179,870 | |
| | 180 | | Erie Higher Education Building Authority, Pennsylvania, College Revenue Bonds, Gannon University, Series 2007-GG3, 5.000%, 5/01/32 – RAAI Insured | 5/17 at 100.00 | N/R | | 183,776 | |
| | 1,265 | | Lycoming County Authority, Pennsylvania, Revenue Bonds, Pennsylvania College of Technology, Series 2012, 5.000%, 5/01/32 | 5/22 at 100.00 | A | | 1,407,717 | |
| | 200 | | Montgomery County Higher Education and Health Authority, Pennsylvania, Revenue Bonds, Arcadia University, Series 2010, 5.625%, 4/01/40 | 4/20 at 100.00 | BBB+ | | 220,202 | |
| | 80 | | New Wilmington, Pennsylvania, Revenue, Westminster College, Series 2007G, 5.125%, 5/01/33 – RAAI Insured | 5/17 at 100.00 | N/R | | 82,774 | |
| | 1,050 | | Pennsylvania Higher Educational Facilities Authority, General Revenue Bonds, State System of Higher Education, Series 2008AH, 5.000%, 6/15/33 | 6/18 at 100.00 | AA | | 1,212,225 | |
| | 285 | | Pennsylvania Higher Educational Facilities Authority, Revenue Bonds, Allegheny College, Series 2006, 4.750%, 5/01/31 | 5/16 at 100.00 | A– | | 298,506 | |
| | 610 | | Pennsylvania Higher Educational Facilities Authority, Revenue Bonds, Drexel University, Series 2007A, 5.000%, 5/01/37 – NPFG Insured | 11/17 at 100.00 | A | | 657,586 | |
| | 600 | | Pennsylvania Higher Educational Facilities Authority, Revenue Bonds, Gwynedd Mercy College, Series 2012-KK1, 5.375%, 5/01/42 | 5/22 at 100.00 | BBB– | | 632,160 | |
| | 800 | | Pennsylvania Higher Educational Facilities Authority, Revenue Bonds, Temple University, First Series of 2006, 5.000%, 4/01/21 – NPFG Insured | 4/16 at 100.00 | Aa3 | | 907,968 | |
| | 2,000 | | Pennsylvania Higher Educational Facilities Authority, Revenue Bonds, Temple University, First Series of 2012, 5.000%, 4/01/42 | 4/22 at 100.00 | Aa3 | | 2,261,979 | |
| | 90 | | Pennsylvania Higher Educational Facilities Authority, Revenue Bonds, Thomas Jefferson University, Series 2012, 5.000%, 3/01/42 | 9/22 at 100.00 | A+ | | 101,185 | |
| | | | Pennsylvania Higher Educational Facilities Authority, Revenue Bonds, University of the Sciences in Philadelphia, Series 2012: | | | | | |
| | 140 | | 4.000%, 11/01/39 | 11/22 at 100.00 | A3 | | 142,300 | |
| | 265 | | 5.000%, 11/01/42 | 11/22 at 100.00 | A3 | | 293,228 | |
| | 530 | | Philadelphia Authority for Industrial Development, Pennsylvania, Revenue Bonds, Leadership Learning Partners, Series 2005A, 5.375%, 7/01/36 | 1/13 at 102.00 | N/R | | 383,201 | |
| | 120 | | Philadelphia Authority for Industrial Development, Pennsylvania, Revenue Bonds, MaST Charter School Project, Series 2010, 6.000%, 8/01/35 | 8/20 at 100.00 | BBB+ | | 135,978 | |
| | 270 | | Philadelphia Authority for Industrial Development, Pennsylvania, Revenue Bonds, Richard Allen Preparatory Charter School, Series 2006, 6.250%, 5/01/33 | 5/16 at 100.00 | BBB– | | 280,889 | |
| | 600 | | State Public School Building Authority, Pennsylvania, College Revenue Bonds, Northampton County Area Community College, Series 2011, 5.500%, 3/01/31 | 3/21 at 100.00 | A1 | | 699,498 | |
| | 1,000 | | Union County, Higher Education Facilities Financing Authority, Pennsylvania, Revenue Bonds, Bucknell University, Series 2002A, 5.250%, 4/01/20 | 4/13 at 100.00 | Aa2 | | 1,020,950 | |
| | 50 | | Wilkes-Barre Finance Authority, Pennsylvania, Revenue Bonds, University of Scranton, Series 2010, 5.000%, 11/01/40 | 11/20 at 100.00 | A | | 55,655 | |
| | 13,710 | | Total Education and Civic Organizations | | | | 14,856,841 | |
| | | Nuveen Pennsylvania Dividend Advantage Municipal Fund 2 (continued) |
| NVY | | Portfolio of Investments |
October 31, 2012 (Unaudited)
| | Principal | | | Optional Call | | | | |
| | Amount (000) | | Description (1) | Provisions (2) | Ratings (3) | | Value | |
| | | | Health Care – 23.6% (16.3% of Total Investments) | | | | | |
| $ | 625 | | Allegheny County Hospital Development Authority, Pennsylvania, Revenue Bonds, Ohio Valley General Hospital, Series 2005A, 5.125%, 4/01/35 | 4/15 at 100.00 | Ba2 | $ | 604,356 | |
| | 435 | | Allentown Area Hospital Authority, Pennsylvania, Revenue Bonds, Sacred Heart Hospital, Series 2005, 6.000%, 11/15/16 | No Opt. Call | N/R | | 442,143 | |
| | 650 | | Beaver County Hospital Authority, Pennsylvania, Revenue Bonds, Heritage Valley Health System, Inc., Series 2012, 5.000%, 5/15/26 | 5/21 at 100.00 | AA– | | 743,126 | |
| | 835 | | Berks County Municipal Authority, Pennsylvania, Revenue Bonds, Reading Hospital and Medical Center Project, Series 2012A, 5.000%, 11/01/44 | 5/22 at 100.00 | AA | | 924,454 | |
| | 595 | | Central Bradford Progress Authority, Pennsylvania, Revenue Bonds, Guthrie Health, Series 2011, 5.375%, 12/01/41 | 12/21 at 100.00 | AA– | | 676,932 | |
| | 200 | | Dauphin County General Authority, Pennsylvania, Health System Revenue Bonds, Pinnacle Health System Project, Series 2012A, 5.000%, 6/01/42 | 6/22 at 100.00 | A | | 216,198 | |
| | 300 | | Erie County Hospital Authority, Pennsylvania, Hospital Revenue Bonds, Saint Vincent Health Center Project, Series 2010A, 7.000%, 7/01/27 | 7/20 at 100.00 | Ba2 | | 331,362 | |
| | 95 | | Erie County Hospital Authority, Pennsylvania, Revenue Bonds, Hamot Health Foundation, Series 2007, 5.000%, 11/01/37 – CIFG Insured | 11/17 at 100.00 | Aa3 | | 101,732 | |
| | 835 | | Franklin County Industrial Development Authority, Pennsylvania, Revenue Bonds, Chambersburg Hospital Project, Series 2010, 5.375%, 7/01/42 | 7/20 at 100.00 | A+ | | 916,763 | |
| | 270 | | Fulton County, Pennsylvania, Industrial Development Authority Hospital Revenue Bonds, Fulton County Medical Center Project, Series 2006, 5.900%, 7/01/40 | 7/16 at 100.00 | N/R | | 275,816 | |
| | 475 | | Lancaster County Hospital Authority, Pennsylvania, Health System Revenue Bonds, Lancaster General Hospital Project, Tender Option Bond 4234, 13.400%, 01/01/36 (IF) | 1/22 at 100.00 | AA– | | 625,347 | |
| | 600 | | Lebanon County Health Facilities Authority, Pennsylvania, Revenue Bonds, Good Samaritan Hospital Project, Series 2002, 5.900%, 11/15/28 | 11/12 at 101.00 | BB+ | | 606,564 | |
| | 740 | | Lehigh County General Purpose Authority, Pennsylvania, Hospital Revenue Bonds, Lehigh Valley Health Network, Series 2008A, 5.000%, 7/01/33 – AGM Insured | 7/18 at 100.00 | AA– | | 796,773 | |
| | 1,155 | | Lehigh County General Purpose Authority, Pennsylvania, Revenue Bonds, Good Shepherd Group, Series 2007, 5.000%, 11/01/37 – AGC Insured | 11/17 at 100.00 | AA– | | 1,240,689 | |
| | 145 | | Monroe County Hospital Authority, Hospital Revenue Bonds, Pocono Medical Center, Series 2012A, 5.000%, 1/01/41 | 1/22 at 100.00 | A | | 155,511 | |
| | 160 | | Monroe County Hospital Authority, Pennsylvania, Hospital Revenue Bonds, Pocono Medical Center, Series 2007, 5.125%, 1/01/37 | 1/17 at 100.00 | A | | 166,307 | |
| | 350 | | Montgomery County Higher Education and Health Authority, Pennsylvania, Hospital Revenue Bonds, Abington Memorial Hospital Obligated Group, Series 2012A, 5.000%, 6/01/31 | 6/22 at 100.00 | A | | 397,149 | |
| | 175 | | Montgomery County Industrial Development Authority, Pennsylvania, FHA Insured Mortgage Revenue Bonds, New Regional Medical Center Project, Series 2010, 5.375%, 8/01/38 | 8/20 at 100.00 | AA | | 201,647 | |
| | 925 | | Montgomery County Industrial Development Authority, Pennsylvania, Health Facilities Revenue Bonds, Jefferson Health System, Series 2012A, 5.000%, 10/01/41 | 4/22 at 100.00 | AA | | 1,024,900 | |
| | 620 | | Pennsylvania Higher Educational Facilities Authority, Revenue Bonds, University of Pennsylvania Health System, Series 2012A, 5.000%, 8/15/42 | 8/22 at 100.00 | AA– | | 692,397 | |
| | 450 | | Philadelphia Hospitals and Higher Education Facilities Authority, Pennsylvania, Hospital Revenue Bonds, Temple University Health System Obligated Group, Series 2012A, 5.625%, 7/01/42 | 7/22 at 100.00 | BBB– | | 478,769 | |
| | 300 | | Philadelphia Hospitals and Higher Education Facilities Authority, Pennsylvania, Health System Revenue Bonds, Jefferson Health System, Series 2010B, 5.000%, 5/15/40 | 5/20 at 100.00 | AA | | 328,860 | |
| | 350 | | Philadelphia Hospitals and Higher Education Facilities Authority, Pennsylvania, Hospital Revenue Bonds, Children’s Hospital of Philadelphia, Tender Option Bond Trust 3975, 13.391%, 7/01/19 (IF) | No Opt. Call | AA | | 469,571 | |
| | 260 | | Southcentral Pennsylvania General Authority, Revenue Bonds, Hanover Hospital Inc., Series 2005, 5.000%, 12/01/25 (WI/DD, Settling 11/01/12) – RAAI Insured | 12/15 at 100.00 | BBB– | | 267,441 | |
| | | | West Shore Area Authority, Cumberland County, Pennsylvania, Hospital Revenue Bonds, Holy Spirit Hospital of the Sisters of Christian Charity Project, Series 2011: | | | | | |
| | 100 | | 6.250%, 1/01/31 | 1/21 at 100.00 | BBB+ | | 118,873 | |
| | 335 | | 6.500%, 1/01/36 | 1/21 at 100.00 | BBB+ | | 400,181 | |
| | Principal | | | Optional Call | | | | |
| | Amount (000) | | Description (1) | Provisions (2) | Ratings (3) | | Value | |
| | | | Health Care (continued) | | | | | |
| | | | West Shore Area Authority, Cumberland County, Pennsylvania, Hospital Revenue Bonds, Holy Spirit Hospital of the Sisters of Christian Charity, Series 2011B: | | | | | |
| $ | 220 | | 5.625%, 1/01/32 | 1/22 at 100.00 | BBB+ | $ | 248,186 | |
| | 250 | | 5.750%, 1/01/41 | 1/22 at 100.00 | BBB+ | | 287,320 | |
| | 12,450 | | Total Health Care | | | | 13,739,367 | |
| | | | Housing/Multifamily – 2.0% (1.4% of Total Investments) | | | | | |
| | 200 | | Pennsylvania Higher Educational Facilities Authority, Revenue Bonds, Edinboro University Foundation Student Housing Project, Series 2010, 6.000%, 7/01/43 | 7/20 at 100.00 | BBB– | | 226,598 | |
| | 800 | | Pennsylvania Higher Educational Facilities Authority, Revenue Bonds, Slippery Rock University Foundation Inc., Student Housing Project, Series 2005A, 5.000%, 7/01/37 – SYNCORA GTY Insured | 7/15 at 100.00 | BBB+ | | 816,144 | |
| | 120 | | Philadelphia Authority for Industrial Development, Pennsylvania, Multifamily Housing Revenue Bonds, Presbyterian Homes Germantown - Morrisville Project, Series 2005A, 5.625%, 7/01/35 | 5/15 at 102.00 | Baa3 | | 121,682 | |
| | 1,120 | | Total Housing/Multifamily | | | | 1,164,424 | |
| | | | Housing/Single Family – 5.8% (4.0% of Total Investments) | | | | | |
| | 245 | | Pennsylvania Housing Finance Agency, Single Family Mortgage Revenue Bonds, Series 1995A, 4.900%, 10/01/37 (Alternative Minimum Tax) | 10/15 at 100.00 | AA+ | | 250,079 | |
| | 60 | | Pennsylvania Housing Finance Agency, Single Family Mortgage Revenue Bonds, Series 2006-93A, 4.950%, 10/01/26 (Alternative Minimum Tax) | 4/15 at 100.00 | AA+ | | 61,924 | |
| | 225 | | Pennsylvania Housing Finance Agency, Single Family Mortgage Revenue Bonds, Series 2006-95A, 4.900%, 10/01/37 (Alternative Minimum Tax) (UB) | 10/15 at 100.00 | AA+ | | 229,665 | |
| | 70 | | Pennsylvania Housing Finance Agency, Single Family Mortgage Revenue Bonds, Series 2006-93A, 4.950%, 10/01/26 (Alternative Minimum Tax) (UB) | 4/15 at 100.00 | AA+ | | 72,245 | |
| | 1,100 | | Pennsylvania Housing Finance Agency, Single Family Mortgage Revenue Bonds, Series 2007-97A, 4.600%, 10/01/27 (Alternative Minimum Tax) (UB) | 10/16 at 100.00 | AA+ | | 1,141,250 | |
| | 345 | | Pennsylvania Housing Finance Agency, Single Family Mortgage Revenue Bonds, Series 2007-98A, 4.850%, 10/01/31 (Alternative Minimum Tax) (UB) | 10/16 at 100.00 | AA+ | | 357,687 | |
| | 400 | | Pennsylvania Housing Finance Agency, Single Family Mortgage Revenue Bonds, Series 2011-112, 5.000%, 10/01/25 | 10/20 at 100.00 | AA+ | | 440,436 | |
| | 665 | | Pennsylvania Housing Finance Agency, Single Family Mortgage Revenue Bonds, Tender Option Bonds Trust 3950, 12.451%, 4/01/27 (IF) | 4/21 at 100.00 | AA+ | | 841,278 | |
| | 3,110 | | Total Housing/Single Family | | | | 3,394,564 | |
| | | | Industrials – 0.5% (0.3% of Total Investments) | | | | | |
| | 255 | | Pennsylvania Economic Development Financing Authority, Exempt Facilities Revenue Refunding Bonds, Amtrak Project, Series 2012A, 5.000%, 11/01/27 (Alternative Minimum Tax) | 11/22 at 100.00 | A1 | | 286,765 | |
| | | | Long-Term Care – 9.6% (6.6% of Total Investments) | | | | | |
| | | | Bucks County Industrial Development Authority, Pennsylvania, Revenue Bonds, Lutheran Community at Telford Center, Series 2007: | | | | | |
| | 250 | | 5.750%, 1/01/27 | 1/17 at 100.00 | N/R | | 256,718 | |
| | 400 | | 5.750%, 1/01/37 | 1/17 at 100.00 | N/R | | 405,424 | |
| | 1,000 | | Cumberland County Municipal Authority Revenue Bonds, Pennsylvania, Diakon Lutheran Social Ministries Project, Series 2009, 6.375%, 1/01/39 | 1/19 at 100.00 | BBB+ | | 1,116,440 | |
| | 300 | | Cumberland County Municipal Authority, Pennsylvania, Revenue Bonds, Diakon Lutheran Social Ministries, Series 2007, 5.000%, 1/01/36 | 1/17 at 100.00 | BBB+ | | 309,417 | |
| | 300 | | Delaware County Authority, Revenue Bonds, Elwyn, Inc. Project, Series 2010, 5.000%, 6/01/21 | 6/17 at 100.00 | BBB | | 315,648 | |
| | 205 | | Lancaster County Hospital Authority, Pennsylvania, Health Center Revenue Bonds, Masonic Homes Project, Series 2006, 5.000%, 11/01/36 | 11/16 at 100.00 | A | | 213,856 | |
| | 50 | | Lancaster County Hospital Authority, Pennsylvania, Health Center Revenue Bonds, Saint Anne’s Retirement Community, Inc. , Series 2012, 5.000%, 4/01/33 (WI/DD, Settling 11/01/12) | 4/22 at 100.00 | BB+ | | 50,334 | |
| | 185 | | Lancaster County Hospital Authority, Pennsylvania, Revenue Bonds, Brethren Village Project, Series 2008A, 6.375%, 7/01/30 | 7/17 at 100.00 | N/R | | 199,545 | |
| | 785 | | Lebanon County Health Facilities Authority, Pennsylvania, Health Center Revenue Bonds, Pleasant View Retirement Community, Series 2005A, 5.300%, 12/15/26 | 12/14 at 100.00 | N/R | | 797,309 | |
| | | Nuveen Pennsylvania Dividend Advantage Municipal Fund 2 (continued) |
| NVY | | Portfolio of Investments |
October 31, 2012 (Unaudited)
| | Principal | | | Optional Call | | | | |
| | Amount (000) | | Description (1) | Provisions (2) | Ratings (3) | | Value | |
| | | | Long-Term Care (continued) | | | | | |
| $ | 200 | | Montgomery Count Industrial Development Authority, Pennsylvania, Revenue Refunding Bonds, ACTS Retirement-Life Communities, Inc. , Series 2012, 5.000%, 11/15/26 | 5/22 at 100.00 | A– | $ | 221,328 | |
| | | | Pennsylvania Economic Development Financing Authority, Revenue Bonds, Northwestern Human Services Inc., Series 1998A: | | | | | |
| | 870 | | 5.250%, 6/01/14 | 11/12 at 100.00 | BB | | 871,114 | |
| | 50 | | 5.125%, 6/01/18 | 11/12 at 100.00 | BB | | 50,023 | |
| | 750 | | Philadelphia Authority for Industrial Development, Pennsylvania, Revenue Bonds, Philadelphia Corporation for the Aging Project, Series 2001B, 5.250%, 7/01/23 – AMBAC Insured | 7/13 at 100.00 | Baa1 | | 754,748 | |
| | 5,345 | | Total Long-Term Care | | | | 5,561,904 | |
| | | | Materials – 2.5% (1.7% of Total Investments) | | | | | |
| | 400 | | Allegheny County Industrial Development Authority, Pennsylvania, Revenue Bonds, United States Steel Corporation, Series 2005, 5.500%, 11/01/16 | No Opt. Call | BB | | 420,168 | |
| | 280 | | Bradford County Industrial Development Authority, Pennsylvania, Solid Waste Disposal Revenue Bonds, International Paper Company, Series 2005B, 5.200%, 12/01/19 (Alternative Minimum Tax) | 12/15 at 100.00 | BBB | | 300,398 | |
| | 750 | | Pennsylvania Economic Development Financing Authority, Exempt Facilities Revenue Bonds, National Gypsum Company, Series 1997B, 6.125%, 11/01/27 (Alternative Minimum Tax) | 5/13 at 100.00 | N/R | | 738,810 | |
| | 1,430 | | Total Materials | | | | 1,459,376 | |
| | | | Tax Obligation/General – 23.2% (16.1% of Total Investments) | | | | | |
| | 1,135 | | Allegheny County, Pennsylvania, General Obligation Bonds, Series C69-C70 of 2012, 5.000%, 12/01/37 | 12/22 at 100.00 | A+ | | 1,265,797 | |
| | 4,000 | | Delaware Valley Regional Finance Authority, Pennsylvania, Local Government Revenue Bonds, Series 2002, 5.750%, 7/01/17 (UB) | No Opt. Call | A+ | | 4,660,160 | |
| | 1,375 | | Heidelberg, Lebanon County, Pennsylvania, Guaranteed Sewer Revenue Bonds, Series 2011, 5.125%, 12/01/46 | 12/16 at 100.00 | A | | 1,454,090 | |
| | 1,000 | | Luzerne County, Pennsylvania, General Obligation Bonds, Series 2008B, 5.000%, 12/15/27 – AGM Insured | 6/18 at 100.00 | AA– | | 1,048,110 | |
| | 375 | | Philadelphia School District, Pennsylvania, General Obligation Bonds, Series 2007A, 5.000%, 6/01/34 – FGIC Insured | No Opt. Call | AA | | 457,451 | |
| | 725 | | Philadelphia, Pennsylvania, General Obligation Bonds, Refunding Series 2011, 6.500%, 8/01/41 | 8/20 at 100.00 | A2 | | 887,741 | |
| | 950 | | Pine-Richland School District, Pennsylvania, General Obligation Bonds, School Improvement Series 2005, 5.000%, 7/15/35 – AGM Insured | 7/15 at 100.00 | AA– | | 1,009,309 | |
| | 225 | | Pittsburgh, Pennsylvania, General Obligation Bonds, Series 2006B, 5.250%, 9/01/16 – AGM Insured | No Opt. Call | AA– | | 259,110 | |
| | 360 | | Radnor Township School District, Delaware County, Pennsylvania, General Obligation Bonds, Series 2012, 3.000%, 2/15/34 | 2/18 at 100.00 | Aa2 | | 351,659 | |
| | 2,510 | | Reading School District, Berks County, Pennsylvania, General Obligation Bonds, Series 2003B, 0.000%, 1/15/32 – FGIC Insured | No Opt. Call | A | | 1,162,331 | |
| | 180 | | Scranton Parking Authority, Pennsylvania, Guaranteed Parking Revenue Bonds, Series 2004, 5.000%, 9/15/33 – FGIC Insured | 9/13 at 100.00 | BBB | | 168,473 | |
| | 135 | | Scranton, Pennsylvania, General Obligation Bonds, Series 2012A, 8.500%, 9/01/22 | No Opt. Call | N/R | | 131,913 | |
| | 600 | | York County, Pennsylvania, General Obligation Bonds, Series 2006, 5.000%, 6/01/33 – NPFG Insured | 12/15 at 100.00 | AA | | 667,164 | |
| | 13,570 | | Total Tax Obligation/General | | | | 13,523,308 | |
| | | | Tax Obligation/Limited – 19.0% (13.1% of Total Investments) | | | | | |
| | 1,000 | | Allegheny County Redevelopment Authority, Pennsylvania, TIF Revenue Bonds, Pittsburg Mills Project, Series 2004, 5.600%, 7/01/23 | 7/15 at 101.00 | N/R | | 1,033,320 | |
| | 250 | | Allentown Neighborhood Improvement Zone Development Authority, Pennsylvania, Tax Revenue Bonds, Series 2012A, 5.000%, 5/01/35 | 5/22 at 100.00 | Baa2 | | 267,558 | |
| | 1,500 | | Dormitory Authority of the State of New York, Revenue Bonds, School Districts Financing Program, Series 2009C, 5.125%, 10/01/36 – AGC Insured | 10/19 at 100.00 | AA– | | 1,684,274 | |
| | 4,000 | | Harrisburg Parking Authority, Pennsylvania, Guaranteed Revenue Refunding Bonds, Series 2001J, 5.000%, 9/01/22 – NPFG Insured | 3/13 at 100.00 | Baa2 | | 3,822,999 | |
| | 610 | | Pennsylvania Turnpike Commission, Oil Franchise Tax Revenue Bonds, Senior Lien Series 2003A, 5.000%, 12/01/32 – NPFG Insured | 12/18 at 100.00 | AA | | 678,619 | |
| | Principal | | | Optional Call | | | | |
| | Amount (000) | | Description (1) | Provisions (2) | Ratings (3) | | Value | |
| | | | Tax Obligation/Limited (continued) | | | | | |
| $ | 1,200 | | Pennsylvania Turnpike Commission, Registration Fee Revenue Bonds, Series 2005A, 5.250%, 7/15/18 – AGM Insured | No Opt. Call | AA– | $ | 1,463,136 | |
| | 660 | | Pittsburgh and Allegheny County Sports and Exhibition Authority, Pennsylvania, Hotel Room Excise Tax Revenue Bonds, Refunding Series 2012, 5.000%,
2/01/26 – AGC Insured | 8/22 at 100.00 | AA– | | 768,537 | |
| | 800 | | Puerto Rico Highway and Transportation Authority, Highway Revenue Bonds, Series 2007N, 5.250%, 7/01/33 – NPFG Insured | No Opt. Call | Baa1 | | 857,168 | |
| | 710 | | Puerto Rico Infrastructure Financing Authority, Special Tax Revenue Bonds, Series 2005A, 0.000%, 7/01/32 – FGIC Insured | No Opt. Call | BBB+ | | 216,096 | |
| | 240 | | Washington County Redevelopment Authority, Pennsylvania, Tanger Outlet Victory Center Tax Increment Bonds, Series 2006A, 5.450%, 7/01/35 | 7/17 at 100.00 | N/R | | 246,638 | |
| | 10,970 | | Total Tax Obligation/Limited | | | | 11,038,345 | |
| | | | Transportation – 10.4% (7.2% of Total Investments) | | | | | |
| | 720 | | Delaware River Port Authority, New Jersey and Pennsylvania, Revenue Bonds, Series 2010E, 5.000%, 1/01/40 | 1/20 at 100.00 | A– | | 806,544 | |
| | | | Pennsylvania Turnpike Commission, Motor License Fund-Enhanced Subordinate Special Revenue Bonds, Series 2010A: | | | | | |
| | 875 | | 0.000%, 12/01/34 | 12/20 at 100.00 | AA | | 850,255 | |
| | 250 | | 5.000%, 12/01/38 | 12/19 at 100.00 | AA | | 278,060 | |
| | 1,000 | | Pennsylvania Turnpike Commission, Motor License Fund-Enhanced Turnpike Subordinate Special Revenue, Series 2011B, 5.000%, 12/01/41 | 12/21 at 100.00 | AA | | 1,129,530 | |
| | 670 | | Pennsylvania Turnpike Commission, Turnpike Revenue Bonds, Series 2006A, 5.000%, 12/01/24 – AMBAC Insured | 6/16 at 100.00 | Aa3 | | 759,103 | |
| | 150 | | Pennsylvania Turnpike Commission, Turnpike Revenue Bonds, Subordinate Lien, Refunding Series 2010B-1, 5.000%, 12/01/37 | 12/19 at 100.00 | A– | | 162,974 | |
| | 1,000 | | Pennsylvania Turnpike Commission, Turnpike Subordinate Revenue Bonds, Series 2009C, 0.000%, 6/01/33 – AGM Insured | 6/26 at 100.00 | AA | | 1,069,140 | |
| | 1,000 | | Susquehanna Area Regional Airport Authority, Pennsylvania, Airport System Revenue Bonds, Series 2003A, 5.000%, 1/01/28 – AMBAC Insured (Alternative Minimum Tax) | 1/13 at 100.00 | Baa3 | | 970,950 | |
| | 5,665 | | Total Transportation | | | | 6,026,556 | |
| | | | U.S. Guaranteed – 6.1% (4.2% of Total Investments) (4) | | | | | |
| | 1,000 | | Cumberland County Municipal Authority, Pennsylvania, Retirement Community Revenue Bonds, Wesley Affiliated Services Inc., Series 2002A, 7.125%, 1/01/25 (Pre-refunded 1/01/13) | 1/13 at 101.00 | N/R (4) | | 1,021,390 | |
| | 130 | | Delaware River Joint Toll Bridge Commission, New Jersey and Pennsylvania, Revenue Bonds, Series 2003, 5.250%, 7/01/17 (Pre-refunded 7/01/13) | 7/13 at 100.00 | A2 (4) | | 134,286 | |
| | 315 | | Philadelphia Authority for Industrial Development, Pennsylvania, Revenue Bonds, Franklin Towne Charter High School, Series 2006A, 5.250%, 1/01/27 (Pre-refunded 1/01/17) | 1/17 at 100.00 | Baa1 (4) | | 370,837 | |
| | 1,650 | | Philadelphia Gas Works, Pennsylvania, Revenue Bonds, General Ordinance, Fourth Series 1998, 5.250%, 8/01/20 (Pre-refunded 8/01/13) – AGM Insured | 8/13 at 100.00 | AA– (4) | | 1,711,792 | |
| | 45 | | Philadelphia Gas Works, Pennsylvania, Revenue Bonds, Twelfth Series 1990B, 7.000%, 5/15/20 – NPFG Insured (ETM) | No Opt. Call | BBB (4) | | 55,686 | |
| | 225 | | St. Mary Hospital Authority, Pennsylvania, Health System Revenue Bonds, Catholic Health East, Series 2004B, 5.375%, 11/15/34 (Pre-refunded 11/15/14) | 11/14 at 100.00 | A+ (4) | | 247,439 | |
| | 3,365 | | Total U.S. Guaranteed | | | | 3,541,430 | |
| | | | Utilities – 4.0% (2.8% of Total Investments) | | | | | |
| | 900 | | Beaver County Industrial Development Authority, Pennsylvania, Pollution Control Revenue Refunding Bonds, FirstEnergy Nuclear Generation Project, Series 2008A, 2.700%, 4/01/35 (Mandatory put 4/02/18) | No Opt. Call | BBB– | | 902,745 | |
| | 145 | | Philadelphia Gas Works, Pennsylvania, Revenue Bonds, General Ordinance, Fifth Series 2004A-1, 5.000%, 9/01/26 – AGM Insured | 9/14 at 100.00 | AA– | | 153,045 | |
| | 1,240 | | Philadelphia Gas Works, Pennsylvania, Revenue Bonds, Seventh Series, 2007, 5.000%, 10/01/37 – AMBAC Insured | 10/17 at 100.00 | BBB+ | | 1,292,278 | |
| | 2,285 | | Total Utilities | | | | 2,348,068 | |
| | | Nuveen Pennsylvania Dividend Advantage Municipal Fund 2 (continued) |
| NVY | | Portfolio of Investments |
October 31, 2012 (Unaudited)
| | Principal | | | Optional Call | | | | |
| | Amount (000) | | Description (1) | Provisions (2) | Ratings (3) | | Value | |
| | | | Water and Sewer – 12.6% (8.7% of Total Investments) | | | | | |
| $ | 4,500 | | Bucks County Industrial Development Authority, Pennsylvania, Water Facility Revenue Bonds, Pennsylvania Suburban Water Company, Series 2002, 5.550%, 9/01/32 – NPFG Insured (Alternative Minimum Tax) | 11/12 at 100.00 | AA– | $ | 4,507,919 | |
| | 245 | | Bucks County Water and Sewer Authority, Pennsylvania, Revenue Bonds, Tender Option Bond Trust 4015, 13.102%, 12/01/19 (IF) (5) | No Opt. Call | AA– | | 365,231 | |
| | 600 | | Harrisburg Authority, Dauphin County, Pennsylvania, Water Revenue Refunding Bonds, Series 2004, 5.000%, 7/15/22 – AGM Insured | 7/14 at 100.00 | AA– | | 602,238 | |
| | 400 | | Luzerne County Industrial Development Authority, Pennsylvania, Water Facility Revenue Refunding Bonds, Pennsylvania-American Water Company, Series 2009, 5.500%, 12/01/39 | 12/19 at 100.00 | A | | 451,532 | |
| | 500 | | Pennsylvania Economic Development Financing Authority, Water Facilities Revenue Bonds, Aqua Pennsylvania, Inc. Project, Series 2009A, 5.000%, 10/01/39 | 10/19 at 100.00 | AA– | | 558,555 | |
| | 750 | | Philadelphia, Pennsylvania, Water and Wastewater Revenue Bonds, Series 2011A, 5.000%, 1/01/41 | 1/21 at 100.00 | A1 | | 844,305 | |
| | 6,995 | | Total Water and Sewer | | | | 7,329,780 | |
| $ | 80,270 | | Total Investments (cost $78,824,481) – 144.8% | | | | 84,270,728 | |
| | | | Floating Rate Obligations – (6.9)% | | | | (4,035,000 | ) |
| | | | MuniFund Term Preferred Shares, at Liquidation Value – (42.2)% (6) | | | | (24,550,000 | ) |
| | | | Other Assets Less Liabilities – 4.3% | | | | 2,509,671 | |
| | | | Net Assets Applicable to Common Shares – 100% | | | $ | 58,195,399 | |
| (1) | | All percentages shown in the Portfolio of Investments are based on net assets applicable to Common shares unless otherwise noted. |
| (2) | | Optional Call Provisions: Dates (month and year) and prices of the earliest optional call or redemption. There may be other call provisions at varying prices at later dates. Certain mortgage-backed securities may be subject to periodic principal paydowns. |
| (3) | | Ratings: Using the highest of Standard & Poor’s Group (“Standard & Poor’s”), Moody’s Investors Service, Inc. (“Moody’s”) or Fitch, Inc. (“Fitch”) rating. Ratings below BBB by Standard & Poor’s, Baa by Moody’s or BBB by Fitch are considered to be below investment grade. Holdings designated N/R are not rated by any of these national rating agencies. |
| (4) | | Backed by an escrow or trust containing sufficient U.S. Government or U.S. Government agency securities, which ensure the timely payment of principal and interest. Certain bonds backed by U.S. Government or agency securities are regarded as having an implied rating equal to the rating of such securities. |
| (5) | | Investment, or portion of investment, has been pledged to collateralize the net payment obligations for investments in inverse floating rate transactions. |
| (6) | | MuniFund Term Preferred Shares, at Liquidation Value as a percentage of Total Investments is 29.1%. |
| N/R | | Not rated. |
| WI/DD | | Investment, or portion of investment, purchased on a when-issued or delayed delivery basis. |
| (ETM) | | Escrowed to maturity. |
| (IF) | | Inverse floating rate investment. |
| (UB) | | Underlying bond of an inverse floating rate trust reflected as a financing transaction. See Notes to Financial Statements, Footnote 1 – General Information and Significant Accounting Policies, Inverse Floating Rate Securities for more information. |
See accompanying notes to financial statements.
| | | Nuveen Pennsylvania Municipal Value Fund |
| NPN | | Portfolio of Investments |
| | | October 31, 2012 (Unaudited) |
| | Principal | | | Optional Call | | | | |
| | Amount (000) | | Description (1) | Provisions (2) | Ratings (3) | | Value | |
| | | | Consumer Staples – 3.8% (3.8% of Total Investments) | | | | | |
| $ | 650 | | District of Columbia Tobacco Settlement Corporation, Tobacco Settlement Asset-Backed Bonds, Series 2001, 6.500%, 5/15/33 | No Opt. Call | Baa1 | $ | 771,466 | |
| | | | Education and Civic Organizations – 10.5% (10.8% of Total Investments) | | | | | |
| | 675 | | Delaware County Authority, Pennsylvania, Revenue Bonds, Neumann College, Series 2008, 6.000%, 10/01/30 | 10/18 at 100.00 | BBB | | 745,477 | |
| | 500 | | Lehigh County General Purpose Authority, Pennsylvania, College Revenue Bonds, Muhlenberg College Project, Series 2009, 5.250%, 2/01/39 | 2/19 at 100.00 | A+ | | 553,295 | |
| | 500 | | Montgomery County Higher Education and Health Authority, Pennsylvania, Revenue Bonds, Arcadia University, Series 2006, 5.000%, 4/01/36 – RAAI Insured | 4/16 at 100.00 | BBB+ | | 512,270 | |
| | 20 | | Pennsylvania Higher Educational Facilities Authority, Revenue Bonds, Thomas Jefferson University, Series 2012, 5.000%, 3/01/42 | 9/22 at 100.00 | A+ | | 22,486 | |
| | | | Pennsylvania Higher Educational Facilities Authority, Revenue Bonds, University of the Sciences in Philadelphia, Series 2012: | | | | | |
| | 35 | | 4.000%, 11/01/39 | 11/22 at 100.00 | A3 | | 35,575 | |
| | 60 | | 5.000%, 11/01/42 | 11/22 at 100.00 | A3 | | 66,391 | |
| | 50 | | Pennsylvania Higher Educational Facilities Authority, Revenue Bonds, Widener University, Series 2003, 5.400%, 7/15/36 | 7/13 at 100.00 | A– | | 51,336 | |
| | 50 | | Philadelphia Authority for Industrial Development, Pennsylvania, Revenue Bonds, MaST Charter School Project, Series 2010, 6.000%, 8/01/35 | 8/20 at 100.00 | BBB+ | | 56,658 | |
| | 100 | | Wilkes-Barre Finance Authority, Pennsylvania, Revenue Bonds, University of Scranton, Series 2010, 5.000%, 11/01/40 | 11/20 at 100.00 | A | | 111,310 | |
| | 1,990 | | Total Education and Civic Organizations | | | | 2,154,798 | |
| | | | Health Care – 22.1% (22.7% of Total Investments) | | | | | |
| | 650 | | Allegheny County Hospital Development Authority, Pennsylvania, University of Pittsburgh Medical Center Revenue Bonds, Series 2009A, 5.500%, 8/15/34 | 8/19 at 100.00 | Aa3 | | 736,093 | |
| | 25 | | Dauphin County General Authority, Pennsylvania, Health System Revenue Bonds, Pinnacle Health System Project, Series 2012A, 5.000%, 6/01/42 | 6/22 at 100.00 | A | | 27,025 | |
| | 600 | | Geisinger Authority, Montour County, Pennsylvania, Health System Revenue Bonds, Geisinger Health System, Series 2009A, 5.250%, 6/01/39 | 6/19 at 100.00 | AA | | 669,648 | |
| | 100 | | Illinois Finance Authority, Revenue Bonds, OSF Healthcare System, Series 2007A, 5.750%, 11/15/37 | 11/17 at 100.00 | A | | 110,043 | |
| | 100 | | Lycoming County Authority, Pennsylvania, Health System Revenue Bonds, Susquehanna Health System Project, Series 2009, 5.750%, 7/01/39 | 7/19 at 100.00 | A– | | 111,290 | |
| | 500 | | Pennsylvania Economic Development Financing Authority, Health System Revenue Bonds , Albert Einstein Healthcare, Series 2009A, 6.250%, 10/15/23 | 10/19 at 100.00 | BBB+ | | 589,500 | |
| | 100 | | Philadelphia Hospitals and Higher Education Facilities Authority, Pennsylvania, Hospital Revenue Bonds, Temple University Health System Obligated Group, Series 2012A, 5.625%, 7/01/42 | 7/22 at 100.00 | BBB– | | 106,393 | |
| | 1,200 | | Southcentral Pennsylvania General Authority, Revenue Bonds, Hanover Hospital Inc., Series 2005, 5.000%, 12/01/29 – RAAI Insured | 12/15 at 100.00 | BBB– | | 1,224,873 | |
| | 730 | | St. Mary Hospital Authority, Pennsylvania, Health System Revenue Bonds, Catholic Health East, Series 2009D, 6.250%, 11/15/34 | 5/19 at 100.00 | A+ | | 847,567 | |
| | 100 | | West Shore Area Authority, Cumberland County, Pennsylvania, Hospital Revenue Bonds, Holy Spirit Hospital of the Sisters of Christian Charity, Series 2011B, 5.750%, 1/01/41 | 1/22 at 100.00 | BBB+ | | 114,928 | |
| | 4,105 | | Total Health Care | | | | 4,537,360 | |
| | | | Housing/Multifamily – 4.5% (4.6% of Total Investments) | | | | | |
| | 50 | | Pennsylvania Higher Educational Facilities Authority, Revenue Bonds, Edinboro University Foundation Student Housing Project, Series 2010, 6.000%, 7/01/43 | 7/20 at 100.00 | BBB– | | 56,650 | |
| | 800 | | Pittsburgh Urban Redevelopment Authority, Pennsylvania, Multifamily Housing Revenue Bonds, Eva P. Mithcell Residence Project, Series 2009, 5.100%, 10/20/44 | 10/19 at 100.00 | Aaa | | 865,687 | |
| | 850 | | Total Housing/Multifamily | | | | 922,337 | |
| | | Nuveen Pennsylvania Municipal Value Fund (continued) |
| NPN | | Portfolio of Investments |
October 31, 2012 (Unaudited)
| | Principal | | | Optional Call | | | | |
| | Amount (000) | | Description (1) | Provisions (2) | Ratings (3) | | Value | |
| | | | Housing/Single Family – 4.2% (4.3% of Total Investments) | | | | | |
| $ | 800 | | Pennsylvania Housing Finance Agency, Single Family Mortgage Revenue Bonds, Series 2009-105-C, 5.000%, 10/01/39 | 4/19 at 100.00 | AA+ | $ | 858,896 | |
| | | | Long-Term Care – 4.3% (4.4% of Total Investments) | | | | | |
| | 750 | | Montgomery County Industrial Development Authority, Pennsylvania, Retirement Communities Revenue Bonds, ACTS Retirement - Life Communities, Inc. Obligated Group, Series 2009A-1. 6.250%, 11/15/29 | 11/19 at 100.00 | A– | | 877,987 | |
| | | | Tax Obligation/General – 8.0% (8.2% of Total Investments) | | | | | |
| | 700 | | Bethel Park School District, Allegheny County, Pennsylvania, General Obligation Bonds, Series 2009, 5.100%, 8/01/33 | 8/19 at 100.00 | Aa2 | | 848,022 | |
| | | | Deer Lakes School District, Allegheny County, Pennsylvania, General Obligation Bonds, Series 2011A: | | | | | |
| | 100 | | 3.000%, 10/01/13 – AGM Insured | No Opt. Call | Aa3 | | 102,221 | |
| | 150 | | 3.000%, 10/01/14 – AGM Insured | No Opt. Call | Aa3 | | 156,372 | |
| | 80 | | Philadelphia School District, Pennsylvania, General Obligation Bonds, Series 2011C, 3.000%, 9/01/13 | No Opt. Call | AA | | 81,845 | |
| | 290 | | Pittsburgh, Pennsylvania, General Obligation Bonds, Series 2012B, 5.000%, 9/01/26 | 9/22 at 100.00 | A1 | | 338,204 | |
| | 100 | | Radnor Township School District, Delaware County, Pennsylvania, General Obligation Bonds, Series 2012, 3.000%, 2/15/34 | 2/18 at 100.00 | Aa2 | | 97,683 | |
| | 25 | | Scranton, Pennsylvania, General Obligation Bonds, Series 2012A, 8.500%, 9/01/22 | No Opt. Call | N/R | | 24,428 | |
| | 1,445 | | Total Tax Obligation/General | | | | 1,648,775 | |
| | | | Tax Obligation/Limited – 19.2% (19.7% of Total Investments) | | | | | |
| | 25 | | Allentown Neighborhood Improvement Zone Development Authority, Pennsylvania, Tax Revenue Bonds, Series 2012A, 5.000%, 5/01/35 | 5/22 at 100.00 | Baa2 | | 26,756 | |
| | 240 | | Government of Guam, Business Privilege Tax Bonds, Series 2011A, 5.250%, 1/01/36 | 1/22 at 100.00 | A | | 270,773 | |
| | 550 | | Guam Government, Limited Obligation Section 30 Revenue Bonds, Series 2009A, 5.750%, 12/01/34 | 12/19 at 100.00 | BBB+ | | 618,035 | |
| | 1,075 | | Harrisburg Parking Authority, Dauphin County, Pennsylvania, Guaranteed Parking Revenue Bonds, Series 2007R, 4.250%, 5/15/21 – SYNCORA GTY Insured | 11/16 at 100.00 | N/R | | 949,708 | |
| | 750 | | Philadelphia Municipal Authority, Philadelphia, Pennsylvania, Lease Revenue Bonds, Series 2009, 6.500%, 4/01/34 | 4/19 at 100.00 | A2 | | 873,367 | |
| | 750 | | Puerto Rico Sales Tax Financing Corporation, Sales Tax Revenue Bonds, First Subordinate Series 2009A, 6.000%, 8/01/42 | 8/19 at 100.00 | A+ | | 830,670 | |
| | 350 | | Southeastern Pennsylvania Transportation Authority, Capital Grant Receipts Bonds, Federal Transit Administration Section 5309 Fixed Guideway Modernization Formula Funds, Series 2011, 3.000%, 6/01/15 | No Opt. Call | A+ | | 368,172 | |
| | 3,740 | | Total Tax Obligation/Limited | | | | 3,937,481 | |
| | | | Transportation – 6.0% (6.1% of Total Investments) | | | | | |
| | 240 | | Delaware River Port Authority, New Jersey and Pennsylvania, Revenue Bonds, Series 2010E, 5.000%, 1/01/40 | 1/20 at 100.00 | A– | | 268,848 | |
| | | | Pennsylvania Turnpike Commission, Motor License Fund-Enhanced Subordinate Special Revenue Bonds, Series 2010A: | | | | | |
| | 580 | | 0.000%, 12/01/34 | 12/20 at 100.00 | AA | | 563,598 | |
| | 100 | | 5.000%, 12/01/38 | 12/19 at 100.00 | AA | | 111,224 | |
| | 50 | | Pennsylvania Turnpike Commission, Turnpike Revenue Bonds, Subordinate Lien, Refunding Series 2010B-1, 5.000%, 12/01/37 | 12/19 at 100.00 | A– | | 54,325 | |
| | 30 | | Susquehanna Area Regional Airport Authority, Pennsylvania, Airport System Revenue Bonds, Series 2003A, 5.000%, 1/01/28 – AMBAC Insured (Alternative Minimum Tax) | 1/13 at 100.00 | Baa3 | | 29,129 | |
| | 200 | | Susquehanna Area Regional Airport Authority, Pennsylvania, Airport System Revenue Bonds, Series 2003B, 5.000%, 1/01/33 – AMBAC Insured | 1/13 at 100.00 | Baa3 | | 200,018 | |
| | 1,200 | | Total Transportation | | | | 1,227,142 | |
| | Principal | | | Optional Call | | | | |
| | Amount (000) | | Description (1) | Provisions (2) | Ratings (3) | | Value | |
| | | | U.S. Guaranteed – 2.1% (2.2% of Total Investments) (4) | | | | | |
| $ | 5 | | Allegheny County Hospital Development Authority, Pennsylvania, Hospital Revenue Bonds, Allegheny Valley Hospital - Sublessee, Series 1982Q, 7.000%, 8/01/15 (ETM) | No Opt. Call | AA+ (4) | $ | 5,674 | |
| | 200 | | Hazleton Area School District, Luzerne County, Pennsylvania, General Obligation Bonds, Series 2004, 5.125%, 3/01/28 (Pre-refunded 9/01/14) – AGM Insured | 9/14 at 100.00 | Aa3 (4) | | 217,594 | |
| | 200 | | Wisconsin Health and Educational Facilities Authority, Revenue Bonds, ProHealth Care, Inc. Obligated Group, Series 2009, 6.625%, 2/15/32 (Pre-refunded 2/18/14) | 2/14 at 100.00 | A+ (4) | | 216,212 | |
| | 405 | | Total U.S. Guaranteed | | | | 439,480 | |
| | | | Utilities – 0.9% (0.9% of Total Investments) | | | | | |
| | 180 | | Delaware County Industrial Development Authority, Pennsylvania, Resource Recovery Revenue Refunding Bonds, Series 1997A, 6.100%, 7/01/13 (Mandatory put 1/01/13) | No Opt. Call | Ba1 | | 180,734 | |
| | | | Water and Sewer – 12.0% (12.3% of Total Investments) | | | | | |
| | 175 | | Bucks County Water and Sewer Authority, Pennsylvania, Revenue Bonds, Tender Option Bond Trust 4015, 13.102%, 12/01/19 (IF) (5) | No Opt. Call | AA– | | 260,880 | |
| | 750 | | Chester County Industrial Development Authority, Pennsylvania, Water Facilities Revenue Bonds, Aqua Pennsylvania Inc. Project, Series 2007A, 5.000%, 2/01/40 – FGIC Insured (Alternative Minimum Tax) | 2/17 at 100.00 | AA– | | 792,360 | |
| | | | Philadelphia, Pennsylvania, Water and Wastewater Revenue Bonds, Series 2009A: | | | | | |
| | 750 | | 5.250%, 1/01/32 | 1/19 at 100.00 | A1 | | 845,903 | |
| | 500 | | 5.250%, 1/01/36 | 1/19 at 100.00 | A1 | | 557,375 | |
| | 2,175 | | Total Water and Sewer | | | | 2,456,518 | |
| $ | 18,290 | | Total Investments (cost $17,374,865) – 97.6% | | | | 20,012,974 | |
| | | | Other Assets Less Liabilities – 2.4% | | | | 497,327 | |
| | | | Net Assets Applicable to Common Shares – 100% | | | $ | 20,510,301 | |
| (1) | | All percentages shown in the Portfolio of Investments are based on net assets applicable to Common shares unless otherwise noted. |
| (2) | | Optional Call Provisions: Dates (month and year) and prices of the earliest optional call or redemption. There may be other call provisions at varying prices at later dates. Certain mortgage-backed securities may be subject to periodic principal paydowns. |
| (3) | | Ratings: Using the highest of Standard & Poor’s Group (“Standard & Poor’s”), Moody’s Investors Service, Inc. (“Moody’s”) or Fitch, Inc. (“Fitch”) rating. Ratings below BBB by Standard & Poor’s, Baa by Moody’s or BBB by Fitch are considered to be below investment grade. Holdings designated N/R are not rated by any of these national rating agencies. |
| (4) | | Backed by an escrow or trust containing sufficient U.S. Government or U.S. Government agency securities, which ensure the timely payment of principal and interest. Certain bonds backed by U.S. Government or agency securities are regarded as having an implied rating equal to the rating of such securities. |
| (5) | | Investment, or portion of investment, has been pledged to collateralize the net payment obligations for investments in inverse floating rate transactions. |
| N/R | | Not rated. |
| (ETM) | | Escrowed to maturity. |
| (IF) | | Inverse floating rate investment. |
See accompanying notes to financial statements.
| | | Statement of |
| | | Assets & Liabilities |
| | | October 31, 2012 (Unaudited) |
| | | | New Jersey Investment Quality (NQJ | ) | | New Jersey Premium Income (NNJ | ) | | New Jersey Dividend Advantage (NXJ | ) | | New Jersey Dividend Advantage 2 (NUJ | ) | | New Jersey Municipal Value (NJV | ) |
| Assets | | | | | | | | | | | | | | | | |
Investments, at value (cost $426,817,472, $260,494,351, $135,397,704, $96,848,290 and $23,463,155, respectively) | | $ | 458,423,696 | | $ | 283,145,167 | | $ | 148,660,517 | | $ | 103,767,661 | | $ | 27,332,612 | |
| Cash | | | 2,146,627 | | | 437,858 | | | 301,517 | | | 509,081 | | | 571,320 | |
| Receivables: | | | | | | | | | | | | | | | | |
| Interest | | | 6,875,374 | | | 4,061,229 | | | 2,011,776 | | | 1,595,828 | | | 379,287 | |
| Investments sold | | | 1,020,683 | | | — | | | — | | | 1,037,667 | | | — | |
| Deferred offering costs | | | 774,430 | | | 534,367 | | | 437,819 | | | 510,690 | | | — | |
| Other assets | | | 152,582 | | | 96,192 | | | 3,523 | | | 3,369 | | | 570 | |
| Total assets | | | 469,393,392 | | | 288,274,813 | | | 151,415,152 | | | 107,424,296 | | | 28,283,789 | |
| Liabilities | | | | | | | | | | | | | | | | |
| Floating rate obligations | | | — | | | — | | | — | | | — | | | 1,500,000 | |
| Cash overdraft | | | — | | | — | | | — | | | — | | | — | |
| Payables: | | | | | | | | | | | | | | | | |
| Common share dividends | | | 1,262,607 | | | 759,772 | | | 411,775 | | | 293,003 | | | 78,989 | |
| Interest | | | — | | | — | | | 85,979 | | | 58,413 | | | — | |
| Investments purchased | | | 701,944 | | | 1,838,928 | | | — | | | 919,464 | | | — | |
| Offering costs | | | — | | | — | | | 74,924 | | | 66,748 | | | — | |
| MuniFund Term Preferred (MTP) Shares,at liquidation value | | | — | | | — | | | 44,861,000 | | | 35,050,000 | | | — | |
| Variable Rate Demand Preferred (VRDP) Shares,at liquidation value | | | 144,300,000 | | | 88,600,000 | | | — | | | — | | | — | |
| Accrued expenses: | | | | | | | | | | | | | | | | |
| Management fees | | | 242,354 | | | 149,578 | | | 80,409 | | | 56,320 | | | 13,586 | |
| Directors/Trustees fees | | | 55,044 | | | 33,075 | | | 1,109 | | | 779 | | | 196 | |
| Other | | | 117,803 | | | 81,184 | | | 62,051 | | | 54,630 | | | 18,288 | |
| Total liabilities | | | 146,679,752 | | | 91,462,537 | | | 45,577,247 | | | 36,499,357 | | | 1,611,059 | |
| Net assets applicable to Common shares | | $ | 322,713,640 | | $ | 196,812,276 | | $ | 105,837,905 | | $ | 70,924,939 | | $ | 26,672,730 | |
| Common shares outstanding | | | 20,475,963 | | | 12,065,299 | | | 6,569,912 | | | 4,525,735 | | | 1,562,489 | |
| Net asset value per Common share outstanding (net assets applicable to Common shares, divided by Common shares outstanding) | | $ | 15.76 | | $ | 16.31 | | $ | 16.11 | | $ | 15.67 | | $ | 17.07 | |
| Net assets applicable to Common shares consist of: | | | | | | | | | | | | | | | | |
| Common shares, $.01 par value per share | | $ | 204,760 | | $ | 120,653 | | $ | 65,699 | | $ | 45,257 | | $ | 15,625 | |
| Paid-in surplus | | | 289,030,021 | | | 172,305,973 | | | 92,998,986 | | | 63,953,208 | | | 22,314,216 | |
| Undistributed (Over-distribution of) net investment income | | | 3,588,312 | | | 2,599,320 | | | 380,781 | | | 382,397 | | | 65,193 | |
| Accumulated net realized gain (loss) | | | (1,715,677 | ) | | (864,486 | ) | | (870,374 | ) | | (375,294 | ) | | 408,239 | |
| Net unrealized appreciation (depreciation) | | | 31,606,224 | | | 22,650,816 | | | 13,262,813 | | | 6,919,371 | | | 3,869,457 | |
| Net assets applicable to Common shares | | $ | 322,713,640 | | $ | 196,812,276 | | $ | 105,837,905 | | $ | 70,924,939 | | $ | 26,672,730 | |
| Authorized shares: | | | | | | | | | | | | | | | | |
| Common | | | 200,000,000 | | | 200,000,000 | | | Unlimited | | | Unlimited | | | Unlimited | |
| Preferred | | | 1,000,000 | | | 1,000,000 | | | Unlimited | | | Unlimited | | | N/A | |
| N/A – Fund is not authorized to issue Preferred shares. | | | | | | | | | | | | | | | | |
See accompanying notes to financial statements.
| | | | Pennsylvania Investment Quality (NQP | ) | | Pennsylvania Premium Income 2 (NPY | ) | | Pennsylvania Dividend Advantage (NXM | ) | | Pennsylvania Dividend Advantage 2 (NVY | ) | | Pennsylvania Municipal Value (NPN | ) |
| Assets | | | | | | | | | | | | | | | | |
Investments, at value (cost $342,604,525, $312,972,813, $68,396,927, $78,824,481 and $17,374,865, respectively) | | $ | 374,252,833 | | $ | 341,879,696 | | $ | 74,050,497 | | $ | 84,270,728 | | $ | 20,012,974 | |
| Cash | | | 1,424,394 | | | 392,639 | | | 677,545 | | | — | | | 301,918 | |
| Receivables: | | | | | | | | | | | | | | | | |
| Interest | | | 5,568,607 | | | 5,109,590 | | | 1,085,004 | | | 1,144,323 | | | 271,190 | |
| Investments sold | | | 22,510,578 | | | 6,095,355 | | | 1,114,642 | | | 1,767,367 | | | 10,000 | |
| Deferred offering costs | | | 646,631 | | | 594,057 | | | 403,452 | | | 420,722 | | | — | |
| Other assets | | | 122,098 | | | 110,871 | | | 3,273 | | | 3,261 | | | 499 | |
| Total assets | | | 404,525,141 | | | 354,182,208 | | | 77,334,413 | | | 87,606,401 | | | 20,596,581 | |
| Liabilities | | | | | | | | | | | | | | | | |
| Floating rate obligations | | | 25,810,000 | | | 10,115,000 | | | 530,000 | | | 4,035,000 | | | — | |
| Cash overdraft | | | — | | | — | | | — | | | 9,240 | | | — | |
| Payables: | | | | | | | | | | | | | | | | |
| Common share dividends | | | 1,097,299 | | | 991,600 | | | 211,273 | | | 269,820 | | | 58,794 | |
| Interest | | | — | | | — | | | 40,582 | | | 43,983 | | | — | |
| Investments purchased | | | 2,685,139 | | | 210,802 | | | 302,079 | | | 323,070 | | | — | |
| Offering costs | | | — | | | — | | | 101,217 | | | 86,623 | | | — | |
| MuniFund Term Preferred (MTP) Shares, at liquidation value | | | — | | | — | | | 23,190,000 | | | 24,550,000 | | | — | |
| Variable Rate Demand Preferred (VRDP) Shares, at liquidation value | | | 112,500,000 | | | 100,000,000 | | | — | | | — | | | — | |
| Accrued expenses: | | | | | | | | | | | | | | | | |
| Management fees | | | 195,624 | | | 180,156 | | | 40,597 | | | 45,817 | | | 10,052 | |
| Directors/Trustees fees | | | 44,281 | | | 40,829 | | | 560 | | | 610 | | | 151 | |
| Other | | | 102,223 | | | 97,137 | | | 43,967 | | | 46,839 | | | 17,283 | |
| Total liabilities | | | 142,434,566 | | | 111,635,524 | | | 24,460,275 | | | 29,411,002 | | | 86,280 | |
| Net assets applicable to Common shares | | $ | 262,090,575 | | $ | 242,546,684 | | $ | 52,874,138 | | $ | 58,195,399 | | $ | 20,510,301 | |
| Common shares outstanding | | | 16,103,410 | | | 15,595,551 | | | 3,321,984 | | | 3,726,116 | | | 1,219,352 | |
| Net asset value per Common share outstanding (net assets applicable to Common shares, divided by Common shares outstanding) | | $ | 16.28 | | $ | 15.55 | | $ | 15.92 | | $ | 15.62 | | $ | 16.82 | |
| Net assets applicable to Common shares consist of: | | | | | | | | | | | | | | | | |
| Common shares, $.01 par value per share | | $ | 161,034 | | $ | 155,956 | | $ | 33,220 | | $ | 37,261 | | $ | 12,194 | |
| Paid-in surplus | | | 228,240,819 | | | 213,674,089 | | | 46,983,897 | | | 52,626,149 | | | 17,430,475 | |
| Undistributed (Over-distribution of) net investment income | | | 2,573,091 | | | 3,199,986 | | | 212,460 | | | 325,829 | | | 61,949 | |
| Accumulated net realized gain (loss) | | | (532,677 | ) | | (3,390,230 | ) | | (9,009 | ) | | (240,087 | ) | | 367,574 | |
| Net unrealized appreciation (depreciation) | | | 31,648,308 | | | 28,906,883 | | | 5,653,570 | | | 5,446,247 | | | 2,638,109 | |
| Net assets applicable to Common shares | | $ | 262,090,575 | | $ | 242,546,684 | | $ | 52,874,138 | | $ | 58,195,399 | | $ | 20,510,301 | |
| Authorized shares: | | | | | | | | | | | | | | | | |
| Common | | | Unlimited | | | Unlimited | | | Unlimited | | | Unlimited | | | Unlimited | |
| Preferred | | | Unlimited | | | Unlimited | | | Unlimited | | | Unlimited | | | N/A | |
| N/A – Fund is not authorized to issue Preferred shares. | | | | | | | | | | | | | | | | |
See accompanying notes to financial statements.
Six Months Ended October 31, 2012 (Unaudited)
| | | | New Jersey Investment Quality (NQJ | ) | | New Jersey Premium Income (NNJ | ) | | New Jersey Dividend Advantage (NXJ | ) | | New Jersey Dividend Advantage 2 (NUJ | ) | | New Jersey Municipal Value (NJV | ) |
| Investment Income | | $ | 10,685,131 | | $ | 6,568,767 | | $ | 3,351,612 | | $ | 2,439,123 | | $ | 634,013 | |
| Expenses | | | | | | | | | | | | | | | | |
| Management fees | | | 1,431,295 | | | 883,568 | | | 474,407 | | | 332,841 | | | 80,233 | |
| Shareholder servicing agent fees and expenses | | | 11,984 | | | 7,445 | | | 8,715 | | | 8,775 | | | 95 | |
| Interest expense and amortization of offering costs | | | 231,116 | | | 143,843 | | | 666,006 | | | 432,355 | | | 5,971 | |
| Liquidity fees | | | 563,383 | | | 345,917 | | | — | | | — | | | — | |
| Remarketing fees | | | 73,753 | | | 45,284 | | | — | | | — | | | — | |
| Custodian’s fees and expenses | | | 37,297 | | | 24,461 | | | 15,046 | | | 11,168 | | | 4,369 | |
| Directors/Trustees fees and expenses | | | 6,908 | | | 4,222 | | | 2,209 | | | 1,556 | | | 379 | |
| Professional fees | | | 29,336 | | | 22,421 | | | 15,114 | | | 13,308 | | | 8,725 | |
| Shareholder reporting expenses | | | 47,495 | | | 31,134 | | | 29,998 | | | 24,745 | | | 5,813 | |
| Stock exchange listing fees | | | 4,250 | | | 4,250 | | | 7,969 | | | 7,835 | | | 101 | |
| Investor relations expense | | | 19,847 | | | 12,444 | | | 7,198 | | | 5,520 | | | 1,574 | |
| Other expenses | | | 29,311 | | | 28,703 | | | 13,954 | | | 11,959 | | | 2,438 | |
| Total expenses before custodian fee credit | | | 2,485,975 | | | 1,553,692 | | | 1,240,616 | | | 850,062 | | | 109,698 | |
| Custodian fee credit | | | (1,123 | ) | | (686 | ) | | (1,047 | ) | | (1,368 | ) | | (336 | ) |
| Net expenses | | | 2,484,852 | | | 1,553,006 | | | 1,239,569 | | | 848,694 | | | 109,362 | |
| Net investment income (loss) | | | 8,200,279 | | | 5,015,761 | | | 2,112,043 | | | 1,590,429 | | | 524,651 | |
| Realized and Unrealized Gain (Loss) | | | | | | | | | | | | | | | | |
| Net realized gain (loss) from investments | | | 648,086 | | | 280,106 | | | 94,401 | | | 292,705 | | | 71,735 | |
| Change in net unrealized appreciation (depreciation) of investments | | | 9,093,331 | | | 5,391,112 | | | 5,661,786 | | | 1,998,313 | | | 637,745 | |
| Net realized and unrealized gain (loss) | | | 9,741,417 | | | 5,671,218 | | | 5,756,187 | | | 2,291,018 | | | 709,480 | |
| Net increase (decrease) in net assets applicable to Common shares from operations | | $ | 17,941,696 | | $ | 10,686,979 | | $ | 7,868,230 | | $ | 3,881,447 | | $ | 1,234,131 | |
See accompanying notes to financial statements.
| | | | Pennsylvania Investment Quality (NQP | ) | | Pennsylvania Premium Income 2 (NPY | ) | | Pennsylvania Dividend Advantage (NXM | ) | | Pennsylvania Dividend Advantage 2 (NVY | ) | | Pennsylvania Municipal Value (NPN | ) |
| Investment Income | | $ | 9,032,077 | | $ | 8,338,471 | | $ | 1,776,463 | | $ | 2,114,495 | | $ | 506,926 | |
| Expenses | | | | | | | | | | | | | | | | |
| Management fees | | | 1,154,816 | | | 1,066,073 | | | 239,945 | | | 271,042 | | | 59,293 | |
| Shareholder servicing agent fees and expenses | | | 12,525 | | | 10,515 | | | 8,780 | | | 8,720 | | | 71 | |
| Interest expense and amortization of offering costs | | | 243,277 | | | 205,081 | | | 312,242 | | | 348,658 | | | — | |
| Liquidity fees | | | 439,228 | | | 390,423 | | | — | | | — | | | — | |
| Remarketing fees | | | 57,500 | | | 51,111 | | | — | | | — | | | — | |
| Custodian’s fees and expenses | | | 30,699 | | | 28,806 | | | 9,850 | | | 9,940 | | | 3,539 | |
| Directors/Trustees fees and expenses | | | 5,547 | | | 5,085 | | | 1,119 | | | 1,219 | | | 292 | |
| Professional fees | | | 25,899 | | | 24,540 | | | 12,578 | | | 12,743 | | | 8,598 | |
| Shareholder reporting expenses | | | 42,826 | | | 41,584 | | | 17,585 | | | 19,609 | | | 5,528 | |
| Stock exchange listing fees | | | 4,250 | | | 4,250 | | | 7,792 | | | 7,783 | | | 79 | |
| Investor relations expense | | | 17,228 | | | 15,799 | | | 4,157 | | | 4,593 | | | 1,365 | |
| Other expenses | | | 26,545 | | | 25,873 | | | 13,080 | | | 11,210 | | | 2,174 | |
| Total expenses before custodian fee credit | | | 2,060,340 | | | 1,869,140 | | | 627,128 | | | 695,517 | | | 80,939 | |
| Custodian fee credit | | | (4,607 | ) | | (1,709 | ) | | (1,167 | ) | | (554 | ) | | (199 | ) |
| Net expenses | | | 2,055,733 | | | 1,867,431 | | | 625,961 | | | 694,963 | | | 80,740 | |
| Net investment income (loss) | | | 6,976,344 | | | 6,471,040 | | | 1,150,502 | | | 1,419,532 | | | 426,186 | |
| Realized and Unrealized Gain (Loss) | | | | | | | | | | | | | | | | |
| Net realized gain (loss) from investments | | | 435,431 | | | 697,717 | | | 129,856 | | | 147,572 | | | 23,294 | |
| Change in net unrealized appreciation (depreciation) of investments | | | 8,014,133 | | | 5,889,362 | | | 1,647,652 | | | 1,715,272 | | | 500,306 | |
| Net realized and unrealized gain (loss) | | | 8,449,564 | | | 6,587,079 | | | 1,777,508 | | | 1,862,844 | | | 523,600 | |
| Net increase (decrease) in net assets applicable to Common shares from operations | | $ | 15,425,908 | | $ | 13,058,119 | | $ | 2,928,010 | | $ | 3,282,376 | | $ | 949,786 | |
See accompanying notes to financial statements.
| | | Statement of |
| | | Changes in Net Assets (Unaudited) |
| | | | New Jersey Investment Quality (NQJ) | | | New Jersey Premium Income (NNJ) | |
| | | | Six Months Ended 10/31/12 | | | Year Ended 4/30/12 | | | Six Months Ended 10/31/12 | | | Year Ended 4/30/12 | |
| Operations | | | | | | | | | | | | | |
| Net investment income (loss) | | $ | 8,200,279 | | $ | 17,008,773 | | $ | 5,015,761 | | $ | 10,267,598 | |
| Net realized gain (loss) from investments | | | 648,086 | | | (865,021 | ) | | 280,106 | | | (308,644 | ) |
| Change in net unrealized appreciation (depreciation) of investments | | | 9,093,331 | | | 34,150,935 | | | 5,391,112 | | | 20,146,359 | |
| Net increase (decrease) in net assets applicable to Common shares from operations | | | 17,941,696 | | | 50,294,687 | | | 10,686,979 | | | 30,105,313 | |
| Distributions to Common Shareholders | | | | | | | | | | | | | |
| From net investment income | | | (8,656,119 | ) | | (17,181,129 | ) | | (5,243,467 | ) | | (10,280,951 | ) |
| From accumulated net realized gains | | | — | | | — | | | — | | | (126,384 | ) |
| Decrease in net assets applicable to Common shares from distributions to Common shareholders | | | (8,656,119 | ) | | (17,181,129 | ) | | (5,243,467 | ) | | (10,407,335 | ) |
| Capital Share Transactions | | | | | | | | | | | | | |
| Net proceeds from Common shares issued to shareholders due to reinvestment of distributions | | | 346,517 | | | — | | | 368,701 | | | 89,789 | |
| Net increase (decrease) in net assets applicable to Common shares from capital share transactions | | | 346,517 | | | — | | | 368,701 | | | 89,789 | |
| Net increase (decrease) in net assets applicable to Common shares | | | 9,632,094 | | | 33,113,558 | | | 5,812,213 | | | 19,787,767 | |
| Net assets applicable to Common shares at the beginning of period | | | 313,081,546 | | | 279,967,988 | | | 191,000,063 | | | 171,212,296 | |
| Net assets applicable to Common shares at the end of period | | $ | 322,713,640 | | $ | 313,081,546 | | $ | 196,812,276 | | $ | 191,000,063 | |
| Undistributed (Over-distribution of) net investment income at the end of period | | $ | 3,588,312 | | $ | 4,044,152 | | $ | 2,599,320 | | $ | 2,827,026 | |
See accompanying notes to financial statements.
| | | | New Jersey Dividend Advantage (NXJ) | | | New Jersey Dividend Advantage 2 (NUJ) | | | New Jersey Municipal Value (NJV) | |
| | | | Six Months Ended 10/31/12 | | | Year Ended 4/30/12 | | | Six Months Ended 10/31/12 | | | Year Ended 4/30/12 | | | Six Months Ended 10/31/12 | | | Year Ended 4/30/12 | |
| Operations | | | | | | | | | | | | | | | | | | | |
| Net investment income (loss) | | $ | 2,112,043 | | $ | 4,635,973 | | $ | 1,590,429 | | $ | 3,483,887 | | $ | 524,651 | | $ | 1,171,320 | |
| Net realized gain (loss) from investments | | | 94,401 | | | (480,592 | ) | | 292,705 | | | (338,868 | ) | | 71,735 | | | 349,986 | |
| Change in net unrealized appreciation (depreciation) of investments | | | 5,661,786 | | | 12,538,713 | | | 1,998,313 | | | 8,174,233 | | | 637,745 | | | 2,619,397 | |
| Net increase (decrease) in net assets applicable to Common shares from operations | | | 7,868,230 | | | 16,694,094 | | | 3,881,447 | | | 11,319,252 | | | 1,234,131 | | | 4,140,703 | |
| Distributions to Common Shareholders | | | | | | | | | | | | | | | | | | | |
| From net investment income | | | (2,608,255 | ) | | (5,479,307 | ) | | (1,895,979 | ) | | (3,881,115 | ) | | (531,136 | ) | | (1,180,090 | ) |
| From accumulated net realized gains | | | — | | | (35,478 | ) | | — | | | (39,352 | ) | | — | | | — | |
| Decrease in net assets applicable to Common shares from distributions to Common shareholders | | | (2,608,255 | ) | | (5,514,785 | ) | | (1,895,979 | ) | | (3,920,467 | ) | | (531,136 | ) | | (1,180,090 | ) |
| Capital Share Transactions | | | | | | | | | | | | | | | | | | | |
| Net proceeds from Common shares issued to shareholders due to reinvestment of distributions | | | — | | | — | | | 28,171 | | | 9,602 | | | 13,131 | | | 15,231 | |
| Net increase (decrease) in net assets applicable to Common shares from capital share transactions | | | — | | | — | | | 28,171 | | | 9,602 | | | 13,131 | | | 15,231 | |
| Net increase (decrease) in net assets applicable to Common shares | | | 5,259,975 | | | 11,179,309 | | | 2,013,639 | | | 7,408,387 | | | 716,126 | | | 2,975,844 | |
| Net assets applicable to Common shares at the beginning of period | | | 100,577,930 | | | 89,398,621 | | | 68,911,300 | | | 61,502,913 | | | 25,956,604 | | | 22,980,760 | |
| Net assets applicable to Common shares at the end of period | | $ | 105,837,905 | | $ | 100,577,930 | | $ | 70,924,939 | | $ | 68,911,300 | | $ | 26,672,730 | | $ | 25,956,604 | |
| Undistributed (Over-distribution of) net investment income at the end of period | | $ | 380,781 | | $ | 876,993 | | $ | 382,397 | | $ | 687,947 | | $ | 65,193 | | $ | 71,678 | |
See accompanying notes to financial statements.
| | | Statement of |
| | | Changes in Net Assets (Unaudited) (continued) |
| | | | Pennsylvania Investment Quality (NQP) | | | Pennsylvania Premium Income 2 (NPY) | |
| | | | Six Months Ended 10/31/12 | | | Year Ended 4/30/12 | | | Six Months Ended 10/31/12 | | | Year Ended 4/30/12 | |
| Operations | | | | | | | | | | | | | |
| Net investment income (loss) | | $ | 6,976,344 | | $ | 14,531,161 | | $ | 6,471,040 | | $ | 12,986,690 | |
| Net realized gain (loss) from investments | | | 435,431 | | | 1,184,990 | | | 697,717 | | | 553,848 | |
| Change in net unrealized appreciation (depreciation) of investments | | | 8,014,133 | | | 26,107,807 | | | 5,889,362 | | | 24,759,260 | |
| Net increase (decrease) in net assets applicable to Common shares from operations | | | 15,425,908 | | | 41,823,958 | | | 13,058,119 | | | 38,299,798 | |
| Distributions to Common Shareholders | | | | | | | | | | | | | |
| From net investment income | | | (7,532,183 | ) | | (14,891,410 | ) | | (6,550,131 | ) | | (13,100,263 | ) |
| From accumulated net realized gains | | | — | | | — | | | — | | | — | |
| Decrease in net assets applicable to Common shares from distributions to Common shareholders | | | (7,532,183 | ) | | (14,891,410 | ) | | (6,550,131 | ) | | (13,100,263 | ) |
| Capital Share Transactions | | | | | | | | | | | | | |
| Net proceeds from Common shares issued to shareholders due to reinvestment of distributions | | | 259,859 | | | 99,350 | | | — | | | — | |
| Net increase (decrease) in net assets applicable to Common shares from capital share transactions | | | 259,859 | | | 99,350 | | | — | | | — | |
| Net increase (decrease) in net assets applicable to Common shares | | | 8,153,584 | | | 27,031,898 | | | 6,507,988 | | | 25,199,535 | |
| Net assets applicable to Common shares at the beginning of period | | | 253,936,991 | | | 226,905,093 | | | 236,038,696 | | | 210,839,161 | |
| Net assets applicable to Common shares at the end of period | | $ | 262,090,575 | | $ | 253,936,991 | | $ | 242,546,684 | | $ | 236,038,696 | |
| Undistributed (Over-distribution of)net investment income at the end of period | | $ | 2,573,091 | | $ | 3,128,930 | | $ | 3,199,986 | | $ | 3,279,077 | |
See accompanying notes to financial statements.
| | | | Pennsylvania Dividend Advantage (NXM) | | | Pennsylvania Dividend Advantage 2 (NVY) | | | Pennsylvania Municipal Value (NPN) | |
| | | | Six Months Ended 10/31/12 | | | Year Ended 4/30/12 | | | Six Months Ended 10/31/12 | | | Year Ended 4/30/12 | | | Six Months Ended 10/31/12 | | | Year Ended 4/30/12 | |
| Operations | | | | | | | | | | | | | | | | | | | |
| Net investment income (loss) | | $ | 1,150,502 | | $ | 2,456,220 | | $ | 1,419,532 | | $ | 2,941,594 | | $ | 426,186 | | $ | 882,773 | |
| Net realized gain (loss) from investments | | | 129,856 | | | 165,896 | | | 147,572 | | | 152,162 | | | 23,294 | | | 371,929 | |
| Change in net unrealized appreciation (depreciation) of investments | | | 1,647,652 | | | 5,231,434 | | | 1,715,272 | | | 4,576,945 | | | 500,306 | | | 1,560,979 | |
| Net increase (decrease) in net assets applicable to Common shares from operations | | | 2,928,010 | | | 7,853,550 | | | 3,282,376 | | | 7,670,701 | | | 949,786 | | | 2,815,681 | |
| Distributions to Common Shareholders | | | | | | | | | | | | | | | | | | | |
| From net investment income | | | (1,343,743 | ) | | (2,870,194 | ) | | (1,665,574 | ) | | (3,331,148 | ) | | (387,754 | ) | | (868,179 | ) |
| From accumulated net realized gains | | | — | | | (214,268 | ) | | — | | | (230,647 | ) | | — | | | (27,923 | ) |
| Decrease in net assets applicable to Common shares from distributions to Common shareholders | | | (1,343,743 | ) | | (3,084,462 | ) | | (1,665,574 | ) | | (3,561,795 | ) | | (387,754 | ) | | (896,102 | ) |
| Capital Share Transactions | | | | | | | | | | | | | | | | | | | |
| Net proceeds from Common shares issued to shareholders due to reinvestment of distributions | | | — | | | — | | | — | | | — | | | — | | | — | |
| Net increase (decrease) in net assets applicable to Common shares from capital share transactions | | | — | | | — | | | — | | | — | | | — | | | — | |
| Net increase (decrease) in net assets applicable to Common shares | | | 1,584,267 | | | 4,769,088 | | | 1,616,802 | | | 4,108,906 | | | 562,032 | | | 1,919,579 | |
| Net assets applicable to Common shares at the beginning of period | | | 51,289,871 | | | 46,520,783 | | | 56,578,597 | | | 52,469,691 | | | 19,948,269 | | | 18,028,690 | |
| Net assets applicable to Common shares at the end of period | | $ | 52,874,138 | | $ | 51,289,871 | | $ | 58,195,399 | | $ | 56,578,597 | | $ | 20,510,301 | | $ | 19,948,269 | |
| Undistributed (Over-distribution of) net investment income at the end of period | | $ | 212,460 | | $ | 405,701 | | $ | 325,829 | | $ | 571,871 | | $ | 61,949 | | $ | 23,517 | |
See accompanying notes to financial statements.
Six Months Ended October 31, 2012 (Unaudited)
| | | | New Jersey Investment Quality (NQJ | ) | | New Jersey Premium Income (NNJ | ) | | New Jersey Dividend Advantage (NXJ | ) |
| Cash Flows from Operating Activities: | | | | | | | | | | |
| Net Increase (Decrease) in Net Assets Applicable to Common Shares from Operations | | $ | 17,941,696 | | $ | 10,686,979 | | $ | 7,868,230 | |
Adjustments to reconcile the net increase (decrease) in net assets applicable to Common shares from operations to net cash provided by (used in) operating activities: | | | | | | | | | | |
| Purchases of investments | | | (33,535,554 | ) | | (19,704,652 | ) | | (12,401,329 | ) |
| Proceeds from sales and maturities of investments | | | 34,622,877 | | | 16,824,173 | | | 12,714,491 | |
| Proceeds from (Purchases of) short-term investments, net | | | — | | | — | | | — | |
| Amortization (Accretion) of premiums and discounts, net | | | 184,860 | | | 43,168 | | | (181,143 | ) |
| (Increase) Decrease in: | | | | | | | | | | |
| Receivable for interest | | | 15,189 | | | 33,508 | | | 144,224 | |
| Receivable for investments sold | | | (1,020,683 | ) | | 1,186,321 | | | 5,266,677 | |
| Other assets | | | 2,109 | | | 1,262 | | | 10,809 | |
| Increase (Decrease) in: | | | | | | | | | | |
| Payable for interest | | | — | | | — | | | (5,725 | ) |
| Payable for investments purchased | | | 701,944 | | | 1,838,928 | | | (5,671,303 | ) |
| Accrued management fees | | | 11,990 | | | 7,311 | | | 4,994 | |
| Accrued Directors/Trustees fees | | | 940 | | | 582 | | | (32 | ) |
| Accrued other expenses | | | 21,458 | | | 7,759 | | | 12,598 | |
| Net realized (gain) loss from investments | | | (648,086 | ) | | (280,106 | ) | | (94,401 | ) |
| Change in net unrealized (appreciation) depreciation of investments | | | (9,093,331 | ) | | (5,391,112 | ) | | (5,661,786 | ) |
| Taxes paid on undistributed capital gains | | | (36 | ) | | — | | | (127 | ) |
| Net cash provided by (used in) operating activities | | | 9,205,373 | | | 5,254,121 | | | 2,006,177 | |
| Cash Flows from Financing Activities | | | | | | | | | | |
| (Increase) Decrease in deferred offering costs | | | (24,323 | ) | | 60,910 | | | 155,820 | |
| Increase (Decrease) in: | | | | | | | | | | |
| Floating rate obligations | | | — | | | — | | | — | |
| Cash overdraft | | | — | | | — | | | — | |
| Payable for offering costs | | | (22,365 | ) | | (89,123 | ) | | (32,874 | ) |
| Cash distributions paid to Common shareholders | | | (8,305,663 | ) | | (4,871,433 | ) | | (2,634,335 | ) |
| Net cash provided by (used in) financing activities | | | (8,352,351 | ) | | (4,899,646 | ) | | (2,511,389 | ) |
| Net Increase (Decrease) in Cash | | | 853,022 | | | 354,475 | | | (505,212 | ) |
| Cash at the beginning of period | | | 1,293,605 | | | 83,383 | | | 806,729 | |
| Cash at the end of Period | | $ | 2,146,627 | | $ | 437,858 | | $ | 301,517 | |
Supplemental Disclosure of Cash Flow Information
Non-cash financing activities not included herein consist of reinvestments of Common share distributions of $346,517 and $368,701 for New Jersey Investment Quality (NQJ) and New Jersey Premium Income (NNJ), respectively.
| | | | New Jersey | | | New Jersey | | | New Jersey | |
| | | | Investment | | | Premium | | | Dividend | |
| | | | Quality | | | Income | | | Advantage | |
| | | | (NQJ | ) | | (NNJ | ) | | (NXJ | ) |
| Cash paid for interest (excluding amortization of offering costs) | | $ | 217,515 | | $ | 133,554 | | $ | 515,910 | |
See accompanying notes to financial statements.
| | | | New Jersey | | | Pennsylvania | | | Pennsylvania | |
| | | | Dividend | | | Investment | | | Premium | |
| | | | Advantage 2 | | | Quality | | | Income 2 | |
| | | | (NUJ | ) | | (NQP | ) | | (NPY | ) |
| Cash Flows from Operating Activities: | | | | | | | | | | |
| Net Increase (Decrease) in Net Assets Applicable to Common Shares from Operations | | $ | 3,881,447 | | $ | 15,425,908 | | $ | 13,058,119 | |
Adjustments to reconcile the net increase (decrease) in net assets applicable to Common shares from operations to net cash provided by (used in) operating activities: | | | | | | | | | | |
| Purchases of investments | | | (14,542,511 | ) | | (24,749,753 | ) | | (21,547,290 | ) |
| Proceeds from sales and maturities of investments | | | 14,933,450 | | | 43,209,284 | | | 27,818,717 | |
| Proceeds from (Purchases of) short-term investments, net | | | — | | | 2,000,000 | | | — | |
| Amortization (Accretion) of premiums and discounts, net | | | 25,984 | | | 165,165 | | | 33,446 | |
| (Increase) Decrease in: | | | | | | | | | | |
| Receivable for interest | | | 37,592 | | | (54,056 | ) | | 179,421 | |
| Receivable for investments sold | | | (1,037,667 | ) | | (21,892,266 | ) | | (6,035,355 | ) |
| Other assets | | | 9,783 | | | 1,615 | | | 1,413 | |
| Increase (Decrease) in: | | | | | | | | | | |
| Payable for interest | | | (3,888 | ) | | — | | | — | |
| Payable for investments purchased | | | 919,464 | | | (4,999,471 | ) | | (798,574 | ) |
| Accrued management fees | | | 2,681 | | | 10,206 | | | 8,748 | |
| Accrued Directors/Trustees fees | | | (36 | ) | | 754 | | | 677 | |
| Accrued other expenses | | | 9,046 | | | 16,176 | | | 16,362 | |
| Net realized (gain) loss from investments | | | (292,705 | ) | | (435,431 | ) | | (697,717 | ) |
| Change in net unrealized (appreciation) depreciation of investments | | | (1,998,313 | ) | | (8,014,133 | ) | | (5,889,362 | ) |
| Taxes paid on undistributed capital gains | | | — | | | (39 | ) | | (235 | ) |
| Net cash provided by (used in) operating activities | | | 1,944,327 | | | 683,959 | | | 6,148,370 | |
| Cash Flows from Financing Activities | | | | | | | | | | |
| (Increase) Decrease in deferred offering costs | | | 85,736 | | | 14,396 | | | 32,798 | |
| Increase (Decrease) in: | | | | | | | | | | |
| Floating rate obligations | | | — | | | (815,000 | ) | | (1,760,000 | ) |
| Cash overdraft | | | — | | | — | | | — | |
| Payable for offering costs | | | 168 | | | (57,896 | ) | | (72,272 | ) |
| Cash distributions paid to Common shareholders | | | (1,888,843 | ) | | (7,265,236 | ) | | (6,545,381 | ) |
| Net cash provided by (used in) financing activities | | | (1,802,939 | ) | | (8,123,736 | ) | | (8,344,855 | ) |
| Net Increase (Decrease) in Cash | | | 141,388 | | | (7,439,777 | ) | | (2,196,485 | ) |
| Cash at the beginning of period | | | 367,693 | | | 8,864,171 | | | 2,589,124 | |
| Cash at the end of Period | | $ | 509,081 | | $ | 1,424,394 | | $ | 392,639 | |
Supplemental Disclosure of Cash Flow Information
Non-cash financing activities not included herein consist of reinvestments of Common share distributions of $28,171 and $259,859 for New Jersey Dividend Advantage 2 (NUJ) and Pennsylvania Investment Quality (NQP), respectively.
| | | | New Jersey | | | Pennsylvania | | | Pennsylvania | |
| | | | Dividend | | | Investment | | | Premium | |
| | | | Advantage 2 | | | Quality | | | Income 2 | |
| | | | (NUJ | ) | | (NQP | ) | | (NPY | ) |
| Cash paid for interest (excluding amortization of offering costs) | | $ | 350,507 | | $ | 231,516 | | $ | 194,018 | |
See accompanying notes to financial statements.
| | | Statement of |
| | | Cash Flows (continued) |
Six Months Ended October 31, 2012 (Unaudited)
| | | | | | | | |
| | | | Pennsylvania | | | Pennsylvania | |
| | | | Dividend | | | Dividend | |
| | | | Advantage | | | Advantage 2 | |
| | | | (NXM | ) | | (NVY | ) |
| Cash Flows from Operating Activities: | | | | | | | |
| Net Increase (Decrease) in Net Assets Applicable to Common Shares from Operations | | $ | 2,928,010 | | $ | 3,282,376 | |
Adjustments to reconcile the net increase (decrease) in net assets applicable to Common shares from operations to net cash provided by (used in) operating activities: | | | | | | | |
| Purchases of investments | | | (6,606,454 | ) | | (12,721,988 | ) |
| Proceeds from sales and maturities of investments | | | 8,012,708 | | | 12,418,181 | |
| Proceeds from (Purchases of) short-term investments, net | | | — | | | — | |
| Amortization (Accretion) of premiums and discounts, net | | | 4,037 | | | (36,653 | ) |
| (Increase) Decrease in: | | | | | | | |
| Receivable for interest | | | 14,003 | | | 7,420 | |
| Receivable for investments sold | | | 1,293,469 | | | 994,355 | |
| Other assets | | | 9,082 | | | 9,450 | |
| Increase (Decrease) in: | | | | | | | |
| Payable for interest | | | (2,706 | ) | | (2,928 | ) |
| Payable for investments purchased | | | (2,645,751 | ) | | (349,847 | ) |
| Accrued management fees | | | 2,061 | | | 2,210 | |
| Accrued Directors/Trustees fees | | | (23 | ) | | (25 | ) |
| Accrued other expenses | | | 4,399 | | | 5,816 | |
| Net realized (gain) loss from investments | | | (129,856 | ) | | (147,572 | ) |
| Change in net unrealized (appreciation) depreciation of investments | | | (1,647,652 | ) | | (1,715,272 | ) |
| Taxes paid on undistributed capital gains | | | (9,827 | ) | | (3,350 | ) |
| Net cash provided by (used in) operating activities | | | 1,225,500 | | | 1,742,173 | |
| Cash Flows from Financing Activities | | | | | | | |
| (Increase) Decrease in deferred offering costs | | | 67,734 | | | 70,632 | |
| Increase (Decrease) in: | | | | | | | |
| Floating rate obligations | | | (395,000 | ) | | (245,000 | ) |
| Cash overdraft | | | — | | | 9,240 | |
| Payable for offering costs | | | 29,979 | | | (5,612 | ) |
| Cash distributions paid to Common shareholders | | | (1,350,486 | ) | | (1,664,307 | ) |
| Net cash provided by (used in) financing activities | | | (1,647,773 | ) | | (1,835,047 | ) |
| Net Increase (Decrease) in Cash | | | (422,273 | ) | | (92,874 | ) |
| Cash at the beginning of period | | | 1,099,818 | | | 92,874 | |
| Cash at the end of Period | | $ | 677,545 | | $ | — | |
Supplemental Disclosure of Cash Flow Information
| | | | Pennsylvania | | | Pennsylvania | |
| | | | Dividend | | | Dividend | |
| | | | Advantage | | | Advantage 2 | |
| | | | (NXM | ) | | (NVY | ) |
| Cash paid for interest (excluding amortization of offering costs) | | $ | 247,214 | | $ | 280,954 | |
See accompanying notes to financial statements.
THIS PAGE INTENTIONALLY LEFT BLANK
| | | Financial |
| | | Highlights (Unaudited) |
| | | |
| | Selected data for a Common share outstanding throughout each period: |
| | | | | | | Investment Operations | | | Less Distributions | | | | | | | | | | |
| | | | Beginning Common Share Net Asset Value | | | Net Investment Income (Loss) | | | Net Realized/ Unrealized Gain (Loss) | | | Distributions from Net Investment Income to Auction Rate Preferred Share- holders | (a) | | Distributions from Capital Gains to Auction Rate Preferred Share- holders | (a) | | Total | | | Net Investment Income to Common Share- holders | | | Capital Gains to Common Share- holders | | | Total | | | Discount from Common Shares Repurchased and Retired | | | Ending Common Share Net Asset Value | | | Ending Market Value | |
| New Jersey Investment Quality (NQJ) | | | | | | | | | | | | | | | | | | | | | | | | | | | | | | | |
| Year Ended 4/30: | | | | | | | | | | | | | | | | | | | | | | | | | | | | | | | | | | |
| 2013(f) | | $ | 15.31 | | $ | .40 | | $ | .47 | | $ | — | | $ | — | | $ | .87 | | $ | (.42 | ) | $ | — | | $ | (.42 | ) | $ | — | | $ | 15.76 | | $ | 15.99 | |
| 2012 | | | 13.69 | | | .83 | | | 1.63 | | | — | | | — | | | 2.46 | | | (.84 | ) | | — | | | (.84 | ) | | — | | | 15.31 | | | 14.93 | |
| 2011 | | | 14.44 | | | .85 | | | (.73 | ) | | (.01 | ) | | — | | | .11 | | | (.83 | ) | | (.03 | ) | | (.86 | ) | | — | | | 13.69 | | | 12.68 | |
| 2010 | | | 13.00 | | | .92 | | | 1.31 | | | (.03 | ) | | — | | | 2.20 | | | (.76 | ) | | — | | | (.76 | ) | | — | | | 14.44 | | | 13.56 | |
| 2009 | | | 14.26 | | | .91 | | | (1.22 | ) | | (.18 | ) | | (.03 | ) | | (.52 | ) | | (.65 | ) | | (.09 | ) | | (.74 | ) | | — | * | | 13.00 | | | 11.37 | |
| 2008 | | | 14.96 | | | .92 | | | (.67 | ) | | (.26 | ) | | (.01 | ) | | (.02 | ) | | (.65 | ) | | (.03 | ) | | (.68 | ) | | — | | | 14.26 | | | 13.09 | |
| | | | | | | | | | | | | | | | | | | | | | | | | | | | | | | | | | | | | | |
| New Jersey Premium Income (NNJ) | | | | | | | | | | | | | | | | | | | | | | | | | | | | | | | |
| Year Ended 4/30: | | | | | | | | | | | | | | | | | | | | | | | | | | | | | | | | | |
| 2013(f) | | | 15.86 | | | .42 | | | .47 | | | — | | | — | | | .89 | | | (.44 | ) | | — | | | (.44 | ) | | — | | | 16.31 | | | 16.99 | |
| 2012 | | | 14.22 | | | .85 | | | 1.65 | | | — | | | — | | | 2.50 | | | (.85 | ) | | (.01 | ) | | (.86 | ) | | — | | | 15.86 | | | 15.48 | |
| 2011 | | | 14.96 | | | .86 | | | (.76 | ) | | (.01 | ) | | — | | | .09 | | | (.82 | ) | | (.01 | ) | | (.83 | ) | | — | | | 14.22 | | | 13.44 | |
| 2010 | | | 13.83 | | | .90 | | | 1.02 | | | (.03 | ) | | — | * | | 1.89 | | | (.74 | ) | | (.02 | ) | | (.76 | ) | | — | | | 14.96 | | | 14.19 | |
| 2009 | | | 14.64 | | | .88 | | | (.78 | ) | | (.17 | ) | | (.03 | ) | | (.10 | ) | | (.63 | ) | | (.08 | ) | | (.71 | ) | | — | * | | 13.83 | | | 11.96 | |
| 2008 | | | 15.23 | | | .90 | | | (.53 | ) | | (.25 | ) | | (.01 | ) | | .11 | | | (.66 | ) | | (.04 | ) | | (.70 | ) | | — | | | 14.64 | | | 13.48 | |
| (a) | The amounts shown are based on Common share equivalents. |
| (b) | Total Return Based on Market Value is the combination of changes in the market price per share and the effect of reinvested dividend income and reinvested capital gains distributions, if any, at the average price paid per share at the time of reinvestment. The last dividend declared in the period, which is typically paid on the first business day of the following month, is assumed to be reinvested at the ending market price. The actual reinvestment for the last dividend declared in the period may take place over several days, and in some instances may not be based on the market price, so the actual reinvestment price may be different from the price used in the calculation. Total returns are not annualized. |
| | |
| | Total Return Based on Common Share Net Asset Value is the combination of changes in Common share net asset value, reinvested dividend income at net asset value and reinvested capital gains distributions at net asset value, if any. The last dividend declared in the period, which is typically paid on the first business day of the following month, is assumed to be reinvested at the ending net asset value. The actual reinvest price for the last dividend declared in the period may often be based on the Fund’s market price (and not its net asset value), and therefore may be different from the price used in the calculation. Total returns are not annualized. |
| (c) | Ratios do not reflect the effect of custodian fee credits earned on the Fund’s net cash on deposit with the custodian bank, where applicable. |
| | | | | | | Ratios/Supplemental Data | |
| Total Returns | | | | | | Ratios to Average Net Assets Applicable to Common Shares(c)(d) | | | | |
| | | | | | | | | | | | | | | | |
Based on Market Value | (b) | | Based on Common Share Net Asset Value | (b) | | Ending Net Assets Applicable to Common Shares (000) | | | Expenses | (e) | Net Investment Income (Loss) | | | Portfolio Turnover Rate | |
| | | | | | | | | | | | | | | | |
| | | | | | | | | | | | | | | | |
| 10.04 | % | | 5.76 | % | $ | 322,714 | | | 1.56 | %** | 5.13 | %** | | 7 | % |
| 24.98 | | | 18.41 | | | 313,082 | | | 1.61 | | 5.70 | | | 9 | |
| (.46 | ) | | .67 | | | 279,968 | | | 1.55 | | 5.96 | | | 9 | |
| 26.39 | | | 17.23 | | | 295,382 | | | 1.16 | | 6.57 | | | 4 | |
| (7.10) | | | (3.41 | ) | | 265,928 | | | 1.29 | | 6.94 | | | 1 | |
| (3.64 | ) | | (.08 | ) | | 292,194 | | | 1.23 | | 6.30 | | | 17 | |
| | | | | | | | | | | | | | | | |
| | | | | | | | | | | | | | | | |
| 12.72 | | | 5.64 | | | 196,812 | | | 1.59 | ** | 5.14 | ** | | 6 | |
| 22.07 | | | 18.03 | | | 191,000 | | | 1.64 | | 5.62 | | | 10 | |
| .41 | | | .57 | | | 171,212 | | | 1.59 | | 5.85 | | | 7 | |
| 25.45 | | | 13.90 | | | 180,024 | | | 1.19 | | 6.19 | | | 3 | |
| (5.69 | ) | | (.40 | ) | | 166,428 | | | 1.28 | | 6.44 | | | 1 | |
| (6.18 | ) | | .77 | | | 176,374 | | | 1.24 | | 6.04 | | | 19 | |
| (d) | Ratios do not reflect the effect of dividend payments to Auction Rate Preferred shareholders, where applicable; Net Investment Income (Loss) ratios reflect income earned and expenses incurred on assets attributable to Auction Rate Preferred Shares (“ARPS”) and/or VRDP Shares, where applicable. |
| (e) | The expense ratios reflect, among other things, all interest expense and other costs related to VRDP Shares and/or the interest expense deemed to have been paid by the Fund on the floating rate certificates issued by the special purpose trusts for the self-deposited inverse floaters held by the Fund, where applicable, both as described in Footnote 1 – General Information and Significant Accounting Policies, Variable Rate Demand Preferred Shares and Inverse Floating Rate Securities, respectively, as follows: |
| New Jersey Investment Quality (NQJ) | | | | |
| Year Ended 4/30: | | | | |
| 2013(f) | | | .54 | %** |
| 2012 | | | .58 | |
| 2011 | | | .51 | |
| 2010 | | | — | |
| 2009 | | | — | |
| 2008 | | | — | |
| | | | | |
| New Jersey Premium Income (NNJ) | | | | |
| Year Ended 4/30: | | | | |
| 2013(f) | | | .56 | %** |
| 2012 | | | .58 | |
| 2011 | | | .51 | |
| 2010 | | | — | |
| 2009 | | | — | |
| 2008 | | | — | |
| (f) | For the six months ended October 31, 2012. |
| * | Rounds to less than $.01 per share. |
| ** | Annualized. |
See accompanying notes to financial statements.
| | | Financial |
| | | Highlights (Unaudited) (continued) |
| | | |
| | Selected data for a Common share outstanding throughout each period: |
| | | | | | | Investment Operations | | | Less Distributions | | | | | | | | | | |
| | | | Beginning Common Share Net Asset Value | | | Net Investment Income (Loss) | | | Net Realized/ Unrealized Gain (Loss) | | | Distributions from Net Investment Income to Auction Rate Preferred Share- holders | (a) | | Distributions from Capital Gains to Auction Rate Preferred Share– holders | (a) | | Total | | | Net Investment Income to Common Share- holders | | | Capital Gains to Common Share- holders | | | Total | | | Discount from Common Shares Repurchased and Retired | | | Ending Common Share Net Asset Value | | | Ending Market Value | |
| New Jersey Dividend Advantage (NXJ) | | | | | | | | | | | | | | | | | | | | | | | | | | | | | | | |
| Year Ended 4/30: | | | | | | | | | | | | | | | | | | | | | | | | | | | | | | | | | | |
| 2013(f) | | $ | 15.31 | | $ | .32 | | $ | .88 | | $ | — | | $ | — | | $ | 1.20 | | $ | (.40 | ) | $ | — | | $ | (.40 | ) | $ | — | | $ | 16.11 | | $ | 16.53 | |
| 2012 | | | 13.61 | | | .71 | | | 1.83 | | | — | | | — | | | 2.54 | | | (.83 | ) | | (.01 | ) | | (.84 | ) | | — | | | 15.31 | | | 14.92 | |
| 2011 | | | 14.51 | | | .89 | | | (.91 | ) | | (.03 | ) | | — | * | | (.05 | ) | | (.83 | ) | | (.02 | ) | | (.85 | ) | | — | | | 13.61 | | | 12.67 | |
| 2010 | | | 12.97 | | | .91 | | | 1.42 | | | (.03 | ) | | — | * | | 2.30 | | | (.75 | ) | | (.01 | ) | | (.76 | ) | | — | | | 14.51 | | | 13.48 | |
| 2009 | | | 14.26 | | | .91 | | | (1.27 | ) | | (.16 | ) | | (.03 | ) | | (.55 | ) | | (.66 | ) | | (.08 | ) | | (.74 | ) | | — | * | | 12.97 | | | 11.15 | |
| 2008 | | | 15.09 | | | .94 | | | (.80 | ) | | (.25 | ) | | (.01 | ) | | (.12 | ) | | (.68 | ) | | (.03 | ) | | (.71 | ) | | — | | | 14.26 | | | 13.11 | |
| | | | | | | | | | | | | | | | | | | | | | | | | | | | | | | | | | | | | | |
| New Jersey Dividend Advantage 2 (NUJ) | | | | | | | | | | | | | | | | | | | | | | | | | | | | | | | |
| Year Ended 4/30: | | | | | | | | | | | | | | | | | | | | | | | | | | | | | | | | | | |
| 2013(f) | | | 15.23 | | | .35 | | | .51 | | | — | | | — | | | .86 | | | (.42 | ) | | — | | | (.42 | ) | | — | | | 15.67 | | | 16.50 | |
| 2012 | | | 13.60 | | | .77 | | | 1.73 | | | — | | | — | | | 2.50 | | | (.86 | ) | | (.01 | ) | | (.87 | ) | | — | | | 15.23 | | | 15.74 | |
| 2011 | | | 14.47 | | | .85 | | | (.82 | ) | | (.01 | ) | | — | | | .02 | | | (.85 | ) | | (.04 | ) | | (.89 | ) | | — | | | 13.60 | | | 12.55 | |
| 2010 | | | 12.93 | | | .94 | | | 1.45 | | | (.03 | ) | | (.01 | ) | | 2.35 | | | (.78 | ) | | (.03 | ) | | (.81 | ) | | — | | | 14.47 | | | 14.68 | |
| 2009 | | | 14.35 | | | .95 | | | (1.42 | ) | | (.17 | ) | | (.02 | ) | | (.66 | ) | | (.69 | ) | | (.07 | ) | | (.76 | ) | | — | * | | 12.93 | | | 11.46 | |
| 2008 | | | 15.31 | | | .97 | | | (.79 | ) | | (.23 | ) | | (.05 | ) | | (.10 | ) | | (.71 | ) | | (.15 | ) | | (.86 | ) | | — | | | 14.35 | | | 13.59 | |
| (a) | The amounts shown are based on Common share equivalents. |
| (b) | Total Return Based on Market Value is the combination of changes in the market price per share and the effect of reinvested dividend income and reinvested capital gains distributions, if any, at the average price paid per share at the time of reinvestment. The last dividend declared in the period, which is typically paid on the first business day of the following month, is assumed to be reinvested at the ending market price. The actual reinvestment for the last dividend declared in the period may take place over several days, and in some instances may not be based on the market price, so the actual reinvestment price may be different from the price used in the calculation. Total returns are not annualized. |
| | |
| | Total Return Based on Common Share Net Asset Value is the combination of changes in Common share net asset value, reinvested dividend income at net asset value and reinvested capital gains distributions at net asset value, if any. The last dividend declared in the period, which is typically paid on the first business day of the following month, is assumed to be reinvested at the ending net asset value. The actual reinvest price for the last dividend declared in the period may often be based on the Fund’s market price (and not its net asset value), and therefore may be different from the price used in the calculation. Total returns are not annualized. |
| (c) | After expense reimbursement from the Adviser, where applicable. Ratios do not reflect the effect of custodian fee credits earned on the Fund’s net cash on deposit with the custodian bank, where applicable. As of March 31, 2011, the Adviser is no longer reimbursing New Jersey Dividend Advantage (NXJ) for any fees or expenses. As of March 31, 2012, the Adviser is no longer reimbursing New Jersey Dividend Advantage 2 (NUJ) for any fees or expenses. |
| | | | | | | Ratios/Supplemental Data | |
| Total Returns | | | | | | Ratios to Average Net Assets Applicable to Common Shares Before Reimbursement(d) | | | Ratios to Average Net Assets Applicable to Common Shares After Reimbursement(c)(d) | | | | |
| | | | | | | | | | | | | | | | | | | | | | | |
Based on Market Value | (b) | | Based on Common Share Net Asset Value | (b) | | Ending Net Assets Applicable to Common Shares (000) | | | Expenses | (e) | | Net Investment Income (Loss) | | | Expenses | (e) | | Net Investment Income (Loss) | | | Portfolio Turnover Rate | |
| | | | | | | | | | | | | | | | | | | | | | | |
| | | | | | | | | | | | | | | | | | | | | | | |
| 13.62 | % | | 7.87 | % | $ | 105,838 | | | 2.37 | %*** | | 4.03 | %*** | | N/A | | | N/A | | | 8 | % |
| 25.08 | | | 19.09 | | | 100,578 | | | 2.52 | | | 4.82 | | | N/A | | | N/A | | | 15 | |
| .11 | | | (.38 | ) | | 89,399 | | | 1.34 | | | 6.16 | | | 1.27 | % | | 6.23 | % | | 6 | |
| 28.17 | | | 18.03 | | | 95,300 | | | 1.18 | | | 6.35 | | | 1.04 | | | 6.49 | | | 4 | |
| (8.95 | ) | | (3.63 | ) | | 85,230 | | | 1.29 | | | 6.74 | | | 1.06 | | | 6.98 | | | — | ** |
| (12.31 | ) | | (.81 | ) | | 93,762 | | | 1.20 | | | 6.10 | | | .90 | | | 6.40 | | | 17 | |
| | | | | | | | | | | | | | | | | | | | | | | |
| | | | | | | | | | | | | | | | | | | | | | | |
| 7.62 | | | 5.70 | | | 70,925 | | | 2.42 | *** | | 4.52 | *** | | N/A | | | N/A | | | 14 | |
| 33.35 | | | 18.82 | | | 68,911 | | | 2.59 | | | 5.22 | | | 2.52 | | | 5.30 | | | 9 | |
| (8.75 | ) | | .10 | | | 61,503 | | | 1.96 | | | 5.84 | | | 1.81 | | | 5.99 | | | 7 | |
| 35.95 | | | 18.55 | | | 65,410 | | | 1.22 | | | 6.54 | | | 1.00 | | | 6.76 | | | 4 | |
| (9.75 | ) | | (4.36 | ) | | 58,456 | | | 1.33 | | | 6.95 | | | 1.03 | | | 7.25 | | | — | ** |
| (12.41 | ) | | (.60 | ) | | 64,904 | | | 1.25 | | | 6.16 | | | .87 | | | 6.54 | | | 16 | |
| (d) | Ratios do not reflect the effect of dividend payments to Auction Rate Preferred shareholders, where applicable; Net Investment Income (Loss) ratios reflect income earned and expenses incurred on assets attributable to ARPS and/or MTP Shares, where applicable. |
| (e) | The expense ratios reflect, among other things, all interest expense and other costs related to MTP Shares and/or the interest expense deemed to have been paid by the Fund on the floating rate certificates issued by the special purpose trusts for the self-deposited inverse floaters held by the Fund, where applicable, both as described in Footnote 1 – General Information and Significant Accounting Policies, MuniFund Term Preferred Shares and Inverse Floating Rate Securities, respectively, as follows: |
| New Jersey Dividend Advantage (NXJ) | | | | |
| Year Ended 4/30: | | | | |
| 2013(f) | | | 1.27 | %*** |
| 2012 | | | 1.41 | |
| 2011 | | | .15 | |
| 2010 | | | — | |
| 2009 | | | — | |
| 2008 | | | — | |
| | | | | |
| New Jersey Dividend Advantage 2 (NUJ) | | | | |
| Year Ended 4/30: | | | | |
| 2013(f) | | | 1.23 | %*** |
| 2012 | | | 1.33 | |
| 2011 | | | .79 | |
| 2010 | | | — | |
| 2009 | | | — | |
| 2008 | | | — | |
| (f) | For the six months ended October 31, 2012. |
| * | Rounds to less than $.01 per share. |
| ** | Rounds to less than 1%. |
| *** | Annualized. |
| N/A | Fund no longer has a contractual reimbursement agreement with the Adviser. |
See accompanying notes to financial statements.
| | | Financial |
| | | Highlights (Unaudited) (continued) |
| | | |
| | Selected data for a Common share outstanding throughout each period: |
| | | | | | Investment Operations | | Less Distributions | | | | | | | | | | | | | |
| | | | Beginning Common Share Net Asset Value | | | Net Investment Income (Loss) | | | Net Realized/ Unrealized Gain (Loss) | | | Distributions from Net Investment Income to Auction Rate Preferred Share- holders | (a) | | Distributions from Capital Gains to Auction Rate Preferred Share- holders | (a) | | Total | | | Net Investment Income to Common Share- holders | | | Capital Gains to Common Share- holders | | | Total | | | Discount from Common Shares Repur- chased and Retired | | | Offering Costs | | | Ending Common Share Net Asset Value | | | Ending Market Value | |
| New Jersey Municipal Value (NJV) | | | | | | | | | | | | | | | | | | | | | | | | | | | | | | | |
| Year Ended 4/30: | | | | | | | | | | | | | | | | | | | | | | | | | | | | | | | | | | | | | |
| 2013(g) | | $ | 16.62 | | $ | .34 | | $ | .45 | | | N/A | | | N/A | | $ | .79 | | $ | (.34 | ) | $ | — | | $ | (.34 | ) | $ | — | | $ | — | | $ | 17.07 | | $ | 17.17 | |
| 2012 | | | 14.72 | | | .75 | | | 1.91 | | | N/A | | | N/A | | | 2.66 | | | (.76 | ) | | — | | | (.76 | ) | | — | | | — | | | 16.62 | | | 16.34 | |
| 2011 | | | 15.84 | | | .82 | | | (1.15 | ) | | N/A | | | N/A | | | (.33 | ) | | (.77 | ) | | (.02 | ) | | (.79 | ) | | — | | | — | | | 14.72 | | | 13.81 | |
| 2010 | | | 14.29 | | | .70 | | | 1.55 | | | N/A | | | N/A | | | 2.25 | | | (.70 | ) | | — | | | (.70 | ) | | — | | | — | * | | 15.84 | | | 15.21 | |
| 2009(f) | | | 14.33 | | | (.01 | ) | | — | | | N/A | | | N/A | | | (.01 | ) | | — | | | — | | | — | | | — | | | (.03 | ) | | 14.29 | | | 15.00 | |
| | | | | | | | | | | | | | | | | | | | | | | | | | | | | | | | | | | | | | | | | |
| Pennsylvania Investment Quality (NQP) | | | | | | | | | | | | | | | | | | | | | | | | | | | | | | | |
| Year Ended 4/30: | | | | | | | | | | | | | | | | | | | | | | | | | | | | | | | | | | | | | |
| 2013(g) | | | 15.78 | | | .43 | | | .54 | | $ | — | | $ | — | | | .97 | | | (.47 | ) | | — | | | (.47 | ) | | — | | | — | | | 16.28 | | | 16.47 | |
| 2012 | | | 14.11 | | | .90 | | | 1.70 | | | — | | | — | | | 2.60 | | | (.93 | ) | | — | | | (.93 | ) | | — | | | — | | | 15.78 | | | 15.67 | |
| 2011 | | | 14.82 | | | .93 | | | (.73 | ) | | (.01 | ) | | — | | | .19 | | | (.90 | ) | | — | | | (.90 | ) | | — | | | — | | | 14.11 | | | 13.09 | |
| 2010 | | | 13.53 | | | .96 | | | 1.16 | | | (.03 | ) | | — | | | 2.09 | | | (.80 | ) | | — | | | (.80 | ) | | — | * | | — | | | 14.82 | | | 13.64 | |
| 2009 | | | 14.39 | | | .96 | | | (.94 | ) | | (.20 | ) | | — | | | (.18 | ) | | (.68 | ) | | — | | | (.68 | ) | | — | * | | — | | | 13.53 | | | 11.34 | |
| 2008 | | | 15.19 | | | .95 | | | (.81 | ) | | (.29 | ) | | — | | | (.15 | ) | | (.66 | ) | | — | | | (.66 | ) | | .01 | | | — | | | 14.39 | | | 13.10 | |
| (a) | The amounts shown are based on Common share equivalents. |
| (b) | Total Return Based on Market Value is the combination of changes in the market price per share and the effect of reinvested dividend income and reinvested capital gains distributions, if any, at the average price paid per share at the time of reinvestment. The last dividend declared in the period, which is typically paid on the first business day of the following month, is assumed to be reinvested at the ending market price. The actual reinvestment for the last dividend declared in the period may take place over several days, and in some instances may not be based on the market price, so the actual reinvestment price may be different from the price used in the calculation. Total returns are not annualized. |
| | |
| | Total Return Based on Common Share Net Asset Value is the combination of changes in Common share net asset value, reinvested dividend income at net asset value and reinvested capital gains distributions at net asset value, if any. The last dividend declared in the period, which is typically paid on the first business day of the following month, is assumed to be reinvested at the ending net asset value. The actual reinvest price for the last dividend declared in the period may often be based on the Fund’s market price (and not its net asset value), and therefore may be different from the price used in the calculation. Total returns are not annualized. |
| (c) | Ratios do not reflect the effect of custodian fee credits earned on the Fund’s net cash on deposit with the custodian bank, where applicable. |
| | | | Ratios/Supplemental Data | |
| Total Returns | | | | | | Ratios to Average Net Assets Applicable to Common Shares(c)(d) | | | | |
| | | | | | | | | | | | | | | | | |
Based on Market Value | (b) | | Based on Common Share Net Asset Value | (b) | | Ending Net Assets Applicable to Common Shares (000) | | | Expenses | (e) | | Net Investment Income (Loss) | | | Portfolio Turnover Rate | |
| | | | | | | | | | | | | | | | | |
| | | | | | | | | | | | | | | | | |
| 7.23 | % | | 4.79 | % | $ | 26,673 | | | .83 | %** | | 3.95 | %** | | 4 | % |
| 24.34 | | | 18.43 | | | 25,957 | | | .85 | | | 4.76 | | | 20 | |
| (4.19 | ) | | (2.17 | ) | | 22,981 | | | .85 | | | 5.32 | | | 2 | |
| 6.32 | | | 16.05 | | | 24,722 | | | .82 | | | 4.63 | | | 5 | |
| — | | | (.24 | ) | | 20,891 | | | .64 | ** | | (.64 | )** | | 0 | |
| | | | | | | | | | | | | | | | | |
| | | | | | | | | | | | | | | | | |
| 8.21 | | | 6.20 | | | 262,091 | | | 1.59 | ** | | 5.36 | ** | | 6 | |
| 27.48 | | | 18.88 | | | 253,937 | | | 1.63 | | | 6.00 | | | 18 | |
| 2.43 | | | 1.27 | | | 226,905 | | | 1.60 | | | 6.38 | | | 8 | |
| 27.87 | | | 15.74 | | | 238,368 | | | 1.23 | | | 6.72 | | | 6 | |
| (7.99 | ) | | (1.01 | ) | | 218,353 | | | 1.50 | | | 7.23 | | | 3 | |
| (1.78 | ) | | (.92 | ) | | 232,528 | | | 1.65 | | | 6.48 | | | 20 | |
| (d) | Ratios do not reflect the effect of dividend payments to Auction Rate Preferred shareholders, where applicable; Net Investment Income (Loss) ratios reflect income earned and expenses incurred on assets attributable to ARPS and/or VRDP Shares, where applicable. |
| (e) | The expense ratios reflect, among other things, all interest expense and other costs related to VRDP Shares and/or the interest expense deemed to have been paid by the Fund on the floating rate certificates issued by the special purpose trusts for the self-deposited inverse floaters held by the Fund, where applicable, both as described in Footnote 1 – General Information and Significant Accounting Policies, Variable Rate Demand Preferred Shares and Inverse Floating Rate Securities, respectively, as follows: |
| New Jersey Municipal Value (NJV) | | | | |
| Year Ended 4/30: | | | | |
| 2013(g) | | | .05 | %** |
| 2012 | | | .04 | |
| 2011 | | | .06 | |
| 2010 | | | .06 | |
| 2009(f) | | | — | |
| | | | | |
| Pennsylvania Investment Quality (NQP) | | | | |
| Year Ended 4/30: | | | | |
| 2013(g) | | | .57 | %** |
| 2012 | | | .61 | |
| 2011 | | | .55 | |
| 2010 | | | .07 | |
| 2009 | | | .19 | |
| 2008 | | | .38 | |
| (f) | For the period April 28, 2009 (commencement of operations) through April 30, 2009. |
| (g) | For the six months ended October 31, 2012. |
| N/A | Fund is not authorized to issue ARPS. |
| * | Rounds to less than $.01 per share. |
| ** | Annualized. |
See accompanying notes to financial statements.
| | | Financial |
| | | Highlights (Unaudited) (continued) |
| | | |
| | Selected data for a Common share outstanding throughout each period: |
| | | | | | Investment Operations | | Less Distributions | | | | | | | | | | |
| | | | Beginning Common Share Net Asset Value | | | Net Investment Income (Loss) | | | Net Realized/ Unrealized Gain (Loss) | | | Distributions from Net Investment Income to Auction Rate Preferred Share- holders | (a) | | Distributions from Capital Gains to Auction Rate Preferred Share- holders | (a) | | Total | | | Net Investment Income to Common Share- holders | | | Capital Gains to Common Share- holders | | | Total | | | Discount from Common Shares Repurchased and Retired | | | Ending Common Share Net Asset Value | | | Ending Market Value | |
| Pennsylvania Premium Income 2 (NPY) | | | | | | | | | | | | | | | | | | | | | | | | | | | | | | | |
| Year Ended 4/30: | | | | | | | | | | | | | | | | | | | | | | | | | | | | | | | | | | |
| 2013(f) | | $ | 15.14 | | $ | .41 | | $ | .42 | | $ | — | | $ | — | | $ | .83 | | $ | (.42 | ) | $ | — | | $ | (.42 | ) | $ | — | | $ | 15.55 | | $ | 15.17 | |
| 2012 | | | 13.52 | | | .83 | | | 1.63 | | | — | | | — | | | 2.46 | | | (.84 | ) | | — | | | (.84 | ) | | — | | | 15.14 | | | 14.51 | |
| 2011 | | | 14.11 | | | .85 | | | (.59 | ) | | (.01 | ) | | — | | | .25 | | | (.84 | ) | | — | | | (.84 | ) | | — | | | 13.52 | | | 12.29 | |
| 2010 | | | 12.72 | | | .91 | | | 1.28 | | | (.03 | ) | | — | | | 2.16 | | | (.77 | ) | | — | | | (.77 | ) | | — | * | | 14.11 | | | 12.91 | |
| 2009 | | | 13.74 | | | .91 | | | (1.12 | ) | | (.19 | ) | | — | | | (.40 | ) | | (.62 | ) | | — | | | (.62 | ) | | — | * | | 12.72 | | | 10.60 | �� |
| 2008 | | | 14.70 | | | .90 | | | (.94 | ) | | (.26 | ) | | (.02 | ) | | (.32 | ) | | (.61 | ) | | (.04 | ) | | (.65 | ) | | .01 | | | 13.74 | | | 12.30 | |
| | | | | | | | | | | | | | | | | | | | | | | | | | | | | | | | | | | | | | |
| Pennsylvania Dividend Advantage (NXM) | | | | | | | | | | | | | | | | | | | | | | | | | | | | | | | |
| Year Ended 4/30: | | | | | | | | | | | | | | | | | | | | | | | | | | | | | | | | | | |
| 2013(f) | | | 15.44 | | | .35 | | | .53 | | | — | | | — | | | .88 | | | (.40 | ) | | — | | | (.40 | ) | | — | | | 15.92 | | | 15.57 | |
| 2012 | | | 14.00 | | | .74 | | | 1.62 | | | — | | | — | | | 2.36 | | | (.86 | ) | | (.06 | ) | | (.92 | ) | | — | | | 15.44 | | | 14.42 | |
| 2011 | | | 14.73 | | | .85 | | | (.65 | ) | | (.01 | ) | | — | | | .19 | | | (.87 | ) | | (.05 | ) | | (.92 | ) | | — | | | 14.00 | | | 12.85 | |
| 2010 | | | 13.09 | | | .96 | | | 1.55 | | | (.03 | ) | | (.01 | ) | | 2.47 | | | (.79 | ) | | (.04 | ) | | (.83 | ) | | — | * | | 14.73 | | | 13.77 | |
| 2009 | | | 14.47 | | | .97 | | | (1.47 | ) | | (.18 | ) | | — | | | (.68 | ) | | (.70 | ) | | — | | | (.70 | ) | | — | * | | 13.09 | | | 11.31 | |
| 2008 | | | 15.36 | | | .97 | | | (.84 | ) | | (.25 | ) | | (.02 | ) | | (.14 | ) | | (.70 | ) | | (.05 | ) | | (.75 | ) | | — | | | 14.47 | | | 13.61 | |
| (a) | The amounts shown are based on Common share equivalents. |
| (b) | Total Return Based on Market Value is the combination of changes in the market price per share and the effect of reinvested dividend income and reinvested capital gains distributions, if any, at the average price paid per share at the time of reinvestment. The last dividend declared in the period, which is typically paid on the first business day of the following month, is assumed to be reinvested at the ending market price. The actual reinvestment for the last dividend declared in the period may take place over several days, and in some instances may not be based on the market price, so the actual reinvestment price may be different from the price used in the calculation. Total returns are not annualized. |
| | |
| | Total Return Based on Common Share Net Asset Value is the combination of changes in Common share net asset value, reinvested dividend income at net asset value and reinvested capital gains distributions at net asset value, if any. The last dividend declared in the period, which is typically paid on the first business day of the following month, is assumed to be reinvested at the ending net asset value. The actual reinvest price for the last dividend declared in the period may often be based on the Fund’s market price (and not its net asset value), and therefore may be different from the price used in the calculation. Total returns are not annualized. |
| (c) | After expense reimbursement from the Adviser, where applicable. Ratios do not reflect the effect of custodian fee credits earned on the Fund’s net cash on deposit with the custodian bank, where applicable. As of March 31, 2011, the Adviser is no longer reimbursing Pennsylvania Dividend Advantage (NXM) for any fees or expenses. |
| | | | | | | Ratios/Supplemental Data | |
| Total Returns | | | | | | Ratios to Average Net Assets Applicable to Common Shares Before Reimbursement(d) | | | Ratios to Average Net Assets Applicable to Common Shares After Reimbursement(c)(d) | | | | |
| | | | | | | | | | | | | | | | | | | | | | | |
Based on Market Value | (b) | | Based on Common Share Net Asset Value | (b) | | Ending Net Assets Applicable to Common Shares (000) | | | Expenses | (e) | | Net Investment Income (Loss) | | | Expenses | (e) | | Net Investment Income (Loss) | | | Portfolio Turnover Rate | |
| | | | | | | | | | | | | | | | | | | | | | | |
| | | | | | | | | | | | | | | | | | | | | | | |
| 7.51 | % | | 5.53 | % | $ | 242,547 | | | 1.55 | %** | | 5.36 | %** | | N/A | | | N/A | | | 6 | % |
| 25.53 | | | 18.63 | | | 236,039 | | | 1.59 | | | 5.75 | | | N/A | | | N/A | | | 8 | |
| 1.48 | | | 1.75 | | | 210,839 | | | 1.56 | | | 6.13 | | | N/A | | | N/A | | | 8 | |
| 29.70 | | | 17.35 | | | 220,113 | | | 1.21 | | | 6.67 | | | N/A | | | N/A | | | 5 | |
| (8.43 | ) | | (2.65 | ) | | 198,739 | | | 1.35 | | | 7.28 | | | N/A | | | N/A | | | 6 | |
| (5.26 | ) | | (2.06 | ) | | 215,252 | | | 1.55 | | | 6.36 | | | N/A | | | N/A | | | 27 | |
| | | | | | | | | | | | | | | | | | | | | | | |
| | | | | | | | | | | | | | | | | | | | | | | |
| 10.90 | | | 5.78 | | | 52,874 | | | 2.39 | ** | | 4.38 | ** | | N/A | | | N/A | | | 9 | |
| 19.96 | | | 17.37 | | | 51,290 | | | 2.55 | | | 4.98 | | | N/A | | | N/A | | | 20 | |
| (.27 | ) | | 1.23 | | | 46,521 | | | 1.94 | | | 5.78 | | | 1.87 | % | | 5.85 | % | | 8 | |
| 29.85 | | | 19.29 | | | 48,934 | | | 1.26 | | | 6.66 | | | 1.11 | | | 6.81 | | | 5 | |
| (11.67 | ) | | (4.57 | ) | | 43,587 | | | 1.37 | | | 7.17 | | | 1.14 | | | 7.39 | | | 4 | |
| (8.46 | ) | | (.87 | ) | | 48,211 | | | 1.39 | | | 6.26 | | | 1.09 | | | 6.55 | | | 20 | |
| (d) | Ratios do not reflect the effect of dividend payments to Auction Rate Preferred shareholders, where applicable; Net Investment Income (Loss) ratios reflect income earned and expenses incurred on assets attributable to ARPS, MTP Shares and/or VRDP Shares, where applicable. |
| (e) | The expense ratios reflect, among other things, all interest expense and other costs related to MTP Shares, VRDP Shares and/or the interest expense deemed to have been paid by the Fund on the floating rate certificates issued by the special purpose trusts for the self-deposited inverse floaters held by the Fund, where applicable, each as described in Footnote 1 – General Information and Significant Accounting Policies, MuniFund Term Preferred Shares, Variable Rate Demand Preferred Shares and Inverse Floating Rate Securities, respectively, as follows: |
| Pennsylvania Premium Income 2 (NPY) | | | | |
| Year Ended 4/30: | | | | |
| 2013(f) | | | .54 | %** |
| 2012 | | | .57 | |
| 2011 | | | .52 | |
| 2010 | | | .05 | |
| 2009 | | | .04 | |
| 2008 | | | .27 | |
| | | | | |
| Pennsylvania Dividend Advantage (NXM) | | | | |
| Year Ended 4/30: | | | | |
| 2013(f) | | | 1.19 | %** |
| 2012 | | | 1.28 | |
| 2011 | | | .76 | |
| 2010 | | | .02 | |
| 2009 | | | — | |
| 2008 | | | .11 | |
| (f) | For the six months ended October 31, 2012. |
| N/A | Fund did not have, or no longer has, a contractual reimbursement agreement with the Adviser. |
| * | Rounds to less than $.01 per share. |
| ** | Annualized. |
See accompanying notes to financial statements.
| | | Financial |
| | | Highlights (Unaudited) (continued) |
| | | |
| | Selected data for a Common share outstanding throughout each period: |
| | | | | | | Investment Operations | | | Less Distributions | | | | | | | | | | | | | |
| | | | Beginning Common Share Net Asset Value | | | Net Investment Income (Loss) | | | Net Realized/ Unrealized Gain (Loss) | | | Distributions from Net Investment Income to Auction Rate Preferred Share- holders | (a) | | Distributions from Capital Gains to Auction Rate Preferred Share- holders | (a) | | Total | | | Net Investment Income to Common Share- holders | | | Capital Gains to Common Share- holders | | | Total | | | Discount from Common Shares Repur- chased and Retired | | | Offering Costs | | | Ending Common Share Net Asset Value | | | Ending Market Value | |
| Pennsylvania Dividend Advantage 2 (NVY) | | | | | | | | | | | | | | | | | | | | | | | | | | | | | | | |
| Year Ended 4/30: | | | | | | | | | | | | | | | | | | | | | | | | | | | | | | | | | | | | | |
| 2013(g) | | $ | 15.18 | | $ | .38 | | $ | .51 | | $ | — | | $ | — | | $ | .89 | | $ | (.45 | ) | $ | — | | $ | (.45 | ) | $ | — | | $ | — | | $ | 15.62 | | $ | 15.60 | |
| 2012 | | | 14.08 | | | .79 | | | 1.26 | | | — | | | — | | | 2.05 | | | (.89 | ) | | (.06 | ) | | (.95 | ) | | — | | | — | | | 15.18 | | | 14.90 | |
| 2011 | | | 14.74 | | | .89 | | | (.60 | ) | | (.01 | ) | | — | | | .28 | | | (.89 | ) | | (.05 | ) | | (.94 | ) | | — | | | — | | | 14.08 | | | 13.00 | |
| 2010 | | | 13.42 | | | .97 | | | 1.27 | | | (.02 | ) | | (.01 | ) | | 2.21 | | | (.82 | ) | | (.07 | ) | | (.89 | ) | | — | | | — | | | 14.74 | | | 14.19 | |
| 2009 | | | 14.49 | | | .99 | | | (1.17 | ) | | (.19 | ) | | — | * | | (.37 | ) | | (.70 | ) | | — | * | | (.70 | ) | | — | | | — | | | 13.42 | | | 11.45 | |
| 2008 | | | 15.34 | | | .99 | | | (.80 | ) | | (.26 | ) | | (.02 | ) | | (.09 | ) | | (.71 | ) | | (.05 | ) | | (.76 | ) | | — | | | — | | | 14.49 | | | 13.40 | |
| | | | | | | | | | | | | | | | | | | | | | | | | | | | | | | | | | | | | | | | | |
| Pennsylvania Municipal Value (NPN) | | | | | | | | | | | | | | | | | | | | | | | | | | | | | | | |
| Year Ended 4/30: | | | | | | | | | | | | | | | | | | | | | | | | | | | | | | | | | | | | | |
| 2013(g) | | | 16.36 | | | .35 | | | .43 | | | N/A | | | N/A | | | .78 | | | (.32 | ) | | — | | | (.32 | ) | | — | | | — | | | 16.82 | | | 16.02 | |
| 2012 | | | 14.79 | | | .72 | | | 1.58 | | | N/A | | | N/A | | | 2.30 | | | (.71 | ) | | (.02 | ) | | (.73 | ) | | — | | | — | | | 16.36 | | | 15.38 | |
| 2011 | | | 15.46 | | | .79 | | | (.70 | ) | | N/A | | | N/A | | | .09 | | | (.76 | ) | | — | | | (.76 | ) | | — | | | — | | | 14.79 | | | 13.96 | |
| 2010 | | | 14.29 | | | .70 | | | 1.19 | | | N/A | | | N/A | | | 1.89 | | | (.72 | ) | | — | | | (.72 | ) | | — | | | — | * | | 15.46 | | | 15.43 | |
| 2009(f) | | | 14.33 | | | (.01 | ) | | — | | | N/A | | | N/A | | | (.01 | ) | | — | | | — | | | — | | | — | | | (.03 | ) | | 14.29 | | | 15.05 | |
| (a) | The amounts shown are based on Common share equivalents. |
| (b) | Total Return Based on Market Value is the combination of changes in the market price per share and the effect of reinvested dividend income and reinvested capital gains distributions, if any, at the average price paid per share at the time of reinvestment. The last dividend declared in the period, which is typically paid on the first business day of the following month, is assumed to be reinvested at the ending market price. The actual reinvestment for the last dividend declared in the period may take place over several days, and in some instances may not be based on the market price, so the actual reinvestment price may be different from the price used in the calculation. Total returns are not annualized. |
| | |
| | Total Return Based on Common Share Net Asset Value is the combination of changes in Common share net asset value, reinvested dividend income at net asset value and reinvested capital gains distributions at net asset value, if any. The last dividend declared in the period, which is typically paid on the first business day of the following month, is assumed to be reinvested at the ending net asset value. The actual reinvest price for the last dividend declared in the period may often be based on the Fund’s market price (and not its net asset value), and therefore may be different from the price used in the calculation. Total returns are not annualized. |
| (c) | After expense reimbursement from the Adviser, where applicable. Ratios do not reflect the effect of custodian fee credits earned on the Fund’s net cash on deposit with the custodian bank, where applicable. As of March 31, 2012, the Adviser is no longer reimbursing Pennsylvania Dividend Advantage 2 (NVY) for any fees and expenses. |
| | | | Ratios/Supplemental Data | |
| Total Returns | | | | | | Ratios to Average Net Assets Applicable to Common Shares Before Reimbursement(d) | | | Ratios to Average Net Assets Applicable to Common Shares After Reimbursement(c)(d) | | | | |
| | | | | | | | | | | | | | | | | | | | | | | |
Based on Market Value | (b) | | Based on Common Share Net Asset Value | (b) | | Ending Net Assets Applicable to Common Shares (000) | | | Expenses | (e) | | Net Investment Income (Loss) | | | Expenses | (e) | | Net Investment Income (Loss) | | | Portfolio Turnover Rate | |
| | | | | | | | | | | | | | | | | | | | | | | |
| | | | | | | | | | | | | | | | | | | | | | | |
| 7.81% | | | 5.90 | % | $ | 58,195 | | | 2.40 | %** | | 4.91 | %** | | N/A | | | N/A | | | 15 | % |
| 22.71 | | | 15.01 | | | 56,579 | | | 2.54 | | | 5.30 | | | 2.47 | % | | 5.37 | % | | 11 | |
| (2.00 | ) | | 1.89 | | | 52,470 | | | 1.88 | | | 5.94 | | | 1.74 | | | 6.08 | | | 7 | |
| 32.47 | | | 16.80 | | | 54,920 | | | 1.30 | | | 6.61 | | | 1.08 | | | 6.83 | | | 5 | |
| (9.16 | ) | | (2.33 | ) | | 49,993 | | | 1.37 | | | 7.07 | | | 1.06 | | | 7.38 | | | 4 | |
| (6.81 | ) | | (.60 | ) | | 53,997 | | | 1.40 | | | 6.29 | | | 1.02 | | | 6.66 | | | 27 | |
| | | | | | | | | | | | | | | | | | | | | | | |
| | | | | | | | | | | | | | | | | | | | | | | |
| 6.28 | | | 4.79 | | | 20,510 | | | .79 | ** | | 4.18 | ** | | N/A | | | N/A | | | 2 | |
| 15.68 | | | 15.89 | | | 19,948 | | | .86 | | | 4.60 | | | N/A | | | N/A | | | 11 | |
| (4.77 | ) | | .59 | | | 18,029 | | | .87 | | | 5.17 | | | N/A | | | N/A | | | 3 | |
| 7.52 | | | 13.49 | | | 18,805 | | | .82 | | | 4.68 | | | N/A | | | N/A | | | 5 | |
| .33 | | | (.31 | ) | | 15,816 | | | .66 | ** | | (.66 | )** | | N/A | | | N/A | | | 0 | |
| (d) | Ratios do not reflect the effect of dividend payments to Auction Rate Preferred shareholders, where applicable; Net Investment Income (Loss) ratios reflect income earned and expenses incurred on assets attributable to ARPS and/or MTP Shares, where applicable. |
| (e) | The expense ratios reflect, among other things, all interest expense and other costs related to MTP Shares and/or the interest expense deemed to have been paid by the Fund on the floating rate certificates issued by the special purpose trusts for the self-deposited inverse floaters held by the Fund, where applicable, both as described in Footnote 1 – General Information and Significant Accounting Policies, MuniFund Term Preferred Shares and Inverse Floating Rate Securities, respectively, as follows: |
| Pennsylvania Dividend Advantage 2 (NVY) | | | | |
| Year Ended 4/30: | | | | |
| 2013(g) | | | 1.21 | %** |
| 2012 | | | 1.28 | |
| 2011 | | | .71 | |
| 2010 | | | .08 | |
| 2009 | | | .01 | |
| 2008 | | | .11 | |
| | | | | |
| Pennsylvania Municipal Value (NPN) | | | | |
| Year Ended 4/30: | | | | |
| 2013(g) | | | — | % |
| 2012 | | | — | |
| 2011 | | | — | |
| 2010 | | | — | |
| 2009(f) | | | — | |
| (f) | For the period April 28, 2009 (commencement of operations) through April 30, 2009. |
| (g) | For the six months ended October 31, 2012. |
| N/A | Fund is not authorized to issue ARPS and does not have, or no longer has, a contractual reimbursement agreement with the Adviser. |
| * | Rounds to less than $.01 per share. |
| ** | Annualized. |
See accompanying notes to financial statements.
| | | Financial |
| | | Highlights (Unaudited) (continued) |
| | | | ARPS at the End of Period | | | MTP Shares at the End of Period | | | VRDP Shares at the End of Period | |
| | | | Aggregate Amount Outstanding (000) | | | Asset Coverage Per $25,000 Share | | | Aggregate Amount Outstanding (000) | | | Ending Market Value Per Share | | | Average Market Value Per Share | | | Asset Coverage Per $10 Share | | | Aggregate Amount Outstanding (000) | | | Asset Coverage Per $100,000 Share | |
| New Jersey Investment Quality (NQJ) | | | | | | | | | | | | | | | | | | | |
| Year Ended 4/30: | | | | | | | | | | | | | | | | | | | | | | |
| 2013(a) | | $ | — | | $ | — | | $ | — | | $ | — | | $ | — | | $ | — | | $ | 144,300 | | $ | 323,641 | |
| 2012 | | | — | | | — | | | — | | | — | | | �� | | | — | | | 144,300 | | | 316,966 | |
| 2011 | | | — | | | — | | | — | | | — | | | — | | | — | | | 144,300 | | | 294,018 | |
| 2010 | | | 143,450 | | | 76,478 | | | — | | | — | | | — | | | — | | | — | | | — | |
| 2009 | | | 149,825 | | | 69,373 | | | — | | | — | | | — | | | — | | | — | | | — | |
| 2008 | | | 162,000 | | | 70,092 | | | — | | | — | | | — | | | — | | | — | | | — | |
| | | | | | | | | | | | | | | | | | | | | | | | | | |
| New Jersey Premium Income (NNJ) | | | | | | | | | | | | | | | | | | | |
| Year Ended 4/30: | | | | | | | | | | | | | | | | | | | | | | |
| 2013(a) | | | — | | | — | | | — | | | — | | | — | | | — | | | 88,600 | | | 322,136 | |
| 2012 | | | — | | | — | | | — | | | — | | | — | | | — | | | 88,600 | | | 315,576 | |
| 2011 | | | — | | | — | | | — | | | — | | | — | | | — | | | 88,600 | | | 293,242 | |
| 2010 | | | 87,875 | | | 76,216 | | | — | | | — | | | — | | | — | | | — | | | — | |
| 2009 | | | 91,600 | | | 70,422 | | | — | | | — | | | — | | | — | | | — | | | — | |
| 2008 | | | 91,600 | | | 73,137 | | | — | | | — | | | — | | | — | | | — | | | — | |
| | | | | | | | | | | | | | | | | | | | | | | | | | |
| New Jersey Dividend Advantage (NXJ) | | | | | | | | | | | | | | | | | | | |
| Year Ended 4/30: | | | | | | | | | | | | | | | | | | | | | | |
| 2013(a) | | | — | | | — | | | 44,861 | | | 10.08 | | | 10.11 | | | 33.59 | | | — | | | — | |
| 2012 | | | — | | | — | | | 44,861 | | | 10.08 | | | 10.07 | | | 32.42 | | | — | | | — | |
| 2011 | | | — | | | — | | | 44,861 | | | 9.94 | | | 9.95 | ^ | | 29.93 | | | — | | | — | |
| 2010 | | | 43,925 | | | 79,240 | | | — | | | — | | | — | | | — | | | — | | | — | |
| 2009 | | | 47,025 | | | 70,311 | | | — | | | — | | | — | | | — | | | — | | | — | |
| 2008 | | | 48,000 | | | 73,834 | | | — | | | — | | | — | | | — | | | — | | | — | |
| | | | | | | | | | | | | | | | | | | | | | | | | | |
| New Jersey Dividend Advantage 2 (NUJ) | | | | | | | | | | | | | | | | | | | |
| Year Ended 4/30: | | | | | | | | | | | | | | | | | | | | | | |
| 2013(a) | | | — | | | — | | | 35,050 | | | 10.04 | | | 10.05 | | | 30.24 | | | — | | | — | |
| 2012 | | | — | | | — | | | 35,050 | | | 10.04 | | | 9.91 | | | 29.66 | | | — | | | — | |
| 2011 | | | — | | | — | | | 35,050 | | | 9.62 | | | 9.65 | ^^ | | 27.55 | | | — | | | — | |
| 2010 | | | 31,225 | | | 77,370 | | | — | | | — | | | — | | | — | | | — | | | — | |
| 2009 | | | 32,600 | | | 69,828 | | | — | | | — | | | — | | | — | | | — | | | — | |
| 2008 | | | 34,500 | | | 72,032 | | | — | | | — | | | — | | | — | | | — | | | — | |
| (a) | For the six months ended October 31, 2012. |
| ^ | For the period March 24, 2011 (first issuance date of shares) through April 30, 2011. |
| ^^ | For the period October 1, 2010 (first issuance date of shares) through April 30, 2011. |
See accompanying notes to financial statements.
| | | | ARPS at the End of Period | | | MTP Shares at the End of Period | | | VRDP Shares at the End of Period | |
| | | | Aggregate Amount Outstanding (000) | | | Asset Coverage Per $25,000 Share | | | Aggregate Amount Outstanding (000) | | | Ending Market Value Per Share | | | Average Market Value Per Share | | | Asset Coverage Per $10 Share | | | Aggregate Amount Outstanding (000) | | | Asset Coverage Per $100,000 Share | |
| Pennsylvania Investment Quality (NQP) | | | | | | | | | | | | | | | | | | | |
| Year Ended 4/30: | | | | | | | | | | | | | | | | | | | | | | |
| 2013(a) | | $ | — | | $ | — | | $ | — | | $ | — | | $ | — | | $ | — | | $ | 112,500 | | $ | 332,969 | |
| 2012 | | | — | | | — | | | — | | | — | | | — | | | — | | | 112,500 | | | 325,722 | |
| 2011 | | | — | | | — | | | — | | | — | | | — | | | — | | | 112,500 | | | 301,693 | |
| 2010 | | | 111,750 | | | 78,326 | | | — | | | — | | | — | | | — | | | — | | | — | |
| 2009 | | | 111,750 | | | 73,849 | | | — | | | — | | | — | | | — | | | — | | | — | |
| 2008 | | | 132,000 | | | 69,039 | | | — | | | — | | | — | | | — | | | — | | | — | |
| | | | | | | | | | | | | | | | | | | | | | | | | | |
| Pennsylvania Premium Income 2 (NPY) | | | | | | | | | | | | | | | | | | | |
| Year Ended 4/30: | | | | | | | | | | | | | | | | | | | | | | |
| 2013(a) | | | — | | | — | | | — | | | — | | | — | | | — | | | 100,000 | | | 342,547 | |
| 2012 | | | — | | | — | | | — | | | — | | | — | | | — | | | 100,000 | | | 336,039 | |
| 2011 | | | — | | | — | | | — | | | — | | | — | | | — | | | 100,000 | | | 310,839 | |
| 2010 | | | 99,275 | | | 80,430 | | | — | | | — | | | — | | | — | | | — | | | — | |
| 2009 | | | 99,275 | | | 75,047 | | | — | | | — | | | — | | | — | | | — | | | — | |
| 2008 | | | 118,100 | | | 70,566 | | | — | | | — | | | — | | | — | | | — | | | — | |
| | | | | | | | | | | | | | | | | | | | | | | | | | |
| Pennsylvania Dividend Advantage (NXM) | | | | | | | | | | | | | | | | | | | |
| Year Ended 4/30: | | | | | | | | | | | | | | | | | | | | | | |
| 2013(a) | | | — | | | — | | | 23,190 | | | 10.04 | | | 10.05 | | | 32.80 | | | — | | | — | |
| 2012 | | | — | | | — | | | 23,190 | | | 10.07 | | | 9.95 | | | 32.12 | | | — | | | — | |
| 2011 | | | — | | | — | | | 23,190 | | | 9.65 | | | 9.75 | Ω | | 30.06 | | | — | | | — | |
| 2010 | | | 22,500 | | | 79,372 | | | — | | | — | | | — | | | — | | | — | | | — | |
| 2009 | | | 22,500 | | | 73,430 | | | — | | | — | | | — | | | — | | | — | | | — | |
| 2008 | | | 25,000 | | | 73,211 | | | — | | | — | | | — | | | — | | | — | | | — | |
| | | | | | | | | | | | | | | | | | | | | | | | | | |
| Pennsylvania Dividend Advantage 2 (NVY) | | | | | | | | | | | | | | | | | | | |
| Year Ended 4/30: | | | | | | | | | | | | | | | | | | | | | | |
| 2013(a) | | | — | | | — | | | 24,550 | | | 10.05 | | | 10.05 | | | 33.70 | | | — | | | — | |
| 2012 | | | — | | | — | | | 24,550 | | | 10.01 | | | 9.96 | | | 33.05 | | | — | | | — | |
| 2011 | | | — | | | — | | | 24,550 | | | 9.75 | | | 9.68 | ΩΩ | | 31.37 | | | — | | | — | |
| 2010 | | | 23,000 | | | 84,696 | | | — | | | — | | | — | | | — | | | — | | | — | |
| 2009 | | | 23,000 | | | 79,340 | | | — | | | — | | | — | | | — | | | — | | | — | |
| 2008 | | | 28,500 | | | 72,366 | | | — | | | — | | | — | | | — | | | — | | | — | |
| (a) | For the six months ended October 31, 2012. |
| Ω | For the period October 4, 2010 (first issuance date of shares) through April 30, 2011. |
| ΩΩ | For the period October 27, 2010 (first issuance date of shares) through April 30, 2011. |
See accompanying notes to financial statements.
| | | Notes to |
| | | Financial Statements (Unaudited) |
1. General Information and Significant Accounting Policies
General Information
The funds covered in this report and their corresponding Common share stock exchange symbols are Nuveen New Jersey Investment Quality Municipal Fund, Inc. (NQJ), Nuveen New Jersey Premium Income Municipal Fund, Inc. (NNJ), Nuveen New Jersey Dividend Advantage Municipal Fund (NXJ), Nuveen New Jersey Dividend Advantage Municipal Fund 2 (NUJ), Nuveen New Jersey Municipal Value Fund (NJV), Nuveen Pennsylvania Investment Quality Municipal Fund (NQP), Nuveen Pennsylvania Premium Income Municipal Fund 2 (NPY), Nuveen Pennsylvania Dividend Advantage Municipal Fund (NXM), Nuveen Pennsylvania Dividend Advantage Municipal Fund 2 (NVY) and Nuveen Pennsylvania Municipal Value Fund (NPN) (each a “Fund” and collectively, the “Funds”). Common shares of New Jersey Investment Quality (NQJ), New Jersey Premium Income (NNJ), Pennsylvania Investment Quality (NQP) and Pennsylvania Premium Income 2 (NPY), are traded on the New York Stock Exchange (“NYSE”) while Common shares of New Jersey Dividend Advantage (NXJ), New Jersey Dividend Advantage 2 (NUJ), New Jersey Municipal Value (NJV), Pennsylvania Dividend Advantage (NXM), Pennsylvania Dividend Advantage 2 (NVY) and Pennsylvania Municipal Value (NPN) are traded on the NYSE MKT (formerly known as NYSE Amex). The Funds are registered under the Investment Company Act of 1940, as amended, as diversified (non-diversified for New Jersey Dividend Advantage 2 (NUJ), New Jersey Municipal Value (NJV) and Pennsylvania Municipal Value (NPN)), closed-end registered investment companies.
Each Fund seeks to provide current income exempt from both regular federal and designated state income taxes by investing primarily in a portfolio of municipal obligations issued by state and local government authorities within a single state or certain U.S. territories.
Significant Accounting Policies
The following is a summary of significant accounting policies followed by the Funds in the preparation of their financial statements in accordance with U.S. generally accepted accounting principles (“U.S. GAAP”).
Investment Valuation
Prices of municipal bonds are provided by a pricing service approved by the Funds’ Board of Directors/Trustees. These securities are generally classified as Level 2 for fair value measurement purposes. The pricing service establishes a security’s fair value using methods that may include consideration of the following: yields or prices of investments of comparable quality, type of issue, coupon, maturity and rating, market quotes or indications of value from security dealers, evaluations of anticipated cash flows or collateral, general market conditions and other information and analysis, including the obligor’s credit characteristics considered relevant. In pricing certain securities, particularly less liquid and lower quality securities, the pricing service may consider information about a security, its issuer, or market activity, provided by Nuveen Fund Advisors, Inc. (the “Adviser”), a wholly-owned subsidiary of Nuveen Investments Inc. (“Nuveen”). These securities are generally classified as Level 2 or Level 3 depending on the priority of the significant inputs.
Certain securities may not be able to be priced by the pre-established pricing methods as described above. Such securities may be valued by the Funds’ Board of Directors/Trustees or its designee at fair value. These securities generally include, but are not limited to, restricted securities (securities which may not be publicly sold without registration under the Securities Act of 1933, as amended) for which a pricing service is unable to provide a market price; securities whose trading has been formally suspended; debt securities that have gone into default and for which there is no current market quotation; a security whose market price is not available from a pre-established pricing source; a security with respect to which an event has occurred that is likely to materially affect the value of the security after the market has closed but before the calculation of a Fund’s net asset value (as may be the case in non-U.S. markets on which the security is primarily traded) or make it difficult or impossible to obtain a reliable market quotation; and a security whose price, as provided by the pricing service, is not deemed to reflect the security’s fair value. As a general principle, the fair value of a security would appear to be the amount that the owner might reasonably expect to receive for it in a current sale. A variety of factors may be considered in determining the fair value of such securities, which may include consideration of the following: yields or prices of investments of comparable quality, type of issue, coupon, maturity and rating, market quotes or indications of value from security dealers, evaluations of anticipated cash flows or collateral, general market conditions and other information and analysis, including the obligor’s credit characteristics considered relevant. These securities are generally classified as Level 2 or Level 3 depending on the priority of the significant inputs. Regardless of the method employed to value a particular security, all valuations are subject to review by the Funds’ Board of Directors/Trustees or its designee.
Refer to Footnote 2 – Fair Value Measurements for further details on the leveling of securities held by the Funds as of the end of the reporting period.
Investment Transactions
Investment transactions are recorded on a trade date basis. Realized gains and losses from transactions are determined on the specific identification method, which is the same basis used for federal income tax purposes. Investments purchased on a when-issued/delayed delivery basis may have extended settlement periods. Any investments so purchased are subject to market fluctuation during this period. The Funds have instructed the custodian to earmark securities in the Funds’ portfolios with a current value at least equal to the amount of the when-issued/delayed delivery purchase commitments. At October 31, 2012, New Jersey Investment Quality (NQJ), New Jersey Premium Income (NNJ), New Jersey Dividend Advantage 2 (NUJ) Pennsylvania Investment Quality (NQP), Pennsylvania Premium Income 2 (NPY), Pennsylvania Dividend Advantage (NXM) and Pennsylvania Dividend Advantage 2 (NVY) had outstanding when-issued/delayed delivery Purchase commitments of $701,944, $1,838,928, $919,464, $2,685,139, $210,802, $ 302,079 and $323,070, respectively. There was no such outstanding purchase commitments in any of the other Funds.
Investment Income
Investment income, which reflects the amortization of premiums and includes accretion of discounts for financial reporting purposes, is recorded on an accrual basis.
Income Taxes
Each Fund is a separate taxpayer for federal income tax purposes. Each Fund intends to distribute substantially all of its net investment income and net capital gains to shareholders and to otherwise comply with the requirements of Subchapter M of the Internal Revenue Code applicable to regulated investment companies. Therefore, no federal income tax provision is required. Furthermore, each Fund intends to satisfy conditions that will enable interest from municipal securities, which is exempt from regular federal and designated state income taxes, to retain such tax-exempt status when distributed to shareholders of the Funds. Net realized capital gains and ordinary income distributions paid by the Funds are subject to federal taxation.
For all open tax years and all major taxing jurisdictions, management of the Funds has concluded that there are no significant uncertain tax positions that would require recognition in the financial statements. Open tax years are those that are open for examination by taxing authorities (i.e., generally the last four tax year ends and the interim tax period since then). Furthermore, management of the Funds is also not aware of any tax positions for which it is reasonably possible that the total amounts of unrecognized tax benefits will significantly change in the next twelve months.
Dividends and Distributions to Common Shareholders
Dividends from net investment income are declared monthly. Net realized capital gains and/or market discount from investment transactions, if any, are distributed to shareholders at least annually. Furthermore, capital gains are distributed only to the extent they exceed available capital loss carryforwards.
Distributions to Common shareholders of net investment income, net realized capital gains and/or market discount, if any, are recorded on the ex-dividend date. The amount and timing of distributions are determined in accordance with federal income tax regulations, which may differ from U.S. GAAP.
Auction Rate Preferred Shares
Each Fund except New Jersey Municipal Value (NJV) and Pennsylvania Municipal Value (NPN) is authorized to issue Auction Rate Preferred Shares (“ARPS”). As of October 31, 2012, and during the six months ended October 31, 2012, the Funds did not have any APRS outstanding.
| | | Notes to |
| | | Financial Statements (Unaudited) (continued) |
MuniFund Term Preferred Shares
The following Funds have issued and outstanding MuniFund Term Preferred (“MTP”) Shares, with a $10 stated (“par”) value per share. Proceeds from the issuance of MTP Shares, net of offering expenses, were used to redeem all, or a portion of, the remainder of each Fund’s outstanding ARPS. Each Fund’s MTP Shares are issued in one Series. Dividends on MTP Shares, which are recognized as interest expense for financial reporting purposes, are paid monthly at a fixed annual rate, subject to adjustments in certain circumstances. The MTP Shares trade on the NYSE. As of October 31, 2012, the number of MTP Shares outstanding, annual interest rate and NYSE “ticker” symbol for each Fund are as follows:
| | | | New Jersey Dividend Advantage (NXJ) | | | New Jersey Dividend Advantage 2 (NUJ) | |
| | | | | | | Annual | | | | | | | | | Annual | | | | |
| | | | Shares | | | Interest | | | NYSE | | | Shares | | | Interest | | | NYSE | |
| | | | Outstanding | | | Rate | | | Ticker | | | Outstanding | | | Rate | | | Ticker | |
| Series: | | | | | | | | | | | | | | | | | | | |
| 2014 | | | 4,486,100 | | | 2.30 | % | | NXJ Pr A | | | — | | | — | | | — | |
| 2015 | | | — | | | — | | | — | | | 3,505,000 | | | 2.00 | % | | NUJ Pr C | |
| | | | Pennsylvania Dividend Advantage (NXM) | | | Pennsylvania Dividend Advantage 2 (NVY) | |
| | | | | | | Annual | | | | | | | | | Annual | | | | |
| | | | Shares | | | Interest | | | NYSE | | | Shares | | | Interest | | | NYSE | |
| | | | Outstanding | | | Rate | | | Ticker | | | Outstanding | | | Rate | | | Ticker | |
| Series: | | | | | | | | | | | | | | | | | | | |
| 2015 | | | 2,319,000 | | | 2.10 | % | | NXM Pr C | | | 2,455,000 | | | 2.15 | % | | NVY Pr C | |
Each Fund is obligated to redeem its MTP Shares by the date as specified in its offering document (“Term Redemption Date”), unless earlier redeemed or repurchased by the Fund. MTP Shares are subject to optional and mandatory redemption in certain circumstances. MTP Shares will be subject to redemption at the option of each Fund (“Optional Redemption Date”), subject to a payment of premium for one year following the Optional Redemption Date (“Premium Expiration Date”), and at par thereafter. MTP Shares also will be subject to redemption, at the option of each Fund, at par in the event of certain changes in the credit rating of the MTP Shares. Each Fund may be obligated to redeem certain of the MTP Shares if the Fund fails to maintain certain asset coverage and leverage ratio requirements and such failures are not cured by the applicable cure date. The redemption price per share is equal to the sum of the liquidation value per share plus any accumulated but unpaid dividends. The Term Redemption Date, Optional Redemption Date and Premium Expiration Date for each Fund’s series of MTP Shares are as follows:
| | | | New Jersey | | | New Jersey | | | Pennsylvania | | | Pennsylvania | |
| | | | Dividend | | | Dividend | | | Dividend | | | Dividend | |
| | | | Advantage | | | Advantage 2 | | | Advantage | | | Advantage 2 | |
| | | | (NXJ | ) | | (NUJ | ) | | (NXM | ) | | (NVY | ) |
| | | | Series 2014 | | | Series 2015 | | | Series 2015 | | | Series 2015 | |
| Term Redemption Date | | | April 1, 2014 | | | November 1, 2015 | | | November 1, 2015 | | | November 1, 2015 | |
| Optional Redemption Date | | | April 1, 2012 | | | November 1, 2011 | | | November 1, 2011 | | | November 1, 2011 | |
| Premium Expiration Date | | | March 31, 2013 | | | October 31, 2012 | | | October 31, 2012 | | | October 31, 2012 | |
The average liquidation value for each Fund during the six months ended October 31, 2012, was as follows:
| | | | New Jersey | | | New Jersey | | | Pennsylvania | | | Pennsylvania | |
| | | | Dividend | | | Dividend | | | Dividend | | | Dividend | |
| | | | Advantage | | | Advantage 2 | | | Advantage | | | Advantage 2 | |
| | | | (NXJ | ) | | (NUJ | ) | | (NXM | ) | | (NVY | ) |
| Average liquidation value of MTP Shares outstanding | | $ | 44,861,000 | | $ | 35,050,000 | | $ | 23,190,000 | | $ | 24,550,000 | |
For financial reporting purposes only, the liquidation value of MTP Shares is recorded as a liability on the Statement of Assets and Liabilities. Unpaid dividends on MTP Shares are recognized as a component of “Interest payable” on the Statement of Assets and Liabilities. Dividends paid on MTP Shares are recognized as a component of “Interest expense and amortization of offering costs” on the Statement of Operations.
Variable Rate Demand Preferred Shares
The following Funds have issued and outstanding Variable Rate Demand Preferred (“VRDP”) Shares, with a $100,000 liquidation value per share. New Jersey Investment Quality (NQJ), New Jersey Premium Income (NNJ), Pennsylvania Investment Quality (NQP) and Pennsylvania Premium Income 2 (NPY) issued their VRDP Shares in a privately negotiated offering. Proceeds of each Fund’s offering were used to redeem all, or a portion of, each Fund’s outstanding ARPS. The VRDP Shares were offered to qualified institutional buyers pursuant to Rule 144A under the Securities Act of 1933. As of October 31, 2012, the number of VRDP Shares outstanding and maturity date for each Fund are as follows:
| | | | New Jersey | | | New Jersey | | | Pennsylvania | | | Pennsylvania | |
| | | | Investment | | | Premium | | | Investment | | | Premium | |
| | | | Quality | | | Income | | | Quality | | | Income 2 | |
| | | | (NQJ | ) | | (NNJ | ) | | (NQP | ) | | (NPY | ) |
| Series | | | 1 | | | 1 | | | 1 | | | 1 | |
| VRDP Shares outstanding | | | 1,443 | | | 886 | | | 1,125 | | | 1,000 | |
| Maturity | | | August 1, 2040 | | | August 1, 2040 | | | August 1, 2040 | | | August 1, 2040 | |
VRDP Shares include a liquidity feature that allows VRDP shareholders to have their shares purchased by a liquidity provider with whom each Fund has contracted in the event that purchase orders for VRDP Shares in a remarketing are not sufficient in number to be matched with the sale orders in that remarketing. Each Fund is required to redeem any VRDP Shares that are still owned by the liquidity provider after six months of continuous, unsuccessful remarketing. Each Fund pays an annual remarketing fee of .10% on the aggregate principal amount of all VRDP Shares outstanding. Each Fund’s VRDP Shares have successfully remarketed since issuance.
Dividends on the VRDP Shares (which are treated as interest payments for financial reporting purposes) are set weekly at a rate established by a remarketing agent; therefore, the market value of the VRDP Shares is expected to approximate its liquidation value. If remarketings for VRDP Shares are continuously unsuccessful for six months, the maximum rate is designed to escalate according to a specified schedule in order to enhance the remarketing agent’s ability to successfully remarket the VRDP Shares.
Subject to certain conditions, VRDP Shares may be redeemed, in whole or in part, at any time at the option of each Fund. Each Fund may also redeem certain of the VRDP Shares if the Fund fails to maintain certain asset coverage requirements and such failures are not cured by the applicable cure date. The redemption price per share is equal to the sum of the liquidation value per share plus any accumulated but unpaid dividends.
The average liquidation value of VRDP Shares outstanding and annualized dividend rate of VRDP Shares for each Fund during the six months ended October 31, 2012, were as follows:
| | | | New Jersey | | | New Jersey | | | Pennsylvania | | | Pennsylvania | |
| | | | Investment | | | Premium | | | Investment | | | Premium | |
| | | | Quality | | | Income | | | Quality | | | Income 2 | |
| | | | (NQJ | ) | | (NNJ | ) | | (NQP | ) | | (NPY | ) |
| Average liquidation value of VRDP Shares outstanding | | | 144,300,000 | | | 88,600,000 | | | 112,500,000 | | | 100,000,000 | |
| Annualized dividend rate | | | 0.30 | % | | 0.30 | % | | 0.30 | % | | 0.30 | % |
For financial reporting purposes only, the liquidation value of VRDP Shares is recognized as a liability on the Statement of Assets and Liabilities. Unpaid dividends on VRDP Shares are recognized as a component of “Interest payable” on the Statement of Assets and Liabilities. Dividends paid on the VRDP Shares are recognized as a component of “Interest expense and amortization of offering costs” on the Statement of Operations. In addition to interest expense, each Fund also pays a per annum liquidity fee to the liquidity provider as well as a remarketing fee, which are recognized as “Liquidity fees” and “Remarketing fees,” respectively, on the Statement of Operations.
Inverse Floating Rate Securities
Each Fund is authorized to invest in inverse floating rate securities. An inverse floating rate security is created by depositing a municipal bond, typically with a fixed interest rate, into a special purpose trust created by a broker-dealer. In turn, this trust (a) issues floating rate certificates, in face amounts equal to some fraction of the deposited bond’s par amount or market value, that typically pay short-term tax-exempt interest rates to third parties, and (b) issues to a long-term investor (such as one of the Funds) an inverse floating rate certificate (sometimes referred to as an “inverse floater”) that represents all remaining or residual interest in the trust. The income received by the inverse floater holder varies inversely with the short-term rate paid to the floating rate certificates’ holders, and in most circumstances the inverse floater holder bears substantially all of the underlying bond’s downside investment risk and also benefits disproportionately from any potential appreciation of the underlying bond’s value. The price of an inverse floating rate security will be more volatile than that of the underlying bond because the interest rate is dependent on not only the fixed coupon rate of the underlying bond but also on the short-term interest paid on the floating rate certificates, and because the inverse floating rate security essentially bears the risk of loss of the greater face value of the underlying bond.
| | | Notes to |
| | | Financial Statements (Unaudited) (continued) |
A Fund may purchase an inverse floating rate security in a secondary market transaction without first owning the underlying bond (referred to as an “externally-deposited inverse floater”), or instead by first selling a fixed-rate bond to a broker-dealer for deposit into the special purpose trust and receiving in turn the residual interest in the trust (referred to as a “self-deposited inverse floater”). The inverse floater held by a Fund gives the Fund the right (a) to cause the holders of the floating rate certificates to tender their notes at par, and (b) to have the broker transfer the fixed-rate bond held by the trust to the Fund, thereby collapsing the trust. An investment in an externally-deposited inverse floater is identified in the Portfolio of Investments as “(IF) – Inverse floating rate investment.” An investment in a self-deposited inverse floater is accounted for as a financing transaction. In such instances, a fixed-rate bond deposited into a special purpose trust is identified in the Portfolio of Investments as “(UB) – Underlying bond of an inverse floating rate trust reflected as a financing transaction,” with the Fund accounting for the short-term floating rate certificates issued by the trust as “Floating rate obligations” on the Statement of Assets and Liabilities. In addition, the Fund reflects in “Investment Income” the entire earnings of the underlying bond and recognizes the related interest paid to the holders of the short-term floating rate certificates as a component of “Interest expense and amortization of offering costs” on the Statement of Operations.
During the six months ended October 31, 2012, each Fund invested in externally-deposited inverse floaters and/or self-deposited inverse floaters.
Each Fund may also enter into shortfall and forbearance agreements (sometimes referred to as a “recourse trust” or “credit recovery swap”) (such agreements referred to herein as “Recourse Trusts”) with a broker-dealer by which a Fund agrees to reimburse the broker-dealer, in certain circumstances, for the difference between the liquidation value of the fixed-rate bond held by the trust and the liquidation value of the floating rate certificates issued by the trust plus any shortfalls in interest cash flows. Under these agreements, a Fund’s potential exposure to losses related to or on inverse floaters may increase beyond the value of a Fund’s inverse floater investments as a Fund may potentially be liable to fulfill all amounts owed to holders of the floating rate certificates. At period end, any such shortfall is recognized as “Unrealized depreciation on Recourse Trusts” on the Statement of Assets and Liabilities.
At October 31, 2012, each Fund’s maximum exposure to externally-deposited Recourse Trusts, was as follows:
| | | | New Jersey | | | New Jersey | | | New Jersey | | | New Jersey | | | New Jersey | �� |
| | | | Investment | | | Premium | | | Dividend | | | Dividend | | | Municipal | |
| | | | Quality | | | Income | | | Advantage | | | Advantage 2 | | | Value | |
| | | | (NQJ | ) | | (NNJ | ) | | (NXJ | ) | | (NUJ | ) | | (NJV | ) |
| Maximum exposure to Recourse Trusts | | $ | 9,290,000 | | $ | 5,510,000 | | $ | 2,935,000 | | $ | 2,040,000 | | $ | — | |
| | | | Pennsylvania | | | Pennsylvania | | | Pennsylvania | | | Pennsylvania | | | Pennsylvania | |
| | | | Investment | | | Premium | | | Dividend | | | Dividend | | | Municipal | |
| | | | Quality | | | Income 2 | | | Advantage | | | Advantage 2 | | | Value | |
| | | | (NQP | ) | | (NPY | ) | | (NXM | ) | | (NVY | ) | | (NPN | ) |
| Maximum exposure to Recourse Trusts | | $ | — | | $ | 3,750,000 | | $ | 745,000 | | $ | 495,000 | | $ | 345,000 | |
The average floating rate obligations outstanding and average annual interest rate and fees related to self-deposited inverse floaters for the following Funds during the six months ended October 31, 2012, were as follows:
| | | | New Jersey | | | Pennsylvania | | | Pennsylvania | | | Pennsylvania | | | Pennsylvania | |
| | | | Municipal | | | Investment | | | Premium | | | Dividend | | | Dividend | |
| | | | Value | | | Quality | | | Income 2 | | | Advantage | | | Advantage 2 | |
| | | | (NJV | ) | | (NQP | ) | | (NPY | ) | | (NXM | ) | | (NVY | ) |
| Average floating rate obligations outstanding | | $ | 1,500,000 | | $ | 26,549,946 | | $ | 11,674,212 | | $ | 878,533 | | $ | 4,248,560 | |
| Average annual interest rate and fees | | | 0.79 | % | | 0.46 | % | | 0.74 | % | | 0.84 | % | | 0.80 | % |
Derivative Financial Instruments
Each Fund is authorized to invest in certain derivative instruments, including foreign currency forwards, futures, options and swap contracts. Although the Funds are authorized to invest in such derivative instruments, and may do so in the future, they did not make any such investments during the six months ended October 31, 2012.
Market and Counterparty Credit Risk
In the normal course of business each Fund may invest in financial instruments and enter into financial transactions where risk of potential loss exists due to changes in the market (market risk) or failure of the other party to the transaction to perform (counterparty credit risk). The potential loss could exceed the value of the financial assets recorded on the financial statements. Financial assets, which potentially expose each Fund to counterparty credit risk, consist principally of cash due from counterparties on forward, option and swap transactions, when applicable. The extent of each Fund’s exposure to counterparty credit risk in respect to these financial assets approximates their carrying value as recorded on the Statement of Assets and Liabilities. Futures contracts, when applicable, expose a Fund to minimal counterparty credit risk as they are exchange traded and the exchange’s clearinghouse, which is counterparty to all exchange traded futures, guarantees the futures contracts against default.
Each Fund helps manage counterparty credit risk by entering into agreements only with counterparties the Adviser believes have the financial resources to honor their obligations and by having the Adviser monitor the financial stability of the counterparties. Additionally, counterparties may be required to pledge collateral daily (based on the daily valuation of the financial asset) on behalf of each Fund with a value approximately equal to the amount of any unrealized gain above a pre-determined threshold. Reciprocally, when each Fund has an unrealized loss, the Funds have instructed the custodian to pledge assets of the Funds as collateral with a value approximately equal to the amount of the unrealized loss above a pre-determined threshold. Collateral pledges are monitored and subsequently adjusted if and when the valuations fluctuate, either up or down, by at least the predetermined threshold amount.
Zero Coupon Securities
Each Fund is authorized to invest in zero coupon securities. A zero coupon security does not pay a regular interest coupon to its holders during the life of the security. Income to the holder of the security comes from accretion of the difference between the original purchase price of the security at issuance and the par value of the security at maturity and is effectively paid at maturity. The market prices of zero coupon securities generally are more volatile than the market prices of securities that pay interest periodically.
Offering Costs
Costs incurred by New Jersey Dividend Advantage (NXJ), New Jersey Dividend Advantage 2 (NUJ), Pennsylvania Dividend Advantage (NXM) and Pennsylvania Dividend Advantage 2 (NVY) in connection with their offerings of MTP Shares were recorded as deferred charges, which are being amortized over the life of the shares. Costs incurred by New Jersey Investment Quality (NQJ), New Jersey Premium Income (NNJ), Pennsylvania Investment Quality (NQP) and Pennsylvania Premium Income 2 (NPY) in connection with their offerings of VRDP Shares were recorded as deferred charges which are being amortized over the life of the shares. Each Fund’s amortized deferred charges are recognized as a component of “Interest expense and amortization of offering costs” on the Statement of Operations.
Custodian Fee Credit
Each Fund has an arrangement with the custodian bank whereby certain custodian fees and expenses are reduced by net credits earned on each Fund’s cash on deposit with the bank. Such deposit arrangements are an alternative to overnight investments. Credits for cash balances may be offset by charges for any days on which a Fund overdraws its account at the custodian bank.
Indemnifications
Under the Funds’ organizational documents, their officers and directors/trustees are indemnified against certain liabilities arising out of the performance of their duties to the Funds. In addition, in the normal course of business, the Funds enter into contracts that provide general indemnifications to other parties. The Funds’ maximum exposure under these arrangements is unknown as this would involve future claims that may be made against the Funds that have not yet occurred. However, the Funds have not had prior claims or losses pursuant to these contracts and expect the risk of loss to be remote.
Use of Estimates
The preparation of financial statements in conformity with U.S. GAAP requires management to make estimates and assumptions that affect the reported amounts of assets and liabilities at the date of the financial statements and the reported amounts of increases and decreases in net assets applicable to Common shares from operations during the reporting period. Actual results may differ from those estimates.
2. Fair Value Measurements
Fair value is defined as the price that the Funds would receive upon selling an investment or transferring a liability in an orderly transaction to an independent buyer in the principal or most advantageous market for the investment. A three-tier hierarchy is used to maximize the use of observable market data and minimize the use of unobservable inputs and to establish classification of fair value measurements for disclosure purposes.
Observable inputs reflect the assumptions market participants would use in pricing the asset or liability. Observable inputs are based on market data obtained from sources independent of the reporting entity. Unobservable inputs reflect the reporting entity’s own assumptions about the assumptions market participants would use in pricing the asset or liability. Unobservable inputs are based on the best information available in the circumstances.
| | | Notes to |
| | | Financial Statements (Unaudited) (continued) |
The following is a summary of the three-tiered hierarchy of valuation input levels.
| | Level 1 – | Inputs are unadjusted and prices are determined using quoted prices in active markets for identical securities. |
| | Level 2 – | Prices are determined using other significant observable inputs (including quoted prices for similar securities, interest rates, prepayment speeds, credit risk, etc.). |
| | Level 3 – | Prices are determined using significant unobservable inputs (including management’s assumptions in determining the fair value of investments). |
The inputs or methodologies used for valuing securities are not an indication of the risks associated with investing in those securities. The following is a summary of each Fund’s fair value measurements as of the end of the reporting period:
| New Jersey Investment Quality (NQJ) | | | Level 1 | | | Level 2 | | | Level 3 | | | Total | |
| Long-Term Investments*: | | | | | | | | | | | | | |
| Municipal Bonds | | $ | — | | $ | 458,423,696 | | $ | — | | $ | 458,423,696 | |
| | | | | | | | | | | | | | |
| New Jersey Premium Income (NNJ) | | | Level 1 | | | Level 2 | | | Level 3 | | | Total | |
| Long-Term Investments*: | | | | | | | | | | | | | |
| Municipal Bonds | | $ | — | | $ | 283,145,167 | | $ | — | | $ | 283,145,167 | |
| | | | | | | | | | | | | | |
| New Jersey Dividend Advantage (NXJ) | | | Level 1 | | | Level 2 | | | Level 3 | | | Total | |
| Long-Term Investments*: | | | | | | | | | | | | | |
| Municipal Bonds | | $ | — | | $ | 148,660,517 | | $ | — | | $ | 148,660,517 | |
| | | | | | | | | | | | | | |
| New Jersey Dividend Advantage 2 (NUJ) | | | Level 1 | | | Level 2 | | | Level 3 | | | Total | |
| Long-Term Investments*: | | | | | | | | | | | | | |
| Municipal Bonds | | $ | — | | $ | 103,767,661 | | $ | — | | $ | 103,767,661 | |
| | | | | | | | | | | | | | |
| New Jersey Municipal Value (NJV) | | | Level 1 | | | Level 2 | | | Level 3 | | | Total | |
| Long-Term Investments*: | | | | | | | | | | | | | |
| Municipal Bonds | | $ | — | | $ | 27,332,612 | | $ | — | | $ | 27,332,612 | |
| | | | | | | | | | | | | | |
| Pennsylvania Investment Quality (NQP) | | | Level 1 | | | Level 2 | | | Level 3 | | | Total | |
| Long-Term Investments*: | | | | | | | | | | | | | |
| Municipal Bonds | | $ | — | | $ | 374,252,833 | | $ | — | | $ | 374,252,833 | |
| | | | | | | | | | | | | | |
| Pennsylvania Premium Income 2 (NPY) | | | Level 1 | | | Level 2 | | | Level 3 | | | Total | |
| Long-Term Investments*: | | | | | | | | | | | | | |
| Municipal Bonds | | $ | — | | $ | 341,879,696 | | $ | — | | $ | 341,879,696 | |
| | | | | | | | | | | | | | |
| Pennsylvania Dividend Advantage (NXM) | | | Level 1 | | | Level 2 | | | Level 3 | | | Total | |
| Long-Term Investments*: | | | | | | | | | | | | | |
| Municipal Bonds | | $ | — | | $ | 74,050,497 | | $ | — | | $ | 74,050,497 | |
| | | | | | | | | | | | | | |
| Pennsylvania Dividend Advantage 2 (NVY) | | | Level 1 | | | Level 2 | | | Level 3 | | | Total | |
| Long-Term Investments*: | | | | | | | | | | | | | |
| Municipal Bonds | | $ | — | | $ | 84,270,728 | | $ | — | | $ | 84,270,728 | |
| | | | | | | | | | | | | | |
| Pennsylvania Municipal Value (NPN) | | | Level 1 | | | Level 2 | | | Level 3 | | | Total | |
| Long-Term Investments*: | | | | | | | | | | | | | |
| Municipal Bonds | | $ | — | | $ | 20,012,974 | | $ | — | | $ | 20,012,974 | |
* Refer to the Fund’s Portfolio of Investments for industry classifications.
The Nuveen funds’ Board of Directors/Trustees is responsible for the valuation process and has delegated the oversight of the daily valuation process to the Adviser’s Valuation Committee. The Valuation Committee, pursuant to the valuation policies and procedures adopted by the Board of Directors/Trustees, is responsible for making fair value determinations, evaluating the effectiveness of the funds’ pricing policies, and reporting to the Board of Directors/Trustees. The Valuation Committee is aided in its efforts by the Adviser’s dedicated Securities Valuation Team, which is responsible for administering the daily valuation process and applying fair value methodologies as approved by the Valuation Committee. When determining the reliability of independent pricing services for investments owned by the funds, the Valuation Committee, among other things, conducts due diligence reviews of the pricing services and monitors the quality of security prices received through various testing reports conducted by the Securities Valuation Team.
The Valuation Committee will consider pricing methodologies it deems relevant and appropriate when making fair value determinations. Examples of possible methodologies include, but are not limited to, multiple of earnings; discount from market of a similar freely traded security; discounted cash-flow analysis; book value or a multiple thereof; risk premium/yield analysis; yield to maturity; and/or fundamental investment analysis. The Valuation Committee will also consider factors it deems relevant and appropriate in light of the facts and circumstances. Examples of possible factors include, but are not limited to, the type of security; the issuer’s financial statements; the purchase price of the security; the discount from market value of unrestricted securities of the same class at the time of purchase; analysts’ research and observations from financial institutions; information regarding any transactions or offers with respect to the security; the existence of merger proposals or tender offers affecting the security; the price and extent of public trading in similar securities of the issuer or comparable companies; and the existence of a shelf registration for restricted securities.
For each portfolio security that has been fair valued pursuant to the policies adopted by the Board of Directors/Trustees, the fair value price is compared against the last available and next available market quotations. The Valuation Committee reviews the results of such testing and fair valuation occurrences are reported to the Board of Directors/Trustees.
3. Derivative Instruments and Hedging Activities
The Funds record derivative instruments at fair value, with changes in fair value recognized on the Statement of Operations, when applicable. Even though the Funds’ investments in derivatives may represent economic hedges, they are not considered to be hedge transactions for financial reporting purposes. The Funds did not invest in derivative instruments during the six months ended October 31, 2012.
4. Fund Shares
Common Shares
Transactions in Common shares were as follows:
| | | | New Jersey | | | New Jersey | | | New Jersey | |
| | | | Investment Quality (NQJ) | | | Premium Income (NNJ) | | | Dividend Advantage (NXJ) | |
| | | | Six Months | | | | | | Six Months | | | | | | Six Months | | | | |
| | | | Ended | | | Year Ended | | | Ended | | | Year Ended | | | Ended | | | Year Ended | |
| | | | 10/31/12 | | | 4/30/12 | | | 10/31/12 | | | 4/30/12 | | | 10/31/12 | | | 4/30/12 | |
| Common shares issued to shareholders due to reinvestment of distributions | | | 22,241 | | | — | | | 22,858 | | | 5,845 | | | — | | | — | |
| | | | | | | | | | New Jersey | | | New Jersey | |
| | | | | | | | | | Dividend Advantage 2 (NUJ) | | | Municipal Value (NJV) | |
| | | | | | | | | | Six Months | | | | | | Six Months | | | | |
| | | | | | | | | | Ended | | | Year Ended | | | Ended | | | Year Ended | |
| | | | | | | | | | 10/31/12 | | | 4/30/12 | | | 10/31/12 | | | 4/30/12 | |
| Common shares issued to shareholders due to reinvestment of distributions | | | 1,793 | | | 629 | | | 778 | | | 924 | |
| | | | Pennsylvania Investment Quality (NQP) | | | Pennsylvania Premium Income 2 (NPY) | | | Pennsylvania Dividend Advantage (NXM) | |
| | | | Six Months | | | | | | Six Months | | | | | | Six Months | | | | |
| | | | Ended | | | Year Ended | | | Ended | | | Year Ended | | | Ended | | | Year Ended | |
| | | | 10/31/12 | | | 4/30/12 | | | 10/31/12 | | | 4/30/12 | | | 10/31/12 | | | 4/30/12 | |
| Common shares issued to shareholders due to reinvestment of distributions | | | 16,127 | | | 6,385 | | | — | | | — | | | — | | | — | |
| | | | | | | | | | Pennsylvania Dividend Advantage 2 (NVY) | | | Pennsylvania Municipal Value (NPN) | |
| | | | | | | | | | Six Months | | | | | | Six Months | | | | |
| | | | | | | | | | Ended | | | Year Ended | | | Ended | | | Year Ended | |
| | | | | | | | | | 10/31/12 | | | 4/30/12 | | | 10/31/12 | | | 4/30/12 | |
| Common shares issued to shareholders due to reinvestment of distributions | | | — | | | — | | | — | | | — | |
| | | Notes to |
| | | Financial Statements (Unaudited) (continued) |
5. Investment Transactions
Purchases and sales (including maturities but excluding short-term investments, where applicable) during the six months ended October 31, 2012, were as follows:
| | | | New Jersey | | | New Jersey | | | New Jersey | | | New Jersey | | | New Jersey | |
| | | | Investment | | | Premium | | | Dividend | | | Dividend | | | Municipal | |
| | | | Quality | | | Income | | | Advantage | | | Advantage 2 | | | Value | |
| | | | (NQJ | ) | | (NNJ | ) | | (NXJ | ) | | (NUJ | ) | | (NJV | ) |
| Purchases | | $ | 33,535,554 | | $ | 19,704,652 | | $ | 12,401,329 | | $ | 14,542,511 | | $ | 993,165 | |
| Sales and maturities | | | 34,622,877 | | | 16,824,173 | | | 12,714,491 | | | 14,933,450 | | | 1,191,203 | |
| | | | Pennsylvania | | | Pennsylvania | | | Pennsylvania | | | Pennsylvania | | | Pennsylvania | |
| | | | Investment | | | Premium | | | Dividend | | | Dividend | | | Municipal | |
| | | | Quality | | | Income 2 | | | Advantage | | | Advantage 2 | | | Value | |
| | | | (NQP | ) | | (NPY | ) | | (NXM | ) | | (NVY | ) | | (NPN | ) |
| Purchases | | $ | 24,749,753 | | $ | 21,547,290 | | $ | 6,606,454 | | $ | 12,721,988 | | $ | 391,796 | |
| Sales and maturities | | | 43,209,284 | | | 27,818,717 | | | 8,012,708 | | | 12,418,181 | | | 550,000 | |
6. Income Tax Information
The following information is presented on an income tax basis. Differences between amounts for financial statement and federal income tax purposes are primarily due to timing differences in recognizing taxable market discount, timing differences in recognizing certain gains and losses on investment transactions and the treatment of investments in inverse floating rate securities reflected as financing transactions, if any. To the extent that differences arise that are permanent in nature, such amounts are reclassified within the capital accounts as detailed below. Temporary differences do not require reclassification. Temporary and permanent differences do not impact the net asset values of the Funds.
At October 31, 2012, the cost and unrealized appreciation (depreciation) of investments, as determined on a federal income tax basis, were as follows:
| | | | New Jersey | | | New Jersey | | | New Jersey | | | New Jersey | | | New Jersey | |
| | | | Investment | | | Premium | | | Dividend | | | Dividend | | | Municipal | |
| | | | Quality | | | Income | | | Advantage | | | Advantage 2 | | | Value | |
| | | | (NQJ | ) | | (NNJ | ) | | (NXJ | ) | | (NUJ | ) | | (NJV | ) |
| Cost of investments | | $ | 426,447,106 | | $ | 260,096,467 | | $ | 135,303,312 | | $ | 96,762,340 | | $ | 21,857,450 | |
| Gross unrealized: | | | | | | | | | | | | | | | | |
| Appreciation | | $ | 34,408,831 | | $ | 23,512,593 | | $ | 13,621,289 | | $ | 7,185,639 | | $ | 4,016,876 | |
| Depreciation | | | (2,432,241 | ) | | (463,893 | ) | | (264,084 | ) | | (180,318 | ) | | (41,714 | ) |
| Net unrealized appreciation (depreciation) of investments | | $ | 31,976,590 | | $ | 23,048,700 | | $ | 13,357,205 | | $ | 7,005,321 | | $ | 3,975,162 | |
| | | | Pennsylvania | | | Pennsylvania | | | Pennsylvania | | | Pennsylvania | | | Pennsylvania | |
| | | | Investment | | | Premium | | | Dividend | | | Dividend | | | Municipal | |
| | | | Quality | | | Income 2 | | | Advantage | | | Advantage 2 | | | Value | |
| | | | (NQP | ) | | (NPY | ) | | (NXM | ) | | (NVY | ) | | (NPN | ) |
| Cost of investments | | $ | 317,145,327 | | $ | 304,041,862 | | $ | 68,043,317 | | $ | 75,126,988 | | $ | 17,275,980 | |
| Gross unrealized: | | | | | | | | | | | | | | | | |
| Appreciation | | $ | 32,264,944 | | $ | 30,194,366 | | $ | 6,013,716 | | $ | 5,941,661 | | $ | 2,736,994 | |
| Depreciation | | | (967,459 | ) | | (2,471,635 | ) | | (536,495 | ) | | (832,885 | ) | | — | |
| Net unrealized appreciation (depreciation) of investments | | $ | 31,297,485 | | $ | 27,722,731 | | $ | 5,477,221 | | $ | 5,108,776 | | $ | 2,736,994 | |
Permanent differences, primarily due to federal taxes paid, taxable market discount, nondeductible offering costs and distribution character reclassifications, resulted in reclassifications among the Funds’ components of Common share net assets at April 30, 2012, the Funds’ last tax year end, as follows:
| | | | New Jersey | | | New Jersey | | | New Jersey | | | New Jersey | | | New Jersey | |
| | | | Investment | | | Premium | | | Dividend | | | Dividend | | | Municipal | |
| | | | Quality | | | Income | | | Advantage | | | Advantage 2 | | | Value | |
| | | | (NQJ | ) | | (NNJ | ) | | (NXJ | ) | | (NUJ | ) | | (NJV | ) |
| Paid-in-surplus | | $ | (5,082 | ) | $ | (7,606 | ) | $ | (303,445 | ) | $ | (164,434 | ) | $ | — | |
| Undistributed (Over-distribution of) net investment income | | | 796 | | | (9,318 | ) | | 303,278 | | | 157,917 | | | (900 | ) |
| Accumulated net realized gain (loss) | | | 4,286 | | | 16,924 | | | 167 | | | 6,517 | | | 900 | |
| | | | | | | | | | | | | | | | | |
| | | | Pennsylvania | | | Pennsylvania | | | Pennsylvania | | | Pennsylvania | | | Pennsylvania | |
| | | | Investment | | | Premium | | | Dividend | | | Dividend | | | Municipal | |
| | | | Quality | | | Income 2 | | | Advantage | | | Advantage 2 | | | Value | |
| | | | (NQP | ) | | (NPY | ) | | (NXM | ) | | (NVY | ) | | (NPN | ) |
| Paid-in-surplus | | $ | (13,335 | ) | $ | (13,077 | ) | $ | (118,334 | ) | $ | (128,173 | ) | $ | — | |
| Undistributed (Over-distribution of) net investment income | | | 1,076 | | | 11,460 | | | 128,338 | | | 138,807 | | | — | |
| Accumulated net realized gain (loss) | | | 12,259 | | | 1,617 | | | (10,004 | ) | | (10,634 | ) | | — | |
The tax components of undistributed net tax-exempt income, net ordinary income and net long-term capital gains at April 30, 2012, the Funds’ last tax year end, were as follows:
| | | | New Jersey | | | New Jersey | | | New Jersey | | | New Jersey | | | New Jersey | |
| | | | Investment | | | Premium | | | Dividend | | | Dividend | | | Municipal | |
| | | | Quality | | | Income | | | Advantage | | | Advantage 2 | | | Value | |
| | | | (NQJ | ) | | (NNJ | ) | | (NXJ | ) | | (NUJ | ) | | (NJV | ) |
| Undistributed net tax-exempt income * | | $ | 5,184,523 | | $ | 3,357,664 | | $ | 1,352,732 | | $ | 995,653 | | $ | 60,273 | |
| Undistributed net ordinary income ** | | | 11,208 | | | — | | | — | | | — | | | 23,534 | |
| Undistributed net long-term capital gains | | | — | | | — | | | — | | | — | | | 324,771 | |
| | | | | | | | | | | | | | | | | |
| | | | Pennsylvania | | | Pennsylvania | | | Pennsylvania | | | Pennsylvania | | | Pennsylvania | |
| | | | Investment | | | Premium | | | Dividend | | | Dividend | | | Municipal | |
| | | | Quality | | | Income 2 | | | Advantage | | | Advantage 2 | | | Value | |
| | | | (NQP | ) | | (NPY | ) | | (NXM | ) | | (NVY | ) | | (NPN | ) |
| Undistributed net tax-exempt income * | | $ | 4,234,573 | | $ | 3,928,407 | | $ | 583,838 | | $ | 796,022 | | $ | — | |
| Undistributed net ordinary income ** | | | 258 | | | 1,566 | | | 8,397 | | | 333 | | | 2,194 | |
| Undistributed net long-term capital gains | | | — | | | — | | | 120,900 | | | 53,104 | | | 343,924 | |
| * | Undistributed net tax-exempt income (on a tax basis) has not been reduced for the dividend declared on April 2, 2012, paid on May 1, 2012. |
| ** | Net ordinary income consists of taxable market discount income and net short-term capital gains, if any. |
The tax character of distributions paid during the Funds’ last tax year ended April 30, 2012 was designated for purposes of the dividends paid deduction as follows:
| | | Notes to |
| | | Financial Statements (Unaudited) (continued) |
| | | | New Jersey | | | New Jersey | | | New Jersey | | | New Jersey | | | New Jersey | |
| | | | Investment | | | Premium | | | Dividend | | | Dividend | | | Municipal | |
| | | | Quality | | | Income | | | Advantage | | | Advantage 2 | | | Value | |
| | | | (NQJ | ) | | (NNJ | ) | | (NXJ | ) | | (NUJ | ) | | (NJV | ) |
| Distributions from net tax-exempt income | | $ | 17,588,708 | | $ | 10,501,726 | | $ | 6,539,873 | | $ | 4,582,076 | | $ | 1,189,401 | |
| Distributions from net ordinary income** | | | — | | | 22 | | | 23 | | | 15 | | | — | |
| Distributions from net long-term capital gains | | | — | | | 126,108 | | | 35,371 | | | 39,345 | | | — | |
| | | | | | | | | | | | | | | | | |
| | | | Pennsylvania | | | Pennsylvania | | | Pennsylvania | | | Pennsylvania | | | Pennsylvania | |
| | | | Investment | | | Premium | | | Dividend | | | Dividend | | | Municipal | |
| | | | Quality | | | Income 2 | | | Advantage | | | Advantage 2 | | | Value | |
| | | | (NQP | ) | | (NPY | ) | | (NXM | ) | | (NVY | ) | | (NPN | ) |
| Distributions from net tax-exempt income | | $ | 15,192,389 | | $ | 13,403,976 | | $ | 3,367,151 | | $ | 3,858,983 | | $ | 873,988 | |
| Distributions from net ordinary income** | | | — | | | — | | | — | | | — | | | 6,384 | |
| Distributions from net long-term capital gains | | | — | | | — | | | 214,268 | | | 230,647 | | | 27,923 | |
** Net ordinary income consists of taxable market discount income and net short-term capital gains, if any.
At April 30, 2012, the Funds’ last tax year end, the following Funds had unused capital loss carryforwards available for federal income tax purposes to be applied against future capital gains, if any. If not applied, the carryforwards will expire as follows:
| | | | Pennsylvania | | | Pennsylvania | |
| | | | Investment | | | Premium | |
| | | | Quality | | | Income 2 | |
| | | | (NQP | ) | | (NPY | ) |
| Expiration April 30, 2017 | | $ | 440,154 | | $ | 2,415,518 | |
During the Funds’ last tax year ended April 30, 2012, the following Funds utilized capital loss carryforwards as follows:
| | | | | | | | | | | | | | |
| | | | New Jersey | | | Pennsylvania | | | Pennsylvania | | | Pennsylvania | |
| | | | Municipal | | | Investment | | | Premium | | | Municipal | |
| | | | Value | | | Quality | | | Income 2 | | | Value | |
| | | | (NJV | ) | | (NQP | ) | | (NPY | ) | | (NPN | ) |
| Utilized capital loss carryforwards | | $ | 18,711 | | $ | 1,197,249 | | $ | 555,465 | | $ | 82 | |
Under the Regulated Investment Company Modernization Act of 2010, capital losses incurred by the Funds after December 31, 2010, will not be subject to expiration. Capital losses incurred that will be carried forward are as follows:
| | | | | | | | | | | | | | |
| | | | New Jersey | | | New Jersey | | | New Jersey | | | New Jersey | |
| | | | Investment | | | Premium | | | Dividend | | | Dividend | |
| | | | Quality | | | Income | | | Advantage | | | Advantage 2 | |
| | | | (NQJ | ) | | (NNJ | ) | | (NXJ | ) | | (NUJ | ) |
| Post-enactment losses: | | | | | | | | | | | | | |
| Short-term | | $ | — | | $ | — | | $ | — | | $ | — | |
| Long-term | | | 2,363,801 | | | 1,144,592 | | | 964,362 | | | 667,783 | |
The Funds have elected to defer losses incurred from November 1, 2011 through April 30, 2012, the Funds’ last tax year end, in accordance with federal income tax rules. These losses are treated as having arisen on the first day of the current fiscal year. The following Funds have elected to defer post-October losses as follows:
| | | | | | | | |
| | | | New Jersey | | | New Jersey | |
| | | | Dividend | | | Municipal | |
| | | | Advantage | | | Value | |
| | | | (NXJ | ) | | (NJV | ) |
| Post-October capital losses | | $ | 539 | | $ | 1,546 | |
| Late-year ordinary losses | | | — | | | — | |
7. Management Fees and Other Transactions with Affiliates
Each Fund’s management fee consists of two components — a fund-level fee, based only on the amount of assets within the Fund, and a complex-level fee, based on the aggregate amount of all eligible fund assets managed by the Adviser. This pricing structure enables Fund shareholders to benefit from growth in the assets within their respective Fund as well as from growth in the amount of complex-wide assets managed by the Adviser.
The annual fund-level fee for each Fund, payable monthly, is calculated according to the following schedules:
| | | | New Jersey Investment Quality (NQJ) |
| | | | New Jersey Premium Income (NNJ) |
| | | | Pennsylvania Investment Quality (NQP) |
| | | | Pennsylvania Premium Income 2 (NPY) |
| Average Daily Managed Assets* | | | Fund-Level Fee Rate |
| For the first $125 million | | | .4500 | % |
| For the next $125 million | | | .4375 | |
| For the next $250 million | | | .4250 | |
| For the next $500 million | | | .4125 | |
| For the next $1 billion | | | .4000 | |
| For the next $3 billion | | | .3875 | |
| For managed assets over $5 billion | | | .3750 | |
| | | | | |
| | | | New Jersey Dividend Advantage (NXJ) |
| | | | New Jersey Dividend Advantage 2 (NUJ) |
| | | | Pennsylvania Dividend Advantage (NXM) |
| | | | Pennsylvania Dividend Advantage 2 (NVY) |
| Average Daily Managed Assets* | | | Fund-Level Fee Rate |
| For the first $125 million | | | .4500 | % |
| For the next $125 million | | | .4375 | |
| For the next $250 million | | | .4250 | |
| For the next $500 million | | | .4125 | |
| For the next $1 billion | | | .4000 | |
| For managed assets over $2 billion | | | .3750 | |
| | | | | |
| | | | New Jersey Municipal Value (NJV) |
| | | | Pennsylvania Municipal Value (NPN) |
| Average Daily Managed Assets* | | | Fund-Level Fee Rate |
| For the first $125 million | | | .4000 | % |
| For the next $125 million | | | .3875 | |
| For the next $250 million | | | .3750 | |
| For the next $500 million | | | .3625 | |
| For the next $1 billion | | | .3500 | |
| For managed assets over $2 billion | | | .3375 | |
| | | Notes to |
| | | Financial Statements (Unaudited) (continued) |
The annual complex-level fee for each Fund, payable monthly, is calculated according to the following schedule:
| Complex-Level Managed Asset Breakpoint Level* | | | Effective Rate at Breakpoint Level |
| $55 billion | | | .2000 | % |
| $56 billion | | | .1996 | |
| $57 billion | | | .1989 | |
| $60 billion | | | .1961 | |
| $63 billion | | | .1931 | |
| $66 billion | | | .1900 | |
| $71 billion | | | .1851 | |
| $76 billion | | | .1806 | |
| $80 billion | | | .1773 | |
| $91 billion | | | .1691 | |
| $125 billion | | | .1599 | |
| $200 billion | | | .1505 | |
| $250 billion | | | .1469 | |
| $300 billion | | | .1445 | |
| * | For the fund-level and complex-level fees, managed assets include closed-end fund assets managed by the Adviser that are attributable to financial leverage. For these purposes, financial leverage includes the funds’ use of preferred stock and borrowings and certain investments in the residual interest certificates (also called inverse floating rate securities) in tender option bond (TOB) trusts, including the portion of assets held by a TOB trust that has been effectively financed by the trust’s issuance of floating rate securities, subject to an agreement by the Adviser as to certain funds to limit the amount of such assets for determining managed assets in certain circumstances. The complex-level fee is calculated based upon the aggregate daily managed assets of all Nuveen Funds that constitute “eligible assets.” Eligible assets do not include assets attributable to investments in other Nuveen Funds and assets in excess of $2 billion added to the Nuveen Fund complex in connection with the Adviser’s assumption of the management of the former First American Funds effective January 1, 2011. As of October 31, 2012, the complex-level fee rate for these Funds was .1691%. |
The management fee compensates the Adviser for overall investment advisory and administrative services and general office facilities. The Adviser is responsible for each Fund’s overall strategy and asset allocation decisions. The Adviser has entered into sub-advisory agreements with Nuveen Asset Management, LLC, (the “Sub-Adviser”), a wholly-owned subsidiary of the Adviser, under which the Sub-Adviser manages the investment portfolios of the Funds. The Sub-Adviser is compensated for its services to the Funds from the management fees paid to the Adviser.
The Funds pay no compensation directly to those of its directors/trustees who are affiliated with the Adviser or to its officers, all of whom receive remuneration for their services to the Funds from the Adviser or its affiliates. The Board of Directors/Trustees has adopted a deferred compensation plan for independent directors/trustees that enables directors/trustees to elect to defer receipt of all or a portion of the annual compensation they are entitled to receive from certain Nuveen-advised funds. Under the plan, deferred amounts are treated as though equal dollar amounts had been invested in shares of select Nuveen-advised funds.
8. New Accounting Pronouncements
Financial Accounting Standards Board (“FASB”) Balance Sheet (Topic 210): Disclosures about Offsetting Assets and Liabilities
In December 2011, the FASB issued Accounting Standards Update (“ASU”) No. 2011-11 (“ASU No. 2011-11”) to enhance disclosures about financial instruments and derivative instruments that are subject to offsetting (“netting”) on the Statement of Assets and Liabilities. This information will enable users of the entity’s financial statements to evaluate the effect or potential effect of netting arrangements on the entity’s financial position. ASU No. 2011-11 is effective prospectively during interim or annual periods beginning on or after January 1, 2013. At this time, management is evaluating the implications of this guidance and the impact it will have to the financial statements amounts and footnote disclosures, if any.
Annual Investment Management
Agreement Approval Process (Unaudited)
The Board of Trustees or Directors (as the case may be) (each, a “Board” and each Trustee or Director, a “Board Member”) of the Funds, including the Board Members who are not parties to the Funds’ advisory or sub-advisory agreements or “interested persons” of any such parties (the “Independent Board Members”), is responsible for approving the advisory agreements (each, an “Investment Management Agreement”) between each Fund and Nuveen Fund Advisors, Inc. (the “Advisor”) and the sub-advisory agreements (each, a “Sub-Advisory Agreement”) between the Advisor and Nuveen Asset Management, LLC (the “Sub-Advisor”) (the Investment Management Agreements and the Sub-Advisory Agreements are referred to collectively as the “Advisory Agreements”) and their periodic continuation. Pursuant to the Investment Company Act of 1940, as amended (the “1940 Act”), the Board is required to consider the continuation of the Advisory Agreements on an annual basis. Accordingly, at an in-person meeting held on May 21-23, 2012 (the “May Meeting”), the Board, including a majority of the Independent Board Members, considered and approved the continuation of the Advisory Agreements for the Funds for an additional one-year period.
In preparation for its considerations at the May Meeting, the Board requested and received extensive materials prepared in connection with the review of the Advisory Agreements. The materials provided a broad range of information regarding the Funds, the Advisor and the Sub-Advisor (the Advisor and the Sub-Advisor are collectively, the “Fund Advisers” and each, a “Fund Adviser”). As described in more detail below, the information provided included, among other things, a review of Fund performance, including Fund investment performance assessments against peer groups and appropriate benchmarks, a comparison of Fund fees and expenses relative to peers, a description and assessment of shareholder service levels for the Funds, a summary of the performance of certain service providers, a review of product initiatives and shareholder communications and an analysis of the Advisor’s profitability with comparisons to comparable peers in the managed fund business. As part of its annual review, the Board also held a separate meeting on April 18-19, 2012, to review the Funds’ investment performance and consider an analysis provided by the Advisor of the Sub-Advisor which generally evaluated the Sub-Advisor’s investment team, investment mandate, organizational structure and history, investment philosophy and process, performance of the applicable Fund, and significant changes to the foregoing. As a result of its review of the materials and discussions, the Board presented the Advisor with questions and the Advisor responded.
Annual Investment Management Agreement
Approval Process (Unaudited) (continued)
The materials and information prepared in connection with the annual review of the Advisory Agreements supplement the information and analysis provided to the Board during the year. In this regard, throughout the year, the Board, acting directly or through its committees, regularly reviews the performance and various services provided by the Advisor and the Sub-Advisor. The Board meets at least quarterly as well as at other times as the need arises. At its quarterly meetings, the Board reviews reports by the Advisor which include, among other things, Fund performance, a review of the investment teams and reports on compliance, regulatory matters and risk management. The Board also meets with key investment personnel managing the Fund portfolios during the year. In October 2011, the Board also created two new standing committees (the Open-end Fund Committee and the Closed-end Fund Committee) to assist the full Board in monitoring and gaining a deeper insight into the distinctive issues and business practices of open-end and closed-end funds.
In addition, the Board continues its program of seeking to have the Board Members or a subset thereof visit each sub-advisor to the Nuveen funds at least once over a multiple year rotation, meeting with key investment and business personnel. In this regard, the Board visited with the Sub-Advisor’s municipal team in Minneapolis in September 2011, and with the Sub-Advisor’s municipal team in Chicago in November 2011. Further, an ad hoc committee of the Board visited the then-current transfer agents of the Nuveen funds in 2011 and the audit committee of the Board visited the various pricing agents for the Nuveen funds in January 2012. The Board considers factors and information that are relevant to its annual consideration of the renewal of the Advisory Agreements at the meetings held throughout the year. Accordingly, the Board considers the information provided and knowledge gained at these meetings when performing its annual review of the Advisory Agreements. The Independent Board Members are assisted throughout the process by independent legal counsel who provided materials describing applicable law and the duties of directors or trustees in reviewing advisory contracts and met with the Independent Board Members in executive sessions without management present. In addition, it is important to recognize that the management arrangements for the Nuveen funds are the result of many years of review and discussion between the Independent Board Members and fund management and that the Board Members’ conclusions may be based, in part, on their consideration of fee arrangements and other factors developed in previous years.
The Board considered all factors it believed relevant with respect to each Fund, including among other factors: (a) the nature, extent and quality of the services provided by the Fund Advisers, (b) the investment performance of the Fund and Fund Advisers, (c) the advisory fees and costs of the services to be provided to the Fund and the profitability of the Fund Advisers, (d) the extent of any economies of scale, (e) any benefits derived by the Fund Advisers from the relationship with the Fund and (f) other factors. Each Board Member may have accorded different weight to the various factors in reaching his or her conclusions with respect to a Fund’s Advisory Agreements. The Independent Board Members did not identify any single factor as all important or
controlling. The Independent Board Members’ considerations were instead based on a comprehensive consideration of all the information presented. The principal factors considered by the Board and its conclusions are described below.
A. Nature, Extent and Quality of Services
In considering renewal of the Advisory Agreements, the Independent Board Members considered the nature, extent and quality of the Fund Adviser’s services, including advisory services and the resulting Fund performance and administrative services. The Independent Board Members further considered the overall reputation and capabilities of the Advisor and its affiliates, the commitment of the Advisor to provide high quality service to the Funds, their overall confidence in the Advisor’s integrity and the Advisor’s responsiveness to questions and concerns raised by them. The Independent Board Members reviewed materials outlining, among other things, the Fund Adviser’s organization and business; the types of services that the Fund Adviser or its affiliates provide to the Funds; the performance record of the applicable Fund (as described in further detail below); and any initiatives Nuveen had taken for the applicable fund product line.
In considering advisory services, the Board recognized that the Advisor provides various oversight, administrative, compliance and other services for the Funds and the Sub-Advisor generally provides the portfolio investment management services to the Funds. In reviewing the portfolio management services provided to each Fund, the Board reviewed the materials provided by the Nuveen Investment Services Oversight Team analyzing, among other things, the Sub-Advisor’s investment team and changes thereto, organization and history, assets under management, Fund objectives and mandate, the investment team’s philosophy and strategies in managing the Fund, developments affecting the Sub-Advisor or Fund and Fund performance. The Independent Board Members also reviewed portfolio manager compensation arrangements to evaluate each Fund Adviser’s ability to attract and retain high quality investment personnel, preserve stability, and reward performance but not provide an inappropriate incentive to take undue risks. In addition, the Board considered the Advisor’s execution of its oversight responsibilities over the Sub-Advisor. Given the importance of compliance, the Independent Board Members also considered Nuveen’s compliance program, including the report of the chief compliance officer regarding the Funds’ compliance policies and procedures; the resources dedicated to compliance; and the record of compliance with the policies and procedures.
In addition to advisory services, the Board considered the quality and extent of administrative and other non-investment advisory services the Advisor and its affiliates provide to the Funds, including product management, investment services (such as oversight of investment policies and procedures, risk management, and pricing), fund administration, oversight of service providers, shareholder services and communications,
Annual Investment Management Agreement
Approval Process (Unaudited) (continued)
administration of Board relations, regulatory and portfolio compliance, legal support, managing leverage and promoting an orderly secondary market for common shares. The Board further recognized Nuveen’s additional investments in personnel, including in compliance and risk management.
In reviewing the services provided, the Board also reviewed materials describing various notable initiatives and projects the Advisor performed in connection with the closed-end fund product line. These initiatives included completion of the refinancing of auction rate preferred securities; efforts to eliminate product overlap with fund mergers; elimination of the insurance mandate on several funds; ongoing services to manage leverage that has become increasingly complex; continued secondary market offerings, share repurchases and other support initiatives for certain funds; and continued communications efforts with shareholders, fund analysts and financial advisers. With respect to the latter, the Independent Board Members noted Nuveen’s continued commitment to supporting the secondary market for the common shares of its closed-end funds through a comprehensive secondary market communication program designed to raise investor and analyst awareness and understanding of closed-end funds. Nuveen’s support services included, among other things: continuing communications concerning the refinancing efforts related to auction rate preferred securities; supporting and promoting munifund term preferred shares (MTP) including by launching a microsite dedicated to MTP shares; sponsoring and participating in conferences; communicating with closed-end fund analysts covering the Nuveen funds throughout the year; providing marketing and product updates for the closed-end funds; and maintaining and enhancing a closed-end fund website.
Based on their review, the Independent Board Members found that, overall, the nature, extent and quality of services provided to the respective Funds under each applicable Advisory Agreement were satisfactory.
B. The Investment Performance of the Funds and Fund Advisers
The Board, including the Independent Board Members, reviewed and considered the performance history of each Fund over various time periods. The Board reviewed, among other things, each Fund’s historic investment performance as well as information comparing the Fund’s performance information with that of other funds (the “Performance Peer Group”) based on data compiled by Nuveen that was provided by an independent provider of mutual fund data and with recognized and/or customized benchmarks (i.e., benchmarks derived from multiple recognized benchmarks).
The Board reviewed reports, including a comprehensive analysis of the Funds’ performance and the applicable investment team. In this regard, the Board reviewed each Fund’s total return information compared to its Performance Peer Group for the quarter, one-, three- and five-year periods ending December 31, 2011, as well as performance
information reflecting the first quarter of 2012 (or for the periods available for the Nuveen New Jersey Municipal Value Fund (the “New Jersey Municipal Value Fund”) and the Nuveen Pennsylvania Municipal Value Fund (the “Pennsylvania Municipal Value Fund”), which did not exist for part of the foregoing time frame). In addition, the Board reviewed each Fund’s total return information compared to recognized and/or customized benchmarks for the quarter, one- and three-year periods ending December 31, 2011, as well as performance information reflecting the first quarter of 2012 (or for the periods available for the New Jersey Municipal Value Fund and the Pennsylvania Municipal Value Fund, which did not exist for part of the foregoing time frame).
The Independent Board Members also reviewed historic premium and discount levels, including a summary of actions taken to address or discuss other developments affecting the secondary market discounts of various funds. This information supplemented the fund performance information provided to the Board at each of its quarterly meetings.
In reviewing performance comparison information, the Independent Board Members recognized that the usefulness of the comparisons of the performance of certain funds with the performance of their respective Performance Peer Group may be limited because the Performance Peer Group may not adequately represent the objectives and strategies of the applicable funds or may be limited in size or number. In this regard, the Independent Board Members noted that the Performance Peer Groups of the New Jersey Municipal Value Fund and the Pennsylvania Municipal Value Fund were classified as having significant differences from such Funds based on various considerations such as special fund objectives, potential investable universe and the composition of the peer set (e.g., the number and size of competing funds and number of competing managers). The Independent Board Members also noted that the investment experience of a particular shareholder in the Nuveen funds will vary depending on when such shareholder invests in the applicable fund, the class held (if multiple classes are offered in a fund) and the performance of the fund (or respective class) during that shareholder’s investment period. In addition, although the performance below reflects the performance results for the time periods ending as of the most recent calendar year end (unless otherwise indicated), the Board also recognized that selecting a different ending time period may derive different results. Furthermore, while the Board is cognizant of the relevant performance of a fund’s peer set and/or benchmark(s), the Board evaluated fund performance in light of the respective fund’s investment objectives, investment parameters and guidelines and recognized that the objectives, investment parameters and guidelines of peers and/or benchmarks may differ to some extent, thereby resulting in differences in performance results. Nevertheless, with respect to any Nuveen funds that the Board considers to have underperformed their peers and/or benchmarks from time to time, the Board monitors such funds closely and considers any steps necessary or appropriate to address such issues.
Annual Investment Management Agreement
Approval Process (Unaudited) (continued)
In considering the results of the comparisons, the Independent Board Members observed, among other things, that the Nuveen Pennsylvania Investment Quality Municipal Fund (the “Pennsylvania Investment Quality Fund”), the Nuveen Pennsylvania Premium Income Municipal Fund 2 (the “Pennsylvania Premium Income Fund 2”), the Nuveen New Jersey Dividend Advantage Municipal Fund, the Nuveen Pennsylvania Dividend Advantage Municipal Fund and the Nuveen New Jersey Dividend Advantage Municipal Fund 2 had satisfactory performance compared to their peers, performing in the second or third quartile over various periods (and that the Pennsylvania Investment Quality Fund and the Pennsylvania Premium Income Fund 2 were in the first quartile for the five-year period). In addition, they noted that the Nuveen New Jersey Premium Income Municipal Fund, Inc. (the “New Jersey Premium Income Fund”), the Nuveen New Jersey Investment Quality Municipal Fund, Inc. (the “New Jersey Investment Quality Fund”), and the Nuveen Pennsylvania Dividend Advantage Municipal Fund 2 lagged their peers somewhat in the shorter one- and three-year periods, but demonstrated more favorable performance in the longer five-year period. As noted above, the New Jersey Municipal Value Fund and the Pennsylvania Municipal Value Fund had significant differences from their respective Performance Peer Groups. The Independent Board Members, however, noted that they were each relatively new with a shorter performance history available, thereby limiting the ability to make a meaningful assessment of performance.
Based on their review, the Independent Board Members determined that each Fund’s investment performance had been satisfactory.
| C. | Fees, Expenses and Profitability |
| | 1. Fees and Expenses |
| | The Board evaluated the management fees and expenses of each Fund reviewing, among other things, such Fund’s gross management fees, net management fees and net expense ratios in absolute terms as well as compared to the fee and expenses of a comparable universe of funds provided by an independent fund data provider (the “Peer Universe”) and any expense limitations. |
| | |
| | The Independent Board Members further reviewed the methodology regarding the construction of the applicable Peer Universe. In reviewing the comparisons of fee and expense information, the Independent Board Members took into account that in certain instances various factors such as: the limited size and particular composition of the Peer Universe (including the inclusion of other Nuveen funds in the peer set); expense anomalies; changes in the funds comprising the Peer Universe from year to year; levels of reimbursement or fee waivers; the timing of information used; the differences in the type and use of leverage; and differences in the states reflected in |
| | the Peer Universe may impact the comparative data, thereby limiting somewhat the ability to make a meaningful comparison with peers. |
| | |
| | In reviewing the fee schedule for a Fund, the Independent Board Members also considered the fund-level and complex-wide breakpoint schedules (described in further detail below) and any fee waivers and reimbursements provided by Nuveen (applicable, in particular, for certain closed-end funds launched since 1999). In reviewing fees and expenses (excluding leverage costs and leveraged assets), the Board considered the expenses and fees to be higher if they were over 10 basis points higher, slightly higher if they were approximately 6 to 10 basis points higher, in line if they were within approximately 5 basis points higher than the peer average and below if they were below the peer average of the Peer Universe. In reviewing the reports, the Board noted that the overwhelming majority of the Nuveen funds were at, close to or below their peer set average based on the net total expense ratio. |
| | |
| | The Independent Board Members noted that the New Jersey Investment Quality Fund and the New Jersey Premium Income Fund had net management fees slightly higher than their respective peer averages, but net expense ratios below their respective peer averages. In addition, the Independent Board Members noted that each of the other Funds had net management fees and net expense ratios (including fee waivers and expense reimbursements) below or in line with their respective peer averages. |
| | |
| | Based on their review of the fee and expense information provided, the Independent Board Members determined that each Fund’s management fees were reasonable in light of the nature, extent and quality of services provided to the Fund. |
| | |
| | 2. Comparisons with the Fees of Other Clients |
| | The Independent Board Members further reviewed information regarding the nature of services and range of fees offered by the Advisor to other clients, including municipal separately managed accounts and passively managed exchange traded funds (ETFs) sub-advised by the Advisor. In evaluating the comparisons of fees, the Independent Board Members noted that the fee rates charged to the Funds and other clients vary, among other things, because of the different services involved and the additional regulatory and compliance requirements associated with registered investment companies, such as the Funds. Accordingly, the Independent Board Members considered the differences in the product types, including, but not limited to, the services provided, the structure and operations, product distribution and costs thereof, portfolio investment policies, investor profiles, account sizes and regulatory requirements. The Independent Board Members noted, in particular, that the range of services provided to the Funds (as discussed above) is much more |
Annual Investment Management Agreement
Approval Process (Unaudited) (continued)
| | extensive than that provided to separately managed accounts. Given the inherent differences in the various products, particularly the extensive services provided to the Funds, the Independent Board Members believe such facts justify the different levels of fees. |
| | |
| | In considering the fees of the Sub-Advisor, the Independent Board Members also considered the pricing schedule or fees that the Sub-Advisor charges for similar investment management services for other Nuveen funds, funds of other sponsors (if any), and other clients (such as retail and/or institutional managed accounts). |
| | |
| | 3. Profitability of Fund Advisers |
| | In conjunction with their review of fees, the Independent Board Members also considered the profitability of Nuveen for its advisory activities and its financial condition. The Independent Board Members reviewed the revenues and expenses of Nuveen’s advisory activities for the last two calendar years, the allocation methodology used in preparing the profitability data and an analysis of the key drivers behind the changes in revenues and expenses that impacted profitability in 2011. The Independent Board Members noted this information supplemented the profitability information requested and received during the year to help keep them apprised of developments affecting profitability (such as changes in fee waivers and expense reimbursement commitments). In this regard, the Independent Board Members noted that they have an Independent Board Member serve as a point person to review and keep them apprised of changes to the profitability analysis and/or methodologies during the year. The Independent Board Members also considered Nuveen’s revenues for advisory activities, expenses, and profit margin compared to that of various unaffiliated management firms with comparable assets under management (based on asset size and asset composition). |
| | |
| | In reviewing profitability, the Independent Board Members recognized the Advisor’s continued investment in its business to enhance its services, including capital improvements to investment technology, updated compliance systems, and additional personnel in compliance, risk management, and product development as well as its ability to allocate resources to various areas of the Advisor as the need arises. In addition, in evaluating profitability, the Independent Board Members also recognized the subjective nature of determining profitability which may be affected by numerous factors including the allocation of expenses. Further, the Independent Board Members recognized the difficulties in making comparisons as the profitability of other advisers generally is not publicly available and the profitability information that is available for certain advisers or management firms may not be representative of the industry and may be affected by, among other things, the adviser’s particular business mix, capital costs, types of funds managed and expense allocations. Notwithstanding the foregoing, the Independent Board Members |
| | reviewed Nuveen’s methodology and assumptions for allocating expenses across product lines to determine profitability. In reviewing profitability, the Independent Board Members recognized Nuveen’s investment in its fund business. Based on their review, the Independent Board Members concluded that the Advisor’s level of profitability for its advisory activities was reasonable in light of the services provided. |
| | |
| | With respect to sub-advisers affiliated with Nuveen, including the Sub-Advisor, the Independent Board Members reviewed the sub-adviser’s revenues, expenses and profitability margins (pre- and post-tax) for its advisory activities and the methodology used for allocating expenses among the internal sub-advisers. Based on their review, the Independent Board Members were satisfied that the Sub-Advisor’s level of profitability was reasonable in light of the services provided. |
| | |
| | In evaluating the reasonableness of the compensation, the Independent Board Members also considered other amounts paid to a Fund Adviser by the Funds as well as any indirect benefits (such as soft dollar arrangements, if any) the Fund Adviser and its affiliates receive, or are expected to receive, that are directly attributable to the management of the Funds, if any. See Section E below for additional information on indirect benefits a Fund Adviser may receive as a result of its relationship with the Funds. Based on their review of the overall fee arrangements of each Fund, the Independent Board Members determined that the advisory fees and expenses of the respective Fund were reasonable. |
D. Economies of Scale and Whether Fee Levels Reflect These Economies of Scale
With respect to economies of scale, the Independent Board Members have recognized the potential benefits resulting from the costs of a fund being spread over a larger asset base, although economies of scale are difficult to measure and predict with precision, particularly on a fund-by-fund basis. One method to help ensure the shareholders share in these benefits is to include breakpoints in the advisory fee schedule. Generally, management fees for funds in the Nuveen complex are comprised of a fund-level component and a complex-level component, subject to certain exceptions. Accordingly, the Independent Board Members reviewed and considered the applicable fund-level breakpoints in the advisory fee schedules that reduce advisory fees as asset levels increase. Further, the Independent Board Members noted that although closed-end funds may from time-to-time make additional share offerings, the growth of their assets will occur primarily through the appreciation of such funds’ investment portfolio.
In addition to fund-level advisory fee breakpoints, the Board also considered the Funds’ complex-wide fee arrangement. Pursuant to the complex-wide fee arrangement, the fees of the funds in the Nuveen complex are generally reduced as the assets in the fund complex reach certain levels. The complex-wide fee arrangement seeks to provide the
Annual Investment Management Agreement
Approval Process (Unaudited) (continued)
benefits of economies of scale to fund shareholders when total fund complex assets increase, even if assets of a particular fund are unchanged or have decreased. The approach reflects the notion that some of Nuveen’s costs are attributable to services provided to all its funds in the complex and therefore all funds benefit if these costs are spread over a larger asset base. In addition, with the acquisition of the funds previously advised by FAF Advisors, Inc., the Board noted that a portion of such funds’ assets at the time of acquisition were deemed eligible to be included in the complex-wide fee calculation in order to deliver fee savings to shareholders in the combined complex and such funds were subject to differing complex-level fee rates.
Based on their review, the Independent Board Members concluded that the breakpoint schedules and complex-wide fee arrangement were acceptable and reflect economies of scale to be shared with shareholders when assets under management increase.
E. Indirect Benefits
In evaluating fees, the Independent Board Members received and considered information regarding potential “fall out” or ancillary benefits the respective Fund Adviser or its affiliates may receive as a result of its relationship with each Fund. In this regard, the Independent Board Members considered any revenues received by affiliates of the Advisor for serving as co-manager in initial public offerings of new closed-end funds as well as revenues received in connection with secondary offerings.
In addition to the above, the Independent Board Members considered whether the Fund Advisers received any benefits from soft dollar arrangements whereby a portion of the commissions paid by a Fund for brokerage may be used to acquire research that may be useful to the Fund Adviser in managing the assets of the Funds and other clients. The Independent Board Members recognized that each Fund Adviser has the authority to pay a higher commission in return for brokerage and research services if it determines in good faith that the commission paid is reasonable in relation to the value of the brokerage and research services provided and may benefit from such soft dollar arrangements. Similarly, the Board recognized that the research received pursuant to soft dollar arrangements by a Fund Adviser may also benefit a Fund and shareholders to the extent the research enhances the ability of the Fund Adviser to manage the Fund. The Independent Board Members noted that the Fund Advisers’ profitability may be somewhat lower if they did not receive the research services pursuant to the soft dollar arrangements and had to acquire such services directly.
Based on their review, the Independent Board Members concluded that any indirect benefits received by a Fund Adviser as a result of its relationship with the Funds were reasonable and within acceptable parameters.
F. Other Considerations
The Independent Board Members did not identify any single factor discussed previously as all-important or controlling. The Board Members, including the Independent Board Members, unanimously concluded that the terms of each Advisory Agreement are fair and reasonable, that the respective Fund Adviser’s fees are reasonable in light of the services provided to each Fund and that the Advisory Agreements be renewed.
Reinvest Automatically,
Easily and Conveniently
Nuveen makes reinvesting easy. A phone call is all it takes to set up your reinvestment account.
Nuveen Closed-End Funds Automatic Reinvestment Plan
Your Nuveen Closed-End Fund allows you to conveniently reinvest distributions in additional Fund shares.
By choosing to reinvest, you’ll be able to invest money regularly and automatically, and watch your investment grow through the power of compounding. Just like distributions in cash, there may be times when income or capital gains taxes may be payable on distributions that are reinvested.
It is important to note that an automatic reinvestment plan does not ensure a profit, nor does it protect you against loss in a declining market.
Easy and convenient
To make recordkeeping easy and convenient, each month you’ll receive a statement showing your total distributions, the date of investment, the shares acquired and the price per share, and the total number of shares you own.
How shares are purchased
The shares you acquire by reinvesting will either be purchased on the open market or newly issued by the Fund. If the shares are trading at or above net asset value at the time of valuation, the Fund will issue new shares at the greater of the net asset value or 95% of the then-current market price. If the shares are trading at less than net asset value, shares for your account will be purchased on the open market. If the Plan Agent begins purchasing Fund shares on the open market while shares are trading below net asset value, but the Fund’s shares subsequently trade at or above their net asset value before the Plan Agent is able to complete its purchases, the Plan Agent may cease open-market purchases and may invest the uninvested portion of the distribution in newly-issued Fund shares at a price equal to the greater of the shares’ net asset value or 95% of the shares’ market value on the last business day immediately prior to the purchase date. Distributions received to purchase shares in the open market will
normally be invested shortly after the distribution payment date. No interest will be paid on distributions awaiting reinvestment. Because the market price of the shares may increase before purchases are completed, the average purchase price per share may exceed the market price at the time of valuation, resulting in the acquisition of fewer shares than if the distribution had been paid in shares issued by the Fund. A pro rata portion of any applicable brokerage commissions on open market purchases will be paid by Plan participants. These commissions usually will be lower than those charged on individual transactions.
Flexible
You may change your distribution option or withdraw from the Plan at any time, should your needs or situation change.
You can reinvest whether your shares are registered in your name, or in the name of a brokerage firm, bank, or other nominee. Ask your investment advisor if his or her firm will participate on your behalf. Participants whose shares are registered in the name of one firm may not be able to transfer the shares to another firm and continue to participate in the Plan.
The Fund reserves the right to amend or terminate the Plan at any time. Although the Fund reserves the right to amend the Plan to include a service charge payable by the participants, there is no direct service charge to participants in the Plan at this time.
Call today to start reinvesting distributions
For more information on the Nuveen Automatic Reinvestment Plan or to enroll in or withdraw from the Plan, speak with your financial advisor or call us at (800) 257-8787.
Glossary of Terms
Used in this Report
| ■ | Auction Rate Bond: An auction rate bond is a security whose interest payments are adjusted periodically through an auction process, which process typically also serves as a means for buying and selling the bond. Auctions that fail to attract enough buyers for all the shares offered for sale are deemed to have “failed,” with current holders receiving a formula-based interest rate until the next scheduled auction. |
| | |
| ■ | Average Annual Total Return: This is a commonly used method to express an investment’s performance over a particular, usually multi-year time period. It expresses the return that would have been necessary each year to equal the investment’s actual cumulative performance (including change in NAV or market price and reinvested dividends and capital gains distributions, if any) over the time period being considered. |
| | |
| ■ | Average Effective Maturity: The market-value-weighted average of the effective maturity dates of the individual securities including cash. In the case of a bond that has been advance-refunded to a call date, the effective maturity is the date on which the bond is scheduled to be redeemed using the proceeds of an escrow account. In most other cases the effective maturity is the stated maturity date of the security. |
| | |
| ■ | Effective Leverage: Effective leverage is a Fund’s effective economic leverage, and includes both regulatory leverage (See Leverage) and the leverage effects of certain derivative investments in the Fund’s portfolio. Currently, the leverage effects of Tender Option Bond (TOB) inverse floater holdings are included in effective leverage values, in addition to any regulatory leverage. |
| | |
| ■ | Gross Domestic Product (GDP): The total market value of all final goods and services produced in a country/region in a given year, equal to total consumer, investment and government spending, plus the value of exports, minus the value of imports. |
| | |
| ■ | Inverse Floating Rate Securities: Inverse floating rate securities, also known as inverse floaters or tender option bonds (TOBs), are created by depositing a municipal bond, typically with a fixed interest rate, into a special purpose trust created by a broker-dealer. This trust, in turn, (a) issues floating rate certificates typically paying short-term tax-exempt interest rates to third parties in amounts equal to some fraction of the deposited bond’s par amount or market value, and (b) issues an inverse floating rate certificate (sometimes referred to as an “inverse floater”) to an investor (such as a Fund) interested in gaining investment exposure to a long-term municipal bond. The income received by the holder of the inverse floater varies inversely with the short-term rate paid to the floating rate certificates’ holders, and in most circumstances the |
| | holder of the inverse floater bears substantially all of the underlying bond’s downside investment risk. The holder of the inverse floater typically also benefits disproportionately from any potential appreciation of the underlying bond’s value. Hence, an inverse floater essentially represents an investment in the underlying bond on a leveraged basis. |
| | |
| ■ | Leverage: Using borrowed money to invest in securities or other assets, seeking to increase the return of an investment or portfolio. |
| | |
| ■ | Leverage-Adjusted Duration: Duration is a measure of the expected period over which a bond’s principal and interest will be paid, and consequently is a measure of the sensitivity of a bond’s or bond Fund’s value to changes when market interest rates change. Generally, the longer a bond’s or Fund’s duration, the more the price of the bond or Fund will change as interest rates change. Leverage-adjusted duration takes into account the leveraging process for a Fund and therefore is longer than the duration of the Fund’s portfolio of bonds. |
| | |
| ■ | Lipper Other States Municipal Debt Funds Classification Average: Calculated using the returns of all closed-end funds in this category. Lipper returns account for the effects of management fees and assume reinvestment of distributions, but do not reflect any applicable sales charges. |
| | |
| ■ | Market Yield (also known as Dividend Yield or Current Yield): An investment’s current annualized dividend divided by its current market price. |
| | |
| ■ | Net Asset Value (NAV): The net market value of all securities held in a portfolio. |
| | |
| ■ | Net Asset Value (NAV) Per Share: The market value of one share of a mutual fund or closed-end fund. For a Fund, the NAV is calculated daily by taking the Fund’s total assets (securities, cash, and accrued earnings), subtracting the Fund’s liabilities, and dividing by the number of shares outstanding. |
| | |
| ■ | Pre-Refunding: Pre-Refunding, also known as advanced refundings or refinancings, is a procedure used by state and local governments to refinance municipal bonds to lower interest expenses. The issuer sells new bonds with a lower yield and uses the proceeds to buy U.S. Treasury securities, the interest from which is used to make payments on the higher-yielding bonds. Because of this collateral, pre-refunding generally raises a bond’s credit rating and thus its value. |
| | |
| ■ | Regulatory Leverage: Regulatory Leverage consists of preferred shares issued by or borrowings of a Fund. Both of these are part of a Fund’s capital structure. Regulatory leverage is sometimes referred to as “‘40 Act Leverage” and is subject to asset coverage limits set in the Investment Company Act of 1940. |
| | |
| ■ | S&P Municipal Bond Index: An unleveraged, market value-weighted index designed to measure the performance of the tax-exempt, investment-grade U.S. municipal bond market. Index returns assume reinvestment of distributions, but do not reflect any applicable sales charges or management fees. |
Glossary of Terms
Used in this Report (continued)
| ■ | S&P New Jersey Municipal Bond Index: An unleveraged, market value-weighted index designed to measure the performance of the tax-exempt, investment-grade New Jersey municipal bond market. Index returns assume reinvestment of distributions, but do not reflect any applicable sales charges or management fees. |
| | |
| ■ | S&P Pennsylvania Municipal Bond Index: An unleveraged, market value-weighted index designed to measure the performance of the tax-exempt, investment-grade Pennsylvania municipal bond market. Index returns assume reinvestment of distributions, but do not reflect any applicable sales charges or management fees. |
| | |
| ■ | Taxable-Equivalent Yield: The yield necessary from a fully taxable investment to equal, on an after-tax basis, the yield of a municipal bond investment. |
| | |
| ■ | Zero Coupon Bond: A zero coupon bond does not pay a regular interest coupon to its holders during the life of the bond. Income to the holder of the bond comes from accretion of the difference between the original purchase price of the bond at issuance and the par value of the bond at maturity and is effectively paid at maturity. The market prices of zero coupon bonds generally are more volatile than the market prices of bonds that pay interest periodically. |
Notes
Notes
Additional Fund Information
Board of
Directors/Trustees
John P. Amboian
Robert P. Bremner
Jack B. Evans
William C. Hunter
David J. Kundert
William J. Schneider
Judith M. Stockdale
Carole E. Stone
Virginia L. Stringer
Terence J. Toth
Fund Manager
Nuveen Fund Advisors, Inc.
333 West Wacker Drive
Chicago, IL 60606
Custodian
State Street Bank
& Trust Company
Boston, MA
Transfer Agent and
Shareholder Services
State Street Bank & Trust
Company
Nuveen Funds
P.O. Box 43071
Providence, RI 02940-3071
(800) 257-8787
Legal Counsel
Chapman and Cutler LLP
Chicago, IL
Independent Registered
Public Accounting Firm
Ernst & Young LLP
Chicago, IL
Quarterly Portfolio of Investments and Proxy Voting Information
You may obtain (i) each Fund’s quarterly portfolio of investments, (ii) information regarding how the Funds voted proxies relating to portfolio securities held during the most recent twelve-month period ended June 30, and (iii) a description of the policies and procedures that the Funds used to determine how to vote proxies relating to portfolio securities without charge, upon request, by calling Nuveen Investments toll-free at (800) 257-8787 or on Nuveen’s website at www.nuveen.com.
You may also obtain this and other Fund information directly from the Securities and Exchange Commission (SEC). The SEC may charge a copying fee for this information. Visit the SEC on-line at http://www.sec.gov or in person at the SEC’s Public Reference Room in Washington, D.C. Call the SEC at (202) 942-8090 for room hours and operation. You may also request Fund information by sending an e-mail request to publicinfo@sec.gov or by writing to the SEC’s Public References Section at 100 F Street NE, Washington, D.C. 20549.
CEO Certification Disclosure
Each Fund’s Chief Executive Officer (CEO) has submitted to the New York Stock Exchange (NYSE) the annual CEO certification as required by Section 303A.12(a) of the NYSE Listed Company Manual.
Each Fund has filed with the SEC the certification of its Chief Executive Officer and Chief Financial Officer required by Section 302 of the Sarbanes-Oxley Act.
Common Share Information
Each Fund intends to repurchase shares of its own common in the future at such times and in such amounts as is deemed advisable. During the period covered by this report, the Funds repurchased shares of their common stock as shown in the accompanying table.
| | | | Common Shares | |
| Fund | | | Repurchased | |
| NQJ | | | — | |
| NNJ | | | — | |
| NXJ | | | — | |
| NUJ | | | — | |
| NJV | | | — | |
| NQP | | | — | |
| NPY | | | — | |
| NXM | | | — | |
| NVY | | | — | |
| NPN | | | — | |
Any future repurchases will be reported to shareholders in the next annual or semi-annual report.
Nuveen Investments:
Serving Investors for Generations
Since 1898, financial advisors and their clients have relied on Nuveen Investments to provide dependable investment solutions through continued adherence to proven, long-term investing principles. Today, we offer a range of high quality equity and fixed-income solutions designed to be integral components of a well-diversified core portfolio.
Focused on meeting investor needs.
Nuveen Investments provides high-quality investment services designed to help secure the long-term goals of institutional and individual investors as well as the consultants and financial advisors who serve them. Nuveen Investments markets a wide range of specialized investment solutions which provide investors access to capabilities of its high-quality boutique investment affiliates—Nuveen Asset Management, Symphony Asset Management, NWQ Investment Management Company, Santa Barbara Asset Management, Tradewinds Global Investors, Winslow Capital Management and Gresham Investment Management. In total, Nuveen Investments managed $220 billion as of September 30, 2012.
Find out how we can help you.
To learn more about how the products and services of Nuveen Investments may be able to help you meet your financial goals, talk to your financial advisor, or call us at (800) 257-8787. Please read the information provided carefully before you invest. Investors should consider the investment objective and policies, risk considerations, charges and expenses of any investment carefully. Where applicable, be sure to obtain a prospectus, which contains this and other relevant information. To obtain a prospectus, please contact your securities representative or Nuveen Investments, 333 W. Wacker Dr., Chicago, IL 60606. Please read the prospectus carefully before you invest or send money.
Learn more about Nuveen Funds at: www.nuveen.com/cef
Distributed by
Nuveen Securities, LLC
333 West Wacker Drive
Chicago, IL 60606
www.nuveen.com
ESA-A-1012D
ITEM 2. CODE OF ETHICS.
Not applicable to this filing.
ITEM 3. AUDIT COMMITTEE FINANCIAL EXPERT.
Not applicable to this filing.
ITEM 4. PRINCIPAL ACCOUNTANT FEES AND SERVICES.
Not applicable to this filing.
ITEM 5. AUDIT COMMITTEE OF LISTED REGISTRANTS.
Not applicable to this filing.
ITEM 6. SCHEDULE OF INVESTMENTS.
(a) See Portfolio of Investments in Item 1.
(b) Not applicable.
ITEM 7. DISCLOSURE OF PROXY VOTING POLICIES AND PROCEDURES FOR CLOSED-END MANAGEMENT INVESTMENT COMPANIES.
Not applicable to this filing.
ITEM 8. PORTFOLIO MANAGERS OF CLOSED-END MANAGEMENT INVESTMENT COMPANIES.
Not applicable to this filing.
ITEM 9. PURCHASES OF EQUITY SECURITIES BY CLOSED-END MANAGEMENT INVESTMENT COMPANY AND AFFILIATED PURCHASERS.
Not applicable.
ITEM 10. SUBMISSION OF MATTERS TO A VOTE OF SECURITY HOLDERS.
There have been no material changes to the procedures by which shareholders may recommend nominees to the registrant's Board implemented after the registrant last provided disclosure in response to this Item.
ITEM 11. CONTROLS AND PROCEDURES.
ITEM 12. EXHIBITS.
File the exhibits listed below as part of this Form.
Pursuant to the requirements of the Securities Exchange Act of 1934 and the Investment Company Act of 1940, the registrant has duly caused this report to be signed on its behalf by the undersigned, thereunto duly authorized.
Kevin J. McCarthy
Pursuant to the requirements of the Securities Exchange Act of 1934 and the Investment Company Act of 1940, this report has been signed below by the following persons on behalf of the registrant and in the capacities and on the dates indicated.
Gifford R. Zimmerman
Stephen D. Foy