UNITED STATES
SECURITIES AND EXCHANGE COMMISSION
Washington, D.C. 20549
FORM 10-K
| x | ANNUAL REPORT PURSUANT TO SECTION 13 OR 15(d) OF THE SECURITIES EXCHANGE ACT OF 1934 |
For the fiscal year ended September 30, 2012
| o | TRANSITION REPORT PURSUANT TO SECTION 13 OR 15(d) OF THE SECURITIES EXCHANGE ACT OF 1934 |
For the Transition Period From to
Commission File Number 0-20600
ZOLTEK COMPANIES, INC.
(Exact name of registrant as specified in its charter)
| Missouri | 43-1311101 |
| (State or other jurisdiction of incorporation or organization) | (I.R.S. Employer Identification No.) |
3101 McKelvey Road,
St. Louis, Missouri 63044
(Address of principal executive offices, including zip code)
Registrant's telephone number, including area code: (314) 291-5110
Securities registered pursuant to Section 12(b) of the Act:
Title of Each Class: | Name of Each Exchange on Which Registered: |
| Common Stock, $.01Par Value per Share | The Nasdaq Stock Market LLC |
| | (Nasdaq Global Select Market) |
Securities registered pursuant to Section 12(g) of the Act: None
Indicate by check mark if the registrant is a well-known seasoned issuer, as defined in Rule 405 of the Securities Act. Yes [ ] No [X]
Indicate by check mark if the registrant is not required to file reports pursuant to Section 13 or Section 15(d) of the Act.
Yes [ ] No [X]
Indicate by check mark whether the registrant (1) has filed all reports required to be filed by Section 13 or 15(d) of the Securities Exchange Act of 1934 during the preceding 12 months (or for such shorter period that the registrant was required to file such reports), and (2) has been subject to such filing requirements for the past 90 days. Yes [X] No [ ]
Indicate by check mark whether the registrant has submitted electronically and posted on its corporate Web site, if any, every Interactive Data File required to be submitted and posted pursuant to Rule 405 of Regulation S-T (§232.405 of this chapter) during the preceding 12 months (or for such shorter period that the registrant was required to submit and post such files). Yes [X] No [ ]
Indicate by check mark if disclosure of delinquent filers pursuant to Item 405 of Regulation S-K (§229.405 of this chapter) is not contained herein, and will not be contained, to the best of registrant's knowledge, in definitive proxy or information statements incorporated by reference in Part III of this Form 10-K or any amendment to this Form 10-K [ ].
Indicate by check mark whether the registrant is a large accelerated filer, an accelerated filer, a non-accelerated filer or a smaller reporting company. See definitions of “large accelerated filer,” “accelerated filer” and “smaller reporting company” in Rule 12b-2 of the Exchange Act. (check one):
Large Accelerated Filer £ Accelerated Filer S
Non-Accelerated Filer £ Smaller Reporting Company £
Indicate by check mark whether the registrant is a shell company (as defined in Rule 12b-2 of the Exchange Act). Yes [ ] No [X]
State the aggregate market value of the voting stock held by non-affiliates of the registrant as of March 31, 2012: approximately $308 million.
Indicate the number of shares outstanding of each of the registrant's classes of common stock as of November 21, 2012: 34,355,192 shares of Common Stock, par value $.01 per share.
DOCUMENTS INCORPORATED BY REFERENCE
The following document is incorporated by reference into the indicated Part of this Report:
Document | Part of Form 10-K |
| Proxy Statement for the 2013 Annual Meeting of Shareholders | III |
| ZOLTEK COMPANIES, INC. |
| INDEX |
| |
| Part I. |
| Item 1. | Business |
| Item 1A. | Risk Factors |
| Item 1B. | Unresolved Staff Comments |
| Item 2. | Properties |
| Item 3. | Legal Proceedings |
| Item 4. | Mine Safety Disclosures |
| | |
| Part II. |
| Item 5. | Market for Registrant's Common Equity, Related Stockholder Matters and Issuer Purchases of Equity Securities |
| Item 6. | Selected Financial Data |
| Item 7. | Management's Discussion and Analysis of Financial Condition and Results of Operations |
| Item 7A. | Quantitative and Qualitative Disclosures About Market Risk |
| Item 8. | Financial Statements and Supplementary Data |
| Item 9. | Changes in and Disagreements with Accountants in Accounting and Financial Disclosure |
| Item 9A. | Controls and Procedures |
| Item 9B. | Other Information |
| | |
| Part III. |
| Item 10. | Directors, Executive Officers and Corporate Governance |
| Item 11. | Executive Compensation |
| Item 12. | Security Ownership of Certain Beneficial Owners and Management and Related Stockholder Matters |
| Item 13. | Certain Relationships and Related Transactions, and Director Independence |
| Item 14. | Principal Accounting Fees and Services |
| | |
| Part IV. |
| Item 15. | Exhibits and Financial Statement Schedules |
| Signatures | |
| Exhibit Index |
This Annual Report on Form 10-K for the fiscal year ended September 30, 2012 and the information incorporated by reference herein contain forward-looking statements, which are inherently subject to risks and uncertainties. See “—Special Note Regarding Forward-Looking Statements.”
General Development of Business
Zoltek Companies, Inc. is an applied technology and advanced materials company. Our mission is to lead the commercialization of carbon fiber through our development of a price-competitive, high-performance reinforcement for composites used in a broad range of commercial products which we sell under the Panex® trade name. In addition to manufacturing carbon fiber, we produce an intermediate product, a stabilized and oxidized acrylic fiber used in flame- and heat-resistant applications which we sell under the Pyron® trade name. Our current business was founded in 1988 and we are incorporated in Missouri.
We led the development of the carbon fiber commercialization concept and we believe we are the largest manufacturer primarily focused on producing low-cost carbon fibers for commercial applications. We have spent over 15 years developing and refining our proprietary technology and manufacturing processes and building capacity.
During 2006, we began our transformation from primarily a development business to an operational phase and continued our expansion plans that were first announced in 2005. Also during 2006, the demand for commercial carbon fibers continued to increase substantially and the aerospace and commercial applications diversified. We believe that this divergence will persist over a long period and validates our commercialization strategy.
Zoltek’s mission to commercialize carbon fibers has proven successful over the past several years, but the development of large volume applications continues to be constrained because converting commercial carbon fibers to a finished product depends to a large degree on a fragmented and inefficient supply chain. Consequently, we are taking the next step in the commercialization process. We are designing new equipment and developing new processing methods to support the commercialization strategy. The goal is to develop higher-throughput, lower-cost conversion methods designed to consolidate the supply chain and open new markets. These value-added, or “composite intermediate” products and processes, are being developed by Zoltek’s research and development (R&D) group.
In April 2010, Zoltek announced the formation of Zoltek Automotive, a subsidiary established to accelerate the incorporation of carbon fiber products into automotive applications. Zoltek Automotive seeks to lead the commercialization effort in the automotive applications, which we believe will ultimately be the largest user of carbon fibers. This group is incorporating the new developments in process equipment and manufacturing techniques into the automotive manufacturing applications.
As a part of this effort, in March 2012, Zoltek announced its collaboration with Magna Exteriors and Interiors, an operating unit of Magna International, Inc. to develop carbon fiber sheet molding compounds for the automotive industry. Magna Incorporated, based in Aurora, Ontario, Canada, is the largest automotive parts manufacturer in North America. The newly developed carbon fiber material combines Zoltek’s Panex 35 commercial carbon fiber with Magna’s EpicBlendSMC™ sheet molding compound formulations. The new material will allow Magna to offer an expanded range of lightweight parts and sub-systems for automotive, commercial truck and other markets. Magna Exteriors and Interiors will sell the sheet molding compound directly to molders.
We are aggressively marketing to obtain new business in both existing and new applications. New applications tend to require relatively long sales cycles due to the qualification of carbon fibers into new product development manufacturing and engineering. Targeted application areas include wind energy, deep sea drilling, infrastructure, aerospace secondary structures, automotive and aircraft brakes. During 2010, we added additional sales personnel in Asia, focusing on markets in China, India and Korea and have begun to see some success through new customers and sales in those regions. During fiscal 2011 and fiscal 2012, our sales increased by 18.1% and 22.8%, respectfully, as we have strengthened our customer base.
In order to manage our business, we focus on two separate business segments: carbon fibers and technical fibers (oxidized acrylic fibers). We also manage the corporate/other segment which consists of ancillary activities not directly related to the carbon fiber or technical fiber segments.
Business Strategy
Our business model focuses on low and sustainable pricing facilitated by low production costs, rapidly scalable capacity and a product line that offers various value-added products and process enhancements.
The principal elements of our business strategy include the following:
Sustainable Price Leadership. We market carbon fibers for use as a base reinforcement material in composites at sustainable price levels resulting in predictable composite costs per unit of strength and stiffness that compare favorably with alternative base construction materials. We also believe our proprietary process and equipment design technology enable us to produce carbon fibers at costs substantially lower than those generally prevailing in the industry and to supply carbon fibers for applications that are not economically viable for our higher-cost competitors. We believe that, with our targeted cost structure, we can maintain sustainable pricing that makes it attractive for customers to commit to high-volume applications.
Support for New Commercial Markets and Applications Development. To further accelerate the commercialization of carbon fibers and carbon fiber composites across a broad range of mass-market applications, we have pursued various initiatives, including partnerships with potential users of carbon fibers to act as catalysts in the development of new low-cost, high-volume products. We believe that our supply relationships with customers for wind energy applications are the direct result of these development efforts. These efforts were recognized as Zoltek was named 2010 “Supplier of the Year” by Vestas Blades A/S, the blade manufacturing division of Vestas Wind Systems A/S.
Our objective is to develop methods to efficiently introduce our carbon fiber into various composite manufacturing processes. We seek to help others achieve new levels of performance across a range of products. As an example, Zoltek continues to advance the development of process equipment and design of downstream products, such as our prepreg (carbon fiber pre-impregnated with bonding resin) production. We seek to supplant inefficient non-value added players in the supply chain to more directly support needs of our end customers who desire to incorporate carbon fiber into their products. Zoltek’s goal is to become the largest carbon fiber prepreg manufacturer in the world.
Capacity Leadership to Keep Pace with Long-Term Demand Growth. We believe that our decision to build and maintain significant available capacity will allow us the ability to enter into additional long-term supply arrangements with high-volume customers. We have developed, and are continually seeking to improve, proprietary continuous carbonization line designs in order to increase efficiency and shorten lead time from the time of the decision to add lines to the time when the lines become operational. In addition, we have continually improved our ability to produce acrylic fiber precursor at low costs and in sufficient quantities to support our growth in carbon fiber capacity. The ability to increase capacity in response to the growth of commercial applications is essential to encouraging development of large-volume applications.
Development of Model for Supporting Long-Term Accelerating Growth. Our industry currently has no established means for supplying identified large scale applications for which carbon fiber composites have been proven to offer transformational technology, such as structural use in mass produced cars to increase fuel efficiency through reduced weight and improved safety due to superior strength and stiffness. Accordingly, in addition to developing a global footprint of our own, Zoltek is seeking to leverage its proprietary expertise by developing a business model with the goal of proliferating carbon fiber technology to new customers in capital intensive industries who desire to partner with us to invest in the plants necessary to launch these high volume applications. Although we expect it will take some time, and our approach will evolve to address opportunities as they develop, we believe this strategy ultimately could support a quantum leap in the commercial carbon fiber industry.
Targeted Applications
We have identified targeted applications for our products with high growth potential across a variety of industries. Among them are:
According to the Global Wind Energy Council (GWEC), the total market for wind turbines was approximately 50 billion Euros ($68 billion) in 2011. GWEC predicts that in 2013, global wind generating capacity will stand at 330 GW, up from 238 GW at the end of 2011. In 2011, China led the global market again in wind power generating capacity. We believe that Asia, particularly China, will continue to see tremendous growth in wind energy over the next ten years. Zoltek believes that as the industry moves to supply off-shore wind turbines that are larger in size, they will continue to incorporate more carbon fibers into their designs. This means that the underlying carbon fiber demand for wind turbine applications should grow at a faster rate than wind generation capacity itself.
Large and more efficient wind turbines represent a faster growing segment of the industry. These turbines require the use of carbon fibers, generally for turbine blades 40 meters or longer. Zoltek believes it is the leading supplier of the low-cost, high-performance carbon fibers used in building the largest and most advanced of these wind turbines.
Zoltek has also expanded its product offering to the wind industry to include fabrics, prepregs and pultruded products. Additionally, we have worked with various wind customers on their design needs in order to effectively incorporate carbon fiber in their products.
Zoltek believes automotive applications are destined to become the largest user of carbon fibers. For years there has been an upward trend in the use of carbon fiber reinforced composites in the manufacture of small-volume and many times hand-made cars. Examples include the Tesla which uses Zoltek fibers for an entire car and the Corvette which use Zoltek carbon fibers for a few specialized parts. While these applications have been growing steadily, we believe the real explosion in demand will come from expanded adaptation of carbon fiber composites into large scale series models produced on an assembly line. Carbon fiber composites in automotive applications are suitable for structural components such as front-end modules, leaf springs and many other chassis components.
In fiscal 2010, Zoltek formed a new subsidiary, Zoltek Automotive, LLC, to speed development of volume automotive applications for large-tow carbon fiber. Our objective is to make the adaptation of carbon fiber technology and processes easy and efficient for automotive companies and their suppliers by developing new production methods that will enable customers to fabricate cost-effective carbon fiber intermediate products. To this end, Zoltek Automotive, LLC is working directly with tier one automotive suppliers on advancing this technology and assisting them in the utilization of carbon fiber with existing and new manufacturing machinery and processes.
Zoltek is also a worldwide provider of filament winding technology. This technology is used in applications such as compressed natural gas (CNG) tanks. With the recent surge in natural gas productions in the U.S. Zoltek is currently identifying more opportunities to build upon this capability.
As the price of oil on the world market continues to fluctuate, oil exploration companies have moved out into deepwater, developing reserves beneath the ocean floor a mile or more below the water’s surface. As a result, demand for strong yet lightweight materials able to stand up to the harsh subsea environment has increased, with a corresponding peak of interest in composites. One of those growth areas has been in buoyancy modules. In another application, a major producer of deepwater umbilicals has tested composite rods utilizing our carbon fibers in fabrication of umbilical products and found them to deliver equal or superior performance at affordable cost, compared to composite rods utilizing aerospace grade carbon fibers. The composite rods are designed to demonstrate the ability to succeed where steel cables begin to fail — in counteracting the greater axial loads encountered in ultra deepwater, meaning depths exceeding 7,500 feet. At these depths, steel is subject to deformation or stretching. Ongoing development work is also being performed on other products like tethers, riser pipes, and choke and kill lines. Additional test projects are being planned to demonstrate the effectiveness of carbon fibers in these and other deep sea drilling applications.
Zoltek is pursuing the market for refurbishment or repair of concrete structural components in bridges, columns, and buildings that were not adequately designed or have deteriorated due to corrosion or time. We believe use of our products for these repairs will reduce maintenance costs and reduce the strain placed on the infrastructure. Our non-corrosive materials are designed for long-term performance and are less expensive which allows for more repairs on a fixed budget.
| | · | Thermoplastic Compounding |
Zoltek is undergoing a major initiative to optimize our chopped and milled carbon fibers that are used to reinforce thermoplastic materials. These thermoplastic materials are used in a variety of electronics applications, and are considered to ultimately be the best material for automotive structural parts. Thermoplastics are now used in electronics, such as hard disk drives, printer applications, medical applications, and anti-static or conductive plastic applications. However, when carbon fiber-reinforced thermoplastics products migrate into structural applications, use of these products will accelerate.
| | · | Aircraft Brakes/Friction Resistance |
We believe our technical fibers segment is the largest supplier of carbon and technical fibers to the leading manufacturers of aircraft brakes. A substantial majority of commercial and defense aircraft have incorporated carbon-carbon brakes into their design due to their superior heat resistance, friction properties and light weight. This business should continue to afford a steady revenue stream with significant growth potential.
| | · | Aerospace Secondary Structures |
Zoltek is actively pursuing new applications with large-volume potential: sales of carbon fiber to leading airplane makers for use in secondary structures such as floors, luggage bins and seats. We believe airplane manufacturers are concerned about future availability and pricing of large quantities of carbon fibers, as all newly designed commercial planes will incorporate extensive utilization of carbon fiber composites. Zoltek can offer considerably lower cost structures than the manufacturers of aerospace-grade carbon fibers and we also have the competitive advantage of being able to deliver large volumes of carbon fibers on a timely basis. Airplane makers are looking for every possible opportunity to reduce fuel burn by eliminating weight, but they are also concerned about their competitive position. They have already turned to carbon fiber for making the flight-worthy primary structures of their most advanced airplanes, and now they are interested in ways to make other structures that use super-lightweight carbon fiber composites. Boeing and Airbus have begun delivering their 787 Dreamliner and A-380 models which has led to unprecedented use of carbon fiber composites for commercial aircraft.
Customers
In fiscal 2012, 2011 and 2010, we reported net sales of $86.6 million, $42.7 million and $49.5 million, respectively, to Vestas Wind Systems, a leading wind turbine manufacturer, which represented 46.5%, 28.1% and 38.6% of our net sales, respectively, during such years. In fiscal 2011, we also reported net sales of $15.8 million, which represented 10.4% of our net sales, to Saertex GMBH & Company, a manufacturer of fabrics for the composite industry, including materials for production of wind turbine blades.
The related open accounts receivable balances for Vestas Wind Systems at September 30, 2012 and 2011 were $22.3 million and $15.0 million, respectively. These were the only customers that represented greater than 10% of consolidated net sales during these fiscal years. We continue to make efforts to expand our customer base through new downstream product offerings and expanded sales efforts that result in reducing our reliance on any one customer.
Backlog
Sales of our products are generally made pursuant to customer purchase orders. In recent years, our customers have increasingly demanded shorter order lead times and “just-in-time” delivery performance. While we have multi-year contracts with certain major customers, most of these contracts specify the customers’ indicated requirements that will be supplied by us and the terms under which the sales will occur, not the specific quantities to be procured. As a result, twelve-month order backlog is not a meaningful indicator of future revenues for us.
Company Operations
We have manufacturing plants in Nyergesujfalu, Hungary, Guadalajara, Mexico, Abilene, Texas, St. Charles and St. Peters, Missouri. Our plant in Hungary is our largest carbon fiber and technical fiber manufacturing facility. Our Hungarian plant also manufactures acrylic fiber precursor, the raw material that we use to make carbon fibers and technical fibers. During fiscal 2012, we expanded our plant in Hungary to allow for greater fabric manufacturing capability. Our Texas plant houses carbon fiber manufacturing lines and value-added processing capabilities. Our St. Charles, Missouri plant is primarily dedicated to the production of technical fibers and carbon fibers for aircraft brake and other friction applications. Our plant in St. Peters, Missouri, opened in October 2011, houses production of resin pre-impregnated carbon fibers called "prepregs" and serves as our primary research and development facility. In addition, we have facilities in Salt Lake City, Utah where we design and build composite manufacturing and filament winding equipment.
We acquired our facility in Guadalajara, Mexico in October 2007. This facility supplies our North American operations with low-cost precursor and serves as an additional site for worldwide carbon fiber production. The plant began precursor and carbon fiber production in the second quarter of fiscal 2009, but due to economic and market conditions, we were forced to curtail production. The plant restarted production in the third quarter of fiscal 2011. The Mexico plant, which we expect will eventually be our largest facility, substantially increases our capacity to produce low-cost carbon fibers on a timely and cost-effective basis. It will further extend our leadership position in the commercial carbon fibers sector by improving the reliability of supply to our customers by serving as a duplicate facility to our Hungarian plant which could qualify as two separate sources.
Acrylic fiber precursor comprises a substantial portion of the total cost of producing carbon fibers. With the addition of our Mexico precursor facility, we believe we have ample supply of high quality, low-cost precursor to supply our foreseeable future requirements.
An element of our strategy is to offer customers value-added processing of the fibers that we produce. Our longer-term focus is on creating integrated solutions for large potential end users by working directly with carbon fiber customers in the primary applications that we target. We perform certain downstream processing, such as weaving, knitting, blending with other fibers, chopping and milling and preparation of pre-form, pre-cut stacks of fabric. The prepreg we manufacture is another downstream product. In addition, our Salt Lake City-based Entec Composite Machines subsidiary designs and builds composite manufacturing equipment and markets the equipment along with manufacturing technology and materials.
We also provide composite design and engineering for development of applications for carbon fiber reinforced composites. We reported research and development expenses of $7.0 million, $8.6 million and $8.2 million in fiscal 2012, 2011 and 2010, respectively. For historical financial information regarding our various business segments, see Note 4 of the Notes to Consolidated Financial Statements.
Competition
Our carbon fibers and technical fibers business segments compete with various other producers of carbon fibers. We believe we are the only publicly-held company that is a “pure-play” in carbon fibers, while all the other six principal competitors’ carbon fiber operations are a relatively small part of their total businesses. Our existing six major competitors have substantially greater research and development, marketing, financial and managerial resources than we do. We are aware of no single manufacturer of carbon fiber products that competes across all of our product lines and applications. We believe our business model distinguishes us from other carbon fiber manufacturers in supporting the long-term growth of the commercial carbon fiber market.
To varying degrees, depending on market conditions and supply, we compete with aerospace grade carbon fiber producers, such as Hexcel Corporation and Cytec Industries of the United States and Toray Group, Toho Tenax and Mitsubishi Chemical of Japan. These carbon fiber producers tend to market higher cost products than our products, with a principal focus on aerospace structural and high price industrial applications. The aerospace carbon fiber manufacturers have tended to enter into direct competition with us primarily when they engage in significant discounting to protect their market share. SGL Carbon is the most direct competitor which also uses a textile-type precursor. SGL is also our principal competitor in selling oxidized fiber. We manufacture our own textile-type precursor. We believe this provides us with a competitive edge as we are not dependent on a third party for this material. Our ability to source products from multiple locations allows us to pursue a much higher percentage of our primary customers’ business by minimizing their supply risk.
The principal areas of competition for our carbon fibers and technical fibers business are sustainable price, quality, development of new applications and ability to reliably meet the customer’s volume requirements and qualifications for particular programs. Carbon fiber production also requires substantial capital expenditures for manufacturing plants and specialized equipment, know-how to economically manufacture carbon fibers to meet technical specifications and the ability to qualify carbon fibers for acceptable performance in downstream applications.
International
The Company conducts its carbon fiber products operations primarily in North America and Europe. The Company sells its carbon fibers globally. There are unique risks attendant to the Company's foreign operations, such as currency fluctuations. For additional information regarding our international operations, see Note 4 of the Notes to Consolidated Financial Statements.
Sources of Supply
As part of its growth strategy, the Company has developed its own precursor acrylic fibers, which are the principal raw material for all of its carbon fibers. The primary source of raw material for the precursor is ACN (acrylonitrile), which is a commodity product with multiple sources.
Environmental
The Company's operations generate various hazardous wastes, including gaseous, liquid and solid materials. The operations of the Company's carbon fibers and technical fibers business segments utilize thermal oxidation of various by-product streams designed to comply with applicable laws and regulations. The plants produce air emissions that are regulated and permitted by various environmental authorities. The plants are required to verify by performance tests that certain emission rates are not exceeded. The Company does not believe that compliance by its carbon fibers and technical fibers operations with applicable environmental regulations will have a material adverse effect upon the Company's future capital expenditure requirements, results of operations or competitive position. There can be no assurance, however, as to the effect of interpretation of current laws or future changes in federal, state or international environmental laws or regulations or their interpretation on the business segments’ results of operations or financial condition.
As of September 30, 2012, we employed approximately 530 persons in our North American operations and approximately 850 in our European operations.
Our U.S. employees are not represented by any collective bargaining organizations. By law, most employees in Hungary are represented by at least one labor union. At Zoltek Zrt., our Hungarian subsidiary, there are two active unions (some Zoltek Zrt. employees belong to both unions). Management meets with union representatives on a regular basis and there have not been any problems or major disagreements with either union in the past five years. At our Mexican subsidiary, employees are also represented by a union which was selected by our subsidiary. We believe that overall our employee relations are good.
AVAILABLE INFORMATION
The Company regularly files periodic reports with the Securities and Exchange Commission (“SEC”), including annual reports on Form 10-K and quarterly reports on Form 10-Q, as well as, from time to time, current reports on Form 8-K and amendments to those reports. These filings are available free of charge on the Company's website at www.zoltek.com, as soon as reasonably practicable after their electronic filing with the SEC. All of the Company’s filings may be read or copied at the SEC’s Public Reference Room at 100 F Street, NE, Washington, DC 20549. Information on the operation of the Public Reference Room can be obtained by calling the SEC at 1-800-SEC-0330. The SEC maintains an Internet website (http://www.sec.gov) that contains reports, proxy and information statements and other information regarding issuers that file electronically.
This Annual Report on Form 10-K for fiscal 2012 and the documents incorporated by reference herein contain forward-looking statements, which are inherently subject to risks and uncertainties. See “—Special Note Regarding Forward Looking Statements.”
SPECIAL NOTE REGARDING FORWARD-LOOKING STATEMENTS
This Form 10-K and the information incorporated by reference in this Form 10-K contain certain statements that constitute “forward-looking statements” within the meaning of Section 27A of the Securities Act of 1933, as amended, and Section 21E of the Securities Exchange Act of 1934, as amended. The words “expect,” “believe,” “goal,” “plan,” “intend,” “estimate,” and similar expressions and variations thereof are intended to specifically identify forward-looking statements. Those statements appear in this Form 10-K, any accompanying Form 10-K supplement and the documents incorporated herein by reference, particularly in the sections entitled “Risk Factors,” “Management’s Discussion and Analysis of Financial Condition and Results of Operations” and “Business,” and include statements regarding the intent, belief or current expectations of us, our directors and officers with respect to, among other things: (1) our financial prospects; (2) our growth strategy and operating strategy, including our focus on facilitating acceleration of the introduction and development of mass market applications for carbon fibers; and (3) our current and expected future revenue.
This Form 10-K and the information incorporated by reference in this report also contain statements that are based on the current expectations of our Company. You are cautioned that any such forward-looking statements are not guarantees of future performance and involve risks and uncertainties, and that actual results may differ materially from those projected in the forward-looking statements as a result of various factors. The factors that might cause such differences include, among others, our ability to: (1) successfully adapt to recessionary conditions in the global economy and substantial volatility in order rates from our wind energy customers, including our principal customer Vestas Wind Systems; (2) penetrate existing, identified and emerging markets, including entering into new supply agreements with large volume customers; (3) continue to improve efficiency at our manufacturing facilities on a timely and cost-effective basis; (4) successfully add new planned capacity for the production of carbon fiber, precursor raw materials and prepregs and meet our obligations under long-term supply agreements; (5) operate profitably; (6) increase or maintain our borrowing at acceptable costs; (7) manage changes in customers’ forecasted requirements for our products; (8) continue investing in application and market development for a range of applications; (9) manufacture low-cost carbon fibers and profitably market them despite fluctuations in raw material and energy costs; (10) successfully operate our Mexican facility to produce acrylic fiber precursor and carbon fibers; (11) successfully continue operations at our Hungarian facility if natural gas supply disruptions occur; (12) successfully prosecute patent litigation; (13) successfully facilitate adoption of our carbon fibers by the auto industry for use in high-volume applications; (14) establish and grow prepreg capacity; (15) speed development of low-cost carbon fiber sheet molding compounds for the automotive industry pursuant to our global collaborative partnership with Magna Exteriors and Interiors; and (16) manage the risks identified under “Risk Factors” and elsewhere in our filings with the SEC.
Because forward-looking statements are inherently subject to risks and uncertainties, some of which cannot be predicted or quantified, you should not rely upon forward-looking statements as predictions of future events. The events and circumstances reflected in the forward-looking statements may not be achieved or occur and actual results could differ materially from those projected in the forward-looking statements.
The following are certain risk factors that could affect Zoltek's business, financial condition and results of operations. These risk factors should be considered in connection with evaluating the forward-looking statements contained in this Annual Report on Form 10-K because these factors could cause the actual results and conditions to differ materially from those indicated in the forward-looking statements. Before you invest in the Company’s securities, you should know that making such an investment involves a high degree of risk, including the risks described below. The risks that we have highlighted here are not the only ones that the Company faces. If any of the risks actually occur, the Company's business, financial condition, results of operations or cash flows could be negatively affected. In that case, the trading price of its securities could decline, and you may lose all or part of your investment.
Our growth and profitability will depend on increases in demand for carbon fibers and entering into new supply relationships.
Historically, our business has been adversely affected during periods of oversupply and capacity constraints. For years prior to fiscal 2004, our financial results were adversely affected by industry oversupply conditions which inhibited adoption of carbon fibers for non-aerospace applications as existing and potential customers were reluctant to commit to incorporate carbon fiber composites into their products due to concerns about the availability of carbon fiber in large volumes at predictable costs. During 2006 and 2007, the divergence in the aerospace and commercial applications and our new supply relationships with wind energy customers led to strains on our ability to meet all the demand from our wind energy customers and we were unable to take on new customers.
We currently have sufficient capacity to meet demand from current wind energy customers and produce carbon fibers for additional large-scale applications. Our capacity expansion resulted in excess capacity costs of $11.7 million in fiscal 2011 which declined to $2.8 million in fiscal 2012. Our future profitability and growth will depend upon our ability to enter into supply relationships with new customers for existing applications utilizing our carbon fibers and the development of new markets for large-scale applications which incorporate our carbon fiber products. Development of new customers for existing applications and new markets for our carbon fiber products will require substantial technical, marketing and sales efforts and the expenditure of significant funds. Development of new markets for carbon fibers may not occur. Our business, operating results and financial condition could be materially and adversely affected if new customers and markets for our carbon fiber products do not develop.
Increases in sales of our carbon fiber products are subject to long sales cycles of our customers.
Our future profitability and growth will depend primarily upon our ability to enter into supply relationships with new customers for existing applications utilizing our carbon fibers and the development of new markets for a broad range of large-scale applications which incorporate our carbon fiber products. Our ability to increase sales of our carbon fiber products is subject to relatively long sales cycles of our customers due to new product development, manufacturing and engineering investments our customers must make to incorporate carbon fiber composites into their products.
A limited number of customers generate a significant portion of our revenue and they may terminate their contracts with us in the event of certain changes in control or may require that we make penalty payments if we fail to perform.
For fiscal 2012, our largest customer represented 46.5% of our revenue and our three next largest customers accounted for a total of 17.0% of our revenue. We anticipate that significant customer concentration will continue for the foreseeable future, although the composition of our largest customers may change from period to period. A substantial portion of our total sales in fiscal 2012 were to customers for wind energy applications. Significant changes in demand for our customers’ wind turbines, the shares of their requirements that are awarded to us or changes in the design or materials used to construct their products could result in a significant loss of business with these customers. Our contracts with certain customers allow them to terminate their agreements with us or require us to make substantial penalty payments if we fail to perform our obligations under our agreements with them. The loss of, or significant reduction in the purchases by, these customers or any other significant customer could have a material adverse effect upon our future revenues and business, results of operations, financial condition or cash flows.
We reported net losses from continuing operations for fiscal 2011, 2010, 2009, 2007 and each of the five fiscal years preceding it.
Although we reported net income in fiscal 2012 and 2008, we have reported losses from continuing operations of $7.1 million, $12.3 million, $17.1 million, $38.2 million, $65.8 million, $2.0 million, $4.2 million, $6.3 million and $3.6 million in fiscal 2002, 2003, 2004, 2005, 2006, 2007, 2009, 2010 and 2011, respectively. If we revert to reporting net losses in fiscal 2013 or later years, our stock price likely will be adversely affected.
Demand for our carbon fiber products may be adversely affected by the current economic and credit environment.
The United States and international economies recently have experienced (and continue to experience) a period of slow economic growth. European economies currently are experiencing recessionary conditions and extreme uncertainty and growth in China has slowed. Current global economic conditions could contribute to a slowdown for products that require significant capital expenditures, including demand for large-scale projects that incorporate our carbon fibers.
Our operations and sales in foreign countries are subject to risks.
For fiscal 2012, approximately 56% of our revenues were derived from products supplied by our operations in Hungary. Our operations in Hungary and Mexico and our sales in other foreign countries are subject to risks associated with foreign operations and markets including the fact that many members of our senior management are resident in the United States, foreign currency fluctuations, changes in regulatory, economic or political conditions, tariffs and other trade barriers, longer payment cycles for accounts receivable, potentially adverse tax consequences, restrictions on repatriation of earnings and the burdens of complying with a wide variety of foreign laws. These factors could have a material adverse effect upon our future revenues and business, results of operations, financial condition or cash flows.
Our ability to fund and manage our anticipated growth will affect our operating results.
The growth in our business has placed, and is expected to continue to place, a significant strain on our management and operations. In order to effectively manage potential long-term growth and to reach growth targets, we will need to add to our carbon fiber manufacturing capacity, have access to adequate financial resources to fund significant capital expenditures and working capital requirements and maintain gross profit margins. We must also pursue a growth strategy and continue to strengthen our operations, including our financial and management information systems, and expand, train and manage our employee workforce. There can be no assurance that we will be able to do so effectively or on a timely basis. Failure to do so could have a material adverse effect upon our future revenues and business, results of operations, financial condition or cash flows. Additionally, in the event that we need to obtain debt or equity financing in the future to fund our growth, we may not be able to obtain additional debt financing on favorable terms.
Our operations are dependent upon our senior management and technical personnel.
Our future operating results depend upon the continued service of our senior management including our Chairman and Chief Executive Officer, Zsolt Rumy, and our technical, management and sales personnel in our domestic and international operations. Our future success will depend upon our continuing ability to attract and retain highly qualified managerial, sales and technical personnel. Competition for such personnel is intense, and there can be no assurance that we will retain our key managerial and technical employees or that we will be successful in attracting, assimilating or retaining other highly qualified personnel in the future.
Our operating results may fluctuate.
Our quarterly results of operations may fluctuate as a result of a number of factors, including the timing of purchase orders for and shipments of our products, our ability to successfully operate our expanding production capacity and changes in production levels. Therefore, quarter-to-quarter comparisons of results of operations have been and will be impacted by the timing of such orders and shipments. In addition, our operating results could be adversely affected by these factors, among others, such as variations in the mix of product sales, price changes in response to competitive factors and interruptions in plant operations.
Developments by competitors may reduce demand for our products and technologies, which may adversely affect our sales.
We compete with various other participants in the advanced materials markets. All of our six principal competitors have substantially greater research and development, manufacturing, marketing, financial and managerial resources than we do. In addition, existing carbon fiber producers, including those that supply aerospace applications, may refocus their activities to produce carbon fiber for commercial applications that compete more directly with us and certain producers have announced plans to do so. Developments by existing or future competitors may render our products or technologies less competitive. In addition, we may not be able to keep pace with new technological developments.
The price volatility of many of our raw materials and energy costs may result in increased production costs, which we may not be able to pass on to our customers.
A substantial portion of our raw materials are subject to price volatility and a significant portion of our manufacturing costs are energy costs. We are not always able to increase product selling prices and, ultimately, pass on underlying cost increases to our customers. In addition, our competitors may be able to obtain raw materials at a lower cost than we can. Additional raw material and energy cost increases that we are not able to pass on to customers or the loss of key customers to competitors as a result of price increases could have a material adverse effect on our future revenues and business, results of operations, financial condition or cash flows.
We could be adversely affected by environmental and safety requirements.
Our operations require the handling, use, storage and disposal of certain regulated materials and wastes. As a result, we are subject to various laws and regulations pertaining to pollution and protection of the environment, health and safety. These requirements govern, among other things, emissions to air, discharge to waters and the generation, handling, storage, treatment and disposal of waste and remediation of contaminated sites. We have made, and will continue to make, capital and other expenditures in order to comply with these laws and regulations. These laws and regulations and their interpretations are complex, change frequently and could become more stringent in the future.
In addition, we may be required to comply with evolving environmental, health and safety laws, regulations or requirements that may be adopted or imposed in the future or to address newly discovered information or conditions that require a response. Although most of our properties have been the subject of environmental site assessments, there can be no assurance that all potential instances of soil and groundwater contamination have been identified, even at those sites where assessments have been conducted. Accordingly, we may discover previously unknown environmental conditions and the cost of remediating such conditions may be material.
Our business depends upon the maintenance of our proprietary technology.
We depend upon our proprietary technology that generally is not subject to patent protection. We rely principally upon trade secret and copyright laws to protect our proprietary technology. We regularly enter into confidentiality agreements with our key employees, customers and potential customers and limit access to and distribution of our trade secrets and other proprietary information. These measures may not be adequate to prevent misappropriation of our technology or to assure that our competitors will not independently develop technologies that are substantially equivalent or superior to our technology. In addition, the laws of other countries in which we operate may not protect our proprietary rights to the same extent as the laws of the United States. We are also subject to the risk of adverse claims and litigation alleging infringement of intellectual property rights of third parties.
We may be obligated to repay a grant from the Hungarian government if certain conditions are not met.
In 2006, the Hungarian government pledged a grant of 2.9 billion Hungarian Forint (“HUF”) to Zoltek Zrt., our Hungarian subsidiary. Based on applicable exchange rates, the total value of such grant was approximately $13.1 million at September 30, 2012. As of September 30, 2012, Zoltek Zrt. had received an aggregate of approximately HUF 2.6 billion ($11.7 million) in funding pursuant to the grant. The grant was used to provide a portion of the capital resources to modernize Zoltek Zrt.’s facility, establish research and development facilities and support buildup of manufacturing capacity of carbon fibers. The grant contains various conditions under which Zoltek Zrt. may be required to pay back all or a portion of the grant, including, among other things, if Zoltek Zrt.: fails to obtain revenue targets; fails to employ an average annual staff of at least 1,200 employees; fails to utilize regional suppliers for at least 45% of its purchases; fails to obtain consent from the Hungarian government prior to selling assets created with grant funds; fails to use grant funds in accordance with the grant agreement; fails to provide appropriate security for the grant; makes or made an untrue statement or supplies or supplied false data in the grant agreement, grant application or during the time of the grant; defaults on its obligations by more than 30 days; withdraws any consents it gave in the grant agreement; or causes a partial or complete failure or hindrance of the project that is the subject of the grant. Certain of these conditions contain targets that must be satisfied during a five-year measurement period from October 2013 to October 2018. We currently anticipate that Zoltek Zrt. will comply with the requirements of the grant agreement when the measurement period begins. However, if Zoltek Zrt. is unable to comply with them or obtain an amendment of the requirements, it would be required to pay back all or a portion of the grant funds, which could have a material adverse effect on our future revenues and business, results of operations, financial condition or cash flow.
We have incurred and will continue to incur substantial costs and demands upon our management as a result of complying with the laws and regulations affecting public companies, which could affect our operating results and make it more difficult to attract and retain qualified management.
As a public company, we have incurred and will continue to incur substantial legal, accounting and other expenses, including costs associated with public company reporting requirements. We also have incurred and will incur costs associated with corporate governance requirements, including requirements under the Sarbanes-Oxley Act of 2002, as well as rules implemented by the SEC and the Nasdaq Global Select Market. These rules and regulations impose legal and financial compliance costs on us. It is possible that these rules and regulations may make it more difficult and more expensive for us to obtain director and officer liability insurance, and we may be required to accept reduced policy limits and coverage or incur substantially higher costs to obtain the same or similar coverage than used to be available. As a result, it may be difficult for us to attract and retain qualified individuals to serve on our board of directors or as our executive officers.
Our stock price has been volatile and may continue to fluctuate.
Our stock price has fluctuated substantially over the past several years. Future announcements concerning us or our competitors or customers, quarterly variations in operating results, announcements of technological innovations, the introduction of new products or changes in product pricing policies by us or our competitors, developments regarding proprietary rights, changes in earnings estimates by analysts or reports regarding us or our industry in the financial press or investment advisory publications, among other factors, could cause the market price of our common stock to fluctuate substantially. In addition, stock prices for many emerging growth companies fluctuate widely for reasons often unrelated to operating results. These fluctuations, as well as general economic, political and market conditions, such as recessions, interest rates, world events, military conflicts or market-sector declines, may materially and adversely affect the market price of our common stock. Any information concerning us, including projections of future operating results, appearing in investment advisory publications or on-line bulletin boards, or otherwise emanating from a source other than from us, should not be relied upon as having been supplied or endorsed by us.
A change of control of our company may be discouraged, delayed or prevented by our classified board of directors, our ability to issue preferred stock, or the voting control of our principal shareholder.
Our Articles of Incorporation divide the board of directors into three classes, with three-year staggered terms. The classified board provision could increase the likelihood that, in the event an outside party acquired a controlling block of our stock, incumbent directors nevertheless would retain their positions for a substantial period, which may have the effect of discouraging, delaying or preventing a change in control. The possible impact of such discouragement, delay or prevention of takeover attempts could adversely affect the price of our common stock.
Our Articles of Incorporation also authorize the issuance of “blank check” preferred stock with such designations, rights and preferences as may be determined from time to time by the board of directors. Accordingly, the board of directors is empowered, without shareholder approval, to issue preferred stock with dividend, liquidation, conversion, voting or other rights that could adversely affect the voting power or other rights of the holders of common stock. Holders of common stock will have no preemptive rights to subscribe for a pro rata portion of any preferred stock that may be issued. If issued, the preferred stock could be utilized, under certain circumstances, as a method of discouraging, delaying or preventing a change in control. The possible impact that the issuance of preferred stock could have on a takeover attempt could adversely affect the price of the common stock. Although we have no present intention to issue any shares of preferred stock, we may do so in the future.
Zsolt Rumy, our founder and principal shareholder, owns approximately 18.1% of outstanding shares of common stock. As a result, he has and will continue to have significant voting control over our company.
Future sales of common stock could affect the price of our common stock.
No prediction can be made as to the effect, if any, that future sales of shares or the availability of shares for sale will have on the market price of our common stock prevailing from time to time. Sales of substantial amounts of common stock, or the perception that such sales might occur, could adversely affect prevailing market prices of our common stock.
We do not currently intend to pay dividends on our common stock.
We have never declared or paid any cash dividends on our common stock and do not currently intend to do so for the foreseeable future. We currently intend to invest our future earnings, if any, to fund our growth. Therefore, you are not likely to receive any dividends on your common stock for the foreseeable future.
Item 1B. Unresolved Staff Comments
None.
Item 2. Properties
The Company's facilities are listed below and are considered to be suitable and adequate for its operations. Except as noted below, all the Company's properties are owned, subject to various mortgage loans.
| Location | | Use | | Approximate Area (in square feet) | | Status |
| | | | | | | |
| St. Louis, Missouri * | | Administrative, marketing and central engineering offices | 30,000 | | Owned |
| | | | | | | |
| St. Charles, Missouri * | | Carbon and technical fiber manufacturing and R&D facility | 107,000 | | Owned |
| | | | | | | |
| St. Peters, Missouri * | | Carbon fiber prepreg and putrusion manufacturing and R&D facility | 135,000 | | Owned |
| | | | | | | |
| Abilene, Texas | | Carbon fiber manufacturing and secondary processing | | 278,000 | | Owned |
| | | | | | | |
| Salt Lake City, Utah | | Composite fabrication equipment design and manufacturing | 65,000 | | Owned |
| | | | | | | |
| Nyergesujfalu, Hungary * | | Carbon and technical fiber, and acrylic fiber precursor manufacturing | 1,500,000 | | Owned |
| | | | | | | |
| Guadalajara, Mexico | | Carbon fiber, and acrylic fiber precursor manufacturing | | 1,400,000 | | Owned |
* Property subject to mortgage
Item 3. Legal Proceedings
Neither we nor any of our properties are currently subject to any material legal proceedings or other regulatory proceedings.
Item 4. Mine Safety Disclosures
Not applicable.
Item 5. Market for Registrant's Common Equity, Related Shareholder Matters and Issuer Purchases of Equity Securities
The Company's common stock (symbol: “ZOLT”) is traded in the Nasdaq Global Select Market. The number of beneficial holders of the Company's stock is approximately 20,000, including shareholders whose shares are held in “nominee” or “street” names. As of September 30, 2012, there were 393 holders of record of the Company’s common stock. The Company has not paid cash dividends on any of its common stock and does not intend to pay cash dividends on common stock for the foreseeable future.
Set forth below are the high and low bid quotations as reported by the Nasdaq Global Select Market for the years indicated. Such prices reflect interdealer closing prices, without retail mark-up, markdown or commission:
| | | Fiscal year ended | | | Fiscal year ended | |
| | | September 30, 2012 | | | September 30, 2011 | |
| | | High | | | Low | | | High | | | Low | |
| First Quarter | | $ | 9.29 | | | $ | 5.60 | | | $ | 11.79 | | | $ | 9.09 | |
| Second Quarter | | | 15.01 | | | | 7.53 | | | | 15.95 | | | | 11.13 | |
| Third Quarter | | | 11.49 | | | | 7.34 | | | | 13.55 | | | | 9.79 | |
| Fourth Quarter | | | 9.61 | | | | 7.62 | | | | 11.63 | | | | 6.43 | |
On November 21, 2012 the last reported sale price of the Company’s common stock was $6.62 per share.
The following table shows the total number of outstanding options and shares available for future issuances of options under the Company's existing stock option plans as of September 30, 2012.
| | | Number of securities to be issued upon exercise of outstanding options, warrants and rights | | | Weighted-average exercise price of outstanding options, warrants and rights | | | Number of securities remaining available for future issuance under equity compensation plans (excluding securities reflected in column (a)) | |
| Plan category | | (a) | | | (b) | | | (c) | |
Equity compensation plans approved by security holders | | | 1,443,837 | | | $ | 8.12 | | | | 628,750 | |
| | | | | | | | | | | | | |
Equity compensation plans not approved by security holders | | | - | | | | - | | | | - | |
| | | | | | | | | | | | | |
| Total | | | 1,443,837 | | | $ | 8.12 | | | | 628,750 | |
The Company currently has no equity compensation plans that are not approved by security holders.
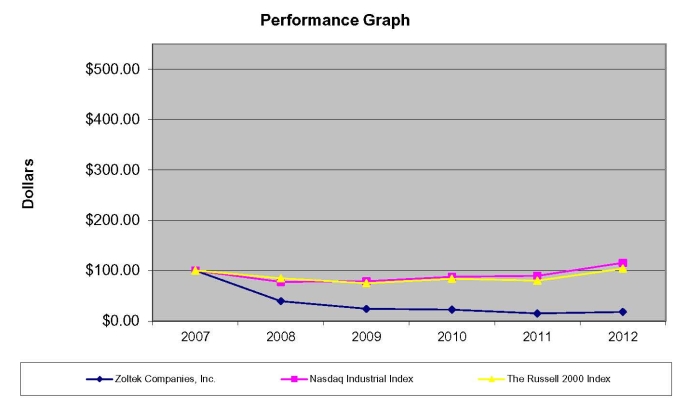
Performance Graph
The graph below shows the cumulative total return on common stock for the period from September 30, 2007 through September 30, 2012, in comparison to the cumulative total return on Russell’s 2000 Index and a Nasdaq peer group that we believe are most comparable to in terms of size and nature of operations. The results shown assume that $100 was invested on September 30, 2007 and that all dividends were reinvested. These indices are included for comparative purposes only and do not reflect whether it is management’s opinion that such indices are an appropriate measure of the relative performance of the stock involved, nor are they intended to forecast or be indicative of future performance of our common stock.
ASSUMES $100 INVESTED ON SEPTEMBER 30, 2007 IN
ZOLTEK COMPANIES, INC. COMMON STOCK,
THE NASDAQ INDUSTRIAL INDEX AND
THE RUSSELL 2000 INDEX
| | | 9/30/2007 | | | 9/30/2008 | | | 9/30/2009 | | | 9/30/2010 | | | 9/30/2011 | | | 9/30/2012 | |
| Zoltek Companies, Inc. | | | 100.00 | | | | 39.22 | | | | 24.07 | | | | 22.28 | | | | 14.74 | | | | 17.63 | |
| Nasdaq Industrial Index | | | 100.00 | | | | 77.43 | | | | 78.56 | | | | 87.68 | | | | 89.41 | | | | 115.35 | |
| The Russell 2000 Index | | | 100.00 | | | | 84.37 | | | | 75.02 | | | | 83.95 | | | | 79.98 | | | | 103.97 | |
Item 6. Selected Financial Data
SELECTED CONSOLIDATED FINANCIAL DATA
(In thousands, except per share data)
| Statement of Operations Data: | | Fiscal year ended September 30, | |
| | | 2012 | | | 2011 | | | 2010 | | | 2009 | | | 2008 | |
| Net sales | | $ | 186,337 | | | $ | 151,686 | | | $ | 128,464 | | | $ | 138,756 | | | $ | 185,616 | |
| Cost of sales | | | 140,693 | | | | 133,985 | | | | 115,172 | | | | 108,096 | | | | 134,393 | |
| Gross profit | | | 45,644 | | | | 17,701 | | | | 13,292 | | | | 30,660 | | | | 51,223 | |
| Application and development costs | | | 7,046 | | | | 8,578 | | | | 8,207 | | | | 7,589 | | | | 8,093 | |
| Litigation charge (1) | | | - | | | | - | | | | - | | | | 238 | | | | 4,884 | |
| Selling, general and administrative expenses | | | 12,957 | | | | 13,852 | | | | 15,649 | | | | 19,438 | | | | 18,239 | |
| Operating income (loss) from continuing operations | | | 25,641 | | | | (4,729 | ) | | | (10,564 | ) | | | 3,395 | | | | 20,007 | |
| Other (expense) income | | | (1,607 | ) | | | 2,066 | | | | 2,384 | | | | (5,492 | ) | | | (7,150 | ) |
| Income tax (expense) benefit | | | (1,182 | ) | | | (911 | ) | | | 1,841 | | | | (2,105 | ) | | | (5,416 | ) |
| | | | | | | | | | | | | | | | | | | | | |
| Net income (loss) | | $ | 22,852 | | | $ | (3,574 | ) | | $ | (6,339 | ) | | $ | (4,202 | ) | | $ | 7,441 | |
| | | | | | | | | | | | | | | | | | | | | |
| Net (loss) income per share: | | | | | | | | | | | | | | | | | | | | |
| Basic income (loss) per share: | | $ | 0.67 | | | $ | (0.10 | ) | | $ | (0.18 | ) | | $ | (0.12 | ) | | $ | 0.22 | |
| Diluted income (loss) per share: | | $ | 0.66 | | | $ | (0.10 | ) | | $ | (0.18 | ) | | $ | (0.12 | ) | | $ | 0.22 | |
| | | | | | | | | | | | | | | | | | | | | |
| Weighted average common shares outstanding - basic | | | 34,358 | | | | 34,378 | | | | 34,411 | | | | 34,402 | | | | 34,042 | |
| Weighted average common shares outstanding - diluted | | | 34,451 | | | | 34,378 | | | | 34,411 | | | | 34,402 | | | | 34,172 | |
| Balance Sheet Data: | | September 30, | |
| | | 2012 | | | 2011 | | | 2010 | | | 2009 | | | 2008 | |
| Working capital | | $ | 115,497 | | | $ | 76,161 | | | $ | 71,972 | | | $ | 76,127 | | | $ | 76,000 | |
| Total assets | | | 358,688 | | | | 322,296 | | | | 322,140 | | | | 366,845 | | | | 440,164 | |
| Current maturities of long-term debt and credit lines | | | 4,161 | | | | 8,394 | | | | 981 | | | | 16,436 | | | | 12,601 | |
| Long-term debt, less current maturities | | | 22,978 | | | | - | | | | - | | | | 981 | | | | 3,562 | |
| Shareholders' equity | | | 300,971 | | | | 281,547 | | | | 292,698 | | | | 315,465 | | | | 346,666 | |
| (1) | Litigation expenses in fiscal 2008 and 2009 related to an action alleging a breach of a supply agreement. |
Item 7. Management's Discussion and Analysis of Financial Condition and Results of Operations
OVERVIEW
The following Management's Discussion and Analysis of Financial Condition and Results of Operations (“MD&A”) is intended to help the reader understand Zoltek, our operations and our business environment. MD&A is provided as a supplement to, and should be read in conjunction with, our Consolidated Financial Statements and the accompanying notes. This overview summarizes the MD&A, which includes the following sections:
Our Business -- a general description of the key drivers that affect our business, the industry in which we operate and the strategic initiatives on which we focus.
Results of Operations -- an analysis of our overall results of operations and segment results for the three fiscal years presented in our consolidated financial statements appears elsewhere in this report. We operate in two principal segments: carbon fiber and technical fiber. Other miscellaneous and corporate are combined into a third business segment called headquarters/other.
Liquidity and Capital Resources -- an analysis of cash flows, sources and uses of cash, contractual obligations, the impact of currency fluctuations and an overview of our financial condition.
Critical Accounting Estimates -- a description of accounting estimates that require critical judgments and estimates.
OUR BUSINESS
EXECUTIVE OVERVIEW
We are an applied technology and advanced materials company. Our mission is to lead in the commercialization of carbon fiber through our development of a price-competitive, high-performance reinforcement for composites used in a broad range of commercial products which we sell under the Panex® trade name. In addition to manufacturing carbon fiber, we produce an intermediate product that we refer to as technical fiber, a stabilized and oxidized acrylic fiber used in flame- and heat-resistant applications which we sell under the Pyron® trade name. We have spent over 15 years developing our proprietary technology and manufacturing processes. We believe that we have the largest capacity primarily focused on producing low-cost carbon fiber for commercial applications.
KEY PERFORMANCE INDICATORS
Our management monitors and analyzes several key performance indicators within each of these segments to manage our business and evaluate our financial and operating performance, including:
Revenue. In the short-term, management closely reviews the volume of product shipments and indicated customer requirements in order to forecast revenue and cash receipts. In the longer-term, management believes that revenue growth through sales to new customers in existing applications and new product applications are the best indicator of whether we are achieving our objective of commercializing carbon fiber. We expect that new applications, including those we are attempting to facilitate, will continue to positively affect demand for our products.
Gross profit. Management focuses on improving the gross profit over the long-term while leading the commercialization of carbon fiber and controlling associated costs. The Company’s strategy is to maintain available unused capacity that positions the Company to capture opportunities in emerging applications. Gross margin was positively impacted during fiscal 2012 by several factors. Production levels increased with improved sales as we brought our Mexican capacity online and increased output in Hungary. We also improved the efficiency of our operations which decreased production costs.
Operating expenses. Our operating expenses are driven by headcount and related administrative costs, marketing costs and research and development costs. We monitor headcount levels in specific geographic and operational areas. We believe that research and development expenditures are an important means by which we can facilitate new product applications.
Cash flow from operating activities. Management believes that operating cash flow is meaningful to investors because it provides a view of Zoltek with respect to sustainability of our ongoing operations and the extent to which we may or may not require external capital. Operating cash flow also provides meaningful insight into the management of our working capital.
Liquidity and cash flows. Due to the variability in revenue, our cash position varies. We closely monitor our expected cash levels, particularly as they relate to operating cash flow, days’ sales outstanding, days’ payables outstanding and inventory turnover. Management aggressively pursues any late receivables and seeks to actively manage inventory levels in order to effectively use working capital. Management also monitors debt levels and the financing costs associated with debt.
BUSINESS TRENDS
Zoltek management has focused its efforts on building on the long-term vision of Zoltek as the leader in commercialization of carbon fibers as a low-cost but high performance reinforcement for composites. Management primarily emphasizes the following areas:
| | · | Sales Efforts in Selected International Markets. We have identified international markets with high growth potential for our existing and emerging commercial applications. Accordingly, we have added sales personnel and increased our marketing efforts in Asia. |
| | · | Business Development in Emerging Applications. We have identified emerging applications for our products with high growth potential across a variety of industries and regions. We have taken a major step toward growing our carbon fiber prepreg and pultrusion capabilities by opening a 135,000 square foot facility outside of St. Louis, Missouri in November 2011. Our intent is to leverage our leadership in commercial carbon fibers to become the leading provider of carbon fiber prepreg and pultrusion in the global marketplace. Our research and development center, to support our targeted applications with high volume manufacturing and processing technologies is located at this facility. We also expanded our plant in Hungary to allow for greater fabric manufacturing capability. |
| | · | Operating Cash Flows and Cash Management. The cash generated by our net income was offset by the buildup of inventory in anticipation of sales growth and contractual requirements and increased receivables. We had operating cash inflows of $17.2 million in fiscal 2012 compared to a cash outflow of $3.2 million in fiscal 2011. |
| | · | Foreign Currency Volatility. The HUF weakened against the U.S. dollar by 15.9% and the Mexican Peso weakened against the U.S. dollar by 10.0% during fiscal 2012 compared fiscal 2011. This resulted in lower processing cost and devaluation of inventory in the respective countries. The Euro weakened against the U.S. dollar by 7.2% during fiscal 2012 compared to fiscal 2011, resulting in decreased revenue from our sales denominated in Euro. The Company’s financial statements will continue to be impacted by foreign currency volatility. |
RESULTS OF OPERATIONS
FISCAL YEAR ENDED SEPTEMBER 30, 2012 COMPARED TO FISCAL YEAR ENDED SEPTEMBER 30, 2011
The Company’s sales increased 22.8%, or $34.6 million, to $186.3 million in fiscal 2012 from $151.7 million in fiscal 2011. Sales growth was attributable primarily to an increase in volume shipped, which accounted for 80.1% of the $34.6 million increase in sales. The weakening of the Euro accounted for a decrease of revenue of approximately $5.9 million. Carbon fiber sales increased 27.3%, or $32.5 million, to $151.5 million during fiscal 2012 from $119.0 million during fiscal 2011. Technical fiber sales increased 6.4%, or $1.9 million, to $32.4 million during fiscal 2012 from $30.5 million during fiscal 2011. Technical fiber sales increased in fiscal 2012 primarily due to increased shipments to aircraft brake customers.
The Company’s cost of sales increased by 5.0% or $6.7 million, to $140.7 million during fiscal 2012 from $134.0 million during fiscal 2011. Our cost of sales increased in response to the increase in production volume to meet the customer demand. Carbon fiber cost of sales increased by 9.9%, or $10.6 million, to $117.4 million during fiscal 2012 from $106.8 million for fiscal 2011, reflecting increased sales and increased production efficiency in combination with a decrease in ACN costs. Technical fiber cost of sales decreased 18.2%, or $4.6 million, to $20.9 million for fiscal 2012 from $25.5 million for fiscal 2011 primarily as a result of the increased production efficiency and a decrease in ACN costs.
The Company’s gross profit margin increased to 24.5% for fiscal 2012 compared to 11.7% for fiscal 2011. The Company's gross profit increased $27.9 million, to $45.6 million during fiscal 2012 from $17.7 million in fiscal 2011. During fiscal 2012, available unused capacity costs decreased to $2.8 million compared to fiscal 2011 when gross margin was negatively impacted by $11.7 million of available unused capacity cost. Carbon fiber gross profit margin increased to 22.5% for fiscal 2012 compared to 10.2% for fiscal 2011. Carbon fiber gross profit increased to $34.1 million from $12.1 million in fiscal 2012 compared to fiscal 2011. The increases in carbon fiber gross profit and gross profit percentage resulted primarily from the increase in the production levels to satisfy the increase in demand indicated above. Technical fiber gross profit increased to $11.6 million, or 35.7% of sales, for fiscal 2012 from $5.0 million, or 16.3% of sales, during fiscal 2011. The increases in technical fiber gross profit and margin resulted from increased production efficiency improving capacity utilization and a decrease in ACN costs.
Application and market development costs were $7.0 million in fiscal 2012 and $8.6 million in fiscal 2011. These costs included product and market development efforts, product trials and product development personnel costs. Targeted emerging applications include automobile components, offshore oil and gas drilling, fire/heat barrier and alternate energy technologies. The decrease from fiscal 2011 to fiscal 2012 was primarily due to decreased spending associated with our prepreg development.
Selling, general and administrative expenses decreased by $0.9 million to $13.0 million in fiscal 2012 from $13.9 million in fiscal 2011. The decrease from fiscal 2011 to fiscal 2012 was primarily due to a $0.5 million decrease in consulting costs and a strengthening of the U.S. dollar against the HUF which resulted in a $0.6 million decrease in our HUF denominated costs.
Operating income was $25.6 million for fiscal 2012 compared to operating loss of $4.7 million in fiscal 2011. Carbon fiber operations reported an increase of $24.9 million in operating income to $27.8 million for fiscal 2012 compared to income of $2.9 million in fiscal 2011. Operating income from technical fibers increased $6.6 million, to $10.3 million for fiscal 2012 from $3.7 million for fiscal 2011. The increase in operating income in the carbon fiber and technical fiber operations in fiscal 2012 related to the increase in sales and production.
Interest expense, net was $0.3 million for fiscal 2012, compared to $0.1 million in fiscal 2011. The increase in interest expense, net, resulted from new credit facilities entered into during fiscal 2012.
Less than $0.1 million of amortization of financing fees, which are non-cash expenses, was recognized during fiscal 2012 compared to no amortization of financing fees in fiscal 2011 (see “Liquidity and Capital Resources-Financing Activity”).
Loss on foreign currency transactions was $0.6 million for fiscal 2012 compared to a gain of $1.5 million for fiscal 2011. During fiscal 2012, the Euro weakened and the U.S. dollar strengthened in value against the HUF. Most of the Company’s accounts receivable is denominated in Euros and U.S dollars. The weakening value of the Euro over fiscal 2012 resulted in a loss recognized in our Hungarian subsidiary, offset somewhat by gains due to the strengthening of the U.S. dollar. During fiscal 2011, the Euro and the U.S. dollar gained in value against the HUF. The translation of the Hungarian subsidiary’s financial statements from its functional currency (HUF) to US dollars is not included in determining net income for the period but is recorded in accumulated other comprehensive loss in equity.
Other expense, net, was $0.9 million in fiscal 2012 compared to $0.6 million for fiscal 2011. Other expense, net consists primarily of loss from the sale of miscellaneous equipment and from miscellaneous fees in Hungary.
Gain on liabilities carried at fair value was $0.1 million at the end of fiscal 2012 compared to a gain of $1.2 million for fiscal 2011 due to the adoption of ASC 815, “Derivatives and Hedging.” (See “– Liquidity and Capital Resources – Derivative Instruments and Fair Value Measurements.”)
Income tax expense was $1.2 million for fiscal 2012 compared to a tax expense of $0.9 million for fiscal 2011. During fiscal 2012, income tax expense of $1.1 million was incurred related to the local Hungarian municipality tax. Local and federal alternative minimum taxes in the U.S. and Mexico were $0.1 million. During fiscal 2011, income tax expense of $0.6 million was incurred related to the local Hungarian municipality tax. An additional income tax expense of $0.1 million was recorded during fiscal 2011 related to increasing the valuation allowance against the deferred tax asset for the Hungarian subsidiary. Local and federal alternative minimum taxes in the U.S. and Mexico were $0.2 million.
The foregoing resulted in a net income of $22.9 million for fiscal 2012 compared to a net loss of $3.6 million for fiscal 2011. Similarly, the Company reported net income per share of $0.67 and net loss per share of $0.10 on a basic basis for fiscal 2012 and 2011, respectively. The Company reported net income per share of $0.66 and net loss per share of $.10 on a diluted basis for fiscal 2012 and 2011, respectively. The weighted average basic and dilutive common shares outstanding were 34.4 and 34.5 million for fiscal 2012, respectively and 34.4 million for both average basic and dilutive common shares outstanding for fiscal 2011.
FISCAL YEAR ENDED SEPTEMBER 30, 2011 COMPARED TO FISCAL YEAR ENDED SEPTEMBER 30, 2010
The Company’s sales increased 18.1%, or $23.2 million, to $151.7 million in fiscal 2011 from $128.5 million in fiscal 2010. Sales growth was attributable primarily to an increase in volume shipped, which accounted for 73% of the $23.2 million increase in sales. Price increases to customers and the strengthening of the Euro accounted for approximately $1.9 million and $2.9 million of the increase in revenue. Carbon fiber sales increased 15.1%, or $15.6 million, to $119.0 million during fiscal 2011 from $103.4 million during fiscal 2010. Technical fiber sales increased 30.8%, or $7.2 million, to $30.5 million during fiscal 2011 from $23.3 million during fiscal 2010. Technical fiber sales increased in fiscal 2011 primarily due to increased shipments to aircraft brake customers.
The Company’s cost of sales increased by 16.3% or $18.8 million, to $134.0 million during fiscal 2011 from $115.2 million during fiscal 2010. Our cost of sales increased in response to the increase in production volume to meet the customer demand. Carbon fiber cost of sales increased by 12.6%, or $11.9 million, to $106.8 million during fiscal 2011 from $94.9 million for fiscal 2010, reflecting high ACN costs. Technical fiber cost of sales increased 33.8%, or $6.4 million, to $25.5 million for fiscal 2011 from $19.1 million for fiscal 2010 primarily as a result of the increased sales and ACN costs.
Included in the Company’s cost of sales in fiscal 2011 were available unused capacity costs of $11.7 million. These costs were comprised of fixed production costs allocated to manufacturing lines which were primarily related to our Mexico plant producing below normal levels and amounted to $10.1 million for the carbon fiber segment and $1.4 million for the technical fiber segment during fiscal 2011. The Company believes maintaining this available unused capacity was necessary to encourage development of significant large-scale applications and maintain a level of readiness as we anticipated a return to more robust market conditions.
The Company's gross profit increased by 33.2%, or $4.4 million, to $17.7 million during fiscal 2011 from $13.3 million in fiscal 2010. Carbon fiber gross profit margin increased to 10.2% for fiscal 2011 compared to 8.2% for fiscal 2010. Carbon fiber gross profit increased to $12.1 million from $8.5 million in fiscal 2011 compared to fiscal 2010. The increases in carbon fiber gross profit and gross profit percentage resulted primarily from the increase in the production levels to satisfy the increase in demand noted above. Technical fiber gross profit increased to $5.0 million, or 16.3% of sales, for fiscal 2011 from $4.2 million, or 18.2% of sales, during fiscal 2010. The increases in technical fiber gross profit and margin resulted from increased production efficiency from improved capacity utilization.
Application and market development costs were $8.6 million in fiscal 2011 and $8.2 million in fiscal 2010. These costs included product and market development efforts, product trials and product development personnel costs. Targeted emerging applications include automobile components, offshore oil and gas drilling, fire/heat barrier and alternate energy technologies. The increase from fiscal 2010 to fiscal 2011 was primarily due to increased focus on developing new production methods that will enable potential automotive customers to fabricate cost-effective carbon fiber intermediate products.
Selling, general and administrative expenses decreased by $1.7 million to $13.9 million in fiscal 2011 from $15.6 million in fiscal 2010. The Company recorded $0.8 million for the cost of employee and director services received in exchange for equity instruments during fiscal 2011, a decrease of $1.2 million from $2.0 million in fiscal 2010. Additionally, the decrease was due to a $0.5 million decrease in bad debt expense, $0.7 million decrease in professional fees, $0.2 million decrease in depreciation expense and a $0.1 million decrease in insurance costs. The Company increased employee costs by $1.0 million, primarily related to corporate sales activities.
Operating loss was $4.7 million for fiscal 2011 compared to operating loss of $10.6 million in fiscal 2010. Carbon fiber operations reported an increase of $2.6 million in operating income to $2.9 million for fiscal 2011 compared to income of $0.3 million in fiscal 2010. The increase in operating income in the carbon fiber operation in fiscal 2011 related to the increase in production and sales. Operating income from technical fibers increased $0.3 million, to $3.7 million for fiscal 2011 from $3.4 million for fiscal 2010.
Interest expense, net was $0.1 million for fiscal 2011, compared to $0.3 million in fiscal 2010. The decrease in interest expense, net, resulted from the repayment of debt during fiscal 2010.
No amortization of financing fees, which are non-cash expenses, was recognized during fiscal 2011 compared to $0.3 million during fiscal 2010. (See “Liquidity and Capital Resources – Financing Activity.”)
Gain on foreign currency transactions was $1.5 million for fiscal 2011 compared to $1.9 million for fiscal 2010. During fiscal 2011, the Euro and the U.S. dollar gained in value against the HUF. As most of the Company’s accounts receivable is denominated in Euros, the strengthening value over fiscal 2011 resulted in a gain recognized in our Hungarian subsidiary. This gain during fiscal 2011 was offset by currency gains incurred related to US dollar-denominated intercompany receivables; however, an overall gain was recognized. The translation of the Hungarian subsidiary’s financial statements from its functional currency (HUF) to US dollars is not included in determining net income for the period but is recorded in accumulated other comprehensive loss in equity.
Other expense, net, was $0.6 million in fiscal 2011 compared to $0.7 million for fiscal 2010. Other expense, net consists primarily of loss from the sale of miscellaneous equipment and from miscellaneous fees in Hungary.
Gain on liabilities carried at fair value was $1.2 million at the end of fiscal 2011 compared to a gain of $1.8 million for fiscal 2010 due to the adoption of ASC 815, “Derivatives and Hedging.” (See “Liquidity and Capital Resources – Derivative Instruments and Fair Value Measurements.”)
Income tax expense was $0.9 million for fiscal 2011 compared to a tax benefit of $1.8 million for fiscal 2011. During fiscal 2011, income tax expense of $0.6 million was incurred related to the local Hungarian municipality tax. An additional income tax expense of $0.1 million was recorded during fiscal 2011 related to increasing the valuation allowance against the net operating loss for the Hungarian subsidiary. Local and federal alternative minimum taxes in the U.S. and Mexico were $0.2 million. During fiscal 2010, income tax expense of $0.8 million was incurred related to the local Hungarian municipality tax. This expense was offset by the release of the $2.2 million reserve on the Company’s uncertain tax positions due to a favorable resolution of a tax position with the Hungarian Tax Authority. An additional income tax benefit of $0.7 million was recorded during fiscal 2010 related to the net operating loss for the Hungarian subsidiary. Local and federal alternative minimum taxes in the U.S. and Mexico were $0.2 million.
The foregoing resulted in a net loss of $3.6 million for fiscal 2011 compared to $6.3 million for fiscal 2010. Similarly, the Company reported net loss per share of $0.10 and $0.18 on a basic and diluted basis for fiscal 2011 and 2010, respectively. The weighted average basic common shares outstanding were 34.4 million for both fiscal 2011 and 2010.
LIQUIDITY AND CAPITAL RESOURCES
The Company believes its cash currently on hand, cash flow from operations and credit facilities should be sufficient to fund its identified liquidity needs over the next twelve months.
CASH FLOWS
Cash Provided By Operating Activities
Operating activities provided $17.4 million of cash during fiscal 2012. An increase in inventory levels used $20.7 million of cash during fiscal 2012 due to a buildup of inventory in anticipation of increased customer demand and contract requirements. Cash flows were positively affected by depreciation of $17.8 million in 2012, which was included in the operating income of $25.6 million. Cash flows were negatively impacted by an increase of $6.0 million in accounts receivable as a result of increased sales levels during fiscal 2012.
Operating activities used $3.2 million of cash during fiscal 2011. An increase in inventory levels used $10.3 million of cash during fiscal 2011 due to a buildup of inventory in anticipation of increased customer demand. Cash flows were positively affected by depreciation of $17.8 million in 2011, which was included in the operating loss of $4.7 million, and $6.4 million due to an increase in trade accounts payable. Cash flows were negatively impacted by an increase of $8.7 million in accounts receivable as a result of increased sales levels, and $3.3 million as other current assets and other assets increased during fiscal 2011.
Cash Used In Investing Activities
Net cash used in investing activities for fiscal 2012 was $21.6 million, which consisted of capital expenditures for energy efficiency gains related to our carbon fiber production in Hungary and expansion of our capacity for our composite intermediates production at our St. Peters, Missouri plant. No funds were received from the Hungarian government as a conditional grant to reimburse capital expenditures and related outlays (see Note 7 of the Notes to Consolidated Financial Statements).
Net cash used in investing activities for fiscal 2011 was $8.0 million, which consisted of capital expenditures on existing production lines and new equipment. This included less than $0.1 million of funds received from the Hungarian government as a conditional grant to reimburse capital expenditures and related outlays.
Cash Used and Provided In Financing Activities
Net cash provided in financing activities was $17.4 million in fiscal 2012 consisting primarily of borrowings under notes payable and lines of credit, net of repayments.
Net cash provided in financing activities was $7.1 million in fiscal 2011 consisting primarily of borrowings under notes payable and lines of credit.
INVENTORIES
The Company evaluates its ending inventories for estimated excess quantities and obsolescence. This evaluation includes analyses of sales levels by product and projections of future demand within specific time horizons. Inventories in excess of future demand, if any, are reserved. Remaining inventory balances are adjusted to approximate the lower of cost on a first-in, first-out basis or market value. Cost includes material, labor and overhead. If future demand or market conditions are less favorable than the Company's projections, additional inventory write-downs may be required and would be reflected in cost of sales on the Company's statement of operations in the period in which the change in projection is made. Under supply arrangements with certain customers, the Company has agreed to maintain levels of inventory on hand.
The Company historically has not experienced material problems related to the pricing or functionality of carbon fibers inventory. Our PanexÒ carbon fibers represent the majority of our inventory balance in continuous tow, fabric, prepreg, chopped and milled forms.
VALUATION OF LONG-LIVED ASSETS
Long-lived assets are reviewed for impairment whenever events or changes in circumstances indicate that the carrying amount may not be recoverable. Zoltek management is responsible for routinely assessing whether impairment indicators are present. The Company expects that the components of each operating segment will exhibit similar financial performance over the long term and, therefore, groups assets accordingly for analyzing whether impairment exists. It is possible that actual future financial performance related to the Company's long-lived assets may materially differ from the Company's determination of expected future financial performance. Additionally, if the Company's expected future financial performance (undiscounted cash flows) was less than the carrying amount of the asset group being analyzed, it would be necessary for the Company to make significant judgments regarding the fair value of the asset due to the specialized nature of much of the Company's carbon fiber production equipment in order to determine the amount of the impairment charge.
HUNGARIAN GRANT
The Hungarian government has pledged a grant of 2.9 billion Hungarian Forint (“HUF”) to Zoltek’s Hungarian subsidiary, which translated at the September 30, 2012 exchange rate, is approximately $13.1 million. The grant is intended to provide a portion of the capital resources to modernize the subsidiary’s facility, establish a research and development center, and support buildup of manufacturing capacity of carbon fibers. Zoltek’s Hungarian subsidiary did not receive any grant funding during fiscal 2012 and received approximately HUF 0.1 billion and HUF 0.1 billion in grant funding during fiscal 2011 and 2010, respectively. As of September 30, 2012, Zoltek Zrt. had received an aggregate of approximately HUF 2.6 billion ($11.7 million) in funding pursuant to the grant. These funds have been recorded as a liability on the Company’s consolidated balance sheet. The liability is being amortized over the life of the assets procured by the grant funds, offsetting the depreciation expense from the assets into which the proceeds of the grant are invested. The Company has presented bank guarantees amounting to 120% of the amount of the grant as received.
The Hungarian subsidiary may be required to repay all or a portion of the grant if, among other things, the Hungarian subsidiary: fails to obtain revenue targets; fails to employ an average annual staff of at least 1,200 employees (as of September 30, 2012 we are below 900); fails to utilize regional suppliers for at least 45% of its purchases; fails to obtain consent from the Hungarian government prior to selling assets created with grant funds; fails to use grant funds in accordance with the grant agreement; fails to provide appropriate security for the grant; makes or made an untrue statement or supplies or supplied false data in the grant agreement, grant application or during the time of the grant; defaults on its obligations by more than 30 days; withdraws any consents it gave in the grant agreement; or causes a partial or complete failure or hindrance of the project that is the subject of the grant. These targets must be achieved during a five-year measurement period from October 2013 to October 2018. Although there can be no assurance, the Company anticipates it will comply with the requirements of the grant agreement when the measurement period begins. However if Zoltek Zrt. is unable to comply with them or obtain an amendment of the requirements, it would be required to pay back all or a portion of the grant funds, which could have a material adverse effect on our future revenues and business, results of operations, financial condition or cash flow.
UNITED STATES GRANT
On September 30, 2011, the United States Department of Energy awarded the Company a grant related to its development of a novel low cost carbon fiber using a lignin/PAN hybrid precursor. If successful, combining this precursor with improvements in operating and energy efficiencies for carbon conversion will provide lower cost carbon fiber for automotive and other applications, such as turbine blades. Zoltek is collaborating with Weyerhauser on this project and together they are allowed a reimbursement of $3.7 million of costs incurred for the project. These funds will be recorded as a reduction to property, plant, and equipment on the Company’s consolidated balance sheet. This contra asset will be amortized over the life of the assets procured by the grant funds, offsetting the depreciation expense from the assets into which the proceeds of the grant are invested.
FINANCING ACTIVITY
Hungarian Financing
On June 15, 2012, Zoltek Zrt. completed an amended credit facility with Raiffeisen Bank Zrt. (the “Lender”) pursuant to which Zoltek Zrt. and the Lender entered into a Credit Facility Agreement, dated as of June 1, 2012, and a Restated and Amended Uncommitted Credit Line Agreement, dated as of June 1, 2012. Under the credit facility, the Lender agreed to provide Zoltek Zrt.: (1) a term facility in the maximum amount of 13.6 million EUR ($17.5 million at the September 30, 2012 exchange rate) (the “Term Facility”) and (2) a multicurrency overdraft facility in the amount of up to 1.12 billion HUF ($5.1 million at the September 30, 2012 exchange rate) (the “Revolving Facility”).
The Term Facility is a five-year term loan and bears interest at 4.17%. Principal under the Term Facility is payable semi-annually in equal installments. The Revolving Facility is a revolving credit facility that expires on March 29, 2013 and has a total commitment of 1.120 billion HUF ($5.1 million at the September 30, 2012 exchange rate) subject to a borrowing base. In addition to the Term Facility and the Revolving Facility, Zoltek Zrt. has obtained from the lender a bank guaranty in the amount of HUF 3.48 billion ($15.7 million at the September 30, 2012 exchange rate) as required by the Hungarian government grant. The obligations of Zoltek Zrt. under this credit facility are guaranteed by the Company.
This credit facility contains representations and warranties, and contains a requirement that Zoltek Zrt. maintain a minimum current asset ratio and minimum annual EBITDA, along with other covenants. The Company was in compliance with all covenants as of September 30, 2012. Zoltek Zrt. had previously maintained a credit facility with the Lender, which expired May 30, 2012 and the facility was replaced with the new facility. As of September 30, 2012, the Company had borrowed $17.5 million from this new credit facility.
US Financing
On March 30, 2012, Zoltek Companies, Inc. entered into a $10 million term loan with Enterprise Bank & Trust (the “Enterprise Loan”) secured by the real property associated with its facilities in the St. Louis, Missouri area. The Enterprise Loan is a seven-year, secured term loan maturing March 30, 2019. Principal of the Enterprise Loan is payable monthly with a balloon payment due at maturity. The Enterprise Loan bears interest at a one-month LIBOR rate, plus 3%. The Company contemporaneously entered into a swap agreement that fixes the interest rate on the Enterprise Loan at 4.75% per annum. The Loan Agreement contains representations and warranties, and contains a requirement that the Company, on a consolidated basis, maintains minimum fixed charge coverage and leverage ratios, along with other covenants. The Company was in compliance with all covenants as of September 30, 2012. As of September 30, 2012, the principal balance of this term loan was $9.7 million.
The Company primarily utilized the proceeds of the Enterprise Loan to repay all outstanding balances under the Company's former U.S. revolving credit facility with its former U.S. Bank; the original borrowings had financed purchase of our St. Peters, Missouri plant.
On April 27, 2012, Zoltek Companies, Inc. entered into a $15 million revolving credit agreement with JPMorgan Chase, N.A., with interest based on LIBOR plus 2.5%, adjusted monthly. The revolving credit facility is subject to a borrowing base and financial covenants and expires on April 27, 2015. The Company was in compliance with all covenants as of September 30, 2012. As of September 30, 2012, the Company had no borrowings under this revolving credit agreement.
FUTURE CONTRACTUAL OBLIGATIONS
In the table below, we set forth our enforceable and legally binding obligations as of September 30, 2012. Some of the amounts included in this table (amounts in thousands) are based on our estimates and assumptions about these obligations, including their durations, anticipated actions by third parties and other factors. The enforceable and legally binding obligations we will actually pay in future periods may vary from those reflected in the table because the estimates and assumptions are subjective. See Note 9 of the Notes to Consolidated Financial Statements for discussion of the Company’s debt agreements.
| | | Payments Due by Period | |
| | | Total | | | Less than 1 Year | | | 1-3 Years | | | 3-5 Years | | | Over 5 Years | |
| Operating lease obligations (a) | | | 7,416 | | | | 911 | | | | 1,656 | | | | 1,615 | | | | 3,234 | |
| Capital leases obligations | | | - | | | | - | | | | - | | | | - | | | | - | |
| Long term debt obligations | | | 27,139 | | | | 4,161 | | | | 8,322 | | | | 8,322 | | | | 6,334 | |
| Total debt and leases | | | 34,555 | | | | 5,072 | | | | 9,978 | | | | 9,937 | | | | 9,568 | |
| Purchase obligations (b) | | | 5,496 | | | | 5,496 | | | | - | | | | - | | | | - | |
| Total contractual obligations | | $ | 40,051 | | | $ | 10,568 | | | $ | 9,978 | | | $ | 9,937 | | | $ | 9,568 | |
| (a) | Includes a one-year and ten-year contract for nitrogen gas facility and equipment of approximately $0.3 million and $0.8 million, respectively, per year. |
| (b) | Purchase obligations include agreements to purchase goods or services that are enforceable and binding and that specify all significant terms, including fixed or minimum quantities to be purchased, fixed, minimum or variable price provisions, and the approximate timing of the transactions. Purchase obligations exclude agreements that are cancelable at any time without penalty. |
SUPPLY CONTRACTS
We are party to a long-term supply contract with our wind energy customer Vestas Wind Systems. In fiscal year 2012, 2011 and 2010, we reported net sales of $86.6 million, $42.7 million and $49.5 million to Vestas Wind Systems, which represented 46.5%, 28.1% and 38.6%, respectively, of our net sales. This was the only customer with whom we have a long-term supply agreement that represented greater than 10% of consolidated net sales during any of these three years. In fiscal 2011, we reported net sales of $15.8 million, which represented 10.4% of our total consolidated net sales to Saertex GMBH & Company, a manufacturer of fabrics for the composite industry, including materials for production of wind turbine blades. We do not have a long-term supply agreement with this customer.
We entered into a supply agreement with Vestas Wind Systems in May 2007, which subsequently has been amended. The contract as currently in effect obligates us to supply carbon fibers under a five-year delivery schedule, and a rolling three-year schedule as long as the supply agreement is in place. Under the agreement and related amendments, Vestas provides us with annual forecasts of its supply requirements, and we receive binding orders for shipments on approximately a monthly basis. We are not guaranteed specific levels of sales under the agreement, and we are subject to liquidated damages if we are unable to perform our obligations under the agreement. In general, the agreement may be terminated by: (1) mutual agreement of the parties, (2) by either party with at least 60 months’ written notice, (3) by either party as a result of a material breach of the agreement that is not remedied within 30 days of receipt of notice of such breach, and (4) by either party in the event of the bankruptcy, insolvency, or change of control of the other party.
In our supply agreement with Vestas, we do not have post-shipment obligations other than that we warrant that our products are free from defects in design, materials, and workmanship at the time of delivery and that the products are produced in accordance with standard production and sales specifications stated in the agreements. The agreement states that the warranty shall continue for a period of five years from the date of delivery of the products.
LEGAL CONTINGENCIES
Legal contingencies have a high degree of uncertainty. We establish reserves when losses from contingencies can be reasonably estimated and become probable. The reserves would reflect management’s estimate of the probable cost of ultimate resolution of the matters and are revised accordingly as facts and circumstances change and, ultimately, when matters are brought to closure. If any litigation matter is resolved unfavorably, the Company could incur obligations in excess of management’s estimate of the outcome, and such resolution could have a material adverse effect on the Company’s consolidated financial condition, results of operations or liquidity. As of September 30, 2012, Zoltek has no recorded material legal reserves.
CRITICAL ACCOUNTING ESTIMATES
Certain of our accounting policies require our management to make difficult, subjective or complex judgments. All of the Company's accounting policies are in compliance with U.S. generally accepted accounting principles (“GAAP”). The Company considers the following policies to be the most critical in understanding the estimates, assumptions and judgments that are involved in preparing our financial statements, and the uncertainties that could affect our results of operations, financial condition and cash flows.
ACCOUNTS RECEIVABLE COLLECTIBILITY
The Company evaluates the collectability of our accounts receivable for each of our segments based on a combination of factors. In circumstances where we are aware of a specific customer's inability to meet its financial obligations to us (e.g., bankruptcy filing or substantial downgrading of credit), we record a specific reserve for bad debts against the amounts due reducing the net recognized receivable to the amount we estimate will be collected. For all other customers, we estimate reserves for bad debts based on the length of time receivables have been past due and our experience with collection. Our bad debt expense on accounts receivable was $0.2 million for fiscal 2012, less than $0.1 million for fiscal 2011 and $0.5 million for fiscal 2010.
CONTINGENT LIABILITIES
The Company is subject to lawsuits, investigations, and other claims related to employment, environmental, service providers, supply agreements, taxing authorities and other matters, and is required to assess the likelihood of any adverse judgments or outcomes to these matters, as well as potential ranges of probable losses. A determination of the amount of reserves and disclosures required, if any, for these contingencies is made after considerable analysis of each individual issue. We accrue for contingent liabilities when an assessment of the risk of loss is probable and can be reasonably estimated.
Our contingent liabilities contain uncertainties because the eventual outcome will result from future events, and determination of current reserves requires estimates and judgments related to future changes in facts and circumstances, differing interpretations of the law and assessments of the amount of damages, and the effectiveness of strategies or other factors beyond our control. However, if actual results are not consistent with our estimates or assumptions, we may be exposed to gains or losses that could be material.
STOCK-BASED COMPENSATION
We measure compensation cost for all share-based awards at fair value. The fair value of stock options is determined using the Black-Scholes valuation model. The Company uses historical volatility for a period of time that is comparable to the expected life of the option. Fair value is recognized as expense over the service period, net of estimated forfeitures, using the straight-line method.
INCOME TAXES
The Company accounts for certain income and expense items differently for financial reporting and income tax purposes. Deferred tax assets and liabilities are determined based on the difference between the financial statement and tax basis of assets and liabilities applying enacted statutory tax rates in effect for the year in which the differences are expected to reverse. A valuation allowance is provided against certain deferred tax assets when realization of those assets are not considered to be more likely than not.
We are subject to the jurisdiction of numerous tax authorities. Our operations in these different jurisdictions are generally taxed on income before taxes adjusted for various differences between tax law and GAAP accounting. Determination of taxable income in any jurisdiction requires the interpretation of the related tax laws and regulations and the use of estimates and assumptions regarding significant future events such as the amount, timing and character of deductions, permissible revenue recognition methods under the tax law and the sources and character of income and tax credits. Changes in tax laws, regulations, agreements and treaties, foreign currency exchange restrictions or our level of operations or profitability in each taxing jurisdiction could have an impact on the amount of income taxes that we provide during any given year. Our tax filings for various periods are subject to audit by the tax authorities in the jurisdictions in which we conduct business.
RECENT ACCOUNTING PRONOUNCEMENTS
See Note 1 of the Notes to the Company's Consolidated Financial Statements.
Item 7A. Quantitative and Qualitative Disclosures about Market Risk
Foreign Currency Risk
The consolidated balance sheets of the Company's international subsidiaries, Zoltek Zrt. and Zoltek de Mexico, were translated from Hungarian Forints and Mexican Pesos to US dollars, respectively, at the exchange rate in effect at the applicable balance sheet date, while its consolidated statements of operations were translated using the average exchange rates in effect for the periods presented. The related translation adjustments are reported as other comprehensive income (loss) within shareholders' equity. Gains and losses from foreign currency transactions of Zoltek Zrt. are included in the results of operations in other expenses. The Company views as long-term its investments in Zoltek Zrt. and Zoltek de Mexico. Zoltek Zrt. has a functional currency of the HUF. As a result, the Company is exposed to foreign currency risks related to this investment. The functional currency of Zoltek de Mexico is the Mexican Peso to the US dollar. The Company does not currently employ a foreign currency hedging strategy related to the sales from Hungary or Mexico. Neither Hungary nor Mexico is considered to be a highly inflationary or deflationary economy.
As of September 30, 2012, the Company had a long-term loan to its Zoltek Zrt. subsidiary of $108 million denominated in US dollars. The potential loss in value of the Company's net foreign currency investment in Zoltek Zrt. resulting from a hypothetical 10% adverse change in quoted foreign currency exchange rate of the HUF against the US dollar amounted to $10.8 million as of both September 30, 2012 and 2011. The Company does not expect repayment of the loan in the foreseeable future. As such, the Company considers this loan as a permanent investment. If the Company chose to cause Zoltek Zrt. to repay the loan, however, there could be negative financial statement consequences. In addition, Zoltek Zrt. routinely sells its products to customers located primarily throughout Europe in sales transactions that are denominated in foreign currencies other than the HUF. Also, Zoltek Zrt. has debt that is denominated in foreign currencies other than the HUF.
As of September 30, 2012, the Company had a long-term loan to its Zoltek de Mexico subsidiary. There is no potential loss in value of the Company's net foreign currency investment in Zoltek de Mexico resulting from an adverse change in quoted foreign currency exchange rate of the Mexican Peso against the US dollar at September 30, 2012 because Zoltek de Mexico’s functional currency is the US dollar. The Company does not expect repayment of the loan in the foreseeable future. As such, the Company considers this loan as a permanent investment.
Commodity Price Risk
We are exposed to commodity price risk arising from changes in the market price of certain raw materials, such as ACN and utilities. Due to competition and market conditions, volatile price increases cannot always be passed on to our customers. Management assesses commodity price trends on a regular basis and adjusts purchasing accordingly. The Company does not currently utilize derivative instruments to hedge purchases of commodities.
Item 8. Financial Statements and Supplementary Data
ZOLTEK COMPANIES, INC.
REPORT OF MANAGEMENT
Management of Zoltek Companies, Inc. is responsible for the preparation and integrity of the Company's financial statements. These statements have been prepared in accordance with generally accepted accounting principles and in the opinion of management fairly present the Company's financial position, results of operations, and cash flow.
The Company maintains accounting and internal control systems to provide reasonable assurance that assets are safeguarded against loss from unauthorized use or disposition and that the financial records are reliable for preparing financial statements. The selection and training of qualified personnel and the establishment and communication of accounting and administrative policies and procedures are important elements of these control systems. As set forth under “Item 9A. Controls and Procedures” of this Annual Report on Form 10-K, the Company's Chief Executive Officer and Chief Financial Officer concluded that no material weaknesses existed as of September 30, 2012.
The Board of Directors, through its Audit Committee consisting solely of non-management directors, meets periodically with management and the Independent Registered Public Accounting Firm to discuss audit and financial reporting matters. To ensure independence, Ernst & Young LLP has direct access to the Audit Committee.
The Report of Ernst & Young LLP, Independent Registered Public Accounting Firm, on its audit of the accompanying financial statements follows. This report states that their audit was performed in accordance with the Standards of the Public Company Accounting Oversight Board (United States). These standards include consideration of internal control over financial reporting controls for the purpose of determining the nature, timing, and extent of auditing procedures necessary for expressing their opinion on the financial statements.
Zsolt Rumy
Chief Executive Officer
November 27, 2012
REPORT OF INDEPENDENT REGISTERED PUBLIC ACCOUNTING FIRM
The Board of Directors and Shareholders of Zoltek Companies, Inc.
We have audited the accompanying consolidated balance sheets of Zoltek Companies, Inc. as of September 30, 2012 and 2011, and the related consolidated statements of operations, comprehensive income, shareholders’ equity, and cash flows for each of the three years in the period ended September 30, 2012. Our audits also include the financial statement schedules listed in the Index at Item 15(a)(2). These financial statements and schedules are the responsibility of the Company’s management. Our responsibility is to express an opinion on these financial statements and schedules based on our audits.
We conducted our audits in accordance with the standards of the Public Company Accounting Oversight Board (United States). Those standards require that we plan and perform the audit to obtain reasonable assurance about whether the financial statements are free of material misstatement. An audit includes examining on a test basis, evidence supporting the amounts and disclosures in the financial statements. An audit also includes assessing the accounting principles used and significant estimates made by management, as well as evaluating the overall financial statement presentation. We believe that our audits provide a reasonable basis for our opinion.
In our opinion, the financial statements referred to above present fairly, in all material respects, the consolidated financial position of Zoltek Companies, Inc. at September 30, 2012 and 2011, and the consolidated results of its operations and its cash flows for each of the three years in the period ended September 30, 2012, in conformity with U.S. generally accepted accounting principles. Also, in our opinion the related financial statement schedules, when considered in relation to the basic financial statements taken as a whole, present fairly, in all material respects, the financial information set forth herein.
We also have audited, in accordance with the standards of the Public Company Accounting Oversight Board (United States), Zoltek Companies, Inc.’s internal control over financial reporting as of September 30, 2012, based on criteria established in Internal Control-Integrated Framework issued by the Committee of Sponsoring Organizations of the Treadway Commission and our report dated November 27, 2012 expressed an unqualified opinion thereon.
/s/ ERNST & YOUNG LLP
St. Louis, Missouri
November 27, 2012
REPORT OF INDEPENDENT REGISTERED PUBLIC ACCOUNTING FIRM
The Board of Directors and Shareholders of Zoltek Companies, Inc.
We have audited Zoltek Companies, Inc.’s internal control over financial reporting as of September 30, 2012, based on criteria established in Internal Control—Integrated Framework issued by the Committee of Sponsoring Organizations of the Treadway Commission (the COSO criteria). Zoltek Companies, Inc.’s management is responsible for maintaining effective internal control over financial reporting, and for its assessment of the effectiveness of internal control over financial reporting included in the accompanying Management’s Report on Internal Control Over Financial Reporting. Our responsibility is to express an opinion on the company’s internal control over financial reporting based on our audit.
We conducted our audit in accordance with the standards of the Public Company Accounting Oversight Board (United States). Those standards require that we plan and perform the audit to obtain reasonable assurance about whether effective internal control over financial reporting was maintained in all material respects. Our audit included obtaining an understanding of internal control over financial reporting, assessing the risk that a material weakness exists, testing and evaluating the design and operating effectiveness of internal control based on the assessed risk, and performing such other procedures as we considered necessary in the circumstances. We believe that our audit provides a reasonable basis for our opinion.
A company’s internal control over financial reporting is a process designed to provide reasonable assurance regarding the reliability of financial reporting and the preparation of financial statements for external purposes in accordance with generally accepted accounting principles. A company’s internal control over financial reporting includes those policies and procedures that (1) pertain to the maintenance of records that, in reasonable detail, accurately and fairly reflect the transactions and dispositions of the assets of the company; (2) provide reasonable assurance that transactions are recorded as necessary to permit preparation of financial statements in accordance with generally accepted accounting principles, and that receipts and expenditures of the company are being made only in accordance with authorizations of management and directors of the company; and (3) provide reasonable assurance regarding prevention or timely detection of unauthorized acquisition, use or disposition of the company’s assets that could have a material effect on the financial statements.
Because of its inherent limitations, internal control over financial reporting may not prevent or detect misstatements. Also, projections of any evaluation of effectiveness to future periods are subject to the risk that controls may become inadequate because of changes in conditions, or that the degree of compliance with the policies or procedures may deteriorate.
In our opinion, Zoltek Companies, Inc. maintained, in all material respects, effective internal control over financial reporting as of September 30, 2012, based on the COSO criteria.
We also have audited, in accordance with the standards of the Public Company Accounting Oversight Board (United States), the consolidated balance sheet of Zoltek Companies, Inc. as of September 30, 2012 and 2011, and the related consolidated statements of operations, comprehensive income, shareholders’ equity, and cash flows for each of the three years ended September 30, 2012 of Zoltek Companies, Inc. and our report dated November 27, 2012 expressed an unqualified opinion thereon.
/s/ ERNST & YOUNG LLP
St. Louis, Missouri
November 27, 2012
ZOLTEK COMPANIES, INC.
CONSOLIDATED BALANCE SHEET
(Amounts in thousands, except share and per share data)
| | | September 30, | |
| | | 2012 | | | 2011 | |
| Assets | | | | | | |
| Current assets: | | | | | | |
| Cash and cash equivalents | | $ | 29,935 | | | $ | 16,980 | |
| Accounts receivable, less allowance for doubtful accounts of $223 and $110 | | | 35,918 | | | | 30,350 | |
| Inventories, net | | | 67,942 | | | | 47,882 | |
| VAT receivable | | | 6,190 | | | | 5,970 | |
| Other current assets | | | 2,617 | | | | 5,968 | |
| Total current assets | | | 142,602 | | | | 107,150 | |
| Property and equipment, net | | | 215,650 | | | | 215,083 | |
| Other assets | | | 436 | | | | 63 | |
| Total assets | | $ | 358,688 | | | $ | 322,296 | |
| | | | | | | | | |
| Liabilities and shareholders' equity | | | | | | | | |
| Current liabilities: | | | | | | | | |
| Borrowings under credit lines | | $ | - | | | $ | 8,394 | |
| Current maturities of long-term debt | | | 4,161 | | | | - | |
| Trade accounts payable | | | 12,473 | | | | 13,643 | |
| Accrued expenses and other liabilities | | | 8,687 | | | | 7,925 | |
| Construction payables | | | 1,784 | | | | 1,027 | |
| Total current liabilities | | | 27,105 | | | | 30,989 | |
| Long-term debt | | | 22,978 | | | | - | |
| Hungarian grant - allowance against future depreciation | | | 6,777 | | | | 7,765 | |
| Deferred tax liabilties | | | 473 | | | | 1,855 | |
| Liabilities carried at fair value | | | 384 | | | | 140 | |
| Total liabilities | | | 57,717 | | | | 40,749 | |
| Commitments and contingencies (See Note 9) | | | | | | | | |
| Shareholders' equity: | | | | | | | | |
Preferred stock, $.01 par value, 1,000,000 shares authorized, no shares issued and outstanding | | | - | | | | - | |
Common stock, $.01 par value, 50,000,000 shares authorized, 34,355,192 and 34,368,192 shares issued and outstanding in 2012 and 2011, respectively | | | 344 | | | | 344 | |
| Additional paid-in capital | | | 481,743 | | | | 480,893 | |
| Accumulated other comprehensive loss | | | (45,827 | ) | | | (41,549 | ) |
| Accumulated deficit | | | (135,289 | ) | | | (158,141 | ) |
| Total shareholders' equity | | | 300,971 | | | | 281,547 | |
| Total liabilities and shareholders' equity | | $ | 358,688 | | | $ | 322,296 | |
The accompanying notes are an integral part of the consolidated financial statements. CONSOLIDATED STATEMENT OF OPERATIONS
(Amounts in thousands, except share and per share data)
| | | Fiscal Year Ended September 30, | |
| | | 2012 | | | 2011 | | | 2010 | |
| | | | | | | | | | |
| Net sales | | $ | 186,337 | | | $ | 151,686 | | | $ | 128,464 | |
| Cost of sales | | | 140,693 | | | | 133,985 | | | | 115,172 | |
| Gross profit | | | 45,644 | | | | 17,701 | | | | 13,292 | |
| Application and development costs | | | 7,046 | | | | 8,578 | | | | 8,207 | |
| Selling, general and administrative expenses | | | 12,957 | | | | 13,852 | | | | 15,649 | |
| Operating income (loss) | | | 25,641 | | | | (4,729 | ) | | | (10,564 | ) |
| Other (expense) income: | | | | | | | | | | | | |
| Interest expense, net | | | (265 | ) | | | (119 | ) | | | (340 | ) |
| (Loss) gain on foreign currency transactions | | | (553 | ) | | | 1,526 | | | | 1,938 | |
| Other expense, net | | | (857 | ) | | | (555 | ) | | | (678 | ) |
| Gain on liabilities carried at fair value | | | 94 | | | | 1,214 | | | | 1,753 | |
| Amortization of financing fees and debt discount | | | (26 | ) | | | - | | | | (289 | ) |
| Income (loss) from continuing operations before income taxes | | | 24,034 | | | | (2,663 | ) | | | (8,180 | ) |
| Income tax expense (benefit) | | | 1,182 | | | | 911 | | | | (1,841 | ) |
| | | | | | | | | | | | | |
| Net income (loss) | | | 22,852 | | | | (3,574 | ) | | | (6,339 | ) |
| | | | | | | | | | | | | |
| Basic earnings (loss) per share | | $ | 0.67 | | | $ | (0.10 | ) | | $ | (0.18 | ) |
| | | | | | | | | | | | | |
| Diluted earnings (loss) per share | | $ | 0.66 | | | $ | (0.10 | ) | | $ | (0.18 | ) |
| | | | | | | | | | | | | |
| Weighted average common shares outstanding – basic | | | 34,358,367 | | | | 34,378,288 | | | | 34,410,608 | |
| | | | | | | | | | | | | |
| Weighted average common shares outstanding – diluted | | | 34,451,367 | | | | 34,378,288 | | | | 34,410,608 | |
The accompanying notes are an integral part of the consolidated financial statements.
CONDENSED CONSOLIDATED STATEMENTS OF COMPREHENSIVE INCOME
| | | Fiscal year ended September 30 | |
| | | 2012 | | | 2011 | | | 2010 | |
| Net income (loss) | | $ | 22,852 | | | $ | (3,574 | ) | | $ | (6,339 | ) |
| Foreign currency translation adjustment | | | (3,894 | ) | | | (8,168 | ) | | | (14,976 | ) |
| Change in unrealized fair value of cash flow hedge, net of tax of $0 | | | (384 | ) | | | | | | | | |
| | | | | | | | | | | | | |
| Comprehensive income (loss) | | $ | 18,574 | | | $ | (11,742 | ) | | $ | (21,315 | ) |
The accompanying notes are an integral part of the consolidated financial statements.
CONSOLIDATED STATEMENT OF CHANGES IN SHAREHOLDERS’ EQUITY
| | | Total Shareholders’ Equity | | | Common Stock | | | Additional Paid-In Capital | | | Accumulated Other Comprehensive Loss | | | Accumulated Deficit | |
| | | | | | | | | | | | | | | | |
| Balance, September 30, 2009 | | $ | 315,465 | | | $ | 344 | | | $ | 494,311 | | | $ | (18,405 | ) | | $ | (160,785 | ) |
| | | | | | | | | | | | | | | | | | | | | |
| Comprehensive loss | | | (21,315 | ) | | | | | | | | | | | (14,976 | ) | | | (6,339 | ) |
| Cash settlement of restricted shares | | | (144 | ) | | | - | | | | (144 | ) | | | - | | | | - | |
| Restricted stock liability reclass | | | (240 | ) | | | - | | | | (240 | ) | | | - | | | | - | |
| Restricted stock expense | | | 349 | | | | - | | | | 349 | | | | - | | | | - | |
| Stock option expense | | | 1,506 | | | | - | | | | 1,506 | | | | - | | | | - | |
Difference between compensation and change in liability for restricted stock awards | | | 138 | | | | - | | | | 138 | | | | - | | | | - | |
Cumulative effect of change in accounting principle | | | (3,061 | ) | | | - | | | | (15,618 | ) | | | - | | | | 12,557 | |
| | | | | | | | | | | | | | | | | | | | | |
| Balance, September 30, 2010 | | $ | 292,698 | | | $ | 344 | | | $ | 480,302 | | | $ | (33,381 | ) | | $ | (154,567 | ) |
| | | | | | | | | | | | | | | | | | | | | |
| Comprehensive loss | | | (11,742 | ) | | | | | | | | | | | (8,168 | ) | | | (3,574 | ) |
| Cash settlement of options | | | (23 | ) | | | - | | | | (23 | ) | | | - | | | | - | |
| Stock option expense | | | 399 | | | | - | | | | 399 | | | | - | | | | - | |
Difference between compensation and change in liability for restricted stock awards | | | 215 | | | | - | | | | 215 | | | | - | | | | - | |
| | | | | | | | | | | | | | | | | | | | | |
| Balance, September 30, 2011 | | $ | 281,547 | | | $ | 344 | | | $ | 480,893 | | | $ | (41,549 | ) | | $ | (158,141 | ) |
| | | | | | | | | | | | | | | | | | | | | |
| Comprehensive income (loss) | | | 18,574 | | | | | | | | | | | | (4,278 | ) | | | 22,852 | |
| Cash proceeds from options | | | 4 | | | | - | | | | 4 | | | | - | | | | - | |
| Stock option expense | | | 833 | | | | - | | | | 833 | | | | - | | | | - | |
Difference between compensation and change in liability for restricted stock awards | | | 13 | | | | - | | | | 13 | | | | - | | | | - | |
| | | | | | | | | | | | | | | | | | | | | |
| Balance, September 30, 2012 | | $ | 300,971 | | | $ | 344 | | | $ | 481,743 | | | $ | (45,827 | ) | | $ | (135,289 | ) |
The accompanying notes are an integral part of the consolidated financial statements.
CONSOLIDATED STATEMENT OF CASH FLOWS
| | | Fiscal Year Ended September 30, | |
| | | 2012 | | | 2011 | | | 2010 | |
| Cash flows from operating activities: | | | | | | | | | |
| Net income (loss) | | $ | 22,852 | | | $ | (3,574 | ) | | $ | (6,339 | ) |
| Adjustments to reconcile net income to net cash from operating activities: | | | | | | | | | | | | |
| Depreciation | | | 17,842 | | | | 17,795 | | | | 16,461 | |
| Amortization of financing fees and debt discount | | | 26 | | | | - | | | | 289 | |
| Deferred taxes | | | (77 | ) | | | 65 | | | | (3,274 | ) |
| Gain on liabilities carried at fair value | | | (94 | ) | | | (1,214 | ) | | | (1,753 | ) |
| Foreign currency transaction losses (gains) | | | 860 | | | | (1,365 | ) | | | (96 | ) |
| Stock compensation expense | | | 977 | | | | 757 | | | | 2,030 | |
| Loss on disposal of assets | | | 635 | | | | 262 | | | | 342 | |
| Changes in assets and liabilities: | | | | | | | | | | | | |
| (Increase) decrease in accounts receivable | | | (5,990 | ) | | | (8,667 | ) | | | 5,361 | |
| (Increase) decrease in inventories | | | (20,651 | ) | | | (10,344 | ) | | | 8,826 | |
| Decrease (increase) in other current assets and other assets | | | 1,490 | | | | (3,338 | ) | | | (1,291 | ) |
| (Decrease) increase in trade accounts payable | | | (1,056 | ) | | | 6,449 | | | | (761 | ) |
| Increase (decrease) in accrued expenses and other liabilities | | | 581 | | | | (43 | ) | | | 2,187 | |
| Net cash provided (used) by operations | | | 17,395 | | | | (3,217 | ) | | | 21,982 | |
| | | | | | | | | | | | | |
| Cash flows from investing activities: | | | | | | | | | | | | |
| Purchases of property and equipment | | | (22,357 | ) | | | (8,177 | ) | | | (4,410 | ) |
| Increase in construction payables | | | 757 | | | | 121 | | | | 114 | |
| Proceeds received from sale of fixed assets | | | - | | | | 24 | | | | 83 | |
| Proceeds received from Hungarian grant | | | - | | | | 22 | | | | 150 | |
| Net cash used in investing activities | | | (21,600 | ) | | | (8,010 | ) | | | (4,063 | ) |
| | | | | | | | | | | | | |
| Cash flows from financing activities: | | | | | | | | | | | | |
| Payment of financing fees | | | (258 | ) | | | - | | | | - | |
| Repayment of convertible debt | | | - | | | | - | | | | (4,249 | ) |
| (Repayment) borrowings of credit lines | | | (8,394 | ) | | | 8,394 | | | | (12,379 | ) |
| Borrowings of notes payable | | | 26,499 | | | | - | | | | - | |
| Repayment of notes payable | | | (333 | ) | | | (981 | ) | | | - | |
| Cash settlement of restricted shares | | | (114 | ) | | | (245 | ) | | | (216 | ) |
| Cash proceeds from (settlement of) stock options | | | 4 | | | | (35 | ) | | | - | |
| Net cash provided (used) in financing activities | | | 17,404 | | | | 7,133 | | | | (16,844 | ) |
| | | | | | | | | | | | | |
| Effect of exchange rate changes on cash and cash equivalents | | | (244 | ) | | | (460 | ) | | | (484 | ) |
| Net increase (decrease) in cash and cash equivalents | | | 12,955 | | | | (4,554 | ) | | | 591 | |
| Cash and cash equivalents at beginning of year | | | 16,980 | | | | 21,534 | | | | 20,943 | |
| Cash and cash equivalents at end of year | | $ | 29,935 | | | $ | 16,980 | | | $ | 21,534 | |
| | | | | | | | | | | | | |
| Supplemental disclosures of cash flow information: | | | | | | | | | | | | |
| Net cash paid during the year for: | | | | | | | | | | | | |
| Interest | | $ | 447 | | | $ | 135 | | | $ | 330 | |
| Income taxes | | | 1,395 | | | | 972 | | | | 1,970 | |
The accompanying notes are an integral part of the consolidated financial statements.
ZOLTEK COMPANIES, INC.
NOTES TO CONSOLIDATED FINANCIAL STATEMENTS
1. SUMMARY OF SIGNIFICANT ACCOUNTING POLICIES
ORGANIZATION AND PRINCIPLES OF CONSOLIDATION
Zoltek Companies, Inc. is a holding company, which operates through wholly-owned subsidiaries, Zoltek Corporation, Zoltek Zrt., Zoltek de Mexico SA de CV, Zoltek de Occidente SA de CV, Engineering Technology Corporation (“Entec Composite Machines”), Zoltek Properties, Inc. and Zoltek Automotive, LLC. Zoltek Corporation (“Zoltek”) develops, manufactures and markets carbon fibers and technical fibers in the United States. Carbon fibers are a low-cost but high performance reinforcement for composites used as the primary building material in everyday commercial products. Technical fibers are an intermediate product used in heat-resistant applications such as aircraft brakes. Zoltek Zrt. is a Hungarian subsidiary that manufactures and markets carbon fibers and technical fibers and manufactures acrylic fiber precursor raw material used in production of carbon fibers and technical fibers. Zoltek de Mexico SA de CV and Zoltek de Occidente SA de CV are Mexican subsidiaries that manufacture carbon fiber and precursor raw material. Entec Composite Machines manufactures and markets filament winding and pultrusion equipment used in the production of large volume composite parts. The Company’s primary sales markets are in Europe and the United States; however, the Company has an increasing presence in Asia. Unless the context otherwise indicates, references to the “Company” are to Zoltek Companies, Inc. and its subsidiaries.
The Consolidated Financial Statements of the Company include the operations of its wholly-owned subsidiaries. All intercompany transactions and balances have been eliminated in consolidation. Certain prior year amounts have been reclassified to conform to the current year presentation.
USE OF ESTIMATES
The preparation of financial statements in conformity with accounting principles generally accepted in the United States of America requires that management make estimates and assumptions that affect amounts reported in the financial statements and accompanying notes. Actual results may differ from those estimates and assumptions.
REVENUE RECOGNITION
Sales transactions are initiated through customer purchase orders or sales agreements which are based on fixed pricing terms. The Company recognizes sales of manufactured products on the date title to the product transfers to the customer, ordinarily upon shipping. Revenues are reported net of any value-added tax or other such tax assessed by a governmental authority on our revenue-producing activities. Costs associated with shipping and handling are included in costs of sales. Revenues generated by Entec Composite Machines are recognized on a percentage of completion basis based on the percentage of total project cost incurred to date which include change orders, revisions to estimates and provisions for anticipated losses on contracts and represented 3% or less of consolidated revenues for all years presented. Revenue from sales of consigned inventory is recognized upon the use of the product by the consignee or according to terms of the contract.
ACCOUNTS RECEIVABLE
The Company reviews its accounts receivable balance on a quarterly basis to identify any specific customers for collectability issues. If the Company deems that an amount due from a customer is uncollectible, the amount is recorded as expense in the statement of operations. The Company evaluates the collectability of our accounts receivable for each of our segments based on a combination of factors. In circumstances where we are aware of a specific customer's inability to meet its financial obligations to us (e.g., bankruptcy filing or substantial downgrading of credit), we record a specific reserve for bad debts against the amounts due reducing the net recognized receivable to the amount we estimate will be collected. For all other customers, we estimate reserves for bad debts based on the length of time receivables have been past due and our experience with collection. We incurred bad debt expense on accounts receivable of $0.2 million for 2012, less than $0.1 million for 2011 and $0.5 million for 2010.
CONCENTRATION OF CREDIT RISK
Zoltek's carbon fiber products are primarily sold to customers in the composite industry and its technical fibers are primarily sold to customers in the aerospace industry. Entec Composite Machines' products are primarily sold in the composite industry. The Company performs ongoing credit evaluations and generally requires collateral for significant export sales to new customers. The Company maintains reserves for potential credit losses and such losses have been within management's expectations.
In fiscal 2012, 2011 and 2010, we reported net sales of carbon fiber of $86.6 million, $42.7 million and $49.5 million, respectively, to Vestas Wind Systems, a leading wind turbine manufacturer, which represented 46.5%, 28.1% and 38.6% of our net sales, respectively, during these years. The related open accounts receivable balances at September 30, 2012 and 2011 were $22.3 million and $15.0 million, respectively. In fiscal 2011, we reported net sales of $15.8 million, which represented 10.4% of our total consolidated net sales to Saertex GMBH & Company, a manufacturer of fabrics for the composite industry, including materials for production of wind turbine blades. There was no open accounts receivable balance from this manufacturer at September 30, 2012. These were the only customers that represented greater than 10% of consolidated net sales during these years.
CASH AND CASH EQUIVALENTS
Cash equivalents include certificates of deposit and overnight repurchase agreements. Cash equivalents are stated at cost plus accrued interest only if the accrued interest is not forfeited through withdrawal. Otherwise cash equivalents are stated at cost with accrued interest held as a receivable. The Company deposits its temporary cash investments with high credit quality financial institutions.
INVENTORIES
Inventories are valued at the lower of cost or market and are removed from inventory under the first-in-first-out method (“FIFO”). Cost of inventory includes material, labor and overhead. The Company recorded inventory valuation reserves of $0.4 million and $0.7 million as of September 30, 2012 and 2011, respectively, to reduce the carrying value of inventories to a net realizable value. This evaluation includes analyses of sales levels by product and projections of future demand within specific time horizons. If future demand or market conditions are less favorable than the Company's projections, additional inventory write-downs may be required and would be reflected in cost of sales on the Company's statement of operations in the period in which the determination is made.
PROPERTY AND EQUIPMENT
Property and equipment are stated at cost. Cost includes expenditures necessary to make the property and equipment ready for its intended use. Expenditures to improve the asset or extend the useful life are capitalized, including interest on funds borrowed to finance the acquisition or construction of major capital additions. The Company did not record any capitalized interest in fiscal 2012, 2011 or 2010. Maintenance and repairs are expensed as incurred. When property is retired or otherwise disposed of, the related cost and accumulated depreciation are removed from the accounts and any profit or loss on disposition is credited or charged to income.
The Company provides for depreciation by charging amounts sufficient to amortize the cost of properties placed in service over their estimated useful lives using straight-line methods. The range of estimated useful lives used in computing depreciation is as follows:
| | Years |
| Buildings and improvements | 30 | - | 40 |
| Machinery and equipment | 3 | - | 20 |
| Furniture and fixtures | 7 | - | 10 |
| Computer hardware and software | 2 | - | 5 |
Long-lived assets are reviewed for impairment whenever events or changes in circumstances indicate that the carrying amount may not be recoverable. If the sum of the expected future undiscounted cash flows is less than the carrying amount of long-lived assets, a loss is recognized for the difference between the fair value and the carrying value of the asset. No impairment charges for long-lived assets were recorded during fiscal 2012, 2011 and 2010.
EARNINGS PER SHARE
In accordance with ASC 260, the Company calculates diluted earnings per share including the impact of the Company's potential stock equivalents. The Company has outstanding stock options and warrants at September 30, 2012, 2011 and 2010, which are not included in the determination of diluted earnings per share because the impact of these potential additional shares is anti-dilutive.
FINANCIAL INSTRUMENTS
The Company does not hold any financial instruments for trading purposes. The carrying value of cash, accounts receivable, interest rate swaps and accounts payable approximated their fair value at September 30, 2012 and 2011. The fair value of the interest rate swap is determined using an internal valuation model which relies on the expected LIBOR yield curve as the most significant input. Additionally included in the model are estimates of counterparty and the Company’s non-performance risk. Model inputs are changed only when corroborated by market data.
The Company adopted the amended guidance of ASC Topic 815-40 (formerly referred to as EITF Issue No. 07-05, “Determining Whether an Instrument (or Embedded Feature) is Indexed to an Entity’s Own Stock,” on October 1, 2009. In connection with the adoption, the Company determined that its outstanding warrants as of the adoption date, which include warrants issued in May 2006, July 2006, October 2006 and December 2006, are not indexed to the Company’s own stock. Accordingly, these warrants should be treated as a liability carried at fair value, which requires separate accounting pursuant to ASC 815. The fair value of the warrants was reclassified from equity to a liability carried at fair value on October 1, 2009.
APPLICATION AND DEVELOPMENT EXPENSES
The Company is actively pursuing the development of a number of applications for the use of its carbon fibers and related products. The Company is executing several internal and collaborative developmental strategies to further the use of carbon fiber and commercial and industrial products made from carbon fiber. As a result, the Company incurs certain costs for research, development and engineering of products and manufacturing processes. These costs are expensed as incurred and totaled approximately $7.0 million, $8.6 million and $8.2 million for fiscal years 2012, 2011, and 2010, respectively. Application and development expenses are presented as an operating item on the Company's consolidated statement of operations. Given the Company's position and strategy within the carbon fiber industry, it is expected that similar or greater levels of application and development expenses will be incurred in future periods.
FOREIGN CURRENCY TRANSLATION
The Company's Hungarian subsidiary, Zoltek Zrt., has a functional currency of the Hungarian Forint (HUF). As a result, the Company is exposed to foreign currency risks related to this investment. The consolidated balance sheet of Zoltek Zrt. was translated from HUF to US dollars, at the exchange rate in effect at the applicable balance sheet date, while its consolidated statements of operations were translated using the average exchange rates in effect for the periods presented. The related translation adjustments are reported as other comprehensive income (loss) within shareholders' equity. Gains and losses from foreign currency transactions of Zoltek Zrt. are included in the results of operations as other income (expense). The HUF weakened by 3.0% against the US dollar during fiscal 2012. Hungarian assets net of liabilities, excluding the long-term intercompany loan were approximately $135 million as of September 30, 2012.
The functional currency of Zoltek de Mexico is the US dollar. Exchange rate gains and losses are recognized on transactions in currencies other than the US dollar and included in operations for the period in which the exchange rates changed.
INCOME TAXES
The Company accounts for certain income and expense items differently for financial reporting and income tax purposes. Deferred tax assets and liabilities are determined based on the difference between the financial statement and tax basis of assets and liabilities applying enacted statutory tax rates in effect for the year in which the differences are expected to reverse. A valuation allowance is provided against certain deferred tax assets when realization of those assets are not considered to be more likely than not. The Company classifies income tax-related interest and penalties below operating income.
RECENTLY ADOPTED ACCOUNTING PRONOUNCEMENTS
In May 2011, the Financial Accounting Standards Board (“FASB”) issued Accounting Standards Update (“ASU”) No. 2011-04, “Fair Value Measurement (Topic 820): Amendments to Achieve Common Fair Value Measurement and Disclosure Requirements in U.S. GAAP and IFRSs.” The amendments in this ASU generally represent clarification of Topic 820, but also include instances where a particular principle or requirement for measuring fair value or disclosing information about fair value measurements has changed. This update results in common principles and requirements for measuring fair value and for disclosing information about fair value measurements in accordance with GAAP and International Financial Reporting Standards (“IFRS”). The amendments are effective for interim and annual periods beginning after December 15, 2011 and are to be applied prospectively. The adoption of this amended guidance did not result in any material change to disclosure in the notes to the Company’s consolidated financial statements (see Note 12 for the disclosures required by this guidance).
In June 2011, the FASB issued ASU No. 2011-05, “Comprehensive Income (Topic 220): Presentation of Comprehensive Income.” This amends existing guidance by allowing only two options for presenting the components of net income and other comprehensive income: (1) in a single continuous financial statement (statement of comprehensive income), or (2) in two separate but consecutive financial statements (consisting of an income statement followed by a separate statement of other comprehensive income). Also, items that are reclassified from other comprehensive income to net income must be presented on the face of the financial statements. ASU No. 2011-05 requires retrospective application, The Company adopted this provision in the second quarter of fiscal 2012.
In July 2012, the Financial Accounting Standards Board (“FASB”) issued an Accounting Standards Update (“ASU”) No. 2012-02, which permits an entity to make a qualitative assessment to determine whether it is more likely than not that an indefinite-lived intangible asset, other than goodwill is impaired. If an entity concludes, based on an evaluation of all relevant qualitative factors, that it is not more likely than not that the fair value of an indefinite-lived intangible asset is less than its carrying amount, it will not be required to perform the quantitative impairment for that asset. The ASU is effective for impairment tests performed for fiscal years beginning after September 15, 2012 (fiscal year 2013), with early adoption permitted. The Company does not expect the adoption of ASU 2012-02 will have a material impact on the Company’s consolidated financial statements.
2. INVENTORIES
Inventories consist of the following (amounts in thousands):
| | | September 30, | |
| | | 2012 | | | 2011 | |
| Raw materials | | $ | 8,631 | | | $ | 7,603 | |
| Work-in-process | | | 15,192 | | | | 11,025 | |
| Finished goods | | | 40,787 | | | | 26,626 | |
| Consigned inventory | | | 2,896 | | | | 2,488 | |
| Supplies and other | | | 436 | | | | 140 | |
| | | $ | 67,942 | | | $ | 47,882 | |
3. PROPERTY, PLANT AND EQUIPMENT
Property, plant and equipment consist of the following (amounts in thousands):
| | | September 30, | |
| | | 2012 | | | 2011 | |
| Land | | $ | 14,435 | | | $ | 12,978 | |
| Buildings and improvements | | | 70,214 | | | | 65,933 | |
| Machinery and equipment | | | 256,977 | | | | 240,784 | |
| Furniture, fixtures and software | | | 7,753 | | | | 7,288 | |
| Spare parts | | | 1,160 | | | | 9,830 | |
| Construction-in-progress | | | 10,366 | | | | 6,880 | |
| | | $ | 360,905 | | | $ | 343,693 | |
| Less: accumulated depreciation | | | (145,255 | ) | | | (128,610 | ) |
| | | $ | 215,650 | | | $ | 215,083 | |
4. BUSINESS SEGMENT AND GEOGRAPHIC INFORMATION
The Company’s strategic business units are based on product lines and comprised of three reportable segments: carbon fibers, technical fibers and corporate/other products. The carbon fibers segment manufactures commercial carbon fibers used as reinforcement material in composites. The technical fibers segment manufactures oxidized acrylic fibers and specialty carbon fibers used to manufacture aircraft brake pads and for heat/fire barrier applications. These two segments also facilitate development of product and process applications to increase the demand for carbon fibers and technical fibers. The carbon fibers and technical fibers segments’ production facilities are located geographically in the United States, Hungary and Mexico. The remaining business represented in the corporate/other products segment relates to water treatment and electrical services provided by the Hungarian operations and costs associated with the corporate headquarters.
Management evaluates the performance of its segments on the basis of operating income (loss) contribution. The following tables present financial information on the Company’s segments as of September 30, 2012 and 2011 and for the fiscal years ended September 30, 2012, 2011 and 2010 (amounts in thousands):
| | | Fiscal year ended September 30, 2012 | |
| | | Carbon Fibers | | | Technical Fibers | | | Corporate/ Other | | | Total | |
| Net sales | | $ | 151,494 | | | $ | 32,425 | | | $ | 2,418 | | | $ | 186,337 | |
| Cost of sales | | | 117,431 | | | | 20,853 | | | | 2,409 | | | | 140,693 | |
| Gross profit | | | 34,063 | | | | 11,572 | | | | 9 | | | | 45,644 | |
| Operating income (loss) | | | 27,818 | | | | 10,328 | | | | (12,505 | ) | | | 25,641 | |
| Depreciation | | | 15,986 | | | | 1,351 | | | | 505 | | | | 17,842 | |
| Capital expenditures | | | 17,434 | | | | 1,208 | | | | 3,715 | | | | 22,357 | |
| | | Fiscal year ended September 30, 2011 | |
| | | Carbon Fibers | | | Technical Fibers | | | Corporate/ Other | | | Total | |
| Net sales | | $ | 118,986 | | | $ | 30,483 | | | $ | 2,217 | | | $ | 151,686 | |
| Cost of sales | | | 106,832 | | | | 25,500 | | | | 1,653 | | | | 133,985 | |
| Gross profit | | | 12,154 | | | | 4,983 | | | | 564 | | | | 17,701 | |
| Operating income (loss) | | | 2,918 | | | | 3,673 | | | | (11,320 | ) | | | (4,729 | ) |
| Depreciation | | | 15,658 | | | | 1,414 | | | | 723 | | | | 17,795 | |
| Capital expenditures | | | 6,574 | | | | 779 | | | | 824 | | | | 8,177 | |
| | | Fiscal year ended September 30, 2010 | |
| | | Carbon Fibers | | | Technical Fibers | | | Corporate/ Other | | | Total | |
| Net sales | | $ | 103,390 | | | $ | 23,301 | | | $ | 1,773 | | | $ | 128,464 | |
| Cost of sales | | | 94,895 | | | | 19,061 | | | | 1,216 | | | | 115,172 | |
| Gross profit | | | 8,495 | | | | 4,240 | | | | 557 | | | | 13,292 | |
| Operating income (loss) | | | 312 | | | | 3,403 | | | | (14,279 | ) | | | (10,564 | ) |
| Depreciation | | | 13,762 | | | | 1,567 | | | | 1,132 | | | | 16,461 | |
| Capital expenditures | | | 3,175 | | | | 627 | | | | 608 | | | | 4,410 | |
| | | Total Assets | |
| | | Carbon Fibers | | Technical Fibers | | Corporate/ Other | | Total | |
| September 30. 2012 | | $ | 301,440 | | | $ | 31,597 | | | $ | 25,651 | | | $ | 358,688 | |
| September 30. 2011 | | $ | 272,397 | | | $ | 28,789 | | | $ | 21,110 | | | $ | 322,296 | |
Sales, long-lived assets, and net assets by geographic area, consist of the following as of and for each of the three fiscal years in the period ended September 30, 2012, 2011 and 2010 (amounts in thousands):
| | | 2012 | | | 2011 | | | 2010 | |
| | | Net Sales(a) | | | Net Long Lived Assets(b) | | | Net Assets | | | Net Sales(a) | | | Net Long Lived Assets(b) | | | Net Assets | | | Net Sales(a) | | | Net Long Lived Assets(b) | | | Net Assets | |
| United States | | $ | 72,269 | | | $ | 47,645 | | | $ | 82,337 | | | $ | 66,342 | | | $ | 41,403 | | | $ | 74,232 | | | $ | 43,762 | | | $ | 41,536 | | | $ | 79,892 | |
| Hungary | | | * | | | | 96,394 | | | | 135,521 | | | | * | | | | 98,326 | | | | 126,589 | | | | * | | | | 112,034 | | | | 132,827 | |
| Germany | | | 34,600 | | | | - | | | | - | | | | 26,250 | | | | - | | | | - | | | | 21,336 | | | | - | | | | - | |
| Other Europe | | | 56,030 | | | | - | | | | - | | | | 45,761 | | | | - | | | | - | | | | 52,441 | | | | - | | | | - | |
| Asia | | | 21,374 | | | | - | | | | - | | | | 11,266 | | | | - | | | | - | | | | 9,989 | | | | - | | | | - | |
| Mexico | | | * | | | | 71,611 | | | | 83,113 | | | | * | | | | 75,354 | | | | 80,726 | | | | * | | | | 78,091 | | | | 79,979 | |
| Other areas | | | 2,064 | | | | - | | | | - | | | | 2,067 | | | | - | | | | - | | | | 936 | | | | - | | | | - | |
| Total | | $ | 186,337 | | | $ | 215,650 | | | $ | 300,971 | | | $ | 151,686 | | | $ | 215,083 | | | $ | 281,547 | | | $ | 128,464 | | | $ | 231,661 | | | $ | 292,698 | |
| (a) | Revenues are attributed to countries based on the delivery location of the customer. |
| (b) | Property and equipment net of accumulated depreciation based on country location of assets. |
| * | Net sales for this country were less than 10% of total sales. Such sales were aggregated into “Other Europe,” “Asia” or“Other areas.” |
5. SUMMARY OF QUARTERLY RESULTS (UNAUDITED)
(Amounts in thousands, except per share data)
| Fiscal year 2012 | | 1st Quarter | | | 2nd Quarter | | | 3rd Quarter | | | 4th Quarter | | | Total | |
| Net sales | | $ | 47,046 | | | $ | 47,014 | | | $ | 48,078 | | | $ | 44,199 | | | $ | 186,337 | |
| Gross profit | | | 13,178 | | | | 10,968 | | | | 11,278 | | | | 10,220 | | | | 45,644 | |
| Net income | | | 9,703 | | | | 3,338 | | | | 5,566 | | | | 4,245 | | | | 22,852 | |
| | | | | | | | | | | | | | | | | | | | | |
| Basic income per share | | $ | 0.28 | | | $ | 0.10 | | | $ | 0.16 | | | $ | 0.13 | | | $ | 0.67 | |
| | | | | | | | | | | | | | | | | | | | | |
| Diluted income per share | | $ | 0.28 | | | $ | 0.10 | | | $ | 0.16 | | | $ | 0.12 | | | $ | 0.66 | |
| Fiscal year 2011 | | 1st Quarter | | | 2nd Quarter | | | 3rd Quarter | | | 4th Quarter | | | Total | |
| Net sales | | $ | 32,862 | | | $ | 37,099 | | | $ | 38,593 | | | $ | 43,132 | | | $ | 151,686 | |
| Gross profit | | | 4,074 | | | | 2,447 | | | | 4,452 | | | | 6,728 | | | | 17,701 | |
| Net (loss) income | | | (1,561 | ) | | | (5,107 | ) | | | (1,461 | ) | | | 4,555 | | | | (3,574 | ) |
| | | | | | | | | | | | | | | | | | | | | |
| Basic and diluted income (loss) per share | | $ | (0.05 | ) | | $ | (0.15 | | | $ | (0.04 | ) | | $ | 0.14 | | | $ | (0.10 | ) |
6. EARNINGS PER SHARE
In accordance with ASC 260, the Company has evaluated its diluted income per share calculation. The Company has outstanding warrants at September 30, 2012, 2011 and 2010, which are not included in the determination of diluted loss per share for the fiscal 2012, 2011 and 2010 because the shares are anti-dilutive. Had these securities been dilutive, an additional 0.9 million, 0.1 million and 0.1 million, respectively, would have been included in the Company’s diluted loss per share calculation for those years.
The following is the diluted impact of the convertible debt and warrants on net loss per share for the fiscal years ended September 30, 2012, 2011 and 2010 respectively:
| | | Fiscal year ended September 30, | |
| | | 2012 | | | 2011 | | | 2010 | |
| Numerators: | | | | | | | | | |
| Net income (loss) | | $ | 22,852 | | | $ | (3,574 | ) | | $ | (6,339 | ) |
| | | | | | | | | | | | | |
| Denominators: | | | | | | | | | | | | |
| Average shares outstanding – basic | | | 34,358 | | | | 34,378 | | | | 34,411 | |
| Impact of stock options | | | 93 | | | | - | | | | - | |
| Average shares outstanding – diluted | | | 34,451 | | | | 34,378 | | | | 34,411 | |
| | | | | | | | | | | | | |
| Basic earnings (loss) per share | | $ | 0.67 | | | $ | (0.10 | ) | | $ | (0.18 | ) |
| | | | | | | | | | | | | |
| Diluted earnings (loss) per share | | $ | 0.66 | | | $ | (0.10 | ) | | $ | (0.18 | ) |
7. FINANCING TRANSACTIONS
The Hungarian government has pledged a grant of 2.9 billion Hungarian Forint (“HUF”) to Zoltek’s Hungarian subsidiary, which translated at the September 30, 2012 exchange rate, is approximately $13.1 million. The grant is intended to provide a portion of the capital resources to modernize the subsidiary’s facility, establish a research and development center, and support buildup of manufacturing capacity of carbon fibers. Zoltek’s Hungarian subsidiary did not receive any grant funding during fiscal 2012 and received approximately HUF 0.1 billion and HUF 0.1 billion in grant funding during fiscal 2011 and 2010, respectively. As of September 30, 2012, Zoltek Zrt. had received an aggregate of approximately HUF 2.6 billion ($11.7 million) in funding pursuant to the grant. These funds have been recorded as a liability on the Company’s consolidated balance sheet. The liability is being amortized over the life of the assets procured by the grant funds, offsetting the depreciation expense from the assets into which the proceeds of the grant are invested. The Company has presented bank guarantees amounting to 120% of the amount of the grant as received.
The Hungarian subsidiary may be required to repay all or a portion of the grant if, among other things, the Hungarian subsidiary: fails to obtain revenue targets; fails to employ an average annual staff of at least 1,200 employees (as of September 30, 2012 we are below 900); fails to utilize regional suppliers for at least 45% of its purchases; fails to obtain consent from the Hungarian government prior to selling assets created with grant funds; fails to use grant funds in accordance with the grant agreement; fails to provide appropriate security for the grant; makes or made an untrue statement or supplies or supplied false data in the grant agreement, grant application or during the time of the grant; defaults on its obligations by more than 30 days; withdraws any consents it gave in the grant agreement; or causes a partial or complete failure or hindrance of the project that is the subject of the grant. These targets must be achieved during a five-year measurement period from October 2013 to October 2018. Although there can be no assurance, the Company anticipates it will comply with the requirements of the grant agreement when the measurement period begins. However if Zoltek Zrt. is unable to comply with them or obtain an amendment of the requirements, it would be required to pay back all or a portion of the grant funds, which could have a material adverse effect on our future revenues and business, results of operations, financial condition or cash flow.
FINANCING ACTIVITY
Hungarian Financing
On June 15, 2012, Zoltek Zrt. completed an amended credit facility with Raiffeisen Bank Zrt. (the “Lender”) pursuant to which Zoltek Zrt. and the Lender entered into a Credit Facility Agreement, dated as of June 1, 2012, and a Restated and Amended Uncommitted Credit Line Agreement, dated as of June 1, 2012. Under the credit facility, the Lender agreed to provide Zoltek Zrt.: (1) a term facility in the maximum amount of 13.6 million EUR ($17.5 million at the September 30, 2012 exchange rate) (the “Term Facility”) and (2) a multicurrency overdraft facility in the amount of up to 1.12 billion HUF ($5.1 million at the September 30, 2012 exchange rate) (the “Revolving Facility”).
The Term Facility is a five-year term loan and bears interest at 4.17%. Principal under the Term Facility is payable semi-annually in equal installments. The Revolving Facility is a revolving credit facility that expires on March 29, 2013 and has a total commitment of 1.120 billion HUF ($5.1 million at the September 30, 2012 exchange rate) subject to a borrowing base. In addition to the Term Facility and the Revolving Facility, Zoltek Zrt. has obtained from the lender a bank guaranty in the amount of HUF 3.48 billion ($15.7 million at the September 30, 2012 exchange rate) as required by the Hungarian government grant. The obligations of Zoltek Zrt. under this credit facility are guaranteed by the Company.
This credit facility contains representations and warranties, and contains a requirement that Zoltek Zrt. maintain a minimum current asset ratio and minimum annual EBITDA, along with other covenants. The Company was in compliance with all covenants as of September 30, 2012. Zoltek Zrt. had previously maintained a credit facility with the Lender, which expired May 30, 2012 and the facility was replaced with the new facility. As of September 30, 2012, the Company had borrowed $17.5 million from this new credit facility.
US Financing
On March 30, 2012, Zoltek Companies, Inc. entered into a $10 million term loan with Enterprise Bank & Trust (the “Enterprise Loan”) secured by the real property associated with its facilities in the St. Louis, Missouri area. The Enterprise Loan is a seven-year term loan maturing March 30, 2019. Principal of the Enterprise Loan is payable monthly with a balloon payment due at maturity. The Enterprise Loan bears interest at a one-month LIBOR rate, plus 3%. The Company contemporaneously entered into a swap agreement that fixes the interest rate on the Enterprise Loan at 4.75% per annum. The loan agreement contains representations and warranties, and contains a requirement that the Company, on a consolidated basis, maintains minimum fixed charge coverage and leverage ratios, along with other covenants. The Company was in compliance with all covenants as of September 30, 2012. As of September 30, 2012, the principal balance of this term loan was $9.7 million.
The Company primarily utilized the proceeds of the Enterprise Loan to repay all outstanding balances under the Company's former U.S. revolving credit facility with its former U.S. Bank; the original borrowings had financed purchase of our St. Peters, Missouri plant.
On April 27, 2012, Zoltek Companies, Inc. entered into a $15 million revolving credit agreement with JPMorgan Chase, N.A., with interest based on LIBOR plus 2.5%, adjusted monthly. The revolving credit facility is subject to a borrowing base and financial covenants and expires on April 27, 2015. The Company was in compliance with all covenants as of September 30, 2012. As of September 30, 2012, the Company had no borrowings under this revolving credit agreement.
Amortization of Financing Fees and Debt Discount
Convertible debt issued in May 2006, July 2006 and October 2006 was considered to have beneficial conversion features because the adjusted conversion price after allocating a portion of the proceeds to the warrants issued in connection with the convertible debt was less than the market price of the Company’s common stock at date of issue. The beneficial conversion was recorded as a reduction in the carrying value of the convertible debt security and accreted to its face value over the life of the convertible security and expensed into the Company’s income statement.
At the time of issuance of convertible debt securities with warrants, the Company recorded the fair value associated with the warrants using the Black-Scholes option-pricing model. This fair value discount was recorded as a reduction in the carrying value of the convertible debt security that was accreted to its face value over the life of the convertible security and expensed into the Company’s income statement.
The table below shows the impact of amortization of financing fees and debt discount on the financial results for the fiscal years ended September 30, 2012, 2011 and 2010 (in thousands):
| Fiscal year ended September 30, | | Warrants | | | Conversion Features | | | Deferred Financing Costs | | | Total | |
| 2012 | | $ | - | | | $ | - | | | $ | 26 | | | $ | 26 | |
| 2011 | | | - | | | | - | | | | - | | | | - | |
| 2010 | | | 87 | | | | 105 | | | | 97 | | | | 289 | |
8. STOCK COMPENSATION EXPENSE
The Company maintains long-term incentive plans that authorize the Board of Directors or its Compensation Committee (the “Committee”) to grant key employees, officers and directors of the Company incentive or nonqualified stock options, stock appreciation rights, performance shares, restricted shares and performance units. The Committee determines the prices and terms at which awards may be granted along with the duration of the restriction periods and performance targets. All issuances are granted out of shares authorized, as the Company has no treasury stock. The Company has the option, in its sole discretion, to settle awards under its 2008 incentive plans in cash, in lieu of issuing shares.
For fiscal 2012, 2011 and 2010, the Company recorded into selling and general administrative expenses and into its corporate/other segment $1.0 million, $0.8 million and $2.0 million, respectively, for the cost of employee and director services received in exchange for equity instruments based on the grant-date fair value of those instruments in accordance with the provisions of ASC 718. There were no recognized tax benefits during fiscal 2012, 2011 or 2010, as any benefit is offset by the Company's full valuation allowance on its net deferred tax asset. The Company has not recognized the windfall tax benefit as the resulting deduction has not been realized via a reduction of income taxes payable.
Stock option awards. During fiscal 2012 the Company awarded performance-based based stock options with separate performance conditions for vesting in respect of the Company’s results and individual performances in fiscal 2012, 2013 and 2014, to named executive officers and other key employees. The Company will recognize compensation expense related to each separate service period during the applicable period. The maximum number of performance-based options available to vest subject to certain operating performance targets is 1,188,750 and subject to the performance measures in a given fiscal year. The Company determined that a grant date, for purposes of measuring compensation expense in accordance with ASC 718, has been established for all three performance years as a mutual understanding of key terms and conditions was demonstrated. Also, during fiscal 2012, the Company granted 105,000 stock options with a vesting period through December 2012 to certain key employees.
Annually, options to purchase 7,500 shares of common stock are issued to each director, other than the CEO, with an exercise price equal to the fair market value of the shares. In addition, newly elected directors receive options to purchase 7,500 shares of common stock. All such options vest immediately at time of grant. Directors were issued options to purchase 37,500 shares of common stock at an exercise price of $14.58 during fiscal 2012.
The following tables summarize information for options currently outstanding and exercisable at September 30, 2012:
| | | Options Outstanding | |
| Range of Exercise Prices | | Number | | | Wtd. Avg. Remaining Life (years) | | | Wtd. Avg. Exercise Price | | | Aggregate Intrinsic Value | |
| $ 5.47-5.72 | | | 1,143,750 | | | | 8 | | | $ | 5.71 | | | $ | 2,260,688 | |
| 8.02-8.60 | | | 110,087 | | | | 5 | | | | 8.39 | | | | - | |
| 11.94-24.12 | | | 115,000 | | | | 4 | | | | 15.40 | | | | - | |
| 31.07-36.73 | | | 75,000 | | | | 3 | | | | 33.33 | | | | - | |
| $ 5.47-36.73 | | | 1,443,837 | | | | | | | | | | | $ | 2,260,688 | |
| | | Options Exercisable | |
| Range of Exercise Prices | | Number | | | Wtd. Avg. Remaining Life (years) | | | Wtd. Avg. Exercise Price | | | Aggregate Intrinsic Value | |
| $ 5.47-5.72 | | | 30,000 | | | | 1 | | | $ | 5.47 | | | $ | 66,600 | |
| 8.02-8.60 | | | 80,087 | | | | 3 | | | | 8.53 | | | | - | |
| 11.94-24.12 | | | 115,000 | | | | 4 | | | | 15.40 | | | | - | |
| 31.07-36.73 | | | 75,000 | | | | 3 | | | | 33.33 | | | | - | |
| $ 5.47-36.73 | | | 300,087 | | | | | | | | | | | $ | 66,600 | |
Presented below is a summary of stock option plans activity for fiscal 2012:
| | | Options | | | Wtd. Avg. Exercise Price | | | Aggregate Intrinsic Value | |
| Exercisable at September 30, 2010 | | | 410,837 | | | $ | 22.23 | | | $ | 230,191 | |
| Outstanding at September 30, 2010 | | | 427,087 | | | $ | 22.21 | | | $ | 230,191 | |
| Granted | | | 37,500 | | | | 11.94 | | | | | |
| Exercised | | | (7,500 | ) | | | 5.47 | | | | 7,200 | |
| Forfeited or expired | | | (42,500 | ) | | | 23.93 | | | | | |
| Outstanding at September 30, 2011 | | | 414,587 | | | $ | 21.41 | | | $ | 395,517 | |
| Exercisable at September 30, 2011 | | | 403,337 | | | $ | 21.43 | | | $ | 395,517 | |
| | | | | | | | | | | | | |
| Outstanding at September 30, 2011 | | | 414,587 | | | $ | 21.41 | | | $ | 395,517 | |
| Granted | | | 1,331,250 | | | | 6.02 | | | | | |
| Exercised | | | (2,000 | ) | | | 2.07 | | | | 11,240 | |
| Forfeited or expired | | | (300,000 | ) | | | 17.20 | | | | | |
| Outstanding at September 30, 2012 | | | 1,443,837 | | | $ | 8.12 | | | $ | 2,260,688 | |
| Exercisable at September 30, 2012 | | | 300,087 | | | $ | 17.06 | | | $ | 66,600 | |
The fair value of each option grant is estimated on the date of the grant using the Black-Scholes option-pricing model with the following weighted average assumptions:
| Assumptions | | Fiscal 2012 | | | Fiscal 2011 | | | Fiscal 2010 | |
| Expected life of option (in years) | | 3 | - | 5 | | | 5 | | | 3.8 | |
| Risk-free interest rate | | 0.4% | - | 0.8% | | | | 2.4 | % | | | 0.4 | % |
| Volatility of stock | | 72% | - | 79% | | | | 73 | % | | | 77 | % |
| Forfeiture rate | | 0% | - | 16% | | | | 0 | % | | | 0 | % |
The fair value of the options granted during fiscal 2012, 2011 and 2010 was $4.4 million, $0.3 million and $0.2 million, respectively. As of September 30, 2012, the Company had $2.7 million total unrecognized compensation expense, net of estimated forfeitures related to stock option plans which will be recognized as expense over a remaining weighted average period of 1 year. Cash proceeds received from the exercise of stock options were less than $0.1 million, $0.1 million and $0.0 million for fiscal 2012, 2011 and 2010, respectively. The Company uses historical volatility for a period of time that is comparable to the expected life of the option.
Restricted stock awards. Under the Company’s equity incentive plans, employees and directors may be granted restricted stock awards with participation rights which are valued based upon the fair market value on the date of the grant. The balance of restricted stock shares outstanding was 15,000 shares, 30,000 shares and 51,250 shares as of September 30, 2012, 2011 and 2010, respectively.
In accordance with ASC 718, the Company determined its practice of settling vested restricted shares in cash resulted in a modification from equity to liability accounting for the remaining unvested restricted shares. The fair value of the modified liability award is measured each reporting date through settlement and any adjustments to increase or decrease the liability are recorded either as compensation cost or a charge to equity.
The minimum remaining compensation cost to be recognized over the remaining vesting period is less than $0.1 million and is equal to the amount of unrecognized expense of the original award at grant date fair value. To the extent the fair value of unvested restricted stock at the end of the period exceeds the grant date fair value; any incremental expense is recognized during the period.
During fiscal 2012, the Company continued to recognize compensation cost for the original value of the award as the fair value of the original award is greater than the period-end fair value of unvested restricted shares. The difference between the change in the fair value of the liability and stock compensation recognized during the year of less than $0.1 million was recorded to additional paid-in capital.
9. COMMITMENTS AND CONTINGENCIES
We rent office facilities and equipment under various operating leases. Rent expense for all operating leases was $1.3 million, $1.6 million and $1.5 million for the fiscal years ended September 30, 2012, 2011 and 2010, respectively.
The following table sets forth the future minimum lease commitments under operating leases at September 30, 2012 (amounts in thousands):
| September 30, | | Future Commitments for Operating Leases | |
| 2013 | | $ | 911 | |
| 2014 | | | 840 | |
| 2015 | | | 816 | |
| 2016 | | | 809 | |
| 2017 | | | 806 | |
| Thereafter | | | 3,234 | |
| Total | | $ | 7,416 | |
We have rented forklifts and water treatment equipment under various capital leases in past years. We had no lease expense for capital leases for the fiscal year ended September 30, 2012 and $0.1 million for each of the fiscal years ended September 30, 2011 and 2010.
LEGAL
Legal contingencies have a high degree of uncertainty. We record reserves when losses from contingencies can be reasonably estimated and become probable. The reserves would reflect management’s estimate of the probable cost of ultimate resolution of the matters and are revised accordingly as facts and circumstances change and, ultimately, when matters are brought to closure. If any litigation matter is resolved unfavorably, the Company could incur obligations in excess of management’s estimate of the outcome, and such resolution could have a material adverse effect on the Company’s consolidated financial condition, results of operations or liquidity. In addition, we may incur additional legal costs in connection with pursuing and defending such actions.
The Company is exposed to various claims and legal proceedings arising out of the normal course of its business. Although there can be no assurance, in the opinion of management, the ultimate outcome of such claims and lawsuits when and if they arise should not have a material adverse effect on the Company’s consolidated financial condition, results of operations or liquidity. As of September 30, 2012, Zoltek has no recorded material legal reserves.
SOURCES OF SUPPLY
As part of its growth strategy, the Company has developed and manufactures its own precursor acrylic fibers and all of its carbon fibers and technical fibers. The primary source of raw material for the precursor is ACN (acrylonitrile), which is a commodity product with multiple sources.
10. INCOME TAXES
The components of income tax expense (benefit) for the fiscal years ended September 30, 2012, 2011 and 2010 are as follows (amounts in thousands):
| | | 2012 | | | 2011 | | | 2010 | |
| From continuing operations: | | | | | | | | | |
| Current: | | | | | | | | | |
| Federal | | $ | 52 | | | $ | 128 | | | $ | 121 | |
| State | | | (14 | ) | | | 3 | | | | 12 | |
| Foreign | | | 1,215 | | | | 611 | | | | 849 | |
| | | | 1,253 | | | | 742 | | | | 982 | |
| Deferred: | | | | | | | | | | | | |
| Federal | | | - | | | | - | | | | - | |
| State | | | - | | | | - | | | | - | |
| Non - U.S. | | | (71 | ) | | | 169 | | | | (2,823 | ) |
| | | | (71 | ) | | | 169 | | | | (2,823 | ) |
| Total operations | | $ | 1,182 | | | $ | 911 | | | $ | (1,841 | ) |
Deferred income taxes reflect the tax impact of carryforwards and temporary differences between the amount of assets and liabilities for financial reporting purposes and such amounts as measured by tax laws and regulations. Cumulative carryforwards and temporary differences giving rise to the net deferred income tax liability at September 30 are as follows (amounts in thousands):
| | | September 30, | |
| | | 2012 | | | 2011 | |
| Deferred tax assets: | | | | | | |
| Accrued employee compensation | | $ | 107 | | | $ | 103 | |
| Reserves | | | 273 | | | | 151 | |
| Other assets | | | 17 | | | | 18 | |
| Non-Qualified Stock Compensation | | | 1,236 | | | | 945 | |
| Net operating loss and credit carryforwards | | | 32,628 | | | | 33,501 | |
| | | | 34,261 | | | | 34,718 | |
| | | | | | | | | |
| Deferred tax liabilities: | | | | | | | | |
| Property, plant and equipment | | | (12,255 | ) | | | (10,358 | ) |
| Prepaid expenses | | | (162 | ) | | | (165 | ) |
| Other liabilities | | | | | | | - | |
| | | | (12,417 | ) | | | (10,523 | ) |
| Total deferred taxes | | | 21,844 | | | | 24,195 | |
| Less: valuation allowance | | | (22,137 | ) | | | (24,573 | ) |
| Net deferred tax liability | | $ | (293 | ) | | $ | (378 | ) |
| | | | | | | | | |
| Classification of deferred taxes: | | | | | | | | |
| Current deferred tax asset (included in other current assets) | | $ | 180 | | | $ | 1,477 | |
| Long-term deferred tax liability | | | (473 | ) | | | (1,855 | ) |
| | | $ | (293 | ) | | $ | (378 | ) |
In the consolidated balance sheets, these deferred tax assets and liabilities are classified as either current or non-current based on the classification of the related liability or asset for financial reporting. A deferred tax asset or liability that is not related to an asset or liability for financial reporting, including deferred taxes related to carryforwards, is classified according to the expected reversal date of the temporary differences as of the end of the year.
The provision for income taxes at September 30 differs from the amount using the statutory federal income tax rate (34%) as follows (amounts in thousands):
| | | 2012 | | | 2011 | | | 2010 | |
| At statutory rate: | | | | | | | | | |
| Income tax (benefit) expense on income (loss) from operations | | $ | 8,172 | | | $ | (905 | ) | | $ | (2,781 | ) |
| Increases (decreases): | | | | | | | | | | | | |
| Change in effective tax rate on non-U.S. operations | | | (4,540 | ) | | | (175 | ) | | | 1,253 | |
| Change in valuation allowance on net operating loss | | | (1,782 | ) | | | (395 | ) | | | 281 | |
| State taxes, net of federal benefit | | | (22 | ) | | | 33 | | | | 149 | |
| Local taxes, non-U.S. | | | 1,018 | | | | 611 | | | | 711 | |
| Change of uncertain tax positions | | | (71 | ) | | | (46 | ) | | | (2,173 | ) |
| Reflection of tax rate change – non-U.S. | | | (2,506 | ) | | | 1,748 | | | | 527 | |
| Amortization of warrant discount | | | - | | | | - | | | | 65 | |
| Fair market value of warrants | | | (32 | ) | | | (422 | ) | | | (596 | ) |
| R&D credits | | | (33 | ) | | | (186 | ) | | | - | |
| Mexico Inflationary Adjustment | | | 921 | | | | 560 | | | | 678 | |
| Other | | | 57 | | | | 88 | | | | 45 | |
| | | $ | 1,182 | | | $ | 911 | | | $ | (1,841 | ) |
The change in valuation allowance is impacted by the expected realization of deferred assets related to tax carryforwards and temporary differences.
The consolidated income (loss) from continuing operations before income taxes by domestic and foreign sources for the years ended September 30, 2012, 2011 and 2010 was as follows (amounts in thousands):
| | | 2012 | | | 2011 | | | 2010 | |
| | | | | | | | | | |
| Domestic | | $ | (996 | ) | | $ | 3,041 | | | $ | 5,760 | |
| Foreign | | | 25,030 | | | | (5,704 | ) | | | (13,940 | ) |
| Income (Loss) from operations before income taxes | | $ | 24,034 | | | $ | (2,663 | ) | | $ | (8,180 | ) |
The Company currently has domestic net operating loss carryforwards of approximately $63.0 million available to offset future tax liabilities, which expire between 2021 and 2029. Included in the net operating loss carry-forwards are stock option deductions of approximately $19.9 million. The benefits of these tax deductions, referred to as excess tax benefits, will be credited to additional paid-in capital upon being realized or recognized. The Company has recorded a full valuation allowance against its deferred tax asset because it is more likely than not that the value of the deferred tax asset will not be realized.
The Company currently has a foreign net operating loss carryforward of approximately $80.4 million. $33.5 million expires between 2017 and 2021 and $46.9 million has unlimited carryforward. Though the Hungarian loss carryforward does not expire, utilization is limited to 50% of the taxable income generated beginning with fiscal 2013 and beyond thus extending the anticipated carryforward period of these net operating losses.
Revolving Credit Facilities
U.S. Operations – The Company’s U.S. subsidiary has a revolving credit facility with JPMorgan Chase, N.A., the term of which expires April 27, 2015. There were no borrowings outstanding under this facility as of September 30, 2012. The credit facility is subject to a borrowing base and other financial covenants.
Hungarian Operations – The Company’s Hungarian subsidiary has a revolving credit facility with Raiffeisen Bank Zrt., which expires March 29, 2013. The credit facility has a total commitment of 1.120 billion HUF ($5.1 million at the September 30, 2012 exchange rate). There were no borrowings outstanding under this credit facility at September 30, 2012. The credit facility is subject to a borrowing base.
Term Facilities
US Operations – The Company has a term loan with Enterprise Bank & Trust secured by the real property associated with certain of its facilities in the St. Louis, Missouri area. The term loan is a seven-year loan maturing March 30, 2019. The loan agreement contains a requirement that the Company, on a consolidated basis, maintains minimum fixed charge coverage and leverage ratios, along with other covenants.
Hungarian Operations – The Company’s Hungarian subsidiary has a term facility with Raiffeisen Bank Zrt., which matures June 15, 2017. The facility agreement contains a requirement that Zoltek Zrt. maintain a minimum current asset ratio and minimum annual EBITDA, along with other covenants.
Credit lines consist of the following (amounts in thousands):
| | | September 30, 2012 | | | September 30, 2011 | |
| | | | | | | |
| US revolving facility | | $ | - | | | $ | 8,394 | |
| Hungarian revolving facility | | | - | | | | - | |
| Total credit lines | | $ | - | | | $ | 8,394 | |
The Company’s long-term debt consists of the following (amounts in thousands):
| | | September 30, 2012 | | | September 30, 2011 | |
| | | | | | | |
| US term loan | | $ | 9,667 | | | $ | - | |
| Hungarian term facility | | | 17,472 | | | | - | |
| Total Long-Term Debt Including Current Maturities | | $ | 27,139 | | | $ | - | |
| Less: Amounts Payable Within One Year | | | (4,161 | ) | | | - | |
| Total Long-Term Debt, Less Current Maturities | | $ | 22,978 | | | $ | - | |
12. FAIR VALUE MEASUREMENT OF INSTRUMENTS Zoltek adopted ASC 820 on October 1, 2008. ASC 820 defines fair value, establishes a framework for measuring fair value, and expands disclosures about fair value measurements. The fair value hierarchy for disclosure of fair value measurements under ASC 820 is as follows:
Level 1 — Valuations based on quoted prices for identical assets or liabilities in active markets that the Company has the ability to access.
Level 2 — Valuations based on quoted prices in markets that are not active or for which all significant inputs are observable, either directly or indirectly.
Level 3 — Valuations based on inputs that are unobservable and significant to the overall fair value measurement.
Interest Rate Swap
On March 30, 2012, the Company entered into an interest rate swap agreement that fixes the interest rate on its term loan in order to manage the risk associated with changes in interest rates. This interest rate swap has been designated as a cash flow hedge of our expected interest payments under the FASB’s ASC Topic 815, Derivatives and Hedging. This instrument effectively converts variable interest payments on the term loan into fixed payments. In a cash flow hedge, the effective portion of the change in fair value of the hedging derivative is recorded in accumulated other comprehensive income (loss) and is subsequently reclassified into earnings during the same period in which the hedged item affects earnings. The change in fair value of any ineffective portion of the hedging derivative is recognized immediately in earnings. The fair value of the interest rate swap is determined using an internal valuation model which relies on the expected LIBOR yield curve as the most significant input. Additionally included in the model are estimates of counterparty and the Company’s non-performance risk. Because the significant input is directly observable or can be corroborated by observable market data, we have categorized the interest rate swap as Level 2 within the fair value hierarchy.
Warrants and Restricted Shares
The Company adopted ASC 815-40 on October 1, 2009. In connection with the adoption, the Company determined that its outstanding warrants as of the adoption date, which include warrants issued in May 2006, July 2006, October 2006 and December 2006, are not indexed to the Company’s own stock. Accordingly, these warrants should be treated as a liability carried at fair value, which requires separate accounting pursuant to ASC 815-40. The fair value of the warrants was reclassified from equity to a liability carried at fair value on October 1, 2009.
The Company used a Black-Scholes pricing model to determine the fair value of the warrants. Fair values under the Black-Scholes model are partially based on the expected remaining life of the warrants, which is an unobservable input. Therefore, we have deemed the liability associated with the outstanding warrants to have Level 3 inputs. If the inputs used to measure the financial assets and liabilities fall within more than one level described above, the categorization is based on the lowest level input that is significant to the fair value measurement of the instrument.
The fair value of the warrants is determined using the Black-Scholes option-pricing model with the following weighted average assumptions as of September 30, 2012:
| Outstanding Warrant Issuances | |
| | |
| | | December 2006 | |
| Warrants issued - shares | | 827,789 | |
| Expiration of warrants | | December 2012 | |
| Per share exercise price of warrants | | $ | 28.06 | |
| Expected remaining life of warrants (in years) | | | 0.21 | |
| Risk-free interest rate | | | 0.09 | % |
| Stock volatility | | | 71.44 | % |
| Dividend yield | | | 0.00 | % |
A liability carried at fair value of $3.1 million was established related to the warrants as of October 1, 2009. The adoption of ASC 815-40 also resulted in a cumulative adjustment to accumulated deficit of $12.6 million and a cumulative adjustment to additional paid-in capital of $15.6 million. The warrants are remeasured and adjusted to fair value at the end of each reporting period. If the warrants are not exercised, the liability will continue to be remeasured each quarter over the remaining contractual life of the warrants.
At September 30, 2012, the Company remeasured the outstanding warrant liability and recorded a fair value of less than $0.1 million. As a result of the remeasurement, the Company recorded a change in fair value associated with these warrants as a gain totaling less than $0.1 million for fiscal 2012.
Beginning in the quarter ended June 30, 2010, the Company determined that liability classification of its restricted shares is appropriate based on the recent practice of settling restricted shares in cash. The unamortized fair value of the restricted shares was reclassified from equity to a liability carried at fair value on April 1, 2010. The fair value of the restricted shares is determined using the current market price for the shares and an estimated forfeiture rate, an unobservable input:
| Outstanding Restricted Stock | |
| | | | |
| Shares outstanding - shares | | 15,000 | |
| Share price | | $ | 7.69 | |
| Forfeiture Rate | | | 0.00 | % |
Although the market price of the shares are based on quoted prices in an active market, the forfeiture rate is considered to be a significant input and therefore we have deemed the liability associated with the restricted shares to be Level 3.
The fair value of warrants, restricted shares, and the interest rate swap as of September 30, 2012 and 2011 was as follows (amounts in thousands, except per share amounts):
| Description | | Wtd. Avg Fair Value Per Share | | | Shares Issuable Upon Exercise | | | Total | | | Level 1 | | | Level 2 | | | Level 3 | |
| | | | | | | | | | | | | | | | | | | |
| Warrants -- October 2006 Issuance | | | | | | | | | | | | | | | | |
| As of September 30, 2011 | | | - | | | | 102,835 | | | | - | | | | - | | | | - | | | | - | |
| As of September 30, 2012 | | | - | | | | - | | | | - | | | | - | | | | - | | | | - | |
| | | | | | | | | | | | | | | | | | | | | | | | | |
| Warrants -- December 2006 Issuance | | | | | | | | | | | | | | | | | | | | | |
| As of September 30, 2011 | | | 0.11 | | | | 827,789 | | | | 94 | | | | - | | | | - | | | | 94 | |
| As of September 30, 2012 | | | - | | | | 827,789 | | | | - | | | | - | | | | - | | | | - | |
| | | | | | | | | | | | | | | | | | | | | | | | | |
| Restricted Shares | | | | | | | | | | | | | | | | | | | | | | | | |
| As of September 30, 2011 | | | 3.07 | | | | 30,000 | | | | 92 | | | | - | | | | - | | | | 92 | |
| As of September 30, 2012 | | | 7.33 | | | | 15,000 | | | | 110 | | | | - | | | | - | | | | 110 | |
| | | | | | | | | | | | | | | | | | | | | | | | | |
| Interest Rate Swap | | | | | | | | | | | | | | | | | | | | | | | | |
| As of September 30, 2011 | | | - | | | | - | | | | - | | | | - | | | | - | | | | - | |
| As of September 30, 2012 | | | - | | | | - | | | | 384 | | | | - | | | | 384 | | | | - | |
During the fiscal 2012, 102,835 warrants expired. The fair value liability balance of warrants decreased by $0.1 million during fiscal 2012 related to a decrease in fair value during fiscal 2012. The restricted shares balance increased by less than $0.1 million related to an increase in fair value of $0.1 million recorded as selling, general and administrative expenses offset by the settlement of $0.1 million (15,000 shares) that vested during fiscal 2012, for a total balance of $0.1 million at September 30, 2012, from $0.1 million at September 30, 2011. Both the warrant and restricted stock fair value balances are recorded as short-term liabilities in “Accrued expenses and other liabilities” on the balance sheet. The interest rate swap balance increased by $0.4 million related to an increase in fair value. The interest rate swap balance is recorded as a long-term liability in “Liabilities carried at fair value” on the balance sheet.
| Derivatives designated as hedging instruments | | Change in Unrealized Gain (Loss) Recognized in Accumulated Other Comprehensive Loss | |
| | | | |
| Interest Rate Swap | | | |
| | | | |
| Twelve months ended September 30, 2012 | | $ | (384 | ) |
As of September, 2012, no deferred gains or losses are expected to be reclassified into earnings as interest expense related to the interest rate swap over the next twelve months as its critical terms matched those of the term loan at inception and through September 30, 2012.
The recorded amounts of cash, accounts receivable, debt, and accounts payable approximate their fair values at both September 30, 2012 and 2011.
The Company maintains a 401(k) Profit Sharing Plan for the benefit of employees who have completed six months of service, worked 501 or more hours in the current year and attained 21 years of age. No contributions were made by the Company for fiscal years 2012, 2011 and 2010.
Item 9. Changes in and Disagreements with Accountants on Accounting and Financial Disclosures
Item 9A. Controls and Procedures
Evaluation of Controls and Procedures
Under the supervision and with the participation of our management, including our Chief Executive Officer and Chief Financial Officer, we conducted an evaluation of the effectiveness of the Company’s disclosure controls and procedures, as defined in Rules 13a-15(e) and 15d-15(e) of the Securities and Exchange Act of 1934 as amended (the “Exchange Act.”). Based on that evaluation, the Chief Executive Officer and Chief Financial Officer has concluded that as of September 30, 2012, the Company’s disclosure controls and procedures were effective.
Management’s Report on Internal Control over Financial Reporting
Our management is responsible for establishing and maintaining adequate internal control over financial reporting, as defined in Rule 13a-15(f) under the Exchange Act. Under the supervision and with the participation of our management, including the Chief Executive Officer and Chief Financial Officer, we conducted an evaluation of the effectiveness of our internal control over financial reporting as of September 30, 2012. All internal control systems have inherent limitations, including the possibility of circumvention and overriding the control. Accordingly, even effective internal control can provide only reasonable assurance as to the reliability of financial statement preparation and presentation. Further, because of changes in conditions, the effectiveness of internal control may vary over time.
In making its evaluation, our management used the criteria set forth by the Committee of Sponsoring Organizations of the Treadway Commission (“COSO”) in Internal Control-Integrated Framework. Based upon this evaluation, our management has concluded that as of September 30, 2012, our internal control over financial reporting was effective.
Attestation Report of Independent Registered Public Accounting Firm
Our independent registered public accounting firm, Ernst & Young LLP, has audited the effectiveness of our internal control over financial reporting, as of September 30, 2012, as stated in its report which is included herein.
Changes in Internal Control over Financial Reporting
There were no changes in our internal control over financial reporting that occurred during the quarter ended September 30, 2012 that materially affected, or are reasonably likely to materially affect, our internal control over financial reporting.
Item 9B. Other Information
None.
Item 10. Directors, Executive Officers and Corporate Governance
The information set forth under the captions “Election of Directors,” “Other Matters” and “Compliance with Section 16(a) of the Securities Exchange Act of 1934” in the registrant's Proxy Statement for its 2013 Annual Meeting of Shareholders is incorporated herein by this reference.
The name, age, position and principal occupation of each of the executive officers of the Company is set forth below:
Zsolt Rumy, age 69, is the founder of the Company and has served as its Chairman, Chief Executive Officer and President and as a Director since 1975 and served as its interim Chief Financial Officer from May 2008 to April 2009. Mr. Rumy received a B.S. degree in Chemical Engineering from the University of Minnesota in 1966.
Andrew W. Whipple, age 49, has served as the Chief Financial Officer since April 2009. Prior to this, he served as Chief Accounting Officer of the Company from May 2008 to April 2009. Mr. Whipple served as a Senior Manager in the St. Louis office of Deloitte & Touche, LLP where he worked from 1993 to 1998, when he joined Digital Teleport, Inc. as its Controller and was later promoted to Chief Financial Officer. After Digital Teleport was acquired by CenturyTel in June of 2003, he became Vice President of Operational Support at the telecommunications company and served there for four years prior to joining E3 Biofuels as its Chief Financial Officer from 2007 to 2008. Mr. Whipple is a CPA and received a B.S. degree in accounting from Virginia Tech in 1985.
George E. Husman, 67, has served as the Chief Technology Officer of the Company since January 2007. Mr. Husman holds a B.S. in aerospace engineering from the University of Cincinnati and a M.S. in materials engineering from the University of Dayton. He spent 18 years at the Materials Directorate at Wright-Patterson Air Force Base in research and management positions, including Director of the Nonmetallic Materials Division. Upon leaving the Air Force in 1986, he joined BASF Structural Materials, Inc., in Charlotte, North Carolina, as Vice President for Business Development. At BASF, he also served as VP & General Manager of Thermoplastic Composites and Vice President for Research and Development. In 1993, Mr. Husman joined Southern Research Institute in Birmingham, Alabama, as Vice President of the Engineering Division, and prior to joining Zoltek, he was the Associate Director for Research in the School of Engineering at the University of Alabama at Birmingham.
Dr. Philip Schell, 56, has served as Executive Vice President-Wind Energy since January 2011. Prior to this, he served as Vice President of Sales since July 2009. Prior to joining Zoltek, Dr. Schell was Director of Corporate Growth at Fibergrate Composite Structures from August 2006 to July 2009. Additionally, he has worked at PPG Industries and Saint-Gobain Vetrotex in their Fiber Glass business units as well the adhesives business unit of Ashland Chemical. During his time with PPG, Dr. Schell spent five years as European Research Manager for PPG’s fiber glass business located in Hoogezand, The Netherlands. Dr. Schell holds over 10 United States patents from research and development work carried out at PPG Industries and Ashland and has published several papers in various American Chemical Society journals from work carried out in graduate school. He earned a B.A. in chemistry from Benedictine College and a Ph.D. from Kansas State University in Physical Organic Chemistry.
David Purcell, 37, has served as Vice President-Composite Intermediates Division since January 2011. Prior to this, he served as the Director of Marketing and Business Development from January 2008 to 2011. Prior to joining Zoltek, Mr. Purcell spent ten years as a management consultant in Deloitte’s Strategy & Operations Group, where he primarily worked on mergers & acquisitions in the high-tech manufacturing industry. Mr. Purcell holds an MBA and Masters in Engineering from the University of Michigan, and a B.S. in Mechanical Engineering from Bucknell University.
Item 11. Executive Compensation
The information set forth under the captions “Directors' Fees” and “Compensation of Executive Officers” in the registrant's Proxy Statement for its 2013 Annual Meeting of Shareholders is incorporated herein by this reference.
Item 12. Security Ownership of Certain Beneficial Owners and Management and Related Stockholder Matters
The information set forth under the captions “Voting Securities and Principal Holders Thereof” and “Security Ownership by Management” in the registrant's Proxy Statement for its 2013 Annual Meeting of Shareholders is incorporated herein by this reference.
Item 13. Certain Relationships and Related Transactions, and Director Independence
The information set forth under the captions “Certain Transactions” and “Election of Directors” in the registrant's Proxy Statement for its 2013 Annual Meeting of Shareholders is incorporated herein by this reference.
Item 14. Principal Accounting Fees and Services
The information set forth under the caption “Principal Accountant Fees and Services” in the registrant's Proxy Statement for its 2013 Annual Meeting of Shareholders is incorporated herein by this reference.
Item 15. Exhibits and Financial Statement Schedules
(a) (1) Financial statements: The following financial statements and reports thereon are included in Item 8 of this report:
Report of Management
Reports of Independent Registered Public Accounting Firm – Ernst & Young LLP*
Consolidated Balance Sheets as of September 30, 2012 and 2011
Consolidated Statements of Operations for the years ended September 30, 2012, 2011 and 2010
Consolidated Statements of Changes in Shareholders' Equity for the years ended September 30, 2012, 2011 and 2010
Consolidated Statements of Cash Flows for the years ended September 30, 2012, 2011 and 2010
Notes to Consolidated Financial Statements
*Report on financial statement schedule is included in Exhibit 23.1 hereto.
(2) The following financial statement schedule is included in Part IV of this report:
Rule 12-09 Valuation and Qualifying Accounts and Reserves
For the fiscal year ended September 30, 2012Rule 12-09 Valuation and Qualifying Accounts and Reserves(Amounts in thousands)
| Column A | | Column B | | Column C | | | Column D | | | Column E | |
| | | | | Additions | | | | | | | |
| | | Balance at beginning of period | | Charged to costs and expenses | | | Charged to other accounts describe | | | Deductions describe | | | Balance at end of period | |
| Reserve for doubtful accounts | | $ | 110 | | $ | 190 | (1) | | | | | $ | 77 | (9) | | $ | 223 | |
| Reserve for inventory valuation | | $ | 659 | | $ | 247 | (3) | | | | | $ | 553 | (4) | | $ | 353 | |
| Deferred tax valuation | | $ | 24,573 | | | | | | | | | | $ | 2,436 | (5)(6)(10) | | $ | 22,137 | |
For the fiscal year ended September 30, 2011Rule 12-09 Valuation and Qualifying Accounts and Reserves(Amounts in thousands)
| Column A | | Column B | | Column C | | | Column D | | | Column E | |
| | | | | | Additions | | | | | | | | | |
| | | Balance at beginning of period | | Charged to costs and expenses | | | Charged to other accounts describe | | | Deductions describe | | | Balance at end of period | |
| Reserve for doubtful accounts | | $ | 178 | | $ | 26 | (1) | | $ | - | | | $ | 94 | (2) | | $ | 110 | |
| Reserve for inventory valuation | | $ | 879 | | $ | 454 | (3) | | $ | - | | | $ | 674 | (4) | | $ | 659 | |
| Deferred tax valuation | | $ | 22,053 | | $ | - | | | $ | 2,520 | (6)(7)(8) | | | | | | $ | 24,573 | |
For the fiscal year ended September 30, 2010Rule 12-09 Valuation and Qualifying Accounts and Reserves(Amounts in thousands)
| Column A | | Column B | | Column C | | | Column D | | | Column E | |
| | | | | | Additions | | | | | | | | | |
| | | Balance at beginning of period | | Charged to costs and expenses | | | Charged to other accounts describe | | | Deductions describe | | | Balance at end of period | |
| Reserve for doubtful accounts | | $ | 2,356 | | $ | 497 | (1) | | $ | - | | | $ | 2,675 | (2) | | $ | 178 | |
| Reserve for inventory valuation | | $ | 665 | | $ | 214 | (3) | | $ | - | | | $ | - | | | $ | 879 | |
| Deferred tax valuation | | $ | 21,634 | | $ | - | | | $ | 419 | (6)(7)(8) | | $ | - | | | $ | 22,053 | |
| | (1) | Reserving of doubtful receivable. |
| | | Recovery of receivables previously listed as doubtful. |
| | (3) | Increase reserve for slow-moving product. |
| | (4) | Write off of slow moving inventory. |
| | (5) | Includes increase in effective tax rate in Hungary. |
| | (6) | Includes a reduction in required valuation allowance due to domestic net operating loss (“NOL”) utilization. |
| | (7) | Reduction in required valuation due to non-qualified stock options deduction for which no cash benefit has been realized. |
| | (8) | Increase NOL due to losses incurred in Mexico. |
| | (9) | Write-off of uncollectible receivable. |
| | (10) | Includes a reduction in required valuation allowance due to foreign NOL utilization. |
Schedules other than those listed above have been omitted because they are either not required or not applicable, or because the information is presented in the consolidated financial statements or the notes thereto.
Pursuant to the requirements of Section 13 or 15(d) of the Securities Exchange Act of 1934, the registrant has duly caused this report to be signed on its behalf by the undersigned, thereunto duly authorized.
ZOLTEK COMPANIES, INC.
(Registrant)
| | By: | /s/ ZSOLT RUMY | |
| | | Zsolt Rumy, Chairman of the Board, President and | |
| | | Chief Executive Officer | |
Date: November 27, 2012
Pursuant to the requirements of the Securities Exchange Act of 1934, this report has been signed below by the following persons on behalf of the registrant and in the capacities and on the dates indicated.
| Signature | | Title | | Date |
| | | | | |
| /s/ ZSOLT RUMY | | Chairman, President, | | |
| Zsolt Rumy | | Chief Executive Officer and Director | | November 27, 2012 |
| | | | | |
| | | | | |
| /s/ ANDREW W. WHIPPLE | | Chief Financial Officer | | November 27, 2012 |
| Andrew W. Whipple | | | | |
| | | | | |
| | | | | |
| /s/ LINN H. BEALKE | | Director | | November 27, 2012 |
| Linn H. Bealke | | | | |
| | | | | |
| | | | | |
| /s/ CHARLES A. DILL | | Director | | November 27, 2012 |
| Charles A. Dill | | | | |
| | | | | |
| | | | | |
| /s/ GEORGE E. HUSMAN | | Director | | November 27, 2012 |
| George E. Husman | | | | |
| | | | | |
| | | | | |
| /s/ MICHAEL D. LATTA | | Director | | November 27, 2012 |
| Michael D. Latta | | | | |
| | | | | |
| | | | | |
| /s/ PEDRO REYNOSO | | Director | | November 27, 2012 |
| Pedro Reynoso | | | | |
Exhibit Number | | Description |
| | | |
| 3.1 | | Restated Articles of Incorporation of the Registrant dated October 7, 1992, filed as Exhibit 3.1 to Registrant’s Registration Statement on Form S-3 (Reg. No.333-143996) and incorporated herein by reference. |
| | | |
| 3.2 | | Certificate of Amendment of Restated Articles of Incorporation of the Registrant dated February 15, 1996, filed as Exhibit 3.2 to Registrant’s Registration Statement on Form S-3 (Reg. No.333-143996) and incorporated herein by reference. |
| | | |
| 3.3 | | Certificate of Amendment of Restated Articles of Incorporation of the Registrant dated February 7, 1997, filed as Exhibit 3.3 to Registrant’s Registration Statement on Form S-3 (Reg. No.333-143996) and incorporated herein by reference. |
| | | |
| 3.4 | | Restated By-Laws of the Registrant dated September 22, 1992, filed as Exhibit 3.4 to Registrant’s Registration Statement on Form S-3 (Reg. No.333-143996) and incorporated herein by reference. |
| | | |
| 4.1 | | Form of certificate for Common Stock, filed as Exhibit 4.1 to Registrant’s Registration Statement on Form S-1 (Reg. No. 33-51142) and incorporated herein by reference. |
| | | |
| 4.2 | | Amendment No. 1 to Loan and Warrant Agreement and Registration Rights Agreement among the Registrant and the Lender parties thereto, filed as Exhibit 4.2 to the Registrant’s Current Report on Form 8-K dated April 28, 2006 and incorporated herein by reference. |
| | | |
| 4.3 | | Form of Warrant, filed as Exhibit 4.4 to the Registrant’s Current Report on Form 8-K dated April 28, 2006 and incorporated herein by reference. |
| | | |
| 4.4 | | Amendment No. 2 to Loan and Warrant Agreement and Registration Rights Agreement, dated as of December 14, 2006, among the Registrant and the Lenders, filed as Exhibit 4.3 to the Registrant’s Current Report on Form 8-K dated December 14, 2006 and incorporated herein by reference. |
| | | |
| 4.5 | | Form of Warrant, filed as Exhibit 4.4 to the Registrant’s Current Report on Form 8-K dated December 14, 2006 and incorporated herein by reference. |
| | | |
| 10.1 | | Zoltek Companies, Inc. Amended and Restated Directors Stock Option Plan filed as Exhibit 10.1 to Registrant's Quarterly Report on Form 10-Q dated August 13, 1999 is incorporated herein by reference. |
| | | |
| 10.2 | | Credit Agreement, dated April 27, 2012 by and among Zoltek Companies,Inc., Zoltek Corporation, Zoltek Properties, Inc , Engineering Technology Corporation, Zoltek Automotive, and Zoltek Composite Intermediates LLC, in favor of JPMorgan Chase Bank, N.A. filed as Exhibit 10.1 to Registrants Quarterly Report on Form 10-Q for the quarter ended June 30, 2012, is incorporated herein by reference. |
| | | |
| 10.3 | | Amended Credit Facility Agreement, dated June 1, 2012, between Raiffeisen Bank and Zoltek Zrt., the wholly owned subsidiary of Zoltek Companies,Inc., filed as Exhibit 10.2 to Registrants Quarterly Report on Form 10-Q for the quarter ended June 30, 2012, is incorporated herein by reference. |
| | | |
| 10.4 | | Zoltek Companies, Inc. 2003 Long-Term Equity Incentive Plan, filed as Appendix A to Registrant's definitive proxy statement for the 2002 Annual Meeting of Shareholders is incorporated herein by reference. |
| | | |
| 10.5 | | Restated and Amended Uncommitted Credit Line Agreement, dated June 1, 2012, between Raiffeisen Bank and Zoltek Zrt., the wholly owned subsidiary of Zoltek Companies,Inc., filed as Exhibit 10.3 to Registrants Quarterly Report on Form 10-Q for the quarter ended June 30, 2012, is incorporated herein by reference. |
| | | |
| 10.6 | | Zoltek Companies, Inc. 2008 Director Incentive Plan, filed as Appendix A to the Registrant’s Proxy Statement on Schedule 14A filed on January 2, 2008 and incorporated herein by this reference.* |
| | | |
| 10.7 | | Zoltek Companies, Inc. 2008 Long Term Incentive Plan, filed as Appendix B to the Registrant’s Proxy Statement on Schedule 14A filed on January 2, 2008 and incorporated herein by this reference.* |
| | | |
| 10.8 | | Second Trade Agreement dated as of May 29, 2007, between Vestas Wind Systems A/S and Zoltek Companies, Inc., filed as Exhibit 10.11 to the Registrant’s Annual Report on Form 10-K/A for the year ended September 30, 2008, and incorporated herein by this reference.** |
| | | |
| 10.9 | | Joint and Several Guarantee Agreement, dated June 1, 2012, between Raiffeisen Bank and Zoltek Zrt., the wholly owned subsidiary of Zoltek Companies,Inc., filed as Exhibit 10.4 to Registrants Quarterly Report on Form 10-Q for the quarter ended June 30, 2012, is incorporated herein by reference. |
| | | |
| 21 | | Subsidiaries of the Registrant filed as Exhibit 21 to the Registrant’s Annual Report on Form 10-K for the fiscal year ended September 30, 2007 and incorporated herein by reference. |
| | | |
| 23.1 | | Consent of Ernst & Young LLP. |
| 31.1 | | Certification of Chief Executive Officer pursuant to Rule 13a-14(a) under the Securities Exchange Act of 1934, as amended is filed herewith. |
| | | |
| 31.2 | | Certification of Chief Financial Officer pursuant to Rule 13a-14(a) under the Securities Exchange Act of 1934, as amended is filed herewith. |
| | | |
| 32.1 | | Certification of Chief Executive Officer pursuant to 18 U.S.C. Section 1350, as adopted pursuant to Section 906 of the Sarbanes-Oxley Act of 2002 is filed herewith. |
| | | |
| 32.2 | | Certification of Chief Financial Officer pursuant to 18 U.S.C. Section 1350, as adopted pursuant to Section 906 of the Sarbanes-Oxley Act of 2002 is filed herewith. |
| | | |
101.INS*** | | XBRL Instance |
| | | |
| 101.SCH*** | | XBRL Taxonomy Extension Schema |
| | | |
| 101.CAL*** | | XBRL Taxonomy Extension Calculation |
| | | |
| 101.DEF*** | | XBRL Taxonomy Extension Definition |
| | | |
| 101.LAB*** | | XBRL Taxonomy Extension Labels |
| | | |
| 101.PRE*** | | XBRL Taxonomy Extension Presentation |
| | | |
| * | | Management compensatory plan or arrangement |
| | | |
| ** | | Confidential portions of this exhibit have been redacted and filed separately with the Securities and Exchange Commission pursuant to a confidential treatment request in accordance with Rule 24b-2 of the Securities Exchange Act of 1934, as amended. |
| | | |
| *** | | information is furnished and not filed or a part of a registration statement or prospectus for purposes of Sections 11 or 12 of the Securities Act of 1933, as amended, is deemed not filed for purposes of Section 18 of the Securities Exchange Act of 1934, as amended, and otherwise is not subject to liability under these sections. |
55