EXHIBIT 99

Quarterly
Operating Supplement
Fourth Quarter 2003
Quarterly Operating Supplement
Table of Contents
| | |
| | | Page
|
Company Profile | | 2 |
| |
Company Information | | 2 |
| |
Key Financial Highlights | | 3 |
| |
Statutory Income Statements | | 4 |
| |
Statutory Balance Sheets | | 5 |
| |
Gross Premiums Written by Product | | 6 |
| |
Total Claims-Paying Resources and Leverage Ratios | | 6 |
| |
Investment Portfolio Highlights | | 7 |
| |
Insured Portfolio Highlights | | 8 |
| |
Management Team | | 12 |
| | |
1 | | Quarterly Operating Supplement for the Period Ended December 31, 2003 /Table of Contents |
Quarterly Operating Supplement
Radian Asset Assurance Inc.
Quarterly Operating Supplement
December 31, 2003
Company Profile
Radian Asset Assurance Inc., founded in 1985 and rated AA by Standard & Poor’s and Fitch, provides credit enhancement to the holders of debt obligations and asset-backed securities. As a direct writer of financial guaranty insurance for municipal bonds, asset-backed securities and structured transactions, the Company plays an important role in extending the benefits of insurance to a broad range of institutions and securities issuers.
Radian Asset Assurance Inc. is a subsidiary of Radian Group Inc. (NYSE: RDN), a global credit enhancement provider headquartered in Philadelphia, with significant operations in New York City and London.
| | |
Company Information | | |
| |
Radian Asset Assurance Inc. | | Contact: |
335 Madison Avenue | | John C. DeLuca |
New York, New York 10017 | | Senior Vice President, Market Development |
1 877 337.4925 (within the U.S.) | | 1 212 984.9222 |
1 212 983.3100 | | john.deluca@radian.biz |
| | |
2 | | Quarterly Operating Supplement for the Period Ended December 31, 2003 /Company Profile / Company Information |
Quarterly Operating Supplement
Radian Group Inc. and Subsidiaries
Key Financial Highlights* ($ Thousands)
| | | | | | | | | | | | | |
| | | Twelve months ended December 31, 2003
|
| | | Mortgage
Insurance
| | Financial
Services
| | | Financial
Guaranty
| | Total
|
Net premiums written | | $ | 741,840 | | $ | — | | | $ | 368,637 | | $ | 1,110,477 |
| | |
|
| |
|
|
| |
|
| |
|
|
Net premiums earned | | $ | 759,620 | | $ | — | | | $ | 248,563 | | $ | 1,008,183 |
Net investment income | | | 107,690 | | | 36 | | | | 78,437 | | | 186,163 |
Equity in net income of affiliates | | | — | | | 95,507 | | | | 9,969 | | | 105,476 |
Other income | | | 32,003 | | | 27,680 | | | | 3,639 | | | 63,322 |
| | |
|
| |
|
|
| |
|
| |
|
|
Total revenues | | | 899,313 | | | 123,223 | | | | 340,608 | | | 1,363,144 |
| | |
|
| |
|
|
| |
|
| |
|
|
Provision for losses(1) | | | 309,272 | | | — | | | | 166,782 | | | 476,054 |
Policy acquisition costs | | | 70,195 | | | — | | | | 58,323 | | | 128,518 |
Other operating expenses | | | 125,951 | | | 47,058 | | | | 38,068 | | | 211,077 |
Interest expense | | | 21,467 | | | 3,162 | | | | 12,913 | | | 37,542 |
| | |
|
| |
|
|
| |
|
| |
|
|
Total expenses | | | 526,885 | | | 50,220 | | | | 276,086 | | | 853,191 |
| | |
|
| |
|
|
| |
|
| |
|
|
Gain/(loss) on disposition of investments | | | 8,123 | | | (2,284 | ) | | | 11,548 | | | 17,387 |
Change in fair value of derivative instruments | | | 3,275 | | | 90 | | | | 774 | | | 4,139 |
| | |
|
| |
|
|
| |
|
| |
|
|
Net gains/(losses) | | | 11,398 | | | (2,194 | ) | | | 12,322 | | | 21,526 |
| | |
|
| |
|
|
| |
|
| |
|
|
Pretax income | | | 383,826 | | | 70,809 | | | | 76,844 | | | 531,479 |
| | | | |
Income tax provision | | | 104,013 | | | 28,313 | | | | 13,252 | | | 145,578 |
| | |
|
| |
|
|
| |
|
| |
|
|
Net income | | $ | 279,813 | | $ | 42,496 | | | $ | 63,592 | | $ | 385,901 |
| | |
|
| |
|
|
| |
|
| |
|
|
Total assets | | $ | 3,849,210 | | $ | 314,628 | | | $ | 2,281,929 | | $ | 6,445,767 |
Deferred policy acquisition costs | | | 79,542 | | | — | | | | 139,237 | | | 218,779 |
Reserve for losses | | | 513,473 | | | — | | | | 276,907 | | | 790,380 |
Unearned premiums | | | 93,415 | | | — | | | | 625,234 | | | 718,649 |
| | | | |
Equity | | $ | 1,850,796 | | $ | 260,918 | | | $ | 1,114,130 | | $ | 3,225,844 |
| * | Reported on a GAAP basis. |
| (1) | On January 14, 2004, Radian Asset Assurance Inc. (the “Company”), which is included in the Financial Guaranty business segment of the Company’s ultimate parent, Radian Group Inc. (“Radian Group”), announced it would have claims from a single manufactured housing transaction that the Company reinsured from Radian Insurance Inc., an affiliate of the Company. The Company received its first default notice related to this transaction on January 27, 2004. The Company established $111.25 million in loss reserves for this transaction in 2003 for GAAP purposes. These reserves were established on a Statutory basis in 2004. The Company expects losses to be paid out over the next several years. The Company also announced that it would immediately receive $65.0 million in capital from Radian Group to offset (on an after-tax basis) the effect of this loss on the Company. |
| 3 | Quarterly Operating Supplement for the Period Ended December 31, 2003 /Key Financial Highlights |
Quarterly Operating Supplement
Radian Asset Assurance Inc.
Statutory Income Statements ($ Thousands)
| | | | | | | | | | | | | | | | |
| | | Quarter ended
| | | Twelve months ended
| |
| | | December 31
2003
| | | December 31
2002
| | | December 31
2003
| | | December 31
2002
| |
Revenues | | | | | | | | | | | | | | | | |
Gross premiums written | | $ | 79,684 | | | $ | 50,048 | | | $ | 194,870 | | | $ | 195,530 | |
Reinsurance premiums ceded | | | (5,575 | ) | | | (2,311 | ) | | | (25,697 | ) | | | (24,617 | ) |
| | |
|
|
| |
|
|
| |
|
|
| |
|
|
|
Net premiums written | | | 74,109 | | | | 47,737 | | | | 169,173 | | | | 170,913 | |
Increase in unearned premiums | | | (46,014 | ) | | | (19,465 | ) | | | (64,477 | ) | | | (76,765 | ) |
| | |
|
|
| |
|
|
| |
|
|
| |
|
|
|
Premiums earned | | | 28,095 | | | | 28,272 | | | | 104,696 | | | | 94,148 | |
| | |
|
|
| |
|
|
| |
|
|
| |
|
|
|
Net investment income | | | 7,387 | | | | 6,203 | | | | 29,542 | | | | 24,990 | |
Net realized gain on sale of investments | | | 1,669 | | | | 1,511 | | | | 4,318 | | | | 2,205 | |
| | |
|
|
| |
|
|
| |
|
|
| |
|
|
|
Net investment gains | | | 9,056 | | | | 7,714 | | | | 33,860 | | | | 27,195 | |
| | |
|
|
| |
|
|
| |
|
|
| |
|
|
|
Other (expense) income | | | (1,100 | ) | | | 120 | | | | (923 | ) | | | 594 | |
| | |
|
|
| |
|
|
| |
|
|
| |
|
|
|
Total revenues | | | 36,051 | | | | 36,106 | | | | 137,633 | | | | 121,937 | |
| | |
|
|
| |
|
|
| |
|
|
| |
|
|
|
Expenses | | | | | | | | | | | | | | | | |
Losses and loss adjustment expenses incurred | | | 13,060 | | | | 7,192 | | | | 25,730 | | | | 32,151 | |
Commissions incurred | | | (550 | ) | | | 3,959 | | | | (6,964 | ) | | | 12,386 | |
Other underwriting expenses | | | 14,433 | | | | 5,990 | | | | 49,176 | | | | 31,805 | |
| | |
|
|
| |
|
|
| |
|
|
| |
|
|
|
Total expenses | | | 26,943 | | | | 17,141 | | | | 67,942 | | | | 76,342 | |
| | |
|
|
| |
|
|
| |
|
|
| |
|
|
|
Income before income taxes | | | 9,108 | | | | 18,965 | | | | 69,691 | | | | 45,595 | |
Federal and foreign income taxes | | | 3,801 | | | | 6,622 | | | | 9,335 | | | | 13,371 | |
| | |
|
|
| |
|
|
| |
|
|
| |
|
|
|
Net income | | $ | 5,307 | | | $ | 12,343 | | | $ | 60,356 | | | $ | 32,224 | |
| | |
|
|
| |
|
|
| |
|
|
| |
|
|
|
Financial Ratios | | | | | | | | | | | | | | | | |
Loss and LAE Ratio | | | 46.5 | % | | | 25.4 | % | | | 24.6 | % | | | 34.1 | % |
Underwriting Expense Ratio | | | 18.7 | % | | | 20.8 | % | | | 25.0 | % | | | 25.9 | % |
| | |
|
|
| |
|
|
| |
|
|
| |
|
|
|
Combined Ratio | | | 65.2 | % | | | 46.2 | % | | | 49.6 | % | | | 60.0 | % |
| | |
|
|
| |
|
|
| |
|
|
| |
|
|
|
Effective April 30, 2003, Radian Asset Assurance Inc. (the “Company”) entered into an assumptive reinsurance agreement, in regard to its Trade Credit product, with an affiliated company (Radian Reinsurance Inc.) whereby the Company reversed assumed unearned premiums of $21.5 million and loss and loss adjustment reserves of $38.2 million. This transaction had no impact on premiums earned or losses and loss adjustment expenses incurred.
| | |
4 | | Quarterly Operating Supplement for the Period Ended December 31, 2003 /Statutory Income Statements |
Quarterly Operating Supplement
Radian Asset Assurance Inc.
Statutory Balance Sheets ($ Thousands)
| | | | | | |
| | | December 31
2003
| | December 31
2002
|
Assets | | | | | | |
Long-term bonds | | $ | 670,790 | | $ | 550,512 |
Preferred stock | | | 32,252 | | | 24,585 |
Common stock | | | 74,204 | | | 1,156 |
Cash and short-term investments | | | 67,333 | | | 46,100 |
Receivable for securities | | | 515 | | | 149 |
| | |
|
| |
|
|
Total Investments | | | 845,094 | | | 622,502 |
| | |
Investment income due and accrued | | | 9,722 | | | 6,919 |
Premiums receivable | | | 12,805 | | | 22,449 |
Funds held by reinsured companies | | | 73 | | | 1,863 |
Current federal income tax recoverable | | | 609 | | | — |
Net deferred tax asset | | | 1,130 | | | 1,531 |
Other assets | | | — | | | 2,118 |
| | |
|
| |
|
|
Total Assets | | $ | 869,433 | | $ | 657,382 |
| | |
|
| |
|
|
Liabilities | | | | | | |
Contingency reserve | | $ | 59,462 | | $ | 39,272 |
Losses and loss adjustment expenses | | | 19,847 | | | 50,453 |
Reinsurance payable on paid losses and loss adjustment expenses | | | 2,434 | | | 4,843 |
Unearned premiums | | | 298,178 | | | 233,701 |
Provision for reinsurance | | | 284 | | | 284 |
Payable to affiliates | | | 18,076 | | | 2,200 |
Payable for securities | | | 2,962 | | | 6,660 |
Ceded reinsurance premiums payable | | | 1,395 | | | 2,670 |
Federal and foreign income taxes payable | | | 3,642 | | | 5,360 |
Funds held under reinsurance treaties | | | 6,696 | | | — |
Accrued expenses and other liabilities | | | 3,463 | | | 2,480 |
| | |
|
| |
|
|
Total Liabilities | | | 416,439 | | | 347,923 |
| | |
|
| |
|
|
Policyholders’ Surplus | | | | | | |
Common stock | | | 15,000 | | | 15,000 |
Additional paid-in capital | | | 326,714 | | | 229,077 |
Unassigned funds | | | 111,280 | | | 65,382 |
| | |
|
| |
|
|
Total Policyholders’ Surplus | | | 452,994 | | | 309,459 |
| | |
|
| |
|
|
Total Liabilities and Policyholders’ Surplus | | $ | 869,433 | | $ | 657,382 |
| | |
|
| |
|
|
Qualified Statutory Capital | | $ | 512,456 | | $ | 348,731 |
| | |
|
| |
|
|
Effective April 30, 2003, Radian Asset Assurance Inc. (the “Company”) entered into an assumptive reinsurance agreement, in regard to its Trade Credit product, with an affiliated company (Radian Reinsurance Inc.) whereby the Company reversed assumed unearned premiums of $21.5 million and loss and loss adjustment reserves of $38.2 million. This transaction had no impact on premiums earned or losses and loss adjustment expenses incurred.
| | |
5 | | Quarterly Operating Supplement for the Period Ended December 31, 2003 /Statutory Balance Sheets |
Quarterly Operating Supplement
Radian Asset Assurance Inc.
Gross Premiums Written by Product ($ Thousands)
| | | | | | | | | | | | | | | | | | | |
| | | 4th Qtr
2003
| | 4th Qtr
2002
| | % Change
| | | YTD 2003
| | | YTD 2002
| | % Change
| |
Public Finance Direct | | $ | 42,036 | | $ | 19,575 | | 114.7 | % | | $ | 85,316 | | | $ | 63,431 | | 34.5 | % |
Structured Finance Direct | | | 34,276 | | | 14,771 | | 132.0 | % | | | 102,800 | | | | 72,788 | | 41.2 | % |
Public Finance Reinsurance | | | 860 | | | — | | — | | | | 5,610 | | | | 2,468 | | 127.3 | % |
Structured Finance Reinsurance | | | 2,512 | | | 5,162 | | –51.3 | % | | | 10,837 | | | | 18,878 | | –42.6 | % |
Trade Credit Reinsurance | | | — | | | 10,540 | | –100.0 | % | | | (9,693 | ) | | | 37,965 | | –125.5 | % |
| | |
|
| |
|
| | | | |
|
|
| |
|
| | | |
| | | $ | 79,684 | | $ | 50,048 | | 59.2 | % | | $ | 194,870 | | | $ | 195,530 | | –0.3 | % |
| | |
|
| |
|
| | | | |
|
|
| |
|
| | | |
Effective April 30, 2003, Radian Asset Assurance Inc. (the “Company”) entered into an assumptive reinsurance agreement, in regard to its Trade Credit product, with an affiliated company (Radian Reinsurance Inc.) whereby the Company reversed assumed unearned premiums of $21.5 million and loss and loss adjustment reserves of $38.2 million. This transaction had no impact on premiums earned or losses and loss adjustment expenses incurred.
Total Claims-Paying Resources and Leverage Ratios
($ Thousands except ratios)
| | | | | | | | | |
| | | December 31
2003
| | December 31
2002
| | % Change
| |
Capital and Surplus | | $ | 452,994 | | $ | 309,459 | | 46 | % |
Contingency Reserve | | | 59,462 | | | 39,272 | | 51 | % |
| | |
|
| |
|
| | | |
Qualified Statutory Capital | | | 512,456 | | | 348,731 | | 47 | % |
| | | |
Unearned Premium Reserve | | | 298,178 | | | 233,701 | | 28 | % |
Loss and Loss Expense Reserves | | | 19,847 | | | 50,453 | | –61 | % |
| | |
|
| |
|
| | | |
Total Policyholders’ Reserves | | | 830,481 | | | 632,885 | | 31 | % |
| | | |
Present Value of Future Installment Premiums | | | 190,266 | | | 151,032 | | 26 | % |
| | | |
Reinsurance and Soft Capital Facilities | | | 200,000 | | | 15,000 | | 1,233 | % |
| | |
|
| |
|
| | | |
Total Claims-Paying Resources | | $ | 1,220,747 | | $ | 798,917 | | 53 | % |
| | |
|
| |
|
| | | |
Total Debt Service (Principal and Interest) Outstanding | | $ | 28,961,961 | | $ | 22,081,339 | | 31 | % |
Capital Leverage Ratio1 | | | 57:1 | | | 63:1 | | | |
Claims-Paying Ratio2 | | | 24:1 | | | 28:1 | | | |
| 1 | Capital Leverage Ratio: Total debt service/Qualified statutory capital. |
| 2 | Claims-Paying Ratio: Total debt service/Total claims-paying resources. |
| | |
6 | | Quarterly Operating Supplement for the Period Ended December 31, 2003 /Gross Premiums / Total Claims-Paying Resources |
Quarterly Operating Supplement
Radian Asset Assurance Inc.
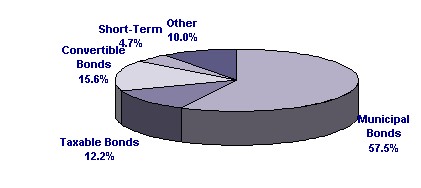
Investment Portfolio Highlights
Asset Quality
As of December 31, 2003, the book value of our investment portfolio was $823.5 million, with an average duration of 4.6 years.
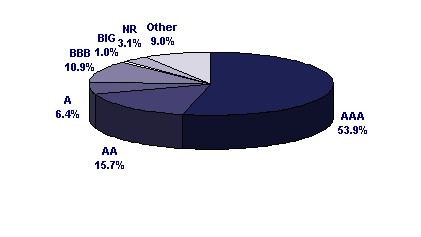
Asset Class
Our conservative portfolio is invested primarily in fixed-income securities. Our primary objective is to achieve total return, with a secondary objective of maximizing after-tax income.
| | |
7 | | Quarterly Operating Supplement for the Period Ended December 31, 2003 /Investment Portfolio Highlights |
Quarterly Operating Supplement
Radian Asset Assurance Inc.
Insured Portfolio Highlights ($ Thousands)
Geographic Diversification
| | | | | | | | | | | | |
State
| | Net Par
(12/31/2003)
| | Percent
of total
| | | Net Par
(12/31/2002)
| | Percent
of total
| |
New York | | $ | 1,279,650 | | 6.1 | % | | $ | 1,019,026 | | 6.7 | % |
Pennsylvania | | | 1,218,444 | | 5.9 | % | | | 993,019 | | 6.5 | % |
Texas | | | 1,081,670 | | 5.2 | % | | | 1,133,571 | | 7.4 | % |
Florida | | | 708,912 | | 3.4 | % | | | 649,067 | | 4.3 | % |
California | | | 695,664 | | 3.4 | % | | | 494,536 | | 3.2 | % |
Colorado | | | 511,114 | | 2.5 | % | | | 371,126 | | 2.4 | % |
Connecticut | | | 447,951 | | 2.2 | % | | | 463,912 | | 3.0 | % |
Illinois | | | 395,050 | | 1.9 | % | | | 362,451 | | 2.4 | % |
Ohio | | | 357,977 | | 1.7 | % | | | 215,141 | | 1.4 | % |
Massachusetts | | | 352,506 | | 1.7 | % | | | 266,640 | | 1.8 | % |
Total of top ten states | | | 7,048,938 | | 34.0 | % | | | 5,968,489 | | 39.1 | % |
Total of other states | | | 4,343,800 | | 21.0 | % | | | 3,406,208 | | 22.3 | % |
Domestic structured finance | | | 8,918,367 | | 43.0 | % | | | 5,282,486 | | 34.6 | % |
International | | | 406,482 | | 2.0 | % | | | 608,706 | | 4.0 | % |
Total | | $ | 20,717,587 | | 100.0 | % | | $ | 15,265,889 | | 100.0 | % |
| | |
8 | | Quarterly Operating Supplement for the Period Ended December 31, 2003 /Insured Portfolio Highlights |
Quarterly Operating Supplement
Radian Asset Assurance Inc.
Insured Portfolio Highlights ($ Thousands)
Sector Breakout
| | | | | | | | | | | | |
Public Finance
| | Net Par
(12/31/2003)
| | Percent
of total
| | | Net Par
(12/31/2002)
| | Percent
of total
| |
Healthcare | | $ | 2,603,369 | | 12.5 | % | | $ | 1,997,820 | | 13.1 | % |
General Obligations | | | 2,460,205 | | 11.9 | % | | | 2,105,718 | | 13.7 | % |
Education | | | 1,939,787 | | 9.4 | % | | | 1,549,056 | | 10.1 | % |
Long-Term Care | | | 1,054,633 | | 5.1 | % | | | 840,073 | | 5.5 | % |
Utilities | | | 890,419 | | 4.3 | % | | | 827,500 | | 5.4 | % |
Tax-Backed | | | 757,979 | | 3.7 | % | | | 497,104 | | 3.3 | % |
Other Public Finance | | | 680,833 | | 3.3 | % | | | 468,386 | | 3.1 | % |
Transportation | | | 405,082 | | 1.9 | % | | | 408,275 | | 2.7 | % |
Second-To-Pay Muni Wrap | | | 387,730 | | 1.8 | % | | | 442,891 | | 2.9 | % |
Housing | | | 183,462 | | 0.9 | % | | | 208,523 | | 1.4 | % |
Investor-Owned Utilities | | | 57,308 | | 0.3 | % | | | 59,856 | | 0.4 | % |
Subtotal Public Finance | | $ | 11,420,807 | | 55.1 | % | | $ | 9,405,202 | | 61.6 | % |
| | | | |
Structured Finance
| | Net Par
(12/31/2003)
| | Percent
of total
| | | Net Par
(12/31/2002)
| | Percent
of total
| |
Collateralized Debt Obligations | | $ | 6,720,501 | | 32.5 | % | | $ | 4,227,312 | | 27.6 | % |
Asset-Backed – Consumer | | | 981,871 | | 4.7 | % | | | 649,398 | | 4.3 | % |
Asset-Backed – Mortgage and MBS | | | 975,114 | | 4.7 | % | | | 192,886 | | 1.3 | % |
Asset-Backed – Commercial and Other | | | 397,647 | | 1.9 | % | | | 490,718 | | 3.2 | % |
Other Structured Finance | | | 221,647 | | 1.1 | % | | | 300,373 | | 2.0 | % |
Subtotal Structured Finance | | $ | 9,296,780 | | 44.9 | % | | $ | 5,860,687 | | 38.4 | % |
Total | | $ | 20,717,587 | | 100.0 | % | | $ | 15,265,889 | | 100.0 | % |
| | |
9 | | Quarterly Operating Supplement for the Period Ended December 31, 2003 /Insured Portfolio Highlights |
Quarterly Operating Supplement
Radian Asset Assurance Inc.
Insured Portfolio Highlights ($ Thousands)
Rating Distribution
| | | | | | | | | | | | |
Rating*
| | Net Par
(12/31/2003)
| | Percent
of total
| | | Net Par
(12/31/2002)
| | Percent
of total
| |
AAA | | $ | 4,998,370 | | 24.1 | % | | $ | 2,434,386 | | 16.0 | % |
AA | | | 3,072,299 | | 14.8 | % | | | 2,903,551 | | 19.0 | % |
A | | | 3,652,262 | | 17.6 | % | | | 2,638,433 | | 17.3 | % |
BBB | | | 7,625,867 | | 36.8 | % | | | 5,682,251 | | 37.2 | % |
Investment Grade | | | 406,110 | | 2.0 | % | | | 198,467 | | 1.3 | % |
Below Investment Grade | | | 634,814 | | 3.1 | % | | | 719,055 | | 4.7 | % |
Not Rated | | | 327,865 | | 1.6 | % | | | 689,746 | | 4.5 | % |
Total | | $ | 20,717,587 | | 100.0 | % | | $ | 15,265,889 | | 100.0 | % |
| * | Indicated category reflects highest rating of the three rating agencies. |
| | |
10 | | Quarterly Operating Supplement for the Period Ended December 31, 2003 /Insured Portfolio Highlights |
Quarterly Operating Supplement
Radian Asset Assurance Inc.
Insured Portfolio Highlights ($ Thousands)
10 Largest Public Finance Exposures
| | | | | | | | |
| | | Net Par
(12/31/2003)
| | Percent of
total Net Par
| | | Rating*
|
New York, New York GO | | $ | 184,223 | | 0.89 | % | | A |
Muni Leveraged Lease | | | 145,377 | | 0.70 | % | | A |
Virgin Islands Pub Fin Auth | | | 124,255 | | 0.60 | % | | BBB |
Jefferson Cnty Ala Sewer | | | 106,168 | | 0.51 | % | | A |
Second-To-Pay Muni Wrap | | | 90,000 | | 0.43 | % | | AAA |
Second-To-Pay Muni Wrap | | | 90,000 | | 0.43 | % | | AAA |
Second-To-Pay Muni Wrap | | | 88,000 | | 0.42 | % | | AAA |
Interlocken Consolidated Metropolitan District | | | 83,640 | | 0.40 | % | | BBB– |
Long Island Univ – New York St Dorm Auth | | | 81,393 | | 0.39 | % | | BBB– |
Orlando Regional Health Systems Florida | | | 78,558 | | 0.38 | % | | A– |
Total top ten | | $ | 1,071,614 | | 5.15 | % | | |
| | | |
10 Largest Structured Finance Exposures | | | | | | | | |
| | | |
| | | Net Par
(12/31/2003)
| | Percent of total Net Par
| | | Rating*
|
European Static Synthetic CDO | | $ | 270,900 | | 1.31 | % | | AAA |
U.S. Static Synthetic CDO | | | 270,000 | | 1.30 | % | | AAA |
U.S. Static Synthetic CDO | | | 270,000 | | 1.30 | % | | AA |
European Static Synthetic CDO | | | 264,590 | | 1.28 | % | | AAA |
CDO of ABS | | | 257,529 | | 1.24 | % | | AA |
U.S. Static Synthetic CDO | | | 252,051 | | 1.22 | % | | AA |
U.S. Static Synthetic CDO | | | 250,000 | | 1.21 | % | | AAA |
U.S. Static Synthetic CDO | | | 250,000 | | 1.21 | % | | AA+ |
U.S. Static Synthetic CDO | | | 250,000 | | 1.21 | % | | AAA |
European RMBS | | | 226,438 | | 1.09 | % | | AAA |
Total top ten | | $ | 2,561,508 | | 12.37 | % | | |
| * | Indicated category reflects highest rating of the three rating agencies. |
| | |
11 | | Quarterly Operating Supplement for the Period Ended December 31, 2003 /Insured Portfolio Highlights |
Quarterly Operating Supplement
Radian Asset Assurance Inc.
Management Team
Martin A. Kamarck
President
David J. Beidler
Senior Vice President, Senior Counsel
Edward McC. Bowers
Senior Vice President, Global Structured Products
Sally B. Campbell
Senior Vice President, Public Finance
John C. DeLuca
Senior Vice President, Market Development
Bonita Z. Dorland
Senior Vice President, Chief Risk Officer
Andrew C.J. Poole
Managing Director, Radian Representatives Ltd.
Jack Praschnik
Senior Vice President, Global Strategies
Patrick Rossi
Senior Vice President, Controller
Jeffrey C. Salton
Senior Vice President, Operations and Analysis
| | |
12 | | Quarterly Operating Supplement for the Period Ended December 31, 2003 /Radian Asset Assurance Inc. Management Team |

Quarterly
Operating Supplement
Fourth Quarter 2003
Quarterly Operating Supplement
Table of Contents
| | |
| | | Page
|
Company Profile | | 2 |
| |
Company Information | | 2 |
| |
Key Financial Highlights | | 3 |
| |
Statutory Income Statements | | 4 |
| |
Statutory Balance Sheets | | 5 |
| |
Gross Premiums Written by Product | | 6 |
| |
Total Claims-Paying Resources and Leverage Ratios | | 6 |
| |
Investment Portfolio Highlights | | 7 |
| |
Insured Portfolio Highlights | | 8 |
| |
Management Team | | 12 |
| | |
1 | | Quarterly Operating Supplement for the Period Ended December 31, 2003 /Table of Contents |
Quarterly Operating Supplement
Radian Reinsurance Inc.
Quarterly Operating Supplement
December 31, 2003
Company Profile
Radian Reinsurance Inc., founded in 1986 and rated AA by Fitch Ratings and Standard & Poor’s and Aa2 by Moody’s, was the first company dedicated exclusively to the reinsurance of investment-grade securities. The Company is a leading provider of treaty and facultative reinsurance for primary insurers of municipal bonds, asset-backed obligations and structured finance obligations, helping insurers manage portfolio risk exposure, increase insurance capacity, and meet regulatory and rating-agency capital requirements.
Radian Reinsurance Inc. is a subsidiary of Radian Group Inc. (NYSE: RDN), a global credit enhancement provider headquartered in Philadelphia, with significant operations in New York City and London.
| | |
Company Information | | |
Radian Reinsurance Inc. | | Contact: |
335 Madison Avenue | | John C. DeLuca |
New York, New York 10017 | | Senior Vice President, Market Development |
1 877 337.4925 (within the U.S.) | | 1 212 984.9222 |
1 212 983.3100 | | john.deluca@radian.biz |
| | |
2 | | Quarterly Operating Supplement for the Period Ended December 31, 2003 /Company Profile / Company Information |
Quarterly Operating Supplement
Radian Group Inc. and Subsidiaries
Key Financial Highlights* ($ Thousands)
| | | | | | | | | | | | | |
| | | Twelve months ended December 31, 2003
|
| | | Mortgage
Insurance
| | Financial
Services
| | | Financial
Guaranty
| | Total
|
Net premiums written | | $ | 741,840 | | $ | — | | | $ | 368,637 | | $ | 1,110,477 |
| | |
|
| |
|
|
| |
|
| |
|
|
Net premiums earned | | $ | 759,620 | | $ | — | | | $ | 248,563 | | $ | 1,008,183 |
Net investment income | | | 107,690 | | | 36 | | | | 78,437 | | | 186,163 |
Equity in net income of affiliates | | | — | | | 95,507 | | | | 9,969 | | | 105,476 |
Other income | | | 32,003 | | | 27,680 | | | | 3,639 | | | 63,322 |
| | |
|
| |
|
|
| |
|
| |
|
|
Total revenues | | | 899,313 | | | 123,223 | | | | 340,608 | | | 1,363,144 |
| | |
|
| |
|
|
| |
|
| |
|
|
Provision for losses(1) | | | 309,272 | | | — | | | | 166,782 | | | 476,054 |
Policy acquisition costs | | | 70,195 | | | — | | | | 58,323 | | | 128,518 |
Other operating expenses | | | 125,951 | | | 47,058 | | | | 38,068 | | | 211,077 |
Interest expense | | | 21,467 | | | 3,162 | | | | 12,913 | | | 37,542 |
| | |
|
| |
|
|
| |
|
| |
|
|
Total expenses | | | 526,885 | | | 50,220 | | | | 276,086 | | | 853,191 |
| | |
|
| |
|
|
| |
|
| |
|
|
Gain/(loss) on disposition of investments | | | 8,123 | | | (2,284 | ) | | | 11,548 | | | 17,387 |
Change in fair value of derivative instruments | | | 3,275 | | | 90 | | | | 774 | | | 4,139 |
| | |
|
| |
|
|
| |
|
| |
|
|
Net gains/(losses) | | | 11,398 | | | (2,194 | ) | | | 12,322 | | | 21,526 |
| | |
|
| |
|
|
| |
|
| |
|
|
Pretax income | | | 383,826 | | | 70,809 | | | | 76,844 | | | 531,479 |
| | | | |
Income tax provision | | | 104,013 | | | 28,313 | | | | 13,252 | | | 145,578 |
| | |
|
| |
|
|
| |
|
| |
|
|
Net income | | $ | 279,813 | | $ | 42,496 | | | $ | 63,592 | | $ | 385,901 |
| | |
|
| |
|
|
| |
|
| |
|
|
Total assets | | $ | 3,849,210 | | $ | 314,628 | | | $ | 2,281,929 | | $ | 6,445,767 |
Deferred policy acquisition costs | | | 79,542 | | | — | | | | 139,237 | | | 218,779 |
Reserve for losses | | | 513,473 | | | — | | | | 276,907 | | | 790,380 |
Unearned premiums | | | 93,415 | | | — | | | | 625,234 | | | 718,649 |
| | | | |
Equity | | $ | 1,850,796 | | $ | 260,918 | | | $ | 1,114,130 | | $ | 3,225,844 |
| * | Reported on a GAAP basis. |
| (1) | On January 14, 2004, Radian Asset Assurance Inc. (“Radian Asset Assurance”), an affiliate of Radian Reinsurance Inc. (the “Company”), which is included in the Financial Guaranty business segment of the Company’s ultimate parent, Radian Group Inc. (“Radian Group”), announced it would have claims from a single manufactured housing transaction that Radian Asset Assurance reinsured from Radian Insurance Inc., another affiliate of the Company and Radian Asset Assurance. Radian Asset Assurance received its first default notice related to this transaction on January 27, 2004. Radian Asset Assurance established $111.25 million in loss reserves for this transaction in 2003 for GAAP purposes. These reserves were established on a Statutory basis in 2004. Radian Asset Assurance expects losses to be paid out over the next several years. Radian Asset Assurance also announced that it would immediately receive $65.0 million in capital from Radian Group to offset (on an after-tax basis) the effect of this loss. |
| 3 | Quarterly Operating Supplement for the Period Ended December 31, 2003 /Key Financial Highlights |
Quarterly Operating Supplement
Radian Reinsurance Inc.
Statutory Income Statements ($ Thousands)
| | | | | | | | | | | | | | | | |
| | | Quarter ended
| | | Twelve months ended
| |
| | | December 31
2003
| | | December 31
2002
| | | December 31
2003
| | | December 31
2002
| |
Revenues | | | | | | | | | | | | | | | | |
Gross premiums written | | $ | 20,678 | | | $ | 28,775 | | | $ | 187,501 | | | $ | 111,713 | |
Reinsurance premiums ceded | | | (1,076 | ) | | | (8 | ) | | | (3,247 | ) | | | (1,576 | ) |
| | |
|
|
| |
|
|
| |
|
|
| |
|
|
|
Net premiums written | | | 19,602 | | | | 28,767 | | | | 184,254 | | | | 110,137 | |
Decrease (increase) in unearned premiums | | | 21,531 | | | | (5,205 | ) | | | (42,998 | ) | | | (29,385 | ) |
| | |
|
|
| |
|
|
| |
|
|
| |
|
|
|
Premiums earned | | | 41,133 | | | | 23,562 | | | | 141,256 | | | | 80,752 | |
| | |
|
|
| |
|
|
| |
|
|
| |
|
|
|
Net investment income | | | 12,312 | | | | 11,698 | | | | 48,505 | | | | 47,864 | |
Net realized gain (loss) on sale of investments | | | 760 | | | | (181 | ) | | | 6,823 | | | | 6,139 | |
| | |
|
|
| |
|
|
| |
|
|
| |
|
|
|
Net investment gains | | | 13,072 | | | | 11,517 | | | | 55,328 | | | | 54,003 | |
| | |
|
|
| |
|
|
| |
|
|
| |
|
|
|
Other (expense) income | | | (1,546 | ) | | | 47 | | | | (4,438 | ) | | | 106 | |
| | |
|
|
| |
|
|
| |
|
|
| |
|
|
|
Total revenues | | | 52,659 | | | | 35,126 | | | | 192,146 | | | | 134,861 | |
| | |
|
|
| |
|
|
| |
|
|
| |
|
|
|
Expenses | | | | | | | | | | | | | | | | |
Losses and loss adjustment expenses incurred | | | 16,371 | | | | 7,427 | | | | 36,523 | | | | 14,304 | |
Commissions incurred | | | 2,719 | | | | 9,228 | | | | 57,128 | | | | 34,182 | |
Other underwriting expenses | | | 5,412 | | | | 2,321 | | | | 16,999 | | | | 9,230 | |
| | |
|
|
| |
|
|
| |
|
|
| |
|
|
|
Total expenses | | | 24,502 | | | | 18,976 | | | | 110,650 | | | | 57,716 | |
| | |
|
|
| |
|
|
| |
|
|
| |
|
|
|
Income before income taxes | | | 28,157 | | | | 16,150 | | | | 81,496 | | | | 77,145 | |
Federal and foreign income tax (benefit) expense | | | (6,827 | ) | | | 2,937 | | | | 2,473 | | | | 4,580 | |
| | |
|
|
| |
|
|
| |
|
|
| |
|
|
|
Net income | | $ | 34,984 | | | $ | 13,213 | | | $ | 79,023 | | | $ | 72,565 | |
| | |
|
|
| |
|
|
| |
|
|
| |
|
|
|
Financial Ratios | | | | | | | | | | | | | | | | |
Loss and LAE Ratio | | | 39.8 | % | | | 31.5 | % | | | 25.9 | % | | | 17.7 | % |
Underwriting Expense Ratio | | | 41.5 | % | | | 40.1 | % | | | 40.2 | % | | | 39.4 | % |
| | |
|
|
| |
|
|
| |
|
|
| |
|
|
|
Combined Ratio | | | 81.3 | % | | | 71.6 | % | | | 66.1 | % | | | 57.1 | % |
| | |
|
|
| |
|
|
| |
|
|
| |
|
|
|
Effective April 30, 2003, Radian Reinsurance Inc. (the “Company”) entered into an assumptive reinsurance agreement, in regard to its Trade Credit product, with an affiliated company (Radian Asset Assurance Inc.) whereby the Company assumed unearned premiums of $21.5 million and loss and loss adjustment reserves of $38.2 million. This transaction had no impact on premiums earned or losses and loss adjustment expenses incurred.
Effective December 31, 2003, the Company entered into a novation agreement, in regard to its Trade Credit product, with an affiliated company (Radian Asset Assurance Limited) whereby the Company novated unearned premiums of $20.0 million and loss and loss adjustment reserves of $26.7 million. This transaction had no impact on premiums earned or losses and loss adjustment expenses incurred.
| | |
4 | | Quarterly Operating Supplement for the Period Ended December 31, 2003 /Statutory Income Statements |
Quarterly Operating Supplement
Radian Reinsurance Inc.
Statutory Balance Sheets ($ Thousands)
| | | | | | |
| | | December 31
2003
| | December 31
2002
|
Assets | | | | | | |
Long-term bonds | | $ | 991,764 | | $ | 905,719 |
Cash and short-term investments | | | 76,397 | | | 21,971 |
Receivable for securities | | | — | | | 654 |
| | |
|
| |
|
|
Total Investments | | | 1,068,161 | | | 928,344 |
| | |
Investment income due and accrued | | | 13,930 | | | 12,817 |
Premiums receivable | | | 9,746 | | | 5,100 |
Funds held by reinsured companies | | | 7,575 | | | 524 |
Current federal income tax recoverable | | | 7,957 | | | 3,174 |
Net deferred tax asset | | | 1,889 | | | 1,991 |
Receivable from affiliates | | | — | | | 790 |
Other assets | | | 2,316 | | | 1,360 |
| | |
|
| |
|
|
Total Assets | | $ | 1,111,574 | | $ | 954,100 |
| | |
|
| |
|
|
Liabilities | | | | | | |
Contingency reserve | | $ | 261,850 | | $ | 280,376 |
Losses and loss adjustment expenses | | | 43,002 | | | 16,114 |
Reinsurance payable on paid losses and loss adjustment expenses | | | 3,625 | | | 1,262 |
Unearned premiums | | | 412,308 | | | 369,310 |
Payable for securities | | | — | | | 3,840 |
Commissions and contingent profit commissions | | | 742 | | | 735 |
Ceded reinsurance premiums payable | | | 1,245 | | | 7 |
Payable to affiliates | | | 7,274 | | | — |
Accrued expenses and other liabilities | | | 11,448 | | | 10,320 |
| | |
|
| |
|
|
Total Liabilities | | | 741,494 | | | 681,964 |
| | |
|
| |
|
|
Policyholders’ Surplus | | | | | | |
Common stock | | | 15,000 | | | 15,000 |
Additional paid-in capital | | | 186,500 | | | 186,500 |
Unassigned funds | | | 168,580 | | | 70,636 |
| | |
|
| |
|
|
Total Policyholders’ Surplus | | | 370,080 | | | 272,136 |
| | |
|
| |
|
|
Total Liabilities and Policyholders’ Surplus | | $ | 1,111,574 | | $ | 954,100 |
| | |
|
| |
|
|
Qualified Statutory Capital | | $ | 631,930 | | $ | 552,512 |
| | |
|
| |
|
|
Effective April 30, 2003, Radian Reinsurance Inc. (the “Company”) entered into an assumptive reinsurance agreement, in regard to its Trade Credit product, with an affiliated company (Radian Asset Assurance Inc.) whereby the Company assumed unearned premiums of $21.5 million and loss and loss adjustment reserves of $38.2 million. This transaction had no impact on premiums earned or losses and loss adjustment expenses incurred.
Effective December 31, 2003, the Company entered into a novation agreement, in regard to its Trade Credit product, with an affiliated company (Radian Asset Assurance Limited) whereby the Company novated unearned premiums of $20.0 million and loss and loss adjustment reserves of $26.7 million. This transaction had no impact on premiums earned or losses and loss adjustment expenses incurred.
| | |
5 | | Quarterly Operating Supplement for the Period Ended December 31, 2003 /Statutory Balance Sheets |
Quarterly Operating Supplement
Radian Reinsurance Inc.
Gross Premiums Written by Product ($ Thousands)
| | | | | | | | | | | | | | | | | | | |
| | | 4th Qtr
2003
| | | 4th Qtr
2002
| | % Change
| | | YTD 2003
| | YTD 2002
| | % Change
| |
Public Finance | | $ | 14,952 | | | $ | 13,910 | | 7 | % | | $ | 86,982 | | $ | 58,172 | | 50 | % |
Structured Finance | | | 12,619 | | | | 11,281 | | 12 | % | | | 51,183 | | | 41,647 | | 23 | % |
Trade Credit Reinsurance | | | (6,893 | ) | | | 3,584 | | –292 | % | | | 49,336 | | | 11,894 | | 315 | % |
| | |
|
|
| |
|
| | | | |
|
| |
|
| | | |
| | | $ | 20,678 | | | $ | 28,775 | | –28 | % | | $ | 187,501 | | $ | 111,713 | | 68 | % |
| | |
|
|
| |
|
| | | | |
|
| |
|
| | | |
Effective April 30, 2003, Radian Reinsurance Inc. (the “Company”) entered into an assumptive reinsurance agreement, in regard to its Trade Credit product, with an affiliated company (Radian Asset Assurance Inc.) whereby the Company assumed unearned premiums of $21.5 million and loss and loss adjustment reserves of $38.2 million. This transaction had no impact on premiums earned or losses and loss adjustment expenses incurred.
Effective December 31, 2003, the Company entered into a novation agreement, in regard to its Trade Credit product, with an affiliated company (Radian Asset Assurance Limited) whereby the Company novated unearned premiums of $20.0 million and loss and loss adjustment reserves of $26.7 million. This transaction had no impact on premiums earned or losses and loss adjustment expenses incurred.
Total Claims-Paying Resources and Leverage Ratios
($ Thousands except ratios)
| | | | | | | | | |
| | | December 31
2003
| | December 31
2002
| | % Change
| |
Capital and Surplus | | $ | 370,080 | | $ | 272,136 | | 36 | % |
Contingency Reserve | | | 261,850 | | | 280,376 | | –7 | % |
| | |
|
| |
|
| | | |
Qualified Statutory Capital | | | 631,930 | | | 552,512 | | 14 | % |
| | | |
Unearned Premium Reserve | | | 412,308 | | | 369,310 | | 12 | % |
Loss and Loss Expense Reserves | | | 43,002 | | | 16,114 | | 167 | % |
| | |
|
| |
|
| | | |
Total Policyholders’ Reserves | | | 1,087,240 | | | 937,936 | | 16 | % |
Present Value of Future Installment Premiums | | | 254,102 | | | 249,108 | | 2 | % |
| | | |
Reinsurance and Soft-Capital Facilities | | | 125,000 | | | 150,000 | | –17 | % |
| | |
|
| |
|
| | | |
Total Claims-Paying Resources | | $ | 1,466,342 | | $ | 1,337,044 | | 10 | % |
| | |
|
| |
|
| | | |
Total Debt Service | | | | | | | | | |
(Principal and Interest) Outstanding | | $ | 90,231,840 | | $ | 82,674,463 | | 9 | % |
Capital Leverage Ratio1 | | | 143:1 | | | 150:1 | | | |
Claims-Paying Ratio2 | | | 62:1 | | | 62:1 | | | |
| 1 | Capital Leverage Ratio. Total debt service/Qualified statutory capital. |
| 2 | Claims-Paying Ratio. Total debt service/Total claims-paying resources. |
| | |
6 | | Quarterly Operating Supplement for the Period Ended December 31, 2003 /Gross Premiums / Total Claims-Paying Resources |
Quarterly Operating Supplement
Radian Reinsurance Inc.
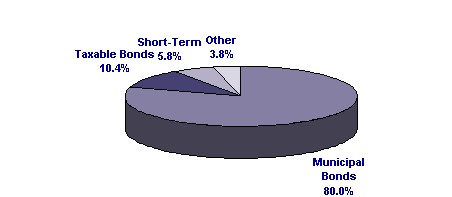
Investment Portfolio Highlights
Asset Quality
As of December 31, 2003, the book value of our investment portfolio was $1.1 billion, with an average duration of 5.5 years.
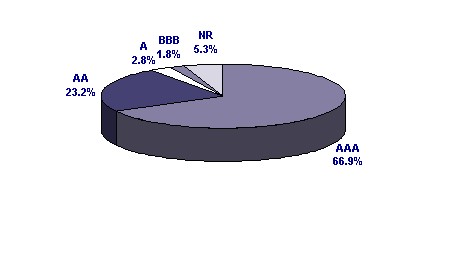
Asset Class
Our conservative portfolio is invested primarily in fixed-income securities. Our primary objective is to achieve total return, with a secondary objective of maximizing after-tax income.
| | |
7 | | Quarterly Operating Supplement for the Period Ended December 31, 2003 /Investment Portfolio Highlights |
Quarterly Operating Supplement
Radian Reinsurance Inc.
Insured Portfolio Highlights ($ Thousands)
Geographic Diversification
| | | | | | | | | | | | |
State
| | Net Par
(12/31/2003)
| | Percent
of total
| | | Net Par
(12/31/2002)
| | Percent
of total
| |
California | | $ | 5,559,232 | | 9.7 | % | | $ | 5,054,594 | | 9.8 | % |
New York | | | 3,650,233 | | 6.3 | % | | | 3,361,363 | | 6.6 | % |
Texas | | | 2,645,631 | | 4.6 | % | | | 2,221,825 | | 4.4 | % |
Florida | | | 2,422,728 | | 4.2 | % | | | 2,376,386 | | 4.7 | % |
Illinois | | | 2,307,437 | | 4.0 | % | | | 2,298,487 | | 4.5 | % |
New Jersey | | | 1,933,361 | | 3.4 | % | | | 1,935,968 | | 3.8 | % |
Massachusetts | | | 1,882,621 | | 3.3 | % | | | 1,791,923 | | 3.5 | % |
Pennsylvania | | | 1,731,354 | | 3.0 | % | | | 1,791,052 | | 3.5 | % |
Puerto Rico | | | 1,096,917 | | 1.9 | % | | | 1,092,288 | | 2.1 | % |
Washington | | | 1,033,840 | | 1.8 | % | | | 928,917 | | 1.8 | % |
Total of top ten states | | | 24,263,354 | | 42.2 | % | | | 22,852,803 | | 44.7 | % |
Total of other states | | | 14,945,109 | | 26.0 | % | | | 14,208,643 | | 27.8 | % |
Domestic structured finance | | | 11,927,230 | | 20.7 | % | | | 9,885,628 | | 19.4 | % |
International | | | 6,384,637 | | 11.1 | % | | | 4,124,347 | | 8.1 | % |
Total | | $ | 57,520,330 | | 100.0 | % | | $ | 51,071,421 | | 100.0 | % |
| | |
8 | | Quarterly Operating Supplement for the Period Ended December 31, 2003 /Insured Portfolio Highlights |
Quarterly Operating Supplement
Radian Reinsurance Inc.
Insured Portfolio Highlights ($ Thousands)
Sector Breakout
| | | | | | | | | | | | |
Public Finance
| | Net Par
(12/31/2003)
| | Percent
of total
| | | Net Par
(12/31/2002)
| | Percent
of total
| |
General Obligations | | $ | 11,926,347 | | 20.6 | % | | $ | 10,560,096 | | 20.7 | % |
Utilities | | | 7,034,723 | | 12.2 | % | | | 6,802,514 | | 13.3 | % |
Transportation | | | 6,808,469 | | 11.8 | % | | | 5,952,153 | | 11.7 | % |
Healthcare | | | 6,270,554 | | 10.9 | % | | | 6,204,510 | | 12.1 | % |
Tax-Backed | | | 3,615,302 | | 6.3 | % | | | 3,377,458 | | 6.6 | % |
Investor-Owned Utilities | | | 2,176,923 | | 3.8 | % | | | 1,904,838 | | 3.7 | % |
Education | | | 1,878,134 | | 3.3 | % | | | 1,575,248 | | 3.1 | % |
Housing | | | 1,192,983 | | 2.1 | % | | | 1,184,544 | | 2.3 | % |
Other Public Finance | | | 594,681 | | 1.0 | % | | | 672,199 | | 1.3 | % |
Second-To-Pay Muni Wrap | | | 405,073 | | 0.7 | % | | | 405,496 | | 0.8 | % |
Long-Term Care | | | 93,903 | | 0.2 | % | | | 94,790 | | 0.2 | % |
Subtotal Public Finance | | $ | 41,997,092 | | 72.9 | % | | $ | 38,733,846 | | 75.8 | % |
| | | | |
Structured Finance
| | Net Par
(12/31/2003)
| | Percent
of total
| | | Net Par
(12/31/2002)
| | Percent
of total
| |
Asset-Backed – Consumer | | $ | 6,247,278 | | 10.9 | % | | $ | 5,514,421 | | 10.8 | % |
Collateralized Debt Obligations | | | 4,078,503 | | 7.1 | % | | | 2,552,035 | | 5.0 | % |
Asset-Backed – Commercial and Other | | | 2,848,456 | | 5.0 | % | | | 2,489,820 | | 4.9 | % |
Asset-Backed – Mortgage and MBS | | | 1,590,747 | | 2.8 | % | | | 992,167 | | 1.9 | % |
Other Structured Finance | | | 758,254 | | 1.3 | % | | | 789,132 | | 1.6 | % |
Subtotal Structured Finance | | $ | 15,523,238 | | 27.1 | % | | $ | 12,337,575 | | 24.2 | % |
Total | | $ | 57,520,330 | | 100.0 | % | | $ | 51,071,421 | | 100.0 | % |
| | |
9 | | Quarterly Operating Supplement for the Period Ended December 31, 2003 /Insured Portfolio Highlights |
Quarterly Operating Supplement
Radian Reinsurance Inc.
Insured Portfolio Highlights ($ Thousands)
Rating Distribution
| | | | | | | | | | | | |
Rating*
| | Net Par
(12/31/2003)
| | Percent
of total
| | | Net Par
(12/31/2002)
| | Percent
of total
| |
AAA | | $ | 7,134,726 | | 12.4 | % | | $ | 4,107,705 | | 8.0 | % |
AA | | | 14,384,011 | | 25.0 | % | | | 12,018,943 | | 23.5 | % |
A | | | 23,100,368 | | 40.2 | % | | | 21,409,661 | | 41.9 | % |
BBB | | | 10,405,340 | | 18.1 | % | | | 9,616,900 | | 18.8 | % |
Investment Grade | | | 193,402 | | 0.3 | % | | | 445,010 | | 0.9 | % |
Below Investment Grade | | | 638,460 | | 1.1 | % | | | 512,053 | | 1.0 | % |
Not Rated | | | 1,664,023 | | 2.9 | % | | | 2,961,149 | | 5.9 | % |
Total | | $ | 57,520,330 | | 100.0 | % | | $ | 51,071,421 | | 100.0 | % |
| * | Indicated category reflects highest rating of the three rating agencies. |
| | |
10 | | Quarterly Operating Supplement for the Period Ended December 31, 2003 /Insured Portfolio Highlights |
Quarterly Operating Supplement
Radian Reinsurance Inc.
Insured Portfolio Highlights ($ Thousands)
10 Largest Public Finance Exposures
| | | | | | | | |
| | | Net Par
(12/31/2003)
| | Percent of
total Net Par
| | | Rating*
|
Long Island Power Authority NY | | $ | 324,068 | | 0.56 | % | | A– |
Illinois State GO | | | 296,619 | | 0.52 | % | | AA |
California State | | | 284,974 | | 0.50 | % | | A |
California State Public Works Board – Lease | | | 279,947 | | 0.49 | % | | BBB+ |
San Francisco, California City & County Airports | | | 278,958 | | 0.48 | % | | A+ |
Denver, Colorado Airport Revenue | | | 273,508 | | 0.48 | % | | A |
Chicago – O’Hare International Airport | | | 265,080 | | 0.46 | % | | A– |
New York, NY | | | 263,908 | | 0.46 | % | | A |
Houston, Texas – Water & Sewer | | | 263,509 | | 0.46 | % | | A |
Puerto Rico Commonwealth Highway & Transit | | | 238,643 | | 0.41 | % | | A |
Total top ten | | $ | 2,769,214 | | 4.82 | % | | |
|
10 Largest Structured Finance Exposures |
| | | Net Par
(12/31/2003)
| | Percent of
total Net Par
| | | Rating*
|
Pilgrim Principal Protection Fund | | $ | 308,076 | | 0.54 | % | | AAA |
European Static Synthetic CDO | | | 288,000 | | 0.50 | % | | AAA |
U.S. Static Synthetic CDO | | | 285,000 | | 0.50 | % | | AA |
European RMBS | | | 226,438 | | 0.39 | % | | AAA |
European RMBS | | | 223,471 | | 0.39 | % | | AAA |
Providian Gateway Master Trust | | | 216,878 | | 0.38 | % | | BBB |
U.S. Static Synthetic CDO | | | 204,000 | | 0.35 | % | | AAA |
Mid-State Homes Trust IV | | | 190,425 | | 0.33 | % | | BBB |
U.S. Static Synthetic CDO | | | 180,000 | | 0.31 | % | | AAA |
ABCP | | | 167,500 | | 0.29 | % | | BBB |
Total top ten | | $ | 2,289,788 | | 3.98 | % | | |
| * | Indicated category reflects highest rating of the three rating agencies. |
| | |
11 | | Quarterly Operating Supplement for the Period Ended December 31, 2003 /Insured Portfolio Highlights |
Quarterly Operating Supplement
Radian Reinsurance Inc.
Management Team
Martin A. Kamarck
President
David J. Beidler
Senior Vice President, Senior Counsel
Edward McC. Bowers
Senior Vice President, Global Structured Products
Sally B. Campbell
Senior Vice President, Public Finance
John C. DeLuca
Senior Vice President, Market Development
Bonita Z. Dorland
Senior Vice President, Chief Risk Officer
Andrew C.J. Poole
Managing Director, Radian Representatives Ltd.
Jack Praschnik
Senior Vice President, Global Strategies
Patrick Rossi
Senior Vice President, Controller
Jeffrey C. Salton
Senior Vice President, Operations and Analysis
| | |
12 | | Quarterly Operating Supplement for the Period Ended December 31, 2003 /Radian Reinsurance Inc. Management Team |