Exhibit 99.2

|
Quarterly |
Operating Supplement |
First Quarter 2004 |
Quarterly Operating Supplement
Table of Contents
| | |
| | | Page
|
Introductory Note | | 2 |
| |
Company Profile | | 2 |
| |
Company Information | | 2 |
| |
Key Financial Highlights | | 3 |
| |
Segment Information–Financial Guaranty | | 4 |
| |
Statutory Income Statements | | 5 |
| |
Statutory Balance Sheets | | 6 |
| |
Gross Premiums Written by Product | | 7 |
| |
Total Claims-Paying Resources and Leverage Ratios | | 7 |
| |
Investment Portfolio Highlights | | 8 |
| |
Insured Portfolio Highlights | | 9 |
| |
Management Team | | 13 |
| |
Safe Harbor Statement | | 14 |
| | |
1 | | Quarterly Operating Supplement for the Period Ended March 31, 2004 /Table of Contents |
Quarterly Operating Supplement
Radian Reinsurance Inc.
Quarterly Operating Supplement
March 31, 2004
Introductory Note
Radian Reinsurance Inc. was merged with and into Radian Asset Assurance Inc. effective as of June 1, 2004. All current year information presented herein is as of and/or for the quarter ended March 31, 2004 and does not take into account the effects of this merger.
Company Profile
Radian Reinsurance Inc., founded in 1986 and rated AA by Fitch Ratings and Standard & Poor’s and Aa3 by Moody’s, was the first company dedicated exclusively to the reinsurance of investment-grade securities. The Company is a leading provider of treaty and facultative reinsurance for primary insurers of municipal bonds, asset-backed obligations and structured finance obligations, helping insurers manage portfolio risk exposure, increase insurance capacity, and meet regulatory and rating-agency capital requirements.
Radian Reinsurance Inc. is a subsidiary of Radian Group Inc. (NYSE: RDN), a global credit enhancement provider headquartered in Philadelphia, with significant operations in New York City and London.
| | |
Company Information | | |
| |
Radian Reinsurance Inc. | | Contact: |
335 Madison Avenue | | John C. DeLuca |
New York, New York 10017 | | Senior Vice President, Market Development |
1 877 337.4925 (within the U.S.) | | 1 212 984.9222 |
1 212 983.3100 | | john.deluca@radian.biz |
| | |
2 | | Quarterly Operating Supplement for the Period Ended March 31, 2004/ Introductory Note / Company Profile / Company Information |
Quarterly Operating Supplement
Radian Group Inc. and Subsidiaries
Key Financial Highlights* ($ Thousands)
| | | | | | | | | | | | | |
| | | Quarter ended March 31, 2004
|
| | | Mortgage
Insurance
| | Financial
Services
| | Financial
Guaranty
| | | Total
|
Net premiums written | | $ | 205,669 | | $ | — | | $ | (24,241 | ) | | $ | 181,428 |
| | |
|
| |
|
| |
|
|
| |
|
|
Net premiums earned | | $ | 207,116 | | $ | — | | $ | 36,304 | | | $ | 243,420 |
Net investment income | | | 28,513 | | | 48 | | | 21,144 | | | | 49,705 |
Equity in net income/(loss) of affiliates | | | — | | | 33,402 | | | (920 | ) | | | 32,482 |
Other income | | | 5,486 | | | 2,874 | | | 40 | | | | 8,400 |
| | |
|
| |
|
| |
|
|
| |
|
|
Total revenues | | | 241,115 | | | 36,324 | | | 56,568 | | | | 334,007 |
| | |
|
| |
|
| |
|
|
| |
|
|
Provision for losses | | | 98,123 | | | — | | | 16,644 | | | | 114,767 |
Policy acquisition costs | | | 17,142 | | | — | | | 5,141 | | | | 22,283 |
Other operating expenses | | | 37,746 | | | 3,979 | | | 11,434 | | | | 53,159 |
Interest expense | | | 5,503 | | | 724 | | | 3,427 | | | | 9,654 |
| | |
|
| |
|
| |
|
|
| |
|
|
Total expenses | | | 158,514 | | | 4,703 | | | 36,646 | | | | 199,863 |
| | |
|
| |
|
| |
|
|
| |
|
|
Gain/(loss) on disposition of investments | | | 24,122 | | | 3,173 | | | (619 | ) | | | 26,676 |
Change in fair value of derivative instruments | | | 4,426 | | | 49 | | | 172 | | | | 4,647 |
| | |
|
| |
|
| |
|
|
| |
|
|
Net gains/(losses) | | | 28,548 | | | 3,222 | | | (447 | ) | | | 31,323 |
| | |
|
| |
|
| |
|
|
| |
|
|
Pretax income | | | 111,149 | | | 34,843 | | | 19,475 | | | | 165,467 |
| | | | |
Income tax provision | | | 30,647 | | | 12,195 | | | 2,615 | | | | 45,457 |
| | |
|
| |
|
| |
|
|
| |
|
|
Net income | | $ | 80,502 | | $ | 22,648 | | $ | 16,860 | | | $ | 120,010 |
| | |
|
| |
|
| |
|
|
| |
|
|
Total assets | | $ | 3,929,574 | | $ | 304,921 | | $ | 2,306,598 | | | $ | 6,541,093 |
Deferred policy acquisition costs | | | 79,092 | | | — | | | 121,999 | | | | 201,091 |
Reserve for losses | | | 521,102 | | | — | | | 265,013 | | | | 786,115 |
Unearned premiums | | | 92,228 | | | — | | | 564,081 | | | | 656,309 |
| | | | |
Equity | | $ | 1,905,233 | | $ | 250,212 | | $ | 1,188,040 | | | $ | 3,343,485 |
| * | Reported on a GAAP basis. |
| | |
3 | | Quarterly Operating Supplement for the Period Ended March 31, 2004/ Key Financial Highlights |
Quarterly Operating Supplement
Radian Group Inc. and Subsidiaries
Segment Information–Financial Guaranty ($ Thousands)
| | | | | | | | | | | | |
| | | Quarter ended March 31, 2004
| |
| | | As Reported
| | | Impact of
Clawback
| | | As Adjusted
Excluding
Clawback
| |
Net premiums written | | $ | (24,241 | ) | | $ | (96,417 | ) | | $ | 72,176 | |
| | |
|
|
| |
|
|
| |
|
|
|
Net premiums earned | | $ | 36,304 | | | $ | (24,892 | ) | | $ | 61,196 | |
Net investment income | | | 21,144 | | | | — | | | | 21,144 | |
Equity in net loss of affiliates | | | (920 | ) | | | — | | | | (920 | ) |
Other income | | | 40 | | | | — | | | | 40 | |
| | |
|
|
| |
|
|
| |
|
|
|
Total revenues | | | 56,568 | | | | (24,892 | ) | | | 81,460 | |
| | |
|
|
| |
|
|
| |
|
|
|
Provision for losses | | | 16,644 | | | | — | | | | 16,644 | |
Policy acquisition costs | | | 5,141 | | | | (9,766 | ) | | | 14,907 | |
Other operating expenses | | | 11,434 | | | | — | | | | 11,434 | |
Interest expense | | | 3,427 | | | | — | | | | 3,427 | |
| | |
|
|
| |
|
|
| |
|
|
|
Total expenses | | | 36,646 | | | | (9,766 | ) | | | 46,412 | |
| | |
|
|
| |
|
|
| |
|
|
|
Loss on disposition of investments | | | (619 | ) | | | — | | | | (619 | ) |
Change in fair value of derivative instruments | | | 172 | | | | (791 | ) | | | 963 | |
| | |
|
|
| |
|
|
| |
|
|
|
Net (losses)/gains | | | (447 | ) | | | (791 | ) | | | 344 | |
| | |
|
|
| |
|
|
| |
|
|
|
Pretax income | | | 19,475 | | | | (15,917 | ) | | | 35,392 | |
Income tax provision | | | 2,615 | | | | (5,571 | ) | | | 8,186 | |
| | |
|
|
| |
|
|
| |
|
|
|
Net income | | $ | 16,860 | | | $ | (10,346 | ) | | $ | 27,206 | |
| | |
|
|
| |
|
|
| |
|
|
|
The above schedule shows the Financial Guaranty Segment, on a GAAP basis, as reported (Column 1) and adjustments (Column 2) to reflect the income statement impact of the recapture (referred to above as the clawback) of business previously ceded to Radian Reinsurance Inc. (the “Company”) by one of the primary insurer customers of the Financial Guaranty Segment. The adjusted numbers are shown in Column 3. The impact of the clawback (Column 2) reflects the clawback of business ceded to the Company in prior periods. This clawback will only affect the first quarter (and, as a result, the year-to-date periods) of 2004. Accordingly, management believes that Column 3 provides useful information to investors by presenting a more meaningful basis of comparison for the Financial Guaranty Segment’s future results.
| | |
4 | | Quarterly Operating Supplement for the Period Ended March 31, 2004/ Segment Information–Financial Guaranty |
Quarterly Operating Supplement
Radian Reinsurance Inc.
Statutory Income Statements ($ Thousands)
| | | | | | | | |
| | | Quarter ended
| |
| | | March 31
2004
| | | March 31
2003
| |
Revenues | | | | | | | | |
Gross premiums written | | $ | (72,338 | ) | | $ | 45,804 | |
Reinsurance premiums ceded | | | 1,277 | | | | (166 | ) |
| | |
|
|
| |
|
|
|
Net premiums written | | | (71,061 | ) | | | 45,638 | |
Decrease (increase) in unearned premiums | | | 93,438 | | | | (20,057 | ) |
| | |
|
|
| |
|
|
|
Premiums earned | | | 22,377 | | | | 25,581 | |
| | |
|
|
| |
|
|
|
Net investment income | | | 12,339 | | | | 12,212 | |
Net realized gain on sale of investments | | | 2,313 | | | | 2,700 | |
| | |
|
|
| |
|
|
|
Net investment gains | | | 14,652 | | | | 14,912 | |
| | |
|
|
| |
|
|
|
Other (expense) income | | | (1,646 | ) | | | 58 | |
| | |
|
|
| |
|
|
|
Total revenues | | | 35,383 | | | | 40,551 | |
| | |
|
|
| |
|
|
|
Expenses | | | | | | | | |
Losses and loss adjustment expenses incurred | | | (96 | ) | | | 3,478 | |
Commissions incurred | | | (24,907 | ) | | | 16,591 | |
Other underwriting expenses | | | 4,643 | | | | 1,846 | |
| | |
|
|
| |
|
|
|
Total expenses | | | (20,360 | ) | | | 21,915 | |
| | |
|
|
| |
|
|
|
Income before income taxes | | | 55,743 | | | | 18,636 | |
Federal and foreign income tax expense | | | 11,814 | | | | 2,711 | |
| | |
|
|
| |
|
|
|
Net income | | $ | 43,929 | | | $ | 15,925 | |
| | |
|
|
| |
|
|
|
Financial Ratios | | | | | | | | |
Loss and LAE Ratio | | | –0.4 | % | | | 13.6 | % |
Underwriting Expense Ratio | | | 28.5 | % | | | 40.4 | % |
| | |
|
|
| |
|
|
|
Combined Ratio | | | 28.1 | % | | | 54.0 | % |
| | |
|
|
| |
|
|
|
On February 11, 2004, the Company announced that, effective January 31st, one of its primary insurers was exercising its right to recapture business, which had been assumed by the Company as part of the Company’s reinsurance agreements.
Similar to the terms of many of the Company’s reinsurance agreements with other primary insurers, the reinsurance agreements with the applicable primary insurer grant the primary insurer the right to recapture business assumed by the Company under certain circumstances. This recapture right was triggered by the Company’s financial strength rating downgrade from AAA to AA by Standard and Poor’s, which occurred on October 4, 2002.
In connection with the recapture, the Company has returned approximately $16.4 billion of par in force and approximately $96.4 million of statutory unearned premium reserves to the primary insurer. In addition, the Company has been reimbursed by the primary insurer for policy acquisition costs of approximately $31.0 million. The Company has also reimbursed the primary insurer approximately $7.5 million for case reserves which were net of $4.0 million of salvage.
The Company has reached agreements with its other primary insurer customers, without additional cost to the Company, where they have agreed not to exercise their recapture or ceding commission increase rights with respect to the downgrade by Standard and Poor’s.
| | |
5 | | Quarterly Operating Supplement for the Period Ended March 31, 2004/ Statutory Income Statements |
Quarterly Operating Supplement
Radian Reinsurance Inc.
Statutory Balance Sheets ($ Thousands)
| | | | | | |
| | | March 31
2004
| | December 31
2003
|
Assets | | | | | | |
Long-term bonds | | $ | 995,845 | | $ | 991,764 |
Cash and short-term investments | | | 14,913 | | | 76,397 |
Receivable for securities | | | 243 | | | — |
| | |
|
| |
|
|
Total Investments | | | 1,011,001 | | | 1,068,161 |
| | |
Investment income due and accrued | | | 13,345 | | | 13,930 |
Premiums receivable | | | 8,069 | | | 9,746 |
Funds held by reinsured companies | | | 5,211 | | | 7,575 |
Current federal income tax recoverable | | | — | | | 7,957 |
Net deferred tax asset | | | 1,584 | | | 1,889 |
Other assets | | | 1,922 | | | 2,316 |
| | |
|
| |
|
|
Total Assets | | $ | 1,041,132 | | $ | 1,111,574 |
| | |
|
| |
|
|
Liabilities | | | | | | |
Contingency reserve | | $ | 173,429 | | $ | 261,850 |
Losses and loss adjustment expenses | | | 20,892 | | | 43,002 |
Reinsurance payable on paid losses and loss adjustment expenses | | | 528 | | | 3,625 |
Current federal income taxes | | | 12,862 | | | — |
Unearned premiums | | | 318,870 | | | 412,308 |
Payable for securities | | | 3,052 | | | — |
Commissions and contingent profit commissions | | | 929 | | | 742 |
Ceded reinsurance premiums payable | | | 1,158 | | | 1,245 |
Payable to affiliates | | | 5,279 | | | 7,274 |
Accrued expenses and other liabilities | | | 1,880 | | | 11,448 |
| | |
|
| |
|
|
Total Liabilities | | | 538,879 | | | 741,494 |
| | |
|
| |
|
|
Policyholders’ Surplus | | | | | | |
Common stock | | | 15,000 | | | 15,000 |
Additional paid-in capital | | | 186,500 | | | 186,500 |
Unassigned funds | | | 300,753 | | | 168,580 |
| | |
|
| |
|
|
Total Policyholders’ Surplus | | | 502,253 | | | 370,080 |
| | |
|
| |
|
|
Total Liabilities and Policyholders’ Surplus | | $ | 1,041,132 | | $ | 1,111,574 |
| | |
|
| |
|
|
Qualified Statutory Capital | | $ | 675,682 | | $ | 631,930 |
| | |
|
| |
|
|
On February 11, 2004, the Company announced that, effective January 31st, one of its primary insurers was exercising its right to recapture business, which had been assumed by the Company as part of the Company’s reinsurance agreements.
Similar to the terms of many of the Company’s reinsurance agreements with other primary insurers, the reinsurance agreements with the applicable primary insurer grant the primary insurer the right to recapture business assumed by the Company under certain circumstances. This recapture right was triggered by the Company’s financial strength rating downgrade from AAA to AA by Standard and Poor’s, which occurred on October 4, 2002.
In connection with the recapture, the Company has returned approximately $16.4 billion of par in force and approximately $96.4 million of statutory unearned premium reserves to the primary insurer. In addition, the Company has been reimbursed by the primary insurer for policy acquisition costs of approximately $31.0 million. The Company has also reimbursed the primary insurer approximately $7.5 million for case reserves which were net of $4.0 million of salvage.
The Company has reached agreements with its other primary insurer customers, without additional cost to the Company, where they have agreed not to exercise their recapture or ceding commission increase rights with respect to the downgrade by Standard and Poor’s.
Effective April 30, 2003, the Company entered into an assumption reinsurance agreement, with regard to its Trade Credit business, with an affiliated company (Radian Asset Assurance Inc.) whereby the Company assumed unearned premiums of $21.5 million and loss and loss adjustment reserves of $38.2 million. This transaction had no impact on premiums earned or losses and loss adjustment expenses incurred.
Effective December 31, 2003, the Company entered into a novation agreement, with regard to its Trade Credit business, with an affiliated company (Radian Asset Assurance Limited) whereby the Company novated unearned premiums of $20.0 million and loss and loss adjustment reserves of $26.7 million. This transaction had no impact on premiums earned or losses and loss adjustment expenses incurred.
| | |
6 | | Quarterly Operating Supplement for the Period Ended March 31, 2004/ Statutory Balance Sheets |
Quarterly Operating Supplement
Radian Reinsurance Inc.
Gross Premiums Written by Product ($ Thousands)
| | | | | | | | | | |
| | | 1st Qtr
2004
| | | 1st Qtr
2003
| | % Change
| |
Public Finance | | $ | (68,326 | ) | | $ | 26,790 | | –355 | % |
Structured Finance | | | 1,530 | | | | 11,792 | | –87 | % |
Trade Credit Reinsurance | | | (5,542 | ) | | | 7,222 | | –177 | % |
| | |
|
|
| |
|
| | | |
| | | $ | (72,338 | ) | | $ | 45,804 | | –258 | % |
| | |
|
|
| |
|
| | | |
On February 11, 2004, Radian Reinsurance Inc. (the “Company”) announced that, effective January 31st, one of its primary insurers was exercising its right to recapture business, which had been assumed by the Company as part of the Company’s reinsurance agreements.
Similar to the terms of many of the Company’s reinsurance agreements with other primary insurers, the reinsurance agreements with the applicable primary insurer grant the primary insurer the right to recapture business assumed by the Company under certain circumstances. This recapture right was triggered by the Company’s financial strength rating downgrade from AAA to AA by Standard and Poor’s, which occurred on October 4, 2002.
In connection with the recapture, the Company has returned approximately $16.4 billion of par in force and approximately $96.4 million of statutory unearned premium reserves to the primary insurer. In addition, the Company has been reimbursed by the primary insurer for policy acquisition costs of approximately $31.0 million. The Company has also reimbursed the primary insurer approximately $7.5 million for case reserves which were net of $4.0 million of salvage.
The Company has reached agreements with its other primary insurer customers, without additional cost to the Company, where they have agreed not to exercise their recapture or ceding commission increase rights with respect to the downgrade by Standard and Poor’s.
Total Claims-Paying Resources and Leverage Ratios
($ Thousands except ratios)
| | | | | | | | | |
| | | March 31
2004
| | December 31
2003
| | % Change
| |
Capital and Surplus | | $ | 502,253 | | $ | 370,080 | | 36 | % |
Contingency Reserve | | | 173,429 | | | 261,850 | | –34 | % |
| | |
|
| |
|
| | | |
Qualified Statutory Capital | | | 675,682 | | | 631,930 | | 7 | % |
| | | |
Unearned Premium Reserve | | | 318,870 | | | 412,308 | | –23 | % |
Loss and Loss Expense Reserves | | | 20,892 | | | 43,002 | | –51 | % |
| | |
|
| |
|
| | | |
Total Policyholders’ Reserves | | | 1,015,444 | | | 1,087,240 | | –7 | % |
| | | |
Present Value of Future Installment Premiums | | | 149,640 | | | 254,102 | | –41 | % |
Reinsurance and Soft-Capital Facilities | | | 95,000 | | | 125,000 | | –24 | % |
| | |
|
| |
|
| | | |
Total Claims-Paying Resources | | $ | 1,260,084 | | $ | 1,466,342 | | –14 | % |
| | |
|
| |
|
| | | |
Total Debt Service (Principal and Interest) Outstanding | | $ | 66,236,347 | | $ | 90,231,840 | | –27 | % |
Capital Leverage Ratio1 | | | 98:1 | | | 143:1 | | | |
Claims-Paying Ratio2 | | | 53:1 | | | 62:1 | | | |
| 1 | Capital Leverage Ratio: Total debt service/Qualified statutory capital. |
| 2 | Claims-Paying Ratio: Total debt service/Total claims-paying resources. |
| | |
7 | | Quarterly Operating Supplement for the Period Ended March 31, 2004/ Gross Premiums / Total Claims-Paying Resources |
Quarterly Operating Supplement
Radian Reinsurance Inc.
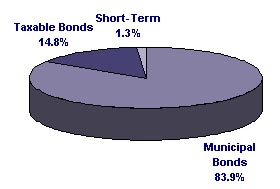
Investment Portfolio Highlights
Asset Quality
As of March 31, 2004, the book value of our investment portfolio was $1.0 billion, with an average duration of 5.5 years.
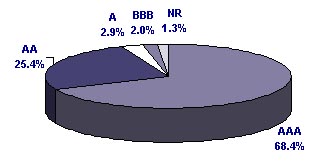
Asset Class
Our conservative portfolio is invested primarily in fixed-income securities. Our primary objective is to achieve total return, with a secondary objective of maximizing after-tax income.
| | |
8 | | Quarterly Operating Supplement for the Period Ended March 31, 2004/ Investment Portfolio Highlights |
Quarterly Operating Supplement
Radian Reinsurance Inc.
Insured Portfolio Highlights ($ Thousands)
Geographic Diversification
| | | | | | | | | | | | |
State
| | Net Par
(3/31/2004)
| | Percent
of total
| | | Net Par
(12/31/2003)
| | Percent
of total
| |
California | | $ | 4,006,158 | | 9.8 | % | | $ | 5,559,232 | | 9.7 | % |
New York | | | 2,975,676 | | 7.2 | % | | | 3,650,233 | | 6.3 | % |
Texas | | | 2,270,954 | | 5.5 | % | | | 2,645,631 | | 4.6 | % |
Illinois | | | 1,934,376 | | 4.7 | % | | | 2,307,437 | | 4.0 | % |
Florida | | | 1,794,250 | | 4.4 | % | | | 2,422,728 | | 4.2 | % |
Pennsylvania | | | 1,380,721 | | 3.3 | % | | | 1,731,354 | | 3.0 | % |
Massachusetts | | | 1,307,496 | | 3.2 | % | | | 1,882,621 | | 3.3 | % |
New Jersey | | | 1,079,686 | | 2.6 | % | | | 1,933,361 | | 3.4 | % |
Puerto Rico | | | 842,348 | | 2.0 | % | | | 1,096,917 | | 1.9 | % |
Washington | | | 756,546 | | 1.8 | % | | | 1,033,840 | | 1.8 | % |
Total of top ten states | | | 18,348,211 | | 44.5 | % | | | 24,263,354 | | 42.2 | % |
Total of other states | | | 11,664,852 | | 28.3 | % | | | 14,945,109 | | 26.0 | % |
Domestic structured finance | | | 7,228,498 | | 17.5 | % | | | 11,927,230 | | 20.7 | % |
International | | | 3,995,625 | | 9.7 | % | | | 6,384,637 | | 11.1 | % |
Total | | $ | 41,237,186 | | 100.0 | % | | $ | 57,520,330 | | 100.0 | % |
| | |
9 | | Quarterly Operating Supplement for the Period Ended March 31, 2004/ Insured Portfolio Highlights |
Quarterly Operating Supplement
Radian Reinsurance Inc.
Insured Portfolio Highlights ($ Thousands)
Sector Breakout
| | | | | | | | | | | | |
Public Finance
| | Net Par
(3/31/2004)
| | Percent
of total
| | | Net Par
(12/31/2003)
| | Percent
of total
| |
General Obligations | | $ | 9,610,145 | | 23.2 | % | | $ | 11,926,347 | | 20.6 | % |
Utilities | | | 5,234,498 | | 12.7 | % | | | 7,034,723 | | 12.2 | % |
Healthcare | | | 4,996,790 | | 12.1 | % | | | 6,270,554 | | 10.9 | % |
Transportation | | | 4,405,094 | | 10.7 | % | | | 6,808,469 | | 11.8 | % |
Tax-Backed | | | 2,849,879 | | 6.9 | % | | | 3,615,302 | | 6.3 | % |
Investor-Owned Utilities | | | 1,723,642 | | 4.2 | % | | | 2,176,923 | | 3.8 | % |
Education | | | 1,269,217 | | 3.1 | % | | | 1,878,134 | | 3.3 | % |
Housing | | | 717,560 | | 1.7 | % | | | 1,192,983 | | 2.1 | % |
Other Public Finance | | | 494,309 | | 1.2 | % | | | 594,681 | | 1.0 | % |
Second-To-Pay Muni Wrap | | | 404,187 | | 1.0 | % | | | 405,073 | | 0.7 | % |
Long-Term Care | | | 86,137 | | 0.2 | % | | | 93,903 | | 0.2 | % |
Subtotal Public Finance | | $ | 31,791,458 | | 77.0 | % | | $ | 41,997,092 | | 72.9 | % |
| | | | |
Structured Finance
| | Net Par
(3/31/2004)
| | Percent
of total
| | | Net Par
(12/31/2003)
| | Percent
of total
| |
Collateralized Debt Obligations | | $ | 3,204,075 | | 7.8 | % | | $ | 4,078,503 | | 7.1 | % |
Asset-Backed – Consumer | | | 2,704,973 | | 6.6 | % | | | 6,247,278 | | 10.9 | % |
Asset-Backed – Commercial and Other | | | 1,621,175 | | 3.9 | % | | | 2,848,456 | | 5.0 | % |
Asset-Backed – Mortgage and MBS | | | 1,176,133 | | 2.9 | % | | | 1,590,747 | | 2.8 | % |
Other Structured Finance | | | 739,372 | | 1.8 | % | | | 758,254 | | 1.3 | % |
Subtotal Structured Finance | | $ | 9,445,728 | | 23.0 | % | | $ | 15,523,238 | | 27.1 | % |
Total | | $ | 41,237,186 | | 100.0 | % | | $ | 57,520,330 | | 100.0 | % |
| | |
10 | | Quarterly Operating Supplement for the Period Ended March 31, 2004/ Insured Portfolio Highlights |
Quarterly Operating Supplement
Radian Reinsurance Inc.
Insured Portfolio Highlights ($ Thousands)
Rating Distribution
| | | | | | | | | | | | |
Rating*
| | Net Par
(3/31/2004)
| | Percent
of total
| | | Net Par
(12/31/2003)
| | Percent
of total
| |
AAA | | $ | 4,952,765 | | 11.9 | % | | $ | 7,134,726 | | 12.4 | % |
AA | | | 11,403,346 | | 27.7 | % | | | 14,384,011 | | 25.0 | % |
A | | | 17,011,608 | | 41.3 | % | | | 23,100,368 | | 40.2 | % |
BBB | | | 6,231,100 | | 15.1 | % | | | 10,405,340 | | 18.1 | % |
Investment Grade | | | 71,983 | | 0.2 | % | | | 193,402 | | 0.3 | % |
Below Investment Grade | | | 480,393 | | 1.2 | % | | | 638,460 | | 1.1 | % |
Not Rated | | | 1,085,991 | | 2.6 | % | | | 1,664,023 | | 2.9 | % |
Total | | $ | 41,237,186 | | 100.0 | % | | $ | 57,520,330 | | 100.0 | % |
| * | Indicated category reflects highest rating of the three rating agencies. |
| | |
11 | | Quarterly Operating Supplement for the Period Ended March 31, 2004 / Insured Portfolio Highlights |
Quarterly Operating Supplement
Radian Reinsurance Inc.
Insured Portfolio Highlights ($ Thousands)
10 Largest Public Finance Exposures
| | | | | | | | |
| | | Net Par
(3/31/2004)
| | Percent of
total Net
Par
| | | Rating*
|
Long Island Power Authority NY | | $ | 295,368 | | 0.72 | % | | A– |
Illinois State GO | | | 261,846 | | 0.63 | % | | AA |
California State | | | 247,031 | | 0.60 | % | | Baa1 |
Puerto Rico Commonwealth Highway & Transit | | | 235,623 | | 0.57 | % | | A |
City of Houston, Texas | | | 230,483 | | 0.56 | % | | AA |
New York City Muni Water Finance | �� | | 225,352 | | 0.55 | % | | AA |
City of Chicago | | | 218,845 | | 0.53 | % | | A+ |
New York & New Jersey Port Authority | | | 218,525 | | 0.53 | % | | AA– |
Houston Airport System | | | 216,792 | | 0.53 | % | | A1 |
Southern California Public Power Authority | | | 207,165 | | 0.50 | % | | Aa2 |
Total top ten | | $ | 2,357,030 | | 5.72 | % | | |
10 Largest Structured Finance Exposures
| | | | | | | | |
| | | Net Par
(3/31/2004)
| | Percent of total Net
Par
| | | Rating*
|
European Static Synthetic CDO | | $ | 288,000 | | 0.70 | % | | AAA |
U.S. Static Synthetic CDO | | | 270,000 | | 0.65 | % | | AA |
European RMBS | | | 220,955 | | 0.54 | % | | AAA |
U.S. Static Synthetic CDO | | | 204,000 | | 0.49 | % | | AAA |
Mid-State Homes Trust IV | | | 190,425 | | 0.46 | % | | BBB |
European RMBS | | | 188,394 | | 0.46 | % | | AAA |
U.S. Static Synthetic CDO | | | 180,000 | | 0.44 | % | | AAA |
ABCP | | | 167,500 | | 0.41 | % | | BBB |
Leveraged Lease | | | 163,001 | | 0.40 | % | | AAA |
Providian Gateway Master Trust | | | 150,000 | | 0.36 | % | | BBB |
Total top ten | | $ | 2,022,275 | | 4.91 | % | | |
| * | Indicated category reflects highest rating of the three rating agencies except for leveraged lease which was provided by the ceding company. |
| | |
12 | | Quarterly Operating Supplement for the Period Ended March 31, 2004 / Insured Portfolio Highlights |
Quarterly Operating Supplement
Radian Reinsurance Inc.
Management Team
Martin A. Kamarck
President
David J. Beidler
Senior Vice President, Senior Counsel
Sally B. Campbell
Senior Vice President, Public Finance
John C. DeLuca
Senior Vice President, Market Development
Bonita Z. Dorland
Senior Vice President, Chief Risk Officer
Paul C. Larsen
Vice President, Managing Director of Client and Portfolio Management
Anna M. Laudon
Vice President, Managing Director of Asset Backed Securities
Andrew C.J. Poole
Managing Director, Radian Asset Assurance Ltd. & Radian Representatives Ltd.
Jack Praschnik
Senior Vice President, Global Strategies
Andrew Reid
Vice President, Managing Director of Global Markets
Patrick Rossi
Senior Vice President, Controller
Jeffrey C. Salton
Senior Vice President, Operations and Analysis
Hao Wu
Vice President, Managing Director of Financial Products
| | |
13 | | Quarterly Operating Supplement for the Period Ended March 31, 2004/ Radian Reinsurance Inc. Management Team |
Quarterly Operating Supplement
Radian Reinsurance Inc.
Safe Harbor Statement
All statements in this document that address operating performance, events or developments that we expect or anticipate may occur in the future are “forward-looking statements” within the meaning of Section 27A of the Securities Act of 1933, Section 21E of the Securities Exchange Act of 1934 and the U.S. Private Securities Litigation Reform Act of 1995. These statements are made on the basis of management’s current views and assumptions with respect to future events.
The forward-looking statements involve risks and uncertainties including the following: changes in general financial and political conditions, such as extended national or regional economic recessions, changes in housing values, changes or volatility in interest rates, or other political instability; changes in investor perception of the strength of private mortgage insurers or financial guaranty providers, and risks faced by the businesses, municipalities or pools of assets covered by Radian’s insurance; the loss of significant customers with whom Radian has a concentration of its insurance in force; rising delinquencies in mortgage loans insured by Radian resulting from increased consolidation of mortgage lenders and servicers; increased severity or frequency of losses associated with certain Radian products that are riskier than traditional mortgage insurance and municipal guaranty insurance policies; material changes in persistency rates of Radian’s mortgage insurance policies; downgrades of the insurance financial-strength ratings assigned by the major ratings agencies to Radian’s operating subsidiaries; intense competition from others and from alternative products to private mortgage insurance and financial guaranty insurance; changes in the business practices of Fannie Mae and Freddie Mac; legislative and regulatory changes affecting demand for private mortgage insurance and financial guaranty insurance; changes in claims against mortgage insurance products resulting from the aging of Radian’s mortgage insurance policies; changes in Radian’s ability to maintain sufficient reinsurance capacity in an increasingly concentrated reinsurance market; vulnerability to the performance of Radian’s strategic investments; and the loss of executive officers or other key personnel.
Investors are also directed to other risks discussed in documents filed by Radian with the SEC, including the factors detailed in our annual report on Form 10-K for the year ended December 31, 2003 in the section immediately preceding Part I of the report.
Radian does not intend to and disclaims any duty or obligation to update or revise any forward-looking statements made in this document to reflect new information, future events or for any other reason.
| | |
14 | | Quarterly Operating Supplement for the Period Ended March 31, 2004/ Safe Harbor Statement |