Exhibit 99.1

Quarterly
Operating Supplement
First Quarter 2006
Quarterly Operating Supplement
Table of Contents
| | |
| | | Page |
Introductory Note | | 2 |
| |
Company Profile | | 2 |
| |
Company Information | | 2 |
| |
Consolidated GAAP Income Statements | | 3 |
| |
Consolidated GAAP Balance Sheets | | 4 |
| |
Statutory Information | | 5 |
| |
Total Claims-Paying Resources and Leverage Ratios | | 5 |
| |
Consolidated Gross Premiums Written by Product | | 6 |
| |
Consolidated Net Premiums Earned by Product | | 6 |
| |
Consolidated Net Unearned Premium Amortization and Estimated Future Installment Premiums | | 6 |
| |
Consolidated Selected Loss Information | | 7 |
| |
Consolidated Selected Derivative Information | | 8 |
| |
Consolidated Investment Portfolio Highlights | | 9 |
| |
Consolidated Insured Portfolio Highlights | | 10 |
| |
Consolidated CDO Exposure | | 14 |
| |
Consolidated Explanatory Notes | | 15 |
| |
Safe Harbor Statement | | 16 |
| | |
1 | | Quarterly Operating Supplement for the Period Ended March 31, 2006 /Table of Contents |
Quarterly Operating Supplement
Radian Asset Assurance Inc.
Quarterly Operating Supplement
March 31, 2006
Introductory Note
This operating supplement presents financial information for Radian Asset Assurance Inc. (Radian) and its consolidated subsidiaries on a GAAP basis, and includes selected information prepared on a statutory accounting basis. The financial information for Radian contained in operating supplements prior to the Second Quarter 2005 was prepared on a statutory accounting basis.
Company Profile
Radian, founded in 1985 and rated AA by Standard & Poor’s, a division of The McGraw-Hill Companies (S&P) and Fitch Ratings and Aa3 by Moody’s Investor Service (Moody’s), is a leading financial guarantor of structured finance and public finance transactions. As a direct writer of financial guaranty insurance for municipal bonds, asset-backed securities and structured transactions, Radian plays an important role in extending the benefits of insurance to a broad range of institutions and securities issuers. Radian is also a leading provider of reinsurance to the major monoline financial guarantors. In addition Radian provides trade credit reinsurance which was placed in runoff in 2005.
Radian is a subsidiary of Radian Group Inc. (NYSE: RDN), a global credit risk management company headquartered in Philadelphia with significant operations in both New York and London.
Company Information
| | |
Radian Asset Assurance Inc. | | Contact: |
335 Madison Avenue | | John C. DeLuca |
New York, New York 10017 | | Senior Vice President, Public Finance - Marketing |
1 877 337.4925 (within the U.S.) | | 1 212 984.9222 |
1 212 983.3100 | | john.deluca@radian.biz |
| | |
2 | | Quarterly Operating Supplement for the Period Ended March 31, 2006 /Introductory Note / Company Profile / Company Information |
Quarterly Operating Supplement
Radian Asset Assurance Inc.
Consolidated GAAP Income Statements* ($ Thousands)
(Unaudited)
| | | | | | | | |
| | | Quarter ended | |
| | | March 31
2006 | | | March 31 2005 | |
Revenues | | | | | | | | |
Gross premiums written | | $ | 55,730 | | | $ | 14,115 | |
Ceded premiums written | | | (2,214 | ) | | | (2,523 | ) |
| | | | | | | | |
Net premiums written | | | 53,516 | | | | 11,592 | |
(Increase) decrease in deferred premium revenue | | | (3,601 | ) | | | 41,180 | |
| | | | | | | | |
Premiums earned | | | 49,915 | | | | 52,772 | |
| | |
Net investment income | | | 21,780 | | | | 21,623 | |
(Loss)/gain on sale of investments | | | (253 | ) | | | 3,382 | |
Change in fair value of derivative instruments | | | 8,509 | | | | (11,179 | ) |
| | | | | | | | |
Total revenues | | | 79,951 | | | | 66,598 | |
| | | | | | | | |
| | |
Expenses | | | | | | | | |
Losses and loss adjustment expenses | | | 7,182 | | | | 11,135 | |
Policy acquisition costs | | | 13,972 | | | | 14,465 | |
Other operating expenses | | | 14,845 | | | | 14,057 | |
Other expense | | | 3,452 | | | | 2,923 | |
| | | | | | | | |
Total expenses | | | 39,451 | | | | 42,580 | |
| | | | | | | | |
| | |
Income before income taxes | | | 40,500 | | | | 24,018 | |
Income tax expense | | | 9,936 | | | | 2,193 | |
| | | | | | | | |
Net income | | $ | 30,564 | | | $ | 21,825 | |
| | | | | | | | |
| * | See Consolidated Explanatory Notes on page 15. |
| | |
3 | | Quarterly Operating Supplement for the Period Ended March 31, 2006 /Consolidated GAAP Income Statements |
Quarterly Operating Supplement
Radian Asset Assurance Inc.
Consolidated GAAP Balance Sheets* ($ Thousands)**
(Unaudited)
| | | | | | |
| | | March 31
2006 | | December 31
2005 |
Assets | | | | | | |
Investments: | | | | | | |
Fixed maturities, available for sale, at fair value (amortized cost $1,935,134 and $1,934,133) | | $ | 1,970,467 | | $ | 1,987,565 |
Trading securities, at fair value (cost $18,320 and $17,318) | | | 27,932 | | | 23,264 |
Common stock, at fair value (cost $931 and $931) | | | 1,164 | | | 1,164 |
Short-term investments | | | 82,928 | | | 101,691 |
| | | | | | |
Total Investments | | | 2,082,491 | | | 2,113,684 |
Cash and cash equivalents | | | 4,992 | | | 5,925 |
Accrued interest and dividends receivable | | | 24,438 | | | 26,372 |
Premiums and other receivables | | | 29,363 | | | 39,824 |
Deferred policy acquisition costs | | | 140,431 | | | 140,658 |
Prepaid reinsurance premiums | | | 3,004 | | | 1,546 |
Reinsurance recoverable on unpaid losses | | | 2,720 | | | 2,699 |
Prepaid federal income taxes | | | 14,995 | | | 14,995 |
Federal income tax recoverable | | | 29,665 | | | 3,163 |
Credit derivatives | | | 94,866 | | | 23,385 |
Other assets | | | 13,974 | | | 10,954 |
| | | | | | |
Total Assets | | $ | 2,440,939 | | $ | 2,383,205 |
| | | | | | |
Liabilities and Shareholder’s Equity | | | | | | |
| | |
Liabilities | | | | | | |
Losses and loss adjustment expenses | | $ | 186,225 | | $ | 186,425 |
Reinsurance payable on paid losses and loss adjustment expenses | | | 4,073 | | | 6,142 |
Deferred premium revenue | | | 639,624 | | | 634,424 |
Deferred federal income taxes | | | 89,643 | | | 66,231 |
Payable to affiliates | | | 5,500 | | | 8,065 |
Accrued expenses and other liabilities | | | 28,797 | | | 21,439 |
| | | | | | |
Total Liabilities | | | 953,862 | | | 922,726 |
| | | | | | |
| | |
Shareholder’s Equity | | | | | | |
Common stock — $150 par value | | | | | | |
Authorized, issued and outstanding — 100,000 shares | | | 15,000 | | | 15,000 |
Additional paid-in capital | | | 597,563 | | | 590,579 |
Retained earnings | | | 848,272 | | | 817,708 |
Accumulated other comprehensive income | | | 26,242 | | | 37,192 |
| | | | | | |
Total Shareholder’s Equity | | | 1,487,077 | | | 1,460,479 |
| | | | | | |
Total Liabilities and Shareholder’s Equity | | $ | 2,440,939 | | $ | 2,383,205 |
| | | | | | |
| * | See Consolidated Explanatory Notes on page 15. |
| | |
4 | | Quarterly Operating Supplement for the Period Ended March 31, 2006 /Consolidated GAAP Balance Sheets |
Quarterly Operating Supplement
Radian Asset Assurance Inc.
Statutory Information* ($ Thousands except ratios)
| | | | | | | | | | | |
| | | Quarter ended | | | | |
| | | March 31 2006 | | | March 31 2005 | | | Percent
Change | |
Statutory Net (Loss) Income | | $ | (23,560 | ) | | $ | 38,294 | | | –161.5 | % |
| | | | | | | | | | | |
| | |
Statutory Ratios | | Quarter ended | | | | |
| | | March 31 2006 | | | March 31 2005 | | | | |
Loss and Loss Adjustment Expense Ratio | | | 182.3 | % | | | 4.1 | % | | | |
Underwriting Expense Ratio | | | 49.5 | % | | | 841.2 | % | | | |
| | | | | | | | | | | |
Combined Ratio | | | 231.8 | % | | | 845.3 | % | | | |
| | | | | | | | | | | |
Total Claims-Paying Resources and Leverage Ratios*
($ Thousands except ratios)
| | | | | | |
| | | March 31 2006 | | December 31 2005 |
Capital and Surplus | | $ | 970,030 | | $ | 994,487 |
Contingency Reserve | | | 283,163 | | | 271,907 |
| | | | | | |
Qualified Statutory Capital | | | 1,253,193 | | | 1,266,394 |
| | |
Unearned Premium Reserve | | | 743,222 | | | 732,092 |
Loss and Loss Expense Reserves | | | 63,809 | | | 58,627 |
| | | | | | |
Total Policyholders’ Reserves | | | 2,060,224 | | | 2,057,113 |
| | |
Present Value of Future Installment Premiums | | | 291,887 | | | 300,038 |
| | |
Reinsurance and Soft Capital Facilities | | | 150,000 | | | 150,000 |
| | | | | | |
Total Claims-Paying Resources | | $ | 2,502,111 | | $ | 2,507,151 |
| | | | | | |
| | |
Net Debt Service (Principal and Interest) Outstanding | | $ | 117,760,958 | | $ | 110,168,629 |
Capital Leverage Ratio 1 | | | 94:1 | | | 87:1 |
Claims-Paying Ratio2 | | | 47:1 | | | 44:1 |
| * | See Consolidated Explanatory Notes on page 15. |
| 1 | Capital Leverage Ratio: Net debt service/Qualified statutory capital. |
| 2 | Claims-Paying Ratio: Net debt service/Total claims-paying resources. |
| | |
5 | | Quarterly Operating Supplement for the Period Ended March 31, 2006 /Statutory Information / Total Claims-PayingResources |
Quarterly Operating Supplement
Radian Asset Assurance Inc.
Consolidated Gross Premiums Written by Product* ($ Thousands)
| | | | | | | | | | |
| | | Quarter ended | | | | |
| | | March 31
2006 | | March 31 2005 | | | Percent
Change | |
Public Finance Direct | | $ | 13,568 | | $ | 15,433 | | | –12.1 | % |
Structured Finance Direct | | | 18,355 | | | 16,837 | | | 9.0 | % |
Public Finance Reinsurance | | | 17,983 | | | 17,026 | | | 5.6 | % |
Structured Finance Reinsurance | | | 3,053 | | | 6,879 | | | –55.6 | % |
Trade Credit Reinsurance | | | 2,771 | | | 12,682 | | | –78.2 | % |
| | | | | | | | | | |
| | | 55,730 | | | 68,857 | | | –19.1 | % |
Impact of Recapture | | | — | | | (54,742 | ) | | | |
| | | | | | | | | | |
| | $ | 55,730 | | $ | 14,115 | | | 294.8 | % |
| | | | | | | | | | |
| | | |
Consolidated Net Premiums Earned by Product* ($ Thousands) | | | | | | | | | | |
| | |
| | | Quarter ended | | | | |
| | | March 31 2006 | | March 31 2005 | | | Percent
Change | |
Public Finance Direct | | $ | 7,843 | | $ | 8,963 | | | –12.5 | % |
Structured Finance Direct | | | 21,453 | | | 18,162 | | | 18.1 | % |
Public Finance Reinsurance | | | 8,293 | | | 8,513 | | | –2.6 | % |
Structured Finance Reinsurance | | | 4,641 | | | 7,266 | | | –36.1 | % |
Trade Credit Reinsurance | | | 7,685 | | | 14,407 | | | –46.7 | % |
| | | | | | | | | | |
| | | 49,915 | | | 57,311 | | | –12.9 | % |
Impact of Recapture | | | — | | | (4,539 | ) | | | |
| | | | | | | | | | |
| | $ | 49,915 | | $ | 52,772 | | | –5.4 | % |
| | | | | | | | | | |
Consolidated Net Unearned Premium Amortization and Estimated Future Installment Premiums**
As of March 31, 2006
($ Millions)
| | | | | | | | | | | | |
| | | Ending Net Unearned
Premiums | | Unearned Premium
Amortization | | Future Installments | | Total Premium Earnings |
2006 | | $ | 559.0 | | $ | 77.6 | | $ | 47.9 | | $ | 125.5 |
2007 | | | 496.1 | | | 62.9 | | | 68.9 | | | 131.8 |
2008 | | | 442.3 | | | 53.8 | | | 51.7 | | | 105.5 |
2009 | | | 398.7 | | | 43.6 | | | 44.3 | | | 87.9 |
2010 | | | 361.5 | | | 37.2 | | | 29.9 | | | 67.1 |
| | | | | | | | | | | | |
2006 – 2010 | | | 361.5 | | | 275.1 | | | 242.7 | | | 517.8 |
2011 – 2015 | | | 209.2 | | | 152.3 | | | 67.9 | | | 220.2 |
2016 – 2020 | | | 104.4 | | | 104.8 | | | 21.5 | | | 126.3 |
2021 – 2025 | | | 40.4 | | | 64.0 | | | 13.4 | | | 77.4 |
After 2025 | | | 0.0 | | | 40.4 | | | 16.1 | | | 56.5 |
| | | | | | | | | | | | |
Total | | | – | | $ | 636.6 | | $ | 361.6 | | $ | 998.2 |
| * | See Consolidated Explanatory Notes on page 15. |
| ** | This table depicts the expected amortization of the unearned premium for the existing financial guaranty portfolio, assuming no advance refundings as of March 31, 2006. Expected maturities will differ from contractual maturities because borrowers have the right to call or repay financial guaranty obligations. Unearned premium amounts are net of prepaid reinsurance. |
| | |
6 | | Quarterly Operating Supplement for the Period Ended March 31, 2006 /Consolidated: Gross Premiums Written / Net Premiums Earned / Net Unearned Premium |
Quarterly Operating Supplement
Radian Asset Assurance Inc.
Consolidated Selected Loss Information*
($ Thousands)
Components of Claims Paid and Incurred Losses and Loss Adjustment Expenses
| | | | | | | |
| | | Quarter ended |
| | | March 31 2006 | | | March 31 2005 |
Claims Paid | | | | | | | |
Trade Credit | | $ | 3,727 | | | $ | 4,358 |
Financial Guaranty | | | (209 | ) | | | 12,228 |
Conseco Finance Corp | | | 4,317 | | | | 7,969 |
| | | | | | | |
Total | | $ | 7,835 | | | $ | 24,555 |
| | | | | | | |
Incurred Losses and Loss Adjustment Expenses | | | | | | | |
Trade Credit | | $ | 3,595 | | | $ | 6,603 |
Financial Guaranty | | | 4,869 | | | | 4,532 |
Conseco Finance Corp | | | (1,282 | ) | | | — |
| | | | | | | |
Total | | $ | 7,182 | | | $ | 11,135 |
| | | | | | | |
Components of Losses and Loss Adjustment Expense Reserves | | | | | | | |
| | | March 31 2006 | | | December 31 2005 |
Financial Guaranty | | | | | | | |
Case | | $ | 56,734 | | | $ | 53,928 |
Allocated non-specific | | | 20,750 | | | | 27,750 |
Unallocated non-specific | | | 58,689 | | | | 54,878 |
| | | | | | | |
| | | 136,173 | | | | 136,556 |
| | | | | | | |
Trade Credit and Other | | | | | | | |
Case | | | 25,233 | | | | 19,051 |
IBNR | | | 24,819 | | | | 30,818 |
| | | | | | | |
| | | 50,052 | | | | 49,869 |
| | | | | | | |
Total | | $ | 186,225 | | | $ | 186,425 |
| | | | | | | |
| * | See Consolidated Explanatory Notes on page 15. |
| | |
7 | | Quarterly Operating Supplement for the Period Ended March 31, 2006 /Consolidated Selected Loss Information |
Quarterly Operating Supplement
Radian Asset Assurance Inc.
Consolidated Selected Derivative Information*
($ Millions)
| | | | | | | | |
| | | March 31
2006 | | | December 31
2005 | |
Notional value | | $ | 27,817.1 | | | $ | 22,724.8 | |
| | | | | | | | |
Gross unrealized gains | | $ | 117.6 | | | $ | 95.5 | |
Gross unrealized losses | | | 22.7 | | | | 72.1 | |
| | | | | | | | |
Net gains | | $ | 94.9 | | | $ | 23.4 | |
| | | | | | | | |
| | |
Balance at January 1 | | $ | 23.4 | | | $ | 25.3 | |
Net unrealized gains recorded | | | 4.9 | | | | 5.7 | |
Settlements of derivatives contracts: | | | | | | | | |
Defaults | | | | | | | | |
Recoveries | | | (1.4 | ) | | | (7.7 | ) |
Payments | | | 68.0 | | | | 0.1 | |
Early termination receipts | | | — | | | | — | |
| | | | | | | | |
Balance at end of period | | $ | 94.9 | | | $ | 23.4 | |
| | | | | | | | |
| * | See Consolidated Explanatory Notes on page 15. |
| | |
8 | | Quarterly Operating Supplement for the Period Ended March 31, 2006 /Consolidated Selected Derivative Information |
Quarterly Operating Supplement
Radian Asset Assurance Inc.
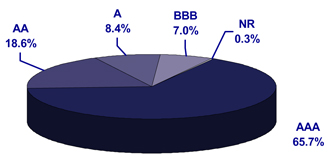
Consolidated Investment Portfolio Highlights
Asset Quality
As of March 31, 2006, the book value of our investment portfolio was $2.1 billion, with an average duration of 5.8 years.
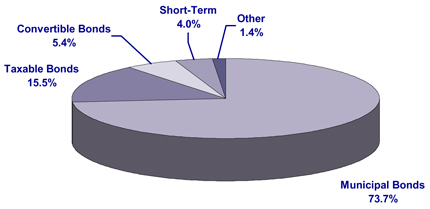
Asset Class
Our conservative portfolio is invested primarily in fixed-income securities. Our primary objective is to achieve total return, with a secondary objective of maximizing after-tax income.
| | |
9 | | Quarterly Operating Supplement for the Period Ended March 31, 2006 /Consolidated Investment Portfolio Highlights |
Quarterly Operating Supplement
Radian Asset Assurance Inc.
Consolidated Insured Portfolio Highlights*
($ Millions)
Geographic Diversification
| | | | | | | | | | | | |
State | | Net Par Outstanding (03/31/2006) | | Percent of total Net Par | | | Net Par Outstanding (12/31/2005) | | Percent of total Net Par | |
California | | $ | 5,580 | | 6.7 | % | | $ | 5,182 | | 6.8 | % |
New York | | | 5,004 | | 6.0 | % | | | 4,835 | | 6.3 | % |
Texas | | | 3,650 | | 4.4 | % | | | 3,625 | | 4.7 | % |
Pennsylvania | | | 3,045 | | 3.7 | % | | | 2,907 | | 3.8 | % |
Florida | | | 2,858 | | 3.4 | % | | | 2,681 | | 3.5 | % |
Illinois | | | 2,701 | | 3.3 | % | | | 2,654 | | 3.5 | % |
New Jersey | | | 2,182 | | 2.6 | % | | | 1,994 | | 2.6 | % |
Massachusetts | | | 2,170 | | 2.6 | % | | | 2,178 | | 2.8 | % |
Washington | | | 1,523 | | 1.8 | % | | | 1,549 | | 2.0 | % |
Colorado | | | 1,173 | | 1.4 | % | | | 1,165 | | 1.5 | % |
Top ten states – public finance subtotal | | | 29,886 | | 35.9 | % | | | 28,770 | | 37.5 | % |
Total of other states – public finance | | | 17,241 | | 20.7 | % | | | 16,960 | | 22.2 | % |
Domestic structured finance | | | 28,606 | | 34.4 | % | | | 24,595 | | 32.1 | % |
International | | | 7,518 | | 9.0 | % | | | 6,249 | | 8.2 | % |
| | | | | | | | | | | | |
Total | | $ | 83,251 | | 100.0 | % | | $ | 76,574 | | 100.0 | % |
| * | See Consolidated Explanatory Notes on page 15. |
| | |
10 | | Quarterly Operating Supplement for the Period Ended March 31, 2006 /Consolidated Insured Portfolio Highlights |
Quarterly Operating Supplement
Radian Asset Assurance Inc.
Consolidated Insured Portfolio Highlights*
($ Millions)
Sector Breakout
| | | | | | | | | | | | | | | | | | | | | | | | |
Public Finance | | Gross Par Outstanding (03/31/2006) | | Percent of total Gross Par | | | Net Par Outstanding (03/31/2006) | | Percent of total Net Par | | | Gross Par Outstanding (12/31/2005) | | Percent of total Gross Par | | | Net Par Outstanding (12/31/2005) | | Percent of total Net Par | |
General Obligations | | $ | 15,743 | | 18.5 | % | | $ | 15,724 | | 18.9 | % | | $ | 15,179 | | 19.4 | % | | $ | 15,160 | | 19.8 | % |
Healthcare | | | 9,056 | | 10.7 | % | | | 9,056 | | 10.9 | % | | | 8,727 | | 11.2 | % | | | 8,727 | | 11.4 | % |
Utilities | | | 5,955 | | 7.0 | % | | | 5,843 | | 7.0 | % | | | 5,798 | | 7.4 | % | | | 5,686 | | 7.4 | % |
Transportation | | | 4,800 | | 5.7 | % | | | 4,800 | | 5.8 | % | | | 4,739 | | 6.1 | % | | | 4,739 | | 6.2 | % |
Tax Backed | | | 4,735 | | 5.6 | % | | | 4,732 | | 5.7 | % | | | 4,543 | | 5.8 | % | | | 4,540 | | 5.9 | % |
Education | | | 3,730 | | 4.4 | % | | | 3,730 | | 4.5 | % | | | 3,513 | | 4.5 | % | | | 3,513 | | 4.6 | % |
Investor Owned Utilities | | | 2,326 | | 2.7 | % | | | 2,192 | | 2.6 | % | | | 1,819 | | 2.3 | % | | | 1,690 | | 2.2 | % |
Long Term Care | | | 1,392 | | 1.6 | % | | | 1,392 | | 1.7 | % | | | 1,292 | | 1.6 | % | | | 1,292 | | 1.7 | % |
Other Public Finance | | | 1,012 | | 1.2 | % | | | 757 | | 0.9 | % | | | 1,106 | | 1.4 | % | | | 851 | | 1.1 | % |
Housing | | | 610 | | 0.7 | % | | | 610 | | 0.7 | % | | | 618 | | 0.8 | % | | | 618 | | 0.8 | % |
Second-To-Pay Municipal Wrap | | | 416 | | 0.5 | % | | | 417 | | 0.5 | % | | | 427 | | 0.5 | % | | | 427 | | 0.6 | % |
| | | | | | | | | | | | | | | | | | | | | | | | |
Subtotal Public Finance | | $ | 49,775 | | 58.6 | % | | $ | 49,253 | | 59.2 | % | | $ | 47,761 | | 61.0 | % | | $ | 47,243 | | 61.7 | % |
| | | | | | | | |
Structured Finance | | Gross Par
Outstanding
(03/31/2006) | | Percent
of total
Gross Par | | | Net Par
Outstanding
(03/31/2006) | | Percent
of total
Net Par | | | Gross Par
Outstanding
(12/31/2005) | | Percent
of total
Gross Par | | | Net Par
Outstanding
(12/31/2005) | | Percent
of total
Net Par | |
Collateralized Debt Obligations | | $ | 28,011 | | 33.0 | % | | $ | 28,011 | | 33.6 | % | | $ | 22,736 | | 29.1 | % | | $ | 22,736 | | 29.7 | % |
Asset Backed - Consumer | | | 1,859 | | 2.2 | % | | | 1,859 | | 2.2 | % | | | 1,714 | | 2.2 | % | | | 1,714 | | 2.2 | % |
Asset Backed - Commercial and Other | | | 1,598 | | 1.9 | % | | | 1,598 | | 1.9 | % | | | 1,784 | | 2.3 | % | | | 1,784 | | 2.3 | % |
Asset Backed - Mortgage and MBS | | | 2,359 | | 2.8 | % | | | 1,220 | | 1.5 | % | | | 2,448 | | 3.1 | % | | | 1,287 | | 1.7 | % |
Other Structured Finance | | | 1,310 | | 1.5 | % | | | 1,310 | | 1.6 | % | | | 1,810 | | 2.3 | % | | | 1,810 | | 2.4 | % |
| | | | | | | | | | | | | | | | | | | | | | | | |
Subtotal Structured Finance | | | 35,137 | | 41.4 | % | | | 33,998 | | 40.8 | % | | | 30,492 | | 39.0 | % | | | 29,331 | | 38.3 | % |
| | | | | | | | | | | | | | | | | | | | | | | | |
Total | | $ | 84,912 | | 100.0 | % | | $ | 83,251 | | 100.0 | % | | $ | 78,253 | | 100.0 | % | | $ | 76,574 | | 100.0 | % |
| | | | | | | | |
Rating Distribution | | | | | | | | | | | | | | | | | | | | | | | | |
Rating** | | Gross Par
Outstanding
(03/31/2006) | | Percent
of total
Gross Par | | | Net Par
Outstanding
(03/31/2006) | | Percent
of total
Net Par | | | Gross Par
Outstanding
(12/31/2005) | | Percent
of total
Gross Par | | | Net Par
Outstanding
(12/31/2005) | | Percent
of total
Net Par | |
AAA | | $ | 28,936 | | 34.1 | % | | $ | 27,664 | | 33.2 | % | | $ | 23,825 | | 30.4 | % | | $ | 22,535 | | 29.5 | % |
AA | | | 16,364 | | 19.3 | % | | | 16,276 | | 19.6 | % | | | 16,480 | | 21.1 | % | | | 16,391 | | 21.4 | % |
A | | | 20,301 | | 23.9 | % | | | 20,000 | | 24.0 | % | | | 19,624 | | 25.1 | % | | | 19,324 | | 25.2 | % |
BBB | | | 15,816 | | 18.6 | % | | | 15,816 | | 19.0 | % | | | 15,350 | | 19.6 | % | | | 15,350 | | 20.0 | % |
Investment Grade | | | 482 | | 0.6 | % | | | 482 | | 0.6 | % | | | 584 | | 0.7 | % | | | 584 | | 0.8 | % |
Below Investment Grade | | | 1,316 | | 1.5 | % | | | 1,316 | | 1.6 | % | | | 1,454 | | 1.9 | % | | | 1,454 | | 1.9 | % |
Not Rated | | | 1,697 | | 2.0 | % | | | 1,697 | | 2.0 | % | | | 936 | | 1.2 | % | | | 936 | | 1.2 | % |
| | | | | | | | | | | | | | | | | | | | | | | | |
Total | | $ | 84,912 | | 100.0 | % | | $ | 83,251 | | 100.0 | % | | $ | 78,253 | | 100.0 | % | | $ | 76,574 | | 100.0 | % |
| * | See Consolidated Explanatory Notes on page 15. |
| ** | Indicated category reflects highest rating of the three rating agencies. |
| | |
11 | | Quarterly Operating Supplement for the Period Ended March 31, 2006 /Consolidated Insured Portfolio Highlights |
Quarterly Operating Supplement
Radian Asset Assurance Inc.
Consolidated Insured Portfolio Highlights*
($ Millions)
10 Largest Public Finance Exposures
| | | | | | | | |
| | | Net Par
Outstanding
(03/31/2006) | | Percent
of total
Net Par | | | Rating 1 |
New York, New York GO | | $ | 660 | | 0.8 | % | | A+ |
California State GO | | | 612 | | 0.7 | % | | A |
Port Authority Of New York & New Jersey | | | 474 | | 0.6 | % | | AA- |
Chicago, City Of | | | 401 | | 0.5 | % | | AA- |
Massachusetts State GO | | | 334 | | 0.4 | % | | AA |
Metropolitan Transportation Authority New York | | | 319 | | 0.4 | % | | A |
New Jersey Econ Dev Auth School Fac | | | 314 | | 0.4 | % | | AA- |
New York City Muni Water Finance | | | 307 | | 0.4 | % | | AA+ |
Long Island Power Authority New York | | | 305 | | 0.4 | % | | A- |
Jefferson County Alabama Gas & Sewer | | | 275 | | 0.3 | % | | AA- |
| | | | | | | | |
Total | | $ | 4,001 | | 4.9 | % | | |
| | | |
11 Largest Structured Finance Exposures | | | | | | | | |
| | | |
| | | Net Par
Outstanding
(03/31/2006) | | Percent of total Net Par | | | Rating2 |
US Static Synthetic Investment Grade CDO | | $ | 450 | | 0.5 | % | | AAA |
UK Static Synthetic Investment Grade CDO | | | 450 | | 0.5 | % | | AAA |
US Static Synthetic Investment Grade CDO | | | 450 | | 0.5 | % | | AAA |
US Static Synthetic Investment Grade CDO | | | 450 | | 0.5 | % | | AAA |
US Static Synthetic Investment Grade CDO | | | 450 | | 0.5 | % | | AAA |
Global Static Synthetic Investment Grade CDO | | | 450 | | 0.5 | % | | AAA |
US Static Synthetic Investment Grade CDO | | | 450 | | 0.5 | % | | AAA |
US Static Synthetic Investment Grade CDO | | | 450 | | 0.5 | % | | AAA |
US Static Synthetic Investment Grade CDO | | | 450 | | 0.5 | % | | AAA |
Global Static Synthetic Investment Grade CDO | | | 450 | | 0.5 | % | | AAA |
Second to Pay CDO Wrap | | | 450 | | 0.5 | % | | AAA |
| | | | | | | | |
Total | | $ | 4,950 | | 5.5 | % | | |
| * | See Consolidated Explanatory Notes on page 15. |
| 1 | Indicated category reflects highest rating of the three rating agencies. |
| 2 | Indicated category reflects highest rating of the three rating agencies. Represents lowest attachment point of transactions. |
| | |
12 | | Quarterly Operating Supplement for the Period Ended March 31, 2006 /Consolidated Insured Portfolio Highlights |
Quarterly Operating Supplement
Radian Asset Assurance Inc.
Consolidated Insured Portfolio Highlights*
($ Millions)
Net Debt Service Amortization
| | | | | | |
| | | Scheduled Net Debt Service Amortization as of March 31, 2006 | | Ending Net Debt Service Outstanding |
2006 | | $ | 4,753 | | $ | 113,110 |
2007 | | | 7,409 | | | 105,701 |
2008 | | | 6,350 | | | 99,351 |
2009 | | | 8,392 | | | 90,959 |
2010 | | | 8,981 | | | 81,978 |
2011-2015 | | | 31,554 | | | 50,424 |
2016-2020 | | | 18,584 | | | 31,840 |
2021-2025 | | | 14,010 | | | 17,830 |
After 2025 | | | 17,830 | | | — |
| | | | | | |
Total | | $ | 117,863 | | | |
| * | See Consolidated Explanatory Notes on page 15. |
| | |
13 | | Quarterly Operating Supplement for the Period Ended March 31, 2006 /Consolidated Insured Portfolio Highlights |
Quarterly Operating Supplement
Radian Asset Assurance Inc.
Consolidated CDO Exposure* ($ Millions)
Total CDO Exposure
| | | | | | | | | | | | |
| | | Net Par Outstanding
(03/31/2006) | | Percent of Total CDO Net Par | | | Net Par Outstanding
(12/31/2005) | | Percent of Total CDO Net Par | |
Direct | | $ | 26,859 | | 95.9 | % | | $ | 21,442 | | 94.3 | % |
Assumed | | | 1,152 | | 4.1 | % | | | 1,294 | | 5.7 | % |
| | | | | | | | | | | | |
Total | | $ | 28,011 | | 100.0 | % | | $ | 22,736 | | 100.0 | % |
| | | | |
Total CDO Portfolio Rating Distribution | | | | | | | | | | | | |
| | | | |
| | | Net Par Outstanding
(03/31/2006) | | Percent of Total CDO
Net Par | | | Net Par Outstanding
(12/31/2005) | | Percent of Total CDO
Net Par | |
AAA | | $ | 23,691 | | 84.6 | % | | $ | 18,267 | | 80.3 | % |
AA | | | 2,454 | | 8.8 | % | | | 2,470 | | 10.9 | % |
A | | | 614 | | 2.2 | % | | | 604 | | 2.7 | % |
BBB | | | 894 | | 3.2 | % | | | 982 | | 4.3 | % |
Below Investment Grade | | | 127 | | 0.4 | % | | | 413 | | 1.8 | % |
Not Rated | | | 231 | | 0.8 | % | | | — | | 0.0 | % |
| | | | | | | | | | | | |
Total | | $ | 28,011 | | 100.0 | % | | $ | 22,736 | | 100.0 | % |
| | | | |
Direct CDO Underlying Asset Types | | | | | | | | | | | | |
| | | | |
| | | Net Par
Outstanding
(03/31/2006) | | Percent of
Total CDO
Net Par | | | Net Par
Outstanding
(12/31/2005) | | Percent of
Total CDO
Net Par | |
Corporates | | $ | 25,447 | | 94.7 | % | | $ | 20,019 | | 93.4 | % |
ABS | | | 1,412 | | 5.3 | % | | | 1,423 | | 6.6 | % |
| | | | | | | | | | | | |
Total | | $ | 26,859 | | 100.0 | % | | $ | 21,442 | | 100.0 | % |
| * | All direct CDO deals are synthetic. $24,271 million of direct CDO net par outstanding, representing 90.4% of net par outstanding, was comprised of static deals as of 3/31/06. $2,588 million of direct CDO net par outstanding, representing 9.6% of net par outstanding, was comprised of managed deals as of 3/31/06. |
| | |
14 | | Quarterly Operating Supplement for the Period Ended March 31, 2006 / Consolidated CDO Exposure |
Quarterly Operating Supplement
Radian Asset Assurance Inc.
Consolidated Explanatory Notes
1. The accompanying unaudited GAAP financial information includes the accounts of Radian, Radian Asset Assurance Limited, Radian Financial Products Limited, Van-American Companies, Inc. and Asset Recovery Solutions.
These unaudited consolidated financial statements do not include all of the information and disclosures required by generally accepted accounting principles. These financial statements should be read in conjunction with the audited consolidated financial statements and notes thereto, including the Report of Independent Registered Public Accounting Firm for Radian for the year ended December 31, 2005, as filed in accordance with 15c2-12 of the Securities Exchange Act of 1934.
2. In May 2004, Moody’s provided Radian with an initial insurance financial strength rating of Aa3. Concurrently, and in anticipation of the merger of Radian Reinsurance Inc. (Radian Reinsurance) with and into Radian, Moody’s downgraded the insurance financial strength rating of Radian Reinsurance from Aa2 to Aa3. As a result of this downgrade, two of the primary insurer customers had the right to recapture previously written business ceded to Radian Reinsurance. One of these customers agreed, without cost to or concessions by Radian, to waive its recapture rights. Effective February 28, 2005, the remaining primary insurer customer with recapture rights recaptured approximately $7.4 billion of par in-force that it had ceded to Radian Reinsurance, including $54.7 million of premiums written through the recapture date, $4.5 million of which already had been treated as earned under GAAP and was required to be recorded as an immediate reduction of earned premium at the time of recapture. Also, in connection with the recapture in the first quarter of 2005, Radian was reimbursed for policy acquisition costs of approximately $17.1 million for which the carrying value under GAAP was $18.8 million. This required Radian to write-off policy acquisition costs of $1.7 million. The aggregate result of the recapture was a reduction in pre-tax income of $6.2 million. In March 2005, without cost to or concessions by Radian, this customer waived its remaining right to recapture an additional $5.2 billion of par in force that it had ceded to Radian through December 31, 2004.
3. For the quarter ended March 31, 2006, net premiums written were $53.5 million as compared to $11.6 million for the same period in 2005. This increase was primarily the result of the 2005 recapture which reduced net premiums written by $54.7 million in 2005 coupled with the $9.9 million decrease in Trade Credit gross premiums period over period as a result of Radian’s exiting this line of business.
4. For the quarter ended March 31, 2006, the change in fair value of derivatives was $8.5 million as compared to $(11.1) million for the same period in 2005. The 2006 gain is primarily due to tighter credit spreads on new and existing deals that was partially offset by a loss of $17.2 million on a credit that was settled in March 2006. The 2005 loss was primarily driven by an $11.9 million loss on one high-yield deal.
5. At March 31, 2006, the mark to market on credit derivatives was $94.9 million compared to a mark to market of $23.4 million at December 31, 2005. The increase in the mark was primarily due to Radian paying $68.0 million to a counterparty in March 2006 in consideration for the termination of one credit.
6. The statutory net loss for the period ended March 31, 2006 includes $68.0 million of losses and loss adjustment expenses incurred related to the payment for the termination of one credit.
7. The underwriting expense ratio of 841.2% for the quarter ended March 31, 2005 reflected the recapture of $54.7 million of premiums written and a related reduction in commissions of $17.1 million. As a result, premiums written during the period were $1.0 million and underwriting expenses were $8.7 million.
| | |
15 | | Quarterly Operating Supplement for the Period Ended March 31, 2006 /Consolidated Explanatory Notes |
Quarterly Operating Supplement
Safe Harbor Statement
All statements made in this document that address events or developments that we expect or anticipate may occur in the future are “forward-looking statements” within the meaning of Section 27A of the Securities Act of 1933, Section 21E of the Securities Exchange Act of 1934 and the U.S. Private Securities Litigation Reform Act of 1995. These statements are made on the basis of management’s current views and assumptions with respect to future events. The forward-looking statements, as well as our prospects as a whole, are subject to risks and uncertainties, including the following: changes in general financial and political conditions such as extended national or regional economic recessions (or expansions), changes in housing values, population trends and changes in household formation patterns, changes in unemployment rates, or changes or volatility in interest rates; changes in investor perception of the strength of private mortgage insurers or financial guaranty providers, and risks faced by the businesses, municipalities or pools of assets covered by our insurance; the loss of a customer with whom we have a concentration of our insurance in force; increased severity or frequency of losses associated with certain of our products that are riskier than traditional mortgage insurance and municipal guaranty insurance policies; material changes in persistency rates of our mortgage insurance policies; downgrades of, or other ratings actions with respect to, our credit ratings or the insurance financial-strength ratings assigned by the major ratings agencies to our operating subsidiaries; heightened competition from other insurance providers and from alternative products to private mortgage insurance and financial guaranty insurance; changes in the charters or business practices of Fannie Mae and Freddie Mac; the application of federal or state consumers lending, insurance and other applicable laws and regulations, or unfavorable changes in these laws and regulations or the way they are interpreted including legislative and regulatory changes affecting demand for private mortgage insurance or financial guaranty insurance; the possibility that we may fail to estimate accurately the likelihood, magnitude and timing of losses in connection with establishing loss reserves for our mortgage insurance or financial guaranty businesses or to estimate accurately the fair value amounts of derivative financial guaranty contracts in determining gains and losses on these contracts; changes in accounting guidance from the SEC or the Financial Accounting Standards Board regarding income recognition and the treatment of loss reserves in the mortgage insurance or financial guaranty industries; changes in claims against mortgage insurance products resulting from the aging of our mortgage insurance policies; vulnerability to the performance of our strategic investments; changes in the availability of affordable or adequate reinsurance for our non-prime risk; international expansion of our mortgage insurance and financial guaranty businesses into new markets and risks associated with our international business activities. For more information regarding these risks and uncertainties as well as certain additional risks faced by us, please refer to the risk factors detailed in Item 1A of Part I of Radian Group Inc.’s annual report on Form 10-K for the year ended December 31, 2005. We caution you not to place undue reliance on these forward-looking statements, which are current only as of the date on which this information was publicly released. We do not intend to, and disclaim any duty or obligation to, update or revise any forward-looking statements made in this document to reflect new information, future events or for any other reason.
| | |
16 | | Quarterly Operating Supplement for the Period Ended March 31, 2006 /Safe Harbor Statement |