 Third Quarter 2007 Exhibit 99.2 |
 1 Safe Harbor Statement All statements made during our third-quarter conference call and in the accompanying presentation that address events or developments that we expect or anticipate may occur in the future are “forward-looking statements” within the meaning of Section 27A of the Securities Act of 1933, Section 21E of the Securities Exchange Act of 1934 and the U.S. Private Securities Litigation Reform Act of 1995. These statements, which include projections regarding revenues and losses as well as other statements regarding our future financial condition, are made on the basis of management’s current views and assumptions with respect to future events. These forward-looking statements, as well as our prospects as a whole, are subject to risks and uncertainties, including the following: changes in general financial and political conditions such as extended national or regional economic recessions (or expansions), changes in housing demand or mortgage originations, changes in housing values, population trends and changes in household formation patterns, changes in unemployment rates, changes or volatility in interest rates, consumer confidence, or credit spreads; future credit market disruptions – in particular, further deterioration in the housing, mortgage and related credit markets, which would harm our future consolidated results of operations and, if more severe than our current predictions, could cause our ultimate projected losses on our existing mortgage insurance portfolio to be inaccurate; adverse changes in the liquidity in the capital markets and the contraction of credit markets; changes in investor perception of the strength of private mortgage insurers or financial guaranty providers; risks faced by the businesses, municipalities or pools of assets covered by our insurance; the loss of a customer with whom we have a concentration of our insurance in force or the influence of large customers; increased severity or frequency of losses associated with certain of our products that are riskier than traditional mortgage insurance and financial guaranty insurance policies; material changes in the persistency rates of our mortgage insurance policies; losses associated with the aging of our mortgage insurance portfolio; ratings actions with respect to our credit ratings or the insurance financial- strength ratings assigned by the major ratings agencies to our operating subsidiaries – in particular, our ratings that are currently under review for possible downgrade by Moody’s; heightened competition from other insurance providers, from federal and state governmental or quasi-governmental entities such as the FHA and from alternative products to private mortgage insurance and financial guaranty insurance; changes in the charters or business practices of Fannie Mae and Freddie Mac; the application of federal or state consumer, lending, insurance and other applicable laws and regulations, or changes in these laws and regulations or the way they are interpreted; the possibility that we may fail to estimate accurately the likelihood, magnitude and timing of losses in connection with establishing loss reserves for our mortgage insurance or financial guaranty businesses or to estimate accurately the fair value amounts of derivative financial guaranty contracts in determining gains and losses on these contracts; changes in accounting guidance from the SEC or the Financial Accounting Standards Board regarding income recognition and the treatment of loss reserves in the mortgage insurance or financial guaranty industries; vulnerability to the performance of our strategic investments; proceeds we may receive from a sale of our interest in C- BASS or the assets of C-BASS or in connection with the exercise of the outstanding option to purchase our remaining interests in Sherman; legal and other limitations on the amount of dividends that we may receive from our insurance subsidiaries; international expansion of our mortgage insurance and financial guaranty businesses into new markets and risks associated with our international business activities. For more information regarding these risks and uncertainties, as well as certain additional risks that we face, investors should refer to the risk factors detailed in Part I, Item 1A of our annual report on Form 10-K for the year ended December 31, 2006. We caution you not to place undue reliance on these forward-looking statements, which are current only as of the date of this presentation. We do not intend to, and disclaim any duty or obligation to, update or revise any forward-looking statements made during today’s investor call or included in the accompanying presentation to reflect new information, future events or for any other reason. |
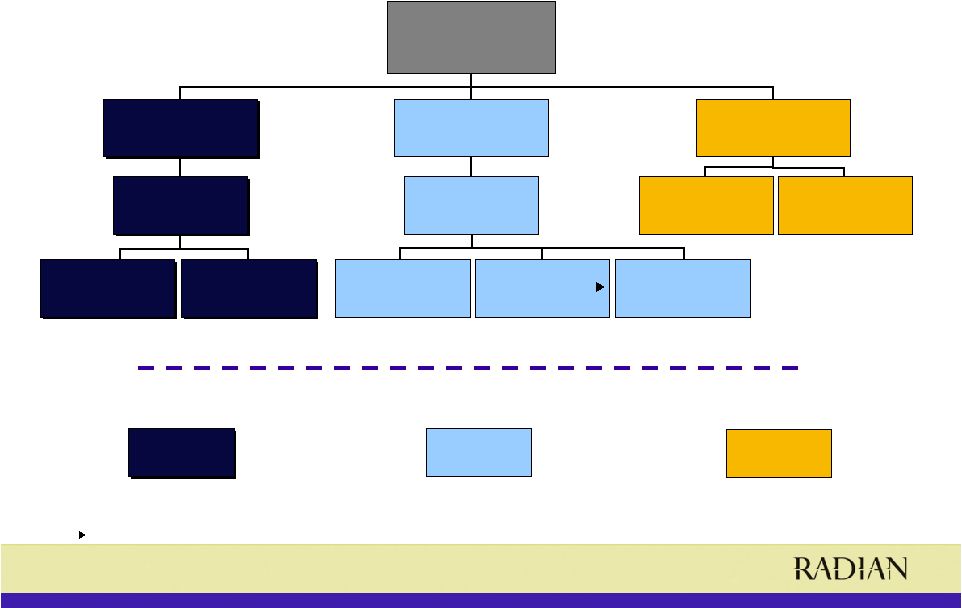 3 Business Segment Structure Radian Mortgage Insurance Financial Services Radian Asset Assurance Ltd.* (AA/Aa3/AA) Radian Asset Assurance Ltd.* (AA/Aa3/AA) Radian Financial Products Ltd.* Radian Financial Products Ltd.* C-BASS 46% Interest Sherman 22% Interest Financial Guaranty Financial Guaranty Radian Asset Assurance Inc. (AA/Aa3/AA) Radian Asset Assurance Inc. (AA/Aa3/AA) Radian Insurance Inc. (AA/Aa3/AA) Radian Europe Ltd.* (AA/NR/AA ) Radian Guaranty Inc. (AA/Aa3/AA) Radian Australia Ltd.* (NR/NR/NR) $1,429 MM $1,429 MM $1,925 MM $94 MM Segment Equity at 9/30/07 * International Entities To be Liquidated by the End of 2007 |
 4 Financial Highlights Dollars in millions. As of 9/30/07 Assets $8,214.9 Loss reserves $1,094.7 Unearned premiums $1,045.3 Stockholders’ equity $3,447.5 Market capitalization $1,872.4 Debt to capital ratio 21.6% Book value per share $42.86 |
 5 3 rd Quarter 2007 Book Value Change Dollars in millions except per share amounts Total Per Share 6/30/2007 Book Value $4.1 B 51.53 $ Pre-tax After-tax impact C-BASS Impairment (468) (304) NIMS mark-to-market (366) (2) (238) Financial Guaranty mark-to-market (256) (166) Second-Lien premium deficiency (155) (101) FG Reserve for CDO of ABS transaction (50) (33) Sherman Gain on Sale 182 118 All Other - 26 0.33 BV per share impact (3.78) (2.96) (2.06) (1.26) (0.41) 1.47 9/30/2007 Book Value $3.4 B 42.86 $ (1) (3) (2) Includes approximately $270 million of projected future principal credit losses (3) Represents an acceleration of the present value of expected future losses (approximately $300 million as previously disclosed) and future expenses less expected future premiums (1) Does not include possible write-down of between $0 and $50 million related to our loan to C-BASS EPS impact (3.78) $ (2.96) (2.06) (1.26) (0.41) 1.47 0.22 Quarter Ended 9/30/2007 EPS (8.78) $ |
 6 Diversification Risk In Force/ Net Par Outstanding by Product Dollars in millions. * less than 1% Business Line Product RIF/Net Par Outstanding as of 9/30/07 Percent of Porfolio Financial Guaranty Direct Public Finance $47,704.1 30% Public Finance Reinsurance 41,592.6 27% Direct Structured Finance 18,168.9 12% Structured Finance Reinsurance 5,300.4 3% Total FG Net Par Outstanding 112,766.0 72% Mortgage Insurance Primary Prime MI 20,908.0 13% Primary Non-Prime MI 8,493.0 5% Pool MI 2,987.0 2% Second Liens 1,007.0 1% NIMs 712.0 *% International 8,625.0 6% Other 212.0 *% Total MI RIF 42,944.0 28% Total Radian RIF/Net Par Outstanding $155,710.0 100% |
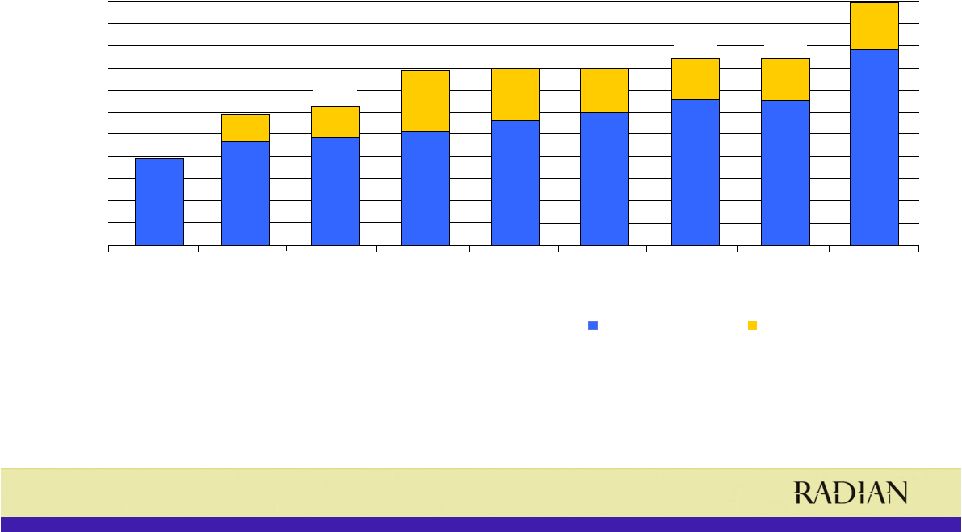 7 Total Loss Reserves Dollars in millions. 390.0 484.7 513.5 559.6 596.2 653.2 651.2 885.0 209.7 465.4 123.2 139.9 276.9 241.4 204.8 189.1 189.7 $0 $100 $200 $300 $400 $500 $600 $700 $800 $900 $1,000 $1,100 2000 2001 2002 2003 2004 2005 2006 3Q 2006 3Q 2007 Mortgage Insurance Financial Guaranty 588.6 790.4 624.6 1,094.7 801.0 801.0 842.3 840.9 |
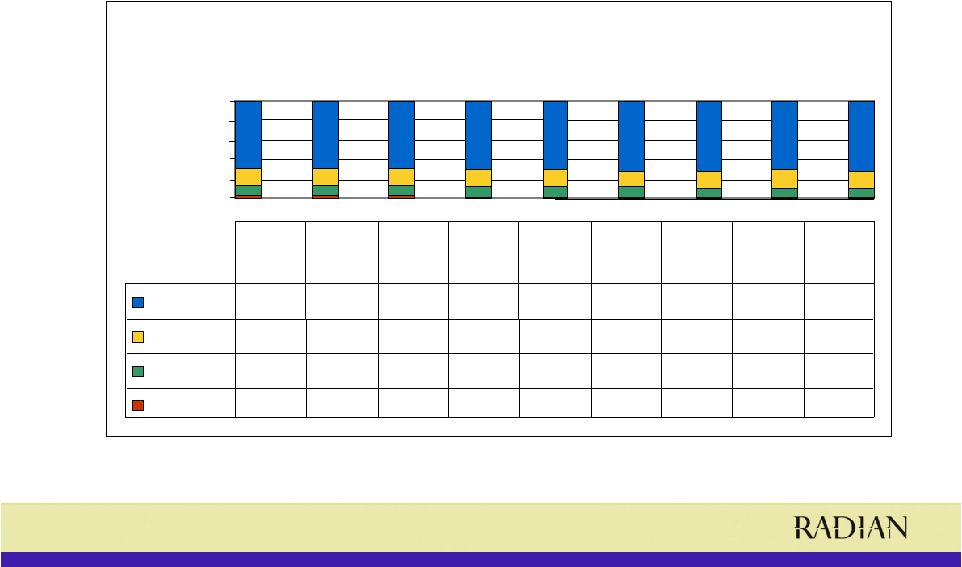 8 Primary Mortgage Insurance Risk in Force by Product Primary RIF by Product 0% 20% 40% 60% 80% 100% Prime 68.7% 69.3% 68.9% 69.8% 70.8% 71.9% 71.8% 70.9% 71.1% Alt A 17.7% 17.5% 17.5% 17.3% 17.0% 16.7% 17.3% 18.5% 18.6% A minus 10.7% 10.5% 10.8% 10.5% 10.0% 9.5% 9.2% 9.2% 9.1% B/C 2.9% 2.7% 2.8% 2.4% 2.2% 1.9% 1.7% 1.4% 1.2% Sep-05 Dec-05 Mar-06 Jun-06 Sep-06 Dec-06 Mar-07 Jun-07 Sep-07 |
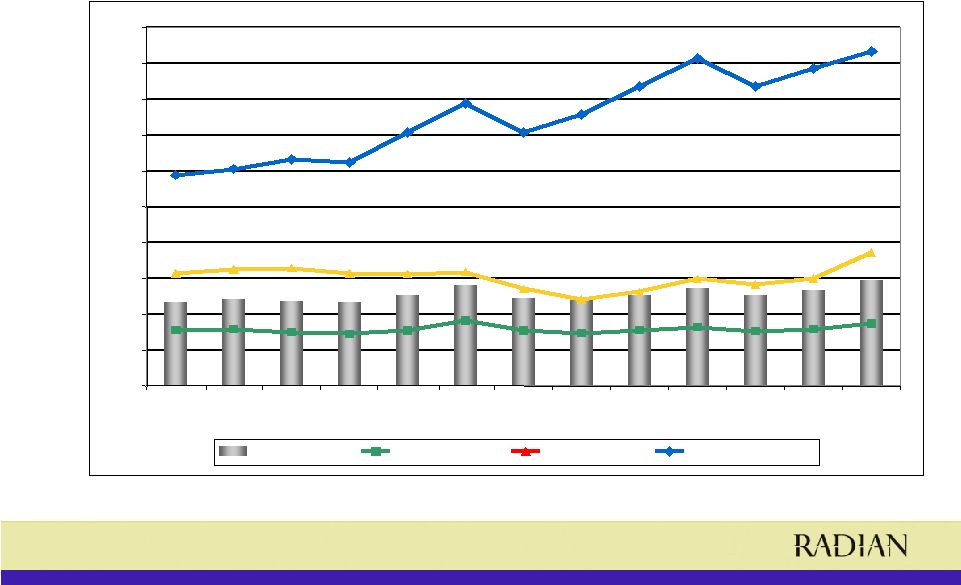 9 Primary Mortgage Insurance Default Rates by Prime, Alt A and SubPrime 0% 2% 4% 6% 8% 10% 12% 14% 16% 18% 20% 2004 Q3 2004 Q4 2005 Q1 2005 Q2 2005 Q3 2005 Q4 2006 Q1 2006 Q2 2006 Q3 2006 Q4 2007 Q1 2007 Q2 2007 Q3 Primary Total Primary Prime Primary Alt A Primary SubPrime |
 10 Dollars in billions. Financial Guaranty Net Par Outstanding by Product $112.8 billion as of 9/30/07 36.5 13.2 21.6 15.1 41.4 39.6 47.7 18.2 46.9 $0 $5 $10 $15 $20 $25 $30 $35 $40 $45 $50 $55 Reinsurance Direct Public Finance Direct Structured 9/30/2005 9/30/2006 9/30/2007 |
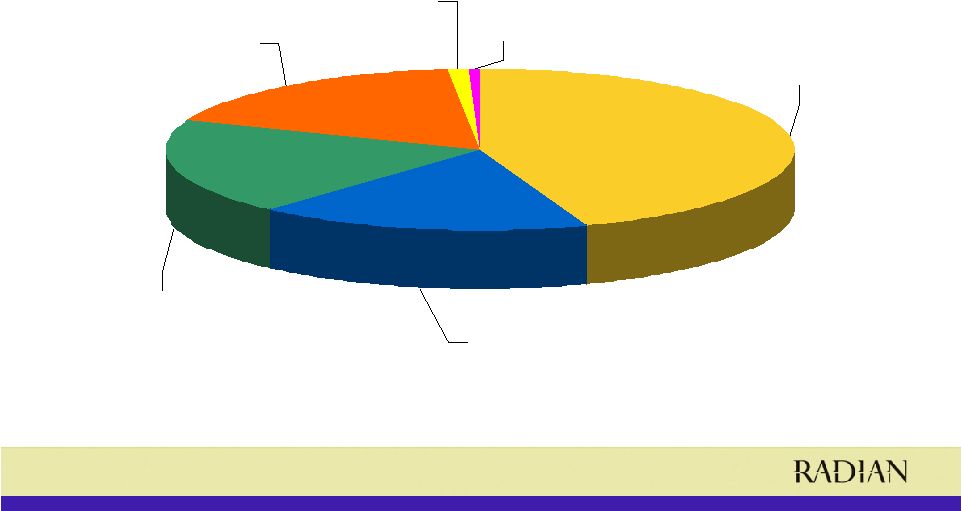
 11 Financial Guaranty Product Line and Sector Mix $112.8 billion in net par outstanding as of 9/30/07 5.7 Utilities 5.1 Tax-backed 1.4 Long term care 3.1 Investor owned utilities 0.6 Housing 3.8% Education 53.0 % Subtotal 1.4 Other public finance 5.6 Transportation 9.4 Healthcare 16.9 General obligations Percent Sector Public Finance 0.9 Asset-backed – mortgage and MBS 1.1% Asset-backed – commercial and other 47.0% Subtotal 2.3 Other structured finance 41.5 CDOs 1.2 Asset-backed –consumer Percent Sector Structured Finance |
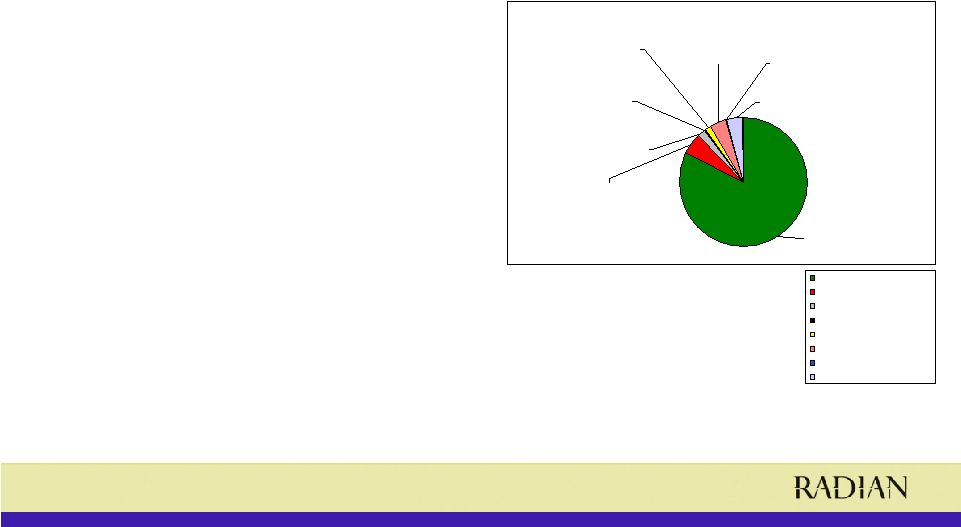
 12 BBB 18% AA 17% A 19% AAA 44% BIG 1% NR 1% Financial Guaranty Net Par Outstanding by Rating * Indicated ratings category reflects the highest rating assigned to the underlying obligation from the three rating agencies (S&P, Moody’s and Fitch), or, if no such rating has been assigned, Radian’s rating estimate of the obligation utilizing rating agency models and methodologies to the extent available. Radian’s rating estimates are subject to revision at any time and may differ from the credit ratings ultimately assigned by the three rating agencies. $112.8 billion in net par outstanding as of 9/30/07 |
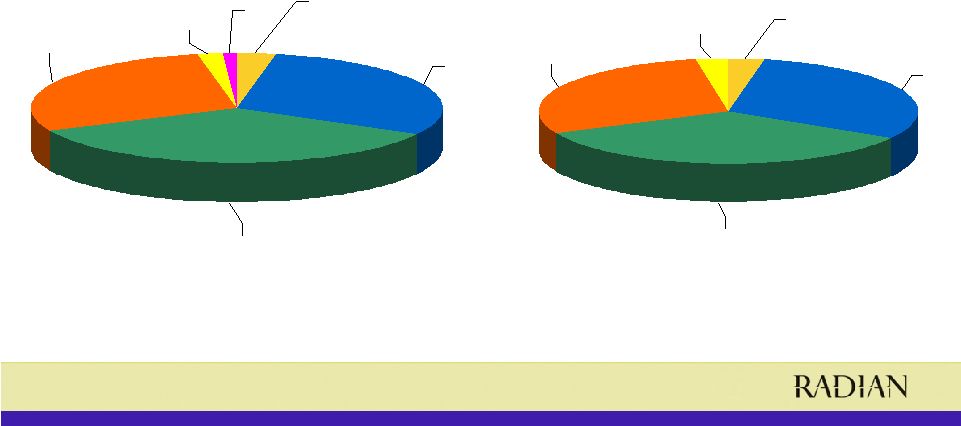 13 $51.8 billion in net par as of 9/30/06; $59.8 billion in net par outstanding as of 9/30/07 Financial Guaranty Public Finance Net Par Outstanding by Rating Direct and Assumed NR 0% BIG 3% AA 31% A 34% BBB 29% AAA 3% 9/30/06 9/30/07 NR 1% BIG 2% AA 30% A 35% BBB 29% AAA 3% * Indicated ratings category reflects the highest rating assigned to the underlying obligation from the three rating agencies (S&P, Moody’s and Fitch), or, if no such rating has been assigned, Radian’s rating estimate of the obligation utilizing rating agency models and methodologies to the extent available. Radian’s rating estimates are subject to revision at any time and may differ from the credit ratings ultimately assigned by the three rating agencies. |
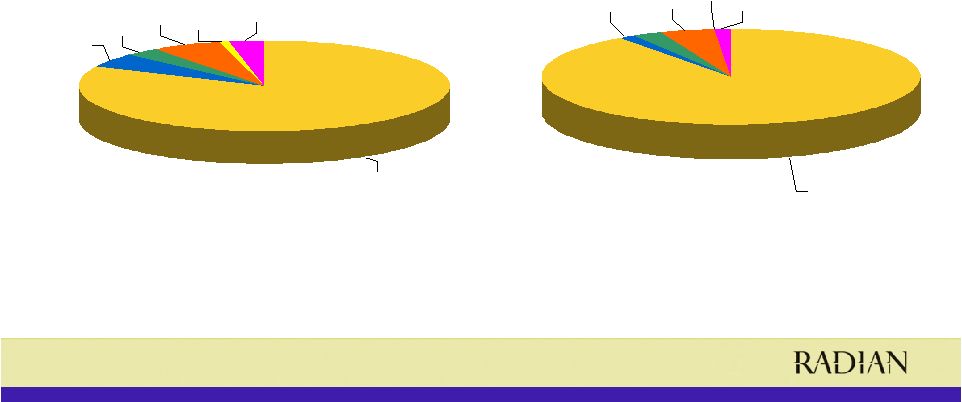 14 $44.3 billion in net par as of 9/30/06; $53.0 billion in net par outstanding as of 9/30/07 NR 1% BIG 0% AA 2% A 2% BBB 5% AAA 90% 9/30/06 9/30/07 NR 3% BIG 1 % AA 5% A 3% BBB 6% AAA 82% * Indicated ratings category reflects the highest rating assigned to the underlying obligation from the three rating agencies (S&P, Moody’s and Fitch), or, if no such rating has been assigned, Radian’s rating estimate of the obligation utilizing rating agency models and methodologies to the extent available. Radian’s rating estimates are subject to revision at any time and may differ from the credit ratings ultimately assigned by the three rating agencies. Financial Guaranty Structured Net Par Outstanding by Rating Direct and Assumed |
 15 Financial Guaranty Non-CDO RMBS Portfolio: Breakdown by Asset Type $1,013 MM Domestic RMBS as of September 30, 2007 $359 MM 17 Policies 35% $0 MM 0 Policies 0% $0 MM 0 Policies 0% $205 MM 10 Policies 54% $154 MM 7 Policies 27% % Direct 9% 0% 0% 1% 15% A 19% / 18% 0% / 0% 24% / 24% 20% / 9% 18% / 24% % 2006/2007 Vintage 51% 100% 59% 87% 27% AAA 5% 0% 41% 8% 0% AA 19% 0% 0% 4% 31% BBB* 27% $427 MM 175 Policies 73% 57% $581 MM 182 Policies SubPrime 0% $6 MM 6 Policies 100% 1% $6 MM 6 Policies Second to Pay 0% $46 MM 7 Policies 100% 5% $46 MM 7 Policies Alt A $1,013 MM 299 Policies $380 MM 104 Policies Total Net Par Outstanding 0% $175 MM 94 Policies 46% 37% Prime $654 MM 282 Policies 65% % Assumed from AAA Primaries 100% % of RMBS Portfolio 16% BIG** Total RMBS *100% of the BBB exposure is assumed through treaties from the AAA primaries **All of the BIG exposure is on Radian’s Watch List and reserves have been established for these as needed ****Ratings are based on internal ratings. Note: No direct RMBS have been written since 2005 and no direct SubPrime RMBS have been written since 2004 |
 16 Financial Guaranty CDO Portfolio $46.8 Billion Net Par Outstanding as of September 30, 2007 Direct exposure ($44.9 billion; 96% of CDO exposure): • Synthetic Corporate CDOs attach at the AAA level or higher, with an average attachment point of 2.6x the AAA level and a weighted average tenor of 6 years – More than 84% have attachments of at least 2x the AAA level as determined by S&P CDO Evaluator – On an outstanding notional basis, at least 95% of the transactions we have insured (with a typical portfolio of 100-150 referenced corporate entities) can sustain at least 15 defaults (30% recovery assumption) without Radian Asset incurring a loss • Trust Preferred CDOs attach at AAA or multiple of AAA level • CLOs - 2 nd -to-pay transactions with AAA monolines wrapping underlying • 87% of CDOs of ABS net par outstanding is rated AAA • 100% of CDOs of CMBS and Multi-sector CDOs net par outstanding is rated AAA Assumed exposure ($1.9 billion; 4% of CDO exposure): • Over 285 credits through reinsurance • 2 deals on Intensified Surveillance List totaling $15.3 million • 4 deals on Case Reserve List totaling $2.5 million *One multi-sector CDO with net par outstanding of $257 million **Includes $100 million market value extendible note program ***One second to pay CDO of corporate bonds with net par outstanding of $164 million Note: See CDOs of ABS, CDOs of CMBS, and Multi-sector CDOs table for detail on these sectors CDO Exposure by Net Par Outstanding Assumed CDOs $1.9B, 4% Synthetic Corporate CDOs - $38.6B, 82% Multi-sector CDO* $0.3B, 1% CDOs of CMBS $1.8B, 4% Trust Preferred CDOs $2.5B, 5% Second to Pay CLOs $0.9B, 2% Second to Pay CDOs*** $0.2B, <1% CDOs of ABS** $0.8B, 2% Synthetic Corporate CDOs Trust Preferred CDOs Second to Pay CLOs Second to Pay CDOs*** CDOs of ABS** CDOs of CMBS Multi-sector CDO* Assumed CDOs |
 17 • Radian Asset has three CDOs of ABS with net par outstanding of $760.8 million, of which 2 are rated AAA ($660.8 million) and 1 is rated BBB ($100 million). • The BBB rated transaction is the market value extendible note program discussed on our September 27 th Financial Guaranty investor call in which Radian has a $100 million exposure. This transaction is supported by high investment grade assets, with 67% of the underlying collateral rated AAA and the remaining 33% rated AA as of September 30, 2007. One $2.8 million RMBS bond in this transaction’s total collateral pool was downgraded by S&P from AA to B on October 27, 2007. An extension event has occurred and the six month liquidation period has commenced. • The ratings on both of Radian’s AAA CDOs of ABS have remained stable. The underlying collateral of one of these deals was impacted by Moody’s and S&P’s rating actions since July 2007. The downgrades affected 19 credits representing $102 million in a collateral pool of 129 credits totaling $631.4 million. Total subordination equals $127.8 million. 100% of the subprime RMBS could default with a 50% recovery rate before Radian would pay one dollar of loss assuming no defaults of non-subprime RMBS. Financial Guaranty CDO Portfolio: Ratings Downgrade Impact Analysis |
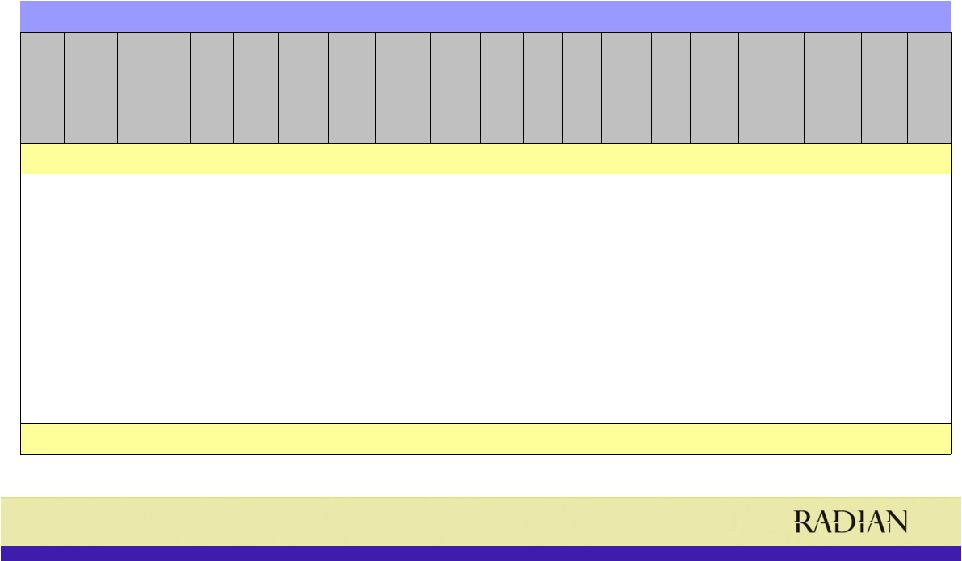 18 Financial Guaranty CDO of ABS, CMBS, and Multi-sector Portfolio Table As of September 30, 2007 $2,846,950,213.25 Total 0.00% 0.00% 7.00% 2.40% Aaa AAA 100.00% 0.00% 0.00% 0.00% 0.00% 0.00% 100.00% 0.00% 0.00% 0.00% $430,000,000.00 2047 2007 0.00% 0.00% 6.50% 5.52% N/R AAA 100.00% 0.00% 0.00% 0.00% 0.00% 0.00% 100.00% 0.00% 0.00% 0.00% $352,500,000.00 2056 2006 0.00% 0.00% 5.07% 0.63% N/R AAA 100.00% 0.00% 0.00% 0.00% 0.00% 0.00% 100.00% 0.00% 0.00% 0.00% $598,500,000.00 2049 2006 0.00% 0.00% 6.75% 2.40% N/R AAA 100.00% 0.00% 0.00% 0.00% 0.00% 0.00% 100.00% 0.00% 0.00% 0.00% $450,000,000.00 2047 2006 96.11% 82.45% 20.02% 4.85% Aaa AAA 100.00% 4.75% 2.81% 13.40% 0.00% 0.00% 13.37% 42.53% 23.14% 0.00% $510,773,213.25 2046 2006 100.00% 100.00% 13.00% 4.52% N/R AAA 100.00% 0.00% 0.00% 0.00% 1.49% 8.51% 0.00% 15.78% 49.05% 25.17% $150,000,000.00 2010 2005 100.00% 100.00% 19.46% 2.20% Aaa AAA 100.00% 0.00% 0.00% 0.00% 2.22% 26.97% 0.00% 0.00% 38.76% 32.05% $255,177,000.00 2009 2004 96.88% 89.15% 2.02% 7.75% N/R BBB 100.00% 3.57% 0.81% 12.47% 0.00% 0.00% 23.56% 24.06% 30.19% 5.33% $100,000,000.00 2010 2003 % Sub Prime A or Better % RMBS A or Better Radian Asset Attachment Point Original AAA Subordination Moody's Rating S&P Rating Total Collateral Pool Other CDO of CDO CDO of ABS High Yield Grade Corporate Investment Grade Corporate CMBS Subprime RMBS RMBS ABS Net Par Outstanding Legal Final Maturity Year Insured $2,846,950,213.25 Total 0.00% 0.00% 7.00% 2.40% Aaa AAA 100.00% 0.00% 0.00% 0.00% 0.00% 0.00% 100.00% 0.00% 0.00% 0.00% $430,000,000.00 2047 2007 0.00% 0.00% 6.50% 5.52% N/R AAA 100.00% 0.00% 0.00% 0.00% 0.00% 0.00% 100.00% 0.00% 0.00% 0.00% $352,500,000.00 2056 2006 0.00% 0.00% 5.07% 0.63% N/R AAA 100.00% 0.00% 0.00% 0.00% 0.00% 0.00% 100.00% 0.00% 0.00% 0.00% $598,500,000.00 2049 2006 0.00% 0.00% 6.75% 2.40% N/R AAA 100.00% 0.00% 0.00% 0.00% 0.00% 0.00% 100.00% 0.00% 0.00% 0.00% $450,000,000.00 2047 2006 96.11% 82.45% 20.02% 4.85% Aaa AAA 100.00% 4.75% 2.81% 13.40% 0.00% 0.00% 13.37% 42.53% 23.14% 0.00% $510,773,213.25 2046 2006 100.00% 100.00% 13.00% 4.52% N/R AAA 100.00% 0.00% 0.00% 0.00% 1.49% 8.51% 0.00% 15.78% 49.05% 25.17% $150,000,000.00 2010 2005 100.00% 100.00% 19.46% 2.20% Aaa AAA 100.00% 0.00% 0.00% 0.00% 2.22% 26.97% 0.00% 0.00% 38.76% 32.05% $255,177,000.00 2009 2004 96.88% 89.15% 2.02% 7.75% N/R BBB 100.00% 3.57% 0.81% 12.47% 0.00% 0.00% 23.56% 24.06% 30.19% 5.33% $100,000,000.00 2010 2003 % Sub Prime A or Better % RMBS A or Better Radian Asset Attachment Point Original AAA Subordination Moody's Rating S&P Rating Total Collateral Pool Other CDO CDO of ABS High Yield Grade Corporate Investment Grade Corporate CMBS Subprime RMBS RMBS ABS Net Par Outstanding Legal Final Maturity Year Insured Type of Collateral as a Percentage of Total Pool as of Sept 30th 2007 |
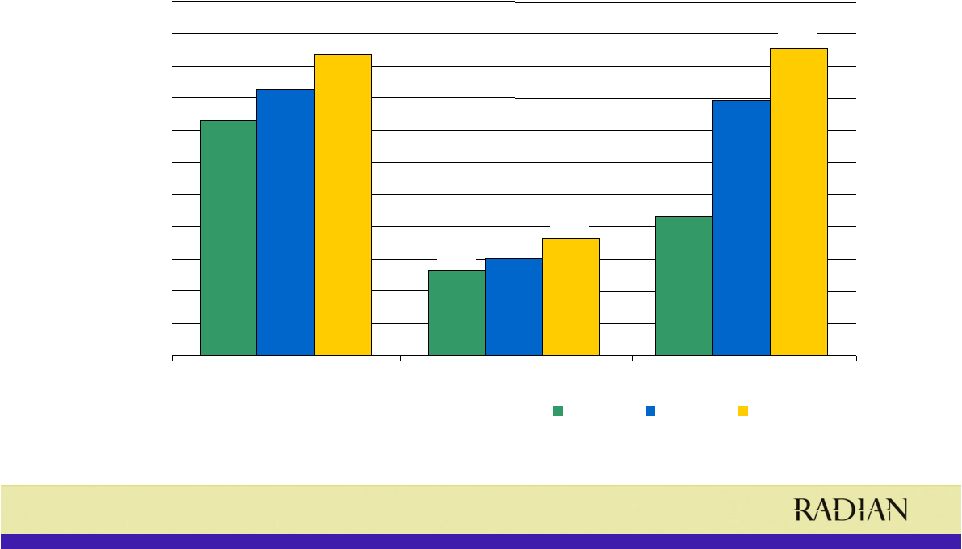
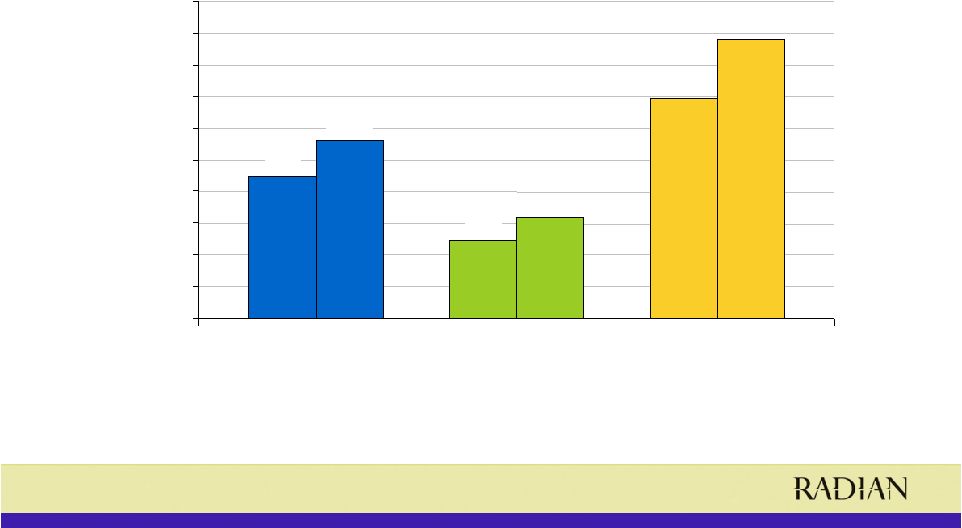 19 Financial Guaranty Adjusted Gross Written Premiums (AGWP) Growth* Direct Business Only *Includes upfront premiums written and present value of estimated future installment premiums for new direct business writing. See reconciliation to net written premiums. Dollars in millions. 9 M 9 M 2006 2007 Structured Finance 9 M 9 M 2006 2007 Public Finance 9 M 9 M 2006 2007 Total Direct 138.9 90.1 112.2 48.8 64.3 176.5 $0 $20 $40 $60 $80 $100 $120 $140 $160 $180 $200 |
 20 Financial Guaranty Reconciliation of Adjusted Gross Written Premiums Direct Only to Net Premiums Written (Insurance and Derivatives) Deduction Addition Deduction Total Present Value Installment Premiums Ceded Additions Adjusted Gross of Estimated Future on Policies Written Premiums on and Net Premiums Written Premium Installment Premiums in Previous Years Direct Business Deductions Written Q 3 06 Structured Finance Direct $20,705 $15,565 $14,486 $106 ($1,185) $19,520 Public Finance Direct $10,798 $0 $391 ($2) $393 $11,191 Q 3 07 Structured Finance Direct $44,107 $39,468 $10,175 $258 ($29,551) $14,556 Public Finance Direct $31,930 $14,198 $552 $56 ($13,702) $18,228 9M 06 Structured Finance Direct $90,144 $76,417 $45,738 $339 ($31,018) $59,126 Public Finance Direct $48,808 $74 $860 ($4) $790 $49,598 9M 07 Structured Finance Direct $112,234 $101,725 $30,945 $367 ($71,147) $41,087 Public Finance Direct $64,343 $15,568 $757 $56 ($14,867) $49,476 ($ in thousands) |
 21 |