Table of Contents
UNITED STATES
SECURITIES AND EXCHANGE COMMISSION
Washington, D.C. 20549
FORMN-CSR
CERTIFIED SHAREHOLDER REPORT OF REGISTERED
MANAGEMENT INVESTMENT COMPANIES
Investment Company Act file number:811-07142
HIGHLAND FUNDS II
(Exact name of registrant as specified in charter)
200 Crescent Court
Suite 700
Dallas, Texas 75201
(Address of principal executive offices)(Zip code)
Highland Capital Management Fund Advisors, L.P.
200 Crescent Court
Suite 700
Dallas, Texas 75201
(Name and Address of Agent for Service)
Registrant’s telephone number, including area code:(877) 665-1287
Date of fiscal year end: September 30
Date of reporting period: September 30, 2018
Table of Contents
Item 1. Reports to Stockholders.
A copy of the Annual Reports transmitted to shareholders pursuant toRule 30e-1 under the Investment Company Act of 1940, as amended (the “1940 Act”), is attached herewith (the “Annual Reports”). This report on FormN-CSR covers information for the year ended September 30, 2018 for Highland Global Allocation Fund (“Global Allocation Fund”). Highland Premier Growth Equity Fund (the “Premier Growth Equity Fund”), HighlandSmall-Cap Equity Fund (the“Small-Cap Equity Fund”), Highland Total Return Fund (the “Total Return Fund”), HighlandTax-Exempt Fund (the“Tax-Exempt Fund”), Highland Fixed Income Fund (the “Fixed Income Fund”), and Highland Energy MLP Fund (the “Energy MLP Fund”) have been reported separately.
Table of Contents

Highland Funds II
Highland Premier Growth Equity Fund
Highland Small-Cap Equity Fund
Highland Total Return Fund
Highland Tax-Exempt Fund
Highland Fixed Income Fund
Annual Report
September 30, 2018
Table of Contents
Highland Funds II
Highland Premier Growth Equity Fund
Highland Small-Cap Equity Fund
Highland Total Return Fund
Highland Tax-Exempt Fund
Highland Fixed Income Fund
| 1 | ||||
| 11 | ||||
| 16 | ||||
| 17 | ||||
| 40 | ||||
| 44 | ||||
| 46 | ||||
Statements of Changes in Net Assets - Capital Stock Activity - Shares | 49 | |||
| 52 | ||||
| 53 | ||||
| 68 | ||||
| 87 | ||||
| 88 | ||||
| 99 |
Economic and market conditions change frequently.
There is no assurance that the trends described in this report will continue or commence.
A prospectus must precede or accompany this report. Please read the prospectus carefully before you invest.
Table of Contents
PORTFOLIO MANAGER COMMENTARY (unaudited)
| September 30, 2018 | Highland Premier Growth Equity Fund | |
Performance Overview
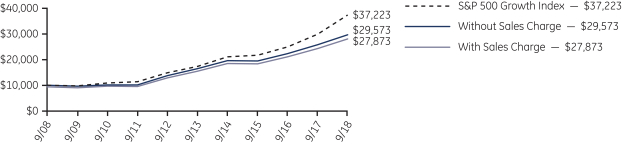
For the twelve-month period ended September 30, 2018, the Highland Premier Growth Equity Fund (the “Fund”) returned 15.38% for Class Y shares.1 The Fund’s benchmark the S&P 500 Growth Index returned 17.91%.
Manager’s Discussion
The Fund’s top investment themes during the year were technology, financials, consumer discretionary and communication services. Financials, Consumer Discretionary and Healthcare investments were the Fund’s top performance drivers during the year. Top contributors for the year included Amazon, Fortinet, Collegium Pharmaceutical and Visa. The Fund also uses derivatives such as options to protect from and/or to take advantage of market and issuer-related risks. These derivatives were a positive driver of performance during the period. Energy investments were the Fund’s largest detractor by sector primarily driven by underperformance in C&J Energy Services and Concho Resources. The Fund’s portfolio turnover rates increased year-over-year due to decreased capital activity as well as rebalancing/repositioning with the addition of a new portfolio manager.
| 1. | Only eligible investors may purchase class Y shares |
| Annual Report | 1 |
Table of Contents
PORTFOLIO MANAGER COMMENTARY (unaudited)
| September 30, 2018 | Highland Premier Growth Equity Fund | |
Highland Premier Growth Equity Fund - Class A
Growth of Hypothetical $10,000 Investment
| Average Annual Total Returns | ||||||||||||||||||||||||
Class A | Class C | Class Y | ||||||||||||||||||||||
Without Sales Charge | With Sales Charge | Without Sales Charge | With Sales Charge | Without Sales Charge | With Sales Charge | |||||||||||||||||||
| Year Ended September 30, 2018 | 15.14 | % | 8.52 | % | 14.28 | % | 13.45 | % | 15.38 | % | n/a | |||||||||||||
| Five Year | 12.45 | % | 11.13 | % | 11.61 | % | 11.61 | % | 12.73 | % | n/a | |||||||||||||
| Ten Year | 11.45 | % | 10.80 | % | 10.62 | % | 10.62 | % | 11.73 | % | n/a | |||||||||||||
Returns shown in the chart and table do not reflect taxes that a shareholder would pay on Fund distributions or on the sale of the Fund shares.
“Without Sales Charge” returns do not include sales charges or contingent deferred sales charges (“CDSC”). “With Sales Charge” returns reflect the maximum sales charge of 5.75% on Class A Shares. The CDSC on Class C Shares is 1.00% within the first year for each purchase; there is no CDSC on Class C Shares thereafter. The performance data quoted represents past performance and is no guarantee of future results. Investment return and principal value will fluctuate so that an investor’s share when redeemed may be worth more or less than their original cost. Current performance may be lower or higher than the performance data quoted. For performance data current to the most recentmonth-end, please visit our website at www.highlandfunds.com. The gross expense ratio as reported in the Fund’s financial highlights was as follows: Class A: 1.19%, Class C: 1.95%, and Class Y: 0.94%.
See Notes to Performance on page 1 for more information.
Stock prices may fall or fail to rise over time for several reasons, including general financial market conditions and factors related to a specific issuer or industry. The Fund invests in growth stocks that may be more volatile because they are more sensitive to market conditions. The Fund invests inmid-cap companies which may entail greater risks and less liquidity due to narrower product lines and more limited resources than larger companies. The Fund may invest in foreign securities which may cause more volatility and less liquidity due to currency changes, political instability and accounting differences. The Fund’s investments in derivatives may involve more volatility and less liquidity because of the risk that an investment may not correlate to the performance of the underlying securities.
Mutual fund investing involves risk including the possible loss of principal.
| 2 | Annual Report |
Table of Contents
PORTFOLIO MANAGER COMMENTARY (unaudited)
| September 30, 2018 | HighlandSmall-Cap Equity Fund | |
Performance Overview
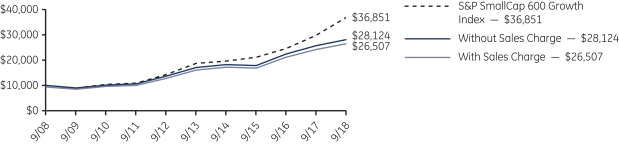
For the twelve-month period ended September 30, 2018, the Highland Small Cap Equity Fund (the “Fund”) returned 9.50% for Class A shares, 8.64% for Class C shares and 9.55% for Class Y shares. The Fund’s benchmark, the S&P Small Cap 600 Growth Index, returned 24.05% for the same period.
Manager’s Discussion
The Fund’s top investment themes during the year were healthcare, financials and materials. Materials and technology investments were the Fund’s top performance drivers during the year. MPM Holdings, the Fund’s largest single name position was the biggest contributor to performance. The majority of outperformance from technology came from the Fund’s positions in Fortinet and SS&C Technologies. Healthcare and Financials were the largest detractors over the year. Names such as Community Health Systems, Portola Pharmaceuticals and TG Therapeutics were a few of the top detractors within healthcare. The Fund’s largest detractor was the financial sector, specifically Greek Banks, including National Bank of Greece, Alpha Bank and Eurobank Ergasias. The Fund also uses derivatives such as options and futures to protect from and/or to take advantage of market and issuer-related risks. These derivatives had a positive impact on performance during the period. The Fund’s portfolio turnover rates decreased year-over-year due to an decrease in capital activity and changing market dynamics.
| Annual Report | 3 |
Table of Contents
PORTFOLIO MANAGER COMMENTARY (unaudited)
| September 30, 2018 | HighlandSmall-Cap Equity Fund | |
HighlandSmall-Cap Equity Fund - Class A
Growth of Hypothetical $10,000 Investment
| Average Annual Total Returns | ||||||||||||||||||||||||
Class A | Class C | Class Y | ||||||||||||||||||||||
Without Sales Charge | With Sales Charge | Without Sales Charge | With Sales Charge | Without Sales Charge | With Sales Charge | |||||||||||||||||||
| Year Ended September 30, 2018 | 9.50 | % | 3.20 | % | 8.64 | % | 7.79 | % | 9.55 | % | n/a | |||||||||||||
| Five Year | 10.48 | % | 9.18 | % | 9.67 | % | 9.67 | % | 10.73 | % | n/a | |||||||||||||
| Ten Year | 10.89 | % | 10.24 | % | 10.06 | % | 10.06 | % | 11.17 | % | n/a | |||||||||||||
Returns shown in the chart and table do not reflect taxes that a shareholder would pay on Fund distributions or on the sale of the Fund shares.
“Without Sales Charge” returns do not include sales charges or contingent deferred sales charges (“CDSC”). “With Sales Charge” returns reflect the maximum sales charge of 5.75% on Class A Shares. The CDSC on Class C Shares is 1.00% within the first year for each purchase; there is no CDSC on Class C Shares thereafter. The performance data quoted represents past performance and is no guarantee of future results. Investment return and principal value will fluctuate so that an investor’s share when redeemed may be worth more or less than their original cost. Current performance may be lower or higher than the performance data quoted. For performance data current to the most recentmonth-end, please visit our website at www.highlandfunds.com. The gross expense ratio as reported in the Fund’s financial highlights was as follows: Class A: 2.94%, Class C: 3.69%, and Class Y: 2.71%.
See Notes to Performance on page 1 for more information.
Stock prices may fall or fail to rise over time for several reasons, including general financial market conditions and factors related to a specific issuer or industry. The Fund invests in growth stocks that may be more volatile because they are more sensitive to market conditions. The Fund invests inmid-cap companies which may entail greater risks and less liquidity due to narrower product lines and more limited resources than larger companies. The Fund may invest in foreign securities which may cause more volatility and less liquidity due to currency changes, political instability and accounting differences. The Fund’s investments in derivatives may involve more volatility and less liquidity because of the risk that an investment may not correlate to the performance of the underlying securities.
Mutual fund investing involves risk including the possible loss of principal.
| 4 | Annual Report |
Table of Contents
PORTFOLIO MANAGER COMMENTARY (unaudited)
| September 30, 2018 | Highland Total Return Fund | |
Performance Overview
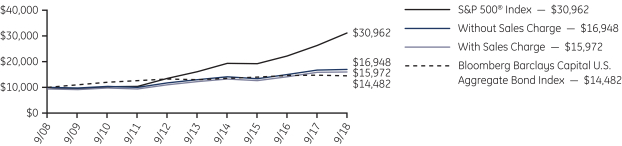
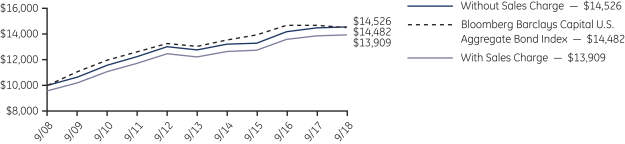
For the twelve-month period ended September 30, 2018, the Highland Total Return Fund (the “Fund”) returned 1.17% for Class A shares, 0.39% for Class C shares and 1.41% for Class Y shares. The Fund’s benchmarks, the Bloomberg Barclays Capital US Aggregate Bond Index and the S&P 500 Index, returned -1.22% and 17.91%, respectively, for the same period.
Manager’s Discussion
The Fund seeks to maximize total return by investing primarily in a combination of U.S. and International equity and debt securities. We utilize an active approach to asset allocation and hold concentrated positions. Our valuation discipline across asset classes and independent insights ensure each investment candidate is evaluated from varying perspectives. Ideas compete for capital.
After being in the 4th and 13th percentile last year for the 1 & 3 year periods, the Fund attracted a material amount of assets just as the market lifted into the Trump tax cuts. The capital came in faster than it could be responsibly deployed which moved our 3 year number to the middle of the pack after a very poor 1 year number. As the market’s momentum orientation has begun to fade, detractors in consumer staples and cable should reverse. We believe the corporate values in media and natural resources will continue to grow even if the investment environment normalizes between momentum and valuation. With all of last fall’s proceeds deployed, our focus onout-of-favor companies with solid long-term prospects and attractive free cash yields can continue its ascent versus today’s very momentum oriented security markets.
The Fund’s only significant change has been to allocate a significant portion of fixed income into low duration corporate and government bonds which we believe is warranted by the very flat yield curve. The decision to preserve the ability to dynamically allocate capital has proved fruitful during our management tenure.
| Annual Report | 5 |
Table of Contents
PORTFOLIO MANAGER COMMENTARY (unaudited)
| September 30, 2018 | Highland Total Return Fund | |
Highland Total Return Fund - Class A
Growth of Hypothetical $10,000 Investment
| Average Annual Total Returns | ||||||||||||||||||||||||
Class A | Class C | Class Y | ||||||||||||||||||||||
Without Sales Charge | With Sales Charge | Without Sales Charge | With Sales Charge | Without Sales Charge | With Sales Charge | |||||||||||||||||||
| Year Ended September 30, 2018 | 1.17 | % | -4.66 | % | 0.39 | % | -0.56 | % | 1.41 | % | n/a | |||||||||||||
| Five Year | 5.41 | % | 4.17 | % | 4.62 | % | 4.62 | % | 5.66 | % | n/a | |||||||||||||
| Ten Year | 5.42 | % | 4.79 | % | 4.63 | % | 4.63 | % | 5.67 | % | n/a | |||||||||||||
Returns shown in the chart and table do not reflect taxes that a shareholder would pay on Fund distributions or on the sale of the Fund shares.
“Without Sales Charge” returns do not include sales charges or contingent deferred sales charges (“CDSC”). “With Sales Charge” returns reflect the maximum sales charge of 5.75% on Class A Shares. The CDSC on Class C Shares is 1.00% within the first year for each purchase; there is no CDSC on Class C Shares thereafter. The performance data quoted represents past performance and is no guarantee of future results. Investment return and principal value will fluctuate so that an investor’s share when redeemed may be worth more or less than their original cost. Current performance may be lower or higher than the performance data quoted. For performance data current to the most recentmonth-end, please visit our website at www.highlandfunds.com. The gross expense ratio as reported in the Fund’s financial highlights was as follows: Class A: 1.17%, Class C: 1.93%, and Class Y: 0.92%.
See Notes to Performance on page 1 for more information.
Stock and bond prices may fall or fail to rise over time for several reasons, including general financial market conditions, factors related to a specific issuer or industry and, with respect to bond prices, changing market perceptions of the risk of default and changes in government intervention. These factors may also lead to increased volatility and reduced liquidity in the bond markets. The Fund is subject to the same risks as the underlying bonds in the portfolio such as credit risk, interest rate and prepayment risk. As interest rates rise, the value of bonds will decline and an investor can lose principal. The Fund may invest in foreign securities which may cause more volatility and less liquidity due to currency changes, political instability and accounting differences. The Fund may also invest in small andmid-cap companies, derivatives and high yield debt (also known as junk bonds) which involves significant risks and losses may occur.
Mutual fund investing involves risk including the possible loss of principal.
| 6 | Annual Report |
Table of Contents
PORTFOLIO MANAGER COMMENTARY (unaudited)
| September 30, 2018 | HighlandTax-Exempt Fund | |
Performance Overview
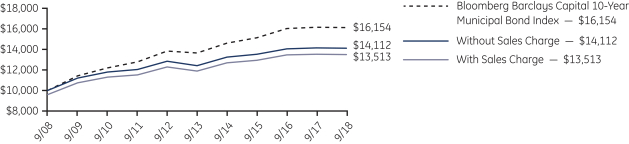
For the twelve-month period ended September 30, 2018, the Highland Tax-Exempt Fund (the “Fund”) returned -0.22% for Class A shares, -0.97% for Class C shares and -0.02% for Class Y shares. The Fund’s benchmark, the Bloomberg Barclays Capital 10-year Municipal Bond Index, returned 0.14% for the same period.
Manager’s Discussion
The Fund has been positioned for rising interest rates and has a duration of 3.74 years versus the Bloomberg Barclays Capital10-year Municipal Bond Index duration of 5.81 years. The Fund benefitted from the sale of select longer duration securities and the purchase of variable rate securities during the reporting period ending September 30, 2018 - a time when the municipal yield curve flattened. The yield curve shifted steeply upward since that period, which negatively contributed to the Fund’s performance, its benchmark and peer group.
| Annual Report | 7 |
Table of Contents
PORTFOLIO MANAGER COMMENTARY (unaudited)
| September 30, 2018 | HighlandTax-Exempt Fund | |
HighlandTax-Exempt Fund - Class A
Growth of Hypothetical $10,000 Investment
| Average Annual Total Returns | ||||||||||||||||||||||||
Class A | Class C | Class Y | ||||||||||||||||||||||
Without Sales Charge | With Sales Charge | Without Sales Charge | With Sales Charge | Without Sales Charge | With Sales Charge | |||||||||||||||||||
| Year Ended September 30, 2018 | -0.22 | % | -4.48 | % | -0.97 | % | -1.92 | % | -0.02 | % | n/a | |||||||||||||
| Five Year | 2.58 | % | 1.69 | % | 1.82 | % | 1.82 | % | 2.82 | % | n/a | |||||||||||||
| Ten Year | 3.51 | % | 3.06 | % | 2.73 | % | 2.73 | % | 3.75 | % | n/a | |||||||||||||
Returns shown in the chart and table do not reflect taxes that a shareholder would pay on Fund distributions or on the sale of the Fund shares.
“Without Sales Charge” returns do not include sales charges or contingent deferred sales charges (“CDSC”). “With Sales Charge” returns reflect the maximum sales charge of 4.25% on Class A Shares. The CDSC on Class C Shares is 1.00% within the first year for each purchase; there is no CDSC on Class C Shares thereafter. The performance data quoted represents past performance and is no guarantee of future results. Investment return and principal value will fluctuate so that an investor’s share when redeemed may be worth more or less than their original cost. Current performance may be lower or higher than the performance data quoted. For performance data current to the most recentmonth-end, please visit our website at www.highlandfunds.com. The gross expense ratio as reported in the Fund’s financial highlights was as follows: Class A: 1.49%, Class C: 2.25%, and Class Y: 1.23%.
A portion of theTax-Exempt Fund’s income may be subject to state, federal and/or alternative minimum tax. Capital gains, if any, are subject to capital gains tax.
See Notes to Performance on page 1 for more information.
The value of bonds in the fund’s portfolio may fall or fail to rise over extended periods of time for a variety of reasons, including general financial market conditions, changing market perceptions of the risk of default, changes in government intervention, and factors related to a specific issuer. These factors may also lead to periods of high volatility and reduced liquidity in the bond markets. The Fund is subject to the same risks as the underlying bonds in the portfolio such as credit risk, interest rate and prepayment risk. As interest rates rise, the value of bonds will decline and an investor can lose principal. The Fund invests in municipal securities which may be affected by adverse legislative or political changes of the municipality. The Fund’s income may be subject to certain state and local taxes and depending on an investor’s status, to the federal alternative minimum tax (AMT).
Mutual fund investing involves risk including the possible loss of principal.
| 8 | Annual Report |
Table of Contents
PORTFOLIO MANAGER COMMENTARY (unaudited)
| September 30, 2018 | Highland Fixed Income Fund | |
Performance Overview
For the twelve-month period ended September 30, 2018, the Highland Fixed Income Fund (the “Fund”) returned 0.43% for Class A shares, -0.23% for Class C shares and 0.68% for Class Y shares. The Fund’s benchmark, the Bloomberg Barclays Capital US Aggregate Bond Index, returned -1.22% over the same period.
Manager’s Discussion
The Fund benefitted from a lower sensitivity to rising interest rates as the duration of the portfolio has remained lower than in past periods. Variable rate and Fixed-to-Float securities have comprised up to 40% of the portfolio throughout the course of the fiscal year and have contributed positively to the return on the Fund. Additionally, the Fund’s investments in short-term corporate credit, closed-end funds, and publicly traded REITS outperformed the broader market. Under-exposure to U.S. Treasury securities also contributed to outperformance of the benchmark. An asset class which detracted from performance was the RMBS pass-through securities. At a time when many investors are struggling to obtain adequate risk compensation, lower duration, high quality short-term debt is our preferred Fixed Income exposure. If interest rates continue to rise or credit spreads widen out, we think the Fund will continue to provide a safe investment thesis.
The Fund continues to be well positioned for rising interest rates and has a duration of 3.16 years versus the Barclays Aggregate Index of 5.95 years. The Fund continues to reduce the number of legacy holdings and upgrade the credit quality in the portfolio.
| Annual Report | 9 |
Table of Contents
PORTFOLIO MANAGER COMMENTARY (unaudited)
| September 30, 2018 | Highland Fixed Income Fund | |
Highland Fixed Income Fund - Class A
Growth of Hypothetical $10,000 Investment
| Average Annual Total Returns | ||||||||||||||||||||||||
Class A | Class C | Class Y | ||||||||||||||||||||||
Without Sales Charge | With Sales Charge | Without Sales Charge | With Sales Charge | Without Sales Charge | With Sales Charge | |||||||||||||||||||
| Year Ended September 30, 2018 | 0.43 | % | -3.86 | % | -0.23 | % | -1.21 | % | 0.68 | % | n/a | |||||||||||||
| Five Year | 2.64 | % | 1.75 | % | 1.88 | % | 1.88 | % | 2.90 | % | n/a | |||||||||||||
| Ten Year | 3.80 | % | 3.35 | % | 3.03 | % | 3.03 | % | 4.06 | % | n/a | |||||||||||||
Returns shown in the chart and table do not reflect taxes that a shareholder would pay on Fund distributions or on the sale of the Fund shares.
“Without Sales Charge” returns do not include sales charges or contingent deferred sales charges (“CDSC”). “With Sales Charge” returns reflect the maximum sales charge of 4.25% on Class A Shares. The CDSC on Class C Shares is 1.00% within the first year for each purchase; there is no CDSC on Class C Shares thereafter. The performance data quoted represents past performance and is no guarantee of future results. Investment return and principal value will fluctuate so that an investor’s share when redeemed may be worth more or less than their original cost. Current performance may be lower or higher than the performance data quoted. For performance data current to the most recentmonth-end, please visit our website at www.highlandfunds.com. The gross expense ratio as reported in the Fund’s financial highlights was as follows: Class A: 0.92%, Class C: 1.67%, and Class Y: 0.67%.
See Notes to Performance on page 1 for more information.
The value of bonds in the fund’s portfolio may fall or fail to rise over extended periods of time for a variety of reasons, including general financial market conditions, changing market perceptions of the risk of default, changes in government intervention, and factors related to a specific issuer. These factors may also lead to periods of high volatility and reduced liquidity in the bond markets. The Fund is subject to the same risks as the underlying bonds in the portfolio such as credit risk, interest rate and prepayment risk. As interest rates rise, the value of bonds will decline and an investor can lose principal. The fund may invest in derivatives, high yield debt (also known as junk bonds) and mortgage backed securities which involve significant risks and losses may occur. The Fund may also invest in foreign and emerging market securities which include risks relating to social and political stability, market illiquidity and currency volatility.
Mutual fund investing involves risk including the possible loss of principal.
| 10 | Annual Report |
Table of Contents
| Highland Premier Growth Equity Fund | ||
Objective
Highland Premier Growth Equity Fund seeks long-term growth of capital and future income rather than current income.
Net Assets as of September 30, 2018
$148.1 million
Portfolio Data as of September 30, 2018
The information below provides a snapshot of Highland Premier Growth Equity Fund at the end of the reporting period. Highland Premier Growth Equity Fund is actively managed and the composition of its portfolio will change over time. Current and future holdings are subject to risk.
| Industry Classifications as of 09/30/2018 (%)(1) | ||||
Software & Services | 33.4 | |||
Semiconductors & Semiconductor Equipment | 11.8 | |||
Technology Hardware & Equipment | 11.5 | |||
Pharmaceuticals, Biotechnology & Life Sciences | 6.4 | |||
Retailing | 6.1 | |||
Energy | 5.5 | |||
Diversified Financials | 3.1 | |||
Healthcare Equipment & Services | 2.7 | |||
Banks | 2.1 | |||
Transportation | 2.1 | |||
Capital Goods | 2.0 | |||
Telecommunication Services | 1.8 | |||
Media | 1.8 | |||
Utilities | 1.5 | |||
Materials | 1.3 | |||
Real Estate | 0.7 | |||
Other Investments and Assets & Liabilities | 6.2 | |||
| Top 10 Holdings as of 09/30/2018 (%)(1) | ||||
Apple, Inc. (Common Stocks) | 3.5 | |||
Alphabet, Inc. (Common Stocks) | 3.2 | |||
Amazon.com, Inc. (Common Stocks) | 3.1 | |||
Microsoft Corp. (Common Stocks) | 3.0 | |||
Lumentum Holdings, Inc. (Common Stocks) | 2.8 | |||
Bio-Rad Laboratories, Inc. (Common Stocks) | 2.7 | |||
NVIDIA Corp. (Common Stocks) | 2.7 | |||
Dell Technologies, Inc. (Common Stocks) | 2.6 | |||
Take-Two Interactive Software, Inc. (Common Stocks) | 2.5 | |||
Micron Technology, Inc. (Common Stocks) | 2.5 | |||
| (1) | Industries and holdings are calculated as a percentage of total net assets. |
| Annual Report | 11 |
Table of Contents
FUND PROFILE (unaudited)
| HighlandSmall-Cap Equity Fund | ||
Objective
HighlandSmall-Cap Equity Fund seeks long-term growth of capital.
Net Assets as of September 30, 2018
$51.0 million
Portfolio Data as of September 30, 2018
The information below provides a snapshot of HighlandSmall-Cap Equity Fund at the end of the reporting period. HighlandSmall-Cap Equity Fund is actively managed and the composition of its portfolio will change over time. Current and future holdings are subject to risk.
| Industry Classifications as of 09/30/2018 (%)(1) | ||||
Pharmaceuticals, Biotechnology & Life Sciences | 26.4 | |||
Materials | 17.4 | |||
Banks | 13.5 | |||
Real Estate | 12.8 | |||
Energy | 11.2 | |||
Software & Services | 8.0 | |||
Healthcare Equipment & Services | 7.1 | |||
Retailing | 7.0 | |||
Utilities | 4.0 | |||
Transportation | 2.6 | |||
Diversified Financials | 2.4 | |||
Capital Goods | 2.0 | |||
Consumer Durables & Apparel | 1.1 | |||
Media | 0.8 | |||
Automobiles & Components | 0.7 | |||
Food & Staples Retailing | 0.7 | |||
Consumer Services | 0.7 | |||
Commercial & Professional Services | 0.7 | |||
Other Investments and Assets & Liabilities | (19.1 | ) | ||
| Top 10 Holdings as of 09/30/2018 (%)(1) | ||||
MPM Holdings, Inc. (Common Stocks) | 15.1 | |||
Eurobank Ergasias SA (Common Stocks) | 4.6 | |||
Portola Pharmaceuticals, Inc. (Common Stocks) | 4.1 | |||
Jernigan Capital, Inc. (Common Stocks) | 4.0 | |||
Heron Therapeutics, Inc. (Common Stocks) | 4.0 | |||
Alpha Bank AE (Common Stocks) | 3.8 | |||
NexPoint Strategic Opportunities Fund (Registered Investment Companies) | 3.8 | |||
NexPoint Residential Trust, Inc. (Common Stocks) | 3.7 | |||
Coherus Biosciences, Inc. (Common Stocks) | 3.6 | |||
Fortinet, Inc. (Common Stocks) | 3.5 | |||
| (1) | Industries and holdings are calculated as a percentage of total net assets. |
| 12 | Annual Report |
Table of Contents
FUND PROFILE (unaudited)
| Highland Total Return Fund | ||
Objective
Highland Total Return Fund seeks maximum total return, which includes both income and capital appreciation.
Net Assets as of September 30, 2018
$90.9 million
Portfolio Data as of September 30, 2018
The information below provides a snapshot of Highland Total Return Fund at the end of the reporting period. Highland Total Return Fund is actively managed and the composition of its portfolio will change over time. Current and future holdings are subject to risk.
| Quality Breakdown as of 09/30/2018 (%)(1)(2) | ||||
AAA | 0.0 | † | ||
AA | 3.3 | |||
A | 24.1 | |||
BBB | 34.8 | |||
BB | 1.0 | |||
B | 0.3 | |||
Not Rated | 36.5 | |||
| Sector Classifications as of 09/30/2018 (%)(1) | ||||
Common Stocks | 62.6 | |||
Corporate Bonds & Notes | 15.3 | |||
Registered Investment Companies | 6.3 | |||
U.S. Treasury Bills | 5.5 | |||
Other Investments and Assets & Liabilities | 5.2 | |||
Preferred Stocks | 1.7 | |||
U.S. Treasuries | 1.6 | |||
Agency Mortgage-Backed Securities | 1.6 | |||
Foreign Corporate Bonds & Notes | 0.1 | |||
Non-Agency Collateralized Mortgage-Backed Securities | 0.1 | |||
Agency Collateralized Mortgage Obligations | 0.0 | † | ||
Asset-Backed Securities | 0.0 | † | ||
| Top 10 Holdings as of 09/30/2018 (%)(1)(2) | ||||
PICO Holdings, Inc. (Common Stocks) | 8.7 | |||
Bollore SA (Common Stocks) | 5.0 | |||
Liberty Media Corp-Liberty Formula One (Common Stocks) | 4.7 | |||
CenturyLink, Inc. (Common Stocks) | 4.6 | |||
Berkshire Hathaway, Inc. (Common Stocks) | 4.0 | |||
Philip Morris International, Inc. (Common Stocks) | 3.3 | |||
Alphabet, Inc. (Common Stocks) | 3.2 | |||
Financiere de L’Odet SA (Common Stocks) | 3.0 | |||
Liberty Global PLC (Common Stocks) | 2.7 | |||
Vivendi SA (Common Stocks) | 2.4 | |||
| (1) | Quality is calculated as a percentage of total bonds & notes. Sectors and holdings are calculated as a percentage of total net assets. The quality ratings reflected were issued by Standard & Poors, a nationally recognized statistical rating organization. Ratings are measured on a scale that generally ranges from AAA (highest) to D (lowest). Quality ratings reflect the credit quality of the underlying bonds in the Fund’s portfolio and not that of the Fund itself. Quality Ratings are subject to change. |
| (2) | Excludes the Fund’s investments of cash collateral received in connection with securities lending in the amount of $2,706,070 and cash equivalent investments in the amount of $5,515,101. |
| (†) | Less than 0.05% |
| Annual Report | 13 |
Table of Contents
FUND PROFILE (unaudited)
| HighlandTax-Exempt Fund | ||
Objective
HighlandTax-Exempt Fund seeks as high a level of income exempt from federal income taxation as is consistent with the preservation of capital.
Net Assets as of September 30, 2018
$12.1 million
Portfolio Data as of September 30, 2018
The information below provides a snapshot of HighlandTax-Exempt Fund at the end of the reporting period. HighlandTax-Exempt Fund is actively managed and the composition of its portfolio will change over time. Current and future holdings are subject to risk.
| Quality Breakdown as of 09/30/2018 (%)(1)(2) | ||||
AAA | 6.9 | |||
AA | 38.1 | |||
A | 31.5 | |||
BBB | 11.7 | |||
Not Rated | 11.8 | |||
| Sector Classifications as of 09/30/2018 (%)(1) | ||||
Municipal Bonds & Notes | 98.1 | |||
Cash Equivalents | 3.2 | |||
Other Investments and Assets & Liabilities | (1.3 | ) | ||
| Top 10 Holdings as of 09/30/2018 (%)(1)(2) | ||||
Great Lakes Water Authority Water Supply System 5.00%, 07/01/29 (Municipal Bonds & Notes) | 4.7 | |||
Carol Stream Park District, GO 5.00%, 01/01/32 (Municipal Bonds & Notes) | 4.6 | |||
Golden State Tobacco Securitization Corp. 5.00%, 06/01/29 (Municipal Bonds & Notes) | 4.6 | |||
Regional Transportation District, CO 5.00%, 11/01/27 (Municipal Bonds & Notes) | 4.6 | |||
Alaska Housing Finance Corp. 5.00%, 12/01/2027 (Municipal Bonds & Notes) | 4.6 | |||
New Jersey Economic Development Authority 5.00%, 06/15/29 (Municipal Bonds & Notes) | 4.5 | |||
Pennsylvania Turnpike Commission 5.00%, 12/01/32 (Municipal Bonds & Notes) | 4.5 | |||
Central Texas Turnpike System 5.00%, 08/15/31 (Municipal Bonds & Notes) | 4.5 | |||
New Jersey Educational Facilities Authority 5.00%, 06/15/26 (Municipal Bonds & Notes) | 4.5 | |||
District of Columbia 5.00%, 04/01/30 (Municipal Bonds & Notes) | 4.5 | |||
| (1) | Quality is calculated as a percentage of total bonds & notes. Sectors and holdings are calculated as a percentage of total net assets. The quality ratings reflected were issued by Standard & Poors, a nationally recognized statistical rating organization. Ratings are measured on a scale that generally ranges from AAA (highest) to D (lowest). Quality ratings reflect the credit quality of the underlying bonds in the Fund’s portfolio and not that of the Fund itself. Credit quality ratings assigned by a rating agency are subjective opinions, not statements of fact, and are subject to change, including daily. The ratings assigned by credit rating agencies are but one of the considerations that the Fund’s investment adviser incorporates into its credit analysis process, along with such other issuer specific factors as cash flows, capital structure and leverage ratios, ability to deleverage through free cash flow, quality of management, market positioning and access to capital, as well as such security-specific factors as the terms of the security (e.g., interest rate, and time to maturity) and the amount of any collateral. Quality Ratings are subject to change. A portion of theTax-Exempt Fund’s income may be subject to state, federal and/or alternative minimum tax. Capital gains, if any, are subject to capital gains tax. |
| (2) | Excludes the Fund’s cash equivalent investments in the amount of $382,611. |
| 14 | Annual Report |
Table of Contents
FUND PROFILE (unaudited)
| Highland Fixed Income Fund | ||
Objective
Highland Fixed Income Fund seeks maximum income consistent with prudent investment management and the preservation of capital.
Net Assets as of September 30, 2018
$196.3 million
Portfolio Data as of September 30, 2018
The information below provides a snapshot of Highland Fixed Income Fund at the end of the reporting period. Highland Fixed Income Fund is actively managed and the composition of its portfolio will change over time. Current and future holdings are subject to risk.
| Quality Breakdown as of 09/30/2018 (%)(1)(2) | ||||
AAA | 5.8 | |||
AA | 8.3 | |||
A | 9.2 | |||
BBB | 37.6 | |||
BB | 2.9 | |||
B | 0.6 | |||
CCC | 0.2 | |||
Not Rated | 35.4 | |||
| Sector Classifications as of 09/30/2018 (%)(1) | ||||
Corporate Bonds & Notes | 44.0 | |||
Agency Mortgage-Backed Securities | 12.4 | |||
Registered Investment Companies | 8.2 | |||
Municipal Bonds & Notes | 8.1 | |||
Asset-Backed Securities | 7.5 | |||
U.S. Treasuries | 4.4 | |||
Foreign Corporate Bonds & Notes | 3.3 | |||
Agency Collateralized Mortgage Obligations | 3.2 | |||
U.S. Government Agencies | 2.8 | |||
Preferred Stocks | 2.7 | |||
Common Stocks | 2.2 | |||
U.S. Government Agency - Asset-Backed Securities | 2.0 | |||
U.S. Treasury Bills | 1.3 | |||
Non-Agency Collateralized Mortgage-Backed Securities | 0.9 | |||
Other Investments and Assets & Liabilities(3) | (3.0 | ) | ||
| Top 10 Holdings as of 09/30/2018 (%)(1)(2) | ||||
U.S. Treasury Note 1.63%, 07/31/20 (U.S. Treasuries) | 2.0 | |||
JPMorgan Chase & Co. 5.00%, 07/01/19 (Corporate Bonds & Notes) | 1.5 | |||
U.S. Treasury Bill (U.S. Treasury Bills) | 1.3 | |||
SBA Small Business Investment Cos. 3.55%, 09/11/28 (U.S. Government Agency - Asset-Backed Securities) | 1.3 | |||
American Express Co. 2.20%, 10/30/20 (Corporate Bonds & Notes) | 1.3 | |||
Small Business Administration Pools 2.40%, 12/25/43 (Agency Mortgage-Backed Securities) | 1.3 | |||
U.S. Treasury Note 2.25%, 10/31/24 (U.S. Treasuries) | 1.2 | |||
WEC Energy Group, Inc. 4.43%, 05/15/67 (Corporate Bonds & Notes) | 1.2 | |||
U.S. Treasury Notes 1.13%, 09/30/21 (U.S. Treasuries) | 1.2 | |||
American Express Credit Account Master Trust 2.99%, 12/15/23 (Asset-Backed Securities) | 1.2 | |||
| (1) | Quality is calculated as a percentage of total bonds & notes. Sectors and holdings are calculated as a percentage of total net assets. The quality ratings reflected were issued by Standard & Poors, a nationally recognized statistical rating organization. Ratings are measured on a scale that generally ranges from AAA (highest) to D (lowest). Quality ratings reflect the credit quality of the underlying bonds in the Fund’s portfolio and not that of the Fund itself. Quality Ratings are subject to change. |
| (2) | Excludes the Fund’s investment in an investment company purchased with cash collateral from securities lending and cash equivalent investments. |
| (3) | Includes the Fund’s investments of cash collateral received in connection with securities lending in the amount of $9,185,443 and cash equivalent investments in the amount of $2,498,173. |
| Annual Report | 15 |
Table of Contents
| September 30, 2018 | ||
A guide to understanding each Fund’s financial statements
| Investment Portfolio | The Investment Portfolio details each of the Fund’s holdings and their market value as of the last day of the reporting period. Portfolio holdings are organized by type of asset and industry to demonstrate areas of concentration and diversification. | |
| Statement of Assets and Liabilities | This statement details each Fund’s assets, liabilities, net assets and share price for each share class as of the last day of the reporting period. Net assets are calculated by subtracting all of a Fund’s liabilities (including any unpaid expenses) from the total of the Fund’s investment andnon-investment assets. The net asset value per share for each class is calculated by dividing net assets allocated to that share class by the number of shares outstanding in that class as of the last day of the reporting period. | |
| Statement of Operations | This statement reports income earned by each Fund and the expenses incurred by each Fund during the reporting period. The Statement of Operations also shows any net gain or loss a Fund realized on the sales of its holdings during the period as well as any unrealized gains or losses recognized over the period. The total of these results represents a Fund’s net increase or decrease in net assets from operations. | |
| Statement of Changes in Net Assets | This statement details how each Fund’s net assets were affected by its operating results, distributions to shareholders and shareholder transactions (e.g., subscriptions, redemptions and distribution reinvestments) during the reporting period. The Statement of Changes in Net Assets also details changes in the number of shares outstanding. | |
| Statement of Cash Flows | This statement reports net cash and foreign currency provided or used by operating, investing and financing activities and the net effect of those flows on cash and foreign currency during the period. | |
| Financial Highlights | The Financial Highlights demonstrate how each Fund’s net asset value per share was affected by the Fund’s operating results. The Financial Highlights also disclose the classes’ performance and certain key ratios (e.g., net expenses and net investment income as a percentage of average net assets). | |
| Notes to Financial Statements | These notes disclose the organizational background of the Funds, certain of their significant accounting policies (including those surrounding security valuation, income recognition and distributions to shareholders), federal tax information, fees and compensation paid to affiliates and significant risks and contingencies. | |
| 16 | Annual Report |
Table of Contents
| As of September 30, 2018 | Highland Premier Growth Equity Fund | |
Shares | Value ($) | |||||||
Common Stocks - 92.5% | ||||||||
| BANKS - 2.1% | ||||||||
| 30,000 | CIT Group, Inc. | 1,548,300 | ||||||
| 30,000 | Popular, Inc. | 1,537,500 | ||||||
|
| |||||||
| 3,085,800 | ||||||||
|
| |||||||
| CAPITAL GOODS - 2.0% | ||||||||
| 10,000 | Roper Technologies, Inc. | 2,962,100 | ||||||
|
| |||||||
| DIVERSIFIED FINANCIALS - 3.1% | ||||||||
| 10,000 | Citigroup, Inc. | 717,400 | ||||||
| 30,000 | E*TRADE Financial Corp. (a) | 1,571,700 | ||||||
| 35,000 | LPL Financial Holdings, Inc. | 2,257,850 | ||||||
|
| |||||||
| 4,546,950 | ||||||||
|
| |||||||
| ENERGY - 5.5% | ||||||||
| 30,000 | Continental Resources, Inc. (a) | 2,048,400 | ||||||
| 18,000 | EOG Resources, Inc. | 2,296,260 | ||||||
| 53,000 | Oasis Petroleum, Inc. (a) | 751,540 | ||||||
| 15,000 | Whiting Petroleum Corp. (a) | 795,600 | ||||||
| 110,000 | WPX Energy, Inc. (a) | 2,213,200 | ||||||
|
| |||||||
| 8,105,000 | ||||||||
|
| |||||||
| HEALTHCARE EQUIPMENT & SERVICES - 2.7% | ||||||||
| 31,000 | Abbott Laboratories | 2,274,160 | ||||||
| 16,000 | LHC Group, Inc. (a) | 1,647,840 | ||||||
|
| |||||||
| 3,922,000 | ||||||||
|
| |||||||
| MATERIALS - 1.3% | ||||||||
| 2,000 | Omnimax International, Inc. (a)(b)(c) | 502,100 | ||||||
| 3,000 | Sherwin-Williams Co. (The) | 1,365,630 | ||||||
|
| |||||||
| 1,867,730 | ||||||||
|
| |||||||
| MEDIA (a) - 1.8% | ||||||||
| 50,000 | Live Nation Entertainment, Inc. | 2,723,500 | ||||||
|
| |||||||
| PHARMACEUTICALS, BIOTECHNOLOGY & LIFE SCIENCES - 6.4% | ||||||||
| 13,000 | Bio-Rad Laboratories, Inc., Class A (a) | 4,068,870 | ||||||
| 241,000 | Minerva Neurosciences, Inc. (a) | 3,024,550 | ||||||
| 10,000 | Thermo Fisher Scientific, Inc. | 2,440,800 | ||||||
|
| |||||||
| 9,534,220 | ||||||||
|
| |||||||
| REAL ESTATE - 0.7% | ||||||||
| 17,000 | CyrusOne, Inc., REIT | 1,077,800 | ||||||
|
| |||||||
| RETAIL - 6.1% | ||||||||
| 2,300 | Amazon.com, Inc. (a) | 4,606,900 | ||||||
| 7,000 | Home Depot, Inc. (The) | 1,450,050 | ||||||
| 8,000 | Netflix, Inc. (a) | 2,993,040 | ||||||
|
| |||||||
| 9,049,990 | ||||||||
|
| |||||||
| SEMICONDUCTORS & SEMICONDUCTOR EQUIPMENT - 11.8% | ||||||||
| 140,000 | Marvell Technology Group, Ltd. | 2,702,000 | ||||||
| 44,000 | Mellanox Technologies, Ltd. (a) | 3,231,800 | ||||||
| 81,000 | Micron Technology, Inc. (a)(d) | 3,663,630 | ||||||
| 14,000 | Monolithic Power Systems, Inc. | 1,757,420 | ||||||
| 14,000 | NVIDIA Corp. | 3,934,280 | ||||||
| 12,000 | Universal Display Corp. (e) | 1,414,800 | ||||||
| 10,000 | Xilinx, Inc. | 801,700 | ||||||
|
| |||||||
| 17,505,630 | ||||||||
|
| |||||||
Shares | Value ($) | |||||||
| SOFTWARE & SERVICES - 32.1% | ||||||||
| 18,000 | Activision Blizzard, Inc. | 1,497,420 | ||||||
| 10,000 | Alibaba Group Holding, Ltd. ADR (a) | 1,647,600 | ||||||
| 4,000 | Alphabet, Inc., Class C (a) | 4,773,880 | ||||||
| 8,500 | Autodesk, Inc. (a) | 1,326,935 | ||||||
| 20,000 | Cornerstone OnDemand, Inc. (a) | 1,135,000 | ||||||
| 39,000 | Dell Technologies, Inc., Class V (a) | 3,787,680 | ||||||
| 22,800 | EPAM Systems, Inc. (a) | 3,139,560 | ||||||
| 22,000 | Facebook, Inc., Class A (a) | 3,618,120 | ||||||
| 38,300 | Microsoft Corp. | 4,380,371 | ||||||
| 36,000 | Nutanix, Inc., Class A (a) | 1,537,920 | ||||||
| 31,300 | PayPal Holdings, Inc. (a) | 2,749,392 | ||||||
| 32,000 | RealPage, Inc. (a) | 2,108,800 | ||||||
| 12,500 | salesforce.com, Inc. (a) | 1,987,875 | ||||||
| 11,000 | ServiceNow, Inc. (a) | 2,151,930 | ||||||
| 14,000 | Shopify, Inc., Class A (a) | 2,302,440 | ||||||
| 14,500 | Spotify Technology SA (a) | 2,622,035 | ||||||
| 27,000 | Take-Two Interactive Software, Inc. (a) | 3,725,730 | ||||||
| 20,000 | Visa, Inc., Class A (d) | 3,001,800 | ||||||
|
| |||||||
| 47,494,488 | ||||||||
|
| |||||||
| TECHNOLOGY HARDWARE & EQUIPMENT - 11.5% | ||||||||
| 23,000 | Apple, Inc. | 5,192,020 | ||||||
| 9,500 | Arista Networks, Inc. (a) | 2,525,670 | ||||||
| 15,000 | Ciena Corp. (a) | 468,600 | ||||||
| 110,000 | Flextronics International, Ltd. (a) | 1,443,200 | ||||||
| 70,000 | Lumentum Holdings, Inc. (a)(e) | 4,196,500 | ||||||
| 14,200 | Palo Alto Networks, Inc. (a) | 3,198,692 | ||||||
|
| |||||||
| 17,024,682 | ||||||||
|
| |||||||
| TELECOMMUNICATION SERVICES - 1.8% | ||||||||
| 27,000 | Softbank Corp. | 2,726,504 | ||||||
|
| |||||||
| TRANSPORTATION (a) - 2.1% | ||||||||
| 27,000 | XPO Logistics, Inc. | 3,082,590 | ||||||
|
| |||||||
| UTILITIES (a) - 1.5% | ||||||||
| 90,000 | Vistra Energy Corp. | 2,239,200 | ||||||
|
| |||||||
Total Common Stocks | 136,948,184 | |||||||
|
| |||||||
Preferred Stocks - 1.3% | ||||||||
| SOFTWARE & SERVICES (b)(c)(f) - 1.3% | ||||||||
| 434,783 | AMINO, Inc., Series C | 1,952,176 | ||||||
|
| |||||||
Total Preferred Stocks | 1,952,176 | |||||||
|
| |||||||
Exchange-Traded Funds (e) - 0.4% | ||||||||
| 10,000 | SPDR S&P Regional Banking ETF | 594,200 | ||||||
|
| |||||||
Total Exchange-Traded Funds | 594,200 | |||||||
|
| |||||||
Contracts | ||||||||
Purchased Call Options - 0.1% | ||||||||
Total Purchased Call Options | 123,000 | |||||||
|
| |||||||
| See Glossary on page 38 for abbreviations along with accompanying Notes to Financial Statements. | 17 |
Table of Contents
INVESTMENT PORTFOLIO (continued)
| As of September 30, 2018 | Highland Premier Growth Equity Fund | |
Principal Amount ($) | Value ($) | |||||||
Purchased Put Options - 0.0% | ||||||||
Total Purchased Put Options | 15,500 | |||||||
|
| |||||||
Shares | ||||||||
Registered Investment Companies - 5.6% | ||||||||
| 185,465 | Highland Merger Arbitrage Fund (g) | 3,965,240 | ||||||
| 85,852 | NexPoint Strategic Opportunities Fund, Common (g) | 1,923,085 | ||||||
| 2,360,264 | State Street Navigator Securities Lending Government Money Market Portfolio 1.82% (h) | 2,360,264 | ||||||
|
| |||||||
Total Registered Investment Companies | 8,248,589 | |||||||
|
| |||||||
Total Investments - 99.9% | 147,881,649 | |||||||
|
| |||||||
(Cost $137,514,833) | ||||||||
Other Assets & Liabilities, Net - 0.1% | 186,341 | |||||||
|
| |||||||
Net Assets - 100.0% | 148,067,990 | |||||||
|
| |||||||
| (a) | Non-income producing security. |
| (b) | Represents fair value as determined by the Fund’s Board of Trustees (the “Board”), or its designee in good faith, pursuant to the policies and procedures approved by the Board. The Board considers fair valued securities to be securities for which market quotations are not readily available and these securities may be valued using a combination of observable and unobservable inputs. Securities with a total aggregate value of $2,454,276, or 1.7% of net assets, were fair valued under the Fund’s valuation procedures as of September 30, 2018. See Note 2. |
| (c) | Classified as Level 3 within the three-tier fair value hierarchy. Please see. Note 2 for an explanation of this hierarchy, as well as a list of unobservable inputs used in the valuation of these instruments. |
| (d) | All or part of this security is pledged as collateral for short sales and written options contracts. The market value of the securities pledged as collateral was $5,914,980. |
| (e) | Securities (or a portion of securities) on loan. As of September 30, 2018, the market value of securities loaned was $6,499,950. The loaned securities were secured with cash and securities collateral of $6,711,500. Collateral is calculated based on prior day’s prices. See Note 4. |
| (f) | Restricted Securities. These securities are not registered and may not be sold to the public. There are legal and/or contractual restrictions on resale. The Fund does not have the right to demand that such securities be registered. The values of these securities are determined by valuations provided by pricing services, brokers, dealers, market makers, or in good faith under the procedures established by the Fund’s Board of Trustees. Additional Information regarding such securities follows: |
| Restricted Security | Security Type | Acquisition Date | Cost of Security | Market Value at Period End | Percent of Net Assets | |||||||||||||
AMINO, Inc. | Preferred Stocks | 11/18/2016 | $ | 2,500,002 | $ | 1,952,176 | 1.3 | % | ||||||||||
| (g) | Affiliated issuer. Assets with a total aggregate market value of $5,888,325, or 4.0% of net assets, were affiliated with the Fund as of September 30, 2018. See Note 10 to the financial statements. |
| (h) | Represents investments of cash collateral received in connection with securities lending. |
As of September 30, 2018, $8,792,243 in cash was segregated or on deposit with the brokers to cover investments sold short and written options and is included in “Other Assets & Liabilities, Net.
| Overnight and Continuous | Total | |||||||
Securities Lending Transactions1 |
| |||||||
Common Stocks | $ | 1,286,108 | $ | 1,286,108 | ||||
Exchange-Traded Funds | 1,074,156 | 1,074,156 | ||||||
|
| |||||||
Total Borrowings | $ | 2,360,264 | $ | 2,360,264 | ||||
|
| |||||||
Gross amount of recognized liabilities for securities lending transactions |
| $ | 2,360,264 | |||||
| 1 | Amounts represent the payable for cash collateral received on securities on loan. This will generally be in “Overnight and Continuous” column as the securities are typically callable on demand. |
Purchased options contracts outstanding as of September 30, 2018 were as follows:
| Description | Exercise Price | Counterparty | Expiration Date | Number of Contracts | Notional Value | Premium | Value | |||||||||||||||||||||
PURCHASED CALL OPTIONS: |
| |||||||||||||||||||||||||||
Facebook, Inc., Call | $ | 165.00 | | Jefferies & Co., Inc. | | November 2018 | 150 | 2,475,000 | $ | 125,684 | $ | 123,000 | ||||||||||||||||
PURCHASED PUT OPTIONS: |
| |||||||||||||||||||||||||||
Invesco QQQ Trust Series., Put | $ | 173.00 | | Jefferies & Co., Inc. | | October 2018 | 500 | 8,650,000 | 55,837 | 15,500 | ||||||||||||||||||
|
|
|
| |||||||||||||||||||||||||
Total Purchased Options Contracts |
| $ | 181,521 | $ | 138,500 | |||||||||||||||||||||||
|
|
|
| |||||||||||||||||||||||||
| 18 | See Glossary on page 38 for abbreviations along with accompanying Notes to Financial Statements. |
Table of Contents
INVESTMENT PORTFOLIO (continued)
| As of September 30, 2018 | Highland Premier Growth Equity Fund | |
Written options contracts outstanding as of September 30, 2018 were as follows:
| Description | Exercise Price | Counterparty | Expiration Date | Number of Contracts | Notional Value | Premium | Value | |||||||||||||||||||||
WRITTEN CALL OPTIONS: |
| |||||||||||||||||||||||||||
Facebook, Inc., Call | $ | 185.00 | | Jefferies & Co., Inc. | | November 2018 | 150 | 2,775,000 | $ | 27,486 | $ | (28,200 | ) | |||||||||||||||
WRITTEN PUT OPTIONS: |
| |||||||||||||||||||||||||||
Facebook, Inc., Put | $ | 165.00 | | Jefferies & Co., Inc. | | November 2018 | 91 | 1,501,500 | 69,952 | (74,802 | ) | |||||||||||||||||
|
|
|
| |||||||||||||||||||||||||
Total Written Options Contracts |
| $ | 97,438 | $ | (103,002 | ) | ||||||||||||||||||||||
|
|
|
| |||||||||||||||||||||||||
Swap contracts outstanding as of September 30, 2018 were as follows:
Swap Contracts Outstanding
| Underlying Instrument | Financing Rate | Payment Frequency | Counter- party | Expiration Date | Currency | Notional Amount | Upfront Premiums Paid (Received) | Unrealized Appreciation/ (Depreciation) | Market Value | |||||||||||||||||||||||||||
MSHDSSFT | | 1 Day USD Fed Funds Effective plus 0.35% | | Quarterly | | Morgan Stanley & Co. | | August 17, 2020 | USD | $ | 1,324,101 | $ | 1,243 | $ | 2,662 | $ | 3,905 | |||||||||||||||||||
MSQQUMOL | | 1 Day USD Fed Funds Effective plus 0.45% | | Quarterly | | Morgan Stanley & Co. | | September 10, 2020 | 2,206,868 | 2,170 | (32,659 | ) | (30,489 | ) | ||||||||||||||||||||||
MSQQUTML | | 1 Day USD Fed Funds Effective plus 0.40% | | Quarterly | | Morgan Stanley & Co. | | September 10, 2020 | 3,290,846 | 3,273 | (15,476 | ) | (12,203 | ) | ||||||||||||||||||||||
|
| |||||||||||||||||||||||||||||||||||
Total Swap Contracts Outstanding |
| $ | (38,787 | ) | ||||||||||||||||||||||||||||||||
|
| |||||||||||||||||||||||||||||||||||
The following table represents the 50 largest equity basket holdings underlying the total return swap in MS (Morgan Stanley) Highland MSQQUMOL as of September 30, 2018.
| Security Description | Shares | Market Value as of 9/30/18 | Percent of Basket’s Net Assets | |||||||||
MS Highland MSQQUMOL | ||||||||||||
Amazon.Com Inc. | 320 | $ | 641,608 | 2.00 | % | |||||||
Advanced Micro Devices | 20,771 | 641,608 | 2.00 | % | ||||||||
Square Inc. - Class A | 6,480 | 641,608 | 2.00 | % | ||||||||
Twitter Inc. | 22,544 | 641,608 | 2.00 | % | ||||||||
Netflix Inc. | 1,715 | 641,608 | 2.00 | % | ||||||||
Valero Energy Corp. | 5,641 | 641,608 | 2.00 | % | ||||||||
Lululemon Athletica Inc. | 3,948 | 641,580 | 2.00 | % | ||||||||
Abiomed Inc. | 1,394 | 626,994 | 1.95 | % | ||||||||
Splunk Inc. | 4,589 | 554,891 | 1.73 | % | ||||||||
Marathon Oil Corp. | 22,135 | 515,295 | 1.61 | % | ||||||||
Rh | 3,899 | 510,746 | 1.59 | % | ||||||||
Align Technology Inc. | 1,288 | 503,913 | 1.57 | % | ||||||||
Macy’s Inc. | 13,733 | 476,963 | 1.49 | % | ||||||||
Kohls Corp. | 6,204 | 462,540 | 1.44 | % | ||||||||
Netapp Inc. | 5,332 | 457,957 | 1.43 | % | ||||||||
Ww Grainger Inc. | 1,266 | 452,540 | 1.41 | % | ||||||||
Wayfair Inc. - Class A | 3,008 | 444,164 | 1.38 | % | ||||||||
Tandem Diabetes Care Inc. | 10,147 | 434,713 | 1.36 | % | ||||||||
Fortinet Inc. | 4,531 | 418,097 | 1.30 | % | ||||||||
Twilio Inc. - Class A | 4,831 | 416,807 | 1.30 | % | ||||||||
Okta Inc. | 5,892 | 414,527 | 1.29 | % | ||||||||
Nutanix Inc. - Class A | 9,453 | 403,843 | 1.26 | % | ||||||||
Molina Healthcare Inc. | 2,702 | 401,840 | 1.25 | % | ||||||||
| See Glossary on page 38 for abbreviations along with accompanying Notes to Financial Statements. | 19 |
Table of Contents
INVESTMENT PORTFOLIO (continued)
| As of September 30, 2018 | Highland Premier Growth Equity Fund | |
| Security Description | Shares | Market Value as of 9/30/18 | Percent of Basket’s Net Assets | |||||||||
Hollyfrontier Corp. | 5,503 | $ | 384,692 | 1.20 | % | |||||||
Five Below | 2,936 | 381,879 | 1.19 | % | ||||||||
Copart Inc. | 7,285 | 375,417 | 1.17 | % | ||||||||
Grubhub Inc. | 2,638 | 365,685 | 1.14 | % | ||||||||
Sarepta Therapeutics Inc. | 2,133 | 344,438 | 1.07 | % | ||||||||
Burlington Stores Inc. | 2,076 | 338,264 | 1.05 | % | ||||||||
Trade Desk Inc. - Class A | 2,228 | 336,236 | 1.05 | % | ||||||||
Etsy Inc. | 6,230 | 320,101 | 1.00 | % | ||||||||
Godaddy Inc. - Class A | 3,809 | 317,642 | 0.99 | % | ||||||||
Atlassian Corp., Plc - Class A | 3,186 | 306,302 | 0.95 | % | ||||||||
Dexcom Inc. | 2,099 | 300,273 | 0.94 | % | ||||||||
Cf Industries Holdings Inc. | 5,237 | 285,079 | 0.89 | % | ||||||||
Match Group Inc. | 4,842 | 280,416 | 0.87 | % | ||||||||
Ptc Inc. | 2,614 | 277,542 | 0.87 | % | ||||||||
Continental Resources Inc. | 4,038 | 275,707 | 0.86 | % | ||||||||
Viking Therapeutics Inc. | 15,526 | 270,465 | 0.84 | % | ||||||||
Nektar Therapeutics | 4,408 | 268,735 | 0.84 | % | ||||||||
Healthequity Inc. | 2,823 | 266,476 | 0.83 | % | ||||||||
Svb Financial Group | 832 | 258,546 | 0.81 | % | ||||||||
Wpx Energy Inc. | 12,615 | 253,811 | 0.79 | % | ||||||||
Whiting Petroleum Corp. | 4,521 | 239,795 | 0.75 | % | ||||||||
Paycom Software Inc. | 1,504 | 233,731 | 0.73 | % | ||||||||
Teladoc Health Inc. | 2,696 | 232,835 | 0.73 | % | ||||||||
Ligand Pharmaceuticals | 832 | 228,449 | 0.71 | % | ||||||||
Inogen Inc. | 935 | 228,212 | 0.71 | % | ||||||||
Exact Sciences Corp. | 2,829 | 223,245 | 0.70 | % | ||||||||
Urban Outfitters Inc. | 5,357 | 219,082 | 0.68 | % | ||||||||
|
|
|
|
|
| |||||||
Total | 273,557 | $ | 19,800,113 | 61.72 | % | |||||||
|
|
|
|
|
| |||||||
The following table represents the holdings underlying the total return swap in MS (Morgan Stanley) Highland MSQQUTML as of September 30, 2018.
| Security Description | Shares | Market Value as of 9/30/18 | Percent of Basket’s Net Assets | |||||||||
MS Highland MSQQUTML | ||||||||||||
Advanced Micro Devices | 7,852 | $ | 242,548 | 3.50 | % | |||||||
Twitter Inc. | 8,522 | 242,548 | 3.50 | % | ||||||||
Square Inc. - Class A | 2,450 | 242,548 | 3.50 | % | ||||||||
Netflix Inc. | 648 | 242,548 | 3.50 | % | ||||||||
Amazon.Com Inc. | 121 | 242,548 | 3.50 | % | ||||||||
Splunk Inc. | 2,006 | 242,548 | 3.50 | % | ||||||||
Wayfair Inc. - Class A | 1,642 | 242,548 | 3.50 | % | ||||||||
Netapp Inc. | 2,824 | 242,548 | 3.50 | % | ||||||||
Fortinet Inc. | 2,629 | 242,548 | 3.50 | % | ||||||||
Twilio Inc. - Class A | 2,811 | 242,548 | 3.50 | % | ||||||||
Okta Inc. | 3,447 | 242,548 | 3.50 | % | ||||||||
Nutanix Inc. - Class A | 5,678 | 242,548 | 3.50 | % | ||||||||
Grubhub Inc. | 1,750 | 242,548 | 3.50 | % | ||||||||
Trade Desk Inc. - Class A | 1,607 | 242,548 | 3.50 | % | ||||||||
Etsy Inc. | 4,721 | 242,547 | 3.50 | % | ||||||||
Godaddy Inc. - Class A | 2,909 | 242,547 | 3.50 | % | ||||||||
Atlassian Corp. Plc - Class A | 2,504 | 240,697 | 3.47 | % | ||||||||
Match Group Inc. | 3,807 | 220,435 | 3.18 | % | ||||||||
Ptc Inc. | 2,055 | 218,175 | 3.15 | % | ||||||||
Paycom Software Inc. | 1,182 | 183,736 | 2.65 | % | ||||||||
Coupa Software Inc. | 2,043 | 161,624 | 2.33 | % | ||||||||
| 20 | See Glossary on page 38 for abbreviations along with accompanying Notes to Financial Statements. |
Table of Contents
INVESTMENT PORTFOLIO (continued)
| As of September 30, 2018 | Highland Premier Growth Equity Fund | |
| Security Description | Shares | Market Value as of 9/30/18 | Percent of Basket’s Net Assets | |||||||||
New Relic Inc. | 1,686 | $ | 158,836 | 2.29 | % | |||||||
Intelsat Sa | 4,890 | 146,701 | 2.12 | % | ||||||||
Zendesk Inc. | 2,062 | 146,432 | 2.11 | % | ||||||||
World Wrestling Entertain - Class A | 1,510 | 146,038 | 2.11 | % | ||||||||
Pure Storage Inc. - Class A | 5,065 | 131,442 | 1.90 | % | ||||||||
Cree Inc. | 3,207 | 121,446 | 1.75 | % | ||||||||
Hubspot Inc. | 791 | 119,362 | 1.72 | % | ||||||||
Ringcentral Inc. - Class A | 1,172 | 109,064 | 1.57 | % | ||||||||
Alteryx Inc. - Class A | 1,688 | 96,549 | 1.39 | % | ||||||||
Aspen Technology Inc. | 788 | 89,813 | 1.30 | % | ||||||||
Liveramp Holdings Inc. | 1,553 | 76,749 | 1.11 | % | ||||||||
2u Inc. | 841 | 63,262 | 0.91 | % | ||||||||
Five9 Inc. | 1,214 | 53,046 | 0.77 | % | ||||||||
Varonis Systems Inc. | 710 | 52,009 | 0.75 | % | ||||||||
Bottomline Technologies (De) | 694 | 50,464 | 0.73 | % | ||||||||
Unisys Corp. | 2,432 | 49,603 | 0.72 | % | ||||||||
Iridium Communications Inc. | 2,073 | 46,640 | 0.67 | % | ||||||||
Yext Inc. | 1,922 | 45,546 | 0.66 | % | ||||||||
Qualys Inc. | 500 | 44,587 | 0.64 | % | ||||||||
Rapid7 Inc. | 1,001 | 36,945 | 0.53 | % | ||||||||
Everbridge Inc. | 619 | 35,687 | 0.51 | % | ||||||||
Novanta Inc. | 469 | 32,047 | 0.46 | % | ||||||||
Apptio Inc. - Class A | 841 | 31,066 | 0.45 | % | ||||||||
Carbonite Inc. | 750 | 26,740 | 0.39 | % | ||||||||
Appfolio Inc. - Class A | 322 | 25,220 | 0.36 | % | ||||||||
USA Technologies Inc. | 3,145 | 22,644 | 0.33 | % | ||||||||
Workiva Inc. | 565 | 22,313 | 0.33 | % | ||||||||
Glu Mobile Inc. | 2,993 | 22,298 | 0.32 | % | ||||||||
Shotspotter Inc. | 358 | 21,961 | 0.32 | % | ||||||||
|
|
|
|
|
| |||||||
Total | 109,069 | $ | 6,929,943 | 100.00 | % | |||||||
|
|
|
|
|
| |||||||
| See Glossary on page 38 for abbreviations along with accompanying Notes to Financial Statements. | 21 |
Table of Contents
INVESTMENT PORTFOLIO
| As of September 30, 2018 | HighlandSmall-Cap Equity Fund | |
Shares | Value ($) | |||||||
Common Stocks - 111.3% | ||||||||
| AUTOMOBILES & COMPONENTS (a)(b) - 0.7% | ||||||||
| 8,200 | Gentherm, Inc. | 372,690 | ||||||
|
| |||||||
| BANKS - 13.5% | ||||||||
| 5,000,000 | Alpha Bank AE ADR (b) | 1,925,000 | ||||||
| 3,094 | Canadian Imperial Bank of Commerce (a) | 290,124 | ||||||
| 12,000 | CIT Group, Inc. (c) | 619,320 | ||||||
| 6,377,500 | Eurobank Ergasias SA ADR (b) | 2,345,644 | ||||||
| 2,430 | IBERIABANK Corp. (a) | 197,681 | ||||||
| 744,050 | National Bank of Greece SA (b) | 1,512,374 | ||||||
|
| |||||||
| 6,890,143 | ||||||||
|
| |||||||
| CAPITAL GOODS - 2.0% | ||||||||
| 28,100 | Luxfer Holdings PLC (c) | 653,325 | ||||||
| 1,400 | Teledyne Technologies, Inc. (a)(b) | 345,352 | ||||||
|
| |||||||
| 998,677 | ||||||||
|
| |||||||
| COMMERCIAL & PROFESSIONAL SERVICES (a) - 0.7% | ||||||||
| 20,000 | Resources Connection, Inc. | 332,000 | ||||||
|
| |||||||
| CONSUMER DURABLES & APPAREL (a) - 1.1% | ||||||||
| 6,000 | Oxford Industries, Inc. | 541,200 | ||||||
|
| |||||||
| CONSUMER SERVICES (a)(b) - 0.7% | ||||||||
| 20,300 | K12, Inc. | 359,310 | ||||||
|
| |||||||
| DIVERSIFIED FINANCIALS - 2.4% | ||||||||
| 19,070 | Cannae Holdings, Inc. (a)(b) | 399,517 | ||||||
| 7,275 | KKR & Co., Inc., Class A | 198,389 | ||||||
| 57,120 | Oaktree Specialty Lending Corp. (a) | 283,315 | ||||||
| 3,835 | Raymond James Financial, Inc. (a) | 353,012 | ||||||
|
| |||||||
| 1,234,233 | ||||||||
|
| |||||||
| ENERGY (a) - 3.4% | ||||||||
| 27,000 | C&J Energy Services, Inc. (b)(d) | 561,600 | ||||||
| 6,420 | Dril-Quip, Inc. (b) | 335,445 | ||||||
| 10,650 | Oil States International, Inc. (b) | 353,580 | ||||||
| 15,920 | SM Energy Co. | 501,958 | ||||||
|
| |||||||
| 1,752,583 | ||||||||
|
| |||||||
| FOOD & STAPLES RETAILING (a) - 0.7% | ||||||||
| 18,400 | SpartanNash Co. | 369,104 | ||||||
|
| |||||||
| HEALTHCARE EQUIPMENT & SERVICES - 7.1% | ||||||||
| 20,000 | K2M Group Holdings, Inc. (b)(c) | 547,400 | ||||||
| 4,025 | LHC Group, Inc. (b)(c) | 414,535 | ||||||
| 3,475 | LifePoint Health, Inc. (a)(b) | 223,790 | ||||||
| 8,245 | MEDNAX, Inc. (b)(c) | 384,712 | ||||||
| 5,720 | Molina Healthcare, Inc. (a)(b) | 850,564 | ||||||
| 2,450 | NuVasive, Inc. (a)(b) | 173,901 | ||||||
| 26,785 | Patterson Cos., Inc. (a)(c)(d) | 654,893 | ||||||
| 22,400 | Surgery Partners, Inc. (a)(b)(c) | 369,600 | ||||||
|
| |||||||
| 3,619,395 | ||||||||
|
| |||||||
| MATERIALS (a) - 17.4% | ||||||||
| 26,100 | Loma Negra Cia Industrial Argentina SA ADR (b) | 230,724 | ||||||
| 250,000 | MPM Holdings, Inc. (b) | 7,690,000 | ||||||
| 2,205 | Quaker Chemical Corp. | 445,873 | ||||||
Shares | Value ($) | |||||||
| MATERIALS (continued) | ||||||||
| 6,600 | Sensient Technologies Corp. | 504,966 | ||||||
|
| |||||||
| 8,871,563 | ||||||||
|
| |||||||
| MEDIA (a) - 0.8% | ||||||||
| 15,275 | Sinclair Broadcast Group, Inc., Class A | 433,046 | ||||||
|
| |||||||
| PHARMACEUTICALS, BIOTECHNOLOGY & LIFE SCIENCES (b) - 26.4% | ||||||||
| 15,500 | Acorda Therapeutics, Inc. (a) | 304,575 | ||||||
| 16,600 | Aerie Pharmaceuticals, Inc. (d) | 1,021,730 | ||||||
| 52,300 | Amicus Therapeutics, Inc. (d) | 632,307 | ||||||
| 9,000 | ANI Pharmaceuticals, Inc. (a)(c) | 508,860 | ||||||
| 2,582 | Charles River Laboratories International, Inc. (c) | 347,382 | ||||||
| 110,825 | Coherus Biosciences, Inc. (a)(c)(d) | 1,828,612 | ||||||
| 35,716 | Collegium Pharmaceutical, Inc. (c)(d) | 526,454 | ||||||
| 119,520 | Egalet Corp. (c) | 14,832 | ||||||
| 63,734 | Heron Therapeutics, Inc. (c)(d) | 2,017,181 | ||||||
| 6,650 | Intersect ENT, Inc. (a) | 191,188 | ||||||
| 52,870 | MiMedx Group, Inc. (a)(c)(d) | 326,737 | ||||||
| 2,100 | Nektar Therapeutics (c) | 128,016 | ||||||
| 8,750 | Pacira Pharmaceuticals, Inc. (c) | 430,063 | ||||||
| 77,800 | Paratek Pharmaceuticals, Inc. (a)(d) | 754,660 | ||||||
| 79,050 | Portola Pharmaceuticals, Inc. (a)(d) | 2,105,101 | ||||||
| 4,255 | PRA Health Sciences, Inc. (a)(c) | 468,858 | ||||||
| 67,500 | TG Therapeutics, Inc. (a)(c)(d) | 378,000 | ||||||
| 14,255 | Ultragenyx Pharmaceutical, Inc. (a)(c)(d) | 1,088,227 | ||||||
| 40,400 | Veracyte, Inc. (c)(d) | 385,820 | ||||||
|
| |||||||
| 13,458,603 | ||||||||
|
| |||||||
| REAL ESTATE - 12.8% | ||||||||
| 40,575 | Forest City Realty Trust, Inc., Class A, REIT (a) | 1,018,027 | ||||||
| 48,500 | Independence Realty Trust, Inc., REIT (a)(c) | 510,705 | ||||||
| 105,461 | Jernigan Capital, Inc., REIT (c)(d) | 2,034,343 | ||||||
| 56,551 | NexPoint Residential Trust, Inc., REIT (a)(c)(e) | 1,877,493 | ||||||
| 12,277 | RAIT Financial Trust, REIT | 36,831 | ||||||
| 14,300 | RLJ Lodging Trust, REIT (a) | 315,029 | ||||||
| 10,266 | Spirit MTA REIT, REIT | 118,264 | ||||||
| 78,000 | Spirit Realty Capital, Inc., REIT (a) | 628,680 | ||||||
|
| |||||||
| 6,539,372 | ||||||||
|
| |||||||
| RETAILING - 7.0% | ||||||||
| 233,527 | Barnes & Noble, Inc. (a) | 1,354,457 | ||||||
| 58,500 | Francesca’s Holdings Corp. (b)(c) | 217,035 | ||||||
| 21,850 | Genesco, Inc. (a)(b) | 1,029,135 | ||||||
| 7,075 | LKQ Corp. (a)(b) | 224,065 | ||||||
| 8,195 | Tractor Supply Co. (a) | 744,762 | ||||||
|
| |||||||
| 3,569,454 | ||||||||
|
| |||||||
| SOFTWARE & SERVICES (a) - 8.0% | ||||||||
| 4,620 | CoreLogic, Inc. (b) | 228,274 | ||||||
| 5,500 | Cornerstone OnDemand, Inc. (b) | 312,125 | ||||||
| 19,575 | Fortinet, Inc. (b) | 1,806,185 | ||||||
| 6,750 | Science Applications International Corp. | 544,050 | ||||||
| 12,700 | SS&C Technologies Holdings, Inc. | 721,741 | ||||||
| 12,340 | Teradata Corp. (b) | 465,342 | ||||||
|
| |||||||
| 4,077,717 | ||||||||
|
| |||||||
| 22 | See Glossary on page 38 for abbreviations along with accompanying Notes to Financial Statements. |
Table of Contents
INVESTMENT PORTFOLIO (continued)
| As of September 30, 2018 | HighlandSmall-Cap Equity Fund | |
Shares | Value ($) | |||||||
Common Stocks (continued) | ||||||||
| TRANSPORTATION - 2.6% | ||||||||
| 98,450 | Corp. America Airports SA (b)(c) | 840,763 | ||||||
| 14,000 | JetBlue Airways Corp. (a)(b) | 271,040 | ||||||
| 5,160 | Matson, Inc. (a)(c) | 204,542 | ||||||
|
| |||||||
| 1,316,345 | ||||||||
|
| |||||||
| UTILITIES - 4.0% | ||||||||
| 61,000 | Central Puerto SA ADR (c) | 628,300 | ||||||
| 6,700 | NRG Energy, Inc. (a) | 250,580 | ||||||
| 45,775 | Vistra Energy Corp. (a)(b) | 1,138,882 | ||||||
|
| |||||||
| 2,017,762 | ||||||||
|
| |||||||
Total Common Stocks | 56,753,197 | |||||||
|
| |||||||
Master Limited Partnerships - 7.8% | ||||||||
| ENERGY (a) - 7.8% | ||||||||
| 16,440 | Andeavor Logistics LP | 798,326 | ||||||
| 52,925 | Dynagas LNG Partners LP | 464,152 | ||||||
| 71,290 | Energy Transfer Equity LP | 1,242,585 | ||||||
| 7,150 | Plains All American Pipeline LP | 178,822 | ||||||
| 28,510 | SemGroup Corp., Class A (d) | 628,646 | ||||||
| 22,475 | Western Gas Equity Partners LP | 672,901 | ||||||
|
| |||||||
| 3,985,432 | ||||||||
|
| |||||||
Total Master Limited Partnerships | 3,985,432 | |||||||
|
| |||||||
Registered Investment Companies - 5.5% | ||||||||
| 85,855 | NexPoint Strategic Opportunities Fund, Common (a)(c)(e) | 1,923,152 | ||||||
| 861,707 | State Street Navigator Securities Lending Government Money Market Portfolio 1.82% (f) | 861,707 | ||||||
|
| |||||||
Total Registered Investment Companies | 2,784,859 | |||||||
|
| |||||||
Total Investments - 124.6% | 63,523,488 | |||||||
|
| |||||||
(Cost $59,087,893) | ||||||||
Securities Sold Short (g) - (18.4)% | ||||||||
| EXCHANGE-TRADED FUNDS - (18.4)% | ||||||||
| (104,500) | Direxion Daily Small Cap Bull 3X Shares ETF | (9,353,795 | ) | |||||
|
| |||||||
Total Exchange-Traded Funds | (9,353,795 | ) | ||||||
|
| |||||||
Total Securities Sold Short | (9,353,795 | ) | ||||||
|
| |||||||
Other Assets & Liabilities, Net - (6.2)% | (3,168,680 | ) | ||||||
|
| |||||||
Net Assets - 100.0% | 51,001,013 | |||||||
|
| |||||||
| (a) | All or part of this security is pledged as collateral for the credit facility with Bank of New York Mellon. The market value of the securities pledged as collateral was $37,842,229. |
| (b) | Non-income producing security. |
| (c) | All or part of this security is pledged as collateral for short sales. The market value of the securities pledged as collateral was $13,427,368. |
| (d) | Securities (or a portion of securities) on loan. As of September 30, 2018, the market value of securities loaned was $6,802,834. The loaned securities were secured with cash and securities collateral of $6,978,435. Collateral is calculated based on prior day’s prices. See Note 4. |
| (e) | Affiliated issuer. Assets with a total aggregate market value of $3,800,645, or 7.5% of net assets, were affiliated with the Fund as of September 30, 2018. See Note 10 to the financial statements. |
| (f) | Represents investments of cash collateral received in connection with securities lending. |
| (g) | As of September 30, 2018, $9,715,571 in cash was segregated or on deposit with the brokers to cover investments sold short and is included in “Other Assets & Liabilities, Net. |
| Overnight and Continuous | Total | |||||||
Securities Lending Transactions1 |
| |||||||
Common Stocks | $ | 861,707 | $ | 861,707 | ||||
|
| |||||||
Total Borrowings | $ | 861,707 | $ | 861,707 | ||||
|
| |||||||
Gross amount of recognized liabilities for securities lending transactions |
| $ | 861,707 | |||||
| 1 | Amounts represent the payable for cash collateral received on securities on loan. This will generally be in “Overnight and Continuous” column as the securities are typically callable on demand. |
| See Glossary on page 38 for abbreviations along with accompanying Notes to Financial Statements. | 23 |
Table of Contents
INVESTMENT PORTFOLIO
| As of September 30, 2018 | Highland Total Return Fund | |
Principal Amount ($) | Value ($) | |||||||
Bonds & Notes - 24.2% | ||||||||
| AGENCY COLLATERALIZED MORTGAGE OBLIGATIONS - 0.0% | ||||||||
| 61,424 | Federal National Mortgage Assoc. REMIC | 8,909 | ||||||
| 4,189 | Federal National Mortgage Assoc. STRIPS | 3,483 | ||||||
|
| |||||||
Total Agency Collateralized Mortgage Obligations | 12,392 | |||||||
|
| |||||||
| AGENCY MORTGAGE-BACKED SECURITIES - 1.6% | ||||||||
| 53,793 | Federal Home Loan Mortgage Corp. | 57,425 | ||||||
| 447,810 | Federal National Mortgage Assoc. | 432,401 | ||||||
| 202,765 | 3.50%, 11/01/2042 - 02/01/2043 (d) | 201,302 | ||||||
| 79,034 | 4.00%, 02/01/2044 | 80,286 | ||||||
| 153,284 | 4.50%, 02/01/2040 - 01/01/2041 (d) | 159,589 | ||||||
| 76,235 | 5.00%, 06/01/2041 | 81,287 | ||||||
| 115,138 | Government National Mortgage Assoc. | 112,554 | ||||||
| 114,806 | 3.50%, 05/20/2043 | 114,847 | ||||||
| 131,553 | 4.00%, 01/20/2041 - 04/20/2043 (d) | 135,061 | ||||||
| 49,668 | 4.50%, 05/20/2040 - 03/20/2041 (d) | 52,085 | ||||||
|
| |||||||
Total Agency Mortgage-Backed Securities | 1,426,837 | |||||||
|
| |||||||
| ASSET-BACKED SECURITIES (b) - 0.0% | ||||||||
| 2 | Bear Stearns Asset-Backed Securities Trust | 2 | ||||||
|
| |||||||
| CORPORATE BONDS & NOTES - 15.3% | ||||||||
Automobiles & Components - 0.2% | ||||||||
| 200,000 | Toyota Motor Credit Corp., MTN | 199,949 | ||||||
|
| |||||||
Banks - 0.1% | ||||||||
| 27,000 | Bank of America Corp. Series L | 26,997 | ||||||
| 25,000 | Goldman Sachs Group, Inc. (The), MTN3M USD LIBOR + 1.600%, FRN | 25,214 | ||||||
| 21,000 | Morgan Stanley, MTN3M USD LIBOR + 1.500%, FRN | 21,022 | ||||||
|
| |||||||
| 73,233 | ||||||||
|
| |||||||
Consumer Durables & Apparel - 0.0% | ||||||||
| 20,000 | DR Horton, Inc. | 20,026 | ||||||
| 19,000 | Lennar Corp. | 19,190 | ||||||
|
| |||||||
| 39,216 | ||||||||
|
| |||||||
Principal Amount ($) | Value ($) | |||||||
Consumer Services - 0.4% | ||||||||
| 350,000 | Marriott International, Inc. | 350,018 | ||||||
| 32,000 | MGM Resorts International | 32,640 | ||||||
|
| |||||||
| 382,658 | ||||||||
|
| |||||||
Diversified Financials - 2.4% | ||||||||
| 500,000 | Ford Motor Credit Co. LLC | 498,589 | ||||||
| 250,000 | General Motors Financial Co., Inc. | 250,212 | ||||||
| 12,000 | 3.50%, 07/10/2019 | 12,054 | ||||||
| 71,000 | Goldman Sachs Group, Inc. (The) | 71,004 | ||||||
| 13,000 | Goldman Sachs Group, Inc. (The), MTN | 13,227 | ||||||
| 1,000,000 | JPMorgan Chase & Co. | 989,956 | ||||||
| 370,000 | 5.81%, 10/30/2018 (b)(e) | 372,035 | ||||||
|
| |||||||
| 2,207,077 | ||||||||
|
| |||||||
Energy - 0.5% | ||||||||
| 200,000 | Kinder Morgan, Inc. | 199,836 | ||||||
| 42,000 | 5.63%, 11/15/2023 (f) | 44,881 | ||||||
| 235,000 | TransCanada PipeLines, Ltd. | 237,927 | ||||||
|
| |||||||
| 482,644 | ||||||||
|
| |||||||
Food, Beverage & Tobacco - 1.7% | ||||||||
| 800,000 | Altria Group, Inc. | 805,891 | ||||||
| 250,000 | Molson Coors Brewing Co. | 249,038 | ||||||
| 479,000 | Philip Morris International, Inc. | 478,103 | ||||||
|
| |||||||
| 1,533,032 | ||||||||
|
| |||||||
Healthcare Equipment & Services - 1.4% | ||||||||
| 375,000 | Edwards Lifesciences Corp. | 375,039 | ||||||
| 44,000 | HCA, Inc. | 45,892 | ||||||
| 5,000 | McKesson Corp. | 4,990 | ||||||
| 9,000 | Medtronic, Inc. | 8,942 | ||||||
| 50,000 | Tenet Healthcare Corp. | 50,812 | ||||||
| 30,000 | 6.00%, 10/01/2020 | 31,060 | ||||||
| 707,000 | Walgreen Co. | 711,827 | ||||||
|
| |||||||
| 1,228,562 | ||||||||
|
| |||||||
Household & Personal Products - 0.5% | ||||||||
| 411,000 | Kimberly-Clark Corp. | 409,213 | ||||||
|
| |||||||
| 24 | See Glossary on page 38 for abbreviations along with accompanying Notes to Financial Statements. |
Table of Contents
INVESTMENT PORTFOLIO (continued)
| As of September 30, 2018 | Highland Total Return Fund | |
Principal Amount ($) | Value ($) | |||||||
Bonds & Notes (continued) | ||||||||
Industrials - 1.2% | ||||||||
| 645,000 | General Electric Co. | 629,197 | ||||||
| 20,000 | Illinois Tool Works, Inc. | 19,949 | ||||||
| 202,000 | Stanley Black & Decker, Inc. | 201,689 | ||||||
| 230,000 | 2.45%, 11/17/2018 | 229,904 | ||||||
|
| |||||||
| 1,080,739 | ||||||||
|
| |||||||
Industrials - 0.7% | ||||||||
| 563,000 | Boeing Co. (The) | 571,302 | ||||||
| 100,000 | Unilever Capital Corp. | 99,854 | ||||||
|
| |||||||
| 671,156 | ||||||||
|
| |||||||
Insurance - 0.6% | ||||||||
| 21,000 | CNA Financial Corp. | 21,932 | ||||||
| 500,000 | Prudential Financial, Inc. | 521,875 | ||||||
|
| |||||||
| 543,807 | ||||||||
|
| |||||||
Materials - 0.2% | ||||||||
| 132,000 | Dow Chemical Co. (The) | 136,528 | ||||||
| 5,000 | EI du Pont de Nemours & Co. | 5,067 | ||||||
| 10,000 | Monsanto Co. | 9,986 | ||||||
|
| |||||||
| 151,581 | ||||||||
|
| |||||||
Media - 1.1% | ||||||||
| 25,000 | 21st Century Fox America, Inc. | 25,421 | ||||||
| 40,000 | Time Warner Cable LLC | 41,027 | ||||||
| 800,000 | 8.75%, 02/14/2019 | 816,604 | ||||||
| 27,000 | Walt Disney Co. (The), MTN | 26,866 | ||||||
| 130,000 | 5.50%, 03/15/2019 | 131,773 | ||||||
|
| |||||||
| 1,041,691 | ||||||||
|
| |||||||
Pharmaceuticals, Biotechnology & Life Sciences - 1.1% | ||||||||
| 425,000 | Amgen, Inc. | 429,510 | ||||||
| 5,000 | Bristol-Myers Squibb Co. | 4,982 | ||||||
| 500,000 | Pfizer, Inc. | 498,689 | ||||||
| 26,000 | Roche Holdings, Inc. | 25,861 | ||||||
|
| |||||||
| 959,042 | ||||||||
|
| |||||||
Principal Amount ($) | Value ($) | |||||||
Real Estate - 0.4% | ||||||||
| 299,000 | American Tower Corp., REIT | 299,545 | �� | |||||
| 30,000 | Iron Mountain, Inc., REIT | 30,844 | ||||||
|
| |||||||
| 330,389 | ||||||||
|
| |||||||
Retailing - 0.0% | ||||||||
| 2,000 | McDonald’s Corp., MTN | 1,999 | ||||||
|
| |||||||
Semiconductors & Semiconductor Equipment - 0.4% | ||||||||
| 340,000 | Broadcom Corp. | 339,914 | ||||||
| 16,000 | Xilinx, Inc. | 15,973 | ||||||
|
| |||||||
| 355,887 | ||||||||
|
| |||||||
Technology Hardware & Equipment - 0.0% | ||||||||
| 6,000 | Cisco Systems, Inc. | 6,052 | ||||||
|
| |||||||
Telecommunication Services - 0.2% | ||||||||
| 95,000 | AT&T, Inc. | 96,114 | ||||||
| 15,000 | Discovery Communications LLC | 14,911 | ||||||
| 17,000 | Hughes Satellite Systems Corp. | 17,372 | ||||||
| 525,504 | iHeartCommunications, Inc., PIK (h) | 69,629 | ||||||
|
| |||||||
| 198,026 | ||||||||
|
| |||||||
Transportation - 0.9% | ||||||||
| 500,000 | Canadian Pacific Railway Co. | 513,751 | ||||||
| 25,000 | FedEx Corp. | 25,367 | ||||||
| 232,000 | Union Pacific Corp. | 231,639 | ||||||
| 50,000 | 7.88%, 01/15/2019 | 50,747 | ||||||
|
| |||||||
| 821,504 | ||||||||
|
| |||||||
Utilities - 1.3% | ||||||||
| 395,000 | Sempra Energy | 405,130 | ||||||
| 500,000 | Southwestern Electric Power Co. | 505,433 | ||||||
| 250,000 | WEC Energy Group, Inc. | 243,427 | ||||||
|
| |||||||
| 1,153,990 | ||||||||
|
| |||||||
Total Corporate Bonds & Notes | 13,871,447 | |||||||
|
| |||||||
| See Glossary on page 38 for abbreviations along with accompanying Notes to Financial Statements. | 25 |
Table of Contents
INVESTMENT PORTFOLIO (continued)
| As of September 30, 2018 | Highland Total Return Fund | |
Principal Amount | Value ($) | |||||||
Bonds & Notes (continued) | ||||||||
| FOREIGN CORPORATE BONDS & NOTES - 0.1% | ||||||||
Capital Goods - 0.1% | ||||||||
| 61,000 | Bombardier, Inc. | 64,012 | ||||||
|
| |||||||
Utilities - 0.0% | ||||||||
| 64,000 | Electricite de France SA | 63,896 | ||||||
|
| |||||||
Total Foreign Corporate Bonds & Notes | 127,908 | |||||||
|
| |||||||
Principal Amount ($) | ||||||||
| NON-AGENCY COLLATERALIZED MORTGAGE-BACKED SECURITIES - 0.1% | ||||||||
| 14,592 | Banc of America Commercial Mortgage Trust | 14,667 | ||||||
| 60,000 | JPMBB Commercial Mortgage Securities Trust | 61,462 | ||||||
LB-UBS Commercial Mortgage Trust | ||||||||
| 1,907 | Series2007-C6, Class AMFL | 1,906 | ||||||
| 1,668 | Series2007-C6, Class AM, VRN | 1,668 | ||||||
| 40,000 | WF-RBS Commercial Mortgage Trust | 40,895 | ||||||
|
| |||||||
TotalNon-Agency Collateralized Mortgage-Backed Securities | 120,598 | |||||||
|
| |||||||
| U.S. TREASURIES - 1.6% | ||||||||
| 500,000 | U.S. Treasury Notes | 498,799 | ||||||
| 500,000 | 1.38%, 01/15/2020 (i) | 491,562 | ||||||
| 500,000 | 1.75%, 12/31/2020 | 488,193 | ||||||
|
| |||||||
Total U.S. Treasuries | 1,478,554 | |||||||
|
| |||||||
| U.S. TREASURY BILLS - 5.5% | ||||||||
| 1,000,000 | U.S. Treasury Bill | 997,405 | ||||||
| 2,000,000 | U.S. Treasury Bill | 1,989,620 | ||||||
| 2,000,000 | U.S. Treasury Bill | 1,973,249 | ||||||
|
| |||||||
Total U.S. Treasury Bills | 4,960,274 | |||||||
|
| |||||||
Total Bonds & Notes | 21,998,012 | |||||||
|
| |||||||
Shares | Value ($) | |||||||
Domestic Equity - 40.7% | ||||||||
| COMMON STOCKS - 39.0% | ||||||||
Consumer Durables & Apparel - 2.6% | ||||||||
| 2,487 | JG Boswell Co. (i) | 1,620,280 | ||||||
| 18,400 | Lennar Corp., Class B | 708,400 | ||||||
|
| |||||||
| 2,328,680 | ||||||||
|
| |||||||
Consumer Services (i) - 0.3% | ||||||||
| 20,000 | Collectors Universe, Inc. | 296,000 | ||||||
|
| |||||||
Diversified Financials - 13.5% | ||||||||
| 16,870 | Berkshire Hathaway, Inc., Class B (j) | 3,612,036 | ||||||
| 20,041 | Oaktree Capital Group LLC | 829,697 | ||||||
| 627,422 | PICO Holdings, Inc. (j) | 7,874,146 | ||||||
|
| |||||||
| 12,315,879 | ||||||||
|
| |||||||
Energy (j) - 0.3% | ||||||||
| 23,800 | SandRidge Energy, Inc. | 258,706 | ||||||
|
| |||||||
Food, Beverage & Tobacco - 3.3% | ||||||||
| 36,500 | Philip Morris International, Inc. | 2,976,210 | ||||||
|
| |||||||
Materials (j) - 0.4% | ||||||||
| 3,877 | Keweenaw Land Association, Ltd. | 360,561 | ||||||
|
| |||||||
Media - 7.9% | ||||||||
| 1,715 | Charter Communications, Inc., Class A (j) | 558,884 | ||||||
| 21,600 | GCI Liberty, Inc., Class A (j) | 1,101,600 | ||||||
| 119,379 | Liberty Media Corp-Liberty Formula One, Class A (i)(j) | 4,247,505 | ||||||
| 17,300 | Reading International, Inc., Class A (j) | 273,340 | ||||||
| 22,475 | Twenty-First Century Fox, Inc., Class B | 1,029,805 | ||||||
|
| |||||||
| 7,211,134 | ||||||||
|
| |||||||
Real Estate - 2.2% | ||||||||
| 36,650 | Gramercy Property Trust, REIT | 1,005,676 | ||||||
| 1,295 | Phillips Edison Grocery Center REIT I, Inc. (j)(k)(l) | 13,535 | ||||||
| 20,900 | VEREIT, Inc., REIT | 151,734 | ||||||
| 23,500 | Zayo Group Holdings, Inc. (j) | 815,920 | ||||||
|
| |||||||
| 1,986,865 | ||||||||
|
| |||||||
Software & Services (j) - 3.9% | ||||||||
| 581 | Alphabet, Inc., Class A | 701,314 | ||||||
| 2,403 | Alphabet, Inc., Class C | 2,867,908 | ||||||
|
| |||||||
| 3,569,222 | ||||||||
|
| |||||||
Telecommunication Services - 4.6% | ||||||||
| 195,904 | CenturyLink, Inc. | 4,153,165 | ||||||
|
| |||||||
Total Common Stocks | 35,456,422 | |||||||
|
| |||||||
| PREFERRED STOCKS - 1.7% | ||||||||
Diversified Financials - 0.6% | ||||||||
| 395 | Wells Fargo & Co., Series L 7.500% | 508,491 | ||||||
|
| |||||||
| 26 | See Glossary on page 38 for abbreviations along with accompanying Notes to Financial Statements. |
Table of Contents
INVESTMENT PORTFOLIO (continued)
| As of September 30, 2018 | Highland Total Return Fund | |
Shares | Value ($) | |||||||
Domestic Equity (continued) | ||||||||
Real Estate - 0.5% | ||||||||
| 10,200 | American Homes 4 Rent, Series E 6.350% | 249,594 | ||||||
| 200 | Gramercy Property Trust, Series A 7.125% (i) | 4,996 | ||||||
| 7,492 | RLJ Lodging Trust, Series A 1.950% | 197,040 | ||||||
|
| |||||||
| 451,630 | ||||||||
|
| |||||||
Telecommunication Services - 0.6% | ||||||||
| 11,400 | Qwest Corp. 6.750% | 274,204 | ||||||
| 11,700 | Qwest Corp. 6.500% | 272,903 | ||||||
|
| |||||||
| 547,107 | ||||||||
|
| |||||||
Total Preferred Stocks | 1,507,228 | |||||||
|
| |||||||
Total Domestic Equity | 36,963,650 | |||||||
|
| |||||||
Foreign Equity - 23.6% | ||||||||
| COMMON STOCKS - 23.6% | ||||||||
Consumer Durables & Apparel - 0.9% | ||||||||
| 13,110 | Sony Corp. ADR | 795,122 | ||||||
|
| |||||||
Diversified Financials - 0.8% | ||||||||
| 16,520 | Brookfield Asset Management, Inc., Class A | 735,636 | ||||||
|
| |||||||
Food, Beverage & Tobacco - 3.0% | ||||||||
| 18,270 | Anheuser-Busch InBev NV ADR (i) | 1,599,904 | ||||||
| 715,960 | Becle S.A.B. de C.V. | 1,156,685 | ||||||
|
| |||||||
| 2,756,589 | ||||||||
|
| |||||||
Media - 5.2% | ||||||||
| 88,249 | Liberty Global PLC, Series C (j) | 2,485,092 | ||||||
| 85,700 | Vivendi SA ADR (i) | 2,197,348 | ||||||
|
| |||||||
| 4,682,440 | ||||||||
|
| |||||||
Pharmaceuticals, Biotechnology & Life Sciences - 4.0% | ||||||||
| 24,321 | Bayer AG | 2,161,318 | ||||||
| 45,800 | Bayer AG ADR | 1,014,012 | ||||||
| 16,800 | Roche Holding AG, ADR | 506,688 | ||||||
|
| |||||||
| 3,682,018 | ||||||||
|
| |||||||
Software & Services (i) - 0.8% | ||||||||
| 16,730 | Nintendo Co., Ltd. ADR | 760,629 | ||||||
|
| |||||||
Telecommunication Services (i)(j) - 0.9% | ||||||||
| 132,350 | Telecom Italia SpA/Milano ADR | 794,100 | ||||||
|
| |||||||
Transportation - 8.0% | ||||||||
| 1,053,050 | Bollore SA | 4,549,996 | ||||||
| 10,000 | Bollore SA | 43,000 | ||||||
| 2,877 | Financiere de L’Odet SA | 2,700,040 | ||||||
|
| |||||||
| 7,293,036 | ||||||||
|
| |||||||
Total Common Stocks | 21,499,570 | |||||||
|
| |||||||
Total Foreign Equity | 21,499,570 | |||||||
|
| |||||||
Shares | Value ($) | |||||||
Registered Investment Companies - 6.3% | ||||||||
| 11,446 | BlackRock Taxable Municipal Bond Trust | 242,655 | ||||||
| 12,257 | Cohen & Steers, Ltd., Duration Preferred & Income Fund, Inc. | 291,839 | ||||||
| 20,879 | Flaherty & Crumrine Dynamic Preferred & Income Fund, Inc. | 484,393 | ||||||
| 38,545 | Flaherty & Crumrine Preferred Securities Income Fund, Inc. (i) | 702,290 | ||||||
| 66,908 | Kayne Anderson Midstream/Energy Fund, Inc. | 856,422 | ||||||
| 10,926 | Nuveen Build America Bond Fund | 218,520 | ||||||
| 2,706,070 | State Street Navigator Securities Lending Government Money Market Portfolio 1.82% (m) | 2,706,070 | ||||||
| 39,710 | TCW Strategic Income Fund, Inc. (i) | 222,376 | ||||||
|
| |||||||
Total Registered Investment Companies | 5,724,565 | |||||||
|
| |||||||
Principal Amount ($) | ||||||||
Cash Equivalents - 6.1% | ||||||||
| COMMERCIAL PAPER - 1.4% | ||||||||
| 1,000,000 | Apple, Inc. | 998,922 | ||||||
| 250,000 | Campbell Soup Co. | 249,918 | ||||||
|
| |||||||
Total Commercial Paper | 1,248,840 | |||||||
|
| |||||||
Shares | ||||||||
| MONEY MARKET FUNDS - 4.7% | ||||||||
| 4,266,261 | State Street Institutional U.S. Government Money Market Fund, Premier Class 1.97% | 4,266,261 | ||||||
|
| |||||||
Total Money Market Funds | 4,266,261 | |||||||
|
| |||||||
Total Cash Equivalents | 5,515,101 | |||||||
|
| |||||||
Total Investments - 100.9% | 91,700,898 | |||||||
|
| |||||||
(Cost $89,274,544) | ||||||||
Other Assets & Liabilities, Net - (0.9)% | (810,808 | ) | ||||||
|
| |||||||
Net Assets - 100.0% | 90,890,090 | |||||||
|
| |||||||
| (a) | Interest only security (“IO”). These types of securities represent the right to receive the monthly interest payments on an underlying pool of mortgages. Payments of principal on the pool reduce the value of the “interest only” holding. |
| (b) | Variable or floating rate security. The base lending rates are generally the lending rate offered by one or more European banks such as the LIBOR. The interest rate shown reflects the rate in effect September 30, 2018. LIBOR, otherwise known as London Interbank Offered Rate, is the benchmark interest rate that banks charge each other for short-term loans. Current LIBOR rates include 1 month which is equal to 2.26% and 3 months equal to 2.40%. |
| (c) | Principal only security (“PO”). These types of securities represent the right to receive the monthly principal payments on an underlying pool of mortgages. No payments of interest on the pool are passed through to the “principal only” holder. |
| (d) | Securities are grouped by coupon and represent a range of maturities. |
| See Glossary on page 38 for abbreviations along with accompanying Notes to Financial Statements. | 27 |
Table of Contents
INVESTMENT PORTFOLIO (continued)
| As of September 30, 2018 | Highland Total Return Fund | |
| (e) | Perpetual maturity. Maturity date presented represents the next call date. |
| (f) | Securities exempt from registration under Rule 144A of the 1933 Act. These securities may only be resold in transaction exempt from registration to qualified institutional buyers. At September 30, 2018, these securities amounted to $87,559 or 0.1% of net assets. |
| (g) | Security purchased on a when-issued basis. As of September 30, 2018, assets with a total aggregate market value of $375,039, or 0.4% of net assets, were purchased on a when-issued basis. |
| (h) | The issuer is, or is in danger of being, in default of its payment obligation. |
| (i) | Securities (or a portion of securities) on loan. As of September 30, 2018, the market value of securities loaned was $6,511,117. The loaned securities were secured with cash and securities collateral of $6,695,109. Collateral is calculated based on prior day’s prices. See Note 4. |
| (j) | Non-income producing security. |
| (k) | Represents fair value as determined by the Fund’s Board of Trustees (the “Board”), or its designee in good faith, pursuant to the policies and procedures approved by the Board. The Board considers fair valued securities to be securities for which market quotations are not readily available and these securities may be valued using a combination of observable and unobservable inputs. Securities with a total aggregate value of $13,535, or 0.01% of net assets, were fair valued under the Fund’s valuation procedures as of September 30, 2018. See Note 2. |
| (l) | Classified as Level 3 within the three-tier fair value hierarchy. Please see. Note 2 for an explanation of this hierarchy, as well as a list of unobservable inputs used in the valuation of these instruments. |
| (m) | Represents investments of cash collateral received in connection with securities lending. |
The Fund invested in the following countries as of September 30, 2018:
| Country | Percentage (based on Total Investments)* | |||
United States | 75.5 | % | ||
France | 10.4 | % | ||
Germany | 3.5 | % | ||
United Kingdom | 2.7 | % | ||
Belgium | 1.7 | % | ||
Japan | 1.7 | % | ||
Canada | 1.7 | % | ||
Mexico | 1.3 | % | ||
Italy | 0.9 | % | ||
Switzerland | 0.6 | % | ||
|
| |||
| 100.0 | % | |||
|
| |||
| Industry1 | Domestic | Foreign | Percentage (based on Total Investments)* | |||||||||
Diversified Financials | 14.0 | % | 0.8 | % | 14.8 | % | ||||||
Media | 7.9 | % | 5.1 | % | 13.0 | % | ||||||
Transportation | 0.0 | % | 8.0 | % | 8.0 | % | ||||||
Food, Beverage & Tobacco | 3.2 | % | 3.0 | % | 6.2 | % | ||||||
Telecommunication Services | 5.1 | % | 0.9 | % | 6.0 | % | ||||||
Software & Services | 3.9 | % | 0.8 | % | 4.7 | % | ||||||
Pharmaceuticals, Biotechnology & Life Sciences | 0.0 | % | 4.0 | % | 4.0 | % | ||||||
Consumer Durables & Apparel | 2.5 | % | 0.9 | % | 3.4 | % | ||||||
Real Estate | 2.7 | % | 0.0 | % | 2.7 | % | ||||||
Materials | 0.4 | % | 0.0 | % | 0.4 | % | ||||||
Consumer Services | 0.3 | % | 0.0 | % | 0.3 | % | ||||||
Energy | 0.3 | % | 0.0 | % | 0.3 | % | ||||||
|
| |||||||||||
| 63.8 | % | |||||||||||
|
| |||||||||||
| Sector | Percentage (based on Total Investments)* | |||
Agency Mortgage-Backed Securities | 1.6 | % | ||
Corporate Bonds & Notes | 15.1 | % | ||
U.S. Treasuries | 7.0 | % | ||
Other (each less than 1.0%) | 0.3 | % | ||
|
| |||
| 24.0 | % | |||
|
| |||
| Other Instruments | Percentage (based on Total Investments)* | |||
Cash Equivalents | 6.0 | % | ||
Registered Investment Companies | 6.2 | % | ||
|
| |||
| 12.2 | % | |||
|
| |||
| 100.0 | % | |||
|
| |||
CERTAIN TRANSFERS ACCOUNTED FOR AS SECURED BORROWINGS
Remaining Contractual Maturity of the Agreements
| Overnight and Continuous | Total | |||||||
Securities Lending Transactions2 |
| |||||||
Common Stocks | $ | 2,680,931 | $ | 2,680,931 | ||||
Registered Investment Companies | 25,139 | 25,139 | ||||||
|
| |||||||
Total Borrowings | $ | 2,706,070 | $ | 2,706,070 | ||||
|
| |||||||
Gross amount of recognized liabilities for securities lending transactions |
| $ | 2,706,070 | |||||
| 1 | Includes domestic and foreign equity securities. |
| 2 | Amounts represent the payable for cash collateral received on securities on loan. This will generally be in “Overnight and Continuous” column as the securities are typically callable on demand. |
| * | The calculated percentages are based on total investments. The other assets & liabilities, net line has been excluded from the calculation. |
| 28 | See Glossary on page 38 for abbreviations along with accompanying Notes to Financial Statements. |
Table of Contents
INVESTMENT PORTFOLIO
| As of September 30, 2018 | HighlandTax-Exempt Fund | |
Principal Amount ($) | Value ($) | |||||||
Municipal Bonds & Notes - 98.1% | ||||||||
| ALASKA - 4.6% | ||||||||
| 500,000 | Alaska Housing Finance Corp. | 548,835 | ||||||
|
| |||||||
| 548,835 | ||||||||
|
| |||||||
| ARIZONA - 4.2% | ||||||||
| 475,000 | Arizona Sports & Tourism Authority | 509,286 | ||||||
|
| |||||||
| CALIFORNIA - 12.8% | ||||||||
| 120,000 | Adelanto Public Utility Authority | 141,371 | ||||||
| 500,000 | Golden State Tobacco Securitization Corp. | 552,600 | ||||||
| 300,000 | Los Angeles County Public Works Financing Authority | 351,696 | ||||||
| 435,000 | Oxnard Financing Authority | 487,448 | ||||||
| 13,000 | Sacramento, CA Municipal Utility District | 13,287 | ||||||
|
| |||||||
| 1,546,402 | ||||||||
|
| |||||||
| COLORADO - 4.6% | ||||||||
| 500,000 | Regional Transportation District, CO | 549,825 | ||||||
|
| |||||||
| CONNECTICUT - 6.7% | ||||||||
| 250,000 | State of Connecticut Special Tax Revenue | 274,260 | ||||||
| 500,000 | Town of Fairfield, CT, GO | 533,700 | ||||||
|
| |||||||
| 807,960 | ||||||||
|
| |||||||
| DISTRICT OF COLUMBIA (a) - 4.5% | ||||||||
| 500,000 | District of Columbia | 535,855 | ||||||
|
| |||||||
| FLORIDA - 1.8% | ||||||||
| 200,000 | City of Lakeland, FL | 219,042 | ||||||
|
| |||||||
| GEORGIA - 4.2% | ||||||||
| 500,000 | Municipal Electric Authority of Georgia | 503,840 | ||||||
|
| |||||||
| HAWAII - 4.4% | ||||||||
| 500,000 | State of Hawaii Airports System | 527,305 | ||||||
|
| |||||||
| ILLINOIS - 11.4% | ||||||||
| 500,000 | Carol Stream Park District, GO | 556,410 | ||||||
| 460,000 | Illinois Financing Authority | 496,496 | ||||||
Principal Amount ($) | Value ($) | |||||||
| ILLINOIS (continued) | ||||||||
| 315,000 | Illinois State University | 326,781 | ||||||
|
| |||||||
| 1,379,687 | ||||||||
|
| |||||||
| MAINE - 0.1% | ||||||||
| 15,000 | Maine Health & Higher Educational Facilities Authority | 15,735 | ||||||
|
| |||||||
| MASSACHUSETTS - 1.8% | ||||||||
| 200,000 | Massachusetts Water Resources Authority | 221,650 | ||||||
|
| |||||||
| MICHIGAN - 4.7% | ||||||||
| 500,000 | Great Lakes Water Authority Water Supply System | 562,395 | ||||||
|
| |||||||
| MISSOURI - 4.3% | ||||||||
| 500,000 | Missouri Highway & Transportation Commission | 523,135 | ||||||
|
| |||||||
| NEW JERSEY - 9.0% | ||||||||
| 500,000 | New Jersey Economic Development Authority | 546,005 | ||||||
| 500,000 | New Jersey Educational Facilities Authority | 542,210 | ||||||
|
| |||||||
| 1,088,215 | ||||||||
|
| |||||||
| PENNSYLVANIA - 9.7% | ||||||||
| 85,000 | City of Philadelphia, PA Gas Works Co. | 89,343 | ||||||
| 480,000 | Pennsylvania State Higher Educational Facilities Authority | 535,325 | ||||||
| 500,000 | Pennsylvania Turnpike Commission | 544,950 | ||||||
|
| |||||||
| 1,169,618 | ||||||||
|
| |||||||
| TEXAS - 9.3% | ||||||||
| 500,000 | Central Texas Turnpike System | 543,330 | ||||||
| 300,000 | Port of Port Arthur Navigation District | 300,000 | ||||||
| 250,000 | Texas Transportation Commission State Highway Fund | 279,022 | ||||||
|
| |||||||
| 1,122,352 | ||||||||
|
| |||||||
Total Municipal Bonds & Notes | 11,831,137 | |||||||
|
| |||||||
| See Glossary on page 38 for abbreviations along with accompanying Notes to Financial Statements. | 29 |
Table of Contents
INVESTMENT PORTFOLIO (continued)
| As of September 30, 2018 | HighlandTax-Exempt Fund | |
Shares | Value ($) | |||||||
Cash Equivalents - 3.2% | ||||||||
| 382,611 | State Street Institutional U.S. Government Money Market Fund, Premier Class 1.97% | 382,611 | ||||||
|
| |||||||
Total Cash Equivalents | 382,611 | |||||||
|
| |||||||
Total Investments - 101.3% | 12,213,748 | |||||||
|
| |||||||
(Cost $12,050,300) | ||||||||
Other Assets & Liabilities, Net - (1.3)% | (150,884 | ) | ||||||
|
| |||||||
Net Assets - 100.0% | 12,062,864 | |||||||
|
| |||||||
| (a) | Variable or floating rate security. The base lending rates are generally the lending rate offered by one or more European banks such as the LIBOR. The interest rate shown reflects the rate in effect September 30, 2018. LIBOR, otherwise known as London Interbank Offered Rate, is the benchmark interest rate that banks charge each other for short-term loans. Current LIBOR rates include 1 month which is equal to 2.26% and 3 months equal to 2.40%. |
| 30 | See Glossary on page 38 for abbreviations along with accompanying Notes to Financial Statements. |
Table of Contents
INVESTMENT PORTFOLIO
| As of September 30, 2018 | Highland Fixed Income Fund | |
Principal Amount ($) | Value ($) | |||||||
Bonds & Notes - 89.9% | ||||||||
| AGENCY COLLATERALIZED MORTGAGE OBLIGATIONS - 3.2% | ||||||||
| 2,045,944 | Federal National Mortgage Assoc. REMIC | 2,028,580 | ||||||
| 85,188 | Series2010-16, Class PA | 87,014 | ||||||
| 1,498,963 | FRESB 2017-SB42 Mortgage Trust | 1,431,403 | ||||||
| 2,066,065 | FRESB 2018-SB53 Mortgage Trust | 2,062,030 | ||||||
| 650,306 | Government National Mortgage Assoc. | 650,878 | ||||||
|
| |||||||
Total Agency Collateralized Mortgage Obligations | 6,259,905 | |||||||
|
| |||||||
| AGENCY MORTGAGE-BACKED SECURITIES - 12.4% | ||||||||
| 1,070,023 | Federal Home Loan Mortgage Corp. | 1,088,467 | ||||||
| 170,113 | 5.00%, 06/01/2041 | 181,596 | ||||||
| 3,460,604 | Federal National Mortgage Assoc. | 3,341,511 | ||||||
| 1,496,156 | 3.50%, 11/01/2042 - 02/01/2043 (b) | 1,485,408 | ||||||
| 1,198,716 | 3.86%, 07/01/2028 | 1,223,220 | ||||||
| 1,624,727 | 4.00%, 01/01/2041 - 03/01/2044 (b) | 1,653,088 | ||||||
| 2,204,248 | 4.50%, 10/01/2039 - 04/01/2041 (b) | 2,294,919 | ||||||
| 241,079 | 5.00%, 06/01/2041 | 257,055 | ||||||
| 1,288,646 | Government National Mortgage Assoc. | 1,289,108 | ||||||
| 1,314,491 | 4.00%, 01/20/2041 - 04/20/2043 (b) | 1,349,626 | ||||||
| 4,662,888 | Small Business Administration Pools | 4,662,541 | ||||||
| 1,365,494 | 2.48%, 09/25/2036 | 1,364,909 | ||||||
| 4,119,486 | 2.50%, 03/25/2025 - 05/25/2028 (b) | 4,123,653 | ||||||
|
| |||||||
Total Agency Mortgage-Backed Securities | 24,315,101 | |||||||
|
| |||||||
| ASSET-BACKED SECURITIES - 7.5% | ||||||||
| 2,265,000 | American Express Credit Account Master Trust | 2,258,461 | ||||||
| 410,000 | Avis Budget Rental Car Funding AESOP LLC | 404,916 | ||||||
| 60,000 | BMW Vehicle Lease Trust2017-2 | 59,286 | ||||||
| 750,000 | Capital Auto Receivables Asset Trust | 751,185 | ||||||
| 732,299 | DT Auto Owner Trust | 738,280 | ||||||
Principal Amount ($) | Value ($) | |||||||
| ASSET-BACKED SECURITIES (continued) | ||||||||
| 750,000 | First Investors Auto Owner Trust | 749,986 | ||||||
| 750,000 | First Investors Auto Owner Trust2014-2 | 751,192 | ||||||
| 315,748 | Flagship Credit Auto Trust | 315,944 | ||||||
| 2,000,000 | Ford Credit Auto Owner Trust 2014-REV2 | 1,987,498 | ||||||
| 2,200,000 | Ford Credit Auto Owner Trust 2015-REV2 | 2,173,908 | ||||||
| 1,000,000 | GMF Floorplan Owner Revolving Trust | 996,970 | ||||||
| 624,000 | Hertz Vehicle Financing II LP | 622,327 | ||||||
| 503,814 | Santander Drive Auto Receivables Trust | 504,308 | ||||||
| 1,000,000 | Toyota Auto Receivables2017-D Owner Trust | 983,401 | ||||||
| 859,000 | World Financial Network Credit Card Master Trust | 859,510 | ||||||
| 650,000 | World Omni Auto Receivables Trust | 647,420 | ||||||
|
| |||||||
Total Asset-Backed Securities | 14,804,592 | |||||||
|
| |||||||
| CORPORATE BONDS & NOTES - 44.0% | ||||||||
Banks - 7.2% | ||||||||
| 128,000 | Bank of America Corp. | 130,635 | ||||||
| 450,000 | 5.13%, 06/17/2019 (a)(d) | 453,938 | ||||||
| 900,000 | 5.49%, 03/15/2019 | 911,210 | ||||||
| 1,250,000 | 5.88%, 01/05/2021 | 1,319,956 | ||||||
| 311,000 | Bank of America Corp., MTN | 314,340 | ||||||
| 980,000 | 4.09%, 09/28/2020 (a) | 995,117 | ||||||
| 810,000 | Capital One Financial Corp.3M USD LIBOR + 0.950%, FRN | 815,160 | ||||||
| 835,000 | Goldman Sachs Capital III3M USD LIBOR + 0.770%, FRN | 690,963 | ||||||
| 750,000 | Goldman Sachs Group, Inc. (The)3M USD LIBOR + 1.170%, FRN | 758,801 | ||||||
| See Glossary on page 38 for abbreviations along with accompanying Notes to Financial Statements. | 31 |
Table of Contents
INVESTMENT PORTFOLIO (continued)
| As of September 30, 2018 | Highland Fixed Income Fund | |
Principal Amount ($) | Value ($) | |||||||
Bonds & Notes (continued) | ||||||||
Banks (continued) | ||||||||
| 750,000 | Goldman Sachs Group, Inc. (The), MTN3M USD LIBOR + 1.750%, FRN | 778,656 | ||||||
| 500,000 | Independent Bank Group, Inc.VRN | 496,640 | ||||||
| 750,000 | Manufacturers & Traders Trust Co.3M USD LIBOR + 0.640%, VRN | 748,565 | ||||||
| 750,000 | Mellon Capital IV3M USD LIBOR + 0.565%, VRN | 644,910 | ||||||
| 850,000 | NTC Capital II | 803,250 | ||||||
| 250,000 | People’s United Bank NA | 247,285 | ||||||
| 750,000 | State Street Corp.3M USD LIBOR + 1.000%, FRN | 673,125 | ||||||
| 800,000 | USB Capital IX3M USD LIBOR + 1.020%, VRN | 716,000 | ||||||
| 795,000 | Wachovia Capital Trust II3M USD LIBOR + 0.500%, FRN | 735,375 | ||||||
| 750,000 | Wells Fargo & Co. | 759,990 | ||||||
| 884,000 | 5.90%, 06/15/2024 (a)(d) | 898,365 | ||||||
| 230,000 | Wells Fargo & Co., MTN | 227,573 | ||||||
|
| |||||||
| 14,119,854 | ||||||||
|
| |||||||
Capital Goods - 0.6% | ||||||||
| 750,000 | Ares Capital Corp. | 752,356 | ||||||
| 383,000 | General Electric Co., MTN | 379,015 | ||||||
|
| |||||||
| 1,131,371 | ||||||||
|
| |||||||
Chemicals - 0.9% | ||||||||
| 750,000 | Sherwin-Williams Co. (The) | 739,299 | ||||||
| 975,000 | 4.20%, 01/15/2022 | 991,750 | ||||||
|
| |||||||
| 1,731,049 | ||||||||
|
| |||||||
Commercial & Professional Services - 0.4% | ||||||||
| 112,000 | Catholic Health Initiatives | 108,129 | ||||||
| 747,000 | Pitney Bowes, Inc. | 674,250 | ||||||
|
| |||||||
| 782,379 | ||||||||
|
| |||||||
Consumer Services - 0.3% | ||||||||
| 635,000 | Starbucks Corp. | 622,811 | ||||||
|
| |||||||
Principal Amount ($) | Value ($) | |||||||
Diversified Financials - 11.5% | ||||||||
| 2,550,000 | American Express Co. | 2,497,450 | ||||||
| 1,000,000 | 4.90%, 03/15/2020 (a)(d) | 1,001,250 | ||||||
| 750,000 | Block Financial LLC | 757,385 | ||||||
| 175,000 | Charles Schwab Corp. (The)3M USD LIBOR + 4.820%, VRN | 193,375 | ||||||
| 750,000 | Citigroup, Inc. | 770,625 | ||||||
| 150,000 | CNH Industrial Capital LLC | 150,253 | ||||||
| 750,000 | Ford Motor Credit Co. LLC | 742,591 | ||||||
| 200,000 | 5.88%, 08/02/2021 | 209,303 | ||||||
| 750,000 | General Electric Co., MTN3M USD LIBOR + 0.300%, FRN | 724,047 | ||||||
| 250,000 | General Motors Financial Co., Inc. | 251,943 | ||||||
| 197,000 | 3.89%, 01/14/2022 (a) | 200,956 | ||||||
| 311,000 | Goldman Sachs Group, Inc. (The) | 311,016 | ||||||
| 247,000 | 4.00%, 03/03/2024 | 247,994 | ||||||
| 2,000,000 | Goldman Sachs Group, Inc. (The), MTN | 1,987,759 | ||||||
| 516,000 | 3.71%, 08/26/2020 (a) | 521,746 | ||||||
| 500,000 | International Lease Finance Corp. | 529,375 | ||||||
| 2,950,000 | JPMorgan Chase & Co. | 2,975,812 | ||||||
| 500,000 | 5.81%, 10/30/2018 (a)(d) | 502,750 | ||||||
| 2,000,000 | 6.75%, 02/01/2024 (a)(d) | 2,185,000 | ||||||
| 500,000 | Lazard Group LLC | 507,885 | ||||||
| 224,000 | Morgan Stanley | 232,298 | ||||||
| 133,000 | 5.00%, 11/24/2025 | 137,953 | ||||||
| 500,000 | Morgan Stanley & Co., LLC, MTNYOY CPI + 2.000%, VRN | 502,500 | ||||||
| 500,000 | Morgan Stanley, MTN | 491,250 | ||||||
| 250,000 | 3.46%, 12/15/2019 (a) | 247,500 | ||||||
| 500,000 | 3.59%, 01/16/2020 (a) | 500,221 | ||||||
| 237,000 | 4.10%, 05/22/2023 | 238,717 | ||||||
| 750,000 | Stifel Financial Corp. | 746,585 | ||||||
| 1,000,000 | UBS AG | 1,012,108 | ||||||
| 495,000 | Volkswagen Group of America Finance LLC | 492,557 | ||||||
| 750,000 | Western Union Co. (The) | 742,042 | ||||||
|
| |||||||
| 22,612,246 | ||||||||
|
| |||||||
Energy - 2.5% | ||||||||
| 90,000 | Anadarko Petroleum Corp. | 100,106 | ||||||
| 32 | See Glossary on page 38 for abbreviations along with accompanying Notes to Financial Statements. |
Table of Contents
INVESTMENT PORTFOLIO (continued)
| As of September 30, 2018 | Highland Fixed Income Fund | |
Principal Amount ($) | Value ($) | |||||||
Bonds & Notes (continued) | ||||||||
Energy (continued) | ||||||||
| 500,000 | Chesapeake Energy Corp.3M USD LIBOR + 3.250%, FRN | 501,875 | ||||||
| 259,000 | Energy Transfer Partners LP | 285,324 | ||||||
| 65,000 | Kerr-McGee Corp. | 73,282 | ||||||
| 181,000 | Kinder Morgan Energy Partners LP | 177,373 | ||||||
| 205,000 | 4.30%, 05/01/2024 | 207,228 | ||||||
| 150,000 | Kinder Morgan, Inc. | 149,877 | ||||||
| 120,000 | Sabine Pass Liquefaction LLC | 124,879 | ||||||
| 214,000 | Unit Corp. | 215,070 | ||||||
| 1,567,000 | Williams Cos., Inc. (The) | 1,586,257 | ||||||
| 197,000 | 4.55%, 06/24/2024 | 200,390 | ||||||
| 780,000 | 7.88%, 09/01/2021 | 867,422 | ||||||
| 317,000 | Williams Partners LP | 325,442 | ||||||
|
| |||||||
| 4,814,525 | ||||||||
|
| |||||||
Environmental Control - 0.6% | ||||||||
| 1,100,000 | Republic Services, Inc. | 1,158,294 | ||||||
|
| |||||||
Food & Staples Retailing - 1.4% | ||||||||
| 800,000 | CVS Health Corp. | 772,674 | ||||||
| 2,000,000 | 2.80%, 07/20/2020 | 1,982,294 | ||||||
| 60,000 | Ingles Markets, Inc. | 61,050 | ||||||
|
| |||||||
| 2,816,018 | ||||||||
|
| |||||||
Food, Beverage & Tobacco - 1.3% | ||||||||
| 250,000 | Altria Group, Inc. | 248,617 | ||||||
| 108,000 | 2.95%, 05/02/2023 | 104,956 | ||||||
| 108,000 | 4.50%, 05/02/2043 | 104,549 | ||||||
| 199,000 | Anheuser-Busch InBev Worldwide, Inc. | 192,314 | ||||||
| 142,000 | Diageo Investment Corp. | 139,542 | ||||||
| 1,000,000 | Mondelez International, Inc. | 997,691 | ||||||
| 750,000 | Philip Morris International, Inc. | 730,273 | ||||||
| 111,000 | 4.13%, 03/04/2043 | 103,199 | ||||||
|
| |||||||
| 2,621,141 | ||||||||
|
| |||||||
Healthcare Equipment & Services - 0.3% | ||||||||
| 395,000 | Express Scripts Holding Co. | 393,242 | ||||||
| 114,000 | HCA, Inc. | 118,902 | ||||||
|
| |||||||
| 512,144 | ||||||||
|
| |||||||
Principal Amount ($) | Value ($) | |||||||
Industrials - 1.5% | ||||||||
| 54,000 | BNSF Funding Trust I3M USD LIBOR + 2.350%, VRN | 60,075 | ||||||
| 1,500,000 | General Dynamics Corp. | 1,492,536 | ||||||
| 600,000 | General Electric Co. | 585,300 | ||||||
| 775,000 | Masco Corp. | 828,091 | ||||||
|
| |||||||
| 2,966,002 | ||||||||
|
| |||||||
Insurance - 2.5% | ||||||||
| 36,530 | Allstate Corp. (The) | 920,679 | ||||||
| 119,000 | 5.75%, 08/15/2053 (a) | 122,868 | ||||||
| 750,000 | Assured Guaranty US Holdings, Inc. | 774,186 | ||||||
| 224,000 | Berkshire Hathaway, Inc. | 234,057 | ||||||
| 253,000 | Five Corners Funding Trust | 259,936 | ||||||
| 103,000 | Genworth Holdings, Inc. | 88,580 | ||||||
| 101,000 | 7.70%, 06/15/2020 | 104,030 | ||||||
| 221,000 | Liberty Mutual Group, Inc. | 223,695 | ||||||
| 550,000 | MetLife, Inc.3M USD LIBOR + 3.575%, VRN | 558,525 | ||||||
| 750,000 | Old Republic International Corp. | 772,604 | ||||||
| 895,000 | Prudential Financial, Inc.3M USD LIBOR + 3.920%, VRN | 934,156 | ||||||
|
| |||||||
| 4,993,316 | ||||||||
|
| |||||||
Materials (a) - 0.5% | ||||||||
| 1,000,000 | Martin Marietta Materials, Inc.3M USD LIBOR + 0.650%, FRN 2.96%, 05/22/2020 | 1,003,580 | ||||||
|
| |||||||
Media - 1.7% | ||||||||
| 1,140,000 | 21st Century Fox America, Inc. | 1,188,212 | ||||||
| 205,000 | Cequel Communications Holdings I LLC/Cequel Capital Corp. | 206,794 | ||||||
| 103,000 | Comcast Corp. | 102,958 | ||||||
| 775,000 | NBCUniversal Media LLC | 799,428 | ||||||
| 168,000 | Time Warner, Inc. | 166,275 | ||||||
| 946,000 | Warner Media LLC | 957,212 | ||||||
|
| |||||||
| 3,420,879 | ||||||||
|
| |||||||
Pharmaceuticals, Biotechnology & Life Sciences - 0.4% | ||||||||
| 143,000 | AbbVie, Inc. | 142,940 | ||||||
| See Glossary on page 38 for abbreviations along with accompanying Notes to Financial Statements. | 33 |
Table of Contents
INVESTMENT PORTFOLIO (continued)
| As of September 30, 2018 | Highland Fixed Income Fund | |
Principal Amount ($) | Value ($) | |||||||
Bonds & Notes (continued) | ||||||||
Pharmaceuticals, Biotechnology & Life Sciences (continued) | ||||||||
| 187,000 | Endo Finance LLC & Endo Finco, Inc. | 165,495 | ||||||
| 209,000 | Gilead Sciences, Inc. | 209,994 | ||||||
| 97,000 | Mylan, Inc. | 92,928 | ||||||
| 153,000 | Novartis Capital Corp. | 163,597 | ||||||
|
| |||||||
| 774,954 | ||||||||
|
| |||||||
Real Estate - 4.1% | ||||||||
| 220,000 | American Tower Corp., REIT | 220,401 | ||||||
| 750,000 | Corporate Office Properties LP, REIT | 773,323 | ||||||
| 750,000 | EPR Properties, REIT | 783,773 | ||||||
| 2,000,000 | National Retail Properties, Inc. | 1,999,696 | ||||||
| 750,000 | PotlatchDeltic Corp., REIT | 780,741 | ||||||
| 250,000 | Realty Income Corp. | 261,515 | ||||||
| 158,000 | Simon Property Group L.P. 2.35%, 01/30/2022 | 152,744 | ||||||
| 200,000 | 2.50%, 09/01/2020 | 197,428 | ||||||
| 250,000 | 2.50%, 07/15/2021 | 244,808 | ||||||
| 1,394,000 | VEREIT Operating Partnership L.P. 4.13%, 06/01/2021 | 1,407,550 | ||||||
| 698,000 | 4.60%, 02/06/2024 | 701,099 | ||||||
| 569,000 | WP Carey, Inc. | 574,454 | ||||||
|
| |||||||
| 8,097,532 | ||||||||
|
| |||||||
Retailing - 0.4% | ||||||||
| 108,000 | Home Depot, Inc. (The) | 119,809 | ||||||
| 750,000 | Tapestry, Inc. | 744,245 | ||||||
|
| |||||||
| 864,054 | ||||||||
|
| |||||||
Semiconductors & Semiconductor Equipment - 0.1% | ||||||||
| 105,000 | Xilinx, Inc. | 104,823 | ||||||
|
| |||||||
Software & Services - 0.9% | ||||||||
| 750,000 | Amazon.com, Inc. | 824,820 | ||||||
| 750,000 | eBay, Inc. | 746,323 | ||||||
| 154,000 | Oracle Corp. | 155,805 | ||||||
|
| |||||||
| 1,726,948 | ||||||||
|
| |||||||
Technology Hardware & Equipment - 1.0% | ||||||||
| 308,000 | Apple, Inc. | 306,577 | ||||||
Principal Amount ($) | Value ($) | |||||||
Technology Hardware & Equipment (continued) | ||||||||
| 520,000 | HP, Inc. | 520,248 | ||||||
| 500,000 | Motorola Solutions, Inc. | 487,493 | ||||||
| 720,000 | Seagate HDD Cayman | 691,274 | ||||||
|
| |||||||
| 2,005,592 | ||||||||
|
| |||||||
Telecommunication Services - 0.8% | ||||||||
| 262,000 | AT&T, Inc. | 261,916 | ||||||
| 471,000 | 3.29%, 07/15/2021 (a) | 476,772 | ||||||
| 156,000 | 4.45%, 04/01/2024 | 159,283 | ||||||
| 336,000 | 5.15%, 03/15/2042 | 325,376 | ||||||
| 119,000 | Sprint Corp. | 126,140 | ||||||
| 215,000 | Windstream Services LLC | 116,100 | ||||||
|
| |||||||
| 1,465,587 | ||||||||
|
| |||||||
Transportation - 0.5% | ||||||||
| 1,000,000 | Union Pacific Corp. | 1,000,032 | ||||||
|
| |||||||
Utilities - 2.6% | ||||||||
| 103,000 | CMS Energy Corp. | 109,145 | ||||||
| 146,000 | Duke Energy Corp. | 146,515 | ||||||
| 111,000 | Great Plains Energy, Inc. | 113,416 | ||||||
| 142,000 | PacifiCorp | 179,339 | ||||||
| 324,000 | Public Service Electric & Gas Co., MTN | 307,479 | ||||||
| 1,750,000 | Southern Co. (The)3M USD LIBOR + 3.630%, VRN | 1,775,415 | ||||||
| 2,460,000 | WEC Energy Group, Inc.3M USD LIBOR + 2.113%, VRN | 2,395,326 | ||||||
|
| |||||||
| 5,026,635 | ||||||||
|
| |||||||
Total Corporate Bonds & Notes | 86,371,766 | |||||||
|
| |||||||
Principal Amount | ||||||||
| FOREIGN CORPORATE BONDS & NOTES - 3.3% | ||||||||
Banks - 1.1% | ||||||||
| 500,000 | Bank of Nova Scotia (The), MTN3M USD LIBOR + 0.250%, VRN | 502,334 | ||||||
| 200,000 | Bank of Tokyo-Mitsubishi UFJ, Ltd. (The) | 199,683 | ||||||
| 455,000 | Corp. Andina de Fomento | 467,986 | ||||||
| 200,000 | Intesa Sanpaolo SpA | 180,696 | ||||||
| 34 | See Glossary on page 38 for abbreviations along with accompanying Notes to Financial Statements. |
Table of Contents
INVESTMENT PORTFOLIO (continued)
| As of September 30, 2018 | Highland Fixed Income Fund | |
Principal Amount | Value ($) | |||||||
Bonds & Notes (continued) | ||||||||
Banks (continued) | ||||||||
| 394,000 | Macquarie Bank, Ltd. | 393,060 | ||||||
| 249,000 | Mizuho Bank, Ltd. | 248,630 | ||||||
| 240,000 | Standard Chartered PLC | 249,384 | ||||||
|
| |||||||
| 2,241,773 | ||||||||
|
| |||||||
Diversified Financials - 0.1% | ||||||||
| 304,000 | Invesco Finance PLC | 298,868 | ||||||
|
| |||||||
Energy - 0.4% | ||||||||
| 205,000 | CNOOC Nexen Finance (2014) ULC | 207,140 | ||||||
| 138,000 | Nexen Energy ULC | 167,372 | ||||||
| 325,000 | Shell International Finance BV | 324,817 | ||||||
| 106,000 | Statoil ASA | 114,675 | ||||||
| 95,000 | Weatherford International, Ltd. | 68,875 | ||||||
|
| |||||||
| 882,879 | ||||||||
|
| |||||||
Materials - 0.1% | ||||||||
| 205,000 | Nutrien, Ltd. | 202,516 | ||||||
|
| |||||||
Pharmaceuticals, Biotechnology & Life Sciences - 0.9% | ||||||||
| 197,000 | Actavis Funding SCS | 195,099 | ||||||
| 99,000 | 4.85%, 06/15/2044 | 98,215 | ||||||
| 775,000 | CVS Health Corp. | 775,380 | ||||||
| 750,000 | 3.35%, 03/09/2021 | 748,893 | ||||||
|
| |||||||
| 1,817,587 | ||||||||
|
| |||||||
Retailing - 0.4% | ||||||||
| 750,000 | Signet UK Finance PLC | 711,436 | ||||||
|
| |||||||
Software & Services (c) - 0.1% | ||||||||
| 109,000 | Tencent Holdings, Ltd. | 109,262 | ||||||
|
| |||||||
Telecommunication Services - 0.2% | ||||||||
| 295,000 | America Movil SAB de CV | 302,356 | ||||||
|
| |||||||
Total Foreign Corporate Bonds & Notes | 6,566,677 | |||||||
|
| |||||||
Principal Amount ($) | ||||||||
| MUNICIPAL BONDS & NOTES - 8.1% | ||||||||
| 500,000 | Adelanto Public Utility Authority (Insured: AGM) | 503,265 | ||||||
Principal Amount ($) | Value ($) | |||||||
| MUNICIPAL BONDS & NOTES (continued) | ||||||||
| 750,000 | Belding Area Schools, GO | 791,962 | ||||||
| 750,000 | Clark County School District Finance Corp. | 786,465 | ||||||
| 635,000 | Comstock Park Public Schools, GO | 681,914 | ||||||
| 1,500,000 | Illinois Housing Development Authority | 1,500,000 | ||||||
| 635,000 | Industry Public Facilities Authority of California | 649,427 | ||||||
| 750,000 | Kindred Public School District No. 2, GO | 829,095 | ||||||
| 555,000 | Mississippi Business Finance Corp. VRDN | 555,000 | ||||||
| 1,080,000 | 2.15%, 08/01/2021 (a) | 1,080,000 | ||||||
| 720,000 | New York State Dormitory Authority | 726,221 | ||||||
| 1,500,000 | New York State Housing Finance Agency | 1,500,000 | ||||||
| 750,000 | North Texas Tollway Authority | 803,632 | ||||||
| 200,000 | Pennsylvania Turnpike Commission | 210,124 | ||||||
| 320,000 | Port Authority of New York & New Jersey | 332,858 | ||||||
| 300,000 | San Francisco City & County Redevelopment Financing Agency | 392,364 | ||||||
| 470,000 | Stanton Redevelopment Agency | 545,214 | ||||||
| 200,000 | State of California, GOFRN | 201,222 | ||||||
| 2,000,000 | State of Texas, GO | 2,000,000 | ||||||
| 750,000 | Washington Higher Education Facilities Authority | 750,030 | ||||||
| 1,005,000 | Wheaton College | 1,005,000 | ||||||
|
| |||||||
Total Municipal Bonds & Notes | 15,843,793 | |||||||
|
| |||||||
| NON-AGENCY COLLATERALIZED MORTGAGE-BACKED SECURITIES - 0.9% | ||||||||
| 123,372 | Banc of America Commercial Mortgage Trust | 124,005 | ||||||
Commercial Mortgage Pass-Through Certificates | ||||||||
| 120,000 | Series 2014-CR14, Class AM, VRN | 124,723 | ||||||
| 100,000 | Series 2013-LC13, Class AM, VRN | 103,307 | ||||||
| 105,000 | GS Mortgage Securities Trust | 104,774 | ||||||
| See Glossary on page 38 for abbreviations along with accompanying Notes to Financial Statements. | 35 |
Table of Contents
INVESTMENT PORTFOLIO (continued)
| As of September 30, 2018 | Highland Fixed Income Fund | |
Principal Amount ($) | Value ($) | |||||||
Bonds & Notes (continued) | ||||||||
| | NON-AGENCY COLLATERALIZED MORTGAGE-BACKED SECURITIES (continued) | | ||||||
JPMBB Commercial Mortgage Securities Trust | ||||||||
| 100,000 | Series2014-C18, Class C, VRN | 101,342 | ||||||
| 153,000 | Series2013-C17, Class C, VRN | 156,729 | ||||||
LB-UBS Commercial Mortgage Trust | ||||||||
| 11,916 | Series 2007-C6, Class AMFL | 11,914 | ||||||
| 10,486 | Series2007-C6, Class AM, VRN | 10,484 | ||||||
Morgan Stanley Bank of America Merrill Lynch Trust | ||||||||
| 210,000 | Series 2013-C10, Class AS, VRN | 212,503 | ||||||
| 191,000 | Series2013-C10, Class C, VRN | 185,426 | ||||||
Morgan Stanley Capital I Trust | ||||||||
| 100,000 | Series 2012-C4, Class B, VRN | 103,896 | ||||||
| 40,755 | Series2006-T21, Class AJ, VRN | 41,060 | ||||||
WF-RBS Commercial Mortgage Trust | ||||||||
| 115,000 | Series 2013-C17, Class AS | 117,148 | ||||||
| 263,000 | Series 2014-LC14, Class AS, VRN | 268,883 | ||||||
| 140,000 | Series2014-C19, Class B, VRN | 143,567 | ||||||
|
| |||||||
TotalNon-Agency Collateralized Mortgage-Backed Securities | 1,809,761 | |||||||
|
| |||||||
| U.S. GOVERNMENT AGENCIES (f) - 2.8% | ||||||||
| 1,000,000 | Federal Home Loan Mortgage Corp. | 983,685 | ||||||
| 1,000,000 | Federal National Mortgage Assoc. | 992,336 | ||||||
| 2,000,000 | 1.75%, 10/29/2020 | 1,968,014 | ||||||
| 1,500,000 | 2.00%, 06/30/2021 | 1,490,209 | ||||||
|
| |||||||
Total U.S. Government Agencies | 5,434,244 | |||||||
|
| |||||||
| U.S. GOVERNMENT AGENCY - ASSET-BACKED SECURITIES - 2.0% | ||||||||
| 2,500,000 | SBA Small Business Investment Cos. | 2,501,544 | ||||||
| 1,500,000 | United States Small Business Administration | 1,497,513 | ||||||
|
| |||||||
Total U.S. Government Agency -Asset-Backed Securities | 3,999,057 | |||||||
|
| |||||||
Principal Amount ($) | Value ($) | |||||||
| U.S. TREASURIES - 4.4% | ||||||||
| 4,000,000 | U.S. Treasury Note | 3,915,859 | ||||||
| 2,500,000 | 2.25%, 10/31/2024 | 2,397,656 | ||||||
| 2,500,000 | 1.13%, 09/30/2021 | 2,374,318 | ||||||
|
| |||||||
Total U.S. Treasuries | 8,687,833 | |||||||
|
| |||||||
| U.S. TREASURY BILL - 1.3% | ||||||||
| 2,600,000 | U.S. Treasury Bill | 2,586,507 | ||||||
|
| |||||||
Total U.S. Treasury Bills (Cost $2,587,032) | 2,586,507 | |||||||
|
| |||||||
Total Bonds & Notes (Cost $177,405,547) | 176,679,236 | |||||||
|
| |||||||
Shares | ||||||||
Domestic Equity - 4.9% | ||||||||
| COMMON STOCKS - 2.2% | ||||||||
| 76,275 | Gramercy Property Trust, REIT | 2,092,986 | ||||||
| 23,221 | Phillips Edison Grocery Center REIT I, Inc. (g)(h)(i) | 242,662 | ||||||
| 33,250 | Retail Opportunity Investments Corp., REIT (e) | 620,777 | ||||||
| 173,000 | VEREIT, Inc., REIT | 1,255,980 | ||||||
|
| |||||||
Total Common Stocks (Cost $4,794,904) | 4,212,405 | |||||||
|
| |||||||
| PREFERRED STOCKS - 2.7% | ||||||||
Banks - 0.8% | ||||||||
| 22,109 | First Republic Bank, Series E 7.000% (e) | 565,659 | ||||||
| 28,000 | GMAC Capital Trust I, Series 2 8.099% (a) | 740,740 | ||||||
| 6,572 | Wells Fargo & Co., Series Q 5.850% (a)(e) | 170,313 | ||||||
|
| |||||||
| 1,476,712 | ||||||||
|
| |||||||
Financials - 1.0% | ||||||||
| 80,000 | Monroe Capital Corp. | 1,996,000 | ||||||
|
| |||||||
Real Estate - 0.5% | ||||||||
| 18,679 | Brookfield Property REIT, Inc., Series A 6.375% | 453,900 | ||||||
| 13,500 | Gramercy Property Trust, Series A 7.125% (e) | 337,230 | ||||||
| 10,040 | VEREIT, Inc., Series F 6.700% | 249,494 | ||||||
|
| |||||||
| 1,040,624 | ||||||||
|
| |||||||
Telecommunication Services - 0.4% | ||||||||
| 31,475 | Qwest Corp. 6.750% (e) | 757,068 | ||||||
|
| |||||||
Total Preferred Stocks (Cost $5,178,552) | 5,270,404 | |||||||
|
| |||||||
Total Domestic Equity (Cost $9,973,456) | 9,482,809 | |||||||
|
| |||||||
| 36 | See Glossary on page 38 for abbreviations along with accompanying Notes to Financial Statements. |
Table of Contents
INVESTMENT PORTFOLIO (concluded)
| As of September 30, 2018 | Highland Fixed Income Fund | |
Shares | Value ($) | |||||||
Registered Investment Companies - 8.2% | ||||||||
| 60,251 | BlackRock Build America Bond Trust | 1,277,321 | ||||||
| 31,679 | Cohen & Steers, Ltd., Duration Preferred & Income Fund, Inc. | 754,277 | ||||||
| 51,599 | DoubleLine Income Solutions Fund | 1,042,300 | ||||||
| 63,009 | Nuveen Build America Bond Fund | 1,260,180 | ||||||
| 140,000 | Nuveen Credit Strategies Income Fund | 1,115,800 | ||||||
| 62,000 | PIMCO Dynamic Credit & Mortgage Income Fund | 1,495,440 | ||||||
| 9,185,443 | State Street Navigator Securities Lending Government Money Market Portfolio 1.82% (j) | 9,185,443 | ||||||
|
| |||||||
Total Registered Investment Companies (Cost $16,060,328) | 16,130,761 | |||||||
|
| |||||||
Principal Amount ($) | ||||||||
Cash Equivalents - 1.3% | ||||||||
| MONEY MARKET FUND - 1.3% | ||||||||
| 2,498,173 | State Street Institutional U.S. Government Money Market Fund, Premier Class | 2,498,173 | ||||||
Total Money Market Fund (Cost $2,498,173) | ||||||||
|
| |||||||
Total Cash Equivalents (Cost $2,498,173) | 2,498,173 | |||||||
|
| |||||||
Total Investments - 104.3% | 204,790,979 | |||||||
|
| |||||||
(Cost $205,937,504) | ||||||||
Other Assets & Liabilities, Net - (4.3)% | (8,504,605 | ) | ||||||
|
| |||||||
Net Assets - 100.0% | 196,286,374 | |||||||
|
| |||||||
| (a) | Variable or floating rate security. The base lending rates are generally the lending rate offered by one or more European banks such as the LIBOR. The interest rate shown reflects the rate in effect September 30, 2018. LIBOR, otherwise known as London Interbank Offered Rate, is the benchmark interest rate that banks charge each other for short-term loans. Current LIBOR rates include 1 month which is equal to 2.26% and 3 months equal to 2.40%. |
| (b) | Securities are grouped by coupon and represent a range of maturities. |
| (c) | Securities exempt from registration under Rule 144A of the 1933 Act. These securities may only be resold in transaction exempt from registration to qualified institutional buyers. At September 30, 2018, these securities amounted to $11,689,329 or 6.0% of net assets. |
| (d) | Perpetual maturity. Maturity date presented represents the next call date. |
| (e) | Securities (or a portion of securities) on loan. As of September 30, 2018, the market value of securities loaned was $10,550,847. The loaned securities were secured with cash and securities collateral of $10,758,405. Collateral is calculated based on prior day’s prices. See Note 4. |
| (f) | Step coupon bond. The interest rate shown reflects the rate in effect September 30, 2018 and will reset at a future date. |
| (g) | Represents fair value as determined by the Fund’s Board of Trustees (the “Board”), or its designee in good faith, pursuant to the policies and procedures approved by the Board. The Board considers fair valued securities to be securities for which market quotations are not readily available and these securities may be valued using a combination of observable and unobservable inputs. Securities with a total aggregate value of $242,662, or 0.1% of net assets, were fair valued under the Fund’s valuation procedures as of September 30, 2018. See Note 2. |
| (h) | Non-income producing security. |
| (i) | Classified as Level 3 within the three-tier fair value hierarchy. Please see. Note 2 for an explanation of this hierarchy, as well as a list of unobservable inputs used in the valuation of these instruments. |
| (j) | Represents investments of cash collateral received in connection with securities lending. |
| Overnight and Continuous | Total | |||||||
Securities Lending Transactions1 |
| |||||||
Corporate Bonds & Notes | $ | 8,258,793 | $ | 8,258,793 | ||||
Foreign Corporate Bonds & Notes | 735,000 | 735,000 | ||||||
Preferred Stocks | 191,650 | 191,650 | ||||||
|
| |||||||
Total Borrowings | $ | 9,185,443 | $ | 9,185,443 | ||||
|
| |||||||
Gross amount of recognized liabilities for securities lending transactions |
| $ | 9,185,443 | |||||
| 1 | Amounts represent the payable for cash collateral received on securities on loan. This will generally be in “Overnight and Continuous” column as the securities are typically callable on demand. |
| See Glossary on page 38 for abbreviations along with accompanying Notes to Financial Statements. | 37 |
Table of Contents
GLOSSARY: (abbreviations that may be used in the preceding statements)
| Municipal Bond or Agency Abbreviations: | ||
| AGM | Assured Guaranty Municipal Corp. | |
| BAM | Build America Mutual | |
| GO | General Obligation | |
| NATL-RE | National Public Finance Guarantee Corp. | |
| Q-SBLF | Qualified School Board Loan Fund | |
| ST APPROP | State Appropriation | |
| ST RES FD GTY | State Resource Fund Guaranty | |
| Other Abbreviations: | ||
| ADR | American Depositary Receipt | |
| CDO | Collateralized Debt Obligation | |
| CLO | Collateralized Loan Obligation | |
| ETF | Exchange-Traded Fund | |
| GDR | Global Depositary Receipt | |
| MLP | Master Limited Partnership | |
| MTN | Medium-Term Note | |
| PIK | Payment-in-Kind | |
| PLC | Public Limited Company | |
| REIT | Real Estate Investment Trust | |
| REMIC | Real Estate Mortgage Investment Conduit | |
| STRIPS | Separate Trading of Registered Interest and Principal of Security | |
| Underlying Instrument Abbreviations: | ||
| MSHDSSFT | Morgan Stanley SMID Cap Software Index | |
| MSQQUMOL | Morgan Stanley US Momentum Long Index | |
| MSQQUTML | Morgan Stanley US Momentum Long Index | |
| 38 | Annual Report |
Table of Contents
THIS PAGE LEFT BLANK INTENTIONALLY
Table of Contents
STATEMENTS OF ASSETS AND LIABILITIES
| As of September 30, 2018 | ||
| Highland Premier Growth Equity Fund ($) | Highland Small-Cap Equity Fund ($) | |||||||
Assets | ||||||||
Investments, at value(a) | 141,993,324 | 59,722,843 | ||||||
Affiliated investments, at value (Note 10) | 5,888,325 | 3,800,645 | ||||||
|
|
|
| |||||
Total Investments, at value | 147,881,649 | 63,523,488 | ||||||
Cash equivalents (Note 2) | — | — | ||||||
Cash | 1,434,854 | 253,874 | ||||||
Restricted Cash — Futures (Note 3) | — | 3,691 | ||||||
Restricted Cash — Swap (Note 3) | 2,430,000 | — | ||||||
Restricted Cash — Securities Sold Short and Written Options (Note 3) | 8,792,243 | 9,715,571 | ||||||
Foreign currency | 248 | — | ||||||
Swaps, at value | 3,905 | — | ||||||
Receivable for: | ||||||||
Investments sold | 8,266,278 | — | ||||||
Dividends and interest | 25,141 | 75,392 | ||||||
Fund shares sold | 18,080 | 26,965 | ||||||
Investment advisory and administration fees (Note 7) | — | — | ||||||
Prepaid expenses and other assets | 17,361 | 29,507 | ||||||
|
|
|
| |||||
Total assets | 168,869,759 | 73,628,488 | ||||||
|
|
|
| |||||
Liabilities | ||||||||
Notes payable (Note 6) | — | 12,250,000 | ||||||
Securities sold short, at value (Notes 2 and 8) | — | 9,353,795 | ||||||
Written options contracts, at value (Note 3) | 103,002 | — | ||||||
Swaps, at value | 42,692 | — | ||||||
Payable for: | ||||||||
Investments purchased | 17,999,243 | — | ||||||
Upon receipt of securities loaned (Note 4) | 2,360,264 | 861,707 | ||||||
Fund shares redeemed | 70,237 | 58,019 | ||||||
Investment advisory (Note 7) | 68,030 | 14,063 | ||||||
Dividends and interest on securities sold short | — | 1,507 | ||||||
Transfer agent fees | 20,468 | 9,227 | ||||||
Trustees’ fees | 894 | 379 | ||||||
Interest expense and commitment fee payable (Note 6) | 84 | 16,254 | ||||||
Custody fees | 22 | 22 | ||||||
Accrued expenses and other liabilities | 136,833 | 62,502 | ||||||
|
|
|
| |||||
Total liabilities | 20,801,769 | 22,627,475 | ||||||
|
|
|
| |||||
Commitments and Contingencies (Note 7) | ||||||||
Net Assets | 148,067,990 | 51,001,013 | ||||||
|
|
|
| |||||
| 40 | See accompanying Notes to Financial Statements. |
Table of Contents
| Highland Funds II | ||
| Highland Total Return Fund ($) | Highland Tax- Exempt Fund ($) | Highland Fixed Income Fund ($) | ||||||||
| 86,185,797 | 11,831,137 | 202,292,806 | ||||||||
| — | — | — | ||||||||
|
|
|
|
|
| |||||
| 86,185,797 | 11,831,137 | 202,292,806 | ||||||||
| 5,515,101 | 382,611 | 2,498,173 | ||||||||
| 29 | — | 10,017 | ||||||||
| — | — | — | ||||||||
| — | — | — | ||||||||
| — | — | — | ||||||||
| 3 | — | — | ||||||||
| — | — | — | ||||||||
| 2,461,262 | — | 798,375 | ||||||||
| 331,330 | 166,619 | 1,359,280 | ||||||||
| 10,158 | 195 | 514,356 | ||||||||
| — | 4,823 | — | ||||||||
| 17,462 | 15,388 | 18,107 | ||||||||
|
|
|
|
|
| |||||
| 94,521,142 | 12,400,773 | 207,491,114 | ||||||||
|
|
|
|
|
| |||||
| — | — | — | ||||||||
| — | — | — | ||||||||
| — | — | — | ||||||||
| — | — | — | ||||||||
| 687,578 | 300,333 | 1,599,624 | ||||||||
| 2,706,070 | — | 9,185,443 | ||||||||
| 64,809 | 974 | 162,571 | ||||||||
| 37,217 | — | 63,691 | ||||||||
| — | 4,487 | 29,517 | ||||||||
| 11,238 | 1,618 | 16,065 | ||||||||
| 542 | 77 | — | ||||||||
| 39 | — | 75 | ||||||||
| 22 | 22 | 22 | ||||||||
| 123,537 | 30,398 | 147,732 | ||||||||
|
|
|
|
|
| |||||
| 3,631,052 | 337,909 | 11,204,740 | ||||||||
|
|
|
|
|
| |||||
| 90,890,090 | 12,062,864 | 196,286,374 | ||||||||
|
|
|
|
|
| |||||
| See accompanying Notes to Financial Statements. | 41 |
Table of Contents
STATEMENTS OF ASSETS AND LIABILITIES (continued)
| As of September 30, 2018 | ||
| Highland Premier Growth Equity Fund ($) | Highland Small-Cap Equity Fund ($) | |||||||
Net Assets Consist of: | ||||||||
Par value (Note 1) | 5,276 | 3,721 | ||||||
Paid-in capital in excess of par | 91,600,379 | 41,912,925 | ||||||
Total distributable earnings (loss) | 56,462,335 | 9,084,367 | ||||||
|
|
|
| |||||
Net Assets | 148,067,990 | 51,001,013 | ||||||
|
|
|
| |||||
Investments, at cost | 131,820,678 | 55,802,134 | ||||||
Affiliated investments, at cost (Note 10) | 5,694,155 | 3,285,759 | ||||||
Cash equivalents, at cost (Note 2) | — | — | ||||||
Foreign currency, at cost | 247 | — | ||||||
Proceeds from securities sold short | — | 7,556,143 | ||||||
Written option premiums received | 97,438 | — | ||||||
(a) Includes market value of securities on loan: | 6,499,950 | 6,802,834 | ||||||
Class A: | ||||||||
Net assets | 102,527,681 | 36,071,958 | ||||||
Shares outstanding ($0.001 par value; unlimited shares authorized) | 3,584,189 | 2,573,597 | ||||||
Net asset value per share(a)(b) | 28.61 | 14.02 | ||||||
Maximum offering price per share(c) | 30.36 | 14.88 | ||||||
Class C: | ||||||||
Net assets | 10,452,791 | 4,322,837 | ||||||
Shares outstanding ($0.001 par value; unlimited shares authorized) | 537,154 | 462,326 | ||||||
Net asset value and offering price per share(a) | 19.46 | 9.35 | ||||||
Class Y: | ||||||||
Net assets | 35,087,518 | 10,606,218 | ||||||
Shares outstanding ($0.001 par value; unlimited shares authorized) | 1,154,766 | 685,010 | ||||||
Net asset value, offering and redemption price per share | 30.38 | 15.48 | ||||||
| (a) | Redemption price per share is equal to net asset value per share less any applicable contingent deferred sales charge (“CDSC”). |
| (b) | Purchases without an initial sales charge of $1,000,000 or more are subject to a 0.50% CDSC if redeemed within one year of purchase. |
| (c) | The sales charge is 5.75% for all Funds except for theTax-Exempt Fund and Fixed Income Fund, which is 4.25%. On sales of $1,000,000 or more, there is no sales charge and therefore the offering will be lower. |
| 42 | See accompanying Notes to Financial Statements. |
Table of Contents
| Highland Funds II | ||
| Highland Total Return Fund ($) | Highland Tax- Exempt Fund ($) | Highland Fixed Income Fund ($) | ||||||||
| 3,937 | 1,092 | 15,476 | ||||||||
| 85,518,595 | 11,822,781 | 199,674,923 | ||||||||
| 5,367,558 | 238,991 | (3,404,025 | ) | |||||||
|
|
|
|
|
| |||||
| 90,890,090 | 12,062,864 | 196,286,374 | ||||||||
|
|
|
|
|
| |||||
| 83,763,451 | 11,667,689 | 203,439,331 | ||||||||
| — | — | — | ||||||||
| 5,511,093 | 382,611 | 2,498,173 | ||||||||
| 47 | — | — | ||||||||
| — | — | — | ||||||||
| — | — | — | ||||||||
| 6,511,117 | — | 10,550,847 | ||||||||
| 46,187,922 | 11,430,569 | 96,380,485 | ||||||||
| 2,005,731 | 1,035,243 | 7,595,534 | ||||||||
| 23.03 | 11.04 | 12.69 | ||||||||
| 24.44 | 11.53 | 13.25 | ||||||||
| 3,771,087 | 573,031 | 2,970,250 | ||||||||
| 183,896 | 51,946 | 233,771 | ||||||||
| 20.51 | 11.03 | 12.71 | ||||||||
| 40,931,081 | 59,264 | 96,935,639 | ||||||||
| 1,747,178 | 4,942 | 7,646,230 | ||||||||
| 23.43 | 11.99 | 12.68 | ||||||||
| See accompanying Notes to Financial Statements. | 43 |
Table of Contents
| For the Year Ended September 30, 2018 | ||
| Highland Premier Growth Equity Fund ($) | Highland Small-Cap Equity Fund ($) | |||||||
Investment Income | ||||||||
Income: | ||||||||
Dividends from unaffiliated issuers | 1,361,313 | 1,001,341 | ||||||
Dividends from affiliated issuers (Note 10) | 252,198 | 93,630 | ||||||
Less: Foreign taxes withheld | (2,025 | ) | (2,619 | ) | ||||
Securities lending income (Note 4) | 47,576 | 28,877 | ||||||
Interest from unaffiliated issuers | 8,844 | 8,621 | ||||||
Other income | — | — | ||||||
|
|
|
| |||||
Total Income | 1,667,906 | 1,129,850 | ||||||
|
|
|
| |||||
Expenses: | ||||||||
Investment advisory (Note 7) | 892,181 | 640,184 | ||||||
Distribution and shareholder service fees: (Note 7) |
| |||||||
Class A | 272,417 | 100,889 | ||||||
Class C | 121,830 | 47,994 | ||||||
Transfer agent fees | 215,396 | 98,857 | ||||||
Dividends and fees on securities sold short (Note 2) | 3,222 | 146,371 | ||||||
Audit fees | 90,544 | 41,454 | ||||||
Legal fees | 47,927 | 42,375 | ||||||
Accounting services fees | 56,781 | 88,864 | ||||||
Reports to shareholders | 26,115 | 19,199 | ||||||
Registration fees | 47,123 | 50,647 | ||||||
Trustees fees (Note 7) | 31,572 | 11,762 | ||||||
Insurance | 12,853 | 6,281 | ||||||
Interest expense and commitment fees (Note 6) | — | 385,947 | ||||||
Other | 43,720 | 12,748 | ||||||
|
|
|
| |||||
Total operating expenses | 1,861,681 | 1,693,572 | ||||||
Less: Expenses waived or borne by the adviser and administrator | — | (345,549 | ) | |||||
|
|
|
| |||||
Net investment income (loss) | (193,775 | ) | (218,173 | ) | ||||
|
|
|
| |||||
Net Realized and Unrealized Gain (Loss) on Investments | ||||||||
Realized gain (loss) on: | ||||||||
Investments from unaffiliated issuers | 47,573,879 | 5,633,077 | ||||||
Investments from affiliated issuers (Note 10) | 58,181 | 13,495 | ||||||
Securities sold short (Note 2) | (1,279,385 | ) | — | |||||
Swap contracts (Note 3) | 585,201 | — | ||||||
Written options contracts (Note 3) | 107,360 | (1,759,348 | ) | |||||
Futures contracts (Note 3) | — | 1,976,533 | ||||||
Foreign currency related transactions | (32,080 | ) | 7 | |||||
Change in unrealized appreciation (depreciation) on: | ||||||||
Investments in unaffiliated issuers | (24,798,611 | ) | (1,142,414 | ) | ||||
Investments in affiliated issuers (Note 10) | (11,841 | ) | 535,008 | |||||
Securities sold short (Note 2) | — | (1,290,356 | ) | |||||
Swap contracts (Note 3) | (38,787 | ) | — | |||||
Written options contracts (Note 3) | (5,564 | ) | (238,543 | ) | ||||
Futures contracts (Note 3) | — | 548,924 | ||||||
Foreign currency related translations | (22 | ) | (237 | ) | ||||
|
|
|
| |||||
Net realized and unrealized gain (loss) on investments | 22,158,331 | 4,276,146 | ||||||
|
|
|
| |||||
Total increase (decrease) in net assets resulting from operations | 21,964,556 | 4,057,973 | ||||||
|
|
|
| |||||
| 44 | See accompanying Notes to Financial Statements. |
Table of Contents
| Highland Funds II | ||
| Highland Total Return Fund ($) | Highland Tax- Exempt Fund ($) | Highland Fixed Income Fund ($) | ||||||||
| 4,456,933 | — | 929,059 | ||||||||
| — | — | — | ||||||||
| (49,797 | ) | — | (2,822 | ) | ||||||
| 59,541 | — | 38,302 | ||||||||
| 683,242 | 423,041 | 4,159,064 | ||||||||
| 38,750 | — | — | ||||||||
|
|
|
|
|
| |||||
| 5,188,669 | 423,041 | 5,123,603 | ||||||||
|
|
|
|
|
| |||||
| 491,918 | 45,756 | 446,485 | ||||||||
| 126,594 | 30,549 | 253,943 | ||||||||
| 42,264 | 7,909 | 33,793 | ||||||||
| 118,621 | 19,461 | 190,491 | ||||||||
| — | — | — | ||||||||
| 68,720 | 20,464 | 90,398 | ||||||||
| 40,820 | 3,973 | 38,187 | ||||||||
| 76,788 | 15,557 | 88,595 | ||||||||
| 28,676 | 3,448 | 38,949 | ||||||||
| 48,502 | 47,400 | 48,343 | ||||||||
| 20,128 | 2,666 | 29,119 | ||||||||
| 6,594 | 1,053 | 11,076 | ||||||||
| — | — | — | ||||||||
| 8,659 | 2,782 | 10,926 | ||||||||
|
|
|
|
|
| |||||
| 1,078,284 | 201,018 | 1,280,305 | ||||||||
| — | (77,594 | ) | (25,185 | ) | ||||||
|
|
|
|
|
| |||||
| 4,110,385 | 299,617 | 3,868,483 | ||||||||
|
|
|
|
|
| |||||
| 546,224 | 24,137 | (338,257 | ) | |||||||
| — | — | — | ||||||||
| — | — | — | ||||||||
| — | — | — | ||||||||
| — | — | — | ||||||||
| — | — | — | ||||||||
| 4,161 | — | — | ||||||||
| (3,700,743 | ) | (357,698 | ) | (2,742,226 | ) | |||||
| — | — | — | ||||||||
| — | — | — | ||||||||
| — | — | — | ||||||||
| — | — | — | ||||||||
| — | — | — | ||||||||
| 10 | — | (384 | ) | |||||||
|
|
|
|
|
| |||||
| (3,150,348 | ) | (333,561 | ) | (3,080,867 | ) | |||||
|
|
|
|
|
| |||||
| 960,037 | (33,944 | ) | 787,616 | |||||||
|
|
|
|
|
| |||||
| See accompanying Notes to Financial Statements. | 45 |
Table of Contents
STATEMENTS OF CHANGES IN NET ASSETS
| Highland Funds II | ||
| Highland Premier Growth Equity Fund | ||||||||
| Year Ended September 30, 2018 ($) | Year Ended September 30, 2017 ($) | |||||||
Increase (Decrease) in Net Assets | ||||||||
Operations: | ||||||||
Net investment income (loss) | (193,775 | ) | (189,857 | ) | ||||
Net realized gain (loss) on investments, securities sold short, written options, futures contracts and foreign currency transactions | 47,013,156 | 33,461,671 | ||||||
Net increase (decrease) in unrealized appreciation (depreciation) on investments, securities sold short, written options, futures contracts and foreign currency transactions | (24,854,825 | ) | (11,164,573 | ) | ||||
|
|
|
| |||||
Net increase from operations | 21,964,556 | 22,107,241 | ||||||
|
|
|
| |||||
Total distributions to shareholders(a): | ||||||||
Distribution | ||||||||
Class A | (22,677,999 | ) | (24,053,206 | ) | ||||
Class C | (3,707,293 | ) | (5,037,803 | ) | ||||
Class Y | (6,885,689 | ) | (6,603,213 | ) | ||||
|
|
|
| |||||
Total distributions | (33,270,981 | ) | (35,694,222 | ) | ||||
|
|
|
| |||||
Decrease in net assets from operations and distributions | (11,306,425 | ) | (13,586,981 | ) | ||||
|
|
|
| |||||
Share transactions: | ||||||||
Proceeds from sale of shares | ||||||||
Class A | 5,966,614 | 6,265,591 | ||||||
Class C | 824,684 | 883,149 | ||||||
Class Y | 8,025,290 | 9,104,977 | ||||||
Value of distributions reinvested | ||||||||
Class A | 21,857,793 | 23,321,947 | ||||||
Class C | 3,427,323 | 4,479,595 | ||||||
Class Y | 6,693,552 | 5,913,984 | ||||||
Cost of shares redeemed | ||||||||
Class A | (25,752,321 | ) | (30,818,816 | ) | ||||
Class C | (5,160,676 | ) | (10,466,740 | ) | ||||
Class Y | (12,630,417 | ) | (14,195,986 | ) | ||||
|
|
|
| |||||
Net increase (decrease) from shares transactions | 3,251,842 | (5,512,299 | ) | |||||
|
|
|
| |||||
Total decrease in net assets | (8,054,583 | ) | (19,099,280 | ) | ||||
|
|
|
| |||||
Net Assets | ||||||||
Beginning of period | 156,122,573 | 175,221,853 | ||||||
|
|
|
| |||||
End of period | 148,067,990 | 156,122,573 | ||||||
|
|
|
| |||||
| (a) | Per the Securities Exchange Commission release #33-10532 “Disclosure Update and Simplification”; it is no longer required to differentiate distributions from earnings as either from net investment income or net realized capital gains. The presentation for the year ended 9/30/2017 has been adjusted for this change. |
| 46 | See accompanying Notes to Financial Statements. |
Table of Contents
STATEMENTS OF CHANGES IN NET ASSETS (continued)
| Highland Funds II | ||
| Highland Small-Cap Equity Fund | Highland Total Return Fund | |||||||||||||||
| Year Ended September 30, 2018 ($) | Year Ended September 30, 2017 ($) | Year Ended September 30, 2018 ($) | Year Ended September 30, 2017 ($) | |||||||||||||
Increase (Decrease) in Net Assets | ||||||||||||||||
Operations: | ||||||||||||||||
Net investment income | (218,173 | ) | 327,304 | 4,110,385 | 526,370 | |||||||||||
Net realized gain on investments, written options, futures contracts and foreign currency transactions | 5,863,764 | 9,256,583 | 550,385 | 2,321,872 | ||||||||||||
Net increase (decrease) in unrealized appreciation (depreciation) on investments, securities sold short, written options, futures contracts and foreign currency transactions | (1,587,618 | ) | (2,457,714 | ) | (3,700,733 | ) | 5,441,084 | |||||||||
|
|
|
|
|
|
|
| |||||||||
Net increase from operations | 4,057,973 | 7,126,173 | 960,037 | 8,289,326 | ||||||||||||
|
|
|
|
|
|
|
| |||||||||
Total distributions to shareholders(a): | ||||||||||||||||
Distribution | ||||||||||||||||
Class A | (6,252,953 | ) | (1,857,713 | ) | (2,060,602 | ) | (1,010,303 | ) | ||||||||
Class C | (1,052,075 | ) | (194,497 | ) | (180,471 | ) | (62,178 | ) | ||||||||
Class Y | (1,432,331 | ) | (498,751 | ) | (1,748,447 | ) | (234,492 | ) | ||||||||
Return of Capital | ||||||||||||||||
Class A | — | — | (890,212 | ) | — | |||||||||||
Class C | — | — | (67,991 | ) | — | |||||||||||
Class Y | — | — | (786,560 | ) | — | |||||||||||
|
|
|
|
|
|
|
| |||||||||
Total distributions | (8,737,359 | ) | (2,550,991 | ) | (5,734,283 | ) | (1,306,973 | ) | ||||||||
|
|
|
|
|
|
|
| |||||||||
Increase (decrease) in net assets from operations and distributions | (4,679,386 | ) | 4,575,182 | (4,774,246 | ) | 6,982,353 | ||||||||||
|
|
|
|
|
|
|
| |||||||||
Share transactions: | ||||||||||||||||
Proceeds from sale of shares | ||||||||||||||||
Class A | 6,291,443 | 13,620,467 | 949,847 | 1,731,157 | ||||||||||||
Class C | 856,815 | 2,551,911 | 500,459 | 290,493 | ||||||||||||
Class Y | 7,321,659 | 32,864,955 | 8,111,452 | 40,230,133 | ||||||||||||
Value of distributions reinvested | ||||||||||||||||
Class A | 5,959,451 | 1,719,164 | 2,622,770 | 899,697 | ||||||||||||
Class C | 1,017,530 | 182,454 | 157,062 | 34,003 | ||||||||||||
Class Y | 1,400,924 | 492,079 | 2,180,629 | 228,121 | ||||||||||||
Cost of shares redeemed | ||||||||||||||||
Class A | (17,313,668 | ) | (11,009,654 | ) | (11,069,430 | ) | (8,096,911 | ) | ||||||||
Class C | (2,028,520 | ) | (1,067,875 | ) | (1,310,099 | ) | (2,363,399 | ) | ||||||||
Class Y | (23,969,074 | ) | (15,125,842 | ) | (17,518,528 | ) | (3,561,815 | ) | ||||||||
|
|
|
|
|
|
|
| |||||||||
Net increase (decrease) from shares transactions | (20,463,440 | ) | 24,227,659 | (15,375,838 | ) | 29,391,479 | ||||||||||
|
|
|
|
|
|
|
| |||||||||
Total increase (decrease) in net assets | (25,142,826 | ) | 28,802,841 | (20,150,084 | ) | 36,373,832 | ||||||||||
|
|
|
|
|
|
|
| |||||||||
Net Assets | ||||||||||||||||
Beginning of period | 76,143,839 | 47,340,998 | 111,040,174 | 74,666,342 | ||||||||||||
|
|
|
|
|
|
|
| |||||||||
End of period | 51,001,013 | 76,143,839 | 90,890,090 | 111,040,174 | ||||||||||||
|
|
|
|
|
|
|
| |||||||||
| (a) | Per the Securities Exchange Commission release #33-10532 “Disclosure Update and Simplification”; it is no longer required to differentiate distributions from earnings as either from net investment income or net realized capital gains. The presentation for the year ended 9/30/2017 has been adjusted for this change. |
| See accompanying Notes to Financial Statements. | 47 |
Table of Contents
STATEMENTS OF CHANGES IN NET ASSETS (continued)
| Highland Funds II | ||
| Highland Tax-Exempt Fund | Highland Fixed Income Fund | |||||||||||||||
| Year Ended September 30, 2018 ($) | Year Ended September 30, 2017 ($) | Year Ended September 30, 2018 ($) | Year Ended September 30, 2017 ($) | |||||||||||||
Increase (Decrease) in Net Assets | ||||||||||||||||
Operations: | ||||||||||||||||
Net investment income | 299,617 | 366,081 | 3,868,483 | 3,466,323 | ||||||||||||
Net realized gain (loss) on investments | 24,137 | 374,635 | (338,257 | ) | (165,904 | ) | ||||||||||
Net decrease in unrealized appreciation (depreciation) on investments and foreign currency transactions | (357,698 | ) | (1,073,250 | ) | (2,742,610 | ) | (505,611 | ) | ||||||||
|
|
|
|
|
|
|
| |||||||||
Net increase (decrease) from operations | (33,944 | ) | (332,534 | ) | 787,616 | 2,794,808 | ||||||||||
|
|
|
|
|
|
|
| |||||||||
Total distributions to shareholders(a): | ||||||||||||||||
Distribution | ||||||||||||||||
Class A | (632,879 | ) | (348,530 | ) | (2,598,615 | ) | (2,723,500 | ) | ||||||||
Class C | (37,381 | ) | (15,902 | ) | (62,485 | ) | (65,883 | ) | ||||||||
Class Y | (2,441 | ) | (1,819 | ) | (1,230,286 | ) | (660,757 | ) | ||||||||
Return of Capital | ||||||||||||||||
Class A | — | — | (134,542 | ) | (206,179 | ) | ||||||||||
Class C | — | — | (3,235 | ) | (4,988 | ) | ||||||||||
Class Y | — | — | (63,697 | ) | (50,022 | ) | ||||||||||
|
|
|
|
|
|
|
| |||||||||
Total distributions | (672,701 | ) | (366,251 | ) | (4,092,860 | ) | (3,711,329 | ) | ||||||||
|
|
|
|
|
|
|
| |||||||||
Decrease in net assets from operations and distributions | (706,645 | ) | (698,785 | ) | (3,305,244 | ) | (916,521 | ) | ||||||||
|
|
|
|
|
|
|
| |||||||||
Share transactions: | ||||||||||||||||
Proceeds from sale of shares | ||||||||||||||||
Class A | 798,793 | 886,785 | 6,247,782 | 3,899,359 | ||||||||||||
Class C | 121,911 | 357,339 | 1,278,123 | 608,178 | ||||||||||||
Class Y | 283,725 | 277 | 69,669,949 | 31,719,537 | ||||||||||||
Value of distributions reinvested | ||||||||||||||||
Class A | 519,320 | 220,340 | 2,449,565 | 2,604,825 | ||||||||||||
Class C | 25,743 | 7,931 | 58,703 | 50,031 | ||||||||||||
Class Y | 2,401 | 1,360 | 1,241,444 | 646,937 | ||||||||||||
Cost of shares redeemed | ||||||||||||||||
Class A | (2,030,674 | ) | (13,165,238 | ) | (14,798,652 | ) | (19,375,949 | ) | ||||||||
Class C | (504,445 | ) | (1,199,301 | ) | (1,178,704 | ) | (3,294,191 | ) | ||||||||
Class Y | (262,607 | ) | (116,776 | ) | (5,751,153 | ) | (2,570,570 | ) | ||||||||
|
|
|
|
|
|
|
| |||||||||
Net increase (decrease) from shares transactions | (1,045,833 | ) | (13,007,283 | ) | 59,217,057 | 14,288,157 | ||||||||||
|
|
|
|
|
|
|
| |||||||||
Total increase (decrease) in net assets | (1,752,478 | ) | (13,706,068 | ) | 55,911,813 | 13,371,636 | ||||||||||
|
|
|
|
|
|
|
| |||||||||
Net Assets | ||||||||||||||||
Beginning of period | 13,815,342 | 27,521,410 | 140,374,561 | 127,002,925 | ||||||||||||
|
|
|
|
|
|
|
| |||||||||
End of period | 12,062,864 | 13,815,342 | 196,286,374 | 140,374,561 | ||||||||||||
|
|
|
|
|
|
|
| |||||||||
| (a) | Per the Securities Exchange Commission release #33-10532 “Disclosure Update and Simplification”; it is no longer required to differentiate distributions from earnings as either from net investment income or net realized capital gains. The presentation for the year ended 9/30/2017 has been adjusted for this change. |
| 48 | See accompanying Notes to Financial Statements. |
Table of Contents
STATEMENTS OF CHANGES IN NET ASSETS (continued)
| Highland Funds II | ||
| Highland Premier Growth Equity Fund | ||||||||
| Year Ended September 30, 2018 | Year Ended September 30, 2017 | |||||||
CAPITAL STOCK ACTIVITY - SHARES | ||||||||
Class A: | ||||||||
Shares sold | 213,228 | 209,670 | ||||||
Issued for distribution reinvested | 831,410 | 869,573 | ||||||
Shares redeemed | (920,066 | ) | (1,039,983 | ) | ||||
|
|
|
| |||||
Net increase (decrease) in fund shares | 124,572 | 39,260 | ||||||
|
|
|
| |||||
Class C: | ||||||||
Shares sold | 43,297 | 40,867 | ||||||
Issued for distribution reinvested | 190,513 | 221,433 | ||||||
Shares redeemed | (268,487 | ) | (461,266 | ) | ||||
|
|
|
| |||||
Net decrease in fund shares | (34,677 | ) | (198,966 | ) | ||||
|
|
|
| |||||
Class Y: | ||||||||
Shares sold | 271,725 | 300,393 | ||||||
Issued for distribution reinvested | 240,169 | 210,988 | ||||||
Shares redeemed | (425,626 | ) | (451,024 | ) | ||||
|
|
|
| |||||
Net increase (decrease) in fund shares | 86,268 | 60,357 | ||||||
|
|
|
| |||||
| See accompanying Notes to Financial Statements. | 49 |
Table of Contents
STATEMENTS OF CHANGES IN NET ASSETS (continued)
| Highland Funds II | ||
| Highland Small-Cap Equity Fund | Highland Total Return Fund | |||||||||||||||
| Year Ended September 30, 2018 | Year Ended September 30, 2017 | Year Ended September 30, 2018 | Year Ended September 30, 2017 | |||||||||||||
CAPITAL STOCK ACTIVITY - SHARES | ||||||||||||||||
Class A: | ||||||||||||||||
Shares sold | 437,953 | 927,292 | 40,949 | 74,772 | ||||||||||||
Issued for distribution reinvested | 475,405 | 128,348 | 113,810 | 40,374 | ||||||||||||
Shares redeemed | (1,205,840 | ) | (757,663 | ) | (485,240 | ) | (354,059 | ) | ||||||||
|
|
|
|
|
|
|
| |||||||||
Net increase (decrease) in fund shares | (292,482 | ) | 297,977 | (330,481 | ) | (238,913 | ) | |||||||||
|
|
|
|
|
|
|
| |||||||||
Class C: | ||||||||||||||||
Shares sold | 88,010 | 238,650 | 23,698 | 14,037 | ||||||||||||
Issued for distribution reinvested | 121,278 | 18,821 | 7,615 | 1,708 | ||||||||||||
Shares redeemed | (212,902 | ) | (100,031 | ) | (63,948 | ) | (114,531 | ) | ||||||||
|
|
|
|
|
|
|
| |||||||||
Net increase (decrease) in fund shares | (3,614 | ) | 157,440 | (32,635 | ) | (98,786 | ) | |||||||||
|
|
|
|
|
|
|
| |||||||||
Class Y: | ||||||||||||||||
Shares sold | 450,398 | 2,020,193 | 346,231 | 1,653,396 | ||||||||||||
Issued for distribution reinvested | 100,989 | 33,752 | 93,174 | 10,074 | ||||||||||||
Shares redeemed | (1,515,228 | ) | (947,298 | ) | (746,768 | ) | (154,808 | ) | ||||||||
|
|
|
|
|
|
|
| |||||||||
Net increase (decrease) in fund shares | (963,841 | ) | 1,106,647 | (307,363 | ) | 1,508,662 | ||||||||||
|
|
|
|
|
|
|
| |||||||||
| 50 | See accompanying Notes to Financial Statements. |
Table of Contents
STATEMENTS OF CHANGES IN NET ASSETS (continued)
| Highland Funds II | ||
| Highland Tax-Exempt Fund | Highland Fixed Income Fund | |||||||||||||||
| Year Ended September 30, 2018 | Year Ended September 30, 2017 | Year Ended September 30, 2018 | Year Ended September 30, 2017 | |||||||||||||
CAPITAL STOCK ACTIVITY - SHARES | ||||||||||||||||
Class A: | ||||||||||||||||
Shares sold | 70,642 | 76,538 | 484,099 | 302,037 | ||||||||||||
Issued for distribution reinvested | 46,221 | 19,099 | 191,692 | 201,714 | ||||||||||||
Shares redeemed | (181,847 | ) | (1,154,750 | ) | (1,156,386 | ) | (1,503,115 | ) | ||||||||
|
|
|
|
|
|
|
| |||||||||
Net decrease in fund shares | (64,984 | ) | (1,059,113 | ) | (480,595 | ) | (999,364 | ) | ||||||||
|
|
|
|
|
|
|
| |||||||||
Class C: | ||||||||||||||||
Shares sold | 10,770 | 30,632 | 98,509 | 46,944 | ||||||||||||
Issued for distribution reinvested | 2,290 | 689 | 4,588 | 3,872 | ||||||||||||
Shares redeemed | (45,050 | ) | (103,948 | ) | (91,985 | ) | (255,261 | ) | ||||||||
|
|
|
|
|
|
|
| |||||||||
Net increase (decrease) in fund shares | (31,990 | ) | (72,627 | ) | 11,112 | (204,445 | ) | |||||||||
|
|
|
|
|
|
|
| |||||||||
Class Y: | ||||||||||||||||
Shares sold | 23,391 | 22 | 5,480,548 | 2,446,571 | ||||||||||||
Issued for distribution reinvested | 198 | 109 | 97,368 | 50,098 | ||||||||||||
Shares redeemed | (21,652 | ) | (9,429 | ) | (451,487 | ) | (199,047 | ) | ||||||||
|
|
|
|
|
|
|
| |||||||||
Net increase (decrease) in fund shares | 1,937 | (9,298 | ) | 5,126,429 | 2,297,622 | |||||||||||
|
|
|
|
|
|
|
| |||||||||
| See accompanying Notes to Financial Statements. | 51 |
Table of Contents
| Year Ended September 30, 2018 | HighlandSmall-Cap Equity Fund | |
| ($) | ||||
Cash Flows Provided by Operating Activities: | ||||
Net increase in net assets resulting from operations | 4,057,973 | |||
Adjustments to Reconcile Net Increase in Net Assets to Net Cash Provided by Operating Activities Operating Activities: | ||||
Purchases of investment securities | (23,349,368 | ) | ||
Proceeds from disposition of investment securities | 39,170,549 | |||
Purchases of investment securities from affiliated issuers | (1,985,367 | ) | ||
Purchases of purchased options, net | 2,014,007 | |||
Purchases of short-term portfolio investments, net | (861,707 | ) | ||
Proceeds from securities sold short | 5,532,339 | |||
Increase in restricted cash | (6,748,449 | ) | ||
Net premium paid on open written options contracts | (2,062,891 | ) | ||
Net realized gain on investments from unaffiliated issuers | (5,633,077 | ) | ||
Net realized gain on Investments in affiliated issuers | (13,495 | ) | ||
Net realized loss on securities sold short, written options contracts and foreign currency transactions | 1,759,341 | |||
Net change in unrealized appreciation/ (depreciation) on investments, securities sold short, written options contracts and translation on assets and liabilities denominated in foreign currency | 2,136,542 | |||
Decrease in receivable for investments sold | 5,644,466 | |||
Decrease in receivable for dividends and interest | 88,353 | |||
Increase in prepaid expenses and other assets | (2,283 | ) | ||
Increase in payable upon receipt of securities on loan | 861,707 | |||
Decrease in due to broker | (227,641 | ) | ||
Increase in payable for custody fees | 22 | |||
Increase in payable for dividends on short sales | 1,507 | |||
Decrease in payables to related parties | (672 | ) | ||
Decrease in payable for distribution and shareholder service fees | (2,604 | ) | ||
Decrease in payable for variation margin | (2,739 | ) | ||
Decrease in payable for transfer fees | (6,373 | ) | ||
Decrease in payable for interest expense and commitment fees | (9,365 | ) | ||
Decrease in accrued expenses and other liabilities | (16,390 | ) | ||
|
| |||
Net cash flow provided by operating activities | 20,344,385 | |||
|
| |||
Cash Flows Used In Financing Activities: | ||||
Borrowings under credit facility | 23,500,000 | |||
Repayments of credit facility | (11,250,000 | ) | ||
Distributions paid in cash | (359,454 | ) | ||
Payments on shares redeemed | (43,300,364 | ) | ||
Proceeds from shares sold | 14,525,651 | |||
Decrease in due to custodian | (3,206,114 | ) | ||
|
| |||
Net cash flow used in financing activities | (20,090,281 | ) | ||
|
| |||
Effect of exchange rate changes on cash | (230 | ) | ||
|
| |||
Net increase in cash | 253,874 | |||
|
| |||
Cash: | ||||
Beginning of period | — | |||
|
| |||
End of period | 253,874 | |||
|
| |||
Supplemental disclosure of cash flow information: | ||||
Reinvestment of distributions | 8,377,905 | |||
|
| |||
Cash paid during the period for interest and commitment fees | 395,312 | |||
|
| |||
| 52 | See accompanying Notes to Financial Statements. |
Table of Contents
| Highland Premier Growth Equity Fund, Class A | ||
Selected data for a share outstanding throughout each period is as follows:
| For the Years Ended September 30, | ||||||||||||||||||||
| 2018 | 2017 | 2016 | 2015 | 2014 | ||||||||||||||||
Net Asset Value, Beginning of Period | $ | 31.18 | $ | 34.45 | $ | 32.32 | $ | 34.99 | $ | 31.22 | ||||||||||
Income from Investment Operations: |
| |||||||||||||||||||
Net investment income/(loss)(a) | (0.03 | ) | (0.03 | ) | 0.02 | 0.04 | 0.06 | |||||||||||||
Net realized and unrealized gain/(loss) | 4.16 | 4.15 | 4.73 | (0.25 | ) | 5.70 | ||||||||||||||
|
|
|
|
|
|
|
|
|
| |||||||||||
Total from investment operations | 4.13 | 4.12 | 4.75 | (0.21 | ) | 5.76 | ||||||||||||||
Less Distributions Declared to Shareholders: |
| |||||||||||||||||||
From net investment income | — | — | — | — | (0.04 | ) | ||||||||||||||
From net realized gains | (6.70 | ) | (7.39 | ) | (2.62 | ) | (2.46 | ) | (1.95 | ) | ||||||||||
|
|
|
|
|
|
|
|
|
| |||||||||||
Total distributions declared to shareholders | (6.70 | ) | (7.39 | ) | (2.62 | ) | (2.46 | ) | (1.99 | ) | ||||||||||
Net Asset Value, End of Period(b) | $ | 28.61 | $ | 31.18 | $ | 34.45 | $ | 32.32 | $ | 34.99 | ||||||||||
Total Return(b)(c) | 15.14 | % | 15.46 | % | 14.84 | % | (1.10 | )% | 19.08 | % | ||||||||||
Ratios to Average Net Assets(d): |
| |||||||||||||||||||
Net assets, end of period (in 000’s) | $ | 102,528 | $ | 107,865 | $ | 117,817 | $ | 169,434 | $ | 167,187 | ||||||||||
Gross operating expenses(e) | 1.19 | % | 1.27 | % | 1.28 | % | 1.13 | % | 1.16 | % | ||||||||||
Net investment income/(loss) | (0.12 | )% | (0.10 | )% | 0.07 | % | 0.13 | % | 0.17 | % | ||||||||||
Portfolio turnover rate | 258 | % | 83 | % | 77 | % | 18 | % | 20 | % | ||||||||||
| (a) | Net investment income (loss) per share was calculated using average shares outstanding during the period. |
| (b) | The Net Asset Value per share and total return have been calculated based on net assets which include adjustments made in accordance with U.S. Generally Accepted Accounting Principles required at period end for financial reporting purposes. These figures do not necessarily reflect the Net Asset Value per share or total return experienced by the shareholder at period end. |
| (c) | Total return is at net asset value assuming all distributions are reinvested and no initial sales charge or CDSC. For periods with waivers/reimbursements, had the Fund’s investment adviser not waived or reimbursed a portion of expenses, total return would have been lower. |
| (d) | All ratios for the period have been annualized, unless otherwise indicated. |
| (e) | Supplemental expense ratios are shown below: |
| For the Years Ended September 30, | ||||||||||||||||||||
| 2018 | 2017 | 2016 | 2015 | 2014 | ||||||||||||||||
Net operating expenses (net of waiver/reimbursement, if applicable, but gross of all other operating expenses) | 1.19 | % | 1.27 | % | 1.28 | % | 1.13 | % | 1.16 | % | ||||||||||
Interest expense and commitment fees | — | 0.04 | % | 0.04 | % | 0.01 | % | — | ||||||||||||
Dividends and fees on securities sold short | — | — | 0.03 | % | — | — | ||||||||||||||
| See accompanying Notes to Financial Statements. | 53 |
Table of Contents
FINANCIAL HIGHLIGHTS
| Highland Premier Growth Equity Fund, Class C | ||
Selected data for a share outstanding throughout each period is as follows:
| For the Years Ended September 30, | ||||||||||||||||||||
| 2018 | 2017 | 2016 | 2015 | 2014 | ||||||||||||||||
Net Asset Value, Beginning of Period | $ | 23.37 | $ | 27.85 | $ | 26.76 | $ | 29.57 | $ | 26.82 | ||||||||||
Income from Investment Operations: |
| |||||||||||||||||||
Net investment loss(a) | (0.17 | ) | (0.19 | ) | (0.18 | ) | (0.18 | ) | (0.16 | ) | ||||||||||
Net realized and unrealized gain/(loss) | 2.96 | 3.10 | 3.89 | (0.17 | ) | 4.86 | ||||||||||||||
|
|
|
|
|
|
|
|
|
| |||||||||||
Total from investment operations | 2.79 | 2.91 | 3.71 | (0.35 | ) | 4.70 | ||||||||||||||
Less Distributions Declared to Shareholders: |
| |||||||||||||||||||
From net realized gains | (6.70 | ) | (7.39 | ) | (2.62 | ) | (2.46 | ) | (1.95 | ) | ||||||||||
|
|
|
|
|
|
|
|
|
| |||||||||||
Total distributions declared to shareholders | (6.70 | ) | (7.39 | ) | (2.62 | ) | (2.46 | ) | (1.95 | ) | ||||||||||
Net Asset Value, End of Period(b) | $ | 19.46 | $ | 23.37 | $ | 27.85 | $ | 26.76 | $ | 29.57 | ||||||||||
Total Return(b)(c) | 14.28 | % | 14.58 | % | 13.98 | % | (1.82 | )% | 18.21 | % | ||||||||||
Ratios to Average Net Assets(d): |
| |||||||||||||||||||
Net assets, end of period (in 000’s) | $ | 10,453 | $ | 13,365 | $ | 21,466 | $ | 19,096 | $ | 16,290 | ||||||||||
Gross operating expenses(e) | 1.95 | % | 2.02 | % | 2.03 | % | 1.88 | % | 1.91 | % | ||||||||||
Net investment loss | (0.85 | )% | (0.84 | )% | (0.69 | )% | (0.63 | )% | (0.58 | )% | ||||||||||
Portfolio turnover rate | 258 | % | 83 | % | 77 | % | 18 | % | 20 | % | ||||||||||
| (a) | Net investment income (loss) per share was calculated using average shares outstanding during the period. |
| (b) | The Net Asset Value per share and total return have been calculated based on net assets which include adjustments made in accordance with U.S. Generally Accepted Accounting Principles required at period end for financial reporting purposes. These figures do not necessarily reflect the Net Asset Value per share or total return experienced by the shareholder at period end. |
| (c) | Total return is at net asset value assuming all distributions are reinvested and no initial sales charge or CDSC. For periods with waivers/reimbursements, had the Fund’s investment adviser not waived or reimbursed a portion of expenses, total return would have been lower. |
| (d) | All ratios for the period have been annualized, unless otherwise indicated. |
| (e) | Supplemental expense ratios are shown below: |
| For the Years Ended September 30, | ||||||||||||||||||||
| 2018 | 2017 | 2016 | 2015 | 2014 | ||||||||||||||||
Net operating expenses (net of waiver/reimbursement, if applicable, but gross of all other operating expenses) | 1.95 | % | 2.02 | % | 2.03 | % | 1.88 | % | 1.91 | % | ||||||||||
Interest expense and commitment fees | — | 0.04 | % | 0.05 | % | 0.01 | % | — | ||||||||||||
Dividends and fees on securities sold short | — | — | 0.04 | % | — | — | ||||||||||||||
| 54 | See accompanying Notes to Financial Statements. |
Table of Contents
FINANCIAL HIGHLIGHTS
| Highland Premier Growth Equity Fund, Class Y | ||
Selected data for a share outstanding throughout each period is as follows:
| For the Years Ended September 30, | ||||||||||||||||||||
| 2018 | 2017 | 2016 | 2015 | 2014 | ||||||||||||||||
Net Asset Value, Beginning of Period | $ | 32.66 | $ | 35.65 | $ | 33.29 | $ | 35.89 | $ | 31.96 | ||||||||||
Income from Investment Operations: |
| |||||||||||||||||||
Net investment income(a) | 0.04 | 0.04 | 0.10 | 0.14 | 0.14 | |||||||||||||||
Net realized and unrealized gain/(loss) | 4.38 | 4.36 | 4.88 | (0.28 | ) | 5.85 | ||||||||||||||
|
|
|
|
|
|
|
|
|
| |||||||||||
Total from investment operations | 4.42 | 4.40 | 4.98 | (0.14 | ) | 5.99 | ||||||||||||||
Less Distributions Declared to Shareholders: |
| |||||||||||||||||||
From net investment income | — | — | — | — | (0.11 | ) | ||||||||||||||
From net realized gains | (6.70 | ) | (7.39 | ) | (2.62 | ) | (2.46 | ) | (1.95 | ) | ||||||||||
|
|
|
|
|
|
|
|
|
| |||||||||||
Total distributions declared to shareholders | (6.70 | ) | (7.39 | ) | (2.62 | ) | (2.46 | ) | (2.06 | ) | ||||||||||
Net Asset Value, End of Period(b) | $ | 30.38 | $ | 32.66 | $ | 35.65 | $ | 33.29 | $ | 35.89 | ||||||||||
Total Return(b)(c) | 15.38 | % | 15.78 | % | 15.12 | % | (0.87 | )% | 19.40 | % | ||||||||||
Ratios to Average Net Assets(d): |
| |||||||||||||||||||
Net assets, end of period (in 000’s) | $ | 35,088 | $ | 34,893 | $ | 35,939 | $ | 35,521 | $ | 31,036 | ||||||||||
Gross operating expenses(e) | 0.94 | % | 1.02 | % | 1.03 | % | 0.88 | % | 0.91 | % | ||||||||||
Net investment income | 0.13 | % | 0.14 | % | 0.29 | % | 0.38 | % | 0.42 | % | ||||||||||
Portfolio turnover rate | 258 | % | 83 | % | 77 | % | 18 | % | 20 | % | ||||||||||
| (a) | Net investment income (loss) per share was calculated using average shares outstanding during the period. |
| (b) | The Net Asset Value per share and total return have been calculated based on net assets which include adjustments made in accordance with U.S. Generally Accepted Accounting Principles required at period end for financial reporting purposes. These figures do not necessarily reflect the Net Asset Value per share or total return experienced by the shareholder at period end. |
| (c) | Total return is at net asset value assuming all distributions are reinvested and no initial sales charge or CDSC. For periods with waivers/reimbursements, had the Fund’s investment adviser not waived or reimbursed a portion of expenses, total return would have been lower. |
| (d) | All ratios for the period have been annualized, unless otherwise indicated. |
| (e) | Supplemental expense ratios are shown below: |
| For the Years Ended September 30, | ||||||||||||||||||||
| 2018 | 2017 | 2016 | 2015 | 2014 | ||||||||||||||||
Net operating expenses (net of waiver/reimbursement, if applicable, but gross of all other operating expenses) | 0.94 | % | 1.02 | % | 1.03 | % | 0.88 | % | 0.91 | % | ||||||||||
Interest expense and commitment fees | — | 0.04 | % | 0.05 | % | 0.01 | % | — | ||||||||||||
Dividends and fees on securities sold short | — | — | 0.03 | % | — | — | ||||||||||||||
| See accompanying Notes to Financial Statements. | 55 |
Table of Contents
FINANCIAL HIGHLIGHTS
| HighlandSmall-Cap Equity Fund, Class A | ||
Selected data for a share outstanding throughout each period is as follows:
| For the Years Ended September 30, | ||||||||||||||||||||
| 2018 | 2017 | 2016 | 2015 | 2014 | ||||||||||||||||
Net Asset Value, Beginning of Period | $ | 15.23 | $ | 13.99 | $ | 12.96 | $ | 14.90 | $ | 14.93 | ||||||||||
Income from Investment Operations: |
| |||||||||||||||||||
Net investment income/(loss)(a) | (0.05 | ) | 0.08 | 0.11 | 0.01 | (0.04 | ) | |||||||||||||
Net realized and unrealized gain/(loss) | 1.21 | 1.86 | 2.80 | (0.27 | ) | 1.07 | ||||||||||||||
|
|
|
|
|
|
|
|
|
| |||||||||||
Total from investment operations | 1.16 | 1.94 | 2.91 | (0.26 | ) | 1.03 | ||||||||||||||
Less Distributions Declared to Shareholders: |
| |||||||||||||||||||
From net investment income | (0.03 | ) | (0.09 | ) | — | — | — | |||||||||||||
From net realized gains | (2.34 | ) | (0.61 | ) | (1.88 | ) | (1.68 | ) | (1.06 | ) | ||||||||||
|
|
|
|
|
|
|
|
|
| |||||||||||
Total distributions declared to shareholders | (2.37 | ) | (0.70 | ) | (1.88 | ) | (1.68 | ) | (1.06 | ) | ||||||||||
Net Asset Value, End of Period(b) | $ | 14.02 | $ | 15.23 | $ | 13.99 | $ | 12.96 | $ | 14.90 | ||||||||||
Total Return(b)(c) | 9.50 | % | 14.53 | % | 25.87 | % | (2.47 | )% | 6.93 | % | ||||||||||
Ratios to Average Net Assets(d): |
| |||||||||||||||||||
Net assets, end of period (in 000’s) | $ | 36,072 | $ | 43,663 | $ | 35,935 | $ | 29,765 | $ | 33,598 | ||||||||||
Gross operating expenses(e) | 2.94 | % | 2.00 | % | 2.02 | % | 1.67 | % | 1.62 | % | ||||||||||
Net investment income/(loss) | (0.36 | )% | 0.55 | % | 0.90 | % | 0.04 | % | (0.27 | )% | ||||||||||
Portfolio turnover rate | 38 | % | 84 | % | 107 | % | 70 | % | 26 | % | ||||||||||
| (a) | Net investment income (loss) per share was calculated using average shares outstanding during the period. |
| (b) | The Net Asset Value per share and total return have been calculated based on net assets which include adjustments made in accordance with U.S. Generally Accepted Accounting Principles required at period end for financial reporting purposes. These figures do not necessarily reflect the Net Asset Value per share or total return experienced by the shareholder at period end. |
| (c) | Total return is at net asset value assuming all distributions are reinvested and no initial sales charge or CDSC. For periods with waivers/reimbursements, had the Fund’s investment adviser not waived or reimbursed a portion of expenses, total return would have been lower. |
| (d) | All ratios for the period have been annualized, unless otherwise indicated. |
| (e) | Supplemental expense ratios are shown below: |
| For the Years Ended September 30, | ||||||||||||||||||||
| 2018 | 2017 | 2016 | 2015 | 2014 | ||||||||||||||||
Net operating expenses (net of waiver/reimbursement, if applicable, but gross of all other operating expenses) | 2.34 | % | 1.60 | % | 1.40 | % | 1.21 | % | 1.49 | % | ||||||||||
Interest expense and commitment fees | 0.67 | % | 0.18 | % | 0.18 | % | 0.01 | % | — | |||||||||||
Dividends and fees on securities sold short | 0.26 | % | 0.07 | % | — | — | — | |||||||||||||
| 56 | See accompanying Notes to Financial Statements. |
Table of Contents
FINANCIAL HIGHLIGHTS
| HighlandSmall-Cap Equity Fund, Class C | ||
Selected data for a share outstanding throughout each period is as follows:
| For the Years Ended September 30, | ||||||||||||||||||||
| 2018 | 2017 | 2016 | 2015 | 2014 | ||||||||||||||||
Net Asset Value, Beginning of Period | $ | 11.01 | $ | 10.32 | $ | 10.11 | $ | 12.06 | $ | 12.35 | ||||||||||
Income from Investment Operations: |
| |||||||||||||||||||
Net investment income/(loss)(a) | (0.11 | ) | (0.02 | ) | — | (0.08 | ) | (0.13 | ) | |||||||||||
Net realized and unrealized gain/(loss) | 0.79 | 1.35 | 2.09 | (0.19 | ) | 0.90 | ||||||||||||||
|
|
|
|
|
|
|
|
|
| |||||||||||
Total from investment operations | 0.68 | 1.33 | 2.09 | (0.27 | ) | 0.77 | ||||||||||||||
Less Distributions Declared to Shareholders: |
| |||||||||||||||||||
From net investment income | — | (0.03 | ) | — | — | — | ||||||||||||||
From net realized gains | (2.34 | ) | (0.61 | ) | (1.88 | ) | (1.68 | ) | (1.06 | ) | ||||||||||
|
|
|
|
|
|
|
|
|
| |||||||||||
Total distributions declared to shareholders | (2.34 | ) | (0.64 | ) | (1.88 | ) | (1.68 | ) | (1.06 | ) | ||||||||||
Net Asset Value, End of Period(b) | $ | 9.35 | $ | 11.01 | $ | 10.32 | $ | 10.11 | $ | 12.06 | ||||||||||
Total Return(b)(c) | 8.64 | % | 13.73 | % | 24.90 | % | (3.21 | )% | 6.23 | % | ||||||||||
Ratios to Average Net Assets(d): |
| |||||||||||||||||||
Net assets, end of period (in 000’s) | $ | 4,323 | $ | 5,131 | $ | 3,185 | $ | 2,872 | $ | 3,213 | ||||||||||
Gross operating expenses(e) | 3.69 | % | 2.76 | % | 2.77 | % | 2.42 | % | 2.37 | % | ||||||||||
Net investment income/(loss) | (1.12 | )% | (0.23 | )% | 0.15 | % | (0.72 | )% | (1.01 | )% | ||||||||||
Portfolio turnover rate | 38 | % | 84 | % | 107 | % | 70 | % | 26 | % | ||||||||||
| (a) | Net investment income (loss) per share was calculated using average shares outstanding during the period. |
| (b) | The Net Asset Value per share and total return have been calculated based on net assets which include adjustments made in accordance with U.S. Generally Accepted Accounting Principles required at period end for financial reporting purposes. These figures do not necessarily reflect the Net Asset Value per share or total return experienced by the shareholder at period end. |
| (c) | Total return is at net asset value assuming all distributions are reinvested and no initial sales charge or CDSC. For periods with waivers/reimbursements, had the Fund’s investment adviser not waived or reimbursed a portion of expenses, total return would have been lower. |
| (d) | All ratios for the period have been annualized, unless otherwise indicated. |
| (e) | Supplemental expense ratios are shown below: |
| For the Years Ended September 30, | ||||||||||||||||||||
| 2018 | 2017 | 2016 | 2015 | 2014 | ||||||||||||||||
Net operating expenses (net of waiver/reimbursement, if applicable, but gross of all other operating expenses) | 3.09 | % | 2.36 | % | 2.15 | % | 1.96 | % | 2.23 | % | ||||||||||
Interest expense and commitment fees | 0.67 | % | 0.19 | % | 0.18 | % | 0.01 | % | — | |||||||||||
Dividends and fees on securities sold short | 0.26 | % | 0.07 | % | — | — | — | |||||||||||||
| See accompanying Notes to Financial Statements. | 57 |
Table of Contents
FINANCIAL HIGHLIGHTS
| HighlandSmall-Cap Equity Fund, Class Y | ||
Selected data for a share outstanding throughout each period is as follows:
| For the Years Ended September 30, | ||||||||||||||||||||
| 2018 | 2017 | 2016 | 2015 | 2014 | ||||||||||||||||
Net Asset Value, Beginning of Period | $ | 16.59 | $ | 15.16 | $ | 13.86 | $ | 15.79 | $ | 15.72 | ||||||||||
Income from Investment Operations: |
| |||||||||||||||||||
Net investment income(a) | (0.02 | ) | 0.12 | 0.18 | 0.04 | — | ||||||||||||||
Net realized and unrealized gain/(loss) | 1.31 | 2.04 | 3.00 | (0.29 | ) | 1.13 | ||||||||||||||
|
|
|
|
|
|
|
|
|
| |||||||||||
Total from investment operations | 1.29 | 2.16 | 3.18 | (0.25 | ) | 1.13 | ||||||||||||||
Less Distributions Declared to Shareholders: |
| |||||||||||||||||||
From net investment income | (0.06 | ) | (0.12 | ) | — | — | — | |||||||||||||
From net realized gains | (2.34 | ) | (0.61 | ) | (1.88 | ) | (1.68 | ) | (1.06 | ) | ||||||||||
|
|
|
|
|
|
|
|
|
| |||||||||||
Total distributions declared to shareholders | (2.40 | ) | (0.73 | ) | (1.88 | ) | (1.68 | ) | (1.06 | ) | ||||||||||
Net Asset Value, End of Period(b) | $ | 15.48 | $ | 16.59 | $ | 15.16 | $ | 13.86 | $ | 15.79 | ||||||||||
Total Return(b)(c) | 9.55 | % | 14.89 | % | 26.17 | % | (2.25 | )% | 7.24 | % | ||||||||||
Ratios to Average Net Assets(d): |
| |||||||||||||||||||
Net assets, end of period (in 000’s) | $ | 10,606 | $ | 27,350 | $ | 8,221 | $ | 3,579 | $ | 1,745 | ||||||||||
Gross operating expenses(e) | 2.71 | % | 1.78 | % | 1.77 | % | 1.42 | % | 1.37 | % | ||||||||||
Net investment income/(loss) | (0.15 | )% | 0.72 | % | 1.28 | % | 0.28 | % | (0.01 | )% | ||||||||||
Portfolio turnover rate | 38 | % | 84 | % | 107 | % | 70 | % | 26 | % | ||||||||||
| (a) | Net investment income (loss) per share was calculated using average shares outstanding during the period. |
| (b) | The Net Asset Value per share and total return have been calculated based on net assets which include adjustments made in accordance with U.S. Generally Accepted Accounting Principles required at period end for financial reporting purposes. These figures do not necessarily reflect the Net Asset Value per share or total return experienced by the shareholder at period end. |
| (c) | Total return is at net asset value assuming all distributions are reinvested and no initial sales charge or CDSC. For periods with waivers/reimbursements, had the Fund’s investment adviser not waived or reimbursed a portion of expenses, total return would have been lower. |
| (d) | All ratios for the period have been annualized, unless otherwise indicated. |
| (e) | Supplemental expense ratios are shown below: |
| For the Years Ended September 30, | ||||||||||||||||||||
| 2018 | 2017 | 2016 | 2015 | 2014 | ||||||||||||||||
Net operating expenses (net of waiver/reimbursement, if applicable, but gross of all other operating expenses) | 2.10 | % | 1.39 | % | 1.15 | % | 0.96 | % | 1.23 | % | ||||||||||
Interest expense and commitment fees | 0.68 | % | 0.21 | % | 0.18 | % | 0.01 | % | — | |||||||||||
Dividends and fees on securities sold short | 0.25 | % | 0.07 | % | — | — | — | |||||||||||||
| 58 | See accompanying Notes to Financial Statements. |
Table of Contents
FINANCIAL HIGHLIGHTS
| Highland Total Return Fund, Class A | ||
Selected data for a share outstanding throughout each period is as follows:
| For the Years Ended September 30, | ||||||||||||||||||||
| 2018 | 2017 | 2016 | 2015 | 2014 | ||||||||||||||||
Net Asset Value, Beginning of Period | $ | 24.04 | $ | 21.88 | $ | 21.99 | $ | 24.52 | $ | 22.93 | ||||||||||
Income from Investment Operations: |
| |||||||||||||||||||
Net investment income(a) | 0.95 | 0.16 | 0.32 | 0.37 | 0.24 | |||||||||||||||
Net realized and unrealized gain/(loss) | (0.68 | ) | 2.41 | 2.15 | (1.44 | ) | 1.57 | |||||||||||||
|
|
|
|
|
|
|
|
|
| |||||||||||
Total from investment operations | 0.27 | 2.57 | 2.47 | (1.07 | ) | 1.81 | ||||||||||||||
Less Distributions Declared to Shareholders: |
| |||||||||||||||||||
From net investment income | (0.40 | ) | (0.25 | ) | (0.35 | ) | (0.24 | ) | (0.22 | ) | ||||||||||
From net realized gains | (0.50 | ) | (0.16 | ) | (2.23 | ) | (1.22 | ) | — | |||||||||||
From return of capital | (0.38 | ) | — | — | — | — | ||||||||||||||
|
|
|
|
|
|
|
|
|
| |||||||||||
Total distributions declared to shareholders | (1.28 | ) | (0.41 | ) | (2.58 | ) | (1.46 | ) | (0.22 | ) | ||||||||||
Net Asset Value, End of Period(b) | $ | 23.03 | $ | 24.04 | $ | 21.88 | $ | 21.99 | $ | 24.52 | ||||||||||
Total Return(b)(c) | 1.17 | % | 11.89 | % | 11.88 | % | (4.76 | )% | 7.92 | % | ||||||||||
Ratios to Average Net Assets(d): |
| |||||||||||||||||||
Net assets, end of period (in 000’s) | $ | 46,188 | $ | 56,167 | $ | 56,345 | $ | 59,307 | $ | 69,084 | ||||||||||
Gross operating expenses(e) | 1.17 | % | 1.15 | % | 1.15 | % | 1.20 | % | 1.38 | % | ||||||||||
Net investment income | 4.13 | % | 0.65 | % | 1.56 | % | 1.55 | % | 0.99 | % | ||||||||||
Portfolio turnover rate | 105 | % | 99 | % | 94 | % | 175 | % | 121 | % | ||||||||||
| (a) | Net investment income (loss) per share was calculated using average shares outstanding during the period. |
| (b) | The Net Asset Value per share and total return have been calculated based on net assets which include adjustments made in accordance with U.S. Generally Accepted Accounting Principles required at period end for financial reporting purposes. These figures do not necessarily reflect the Net Asset Value per share or total return experienced by the shareholder at period end. |
| (c) | Total return is at net asset value assuming all distributions are reinvested and no initial sales charge or CDSC. For periods with waivers/reimbursements, had the Fund’s investment adviser not waived or reimbursed a portion of expenses, total return would have been lower. |
| (d) | All ratios for the period have been annualized, unless otherwise indicated. |
| (e) | Supplemental expense ratios are shown below: |
| For the Years Ended September 30, | ||||||||||||||||||||
| 2018 | 2017 | 2016 | 2015 | 2014 | ||||||||||||||||
Net operating expenses (net of waiver/reimbursement, if applicable, but gross of all other operating expenses) | 1.17 | % | 1.09 | % | 1.15 | % | 1.20 | % | 1.38 | % | ||||||||||
Interest expense and commitment fees | — | — | — | — | — | |||||||||||||||
Dividends and fees on securities sold short | — | — | — | — | — | |||||||||||||||
| See accompanying Notes to Financial Statements. | 59 |
Table of Contents
FINANCIAL HIGHLIGHTS
| Highland Total Return Fund, Class C | ||
Selected data for a share outstanding throughout each period is as follows:
| For the Years Ended September 30, | ||||||||||||||||||||
| 2018 | 2017 | 2016 | 2015 | 2014 | ||||||||||||||||
Net Asset Value, Beginning of Period | $ | 21.54 | $ | 19.61 | $ | 20.03 | $ | 22.58 | $ | 21.17 | ||||||||||
Income from Investment Operations: |
| |||||||||||||||||||
Net investment income/(loss)(a) | 0.71 | (0.02 | ) | 0.16 | 0.18 | 0.05 | ||||||||||||||
Net realized and unrealized gain/(loss) | (0.63 | ) | 2.17 | 1.93 | (1.31 | ) | 1.45 | |||||||||||||
|
|
|
|
|
|
|
|
|
| |||||||||||
Total from investment operations | 0.08 | 2.15 | 2.09 | (1.13 | ) | 1.50 | ||||||||||||||
Less Distributions Declared to Shareholders: |
| |||||||||||||||||||
From net investment income | (0.31 | ) | (0.06 | ) | (0.28 | ) | (0.20 | ) | (0.09 | ) | ||||||||||
From net realized gains | (0.50 | ) | (0.16 | ) | (2.23 | ) | (1.22 | ) | — | |||||||||||
From return of capital | (0.30 | ) | — | — | — | — | ||||||||||||||
|
|
|
|
|
|
|
|
|
| |||||||||||
Total distributions declared to shareholders | (1.11 | ) | (0.22 | ) | (2.51 | ) | (1.42 | ) | (0.09 | ) | ||||||||||
Net Asset Value, End of Period(b) | $ | 20.51 | $ | 21.54 | $ | 19.61 | $ | 20.03 | $ | 22.58 | ||||||||||
Total Return(b)(c) | 0.39 | % | 11.05 | % | 11.03 | % | (5.45 | )% | 7.10 | % | ||||||||||
Ratios to Average Net Assets(d): |
| |||||||||||||||||||
Net assets, end of period (in 000’s) | $ | 3,771 | $ | 4,664 | $ | 6,183 | $ | 6,292 | $ | 5,690 | ||||||||||
Gross operating expenses(e) | 1.93 | % | 1.90 | % | 1.90 | % | 1.95 | % | 2.13 | % | ||||||||||
Net investment income/(loss) | 3.47 | % | (0.11 | )% | 0.83 | % | 0.81 | % | 0.24 | % | ||||||||||
Portfolio turnover rate | 105 | % | 99 | % | 94 | % | 175 | % | 121 | % | ||||||||||
| (a) | Net investment income (loss) per share was calculated using average shares outstanding during the period. |
| (b) | The Net Asset Value per share and total return have been calculated based on net assets which include adjustments made in accordance with U.S. Generally Accepted Accounting Principles required at period end for financial reporting purposes. These figures do not necessarily reflect the Net Asset Value per share or total return experienced by the shareholder at period end. |
| (c) | Total return is at net asset value assuming all distributions are reinvested and no initial sales charge or CDSC. For periods with waivers/reimbursements, had the Fund’s investment adviser not waived or reimbursed a portion of expenses, total return would have been lower. |
| (d) | All ratios for the period have been annualized, unless otherwise indicated. |
| (e) | Supplemental expense ratios are shown below: |
| For the Years Ended September 30, | ||||||||||||||||||||
| 2018 | 2017 | 2016 | 2015 | 2014 | ||||||||||||||||
Net operating expenses (net of waiver/reimbursement, if applicable, but gross of all other operating expenses) | 1.93 | % | 1.84 | % | 1.90 | % | 1.95 | % | 2.13 | % | ||||||||||
Interest expense and commitment fees | — | — | — | — | — | |||||||||||||||
Dividends and fees on securities sold short | — | — | — | — | — | |||||||||||||||
| 60 | See accompanying Notes to Financial Statements. |
Table of Contents
FINANCIAL HIGHLIGHTS
| Highland Total Return Fund, Class Y | ||
Selected data for a share outstanding throughout each period is as follows:
| For the Years Ended September 30, | ||||||||||||||||||||
| 2018 | 2017 | 2016 | 2015 | 2014 | ||||||||||||||||
Net Asset Value, Beginning of Period | $ | 24.44 | $ | 22.24 | $ | 22.32 | $ | 24.82 | $ | 23.20 | ||||||||||
Income from Investment Operations: |
| |||||||||||||||||||
Net investment income(a) | 1.00 | 0.22 | 0.37 | 0.57 | 0.30 | |||||||||||||||
Net realized and unrealized gain/(loss) | (0.67 | ) | 2.45 | 2.19 | (1.59 | ) | 1.58 | |||||||||||||
|
|
|
|
|
|
|
|
|
| |||||||||||
Total from investment operations | 0.33 | 2.67 | 2.56 | (1.02 | ) | 1.88 | ||||||||||||||
Less Distributions Declared to Shareholders: |
| |||||||||||||||||||
From net investment income | (0.43 | ) | (0.31 | ) | (0.41 | ) | (0.26 | ) | (0.26 | ) | ||||||||||
From net realized gains | (0.50 | ) | (0.16 | ) | (2.23 | ) | (1.22 | ) | — | |||||||||||
From return of capital | (0.41 | ) | — | — | — | — | ||||||||||||||
|
|
|
|
|
|
|
|
|
| |||||||||||
Total distributions declared to shareholders | (1.34 | ) | (0.47 | ) | (2.64 | ) | (1.48 | ) | (0.26 | ) | ||||||||||
Net Asset Value, End of Period(b) | $ | 23.43 | $ | 24.44 | $ | 22.24 | $ | 22.32 | $ | 24.82 | ||||||||||
Total Return(b)(c) | 1.41 | % | 12.15 | % | 12.14 | % | (4.51 | )% | 8.15 | % | ||||||||||
Ratios to Average Net Assets(d): |
| |||||||||||||||||||
Net assets, end of period (in 000’s) | $ | 40,931 | $ | 50,209 | $ | 12,139 | $ | 7,695 | $ | 381 | ||||||||||
Gross operating expenses(e) | 0.92 | % | 0.90 | % | 0.90 | % | 0.90 | % | 1.14 | % | ||||||||||
Net investment income | 4.30 | % | 0.89 | % | 1.73 | % | 2.39 | % | 1.24 | % | ||||||||||
Portfolio turnover rate | 105 | % | 99 | % | 94 | % | 175 | % | 121 | % | ||||||||||
| (a) | Net investment income (loss) per share was calculated using average shares outstanding during the period. |
| (b) | The Net Asset Value per share and total return have been calculated based on net assets which include adjustments made in accordance with U.S. Generally Accepted Accounting Principles required at period end for financial reporting purposes. These figures do not necessarily reflect the Net Asset Value per share or total return experienced by the shareholder at period end. |
| (c) | Total return is at net asset value assuming all distributions are reinvested and no initial sales charge or CDSC. For periods with waivers/reimbursements, had the Fund’s investment adviser not waived or reimbursed a portion of expenses, total return would have been lower. |
| (d) | All ratios for the period have been annualized, unless otherwise indicated. |
| (e) | Supplemental expense ratios are shown below: |
| For the Years Ended September 30, | ||||||||||||||||||||
| 2018 | 2017 | 2016 | 2015 | 2014 | ||||||||||||||||
Net operating expenses (net of waiver/reimbursement, if applicable, but gross of all other operating expenses) | 0.92 | % | 0.84 | % | 0.90 | % | 0.90 | % | 1.14 | % | ||||||||||
Interest expense and commitment fees | — | — | — | — | — | |||||||||||||||
Dividends and fees on securities sold short | — | — | — | — | — | |||||||||||||||
| See accompanying Notes to Financial Statements. | 61 |
Table of Contents
FINANCIAL HIGHLIGHTS
| HighlandTax-Exempt Fund, Class A | ||
Selected data for a share outstanding throughout each period is as follows:
| For the Years Ended September 30, | ||||||||||||||||||||
| 2018 | 2017 | 2016 | 2015 | 2014 | ||||||||||||||||
Net Asset Value, Beginning of Period | $ | 11.64 | $ | 11.82 | $ | 11.94 | $ | 12.08 | $ | 11.64 | ||||||||||
Income from Investment Operations: |
| |||||||||||||||||||
Net investment income(a) | 0.26 | 0.25 | 0.21 | 0.25 | 0.33 | |||||||||||||||
Net realized and unrealized gain/(loss) | (0.29 | ) | (0.18 | ) | 0.24 | — | 0.44 | |||||||||||||
|
|
|
|
|
|
|
|
|
| |||||||||||
Total from investment operations | (0.03 | ) | 0.07 | 0.45 | 0.25 | 0.77 | ||||||||||||||
Less Distributions Declared to Shareholders: |
| |||||||||||||||||||
From net investment income | (0.26 | ) | (0.25 | ) | (0.22 | ) | (0.26 | ) | (0.33 | ) | ||||||||||
From net realized gains | (0.31 | ) | — | (0.35 | ) | (0.13 | ) | — | ||||||||||||
|
|
|
|
|
|
|
|
|
| |||||||||||
Total distributions declared to shareholders | (0.57 | ) | (0.25 | ) | (0.57 | ) | (0.39 | ) | (0.33 | ) | ||||||||||
Net Asset Value, End of Period(b) | $ | 11.04 | $ | 11.64 | $ | 11.82 | $ | 11.94 | $ | 12.08 | ||||||||||
Total Return(b)(c) | (0.22 | )% | 0.67 | % | 3.85 | % | 2.07 | % | 6.67 | % | ||||||||||
Ratios to Average Net Assets(d): |
| |||||||||||||||||||
Net assets, end of period (in 000’s) | $ | 11,431 | $ | 12,802 | $ | 25,515 | $ | 18,435 | $ | 27,149 | ||||||||||
Gross operating expenses(e) | 1.49 | % | 1.32 | % | 1.11 | % | 1.06 | % | 0.98 | % | ||||||||||
Net investment income | 2.34 | % | 2.15 | % | 1.81 | % | 2.11 | % | 2.76 | % | ||||||||||
Portfolio turnover rate | 3 | % | 9 | % | 1 | % | 17 | % | 14 | % | ||||||||||
| (a) | Net investment income (loss) per share was calculated using average shares outstanding during the period. |
| (b) | The Net Asset Value per share and total return have been calculated based on net assets which include adjustments made in accordance with U.S. Generally Accepted Accounting Principles required at period end for financial reporting purposes. These figures do not necessarily reflect the Net Asset Value per share or total return experienced by the shareholder at period end. |
| (c) | Total return is at net asset value assuming all distributions are reinvested and no initial sales charge or CDSC. For periods with waivers/reimbursements, had the Fund’s investment adviser not waived or reimbursed a portion of expenses, total return would have been lower. |
| (d) | All ratios for the period have been annualized, unless otherwise indicated. |
| (e) | Supplemental expense ratios are shown below: |
| For the Years Ended September 30, | ||||||||||||||||||||
| 2018 | 2017 | 2016 | 2015 | 2014 | ||||||||||||||||
Net operating expenses (net of waiver/reimbursement, if applicable, but gross of all other operating expenses) | 0.90 | % | 0.91 | % | 0.91 | % | 0.92 | % | 0.98 | % | ||||||||||
Interest expense and commitment fees | — | 0.01 | % | — | 0.01 | % | — | |||||||||||||
Dividends and fees on securities sold short | — | — | — | — | — | |||||||||||||||
| 62 | See accompanying Notes to Financial Statements. |
Table of Contents
FINANCIAL HIGHLIGHTS
| HighlandTax-Exempt Fund, Class C | ||
Selected data for a share outstanding throughout each period is as follows:
| For the Years Ended September 30, | ||||||||||||||||||||
| 2018 | 2017 | 2016 | 2015 | 2014 | ||||||||||||||||
Net Asset Value, Beginning of Period | $ | 11.63 | $ | 11.81 | $ | 11.94 | $ | 12.07 | $ | 11.63 | ||||||||||
Income from Investment Operations: |
| |||||||||||||||||||
Net investment income(a) | 0.18 | 0.16 | 0.13 | 0.16 | 0.24 | |||||||||||||||
Net realized and unrealized gain/(loss) | (0.29 | ) | (0.17 | ) | 0.22 | — | 0.44 | |||||||||||||
|
|
|
|
|
|
|
|
|
| |||||||||||
Total from investment operations | (0.11 | ) | (0.01 | ) | 0.35 | 0.16 | 0.68 | |||||||||||||
Less Distributions Declared to Shareholders: |
| |||||||||||||||||||
From net investment income | (0.18 | ) | (0.17 | ) | (0.13 | ) | (0.16 | ) | (0.24 | ) | ||||||||||
From net realized gains | (0.31 | ) | — | (0.35 | ) | (0.13 | ) | — | ||||||||||||
|
|
|
|
|
|
|
|
|
| |||||||||||
Total distributions declared to shareholders | (0.49 | ) | (0.17 | ) | (0.48 | ) | (0.29 | ) | (0.24 | ) | ||||||||||
Net Asset Value, End of Period(b) | $ | 11.03 | $ | 11.63 | $ | 11.81 | $ | 11.94 | $ | 12.07 | ||||||||||
Total Return(b)(c) | (0.97 | )% | (0.08 | )% | 3.01 | % | 1.40 | % | 5.88 | % | ||||||||||
Ratios to Average Net Assets(d): |
| |||||||||||||||||||
Net assets, end of period (in 000’s) | $ | 573 | $ | 976 | $ | 1,849 | $ | 1,166 | $ | 925 | ||||||||||
Gross operating expenses(e) | 2.25 | % | 2.07 | % | 1.86 | % | 1.81 | % | 1.73 | % | ||||||||||
Net investment income | 1.58 | % | 1.42 | % | 1.08 | % | 1.37 | % | 2.01 | % | ||||||||||
Portfolio turnover rate | 3 | % | 9 | % | 1 | % | 17 | % | 14 | % | ||||||||||
| (a) | Net investment income (loss) per share was calculated using average shares outstanding during the period. |
| (b) | The Net Asset Value per share and total return have been calculated based on net assets which include adjustments made in accordance with U.S. Generally Accepted Accounting Principles required at period end for financial reporting purposes. These figures do not necessarily reflect the Net Asset Value per share or total return experienced by the shareholder at period end. |
| (c) | Total return is at net asset value assuming all distributions are reinvested and no initial sales charge or CDSC. For periods with waivers/reimbursements, had the Fund’s investment adviser not waived or reimbursed a portion of expenses, total return would have been lower. |
| (d) | All ratios for the period have been annualized, unless otherwise indicated. |
| (e) | Supplemental expense ratios are shown below: |
| For the Years Ended September 30, | ||||||||||||||||||||
| 2018 | 2017 | 2016 | 2015 | 2014 | ||||||||||||||||
Net operating expenses (net of waiver/reimbursement, if applicable, but gross of all other operating expenses) | 1.65 | % | 1.66 | % | 1.66 | % | 1.67 | % | 1.73 | % | ||||||||||
Interest expense and commitment fees | — | 0.01 | % | — | 0.01 | % | — | |||||||||||||
Dividends and fees on securities sold short | — | — | — | — | — | |||||||||||||||
| See accompanying Notes to Financial Statements. | 63 |
Table of Contents
FINANCIAL HIGHLIGHTS
| HighlandTax-Exempt Fund, Class Y | ||
Selected data for a share outstanding throughout each period is as follows:
| For the Years Ended September 30, | ||||||||||||||||||||
| 2018 | 2017 | 2016 | 2015 | 2014 | ||||||||||||||||
Net Asset Value, Beginning of Period | $ | 12.62 | $ | 12.82 | $ | 12.93 | $ | 13.06 | $ | 12.58 | ||||||||||
Income from Investment Operations: |
| |||||||||||||||||||
Net investment income(a) | 0.31 | 0.30 | 0.27 | 0.31 | 0.38 | |||||||||||||||
Net realized and unrealized gain/(loss) | (0.32 | ) | (0.19 | ) | 0.24 | — | 0.48 | |||||||||||||
|
|
|
|
|
|
|
|
|
| |||||||||||
Total from investment operations | (0.01 | ) | 0.11 | 0.51 | 0.31 | 0.86 | ||||||||||||||
Less Distributions Declared to Shareholders: |
| |||||||||||||||||||
From net investment income | (0.31 | ) | (0.31 | ) | (0.27 | ) | (0.31 | ) | (0.38 | ) | ||||||||||
From net realized gains | (0.31 | ) | — | (0.35 | ) | (0.13 | ) | — | ||||||||||||
|
|
|
|
|
|
|
|
|
| |||||||||||
Total distributions declared to shareholders | (0.62 | ) | (0.31 | ) | (0.62 | ) | (0.44 | ) | (0.38 | ) | ||||||||||
Net Asset Value, End of Period(b) | $ | 11.99 | $ | 12.62 | $ | 12.82 | $ | 12.93 | $ | 13.06 | ||||||||||
Total Return(b)(c) | (0.02 | )% | 0.88 | % | 4.03 | % | 2.42 | % | 6.97 | % | ||||||||||
Ratios to Average Net Assets(d): |
| |||||||||||||||||||
Net assets, end of period (in 000’s) | $ | 59 | $ | 38 | $ | 158 | $ | 426 | $ | 167 | ||||||||||
Gross operating expenses(e) | 1.23 | % | 1.07 | % | 0.86 | % | 0.81 | % | 0.72 | % | ||||||||||
Net investment income | 2.53 | % | 2.36 | % | 2.10 | % | 2.40 | % | 3.01 | % | ||||||||||
Portfolio turnover rate | 3 | % | 9 | % | 1 | % | 17 | % | 14 | % | ||||||||||
| (a) | Net investment income (loss) per share was calculated using average shares outstanding during the period. |
| (b) | The Net Asset Value per share and total return have been calculated based on net assets which include adjustments made in accordance with U.S. Generally Accepted Accounting Principles required at period end for financial reporting purposes. These figures do not necessarily reflect the Net Asset Value per share or total return experienced by the shareholder at period end. |
| (c) | Total return is at net asset value assuming all distributions are reinvested and no initial sales charge or CDSC. For periods with waivers/reimbursements, had the Fund’s investment adviser not waived or reimbursed a portion of expenses, total return would have been lower. |
| (d) | All ratios for the period have been annualized, unless otherwise indicated. |
| (e) | Supplemental expense ratios are shown below: |
| For the Years Ended September 30, | ||||||||||||||||||||
| 2018 | 2017 | 2016 | 2015 | 2014 | ||||||||||||||||
Net operating expenses (net of waiver/reimbursement, if applicable, but gross of all other operating expenses) | 0.64 | % | 0.66 | % | 0.66 | % | 0.67 | % | 0.72 | % | ||||||||||
Interest expense and commitment fees | — | 0.01 | % | — | 0.01 | % | — | |||||||||||||
Dividends and fees on securities sold short | — | — | — | — | — | |||||||||||||||
| 64 | See accompanying Notes to Financial Statements. |
Table of Contents
FINANCIAL HIGHLIGHTS
| Highland Fixed Income Fund, Class A | ||
Selected data for a share outstanding throughout each period is as follows:
| For the Years Ended September 30, | ||||||||||||||||||||
| 2018 | 2017 | 2016 | 2015 | 2014 | ||||||||||||||||
Net Asset Value, Beginning of Period | $ | 12.98 | $ | 13.06 | $ | 12.58 | $ | 12.79 | $ | 12.61 | ||||||||||
Income from Investment Operations: |
| |||||||||||||||||||
Net investment income(a) | 0.33 | 0.32 | 0.33 | 0.27 | 0.24 | |||||||||||||||
Net realized and unrealized gain/(loss) | (0.28 | ) | (0.06 | ) | 0.50 | (0.18 | ) | 0.20 | ||||||||||||
|
|
|
|
|
|
|
|
|
| |||||||||||
Total from investment operations | 0.05 | 0.26 | 0.83 | 0.09 | 0.44 | |||||||||||||||
Less Distributions Declared to Shareholders: |
| |||||||||||||||||||
From net investment income | (0.32 | ) | (0.32 | ) | (0.32 | ) | (0.27 | ) | (0.24 | ) | ||||||||||
From return of capital | (0.02 | ) | (0.02 | ) | (0.03 | ) | (0.03 | ) | (0.02 | ) | ||||||||||
|
|
|
|
|
|
|
|
|
| |||||||||||
Total distributions declared to shareholders | (0.34 | ) | (0.34 | ) | (0.35 | ) | (0.30 | ) | (0.26 | ) | ||||||||||
Net Asset Value, End of Period(b) | $ | 12.69 | $ | 12.98 | $ | 13.06 | $ | 12.58 | $ | 12.79 | ||||||||||
Total Return(b)(c) | 0.43 | % | 2.06 | % | 6.72 | % | 0.66 | % | 3.47 | % | ||||||||||
Ratios to Average Net Assets(d): |
| |||||||||||||||||||
Net assets, end of period (in 000’s) | $ | 96,380 | $ | 104,803 | $ | 118,519 | $ | 126,892 | $ | 144,839 | ||||||||||
Gross operating expenses(e) | 0.92 | % | 0.93 | % | 0.91 | % | 0.86 | % | 0.97 | % | ||||||||||
Net investment income | 2.55 | % | 2.48 | % | 2.58 | % | 2.09 | % | 1.91 | % | ||||||||||
Portfolio turnover rate | 45 | % | 20 | % | 46 | % | 57 | % | 283 | % | ||||||||||
| (a) | Net investment income (loss) per share was calculated using average shares outstanding during the period. |
| (b) | The Net Asset Value per share and total return have been calculated based on net assets which include adjustments made in accordance with U.S. Generally Accepted Accounting Principles required at period end for financial reporting purposes. These figures do not necessarily reflect the Net Asset Value per share or total return experienced by the shareholder at period end. |
| (c) | Total return is at net asset value assuming all distributions are reinvested and no initial sales charge or CDSC. For periods with waivers/reimbursements, had the Fund’s investment adviser not waived or reimbursed a portion of expenses, total return would have been lower. |
| (d) | All ratios for the period have been annualized, unless otherwise indicated. |
| (e) | Supplemental expense ratios are shown below: |
| For the Years Ended September 30, | ||||||||||||||||||||
| 2018 | 2017 | 2016 | 2015 | 2014 | ||||||||||||||||
Net operating expenses (net of waiver/reimbursement, if applicable, but gross of all other operating expenses) | 0.89 | % | 0.90 | % | 0.90 | % | 0.86 | % | 0.97 | % | ||||||||||
Interest expense and commitment fees | — | — | — | 0.01 | % | — | ||||||||||||||
Dividends and fees on securities sold short | — | — | — | — | — | |||||||||||||||
| See accompanying Notes to Financial Statements. | 65 |
Table of Contents
FINANCIAL HIGHLIGHTS
| Highland Fixed Income Fund, Class C | ||
Selected data for a share outstanding throughout each period is as follows:
| For the Years Ended September 30, | ||||||||||||||||||||
| 2018 | 2017 | 2016 | 2015 | 2014 | ||||||||||||||||
Net Asset Value, Beginning of Period | $ | 12.99 | $ | 13.08 | $ | 12.60 | $ | 12.80 | $ | 12.62 | ||||||||||
Income from Investment Operations: |
| |||||||||||||||||||
Net investment income(a) | 0.23 | 0.22 | 0.24 | 0.18 | 0.15 | |||||||||||||||
Net realized and unrealized gain/(loss) | (0.26 | ) | (0.06 | ) | 0.50 | (0.18 | ) | 0.19 | ||||||||||||
|
|
|
|
|
|
|
|
|
| |||||||||||
Total from investment operations | (0.03 | ) | 0.16 | 0.74 | — | 0.34 | ||||||||||||||
Less Distributions Declared to Shareholders: |
| |||||||||||||||||||
From net investment income | (0.24 | ) | (0.23 | ) | (0.23 | ) | (0.17 | ) | (0.15 | ) | ||||||||||
From return of capital | (0.01 | ) | (0.02 | ) | (0.03 | ) | (0.03 | ) | (0.01 | ) | ||||||||||
|
|
|
|
|
|
|
|
|
| |||||||||||
Total distributions declared to shareholders | (0.25 | ) | (0.25 | ) | (0.26 | ) | (0.20 | ) | (0.16 | ) | ||||||||||
Net Asset Value, End of Period(b) | $ | 12.71 | $ | 12.99 | $ | 13.08 | $ | 12.60 | $ | 12.80 | ||||||||||
Total Return(b)(c) | (0.23 | )% | 1.23 | % | 5.92 | % | (0.01 | )% | 2.62 | % | ||||||||||
Ratios to Average Net Assets(d): |
| |||||||||||||||||||
Net assets, end of period (in 000’s) | $ | 2,970 | $ | 2,893 | $ | 5,585 | $ | 3,697 | $ | 3,082 | ||||||||||
Gross operating expenses(e) | 1.67 | % | 1.68 | % | 1.66 | % | 1.61 | % | 1.72 | % | ||||||||||
Net investment income | 1.81 | % | 1.74 | % | 1.87 | % | 1.35 | % | 1.16 | % | ||||||||||
Portfolio turnover rate | 45 | % | 20 | % | 46 | % | 57 | % | 283 | % | ||||||||||
| (a) | Net investment income (loss) per share was calculated using average shares outstanding during the period. |
| (b) | The Net Asset Value per share and total return have been calculated based on net assets which include adjustments made in accordance with U.S. Generally Accepted Accounting Principles required at period end for financial reporting purposes. These figures do not necessarily reflect the Net Asset Value per share or total return experienced by the shareholder at period end. |
| (c) | Total return is at net asset value assuming all distributions are reinvested and no initial sales charge or CDSC. For periods with waivers/reimbursements, had the Fund’s investment adviser not waived or reimbursed a portion of expenses, total return would have been lower. |
| (d) | All ratios for the period have been annualized, unless otherwise indicated. |
| (e) | Supplemental expense ratios are shown below: |
| For the Years Ended September 30, | ||||||||||||||||||||
| 2018 | 2017 | 2016 | 2015 | 2014 | ||||||||||||||||
Net operating expenses (net of waiver/reimbursement, if applicable, but gross of all other operating expenses) | 1.64 | % | 1.65 | % | 1.65 | % | 1.61 | % | 1.72 | % | ||||||||||
Interest expense and commitment fees | — | — | — | 0.01 | % | — | ||||||||||||||
Dividends and fees on securities sold short | — | — | — | — | — | |||||||||||||||
| 66 | See accompanying Notes to Financial Statements. |
Table of Contents
FINANCIAL HIGHLIGHTS
| Highland Fixed Income Fund, Class Y | ||
Selected data for a share outstanding throughout each period is as follows:
| For the Years Ended September 30, | ||||||||||||||||||||
| 2018 | 2017 | 2016 | 2015 | 2014 | ||||||||||||||||
Net Asset Value, Beginning of Period | $ | 12.97 | $ | 13.05 | $ | 12.57 | $ | 12.78 | $ | 12.60 | ||||||||||
Income from Investment Operations: |
| |||||||||||||||||||
Net investment income(a) | 0.35 | 0.35 | 0.36 | 0.32 | 0.27 | |||||||||||||||
Net realized and unrealized gain/(loss) | (0.26 | ) | (0.05 | ) | 0.50 | (0.20 | ) | 0.20 | ||||||||||||
|
|
|
|
|
|
|
|
|
| |||||||||||
Total from investment operations | 0.09 | 0.30 | 0.86 | 0.12 | 0.47 | |||||||||||||||
Less Distributions Declared to Shareholders: |
| |||||||||||||||||||
From net investment income | (0.36 | ) | (0.35 | ) | (0.35 | ) | (0.30 | ) | (0.27 | ) | ||||||||||
From return of capital | (0.02 | ) | (0.03 | ) | (0.03 | ) | (0.03 | ) | (0.02 | ) | ||||||||||
|
|
|
|
|
|
|
|
|
| |||||||||||
Total distributions declared to shareholders | (0.38 | ) | (0.38 | ) | (0.38 | ) | (0.33 | ) | (0.29 | ) | ||||||||||
Net Asset Value, End of Period(b) | $ | 12.68 | $ | 12.97 | $ | 13.05 | $ | 12.57 | $ | 12.78 | ||||||||||
Total Return(b)(c) | 0.68 | % | 2.31 | % | 6.99 | % | 0.91 | % | 3.73 | % | ||||||||||
Ratios to Average Net Assets(d): |
| |||||||||||||||||||
Net assets, end of period (in 000’s) | $ | 96,936 | $ | 32,679 | $ | 2,899 | $ | 4,029 | $ | 222 | ||||||||||
Gross operating expenses(e) | 0.67 | % | 0.68 | % | 0.66 | % | 0.61 | % | 0.72 | % | ||||||||||
Net investment income | 2.76 | % | 2.71 | % | 2.83 | % | 2.45 | % | 2.13 | % | ||||||||||
Portfolio turnover rate | 45 | % | 20 | % | 46 | % | 57 | % | 283 | % | ||||||||||
| (a) | Net investment income (loss) per share was calculated using average shares outstanding during the period. |
| (b) | The Net Asset Value per share and total return have been calculated based on net assets which include adjustments made in accordance with U.S. Generally Accepted Accounting Principles required at period end for financial reporting purposes. These figures do not necessarily reflect the Net Asset Value per share or total return experienced by the shareholder at period end. |
| (c) | Total return is at net asset value assuming all distributions are reinvested and no initial sales charge or CDSC. For periods with waivers/reimbursements, had the Fund’s investment adviser not waived or reimbursed a portion of expenses, total return would have been lower. |
| (d) | All ratios for the period have been annualized, unless otherwise indicated. |
| (e) | Supplemental expense ratios are shown below: |
| For the Years Ended September 30, | ||||||||||||||||||||
| 2018 | 2017 | 2016 | 2015 | 2014 | ||||||||||||||||
Net operating expenses (net of waiver/reimbursement, if applicable, but gross of all other operating expenses) | 0.66 | % | 0.65 | % | 0.65 | % | 0.61 | % | 0.72 | % | ||||||||||
Interest expense and commitment fees | — | — | — | 0.01 | % | — | ||||||||||||||
Dividends and fees on securities sold short | — | — | — | — | — | |||||||||||||||
| See accompanying Notes to Financial Statements. | 67 |
Table of Contents
| September 30, 2018 | Highland Funds II | |
Note 1. Organization
Highland Funds II (the “Trust”) is a Massachusetts business trust organized on August 10, 1992. The Trust is registered under the Investment Company Act of 1940, as amended (the “1940 Act”), as anopen-end management investment company. It comprises seven portfolios (each a “Fund” and collectively the “Funds”) that are currently being offered. This report covers information for the year ended September 30, 2018 for five of the Funds: Highland Premier Growth Equity Fund (the “Premier Growth Equity Fund”), HighlandSmall-Cap Equity Fund (the“Small-Cap Equity Fund”), Highland Total Return Fund (the “Total Return Fund”), HighlandTax-Exempt Fund (the“Tax-Exempt Fund”) and Highland Fixed Income Fund (the “Fixed Income Fund”). The Highland Energy MLP Fund and Highland Global Allocation Fund are reported separately.
Fund Shares
Each Fund is authorized to issue an unlimited number of shares of beneficial interest with a par value of $0.001 per share (each a “Share” and collectively, the “Shares”). Each Fund currently offers the following three share classes to investors, Class A, Class C, and Class Y Shares.
Class A Shares are sold with afront-end sales charge. Maximum sales load imposed on purchases of Class A Shares (as a percentage of offering price) is as follows:
| Fund | % | |||
Premier Growth Equity Fund | 5.75 | |||
Small-Cap Equity Fund | 5.75 | |||
Total Return Fund | 5.75 | |||
Tax-Exempt Fund | 4.25 | |||
Fixed Income Fund | 4.25 | |||
There is nofront-end sales charge imposed on individual purchases of Class A Shares of $1 million or more. Purchases of $1 million or more of Class A Shares at net asset value (“NAV”) pursuant to a sales charge waiver are subject to a 0.50% contingent deferred sales charge (“CDSC”) if redeemed within one year of purchase. Thefront-end sales charge is also waived in other instances as described in the Funds’ prospectus.
Class C shares may be subject to a CDSC. The maximum CDSC imposed on redemptions of Class C Shares is 1.00% within the first year of purchase and 0.00% thereafter.
Nofront-end or CDSCs are assessed by the Trust with respect to Class Y Shares of all Funds.
Note 2. Significant Accounting Policies
The following summarizes the significant accounting policies consistently followed by the Funds in the preparation of their financial statements.
Use of Estimates
TheFunds are investment companies that apply the accounting and reporting guidance of Accounting Standards Codification Topic 946 applicable to investment companies. The Funds’financial statements have been prepared in conformity with accounting principles generally accepted in the United States of America (“GAAP”), which require Highland Capital Management Fund Advisors, L.P. (the “Investment Adviser”) to make estimates and assumptions that affect the reported amounts of assets and liabilities, the disclosure of contingent assets and liabilities at the date of the financial statements and the reported amounts of revenue and expenses during the reporting period. Changes in the economic environment, financial markets and any other parameters used in determining these estimates could cause actual results to differ materially.
Determination of Class Net Asset Values
Each Funds’ income, expenses (other than distribution fees and shareholder service fees) and realized and unrealized gains and losses are allocated proportionally each day among each Fund’s respective share classes based upon the relative net assets of each share class. Expenses of the Trust, other than those incurred by a specific Fund, are allocated pro rata among the Funds and their share classes. Certain class specific expenses (such as distribution and shareholder service fees) are allocated to the class that incurs such expense.
Valuation of Investments
In computing the Funds’ net assets attributable to shares, securities with readily available market quotations on the New York Stock Exchange (NYSE), National Association of Securities Dealers Automated Quotation (NASDAQ) or other nationally recognized exchange, use the closing quotations on the respective exchange for valuation of those securities. Securities for which there are no readily available market quotations will be valued pursuant to policies adopted by the Funds’ Board of Trustees (the “Board”). Typically, such securities will be valued at the mean between the most recently quoted bid and ask prices provided by the principal market makers. If there is more than one such principal market maker, the value shall be the average of such means. Securities without a sale price or quotations from principal market makers on the valuation day may be priced by an independent pricing service. Generally, the Funds’ loan and bond positions are not traded on exchanges and consequently are valued based on a mean of the bid and ask price from the third-party pricing services or broker-dealer sources that the Investment Adviser has determined to have the capability which provide appropriate pricing services and which have been approved by the Board.
Securities for which market quotations are not readily available, or for which the Funds have determined that the price
| 68 | Annual Report |
Table of Contents
NOTES TO FINANCIAL STATEMENTS (continued)
| September 30, 2018 | Highland Funds II | |
received from a pricing service or broker-dealer is “stale” or otherwise does not represent fair value (such as when events materially affecting the value of securities occur between the time when market price is determined and calculation of the Funds’ NAV) will be valued by the Funds at fair value, as determined by the Board or its designee in good faith in accordance with procedures approved by the Board, taking into account factors reasonably determined to be relevant, including: (i) the fundamental analytical data relating to the investment; (ii) the nature and duration of restrictions on disposition of the securities; and (iii) an evaluation of the forces that influence the market in which these securities are purchased and sold. In these cases, the Funds’ NAV will reflect the affected portfolio securities’ fair value as determined in the judgment of the Board or its designee instead of being determined by the market. Using a fair value pricing methodology to value securities may result in a value that is different from a security’s most recent sale price and from the prices used by other investment companies to calculate their NAVs. Determination of fair value is uncertain because it involves subjective judgments and estimates.
There can be no assurance that the Funds’ valuation of a security will not differ from the amount that it realizes upon the sale of such security. Those differences could have a material impact to the Funds. The NAV shown in the Funds’ financial statements may vary from the NAV published by each Fund as of its period end because portfolio securities transactions are accounted for on the trade date (rather than the day following the trade date) for financial statement purposes.
Fair Value Measurements
The Funds have performed an analysis of all existing investments and derivative instruments to determine the significance and character of inputs to their fair value determination. The levels of fair value inputs used to measure the Funds’ investments are characterized into a fair value hierarchy. Where inputs for an asset or liability fall into more than one level in the fair value hierarchy, the investment is classified in its entirety based on the lowest level input that is significant to that investment’s valuation. The three levels of the fair value hierarchy are described below:
| Level 1 — | Quoted unadjusted prices for identical instruments in active markets to which the Fund has access at the date of measurement; |
| Level 2 — | Quoted prices for similar instruments in active markets; quoted prices for identical or similar instruments in markets that are not active, but are valued based on executed trades; broker quotations that constitute an executable price; and alternative pricing sources supported by observable inputs are classified within Level 2. Level 2 inputs are either directly or indirectly |
| observable for the asset in connection with market data at the measurement date; and |
| Level 3 — | Model derived valuations in which one or more significant inputs or significant value drivers are unobservable. In certain cases, investments classified within Level 3 may include securities for which the Fund has obtained indicative quotes from broker-dealers that do not necessarily represent prices the broker may be willing to trade on, as such quotes can be subject to material management judgment. Unobservable inputs are those inputs that reflect the Fund’s own assumptions that market participants would use to price the asset or liability based on the best available information. |
The Investment Adviser has established policies and procedures, as described above and approved by the Board, to ensure that valuation methodologies for investments and financial instruments that are categorized within all levels of the fair value hierarchy are fair and consistent. A Pricing Committee has been established to provide oversight of the valuation policies, processes and procedures, and is comprised of personnel from the Investment Adviser and its affiliates. The Pricing Committee meets monthly to review the proposed valuations for investments and financial instruments and is responsible for evaluating the overall fairness and consistent application of established policies.
As of September 30, 2018, the Funds’ investments consisted of senior loans, asset-backed securities, bonds and notes, common stocks, master limited partnerships, registered investment companies, cash equivalents, commercial paper, preferred stocks, exchange-traded funds, rights, warrants, securities sold short, futures, equity swaps, collateralized loan obligations, and options. The fair value of the Funds’ loans, bonds and asset-backed securities are generally based on quotes received from brokers or independent pricing services. Loans, bonds and asset-backed securities with quotes that are based on actual trades with a sufficient level of activity on or near the measurement date are classified as Level 2 assets. Senior loans, bonds and asset-backed securities that are priced using quotes derived from implied values, indicative bids, or a limited number of actual trades are classified as Level 3 assets because the inputs used by the brokers and pricing services to derive the values are not readily observable.
The fair value of the Funds’ common stocks, preferred stocks, exchange-traded funds, rights, warrants and options that are not actively traded on national exchanges are generally priced using quotes derived from implied values, indicative bids, or a limited amount of actual trades and are classified as Level 3 assets because the inputs used by the brokers and pricing services to derive the values are not
| Annual Report | 69 |
Table of Contents
NOTES TO FINANCIAL STATEMENTS (continued)
| September 30, 2018 | Highland Funds II | |
readily observable. Exchange-traded options are valued based on the last trade price on the primary exchange on which they trade. If an option does not trade, themid-price, which is the mean of the bid and ask price, is utilized to value the option.
At the end of each calendar quarter, the Investment Adviser evaluates the Level 2 and 3 assets and liabilities for changes in liquidity, including but not limited to: whether a broker is willing to execute at the quoted price, the depth and consistency of prices from third party services, and the existence of contemporaneous, observable trades in the market. Additionally, the Investment Adviser evaluates the Level 1 and 2
assets and liabilities on a quarterly basis for changes in list ings or delistings on national exchanges.
Due to the inherent uncertainty of determining the fair value of investments that do not have a readily available market value, the fair value of the Funds’ investments may fluctuate from period to period. Additionally, the fair value of investments may differ significantly from the values that would have been used had a ready market existed for such investments and may differ materially from the values the Funds may ultimately realize. Further, such investments may be subject to legal and other restrictions on resale or otherwise less liquid than publicly traded securities.
The inputs or methodology used for valuing securities are not necessarily an indication of the risk associated with investing in those securities. A summary of the inputs used to value each Fund’s assets as of September 30, 2018 is as follows:
| Total value at September 30, 2018 | Level 1 Quoted Price | Level 2 Significant Observable Inputs | Level 3 Significant Unobservable Inputs | |||||||||||||
Premier Growth Equity Fund | ||||||||||||||||
Assets |
| |||||||||||||||
Common Stocks | ||||||||||||||||
Banks | $ | 3,085,800 | $ | 3,085,800 | $ | — | $ | — | ||||||||
Capital Goods | 2,962,100 | 2,962,100 | — | — | ||||||||||||
Diversified Financials | 4,546,950 | 4,546,950 | — | — | ||||||||||||
Energy | 8,105,000 | 8,105,000 | — | — | ||||||||||||
Healthcare Equipment & Services | 3,922,000 | 3,922,000 | — | — | ||||||||||||
Materials | 1,867,730 | 1,365,630 | — | 502,100 | ||||||||||||
Media | 2,723,500 | 2,723,500 | — | — | ||||||||||||
Pharmaceutical, Biotechnology & Life Science | 9,534,220 | 9,534,220 | — | — | ||||||||||||
Real Estate | 1,077,800 | 1,077,800 | — | — | ||||||||||||
Retail | 9,049,990 | 9,049,990 | — | — | ||||||||||||
Semiconductors & Semiconductor Equipment | 17,505,630 | 17,505,630 | — | — | ||||||||||||
Software & Services | 47,494,488 | 47,494,488 | — | — | ||||||||||||
Technology Hardware & Equipment | 17,024,682 | 17,024,682 | — | — | ||||||||||||
Telecommunication Services | 2,726,504 | 2,726,504 | — | — | ||||||||||||
Transportation | 3,082,590 | 3,082,590 | — | — | ||||||||||||
Utilities | 2,239,200 | 2,239,200 | — | — | ||||||||||||
Preferred Stocks | 1,952,176 | — | — | 1,952,176 | ||||||||||||
Exchange-Traded Funds | 594,200 | 594,200 | — | — | ||||||||||||
Purchased Call Options | 123,000 | 123,000 | — | — | ||||||||||||
Purchased Put Options | 15,500 | 15,500 | — | — | ||||||||||||
Registered Investment Companies | 8,248,589 | 8,248,589 | — | — | ||||||||||||
Total Return Swaps | 3,905 | — | 3,905 | — | ||||||||||||
|
|
|
|
|
|
|
| |||||||||
Total Assets | 147,885,554 | 145,427,373 | 3,905 | 2,454,276 | ||||||||||||
|
|
|
|
|
|
|
| |||||||||
Liabilities |
| |||||||||||||||
Other Financial Instruments | ||||||||||||||||
Written Options Contracts | (28,200 | ) | (28,200 | ) | — | — | ||||||||||
Written Put Options Contracts | (74,802 | ) | (74,802 | ) | — | — | ||||||||||
Swap Contracts Outstanding | (42,692 | ) | — | (42,692 | ) | — | ||||||||||
|
|
|
|
|
|
|
| |||||||||
Total Liabilities | (145,694 | ) | (103,002 | ) | (42,692 | ) | — | |||||||||
|
|
|
|
|
|
|
| |||||||||
Total | $ | 147,739,860 | $ | 145,324,371 | $ | (38,787 | ) | $ | 2,454,276 | |||||||
|
|
|
|
|
|
|
| |||||||||
| 70 | Annual Report |
Table of Contents
NOTES TO FINANCIAL STATEMENTS (continued)
| September 30, 2018 | Highland Funds II | |
| Total value at September 30, 2018 | Level 1 Quoted Price | Level 2 Significant Observable Inputs | Level 3 Significant Unobservable Inputs | |||||||||||||
Small-Cap Equity Fund | ||||||||||||||||
Assets |
| |||||||||||||||
Common Stocks(1) | $ | 56,753,197 | $ | 56,753,197 | $ | — | $ | — | ||||||||
Master Limited Partnerships(1) | 3,985,432 | 3,985,432 | — | — | ||||||||||||
Registered Investment Companies | 2,784,859 | 2,784,859 | — | — | ||||||||||||
|
|
|
|
|
|
|
| |||||||||
Total Assets | 63,523,488 | 63,523,488 | — | — | ||||||||||||
|
|
|
|
|
|
|
| |||||||||
Liabilities |
| |||||||||||||||
Securities Sold Short(1) | ||||||||||||||||
Exchange-Traded Funds | (9,353,795 | ) | (9,353,795 | ) | — | — | ||||||||||
|
|
|
|
|
|
|
| |||||||||
Total Liabilities | (9,353,795 | ) | (9,353,795 | ) | — | — | ||||||||||
|
|
|
|
|
|
|
| |||||||||
Total | $ | 54,169,693 | $ | 54,169,693 | $ | — | $ | — | ||||||||
|
|
|
|
|
|
|
| |||||||||
| (1) | See Investment Portfolio detail for industry breakout. |
| Total value at September 30, 2018 | Level 1 Quoted Price | Level 2 Significant Observable Inputs | Level 3 Significant Unobservable Inputs | |||||||||||||
Total Return Fund | ||||||||||||||||
Assets |
| |||||||||||||||
Agency Collateralized Mortgage Obligations | $ | 12,392 | $ | — | $ | 12,392 | $ | — | ||||||||
Agency Mortgage-Backed Securities | 1,426,837 | — | 1,426,837 | — | ||||||||||||
Asset-Backed Securities | 2 | — | 2 | — | ||||||||||||
Corporate Bonds & Notes(1) | 13,871,447 | — | 13,871,447 | — | ||||||||||||
Foreign Corporate Bonds & Notes(1) | 127,908 | — | 127,908 | — | ||||||||||||
Non-Agency Collateralized Mortgage-Backed Securities | 120,598 | — | 120,598 | — | ||||||||||||
U.S. Treasuries | 1,478,554 | — | 1,478,554 | — | ||||||||||||
U.S. Treasury Bills | 4,960,274 | — | 4,960,274 | — | ||||||||||||
Domestic Equity | ||||||||||||||||
Common Stocks | ||||||||||||||||
Consumer Durables & Apparel | 2,328,680 | 2,328,680 | — | — | ||||||||||||
Consumer Services | 296,000 | 296,000 | — | — | ||||||||||||
Diversified Financials | 12,315,879 | 12,315,879 | — | — | ||||||||||||
Energy | 258,706 | 258,706 | — | — | ||||||||||||
Food, Beverage & Tobacco | 2,976,210 | 2,976,210 | — | — | ||||||||||||
Materials | 360,561 | 360,561 | — | — | ||||||||||||
Media | 7,211,134 | 7,211,134 | — | — | ||||||||||||
Real Estate | 1,986,865 | 1,973,330 | — | 13,535 | ||||||||||||
Software & Services | 3,569,222 | 3,569,222 | — | |||||||||||||
Telecommunication Services | 4,153,165 | 4,153,165 | — | — | ||||||||||||
Preferred Stocks(1) | 1,507,228 | 1,507,228 | — | — | ||||||||||||
Foreign Equity | ||||||||||||||||
Common Stocks | 21,499,570 | 21,499,570 | — | — | ||||||||||||
Registered Investment Companies | 5,724,565 | 5,724,565 | — | — | ||||||||||||
Cash Equivalents | 4,266,261 | 4,266,261 | — | — | ||||||||||||
Commercial Paper | 1,248,840 | — | 1,248,840 | — | ||||||||||||
|
|
|
|
|
|
|
| |||||||||
Total | $ | 91,700,898 | $ | 68,440,511 | $ | 23,246,852 | $ | 13,535 | ||||||||
|
|
|
|
|
|
|
| |||||||||
| (1) | See Investment Portfolio detail for industry breakout. |
| Annual Report | 71 |
Table of Contents
NOTES TO FINANCIAL STATEMENTS (continued)
| September 30, 2018 | Highland Funds II | |
| Total value at September 30, 2018 | Level 1 Quoted Price | Level 2 Significant Observable Inputs | Level 3 Significant Unobservable Inputs | |||||||||||||
Tax-Exempt Fund | ||||||||||||||||
Assets |
| |||||||||||||||
Municipal Bonds & Notes(1) | $ | 11,831,137 | $ | — | $ | 11,831,137 | $ | — | ||||||||
Cash Equivalents | 382,611 | 382,611 | — | — | ||||||||||||
|
|
|
|
|
|
|
| |||||||||
Total | $ | 12,213,748 | $ | 382,611 | $ | 11,831,137 | $ | — | ||||||||
|
|
|
|
|
|
|
| |||||||||
| (1) | See Investment Portfolio detail for industry breakout. |
| Total value at September 30, 2018 | Level 1 Quoted Price | Level 2 Significant Observable Inputs | Level 3 Significant Unobservable Inputs | |||||||||||||
Fixed Income Fund | ||||||||||||||||
Assets |
| |||||||||||||||
Agency Collateralized Mortgage Obligations | $ | 6,259,905 | $ | — | $ | 6,259,905 | $ | — | ||||||||
Agency Mortgage-Backed Securities | 24,315,101 | — | 24,315,101 | — | ||||||||||||
Asset-Backed Securities | 14,804,592 | — | 14,804,592 | — | ||||||||||||
Corporate Bonds & Notes | ||||||||||||||||
Banks | 14,119,854 | — | 14,119,854 | — | ||||||||||||
Capital Goods | 1,131,371 | — | 1,131,371 | — | ||||||||||||
Chemicals | 1,731,049 | — | 1,731,049 | — | ||||||||||||
Commercial & Professional Services | 782,379 | — | 782,379 | — | ||||||||||||
Consumer Services | 622,811 | — | 622,811 | — | ||||||||||||
Diversified Financials | 22,612,246 | 1,012,108 | 21,600,138 | — | ||||||||||||
Energy | 4,814,525 | — | 4,814,525 | — | ||||||||||||
Environmental Control | 1,158,294 | — | 1,158,294 | — | ||||||||||||
Food & Staples Retailing | 2,816,018 | — | 2,816,018 | — | ||||||||||||
Food, Beverage & Tobacco | 2,621,141 | — | 2,621,141 | — | ||||||||||||
Healthcare Equipment & Services | 512,144 | — | 512,144 | — | ||||||||||||
Industrials | 2,966,002 | — | 2,966,002 | — | ||||||||||||
Insurance | 4,993,316 | — | 4,993,316 | — | ||||||||||||
Materials | 1,003,580 | — | 1,003,580 | — | ||||||||||||
Media | 3,420,879 | — | 3,420,879 | — | ||||||||||||
Pharmaceuticals, Biotechnology & Life Sciences | 774,954 | — | 774,954 | — | ||||||||||||
Real Estate | 8,097,532 | — | 8,097,532 | — | ||||||||||||
Retailing | 864,054 | — | 864,054 | — | ||||||||||||
Semiconductors & Semiconductor Equipment | 104,823 | — | 104,823 | — | ||||||||||||
Software & Services | 1,726,948 | — | 1,726,948 | — | ||||||||||||
Technology Hardware & Equipment | 2,005,592 | — | 2,005,592 | — | ||||||||||||
Telecommunication Services | 1,465,587 | — | 1,465,587 | — | ||||||||||||
Transportation | 1,000,032 | — | 1,000,032 | — | ||||||||||||
Utilities | 5,026,635 | — | 5,026,635 | — | ||||||||||||
Foreign Corporate Bonds & Notes(1) | 6,566,677 | — | 6,566,677 | — | ||||||||||||
Municipal Bonds & Notes(1) | 15,843,793 | — | 15,843,793 | — | ||||||||||||
Non-Agency Collateralized Mortgage-Backed Securities | 1,809,761 | — | 1,809,761 | — | ||||||||||||
U.S. Government Agencies | 5,434,244 | — | 5,434,244 | — | ||||||||||||
U.S. Government Agency—Asset-Backed Securities | 3,999,057 | — | 3,999,057 | — | ||||||||||||
U.S. Treasuries | 8,687,833 | — | 8,687,833 | — | ||||||||||||
U.S. Treasury Bills | 2,586,507 | — | 2,586,507 | — | ||||||||||||
| 72 | Annual Report |
Table of Contents
NOTES TO FINANCIAL STATEMENTS (continued)
| September 30, 2018 | Highland Funds II | |
| Total value at September 30, 2018 | Level 1 Quoted Price | Level 2 Significant Observable Inputs | Level 3 Significant Unobservable Inputs | |||||||||||||
Fixed Income Fund (continued) | ||||||||||||||||
Domestic Equity | ||||||||||||||||
Common Stocks | ||||||||||||||||
Real Estate | $ | 4,212,405 | $ | 3,969,743 | $ | — | $ | 242,662 | ||||||||
Preferred Stocks(1) | 5,270,404 | 5,270,404 | — | — | ||||||||||||
Registered Investment Companies | 16,130,761 | 16,130,761 | — | — | ||||||||||||
Cash Equivalents | 2,498,173 | 2,498,173 | — | — | ||||||||||||
|
|
|
|
|
|
|
| |||||||||
Total | $ | 204,790,979 | $ | 28,881,189 | $ | 175,667,128 | $ | 242,662 | ||||||||
|
|
|
|
|
|
|
| |||||||||
| (1) | See Investment Portfolio detail for industry breakout. |
The tables below set forth a summary of changes in the Premier Growth Equity Fund, Total Return Fund and Fixed Income Fund assets measured at fair value using significant unobservable inputs (Level 3) for the year ended September 30, 2018.
| Balance as of September 30, 2017 | Transfers Into Level 3 | Transfers Out of Level 3 | Accrued Discounts (Premiums) | Realized Gain (Loss) | Net Unrealized Appreciation (Depreciation) | Net Purchases | Net Sales | Balance as of September 30, 2018 | Change in Unrealized Appreciation (Depreciation) from Investments held at September 30, 2018 | |||||||||||||||||||||||||||||||
Highland Premier Growth Equity Fund |
| |||||||||||||||||||||||||||||||||||||||
Common Stocks | ||||||||||||||||||||||||||||||||||||||||
Materials | $ | — | $ | — | $ | — | $ | — | $ | — | $ | 304,100 | $ | 198,000 | $ | — | $ | 502,100 | $ | 304,100 | ||||||||||||||||||||
Preferred Stocks | ||||||||||||||||||||||||||||||||||||||||
Software & Services | 2,582,611 | — | — | — | — | (630,435 | ) | — | — | 1,952,176 | (630,435 | ) | ||||||||||||||||||||||||||||
|
|
|
|
|
|
|
|
|
|
|
|
|
|
|
|
|
|
|
| |||||||||||||||||||||
Total | $ | 2,582,611 | $ | — | $ | — | $ | — | $ | — | $ | (326,335 | ) | $ | 198,000 | $ | — | $ | 2,454,276 | $ | (326,335 | ) | ||||||||||||||||||
|
|
|
|
|
|
|
|
|
|
|
|
|
|
|
|
|
|
|
| |||||||||||||||||||||
| Balance as of September 30, 2017 | Transfers Into Level 3 | Transfers Out of Level 3 | Accrued Discounts (Premiums) | Realized Gain (Loss) | Net Unrealized Appreciation (Depreciation) | Net Purchases | Net Sales | Balance as of September 30, 2018 | Change in Unrealized Appreciation (Depreciation) from Investments held at September 30, 2018 | |||||||||||||||||||||||||||||||
Highland Total Return Fund |
| |||||||||||||||||||||||||||||||||||||||
Common Stocks | ||||||||||||||||||||||||||||||||||||||||
Real Estate | $ | 10,543 | $ | — | $ | — | $ | — | $ | — | $ | 2,992 | $ | — | $ | — | $ | 13,535 | $ | 2,992 | ||||||||||||||||||||
|
|
|
|
|
|
|
|
|
|
|
|
|
|
|
|
|
|
|
| |||||||||||||||||||||
Total | $ | 10,543 | $ | — | $ | — | $ | — | $ | — | $ | 2,992 | $ | — | $ | — | $ | 13,535 | $ | 2,992 | ||||||||||||||||||||
|
|
|
|
|
|
|
|
|
|
|
|
|
|
|
|
|
|
|
| |||||||||||||||||||||
| Annual Report | 73 |
Table of Contents
NOTES TO FINANCIAL STATEMENTS (continued)
| September 30, 2018 | Highland Funds II | |
| Balance as of September 30, 2017 | Transfers Into Level 3 | Transfers Out of Level 3 | Accrued Discounts (Premiums) | Realized Gain (Loss) | Net Unrealized Appreciation (Depreciation) | Net Purchases | Net Sales | Balance as of September 30, 2018 | Change in Unrealized Appreciation (Depreciation) from Investments held at September 30, 2018 | |||||||||||||||||||||||||||||||
Highland Fixed Income Fund |
| |||||||||||||||||||||||||||||||||||||||
Common Stocks | ||||||||||||||||||||||||||||||||||||||||
Real Estate | $ | 189,021 | $ | — | $ | — | $ | — | $ | — | $ | 53,641 | $ | — | $ | — | $ | 242,662 | $ | 53,641 | ||||||||||||||||||||
|
|
|
|
|
|
|
|
|
|
|
|
|
|
|
|
|
|
|
| |||||||||||||||||||||
Total | $ | 189,021 | $ | — | $ | — | $ | — | $ | — | $ | 53,641 | $ | — | $ | — | $ | 242,662 | $ | 53,641 | ||||||||||||||||||||
|
|
|
|
|
|
|
|
|
|
|
|
|
|
|
|
|
|
|
| |||||||||||||||||||||
Investments designated as Level 3 may include assets valued using quotes or indications furnished by brokers which are based on models or estimates and may not be executable prices. In light of the developing market conditions, the Investment Adviser continues to search for observable data points and evaluate broker quotes and indications received for portfolio investments.
The Funds use end of period market value in the determination of the amount associated with any transfers between levels. For the year ended September 30, 2018, there were no transfers between levels.
The following is a summary of significant unobservable inputs used in the fair valuations of assets and liabilities categorized within Level 3 of the fair value hierarchy:
| Category | Market Value at 9/30/2018 | Valuation Technique | Unobservable Inputs | Input Value(s) | ||||||
Highland Premier Growth Equity Fund | ||||||||||
Preferred Stock | $ | 1,952,176 | Multiples Analysis | Multiple of Revenue | 1.5x - 2.0x | |||||
| Implied Enterprise Value Indications | Weightings | 20% - 80% | ||||||||
Common Stock | 502,100 | Multiples Analysis | Multiple of EBITDA | 6.75x - 8.25x | ||||||
| Discounted Cash Flow | Discount Rate | 12% | ||||||||
| Terminal Multiple | 6.75x | |||||||||
| Implied Equity Value Indications | Weightings | 50% | ||||||||
|
| |||||||||
Total | $ | 2,454,276 | ||||||||
| Category | Market Value at 9/30/2018 | Valuation Technique | Unobservable Inputs | Input Value(s) | ||||||
Highland Total Return Fund | ||||||||||
Common Stocks | $ | 13,535 | Market Approach | Market Index Adjustment | 10% | |||||
| Blended Approach | Weightings | 33.3% | ||||||||
| NAV | Third Party Value Indication | $9.05 | ||||||||
|
| |||||||||
Total | $ | 13,535 | ||||||||
| Category | Market Value at 9/30/2018 | Valuation Technique | Unobservable Inputs | Input Value(s) | ||||||
Highland Fixed Income Fund | ||||||||||
Common Stocks | $ | 242,662 | Market Approach | Market Index Adjustment | 10% | |||||
| NAV | Third Party Value Indication | $9.05 | ||||||||
|
| |||||||||
Total | $ | 242,662 | ||||||||
The significant unobservable input used in the fair value measurement of the Premier Growth Equity Fund’s preferred stock is the revenue multiple. Significant increases
(decreases) in any of those inputs in isolation could result in a significantly higher (lower) fair value measurement.
| 74 | Annual Report |
Table of Contents
NOTES TO FINANCIAL STATEMENTS (continued)
| September 30, 2018 | Highland Funds II | |
The significant unobservable inputs used in the fair value measurement of the Premier Growth Equity Fund’s common equity securities are: multiple of EBITDA, discount rate and terminal multiple. Significant increases (decreases) in any of those inputs in isolation could result in a significantly lower (higher) fair value measurement.
The significant unobservable input used in the fair value measurement of the Total Return Fund’s common stock assets is the market index adjustment. Significant increases (decreases) in any of those inputs in isolation could result in a significantly higher (lower) fair value measurement.
The significant unobservable input used in the fair value measurement of the Fixed Income Fund’s REIT assets is the market index adjustment. Significant increases (decreases) in any of those inputs in isolation could result in a significantly higher (lower) fair value measurement.
In addition to the unobservable inputs utilized for various valuation methodologies, the Investment Adviser frequently uses a combination of two or more valuation methodologies to determine fair value for a single holding. In such instances, the Investment Adviser assesses the methodologies and ascribes weightings to each methodology. The weightings ascribed to any individual methodology ranged from as low as 16.7% to as high as 80% as of September 30, 2018. The selection of weightings is an inherently subjective process, dependent on professional judgment. These selections may have a material impact to the concluded fair value for such holdings.
Security Transactions
Security transactions are accounted for on the trade date. Realized gains/(losses) on investments sold are recorded on the basis of the specific identification method for both financial statement and U.S. federal income tax purposes taking into account any foreign taxes withheld.
Income Recognition
Corporate actions (including cash dividends) are recorded on theex-dividend date, net of applicable withholding taxes, except for certain foreign corporate actions, which are recorded as soon afterex-dividend date as such information becomes available and is verified. Interest income is recorded on the accrual basis.
Accretion of discount on taxable bonds and loans is computed to the call date, while amortization of premium on taxable bonds and loans is computed to the call or maturity date, whichever is shorter, both using the effective yield method. Withholding taxes on foreign dividends have been provided for in accordance with the Funds’ understanding of the applicable country’s tax rules and rates.
U.S. Federal Income Tax Status
Each Fund is treated as a separate taxpayer for U.S. federal income tax purposes. The Funds intend to qualify each year as a “regulated investment company” under Subchapter M of the Internal Revenue Code of 1986, as amended, and will distribute substantially all of their taxable income and gains, if any, for the tax year, and as such will not be subject to U.S. federal income taxes. In addition, the Funds intend to distribute, in each calendar year, all of their net investment income, capital gains and certain other amounts, if any, such that the Funds should not be subject to U.S. federal excise tax. Therefore, no U.S. federal income or excise tax provisions are recorded.
The Investment Adviser has analyzed the Funds’ tax positions taken on U.S. federal income tax returns for all open tax years (current and prior three tax years), and has concluded that no provision for U.S. federal income tax is required in the Funds’ financial statements. The Funds’ U.S. federal and state income and U.S. federal excise tax returns for tax years for which the applicable statutes of limitations have not expired are subject to examination by the Internal Revenue Service and state departments of revenue. Furthermore, the Investment Adviser of the Funds is also not aware of any tax positions for which it is reasonably possible that the total amounts of unrecognized tax benefits will significantly change in the next 12 months.
Distributions to Shareholders
TheTax-Exempt Fund and Fixed Income Fund typically declare investment income dividends daily and pay them monthly. All other Funds typically declare and pay dividends from investment income annually. All Funds typically declare and pay distributions from net realized capital gains in excess of capital loss carryforwards annually.
Cash & Cash Equivalents
The Funds consider liquid assets deposited with a bank and certain short-term debt instruments of sufficient credit quality with original maturities of three months or less to be cash equivalents. The Funds also considers money market instruments that invest in cash equivalents to be cash equivalents. These investments represent amounts held with financial institutions that are readily accessible to pay Fund expenses or purchase investments. Cash and cash equivalents are valued at cost plus accrued interest, which approximates market value. The value of cash equivalents denominated in foreign currencies is determined by converting to U.S. dollars on the date of the Statement of Assets and Liabilities.
Foreign Currency
Accounting records of the Funds are maintained in U.S. dollars. Foreign currencies, investments and other assets and liabilities denominated in foreign currencies are translated
| Annual Report | 75 |
Table of Contents
NOTES TO FINANCIAL STATEMENTS (continued)
| September 30, 2018 | Highland Funds II | |
into U.S. dollars at exchange rates using the current 4:00 PM London Time Spot Rate. Fluctuations in the value of the foreign currencies and other assets and liabilities resulting from changes in exchange rates, between trade and settlement dates on securities transactions and between the accrual and payment dates on dividends, interest income and foreign withholding taxes, are recorded as unrealized foreign currency gains/(losses). Realized gains/(losses) and unrealized appreciation/(depreciation) on investment securities and income and expenses are translated on the respective dates of such transactions. The effects of changes in foreign currency exchange rates on investments in securities are not segregated in the Statement of Operations from the effects of changes in market prices of those securities, but are included with the net realized and unrealized gain or loss on investment securities.
Securities Sold Short
The Funds may sell securities short. A security sold short is a transaction in which the Fund sells a security it does not own in anticipation that the market price of that security will decline. When the Fund sells a security short, it must borrow the security sold short from a broker-dealer and deliver it to the buyer upon conclusion of the transaction. A Fund may have to pay a fee to borrow particular securities and is often obligated to pay over any dividends or other payments received on such borrowed securities. In some circumstances, a Fund may be allowed by its prime broker to utilize proceeds from securities sold short to purchase additional investments, resulting in leverage. Securities and cash held as collateral for securities sold short are shown on the Investments Portfolios for each of the Funds. Cash held as collateral for securities sold short is classified as restricted cash on the Statement of Assets and Liabilities, as applicable. Restricted cash in the amount of $8,792,243 and $9,715,571were held with the broker for the Premier Growth Equity Fund andSmall-Cap Equity Fund, respectively. Additionally, securities valued at $5,914,980 and $13,427,368 were posted in the Premier Growth Equity Fund’s and theSmall-Cap Equity Fund’s segregated account as collateral, respectively.
Other Fee Income
Fee income may consist of origination/closing fees, amendment fees, administrative agent fees, transactionbreak-up fees and other miscellaneous fees. Origination fees, amendment fees, and other similar fees arenon-recurring fee sources. Such fees are received on a transaction by transaction basis and do not constitute a regular stream of income and are recognized when incurred.
Note 3. Derivative Transactions
The Funds are subject to equity securities risk, interest rate risk and currency risk in the normal course of pursuing their
investment objectives. The Funds enter into derivative transactions for the purpose of hedging against the effects of changes in the value of portfolio securities due to anticipated changes in market conditions, to gain market exposure for residual and accumulating cash positions and for managing the duration of fixed income investments.
Futures Contracts
A futures contract represents a commitment for the future purchase or sale of an asset at a specified price on a specified date. The Funds may invest in interest rate, financial and stock or bond index futures contracts subject to certain limitations. The Funds invest in futures contracts to manage their exposure to the stock and bond markets and fluctuations in currency values. Buying futures tends to increase a Fund’s exposure to the underlying instrument while selling futures tends to decrease a Fund’s exposure to the underlying instrument, or economically hedge other Fund investments. With futures contracts, there is minimal counterparty credit risk to the Funds since futures contracts are exchange-traded and the exchange’s clearinghouse, as counterparty to all traded futures, guarantees the futures against default. A Fund’s risks in using these contracts include changes in the value of the underlying instruments,non-performance of the counterparties under the contracts’ terms and changes in the liquidity of the secondary market for the contracts. Futures contracts are valued at the settlement price established each day by the board of trade or exchange on which they principally trade.
Upon entering into a financial futures contract, the Funds are required to pledge to the broker an amount of cash and/or other assets equal to a certain percentage of the contract amount, known as initial margin deposit. Subsequent payments, known as variation margins, are made or can be received by the Funds each day, depending on the daily fluctuation in the fair value of the underlying security. The Funds record an unrealized gain/(loss) equal to the daily variation margin. Should market conditions move unexpectedly, the Funds may not achieve the anticipated benefits of the futures contracts and may incur a loss. The Funds recognize a realized gain/(loss) on the expiration or closing of a futures contract.
At September 30, 2018, the Small Cap Equity Fund held futures contracts as detailed in the notes to the Fund’s Investment Portfolio. The Small Cap Equity Fund entered into futures transactions for the purpose of hedging against the effects of changes in the value of portfolio securities due to anticipated changes in market conditions, and to gain market exposure for residual and accumulating cash positions. Cash held as collateral for futures contracts is shown on the Statement of Assets and Liabilities as “Restricted Cash — Futures.”
| 76 | Annual Report |
Table of Contents
NOTES TO FINANCIAL STATEMENTS (continued)
| September 30, 2018 | Highland Funds II | |
For the year ended September 30, 2018, the Premier Growth Equity, Total Return,Tax-Exempt and Fixed Income Funds did not invest in futures contracts.
Options
The Funds may utilize options on securities or indices to varying degrees as part of their principal investment strategy. An option on a security is a contract that gives the holder of the option, in return for a premium, the right to buy from (in the case of a call) or sell to (in the case of a put) the writer of the option the security underlying the option at a specified exercise or “strike” price. The writer of an option on a security has the obligation upon exercise of the option to deliver the underlying security upon payment of the exercise price or to pay the exercise price upon delivery of the underlying security. The Funds may hold options, write option contracts, or both.
If an option written by a Fund expires unexercised, a Fund realizes on the expiration date a capital gain equal to the premium received by a Fund at the time the option was written. If an option purchased by a Fund expires unexercised, a Fund realizes a capital loss equal to the premium paid. Prior to the earlier of exercise or expiration, an exchange-traded option may be closed out by an offsetting purchase or sale of an option of the same series (type, underlying security, exercise price and expiration). There can be no assurance, however, that a closing purchase or sale transaction can be effected when a Fund desires. A Fund will realize a capital gain from a closing purchase transaction if the cost of the closing option is less than the premium received from writing the option, or, if the cost of the closing option is more than the premium received from writing the option, a capital loss. A Fund will realize a capital gain from a closing sale transaction if the premium received from the sale is more than the original premium paid when the option position was opened, or a capital loss, if the premium received from a sale is less than the original premium paid.
During the year ended September 30, 2018, the Premier Growth Equity andSmall-Cap Equity Funds had written options to provide leveraged short exposure, and purchased options to provide leveraged long exposure, to the underlying equity, which is consistent with the investment strategies of these Funds.
For the year ended September 30, 2018, the Total Return,Tax-Exempt and Fixed Income Funds did not invest or write in options.
Swap Contracts
The Funds may use swaps as part of its investment strategy or to manage its exposure to interest, commodity, and currency rates as well as adverse movements in the debt and equity markets. Swap agreements are privately negotiated in
theover-the-counter (“OTC”) market or may be executed in a multilateral or other trade facility platform, such as a registered exchange (“centrally cleared swaps”). Total return swaps are agreements to exchange the return generated by one instrument for the return generated by another instrument; for example, the agreement to pay interest in exchange for a market or commodity-linked return based on a notional amount. To the extent the total return of the market or commodity-linked index exceeds the offsetting interest obligation, the Fund will receive a payment from the counterparty. To the extent it is less, the Fund will make a payment to the counterparty. Periodic payments received or made by the Fund are recorded in “Net realized gain (loss) on swap contracts” on the accompanying Statement of Operations and Changes in Net Assets as realized gains or losses, respectively. As of September 30, 2018, the Premier Growth Equity Fund was a party to an open swap contract having a net fair value of $(38,786).
For the year ended September 30, 2018, theSmall-Cap Equity, Total Return,Tax-Exempt and Fixed Income Funds did not invest in swap contracts.
Additional Derivative Information
The Funds follow adopted amendments to authoritative guidance on disclosures about derivative instruments and hedging activities which require that the Funds disclose; a) how and why an entity uses derivative instruments; b) how derivative instruments and related hedged items are accounted for; c) how derivative instruments and related hedged items affect an entity’s financial position, financial performance and cash flows; and d) how the netting of derivatives subject to master netting arrangements (if applicable) affects the net exposure of the Fund related to the derivatives.
The fair value of derivative instruments on the Statement of Assets and Liabilities have the following risk exposure at September 30, 2018:
Fair Value | ||||||||
| Fund | Asset Derivative | Liability Derivative | ||||||
Premier Growth Equity Fund | ||||||||
Equity Price Risk | $ | 142,405 | (1)(2)(3) | $ | (145,694 | )(1)(2)(3) | ||
| (1) | Statement of Assets and Liabilities location: Unaffiliated investments, at value. |
| (2) | Statement of Assets and Liabilities location: Written options contracts, at value. |
| (3) | Statement of Assets and Liabilities location: Swaps, at value. |
To reduce counterparty credit risk with respect toover-the-counter (“OTC”) transactions, the Funds have entered into master netting arrangements, established within the Funds’ International Swap and Derivatives Association, Inc. (“ISDA”) master agreements, which allows
| Annual Report | 77 |
Table of Contents
NOTES TO FINANCIAL STATEMENTS (continued)
| September 30, 2018 | Highland Funds II | |
the Funds to make (or to have an entitlement to receive) a single net payment in the event of default(close-out netting) for outstanding payables and receivables with respect to certain OTC derivative positions in forward currency exchange contracts for each individual counterparty. In addition, the Funds may require that certain counterparties post cash and/or securities in collateral accounts to cover their net payment obligations for those derivative contracts subject to ISDA master agreements. If the counterparty fails to perform under these contracts and agreements, the cash and/or securities will be made available to the Funds.
Certain ISDA master agreements include credit related contingent features which allow counterparties to OTC derivatives to terminate derivative contracts prior to maturity in the event the Funds’ net assets decline by a stated percentage or the Funds fail to meet the terms of its ISDA master agreements, which would cause the Funds to accelerate payment of any net liability owed to the counterparty.
For financial reporting purposes, the Funds do not offset derivative assets and derivative liabilities that are subject to netting arrangements in the Statement of Assets and Liabilities. Bankruptcy or insolvency laws of a particular jurisdiction may impose restrictions on or prohibitions against the right of offset in bankruptcy, insolvency or other events.
Collateral terms are contract specific for OTC derivatives. For derivatives traded under an ISDA master agreement, the collateral requirements are typically calculated by netting the mark to market amount for each transaction under such agreement and comparing that to the value of any collateral currently pledged by the Fund or the Counterparty.
For financial reporting purposes, cash collateral that has been pledged to cover obligations of the Funds, if any, is reported in restricted cash on the Statement of Assets and Liabilities. Generally, the amount of collateral due from or to a party must exceed a minimum transfer amount threshold before a transfer has to be made. To the extent amounts due to the Funds from their counterparties are not fully collateralized, contractually or otherwise, the Funds bear the risk of loss from counterpartynon-performance.
The effect of derivative instruments on the Statement of Operations for the year ended September 30, 2018, is as follows:
| Fund | Net Realized Gain (Loss) on Derivatives | Net Change in Unrealized Appreciation/ (Depreciation) on Derivatives | ||||||
Premier Growth Equity Fund | ||||||||
Equity Price Risk | $ | 1,545,492 | (3)(4)(6) | $ | (44,351 | )(7)(8) | ||
Small-Cap Equity Fund | ||||||||
Equity Price Risk | 1,214,735 | (1)(3)(4) | 1,061,838 | (2)(5)(8) | ||||
| (1) | Statement of Operations location: Realized gain (loss) on future contracts. |
| (2) | Statement of Operations location: Change in unrealized appreciation (depreciation) on futures contracts. |
| (3) | Statement of Operations location: Realized gain (loss) on investments from unaffiliated issuers. |
| (4) | Statement of Operations location: Realized gain (loss) on written options contracts. |
| (5) | Statement of Operations location: Change in unrealized appreciation (depreciation) on investments. |
| (6) | Statement of Operations location: Realized gain (loss) on swap contracts. |
| (7) | Statement of Operations location: Change in unrealized appreciation (depreciation) on swap contracts. |
| (8) | Statement of Operations location: Change in unrealized appreciation (depreciation) on written options contracts. |
The average monthly volume of derivative activity for the year ended September 30, 2018, is as follows:
| Fund | Units/ Contracts | Appreciation/ (Depreciation) | ||||||
Premier Growth Equity Fund | ||||||||
Purchased Options Contracts | 647 | $ | — | |||||
Written Option Contracts | 276 | — | ||||||
Swap Contracts | — | 49,264 | ||||||
Small-Cap Equity Fund | ||||||||
Futures Contracts(1) | — | (162,403 | ) | |||||
Purchased Options Contracts | 2,372 | — | ||||||
Written Options contracts | 1,817 | — | ||||||
| (1) | Futures Contracts average monthly volume is calculated using Appreciation/ (Depreciation). |
Note 4. Securities Lending
Each Fund may seek additional income by making secured loans of its portfolio securities through its custodian, State Street Bank and Trust Company (“State Street”). Such loans will be in an amount not greater thanone-third of the value of the Fund’s total assets. State Street will charge a Fund fees based on a percentage of the securities lending income.
The Funds will receive collateral consisting of cash (U.S. and foreign currency), securities issued or guaranteed by the U.S. government or its agencies or instrumentalities, sovereign debt, convertible bonds, irrevocable bank letters of credit or such other collateral as may be agreed on by the parties to a securities lending arrangement, initially with a value of 102% or 105% of the market value of the loaned securities and thereafter maintained at a value of 100% of the market value of the loaned securities. If the collateral consists ofnon-cash collateral, the borrower will pay the Fund a loan premium fee. If the collateral consists of cash, State Street will reinvest the cash. Although voting rights, or rights to consent, with respect to the loaned securities pass to the borrower, the Fund will recall the loaned securities upon reasonable notice in order that the securities may be voted by the Fund if the holders of such securities are asked to vote upon or consent to matters materially affecting the investment. The Fund also may call such loans in order to sell the securities involved.
| 78 | Annual Report |
Table of Contents
NOTES TO FINANCIAL STATEMENTS (continued)
| September 30, 2018 | Highland Funds II | |
Securities lending transactions are entered into pursuant to Securities Loan Agreements (“SLA”), which provide the right, in the event of default (including bankruptcy or insolvency) for thenon-defaulting party to liquidate the collateral and calculate a net exposure to the defaulting party or request additional collateral. In the event that a borrower defaults, the Funds, as lenders, would offset the market value of the collateral received against the market value of the securities loaned. The value of the collateral is typically greater than that of the market value of the securities loaned, leaving the lender with a net amount payable to the defaulting party. However, bankruptcy or insolvency laws of a particular jurisdiction may impose restrictions on or prohibitions against such a right of offset in the event of a SLA counterparty’s bankruptcy or insolvency. Under the SLA, the Funds can reinvest cash collateral, or, upon an event of default, resell or repledge the collateral, and the borrower can resell or repledge the loaned securities. The risks of securities lending also include the risk that the borrower may not provide additional collateral when required or may not return the securities when due. To mitigate this risk, each Funds benefit from a borrower default indemnity provided by State Street Bank and Trust Company (“State Street”). State Street’s indemnity generally provides for replacement of securities lent or the approximate value thereof.
The following table presents financial instruments that are subject to enforceable netting arrangements as of September 30, 2018.
| Gross Amounts Not Offset in the Statement of Assets and Liabilities | ||||||||||||||||
| Fund | Gross Amounts of Liabilities Presented in Statement of Assets & Liabilities(1) | Financial Instrument(2) | Collateral Received | Net Amount (not less than 0) | ||||||||||||
Premier Growth Equity Fund | $ | 2,360,264 | $ | 6,499,950 | $ | — | $ | — | ||||||||
Small-Cap Equity Fund | 861,707 | 6,802,834 | — | — | ||||||||||||
Total Return Fund | 2,706,070 | 6,511,117 | — | — | ||||||||||||
Fixed Income Fund | 9,185,443 | 10,550,847 | — | — | ||||||||||||
| (1) | In some instances, the actual collateral received and/or pledged may be more than the amount shown here due to overcollateralization. |
| (2) | Represents market value of securities on loan at year end. |
For the year ended September 30, 2018, the market value of securities loaned and the amounts secured with cash and securities collateral, which are included on each Fund’s Investment Portfolio were as follows:
| Fund | Security Lending Market Value | Security Lending Collateral Cash Collateral(1) | Security Lending Collateral Non-Cash Collateral(2) | |||||||||
Premier Growth Equity Fund | $ | 6,499,950 | $ | 2,360,264 | $ | 4,351,236 | ||||||
Small-Cap Equity Fund | 6,802,834 | 861,707 | 6,116,728 | |||||||||
Total Return Fund | 6,511,117 | 2,706,070 | 3,989,039 | |||||||||
Fixed Income Fund | 10,550,847 | 9,185,443 | 1,572,962 | |||||||||
| (1) | The loaned securities were secured with cash collateral which was invested in the State Street Navigator Prime Securities Lending Portfolio. |
| (2) | Security lendingnon-cash collateral consists of U.S. Government Treasury & Agency debt and Sovereign debt. |
Note 5. U.S. Federal Income Tax Information
The character of income and gains to be distributed is determined in accordance with income tax regulations which may differ from U.S. GAAP. These differences include (but are not limited to) investments organized as partnerships for tax purposes, foreign taxes, investments in futures, losses deferred tooff-setting positions, tax treatment of organizationalstart-up costs, losses deferred due to wash sale transactions, tax treatment of net investment loss and distributions in excess of net investment income, dividends deemed paid upon shareholder redemption of Fund shares and tax attributes from Fund reorganizations. Reclassifications are made to the Funds’ capital accounts to reflect income and gains available for distribution (or available capital loss carryovers) under income tax regulations. These reclassifications have no impact on net investment income, realized gains or losses, or NAV of the Funds. The calculation of net investment income per share in the Financial Highlights table excludes these adjustments.
For the year ended September 30, 2018, permanent differences chiefly resulting from net investment losses, dividends on short sales, foreign currency gains and losses, partnership basis adjustments and REITs were identified and reclassified among the components of the Funds’ net assets as follows:
| Fund | Undistributed Investment | Accumulated Net Realized Gain (Loss) | Paid-in-Capital | |||||||||
Premier Growth Equity Fund | $ | 438,176 | $ | (438,175 | ) | $ | (1 | ) | ||||
Small-Cap Equity Fund | 218,175 | (217,527 | ) | (648 | ) | |||||||
Total Return Fund | (2,701,752 | ) | 2,701,888 | (136 | ) | |||||||
Tax-Exempt Fund | 1 | (1 | ) | — | ||||||||
Fixed Income Fund | 27,715 | 29,330 | (57,045 | ) | ||||||||
| Annual Report | 79 |
Table of Contents
NOTES TO FINANCIAL STATEMENTS (continued)
| September 30, 2018 | Highland Funds II | |
At September 30, 2018, the most recent taxyear-end, components of distributable earnings on a tax basis is as follows:
| Fund | Undistributed Income | Undistributed Long-Term Capital Gains | Undistributed Tax-Exempt Income | Other Temporary Differences(1) | Accumulated Capital and Other Losses | Net Tax Appreciation/ (Depreciation)(2) | ||||||||||||||||||
Premier Growth Equity Fund | $ | 1,512,495 | $ | 46,272,654 | $ | — | $ | — | $ | — | $ | 8,677,186 | ||||||||||||
Small-Cap Equity Fund | 2,359,460 | 3,704,735 | — | — | — | 3,020,172 | ||||||||||||||||||
Total Return Fund | — | — | — | — | — | 5,367,558 | ||||||||||||||||||
Tax-Exempt Fund | — | 24,137 | 55,893 | (4,487 | ) | — | 163,448 | |||||||||||||||||
Fixed Income Fund | — | — | — | (29,517 | ) | (1,911,677 | ) | (1,146,226 | ) | |||||||||||||||
| (1) | Other temporary differences are comprised of dividends payable and organizational expenses. |
| (2) | Any differences between book-basis andtax-basis net unrealized appreciation/(depreciation) are primarily due to deferral of losses from wash sale, and other adjustments. |
As of September 30, 2018, the most recent taxyear-end, the following Funds have capital loss carryovers as indicated below. The capital loss carryover is available to offset future realized capital gains to the extent provided in the Code and regulations promulgated thereunder. To the extent that these carryover losses are used to offset future capital gains, it is probable that the gains so offset will not be distributed to shareholders because they would be taxable as ordinary income.
| Fund | 2019 | No Short- | No Expiration Long- Term(1) | Total | ||||||||||||
Premier Growth Equity Fund | $ | — | $ | — | $ | — | $ | — | ||||||||
Small-Cap Equity Fund | — | — | — | — | ||||||||||||
Total Return Fund | — | — | — | — | ||||||||||||
Tax-Exempt Fund | — | — | — | — | ||||||||||||
Fixed Income Fund | — | — | 1,911,677 | 1,911,677 | ||||||||||||
| (1) | Under the Regulated Investment Company Modernization Act of 2010, the Funds will be permitted to carry forward capital losses incurred in taxable years beginning after December 22, 2010 for an unlimited period. However, any losses incurred during those future taxable years will be required to be utilized prior to the losses incurred inpre-enactment taxable years. As a result of this ordering rule,pre-enactment capital loss carryforwards may be more likely to expire unused. Additionally, post-enactment capital losses that are carried forward will retain their character as either short-term or long-term capital losses rather than being considered all short-term as under previous law. |
The tax composition of distributions paid during the years ended September 30, 2018 and September 30, 2017 (unless otherwise indicated) were as follows:
Distributions Paid From: | ||||||||||||||||
| Fund | Exempt Interest | Ordinary Income(1) | Long- Term Capital Gains | Return of Capital(2) | ||||||||||||
Premier Growth Equity Fund | ||||||||||||||||
2018 | $ | — | $ | — | $ | 33,270,981 | $ | — | ||||||||
2017 | — | — | 35,694,222 | — | ||||||||||||
Small-Cap Equity Fund | ||||||||||||||||
2018 | — | 6,352,156 | 2,385,203 | — | ||||||||||||
2017 | — | 321,352 | 2,229,639 | — | ||||||||||||
Total Return Fund | ||||||||||||||||
2018 | — | 1,772,756 | 2,216,764 | 1,744,763 | ||||||||||||
2017 | — | 1,125,467 | 181,506 | — | ||||||||||||
Tax-Exempt Fund | ||||||||||||||||
2018 | 299,703 | — | 372,998 | — | ||||||||||||
2017 | 366,251 | — | — | — | ||||||||||||
Fixed Income Fund | ||||||||||||||||
2018 | — | 3,891,386 | — | 201,474 | ||||||||||||
2017 | — | 3,450,140 | — | 261,189 | ||||||||||||
| (1) | For tax purposes, short-term capital gains distributions, if any, are considered ordinary income distributions. |
| (2) | Additional Information will be distributed on Form 1099 at the end of the calendar year. |
| 80 | Annual Report |
Table of Contents
NOTES TO FINANCIAL STATEMENTS (continued)
| September 30, 2018 | Highland Funds II | |
Unrealized appreciation and depreciation at September 30, 2018, based on cost of investments for U.S. federal income tax purposes was:
| Fund | Gross Appreciation | Gross Depreciation | Net Appreciation/ (Depreciation) | Cost | ||||||||||||
Premier Growth Equity Fund | $ | 12,194,657 | $ | (3,513,735 | ) | $ | 8,680,922 | $ | 139,200,727 | |||||||
Small-Cap Equity Fund | 13,738,762 | (10,718,620 | ) | 3,020,142 | 51,149,551 | |||||||||||
Total Return Fund | 8,192,363 | (2,821,647 | ) | 5,370,716 | 86,330,182 | |||||||||||
Tax-Exempt Fund | 217,524 | (54,076 | ) | 163,448 | 12,050,300 | |||||||||||
Fixed Income Fund | 1,170,259 | (2,316,485 | ) | (1,146,226 | ) | 205,937,205 | ||||||||||
Under current laws, certain capital losses after October 31 may be deferred (and certain ordinary losses after January 1st may be deferred) and treated as occurring on the first day of the following fiscal year. For the fiscal year ended September 30, 2018, the Funds elected to defer the following losses incurred from November 1, 2017 through September 30, 2018:
| Fund | Realized Capital Losses | Ordinary Losses | ||||||
Premier Growth Equity Fund | $ | — | $ | — | ||||
Small-Cap Equity Fund | — | — | ||||||
Total Return Fund | — | — | ||||||
Tax-Exempt Fund | — | — | ||||||
Fixed Income Fund | (316,605 | ) | — | |||||
Note 6. Credit Agreement
On May 18, 2017, theSmall-Cap Equity Fund entered into a Master Margin Loan Agreement (the “Margin Loan Agreement”) with The Bank of New York Mellon. The Margin Loan agreement has a current maturity of May 16, 2019. Interest is charged to theSmall-Cap Equity Fund under the Margin Loan Agreement based on its borrowings at a rate equal to LIBOR plus 1.20%. In addition, theSmall-Cap Equity Fund pays a commitment fee of 0.40% on any undrawn amount. Included in the Statement of Operations is $385,947 of interest expense and commitment fees. At September 30, 2018, the current outstanding amount and fair value was $12,250,000 and $12,327,597, respectively. For the year ended September 30, 2018, theSmall-Cap Equity Fund’s average daily balance under the Margin Loan Agreement was $10,836,301, at a weighted average interest rate of 2.99% for the days outstanding.
Note 7. Advisory, Administration, Service and Distribution, Trustee, and Other Fees
Investment Advisory Fees and Administration Fees
For its investment advisory services, each Fund pays the Investment Adviser a monthly fee, computed and accrued daily, based on an annual rate of the Funds’ Average Daily
Managed Assets. Average Daily Managed Assets of a Fund means the average daily value of the total assets of a Fund less all accrued liabilities of a Fund (other than the aggregate amount of any outstanding borrowings constituting financial leverage).
The table below shows each Fund’s contractual advisory fee with Highland for the year ended September 30, 2018:
| Fund | Annual Fee Rate to Highland | |||
Premier Growth Equity Fund | 0.60 | % | ||
Small-Cap Equity Fund | 0.95 | % | ||
Total Return Fund | 0.50 | % | ||
Tax-Exempt Fund | 0.35 | % | ||
Fixed Income Fund | 0.30 | % | ||
On behalf of the Funds, the Trust has entered into an administration agreement with State Street and pays State Street a fee for administration services. The Investment Adviser generally assists in all aspects of the Funds’ administration and operations and furnishes offices, necessary facilities, equipment and personnel.
Sub-Advisory Fees
The Total Return Fund, theTax-Exempt Fund and the Fixed Income Fund aresub-advised by First Foundation Advisors (“FFA”). The Investment Adviser pays eachsub-advisor an investmentsub-advisory fee out of the advisory fees that it receives from the respective Fund.
Expense Limits and Fee Reimbursements
The Investment Adviser has contractually agreed to limit the total annual operating expenses (exclusive of fees paid by the Funds pursuant to their distribution plans underRule 12b-1 under the 1940 Act, as amended, taxes, such as deferred tax expenses, dividend expenses on short sales, interest payments, brokerage commissions and other transaction costs, acquired fund fees and expenses and extraordinary expenses (collectively, the “Excluded Expenses”)) of the theSmall-Cap Equity Fund, the Total Return Fund, theTax-Exempt Fund and the Fixed Income Fund to 1.15%, 0.95%, 0.65% and 0.65%, respectively, of average daily net
| Annual Report | 81 |
Table of Contents
NOTES TO FINANCIAL STATEMENTS (continued)
| September 30, 2018 | Highland Funds II | |
assets attributable to any class of theSmall-Cap Equity Fund, the Total Return Fund, theTax-Exempt Fund and the Fixed Income Fund (each, an “Expense Cap” and collectively, the “Expense Caps”). The Expense Caps will continue through at least January 31, 2019, and may not be terminated prior to this date without the action or consent of the Board.
Under the expense limitation agreement, the Investment Adviser may recoup waived and/or reimbursed amounts with respect to a Fund withinthirty-six months of the date such amounts were waived or reimbursed, provided the Fund’s total annual operating expenses, including such recoupment, do not exceed the Expense Cap in effect at the time of such waiver/reimbursement
On September 30, 2018, the amounts subject to possible future recoupment under the Funds’ expense limitations were as follows:
Expiring during Fiscal Years Ending September 30, | ||||||||||||
| Fund | 2019 | 2020 | 2021 | |||||||||
Premier Growth Equity Fund | $ | — | $ | — | $ | — | ||||||
Small-Cap Equity Fund | 222,967 | 240,496 | 345,549 | |||||||||
Total Return Fund | — | — | — | |||||||||
Tax-Exempt Fund | 48,223 | 71,485 | 77,594 | |||||||||
Fixed Income Fund | 3,184 | 32,572 | 25,185 | |||||||||
During the year ended September 30, 2018, the Investment Adviser did not recoup any fees previously waived or reimbursed, and $193,129 and $25,890 of fees previously waived and or reimbursed in theSmall-Cap Equity Fund and theTax-Exempt Fund, respectively by the Investment Adviser that were eligible for recoupment expired. No other amounts expired or were recouped from the Funds during the year ended year ended September 30, 2018.
Fees Paid to Officers and Trustees
Each Trustee who is not an “interested person” of the Funds as defined in the 1940 Act (the “Independent Trustees”) receives an annual retainer of $150,000 payable in quarterly installments and allocated among each portfolio in the Highland Fund Complex overseen by such Trustee based on relative net assets. The “Highland Fund Complex” consists of all of the registered investment companies advised by the Investment Adviser or its affiliated advisers and NexPoint Capital, Inc., aclosed-end management investment company that has elected to be treated as a business development company under the 1940 Act as of the date of this report. Effective December 4, 2015, Mr. Powell resigned from his position with the Investment Adviser. Prior to December 8, 2017, Mr. Powell was treated as an Interested Trustee of the Trust for all purposes other than compensation and the Trust’s code of ethics.
The Funds pay no compensation to their officers, all of whom are employees of the Investment Adviser or one of its affiliates.
Distribution and Shareholder Service Fees
The Funds have a distribution and shareholder service plan (each a “Plan” and collectively the “Plans”) pursuant to Rule12b-1 under the 1940 Act. The Plans require the payment of a monthly service fee to Highland Capital Funds Distributor, Inc. (the “Underwriter”) at an annual rate of 0.25% of the average daily net assets attributable to Class A, and Class C shares of the Funds. The Plans also require the payment of a monthly distribution fee to the Underwriter at an annual rate of 0.75% of the average daily net assets attributable to Class C shares. Currently Class Y shares are not subject to a12b-1 fee.
The Underwriter received $3,186 offront-end sales charges from the sale of Class A shares and $2,653 in contingent deferred sales charges from the redemption of Class C shares of the Funds during the year ended September 30, 2018.
| Fund | Class A Front End | Class C CDSC Fees | ||||||
Premier Growth Equity Fund | $ | 405 | $ | 524 | ||||
Small-Cap Equity Fund | 2,185 | 2,075 | ||||||
Total Return Fund | 257 | 52 | ||||||
Tax-Exempt Fund | 2 | — | ||||||
Fixed Income Fund | 337 | 2 | ||||||
Indemnification
Under the Fund’s organizational documents, the officers and Trustees have been granted certain indemnification rights against certain liabilities that may arise out of performance of their duties to the Funds. Additionally, in the normal course of business, the Fund may enter into contracts with service providers that contain a variety of indemnification clauses. The Funds’ maximum exposure under these arrangements is dependent on future claims that may be made against the Funds and, therefore, cannot be estimated.
Note 8. Disclosure of Significant Risks and Contingencies
The primary risks of investing in the Funds are described below in alphabetical order:
Counterparty Risk
Counterparty risk is the potential loss the Funds may incur as a result of the failure of a counterparty or an issuer to make payments according to the terms of a contract. Counterparty risk is measured as the loss the Funds would record if its counterparties failed to perform pursuant to the terms of their obligations to the Funds. Because the Funds may enter intoover-the-counter forwards, options, swaps and other
| 82 | Annual Report |
Table of Contents
NOTES TO FINANCIAL STATEMENTS (continued)
| September 30, 2018 | Highland Funds II | |
derivative financial instruments, the Funds may be exposed to the credit risk of their counterparties. To limit the counterparty risk associated with such transactions, the Funds conduct business only with financial institutions judged by the Investment Adviser to present acceptable credit risk.
Credit Risk
Investments rated below investment grade are commonly referred to as high-yield, high risk or “junk debt.” They are regarded as predominantly speculative with respect to the issuing company’s continuing ability to meet principal and/ or interest payments. Investments in high yield debt and high yield Senior Loans may result in greater NAV fluctuation than if a Fund did not make such investments.
Corporate debt obligations, including Senior Loans, are subject to the risk ofnon-payment of scheduled interest and/or principal.Non-payment would result in a reduction of income to a Fund, a reduction in the value of the corporate debt obligation experiencingnon-payment and a potential decrease in the NAV of the Fund.
Currency Risk
A portion of the Funds’ assets may be quoted or denominated innon-U.S. currencies. These securities may be adversely affected by fluctuations in relative currency exchange rates and by exchange control regulations. The Funds’ investment performance may be negatively affected by a devaluation of a currency in which the Funds’ investments are quoted or denominated. Further, the Funds’ investment performance may be significantly affected, either positively or negatively, by currency exchange rates because the U.S. dollar value of securities quoted or denominated in another currency will increase or decrease in response to changes in the value of such currency in relation to the U.S. dollar.
Derivatives Risk
Derivatives risk is a combination of several risks, including the risks that: (1) an investment in a derivative instrument may not correlate well with the performance of the securities or asset class to which the Fund seeks exposure, (2) derivative contracts, including options, may expire worthless and the use of derivatives may result in losses to the Fund, (3) a derivative instrument entailing leverage may result in a loss greater than the principal amount invested, (4) derivatives not traded on an exchange may be subject to credit risk, for example, if the counterparty does not meet its obligations (see also “Counterparty Risk”), and (5) derivatives not traded on an exchange may be subject to liquidity risk and the related risk that the instrument is difficult or impossible to value accurately. As a general matter, when the Fund establishes certain derivative instrument positions, such as
certain futures, options and forward contract positions, it will segregate liquid assets (such as cash, U.S. Treasury bonds or commercial paper) equivalent to the Fund’s outstanding obligations under the contract or in connection with the position. In addition, changes in laws or regulations may make the use of derivatives more costly, may limit the availability of derivatives, or may otherwise adversely affect the use, value or performance of derivatives. A Fund’s ability to pursue its investment strategy, including its strategy of investing in certain derivative instruments, may be limited to or adversely affected by the Fund’s intention to qualify as a regulated investment company, and its strategy may bear adversely on its ability to so qualify.
Illiquid and Restricted Securities Risk
Certain investments made by the Funds are, and others may be, illiquid, and consequently the Funds may not be able to sell such investments at prices that reflect the Investment Adviser’s assessment of their value or the amount originally paid for such investments by the Funds. Illiquidity may result from the absence of an established market for the investments as well as legal, contractual or other restrictions on their resale and other factors. Furthermore, the nature of the Funds’ investments, especially those in financially distressed companies, may require a long holding period prior to profitability.
Restricted securities (i.e., securities acquired in private placement transactions) and illiquid securities may offer higher yields than comparable publicly traded securities. The Funds, however, may not be able to sell these securities when the Investment Adviser considers it desirable to do so or, to the extent they are sold privately, may have to sell them at less than the price of otherwise comparable securities. Restricted securities are subject to limitations on resale which can have an adverse effect on the price obtainable for such securities. Also, if in order to permit resale the securities are registered under the Securities Act at a Fund’s expense, the Fund’s expenses would be increased. A high percentage of illiquid securities in a Fund creates a risk that such a Fund may not be able to redeem its shares without causing significant dilution to remaining shareholders.
Master Limited Partnership (“MLP”) Risk
Master Limited Partnership Risk is the risk of investing in MLP units, which involves some risks that differ from an investment in the equity securities of a company. The Funds may hold a significant investment in MLP units. Holders of MLP units have limited control and voting rights on matters affecting the partnership. Holders of units issued by an MLP are exposed to a remote possibility of liability for all of the obligations of that MLP in the event that a court determines that the rights of the holders of MLP units to vote to remove
| Annual Report | 83 |
Table of Contents
NOTES TO FINANCIAL STATEMENTS (continued)
| September 30, 2018 | Highland Funds II | |
or replace the general partner of that MLP, to approve amendments to that MLP’s partnership agreement, or to take other action under the partnership agreement of that MLP would constitute “control” of the business of that MLP, or a court or governmental agency determines that the MLP is conducting business in a state without complying with the partnership statute of that state. Holders of MLP units are also exposed to the risk that they will be required to repay amounts to the MLP that are wrongfully distributed to them. Additionally, a sustained reduced demand for crude oil, natural gas and refined petroleum products could adversely affect MLP revenues and cash flows, and changes in the regulatory environment could adversely affect the profitability of MLPs.
Interest Rate Risk
The risk that fixed income securities will decline in value because of changes in interest rates. When interest rates decline, the value of fixed rate securities already held by the Funds can be expected to rise. Conversely, when interest rates rise, the value of existing fixed rate portfolio securities can be expected to decline. A fund with a longer average portfolio duration will be more sensitive to changes in interest rates than a Fund with a shorter average portfolio duration. In addition, the interest rates of floating rate loans typically only adjust to changes in short-term interest rates; long-term interest rates can vary dramatically from short-term interest rates.
Leverage Risk
Each Fund may use leverage in its investment program, including the use of borrowed funds and investments in certain types of options, such as puts, calls and warrants, which may be purchased for a fraction of the price of the underlying securities. While such strategies and techniques increase the opportunity to achieve higher returns on the amounts invested, they also increase the risk of loss. To the extent the Funds purchase securities with borrowed funds, their net assets will tend to increase or decrease at a greater rate than if borrowed funds are not used. If the interest expense on borrowings were to exceed the net return on the portfolio securities purchased with borrowed funds, the Funds’ use of leverage would result in a lower rate of return than if the Funds were not leveraged.
Non-U.S. Securities Risk
Non-U.S. securities risk is the risk associated with investing innon-U.S. issuers. Investments in securities ofnon-U.S. issuers involve certain risks not involved in domestic investments (for example, fluctuations in foreign exchange rates (fornon-U.S. securities not denominated in U.S.dollars); future foreign economic, financial, political and social developments; nationalization; exploration or confiscatory taxation;
smaller markets; different trading and settlement practices; less governmental supervision; and different accounting, auditing and financial recordkeeping standards and requirements) that may result in each Fund experiencing more rapid and extreme changes in value than a fund that invests exclusively in securities of U.S. companies. These risks are magnified for investments in issuers tied economically to emerging markets, the economies of which tend to be more volatile than the economies of developed markets. In addition, certain investments innon-U.S. securities may be subject to foreign withholding and other taxes on interest, dividends, capital gains or other income or proceeds. Those taxes will reduce each Fund’s yield on any such securities.
Senior Loans Risk
The risk that the issuer of a senior may fail to pay interest or principal when due, and changes in market interest rates may reduce the value of the senior loan or reduce the Fund’s returns. The risks associated with senior loans are similar to the risks of high yield debt securities. Senior loans and other debt securities are also subject to the risk of price declines and to increases in interest rates, particularly long-term rates. Senior loans are also subject to the risk that, as interest rates rise, the cost of borrowing increases, which may increase the risk of default. In addition, the interest rates of floating rate loans typically only adjust to changes inshort-term interest rates; long-term interest rates can vary dramatically from short-term interest rates. Therefore, senior loans may not mitigate price declines in a long-term interest rate environment. The Fund’s investments in senior loans are typically below investment grade and are considered speculative because of the credit risk of their issuers.
Short Sales Risk
Short sales by the Funds that are not made where there is an offsetting long position in the asset that it is being sold short theoretically involve unlimited loss potential since the market price of securities sold short may continuously increase. Short selling allows the Funds to profit from declines in market prices to the extent such decline exceeds the transaction costs and costs of borrowing the securities. However, since the borrowed securities must be replaced by purchases at market prices in order to close out the short position, any appreciation in the price of the borrowed securities would result in a loss. Purchasing securities to close out the short position can itself cause the price of securities to rise further, thereby exacerbating the loss. The Funds may mitigate such losses by replacing the securities sold short before the market price has increased significantly. Under adverse market conditions, a Fund might have difficulty purchasing securities to meet margin calls on its short sale delivery obligations, and might have to sell portfolio securities to raise the capital necessary to meet its short sale
| 84 | Annual Report |
Table of Contents
NOTES TO FINANCIAL STATEMENTS (continued)
| September 30, 2018 | Highland Funds II | |
obligations at a time when fundamental investment considerations would not favor such sales.
Note 9. Investment Transactions
Purchases & Sales of Securities
The cost of purchases and the proceeds from sales of investments, other than short-term securities and short-term options, for the year ended September 30, 2018, were as follows:
U.S. Government | Other Securities | |||||||||||||||
| Fund | Purchases | Sales | Purchases | Sales | ||||||||||||
Premier Growth Equity Fund | $ | — | $ | — | $ | 394,764,594 | $ | 427,557,521 | ||||||||
Small-Cap Equity Fund | — | — | 25,037,098 | 38,930,461 | ||||||||||||
Total Return Fund | — | 239,155 | 84,399,773 | 71,522,689 | ||||||||||||
Tax-Exempt Fund | — | — | 438,652 | 1,300,225 | ||||||||||||
Fixed Income Fund | 15,637,916 | 15,267,641 | 111,873,314 | 48,174,785 | ||||||||||||
Note 10. Affiliated Issuers
Under Section 2 (a)(3) of the Investment Company Act of 1940, as amended, a portfolio company is defined as “affiliated” if a fund owns five percent or more of its outstanding voting securities or if the portfolio company is under common control. The table below shows affiliated issuers of the following Funds for the year ended September 30, 2018:
| Highland Premier Growth Equity Fund | ||||||||||||||||||||||||||||||||||||
| Issuer | Shares at September 30, | Beginning Value as of September 30, | Purchases at Cost | Proceeds from | Net Gain/ Affiliated Issuers | Change Unrealized Appreciation/ Depreciation | Ending Value September 30, | Shares at September 30, | Affiliated Income | |||||||||||||||||||||||||||
Other Affiliates |
| |||||||||||||||||||||||||||||||||||
Highland Merger Arbitrage Fund (Registered Investment Companies) | 176,920 | $ | 3,779,008 | $ | 174,131 | $ | (58,181 | ) | $ | 58,181 | $ | 12,101 | $ | 3,965,240 | 185,465 | $ | 174,131 | |||||||||||||||||||
Nexpoint Strategic Opportunities Fund (Registered Investment Companies) | 664 | 15,305 | 1,931,722 | — | — | (23,942 | ) | 1,923,085 | 85,852 | 78,067 | ||||||||||||||||||||||||||
|
|
|
|
|
|
|
|
|
|
|
|
|
|
|
|
|
| |||||||||||||||||||
Total | 177,584 | $ | 3,794,313 | $ | 2,105,853 | $ | (58,181 | ) | $ | 58,181 | $ | (11,841 | ) | $ | 5,888,325 | 271,317 | $ | 252,198 | ||||||||||||||||||
|
|
|
|
|
|
|
|
|
|
|
|
|
|
|
|
|
| |||||||||||||||||||
| HighlandSmall-Cap Equity Fund | ||||||||||||||||||||||||||||||||||||
| Issuer | Shares at September 30, | Beginning September 30, | Purchases at Cost | Proceeds from | Net Gain/ Affiliated Issuers | Change Unrealized Appreciation/ Depreciation | Ending Value September 30, | Shares at September 30, | Affiliated Income | |||||||||||||||||||||||||||
Other Affiliates |
| |||||||||||||||||||||||||||||||||||
NexPoint Residential Trust, Inc., REIT | 54,500 | $ | 1,293,285 | $ | 25,252 | $ | (13,495 | ) | $ | 13,495 | $ | 558,956 | $ | 1,877,493 | 56,551 | $ | 15,560 | |||||||||||||||||||
Nexpoint Strategic Opportunities Fund (Registered Investment Companies) | 664 | 15,305 | 1,931,795 | — | — | (23,948 | ) | 1,923,152 | 85,855 | 78,070 | ||||||||||||||||||||||||||
|
|
|
|
|
|
|
|
|
|
|
|
|
|
|
|
|
| |||||||||||||||||||
Total | 55,164 | $ | 1,308,590 | $ | 1,957,047 | $ | (13,495 | ) | $ | 13,495 | $ | 535,008 | $ | 3,800,645 | 142,406 | $ | 93,630 | |||||||||||||||||||
|
|
|
|
|
|
|
|
|
|
|
|
|
|
|
|
|
| |||||||||||||||||||
The Highland Total Return Fund, the HighlandTax-Exempt Fund and the Highland Fixed Income Fund did not have any affiliated issuers as of September 30, 2018.
Note 11. New Accounting Pronouncements
In November 2016, the FASB issued Accounting Standards Update2016-18, Statement of Cash Flows (Topic 230): Restricted Cash. The amendments in this update require the
statement of cash flows to explain the change during the period in the total of cash, restricted cash and cash equivalents. Amounts generally described as restricted cash or restricted cash equivalents should be included with cash and cash equivalents when reconciling thebeginning-of-period andend-of-period total amounts shown on the statement of cash flows. For public entities this update will be effective for fiscal years beginning after December 15, 2017, and for
| Annual Report | 85 |
Table of Contents
NOTES TO FINANCIAL STATEMENTS (concluded)
| September 30, 2018 | Highland Funds II | |
interim periods within those fiscal years. The Investment Adviser is currently evaluating the impact of this new guidance on the Funds’ financial statements.
In December 2016, the FASB issued Accounting Standards Update2016-19, Technical Corrections and Improvements. The amendments in this update include an amendment to FASB ASC Topic 820, Fair Value Measurement and Disclosures to clarify the difference between a valuation approach and a valuation technique. The amendment also requires an entity to disclose when there has been a change in either or both a valuation approach and/or a valuation technique. For public entities, this update will be effective for fiscal years beginning after December 15, 2017, and for interim periods within those fiscal years. The Investment Adviser is currently evaluating the impact of this new guidance on the Funds’ financial statements.
In March 2017, the FASB issued Accounting Standards Update2017-08, Receivables — Nonrefundable Fees and Other Costs (Subtopic310-20). The amendments in this update shorten the amortization period for certain callable debt securities held at premium. Specifically, the amendments require the premium to be amortized to the earliest call date. The amendments do not require an accounting change for securities held at a discount; the discount continues to be amortized to maturity. For public entities this update will be effective for fiscal years beginning after December 15, 2018, and for interim periods within those fiscal years. The Investment Adviser is currently evaluating the impact of this new guidance on the Funds’ financial statements.
In February 2018, the FASB issued Accounting Standards Update2018-03, Technical Corrections and Improvements to Financial Instruments — Overall (Subtopic825-10): Recognition and Measurement of Financial Assets and Financial Liabilities. The amendments in this update provide a variety of technical corrections and improvements to how entities should account for financial instruments. For public entities this update will be effective for fiscal years beginning after December 15, 2017, and for interim periods within those fiscal years beginning after June 15, 2018. The Investment Adviser is currently evaluating the impact of this new guidance on the Funds’ financial statements.
In August 2018, the FASB issued Accounting Standards Update2018-13, Fair Value Measurement (Topic 820): Disclosure Framework — Changes to the Disclosure Requirements for Fair Value Measurement. The amendments in this update modify a number of disclosure requirements on fair value measurements required to be reported under Topic 820, Fair Value Measurement. The amendments in this update are effective for all entities for fiscal years, and interim periods within those fiscal years, beginning after December 15, 2019. The Investment Adviser is currently evaluating the impact of this new guidance on the Funds’ financial statements.
Note 12. Subsequent Events
Management has evaluated the impact of all subsequent events on the Funds through the date the financial statements were issued, and has determined that there were no subsequent events to report which have not already been recorded or disclosed in these financial statements and accompanying notes.
| 86 | Annual Report |
Table of Contents
REPORT OF INDEPENDENT REGISTERED PUBLIC ACCOUNTING FIRM
To the Board of Trustees of Highland Funds II and Shareholders of Highland Premier Growth Equity Fund, Highland Small-Cap Equity Fund, Highland Total Return Fund, Highland Tax-Exempt Fund, and Highland Fixed Income Fund
Opinions on the Financial Statements
We have audited the accompanying statements of assets and liabilities, including the investment portfolios, of Highland Premier Growth Equity Fund, Highland Small-Cap Equity Fund, Highland Total Return Fund, Highland Tax-Exempt Fund, and Highland Fixed Income Fund (constituting Highland Funds II, hereafter collectively referred to as the “Funds”) as of September 30, 2018, the related statements of operations for the year ended September 30, 2018, the statement of cash flows for the year ended September 30, 2018 for Highland Small-Cap Equity Fund, the statements of changes in net assets for the year ended September 30, 2018, including the related notes, and the financial highlights for the year ended September 30, 2018 (collectively referred to as the “financial statements”). In our opinion, the financial statements present fairly, in all material respects, the financial position of each of the Funds as of September 30, 2018, the results of each of their operations and Highland Small-Cap Equity Fund’s cash flows for the year then ended, the changes in each of their net assets for the year ended September 30, 2018 and each of the financial highlights for the year ended September 30, 2018 in conformity with accounting principles generally accepted in the United States of America.
The financial statements of the Funds as of and for the year ended September 30, 2017 and the financial highlights for each of the periods ended on or prior to September 30, 2017 were audited by other auditors whose report dated November 28, 2017 expressed an unqualified opinion on those financial statements and financial highlights.
Basis for Opinions
These financial statements are the responsibility of the Funds’ management. Our responsibility is to express an opinion on the Funds’ financial statements based on our audits. We are a public accounting firm registered with the Public Company Accounting Oversight Board (United States) (“PCAOB”) and are required to be independent with respect to the Funds in accordance with the U.S. federal securities laws and the applicable rules and regulations of the Securities and Exchange Commission and the PCAOB. We conducted our audits of these financial statements in accordance with the standards of the PCAOB. Those standards require that we plan and perform the audit to obtain reasonable assurance about whether the financial statements are free of material misstatement, whether due to error or fraud.
Our audits included performing procedures to assess the risks of material misstatement of the financial statements, whether due to error or fraud, and performing procedures that respond to those risks. Such procedures included examining, on a test basis, evidence regarding the amounts and disclosures in the financial statements. Our audits also included evaluating the accounting principles used and significant estimates made by management, as well as evaluating the overall presentation of the financial statements. Our procedures included confirmation of securities owned as of September 30, 2018 by correspondence with the custodians and brokers; when replies were not received from brokers, we performed other auditing procedures. We believe that our audits provide a reasonable basis for our opinions.

Dallas, Texas
December 21, 2018
We have served as the auditor of one or more investment companies of Highland Capital Management Fund Advisors, L.P. and its affiliates since 2004.
| Annual Report | 87 |
Table of Contents
ADDITIONAL INFORMATION (unaudited)
| September 30, 2018 | Highland Funds II | |
Tax Information
For the fiscal year ended September 30, 2018, the following Funds are designating the following items with regard to earnings for the year.
| Long-Term Capital Gain Designation | Tax Exempt Income | Qualified Dividends and Corporate Dividends Received Deduction | Qualifying Dividend Income (15% tax rate for QDI) | |||||||||||||
Premier Growth Equity Fund | $ | 33,270,981 | — | % | — | % | — | % | ||||||||
Small-Cap Equity Fund | 2,385,203 | — | 6.35 | 6.62 | ||||||||||||
Total Return Fund | 2,216,764 | — | 88.07 | 83.69 | ||||||||||||
Tax Exempt Fund | 372,998 | 100.00 | — | — | ||||||||||||
Fixed Income Fund | — | — | 4.25 | 5.09 | ||||||||||||
Additional Portfolio Information
The Investment Adviser and its affiliates manage other accounts, including registered and private funds and individual accounts. Although investment decisions for the Funds is made independently from those of such other accounts, the Investment Adviser may, consistent with applicable law, make investment recommendations to other clients or accounts that may be the same or different from those made to the Funds, including investments in different levels of the capital structure of a company, such as equity versus senior loans, or that involve taking contradictory positions in multiple levels of the capital structure. The Investment Adviser has adopted policies and procedures that address the allocation of investment opportunities, execution of portfolio transactions, personal trading by employees and other potential conflicts of interest that are designed to ensure that all client accounts are treated equitably over time. Nevertheless, this may create situations where a client could be disadvantaged because of the investment activities conducted by the Investment Adviser for other client accounts. When the Funds and one or more of such other accounts are prepared to invest in, or desire to dispose of, the same security, available investments or opportunities for each will be allocated in a manner believed by the Investment Adviser to be equitable to the Funds and such other accounts. The Investment Adviser also may aggregate orders to purchase and sell securities for the Funds and such other accounts. Although the Investment Adviser believes that, over time, the potential benefits of participating in volume transactions and negotiating lower transaction costs should benefit all accounts including the Funds, in some cases these activities may adversely affect the price paid or received by the Funds or the size of the position obtained or disposed of by the Funds.
Disclosure of Fund Expenses
As a shareholder of a Fund, you incur two types of costs: (1) transaction costs, including sales charges (loads) on purchases and redemption fees; and (2) ongoing costs, including management fees; distribution(12b-1) and service fees; and other Fund expenses. This example is intended to help you understand the ongoing costs (in dollars) of investing in your Fund and to compare these costs with the ongoing costs of investing in other mutual funds. The example is based on an investment of $1,000 invested at the beginning of the period and held for thesix-month period April 1, 2018 through September 30, 2018, unless otherwise indicated.
This table illustrates your Fund’s costs in two ways:
Actual Expenses:The first part of the table provides information about actual account values and actual expenses. You may use the information in this line, together with the amount you invested, to estimate the expenses that you paid over the period. Simply divide your account value by $1,000 (for example, an $8,600 account value divided by $1,000 = 8.6), then multiply the result by the number in the first line under the heading entitled “Expenses Paid During Period” to estimate the expenses you paid on your account during this period.
Hypothetical Example for Comparison Purposes:The second part of the table provides information about hypothetical account values and hypothetical expenses based on your Fund’s actual expense ratio and an assumed rate of return of 5% per year before expenses, which is not your Fund’s actual return. The actual expense ratio includes voluntary fee waivers or expense reimbursements by the Fund’s investment adviser. The expense ratio would be higher had the fee waivers or expense reimbursements not been in effect. The hypothetical account values and expenses may not be used to estimate the actual ending account balance or expenses you paid for the period. You may use this information to compare the ongoing costs of investing in your Fund and other funds. To do so, compare this 5% hypothetical example with the 5% hypothetical examples that appear in the shareholder reports of the other funds. Please note that the expenses shown in the table are meant to highlight your ongoing costs only and do not reflect any transactional costs, such as sales charges (loads) or redemption fees. Therefore, the second part of the table is useful in comparing ongoing costs only, and will not help you determine the relative total costs of owning different funds. In addition, if these transactional costs were included, your costs would have been higher.
| 88 | Annual Report |
Table of Contents
ADDITIONAL INFORMATION (unaudited) (continued)
| September 30, 2018 | Highland Funds II | |
| Beginning Account Value 04/01/18 | Ending Account Value 09/30/18 | Annualized Expense Ratio(1) | Expenses Paid During the Period(1) | |||||||||||||
Highland Premier Growth Equity Fund |
| |||||||||||||||
Actual Fund Return | ||||||||||||||||
Class A | $ | 1,000.00 | $ | 1,065.20 | 1.15 | % | $ | 5.95 | ||||||||
Class C | 1,000.00 | 1,061.10 | 1.90 | % | 9.82 | |||||||||||
Class Y | 1,000.00 | 1,066.30 | 0.90 | % | 4.66 | |||||||||||
Hypothetical 5% Return (before expenses) | ||||||||||||||||
Class A | $ | 1,000.00 | $ | 1,019.30 | 1.15 | % | $ | 5.82 | ||||||||
Class C | 1,000.00 | 1,015.54 | 1.90 | % | 9.60 | |||||||||||
Class Y | 1,000.00 | 1,020.56 | 0.90 | % | 4.56 | |||||||||||
HighlandSmall-Cap Equity Fund |
| |||||||||||||||
Actual Fund Return | ||||||||||||||||
Class A | $ | 1,000.00 | $ | 1,039.30 | 2.47 | % | $ | 12.63 | ||||||||
Class C | 1,000.00 | 1,034.30 | 3.23 | % | 16.47 | |||||||||||
Class Y | 1,000.00 | 1,038.90 | 2.27 | % | 11.60 | |||||||||||
Hypothetical 5% Return (before expenses) | ||||||||||||||||
Class A | $ | 1,000.00 | $ | 1,012.68 | 2.47 | % | $ | 12.46 | ||||||||
Class C | 1,000.00 | 1,008.87 | 3.23 | % | 16.27 | |||||||||||
Class Y | 1,000.00 | 1,013.69 | 2.27 | % | 11.46 | |||||||||||
Highland Total Return Fund |
| |||||||||||||||
Actual Fund Return | ||||||||||||||||
Class A | $ | 1,000.00 | $ | 1,041.10 | 1.26 | % | $ | 6.45 | ||||||||
Class C | 1,000.00 | 1,036.90 | 2.01 | % | 10.26 | |||||||||||
Class Y | 1,000.00 | 1,042.30 | 1.00 | % | 5.12 | |||||||||||
Hypothetical 5% Return (before expenses) | ||||||||||||||||
Class A | $ | 1,000.00 | $ | 1,018.75 | 1.26 | % | $ | 6.38 | ||||||||
Class C | 1,000.00 | 1,014.99 | 2.01 | % | 10.15 | |||||||||||
Class Y | 1,000.00 | 1,020.05 | 1.00 | % | 5.06 | |||||||||||
HighlandTax-Exempt Fund |
| |||||||||||||||
Actual Fund Return | ||||||||||||||||
Class A | $ | 1,000.00 | $ | 1,004.60 | 0.90 | % | $ | 4.52 | ||||||||
Class C | 1,000.00 | 1,000.80 | 1.66 | % | 8.33 | |||||||||||
Class Y | 1,000.00 | 1,005.60 | 0.65 | % | 3.27 | |||||||||||
Hypothetical 5% Return (before expenses) | ||||||||||||||||
Class A | $ | 1,000.00 | $ | 1,020.56 | 0.90 | % | $ | 4.56 | ||||||||
Class C | 1,000.00 | 1,016.75 | 1.66 | % | 8.39 | |||||||||||
Class Y | 1,000.00 | 1,021.81 | 0.65 | % | 3.29 | |||||||||||
Highland Fixed Income Fund |
| |||||||||||||||
Actual Fund Return | ||||||||||||||||
Class A | $ | 1,000.00 | $ | 1,009.80 | 0.88 | % | $ | 4.43 | ||||||||
Class C | 1,000.00 | 1,006.80 | 1.62 | % | 8.15 | |||||||||||
Class Y | 1,000.00 | 1,011.10 | 0.69 | % | 3.48 | |||||||||||
Hypothetical 5% Return (before expenses) | ||||||||||||||||
Class A | $ | 1,000.00 | $ | 1,020.66 | 0.88 | % | $ | 4.46 | ||||||||
Class C | 1,000.00 | 1,016.95 | 1.62 | % | 8.19 | |||||||||||
Class Y | 1,000.00 | 1,021.61 | 0.69 | % | 3.50 | |||||||||||
| (1) | Expenses are equal to the Fund’s annualized expense ratio multiplied by the average account value over the period, multiplied by the number of days in the most recent fiscal half-year, divided by the number of days in the full fiscal year (183/365). |
Changes of Independent Registered Public Accounting Firms
On September 28, 2018, Highland Energy MLP Fund, Highland Global Allocation Fund, Highland Premier Growth Equity Fund, Highland Small-Cap Equity Fund, Highland Total Return
Fund, Highland Tax-Exempt Fund and Highland Fixed Income Fund, each a series of Highland Funds II (the “Trust”), dismissed KPMG LLP (“KPMG”) as the Trust’s independent registered public accounting firm, effective on such date. The decision to dismiss KPMG was approved by the audit
| Annual Report | 89 |
Table of Contents
ADDITIONAL INFORMATION (unaudited) (continued)
| September 30, 2018 | Highland Funds II | |
committee and by the full board of trustees of the Trust (the “Board”). On September 27, 2018, the Trust approved the appointment of PricewaterhouseCoopers (“PwC”) as the Trust’s independent registered public accounting firm. PwC was engaged by the Trust on November 6, 2018.
KPMG did not issue a report on the Trust’s September 30, 2018 financial statements. KPMG’s audit reports on the Trust’s financial statements as of and for the years ended September 30, 2017 and 2016 did not contain any adverse opinion or disclaimer of opinion, nor were they qualified or modified as to uncertainty, audit scope, or accounting principles.
During its audit of certain affiliated funds with a fiscal year-end of June 30, 2018, KPMG concluded management’s review control over a certain hard-to-value security held by some of those funds and the Highland Global Allocation Fund was not designed at an appropriate level of precision to assess the orderly nature of transactions involving the security and reasonableness and reliability of certain inputs to the fair value model for the security. In connection with this audit, KPMG advised the Funds of the need to expand significantly the scope of its audit. Although Management of the Trust initially disagreed with KPMG’s position, subsequent to KPMG’s dismissal Management ultimately took the position that the transactions were orderly and revised certain non-observable inputs to the fair value model for the security.
KPMG and Management identified a material weakness in the control environment related to the assessment of orderly transactions and non-observable inputs used in fair valuation of a fair valued asset held for the 6/30 Funds. The Trust shares this control environment and the material weakness is relevant to the Highland Global Allocation Fund’s fair valuation.
Other than the disagreements and reportable events disclosed above, during the Trust’s years ended September 30, 2017 and 2016 and the subsequent interim period through September 28, 2018, there were no: (1) disagreements (as defined in Item 304(a)(1)(iv) of Regulation S-K and the related instructions) with KPMG on any matter of accounting principles or practices, financial statement disclosure, or auditing scope or procedures, which disagreements if not resolved to their satisfaction would have caused them to make reference in connection with their opinion to the subject matter of the disagreement, or (2) reportable events (as described in Item 304(a)(1)(v) of Regulation S-K). The audit committee of the Trust discussed the subject matter of these disagreements and reportable events with KPMG. The Trust has authorized KPMG to respond fully to the inquiries of PwC concerning the subject matter of these disagreements and reportable events.
During the years ended September 30, 2017 and 2016 and the subsequent interim period through September 27, 2018, neither Management, the Trust, nor anyone on its behalf,
consulted PwC regarding either (i) the application of accounting principles to a specified transaction, either completed or proposed, or the type of audit opinion that might be rendered on the financial statements of the Trust, and no written report or oral advice was provided to the Trust by PwC that PwC concluded was an important factor considered by the Trust in reaching a decision as to any accounting, auditing or financial reporting issue; or (ii) any matter that was either the subject of a disagreement (as defined in Item 304(a)(1)(iv) of Regulation S-K and the related instructions) or a reportable event (as described in Item 304(a)(1)(v) of Regulation S-K). Subsequent to September 27, 2018, PwC ultimately concluded that the March 2018 TerreStar transactions were orderly.
The Trust provided KPMG and PwC with a copy of the disclosure it is making in response to Item 304(a) of Registration S-K and requested that KPMG and PwC furnish the Trust with letters addressed to the SEC, pursuant to Item 304(a) containing any new information, clarification of the Trust’s expression of its view, or the respects in which it does not agree with the statements made by the Trust in response to Item 304(a). A copy of those letters, if applicable, was not available at the time of this filing.
Approval of Highland Funds II Advisory andSub-Advisory Agreements
The Trust has retained the Investment Adviser to manage the assets of each Fund pursuant to investment advisory agreements between the Investment Adviser and each such Fund (the “Advisory Agreements”). The Investment Adviser has also retained First Foundation Advisors (the“Sub-Adviser” and, together with the Investment Adviser, the “Advisers”) to serve assub-adviser to certain Funds pursuant tosub-advisory agreements (each, a“Sub-Advisory Agreement” and, together with the Advisory Agreements, the “Agreements”) between the Investment Adviser and theSub-Adviser with respect to the Highland-First Foundation Income Fund, the Highland Fixed Income Fund, the HighlandTax-Exempt Fund, and the Highland Total Return Fund. The Agreements were approved by the Funds’ Board of Trustees, including a majority of the Independent Trustees.
Following an initialtwo-year term, each of the Agreements continues in effect fromyear-to-year, provided that such continuance is specifically approved at least annually by the vote of holders of at least a majority of the outstanding shares of the Fund or by the Board of Trustees and, in either event, by a majority of the Independent Trustees of the Fund casting votes in person at a meeting called for such purpose.
During telephonic meetings held on August 16, 2018 and August 28, 2018, the Board of Trustees gave preliminary consideration to information bearing on the continuation of the Agreements for aone-year period commencing November 1, 2018 with respect to each Fund. The primary
| 90 | Annual Report |
Table of Contents
ADDITIONAL INFORMATION (unaudited) (continued)
| September 30, 2018 | Highland Funds II | |
objective of the meetings was to ensure that the Trustees had the opportunity to consider matters they deemed relevant in evaluating the continuation of the Agreements, and to request any additional information they considered reasonably necessary for their deliberations.
At anin-person meeting held on September16-17, 2018, the Board of Trustees, including the Independent Trustees, approved the continuance of the Agreements for aone-year period commencing on November 1, 2018. As part of its review process, the Board of Trustees requested, through Fund counsel and its independent legal counsel, and received from the Advisers, various information and written materials in connection with meetings of the Board of Trustees, including: (1) information regarding the financial soundness of the Advisers and the profitability of the Agreements to the Advisers; (2) information on the advisory and compliance personnel of the Advisers, including compensation arrangements; (3) information on the internal compliance procedures of the Advisers; (4) comparative information showing how the Funds’ fees and operating expenses compare to those of other accounts of the Advisers and comparable funds managed by unaffiliated advisers, both of which follow investment strategies similar to those of the Funds; (5) information on the investment performance of the Funds, including comparisons of the Funds’ performance against that of other registered investment companies and comparable funds that follow investment strategies similar to those of the Funds; (6) information regarding brokerage and portfolio transactions; and (7) information on any legal proceedings or regulatory audits or investigations affecting the Advisers. After the August 2018 meetings, the Trustees requested that the Advisers provide additional information regarding various matters. In addition, the Trustees received an independent report from Morningstar Inc. (“Morningstar”), an independent source of investment company data, relating to each Fund’s performance, volatility and expenses compared to the performance, volatility and expenses of a peer group determined by Morningstar to be comparable. The Trustees also relied on information provided at periodic meetings of the Board of Trustees over the course of the year. The Trustees reviewed various factors discussed in independent counsel’s legal memoranda regarding their responsibilities in considering the Agreements, the detailed information provided by the Advisers and other relevant information and factors. The Trustees’ conclusions as to the approval of the Agreements were based on a comprehensive consideration of all information provided to the Trustees without any single factor being dispositive in and of itself. Some of the factors that figured particularly in the Trustees’ deliberations are described below, although individual Trustees may have evaluated the information presented differently from one another, giving different weights to various factors.
The nature, extent, and quality of the services to be provided by the Advisers.
The Board of Trustees considered the portfolio management services to be provided by the Advisers under the Agreements and the activities related to portfolio management, including use of technology, research capabilities, and investment management staff. The Trustees discussed the relevant experience and qualifications of the personnel providing advisory services, including the background and experience of the members of each Fund’s portfolio management team. The Trustees reviewed the management structure, assets under management and investment philosophies and processes of the Advisers. The Trustees also reviewed and discussed information regarding the Advisers’ compliance policies, procedures and personnel, including portfolio manager compensation arrangements. With regard to each Fund for which the Investment Adviser has retained theSub-Adviser, the Trustees also considered: the services to be provided by the Investment Adviser with respect to the supervision of theSub-Adviser, including a review of the performance of theSub-Adviser of its obligations to the applicable Fund; a review of theSub-Adviser’s investment performance in respect of each applicable Fund; a review and consideration of any changes in the personnel of theSub-Adviser responsible for performing theSub-Adviser’s obligations and making appropriate reports to the Trustees; a review and consideration of any changes in the ownership or senior management of theSub-Adviser and making appropriate reports to the Trustees; and recommendations of the Investment Adviser with respect to the continued retention of theSub-Adviser or the replacement of theSub-Adviser. The Trustees concluded that the Advisers had the quality and depth of personnel and investment methods essential to performing their duties under the Agreements, and that the nature and the quality of such advisory services were satisfactory.
The Advisers’ historical performance in managing the Funds.
The Board of Trustees reviewed the historical performance of each Fund over various time periods and reflected on previous discussions regarding matters bearing on the Advisers’ performance at its meetings throughout the year. With respect to each Fund, the Trustees discussed the historical performance of the Fund and contrasted the relative performance of the Fund and its portfolio management team to that of the Fund’s peers, as represented by certain other registered investment companies and comparable funds that follow investment strategies similar to the Fund, as well as comparable indices and the Fund’s applicable Morningstar category. With respect to each Fund, the Trustees concluded that the Fund’s performance or other relevant factors supported the continuation of the Agreement(s) relating to that Fund for an additionalone-year period.
| Annual Report | 91 |
Table of Contents
ADDITIONAL INFORMATION (unaudited) (continued)
| September 30, 2018 | Highland Funds II | |
In the case of each Fund that had performance that lagged, as applicable, the performance of its Morningstar peer group median, category median and/or benchmark for certain periods, the Trustees considered information provided by the Advisers relating to the attribution of performance results for each such Fund, including information that demonstrated that such Fund’s underperformance was attributable, to a significant extent, to investment decisions (such as security selection or sector allocation) by the Advisers that were reasonable under the circumstances prevailing at the time and consistent with the applicable Fund’s investment objective and policies.
With respect to each Fund, the Trustees concluded that the Fund’s performance and other relevant factors supported the continuation of the Agreements.
The costs of the services to be provided by the Advisers and the profits to be realized by the Advisers and their affiliates from their relationship with the Funds.
The Board of Trustees also gave consideration to the fees payable under the Agreements, the expenses the Advisers incur in providing advisory services and the profitability to the Advisers from managing the Funds, including: (1) information regarding the financial condition of the Advisers; (2) information regarding the total fees and payments received by the Advisers for their services and, with respect to the Investment Adviser, whether such fees are appropriate given economies of scale and other considerations; (3) comparative information showing (a) the fees payable under the Agreements versus the investment advisory fees of certain registered investment companies and comparable funds that follow investment strategies similar to those of the Funds and (b) the expense ratios of the Funds versus the expense ratios of certain registered investment companies and comparable funds that follow investment strategies similar to those of the Funds; (4) information regarding the total fees and payments received and the related amounts waived and/or reimbursed by the Investment Adviser for providing administrative services with respect to certain of the Funds under separate agreements and whether such fees are appropriate; and (5) with respect to those Funds that aresub-advised, the fact that: (a) the fees payable to the Investment Adviser would be reduced by amounts payable to theSub-Adviser for a given period; (b) the Investment Adviser supervised theSub-Adviser; and (c) certain investment advisory services to eachsub-advised Fund are provided by the Investment Adviser. The Trustees also considered theso-called“fall-out benefits” to the Advisers with respect to the Funds, such as the reputational value of serving as Investment Adviser orSub-Adviser, as applicable, to the Funds, potential fees paid to the Advisers’ affiliates by a Fund or portfolio companies for services
provided, including administrative services provided to certain Funds by the Investment Adviser pursuant to separate agreements, the benefits of scale from investment by the Funds in affiliated funds, and the benefits of research made available to the Advisers by reason of brokerage commissions (if any) generated by the Funds’ securities transactions, and, with respect to certain Funds that invest in one or more other funds in the Highland fund complex, the fees paid to the Adviser of the underlying Fund and its affiliates with respect to such investments. After such review, the Trustees determined that the anticipated profitability rates to the Investment Adviser andSub-Adviser with respect to the Agreements were fair and reasonable. The Trustees also took into consideration the amounts waived and/or reimbursed, if any, where expense caps or advisory fee waivers had been implemented.
The extent to which economies of scale would be realized as each Fund grows and whether fee levels reflect these economies of scale for the benefit of shareholders.
The Board of Trustees considered the respective asset levels of the Funds over time and historical net expenses relative to such asset levels, the information provided by the Advisers relating to their costs and information comparing the fee rates charged by the Advisers with fee rates charged by other unaffiliated investment advisers to their clients. The Trustees concluded that the fee structures are reasonable, and with respect to the Investment Adviser, should result in a sharing of economies of scale in view of the information provided. The Board determined to continue to review ways, and the extent to which, economies of scale might be shared between the Adviser and/orSub-Adviser, as applicable, on the one hand and shareholders of the Funds on the other. The Board also requested that the Investment Adviser consider ways in which economies of scale can be shared with Fund shareholders.
Conclusion
Throughout the process, the Board of Trustees was advised by Fund counsel and independent legal counsel, and was empowered to engage such other third parties or request additional information as it deemed appropriate. Following a further discussion of the factors above and the merits of the Agreements and their various provisions, it was noted that in considering the approval of the Agreements, no single factor was determinative to the decision of the Board of Trustees. Rather, after weighing all of the factors and reasons discussed above, the Trustees, including the Independent Trustees, unanimously agreed that the Agreements, including the advisory andsub-advisory fees to be paid to the Advisers are fair and reasonable to the Funds in light of the services that the Advisers provide, the expenses that they incur and the reasonably foreseeable asset levels of the Funds.
| 92 | Annual Report |
Table of Contents
ADDITIONAL INFORMATION (unaudited) (continued)
| September 30, 2018 | Highland Funds II | |
The Board is responsible for the overall management of the Funds, including supervision of the duties performed by the Investment Adviser. The names and birth dates of the Trustees and officers of the Fund, the year each was first elected or appointed to office, their principal business occupations during the last five years, the number of funds overseen by each Trustee and other directorships they hold are shown below. The business address for each Trustee and officer of the Fund is c/o Highland Capital Management Fund Advisors, L.P., 200 Crescent Court, Suite 700, Dallas, TX 75201.
| Name and Date of Birth | Position(s) with the Trust | Term of Office1 and Length of Time Served | Principal Occupation(s) During the Past Five Years | Number of Portfolios in Highland Complex Overseen by the Trustees2 | Other Directorships/ Trusteeships Held During the Past Five Years | Experience, Qualifications, Attributes, Skills for Board Membership | ||||||
| Independent Trustees | ||||||||||||
Timothy K. Hui (6/13/1948) | Trustee | Indefinite Term; Trustee since inception in 2006. | Dean of Educational Resources Emeritus and Special Assistant to the President at Cairn University since July 2018; Dean of Educational Resources at Cairn University from July 2012 until June 2018 and from July 2006 to January 2008. | 25 | None | Significant experience on this board of directors/trustees; administrative and managerial experience; legal training and practice. | ||||||
Bryan A. Ward (2/4/1955) | Trustee | Indefinite Term; Trustee since inception in 2006. | Private Investor, BW Consulting, LLC since 2014; Senior Manager, Accenture, LLP (a consulting firm) from 2002 until retirement in 2014. | 25 | Director of Equity Metrix, LLC. | Significant experience on this and/or other boards of directors/trustees; significant managerial and executive experience; significant experience as a management consultant. | ||||||
| Annual Report | 93 |
Table of Contents
ADDITIONAL INFORMATION (unaudited) (continued)
| September 30, 2018 | Highland Funds II | |
| Name and Date of Birth | Position(s) with the Trust | Term of Office1 and Length of Time Served | Principal Occupation(s) During the Past Five Years | Number of Portfolios in Highland Complex Overseen by the Trustees2 | Other Directorships/ Trusteeships Held During the Past Five Years | Experience, Qualifications, Attributes, Skills for Board Membership | ||||||
| Independent Trustees | ||||||||||||
Dr. Bob Froehlich (4/28/1953) | Trustee | Indefinite Term; Trustee since December 2013. | Retired. | 25 | Trustee of ARC Realty Finance Trust, Inc. (from January 2013 to May 2016); Director of KC Concessions, Inc. (since January 2013); Trustee of Realty Capital Income Funds Trust (from January 2014 to December 2016); Director of American Realty Capital Healthcare Trust II (from January 2013 to June 2016); Director, American Realty Capital Daily Net Asset Value Trust, Inc. (from November 2012 to July 2016); Director of American Sports Enterprise, Inc. (since January 2013); Director of Davidson Investment Advisors (July 2009 to July 2016); Chairman and owner, Kane County Cougars Baseball Club (since January 2013); Advisory Board of Directors, Internet Connectivity Group, Inc. (January 2014 to April 2016); Director of AXAR Acquisition Corp. (formerly AR Capital Acquisition Corp.) (from October 2014 to October 2017); Director of The Midwest League of Professional Baseball Clubs, Inc.; Director of Kane County Cougars Foundation, Inc.; Director of Galen Robotics, Inc.; Chairman and Director of FC Global Realty, Inc. (from May 2017 to June 2018); and Chairman and Director of First Capital Investment Corp. (from March 2017 until March 2018). | Significant experience in the financial industry; significant managerial and executive experience; significant experience on other boards of directors, including as a member of several audit committees. | ||||||
| 94 | Annual Report |
Table of Contents
ADDITIONAL INFORMATION (unaudited) (continued)
| September 30, 2018 | Highland Funds II | |
Name and Date of Birth | Position(s) Trust | Term of Office1 and Length of Time Served | Principal Occupation(s) During the Past Five Years | Number of Fund Trustees2 | Other Directorships/ Held During the Past Five Years | Experience, Qualifications, Attributes, Skills for Board Membership | ||||||
| Independent Trustees | ||||||||||||
John Honis3 (6/16/1958) | Trustee | Indefinite Term; Trustee since July 2013. | President of Rand Advisors, LLC since August 2013; Partner of Highland Capital Management, L.P. (“HCM”) from February 2007 until his resignation in November 2014. | 25 | Manager of Turtle Bay Resort, LLC; and Manager of American Home Patient (from November 2011 to February 2016). | Significant experience in the financial industry; significant managerial and executive experience, including experience as president, chief executive officer or chief restructuring officer of five telecommunication firms; experience on other boards of directors/trustees. | ||||||
Ethan Powell4 (6/20/1975) | Trustee and Chairman of the Board | Indefinite Term; Trustee since December 2013; Chairman of the Board since December 2013; and Executive Vice President and Principal Executive Officer from June 2012 until December 2015. | President and Founder of Impact Shares LLC since December 2015; Trustee/Director of the Highland Fund Complex from June 2012 until July 2013 and since December 2013; Chief Product Strategist of Highland Capital Management Fund Advisors, L.P. (“HCMFA”) from 2012 until December 2015; Senior Retail Fund Analyst of HCM from 2007 until December 2015 and HCMFA from its inception until December 2015; President and Principal Executive Officer of NexPoint Strategic Opportunities Fund (“NHF”) from June 2012 until May 2015; Secretary of NHF from May 2015 until December 2015; Executive Vice President and Principal Executive Officer of Highland Funds I (“HFI”) and Highland Funds II (“HFII”) from June 2012 until December 2015; and Secretary of HFI and HFII from November 2010 to May 2015. | 25 | Trustee of Impact Shares Funds I Trust | Significant experience in the financial industry; significant executive experience including past service as an officer of funds in the Highland Fund Complex; significant administrative and managerial experience. | ||||||
| Annual Report | 95 |
Table of Contents
ADDITIONAL INFORMATION (unaudited) (continued)
| September 30, 2018 | Highland Funds II | |
| Name and Date of Birth | Position(s) with the Trust | Term of Office1 and Length of Time Served | Principal Occupation(s) During the Past Five Years | Number of Portfolios in Highland Complex Overseen by the Trustees2 | Other Directorships/ Trusteeships Held During the Past Five Years | Experience, Qualifications, Attributes, Skills for Board Membership | ||||||
| Interested Trustee | ||||||||||||
Dustin Norris5 (1/6/1984) | Trustee and Secretary | Indefinite Term; Trustee since February 2018; and Secretary since October 2017. | President of Highland Capital Funds Distributor, Inc. since April 2018; Head of Distribution at HCMFA since November 2017; Secretary of Highland Floating Rate Opportunities Fund (“HFRO”), Highland Global Allocation Fund (“GAF”), HFI and HFII since October 2017; Assistant Secretary of HFRO and GAF from August 2017 to October 2017; Chief Product Strategist at HCMFA since September 2015; Director of Product Strategy at HCMFA from May 2014 to September 2015; Assistant Secretary of HFI and HFII from March 2017 to October 2017; Secretary of NHF since December 2015; Assistant Treasurer of NexPoint Real Estate Advisors, L.P. since May 2015; Assistant Treasurer of NexPoint Real Estate Advisors II, L.P. since June 2016; Assistant Treasurer of HFI and HFII from November 2012 to March 2017; Assistant Treasurer of NHF from November 2012 to December 2015; Secretary of NexPoint Capital, Inc. since 2014; Secretary of NexPoint Real Estate Strategies Fund, NexPoint Strategic Income Fund, NexPoint Energy and Materials Opportunities Fund, NexPoint Discount Strategies Fund, NexPoint Healthcare Opportunities Fund, NexPoint Event-Driven Fund and NexPoint Latin American Opportunities Fund (the “Interval Funds”) since March 2016; and Senior Accounting Manager at HCMFA from August 2012 to May 2014. | 25 | None | Significant experience in the financial industry; significant managerial and executive experience, including experience as an officer of the Highland Funds Complex since 2012. | ||||||
| 96 | Annual Report |
Table of Contents
ADDITIONAL INFORMATION (unaudited) (continued)
| September 30, 2018 | Highland Funds II | |
Name and Date of Birth | Position(s) with the Fund | Term of Office and Length of Time Served | Principal Occupation(s) During Past Five Years | |||
| Officers | ||||||
Trey Parker (1/27/1976) | Executive Vice President | Indefinite Term; Executive Vice President since September 2017. | Executive Vice President of HCMFA, NexPoint Advisors, L.P., HFI, HFII, HFRO and GAF since September 2017, Assistant Secretary of Highland Restoration Capital Partners GP, LLC since September 2017; Assistant Secretary of Highland SunBridge GP, LLC since December 2015; Assistant Secretary of HCM since August 2015; Director of CCS Medical, Inc. since August 2018; Director of JHT Holdings, Inc. since August 2013; Director of TerreStar Corporation since March 2013; Director of OmniMax International, Inc. since March 2012; and Secretary of Granite Bay Advisors, L.P. since February 2012. | |||
Frank Waterhouse (4/14/1971) | Treasurer; Principal Accounting Officer, Principal Financial Officer and Principal Executive Officer | Indefinite Term; Treasurer since May 2015. Principal Financial Officer and Principal Accounting Officer since October 2017. Principal Executive Officer since February 2018. | Principal Executive Officer of HFI, HFII, HFRO and GAF since February 2018; Principal Financial Officer and Principal Accounting Officer of HFRO, GAF, NexPoint Capital, Inc., NHF, HFI, HFII, and NexPoint Real Estate Advisors, L.P. since October 2017; Treasurer of HFRO and GAF since August 2017; Assistant Treasurer of Acis Capital Management, L.P. from December 2011 until February 2012; Treasurer of Acis Capital Management, L.P. since February 2012; Assistant Treasurer of HCM from November 2011 until April 2012; Treasurer of HCM since April 2012; Assistant Treasurer of HCMFA from December 2011 until October 2012; Treasurer of HCMFA since October 2012; Treasurer of NexPoint Advisors, L.P. since March 2012 and Treasurer of NexPoint Capital, Inc., NHF, HFI, HFII, and NexPoint Real Estate Advisors, L.P. since May 2015; Treasurer of NexPoint Real Estate Advisors II, L.P. since June 2016; and Treasurer of the Interval Funds since March 2016. | |||
Clifford Stoops (11/17/1970) | Assistant Treasurer | Indefinite Term; Assistant Treasurer since March 2017. | Assistant Treasurer of HFRO and GAF since August 2017; Assistant Treasurer of HFI, HFII, NHF, NexPoint Capital, Inc. and the Interval Funds since March 2017; and Chief Accounting Officer at HCM since December 2011. | |||
Jason Post (1/7/1979) | Chief Compliance Officer | Indefinite Term; Chief Compliance Officer since August 2017. | Chief Compliance Officer and Anti-Money Laundering Officer of HFRO and GAF since August 2017; Chief Compliance Officer and Anti-Money Laundering Officer of HFI, HFII, NHF and NexPoint Capital, Inc. since September 2015; Chief Compliance Officer and Anti-Money Laundering Officer of the Interval Funds since March 2016; and Chief Compliance Officer for HCMFA and NexPoint Advisors, L.P since September 2015. Prior to this role served as Deputy Chief Compliance Officer and Director of Compliance for HCM. | |||
| Annual Report | 97 |
Table of Contents
ADDITIONAL INFORMATION (unaudited) (concluded)
| September 30, 2018 | Highland Funds II | |
Name and Date of Birth | Position(s) with the Fund | Term of Office and Length of Time Served | Principal Occupation(s) During Past Five Years | |||
| Officers | ||||||
Dustin Norris5 (1/6/1984) | Secretary and Trustee | Indefinite Term; Secretary since October 2017. | President of Highland Capital Funds Distributor, Inc. since April 2018; Head of Distribution at HCMFA since November 2017; Secretary of HFRO and GAF, HFI and HFII since October 2017; Assistant Secretary of HFRO and GAAF from August 2017 to October 2017; Secretary of the Interval Funds since March 2016; Chief Product Strategist at HCMFA since September 2015; Director of Product Strategy at HCMFA from May 2014 to September 2015; Secretary of NHF since December 2015; Assistant Secretary of HFI and HFII from March 2017 to October 2017; Assistant Treasurer of NexPoint Real Estate Advisors, L.P. since May 2015; Assistant Treasurer of NexPoint Real Estate Advisors II, L.P. since June 2016; Assistant Treasurer of HFI and HFII from November 2012 to March 2017; Assistant Treasurer of NHF from November 2012 to December 2015; Secretary of NexPoint Capital, Inc. since 2014; and Senior Accounting Manager at HCMFA from August 2012 to May 2014. | |||
| 1 | On an annual basis, as a matter of Board policy, the Governance Committee reviews each Trustee’s performance and determines whether to extend each such Trustee’s service for another year. Effective June 2013, the Board adopted a retirement policy wherein the Governance Committee shall not recommend the continued service as a Trustee of a Board member who is older than 80 years of age at the time the Governance Committee reports its findings to the Board. |
| 2 | The “Highland Fund Complex” consists of NHF, each series of HFI, each series of HFII, HFRO, GAF, the Interval Funds, and NexPoint Capital, Inc., aclosed-end management investment company that has elected to be treated as a business development company under the 1940 Act. |
| 3 | Since May 1, 2015, Mr. Honis has been treated as an Independent Trustee of the Trust. Prior to that date, Mr. Honis was treated as an Interested Trustee because he was a partner of an investment adviser affiliated with the Adviser until his resignation in November 2014. As of September 30, 2018, Mr. Honis was entitled to receive aggregate severance and/or deferred compensation payments of approximately $556,000 from another affiliate of the Adviser. Mr. Honis also serves as a director of a portfolio company affiliated with the Adviser. During the Trust’s last two fiscal years, Mr. Honis’ aggregate compensation from this portfolio company for his services as a director was approximately $50,000. |
In addition, Mr. Honis serves as a trustee of a trust that owns substantially all of the economic interest in an investment adviser affiliated with the Adviser. Mr. Honis indirectly receives an asset-based fee in respect of such interest, which is projected to range from$450,000-$500,000 annually. In light of these relationships between Mr. Honis and affiliates of the Adviser, it is possible that the SEC might in the future determine Mr. Honis to be an interested person of the Trust. |
| 4 | Prior to December 8, 2017, Mr. Powell was treated as an Interested Trustee of the Trust for all purposes other than compensation and the Trust’s code of ethics. |
| 5 | On February 7, 2018, Mr. Norris was appointed as an Interested Trustee of the Trust. |
| 98 | Annual Report |
Table of Contents
IMPORTANT INFORMATION ABOUT THIS REPORT
Investment Adviser
Highland Capital Management Fund Advisors, L.P.
300 Crescent Court, Suite 700
Dallas, TX 75201
Sub-Advisers
First Foundation Advisors
18/01 Von Karman Ave., Suite 700
Irvine, CA 92612-0145
Transfer Agent
DST Asset Manager Solutions, Inc.
2000 Crown Colony Drive
Quincy, MA 02169
Underwriter
Highland Capital Funds Distributor, Inc.
200 Crescent Court, Suite 700
Dallas, TX 75201
Custodian
State Street Bank and Trust Company
One Lincoln Street
Boston, Massachusetts 02111
Independent Registered Public
Accounting Firm
PricewaterhouseCoopers LLP
2121 N. Pearl Street, Suite 2000,
Dallas, TX 75201
Fund Counsel
K&L Gates LLP
1 Lincoln Street
Boston, MA 02111
This report has been prepared for shareholders of Highland Premier Growth Equity Fund, HighlandSmall-Cap Equity Fund, Highland Total Return Fund, HighlandTax-Exempt Fund, and Highland Fixed Income Fund (collectively, the “Funds”). The Funds mail one shareholder report to each shareholder address. If you would like more than one report, please call shareholder services at1-877-665-1287 to request that additional reports be sent to you.
A description of the policies and procedures that the Funds use to determine how to vote proxies relating to their portfolio securities, and the Funds’ proxy voting records for the most recent6-month period ended March 31, are available (i) without charge, upon request, by calling1-877-665-1287 and (ii) on the Securities and Exchange Commission’s website at http://www.sec.gov.
The Funds file their complete schedules of portfolio holdings with the Securities and Exchange Commission for the first and third quarters of each fiscal year on FormN-Q. The Funds’ FormsN-Q are available on the Commission’s website at http://www.sec.gov and also may be reviewed and copied at the Commission’s Public Reference Room in Washington, DC. Information on the Public Reference Room may be obtained by calling1-800-SEC-0330. Shareholders may also obtain the FormN-Q by visiting the Funds’ website at www.highlandfunds.com.
The Statements of Additional Information include additional information about the Funds’ Trustees and are available upon request without charge by calling1-877-665-1287.
| Annual Report | 99 |
Table of Contents

Highland Funds
c/o DST Asset Manager Solutions, Inc.
430 W 7th Street Suite 219424
Kansas City, MO 64105-1407
| Highland Funds II | Annual Report, September 30, 2018 |
| www.highlandfunds.com | HFII-AR-09/18 |
Table of Contents
Highland Energy MLP Fund
Annual Report
September 30, 2018
Table of Contents
Highland Energy MLP Fund
TABLE OF CONTENTS
| 1 | ||||
| 4 | ||||
| 5 | ||||
| 6 | ||||
| 7 | ||||
| 8 | ||||
| 9 | ||||
Statement of Changes in Net Assets — Capital Stock Activity — Shares | 10 | |||
| 11 | ||||
| 12 | ||||
| 15 | ||||
| 25 | ||||
| 26 | ||||
| 37 |
Economic and market conditions change frequently.
There is no assurance that the trends described in this report will continue or commence.
A prospectus must precede or accompany this report. Please read the prospectus carefully before you invest.
Table of Contents
PORTFOLIO MANAGER COMMENTARY (unaudited)
| September 30, 2018 | Highland Energy MLP Fund | |
Performance Overview
For the twelve-month period ending September 30, 2018, the Highland Energy MLP Fund (the “Fund”) returned 0.23% for Class A shares, (0.21)% for Class C shares, and 0.75% for Class Y shares. The Alerian MLP Index, the Fund’s benchmark, returned 4.89% during the same period.
Manager’s Discussion
During the period, the Fund was primarily invested in limited and general partnership interests of master limited partnerships (MLPs) engaged in the processing, transportation, and storage of oil, natural gas, natural gas liquids, and refined products. The Fund’s performance exceeded that of its peers due to the use of leverage and the overweighting of certain positions that were well-poised to benefit from the further normalization in energy commodity pricing and upstream activity during the past year.
The healing process within the MLP sector has continued as many midstream companies have begun to adopt aspects of the post-downturn E&P playbook — namely, living more within cash flow and prudently pursuing growth. On the back of higher and more stabilized commodity prices, E&Ps have increased activity across many of the U.S. shale basins. In fact, crude and natural gas production from these areas now stands at record high levels, and there is no indication that this trend will revert in the near term. The Permian Basin remains the poster child for upstream shale development and rightfully so given the immense resource potential in the basin. However, it also serves as an important example of the need for midstream infrastructure and its continued development. A year ago, the market was concerned about whether excess midstream capacity could be absorbed. Flashing forward to today, production in the Permian Basin now exceeds capacity, and many producers there are confronting widening and more volatile pricing differentials. Midstream companies have responded with plans for additional capacity in the region, providing the impetus for growth that has been lacking for many years. Many of these companies servicing the Permian and other areas will continue to benefit as production volumes rise and fill both existing and future capacity.
The Fund’s outperformance versus its peers was primarily driven by a handful of overweight positions. We rely upon several criteria for determining portfolio suitability, chiefly among which are asset quality, operating footprint, a conservatively-managed capital structure, distribution sustainability, and the lack of an IDR burden.1 Not every position possesses all of the criteria, but the Fund’s best performers (Crestwood Equity Partners (CEQP), Targa Resources (TRGP), and Enterprise Products Partners (EPD)) were selected as overweights because they had most, if not all, of these characteristics. EPD is the bellwether of the MLP sector and certainly benefited from renewed interest in the asset class. However, it also has an attractive asset base and is one of the best-operated businesses in the sector. TRGP has one of the preeminent footprints in the Permian and the growth experienced in the basin was one of the key reasons for its overweight positioning. Perhaps the most interesting contributor to the Fund’s performance was the CEQP holding. Although it checks many of the boxes listed above, it’s a smaller capitalization company that is not as widely followed as some of its larger peers. Given the Fund’s relative size, we were able to build CEQP into a sizable position as the market began to better appreciate the company’s attractive value proposition.
The Fund continues to implement leverage and, as described above, remains positioned around holdings that we believe will benefit disproportionately from further production growth in the U.S. as well as those whose fundamental value is believed to be underappreciated by the broader market.
| 1 | The term IDR burden refers to the payments made by an MLP to its general partner (GP) arising from the GP’s incentive distribution rights (IDRs). |
| Annual Report | 1 |
Table of Contents
PORTFOLIO MANAGER COMMENTARY (unaudited)
| September 30, 2018 | Highland Energy MLP Fund | |
Highland Energy MLP Fund - Class A
Growth of Hypothetical $10,000 Investment
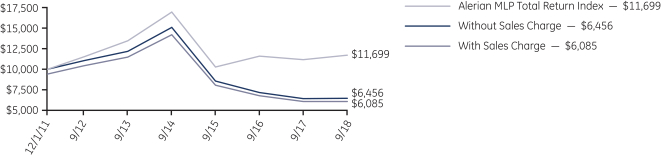
| Average Annual Total Returns | ||||||||||||||||||||||||
Class A | Class C | Class Y | ||||||||||||||||||||||
Without Sales Charge | With Sales Charge | Without Sales Charge | With Sales Charge | Without Sales Charge | With Sales Charge | |||||||||||||||||||
| Year Ended September 30, 2018 | 0.23 | % | -5.54 | % | -0.21 | % | -1.12 | % | 0.75 | % | n/a | |||||||||||||
| Five Year | -11.87 | % | -12.91 | % | -12.48 | % | -12.48 | % | -11.71 | % | n/a | |||||||||||||
| Since Inception: | -6.20 | % | -7.01 | % | -6.83 | % | -6.83 | % | -5.97 | % | n/a | |||||||||||||
“Without Sales Charge” returns do not include sales charges or contingent deferred sales charges (“CDSC”). “With Sales Charge” returns reflect the maximum sales charge of 5.75% on Class A Shares. The CDSC on Class C Shares is 1% within the first year for each purchase; there is no CDSC on Class C Shares thereafter.
Fees and Expenses: The gross expense ratios as reported in the Fund’s financial highlights are Class A: 8.99%, Class C: 9.74% and Class Y: 8.74%. The Advisor has contractually agreed to limit the total annual operating expenses (exclusive of fees paid by the Fund pursuant to its distribution plan under Rule12b-1 under the Investment Company Act of 1940, as amended, taxes, such as deferred tax expenses, dividend expenses on short sales, interest payments, brokerage commissions and other transaction costs, acquired fund fees and expenses, and extraordinary expenses) of the Fund to 1.10% of average daily net assets attributable to any class of the Fund. The Expense Cap will continue through at least January 31, 2019. Performance results reflect any contractual waivers and/ or reimbursements of fund expenses by the Adviser. Absent this limitation, performance results would have been lower.
The performance data quoted here represents past performance and is no guarantee of future results. Investment returns and principal value will fluctuate so that an investor’s shares, when redeemed, may be worth more or less than their original cost. Current performance may be lower or higher than the performance data quoted. For performance data current to the most recentmonth-end, please visit our website at www.highlandfunds.com.
Effective February 1, 2013, the Fund revised its investment strategy to focus on MLP investments. Returns through September 30, 2012 reflect the Fund’s treatment as a regulated investment company under the Internal Revenue Code of 1986, as amended. Returns after September 30, 2012 reflect the Fund’s treatment as a regular corporation, or “C” corporation, for U.S. federal income tax purposes. As a result, returns after September 30, 2012 generally will be reduced by the amount of entity-level income taxes paid by the Fund as a regular corporation and thus will not necessarily be comparable to returns reported while the Fund still qualified as a regulated investment company.
The Fund’s investments in MLPs involve additional risks as compared to the risks of investing in common stock, including risks related to cash flow, dilution and voting rights. The Fund’s investments are concentrated in the energy infrastructure industry with an emphasis on securities issued by MLPs, which may increase price fluctuation. Energy infrastructure companies are subject to risks specific to the industry such as fluctuations in commodity prices, reduced volumes of natural gas or other energy commodities, environmental hazards, changes in the macroeconomic or the regulatory environment or extreme weather. MLPs may trade less frequently than larger companies due to their smaller capitalizations which may result in erratic price movement or difficulty in buying or selling. MLPs are subject to significant regulation and may be adversely affected by changes in the regulatory environment including the risk that a limited partner could lose its tax status as a partnership which could reduce or eliminate distributions paid by MLPs to the Fund. Additional management fees and other expenses are associated with investing in MLP funds. The Fund is subject to certain MLP tax risks and risks associated with accounting for its deferred tax liability which could materially reduce its net asset value. An investment in the Fund is not entitled to the same tax benefits as a direct investment in an MLP. Stock and bond prices may fall or fail to rise over time for several reasons, including general financial market conditions, factors related to a specific issuer or industry and, with respect to bond prices, changing market perceptions of the risk of default and changes in government intervention. These factors may also lead to increased volatility and reduced liquidity in the bond markets. The Fund’s investments in derivatives may involve more volatility and less liquidity because of the risk that an investment may not correlate to the performance of the underlying securities. Investments by the Fund involving leverage may have the effect of increasing the volatility of the Fund’s portfolio, and the risk of loss in excess of invested capital.
The Fund is organized as a Subchapter “C” Corporation which means that it will pay federal income taxes at a corporate rate as well as state and local taxes based on its taxable income. The potential benefit of investing in MLPs generally is their treatment as partnerships for federal income purposes.
| 2 | Annual Report |
Table of Contents
PORTFOLIO MANAGER COMMENTARY (unaudited)
| September 30, 2018 | Highland Energy MLP Fund | |
Because the Fund is a corporation, it will be taxed at the Fund level, which will reduce the amount of cash available for distribution and the Fund’s net asset value. A significant portion of the Fund’s distributions may be tax deferred return of capital (ROC), which reduces a shareholder’s cost basis in its shares and therefore increases any gain or decreases any loss realized when the shares are sold.
Mutual fund investing involves risk, including the possible loss of principal.
Alerian MLP Index is a composite of the 50 most prominent energy master limited partnerships. The index, which is calculated using a float-adjusted, capitalization-weighted methodology, is disseminated real-time on a price-return basis and on a total-return basis.
| Annual Report | 3 |
Table of Contents
| Highland Energy MLP Fund | ||
Objective
Highland Energy MLP Fund seeks to provide investors with current income and capital appreciation.
Net Assets as of September 30, 2018
$28.1 million
Portfolio Data as of September 30, 2018
The information below provides a snapshot of Highland Energy MLP Fund at the end of the reporting period. Highland Energy MLP Fund is actively managed and the composition of its portfolio will change over time. Current and future holdings are subject to risk.
| Top 10 Holdings as of 09/30/2018 (%)(1) | ||||
Energy Transfer Equity LP Master Limited Partnerships | 20.7 | |||
Williams Cos., Inc. (The) Common Stocks | 14.2 | |||
Targa Resources Corp. Common Stocks | 12.1 | |||
Enterprise Products Partners LP Master Limited Partnerships | 11.3 | |||
Kinder Morgan, Inc. Common Stocks | 10.8 | |||
Crestwood Equity Partners Master Limited Partnerships | 8.9 | |||
EnLink Midstream Partners LP Master Limited Partnerships | 7.8 | |||
MPLX LP Master Limited Partnerships | 6.8 | |||
SemGroup Corp. Common Stocks | 6.7 | |||
Andeavor Logistics LP Master Limited Partnerships | 6.6 | |||
| (1) | Holdings are calculated as a percentage of total net assets. |
| 4 | Annual Report |
Table of Contents
| September 30, 2018 | Highland Energy MLP Fund | |
A guide to understanding the Fund’s financial statements
| Investment Portfolio | The Investment Portfolio details the Fund’s holdings and its market value as of the last day of the reporting period. Portfolio holdings are organized by type of asset and industry to demonstrate areas of concentration and diversification. | |
| Statement of Assets and Liabilities | This statement details the Fund’s assets, liabilities, net assets and share price for each share class as of the last day of the reporting period. Net assets are calculated by subtracting all of the Fund’s liabilities (including any unpaid expenses) from the total of the Fund’s investment and noninvestment assets. The net asset value per share for each class is calculated by dividing net assets allocated to that share class by the number of shares outstanding in that class as of the last day of the reporting period. | |
| Statement of Operations | This statement reports income earned by the Fund and the expenses incurred by the Fund during the reporting period. The Statement of Operations also shows any net gain or loss the Fund realized on the sales of its holdings during the period as well as any unrealized gains or losses recognized over the period. The total of these results represents the Fund’s net increase or decrease in net assets from operations. | |
| Statement of Changes in Net Assets | This statement details how the Fund’s net assets were affected by its operating results, distributions to shareholders and shareholder transactions (e.g., subscriptions, redemptions and distribution reinvestments) during the reporting period. The Statement of Changes in Net Assets also details changes in the number of shares outstanding. | |
| Statement of Cash Flows | This statement reports net cash and foreign currency provided or used by operating, investing and financing activities and the net effect of those flows on cash and foreign currency during the period. | |
| Financial Highlights | The Financial Highlights demonstrate how the Fund’s net asset value per share was affected by the Fund’s operating results. The Financial Highlights also disclose the classes’ performance and certain key ratios (e.g., net expenses and net investment income as a percentage of average net assets). | |
| Notes to Financial Statements | These notes disclose the organizational background of the Fund, certain of their significant accounting policies (including those surrounding security valuation, income recognition and distributions to shareholders), federal tax information, fees and compensation paid to affiliates and significant risks and contingencies. | |
| Annual Report | 5 |
Table of Contents
| As of September 30, 2018 | Highland Energy MLP Fund | |
Shares | Value ($) | |||||||
Common Stocks - 50.5% | ||||||||
| ENERGY (a) - 50.5% | ||||||||
| 42,226 | EnLink Midstream LLC | 694,618 | ||||||
| 171,127 | Kinder Morgan, Inc. | 3,034,082 | ||||||
| 47,553 | Plains GP Holdings LP, Class A | 1,166,475 | ||||||
| 85,929 | SemGroup Corp., Class A | 1,894,734 | ||||||
| 60,407 | Targa Resources Corp. | 3,401,518 | ||||||
| 146,974 | Williams Cos., Inc. (The) | 3,996,223 | ||||||
|
| |||||||
| 14,187,650 | ||||||||
|
| |||||||
Total Common Stocks | 14,187,650 | |||||||
|
| |||||||
Master Limited Partnerships - 92.2% | ||||||||
| ENERGY (a) - 92.2% | ||||||||
| 38,329 | Andeavor Logistics LP | 1,861,256 | ||||||
| 40,000 | Buckeye Partners LP | 1,428,400 | ||||||
| 68,416 | Crestwood Equity Partners LP | 2,514,288 | ||||||
| 117,135 | EnLink Midstream Partners LP | 2,183,397 | ||||||
| 333,411 | Energy Transfer Equity LP | 5,811,354 | ||||||
| 110,266 | Enterprise Products Partners LP | 3,167,942 | ||||||
Shares | Value ($) | |||||||
| ENERGY (continued) | ||||||||
| 33,786 | EQT Midstream Partners LP | 1,783,225 | ||||||
| 6,653 | Magellan Midstream Partners LP | 450,541 | ||||||
| 54,963 | MPLX LP | 1,906,117 | ||||||
| 111,974 | NGL Energy Partners LP | 1,298,898 | ||||||
| 21,144 | Plains All American Pipeline LP | 528,812 | ||||||
| 28,222 | Suburban Propane Partners LP | 664,064 | ||||||
| 27,164 | Sunoco LP | 802,696 | ||||||
| 50,660 | Western Gas Equity Partners LP | 1,516,760 | ||||||
|
| |||||||
| 25,917,750 | ||||||||
|
| |||||||
Total Master Limited Partnerships | 25,917,750 | |||||||
|
| |||||||
Total Investments - 142.7% | 40,105,400 | |||||||
|
| |||||||
(Cost $45,871,276) | ||||||||
Other Assets & Liabilities, Net - (42.7)% | (11,997,828 | ) | ||||||
|
| |||||||
Net Assets - 100.0% | 28,107,572 | |||||||
|
| |||||||
| (a) | All or part of these securities are pledged as collateral for the credit facility with Bank of New York Mellon. The market value of the securities pledged as collateral was $40,105,400. |
| 6 | See accompanying Notes to Financial Statements. |
Table of Contents
STATEMENT OF ASSETS AND LIABILITIES
| As of September 30, 2018 | Highland Energy MLP Fund | |
| ($) | ||||
Assets | ||||
Investments, at value | 40,105,400 | |||
|
| |||
Total Investments, at value | 40,105,400 | |||
Cash | 492,480 | |||
Receivable for: | ||||
Fund shares sold | 66,000 | |||
Interest | 282 | |||
Prepaid expenses and other assets | 26,466 | |||
|
| |||
Total assets | 40,690,628 | |||
|
| |||
Liabilities | ||||
Notes payable (Note 5) | 12,400,000 | |||
Payable for: | ||||
Interest expense and commitment fee payable (Note 5) | 37,466 | |||
Fund shares redeemed | 19,710 | |||
Investment advisory and administration fees (Note 6) | 6,624 | |||
Transfer agent fees | 709 | |||
Trustees’ fees | 112 | |||
Accrued expenses and other liabilities | 118,435 | |||
|
| |||
Total liabilities | 12,583,056 | |||
|
| |||
Commitments and Contingencies (Note 7) | ||||
|
| |||
Net Assets | 28,107,572 | |||
|
| |||
Net Assets Consist of: | ||||
Par value (Note 1) | 7,705 | |||
Paid-in capital in excess of par | 63,219,598 | |||
Total distributable earnings (loss) | (35,119,731 | ) | ||
|
| |||
Net Assets | 28,107,572 | |||
|
| |||
Investments, at cost | 45,871,276 | |||
Class A: | ||||
Net assets | 2,371,088 | |||
Shares outstanding ($0.001 par value; unlimited shares authorized) | 647,110 | |||
Net asset value per share(a)(b) | 3.66 | |||
Maximum offering price per share(c) | 3.88 | |||
Class C: | ||||
Net assets | 3,335,378 | |||
Shares outstanding ($0.001 par value; unlimited shares authorized) | 914,483 | |||
Net asset value and offering price per share(a) | 3.65 | |||
Class Y: | ||||
Net assets | 22,401,106 | |||
Shares outstanding ($0.001 par value; unlimited shares authorized) | 6,142,908 | |||
Net asset value, offering and redemption price per share | 3.65 | |||
| (a) | Redemption price per share is equal to net asset value per share less any applicable contingent deferred sales charge (“CDSC”). |
| (b) | Purchases without an initial sales charge of $1,000,000 or more are subject to a 0.50% CDSC if redeemed within one year of purchase. |
| (c) | The sales charge is 5.75%. On sales of $1,000,000 or more, there is no sales charge and therefore the offering will be lower. |
| See accompanying Notes to Financial Statements. | 7 |
Table of Contents
| For the Year Ended September 30, 2018 | Highland Energy MLP Fund | |
| ($) | ||||
Investment Income | ||||
Income: | ||||
Dividends and distributions | 2,676,373 | |||
Return of capital (Note 2) | (2,415,156 | ) | ||
Interest | 1,724 | |||
|
| |||
Total Income | 262,941 | |||
|
| |||
Expenses: | ||||
Investment advisory (Note 6) | 378,741 | |||
Administration fees (Note 6) | 75,748 | |||
Class A | 6,081 | |||
Class C | 33,210 | |||
Audit and tax preparation fees | 108,229 | |||
Registration fees | 48,895 | |||
Accounting services fees | 23,341 | |||
Transfer agent fees | 20,126 | |||
Reports to shareholders | 15,117 | |||
Legal fees | 10,443 | |||
Trustees fees (Note 6) | 5,369 | |||
Insurance | 3,062 | |||
Tax expense | 1,725 | |||
Interest expense and commitment fees (Note 5) | 379,155 | |||
Deferred tax benefit (Note 4) | (130,609 | ) | ||
Other | 2,256 | |||
|
| |||
Total operating expenses before waiver and reimbursement (Note 6) | 980,889 | |||
Less: Expenses waived or borne by the adviser and administrator | (396,795 | ) | ||
|
| |||
Net operating expenses | 584,094 | |||
|
| |||
Net investment loss | (321,153 | ) | ||
|
| |||
Net Realized and Unrealized Gain (Loss) on Investments | ||||
Realized gain (loss) on: | ||||
Investments | (877,739 | ) | ||
Deferred tax benefit (Note 4) | 272,668 | |||
Change in unrealized appreciation (depreciation) on: | ||||
Investments | 2,669,008 | |||
Deferred tax expense (Note 4) | (1,670,268 | ) | ||
|
| |||
Net realized and unrealized gain (loss) on investments | 393,669 | |||
|
| |||
Total increase in net assets resulting from operations | 72,516 | |||
|
| |||
| 8 | See accompanying Notes to Financial Statements. |
Table of Contents
STATEMENT OF CHANGES IN NET ASSETS
| Highland Energy MLP Fund | ||
| Year Ended September 30, 2018 ($) | Year Ended September 30, 2017 ($) | |||||||
Increase (Decrease) in Net Assets | ||||||||
Operations: | ||||||||
Net investment loss | (321,153 | ) | (1,381,449 | ) | ||||
Net realized loss on investments, net of income taxes | (605,071 | ) | (7,607,519 | ) | ||||
Net increase (decrease) in unrealized appreciation (depreciation) on investments, net of income taxes | 998,740 | 5,479,244 | ||||||
|
|
|
| |||||
Net increase (decrease) from operations | 72,516 | (3,509,724 | ) | |||||
|
|
|
| |||||
Total distributions to shareholders(a): | ||||||||
Class A | (230,392 | ) | (408,274 | ) | ||||
Class C | (295,755 | ) | (344,737 | ) | ||||
Class Y | (2,109,695 | ) | (2,425,133 | ) | ||||
|
|
|
| |||||
Total distributions | (2,635,842 | ) | (3,178,144 | ) | ||||
|
|
|
| |||||
Decrease in net assets from operations and distributions | (2,563,326 | ) | (6,687,868 | ) | ||||
|
|
|
| |||||
Share transactions: | ||||||||
Proceeds from sale of shares | ||||||||
Class A | 627,779 | 2,294,254 | ||||||
Class C | 872,489 | 1,734,106 | ||||||
Class Y | 6,550,302 | 4,511,471 | ||||||
Value of distributions reinvested | ||||||||
Class A | 213,454 | 385,749 | ||||||
Class C | 287,028 | 331,432 | ||||||
Class Y | 2,104,686 | 2,416,508 | ||||||
Cost of shares redeemed | ||||||||
Class A | (1,397,183 | ) | (4,593,043 | ) | ||||
Class C | (1,179,124 | ) | (1,463,716 | ) | ||||
Class Y | (4,865,098 | ) | (7,005,478 | ) | ||||
|
|
|
| |||||
Net increase (decrease) from shares transactions | 3,214,333 | (1,388,717 | ) | |||||
|
|
|
| |||||
Total increase (decrease) in net assets | 651,007 | (8,076,585 | ) | |||||
|
|
|
| |||||
Net Assets | ||||||||
Beginning of period | 27,456,565 | 35,533,150 | ||||||
|
|
|
| |||||
End of period | 28,107,572 | 27,456,565 | ||||||
|
|
|
| |||||
| (a) | Per the Securities Exchange Commission release #33-10532 “Disclosure Update and Simplification”; it is no longer required to differentiate distributions from earnings as either from net investment income or net realized capital gains. The presentation for the year ended 9/30/2017 has been adjusted for this change. |
| See accompanying Notes to Financial Statements. | 9 |
Table of Contents
STATEMENT OF CHANGES IN NET ASSETS (continued)
| Highland Energy MLP Fund | ||
| Year Ended September 30, 2018 ($) | Year Ended September 30, 2017 ($) | |||||||
CAPITAL STOCK ACTIVITY - SHARES | ||||||||
Class A: | ||||||||
Shares sold | 170,189 | 482,596 | ||||||
Issued for distribution reinvested | 55,997 | 84,950 | ||||||
Shares redeemed | (352,123 | ) | (983,069 | ) | ||||
|
|
|
| |||||
Net decrease in fund shares | (125,937 | ) | (415,523 | ) | ||||
|
|
|
| |||||
Class C: | ||||||||
Shares sold | 236,842 | 375,312 | ||||||
Issued for distribution reinvested | 75,665 | 73,612 | ||||||
Shares redeemed | (305,996 | ) | (309,152 | ) | ||||
|
|
|
| |||||
Net increase in fund shares | 6,511 | 139,772 | ||||||
|
|
|
| |||||
Class Y: | ||||||||
Shares sold | 1,676,181 | 1,055,255 | ||||||
Issued for distribution reinvested | 554,699 | 542,420 | ||||||
Shares redeemed | (1,281,202 | ) | (1,656,057 | ) | ||||
|
|
|
| |||||
Net increase (decrease) in fund shares | 949,678 | (58,382 | ) | |||||
|
|
|
| |||||
| 10 | See accompanying Notes to Financial Statements. |
Table of Contents
| For the Year Ended September 30, 2018 | Highland Energy MLP Fund | |
| ($) | ||||
Cash Flows Provided by Operating Activities: | ||||
Net increase in net assets resulting from operations | 72,516 | |||
Adjustments to Reconcile Net Increase in Net Assets to Net Cash Used for Operating Activities Operating Activities: | ||||
Purchases of investment securities from unaffiliated issuers | (9,254,018 | ) | ||
Proceeds from disposition of investment securities from unaffiliated issuers | 5,283,923 | |||
Proceeds from return of capital distributions | 2,415,156 | |||
Net realized loss on investments | 877,739 | |||
Net change in unrealized appreciation on investments | (2,669,008 | ) | ||
Decrease in receivable for net deferred tax asset | 1,266,991 | |||
Increase in receivable for dividends and interest | (194 | ) | ||
Increase in prepaid and other assets | (1,147 | ) | ||
Increase in payable to trustees’ fees | 103 | |||
Increase in payables for investment advisory and administration fees | 3,794 | |||
Decrease in payable for distribution and shareholder service fees | (693 | ) | ||
Decrease in payable to transfer agent fees | (2,070 | ) | ||
Increase in payable for interest expense and commitment fees | 1,795 | |||
Increase in accrued expenses and other liabilities | 61,947 | |||
|
| |||
Net cash flow used for operating activities | (1,943,166 | ) | ||
|
| |||
Cash Flows Provided by Financing Activities: | ||||
Borrowings under credit facility | 2,650,000 | |||
Repayments of credit facility | (1,740,000 | ) | ||
Distributions paid in cash | (30,674 | ) | ||
Payments on shares redeemed | (7,422,963 | ) | ||
Proceeds from shares sold | 8,056,343 | |||
|
| |||
Net cash flow provided by financing activities | 1,512,706 | |||
|
| |||
Net decrease in Cash | (430,460 | ) | ||
|
| |||
Cash: | ||||
Beginning of period | 922,940 | |||
|
| |||
End of period | 492,480 | |||
|
| |||
Supplemental disclosure of cash flow information: | ||||
Reinvestment of distributions | 2,605,168 | |||
|
| |||
Cash paid during the period for interest and commitment fees | 377,360 | |||
|
| |||
Cash paid during the period for taxes | 1,725 | |||
|
| |||
| See accompanying Notes to Financial Statements. | 11 |
Table of Contents
| Highland Energy MLP Fund, Class A | ||
Selected data for a share outstanding throughout each period is as follows:
| For the Years Ended September 30, | ||||||||||||||||||||
| 2018 | 2017 | 2016 | 2015 | 2014 | ||||||||||||||||
Net Asset Value, Beginning of Period | $ | 4.01 | $ | 4.94 | $ | 6.58 | $ | 12.17 | $ | 10.32 | ||||||||||
Income from Investment Operations: |
| |||||||||||||||||||
Net investment loss(a) | (0.05 | ) | (0.21 | ) | (0.11 | ) | (0.12 | ) | (0.13 | ) | ||||||||||
Net realized and unrealized gain/(loss) | 0.06 | (0.27 | ) | (1.03 | ) | (4.94 | ) | 2.52 | ||||||||||||
|
|
|
|
|
|
|
|
|
| |||||||||||
Total from investment operations | 0.01 | (0.48 | ) | (1.14 | ) | (5.06 | ) | 2.39 | ||||||||||||
Less Distributions Declared to Shareholders: |
| |||||||||||||||||||
From net investment income | — | — | — | — | (0.09 | ) | ||||||||||||||
From return of capital | (0.36 | ) | (0.45 | ) | (0.50 | ) | (0.53 | ) | (0.45 | ) | ||||||||||
|
|
|
|
|
|
|
|
|
| |||||||||||
Total distributions declared to shareholders | (0.36 | ) | (0.45 | ) | (0.50 | ) | (0.53 | ) | (0.54 | ) | ||||||||||
Net Asset Value, End of Period(b) | $ | 3.66 | $ | 4.01 | $ | 4.94 | $ | 6.58 | $ | 12.17 | ||||||||||
Total Return(b)(c) | 0.23 | % | (10.35 | )% | (15.98 | )% | (43.12 | )% | 23.83 | % | ||||||||||
Ratios to Average Net Assets(d): |
| |||||||||||||||||||
Net assets, end of period (in 000’s) | $ | 2,371 | $ | 3,100 | $ | 5,875 | $ | 9,575 | $ | 2,758 | ||||||||||
Gross operating expenses(e)(f) | 8.99 | % | 6.31 | % | 10.23 | % | (7.83 | )% | 10.60 | % | ||||||||||
Net investment income/(loss), net of income taxes(f) | (6.54 | )% | (3.89 | )% | (7.18 | )% | 8.76 | % | (8.65 | )% | ||||||||||
Portfolio turnover rate | 15 | % | 8 | % | 49 | % | 33 | % | 40 | % | ||||||||||
| (a) | Net investment income (loss) per share was calculated using average shares outstanding during the period. |
| (b) | The Net Asset Value per share and total return have been calculated based on net assets which include adjustments made in accordance with U.S. Generally Accepted Accounting Principles required at period end for financial reporting purposes. These figures do not necessarily reflect the Net Asset Value per share or total return experienced by the shareholder at period end. |
| (c) | Total return is at net asset value assuming all distributions are reinvested and no initial sales charge or CDSC. For periods with waivers/reimbursements, had the Fund’s investment adviser not waived or reimbursed a portion of expenses, total return would have been lower. |
| (d) | All ratios for the period have been annualized, unless otherwise indicated. |
| (e) | Supplemental expense ratios are shown below: |
| For the Years Ended September 30, | ||||||||||||||||||||
| 2018 | 2017 | 2016 | 2015 | 2014 | ||||||||||||||||
Gross operating expenses excluding income tax expense/(benefit) | 4.26 | % | 3.82 | % | 4.01 | % | 2.05 | % | 3.02 | % | ||||||||||
Net operating expenses (net of waiver/reimbursement and excluding income tax expense/(benefit), if applicable, but gross of all other operating expenses) | 2.78 | % | 2.35 | % | 2.18 | % | 1.65 | % | 1.45 | % | ||||||||||
Interest expense and commitment fees | 1.42 | % | 0.99 | % | 0.79 | % | 0.29 | % | — | |||||||||||
| (f) | Calculation includes the impact of deferred tax expense/benefit. |
| 12 | See accompanying Notes to Financial Statements. |
Table of Contents
FINANCIAL HIGHLIGHTS
| Highland Energy MLP Fund, Class C | ||
Selected data for a share outstanding throughout each period is as follows:
| For the Years Ended September 30, | ||||||||||||||||||||
| 2018 | 2017 | 2016 | 2015 | 2014 | ||||||||||||||||
Net Asset Value, Beginning of Period | $ | 3.99 | $ | 4.93 | $ | 6.56 | $ | 12.16 | $ | 10.34 | ||||||||||
Income from Investment Operations: |
| |||||||||||||||||||
Net investment loss(a) | (0.08 | ) | (0.24 | ) | (0.14 | ) | (0.19 | ) | (0.20 | ) | ||||||||||
Net realized and unrealized gain/(loss) | 0.07 | (0.28 | ) | (1.02 | ) | (4.94 | ) | 2.52 | ||||||||||||
|
|
|
|
|
|
|
|
|
| |||||||||||
Total from investment operations | (0.01 | ) | (0.52 | ) | (1.16 | ) | (5.13 | ) | 2.32 | |||||||||||
Less Distributions Declared to Shareholders: |
| |||||||||||||||||||
From net investment income | — | — | — | — | (0.08 | ) | ||||||||||||||
From return of capital | (0.33 | ) | (0.42 | ) | (0.47 | ) | (0.47 | ) | (0.42 | ) | ||||||||||
|
|
|
|
|
|
|
|
|
| |||||||||||
Total distributions declared to shareholders | (0.33 | ) | (0.42 | ) | (0.47 | ) | (0.47 | ) | (0.50 | ) | ||||||||||
Net Asset Value, End of Period(b) | $ | 3.65 | $ | 3.99 | $ | 4.93 | $ | 6.56 | $ | 12.16 | ||||||||||
Total Return(b)(c) | (0.21 | )% | (11.26 | )% | (16.49 | )% | (43.55 | )% | 23.02 | % | ||||||||||
Ratios to Average Net Assets(d): |
| |||||||||||||||||||
Net assets, end of period (in 000’s) | $ | 3,335 | $ | 3,627 | $ | 3,788 | $ | 2,523 | $ | 491 | ||||||||||
Gross operating expenses(e)(f) | 9.74 | % | 7.06 | % | 10.98 | % | (7.08 | )% | 11.27 | % | ||||||||||
Net investment income/(loss), net of income taxes(f) | (7.28 | )% | (4.60 | )% | (7.93 | )% | 8.02 | % | (9.24 | )% | ||||||||||
Portfolio turnover rate | 15 | % | 8 | % | 49 | % | 33 | % | 40 | % | ||||||||||
| (a) | Net investment income (loss) per share was calculated using average shares outstanding during the period. |
| (b) | The Net Asset Value per share and total return have been calculated based on net assets which include adjustments made in accordance with U.S. Generally Accepted Accounting Principles required at period end for financial reporting purposes. These figures do not necessarily reflect the Net Asset Value per share or total return experienced by the shareholder at period end. |
| (c) | Total return is at net asset value assuming all distributions are reinvested and no initial sales charge or CDSC. For periods with waivers/reimbursements, had the Fund’s investment adviser not waived or reimbursed a portion of expenses, total return would have been lower. |
| (d) | All ratios for the period have been annualized, unless otherwise indicated. |
| (e) | Supplemental expense ratios are shown below: |
| For the Years Ended September 30, | ||||||||||||||||||||
| 2018 | 2017 | 2016 | 2015 | 2014 | ||||||||||||||||
Gross operating expenses excluding income tax expense/(benefit) | 5.01 | % | 4.57 | % | 4.76 | % | 2.80 | % | 3.69 | % | ||||||||||
Net operating expenses (net of waiver/reimbursement and excluding income tax expense/(benefit), if applicable, but gross of all other operating expenses) | 3.53 | % | 3.10 | % | 2.93 | % | 2.40 | % | 2.10 | % | ||||||||||
Interest expense and commitment fees | 1.42 | % | 0.99 | % | 0.79 | % | 0.29 | % | — | |||||||||||
| (f) | Calculation includes the impact of deferred tax expense/benefit. |
| See accompanying Notes to Financial Statements. | 13 |
Table of Contents
FINANCIAL HIGHLIGHTS
| Highland Energy MLP Fund, Class Y | ||
Selected data for a share outstanding throughout each period is as follows:
| For the Years Ended September 30, | ||||||||||||||||||||
| 2018 | 2017 | 2016 | 2015 | 2014 | ||||||||||||||||
Net Asset Value, Beginning of Period | $ | 3.99 | $ | 4.93 | $ | 6.60 | $ | 12.21 | $ | 10.34 | ||||||||||
Income from Investment Operations: |
| |||||||||||||||||||
Net investment loss(a) | (0.04 | ) | (0.19 | ) | (0.10 | ) | (0.09 | ) | (0.08 | ) | ||||||||||
Net realized and unrealized gain/(loss) | 0.07 | (0.28 | ) | (1.06 | ) | (4.97 | ) | 2.52 | ||||||||||||
|
|
|
|
|
|
|
|
|
| |||||||||||
Total from investment operations | 0.03 | (0.47 | ) | (1.16 | ) | (5.06 | ) | 2.44 | ||||||||||||
Less Distributions Declared to Shareholders: |
| |||||||||||||||||||
From net investment income | — | — | — | — | (0.09 | ) | ||||||||||||||
From return of capital | (0.37 | ) | (0.47 | ) | (0.51 | ) | (0.55 | ) | (0.48 | ) | ||||||||||
|
|
|
|
|
|
|
|
|
| |||||||||||
Total distributions declared to shareholders | (0.37 | ) | (0.47 | ) | (0.51 | ) | (0.55 | ) | (0.57 | ) | ||||||||||
Net Asset Value, End of Period(b) | $ | 3.65 | $ | 3.99 | $ | 4.93 | $ | 6.60 | $ | 12.21 | ||||||||||
Total Return(b)(c) | 0.75 | % | (10.32 | )% | (16.14 | )% | (43.01 | )% | 24.25 | % | ||||||||||
Ratios to Average Net Assets(d): |
| |||||||||||||||||||
Net assets, end of period (in 000’s) | $ | 22,401 | $ | 20,729 | $ | 25,870 | $ | 28,707 | $ | 29,741 | ||||||||||
Gross operating expenses(e)(f) | 8.74 | % | 6.06 | % | 9.98 | % | (8.08 | )% | 10.26 | % | ||||||||||
Net investment income/(loss), net of income taxes(f) | (6.27 | )% | (3.61 | )% | (6.93 | )% | 9.01 | % | (8.68 | )% | ||||||||||
Portfolio turnover rate | 15 | % | 8 | % | 49 | % | 33 | % | 40 | % | ||||||||||
| (a) | Net investment income (loss) per share was calculated using average shares outstanding during the period. |
| (b) | The Net Asset Value per share and total return have been calculated based on net assets which include adjustments made in accordance with U.S. Generally Accepted Accounting Principles required at period end for financial reporting purposes. These figures do not necessarily reflect the Net Asset Value per share or total return experienced by the shareholder at period end. |
| (c) | Total return is at net asset value assuming all distributions are reinvested and no initial sales charge or CDSC. For periods with waivers/reimbursements, had the Fund’s investment adviser not waived or reimbursed a portion of expenses, total return would have been lower. |
| (d) | All ratios for the period have been annualized, unless otherwise indicated. |
| (e) | Supplemental expense ratios are shown below: |
| For the Years Ended September 30, | ||||||||||||||||||||
| 2018 | 2017 | 2016 | 2015 | 2014 | ||||||||||||||||
Gross operating expenses excluding income tax expense/(benefit) | 4.01 | % | 3.57 | % | 3.76 | % | 1.80 | % | 2.68 | % | ||||||||||
Net operating expenses (net of waiver/reimbursement and excluding income tax expense/(benefit), if applicable, but gross of all other operating expenses) | 2.52 | % | 2.10 | % | 1.93 | % | 1.40 | % | 1.10 | % | ||||||||||
Interest expense and commitment fees | 1.42 | % | 0.99 | % | 0.79 | % | 0.29 | % | — | |||||||||||
| (f) | Calculation includes the impact of deferred tax expense/benefit. |
| 14 | See accompanying Notes to Financial Statements. |
Table of Contents
| September 30, 2018 | Highland Energy MLP Fund | |
Note 1. Organization
Highland Funds II (the “Trust”) is a Massachusetts business trust organized on August 10, 1992. The Trust is registered under the Investment Company Act of 1940, as amended (the “1940 Act”), as anopen-end management investment company. It comprises seven portfolios that are currently being offered as of September 30, 2018 including the Highland Energy MLP Fund (“the Fund”). The other portfolios are reported separately from the Fund.
Fund Shares
The Fund is authorized to issue an unlimited number of shares of beneficial interest with a par value of $0.001 per share (each a “Share” and collectively, the “Shares”). The Fund currently offers the following three share classes to investors, Class A, Class C and Class Y Shares.
Class A Shares are sold with afront-end sales charge. Maximum sales load imposed on purchases of Class A Shares (as a percentage of offering price) is 5.75%.
There is nofront-end sales charge imposed on individual purchases of Class A Shares of $1 million or more. Thefront-end sales charge is also waived in other instances as described in the Fund’s prospectus. Purchases of $1 million or more of Class A Shares at net asset value (“NAV”) pursuant to a sales charge waiver are subject to a 0.50% contingent deferred sales charge (“CDSC”) if redeemed within one year of purchase.
Class C Shares may be subject to a CDSC. The maximum CDSC imposed on redemptions of Class C Shares is 1.00% within the first year of purchase and 0.00% thereafter.
Nofront-end or CDSCs are assessed by the Trust with respect to Class Y Shares of the Fund.
Note 2. Significant Accounting Policies
The following summarizes the significant accounting policies consistently followed by the Fund in the preparation of its financial statements.
Use of Estimates
TheFund is an investment company that applies the accounting and reporting guidance of Accounting Standards Codification Topic 946 applicable to investment companies. The Fund’sfinancial statements have been prepared in conformity with accounting principles generally accepted in the United States of America (“GAAP”), which require Highland Capital Management Fund Advisors, L.P. (the “Investment Adviser”) to make estimates and assumptions that affect the reported amounts of assets and liabilities, the disclosure of contingent assets and liabilities at the date of the financial statements and the reported amounts of revenue and expenses during the reporting period. Changes in the
economic environment, financial markets and any other parameters used in determining these estimates could cause actual results to differ materially.
Determination of Class Net Asset Values
The Fund’s income, expenses (other than distribution fees and shareholder service fees) and realized and unrealized gains and losses are allocated proportionally each day among the Fund’s respective share classes based upon the relative net assets of each share class. Expenses of the Trust, other than those incurred by a specific Fund, are allocated pro rata among the Funds and their share classes. Certain class specific expenses (such as distribution and shareholder service fees) are allocated to the class that incurs such expense.
Valuation of Investments
In computing the Fund’s net assets attributable to shares, securities with readily available market quotations on the New York Stock Exchange (NYSE), National Association of Securities Dealers Automated Quotation (NASDAQ) or other nationally recognized exchange, use the closing quotations on the respective exchange for valuation of those securities. Securities for which there are no readily available market quotations will be valued pursuant to policies adopted by the Fund’s Board of Trustees (the “Board”). Typically, such securities will be valued at the mean between the most recently quoted bid and ask prices provided by the principal market makers. If there is more than one such principal market maker, the value shall be the average of such means. Securities without a sale price or quotations from principal market makers on the valuation day may be priced by an independent pricing service. Generally, the Fund’s loan and bond positions are not traded on exchanges and consequently are valued based on a mean of the bid and ask price from the third-party pricing services or broker-dealer sources that the Investment Adviser has determined to have the capability which provide appropriate pricing services and which have been approved by the Board.
Securities for which market quotations are not readily available, or for which the Fund has determined that the price received from a pricing service or broker-dealer is “stale” or otherwise does not represent fair value (such as when events materially affecting the value of securities occur between the time when market price is determined and calculation of the Fund’s NAV, will be valued by the Fund at fair value, as determined by the Board or its designee in good faith in accordance with procedures approved by the Board, taking into account factors reasonably determined to be relevant, including but not limited to: (i) the fundamental analytical data relating to the investment; (ii) the nature and duration of restrictions on disposition of the securities; and (iii) an evaluation of the forces that influence the market in
| Annual Report | 15 |
Table of Contents
NOTES TO FINANCIAL STATEMENTS (continued)
| September 30, 2018 | Highland Energy MLP Fund | |
which these securities are purchased and sold. In these cases, the Fund’s NAV will reflect the affected portfolio securities’ fair value as determined in the judgment of the Board or its designee instead of being determined by the market. Using a fair value pricing methodology to value securities may result in a value that is different from a security’s most recent sale price and from the prices used by other investment companies to calculate their NAVs. Determination of fair value is uncertain because it involves subjective judgments and estimates.
There can be no assurance that the Fund’s valuation of a security will not differ from the amount that it realizes upon the sale of such security. Those differences could have a material impact to the Fund. The NAV shown in the Fund’s financial statements may vary from the NAV published by the Fund as of its period end because portfolio securities transactions are accounted for on the trade date (rather than the day following the trade date) for financial statement purposes.
Fair Value Measurements
The Fund has performed an analysis of all existing investments and derivative instruments to determine the significance and character of inputs to their fair value determination. The levels of fair value inputs used to measure the Fund’s investments are characterized into a fair value hierarchy. Where inputs for an asset or liability fall into more than one level in the fair value hierarchy, the investment is classified in its entirety based on the lowest level input that is significant to that investment’s valuation. The three levels of the fair value hierarchy are described below:
| Level 1 — | Quoted unadjusted prices for identical instruments in active markets to which the Fund has access at the date of measurement; |
| Level 2 — | Quoted prices for similar instruments in active markets; quoted prices for identical or similar instruments in markets that are not active, but are valued based on executed trades; broker quotations that constitute an executable price; and alternative pricing sources supported by observable inputs are classified within Level 2. Level 2 inputs are either directly or indirectly observable for the asset in connection with market data at the measurement date; and |
| Level 3 — | Model derived valuations in which one or more significant inputs or significant value drivers are unobservable. In certain cases, investments classified within Level 3 may include securities for which the Fund has obtained indicative quotes from broker-dealers that do not necessarily represent prices the broker may be willing to |
| trade on, as such quotes can be subject to material management judgment. Unobservable inputs are those inputs that reflect the Fund’s own assumptions that market participants would use to price the asset or liability based on the best available information. |
The Investment Adviser has established policies and procedures, as described above and approved by the Board, to ensure that valuation methodologies for investments and financial instruments that are categorized within all levels of the fair value hierarchy are fair and consistent. A Pricing Committee has been established to provide oversight of the valuation policies, processes and procedures, and is comprised of personnel from the Investment Adviser and its affiliates. The Pricing Committee meets monthly to review the proposed valuations for investments and financial instruments and is responsible for evaluating the overall fairness and consistent application of established policies.
As of September 30, 2018, the Fund’s investments consisted of common stocks and master limited partnerships. If applicable, the fair values of the Fund’s common stocks and master limited partnerships that are not actively traded on national exchanges are generally priced using quotes derived from implied values, indicative bids, or a limited amount of actual trades and are classified as Level 3 assets because the inputs used by the brokers and pricing services to derive the values are not readily observable. Exchange-traded options are valued based on the last trade price on the primary exchange on which they trade. If an option does not trade, themid-price, which is the mean of the bid and ask price, is utilized to value the option.
At the end of each calendar quarter, the Investment Adviser evaluates the Level 2 and 3 assets and liabilities for changes in liquidity, including but not limited to: whether a broker is willing to execute at the quoted price, the depth and consistency of prices from third party services, and the existence of contemporaneous, observable trades in the market. Additionally, the Investment Adviser evaluates the Level 1 and 2 assets and liabilities on a quarterly basis for changes in listings or delistings on national exchanges.
Due to the inherent uncertainty of determining the fair value of investments that do not have a readily available market value, the fair value of the Fund’s investments may fluctuate from period to period. Additionally, the fair value of investments may differ significantly from the values that would have been used had a ready market existed for such investments and may differ materially from the values the Fund may ultimately realize. Further, such investments may be subject to legal and other restrictions on resale or otherwise less liquid than publicly traded securities.
| 16 | Annual Report |
Table of Contents
NOTES TO FINANCIAL STATEMENTS (continued)
| September 30, 2018 | Highland Energy MLP Fund | |
The inputs or methodology used for valuing securities are not necessarily an indication of the risk associated with investing in those securities. Transfers in and out of the levels are recognized at the value at the end of the period. A summary of the inputs used to value the Fund’s assets as of September 30, 2018 is as follows:
| Total value at September 30, 2018 | Level 1 Quoted Price | Level 2 Significant Observable Inputs | Level 3 Significant Unobservable Inputs | |||||||||||||
Energy MLP Fund |
| |||||||||||||||
Assets |
| |||||||||||||||
Common Stocks(1) | $ | 14,187,650 | $ | 14,187,650 | $ | — | $ | — | ||||||||
Master Limited Partnerships(1) | 25,917,750 | 25,917,750 | — | — | ||||||||||||
|
|
|
|
|
|
|
| |||||||||
Total | $ | 40,105,400 | $ | 40,105,400 | $ | — | $ | — | ||||||||
|
|
|
|
|
|
|
| |||||||||
| (1) | See Investment Portfolio detail for industry breakout. |
Security Transactions
Security transactions are accounted for on the trade date. Realized gains/(losses) on investments sold are recorded on the basis of the specific identification method for both financial statement and U.S. federal income tax purposes taking into account any foreign taxes withheld.
Income Recognition
Corporate actions (including cash dividends) are recorded on theex-dividend date, net of applicable withholding taxes, except for certain foreign corporate actions, which are recorded as soon afterex-dividend date as such information becomes available and is verified. Interest income is recorded on the accrual basis.
Partnership Accounting Policy
The Fund records its pro rata share of the income (loss) and capital gains (losses) allocated from the underlying partnerships, determines the amount of distributions received from underlying partnerships and accordingly adjusts the cost basis of the underlying partnerships for return of capital. These amounts are included in the Fund’s Statement of Operations as “Dividends and distributions” and “Return of capital.”
U.S. Federal Income Tax Status
The Fund will be taxable as a regular corporation, or a “C” corporation, for U.S. federal income tax purposes, and thus will pay entity-level taxes as described below. Prior to the Fund’s taxable year ending September 30, 2013, the Fund elected to be treated and qualified annually as a regulated investment company (“RIC”) accorded special tax treatment under the Internal Revenue Code of 1986, as amended (the “Code”).
Master Limited Partnerships
Master Limited Partnerships, commonly referred to as “MLPs,” are generally organized under state law as limited partnerships or limited liability companies. The Fund intends to primarily invest in MLPs treated as partnerships under the
Code, and whose interests or “units” are traded on securities exchanges like shares of corporate stock. To be treated as a partnership for U.S. federal income tax purposes, an MLP whose units are traded on a securities exchange must receive at least 90% of its income from qualifying sources such as interest, dividends, real estate rents, gain from the sale or disposition of real property, income and gain from mineral or natural resources activities, income and gain from the transportation or storage of certain fuels, and, in certain circumstances, income and gain from commodities or futures, forwards and options with respect to commodities. Mineral or natural resources activities include exploration, development, production, processing, mining, refining, marketing and transportation (including pipelines), of oil and gas, minerals, geothermal energy, fertilizer, timber or industrial source carbon dioxide. An MLP consists of a general partner and limited partners (or in the case of MLPs organized as limited liability companies, a managing member and members). The general partner or managing member typically controls the operations and management of the MLP and has an ownership stake in the partnership. The limited partners or members, through their ownership of limited partner or member interests, provide capital to the entity, are intended to have no role in the operation and management of the entity and receive cash distributions. The MLPs themselves generally do not pay U.S. federal income taxes. Thus, unlike investors in corporate securities, direct MLP investors are generally not subject to double taxation (i.e., corporate level tax and tax on corporate dividends). Currently, most MLPs operate in the energy and/or natural resources sector.
Income Taxes
Since implementing the Fund’s revised strategy to concentrate in MLP investments, the Fund is no longer eligible for treatment as a regulated investment company under the Code. Accordingly, the Fund is treated as a regular corporation, or “C” corporation, for U.S. federal income tax purposes. As a result, the Fund is subject to U.S. federal income
| Annual Report | 17 |
Table of Contents
NOTES TO FINANCIAL STATEMENTS (continued)
| September 30, 2018 | Highland Energy MLP Fund | |
tax on its taxable income at the graduated rates applicable to corporations as well as state and local income taxes. The Fund’s MLP investments operate in various state and local jurisdictions.
The Fund invests its assets primarily in MLPs, which generally are treated as partnerships for federal income tax purposes. As a limited partner in the MLPs, the Fund includes its allocable share of the MLP’s taxable income in computing its own taxable income. Deferred income taxes reflect (i) taxes on unrealized gains (losses), which are attributable to the temporary difference between fair market value and tax basis, (ii) the net tax effects of temporary differences between the carrying amounts of assets and liabilities for financial reporting purposes and the amounts used for income tax purposes and (iii) the net tax benefit of accumulated net operating and capital losses.
In calculating the Fund’s daily NAV, the Fund will account for its deferred tax liability and/or asset balances. The Fund will accrue, in accordance with GAAP, a deferred income tax liability balance, at the currently effective statutory U.S. federal income tax rate plus an estimated state and local income tax rate, for its future tax liability associated with the capital appreciation of its investments and the distributions received by the Fund on equity securities of MLPs considered to be return of capital and for any net operating gains. Any deferred tax liability balance will reduce the Fund’s NAV. Upon the Fund’s sale of a portfolio security, the Fund may be liable for previously deferred taxes. If the Fund is required to sell portfolio securities to meet redemption requests, the Fund may recognize income and gains for U.S. federal, state and local income tax purposes, which will result in corporate income taxes imposed on the Fund.
The Fund also will accrue, in accordance with GAAP, a deferred tax asset balance, which reflects an estimate of the Fund’s future tax benefit associated with net operating losses, capital loss carryforwards and unrealized losses. To the extent the Fund has a net deferred tax asset balance, the Fund may record a valuation allowance, which would offset the value of some or all of the Fund’s deferred tax asset balance. The Fund intends to assess whether a valuation allowance is required to offset some or all of any deferred tax asset balance in connection with the calculation of the Fund’s daily NAV; however, to the extent the final valuation allowance differs from the estimates of the Fund used in calculating the Fund’s daily NAV, the application of such final valuation allowance could have a material impact on the Fund’s NAV. In the assessment for a valuation allowance, consideration is given to all positive and negative evidence related to the realization of the deferred tax asset. This assessment considers, among other matters, the nature, frequency and severity of current and cumulative losses,
forecasts of future profitability (which are highly dependent on future cash distributions from the Fund’s MLP holdings), the duration of statutory carryforward periods and the associated risk that operating and capital loss carryforwards may expire unused. From time to time, the Fund may modify its estimates or assumptions regarding its deferred tax liability and/or asset balance as new information becomes available. Such modifications, changes in generally accepted accounting principles or related guidance or interpretations thereof, limitations imposed on net operating and capital losses (if any) and changes in applicable tax law could result in increases or decreases in the Fund’s NAV per share, which could be material. As of September 30, 2018, the valuation allowance amounted to $8,121,301. For all open tax years and for all major jurisdictions, management of the Fund has concluded that there are no other significant uncertain tax positions that would require recognition in the financial statements. Furthermore, management of the Fund is also not aware of any tax positions for which it is reasonably possible that the total amounts of unrecognized tax benefits will significantly change in the next twelve months.
The Fund may rely to some extent on information provided by the MLPs, which may not necessarily be timely, to estimate taxable income allocable to the MLP units held in the portfolio and to estimate the associated deferred tax assets or liabilities. Such estimates are made in good faith. From time to time, as new information becomes available, the Fund modifies its estimates or assumptions regarding the deferred tax assets or liabilities.
The Fund’s policy is to classify interest and penalties associated with underpayment of federal and state income taxes, if any, as income tax expense on its Statement of Operations. The Fund files tax returns in U.S. federal and state jurisdictions. As of September 30, 2018, the Fund is generally no longer subject to income tax examinations by U.S. federal, state, or local tax authorities for calendar years prior to September 30, 2014.
Return of Capital Estimates
Distributions received from the Fund’s investments in MLPs generally are comprised of income and return of capital. The Fund records investment income and return of capital based on estimates made at the time such distributions are received. Such estimates are based on historical information available from each MLP and other industry sources. These estimates may subsequently be revised based on information received from MLPs after their tax reporting periods are concluded. For the year ended September 30, 2018, the Fund estimated that approximately 90% of the MLP distributions received would be treated as a return of capital. The Fund recorded as return of capital the amount of $2,415,156 of dividends and distributions received from its investments.
| 18 | Annual Report |
Table of Contents
NOTES TO FINANCIAL STATEMENTS (continued)
| September 30, 2018 | Highland Energy MLP Fund | |
Distributions to Shareholders
The Fund intends to make quarterly cash distributions of all or substantially all cash distributions the Fund receives from MLP investments, after allowance for any fund-level taxes to its shareholders. Due to the tax treatment of the Fund’s allocations and distributions from MLPs, the Investment Adviser expects that a significant portion of the Fund’s distributions to shareholders will typically be treated as a return of capital in the hands of shareholders for U.S. federal income tax purposes (i.e., as distributions in excess of the Fund’s current and accumulated earnings and profits as described below). However, no assurance can be given in this regard; just as the Fund’s corporate income tax liability can fluctuate materially from year to year, the extent to which the Fund is able to make return of capital distributions also can vary materially from year to year depending on a number of different factors, including the composition of the Fund’s portfolio (i.e., as between MLP equity securities and other investments, the level of allocations of net income and other tax items to the Fund from its underlying MLP investments during a particular taxable year, the length of time the Fund has owned the MLP equity securities in its portfolio, and the extent to which the Fund disposes of MLP equity securities during a particular year, including, if necessary, to meet Fund shareholder redemption requests).
In general, a distribution will constitute a return of capital to a shareholder, rather than a dividend, to the extent such distribution exceeds the Fund’s current and accumulated earnings and profits. The portion of any distribution treated as a return of capital will constitute atax-free return of capital to the extent of the shareholder’s basis in the Fund shares and thereafter generally will be taxable to the shareholder as capital gain. Any such distribution, in turn, will result in a reduction in a shareholder’s basis in the Fund’s shares (but not below zero) to the extent of the return of capital and in the shareholder’s recognizing more gain or less loss (that is, will result in an increase of a shareholder’s tax liability) when the shareholder later sells shares of the Fund. To permit the Fund to maintain a more stable distribution rate, the Fund may distribute less or more than the entire amount of cash it receives from its investments in a particular period. Any undistributed cash would be available to supplement future distributions, and until distributed would add to the Fund’s NAV. Correspondingly, such amounts, once distributed, reduce the Fund’s NAV. In addition, in the discretion of the Fund, the Fund may determine not to make distributions at one or more times during the year, including by reason of potential adverse tax consequences to shareholders.
Cash & Cash Equivalents
The Fund considers liquid assets deposited with a bank and certain short-term debt instruments of sufficient credit quality
with original maturities of three months or less to be cash equivalents. The Fund also considers money market instruments that invest in cash equivalents to be cash equivalents. These investments represent amounts held with financial institutions that are readily accessible to pay Fund expenses or purchase investments. Cash and cash equivalents are valued at cost plus accrued interest, which approximates market value. The value of cash equivalents denominated in foreign currencies is determined by converting to U.S. dollars on the date of the Statement of Assets and Liabilities.
Other Fee Income
Fee income may consist of origination/closing fees, amendment fees, administrative agent fees, transactionbreak-up fees and other miscellaneous fees. Origination fees, amendment fees, and other similar fees arenon-recurring fee sources. Such fees are received on a transaction by transaction basis and do not constitute a regular stream of income and are recognized when incurred.
Note 3. Securities Lending
The Fund may make secured loans of its portfolio securities amounting to not more than 30% of the value of its total assets, thereby realizing additional income. The risks in lending portfolio securities, as with other extensions of credit, consist of possible delays in recovery of the securities or possible loss of rights in the collateral should the borrower fail financially and possible investment losses in the investment of collateral. Pursuant to the Fund’s securities lending policy, securities loans are made to borrowers pursuant to agreements requiring that loans be continuously secured by collateral in cash (U.S. and foreign currency), securities issued or guaranteed by the U.S. government or its agencies or instrumentalities, sovereign debt, convertible bonds, irrevocable bank letters of credit or such other collateral as may be agreed on by the parties to a securities lending arrangement, initially with a value of 102% or 105% of the market value of the loaned securities and thereafter maintained at a value of 100% of the market value of the loaned securities. Collateral must be valued daily by the Custodian and the borrower will be required to provide additional collateral should the market value of the loaned securities increase. If the collateral consists ofnon-cash collateral, the borrower will pay the Fund a loan premium fee. If the collateral consists of cash, State Street Bank and Trust Company (“State Street”) will reinvest the cash. Although voting rights, or rights to consent, with respect to the loaned securities pass to the borrower, the Fund will recall the loaned securities upon reasonable notice in order that the securities may be voted by the Fund if the holders of such securities are asked to vote upon or consent to matters materially affecting the investment. The Fund also may call such loans in order to sell the securities involved.
| Annual Report | 19 |
Table of Contents
NOTES TO FINANCIAL STATEMENTS (continued)
| September 30, 2018 | Highland Energy MLP Fund | |
Securities lending transactions are entered into pursuant to Securities Loan Agreements (“SLA”), which provide the right, in the event of default (including bankruptcy or insolvency) for thenon-defaulting party to liquidate the collateral and calculate a net exposure to the defaulting party or request additional collateral. In the event that a borrower defaults, the Fund, as lender, would offset the market value of the collateral received against the market value of the securities loaned. The value of the collateral is typically greater than that of the market value of the securities loaned, leaving the lender with a net amount payable to the defaulting party. However, bankruptcy or insolvency laws of a particular jurisdiction may impose restrictions on or prohibitions against such a right of offset in the event of a SLA counterparty’s bankruptcy or insolvency. Under the SLA, the Fund can reinvest cash collateral, or, upon an event of default, resell or repledge the collateral, and the borrower can resell or repledge the loaned securities. The risks of securities lending also include the risk that the borrower may not provide additional collateral when required or may not return the securities when due. To mitigate this risk, the Fund benefits from a borrower default indemnity provided by State Street Bank and Trust Company (“State Street”). State Street’s indemnity generally provides for replacement of securities lent or the approximate value thereof. During the year ended September 30, 2018, the Funddid not participate in securities lending.
Note 4. U.S. Federal Income Tax Information
The character of income and gains to be distributed is determined in accordance with U.S. federal income tax regulations which may differ from U.S. GAAP. These differences include (but are not limited to) differences with respect to the treatment of investments organized as partnerships for tax purposes, foreign taxes, investments in futures, losses deferred tooff-setting positions, tax treatment of organizationalstart-up costs, losses deferred due to wash sale transactions, dividends deemed paid upon shareholder redemption of Fund shares and tax attributes from Fund reorganizations. The calculation of net investment income per share in the Financial Highlights table excludes these adjustments.
As of September 30, 2018, the Fund’s income tax provision consisted of the following:
| Current | Deferred | Total | ||||||||||
Federal Tax Expense | $ | — | $ | 1,128,114 | $ | 1,128,114 | ||||||
State Tax Expense | — | 138,877 | 138,877 | |||||||||
|
|
|
|
|
| |||||||
Total Tax Expense | $ | — | $ | 1,266,991 | $ | 1,266,991 | ||||||
|
|
|
|
|
| |||||||
Deferred income taxes reflect (i) taxes on unrealized gains/ (losses), which are attributable to the difference between
fair market value and tax basis; (ii) the net tax effects of temporary differences between the carrying amounts of assets and liabilities for financial reporting purposes and the amounts used for income tax purposes; (iii) the net tax benefit of net operating losses and (iv) remeasurement of the net deferred tax assets. The applicable tax rate for the fiscal year ended September 30, 2018 of 24.25% represents the weighted average United States Federal statutory tax rate.
Total income taxes were different from the amount computed by applying the federal statutory income tax rate of 24.25% to the net investment loss and realized and unrealized gains (losses) on investments before taxes for the year ended September 30, 2018 as follows:
| 2018 | ||||
Tax at U.S. federal statutory income tax rate | 24.25 | % | ||
State income taxes, net of federal benefit | 2.48 | |||
Dividends received deduction | (7.47 | ) | ||
Change in tax rate | 21.66 | |||
Change in valuation allowance | 49.50 | |||
Other | 4.17 | |||
|
| |||
Effective Income Tax Rate | 94.59 | % | ||
H.R.1, Tax Cuts and Jobs Act (“Tax Act”) was enacted on December 22, 2017. The Tax Act includes significant changes to the Internal Revenue Code of 1986, as amended, that significantly change the taxation of business entities. ASC 740, Accounting for Income Taxes, requires companies to recognize the effect of tax law changes in the period of enactment. The Tax Act reduces the U.S. corporate statutory tax rate from 35 percent to 21 percent for years after 2017. The Fund has remeasured the U.S. deferred tax assets and liabilities as of the enactment date to reflect the reduced rate that will apply in future periods when these deferred taxes will reverse, resulting in a reduction of the net deferred tax assets by $4,991,383, which is offset by the reduction in valuation allowance by $4,701,242, for a total reduction to the deferred tax balance of $290,141. Deferred tax expense of $1,266,991 is principally related to the remeasurement of our deferred tax assets that are deemed to reverse at the new 21% tax rate partially offset by the deferred tax benefit on the unrealized losses recognized in the current year.
For the year ended September 30, 2018, the Fund’s effective tax rate of 94.59% was greater than the combined federal and state tax rate of 26.73% due in large part to the change in valuation allowance.
| 20 | Annual Report |
Table of Contents
NOTES TO FINANCIAL STATEMENTS (continued)
| September 30, 2018 | Highland Energy MLP Fund | |
As of September 30, 2018, significant components of the Fund’s net deferred tax assets were as follows:
| Total | ||||
Net unrealized losses (gains) on investments | $ | 1,819,388 | ||
Net operating loss carryforward | 1,935,044 | |||
Capital loss carryforward | 5,691,822 | |||
|
| |||
Total deferred tax assets | 9,446,254 | |||
|
| |||
Valuation allowance | (8,121,301 | ) | ||
|
| |||
Total DTA, net of valuation allowance | 1,324,953 | |||
|
| |||
Deferred tax liability: unrealized ordinary income | (1,324,953 | ) | ||
|
| |||
Total DTA, net of Deferred Tax Liability | $ | — | ||
|
| |||
As of September 30, 2018, the Fund has tax attributes that carry forward for varying periods. The Fund’s federal net operating loss carryforward of $6,809,459 that originated during 2015 — 2017 can be carried back two years or forward twenty years to reduce the Fund’s net income realized during those other years. The Fund’s federal net operating losses will begin to expire in 2034 if they are not utilized. The Fund’s federal operating loss of $1,395,020 created in 2018 can be carried forward indefinitely as a result of the Tax Act. The Fund has state net operating losses of $3,837,098 (net of estimated state apportionment) that can reduce the Fund’s state taxable income and will begin to expire in 2024 if they are not utilized. The Fund’s capital losses of $24,133,011 originated in 2015 — 2018. The net capital loss generally can be carried back three years and forward five years to offset any capital gains realized during those other years. The Fund has recorded a partial valuation allowance in connection with federal and state net operating loss carryforwards (as discussed below) and a full valuation in connection with the capital loss carryforwards. The Fund Management believes it is more likely than not that the tax benefits will not be recognized for the valuation allowance established. In the event a capital loss carryover or net operating loss carryover cannot be utilized in the carryover periods, the Fund’s U.S. federal income tax liability may be higher than expected, which will result in less cash available to distribute to shareholders.
The Fund periodically reviews the recoverability of its deferred tax assets based on the weight of available evidence and the criteria for whether it is more likely than not that the asset would be utilized under ASC 740. In analyzing the potential need for a valuation allowance, the Fund considered the fact that it has incurred a cumulative loss over the three-year period ended September 30, 2018. A significant portion of the Fund’s netpre-tax losses related to unrealized depreciation of investments that arose during the 2015 and 2016 fiscal years as a result of decline in the overall financial, commodity and MLP markets.
The balance of the deferred tax asset, net of valuation allowance, is made up of one component. The component represents net operating losses which are offset by the unrealized ordinary income under Section 751 of the Code that is measurable for the Fund’s open partnership investments. This amount is reflected as a deferred tax liability in the above table. The valuation allowance decreased approximately $4,228,601 from September 30, 2017 primarily as a result of the remeasurement relating to the change in federal tax rates, offset by an increase due to changes in unrealized values of the Fund’s assets, realized losses, net operating losses, tax rate changes, the Investment Adviser’s estimate of measurable Section 751 unrealized ordinary income, and the ability for the Fund to realize future tax benefits from unrealized losses.
In accordance with its policies and procedures, the Fund has reviewed its financial forecasts, including the time horizon of those forecasts, in relation to actual results and expected future trends related to its MLP holdings. As a result of unexpected significant decreases in MLP cash distributions, merger activity, and general uncertainty from the events causing the recent decline in oil prices, the Fund changed its assessment regarding the recoverability of the unrealized losses on its c-corporation holdings which led to an additional valuation allowance being placed on those deferred tax assets. The additional valuation allowance required to reduce the deferred tax asset related to the c-corporation holdings had a material impact on the Fund’s net asset value and results of operations in the current period.
The Fund will continue to review multiple factors, particularly the time horizon of financial forecasts, that impact the recoverability of its deferred tax assets on an ongoing basis. If the Fund’s assessment changes regarding its current valuation allowance, it could have a material impact on the Fund’s net asset value and results of operations in the period it is recorded.
The tax character of distributions paid during the year ended September 30, 2018 and September 30, 2017 was as follows:
| Year | Return of Capital | Earnings & Profit | ||||||
2018 | $ | 2,635,842 | $ | — | ||||
2017 | 3,178,144 | — | ||||||
Unrealized appreciation and depreciation as of September 30, 2018, based on cost of investments for U.S. federal income tax purposes is:
| Gross Appreciation | Gross Depreciation | Net Appreciation/ (Depreciation Before Tax | Net Appreciation/ (Depreciation After Tax | Cost(1) | ||||||||||||
$1,005,530 | $ | 8,658,545 | $ | (7,635,016 | ) | $ | (5,848,036 | ) | $ | 47,840,563 | ||||||
| (1) | Cost is reflected net of estimated unrealized Section 751 ordinary income of $5,617,728 within the Fund’s partnership positions. |
| Annual Report | 21 |
Table of Contents
NOTES TO FINANCIAL STATEMENTS (continued)
| September 30, 2018 | Highland Energy MLP Fund | |
Note 5. Credit Agreement
On March 2, 2016 the Fund entered into a Master Margin Loan Agreement (the “Agreement”) with The Bank of New York Mellon. The agreement has a current maturity of February 27, 2019. Interest is charged to the Fund based on its borrowings at a rate equal to 1 month LIBOR plus 1.10%. In addition, the Fund pays a commitment fee of 0.40% on any undrawn amount. Included in the Statement of Operations is $379,155 of interest expense and commitment fees. As of September 30, 2018, the Fund had an outstanding balance of $12,400,000 under the Agreement. The fair value of the outstanding debt under the Agreement was estimated to be $12,451,820, and would be categorized as Level 3 within the fair value hierarchy. The fair value was estimated based on discounting the cash flows owed using a discount rate of 0.50% over the 5 month risk free rate. For the year ended September 30, 2018, the Fund’s average daily note balance was $11,140,192 at a weighted average interest rate of 2.82% for the days outstanding.
Note 6. Transactions with Affiliates & Expenses Incurred by the Fund
Investment Advisory Fees and Administration Fees
For its investment advisory and administrative services, the Fund pays the Investment Adviser a monthly fee, computed and accrued daily, based on an annual rate of the Fund’s Average Daily Managed Assets. Average Daily Managed Assets of the Fund means the average daily value of the total assets of the Fund less all accrued liabilities of the Fund (other than the aggregate amount of any outstanding borrowings constituting financial leverage). The Fund’s contractual advisory fee with the Investment Adviser for the year ended September 30, 2018 was 1.00%.
The Investment Adviser provides administrative services for a monthly administration fee, computed and accrued daily, at an annual rate of 0.20% of the Fund’s Average Daily Managed Assets. During the year ended September 30, 2018, the Investment Adviser waived $71,961 in administrative fees for the Fund. This administration fee waiver is voluntary and is subject to termination at any time by the Investment Adviser without notice.
Expense Limits and Fee Reimbursements
The Investment Adviser has contractually agreed to limit the total annual operating expenses of the Fund (exclusive of fees paid by the Fund pursuant to its distribution plan under Rule12b-1 under the 1940 Act, taxes, such as deferred tax expenses, dividend expenses on short sales, interest payments, brokerage commissions and other transaction costs, acquired fund fees and expenses, and extraordinary expenses) of the Fund to 1.10% of average daily net assets
attributable to any class of the Fund (the “Expense Cap”). The Expense Cap will continue through at least January 31, 2019, and may not be terminated prior to this date without the action or consent of the Board. Under the Expense Cap, the Investment Adviser may recoup waived and/or reimbursed amounts with respect to a Fund withinthirty-six months of the date such amounts were waived or reimbursed, provided the Fund’s total annual operating expenses, including such recoupment, do not exceed the Expense Cap in effect at the time of such waiver/reimbursement. On September 30, 2018, the amount subject to possible future recoupment under the Funds’ expense limitation agreement were as follows:
Expiring during Fiscal Years Ending | ||||||||||||
| Fund | 2019 | 2020 | 2021 | |||||||||
Highland Energy MLP Fund | $ | 458,560 | $ | 381,492 | $ | 324,834 | ||||||
During the year ended September 30, 2018, the Investment Adviser did not recoup any fees previously waived or reimbursed and $101,941 of fees previously waived and or reimbursed by the Investment Adviser that were eligible for recoupment expired.
Fees Paid to Officers and Trustees
Each Trustee who is not an “interested person” of the Fund as defined in the 1940 Act (the “Independent Trustees”) receives an annual retainer of $150,000 payable in quarterly installments and allocated among each portfolio in the Highland Fund Complex overseen by such Trustee based on relative net assets. The “Highland Fund Complex” consists of all of the registered investment companies advised by the Investment Adviser or its affiliated advisers and NexPoint Capital, Inc., aclosed-end management investment company that has elected to be treated as a business development company under the 1940 Act as of the date of this report. Effective December 4, 2015, Mr. Powell resigned from his position with the Investment Adviser. Prior to December 8, 2017, Mr. Powell was treated as an Interested Trustee of the Trust for all purposes other than compensation and the Trust’s code of ethics.
The Fund pays no compensation to its officers, all of whom are employees of the Investment Adviser or one of its affiliates.
Distribution and Shareholder Service Fees
The Fund has a distribution and shareholder service plan (the “Plan”) pursuant toRule12b-1 under the 1940 Act. The Plan requires the payment of a monthly service fee to Highland Capital Funds Distributor, Inc. (the “Underwriter”) at an annual rate of 0.25% of the average daily net assets attributable to Class A and Class C shares of the Fund. In addition,
| 22 | Annual Report |
Table of Contents
NOTES TO FINANCIAL STATEMENTS (continued)
| September 30, 2018 | Highland Energy MLP Fund | |
the Plan also requires the payment of a monthly distribution fee to the Underwriter at an annual rate of 0.10% of the average daily net assets attributable to Class A shares. The Fund is not currently authorized by the Board to pay such fees but may at any time without shareholder approval. The Plan also requires the payment of a monthly distribution fee to the Underwriter at an annual rate of 0.75% of the average daily net assets attributable to Class C shares. Currently Class Y shares are not subject to a12b-1 fee.
The Underwriter received $1,318 of front end sales charges from the sale of Class A shares and $5,053 in contingent deferred sales charges from the redemption of Class C shares of the Fund during the year ended September 30, 2018.
Indemnification
Under the Trust’s organizational documents, the officers and Trustees have been granted certain indemnification rights against certain liabilities that may arise out of performance of their duties to the Trust. Additionally, in the normal course of business, the Trust may enter into contracts with service providers that contain a variety of indemnification clauses. The Trust’s maximum exposure under these arrangements is dependent on future claims that may be made against the Trust and, therefore, cannot be estimated.
Note 7. Disclosure of Significant Risks and Contingencies
The primary risks of investing in the Fund are described below in alphabetical order:
Counterparty Risk
Counterparty risk is the risk that the counterparty (the other party to a transaction or an agreement or the party with whom the Fund executes transactions) to a transaction with the Fund may be unable or unwilling to make timely principal, interest or settlement payments, or otherwise honor its obligations.
Industry Concentration Risk
Industry Concentration Risk is the risk that the Fund may be particularly susceptible to economic, political or regulatory events affecting those industries in which the Fund focuses its investments. Because the Fund normally invests at least 80% of the value of its assets in MLP investments, the Fund’s performance largely depends on the overall condition of these industries and the Fund is susceptible to economic, political and regulatory risks or other occurrences associated with these industries.
Leverage Risk
Leverage risk is the risk associated with the use of leverage for investment purposes to create opportunities for greater
total returns. Any investment income or gains earned with respect to the amounts borrowed that are in excess of the interest that is due on the borrowing will augment the Fund’s income. Conversely, if the investment performance with respect to the amounts borrowed fails to cover the interest on such borrowings, the value of the Fund’s shares may decrease more quickly than would otherwise be the case. Interest payments and fees incurred in connection with such borrowings will reduce the amount of net income available for payment to Fund shareholders.
MLP Risk
MLP Risk is the risk of investing in MLP units, which involves some risks that differ from an investment in the equity securities of a company. The Fund intends to invest substantially in MLP units. Holders of MLP units have limited control and voting rights on matters affecting the partnership. Holders of units issued by an MLP are exposed to a remote possibility of liability for all of the obligations of that MLP in the event that a court determines that the rights of the holders of MLP units to vote to remove or replace the general partner of that MLP, to approve amendments to that MLP’s partnership agreement, or to take other action under the partnership agreement of that MLP would constitute “control” of the business of that MLP, or a court or governmental agency determines that the MLP is conducting business in a state without complying with the partnership statute of that state. Holders of MLP units are also exposed to the risk that they will be required to repay amounts to the MLP that are wrongfully distributed to them. Investments in MLP units also present special tax risks. See “MLP Tax Risk” below.
MLP Tax Risk
MLP Tax risk is the risk that the MLPs in which the Fund invests will fail to be treated as partnerships for U.S. federal income tax purposes. The Fund’s ability to meet its investment objective will depend, in large measure, on the level of dividends, distributions or income it receives from the MLPs in which it invests and on the MLPs’ continued treatment as partnerships for U.S. federal income tax purposes. If an MLP does not meet current legal requirements to maintain its partnership status, or if it is unable to do so because of tax or other law changes, it would be treated as a corporation for U.S. federal income tax purposes. In that case, the MLP would be obligated to pay U.S. federal income tax (as well as state and local taxes) at the entity level on its taxable income and distributions received by the Fund would be taxable to the Fund as dividend income to the extent of the MLP’s current and accumulated earnings and profits for federal tax purposes. The classification of an MLP as a corporation for U.S. federal income tax purposes could have the effect of reducing the amount of cash available for distribution by the MLP and the value of the Fund’s investment in any such
| Annual Report | 23 |
Table of Contents
NOTES TO FINANCIAL STATEMENTS (concluded)
| September 30, 2018 | Highland Energy MLP Fund | |
MLP. As a result, the value of the Fund’s shares and the cash available for distribution to Fund shareholders could be materially reduced.
Note 8. Investment Transactions Purchases and Sales of Securities
The cost of purchases and the proceeds from sales of investments, other than short-term securities and short-term options for the year ended September 30, 2018, were as follows:
Other Securities | ||||
| Purchases | Sales | |||
| $9,254,018 | $ | 5,283,923 | ||
Note 9. Significant Shareholders
The number of shareholders each owning 5% or more of the Fund is listed below. The total percentage of the Fund held by such external shareholders as well as percentage of the Fund held by certain directly and indirectly wholly-owned subsidiaries of the Investment Adviser and their affiliates (“Highland Affiliates”) at September 30, 2018 were:
| Number | % of Fund Held | |||
3 | 79.6 | % | ||
Note 10. New Accounting Pronouncements
In November 2016, the FASB issued Accounting Standards Update2016-18, Statement of Cash Flows (Topic 230): Restricted Cash. The amendments in this update require the statement of cash flows to explain the change during the period in the total of cash, restricted cash and cash equivalents. Amounts generally described as restricted cash or restricted cash equivalents should be included with cash and cash equivalents when reconciling thebeginning-of-period andend-of-period total amounts shown on the statement of cash flows. For public entities this update will be effective for fiscal years beginning after December 15, 2017, and for interim periods within those fiscal years. The Investment Adviser is currently evaluating the impact of this new guidance on the Fund’s financial statements.
In December 2016, the FASB issued Accounting Standards Update2016-19, Technical Corrections and Improvements. The amendments in this update include an amendment to FASB ASC Topic 820, Fair Value Measurement and Disclosures to clarify the difference between a valuation approach and a valuation technique. The amendment also requires an entity to disclose when there has been a change in either or both a valuation approach and/or a valuation technique. For public entities, this update will be effective
for fiscal years beginning after December 15, 2017, and for interim periods within those fiscal years. The Investment Adviser is currently evaluating the impact of this new guidance on the Fund’s financial statements.
In March 2017, the FASB issued Accounting Standards Update2017-08, Receivables — Nonrefundable Fees and Other Costs (Subtopic310-20). The amendments in this update shorten the amortization period for certain callable debt securities held at premium. Specifically, the amendments require the premium to be amortized to the earliest call date. The amendments do not require an accounting change for securities held at a discount; the discount continues to be amortized to maturity. For public entities this update will be effective for fiscal years beginning after December 15, 2018, and for interim periods within those fiscal years. The Investment Adviser is currently evaluating the impact of this new guidance on the Fund’s financial statements.
In February 2018, the FASB issued Accounting Standards Update2018-03, Technical Corrections and Improvements to Financial Instruments — Overall (Subtopic825-10): Recognition and Measurement of Financial Assets and Financial Liabilities. The amendments in this update provide a variety of technical corrections and improvements to how entities should account for financial instruments. For public entities this update will be effective for fiscal years beginning after December 15, 2017, and for interim periods within those fiscal years beginning after June 15, 2018. The Investment Adviser is currently evaluating the impact of this new guidance on the Fund’s financial statements.
In August 2018, the FASB issued Accounting Standards Update2018-13, Fair Value Measurement (Topic 820): Disclosure Framework — Changes to the Disclosure Requirements for Fair Value Measurement. The amendments in this update modify a number of disclosure requirements on fair value measurements required to be reported under Topic 820, Fair Value Measurement. The amendments in this update are effective for all entities for fiscal years, and interim periods within those fiscal years, beginning after December 15, 2019. The Investment Adviser is currently evaluating the impact of this new guidance on the Fund’s financial statements.
Note 11. Subsequent Events
Management has evaluated the impact of all subsequent events on the Fund through the date the financial statements were issued, and has determined that there were no subsequent events to report which have not already been recorded or disclosed in these financial statements and accompanying notes.
| 24 | Annual Report |
Table of Contents
REPORT OF INDEPENDENT REGISTERED PUBLIC ACCOUNTING FIRM
To the Board of Trustees of Highland Funds II and Shareholders of Highland Energy MLP Fund
Opinion on the Financial Statements
We have audited the accompanying statement of assets and liabilities, including the investment portfolio, of Highland Energy MLP Fund (the “Fund”), a series of Highland Funds II, as of September 30, 2018, the related statements of operations and cash flows for the year ended September 30, 2018, the statement of changes in net assets for the year ended September 30, 2018, including the related notes, and the financial highlights for the year ended September 30, 2018 (collectively referred to as the “financial statements”). In our opinion, the financial statements present fairly, in all material respects, the financial position of the Fund as of September 30, 2018, the results of its operations and its cash flows for the year then ended, the changes in its net assets for the year ended September 30, 2018 and the financial highlights for the year ended September 30, 2018 in conformity with accounting principles generally accepted in the United States of America.
The financial statements of the Fund as of and for the year ended September 30, 2017 and the financial highlights for each of the periods ended on or prior to September 30, 2017 were audited by other auditors whose report dated November 28, 2017 expressed an unqualified opinion on those financial statements and financial highlights.
Basis for Opinion
These financial statements are the responsibility of the Fund’s management. Our responsibility is to express an opinion on the Fund’s financial statements based on our audit. We are a public accounting firm registered with the Public Company Accounting Oversight Board (United States) (“PCAOB”) and are required to be independent with respect to the Fund in accordance with the U.S. federal securities laws and the applicable rules and regulations of the Securities and Exchange Commission and the PCAOB.
We conducted our audit of these financial statements in accordance with the standards of the PCAOB. Those standards require that we plan and perform the audit to obtain reasonable assurance about whether the financial statements are free of material misstatement, whether due to error or fraud.
Our audit included performing procedures to assess the risks of material misstatement of the financial statements, whether due to error or fraud, and performing procedures that respond to those risks. Such procedures included examining, on a test basis, evidence regarding the amounts and disclosures in the financial statements. Our audit also included evaluating the accounting principles used and significant estimates made by management, as well as evaluating the overall presentation of the financial statements. Our procedures included confirmation of securities owned as of September 30, 2018 by correspondence with the custodian and brokers; when replies were not received from brokers, we performed other auditing procedures. We believe that our audit provides a reasonable basis for our opinion.
Dallas, Texas
December 21, 2018
We have served as the auditor of one or more investment companies of Highland Capital Management Fund Advisors, L.P. and its affiliates since 2004.
| Annual Report | 25 |
Table of Contents
ADDITIONAL INFORMATION (unaudited)
| September 30, 2018 | Highland Energy MLP Fund | |
Additional Portfolio Information
The Investment Adviser and its affiliates manage other accounts, including registered and private funds and individual accounts. Although investment decisions for the Fund is made independently from those of such other accounts, the Investment Adviser may, consistent with applicable law, make investment recommendations to other clients or accounts that may be the same or different from those made to the Fund, including investments in different levels of the capital structure of a company, such as equity versus senior loans, or that involve taking contradictory positions in multiple levels of the capital structure. The Investment Adviser has adopted policies and procedures that address the allocation of investment opportunities, execution of portfolio transactions, personal trading by employees and other potential conflicts of interest that are designed to ensure that all client accounts are treated equitably over time. Nevertheless, this may create situations where a client could be disadvantaged because of the investment activities conducted by the Investment Adviser for other client accounts. When the Fund and one or more of such other accounts are prepared to invest in, or desire to dispose of, the same security, available investments or opportunities for each will be allocated in a manner believed by the Investment Adviser to be equitable to the Fund and such other accounts. The Investment Adviser also may aggregate orders to purchase and sell securities for the Fund and such other accounts. Although the Investment Adviser believes that, over time, the potential benefits of participating in volume transactions and negotiating lower transaction costs should benefit all accounts including the Fund, in some cases these activities may adversely affect the price paid or received by the Fund or the size of the position obtained or disposed of by the Fund.
Disclosure of Fund Expenses
As a shareholder of a Fund, you incur two types of costs: (1) transaction costs, including sales charges (loads) on purchases and redemption fees; and (2) ongoing costs, including management fees; distribution(12b-1) and service fees; and other Fund expenses. This example is intended to help you understand the ongoing costs (in dollars) of investing in your Fund and to compare these costs with the ongoing costs of investing in other mutual funds. The example is based on an investment of $1,000 invested at the beginning of the period and held for thesix-month period April 1, 2018 through September 30, 2018, unless otherwise indicated.
This table illustrates your Fund’s costs in two ways:
Actual Expenses: The first part of the table provides information about actual account values and actual expenses. You may use the information in this line, together with the amount you invested, to estimate the expenses that
you paid over the period. Simply divide your account value by $1,000 (for example, an $8,600 account value divided by $1,000 = 8.6), then multiply the result by the number in the first line under the heading entitled “Expenses Paid During Period” to estimate the expenses you paid on your account during this period.
Hypothetical Example for Comparison Purposes: The second part of the table provides information about hypothetical account values and hypothetical expenses based on your Fund’s actual expense ratio and an assumed rate of return of 5% per year before expenses, which is not your Fund’s actual return. The actual expense ratio includes voluntary fee waivers or expense reimbursements by the Fund’s investment adviser. The expense ratio would be higher had the fee waivers or expense reimbursements not been in effect. The hypothetical account values and expenses may not be used to estimate the actual ending account balance or expenses you paid for the period. You may use this information to compare the ongoing costs of investing in your Fund and other funds. To do so, compare this 5% hypothetical example with the 5% hypothetical examples that appear in the shareholder reports of the other funds. Please note that the expenses shown in the table are meant to highlight your ongoing costs only and do not reflect any transactional costs, such as sales charges (loads) or redemption fees. Therefore, the second part of the table is useful in comparing ongoing costs only, and will not help you determine the relative total costs of owning different funds. In addition, if these transactional costs were included, your costs would have been higher.
| Beginning Account Value 04/01/18 | Ending Account Value 09/30/18 | Annualized Expense Ratio | Expenses Paid During the Period | |||||||||||||
Highland Energy MLP Fund |
| |||||||||||||||
Actual Fund Return | ||||||||||||||||
Class A | $ | 1,000.00 | $ | 1,200.30 | 10.17 | % | $ | 56.10 | ||||||||
Class C | 1,000.00 | 1,200.70 | 11.33 | % | 62.51 | |||||||||||
Class Y | 1,000.00 | 1,206.20 | 10.41 | % | 57.57 | |||||||||||
Hypothetical 5% Return (before expenses) |
| |||||||||||||||
Class A | $ | 1,000.00 | $ | 974.08 | 10.17 | % | $ | 50.33 | ||||||||
Class C | 1,000.00 | 968.26 | 11.33 | % | 55.90 | |||||||||||
Class Y | 1,000.00 | 972.88 | 10.41 | % | 51.48 | |||||||||||
Changes of Independent Registered Public Accounting Firms
On September 28, 2018, Highland Energy MLP Fund, Highland Global Allocation Fund, Highland Premier Growth Equity Fund, Highland Small-Cap Equity Fund, Highland Total Return Fund, Highland Tax-Exempt Fund and Highland Fixed Income Fund, each a series of Highland Funds II (the “Trust”), dismissed KPMG LLP (“KPMG”) as the Trust’s independent
| 26 | Annual Report |
Table of Contents
ADDITIONAL INFORMATION (unaudited) (continued)
| September 30, 2018 | Highland Energy MLP Fund | |
registered public accounting firm, effective on such date. The decision to dismiss KPMG was approved by the audit committee and by the full board of trustees of the Trust (the “Board”). On September 27, 2018, the Trust approved the appointment of PricewaterhouseCoopers (“PwC”) as the Trust’s independent registered public accounting firm. PwC was engaged by the Trust on November 6, 2018.
KPMG did not issue a report on the Trust’s September 30, 2018 financial statements. KPMG’s audit reports on the Trust’s financial statements as of and for the years ended September 30, 2017 and 2016 did not contain any adverse opinion or disclaimer of opinion, nor were they qualified or modified as to uncertainty, audit scope, or accounting principles.
During its audit of certain affiliated funds with a fiscal year-end of June 30, 2018, KPMG concluded management’s review control over a certain hard-to-value security held by some of those funds and the Highland Global Allocation Fund was not designed at an appropriate level of precision to assess the orderly nature of transactions involving the security and reasonableness and reliability of certain inputs to the fair value model for the security. In connection with this audit, KPMG advised the Funds of the need to expand significantly the scope of its audit. Although Management of the Trust initially disagreed with KPMG’s position, subsequent to KPMG’s dismissal Management ultimately took the position that the transactions were orderly and revised certain non-observable inputs to the fair value model for the security.
KPMG and Management identified a material weakness in the control environment related to the assessment of orderly transactions and non-observable inputs used in fair valuation of a fair valued asset held for the 6/30 Funds. The Trust shares this control environment and the material weakness is relevant to the Highland Global Allocation Fund’s fair valuation.
Other than the disagreements and reportable events disclosed above, during the Trust’s years ended September 30, 2017 and 2016 and the subsequent interim period through September 28, 2018, there were no: (1) disagreements (as defined in Item 304(a)(1)(iv) of Regulation S-K and the related instructions) with KPMG on any matter of accounting principles or practices, financial statement disclosure, or auditing scope or procedures, which disagreements if not resolved to their satisfaction would have caused them to make reference in connection with their opinion to the subject matter of the disagreement, or (2) reportable events (as described in Item 304(a)(1)(v) of Regulation S-K). The audit committee of the Trust discussed the subject matter of these disagreements and reportable events with KPMG. The Trust has authorized KPMG to respond fully to the inquiries of PwC concerning the subject matter of these disagreements and reportable events.
During the years ended September 30, 2017 and 2016 and the subsequent interim period through September 27, 2018, neither Management, the Trust, nor anyone on its behalf, consulted PwC regarding either (i) the application of accounting principles to a specified transaction, either completed or proposed, or the type of audit opinion that might be rendered on the financial statements of the Trust, and no written report or oral advice was provided to the Trust by PwC that PwC concluded was an important factor considered by the Trust in reaching a decision as to any accounting, auditing or financial reporting issue; or (ii) any matter that was either the subject of a disagreement (as defined in Item 304(a)(1)(iv) of Regulation S-K and the related instructions) or a reportable event (as described in Item 304(a)(1)(v) of Regulation S-K). Subsequent to September 27, 2018, PwC ultimately concluded that the March 2018 TerreStar transactions were orderly.
The Trust provided KPMG and PwC with a copy of the disclosure it is making in response to Item 304(a) of Registration S-K and requested that KPMG and PwC furnish the Trust with letters addressed to the SEC, pursuant to Item 304(a) containing any new information, clarification of the Trust’s expression of its view, or the respects in which it does not agree with the statements made by the Trust in response to Item 304(a). A copy of those letters, if applicable, was not available at the time of this filing.
Approval of Highland Funds II Advisory Agreement (MLP Fund)
The Trust has retained the Investment Adviser to manage the assets of the Fund pursuant to an investment advisory agreement between the Investment Adviser and the Fund (the “Advisory Agreement”). The Advisory Agreement was approved by the Fund’s Board of Trustees, including a majority of the Independent Trustees.
Following an initialtwo-year term, the Advisory Agreement continues in effect fromyear-to-year, provided that such continuance is specifically approved at least annually by the vote of holders of at least a majority of the outstanding shares of the Fund or by the Board of Trustees and, in either event, by a majority of the Independent Trustees of the Fund casting votes in person at a meeting called for such purpose.
During telephonic meetings held on August 16, 2018 and August 28, 2018, the Board of Trustees gave preliminary consideration to information bearing on the continuation of the Advisory Agreement for aone-year period commencing November 1, 2018 with respect to the Fund. The primary objective of the meetings was to ensure that the Trustees had the opportunity to consider matters they deemed relevant in evaluating the continuation of the Advisory Agreement, and to request any additional information they considered reasonably necessary for their deliberations.
| Annual Report | 27 |
Table of Contents
ADDITIONAL INFORMATION (unaudited) (continued)
| September 30, 2018 | Highland Energy MLP Fund | |
At anin-person meeting held on September16-17, 2018, the Board of Trustees, including the Independent Trustees, approved the continuance of the Advisory Agreement for aone-year period commencing on November 1, 2018. As part of its review process, the Board of Trustees requested, through Fund counsel and its independent legal counsel, and received from the Investment Adviser, various information and written materials in connection with meetings of the Board of Trustees, including: (1) information regarding the financial soundness of the Investment Adviser and the profitability of the Advisory Agreement to the Investment Adviser; (2) information on the advisory and compliance personnel of the Investment Adviser, including compensation arrangements; (3) information on the internal compliance procedures of the Investment Adviser; (4) comparative information showing how the Fund’s fees and operating expenses compare to those of other accounts of the Investment Adviser and comparable funds that follow investment strategies similar to those of the Fund; (5) information on the investment performance of the Fund, including comparisons of the Fund’s performance against that of other registered investment companies and comparable funds that follow investment strategies similar to those of the Fund; (6) information regarding brokerage and portfolio transactions; and (7) information on any legal proceedings or regulatory audits or investigations affecting the Investment Adviser. After the August 2018 meetings, the Trustees requested that the Investment Adviser provide additional information regarding various matters. In addition, the Trustees received an independent report from Morningstar Inc. (“Morningstar”), an independent source of investment company data, relating to the Fund’s performance, volatility and expenses compared to the performance, volatility and expenses of a peer group determined by Morningstar to be comparable. The Trustees also relied on information provided at periodic meetings of the Board of Trustees over the course of the year. The Trustees reviewed various factors discussed in independent counsel’s legal memoranda regarding their responsibilities in considering the Agreements, the detailed information provided by the Investment Adviser and other relevant information and factors. The Trustees’ conclusions as to the approval of the continuation of the Advisory Agreement were based on a comprehensive consideration of all information provided to the Trustees without any single factor being dispositive in and of itself. Some of the factors that figured particularly in the Trustees’ deliberations are described below, although individual Trustees may have evaluated the information presented differently from one another, giving different weights to various factors.
The nature, extent, and quality of the services to be provided by the Investment Adviser
The Board of Trustees considered the portfolio management services to be provided by the Investment Adviser under the Advisory Agreement and the activities related to portfolio management, including use of technology, research capabilities, and investment management staff. The Trustees discussed the relevant experience and qualifications of the personnel providing advisory services, including the background and experience of the members of the Fund’s portfolio management team. The Trustees reviewed the management structure, assets under management and investment philosophy and process of the Investment Adviser. The Trustees also reviewed and discussed information regarding the Investment Adviser’s compliance policies, procedures and personnel, including compensation arrangements. The Trustees concluded that the Investment Adviser had the quality and depth of personnel and investment methods essential to performing its duties under the Advisory Agreement, and that the nature and the quality of such advisory services were satisfactory.
The Investment Adviser’s historical performance in managing the Fund
The Board of Trustees reviewed the historical performance of the Fund over various time periods and reflected on previous discussions regarding matters bearing on the Investment Adviser’s performance at its meetings throughout the year. The Trustees discussed the historical performance of the Fund and contrasted the relative performance of the Fund and its portfolio management team to that of the Fund’s peers, as represented by certain other registered investment companies and comparable funds that follow investment strategies similar to the Fund, as well as comparable indices and the Fund’s applicable Morningstar category. With respect to the Fund, the Trustees concluded that the Fund’s performance or other relevant factors supported the continuation of the Advisory Agreement for an additionalone-year period.
Although the Fund’s performance lagged that of its benchmark, Morningstar peer group median and category median for certain periods, the Trustees also noted prior periods of recent outperformance of the Fund’s benchmark, Morningstar peer group median and category median, and determined that the performance did not necessitate any additional review. The Trustees further considered information provided by the Investment Adviser relating to the attribution of performance results for the Fund, including information that demonstrated that the Fund’s historical
| 28 | Annual Report |
Table of Contents
ADDITIONAL INFORMATION (unaudited) (concluded)
| September 30, 2018 | Highland Energy MLP Fund | |
underperformance was driven by leverage and attributable, to a significant extent, to investment decisions (such as security selection or sector allocation) by the Investment Adviser that were reasonable under the circumstances prevailing at the time and consistent with the Fund’s investment objective and policies.
The Trustees concluded that the Fund’s performance and other relevant factors supported the continuation of the Advisory Agreement.
The costs of the services to be provided by the Investment Adviser and the profits to be realized by the Investment Adviser and its affiliates from its relationship with the Fund
The Board of Trustees also gave consideration to the fees payable under the Advisory Agreement, the expenses the Investment Adviser incurs in providing advisory services and the profitability to the Investment Adviser from managing the Fund, including: (1) information regarding the financial condition of the Investment Adviser; (2) information regarding the total fees and payments received by the Investment Adviser for its services and whether such fees are appropriate given economies of scale and other considerations; (3) comparative information showing (a) the fees payable under the Advisory Agreement versus the investment advisory fees of certain registered investment companies and comparable funds that follow investment strategies similar to that of the Fund and (b) the expense ratio of the Fund versus the expense ratios of certain registered investment companies and comparable funds that follow investment strategies similar to that of the Fund; and (4) information regarding the total fees and payments received and the related amounts waived and/or reimbursed by the Investment Adviser for providing administrative services with respect to the Fund under a separate agreement and whether such fees are appropriate. The Trustees also considered theso-called“fall-out benefits” to the Investment Adviser with respect to the Fund, such as the reputational value of serving as Investment Adviser to the Fund, potential fees paid to the Investment Adviser’s affiliates by the Fund or portfolio companies for services provided, including administrative services provided to the Fund by the Investment Adviser pursuant to a separate agreement, the benefits of scale from investment by the Fund in affiliated funds, and the benefits of research made available to the Investment Adviser by reason of brokerage commissions (if any) generated by the Fund’s securities transactions, and, with respect to investments in one or more other funds in
the Highland fund complex, the fees paid to the Investment Adviser of the underlying Fund and its affiliates with respect to such investments. After such review, the Trustees determined that the anticipated profitability rate to the Investment Adviser with respect to the Advisory Agreement was fair and reasonable. The Trustees also took into consideration that the Investment Adviser agreed to waive fees and/or reimburse expenses to cap the total annual fund operating expenses.
The extent to which economies of scale would be realized as the Fund grows and whether fee levels reflect these economies of scale for the benefit of shareholders
The Board of Trustees considered the asset levels of the Fund over time and historical net expenses relative to such asset levels, the information provided by the Investment Adviser relating to its costs and also information comparing the fee rate charged by the Investment Adviser with fee rates charged by other unaffiliated investment advisers to their clients. The Trustees concluded that the Fund’s fee structure is reasonable, and with respect to the Investment Adviser, should result in a sharing of economies of scale in view of the information provided. The Board determined to continue to review ways, and the extent to which, economies of scale might be shared between the Investment Adviser on the one hand and shareholders of the Fund on the other. The Board also requested that the Investment Adviser consider ways in which economies of scale can be shared with Fund shareholders.
Conclusion
Throughout the process, the Board of Trustees was advised by Fund counsel and independent legal counsel, and was empowered to engage such other third parties or request additional information as it deemed appropriate. Following a further discussion of the factors above and the merits of the Advisory Agreement and its various provisions, it was noted that in considering the approval of the Advisory Agreement, no single factor was determinative to the decision of the Board of Trustees. Rather, after weighing all of the factors and reasons discussed above, the Trustees, including the Independent Trustees, unanimously agreed that the Advisory Agreement, including the advisory fee to be paid to the Investment Adviser is fair and reasonable to the Fund in light of the services that the Investment Adviser provides, the expenses that it incurs and the reasonably foreseeable asset levels of the Fund.
| Annual Report | 29 |
Table of Contents
ADDITIONAL INFORMATION (unaudited) (continued)
| September 30, 2018 | Highland Energy MLP Fund | |
The Board is responsible for the overall management of the Funds, including supervision of the duties performed by the Investment Adviser. The names and birth dates of the Trustees and officers of the Fund, the year each was first elected or appointed to office, their principal business occupations during the last five years, the number of funds overseen by each Trustee and other directorships they hold are shown below. The business address for each Trustee and officer of the Fund is c/o Highland Capital Management Fund Advisors, L.P., 200 Crescent Court, Suite 700, Dallas, TX 75201.
Name and Date of Birth | Position(s) with the Trust | Term of Office1 and Length of Time Served | Principal Occupation(s) During the Past Five Years | Number of Portfolios in Highland Fund Complex Overseen by the Trustees2 | Other Directorships/ Trusteeships Held During the Past Five Years | Experience, Qualifications, Attributes, Skills for Board Membership | ||||||
| Independent Trustees | ||||||||||||
Timothy K. Hui (6/13/1948) | Trustee | Indefinite Term; Trustee since inception in 2006. | Dean of Educational Resources Emeritus and Special Assistant to the President at Cairn University since July 2018; Dean of Educational Resources at Cairn University from July 2012 until June 2018 and from July 2006 to January 2008. | 25 | None | Significant experience on this board of directors/trustees; administrative and managerial experience; legal training and practice. | ||||||
Bryan A. Ward (2/4/1955) | Trustee | Indefinite Term; Trustee since inception in 2006. | Private Investor, BW Consulting, LLC since 2014; Senior Manager, Accenture, LLP (a consulting firm) from 2002 until retirement in 2014. | 25 | Director of Equity Metrix, LLC. | Significant experience on this and/or other boards of directors/trustees; significant managerial and executive experience; significant experience as a management consultant. | ||||||
| 30 | Annual Report |
Table of Contents
ADDITIONAL INFORMATION (unaudited) (continued)
| September 30, 2018 | Highland Energy MLP Fund | |
Name and Date of Birth | Position(s) with the Trust | Term of Office1 and Length of Time Served | Principal Occupation(s) During the Past Five Years | Number of Portfolios in Highland Fund Complex Overseen by the Trustees2 | Other Directorships/ Trusteeships Held During the Past Five Years | Experience, Qualifications, Attributes, Skills for Board Membership | ||||||
| Independent Trustees | ||||||||||||
Dr. Bob Froehlich (4/28/1953) | Trustee | Indefinite Term; Trustee since December 2013. | Retired. | 25 | Trustee of ARC Realty Finance Trust, Inc. (from January 2013 to May 2016); Director of KC Concessions, Inc. (since January 2013); Trustee of Realty Capital Income Funds Trust (from January 2014 to December 2016); Director of American Realty Capital Healthcare Trust II (from January 2013 to June 2016); Director, American Realty Capital Daily Net Asset Value Trust, Inc. (from November 2012 to July 2016); Director of American Sports Enterprise, Inc. (since January 2013); Director of Davidson Investment Advisors (July 2009 to July 2016); Chairman and owner, Kane County Cougars Baseball Club (since January 2013); Advisory Board of Directors, Internet Connectivity Group, Inc. (January 2014 to April 2016); Director of AXAR Acquisition Corp. (formerly AR Capital Acquisition Corp.) (from October 2014 to October 2017); Director of The Midwest League of Professional Baseball Clubs, Inc.; Director of Kane County Cougars Foundation, Inc.; Director of Galen Robotics, Inc.; Chairman and Director of FC Global Realty, Inc. (from May 2017 to June 2018); and Chairman and Director of First Capital Investment Corp. (from March 2017 until March 2018). | Significant experience in the financial industry; significant managerial and executive experience; significant experience on other boards of directors, including as a member of several audit committees. | ||||||
| Annual Report | 31 |
Table of Contents
ADDITIONAL INFORMATION (unaudited) (continued)
| September 30, 2018 | Highland Energy MLP Fund | |
Name and Date of Birth | Position(s) with the Trust | Term of Office1 and Length of Time Served | Principal Occupation(s) During the Past Five Years | Number of Portfolios in Highland Fund Complex Overseen by the Trustees2 | Other Directorships/ Trusteeships Held During the Past Five Years | Experience, Qualifications, Attributes, Skills for Board Membership | ||||||
| Independent Trustees | ||||||||||||
John Honis3 (6/16/1958) | Trustee | Indefinite Term; Trustee since July 2013. | President of Rand Advisors, LLC since August 2013; Partner of Highland Capital Management, L.P. (“HCM”) from February 2007 until his resignation in November 2014. | 25 | Manager of Turtle Bay Resort, LLC; and Manager of American Home Patient (from November 2011 to February 2016). | Significant experience in the financial industry; significant managerial and executive experience, including experience as president, chief executive officer or chief restructuring officer of five telecommunication firms; experience on other boards of directors/trustees. | ||||||
| 32 | Annual Report |
Table of Contents
ADDITIONAL INFORMATION (unaudited) (continued)
| September 30, 2018 | Highland Energy MLP Fund | |
Name and Date of Birth | Position(s) with the Trust | Term of Office1 and Length of Time Served | Principal Occupation(s) During the Past Five Years | Number of Portfolios in Highland Fund Complex Overseen by the Trustees2 | Other Directorships/ Trusteeships Held During the Past Five Years | Experience, Qualifications, Attributes, Skills for Board Membership | ||||||
| Independent Trustees | ||||||||||||
Ethan Powell4 (6/20/1975) | Trustee and Chairman of the Board | Indefinite Term; Trustee since December 2013; Chairman of the Board since December 2013; and Executive Vice President and Principal Executive Officer from June 2012 until December 2015. | President and Founder of Impact Shares LLC since December 2015; Trustee/Director of the Highland Fund Complex from June 2012 until July 2013 and since December 2013; Chief Product Strategist of Highland Capital Management Fund Advisors, L.P. (“HCMFA”) from 2012 until December 2015; Senior Retail Fund Analyst of HCM from 2007 until December 2015 and HCMFA from its inception until December 2015; President and Principal Executive Officer of NexPoint Strategic Opportunities Fund (“NHF”) from June 2012 until May 2015; Secretary of NHF from May 2015 until December 2015; Executive Vice President and Principal Executive Officer of Highland Funds I (“HFI”) and Highland Funds II (“HFII”) from June 2012 until December 2015; and Secretary of HFI and HFII from November 2010 to May 2015. | 25 | Trustee of Impact Shares Funds I Trust | Significant experience in the financial industry; significant executive experience including past service as an officer of funds in the Highland Fund Complex; significant administrative and managerial experience. | ||||||
| Annual Report | 33 |
Table of Contents
ADDITIONAL INFORMATION (unaudited) (continued)
| September 30, 2018 | Highland Energy MLP Fund | |
Name and Date of Birth | Position(s) with the Trust | Term of Office1 and Length of Time Served | Principal Occupation(s) During the Past Five Years | Number of Portfolios in Highland Fund Complex Overseen by the Trustees2 | Other Directorships/ Trusteeships Held During the Past Five Years | Experience, Qualifications, Attributes, Skills for Board Membership | ||||||
| Interested Trustee | ||||||||||||
Dustin Norris5 (1/6/1984) | Trustee and Secretary | Indefinite Term; Trustee since February 2018; and Secretary since October 2017. | President of Highland Capital Funds Distributor, Inc. since April 2018; Head of Distribution at HCMFA since November 2017; Secretary of Highland Floating Rate Opportunities Fund (“HFRO”), Highland Global Allocation Fund (“GAF”), HFI and HFII since October 2017; Assistant Secretary of HFRO and GAF from August 2017 to October 2017; Chief Product Strategist at HCMFA since September 2015; Director of Product Strategy at HCMFA from May 2014 to September 2015; Assistant Secretary of HFI and HFII from March 2017 to October 2017; Secretary of NHF since December 2015; Assistant Treasurer of NexPoint Real Estate Advisors, L.P. since May 2015; Assistant Treasurer of NexPoint Real Estate Advisors II, L.P. since June 2016; Assistant Treasurer of HFI and HFII from November 2012 to March 2017; Assistant Treasurer of NHF from November 2012 to December 2015; Secretary of NexPoint Capital, Inc. since 2014; Secretary of NexPoint Real Estate Strategies Fund, NexPoint Strategic Income Fund, NexPoint Energy and Materials Opportunities Fund, NexPoint Discount Strategies Fund, NexPoint Healthcare Opportunities Fund, NexPoint Event-Driven Fund and NexPoint Latin American Opportunities Fund (the “Interval Funds”) since March 2016; and Senior Accounting Manager at HCMFA from August 2012 to May 2014. | 25 | None | Significant experience in the financial industry; significant managerial and executive experience, including experience as an officer of the Highland Funds Complex since 2012. | ||||||
| 34 | Annual Report |
Table of Contents
ADDITIONAL INFORMATION (unaudited) (continued)
| September 30, 2018 | Highland Energy MLP Fund | |
Name and Date of Birth | Position(s) with the Fund | Term of Office and Length of Time Served | Principal Occupation(s) During Past Five Years | |||
| Officers | ||||||
Trey Parker (1/27/1976) | Executive Vice President | Indefinite Term; Executive Vice President since September 2017. | Executive Vice President of HCMFA, NexPoint Advisors, L.P., HFI, HFII, HFRO and GAF since September 2017, Assistant Secretary of Highland Restoration Capital Partners GP, LLC since September 2017; Assistant Secretary of Highland SunBridge GP, LLC since December 2015; Assistant Secretary of HCM since August 2015; Director of CCS Medical, Inc. since August 2018; Director of JHT Holdings, Inc. since August 2013; Director of TerreStar Corporation since March 2013; Director of OmniMax International, Inc. since March 2012; and Secretary of Granite Bay Advisors, L.P. since February 2012. | |||
Frank Waterhouse (4/14/1971) | Treasurer; Principal Accounting Officer, Principal Financial Officer and Principal Executive Officer | Indefinite Term; Treasurer since May 2015. Principal Financial Officer and Principal Accounting Officer since October 2017. Principal Executive Officer since February 2018. | Principal Executive Officer of HFI, HFII, HFRO and GAF since February 2018; Principal Financial Officer and Principal Accounting Officer of HFRO, GAF, NexPoint Capital, Inc., NHF, HFI, HFII, and NexPoint Real Estate Advisors, L.P. since October 2017; Treasurer of HFRO and GAF since August 2017; Assistant Treasurer of Acis Capital Management, L.P. from December 2011 until February 2012; Treasurer of Acis Capital Management, L.P. since February 2012; Assistant Treasurer of HCM from November 2011 until April 2012; Treasurer of HCM since April 2012; Assistant Treasurer of HCMFA from December 2011 until October 2012; Treasurer of HCMFA since October 2012; Treasurer of NexPoint Advisors, L.P. since March 2012 and Treasurer of NexPoint Capital, Inc., NHF, HFI, HFII, and NexPoint Real Estate Advisors, L.P. since May 2015; Treasurer of NexPoint Real Estate Advisors II, L.P. since June 2016; and Treasurer of the Interval Funds since March 2016. | |||
Clifford Stoops (11/17/1970) | Assistant Treasurer | Indefinite Term; Assistant Treasurer since March 2017. | Assistant Treasurer of HFRO and GAF since August 2017; Assistant Treasurer of HFI, HFII, NHF, NexPoint Capital, Inc. and the Interval Funds since March 2017; and Chief Accounting Officer at HCM since December 2011. | |||
Jason Post (1/7/1979) | Chief Compliance Officer | Indefinite Term; Chief Compliance Officer since August 2017. | Chief Compliance Officer and Anti-Money Laundering Officer of HFRO and GAF since August 2017; Chief Compliance Officer and Anti-Money Laundering Officer of HFI, HFII, NHF and NexPoint Capital, Inc. since September 2015; Chief Compliance Officer and Anti-Money Laundering Officer of the Interval Funds since March 2016; and Chief Compliance Officer for HCMFA and NexPoint Advisors, L.P since September 2015. Prior to this role served as Deputy Chief Compliance Officer and Director of Compliance for HCM. | |||
| Annual Report | 35 |
Table of Contents
ADDITIONAL INFORMATION (unaudited) (concluded)
| September 30, 2018 | Highland Energy MLP Fund | |
Name and Date of Birth | Position(s) with the Fund | Term of Office and Length of Time Served | Principal Occupation(s) During Past Five Years | |||
| Officers | ||||||
Dustin Norris5 (1/6/1984) | Secretary and Trustee | Indefinite Term; Secretary since October 2017. | President of Highland Capital Funds Distributor, Inc. since April 2018; Head of Distribution at HCMFA since November 2017; Secretary of HFRO and GAF, HFI and HFII since October 2017; Assistant Secretary of HFRO and GAAF from August 2017 to October 2017; Secretary of the Interval Funds since March 2016; Chief Product Strategist at HCMFA since September 2015; Director of Product Strategy at HCMFA from May 2014 to September 2015; Secretary of NHF since December 2015; Assistant Secretary of HFI and HFII from March 2017 to October 2017; Assistant Treasurer of NexPoint Real Estate Advisors, L.P. since May 2015; Assistant Treasurer of NexPoint Real Estate Advisors II, L.P. since June 2016; Assistant Treasurer of HFI and HFII from November 2012 to March 2017; Assistant Treasurer of NHF from November 2012 to December 2015; Secretary of NexPoint Capital, Inc. since 2014; and Senior Accounting Manager at HCMFA from August 2012 to May 2014. | |||
| 1 | On an annual basis, as a matter of Board policy, the Governance Committee reviews each Trustee’s performance and determines whether to extend each such Trustee’s service for another year. Effective June 2013, the Board adopted a retirement policy wherein the Governance Committee shall not recommend the continued service as a Trustee of a Board member who is older than 80 years of age at the time the Governance Committee reports its findings to the Board. |
| 2 | The “Highland Fund Complex” consists of NHF, each series of HFI, each series of HFII, HFRO, GAF, the Interval Funds, and NexPoint Capital, Inc., aclosed-end management investment company that has elected to be treated as a business development company under the 1940 Act. |
| 3 | Since May 1, 2015, Mr. Honis has been treated as an Independent Trustee of the Trust. Prior to that date, Mr. Honis was treated as an Interested Trustee because he was a partner of an investment adviser affiliated with the Adviser until his resignation in November 2014. As of September 30, 2018, Mr. Honis was entitled to receive aggregate severance and/or deferred compensation payments of approximately $556,000 from another affiliate of the Adviser. Mr. Honis also serves as a director of a portfolio company affiliated with the Adviser. During the Trust’s last two fiscal years, Mr. Honis’ aggregate compensation from this portfolio company for his services as a director was approximately $50,000. |
In addition, Mr. Honis serves as a trustee of a trust that owns substantially all of the economic interest in an investment adviser affiliated with the Adviser. Mr. Honis indirectly receives an asset-based fee in respect of such interest, which is projected to range from$450,000-$500,000 annually. In light of these relationships between Mr. Honis and affiliates of the Adviser, it is possible that the SEC might in the future determine Mr. Honis to be an interested person of the Trust. |
| 4 | Prior to December 8, 2017, Mr. Powell was treated as an Interested Trustee of the Trust for all purposes other than compensation and the Trust’s code of ethics. |
| 5 | On February 7, 2018, Mr. Norris was appointed as an Interested Trustee of the Trust. |
| 36 | Annual Report |
Table of Contents
IMPORTANT INFORMATION ABOUT THIS REPORT
Investment Adviser
Highland Capital Management Fund Advisors, L.P.
200 Crescent Court, Suite 700
Dallas, TX 75201
Transfer Agent
DST Asset Manager Solutions, Inc.
2000 Crown Colony Drive
Quincy, MA 02169
Underwriter
Highland Capital Funds Distributor, Inc.
200 Crescent Court, Suite 700
Dallas, TX 75201
Custodian
State Street Bank and Trust Company
One Lincoln Street
Boston, Massachusetts 02111
Independent Registered Public Accounting Firm
PricewaterhouseCoopers LLP
2121 N. Pearl Street, Suite 2000
Dallas, TX 75201
Fund Counsel
K&L Gates LLP
1 Lincoln Street
Boston, MA 02111
This report has been prepared for shareholders of Highland Energy MLP Fund. The Fund mails one shareholder report to each shareholder address. If you would like more than one report, please call shareholder services at1-877-665-1287 to request that additional reports be sent to you.
A description of the policies and procedures that the Fund uses to determine how to vote proxies relating to its portfolio securities, and the Fund’s proxy voting records for the most recent12-month period ended September 30, are available (i) without charge, upon request, by calling1-877-665-1287 and (ii) on the Securities and Exchange Commission’s website at http://www.sec.gov.
The Fund files its complete schedule of portfolio holdings with the Securities and Exchange Commission for the first and third quarters of each fiscal year on FormN-Q. The Fund’s FormsN-Q are available on the Commission’s website at http://www.sec.gov and also may be reviewed and copied at the Commission’s Public Reference Room in Washington, DC. Information on the Public Reference Room may be obtained by calling1-800-SEC-0330. Shareholders may also obtain the FormN-Q by visiting the Fund’s website at www.highlandfunds.com.
The Statement of Additional Information includes additional information about the Fund’s Trustees and is available upon request without charge by calling1-877-665-1287.
| Annual Report | 37 |
Table of Contents
Highland Funds
c/o DST Asset Manager Solutions, Inc.
430 W 7th Street Suite 219424
Kansas City, MO 64105-1407

| Highland Energy MLP Fund | Annual Report, September 30, 2018 |
| www.highlandfunds.com | HFII-MLP-AR-09/18 |
Table of Contents
Item 2. Code of Ethics.
| (a) | Highland Funds II (the “Registrant”), as of the end of the period covered by this report, has adopted a code of ethics that applies to the Registrant’s principal executive officer, principal financial officer, principal accounting officer or controller, or persons performing similar functions, regardless of whether these individuals are employed by the Registrant or a third party. |
| (b) | Not applicable. |
| (c) | There have been no amendments, during the period covered by this report, to a provision of the code of ethics that applies to the Registrant’s principal executive officer, principal financial officer, principal accounting officer or controller, or persons performing similar functions, regardless of whether these individuals are employed by the Registrant or a third party, and that relates to any element of the code of ethics description. |
| (d) | The Registrant has not granted any waiver, including any implicit waiver, from a provision of the code of ethics that applies to the Registrant’s principal executive officer, principal financial officer, principal accounting officer or controller, or persons performing similar functions, regardless of whether these individuals are employed by the Registrant or a third party, that relates to one or more of the items set forth in paragraph (b) of this item’s instructions. |
| (e) | Not applicable. |
| (f) | The Registrant’s code of ethics that applies to the Registrant’s principal executive officer, principal financial officer, principal accounting officer or controller, or persons performing similar functions is filed herewith as Exhibit (a)(1). |
Item 3. Audit Committee Financial Expert.
As of the end of the period covered by the report, the Registrant’s Board of Trustees (the “Board”) has determined that Bryan A. Ward, a member of the Audit & Qualified Legal Compliance Committee of the Board (the “Audit Committee”), is an audit committee financial expert as defined by the Securities and Exchange Commission (the “SEC”) in Item 3 ofForm N-CSR. Mr. Ward is “independent” as defined by the SEC for purposes of this Item 3 ofForm N-CSR.
Item 4. Principal Accountant Fees and Services.
Audit Fees
| (a) | The aggregate fees billed in each of the last two fiscal years for professional services rendered by the principal accountant for the audit of the Registrant’s annual financial statements or services that are normally provided by the accountant in connection with statutory and regulatory filings or engagements for those fiscal years are $409,000 for the fiscal year ended September 30, 2017 and $564,000 for the fiscal year ended September 30, 2018. |
Audit-Related Fees
| (b) | The aggregate fees billed in each of the last two fiscal years for assurance and related services by the principal accountant that are reasonably related to the performance of the audit of the Registrant’s financial statements and are not reported under paragraph (a) of this Item are $91,000 for the fiscal year ended September 30, 2017 and $101,000 for the fiscal year ended September 30, 2018. |
Tax Fees
| (c) | The aggregate fees billed in each of the last two fiscal years for professional services rendered by the principal accountant for tax compliance, tax advice, and tax planning are $32,975 for the fiscal year ended September 30, 2017 and $35,500 for the fiscal year ended September 30, 2018. Such services related to assistance on the Registrant’s tax returns and excise tax calculations. |
Table of Contents
All Other Fees
| (d) | The aggregate fees billed in each of the last two fiscal years for products and services provided by the principal accountant, other than the services reported in paragraphs (a) through (c) of this Item are $0 for the fiscal year ended September 30, 2017 and $0 for the fiscal year ended September 30, 2018. |
| (e)(1) | Disclose the AuditCommittee’s pre-approval policies and procedures described in paragraph (c)(7) ofRule 2-01 ofRegulation S-X. (As used below, the term “Funds” includes the Registrant.) |
The Audit Committee shall:
| (a) | have direct responsibility for the appointment, compensation, retention and oversight of the Funds’ independent auditors and, in connection therewith, to review and evaluate matters potentially affecting the independence and capabilities of the auditors; and |
| (b) | reviewand pre-approve (including associated fees) all audit and other services to be provided by the independent auditors to the Funds andall non-audit services to be provided by the independent auditors to the Funds’ investment adviser or any entity controlling, controlled by or under common control with the investment adviser (an “Adviser Affiliate”) that provides ongoing services to the Funds, if the engagement relates directly to the operations and financial reporting of the Funds; and |
| (c) | establish, to the extent permitted by law and deemed appropriate by the Audit Committee,detailed pre-approval policies and procedures for such services; and |
| (d) | review and consider whether the independent auditors’ provision ofany non-audit services to the Funds, the Funds’ investment adviser or an Adviser Affiliatenot pre-approved by the Audit Committee are compatible with maintaining the independence of the independent auditors. |
| (e)(2) | The percentage of services described in each of paragraphs (b) through (d) of this Item that were approved by the Audit Committee pursuant to paragraph (c)(7)(i)(C) ofRule 2-01 ofRegulation S-X are as follows: |
| (b) | 100% |
| (c) | 100% |
| (d) | 100% |
| (f) | The percentage of hours expended on the principal accountant’s engagement to audit the Registrant’s financial statements for the most recent fiscal year that were attributed to work performed by persons other than the principal accountant’s full-time, permanent employees was less than fifty percent. |
| (g) | Theaggregate non-audit fees billed by the Registrant’s accountant for services rendered to the Registrant, and rendered to the Registrant’s investment adviser (not includingany sub-adviser whose role is primarily portfolio management and is subcontracted with or overseen by another investment adviser), and an Adviser Affiliate that provides ongoing services to the Registrant for each of the last two fiscal years of the Registrant was $32,975 for the fiscal year ended September 30, 2017 and $35,500 for the fiscal year ended September 30, 2018. |
| (h) | The Registrant’s Audit Committee has considered whether the provisionof non-audit services that were rendered to the Registrant’s investment adviser (not includingany sub-adviser whose role is primarily portfolio management and is subcontracted with or overseen by another investment adviser), and an Adviser Affiliate that provides ongoing services to the Registrant that werenot pre-approved pursuant to paragraph (c)(7)(ii) ofRule 2-01 ofRegulation S-X is compatible with maintaining the principal accountant’s independence. |
Item 5. Audit Committee of Listed Registrants.
The Registrant has a separately-designated standing audit committee, the Audit and Qualified Legal Compliance Committee, established in accordance with Section 3(a)(58)(A) of the Securities Exchange Act of 1934, as amended. It is composed of the following Trustees, each of whom is not an “interested person” as defined in the 1940 Act:
Dr. Bob Froehlich
Timothy K. Hui
Bryan A. Ward
Table of Contents
Item 6. Investments.
| (a) | Schedule of Investments in securities of unaffiliated issuers as of the close of the reporting period is included as part of the Semi-Annual Reports filed under Item 1 of this form. |
| (b) | Not applicable. |
Item 7. Disclosure of Proxy Voting Policies and Procedures forClosed-End Management Investment Companies.
Not applicable.
Item 8. Portfolio Managers ofClosed-End Management Investment Companies.
Not applicable.
Item 9. Purchases of Equity Securities byClosed-End Management Investment Company and Affiliated Purchasers.
Not applicable.
Item 10. Submission of Matters to a Vote of Security Holders.
There have been no material changes to the procedures by which shareholders may recommend nominees to Highland Funds II’s (“the Registrant”) Board of Trustees.
Item 11. Controls and Procedures.
| (a) | The Registrant maintains disclosure controls and procedures that are designed to ensure that information required to be disclosed in the Registrant’s filings under the Securities Exchange Act of 1934, as amended (the “Exchange Act”), and the Investment Company Act of 1940, as amended, is recorded, processed, summarized and reported within the periods specified in the rules and forms of the Securities and Exchange Commission. Such information is accumulated and communicated to the Registrant’s management, including its principal executive officer and principal financial officer, as appropriate, to allow timely decisions regarding required disclosure. The Registrant’s management, including the principal executive officer and principal financial officer, recognizes that any set of controls and procedures, no matter how well designed and operated, can provide only reasonable assurance of achieving the desired control objectives. |
Within 90 days prior to the filing date of the Shareholder Report on FormN-CSR, Management carried out an evaluation of the effectiveness of the design and operation of the Registrant’s disclosure controls and procedures. Based on such evaluation, the principal executive officer and principal financial officer concluded that the Registrant’s disclosure controls and procedures were not effective due to a material weakness for the Highland Global Allocation Fund (the “Fund”) relating to the application of ASC 820 and reasonableness and reliability of assumptions used in the fair value model which are monitored by the Valuation Committee through the operation of a review control. This control was not designed at an appropriate level of precision to ensure the accurate valuation of Level 3 securities. A material weakness (as defined in Rule12b-2 under the Exchange Act) is a deficiency, or a combination of deficiencies, in internal control over financial reporting such that there is a reasonable possibility that a material misstatement of the Registrant’s annual or interim financial statements will not be prevented or detected on a timely basis. This material weakness resulted in material pricing errors related to ahard-to-value security held by Fund, over a period of time, which resulted in the reprocessing of investor capital activity, as well as material misstatements to the Fund’s semi-annual financial statements as of March 31, 2018 and a material error that was corrected in the annual financial statements for the year ended September 30, 2018. Additionally, this material weakness could result in a misstatement to the investment balances or disclosures that would result in a material misstatement to the annual or interim financial statements that would not be prevented or detected.
Management has developed a plan to remediate the material weakness described above. Management utilizes a ValuationSub-Committee as part of its existing valuation process. Management will undertake the addition of a review control by adding one or more members to the ValuationSub-Committee to conduct control activities designed to operate at a level of precision which will enable such errors to be detected. Additionally, Management will undertake enhancements to its Valuation Committee by providing training materials to members of its Valuation Committee with respect to the application of ASC 820 as well as the usage of subject matter expert inputs as inputs to fair value determinations. Finally, management will undertake enhancements to its review control by designing additional control activities to more precisely assess the application of ASC 820 to fair value models.
| (b) | Changes in Internal Controls. Other than the planned enhancements to controls noted above, there have been no changes in the Registrant’s internal controls or in other factors that could materially affect the internal controls over financial reporting subsequent to the date of their evaluation in connection with the preparation of this Shareholder Report on FormN-CSR |
Table of Contents
Item 12. Disclosure of Securities Lending Activities forClosed-End Management Investment Companies.
| (a) | Not applicable. |
| (b) | Not applicable. |
Item 13. Exhibits.
| (a)(1) |
| (a)(2) | Certification pursuant to Rule30a-2(a) under the 1940 Act and Section 302 of the Sarbanes-Oxley Act of 2002 is attached hereto. |
| (a)(3) | Not applicable. |
(a)(4)(i) Certification pursuant to Item 4.01 of Form 8-K under the Exchange Act (17 CFR 249.308) is attached hereto.
(a)(4)(ii) Letter from former accountant pursuant to Item 304(a) under RegulationS-K is attached hereto.
| (b) | Certification pursuant to Rule30a-2(b) under the 1940 Act and Section 906 of the Sarbanes-Oxley Act of 2002 is attached hereto. |
Table of Contents
SIGNATURES
Pursuant to the requirements of the Securities Exchange Act of 1934, as amended, and the Investment Company Act of 1940, as amended, the Registrant has duly caused this report to be signed on its behalf by the undersigned, thereunto duly authorized.
HIGHLAND FUNDS II
By (Signature and Title): | /s/ Frank Waterhouse | |
| Frank Waterhouse | ||
| Treasurer, Principal Accounting Officer, Principal Financial Officer, and Principal Executive Officer |
Date: March 11, 2019
Pursuant to the requirements of the Securities Exchange Act of 1934, as amended, and the Investment Company Act of 1940, as amended, this report has been signed below by the following person(s) on behalf of the Registrant and in the capacities and on the dates indicated.
By (Signature and Title): | /s/ Frank Waterhouse | |
| Frank Waterhouse | ||
| Treasurer, Principal Accounting Officer, Principal Financial Officer, and Principal Executive Officer |
Date: March 11, 2019