Letter to
Q2 2021 | August 3, 2021
Second Quarter 2021 Financial Highlights1 | | | | | | | | | | | | | | | | | |
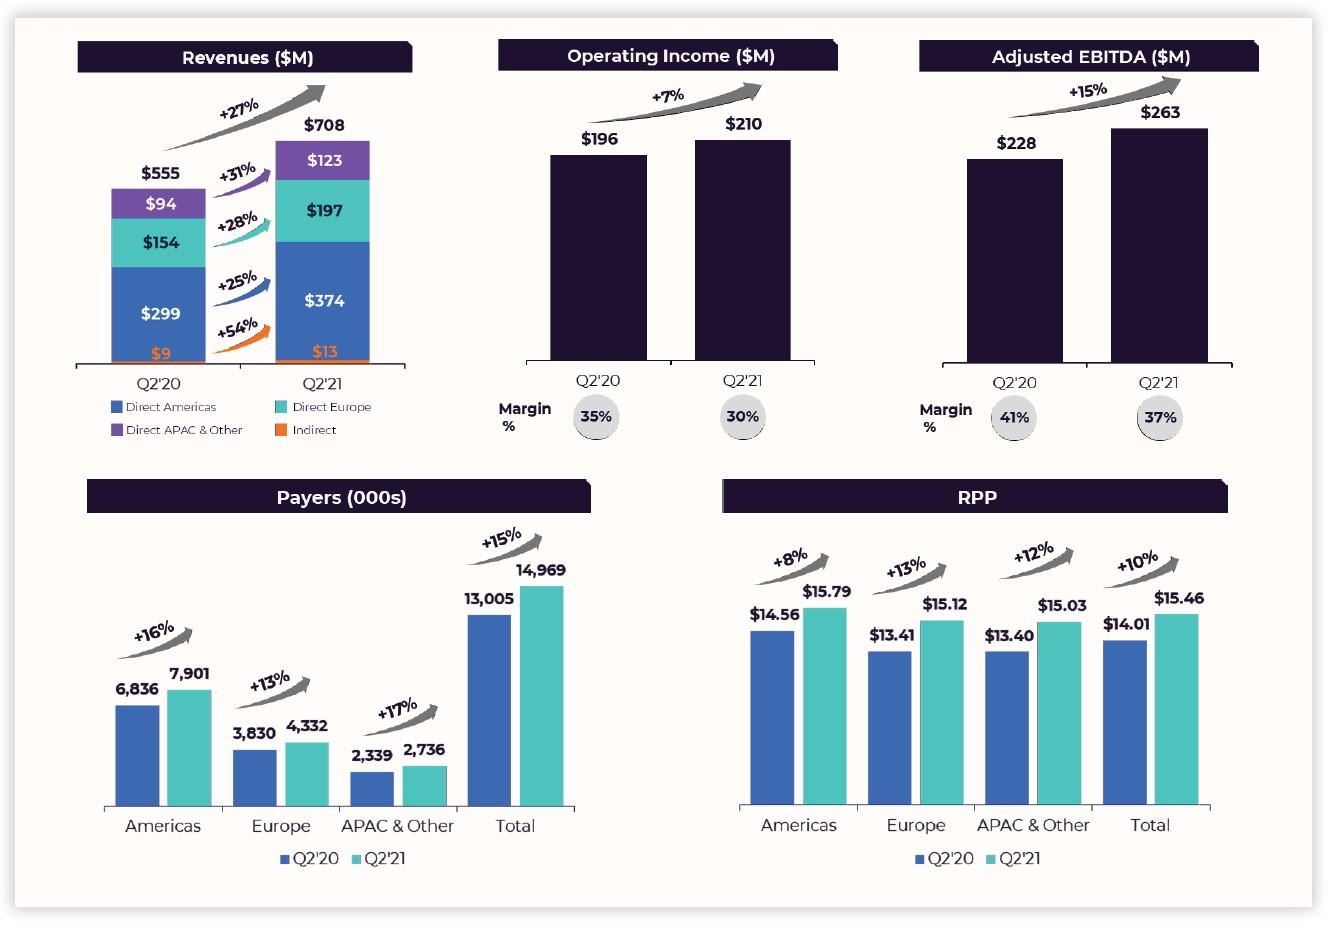
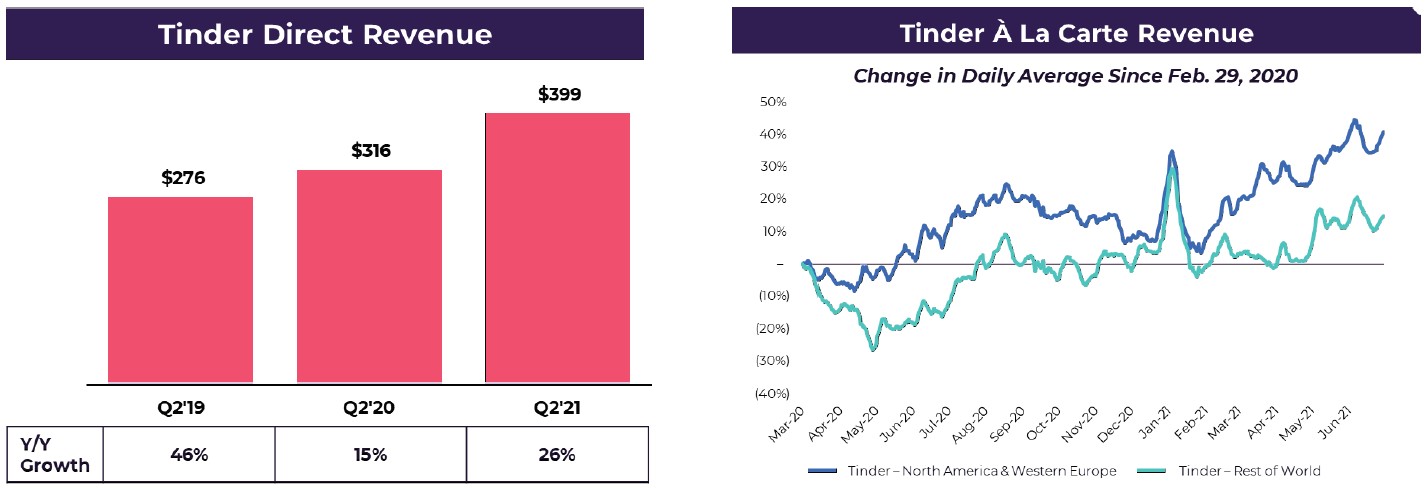
| • | | Total revenue grew 27% over the prior year quarter to $708 million. | • | | Tinder Direct Revenue grew 26% year-over-year, driven by 17% Payers growth to 9.6 million and RPP growth of 8%. |
| |
| | | |
| | | | |
| • | | Operating income was $210 million, an increase of 7% over the prior year quarter representing an operating margin of 30%. | | | |
| • | | All Other Brands collectively grew Direct Revenue 28% year-over-year, driven by 14% RPP growth and 12% Payers growth to 5.4 million. |
| | |
| | | |
| | | | |
| • | | Adjusted EBITDA was $263 million, an increase of 15% over the prior year quarter representing an Adjusted EBITDA margin of 37%. | | |
| | | |
| | • | | Year-to-date operating cash flow and free cash flow were $351 million and $318 million, respectively. |
| | |
| | | |
| | | | |
| • | | Payers increased 15% to 15.0 million, up from 13.0 million in the prior year quarter. | | | |
| | | |
| | | | |
| | | | | |
| • | | RPP increased 10% over the prior year quarter to $15.46. | | | |
| | | |
| | | | |
1 As reported numbers include the contribution from Hyperconnect since the closing of the acquisition on June 17, 2021. For more detail, see page 21.
Dear Shareholders,
We are inspired by all the stories about people using our products to connect again as the world gradually reopens. Our business performed well during the second quarter, and we continue to be optimistic about our momentum as we enter the second half of the year. We are seeing a strong recovery in the U.S. and improvement in Europe as well, but important markets for us such as India, South Korea, Brazil, and Japan are further behind on the COVID recovery curve. Against this backdrop, our business is showing clear signs of strength, with more room to run as additional markets come up the vaccination curve. While COVID continues to create uncertainty and the variants are increasingly a concern, our business has proven to be quite resilient.
We often state that our mission is to facilitate joyful connections and meaningful relationships. In the second quarter, we supported this mission through various “firsts.” For the first time in our company’s history, the White House, and the UK and French governments approached us to collaborate on marketing and product initiatives to encourage singles to get vaccinated and start dating. We also closed our first acquisition as a fully independent company, bringing Hyperconnect® and its very talented tech and product teams, to our portfolio. We published our first Impact Report, detailing our approach to critical social, environmental and governance issues.
We are looking forward to forging ahead with more firsts. There are many exciting marketing and product initiatives going on across Match Group, especially at Tinder® and with our planned integrations with Hyperconnect. We provide an overview in the pages that follow and look forward to sharing many more details in the coming quarters.
Enjoy the rest of the summer and Vax that Thang Up,
| | | | | |
| |
| Shar Dubey | Gary Swidler |
| Chief Executive Officer | Chief Operating Officer
& Chief Financial Officer |
Business Trends
Q2 2021 Performance
Our performance in the second quarter is a testament to the strength of both our business and the dating category itself. We reached 15 million Payers, and Total Revenue grew 27% year-over-year. Tinder continued its revenue acceleration, growing Direct Revenue 26%, and achieving its highest year-over-year growth in Direct Revenue, Payers and RPP since before the pandemic began. All Other Brands maintained their strong trend, growing 28%. This balanced growth led to the highest revenue growth quarter that Match Group has seen since the third quarter of 2018, well before most of us had heard the term “coronavirus.”
Accelerating Product Evolution and Revenue Growth at Tinder
We are excited about the product roadmap and execution velocity at Tinder, as the brand expands from a like/match/message-only paradigm to a multi-dimensional experience which also allows for serendipitous connections across shared interests. The combination of Gen Z’s comfort with building relationships online and the overall acceleration of the category throughout the pandemic has created the conditions to make this longer-term vision possible. The Tinder team is laying the building blocks for a rich product experience that will develop over the coming quarters. While we will not compromise the core Tinder experience that has made it the most popular dating product in the world, we are excited to expand the app to make it feel more like real-life dating and connecting.

During the second quarter, Tinder made substantial progress on this longer-term vision, announcing an array of new product features. This included the introduction of video within Tinder profiles, an important step in the evolution of self-expression in the app. Building on the success of the Swipe Night™ series and VIBES, Hot Takes gives members the opportunity to chat with someone before they match in a low-stakes game. This is the first-time members can chat before they match. These new features are driving enhanced engagement, higher match rates and are resonating especially well with women. Tinder also introduced a new section within the app, called Explore, where members can discover matches who share similar Passions and explore different sides of Tinder like Pet or Chef Mode.
Tinder’s testing of in-app virtual currency is performing well with plans to continue toward a more feature rich, global test during the back half of the year.
As vaccination rates continue to rise, Tinder Direct Revenue growth is accelerating, as users’ propensity to pay is increasing. This higher propensity to pay can best be seen by looking at the trends in non-recurring à la carte revenue. The second quarter saw improvement across nearly all geographies, which drove à la carte revenue to the highest levels since the pandemic began. North America and Western Europe are still outpacing the rest of world, but there is underlying strength in a number of other geographies as well. Engagement on the platform remains elevated compared to last year, across both gender and age cohorts. Daily average Swipe® activity is +13%, daily average messages are +12%, and conversations are +38% longer compared to the prior year quarter.
Resurgence of Non-Tinder Portfolio
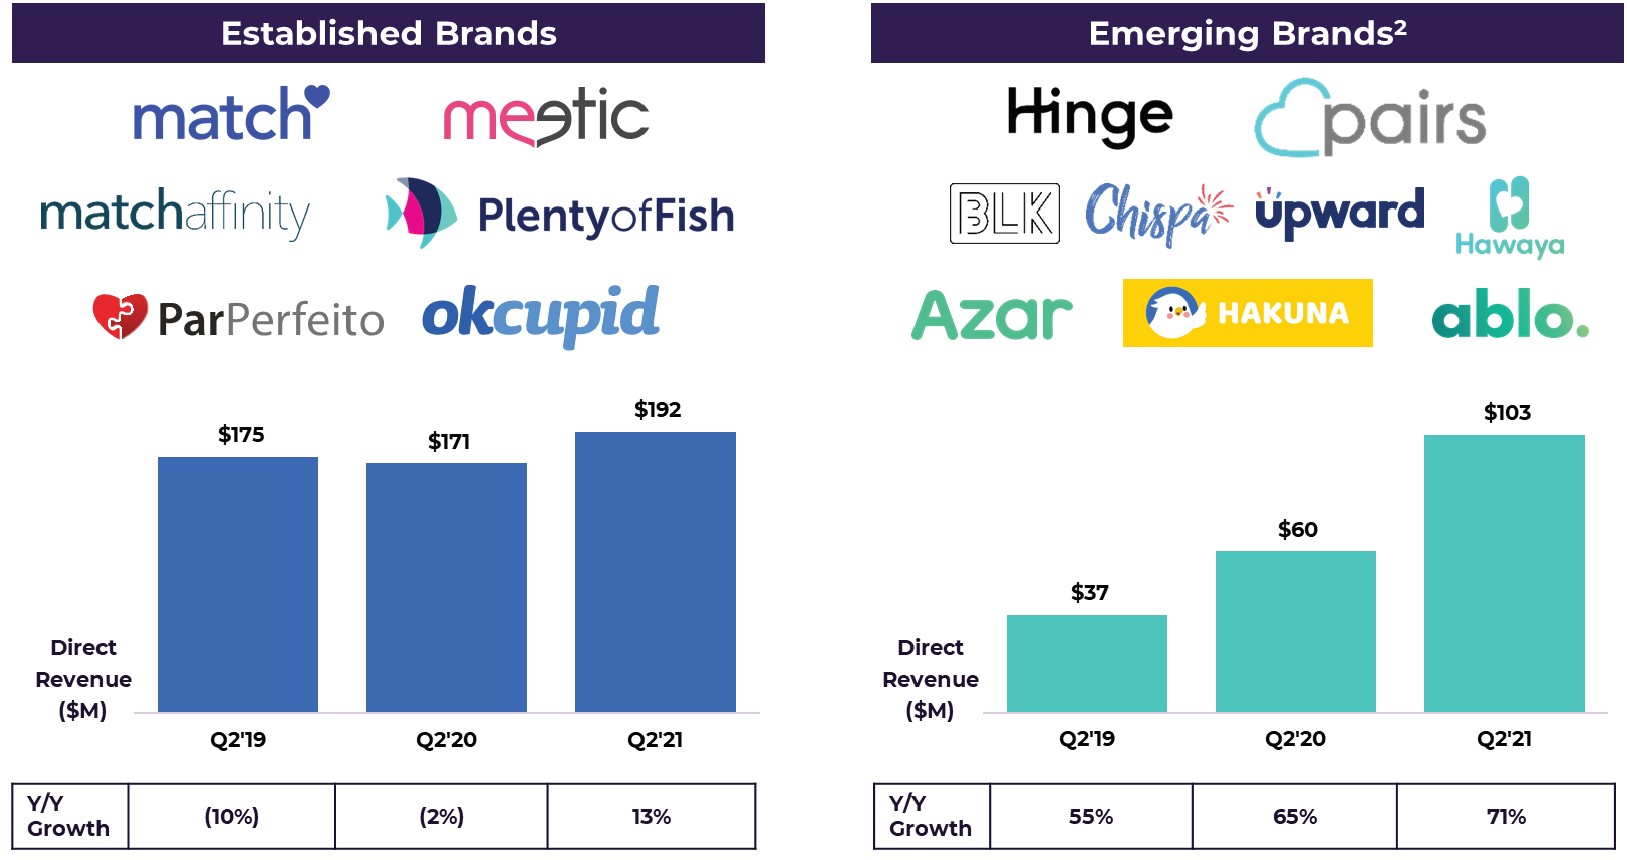
Investors frequently ask how Match Group reinvigorated the non-Tinder portfolio back to meaningful revenue growth. In addressing this, we think it is helpful to categorize this portfolio into two groups: Established Brands and Emerging Brands. The Established Brands primarily entered the category as desktop-first brands and have transitioned to mobile over time. The Emerging Brands have been more recently acquired or incubated, and they tend to be faster growing.
 2
2Our strategy to achieve mid-to-high teens revenue growth at Match Group has been premised on two prongs (aside from continuing to grow Tinder): one, returning our Established Brands to growth; and two, making new bets in Emerging Brands that contribute to growth in a reasonably short timeframe.
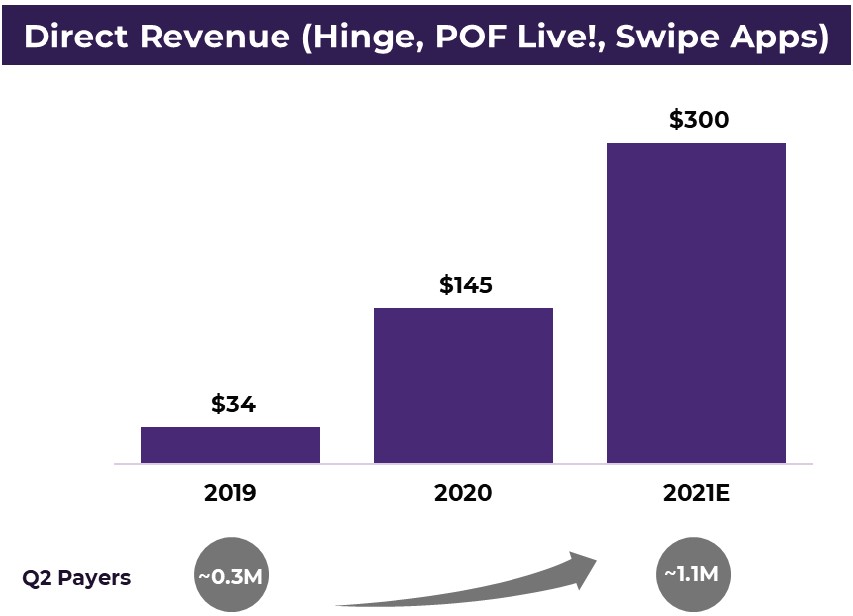
Over the past couple of years, we have executed effectively on this two-pronged strategy at the non-Tinder brands. Hinge® exemplifies how we have created value via acquisition by leveraging best practices from across the portfolio to build a major dating brand. POF® Live! demonstrates how we can innovate on product within an Established Brand to create a new revenue stream. The Swipe Apps (BLK®, Chispa™ and Upward®) are examples of apps that we successfully incubated to target underserved demographics. The progression of Direct Revenue at these three businesses can be seen in the chart to the right. POF Live! and Swipe Apps are on track to contribute at least $50M of revenue in 2021. Hinge grew revenue close to 150% in the second quarter and remains on track to more than double revenue in 2021.
2 Includes revenue contribution from Hyperconnect since the closing of the acquisition on June 17, 2021, net of purchase accounting adjustments.
The final piece of returning this group to growth has been revitalizing some of the Established Brands to make them culturally relevant again through product and marketing innovation. For instance, Match® materially increased engagement in younger users by launching a free tier and followed up the viral sensation “Match Made in Hell” commercial with another re-opening hit in Q2 – The Match Wedding Singers. Each of our Established Brands has made significant strides over the past two years to get back into the cultural conversation, which is critical for creating sustainable growth, and each brand has found a space for itself in today’s market.
Welcoming Hyperconnect to the Portfolio
Near the end of the second quarter, we closed the acquisition of Hyperconnect, which brings two new Emerging Brands into our portfolio — Azar® and Hakuna™. Combined, these two brands have over 570K Payers with RPP approaching $35 and approximately 90% of their revenue coming from à la carte. These video-based brands expand our capabilities to enable people to meet and create social connections online that remain online, and broaden our products for social discovery in addition to dating.
Azar, launched in 2014, enables users to video chat with people around the world, powered by real-time language translations. The user base is predominantly in Asia and growing in Europe. Virtual currency can be utilized to enhance search filters such as specifying regions and to purchase self-decoration offerings like stickers.
Hakuna, launched in 2019, is an interactive, social live streaming app that enables group video and audio broadcast. Users can connect with others through communities built around shared interests and the user base is predominately in Asia today. Hakuna is primarily an à la carte business and its monetization features include virtual gifting, AR-powered avatars, and profile enhancements. Due to the nature of monetization on Hakuna, it has a much higher RPP than Azar.
We have been working closely with the Hyperconnect team since closing the acquisition only six weeks ago, and our multi-pronged thesis for the acquisition remains very much intact. They bring us significant capability in Asian markets, with Gen Z, with in-app currency, and with video, AR and AI technology. We believe we can help turbocharge their apps given our expertise in performance marketing and via our teams on the ground in critical markets including Japan, the U.S. and Western Europe.
What excites us most about having Hyperconnect in the Match Group family are the opportunities for shared synergies between Hyperconnect’s technology and Match Group’s other brands. We are refining plans to selectively implement 1:1 audio and video chat, group live video, and live streaming from Hyperconnect at several of our brands over the next 12- 24 months. Our expectation is that at least two of our brands will have integrations with Hyperconnect technology by the end of 2021.
Looking longer-term, we see new applications of AR and enhanced AI-based technology that Hyperconnect’s internal incubation lab, HyperX, is developing, which we expect will give us innovative tools to enable more immersive and interactive dating experiences online. Our ultimate vision is to harness technology to make the online experience as rich as real-life interactions so that people never have to go on a bad ‘first date’ again.
For 25 years our mission has been to facilitate connections for people with others that they do not know. The pandemic amplified loneliness and feelings of isolation, which has accelerated the adoption of social discovery products as consumers look for safe ways to socialize and find friends online. We believe there is no other company that is better positioned to help solve this basic human need. With Hyperconnect in the fold, Match Group has an exceptional platform of apps to connect people around the world for social discovery and dating and stands to benefit as this market continues to grow.
Financial Outlook
Q3 2021 and FY 2021
For Q3, we expect total revenue of $790 million to $805 million, representing 23%-26% year- over-year growth as we build upon our strong performance from last summer, when people emerged from the initial Covid lockdowns.
In the second half of the year, we expect Total Match Group to grow revenue north of 25% year-over-year. We expect Tinder to grow revenue close to 20% year-over-year, the Established Brands to grow in the single-digits year-over-year, and the Emerging Brands, which now include Hyperconnect’s products, to grow well over 100% year-over-year.
With the addition of Hyperconnect, we now expect full-year 2021 revenue to exceed $3 billion. Given the strong performance of the Match Group dating businesses in the first half of the year, our full-year outlook for those brands now reflects year-over-year growth in the low 20% range, up from the previous outlook of high-teens year-over-year growth.
| | | | | | | | | | | | | | |
| Revenue Outlook | | Q3 2021 | | FY 20213 |
| MTCH (ex-Hyperconnect) | | $735 to $745 million | | $2,875 to $2,890 million |
| | | | |
| Hyperconnect | | $55 to $60 million | | $125 to $135 million |
| | | | |
| Total MTCH | | $790 to $805 million | | $3,000 to $3,025 million |
Our focus for Hyperconnect in the short-term is not solely to maximize revenue or EBITDA. We are planning to allocate more Hyperconnect resources to build and refine technologies that we can integrate into Match Group’s other brands in the second half, as well as invest in emerging technologies that we expect to have longer-term impacts on our business. We anticipate Hyperconnect to operate on a relatively breakeven EBITDA basis in the second half of the year.3
We expect Total Match Group Q3 EBITDA to be in the range of $275 million to $280 million and full-year 2021 EBITDA to be between $1,045 million and $1,060 million. This reflects an additional $15 million in the second half of the year for increased government relations costs associated with advocacy related to app store practices around the globe and for legal matters including the former Tinder employee litigation, which is currently scheduled to go to trial in November.
3 Includes second quarter revenue contribution from Hyperconnect since the closing of the acquisition on June 17, 2021, net of purchase accounting adjustments.
Conference Call
Match Group will audiocast a conference call to answer questions regarding its second quarter financial results on Wednesday, August 4, 2021 at 8:30 a.m. Eastern Time. This call will include the disclosure of certain information, including forward-looking information, which may be material to an investor’s understanding of Match Group’s business. The live audiocast will be open to the public on Match Group’s investor relations website at https://ir.mtch.com.
Financial Results
Revenue | | | | | | | | | | | | | | | | | |
| Three Months Ended June 30, | | |
| 2021 | | 2020 | | Change |
| | | | | |
| (In thousands, except RPP) | | |
| Direct Revenue: | | | | | |
| Americas | $ | 374,388 | | | $ | 298,693 | | | 25% |
| Europe | 196,542 | | | 154,050 | | | 28% |
| APAC and Other | 123,392 | | | 93,998 | | | 31% |
| Total Direct Revenue | 694,322 | | | 546,741 | | | 27% |
| Indirect Revenue | 13,438 | | | 8,709 | | | 54% |
| Total Revenue | $ | 707,760 | | | $ | 555,450 | | | 27% |
| | | | | |
| | | | | |
| | | | | |
| | | | | |
| | | | | |
| | | | | |
| | | | | |
| Payers | | | | | |
| Americas | 7,901 | | | 6,836 | | | 16% |
| Europe | 4,332 | | | 3,830 | | | 13% |
| APAC and Other | 2,736 | | | 2,339 | | | 17% |
| Total Payers | 14,969 | | | 13,005 | | | 15% |
| | | | | |
| | | | | |
| | | | | |
| Revenue per Payer (“RPP”) | | | | | |
| Americas | $ | 15.79 | | | $ | 14.56 | | | 8% |
| Europe | $ | 15.12 | | | $ | 13.41 | | | 13% |
| APAC and Other | $ | 15.03 | | | $ | 13.40 | | | 12% |
| Total RPP | $ | 15.46 | | | $ | 14.01 | | | 10% |
| | | | | |
| | | | | |
Revenue in the second quarter of 2021 includes $4.3 million, net of purchase accounting adjustments, from Hyperconnect, following the close of the acquisition on June 17, 2021. Growth in Payers across all geographies was driven by Tinder, with Hinge and the Swipe Apps (BLK, Chispa, and Upward) contributing in the Americas and Pairs contributing in APAC and Other. Americas RPP increased primarily due to subscriptions and à la carte purchases at Hinge, with additional increases from à la carte purchases at Tinder and POF Live. Europe and APAC and Other RPP increased primarily due to subscriptions and à la carte purchases at Tinder. Europe and APAC and Other RPP were favorably impacted by the strength of various currencies relative to the U.S. dollar.
Operating Income and Adjusted EBTIDA
| | | | | | | | | | | | | | | | | |
| Three Months Ended June 30, | | |
| 2021 | | 2020 | | Change |
| | | | | |
| (In thousands) | | |
| Operating Income | $ | 209,914 | | | $ | 195,594 | | | 7% |
| Operating Income Margin | 30 | % | | 35 | % | | (5.6) points |
| Adjusted EBITDA | $ | 262,613 | | | $ | 227,803 | | | 15% |
| Adjusted EBITDA Margin | 37 | % | | 41 | % | | (3.9) points |
Operating Costs and Expenses
Total operating costs and expenses increased 38% in total dollars as the global economy began to reopen following the COVID-19 pandemic compared to the second quarter of 2020 when costs and expenses were reduced due to the start of the pandemic. Cost of revenue increased primarily due to an increase of in-app purchase fees and fees associated with live streaming video at Plenty of Fish. Total selling and marketing expense increased as a result of higher marketing spend across our portfolio. General and administrative expense increased primarily due to an increase in stock-based compensation related to new stock-based awards granted in the current year and $8.7 million of stock-based compensation expense related to new grants associated with the Hyperconnect acquisition, increased legal fees, and professional fees associated with the acquisition of Hyperconnect of $3.5 million. Product development expense increased due to increased engineering headcount at Hinge and Tinder.
| | | | | | | | | | | | | | | | | | | | | | | | | | | | | |
| Q2 2021 | | % of Revenue | | Q2 2020 | | % of Revenue | | Change |
| | | | | | | | | |
| (In thousands) | | |
| Cost of revenue | $ | 193,099 | | | 27% | | $ | 148,853 | | | 27% | | 30% |
| Selling and marketing expense | 128,918 | | | 18% | | 90,801 | | | 16% | | 42% |
| General and administrative expense | 113,393 | | | 16% | | 68,204 | | | 12% | | 66% |
| Product development expense | 52,133 | | | 7% | | 41,929 | | | 8% | | 24% |
| Depreciation | 10,061 | | | 1% | | 9,669 | | | 2% | | 4% |
| Amortization of intangibles | 242 | | | —% | | 400 | | | —% | | (40)% |
| Total operating costs and expenses | $ | 497,846 | | | 70% | | $ | 359,856 | | | 65% | | 38% |
Acquisition of Hyperconnect
On June 17, 2021, Match Group completed the acquisition of Hyperconnect, Inc. The purchase price was $1.75 billion, net of cash acquired. The acquisition was funded with cash on hand and the issuance of 5.9 million shares of Match Group common stock.
Liquidity and Capital Resources
For the six months ended June 30, 2021, we generated operating cash flow attributable to continuing operations of $351 million and Free Cash Flow of $318 million.
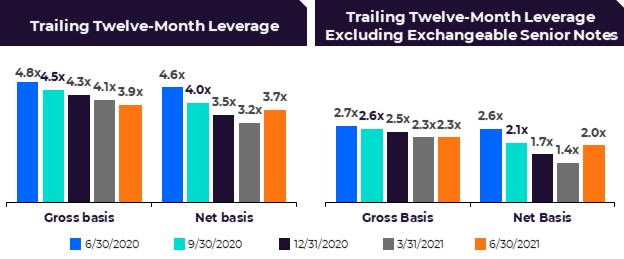
As of June 30, 2021, we had $249 million in cash and cash equivalents and short-term investments and $3.8 billion of long-term debt, including $1.7 billion of Exchangeable Senior Notes. Our $750 million revolving credit facility was undrawn as of June 30, 2021. The Delayed Draw Term Loan was terminated effective June 18, 2021 in accordance with its terms.
Income Taxes
In both the second quarter of 2021 and 2020, Match Group recorded an income tax provision from continuing operations of $37 million, representing an effective tax rate of 21%. The tax rate in 2021 and 2020 benefited from excess tax benefits generated by the exercise or vesting of stock-based awards, partially offset in 2020 by a non-recurring increase in the valuation allowance for foreign tax credits.
GAAP Financial Statements
Consolidated Statement of Operations | | | | | | | | | | | | | | | | | | | | | | | |
| | Three Months Ended June 30, | | Six Months Ended June 30, |
| | 2021 | | 2020 | | 2021 | | 2020 |
| | | | | | | |
| | (In thousands, except per share data) |
| Revenue | $ | 707,760 | | | $ | 555,450 | | | $ | 1,375,372 | | | $ | 1,100,092 | |
| Operating costs and expenses: | | | | | | | |
| Cost of revenue (exclusive of depreciation shown separately below) | 193,099 | | | 148,853 | | | 372,554 | | | 292,747 | |
| Selling and marketing expense | 128,918 | | | 90,801 | | | 273,906 | | | 215,291 | |
| General and administrative expense | 113,393 | | | 68,204 | | | 201,058 | | | 147,523 | |
| Product development expense | 52,133 | | | 41,929 | | | 107,709 | | | 85,699 | |
| Depreciation | 10,061 | | | 9,669 | | | 20,518 | | | 19,063 | |
| Amortization of intangibles | 242 | | | 400 | | | 455 | | | 6,803 | |
| Total operating costs and expenses | 497,846 | | | 359,856 | | | 976,200 | | | 767,126 | |
| Operating income | 209,914 | | | 195,594 | | | 399,172 | | | 332,966 | |
| Interest expense | (32,219) | | | (34,751) | | | (64,057) | | | (66,645) | |
| | | | | | | |
| Other (expense) income, net | (355) | | | 17,410 | | | (1,674) | | | 21,264 | |
| Earnings from continuing operations, before tax | 177,340 | | | 178,253 | | | 333,441 | | | 287,585 | |
| Income tax (provision) benefit | (37,320) | | | (36,856) | | | (19,573) | | | 11,346 | |
| Net earnings from continuing operations | 140,020 | | | 141,397 | | | 313,868 | | | 298,931 | |
| | | | | | | |
| | | | | | | |
| | | | | | | |
| Earnings (loss) from discontinued operations, net of tax | 509 | | | (34,611) | | | 509 | | | (366,578) | |
| Net earnings (loss) | 140,529 | | | 106,786 | | | 314,377 | | | (67,647) | |
| Net loss (earnings) attributable to noncontrolling interests | 366 | | | (31,869) | | | 768 | | | (60,266) | |
| Net earnings (loss) attributable to Match Group, Inc. shareholders | $ | 140,895 | | | $ | 74,917 | | | $ | 315,145 | | | $ | (127,913) | |
| | | | | | | |
| Net earnings per share from continuing operations: | | | | | | | |
| Basic | $ | 0.52 | | | $ | 0.61 | | | $ | 1.17 | | | $ | 1.30 | |
| Diluted | $ | 0.46 | | | $ | 0.54 | | | $ | 1.04 | | | $ | 1.15 | |
| Net earnings (loss) per share attributable to Match Group, Inc. shareholders: | | | | | | | |
| Basic | $ | 0.52 | | | $ | 0.41 | | | $ | 1.17 | | | $ | (0.70) | |
| Diluted | $ | 0.46 | | | $ | 0.36 | | | $ | 1.04 | | | $ | (0.63) | |
| | | | | | | |
| | | | | | | |
| | | | | | | |
| Basic shares outstanding | 271,254 | | | 183,477 | | | 269,959 | | | 183,297 | |
| Diluted shares outstanding | 311,087 | | | 207,840 | | | 310,856 | | | 206,142 | |
| | | | | | | |
| Stock-based compensation expense by function: | | | | | | | |
| Cost of revenue | $ | 1,012 | | | $ | 969 | | | $ | 2,001 | | | $ | 2,136 | |
| Selling and marketing expense | 3,087 | | | 1,295 | | | 4,352 | | | 2,442 | |
| General and administrative expense | 27,580 | | | 10,634 | | | 46,060 | | | 21,515 | |
| Product development expense | 10,717 | | | 9,242 | | | 20,099 | | | 17,219 | |
| Total stock-based compensation expense | $ | 42,396 | | | $ | 22,140 | | | $ | 72,512 | | | $ | 43,312 | |
Consolidated Balance Sheet | | | | | | | | | | | |
| June 30, 2021 | | December 31, 2020 |
| | | |
| (In thousands) |
| ASSETS | | | |
| Cash and cash equivalents | $ | 236,460 | | | $ | 739,164 | |
| Short-term investments | 12,453 | | | — | |
| Accounts receivable, net | 259,325 | | | 137,023 | |
| | | |
| Other current assets | 126,238 | | | 144,025 | |
| | | |
| Total current assets | 634,476 | | | 1,020,212 | |
| | | |
| | | |
| Property and equipment, net | 129,916 | | | 107,799 | |
| Goodwill | 2,973,121 | | | 1,270,532 | |
| Intangible assets, net | 227,045 | | | 230,900 | |
| Deferred income taxes | 314,029 | | | 293,487 | |
| | | |
| Other non-current assets | 155,346 | | | 123,524 | |
| | | |
| TOTAL ASSETS | $ | 4,433,933 | | | $ | 3,046,454 | |
| | | |
| LIABILITIES AND SHAREHOLDERS’ EQUITY | | | |
| LIABILITIES | | | |
| | | |
| | | |
| Accounts payable | $ | 57,937 | | | $ | 29,200 | |
| Deferred revenue | 262,968 | | | 239,088 | |
| | | |
| Accrued expenses and other current liabilities | 257,062 | | | 231,748 | |
| | | |
| Total current liabilities | 577,967 | | | 500,036 | |
| | | |
| Long-term debt, net | 3,845,555 | | | 3,840,930 | |
| Income taxes payable | 13,061 | | | 14,582 | |
| Deferred income taxes | 16,415 | | | 17,213 | |
| | | |
| Other long-term liabilities | 114,783 | | | 86,428 | |
| | | |
| | | |
| Redeemable noncontrolling interest | 1,240 | | | 640 | |
| | | |
| Commitment and contingencies | | | |
| | | |
| SHAREHOLDERS’ EQUITY | | | |
| Common stock | 277 | | | 267 | |
| | | |
| | | |
| | | |
| | | |
| Additional paid-in capital | 8,068,659 | | | 7,089,007 | |
| Retained deficit | (8,107,092) | | | (8,422,237) | |
| Accumulated other comprehensive loss | (104,089) | | | (81,454) | |
| | | |
| Total Match Group, Inc. shareholders’ equity | (142,245) | | | (1,414,417) | |
| Noncontrolling interests | 7,157 | | | 1,042 | |
| Total shareholders’ equity | (135,088) | | | (1,413,375) | |
| TOTAL LIABILITIES AND SHAREHOLDERS’ EQUITY | $ | 4,433,933 | | | $ | 3,046,454 | |
Consolidated Statement of Cash Flows | | | | | | | | | | | |
| | Six Months Ended June 30, |
| | 2021 | | 2020 |
| | | |
| | (In thousands) |
| Cash flows from operating activities attributable to continuing operations: | | | |
| Net earnings (loss) | $ | 314,377 | | | $ | (67,647) | |
| Add back: (earnings) loss from discontinued operations, net of tax | (509) | | | 366,578 | |
| Net earnings from continuing operations | 313,868 | | | 298,931 | |
| Adjustments to reconcile net earnings from continuing operations to net cash provided by operating activities attributable to continuing operations: | | | |
| Stock-based compensation expense | 72,512 | | | 43,312 | |
| Depreciation | 20,518 | | | 19,063 | |
| Amortization of intangibles | 455 | | | 6,803 | |
| Deferred income taxes | (20,731) | | | (16,060) | |
| | | |
| | | |
| Other adjustments, net | 7,407 | | | 19,667 | |
| Changes in assets and liabilities | | | |
| Accounts receivable | (103,127) | | | (69,228) | |
| Other assets | 32,622 | | | (10,144) | |
| Accounts payable and other liabilities | (17,320) | | | (13,349) | |
| Income taxes payable and receivable | 18,899 | | | (16,241) | |
| Deferred revenue | 25,712 | | | 13,133 | |
| Net cash provided by operating activities attributable to continuing operations | 350,815 | | | 275,887 | |
| Cash flows from investing activities attributable to continuing operations: | | | |
| Net cash used in business combinations, net of cash acquired | (840,869) | | | — | |
| Capital expenditures | (32,392) | | | (18,124) | |
| | | |
| | | |
| | | |
| | | |
| Net cash distribution related to Separation of IAC | — | | | (2,448,749) | |
| Other, net | (255) | | | (118) | |
| Net cash used in investing activities attributable to continuing operations | (873,516) | | | (2,466,991) | |
| Cash flows from financing activities attributable to continuing operations: | | | |
| Borrowings under the Credit Facility | — | | | 20,000 | |
| Proceeds from Senior Notes offerings | — | | | 1,000,000 | |
| | | |
| Principal payments on Credit Facility | — | | | (400,000) | |
| | | |
| | | |
| | | |
| | | |
| | | |
| Debt issuance costs | (851) | | | (13,195) | |
| | | |
| Proceeds from issuance of common stock pursuant to stock-based awards | 37,333 | | | — | |
| Withholding taxes paid on behalf of employees on net settled stock-based awards of Former Match Group and Match Group | (11,380) | | | (209,698) | |
| | | |
| | | |
| Purchase of Former Match Group treasury stock | — | | | (132,868) | |
| | | |
| Purchase of noncontrolling interests | (1,473) | | | (15,827) | |
| | | |
| | | |
| Other, net | — | | | (12,745) | |
| Net cash provided by financing activities attributable to continuing operations | 23,629 | | | 235,667 | |
| Total cash used in continuing operations | (499,072) | | | (1,955,437) | |
| Net cash provided by operating activities attributable to discontinued operations | — | | | 20,031 | |
| Net cash used in investing activities attributable to discontinued operations | — | | | (963,420) | |
| Net cash used in financing activities attributable to discontinued operations | — | | | (110,959) | |
| Total cash used in discontinued operations | — | | | (1,054,348) | |
| Effect of exchange rate changes on cash, cash equivalents, and restricted cash | (3,636) | | | (1,152) | |
| Net decrease in cash, cash equivalents, and restricted cash | (502,708) | | | (3,010,937) | |
| Cash, cash equivalents, and restricted cash at beginning of period | 739,302 | | | 3,140,358 | |
| Cash, cash equivalents, and restricted cash at end of period | $ | 236,594 | | | $ | 129,421 | |
Earnings Per Share
Weighted average basic and diluted shares outstanding for all periods prior to the separation of Match Group from IAC/InterActiveCorp on June 30, 2020 reflect the share position of the company formerly known as IAC/InterActiveCorp multiplied by the separation exchange ratio of 2.1584.
The following tables set forth the computation of the basic and diluted earnings per share attributable to Match Group shareholders:
| | | | | | | | | | | | | | | | | | | | | | | |
| Three Months Ended June 30, |
| 2021 | | 2020 |
| Basic | | Diluted | | Basic | | Diluted |
| | | | | | | |
| (In thousands, except per share data) |
| Numerator | | | | | | | |
| Net earnings from continuing operations | $ | 140,020 | | | $ | 140,020 | | | $ | 141,397 | | | $ | 141,397 | |
| Net loss (earnings) attributable to noncontrolling interests | 366 | | | 366 | | | (29,816) | | | (29,816) | |
| Impact from subsidiaries’ dilutive securities of continuing operations | — | | | (388) | | | — | | | (3,947) | |
| Interest on dilutive Exchangeable Senior Notes, net of tax | — | | | 4,075 | | | — | | | 4,070 | |
| Net earnings from continuing operations attributable to Match Group, Inc. shareholders | $ | 140,386 | | | $ | 144,073 | | | $ | 111,581 | | | $ | 111,704 | |
| | | | | | | |
| Earnings (loss) from discontinued operations, net of tax | $ | 509 | | | $ | 509 | | | $ | (34,611) | | | $ | (34,611) | |
| Net earnings attributable to noncontrolling interests of discontinued operations | — | | | — | | | (2,053) | | | (2,053) | |
| Impact from subsidiaries’ dilutive securities of discontinued operations | — | | | — | | | — | | | (356) | |
| Net earnings (loss) from discontinued operations attributable to shareholders | $ | 509 | | | $ | 509 | | | $ | (36,664) | | | $ | (37,020) | |
| Net earnings attributable to Match Group, Inc. shareholders | $ | 140,895 | | | $ | 144,582 | | | $ | 74,917 | | | $ | 74,684 | |
| | | | | | | |
| Denominator | | | | | | | |
| Weighted average basic shares outstanding | 271,254 | | | 271,254 | | | 183,477 | | | 183,477 | |
| Dilutive securities | — | | | 14,671 | | | — | | | 8,664 | |
| Dilutive shares from Exchangeable Senior Notes, if-converted | — | | | 25,162 | | | — | | | 15,699 | |
| Denominator for earnings per share—weighted average shares | 271,254 | | | 311,087 | | | 183,477 | | | 207,840 | |
| | | | | | | |
| Earnings per share: | | | | | | | |
| Earnings per share from continuing operations | $ | 0.52 | | | $ | 0.46 | | | $ | 0.61 | | | $ | 0.54 | |
| Earnings (loss) per share from discontinued operations, net of tax | $ | 0.00 | | | $ | 0.00 | | | $ | (0.20) | | | $ | (0.18) | |
| Earnings per share attributable to Match Group, Inc. shareholders | $ | 0.52 | | | $ | 0.46 | | | $ | 0.41 | | | $ | 0.36 | |
| | | | | | | | | | | | | | | | | | | | | | | |
| Six Months Ended June 30, |
| 2021 | | 2020 |
| Basic | | Diluted | | Basic | | Diluted |
| | | | | | | |
| (In thousands, except per share data) |
| Numerator | | | | | | | |
| Net earnings from continuing operations | $ | 313,868 | | | $ | 313,868 | | | $ | 298,931 | | | $ | 298,931 | |
| Net loss (earnings) attributable to noncontrolling interests | 768 | | | 768 | | | (60,585) | | | (60,585) | |
| Impact from subsidiaries’ dilutive securities | — | | | (428) | | | — | | | (9,427) | |
| Interest on dilutive Exchangeable Senior Notes, net of tax | — | | | 8,150 | | | — | | | 8,139 | |
| Net earnings from continuing operations attributable to Match Group, Inc. shareholders | $ | 314,636 | | | $ | 322,358 | | | $ | 238,346 | | | $ | 237,058 | |
| | | | | | | |
| Earnings (loss) from discontinued operations, net of tax | $ | 509 | | | $ | 509 | | | $ | (366,578) | | | $ | (366,578) | |
| Net loss attributable to noncontrolling interests of discontinued operations | — | | | — | | | 319 | | | 319 | |
| Impact from subsidiaries’ dilutive securities of discontinued operations | — | | | — | | | — | | | (240) | |
| Net earnings (loss) from discontinued operations attributable to shareholders | 509 | | | 509 | | | (366,259) | | | (366,499) | |
| Net earnings (loss) attributable to Match Group, Inc. shareholders | $ | 315,145 | | | $ | 322,867 | | | $ | (127,913) | | | $ | (129,441) | |
| | | | | | | |
| Denominator | | | | | | | |
| Weighted average basic shares outstanding | 269,959 | | | 269,959 | | | 183,297 | | | 183,297 | |
| Dilutive securities | — | | | 15,735 | | | — | | | 7,146 | |
| Dilutive shares from Exchangeable Senior Notes, if-converted | — | | | 25,162 | | | — | | | 15,699 | |
| Denominator for earnings per share—weighted average shares | 269,959 | | | 310,856 | | | 183,297 | | | 206,142 | |
| | | | | | | |
| Earnings per share: | | | | | | | |
| Earnings per share from continuing operations | $ | 1.17 | | | $ | 1.04 | | | $ | 1.30 | | | $ | 1.15 | |
| Earnings (loss) per share from discontinued operations, net of tax | $ | 0.00 | | | $ | 0.00 | | | $ | (2.00) | | | $ | (1.78) | |
| Earnings (loss) per share attributable to Match Group, Inc. shareholders | $ | 1.17 | | | $ | 1.04 | | | $ | (0.70) | | | $ | (0.63) | |
Trended Metrics
| | | | | | | | | | | | | | | | | | | | | | | | | | | | | | | | | | | | | | | | | | | | | | | | | | | | | | | | | | | | | | | | | | | | | | | | | | | | | | | | | | | |
| 2019 | | 2020 | | 2021 | | | | | | | | Year Ended December 31, |
| Q1 | | Q2 | | Q3 | | Q4 | | Q1 | | Q2 | | Q3 | | Q4 | | | | Q1 | | Q2 | | | | | | | | | | | | 2019 | | 2020 |
| | | | | | | | | | | | | | | | | | | | | | | | | | | | | | | | | | | |
Revenue (in millions, rounding differences may occur) | | | | | | | | | | | | | | | | | | | | |
| Direct Revenue | | | | | | | | | | | | | | | | | | | | | | | | | | | | | | | | | | | |
| Americas | $ | 252.5 | | | $ | 267.3 | | | $ | 286.5 | | | $ | 283.9 | | | $ | 281.2 | | | $ | 298.7 | | | $ | 336.8 | | | $ | 331.2 | | | | | $ | 344.3 | | | $ | 374.4 | | | | | | | | | | | | | $ | 1,090.2 | | | $ | 1,248.0 | |
| Europe | 131.1 | | | 141.6 | | | 154.3 | | | 157.4 | | | 156.5 | | | 154.1 | | | 181.6 | | | 188.0 | | | | | 189.1 | | | 196.5 | | | | | | | | | | | | | 584.4 | | | 680.1 | |
| APAC and Other | 70.3 | | | 78.4 | | | 90.1 | | | 93.7 | | | 97.1 | | | 94.0 | | | 109.8 | | | 115.7 | | | | | 121.9 | | | 123.4 | | | | | | | | | | | | | 332.6 | | | 416.6 | |
| Total Direct Revenue | 454.0 | | | 487.3 | | | 530.9 | | | 535.0 | | | 534.8 | | | 546.7 | | | 628.3 | | | 634.9 | | | | | 655.2 | | | 694.3 | | | | | | | | | | | | | 2,007.2 | | | 2,344.7 | |
| Indirect Revenue | 10.7 | | | 10.7 | | | 10.5 | | | 12.2 | | | 9.8 | | | 8.7 | | | 11.5 | | | 16.5 | | | | | 12.4 | | | 13.4 | | | | | | | | | | | | | 44.1 | | | 46.5 | |
| Total Revenue | $ | 464.6 | | | $ | 498.0 | | | $ | 541.5 | | | $ | 547.2 | | | $ | 544.6 | | | $ | 555.5 | | | $ | 639.8 | | | $ | 651.4 | | | | | $ | 667.6 | | | $ | 707.7 | | | | | | | | | | | | | $ | 2,051.3 | | | $ | 2,391.3 | |
| | | | | | | | | | | | | | | | | | | | | | | | | | | | | | | | | | | |
| | | | | | | | | | | | | | | | | | | | |
| | | | | | | | | | | | | | | | | | | | | | | | | | | | | | | | | | | |
| | | | | | | | | | | | | | | | | | | | | | | | | | | | | | | | | | | |
| | | | | | | | | | | | | | | | | | | | | | | | | | | | | | | | | | | |
| | | | | | | | | | | | | | | | | | | | | | | | | | | | | | | | | | | |
| | | | | | | | | | | | | | | | | | | | | | | | | | | | | | | | | | | |
Payers (in thousands) | | | | | | | | | | | | | | | | | | | | | | | | | | | | | | | | | | | |
| Americas | 5,919 | | | 6,255 | | | 6,601 | | | 6,709 | | | 6,691 | | | 6,836 | | | 7,455 | | | 7,469 | | | | | 7,595 | | | 7,901 | | | | | | | | | | | | | 6,371 | | | 7,113 | |
| Europe | 3,267 | | | 3,482 | | | 3,747 | | | 3,896 | | | 3,899 | | | 3,830 | | | 4,154 | | | 4,229 | | | | | 4,255 | | | 4,332 | | | | | | | | | | | | | 3,598 | | | 4,028 | |
| APAC and Other | 1,711 | | | 1,875 | | | 2,060 | | | 2,317 | | | 2,417 | | | 2,339 | | | 2,417 | | | 2,463 | | | | | 2,567 | | | 2,736 | | | | | | | | | | | | | 1,991 | | | 2,409 | |
| Total Payers | 10,897 | | | 11,612 | | | 12,408 | | | 12,922 | | | 13,007 | | | 13,005 | | | 14,026 | | | 14,161 | | | | | 14,417 | | | 14,969 | | | | | | | | | | | | | 11,960 | | | 13,550 | |
| | | | | | | | | | | | | | | | | | | | | | | | | | | | | | | | | | | |
| RPP | | | | | | | | | | | | | | | | | | | | | | | | | | | | | | | | | | | |
| Americas | $ | 14.22 | | | $ | 14.24 | | | $ | 14.47 | | | $ | 14.10 | | | $ | 14.01 | | | $ | 14.56 | | | $ | 15.06 | | | $ | 14.78 | | | | | $ | 15.11 | | | $ | 15.79 | | | | | | | | | | | | | $ | 14.26 | | | $ | 14.62 | |
| Europe | $ | 13.38 | | | $ | 13.55 | | | $ | 13.73 | | | $ | 13.46 | | | $ | 13.38 | | | $ | 13.41 | | | $ | 14.57 | | | $ | 14.81 | | | | | $ | 14.81 | | | $ | 15.12 | | | | | | | | | | | | | $ | 13.54 | | | $ | 14.07 | |
| APAC and Other | $ | 13.70 | | | $ | 13.94 | | | $ | 14.58 | | | $ | 13.48 | | | $ | 13.39 | | | $ | 13.40 | | | $ | 15.15 | | | $ | 15.66 | | | | | $ | 15.83 | | | $ | 15.03 | | | | | | | | | | | | | $ | 13.92 | | | $ | 14.41 | |
| Total RPP | $ | 13.89 | | | $ | 13.99 | | | $ | 14.26 | | | $ | 13.80 | | | $ | 13.71 | | | $ | 14.01 | | | $ | 14.93 | | | $ | 14.95 | | | | | $ | 15.15 | | | $ | 15.46 | | | | | | | | | | | | | $ | 13.99 | | | $ | 14.42 | |
Note: Our ability to eliminate duplicate Payers at a brand level for periods prior to Q2 2020 is impacted by data privacy requirements which require that we anonymize data after 12 months, therefore Payer data for those periods is likely overstated. Additionally, as Payers is a component of the RPP calculation, RPP is likely commensurately understated for these same periods due to these data privacy limitations.
Reconciliations of GAAP to Non-GAAP Measures
Reconciliation of Net Earnings to Adjusted EBITDA | | | | | | | | | | | | | | | | | | | | | | | |
| Three Months Ended June 30, | | Six Months Ended June 30, |
| 2021 | | 2020 | | 2021 | | 2020 |
| | | | | | | |
| (Dollars in thousands) |
| Net earnings (loss) attributable to Match Group, Inc. shareholders | $ | 140,895 | | | $ | 74,917 | | | $ | 315,145 | | | $ | (127,913) | |
| Add back: | | | | | | | |
| Net (loss) earnings attributable to noncontrolling interests | (366) | | | 31,869 | | | (768) | | | 60,266 | |
| (Earnings) loss from discontinued operations, net of tax | (509) | | | 34,611 | | | (509) | | | 366,578 | |
| Income tax provision (benefit) | 37,320 | | | 36,856 | | | 19,573 | | | (11,346) | |
| Other expense (income), net | 355 | | | (17,410) | | | 1,674 | | | (21,264) | |
| Interest expense | 32,219 | | | 34,751 | | | 64,057 | | | 66,645 | |
| Operating Income | 209,914 | | | 195,594 | | | 399,172 | | | 332,966 | |
| Stock-based compensation expense | 42,396 | | | 22,140 | | | 72,512 | | | 43,312 | |
| Depreciation | 10,061 | | | 9,669 | | | 20,518 | | | 19,063 | |
| Amortization of intangibles | 242 | | | 400 | | | 455 | | | 6,803 | |
| | | | | | | |
| Adjusted EBITDA | $ | 262,613 | | | $ | 227,803 | | | $ | 492,657 | | | $ | 402,144 | |
| | | | | | | |
| Revenue | $ | 707,760 | | | $ | 555,450 | | | $ | 1,375,372 | | | $ | 1,100,092 | |
| Operating income margin | 30 | % | | 35 | % | | 29 | % | | 30 | % |
| Adjusted EBITDA margin | 37 | % | | 41 | % | | 36 | % | | 37 | % |
Reconciliation of Operating Cash Flow Attributable to Continuing Operations to Free Cash Flow | | | | | | | | | | | |
| Six Months Ended June 30, |
| 2021 | | 2020 |
| | | |
| (In thousands) |
| Net cash provided by operating activities attributable to continuing operations | $ | 350,815 | | | $ | 275,887 | |
| Capital expenditures | (32,392) | | | (18,124) | |
| Free Cash Flow | $ | 318,423 | | | $ | 257,763 | |
Reconciliation of GAAP Net Income to Adjusted EBITDA excluding Hyperconnect
| | | | | | | | | | | | | | | | | |
| Three Months Ended June 30, 2021 |
| As Reported | | Hyperconnect | | Match Group excluding Hyperconnect |
| | | | | |
| (Dollars in thousands) |
| Net earnings (loss) attributable to Match Group, Inc. shareholders | $ | 140,895 | | | $ | (11,704) | | | $ | 152,599 | |
| Add back: | | | | | |
| Net loss attributable to noncontrolling interests | (366) | | | — | | | (366) | |
| Earnings from discontinued operations, net of tax | (509) | | | — | | | (509) | |
| Income tax provision | 37,320 | | | 11 | | | 37,309 | |
| Other expense (income), net | 355 | | | (182) | | | 537 | |
| Interest expense | 32,219 | | | — | | | 32,219 | |
| Operating Income (loss) | 209,914 | | | (11,875) | | | 221,789 | |
| Stock-based compensation expense | 42,396 | | | 8,672 | | | 33,724 | |
| Depreciation | 10,061 | | | 90 | | | 9,971 | |
| Amortization of intangibles | 242 | | | — | | | 242 | |
| | | | | |
| Adjusted EBITDA | $ | 262,613 | | | $ | (3,113) | | | $ | 265,726 | |
| | | | | |
| Revenue | $ | 707,760 | | | $ | 4,338 | | | $ | 703,422 | |
| Operating income margin | 30 | % | | | | 32 | % |
| Adjusted EBITDA margin | 37 | % | | | | 38 | % |
Reconciliation of GAAP Revenue to Non-GAAP Revenue, Excluding Foreign Exchange Effects
| | | | | | | | | | | | | | | | | | | | | | | | | | | | | | | | | | | | | | | | | | | | | | | |
| | Three Months Ended June 30, | | Six Months Ended June 30, |
| | 2021 | | $ Change | | % Change | | 2020 | | 2021 | | $ Change | | % Change | | 2020 |
| | | | | | | | | | | | | | | |
| | (Dollars in millions, rounding differences may occur) |
| Revenue, as reported | $ | 707.8 | | | $ | 152.3 | | | 27% | | $ | 555.5 | | | $ | 1,375.4 | | | $ | 275.3 | | | 25% | | $ | 1,100.1 | |
| Foreign exchange effects | (24.2) | | | | | | | | | (42.5) | | | | | | | |
| Revenue excluding foreign exchange effects | $ | 683.5 | | | $ | 128.1 | | | 23% | | $ | 555.5 | | | $ | 1,332.9 | | | $ | 232.8 | | | 21% | | $ | 1,100.1 | |
| | | | | | | | | | | | | | | |
| Americas Direct Revenue, as reported | $ | 374.4 | | | $ | 75.7 | | | 25% | | $ | 298.7 | | | $ | 718.7 | | | $ | 138.7 | | | 24% | | $ | 579.9 | |
| Foreign exchange effects | (2.5) | | | | | | | | | (0.6) | | | | | | | |
| Americas Direct Revenue, excluding foreign exchange effects | $ | 371.9 | | | $ | 73.2 | | | 25% | | $ | 298.7 | | | $ | 718.0 | | | $ | 138.1 | | | 24% | | $ | 579.9 | |
| | | | | | | | | | | | | | | |
| Europe Direct Revenue, as reported | $ | 196.5 | | | $ | 42.5 | | | 28% | | $ | 154.1 | | | $ | 385.6 | | | $ | 75.1 | | | 24% | | $ | 310.5 | |
| Foreign exchange effects | (18.5) | | | | | | | | | (33.1) | | | | | | | |
| Europe Direct Revenue, excluding foreign exchange effects | $ | 178.0 | | | $ | 24.0 | | | 16% | | $ | 154.1 | | | $ | 352.5 | | | $ | 42.0 | | | 14% | | $ | 310.5 | |
| | | | | | | | | | | | | | | |
| APAC and Other Direct Revenue, as reported | $ | 123.4 | | | $ | 29.4 | | | 31% | | $ | 94.0 | | | $ | 245.3 | | | $ | 54.2 | | | 28% | | $ | 191.1 | |
| Foreign exchange effects | (2.7) | | | | | | | | | (8.0) | | | | | | | |
| APAC and Other Direct Revenue, excluding foreign exchange effects | $ | 120.7 | | | $ | 26.7 | | | 28% | | $ | 94.0 | | | $ | 237.3 | | | $ | 46.2 | | | 24% | | $ | 191.1 | |
Reconciliation of GAAP Revenue to Non-GAAP Revenue, Excluding Foreign Exchange Effects (Revenue per Payer)
| | | | | | | | | | | | | | | | | | | | | | | | | | | | | | | | | | | | | | | | | | | | | | | |
| | Three Months Ended June 30, | | Six Months Ended June 30, |
| | 2021 | | $ Change | | % Change | | 2020 | | 2021 | | $ Change | | % Change | | 2020 |
| | | | | | | | | | | | | | | |
| RPP, as reported | $ | 15.46 | | | $ | 1.45 | | | 10% | | $ | 14.01 | | | $ | 15.31 | | | $ | 1.45 | | | 10% | | $ | 13.86 | |
| Foreign exchange effects | (0.53) | | | | | | | | | (0.48) | | | | | | | |
| RPP, excluding foreign exchange effects | $ | 14.93 | | | $ | 0.92 | | | 7% | | $ | 14.01 | | | $ | 14.83 | | | $ | 0.97 | | | 7% | | $ | 13.86 | |
| | | | | | | | | | | | | | | |
| Americas RPP, as reported | $ | 15.79 | | | $ | 1.23 | | | 8% | | $ | 14.56 | | | $ | 15.46 | | | $ | 1.17 | | | 8% | | $ | 14.29 | |
| Foreign exchange effects | (0.10) | | | | | | | | | (0.01) | | | | | | | |
| Americas RPP, excluding foreign exchange effects | $ | 15.69 | | | $ | 1.13 | | | 8% | | $ | 14.56 | | | $ | 15.45 | | | $ | 1.16 | | | 8% | | $ | 14.29 | |
| | | | | | | | | | | | | | | |
| Europe RPP, as reported | $ | 15.12 | | | 1.71 | | 13% | | $ | 13.41 | | | $ | 14.97 | | | 1.58 | | 12% | | $ | 13.39 | |
| Foreign exchange effects | (1.43) | | | | | | | | | (0.71) | | | | | | | |
| Europe RPP, excluding foreign exchange effects | $ | 13.69 | | | $ | 0.28 | | | 2% | | $ | 13.41 | | | $ | 14.26 | | | $ | 0.87 | | | 6% | | $ | 13.39 | |
| | | | | | | | | | | | | | | |
| APAC and Other RPP, as reported | $ | 15.03 | | | $ | 1.63 | | | 12% | | $ | 13.40 | | | $ | 15.42 | | | $ | 2.03 | | | 15% | | $ | 13.39 | |
| Foreign exchange effects | (0.34) | | | | | | | | | (0.52) | | | | | | | |
| APAC and Other RPP, excluding foreign exchange effects | $ | 14.69 | | | $ | 1.29 | | | 10% | | $ | 13.40 | | | $ | 14.90 | | | $ | 1.51 | | | 11% | | $ | 13.39 | |
Reconciliation of Forecasted Operating Income to Adjusted EBITDA | | | | | | | | | | | |
| Three Months Ended September 30, 2021 | | Full Year Ended December 31, 2021 |
| | | |
| (In millions) |
| Operating Income | $223 to $228 | | $850 to $865 |
| Stock-based compensation expense | 38 | | | 149 | |
| Depreciation and amortization of intangibles | 14 | | | 46 | |
| Adjusted EBITDA | $275 to $280 | | $1,045 to $1,060 |
Dilutive Securities
Match Group has various tranches of dilutive securities. The table below details these securities and their potentially dilutive impact (shares in millions; rounding differences may occur).
| | | | | | | | | | | | | | | | | | | |
| Average Exercise Price | | 7/30/2021 | | |
| Share Price | | | $159.27 | | | | | | | | |
| Absolute Shares | | | 276.8 | | | | | | | | |
| | | | | | | | | | | |
| Vested Options | $19.54 | | 4.1 | | | | | | | | |
| Unvested Options and Awards | | | | | | | | | | | |
| Unvested Options | $28.58 | | 0.5 | | | | | | | | |
| RSUs and subsidiary denominated equity awards | | | 4.8 | | | | | | | | |
| Total Dilution - Unvested Options and Awards | | | 5.3 | | | | | | | | |
| Outstanding Warrants | | | | | | | | | | | |
| Warrants expiring on January 1, 2023 (11.8 million outstanding) | $68.22 | | 6.7 | | | | | | | | |
| Warrants expiring on September 15, 2026 (6.6 million outstanding) | $134.76 | | 1.0 | | | | | | | | |
| Warrants expiring on April 15, 2030 (6.8 million outstanding) | $134.82 | | 1.0 | | | | | | | | |
| Total Dilution - Outstanding Warrants | | | 8.8 | | | | | | | | |
| | | | | | | | | | | |
| Total Dilution | | | 18.2 | | | | | | | | |
| % Dilution | | | 6.2% | | | | | | | | |
| Total Diluted Shares Outstanding | | | 295.0 | | | | | | | | |
The dilutive securities presentation above is calculated using the methods and assumptions described below; these are different from GAAP dilution, which is calculated based on the treasury stock method.
Options — The table above assumes the option exercise price is used to repurchase Match Group shares.
RSUs and subsidiary denominated equity awards — The table above assumes RSUs are fully dilutive. All performance-based and market-based awards reflect the expected shares that will vest based on current performance or market estimates. The table assumes no change in the fair value estimate of the subsidiary denominated equity awards from the values used for GAAP purposes at June 30, 2021.
Exchangeable Senior Notes — The Company has three series of Exchangeable Senior Notes outstanding. In the event of an exchange, each series of Exchangeable Senior Notes can be settled in cash, shares, or a combination of cash and shares. At the time of each Exchangeable Senior Notes issuance, the Company purchased call options with a strike price equal to the exchange price of each series of Exchangeable Senior Notes (“Note Hedge”), which can be used to offset the dilution of each series of the Exchangeable Senior Notes. No dilution is reflected in the table above for any of the Exchangeable Senior Notes, all of which are currently exchangeable, because it is the Company’s intention to settle the Exchangeable Senior Notes with cash equal to the face amount of the notes; any shares issued would be offset by shares received upon exercise of the Note Hedge.
Warrants — At the time of the issuance of each series of Exchangeable Senior Notes, the Company also sold warrants for the number of shares with the strike prices reflected in the table above. The cash generated from the exercise of the warrants is assumed to be used to repurchase Match Group shares and the resulting net dilution, if any, is reflected in the table above.
Principles of Financial Reporting
Match Group reports Adjusted EBITDA, Adjusted EBITDA Margin, Free Cash Flow, and Revenue Excluding Foreign Exchange Effects, all of which are supplemental measures to U.S. generally accepted accounting principles (“GAAP”). The Adjusted EBITDA, Adjusted EBITDA Margin, and Free Cash Flow measures are among the primary metrics by which we evaluate the performance of our business, on which our internal budget is based and by which management is compensated. Revenue Excluding Foreign Exchange Effects provides a comparable framework for assessing the performance of our business without the effect of exchange rate differences when compared to prior periods. We believe that investors should have access to the same set of tools that we use in analyzing our results. These non-GAAP measures should be considered in addition to results prepared in accordance with GAAP, but should not be considered a substitute for or superior to GAAP results. Match Group endeavors to compensate for the limitations of the non-GAAP measures presented by providing the comparable GAAP measures with equal or greater prominence and descriptions of the reconciling items, including quantifying such items, to derive the non-GAAP measures. We encourage investors to examine the reconciling adjustments between the GAAP and non-GAAP measures, which we describe below. Interim results are not necessarily indicative of the results that may be expected for a full year.
Definitions of Non-GAAP Measures
Adjusted Earnings Before Interest, Taxes, Depreciation and Amortization (Adjusted EBITDA) is defined as operating income excluding: (1) stock-based compensation expense; (2) depreciation; and (3) acquisition-related items consisting of (i) amortization of intangible assets and impairments of goodwill and intangible assets, if applicable, and (ii) gains and losses recognized on changes in the fair value of contingent consideration arrangements, as applicable. We believe Adjusted EBITDA is useful to analysts and investors as this measure allows a more meaningful comparison between our performance and that of our competitors. The above items are excluded from our Adjusted EBITDA measure because they are non-cash in nature. Adjusted EBITDA has certain limitations because it excludes certain expenses.
Adjusted EBITDA Margin is defined as Adjusted EBITDA divided by revenues. We believe Adjusted EBITDA margin is useful for analysts and investors as this measure allows a more meaningful comparison between our performance and that of our competitors. Adjusted EBITDA margin has certain limitations in that it does not take into account the impact to our consolidated statement of operations of certain expenses.
Free Cash Flow is defined as net cash provided by operating activities from continuing operations, less capital expenditures. We believe Free Cash Flow is useful to investors because it represents the cash that our operating businesses generate, before taking into account non-operational cash movements. Free Cash Flow has certain limitations in that it does not represent the total increase or decrease in the cash balance for the period, nor does it represent the residual cash flow for discretionary expenditures. Therefore, we think it is important to evaluate Free Cash Flow along with our consolidated statement of cash flows.
We look at Free Cash Flow as a measure of the strength and performance of our businesses, not for valuation purposes. In our view, applying “multiples” to Free Cash Flow is inappropriate because it is subject to timing, seasonality and one-time events. We manage our business for cash and we think it is of utmost importance to maximize cash – but our primary valuation metric is Adjusted EBITDA.
Revenue Excluding Foreign Exchange Effects is calculated by translating current period revenues using prior period exchange rates. The percentage change in Revenue Excluding Foreign Exchange Effects is calculated by determining the change in current period revenues over prior period revenues where current period revenues are translated using prior period exchange rates. We believe the impact of foreign exchange rates on Match Group, due to its global reach, may be an important factor in understanding period over period comparisons if movement in rates is significant. Since our results are reported in U.S. dollars, international revenues are favorably impacted as the U.S. dollar weakens relative to other currencies, and unfavorably impacted as the U.S dollar strengthens relative to other currencies. We believe the presentation of revenue excluding foreign exchange effects in addition to reported revenue helps improve the ability to understand Match Group’s performance because it excludes the impact of foreign currency volatility that is not indicative of Match Group’s core operating results.
Non-Cash Expenses That Are Excluded From Our Non-GAAP Measures
Stock-based compensation expense consists principally of expense associated with the grants of stock options, RSUs, performance-based RSUs and market-based awards. These expenses are not paid in cash, and we include the related shares in our fully diluted shares outstanding using the treasury stock method; however, performance-based RSUs and market-based awards are included only to the extent the applicable performance or market condition(s) have been met (assuming the end of the reporting period is the end of the contingency period). To the extent stock-based awards are settled on a net basis, we remit the required tax-withholding amounts from our current funds.
Depreciation is a non-cash expense relating to our property and equipment and is computed using the straight-line method to allocate the cost of depreciable assets to operations over their estimated useful lives, or, in the case of leasehold improvements, the lease term, if shorter.
Amortization of intangible assets and impairments of goodwill and intangible assets are non-cash expenses related primarily to acquisitions. At the time of an acquisition, the identifiable definite-lived intangible assets of the acquired company, such as customer lists, trade names and technology, are valued and amortized over their estimated lives. Value is also assigned to (i) acquired indefinite-lived intangible assets, which consist of trade names and trademarks, and (ii) goodwill, which are not subject to amortization. An impairment is recorded when the carrying value of an intangible asset or goodwill exceeds its fair value. We believe that intangible assets represent costs incurred by the acquired company to build value prior to acquisition and the related amortization and impairment charges of intangible assets or goodwill, if applicable, are not ongoing costs of doing business.
Additional Definitions
Americas includes North America, Central America, South America, and the Caribbean islands.
Europe includes continental Europe, the British Isles, Iceland, Greenland, and Russia, but excludes Turkey (which is included in APAC and Other).
APAC and Other includes Asia, Australia, the Pacific islands, the Middle East, and Africa.
Direct Revenue is revenue that is received directly from end users of our services and includes both subscription and à la carte revenue.
Indirect Revenue is revenue that is not received directly from end users of our services, substantially all of which is advertising revenue.
Payers are unique users at a brand level in a given month from whom we earned Direct Revenue. When presented as a quarter-to-date or year-to-date value, Payers represents the average of the monthly values for the respective period presented. At a consolidated level, duplicate Payers may exist when we earn revenue from the same individual at multiple brands in a given month, as we are unable to identify unique individuals across brands in the Match Group portfolio.
Revenue per Payer (“RPP”) is the average monthly revenue earned from a Payer and is Direct Revenue for a period divided by the Payers in the period, further divided by the number of months in the period.
Leverage on a gross basis is calculated as principal debt balance divided by Adjusted EBITDA for the period referenced.
Leverage on a net basis is calculated as principal debt balance less cash and cash equivalents and short-term investments divided by Adjusted EBITDA for the period referenced.
Other Information
Safe Harbor Statement Under the Private Securities Litigation Reform Act of 1995
This letter and our conference call, which will be held at 8:30 a.m. Eastern Time on August 4, 2021, may contain “forward-looking statements” within the meaning of the Private Securities Litigation Reform Act of 1995. All statements that are not historical facts are “forward looking statements.” The use of words such as “anticipates,” “estimates,” “expects,” “plans” and “believes,” among others, generally identify forward-looking statements. These forward-looking statements include, among others, statements relating to: Match Group’s future financial performance, Match Group’s business prospects and strategy, anticipated trends, and other similar matters. These forward-looking statements are based on management’s current expectations and assumptions about future events, which are inherently subject to uncertainties, risks and changes in circumstances that are difficult to predict. Actual results could differ materially from those contained in these forward-looking statements for a variety of reasons, including, among others: competition, our ability to maintain user rates on our higher monetizing services, our ability to attract users to our services through cost-effective marketing and related efforts, foreign currency exchange rate fluctuations, our ability to distribute our services through third parties and offset related fees, the integrity and scalability of our systems and infrastructure (and those of third parties) and our ability to adapt ours to changes in a timely and cost-effective manner, our ability to protect our systems from cyberattacks and to protect personal and confidential user information, risks relating to certain of our international operations and acquisitions, certain risks relating to our relationship with IAC post-separation, the impact of the outbreak of COVID-19 coronavirus, the risks inherent in separating Match Group from IAC, including uncertainties related to, among other things, the expected benefits of the separation, any litigation arising out of or relating to the transaction, the tax treatment of the transaction, and the impact of the separation on the businesses of Match Group, and uncertainties related to the acquisition of Hyperconnect, including, among other things, the costs and expected benefits of the transaction, any litigation arising out of or relating to the transaction, and the impact of the transaction on the businesses of Match Group. Certain of these and other risks and uncertainties are discussed in Match Group’s filings with the Securities and Exchange Commission. Other unknown or unpredictable factors that could also adversely affect Match Group’s business, financial condition and results of operations may arise from time to time. In light of these risks and uncertainties, these forward-looking statements may not prove to be accurate. Accordingly, you should not place undue reliance on these forward-looking statements, which only reflect the views of Match Group management as of the date of this letter. Match Group does not undertake to update these forward-looking statements.
About Match Group
Match Group (NASDAQ: MTCH), through its portfolio companies, is a leading provider of digital technologies designed to help people make meaningful connections. Our global portfolio of brands includes Tinder®, Match®, Meetic®, OkCupid®, Hinge®, Pairs™, PlentyOfFish®, OurTime®, Azar®, Hakuna Live™, and more, each built to increase our users’ likelihood of connecting with others. Through our trusted brands, we provide tailored services to meet the varying preferences of our users. Our services are available in over 40 languages to our users all over the world.
Contact Us | | | | | |
Bill Archer Match Group Investor Relations ir@match.com | Justine Sacco Match Group Corporate Communications matchgroupPR@match.com |
| |
Match Group 8750 North Central Expressway, Suite 1400, Dallas, TX 75231, (214) 576-9352 https://mtch.com |