Letter to
Q4 2021 | February 1, 2022
Fourth Quarter 2021 Financial Highlights1 | | | | | | | | | | | | | | | | | |
| • | | Total Revenue grew 24% over the prior year quarter to $806 million. | • | | Tinder Direct Revenue grew 23% over the prior year quarter driven by 18% Payers growth to 10.6 million and RPP growth of 4%. |
| |
| | | |
| | | | |
| • | | Operating income was $232 million, an increase of 9% over the prior year quarter representing an operating margin of 29%. | | |
| | | |
| | • | | All Other Brands collectively grew Direct Revenue 26% year-over-year, driven by 16% RPP growth and 9% Payers growth to 5.7 million. |
| | |
| | | | |
| • | | Adjusted Operating Income1 was $290 million, an increase of 18% over the prior year quarter representing an Adjusted Operating Income margin of 36%. | | |
| | |
| | | | |
| | • | | Full year 2021 operating cash flow and free cash flow were $912 million and $833 million, respectively. |
| | |
| | | | |
| • | | Payers increased 15% to 16.2 million, up from 14.2 million in the prior year quarter. | | |
| | | |
| | | | |
| | | | | |
| • | | RPP increased 8% over the prior year quarter to $16.16. | | | |
| | | |
| | | | |

1 We have updated the title of our primary non-GAAP measure to “Adjusted Operating Income” from our previous title “Adjusted EBITDA.” We believe this updated title better reflects how management views this non-GAAP measure in relation to the closest GAAP measure, operating income. The calculation of the non-GAAP measure has not changed, and therefore the reconciliation of net income (loss) to operating income and to Adjusted Operating Income have also not changed. See “Non-GAAP Financial Measures” below for the full definition of Adjusted Operating Income and a reconciliation of net (loss) earnings attributable to Match Group, Inc. shareholders to operating income and Adjusted Operating Income.
Dear Shareholders,
We're very pleased with the way our businesses and our teams performed in 2021, as we continued to innovate on marketing and products and to bring joy to millions of users around the world looking for connections. We doubled down on our investment in safety, worked with a number of governments on COVID education and won several “Best Places to Work” awards. And our brands continued to deliver great financial results, with Total Revenue growing over 20% both in the fourth quarter and for the full year in 2021.
We’re pleased that so many jurisdictions around the world have taken up the mantle of restoring fairness to the app store ecosystem and checking the power these gatekeepers hold. The Netherlands recently ruled that Apple is violating Dutch and EU law by forcing dating companies to use its in-app payment system. In the U.S., a Senate subcommittee is working on a bill that would eliminate mandatory use of in-app payment. Russia, India, and other countries have raised serious concerns over these practices, following South Korea, who passed the first law mandating changes to the store structure. While the timing of changes remains uncertain, we do believe more changes are coming.
As we look to 2022, there are many more opportunities we plan to tackle. Tinder remains the leader in our category and continues to find ways to make the app more effective and fun to use for its growing user base. Hinge is well on its way to becoming the second largest global dating app within a few years’ time and is now focusing on expansion into non-English speaking markets. We also continue to build out live-streaming video, audio chat rooms, and 1:1 video chat at many of our brands, and to launch new brands to target underserved demographics. The Hyperconnect team is relentlessly focused on building the next generation of products that help people make meaningful connections, and we continue to leverage their tech across our platform. The next digital evolution into the metaverse presents us many opportunities, and we’re confident we’re positioned to capitalize on them. We believe the future for Match Group is very bright.
Happy Valentine’s Day to all.
| | | | | |
| |
| Shar Dubey | Gary Swidler |
| Chief Executive Officer | Chief Operating Officer
& Chief Financial Officer |
Business Trends
2021 In Review
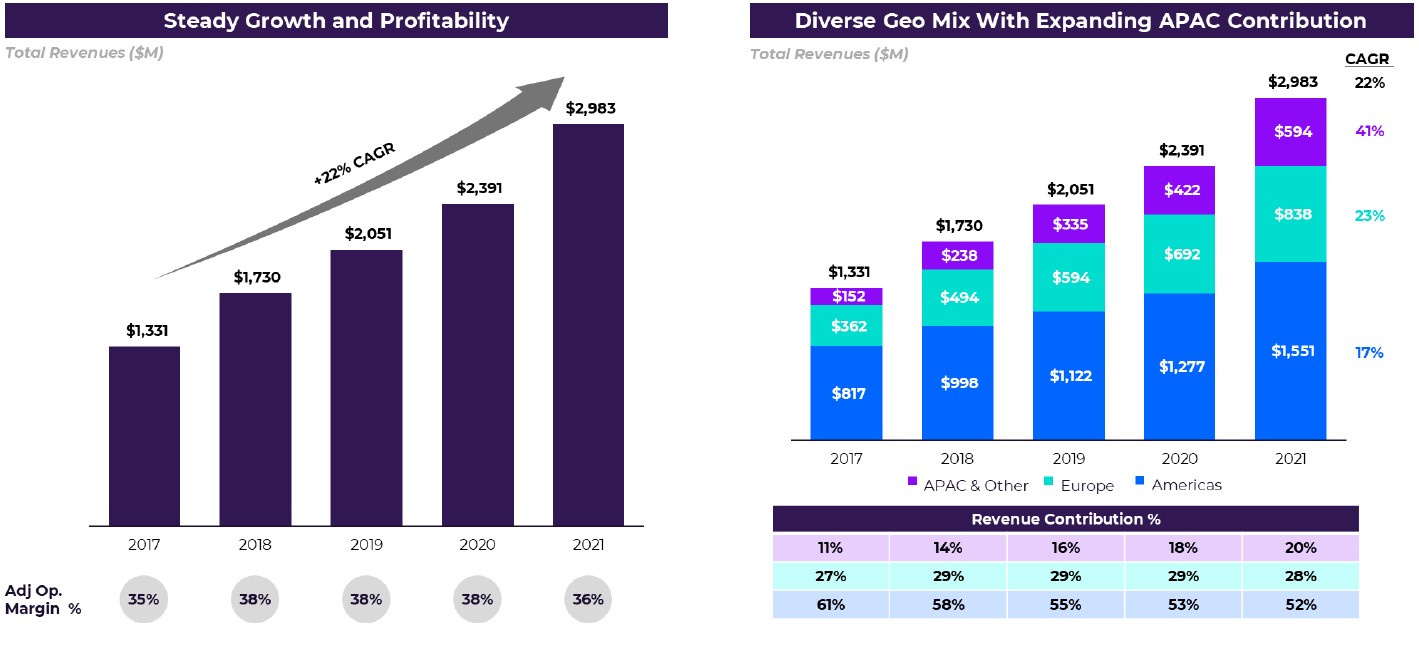
In 2021, Match Group’s Total Revenue was just under $3.0 billion, Operating Income was just over $850 million, and Adjusted Operating Income (formerly referred to as Adjusted EBITDA) was just shy of $1.1 billion, growing 25%, 14%, and 19%, respectively, over the prior year, demonstrating the power and resiliency of our category and our business. At the end of 2021, quarterly Payers reached 16.2 million, up 15% year-over-year, and RPP was up 8% year-over-year.
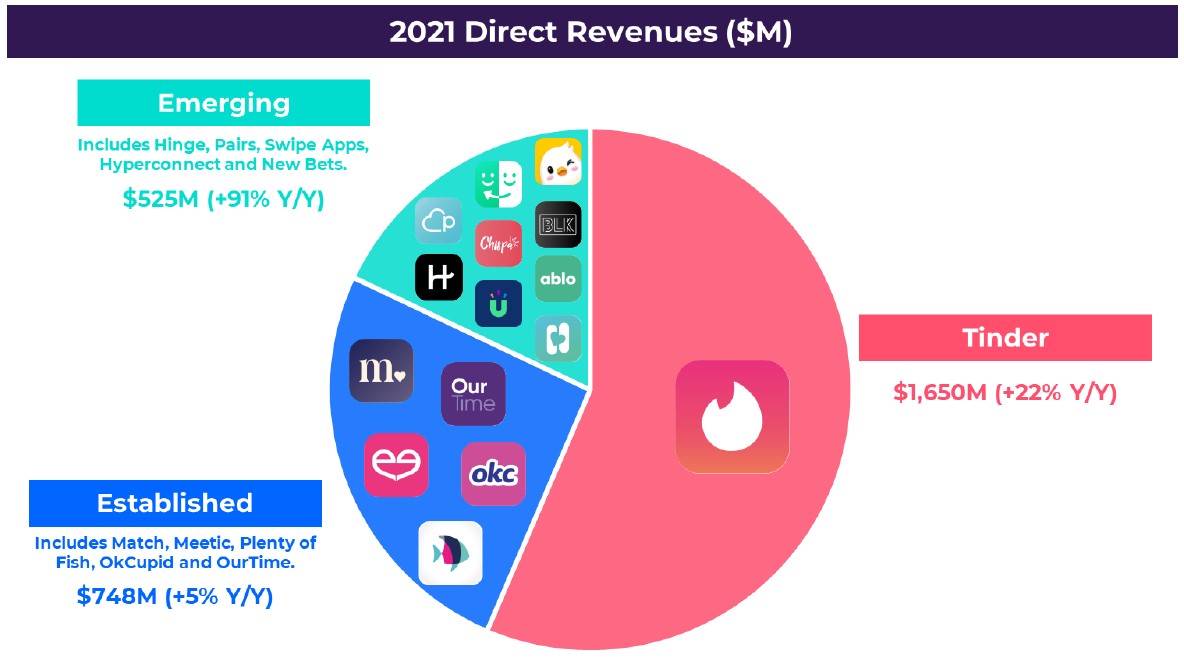
Tinder generated nearly $1.7 billion in Direct Revenue in 2021, up 22% over 2020, with year-over-year growth above 20% in each of the last three quarters of the year. Growth in Payers was particularly strong at Tinder® in 2021, up 16% year-over-year as our iconic brand continues to deliver innovative product features and optimizations that drive consistent global growth. All Other Brands grew Direct Revenue to just under $1.3 billion in 2021, a remarkable 29% year-over-year growth rate, driven by 11% growth in Payers and 16% growth in RPP.
Within All Other Brands, the Emerging Brands, led by Hinge®, produced $525 million of Direct Revenue in 2021, achieving a 91% year-over-year growth rate. The Established Brands grew Direct Revenue 5% year-over-year to $748 million. Our 2021 performance demonstrates that our portfolio strategy positions us to achieve consistent mid-to-high teens revenue growth over the long-term.
Zooming out to a five-year view, including the challenging two-year period impacted by COVID, demonstrates the strength of our business even more clearly. During that period, Match Group grew Total Revenue 22%, with a best-in-class margin profile. We’ve also made significant progress expanding our geographic reach, with Total Revenue from our APAC & Other segment contributing over 20% of the total in 2021. With our 600+ strong team on the ground in Asia, we’re confident we can drive meaningful growth in the region, where we see significant opportunity given the young, internet-savvy population.
Q4 2021 Performance
In the fourth quarter, Match Group grew Total Revenue 24% year-over-year to $806 million, as Tinder grew Direct Revenue 23%, an acceleration from the prior quarter, and All Other Brands grew Direct Revenue 26% year-over-year. While we were able to deliver strong top-line growth in the fourth quarter, we did continue to experience continuing COVID impacts, especially in certain Asian markets like Japan and more recently due to the emergence of Omicron, which reduced mobility in many markets starting in early December.
The strengthening of the US dollar relative to several other currencies also impacted our Q4 performance. Negative impacts from foreign exchange (FX) were $9 million more than we expected when we provided our outlook for Q4 in early November. Adjusted Operating Income was $290 million in Q4. We pulled back on marketing spend, which increased only 3% year-over-year, as we maintained our ROI discipline and also closely managed the business to generate some additional cost savings.
Tinder
Tinder achieved a record number of active users on its platform globally in 2021. In fact, Tinder steadily grew users on a year-over-year basis in all four quarters of 2021. Engagement on the platform continues to be robust, with daily average Swipe® and messaging activity at or near all-time highs in Q4 2021.
Since its launch, Tinder, with its revolutionary and patented Swipe® interface, made it easier than ever to meet new people around the world. But the pain points for users have remained: What do people say to potential partners? How do they find common ground? Also, younger daters, Gen Z in particular, prefer to know more about someone before they meet in real life than Tinder has historically offered.
Tinder’s new Explore® area seeks to address these challenges. Explore provides a space where Tinder members can discover people who are into the same things, as well as participate in experiences that help people get to know each other better once they meet. Music Mode™, which launched in late Q4, blends the well-known behavior of connecting over a shared interest in music and brings that to life in a rich and engaging way; more than 50% of Tinder members have already tried it. Hot Takes™ is a pre-match experience that replicates the flirty banter that often happens at a party. Members meeting in Hot Takes are engaging in conversations that are twice as long as those meeting outside it.

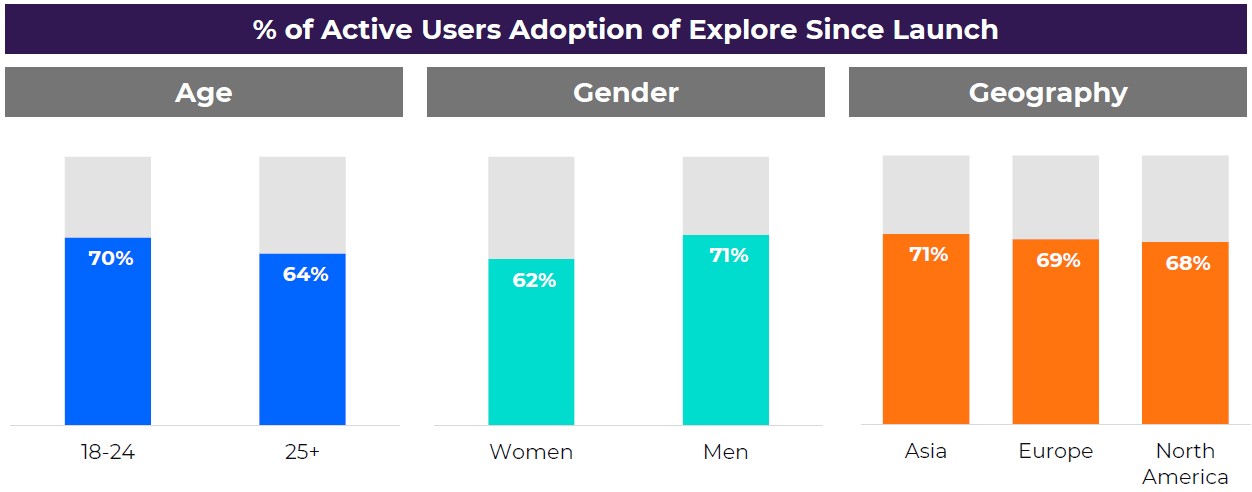
Explore improves the experience for Tinder members by providing them with greater control over their own dating destiny, driving greater user satisfaction, and better positions the app to bring new people into the category. Explore adoption levels are higher among Gen Z, international users, and paying subscribers. Women have a meaningfully improved experience with more robust discovery options
driving them to Swipe Right more frequently, send more first messages, and engage in more conversations. Explore also enables Tinder to localize product-market fit and surface more region-specific profile information, cultural events, and content. To date, the level of adoption of Explore has exceeded our expectations, with approximately two-thirds of active users engaging with Explore.
Tinder continues to make strong progress on the product roadmap we laid out in detail in last quarter’s shareholder letter. Tinder continues to roll out out Tinder Coins, their in-app virtual currency, which is now in a dozen countries. Coins will help power Tinder’s virtual goods ecosystem that is being built in 2022. Tinder is also considering ways to leverage Hyperconnect’s new immersive experiences and Explore provides the ideal surface area to experiment.
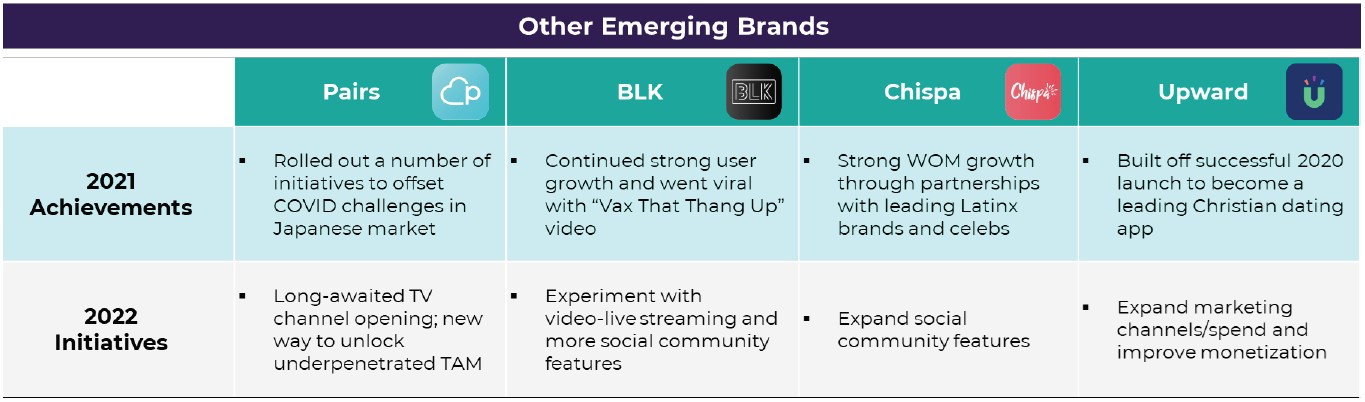
Emerging Brands
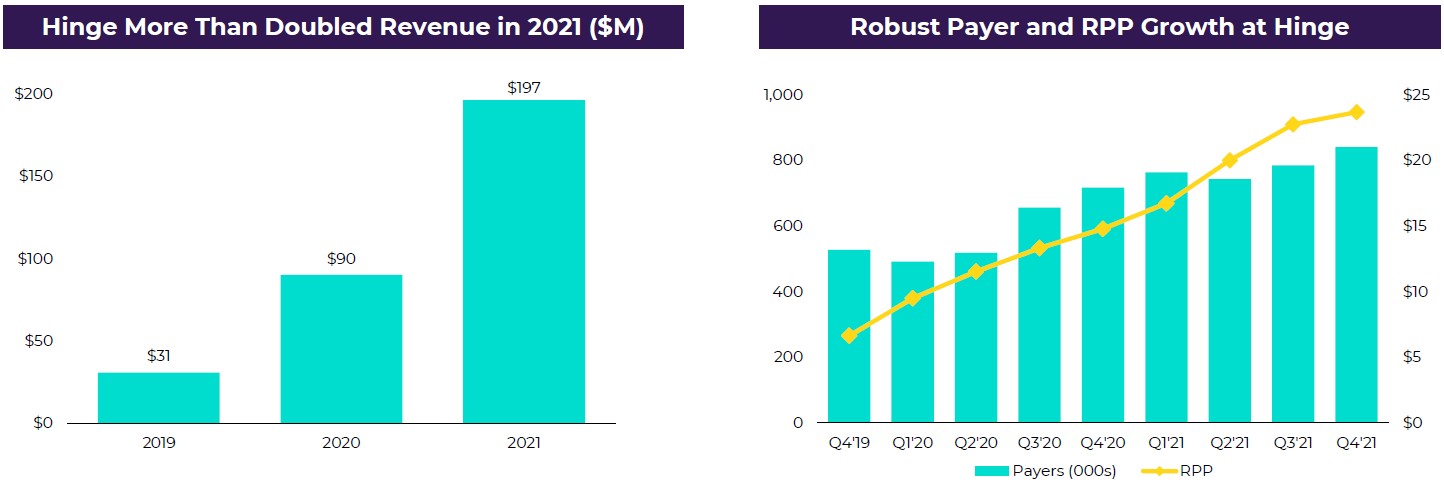
Among our Emerging Brands, Hinge continues to be the standout. Hinge has made tremendous progress since our acquisition and meaningful opportunities lie ahead. Since our initial investment in the company, Hinge has executed extremely well on its growth plan by capturing meaningful user share across English-speaking markets and more recently making significant strides in monetization. Global RPP and Total Revenue have both increased over 200% since 2018. Hinge more than doubled Total Revenue in 2021 on a year-over-year basis to just under $200 million.
Hinge downloads saw a material acceleration in Q4 2021, leading to a great start in 2022. Third-party data2 now shows that Hinge is the 2nd most downloaded dating app in several key English-speaking markets, including the United Kingdom, during the critical peak season since New Year’s Day.
On the product front, Hinge continues to innovate and resonate with users by launching category-first features such as Voice Prompts™. Over 1 million users have recorded a Voice Prompt, which has led to incredible virality on TikTok and other social media platforms.
Hinge is now focused on international expansion and expects to begin launching in select European countries in Q2 2022.
Hyperconnect® is also moving in the right direction. Both the Azar® and Hakuna™ apps saw better performance in December compared to the preceding months. Hyperconnect rolled out live streaming on the Azar app and a new immersive discovery experience on the Hakuna app. Hyperconnect is intensifying their focus on the Japanese and Korean markets where we believe there is meaningful long-term opportunity. While there is more work to do, we’re encouraged by the stabilizing performance and vast opportunities we see, especially with younger users.
Equally important, several of our other brands have begun to leverage Hyperconnect’s technology. Meetic opened online video cafes, which have been very well received by its user base. Match is offering 1:1 video chat on its app and has replaced the third-party provider it was previously using. Both integrations have gone extremely well, and Pairs and POF intend to leverage Hyperconnect’s tech into their apps in early 2022.
Like many across tech, we believe the metaverse will be the next evolution following the shift to mobile. It is relatively easy to imagine a virtual world in which avatars, often dressed in their favorite outfits, move around to meet new people and connect with others through games, entertainment, and shared experiences (just as people do in the real world). This should present us exciting opportunities and attract a new generation of digital users, and we believe we’re well positioned to help lead dating and social discovery into that new world. Korea has been an early adopter of metaverse experiences, and our Hyperconnect team there has a number of initiatives underway which we plan to leverage across our business as we enter this next phase, as we are doing with their live video and audio capabilities.
2 Source: App Annie
Much more detail to come on this, but we are busily preparing for this next evolution and excited for its potential.
Established Brands
Our Established Brands continue to make important strides on both product and marketing innovation and in carving out a space for themselves in today’s market. Both Match and Meetic continue to optimize their monetization models, and both are incorporating audio and video further into their apps, powered by Hyperconnect technology. OkCupid® continues to expand in select international markets and began testing live-streaming video in late 2021. POF continues to refine its core dating experience and to build its live-streaming offerings. Match also launched a new premium positioning for serious daters, declaring that “Adults Date Better™.” We also launched a new dating brand called Stir®, focused on single parents, leveraging the Match platform. It is off to a strong start.

As our business continues to expand globally, we regularly cross-leverage learnings across our diverse portfolio of brands and apps so that we can continue to lead the way in helping people make meaningful connections. This strategy has been successful for us since the creation of Match Group, enabling us to deliver strong growth by replicating wins across the portfolio, and benefitting from our breadth and diversity. The last two years have been made more challenging by COVID, but our team and our business have remained incredibly resilient. We’re confident the business is well positioned for 2022 and beyond.
Financial Outlook
FY 2022
Our 2022 Total Revenue outlook is for 15% to 20% year-over-year growth led by high-teens growth at Tinder and continued rapid growth at Hinge. That’s a slightly more conservative outlook than we previously provided, which is due to two macro headwinds: FX and COVID/Omicron. Our current outlook reflects approximately three points of negative impact on revenue growth versus our prior outlook due to these factors. Approximately $60 million (two points) of that is due to worsening FX impacts since our last update. The balance of the impact is from the rapid spread of the Omicron variant, which is affecting early 2022 performance.
While the pandemic trajectory has been extremely difficult to predict, we are forecasting improved momentum as we move into the spring and summer months. The extent of the rebound -- will we finally get a ‘summer of love’ in 2022? -- could notably impact our overall 2022 year-over-year growth trajectory.
We continue to expect slight (50-100bps) margin improvement ex-Hyperconnect, as a reduction in Google subscription fees and legal costs is partially reinvested in safety and CSR initiatives as well as headcount costs given the strong labor market. For the company as a whole, with a full year of Hyperconnect included, we expect to achieve a similar margin in 2022 as we did in 2021.
Q1 2022
We expect Total Revenue of $790 million to $800 million, implying 18%-20% year-over-year growth, including the FX headwinds and Omicron impacts, which are particularly weighted in the first quarter. We expect Adjusted Operating Income of $260 million to $265 million, reflecting typically lower first quarter margins.
| | | | | | | | | | | | | | |
| | Total Revenue | | Adjusted Operating Income |
| Q1 2022 | | $790 to $800 million | | $260 to $265 million |
| | | | |
| | | | |
| | | | |
| | | | |
Conference Call
Match Group will audiocast a conference call to answer questions regarding its fourth quarter financial results on Wednesday, February 2, 2022 at 8:30 a.m. Eastern Time. This call will include the disclosure of certain information, including forward-looking information, which may be material to an investor’s understanding of Match Group’s business. The live audiocast will be open to the public on Match Group’s investor relations website at https://ir.mtch.com.
Financial Results
Revenue | | | | | | | | | | | | | | | | | |
| Three Months Ended December 31, | | |
| 2021 | | 2020 | | Change |
| | | | | |
| (In thousands, except RPP) | | |
| Direct Revenue: | | | | | |
| Americas | $ | 399,794 | | | $ | 331,231 | | | 21% |
| Europe | 218,546 | | | 187,961 | | | 16% |
| APAC and Other | 169,303 | | | 115,701 | | | 46% |
| Total Direct Revenue | 787,643 | | | 634,893 | | | 24% |
| Indirect Revenue | 18,427 | | | 16,514 | | | 12% |
| Total Revenue | $ | 806,070 | | | $ | 651,407 | | | 24% |
| | | | | |
| | | | | |
| | | | | |
| | | | | |
| | | | | |
| | | | | |
| | | | | |
| Payers | | | | | |
| Americas | 8,230 | | | 7,469 | | | 10% |
| Europe | 4,660 | | | 4,229 | | | 10% |
| APAC and Other | 3,359 | | | 2,463 | | | 36% |
| Total Payers | 16,249 | | | 14,161 | | | 15% |
| | | | | |
| | | | | |
| | | | | |
| Revenue Per Payer (“RPP”) | | | | | |
| Americas | $ | 16.19 | | | $ | 14.78 | | | 10% |
| Europe | $ | 15.63 | | | $ | 14.81 | | | 6% |
| APAC and Other | $ | 16.80 | | | $ | 15.66 | | | 7% |
| Total RPP | $ | 16.16 | | | $ | 14.95 | | | 8% |
| | | | | |
| | | | | |
Growth in Payers was driven by Tinder across all geographies, and by the acquisition of Hyperconnect in APAC and Other. Hinge also contributed to the growth in Payers in Americas. Americas RPP increased primarily due to increases in subscriptions and à la carte purchases at Hinge. Europe RPP increased primarily due to increases in subscriptions and à la carte purchases at Tinder, while APAC and Other RPP increased primarily due to the acquisition of Hyperconnect. Europe RPP was unfavorably impacted by the strength of the U.S. Dollar relative to the Euro.
Operating Income and Adjusted Operating Income
Note: We have updated the title of our primary non-GAAP measure to “Adjusted Operating Income” from our previous title “Adjusted EBITDA.” We believe this updated title better reflects how management views this non-GAAP measure in relation to the closest GAAP measure, operating income. The calculation of the non-GAAP measure has not changed, and therefore the reconciliation of net income (loss) to operating income and to Adjusted Operating Income have also not changed. See “Non-GAAP Financial Measures” below for the full definition of Adjusted Operating Income and a reconciliation of net (loss) earnings attributable to Match Group, Inc. shareholders to operating income and Adjusted Operating Income.
| | | | | | | | | | | | | | | | | |
| Three Months Ended December 31, | | |
| 2021 | | 2020 | | Change |
| | | | | |
| (In thousands) | | |
| Operating Income | $ | 231,917 | | | $ | 212,582 | | | 9% |
| Operating Income Margin | 29 | % | | 33 | % | | (3.9) points |
| Adjusted Operating Income | $ | 290,470 | | | $ | 245,453 | | | 18% |
| Adjusted Operating Income Margin | 36 | % | | 38 | % | | (1.6) points |
Operating Costs and Expenses
| | | | | | | | | | | | | | | | | | | | | | | | | | | | | |
| Q4 2021 | | % of Revenue | | Q4 2020 | | % of Revenue | | Change |
| | | | | | | | | |
| (In thousands) | | |
| Cost of revenue | $ | 234,543 | | | 29% | | $ | 173,263 | | | 27% | | 35% |
| Selling and marketing expense | 139,165 | | | 17% | | 134,757 | | | 21% | | 3% |
| General and administrative expense | 110,261 | | | 14% | | 74,723 | | | 11% | | 48% |
| Product development expense | 66,366 | | | 8% | | 44,832 | | | 7% | | 48% |
| Depreciation | 10,780 | | | 1% | | 10,987 | | | 2% | | (2)% |
| Amortization of intangibles | 13,038 | | | 2% | | 263 | | | —% | | NM |
| Total operating costs and expenses | $ | 574,153 | | | 71% | | $ | 438,825 | | | 67% | | 31% |
________________________
NM = not meaningful
Total operating costs and expenses increased 31% year-over-year, with slightly less than half of the total increase resulting from the acquisition of Hyperconnect. The increase in amortization of intangibles is due to the acquisition of Hyperconnect, as intangible assets associated with the acquisition began amortizing in the third quarter of 2021.
Excluding the acquisition of Hyperconnect: Cost of revenue increased 21% year-over-year primarily due to an increase in in-app purchase fees. Total selling and marketing expense decreased $12 million year-over-year as rates were higher during the 2021 holiday marketing period leading us to reduce overall spend to meet our return thresholds. General and administrative expense increased 38% year-over-year primarily due to an increase in legal and professional fees. Product development expense increased 31% year-over-year primarily due to increased engineering headcount at Tinder.
Liquidity and Capital Resources
For the year ended December 31, 2021, we generated operating cash flow attributable to continuing operations of $912 million and Free Cash Flow of $833 million.
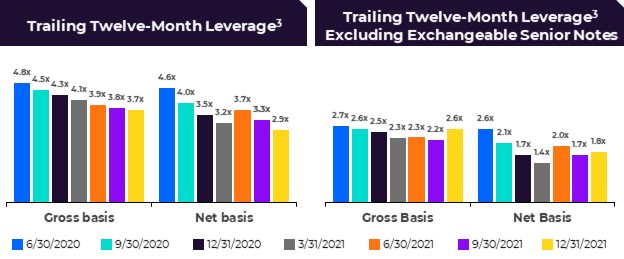
As of December 31, 2021, we had $827 million in cash and cash equivalents and short-term investments and $4.0 billion of long-term debt, including $1.3 billion of Exchangeable Senior Notes. Our $750 million revolving credit facility was undrawn as of December 31, 2021.3
Settlement of Former Tinder Employee Litigation
On December 1, 2021, we agreed to settle the pending, threatened, and potential claims at issue in Rad, et al. v IAC/InterActiveCorp, et al. and related arbitrations. Under the terms of the agreement, Match Group agreed to pay the plaintiffs and claimants $441 million and plaintiffs and claimants agreed to dismiss all claims in trial and in arbitration. We expect to pay the settlement amount in the first quarter of 2022 utilizing cash on hand. The $441 million settlement is included in other expense, net for the three months ended December 31, 2021.
Income Taxes
In the fourth quarter of 2021, Match Group recorded an income tax benefit from continuing operations of $58 million. In the fourth quarter of 2020, Match Group recorded an income tax provision from continuing operations of $28 million. The tax benefit in 2021 and the tax provision in 2020 both benefited from (i) excess tax benefits generated by the exercise or vesting of stock-based awards and (ii) research credits.
3 Leverage is calculated utilizing the non-GAAP measure Adjusted Operating Income as the denominator. For a reconciliation of the non-GAAP measure for each period presented, see page 21.
GAAP Financial Statements
Consolidated Statement of Operations | | | | | | | | | | | | | | | | | | | | | | | |
| | Three Months Ended December 31, | | Twelve Months Ended December 31, |
| | 2021 | | 2020 | | 2021 | | 2020 |
| | | | | | | |
| | (In thousands, except per share data) |
| Revenue | $ | 806,070 | | | $ | 651,407 | | | $ | 2,983,277 | | | $ | 2,391,269 | |
| Operating costs and expenses: | | | | | | | |
| Cost of revenue (exclusive of depreciation shown separately below) | 234,543 | | | 173,263 | | | 839,308 | | | 635,833 | |
| Selling and marketing expense | 139,165 | | | 134,757 | | | 566,459 | | | 479,907 | |
| General and administrative expense | 110,261 | | | 74,723 | | | 414,821 | | | 311,207 | |
| Product development expense | 66,366 | | | 44,832 | | | 241,049 | | | 169,811 | |
| Depreciation | 10,780 | | | 10,987 | | | 41,402 | | | 41,271 | |
| Amortization of intangibles | 13,038 | | | 263 | | | 28,559 | | | 7,525 | |
| Total operating costs and expenses | 574,153 | | | 438,825 | | | 2,131,598 | | | 1,645,554 | |
| Operating income | 231,917 | | | 212,582 | | | 851,679 | | | 745,715 | |
| Interest expense | (34,586) | | | (31,970) | | | (130,493) | | | (130,624) | |
| | | | | | | |
| Other (expense) income, net | (424,152) | | | (3,480) | | | (465,038) | | | 15,861 | |
| (Loss) earnings from continuing operations, before tax | (226,821) | | | 177,132 | | | 256,148 | | | 630,952 | |
| Income tax benefit (provision) | 58,097 | | | (28,497) | | | 19,897 | | | (43,273) | |
| Net (loss) earnings from continuing operations | (168,724) | | | 148,635 | | | 276,045 | | | 587,679 | |
| | | | | | | |
| | | | | | | |
| | | | | | | |
| Earnings (loss) from discontinued operations, net of tax | — | | | — | | | 509 | | | (366,070) | |
| Net (loss) earnings | (168,724) | | | 148,635 | | | 276,554 | | | 221,609 | |
| Net loss (earnings) attributable to noncontrolling interests | 92 | | | 400 | | | 1,169 | | | (59,280) | |
| Net (loss) earnings attributable to Match Group, Inc. shareholders | $ | (168,632) | | | $ | 149,035 | | | $ | 277,723 | | | $ | 162,329 | |
| | | | | | | |
| Net (loss) earnings per share from continuing operations: | | | | | | | |
| Basic | $ | (0.60) | | | $ | 0.56 | | | $ | 1.01 | | | $ | 2.36 | |
| Diluted | $ | (0.60) | | | $ | 0.50 | | | $ | 0.93 | | | $ | 2.09 | |
| Net (loss) earnings per share attributable to Match Group, Inc. shareholders: | | | | | | | |
| Basic | $ | (0.60) | | | $ | 0.56 | | | $ | 1.01 | | | $ | 0.73 | |
| Diluted | $ | (0.60) | | | $ | 0.50 | | | $ | 0.93 | | | $ | 0.66 | |
| | | | | | | |
| | | | | | | |
| | | | | | | |
| Basic shares outstanding | 282,979 | | | 266,395 | | | 275,004 | | | 223,433 | |
| Diluted shares outstanding | 282,979 | | | 307,582 | | | 304,840 | | | 256,020 | |
| | | | | | | |
| Stock-based compensation expense by function: | | | | | | | |
| Cost of revenue | $ | 1,593 | | | $ | 1,058 | | | $ | 5,554 | | | $ | 4,201 | |
| Selling and marketing expense | 1,829 | | | 1,297 | | | 7,941 | | | 5,141 | |
| General and administrative expense | 15,651 | | | 10,789 | | | 81,420 | | | 59,174 | |
| Product development expense | 15,662 | | | 8,477 | | | 51,901 | | | 33,752 | |
| Total stock-based compensation expense | $ | 34,735 | | | $ | 21,621 | | | $ | 146,816 | | | $ | 102,268 | |
Consolidated Balance Sheet | | | | | | | | | | | |
| December 31, 2021 | | December 31, 2020 |
| | | |
| (In thousands) |
| ASSETS | | | |
| Cash and cash equivalents | $ | 815,384 | | | $ | 739,164 | |
| Short-term investments | 11,818 | | | — | |
| Accounts receivable, net | 188,482 | | | 137,023 | |
| | | |
| | | |
| Other current assets | 202,568 | | | 144,025 | |
| | | |
| Total current assets | 1,218,252 | | | 1,020,212 | |
| | | |
| | | |
| Property and equipment, net | 163,256 | | | 107,799 | |
| Goodwill | 2,411,996 | | | 1,270,532 | |
| Intangible assets, net | 771,697 | | | 230,900 | |
| Deferred income taxes | 334,937 | | | 293,487 | |
| | | |
| Other non-current assets | 163,150 | | | 123,524 | |
| | | |
| TOTAL ASSETS | $ | 5,063,288 | | | $ | 3,046,454 | |
| | | |
| LIABILITIES AND SHAREHOLDERS’ EQUITY | | | |
| LIABILITIES | | | |
| Current maturities of long-term debt, net | $ | 99,927 | | | $ | — | |
| | | |
| Accounts payable | 37,871 | | | 29,200 | |
| Deferred revenue | 262,131 | | | 239,088 | |
| | | |
| | | |
| Accrued expenses and other current liabilities | 768,366 | | | 231,748 | |
| | | |
| Total current liabilities | 1,168,295 | | | 500,036 | |
| | | |
| Long-term debt, net of current maturities | 3,829,421 | | | 3,840,930 | |
| Income taxes payable | 13,842 | | | 14,582 | |
| Deferred income taxes | 130,261 | | | 17,213 | |
| | | |
| | | |
| Other long-term liabilities | 116,051 | | | 86,428 | |
| | | |
| | | |
| Redeemable noncontrolling interest | 1,260 | | | 640 | |
| | | |
| Commitment and contingencies | | | |
| | | |
| SHAREHOLDERS’ EQUITY | | | |
| Common stock | 283 | | | 267 | |
| | | |
| | | |
| | | |
| | | |
| Additional paid-in capital | 8,164,216 | | | 7,089,007 | |
| Retained deficit | (8,144,514) | | | (8,422,237) | |
| Accumulated other comprehensive loss | (223,754) | | | (81,454) | |
| | | |
| Total Match Group, Inc. shareholders’ equity | (203,769) | | | (1,414,417) | |
| Noncontrolling interests | 7,927 | | | 1,042 | |
| Total shareholders’ equity | (195,842) | | | (1,413,375) | |
| TOTAL LIABILITIES AND SHAREHOLDERS’ EQUITY | $ | 5,063,288 | | | $ | 3,046,454 | |
Consolidated Statement of Cash Flows | | | | | | | | | | | |
| | Twelve Months Ended December 31, |
| | 2021 | | 2020 |
| | | |
| | (In thousands) |
| Cash flows from operating activities attributable to continuing operations: | | | |
| Net earnings | $ | 276,554 | | | $ | 221,609 | |
| Add back: (earnings) loss from discontinued operations, net of tax | (509) | | | 366,070 | |
| Net earnings from continuing operations | 276,045 | | | 587,679 | |
| Adjustments to reconcile net earnings from continuing operations to net cash provided by operating activities attributable to continuing operations: | | | |
| Stock-based compensation expense | 146,816 | | | 102,268 | |
| Depreciation | 41,402 | | | 41,271 | |
| Amortization of intangibles | 28,559 | | | 7,525 | |
| Deferred income taxes | (57,969) | | | 15,384 | |
| | | |
| | | |
| Other adjustments, net | 27,690 | | | 27,281 | |
| Changes in assets and liabilities | | | |
| Accounts receivable | (34,021) | | | (24,213) | |
| Other assets | 1,743 | | | (33,224) | |
| Accounts payable and other liabilities | 458,757 | | | 24,155 | |
| Income taxes payable and receivable | (2,854) | | | 16,913 | |
| Deferred revenue | 26,331 | | | 23,513 | |
| Net cash provided by operating activities attributable to continuing operations | 912,499 | | | 788,552 | |
| Cash flows from investing activities attributable to continuing operations: | | | |
| Net cash used in business combinations, net of cash acquired | (859,905) | | | — | |
| Capital expenditures | (79,971) | | | (42,376) | |
| | | |
| | | |
| | | |
| Purchases of investments | — | | | (9,115) | |
| Net cash distribution related to Separation of IAC | — | | | (3,870,550) | |
| Other, net | 51 | | | (90) | |
| Net cash used in investing activities attributable to continuing operations | (939,825) | | | (3,922,131) | |
| Cash flows from financing activities attributable to continuing operations: | | | |
| Borrowings under the Credit Facility | — | | | 20,000 | |
| Proceeds from Senior Notes offerings | 500,000 | | | 1,000,000 | |
| | | |
| Principal payments on Credit Facility | — | | | (20,000) | |
| | | |
| Principal payments on Senior Notes | — | | | (400,000) | |
| | | |
| | | |
| | | |
| Payments to settle exchangeable notes | (630,658) | | | — | |
| Proceeds from the settlement of exchangeable note hedges | 1,089,592 | | | — | |
| Payments to settle warrants related to exchangeable notes | (882,187) | | | — | |
| Debt issuance costs | (7,124) | | | (13,517) | |
| Proceeds from stock offering | — | | | 1,421,801 | |
| Proceeds from issuance of common stock pursuant to stock-based awards | 58,424 | | | 155,402 | |
| Withholding taxes paid on behalf of employees on net settled stock-based awards of Former Match Group and Match Group | (15,726) | | | (211,958) | |
| | | |
| | | |
| Purchase of Former Match Group treasury stock | — | | | (132,868) | |
| | | |
| Purchase of noncontrolling interests | (1,473) | | | (15,827) | |
| | | |
| | | |
| Other, net | 258 | | | (15,187) | |
| Net cash provided by financing activities attributable to continuing operations | 111,106 | | | 1,787,846 | |
| Total cash provided by (used in) continuing operations | 83,780 | | | (1,345,733) | |
| Net cash provided by operating activities attributable to discontinued operations | — | | | 13,630 | |
| Net cash used in investing activities attributable to discontinued operations | — | | | (963,420) | |
| Net cash used in financing activities attributable to discontinued operations | — | | | (110,959) | |
| Total cash used in discontinued operations | — | | | (1,060,749) | |
| Effect of exchange rate changes on cash, cash equivalents, and restricted cash | (7,570) | | | 5,426 | |
| Net increase (decrease) in cash, cash equivalents, and restricted cash | 76,210 | | | (2,401,056) | |
| Cash, cash equivalents, and restricted cash at beginning of period | 739,302 | | | 3,140,358 | |
| Cash, cash equivalents, and restricted cash at end of period | $ | 815,512 | | | $ | 739,302 | |
Earnings Per Share
Weighted average basic and diluted shares outstanding for all periods prior to the separation of Match Group from IAC/InterActiveCorp on June 30, 2020 reflect the share position of the company formerly known as IAC/InterActiveCorp multiplied by the separation exchange ratio of 2.1584.
The following tables set forth the computation of the basic and diluted earnings per share attributable to Match Group shareholders:
| | | | | | | | | | | | | | | | | | | | | | | |
| Three Months Ended December 31, |
| 2021 | | 2020 |
| Basic | | Diluted | | Basic | | Diluted |
| | | | | | | |
| (In thousands, except per share data) |
| Numerator | | | | | | | |
| Net (loss) earnings | $ | (168,724) | | | $ | (168,724) | | | $ | 148,635 | | | $ | 148,635 | |
| Net loss attributable to noncontrolling interests | 92 | | | 92 | | | 400 | | | 400 | |
| Impact from subsidiaries’ dilutive securities | — | | | — | | | — | | | (176) | |
| Interest on dilutive Exchangeable Senior Notes, net of tax | — | | | — | | | — | | | 4,075 | |
| Net (loss) earnings attributable to Match Group, Inc. shareholders | $ | (168,632) | | | $ | (168,632) | | | $ | 149,035 | | | $ | 152,934 | |
| | | | | | | |
| | | | | | | |
| | | | | | | |
| | | | | | | |
| | | | | | | |
| | | | | | | |
| | | | | | | |
| Denominator | | | | | | | |
| Weighted average basic shares outstanding | 282,979 | | | 282,979 | | | 266,395 | | | 266,395 | |
| Dilutive securities | — | | | — | | | — | | | 16,025 | |
| Dilutive shares from Exchangeable Senior Notes, if-converted | — | | | — | | | — | | | 25,162 | |
| Denominator for earnings per share—weighted average shares | 282,979 | | | 282,979 | | | 266,395 | | | 307,582 | |
| | | | | | | |
| (Loss) earnings per share: | | | | | | | |
| | | | | | | |
| | | | | | | |
| (Loss) earnings per share attributable to Match Group, Inc. shareholders | $ | (0.60) | | | $ | (0.60) | | | $ | 0.56 | | | $ | 0.50 | |
| | | | | | | | | | | | | | | | | | | | | | | |
| Twelve Months Ended December 31, |
| 2021 | | 2020 |
| Basic | | Diluted | | Basic | | Diluted |
| | | | | | | |
| (In thousands, except per share data) |
| Numerator | | | | | | | |
| Net earnings from continuing operations | $ | 276,045 | | | $ | 276,045 | | | $ | 587,679 | | | $ | 587,679 | |
| Net loss (earnings) attributable to noncontrolling interests | 1,169 | | | 1,169 | | | (59,599) | | | (59,599) | |
| Impact from subsidiaries’ dilutive securities from continuing operations | — | | | (993) | | | — | | | (9,999) | |
| Interest on dilutive Exchangeable Senior Notes, net of tax | — | | | 6,616 | | | — | | | 16,300 | |
| Net earnings from continuing operations attributable to Match Group, Inc. shareholders | $ | 277,214 | | | $ | 282,837 | | | $ | 528,080 | | | $ | 534,381 | |
| | | | | | | |
| Earnings (loss) from discontinued operations, net of tax | $ | 509 | | | $ | 509 | | | $ | (366,070) | | | $ | (366,070) | |
| Net loss attributable to noncontrolling interests of discontinued operations | — | | | — | | | 319 | | | 319 | |
| Impact from subsidiaries’ dilutive securities from discontinued operations | — | | | — | | | — | | | (240) | |
| Net earnings (loss) from discontinued operations attributable to shareholders | 509 | | | 509 | | | (365,751) | | | (365,991) | |
| Net earnings attributable to Match Group, Inc. shareholders | $ | 277,723 | | | $ | 283,346 | | | $ | 162,329 | | | $ | 168,390 | |
| | | | | | | |
| Denominator | | | | | | | |
| Weighted average basic shares outstanding | 275,004 | | | 275,004 | | | 223,433 | | | 223,433 | |
| Dilutive securities | — | | | 13,866 | | | — | | | 12,157 | |
| Dilutive shares from Exchangeable Senior Notes, if-converted | — | | | 15,970 | | | — | | | 20,430 | |
| Denominator for earnings per share—weighted average shares | 275,004 | | | 304,840 | | | 223,433 | | | 256,020 | |
| | | | | | | |
| Earnings per share: | | | | | | | |
| Earnings per share from continuing operations | $ | 1.01 | | | $ | 0.93 | | | $ | 2.36 | | | $ | 2.09 | |
| Earnings (loss) per share from discontinued operations, net of tax | $ | 0.00 | | | $ | 0.00 | | | $ | (1.64) | | | $ | (1.43) | |
| Earnings per share attributable to Match Group, Inc. shareholders | $ | 1.01 | | | $ | 0.93 | | | $ | 0.73 | | | $ | 0.66 | |
Trended Metrics
| | | | | | | | | | | | | | | | | | | | | | | | | | | | | | | | | | | | | | | | | | | | | | | | | | | | | | | | | | | | | | | | | | | | | | | | | | | | | | | | | | | | | | | | | | | | | | | | | |
| 2019 | | 2020 | | 2021 | | | | | | | | Year Ended December 31, |
| Q1 | | Q2 | | Q3 | | Q4 | | Q1 | | Q2 | | Q3 | | Q4 | | | | Q1 | | Q2 | | Q3 | | Q4 | | | | | | | | 2019 | | 2020 | | 2021 |
| | | | | | | | | | | | | | | | | | | | | | | | | | | | | | | | | | | | | |
Revenue (in millions, rounding differences may occur) | | | | | | | | | | | | | | | | | | | | | | |
| Direct Revenue | | | | | | | | | | | | | | | | | | | | | | | | | | | | | | | | | | | | | |
| Americas | $ | 252.5 | | | $ | 267.3 | | | $ | 286.5 | | | $ | 283.9 | | | $ | 281.2 | | | $ | 298.7 | | | $ | 336.8 | | | $ | 331.2 | | | | | $ | 344.3 | | | $ | 374.4 | | | $ | 393.6 | | | $ | 399.8 | | | | | | | | | $ | 1,090.2 | | | $ | 1,248.0 | | | $ | 1,512.1 | |
| Europe | 131.1 | | | 141.6 | | | 154.3 | | | 157.4 | | | 156.5 | | | 154.1 | | | 181.6 | | | 188.0 | | | | | 189.1 | | | 196.5 | | | 217.7 | | | 218.5 | | | | | | | | | 584.4 | | | 680.1 | | | 821.8 | |
| APAC and Other | 70.3 | | | 78.4 | | | 90.1 | | | 93.7 | | | 97.1 | | | 94.0 | | | 109.8 | | | 115.7 | | | | | 121.9 | | | 123.4 | | | 174.4 | | | 169.3 | | | | | | | | | 332.6 | | | 416.6 | | | 589.0 | |
| Total Direct Revenue | 454.0 | | | 487.3 | | | 530.9 | | | 535.0 | | | 534.8 | | | 546.7 | | | 628.3 | | | 634.9 | | | | | 655.2 | | | 694.3 | | | 785.7 | | | 787.6 | | | | | | | | | 2,007.2 | | | 2,344.7 | | | 2,922.9 | |
| Indirect Revenue | 10.7 | | | 10.7 | | | 10.5 | | | 12.2 | | | 9.8 | | | 8.7 | | | 11.5 | | | 16.5 | | | | | 12.4 | | | 13.4 | | | 16.1 | | | 18.4 | | | | | | | | | 44.1 | | | 46.5 | | | 60.4 | |
| Total Revenue | $ | 464.6 | | | $ | 498.0 | | | $ | 541.5 | | | $ | 547.2 | | | $ | 544.6 | | | $ | 555.5 | | | $ | 639.8 | | | $ | 651.4 | | | | | $ | 667.6 | | | $ | 707.8 | | | $ | 801.8 | | | $ | 806.1 | | | | | | | | | $ | 2,051.3 | | | $ | 2,391.3 | | | $ | 2,983.3 | |
| | | | | | | | | | | | | | | | | | | | | | | | | | | | | | | | | | | | | |
| | | | | | | | | | | | | | | | | | | | | | |
| | | | | | | | | | | | | | | | | | | | | | | | | | | | | | | | | | | | | |
| | | | | | | | | | | | | | | | | | | | | | | | | | | | | | | | | | | | | |
| | | | | | | | | | | | | | | | | | | | | | | | | | | | | | | | | | | | | |
| | | | | | | | | | | | | | | | | | | | | | | | | | | | | | | | | | | | | |
| | | | | | | | | | | | | | | | | | | | | | | | | | | | | | | | | | | | | |
Payers (in thousands) | | | | | | | | | | | | | | | | | | | | | | | | | | | | | | | | | | | | | |
| Americas | 5,919 | | | 6,255 | | | 6,601 | | | 6,709 | | | 6,691 | | | 6,836 | | | 7,455 | | | 7,469 | | | | | 7,595 | | | 7,901 | | | 8,309 | | | 8,230 | | | | | | | | | 6,371 | | | 7,113 | | | 8,009 | |
| Europe | 3,267 | | | 3,482 | | | 3,747 | | | 3,896 | | | 3,899 | | | 3,830 | | | 4,154 | | | 4,229 | | | | | 4,255 | | | 4,332 | | | 4,710 | | | 4,660 | | | | | | | | | 3,598 | | | 4,028 | | | 4,489 | |
| APAC and Other | 1,711 | | | 1,875 | | | 2,060 | | | 2,317 | | | 2,417 | | | 2,339 | | | 2,417 | | | 2,463 | | | | | 2,567 | | | 2,736 | | | 3,284 | | | 3,359 | | | | | | | | | 1,991 | | | 2,409 | | | 2,987 | |
| Total Payers | 10,897 | | | 11,612 | | | 12,408 | | | 12,922 | | | 13,007 | | | 13,005 | | | 14,026 | | | 14,161 | | | | | 14,417 | | | 14,969 | | | 16,303 | | | 16,249 | | | | | | | | | 11,960 | | | 13,550 | | | 15,485 | |
| | | | | | | | | | | | | | | | | | | | | | | | | | | | | | | | | | | | | |
| RPP | | | | | | | | | | | | | | | | | | | | | | | | | | | | | | | | | | | | | |
| Americas | $ | 14.22 | | | $ | 14.24 | | | $ | 14.47 | | | $ | 14.10 | | | $ | 14.01 | | | $ | 14.56 | | | $ | 15.06 | | | $ | 14.78 | | | | | $ | 15.11 | | | $ | 15.79 | | | $ | 15.79 | | | $ | 16.19 | | | | | | | | | $ | 14.26 | | | $ | 14.62 | | | $ | 15.73 | |
| Europe | $ | 13.38 | | | $ | 13.55 | | | $ | 13.73 | | | $ | 13.46 | | | $ | 13.38 | | | $ | 13.41 | | | $ | 14.57 | | | $ | 14.81 | | | | | $ | 14.81 | | | $ | 15.12 | | | $ | 15.41 | | | $ | 15.63 | | | | | | | | | $ | 13.54 | | | $ | 14.07 | | | $ | 15.25 | |
| APAC and Other | $ | 13.70 | | | $ | 13.94 | | | $ | 14.58 | | | $ | 13.48 | | | $ | 13.39 | | | $ | 13.40 | | | $ | 15.15 | | | $ | 15.66 | | | | | $ | 15.83 | | | $ | 15.03 | | | $ | 17.71 | | | $ | 16.80 | | | | | | | | | $ | 13.92 | | | $ | 14.41 | | | $ | 16.43 | |
| Total RPP | $ | 13.89 | | | $ | 13.99 | | | $ | 14.26 | | | $ | 13.80 | | | $ | 13.71 | | | $ | 14.01 | | | $ | 14.93 | | | $ | 14.95 | | | | | $ | 15.15 | | | $ | 15.46 | | | $ | 16.06 | | | $ | 16.16 | | | | | | | | | $ | 13.99 | | | $ | 14.42 | | | $ | 15.73 | |
Note: Our ability to eliminate duplicate Payers at a brand level for periods prior to Q2 2020 is impacted by data privacy requirements which require that we anonymize data after 12 months, therefore Payer data for those periods is likely overstated. Additionally, as Payers is a component of the RPP calculation, RPP is likely commensurately understated for these same periods due to these data privacy limitations.
Reconciliations of GAAP to Non-GAAP Measures
Reconciliation of Net Earnings to Adjusted Operating Income | | | | | | | | | | | | | | | | | | | | | | | |
| Three Months Ended December 31, | | Twelve Months Ended December 31, |
| 2021 | | 2020 | | 2021 | | 2020 |
| | | | | | | |
| (Dollars in thousands) |
| Net (loss) earnings attributable to Match Group, Inc. shareholders | $ | (168,632) | | | $ | 149,035 | | | $ | 277,723 | | | $ | 162,329 | |
| Add back: | | | | | | | |
| Net (loss) earnings attributable to noncontrolling interests | (92) | | | (400) | | | (1,169) | | | 59,280 | |
| (Earnings) loss from discontinued operations, net of tax | — | | | — | | | (509) | | | 366,070 | |
| Income tax (benefit) provision | (58,097) | | | 28,497 | | | (19,897) | | | 43,273 | |
| Other expense (income), net | 424,152 | | | 3,480 | | | 465,038 | | | (15,861) | |
| Interest expense | 34,586 | | | 31,970 | | | 130,493 | | | 130,624 | |
| Operating Income | 231,917 | | | 212,582 | | | 851,679 | | | 745,715 | |
| Stock-based compensation expense | 34,735 | | | 21,621 | | | 146,816 | | | 102,268 | |
| Depreciation | 10,780 | | | 10,987 | | | 41,402 | | | 41,271 | |
| Amortization of intangibles | 13,038 | | | 263 | | | 28,559 | | | 7,525 | |
| | | | | | | |
| Adjusted Operating Income | $ | 290,470 | | | $ | 245,453 | | | $ | 1,068,456 | | | $ | 896,779 | |
| | | | | | | |
| Revenue | $ | 806,070 | | | $ | 651,407 | | | $ | 2,983,277 | | | $ | 2,391,269 | |
| Operating income margin | 29 | % | | 33 | % | | 29 | % | | 31 | % |
| Adjusted Operating Income margin | 36 | % | | 38 | % | | 36 | % | | 38 | % |
Reconciliation of Net Earnings to Adjusted Operating Income used in Leverage Ratios | | | | | | | | | | | | | | | | | | | | | | | | | | | | | | | | | | | | | | | | | |
| Twelve months ended |
| 6/30/2020 | | 9/30/2020 | | 12/31/2020 | | 3/31/2021 | | 6/30/2021 | | 9/30/2021 | | 12/31/2021 |
| | | | | | | | | | | | | |
| (In thousands) |
| Net earnings attributable to Match Group, Inc. shareholders | $ | 116,520 | | | $ | 121,935 | | | $ | 162,329 | | | $ | 539,409 | | | $ | 605,387 | | | $ | 595,390 | | | $ | 277,723 | |
| Add back: | | | | | | | | | | | | | |
| Net earnings (loss) attributable to noncontrolling interests | 115,341 | | | 83,527 | | | 59,280 | | | 30,481 | | | (1,754) | | | (1,477) | | | (1,169) | |
| Loss (earnings) from discontinued operations, net of tax | 340,259 | | | 361,732 | | | 366,070 | | | 34,103 | | | (1,017) | | | (509) | | | (509) | |
| Income tax provision (benefit) | 9,592 | | | 32,180 | | | 43,273 | | | 73,728 | | | 74,192 | | | 66,697 | | | (19,897) | |
| Other (income) expense, net | (18,188) | | | (13,477) | | | (15,861) | | | (10,688) | | | 7,077 | | | 44,366 | | | 465,038 | |
| Interest expense | 126,027 | | | 128,585 | | | 130,624 | | | 130,568 | | | 128,036 | | | 127,877 | | | 130,493 | |
| Operating Income | 689,551 | | | 714,482 | | | 745,715 | | | 797,601 | | | 811,921 | | | 832,344 | | | 851,679 | |
| Stock-based compensation expense | 83,024 | | | 99,554 | | | 102,268 | | | 111,212 | | | 131,468 | | | 133,702 | | | 146,816 | |
| Depreciation | 36,373 | | | 39,061 | | | 41,271 | | | 42,334 | | | 42,726 | | | 41,609 | | | 41,402 | |
| Amortization of intangibles | 14,707 | | | 14,525 | | | 7,525 | | | 1,335 | | | 1,177 | | | 15,784 | | | 28,559 | |
| | | | | | | | | | | | | |
| Adjusted Operating Income | $ | 823,655 | | | $ | 867,622 | | | $ | 896,779 | | | $ | 952,482 | | | $ | 987,292 | | | $ | 1,023,439 | | | $ | 1,068,456 | |
Reconciliation of Operating Cash Flow Attributable to Continuing Operations to Free Cash Flow | | | | | | | | | | | |
| Twelve Months Ended December 31, |
| 2021 | | 2020 |
| | | |
| (In thousands) |
| Net cash provided by operating activities attributable to continuing operations | $ | 912,499 | | | $ | 788,552 | |
| Capital expenditures | (79,971) | | | (42,376) | |
| Free Cash Flow | $ | 832,528 | | | $ | 746,176 | |
Reconciliation of Forecasted Operating Income to Adjusted Operating Income | | | | | | | |
| Three Months Ended March 31, 2022 | | |
| | | |
| (In millions) |
| Operating Income | $195 to $200 | | |
| Stock-based compensation expense | 42 | | | |
| Depreciation and amortization of intangibles | 23 | | | |
| Adjusted Operating Income | $260 to $265 | | |
Reconciliation of GAAP Revenue to Non-GAAP Revenue, Excluding Foreign Exchange Effects
| | | | | | | | | | | | | | | | | | | | | | | | | | | | | | | | | | | | | | | | | | | | | | | |
| | Three Months Ended December 31, | | Twelve Months Ended December 31, |
| | 2021 | | $ Change | | % Change | | 2020 | | 2021 | | $ Change | | % Change | | 2020 |
| | | | | | | | | | | | | | | |
| | (Dollars in millions, rounding differences may occur) |
| Revenue, as reported | $ | 806.1 | | | $ | 154.7 | | | 24% | | $ | 651.4 | | | $ | 2,983.3 | | | $ | 592.0 | | | 25% | | $ | 2,391.3 | |
| Foreign exchange effects | 11.9 | | | | | | | | | (35.2) | | | | | | | |
| Revenue, excluding foreign exchange effects | $ | 817.9 | | | $ | 166.5 | | | 26% | | $ | 651.4 | | | $ | 2,948.1 | | | $ | 556.8 | | | 23% | | $ | 2,391.3 | |
| | | | | | | | | | | | | | | |
| Americas Direct Revenue, as reported | $ | 399.8 | | | $ | 68.6 | | | 21% | | $ | 331.2 | | | $ | 1,512.1 | | | $ | 264.1 | | | 21% | | $ | 1,248.0 | |
| Foreign exchange effects | 0.3 | | | | | | | | | (1.5) | | | | | | | |
| Americas Direct Revenue, excluding foreign exchange effects | $ | 400.1 | | | $ | 68.9 | | | 21% | | $ | 331.2 | | | $ | 1,510.6 | | | $ | 262.6 | | | 21% | | $ | 1,248.0 | |
| | | | | | | | | | | | | | | |
| Europe Direct Revenue, as reported | $ | 218.5 | | | $ | 30.6 | | | 16% | | $ | 188.0 | | | $ | 821.8 | | | $ | 141.7 | | | 21% | | $ | 680.1 | |
| Foreign exchange effects | 4.0 | | | | | | | | | (33.9) | | | | | | | |
| Europe Direct Revenue, excluding foreign exchange effects | $ | 222.6 | | | $ | 34.6 | | | 18% | | $ | 188.0 | | | $ | 787.9 | | | $ | 107.8 | | | 16% | | $ | 680.1 | |
| | | | | | | | | | | | | | | |
| APAC and Other Direct Revenue, as reported | $ | 169.3 | | | $ | 53.6 | | | 46% | | $ | 115.7 | | | $ | 589.0 | | | $ | 172.4 | | | 41% | | $ | 416.6 | |
| Foreign exchange effects | 7.3 | | | | | | | | | 0.9 | | | | | | | |
| APAC and Other Direct Revenue, excluding foreign exchange effects | $ | 176.6 | | | $ | 60.9 | | | 53% | | $ | 115.7 | | | $ | 589.9 | | | $ | 173.3 | | | 42% | | $ | 416.6 | |
Reconciliation of GAAP Revenue to Non-GAAP Revenue, Excluding Foreign Exchange Effects (Revenue Per Payer)
| | | | | | | | | | | | | | | | | | | | | | | | | | | | | | | | | | | | | | | | | | | | | | | |
| | Three Months Ended December 31, | | Twelve Months Ended December 31, |
| | 2021 | | $ Change | | % Change | | 2020 | | 2021 | | $ Change | | % Change | | 2020 |
| | | | | | | | | | | | | | | |
| RPP, as reported | $ | 16.16 | | | $ | 1.21 | | | 8% | | $ | 14.95 | | | $ | 15.73 | | | $ | 1.31 | | | 9% | | $ | 14.42 | |
| Foreign exchange effects | 0.24 | | | | | | | | | (0.19) | | | | | | | |
| RPP, excluding foreign exchange effects | $ | 16.40 | | | $ | 1.45 | | | 10% | | $ | 14.95 | | | $ | 15.54 | | | $ | 1.12 | | | 8% | | $ | 14.42 | |
| | | | | | | | | | | | | | | |
| Americas RPP, as reported | $ | 16.19 | | | $ | 1.41 | | | 10% | | $ | 14.78 | | | $ | 15.73 | | | $ | 1.11 | | | 8% | | $ | 14.62 | |
| Foreign exchange effects | 0.02 | | | | | | | | | (0.01) | | | | | | | |
| Americas RPP, excluding foreign exchange effects | $ | 16.21 | | | $ | 1.43 | | | 10% | | $ | 14.78 | | | $ | 15.72 | | | $ | 1.10 | | | 8% | | $ | 14.62 | |
| | | | | | | | | | | | | | | |
| Europe RPP, as reported | $ | 15.63 | | | 0.82 | | 6% | | $ | 14.81 | | | $ | 15.25 | | | 1.18 | | 8% | | $ | 14.07 | |
| Foreign exchange effects | 0.29 | | | | | | | | | (0.35) | | | | | | | |
| Europe RPP, excluding foreign exchange effects | $ | 15.92 | | | $ | 1.11 | | | 7% | | $ | 14.81 | | | $ | 14.90 | | | $ | 0.83 | | | 6% | | $ | 14.07 | |
| | | | | | | | | | | | | | | |
| APAC and Other RPP, as reported | $ | 16.80 | | | $ | 1.14 | | | 7% | | $ | 15.66 | | | $ | 16.43 | | | $ | 2.02 | | | 14% | | $ | 14.41 | |
| Foreign exchange effects | 0.73 | | | | | | | | | 0.03 | | | | | | | |
| APAC and Other RPP, excluding foreign exchange effects | $ | 17.53 | | | $ | 1.87 | | | 12% | | $ | 15.66 | | | $ | 16.46 | | | $ | 2.05 | | | 14% | | $ | 14.41 | |
Dilutive Securities
Match Group has various tranches of dilutive securities. The table below details these securities and their potentially dilutive impact (shares in millions; rounding differences may occur).
| | | | | | | | | | | | | | | | | | | |
| Average Exercise Price | | 1/28/2022 | | |
| Share Price | | | $109.22 | | | | | | | | |
| Absolute Shares | | | 283.5 | | | | | | | | |
| | | | | | | | | | | |
| Vested Options | $20.10 | | 3.5 | | | | | | | | |
| Unvested Options and Awards | | | | | | | | | | | |
| Unvested Options | $33.01 | | 0.1 | | | | | | | | |
| RSUs and subsidiary denominated equity awards | | | 5.8 | | | | | | | | |
| Total Dilution - Unvested Options and Awards | | | 5.9 | | | | | | | | |
| Outstanding Warrants | | | | | | | | | | | |
| Warrants expiring on January 1, 2023 (2.4 million outstanding) | $68.22 | | 0.9 | | | | | | | | |
| Warrants expiring on September 15, 2026 (6.6 million outstanding) | $134.76 | | — | | | | | | | | |
| Warrants expiring on April 15, 2030 (6.8 million outstanding) | $134.82 | | — | | | | | | | | |
| Total Dilution - Outstanding Warrants | | | 0.9 | | | | | | | | |
| | | | | | | | | | | |
| Total Dilution | | | 10.2 | | | | | | | | |
| % Dilution | | | 3.5% | | | | | | | | |
| Total Diluted Shares Outstanding | | | 293.8 | | | | | | | | |
The dilutive securities presentation above is calculated using the methods and assumptions described below; these are different from GAAP dilution, which is calculated based on the treasury stock method.
Options — The table above assumes the option exercise price is used to repurchase Match Group shares.
RSUs and subsidiary denominated equity awards — The table above assumes RSUs are fully dilutive. All performance-based and market-based awards reflect the expected shares that will vest based on current performance or market estimates. The table assumes no change in the fair value estimate of the subsidiary denominated equity awards from the values used for GAAP purposes at December 31, 2021.
Exchangeable Senior Notes — The Company has three series of Exchangeable Senior Notes outstanding. In the event of an exchange, each series of Exchangeable Senior Notes can be settled in cash, shares, or a combination of cash and shares. At the time of each Exchangeable Senior Notes issuance, the Company purchased call options with a strike price equal to the exchange price of each series of Exchangeable Senior Notes (“Note Hedge”), which can be used to offset the dilution of each series of the Exchangeable Senior Notes. No dilution is reflected in the table above for any of the Exchangeable Senior Notes, all of which are currently exchangeable, because it is the Company’s intention to settle the Exchangeable Senior Notes with cash equal to the face amount of the notes; any shares issued would be offset by shares received upon exercise of the Note Hedge.
Warrants — At the time of the issuance of each series of Exchangeable Senior Notes, the Company also sold warrants for the number of shares with the strike prices reflected in the table above. The cash generated from the exercise of the warrants is assumed to be used to repurchase Match Group shares and the resulting net dilution, if any, is reflected in the table above.
Non-GAAP Financial Measures
Match Group reports Adjusted Operating Income, Adjusted Operating Income Margin, Free Cash Flow, and Revenue Excluding Foreign Exchange Effects, all of which are supplemental measures to U.S. generally accepted accounting principles (“GAAP”). The Adjusted Operating Income, Adjusted Operating Income Margin, and Free Cash Flow measures are among the primary metrics by which we evaluate the performance of our business, on which our internal budget is based and by which management is compensated. Revenue Excluding Foreign Exchange Effects provides a comparable framework for assessing the performance of our business without the effect of exchange rate differences when compared to prior periods. We believe that investors should have access to the same set of tools that we use in analyzing our results. These non-GAAP measures should be considered in addition to results prepared in accordance with GAAP, but should not be considered a substitute for or superior to GAAP results. Match Group endeavors to compensate for the limitations of the non-GAAP measures presented by providing the comparable GAAP measures and descriptions of the reconciling items, including quantifying such items, to derive the non-GAAP measures. We encourage investors to examine the reconciling adjustments between the GAAP and non-GAAP measures, which we describe below. Interim results are not necessarily indicative of the results that may be expected for a full year.
Definitions of Non-GAAP Measures
Adjusted Operating Income is defined as operating income excluding: (1) stock-based compensation expense; (2) depreciation; and (3) acquisition-related items consisting of (i) amortization of intangible assets and impairments of goodwill and intangible assets, if applicable, and (ii) gains and losses recognized on changes in the fair value of contingent consideration arrangements, as applicable. We believe Adjusted Operating Income is useful to analysts and investors as this measure allows a more meaningful comparison between our performance and that of our competitors. The above items are excluded from our Adjusted Operating Income measure because they are non-cash in nature. Adjusted Operating Income has certain limitations because it excludes certain expenses.
Adjusted Operating Income Margin is defined as Adjusted Operating Income divided by revenues. We believe Adjusted Operating Income margin is useful for analysts and investors as this measure allows a more meaningful comparison between our performance and that of our competitors. Adjusted Operating Income margin has certain limitations in that it does not take into account the impact to our consolidated statement of operations of certain expenses.
Free Cash Flow is defined as net cash provided by operating activities from continuing operations, less capital expenditures. We believe Free Cash Flow is useful to investors because it represents the cash that our operating businesses generate, before taking into account non-operational cash movements. Free Cash Flow has certain limitations in that it does not represent the total increase or decrease in the cash balance for the period, nor does it represent the residual cash flow for discretionary expenditures. Therefore, we think it is important to evaluate Free Cash Flow along with our consolidated statement of cash flows.
We look at Free Cash Flow as a measure of the strength and performance of our businesses, not for valuation purposes. In our view, applying “multiples” to Free Cash Flow is inappropriate because it is subject to timing, seasonality and one-time events. We manage our business for cash and we think it is of utmost importance to maximize cash – but our primary valuation metric is Adjusted Operating Income.
Revenue Excluding Foreign Exchange Effects is calculated by translating current period revenues using prior period exchange rates. The percentage change in Revenue Excluding Foreign Exchange Effects is calculated by determining the change in current period revenues over prior period revenues where current period revenues are translated using prior period exchange rates. We believe the impact of foreign exchange rates on Match Group, due to its global reach, may be an important factor in understanding period over period comparisons if movement in rates is significant. Since our results are reported in U.S. dollars, international revenues are favorably impacted as the U.S. dollar weakens relative to other currencies, and unfavorably impacted as the U.S. dollar strengthens relative to other currencies. We believe the presentation of revenue excluding foreign exchange effects in addition to reported revenue helps improve the ability to understand Match Group’s performance because it excludes the impact of foreign currency volatility that is not indicative of Match Group’s core operating results.
Non-Cash Expenses That Are Excluded From Our Non-GAAP Measures
Stock-based compensation expense consists principally of expense associated with the grants of stock options, RSUs, performance-based RSUs and market-based awards. These expenses are not paid in cash, and we include the related shares in our fully diluted shares outstanding using the treasury stock method; however, performance-based RSUs and market-based awards are included only to the extent the applicable performance or market condition(s) have been met (assuming the end of the reporting period is the end of the contingency period). To the extent stock-based awards are settled on a net basis, we remit the required tax-withholding amounts from our current funds.
Depreciation is a non-cash expense relating to our property and equipment and is computed using the straight-line method to allocate the cost of depreciable assets to operations over their estimated useful lives, or, in the case of leasehold improvements, the lease term, if shorter.
Amortization of intangible assets and impairments of goodwill and intangible assets are non-cash expenses related primarily to acquisitions. At the time of an acquisition, the identifiable definite-lived intangible assets of the acquired company, such as customer lists, trade names and technology, are valued and amortized over their estimated lives. Value is also assigned to (i) acquired indefinite-lived intangible assets, which consist of trade names and trademarks, and (ii) goodwill, which are not subject to amortization. An impairment is recorded when the carrying value of an intangible asset or goodwill exceeds its fair value. We believe that intangible assets represent costs incurred by the acquired company to build value prior to acquisition and the related amortization and impairment charges of intangible assets or goodwill, if applicable, are not ongoing costs of doing business.
Additional Definitions
Americas includes North America, Central America, South America, and the Caribbean islands.
Europe includes continental Europe, the British Isles, Iceland, Greenland, and Russia, but excludes Turkey (which is included in APAC and Other).
APAC and Other includes Asia, Australia, the Pacific islands, the Middle East, and Africa.
Direct Revenue is revenue that is received directly from end users of our services and includes both subscription and à la carte revenue.
Indirect Revenue is revenue that is not received directly from end users of our services, substantially all of which is advertising revenue.
Payers are unique users at a brand level in a given month from whom we earned Direct Revenue. When presented as a quarter-to-date or year-to-date value, Payers represents the average of the monthly values for the respective period presented. At a consolidated level, duplicate Payers may exist when we earn revenue from the same individual at multiple brands in a given month, as we are unable to identify unique individuals across brands in the Match Group portfolio.
Revenue Per Payer (“RPP”) is the average monthly revenue earned from a Payer and is Direct Revenue for a period divided by the Payers in the period, further divided by the number of months in the period.
Leverage on a gross basis is calculated as principal debt balance divided by Adjusted Operating Income for the period referenced.
Leverage on a net basis is calculated as principal debt balance less cash and cash equivalents and short-term investments divided by Adjusted Operating Income for the period referenced.
Other Information
Safe Harbor Statement Under the Private Securities Litigation Reform Act of 1995
This letter and our conference call, which will be held at 8:30 a.m. Eastern Time on February 2, 2022, may contain “forward-looking statements” within the meaning of the Private Securities Litigation Reform Act of 1995. All statements that are not historical facts are “forward looking statements.” The use of words such as “anticipates,” “estimates,” “expects,” “plans” and “believes,” among others, generally identify forward-looking statements. These forward-looking statements include, among others, statements relating to: Match Group’s future financial performance, Match Group’s business prospects and strategy, anticipated trends, and other similar matters. These forward-looking statements are based on management’s current expectations and assumptions about future events, which are inherently subject to uncertainties, risks and changes in circumstances that are difficult to predict. Actual results could differ materially from those contained in these forward-looking statements for a variety of reasons, including, among others: competition, our ability to maintain user rates on our higher monetizing services, our ability to attract users to our services through cost-effective marketing and related efforts, foreign currency exchange rate fluctuations, our ability to distribute our services through third parties and offset related fees, the integrity and scalability of our systems and infrastructure (and those of third parties) and our ability to adapt ours to changes in a timely and cost-effective manner, our ability to protect our systems from cyberattacks and to protect personal and confidential user information, risks relating to certain of our international operations and acquisitions, certain risks relating to our relationship with IAC post-separation, the impact of the outbreak of COVID-19 coronavirus, the risks inherent in separating Match Group from IAC, including uncertainties related to, among other things, the expected benefits of the separation, any litigation arising out of or relating to the transaction, the tax treatment of the transaction, and the impact of the separation on the businesses of Match Group, and uncertainties related to the acquisition of Hyperconnect, including, among other things, the expected benefits of the transaction, any litigation arising out of or relating to the transaction, and the impact of the transaction on the businesses of Match Group. Certain of these and other risks and uncertainties are discussed in Match Group’s filings with the Securities and Exchange Commission. Other unknown or unpredictable factors that could also adversely affect Match Group’s business, financial condition and results of operations may arise from time to time. In light of these risks and uncertainties, these forward-looking statements may not prove to be accurate. Accordingly, you should not place undue reliance on these forward-looking statements, which only reflect the views of Match Group management as of the date of this letter. Match Group does not undertake to update these forward-looking statements.
About Match Group
Match Group (NASDAQ: MTCH), through its portfolio companies, is a leading provider of digital technologies designed to help people make meaningful connections. Our global portfolio of brands includes Tinder®, Match®, Meetic®, OkCupid®, Hinge®, Pairs™, PlentyOfFish®, OurTime®, Azar®, Hakuna Live™, and more, each built to increase our users’ likelihood of connecting with others. Through our trusted brands, we provide tailored services to meet the varying preferences of our users. Our services are available in over 40 languages to our users all over the world.
Contact Us | | | | | |
Bill Archer Match Group Investor Relations ir@match.com | Justine Sacco Match Group Corporate Communications matchgroupPR@match.com |
| |
Match Group 8750 North Central Expressway, Suite 1400, Dallas, TX 75231, (214) 576-9352 https://mtch.com |