Letter to
Q3 2023 | October 31, 2023
Third Quarter 2023 Financial Highlights
| | | | | | | | | | | | | | | | | |
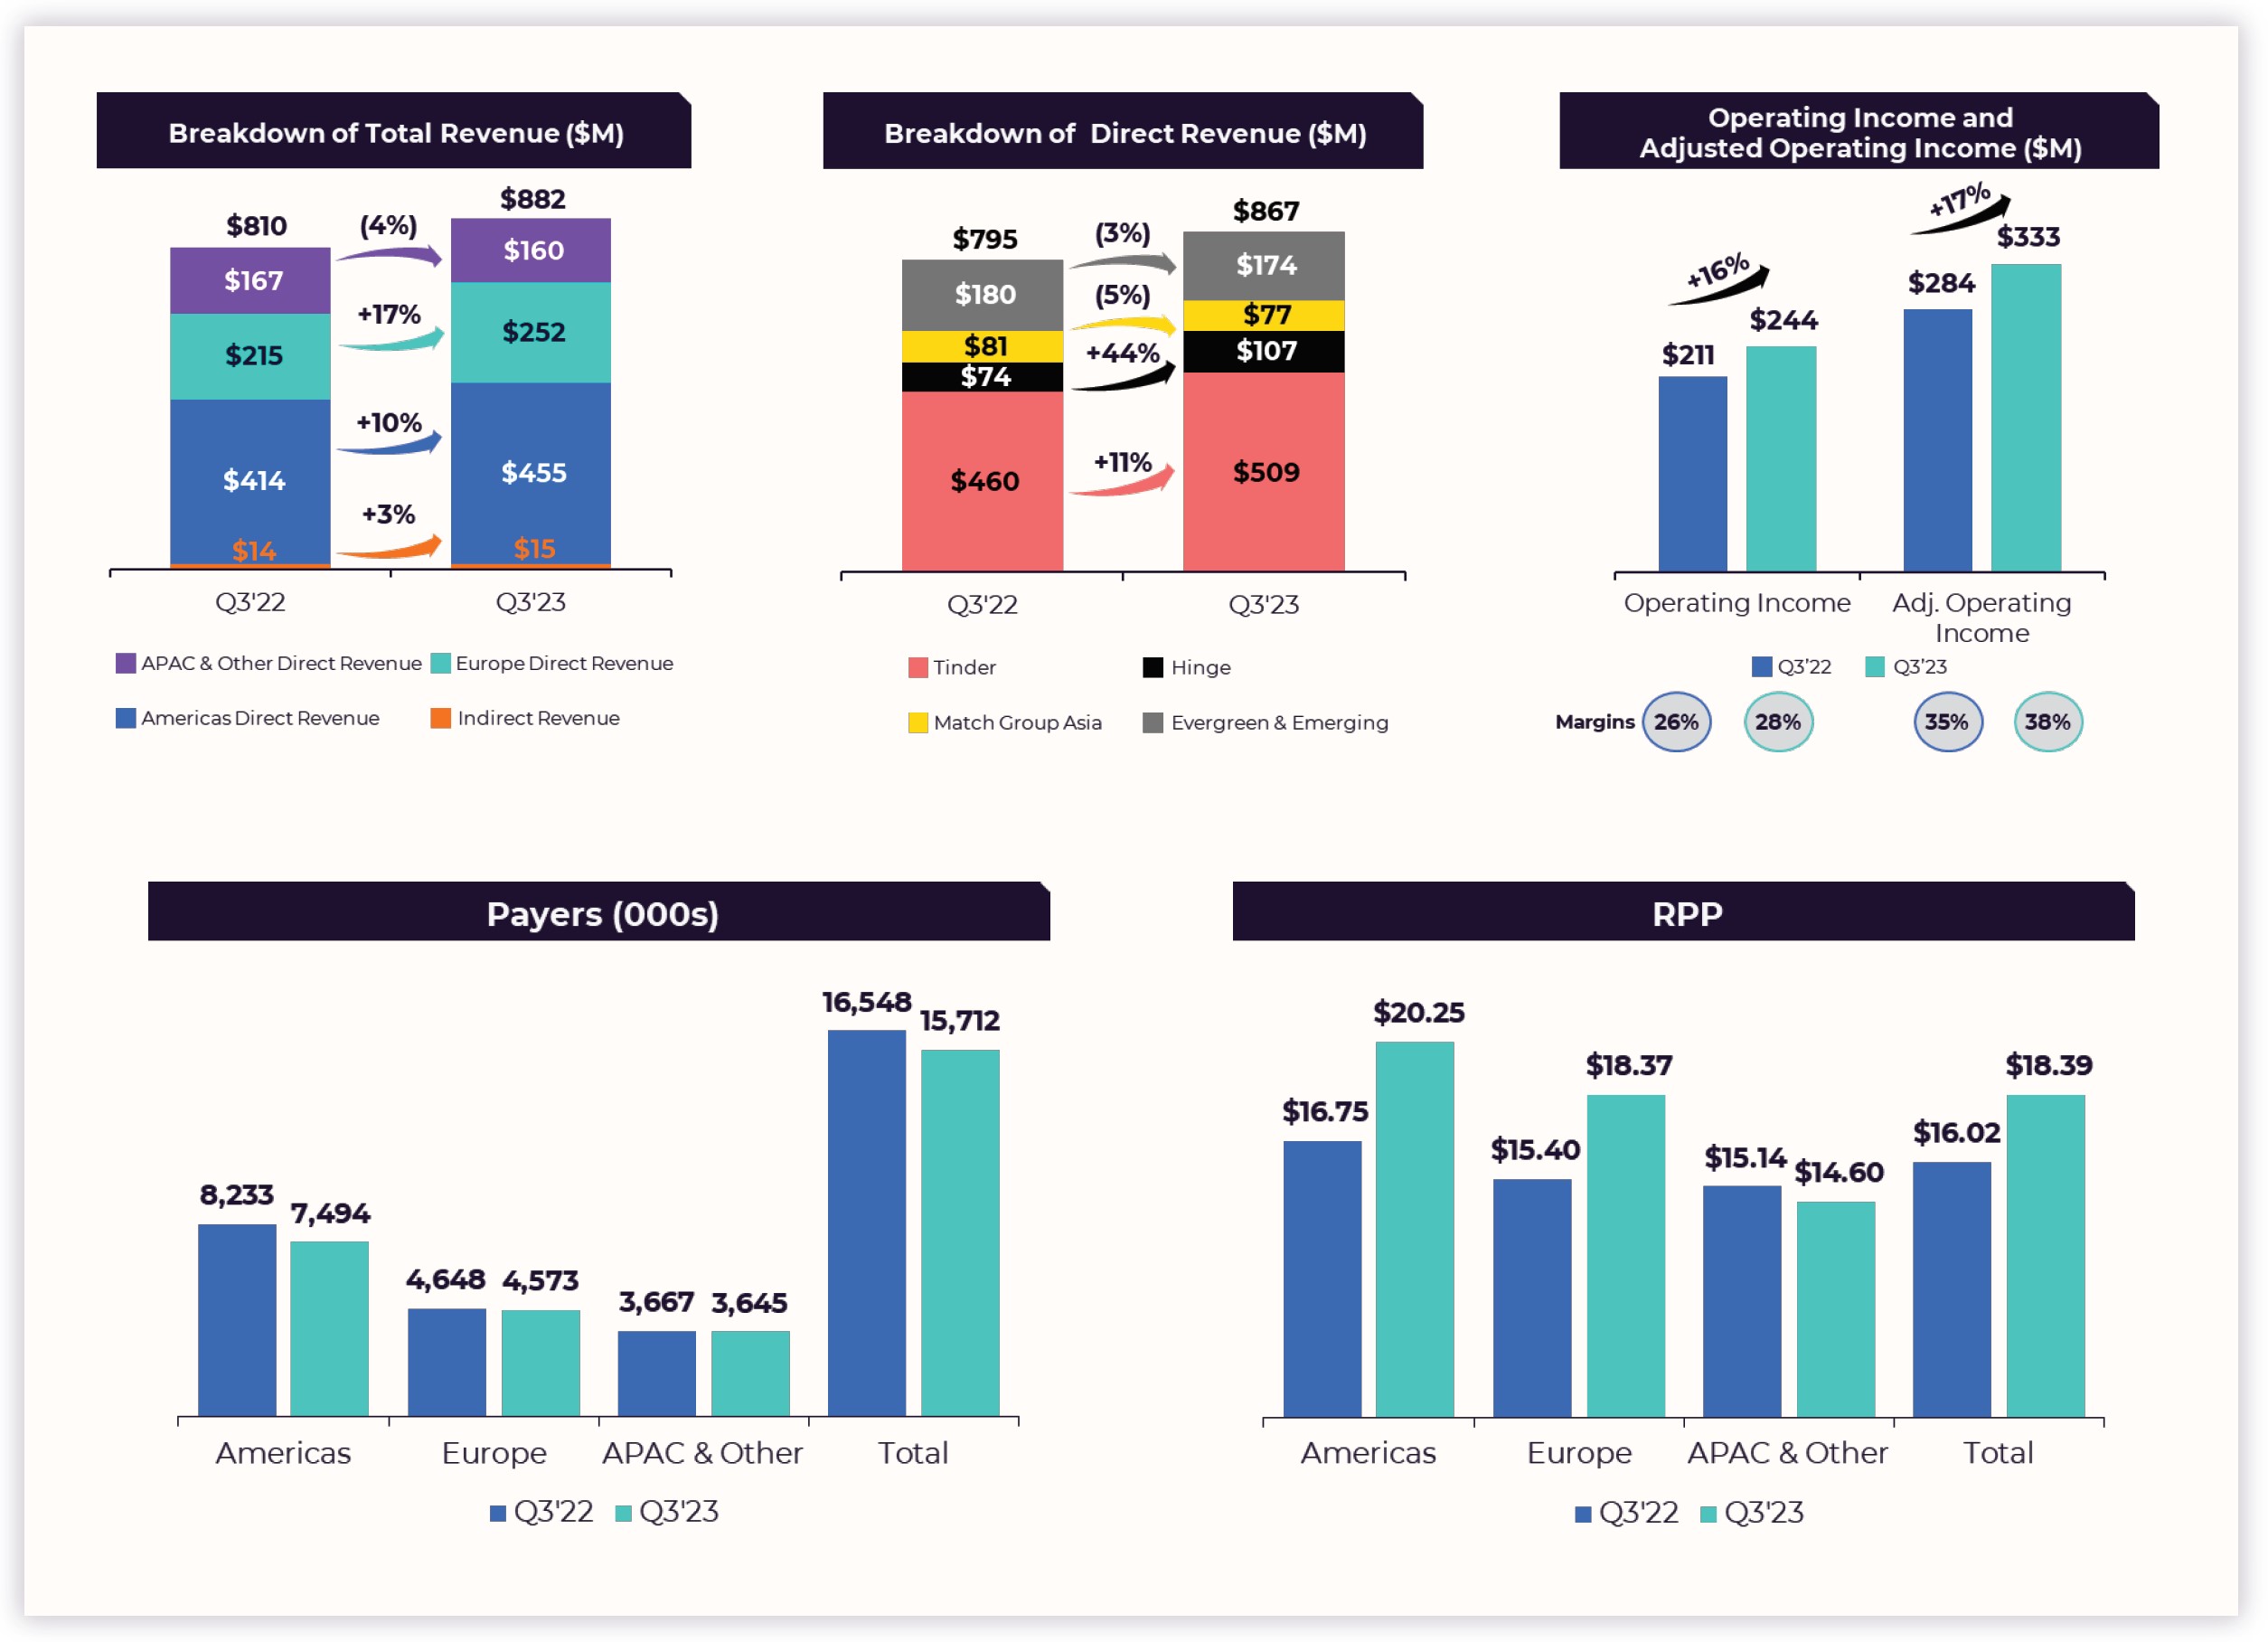
| • | | Total Revenue grew 9% over the prior year quarter to $882 million. | • | | Operating income was $244 million, up 16% versus the prior year quarter, representing an operating margin of 28%. |
| |
| | | |
| | | | |
| • | | Tinder Direct Revenue was up 11%, while collectively our other brands’ Direct Revenue was up 7% over the prior year quarter. Within our other brands, Hinge Direct Revenue was up 44% versus the prior year quarter. | | | |
| • | | Adjusted Operating Income was $333 million, up 17% versus the prior year quarter, representing an Adjusted Operating Income Margin of 38%. |
| | |
| | | |
| | | |
| | | |
| | | | |
| | | • | | Operating Cash Flow and Free Cash Flow were $621 million and $571 million, respectively, year-to-date as of September 30, 2023. |
| • | | Payers declined 5% to 15.7 million over the prior year quarter. | |
| | |
| | | |
| | | | |
| • | | RPP increased 15% over the prior year quarter to $18.39. | | | |
| | | |
| | | | |
Dear Shareholders,
We’ve been focused on two key sets of initiatives in 2023. First, we’ve encouraged the teams at each of our businesses to sharpen product and marketing execution and achieve clearly defined operating and financial objectives. Second, we’ve emphasized innovation, with our teams collaborating globally to build AI-driven features that we believe will help solve key user pain points and bring new users into the category.
In more specifics: Tinder’s goal was to reach double-digit Direct Revenue growth by Q4 along with improving marketing and product execution informed by user feedback. At Hinge, the objectives were major European market expansion, continued growth in English-speaking markets, and accelerating overall revenue growth. MG Asia focused on reinvigorating growth at Azar and Pairs, while vastly improving profitability at Hyperconnect. Evergreen & Emerging’s objective was to develop a path to greater efficiency through team and platform consolidation, while also incubating some exciting new bets.
And the results are clear: The Company’s operating and financial performance has improved throughout the year. In Q3, Tinder delivered double-digit year-over-year Direct Revenue growth, which was one quarter ahead of our initial expectations. At the same time, the team is continuing to roll out key marketing and product initiatives which we expect will drive 2024 (and beyond) results. Hinge grew Direct Revenue 44% year-over-year in Q3 as it continued to achieve all-time highs in app downloads and global popularity, vaulting to #1 by downloads in several critical markets. At MG Asia, the Azar app has benefited from AI-driven innovation, Hyperconnect’s profitability has significantly improved, and we’re leveraging the team there to build exciting AI-enabled features for the entire Match Group portfolio. Evergreen & Emerging rolled out our new app, Archer, nationwide to a strong reception, while at the same time improving efficiency.
While our collective efforts have put the Company on much improved footing, there is still much work to be done to sustain this momentum, especially amid an uncertain macro backdrop. We’re confident our accomplishments thus far in 2023 have laid the groundwork for an even stronger future ahead for Match Group. Our energy levels are high, our objectives are clear, and we have the right team to keep delivering results for shareholders.
| | | | | |
| |
| Bernard Kim (“BK”) | Gary Swidler |
| Chief Executive Officer | President &
Chief Financial Officer |
Quarter in Review
Q3 2023 Performance
In Q3, Match Group delivered the strongest quarterly Total Revenue in Company history at $882 million, up 9% year-over-year (“Y/Y”), along with record levels of profitability, demonstrating the power of our portfolio to yield financial performance that is among best-in-class.
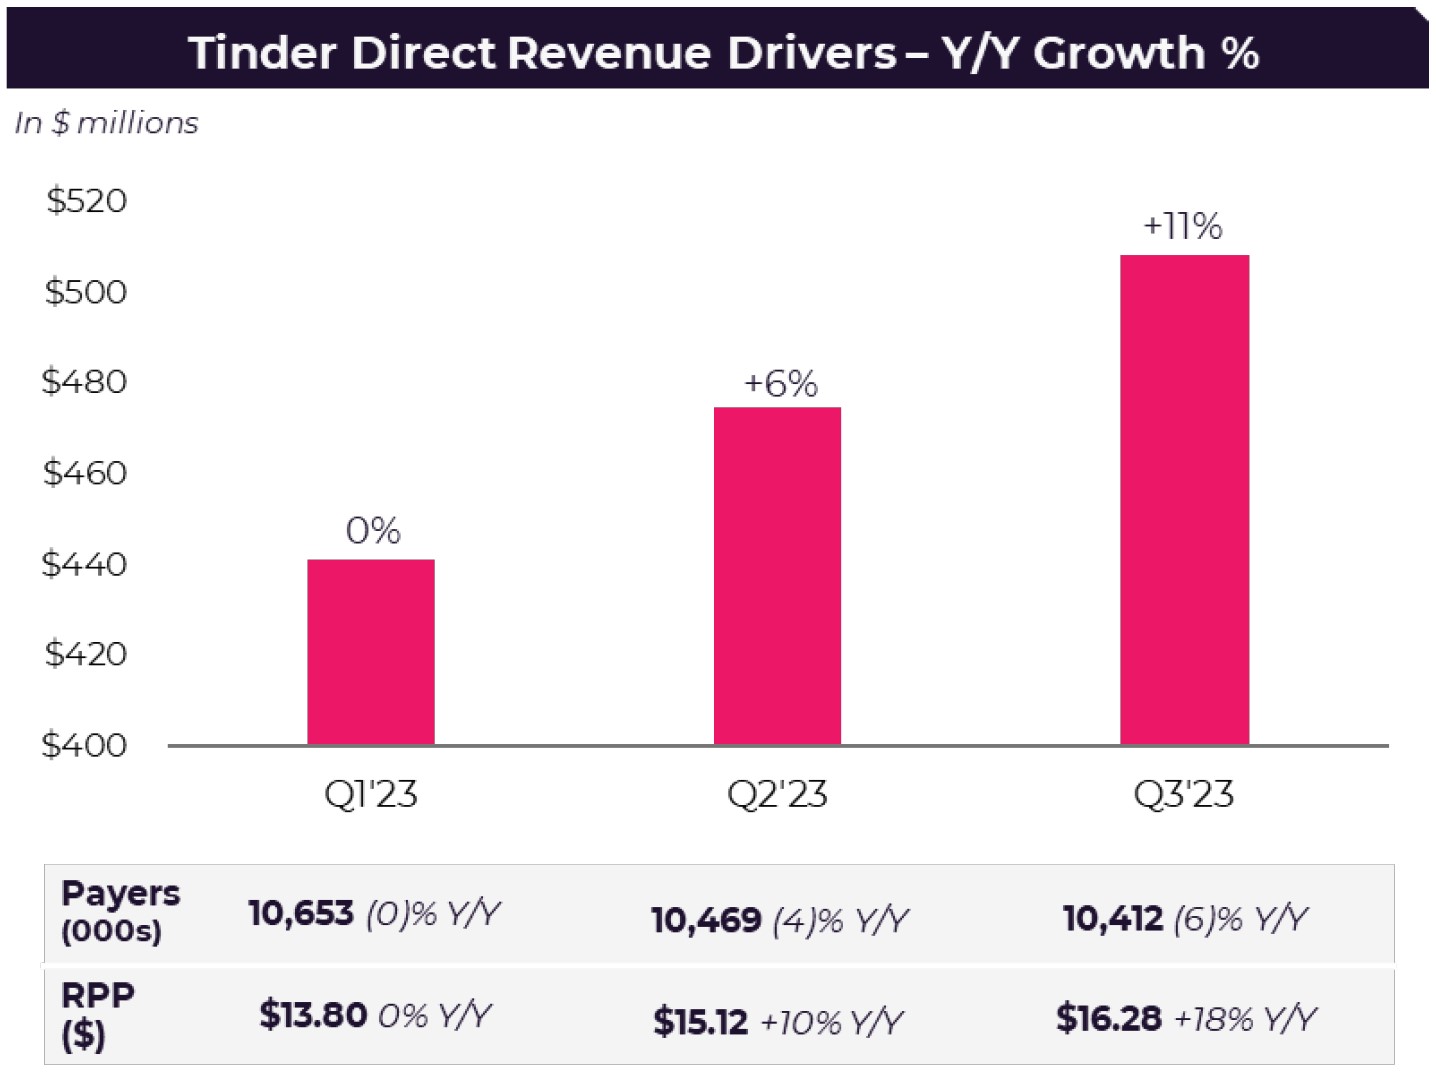
Tinder® Direct Revenue grew 11% Y/Y to $509 million, driven by a continued tailwind from U.S. pricing optimizations and weekly subscription packages. As a result, RPP rose 18% Y/Y to $16.28, partially offset by a 6% Y/Y decline in Payers to 10.4 million, primarily due to the expected impact of U.S. price optimizations on conversion.
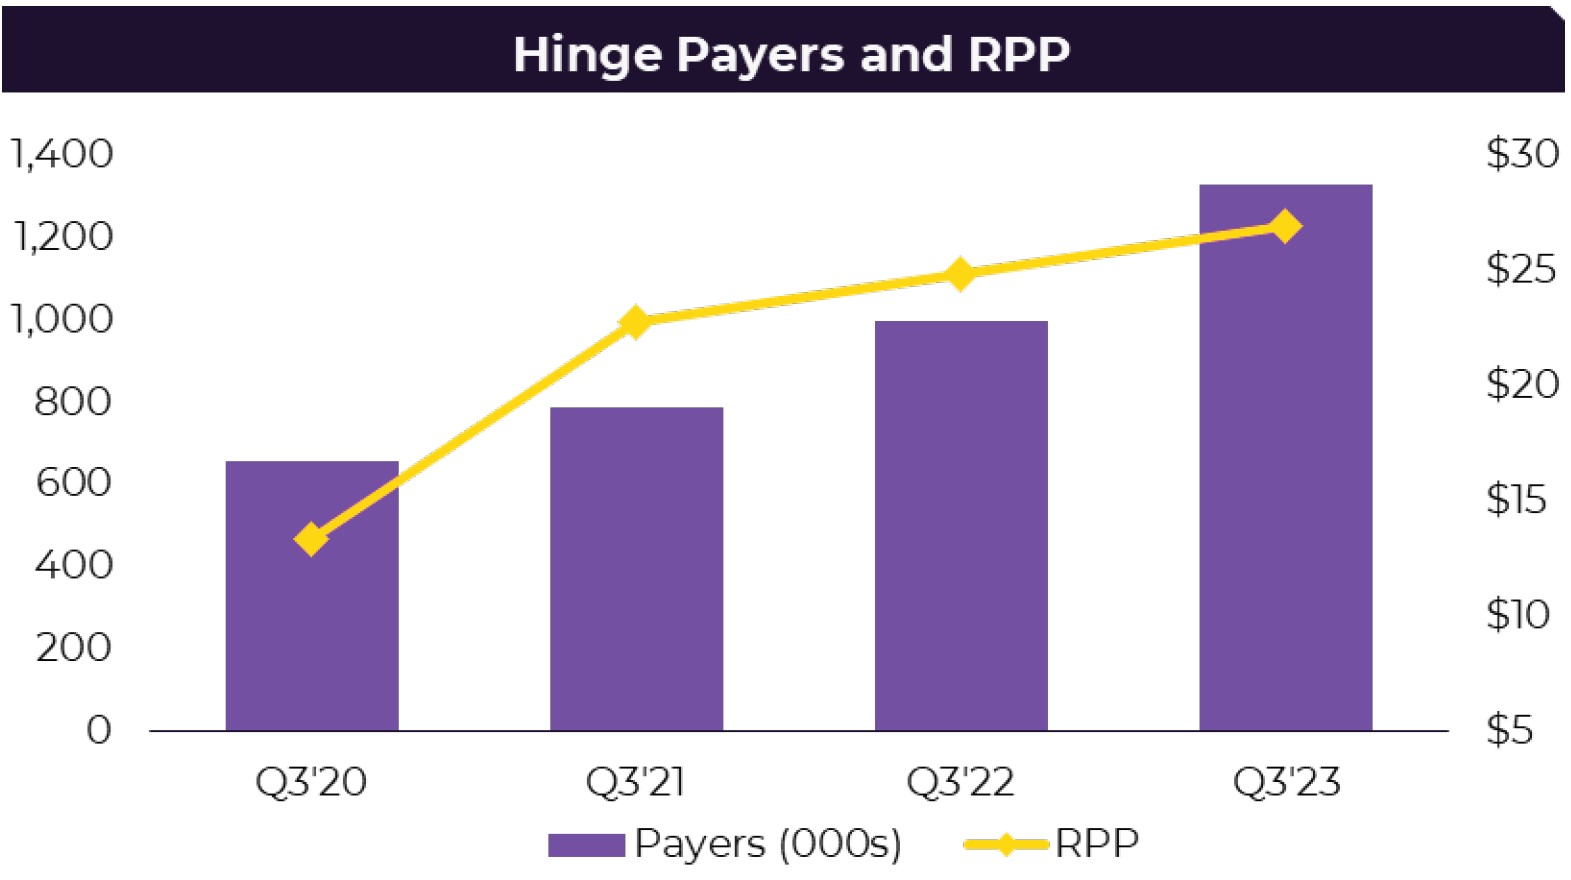
Hinge® Direct Revenue grew 44% Y/Y to $107 million. Hinge continued to enjoy robust user and download growth through Q3 in its core English-speaking and European expansion markets, with year-to-date downloads in these regions up 44% Y/Y1. Q3 Payers grew 33% Y/Y to 1.3 million and RPP rose 8% Y/Y to nearly $27.
Match Group Asia (“MG Asia”) Direct Revenue declined 5% Y/Y to $77 million, holding Y/Y declines essentially flat on a sequential basis. Azar® delivered another quarter of strong double-digit growth, helping to partially offset weakness at Hakuna® and Pairs™, which continues to be affected by overall muted growth in Japan.
Evergreen & Emerging (“E&E”) Direct Revenue declined 3% Y/Y to $174 million, representing a moderation in declines compared to prior quarters. Emerging brands’ Direct Revenue continued to grow strongly at nearly 40% Y/Y and Archer is showing solid early user momentum. Evergreen brands continue to focus on marketing and other operating cost discipline, allowing for incremental investments in growth opportunities elsewhere in the portfolio.
Q3 Operating Income was a record $244 million, up 16% Y/Y, representing a margin of 28%. Total Operating Costs and Expenses were up 7% Y/Y, down two points as a percentage of Total Revenue. Cost of revenue was up 3% Y/Y, but down two points as a percentage of Total Revenue at 29%. IAP fees, which included the final $3 million escrow payment related to the Google litigation, increased half a point Y/Y as a percentage of Total Revenue. Selling and marketing expenses were up $24 million, or 18% Y/Y, and up one point as a percentage of Total Revenue at 17%. General and administrative expenses were down 6% Y/Y, decreasing two points as a percentage of Total Revenue to 12%. Product and development expenses were up 7% Y/Y, and flat as a percentage of Total Revenue at 11%.
Adjusted Operating Income (“AOI”) of $333 million, the highest level of AOI in the Company’s history, was up 17% Y/Y, representing a 38% margin.
1 Source: Sensor Tower. Combined downloads across Apple App Store and Google Play Store.
Business Updates
TINDER
Gen Z-Focused Marketing Push
Earlier in the year, Tinder introduced It Starts with a Swipe™ as a critical first step in reclaiming its brand narrative following many years of relying predominantly on viral growth. Since launch, the campaign has driven increased brand consideration and intent, and improved download and reactivation trends, particularly among younger users and women.
In late August, after a three-year hiatus due to the pandemic and campus closures, Tinder began marketing on college campuses again and launched the nationwide Swipe Off™ challenge. The challenge awarded the most engaged school, Arizona State University, with a free concert that will be headlined by well-known rapper Saweetie. The challenge proved highly valuable in driving increased user engagement, with double-digit growth in Swipe volume across the top 20 most active Tinder U schools.
Tinder elected to briefly pull back on the It Starts with a Swipe campaign in late summer to focus resources on the back-to-school season. As a result, total new users2 in the U.S. declined to 6% Y/Y in September, as compared to a 2% decline in June. However, over that same period, new users consisting of women 18-29 years old did not see the same step back, demonstrating the impact of Tinder’s sharper focus on younger women.
In late October, Tinder rolled out a new feature called Tinder MatchmakerTM, which allows users to let their friends make profile recommendations for them. The launch was coupled with a major marketing push featuring Gen Z icon Coi Leray as the campaign’s spokesperson.
2 New Users represents an average of total daily first-time users and returning users who have not been active on Tinder in the past 28 days.
Continued Product Momentum with Monetization Delivering Ahead of Expectations
Tinder is executing well against its Fall product roadmap. In mid-September, Tinder began testing its ultra-premium subscription tier, Tinder SELECT®, which aims to provide users more chances to connect with the most sought-after profiles. Tinder continues to gradually roll out the new offering and is working to ensure that members understand its compelling value.
By year end, Tinder is planning to roll out the first phase of its product refresh designed to better meet the expectations of its core Gen Z audience. While Tinder’s iconic Swipe® functionality and ease of use will remain central to the experience, the refreshed product will provide the optionality to dive deeper and engage more authentically via quizzes, prompts, and other elements that help to better bring profiles to life. Tinder is also continuing its efforts to improve trust and safety and ecosystem health, with particular focus on women’s experience. We remain confident that these efforts will collectively lead to improved user acquisition and retention, as well as revenue trends, over time.
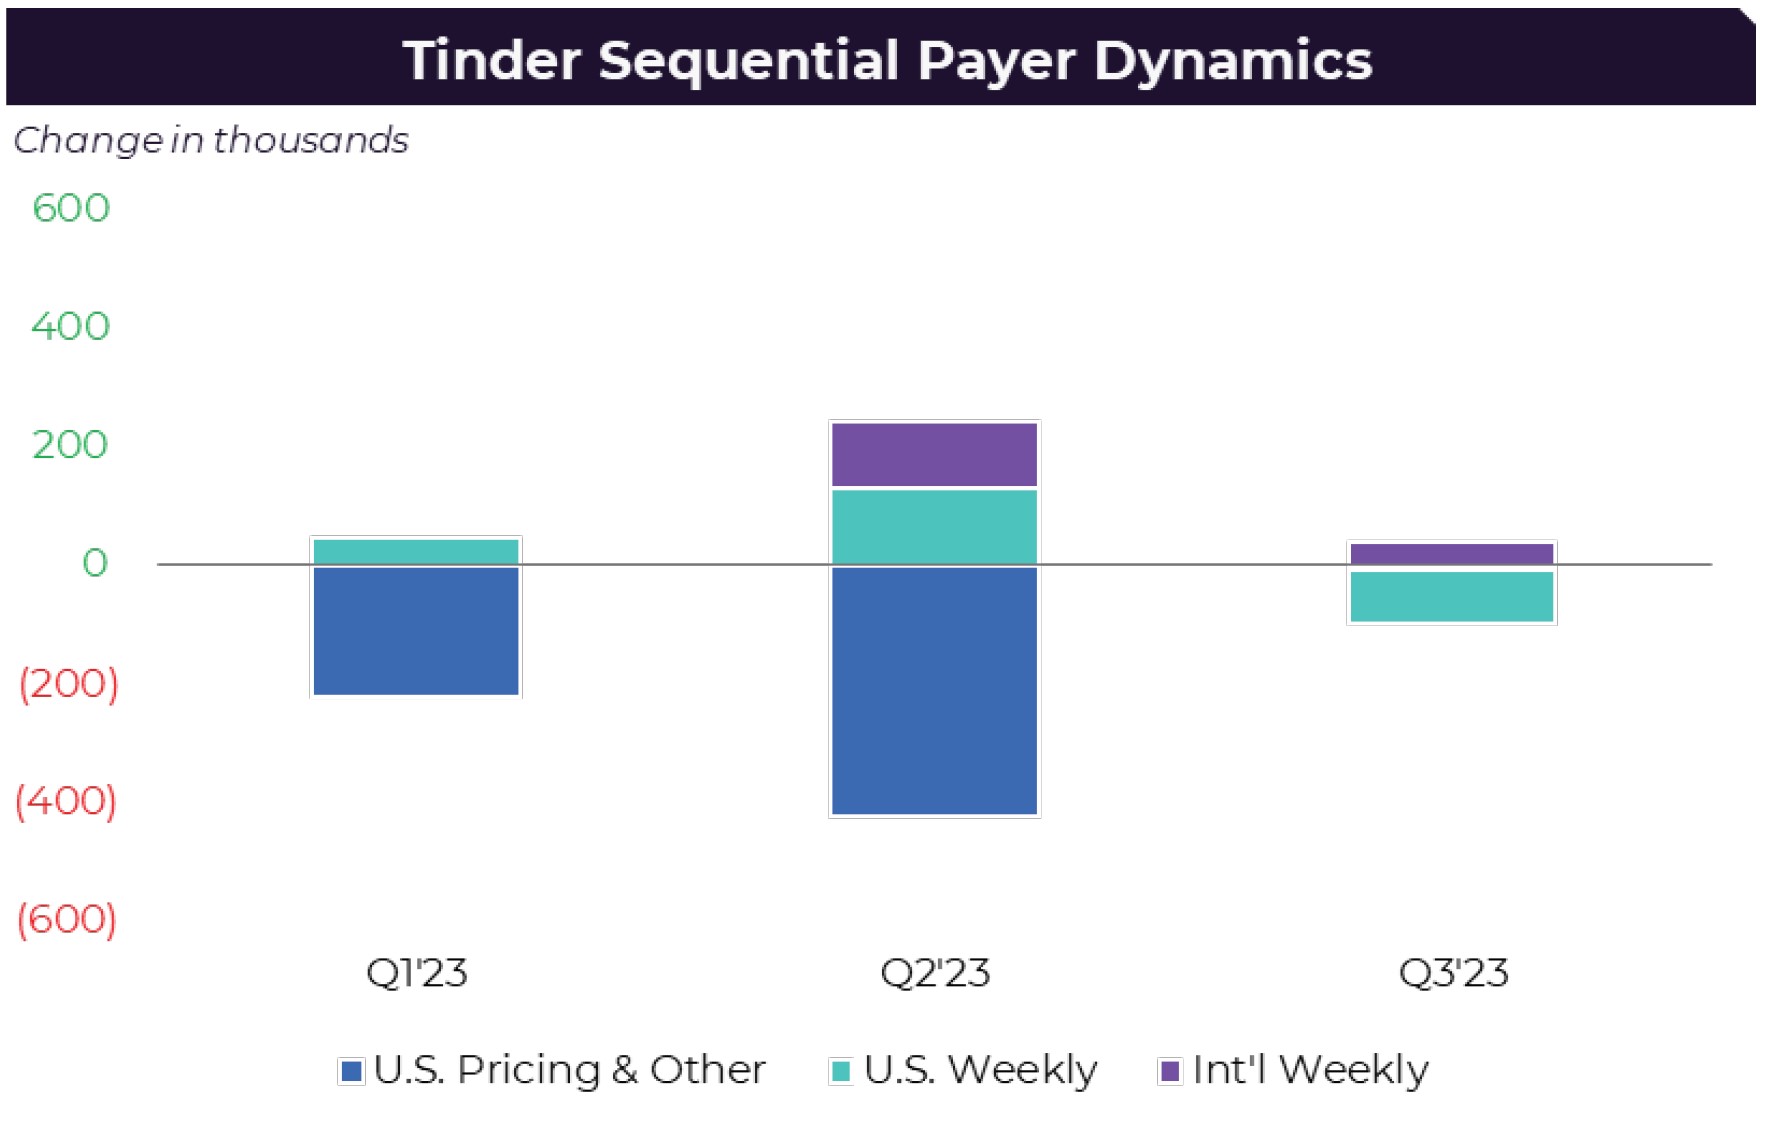
Beginning in late Q1 Tinder rolled out a series of monetization efforts to help drive ’23 revenue growth. These efforts included significant price optimizations in the U.S. and the introduction of weekly subscriptions in the U.S. followed by several key international markets. These optimizations have succeeded as planned, driving increased revenue momentum throughout the year and much higher RPP (up 42% Y/Y in the U.S. in Q3, for example). However, they’ve also had the expected impacts on Tinder’s Payer count. The price increases have reduced conversion, leading to an anticipated decline in Y/Y Payers (as shown in the chart below), as well as adversely impacted sequential Payer trends. The weekly packages also create Payer variability by increasing the Payer count in the quarter when they are introduced but reducing it in the subsequent period when these shorter duration Payers generally fall out of the Payer count. Unlike the impact on Payers from the pricing changes, which has the effect of resetting the Payer baseline, the sequential variability introduced by the weekly packages is expected to largely even out over time. We’ve provided more details on the effects of the pricing optimizations and weekly packages on Tinder’s Payers on page 13.
HINGE
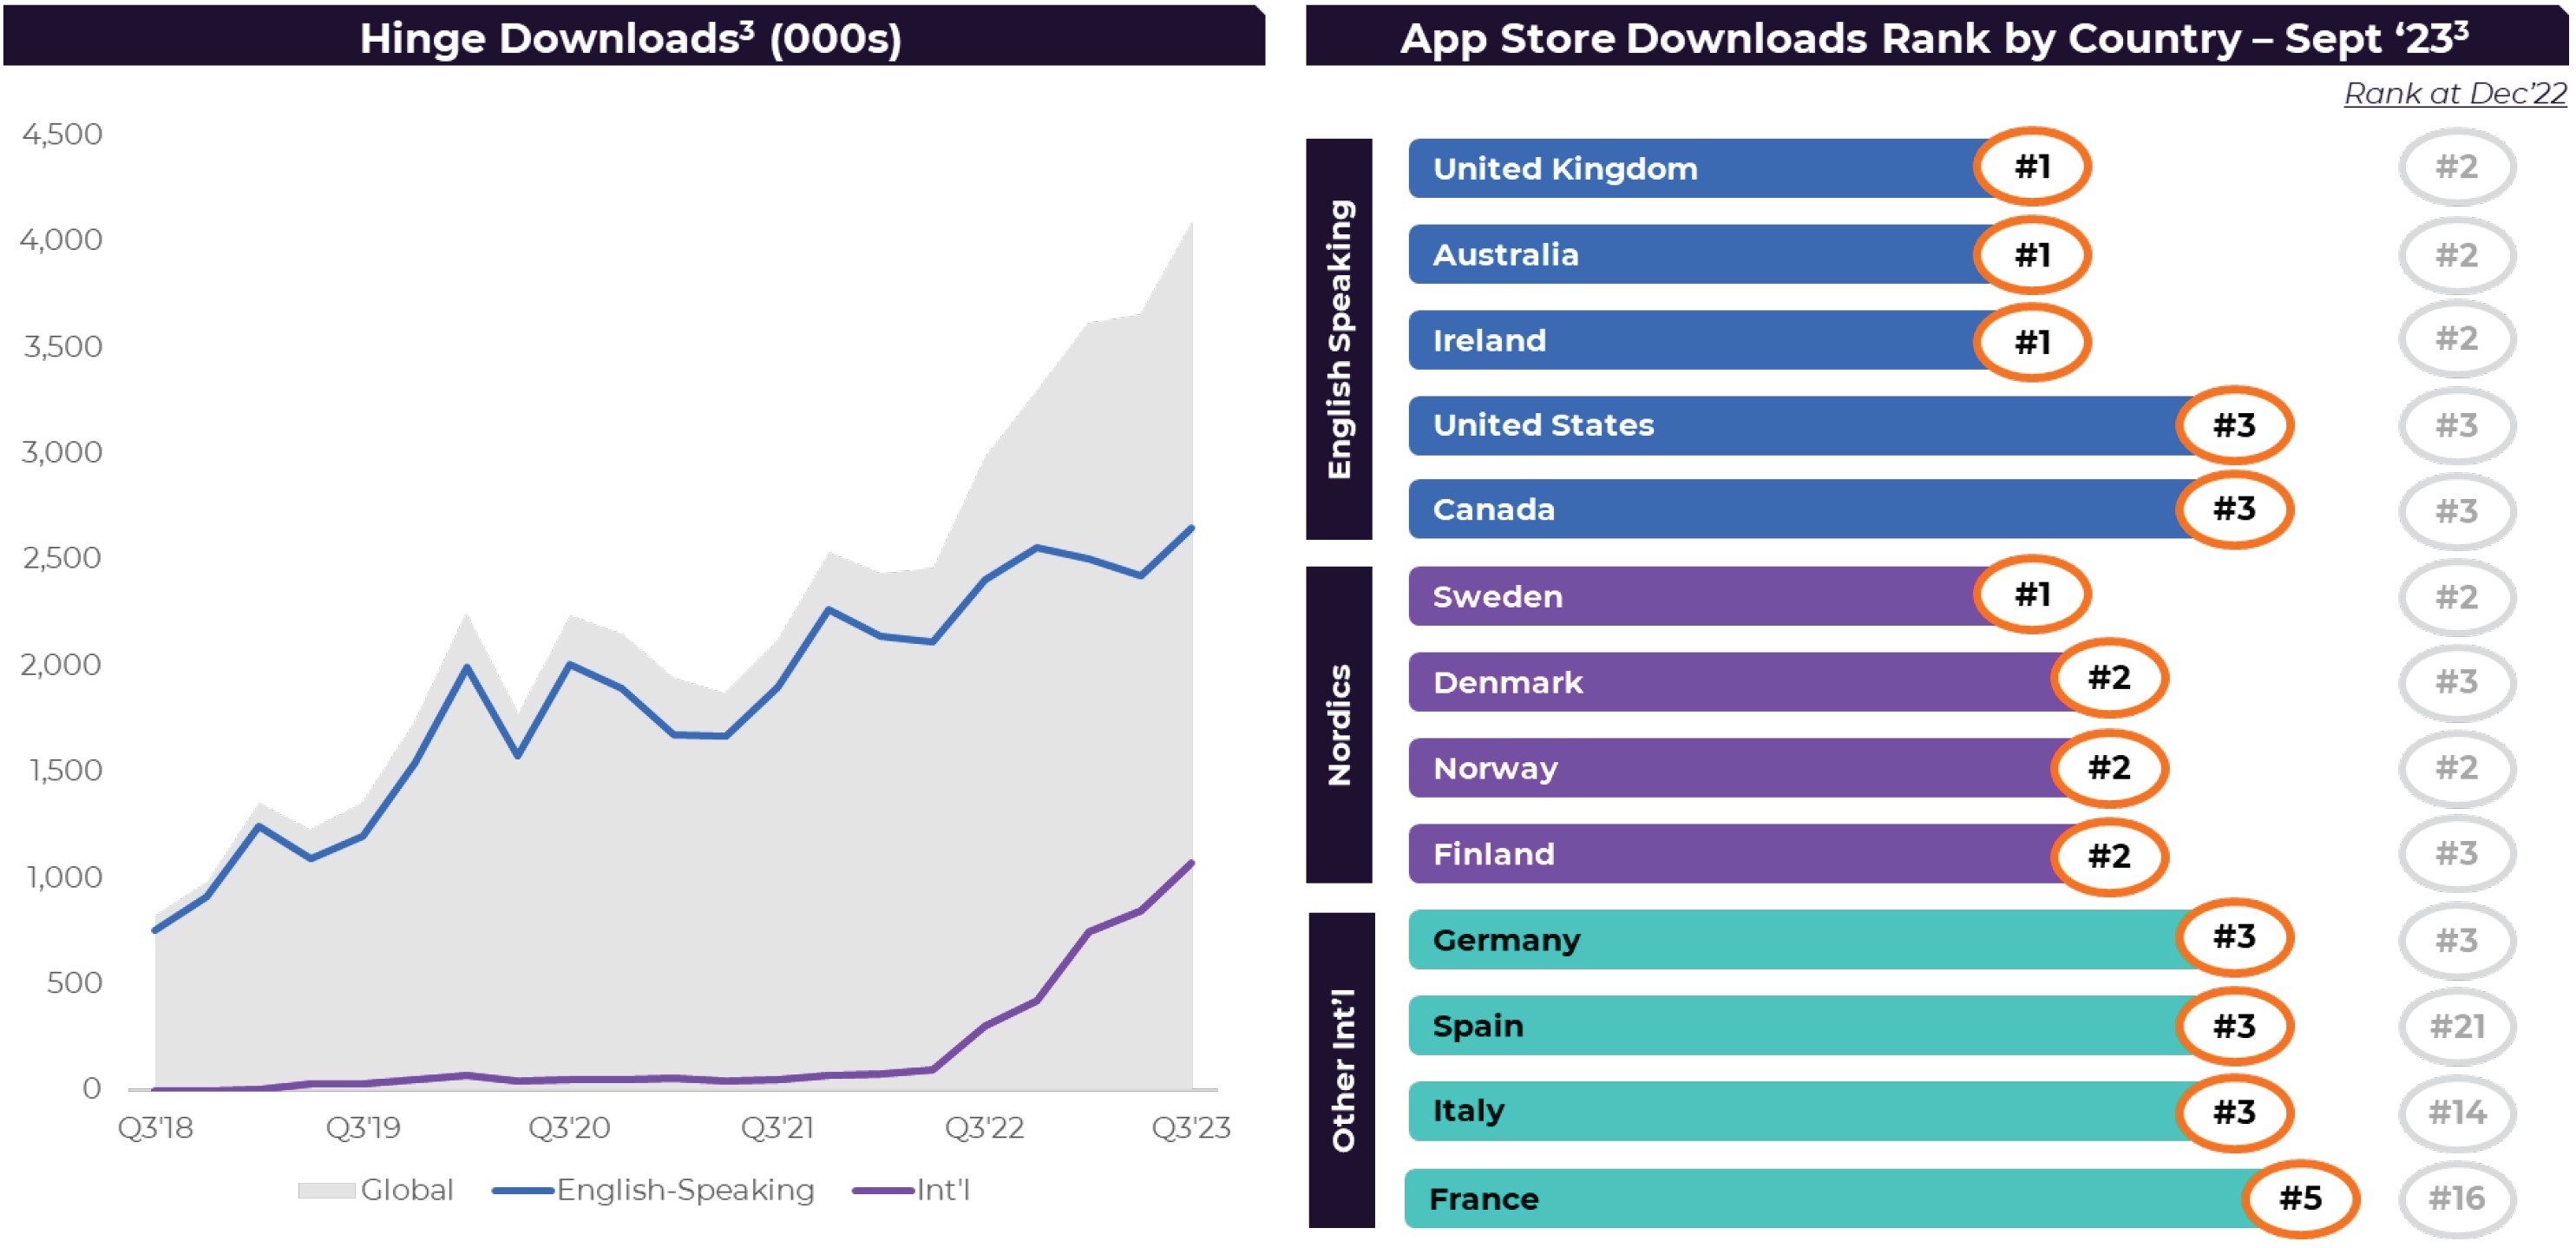
Hinge’s performance has remained incredibly strong throughout 2023, with accelerating user and revenue momentum, as it continues to effectively execute against its three key growth levers: core market user growth; European user growth; and revenue initiatives. Notably, Q3 was Hinge’s strongest download quarter ever, proving that Hinge’s brand narrative and product-market fit are resonating and that there is ample growth opportunity.
 3
3In core English-speaking countries, Hinge recorded the number one rank in downloads in the U.K. and Australia, which are both highly competitive markets, and maintained a top three position in the U.S. and Canada. In Europe, Hinge ranks second or third by downloads in virtually all key countries. The 2023 run up in download rankings across Europe has been striking.
Hinge is only in the early stages of building out its monetization efforts. In Q3, Hinge had 1.3 million Payers with an RPP of nearly $27. Hinge fully rolled out weekly subscriptions in the U.S. and began testing them in the U.K., Australia, Canada, and the EU. As expected, early results show conversion gains and revenue accretion. Additionally, Hinge has started testing price optimizations across geographies, which will enable the brand to offer varying rates instead of a single static rate across markets. We are optimistic that Hinge has an incredible amount of user growth and monetization runway.
3 Source: Sensor Tower. Combined downloads across Apple App Store and Google Play Store.
MATCH GROUP ASIA
Hyperconnect® continues to see solid performance at its Azar app. Azar’s Direct Revenue grew 20% Y/Y in Q3, its second consecutive quarter of 20% or better growth, as its AI-enabled matching algorithm continues to drive user engagement and monetization wins. We’re planning to make an international push for the Azar app, beginning with Europe and then extending to the U.S. over the coming quarters. At Hakuna, Hyperconnect continues to monitor the effectiveness of its reimagined features, which aim to establish a more personal connection between creators and their audience.
The talented Hyperconnect team has become an AI center of excellence that is helping build new features that can be implemented portfolio wide. While all of this has been occurring, profitability at Hyperconnect has reached the highest level since our acquisition and is exceeding our 2023 target.
While the Japanese market for online dating has remained under pressure since the pandemic, Pairs was able to advertise on TV for the first time ever starting in September. We’re optimistic this channel will help further reduce stigma and reignite momentum in Japan over time.
EVERGREEN & EMERGING
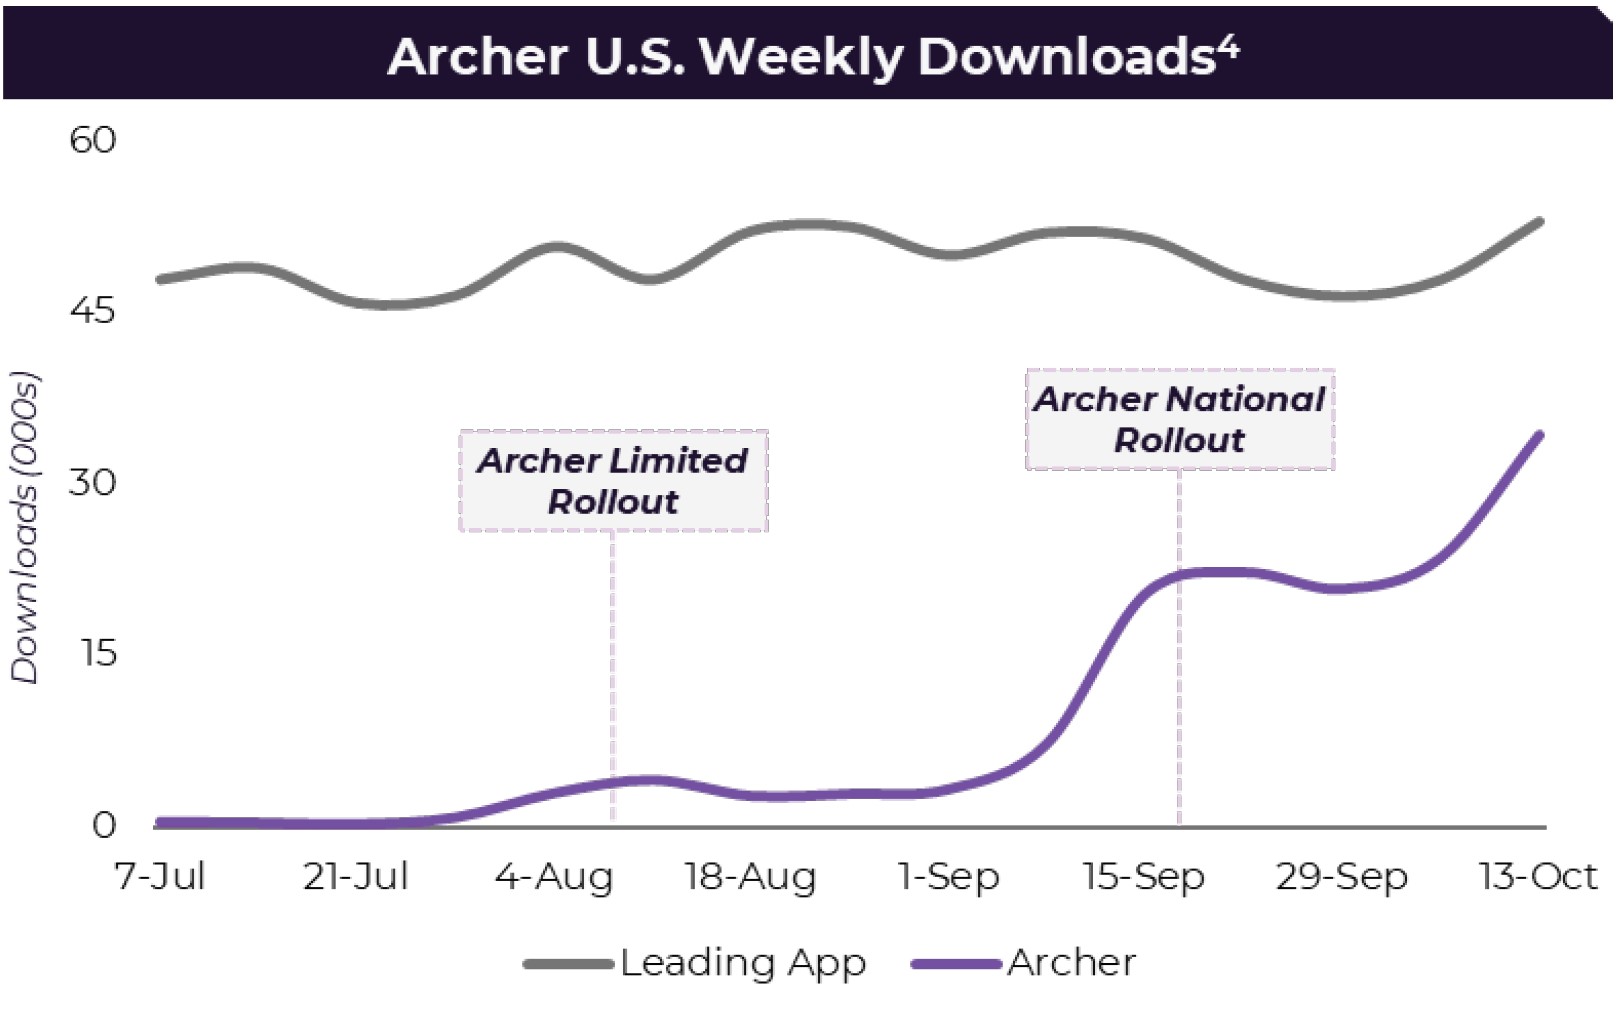
In E&E, the new Archer™ app, targeted at gay, bisexual, and queer men, has been met with strong initial interest. Archer’s safer and more social user experience has enabled it to quickly become the second most downloaded app focused on this demographic group in the U.S., with minimal marketing spend. Notably, in September, Archer achieved average downloads that were approximately one-third of those of the leading app in this space, after just a month on the market. A nationwide PR campaign began on October 11, National Coming Out Day, which has helped propel Archer to gain further share.
 4
4The League recently launched its first-ever brand marketing campaign, called GoalDigger, which focuses on users who are ambitious and goal-oriented. The app also now includes a GoalMates™ feature, which encourages members to openly share their goals on their profile to improve user matching.
4 Source: Sensor Tower. Combined downloads across Apple App Store and Google Play Store
Capital Allocation
In Q2, we stated our intent to return at least 50% of our free cash flow (“FCF”) to shareholders, via share buybacks or other means. Given the Company’s significant FCF generation and minimal capital needs, we believe that returning a large part of our FCF to shareholders will help enhance long-term shareholder value.
In Q3, we repurchased $300 million of stock, for a total of $445 million repurchased year-to-date, which has reduced our share count by 2.8% from the beginning of the year, net of shares issued under our employee stock plans. Given our expectations for roughly $800 million of FCF in ‘23, we’ve already exceeded our 50% return of capital target. Notably, it is a target and not a limit, and we intend to continue to opportunistically buy back shares. We currently have $667 million remaining under our $1 billion repurchase program. We expect our FCF to grow materially in ‘24 (in part due to the timing of an app store cash receipt), which should enable our levels of capital return to grow as well.
We ended Q3 with a trailing twelve-month net leverage5 of 2.7x, which was below our previously articulated target of under 3x, and over $700 million of cash on hand. While we’re comfortable with our current net leverage level and lack of near-term debt maturities, we also recognize that challenging macro conditions, most notably rising interest rates, currently dictate prudence and thus we are not averse to having our net leverage level decline further.
We’re a growth company at heart, and we continue to see opportunities to invest in a disciplined manner in innovation to drive strong organic growth. We recognize that organic growth is the most attractive lever from a shareholder value perspective, and we believe we are currently funding the right bets on innovation through our income statement. Acquisitions also have historically been an important tool for us and while they do not always work out as expected, acquisitions such as Hinge, which we fully acquired for approximately $25 million in ‘18, demonstrate the value we can create when we combine our experience and capabilities with a desirable target.
Our acquisition approach will be highly disciplined and focused. We expect our acquisitions to be in the dating space or near-adjacencies that are consistent with our Company mission, and/or of enabling technologies that accelerate delivering on our mission. We believe that acquisitions should remain a component of our strategy and that we must maintain the financial flexibility to execute as opportunities present themselves. The bar for our use of capital for acquisitions, though, is high. Any target needs to be strategically compelling and at an appropriate valuation that reflects the current environment. If we do not identify such targets, we expect to return further excess capital to shareholders.
5 Leverage is calculated utilizing the non-GAAP measure Adjusted Operating Income as the denominator. For a reconciliation of the non-GAAP measure for each period presented, see page 23.
Financial Outlook
Q4 and Full Year 2023
For Q4, we expect Match Group Total Revenue of $855 million to $865 million, which includes $27 million more in Q4 FX headwinds than we anticipated at the time of our last earnings call and risk on approximately $7 million of quarterly revenue that our brands collectively generate in Israel, given the ongoing events there. It also reflects some risk of business deterioration due to weakening macro conditions globally, including at our advertising business and on à la carte revenue at Tinder.
We expect Q4 Match Group AOI to be $305 to $310 million, up 7% to 9% Y/Y, representing a margin of 36% at the midpoint of the ranges. We expect marketing spend to be up modestly Y/Y due to a number of key year-end marketing initiatives at Tinder and several other of our other growth brands as we seek to build incremental user momentum for ‘24.
For Tinder, we expect Q4 Y/Y Direct Revenue growth of approximately 11% driven by slightly greater Y/Y RPP increases due to U.S. price optimizations and weekly subscriptions, and slightly larger Y/Y Payer declines than in Q3, again primarily due to the U.S. price optimizations. Additional FX headwinds and the events in Israel, as well as macro concerns including U.S. student loan resumption impacts, are incorporated into our Q4 Tinder outlook.
| | | | | | | | | | | | | | |
| | Total Revenue | | Adjusted Operating Income |
| Q4 2023 | | $855 to $865 million | | $305 to $310 million |
| | | | |
| | | | |
| | | | |
| | | | |
For the full year 2023 we expect to deliver Total Revenue growth Company-wide towards the lower end of the range we provided a year ago. We expect full year ’23 AOI margins to be improved over ‘22, which is in-line with our most recent outlook and ahead of the expectations we provided a year ago.
Note, that our Q4 and full year 2023 outlooks do not include any impacts from the Google lawsuit settlement discussed below.
Preliminary Thoughts on 2024
Given our strong team and the execution and revenue momentum we’ve built in the back half of ’23, we expect to enter ’24 continuing to deliver 10%+ Y/Y Total Revenue growth. The most critical component to maintaining that level of revenue growth for the full year will be the ability of Tinder’s ongoing marketing and product initiatives to deliver as the impacts of the ’23 optimizations anniversary. We currently believe the most likely outcome is for full year ’24 Y/Y Total Revenue growth in the high-single-digits (inclusive of an assumed two-point FX headwind), but we want to allow Tinder’s execution momentum to build for another quarter and macro conditions to clarify before further pinpointing our full year outlook.
Our Y/Y Tinder Direct Revenue growth outlook is in line with that of the Company as a whole. We expect single-digit Y/Y RPP growth in ’24 and improving Y/Y Payer growth over the course of ’24 as the ‘23 price optimizations anniversary and momentum builds from product and marketing initiatives. We expect the non-Tinder brands collectively to deliver high-single-digit Y/Y Direct Revenue growth in ’24. We expect Hinge to continue to focus on expansion in Europe and to deliver similar Y/Y Direct Revenue growth rates in ’24 as in ’23.
Our objective is to deliver ’24 Match Group AOI margins that are at least at the same level we expect to achieve in ’23, despite headwinds from IAP and from compliance activities, including due to the implementation of the EU’s Digital Services Act. Our outlook incorporates the expected impact of the Google settlement discussed below, but no additional changes to app store policies in ’24.
As we continue our planning for ’24, we have several key goals and guideposts in mind: 1) ensuring appropriate levels of marketing spend at our key growth brands including Tinder and Hinge and applying cost reductions among the Evergreen brands to help offset; 2) investing in innovation, including for AI technologists and capabilities as we seek to reduce user pain points in online dating and build new experiences to increase user adoption; and 3) maintaining operating cost discipline overall and limiting hiring to key growth areas.
Google Lawsuit Settlement
Today, the Match plaintiffs and Google informed the court that they have reached a binding term sheet for a settlement of their respective claims against each other in the Match Group, LLC et al vs. Google LLC et al lawsuit. Under the terms, the $40 million placed in escrow will be returned to Match Group and no other amounts will be owed by the Match plaintiffs to Google relating to the claims in the lawsuit for the period ending December 31, 2023. The parties have agreed that by March 31, 2024 Match Group’s apps will implement Google’s User Choice Billing pursuant to which Match Group brands will pay standard rates of 15% on subscriptions and 30% on à la carte transactions for in-app transactions processed through Google’s payment system and 11% on subscriptions and 26% on à la carte transactions for in-app transactions processed through our payment systems. The parties will enter a new partnership agreement that will provide value exchange across their broad relationship, which we expect will essentially offset the additional costs that Match Group brands expect to incur over the three years starting in 2024 associated with the implementation and continued use of User Choice Billing in compliance with Google’s payment policy during that period.
Detail on Tinder Monetization Efforts
As discussed above, Tinder introduced U.S. price optimizations and rolled out weekly subscription packages in the U.S. and several key international markets in early ‘23. The U.S. price optimizations have significantly increased RPP and revenue, but have caused a decline in the number of Payers, essentially resetting the Payer base at a lower number but paying a higher rate. The weekly subscriptions created an initial positive lift in Payer count, but due to the shorter duration of these packages, they quickly have a largely offsetting reduction in the Payer count. This results in significant variability on the Payer count on a sequential basis, which normalizes over time.
The U.S. price optimizations, which began in late Q1, had a negative impact on Q1 and Q2 Payers as conversion of the most price sensitive users declined. This negative impact of U.S. price optimizations on Payers was partially offset by the introduction of weekly packages in the U.S. in early Q2, as well as testing in key international markets in late Q2, which together had a positive impact to Payers as the lower-priced entry point meaningfully lifted conversion of new and existing users.
We began to see the expected weekly subscriber dynamics play out in Q3, as headwinds to Payers from the roll off of U.S. weekly subscribers were partially offset by tailwinds from the full rollout of weekly subscriptions in key international markets. In addition, U.S. pricing optimizations had a smaller impact to Payers in Q3 than in Q2 as more of the Payer base was on the new prices.
In Q4, we estimate that Tinder’s sequential Payer count will be negatively impacted by more than 200,000 Payers due to U.S. and international weekly subscribers falling out of the Payer count, but without the offsetting benefit of the initial roll outs of weekly packages in additional markets that we had in Q2 and Q3. We estimate roughly 40% of the decline will be from U.S. and 60% from international weekly subscribers. We expect the sequential impact of weekly subscriptions packages we introduced in ’23 to normalize in early ’24.
Conference Call
Match Group will audiocast a conference call to answer questions regarding its third quarter financial results on Wednesday, November 1, 2023 at 8:30 a.m. Eastern Time. This call will include the disclosure of certain information, including forward-looking information, which may be material to an investor’s understanding of Match Group’s business. The live audiocast will be open to the public on Match Group’s investor relations website at https://ir.mtch.com.
Financial Results
Revenue and Key Drivers | | | | | | | | | | | | | | | | | |
| Three Months Ended September 30, | | |
| 2023 | | 2022 | | Change |
| | | | | |
| (In thousands, except RPP) | | |
| Revenue | | | | | |
| Direct Revenue: | | | | | |
| Americas | $ | 455,210 | | | $ | 413,805 | | | 10% |
| Europe | 251,982 | | | 214,771 | | | 17% |
| APAC and Other | 159,608 | | | 166,568 | | | (4)% |
| Total Direct Revenue | 866,800 | | | 795,144 | | | 9% |
| Indirect Revenue | 14,800 | | | 14,402 | | | 3% |
| Total Revenue | $ | 881,600 | | | $ | 809,546 | | | 9% |
| | | | | |
| Direct Revenue | | | | | |
| Tinder | $ | 508,521 | | | $ | 460,179 | | | 11% |
| Hinge | 107,265 | | | 74,363 | | | 44% |
| MG Asia | 76,765 | | | 80,604 | | | (5)% |
| Evergreen and Emerging | 174,249 | | | 179,998 | | | (3)% |
| Total Direct Revenue | $ | 866,800 | | | $ | 795,144 | | | 9% |
| | | | | |
| Payers | | | | | |
| Americas | 7,494 | | | 8,233 | | | (9)% |
| Europe | 4,573 | | | 4,648 | | | (2)% |
| APAC and Other | 3,645 | | | 3,667 | | | (1)% |
| Total Payers | 15,712 | | | 16,548 | | | (5)% |
| | | | | |
| | | | | |
| | | | | |
| Revenue Per Payer (“RPP”) | | | | | |
| Americas | $ | 20.25 | | | $ | 16.75 | | | 21% |
| Europe | $ | 18.37 | | | $ | 15.40 | | | 19% |
| APAC and Other | $ | 14.60 | | | $ | 15.14 | | | (4)% |
| Total RPP | $ | 18.39 | | | $ | 16.02 | | | 15% |
| | | | | |
| | | | | |
Operating Income and Adjusted Operating Income
| | | | | | | | | | | | | | | | | |
| Three Months Ended September 30, | | |
| 2023 | | 2022 | | Change |
| | | | | |
| (In thousands) | | |
| Operating Income | $ | 243,559 | | | $ | 210,635 | | | 16% |
| Operating Income Margin | 28 | % | | 26 | % | | 1.6 points |
| Adjusted Operating Income | $ | 333,103 | | | $ | 284,182 | | | 17% |
| Adjusted Operating Income Margin | 38 | % | | 35 | % | | 2.7 points |
Operating Costs and Expenses
| | | | | | | | | | | | | | | | | | | | | | | | | | | | | |
| Q3 2023 | | % of Revenue | | Q3 2022 | | % of Revenue | | Change |
| | | | | | | | | |
| (In thousands) | | |
| Cost of revenue | $ | 255,598 | | | 29% | | $ | 246,962 | | | 31% | | 3% |
| Selling and marketing expense | 153,408 | | | 17% | | 129,615 | | | 16% | | 18% |
| General and administrative expense | 107,095 | | | 12% | | 114,169 | | | 14% | | (6)% |
| Product development expense | 94,141 | | | 11% | | 87,880 | | | 11% | | 7% |
| Depreciation | 17,310 | | | 2% | | 10,679 | | | 1% | | 62% |
| Amortization of intangibles | 10,489 | | | 1% | | 9,606 | | | 1% | | 9% |
| Total operating costs and expenses | $ | 638,041 | | | 72% | | $ | 598,911 | | | 74% | | 7% |
Liquidity and Capital Resources
During the nine months ended September 30, 2023, we generated operating cash flow of $621 million and Free Cash Flow of $571 million, both of which were unfavorably impacted by the timing of a cash receipt from an app store.
During the quarter ended September 30, 2023, we repurchased 6.7 million shares of our common stock for $300 million on a trade date basis at an average price of $44.99. As of October 31, 2023, $667 million in aggregate value of shares of Match Group stock remains available under our previously announced share repurchase program.
As of September 30, 2023, we had $713 million in cash and cash equivalents and short-term investments and $3.9 billion of long-term debt, $3.5 billion of which is fixed rate debt, including $1.2 billion of Exchangeable Senior Notes. Our $750 million revolving credit facility was undrawn as of September 30, 2023. Match Group’s trailing twelve-month leverage6 as of September 30, 2023 is 3.3x on a gross basis and 2.7x on a net basis.
Income Taxes
We recorded an income tax provision of $47 million in the third quarter of 2023, which equates to an effective tax rate of 22%. In the third quarter of 2022, the income tax provision was $48 million, which equates to an effective rate of 27%.
6 Leverage is calculated utilizing the non-GAAP measure Adjusted Operating Income as the denominator. For a reconciliation of the non-GAAP measure for each period presented, see page 23.
GAAP Financial Statements
Consolidated Statement of Operations | | | | | | | | | | | | | | | | | | | | | | | |
| | Three Months Ended September 30, | | Nine Months Ended September 30, |
| | 2023 | | 2022 | | 2023 | | 2022 |
| | | | | | | |
| | (In thousands, except per share data) |
| Revenue | $ | 881,600 | | | $ | 809,546 | | | $ | 2,498,276 | | | $ | 2,402,690 | |
| Operating costs and expenses: | | | | | | | |
| Cost of revenue (exclusive of depreciation shown separately below) | 255,598 | | | 246,962 | | | 745,902 | | | 724,038 | |
| Selling and marketing expense | 153,408 | | | 129,615 | | | 427,364 | | | 407,182 | |
| General and administrative expense | 107,095 | | | 114,169 | | | 305,404 | | | 325,512 | |
| Product development expense | 94,141 | | | 87,880 | | | 286,614 | | | 253,084 | |
| Depreciation | 17,310 | | | 10,679 | | | 42,427 | | | 32,664 | |
| Impairments and amortization of intangibles | 10,489 | | | 9,606 | | | 33,921 | | | 251,838 | |
| Total operating costs and expenses | 638,041 | | | 598,911 | | | 1,841,632 | | | 1,994,318 | |
| Operating income | 243,559 | | | 210,635 | | | 656,644 | | | 408,372 | |
| Interest expense | (40,380) | | | (36,814) | | | (119,473) | | | (107,333) | |
| | | | | | | |
| Other income, net | 7,905 | | | 2,326 | | | 14,729 | | | 8,435 | |
| Earnings before income taxes | 211,084 | | | 176,147 | | | 551,900 | | | 309,474 | |
| Income tax provision | (47,328) | | | (47,881) | | | (130,108) | | | (32,966) | |
| | | | | | | |
| | | | | | | |
| | | | | | | |
| | | | | | | |
| | | | | | | |
| Net earnings | 163,756 | | | 128,266 | | | 421,792 | | | 276,508 | |
| Net (earnings) loss attributable to noncontrolling interests | (29) | | | 430 | | | 89 | | | 863 | |
| Net earnings attributable to Match Group, Inc. shareholders | $ | 163,727 | | | $ | 128,696 | | | $ | 421,881 | | | $ | 277,371 | |
| | | | | | | |
| | | | | | | |
| | | | | | | |
| | | | | | | |
| Net earnings per share attributable to Match Group, Inc. shareholders: | | | | | | | |
| Basic | $ | 0.59 | | | $ | 0.46 | | | $ | 1.52 | | | $ | 0.98 | |
| Diluted | $ | 0.57 | | | $ | 0.44 | | | $ | 1.46 | | | $ | 0.94 | |
| | | | | | | |
| | | | | | | |
| | | | | | | |
| Basic shares outstanding | 275,223 | | | 281,314 | | | 277,524 | | | 283,621 | |
| Diluted shares outstanding | 293,380 | | | 299,994 | | | 294,996 | | | 297,023 | |
| | | | | | | |
| Stock-based compensation expense by function: | | | | | | | |
| Cost of revenue | $ | 1,521 | | | $ | 1,440 | | | $ | 4,511 | | | $ | 4,547 | |
| Selling and marketing expense | 2,374 | | | 2,011 | | | 6,845 | | | 5,830 | |
| General and administrative expense | 27,862 | | | 26,154 | | | 69,067 | | | 80,085 | |
| Product development expense | 29,988 | | | 23,657 | | | 83,522 | | | 59,862 | |
| Total stock-based compensation expense | $ | 61,745 | | | $ | 53,262 | | | $ | 163,945 | | | $ | 150,324 | |
Consolidated Balance Sheet | | | | | | | | | | | |
| September 30, 2023 | | December 31, 2022 |
| | | |
| (In thousands) |
| ASSETS | | | |
| Cash and cash equivalents | $ | 706,881 | | | $ | 572,395 | |
| Short-term investments | 5,936 | | | 8,723 | |
| Accounts receivable, net | 288,084 | | | 191,940 | |
| | | |
| | | |
| Other current assets | 117,374 | | | 109,327 | |
| | | |
| Total current assets | 1,118,275 | | | 882,385 | |
| | | |
| | | |
| Property and equipment, net | 190,672 | | | 176,136 | |
| Goodwill | 2,267,852 | | | 2,348,366 | |
| Intangible assets, net | 310,705 | | | 357,747 | |
| Deferred income taxes | 227,981 | | | 276,947 | |
| | | |
| Other non-current assets | 133,410 | | | 141,183 | |
| | | |
| TOTAL ASSETS | $ | 4,248,895 | | | $ | 4,182,764 | |
| | | |
| LIABILITIES AND SHAREHOLDERS’ EQUITY | | | |
| LIABILITIES | | | |
| | | |
| | | |
| Accounts payable | $ | 11,329 | | | $ | 13,699 | |
| Deferred revenue | 227,002 | | | 252,718 | |
| | | |
| | | |
| Accrued expenses and other current liabilities | 331,804 | | | 289,937 | |
| | | |
| Total current liabilities | 570,135 | | | 556,354 | |
| | | |
| Long-term debt, net | 3,840,589 | | | 3,835,726 | |
| Income taxes payable | 11,385 | | | 13,282 | |
| Deferred income taxes | 26,615 | | | 32,631 | |
| | | |
| | | |
| Other long-term liabilities | 99,183 | | | 103,652 | |
| | | |
| | | |
| Redeemable noncontrolling interest | — | | | — | |
| | | |
| Commitments and contingencies | | | |
| | | |
| SHAREHOLDERS’ EQUITY | | | |
| Common stock | 289 | | | 287 | |
| | | |
| | | |
| | | |
| | | |
| Additional paid-in capital | 8,455,056 | | | 8,273,637 | |
| Retained deficit | (7,360,687) | | | (7,782,568) | |
| Accumulated other comprehensive loss | (463,533) | | | (369,182) | |
| Treasury stock | (930,563) | | | (482,049) | |
| Total Match Group, Inc. shareholders’ equity | (299,438) | | | (359,875) | |
| Noncontrolling interests | 426 | | | 994 | |
| Total shareholders’ equity | (299,012) | | | (358,881) | |
| TOTAL LIABILITIES AND SHAREHOLDERS’ EQUITY | $ | 4,248,895 | | | $ | 4,182,764 | |
Consolidated Statement of Cash Flows | | | | | | | | | | | |
| | Nine Months Ended September 30, |
| | 2023 | | 2022 |
| | | |
| | (In thousands) |
| Cash flows from operating activities: | | | |
| | | |
| | | |
| Net earnings | $ | 421,792 | | | $ | 276,508 | |
| Adjustments to reconcile net earnings to net cash provided by operating activities: | | | |
| Stock-based compensation expense | 163,945 | | | 150,324 | |
| Depreciation | 42,427 | | | 32,664 | |
| Impairments and amortization of intangibles | 33,921 | | | 251,838 | |
| Deferred income taxes | 44,789 | | | 6,517 | |
| | | |
| | | |
| Other adjustments, net | 6,647 | | | 1,362 | |
| Changes in assets and liabilities | | | |
| Accounts receivable | (100,134) | | | 6,985 | |
| Other assets | 7,457 | | | 53,757 | |
| Accounts payable and other liabilities | 15,701 | | | (467,343) | |
| Income taxes payable and receivable | 7,779 | | | (11,721) | |
| Deferred revenue | (23,652) | | | (440) | |
| Net cash provided by operating activities | 620,672 | | | 300,451 | |
| Cash flows from investing activities: | | | |
| Cash used in business combinations, net of cash acquired | — | | | (25,681) | |
| Capital expenditures | (50,020) | | | (38,373) | |
| | | |
| | | |
| | | |
| | | |
| | | |
| Other, net | 2,444 | | | 2,615 | |
| Net cash used in investing activities | (47,576) | | | (61,439) | |
| Cash flows from financing activities: | | | |
| | | |
| | | |
| | | |
| | | |
| | | |
| | | |
| | | |
| | | |
| | | |
| Payments to settle exchangeable notes | — | | | (117,755) | |
| Proceeds from the settlement of exchangeable note hedges | — | | | 61,459 | |
| Payments to settle warrants related to exchangeable notes | — | | | (7,482) | |
| | | |
| | | |
| Proceeds from issuance of common stock pursuant to stock-based awards | 16,407 | | | 16,788 | |
| Withholding taxes paid on behalf of employees on net settled stock-based awards | (5,933) | | | (106,688) | |
| | | |
| | | |
| | | |
| Purchase of treasury stock | (445,108) | | | (482,049) | |
| | | |
| Purchase of noncontrolling interests | (1,872) | | | (10,554) | |
| | | |
| | | |
| Other, net | — | | | 10 | |
| Net cash used in financing activities | (436,506) | | | (646,271) | |
| Total cash provided (used) | 136,590 | | | (407,259) | |
| | | |
| | | |
| | | |
| | | |
| Effect of exchange rate changes on cash, cash equivalents, and restricted cash | (2,104) | | | (17,501) | |
| Net increase (decrease) in cash, cash equivalents, and restricted cash | 134,486 | | | (424,760) | |
| Cash, cash equivalents, and restricted cash at beginning of period | 572,516 | | | 815,512 | |
| Cash, cash equivalents, and restricted cash at end of period | $ | 707,002 | | | $ | 390,752 | |
Earnings Per Share
The following tables set forth the computation of the basic and diluted earnings per share attributable to Match Group shareholders:
| | | | | | | | | | | | | | | | | | | | | | | |
| Three Months Ended September 30, |
| 2023 | | 2022 |
| Basic | | Diluted | | Basic | | Diluted |
| | | | | | | |
| (In thousands, except per share data) |
| Numerator | | | | | | | |
| Net earnings | $ | 163,756 | | | $ | 163,756 | | | $ | 128,266 | | | $ | 128,266 | |
| Net (earnings) loss attributable to noncontrolling interests | (29) | | | (29) | | | 430 | | | 430 | |
| Impact from subsidiaries’ dilutive securities | — | | | (12) | | | — | | | (42) | |
| Interest on dilutive Exchangeable Senior Notes, net of tax | — | | | 3,179 | | | — | | | 3,206 | |
| | | | | | | |
| | | | | | | |
| | | | | | | |
| | | | | | | |
| | | | | | | |
| | | | | | | |
| Net earnings attributable to Match Group, Inc. shareholders | $ | 163,727 | | | $ | 166,894 | | | $ | 128,696 | | | $ | 131,860 | |
| | | | | | | |
| Denominator | | | | | | | |
| Weighted average basic shares outstanding | 275,223 | | | 275,223 | | | 281,314 | | | 281,314 | |
| Dilutive securities | — | | | 4,760 | | | — | | | 4,276 | |
| Dilutive shares from Exchangeable Senior Notes, if-converted | — | | | 13,397 | | | — | | | 14,404 | |
| Denominator for earnings per share—weighted average shares | 275,223 | | | 293,380 | | | 281,314 | | | 299,994 | |
| | | | | | | |
| Earnings per share: | | | | | | | |
| | | | | | | |
| | | | | | | |
| Earnings per share attributable to Match Group, Inc. shareholders | $ | 0.59 | | | $ | 0.57 | | | $ | 0.46 | | | $ | 0.44 | |
| | | | | | | | | | | | | | | | | | | | | | | |
| Nine Months Ended September 30, |
| 2023 | | 2022 |
| Basic | | Diluted | | Basic | | Diluted |
| | | | | | | |
| (In thousands, except per share data) |
| Numerator | | | | | | | |
| Net earnings | $ | 421,792 | | | $ | 421,792 | | | $ | 276,508 | | | $ | 276,508 | |
| Net loss attributable to noncontrolling interests | 89 | | | 89 | | | 863 | | | 863 | |
| Impact from subsidiaries’ dilutive securities | — | | | (76) | | | — | | | (196) | |
| Interest on dilutive Exchangeable Senior Notes, net of tax | — | | | 9,536 | | | — | | | 3,201 | |
| | | | | | | |
| | | | | | | |
| | | | | | | |
| | | | | | | |
| | | | | | | |
| | | | | | | |
| Net earnings attributable to Match Group, Inc. shareholders | $ | 421,881 | | | $ | 431,341 | | | $ | 277,371 | | | $ | 280,376 | |
| | | | | | | |
| Denominator | | | | | | | |
| Weighted average basic shares outstanding | 277,524 | | | 277,524 | | | 283,621 | | | 283,621 | |
| Dilutive securities | — | | | 4,075 | | | — | | | 5,417 | |
| Dilutive shares from Exchangeable Senior Notes, if-converted | — | | | 13,397 | | | — | | | 7,985 | |
| Denominator for earnings per share—weighted average shares | 277,524 | | | 294,996 | | | 283,621 | | | 297,023 | |
| | | | | | | |
| Earnings per share: | | | | | | | |
| | | | | | | |
| | | | | | | |
| Earnings per share attributable to Match Group, Inc. shareholders | $ | 1.52 | | | $ | 1.46 | | | $ | 0.98 | | | $ | 0.94 | |
Trended Metrics
| | | | | | | | | | | | | | | | | | | | | | | | | | | | | | | | | | | | | | | | | | | | | | | | | | | | | | | | | | | | | | | | | | | | | | | | | | | | | | | | | | | |
| | | | | | | 2022 | | 2023 | | |
| | | | | | | | | | | | | | | | | | | | | | | | | | | Q1 | | Q2 | | Q3 | | Q4 | | Q1 | | Q2 | | Q3 | | | | | | | | | | | | | | | | |
| | | | | | | | | | | | | | | | | | | | | | | | | | | | | | | | | | | | | | | | | | | | | | | | | | | | | | | |
Revenue (in millions, rounding differences may occur) | | | | | | | | | | | | | | | | | | | | | | |
| Direct Revenue | | | | | | | | | | | | | | | | | | | | | | | | | | | | | | | | | | | | | | | | | | | | | | | | | | | | | | | |
| Americas | | | | | | | | | | | | | | | | | | | | | | | | | | | $ | 400.0 | | | $ | 408.7 | | | $ | 413.8 | | | $ | 406.6 | | | $ | 405.9 | | | $ | 429.9 | | | $ | 455.2 | | | | | | | | | | | | | | | | | |
| Europe | | | | | | | | | | | | | | | | | | | | | | | | | | | 215.3 | | | 208.5 | | | 214.8 | | | 210.3 | | | 212.5 | | | 227.7 | | | 252.0 | | | | | | | | | | | | | | | | | |
| APAC and Other | | | | | | | | | | | | | | | | | | | | | | | | | | | 168.5 | | | 163.0 | | | 166.6 | | | 154.2 | | | 156.0 | | | 158.5 | | | 159.6 | | | | | | | | | | | | | | | | | |
| Total Direct Revenue | | | | | | | | | | | | | | | | | | | | | | | | | | | 783.8 | | | 780.2 | | | 795.1 | | | 771.1 | | | 774.4 | | | 816.1 | | | 866.8 | | | | | | | | | | | | | | | | | |
| Indirect Revenue | | | | | | | | | | | | | | | | | | | | | | | | | | | 14.8 | | | 14.4 | | | 14.4 | | | 15.1 | | | 12.7 | | | 13.4 | | | 14.8 | | | | | | | | | | | | | | | | | |
| Total Revenue | | | | | | | | | | | | | | | | | | | | | | | | | | | $ | 798.6 | | | $ | 794.5 | | | $ | 809.5 | | | $ | 786.2 | | | $ | 787.1 | | | $ | 829.6 | | | $ | 881.6 | | | | | | | | | | | | | | | | | |
| | | | | | | | | | | | | | | | | | | | | | | | | | | | | | | | | | | | | | | | | | | | | | | | | | | | | | | |
Direct Revenue (in millions, rounding differences may occur) | | | | | | | | | | | | | | | | | | | | | | |
| Tinder | | | | | | | | | | | | | | | | | | | | | | | | | | | $ | 441.0 | | | $ | 449.1 | | | $ | 460.2 | | | $ | 444.2 | | | $ | 441.1 | | | $ | 474.7 | | | $ | 508.5 | | | | | | | | | | | | | | | | | |
| Hinge | | | | | | | | | | | | | | | | | | | | | | | | | | | 65.0 | | | 67.1 | | | 74.4 | | | 77.2 | | | 82.8 | | | 90.3 | | | 107.3 | | | | | | | | | | | | | | | | | |
| MG Asia | | | | | | | | | | | | | | | | | | | | | | | | | | | 87.2 | | | 79.6 | | | 80.6 | | | 74.3 | | | 75.7 | | | 76.6 | | | 76.8 | | | | | | | | | | | | | | | | | |
| Evergreen & Emerging | | | | | | | | | | | | | | | | | | | | | | | | | | | 190.7 | | | 184.3 | | | 180.0 | | | 175.4 | | | 174.9 | | | 174.5 | | | 174.2 | | | | | | | | | | | | | | | | | |
| Total Direct Revenue | | | | | | | | | | | | | | | | | | | | | | | | | | | $ | 783.8 | | | $ | 780.2 | | | $ | 795.1 | | | $ | 771.1 | | | $ | 774.4 | | | $ | 816.1 | | | $ | 866.8 | | | | | | | | | | | | | | | | | |
| | | | | | | | | | | | | | | | | | | | | | | | | | | | | | | | | | | | | | | | | | | | | | | | | | | | | | | |
Payers (in thousands) | | | | | | | | | | | | | | | | | | | | | | | | | | | | | | | | | | | | | | | | | | | | | | | | | | | | | | | |
| Americas | | | | | | | | | | | | | | | | | | | | | | | | | | | 8,159 | | | 8,225 | | | 8,233 | | | 8,059 | | | 7,989 | | | 7,717 | | | 7,494 | | | | | | | | | | | | | | | | | |
| Europe | | | | | | | | | | | | | | | | | | | | | | | | | | | 4,732 | | | 4,564 | | | 4,648 | | | 4,451 | | | 4,397 | | | 4,417 | | | 4,573 | | | | | | | | | | | | | | | | | |
| APAC and Other | | | | | | | | | | | | | | | | | | | | | | | | | | | 3,443 | | | 3,606 | | | 3,667 | | | 3,555 | | | 3,488 | | | 3,496 | | | 3,645 | | | | | | | | | | | | | | | | | |
| Total Payers | | | | | | | | | | | | | | | | | | | | | | | | | | | 16,334 | | | 16,395 | | | 16,548 | | | 16,065 | | | 15,874 | | | 15,630 | | | 15,712 | | | | | | | | | | | | | | | | | |
| | | | | | | | | | | | | | | | | | | | | | | | | | | | | | | | | | | | | | | | | | | | | | | | | | | | | | | |
| RPP | | | | | | | | | | | | | | | | | | | | | | | | | | | | | | | | | | | | | | | | | | | | | | | | | | | | | | | |
| Americas | | | | | | | | | | | | | | | | | | | | | | | | | | | $ | 16.34 | | | $ | 16.56 | | | $ | 16.75 | | | $ | 16.81 | | | $ | 16.94 | | | $ | 18.57 | | | $ | 20.25 | | | | | | | | | | | | | | | | | |
| Europe | | | | | | | | | | | | | | | | | | | | | | | | | | | $ | 15.17 | | | $ | 15.23 | | | $ | 15.40 | | | $ | 15.75 | | | $ | 16.11 | | | $ | 17.18 | | | $ | 18.37 | | | | | | | | | | | | | | | | | |
| APAC and Other | | | | | | | | | | | | | | | | | | | | | | | | | | | $ | 16.32 | | | $ | 15.06 | | | $ | 15.14 | | | $ | 14.46 | | | $ | 14.91 | | | $ | 15.11 | | | $ | 14.60 | | | | | | | | | | | | | | | | | |
| Total RPP | | | | | | | | | | | | | | | | | | | | | | | | | | | $ | 16.00 | | | $ | 15.86 | | | $ | 16.02 | | | $ | 16.00 | | | $ | 16.26 | | | $ | 17.41 | | | $ | 18.39 | | | | | | | | | | | | | | | | | |
Reconciliations of GAAP to Non-GAAP Measures
Reconciliation of Net Earnings to Adjusted Operating Income | | | | | | | | | | | | | | | | | | | | | | | |
| Three Months Ended September 30, | | Nine Months Ended September 30, |
| 2023 | | 2022 | | 2023 | | 2022 |
| | | | | | | |
| (Dollars in thousands) |
| Net earnings attributable to Match Group, Inc. shareholders | $ | 163,727 | | | $ | 128,696 | | | $ | 421,881 | | | $ | 277,371 | |
| Add back: | | | | | | | |
| Net earnings (loss) attributable to noncontrolling interests | 29 | | | (430) | | | (89) | | | (863) | |
| | | | | | | |
| Income tax provision | 47,328 | | | 47,881 | | | 130,108 | | | 32,966 | |
| Other income, net | (7,905) | | | (2,326) | | | (14,729) | | | (8,435) | |
| Interest expense | 40,380 | | | 36,814 | | | 119,473 | | | 107,333 | |
| Operating income | 243,559 | | | 210,635 | | | 656,644 | | | 408,372 | |
| Stock-based compensation expense | 61,745 | | | 53,262 | | | 163,945 | | | 150,324 | |
| Depreciation | 17,310 | | | 10,679 | | | 42,427 | | | 32,664 | |
| Impairments and amortization of intangibles | 10,489 | | | 9,606 | | | 33,921 | | | 251,838 | |
| | | | | | | |
| Adjusted Operating Income | $ | 333,103 | | | $ | 284,182 | | | $ | 896,937 | | | $ | 843,198 | |
| | | | | | | |
| Revenue | $ | 881,600 | | | $ | 809,546 | | | $ | 2,498,276 | | | $ | 2,402,690 | |
| Operating income margin | 28 | % | | 26 | % | | 26 | % | | 17 | % |
| Adjusted Operating Income margin | 38 | % | | 35 | % | | 36 | % | | 35 | % |
Reconciliation of Net Earnings to Adjusted Operating Income used in Leverage Ratios | | | | | | | | | | | | | | | | | | | | | | | |
| | | | | | | | | | | | | | | | | | | Twelve months ended |
| | | | | | | | | | | | | | | | | | | 9/30/2023 |
| | | | | | | | | | | | | | | | | | | |
| | | | | | | | | | | | | | | | | | | (In thousands) |
| Net earnings attributable to Match Group, Inc. shareholders | | | | | | | | | | | | | | | | | | | $ | 506,456 | |
| Add back: | | | | | | | | | | | | | | | | | | | |
| Net loss attributable to noncontrolling interests | | | | | | | | | | | | | | | | | | | (1,311) | |
| Loss from discontinued operations, net of tax | | | | | | | | | | | | | | | | | | | 2,211 | |
| Income tax provision | | | | | | | | | | | | | | | | | | | 112,503 | |
| Other income, net | | | | | | | | | | | | | | | | | | | (14,327) | |
| Interest expense | | | | | | | | | | | | | | | | | | | 157,687 | |
| Operating Income | | | | | | | | | | | | | | | | | | | 763,277 | |
| Stock-based compensation expense | | | | | | | | | | | | | | | | | | | 217,501 | |
| Depreciation | | | | | | | | | | | | | | | | | | | 53,357 | |
| Impairments and amortization of intangibles | | | | | | | | | | | | | | | | | | | 148,340 | |
| | | | | | | | | | | | | | | | | | | |
| Adjusted Operating Income | | | | | | | | | | | | | | | | | | | $ | 1,182,475 | |
Reconciliation of Operating Cash Flow to Free Cash Flow | | | | | | | | | | | |
| Nine Months Ended September 30, |
| 2023 | | 2022 |
| | | |
| (In thousands) |
| Net cash provided by operating activities | $ | 620,672 | | | $ | 300,451 | |
| Capital expenditures | (50,020) | | | (38,373) | |
| Free Cash Flow | $ | 570,652 | | | $ | 262,078 | |
Reconciliation of Forecasted Operating Income to Adjusted Operating Income | | | | | | | |
| Three Months Ended December 31, 2023 |
| | | |
| | | |
| (In millions) |
| Operating Income | $212 to $217 | | |
| Stock-based compensation expense | 65 | | |
| Depreciation and amortization of intangibles | 28 | | |
| Adjusted Operating Income | $305 to $310 | | |
Reconciliation of GAAP Revenue to Non-GAAP Revenue, Excluding Foreign Exchange Effects
| | | | | | | | | | | | | | | | | | | | | | | | | | | | | | | | | | | | | | | | | | | | | | | |
| | Three Months Ended September 30, | | Nine Months Ended September 30, |
| | 2023 | | $ Change | | % Change | | 2022 | | 2023 | | $ Change | | % Change | | 2022 |
| | | | | | | | | | | | | | | |
| | (Dollars in millions, rounding differences may occur) |
| Revenue, as reported | $ | 881.6 | | | $ | 72.1 | | | 9% | | $ | 809.5 | | | $ | 2,498.3 | | | $ | 95.6 | | | 4% | | $ | 2,402.7 | |
| Foreign exchange effects | (2.1) | | | | | | | | | 46.8 | | | | | | | |
| Revenue, excluding foreign exchange effects | $ | 879.5 | | | $ | 70.0 | | | 9% | | $ | 809.5 | | | $ | 2,545.1 | | | $ | 142.4 | | | 6% | | $ | 2,402.7 | |
| | | | | | | | | | | | | | | |
| Total Direct Revenue, as reported | $ | 866.8 | | | $ | 71.7 | | | 9% | | $ | 795.1 | | | $ | 2,457.4 | | | $ | 98.2 | | | 4% | | $ | 2,359.1 | |
| Foreign exchange effects | (1.9) | | | | | | | | | 46.5 | | | | | | | |
| Total Direct Revenue, excluding foreign exchange effects | $ | 864.9 | | | $ | 69.7 | | | 9% | | $ | 795.1 | | | $ | 2,503.9 | | | $ | 144.8 | | | 6% | | $ | 2,359.1 | |
| | | | | | | | | | | | | | | |
| Americas Direct Revenue, as reported | $ | 455.2 | | | $ | 41.4 | | | 10% | | $ | 413.8 | | | $ | 1,291.1 | | | $ | 68.6 | | | 6% | | $ | 1,222.5 | |
| Foreign exchange effects | 2.5 | | | | | | | | | 10.2 | | | | | | | |
| Americas Direct Revenue, excluding foreign exchange effects | $ | 457.7 | | | $ | 43.9 | | | 11% | | $ | 413.8 | | | $ | 1,301.3 | | | $ | 78.8 | | | 6% | | $ | 1,222.5 | |
| | | | | | | | | | | | | | | |
| Europe Direct Revenue, as reported | $ | 252.0 | | | $ | 37.2 | | | 17% | | $ | 214.8 | | | $ | 692.2 | | | $ | 53.6 | | | 8% | | $ | 638.6 | |
| Foreign exchange effects | (16.6) | | | | | | | | | (5.6) | | | | | | | |
| Europe Direct Revenue, excluding foreign exchange effects | $ | 235.3 | | | $ | 20.6 | | | 10% | | $ | 214.8 | | | $ | 686.6 | | | $ | 48.1 | | | 8% | | $ | 638.6 | |
| | | | | | | | | | | | | | | |
| APAC and Other Direct Revenue, as reported | $ | 159.6 | | | $ | (7.0) | | | (4)% | | $ | 166.6 | | | $ | 474.1 | | | $ | (24.0) | | | (5)% | | $ | 498.0 | |
| Foreign exchange effects | 12.2 | | | | | | | | | 41.9 | | | | | | | |
| APAC and Other Direct Revenue, excluding foreign exchange effects | $ | 171.8 | | | $ | 5.3 | | | 3% | | $ | 166.6 | | | $ | 516.0 | | | $ | 18.0 | | | 4% | | $ | 498.0 | |
| | | | | | | | | | | | | | | |
| Tinder Direct Revenue, as reported | $ | 508.5 | | | $ | 48.3 | | | 11% | | $ | 460.2 | | | $ | 1,424.4 | | | $ | 74.1 | | | 5% | | $ | 1,350.3 | |
| Foreign exchange effects | (4.1) | | | | | | | | | 23.3 | | | | | | | |
| Tinder Direct Revenue, excluding foreign exchange effects | $ | 504.4 | | | $ | 44.2 | | | 10% | | $ | 460.2 | | | $ | 1,447.7 | | | $ | 97.4 | | | 7% | | $ | 1,350.3 | |
| | | | | | | | | | | | | | | |
| Hinge Direct Revenue, as reported | $ | 107.3 | | | $ | 32.9 | | | 44% | | $ | 74.4 | | | $ | 280.3 | | | $ | 73.9 | | | 36% | | $ | 206.5 | |
| Foreign exchange effects | (0.7) | | | | | | | | | 1.6 | | | | | | | |
| Hinge Direct Revenue, excluding foreign exchange effects | $ | 106.6 | | | $ | 32.2 | | | 43% | | $ | 74.4 | | | $ | 281.9 | | | $ | 75.5 | | | 37% | | $ | 206.5 | |
| | | | | | | | | | | | | | | |
| MG Asia Direct Revenue, as reported | $ | 76.8 | | | $ | (3.8) | | | (5)% | | $ | 80.6 | | | $ | 229.0 | | | $ | (18.4) | | | (7)% | | $ | 247.5 | |
| Foreign exchange effects | 5.1 | | | | | | | | | 19.6 | | | | | | | |
| MG Asia Direct Revenue, excluding foreign exchange effects | $ | 81.8 | | | $ | 1.2 | | | 2% | | $ | 80.6 | | | $ | 248.6 | | | $ | 1.2 | | | —% | | $ | 247.5 | |
| | | | | | | | | | | | | | | |
| E&E Direct Revenue, as reported | $ | 174.2 | | | $ | (5.7) | | | (3)% | | $ | 180.0 | | | $ | 523.6 | | | $ | (31.3) | | | (6)% | | $ | 554.9 | |
| Foreign exchange effects | (2.2) | | | | | | | | | 2.1 | | | | | | | |
| E&E Direct Revenue, excluding foreign exchange effects | $ | 172.0 | | | $ | (8.0) | | | (4)% | | $ | 180.0 | | | $ | 525.7 | | | $ | (29.2) | | | (5)% | | $ | 554.9 | |
| | | | | | | | | | | | | | | |
| All other brands excluding Tinder Direct Revenue, as reported | $ | 358.3 | | | $ | 23.3 | | | 7% | | $ | 335.0 | | | $ | 1,033.0 | | | $ | 24.1 | | | 2% | | $ | 1,008.9 | |
| Foreign exchange effects | 2.2 | | | | | | | | | 23.3 | | | | | | | |
| All other brands excluding Tinder Direct Revenue, excluding foreign exchange effects | $ | 360.5 | | | $ | 25.5 | | | 8% | | $ | 335.0 | | | $ | 1,056.2 | | | $ | 47.4 | | | 5% | | $ | 1,008.9 | |
Reconciliation of GAAP Revenue to Non-GAAP Revenue, Excluding Foreign Exchange Effects (Revenue Per Payer)
| | | | | | | | | | | | | | | | | | | | | | | | | | | | | | | | | | | | | | | | | | | | | | | |
| | Three Months Ended September 30, | | Nine Months Ended September 30, |
| | 2023 | | $ Change | | % Change | | 2022 | | 2023 | | $ Change | | % Change | | 2022 |
| | | | | | | | | | | | | | | |
| RPP, as reported | $ | 18.39 | | | $ | 2.37 | | | 15% | | $ | 16.02 | | | $ | 17.35 | | | $ | 1.39 | | | 9% | | $ | 15.96 | |
| Foreign exchange effects | (0.04) | | | | | | | | | 0.32 | | | | | | | |
| RPP, excluding foreign exchange effects | $ | 18.35 | | | $ | 2.33 | | | 15% | | $ | 16.02 | | | $ | 17.67 | | | $ | 1.71 | | | 11% | | $ | 15.96 | |
| | | | | | | | | | | | | | | |
| Americas RPP, as reported | $ | 20.25 | | | $ | 3.50 | | | 21% | | $ | 16.75 | | | $ | 18.55 | | | $ | 2.00 | | | 12% | | $ | 16.55 | |
| Foreign exchange effects | 0.11 | | | | | | | | | 0.15 | | | | | | | |
| Americas RPP, excluding foreign exchange effects | $ | 20.36 | | | $ | 3.61 | | | 22% | | $ | 16.75 | | | $ | 18.70 | | | $ | 2.15 | | | 13% | | $ | 16.55 | |
| | | | | | | | | | | | | | | |
| Europe RPP, as reported | $ | 18.37 | | | $ | 2.97 | | | 19% | | $ | 15.40 | | | $ | 17.23 | | | $ | 1.96 | | | 13% | | $ | 15.27 | |
| Foreign exchange effects | (1.22) | | | | | | | | | (0.13) | | | | | | | |
| Europe RPP, excluding foreign exchange effects | $ | 17.15 | | | $ | 1.75 | | | 11% | | $ | 15.40 | | | $ | 17.10 | | | $ | 1.83 | | | 12% | | $ | 15.27 | |
| | | | | | | | | | | | | | | |
| APAC and Other RPP, as reported | $ | 14.60 | | | $ | (0.54) | | | (4)% | | $ | 15.14 | | | $ | 14.86 | | | $ | (0.63) | | | (4)% | | $ | 15.49 | |
| Foreign exchange effects | 1.12 | | | | | | | | | 1.31 | | | | | | | |
| APAC and Other RPP, excluding foreign exchange effects | $ | 15.72 | | | $ | 0.58 | | | 4% | | $ | 15.14 | | | $ | 16.17 | | | $ | 0.68 | | | 4% | | $ | 15.49 | |
Dilutive Securities
Match Group has various tranches of dilutive securities. The table below details these securities and their potentially dilutive impact (shares in millions; rounding differences may occur).
| | | | | | | | | | | | | | | | | | | |
| Average Exercise Price | | 10/27/2023 | | |
| Share Price | | | $33.98 | | | | | | | | |
| Absolute Shares | | | 271.8 | | | | | | | | |
| | | | | | | | | | | |
| | | | | | | | | | | |
| Equity Awards | | | | | | | | | | | |
| Options | $17.80 | | 1.3 | | | | | | | | |
| RSUs and subsidiary denominated equity awards | | | 10.5 | | | | | | | | |
| Total Dilution - Equity Awards | | | 11.8 | | | | | | | | |
| Outstanding Warrants | | | | | | | | | | | |
| Warrants expiring on September 15, 2026 (6.6 million outstanding) | $134.76 | | — | | | | | | | | |
| Warrants expiring on April 15, 2030 (6.8 million outstanding) | $134.82 | | — | | | | | | | | |
| Total Dilution - Outstanding Warrants | | | — | | | | | | | | |
| | | | | | | | | | | |
| Total Dilution | | | 11.8 | | | | | | | | |
| % Dilution | | | 4.2% | | | | | | | | |
| Total Diluted Shares Outstanding | | | 283.6 | | | | | | | | |
______________________
The dilutive securities presentation above is calculated using the methods and assumptions described below; these are different from GAAP dilution, which is calculated based on the treasury stock method.
Options — The table above assumes the option exercise price is used to repurchase Match Group shares.
RSUs and subsidiary denominated equity awards — The table above assumes RSUs are fully dilutive. All performance-based and market-based awards reflect the expected shares that will vest based on current performance or market estimates. The table assumes no change in the fair value estimate of the subsidiary denominated equity awards from the values used for GAAP purposes at September 30, 2023.
Exchangeable Senior Notes — The Company has two series of Exchangeable Senior Notes outstanding. In the event of an exchange, each series of Exchangeable Senior Notes can be settled in cash, shares, or a combination of cash and shares. At the time of each Exchangeable Senior Notes issuance, the Company purchased call options with a strike price equal to the exchange price of each series of Exchangeable Senior Notes (“Note Hedge”), which can be used to offset the dilution of each series of the Exchangeable Senior Notes. No dilution is reflected in the table above for any of the Exchangeable Senior Notes because it is the Company’s intention to settle the Exchangeable Senior Notes with cash equal to the face amount of the notes; any shares issued would be offset by shares received upon exercise of the Note Hedge.
Warrants — At the time of the issuance of each series of Exchangeable Senior Notes, the Company also sold warrants for the number of shares with the strike prices reflected in the table above. The cash generated from the exercise of the warrants is assumed to be used to repurchase Match Group shares and the resulting net dilution, if any, is reflected in the table above.
Non-GAAP Financial Measures
Match Group reports Adjusted Operating Income, Adjusted Operating Income Margin, Free Cash Flow, and Revenue Excluding Foreign Exchange Effects, all of which are supplemental measures to U.S. generally accepted accounting principles (“GAAP”). The Adjusted Operating Income, Adjusted Operating Income Margin, and Free Cash Flow measures are among the primary metrics by which we evaluate the performance of our business, on which our internal budget is based and by which management is compensated. Revenue Excluding Foreign Exchange Effects provides a comparable framework for assessing the performance of our business without the effect of exchange rate differences when compared to prior periods. We believe that investors should have access to the same set of tools that we use in analyzing our results. These non-GAAP measures should be considered in addition to results prepared in accordance with GAAP, but should not be considered a substitute for or superior to GAAP results. Match Group endeavors to compensate for the limitations of the non-GAAP measures presented by providing the comparable GAAP measures and descriptions of the reconciling items, including quantifying such items, to derive the non-GAAP measures. We encourage investors to examine the reconciling adjustments between the GAAP and non-GAAP measures, which we describe below. Interim results are not necessarily indicative of the results that may be expected for a full year.
Definitions of Non-GAAP Measures
Adjusted Operating Income is defined as operating income excluding: (1) stock-based compensation expense; (2) depreciation; and (3) acquisition-related items consisting of (i) amortization of intangible assets and impairments of goodwill and intangible assets, if applicable, and (ii) gains and losses recognized on changes in the fair value of contingent consideration arrangements, as applicable. We believe Adjusted Operating Income is useful to analysts and investors as this measure allows a more meaningful comparison between our performance and that of our competitors. The above items are excluded from our Adjusted Operating Income measure because they are non-cash in nature. Adjusted Operating Income has certain limitations because it excludes certain expenses.
Adjusted Operating Income Margin is defined as Adjusted Operating Income divided by revenues. We believe Adjusted Operating Income Margin is useful for analysts and investors as this measure allows a more meaningful comparison between our performance and that of our competitors. Adjusted Operating Income margin has certain limitations in that it does not take into account the impact to our consolidated statement of operations of certain expenses.
Free Cash Flow is defined as net cash provided by operating activities, less capital expenditures. We believe Free Cash Flow is useful to investors because it represents the cash that our operating businesses generate, before taking into account non-operational cash movements. Free Cash Flow has certain limitations in that it does not represent the total increase or decrease in the cash balance for the period, nor does it represent the residual cash flow for discretionary expenditures. Therefore, we think it is important to evaluate Free Cash Flow along with our consolidated statement of cash flows.
We look at Free Cash Flow as a measure of the strength and performance of our businesses, not for valuation purposes. In our view, applying “multiples” to Free Cash Flow is inappropriate because it is subject to timing, seasonality and one-time events. We manage our business for cash and we think it is of utmost importance to maximize cash – but our primary valuation metric is Adjusted Operating Income.
Revenue Excluding Foreign Exchange Effects is calculated by translating current period revenues using prior period exchange rates. The percentage change in Revenue Excluding Foreign Exchange Effects is calculated by determining the change in current period revenues over prior period revenues where current period revenues are translated using prior period exchange rates. We believe the impact of foreign exchange rates on Match Group, due to its global reach, may be an important factor in understanding period over period comparisons if movement in rates is significant. Since our results are reported in U.S. dollars, international revenues are favorably impacted as the U.S. dollar weakens relative to other currencies, and unfavorably impacted as the U.S. dollar strengthens relative to other currencies. We believe the presentation of revenue excluding foreign exchange effects in addition to reported revenue helps improve the ability to understand Match Group’s performance because it excludes the impact of foreign currency volatility that is not indicative of Match Group’s core operating results.
Non-Cash Expenses That Are Excluded From Our Non-GAAP Measures
Stock-based compensation expense consists principally of expense associated with the grants of stock options, RSUs, performance-based RSUs and market-based awards. These expenses are not paid in cash, and we include the related shares in our fully diluted shares outstanding using the treasury stock method; however, performance-based RSUs and market-based awards are included only to the extent the applicable performance or market condition(s) have been met (assuming the end of the reporting period is the end of the contingency period). To the extent stock-based awards are settled on a net basis, we remit the required tax-withholding amounts from our current funds.
Depreciation is a non-cash expense relating to our property and equipment and is computed using the straight-line method to allocate the cost of depreciable assets to operations over their estimated useful lives, or, in the case of leasehold improvements, the lease term, if shorter.
Amortization of intangible assets and impairments of goodwill and intangible assets are non-cash expenses related primarily to acquisitions. At the time of an acquisition, the identifiable definite-lived intangible assets of the acquired company, such as customer lists, trade names and technology, are valued and amortized over their estimated lives. Value is also assigned to (i) acquired indefinite-lived intangible assets, which consist of trade names and trademarks, and (ii) goodwill, which are not subject to amortization. An impairment is recorded when the carrying value of an intangible asset or goodwill exceeds its fair value. We believe that intangible assets represent costs incurred by the acquired company to build value prior to acquisition and the related amortization and impairment charges of intangible assets or goodwill, if applicable, are not ongoing costs of doing business.
Additional Definitions
Americas includes North America, Central America, South America, and the Caribbean islands.
Europe includes continental Europe, the British Isles, Iceland, Greenland, and Russia (ceased operations in June 2023), but excludes Turkey (which is included in APAC and Other).
APAC and Other includes Asia, Australia, the Pacific islands, the Middle East, and Africa.
Match Group Asia (“MG Asia”) consists of the brands primarily focused on Asia including Pairs, Azar, and Hakuna.
Evergreen & Emerging (“E&E”) consists primarily of the brands Match, Meetic, OkCupid, Plenty of Fish, BLK, Chispa, and The League.
Direct Revenue is revenue that is received directly from end users of our services and includes both subscription and à la carte revenue.
Indirect Revenue is revenue that is not received directly from end users of our services, substantially all of which is advertising revenue.
Payers are unique users at a brand level in a given month from whom we earned Direct Revenue. When presented as a quarter-to-date or year-to-date value, Payers represents the average of the monthly values for the respective period presented. At a consolidated level, duplicate Payers may exist when we earn revenue from the same individual at multiple brands in a given month, as we are unable to identify unique individuals across brands in the Match Group portfolio.
Revenue Per Payer (“RPP”) is the average monthly revenue earned from a Payer and is Direct Revenue for a period divided by the Payers in the period, further divided by the number of months in the period.
Leverage on a gross basis is calculated as principal debt balance divided by Adjusted Operating Income for the period referenced.
Leverage on a net basis is calculated as principal debt balance less cash and cash equivalents and short-term investments divided by Adjusted Operating Income for the period referenced.
Other Information
Safe Harbor Statement Under the Private Securities Litigation Reform Act of 1995
This letter and our conference call, which will be held at 8:30 a.m. Eastern Time on November 1, 2023, may contain “forward-looking statements” within the meaning of the Private Securities Litigation Reform Act of 1995. All statements that are not historical facts are “forward looking statements.” The use of words such as “anticipates,” “estimates,” “expects,” “plans” and “believes,” among others, generally identify forward-looking statements. These forward-looking statements include, among others, statements relating to: Match Group’s future financial performance, Match Group’s business prospects and strategy, anticipated trends, and other similar matters. These forward-looking statements are based on management’s current expectations and assumptions about future events, which are inherently subject to uncertainties, risks and changes in circumstances that are difficult to predict. Actual results could differ materially from those contained in these forward-looking statements for a variety of reasons, including, among others: competition, our ability to maintain user rates on our higher monetizing services, our ability to attract users to our services through cost-effective marketing and related efforts, foreign currency exchange rate fluctuations, our ability to distribute our services through third parties and offset related fees, the integrity and scalability of our systems and infrastructure (and those of third parties) and our ability to adapt ours to changes in a timely and cost-effective manner, our ability to protect our systems from cyberattacks and to protect personal and confidential user information, risks relating to our use of artificial intelligence, risks relating to certain of our international operations and acquisitions, certain risks relating to our relationship with IAC post-separation, the impact of the outbreak of pandemics such as the COVID-19 coronavirus, the risks inherent in separating Match Group from IAC, including uncertainties related to, among other things, the tax treatment of the transaction, uncertainties related to the acquisition of Hyperconnect, including, among other things, the expected benefits of the transaction, any litigation arising out of or relating to the transaction, and the impact of the transaction on the businesses of Match Group, and inflation and other macroeconomic conditions. Certain of these and other risks and uncertainties are discussed in Match Group’s filings with the Securities and Exchange Commission. Other unknown or unpredictable factors that could also adversely affect Match Group’s business, financial condition and results of operations may arise from time to time. In light of these risks and uncertainties, these forward-looking statements may not prove to be accurate. Accordingly, you should not place undue reliance on these forward-looking statements, which only reflect the views of Match Group management as of the date of this letter. Match Group does not undertake to update these forward-looking statements.
About Match Group
Match Group (NASDAQ: MTCH), through its portfolio companies, is a leading provider of digital technologies designed to help people make meaningful connections. Our global portfolio of brands includes Tinder®, Hinge®, Match®, Meetic®, OkCupid®, Pairs™, PlentyOfFish®, Azar®, Hakuna®, and more, each built to increase our users’ likelihood of connecting with others. Through our trusted brands, we provide tailored services to meet the varying preferences of our users. Our services are available in over 40 languages to our users all over the world.
Contact Us | | | | | |
Tanny Shelburne Match Group Investor Relations ir@match.com | Justine Sacco Match Group Corporate Communications matchgroupPR@match.com |
| |
Match Group 8750 North Central Expressway, Suite 1400, Dallas, TX 75231, (214) 576-9352 https://mtch.com |