EXHIBIT 99.3

Link to searchable text of slide shown above
Link to searchable text of slide shown above
Link to searchable text of slide shown above
Link to searchable text of slide shown above
Link to searchable text of slide shown above
Link to searchable text of slide shown above
Link to searchable text of slide shown above
Link to searchable text of slide shown above
Link to searchable text of slide shown above
Link to searchable text of slide shown above
Link to searchable text of slide shown above
Link to searchable text of slide shown above
Link to searchable text of slide shown above
Link to searchable text of slide shown above
Searchable text section of graphics shown above
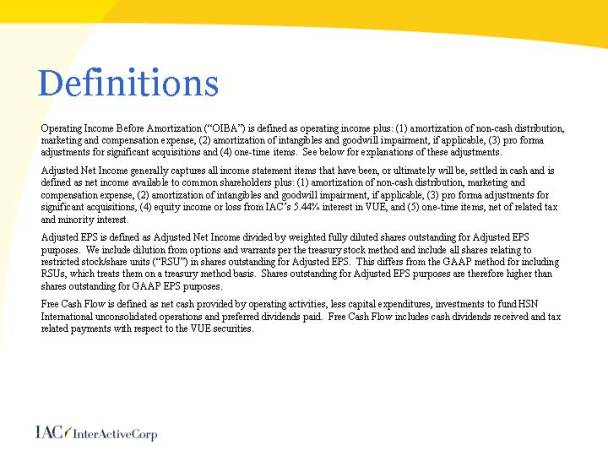
Operating Income Before Amortization (“OIBA”) is defined as operating income plus: (1) amortization of non-cash distribution, marketing and compensation expense, (2) amortization of intangibles and goodwill impairment, if applicable, (3) pro forma adjustments for significant acquisitions and (4) one-time items. See below for explanations of these adjustments.
Adjusted Net Income generally captures all income statement items that have been, or ultimately will be, settled in cash and is defined as net income available to common shareholders plus: (1) amortization of non-cash distribution, marketing and compensation expense, (2) amortization of intangibles and goodwill impairment, if applicable, (3) pro forma adjustments for significant acquisitions, (4) equity income or loss from IAC’s5.44% interest in VUE, and (5) one-time items, net of related tax and minority interest.
Adjusted EPS is defined as Adjusted Net Income divided by weighted fully diluted shares outstanding for Adjusted EPS purposes. We include dilution from options and warrants per thetreasury stock method and include all shares relating to restricted stock/share units (“RSU”) in shares outstanding for Adjusted EPS. This differs from the GAAP method for including RSUs, which treats them on a treasury method basis. Shares outstanding for Adjusted EPS purposes are therefore higher than shares outstanding for GAAP EPS purposes.
Free Cash Flow is defined as net cash provided by operating activities, less capital expenditures, investments to fund HSN International unconsolidated operations and preferred dividends paid. Free Cash Flow includes cash dividends received and tax related payments with respect to the VUE securities.
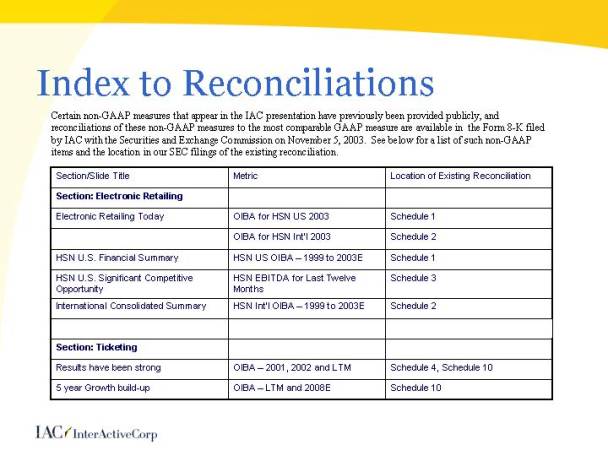
Certain non-GAAP measures that appear in the IAC presentation have previously been provided publicly, and reconciliations of these non-GAAP measures to the most comparable GAAP measure are available in the Form 8-K filed by IAC with the Securities and Exchange Commission on November 5, 2003. See below for a list of such non-GAAP items and the location in our SEC filings of the existing reconciliation.
Section/Slide Title |
| Metric |
| Location of Existing Reconciliation |
|
Section: Electronic Retailing |
|
|
|
|
|
Electronic Retailing Today |
| OIBA for HSN US 2003 |
| Schedule 1 |
|
|
| OIBA for HSN Int’l 2003 |
| Schedule 2 |
|
HSN U.S. Financial Summary |
| HSN US OIBA—1999 to 2003E |
| Schedule 1 |
|
HSN U.S. Significant Competitive Opportunity |
| HSN EBITDA for Last Twelve Months |
| Schedule 3 |
|
International Consolidated Summary |
| HSN Int'l OIBA—1999 to 2003E |
| Schedule 2 |
|
|
|
|
|
|
|
Section: Ticketing |
|
|
|
|
|
Results have been strong |
| OIBA—2001, 2002 and LTM |
| Schedule 4, Schedule 10 |
|
5 year Growth build-up |
| OIBA—LTM and 2008E |
| Schedule 10 |
|
Index to Reconciliations
Section/Slide Title |
| Metric |
| Location of Existing Reconciliation |
|
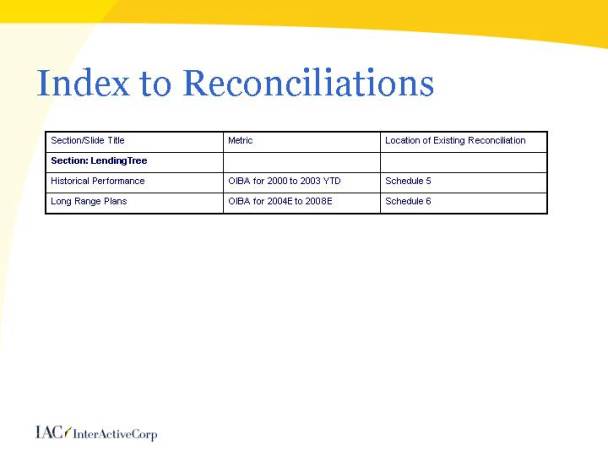
Section: LendingTree |
|
|
|
|
|
Historical Performance |
| OIBA for 2000 to 2003 YTD |
| Schedule 5 |
|
Long Range Plans |
| OIBA for 2004E to 2008E |
| Schedule 6 |
|
Index to Reconciliations
Section/Slide Title |
| Metric |
| Location of Existing Reconciliation |
|
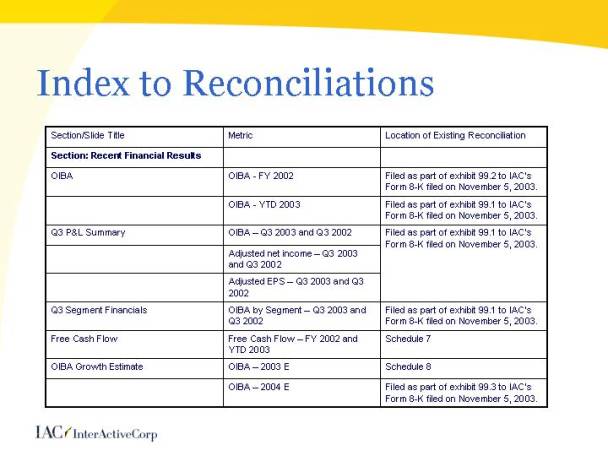
Section: Recent Financial Results |
|
|
|
|
|
OIBA |
| OIBA—FY 2002 |
| Filed as part of exhibit 99.2 to IAC’s Form 8-K filed on November 5, 2003. |
|
|
| OIBA—YTD 2003 |
| Filed as part of exhibit 99.1 to IAC’s Form 8-K filed on November 5, 2003. |
|
Q3 P&L Summary |
| OIBA—Q3 2003 and Q3 2002 |
| Filed as part of exhibit 99.1 to IAC’s Form 8-K filed on November 5, 2003. |
|
|
| Adjusted net income—Q3 2003 and Q3 2002 |
| Filed as part of exhibit 99.1 to IAC’s Form 8-K filed on November 5, 2003. |
|
|
| Adjusted EPS—Q3 2003 and Q3 2002 |
| Filed as part of exhibit 99.1 to IAC’s Form 8-K filed on November 5, 2003. |
|
Q3 Segment Financials |
| OIBA by Segment—Q3 2003 and Q3 2002 |
| Filed as part of exhibit 99.1 to IAC’s Form 8-K filed on November 5, 2003. |
|
Free Cash Flow |
| Free Cash Flow—FY 2002 and YTD 2003 |
| Schedule 7 |
|
OIBA Growth Estimate |
| OIBA—2003 E |
| Schedule 8 |
|
|
| OIBA—2004 E |
| Filed as part of exhibit 99.3 to IAC’s Form 8-K filed on November 5, 2003. |
|
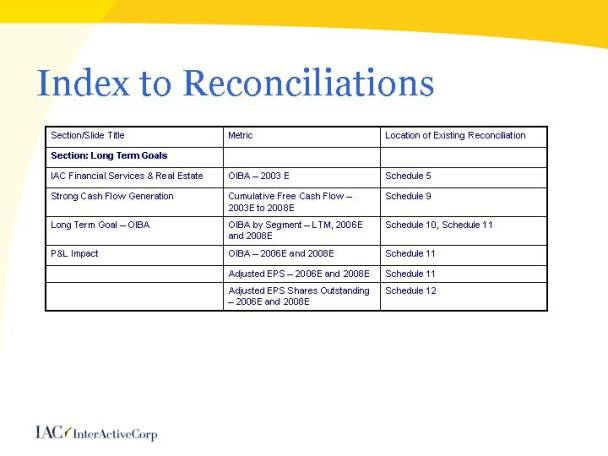
Index to Reconciliations
Section/Slide Title |
| Metric |
| Location of Existing Reconciliation |
|
Section: Long Term Goals |
|
|
|
|
|
IAC Financial Services & Real Estate |
| OIBA—2003 E |
| Schedule 5 |
|
Strong Cash Flow Generation |
| Cumulative Free Cash Flow—2003E to 2008E |
| Schedule 9 |
|
Long Term Goal—OIBA |
| OIBA by Segment—LTM, 2006E and 2008E |
| Schedule 10, Schedule 11 |
|
P&L Impact |
| OIBA—2006E and 2008E |
| Schedule 11 |
|
|
| Adjusted EPS—2006E and 2008E |
| Schedule 11 |
|
|
| Adjusted EPS Shares Outstanding— 2006E and 2008E |
| Schedule 12 |
|
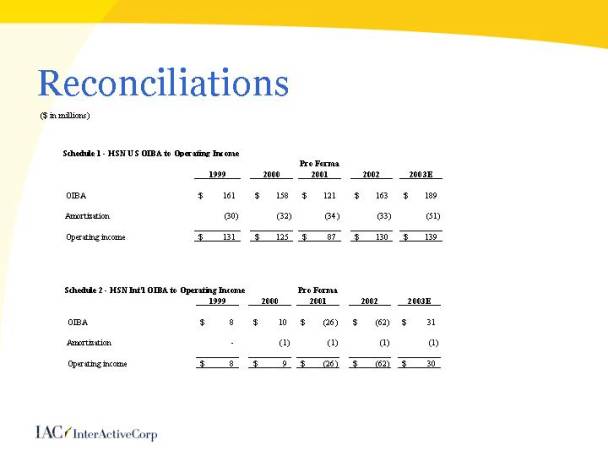
Schedule 1 - HSN US OIBA to Operating Income
|
| Pro Forma |
| |||||||||||||
|
| 1999 |
| 2000 |
| 2001 |
| 2002 |
| 2003E |
| |||||
|
|
|
|
|
|
|
|
|
|
|
| |||||
OIBA |
| $ | 161 |
| $ | 158 |
| $ | 121 |
| $ | 163 |
| $ | 189 |
|
|
|
|
|
|
|
|
|
|
|
|
| |||||
Amortization |
| (30 | ) | (32 | ) | (34 | ) | (33 | ) | (51 | ) | |||||
|
|
|
|
|
|
|
|
|
|
|
| |||||
Operating income |
| $ | 131 |
| $ | 125 |
| $ | 87 |
| $ | 130 |
| $ | 139 |
|
Schedule 2 - HSN Int’l OIBA to Operating Income
|
| Pro Forma |
| |||||||||||||
|
| 1999 |
| 2000 |
| 2001 |
| 2002 |
| 2003E |
| |||||
|
|
|
|
|
|
|
|
|
|
|
| |||||
OIBA |
| $ | 8 |
| $ | 10 |
| $ | (26 | ) | $ | (62 | ) | $ | 31 |
|
|
|
|
|
|
|
|
|
|
|
|
| |||||
Amortization |
| — |
| (1 | ) | (1 | ) | (1 | ) | (1 | ) | |||||
|
|
|
|
|
|
|
|
|
|
|
| |||||
Operating income |
| $ | 8 |
| $ | 9 |
| $ | (26 | ) | $ | (62 | ) | $ | 30 |
|
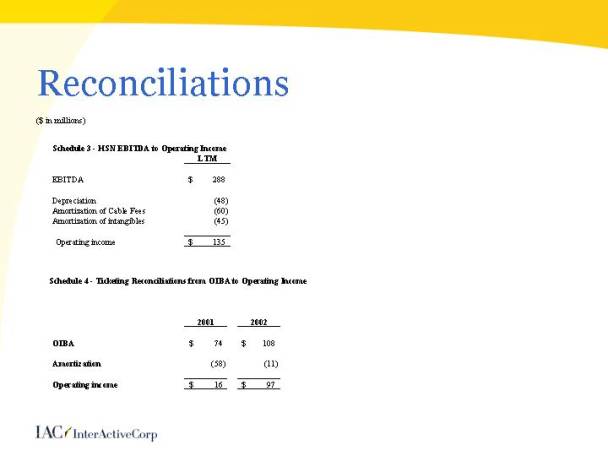
Reconciliations
($ in millions)
Schedule 3 - HSN EBITDA to Operating Income
|
| LTM |
| |
|
|
|
| |
EBITDA |
| $ | 288 |
|
|
|
|
| |
Depreciation |
| (48 | ) | |
Amortization of Cable Fees |
| (60 | ) | |
Amortization of intangibles |
| (45 | ) | |
|
|
|
| |
Operating income |
| $ | 135 |
|
Schedule 4 - Ticketing Reconciliations from OIBA to Operating Income
|
| 2001 |
| 2002 |
| ||
|
|
|
|
|
| ||
OIBA |
| $ | 74 |
| $ | 108 |
|
|
|
|
|
|
| ||
Amortization |
| (58 | ) | (11 | ) | ||
|
|
|
|
|
| ||
Operating income |
| $ | 16 |
| $ | 97 |
|
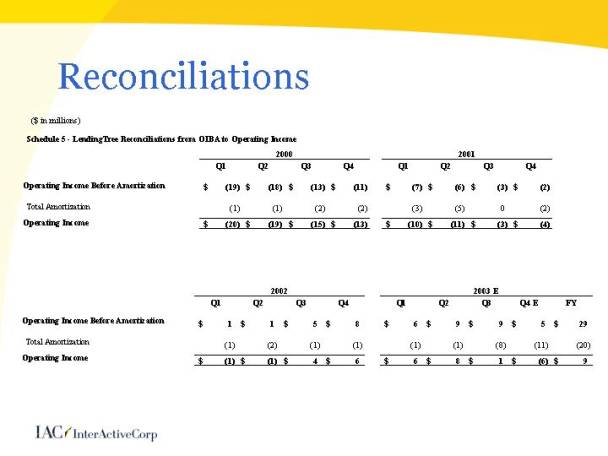
Reconciliations
Schedule 5 - LendingTree Reconciliations from OIBA to Operating Income ($ in millions)
|
| 2000 |
| 2001 |
|
|
| ||||||||||||||||||||||
|
| Q1 |
| Q2 |
| Q3 |
| Q4 |
| Q1 |
| Q2 |
| Q3 |
| Q4 |
|
|
| ||||||||||
|
|
|
|
|
|
|
|
|
|
|
|
|
|
|
|
|
|
|
| ||||||||||
Operating Income Before Amortization |
| $ | (19 | ) | $ | (18 | ) | $ | (13 | ) | $ | (11 | ) | $ | (7 | ) | $ | (6 | ) | $ | (3 | ) | $ | (2 | ) |
|
| ||
Total Amortization |
| (1 | ) | (1 | ) | (2 | ) | (2 | ) | (3 | ) | (5 | ) | 0 |
| (2 | ) |
|
| ||||||||||
Operating Income |
| $ | (20 | ) | $ | (19 | ) | $ | (15 | ) | $ | (13 | ) | $ | (10 | ) | $ | (11 | ) | $ | (3 | ) | $ | (4 | ) |
|
| ||
|
|
|
|
|
|
|
|
|
|
|
|
|
|
|
|
|
|
|
| ||||||||||
|
|
|
|
|
|
|
|
|
|
|
|
|
|
|
|
|
|
|
| ||||||||||
|
|
|
|
|
|
|
|
|
|
|
|
|
|
|
|
|
|
|
| ||||||||||
|
| 2002 |
| 2003 E |
| ||||||||||||||||||||||||
|
| Q1 |
| Q2 |
| Q3 |
| Q4 |
| Q1 |
| Q2 |
| Q3 |
| Q4 E |
| FY |
| ||||||||||
Operating Income Before Amortization |
| $ | 1 |
| $ | 1 |
| $ | 5 |
| $ | 8 |
| $ | 6 |
| $ | 9 |
| $ | 9 |
| $ | 5 |
| $ | 29 |
| |
Total Amortization |
| (1 | ) | (2 | ) | (1 | ) | (1 | ) | (1 | ) | (1 | ) | (8 | ) | (11 | ) | (20 | ) | ||||||||||
Operating Income |
| $ | (1 | ) | $ | (1 | ) | $ | 4 |
| $ | 6 |
| $ | 6 |
| $ | 8 |
| $ | 1 |
| $ | (6 | ) | $ | 9 |
| |
Reconciliations
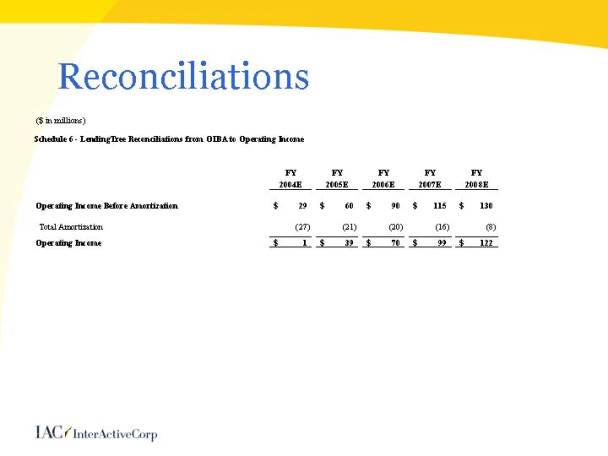
Schedule 6 - LendingTree Reconciliations from OIBA to Operating Income
|
| FY |
| FY |
| FY |
| FY |
| FY |
| |||||
|
| 2004E |
| 2005E |
| 2006E |
| 2007E |
| 2008E |
| |||||
|
|
|
|
|
|
|
|
|
|
|
| |||||
Operating Income Before Amortization |
| $ | 29 |
| $ | 60 |
| $ | 90 |
| $ | 115 |
| $ | 130 |
|
Total Amortization |
| (27 | ) | (21 | ) | (20 | ) | (16 | ) | (8 | ) | |||||
Operating Income |
| $ | 1 |
| $ | 39 |
| $ | 70 |
| $ | 104 |
| $ | 122 |
|
Reconciliations
($ in millions)
Schedule 7 - IAC Reconciliations from Free Cash Flow to Cash from Operations
|
| Q1 |
| Q2 |
| Q3 |
| Q4 |
| FY |
| Q1 |
| Q2 |
| Q3 |
| 2003 |
|
|
| 2002 |
| 2002 |
| 2002 |
| 2002 |
| 2002 |
| 2003 |
| 2003 |
| 2003 |
| YTD |
|
|
|
|
|
|
|
|
|
|
|
|
|
|
|
|
|
|
|
|
|
Net cash provided by Operating activities |
| $187 |
| $251 |
| $186 |
| $154 |
| $778 |
| $476 |
| $463 |
| $206 |
| $1,145 |
|
|
|
|
|
|
|
|
|
|
|
|
|
|
|
|
|
|
|
|
|
Capital expenditures |
| (27 | ) | (46 | ) | (34 | ) | (55 | ) | (162 | ) | (34 | ) | (53 | ) | (43 | ) | (130 | ) |
Investments to fund unconsol subs |
| (1 | ) | (26 | ) | (5 | ) | (0 | ) | (32 | ) | — |
| — |
| — |
| — |
|
Tax distributions from VUE |
| — |
| — |
| — |
| — |
| — |
| — |
| 1 |
| — |
| 1 |
|
Preferred dividend paid |
|
|
| (4 | ) | (3 | ) | (3 | ) | (10 | ) | (3 | ) | (3 | ) | (3 | ) | (10 | ) |
FCF |
| $160 |
| $175 |
| $143 |
| $96 |
| $575 |
| $439 |
| $408 |
| $160 |
| $1,007 |
|
Reconciliations
($ in millions)
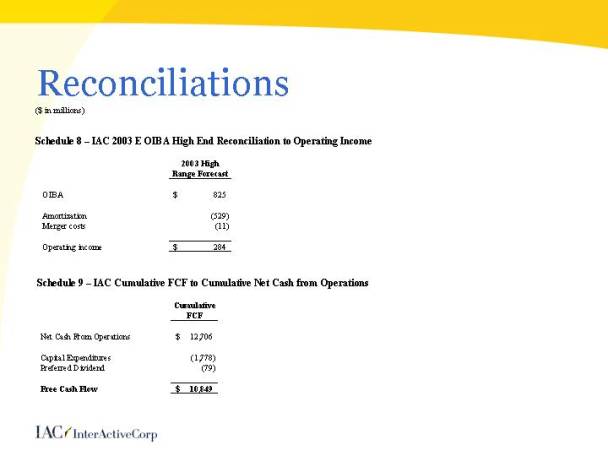
Schedule 8 - IAC 2003 E OIBA High End Reconciliation to Operating Income
|
| 2003 High |
| |
|
| Range Forecast |
| |
|
|
|
| |
OIBA |
| $ | 825 |
|
|
|
|
| |
Amortization |
| (529 | ) | |
Merger costs |
| (11 | ) | |
|
|
|
| |
Operating income |
| $ | 284 |
|
Schedule 9 - IAC Cumulative FCF to Cumulative Net Cash from Operations
|
| Cumulative |
| |
|
| FCF |
| |
|
|
|
| |
Net Cash From Operations |
| $ | 12,706 |
|
|
|
|
| |
Capital Expenditures |
| (1,778 | ) | |
|
|
|
| |
Preferred Dividend |
| (79 | ) | |
|
|
|
| |
Free Cash Flow |
| $ | 10,849 |
|
Reconciliations
($ in millions)
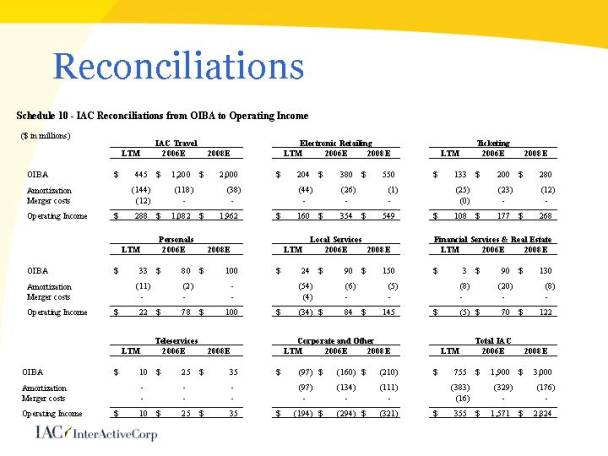
Schedule 10 - IAC Reconciliations from OIBA to Operating Income
|
| IAC Travel |
| Electronic Retailing |
| Ticketing |
| |||||||||||||||||||||
|
| LTM |
| 2006E |
| 2008E |
| LTM |
| 2006E |
| 2008E |
| LTM |
| 2006E |
| 2008E |
| |||||||||
|
|
|
|
|
|
|
|
|
|
|
|
|
|
|
|
|
|
|
| |||||||||
OIBA |
| $ | 445 |
| $ | 1,200 |
| $ | 2,000 |
| $ | 204 |
| $ | 380 |
| $ | 550 |
| $ | 133 |
| $ | 200 |
| $ | 280 |
|
Amortization |
| (144 | ) | (118 | ) | (38 | ) | (44 | ) | (26 | ) | (1 | ) | (25 | ) | (23 | ) | (12 | ) | |||||||||
Merger costs |
| (12 | ) | — |
| — |
| — |
| — |
| — |
| (0 | ) | — |
| — |
| |||||||||
Operating Income |
| $ | 288 |
| $ | 1,082 |
| $ | 1,962 |
| $ | 160 |
| $ | 354 |
| $ | 549 |
| $ | 108 |
| $ | 177 |
| $ | 268 |
|
|
|
|
|
|
|
|
|
|
|
|
|
|
|
|
|
|
|
|
| |||||||||
|
|
|
|
|
|
|
|
|
|
|
|
|
|
|
|
|
|
|
| |||||||||
|
| Personals |
| Local Services |
| Financial Services & Real Estate |
| |||||||||||||||||||||
|
| LTM |
| 2006E |
| 2008E |
| LTM |
| 2006E |
| 2008E |
| LTM |
| 2006E |
| 2008E |
| |||||||||
|
|
|
|
|
|
|
|
|
|
|
|
|
|
|
|
|
|
|
| |||||||||
OIBA |
| $ | 33 |
| $ | 80 |
| $ | 100 |
| $ | 24 |
| $ | 90 |
| $ | 150 |
| $ | 3 |
| $ | 90 |
| $ | 130 |
|
Amortization |
| (11 | ) | (2 | ) | — |
| (54 | ) | (6 | ) | (5 | ) | (8 | ) | (20 | ) | (8 | ) | |||||||||
Merger costs |
| — |
| — |
| — |
| (4 | ) | — |
| — |
| — |
| — |
| — |
| |||||||||
Operating Income |
| $ | 22 |
| $ | 78 |
| $ | 100 |
| $ | (34 | ) | $ | 84 |
| $ | 145 |
| $ | (5 | ) | $ | 70 |
| $ | 122 |
|
|
|
|
|
|
|
|
|
|
|
|
|
|
|
|
|
|
|
|
| |||||||||
|
|
|
|
|
|
|
|
|
|
|
|
|
|
|
|
|
|
|
| |||||||||
|
| Teleservices |
| Corporate and Other |
| Total IAC |
| |||||||||||||||||||||
|
| LTM |
| 2006E |
| 2008E |
| LTM |
| 2006E |
| 2008E |
| LTM |
| 2006E |
| 2008E |
| |||||||||
|
|
|
|
|
|
|
|
|
|
|
|
|
|
|
|
|
|
|
| |||||||||
OIBA |
| $ | 10 |
| $ | 25 |
| $ | 35 |
| $ | (97 | ) | $ | (160 | ) | $ | (210 | ) | $ | 755 |
| $ | 1,900 |
| $ | 3,000 |
|
Amortization |
| — |
| — |
| — |
| (97 | ) | (134 | ) | (111 | ) | (383 | ) | (329 | ) | (176 | ) | |||||||||
Merger costs |
| — |
| — |
| — |
| — |
| — |
| — |
| (16 | ) | — |
| — |
| |||||||||
Operating Income |
| $ | 10 |
| $ | 25 |
| $ | 35 |
| $ | (194 | ) | $ | (294 | ) | $ | (321 | ) | $ | 355 |
| $ | 1,571 |
| $ | 2,824 |
|
Reconciliations
Schedule 11 - IAC Reconciliations from GAAP EPS to Adjusted EPS
$ in billions except per share data |
| 2006E |
| 2008E |
| ||
|
|
|
|
|
| ||
OIBA |
| $ | 1.9 |
| $ | 3.0 |
|
Amortization |
| (0.3 | ) | (0.2 | ) | ||
Operating Income |
| 1.6 |
| 2.8 |
| ||
Interest and Other Income |
| 0.2 |
| 0.3 |
| ||
Income before Taxes and Minority Interest |
| 1.8 |
| 3.1 |
| ||
Income Taxes |
| (0.7 | ) | (1.2 | ) | ||
Minority Interest |
| (0.0 | ) | (0.0 | ) | ||
Net Income before Preferred |
| 1.1 |
| 1.9 |
| ||
Preferred Dividend |
| — |
| (0.0 | ) | ||
Net Income Available to Common Shareholders |
| 1.1 |
| 1.9 |
| ||
GAAP Diluted Shares (in millions) |
| 755 |
| 730 |
| ||
GAAP EPS |
| $ | 1.40 |
| $ | 2.55 |
|
|
|
|
|
|
| ||
Adjusted Net Income Calculation |
|
|
|
|
| ||
|
|
|
|
|
| ||
Net Income |
| 1.1 |
| 1.9 |
| ||
Amortization of non-cash items and intangibles |
| 0.3 |
| 0.2 |
| ||
Impact of income taxes and minority interest |
| (0.1 | ) | (0.1 | ) | ||
Adjusted Net Income |
| $ | 1.3 |
| $ | 2.0 |
|
|
|
|
|
|
| ||
Adjusted Outstanding Shares (in millions) |
| 766 |
| 741 |
| ||
|
|
|
|
|
| ||
Adjusted EPS |
| $ | 1.70 |
| $ | 2.65 |
|
Reconciliations
Schedule 12 - IAC Reconciliations from GAAP Diluted Shares to Adjusted EPS Shares
|
| 2006E |
| 2008E |
|
Basic Shares Outstanding |
| 668 |
| 642 |
|
Treasury method options, warrants and restricted stock |
| 65 |
| 65 |
|
Expedia Preferred |
| 22 |
| 23 |
|
GAAP Diluted Shares Outstanding |
| 755 |
| 730 |
|
Additional restricted shares for calculating Adjusted EPS |
| 11 |
| 10 |
|
Adjusted EPS shares outstanding |
| 766 |
| 741 |
|