UNITED STATES
SECURITIES AND EXCHANGE COMMISSION
Washington, D.C. 20549
FORM N-CSR
CERTIFIED SHAREHOLDER REPORT
OF
REGISTERED MANAGEMENT INVESTMENT COMPANIES
| | |
| Investment Company Act file number: | 811-7043 | |
| | |
| Name of Registrant: | Vanguard Admiral Funds |
| |
| Address of Registrant: | P.O. Box 2600 |
| | Valley Forge, PA 19482 |
| |
| Name and address of agent for service: | Heidi Stam, Esquire |
| | P.O. Box 876 |
| | Valley Forge, PA 19482 |
| |
| Registrant’s telephone number, including area code: (610) 669-1000 |
|
| Date of fiscal year end: August 31 | |
| |
| Date of reporting period: September 1, 2010 – February 28, 2011 |
|
| Item 1: Reports to Shareholders | |

|
| Vanguard Money Market Funds |
| Semiannual Report |
|
| February 28, 2011 |

|
| Vanguard Prime Money Market Fund |
| Vanguard Federal Money Market Fund |
| Vanguard Admiral™ Treasury Money Market Fund |
|
> For the six months ended February 28, 2011, the Vanguard Money Market Funds earned near-zero returns.
> Money market yields have remained negligible because of the Federal Reserve’s low-interest-rate policy, which aims to speed the economic recovery.
> While the three Vanguard funds posted slightly positive returns, the average return of peer-group funds was 0%.
| |
| Contents | |
| Your Fund’s Total Returns. | 1 |
| Chairman’s Letter. | 2 |
| Advisor’s Report. | 7 |
| Prime Money Market Fund. | 8 |
| Federal Money Market Fund. | 30 |
| Admiral Treasury Money Market Fund. | 40 |
| About Your Fund’s Expenses. | 48 |
| Glossary. | 50 |
Please note: The opinions expressed in this report are just that—informed opinions. They should not be considered promises or advice.
Also, please keep in mind that the information and opinions cover the period through the date on the front of this report. Of course, the
risks of investing in your fund are spelled out in the prospectus.
See the Glossary for definitions of investment terms used in this report.
Cover photograph: Jean Maher.
Your Fund’s Total Returns
| | |
| Six Months Ended February 28, 2011 | | |
| | 7-Day | Total |
| | SEC Yields | Returns |
| Vanguard Prime Money Market Fund | | |
| Investor Shares | 0.07% | 0.04% |
| Institutional Shares | 0.19 | 0.10 |
| Money Market Funds Average | | 0.00 |
| Money Market Funds Average: Derived from data provided by Lipper Inc. | | |
| Vanguard Federal Money Market Fund | 0.02% | 0.01% |
| Government Money Market Funds Average | | 0.00 |
| Government Money Market Funds Average: Derived from data provided by Lipper Inc. | | |
| Vanguard Admiral Treasury Money Market Fund | 0.02% | 0.01% |
| iMoneyNet Money Fund Report’s 100% Treasury Funds Average | | 0.00 |
| iMoneyNet Money Fund Report’s 100% Treasury Funds Average: Derived from data provided by iMoneyNet, Inc. |
| The 7-day SEC yield of a money market fund more closely reflects the current earnings of the fund than its total return. |
| Institutional Shares are available to certain institutional investors who meet specific administrative, service, and account-size criteria. |
1

Chairman’s Letter
Dear Shareholder,
A description of money market mutual fund performance over the past six months will have a familiar ring to many investors. Yields of the Vanguard Money Market Funds continued to be a hairsbreadth above zero as the Federal Reserve kept short-term interest rates at a historically low level.
This restrictive interest rate environment has been a challenge ably met by the funds’ advisor, Vanguard Fixed Income Group. Our funds’ returns were slight in the half-year ended February 28, but they were ahead of the 0% average return of competing money market funds, and we didn’t waver from our mandate to invest in very high-credit-quality securities.
During the period, U.S. money market funds continued to implement changes required by the Securities and Exchange Commission (SEC) in reaction to the financial crisis of 2008. In our last report to you, I noted one of these new requirements, which involved an enhancement to fund liquidity. Since then, money market funds have begun posting their holdings five business days after the end of each month on their websites. In addition, the SEC has begun posting, with a 60-day delay, funds’ “shadow net asset values” on its own site. Shadow NAVs reflect the typically very modest changes in market prices of fund investments. Federal policy-makers are pondering additional changes, and Vanguard has been providing research and comments.
2
We applaud these developments, which support the transparency and credit quality of all money market funds. None of the changes alter the exacting standards for credit quality and liquidity to which we have traditionally managed your funds.
We continue to believe that money market funds play an important role in most investors’ portfolios, as well as in the broad economy.
Longer-term interest rates rose, depressing bond prices
U.S. interest rates hovered near generational lows early in the period but then moved higher for all but the shortest-term securities, putting pressure on bond prices. For the six months ended February 28, the broad taxable bond market produced
a small negative return. The municipal bond market did worse. Corporate bonds outperformed government debt as investors stretched for yield beyond government securities, where rates remained low by historical standards.
As I noted earlier, the Federal Reserve held its target for short-term interest rates near 0%, as it has since December 2008. This stance kept the returns available from money market instruments such as the 3-month Treasury bill in the same neighborhood.
A fretful start, an optimistic finish for global stock markets
Stock markets rallied from their midsummer malaise to produce exceptional returns for the half-year. At the start of the
| | | |
| Market Barometer | | | |
| | Total Returns |
| | Periods Ended February 28, 2011 |
| | Six | One | Five Years |
| | Months | Year | (Annualized) |
| Bonds | | | |
| Barclays Capital U.S. Aggregate Bond Index (Broad | | | |
| taxable market) | -0.83% | 4.93% | 5.80% |
| Barclays Capital Municipal Bond Index (Broad tax-exempt | | | |
| market) | -3.51 | 1.72 | 4.07 |
| Citigroup Three-Month U.S. Treasury Bill Index | 0.06 | 0.14 | 2.16 |
| |
| Stocks | | | |
| Russell 1000 Index (Large-caps) | 28.65% | 23.54% | 3.17% |
| Russell 2000 Index (Small-caps) | 37.55 | 32.60 | 3.80 |
| Dow Jones U.S. Total Stock Market Index | 29.24 | 24.45 | 3.59 |
| MSCI All Country World Index ex USA (International) | 22.16 | 21.12 | 4.23 |
| |
| CPI | | | |
| Consumer Price Index | 1.37% | 2.11% | 2.18% |
3
period, the U.S. economy seemed in danger of tipping back into recession. By the end, hopes were high that it had reached escape velocity, propelled by steady job growth and notable strength in the manufacturing sector. Smaller stocks, which are especially sensitive to the rhythms of the business cycle, produced the highest six-month returns.
In Europe, investor optimism subdued sovereign-debt jitters, driving stock prices higher. Developed markets in the Pacific region perked up on signs of recovery in global trade. Australian stocks posted especially strong returns, benefiting from a surge in the prices of metals and other natural resources. Emerging stock markets trailed a few steps behind their developed-market counterparts. Most major currencies
appreciated relative to the U.S. dollar, enhancing returns from abroad for U.S.-based investors.
The funds’ investments are chosen very, very selectively
As of February 28, the yields of the Prime and Federal Money Market Funds were slightly lower than those we reported to you six months ago; the Admiral Treasury Fund’s yield was unchanged. Both the Admiral Treasury and Federal Money Market Funds had a 7-day SEC yield of about 0.02%. (These funds have been closed to new investors since 2009.) The Investor Shares of the Prime Money Market Fund yielded 0.07%, while the Institutional Shares, because of their lower expense ratio, yielded 0.19%.
| | | |
| Expense Ratios | | | |
| Your Fund Compared With Its Peer Group | | | |
| | Investor | Institutional | Peer Group |
| | Shares | Shares | Average |
| Prime Money Market Fund | 0.23% | 0.09% | 0.40% |
| Federal Money Market Fund | 0.22 | — | 0.29 |
| Admiral Treasury Money Market Fund | 0.14 | — | 0.21 |
The fund expense ratios shown are from the prospectus dated December 23, 2010, and represent estimated costs for the current fiscal year.
For the six months ended February 28, 2011, the funds’ annualized expense ratios were: for the Prime Money Market Fund, 0.23% for Investor
Shares and 0.09% for Institutional Shares; for the Federal Money Market Fund, 0.22%; for the Admiral Treasury Money Market Fund, 0.14%.
Peer-group expense ratios are derived from data provided by Lipper Inc. and capture information through year-end 2010.
Peer groups are: for the Prime Money Market Fund Investor Shares, Money Market Funds; for the Federal Money Market Fund, Government
Money Market Funds; for the Admiral Treasury Money Market Fund, U.S. Treasury Money Market Funds.
4
In this environment of super-low short-term interest rates, our advisor sought to produce as much income as possible consistent with the funds’ prospectus goal of investing only in very high-quality money market instruments. Every potential holding—particularly those for the Prime Money Market Fund, which invests in corporate and foreign-government securities—is thoroughly vetted by a team of experienced credit analysts.
At the end of February, about one-third of the Prime Money Market Fund’s assets were invested in bank certificates of deposit, mostly in the form of Eurodollar CDs or Yankee CDs. The former are held outside the United States and are typically issued by London banks; the latter are
typically issued by the New York branches of foreign banks. Both are denominated in dollars.
About a fifth of the fund’s holdings consisted of commercial paper (a type of unsecured debt typically backed by bank lines of credit) issued by foreign governments and by financial and industrial firms in the United States and abroad. Smaller portions of the portfolio were invested in state and local government securities and repurchase agreements, which are short-term loans backed by government and agency securities.
The Prime Money Market Fund held dollar-denominated instruments from a geographically diversified group of banks
| | | |
| Changes in Yields | | | |
| | | | 7-Day SEC Yield |
| | February 28, | August 31, | February 28, |
| Money Market Fund | 2011 | 2010 | 2010 |
| Prime | | | |
| Investor Shares | 0.07% | 0.13% | 0.01% |
| Institutional Shares | 0.19 | 0.26 | 0.15 |
| Federal | 0.02 | 0.05 | 0.01 |
| Admiral Treasury | 0.02 | 0.02 | 0.01 |
5
in Canada, Australia, New Zealand, and selected European countries. The fund has no direct exposure to securities of the financially stretched European countries—Portugal, Ireland, Italy, Greece, and Spain—that have been wrestling with sovereign-debt challenges.
As of February 28, the largest portion of the fund’s investments—about 40%—were in U.S. government and agency obligations, which have the highest credit standing. Our other two money market funds have a more exclusive focus, as their names imply: The Admiral Treasury Money Market Fund concentrates on U.S. Treasury securities, while the Federal Money Market Fund typically focuses on securities issued by agencies of the federal government.
When will short-term rates bounce off the bottom?
Despite their low yields, the Vanguard Money Market Funds continue to carry out their primary function admirably, serving as low-cost vehicles in which you can hold your short-term reserves with confidence that they are invested in securities of high quality.
So what’s next for short-term interest rates? No one can know for certain, of course, what the Federal Reserve’s policy will be or what will happen in the financial markets. That’s the nature of investing, and it’s why we recommend an investment program that is balanced and diversified among stocks, bonds, and money market funds.
At this point, while many economists believe that the Federal Reserve will take steps to boost short-term rates late in 2011, Vanguard’s economists suspect that such action will more likely take place in early 2012. Note that our economists often share their latest views at vanguard.com.
As always, thank you for entrusting your assets to Vanguard.
Sincerely,

F. William McNabb III
Chairman and Chief Executive Officer
March 9, 2011
6
Advisor’s Report
For the six months ended February 28, 2011, the three Vanguard Money Market Funds produced negligible returns. As with all money market funds, yields have been weighed down by the Federal Reserve Board’s policy of keeping short-term interest rates very low in an attempt to spur economic growth. The Fed has maintained its target federal funds rate between 0% and 0.25% since December 2008 and has continued to state that it plans to keep short-term rates low “for an extended period.” In November the Fed announced a strategy aimed at tamping down longer-term interest rates as well through a massive bond-buying program.
The funds’ returns ranged from 0.01% for the Admiral Treasury and Federal Money Market Funds to 0.10% for the Institutional Shares of the Prime Money Market Fund. By comparison, the average return of peer-group money market funds was 0%.
Investing in a difficult market
The half-year began in a period of heightened sovereign-debt risk in Europe. Financial conditions in Greece deteriorated and prompted intervention by the European Union and the International Monetary Fund. These actions mitigated some of the worry about Greece, but concern lingered about high levels of debt in other countries.
As conditions evolved, we modified the exposures in the Prime Money Market Fund to reflect our concerns about the potential for further deterioration in Europe. We increased our holdings in
Canadian and Australian banks, which had limited exposure to regions we were concerned about.
During this period, we continued to take advantage of relative value opportunities in the U.S. Treasury and agency markets. A consequence of the housing crisis has been a decline in money-market-eligible agency issuance, while yields on short-term agency discount notes have remained relatively close to those of U.S. Treasury bills. Because of this, we increased the allocation to Treasury bills in the Prime and Federal Money Market Funds. As an alternative to the discount agency notes, we have been able to accumulate a position in floating-rate agency securities at more favorable yields.
The outlook
The good news is that the economy is showing signs of improvement. The employment situation has gotten better and retail sales have grown. We believe we have entered a period of self-sustaining recovery that will eventually lead the Federal Reserve to tighten monetary policy. As always, we will continue to monitor the situation and adjust the portfolios accordingly should the expansion prove to be faster than anticipated.
David R. Glocke, Principal
Vanguard Fixed Income Group
March 15, 2011
7
Prime Money Market Fund
Fund Profile
As of February 28, 2011
| | |
| Financial Attributes | | |
| | Investor | Institutional |
| | Shares | Shares |
| Ticker Symbol | VMMXX | VMRXX |
| Expense Ratio1 | 0.23% | 0.09% |
| 7-Day SEC Yield | 0.07% | 0.19% |
| Average Weighted | | |
| Maturity | 57 days | 57 days |
| |
| Sector Diversification (% of portfolio) | |
| Certificates of Deposit | | 1.3% |
| Repurchase Agreements | | 6.4 |
| U.S. Treasury Bills | | 15.9 |
| Yankee/Foreign | | 39.1 |
| Commercial Paper | | 8.1 |
| U.S. Government Agency Obligations | 24.9 |
| Other | | 4.3 |
The agency and mortgage-backed securities sectors may include issues from government-sponsored enterprises; such issues are not
backed by the full faith and credit of the U.S. government.
| |
| Distribution by Credit Quality (% of portfolio) |
| First Tier | 100.0% |
| For information about these ratings, see the Glossary entry for Credit Quality. |
1 The expense ratios shown are from the prospectus dated December 23, 2010, and represent estimated costs for the current fiscal year. For
the six months ended February 28, 2011, the annualized expense ratios were 0.23% for Investor Shares and 0.09% for Institutional Shares.
8
Prime Money Market Fund
Performance Summary
Investment returns will fluctuate. All of the returns in this report represent past performance, which is not a guarantee of future results that may be achieved by the fund. (Current performance may be lower or higher than the performance data cited. For performance data current to the most recent month-end, visit our website at vanguard.com/performance.) The returns shown do not reflect taxes that a shareholder would pay on fund distributions. An investment in a money market fund is not insured or guaranteed by the Federal Deposit Insurance Corporation or any other government agency. Although the fund seeks to preserve the value of your investment at $1 per share, it is possible to lose money by investing in the fund. The fund’s 7-day SEC yield reflects its current earnings more closely than do the average annual returns.
Fiscal-Year Total Returns (%): August 31, 2000, Through February 28, 2011
| | |
| | | Money |
| | | Market |
| | | Funds |
| | Investor Shares | Average |
| Fiscal Year | Total Returns | Total Returns |
| 2001 | 5.43% | 4.75% |
| 2002 | 2.09 | 1.40 |
| 2003 | 1.12 | 0.60 |
| 2004 | 0.83 | 0.39 |
| 2005 | 2.31 | 1.68 |
| 2006 | 4.38 | 3.69 |
| 2007 | 5.23 | 4.55 |
| 2008 | 3.60 | 3.02 |
| 2009 | 1.31 | 0.62 |
| 2010 | 0.08 | 0.02 |
| 2011 | 0.04 | 0.00 |
| 7-day SEC yield (2/28/2011): 0.07% |
| Money Market Funds Average: Derived from data provided by Lipper Inc. |
| Note: For 2011, performance data reflect the six months ended February 28, 2011. |
Average Annual Total Returns: Periods Ended December 31, 2010
This table presents average annual total returns through the latest calendar quarter—rather than through the end of the fiscal period. Securities and Exchange Commission rules require that we provide this information.
| | | | |
| | Inception | One | Five | Ten |
| | Date | Year | Years | Years |
| Investor Shares | 6/4/1975 | 0.06% | 2.66% | 2.41% |
| Institutional Shares | 10/3/1989 | 0.20 | 2.81 | 2.59 |
See Financial Highlights for dividend information.
9
Prime Money Market Fund
Financial Statements (unaudited)
Statement of Net Assets
As of February 28, 2011
The fund reports a complete list of its holdings in various monthly and quarterly regulatory filings.
The fund publishes its holdings on a monthly basis at vanguard.com and files them with the Securities and Exchange Commission on Form N-MFP. The fund’s Form N-MFP filings become public 60 days after the relevant month-end, and may be viewed at sec.gov or via a link on the “Portfolio Holdings” page on vanguard.com. For the second and fourth fiscal quarters, the lists appear in the fund’s semiannual and annual reports to shareholders. For the first and third fiscal quarters, the fund files the lists with the SEC on Form N-Q. Shareholders can look up the fund’s Forms N-Q on the SEC’s website at sec.gov. Forms N-Q may also be reviewed and copied at the SEC’s Public Reference Room (see the back cover of this report for further information).
| | | | | |
| | | | | Face | Market |
| | | | Maturity | Amount | Value |
| | | Yield1 | Date | ($000) | ($000) |
| U.S. Government and Agency Obligations (41.9%) | | | |
| 2 | Fannie Mae Discount Notes | 0.180% | 3/2/11 | 48,000 | 48,000 |
| 2 | Fannie Mae Discount Notes | 0.180% | 4/6/11 | 30,000 | 29,995 |
| 2 | Federal Home Loan Bank Discount Notes | 0.200% | 3/2/11 | 119,000 | 118,999 |
| 2 | Federal Home Loan Bank Discount Notes | 0.200% | 3/4/11 | 76,000 | 75,999 |
| 2 | Federal Home Loan Bank Discount Notes | 0.170% | 3/23/11 | 398,000 | 397,959 |
| 2 | Federal Home Loan Bank Discount Notes | 0.170% | 3/25/11 | 602,000 | 601,932 |
| 2 | Federal Home Loan Bank Discount Notes | 0.165% | 4/4/11 | 50,000 | 49,992 |
| 2 | Federal Home Loan Bank Discount Notes | 0.180% | 4/6/11 | 55,000 | 54,990 |
| 2 | Federal Home Loan Bank Discount Notes | 0.165%–0.180% | 4/8/11 | 763,000 | 762,866 |
| 2 | Federal Home Loan Bank Discount Notes | 0.180% | 4/13/11 | 582,000 | 581,875 |
| 2 | Federal Home Loan Bank Discount Notes | 0.190% | 4/27/11 | 70,000 | 69,979 |
| 2,3 | Federal Home Loan Banks | 0.182% | 5/13/11 | 1,079,640 | 1,079,595 |
| 2,3 | Federal Home Loan Banks | 0.231% | 1/9/12 | 593,000 | 592,835 |
| 2,3 | Federal Home Loan Banks | 0.232% | 1/23/12 | 425,000 | 424,904 |
| 2,3 | Federal Home Loan Banks | 0.227% | 1/26/12 | 405,000 | 404,889 |
| 2,3 | Federal Home Loan Banks | 0.223% | 2/1/12 | 750,000 | 749,776 |
| 2,3 | Federal Home Loan Banks | 0.228% | 2/3/12 | 122,000 | 121,966 |
| 2,3 | Federal Home Loan Banks | 0.233% | 2/3/12 | 484,000 | 483,865 |
| 2,3 | Federal Home Loan Mortgage Corp. | 0.213% | 12/21/11 | 1,500,000 | 1,499,388 |
| 2,3 | Federal Home Loan Mortgage Corp. | 0.353% | 4/7/11 | 3,247,000 | 3,246,977 |
| 2,3 | Federal Home Loan Mortgage Corp. | 0.221% | 5/4/11 | 500,000 | 499,983 |
| 2,3 | Federal Home Loan Mortgage Corp. | 0.241% | 8/5/11 | 1,250,000 | 1,250,094 |
| 2,3 | Federal Home Loan Mortgage Corp. | 0.225% | 12/16/11 | 515,000 | 514,835 |
| 2,3 | Federal Home Loan Mortgage Corp. | 0.225% | 2/16/12 | 470,400 | 470,210 |
| 2,3 | Federal Home Loan Mortgage Corp. | 0.201% | 8/24/12 | 2,515,000 | 2,513,210 |
| 2,3 | Federal National Mortgage Assn. | 0.293% | 12/20/11 | 494,500 | 494,319 |
| 2,3 | Federal National Mortgage Assn. | 0.192% | 5/13/11 | 3,000,000 | 2,999,940 |
| 2,3 | Federal National Mortgage Assn. | 0.161% | 7/27/11 | 2,000,000 | 1,999,675 |
| 2,3 | Federal National Mortgage Assn. | 0.174% | 8/11/11 | 1,000,000 | 999,730 |
| 2,3 | Federal National Mortgage Assn. | 0.282% | 8/23/12 | 1,455,500 | 1,454,845 |
| 2,3 | Federal National Mortgage Assn. | 0.294% | 9/17/12 | 988,000 | 987,691 |
| 2,3 | Federal National Mortgage Assn. | 0.282% | 11/23/12 | 1,772,795 | 1,771,863 |
| 2,3 | Federal National Mortgage Assn. | 0.291% | 12/28/12 | 219,000 | 218,919 |
| 2 | Freddie Mac Discount Notes | 0.180% | 4/4/11 | 256,099 | 256,055 |
| 2 | Freddie Mac Discount Notes | 0.165% | 4/5/11 | 23,000 | 22,996 |
| 2 | Freddie Mac Discount Notes | 0.180% | 4/11/11 | 50,000 | 49,990 |
10
Prime Money Market Fund
| | | | |
| | | | Face | Market |
| | | Maturity | Amount | Value |
| | Yield1 | Date | ($000) | ($000) |
| United States Treasury Bill | 0.160% | 3/3/11 | 1,000,000 | 999,991 |
| United States Treasury Bill | 0.145% | 3/10/11 | 1,825,000 | 1,824,934 |
| United States Treasury Bill | 0.160% | 3/17/11 | 500,000 | 499,964 |
| United States Treasury Bill | 0.165% | 4/14/11 | 500,000 | 499,899 |
| United States Treasury Bill | 0.170% | 4/28/11 | 840,000 | 839,770 |
| United States Treasury Bill | 0.160% | 5/12/11 | 1,500,000 | 1,499,520 |
| United States Treasury Bill | 0.194%–0.195% | 5/26/11 | 2,400,000 | 2,398,884 |
| United States Treasury Bill | 0.145% | 6/2/11 | 800,000 | 799,707 |
| United States Treasury Bill | 0.180% | 6/9/11 | 500,000 | 499,750 |
| United States Treasury Bill | 0.190%–0.191% | 6/16/11 | 1,550,000 | 1,549,124 |
| United States Treasury Bill | 0.185% | 6/23/11 | 2,000,000 | 1,998,828 |
| United States Treasury Bill | 0.225% | 6/30/11 | 2,000,000 | 1,998,487 |
| United States Treasury Bill | 0.190% | 7/7/11 | 979,000 | 978,339 |
| United States Treasury Bill | 0.155% | 8/25/11 | 900,000 | 899,314 |
| United States Treasury Bill | 0.170% | 9/1/11 | 568,120 | 567,632 |
| Total U.S. Government and Agency Obligations (Cost $45,755,279) | | | 45,755,279 |
| Commercial Paper (17.0%) | | | | |
| Finance—Auto (1.9%) | | | | |
| American Honda Finance Corp. | 0.240% | 3/2/11 | 107,000 | 106,999 |
| American Honda Finance Corp. | 0.280% | 3/18/11 | 50,000 | 49,993 |
| American Honda Finance Corp. | 0.240% | 4/4/11 | 41,000 | 40,991 |
| American Honda Finance Corp. | 0.250% | 4/18/11 | 141,000 | 140,953 |
| American Honda Finance Corp. | 0.240% | 5/16/11 | 51,000 | 50,974 |
| Toyota Credit Canada Inc. | 0.391% | 4/15/11 | 24,500 | 24,488 |
| Toyota Credit Canada Inc. | 0.371% | 4/26/11 | 74,000 | 73,957 |
| Toyota Credit Canada Inc. | 0.341% | 5/16/11 | 25,000 | 24,982 |
| Toyota Motor Credit Corp. | 0.381% | 3/1/11 | 207,600 | 207,600 |
| Toyota Motor Credit Corp. | 0.391% | 4/15/11 | 148,500 | 148,428 |
| Toyota Motor Credit Corp. | 0.260% | 4/20/11 | 92,000 | 91,967 |
| Toyota Motor Credit Corp. | 0.371% | 4/26/11 | 84,000 | 83,952 |
| Toyota Motor Credit Corp. | 0.331% | 5/16/11 | 82,500 | 82,443 |
| Toyota Motor Credit Corp. | 0.240% | 5/17/11 | 79,000 | 78,959 |
| Toyota Motor Credit Corp. | 0.240% | 5/19/11 | 79,000 | 78,958 |
| Toyota Motor Credit Corp. | 0.351% | 5/20/11 | 99,000 | 98,923 |
| Toyota Motor Credit Corp. | 0.250%–0.351% | 5/23/11 | 138,600 | 138,497 |
| Toyota Motor Credit Corp. | 0.351% | 5/24/11 | 99,000 | 98,919 |
| Toyota Motor Credit Corp. | 0.250% | 5/26/11 | 148,250 | 148,162 |
| Toyota Motor Credit Corp. | 0.381% | 5/31/11 | 99,000 | 98,905 |
| Toyota Motor Credit Corp. | 0.250% | 6/2/11 | 207,600 | 207,466 |
| | | | | 2,076,516 |
| Finance—Other (3.8%) | | | | |
| General Electric Capital Corp. | 0.391% | 3/16/11 | 250,000 | 249,959 |
| General Electric Capital Corp. | 0.431% | 4/8/11 | 247,000 | 246,888 |
| General Electric Capital Corp. | 0.411% | 4/22/11 | 300,000 | 299,822 |
| General Electric Capital Corp. | 0.411% | 4/27/11 | 494,000 | 493,679 |
| General Electric Capital Corp. | 0.401% | 5/23/11 | 500,000 | 499,539 |
| General Electric Capital Corp. | 0.361% | 5/27/11 | 396,000 | 395,655 |
| General Electric Capital Corp. | 0.361% | 5/31/11 | 396,000 | 395,640 |
| General Electric Capital Corp. | 0.301% | 7/18/11 | 250,000 | 249,710 |
| 4 Straight-A Funding LLC | 0.240% | 3/2/11 | 7,000 | 7,000 |
| 4 Straight-A Funding LLC | 0.250% | 3/2/11 | 7,712 | 7,712 |
| 4 Straight-A Funding LLC | 0.240% | 3/7/11 | 45,000 | 44,998 |
| 4 Straight-A Funding LLC | 0.240% | 3/7/11 | 50,000 | 49,998 |
11
Prime Money Market Fund
| | | | |
| | | | Face | Market |
| | | Maturity | Amount | Value |
| | Yield1 | Date | ($000) | ($000) |
| 4 Straight-A Funding LLC | 0.240% | 3/7/11 | 29,000 | 28,999 |
| 4 Straight-A Funding LLC | 0.240%–0.250% | 3/7/11 | 94,685 | 94,681 |
| 4 Straight-A Funding LLC | 0.250% | 4/4/11 | 60,000 | 59,986 |
| 4 Straight-A Funding LLC | 0.250% | 4/4/11 | 161,000 | 160,962 |
| 4 Straight-A Funding LLC | 0.250% | 4/5/11 | 73,000 | 72,982 |
| 4 Straight-A Funding LLC | 0.250% | 4/6/11 | 61,000 | 60,985 |
| 4 Straight-A Funding LLC | 0.250% | 4/7/11 | 33,000 | 32,992 |
| 4 Straight-A Funding LLC | 0.250% | 4/7/11 | 29,000 | 28,993 |
| 4 Straight-A Funding LLC | 0.250% | 4/7/11 | 17,000 | 16,996 |
| 4 Straight-A Funding LLC | 0.250% | 4/8/11 | 138,500 | 138,463 |
| 4 Straight-A Funding LLC | 0.250% | 4/8/11 | 65,000 | 64,983 |
| 4 Straight-A Funding LLC | 0.250% | 4/11/11 | 40,300 | 40,289 |
| 4 Straight-A Funding LLC | 0.250% | 4/11/11 | 75,000 | 74,979 |
| 4 Straight-A Funding LLC | 0.250% | 4/11/11 | 32,500 | 32,491 |
| 4 Straight-A Funding LLC | 0.240% | 5/5/11 | 58,000 | 57,975 |
| 4 Straight-A Funding LLC | 0.245% | 5/5/11 | 35,000 | 34,984 |
| 4 Straight-A Funding LLC | 0.240% | 5/9/11 | 200,000 | 199,908 |
| 4 Straight-A Funding LLC | 0.250% | 5/9/11 | 36,985 | 36,967 |
| 4 Straight-A Funding LLC | 0.250% | 5/13/11 | 33,000 | 32,983 |
| | | | | 4,212,198 |
| Foreign Banks (5.5%) | | | | |
| 4 Australia & New Zealand Banking Group, Ltd. | 0.311% | 5/3/11 | 197,000 | 196,893 |
| 4 Australia & New Zealand Banking Group, Ltd. | 0.336% | 7/29/11 | 41,000 | 40,943 |
| 4 Australia & New Zealand Banking Group, Ltd. | 0.336% | 8/1/11 | 24,670 | 24,635 |
| 4 Australia & New Zealand Banking Group, Ltd. | 0.336% | 8/2/11 | 198,000 | 197,716 |
| 4 Commonwealth Bank of Australia | 0.280% | 4/6/11 | 500,000 | 499,860 |
| 4 Commonwealth Bank of Australia | 0.280% | 4/12/11 | 198,550 | 198,485 |
| 4 Commonwealth Bank of Australia | 0.270% | 4/29/11 | 181,000 | 180,920 |
| 4 Commonwealth Bank of Australia | 0.361% | 6/14/11 | 199,000 | 198,791 |
| 4 Commonwealth Bank of Australia | 0.341% | 8/31/11 | 60,400 | 60,296 |
| 4 Danske Corp. | 0.265% | 3/9/11 | 500,000 | 499,971 |
| 4 Danske Corp. | 0.270% | 3/18/11 | 500,000 | 499,936 |
| Lloyds TSB Bank plc | 0.260% | 3/21/11 | 540,000 | 539,922 |
| Nordea North America Inc. | 0.381% | 7/12/11 | 102,482 | 102,338 |
| 4 Westpac Banking Corp. | 0.311% | 4/14/11 | 150,000 | 149,943 |
| 4 Westpac Banking Corp. | 0.341% | 7/12/11 | 500,000 | 499,372 |
| 4 Westpac Banking Corp. | 0.341% | 7/25/11 | 495,000 | 494,318 |
| 4 Westpac Banking Corp. | 0.341% | 7/28/11 | 497,000 | 496,301 |
| 4 Westpac Banking Corp. | 0.341% | 8/1/11 | 350,000 | 349,494 |
| 4 Westpac Banking Corp. | 0.341% | 8/4/11 | 350,000 | 349,484 |
| 4 Westpac Banking Corp. | 0.341% | 8/8/11 | 448,000 | 447,323 |
| | | | | 6,026,941 |
| Foreign Governments (0.5%) | | | | |
| Banque et Caisse d’Epargne de L’Etat | 0.320% | 4/7/11 | 163,100 | 163,046 |
| Banque et Caisse d’Epargne de L’Etat | 0.340% | 5/4/11 | 38,000 | 37,977 |
| Banque et Caisse d’Epargne de L’Etat | 0.260% | 5/16/11 | 175,000 | 174,904 |
| Banque et Caisse d’Epargne de L’Etat | 0.341% | 8/31/11 | 100,000 | 99,827 |
| | | | | 475,754 |
| Foreign Industrial (2.7%) | | | | |
| 4 Nestle Capital Corp. | 0.210% | 3/2/11 | 247,000 | 246,999 |
| 4 Nestle Capital Corp. | 0.200% | 3/14/11 | 200,000 | 199,986 |
| 4 Nestle Capital Corp. | 0.180% | 4/12/11 | 42,000 | 41,991 |
| 4 Nestle Capital Corp. | 0.210% | 4/27/11 | 345,000 | 344,885 |
12
Prime Money Market Fund
| | | | |
| | | | Face | Market |
| | | Maturity | Amount | Value |
| | Yield1 | Date | ($000) | ($000) |
| 4 Nestle Capital Corp. | 0.200% | 5/17/11 | 317,000 | 316,864 |
| Nestle Finance International Ltd. | 0.180% | 3/7/11 | 109,000 | 108,997 |
| Nestle Finance International Ltd. | 0.180% | 3/11/11 | 38,000 | 37,998 |
| Nestle Finance International Ltd. | 0.200% | 5/26/11 | 117,600 | 117,544 |
| 4 Novartis Finance Corp. | 0.321% | 3/2/11 | 46,000 | 46,000 |
| 4 Novartis Finance Corp. | 0.190%–0.200% | 4/14/11 | 157,150 | 157,113 |
| 4 Novartis Finance Corp. | 0.190% | 4/15/11 | 56,655 | 56,641 |
| 4 Novartis Finance Corp. | 0.190% | 4/18/11 | 86,000 | 85,978 |
| 4 Novartis Finance Corp. | 0.190%–0.200% | 4/19/11 | 76,700 | 76,680 |
| 4 Novartis Securities Investment Ltd. | 0.220% | 5/9/11 | 39,000 | 38,983 |
| 4 Novartis Securities Investment Ltd. | 0.240% | 6/13/11 | 156,000 | 155,892 |
| 4 Shell International Finance BV | 0.331% | 3/1/11 | 55,000 | 55,000 |
| 4 Shell International Finance BV | 0.321%–0.331% | 3/2/11 | 147,750 | 147,749 |
| 4 Shell International Finance BV | 0.260% | 4/1/11 | 40,000 | 39,991 |
| 4 Total Capital Canada, Ltd. | 0.321% | 7/13/11 | 199,000 | 198,763 |
| 4 Total Capital Canada, Ltd. | 0.321% | 7/14/11 | 297,000 | 296,644 |
| 4 Total Capital Canada, Ltd. | 0.321% | 7/19/11 | 154,000 | 153,808 |
| | | | | 2,924,506 |
| Industrial (2.6%) | | | | |
| Chevron Corp. | 0.180% | 3/11/11 | 59,000 | 58,997 |
| 4 Cisco Systems Inc. | 0.210% | 4/13/11 | 32,000 | 31,992 |
| 4 Cisco Systems Inc. | 0.210% | 4/20/11 | 158,000 | 157,954 |
| 4 Cisco Systems Inc. | 0.215% | 5/4/11 | 154,000 | 153,941 |
| 4 Coca Cola Co. | 0.220% | 4/4/11 | 82,000 | 81,983 |
| 4 Coca Cola Co. | 0.200%–0.230% | 4/6/11 | 234,850 | 234,798 |
| 4 Coca Cola Co. | 0.220% | 5/13/11 | 81,700 | 81,663 |
| 4 Coca Cola Co. | 0.210% | 5/16/11 | 9,500 | 9,496 |
| Exxon Mobil Corp. | 0.180% | 3/17/11 | 118,000 | 117,991 |
| General Electric Co. | 0.220% | 3/8/11 | 150,000 | 149,994 |
| General Electric Co. | 0.220% | 3/14/11 | 177,000 | 176,986 |
| 4 Google Inc. | 0.210% | 3/1/11 | 20,000 | 20,000 |
| 4 Google Inc. | 0.200% | 3/3/11 | 43,900 | 43,899 |
| 4 Google Inc. | 0.220% | 3/14/11 | 29,000 | 28,998 |
| 4 Google Inc. | 0.180% | 4/14/11 | 49,000 | 48,989 |
| 4 Google Inc. | 0.180% | 4/18/11 | 13,500 | 13,497 |
| 4 Johnson & Johnson | 0.210% | 3/10/11 | 76,000 | 75,996 |
| 4 Johnson & Johnson | 0.220% | 3/21/11 | 49,400 | 49,394 |
| 4 Johnson & Johnson | 0.210%–0.220% | 4/7/11 | 119,000 | 118,974 |
| 4 Johnson & Johnson | 0.210% | 4/14/11 | 48,000 | 47,988 |
| 4 Merck & Co Inc. | 0.180%–0.190% | 3/14/11 | 143,400 | 143,390 |
| 4 Merck & Co Inc. | 0.180%–0.190% | 3/15/11 | 122,700 | 122,691 |
| 4 Merck & Co Inc. | 0.190% | 3/16/11 | 53,000 | 52,996 |
| 4 Procter & Gamble Co. | 0.190% | 4/19/11 | 25,871 | 25,864 |
| 4 Procter & Gamble Co. | 0.180% | 4/25/11 | 205,000 | 204,944 |
| 4 Procter & Gamble Co. | 0.190% | 4/26/11 | 115,004 | 114,970 |
| 4 Procter & Gamble Co. | 0.180% | 4/27/11 | 57,700 | 57,683 |
| 4 Procter & Gamble Co. | 0.200% | 5/18/11 | 90,000 | 89,961 |
| 4 Procter & Gamble Co. | 0.200% | 5/25/11 | 75,000 | 74,965 |
| 4 Procter & Gamble Co. | 0.200% | 5/26/11 | 45,000 | 44,978 |
| 4 Wal-Mart Stores, Inc. | 0.200% | 3/21/11 | 50,000 | 49,994 |
| 4 Wal-Mart Stores, Inc. | 0.210% | 4/11/11 | 10,000 | 9,998 |
| 4 Wal-Mart Stores, Inc. | 0.180% | 4/18/11 | 171,000 | 170,959 |
| | | | | 2,866,923 |
| Total Commercial Paper (Cost $18,582,838) | | | | 18,582,838 |
13
Prime Money Market Fund
| | | | |
| | | | Face | Market |
| | | Maturity | Amount | Value |
| | Yield1 | Date | ($000) | ($000) |
| Certificates of Deposit (32.8%) | | | | |
| Domestic Banks (1.3%) | | | | |
| State Street Bank & Trust Co. | 0.350% | 3/7/11 | 500,000 | 500,000 |
| State Street Bank & Trust Co. | 0.340% | 3/14/11 | 400,000 | 400,000 |
| State Street Bank & Trust Co. | 0.250% | 5/12/11 | 235,000 | 235,000 |
| State Street Bank & Trust Co. | 0.250% | 5/16/11 | 148,000 | 148,000 |
| State Street Bank & Trust Co. | 0.250% | 5/17/11 | 148,000 | 148,000 |
| | | | | 1,431,000 |
| Eurodollar Certificates of Deposit (10.2%) | | | | |
| Australia & New Zealand Banking Group, Ltd. | 0.325% | 4/4/11 | 342,000 | 342,000 |
| Australia & New Zealand Banking Group, Ltd. | 0.310% | 4/21/11 | 500,000 | 500,000 |
| Australia & New Zealand Banking Group, Ltd. | 0.270% | 5/9/11 | 157,000 | 157,000 |
| Australia & New Zealand Banking Group, Ltd. | 0.350% | 6/8/11 | 175,000 | 175,000 |
| Australia & New Zealand Banking Group, Ltd. | 0.340% | 8/3/11 | 321,000 | 321,000 |
| Commonwealth Bank of Australia | 0.280% | 4/20/11 | 750,000 | 750,000 |
| Commonwealth Bank of Australia | 0.280% | 4/26/11 | 400,000 | 400,000 |
| Commonwealth Bank of Australia | 0.310% | 4/26/11 | 280,000 | 280,000 |
| DNB NOR Bank ASA (London Branch) | 0.260% | 3/14/11 | 500,000 | 500,000 |
| DNB NOR Bank ASA (London Branch) | 0.260% | 3/14/11 | 280,000 | 280,000 |
| HSBC Bank plc | 0.320% | 4/8/11 | 750,000 | 750,000 |
| HSBC Bank plc | 0.320% | 4/8/11 | 750,000 | 750,000 |
| HSBC Bank plc | 0.320% | 4/14/11 | 145,000 | 145,000 |
| HSBC Bank plc | 0.320% | 4/14/11 | 236,000 | 236,000 |
| Lloyds TSB Bank plc | 0.280% | 5/3/11 | 125,000 | 125,000 |
| Lloyds TSB Bank plc | 0.290% | 5/9/11 | 710,000 | 710,000 |
| Lloyds TSB Bank plc | 0.290% | 5/31/11 | 360,000 | 360,000 |
| National Australia Bank Ltd. | 0.430% | 6/3/11 | 745,000 | 745,000 |
| National Australia Bank Ltd. | 0.400% | 6/30/11 | 198,000 | 198,007 |
| National Australia Bank Ltd. | 0.390% | 7/5/11 | 750,000 | 750,000 |
| National Australia Bank Ltd. | 0.360% | 7/12/11 | 360,000 | 360,000 |
| National Australia Bank Ltd. | 0.355% | 7/20/11 | 230,000 | 230,004 |
| National Australia Bank Ltd. | 0.340% | 8/3/11 | 150,000 | 150,000 |
| National Australia Bank Ltd. | 0.360% | 8/10/11 | 100,000 | 100,002 |
| National Australia Bank Ltd. | 0.360% | 8/11/11 | 500,000 | 500,011 |
| Royal Bank of Scotland plc | 0.270% | 4/21/11 | 500,000 | 500,000 |
| Toronto Dominion Bank | 0.250% | 4/4/11 | 300,000 | 300,000 |
| Toronto Dominion Bank | 0.250% | 4/14/11 | 250,000 | 250,000 |
| Toronto Dominion Bank | 0.270% | 5/9/11 | 247,000 | 247,000 |
| | | | | 11,111,024 |
| Yankee Certificates of Deposit (21.3%) | | | | |
| Abbey National Treasury Services plc (US Branch) | 0.850% | 3/1/11 | 461,000 | 461,000 |
| Abbey National Treasury Services plc (US Branch) | 0.300% | 3/9/11 | 250,000 | 250,000 |
| Abbey National Treasury Services plc (US Branch) | 0.750% | 3/21/11 | 500,000 | 500,000 |
| Abbey National Treasury Services plc (US Branch) | 0.740% | 4/20/11 | 500,000 | 500,000 |
| Abbey National Treasury Services plc (US Branch) | 0.740% | 5/3/11 | 530,000 | 530,000 |
| Abbey National Treasury Services plc (US Branch) | 0.450% | 6/1/11 | 400,000 | 400,000 |
| Bank of Montreal (Chicago Branch) | 0.270% | 3/1/11 | 450,000 | 450,000 |
| Bank of Montreal (Chicago Branch) | 0.270% | 3/1/11 | 194,000 | 194,000 |
| Bank of Montreal (Chicago Branch) | 0.270% | 3/9/11 | 164,000 | 164,000 |
| Bank of Montreal (Chicago Branch) | 0.270% | 3/10/11 | 121,000 | 121,000 |
| Bank of Montreal (Chicago Branch) | 0.230% | 3/22/11 | 500,000 | 500,000 |
| Bank of Nova Scotia (Houston Branch) | 0.280% | 3/7/11 | 269,000 | 269,000 |
14
Prime Money Market Fund
| | | | |
| | | | Face | Market |
| | | Maturity | Amount | Value |
| | Yield1 | Date | ($000) | ($000) |
| Bank of Nova Scotia (Houston Branch) | 0.290% | 3/7/11 | 506,000 | 506,000 |
| Bank of Nova Scotia (Houston Branch) | 0.270% | 4/14/11 | 600,000 | 600,000 |
| Bank of Nova Scotia (Houston Branch) | 0.270% | 5/11/11 | 99,000 | 99,000 |
| Bank of Nova Scotia (Houston Branch) | 0.270% | 5/12/11 | 100,000 | 100,000 |
| Bank of Nova Scotia (Houston Branch) | 0.280% | 5/18/11 | 50,000 | 50,001 |
| Bank of Nova Scotia (Houston Branch) | 0.270% | 5/23/11 | 545,000 | 545,000 |
| Bank of Nova Scotia (Houston Branch) | 0.340% | 6/13/11 | 398,000 | 398,000 |
| Bank of Nova Scotia (Houston Branch) | 0.330% | 8/9/11 | 675,000 | 675,000 |
| DNB NOR Bank ASA (New York Branch) | 0.290% | 4/5/11 | 200,000 | 200,000 |
| DNB NOR Bank ASA (New York Branch) | 0.290% | 4/20/11 | 405,000 | 405,000 |
| DNB NOR Bank ASA (New York Branch) | 0.280% | 5/2/11 | 300,000 | 300,000 |
| DNB NOR Bank ASA (New York Branch) | 0.280% | 5/3/11 | 475,000 | 475,000 |
| Lloyds TSB Bank plc (New York Branch) | 0.270% | 3/10/11 | 435,000 | 435,000 |
| Nordea Bank Finland plc (New York Branch) | 0.280% | 5/3/11 | 500,000 | 500,000 |
| Nordea Bank Finland plc (New York Branch) | 0.370% | 7/5/11 | 247,000 | 247,000 |
| Nordea Bank Finland plc (New York Branch) | 0.380% | 7/18/11 | 394,000 | 394,000 |
| Nordea Bank Finland plc (New York Branch) | 0.370% | 7/21/11 | 200,000 | 200,000 |
| Nordea Bank Finland plc (New York Branch) | 0.350% | 8/2/11 | 500,000 | 500,000 |
| Nordea Bank Finland plc (New York Branch) | 0.350% | 8/4/11 | 300,000 | 300,000 |
| Nordea Bank Finland plc (New York Branch) | 0.410% | 8/26/11 | 250,000 | 250,074 |
| Rabobank Nederland NV (New York Branch) | 0.330% | 3/7/11 | 350,000 | 350,000 |
| Rabobank Nederland NV (New York Branch) | 0.335% | 3/16/11 | 92,000 | 92,001 |
| Rabobank Nederland NV (New York Branch) | 0.325% | 4/1/11 | 150,000 | 150,001 |
| Rabobank Nederland NV (New York Branch) | 0.310% | 5/5/11 | 995,000 | 995,000 |
| Rabobank Nederland NV (New York Branch) | 0.370% | 7/14/11 | 500,000 | 500,000 |
| Rabobank Nederland NV (New York Branch) | 0.370% | 8/3/11 | 535,000 | 535,000 |
| Rabobank Nederland NV (New York Branch) | 0.350% | 9/1/11 | 645,000 | 645,000 |
| Royal Bank of Canada (New York Branch) | 0.310% | 3/10/11 | 742,000 | 742,000 |
| Royal Bank of Canada (New York Branch) | 0.320% | 6/7/11 | 1,250,000 | 1,250,000 |
| Royal Bank of Canada (New York Branch) | 0.330% | 8/14/11 | 260,000 | 260,000 |
| Svenska Handelsbanken (New York Branch) | 0.280% | 3/10/11 | 150,000 | 150,000 |
| Svenska Handelsbanken (New York Branch) | 0.310% | 5/4/11 | 500,000 | 500,000 |
| Svenska Handelsbanken (New York Branch) | 0.280% | 6/1/11 | 625,000 | 625,000 |
| Svenska Handelsbanken (New York Branch) | 0.360% | 7/28/11 | 496,000 | 496,000 |
| Svenska Handelsbanken (New York Branch) | 0.360% | 8/1/11 | 497,000 | 497,000 |
| Svenska Handelsbanken (New York Branch) | 0.350% | 8/4/11 | 100,000 | 100,000 |
| Svenska Handelsbanken (New York Branch) | 0.355% | 8/24/11 | 900,000 | 900,000 |
| Toronto Dominion Bank (New York Branch) | 0.250% | 3/7/11 | 100,000 | 100,000 |
| Toronto Dominion Bank (New York Branch) | 0.250% | 3/9/11 | 250,000 | 250,000 |
| Toronto Dominion Bank (New York Branch) | 0.300% | 3/10/11 | 25,000 | 25,000 |
| Toronto Dominion Bank (New York Branch) | 0.240% | 3/14/11 | 300,000 | 300,000 |
| Toronto Dominion Bank (New York Branch) | 0.280% | 3/21/11 | 297,000 | 297,000 |
| Toronto Dominion Bank (New York Branch) | 0.280% | 3/22/11 | 198,000 | 198,000 |
| Toronto Dominion Bank (New York Branch) | 0.300% | 5/16/11 | 247,000 | 247,000 |
| Toronto Dominion Bank (New York Branch) | 0.330% | 5/26/11 | 495,000 | 495,000 |
| Toronto Dominion Bank (New York Branch) | 0.330% | 6/1/11 | 492,000 | 492,000 |
| Westpac Banking Corp. (New York Branch) | 0.350% | 6/3/11 | 500,000 | 500,000 |
| | | | | 23,209,077 |
| Total Certificates of Deposit (Cost $35,751,101) | | | | 35,751,101 |
15
Prime Money Market Fund
| | | | |
| | | | Face | Market |
| | | Maturity | Amount | Value |
| | Yield1 | Date | ($000) | ($000) |
| Repurchase Agreements (6.6%) | | | | |
| Barclays Capital Inc. | | | | |
| (Dated 1/4/11, Repurchase Value | | | | |
| $392,128,000, collateralized by Federal | | | | |
| Home Loan Bank 0.750%, 12/21/11, | | | | |
| Federal Home Loan Mortgage Corp. | | | | |
| 3.000%–4.750%, 7/28/14–1/19/16, and | | | | |
| Federal National Mortgage Assn. | | | | |
| 0.000%–1.625%, 8/8/11–10/26/15) | 0.200% | 3/4/11 | 392,000 | 392,000 |
| Barclays Capital Inc. | | | | |
| (Dated 2/25/11, Repurchase Value | | | | |
| $1,250,307,000, collateralized by Federal | | | | |
| Farm Credit Bank 0.000%–6.260%, | | | | |
| 3/11/11–8/3/37, Federal Home Loan Bank | | | | |
| 0.000%–5.750%, 3/1/11–7/15/36, Federal | | | | |
| Home Loan Mortgage Corp. 0.000%–6.750%, | | | | |
| 3/7/11–9/15/29, Federal National Mortgage | | | | |
| Assn. Discount Note 4/20/11–6/15/11, and | | | | |
| Federal National Mortgage Assn. | | | | |
| 0.000%–6.160%, 3/15/11–7/15/37) | 0.150% | 3/7/11 | 1,250,000 | 1,250,000 |
| Barclays Capital Inc. | | | | |
| (Dated 2/9/11, Repurchase Value $630,084,000, | | | | |
| collateralized by U.S. Treasury Inflation Indexed | | | | |
| Note 1.875%–2.375%, 7/15/13–1/15/17) | 0.160% | 3/7/11 | 630,000 | 630,000 |
| BNP Paribas Securities Corp. | | | | |
| (Dated 2/28/11, Repurchase Value $111,210,000, | | | | |
| collateralized by U.S. Treasury Note 0.500%, | | | | |
| 10/15/13) | 0.170% | 3/1/11 | 111,209 | 111,209 |
| Deutsche Bank Securities, Inc. | | | | |
| (Dated 2/25/11, Repurchase Value $1,250,307,000, | | | | |
| collateralized by Federal Farm Credit Bank | | | | |
| 0.000%–6.280%, 3/4/11–12/16/15, Federal Home | | | | |
| Loan Bank 0.000%–5.750%, 3/10/11–3/13/20, | | | | |
| Federal Home Loan Mortgage Corp. | | | | |
| 0.000%–6.750%, 3/15/11–7/15/32, Federal | | | | |
| National Mortgage Assn. Discount Note 4/6/11, | | | | |
| and Federal National Mortgage Assn. | | | | |
| 0.000%–7.250%, 3/8/11–7/15/37) | 0.150% | 3/7/11 | 1,250,000 | 1,250,000 |
| Deutsche Bank Securities, Inc. | | | | |
| (Dated 1/10/11, Repurchase Value $1,000,295,000, | | | | |
| collateralized by U.S. Treasury Bill 0.000%, | | | | |
| 3/10/11, U.S. Treasury Inflation Indexed Note | | | | |
| 1.250%–3.375%, 4/15/11–1/15/20, U.S. Treasury | | | | |
| Inflation Indexed Bond 1.750%–3.375%, | | | | |
| 1/15/28–4/15/32, U.S. Treasury Note | | | | |
| 0.375%–5.125%, 5/15/12–10/31/16, and | | | | |
| U.S. Treasury Bond 4.375%, 5/15/40) | 0.180% | 3/7/11 | 1,000,000 | 1,000,000 |
16
Prime Money Market Fund
| | | | |
| | | | Face | Market |
| | | Maturity | Amount | Value |
| | Yield1 | Date | ($000) | ($000) |
| Goldman Sachs & Co. | | | | |
| (Dated 2/28/11, Repurchase Value $245,001,000, | | | | |
| collateralized by Federal Home Loan Mortgage | | | | |
| Corp. 0.000%–4.500%, 6/20/11–1/15/13) | 0.180% | 3/1/11 | 245,000 | 245,000 |
| RBC Capital Markets Corp. | | | | |
| (Dated 2/28/11, Repurchase Value $50,000,000, | | | | |
| collateralized by U.S. Treasury Note 2.125%, | | | | |
| 2/29/16) | 0.170% | 3/1/11 | 50,000 | 50,000 |
| RBS Securities, Inc. | | | | |
| (Dated 2/28/11, Repurchase Value $391,096,000, | | | | |
| collateralized by U.S. Treasury Note | | | | |
| 1.750%–4.500%, 11/30/11–1/31/14) | 0.150% | 3/7/11 | 391,000 | 391,000 |
| RBS Securities, Inc. | | | | |
| (Dated 2/9/11, Repurchase Value $420,052,000, | | | | |
| collateralized by U.S. Treasury Note | | | | |
| 2.000%–4.500%, 11/30/11–11/30/13, and | | | | |
| U.S. Treasury Bond 6.000%, 2/15/26) | 0.160% | 3/7/11 | 420,000 | 420,000 |
| RBS Securities, Inc. | | | | |
| (Dated 2/4/11, Repurchase Value $421,065,000, | | | | |
| collateralized by U.S. Treasury Bill 0.000%, | | | | |
| 3/3/11–12/15/11, and U.S. Treasury Note 2.125%, | | | | |
| 2/29/16) | 0.180% | 3/7/11 | 421,000 | 421,000 |
| Societe Generale | | | | |
| (Dated 2/28/11, Repurchase Value $600,003,000, | | | | |
| collateralized by U.S. Treasury Bill 0.000%, | | | | |
| 8/25/11, and U.S. Treasury Inflation Indexed | | | | |
| Note 1.875%–2.500%, 7/15/13–7/15/19) | 0.160% | 3/1/11 | 600,000 | 600,000 |
| Societe Generale | | | | |
| (Dated 2/28/11, Repurchase Value $145,001,000, | | | | |
| collateralized by U.S. Treasury Inflation Indexed | | | | |
| Bond 3.625%, 4/15/28) | 0.170% | 3/1/11 | 145,000 | 145,000 |
| Societe Generale | | | | |
| (Dated 2/25/11, Repurchase Value $300,074,000, | | | | |
| collateralized by Federal Home Loan Bank | | | | |
| 0.000%–5.000%, 3/11/11–6/12/20, Federal | | | | |
| Home Loan Mortgage Corp. 0.000%–5.500%, | | | | |
| 6/20/11–2/9/15, and Federal National Mortgage | | | | |
| Assn. 0.375%–5.625%, 3/23/11–7/15/37) | 0.150% | 3/7/11 | 300,000 | 300,000 |
| Total Repurchase Agreements (Cost $7,205,209) | | | | 7,205,209 |
| |
| | | | Shares | |
| Money Market Fund (1.3%) | | | | |
| 5 Vanguard Municipal Cash Management Fund | | | | |
| (Cost $1,402,395) | 0.231% | | 1,402,395,308 | 1,402,395 |
17
Prime Money Market Fund
| | | | |
| | | | Face | Market |
| | | Maturity | Amount | Value |
| | Yield1 | Date | ($000) | ($000) |
| Tax-Exempt Municipal Bonds (3.1%) | | | | |
| Akron OH Bath & Copley Joint Township | | | | |
| Hospital District Revenue (Akron General | | | | |
| Health System) VRDO | 0.250% | 3/7/11 | 19,500 | 19,500 |
| Arizona Health Facilities Authority Revenue | | | | |
| (Banner Health) VRDO | 0.230% | 3/7/11 | 35,400 | 35,400 |
| Arizona Health Facilities Authority Revenue | | | | |
| (Banner Health) VRDO | 0.280% | 3/7/11 | 39,315 | 39,315 |
| Ascension Parish LA Industrial Development | | | | |
| Board Revenue (IMTT-Geismar Project) VRDO | 0.240% | 3/7/11 | 79,000 | 79,000 |
| Bi-State Development Agency of the | | | | |
| Missouri-Illinois Metropolitan District VRDO | 0.270% | 3/7/11 | 29,800 | 29,800 |
| Birmingham AL Public Educational Building | | | | |
| Student Housing Revenue (University of | | | | |
| Alabama at Birmingham Project) VRDO | 0.260% | 3/7/11 | 17,100 | 17,100 |
| Board of Regents of the University of | | | | |
| Texas System Revenue Financing | | | | |
| System Revenue VRDO | 0.180% | 3/7/11 | 17,425 | 17,425 |
| Board of Regents of the University of | | | | |
| Texas System Revenue Financing | | | | |
| System Revenue VRDO | 0.200% | 3/7/11 | 58,300 | 58,300 |
| Board of Regents of the University of | | | | |
| Texas System Revenue Financing | | | | |
| System Revenue VRDO | 0.200% | 3/7/11 | 95,000 | 95,000 |
| Boone County KY Pollution Control Revenue | | | | |
| (Duke Energy Kentucky Inc. Project) VRDO | 0.220% | 3/7/11 | 19,000 | 19,000 |
| California Health Facilities Financing Authority | | | | |
| Revenue (Stanford Hospital) VRDO | 0.230% | 3/7/11 | 66,500 | 66,500 |
| California Housing Finance Agency Home | | | | |
| Mortgage Revenue VRDO | 0.230% | 3/7/11 | 24,845 | 24,845 |
| California Housing Finance Agency Home | | | | |
| Mortgage Revenue VRDO | 0.260% | 3/7/11 | 15,200 | 15,200 |
| California Infrastructure & Economic | | | | |
| Development Bank Revenue (Orange County | | | | |
| Performing Arts Center) VRDO | 0.200% | 3/7/11 | 35,900 | 35,900 |
| California Statewide Communities Development | | | | |
| Authority Revenue (Los Angeles County | | | | |
| Museum of Art Project) VRDO | 0.200% | 3/7/11 | 19,000 | 19,000 |
| California Statewide Communities Development | | | | |
| Authority Revenue (Redlands Community | | | | |
| Hospital) VRDO | 0.240% | 3/7/11 | 22,100 | 22,100 |
| Cleveland-Cuyahoga County OH Port Authority | | | | |
| Revenue (SPC Buildings 1 & 3 LLC) VRDO | 0.250% | 3/7/11 | 24,000 | 24,000 |
| Colorado Health Facilities Authority Revenue | | | | |
| (Adventist Health System/Sunbelt | | | | |
| Obligated Group) VRDO | 0.250% | 3/7/11 | 12,150 | 12,150 |
| Columbus OH Regional Airport Authority | | | | |
| Airport Revenue (Oasbo Expanded | | | | |
| Asset Program) VRDO | 0.260% | 3/7/11 | 21,100 | 21,100 |
| Connecticut Health & Educational Facilities | | | | |
| Authority Revenue (Yale University) VRDO | 0.180% | 3/7/11 | 35,000 | 35,000 |
| Curators of the University of Missouri System | | | | |
| Facilities Revenue VRDO | 0.240% | 3/7/11 | 43,900 | 43,900 |
18
Prime Money Market Fund
| | | | |
| | | | Face | Market |
| | | Maturity | Amount | Value |
| | Yield1 | Date | ($000) | ($000) |
| Delaware River Port Authority Pennsylvania & | | | | |
| New Jersey Revenue VRDO | 0.270% | 3/7/11 | 76,100 | 76,100 |
| District of Columbia Revenue | | | | |
| (George Washington University) VRDO | 0.290% | 3/7/11 | 27,560 | 27,560 |
| District of Columbia Revenue | | | | |
| (Georgetown University) VRDO | 0.230% | 3/7/11 | 7,575 | 7,575 |
| District of Columbia Revenue | | | | |
| (Georgetown University) VRDO | 0.230% | 3/7/11 | 17,200 | 17,200 |
| District of Columbia Revenue | | | | |
| (Washington Drama Society) VRDO | 0.250% | 3/7/11 | 20,375 | 20,375 |
| Fairfax County VA Economic Development | | | | |
| Authority Resource Recovery Revenue | | | | |
| (Lorton Arts Foundation Project) VRDO | 0.250% | 3/7/11 | 10,600 | 10,600 |
| Harris County TX Cultural Education Facilities | | | | |
| Finance Corp. Hospital Revenue (Memorial | | | | |
| Hermann Healthcare System) VRDO | 0.250% | 3/7/11 | 42,000 | 42,000 |
| Harris County TX Health Facilities Development | | | | |
| Corp. Hospital Revenue (Baylor College of | | | | |
| Medicine) VRDO | 0.240% | 3/7/11 | 42,500 | 42,500 |
| Idaho Housing & Finance Association Single | | | | |
| Family Mortgage Revenue VRDO | 0.260% | 3/7/11 | 17,200 | 17,200 |
| Illinois Development Finance Authority Revenue | | | | |
| (Chicago Horticultural Society) VRDO | 0.270% | 3/7/11 | 16,300 | 16,300 |
| Illinois Finance Authority Pollution Control Revenue | | | | |
| (Commonwealth Edison Co. Project) VRDO | 0.260% | 3/7/11 | 29,400 | 29,400 |
| Illinois Finance Authority Revenue | | | | |
| (Carle Healthcare System) VRDO | 0.210% | 3/7/11 | 44,665 | 44,665 |
| Illinois Finance Authority Revenue | | | | |
| (Ingalls Health System) VRDO | 0.270% | 3/7/11 | 43,000 | 43,000 |
| Illinois Finance Authority Revenue (Little Co. of | | | | |
| Mary Hospital & Health Care Centers) VRDO | 0.260% | 3/7/11 | 18,480 | 18,480 |
| Illinois Finance Authority Revenue | | | | |
| (Loyola University Health System) VRDO | 0.260% | 3/7/11 | 35,450 | 35,450 |
| Illinois Finance Authority Revenue (Museum of | | | | |
| Science & Industry) VRDO | 0.270% | 3/7/11 | 13,000 | 13,000 |
| Indiana Development Finance Authority | | | | |
| Educational Facilities Revenue (Indianapolis | | | | |
| Museum of Art Inc. Project) VRDO | 0.280% | 3/7/11 | 14,400 | 14,400 |
| Indiana Educational Facilities Authority Revenue | | | | |
| (Wabash College) VRDO | 0.280% | 3/7/11 | 23,940 | 23,940 |
| Jacksonville FL Capital Project Revenue VRDO | 0.270% | 3/7/11 | 26,400 | 26,400 |
| Kansas City MO Industrial Development | | | | |
| Authority Revenue (Downtown | | | | |
| Redevelopment District) VRDO | 0.280% | 3/7/11 | 27,535 | 27,535 |
| Kansas City MO Industrial Development Authority | | | | |
| Revenue (Downtown Redevelopment District) | | | | |
| VRDO | 0.280% | 3/7/11 | 11,220 | 11,220 |
| 6 Los Angeles CA Department of Water & Power | | | | |
| Revenue TOB VRDO | 0.310% | 3/7/11 | 13,000 | 13,000 |
| Los Angeles CA Wastewater | | | | |
| System Revenue VRDO | 0.180% | 3/7/11 | 37,400 | 37,400 |
| Los Angeles CA Wastewater | | | | |
| System Revenue VRDO | 0.200% | 3/7/11 | 20,400 | 20,400 |
| Los Angeles CA Wastewater | | | | |
| System Revenue VRDO | 0.250% | 3/7/11 | 27,740 | 27,740 |
19
Prime Money Market Fund
| | | | |
| | | | Face | Market |
| | | Maturity | Amount | Value |
| | Yield1 | Date | ($000) | ($000) |
| Los Angeles CA Wastewater | | | | |
| System Revenue VRDO | 0.250% | 3/7/11 | 23,200 | 23,200 |
| Loudoun County VA Industrial Development | | | | |
| Authority Revenue (Howard Hughes | | | | |
| Medical Institute) VRDO | 0.220% | 3/7/11 | 18,855 | 18,855 |
| Loudoun County VA Industrial Development | | | | |
| Authority Revenue (Howard Hughes | | | | |
| Medical Institute) VRDO | 0.240% | 3/7/11 | 49,365 | 49,365 |
| Maine Health & Higher Educational Facilities | | | | |
| Authority Revenue (Bowdoin College) VRDO | 0.270% | 3/7/11 | 15,130 | 15,130 |
| Maryland Health & Higher Educational Facilities | | | | |
| Authority Revenue (University of Maryland | | | | |
| Medical System) VRDO | 0.250% | 3/7/11 | 30,160 | 30,160 |
| Massachusetts Health & Educational Facilities | | | | |
| Authority Revenue (Bentley College) VRDO | 0.230% | 3/7/11 | 21,900 | 21,900 |
| Massachusetts Health & Educational Facilities | | | | |
| Authority Revenue (MIT) VRDO | 0.200% | 3/7/11 | 19,320 | 19,320 |
| 6 Massachusetts State Transportation Fund | | | | |
| Revenue TOB VRDO | 0.310% | 3/7/11 | 13,100 | 13,100 |
| Metropolitan Atlanta GA Rapid Transportation | | | | |
| Authority Georgia Sales Tax Revenue VRDO | 0.240% | 3/7/11 | 43,100 | 43,100 |
| Miami-Dade County FL Special Obligation | | | | |
| Revenue (Juvenile Courthouse Project) VRDO | 0.220% | 3/7/11 | 25,350 | 25,350 |
| Michigan Higher Education Facilities Authority | | | | |
| Revenue (Albion College) VRDO | 0.260% | 3/7/11 | 13,000 | 13,000 |
| Michigan Hospital Finance Authority Revenue | | | | |
| (Ascension Health Credit Group) VRDO | 0.230% | 3/7/11 | 45,400 | 45,400 |
| Michigan Hospital Finance Authority Revenue | | | | |
| (Henry Ford Health System) VRDO | 0.250% | 3/7/11 | 32,925 | 32,925 |
| Middletown OH Hospital Facilities Revenue | | | | |
| (Atrium Medical Center) VRDO | 0.250% | 3/7/11 | 22,000 | 22,000 |
| Minneapolis & St. Paul MN Housing & | | | | |
| Redevelopment Authority Health Care | | | | |
| System Revenue (Allina Health System) VRDO | 0.230% | 3/7/11 | 15,000 | 15,000 |
| Missouri Health & Educational Facilities | | | | |
| Authority Health Facilities Revenue | | | | |
| (BJC Health System) VRDO | 0.230% | 3/7/11 | 18,000 | 18,000 |
| Missouri Health & Educational Facilities | | | | |
| Authority Health Facilities Revenue | | | | |
| (SSM Health Care) VRDO | 0.220% | 3/7/11 | 84,100 | 84,100 |
| New Jersey Health Care Facilities Financing | | | | |
| Authority Revenue (AHS Hospital Corp.) VRDO | 0.250% | 3/7/11 | 38,730 | 38,730 |
| New Jersey Health Care Facilities Financing | | | | |
| Authority Revenue (Hospital Capital Asset | | | | |
| Pooled Program) VRDO | 0.230% | 3/7/11 | 19,600 | 19,600 |
| New Jersey Transportation Trust Fund Authority | | | | |
| Transportation System Revenue VRDO | 0.230% | 3/7/11 | 32,800 | 32,800 |
| New Mexico Finance Authority Transportation | | | | |
| Revenue VRDO | 0.260% | 3/7/11 | 48,900 | 48,900 |
| New York City NY GO VRDO | 0.200% | 3/7/11 | 58,550 | 58,550 |
| New York City NY GO VRDO | 0.230% | 3/7/11 | 29,800 | 29,800 |
| New York City NY GO VRDO | 0.260% | 3/7/11 | 11,775 | 11,775 |
| New York City NY GO VRDO | 0.260% | 3/7/11 | 9,825 | 9,825 |
20
Prime Money Market Fund
| | | | |
| | | | Face | Market |
| | | Maturity | Amount | Value |
| | Yield1 | Date | ($000) | ($000) |
| New York City NY Housing Development Corp. | | | | |
| Multi-Family Rental Housing Revenue | | | | |
| (Carnegie Park) VRDO | 0.230% | 3/7/11 | 39,505 | 39,505 |
| New York City NY Housing Development Corp. | | | | |
| Multi-Family Rental Housing Revenue | | | | |
| (Monterey) VRDO | 0.220% | 3/7/11 | 21,980 | 21,980 |
| New York City NY Housing Development Corp. | | | | |
| Multi-Family Rental Housing Revenue | | | | |
| (One Columbus Place Development) VRDO | 0.250% | 3/7/11 | 8,100 | 8,100 |
| New York State Dormitory Authority Revenue | | | | |
| (Fordham University) VRDO | 0.230% | 3/7/11 | 31,085 | 31,085 |
| New York State Dormitory Authority Revenue | | | | |
| (Fordham University) VRDO | 0.230% | 3/7/11 | 30,885 | 30,885 |
| New York State Housing Finance Agency Housing | | | | |
| Revenue (10 Liberty Street) VRDO | 0.220% | 3/7/11 | 20,500 | 20,500 |
| New York State Housing Finance Agency Housing | | | | |
| Revenue (125 West 31st Street) VRDO | 0.260% | 3/7/11 | 42,300 | 42,300 |
| New York State Housing Finance Agency Housing | | | | |
| Revenue (20 River Terrace Housing) | | | | |
| VRDO | 0.250% | 3/7/11 | 17,300 | 17,300 |
| New York State Housing Finance Agency Housing | | | | |
| Revenue (320 West 38th Street) VRDO | 0.240% | 3/7/11 | 31,500 | 31,500 |
| New York State Housing Finance Agency Housing | | | | |
| Revenue (330 West 39th Street) VRDO | 0.260% | 3/7/11 | 26,100 | 26,100 |
| New York State Housing Finance Agency Housing | | | | |
| Revenue (70 Battery Place) VRDO | 0.250% | 3/7/11 | 12,800 | 12,800 |
| New York State Housing Finance Agency Housing | | | | |
| Revenue (Clinton Green North) VRDO | 0.260% | 3/7/11 | 24,400 | 24,400 |
| New York State Urban Development Corp. | | | | |
| Revenue (Service Contract) VRDO | 0.230% | 3/7/11 | 10,375 | 10,375 |
| North Texas Tollway Authority System | | | | |
| Revenue VRDO | 0.250% | 3/7/11 | 35,100 | 35,100 |
| Oakland University of Michigan Revenue VRDO | 0.270% | 3/7/11 | 8,900 | 8,900 |
| Ohio Higher Educational Facility Commission | | | | |
| Revenue (University Hospitals Health | | | | |
| System Inc.) VRDO | 0.250% | 3/7/11 | 25,000 | 25,000 |
| Ohio State University General Receipts | | | | |
| Revenue VRDO | 0.220% | 3/7/11 | 29,525 | 29,525 |
| Ohio State University General Receipts | | | | |
| Revenue VRDO | 0.230% | 3/7/11 | 115,300 | 115,300 |
| Pennsylvania Higher Educational Facilities | | | | |
| Authority Revenue (University of Pennsylvania | | | | |
| Health System) VRDO | 0.260% | 3/7/11 | 45,065 | 45,065 |
| Philadelphia PA Industrial Development Authority | | | | |
| Lease Revenue VRDO | 0.270% | 3/7/11 | 18,400 | 18,400 |
| Pittsburgh PA Water & Sewer Authority | | | | |
| Revenue VRDO | 0.280% | 3/7/11 | 57,850 | 57,850 |
| Salem OH Hospital Facilities Revenue (Salem | | | | |
| Community Hospital Project) VRDO | 0.250% | 3/7/11 | 14,000 | 14,000 |
| 6 Seattle WA Municipal Light & Power Revenue | | | | |
| TOB VRDO | 0.310% | 3/7/11 | 6,400 | 6,400 |
| South Carolina Transportation Infrastructure | | | | |
| Revenue VRDO | 0.220% | 3/7/11 | 47,300 | 47,300 |
21
Prime Money Market Fund
| | | | |
| | | | Face | Market |
| | | Maturity | Amount | Value |
| | Yield1 | Date | ($000) | ($000) |
| Southern California Public Power Authority | | | | |
| Revenue (Palo Verde Project) VRDO | 0.240% | 3/7/11 | 11,200 | 11,200 |
| Tarrant County TX Cultural Education Facilities | | | | |
| Finance Corp. Revenue (CHRISTUS Health) | | | | |
| VRDO | 0.260% | 3/7/11 | 18,400 | 18,400 |
| Texas Department of Housing & Community | | | | |
| Affairs Single Family Revenue VRDO | 0.280% | 3/7/11 | 28,900 | 28,900 |
| Texas Department of Housing & Community | | | | |
| Affairs Single Family Revenue VRDO | 0.280% | 3/7/11 | 42,400 | 42,400 |
| Texas Department of Housing & Community | | | | |
| Affairs Single Family Revenue VRDO | 0.280% | 3/7/11 | 24,300 | 24,300 |
| University of Alabama Birmingham Hospital | | | | |
| Revenue VRDO | 0.290% | 3/7/11 | 24,100 | 24,100 |
| University of South Florida Financing Corp. | | | | |
| COP VRDO | 0.250% | 3/7/11 | 41,535 | 41,535 |
| University of Texas Permanent University | | | | |
| Fund Revenue VRDO | 0.180% | 3/7/11 | 66,605 | 66,605 |
| University of Texas Permanent University | | | | |
| Fund Revenue VRDO | 0.180% | 3/7/11 | 153,900 | 153,900 |
| Utah Housing Corp. Single Family Mortgage | | | | |
| Revenue VRDO | 0.260% | 3/7/11 | 16,000 | 16,000 |
| Utah Housing Corp. Single Family Mortgage | | | | |
| Revenue VRDO | 0.260% | 3/7/11 | 19,250 | 19,250 |
| Virginia Small Business Financing Authority | | | | |
| Health Facilities Revenue (Bon Secours Health | | | | |
| System Inc.) VRDO | 0.260% | 3/7/11 | 7,200 | 7,200 |
| Warren County KY Revenue (Western Kentucky | | | | |
| University Student Life Foundation Inc. Project) | | | | |
| VRDO | 0.280% | 3/7/11 | 20,100 | 20,100 |
| Washington County PA Authority Revenue | | | | |
| (Girard Estate Project) VRDO | 0.280% | 3/7/11 | 11,345 | 11,345 |
| Washington Health Care Facilities Authority | | | | |
| Revenue (MultiCare Health System) VRDO | 0.250% | 3/7/11 | 24,975 | 24,975 |
| Washington Health Care Facilities Authority | | | | |
| Revenue (Swedish Health Services) VRDO | 0.230% | 3/7/11 | 20,500 | 20,500 |
| West Virginia Hospital Finance Authority Hospital | | | | |
| Revenue (Charleston Area Medical Center Inc.) | | | | |
| VRDO | 0.250% | 3/7/11 | 30,260 | 30,260 |
| Wisconsin Health & Educational Facilities Authority | | | | |
| Revenue (Aurora Health Care Inc.) VRDO | 0.260% | 3/7/11 | 31,200 | 31,200 |
| Total Tax-Exempt Municipal Bonds (Cost $3,444,700) | | | | 3,444,700 |
| Total Investments (102.7%) (Cost $112,141,522) | | | | 112,141,522 |
| Other Assets and Liabilities (-2.7%) | | | | |
| Other Assets | | | | 696,801 |
| Liabilities | | | | (3,664,941) |
| | | | | (2,968,140) |
| Net Assets (100%) | | | | 109,173,382 |
22
Prime Money Market Fund
| |
| At February 28, 2011, net assets consisted of: | |
| | Amount |
| | ($000) |
| Paid-in-Capital | 109,165,475 |
| Undistributed Net Investment Income | — |
| Accumulated Net Realized Gains | 7,907 |
| Net Assets | 109,173,382 |
| |
| Investor Shares—Net Assets | |
| Applicable to 88,451,537,150 outstanding $.001 par value shares of | |
| beneficial interest (unlimited authorization) | 88,467,369 |
| Net Asset Value Per Share—Investor Shares | $1.00 |
| |
| Institutional Shares—Net Assets | |
| Applicable to 20,703,285,798 outstanding $.001 par value shares of | |
| beneficial interest (unlimited authorization) | 20,706,013 |
| Net Asset Value Per Share—Institutional Shares | $1.00 |
See Note A in Notes to Financial Statements.
1 Represents annualized yield at date of purchase for discount securities, and coupon for coupon-bearing securities.
2 The issuer operates under a congressional charter; its securities are not backed by the full faith and credit of the U.S. government.
3 Adjustable-rate security.
4 Security exempt from registration under Section 4(2) of the Securities Act of 1933. Such securities may be sold in transactions exempt from
registration only to dealers in that program or other “accredited investors.” At February 28, 2011, the aggregate value of these securities
was $11,788,908,000, representing 10.8% of net assets.
5 Affiliated money market fund available only to Vanguard funds and certain trusts and accounts managed by Vanguard. Rate shown is the
7-day yield.
6 Security exempt from registration under Rule 144A of the Securities Act of 1933. Such securities may be sold in transactions exempt from
registration, normally to qualified institutional buyers. At February 28, 2011, the aggregate value of these securities was $32,500,000.
GO—General Obligation Bond.
TOB—Tender Option Bond.
VRDO—Variable Rate Demand Obligation.
See accompanying Notes, which are an integral part of the Financial Statements.
23
Prime Money Market Fund
Statement of Operations
| |
| | Six Months Ended |
| | February 28, 2011 |
| | ($000) |
| Investment Income | |
| Income | |
| Interest1 | 159,999 |
| Total Income | 159,999 |
| Expenses | |
| The Vanguard Group—Note B | |
| Investment Advisory Services | 2,568 |
| Management and Administrative—Investor Shares | 80,772 |
| Management and Administrative—Institutional Shares | 4,968 |
| Marketing and Distribution—Investor Shares | 14,977 |
| Marketing and Distribution—Institutional Shares | 3,270 |
| Custodian Fees | 790 |
| Shareholders’ Reports—Investor Shares | 338 |
| Shareholders’ Reports—Institutional Shares | 48 |
| Trustees’ Fees and Expenses | 76 |
| Total Expenses | 107,807 |
| Net Investment Income | 52,192 |
| Realized Net Gain (Loss) on Investment Securities Sold | (9,380) |
| Net Increase (Decrease) in Net Assets Resulting from Operations | 42,812 |
| 1 Interest income from an affiliated company of the fund was $1,515,000. |
See accompanying Notes, which are an integral part of the Financial Statements.
24
Prime Money Market Fund
Statement of Changes in Net Assets
| | |
| | Six Months Ended | Year Ended |
| | February 28, | August 31, |
| | 2011 | 2010 |
| | ($000) | ($000) |
| Increase (Decrease) in Net Assets | | |
| Operations | | |
| Net Investment Income | 52,192 | 118,919 |
| Realized Net Gain (Loss) | (9,380) | 1,651 |
| Net Increase (Decrease) in Net Assets Resulting from Operations | 42,812 | 120,570 |
| Distributions | | |
| Net Investment Income | | |
| Investor Shares | (31,372) | (78,239) |
| Institutional Shares | (20,820) | (40,680) |
| Realized Capital Gain | | |
| Investor Shares | — | — |
| Institutional Shares | — | — |
| Total Distributions | (52,192) | (118,919) |
| Capital Share Transactions | | |
| Investor Shares | (207,208) | (7,395,143) |
| Institutional Shares | 1,598,423 | 784,242 |
| Net Increase (Decrease) from Capital Share Transactions | 1,391,215 | (6,610,901) |
| Total Increase (Decrease) | 1,381,835 | (6,609,250) |
| Net Assets | | |
| Beginning of Period | 107,791,547 | 114,400,797 |
| End of Period | 109,173,382 | 107,791,547 |
See accompanying Notes, which are an integral part of the Financial Statements.
25
Prime Money Market Fund
Financial Highlights
| | | | | | | |
| Investor Shares | | | | | | | |
| | | Six Months | | | | | |
| | | Ended | | | | | |
| For a Share Outstanding | | February 28, | Year Ended August 31, |
| Throughout Each Period | | 2011 | 2010 | 2009 | 2008 | 2007 | 2006 |
| Net Asset Value, Beginning of Period | $1.00 | $1.00 | $1.00 | $1.00 | $1.00 | $1.00 |
| Investment Operations | | | | | | | |
| Net Investment Income | | .0003 | .001 | .013 | .035 | .051 | .043 |
| Net Realized and Unrealized Gain (Loss) | | | | | | |
| on Investments | | — | — | — | — | — | — |
| Total from Investment Operations | .0003 | .001 | .013 | .035 | .051 | .043 |
| Distributions | | | | | | | |
| Dividends from Net Investment Income | (.0003) | (.001) | (.013) | (.035) | (.051) | (.043) |
| Distributions from Realized Capital Gains | — | — | — | — | — | — |
| Total Distributions | | (.0003) | (.001) | (.013) | (.035) | (.051) | (.043) |
| Net Asset Value, End of Period | $1.00 | $1.00 | $1.00 | $1.00 | $1.00 | $1.00 |
| |
| Total Return1 | | 0.04% | 0.08% | 1.31% | 3.60% | 5.23% | 4.38% |
| |
| Ratios/Supplemental Data | | | | | | | |
| Net Assets, End of Period (Millions) | $88,467 | $88,684 | $96,078 | $92,483 | $84,052 | $64,578 |
| Ratio of Total Expenses to | | | | | | | |
| Average Net Assets | | 0.23% | 0.23% | 0.28%2 | 0.23% | 0.24% | 0.29% |
| Ratio of Net Investment Income to | | | | | | |
| Average Net Assets | | 0.07% | 0.08% | 1.25% | 3.49% | 5.10% | 4.33% |
The expense ratio and net income ratio for the current period have been annualized.
1 Total returns do not include account service fees that may have applied in the periods shown. Fund prospectuses provide information about
any applicable account service fees.
2 Includes 0.03% of fees to participate in the Treasury Temporary Guarantee Program for Money Market Funds.
See accompanying Notes, which are an integral part of the Financial Statements.
26
Prime Money Market Fund
Financial Highlights
| | | | | | | |
| Institutional Shares | | | | | | | |
| | | Six Months | | | | | |
| | | Ended | | | | | |
| For a Share Outstanding | | February 28, | Year Ended August 31, |
| Throughout Each Period | | 2011 | 2010 | 2009 | 2008 | 2007 | 2006 |
| Net Asset Value, Beginning of Period | $1.00 | $1.00 | $1.00 | $1.00 | $1.00 | $1.00 |
| Investment Operations | | | | | | | |
| Net Investment Income | | .001 | .002 | .015 | .037 | .053 | .045 |
| Net Realized and Unrealized Gain (Loss) | | | | | | |
| on Investments | | — | — | — | — | — | — |
| Total from Investment Operations | .001 | .002 | .015 | .037 | .053 | .045 |
| Distributions | | | | | | | |
| Dividends from Net Investment Income | (.001) | (.002) | (.015) | (.037) | (.053) | (.045) |
| Distributions from Realized Capital Gains | — | — | — | — | — | — |
| Total Distributions | | (.001) | (.002) | (.015) | (.037) | (.053) | (.045) |
| Net Asset Value, End of Period | $1.00 | $1.00 | $1.00 | $1.00 | $1.00 | $1.00 |
| |
| Total Return | | 0.10% | 0.22% | 1.47% | 3.75% | 5.39% | 4.58% |
| |
| Ratios/Supplemental Data | | | | | | | |
| Net Assets, End of Period (Millions) | $20,706 | $19,107 | $18,323 | $13,844 | $10,022 | $6,269 |
| Ratio of Total Expenses to | | | | | | | |
| Average Net Assets | | 0.09% | 0.09% | 0.13%1 | 0.08% | 0.08% | 0.09% |
| Ratio of Net Investment Income to | | | | | | |
| Average Net Assets | | 0.21% | 0.22% | 1.40% | 3.64% | 5.26% | 4.53% |
| The expense ratio and net income ratio for the current period have been annualized. |
| 1 Includes 0.03% of fees to participate in the Treasury Temporary Guarantee Program for Money Market Funds. |
See accompanying Notes, which are an integral part of the Financial Statements.
27
Prime Money Market Fund
Notes to Financial Statements
Vanguard Prime Money Market Fund is registered under the Investment Company Act of 1940 as an open-end investment company, or mutual fund. The fund invests in short-term debt instruments of companies primarily operating in specific industries, particularly financial services; the issuers’ abilities to meet their obligations may be affected by economic developments in such industries. The fund offers two classes of shares, Investor Shares and Institutional Shares. Investor Shares are available to any investor who meets the fund’s minimum purchase requirements. Institutional Shares are designed for institutional investors who meet certain administrative, service, and account-size criteria.
A. The following significant accounting policies conform to generally accepted accounting principles for U.S. mutual funds. The fund consistently follows such policies in preparing its financial statements.
1. Security Valuation: Securities are valued at amortized cost, which approximates market value. Investments in Vanguard Municipal Cash Management Fund are valued at that fund’s net asset value.
2. Repurchase Agreements: The fund invests in repurchase agreements. Securities pledged as collateral for repurchase agreements are held by a custodian bank until the agreements mature. Each agreement requires that the market value of the collateral be sufficient to cover payments of interest and principal; however, in the event of default or bankruptcy by the other party to the agreement, retention of the collateral may be subject to legal proceedings.
3. Federal Income Taxes: The fund intends to continue to qualify as a regulated investment company and distribute all of its taxable income. Management has analyzed the fund’s tax positions taken for all open federal income tax years (August 31, 2007–2010), and for the period ended February 28, 2011, and has concluded that no provision for federal income tax is required in the fund’s financial statements.
4. Distributions: Distributions from net investment income are declared daily and paid on the first business day of the following month.
5. Other: Interest income includes income distributions received from Vanguard Municipal Cash Management Fund and is accrued daily. Premiums and discounts on debt securities purchased are amortized and accreted, respectively, to interest income over the lives of the respective securities. Security transactions are accounted for on the date securities are bought or sold. Costs used to determine realized gains (losses) on the sale of investment securities are those of the specific securities sold.
Each class of shares has equal rights as to assets and earnings, except that each class separately bears certain class-specific expenses related to maintenance of shareholder accounts (included in Management and Administrative expenses) and shareholder reporting. Marketing and distribution expenses are allocated to each class of shares based on a method approved by the board of trustees. Income, other non-class-specific expenses, and gains and losses on investments are allocated to each class of shares based on its relative net assets.
B. The Vanguard Group furnishes at cost investment advisory, corporate management, administrative, marketing, and distribution services. The costs of such services are allocated to the fund under methods approved by the board of trustees. The fund has committed to provide up to 0.40% of its net assets in capital contributions to Vanguard. At February 28, 2011, the fund had contributed capital of $18,073,000 to Vanguard (included in Other Assets), representing 0.02% of the fund’s net assets and 7.23% of Vanguard’s capitalization. The fund’s trustees and officers are also directors and officers of Vanguard. Beginning in July 2009, Vanguard and the board of trustees agreed to temporarily limit certain net operating expenses in excess of the fund’s daily yield so as to maintain a zero or positive yield for the fund. Vanguard and the board of trustees may terminate the temporary expense limitation at any time.
28
Prime Money Market Fund
C. Various inputs may be used to determine the value of the fund’s investments. These inputs are summarized in three broad levels for financial statement purposes. The inputs or methodologies used to value securities are not necessarily an indication of the risk associated with investing in those securities.
Level 1—Quoted prices in active markets for identical securities.
Level 2—Other significant observable inputs (including quoted prices for similar securities, interest rates, prepayment speeds, credit risk, etc.).
Level 3—Significant unobservable inputs (including the fund’s own assumptions used to determine the fair value of investments).
The fund’s investment in Vanguard Municipal Cash Management Fund is valued based on Level 1 inputs. All of the fund’s other investments were valued using amortized cost, in accordance with rules under the Investment Company Act of 1940. Amortized cost approximates the current fair value of a security, but since the value is not obtained from a quoted price in an active market, securities valued at amortized cost are considered to be valued using Level 2 inputs.
D. Capital share transactions for each class of shares were:
| | | | |
| | Six Months Ended | Year Ended |
| | February 28, 2011 | August 31, 2010 |
| | Amount | Shares | Amount | Shares |
| | ($000) | (000) | ($000) | (000) |
| Investor Shares | | | | |
| Issued | 56,684,897 | 56,684,897 | 99,880,454 | 99,880,454 |
| Issued in Lieu of Cash Distributions | 30,625 | 30,625 | 76,231 | 76,231 |
| Redeemed | (56,922,730) | (56,922,730) | (107,351,828) | (107,351,828) |
| Net Increase (Decrease)—Investor Shares | (207,208) | (207,208) | (7,395,143) | (7,395,143) |
| Institutional Shares | | | | |
| Issued | 10,498,094 | 10,498,094 | 16,052,323 | 16,052,323 |
| Issued in Lieu of Cash Distributions | 20,182 | 20,182 | 39,524 | 39,524 |
| Redeemed | (8,919,853) | (8,919,853) | (15,307,605) | (15,307,605) |
| Net Increase (Decrease)—Institutional Shares | 1,598,423 | 1,598,423 | 784,242 | 784,242 |
E. In preparing the financial statements as of February 28, 2011, management considered the impact of subsequent events for potential recognition or disclosure in these financial statements.
29
Federal Money Market Fund
Fund Profile
As of February 28, 2011
| |
| Financial Attributes | |
| Ticker Symbol | VMFXX |
| Expense Ratio1 | 0.22% |
| 7-Day SEC Yield | 0.02% |
| Average Weighted | |
| Maturity | 49 days |
| |
| Sector Diversification (% of portfolio) | |
| U.S. Treasury Bills | 15.6% |
| U.S. Government Agency Obligations | 81.2 |
| Repurchase Agreements | 3.2 |
The agency and mortgage-backed securities sectors may include issues from government-sponsored enterprises; such issues are not
backed by the full faith and credit of the U.S. government.
| |
| Distribution by Credit Quality (% of portfolio) |
| First Tier | 100.0% |
| For information about these ratings, see the Glossary entry for |
| Credit Quality. | |
1 The expense ratio shown is from the prospectus dated December 23, 2010, and represents estimated costs for the current fiscal year. For
the six months ended February 28, 2011, the annualized expense ratio was 0.22%.
30
Federal Money Market Fund
Performance Summary
Investment returns will fluctuate. All of the returns in this report represent past performance, which is not a guarantee of future results that may be achieved by the fund. (Current performance may be lower or higher than the performance data cited. For performance data current to the most recent month-end, visit our website at vanguard.com/performance.) The returns shown do not reflect taxes that a shareholder would pay on fund distributions. An investment in a money market fund is not insured or guaranteed by the Federal Deposit Insurance Corporation or any other government agency. Although the fund seeks to preserve the value of your investment at $1 per share, it is possible to lose money by investing in the fund. The fund’s 7-day SEC yield reflects its current earnings more closely than do the average annual returns.
Fiscal-Year Total Returns (%): August 31, 2000, Through February 28, 2011
| | |
| | | Gov’t Money |
| | | Market Funds |
| | | Average |
| Fiscal Year | Total Returns | Total Returns |
| 2001 | 5.41% | 4.82% |
| 2002 | 2.12 | 1.48 |
| 2003 | 1.11 | 0.64 |
| 2004 | 0.82 | 0.40 |
| 2005 | 2.26 | 1.73 |
| 2006 | 4.31 | 3.78 |
| 2007 | 5.17 | 4.58 |
| 2008 | 3.46 | 2.71 |
| 2009 | 1.06 | 0.43 |
| 2010 | 0.04 | 0.00 |
| 2011 | 0.01 | 0.00 |
| 7-day SEC yield (2/28/2011): 0.02% |
| Government Money Market Funds Average: Derived from data provided by Lipper Inc. |
| Note: For 2011, performance data reflect the six months ended February 28, 2011. |
Average Annual Total Returns: Periods Ended December 31, 2010
This table presents average annual total returns through the latest calendar quarter—rather than through the end of the fiscal period. Securities and Exchange Commission rules require that we provide this information.
| | | | |
| | Inception | One | Five | Ten |
| | Date | Year | Years | Years |
| Federal Money Market Fund | 7/13/1981 | 0.02% | 2.55% | 2.35% |
See Financial Highlights for dividend information.
31
Federal Money Market Fund
Financial Statements (unaudited)
Statement of Net Assets
As of February 28, 2011
The fund reports a complete list of its holdings in various monthly and quarterly regulatory filings.
The fund publishes its holdings on a monthly basis at vanguard.com and files them with the Securities and Exchange Commission on Form N-MFP. The fund’s Form N-MFP filings become public 60 days after the relevant month-end, and may be viewed at sec.gov or via a link on the “Portfolio Holdings” page on vanguard.com. For the second and fourth fiscal quarters, the lists appear in the fund’s semiannual and annual reports to shareholders. For the first and third fiscal quarters, the fund files the lists with the SEC on Form N-Q. Shareholders can look up the fund’s Forms N-Q on the SEC’s website at sec.gov. Forms N-Q may also be reviewed and copied at the SEC’s Public Reference Room (see the back cover of this report for further information).
| | | | | |
| | | | | Face | Market |
| | | | Maturity | Amount | Value |
| | | Yield1 | Date | ($000) | ($000) |
| U.S. Government and Agency Obligations (103.0%) | | | |
| 2 | Fannie Mae Discount Notes | 0.200% | 3/1/11 | 75,000 | 75,000 |
| 2 | Fannie Mae Discount Notes | 0.200% | 3/2/11 | 109,333 | 109,332 |
| 2 | Fannie Mae Discount Notes | 0.240% | 3/9/11 | 15,000 | 14,999 |
| 2 | Fannie Mae Discount Notes | 0.240% | 3/16/11 | 138,567 | 138,553 |
| 2 | Fannie Mae Discount Notes | 0.240% | 3/23/11 | 30,000 | 29,996 |
| 2 | Fannie Mae Discount Notes | 0.250% | 4/6/11 | 30,000 | 29,993 |
| 2 | Fannie Mae Discount Notes | 0.180% | 4/13/11 | 120,000 | 119,974 |
| 2 | Fannie Mae Discount Notes | 0.185% | 4/20/11 | 85,000 | 84,978 |
| 2 | Fannie Mae Discount Notes | 0.180% | 4/27/11 | 125,000 | 124,964 |
| 2 | Fannie Mae Discount Notes | 0.230% | 6/8/11 | 43,462 | 43,435 |
| 2 | Fannie Mae Discount Notes | 0.230%–0.240% | 6/15/11 | 154,648 | 154,541 |
| 2 | Fannie Mae Discount Notes | 0.190% | 6/20/11 | 75,000 | 74,956 |
| 2 | Fannie Mae Discount Notes | 0.250% | 7/1/11 | 13,000 | 12,989 |
| 2 | Fannie Mae Discount Notes | 0.200% | 7/8/11 | 6,800 | 6,795 |
| 2 | Fannie Mae Discount Notes | 0.190% | 8/10/11 | 60,000 | 59,949 |
| 2 | Fannie Mae Discount Notes | 0.210% | 8/17/11 | 4,000 | 3,996 |
| 2 | Fannie Mae Discount Notes | 0.200% | 8/24/11 | 22,444 | 22,422 |
| 2 | Federal Home Loan Bank Discount Notes | 0.220% | 3/2/11 | 41,567 | 41,567 |
| 2 | Federal Home Loan Bank Discount Notes | 0.190% | 3/25/11 | 100,000 | 99,987 |
| 2 | Federal Home Loan Bank Discount Notes | 0.180% | 4/15/11 | 320,000 | 319,928 |
| 2 | Federal Home Loan Bank Discount Notes | 0.190% | 4/25/11 | 75,000 | 74,978 |
| 2 | Federal Home Loan Bank Discount Notes | 0.180%–0.185% | 4/27/11 | 30,000 | 29,991 |
| 2 | Federal Home Loan Bank Discount Notes | 0.200% | 5/4/11 | 70,000 | 69,975 |
| 2 | Federal Home Loan Bank Discount Notes | 0.210% | 5/12/11 | 45,000 | 44,981 |
| 2 | Federal Home Loan Bank Discount Notes | 0.220% | 5/25/11 | 155,250 | 155,169 |
| 2 | Federal Home Loan Bank Discount Notes | 0.240% | 6/1/11 | 35,555 | 35,533 |
| 2 | Federal Home Loan Bank Discount Notes | 0.230% | 6/17/11 | 45,000 | 44,969 |
| 2 | Federal Home Loan Bank Discount Notes | 0.190% | 8/17/11 | 85,000 | 84,924 |
| 2,3 | Federal Home Loan Banks | 0.182% | 5/13/11 | 165,000 | 164,993 |
| 2,3 | Federal Home Loan Banks | 0.167% | 7/25/11 | 70,000 | 69,982 |
| 2,3 | Federal Home Loan Banks | 0.184% | 9/9/11 | 24,000 | 23,994 |
| 2,3 | Federal Home Loan Banks | 0.212% | 9/23/11 | 41,000 | 40,995 |
| 2,3 | Federal Home Loan Banks | 0.231% | 1/9/12 | 150,000 | 149,958 |
| 2,3 | Federal Home Loan Banks | 0.232% | 1/23/12 | 25,000 | 24,994 |
| 2,3 | Federal Home Loan Banks | 0.228% | 2/3/12 | 100,000 | 99,972 |
| 2,3 | Federal Home Loan Mortgage Corp. | 0.353% | 4/7/11 | 500,000 | 499,996 |
32
Federal Money Market Fund
| | | | | |
| | | | | Face | Market |
| | | | Maturity | Amount | Value |
| | | Yield1 | Date | ($000) | ($000) |
| 2,3 | Federal Home Loan Mortgage Corp. | 0.241% | 8/5/11 | 95,000 | 94,996 |
| 2,3 | Federal Home Loan Mortgage Corp. | 0.225% | 12/16/11 | 35,000 | 34,989 |
| 2,3 | Federal Home Loan Mortgage Corp. | 0.225% | 2/16/12 | 75,000 | 74,971 |
| 2,3 | Federal Home Loan Mortgage Corp. | 0.201% | 8/24/12 | 60,000 | 59,957 |
| 2,3 | Federal National Mortgage Assn. | 0.282% | 8/23/12 | 150,000 | 150,023 |
| 2,3 | Federal National Mortgage Assn. | 0.294% | 9/17/12 | 40,000 | 39,988 |
| 2,3 | Federal National Mortgage Assn. | 0.282% | 11/23/12 | 70,000 | 69,963 |
| 2 | Freddie Mac Discount Notes | 0.240% | 3/14/11 | 20,000 | 19,998 |
| 2 | Freddie Mac Discount Notes | 0.240% | 3/21/11 | 70,371 | 70,362 |
| 2 | Freddie Mac Discount Notes | 0.180% | 3/28/11 | 97,800 | 97,787 |
| 2 | Freddie Mac Discount Notes | 0.230% | 4/18/11 | 10,000 | 9,997 |
| 2 | Freddie Mac Discount Notes | 0.230% | 4/21/11 | 5,650 | 5,648 |
| 2 | Freddie Mac Discount Notes | 0.180%–0.185% | 5/2/11 | 153,082 | 153,033 |
| 2 | Freddie Mac Discount Notes | 0.180% | 5/9/11 | 150,000 | 149,948 |
| 2 | Freddie Mac Discount Notes | 0.230% | 5/23/11 | 14,619 | 14,611 |
| 2 | Freddie Mac Discount Notes | 0.240% | 5/31/11 | 50,000 | 49,970 |
| 2 | Freddie Mac Discount Notes | 0.230% | 6/13/11 | 60,000 | 59,960 |
| 2 | Freddie Mac Discount Notes | 0.240% | 6/22/11 | 38,460 | 38,431 |
| 2 | Freddie Mac Discount Notes | 0.240% | 6/27/11 | 80,000 | 79,937 |
| 2 | Freddie Mac Discount Notes | 0.200% | 7/12/11 | 4,654 | 4,651 |
| 2 | Freddie Mac Discount Notes | 0.200% | 7/18/11 | 85,000 | 84,934 |
| 2 | Freddie Mac Discount Notes | 0.250% | 7/25/11 | 20,000 | 19,980 |
| 2 | Freddie Mac Discount Notes | 0.210% | 8/8/11 | 4,504 | 4,500 |
| | United States Treasury Bill | 0.190% | 3/3/11 | 200,000 | 199,998 |
| | United States Treasury Bill | 0.180% | 3/10/11 | 120,000 | 119,995 |
| | United States Treasury Bill | 0.190% | 3/17/11 | 120,000 | 119,990 |
| | United States Treasury Bill | 0.181% | 5/19/11 | 100,000 | 99,960 |
| | United States Treasury Bill | 0.196% | 5/26/11 | 20,000 | 19,991 |
| | United States Treasury Bill | 0.145%–0.212% | 6/2/11 | 310,000 | 309,876 |
| | United States Treasury Bill | 0.190% | 6/16/11 | 10,000 | 9,994 |
| Total U.S. Government and Agency Obligations (Cost $5,452,196) | | | 5,452,196 |
| Repurchase Agreements (3.4%) | | | | |
| | Barclays Capital Inc. | | | | |
| | (Dated 1/4/11, Repurchase Value | | | | |
| | $20,007,000, collateralized by Federal | | | | |
| | Home Loan Bank 0.750%, 12/21/11, and | | | | |
| | Federal Home Loan Mortgage Corp. | | | | |
| | 0.875%, 10/28/13) | 0.200% | 3/4/11 | 20,000 | 20,000 |
| | BNP Paribas Securities Corp. | | | | |
| | (Dated 2/28/11, Repurchase Value | | | | |
| | $6,252,000, collateralized by U.S. Treasury | | | |
| | Note 0.500%–2.750%, 11/15/13–2/28/18) | 0.170% | 3/1/11 | 6,252 | 6,252 |
| | BNP Paribas Securities Corp. | | | | |
| | (Dated 1/11/11, Repurchase Value | | | | |
| | $100,030,000, collateralized by U.S. | | | | |
| | Treasury Inflation Indexed Bond | | | | |
| | 1.750%–2.375%, 1/15/25–1/15/28, and | | | | |
| | U.S. Treasury Inflation Indexed Note | | | | |
| | 1.875%–3.000%, 7/15/12–7/15/19) | 0.180% | 3/7/11 | 100,000 | 100,000 |
| | Deutsche Bank Securities, Inc. | | | | |
| | (Dated 1/11/11, Repurchase Value | | | | |
| | $50,015,000, collateralized by U.S. | | | | |
| | Treasury Inflation Indexed Note 1.375%, | | | | |
| | 7/15/18, and U.S. Treasury Note 4.500%, | | | | |
| | 11/30/11) | 0.180% | 3/7/11 | 50,000 | 50,000 |
33
Federal Money Market Fund
| | | | |
| | | | Face | Market |
| | | Maturity | Amount | Value |
| | Yield1 | Date | ($000) | ($000) |
| Societe Generale | | | | |
| (Dated 2/28/11, Repurchase Value | | | | |
| $5,000,000, collateralized by U.S. Treasury | | | | |
| Inflation Indexed Bond 2.000%, 1/15/26) | 0.170% | 3/1/11 | 5,000 | 5,000 |
| Total Repurchase Agreements (Cost $181,252) | | | | 181,252 |
| Total Investments (106.4%) (Cost $5,633,448) | | | | 5,633,448 |
| Other Assets and Liabilities (-6.4%) | | | | |
| Other Assets | | | | 8,502 |
| Liabilities | | | | (344,921) |
| | | | | (336,419) |
| Net Assets (100%) | | | | |
| Applicable to 5,296,422,996 outstanding $.001 par value shares of | | | |
| beneficial interest (unlimited authorization) | | | | 5,297,029 |
| Net Asset Value per Share | | | | $1.00 |
| |
| Statement of Assets and Liabilities | | | | |
| Assets | | | | |
| Investments in Securities, at Value | | | | 5,633,448 |
| Receivables for Capital Shares Issued | | | | 3,212 |
| Other Assets | | | | 5,290 |
| Total Assets | | | | 5,641,950 |
| Liabilities | | | | |
| Payables for Investment Securities Purchased | | | | 332,279 |
| Payables for Capital Shares Redeemed | | | | 9,831 |
| Other Liabilities | | | | 2,811 |
| Total Liabilities | | | | 344,921 |
| Net Assets | | | | 5,297,029 |
| |
| |
| At February 28, 2011, net assets consisted of: | | | | |
| | | | | Amount |
| | | | | ($000) |
| Paid-in-Capital | | | | 5,296,942 |
| Undistributed Net Investment Income | | | | — |
| Accumulated Net Realized Gains | | | | 87 |
| Net Assets | | | | 5,297,029 |
See Note A in Notes to Financial Statements.
1 Represents annualized yield at date of purchase for discount securities, and coupon for coupon-bearing securities.
2 The issuer operates under a congressional charter; its securities are not backed by the full faith and credit of the U.S. government.
3 Adjustable-rate security.
See accompanying Notes, which are an integral part of the Financial Statements.
34
Federal Money Market Fund
Statement of Operations
| |
| | Six Months Ended |
| | February 28, 2011 |
| | ($000) |
| Investment Income | |
| Income | |
| Interest | 6,727 |
| Total Income | 6,727 |
| Expenses | |
| The Vanguard Group—Note B | |
| Investment Advisory Services | 139 |
| Management and Administrative | 4,975 |
| Marketing and Distribution | 1,013 |
| Custodian Fees | 49 |
| Shareholders’ Reports | 22 |
| Trustees’ Fees and Expenses | 4 |
| Total Expenses | 6,202 |
| Net Investment Income | 525 |
| Realized Net Gain (Loss) on Investment Securities Sold | 24 |
| Net Increase (Decrease) in Net Assets Resulting from Operations | 549 |
See accompanying Notes, which are an integral part of the Financial Statements.
35
Federal Money Market Fund
Statement of Changes in Net Assets
| | |
| | Six Months Ended | Year Ended |
| | February 28, | August 31, |
| | 2011 | 2010 |
| | ($000) | ($000) |
| Increase (Decrease) in Net Assets | | |
| Operations | | |
| Net Investment Income | 525 | 3,190 |
| Realized Net Gain (Loss) | 24 | 63 |
| Net Increase (Decrease) in Net Assets Resulting from Operations | 549 | 3,253 |
| Distributions | | |
| Net Investment Income | (525) | (3,190) |
| Realized Capital Gain | — | — |
| Total Distributions | (525) | (3,190) |
| Capital Share Transactions (at $1.00) | | |
| Issued | 247,820 | 617,905 |
| Issued in Lieu of Cash Distributions | 512 | 3,094 |
| Redeemed | (999,313) | (3,959,429) |
| Net Increase (Decrease) from Capital Share Transactions | (750,981) | (3,338,430) |
| Total Increase (Decrease) | (750,957) | (3,338,367) |
| Net Assets | | |
| Beginning of Period | 6,047,986 | 9,386,353 |
| End of Period | 5,297,029 | 6,047,986 |
See accompanying Notes, which are an integral part of the Financial Statements.
36
Federal Money Market Fund
Financial Highlights
| | | | | | | |
| | | Six Months | | | | | |
| | | Ended | | | | | |
| For a Share Outstanding | | | Year Ended August 31, |
| Throughout Each Period | | 2011 | 2010 | 2009 | 2008 | 2007 | 2006 |
| Net Asset Value, Beginning of Period | $1.00 | $1.00 | $1.00 | $1.00 | $1.00 | $1.00 |
| Investment Operations | | | | | | | |
| Net Investment Income | | .0001 | .0004 | .011 | .034 | .051 | .042 |
| Net Realized and Unrealized Gain (Loss) | | | | | | |
| on Investments | | — | — | — | — | — | — |
| Total from Investment Operations | .0001 | .0004 | .011 | .034 | .051 | .042 |
| Distributions | | | | | | | |
| Dividends from Net Investment Income | (.0001) | (.0004) | (.011) | (.034) | (.051) | (.042) |
| Distributions from Realized Capital Gains | — | — | — | — | — | — |
| Total Distributions | | (.0001) | (.0004) | (.011) | (.034) | (.051) | (.042) |
| Net Asset Value, End of Period | $1.00 | $1.00 | $1.00 | $1.00 | $1.00 | $1.00 |
| |
| Total Return1 | | 0.01% | 0.04% | 1.06% | 3.46% | 5.17% | 4.31% |
| |
| Ratios/Supplemental Data | | | | | | | |
| Net Assets, End of Period (Millions) | $5,297 | $6,048 | $9,386 | $8,982 | $7,672 | $6,360 |
| Ratio of Total Expenses to | | | | | | | |
| Average Net Assets | | 0.22% | 0.22% | 0.27%2 | 0.23% | 0.24% | 0.29% |
| Ratio of Net Investment Income to | | | | | | |
| Average Net Assets | | 0.02% | 0.04% | 1.03% | 3.33% | 5.05% | 4.25% |
The expense ratio and net income ratio for the current period have been annualized.
1 Total returns do not include account service fees that may have applied in the periods shown. Fund prospectuses provide information about
any applicable account service fees.
2 Includes 0.02% of fees to participate in the Treasury Temporary Guarantee Program for Money Market Funds.
See accompanying Notes, which are an integral part of the Financial Statements.
37
Federal Money Market Fund
Notes to Financial Statements
Vanguard Federal Money Market Fund is registered under the Investment Company Act of 1940 as an open-end investment company, or mutual fund. The fund invests in short-term debt instruments issued by the U.S. government or its agencies and instrumentalities, and repurchase agreements collateralized by such instruments.
A. The following significant accounting policies conform to generally accepted accounting principles for U.S. mutual funds. The fund consistently follows such policies in preparing its financial statements.
1. Security Valuation: Securities are valued at amortized cost, which approximates market value.
2. Repurchase Agreements: The fund invests in repurchase agreements. Securities pledged as collateral for repurchase agreements are held by a custodian bank until the agreements mature. Each agreement requires that the market value of the collateral be sufficient to cover payments of interest and principal; however, in the event of default or bankruptcy by the other party to the agreement, retention of the collateral may be subject to legal proceedings.
3. Federal Income Taxes: The fund intends to continue to qualify as a regulated investment company and distribute all of its taxable income. Management has analyzed the fund’s tax positions taken for all open federal income tax years (August 31, 2007–2010), and for the period ended February 28, 2011, and has concluded that no provision for federal income tax is required in the fund’s financial statements.
4. Distributions: Distributions from net investment income are declared daily and paid on the first business day of the following month.
5. Other: Interest income is accrued daily. Premiums and discounts on debt securities purchased are amortized and accreted, respectively, to interest income over the lives of the respective securities. Security transactions are accounted for on the date securities are bought or sold. Costs used to determine realized gains (losses) on the sale of investment securities are those of the specific securities sold.
B. The Vanguard Group furnishes at cost investment advisory, corporate management, administrative, marketing, and distribution services. The costs of such services are allocated to the fund under methods approved by the board of trustees. The fund has committed to provide up to 0.40% of its net assets in capital contributions to Vanguard. At February 28, 2011, the fund had contributed capital of $900,000 to Vanguard (included in Other Assets), representing 0.02% of the fund’s net assets and 0.36% of Vanguard’s capitalization. The fund’s trustees and officers are also directors and officers of Vanguard. Beginning in July 2009, Vanguard and the board of trustees agreed to temporarily limit certain net operating expenses in excess of the fund’s daily yield so as to maintain a zero or positive yield for the fund. Vanguard and the board of trustees may terminate the temporary expense limitation at any time.
38
Federal Money Market Fund
C. Various inputs may be used to determine the value of the fund’s investments. These inputs are summarized in three broad levels for financial statement purposes. The inputs or methodologies used to value securities are not necessarily an indication of the risk associated with investing in those securities.
Level 1—Quoted prices in active markets for identical securities.
Level 2—Other significant observable inputs (including quoted prices for similar securities, interest rates, prepayment speeds, credit risk, etc.).
Level 3—Significant unobservable inputs (including the fund’s own assumptions used to determine the fair value of investments).
At February 28, 2011, 100% of the fund’s investments were valued using amortized cost, in accordance with rules under the Investment Company Act of 1940. Amortized cost approximates the current fair value of a security, but since the value is not obtained from a quoted price in an active market, securities valued at amortized cost are considered to be valued using Level 2 inputs.
D. In preparing the financial statements as of February 28, 2011, management considered the impact of subsequent events for potential recognition or disclosure in these financial statements.
39
Admiral Treasury Money Market Fund
Fund Profile
As of February 28, 2011
| |
| Financial Attributes | |
| Ticker Symbol | VUSXX |
| Expense Ratio1 | 0.14% |
| 7-Day SEC Yield | 0.02% |
| Average Weighted | |
| Maturity | 55 days |
| |
| Sector Diversification (% of portfolio) | |
| U.S. Treasury Bills | 100.0% |
The agency and mortgage-backed securities sectors may include
issues from government-sponsored enterprises; such issues are not
backed by the full faith and credit of the U.S. government.
| |
| Distribution by Credit Quality (% of portfolio) |
| First Tier | 100.0% |
| For information about these ratings, see the Glossary entry for Credit Quality. |
1 The expense ratio shown is from the prospectus dated December 23, 2010, and represents estimated costs for the current fiscal year. For
the six months ended February 28, 2011, the annualized expense ratio was 0.14%.
40
Admiral Treasury Money Market Fund
Performance Summary
Investment returns will fluctuate. All of the returns in this report represent past performance, which is not a guarantee of future results that may be achieved by the fund. (Current performance may be lower or higher than the performance data cited. For performance data current to the most recent month-end, visit our website at vanguard.com/performance.) The returns shown do not reflect taxes that a shareholder would pay on fund distributions. An investment in a money market fund is not insured or guaranteed by the Federal Deposit Insurance Corporation or any other government agency. Although the fund seeks to preserve the value of your investment at $1 per share, it is possible to lose money by investing in the fund. The fund’s 7-day SEC yield reflects its current earnings more closely than do the average annual returns.
| | |
| Fiscal-Year Total Returns (%): August 31, 2000, Through February 28, 2011 | | |
| | | iMoneyNet |
| | | Average |
| Fiscal Year | Total Returns | Total Returns |
| 2001 | 5.31% | 4.73% |
| 2002 | 2.15 | 1.58 |
| 2003 | 1.20 | 0.67 |
| 2004 | 0.91 | 0.39 |
| 2005 | 2.29 | 1.61 |
| 2006 | 4.22 | 3.54 |
| 2007 | 5.01 | 4.34 |
| 2008 | 3.08 | 2.08 |
| 2009 | 0.70 | 0.17 |
| 2010 | 0.03 | 0.00 |
| 2011 | 0.01 | 0.00 |
7-day SEC yield (2/28/2011): 0.02%
iMoneyNet Money Fund Report’s 100% Treasury Funds Average: Derived from data provided by iMoneyNet, Inc.
Note: For 2011, performance data reflect the six months ended February 28, 2011.
Average Annual Total Returns: Periods Ended December 31, 2010
This table presents average annual total returns through the latest calendar quarter—rather than through the end of the fiscal period. Securities and Exchange Commission rules require that we provide this information.
| | | | |
| | Inception | One | Five | Ten |
| | Date | Year | Years | Years |
| Admiral Treasury Money Market | | | | |
| Fund | 12/14/1992 | 0.01% | 2.35% | 2.27% |
See Financial Highlights for dividend information.
41
Admiral Treasury Money Market Fund
Financial Statements (unaudited)
Statement of Net Assets
As of February 28, 2011
The fund reports a complete list of its holdings in various monthly and quarterly regulatory filings.
The fund publishes its holdings on a monthly basis at vanguard.com and files them with the Securities and Exchange Commission on Form N-MFP. The fund’s Form N-MFP filings become public 60 days after the relevant month-end, and may be viewed at sec.gov or via a link on the “Portfolio Holdings” page on vanguard.com. For the second and fourth fiscal quarters, the lists appear in the fund’s semiannual and annual reports to shareholders. For the first and third fiscal quarters, the fund files the lists with the SEC on Form N-Q. Shareholders can look up the fund’s Forms N-Q on the SEC’s website at sec.gov. Forms N-Q may also be reviewed and copied at the SEC’s Public Reference Room (see the back cover of this report for further information).
| | | | |
| | | | Face | Market |
| | | Maturity | Amount | Value |
| | Yield1 | Date | ($000) | ($000) |
| U.S. Government and Agency Obligations (106.8%) | | | |
| United States Treasury Bill | 0.175% | 3/3/11 | 1,121,479 | 1,121,468 |
| United States Treasury Bill | 0.145%–0.150% | 3/10/11 | 1,200,000 | 1,199,956 |
| United States Treasury Bill | 0.140%–0.145% | 3/17/11 | 1,296,491 | 1,296,408 |
| United States Treasury Bill | 0.130% | 3/24/11 | 1,219,000 | 1,218,899 |
| United States Treasury Bill | 0.180% | 3/31/11 | 674,000 | 673,899 |
| United States Treasury Bill | 0.150% | 4/7/11 | 1,357,000 | 1,356,791 |
| United States Treasury Bill | 0.150%–0.165% | 4/14/11 | 600,000 | 599,882 |
| United States Treasury Bill | 0.155%–0.170% | 4/21/11 | 1,025,000 | 1,024,769 |
| United States Treasury Bill | 0.155%–0.170% | 4/28/11 | 1,024,000 | 1,023,733 |
| United States Treasury Bill | 0.150%–0.155% | 5/5/11 | 1,416,500 | 1,416,113 |
| United States Treasury Bill | 0.150% | 5/12/11 | 1,295,000 | 1,294,611 |
| United States Treasury Bill | 0.130% | 5/19/11 | 1,371,000 | 1,370,609 |
| United States Treasury Bill | 0.110% | 5/26/11 | 1,447,255 | 1,446,875 |
| United States Treasury Bill | 0.145% | 6/2/11 | 1,321,000 | 1,320,516 |
| United States Treasury Bill | 0.225% | 6/30/11 | 350,000 | 349,735 |
| United States Treasury Bill | 0.180% | 7/14/11 | 573,000 | 572,613 |
| United States Treasury Bill | 0.185% | 7/21/11 | 450,000 | 449,672 |
| United States Treasury Bill | 0.180% | 7/28/11 | 224,000 | 223,833 |
| Total U.S. Government and Agency Obligations (Cost $17,960,382) | | | 17,960,382 |
| Total Investments (106.8%) (Cost $17,960,382) | | | 17,960,382 |
| Other Assets and Liabilities (-6.8%) | | | | |
| Other Assets | | | | 212,927 |
| Liabilities | | | | (1,350,314) |
| | | | | (1,137,387) |
| Net Assets (100%) | | | | |
| Applicable to 16,819,927,035 outstanding $.001 par value shares of | | | |
| beneficial interest (unlimited authorization) | | | 16,822,995 |
| Net Asset Value per Share | | | $1.00 |
42
| |
| Admiral Treasury Money Market Fund | |
| |
| |
| |
| | Market |
| | Value |
| | ($000) |
| Statement of Assets and Liabilities | |
| Assets | |
| Investments in Securities, at Value | 17,960,382 |
| Receivables for Investment Securities Sold | 199,992 |
| Receivables for Capital Shares Issued | 6,152 |
| Other Assets | 6,783 |
| Total Assets | 18,173,309 |
| Liabilities | |
| Payables for Investment Securities Purchased | 1,320,516 |
| Payables for Capital Shares Redeemed | 21,632 |
| Other Liabilities | 8,166 |
| Total Liabilities | 1,350,314 |
| Net Assets | 16,822,995 |
| |
| |
| At February 28, 2011, net assets consisted of: | |
| | Amount |
| | ($000) |
| Paid-in-Capital | 16,822,979 |
| Undistributed Net Investment Income | — |
| Accumulated Net Realized Gains | 16 |
| Net Assets | 16,822,995 |
See Note A in Notes to Financial Statements.
1 Represents annualized yield at date of purchase for discount securities, and coupon for coupon-bearing securities.
See accompanying Notes, which are an integral part of the Financial Statements.
43
Admiral Treasury Money Market Fund
Statement of Operations
| |
| | Six Months Ended |
| | February 28, 2011 |
| | ($000) |
| Investment Income | |
| Income | |
| Interest | 13,645 |
| Total Income | 13,645 |
| Expenses | |
| The Vanguard Group—Note B | |
| Investment Advisory Services | 431 |
| Management and Administrative | 9,225 |
| Marketing and Distribution | 2,601 |
| Custodian Fees | 135 |
| Shareholders’ Reports | 33 |
| Trustees’ Fees and Expenses | 11 |
| Total Expenses | 12,436 |
| Net Investment Income | 1,209 |
| Realized Net Gain (Loss) on Investment Securities Sold | (17) |
| Net Increase (Decrease) in Net Assets Resulting from Operations | 1,192 |
See accompanying Notes, which are an integral part of the Financial Statements.
44
Admiral Treasury Money Market Fund
Statement of Changes in Net Assets
| | |
| | Six Months Ended | Year Ended |
| | February 28, | August 31, |
| | 2011 | 2010 |
| | ($000) | ($000) |
| Increase (Decrease) in Net Assets | | |
| Operations | | |
| Net Investment Income | 1,209 | 6,087 |
| Realized Net Gain (Loss) | (17) | 33 |
| Net Increase (Decrease) in Net Assets Resulting from Operations | 1,192 | 6,120 |
| Distributions | | |
| Net Investment Income | (1,209) | (6,087) |
| Realized Capital Gain | — | — |
| Total Distributions | (1,209) | (6,087) |
| Capital Share Transactions (at $1.00) | | |
| Issued | 485,942 | 1,061,537 |
| Issued in Lieu of Cash Distributions | 1,172 | 5,859 |
| Redeemed | (2,390,500) | (7,775,844) |
| Net Increase (Decrease) from Capital Share Transactions | (1,903,386) | (6,708,448) |
| Total Increase (Decrease) | (1,903,403) | (6,708,415) |
| Net Assets | | |
| Beginning of Period | 18,726,398 | 25,434,813 |
| End of Period | 16,822,995 | 18,726,398 |
See accompanying Notes, which are an integral part of the Financial Statements.
45
Admiral Treasury Money Market Fund
Financial Highlights
| | | | | | |
| | Six Months | | | | | |
| | Ended | | | | | |
| For a Share Outstanding | February 28, | Year Ended August 31, |
| Throughout Each Period | 2011 | 2010 | 2009 | 2008 | 2007 | 2006 |
| Net Asset Value, Beginning of Period | $1.00 | $1.00 | $1.00 | $1.00 | $1.00 | $1.00 |
| Investment Operations | | | | | | |
| Net Investment Income | .0001 | .0003 | .007 | .030 | .049 | .041 |
| Net Realized and Unrealized Gain (Loss) | | | | | | |
| on Investments | — | — | — | — | — | — |
| Total from Investment Operations | .0001 | .0003 | .007 | .030 | .049 | .041 |
| Distributions | | | | | | |
| Dividends from Net Investment Income | (.0001) | (.0003) | (.007) | (.030) | (.049) | (.041) |
| Distributions from Realized Capital Gains | — | — | — | — | — | — |
| Total Distributions | (.0001) | (.0003) | (.007) | (.030) | (.049) | (.041) |
| Net Asset Value, End of Period | $1.00 | $1.00 | $1.00 | $1.00 | $1.00 | $1.00 |
| |
| Total Return1 | 0.01% | 0.03% | 0.70% | 3.08% | 5.02% | 4.22% |
| |
| Ratios/Supplemental Data | | | | | | |
| Net Assets, End of Period (Millions) | $16,823 | $18,726 | $25,435 | $23,289 | $20,064 | $15,982 |
| Ratio of Total Expenses to | | | | | | |
| Average Net Assets | 0.14% | 0.14% | 0.15%2 | 0.10% | 0.10% | 0.13% |
| Ratio of Net Investment Income to | | | | | | |
| Average Net Assets | 0.01% | 0.03% | 0.74% | 2.98% | 4.90% | 4.15% |
The expense ratio and net income ratio for the current period have been annualized.
1 Total returns do not include account service fees that may have applied in the periods shown. Fund prospectuses provide information about
any applicable account service fees.
2 Includes 0.03% of fees to participate in the Treasury Temporary Guarantee Program for Money Market Funds.
See accompanying Notes, which are an integral part of the Financial Statements.
46
Admiral Treasury Money Market Fund
Notes to Financial Statements
Vanguard Admiral Treasury Money Market Fund is registered under the Investment Company Act of 1940 as an open-end investment company, or mutual fund. The fund invests in short-term debt instruments backed by the full faith and credit of the U.S. government.
A. The following significant accounting policies conform to generally accepted accounting principles for U.S. mutual funds. The fund consistently follows such policies in preparing its financial statements.
1. Security Valuation: Securities are valued at amortized cost, which approximates market value.
2. Federal Income Taxes: The fund intends to continue to qualify as a regulated investment company and distribute all of its taxable income. Management has analyzed the fund’s tax positions taken for all open federal income tax years (August 31, 2007–2010), and for the period ended February 28, 2011, and has concluded that no provision for federal income tax is required in the fund’s financial statements.
3. Distributions: Distributions from net investment income are declared daily and paid on the first business day of the following month.
4. Other: Interest income is accrued daily. Premiums and discounts on debt securities purchased are amortized and accreted, respectively, to interest income over the lives of the respective securities. Security transactions are accounted for on the date securities are bought or sold. Costs used to determine realized gains (losses) on the sale of investment securities are those of the specific securities sold.
B. The Vanguard Group furnishes at cost investment advisory, corporate management, administrative, marketing, and distribution services. The costs of such services are allocated to the fund under methods approved by the board of trustees. The fund has committed to provide up to 0.40% of its net assets in capital contributions to Vanguard. At February 28, 2011, the fund had contributed capital of $2,850,000 to Vanguard (included in Other Assets), representing 0.02% of the fund’s net assets and 1.14% of Vanguard’s capitalization. The fund’s trustees and officers are also directors and officers of Vanguard. Beginning in July 2009, Vanguard and the board of trustees agreed to temporarily limit certain net operating expenses in excess of the fund’s daily yield so as to maintain a zero or positive yield for the fund. Vanguard and the board of trustees may terminate the temporary expense limitation at any time.
C. Various inputs may be used to determine the value of the fund’s investments. These inputs are summarized in three broad levels for financial statement purposes. The inputs or methodologies used to value securities are not necessarily an indication of the risk associated with investing in those securities.
Level 1—Quoted prices in active markets for identical securities.
Level 2—Other significant observable inputs (including quoted prices for similar securities, interest rates, prepayment speeds, credit risk, etc.).
Level 3—Significant unobservable inputs (including the fund’s own assumptions used to determine the fair value of investments).
At February 28, 2011, 100% of the fund’s investments were valued using amortized cost, in accordance with rules under the Investment Company Act of 1940. Amortized cost approximates the current fair value of a security, but since the value is not obtained from a quoted price in an active market, securities valued at amortized cost are considered to be valued using Level 2 inputs.
D. In preparing the financial statements as of February 28, 2011, management considered the impact of subsequent events for potential recognition or disclosure in these financial statements.
47
About Your Fund’s Expenses
As a shareholder of the fund, you incur ongoing costs, which include costs for portfolio management, administrative services, and shareholder reports (like this one), among others. Operating expenses, which are deducted from a fund’s gross income, directly reduce the investment return of the fund.
A fund’s expenses are expressed as a percentage of its average net assets. This figure is known as the expense ratio. The following examples are intended to help you understand the ongoing costs (in dollars) of investing in your fund and to compare these costs with those of other mutual funds. The examples are based on an investment of $1,000 made at the beginning of the period shown and held for the entire period.
The accompanying table illustrates your fund’s costs in two ways:
• Based on actual fund return. This section helps you to estimate the actual expenses that you paid over the period. The ”Ending Account Value“ shown is derived from the fund‘s actual return, and the third column shows the dollar amount that would have been paid by an investor who started with $1,000 in the fund. You may use the information here, together with the amount you invested, to estimate the expenses that you paid over the period.
To do so, simply divide your account value by $1,000 (for example, an $8,600 account value divided by $1,000 = 8.6), then multiply the result by the number given for your fund under the heading ”Expenses Paid During Period.“
• Based on hypothetical 5% yearly return. This section is intended to help you compare your fund‘s costs with those of other mutual funds. It assumes that the fund had a yearly return of 5% before expenses, but that the expense ratio is unchanged. In this case—because the return used is not the fund’s actual return—the results do not apply to your investment. The example is useful in making comparisons because the Securities and Exchange Commission requires all mutual funds to calculate expenses based on a 5% return. You can assess your fund’s costs by comparing this hypothetical example with the hypothetical examples that appear in shareholder reports of other funds.
Note that the expenses shown in the table are meant to highlight and help you compare ongoing costs only and do not reflect transaction costs incurred by the fund for buying and selling securities. Further, the expenses do not include the account service fee described in the prospectus (the fee does not apply to the Prime Money Market Fund’s Institutional Shares or the Admiral Treasury Money Market Fund). If such a fee were applied to your account, your costs would be higher. Your fund does not charge transaction fees, such as purchase or redemption fees, nor does it carry a “sales load.”
The calculations assume no shares were bought or sold during the period. Your actual costs may have been higher or lower, depending on the amount of your investment and the timing of any purchases or redemptions.
You can find more information about the fund’s expenses, including annual expense ratios, in the Financial Statements section of this report. For additional information on operating expenses and other shareholder costs, please refer to your fund’s current prospectus.
48
| | | |
| Six Months Ended February 28, 2011 | | | |
| | Beginning | Ending | Expenses |
| | Account Value | Account Value | Paid During |
| | 8/31/2010 | 2/28/2011 | Period |
| Based on Actual Fund Return | | | |
| Prime Money Market Fund | | | |
| Investor Shares | $1,000.00 | $1,000.36 | $1.14 |
| Institutional Shares | 1,000.00 | 1,001.04 | 0.45 |
| Federal Money Market Fund | $1,000.00 | $1,000.09 | $1.09 |
| Admiral Treasury Money Market Fund | $1,000.00 | $1,000.07 | $0.69 |
| Based on Hypothetical 5% Yearly Return | | | |
| Prime Money Market Fund | | | |
| Investor Shares | $1,000.00 | $1,023.65 | $1.15 |
| Institutional Shares | 1,000.00 | 1,024.35 | 0.45 |
| Federal Money Market Fund | $1,000.00 | $1,023.70 | $1.10 |
| Admiral Treasury Money Market Fund | $1,000.00 | $1,024.10 | $0.70 |
The calculations are based on expenses incurred in the most recent six-month period. The funds’ annualized six-month expense ratios for that
period are: for the Prime Money Market Fund, 0.23% for Investor Shares and 0.09% for Institutional Shares; for the Federal Money Market
Fund, 0.22%; and for the Admiral Treasury Money Market Fund, 0.14%. The dollar amounts shown as “Expenses Paid” are equal to the
annualized expense ratio multiplied by the average account value over the period, multiplied by the number of days in the most recent
six-month period, then divided by the number of days in the most recent 12-month period.
49
Glossary
SEC Yields. A money market fund’s 7-day SEC yield is calculated by annualizing its income distributions for the previous seven days, as required by the U.S. Securities and Exchange Commission.
Average Weighted Maturity. The average length of time until fixed income securities held by a fund reach maturity and are repaid. The figure reflects the proportion of fund assets represented by each security.
Credit Quality. The credit ratings assigned to fixed income securities are an indicator of risk. They represent a rating agency’s assessment of the issuer’s ability to meet its obligations. For Vanguard money market funds, the Distribution by Credit Quality table was revised to include tier ratings for consistency with SEC Rule 2a-7 under the Investment Company Act of 1940, which governs money market funds. A First Tier security is one that is eligible for money market funds and that is rated in the highest category for short-term debt obligations by nationally recognized statistical rating organizations. An unrated security is considered to be First Tier if it represents quality comparable to that of a rated security, as determined in accordance with the SEC rule. A Second Tier security is one that is eligible for money market funds and is not a First Tier security.
Expense Ratio. The percentage of a fund’s average net assets used to pay its annual administrative and advisory expenses. These expenses directly reduce returns to investors.
Inception Date. The date on which the assets of a fund (or one of its share classes) are first invested in accordance with the fund’s investment objective. For funds with a subscription period, the inception date is the day after that period ends. Investment performance is measured from the inception date.
50
This page intentionally left blank.
The People Who Govern Your Fund
The trustees of your mutual fund are there to see that the fund is operated and managed in your best interests since, as a shareholder, you are a part owner of the fund. Your fund’s trustees also serve on the board of directors of The Vanguard Group, Inc., which is owned by the Vanguard funds and provides services to them on an at-cost basis.
A majority of Vanguard’s board members are independent, meaning that they have no affiliation with Vanguard or the funds they oversee, apart from the sizable personal investments they have made as private individuals. The independent board members have distinguished backgrounds in business, academia, and public service. Each of the trustees and executive officers oversees 179 Vanguard funds.
The following table provides information for each trustee and executive officer of the fund. More information about the trustees is in the Statement of Additional Information, which can be obtained, without charge, by contacting Vanguard at 800-662-7447, or online at vanguard.com.
| |
| Interested Trustee1 | and President (2006–2008) of Rohm and Haas Co. |
| | (chemicals); Director of Tyco International, Ltd. |
| F. William McNabb III | (diversified manufacturing and services) and Hewlett- |
| Born 1957. Trustee Since July 2009. Chairman of the | Packard Co. (electronic computer manufacturing); |
| Board. Principal Occupation(s) During the Past Five | Senior Advisor at New Mountain Capital; Trustee |
| Years: Chairman of the Board of The Vanguard Group, | of The Conference Board; Member of the Board of |
| Inc., and of each of the investment companies served | Managers of Delphi Automotive LLP (automotive |
| by The Vanguard Group, since January 2010; Director | components). |
| of The Vanguard Group since 2008; Chief Executive | |
| Officer and President of The Vanguard Group and of | Amy Gutmann |
| each of the investment companies served by The | Born 1949. Trustee Since June 2006. Principal |
| Vanguard Group since 2008; Director of Vanguard | Occupation(s) During the Past Five Years: President |
| Marketing Corporation; Managing Director of The | of the University of Pennsylvania; Christopher H. |
| Vanguard Group (1995–2008). | Browne Distinguished Professor of Political Science |
| | in the School of Arts and Sciences with secondary |
| | appointments at the Annenberg School for Commu- |
| Independent Trustees | nication and the Graduate School of Education |
| | of the University of Pennsylvania; Director of |
| Emerson U. Fullwood | Carnegie Corporation of New York, Schuylkill River |
| Born 1948. Trustee Since January 2008. Principal | Development Corporation, and Greater Philadelphia |
| Occupation(s) During the Past Five Years: Executive | Chamber of Commerce; Trustee of the National |
| Chief Staff and Marketing Officer for North America | Constitution Center; Chair of the Presidential |
| and Corporate Vice President (retired 2008) of Xerox | Commission for the Study of Bioethical Issues. |
| Corporation (document management products and | |
| services); Executive in Residence and 2010 | JoAnn Heffernan Heisen |
| Distinguished Minett Professor at the Rochester | Born 1950. Trustee Since July 1998. Principal |
| Institute of Technology; Director of SPX Corporation | Occupation(s) During the Past Five Years: Corporate |
| (multi-industry manufacturing), the United Way of | Vice President and Chief Global Diversity Officer |
| Rochester, Amerigroup Corporation (managed health | (retired 2008) and Member of the Executive |
| care), the University of Rochester Medical Center, | Committee (1997–2008) of Johnson & Johnson |
| Monroe Community College Foundation, and North | (pharmaceuticals/consumer products); Director of |
| Carolina A&T University. | Skytop Lodge Corporation (hotels), the University |
| | Medical Center at Princeton, the Robert Wood |
| Rajiv L. Gupta | Johnson Foundation, and the Center for Work Life |
| Born 1945. Trustee Since December 2001. 2 | Policy; Member of the Advisory Board of the |
| Principal Occupation(s) During the Past Five Years: | Maxwell School of Citizenship and Public Affairs |
| Chairman and Chief Executive Officer (retired 2009) | at Syracuse University. |
| | |
| F. Joseph Loughrey | Thomas J. Higgins | |
| Born 1949. Trustee Since October 2009. Principal | Born 1957. Chief Financial Officer Since September |
| Occupation(s) During the Past Five Years: President | 2008. Principal Occupation(s) During the Past Five |
| and Chief Operating Officer (retired 2009) and Vice | Years: Principal of The Vanguard Group, Inc.; Chief |
| Chairman of the Board (2008–2009) of Cummins Inc. | Financial Officer of each of the investment companies |
| (industrial machinery); Director of SKF AB (industrial | served by The Vanguard Group since 2008; Treasurer |
| machinery), Hillenbrand, Inc. (specialized consumer | of each of the investment companies served by The |
| services), the Lumina Foundation for Education, and | Vanguard Group (1998–2008). |
| Oxfam America; Chairman of the Advisory Council | | |
| for the College of Arts and Letters and Member | Kathryn J. Hyatt | |
| of the Advisory Board to the Kellogg Institute for | Born 1955. Treasurer Since November 2008. Principal |
| International Studies at the University of Notre Dame. | Occupation(s) During the Past Five Years: Principal |
| | of The Vanguard Group, Inc.; Treasurer of each of |
| André F. Perold | the investment companies served by The Vanguard |
| Born 1952. Trustee Since December 2004. Principal | Group since 2008; Assistant Treasurer of each of the |
| Occupation(s) During the Past Five Years: George | investment companies served by The Vanguard Group |
| Gund Professor of Finance and Banking at the Harvard | (1988–2008). | |
| Business School; Chair of the Investment Committee | | |
| of HighVista Strategies LLC (private investment firm). | Heidi Stam | |
| | Born 1956. Secretary Since July 2005. Principal |
| Alfred M. Rankin, Jr. | Occupation(s) During the Past Five Years: Managing |
| Born 1941. Trustee Since January 1993. Principal | Director of The Vanguard Group, Inc., since 2006; |
| Occupation(s) During the Past Five Years: Chairman, | General Counsel of The Vanguard Group since 2005; |
| President, and Chief Executive Officer of NACCO | Secretary of The Vanguard Group and of each of the |
| Industries, Inc. (forklift trucks/housewares/lignite); | investment companies served by The Vanguard Group |
| Director of Goodrich Corporation (industrial products/ | since 2005; Director and Senior Vice President of |
| aircraft systems and services) and the National | Vanguard Marketing Corporation since 2005; |
| Association of Manufacturers; Chairman of the | Principal of The Vanguard Group (1997–2006). |
| Federal Reserve Bank of Cleveland; Vice Chairman | | |
| of University Hospitals of Cleveland; President of | | |
| the Board of The Cleveland Museum of Art. | Vanguard Senior Management Team |
| |
| Peter F. Volanakis | R. Gregory Barton | Michael S. Miller |
| Born 1955. Trustee Since July 2009. Principal | Mortimer J. Buckley | James M. Norris |
| Occupation(s) During the Past Five Years: President | Kathleen C. Gubanich | Glenn W. Reed |
| and Chief Operating Officer (retired 2010) of Corning | Paul A. Heller | George U. Sauter |
| Incorporated (communications equipment); Director of | | |
| Corning Incorporated (2000–2010) and Dow Corning | | |
| (2001–2010); Overseer of the Amos Tuck School of | Chairman Emeritus and Senior Advisor |
| Business Administration at Dartmouth College. | | |
| | John J. Brennan | |
| | Chairman, 1996–2009 | |
| Executive Officers | Chief Executive Officer and President, 1996–2008 |
| |
| Glenn Booraem | | |
| Born 1967. Controller Since July 2010. Principal | | |
| Occupation(s) During the Past Five Years: Principal | Founder | |
| of The Vanguard Group, Inc.; Controller of each of | John C. Bogle | |
| the investment companies served by The Vanguard | Chairman and Chief Executive Officer, 1974–1996 |
| Group since 2010; Assistant Controller of each of | | |
| the investment companies served by The Vanguard | | |
| Group (2001–2010). | | |
1 Mr. McNabb is considered an “interested person,” as defined in the Investment Company Act of 1940, because he is an officer of the
Vanguard funds.
2 December 2002 for Vanguard Equity Income Fund, Vanguard Growth Equity Fund, the Vanguard Municipal Bond Funds, and the Vanguard
State Tax-Exempt Funds.

| |
| | P.O. Box 2600 |
| | Valley Forge, PA 19482-2600 |
| |
| |
| |
| Connect with Vanguard® > vanguard.com | |
| |
| |
| |
| Fund Information > 800-662-7447 | |
| Direct Investor Account Services > 800-662-2739 | |
| Institutional Investor Services > 800-523-1036 | |
| Text Telephone for People | |
| With Hearing Impairment > 800-749-7273 | |
| |
| This material may be used in conjunction | |
| with the offering of shares of any Vanguard | |
| fund only if preceded or accompanied by | |
| the fund’s current prospectus. | |
| |
| All comparative mutual fund data are from Lipper Inc. or | |
| Morningstar, Inc., unless otherwise noted. | |
| |
| You can obtain a free copy of Vanguard’s proxy voting | |
| guidelines by visiting vanguard.com/proxyreporting or by | |
| calling Vanguard at 800-662-2739. The guidelines are | |
| also available from the SEC’s website, sec.gov. In | |
| addition, you may obtain a free report on how your fund | |
| voted the proxies for securities it owned during the 12 | |
| months ended June 30. To get the report, visit either | |
| vanguard.com/proxyreporting or sec.gov. | |
| |
| You can review and copy information about your fund at | |
| the SEC’s Public Reference Room in Washington, D.C. To | |
| find out more about this public service, call the SEC at | |
| 202-551-8090. Information about your fund is also | |
| available on the SEC’s website, and you can receive | |
| copies of this information, for a fee, by sending a | |
| request in either of two ways: via e-mail addressed to | |
| publicinfo@sec.gov or via regular mail addressed to the | |
| Public Reference Section, Securities and Exchange | |
| Commission, Washington, DC 20549-1520. | |
| |
| |
| | © 2011 The Vanguard Group, Inc. |
| | All rights reserved. |
| | Vanguard Marketing Corporation, Distributor. |
| |
| | Q302 042011 |

|
| Vanguard S&P Mid-Cap 400 Index Funds |
| Semiannual Report |
|
| February 28, 2011 |

|
| Vanguard S&P Mid-Cap 400 Index Fund |
| Vanguard S&P Mid-Cap 400 Value Index Fund |
| Vanguard S&P Mid-Cap 400 Growth Index Fund |
|
> The Vanguard S&P Mid-Cap 400 Index Funds made their debut in a period
of stock market strength, delivering double-digit returns since their inception.
> All three funds closely tracked the returns of their benchmark indexes.
> Information technology, energy, and industrial stocks were especially
strong performers.
| |
| Contents | |
| |
| Your Fund’s Total Returns | 1 |
| Chairman’s Letter | 2 |
| S&P Mid-Cap 400 Index Fund | 6 |
| S&P Mid-Cap 400 Value Index Fund | 18 |
| S&P Mid-Cap 400 Growth Index Fund | 30 |
| Trustees Approve Advisory Arrangement | 41 |
| Glossary | 42 |
Please note: The opinions expressed in this report are just that—informed opinions. They should not be considered promises or advice.
Also, please keep in mind that the information and opinions cover the period through the date on the front of this report. Of course, the
risks of investing in your fund are spelled out in the prospectus.
See the Glossary for definitions of investment terms used in this report.
Cover photograph: Jean Maher.
Your Fund’s Total Returns
| | |
| Period Ended February 28, 2011 | | |
| | Ticker | Total Returns |
| | Symbol | Since Inception |
| Vanguard S&P Mid-Cap 400 Index Fund | | |
| ETF Shares (Inception: 9/7/2010) | IVOO | |
| Market Price | | 28.76% |
| Net Asset Value | | 28.75 |
| S&P MidCap 400 Index | | 28.84 |
| Mid-Cap Core Funds Average1 | | 27.59 |
| |
| Vanguard S&P Mid-Cap 400 Value Index Fund | | |
| Institutional Shares (Inception: 11/2/2010) | VMFVX | 15.42% |
| ETF Shares (Inception: 9/7/2010) | IVOV | |
| Market Price | | 26.49 |
| Net Asset Value | | 26.82 |
| S&P MidCap 400 Value Index | | 26.96 |
| Mid-Cap Value Funds Average1 | | 26.01 |
| |
| Vanguard S&P Mid-Cap 400 Growth Index Fund | | |
| ETF Shares (Inception: 9/7/2010) | IVOG | |
| Market Price | | 30.61% |
| Net Asset Value | | 30.55 |
| S&P MidCap 400 Growth Index | | 30.64 |
| Mid-Cap Growth Funds Average1 | | 29.17 |
Institutional Shares are available to certain institutional investors who meet specific administrative, service, and account-size criteria.
The Vanguard ETF® Shares shown are traded on the NYSE Arca exchange and are available only through brokers. The table provides
ETF returns based on both the NYSE Arca market price and the net asset value for a share. U.S. Pat. No. 6,879,964 B2; 7,337,138.
For the ETF Shares, the market price is determined by the midpoint of the bid-offer spread as of the closing time of the New York Stock
Exchange (generally 4 p.m., Eastern time). The net asset value is also determined as of the NYSE closing time. For more information about
how the ETF Shares’ market prices have compared with their net asset value, visit vanguard.com, select your ETF, and then select the Price
and Performance tab. The ETF premium/discount analysis there shows the percentages of days on which the ETF Shares’ market price was
above or below the NAV.
1 Derived from data provided by Lipper Inc.
1

Chairman’s Letter
Dear Shareholder,
In the brief period since their September 2010 inception, the Vanguard S&P Mid-Cap 400 Index Funds produced exceptional returns, benefiting from the broad-based rally among medium-sized stocks.
The returns of the funds’ ETF Shares ranged from 26.82% for Vanguard S&P Mid-Cap 400 Value Index Fund to 30.55% for Vanguard S&P Mid-Cap 400 Growth Index Fund. (Returns are based on changes in the funds’ net asset values, adjusted to account for dividend distributions during the period.) Vanguard S&P Mid-Cap 400 Index Fund, a blend of the Growth and Value Funds, returned 28.75%. After the launch of the ETF Shares for all three funds, the S&P Mid-Cap 400 Value Index Fund introduced Institutional Shares.
The new S&P Mid-Cap 400 Index Funds mark an extension of Vanguard’s equity indexing franchise, which now includes suites of broad-market portfolios benchmarked to the Russell, Standard & Poor’s, and MSCI indexes. Our research indicates that correlation among the returns of the indexes from all three providers is very high. We would expect limited differences in long-term performance from one provider’s index to another.
2
This report begins with a look at the investment environment throughout the full six months of the new funds’ fiscal half-year and then reviews the drivers of fund performance during their briefer period of operation.
A fretful start, an optimistic finish for global stock markets
Stock markets rallied from their midsummer malaise to produce exceptional returns for the six months ended February 28. At the start of the period, the U.S. economy seemed in danger of tipping back into recession. By the end, hopes were high that it had reached escape velocity, propelled by steady job growth and notable strength in the manufacturing sector. Smaller stocks,
which are especially sensitive to the rhythms of the business cycle, produced the highest six-month returns.
In Europe, investor optimism subdued sovereign-debt jitters, driving stock prices higher. Developed markets in the Pacific region perked up on signs of recovery in global trade. Australian stocks posted especially strong returns, benefiting from a surge in the prices of metals and other natural resources. Emerging stock markets trailed a few steps behind their developed-market counterparts. Most major currencies appreciated relative to the U.S. dollar, enhancing returns from abroad for U.S.-based investors.
| | | |
| Market Barometer | | | |
| | Total Returns |
| | Periods Ended February 28, 2011 |
| | Six | One | Five Years |
| | Months | Year | (Annualized) |
| Stocks | | | |
| Russell 1000 Index (Large-caps) | 28.65% | 23.54% | 3.17% |
| Russell 2000 Index (Small-caps) | 37.55 | 32.60 | 3.80 |
| Dow Jones U.S. Total Stock Market Index | 29.24 | 24.45 | 3.59 |
| MSCI All Country World Index ex USA (International) | 22.16 | 21.12 | 4.23 |
| |
| Bonds | | | |
| Barclays Capital U.S. Aggregate Bond Index | | | |
| (Broad taxable market) | –0.83% | 4.93% | 5.80% |
| Barclays Capital Municipal Bond Index | | | |
| (Broad tax-exempt market) | –3.51 | 1.72 | 4.07 |
| Citigroup Three-Month Treasury Bill Index | 0.06 | 0.14 | 2.16 |
| |
| CPI | | | |
| Consumer Price Index | 1.37% | 2.11% | 2.18% |
3
Interest rates rose, depressing bond prices
U.S. interest rates hovered near generational lows early in the period, but then moved higher, putting pressure on bond prices. For the six-month period, the broad taxable bond market produced a small negative return. The municipal bond market did worse. Corporate bonds outperformed government debt, as investors stretched for yield beyond government securities, where rates remained low by historical standards.
As it has since December 2008, the Federal Reserve held its target for short-term interest rates near 0%. This stance kept the returns available from money market instruments, such as the 3-month Treasury bill, in the same neighborhood.
Funds debuted amid stock market strength
During their first few months of operation, the Vanguard S&P Mid-Cap 400 Index Funds benefited from general strength among midsized stocks. Information technology stocks were among the best performers, rallying on both consumer enthusiasm for platforms such as tablets and smart phones and signs that business investment is set to pick up. The strength of tech stocks helped all three funds but made an especially big contribution to Vanguard S&P Mid-Cap 400 Growth Index Fund. At the end of the period, tech stocks accounted for almost 24% of fund assets.
Energy stocks delivered exceptional returns, reflecting rising oil prices and a gradual clearing of the clouds that have hung over energy stocks since the Gulf oil spill. The sector made significant contributions to all three funds. Industrials were another source of strength, particularly in Vanguard S&P Mid-Cap 400 Value Index Fund. Machinery makers and transportation companies performed well as activity on factory floors began to pick up.
Weak spots were conspicuous by their absence. Utilities and telecommunication stocks produced some of the weakest returns, but that generally meant absolute returns in the double digits.
All three funds succeeded in capturing most of the returns of their target indexes. Fund returns were within 14 basis points (0.14 percentage point) of the index results, a shortfall consistent with the costs of managing a real-world portfolio. Such performance is a tribute to Vanguard Quantitative Equity Group, the funds’ advisor, which has spent more than 35 years developing and refining index-fund management strategies. The funds’ low costs are an important ally in the advisor’s effort to capture the index return.
4
Solid building blocks for a long-term portfolio
It would be wonderful if the exceptional returns produced during the funds’ first few months could be expected to continue forever. The stock market doesn’t work that way, however. Returns are volatile, with periods of strength often followed by stretches of weakness. And, as we have seen in recent weeks, unpredictable events such as those in the Middle East, North Africa, and Japan can disrupt market trends. That’s why we counsel investors to develop allocations to stock, bond, and money market funds in proportions consistent with their goals and ability to withstand the stock market’s occasionally sharp declines.
The new Vanguard S&P Mid-Cap 400 Index Funds can be powerful building blocks in such a portfolio. They provide comprehensive, low-cost exposure to the U.S. stock market’s midsized companies.
Thank you for entrusting your assets to Vanguard.
Sincerely,

F. William McNabb III
Chairman and Chief Executive Officer
March 14, 2011
| | | | |
| Your Fund’s Performance at a Glance | | | | |
| Inception Through February 28, 2011 | | | | |
| | | | Distributions Per Share |
| | Starting | Ending | Income | Capital |
| Share Price | Share Price | Dividends | Gains |
| Vanguard S&P Mid-Cap 400 Index Fund | | | | |
| ETF Shares (Inception: 9/7/2010) | $49.95 | $64.12 | $0.180 | $0.000 |
| Vanguard S&P Mid-Cap 400 Value Index Fund | | | | |
| Institutional Shares (Inception: 11/2/2010) | $109.35 | $125.65 | $0.529 | $0.000 |
| ETF Shares (Inception: 9/7/2010) | 49.86 | 62.96 | 0.256 | 0.000 |
| Vanguard S&P Mid-Cap 400 Growth Index Fund | | | | |
| ETF Shares (Inception: 9/7/2010) | $50.04 | $65.22 | $0.100 | $0.000 |
5
S&P Mid-Cap 400 Index Fund
Fund Profile
As of February 28, 2011
| | | |
| Portfolio Characteristics | | |
| | | Target | Broad |
| | Fund | Index1 | Index2 |
| Number of Stocks | 400 | 400 | 3,845 |
| Median Market Cap | $3.6B | $3.6B | $31.4B |
| Price/Earnings Ratio | 23.0x | 23.0x | 17.9x |
| Price/Book Ratio | 2.2x | 2.2x | 2.3x |
| Yield3 | 1.1% | 1.3% | 1.6% |
| Return on Equity | 14.0% | 14.0% | 19.2% |
| Earnings Growth Rate | 3.6% | 3.6% | 5.4% |
| Foreign Holdings | 0.0% | 0.0% | 0.0% |
| Turnover Rate4 | 12% | — | — |
| Expense Ratio5 | | | |
| ETF Shares | 0.15% | | |
| Short-Term Reserves | 0.0% | — | — |
| | | |
| Sector Diversification (% of equity exposure) |
| | | Target | Broad |
| | Fund | Index1 | Index2 |
| Consumer Discretionary | 14.1% | 14.1% | 11.8% |
| Consumer Staples | 3.6 | 3.6 | 9.1 |
| Energy | 6.6 | 6.6 | 11.6 |
| Financials | 20.0 | 20.0 | 16.6 |
| Health Care | 11.4 | 11.4 | 10.5 |
| Industrials | 15.0 | 15.0 | 11.4 |
| Information Technology | 16.2 | 16.2 | 18.9 |
| Materials | 6.7 | 6.7 | 4.5 |
| Telecommunication | | | |
| Services | 0.5 | 0.5 | 2.5 |
| Utilities | 5.9 | 5.9 | 3.1 |
| | |
| Ten Largest Holdings6 (% of total net assets) |
| |
| Cimarex Energy Co. | Oil & Gas Exploration | |
| | & Production | 0.8% |
| Edwards Lifesciences | Health Care | |
| Corp. | Equipment | 0.8 |
| Vertex Pharmaceuticals | | |
| Inc. | Biotechnology | 0.8 |
| BorgWarner Inc. | Auto Parts | |
| | & Equipment | 0.7 |
| New York Community | Thrifts & Mortgage | |
| Bancorp Inc. | Finance | 0.7 |
| Chipotle Mexican | | |
| Grill Inc. Class A | Restaurants | 0.6 |
| Bucyrus International Inc. | Construction | |
| Class A | & Farm Machinery | |
| | & Heavy Trucks | 0.6 |
| Pride International Inc. | Oil & Gas Drilling | 0.6 |
| Lubrizol Corp. | Specialty Chemicals | 0.6 |
| Lam Research Corp. | Semiconductor | |
| | Equipment | 0.6 |
| Top Ten | | 6.8% |
Investment Focus

1 S&P MidCap 400 Index.
2 Dow Jones U.S. Total Stock Market Index.
3 30-day SEC yield for the fund; annualized dividend yield for the indexes. See the Glossary.
4 Annualized.
5 The expense ratio shown is from the prospectus dated September 7, 2010, and represents estimated costs for the current fiscal year. For the
period ended February 28, 2011, the annualized expense ratio was 0.15%.
6 The holdings listed exclude any temporary cash investments and equity index products.
6
S&P Mid-Cap 400 Index Fund
Performance Summary
All of the returns in this report represent past performance, which is not a guarantee of future results that may be achieved by the fund. (Current performance may be lower or higher than the performance data cited. For performance data current to the most recent month-end, visit our website at vanguard.com/performance.) Note, too, that both investment returns and principal value can fluctuate widely, so an investor’s shares, when sold, could be worth more or less than their original cost. The returns shown do not reflect taxes that a shareholder would pay on fund distributions or on the sale of fund shares.
Fiscal-Period Total Returns (%): September 7, 2010, Through February 28, 2011
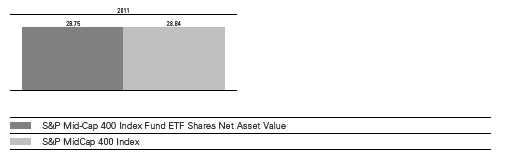
Total Returns: Period Ended December 31, 2010
This table presents returns through the latest calendar quarter—rather than through the end of the fiscal period.
Securities and Exchange Commission rules require that we provide this information.
| | |
| | | Since |
| | Inception Date | Inception |
| ETF Shares | 9/7/2010 | |
| Market Price | | 21.44% |
| Net Asset Value | | 20.64 |
S&P Mid-Cap 400 Index Fund
Financial Statements (unaudited)
Statement of Net Assets
As of February 28, 2011
The fund reports a complete list of its holdings in regulatory filings four times in each fiscal year, at the quarter-ends. For the second and fourth fiscal quarters, the lists appear in the fund’s semiannual and annual reports to shareholders. For the first and third fiscal quarters, the fund files the lists with the Securities and Exchange Commission on Form N-Q. Shareholders can look up the fund’s Forms N-Q on the SEC’s website at sec.gov. Forms N-Q may also be reviewed and copied at the SEC’s Public Reference Room (see the back cover of this report for further information).
| | | |
| | | | Market |
| | | | Value• |
| | Shares | ($000) |
| Common Stocks (100.0%) | | |
| Consumer Discretionary (14.1%) | | |
| * | BorgWarner Inc. | 1,240 | 96 |
| * | Chipotle Mexican Grill Inc. | | |
| | Class A | 336 | 82 |
| * | Dollar Tree Inc. | 1,358 | 68 |
| | Advance Auto Parts Inc. | 912 | 57 |
| | PetSmart Inc. | 1,276 | 52 |
| | Gentex Corp. | 1,529 | 46 |
| * | NVR Inc. | 62 | 45 |
| | Phillips-Van Heusen Corp. | 725 | 44 |
| * | Fossil Inc. | 557 | 43 |
| | Williams-Sonoma Inc. | 1,152 | 42 |
| | Tractor Supply Co. | 794 | 41 |
| * | Panera Bread Co. Class A | 333 | 39 |
| * | LKQ Corp. | 1,569 | 37 |
| * | Deckers Outdoor Corp. | 418 | 37 |
| | Tupperware Brands Corp. | 684 | 37 |
| | Sotheby’s | 734 | 36 |
| * | Dick’s Sporting Goods Inc. | 963 | 36 |
| * | Mohawk Industries Inc. | 614 | 36 |
| * | Toll Brothers Inc. | 1,583 | 34 |
| | Foot Locker Inc. | 1,689 | 34 |
| | American Eagle Outfitters Inc. | 2,135 | 33 |
| | Guess? Inc. | 692 | 31 |
| * | J Crew Group Inc. | 697 | 30 |
| | Service Corp. International | 2,652 | 29 |
| * | Warnaco Group Inc. | 487 | 29 |
| | Polaris Industries Inc. | 369 | 28 |
| * | Hanesbrands Inc. | 1,049 | 27 |
| | Chico’s FAS Inc. | 1,927 | 26 |
| * | Aeropostale Inc. | 1,011 | 26 |
| * | Under Armour Inc. Class A | 385 | 25 |
| * | WMS Industries Inc. | 626 | 25 |
| * | Lamar Advertising Co. Class A | 627 | 24 |
| | John Wiley & Sons Inc. Class A | 503 | 24 |
| * | Ascena Retail Group Inc. | 760 | 24 |
| | Brinker International Inc. | 998 | 24 |
| | Rent-A-Center Inc. | 696 | 23 |
| | | |
| * | Bally Technologies Inc. | 589 | 23 |
| * | DreamWorks Animation | | |
| | SKG Inc. Class A | 786 | 22 |
| * | Saks Inc. | 1,771 | 22 |
| * | ITT Educational Services Inc. | 284 | 22 |
| | Strayer Education Inc. | 147 | 20 |
| | Aaron’s Inc. | 805 | 19 |
| * | Cheesecake Factory Inc. | 643 | 19 |
| * | Life Time Fitness Inc. | 454 | 17 |
| * | Career Education Corp. | 710 | 17 |
| | Wendy’s/Arby’s Group Inc. | | |
| | Class A | 3,559 | 17 |
| * | Office Depot Inc. | 3,006 | 16 |
| * | Collective Brands Inc. | 695 | 16 |
| * | Timberland Co. Class A | 423 | 16 |
| | Thor Industries Inc. | 457 | 15 |
| * | AnnTaylor Stores Corp. | 628 | 15 |
| | Meredith Corp. | 395 | 14 |
| * | New York Times Co. Class A | 1,282 | 13 |
| | Matthews International Corp. | | |
| | Class A | 322 | 12 |
| | Regis Corp. | 618 | 11 |
| | MDC Holdings Inc. | 406 | 11 |
| | KB Home | 786 | 10 |
| | Bob Evans Farms Inc. | 326 | 10 |
| * | Eastman Kodak Co. | 2,917 | 10 |
| | American Greetings Corp. | | |
| | Class A | 428 | 9 |
| | International Speedway Corp. | | |
| | Class A | 320 | 9 |
| | Scholastic Corp. | 268 | 8 |
| * | 99 Cents Only Stores | 500 | 8 |
| | Ryland Group Inc. | 476 | 8 |
| * | Boyd Gaming Corp. | 598 | 6 |
| * | Scientific Games Corp. Class A | 676 | 6 |
| | Barnes & Noble Inc. | 424 | 6 |
| | Harte-Hanks Inc. | 414 | 5 |
| | | | 1,802 |
8
S&P Mid-Cap 400 Index Fund
| | | |
| | | | Market |
| | | | Value• |
| | | Shares | ($000) |
| Consumer Staples (3.6%) | | |
| | Church & Dwight Co. Inc. | 775 | 58 |
| * | Green Mountain Coffee | | |
| | Roasters Inc. | 1,266 | 52 |
| * | Energizer Holdings Inc. | 768 | 51 |
| * | Hansen Natural Corp. | 752 | 43 |
| * | Smithfield Foods Inc. | 1,811 | 42 |
| | Corn Products International | | |
| | Inc. | 823 | 40 |
| * | Ralcorp Holdings Inc. | 600 | 39 |
| | Alberto-Culver Co. Class B | 937 | 35 |
| * | BJ’s Wholesale Club Inc. | 595 | 29 |
| | Flowers Foods Inc. | 822 | 22 |
| | Ruddick Corp. | 465 | 17 |
| | Lancaster Colony Corp. | 208 | 12 |
| | Universal Corp. | 257 | 11 |
| | Tootsie Roll Industries Inc. | 261 | 7 |
| | | | 458 |
| Energy (6.6%) | | |
| | Cimarex Energy Co. | 921 | 107 |
| * | Pride International Inc. | 1,907 | 79 |
| * | Plains Exploration | | |
| | & Production Co. | 1,525 | 60 |
| | Arch Coal Inc. | 1,763 | 59 |
| | SM Energy Co. | 685 | 50 |
| * | Oceaneering International Inc. | 588 | 49 |
| | Patterson-UTI Energy Inc. | 1,677 | 46 |
| * | Forest Oil Corp. | 1,230 | 44 |
| | Southern Union Co. | 1,358 | 39 |
| | Tidewater Inc. | 557 | 35 |
| * | Superior Energy Services Inc. | 862 | 33 |
| * | Frontier Oil Corp. | 1,157 | 32 |
| * | Dril-Quip Inc. | 372 | 28 |
| * | Atwood Oceanics Inc. | 606 | 27 |
| * | Unit Corp. | 431 | 26 |
| * | Patriot Coal Corp. | 986 | 23 |
| * | Bill Barrett Corp. | 511 | 20 |
| * | Quicksilver Resources Inc. | 1,273 | 20 |
| * | Northern Oil and Gas Inc. | 564 | 18 |
| * | Helix Energy Solutions Group | | |
| | Inc. | 1,132 | 17 |
| * | Exterran Holdings Inc. | 701 | 16 |
| * | Comstock Resources Inc. | 508 | 13 |
| | Overseas Shipholding Group | | |
| | Inc. | 288 | 10 |
| | | | 851 |
| Financials (20.0%) | | |
| | New York Community | | |
| | Bancorp Inc. | 4,754 | 89 |
| | Macerich Co. | 1,411 | 71 |
| | AMB Property Corp. | 1,827 | 66 |
| | SL Green Realty Corp. | 856 | 65 |
| * | Affiliated Managers Group Inc. | 561 | 60 |
| | | |
| | Nationwide Health Properties | | |
| | Inc. | 1,378 | 59 |
| | Federal Realty Investment | | |
| | Trust | 668 | 56 |
| | Rayonier Inc. | 877 | 54 |
| | Everest Re Group Ltd. | 593 | 53 |
| | UDR Inc. | 1,994 | 48 |
| | Reinsurance Group | | |
| | of America Inc. Class A | 798 | 48 |
| | Alexandria Real Estate | | |
| | Equities Inc. | 600 | 48 |
| * | MSCI Inc. Class A | 1,295 | 46 |
| | Realty Income Corp. | 1,274 | 46 |
| | Jones Lang LaSalle Inc. | 463 | 46 |
| | Camden Property Trust | 745 | 44 |
| | Essex Property Trust Inc. | 341 | 42 |
| | Liberty Property Trust | 1,243 | 42 |
| | Raymond James Financial Inc. | 1,089 | 42 |
| | Eaton Vance Corp. | 1,291 | 40 |
| | Regency Centers Corp. | 893 | 40 |
| | HCC Insurance Holdings Inc. | 1,257 | 39 |
| | Cullen/Frost Bankers Inc. | 663 | 39 |
| | WR Berkley Corp. | 1,290 | 39 |
| | Duke Realty Corp. | 2,731 | 38 |
| | Waddell & Reed Financial Inc. | | |
| | Class A | 931 | 38 |
| | Senior Housing Properties | | |
| | Trust | 1,527 | 37 |
| | East West Bancorp Inc. | 1,606 | 37 |
| | Arthur J Gallagher & Co. | 1,162 | 36 |
| | SEI Investments Co. | 1,583 | 36 |
| | Transatlantic Holdings Inc. | 685 | 35 |
| | Old Republic International | | |
| | Corp. | 2,761 | 35 |
| | Fidelity National Financial Inc. | | |
| | Class A | 2,480 | 34 |
| | Weingarten Realty Investors | 1,314 | 34 |
| | Commerce Bancshares Inc. | 845 | 34 |
| | Brown & Brown Inc. | 1,274 | 33 |
| | First Niagara Financial Group | | |
| | Inc. | 2,285 | 33 |
| | BRE Properties Inc. | 693 | 33 |
| | Taubman Centers Inc. | 591 | 33 |
| | Jefferies Group Inc. | 1,343 | 32 |
| | Mack-Cali Realty Corp. | 930 | 32 |
| | Hospitality Properties Trust | 1,350 | 31 |
| | City National Corp. | 503 | 30 |
| | American Financial Group Inc. | 853 | 30 |
| | Associated Banc-Corp | 1,897 | 27 |
| | Protective Life Corp. | 939 | 27 |
| | Apollo Investment Corp. | 2,133 | 26 |
| | Highwoods Properties Inc. | 777 | 26 |
| | Corporate Office Properties | | |
| | Trust | 729 | 26 |
9
S&P Mid-Cap 400 Index Fund
| | | |
| | | | Market |
| | | | Value• |
| | Shares | ($000) |
| | Omega Healthcare Investors | | |
| | Inc. | 1,069 | 26 |
| | Bank of Hawaii Corp. | 529 | 25 |
| * | SVB Financial Group | 460 | 25 |
| | Aspen Insurance Holdings Ltd. | 830 | 25 |
| | Valley National Bancorp | 1,770 | 24 |
| | Fulton Financial Corp. | 2,158 | 23 |
| | StanCorp Financial Group Inc. | 502 | 23 |
| | Hanover Insurance Group Inc. | 488 | 23 |
| | TCF Financial Corp. | 1,379 | 22 |
| | Washington Federal Inc. | 1,239 | 22 |
| | Synovus Financial Corp. | 8,518 | 22 |
| | Prosperity Bancshares Inc. | 506 | 21 |
| | FirstMerit Corp. | 1,197 | 20 |
| | Greenhill & Co. Inc. | 272 | 20 |
| | Webster Financial Corp. | 801 | 19 |
| | First American Financial Corp. | 1,131 | 18 |
| | NewAlliance Bancshares Inc. | 1,136 | 18 |
| | Potlatch Corp. | 430 | 17 |
| | Westamerica Bancorporation | 314 | 16 |
| | Mercury General Corp. | 383 | 16 |
| | Unitrin Inc. | 536 | 16 |
| | Cathay General Bancorp | 844 | 15 |
| | Trustmark Corp. | 612 | 14 |
| | BancorpSouth Inc. | 790 | 13 |
| | Astoria Financial Corp. | 884 | 12 |
| | International Bancshares Corp. | 590 | 11 |
| | Equity One Inc. | 501 | 10 |
| | Cousins Properties Inc. | 1,105 | 9 |
| | PacWest Bancorp | 336 | 7 |
| | | | 2,567 |
| Health Care (11.4%) | | |
| * | Edwards Lifesciences Corp. | 1,240 | 105 |
| * | Vertex Pharmaceuticals Inc. | 2,215 | 103 |
| * | Henry Schein Inc. | 1,003 | 69 |
| | Perrigo Co. | 903 | 69 |
| | Beckman Coulter Inc. | 752 | 63 |
| * | Mettler-Toledo International | | |
| | Inc. | 356 | 61 |
| * | Hologic Inc. | 2,830 | 57 |
| * | ResMed Inc. | 1,640 | 52 |
| | Universal Health Services Inc. | | |
| | Class B | 1,061 | 49 |
| * | IDEXX Laboratories Inc. | 624 | 48 |
| * | Endo Pharmaceuticals | | |
| | Holdings Inc. | 1,252 | 44 |
| * | Allscripts Healthcare | | |
| | Solutions Inc. | 2,029 | 43 |
| * | Community Health | | |
| | Systems Inc. | 1,004 | 41 |
| * | Covance Inc. | 707 | 40 |
| * | United Therapeutics Corp. | 543 | 37 |
| | Omnicare Inc. | 1,257 | 36 |
| | Pharmaceutical Product | | |
| | Development Inc. | 1,296 | 36 |
| | | |
| * | Mednax Inc. | 518 | 34 |
| * | Kinetic Concepts Inc. | 684 | 33 |
| * | Gen-Probe Inc. | 523 | 33 |
| | Lincare Holdings Inc. | 1,067 | 31 |
| * | Health Net Inc. | 1,036 | 30 |
| | Techne Corp. | 402 | 29 |
| * | Health Management | | |
| | Associates Inc. Class A | 2,752 | 28 |
| | Hill-Rom Holdings Inc. | 684 | 26 |
| | Teleflex Inc. | 438 | 26 |
| * | Bio-Rad Laboratories Inc. | | |
| | Class A | 210 | 24 |
| * | VCA Antech Inc. | 934 | 23 |
| * | Charles River Laboratories | | |
| | International Inc. | 627 | 23 |
| * | LifePoint Hospitals Inc. | 572 | 22 |
| | STERIS Corp. | 641 | 22 |
| | Owens & Minor Inc. | 687 | 21 |
| | Medicis Pharmaceutical Corp. | | |
| | Class A | 655 | 21 |
| | Masimo Corp. | 639 | 19 |
| * | Thoratec Corp. | 637 | 18 |
| * | WellCare Health Plans Inc. | 470 | 18 |
| * | Immucor Inc. | 752 | 15 |
| * | Kindred Healthcare Inc. | 424 | 11 |
| | | | 1,460 |
| Industrials (15.0%) | | |
| | Bucyrus International Inc. | | |
| | Class A | 884 | 80 |
| | AMETEK Inc. | 1,736 | 73 |
| * | Kansas City Southern | 1,113 | 60 |
| | Manpower Inc. | 884 | 56 |
| * | AGCO Corp. | 1,014 | 55 |
| | KBR Inc. | 1,637 | 54 |
| | Donaldson Co. Inc. | 829 | 47 |
| | Hubbell Inc. Class B | 655 | 44 |
| | SPX Corp. | 547 | 44 |
| | Timken Co. | 875 | 43 |
| | Gardner Denver Inc. | 571 | 42 |
| * | URS Corp. | 897 | 42 |
| | JB Hunt Transport Services | | |
| | Inc. | 964 | 40 |
| | Nordson Corp. | 368 | 40 |
| * | Terex Corp. | 1,187 | 40 |
| | Pentair Inc. | 1,077 | 40 |
| * | BE Aerospace Inc. | 1,117 | 38 |
| * | Aecom Technology Corp. | 1,286 | 37 |
| | IDEX Corp. | 892 | 37 |
| * | Shaw Group Inc. | 925 | 37 |
| | Waste Connections Inc. | 1,249 | 36 |
| * | Oshkosh Corp. | 987 | 35 |
| | Kennametal Inc. | 897 | 34 |
| | Lincoln Electric Holdings Inc. | 458 | 33 |
| * | Kirby Corp. | 580 | 32 |
| * | Thomas & Betts Corp. | 562 | 31 |
10
S&P Mid-Cap 400 Index Fund
| | | |
| | | | Market |
| | | | Value• |
| | Shares | ($000) |
| | MSC Industrial Direct Co. | | |
| | Class A | 488 | 31 |
| | Regal-Beloit Corp. | 419 | 31 |
| * | Corrections Corp. of America | 1,205 | 30 |
| | Harsco Corp. | 873 | 30 |
| | Wabtec Corp. | 520 | 29 |
| | Towers Watson & Co. Class A | 491 | 29 |
| | Carlisle Cos. Inc. | 666 | 29 |
| | Trinity Industries Inc. | 873 | 27 |
| * | Copart Inc. | 646 | 27 |
| | Acuity Brands Inc. | 467 | 26 |
| | Graco Inc. | 648 | 26 |
| | Alliant Techsystems Inc. | 363 | 26 |
| | Valmont Industries Inc. | 235 | 24 |
| | Landstar System Inc. | 534 | 24 |
| * | Alaska Air Group Inc. | 399 | 24 |
| | Crane Co. | 500 | 24 |
| | Lennox International Inc. | 487 | 24 |
| * | Clean Harbors Inc. | 252 | 23 |
| | Woodward Inc. | 642 | 21 |
| * | United Rentals Inc. | 667 | 21 |
| | Con-way Inc. | 602 | 20 |
| | Watsco Inc. | 302 | 19 |
| | Alexander & Baldwin Inc. | 444 | 19 |
| | GATX Corp. | 499 | 17 |
| * | FTI Consulting Inc. | 502 | 17 |
| | Herman Miller Inc. | 614 | 16 |
| | Brink’s Co. | 508 | 16 |
| | HNI Corp. | 484 | 15 |
| | Corporate Executive Board Co. | 368 | 15 |
| | Deluxe Corp. | 552 | 14 |
| | Rollins Inc. | 680 | 13 |
| * | JetBlue Airways Corp. | 2,162 | 12 |
| | Mine Safety Appliances Co. | 330 | 12 |
| * | Korn/Ferry International | 497 | 11 |
| | Werner Enterprises Inc. | 476 | 11 |
| * | AirTran Holdings Inc. | 1,456 | 11 |
| | Granite Construction Inc. | 365 | 10 |
| | | | 1,924 |
| Information Technology (16.2%) | | |
| * | Lam Research Corp. | 1,343 | 74 |
| * | Atmel Corp. | 4,972 | 73 |
| * | Skyworks Solutions Inc. | 1,996 | 72 |
| * | Rovi Corp. | 1,209 | 67 |
| * | Riverbed Technology Inc. | 1,596 | 66 |
| * | Trimble Navigation Ltd. | 1,308 | 64 |
| * | Cree Inc. | 1,176 | 62 |
| * | Avnet Inc. | 1,649 | 56 |
| * | ANSYS Inc. | 987 | 56 |
| | Factset Research Systems | | |
| | Inc. | 503 | 53 |
| * | Arrow Electronics Inc. | 1,256 | 49 |
| * | Informatica Corp. | 1,018 | 48 |
| * | TIBCO Software Inc. | 1,826 | 45 |
| * | Synopsys Inc. | 1,621 | 45 |
| | | |
| * | Polycom Inc. | 930 | 44 |
| * | Alliance Data Systems Corp. | 564 | 44 |
| * | Equinix Inc. | 501 | 43 |
| * | MICROS Systems Inc. | 878 | 42 |
| | Global Payments Inc. | 870 | 42 |
| | Solera Holdings Inc. | 765 | 39 |
| * | Rackspace Hosting Inc. | 1,055 | 39 |
| * | Cypress Semiconductor Corp. | 1,815 | 38 |
| * | Gartner Inc. | 927 | 35 |
| * | Ingram Micro Inc. | 1,713 | 34 |
| | Lender Processing Services | | |
| | Inc. | 990 | 34 |
| * | NCR Corp. | 1,727 | 33 |
| * | Vishay Intertechnology Inc. | 1,809 | 32 |
| | ADTRAN Inc. | 690 | 31 |
| | Broadridge Financial Solutions | | |
| | Inc. | 1,356 | 31 |
| * | Parametric Technology Corp. | 1,281 | 30 |
| | Jack Henry & Associates Inc. | 937 | 30 |
| | National Instruments Corp. | 954 | 30 |
| * | Cadence Design Systems Inc. | 2,916 | 29 |
| * | Ciena Corp. | 1,023 | 28 |
| * | Concur Technologies Inc. | 495 | 26 |
| | Diebold Inc. | 723 | 25 |
| * | Tech Data Corp. | 509 | 25 |
| * | Itron Inc. | 438 | 25 |
| * | AOL Inc. | 1,171 | 24 |
| * | International Rectifier Corp. | 754 | 24 |
| * | Fairchild Semiconductor | | |
| | International Inc. Class A | 1,341 | 24 |
| * | Zebra Technologies Corp. | 620 | 23 |
| * | RF Micro Devices Inc. | 2,999 | 23 |
| * | Silicon Laboratories Inc. | 474 | 22 |
| * | CoreLogic Inc. | 1,145 | 21 |
| * | QLogic Corp. | 1,144 | 21 |
| * | NeuStar Inc. Class A | 800 | 20 |
| | DST Systems Inc. | 386 | 20 |
| * | Mentor Graphics Corp. | 1,207 | 19 |
| * | Convergys Corp. | 1,320 | 19 |
| | Plantronics Inc. | 516 | 18 |
| | Intersil Corp. Class A | 1,375 | 18 |
| * | Quest Software Inc. | 656 | 18 |
| * | Semtech Corp. | 691 | 16 |
| * | Acxiom Corp. | 861 | 15 |
| * | Digital River Inc. | 428 | 14 |
| * | Integrated Device Technology | | |
| | Inc. | 1,697 | 13 |
| * | ValueClick Inc. | 872 | 13 |
| * | SRA International Inc. Class A | 462 | 13 |
| | Fair Isaac Corp. | 438 | 12 |
| * | ACI Worldwide Inc. | 362 | 11 |
| * | Mantech International Corp. | | |
| | Class A | 242 | 10 |
| * | Advent Software Inc. | 341 | 10 |
| | | | 2,080 |
11
S&P Mid-Cap 400 Index Fund
| | | |
| | | | Market |
| | | | Value• |
| | Shares | ($000) |
| Materials (6.7%) | | |
| | Lubrizol Corp. | 712 | 77 |
| | Albemarle Corp. | 997 | 57 |
| | Ashland Inc. | 860 | 48 |
| | Reliance Steel | | |
| | & Aluminum Co. | 812 | 45 |
| | Martin Marietta Materials Inc. | 496 | 44 |
| | Steel Dynamics Inc. | 2,366 | 44 |
| | Valspar Corp. | 1,074 | 41 |
| | Sonoco Products Co. | 1,126 | 41 |
| | Aptargroup Inc. | 728 | 35 |
| | Compass Minerals | | |
| | International Inc. | 355 | 33 |
| | RPM International Inc. | 1,398 | 32 |
| | Packaging Corp. of America | 1,112 | 32 |
| | Cabot Corp. | 714 | 31 |
| | Cytec Industries Inc. | 540 | 31 |
| | Rock-Tenn Co. Class A | 422 | 29 |
| | Scotts Miracle-Gro Co. Class A | 501 | 28 |
| | Temple-Inland Inc. | 1,178 | 28 |
| | Greif Inc. Class A | 336 | 22 |
| | Commercial Metals Co. | 1,240 | 21 |
| | Carpenter Technology Corp. | 485 | 20 |
| | Silgan Holdings Inc. | 544 | 20 |
| * | Intrepid Potash Inc. | 480 | 18 |
| | Sensient Technologies Corp. | 539 | 18 |
| | Olin Corp. | 879 | 16 |
| * | Louisiana-Pacific Corp. | 1,445 | 15 |
| | NewMarket Corp. | 107 | 14 |
| | Minerals Technologies Inc. | 200 | 13 |
| | Worthington Industries Inc. | 605 | 12 |
| | | | 865 |
| Telecommunication Services (0.5%) | |
| | Telephone & Data Systems | | |
| | Inc. | 996 | 33 |
| * | tw telecom inc Class A | 1,641 | 31 |
| | | | 64 |
| Utilities (5.9%) | | |
| | National Fuel Gas Co. | 895 | 65 |
| | OGE Energy Corp. | 1,063 | 51 |
| | NSTAR | 1,125 | 51 |
| | Energen Corp. | 784 | 48 |
| | Alliant Energy Corp. | 1,209 | 48 |
| | MDU Resources Group Inc. | 2,053 | 44 |
| | UGI Corp. | 1,197 | 38 |
| | NV Energy Inc. | 2,565 | 38 |
| | |
| Questar Corp. | 1,911 | 34 |
| DPL Inc. | 1,299 | 34 |
| Aqua America Inc. | 1,500 | 34 |
| Atmos Energy Corp. | 985 | 33 |
| AGL Resources Inc. | 853 | 32 |
| Westar Energy Inc. | 1,214 | 32 |
| Great Plains Energy Inc. | 1,486 | 28 |
| Hawaiian Electric Industries | | |
| Inc. | 1,032 | 25 |
| Vectren Corp. | 896 | 24 |
| Cleco Corp. | 670 | 22 |
| WGL Holdings Inc. | 560 | 21 |
| IDACORP Inc. | 536 | 20 |
| Black Hills Corp. | 422 | 13 |
| PNM Resources Inc. | 932 | 12 |
| * Dynegy Inc. Class A | 1,097 | 6 |
| | | 753 |
| Total Common Stocks | | |
| (Cost $11,341) | | 12,824 |
| Total Investments (100.0%) | | |
| (Cost $11,341) | | 12,824 |
| Other Assets and Liabilities (0.0%) | |
| Other Assets | | 122 |
| Liabilities | | (122) |
| | | — |
| Net Assets (100%) | | |
| Applicable to 200,000 outstanding | |
| $.001 par value shares of beneficial | |
| interest (unlimited authorization) | | 12,824 |
| Net Asset Value Per Share—ETF Shares | $64.12 |
| |
| |
| At February 28, 2011, net assets consisted of: |
| | | Amount |
| | | ($000) |
| Paid-in Capital | | 11,286 |
| Undistributed Net Investment Income | 17 |
| Accumulated Net Realized Gains | | 38 |
| Unrealized Appreciation (Depreciation) | 1,483 |
| Net Assets | | 12,824 |
• See Note A in Notes to Financial Statements.
* Non-income-producing security.
See accompanying Notes, which are an integral part of the Financial Statements.
12
S&P Mid-Cap 400 Index Fund
Statement of Operations
| |
| | September 7, 20101 to |
| | February 28, 2011 |
| | ($000) |
| Investment Income | |
| Income | |
| Dividends | 49 |
| Total Income | 49 |
| Expenses | |
| The Vanguard Group—Note B | |
| Management and Administrative | 3 |
| Custodian Fees | 2 |
| Total Expenses | 5 |
| Net Investment Income | 44 |
| Realized Net Gain (Loss) on Investment Securities Sold | 80 |
| Change in Unrealized Appreciation (Depreciation) of Investment Securities | 1,483 |
| Net Increase (Decrease) in Net Assets Resulting from Operations | 1,607 |
| 1 Inception. |
See accompanying Notes, which are an integral part of the Financial Statements.
13
S&P Mid-Cap 400 Index Fund
Statement of Changes in Net Assets
| |
| | September 7, 20101 to |
| | February 28, 2011 |
| | ($000) |
| Increase (Decrease) in Net Assets | |
| Operations | |
| Net Investment Income | 44 |
| Realized Net Gain (Loss) | 80 |
| Change in Unrealized Appreciation (Depreciation) | 1,483 |
| Net Increase (Decrease) in Net Assets Resulting from Operations | 1,607 |
| Distributions | |
| Net Investment Income | |
| Institutional Shares | — |
| ETF Shares | (27) |
| Realized Capital Gain | |
| Institutional Shares | — |
| ETF Shares | — |
| Total Distributions | (27) |
| Capital Share Transactions | |
| Institutional Shares | (2) |
| ETF Shares | 11,246 |
| Net Increase (Decrease) from Capital Share Transactions | 11,244 |
| Total Increase (Decrease) | 12,824 |
| Net Assets | |
| Beginning of Period | — |
| End of Period2 | 12,824 |
| 1 Inception. |
| 2 Net Assets—End of Period includes undistributed net investment income of $17,000. |
See accompanying Notes, which are an integral part of the Financial Statements.
14
S&P Mid-Cap 400 Index Fund
Financial Highlights
| |
| ETF Shares | |
| | September 7, 20101 to |
| For a Share Outstanding Throughout the Period | February 28, 2011 |
| Net Asset Value, Beginning of Period | $49.95 |
| Investment Operations | |
| Net Investment Income | .264 |
| Net Realized and Unrealized Gain (Loss) on Investments | 14.086 |
| Total from Investment Operations | 14.350 |
| Distributions | |
| Dividends from Net Investment Income | (.180) |
| Distributions from Realized Capital Gains | — |
| Total Distributions | (.180) |
| Net Asset Value, End of Period | $64.12 |
| |
| Total Return | 28.75% |
| |
| Ratios/Supplemental Data | |
| Net Assets, End of Period (Millions) | $13 |
| Ratio of Total Expenses to Average Net Assets | 0.15% |
| Ratio of Net Investment Income to Average Net Assets | 1.26% |
| Portfolio Turnover Rate2 | 12% |
| The expense ratio, net income ratio, and turnover rate for the current period have been annualized. |
| 1 Inception. |
| 2 Excludes the value of portfolio securities received or delivered as a result of in-kind purchases or redemptions of the fund’s capital shares, |
| including ETF Creation Units. |
See accompanying Notes, which are an integral part of the Financial Statements.
15
S&P Mid-Cap 400 Index Fund
Notes to Financial Statements
Vanguard S&P Mid-Cap 400 Index Fund is registered under the Investment Company Act of 1940 as an open-end investment company, or mutual fund. The fund offers two classes of shares: Institutional Shares and ETF Shares. Institutional Shares are designed for investors who meet certain administrative, service, and account-size criteria. Institutional Shares were first issued on December 15, 2010. On December 17, 2010, the sole shareholder redeemed all shares. As of February 28, 2011, there were no investors in the Institutional share class. ETF Shares were first issued on September 7, 2010, and first offered to the public on September 9, 2010. ETF Shares are listed for trading on the NYSE Arca, Inc.; they can be purchased and sold through a broker.
A. The following significant accounting policies conform to generally accepted accounting principles for U.S. mutual funds. The fund consistently follows such policies in preparing its financial statements.
1. Security Valuation: Securities are valued as of the close of trading on the New York Stock Exchange (generally 4 p.m., Eastern time) on the valuation date. Equity securities are valued at the latest quoted sales prices or official closing prices taken from the primary market in which each security trades; such securities not traded on the valuation date are valued at the mean of the latest quoted bid and asked prices. Securities for which market quotations are not readily available, or whose values have been materially affected by events occurring before the fund’s pricing time but after the close of the securities’ primary markets, are valued by methods deemed by the board of trustees to represent fair value.
2. Federal Income Taxes: The fund intends to qualify as a regulated investment company and distribute all of its taxable income. Management has analyzed the fund’s tax positions taken for its open federal income tax period ended February 28, 2011, and has concluded that no provision for federal income tax is required in the fund’s financial statements.
3. Distributions: Distributions to shareholders are recorded on the ex-dividend date.
4. Other: Dividend income is recorded on the ex-dividend date. Security transactions are accounted for on the date securities are bought or sold. Costs used to determine realized gains (losses) on the sale of investment securities are those of the specific securities sold.
B. The Vanguard Group furnishes at cost investment advisory, corporate management, administrative, marketing, and distribution services. The costs of such services are allocated to the fund under methods approved by the board of trustees. The fund has committed to provide up to 0.40% of its net assets in capital contributions to Vanguard. At February 28, 2011, the fund had contributed capital of $2,000 to Vanguard (included in Other Assets), representing 0.02% of the fund’s net assets and 0.00% of Vanguard’s capitalization. The fund’s trustees and officers are also directors and officers of Vanguard.
C. Various inputs may be used to determine the value of the fund’s investments. These inputs are summarized in three broad levels for financial statement purposes. The inputs or methodologies used to value securities are not necessarily an indication of the risk associated with investing in those securities.
Level 1—Quoted prices in active markets for identical securities.
Level 2—Other significant observable inputs (including quoted prices for similar securities, interest rates, prepayment speeds, credit risk, etc.).
Level 3—Significant unobservable inputs (including the fund’s own assumptions used to determine the fair value of investments).
16
S&P Mid-Cap 400 Index Fund
At February 28, 2011, 100% of the fund’s investments were valued based on Level 1 inputs.
D. Distributions are determined on a tax basis and may differ from net investment income and realized capital gains for financial reporting purposes. Differences may be permanent or temporary. Permanent differences are reclassified among capital accounts in the financial statements to reflect their tax character. Temporary differences arise when certain items of income, expense, gain, or loss are recognized in different periods for financial statement and tax purposes; these differences will reverse at some time in the future. Differences in classification may also result from the treatment of short-term gains as ordinary income for tax purposes. The fund’s tax-basis capital gains and losses are determined only at the end of each fiscal year.
During the period ended February 28, 2011, the fund realized $42,000 of net capital gains resulting from in-kind redemptions—in which shareholders exchanged fund shares for securities held by the fund rather than for cash. Because such gains are not taxable to the fund, and are not distributed to shareholders, they have been reclassified from accumulated net realized gains to paid-in capital.
At February 28, 2011, the cost of investment securities for tax purposes was $11,341,000. Net unrealized appreciation of investment securities for tax purposes was $1,483,000, consisting of unrealized gains of $1,524,000 on securities that had risen in value since their purchase and $41,000 in unrealized losses on securities that had fallen in value since their purchase.
E. During the period ended February 28, 2011, the fund purchased $11,898,000 of investment securities and sold $637,000 of investment securities, other than temporary cash investments.
F. Capital share transactions for each class of shares were:
| | |
| | | Inception1 to |
| | | February 28, 2011 |
| | Amount | Shares |
| | ($000) | (000) |
| Institutional Shares | | |
| Issued | 155 | 1 |
| Issued in Lieu of Cash Distributions | — | — |
| Redeemed | (157) | (1) |
| Net Increase (Decrease)—Institutional Shares | (2) | — |
| ETF Shares | | |
| Issued | 11,246 | 200 |
| Issued in Lieu of Cash Distributions | — | — |
| Redeemed | — | — |
| Net Increase (Decrease)—ETF Shares | 11,246 | 200 |
| 1 Inception was September 7, 2010, for ETF Shares and December 15, 2010, for Institutional Shares. On December 17, 2010, the sole |
| shareholder in the Institutional share class redeemed all shares. As of February 28, 2011, there were no investors in the Institutional |
| share class. |
G. In preparing the financial statements as of February 28, 2011, management considered the impact of subsequent events for potential recognition or disclosure in these financial statements.
17
S&P Mid-Cap 400 Value Index Fund
Fund Profile
As of February 28, 2011
| | | |
| Portfolio Characteristics | | |
| | | Target | Broad |
| | Fund | Index1 | Index2 |
| Number of Stocks | 293 | 293 | 3,845 |
| Median Market Cap | $3.3B | $3.3B | $31.4B |
| Price/Earnings Ratio | 22.3x | 22.3x | 17.9x |
| Price/Book Ratio | 1.7x | 1.7x | 2.3x |
| Yield3 | | 1.7% | 1.6% |
| Institutional Shares | 1.7% | | |
| ETF Shares | 1.5% | | |
| Return on Equity | 11.3% | 11.3% | 19.2% |
| Earnings Growth Rate | –2.4% | –2.4% | 5.4% |
| Foreign Holdings | 0.0% | 0.0% | 0.0% |
| Turnover Rate4 | 24% | — | — |
| Expense Ratio5 | | | |
| Institutional Shares | 0.08% | | |
| ETF Shares | 0.20% | | |
| Short-Term Reserves | 0.0% | — | — |
| | | |
| Sector Diversification (% of equity exposure) |
| | | Target | Broad |
| | Fund | Index1 | Index2 |
| Consumer Discretionary | 8.6% | 8.6% | 11.8% |
| Consumer Staples | 3.8 | 3.8 | 9.1 |
| Energy | 7.8 | 7.8 | 11.6 |
| Financials | 26.5 | 26.5 | 16.6 |
| Health Care | 7.4 | 7.4 | 10.5 |
| Industrials | 17.3 | 17.3 | 11.4 |
| Information Technology | 9.0 | 9.0 | 18.9 |
| Materials | 8.7 | 8.7 | 4.5 |
| Telecommunication | | | |
| Services | 0.5 | 0.5 | 2.5 |
| Utilities | 10.4 | 10.4 | 3.1 |
| | |
| Ten Largest Holdings6 (% of total net assets) |
| |
| New York Community | Thrifts & Mortgage | |
| Bancorp Inc. | Finance | 1.4% |
| Pride International Inc. | Oil & Gas Drilling | 1.2 |
| Plains Exploration | Oil & Gas Exploration | |
| & Production Co. | & Production | 0.9 |
| Avnet Inc. | Technology | |
| | Distributors | 0.9 |
| Manpower Inc. | Human Resource | |
| | & Employment | |
| | Services | 0.9 |
| Vertex Pharmaceuticals | | |
| Inc. | Biotechnology | 0.8 |
| KBR Inc. | Construction | |
| | & Engineering | 0.8 |
| Everest Re Group Ltd. | Reinsurance | 0.8 |
| OGE Energy Corp. | Multi-Utilities | 0.8 |
| NSTAR | Multi-Utilities | 0.8 |
| Top Ten | | 9.3% |
Investment Focus
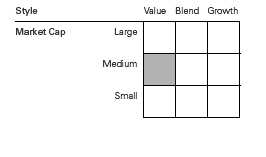
1 S&P MidCap 400 Value Index.
2 Dow Jones U.S. Total Stock Market Index.
3 30-day SEC yield for the fund; annualized dividend yield for the indexes. See the Glossary.
4 Annualized.
5 The expense ratios shown are from the prospectus dated September 7, 2010, and represents estimated costs for the current fiscal year.
For the period ended February 28, 2011, the annualized expense ratios were 0.08% for Institutional Shares and 0.20% for ETF Shares.
6 The holdings listed exclude any temporary cash investments and equity index products.
18
S&P Mid-Cap 400 Value Index Fund
Performance Summary
All of the returns in this report represent past performance, which is not a guarantee of future results that may be achieved by the fund. (Current performance may be lower or higher than the performance data cited. For performance data current to the most recent month-end, visit our website at vanguard.com/performance.) Note, too, that both investment returns and principal value can fluctuate widely, so an investor’s shares, when sold, could be worth more or less than their original cost. The returns shown do not reflect taxes that a shareholder would pay on fund distributions or on the sale of fund shares.
Fiscal-Period Total Returns (%): September 7, 2010, Through February 28, 2011
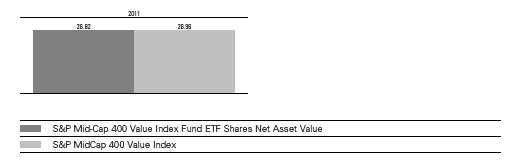
Total Returns: Period Ended December 31, 2010
This table presents returns through the latest calendar quarter—rather than through the end of the fiscal period.
Securities and Exchange Commission rules require that we provide this information.
| | |
| | | Since |
| | Inception Date | Inception |
| Institutional Shares | 11/2/2010 | 7.97% |
| ETF Shares | 9/7/2010 | |
| Market Price | | 19.32 |
| Net Asset Value | | 18.66 |
See Financial Highlights for dividend and capital gains information.
19
S&P Mid-Cap 400 Value Index Fund
Financial Statements (unaudited)
Statement of Net Assets
As of February 28, 2011
The fund reports a complete list of its holdings in regulatory filings four times in each fiscal year, at the quarter-ends. For the second and fourth fiscal quarters, the lists appear in the fund’s semiannual and annual reports to shareholders. For the first and third fiscal quarters, the fund files the lists with the Securities and Exchange Commission on Form N-Q. Shareholders can look up the fund’s Forms N-Q on the SEC’s website at sec.gov. Forms N-Q may also be reviewed and copied at the SEC’s Public Reference Room (see the back cover of this report for further information).
| | | |
| | | | Market |
| | | | Value• |
| | | Shares | ($000) |
| Common Stocks (100.0%) | | |
| Consumer Discretionary (8.6%) | | |
| * | NVR Inc. | 134 | 98 |
| * | BorgWarner Inc. | 1,106 | 86 |
| * | Mohawk Industries Inc. | 1,335 | 78 |
| | Foot Locker Inc. | 3,696 | 73 |
| * | Toll Brothers Inc. | 3,427 | 73 |
| | Rent-A-Center Inc. | 1,523 | 50 |
| * | Saks Inc. | 3,820 | 47 |
| | Aaron’s Inc. | 1,732 | 41 |
| | American Eagle Outfitters Inc. | 2,649 | 41 |
| * | Hanesbrands Inc. | 1,456 | 38 |
| * | Career Education Corp. | 1,564 | 38 |
| | Wendy’s/Arby’s Group Inc. | | |
| | Class A | 7,643 | 36 |
| * | Office Depot Inc. | 6,580 | 35 |
| * | Collective Brands Inc. | 1,529 | 35 |
| | Thor Industries Inc. | 1,007 | 33 |
| | Service Corp. International | 2,787 | 30 |
| * | New York Times Co. Class A | 2,807 | 29 |
| | Brinker International Inc. | 1,118 | 26 |
| | Matthews International Corp. | | |
| | Class A | 700 | 26 |
| | Regis Corp. | 1,367 | 24 |
| | MDC Holdings Inc. | 895 | 23 |
| | KB Home | 1,715 | 23 |
| | Bob Evans Farms Inc. | 721 | 23 |
| * | Eastman Kodak Co. | 6,386 | 22 |
| | John Wiley & Sons Inc. | | |
| | Class A | 440 | 21 |
| | American Greetings Corp. | | |
| | Class A | 952 | 21 |
| | International Speedway Corp. | | |
| | Class A | 695 | 19 |
| | Ryland Group Inc. | 1,047 | 18 |
| | Scholastic Corp. | 564 | 18 |
| | Meredith Corp. | 502 | 18 |
| * | Timberland Co. Class A | 458 | 17 |
| | | |
| * | Boyd Gaming Corp. | 1,317 | 14 |
| * | Scientific Games Corp. | | |
| | Class A | 1,502 | 13 |
| | Barnes & Noble Inc. | 929 | 12 |
| | Harte-Hanks Inc. | 924 | 12 |
| * | 99 Cents Only Stores | 556 | 9 |
| | | | 1,220 |
| Consumer Staples (3.8%) | | |
| * | Smithfield Foods Inc. | 3,939 | 91 |
| * | Ralcorp Holdings Inc. | 1,303 | 85 |
| * | Energizer Holdings Inc. | 955 | 64 |
| | Church & Dwight Co. Inc. | 844 | 64 |
| * | BJ’s Wholesale Club Inc. | 1,296 | 63 |
| | Corn Products International | | |
| | Inc. | 808 | 39 |
| | Ruddick Corp. | 1,015 | 37 |
| | Alberto-Culver Co. Class B | 917 | 34 |
| | Universal Corp. | 565 | 24 |
| | Flowers Foods Inc. | 845 | 22 |
| | Lancaster Colony Corp. | 196 | 11 |
| | Tootsie Roll Industries Inc. | 330 | 9 |
| | | | 543 |
| Energy (7.8%) | | |
| * | Pride International Inc. | 4,168 | 173 |
| * | Plains Exploration | | |
| | & Production Co. | 3,327 | 130 |
| | Patterson-UTI Energy Inc. | 3,655 | 100 |
| | Cimarex Energy Co. | 844 | 98 |
| | Southern Union Co. | 2,957 | 84 |
| | Tidewater Inc. | 1,220 | 76 |
| * | Frontier Oil Corp. | 2,510 | 70 |
| | Arch Coal Inc. | 2,083 | 70 |
| * | Unit Corp. | 943 | 56 |
| * | Forest Oil Corp. | 1,499 | 53 |
| | SM Energy Co. | 629 | 46 |
| * | Helix Energy Solutions | | |
| | Group Inc. | 2,505 | 39 |
| * | Exterran Holdings Inc. | 1,501 | 34 |
20
S&P Mid-Cap 400 Value Index Fund
| | | |
| | | | Market |
| | | | Value• |
| | | Shares | ($000) |
| * | Comstock Resources Inc. | 1,124 | 30 |
| * | Patriot Coal Corp. | 1,079 | 26 |
| | Overseas Shipholding | | |
| | Group Inc. | 635 | 21 |
| | | | 1,106 |
| Financials (26.5%) | | |
| | New York Community | | |
| | Bancorp Inc. | 10,343 | 193 |
| | Everest Re Group Ltd. | 1,298 | 115 |
| | Reinsurance Group of | | |
| | America Inc. Class A | 1,738 | 105 |
| | AMB Property Corp. | 2,639 | 96 |
| | Raymond James Financial Inc. | 2,374 | 91 |
| | HCC Insurance Holdings Inc. | 2,738 | 85 |
| | Cullen/Frost Bankers Inc. | 1,447 | 85 |
| | WR Berkley Corp. | 2,824 | 85 |
| | East West Bancorp Inc. | 3,513 | 82 |
| | Transatlantic Holdings Inc. | 1,503 | 77 |
| | Old Republic International | | |
| | Corp. | 6,046 | 76 |
| | Fidelity National Financial Inc. | | |
| | Class A | 5,390 | 75 |
| | Commerce Bancshares Inc. | 1,842 | 74 |
| | First Niagara Financial | | |
| | Group Inc. | 4,965 | 72 |
| | Hospitality Properties Trust | 2,934 | 67 |
| | City National Corp. | 1,101 | 65 |
| | American Financial Group Inc. | 1,868 | 65 |
| | Alexandria Real Estate | | |
| | Equities Inc. | 776 | 62 |
| | Rayonier Inc. | 994 | 61 |
| | Associated Banc-Corp | 4,109 | 59 |
| | Protective Life Corp. | 2,034 | 58 |
| | Apollo Investment Corp. | 4,632 | 57 |
| | UDR Inc. | 2,335 | 57 |
| | Federal Realty Investment | | |
| | Trust | 672 | 57 |
| * | Affiliated Managers Group Inc. | 527 | 56 |
| | Liberty Property Trust | 1,627 | 55 |
| | Nationwide Health Properties | | |
| | Inc. | 1,282 | 55 |
| | Duke Realty Corp. | 3,891 | 55 |
| | Valley National Bancorp | 3,830 | 52 |
| | Fulton Financial Corp. | 4,724 | 51 |
| | Regency Centers Corp. | 1,127 | 51 |
| | StanCorp Financial Group Inc. | 1,092 | 50 |
| | Hanover Insurance Group Inc. | 1,071 | 50 |
| | Weingarten Realty Investors | 1,915 | 50 |
| | Camden Property Trust | 831 | 49 |
| | TCF Financial Corp. | 3,014 | 49 |
| | Synovus Financial Corp. | 18,644 | 48 |
| | Washington Federal Inc. | 2,672 | 47 |
| | Mack-Cali Realty Corp. | 1,363 | 46 |
| | Prosperity Bancshares Inc. | 1,109 | 45 |
| | | |
| | Jefferies Group Inc. | 1,881 | 45 |
| | Essex Property Trust Inc. | 364 | 45 |
| | Arthur J Gallagher & Co. | 1,434 | 45 |
| | Senior Housing Properties | | |
| | Trust | 1,828 | 45 |
| | FirstMerit Corp. | 2,583 | 44 |
| | SEI Investments Co. | 1,767 | 41 |
| | Webster Financial Corp. | 1,740 | 40 |
| | Brown & Brown Inc. | 1,500 | 39 |
| | NewAlliance Bancshares Inc. | 2,495 | 39 |
| | First American Financial Corp. | 2,476 | 39 |
| | BRE Properties Inc. | 761 | 36 |
| | Realty Income Corp. | 1,001 | 36 |
| * | SVB Financial Group | 649 | 35 |
| | Bank of Hawaii Corp. | 745 | 35 |
| | Mercury General Corp. | 845 | 35 |
| | Unitrin Inc. | 1,182 | 35 |
| | Eaton Vance Corp. | 1,096 | 34 |
| | Highwoods Properties Inc. | 1,004 | 34 |
| | Cathay General Bancorp | 1,864 | 33 |
| | Trustmark Corp. | 1,350 | 32 |
| | Aspen Insurance Holdings Ltd. 1,017 | 30 |
| | BancorpSouth Inc. | 1,744 | 28 |
| | Astoria Financial Corp. | 1,952 | 27 |
| | Omega Healthcare Investors | | |
| | Inc. | 1,123 | 27 |
| | Potlatch Corp. | 637 | 24 |
| | International Bancshares Corp. 1,254 | 24 |
| | Greenhill & Co. Inc. | 306 | 22 |
| | Equity One Inc. | 1,097 | 21 |
| | Cousins Properties Inc. | 2,464 | 21 |
| | Westamerica Bancorporation | 394 | 20 |
| | Taubman Centers Inc. | 338 | 19 |
| | PacWest Bancorp | 748 | 15 |
| | | | 3,773 |
| Health Care (7.4%) | | |
| * | Vertex Pharmaceuticals Inc. | 2,557 | 119 |
| * | Community Health Systems | | |
| | Inc. | 2,198 | 90 |
| * | Hologic Inc. | 4,074 | 82 |
| | Beckman Coulter Inc. | 953 | 79 |
| | Omnicare Inc. | 2,752 | 79 |
| * | Henry Schein Inc. | 1,007 | 70 |
| * | Health Net Inc. | 2,269 | 67 |
| | Teleflex Inc. | 949 | 55 |
| * | LifePoint Hospitals Inc. | 1,251 | 49 |
| | Pharmaceutical Product | | |
| | Development Inc. | 1,722 | 47 |
| | Owens & Minor Inc. | 1,504 | 47 |
| * | Covance Inc. | 678 | 38 |
| | Hill-Rom Holdings Inc. | 913 | 35 |
| * | Charles River Laboratories | | |
| | International Inc. | 753 | 27 |
| | Techne Corp. | 369 | 26 |
21
S&P Mid-Cap 400 Value Index Fund
| | | |
| | | | Market |
| | | | Value• |
| | | Shares | ($000) |
| * | VCA Antech Inc. | 1,024 | 26 |
| | STERIS Corp. | 702 | 24 |
| * | Kindred Healthcare Inc. | 937 | 23 |
| * | Bio-Rad Laboratories Inc. | | |
| | Class A | 195 | 22 |
| * | WellCare Health Plans Inc. | 495 | 19 |
| | Masimo Corp. | 560 | 17 |
| * | Immucor Inc. | 665 | 13 |
| | | | 1,054 |
| Industrials (17.3%) | | |
| | Manpower Inc. | 1,937 | 123 |
| | KBR Inc. | 3,585 | 118 |
| * | URS Corp. | 1,965 | 92 |
| * | Terex Corp. | 2,584 | 87 |
| | Pentair Inc. | 2,342 | 87 |
| * | Aecom Technology Corp. | 2,815 | 81 |
| * | Shaw Group Inc. | 2,017 | 80 |
| * | Kansas City Southern | 1,340 | 72 |
| | Harsco Corp. | 1,911 | 65 |
| | Carlisle Cos. Inc. | 1,448 | 62 |
| | AMETEK Inc. | 1,406 | 59 |
| | Trinity Industries Inc. | 1,893 | 59 |
| * | AGCO Corp. | 1,060 | 58 |
| | Alliant Techsystems Inc. | 791 | 57 |
| | Kennametal Inc. | 1,306 | 50 |
| | SPX Corp. | 608 | 49 |
| | Timken Co. | 976 | 48 |
| | Donaldson Co. Inc. | 835 | 47 |
| | Lincoln Electric Holdings Inc. | 653 | 47 |
| | Hubbell Inc. Class B | 670 | 45 |
| | Con-way Inc. | 1,300 | 42 |
| | JB Hunt Transport Services | | |
| | Inc. | 991 | 41 |
| | Alexander & Baldwin Inc. | 980 | 41 |
| | Regal-Beloit Corp. | 541 | 40 |
| | GATX Corp. | 1,099 | 38 |
| | Towers Watson & Co. | | |
| | Class A | 645 | 38 |
| | Nordson Corp. | 339 | 37 |
| | Acuity Brands Inc. | 644 | 36 |
| | IDEX Corp. | 855 | 35 |
| * | Oshkosh Corp. | 970 | 35 |
| | Brink’s Co. | 1,101 | 34 |
| | HNI Corp. | 1,064 | 34 |
| | Landstar System Inc. | 747 | 33 |
| | Waste Connections Inc. | 1,121 | 33 |
| | Lennox International Inc. | 639 | 31 |
| * | Kirby Corp. | 560 | 31 |
| | Graco Inc. | 740 | 30 |
| | MSC Industrial Direct Co. | | |
| | Class A | 455 | 29 |
| * | Clean Harbors Inc. | 310 | 29 |
| * | Corrections Corp. of America | 1,125 | 28 |
| | Watsco Inc. | 424 | 27 |
| * | JetBlue Airways Corp. | 4,788 | 27 |
| | | |
| | Wabtec Corp. | 478 | 27 |
| | Mine Safety Appliances Co. | 733 | 27 |
| * | United Rentals Inc. | 848 | 26 |
| * | Thomas & Betts Corp. | 456 | 25 |
| * | Korn/Ferry International | 1,099 | 25 |
| | Werner Enterprises Inc. | 1,052 | 25 |
| | Herman Miller Inc. | 867 | 23 |
| * | AirTran Holdings Inc. | 3,185 | 23 |
| | Granite Construction Inc. | 810 | 23 |
| * | Alaska Air Group Inc. | 358 | 21 |
| | Crane Co. | 450 | 21 |
| | Deluxe Corp. | 743 | 19 |
| | Valmont Industries Inc. | 168 | 17 |
| * | FTI Consulting Inc. | 519 | 17 |
| | Corporate Executive Board Co. | 343 | 14 |
| | | | 2,468 |
| Information Technology (9.0%) | | |
| * | Avnet Inc. | 3,608 | 123 |
| * | Arrow Electronics Inc. | 2,750 | 108 |
| * | Lam Research Corp. | 1,431 | 79 |
| * | Ingram Micro Inc. | 3,721 | 74 |
| * | NCR Corp. | 3,783 | 72 |
| * | Tech Data Corp. | 1,107 | 55 |
| | Diebold Inc. | 1,559 | 55 |
| * | AOL Inc. | 2,535 | 53 |
| * | Trimble Navigation Ltd. | 1,055 | 52 |
| * | CoreLogic Inc. | 2,473 | 46 |
| * | Synopsys Inc. | 1,659 | 46 |
| * | Convergys Corp. | 2,893 | 41 |
| | Intersil Corp. Class A | 2,954 | 38 |
| * | Cadence Design Systems Inc. | 3,427 | 34 |
| | Broadridge Financial Solutions | | |
| | Inc. | 1,455 | 33 |
| * | Parametric Technology Corp. | 1,371 | 32 |
| * | Ciena Corp. | 1,134 | 31 |
| | National Instruments Corp. | 982 | 31 |
| * | Vishay Intertechnology Inc. | 1,644 | 29 |
| * | International Rectifier Corp. | 889 | 29 |
| * | Integrated Device Technology | | |
| | Inc. | 3,646 | 28 |
| * | SRA International Inc. | | |
| | Class A | 1,017 | 28 |
| * | Mentor Graphics Corp. | 1,692 | 27 |
| * | Fairchild Semiconductor | | |
| | International Inc. Class A | 1,265 | 22 |
| | DST Systems Inc. | 422 | 22 |
| * | Acxiom Corp. | 1,066 | 18 |
| | Fair Isaac Corp. | 606 | 17 |
| * | Itron Inc. | 288 | 16 |
| | Plantronics Inc. | 407 | 14 |
| * | Mantech International Corp. | | |
| | Class A | 263 | 11 |
| * | ValueClick Inc. | 672 | 10 |
| | | | 1,274 |
22
S&P Mid-Cap 400 Value Index Fund
| | | |
| | | | Market |
| | | | Value• |
| | | Shares | ($000) |
| Materials (8.7%) | | |
| | Ashland Inc. | 1,871 | 105 |
| | Reliance Steel & Aluminum | | |
| | Co. | 1,772 | 98 |
| | Steel Dynamics Inc. | 5,154 | 95 |
| | Valspar Corp. | 2,338 | 89 |
| | Sonoco Products Co. | 2,442 | 88 |
| | RPM International Inc. | 3,063 | 70 |
| | Cabot Corp. | 1,552 | 67 |
| | Cytec Industries Inc. | 1,172 | 67 |
| | Martin Marietta Materials Inc. | 714 | 64 |
| | Temple-Inland Inc. | 2,562 | 60 |
| | Greif Inc. Class A | 740 | 48 |
| | Commercial Metals Co. | 2,715 | 45 |
| | Sensient Technologies Corp. | 1,180 | 40 |
| | Aptargroup Inc. | 749 | 36 |
| | Olin Corp. | 1,889 | 35 |
| | Packaging Corp. of America | 1,217 | 35 |
| * | Louisiana-Pacific Corp. | 3,125 | 32 |
| | Scotts Miracle-Gro Co. | | |
| | Class A | 534 | 30 |
| | Rock-Tenn Co. Class A | 426 | 29 |
| | Minerals Technologies Inc. | 439 | 29 |
| | Carpenter Technology Corp. | 657 | 27 |
| | Worthington Industries Inc. | 1,318 | 26 |
| | Silgan Holdings Inc. | 608 | 22 |
| | | | 1,237 |
| Telecommunication Services (0.5%) | | |
| | Telephone & Data Systems | | |
| | Inc. | 2,181 | 73 |
| |
| Utilities (10.4%) | | |
| | OGE Energy Corp. | 2,315 | 111 |
| | NSTAR | 2,460 | 111 |
| | Energen Corp. | 1,707 | 104 |
| | Alliant Energy Corp. | 2,631 | 104 |
| | MDU Resources Group Inc. | 4,470 | 96 |
| | UGI Corp. | 2,623 | 84 |
| | NV Energy Inc. | 5,584 | 82 |
| | Questar Corp. | 4,148 | 74 |
| | Atmos Energy Corp. | 2,146 | 73 |
| | AGL Resources Inc. | 1,853 | 71 |
| | Westar Energy Inc. | 2,645 | 69 |
| | National Fuel Gas Co. | 936 | 68 |
| | Great Plains Energy Inc. | 3,221 | 62 |
| | Hawaiian Electric Industries | | |
| | Inc. | 2,236 | 54 |
| | Vectren Corp. | 1,939 | 51 |
| | Cleco Corp. | 1,442 | 47 |
| | |
| WGL Holdings Inc. | 1,212 | 46 |
| IDACORP Inc. | 1,169 | 44 |
| DPL Inc. | 1,469 | 38 |
| Aqua America Inc. | 1,600 | 36 |
| PNM Resources Inc. | 2,058 | 27 |
| Black Hills Corp. | 466 | 14 |
| * Dynegy Inc. Class A | 2,458 | 14 |
| | | 1,480 |
| Total Common Stocks | | |
| (Cost $12,365) | | 14,228 |
| Total Investments (100.0%) | | |
| (Cost $12,365) | | 14,228 |
| Other Assets and Liabilities (0.0%) | |
| Other Assets | | 32 |
| Liabilities | | (31) |
| | | 1 |
| Net Assets (100%) | | 14,229 |
| |
| |
| At February 28, 2011, net assets consisted of: |
| | | Amount |
| | | ($000) |
| Paid-in Capital | | 12,136 |
| Undistributed Net Investment Income | 35 |
| Accumulated Net Realized Gains | | 195 |
| Unrealized Appreciation (Depreciation) | 1,863 |
| Net Assets | | 14,229 |
| |
| |
| Institutional Shares—Net Assets | | |
| Applicable to 88,186 outstanding | | |
| $.001 par value shares of beneficial | |
| interest (unlimited authorization) | | 11,081 |
| Net Asset Value Per Share— | | |
| Institutional Shares | | $125.65 |
| |
| |
| ETF Shares—Net Assets | | |
| Applicable to 50,000 outstanding | | |
| $.001 par value shares of beneficial | |
| interest (unlimited authorization) | | 3,148 |
| Net Asset Value Per Share— | | |
| ETF Shares | | $62.96 |
• See Note A in Notes to Financial Statements.
* Non-income-producing security.
See accompanying Notes, which are an integral part of the Financial Statements.
23
S&P Mid-Cap 400 Value Index Fund
Statement of Operations
| |
| | September 7, 20101 to |
| | February 28, 2011 |
| | ($000) |
| Investment Income | |
| Income | |
| Dividends | 100 |
| Total Income | 100 |
| Expenses | |
| The Vanguard Group—Note B | |
| Management and Administrative—Institutional Shares | 1 |
| Management and Administrative—ETF Shares | 2 |
| Custodian Fees | 3 |
| Total Expenses | 6 |
| Net Investment Income | 94 |
| Realized Net Gain (Loss) on Investment Securities Sold | 403 |
| Change in Unrealized Appreciation (Depreciation) of Investment Securities | 1,863 |
| Net Increase (Decrease) in Net Assets Resulting from Operations | 2,360 |
| 1 Inception. |
See accompanying Notes, which are an integral part of the Financial Statements.
24
S&P Mid-Cap 400 Value Index Fund
Statement of Changes in Net Assets
| |
| | September 7, 20101 to |
| | February 28, 2011 |
| | ($000) |
| Increase (Decrease) in Net Assets | |
| Operations | |
| Net Investment Income | 94 |
| Realized Net Gain (Loss) | 403 |
| Change in Unrealized Appreciation (Depreciation) | 1,863 |
| Net Increase (Decrease) in Net Assets Resulting from Operations | 2,360 |
| Distributions | |
| Net Investment Income | |
| Institutional Shares | (46) |
| ETF Shares | (13) |
| Realized Capital Gain | |
| Institutional Shares | — |
| ETF Shares | — |
| Total Distributions | (59) |
| Capital Share Transactions | |
| Institutional Shares | 9,647 |
| ETF Shares | 2,281 |
| Net Increase (Decrease) from Capital Share Transactions | 11,928 |
| Total Increase (Decrease) | 14,229 |
| Net Assets | |
| Beginning of Period | — |
| End of Period2 | 14,229 |
| 1 Inception. |
| 2 Net Assets—End of Period includes undistributed net investment income of $35,000. |
See accompanying Notes, which are an integral part of the Financial Statements.
25
S&P Mid-Cap 400 Value Index Fund
Financial Highlights
| |
| Institutional Shares | |
| | November 2, 20101 to |
| For a Share Outstanding Throughout the Period | February 28, 2011 |
| Net Asset Value, Beginning of Period | $109.35 |
| Investment Operations | |
| Net Investment Income | .409 |
| Net Realized and Unrealized Gain (Loss) on Investments | 16.420 |
| Total from Investment Operations | 16.829 |
| Distributions | |
| Dividends from Net Investment Income | (.529) |
| Distributions from Realized Capital Gains | — |
| Total Distributions | (.529) |
| Net Asset Value, End of Period | $125.65 |
| |
| Total Return | 15.42% |
| |
| Ratios/Supplemental Data | |
| Net Assets, End of Period (Millions) | $11 |
| Ratio of Total Expenses to Average Net Assets | 0.08% |
| Ratio of Net Investment Income to Average Net Assets | 1.91% |
| Portfolio Turnover Rate2 | 24% |
| The expense ratio, net income ratio, and turnover rate for the current period have been annualized. |
| 1 Inception. |
| 2 Excludes the value of portfolio securities received or delivered as a result of in-kind purchases or redemptions of the fund’s capital shares, |
| including ETF Creation Units. |
See accompanying Notes, which are an integral part of the Financial Statements.
26
S&P Mid-Cap 400 Value Index Fund
Financial Highlights
| |
| ETF Shares | |
| | September 7, 20101 to |
| For a Share Outstanding Throughout the Period | February 28, 2011 |
| Net Asset Value, Beginning of Period | $49.86 |
| Investment Operations | |
| Net Investment Income | .403 |
| Net Realized and Unrealized Gain (Loss) on Investments | 12.953 |
| Total from Investment Operations | 13.356 |
| Distributions | |
| Dividends from Net Investment Income | (.256) |
| Distributions from Realized Capital Gains | — |
| Total Distributions | (.256) |
| Net Asset Value, End of Period | $62.96 |
| |
| Total Return | 26.82% |
| |
| Ratios/Supplemental Data | |
| Net Assets, End of Period (Millions) | $3 |
| Ratio of Total Expenses to Average Net Assets | 0.20% |
| Ratio of Net Investment Income to Average Net Assets | 1.79% |
| Portfolio Turnover Rate2 | 24% |
| The expense ratio, net income ratio, and turnover rate for the current period have been annualized. |
| 1 Inception. |
| 2 Excludes the value of portfolio securities received or delivered as a result of in-kind purchases or redemptions of the fund’s capital shares, |
| including ETF Creation Units. |
See accompanying Notes, which are an integral part of the Financial Statements.
27
S&P Mid-Cap 400 Value Index Fund
Notes to Financial Statements
Vanguard S&P Mid-Cap 400 Value Index Fund is registered under the Investment Company Act of 1940 as an open-end investment company, or mutual fund. The fund offers two classes of shares: Institutional Shares and ETF Shares. Institutional Shares are designed for investors who meet certain administrative, service, and account-size criteria. Institutional Shares were first issued on November 2, 2010. ETF Shares were first issued on September 7, 2010, and first offered to the public on September 9, 2010. ETF Shares are listed for trading on the NYSE Arca, Inc.; they can be purchased and sold through a broker.
A. The following significant accounting policies conform to generally accepted accounting principles for U.S. mutual funds. The fund consistently follows such policies in preparing its financial statements.
1. Security Valuation: Securities are valued as of the close of trading on the New York Stock Exchange (generally 4 p.m., Eastern time) on the valuation date. Equity securities are valued at the latest quoted sales prices or official closing prices taken from the primary market in which each security trades; such securities not traded on the valuation date are valued at the mean of the latest quoted bid and asked prices. Securities for which market quotations are not readily available, or whose values have been materially affected by events occurring before the fund’s pricing time but after the close of the securities’ primary markets, are valued by methods deemed by the board of trustees to represent fair value.
2. Federal Income Taxes: The fund intends to qualify as a regulated investment company and distribute all of its taxable income. Management has analyzed the fund’s tax positions taken for its open federal income tax period ended February 28, 2011, and has concluded that no provision for federal income tax is required in the fund’s financial statements.
3. Distributions: Distributions to shareholders are recorded on the ex-dividend date.
4. Other: Dividend income is recorded on the ex-dividend date. Security transactions are accounted for on the date securities are bought or sold. Costs used to determine realized gains (losses) on the sale of investment securities are those of the specific securities sold.
Each class of shares has equal rights as to assets and earnings, except that each class separately bears certain class-specific expenses related to maintenance of shareholder accounts (included in Management and Administrative expenses) and shareholder reporting. Marketing and distribution expenses are allocated to each class of shares based on a method approved by the board of trustees. Income, other non-class-specific expenses, and gains and losses on investments are allocated to each class of shares based on its relative net assets.
B. The Vanguard Group furnishes at cost investment advisory, corporate management, administrative, marketing, and distribution services. The costs of such services are allocated to the fund under methods approved by the board of trustees. The fund has committed to provide up to 0.40% of its net assets in capital contributions to Vanguard. At February 28, 2011, the fund had contributed capital of $3,000 to Vanguard (included in Other Assets), representing 0.02% of the fund’s net assets and 0.00% of Vanguard’s capitalization. The fund’s trustees and officers are also directors and officers of Vanguard.
C. Various inputs may be used to determine the value of the fund’s investments. These inputs are summarized in three broad levels for financial statement purposes. The inputs or methodologies used to value securities are not necessarily an indication of the risk associated with investing in those securities.
28
S&P Mid-Cap 400 Value Index Fund
Level 1—Quoted prices in active markets for identical securities.
Level 2—Other significant observable inputs (including quoted prices for similar securities, interest rates, prepayment speeds, credit risk, etc.).
Level 3—Significant unobservable inputs (including the fund’s own assumptions used to determine the fair value of investments).
At February 28, 2011, 100% of the fund’s investments were valued based on Level 1 inputs.
D. Distributions are determined on a tax basis and may differ from net investment income and realized capital gains for financial reporting purposes. Differences may be permanent or temporary. Permanent differences are reclassified among capital accounts in the financial statements to reflect their tax character. Temporary differences arise when certain items of income, expense, gain, or loss are recognized in different periods for financial statement and tax purposes; these differences will reverse at some time in the future. Differences in classification may also result from the treatment of short-term gains as ordinary income for tax purposes. The fund’s tax-basis capital gains and losses are determined only at the end of each fiscal year.
During the period ended February 28, 2011, the fund realized $208,000 of net capital gains resulting from in-kind redemptions—in which shareholders exchanged fund shares for securities held by the fund rather than for cash. Because such gains are not taxable to the fund, and are not distributed to shareholders, they have been reclassified from accumulated net realized gains to paid-in capital.
At February 28, 2011, the cost of investment securities for tax purposes was $12,365,000. Net unrealized appreciation of investment securities for tax purposes was $1,863,000, consisting of unrealized gains of $1,929,000 on securities that had risen in value since their purchase and $66,000 in unrealized losses on securities that had fallen in value since their purchase.
E. During the period ended February 28, 2011, the fund purchased $16,872,000 of investment securities and sold $4,910,000 of investment securities, other than temporary cash investments.
F. Capital share transactions for each class of shares were:
| | |
| | | Inception1 to |
| | | February 28, 2011 |
| | Amount | Shares |
| | ($000) | (000) |
| Institutional Shares | | |
| Issued | 9,601 | 88 |
| Issued in Lieu of Cash Distributions | 46 | — |
| Redeemed | — | — |
| Net Increase (Decrease)—Institutional Shares | 9,647 | 88 |
| ETF Shares | | |
| Issued | 4,986 | 100 |
| Issued in Lieu of Cash Distributions | — | — |
| Redeemed | (2,705) | (50) |
| Net Increase (Decrease)—ETF Shares | 2,281 | 50 |
| 1 Inception was September 7, 2010, for the ETF Shares and November 2, 2010, for the Institutional Shares. |
G. In preparing the financial statements as of February 28, 2011, management considered the impact of subsequent events for potential recognition or disclosure in these financial statements.
29
S&P Mid-Cap 400 Growth Index Fund
Fund Profile
As of February 28, 2011
| | | |
| Portfolio Characteristics | | |
| | | Target | Broad |
| | Fund | Index1 | Index2 |
| Number of Stocks | 239 | 239 | 3,845 |
| Median Market Cap | $4.0B | $4.0B | $31.4B |
| Price/Earnings Ratio | 23.9x | 23.9x | 17.9x |
| Price/Book Ratio | 3.4x | 3.4x | 2.3x |
| Yield3 | 0.6% | 0.8% | 1.6% |
| Return on Equity | 16.9% | 16.9% | 19.2% |
| Earnings Growth Rate | 9.7% | 9.7% | 5.4% |
| Foreign Holdings | 0.0% | 0.0% | 0.0% |
| Turnover Rate4 | 25% | — | — |
| Expense Ratio5 | | | |
| ETF Shares | 0.20% | �� | |
| Short-Term Reserves | 0.0% | — | — |
| | | |
| Sector Diversification (% of equity exposure) |
| | | Target | Broad |
| | Fund | Index1 | Index2 |
| Consumer Discretionary 19.7% | 19.7% | 11.8% |
| Consumer Staples | 3.3 | 3.3 | 9.1 |
| Energy | 5.5 | 5.5 | 11.6 |
| Financials | 13.3 | 13.3 | 16.6 |
| Health Care | 15.5 | 15.5 | 10.5 |
| Industrials | 12.6 | 12.6 | 11.4 |
| Information Technology | 23.7 | 23.7 | 18.9 |
| Materials | 4.7 | 4.7 | 4.5 |
| Telecommunication | | | |
| Services | 0.5 | 0.5 | 2.5 |
| Utilities | 1.2 | 1.2 | 3.1 |
| | |
| Ten Largest Holdings6 (% of total net assets) |
| |
| Edwards Lifesciences | Health Care | |
| Corp. | Equipment | 1.7% |
| Chipotle Mexican | | |
| Grill Inc. Class A | Restaurants | 1.3 |
| Bucyrus International Inc. | Construction | |
| Class A | & Farm Machinery | |
| | & Heavy Trucks | 1.3 |
| Lubrizol Corp. | Specialty Chemicals | 1.2 |
| Atmel Corp. | Semiconductors | 1.2 |
| Macerich Co. | Retail REITs | 1.1 |
| Skyworks Solutions Inc. | Semiconductors | 1.1 |
| Perrigo Co. | Pharmaceuticals | 1.1 |
| Dollar Tree Inc. | General | |
| | Merchandise Stores | 1.1 |
| Rovi Corp. | Systems Software | 1.1 |
| Top Ten | | 12.2% |
Investment Focus
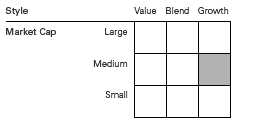
1 S&P MidCap 400 Growth Index.
2 Dow Jones U.S. Total Stock Market Index.
3 30-day SEC yield for the fund; annualized dividend yield for the indexes. See the Glossary.
4 Annualized.
5 The expense ratio shown is from the prospectus dated September 7, 2010, and represents estimated costs for the current fiscal year. For the
period ended February 28, 2011, the annualized expense ratio was 0.20%.
6 The holdings listed exclude any temporary cash investments and equity index products.
30
S&P Mid-Cap 400 Growth Index Fund
Performance Summary
All of the returns in this report represent past performance, which is not a guarantee of future results that may be achieved by the fund. (Current performance may be lower or higher than the performance data cited. For performance data current to the most recent month-end, visit our website at vanguard.com/performance.) Note, too, that both investment returns and principal value can fluctuate widely, so an investor’s shares, when sold, could be worth more or less than their original cost. The returns shown do not reflect taxes that a shareholder would pay on fund distributions or on the sale of fund shares.
Fiscal-Period Total Returns (%): September 7, 2010, Through February 28, 2011
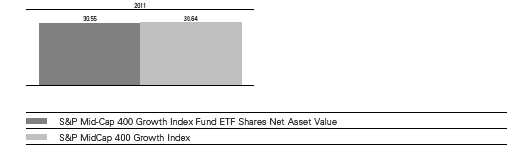
Total Returns: Period Ended December 31, 2010
This table presents returns through the latest calendar quarter—rather than through the end of the fiscal period.
Securities and Exchange Commission rules require that we provide this information.
| | |
| | | Since |
| | Inception Date | Inception |
| ETF Shares | 9/7/2010 | |
| Market Price | | 22.57% |
| Net Asset Value | | 22.54 |
See Financial Highlights for dividend and capital gains information.
31
S&P Mid-Cap 400 Growth Index Fund
Financial Statements (unaudited)
Statement of Net Assets
As of February 28, 2011
The fund reports a complete list of its holdings in regulatory filings four times in each fiscal year, at the quarter-ends. For the second and fourth fiscal quarters, the lists appear in the fund’s semiannual and annual reports to shareholders. For the first and third fiscal quarters, the fund files the lists with the Securities and Exchange Commission on Form N-Q. Shareholders can look up the fund’s Forms N-Q on the SEC’s website at sec.gov. Forms N-Q may also be reviewed and copied at the SEC’s Public Reference Room (see the back cover of this report for further information).
| | | |
| | | | Market |
| | | | Value• |
| | | Shares | ($000) |
| Common Stocks (100.0%) | | |
| Consumer Discretionary (19.7%) | | |
| * | Chipotle Mexican Grill Inc. | | |
| | Class A | 1,046 | 256 |
| * | Dollar Tree Inc. | 4,230 | 213 |
| | Advance Auto Parts Inc. | 2,840 | 178 |
| * | BorgWarner Inc. | 2,268 | 176 |
| | PetSmart Inc. | 3,973 | 162 |
| | Gentex Corp. | 4,742 | 144 |
| | Phillips-Van Heusen Corp. | 2,242 | 135 |
| * | Fossil Inc. | 1,736 | 133 |
| | Williams-Sonoma Inc. | 3,586 | 129 |
| | Tractor Supply Co. | 2,463 | 128 |
| * | Panera Bread Co. Class A | 1,026 | 120 |
| * | LKQ Corp. | 4,879 | 116 |
| * | Deckers Outdoor Corp. | 1,302 | 115 |
| | Tupperware Brands Corp. | 2,134 | 115 |
| | Sotheby’s | 2,266 | 112 |
| * | Dick’s Sporting Goods Inc. | 2,994 | 111 |
| | Guess? Inc. | 2,145 | 97 |
| * | J Crew Group Inc. | 2,160 | 93 |
| * | Warnaco Group Inc. | 1,506 | 88 |
| | Polaris Industries Inc. | 1,145 | 86 |
| | Chico’s FAS Inc. | 6,000 | 82 |
| * | Aeropostale Inc. | 3,127 | 81 |
| * | Under Armour Inc. Class A | 1,189 | 79 |
| * | WMS Industries Inc. | 1,952 | 78 |
| * | Lamar Advertising Co. Class A | 1,939 | 75 |
| * | Ascena Retail Group Inc. | 2,341 | 73 |
| * | Bally Technologies Inc. | 1,811 | 70 |
| * | ITT Educational Services Inc. | 885 | 67 |
| * | DreamWorks Animation | | |
| | SKG Inc. Class A | 2,410 | 67 |
| | Strayer Education Inc. | 456 | 63 |
| * | Cheesecake Factory Inc. | 2,002 | 58 |
| * | Life Time Fitness Inc. | 1,415 | 54 |
| | Service Corp. International | 4,294 | 47 |
| * | AnnTaylor Stores Corp. | 1,959 | 46 |
| | | |
| | John Wiley & Sons Inc. | | |
| | Class A | 942 | 45 |
| | American Eagle Outfitters Inc. | 2,843 | 44 |
| | Brinker International Inc. | 1,533 | 36 |
| * | Hanesbrands Inc. | 1,170 | 30 |
| * | Timberland Co. Class A | 644 | 24 |
| | Meredith Corp. | 510 | 18 |
| * | 99 Cents Only Stores | 782 | 13 |
| | | | 3,857 |
| Consumer Staples (3.3%) | | |
| * | Green Mountain Coffee | | |
| | Roasters Inc. | 3,916 | 160 |
| * | Hansen Natural Corp. | 2,334 | 134 |
| | Church & Dwight Co. Inc. | 1,202 | 91 |
| * | Energizer Holdings Inc. | 1,027 | 69 |
| | Corn Products International | | |
| | Inc. | 1,405 | 69 |
| | Alberto-Culver Co. Class B | 1,595 | 59 |
| | Flowers Foods Inc. | 1,361 | 36 |
| | Lancaster Colony Corp. | 367 | 21 |
| | Tootsie Roll Industries Inc. | 353 | 10 |
| | | | 649 |
| Energy (5.5%) | | |
| | Cimarex Energy Co. | 1,660 | 193 |
| * | Oceaneering International Inc. | 1,828 | 153 |
| * | Superior Energy Services Inc. | 2,663 | 102 |
| | SM Energy Co. | 1,236 | 89 |
| * | Dril-Quip Inc. | 1,159 | 89 |
| * | Atwood Oceanics Inc. | 1,898 | 86 |
| | Arch Coal Inc. | 2,528 | 85 |
| * | Quicksilver Resources Inc. | 3,970 | 61 |
| * | Bill Barrett Corp. | 1,572 | 61 |
| * | Forest Oil Corp. | 1,679 | 60 |
| * | Northern Oil and Gas Inc. | 1,759 | 56 |
| * | Patriot Coal Corp. | 1,525 | 36 |
| | | | 1,071 |
32
S&P Mid-Cap 400 Growth Index Fund
| | | |
| | | | Market |
| | | | Value• |
| | | Shares | ($000) |
| Financials (13.3%) | | |
| | Macerich Co. | 4,395 | 223 |
| | SL Green Realty Corp. | 2,644 | 200 |
| * | MSCI Inc. Class A | 4,013 | 142 |
| | Jones Lang LaSalle Inc. | 1,441 | 142 |
| | Waddell & Reed Financial Inc. | | |
| | Class A | 2,885 | 117 |
| * | Affiliated Managers Group Inc. | 993 | 106 |
| | Nationwide Health Properties | | |
| | Inc. | 2,432 | 104 |
| | Federal Realty Investment | | |
| | Trust | 1,123 | 95 |
| | Realty Income Corp. | 2,533 | 91 |
| | Corporate Office Properties | | |
| | Trust | 2,264 | 81 |
| | Rayonier Inc. | 1,309 | 80 |
| | Eaton Vance Corp. | 2,442 | 76 |
| | Taubman Centers Inc. | 1,367 | 76 |
| | AMB Property Corp. | 1,934 | 70 |
| | UDR Inc. | 2,820 | 69 |
| | Camden Property Trust | 1,137 | 67 |
| | Essex Property Trust Inc. | 540 | 67 |
| | Alexandria Real Estate | | |
| | Equities Inc. | 763 | 61 |
| | SEI Investments Co. | 2,407 | 55 |
| | Regency Centers Corp. | 1,162 | 53 |
| | Senior Housing Properties | | |
| | Trust | 2,128 | 52 |
| | Liberty Property Trust | 1,539 | 52 |
| | BRE Properties Inc. | 1,083 | 51 |
| | Arthur J Gallagher & Co. | 1,540 | 48 |
| | Brown & Brown Inc. | 1,818 | 48 |
| | Duke Realty Corp. | 2,985 | 42 |
| | Omega Healthcare Investors | | |
| | Inc. | 1,732 | 42 |
| | Jefferies Group Inc. | 1,507 | 36 |
| | Weingarten Realty Investors | 1,347 | 35 |
| | Highwoods Properties Inc. | 998 | 34 |
| | Aspen Insurance Holdings Ltd. | 1,131 | 33 |
| | Mack-Cali Realty Corp. | 950 | 32 |
| | Greenhill & Co. Inc. | 421 | 30 |
| | Bank of Hawaii Corp. | 574 | 27 |
| * | SVB Financial Group | 491 | 27 |
| | Westamerica Bancorporation | 420 | 22 |
| | Potlatch Corp. | 440 | 17 |
| | | | 2,603 |
| Health Care (15.5%) | | |
| * | Edwards Lifesciences Corp. | 3,857 | 328 |
| | Perrigo Co. | 2,804 | 214 |
| * | Mettler-Toledo International | | |
| | Inc. | 1,109 | 190 |
| * | ResMed Inc. | 5,108 | 161 |
| * | IDEXX Laboratories Inc. | 1,943 | 151 |
| | | |
| * | Vertex Pharmaceuticals Inc. | 3,226 | 151 |
| | Universal Health Services Inc. | | |
| | Class B | 3,286 | 150 |
| * | Endo Pharmaceuticals | | |
| | Holdings Inc. | 3,905 | 139 |
| * | Allscripts Healthcare | | |
| | Solutions Inc. | 6,321 | 135 |
| * | Henry Schein Inc. | 1,684 | 116 |
| * | United Therapeutics Corp. | 1,692 | 114 |
| * | Mednax Inc. | 1,611 | 105 |
| * | Kinetic Concepts Inc. | 2,115 | 104 |
| * | Gen-Probe Inc. | 1,629 | 102 |
| | Lincare Holdings Inc. | 3,298 | 97 |
| * | Health Management | | |
| | Associates Inc. Class A | 8,482 | 85 |
| | Beckman Coulter Inc. | 985 | 82 |
| * | Covance Inc. | 1,221 | 69 |
| | Medicis Pharmaceutical Corp. | | |
| | Class A | 2,040 | 65 |
| * | Hologic Inc. | 2,985 | 60 |
| * | Thoratec Corp. | 1,976 | 55 |
| | Techne Corp. | 727 | 52 |
| * | Bio-Rad Laboratories Inc. | | |
| | Class A | 382 | 44 |
| | Pharmaceutical Product | | |
| | Development Inc. | 1,566 | 43 |
| * | VCA Antech Inc. | 1,459 | 36 |
| | Masimo Corp. | 1,197 | 36 |
| | STERIS Corp. | 998 | 34 |
| | Hill-Rom Holdings Inc. | 836 | 32 |
| * | Charles River Laboratories | | |
| | International Inc. | 869 | 32 |
| * | WellCare Health Plans Inc. | 738 | 28 |
| * | Immucor Inc. | 1,403 | 27 |
| | | | 3,037 |
| Industrials (12.6%) | | |
| | Bucyrus International Inc. | | |
| | Class A | 2,737 | 249 |
| | AMETEK Inc. | 3,406 | 143 |
| | Gardner Denver Inc. | 1,773 | 130 |
| * | BE Aerospace Inc. | 3,455 | 116 |
| * | AGCO Corp. | 1,636 | 90 |
| * | Copart Inc. | 2,011 | 84 |
| * | Kansas City Southern | 1,560 | 84 |
| | Donaldson Co. Inc. | 1,398 | 79 |
| | Hubbell Inc. Class B | 1,075 | 73 |
| | Nordson Corp. | 666 | 73 |
| | Waste Connections Inc. | 2,295 | 66 |
| | SPX Corp. | 831 | 66 |
| | JB Hunt Transport Services | | |
| | Inc. | 1,583 | 66 |
| | Woodward Inc. | 1,994 | 66 |
| | Timken Co. | 1,334 | 65 |
33
S&P Mid-Cap 400 Growth Index Fund
| | | |
| | | | Market |
| | | | Value• |
| | | Shares | ($000) |
| | IDEX Corp. | 1,549 | 64 |
| * | Thomas & Betts Corp. | 1,103 | 61 |
| * | Oshkosh Corp. | 1,686 | 60 |
| * | Kirby Corp. | 1,013 | 56 |
| | MSC Industrial Direct Co. | | |
| | Class A | 859 | 54 |
| | Wabtec Corp. | 940 | 53 |
| * | Corrections Corp. of America | 2,123 | 53 |
| | Valmont Industries Inc. | 484 | 49 |
| * | Alaska Air Group Inc. | 735 | 44 |
| | Crane Co. | 921 | 43 |
| | Rollins Inc. | 2,140 | 42 |
| | Graco Inc. | 973 | 40 |
| | Regal-Beloit Corp. | 536 | 39 |
| | Towers Watson & Co. Class A | 615 | 36 |
| | Lincoln Electric Holdings Inc. | 501 | 36 |
| | Kennametal Inc. | 919 | 35 |
| * | Clean Harbors Inc. | 330 | 30 |
| | Acuity Brands Inc. | 533 | 30 |
| | Lennox International Inc. | 610 | 30 |
| * | FTI Consulting Inc. | 822 | 27 |
| | Landstar System Inc. | 601 | 27 |
| | Corporate Executive Board Co. | 664 | 27 |
| * | United Rentals Inc. | 829 | 26 |
| | Watsco Inc. | 335 | 22 |
| | Herman Miller Inc. | 686 | 18 |
| | Deluxe Corp. | 667 | 17 |
| | | | 2,469 |
| Information Technology (23.7%) | | |
| * | Atmel Corp. | 15,481 | 227 |
| * | Skyworks Solutions Inc. | 6,192 | 223 |
| * | Rovi Corp. | 3,738 | 207 |
| * | Riverbed Technology Inc. | 4,966 | 205 |
| * | Cree Inc. | 3,664 | 193 |
| * | ANSYS Inc. | 3,074 | 173 |
| | Factset Research Systems | | |
| | Inc. | 1,567 | 164 |
| * | Informatica Corp. | 3,170 | 149 |
| * | TIBCO Software Inc. | 5,641 | 139 |
| * | Alliance Data Systems Corp. | 1,757 | 138 |
| * | Polycom Inc. | 2,885 | 138 |
| * | Equinix Inc. | 1,554 | 134 |
| * | MICROS Systems Inc. | 2,722 | 130 |
| | Global Payments Inc. | 2,692 | 129 |
| * | Trimble Navigation Ltd. | 2,556 | 126 |
| | Solera Holdings Inc. | 2,373 | 121 |
| * | Rackspace Hosting Inc. | 3,281 | 121 |
| * | Cypress Semiconductor Corp. | 5,603 | 118 |
| * | Lam Research Corp. | 2,119 | 116 |
| * | Gartner Inc. | 2,890 | 109 |
| | Lender Processing Services | | |
| | Inc. | 3,085 | 105 |
| | | |
| | ADTRAN Inc. | 2,132 | 97 |
| | Jack Henry & Associates Inc. | 2,893 | 92 |
| * | Concur Technologies Inc. | 1,543 | 80 |
| * | Synopsys Inc. | 2,666 | 74 |
| * | Zebra Technologies Corp. | 1,902 | 71 |
| * | RF Micro Devices Inc. | 9,242 | 69 |
| * | Silicon Laboratories Inc. | 1,471 | 67 |
| * | QLogic Corp. | 3,568 | 65 |
| * | NeuStar Inc. Class A | 2,483 | 63 |
| * | Vishay Intertechnology Inc. | 3,232 | 56 |
| * | Quest Software Inc. | 2,032 | 55 |
| * | Itron Inc. | 953 | 54 |
| * | Semtech Corp. | 2,107 | 50 |
| | Broadridge Financial Solutions | | |
| | Inc. | 2,154 | 49 |
| | National Instruments Corp. | 1,576 | 49 |
| * | Parametric Technology Corp. | 2,031 | 48 |
| * | Digital River Inc. | 1,341 | 45 |
| * | Ciena Corp. | 1,549 | 43 |
| * | Fairchild Semiconductor | | |
| | International Inc. Class A | 2,385 | 42 |
| * | Cadence Design Systems Inc. | 4,158 | 41 |
| | Plantronics Inc. | 1,034 | 36 |
| * | ACI Worldwide Inc. | 1,126 | 35 |
| * | International Rectifier Corp. | 1,084 | 35 |
| * | Advent Software Inc. | 1,084 | 32 |
| | DST Systems Inc. | 606 | 31 |
| * | ValueClick Inc. | 1,785 | 27 |
| * | Mentor Graphics Corp. | 1,283 | 20 |
| * | Acxiom Corp. | 1,179 | 20 |
| * | Mantech International Corp. | | |
| | Class A | 384 | 17 |
| | Fair Isaac Corp. | 480 | 13 |
| | | | 4,641 |
| Materials (4.7%) | | |
| | Lubrizol Corp. | 2,217 | 241 |
| | Albemarle Corp. | 3,094 | 178 |
| | Compass Minerals | | |
| | International Inc. | 1,106 | 103 |
| * | Intrepid Potash Inc. | 1,497 | 58 |
| | Aptargroup Inc. | 1,197 | 58 |
| | Packaging Corp. of America | 1,735 | 50 |
| | Rock-Tenn Co. Class A | 710 | 49 |
| | Martin Marietta Materials Inc. | 523 | 46 |
| | Scotts Miracle-Gro Co. Class A | 793 | 45 |
| | NewMarket Corp. | 331 | 42 |
| | Silgan Holdings Inc. | 836 | 31 |
| | Carpenter Technology Corp. | 545 | 23 |
| | | | 924 |
| Telecommunication Services (0.5%) | |
| * | tw telecom inc Class A | 5,113 | 95 |
34
S&P Mid-Cap 400 Growth Index Fund
| | |
| | | Market |
| | | Value• |
| | Shares | ($000) |
| Utilities (1.2%) | | |
| National Fuel Gas Co. | 1,444 | 105 |
| Aqua America Inc. | 2,370 | 54 |
| DPL Inc. | 1,929 | 50 |
| Black Hills Corp. | 655 | 20 |
| | | 229 |
| Total Common Stocks | | |
| (Cost $17,698) | | 19,575 |
| Total Investments (100.0%) | | |
| (Cost $17,698) | | 19,575 |
| Other Assets and Liabilities (0.0%) | |
| Other Assets | | 338 |
| Liabilities | | (347) |
| | | (9) |
| Net Assets (100%) | | |
| Applicable to 300,000 outstanding | |
| $.001 par value shares of beneficial | |
| interest (unlimited authorization) | 19,566 |
| Net Asset Value Per Share— | | |
| ETF Shares | | $65.22 |
| |
| At February 28, 2011, net assets consisted of: |
| | Amount |
| | ($000) |
| Paid-in Capital | 17,502 |
| Undistributed Net Investment Income | 14 |
| Accumulated Net Realized Gains | 173 |
| Unrealized Appreciation (Depreciation) | 1,877 |
| Net Assets | 19,566 |
• See Note A in Notes to Financial Statements.
* Non-income-producing security.
See accompanying Notes, which are an integral part of the Financial Statements.
35
S&P Mid-Cap 400 Growth Index Fund
Statement of Operations
| |
| | September 7, 20101 to |
| | February 28, 2011 |
| | ($000) |
| Investment Income | |
| Income | |
| Dividends | 44 |
| Total Income | 44 |
| Expenses | |
| The Vanguard Group—Note B | |
| Management and Administrative | 5 |
| Custodian Fees | 3 |
| Shareholders’ Reports | 2 |
| Total Expenses | 10 |
| Net Investment Income | 34 |
| Realized Net Gain (Loss) on Investment Securities Sold | 471 |
| Change in Unrealized Appreciation (Depreciation) of Investment Securities | 1,877 |
| Net Increase (Decrease) in Net Assets Resulting from Operations | 2,382 |
| 1 Inception. |
See accompanying Notes, which are an integral part of the Financial Statements.
36
S&P Mid-Cap 400 Growth Index Fund
Statement of Changes in Net Assets
| |
| | September 7, 20101 to |
| | February 28, 2011 |
| | ($000) |
| Increase (Decrease) in Net Assets | |
| Operations | |
| Net Investment Income | 34 |
| Realized Net Gain (Loss) | 471 |
| Change in Unrealized Appreciation (Depreciation) | 1,877 |
| Net Increase (Decrease) in Net Assets Resulting from Operations | 2,382 |
| Distributions | |
| Net Investment Income | |
| Institutional Shares | — |
| ETF Shares | (20) |
| Realized Capital Gain | |
| Institutional Shares | — |
| ETF Shares | — |
| Total Distributions | (20) |
| Capital Share Transactions | |
| Institutional Shares | (4) |
| ETF Shares | 17,208 |
| Net Increase (Decrease) from Capital Share Transactions | 17,204 |
| Total Increase (Decrease) | 19,566 |
| Net Assets | |
| Beginning of Period | — |
| End of Period2 | 19,566 |
| 1 Inception. |
| 2 Net Assets—End of Period includes undistributed net investment income of $14,000. |
See accompanying Notes, which are an integral part of the Financial Statements.
37
S&P Mid-Cap 400 Growth Index Fund
Financial Highlights
| |
| ETF Shares | |
| | September 7, 20101 to |
| For a Share Outstanding Throughout the Period | February 28, 2011 |
| Net Asset Value, Beginning of Period | $50.04 |
| Investment Operations | |
| Net Investment Income | .147 |
| Net Realized and Unrealized Gain (Loss) on Investments | 15.133 |
| Total from Investment Operations | 15.280 |
| Distributions | |
| Dividends from Net Investment Income | (.100) |
| Distributions from Realized Capital Gains | — |
| Total Distributions | (.100) |
| Net Asset Value, End of Period | $65.22 |
| |
| Total Return | 30.55% |
| |
| Ratios/Supplemental Data | |
| Net Assets, End of Period (Millions) | $20 |
| Ratio of Total Expenses to Average Net Assets | 0.20% |
| Ratio of Net Investment Income to Average Net Assets | 0.67% |
| Portfolio Turnover Rate2 | 25% |
| The expense ratio, net income ratio, and turnover rate for the current period have been annualized. |
| 1 Inception. |
| 2 Excludes the value of portfolio securities received or delivered as a result of in-kind purchases or redemptions of the fund’s capital shares, |
| including ETF Creation Units. |
See accompanying Notes, which are an integral part of the Financial Statements.
38
S&P Mid-Cap 400 Growth Index Fund
Notes to Financial Statements
Vanguard S&P Mid-Cap 400 Growth Index Fund is registered under the Investment Company Act of 1940 as an open-end investment company, or mutual fund. The fund offers two classes of shares: Institutional Shares and ETF Shares. Institutional Shares are designed for investors who meet certain administrative, service, and account-size criteria. Institutional Shares were first issued on December 15, 2010. On December 17, 2010, the sole shareholder redeemed all shares. As of February 28, 2011, there were no investors in the Institutional share class. ETF Shares were first issued on September 7, 2010, and first offered to the public on September 9, 2010. ETF Shares are listed for trading on the NYSE Arca, Inc.; they can be purchased and sold through a broker.
A. The following significant accounting policies conform to generally accepted accounting principles for U.S. mutual funds. The fund consistently follows such policies in preparing its financial statements.
1. Security Valuation: Securities are valued as of the close of trading on the New York Stock Exchange (generally 4 p.m., Eastern time) on the valuation date. Equity securities are valued at the latest quoted sales prices or official closing prices taken from the primary market in which each security trades; such securities not traded on the valuation date are valued at the mean of the latest quoted bid and asked prices. Securities for which market quotations are not readily available, or whose values have been materially affected by events occurring before the fund’s pricing time but after the close of the securities’ primary markets, are valued by methods deemed by the board of trustees to represent fair value.
2. Federal Income Taxes: The fund intends to qualify as a regulated investment company and distribute all of its taxable income. Management has analyzed the fund’s tax positions taken for its open federal income tax period ended February 28, 2011, and has concluded that no provision for federal income tax is required in the fund’s financial statements.
3. Distributions: Distributions to shareholders are recorded on the ex-dividend date.
4. Other: Dividend income is recorded on the ex-dividend date. Security transactions are accounted for on the date securities are bought or sold. Costs used to determine realized gains (losses) on the sale of investment securities are those of the specific securities sold.
B. The Vanguard Group furnishes at cost investment advisory, corporate management, administrative, marketing, and distribution services. The costs of such services are allocated to the fund under methods approved by the board of trustees. The fund has committed to provide up to 0.40% of its net assets in capital contributions to Vanguard. At February 28, 2011, the fund had contributed capital of $3,000 to Vanguard (included in Other Assets), representing 0.02% of the fund’s net assets and 0.00% of Vanguard’s capitalization. The fund’s trustees and officers are also directors and officers of Vanguard.
C. Various inputs may be used to determine the value of the fund’s investments. These inputs are summarized in three broad levels for financial statement purposes. The inputs or methodologies used to value securities are not necessarily an indication of the risk associated with investing in those securities.
Level 1—Quoted prices in active markets for identical securities.
Level 2—Other significant observable inputs (including quoted prices for similar securities, interest rates, prepayment speeds, credit risk, etc.).
Level 3—Significant unobservable inputs (including the fund’s own assumptions used to determine the fair value of investments).
39
S&P Mid-Cap 400 Growth Index Fund
At February 28, 2011, 100% of the fund’s investments were valued based on Level 1 inputs.
D. Distributions are determined on a tax basis and may differ from net investment income and realized capital gains for financial reporting purposes. Differences may be permanent or temporary. Permanent differences are reclassified among capital accounts in the financial statements to reflect their tax character. Temporary differences arise when certain items of income, expense, gain, or loss are recognized in different periods for financial statement and tax purposes; these differences will reverse at some time in the future. Differences in classification may also result from the treatment of short-term gains as ordinary income for tax purposes. The fund’s tax-basis capital gains and losses are determined only at the end of each fiscal year.
During the period ended February 28, 2011, the fund realized $298,000 of net capital gains resulting from in-kind redemptions—in which shareholders exchanged fund shares for securities held by the fund rather than for cash. Because such gains are not taxable to the fund, and are not distributed to shareholders, they have been reclassified from accumulated net realized gains to paid-in capital.
At February 28, 2011, the cost of investment securities for tax purposes was $17,698,000. Net unrealized appreciation of investment securities for tax purposes was $1,877,000, consisting of unrealized gains of $2,007,000 on securities that had risen in value since their purchase and $130,000 in unrealized losses on securities that had fallen in value since their purchase.
E. During the period ended February 28, 2011, the fund purchased $22,154,000 of investment securities and sold $4,927,000 of investment securities, other than temporary cash investments.
F. Capital share transactions for each class of shares were:
| | |
| | Inception1 to |
| | February 28, 2011 |
| | Amount | Shares |
| | ($000) | (000) |
| Institutional Shares | | |
| Issued | 305 | 3 |
| Issued in Lieu of Cash Distributions | — | — |
| Redeemed | (309) | (3) |
| Net Increase (Decrease)—Institutional Shares | (4) | — |
| ETF Shares | | |
| Issued | 19,926 | 350 |
| Issued in Lieu of Cash Distributions | — | — |
| Redeemed | (2,718) | (50) |
| Net Increase (Decrease)—ETF Shares | 17,208 | 300 |
| 1 Inception was September 7, 2010, for ETF Shares and December 15, 2010, for Institutional Shares. On December 17, 2010, the sole |
| shareholder in the Institutional share class redeemed all shares. As of February 28, 2011, there were no investors in the Institutional |
| share class. |
G. In preparing the financial statements as of February 28, 2011, management considered the impact of subsequent events for potential recognition or disclosure in these financial statements.
40
Trustees Approve Advisory Arrangement
The board of trustees approved the launch of Vanguard S&P Mid-Cap 400 Index Fund, S&P Mid-Cap 400 Value Index Fund, and S&P Mid-Cap 400 Growth Index Fund utilizing an internalized management structure whereby The Vanguard Group, Inc.—through its Quantitative Equity Group—would provide investment advisory services to the funds at cost. The board determined that the investment advisory arrangement with Vanguard was in the best interest of the funds and their prospective shareholders.
The board based its decision upon an evaluation of the advisor’s investment staff, portfolio management process, and performance. The trustees considered the factors discussed below, among others. However, no single factor determined whether the board approved the arrangement. Rather, it was the totality of the circumstances that drove the board’s decision.
Nature, extent, and quality of services
The board considered the quality of the investment management services to be provided to the funds and took into account the organizational depth and stability of the advisor. The board noted that Vanguard has been managing investments for more than three decades. The Quantitative Equity Group adheres to a sound, disciplined investment management process; the team has considerable experience, stability, and depth.
The board concluded that Vanguard’s experience, stability, depth, and performance, among other factors, warranted approval of the advisory arrangement.
Investment performance
The board determined that, in its management of other Vanguard index funds, the Quantitative Equity Group has a track record of consistent performance and disciplined investment processes. Information about each fund’s performance since inception can be found in the Performance Summary pages of this report.
Cost
The board considered the cost of services to be provided and concluded that the funds’ expense ratios will be below the average expense ratios charged by funds in their peer groups. Information about the funds’ expense ratios appears in the Financial Statements pages of this report.
The board does not conduct a profitability analysis of Vanguard, because of Vanguard’s unique “at-cost” structure. Unlike most other mutual fund management companies, Vanguard is owned by the funds it oversees, and produces “profits” only in the form of reduced expenses for fund shareholders.
The benefit of economies of scale
The board concluded that the funds’ low-cost arrangement with Vanguard ensures that the funds will realize economies of scale as they grow, with the cost to shareholders declining as fund assets increase.
The board will consider whether to renew the advisory arrangement after a one-year period.
41
Glossary
30-Day SEC Yield. A fund’s 30-day SEC yield is derived using a formula specified by the U.S. Securities and Exchange Commission. Under the formula, data related to the fund’s security holdings in the previous 30 days are used to calculate the fund’s hypothetical net income for that period, which is then annualized and divided by the fund’s estimated average net assets over the calculation period. For the purposes of this calculation, a security’s income is based on its current market yield to maturity (in the case of bonds) or its projected dividend yield (for stocks). Because the SEC yield represents hypothetical annualized income, it will differ—at times significantly—from the fund’s actual experience. As a result, the fund’s income distributions may be higher or lower than implied by the SEC yield.
Dividend Yield. Dividend income earned by stocks, expressed as a percentage of the aggregate market value (or of net asset value, for a fund). The yield is determined by dividing the amount of the annual dividends by the aggregate value (or net asset value) at the end of the period. For a fund, the dividend yield is based solely on stock holdings and does not include any income produced by other investments.
Earnings Growth Rate. The average annual rate of growth in earnings over the past five years for the stocks now in a fund.
Equity Exposure. A measure that reflects a fund’s investments in stocks and stock futures. Any holdings in short-term reserves are excluded.
Expense Ratio. The percentage of a fund’s average net assets used to pay its annual administrative and advisory expenses. These expenses directly reduce returns to investors.
Foreign Holdings. The percentage of a fund represented by stocks or depositary receipts of companies based outside the United States.
Inception Date. The date on which the assets of a fund (or one of its share classes) are first invested in accordance with the fund’s investment objective. For funds with a subscription period, the inception date is the day after that period ends. Investment performance is measured from the inception date.
Median Market Cap. An indicator of the size of companies in which a fund invests; the midpoint of market capitalization (market price x shares outstanding) of a fund’s stocks, weighted by the proportion of the fund’s assets invested in each stock. Stocks representing half of the fund’s assets have market capitalizations above the median, and the rest are below it.
Price/Book Ratio. The share price of a stock divided by its net worth, or book value, per share. For a fund, the weighted average price/book ratio of the stocks it holds.
Price/Earnings Ratio. The ratio of a stock’s current price to its per-share earnings over the past year. For a fund, the weighted average P/E of the stocks it holds. P/E is an indicator of market expectations about corporate prospects; the higher the P/E, the greater the expectations for a company’s future growth.
Return on Equity. The annual average rate of return generated by a company during the past five years for each dollar of shareholder’s equity (net income divided by shareholder’s equity). For a fund, the weighted average return on equity for the companies whose stocks it holds.
42
Short-Term Reserves. The percentage of a fund invested in highly liquid, short-term securities that can be readily converted to cash.
Turnover Rate. An indication of the fund’s trading activity. Funds with high turnover rates incur higher transaction costs and may be more likely to distribute capital gains (which may be taxable to investors). The turnover rate excludes in-kind transactions, which have minimal impact on costs.
43
The People Who Govern Your Fund
The trustees of your mutual fund are there to see that the fund is operated and managed in your best interests since, as a shareholder, you are a part owner of the fund. Your fund’s trustees also serve on the board of directors of The Vanguard Group, Inc., which is owned by the Vanguard funds and provides services to them on an at-cost basis.
A majority of Vanguard’s board members are independent, meaning that they have no affiliation with Vanguard or the funds they oversee, apart from the sizable personal investments they have made as private individuals. The independent board members have distinguished backgrounds in business, academia, and public service. Each of the trustees and executive officers oversees 179 Vanguard funds.
The following table provides information for each trustee and executive officer of the fund. More information about the trustees is in the Statement of Additional Information, which can be obtained, without charge, by contacting Vanguard at 800-662-7447, or online at vanguard.com.
| |
| Interested Trustee1 | and President (2006–2008) of Rohm and Haas Co. |
| | (chemicals); Director of Tyco International, Ltd. |
| F. William McNabb III | (diversified manufacturing and services) and Hewlett- |
| Born 1957. Trustee Since July 2009. Chairman of the | Packard Co. (electronic computer manufacturing); |
| Board. Principal Occupation(s) During the Past Five | Senior Advisor at New Mountain Capital; Trustee |
| Years: Chairman of the Board of The Vanguard Group, | of The Conference Board; Member of the Board of |
| Inc., and of each of the investment companies served | Managers of Delphi Automotive LLP (automotive |
| by The Vanguard Group, since January 2010; Director | components). |
| of The Vanguard Group since 2008; Chief Executive | |
| Officer and President of The Vanguard Group and of | Amy Gutmann |
| each of the investment companies served by The | Born 1949. Trustee Since June 2006. Principal |
| Vanguard Group since 2008; Director of Vanguard | Occupation(s) During the Past Five Years: President |
| Marketing Corporation; Managing Director of The | of the University of Pennsylvania; Christopher H. |
| Vanguard Group (1995–2008). | Browne Distinguished Professor of Political Science |
| | in the School of Arts and Sciences with secondary |
| | appointments at the Annenberg School for Commu- |
| Independent Trustees | nication and the Graduate School of Education |
| | of the University of Pennsylvania; Director of |
| Emerson U. Fullwood | Carnegie Corporation of New York, Schuylkill River |
| Born 1948. Trustee Since January 2008. Principal | Development Corporation, and Greater Philadelphia |
| Occupation(s) During the Past Five Years: Executive | Chamber of Commerce; Trustee of the National |
| Chief Staff and Marketing Officer for North America | Constitution Center; Chair of the Presidential |
| and Corporate Vice President (retired 2008) of Xerox | Commission for the Study of Bioethical Issues. |
| Corporation (document management products and | |
| services); Executive in Residence and 2010 | JoAnn Heffernan Heisen |
| Distinguished Minett Professor at the Rochester | Born 1950. Trustee Since July 1998. Principal |
| Institute of Technology; Director of SPX Corporation | Occupation(s) During the Past Five Years: Corporate |
| (multi-industry manufacturing), the United Way of | Vice President and Chief Global Diversity Officer |
| Rochester, Amerigroup Corporation (managed health | (retired 2008) and Member of the Executive |
| care), the University of Rochester Medical Center, | Committee (1997–2008) of Johnson & Johnson |
| Monroe Community College Foundation, and North | (pharmaceuticals/consumer products); Director of |
| Carolina A&T University. | Skytop Lodge Corporation (hotels), the University |
| | Medical Center at Princeton, the Robert Wood |
| Rajiv L. Gupta | Johnson Foundation, and the Center for Work Life |
| Born 1945. Trustee Since December 2001.2 | Policy; Member of the Advisory Board of the |
| Principal Occupation(s) During the Past Five Years: | Maxwell School of Citizenship and Public Affairs |
| Chairman and Chief Executive Officer (retired 2009) | at Syracuse University. |
| | |
| F. Joseph Loughrey | Thomas J. Higgins | |
| Born 1949. Trustee Since October 2009. Principal | Born 1957. Chief Financial Officer Since September |
| Occupation(s) During the Past Five Years: President | 2008. Principal Occupation(s) During the Past Five |
| and Chief Operating Officer (retired 2009) and Vice | Years: Principal of The Vanguard Group, Inc.; Chief |
| Chairman of the Board (2008–2009) of Cummins Inc. | Financial Officer of each of the investment companies |
| (industrial machinery); Director of SKF AB (industrial | served by The Vanguard Group since 2008; Treasurer |
| machinery), Hillenbrand, Inc. (specialized consumer | of each of the investment companies served by The |
| services), the Lumina Foundation for Education, and | Vanguard Group (1998–2008). |
| Oxfam America; Chairman of the Advisory Council | | |
| for the College of Arts and Letters and Member | Kathryn J. Hyatt | |
| of the Advisory Board to the Kellogg Institute for | Born 1955. Treasurer Since November 2008. Principal |
| International Studies at the University of Notre Dame. | Occupation(s) During the Past Five Years: Principal |
| | of The Vanguard Group, Inc.; Treasurer of each of |
| André F. Perold | the investment companies served by The Vanguard |
| Born 1952. Trustee Since December 2004. Principal | Group since 2008; Assistant Treasurer of each of the |
| Occupation(s) During the Past Five Years: George | investment companies served by The Vanguard Group |
| Gund Professor of Finance and Banking at the Harvard | (1988–2008). | |
| Business School; Chair of the Investment Committee | | |
| of HighVista Strategies LLC (private investment firm). | Heidi Stam | |
| | Born 1956. Secretary Since July 2005. Principal |
| Alfred M. Rankin, Jr. | Occupation(s) During the Past Five Years: Managing |
| Born 1941. Trustee Since January 1993. Principal | Director of The Vanguard Group, Inc., since 2006; |
| Occupation(s) During the Past Five Years: Chairman, | General Counsel of The Vanguard Group since 2005; |
| President, and Chief Executive Officer of NACCO | Secretary of The Vanguard Group and of each of the |
| Industries, Inc. (forklift trucks/housewares/lignite); | investment companies served by The Vanguard Group |
| Director of Goodrich Corporation (industrial products/ | since 2005; Director and Senior Vice President of |
| aircraft systems and services) and the National | Vanguard Marketing Corporation since 2005; |
| Association of Manufacturers; Chairman of the | Principal of The Vanguard Group (1997–2006). |
| Federal Reserve Bank of Cleveland; Vice Chairman | | |
| of University Hospitals of Cleveland; President of | | |
| the Board of The Cleveland Museum of Art. | Vanguard Senior Management Team |
| |
| Peter F. Volanakis | R. Gregory Barton | Michael S. Miller |
| Born 1955. Trustee Since July 2009. Principal | Mortimer J. Buckley | James M. Norris |
| Occupation(s) During the Past Five Years: President | Kathleen C. Gubanich | Glenn W. Reed |
| and Chief Operating Officer (retired 2010) of Corning | Paul A. Heller | George U. Sauter |
| Incorporated (communications equipment); Director of | | |
| Corning Incorporated (2000–2010) and Dow Corning | | |
| (2001–2010); Overseer of the Amos Tuck School of | Chairman Emeritus and Senior Advisor |
| Business Administration at Dartmouth College. | | |
| | John J. Brennan | |
| | Chairman, 1996–2009 | |
| Executive Officers | Chief Executive Officer and President, 1996–2008 |
| |
| Glenn Booraem | | |
| Born 1967. Controller Since July 2010. Principal | | |
| Occupation(s) During the Past Five Years: Principal | Founder | |
| of The Vanguard Group, Inc.; Controller of each of | John C. Bogle | |
| the investment companies served by The Vanguard | Chairman and Chief Executive Officer, 1974–1996 |
| Group since 2010; Assistant Controller of each of | | |
| the investment companies served by The Vanguard | | |
| Group (2001–2010). | | |
1 Mr. McNabb is considered an “interested person,” as defined in the Investment Company Act of 1940, because he is an officer of the
Vanguard funds.
2 December 2002 for Vanguard Equity Income Fund, Vanguard Growth Equity Fund, the Vanguard Municipal Bond Funds, and the Vanguard
State Tax-Exempt Funds.

| | P.O. Box 2600 |
| | Valley Forge, PA 19482-2600 |
| |
| |
| |
| Connect with Vanguard® > vanguard.com | |
| |
| |
| |
| Fund Information > 800-662-7447 | Standard & Poor’s®, S&P ®, and S&P MidCap 400® are |
| | registered trademarks of Standard & Poor’s Financial |
| Direct Investor Account Services > 800-662-2739 | Services LLC (”S&P”) and have been licensed for use |
| | by The Vanguard Group, Inc. The Vanguard mutual funds |
| Institutional Investor Services > 800-523-1036 | and ETFs are not sponsored, endorsed, sold, or promoted |
| | by S&P or its Affiliates, and S&P and its Affiliates make |
| Text Telephone for People | no representation, warranty, or condition regarding the |
| With Hearing Impairment > 800-749-7273 | advisability of buying, selling, or holding units/shares |
| This material may be used in conjunction | in the funds. |
| with the offering of shares of any Vanguard | |
| fund only if preceded or accompanied by | |
| the fund’s current prospectus. | |
| |
| All comparative mutual fund data are from Lipper Inc. | |
| or Morningstar, Inc., unless otherwise noted. | |
| |
| You can obtain a free copy of Vanguard’s proxy voting | |
| guidelines by visiting vanguard.com/proxyreporting or | |
| by calling Vanguard at 800-662-2739. The guidelines | |
| are also available from the SEC’s website, sec.gov. | |
| In addition, you may obtain a free report on how your | |
| fund voted the proxies for securities it owned during | |
| the 12 months ended June 30. To get the report, visit | |
| either vanguard.com/proxyreporting or sec.gov. | |
| |
| You can review and copy information about your fund | |
| at the SEC’s Public Reference Room in Washington, D.C. | |
| To find out more about this public service, call the SEC | |
| at 202-551-8090. Information about your fund is also | |
| available on the SEC’s website, and you can receive | |
| copies of this information, for a fee, by sending a | |
| request in either of two ways: via e-mail addressed to | |
| publicinfo@sec.gov or via regular mail addressed to the | |
| Public Reference Section, Securities and Exchange | |
| Commission, Washington, DC 20549-1520. | |
| |
| | © 2011 The Vanguard Group, Inc. |
| | All rights reserved. |
| | Vanguard Marketing Corporation, Distributor. |
| | Q18422 042011 |

| Vanguard S&P 500 Value |
| and Growth Index Funds |
| Semiannual Report |
|
| February 28, 2011 |

|
| Vanguard S&P 500 Value Index Fund |
| Vanguard S&P 500 Growth Index Fund |
|
> The Vanguard S&P 500 Value and Growth Index Funds made their debut in a
period of stock market strength, returning almost 23% each for the period since
their inception.
> The funds closely tracked the returns of their respective benchmark indexes.
> Information technology made significant contributions to the Growth Fund,
while the Value Fund rallied on strength in the energy and financial sectors.
| |
| Contents | |
| |
| Your Fund’s Total Returns | 1 |
| Chairman’s Letter | 2 |
| S&P 500 Value Index Fund | 6 |
| S&P 500 Growth Index Fund | 18 |
| Trustees Approve Advisory Arrangement | 30 |
| Glossary | 31 |
Please note: The opinions expressed in this report are just that—informed opinions. They should not be considered promises or advice. Also, please keep in mind that the information and opinions cover the period through the date on the front of this report. Of course, the risks of investing in your fund are spelled out in the prospectus.
See the Glossary for definitions of investment terms used in this report.
Cover photograph: Jean Maher.
Your Fund’s Total Returns
| | |
| Period Ended February 28, 2011 | | |
| | | Total |
| | | Returns |
| | Ticker | Since |
| | Symbol | Inception |
| Vanguard S&P 500 Value Index Fund | | |
| ETF Shares (Inception: 9/7/2010) | VOOV | |
| Market Price | | 22.71% |
| Net Asset Value | | 22.61 |
| S&P 500 Value Index | | 22.69 |
| Large-Cap Value Funds Average1 | | 21.37 |
| |
| Vanguard S&P 500 Growth Index Fund | | |
| ETF Shares (Inception: 9/7/2010) | VOOG | |
| Market Price | | 22.79% |
| Net Asset Value | | 22.74 |
| S&P 500 Growth Index | | 22.82 |
| Large-Cap Growth Funds Average1 | | 23.43 |
| | | | |
| Your Fund’s Performance at a Glance | | | | |
| Inception Through February 28, 2011 | | | | |
| | | | Distributions Per Share |
| | Starting | Ending | Income | Capital |
| | Share Price | Share Price | Dividends | Gains |
| Vanguard S&P 500 Value Index Fund | | | | |
| ETF Shares (Inception: 9/7/2010) | $49.93 | $60.81 | $0.380 | $0.000 |
| Vanguard S&P 500 Growth Index Fund | | | | |
| ETF Shares (Inception: 9/7/2010) | $50.23 | $61.43 | $0.210 | $0.000 |
The Vanguard ETF® Shares shown are traded on the NYSE Arca exchange and are available only through brokers. The table provides ETF
returns based on both the NYSE Arca market price and the net asset value for a share. U.S. Pat. No. 6,879,964 B2; 7,337,138.
For the ETF Shares, the market price is determined by the midpoint of the bid-offer spread as of the closing time of the New York Stock
Exchange (generally 4 p.m., Eastern time). The net asset value is also determined as of the NYSE closing time. For more information about
how the ETF Shares’ market prices have compared with their net asset value, visit vanguard.com, select your ETF, and then select the Price
and Performance tab. The ETF premium/discount analysis there shows the percentages of days on which the ETF Shares’ market price was
above or below the NAV.
1 Derived from data provided by Lipper Inc.
1

Chairman’s Letter
Dear Shareholder,
In the brief period since their September 2010 inception, the Vanguard S&P 500 Value and Growth Index Funds produced exceptional and, coincidentally, almost identical returns. The Growth Fund returned 22.74% (based on changes in net asset value, adjusted to account for the fund’s dividend distributions during the period), while its Value counterpart returned 22.61%. Vanguard also offers exchange-traded and conventional shares in Vanguard 500 Index Fund, a blend of the Growth and Value Funds. Vanguard 500 Index Fund, the world’s first index mutual fund, is covered in a separate report.
The new S&P 500 Value and Growth Index Funds mark an extension of Vanguard’s equity indexing franchise, which now includes suites of broad-market portfolios benchmarked to the Russell, Standard & Poor’s, and MSCI indexes. Our research indicates that correlation among the returns of the indexes from all three providers is very high. We would expect limited differences in long-term performance from one provider’s index to another.
This report begins with a look at the investment environment throughout the full six months of the new funds’ fiscal half-year and then reviews the drivers of fund performance during their briefer period of operation.

A fretful start, an optimistic finish for global stock markets
Stock markets rallied from their midsummer malaise to produce exceptional returns for the six months ended February 28. At the start of the period, the U.S. economy seemed in danger of tipping back into recession. By the end, hopes were high that it had reached escape velocity, propelled by steady job growth and notable strength in the manufacturing sector. Smaller stocks, which are especially sensitive to the rhythms of the business cycle, produced the highest six-month returns.
In Europe, investor optimism subdued sovereign-debt jitters, driving stock prices higher. Developed markets in the Pacific region perked up on signs of recovery
in global trade. Australian stocks posted especially strong returns, benefiting from a surge in the prices of metals and other natural resources. Emerging stock markets trailed a few steps behind their developed-market counterparts. Most major currencies appreciated relative to the U.S. dollar, enhancing returns from abroad for U.S.-based investors.
Interest rates rose, depressing bond prices
U.S. interest rates hovered near generational lows early in the period but then moved higher, putting pressure on bond prices. For the six-month period, the broad taxable bond market produced a small negative return. The municipal bond market did worse. Corporate bonds outperformed government debt as
| | | |
| Market Barometer | | | |
| | Total Returns |
| | Periods Ended February 28, 2011 |
| | Six | One | Five Years |
| | Months | Year | (Annualized) |
| Stocks | | | |
| Russell 1000 Index (Large-caps) | 28.65% | 23.54% | 3.17% |
| Russell 2000 Index (Small-caps) | 37.55 | 32.60 | 3.80 |
| Dow Jones U.S. Total Stock Market Index | 29.24 | 24.45 | 3.59 |
| MSCI All Country World Index ex USA (International) | 22.16 | 21.12 | 4.23 |
| |
| Bonds | | | |
| Barclays Capital U.S. Aggregate Bond Index | | | |
| (Broad taxable market) | –0.83% | 4.93% | 5.80% |
| Barclays Capital Municipal Bond Index | | | |
| (Broad tax-exempt market) | –3.51 | 1.72 | 4.07 |
| Citigroup Three-Month U.S. Treasury Bill Index | 0.06 | 0.14 | 2.16 |
| |
| CPI | | | |
| Consumer Price Index | 1.37% | 2.11% | 2.18% |
3
investors stretched for yield beyond government securities, where rates remained low by historical standards.
As it has since December 2008, the Federal Reserve held its target for short-term interest rates near 0%. This stance kept the returns available from money market instruments such as the 3-month Treasury bill in the same neighborhood.
Funds debuted amid stock market strength
During their first few months of operation, the Vanguard S&P 500 Value and Growth Index Funds benefited from general strength among large-cap stocks. In the S&P 500 Growth Index Fund, information technology stocks were among the best performers, rallying on both consumer enthusiasm for platforms such as tablets and smart phones and signs that business investment is set to pick up. These stocks account for almost one-third of the Growth Fund’s assets.
Energy, consumer discretionary, and industrial stocks also made big contributions. Industrial stocks rallied as manufacturing and agricultural businesses demonstrated notable strength. The energy sector’s high return reflected rising oil prices and a gradual clearing of the clouds that have hung over these stocks since the Gulf oil spill. Equipment and service providers were some of the energy sector’s best performers.
The S&P 500 Value Index Fund also benefited from the rally in energy, consumer discretionary, and industrial stocks. Financial stocks, which accounted for almost 27% of fund assets at the end of the period, made one of the largest contributions to performance. The big commercial and investment banks continued to wrestle with a number of challenges, but the long period of low interest rates and accommodative capital markets helped restore the sector’s financial health, positioning financial services providers for growth as the economy grinds into gear.
Weak spots were conspicuous by their absence. In both the Growth and Value Funds, the utilities, telecommunication, and consumer staples sectors produced below-benchmark returns.
The two funds succeeded in capturing most of the returns of their target indexes. Fund returns were within 8 basis points (0.08 percentage point) of the index results, a shortfall consistent with the costs of managing a real-world portfolio. Such performance is a tribute to Vanguard Quantitative Equity Group, the funds’ advisor, which has spent more than 35 years developing and refining index fund management strategies. The funds’ low costs are an important ally in the advisor’s effort to capture the index return.
4
Solid building blocks for a long-term portfolio
It would be wonderful if the exceptional returns produced during the funds’ first few months could be expected to continue forever. The stock market doesn’t work that way, however. Returns are volatile, with periods of strength often followed by stretches of weakness. And, as we have seen in recent weeks, unpredictable events such as those in the Middle East, North Africa, and Japan can disrupt market trends. That’s why we counsel investors to develop allocations to stock, bond, and money market funds in proportions consistent with their goals and ability to withstand the stock market’s occasionally sharp declines.
The new Vanguard S&P 500 Value and Growth Index Funds can be powerful building blocks for such a portfolio. Together with Vanguard 500 Index Fund, they provide comprehensive, low-cost exposure to the large-cap segment of the U.S. stock market.
Thank you for entrusting your assets to Vanguard.
Sincerely,

F. William McNabb III
Chairman and Chief Executive Officer
March 14, 2011
S&P 500 Value Index Fund
Fund Profile
As of February 28, 2011
| | | |
| Portfolio Characteristics | | |
| | | Target | Broad |
| | Fund | Index1 | Index2 |
| Number of Stocks | 339 | 338 | 3,845 |
| Median Market Cap | $49.7B | $49.2B | $31.4B |
| Price/Earnings Ratio | 15.8x | 15.8x | 17.9x |
| Price/Book Ratio | 1.7x | 1.7x | 2.3x |
| Yield3 | 1.8% | 2.1% | 1.6% |
| Return on Equity | 16.3% | 16.3% | 19.2% |
| Earnings Growth Rate | –2.5% | –2.4% | 5.4% |
| Foreign Holdings | 0.0% | 0.0% | 0.0% |
| Turnover Rate4 | 18% | — | — |
| Expense Ratio5 | 0.15% | — | — |
| Short-Term Reserves | 0.0% | — | — |
| | | |
| Sector Diversification (% of equity exposure) |
| | | Target | Broad |
| | Fund | Index1 | Index2 |
| Consumer Discretionary | 7.3% | 7.3% | 11.8% |
| Consumer Staples | 9.0 | 9.0 | 9.1 |
| Energy | 18.6 | 18.6 | 11.6 |
| Financials | 26.8 | 26.9 | 16.6 |
| Health Care | 8.8 | 8.7 | 10.5 |
| Industrials | 11.7 | 11.7 | 11.4 |
| Information Technology | 5.6 | 5.6 | 18.9 |
| Materials | 3.1 | 3.1 | 4.5 |
| Telecommunication | | | |
| Services | 3.1 | 3.1 | 2.5 |
| Utilities | 6.0 | 6.0 | 3.1 |
| | |
| Ten Largest Holdings6 (% of total net assets) |
| |
| Exxon Mobil Corp. | Integrated Oil & | |
| | Gas | 7.2% |
| General Electric Co. | Industrial | |
| | Conglomerates | 3.7 |
| Chevron Corp. | Integrated Oil & | |
| | Gas | 3.5 |
| JPMorgan Chase & Co. | Diversified Financial | |
| | Services | 3.0 |
| Pfizer Inc. | Pharmaceuticals | 2.6 |
| Berkshire Hathaway Inc. | Property & Casualty | |
| Class B | Insurance | 2.5 |
| Bank of America Corp. | Diversified Financial | |
| | Services | 2.4 |
| Citigroup Inc. | Diversified Financial | |
| | Services | 2.3 |
| ConocoPhillips | Integrated Oil & | |
| | Gas | 1.9 |
| Wal-Mart Stores Inc. | Hypermarkets & | |
| | Super Centers | 1.7 |
| Top Ten | | 30.8% |
Investment Focus
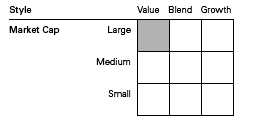
1 S&P 500 Value Index.
2 Dow Jones U.S. Total Stock Market Index.
3 30-day SEC yield for the fund; annualized dividend yield for the indexes. See the Glossary.
4 Annualized.
5 The expense ratio shown is from the prospectus dated September 7, 2010, and represents estimated costs for the current fiscal year.
For the fiscal period ended February 28, 2011, the annualized expense ratio was 0.15%.
6 The holdings listed exclude any temporary cash investments and equity index products.
S&P 500 Value Index Fund
Performance Summary
All of the returns in this report represent past performance, which is not a guarantee of future results that may be achieved by the fund. (Current performance may be lower or higher than the performance data cited. For performance data current to the most recent month-end, visit our website at vanguard.com/performance.) Note, too, that both investment returns and principal value can fluctuate widely, so an investor’s shares, when sold, could be worth more or less than their original cost. The returns shown do not reflect taxes that a shareholder would pay on fund distributions or on the sale of fund shares.
Fiscal-Period Total Returns (%): September 7, 2010, Through February 28, 2011
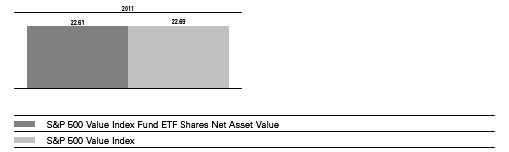
Total Returns: Period Ended December 31, 2010
This table presents returns through the latest calendar quarter—rather than through the end of the fiscal period.
Securities and Exchange Commission rules require that we provide this information.
| | |
| | | Since |
| | Inception Date | Inception |
| ETF Shares | 9/7/2010 | |
| Market Price | | 14.58% |
| Net Asset Value | | 14.56 |
See Financial Highlights for dividend and capital gains information.
7
S&P 500 Value Index Fund
Financial Statements (unaudited)
Statement of Net Assets
As of February 28, 2011
The fund reports a complete list of its holdings in regulatory filings four times in each fiscal year, at the quarter-ends. For the second and fourth fiscal quarters, the lists appear in the fund’s semiannual and annual reports to shareholders. For the first and third fiscal quarters, the fund files the lists with the Securities and Exchange Commission on Form N-Q. Shareholders can look up the fund’s Forms N-Q on the SEC’s website at sec.gov. Forms N-Q may also be reviewed and copied at the SEC’s Public Reference Room (see the back cover of this report for further information).
| | | |
| | | | Market |
| | | | Value• |
| | Shares | ($000) |
| Common Stocks (99.8%) | | |
| Consumer Discretionary (7.2%) | | |
| | Home Depot Inc. | 4,158 | 156 |
| | Time Warner Inc. | 2,822 | 108 |
| | Walt Disney Co. | 2,210 | 97 |
| | Lowe’s Cos. Inc. | 3,501 | 92 |
| | Johnson Controls Inc. | 1,707 | 70 |
| * | Ford Motor Co. | 3,918 | 59 |
| | News Corp. Class A | 2,445 | 42 |
| | CBS Corp. Class B | 1,737 | 41 |
| | Target Corp. | 776 | 41 |
| | Fortune Brands Inc. | 385 | 24 |
| | Carnival Corp. | 537 | 23 |
| | Time Warner Cable Inc. | 316 | 23 |
| | Genuine Parts Co. | 399 | 21 |
| | JC Penney Co. Inc. | 597 | 21 |
| | Staples Inc. | 923 | 20 |
| | Stanley Black & Decker Inc. | 212 | 16 |
| * | Kohl’s Corp. | 297 | 16 |
| | Whirlpool Corp. | 192 | 16 |
| | Omnicom Group Inc. | 286 | 14 |
| | Newell Rubbermaid Inc. | 734 | 14 |
| | Harley-Davidson Inc. | 337 | 14 |
| | McGraw-Hill Cos. Inc. | 336 | 13 |
| | H&R Block Inc. | 788 | 12 |
| | Best Buy Co. Inc. | 362 | 12 |
| | Gap Inc. | 491 | 11 |
| | Gannett Co. Inc. | 610 | 10 |
| | Macy’s Inc. | 410 | 10 |
| * | Sears Holdings Corp. | 114 | 9 |
| | VF Corp. | 93 | 9 |
| * | Goodyear Tire & Rubber Co. | 613 | 9 |
| | Leggett & Platt Inc. | 371 | 8 |
| | Mattel Inc. | 337 | 8 |
| | DR Horton Inc. | 705 | 8 |
| * | GameStop Corp. Class A | 387 | 8 |
| | International Game Technology | 434 | 7 |
| | Washington Post Co. Class B | 14 | 6 |
| * | Pulte Group Inc. | 829 | 6 |
| | | |
| * | AutoNation Inc. | 168 | 6 |
| | Abercrombie & Fitch Co. | 95 | 5 |
| | RadioShack Corp. | 287 | 4 |
| | Lennar Corp. Class A | 202 | 4 |
| | Harman International | | |
| | Industries Inc. | 75 | 4 |
| * | Big Lots Inc. | 83 | 3 |
| | | | 1,100 |
| Consumer Staples (9.0%) | | |
| | Wal-Mart Stores Inc. | 4,971 | 258 |
| | Procter & Gamble Co. | 3,693 | 233 |
| | CVS Caremark Corp. | 3,447 | 114 |
| | Walgreen Co. | 2,348 | 102 |
| | Altria Group Inc. | 3,441 | 87 |
| | Costco Wholesale Corp. | 1,096 | 82 |
| | Kraft Foods Inc. | 2,301 | 73 |
| | Archer-Daniels-Midland Co. | 1,618 | 60 |
| | Sysco Corp. | 1,485 | 41 |
| | Kroger Co. | 1,620 | 37 |
| | Kimberly-Clark Corp. | 405 | 27 |
| | ConAgra Foods Inc. | 1,122 | 26 |
| | General Mills Inc. | 604 | 23 |
| | JM Smucker Co. | 302 | 21 |
| | Safeway Inc. | 938 | 21 |
| | Molson Coors Brewing Co. | | |
| | Class B | 399 | 18 |
| | Lorillard Inc. | 209 | 16 |
| | HJ Heinz Co. | 295 | 15 |
| | Reynolds American Inc. | 422 | 15 |
| | Tyson Foods Inc. Class A | 759 | 14 |
| | Kellogg Co. | 248 | 13 |
| | Sara Lee Corp. | 766 | 13 |
| * | Constellation Brands Inc. | | |
| | Class A | 462 | 9 |
| | Clorox Co. | 135 | 9 |
| | Hershey Co. | 161 | 8 |
| | Campbell Soup Co. | 229 | 8 |
| | McCormick & Co. Inc. | 131 | 6 |
| * | Dean Foods Co. | 460 | 5 |
8
S&P 500 Value Index Fund
| | | |
| | | | Market |
| | | | Value• |
| | | Shares | ($000) |
| | SUPERVALU Inc. | 535 | 5 |
| | Hormel Foods Corp. | 138 | 4 |
| | | | 1,363 |
| Energy (18.5%) | | |
| | Exxon Mobil Corp. | 12,795 | 1,094 |
| | Chevron Corp. | 5,106 | 530 |
| | ConocoPhillips | 3,728 | 290 |
| | Occidental Petroleum Corp. | 1,030 | 105 |
| | Marathon Oil Corp. | 1,800 | 89 |
| | Hess Corp. | 765 | 67 |
| | Anadarko Petroleum Corp. | 803 | 66 |
| | Devon Energy Corp. | 689 | 63 |
| | Apache Corp. | 497 | 62 |
| | Halliburton Co. | 1,108 | 52 |
| | Williams Cos. Inc. | 1,479 | 45 |
| | Baker Hughes Inc. | 617 | 44 |
| | Valero Energy Corp. | 1,448 | 41 |
| | EOG Resources Inc. | 351 | 39 |
| | Chesapeake Energy Corp. | 1,033 | 37 |
| | Noble Energy Inc. | 246 | 23 |
| | Spectra Energy Corp. | 826 | 22 |
| * | Nabors Industries Ltd. | 728 | 21 |
| | Murphy Oil Corp. | 246 | 18 |
| | QEP Resources Inc. | 448 | 18 |
| | El Paso Corp. | 751 | 14 |
| * | Rowan Cos. Inc. | 322 | 14 |
| | Sunoco Inc. | 303 | 13 |
| | Range Resources Corp. | 209 | 11 |
| | EQT Corp. | 211 | 10 |
| * | Tesoro Corp. | 360 | 8 |
| | Helmerich & Payne Inc. | 122 | 8 |
| | Noble Corp. | 156 | 7 |
| | Cabot Oil & Gas Corp. | 151 | 7 |
| | | | 2,818 |
| Financials (26.8%) | | |
| | JPMorgan Chase & Co. | 9,919 | 463 |
| * | Berkshire Hathaway Inc. | | |
| | Class B | 4,390 | 383 |
| | Bank of America Corp. | 25,590 | 366 |
| * | Citigroup Inc. | 73,712 | 345 |
| | Wells Fargo & Co. | 6,792 | 219 |
| | Goldman Sachs Group Inc. | 1,297 | 212 |
| | US Bancorp | 4,867 | 135 |
| | Morgan Stanley | 3,838 | 114 |
| | MetLife Inc. | 2,299 | 109 |
| | Bank of New York | | |
| | Mellon Corp. | 3,146 | 96 |
| | PNC Financial Services | | |
| | Group Inc. | 1,333 | 82 |
| | Prudential Financial Inc. | 1,230 | 81 |
| | Travelers Cos. Inc. | 1,104 | 66 |
| | Capital One Financial Corp. | 1,166 | 58 |
| | State Street Corp. | 1,281 | 57 |
| | ACE Ltd. | 866 | 55 |
| | | |
| | CME Group Inc. | 171 | 53 |
| | American Express Co. | 1,202 | 52 |
| | BB&T Corp. | 1,770 | 49 |
| | Chubb Corp. | 774 | 47 |
| | AON Corp. | 843 | 44 |
| | Allstate Corp. | 1,374 | 44 |
| | Marsh & McLennan Cos. Inc. | 1,389 | 42 |
| | SunTrust Banks Inc. | 1,279 | 39 |
| | Progressive Corp. | 1,683 | 35 |
| | Loews Corp. | 801 | 35 |
| | Fifth Third Bancorp | 2,332 | 34 |
| | Weyerhaeuser Co. | 1,367 | 33 |
| | Hartford Financial Services | | |
| | Group Inc. | 1,122 | 33 |
| | Discover Financial Services | 1,374 | 30 |
| | Principal Financial Group Inc. | 818 | 28 |
| | Aflac Inc. | 468 | 28 |
| | M&T Bank Corp. | 303 | 27 |
| | Charles Schwab Corp. | 1,392 | 26 |
| | Lincoln National Corp. | 806 | 26 |
| | NYSE Euronext | 667 | 25 |
| | Regions Financial Corp. | 3,170 | 24 |
| | ProLogis | 1,452 | 24 |
| | Unum Group | 800 | 21 |
| | Vornado Realty Trust | 224 | 21 |
| | Northern Trust Corp. | 402 | 21 |
| | XL Group plc Class A | 825 | 19 |
| * | SLM Corp. | 1,226 | 18 |
| | Boston Properties Inc. | 189 | 18 |
| | Host Hotels & Resorts Inc. | 950 | 18 |
| | Comerica Inc. | 445 | 17 |
| | Franklin Resources Inc. | 134 | 17 |
| | Invesco Ltd. | 625 | 17 |
| * | Genworth Financial Inc. | | |
| | Class A | 1,234 | 16 |
| | KeyCorp | 1,773 | 16 |
| | Public Storage | 141 | 16 |
| | HCP Inc. | 409 | 16 |
| | Legg Mason Inc. | 391 | 14 |
| | Cincinnati Financial Corp. | 412 | 14 |
| | Kimco Realty Corp. | 714 | 14 |
| | American International | | |
| | Group Inc. | 365 | 14 |
| | Torchmark Corp. | 205 | 13 |
| | People’s United Financial Inc. | 938 | 12 |
| | Health Care REIT Inc. | 214 | 11 |
| | Assurant Inc. | 274 | 11 |
| * | NASDAQ OMX Group Inc. | 379 | 11 |
| | Huntington Bancshares Inc. | 1,519 | 10 |
| | Marshall & Ilsley Corp. | 1,333 | 10 |
| | Zions Bancorporation | 442 | 10 |
| | Plum Creek Timber Co. Inc. | 218 | 9 |
| * | E*Trade Financial Corp. | 562 | 9 |
| | Moody’s Corp. | 248 | 8 |
| * | First Horizon National Corp. | 665 | 8 |
9
S&P 500 Value Index Fund
| | | |
| | | | Market |
| | | | Value• |
| | | Shares | ($000) |
| | Hudson City Bancorp Inc. | 605 | 7 |
| | Leucadia National Corp. | 200 | 7 |
| | Apartment Investment & | | |
| | Management Co. | 135 | 4 |
| | Janus Capital Group Inc. | 245 | 3 |
| | Federated Investors Inc. | | |
| | Class B | 85 | 2 |
| | | | 4,071 |
| Health Care (8.8%) | | |
| | Pfizer Inc. | 20,324 | 391 |
| | Johnson & Johnson | 2,787 | 171 |
| | UnitedHealth Group Inc. | 2,791 | 119 |
| | Merck & Co. Inc. | 2,736 | 89 |
| * | WellPoint Inc. | 1,003 | 67 |
| * | Amgen Inc. | 1,108 | 57 |
| | Bristol-Myers Squibb Co. | 2,008 | 52 |
| | McKesson Corp. | 643 | 51 |
| | Medtronic Inc. | 993 | 40 |
| | Aetna Inc. | 1,016 | 38 |
| | Cardinal Health Inc. | 893 | 37 |
| | Baxter International Inc. | 535 | 28 |
| * | Humana Inc. | 427 | 28 |
| * | Boston Scientific Corp. | 3,831 | 27 |
| * | Thermo Fisher Scientific Inc. | 406 | 23 |
| | Becton Dickinson and Co. | 210 | 17 |
| | Covidien plc | 314 | 16 |
| * | CareFusion Corp. | 563 | 15 |
| | AmerisourceBergen Corp. | | |
| | Class A | 345 | 13 |
| * | Zimmer Holdings Inc. | 187 | 12 |
| * | Coventry Health Care Inc. | 374 | 11 |
| | Quest Diagnostics Inc. | 197 | 11 |
| * | Forest Laboratories Inc. | 248 | 8 |
| * | Cephalon Inc. | 117 | 7 |
| | DENTSPLY International Inc. | 133 | 5 |
| | PerkinElmer Inc. | 135 | 3 |
| | | | 1,336 |
| Industrials (11.7%) | | |
| | General Electric Co. | 27,035 | 566 |
| | United Parcel Service Inc. | | |
| | Class B | 1,203 | 89 |
| | Caterpillar Inc. | 740 | 76 |
| | 3M Co. | 816 | 75 |
| | FedEx Corp. | 797 | 72 |
| | United Technologies Corp. | 819 | 68 |
| | Lockheed Martin Corp. | 749 | 59 |
| | Boeing Co. | 747 | 54 |
| | Emerson Electric Co. | 863 | 51 |
| | Northrop Grumman Corp. | 738 | 49 |
| | Union Pacific Corp. | 490 | 47 |
| | Honeywell International Inc. | 717 | 42 |
| | Norfolk Southern Corp. | 547 | 36 |
| | Illinois Tool Works Inc. | 595 | 32 |
| | General Dynamics Corp. | 421 | 32 |
| | | |
| | Tyco International Ltd. | 659 | 30 |
| | CSX Corp. | 382 | 29 |
| | Waste Management Inc. | 740 | 27 |
| | Danaher Corp. | 534 | 27 |
| | PACCAR Inc. | 530 | 27 |
| | Raytheon Co. | 483 | 25 |
| | Eaton Corp. | 223 | 25 |
| | L-3 Communications | | |
| | Holdings Inc. | 290 | 23 |
| | Textron Inc. | 692 | 19 |
| * | Jacobs Engineering Group Inc. | 317 | 16 |
| | Parker Hannifin Corp. | 169 | 15 |
| | Dover Corp. | 220 | 14 |
| | Fluor Corp. | 195 | 14 |
| | Pitney Bowes Inc. | 519 | 13 |
| | ITT Corp. | 221 | 13 |
| | Masco Corp. | 905 | 12 |
| * | Quanta Services Inc. | 538 | 12 |
| | Expeditors International of | | |
| | Washington Inc. | 237 | 11 |
| | Southwest Airlines Co. | 933 | 11 |
| | Republic Services Inc. Class A | 352 | 10 |
| | RR Donnelley & Sons Co. | 522 | 10 |
| | Cintas Corp. | 327 | 9 |
| | Robert Half International Inc. | 215 | 7 |
| | Avery Dennison Corp. | 170 | 7 |
| | Ryder System Inc. | 132 | 6 |
| | Iron Mountain Inc. | 242 | 6 |
| | Snap-On Inc. | 81 | 5 |
| | Equifax Inc. | 125 | 4 |
| | | | 1,775 |
| Information Technology (5.6%) | | |
| | Intel Corp. | 5,944 | 128 |
| | Hewlett-Packard Co. | 2,646 | 115 |
| * | Cisco Systems Inc. | 6,047 | 112 |
| * | Dell Inc. | 4,255 | 67 |
| | Xerox Corp. | 3,538 | 38 |
| | Applied Materials Inc. | 2,078 | 34 |
| | Corning Inc. | 1,476 | 34 |
| * | Motorola Solutions Inc. | 856 | 33 |
| * | Yahoo! Inc. | 1,763 | 29 |
| * | Motorola Mobility | | |
| | Holdings Inc. | 749 | 23 |
| | Automatic Data | | |
| | Processing Inc. | 452 | 23 |
| | Fidelity National Information | | |
| | Services Inc. | 679 | 22 |
| * | Adobe Systems Inc. | 623 | 21 |
| | Computer Sciences Corp. | 394 | 19 |
| * | NVIDIA Corp. | 638 | 14 |
| | Paychex Inc. | 353 | 12 |
| | KLA-Tencor Corp. | 218 | 11 |
| | Jabil Circuit Inc. | 492 | 11 |
| * | Fiserv Inc. | 166 | 11 |
10
S&P 500 Value Index Fund
| | | |
| | | | Market |
| | | | Value• |
| | | Shares | ($000) |
| * | Electronic Arts Inc. | 477 | 9 |
| | CA Inc. | 322 | 8 |
| * | MEMC Electronic | | |
| | Materials Inc. | 574 | 8 |
| * | Lexmark International Inc. | | |
| | Class A | 198 | 7 |
| | VeriSign Inc. | 196 | 7 |
| | Harris Corp. | 147 | 7 |
| * | SAIC Inc. | 405 | 7 |
| | Molex Inc. | 221 | 6 |
| * | LSI Corp. | 868 | 5 |
| * | Novell Inc. | 887 | 5 |
| | Tellabs Inc. | 941 | 5 |
| | National Semiconductor Corp. | 322 | 5 |
| * | Novellus Systems Inc. | 123 | 5 |
| | Total System Services Inc. | 248 | 4 |
| * | Teradyne Inc. | 200 | 4 |
| * | Monster Worldwide Inc. | 161 | 3 |
| * | Compuware Corp. | 194 | 2 |
| | | | 854 |
| Materials (3.1%) | | |
| | Dow Chemical Co. | 2,945 | 109 |
| | EI du Pont de Nemours & Co. | 954 | 52 |
| | Monsanto Co. | 617 | 44 |
| | Alcoa Inc. | 2,582 | 43 |
| | Nucor Corp. | 806 | 39 |
| | International Paper Co. | 1,116 | 31 |
| | Air Products & Chemicals Inc. | 246 | 23 |
| | United States Steel Corp. | 278 | 16 |
| | Vulcan Materials Co. | 323 | 15 |
| | PPG Industries Inc. | 166 | 15 |
| * | Owens-Illinois Inc. | 417 | 13 |
| | MeadWestvaco Corp. | 429 | 13 |
| | Sealed Air Corp. | 402 | 11 |
| | Allegheny Technologies Inc. | 151 | 10 |
| | Sherwin-Williams Co. | 111 | 9 |
| | Bemis Co. Inc. | 275 | 9 |
| | Eastman Chemical Co. | 90 | 8 |
| | AK Steel Holding Corp. | 281 | 4 |
| | Airgas Inc. | 64 | 4 |
| * | Titanium Metals Corp. | 133 | 3 |
| | | | 471 |
| Telecommunication Services (3.1%) | |
| | AT&T Inc. | 8,697 | 247 |
| | Verizon Communications Inc. | 4,303 | 159 |
| * | Sprint Nextel Corp. | 7,642 | 33 |
| | CenturyLink Inc. | 386 | 16 |
| | Frontier | | |
| | Communications Corp. | 1,343 | 12 |
| | Windstream Corp. | 493 | 6 |
| | | | 473 |
| Utilities (6.0%) | | |
| | Exelon Corp. | 1,675 | 70 |
| | Duke Energy Corp. | 3,379 | 61 |
| | | |
| | NextEra Energy Inc. | 1,061 | 59 |
| | Southern Co. | 1,305 | 50 |
| | PG&E Corp. | 1,001 | 46 |
| | American Electric | | |
| | Power Co. Inc. | 1,226 | 44 |
| | Public Service Enterprise | | |
| | Group Inc. | 1,294 | 42 |
| | FirstEnergy Corp. | 1,054 | 40 |
| | Dominion Resources Inc. | 844 | 38 |
| | Consolidated Edison Inc. | 742 | 37 |
| | Progress Energy Inc. | 748 | 34 |
| | Entergy Corp. | 459 | 33 |
| | Sempra Energy | 607 | 32 |
| | PPL Corp. | 1,224 | 31 |
| | Edison International | 822 | 30 |
| | Xcel Energy Inc. | 1,161 | 28 |
| * | AES Corp. | 1,689 | 21 |
| | DTE Energy Co. | 427 | 20 |
| | Oneok Inc. | 268 | 17 |
| | Ameren Corp. | 604 | 17 |
| | CenterPoint Energy Inc. | 1,061 | 17 |
| | Constellation Energy | | |
| | Group Inc. | 508 | 16 |
| | Northeast Utilities | 445 | 15 |
| | NiSource Inc. | 701 | 13 |
| * | NRG Energy Inc. | 632 | 13 |
| | CMS Energy Corp. | 619 | 12 |
| | SCANA Corp. | 287 | 12 |
| | Pinnacle West Capital Corp. | 273 | 12 |
| | Pepco Holdings Inc. | 565 | 11 |
| | TECO Energy Inc. | 540 | 10 |
| | Integrys Energy Group Inc. | 196 | 10 |
| | Wisconsin Energy Corp. | 160 | 9 |
| | Nicor Inc. | 115 | 6 |
| | | | 906 |
| Total Common Stocks | | |
| (Cost $13,695) | | 15,167 |
| Total Investments (99.8%) | | |
| (Cost $13,695) | | 15,167 |
| Other Assets and Liabilities (0.2%) | |
| Other Assets | | 76 |
| Liabilities | | (41) |
| | | | 35 |
| ETF Shares—Net Assets (100%) | | |
| Applicable to 250,000 outstanding | |
| $.001 par value shares of beneficial | |
| interest (unlimited authorization) | | 15,202 |
| Net Asset Value Per Share— | | |
| ETF Shares | | $60.81 |
11
S&P 500 Value Index Fund
| |
| At February 28, 2011, net assets consisted of: |
| | Amount |
| | ($000) |
| Paid-in Capital | 13,538 |
| Undistributed Net Investment Income | 44 |
| Accumulated Net Realized Gains | 148 |
| Unrealized Appreciation (Depreciation) | 1,472 |
| Net Assets | 15,202 |
• See Note A in Notes to Financial Statements.
* Non-income-producing security.
REIT—Real Estate Investment Trust.
See accompanying Notes, which are an integral part of the Financial Statements.
12
S&P 500 Value Index Fund
Statement of Operations
| |
| | September 7, 20101 to |
| | February 28, 2011 |
| | ($000) |
| Investment Income | |
| Income | |
| Dividends | 107 |
| Total Income | 107 |
| Expenses | |
| The Vanguard Group—Note B | |
| Management and Administrative | 3 |
| Custodian Fees | 3 |
| Total Expenses | 6 |
| Net Investment Income | 101 |
| Realized Net Gain (Loss) on Investment Securities Sold | 148 |
| Change in Unrealized Appreciation (Depreciation) of Investment Securities | 1,472 |
| Net Increase (Decrease) in Net Assets Resulting from Operations | 1,721 |
| 1 Inception. |
See accompanying Notes, which are an integral part of the Financial Statements.
13
S&P 500 Value Index Fund
Statement of Changes in Net Assets
| |
| | September 7, 20101 to |
| | February 28, 2011 |
| | ($000) |
| Increase (Decrease) in Net Assets | |
| Operations | |
| Net Investment Income | 101 |
| Realized Net Gain (Loss) | 148 |
| Change in Unrealized Appreciation (Depreciation) | 1,472 |
| Net Increase (Decrease) in Net Assets Resulting from Operations | 1,721 |
| Distributions | |
| Net Investment Income | (57) |
| Realized Capital Gain | — |
| Total Distributions | (57) |
| Capital Share Transactions | |
| Issued | 13,538 |
| Issued in Lieu of Cash Distributions | — |
| Redeemed | — |
| Net Increase (Decrease) from Capital Share Transactions | 13,538 |
| Total Increase (Decrease) | 15,202 |
| Net Assets | |
| Beginning of Period | — |
| End of Period2 | 15,202 |
1 Inception.
2 Net Assets—End of Period includes undistributed net investment income of $44,000.
See accompanying Notes, which are an integral part of the Financial Statements.
14
S&P 500 Value Index Fund
Financial Highlights
| |
| ETF Shares | |
| | September 7, 20101 to |
| For a Share Outstanding Throughout the Period | February 28, 2011 |
| Net Asset Value, Beginning of Period | $49.93 |
| Investment Operations | |
| Net Investment Income | .554 |
| Net Realized and Unrealized Gain (Loss) on Investments | 10.706 |
| Total from Investment Operations | 11.260 |
| Distributions | |
| Dividends from Net Investment Income | (.380) |
| Distributions from Realized Capital Gains | — |
| Total Distributions | (.380) |
| Net Asset Value, End of Period | $60.81 |
| |
| Total Return | 22.61% |
| |
| Ratios/Supplemental Data | |
| Net Assets, End of Period (Millions) | $15 |
| Ratio of Total Expenses to Average Net Assets | 0.15% |
| Ratio of Net Investment Income to Average Net Assets | 2.41% |
| Portfolio Turnover Rate2 | 18% |
The expense ratio, net income ratio, and turnover rate for the current period have been annualized. 1 Inception.
2 Excludes the value of portfolio securities received or delivered as a result of in-kind purchases or redemptions of the fund’s capital shares, including ETF Creation Units.
S&P 500 Value Index Fund
Notes to Financial Statements
Vanguard S&P 500 Value Index Fund is registered under the Investment Company Act of 1940 as an open-end investment company, or mutual fund. The fund offers two classes of shares: Institutional Shares and ETF Shares. Institutional Shares are designed for investors who meet certain administrative, service, and account-size criteria. The fund has not issued any Institutional Shares as of February 28, 2011. ETF Shares were first issued on September 7, 2010, and first offered to the public on September 9, 2010. ETF Shares are listed for trading on the NYSE Arca, Inc.; they can be purchased and sold through a broker.
A. The following significant accounting policies conform to generally accepted accounting principles for U.S. mutual funds. The fund consistently follows such policies in preparing its financial statements.
1. Security Valuation: Securities are valued as of the close of trading on the New York Stock Exchange (generally 4 p.m., Eastern time) on the valuation date. Equity securities are valued at the latest quoted sales prices or official closing prices taken from the primary market in which each security trades; such securities not traded on the valuation date are valued at the mean of the latest quoted bid and asked prices. Securities for which market quotations are not readily available, or whose values have been materially affected by events occurring before the fund’s pricing time but after the close of the securities’ primary markets, are valued by methods deemed by the board of trustees to represent fair value.
2. Federal Income Taxes: The fund intends to qualify as a regulated investment company and distribute all of its taxable income. Management has analyzed the fund’s tax positions taken for its open federal income tax period ended February 28, 2011, and has concluded that no provision for federal income tax is required in the fund’s financial statements.
3. Distributions: Distributions to shareholders are recorded on the ex-dividend date.
4. Other: Dividend income is recorded on the ex-dividend date. Security transactions are accounted for on the date securities are bought or sold. Costs used to determine realized gains (losses) on the sale of investment securities are those of the specific securities sold.
B. The Vanguard Group furnishes at cost investment advisory, corporate management, administrative, marketing, and distribution services. The costs of such services are allocated to the fund under methods approved by the board of trustees. The fund has committed to provide up to 0.40% of its net assets in capital contributions to Vanguard. At February 28, 2011, the fund had contributed capital of $2,000 to Vanguard (included in Other Assets), representing 0.01% of the fund’s net assets and 0.00% of Vanguard’s capitalization. The fund’s trustees and officers are also directors and officers of Vanguard.
C. Various inputs may be used to determine the value of the fund’s investments. These inputs are summarized in three broad levels for financial statement purposes. The inputs or methodologies used to value securities are not necessarily an indication of the risk associated with investing in those securities.
Level 1—Quoted prices in active markets for identical securities.
Level 2—Other significant observable inputs (including quoted prices for similar securities, interest rates, prepayment speeds, credit risk, etc.).
Level 3—Significant unobservable inputs (including the fund’s own assumptions used to determine the fair value of investments).
At February 28, 2011, 100% of the fund’s investments were valued based on Level 1 inputs.
16
S&P 500 Value Index Fund
D. Distributions are determined on a tax basis and may differ from net investment income and realized capital gains for financial reporting purposes. Differences may be permanent or temporary. Permanent differences are reclassified among capital accounts in the financial statements to reflect their tax character. Temporary differences arise when certain items of income, expense, gain, or loss are recognized in different periods for financial statement and tax purposes; these differences will reverse at some time in the future. Differences in classification may also result from the treatment of short-term gains as ordinary income for tax purposes. The fund’s tax-basis capital gains and losses are determined only at the end of each fiscal year.
At February 28, 2011, the cost of investment securities for tax purposes was $13,695,000. Net unrealized appreciation of investment securities for tax purposes was $1,472,000, consisting of unrealized gains of $1,511,000 on securities that had risen in value since their purchase and $39,000 in unrealized losses on securities that had fallen in value since their purchase.
E. During the period ended February 28, 2011, the fund purchased $15,169,000 of investment securities and sold $1,622,000 of investment securities, other than temporary cash investments.
F. Capital shares issued and redeemed were:
| |
| | September 7, 20101 to |
| | February 28, 2011 |
| | Shares |
| | (000) |
| ETF Shares | |
| Issued | 250 |
| Issued in Lieu of Cash Distributions | — |
| Redeemed | — |
| Net Increase (Decrease) in Shares Outstanding | 250 |
| 1 Inception. | |
G. In preparing the financial statements as of February 28, 2011, management considered the impact of subsequent events for potential recognition or disclosure in these financial statements.
17
S&P 500 Growth Index Fund
Fund Profile
As of February 28, 2011
| | | |
| Portfolio Characteristics | | |
| | | Target | Broad |
| | Fund | Index1 | Index2 |
| Number of Stocks | 327 | 327 | 3,845 |
| Median Market Cap | $49.7B | $49.7B | $31.4B |
| Price/Earnings Ratio | 17.7x | 17.7x | 17.9x |
| Price/Book Ratio | 3.6x | 3.6x | 2.3x |
| Yield3 | 1.5% | 1.6% | 1.6% |
| Return on Equity | 25.1% | 25.1% | 19.2% |
| Earnings Growth Rate | 12.6% | 12.6% | 5.4% |
| Foreign Holdings | 0.0% | 0.0% | 0.0% |
| Turnover Rate4 | 20% | — | — |
| Expense Ratio5 | 0.15% | — | — |
| Short-Term Reserves | 0.0% | — | — |
| | | |
| Sector Diversification (% of equity exposure) |
| | | Target | Broad |
| | Fund | Index1 | Index2 |
| Consumer Discretionary | 13.8% | 13.8% | 11.8% |
| Consumer Staples | 11.2 | 11.2 | 9.1 |
| Energy | 7.8 | 7.8 | 11.6 |
| Financials | 5.5 | 5.5 | 16.6 |
| Health Care | 12.6 | 12.6 | 10.5 |
| Industrials | 10.5 | 10.5 | 11.4 |
| Information Technology | 31.4 | 31.4 | 18.9 |
| Materials | 4.1 | 4.1 | 4.5 |
| Telecommunication | | | |
| Services | 2.7 | 2.7 | 2.5 |
| Utilities | 0.4 | 0.4 | 3.1 |
| | |
| Ten Largest Holdings6 (% of total net assets) |
| |
| Apple Inc. | Computer | |
| | Hardware | 5.3% |
| International Business | IT Consulting & | |
| Machines Corp. | Other Services | 3.3 |
| Microsoft Corp. | Systems Software | 3.3 |
| Google Inc. Class A | Internet Software & | |
| | Services | 2.5 |
| Coca-Cola Co. | Soft Drinks | 2.4 |
| Schlumberger Ltd. | Oil & | |
| | Gas Equipment & | |
| | Services | 2.1 |
| Oracle Corp. | Systems Software | 2.1 |
| Philip Morris | Tobacco | |
| International Inc. | | 1.9 |
| Johnson & Johnson | Pharmaceuticals | 1.7 |
| PepsiCo Inc. | Soft Drinks | 1.6 |
| Top Ten | | 26.2% |
Investment Focus
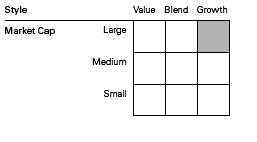
1 S&P 500 Growth Index.
2 Dow Jones U.S. Total Stock Market Index.
3 30-day SEC yield for the fund; annualized dividend yield for the indexes. See the Glossary.
4 Annualized.
5 The expense ratio shown is from the prospectus dated September 7, 2010, and represents estimated costs for the current fiscal year.
For the fiscal period ended February 28, 2011, the annualized expense ratio was 0.15%.
6 The holdings listed exclude any temporary cash investments and equity index products.
18
S&P 500 Growth Index Fund
Performance Summary
All of the returns in this report represent past performance, which is not a guarantee of future results that may be achieved by the fund. (Current performance may be lower or higher than the performance data cited. For performance data current to the most recent month-end, visit our website at vanguard.com/performance.) Note, too, that both investment returns and principal value can fluctuate widely, so an investor’s shares, when sold, could be worth more or less than their original cost. The returns shown do not reflect taxes that a shareholder would pay on fund distributions or on the sale of fund shares.
Fiscal-Period Total Returns (%): September 7, 2010, Through February 28, 2011
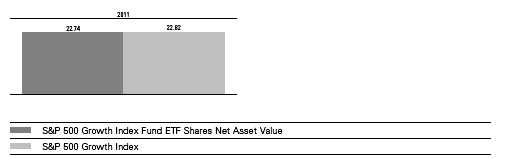
Total Returns: Period Ended December 31, 2010
This table presents returns through the latest calendar quarter—rather than through the end of the fiscal period.
Securities and Exchange Commission rules require that we provide this information.
| | |
| | | Since |
| | Inception Date | Inception |
| ETF Shares | 9/7/2010 | |
| Market Price | | 17.20% |
| Net Asset Value | | 17.18 |
See Financial Highlights for dividend and capital gains information.
19
S&P 500 Growth Index Fund
Financial Statements (unaudited)
Statement of Net Assets
As of February 28, 2011
The fund reports a complete list of its holdings in regulatory filings four times in each fiscal year, at the quarter-ends. For the second and fourth fiscal quarters, the lists appear in the fund’s semiannual and annual reports to shareholders. For the first and third fiscal quarters, the fund files the lists with the Securities and Exchange Commission on Form N-Q. Shareholders can look up the fund’s Forms N-Q on the SEC’s website at sec.gov. Forms N-Q may also be reviewed and copied at the SEC’s Public Reference Room (see the back cover of this report for further information).
| | | |
| | | | Market |
| | | | Value• |
| | | Shares | ($000) |
| Common Stocks (100.1%) | | |
| Consumer Discretionary (13.8%) | | |
| | McDonald’s Corp. | 6,377 | 483 |
| | Comcast Corp. Class A | 16,841 | 434 |
| * | Amazon.com Inc. | 2,141 | 371 |
| | Walt Disney Co. | 6,174 | 270 |
| * | DIRECTV Class A | 5,035 | 231 |
| | NIKE Inc. Class B | 2,309 | 206 |
| * | Ford Motor Co. | 13,321 | 200 |
| | Viacom Inc. Class B | 3,652 | 163 |
| | Starbucks Corp. | 4,477 | 148 |
| | Yum! Brands Inc. | 2,829 | 142 |
| | News Corp. Class A | 7,997 | 139 |
| * | priceline.com Inc. | 296 | 134 |
| | Target Corp. | 2,431 | 128 |
| | TJX Cos. Inc. | 2,392 | 119 |
| | Time Warner Cable Inc. | 1,397 | 101 |
| | Coach Inc. | 1,791 | 98 |
| * | Bed Bath & Beyond Inc. | 1,565 | 75 |
| * | Discovery | | |
| | Communications Inc. | | |
| | Class A | 1,719 | 74 |
| | Starwood Hotels & | | |
| | Resorts Worldwide Inc. | 1,149 | 70 |
| | Marriott International Inc. | | |
| | Class A | 1,739 | 68 |
| | Omnicom Group Inc. | 1,129 | 57 |
| * | Kohl’s Corp. | 1,057 | 57 |
| | Carnival Corp. | 1,326 | 57 |
| | Wynn Resorts Ltd. | 454 | 56 |
| * | NetFlix Inc. | 263 | 54 |
| | Cablevision Systems Corp. | | |
| | Class A | 1,452 | 53 |
| | Ross Stores Inc. | 724 | 52 |
| | Limited Brands Inc. | 1,599 | 51 |
| | Polo Ralph Lauren Corp. | | |
| | Class A | 388 | 49 |
| * | CarMax Inc. | 1,349 | 48 |
| | Tiffany & Co. | 760 | 47 |
| | | |
| | | | Market |
| | | | Value• |
| | | Shares | ($000) |
| * | O’Reilly Automotive Inc. | 838 | 47 |
| | Staples Inc. | 2,185 | 47 |
| | Nordstrom Inc. | 1,015 | 46 |
| * | AutoZone Inc. | 165 | 43 |
| | McGraw-Hill Cos. Inc. | 1,056 | 41 |
| | Darden Restaurants Inc. | 838 | 39 |
| * | Interpublic Group of Cos. Inc. | 2,952 | 39 |
| | Stanley Black & Decker Inc. | 502 | 38 |
| | Family Dollar Stores Inc. | 760 | 38 |
| | Macy’s Inc. | 1,587 | 38 |
| | Hasbro Inc. | 821 | 37 |
| | Best Buy Co. Inc. | 1,138 | 37 |
| * | Apollo Group Inc. Class A | 763 | 35 |
| | Mattel Inc. | 1,365 | 34 |
| | Gap Inc. | 1,484 | 33 |
| | Wyndham Worldwide Corp. | 1,054 | 33 |
| * | Urban Outfitters Inc. | 775 | 30 |
| | VF Corp. | 304 | 29 |
| | Scripps Networks | | |
| | Interactive Inc. Class A | 544 | 28 |
| | Harley-Davidson Inc. | 625 | 25 |
| | Expedia Inc. | 1,220 | 24 |
| | DeVry Inc. | 380 | 21 |
| | Abercrombie & Fitch Co. | 309 | 18 |
| | International Game Technology | 773 | 13 |
| | Harman International | | |
| | Industries Inc. | 242 | 12 |
| * | Big Lots Inc. | 262 | 11 |
| | Lennar Corp. Class A | 481 | 10 |
| | | | 5,081 |
| Consumer Staples (11.2%) | | |
| | Coca-Cola Co. | 14,015 | 896 |
| | Philip Morris | | |
| | International Inc. | 10,952 | 687 |
| | PepsiCo Inc. | 9,566 | 607 |
| | Procter & Gamble Co. | 8,110 | 511 |
| | Colgate-Palmolive Co. | 2,914 | 229 |
| | Kraft Foods Inc. | 5,050 | 161 |
| | Altria Group Inc. | 4,415 | 112 |
20
S&P 500 Growth Index Fund
| | | |
| | | | Market |
| | | | Value• |
| | | Shares | ($000) |
| | Kimberly-Clark Corp. | 1,503 | 99 |
| | General Mills Inc. | 2,439 | 91 |
| | Mead Johnson Nutrition Co. | 1,237 | 74 |
| | Avon Products Inc. | 2,587 | 72 |
| | Estee Lauder Cos. Inc. | | |
| | Class A | 686 | 65 |
| | HJ Heinz Co. | 1,240 | 62 |
| | Coca-Cola Enterprises Inc. | 2,047 | 54 |
| | Whole Foods Market Inc. | 886 | 52 |
| | Kellogg Co. | 930 | 50 |
| | Dr Pepper Snapple Group Inc. | 1,372 | 49 |
| | Brown-Forman Corp. Class B | 627 | 43 |
| | Reynolds American Inc. | 1,044 | 36 |
| | Clorox Co. | 522 | 35 |
| | Sara Lee Corp. | 2,047 | 35 |
| | Lorillard Inc. | 407 | 31 |
| | Hershey Co. | 552 | 29 |
| | McCormick & Co. Inc. | 491 | 23 |
| | Campbell Soup Co. | 612 | 21 |
| | Hormel Foods Corp. | 510 | 14 |
| | | | 4,138 |
| Energy (7.8%) | | |
| | Schlumberger Ltd. | 8,235 | 769 |
| | Occidental Petroleum Corp. | 2,453 | 250 |
| | National Oilwell Varco Inc. | 2,535 | 202 |
| | Apache Corp. | 1,132 | 141 |
| | Halliburton Co. | 2,853 | 134 |
| | Peabody Energy Corp. | 1,623 | 106 |
| | Anadarko Petroleum Corp. | 1,078 | 88 |
| | Devon Energy Corp. | 964 | 88 |
| * | Cameron International Corp. | 1,462 | 87 |
| * | Southwestern Energy Co. | 2,089 | 83 |
| | Baker Hughes Inc. | 1,145 | 81 |
| | EOG Resources Inc. | 706 | 79 |
| | Pioneer Natural | | |
| | Resources Co. | 698 | 71 |
| | Consol Energy Inc. | 1,359 | 69 |
| * | FMC Technologies Inc. | 721 | 68 |
| * | Newfield Exploration Co. | 809 | 59 |
| * | Denbury Resources Inc. | 2,409 | 58 |
| | Chesapeake Energy Corp. | 1,502 | 54 |
| | Noble Corp. | 1,173 | 52 |
| | Spectra Energy Corp. | 1,959 | 52 |
| | El Paso Corp. | 2,463 | 46 |
| | Noble Energy Inc. | 477 | 44 |
| | Murphy Oil Corp. | 580 | 43 |
| | Massey Energy Co. | 612 | 39 |
| | Diamond Offshore Drilling Inc. | 419 | 33 |
| | Range Resources Corp. | 472 | 26 |
| | Helmerich & Payne Inc. | 351 | 23 |
| | EQT Corp. | 406 | 20 |
| | Cabot Oil & Gas Corp. | 268 | 12 |
| | | | 2,877 |
| | | |
| Financials (5.5%) | | |
| | Wells Fargo & Co. | 15,523 | 501 |
| | Simon Property Group Inc. | 1,768 | 194 |
| | American Express Co. | 3,477 | 151 |
| | T Rowe Price Group Inc. | 1,550 | 104 |
| | Aflac Inc. | 1,736 | 102 |
| | Equity Residential | 1,719 | 95 |
| | Ameriprise Financial Inc. | 1,492 | 94 |
| | Franklin Resources Inc. | 564 | 71 |
| | AvalonBay Communities Inc. | 516 | 62 |
| | Public Storage | 506 | 57 |
| * | IntercontinentalExchange Inc. | 442 | 57 |
| | Ventas Inc. | 947 | 52 |
| | Charles Schwab Corp. | 2,696 | 51 |
| | HCP Inc. | 1,232 | 47 |
| * | CB Richard Ellis Group Inc. | | |
| | Class A | 1,746 | 44 |
| | Vornado Realty Trust | 448 | 42 |
| | Boston Properties Inc. | 398 | 38 |
| | Invesco Ltd. | 1,311 | 35 |
| | Host Hotels & Resorts Inc. | 1,770 | 33 |
| | Northern Trust Corp. | 513 | 26 |
| | Leucadia National Corp. | 714 | 24 |
| | Moody’s Corp. | 663 | 21 |
| | Hudson City Bancorp Inc. | 1,748 | 20 |
| | Health Care REIT Inc. | 376 | 20 |
| | Plum Creek Timber Co. Inc. | 448 | 19 |
| | Kimco Realty Corp. | 760 | 15 |
| | Huntington Bancshares Inc. | 1,616 | 11 |
| | KeyCorp | 1,118 | 10 |
| | Apartment Investment & | | |
| | Management Co. | 383 | 10 |
| | Federated Investors Inc. | | |
| | Class B | 352 | 10 |
| | Janus Capital Group Inc. | 531 | 7 |
| | | | 2,023 |
| Health Care (12.6%) | | |
| | Johnson & Johnson | 9,946 | 611 |
| | Abbott Laboratories | 9,330 | 449 |
| | Merck & Co. Inc. | 12,087 | 394 |
| | Eli Lilly & Co. | 6,116 | 211 |
| * | Gilead Sciences Inc. | 4,904 | 191 |
| * | Express Scripts Inc. | 3,175 | 178 |
| | Medtronic Inc. | 4,173 | 167 |
| * | Medco Health Solutions Inc. | 2,563 | 158 |
| * | Amgen Inc. | 3,076 | 158 |
| * | Celgene Corp. | 2,843 | 151 |
| | Bristol-Myers Squibb Co. | 5,584 | 144 |
| | Allergan Inc. | 1,856 | 138 |
| | Stryker Corp. | 2,058 | 130 |
| | Baxter International Inc. | 2,254 | 120 |
| * | Genzyme Corp. | 1,565 | 118 |
| * | St. Jude Medical Inc. | 2,065 | 99 |
21
S&P 500 Growth Index Fund
| | | |
| | | | Market |
| | | | Value• |
| | | Shares | ($000) |
| * | Biogen Idec Inc. | 1,440 | 98 |
| * | Agilent Technologies Inc. | 2,093 | 88 |
| * | Thermo Fisher Scientific Inc. | 1,441 | 80 |
| * | Intuitive Surgical Inc. | 237 | 78 |
| | Becton Dickinson and Co. | 890 | 71 |
| | CIGNA Corp. | 1,632 | 69 |
| * | Life Technologies Corp. | 1,126 | 60 |
| * | Mylan Inc. | 2,624 | 60 |
| * | Laboratory Corp. of | | |
| | America Holdings | 612 | 55 |
| | CR Bard Inc. | 563 | 55 |
| * | Hospira Inc. | 1,007 | 53 |
| * | Varian Medical Systems Inc. | 719 | 50 |
| * | Zimmer Holdings Inc. | 750 | 47 |
| * | DaVita Inc. | 586 | 47 |
| * | Waters Corp. | 550 | 46 |
| * | Cerner Corp. | 430 | 43 |
| * | Watson Pharmaceuticals Inc. | 754 | 42 |
| * | Forest Laboratories Inc. | 1,140 | 37 |
| | AmerisourceBergen Corp. | | |
| | Class A | 853 | 32 |
| | Quest Diagnostics Inc. | 468 | 27 |
| * | Tenet Healthcare Corp. | 2,934 | 21 |
| | DENTSPLY International Inc. | 525 | 20 |
| | Patterson Cos. Inc. | 586 | 20 |
| | PerkinElmer Inc. | 394 | 10 |
| * | Cephalon Inc. | 180 | 10 |
| | | | 4,636 |
| Industrials (10.5%) | | |
| | United Technologies Corp. | 3,623 | 303 |
| | Deere & Co. | 2,560 | 231 |
| | United Parcel Service Inc. | | |
| | Class B | 3,105 | 229 |
| | 3M Co. | 2,371 | 219 |
| | Caterpillar Inc. | 2,069 | 213 |
| | Boeing Co. | 2,657 | 191 |
| | Honeywell International Inc. | 3,016 | 175 |
| | Union Pacific Corp. | 1,818 | 173 |
| | Emerson Electric Co. | 2,493 | 149 |
| | Precision Castparts Corp. | 862 | 122 |
| | Cummins Inc. | 1,194 | 121 |
| | CSX Corp. | 1,357 | 101 |
| | Danaher Corp. | 1,975 | 100 |
| | General Dynamics Corp. | 1,274 | 97 |
| | Ingersoll-Rand plc | 1,959 | 89 |
| | Illinois Tool Works Inc. | 1,587 | 86 |
| | Rockwell Automation Inc. | 856 | 75 |
| | CH Robinson Worldwide Inc. | 1,002 | 72 |
| | Goodrich Corp. | 755 | 65 |
| | Tyco International Ltd. | 1,387 | 63 |
| | Rockwell Collins Inc. | 945 | 61 |
| | Joy Global Inc. | 623 | 61 |
| | Norfolk Southern Corp. | 900 | 59 |
| | | |
| | Fastenal Co. | 888 | 55 |
| | Raytheon Co. | 1,058 | 54 |
| | Eaton Corp. | 485 | 54 |
| | Parker Hannifin Corp. | 576 | 51 |
| | Roper Industries Inc. | 574 | 48 |
| | PACCAR Inc. | 949 | 48 |
| | WW Grainger Inc. | 350 | 47 |
| * | Stericycle Inc. | 515 | 44 |
| | Fluor Corp. | 616 | 44 |
| | Flowserve Corp. | 335 | 42 |
| | Waste Management Inc. | 1,121 | 41 |
| | Dover Corp. | 605 | 39 |
| | Pall Corp. | 697 | 38 |
| | Expeditors International of | | |
| | Washington Inc. | 718 | 34 |
| | ITT Corp. | 588 | 34 |
| | Republic Services Inc. | | |
| | Class A | 1,022 | 30 |
| | Southwest Airlines Co. | 2,301 | 27 |
| | Dun & Bradstreet Corp. | 300 | 24 |
| | Iron Mountain Inc. | 642 | 17 |
| | Equifax Inc. | 446 | 16 |
| | Robert Half International Inc. | 383 | 12 |
| | Avery Dennison Corp. | 250 | 10 |
| | Snap-On Inc. | 158 | 9 |
| | | | 3,873 |
| Information Technology (31.5%) | | |
| * | Apple Inc. | 5,537 | 1,956 |
| | International Business | | |
| | Machines Corp. | 7,499 | 1,214 |
| | Microsoft Corp. | 45,431 | 1,208 |
| * | Google Inc. Class A | 1,506 | 924 |
| | Oracle Corp. | 23,364 | 769 |
| | QUALCOMM Inc. | 9,764 | 582 |
| | Intel Corp. | 19,527 | 419 |
| * | Cisco Systems Inc. | 19,069 | 354 |
| * | EMC Corp. | 12,436 | 338 |
| | Hewlett-Packard Co. | 7,392 | 322 |
| | Texas Instruments Inc. | 7,091 | 252 |
| * | eBay Inc. | 6,926 | 232 |
| | Visa Inc. Class A | 2,943 | 215 |
| * | Cognizant Technology | | |
| | Solutions Corp. Class A | 1,834 | 141 |
| | Mastercard Inc. Class A | 586 | 141 |
| * | Juniper Networks Inc. | 3,153 | 139 |
| | Corning Inc. | 5,943 | 137 |
| | Broadcom Corp. Class A | 2,748 | 113 |
| * | NetApp Inc. | 2,184 | 113 |
| | Automatic Data | | |
| | Processing Inc. | 1,909 | 95 |
| * | Salesforce.com Inc. | 715 | 95 |
| * | Intuit Inc. | 1,688 | 89 |
| | Western Union Co. | 3,962 | 87 |
22
S&P 500 Growth Index Fund
| | | |
| | | | Market |
| | | | Value• |
| | | Shares | ($000) |
| * | Symantec Corp. | 4,690 | 85 |
| * | Citrix Systems Inc. | 1,130 | 79 |
| | Altera Corp. | 1,889 | 79 |
| | Analog Devices Inc. | 1,805 | 72 |
| * | SanDisk Corp. | 1,418 | 70 |
| * | Yahoo! Inc. | 3,701 | 61 |
| | Amphenol Corp. Class A | 1,053 | 60 |
| * | F5 Networks Inc. | 490 | 58 |
| * | Micron Technology Inc. | 5,175 | 58 |
| * | Autodesk Inc. | 1,369 | 58 |
| * | Adobe Systems Inc. | 1,598 | 55 |
| * | BMC Software Inc. | 1,070 | 53 |
| | Xilinx Inc. | 1,560 | 52 |
| | Applied Materials Inc. | 3,149 | 52 |
| * | Teradata Corp. | 1,005 | 48 |
| * | First Solar Inc. | 325 | 48 |
| * | Red Hat Inc. | 1,154 | 48 |
| | Linear Technology Corp. | 1,357 | 47 |
| * | NVIDIA Corp. | 1,999 | 45 |
| * | McAfee Inc. | 924 | 44 |
| * | Western Digital Corp. | 1,383 | 42 |
| | Microchip Technology Inc. | 1,130 | 42 |
| * | Akamai Technologies Inc. | 1,100 | 41 |
| | CA Inc. | 1,553 | 38 |
| | Paychex Inc. | 1,104 | 37 |
| * | JDS Uniphase Corp. | 1,346 | 33 |
| * | Fiserv Inc. | 513 | 32 |
| * | Advanced Micro Devices Inc. | 3,461 | 32 |
| | FLIR Systems Inc. | 963 | 31 |
| | KLA-Tencor Corp. | 484 | 24 |
| | VeriSign Inc. | 572 | 20 |
| | Harris Corp. | 424 | 20 |
| * | Electronic Arts Inc. | 841 | 16 |
| * | SAIC Inc. | 817 | 13 |
| * | Teradyne Inc. | 624 | 12 |
| | National Semiconductor Corp. | 708 | 11 |
| * | Novellus Systems Inc. | 266 | 11 |
| * | LSI Corp. | 1,601 | 10 |
| * | Compuware Corp. | 831 | 9 |
| | Molex Inc. | 310 | 9 |
| * | Monster Worldwide Inc. | 390 | 7 |
| | Total System Services Inc. | 363 | 6 |
| | | | 11,603 |
| Materials (4.1%) | | |
| | Freeport-McMoRan | | |
| | Copper & Gold Inc. | 5,685 | 301 |
| | Praxair Inc. | 1,851 | 184 |
| | EI du Pont de Nemours & Co. | 3,253 | 179 |
| | Newmont Mining Corp. | 2,971 | 164 |
| | Monsanto Co. | 1,781 | 128 |
| | Cliffs Natural Resources Inc. | 816 | 79 |
| | Ecolab Inc. | 1,400 | 68 |
| | Air Products & Chemicals Inc. | 711 | 65 |
| | |
| CF Industries Holdings Inc. | 429 | 61 |
| PPG Industries Inc. | 590 | 52 |
| Sigma-Aldrich Corp. | 731 | 47 |
| Ball Corp. | 1,066 | 38 |
| FMC Corp. | 434 | 34 |
| International Flavors & | | |
| Fragrances Inc. | 480 | 27 |
| Sherwin-Williams Co. | 277 | 23 |
| Eastman Chemical Co. | 221 | 21 |
| Airgas Inc. | 299 | 19 |
| Allegheny Technologies Inc. | 238 | 16 |
| United States Steel Corp. | 208 | 12 |
| * Titanium Metals Corp. | 229 | 4 |
| | | 1,522 |
| Telecommunication Services (2.7%) | |
| AT&T Inc. | 14,982 | 425 |
| Verizon Communications Inc. | 6,827 | 252 |
| * American Tower Corp. | | |
| Class A | 2,410 | 130 |
| Qwest Communications | | |
| International Inc. | 10,528 | 72 |
| CenturyLink Inc. | 916 | 38 |
| Frontier | | |
| Communications Corp. | 2,824 | 24 |
| * MetroPCS | | |
| Communications Inc. | 1,586 | 23 |
| Windstream Corp. | 1,754 | 22 |
| | | 986 |
| Utilities (0.4%) | | |
| Southern Co. | 1,976 | 75 |
| Dominion Resources Inc. | 1,507 | 69 |
| Wisconsin Energy Corp. | 325 | 19 |
| | | 163 |
| Total Common Stocks | | |
| (Cost $33,312) | | 36,902 |
| Total Investments (100.1%) | | |
| (Cost $33,312) | | 36,902 |
| Other Assets and Liabilities (–0.1%) | |
| Other Assets | | 111 |
| Liabilities | | (156) |
| | | (45) |
| ETF Shares—Net Assets (100%) | | |
| Applicable to 600,000 outstanding | |
| $.001 par value shares of beneficial | |
| interest (unlimited authorization) | 36,857 |
| Net Asset Value Per Share— | | |
| ETF Shares | | $61.43 |
23
S&P 500 Growth Index Fund
| |
| At February 28, 2011, net assets consisted of: |
| | Amount |
| | ($000) |
| Paid-in Capital | 32,890 |
| Undistributed Net Investment Income | 81 |
| Accumulated Net Realized Gains | 296 |
| Unrealized Appreciation (Depreciation) | 3,590 |
| Net Assets | 36,857 |
• See Note A in Notes to Financial Statements.
* Non-income-producing security.
REIT—Real Estate Investment Trust.
See accompanying Notes, which are an integral part of the Financial Statements.
24
S&P 500 Growth Index Fund
Statement of Operations
| |
| | September 7, 20101 to |
| | February 28, 2011 |
| | ($000) |
| Investment Income | |
| Income | |
| Dividends | 192 |
| Total Income | 192 |
| Expenses | |
| The Vanguard Group—Note B | |
| Management and Administrative | 7 |
| Custodian Fees | 7 |
| Shareholders’ Reports | 2 |
| Total Expenses | 16 |
| Net Investment Income | 176 |
| Realized Net Gain (Loss) on Investment Securities Sold | 296 |
| Change in Unrealized Appreciation (Depreciation) of Investment Securities | 3,590 |
| Net Increase (Decrease) in Net Assets Resulting from Operations | 4,062 |
| 1 Inception. |
See accompanying Notes, which are an integral part of the Financial Statements.
25
S&P 500 Growth Index Fund
Statement of Changes in Net Assets
| |
| | September 7, 20101 to |
| | February 28, 2011 |
| | ($000) |
| Increase (Decrease) in Net Assets | |
| Operations | |
| Net Investment Income | 176 |
| Realized Net Gain (Loss) | 296 |
| Change in Unrealized Appreciation (Depreciation) | 3,590 |
| Net Increase (Decrease) in Net Assets Resulting from Operations | 4,062 |
| Distributions | |
| Net Investment Income | (95) |
| Realized Capital Gain | — |
| Total Distributions | (95) |
| Capital Share Transactions | |
| Issued | 32,890 |
| Issued in Lieu of Cash Distributions | — |
| Redeemed | — |
| Net Increase (Decrease) from Capital Share Transactions | 32,890 |
| Total Increase (Decrease) | 36,857 |
| Net Assets | |
| Beginning of Period | — |
| End of Period2 | 36,857 |
| 1 Inception. |
| 2 Net Assets—End of Period includes undistributed net investment income of $81,000. |
See accompanying Notes, which are an integral part of the Financial Statements.
26
S&P 500 Growth Index Fund
Financial Highlights
| |
| ETF Shares | |
| | September 7, 20101 to |
| For a Share Outstanding Throughout the Period | February 28, 2011 |
| Net Asset Value, Beginning of Period | $50.23 |
| Investment Operations | |
| Net Investment Income | .345 |
| Net Realized and Unrealized Gain (Loss) on Investments | 11.065 |
| Total from Investment Operations | 11.410 |
| Distributions | |
| Dividends from Net Investment Income | (.210) |
| Distributions from Realized Capital Gains | — |
| Total Distributions | (.210) |
| Net Asset Value, End of Period | $61.43 |
| |
| Total Return | 22.74% |
| |
| Ratios/Supplemental Data | |
| Net Assets, End of Period (Millions) | $37 |
| Ratio of Total Expenses to Average Net Assets | 0.15% |
| Ratio of Net Investment Income to Average Net Assets | 1.60% |
| Portfolio Turnover Rate2 | 20% |
The expense ratio, net income ratio, and turnover rate for the current period have been annualized.
1 Inception.
2 Excludes the value of portfolio securities received or delivered as a result of in-kind purchases or redemptions of the fund’s capital shares,
including ETF Creation Units.
See accompanying Notes, which are an integral part of the Financial Statements.
27
S&P 500 Growth Index Fund
Notes to Financial Statements
Vanguard S&P 500 Growth Index Fund is registered under the Investment Company Act of 1940 as an open-end investment company, or mutual fund. The fund offers two classes of shares: Institutional Shares and ETF Shares. Institutional Shares are designed for investors who meet certain administrative, service, and account-size criteria. The fund has not issued any Institutional Shares as of February 28, 2011. ETF Shares were first issued on September 7, 2010, and first offered to the public on September 9, 2010. ETF Shares are listed for trading on the NYSE Arca, Inc.; they can be purchased and sold through a broker.
A. The following significant accounting policies conform to generally accepted accounting principles for U.S. mutual funds. The fund consistently follows such policies in preparing its financial statements.
1. Security Valuation: Securities are valued as of the close of trading on the New York Stock Exchange (generally 4 p.m., Eastern time) on the valuation date. Equity securities are valued at the latest quoted sales prices or official closing prices taken from the primary market in which each security trades; such securities not traded on the valuation date are valued at the mean of the latest quoted bid and asked prices. Securities for which market quotations are not readily available, or whose values have been materially affected by events occurring before the fund’s pricing time but after the close of the securities’ primary markets, are valued by methods deemed by the board of trustees to represent fair value.
2. Federal Income Taxes: The fund intends to qualify as a regulated investment company and distribute all of its taxable income. Management has analyzed the fund’s tax positions taken for its open federal income tax period ended February 28, 2011, and has concluded that no provision for federal income tax is required in the fund’s financial statements.
3. Distributions: Distributions to shareholders are recorded on the ex-dividend date.
4. Other: Dividend income is recorded on the ex-dividend date. Security transactions are accounted for on the date securities are bought or sold. Costs used to determine realized gains (losses) on the sale of investment securities are those of the specific securities sold.
B. The Vanguard Group furnishes at cost investment advisory, corporate management, administrative, marketing, and distribution services. The costs of such services are allocated to the fund under methods approved by the board of trustees. The fund has committed to provide up to 0.40% of its net assets in capital contributions to Vanguard. At February 28, 2011, the fund had contributed capital of $6,000 to Vanguard (included in Other Assets), representing 0.02% of the fund’s net assets and 0.00% of Vanguard’s capitalization. The fund’s trustees and officers are also directors and officers of Vanguard.
C. Various inputs may be used to determine the value of the fund’s investments. These inputs are summarized in three broad levels for financial statement purposes. The inputs or methodologies used to value securities are not necessarily an indication of the risk associated with investing in those securities.
Level 1—Quoted prices in active markets for identical securities.
Level 2—Other significant observable inputs (including quoted prices for similar securities, interest rates, prepayment speeds, credit risk, etc.).
Level 3—Significant unobservable inputs (including the fund’s own assumptions used to determine the fair value of investments).
At February 28, 2011, 100% of the fund’s investments were valued based on Level 1 inputs.
28
S&P 500 Growth Index Fund
D. Distributions are determined on a tax basis and may differ from net investment income and realized capital gains for financial reporting purposes. Differences may be permanent or temporary. Permanent differences are reclassified among capital accounts in the financial statements to reflect their tax character. Temporary differences arise when certain items of income, expense, gain, or loss are recognized in different periods for financial statement and tax purposes; these differences will reverse at some time in the future. Differences in classification may also result from the treatment of short-term gains as ordinary income for tax purposes. The fund’s tax-basis capital gains and losses are determined only at the end of each fiscal year.
At February 28, 2011, the cost of investment securities for tax purposes was $33,312,000. Net unrealized appreciation of investment securities for tax purposes was $3,590,000, consisting of unrealized gains of $3,829,000 on securities that had risen in value since their purchase and $239,000 in unrealized losses on securities that had fallen in value since their purchase.
E. During the period ended February 28, 2011, the fund purchased $37,709,000 of investment securities and sold $4,693,000 of investment securities, other than temporary cash investments.
F. Capital shares issued and redeemed were:
| |
| | September 7, 20101 to |
| | February 28, 2011 |
| | Shares |
| | (000) |
| ETF Shares | |
| Issued | 600 |
| Issued in Lieu of Cash Distributions | — |
| Redeemed | — |
| Net Increase (Decrease) in Shares Outstanding | 600 |
| 1 Inception. |
G. In preparing the financial statements as of February 28, 2011, management considered the impact of subsequent events for potential recognition or disclosure in these financial statements.
29
Trustees Approve Advisory Arrangement
The board of trustees approved the launch of Vanguard S&P 500 Value Index Fund and S&P 500 Growth Index Fund utilizing an internalized management structure whereby The Vanguard Group, Inc.—through its Quantitative Equity Group—would provide investment advisory services to the funds at cost. The board determined that the investment advisory arrangement with Vanguard was in the best interest of the funds and their prospective shareholders.
The board based its decision upon an evaluation of the advisor’s investment staff, portfolio management process, and performance. The trustees considered the factors discussed below, among others. However, no single factor determined whether the board approved the arrangement. Rather, it was the totality of the circumstances that drove the board’s decision.
Nature, extent, and quality of services
The board considered the quality of the investment management services to be provided to the funds and took into account the organizational depth and stability of the advisor. The board noted that Vanguard has been managing investments for more than three decades. The Quantitative Equity Group adheres to a sound, disciplined investment management process; the team has considerable experience, stability, and depth.
The board concluded that Vanguard’s experience, stability, depth, and performance, among other factors, warranted approval of the advisory arrangement.
Investment performance
The board determined that, in its management of other Vanguard index funds, the Quantitative Equity Group has a track record of consistent performance and disciplined investment processes. Information about each fund’s performance since inception can be found in the Performance Summary pages of this report.
Cost
The board considered the cost of services to be provided and concluded that the funds’ expense ratios will be below the average expense ratios charged by funds in their peer groups. Information about the funds’ expense ratios appears in the Financial Statements of this report.
The board does not conduct a profitability analysis of Vanguard because of Vanguard’s unique “at-cost” structure. Unlike most other mutual fund management companies, Vanguard is owned by the funds it oversees, and it produces “profits” only in the form of reduced expenses for fund shareholders.
The benefit of economies of scale
The board concluded that the funds’ low-cost arrangement with Vanguard ensures that the funds will realize economies of scale as they grow, with the cost to shareholders declining as fund assets increase.
The board will consider whether to renew the advisory arrangement after a one-year period.
30
Glossary
30-Day SEC Yield. A fund’s 30-day SEC yield is derived using a formula specified by the U.S. Securities and Exchange Commission. Under the formula, data related to the fund’s security holdings in the previous 30 days are used to calculate the fund’s hypothetical net income for that period, which is then annualized and divided by the fund’s estimated average net assets over the calculation period. For the purposes of this calculation, a security’s income is based on its current market yield to maturity (in the case of bonds) or its projected dividend yield (for stocks). Because the SEC yield represents hypothetical annualized income, it will differ—at times significantly—from the fund’s actual experience. As a result, the fund’s income distributions may be higher or lower than implied by the SEC yield.
Dividend Yield. Dividend income earned by stocks, expressed as a percentage of the aggregate market value (or of net asset value, for a fund). The yield is determined by dividing the amount of the annual dividends by the aggregate value (or net asset value) at the end of the period. For a fund, the dividend yield is based solely on stock holdings and does not include any income produced by other investments.
Earnings Growth Rate. The average annual rate of growth in earnings over the past five years for the stocks now in a fund.
Equity Exposure. A measure that reflects a fund’s investments in stocks and stock futures. Any holdings in short-term reserves are excluded.
Expense Ratio. The percentage of a fund’s average net assets used to pay its annual administrative and advisory expenses. These expenses directly reduce returns to investors.
Foreign Holdings. The percentage of a fund represented by stocks or depositary receipts of companies based outside the United States.
Inception Date. The date on which the assets of a fund (or one of its share classes) are first invested in accordance with the fund’s investment objective. For funds with a subscription period, the inception date is the day after that period ends. Investment performance is measured from the inception date.
Median Market Cap. An indicator of the size of companies in which a fund invests; the midpoint of market capitalization (market price x shares outstanding) of a fund’s stocks, weighted by the proportion of the fund’s assets invested in each stock. Stocks representing half of the fund’s assets have market capitalizations above the median, and the rest are below it.
Price/Book Ratio. The share price of a stock divided by its net worth, or book value, per share. For a fund, the weighted average price/book ratio of the stocks it holds.
Price/Earnings Ratio. The ratio of a stock’s current price to its per-share earnings over the past year. For a fund, the weighted average P/E of the stocks it holds. P/E is an indicator of market expectations about corporate prospects; the higher the P/E, the greater the expectations for a company’s future growth.
Return on Equity. The annual average rate of return generated by a company during the past five years for each dollar of shareholder’s equity (net income divided by shareholder’s equity). For a fund, the weighted average return on equity for the companies whose stocks it holds.
31
Short-Term Reserves. The percentage of a fund invested in highly liquid, short-term securities that can be readily converted to cash.
Turnover Rate. An indication of the fund’s trading activity. Funds with high turnover rates incur higher transaction costs and may be more likely to distribute capital gains (which may be taxable to investors). The turnover rate excludes in-kind transactions, which have minimal impact on costs.
32
This page intentionally left blank.
This page intentionally left blank.
This page intentionally left blank.
The People Who Govern Your Fund
The trustees of your mutual fund are there to see that the fund is operated and managed in your best interests since, as a shareholder, you are a part owner of the fund. Your fund’s trustees also serve on the board of directors of The Vanguard Group, Inc., which is owned by the Vanguard funds and provides services to them on an at-cost basis.
A majority of Vanguard’s board members are independent, meaning that they have no affiliation with Vanguard or the funds they oversee, apart from the sizable personal investments they have made as private individuals. The independent board members have distinguished backgrounds in business, academia, and public service. Each of the trustees and executive officers oversees 179 Vanguard funds.
The following table provides information for each trustee and executive officer of the fund. More information about the trustees is in the Statement of Additional Information, which can be obtained, without charge, by contacting Vanguard at 800-662-7447, or online at vanguard.com.
| |
| Interested Trustee1 | and President (2006–2008) of Rohm and Haas Co. |
| | (chemicals); Director of Tyco International, Ltd. |
| F. William McNabb III | (diversified manufacturing and services) and Hewlett- |
| Born 1957. Trustee Since July 2009. Chairman of the | Packard Co. (electronic computer manufacturing); |
| Board. Principal Occupation(s) During the Past Five | Senior Advisor at New Mountain Capital; Trustee |
| Years: Chairman of the Board of The Vanguard Group, | of The Conference Board; Member of the Board of |
| Inc., and of each of the investment companies served | Managers of Delphi Automotive LLP (automotive |
| by The Vanguard Group, since January 2010; Director | components). |
| of The Vanguard Group since 2008; Chief Executive | |
| Officer and President of The Vanguard Group and of | Amy Gutmann |
| each of the investment companies served by The | Born 1949. Trustee Since June 2006. Principal |
| Vanguard Group since 2008; Director of Vanguard | Occupation(s) During the Past Five Years: President |
| Marketing Corporation; Managing Director of The | of the University of Pennsylvania; Christopher H. |
| Vanguard Group (1995–2008). | Browne Distinguished Professor of Political Science |
| | in the School of Arts and Sciences with secondary |
| | appointments at the Annenberg School for Commu- |
| Independent Trustees | nication and the Graduate School of Education |
| | of the University of Pennsylvania; Director of |
| Emerson U. Fullwood | Carnegie Corporation of New York, Schuylkill River |
| Born 1948. Trustee Since January 2008. Principal | Development Corporation, and Greater Philadelphia |
| Occupation(s) During the Past Five Years: Executive | Chamber of Commerce; Trustee of the National |
| Chief Staff and Marketing Officer for North America | Constitution Center; Chair of the Presidential |
| and Corporate Vice President (retired 2008) of Xerox | Commission for the Study of Bioethical Issues. |
| Corporation (document management products and | |
| services); Executive in Residence and 2010 | JoAnn Heffernan Heisen |
| Distinguished Minett Professor at the Rochester | Born 1950. Trustee Since July 1998. Principal |
| Institute of Technology; Director of SPX Corporation | Occupation(s) During the Past Five Years: Corporate |
| (multi-industry manufacturing), the United Way of | Vice President and Chief Global Diversity Officer |
| Rochester, Amerigroup Corporation (managed health | (retired 2008) and Member of the Executive |
| care), the University of Rochester Medical Center, | Committee (1997–2008) of Johnson & Johnson |
| Monroe Community College Foundation, and North | (pharmaceuticals/consumer products); Director of |
| Carolina A&T University. | Skytop Lodge Corporation (hotels), the University |
| | Medical Center at Princeton, the Robert Wood |
| Rajiv L. Gupta | Johnson Foundation, and the Center for Work Life |
| Born 1945. Trustee Since December 2001.2 | Policy; Member of the Advisory Board of the |
| Principal Occupation(s) During the Past Five Years: | Maxwell School of Citizenship and Public Affairs |
| Chairman and Chief Executive Officer (retired 2009) | at Syracuse University. |
| | |
| F. Joseph Loughrey | Thomas J. Higgins | |
| Born 1949. Trustee Since October 2009. Principal | Born 1957. Chief Financial Officer Since September |
| Occupation(s) During the Past Five Years: President | 2008. Principal Occupation(s) During the Past Five |
| and Chief Operating Officer (retired 2009) and Vice | Years: Principal of The Vanguard Group, Inc.; Chief |
| Chairman of the Board (2008–2009) of Cummins Inc. | Financial Officer of each of the investment companies |
| (industrial machinery); Director of SKF AB (industrial | served by The Vanguard Group since 2008; Treasurer |
| machinery), Hillenbrand, Inc. (specialized consumer | of each of the investment companies served by The |
| services), the Lumina Foundation for Education, and | Vanguard Group (1998–2008). |
| Oxfam America; Chairman of the Advisory Council | | |
| for the College of Arts and Letters and Member | Kathryn J. Hyatt | |
| of the Advisory Board to the Kellogg Institute for | Born 1955. Treasurer Since November 2008. Principal |
| International Studies at the University of Notre Dame. | Occupation(s) During the Past Five Years: Principal |
| | of The Vanguard Group, Inc.; Treasurer of each of |
| André F. Perold | the investment companies served by The Vanguard |
| Born 1952. Trustee Since December 2004. Principal | Group since 2008; Assistant Treasurer of each of the |
| Occupation(s) During the Past Five Years: George | investment companies served by The Vanguard Group |
| Gund Professor of Finance and Banking at the Harvard | (1988–2008). | |
| Business School; Chair of the Investment Committee | | |
| of HighVista Strategies LLC (private investment firm). | Heidi Stam | |
| | Born 1956. Secretary Since July 2005. Principal |
| Alfred M. Rankin, Jr. | Occupation(s) During the Past Five Years: Managing |
| Born 1941. Trustee Since January 1993. Principal | Director of The Vanguard Group, Inc., since 2006; |
| Occupation(s) During the Past Five Years: Chairman, | General Counsel of The Vanguard Group since 2005; |
| President, and Chief Executive Officer of NACCO | Secretary of The Vanguard Group and of each of the |
| Industries, Inc. (forklift trucks/housewares/lignite); | investment companies served by The Vanguard Group |
| Director of Goodrich Corporation (industrial products/ | since 2005; Director and Senior Vice President of |
| aircraft systems and services) and the National | Vanguard Marketing Corporation since 2005; |
| Association of Manufacturers; Chairman of the | Principal of The Vanguard Group (1997–2006). |
| Federal Reserve Bank of Cleveland; Vice Chairman | | |
| of University Hospitals of Cleveland; President of | | |
| the Board of The Cleveland Museum of Art. | Vanguard Senior Management Team |
| |
| Peter F. Volanakis | R. Gregory Barton | Michael S. Miller |
| Born 1955. Trustee Since July 2009. Principal | Mortimer J. Buckley | James M. Norris |
| Occupation(s) During the Past Five Years: President | Kathleen C. Gubanich | Glenn W. Reed |
| and Chief Operating Officer (retired 2010) of Corning | Paul A. Heller | George U. Sauter |
| Incorporated (communications equipment); Director of | | |
| Corning Incorporated (2000–2010) and Dow Corning | | |
| (2001–2010); Overseer of the Amos Tuck School of | Chairman Emeritus and Senior Advisor |
| Business Administration at Dartmouth College. | | |
| | John J. Brennan | |
| | Chairman, 1996–2009 | |
| Executive Officers | Chief Executive Officer and President, 1996–2008 |
| |
| Glenn Booraem | | |
| Born 1967. Controller Since July 2010. Principal | | |
| Occupation(s) During the Past Five Years: Principal | Founder | |
| of The Vanguard Group, Inc.; Controller of each of | John C. Bogle | |
| the investment companies served by The Vanguard | Chairman and Chief Executive Officer, 1974–1996 |
| Group since 2010; Assistant Controller of each of | | |
| the investment companies served by The Vanguard | | |
| Group (2001–2010). | | |
1 Mr. McNabb is considered an “interested person,” as defined in the Investment Company Act of 1940, because he is an officer of the
Vanguard funds.
2 December 2002 for Vanguard Equity Income Fund, Vanguard Growth Equity Fund, the Vanguard Municipal Bond Funds, and the Vanguard
State Tax-Exempt Funds.

| |
| | P.O. Box 2600 |
| | Valley Forge, PA 19482-2600 |
| |
| |
| |
| Connect with Vanguard® > vanguard.com | |
| |
| |
| |
| Fund Information > 800-662-7447 | Standard & Poor’s®, S&P ®, Standard & Poor’s 500 ®, |
| | 500 ®, S&P 500 Value Index®, and S&P 500 Growth |
| Direct Investor Account Services > 800-662-2739 | Index® are registered trademarks of Standard & |
| | Poor’s Financial Services LLC (”S&P”) and have been |
| Institutional Investor Services > 800-523-1036 | licensed for use by The Vanguard Group, Inc. The |
| | Vanguard mutual funds and ETFs are not sponsored, |
| Text Telephone for People | endorsed, sold, or promoted by S&P or its Affiliates, |
| With Hearing Impairment > 800-749-7273 | and S&P and its Affiliates make no representation, |
| This material may be used in conjunction | warranty, or condition regarding the advisability of |
| with the offering of shares of any Vanguard | buying, selling, or holding units/shares in the funds. |
| fund only if preceded or accompanied by | |
| the fund’s current prospectus. | |
| |
| All comparative mutual fund data are from Lipper Inc. | |
| or Morningstar, Inc., unless otherwise noted. | |
| |
| You can obtain a free copy of Vanguard’s proxy voting | |
| guidelines by visiting vanguard.com/proxyreporting or | |
| by calling Vanguard at 800-662-2739. The guidelines | |
| are also available from the SEC’s website, sec.gov. | |
| In addition, you may obtain a free report on how your | |
| fund voted the proxies for securities it owned during | |
| the 12 months ended June 30. To get the report, visit | |
| either vanguard.com/proxyreporting or sec.gov. | |
| |
| You can review and copy information about your fund | |
| at the SEC’s Public Reference Room in Washington, D.C. | |
| To find out more about this public service, call the SEC | |
| at 202-551-8090. Information about your fund is also | |
| available on the SEC’s website, and you can receive | |
| copies of this information, for a fee, by sending a | |
| request in either of two ways: via e-mail addressed to | |
| publicinfo@sec.gov or via regular mail addressed to the | |
| Public Reference Section, Securities and Exchange | |
| Commission, Washington, DC 20549-1520. | |
| |
| | © 2011 The Vanguard Group, Inc. |
| | All rights reserved. |
| | Vanguard Marketing Corporation, Distributor. |
| | Q18402 042011 |

|
| Vanguard S&P Small-Cap 600 |
| Index Funds Semiannual Report |
| |
| |
| February 28, 2011 |

|
| Vanguard S&P Small-Cap 600 Index Fund |
| Vanguard S&P Small-Cap 600 Value Index Fund |
| Vanguard S&P Small-Cap 600 Growth Index Fund |
> The Vanguard S&P Small-Cap 600 Index Funds made their debut in the midst of
a powerful small-cap rally.
> The funds closely tracked the returns of their respective benchmark indexes.
> The small-cap rally was broad-based, with notable strength in information
technology stocks.
| |
| Contents | |
| |
| Your Fund’s Total Returns | 1 |
| Chairman’s Letter | 2 |
| S&P Small-Cap 600 Index Fund | 7 |
| S&P Small-Cap 600 Value Index Fund | 21 |
| S&P Small-Cap 600 Growth Index Fund | 34 |
| Trustees Approve Advisory Arrangement | 46 |
| Glossary | 47 |
Please note: The opinions expressed in this report are just that—informed opinions. They should not be considered promises or advice.
Also, please keep in mind that the information and opinions cover the period through the date on the front of this report. Of course, the
risks of investing in your fund are spelled out in the prospectus.
See the Glossary for the definitions of investment terms used in this report.
Cover photograph: Jean Maher.
Your Fund’s Total Returns
| | |
| Period Ended February 28, 2011 | | |
| | Ticker | Total Returns |
| | Symbol | Since Inception |
| Vanguard S&P Small-Cap 600 Index Fund | | |
| ETF Shares (Inception: 9/7/2010) | VIOO | |
| Market Price | | 29.44% |
| Net Asset Value | | 29.45 |
| S&P SmallCap 600 Index | | 29.54 |
| Small-Cap Core Funds Average1 | | 30.17 |
| |
| Vanguard S&P Small-Cap 600 Value Index Fund | | |
| ETF Shares (Inception: 9/7/2010) | VIOV | |
| Market Price | | 28.97% |
| Net Asset Value | | 28.14 |
| S&P SmallCap 600 Value Index | | 28.25 |
| Small-Cap Value Funds Average1 | | 29.37 |
| |
| Vanguard S&P Small-Cap 600 Growth Index Fund | | |
| ETF Shares (Inception: 9/7/2010) | VIOG | |
| Market Price | | 30.67% |
| Net Asset Value | | 30.73 |
| S&P SmallCap 600 Growth Index | | 30.86 |
| Small-Cap Growth Funds Average1 | | 31.97 |
The Vanguard ETF® Shares shown are traded on the NYSE Arca exchange and are available only through brokers. The table provides ETF
returns based on both the NYSE Arca market price and the net asset value for a share. U.S. Pat. No. 6,879,964 B2; 7,337,138.
For the ETF Shares, the market price is determined by the midpoint of the bid-offer spread as of the closing time of the New York Stock
Exchange (generally 4 p.m., Eastern time). The net asset value is also determined as of the NYSE closing time. For more information about
how the ETF Shares’ market prices have compared with their net asset value, visit vanguard.com, select your ETF, and then select the Price
and Performance tab. The ETF premium/discount analysis there shows the percentages of days on which the ETF Shares’ market price was
above or below the NAV.
1 Derived from data provided by Lipper Inc.
1

Chairman’s Letter
Dear Shareholder,
In the brief period since their September 2010 inception, the Vanguard S&P Small-Cap 600 Index Funds produced exceptional returns, benefiting from a powerful rally in small-capitalization stocks.
The returns of the funds’ ETF Shares ranged from 28.14% for Vanguard S&P Small-Cap 600 Value Index Fund to 30.73% for Vanguard S&P Small-Cap 600 Growth Index Fund. (Returns are based on changes in the funds’ net asset values, adjusted to account for dividend distributions during the period.) Vanguard S&P Small-Cap 600 Index Fund, a blend of the Growth and Value Funds, returned 29.45%.
The new S&P Small-Cap 600 Index Funds mark an extension of Vanguard’s equity indexing franchise, which now includes suites of broad-market portfolios benchmarked to the Russell, Standard & Poor’s, and MSCI indexes. Our research indicates that correlation among the returns of the indexes from all three providers is very high. We would expect limited differences in long-term performance from one provider’s index to another.
This report begins with a look at the investment environment throughout the full six months of the new funds’ fiscal half-year and then reviews the drivers of fund performance during their briefer period of operation.
2
A fretful start, an optimistic finish for global stock markets
Stock markets rallied from their midsummer malaise to produce exceptional returns for the six months ended February 28. At the start of the period, the U.S. economy seemed in danger of tipping back into recession. By the end, hopes were high that it had reached escape velocity, propelled by steady job growth and notable strength in the manufacturing sector. Smaller stocks, which are especially sensitive to the rhythms of the business cycle, produced the highest six-month returns.
In Europe, investor optimism subdued sovereign-debt jitters, driving stock prices higher. Developed markets in the Pacific region perked up on signs of recovery in
global trade. Australian stocks posted especially strong returns, benefiting from a surge in the prices of metals and other natural resources. Emerging stock markets trailed a few steps behind their developed-market counterparts. Most major currencies appreciated relative to the U.S. dollar, enhancing returns from abroad for U.S.-based investors.
Interest rates rose, depressing bond prices
U.S. interest rates hovered near generational lows early in the period but then moved higher, putting pressure on bond prices. For the six-month period, the broad taxable bond market produced a small negative return. The municipal bond market did worse. Corporate bonds outperformed government debt
| | | |
| Market Barometer | | | |
| | | Total Returns |
| | | Periods Ended February 28, 2011 |
| | Six | One | Five Years |
| | Months | Year | (Annualized) |
| Stocks | | | |
| Stocks | | | |
| Russell 1000 Index (Large-caps) | 28.65% | 23.54% | 3.17% |
| Russell 2000 Index (Small-caps) | 37.55 | 32.60 | 3.80 |
| Dow Jones U.S. Total Stock Market Index | 29.24 | 24.45 | 3.59 |
| MSCI All Country World Index ex USA (International) | 22.16 | 21.12 | 4.23 |
| |
| Bonds | | | |
| Barclays Capital U.S. Aggregate Bond Index | | | |
| (Broad taxable market) | –0.83% | 4.93% | 5.80% |
| Barclays Capital Municipal Bond Index (Broad tax-exempt market) | –3.51 | 1.72 | 4.07 |
| Citigroup 3-Month U.S. Treasury Bill Index | 0.06 | 0.14 | 2.16 |
| |
| CPI | | | |
| Consumer Price Index | 1.37% | 2.11% | 2.18% |
3
as investors stretched for yield beyond government securities, where rates remained low by historical standards.
As it has since December 2008, the Federal Reserve held its target for short-term interest rates near 0%. This stance kept the returns available from money market instruments such as the 3-month Treasury bill in the same neighborhood.
Funds debuted amid stock market strength
During their first few months of operation, the Vanguard S&P Small-Cap 600 Index Funds benefited from general strength among small stocks. Information technology stocks were exceptional performers, rallying on both consumer enthusiasm for platforms such as tablets and smart phones and signs that business investment is set to pick up. The strength of tech stocks helped all three funds but made an especially big contribution to Vanguard S&P Small-Cap 600 Growth Index Fund. At the end of the period, tech stocks accounted for 25% of the fund’s assets.
Industrial stocks also delivered strong returns. The sector’s transportation companies have benefited from a recovery in domestic and international trade and travel, while makers and marketers of machinery and farm equipment have profited from increased activity on factory floors and fast-rising food prices. The sector made significant contributions to all three funds, particularly Vanguard Small-Cap 600 Value Index Fund. Financials were another source of strength in the
Value Fund, where these stocks accounted for about 24% of assets. Banks continued to wrestle with a number of challenges, but the long period of low interest rates helped the sector repair its battered balance sheets and position itself for growth.
Weak spots were few but included utilities and consumer staples stocks, which produced returns in the double-digit range.
The Vanguard Small-Cap 600 Index Funds succeeded in capturing most of the returns of their target indexes. Fund returns based on NAV were within 13 basis points (0.13 percentage point) of their respective index results, a shortfall consistent with the costs of managing a start-up real-world portfolio. Such performance is a tribute to Vanguard Quantitative Equity Group, the funds’ advisor, which has spent more than 35 years developing and refining index-fund management strategies. The funds’ low costs are an important ally in the advisor’s effort to capture the index return.
Solid building blocks for a long-term portfolio
It would be wonderful if the exceptional returns produced during the funds’ first few months could be expected to continue forever. The stock market doesn’t work that way, however. Returns are volatile, with periods of strength often followed by stretches of weakness. And, as we have seen in recent weeks, unpredictable events such as those in the Middle East, North Africa, and Japan can disrupt market trends. That’s why we counsel investors to develop allocations
4
to stock, bond, and money market funds in proportions consistent with their goals and ability to withstand the stock market’s occasionally sharp declines.
The new Vanguard Small-Cap 600 Index Funds can be powerful building blocks in such a portfolio, providing low-cost exposure to the different segments of U.S. small-cap stocks.
Thank you for entrusting your assets to Vanguard.
Sincerely,

F. William McNabb III
Chairman and Chief Executive Officer
March 14, 2011
5
| | | | |
| Your Fund’s Performance at a Glance | | | | |
| Inception Through February 28, 2011 | | | | |
| | | | Distributions Per Share |
| | Starting | Ending | Income | Capital |
| | Share Price | Share Price | Dividends | Gains |
| Vanguard S&P Small-Cap 600 Index Fund | | | | |
| ETF Shares (Inception: 9/7/2010) | $49.81 | $64.11 | $0.360 | $0.000 |
| Vanguard S&P Small-Cap 600 | | | | |
| Value Index Fund | | | | |
| ETF Shares (Inception: 9/7/2010) | $49.79 | $63.42 | $0.370 | $0.000 |
| Vanguard S&P Small-Cap 600 | | | | |
| Growth Index Fund | | | | |
| ETF Shares (Inception: 9/7/2010) | $49.82 | $64.81 | $0.310 | $0.000 |
6
S&P Small-Cap 600 Index Fund
Fund Profile
As of February 28, 2011
| | | |
| Portfolio Characteristics | | |
| | | Target | Broad |
| | Fund | Index1 | Index2 |
| Number of Stocks | 600 | 600 | 3,845 |
| Median Market Cap | $1.2B | $1.2B | $31.4B |
| Price/Earnings Ratio | 24.3x | 24.3x | 17.9x |
| Price/Book Ratio | 2.0x | 2.0x | 2.3x |
| Yield3 | 0.8% | 1.0% | 1.6% |
| Return on Equity | 11.0% | 11.0% | 19.2% |
| Earnings Growth Rate | 4.6% | 4.6% | 5.4% |
| Foreign Holdings | 0.0% | 0.0% | 0.0% |
| Turnover Rate4 | 18% | — | — |
| Expense Ratio5 | 0.15% | — | — |
| Short-Term Reserves | 0.0% | — | — |
| | | |
| Sector Diversification (% of equity exposure) |
| | | Target | Broad |
| | Fund | Index1 | Index2 |
| Consumer Discretionary 14.2% | 14.2% | 11.8% |
| Consumer Staples | 3.5 | 3.5 | 9.1 |
| Energy | 6.1 | 6.1 | 11.6 |
| Financials | 19.1 | 19.1 | 16.6 |
| Health Care | 12.7 | 12.7 | 10.5 |
| Industrials | 16.0 | 16.0 | 11.4 |
| Information Technology | 19.6 | 19.5 | 18.9 |
| Materials | 4.5 | 4.5 | 4.5 |
| Telecommunication | | | |
| Services | 0.6 | 0.7 | 2.5 |
| Utilities | 3.7 | 3.7 | 3.1 |
| | |
| Ten Largest Holdings6 (% of total net assets) |
| |
| Oil States | Oil & Gas Equipment | |
| International Inc. | & Services | 0.7% |
| Varian Semiconductor | Semiconductor | |
| Equipment Associates Inc. Equipment | 0.7 |
| World Fuel Services Corp. | Oil & Gas Refining | |
| | & Marketing | 0.6 |
| AMERIGROUP Corp. | Managed | |
| | Health Care | 0.6 |
| Cooper Cos. Inc. | Health Care | |
| | Supplies | 0.6 |
| Regeneron | | |
| Pharmaceuticals Inc. | Biotechnology | 0.5 |
| Holly Corp. | Oil & Gas Refining | |
| | & Marketing | 0.5 |
| Stifel Financial Corp. | Investment Banking | |
| | & Brokerage | 0.5 |
| BioMed Realty Trust Inc. | Office REITs | 0.5 |
| Lufkin Industries Inc. | Oil & Gas Equipment | |
| | & Services | 0.5 |
| Top Ten | | 5.7% |
Investment Focus
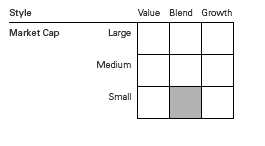
1 S&P SmallCap 600 Index.
2 Dow Jones U.S. Total Stock Market Index.
3 30-day SEC yield for the fund; annualized dividend yield for the indexes. See the Glossary.
4 Annualized.
5 The expense ratio shown is from the prospectus dated September 7, 2010, and represents estimated costs for the current fiscal year.
For the fiscal period ended February 28, 2011, the annualized expense ratio was 0.15%.
6 The holdings listed exclude any temporary cash investments and equity index products.
7
S&P Small-Cap 600 Index Fund
Performance Summary
All of the returns in this report represent past performance, which is not a guarantee of future results that may be achieved by the fund. (Current performance may be lower or higher than the performance data cited. For performance data current to the most recent month-end, visit our website at vanguard.com/performance.) Note, too, that both investment returns and principal value can fluctuate widely, so an investor’s shares, when sold, could be worth more or less than their original cost. The returns shown do not reflect taxes that a shareholder would pay on fund distributions or on the sale of fund shares.
Fiscal-Period Total Returns (%): September 7, 2010, Through February 28, 2011
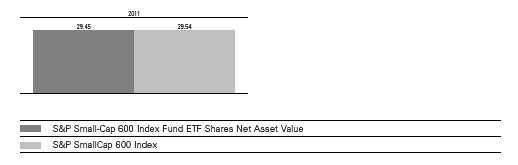
Total Returns: Period Ended December 31, 2010
This table presents returns through the latest calendar quarter—rather than through the end of the fiscal period.
Securities and Exchange Commission rules require that we provide this information.
| | |
| | | Since |
| | Inception Date | Inception |
| ETF Shares | 9/7/2010 | |
| Market Price | | 23.89% |
| Net Asset Value | | 23.82 |
See Financial Highlights for dividend and capital gains information.
8
S&P Small-Cap 600 Index Fund
Financial Statements (unaudited)
Statement of Net Assets
As of February 28, 2011
The fund reports a complete list of its holdings in regulatory filings four times in each fiscal year, at the quarter-ends. For the second and fourth fiscal quarters, the lists appear in the fund’s semiannual and annual reports to shareholders. For the first and third fiscal quarters, the fund files the lists with the Securities and Exchange Commission on Form N-Q. Shareholders can look up the fund’s Forms N-Q on the SEC’s website at sec.gov. Forms N-Q may also be reviewed and copied at the SEC’s Public Reference Room (see the back cover of this report for further information).
| | | |
| | | | Market |
| | | | Value• |
| | | Shares | ($000) |
| Common Stocks (100.0%) | | |
| Consumer Discretionary (14.2%) | | |
| | Brunswick Corp. | 1,130 | 26 |
| | Wolverine World Wide Inc. | 623 | 23 |
| * | Carter’s Inc. | 734 | 21 |
| * | Iconix Brand Group Inc. | 926 | 20 |
| * | Jo-Ann Stores Inc. | 336 | 20 |
| * | Live Nation | | |
| | Entertainment Inc. | 1,904 | 20 |
| * | CROCS Inc. | 1,109 | 20 |
| | Men’s Wearhouse Inc. | 674 | 18 |
| | Hillenbrand Inc. | 795 | 17 |
| * | Coinstar Inc. | 404 | 17 |
| * | JOS A Bank Clothiers Inc. | 352 | 16 |
| * | HSN Inc. | 494 | 16 |
| | Pool Corp. | 640 | 16 |
| * | Childrens Place Retail | | |
| | Stores Inc. | 331 | 15 |
| * | OfficeMax Inc. | 1,088 | 15 |
| * | Jack in the Box Inc. | 675 | 15 |
| | Cracker Barrel Old | | |
| | Country Store Inc. | 293 | 15 |
| * | Cabela’s Inc. | 518 | 14 |
| | Arbitron Inc. | 346 | 14 |
| | PF Chang’s China Bistro Inc. | 296 | 14 |
| | Buckle Inc. | 335 | 13 |
| | Group 1 Automotive Inc. | 307 | 13 |
| * | Steven Madden Ltd. | 297 | 13 |
| * | Texas Roadhouse Inc. Class A | 747 | 13 |
| | Monro Muffler Brake Inc. | 387 | 13 |
| * | Buffalo Wild Wings Inc. | 236 | 13 |
| * | Genesco Inc. | 312 | 12 |
| * | Capella Education Co. | 208 | 12 |
| | Finish Line Inc. Class A | 670 | 12 |
| * | DineEquity Inc. | 200 | 11 |
| * | Hibbett Sports Inc. | 353 | 11 |
| * | Helen of Troy Ltd. | 396 | 11 |
| * | Vitamin Shoppe Inc. | 315 | 11 |
| * | Ruby Tuesday Inc. | 805 | 11 |
| | | |
| * | Blue Nile Inc. | 186 | 11 |
| * | BJ’s Restaurants Inc. | 291 | 10 |
| * | Pinnacle Entertainment Inc. | 793 | 10 |
| * | Meritage Homes Corp. | 403 | 10 |
| * | CEC Entertainment Inc. | 262 | 10 |
| * | American Public | | |
| | Education Inc. | 231 | 10 |
| | Cato Corp. Class A | 382 | 9 |
| * | Skechers U.S.A. Inc. Class A | 439 | 9 |
| * | Interval Leisure Group Inc. | 527 | 9 |
| | Brown Shoe Co. Inc. | 572 | 9 |
| * | Maidenform Brands Inc. | 305 | 8 |
| * | Pre-Paid Legal Services Inc. | 124 | 8 |
| | PEP Boys-Manny Moe & Jack | 649 | 8 |
| | Stage Stores Inc. | 464 | 8 |
| | Ethan Allen Interiors Inc. | 356 | 8 |
| * | Biglari Holdings Inc. | 18 | 8 |
| * | True Religion Apparel Inc. | 319 | 8 |
| * | Papa John’s International Inc. | 253 | 7 |
| * | Quiksilver Inc. | 1,603 | 7 |
| * | Sonic Corp. | 768 | 7 |
| | Fred’s Inc. Class A | 492 | 7 |
| * | Lumber Liquidators | | |
| | Holdings Inc. | 290 | 7 |
| * | Peet’s Coffee & Tea Inc. | 157 | 7 |
| * | Zumiez Inc. | 257 | 7 |
| * | Jakks Pacific Inc. | 351 | 7 |
| * | La-Z-Boy Inc. | 646 | 6 |
| * | Shuffle Master Inc. | 672 | 6 |
| | Sonic Automotive Inc. Class A | 438 | 6 |
| | Callaway Golf Co. | 807 | 6 |
| * | Liz Claiborne Inc. | 1,186 | 6 |
| * | RC2 Corp. | 269 | 6 |
| | Superior Industries | | |
| | International Inc. | 291 | 6 |
| * | Corinthian Colleges Inc. | 1,079 | 6 |
| | Drew Industries Inc. | 237 | 5 |
| * | Winnebago Industries Inc. | 364 | 5 |
| * | California Pizza Kitchen Inc. | 309 | 5 |
| * | Universal Electronics Inc. | 190 | 5 |
9
S&P Small-Cap 600 Index Fund
| | | |
| | | | Market |
| | | | Value• |
| | | Shares | ($000) |
| * | Standard Pacific Corp. | 1,244 | 5 |
| | Universal Technical | | |
| | Institute Inc. | 257 | 5 |
| * | Red Robin Gourmet | | |
| | Burgers Inc. | 195 | 5 |
| | Nutrisystem Inc. | 337 | 4 |
| | Sturm Ruger & Co. Inc. | 239 | 4 |
| | PetMed Express Inc. | 289 | 4 |
| | Oxford Industries Inc. | 174 | 4 |
| | Lithia Motors Inc. Class A | 267 | 4 |
| | Big 5 Sporting Goods Corp. | 273 | 4 |
| | Volcom Inc. | 211 | 4 |
| * | EW Scripps Co. Class A | 379 | 4 |
| * | Perry Ellis International Inc. | 123 | 4 |
| | Marcus Corp. | 263 | 3 |
| * | K-Swiss Inc. Class A | 339 | 3 |
| | Haverty Furniture Cos. Inc. | 236 | 3 |
| * | M/I Homes Inc. | 233 | 3 |
| * | Movado Group Inc. | 215 | 3 |
| | HOT Topic Inc. | 558 | 3 |
| * | Kirkland’s Inc. | 195 | 3 |
| | Standard Motor Products Inc. | 237 | 3 |
| | Christopher & Banks Corp. | 448 | 3 |
| | Stein Mart Inc. | 333 | 3 |
| | Spartan Motors Inc. | 413 | 3 |
| * | Kid Brands Inc. | 271 | 3 |
| * | MarineMax Inc. | 277 | 3 |
| | Blyth Inc. | 67 | 2 |
| * | Coldwater Creek Inc. | 768 | 2 |
| * | Tuesday Morning Corp. | 455 | 2 |
| * | Arctic Cat Inc. | 153 | 2 |
| * | Audiovox Corp. Class A | 234 | 2 |
| * | Ruth’s Hospitality Group Inc. | 385 | 2 |
| * | Multimedia Games Inc. | 345 | 2 |
| | Skyline Corp. | 86 | 2 |
| * | O’Charleys Inc. | 236 | 2 |
| * | Monarch Casino & Resort Inc. | 141 | 1 |
| * | Midas Inc. | 180 | 1 |
| * | Zale Corp. | 299 | 1 |
| | | | 909 |
| Consumer Staples (3.5%) | | |
| * | United Natural Foods Inc. | 617 | 26 |
| * | TreeHouse Foods Inc. | 451 | 24 |
| * | Darling International Inc. | 1,476 | 21 |
| | Casey’s General Stores Inc. | 482 | 20 |
| * | Hain Celestial Group Inc. | 549 | 16 |
| | Diamond Foods Inc. | 280 | 14 |
| | Andersons Inc. | 238 | 11 |
| | Snyders-Lance Inc. | 591 | 11 |
| * | Boston Beer Co. Inc. Class A | 115 | 11 |
| | Sanderson Farms Inc. | 250 | 10 |
| | B&G Foods Inc. Class A | 602 | 9 |
| | WD-40 Co. | 219 | 9 |
| | J&J Snack Foods Corp. | 177 | 8 |
| * | Central Garden and Pet Co. | | |
| | Class A | 696 | 6 |
| | | |
| | Nash Finch Co. | 153 | 6 |
| | Cal-Maine Foods Inc. | 166 | 5 |
| | Spartan Stores Inc. | 283 | 4 |
| * | Alliance One International Inc. | 1,119 | 4 |
| * | Medifast Inc. | 168 | 4 |
| | Calavo Growers Inc. | 150 | 4 |
| * | Seneca Foods Corp. Class A | 111 | 3 |
| | | | 226 |
| Energy (6.1%) | | |
| * | Oil States International Inc. | 645 | 47 |
| | World Fuel Services Corp. | 885 | 37 |
| | Holly Corp. | 565 | 32 |
| | Lufkin Industries Inc. | 382 | 30 |
| | CARBO Ceramics Inc. | 239 | 30 |
| | SEACOR Holdings Inc. | 268 | 25 |
| * | ION Geophysical Corp. | 1,950 | 25 |
| * | Swift Energy Co. | 524 | 22 |
| * | Bristow Group Inc. | 463 | 22 |
| * | Stone Energy Corp. | 623 | 19 |
| * | Petroleum Development Corp. | 300 | 14 |
| * | Tetra Technologies Inc. | 984 | 14 |
| * | Gulfport Energy Corp. | 400 | 12 |
| | Contango Oil & Gas Co. | 163 | 10 |
| | Penn Virginia Corp. | 568 | 9 |
| * | Hornbeck Offshore | | |
| | Services Inc. | 291 | 8 |
| * | Pioneer Drilling Co. | 680 | 8 |
| * | Georesources Inc. | 224 | 7 |
| * | Petroquest Energy Inc. | 691 | 6 |
| | Gulf Island Fabrication Inc. | 179 | 6 |
| * | Basic Energy Services Inc. | 289 | 5 |
| * | Matrix Service Co. | 331 | 5 |
| | | | 393 |
| Financials (19.1%) | | |
| * | Stifel Financial Corp. | 450 | 32 |
| | BioMed Realty Trust Inc. | 1,648 | 30 |
| | Mid-America Apartment | | |
| | Communities Inc. | 438 | 28 |
| | Home Properties Inc. | 475 | 28 |
| | Entertainment | | |
| | Properties Trust | 587 | 28 |
| | Tanger Factory | | |
| | Outlet Centers | 1,024 | 27 |
| | National Retail Properties Inc. | 1,053 | 27 |
| * | Signature Bank | 515 | 27 |
| | LaSalle Hotel Properties | 935 | 26 |
| | Kilroy Realty Corp. | 664 | 26 |
| * | ProAssurance Corp. | 392 | 25 |
| * | DiamondRock Hospitality Co. | 2,101 | 25 |
| | Post Properties Inc. | 624 | 24 |
| | Extra Space Storage Inc. | 1,116 | 22 |
| | Delphi Financial Group Inc. | 693 | 21 |
| | Colonial Properties Trust | 1,066 | 21 |
| | Healthcare Realty Trust Inc. | 812 | 19 |
10
S&P Small-Cap 600 Index Fund
| | | |
| | | | Market |
| | | | Value• |
| | | Shares | ($000) |
| * | Portfolio Recovery | | |
| | Associates Inc. | 220 | 18 |
| * | Ezcorp Inc. Class A | 631 | 18 |
| | Whitney Holding Corp. | 1,215 | 17 |
| | Umpqua Holdings Corp. | 1,466 | 17 |
| | Medical Properties Trust Inc. | 1,426 | 17 |
| | Cash America | | |
| | International Inc. | 377 | 16 |
| | Susquehanna Bancshares Inc. | 1,662 | 16 |
| | EastGroup Properties Inc. | 347 | 16 |
| | UMB Financial Corp. | 384 | 15 |
| | PS Business Parks Inc. | 242 | 15 |
| | Lexington Realty Trust | 1,591 | 15 |
| | Wintrust Financial Corp. | 432 | 14 |
| | Glacier Bancorp Inc. | 923 | 14 |
| | Tower Group Inc. | 530 | 14 |
| | United Bankshares Inc. | 493 | 14 |
| | Sovran Self Storage Inc. | 355 | 14 |
| | Old National Bancorp | 1,220 | 14 |
| | First Financial | | |
| | Bankshares Inc. | 269 | 13 |
| | Franklin Street | | |
| | Properties Corp. | 895 | 13 |
| | Hancock Holding Co. | 380 | 13 |
| * | First Cash Financial | | |
| | Services Inc. | 391 | 13 |
| | Prospect Capital Corp. | 1,054 | 13 |
| | Selective Insurance | | |
| | Group Inc. | 694 | 13 |
| | First Financial Bancorp | 744 | 13 |
| | National Penn | | |
| | Bancshares Inc. | 1,547 | 12 |
| | RLI Corp. | 213 | 12 |
| * | World Acceptance Corp. | 203 | 12 |
| * | Texas Capital Bancshares Inc. | 463 | 12 |
| | Sterling Bancshares Inc. | 1,278 | 12 |
| | First Midwest Bancorp Inc. | 921 | 11 |
| | PrivateBancorp Inc. Class A | 761 | 11 |
| | Community Bank System Inc. | 414 | 10 |
| | Acadia Realty Trust | 522 | 10 |
| | Employers Holdings Inc. | 505 | 10 |
| * | Investment Technology | | |
| | Group Inc. | 526 | 10 |
| | LTC Properties Inc. | 341 | 10 |
| | NBT Bancorp Inc. | 447 | 10 |
| | Pennsylvania Real Estate | | |
| | Investment Trust | 686 | 10 |
| | Columbia Banking | | |
| | System Inc. | 491 | 10 |
| | Provident Financial | | |
| | Services Inc. | 655 | 10 |
| | Infinity Property & | | |
| | Casualty Corp. | 157 | 10 |
| | Safety Insurance Group Inc. | 196 | 9 |
| | Getty Realty Corp. | 317 | 9 |
| | Inland Real Estate Corp. | 979 | 9 |
| | | |
| * | Forestar Group Inc. | 457 | 9 |
| | optionsXpress Holdings Inc. | 531 | 9 |
| * | Piper Jaffray Cos. | 209 | 9 |
| | Interactive Brokers Group Inc. | 539 | 8 |
| | Horace Mann Educators Corp. | 490 | 8 |
| * | Navigators Group Inc. | 154 | 8 |
| * | National Financial | | |
| | Partners Corp. | 564 | 8 |
| | First Commonwealth | | |
| | Financial Corp. | 1,206 | 8 |
| | Brookline Bancorp Inc. | 742 | 8 |
| | Independent Bank Corp. | 265 | 7 |
| | Bank of the Ozarks Inc. | 163 | 7 |
| | S&T Bancorp Inc. | 308 | 7 |
| | Boston Private Financial | | |
| | Holdings Inc. | 944 | 7 |
| * | Pinnacle Financial Partners Inc. | 418 | 7 |
| | Saul Centers Inc. | 144 | 7 |
| | City Holding Co. | 191 | 7 |
| | Home Bancshares Inc. | 289 | 7 |
| | Simmons First National Corp. | | |
| | Class A | 214 | 6 |
| | Universal Health Realty | | |
| | Income Trust | 153 | 6 |
| | Urstadt Biddle Properties Inc. | | |
| | Class A | 303 | 6 |
| | Trustco Bank Corp. NY | 965 | 6 |
| | United Fire & Casualty Co. | 264 | 5 |
| | Dime Community | | |
| | Bancshares Inc. | 344 | 5 |
| | Wilmington Trust Corp. | 1,169 | 5 |
| * | Nara Bancorp Inc. | 472 | 5 |
| * | AMERISAFE Inc. | 231 | 5 |
| | Kite Realty Group Trust | 794 | 4 |
| | Parkway Properties Inc. | 272 | 4 |
| | Tompkins Financial Corp. | 102 | 4 |
| * | eHealth Inc. | 295 | 4 |
| | Cedar Shopping Centers Inc. | 579 | 4 |
| * | TradeStation Group Inc. | 503 | 3 |
| | Sterling Bancorp | 337 | 3 |
| | Bank Mutual Corp. | 570 | 3 |
| | Presidential Life Corp. | 259 | 3 |
| | Stewart Information | | |
| | Services Corp. | 229 | 3 |
| * | Hanmi Financial Corp. | 1,898 | 2 |
| * | LaBranche & Co. Inc. | 458 | 2 |
| | SWS Group Inc. | 356 | 2 |
| | Wilshire Bancorp Inc. | 243 | 2 |
| * | United Community Banks Inc. | 1,171 | 2 |
| * | First BanCorp | 265 | 1 |
| | | | 1,226 |
| Health Care (12.7%) | | |
| * | AMERIGROUP Corp. | 632 | 36 |
| | Cooper Cos. Inc. | 583 | 36 |
| * | Regeneron Pharmaceuticals Inc. 920 | 33 |
| * | Healthspring Inc. | 730 | 28 |
11
S&P Small-Cap 600 Index Fund
| | | |
| | | | Market |
| | | | Value• |
| | | Shares | ($000) |
| * | Dionex Corp. | 223 | 26 |
| * | HMS Holdings Corp. | 347 | 26 |
| * | Salix Pharmaceuticals Ltd. | 729 | 24 |
| * | Catalyst Health Solutions Inc. | 497 | 22 |
| * | American Medical Systems | | |
| | Holdings Inc. | 970 | 21 |
| * | Magellan Health Services Inc. | 425 | 20 |
| | Quality Systems Inc. | 244 | 20 |
| * | Haemonetics Corp. | 316 | 20 |
| * | Centene Corp. | 631 | 19 |
| | Chemed Corp. | 291 | 19 |
| * | PSS World Medical Inc. | 701 | 18 |
| * | Align Technology Inc. | 870 | 18 |
| * | Viropharma Inc. | 997 | 18 |
| * | Parexel International Corp. | 750 | 18 |
| | West Pharmaceutical | | |
| | Services Inc. | 426 | 18 |
| * | Cubist Pharmaceuticals Inc. | 756 | 17 |
| * | Par Pharmaceutical Cos. Inc. | 450 | 14 |
| * | Amedisys Inc. | 375 | 13 |
| * | Integra LifeSciences | | |
| | Holdings Corp. | 259 | 13 |
| * | Zoll Medical Corp. | 268 | 12 |
| | Invacare Corp. | 417 | 12 |
| * | RehabCare Group Inc. | 311 | 12 |
| * | Hanger Orthopedic Group Inc. | 422 | 11 |
| | Meridian Bioscience Inc. | 525 | 11 |
| * | MWI Veterinary Supply Inc. | 162 | 11 |
| * | Neogen Corp. | 294 | 11 |
| * | Gentiva Health Services Inc. | 373 | 11 |
| * | Cyberonics Inc. | 314 | 10 |
| * | Questcor Pharmaceuticals Inc. | 786 | 10 |
| * | CONMED Corp. | 355 | 9 |
| * | Amsurg Corp. Class A | 389 | 9 |
| * | Savient Pharmaceuticals Inc. | 913 | 9 |
| | Analogic Corp. | 161 | 9 |
| * | IPC The Hospitalist Co. Inc. | 213 | 9 |
| * | Air Methods Corp. | 146 | 9 |
| * | Molina Healthcare Inc. | 223 | 8 |
| | Landauer Inc. | 118 | 7 |
| * | Abaxis Inc. | 275 | 7 |
| | Computer Programs & | | |
| | Systems Inc. | 135 | 7 |
| * | Greatbatch Inc. | 291 | 7 |
| * | Bio-Reference Labs Inc. | 304 | 6 |
| * | ICU Medical Inc. | 146 | 6 |
| * | Merit Medical Systems Inc. | 353 | 6 |
| * | Healthways Inc. | 428 | 6 |
| * | LHC Group Inc. | 194 | 6 |
| * | Emergent Biosolutions Inc. | 270 | 6 |
| * | Natus Medical Inc. | 357 | 6 |
| * | Omnicell Inc. | 409 | 6 |
| | Ensign Group Inc. | 162 | 5 |
| * | PharMerica Corp. | 385 | 5 |
| * | Affymetrix Inc. | 889 | 4 |
| | | |
| * | Symmetry Medical Inc. | 451 | 4 |
| * | Corvel Corp. | 81 | 4 |
| * | Almost Family Inc. | 101 | 4 |
| * | Palomar Medical | | |
| | Technologies Inc. | 234 | 4 |
| * | AMN Healthcare Services Inc. | 488 | 4 |
| * | Medcath Corp. | 255 | 4 |
| * | Arqule Inc. | 548 | 4 |
| | Cantel Medical Corp. | 157 | 3 |
| * | eResearchTechnology Inc. | 532 | 3 |
| * | Cross Country Healthcare Inc. | 389 | 3 |
| * | Hi-Tech Pharmacal Co. Inc. | 126 | 3 |
| * | SurModics Inc. | 219 | 3 |
| * | Kensey Nash Corp. | 101 | 3 |
| * | Kendle International Inc. | 188 | 2 |
| * | Cambrex Corp. | 369 | 2 |
| * | CryoLife Inc. | 359 | 2 |
| * | Enzo Biochem Inc. | 418 | 2 |
| * | LCA-Vision Inc. | 234 | 2 |
| | | | 816 |
| Industrials (16.0%) | | |
| * | Esterline Technologies Corp. | 380 | 27 |
| * | EMCOR Group Inc. | 842 | 27 |
| | CLARCOR Inc. | 640 | 26 |
| * | Moog Inc. Class A | 578 | 26 |
| | Toro Co. | 397 | 25 |
| | Actuant Corp. Class A | 862 | 24 |
| | Robbins & Myers Inc. | 570 | 24 |
| * | Teledyne Technologies Inc. | 462 | 24 |
| | Brady Corp. Class A | 670 | 24 |
| | Belden Inc. | 597 | 22 |
| | Curtiss-Wright Corp. | 588 | 22 |
| * | Geo Group Inc. | 822 | 21 |
| * | United Stationers Inc. | 291 | 20 |
| * | Tetra Tech Inc. | 789 | 19 |
| | Triumph Group Inc. | 211 | 18 |
| | AO Smith Corp. | 427 | 17 |
| | Kaydon Corp. | 428 | 17 |
| * | II-VI Inc. | 326 | 17 |
| * | Old Dominion Freight Line Inc. | 537 | 17 |
| | Mueller Industries Inc. | 485 | 16 |
| * | HUB Group Inc. Class A | 469 | 16 |
| | ABM Industries Inc. | 605 | 16 |
| | Applied Industrial | | |
| | Technologies Inc. | 483 | 15 |
| | Healthcare Services Group Inc. | 846 | 15 |
| | Knight Transportation Inc. | 793 | 15 |
| | Watts Water Technologies Inc. | | |
| | Class A | 376 | 15 |
| | Simpson Manufacturing Co. Inc. | 508 | 15 |
| * | AAR Corp. | 507 | 14 |
| | Interface Inc. Class A | 815 | 14 |
| * | Orbital Sciences Corp. | 748 | 13 |
| | ESCO Technologies Inc. | 344 | 13 |
12
S&P Small-Cap 600 Index Fund
| | | |
| | | | Market |
| | | | Value• |
| | | Shares | ($000) |
| * | Insituform Technologies Inc. | | |
| | Class A | 503 | 13 |
| | Briggs & Stratton Corp. | 627 | 13 |
| | Barnes Group Inc. | 587 | 12 |
| * | Ceradyne Inc. | 312 | 12 |
| | Skywest Inc. | 698 | 12 |
| | Lindsay Corp. | 162 | 11 |
| | American Science & | | |
| | Engineering Inc. | 117 | 11 |
| | Heartland Express Inc. | 657 | 11 |
| | Forward Air Corp. | 362 | 11 |
| | Unifirst Corp. | 190 | 11 |
| * | EnPro Industries Inc. | 268 | 11 |
| * | Mobile Mini Inc. | 457 | 10 |
| | Cubic Corp. | 206 | 10 |
| | Kaman Corp. | 323 | 10 |
| * | SYKES Enterprises Inc. | 510 | 9 |
| * | SFN Group Inc. | 683 | 9 |
| * | TrueBlue Inc. | 549 | 9 |
| | Quanex Building | | |
| | Products Corp. | 465 | 9 |
| | Universal Forest Products Inc. | 251 | 9 |
| * | Astec Industries Inc. | 249 | 9 |
| | CIRCOR International Inc. | 213 | 8 |
| | Albany International Corp. | 346 | 8 |
| | Administaff Inc. | 277 | 8 |
| | National Presto Industries Inc. | 65 | 8 |
| | Allegiant Travel Co. Class A | 191 | 8 |
| * | Dycom Industries Inc. | 441 | 8 |
| | G&K Services Inc. Class A | 233 | 8 |
| | Arkansas Best Corp. | 317 | 8 |
| | Badger Meter Inc. | 188 | 7 |
| * | Griffon Corp. | 610 | 7 |
| * | Kelly Services Inc. Class A | 348 | 7 |
| * | Consolidated Graphics Inc. | 134 | 7 |
| * | Exponent Inc. | 173 | 7 |
| | John Bean Technologies Corp. | 352 | 7 |
| | AZZ Inc. | 155 | 7 |
| | Comfort Systems USA Inc. | 476 | 6 |
| | Heidrick & Struggles | | |
| | International Inc. | 219 | 6 |
| * | Navigant Consulting Inc. | 631 | 6 |
| | Viad Corp. | 257 | 6 |
| | Cascade Corp. | 115 | 6 |
| | Encore Wire Corp. | 239 | 6 |
| | Tredegar Corp. | 285 | 6 |
| * | Aerovironment Inc. | 188 | 5 |
| | Standex International Corp. | 158 | 5 |
| | Federal Signal Corp. | 778 | 5 |
| | Apogee Enterprises Inc. | 351 | 5 |
| * | On Assignment Inc. | 456 | 5 |
| * | Dolan Co. | 381 | 5 |
| | AAON Inc. | 147 | 4 |
| * | Orion Marine Group Inc. | 337 | 4 |
| * | Gibraltar Industries Inc. | 379 | 4 |
| | | |
| * | Powell Industries Inc. | 109 | 4 |
| * | GenCorp Inc. | 728 | 4 |
| | Vicor Corp. | 245 | 4 |
| * | School Specialty Inc. | 201 | 3 |
| * | NCI Building Systems Inc. | 211 | 3 |
| | CDI Corp. | 160 | 2 |
| * | Lydall Inc. | 213 | 2 |
| | Lawson Products Inc. | 50 | 1 |
| | Standard Register Co. | 159 | 1 |
| | | | 1,027 |
| Information Technology (19.5%) | | |
| * | Varian Semiconductor | | |
| | Equipment Associates Inc. | 939 | 45 |
| * | TriQuint Semiconductor Inc. | 2,028 | 29 |
| | Anixter International Inc. | 358 | 26 |
| * | Wright Express Corp. | 491 | 25 |
| * | Progress Software Corp. | 828 | 24 |
| * | Veeco Instruments Inc. | 506 | 24 |
| * | Microsemi Corp. | 1,053 | 23 |
| * | CACI International Inc. Class A | 388 | 23 |
| * | Viasat Inc. | 516 | 21 |
| * | Arris Group Inc. | 1,557 | 21 |
| * | CommVault Systems Inc. | 554 | 20 |
| | MKS Instruments Inc. | 647 | 19 |
| * | Hittite Microwave Corp. | 312 | 19 |
| * | Cymer Inc. | 378 | 19 |
| * | Take-Two Interactive | | |
| | Software Inc. | 1,091 | 18 |
| * | j2 Global Communications Inc. | 584 | 17 |
| * | Taleo Corp. Class A | 512 | 17 |
| * | JDA Software Group Inc. | 560 | 17 |
| * | FEI Co. | 492 | 17 |
| | MAXIMUS Inc. | 221 | 16 |
| * | Plexus Corp. | 517 | 16 |
| * | Blue Coat Systems Inc. | 547 | 15 |
| | Littelfuse Inc. | 286 | 15 |
| | Blackbaud Inc. | 562 | 15 |
| * | Netgear Inc. | 455 | 15 |
| * | Benchmark Electronics Inc. | 773 | 15 |
| | Power Integrations Inc. | 361 | 14 |
| * | Rofin-Sinar Technologies Inc. | 368 | 14 |
| | Cognex Corp. | 510 | 14 |
| * | Cabot Microelectronics Corp. | 288 | 14 |
| * | Diodes Inc. | 465 | 13 |
| * | MicroStrategy Inc. Class A | 107 | 13 |
| * | Synaptics Inc. | 427 | 13 |
| * | Scansource Inc. | 344 | 13 |
| * | Ebix Inc. | 477 | 13 |
| * | Harmonic Inc. | 1,217 | 12 |
| * | Stratasys Inc. | 257 | 12 |
| * | Netscout Systems Inc. | 451 | 11 |
| * | Tessera Technologies Inc. | 647 | 11 |
| * | Websense Inc. | 523 | 11 |
| * | Checkpoint Systems Inc. | 510 | 11 |
| * | Brightpoint Inc. | 861 | 11 |
13
S&P Small-Cap 600 Index Fund
| | | |
| | | | Market |
| | | | Value• |
| | Shares | ($000) |
| * | SYNNEX Corp. | 307 | 11 |
| * | DealerTrack Holdings Inc. | 528 | 11 |
| * | Insight Enterprises Inc. | 579 | 11 |
| * | Synchronoss Technologies Inc. | 303 | 10 |
| * | Brooks Automation Inc. | 816 | 10 |
| * | DTS Inc. | 224 | 10 |
| * | DG FastChannel Inc. | 302 | 10 |
| * | Sourcefire Inc. | 363 | 10 |
| | Heartland Payment | | |
| | Systems Inc. | 497 | 10 |
| * | TTM Technologies Inc. | 542 | 10 |
| | Comtech | | |
| | Telecommunications Corp. | 348 | 9 |
| * | Rogers Corp. | 198 | 9 |
| * | Bottomline Technologies Inc. | 418 | 9 |
| | MTS Systems Corp. | 199 | 9 |
| * | OSI Systems Inc. | 244 | 9 |
| * | comScore Inc. | 330 | 9 |
| | Black Box Corp. | 232 | 9 |
| * | Manhattan Associates Inc. | 272 | 9 |
| * | Volterra Semiconductor Corp. | 336 | 8 |
| * | Kulicke & Soffa Industries Inc. | 879 | 8 |
| | Micrel Inc. | 622 | 8 |
| * | CSG Systems International Inc. | 427 | 8 |
| * | TeleTech Holdings Inc. | 363 | 8 |
| | Park Electrochemical Corp. | 258 | 8 |
| * | Avid Technology Inc. | 362 | 8 |
| * | RightNow Technologies Inc. | 293 | 8 |
| * | Advanced Energy | | |
| | Industries Inc. | 479 | 8 |
| * | Newport Corp. | 461 | 8 |
| * | Ultratech Inc. | 301 | 7 |
| * | Standard Microsystems Corp. | 279 | 7 |
| * | Tyler Technologies Inc. | 331 | 7 |
| * | FARO Technologies Inc. | 204 | 7 |
| * | Radiant Systems Inc. | 424 | 7 |
| * | LogMeIn Inc. | 202 | 7 |
| * | ATMI Inc. | 394 | 7 |
| * | Mercury Computer | | |
| | Systems Inc. | 370 | 7 |
| * | Intermec Inc. | 620 | 7 |
| * | Monolithic Power Systems Inc. | 450 | 7 |
| * | Oplink Communications Inc. | 254 | 7 |
| | iGate Corp. | 363 | 7 |
| * | Ceva Inc. | 288 | 7 |
| | United Online Inc. | 1,092 | 7 |
| * | Tekelec | 854 | 7 |
| | Forrester Research Inc. | 180 | 7 |
| * | Interactive Intelligence Inc. | 177 | 6 |
| * | Epicor Software Corp. | 573 | 6 |
| | EPIQ Systems Inc. | 422 | 6 |
| * | Cardtronics Inc. | 303 | 6 |
| | Methode Electronics Inc. | 464 | 5 |
| | Daktronics Inc. | 461 | 5 |
| | CTS Corp. | 427 | 5 |
| | | |
| * | THQ Inc. | 849 | 5 |
| * | Sigma Designs Inc. | 339 | 5 |
| * | Perficient Inc. | 372 | 5 |
| * | Super Micro Computer Inc. | 306 | 5 |
| * | Electro Scientific Industries Inc. | 295 | 4 |
| | Cohu Inc. | 295 | 4 |
| * | Rudolph Technologies Inc. | 390 | 4 |
| * | Ciber Inc. | 870 | 4 |
| * | Knot Inc. | 377 | 4 |
| * | EMS Technologies Inc. | 191 | 4 |
| * | Supertex Inc. | 162 | 4 |
| * | Kopin Corp. | 835 | 4 |
| * | Infospace Inc. | 451 | 4 |
| * | Smith Micro Software Inc. | 383 | 4 |
| * | Exar Corp. | 551 | 4 |
| * | Intevac Inc. | 279 | 4 |
| * | Digi International Inc. | 313 | 3 |
| * | Liquidity Services Inc. | 213 | 3 |
| * | Pericom Semiconductor Corp. | 320 | 3 |
| | Bel Fuse Inc. Class B | 146 | 3 |
| | Pulse Electronics Corp. | 518 | 3 |
| * | Symmetricom Inc. | 550 | 3 |
| * | Integral Systems Inc. | 220 | 3 |
| * | Gerber Scientific Inc. | 315 | 3 |
| * | Radisys Corp. | 301 | 3 |
| * | Novatel Wireless Inc. | 393 | 2 |
| * | DSP Group Inc. | 292 | 2 |
| * | NCI Inc. Class A | 98 | 2 |
| | Stamps.com Inc. | 148 | 2 |
| * | PC-Tel Inc. | 239 | 2 |
| * | Network Equipment | | |
| | Technologies Inc. | 377 | 1 |
| * | LoJack Corp. | 229 | 1 |
| * | Tollgrade Communications Inc. | 129 | 1 |
| * | Agilysys Inc. | 251 | 1 |
| * | Hutchinson Technology Inc. | 293 | 1 |
| * | StarTek Inc. | 149 | 1 |
| | | | 1,248 |
| Materials (4.5%) | | |
| | Eagle Materials Inc. | 567 | 18 |
| * | PolyOne Corp. | 1,197 | 17 |
| | Texas Industries Inc. | 356 | 15 |
| * | OM Group Inc. | 396 | 14 |
| | HB Fuller Co. | 633 | 14 |
| | Buckeye Technologies Inc. | 509 | 13 |
| | Balchem Corp. | 365 | 13 |
| | Schweitzer-Mauduit | | |
| | International Inc. | 228 | 12 |
| * | Century Aluminum Co. | 730 | 12 |
| * | Clearwater Paper Corp. | 148 | 12 |
| | Arch Chemicals Inc. | 324 | 12 |
| * | RTI International Metals Inc. | 389 | 11 |
| * | Brush Engineered Materials Inc. 253 | 11 |
| * | Calgon Carbon Corp. | 728 | 10 |
| | AMCOL International Corp. | 313 | 10 |
14
S&P Small-Cap 600 Index Fund
| | | |
| | | | Market |
| | | | Value• |
| | | Shares | ($000) |
| * | STR Holdings Inc. | 519 | 9 |
| | Kaiser Aluminum Corp. | 183 | 9 |
| | A Schulman Inc. | 395 | 9 |
| | Deltic Timber Corp. | 141 | 9 |
| * | KapStone Paper and | | |
| | Packaging Corp. | 477 | 8 |
| | Stepan Co. | 101 | 7 |
| * | LSB Industries Inc. | 201 | 6 |
| | Quaker Chemical Corp. | 150 | 6 |
| | Wausau Paper Corp. | 617 | 5 |
| | Myers Industries Inc. | 439 | 4 |
| | Zep Inc. | 273 | 4 |
| * | Headwaters Inc. | 758 | 4 |
| * | AM Castle & Co. | 209 | 4 |
| | Neenah Paper Inc. | 185 | 4 |
| | Olympic Steel Inc. | 114 | 3 |
| | American Vanguard Corp. | 261 | 2 |
| | | | 287 |
| Telecommunication Services (0.7%) | |
| * | Neutral Tandem Inc. | 415 | 7 |
| | NTELOS Holdings Corp. | 364 | 7 |
| * | Cincinnati Bell Inc. | 2,561 | 7 |
| * | General Communication Inc. | | |
| | Class A | 510 | 6 |
| * | Cbeyond Inc. | 383 | 5 |
| | Atlantic Tele-Network Inc. | 112 | 5 |
| | USA Mobility Inc. | 277 | 4 |
| | | | 41 |
| Utilities (3.7%) | | |
| | Piedmont Natural Gas Co. Inc. | 909 | 27 |
| | Southwest Gas Corp. | 578 | 22 |
| | New Jersey Resources Corp. | 525 | 22 |
| | South Jersey Industries Inc. | 381 | 21 |
| | UIL Holdings Corp. | 635 | 19 |
| | Unisource Energy Corp. | 466 | 17 |
| | Northwest Natural Gas Co. | 339 | 16 |
| | Avista Corp. | 710 | 16 |
| * | El Paso Electric Co. | 541 | 15 |
| | Allete Inc. | 399 | 15 |
| | NorthWestern Corp. | 466 | 14 |
| | Laclede Group Inc. | 288 | 11 |
| | |
| CH Energy Group Inc. | 196 | 10 |
| American States Water Co. | 233 | 8 |
| Central Vermont Public | | |
| Service Corp. | 156 | 3 |
| | | 236 |
| Total Common Stocks | | |
| (Cost $5,191) | | 6,409 |
| Total Investments (100.0%) | | |
| (Cost $5,191) | | 6,409 |
| Other Assets and Liabilities (0.0%) | | |
| Other Assets | | 53 |
| Liabilities | | (51) |
| | | 2 |
| Net Assets (100%) | | |
| Applicable to 100,000 outstanding | | |
| $.001 par value shares of beneficial | | |
| interest (unlimited authorization) | | 6,411 |
| Net Asset Value Per Share— | | |
| ETF Shares | | $64.11 |
| |
| |
| At February 28, 2011, net assets consisted of: |
| | | Amount |
| | | ($000) |
| Paid-in Capital | | 5,110 |
| Undistributed Net Investment Income | 6 |
| Accumulated Net Realized Gains | | 77 |
| Unrealized Appreciation (Depreciation) | 1,218 |
| Net Assets | | 6,411 |
• See Note A in Notes to Financial Statements.
* Non-income-producing security.
See accompanying Notes, which are an integral part of the Financial Statements.
15
S&P Small-Cap 600 Index Fund
Statement of Operations
| |
| | September 7, 20101 to |
| | February 28, 2011 |
| | ($000) |
| Investment Income | |
| Income | |
| Dividends | 46 |
| Total Income | 46 |
| Expenses | |
| The Vanguard Group—Note B | |
| Management and Administrative | 2 |
| Custodian Fees | 2 |
| Total Expenses | 4 |
| Net Investment Income | 42 |
| Realized Net Gain (Loss) on Investment Securities Sold | 372 |
| Change in Unrealized Appreciation (Depreciation) of Investment Securities | 1,218 |
| Net Increase (Decrease) in Net Assets Resulting from Operations | 1,632 |
| 1 Inception. |
See accompanying Notes, which are an integral part of the Financial Statements.
16
S&P Small-Cap 600 Index Fund
Statement of Changes in Net Assets
| |
| | September 7, |
| | 20101 to |
| | February 28, |
| | 2011 |
| | ($000) |
| Increase (Decrease) in Net Assets | |
| Operations | |
| Net Investment Income | 42 |
| Realized Net Gain (Loss) | 372 |
| Change in Unrealized Appreciation (Depreciation) | 1,218 |
| Net Increase (Decrease) in Net Assets Resulting from Operations | 1,632 |
| Distributions | |
| Net Investment Income | |
| Institutional Shares | — |
| ETF Shares | (36) |
| Realized Capital Gain | |
| Institutional Shares | — |
| ETF Shares | — |
| Total Distributions | (36) |
| Capital Share Transactions | |
| Institutional Shares | (2) |
| ETF Shares | 4,817 |
| Net Increase (Decrease) from Capital Share Transactions | 4,815 |
| Total Increase (Decrease) | 6,411 |
| Net Assets | |
| Beginning of Period | — |
| End of Period2 | 6,411 |
| 1 Inception. |
| 2 Net Assets—End of Period includes undistributed net investment income of $6,000. |
See accompanying Notes, which are an integral part of the Financial Statements.
17
S&P Small-Cap 600 Index Fund
Financial Highlights
| |
| ETF Shares | |
| | September 7, 20101 to |
| For a Share Outstanding Throughout the Period | February 28, 2011 |
| Net Asset Value, Beginning of Period | $49.81 |
| Investment Operations | |
| Net Investment Income | .422 |
| Net Realized and Unrealized Gain (Loss) on Investments | 14.238 |
| Total from Investment Operations | 14.660 |
| Distributions | |
| Dividends from Net Investment Income | (.360) |
| Distributions from Realized Capital Gains | — |
| Total Distributions | (.360) |
| Net Asset Value, End of Period | $64.11 |
| |
| Total Return | 29.45% |
| |
| Ratios/Supplemental Data | |
| Net Assets, End of Period (Millions) | $6 |
| Ratio of Total Expenses to Average Net Assets | 0.15% |
| Ratio of Net Investment Income to Average Net Assets | 1.40% |
| Portfolio Turnover Rate2 | 18% |
| The expense ratio, net income ratio, and turnover rate for the current period have been annualized. |
| 1 Inception. |
| 2 Excludes the value of portfolio securities received or delivered as a result of in-kind purchases or redemptions of the fund’s capital shares, |
| including ETF Creation Units. |
See accompanying Notes, which are an integral part of the Financial Statements.
18
S&P Small-Cap 600 Index Fund
Notes to Financial Statements
Vanguard S&P Small-Cap 600 Index Fund is registered under the Investment Company Act of 1940 as an open-end investment company, or mutual fund. The fund offers two classes of shares: Institutional Shares and ETF Shares. Institutional Shares are designed for investors who meet certain administrative, service, and account-size criteria. Institutional Shares were first issued on December 15, 2010. On December 17, 2010, the sole shareholder redeemed all shares. As of February 28, 2011, there were no investors in the Institutional share class. ETF Shares were first issued on September 7, 2010, and first offered to the public on September 9, 2010. ETF Shares are listed for trading on the NYSE Arca, Inc.; they can be purchased and sold through a broker.
A. The following significant accounting policies conform to generally accepted accounting principles for U.S. mutual funds. The fund consistently follows such policies in preparing its financial statements.
1. Security Valuation: Securities are valued as of the close of trading on the New York Stock Exchange (generally 4 p.m., Eastern time) on the valuation date. Equity securities are valued at the latest quoted sales prices or official closing prices taken from the primary market in which each security trades; such securities not traded on the valuation date are valued at the mean of the latest quoted bid and asked prices. Securities for which market quotations are not readily available, or whose values have been materially affected by events occurring before the fund’s pricing time but after the close of the securities’ primary markets, are valued by methods deemed by the board of trustees to represent fair value.
2. Federal Income Taxes: The fund intends to qualify as a regulated investment company and distribute all of its taxable income. Management has analyzed the fund’s tax positions taken for its open federal income tax period ended February 28, 2011, and has concluded that no provision for federal income tax is required in the fund’s financial statements.
3. Distributions: Distributions to shareholders are recorded on the ex-dividend date.
4. Other: Dividend income is recorded on the ex-dividend date. Security transactions are accounted for on the date securities are bought or sold. Costs used to determine realized gains (losses) on the sale of investment securities are those of the specific securities sold.
B. The Vanguard Group furnishes at cost investment advisory, corporate management, administrative, marketing, and distribution services. The costs of such services are allocated to the fund under methods approved by the board of trustees. The fund has committed to provide up to 0.40% of its net assets in capital contributions to Vanguard. At February 28, 2011, the fund had contributed capital of $1,000 to Vanguard (included in Other Assets), representing 0.02% of the fund’s net assets and 0.00% of Vanguard’s capitalization. The fund’s trustees and officers are also directors and officers of Vanguard.
C. Various inputs may be used to determine the value of the fund’s investments. These inputs are summarized in three broad levels for financial statement purposes. The inputs or methodologies used to value securities are not necessarily an indication of the risk associated with investing in those securities.
Level 1—Quoted prices in active markets for identical securities.
Level 2—Other significant observable inputs (including quoted prices for similar securities, interest rates, prepayment speeds, credit risk, etc.).
Level 3—Significant unobservable inputs (including the fund’s own assumptions used to determine the fair value of investments).
At February 28, 2011, 100% of the fund’s investments were valued based on Level 1 inputs.
19
S&P Small-Cap 600 Index Fund
D. Distributions are determined on a tax basis and may differ from net investment income and realized capital gains for financial reporting purposes. Differences may be permanent or temporary. Permanent differences are reclassified among capital accounts in the financial statements to reflect their tax character. Temporary differences arise when certain items of income, expense, gain, or loss are recognized in different periods for financial statement and tax purposes; these differences will reverse at some time in the future. Differences in classification may also result from the treatment of short-term gains as ordinary income for tax purposes. The fund’s tax-basis capital gains and losses are determined only at the end of each fiscal year.
During the period ended February 28, 2011, the fund realized $295,000 of net capital gains resulting from in-kind redemptions—in which shareholders exchanged fund shares for securities held by the fund rather than for cash. Because such gains are not taxable to the fund, and are not distributed to shareholders, they have been reclassified from accumulated net realized gains to paid-in capital.
At February 28, 2011, the cost of investment securities for tax purposes was $5,191,000. Net unrealized appreciation of investment securities for tax purposes was $1,218,000, consisting of unrealized gains of $1,268,000 on securities that had risen in value since their purchase and $50,000 in unrealized losses on securities that had fallen in value since their purchase.
E. During the period ended February 28, 2011, the fund purchased $8,243,000 of investment securities and sold $3,423,000 of investment securities, other than temporary cash investments.
F. Capital share transactions for each class of shares were:
| | |
| | | Inception1 to |
| | | February 28, 2011 |
| | Amount | Shares |
| | ($000) | (000) |
| Institutional Shares | | |
| Issued | 110 | 1 |
| Issued in Lieu of Cash Distributions | — | — |
| Redeemed | (112) | (1) |
| Net Increase (Decrease)—Institutional Shares | (2) | — |
| ETF Shares | | |
| Issued | 7,569 | 150 |
| Issued in Lieu of Cash Distributions | — | — |
| Redeemed | (2,752) | (50) |
| Net Increase (Decrease)—ETF Shares | 4,817 | 100 |
| 1 Inception was September 7, 2010, for ETF Shares and December 15, 2010, for Institutional Shares. On December 17, 2010, the sole |
| shareholder in the Institutional share class redeemed all shares. As of February 28, 2011, there were no investors in the Institutional |
| share class. |
G. In preparing the financial statements as of February 28, 2011, management considered the impact
of subsequent events for potential recognition or disclosure in these financial statements.
20
S&P Small-Cap 600 Value Index Fund
Fund Profile
As of February 28, 2011
| | | |
| Portfolio Characteristics | | |
| | | Target | Broad |
| | Fund | Index1 | Index2 |
| Number of Stocks | 433 | 433 | 3,845 |
| Median Market Cap | $1.1B | $1.1B | $31.4B |
| Price/Earnings Ratio | 25.6x | 25.5x | 17.9x |
| Price/Book Ratio | 1.6x | 1.6x | 2.3x |
| Yield3 | 1.0% | 1.3% | 1.6% |
| Return on Equity | 8.9% | 8.9% | 19.2% |
| Earnings Growth Rate | –2.2% | –2.2% | 5.4% |
| Foreign Holdings | 0.0% | 0.0% | 0.0% |
| Turnover Rate4 | 28% | — | — |
| Expense Ratio5 | 0.20% | — | — |
| Short-Term Reserves | 0.0% | — | — |
| | | |
| Sector Diversification (% of equity exposure) |
| | | Target | Broad |
| | Fund | Index1 | Index2 |
| Consumer Discretionary | 11.7% | 11.7% | 11.8% |
| Consumer Staples | 3.2 | 3.2 | 9.1 |
| Energy | 6.6 | 6.6 | 11.6 |
| Financials | 23.6 | 23.7 | 16.6 |
| Health Care | 6.7 | 6.7 | 10.5 |
| Industrials | 22.1 | 22.1 | 11.4 |
| Information Technology | 14.1 | 14.0 | 18.9 |
| Materials | 5.3 | 5.3 | 4.5 |
| Telecommunication | | | |
| Services | 0.5 | 0.5 | 2.5 |
| Utilities | 6.2 | 6.2 | 3.1 |
| | |
| Ten Largest Holdings6 (% of total net assets) |
| |
| World Fuel Services Corp. | Oil & Gas Refining | |
| | & Marketing | 1.1% |
| Holly Corp. | Oil & Gas Refining | |
| | & Marketing | 1.0 |
| Esterline | Aerospace & | |
| Technologies Corp. | Defense | 0.8 |
| EMCOR Group Inc. | Construction & | |
| | Engineering | 0.8 |
| Moog Inc. Class A | Aerospace & | |
| | Defense | 0.8 |
| Anixter International Inc. | Technology | |
| | Distributors | 0.8 |
| ProAssurance Corp. | Property & | |
| | Casualty Insurance | 0.8 |
| Actuant Corp. Class A | Industrial Machinery | 0.8 |
| Teledyne | Aerospace & | |
| Technologies Inc. | Defense | 0.7 |
| Brady Corp. Class A | Electrical | |
| | Components | |
| | & Equipment | 0.7 |
| Top Ten | | 8.3% |
Investment Focus
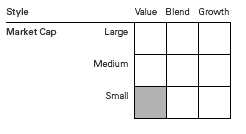
1 S&P SmallCap 600 Value Index.
2 Dow Jones U.S. Total Stock Market Index.
3 30-day SEC yield for the fund; annualized dividend yield for the indexes. See the Glossary.
4 Annualized.
5 The expense ratio shown is from the prospectus dated September 7, 2010, and represents estimated costs for the current fiscal year.
For the fiscal period ended February 28, 2011, the annualized expense ratio was 0.20%.
6 The holdings listed exclude any temporary cash investments and equity index products.
21
S&P Small-Cap 600 Value Index Fund
Performance Summary
All of the returns in this report represent past performance, which is not a guarantee of future results that may be achieved by the fund. (Current performance may be lower or higher than the performance data cited. For performance data current to the most recent month-end, visit our website at vanguard.com/performance.) Note, too, that both investment returns and principal value can fluctuate widely, so an investor’s shares, when sold, could be worth more or less than their original cost. The returns shown do not reflect taxes that a shareholder would pay on fund distributions or on the sale of fund shares.
Fiscal-Period Total Returns (%): September 7, 2010, Through February 28, 2011
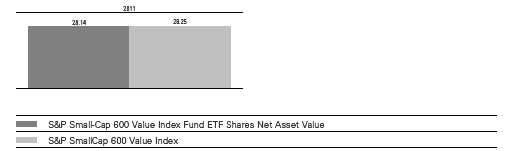
Total Returns: Period Ended December 31, 2010
This table presents returns through the latest calendar quarter—rather than through the end of the fiscal period.
Securities and Exchange Commission rules require that we provide this information.
| | |
| | | Since |
| | Inception Date | Inception |
| ETF Shares | 9/7/2010 | |
| Market Price | | 23.12% |
| Net Asset Value | | 23.05 |
See Financial Highlights for dividend and capital gains information.
22
S&P Small-Cap 600 Value Index Fund
Financial Statements (unaudited)
Statement of Net Assets
As of February 28, 2011
The fund reports a complete list of its holdings in regulatory filings four times in each fiscal year, at the quarter-ends. For the second and fourth fiscal quarters, the lists appear in the fund’s semiannual and annual reports to shareholders. For the first and third fiscal quarters, the fund files the lists with the Securities and Exchange Commission on Form N-Q. Shareholders can look up the fund’s Forms N-Q on the SEC’s website at sec.gov. Forms N-Q may also be reviewed and copied at the SEC’s Public Reference Room (see the back cover of this report for further information).
| | | |
| | | | Market |
| | | | Value• |
| | | Shares | ($000) |
| Common Stocks (100.0%) | | |
| Consumer Discretionary (11.7%) | | |
| * | Live Nation Entertainment Inc. | 3,697 | 39 |
| | Pool Corp. | 1,224 | 31 |
| * | OfficeMax Inc. | 2,102 | 29 |
| * | Jack in the Box Inc. | 1,301 | 29 |
| | Brunswick Corp. | 1,084 | 25 |
| | Group 1 Automotive Inc. | 584 | 25 |
| * | Ruby Tuesday Inc. | 1,590 | 21 |
| * | Helen of Troy Ltd. | 749 | 21 |
| * | Meritage Homes Corp. | 783 | 20 |
| | Wolverine World Wide Inc. | 511 | 19 |
| | Hillenbrand Inc. | 835 | 18 |
| * | Skechers U.S.A. Inc. Class A | 824 | 17 |
| | Brown Shoe Co. Inc. | 1,064 | 16 |
| | PEP Boys-Manny Moe & Jack | 1,285 | 16 |
| * | Childrens Place Retail | | |
| | Stores Inc. | 351 | 16 |
| | Stage Stores Inc. | 916 | 16 |
| | Men’s Wearhouse Inc. | 593 | 16 |
| | Ethan Allen Interiors Inc. | 697 | 15 |
| * | Quiksilver Inc. | 3,244 | 14 |
| * | Vitamin Shoppe Inc. | 395 | 14 |
| | Fred’s Inc. Class A | 983 | 14 |
| * | La-Z-Boy Inc. | 1,300 | 13 |
| | Sonic Automotive Inc. Class A | 886 | 13 |
| | Callaway Golf Co. | 1,614 | 12 |
| * | Pinnacle Entertainment Inc. | 861 | 11 |
| | Drew Industries Inc. | 479 | 11 |
| * | Corinthian Colleges Inc. | 2,114 | 11 |
| * | Winnebago Industries Inc. | 730 | 11 |
| * | Genesco Inc. | 259 | 10 |
| * | Standard Pacific Corp. | 2,489 | 10 |
| * | Red Robin Gourmet | | |
| | Burgers Inc. | 388 | 9 |
| * | Sonic Corp. | 958 | 9 |
| | Lithia Motors Inc. Class A | 545 | 8 |
| * | Liz Claiborne Inc. | 1,585 | 8 |
| * | Jakks Pacific Inc. | 428 | 8 |
| | | |
| | Finish Line Inc. Class A | 427 | 7 |
| | Superior Industries | | |
| | International Inc. | 372 | 7 |
| * | RC2 Corp. | 326 | 7 |
| | Marcus Corp. | 542 | 7 |
| * | K-Swiss Inc. Class A | 681 | 7 |
| | Cato Corp. Class A | 280 | 7 |
| * | Papa John’s International Inc. | 227 | 7 |
| | Haverty Furniture Cos. Inc. | 466 | 6 |
| * | M/I Homes Inc. | 460 | 6 |
| * | Movado Group Inc. | 434 | 6 |
| | HOT Topic Inc. | 1,103 | 6 |
| * | Shuffle Master Inc. | 605 | 6 |
| | Standard Motor Products Inc. | 485 | 6 |
| | Stein Mart Inc. | 675 | 6 |
| | Christopher & Banks Corp. | 888 | 5 |
| | Spartan Motors Inc. | 817 | 5 |
| * | MarineMax Inc. | 548 | 5 |
| | Blyth Inc. | 137 | 5 |
| | Nutrisystem Inc. | 342 | 5 |
| * | EW Scripps Co. Class A | 469 | 4 |
| * | Coldwater Creek Inc. | 1,505 | 4 |
| * | Tuesday Morning Corp. | 902 | 4 |
| | Oxford Industries Inc. | 164 | 4 |
| * | Arctic Cat Inc. | 304 | 4 |
| * | Ruth’s Hospitality Group Inc. | 764 | 4 |
| * | Audiovox Corp. Class A | 460 | 4 |
| * | Multimedia Games Inc. | 692 | 4 |
| | Big 5 Sporting Goods Corp. | 257 | 4 |
| * | Perry Ellis International Inc. | 110 | 3 |
| * | O’Charleys Inc. | 468 | 3 |
| * | Midas Inc. | 356 | 3 |
| * | Zale Corp. | 590 | 2 |
| | Skyline Corp. | 117 | 2 |
| * | Monarch Casino & Resort Inc. | 181 | 2 |
| | | | 742 |
| Consumer Staples (3.2%) | | |
| | Casey’s General Stores Inc. | 937 | 39 |
| * | United Natural Foods Inc. | 469 | 20 |
23
S&P Small-Cap 600 Value Index Fund
| | | |
| | | | Market |
| | | | Value• |
| | | Shares | ($000) |
| | Sanderson Farms Inc. | 472 | 20 |
| * | Hain Celestial Group Inc. | 636 | 19 |
| * | Central Garden and Pet Co. | | |
| | Class A | 1,375 | 13 |
| | Nash Finch Co. | 303 | 12 |
| | Diamond Foods Inc. | 220 | 11 |
| | Andersons Inc. | 217 | 10 |
| | Snyders-Lance Inc. | 568 | 10 |
| | Spartan Stores Inc. | 567 | 9 |
| * | Alliance One International Inc. | 2,181 | 8 |
| | WD-40 Co. | 192 | 8 |
| | B&G Foods Inc. Class A | 495 | 7 |
| * | Seneca Foods Corp. Class A | 230 | 6 |
| | J&J Snack Foods Corp. | 146 | 6 |
| | Cal-Maine Foods Inc. | 124 | 4 |
| | | | 202 |
| Energy (6.6%) | | |
| | World Fuel Services Corp. | 1,704 | 71 |
| | Holly Corp. | 1,094 | 62 |
| * | Bristow Group Inc. | 897 | 43 |
| * | Swift Energy Co. | 655 | 28 |
| | Lufkin Industries Inc. | 330 | 26 |
| * | Tetra Technologies Inc. | 1,866 | 26 |
| * | ION Geophysical Corp. | 1,898 | 24 |
| | Penn Virginia Corp. | 1,117 | 18 |
| * | Petroleum Development Corp. | 376 | 18 |
| | SEACOR Holdings Inc. | 175 | 16 |
| * | Hornbeck Offshore | | |
| | Services Inc. | 565 | 16 |
| * | Stone Energy Corp. | 522 | 16 |
| * | Pioneer Drilling Co. | 1,344 | 15 |
| | Gulf Island Fabrication Inc. | 359 | 11 |
| * | Matrix Service Co. | 654 | 9 |
| * | Petroquest Energy Inc. | 794 | 7 |
| * | Basic Energy Services Inc. | 353 | 7 |
| * | Georesources Inc. | 96 | 3 |
| | | | 416 |
| Financials (23.8%) | | |
| * | ProAssurance Corp. | 760 | 48 |
| | Delphi Financial Group Inc. | 1,344 | 42 |
| | Whitney Holding Corp. | 2,385 | 34 |
| | Umpqua Holdings Corp. | 2,827 | 32 |
| | LaSalle Hotel Properties | 1,134 | 32 |
| | BioMed Realty Trust Inc. | 1,710 | 31 |
| | Susquehanna | | |
| | Bancshares Inc. | 3,190 | 31 |
| | Kilroy Realty Corp. | 734 | 28 |
| | Wintrust Financial Corp. | 846 | 28 |
| | Entertainment | | |
| | Properties Trust | 584 | 28 |
| | Glacier Bancorp Inc. | 1,765 | 28 |
| | United Bankshares Inc. | 945 | 27 |
| * | DiamondRock Hospitality Co. | 2,264 | 27 |
| | Old National Bancorp | 2,339 | 26 |
| | Post Properties Inc. | 657 | 26 |
| | | |
| | Franklin Street | | |
| | Properties Corp. | 1,704 | 26 |
| | Hancock Holding Co. | 725 | 25 |
| | Prospect Capital Corp. | 2,059 | 25 |
| | Colonial Properties Trust | 1,235 | 24 |
| | Selective Insurance Group Inc. | 1,314 | 24 |
| | Healthcare Realty Trust Inc. | 1,009 | 24 |
| | RLI Corp. | 405 | 23 |
| | Home Properties Inc. | 386 | 23 |
| * | Texas Capital Bancshares Inc. | 899 | 23 |
| | Sterling Bancshares Inc. | 2,499 | 23 |
| | Mid-America Apartment | | |
| | Communities Inc. | 343 | 22 |
| | First Midwest Bancorp Inc. | 1,817 | 22 |
| | PrivateBancorp Inc. Class A | 1,436 | 21 |
| | National Retail Properties Inc. | 795 | 20 |
| | Extra Space Storage Inc. | 1,025 | 20 |
| * | Investment Technology | | |
| | Group Inc. | 1,021 | 20 |
| | Employers Holdings Inc. | 971 | 20 |
| | Columbia Banking System Inc. | 963 | 19 |
| | NBT Bancorp Inc. | 843 | 19 |
| | Infinity Property & | | |
| | Casualty Corp. | 304 | 18 |
| | UMB Financial Corp. | 460 | 18 |
| | Safety Insurance Group Inc. | 367 | 18 |
| | Lexington Realty Trust | 1,845 | 18 |
| | National Penn Bancshares Inc. | 2,090 | 17 |
| | Horace Mann Educators Corp. | 965 | 16 |
| * | Piper Jaffray Cos. | 389 | 16 |
| | Interactive Brokers Group Inc. | 1,031 | 16 |
| | Sovran Self Storage Inc. | 410 | 16 |
| * | Navigators Group Inc. | 303 | 16 |
| | Brookline Bancorp Inc. | 1,480 | 15 |
| | First Commonwealth | | |
| | Financial Corp. | 2,286 | 15 |
| | PS Business Parks Inc. | 230 | 15 |
| | Independent Bank Corp. | 532 | 14 |
| | First Financial Bankshares Inc. | 282 | 14 |
| | S&T Bancorp Inc. | 621 | 14 |
| | Boston Private Financial | | |
| | Holdings Inc. | 1,916 | 14 |
| * | Pinnacle Financial Partners Inc. | 844 | 13 |
| | Community Bank System Inc. | 531 | 13 |
| | City Holding Co. | 389 | 13 |
| | First Financial Bancorp | 785 | 13 |
| | EastGroup Properties Inc. | 290 | 13 |
| | Provident Financial | | |
| | Services Inc. | 871 | 13 |
| | Medical Properties Trust Inc. | 1,060 | 12 |
| | Simmons First National Corp. | | |
| | Class A | 432 | 12 |
| | Home Bancshares Inc. | 549 | 12 |
| | Inland Real Estate Corp. | 1,271 | 12 |
| | Tower Group Inc. | 437 | 12 |
24
S&P Small-Cap 600 Value Index Fund
| | | |
| | | | Market |
| | | | Value• |
| | | Shares | ($000) |
| | Trustco Bank Corp. NY | 1,933 | 12 |
| | United Fire & Casualty Co. | 533 | 11 |
| | Pennsylvania Real Estate | | |
| | Investment Trust | 721 | 10 |
| | Wilmington Trust Corp. | 2,292 | 10 |
| * | Nara Bancorp Inc. | 952 | 10 |
| | LTC Properties Inc. | 328 | 10 |
| * | AMERISAFE Inc. | 460 | 9 |
| | Parkway Properties Inc. | 549 | 9 |
| | Kite Realty Group Trust | 1,569 | 9 |
| * | National Financial | | |
| | Partners Corp. | 590 | 8 |
| | Acadia Realty Trust | 414 | 8 |
| | Cedar Shopping Centers Inc. | 1,178 | 7 |
| | Universal Health Realty | | |
| | Income Trust | 172 | 7 |
| * | TradeStation Group Inc. | 1,002 | 7 |
| | Sterling Bancorp | 666 | 7 |
| * | Forestar Group Inc. | 347 | 7 |
| | Getty Realty Corp. | 217 | 6 |
| | Dime Community | | |
| | Bancshares Inc. | 388 | 6 |
| | Urstadt Biddle Properties Inc. | | |
| | Class A | 283 | 6 |
| | Bank of the Ozarks Inc. | 127 | 5 |
| | Presidential Life Corp. | 526 | 5 |
| | Bank Mutual Corp. | 1,128 | 5 |
| | Saul Centers Inc. | 113 | 5 |
| | Stewart Information | | |
| | Services Corp. | 456 | 5 |
| | Tompkins Financial Corp. | 123 | 5 |
| * | Hanmi Financial Corp. | 3,753 | 5 |
| | SWS Group Inc. | 722 | 4 |
| * | LaBranche & Co. Inc. | 912 | 4 |
| | Wilshire Bancorp Inc. | 484 | 3 |
| * | United Community Banks Inc. | 2,328 | 3 |
| * | First BanCorp | 525 | 2 |
| | | | 1,509 |
| Health Care (6.6%) | | |
| * | Centene Corp. | 1,215 | 37 |
| * | AMERIGROUP Corp. | 473 | 27 |
| * | Amedisys Inc. | 712 | 26 |
| | Invacare Corp. | 793 | 24 |
| * | RehabCare Group Inc. | 611 | 23 |
| * | Hanger Orthopedic Group Inc. | 791 | 21 |
| * | Gentiva Health Services Inc. | 728 | 21 |
| | West Pharmaceutical | | |
| | Services Inc. | 463 | 19 |
| * | CONMED Corp. | 685 | 18 |
| * | Amsurg Corp. Class A | 753 | 18 |
| * | PSS World Medical Inc. | 636 | 17 |
| * | Molina Healthcare Inc. | 410 | 14 |
| * | Magellan Health Services Inc. | 294 | 14 |
| * | Healthways Inc. | 860 | 12 |
| | Meridian Bioscience Inc. | 427 | 9 |
| | | |
| * | Affymetrix Inc. | 1,770 | 9 |
| * | PharMerica Corp. | 734 | 9 |
| * | Symmetry Medical Inc. | 892 | 8 |
| * | AMN Healthcare Services Inc. | 980 | 7 |
| * | Medcath Corp. | 513 | 7 |
| | Analogic Corp. | 134 | 7 |
| * | Cross Country Healthcare Inc. | 770 | 6 |
| * | ICU Medical Inc. | 152 | 6 |
| * | Savient Pharmaceuticals Inc. | 652 | 6 |
| * | Greatbatch Inc. | 251 | 6 |
| * | Omnicell Inc. | 413 | 6 |
| * | Palomar Medical | | |
| | Technologies Inc. | 330 | 5 |
| * | Merit Medical Systems Inc. | 286 | 5 |
| * | Natus Medical Inc. | 305 | 5 |
| * | Emergent Biosolutions Inc. | 221 | 5 |
| * | Kendle International Inc. | 370 | 4 |
| * | LHC Group Inc. | 134 | 4 |
| * | Cambrex Corp. | 728 | 4 |
| * | eResearchTechnology Inc. | 574 | 4 |
| * | SurModics Inc. | 197 | 3 |
| * | CryoLife Inc. | 420 | 2 |
| | Cantel Medical Corp. | 100 | 2 |
| * | LCA-Vision Inc. | 299 | 2 |
| | | | 422 |
| Industrials (22.1%) | | |
| * | Esterline Technologies Corp. | 746 | 53 |
| * | EMCOR Group Inc. | 1,648 | 52 |
| * | Moog Inc. Class A | 1,125 | 51 |
| | Actuant Corp. Class A | 1,689 | 48 |
| * | Teledyne Technologies Inc. | 898 | 47 |
| | Brady Corp. Class A | 1,301 | 46 |
| | Curtiss-Wright Corp. | 1,140 | 42 |
| * | Geo Group Inc. | 1,594 | 41 |
| * | United Stationers Inc. | 571 | 38 |
| | Mueller Industries Inc. | 933 | 32 |
| | ABM Industries Inc. | 1,159 | 31 |
| | Applied Industrial | | |
| | Technologies Inc. | 930 | 30 |
| | Robbins & Myers Inc. | 669 | 28 |
| | Simpson Manufacturing | | |
| | Co. Inc. | 974 | 28 |
| | Watts Water Technologies Inc. | | |
| | Class A | 719 | 28 |
| | CLARCOR Inc. | 644 | 26 |
| * | AAR Corp. | 964 | 26 |
| | Briggs & Stratton Corp. | 1,235 | 25 |
| * | Insituform Technologies Inc. | | |
| | Class A | 961 | 25 |
| | Barnes Group Inc. | 1,111 | 24 |
| * | Ceradyne Inc. | 608 | 23 |
| | Belden Inc. | 621 | 23 |
| | Skywest Inc. | 1,345 | 22 |
| | Kaydon Corp. | 532 | 21 |
| | Toro Co. | 328 | 20 |
25
S&P Small-Cap 600 Value Index Fund
| | | |
| | | | Market |
| | | | Value• |
| | | Shares | ($000) |
| | Kaman Corp. | 634 | 20 |
| * | HUB Group Inc. Class A | 537 | 19 |
| * | SFN Group Inc. | 1,288 | 18 |
| | Quanex Building | | |
| | Products Corp. | 917 | 17 |
| * | Astec Industries Inc. | 484 | 17 |
| | Albany International Corp. | 677 | 16 |
| | Universal Forest Products Inc. | 471 | 16 |
| * | Dycom Industries Inc. | 880 | 15 |
| * | Tetra Tech Inc. | 644 | 15 |
| * | Old Dominion Freight Line Inc. | 489 | 15 |
| * | Kelly Services Inc. Class A | 708 | 15 |
| | Knight Transportation Inc. | 791 | 15 |
| | G&K Services Inc. Class A | 453 | 15 |
| | Arkansas Best Corp. | 615 | 15 |
| | AO Smith Corp. | 360 | 15 |
| * | Griffon Corp. | 1,167 | 14 |
| | ESCO Technologies Inc. | 359 | 14 |
| | Comfort Systems USA Inc. | 949 | 13 |
| * | Orbital Sciences Corp. | 682 | 12 |
| | Heartland Express Inc. | 726 | 12 |
| | Heidrick & Struggles | | |
| | International Inc. | 440 | 12 |
| | Interface Inc. Class A | 708 | 12 |
| | Viad Corp. | 507 | 12 |
| * | Navigant Consulting Inc. | 1,236 | 12 |
| | Tredegar Corp. | 575 | 11 |
| | Encore Wire Corp. | 477 | 11 |
| | Standex International Corp. | 315 | 11 |
| * | TrueBlue Inc. | 640 | 10 |
| | Federal Signal Corp. | 1,559 | 10 |
| * | Mobile Mini Inc. | 439 | 10 |
| | Unifirst Corp. | 177 | 10 |
| | Apogee Enterprises Inc. | 705 | 10 |
| * | On Assignment Inc. | 916 | 10 |
| * | SYKES Enterprises Inc. | 491 | 9 |
| | Forward Air Corp. | 306 | 9 |
| | CIRCOR International Inc. | 227 | 9 |
| | Administaff Inc. | 280 | 8 |
| * | Powell Industries Inc. | 223 | 8 |
| * | Gibraltar Industries Inc. | 752 | 8 |
| * | GenCorp Inc. | 1,478 | 8 |
| | Cascade Corp. | 149 | 7 |
| | Cubic Corp. | 142 | 7 |
| | Badger Meter Inc. | 170 | 7 |
| * | School Specialty Inc. | 398 | 6 |
| | John Bean Technologies Corp. | 312 | 6 |
| * | Aerovironment Inc. | 200 | 6 |
| | CDI Corp. | 325 | 5 |
| | AZZ Inc. | 107 | 5 |
| * | NCI Building Systems Inc. | 316 | 4 |
| * | Lydall Inc. | 424 | 4 |
| | AAON Inc. | 120 | 4 |
| | Lawson Products Inc. | 100 | 2 |
| | Standard Register Co. | 316 | 1 |
| | | | 1,402 |
| | | |
| Information Technology (14.1%) | | |
| | Anixter International Inc. | 697 | 50 |
| * | CACI International Inc. Class A | 750 | 45 |
| * | Varian Semiconductor | | |
| | Equipment Associates Inc. | 913 | 44 |
| * | Arris Group Inc. | 3,049 | 40 |
| * | Benchmark Electronics Inc. | 1,498 | 28 |
| * | Scansource Inc. | 654 | 24 |
| | MKS Instruments Inc. | 775 | 23 |
| * | Microsemi Corp. | 1,045 | 23 |
| * | Cymer Inc. | 426 | 22 |
| * | Checkpoint Systems Inc. | 969 | 21 |
| * | Brightpoint Inc. | 1,648 | 21 |
| * | Insight Enterprises Inc. | 1,125 | 21 |
| * | SYNNEX Corp. | 577 | 20 |
| * | Brooks Automation Inc. | 1,591 | 20 |
| * | Take-Two Interactive | | |
| | Software Inc. | 1,138 | 18 |
| | Heartland Payment | | |
| | Systems Inc. | 931 | 18 |
| | Comtech | | |
| | Telecommunications Corp. | 673 | 18 |
| * | FEI Co. | 540 | 18 |
| * | Rofin-Sinar Technologies Inc. | 433 | 17 |
| | Black Box Corp. | 430 | 16 |
| * | Avid Technology Inc. | 726 | 16 |
| * | Intermec Inc. | 1,204 | 14 |
| * | Plexus Corp. | 426 | 13 |
| | United Online Inc. | 2,154 | 13 |
| * | Harmonic Inc. | 1,341 | 13 |
| * | Tekelec | 1,675 | 13 |
| * | Rogers Corp. | 257 | 12 |
| | Cognex Corp. | 427 | 12 |
| | EPIQ Systems Inc. | 819 | 11 |
| | Methode Electronics Inc. | 922 | 11 |
| | Park Electrochemical Corp. | 336 | 11 |
| | CTS Corp. | 857 | 10 |
| * | Advanced Energy | | |
| | Industries Inc. | 619 | 10 |
| * | THQ Inc. | 1,703 | 10 |
| * | Cabot Microelectronics Corp. | 189 | 9 |
| * | ATMI Inc. | 504 | 9 |
| * | Tessera Technologies Inc. | 519 | 9 |
| | MTS Systems Corp. | 195 | 9 |
| * | Standard Microsystems Corp. | 328 | 9 |
| * | Ciber Inc. | 1,749 | 8 |
| * | DealerTrack Holdings Inc. | 397 | 8 |
| * | Ultratech Inc. | 320 | 8 |
| * | EMS Technologies Inc. | 380 | 7 |
| * | Infospace Inc. | 906 | 7 |
| * | FARO Technologies Inc. | 203 | 7 |
| * | Newport Corp. | 423 | 7 |
| * | Digi International Inc. | 629 | 7 |
| * | LogMeIn Inc. | 187 | 7 |
| | Bel Fuse Inc. Class B | 294 | 6 |
| | Cohu Inc. | 412 | 6 |
26
S&P Small-Cap 600 Value Index Fund
| | | |
| | | | Market |
| | | | Value• |
| | Shares | ($000) |
| * | Electro Scientific Industries Inc. | 388 | 6 |
| | Daktronics Inc. | 504 | 6 |
| * | TeleTech Holdings Inc. | 247 | 6 |
| * | Rudolph Technologies Inc. | 465 | 5 |
| * | Gerber Scientific Inc. | 624 | 5 |
| * | Supertex Inc. | 206 | 5 |
| * | Epicor Software Corp. | 452 | 5 |
| * | DSP Group Inc. | 586 | 5 |
| * | Intevac Inc. | 338 | 4 |
| * | Knot Inc. | 430 | 4 |
| * | Super Micro Computer Inc. | 283 | 4 |
| | Pulse Electronics Corp. | 696 | 4 |
| * | PC-Tel Inc. | 474 | 4 |
| * | Sigma Designs Inc. | 236 | 3 |
| * | Symmetricom Inc. | 532 | 3 |
| * | Exar Corp. | 465 | 3 |
| * | Radisys Corp. | 353 | 3 |
| * | Integral Systems Inc. | 238 | 3 |
| * | Pericom Semiconductor Corp. | 262 | 3 |
| * | Agilysys Inc. | 494 | 2 |
| * | Hutchinson Technology Inc. | 579 | 2 |
| * | LoJack Corp. | 293 | 2 |
| * | NCI Inc. Class A | 76 | 2 |
| * | StarTek Inc. | 299 | 2 |
| * | Tollgrade Communications Inc. | 147 | 1 |
| * | Network Equipment | | |
| | Technologies Inc. | 402 | 1 |
| | | | 892 |
| Materials (5.3%) | | |
| | Texas Industries Inc. | 686 | 28 |
| | HB Fuller Co. | 1,202 | 26 |
| | Eagle Materials Inc. | 746 | 24 |
| * | Clearwater Paper Corp. | 281 | 22 |
| | Arch Chemicals Inc. | 617 | 22 |
| | Kaiser Aluminum Corp. | 360 | 18 |
| | A Schulman Inc. | 765 | 17 |
| * | Century Aluminum Co. | 892 | 15 |
| * | RTI International Metals Inc. | 483 | 14 |
| | Stepan Co. | 194 | 14 |
| * | PolyOne Corp. | 960 | 13 |
| * | OM Group Inc. | 332 | 12 |
| * | STR Holdings Inc. | 570 | 10 |
| * | Calgon Carbon Corp. | 734 | 10 |
| | AMCOL International Corp. | 329 | 10 |
| | Wausau Paper Corp. | 1,229 | 10 |
| | Deltic Timber Corp. | 153 | 9 |
| | Myers Industries Inc. | 885 | 9 |
| | Zep Inc. | 545 | 9 |
| * | Brush Engineered | | |
| | Materials Inc. | 177 | 8 |
| | | |
| * | Headwaters Inc. | 1,500 | 8 |
| * | AM Castle & Co. | 416 | 7 |
| | Neenah Paper Inc. | 366 | 7 |
| | Olympic Steel Inc. | 230 | 6 |
| * | LSB Industries Inc. | 187 | 6 |
| | American Vanguard Corp. | 537 | 5 |
| | | | 339 |
| Telecommunication Services (0.5%) | |
| * | Cincinnati Bell Inc. | 5,017 | 13 |
| | NTELOS Holdings Corp. | 334 | 7 |
| | USA Mobility Inc. | 337 | 5 |
| * | General Communication Inc. | | |
| | Class A | 409 | 5 |
| | | | 30 |
| Utilities (6.1%) | | |
| | Southwest Gas Corp. | 1,127 | 44 |
| | New Jersey Resources Corp. | 1,022 | 43 |
| | UIL Holdings Corp. | 1,247 | 38 |
| | Piedmont Natural Gas Co. Inc. | 1,138 | 33 |
| | Unisource Energy Corp. | 899 | 33 |
| | Avista Corp. | 1,395 | 31 |
| | Allete Inc. | 767 | 29 |
| | NorthWestern Corp. | 890 | 27 |
| | South Jersey Industries Inc. | 416 | 23 |
| | Laclede Group Inc. | 546 | 21 |
| | Northwest Natural Gas Co. | 417 | 20 |
| | CH Energy Group Inc. | 386 | 19 |
| * | El Paso Electric Co. | 570 | 16 |
| | American States Water Co. | 219 | 7 |
| | Central Vermont Public | | |
| | Service Corp. | 329 | 7 |
| | | | 391 |
| Total Common Stocks | | |
| (Cost $5,297) | | 6,345 |
| Total Investments (100.0%) | | |
| (Cost $5,297) | | 6,345 |
| Other Assets and Liabilities (0.0%) | |
| Other Assets | | 19 |
| Liabilities | | (22) |
| | | | (3) |
| Net Assets (100%) | | |
| Applicable to 100,000 outstanding | |
| $.001 par value shares of beneficial | |
| interest (unlimited authorization) | | 6,342 |
| Net Asset Value Per Share— | | |
| ETF Shares | | $63.42 |
27
S&P Small-Cap 600 Value Index Fund
| |
| At February 28, 2011, net assets consisted of: |
| | Amount |
| | ($000) |
| Paid-in Capital | 5,110 |
| Undistributed Net Investment Income | 8 |
| Accumulated Net Realized Gains | 176 |
| Unrealized Appreciation (Depreciation) | 1,048 |
| Net Assets | 6,342 |
• See Note A in Notes to Financial Statements.
* Non-income-producing security.
See accompanying Notes, which are an integral part of the Financial Statements.
28
S&P Small-Cap 600 Value Index Fund
Statement of Operations
| |
| | September 7, 20101 to |
| | February 28, 2011 |
| | ($000) |
| Investment Income | |
| Income | |
| Dividends | 51 |
| Total Income | 51 |
| Expenses | |
| The Vanguard Group—Note B | |
| Management and Administrative | 3 |
| Custodian Fees | 2 |
| Shareholders’ Reports | 1 |
| Total Expenses | 6 |
| Net Investment Income | 45 |
| Realized Net Gain (Loss) on Investment Securities Sold | 447 |
| Change in Unrealized Appreciation (Depreciation) of Investment Securities | 1,048 |
| Net Increase (Decrease) in Net Assets Resulting from Operations | 1,540 |
| 1 Inception. |
See accompanying Notes, which are an integral part of the Financial Statements.
29
S&P Small-Cap 600 Value Index Fund
Statement of Changes in Net Assets
| |
| | September 7, |
| | 20101 to |
| | February 28, |
| | 2011 |
| | ($000) |
| Increase (Decrease) in Net Assets | |
| Operations | |
| Net Investment Income | 45 |
| Realized Net Gain (Loss) | 447 |
| Change in Unrealized Appreciation (Depreciation) | 1,048 |
| Net Increase (Decrease) in Net Assets Resulting from Operations | 1,540 |
| Distributions | |
| Net Investment Income | |
| Institutional Shares | — |
| ETF Shares | (37) |
| Realized Capital Gain | |
| Institutional Shares | — |
| ETF Shares | — |
| Total Distributions | (37) |
| Capital Share Transactions | |
| Institutional Shares | (1) |
| ETF Shares | 4,840 |
| Net Increase (Decrease) from Capital Share Transactions | 4,839 |
| Total Increase (Decrease) | 6,342 |
| Net Assets | |
| Beginning of Period | — |
| End of Period2 | 6,342 |
| 1 Inception. |
| 2 Net Assets—End of Period includes undistributed net investment income of $8,000. |
See accompanying Notes, which are an integral part of the Financial Statements.
30
S&P Small-Cap 600 Value Index Fund
Financial Highlights
| |
| ETF Shares | |
| | September 7, 20101 to |
| For a Share Outstanding Throughout the Period | February 28, 2011 |
| Net Asset Value, Beginning of Period | $49.79 |
| Investment Operations | |
| Net Investment Income | .446 |
| Net Realized and Unrealized Gain (Loss) on Investments | 13.554 |
| Total from Investment Operations | 14.000 |
| Distributions | |
| Dividends from Net Investment Income | (.370) |
| Distributions from Realized Capital Gains | — |
| Total Distributions | (.370) |
| Net Asset Value, End of Period | $63.42 |
| |
| Total Return | 28.14% |
| |
| Ratios/Supplemental Data | |
| Net Assets, End of Period (Millions) | $6 |
| Ratio of Total Expenses to Average Net Assets | 0.20% |
| Ratio of Net Investment Income to Average Net Assets | 1.49% |
| Portfolio Turnover Rate2 | 28% |
| The expense ratio, net income ratio, and turnover rate for the current period have been annualized. |
| 1 Inception. |
| 2 Excludes the value of portfolio securities received or delivered as a result of in-kind purchases or redemptions of the fund’s capital shares, |
| including ETF Creation Units. |
See accompanying Notes, which are an integral part of the Financial Statements.
31
S&P Small-Cap 600 Value Index Fund
Notes to Financial Statements
Vanguard S&P Small-Cap 600 Value Index is registered under the Investment Company Act of 1940 as an open-end investment company, or mutual fund. The fund offers two classes of shares: Institutional Shares and ETF Shares. Institutional Shares are designed for investors who meet certain administrative, service, and account-size criteria. Institutional Shares were first issued on December 15, 2010. On December 17, 2010, the sole shareholder redeemed all shares. As of February 28, 2011, there were no investors in the Institutional share class. ETF Shares were first issued on September 7, 2010, and first offered to the public on September 9, 2010. ETF Shares are listed for trading on the NYSE Arca, Inc.; they can be purchased and sold through a broker.
A. The following significant accounting policies conform to generally accepted accounting principles for U.S. mutual funds. The fund consistently follows such policies in preparing its financial statements.
1. Security Valuation: Securities are valued as of the close of trading on the New York Stock Exchange (generally 4 p.m., Eastern time) on the valuation date. Equity securities are valued at the latest quoted sales prices or official closing prices taken from the primary market in which each security trades; such securities not traded on the valuation date are valued at the mean of the latest quoted bid and asked prices. Securities for which market quotations are not readily available, or whose values have been materially affected by events occurring before the fund’s pricing time but after the close of the securities’ primary markets, are valued by methods deemed by the board of trustees to represent fair value.
2. Federal Income Taxes: The fund intends to qualify as a regulated investment company and distribute all of its taxable income. Management has analyzed the fund’s tax positions taken for its open federal income tax period ended February 28, 2011, and has concluded that no provision for federal income tax is required in the fund’s financial statements.
3. Distributions: Distributions to shareholders are recorded on the ex-dividend date.
4. Other: Dividend income is recorded on the ex-dividend date. Security transactions are accounted for on the date securities are bought or sold. Costs used to determine realized gains (losses) on the sale of investment securities are those of the specific securities sold.
B. The Vanguard Group furnishes at cost investment advisory, corporate management, administrative, marketing, and distribution services. The costs of such services are allocated to the fund under methods approved by the board of trustees. The fund has committed to provide up to 0.40% of its net assets in capital contributions to Vanguard. At February 28, 2011, the fund had contributed capital of $1,000 to Vanguard (included in Other Assets), representing 0.02% of the fund’s net assets and 0.00% of Vanguard’s capitalization. The fund’s trustees and officers are also directors and officers of Vanguard.
C. Various inputs may be used to determine the value of the fund’s investments. These inputs are summarized in three broad levels for financial statement purposes. The inputs or methodologies used to value securities are not necessarily an indication of the risk associated with investing in those securities.
Level 1—Quoted prices in active markets for identical securities.
Level 2—Other significant observable inputs (including quoted prices for similar securities, interest rates, prepayment speeds, credit risk, etc.).
Level 3—Significant unobservable inputs (including the fund’s own assumptions used to determine the fair value of investments).
At February 28, 2011, 100% of the fund’s investments were valued based on Level 1 inputs.
32
S&P Small-Cap 600 Value Index Fund
D. Distributions are determined on a tax basis and may differ from net investment income and realized capital gains for financial reporting purposes. Differences may be permanent or temporary. Permanent differences are reclassified among capital accounts in the financial statements to reflect their tax character. Temporary differences arise when certain items of income, expense, gain, or loss are recognized in different periods for financial statement and tax purposes; these differences will reverse at some time in the future. Differences in classification may also result from the treatment of short-term gains as ordinary income for tax purposes. The fund’s tax-basis capital gains and losses are determined only at the end of each fiscal year.
During the period ended February 28, 2011, the fund realized $271,000 of net capital gains resulting from in-kind redemptions—in which shareholders exchanged fund shares for securities held by the fund rather than for cash. Because such gains are not taxable to the fund, and are not distributed to shareholders, they have been reclassified from accumulated net realized gains to paid-in capital.
At February 28, 2011, the cost of investment securities for tax purposes was $5,297,000. Net unrealized appreciation of investment securities for tax purposes was $1,048,000, consisting of unrealized gains of $1,098,000 on securities that had risen in value since their purchase and $50,000 in unrealized losses on securities that had fallen in value since their purchase.
E. During the period ended February 28, 2011, the fund purchased $9,032,000 of investment securities and sold $4,181,000 of investment securities, other than temporary cash investments.
F. Capital share transactions for each class of shares were:
| | |
| | | Inception1 to |
| | | February 28, 2011 |
| | Amount | Shares |
| | ($000) | (000) |
| Institutional Shares | | |
| Issued | 70 | 1 |
| Issued in Lieu of Cash Distributions | — | — |
| Redeemed | (71) | (1) |
| Net Increase (Decrease)—Institutional Shares | (1) | — |
| ETF Shares | | |
| Issued | 7,589 | 150 |
| Issued in Lieu of Cash Distributions | — | — |
| Redeemed | (2,749) | (50) |
| Net Increase (Decrease)—ETF Shares | 4,840 | 100 |
| 1 Inception was September 7, 2010, for ETF Shares and December 15, 2010, for Institutional Shares. On December 17, 2010, the sole |
| shareholder in the Institutional share class redeemed all shares. As of February 28, 2011, there were no investors in the Institutional |
| share class. |
G. In preparing the financial statements as of February 28, 2011, management considered the impact of subsequent events for potential recognition or disclosure in these financial statements.
33
S&P Small-Cap 600 Growth Index Fund
Fund Profile
As of February 28, 2011
| | | |
| Portfolio Characteristics | | |
| | | Target | Broad |
| | Fund | Index1 | Index2 |
| Number of Stocks | 359 | 358 | 3,845 |
| Median Market Cap | $1.3B | $1.3B | $31.4B |
| Price/Earnings Ratio | 23.2x | 23.2x | 17.9x |
| Price/Book Ratio | 2.7x | 2.7x | 2.3x |
| Yield3 | 0.5% | 0.7% | 1.6% |
| Return on Equity | 13.2% | 13.2% | 19.2% |
| Earnings Growth Rate | 11.7% | 11.7% | 5.4% |
| Foreign Holdings | 0.0% | 0.0% | 0.0% |
| Turnover Rate4 | 40% | — | — |
| Expense Ratio5 | 0.20% | — | — |
| Short-Term Reserves | 0.0% | — | — |
| | | |
| Sector Diversification (% of equity exposure) |
| | | Target | Broad |
| | Fund | Index1 | Index2 |
| Consumer Discretionary | 16.8% | 16.8% | 11.8% |
| Consumer Staples | 3.9 | 3.9 | 9.1 |
| Energy | 5.7 | 5.7 | 11.6 |
| Financials | 14.3 | 14.3 | 16.6 |
| Health Care | 19.0 | 19.0 | 10.5 |
| Industrials | 9.7 | 9.7 | 11.4 |
| Information Technology | 25.1 | 25.1 | 18.9 |
| Materials | 3.6 | 3.6 | 4.5 |
| Telecommunication | | | |
| Services | 0.8 | 0.8 | 2.5 |
| Utilities | 1.1 | 1.1 | 3.1 |
| | |
| Ten Largest Holdings6 (% of total net assets) |
| |
| Oil States | Oil & Gas Equipment | |
| International Inc. | & Services | 1.5% |
| Cooper Cos. Inc. | Health Care | |
| | Supplies | 1.1 |
| Regeneron | | |
| Pharmaceuticals Inc. | Biotechnology | 1.1 |
| Stifel Financial Corp. | Investment Banking | |
| | & Brokerage | 1.0 |
| CARBO Ceramics Inc. | Oil & Gas Equipment | |
| | & Services | 0.9 |
| TriQuint | | |
| Semiconductor Inc. | Semiconductors | 0.9 |
| Tanger Factory | | |
| Outlet Centers | Retail REITs | 0.9 |
| Healthspring Inc. | Managed | |
| | Health Care | 0.9 |
| Signature Bank | Regional Banks | 0.8 |
| HMS Holdings Corp. | Health Care | |
| | Services | 0.8 |
| Top Ten | | 9.9% |
Investment Focus
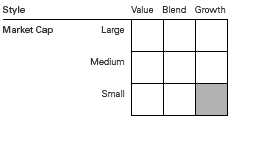
1 S&P SmallCap 600 Growth Index.
2 Dow Jones U.S. Total Stock Market Index.
3 30-day SEC yield for the fund; annualized dividend yield for the indexes. See the Glossary.
4 Annualized.
5 The expense ratio shown is from the prospectus dated September 7, 2010, and represents estimated costs for the current fiscal year.
For the fiscal period ended February 28, 2011, the annualized expense ratio was 0.20%.
6 The holdings listed exclude any temporary cash investments and equity index products.
34
S&P Small-Cap 600 Growth Index Fund
Performance Summary
All of the returns in this report represent past performance, which is not a guarantee of future results that may be achieved by the fund. (Current performance may be lower or higher than the performance data cited. For performance data current to the most recent month-end, visit our website at vanguard.com/performance.) Note, too, that both investment returns and principal value can fluctuate widely, so an investor’s shares, when sold, could be worth more or less than their original cost. The returns shown do not reflect taxes that a shareholder would pay on fund distributions or on the sale of fund shares.
Fiscal-Period Total Returns (%): September 7, 2010, Through February 28, 2011
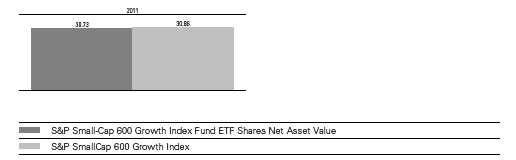
Total Returns: Period Ended December 31, 2010
This table presents returns through the latest calendar quarter—rather than through the end of the fiscal period.
Securities and Exchange Commission rules require that we provide this information.
| | |
| | | Since |
| | Inception Date | Inception |
| ETF Shares | 9/7/2010 | |
| Market Price | | 24.68% |
| Net Asset Value | | 24.58 |
See Financial Highlights for dividend and capital gains information.
35
S&P Small-Cap 600 Growth Index Fund
Financial Statements (unaudited)
Statement of Net Assets
As of February 28, 2011
The fund reports a complete list of its holdings in regulatory filings four times in each fiscal year, at the quarter-ends. For the second and fourth fiscal quarters, the lists appear in the fund’s semiannual and annual reports to shareholders. For the first and third fiscal quarters, the fund files the lists with the Securities and Exchange Commission on Form N-Q. Shareholders can look up the fund’s Forms N-Q on the SEC’s website at sec.gov. Forms N-Q may also be reviewed and copied at the SEC’s Public Reference Room (see the back cover of this report for further information).
| | | |
| | | | Market |
| | | | Value• |
| | Shares | ($000) |
| Common Stocks (100.0%) | | |
| Consumer Discretionary (16.8%) | | |
| * | Carter’s Inc. | 3,007 | 86 |
| * | Iconix Brand Group Inc. | 3,792 | 84 |
| * | Jo-Ann Stores Inc. | 1,377 | 84 |
| * | CROCS Inc. | 4,562 | 81 |
| * | Coinstar Inc. | 1,656 | 71 |
| * | JOS A Bank Clothiers Inc. | 1,445 | 67 |
| * | HSN Inc. | 2,024 | 66 |
| | Cracker Barrel Old | | |
| | Country Store Inc. | 1,221 | 61 |
| * | Cabela’s Inc. | 2,095 | 57 |
| | Arbitron Inc. | 1,409 | 56 |
| | PF Chang’s China Bistro Inc. | 1,201 | 56 |
| | Wolverine World Wide Inc. | 1,456 | 54 |
| | Brunswick Corp. | 2,318 | 53 |
| | Buckle Inc. | 1,365 | 53 |
| * | Steven Madden Ltd. | 1,204 | 52 |
| | Monro Muffler Brake Inc. | 1,580 | 52 |
| * | Texas Roadhouse Inc. Class A | 3,040 | 52 |
| * | Buffalo Wild Wings Inc. | 952 | 50 |
| * | Capella Education Co. | 865 | 50 |
| * | DineEquity Inc. | 811 | 46 |
| * | Hibbett Sports Inc. | 1,462 | 46 |
| * | Blue Nile Inc. | 753 | 43 |
| * | BJ’s Restaurants Inc. | 1,182 | 42 |
| * | CEC Entertainment Inc. | 1,074 | 42 |
| | Men’s Wearhouse Inc. | 1,515 | 40 |
| * | American Public Education Inc. | 940 | 40 |
| * | Interval Leisure Group Inc. | 2,119 | 36 |
| * | Pre-Paid Legal Services Inc. | 511 | 34 |
| * | Maidenform Brands Inc. | 1,222 | 33 |
| | Finish Line Inc. Class A | 1,896 | 33 |
| * | Biglari Holdings Inc. | 76 | 32 |
| | Hillenbrand Inc. | 1,466 | 32 |
| * | True Religion Apparel Inc. | 1,332 | 32 |
| * | Peet’s Coffee & Tea Inc. | 670 | 29 |
| * | Childrens Place Retail | | |
| | Stores Inc. | 625 | 29 |
| | | |
| * | Lumber Liquidators | | |
| | Holdings Inc. | 1,219 | 28 |
| * | Zumiez Inc. | 1,088 | 28 |
| * | Genesco Inc. | 717 | 28 |
| | Cato Corp. Class A | 952 | 23 |
| * | California Pizza Kitchen Inc. | 1,292 | 22 |
| * | Universal Electronics Inc. | 790 | 22 |
| | Universal Technical | | |
| | Institute Inc. | 1,088 | 20 |
| * | Pinnacle Entertainment Inc. | 1,407 | 18 |
| | PetMed Express Inc. | 1,202 | 18 |
| | Sturm Ruger & Co. Inc. | 980 | 18 |
| * | Papa John’s International Inc. | 575 | 17 |
| * | Vitamin Shoppe Inc. | 477 | 17 |
| | Volcom Inc. | 912 | 16 |
| * | Shuffle Master Inc. | 1,535 | 14 |
| * | Kirkland’s Inc. | 818 | 12 |
| * | Sonic Corp. | 1,220 | 11 |
| * | Kid Brands Inc. | 1,122 | 10 |
| * | Jakks Pacific Inc. | 547 | 10 |
| * | RC2 Corp. | 450 | 10 |
| | Oxford Industries Inc. | 389 | 9 |
| | Nutrisystem Inc. | 682 | 9 |
| | Superior Industries | | |
| | International Inc. | 437 | 9 |
| * | Perry Ellis International Inc. | 293 | 8 |
| | Big 5 Sporting Goods Corp. | 602 | 8 |
| * | Liz Claiborne Inc. | 1,624 | 8 |
| * | EW Scripps Co. Class A | 624 | 6 |
| | Skyline Corp. | 116 | 2 |
| * | Monarch Casino & Resort Inc. | 213 | 2 |
| | | | 2,177 |
| Consumer Staples (3.9%) | | |
| * | TreeHouse Foods Inc. | 1,851 | 97 |
| * | Darling International Inc. | 6,099 | 85 |
| * | United Natural Foods Inc. | 1,512 | 64 |
| * | Boston Beer Co. Inc. Class A | 476 | 44 |
| | Diamond Foods Inc. | 690 | 35 |
| * | Hain Celestial Group Inc. | 874 | 26 |
| | Andersons Inc. | 518 | 25 |
36
S&P Small-Cap 600 Growth Index Fund
| | | |
| | | | Market |
| | | | Value• |
| | | Shares | ($000) |
| | Snyders-Lance Inc. | 1,233 | 22 |
| | B&G Foods Inc. Class A | 1,458 | 22 |
| | J&J Snack Foods Corp. | 438 | 19 |
| | WD-40 Co. | 471 | 19 |
| * | Medifast Inc. | 698 | 16 |
| | Calavo Growers Inc. | 630 | 15 |
| | Cal-Maine Foods Inc. | 438 | 13 |
| | | | 502 |
| Energy (5.7%) | | |
| * | Oil States International Inc. | 2,650 | 193 |
| | CARBO Ceramics Inc. | 991 | 123 |
| | SEACOR Holdings Inc. | 745 | 71 |
| | Lufkin Industries Inc. | 865 | 67 |
| * | ION Geophysical Corp. | 3,906 | 50 |
| * | Gulfport Energy Corp. | 1,656 | 49 |
| * | Stone Energy Corp. | 1,447 | 44 |
| | Contango Oil & Gas Co. | 672 | 41 |
| * | Swift Energy Co. | 784 | 34 |
| * | Georesources Inc. | 728 | 23 |
| * | Petroleum Development Corp. | 415 | 19 |
| * | Petroquest Energy Inc. | 1,245 | 11 |
| * | Basic Energy Services Inc. | 470 | 9 |
| | | | 734 |
| Financials (14.3%) | | |
| * | Stifel Financial Corp. | 1,840 | 132 |
| | Tanger Factory Outlet Centers | 4,234 | 113 |
| * | Signature Bank | 2,123 | 110 |
| * | Ezcorp Inc. Class A | 2,604 | 75 |
| * | Portfolio Recovery | | |
| | Associates Inc. | 893 | 74 |
| | Mid-America Apartment | | |
| | Communities Inc. | 1,055 | 69 |
| | National Retail Properties Inc. | 2,663 | 68 |
| | Home Properties Inc. | 1,142 | 67 |
| | Cash America | | |
| | International Inc. | 1,547 | 66 |
| | BioMed Realty Trust Inc. | 3,216 | 58 |
| | Entertainment Properties | | |
| | Trust | 1,193 | 57 |
| * | First Cash Financial | | |
| | Services Inc. | 1,585 | 52 |
| * | World Acceptance Corp. | 819 | 49 |
| | Extra Space Storage Inc. | 2,381 | 47 |
| * | DiamondRock Hospitality Co. | 3,896 | 46 |
| | Kilroy Realty Corp. | 1,177 | 46 |
| | Post Properties Inc. | 1,148 | 45 |
| | Medical Properties Trust Inc. | 3,607 | 42 |
| | LaSalle Hotel Properties | 1,414 | 40 |
| | EastGroup Properties Inc. | 810 | 37 |
| | optionsXpress Holdings Inc. | 2,223 | 36 |
| | Colonial Properties Trust | 1,757 | 35 |
| | Tower Group Inc. | 1,260 | 34 |
| | PS Business Parks Inc. | 499 | 31 |
| | Healthcare Realty Trust Inc. | 1,213 | 28 |
| | | |
| | Getty Realty Corp. | 858 | 25 |
| | Acadia Realty Trust | 1,262 | 25 |
| | First Financial Bankshares Inc. | 488 | 25 |
| | Lexington Realty Trust | 2,537 | 24 |
| | First Financial Bancorp | 1,397 | 24 |
| | UMB Financial Corp. | 588 | 23 |
| | Sovran Self Storage Inc. | 575 | 22 |
| * | Forestar Group Inc. | 1,151 | 22 |
| | Pennsylvania Real Estate | | |
| | Investment Trust | 1,390 | 20 |
| | LTC Properties Inc. | 683 | 20 |
| | Bank of the Ozarks Inc. | 416 | 18 |
| | Saul Centers Inc. | 368 | 17 |
| | National Penn Bancshares Inc. | 2,023 | 16 |
| | Community Bank System Inc. | 623 | 16 |
| * | National Financial | | |
| | Partners Corp. | 1,046 | 15 |
| * | eHealth Inc. | 1,156 | 15 |
| | Provident Financial | | |
| | Services Inc. | 892 | 13 |
| | Inland Real Estate Corp. | 1,302 | 12 |
| | Urstadt Biddle Properties Inc. | | |
| | Class A | 615 | 12 |
| | Universal Health Realty | | |
| | Income Trust | 293 | 12 |
| | Dime Community | | |
| | Bancshares Inc. | 635 | 10 |
| | Tompkins Financial Corp. | 176 | 7 |
| | | | 1,850 |
| Health Care (19.0%) | | |
| | Cooper Cos. Inc. | 2,388 | 148 |
| * | Regeneron | | |
| | Pharmaceuticals Inc. | 3,800 | 138 |
| * | Healthspring Inc. | 2,993 | 113 |
| * | HMS Holdings Corp. | 1,441 | 109 |
| * | Dionex Corp. | 911 | 107 |
| * | Salix Pharmaceuticals Ltd. | 3,030 | 101 |
| * | Catalyst Health Solutions Inc. | 2,043 | 92 |
| * | AMERIGROUP Corp. | 1,581 | 91 |
| * | American Medical Systems | | |
| | Holdings Inc. | 3,998 | 87 |
| | Quality Systems Inc. | 1,000 | 80 |
| * | Haemonetics Corp. | 1,294 | 80 |
| | Chemed Corp. | 1,192 | 78 |
| * | Align Technology Inc. | 3,551 | 74 |
| * | Viropharma Inc. | 4,078 | 73 |
| * | Parexel International Corp. | 3,041 | 71 |
| * | Cubist Pharmaceuticals Inc. | 3,101 | 68 |
| * | Par Pharmaceutical Cos. Inc. | 1,861 | 57 |
| * | Magellan Health Services Inc. | 1,140 | 55 |
| * | Integra LifeSciences | | |
| | Holdings Corp. | 1,064 | 53 |
| * | Zoll Medical Corp. | 1,125 | 52 |
| * | MWI Veterinary Supply Inc. | 652 | 45 |
| * | Neogen Corp. | 1,187 | 44 |
37
S&P Small-Cap 600 Growth Index Fund
| | | |
| | | | Market |
| | | | Value• |
| | | Shares | ($000) |
| * | Questcor Pharmaceuticals Inc. | 3,251 | 42 |
| * | Cyberonics Inc. | 1,260 | 42 |
| * | PSS World Medical Inc. | 1,561 | 41 |
| * | IPC The Hospitalist Co. Inc. | 851 | 35 |
| * | Air Methods Corp. | 584 | 34 |
| | Computer Programs & | | |
| | Systems Inc. | 580 | 31 |
| * | Abaxis Inc. | 1,169 | 31 |
| | Landauer Inc. | 492 | 31 |
| | West Pharmaceutical | | |
| | Services Inc. | 749 | 31 |
| * | Bio-Reference Labs Inc. | 1,281 | 27 |
| | Meridian Bioscience Inc. | 1,234 | 27 |
| * | Savient Pharmaceuticals Inc. | 2,315 | 22 |
| | Ensign Group Inc. | 698 | 21 |
| | Analogic Corp. | 387 | 21 |
| * | Greatbatch Inc. | 690 | 17 |
| * | Corvel Corp. | 341 | 17 |
| * | Almost Family Inc. | 431 | 17 |
| * | LHC Group Inc. | 538 | 16 |
| * | Merit Medical Systems Inc. | 870 | 15 |
| * | Arqule Inc. | 2,312 | 15 |
| * | Emergent Biosolutions Inc. | 662 | 14 |
| * | Natus Medical Inc. | 872 | 14 |
| * | ICU Medical Inc. | 301 | 13 |
| * | Hi-Tech Pharmacal Co. Inc. | 535 | 12 |
| * | Kensey Nash Corp. | 442 | 12 |
| * | Omnicell Inc. | 858 | 11 |
| | Cantel Medical Corp. | 458 | 10 |
| * | Enzo Biochem Inc. | 1,785 | 8 |
| * | eResearchTechnology Inc. | 1,056 | 7 |
| * | SurModics Inc. | 498 | 6 |
| * | Palomar Medical | | |
| | Technologies Inc. | 281 | 4 |
| * | CryoLife Inc. | 596 | 3 |
| * | LCA-Vision Inc. | 351 | 2 |
| * | Genoptix Inc. | 23 | 1 |
| | | | 2,466 |
| Industrials (9.7%) | | |
| | Triumph Group Inc. | 861 | 75 |
| * | II-VI Inc. | 1,328 | 68 |
| | Healthcare Services | | |
| | Group Inc. | 3,446 | 61 |
| | Toro Co. | 934 | 58 |
| | CLARCOR Inc. | 1,265 | 52 |
| | Lindsay Corp. | 655 | 46 |
| | American Science & | | |
| | Engineering Inc. | 470 | 44 |
| * | Tetra Tech Inc. | 1,841 | 43 |
| * | EnPro Industries Inc. | 1,077 | 43 |
| | Belden Inc. | 1,129 | 41 |
| | AO Smith Corp. | 997 | 40 |
| | Robbins & Myers Inc. | 939 | 40 |
| * | Old Dominion Freight Line Inc. | 1,141 | 35 |
| | National Presto Industries Inc. | 273 | 35 |
| | | |
| | Allegiant Travel Co. Class A | 786 | 32 |
| | Interface Inc. Class A | 1,882 | 31 |
| | Knight Transportation Inc. | 1,586 | 30 |
| * | Consolidated Graphics Inc. | 533 | 29 |
| * | Exponent Inc. | 735 | 29 |
| * | Orbital Sciences Corp. | 1,608 | 29 |
| * | HUB Group Inc. Class A | 800 | 28 |
| | Cubic Corp. | 528 | 27 |
| | Forward Air Corp. | 880 | 26 |
| | Kaydon Corp. | 622 | 24 |
| | ESCO Technologies Inc. | 621 | 24 |
| | Unifirst Corp. | 406 | 23 |
| * | Mobile Mini Inc. | 987 | 22 |
| * | SYKES Enterprises Inc. | 1,109 | 21 |
| * | Dolan Co. | 1,605 | 20 |
| | Heartland Express Inc. | 1,137 | 19 |
| | AZZ Inc. | 429 | 18 |
| | Administaff Inc. | 582 | 17 |
| * | Orion Marine Group Inc. | 1,399 | 17 |
| | Badger Meter Inc. | 430 | 17 |
| | CIRCOR International Inc. | 419 | 17 |
| | John Bean Technologies Corp. | 823 | 16 |
| * | TrueBlue Inc. | 964 | 16 |
| | Vicor Corp. | 1,022 | 16 |
| | AAON Inc. | 372 | 11 |
| * | Aerovironment Inc. | 368 | 11 |
| | Cascade Corp. | 169 | 8 |
| * | NCI Building Systems Inc. | 220 | 3 |
| | | | 1,262 |
| Information Technology (25.1%) | | |
| * | TriQuint Semiconductor Inc. | 8,317 | 119 |
| * | Wright Express Corp. | 2,002 | 102 |
| * | Progress Software Corp. | 3,395 | 100 |
| * | Veeco Instruments Inc. | 2,087 | 99 |
| * | Varian Semiconductor | | |
| | Equipment Associates Inc. | 1,935 | 92 |
| * | Viasat Inc. | 2,147 | 89 |
| * | CommVault Systems Inc. | 2,252 | 82 |
| * | Hittite Microwave Corp. | 1,289 | 79 |
| * | j2 Global Communications Inc. | 2,385 | 69 |
| * | Taleo Corp. Class A | 2,116 | 68 |
| * | JDA Software Group Inc. | 2,289 | 68 |
| | MAXIMUS Inc. | 900 | 67 |
| * | Blue Coat Systems Inc. | 2,258 | 64 |
| * | Netgear Inc. | 1,874 | 61 |
| | Littelfuse Inc. | 1,162 | 61 |
| | Blackbaud Inc. | 2,295 | 61 |
| | Power Integrations Inc. | 1,462 | 58 |
| * | Diodes Inc. | 1,880 | 54 |
| * | Synaptics Inc. | 1,784 | 53 |
| * | Ebix Inc. | 1,995 | 53 |
| * | MicroStrategy Inc. Class A | 440 | 52 |
| * | Stratasys Inc. | 1,081 | 49 |
| * | Microsemi Corp. | 2,141 | 47 |
| * | Websense Inc. | 2,184 | 47 |
38
S&P Small-Cap 600 Growth Index Fund
| | | |
| | | | Market |
| | | | Value• |
| | | Shares | ($000) |
| * | Netscout Systems Inc. | 1,828 | 46 |
| * | Synchronoss Technologies Inc. | 1,254 | 43 |
| * | DG FastChannel Inc. | 1,270 | 42 |
| * | DTS Inc. | 897 | 41 |
| * | Sourcefire Inc. | 1,465 | 40 |
| * | TTM Technologies Inc. | 2,261 | 40 |
| * | Cabot Microelectronics Corp. | 804 | 39 |
| * | Plexus Corp. | 1,228 | 39 |
| * | Bottomline Technologies Inc. | 1,689 | 37 |
| * | Manhattan Associates Inc. | 1,146 | 37 |
| * | OSI Systems Inc. | 976 | 37 |
| * | comScore Inc. | 1,331 | 37 |
| * | Volterra Semiconductor Corp. | 1,405 | 35 |
| * | Kulicke & Soffa Industries Inc. | 3,683 | 35 |
| | Micrel Inc. | 2,598 | 35 |
| * | CSG Systems | | |
| | International Inc. | 1,783 | 35 |
| * | RightNow Technologies Inc. | 1,235 | 33 |
| | Cognex Corp. | 1,173 | 33 |
| * | Take-Two Interactive | | |
| | Software Inc. | 2,000 | 32 |
| * | Cymer Inc. | 635 | 32 |
| * | Radiant Systems Inc. | 1,734 | 30 |
| | MKS Instruments Inc. | 974 | 29 |
| * | Mercury Computer | | |
| | Systems Inc. | 1,536 | 29 |
| * | Tyler Technologies Inc. | 1,316 | 29 |
| * | Monolithic Power | | |
| | Systems Inc. | 1,874 | 29 |
| * | FEI Co. | 840 | 28 |
| * | Oplink Communications Inc. | 1,023 | 28 |
| | Forrester Research Inc. | 763 | 28 |
| | iGate Corp. | 1,519 | 27 |
| * | Tessera Technologies Inc. | 1,557 | 27 |
| * | Ceva Inc. | 1,151 | 26 |
| * | DealerTrack Holdings Inc. | 1,295 | 26 |
| * | Interactive Intelligence Inc. | 699 | 24 |
| * | Cardtronics Inc. | 1,260 | 24 |
| * | TeleTech Holdings Inc. | 996 | 23 |
| * | Rofin-Sinar Technologies Inc. | 580 | 22 |
| * | Harmonic Inc. | 2,292 | 22 |
| * | Perficient Inc. | 1,547 | 19 |
| | MTS Systems Corp. | 391 | 18 |
| * | Newport Corp. | 1,034 | 17 |
| * | LogMeIn Inc. | 460 | 16 |
| * | Epicor Software Corp. | 1,469 | 15 |
| * | Ultratech Inc. | 611 | 15 |
| * | FARO Technologies Inc. | 421 | 15 |
| * | Kopin Corp. | 3,378 | 15 |
| * | Smith Micro Software Inc. | 1,570 | 15 |
| * | Liquidity Services Inc. | 895 | 14 |
| * | Rogers Corp. | 289 | 14 |
| * | Standard Microsystems Corp. | 495 | 13 |
| * | Sigma Designs Inc. | 948 | 13 |
| | Park Electrochemical Corp. | 376 | 12 |
| | | |
| * | Advanced Energy | | |
| | Industries Inc. | 733 | 12 |
| * | Super Micro Computer Inc. | 718 | 11 |
| * | ATMI Inc. | 587 | 11 |
| * | Novatel Wireless Inc. | 1,685 | 10 |
| | Daktronics Inc. | 788 | 9 |
| * | Exar Corp. | 1,338 | 9 |
| | Stamps.com Inc. | 624 | 8 |
| * | Pericom Semiconductor Corp. | 751 | 8 |
| * | Rudolph Technologies Inc. | 670 | 7 |
| * | Knot Inc. | 700 | 7 |
| * | Electro Scientific | | |
| | Industries Inc. | 435 | 7 |
| * | Symmetricom Inc. | 1,153 | 7 |
| * | Intevac Inc. | 467 | 6 |
| * | NCI Inc. Class A | 250 | 6 |
| * | Supertex Inc. | 250 | 6 |
| | Cohu Inc. | 386 | 6 |
| * | Integral Systems Inc. | 426 | 5 |
| * | Radisys Corp. | 528 | 4 |
| | Pulse Electronics Corp. | 713 | 4 |
| * | Network Equipment | | |
| | Technologies Inc. | 768 | 3 |
| * | Tollgrade Communications Inc. | 241 | 2 |
| * | LoJack Corp. | 343 | 2 |
| | | | 3,254 |
| Materials (3.6%) | | |
| | Buckeye Technologies Inc. | 2,065 | 54 |
| | Balchem Corp. | 1,492 | 54 |
| | Schweitzer-Mauduit | | |
| | International Inc. | 943 | 52 |
| * | PolyOne Corp. | 2,886 | 40 |
| * | KapStone Paper and | | |
| | Packaging Corp. | 1,997 | 34 |
| * | OM Group Inc. | 920 | 32 |
| * | Brush Engineered | | |
| | Materials Inc. | 696 | 30 |
| | Eagle Materials Inc. | 713 | 23 |
| | Quaker Chemical Corp. | 593 | 23 |
| * | Calgon Carbon Corp. | 1,407 | 20 |
| | AMCOL International Corp. | 630 | 20 |
| * | Century Aluminum Co. | 1,090 | 18 |
| * | STR Holdings Inc. | 968 | 18 |
| * | RTI International Metals Inc. | 565 | 16 |
| | Deltic Timber Corp. | 241 | 15 |
| * | LSB Industries Inc. | 458 | 14 |
| | | | 463 |
| Telecommunication Services (0.8%) | |
| * | Neutral Tandem Inc. | 1,732 | 30 |
| * | Cbeyond Inc. | 1,640 | 23 |
| | Atlantic Tele-Network Inc. | 477 | 19 |
| | NTELOS Holdings Corp. | 848 | 16 |
| * | General Communication Inc. | | |
| | Class A | 1,177 | 14 |
| | USA Mobility Inc. | 449 | 7 |
| | | | 109 |
39
S&P Small-Cap 600 Growth Index Fund
| | |
| | | Market |
| | | Value• |
| | Shares | ($000) |
| Utilities (1.1%) | | |
| Piedmont Natural Gas Co. Inc. | 1,358 | 40 |
| South Jersey Industries Inc. | 672 | 37 |
| * El Paso Electric Co. | 1,003 | 28 |
| Northwest Natural Gas Co. | 510 | 24 |
| American States Water Co. | 515 | 17 |
| | | 146 |
| Total Common Stocks | | |
| (Cost $11,141) | | 12,963 |
| Temporary Cash Investment (0.1%) | |
| Money Market Fund (0.1%) | | |
| 1 Vanguard Market Liquidity | | |
| Fund, 0.213% (Cost $6) | 5,855 | 6 |
| Total Investments (100.1%) | | |
| (Cost $11,147) | | 12,969 |
| Other Assets and Liabilities (–0.1%) | |
| Other Assets | | 223 |
| Liabilities | | (231) |
| | | (8) |
| Net Assets (100%) | | |
| Applicable to 200,000 outstanding | |
| $.001 par value shares of beneficial | |
| interest (unlimited authorization) | 12,961 |
| Net Asset Value Per Share— | | |
| ETF Shares | | $64.81 |
| |
| At February 28, 2011, net assets consisted of: |
| | Amount |
| | ($000) |
| Paid-in Capital | 10,721 |
| Undistributed Net Investment Income | 7 |
| Accumulated Net Realized Gains | 411 |
| Unrealized Appreciation (Depreciation) | 1,822 |
| Net Assets | 12,961 |
• See Note A in Notes to Financial Statements.
* Non-income-producing security.
1 Affiliated money market fund available only to Vanguard funds and certain trusts and accounts managed by Vanguard. Rate shown is
the 7-day yield.
See accompanying Notes, which are an integral part of the Financial Statements.
40
S&P Small-Cap 600 Growth Index Fund
Statement of Operations
| |
| | September 7, 20101 to |
| | February 28, 2011 |
| | ($000) |
| Investment Income | |
| Income | |
| Dividends | 63 |
| Total Income | 63 |
| Expenses | |
| The Vanguard Group—Note B | |
| Management and Administrative | 4 |
| Custodian Fees | 3 |
| Shareholders’ Reports | 2 |
| Total Expenses | 9 |
| Net Investment Income | 54 |
| Realized Net Gain (Loss) on Investment Securities Sold | 462 |
| Change in Unrealized Appreciation (Depreciation) of Investment Securities | 1,822 |
| Net Increase (Decrease) in Net Assets Resulting from Operations | 2,338 |
| 1 Inception. |
See accompanying Notes, which are an integral part of the Financial Statements.
41
S&P Small-Cap 600 Growth Index Fund
Statement of Changes in Net Assets
| |
| | September 7, |
| | 20101 to |
| | February 28, |
| | 2011 |
| | ($000) |
| Increase (Decrease) in Net Assets | |
| Operations | |
| Net Investment Income | 54 |
| Realized Net Gain (Loss) | 462 |
| Change in Unrealized Appreciation (Depreciation) | 1,822 |
| Net Increase (Decrease) in Net Assets Resulting from Operations | 2,338 |
| Distributions | |
| Net Investment Income | |
| Institutional Shares | — |
| ETF Shares | (47) |
| Realized Capital Gain | |
| Institutional Shares | — |
| ETF Shares | — |
| Total Distributions | (47) |
| Capital Share Transactions | |
| Institutional Shares | (6) |
| ETF Shares | 10,676 |
| Net Increase (Decrease) from Capital Share Transactions | 10,670 |
| Total Increase (Decrease) | 12,961 |
| Net Assets | |
| Beginning of Period | — |
| End of Period2 | 12,961 |
| 1 Inception. |
| 2 Net Assets—End of Period includes undistributed net investment income of $7,000. |
See accompanying Notes, which are an integral part of the Financial Statements.
42
S&P Small-Cap 600 Growth Index Fund
Financial Highlights
| |
| ETF Shares | |
| | September 7, 20101 to |
| For a Share Outstanding Throughout the Period | February 28, 2011 |
| Net Asset Value, Beginning of Period | $49.82 |
| Investment Operations | |
| Net Investment Income | .343 |
| Net Realized and Unrealized Gain (Loss) on Investments | 14.957 |
| Total from Investment Operations | 15.300 |
| Distributions | |
| Dividends from Net Investment Income | (.310) |
| Distributions from Realized Capital Gains | — |
| Total Distributions | (.310) |
| Net Asset Value, End of Period | $64.81 |
| |
| Total Return | 30.73% |
| |
| Ratios/Supplemental Data | |
| Net Assets, End of Period (Millions) | $13 |
| Ratio of Total Expenses to Average Net Assets | 0.20% |
| Ratio of Net Investment Income to Average Net Assets | 1.15% |
| Portfolio Turnover Rate2 | 40% |
| The expense ratio, net income ratio, and turnover rate for the current period have been annualized. |
| 1 Inception. |
| 2 Excludes the value of portfolio securities received or delivered as a result of in-kind purchases or redemptions of the fund’s capital shares, |
| including ETF Creation Units. |
See accompanying Notes, which are an integral part of the Financial Statements.
43
S&P Small-Cap 600 Growth Index Fund
Notes to Financial Statements
Vanguard S&P Small-Cap 600 Growth Index Fund is registered under the Investment Company Act of 1940 as an open-end investment company, or mutual fund. The fund offers two classes of shares: Institutional Shares and ETF Shares. Institutional Shares are designed for investors who meet certain administrative, service, and account-size criteria. Institutional Shares were first issued on December 15, 2010. On December 17, 2010, the sole shareholder redeemed all shares. As of February 28, 2011, there were no investors in the Institutional share class. ETF Shares were first issued on September 7, 2010, and first offered to the public on September 9, 2010. ETF Shares are listed for trading on the NYSE Arca, Inc.; they can be purchased and sold through a broker.
A. The following significant accounting policies conform to generally accepted accounting principles for U.S. mutual funds. The fund consistently follows such policies in preparing its financial statements.
1. Security Valuation: Securities are valued as of the close of trading on the New York Stock Exchange (generally 4 p.m., Eastern time) on the valuation date. Equity securities are valued at the latest quoted sales prices or official closing prices taken from the primary market in which each security trades; such securities not traded on the valuation date are valued at the mean of the latest quoted bid and asked prices. Securities for which market quotations are not readily available, or whose values have been materially affected by events occurring before the fund’s pricing time but after the close of the securities’ primary markets, are valued by methods deemed by the board of trustees to represent fair value. Investments in Vanguard Market Liquidity Fund are valued at that fund’s net asset value.
2. Federal Income Taxes: The fund intends to qualify as a regulated investment company and distribute all of its taxable income. Management has analyzed the fund’s tax positions taken for its open federal income tax period ended February 28, 2011, and has concluded that no provision for federal income tax is required in the fund’s financial statements.
3. Distributions: Distributions to shareholders are recorded on the ex-dividend date.
4. Other: Dividend income is recorded on the ex-dividend date. Interest income includes income distributions received from Vanguard Market Liquidity Fund and is accrued daily. Security transactions are accounted for on the date securities are bought or sold. Costs used to determine realized gains (losses) on the sale of investment securities are those of the specific securities sold.
B. The Vanguard Group furnishes at cost investment advisory, corporate management, administrative, marketing, and distribution services. The costs of such services are allocated to the fund under methods approved by the board of trustees. The fund has committed to provide up to 0.40% of its net assets in capital contributions to Vanguard. At February 28, 2011, the fund had contributed capital of $2,000 to Vanguard (included in Other Assets), representing 0.02% of the fund’s net assets and 0.00% of Vanguard’s capitalization. The fund’s trustees and officers are also directors and officers of Vanguard.
C. Various inputs may be used to determine the value of the fund’s investments. These inputs are summarized in three broad levels for financial statement purposes. The inputs or methodologies used to value securities are not necessarily an indication of the risk associated with investing in those securities.
Level 1—Quoted prices in active markets for identical securities.
Level 2—Other significant observable inputs (including quoted prices for similar securities, interest rates, prepayment speeds, credit risk, etc.).
Level 3—Significant unobservable inputs (including the fund’s own assumptions used to determine the fair value of investments).
At February 28, 2011, 100% of the fund’s investments were valued based on Level 1 inputs.
44
S&P Small-Cap 600 Growth Index Fund
D. Distributions are determined on a tax basis and may differ from net investment income and realized capital gains for financial reporting purposes. Differences may be permanent or temporary. Permanent differences are reclassified among capital accounts in the financial statements to reflect their tax character. Temporary differences arise when certain items of income, expense, gain, or loss are recognized in different periods for financial statement and tax purposes; these differences will reverse at some time in the future. Differences in classification may also result from the treatment of short-term gains as ordinary income for tax purposes. The fund’s tax-basis capital gains and losses are determined only at the end of each fiscal year.
During the period ended February 28, 2011, the fund realized $51,000 of net capital gains resulting from in-kind redemptions—in which shareholders exchanged fund shares for securities held by the fund rather than for cash. Because such gains are not taxable to the fund, and are not distributed to shareholders, they have been reclassified from accumulated net realized gains to paid-in capital.
At February 28, 2011, the cost of investment securities for tax purposes was $11,147,000. Net unrealized appreciation of investment securities for tax purposes was $1,822,000, consisting of unrealized gains of $1,945,000 on securities that had risen in value since their purchase and $123,000 in unrealized losses on securities that had fallen in value since their purchase.
E. During the period ended February 28, 2011, the fund purchased $13,663,000 of investment securities and sold $2,983,000 of investment securities, other than temporary cash investments.
F. Capital share transactions for each class of shares were:
| | |
| | | Inception1 to |
| | | February 28, 2011 |
| | Amount | Shares |
| | ($000) | (000) |
| Institutional Shares | | |
| Issued | 228 | 2 |
| Issued in Lieu of Cash Distributions | — | — |
| Redeemed | (234) | (2) |
| Net Increase (Decrease)—Institutional Shares | (6) | — |
| ETF Shares | | |
| Issued | 10,676 | 200 |
| Issued in Lieu of Cash Distributions | — | — |
| Redeemed | — | — |
| Net Increase (Decrease)—ETF Shares | 10,676 | 200 |
| 1 Inception was September 7, 2010, for ETF Shares and December 15, 2010, for Institutional Shares. On December 17, 2010, the sole |
| shareholder in the Institutional share class redeemed all shares. As of February 28, 2011, there were no investors in the Institutional |
| share class. |
G. In preparing the financial statements as of February 28, 2011, management considered the impact
of subsequent events for potential recognition or disclosure in these financial statements.
45
Trustees Approve Advisory Arrangement
The board of trustees approved the launch of Vanguard S&P Small-Cap 600 Index Fund, S&P Small-Cap 600 Value Index Fund, and S&P Small-Cap 600 Growth Index Fund utilizing an internalized management structure whereby the Vanguard Group, Inc.—through its Quantitative Equity Group—would provide investment advisory services to the funds at cost. The board determined that the investment advisory arrangement with Vanguard was in the best interest of the funds and their prospective shareholders.
The board based its decision upon an evaluation of the advisor’s investment staff, portfolio management process, and performance. The trustees considered the factors discussed below, among others. However, no single factor determined whether the board approved the arrangement. Rather, it was the totality of the circumstances that drove the board’s decision.
Nature, extent, and quality of services
The board considered the quality of the investment management services to be provided to the funds and took into account the organizational depth and stability of the advisor. The board noted that Vanguard has been managing investments for more than three decades. The Quantitative Equity Group adheres to a sound, disciplined investment management process; the team has considerable experience, stability, and depth.
The board concluded that Vanguard’s experience, stability, depth, and performance, among other factors, warranted approval of the advisory arrangement.
Investment performance
The board determined that, in its management of other Vanguard index funds, the Quantitative Equity Group has a track record of consistent performance and disciplined investment processes. Information about each fund’s performance since inception can be found in the Performance Summary pages of this report.
Cost
The board considered the cost of services to be provided and concluded that the funds’ expense ratios will be below the average expense ratios charged by funds in their peer groups. Information about the funds’ expense ratios appears in the Financial Statements pages of this report.
The board does not conduct a profitability analysis of Vanguard because of Vanguard’s unique “at-cost” structure. Unlike most other mutual fund management companies, Vanguard is owned by the funds it oversees, and it produces “profits” only in the form of reduced expenses for fund shareholders.
The benefit of economies of scale
The board concluded that the funds’ low-cost arrangement with Vanguard ensures that the funds will realize economies of scale as they grow, with the cost to shareholders declining as fund assets increase.
The board will consider whether to renew the advisory arrangement after a one-year period.
46
Glossary
30-Day SEC Yield. A fund’s 30-day SEC yield is derived using a formula specified by the U.S. Securities and Exchange Commission. Under the formula, data related to the fund’s security holdings in the previous 30 days are used to calculate the fund’s hypothetical net income for that period, which is then annualized and divided by the fund’s estimated average net assets over the calculation period. For the purposes of this calculation, a security’s income is based on its current market yield to maturity (in the case of bonds) or its projected dividend yield (for stocks). Because the SEC yield represents hypothetical annualized income, it will differ—at times significantly—from the fund’s actual experience. As a result, the fund’s income distributions may be higher or lower than implied by the SEC yield.
Dividend Yield. Dividend income earned by stocks, expressed as a percentage of the aggregate market value (or of net asset value, for a fund). The yield is determined by dividing the amount of the annual dividends by the aggregate value (or net asset value) at the end of the period. For a fund, the dividend yield is based solely on stock holdings and does not include any income produced by other investments.
Earnings Growth Rate. The average annual rate of growth in earnings over the past five years for the stocks now in the fund.
Equity Exposure. A measure that reflects a fund’s investments in stocks and stock futures. Any holdings in short-term reserves are excluded.
Expense Ratio. The percentage of a fund’s average net assets used to pay its annual administrative and advisory expenses. These expenses directly reduce returns to investors.
Foreign Holdings. The percentage of a fund represented by stocks or depositary receipts of companies based outside the United States.
Inception Date. The date on which the assets of a fund (or one of its share classes) are first invested in accordance with the fund’s investment objective. For funds with a subscription period, the inception date is the day after that period ends. Investment performance is measured from the inception date.
Median Market Cap. An indicator of the size of companies in which a fund invests; the midpoint of market capitalization (market price x shares outstanding) of a fund’s stocks, weighted by the proportion of the fund’s assets invested in each stock. Stocks representing half of the fund’s assets have market capitalizations above the median, and the rest are below it.
Price/Book Ratio. The share price of a stock divided by its net worth, or book value, per share. For a fund, the weighted average price/book ratio of the stocks it holds.
Price/Earnings Ratio. The ratio of a stock’s current price to its per-share earnings over the past year. For a fund, the weighted average P/E of the stocks it holds. P/E is an indicator of market expectations about corporate prospects; the higher the P/E, the greater the expectations for a company’s future growth.
47
Return on Equity. The annual average rate of return generated by a company during the past five years for each dollar of shareholder’s equity (net income divided by shareholder’s equity). For a fund, the weighted average return on equity for the companies whose stocks it holds.
Short-Term Reserves. The percentage of a fund invested in highly liquid, short-term securities that can be readily converted to cash.
Turnover Rate. An indication of the fund’s trading activity. Funds with high turnover rates incur higher transaction costs and may be more likely to distribute capital gains (which may be taxable to investors). The turnover rate excludes in-kind transactions, which have minimal impact on costs.
48
This page intentionally left blank.
This page intentionally left blank.
This page intentionally left blank.
The People Who Govern Your Fund
The trustees of your mutual fund are there to see that the fund is operated and managed in your best interests since, as a shareholder, you are a part owner of the fund. Your fund’s trustees also serve on the board of directors of The Vanguard Group, Inc., which is owned by the Vanguard funds and provides services to them on an at-cost basis.
A majority of Vanguard’s board members are independent, meaning that they have no affiliation with Vanguard or the funds they oversee, apart from the sizable personal investments they have made as private individuals. The independent board members have distinguished backgrounds in business, academia, and public service. Each of the trustees and executive officers oversees 179 Vanguard funds.
The following table provides information for each trustee and executive officer of the fund. More information about the trustees is in the Statement of Additional Information, which can be obtained, without charge, by contacting Vanguard at 800-662-7447, or online at vanguard.com.
| |
| Interested Trustee1 | and President (2006–2008) of Rohm and Haas Co. |
| | (chemicals); Director of Tyco International, Ltd. |
| F. William McNabb III | (diversified manufacturing and services) and Hewlett- |
| Born 1957. Trustee Since July 2009. Chairman of the | Packard Co. (electronic computer manufacturing); |
| Board. Principal Occupation(s) During the Past Five | Senior Advisor at New Mountain Capital; Trustee |
| Years: Chairman of the Board of The Vanguard Group, | of The Conference Board; Member of the Board of |
| Inc., and of each of the investment companies served | Managers of Delphi Automotive LLP (automotive |
| by The Vanguard Group, since January 2010; Director | components). |
| of The Vanguard Group since 2008; Chief Executive | |
| Officer and President of The Vanguard Group and of | Amy Gutmann |
| each of the investment companies served by The | Born 1949. Trustee Since June 2006. Principal |
| Vanguard Group since 2008; Director of Vanguard | Occupation(s) During the Past Five Years: President |
| Marketing Corporation; Managing Director of The | of the University of Pennsylvania; Christopher H. |
| Vanguard Group (1995–2008). | Browne Distinguished Professor of Political Science |
| | in the School of Arts and Sciences with secondary |
| | appointments at the Annenberg School for Commu- |
| Independent Trustees | nication and the Graduate School of Education |
| | of the University of Pennsylvania; Director of |
| Emerson U. Fullwood | Carnegie Corporation of New York, Schuylkill River |
| Born 1948. Trustee Since January 2008. Principal | Development Corporation, and Greater Philadelphia |
| Occupation(s) During the Past Five Years: Executive | Chamber of Commerce; Trustee of the National |
| Chief Staff and Marketing Officer for North America | Constitution Center; Chair of the Presidential |
| and Corporate Vice President (retired 2008) of Xerox | Commission for the Study of Bioethical Issues. |
| Corporation (document management products and | |
| services); Executive in Residence and 2010 | JoAnn Heffernan Heisen |
| Distinguished Minett Professor at the Rochester | Born 1950. Trustee Since July 1998. Principal |
| Institute of Technology; Director of SPX Corporation | Occupation(s) During the Past Five Years: Corporate |
| (multi-industry manufacturing), the United Way of | Vice President and Chief Global Diversity Officer |
| Rochester, Amerigroup Corporation (managed health | (retired 2008) and Member of the Executive |
| care), the University of Rochester Medical Center, | Committee (1997–2008) of Johnson & Johnson |
| Monroe Community College Foundation, and North | (pharmaceuticals/consumer products); Director of |
| Carolina A&T University. | Skytop Lodge Corporation (hotels), the University |
| | Medical Center at Princeton, the Robert Wood |
| Rajiv L. Gupta | Johnson Foundation, and the Center for Work Life |
| Born 1945. Trustee Since December 2001.2 | Policy; Member of the Advisory Board of the |
| Principal Occupation(s) During the Past Five Years: | Maxwell School of Citizenship and Public Affairs |
| Chairman and Chief Executive Officer (retired 2009) | at Syracuse University. |
| | |
| F. Joseph Loughrey | Thomas J. Higgins | |
| Born 1949. Trustee Since October 2009. Principal | Born 1957. Chief Financial Officer Since September |
| Occupation(s) During the Past Five Years: President | 2008. Principal Occupation(s) During the Past Five |
| and Chief Operating Officer (retired 2009) and Vice | Years: Principal of The Vanguard Group, Inc.; Chief |
| Chairman of the Board (2008–2009) of Cummins Inc. | Financial Officer of each of the investment companies |
| (industrial machinery); Director of SKF AB (industrial | served by The Vanguard Group since 2008; Treasurer |
| machinery), Hillenbrand, Inc. (specialized consumer | of each of the investment companies served by The |
| services), the Lumina Foundation for Education, and | Vanguard Group (1998–2008). |
| Oxfam America; Chairman of the Advisory Council | | |
| for the College of Arts and Letters and Member | Kathryn J. Hyatt | |
| of the Advisory Board to the Kellogg Institute for | Born 1955. Treasurer Since November 2008. Principal |
| International Studies at the University of Notre Dame. | Occupation(s) During the Past Five Years: Principal |
| | of The Vanguard Group, Inc.; Treasurer of each of |
| André F. Perold | the investment companies served by The Vanguard |
| Born 1952. Trustee Since December 2004. Principal | Group since 2008; Assistant Treasurer of each of the |
| Occupation(s) During the Past Five Years: George | investment companies served by The Vanguard Group |
| Gund Professor of Finance and Banking at the Harvard | (1988–2008). | |
| Business School; Chair of the Investment Committee | | |
| of HighVista Strategies LLC (private investment firm). | Heidi Stam | |
| | Born 1956. Secretary Since July 2005. Principal |
| Alfred M. Rankin, Jr. | Occupation(s) During the Past Five Years: Managing |
| Born 1941. Trustee Since January 1993. Principal | Director of The Vanguard Group, Inc., since 2006; |
| Occupation(s) During the Past Five Years: Chairman, | General Counsel of The Vanguard Group since 2005; |
| President, and Chief Executive Officer of NACCO | Secretary of The Vanguard Group and of each of the |
| Industries, Inc. (forklift trucks/housewares/lignite); | investment companies served by The Vanguard Group |
| Director of Goodrich Corporation (industrial products/ | since 2005; Director and Senior Vice President of |
| aircraft systems and services) and the National | Vanguard Marketing Corporation since 2005; |
| Association of Manufacturers; Chairman of the | Principal of The Vanguard Group (1997–2006). |
| Federal Reserve Bank of Cleveland; Vice Chairman | | |
| of University Hospitals of Cleveland; President of | | |
| the Board of The Cleveland Museum of Art. | Vanguard Senior Management Team |
| |
| Peter F. Volanakis | R. Gregory Barton | Michael S. Miller |
| Born 1955. Trustee Since July 2009. Principal | Mortimer J. Buckley | James M. Norris |
| Occupation(s) During the Past Five Years: President | Kathleen C. Gubanich | Glenn W. Reed |
| and Chief Operating Officer (retired 2010) of Corning | Paul A. Heller | George U. Sauter |
| Incorporated (communications equipment); Director of | | |
| Corning Incorporated (2000–2010) and Dow Corning | | |
| (2001–2010); Overseer of the Amos Tuck School of | Chairman Emeritus and Senior Advisor |
| Business Administration at Dartmouth College. | | |
| | John J. Brennan | |
| | Chairman, 1996–2009 | |
| Executive Officers | Chief Executive Officer and President, 1996–2008 |
| |
| Glenn Booraem | | |
| Born 1967. Controller Since July 2010. Principal | | |
| Occupation(s) During the Past Five Years: Principal | Founder | |
| of The Vanguard Group, Inc.; Controller of each of | John C. Bogle | |
| the investment companies served by The Vanguard | Chairman and Chief Executive Officer, 1974–1996 |
| Group since 2010; Assistant Controller of each of | | |
| the investment companies served by The Vanguard | | |
| Group (2001–2010). | | |
1 Mr. McNabb is considered an “interested person,” as defined in the Investment Company Act of 1940, because he is an officer of the
Vanguard funds.
2 December 2002 for Vanguard Equity Income Fund, Vanguard Growth Equity Fund, the Vanguard Municipal Bond Funds, and the Vanguard
State Tax-Exempt Funds.

| |
| | P.O. Box 2600 |
| | Valley Forge, PA 19482-2600 |
| |
| |
| |
| Connect with Vanguard® > vanguard.com | |
| |
| |
| |
| Fund Information > 800-662-7447 | You can review and copy information about your fund |
| | at the SEC’s Public Reference Room in Washington, D.C. |
| Direct Investor Account Services > 800-662-2739 | To find out more about this public service, call the SEC |
| Institutional Investor Services > 800-523-1036 | at 202-551-8090. Information about your fund is also |
| | available on the SEC’s website, and you can receive |
| Text Telephone for People | copies of this information, for a fee, by sending a |
| With Hearing Impairment > 800-749-7273 | request in either of two ways: via e-mail addressed to |
| This material may be used in conjunction | publicinfo@sec.gov or via regular mail addressed to the |
| with the offering of shares of any Vanguard | Public Reference Section, Securities and Exchange |
| fund only if preceded or accompanied by | Commission, Washington, DC 20549-1520. |
| the fund’s current prospectus. | Standard & Poor’s®, S&P ®, Standard & Poor’s SmallCap |
| | 600®, 600®, S&P SmallCap 600 Index®, S&P SmallCap |
| All comparative mutual fund data are from Lipper Inc. | 600 Value Index®, and S&P SmallCap 600 Growth Index® |
| or Morningstar, Inc., unless otherwise noted. | are registered trademarks of Standard & Poor’s Financial |
| You can obtain a free copy of Vanguard’s proxy voting | Services LLC (”S&P”) and have been licensed for use by |
| guidelines by visiting vanguard.com/proxyreporting or | The Vanguard Group, Inc. The Vanguard mutual funds |
| by calling Vanguard at 800-662-2739. The guidelines | and ETFs are not sponsored, endorsed, sold, or promoted |
| are also available from the SEC’s website, sec.gov. | by S&P or its Affiliates, and S&P and its Affiliates make |
| In addition, you may obtain a free report on how your | no representation, warranty, or condition regarding the |
| fund voted the proxies for securities it owned during | advisability of buying, selling, or holding units/shares in |
| the 12 months ended June 30. To get the report, visit | the funds. |
| either vanguard.com/proxyreporting or sec.gov. | |
| |
| |
| |
| |
| | © 2011 The Vanguard Group, Inc. |
| | All rights reserved. |
| | Vanguard Marketing Corporation, Distributor. |
| | Q18452 042011 |
Item 2: Code of Ethics.
Not Applicable.
Item 3: Audit Committee Financial Expert.
Not Applicable.
Item 4: Principal Accountant Fees and Services.
Not Applicable.
Item 5: Audit Committee of Listed Registrants.
Not Applicable.
Item 6: Investments.
Not Applicable.
Item 7: Disclosure of Proxy Voting Policies and Procedures for Closed-End Management Investment Companies.
Not Applicable.
Item 8: Portfolio Managers of Closed-End Management Investment Companies.
Not Applicable.
Item 9: Purchase of Equity Securities by Closed-End Management Investment Company and Affiliated Purchasers.
Not Applicable.
Item 10: Submission of Matters to a Vote of Security Holders.
Not Applicable.
Item 11: Controls and Procedures.
(a) Disclosure Controls and Procedures. The Principal Executive and Financial Officers concluded that the Registrant's Disclosure Controls and Procedures are effective based on their evaluation of the Disclosure Controls and Procedures as of a date within 90 days of the filing date of this report.
(b) Internal Control Over Financial Reporting. There were no significant changes in Registrant’s Internal Control Over Financial Reporting or in other factors that could
significantly affect this control subsequent to the date of the evaluation, including any corrective actions with regard to significant deficiencies and material weaknesses.
Item 12: Exhibits.
(a) Code of Ethics.
(b) Certifications.
Pursuant to the requirements of the Securities Exchange Act of 1934 and the Investment Company Act of 1940, the registrant has duly caused this report to be signed on its behalf by the undersigned, thereunto duly authorized.
| |
| | VANGUARD ADMIRAL FUNDS |
| |
| |
| BY: | /s/ F. WILLIAM MCNABB III* |
| | F. WILLIAM MCNABB III |
| | CHIEF EXECUTIVE OFFICER |
| |
| Date: April 15, 2011 |
Pursuant to the requirements of the Securities Exchange Act of 1934 and the Investment Company Act of 1940, this report has been signed below by the following persons on behalf of the registrant and in the capacities and on the dates indicated.
| |
| | VANGUARD ADMIRAL FUNDS |
| |
| BY: | /s/ F. WILLIAM MCNABB III* |
| | F. WILLIAM MCNABB III |
| | CHIEF EXECUTIVE OFFICER |
| |
| Date: April 15, 2011 |
|
| | VANGUARD ADMIRAL FUNDS |
| |
| BY: | /s/ THOMAS J. HIGGINS* |
| | THOMAS J. HIGGINS |
| | CHIEF FINANCIAL OFFICER |
| |
| Date: April 15, 2011 |
* By: /s/ Heidi Stam
Heidi Stam, pursuant to a Power of Attorney filed on April 26, 2010, see file Number
33-53683, Incorporated by Reference.