FORM 6-K
SECURITIES AND EXCHANGE COMMISSION
Washington, D.C. 20549
Report of Foreign Issuer
Pursuant to Rule 13a-16 or 15d-16
of the Securities Exchange Act of 1934
For the month of January, 2020
Commission File Number: 001-12518
Banco Santander, S.A.
(Exact name of registrant as specified in its charter)
Ciudad Grupo Santander
28660 Boadilla del Monte (Madrid) Spain
(Address of principal executive office)
Indicate by check mark whether the registrant files or will file annual reports under cover of Form 20-F or Form 40-F:
Form 20-F ☒ Form 40-F ☐
Indicate by check mark if the registrant is submitting the Form 6-K in paper as permitted by Regulation S-T Rule 101(b)(1):
Yes ☐ No ☒
Indicate by check mark if the registrant is submitting the Form 6-K in paper as permitted by Regulation S-T Rule 101(b)(7):
Yes ☐ No ☒
Banco Santander, S.A.
TABLE OF CONTENTS

FINANCIAL REPORT
January - December
2019
| Simple Personal Fair |  | |
Financial report
January - December
2019
Index 
| Condensed consolidated financial statement | |
 |
 | All customers, shareholders and the general public can use Santander’s communication channels in all the countries in which the Bank operates. |
 | |
This report was approved by the Board of Directors on 28 January 2020, following a favourable report from the Audit Committee. Important information regarding this report can be found on pages 84 and 85.
Key consolidated data
| BALANCE SHEET (EUR million) | Dec-19 | Sep-19 | % | Dec-19 | Dec-18 | % | Dec-17 | |||||
| Total assets | 1,522,695 | 1,517,885 | 0.3 | 1,522,695 | 1,459,271 | 4.3 | 1,444,305 | |||||
| Loans and advances to customers | 942,218 | 916,003 | 2.9 | 942,218 | 882,921 | 6.7 | 848,915 | |||||
| Customer deposits | 824,365 | 814,285 | 1.2 | 824,365 | 780,496 | 5.6 | 777,730 | |||||
| Total funds | 1,050,765 | 1,035,651 | 1.5 | 1,050,765 | 980,562 | 7.2 | 985,702 | |||||
| Total equity | 110,659 | 108,526 | 2.0 | 110,659 | 107,361 | 3.1 | 106,832 | |||||
| Note: Total funds includes customer deposits, mutual funds, pension funds and managed portfolios | ||||||||||||
| INCOME STATEMENT (EUR million) | Q4'19 | Q3'19 | % | 2019 | 2018 | % | 2017 | |||||
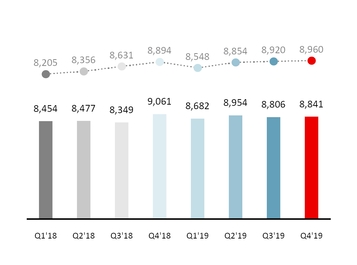
| Net interest income | 8,841 | 8,806 | 0.4 | 35,283 | 34,341 | 2.7 | 34,296 | |||||
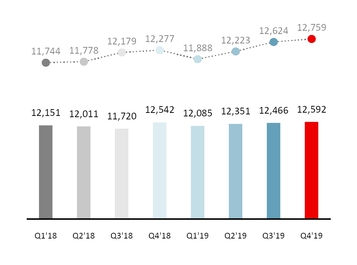
| Total income | 12,327 | 12,466 | (1.1) | 49,229 | 48,424 | 1.7 | 48,355 | |||||
| Net operating income | 6,356 | 6,744 | (5.8) | 25,949 | 25,645 | 1.2 | 25,362 | |||||
| Profit before tax | 3,831 | 2,181 | 75.7 | 12,543 | 14,201 | (11.7) | 12,091 | |||||
| Attributable profit to the parent | 2,783 | 501 | 455.5 | 6,515 | 7,810 | (16.6) | 6,619 | |||||
| Changes in constant euros: | Q4'19 / Q3'19: NII: +0.4%; Total income: -1.0%; Net operating income: -5.1%; Attributable profit: +412.0% | |||||||||||
| 2019 / 2018: NII: +3.5%; Total income: +2.6%; Net operating income: +1.9%; Attributable profit: -15.9% | ||||||||||||
UNDERLYING INCOME STATEMENT (1) (EUR million) | Q4'19 | Q3'19 | % | 2019 | 2018 | % | 2017 | |||||
| Net interest income | 8,841 | 8,806 | 0.4 | 35,283 | 34,341 | 2.7 | 34,296 | |||||
| Total income | 12,592 | 12,466 | 1.0 | 49,494 | 48,424 | 2.2 | 48,392 | |||||
| Net operating income | 6,621 | 6,744 | (1.8) | 26,214 | 25,645 | 2.2 | 25,473 | |||||
| Profit before tax | 3,506 | 3,844 | (8.8) | 14,929 | 14,776 | 1.0 | 13,550 | |||||
| Attributable profit to the parent | 2,072 | 2,135 | (3.0) | 8,252 | 8,064 | 2.3 | 7,516 | |||||
| Changes in constant euros: | Q4'19 / Q3'19: NII: +0.4%; Total income: +1.1%; Net operating income: -1.2%; Attributable profit: -2.3% | |||||||||||
| 2019 / 2018: NII: +3.5%; Total income: +3.2%; Net operating income: +3.0%; Attributable profit: +3.2% | ||||||||||||
| EPS, PROFITABILITY AND EFFICIENCY (%) | Q4'19 | Q3'19 | % | 2019 | 2018 | % | 2017 |
| EPS (euro) | 0.161 | 0.021 | 670.3 | 0.362 | 0.449 | (19.4) | 0.404 |
Underlying EPS (euro) (1) | 0.116 | 0.121 | (4.0) | 0.468 | 0.465 | 0.7 | 0.463 |
| RoE | 9.10 | 7.02 | 6.62 | 8.21 | 7.14 | ||
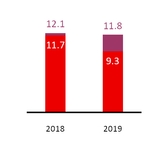
| RoTE | 12.62 | 9.86 | 9.31 | 11.70 | 10.41 | ||
Underlying RoTE (1) | 11.63 | 12.19 | 11.79 | 12.08 | 11.82 | ||
| RoA | 0.68 | 0.56 | 0.54 | 0.64 | 0.58 | ||
| RoRWA | 1.69 | 1.39 | 1.33 | 1.55 | 1.35 | ||
Underlying RoRWA (1) | 1.57 | 1.65 | 1.61 | 1.59 | 1.48 | ||
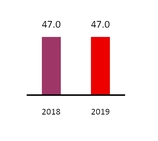
| Efficiency ratio | 47.4 | 45.9 | 47.0 | 47.0 | 47.4 | ||
| SOLVENCY AND NPL RATIOS (%) | Dec-19 | Sep-19 | Dec-19 | Dec-18 | Dec-17 | ||
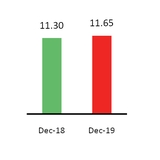
CET1 (2) | 11.65 | 11.30 | 11.65 | 11.30 | 10.84 | ||
Fully loaded Total Capital ratio (2) | 15.02 | 14.68 | 15.02 | 14.77 | 14.48 | ||
| NPL ratio | 3.32 | 3.47 | 3.32 | 3.73 | 4.08 | ||
| Coverage ratio | 68 | 67 | 68 | 67 | 65 | ||
| MARKET CAPITALISATION AND SHARES | Dec-19 | Sep-19 | % | Dec-19 | Dec-18 | % | Dec-17 | ||||||
| Shares (millions) | 16,618 | 16,618 | — | 16,618 | 16,237 | 2.3 | 16,136 | ||||||
| Share price (euro) | 3.730 | 3.737 | (0.2) | 3.730 | 3.973 | (6.1) | 5.479 | ||||||
| Market capitalisation (EUR million) | 61,986 | 62,094 | (0.2) | 61,986 | 64,508 | (3.9) | 88,410 | ||||||
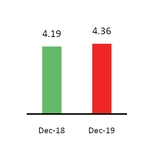
| Tangible book value per share (euro) | 4.36 | 4.25 | 4.36 | 4.19 | 4.15 | ||||||||
| Price / Tangible book value per share (X) | 0.86 | 0.88 | 0.86 | 0.95 | 1.32 | ||||||||
| P/E ratio (X) | 10.30 | 13.90 | 10.30 | 8.84 | 13.56 | ||||||||
| OTHER DATA | Dec-19 | Sep-19 | % | Dec-19 | Dec-18 | % | Dec-17 | |||||
| Number of shareholders | 3,986,093 | 4,025,074 | (1.0) | 3,986,093 | 4,131,489 | (3.5) | 4,029,630 | |||||
| Number of employees | 196,419 | 201,017 | (2.3) | 196,419 | 202,713 | (3.1) | 202,251 | |||||
| Number of branches | 11,952 | 12,691 | (5.8) | 11,952 | 13,217 | (9.6) | 13,697 | |||||
(1) In addition to financial information prepared in accordance with International Financial Reporting Standards (IFRS) and derived from our consolidated financial statements, this report contains certain financial measures that constitute alternative performance measures (APMs) as defined in the Guidelines on Alternative Performance Measures issued by the European Securities and Markets Authority (ESMA) on 5 October 2015 and other non-IFRS measures, including the figures related to “underlying” results, as they are recorded in the separate line of “net capital gains and provisions”, above the line of attributable profit to the parent. Further details are provided on page 12 of this report. For further details of the APMs and non-IFRS measures used, including its definition or a reconciliation between any applicable management indicators and the financial data presented in the consolidated financial statements prepared under IFRS, please see 2018 Annual Financial Report, published in the CNMV on 28 February 2019, our 20-F report for the year ending 31 December 2018 registered with the SEC in the United States as well as the “Alternative performance measures” section of the annex to this report. |
| (2) 2019 and 2018 data applying the IFRS 9 transitional arrangements. |
January - December 2019 |  | 3 |
SANTANDER VISION AND CORPORATE CULTURE
Our success is based on a clear purpose, aim and approach to business.
We are building a more responsible bank
 |  |  | ||
Our purpose | Our aim as a bank | Our how | ||
To help people and businesses prosper. | To be the best open financial services platform, by acting responsibly and earning the lasting loyalty of our people, customers, shareholders and communities. | Everything we do should be Simple, Personal and Fair. | ||
A digital Santander
To continue growing in a sustainable and profitable way and to accelerate execution, we will remain focused on our digital transformation.
Santander expects to accelerate its digital transformation and the launch of global platforms, which will enable the Group to offer new solutions, products and services to our customers, and compete in the open market for new ones
 |  |  | ||
| International transfers | Payment platform | Trading platform | ||
Strong corporate culture
The Santander Way is our global culture, fully aligned to our corporate strategy. It includes our purpose, our aim, and how we do business.

| 4 | | January - December 2019 |
Generating confidence and operating responsibly, we contribute value to all our stakeholders
 |  | • The 2019 Global Engagement Survey had a high participation rate (88%) and reflected the employees' commitment, as 86% of them declared to be proud to work for Santander, 5 percentage points above the financial industry average. In addition, 85% of them believe we are open to change, sharing good practices and fostering innovation.• Santander was one of the 25 best companies to work for at global level, according to the annual ranking by Great Place to Work. It was also awarded Top Employer Europe 2019 and Best Place to Work 2019 in Latin America.• We were also named the Leader in Diversity 2020 by the Financial Times in a new index of 700 European companies. We also reaffirmed our commitment to diversity, renewing the EU led Diversity Charter initiative.• For the third consecutive year, Santander obtained the highest score amongst the 325 companies that form part of the Bloomberg Gender-Equality Index. |
 | • We continued to focus on improving customer loyalty and experience. Progress was reflected in the 1.7 million increase loyal customers, greater penetration as a percentage of active customers and 4.8 million more digital customers in the last 12 months.• We also continued to strengthen our traditional branches and develop new models (SMART, Súper Ágil and Work Café), while investing in new generation ATMs and in contact centres.• With the creation of Santander Global Platform, we have taken an step forward in our digital transformation that will enable us to offer better digital services to individual customers and corporates. We launched several initiatives as scheduled: progress continued on the Global Merchant Services and Global Trade Services platforms, Superdigital is already available in Chile and Openbank began to open accounts to customers in Germany, the Netherlands and Portugal.• In line with our responsible banking commitments, we have financially empowered more than 1,600,000 million people in the year through our microfinance programmes. | |
 | • In November, shareholders received the first interim dividend of EUR 0.10 per share charged to 2019’s earnings in cash. The Board of Directors of the Bank has resolved to submit to the next annual general shareholders meeting that the second payment of the remuneration against the results of 2019 amounts to EUR 0.13 per share by means of a final dividend in cash of EUR 0.10 per share and a scrip dividend (Santander Dividendo Elección scheme) that will entail the payment in cash, for those shareholders who so choose, of EUR 0.03 per share. Santander’s cash dividend would thereby increase to EUR 0.20, a year-on-year increase of c.3%, and the total dividend for 2019 would be EUR 0.23 per share (EUR 0.20 in cash and EUR 0.03 in scrip).• In line with the Bank's innovation and digitalisation strategy, the new corporate website santander.com was launched. Shareholders and investors have a new space where they can access all the information on the share and the Group in a more intuitive way, with new content and a refined user experience. | |
 | • The 2019 Dow Jones Sustainability Index (DJSI) recognised Santander as the world’s most sustainable bank, underscoring our actions in the economic, environmental and social fields.• Santander joined the COP25 this year, where the plans to become carbon neutral in 2020 were announced. In addition, the Group signed the Principles of Collective Commitment to Climate Action together with 30 other banks and is also one of the founding members of the Principles for Responsible Banking of the United Nations.• The Group launched the #SOMOS campaign, a global action for inclusive higher education, promoted by the United Nations, which seeks to achieve an accessible, architectural, social and technological environment, so that people with disabilities can be part of the Group.• In the year, we helped more than 1,200,000 people through our community investment programmes and supported higher education with more than 66,000 scholarships granted. | |
January - December 2019 | | 5 |
GROUP PERFORMANCE

"We earned the loyalty of our customers, delivering record annual revenues and strong underlying profitability. This allowed us to further strengthen our capital base and grow our CET1 capital ratio to 11.65%" |

"Our geographic and businesses diversification continues to drive profitable and sustainable growth: South America remains a growth engine, North America is maintaining its momentum and in Europe, we are making good progress on our efficiency programmes" |
 GROWTH
The Group’s strategy is driving growth in loyal and digital customers and is reflected in greater activity in almost all markets
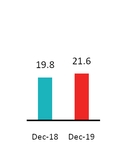
Santander’s strategy continued to focus on boosting the loyalty of our customers. Their number rose again in the fourth quarter and reached 21.6 million, 1.7 million more in the year (+9%), with growth both in individuals and companies.
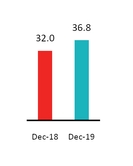
The faster pace of digitalisation is reflected in the growth in digital customers, whose number increased by 4.8 million in the year (+15%) and in greater activity. On average, our customers accessed digital touchpoints five times per week and digital sales represented 36% of total sales, rising 4 percentage points in the year.
| Loyal customers | |
| Millions | |
| Digital customers | |
| Millions | |
| +9% |
| +15% |
As regards volumes, gross loans and advances to customers (excluding reverse repos) and customer funds increased in the quarter (+2% and +1%, respectively).
In the year (at constant exchange rates), gross loans and advances to customers (excluding reverse repos) grew 4% and increased in eight of the 10 core markets. Customer funds rose 6% year-on-year, with growth in demand deposits and mutual funds.
Solid funding structure and liquidity: net loan-to-deposit ratio of 114% (113% in December 2018).
Activity Dec-19 vs. Dec-18 | ||||||||||||
| % change in constant euros | ||||||||||||
| +6% | ||||||||||||
| Demand | ||||||||||||
| +5% | ||||||||||||
| Individuals | ||||||||||||
| +6% | -1% | |||||||||||
| 0% | Time | |||||||||||
| +4% | SMEs | |||||||||||
| +3% | +15% | |||||||||||
| Corporates | Mutual funds | |||||||||||
| Gross loans and advances to customers excl. reverse repos | Customer deposits excl. repos + mutual funds | |||||||||||
| 6 | | January - December 2019 |
GROUP PERFORMANCE
 PROFITABILITY
Solid business model based on customers, scale and diversification, which enabled us to obtain profits on a recurring basis
In a context of lower growth and interest rates, revenue reached a record high, costs reflected synergies in some countries and provisions increased in line with volumes. Underlying attributable profit rose in nine of the 10 core markets.
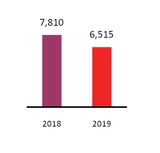
Attributable profit of EUR 6,515 million, affected by net charges of EUR 1,737 million in the 'capital gains and provisions' line (see page 12). Excluding them, underlying attributable profit (EUR 8,252 million) was 2% higher (+3% in constant euros), absorbing the interest rate reduction, higher costs for foreign currency hedging and the impact of implementing IFRS 16.
| Attrib. profit to the parent | |
| EUR million | |
| Earnings per share | |
| Euros | |
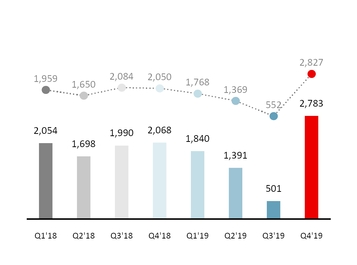
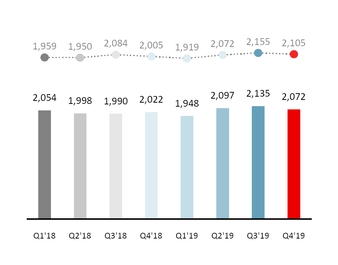
Attributable profit to the parent amounted to a record high of EUR 2,783 million. However it was boosted by the 'net capital gains and provisions' line, which had a positive impact of EUR 711 million. Excluding this, underlying attributable profit was EUR 2,072 million, 2% higher than the fourth quarter of 2018 (+5% excluding the exchange rate impact).
The efficiency ratio stood around 47%, one of the best among our peers. Underlying RoTE was 11.8% and underlying RoRWA 1.61%.
| Efficiency ratio | |
| % | |
| RoTE | |
| % | |
n Total n Underlying* | |
(*) Excluding net capital gains and provisions
 STRENGTH
Santander is strengthening its capital ratios and improving credit quality while maintaining a high level of profitability
The CET1 ratio stood at 11.65% after increasing 35 bps in the quarter (31 bps organically). In the year, gross generation of 97 bps due to the organic generation and the favourable portfolio performance, which was partly offset by regulatory impacts (-62 bps).
Net tangible equity per share (TNAV) at year-end was EUR 4.36 (EUR 4.19 in December 2018). In addition, and in terms of shareholder value creation, the recording of the dividend remuneration should be taken into account. Including it, the TNAV per share increased 8% in the last 12 months.
| CET1* | |
| % | |
| Tangible equity per share | |
| Euros | |
(*) Using the IFRS 9 transitional agreement
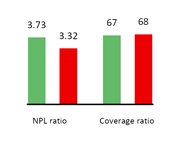
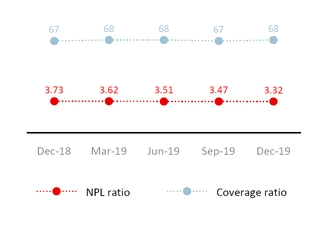
Credit quality continued to improve: the NPL ratio dropped for the tenth consecutive quarter, improving 41 bps in the year and 15 bps in the quarter, and coverage rose to 68% (67% in 2018).
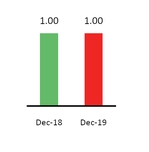
The cost of credit stood at 1.00% in 2019, similar to the previous quarter and to 2018.
| Cost of credit | |
| % | |
| NPL ratio and coverage | |
| % | |
n Dec-18 n Dec-19 | |
January - December 2019 | | 7 |
GRUPO SANTANDER RESULTS
| • | Fourth quarter attributable profit to the parent of EUR 2,783 million, including a net positive impact of EUR 711 million that are outside the ordinary course performance of our business. Excluding these charges, underlying attributable profit was 2% higher than the fourth quarter of 2018 at EUR 2,072 million (+5% excluding the exchange rate impact). |
| • | Attributable profit of EUR 6,515 million in 2019, 17% less than in 2018, after recording net charges that are outside the ordinary course performance of our business amounting to EUR -1,737 million (EUR -254 million in 2018). Excluding these results, the underlying attributable profit was EUR 8,252 million, 2% more than in 2018 (+3% excluding the exchange rate impact). |
| • | By geographic area, nine of our ten core markets grew their underlying profit year-on-year in local currency terms, five of them at double-digit rates. |
| • | In 2019, the results continued to reflect a solid underlying trend: customer revenue reached a record high in the year, costs began to show the synergies obtained in various markets and loan-loss provisions rose in line with volumes. |
| • | As regards profitability ratios: underlying RoTE of 11.8% and underlying RoRWA of 1.61%. |
| Grupo Santander. Summarised income statement | ||||||||||||||||
| EUR million | ||||||||||||||||
| Change | Change | |||||||||||||||
| Q4'19 | Q3'19 | % | % excl. FX | 2019 | 2018 | % | % excl. FX | |||||||||
| Net interest income | 8,841 | 8,806 | 0.4 | 0.4 | 35,283 | 34,341 | 2.7 | 3.5 | ||||||||
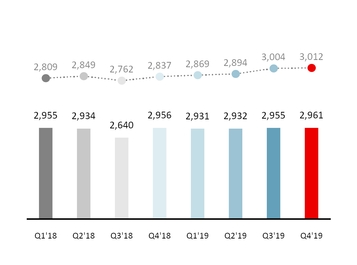
| Net fee income (commission income minus commission expense) | 2,961 | 2,955 | 0.2 | 0.2 | 11,779 | 11,485 | 2.6 | 4.6 | ||||||||
| Gains or losses on financial assets and liabilities and exchange differences (net) | 596 | 424 | 40.6 | 39.5 | 1,531 | 1,797 | (14.8) | (11.0) | ||||||||
| Dividend income | 100 | 72 | 38.9 | 38.0 | 533 | 370 | 44.1 | 44.0 | ||||||||
| Share of results of entities accounted for using the equity method | (119 | ) | 137 | — | — | 324 | 737 | (56.0) | (55.2) | |||||||
| Other operating income / expenses | (52 | ) | 72 | — | — | (221 | ) | (306 | ) | (27.8) | 22.5 | |||||
| Total income | 12,327 | 12,466 | (1.1) | (1.0) | 49,229 | 48,424 | 1.7 | 2.6 | ||||||||
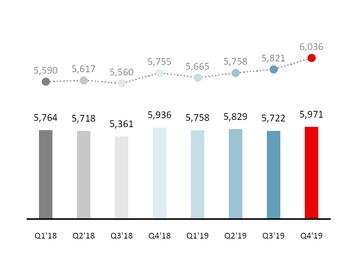
| Operating expenses | (5,971 | ) | (5,722 | ) | 4.4 | 3.7 | (23,280 | ) | (22,779 | ) | 2.2 | 3.4 | ||||
| Administrative expenses | (5,179 | ) | (4,990 | ) | 3.8 | 3.2 | (20,279 | ) | (20,354 | ) | (0.4) | 0.7 | ||||
| Staff costs | (3,053 | ) | (3,008 | ) | 1.5 | 1.0 | (12,141 | ) | (11,865 | ) | 2.3 | 3.2 | ||||
| Other general administrative expenses | (2,126 | ) | (1,982 | ) | 7.3 | 6.5 | (8,138 | ) | (8,489 | ) | (4.1) | (2.8) | ||||
| Depreciation and amortisation | (792 | ) | (732 | ) | 8.2 | 7.1 | (3,001 | ) | (2,425 | ) | 23.8 | 25.5 | ||||
| Impairment or reversal of impairment of financial assets not measured at fair value through profit or loss (net) | (2,542 | ) | (2,442 | ) | 4.1 | 4.3 | (9,352 | ) | (8,986 | ) | 4.1 | 4.3 | ||||
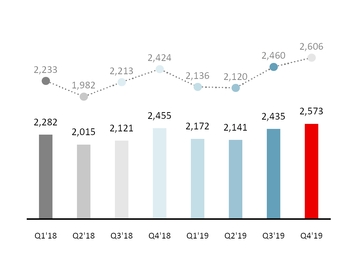
| o/w: net loan-loss provisions | (2,573 | ) | (2,435 | ) | 5.7 | 5.9 | (9,321 | ) | (8,873 | ) | 5.0 | 5.3 | ||||
| Impairment on other assets (net) | (76 | ) | (1,520 | ) | (95.0) | (95.0) | (1,623 | ) | (207 | ) | 684.1 | 677.2 | ||||
| Provisions or reversal of provisions | (979 | ) | (595 | ) | 64.5 | 64.5 | (3,490 | ) | (2,223 | ) | 57.0 | 68.8 | ||||
| Gain or losses on non financial assets and investments, net | 1,038 | 3 | — | — | 1,291 | 28 | — | — | ||||||||
| Negative goodwill recognised in results | — | — | — | — | — | 67 | (100.0 | ) | (100.0 | ) | ||||||
| Gains or losses on non-current assets held for sale not classified as discontinued operations | 34 | (9 | ) | — | — | (232 | ) | (123 | ) | 88.6 | 84.2 | |||||
| Profit or loss before tax from continuing operations | 3,831 | 2,181 | 75.7 | 73.2 | 12,543 | 14,201 | (11.7) | (10.7) | ||||||||
| Tax expense or income from continuing operations | (687 | ) | (1,291 | ) | (46.8) | (45.5) | (4,427 | ) | (4,886 | ) | (9.4) | (7.8) | ||||
| Profit from the period from continuing operations | 3,144 | 890 | 253.3 | 239.2 | 8,116 | 9,315 | (12.9) | (12.3) | ||||||||
| Profit or loss after tax from discontinued operations | — | — | — | — | — | — | — | — | ||||||||
| Profit for the period | 3,144 | 890 | 253.3 | 239.2 | 8,116 | 9,315 | (12.9) | (12.3) | ||||||||
| Attributable profit to non-controlling interests | (361 | ) | (389 | ) | (7.2) | (5.8) | (1,601 | ) | (1,505 | ) | 6.4 | 6.3 | ||||
| Attributable profit to the parent | 2,783 | 501 | 455.5 | 412.0 | 6,515 | 7,810 | (16.6) | (15.9) | ||||||||
| EPS (euros) | 0.161 | 0.021 | 670.3 | 0.362 | 0.449 | (19.4) | ||||||||||
| Diluted EPS (euros) | 0.160 | 0.021 | 669.8 | 0.361 | 0.448 | (19.4) | ||||||||||
| Memorandum items: | ||||||||||||||||
| Average total assets | 1,530,761 | 1,515,606 | 1.0 | 1,508,167 | 1,442,861 | 4.5 | ||||||||||
| Average stockholders' equity | 98,851 | 98,445 | 0.4 | 98,457 | 95,071 | 3.6 | ||||||||||
| 8 | | January - December 2019 |
Ü Evolution of results compared to 2018
The underlying trends of the P&L remained solid compared to 2018, with customer revenue growing, both net interest income and net fee income, costs reflecting the synergies obtained in various units and a cost of credit remained close to historically low levels.
This good performance, however, is not fully reflected in the attributable profit to the parent because of the recording of a net negative amount of EUR 1,737 million for charges that are outside the ordinary course performance of our business, as set out on page 12 of this report. In addition, the comparison is also affected by the interest rate reduction, higher costs for foreign currency hedging and the impact of implementing IFRS 16.
This performance is explained in detail below:
u Revenue
Total income was 2% higher than in 2018 at EUR 49,229 million (+3% excluding the exchange rate impact). Net interest income and net fee income accounted for 95% of total income, well above the average of our competitors, enabling consistent and recurring growth while limiting the impact that periods of high volatility can have on gains on financial transactions. By lines:
| • | Net interest income amounted to EUR 35,283 million, up 3% compared to 2018. Excluding the FX impact, growth was 4% due to greater lending and deposits, and management of spreads in an environment of falling interest rates in the last year in numerous markets, and with still negative interest rates in Europe. There was also a negative impact of EUR 265 million from IFRS 16 application. |
| Net interest income | |
| EUR million | |
žžžlžžž constant euros | |
Net interest income recorded rises in six of the ten core markets in local currency terms. Of note was growth in Argentina driven by high interest rates and greater central bank note volumes and Poland, by the improvement in the cost of deposits and lending dynamics. Portugal and Chile remained stable, and falls were recorded in the UK, affected by the pressure on mortgage spreads and the fall in SVR balances (Standard Variable Rate) and in Spain due to low interest rates, reduced volumes and the impact of IFRS 16.
| • | Net fee income amounted to EUR 11,779 million, 3% more than in 2018. Excluding the exchange rate impact, net fee income was 5% higher, reflecting the greater customer loyalty combined with the growth strategy in higher value-added services and products. Of note was the growth in the most transactional businesses from payment methods, insurance, foreign currency and cheques and transfers. On the other hand, decline in net fee income from advising operations and guarantees, affected by reduced activity in the markets and overdrafts, affected by regulatory impacts. |
By region, the increase was backed mainly by South America, which grew at double digit rates. Of note was Brazil (+12%) with growth in almost all lines, especially in cards and insurance, and Argentina (+84%), driven by greater foreign currency transactions and income from accounts and cash deposits. They also rose in North America, with a positive trend in the US and Mexico. On the other hand, falls in Europe driven by Spain (mainly due to lower activity at SCIB) and the UK (overdrafts and mutual funds).
By global businesses, excluding the exchange rate impact, the total fee income generated by Wealth Management & Insurance, including those transferred to the branch network rose 6% in the year (30% of the Group's total). Fee income from Santander Corporate & Investment Banking increased 1% in 2019, reflecting a clear trend of improvement during the year (fee income in the second half of the year was 12% higher than in the first half of the year).
| Net fee income | |
| EUR million | |
žžžlžžž constant euros | |
January - December 2019 | | 9 |
| • | Gains on financial transactions, which account for 3% of total income, decreased 15% (11% excluding the FX impact) to EUR 1,531 million compared to 2018 mainly due to the higher cost of foreign currency hedging in 2019, combined with the positive performance of markets in the first half of 2018. |
| • | Dividend income was EUR 533 million in 2019, 44% more than in 2018 mainly due to dividends of the trading portfolio. |
| • | The share of results of entities accounted for by the equity method were EUR 324 million in 2019, 56% lower than in 2018 (-55% excluding the FX impact) mainly driven by the sale of Testa and WiZink as well as losses in real estate equity. |
| • | Other operating income recorded a loss of EUR 221 million in 2019. This item includes the contribution to the Deposit Guarantee Fund and the Single Resolution Fund. |
u Costs
Costs totalled EUR 23,280 million, 2% higher year-on-year. Excluding the exchange rate impact, they rose 3% as a result of higher investments in transformation and digitalisation, together with the improvements made to the distribution networks, the slight impact from the integration of the retail and SME business acquired from Deutsche Bank Polska and the impact on Argentina of high inflation.
In real terms (excluding inflation and perimeter), costs were slightly lower, falling or remaining stable for the third year running due to cost management. (-0.4% in 2019, -0.5% in 2018 and +0.3% in 2017).
In 2019 we continued to be one of the world's most efficient global banks, maintaining the efficiency ratio at 47.0%.
| Total income | |
| EUR million | |
žžžlžžž constant euros | |
The Group’s aim is to improve our operational capacity and at the same time manage our costs more efficiently adapted to each area, via an exemplary execution of the integrations and fostering the use of shared services. For a better comparison, the trends by region and market are detailed below:
| • | In Europe, costs are beginning to reflect the synergies of integrations, and fell 1% in nominal terms and 2.4% in real terms. Of note were the declines in Spain (-8%) and Portugal (-4%) due to the efficiencies resulting from the integration of Popular, and the optimisation efforts and the UK (-3%) reflecting the first cost savings from our transformation programme. |
The main rises were in Poland (+7%), impacted by the previously mentioned integration. Excluding this impact, costs rose very slightly, with a a relatively good performance in an environment with high single-digit wage pressure at the national level. In SCF, costs rose 2%, although at a slower pace than business growth, benefiting from the efficiency projects carried out in the year. The efficiency ratio in the region maintained practically stable.
| • | In North America, costs were 5% higher in nominal terms affected by inflation. In real terms, they rose 3% mainly driven by Mexico (+4%), spurred by the three-year investment plan, while in the US they rose 2%. The higher revenue is enabling us to maintain the efficiency ratio in this region. |
| • | Lastly, in South America, the increase in costs was significantly distorted by the very high inflation in Argentina. Excluding it, the increase was 4.6% in nominal terms and 1% in real terms, with Brazil and Chile performing well, combining investments to improve distribution capacity with close to zero growth in costs. Efficiency improvement in the region across all markets. |
We believe this management by region will enable us to continue to optimise costs, which should be reflected in further improvements in the cost-to-income ratio, while improving customer experience.
| Operating expenses | |
| EUR million | |
žžžlžžž constant euros | |
| 10 | | January - December 2019 |
u Impairment or reversal of impairment of financial assets not measured at fair value through profit or loss (net)
Impairment or reversal of impairment of financial assets not measured at fair value through profit or loss (net) were EUR 9,352 million in 2019, a 4% increase compared to 2018 both in euros and excluding the exchange rate impact.
In this item, net loan-loss provisions was 5% higher, both in euros and excluding the exchange rate impact, at EUR 9,321 million. The largest increase was recorded in Europe, while in North and South America, the increases were more moderate, both below the rise in lending volumes.
Cost of credit remained stable at 1.00%
u Impairment on other assets (net)
Impairment on other assets in 2019 increased to EUR 1,623 million after recording the impairment of goodwill ascribed to the UK of EUR 1,491 million. In 2018, this item amounted to EUR 207 million.
u Provisions or reversal of provisions
Provisions (net of reversal provisions) rose 57% in 2019, to EUR 3,490 million (EUR 2,223 million in 2018). Excluding the exchange rate impact, 69% increase primarily due to restructuring charges mainly in Spain and the UK, which are set out on page 12 of this report. In addition, higher provisions for legal claims in Brazil.
u Gains or losses on non-financial assets and investments (net)
Net gains on non-financial assets and investments were EUR 1,291 million in 2019, compared to EUR 28 million in 2018. The increase was mainly due to the recording of capital gains from the agreement with Crédit Agricole S.A. for the integration of the custody businesses and from the sale of 51% our stake in Prisma Medios de Pago S.A. and the revaluation of the rest of the stake (49%).
u Negative goodwill recognised in results
In 2019, EUR 0 million compared to the EUR 67 million recorded in 2018 due to the difference between the fair value of the net assets acquired with the acquisition of Deutsche Bank Polska in Poland and the transaction value.
u Gains or losses on non-current assets held for sale not classified as discontinued operations
This item, which includes mainly impairment of foreclosed assets recorded and the sale of properties acquired upon foreclosure, were EUR -232 million in 2019, compared to EUR -123 million in 2018.
u Profit before tax
Profit before tax was 12% lower than in 2018, at EUR 12,543 million. Excluding the exchange rate impact, it dropped 11%, conditioned by the non-recurring operation mentioned above.
u Income tax
Corporate income tax was EUR 4,427 million in 2019, a 9% decrease year-on-year (-8% excluding the exchange rate impact).
u Attributable profit to non-controlling interests
The attributable profit to non-controlling interests was EUR 1,601 million, 6% higher than in 2018 both in euros and excluding the exchange rate impact.
u Attributable profit to the parent
Attributable profit to the parent amounted to EUR 6,515 million, 17% less compared to 2018. Excluding the exchange rate impact, -16%.
RoE was 6.6%, RoTE 9.3% and RoRWA 1.33% (8.2%, 11.7% y 1.55%, respectively in 2018).
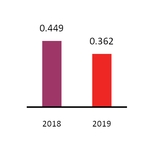
Earnings per share was EUR 0.362, EUR 0.449 in 2018.
| Net loan-loss provisions | |
| EUR million | |
žžžlžžž constant euros | |
| Attributable profit to the parent | |
| EUR million | |
žžžlžžž constant euros | |
January - December 2019 | | 11 |
u Underlying attributable profit to the parent
The attributable profit to the parent previously recorded was affected, in 2019 and 2018, by the results (net of tax), that are outside the ordinary course performance of our business and distort the year-on-year comparison, and are detailed in the table below:
| 2019 | |||
• Restructuring costs | -864 | ||
– Spain ......................................................................... | -600 | ||
– United Kingdom ........................................................ | -127 | ||
– Brazil ......................................................................... | -90 | ||
– Poland ...................................................................... | -23 | ||
– Consumer ................................................................ | -16 | ||
– United States ........................................................... | -8 | ||
• Real estate assets and stakes (Spain) | -405 | ||
• PPI United Kingdom | -183 | ||
• Intangibles and other | -174 | ||
• Capital gains Prisma - Argentina | 136 | ||
• Tax reform Brazil | 551 | ||
• Custody | 693 | ||
| Subtotal | -246 | ||
• Goodwill United Kingdom | -1,491 | ||
NET: EUR -1,737 million | |||
| 2018 | ||
• Integration costs | -320 | |
– Spain ........................................................................ | -280 | |
– Corporate Centre ..................................................... | -40 | |
• Portugal integration | 20 | |
• Badwill Poland | 45 | |
| NET: EUR -254 million | ||
Excluding these results from the various P&L lines where they are recorded, and incorporating them separately in the net capital gains and provisions line, underlying attributable profit to the parent was EUR 8,252 million in 2019 and EUR 8,064 million in 2018, 2% higher year-on-year (+3% without the FX impact).
By region, and excluding the exchange rate impact, of note was double-digit growth in North America (+21%) and South America (+18%), while in Europe, in a more complicated business environment, there was a 3% decline.
By market, nine of the 10 core markets increased in their local currency, and at double-digit rates in Poland, the US, Mexico, Brazil and Argentina. The only decrease was in the UK, mainly because of competitive pressure on revenue.
In 2019, the Group’s underlying RoTE was 11.8% (12.1% in 2018), the underlying RoRWA rose to 1.61% from 1.59% in 2018, and underlying earnings per share EUR 0.468, 1% higher than in 2018.
| Summarised underlying income statement | ||||||||||||||||
| (EUR millIon) | Change | Change | ||||||||||||||
| Q4'19 | Q3'19 | % | % excl. FX | 2019 | 2018 | % | % excl. FX | |||||||||
| Net interest income | 8,841 | 8,806 | 0.4 | 0.4 | 35,283 | 34,341 | 2.7 | 3.5 | ||||||||
| Net fee income | 2,961 | 2,955 | 0.2 | 0.2 | 11,779 | 11,485 | 2.6 | 4.6 | ||||||||
Gains (losses) on financial transactions (1) | 596 | 424 | 40.6 | 39.5 | 1,531 | 1,797 | (14.8) | (11.0) | ||||||||
| Other operating income | 194 | 281 | (31.0) | (31.4) | 901 | 801 | 12.5 | (1.4) | ||||||||
| Total income | 12,592 | 12,466 | 1.0 | 1.1 | 49,494 | 48,424 | 2.2 | 3.2 | ||||||||
| Administrative expenses and amortisations | (5,971 | ) | (5,722 | ) | 4.4 | 3.7 | (23,280 | ) | (22,779 | ) | 2.2 | 3.4 | ||||
| Net operating income | 6,621 | 6,744 | (1.8) | (1.2) | 26,214 | 25,645 | 2.2 | 3.0 | ||||||||
| Net loan-loss provisions | (2,573 | ) | (2,435 | ) | 5.7 | 5.9 | (9,321 | ) | (8,873 | ) | 5.0 | 5.3 | ||||
| Other gains (losses) and provisions | (542 | ) | (465 | ) | 16.6 | 17.2 | (1,964 | ) | (1,996 | ) | (1.6) | (0.5) | ||||
| Profit before tax | 3,506 | 3,844 | (8.8) | (7.9) | 14,929 | 14,776 | 1.0 | 2.0 | ||||||||
| Tax on profit | (1,109 | ) | (1,315 | ) | (15.7) | (14.5) | (5,103 | ) | (5,230 | ) | (2.4) | (0.9) | ||||
| Profit from continuing operations | 2,397 | 2,529 | (5.2) | (4.4) | 9,826 | 9,546 | 2.9 | 3.6 | ||||||||
| Net profit from discontinued operations | — | — | — | — | — | — | — | — | ||||||||
| Consolidated profit | 2,397 | 2,529 | (5.2) | (4.4) | 9,826 | 9,546 | 2.9 | 3.6 | ||||||||
| Non-controlling interests | (325 | ) | (394 | ) | (17.5) | (16.0) | (1,574 | ) | (1,482 | ) | 6.2 | 6.0 | ||||
| Underlying attributable profit to the parent | 2,072 | 2,135 | (3.0) | (2.3) | 8,252 | 8,064 | 2.3 | 3.2 | ||||||||
| Net capital gains and provisions | 711 | (1,634 | ) | — | — | (1,737 | ) | (254 | ) | 583.9 | 582.8 | |||||
| Attributable profit to the parent | 2,783 | 501 | 455.5 | 412.0 | 6,515 | 7,810 | (16.6) | (15.9) | ||||||||
(1) Includes exchange differences.
| 12 | | January - December 2019 |
Ü Fourth quarter results compared to the third quarter of 2019
Attributable profit to the parent amounted to EUR 2,783 million, a record high. However it was boosted by the net capital gains and provisions1 line, as detailed in the previous page.
Excluding these impacts, underlying attributable profit to the parent amounted to EUR 2,072 million, 2% higher than the fourth quarter of 2018 in euros (+5% without the FX impact).
Compared to the third quarter of 2019, it was 3% lower (-2% excluding the exchange rate impact), affected by the contribution to the Deposit Guarantee Fund (DGF) in Spain. Without it, growth was 5% in the quarter. Excluding the exchange rate impact, the increase was also 5%, with the following evolution by lines:
| • | Total income was up 1%, due to the positive performance of customer revenue, up for the third quarter running, and higher gains on financial transactions. This helped to absorb the contribution to the FGD in Spain, excluding it, total income rose 3%. |
| • | Operating expenses rose 4% driven by the high inflation adjustment in Argentina, increased marketing and technology costs in Brazil, investments in Santander Global Platform and Mexico, and higher personnel expenses in the US. |
| • | Loan-loss provisions rose 6% primarily due to the seasonality of SC USA and the increases in the UK, due to a single name case, and Brazil, stemming from portfolio sales in the third quarter and greater volumes in the fourth. |
| Underlying attributable profit to the parent* | |
| EUR million | |
žžžlžžž constant euros | |
(*) Excluding net capital gains and provisions.
(1) Positive results of EUR 693 million stemming from the agreement with Crédit Agricole S.A. for the integration of the custody businesses and EUR 551 million due to changes in tax regulation in Brazil, and negative results of EUR 225 million related to real estate stakes (Spain), EUR 140 million of restructuring costs and EUR 168 million for intangible assets and other.
January - December 2019 | | 13 |
| Grupo Santander. Condensed balance sheet | ||||||||||
| EUR million | ||||||||||
| Change | ||||||||||
| Assets | Dec-19 | Dec-18 | Absolute | % | Dec-17 | |||||
| Cash, cash balances at central banks and other demand deposits | 101,067 | 113,663 | (12,596 | ) | (11.1) | 110,995 | ||||
| Financial assets held for trading | 108,230 | 92,879 | 15,351 | 16.5 | 125,458 | |||||
| Debt securities | 32,041 | 27,800 | 4,241 | 15.3 | 36,351 | |||||
| Equity instruments | 12,437 | 8,938 | 3,499 | 39.1 | 21,353 | |||||
| Loans and advances to customers | 355 | 202 | 153 | 75.7 | 8,815 | |||||
| Loans and advances to central banks and credit institutions | — | — | — | — | 1,696 | |||||
| Derivatives | 63,397 | 55,939 | 7,458 | 13.3 | 57,243 | |||||
| Financial assets designated at fair value through profit or loss | 66,980 | 68,190 | (1,210 | ) | (1.8) | 34,781 | ||||
| Loans and advances to customers | 31,147 | 23,796 | 7,351 | 30.9 | 20,475 | |||||
| Loans and advances to central banks and credit institutions | 28,122 | 32,325 | (4,203 | ) | (13.0) | 9,889 | ||||
| Other (debt securities an equity instruments) | 7,711 | 12,069 | (4,358 | ) | (36.1) | 4,417 | ||||
| Financial assets at fair value through other comprehensive income | 125,708 | 121,091 | 4,617 | 3.8 | 133,271 | |||||
| Debt securities | 118,405 | 116,819 | 1,586 | 1.4 | 128,481 | |||||
| Equity instruments | 2,863 | 2,671 | 192 | 7.2 | 4,790 | |||||
| Loans and advances to customers | 4,440 | 1,601 | 2,839 | 177.3 | — | |||||
| Loans and advances to central banks and credit institutions | — | — | — | — | — | |||||
| Financial assets measured at amortised cost | 995,482 | 946,099 | 49,383 | 5.2 | 916,504 | |||||
| Debt securities | 29,789 | 37,696 | (7,907 | ) | (21.0) | 31,034 | ||||
| Loans and advances to customers | 906,276 | 857,322 | 48,954 | 5.7 | 819,625 | |||||
| Loans and advances to central banks and credit institutions | 59,417 | 51,081 | 8,336 | 16.3 | 65,845 | |||||
| Investments in subsidiaries, joint ventures and associates | 8,772 | 7,588 | 1,184 | 15.6 | 6,184 | |||||
| Tangible assets | 35,235 | 26,157 | 9,078 | 34.7 | 22,975 | |||||
| Intangible assets | 27,687 | 28,560 | (873 | ) | (3.1) | 28,683 | ||||
| Goodwill | 24,246 | 25,466 | (1,220 | ) | (4.8) | 25,769 | ||||
| Other intangible assets | 3,441 | 3,094 | 347 | 11.2 | 2,914 | |||||
| Other assets | 53,534 | 55,044 | (1,510 | ) | (2.7) | 65,454 | ||||
| Total assets | 1,522,695 | 1,459,271 | 63,424 | 4.3 | 1,444,305 | |||||
| Liabilities and shareholders' equity | ||||||||||
| Financial liabilities held for trading | 77,139 | 70,343 | 6,796 | 9.7 | 107,624 | |||||
| Customer deposits | — | — | — | — | 28,179 | |||||
| Debt securities issued | — | — | — | — | — | |||||
| Deposits by central banks and credit institutions | — | — | — | — | 574 | |||||
| Derivatives | 63,016 | 55,341 | 7,675 | 13.9 | 57,892 | |||||
| Other | 14,123 | 15,002 | (879 | ) | (5.9) | 20,979 | ||||
| Financial liabilities designated at fair value through profit or loss | 60,995 | 68,058 | (7,063 | ) | (10.4) | 59,617 | ||||
| Customer deposits | 34,917 | 39,597 | (4,680 | ) | (11.8) | 28,945 | ||||
| Debt securities issued | 3,758 | 2,305 | 1,453 | 63.0 | 3,056 | |||||
| Deposits by central banks and credit institutions | 22,194 | 25,707 | (3,513 | ) | (13.7) | 27,027 | ||||
| Other | 126 | 449 | (323 | ) | (71.9) | 589 | ||||
| Financial liabilities measured at amortised cost | 1,230,745 | 1,171,630 | 59,115 | 5.0 | 1,126,069 | |||||
| Customer deposits | 789,448 | 740,899 | 48,549 | 6.6 | 720,606 | |||||
| Debt securities issued | 258,219 | 244,314 | 13,905 | 5.7 | 214,910 | |||||
| Deposits by central banks and credit institutions | 152,969 | 162,202 | (9,233 | ) | (5.7) | 162,714 | ||||
| Other | 30,109 | 24,215 | 5,894 | 24.3 | 27,839 | |||||
| Liabilities under insurance contracts | 739 | 765 | (26 | ) | (3.4) | 1,117 | ||||
| Provisions | 13,987 | 13,225 | 762 | 5.8 | 14,490 | |||||
| Other liabilities | 28,431 | 27,889 | 542 | 1.9 | 28,556 | |||||
| Total liabilities | 1,412,036 | 1,351,910 | 60,126 | 4.4 | 1,337,472 | |||||
| Shareholders' equity | 122,103 | 118,613 | 3,490 | 2.9 | 116,265 | |||||
| Capital stock | 8,309 | 8,118 | 191 | 2.4 | 8,068 | |||||
| Reserves | 108,941 | 104,922 | 4,019 | 3.8 | 103,608 | |||||
| Attributable profit to the Group | 6,515 | 7,810 | (1,295 | ) | (16.6) | 6,619 | ||||
| Less: dividends | (1,662 | ) | (2,237 | ) | 575 | (25.7) | (2,029 | ) | ||
| Other comprehensive income | (22,032 | ) | (22,141 | ) | 109 | (0.5) | (21,777 | ) | ||
| Minority interests | 10,588 | 10,889 | (301 | ) | (2.8) | 12,344 | ||||
| Total equity | 110,659 | 107,361 | 3,298 | 3.1 | 106,832 | |||||
| Total liabilities and equity | 1,522,695 | 1,459,271 | 63,424 | 4.3 | 1,444,305 | |||||
| 14 | | January - December 2019 |
GRUPO SANTANDER BALANCE SHEET
| • | Overall positive volume performance in the year, with increases in both gross loans and advances to customers (excluding reverse repos) as well as in customer funds. |
| • | Gross loans and advances to customers excluding reverse repos rose 5% year-on-year (+4% in constant euros), with eight of the 10 core countries growing, particularly in North and South America, which grew 10% and 9%, respectively. |
| • | Customer funds increased 7% year-on-year (+6% in constant euros), with growth in nine of our 10 core markets. Demand deposits increased, as well as mutual funds. |
Ü Loans and advances to customers
Gross loans and advances to customers rose to EUR 942,218 million in December 2019, 7% growth year-on-year.
The Group uses gross loans and advances to customers excluding reverse repos for the purpose of analysing traditional commercial banking loans.
| • | Compared to December 2018, gross loans and advances to customers excluding reverse repos and the exchange rate impact increased 4%, with the following evolution by region: |
| – | In Europe, moderate growth (+2%), with different performance by units. Increases in Santander Consumer Finance (+7%, with all countries growing), Poland (+5%) and the UK (+4%), where the increase in mortgages and other retail loans was partially offset by lower exposure to commercial real estate. On the other hand, there were declines in Spain (-6%), due to lower wholesale balances and with institutions, and in Portugal, affected by the sale of non-productive portfolios. |
| – | In North America, the increase was 10%, with the US up 12%, with growth in SC USA and SBNA. Mexico also grew 5%. |
| Gross loans and advances to customers (Excl. reverse repos) | |
| EUR billion | |
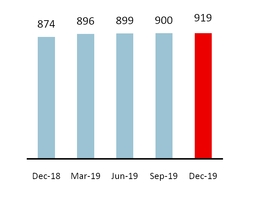
| +5% * |
| Dec-19 / Dec-18 |
(*) In constant EUR: +4%
| – | Growth in South America was 9%, with Brazil and Chile growing 8% and Argentina 40%, the latter driven by peso balances and the impact of the currency's depreciation on dollar balances. |
| • | Quarter-on-quarter, gross loans and advances to customers, excluding reverse repos and the exchange rate impact, rose 2%. Growth of 4% in Brazil, the US, Santander Consumer Finance and Argentina, 3% in Mexico, and 2% in the UK and Chile. Poland and Portugal were broadly stable while Spain decreased 2% mainly due to portfolio sales and lower institutional balances. |
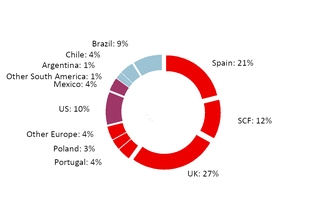
Gross loans and advances to customers excluding reverse repos maintained a balanced structure: individuals (47%), consumer credit (17%), SMEs and corporates (24%) and SCIB (12%).
| Gross loans and advances to customers (Excl. reverse repos) | |
| % operating areas. December 2019 | |
January - December 2019 | | 15 |
Ü Customer funds
Customer deposits amounted to EUR 824,365 million, 6% growth in the last 12 months (in euros).
The Group uses customer funds (customer deposits excluding repos, and including mutual funds) for the purpose of analysing traditional retail banking funds.
| • | Compared to December 2018, customer funds, excluding the exchange rate impact, increased 6%, as follows: |
| – | The strategy focused on increasing loyalty was reflected in demand deposits (+6%), which increased in all units except Mexico. Time deposits remained virtually unchanged overall. Mutual funds rose 15%, with growth in all core markets. |
| – | By markets, customer funds rose in all of them except Mexico, which remained stable. Of note were Argentina (+24%), Brazil (+12%), Chile (+12%) and the US (+11%). There was more moderate growth in Portugal and Santander Consumer Finance (+8% each), Poland (+6%) and Spain (+3%). |
| • | In the fourth quarter, customer funds were 1% higher, both in euros and excluding exchange rate impacts: |
| – | By products, demand deposits rose 1%, with most of the countries growing. Time deposits decreased 2% and mutual funds increased 2%. |
| – | By markets, South America rose 4%, mainly driven by Brazil, North America grew 1% and Europe remained stable. |
Customer funds continued to be well diversified by products: 61% demand deposits, 20% time deposits and 19% mutual funds.
| Customer funds | |
| EUR billion | |
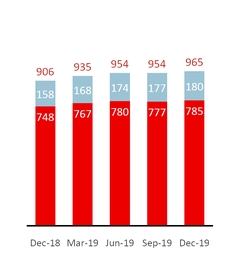
| +7% * |
| +14% |
| +5% |
l Total |
l Mutual funds |
l Deposits excl. repos |
| Dec-19 / Dec-18 |
(*) In constant EUR: +6%
As well as capturing customer deposits, Grupo Santander, for strategic reasons, maintains a selective policy of issuing securities in the international fixed income markets and strives to adapt the frequency and volume of its market operations to the structural liquidity needs of each unit, as well as to the receptiveness of each market.
• In 2019, the Group issued:
| – | Medium- and long-term covered bonds placed in the market of EUR 8,941 million and senior debt amounting to EUR 20,057 million, which includes the EUR 1 billion green bond issued initiating the Bank's global sustainable debt issuance plan. |
| – | There were EUR 19,191 million of securitisations placed in the market. Additionally, the contractual maturity of EUR 1.2 billion of securitisations was extended, totalling EUR 20,391 million. |
| – | Issuances to meet the TLAC (Total Loss-Absorbing Capacity) requirement amounting to EUR 3,850 million, in order to strengthen the Group’s situation (senior non-preferred: EUR 2,778 million, preferred: EUR 1,072 million). |
| – | Maturities of medium- and long-term debt of EUR 23,838 million. |
| • | The net loan-to-deposit ratio was 114% (113% in December 2018). The ratio of deposits plus medium- and long-term funding to the Group’s loans was 113%, underscoring the comfortable funding structure. |
| • | Of note is the EUR 1.5 billion issuance of contingent convertible bonds (CoCos) issued in January 2020, eligible for AT1 regulatory capital treatment, with a coupon of 4.375%. The spread was 6 year midswap plus 4.534%, thanks to strong demand (7 times over subscribed) and the large number of investors. |
| Customer funds | |
| % operating areas. December 2019 | |
| 16 | | January - December 2019 |
SOLVENCY RATIOS
| • | At year-end, the CET1 ratio reached 11.65% after increasing 35 bps in the quarter. In the year, record gross generation of 97 bps partially offset by regulatory impacts (-62 bps). |
| • | Tangible equity per share was EUR 4.36, 4% higher in the year. Including the cash dividend paid, growth was 8%. |
| • | The fully loaded leverage ratio was stable at 5.1% in the year. |
At the end of the quarter, the total phased-in capital ratio stood at 15.05% and the CET1 ratio (phased-in and fully loaded) at 11.65%, comfortably meeting the minimum levels required by the European Central Bank on a consolidated basis (13.18% for the total capital ratio and 9.68% for the CET1 ratio).
In the quarter, we continued to generate capital organically, +31 bps, as a result of underlying profit and the active management of risk weighted assets. As such, the organic generation in the year was 79 bps.
This organic generation, together with favourable market movements benefiting from the held to collect and sell portfolios (due to falling interest rates), a slight positive perimeter impact (the acquisition of minority interests in Mexico and integration of custody business) as well as the negative 15 bps impact from restructuring costs.
| Eligible capital. December 2019* | ||||
| EUR million | ||||
| Phased-in | Fully loaded | |||
| CET1 | 70,497 | 70,497 | ||
| Basic capital | 79,536 | 78,964 | ||
| Eligible capital | 91,067 | 90,937 | ||
| Risk-weighted assets | 605,244 | 605,244 | ||
| CET1 capital ratio | 11.65 | 11.65 | ||
| T1 capital ratio | 13.14 | 13.05 | ||
| Total capital ratio | 15.05 | 15.02 | ||
As a result, the gross generation achieved an increase of 97 bps, boosting the fully loaded CET1 ratio to 12.27% in December, before the accounting and regulatory impacts recorded in this period (-62 bps, mainly because of the IFRS 16 application and TRIMs).
Had the IFRS 9 transitional arrangement not been applied, the total impact on the CET1 would have been -23 bps.
In April 2019, the European Central Bank published the aggregate result of its Supervisory Review and Evaluation Process (SREP) carried out in 2018. Santander has lower capital requirements than the average of SSM banks. This positive differential was wider in 2018 than in 2017.
| Fully-loaded capital ratio* |
| % |
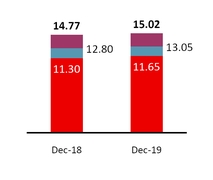
n Total |
n Tier1 |
n CET1 |
| CET1 evolution* |
| % |
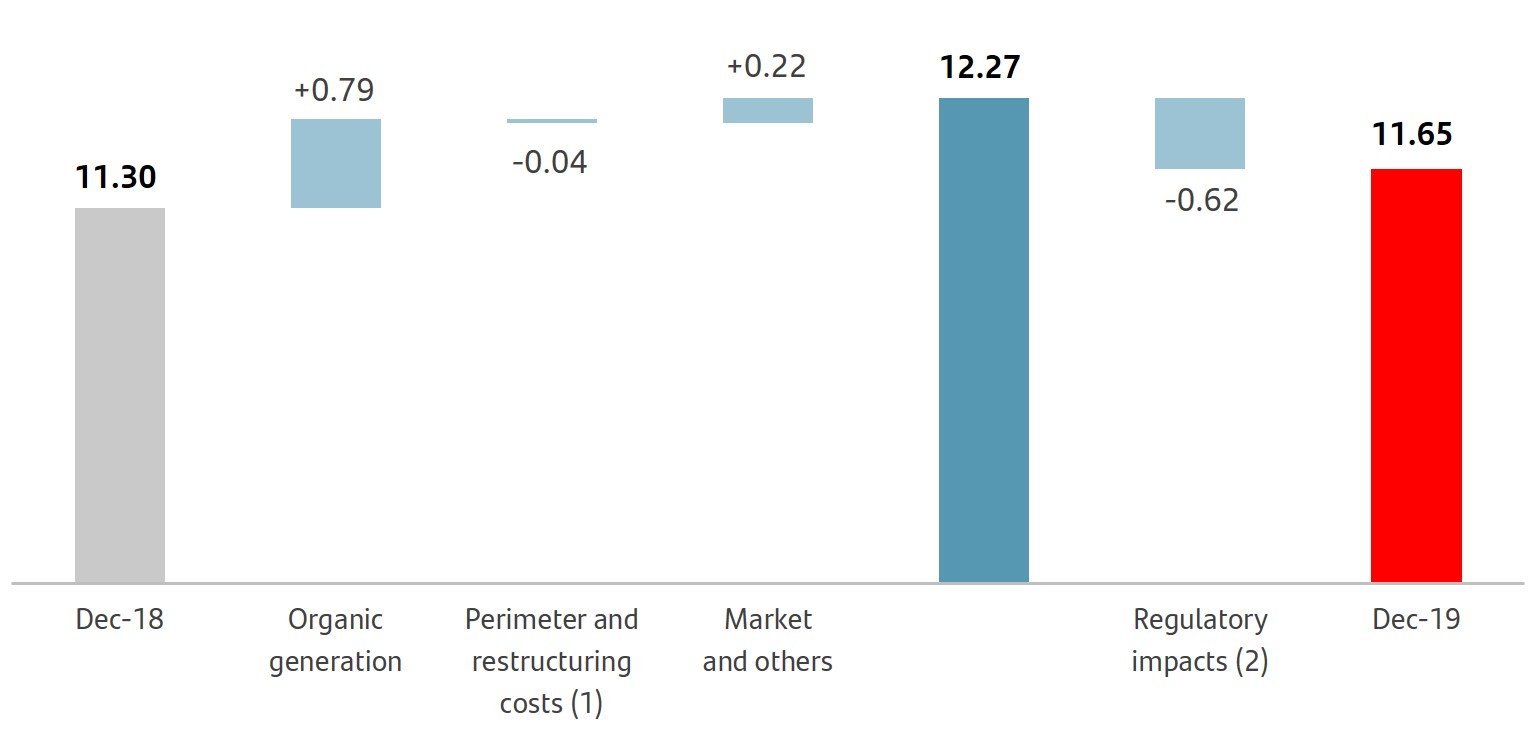 |
| QoQ evolution | |||
| Organic Generation | +31 bps | ||
| Others | +13 bps | ||
| Regulatory Impacts | -9 bps | ||
(1) Restructuring costs (-15 bps); Share buyback Mexico (+4 bps); Custody (+3 bps); Other (+4 bps).
(2) IFRS 16 (-19 bps); models and TRIM (-36 bps); Other (-7 bps).
(*) All 2018 and 2019 data was calculated using the IFRS 9 transitional arrangements, unless otherwise indicated.
January - December 2019 | | 17 |
RISK MANAGEMENT
| • | In the fourth quarter, Santander’s credit quality improved further. Low market risk activity aimed to service our customers and limited exposure to operational risk events continued as in previous quarters, maintaining our medium-low risk profile. |
| • | The NPL ratio ended 2019 at 3.32%, having decreased in the quarter and in the year, while cost of credit remained at 1% levels. Coverage increased to 68%. |
| • | Our market risk exposure, in the fourth quarter, remained at low levels, in spite of the prevailing uncertainty and volatility in the geopolitical scenario. |
| • | The operational risk profile remained stable with a similar distribution of losses by category in the quarter. |
u Credit risk management
The positive trend in credit quality continued during the fourth quarter, supported by the positive year-on-year evolution of the NPL ratio, and a stable coverage and cost of credit.
Non-performing loans amounted to EUR 33,799 million in December, 1% less than in the previous quarter. Excluding the exchange-rate impact, the total volume of NPLs also decreased, due to the reductions observed in our European units despite a slight increase in South and North America.
The Group’s NPL ratio decreased to 3.32% (-15 bps QoQ and -41 bps YoY). Reductions were observed on a year-on-year basis mainly in Portugal, the US, Mexico and Spain. The NPL ratio in Spain continued to be affected by the integration of Banco Popular and the real estate business.
Loan-loss provisions made in the fourth quarter amounted to EUR 2,573 million, 6% greater in constant euros than in the third quarter, mainly driven by seasonality in SC USA and loan growth in Brazil.
Cumulative loan-loss provisions also increased year-on-year adding up to EUR 9,321 million (+5% in constant euros), led by Brazil, the US and SCF, in line with portfolio growth.
Cost of credit remained at similar levels compared to the previous quarter and on a year-on-year basis reflecting the stability of our loan portfolio’s credit quality.
| Credit risk | |||||||
| EUR million | |||||||
| Dec-19 | Dec-18 | Chg (%) | Dec-17 | ||||
| Non-performing loans | 33,799 | 35,692 | (5.3) | 37,596 | |||
| NPL ratio (%) | 3.32 | 3.73 | 4.08 | ||||
| Loan-loss allowances | 22,965 | 24,061 | (4.6) | 24,529 | |||
| For impaired assets | 14,093 | 15,148 | (7.0) | 16,459 | |||
| For other assets | 8,872 | 8,913 | (0.5) | 8,070 | |||
| Coverage ratio (%) | 68 | 67 | 65 | ||||
| Cost of credit (%) | 1.00 | 1.00 | 1.07 | ||||
| NPL and coverage ratios. Total Group |
| % |
| Key metrics geographic performance. December 2019 | ||||||||
| % | NPL | Change (pb) | Coverage | |||||
| ratio | QoQ | YoY | ratio | |||||
| Spain | 6.94 | -29 | -38 | 41 | ||||
| Consumer Finance | 2.30 | 5 | 1 | 106 | ||||
| United Kingdom | 1.01 | -7 | -7 | 37 | ||||
| Portugal | 4.83 | -7 | -111 | 53 | ||||
| Poland | 4.31 | -4 | 3 | 67 | ||||
| US | 2.20 | 2 | -72 | 162 | ||||
| Mexico | 2.19 | -11 | -24 | 128 | ||||
| Brazil | 5.32 | -1 | 7 | 100 | ||||
| Chile | 4.64 | 16 | -2 | 56 | ||||
| Argentina | 3.39 | -25 | 22 | 124 | ||||
| 18 | | January - December 2019 |
| Non-performing loans by quarter | ||||||||||||||||
| EUR million | ||||||||||||||||
| Q1'18 | Q2'18 | Q3'18 | Q4'18 | Q1'19 | Q2'19 | Q3'19 | Q4'19 | |||||||||
| Balance at beginning of period | 37,596 | 37,407 | 36,654 | 36,332 | 35,692 | 35,590 | 34,421 | 34,326 | ||||||||
| Net additions | 2,340 | 2,906 | 2,528 | 3,136 | 2,147 | 2,511 | 3,190 | 2,696 | ||||||||
| Increase in scope of consolidation | — | — | — | 177 | — | — | — | — | ||||||||
| Exchange rate differences and other | 361 | (409 | ) | (140 | ) | (130 | ) | 479 | (162 | ) | (110 | ) | (51 | ) | ||
| Write-offs | (2,890 | ) | (3,250 | ) | (2,710 | ) | (3,823 | ) | (2,728 | ) | (3,518 | ) | (3,175 | ) | (3,172 | ) |
| Balance at period-end | 37,407 | 36,654 | 36,332 | 35,692 | 35,590 | 34,421 | 34,326 | 33,799 | ||||||||
Total loan-loss reserves amounted to EUR 22,965 million. Coverage at the end of 2019 increased to 68% for the Group. It should be taken into account that in Spain and the UK, a large part of their portfolios has real estate collateral, which justifies lower coverage levels.
The Group’s coverage by IFRS 9 stages remained stable on a year-on-year basis, with no significant movements.
u Market risk
The global corporate banking trading activity risk is mainly interest rate driven, focused on servicing our customer's needs and measured in daily VaR terms at 99%. In the fourth quarter, VaR fluctuated around an average value of EUR 10.7 million and reached a maximum of EUR 16.6 million, mainly as a result of the market volatility caused by the political uncertainty in Chile, always within the established limits. These figures are low compared to the size of the Group’s balance sheet and activity. In addition, there are other positions classified for accounting purposes as trading (total VaR of EUR 10.4 million at the end of December 2019).
| Coverage ratio by stage | |||||||
| EUR billion | |||||||
| Exposure* | Coverage | ||||||
| Dec-19 | Dec-19 | Dec-18 | |||||
| Stage 1 | 898 | 0.5 | % | 0.5 | % | ||
| Stage 2 | 53 | 8.7 | % | 9.2 | % | ||
| Stage 3 | 34 | 41.7 | % | 42.4 | % | ||
(*) Exposure subject to impairment.
Stage 1: financial instruments for which no significant increase in credit risk is identified since its initial recognition.
Stage 2: if there has been a significant increase in credit risk since the date of initial recognition but the impairment event has not materialised, the financial instrument is classified in Stage 2.
Stage 3: a financial instrument is catalogued in this stage when it shows effective signs of impairment as a result of one or more events that have already occurred resulting in a loss.
Additionally, there are EUR 24 billion in loans and advances to customers not subject to impairment recorded at mark to market with changes through P&L.
| Trading portfolios*. VaR performance |
| EUR million |
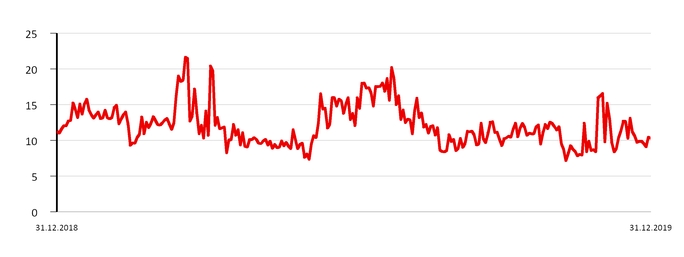
(*) Corporate & Investment Banking performance in financial markets.
January - December 2019 | | 19 |
| Trading portfolios *. VaR by geographic region | |||||||
| EUR million | |||||||
| 2019 | 2018 | ||||||
| Second quarter | Average | Latest | Average | ||||
| Total | 10.7 | 10.3 | 10.1 | ||||
| Europe | 7.3 | 10.1 | 5.3 | ||||
| North America | 4.1 | 3.8 | 5.1 | ||||
| South America | 7.9 | 6.0 | 8.6 | ||||
(*) Activity performance in Corporate & Investment Banking markets.
u Structural and liquidity risk
| • | Regarding structural exchange rate risk, Santander’s CET1 ratio coverage remained around 100% in order to protect it from foreign currency movements. |
| • | In structural interest rate risk, positive performance in the ALCO activity despite high volatility during the quarter, mainly due to the US/China trade tensions and political uncertainty in several countries where the Group operates. |
| • | Regarding liquidity risk, the Group maintained a comfortable position, supported by a robust and diversified liquidity buffer, with ratios well above regulatory limits. |
| Trading portfolios *. VaR by market factor | ||||||||
| EUR million | ||||||||
| Four quarter 2019 | Min. | Avg. | Max. | Last | ||||
| VaR total | 7.1 | 10.7 | 16.6 | 10.3 | ||||
| Diversification effect | (3.3 | ) | (8.7 | ) | (13.3 | ) | (9.9 | ) |
| Interest rate VaR | 6.7 | 8.9 | 12.1 | 9.2 | ||||
| Equity VaR | 1.7 | 3.3 | 5.1 | 4.8 | ||||
| FX VaR | 2.3 | 3.9 | 6.4 | 2.6 | ||||
| Credit spreads VaR | 2.6 | 3.4 | 4.1 | 3.5 | ||||
| Commodities VaR | 0.0 | 0.0 | 0.0 | 0.0 | ||||
(*) Activity performance in Corporate & Investment Banking markets.
NOTE: In the North America and South America and Asia portfolios, VaR corresponding to the credit spreads factor other than sovereign risk is not relevant and is included in the interest rate factor.
u Operational risk
| • | The main focus points in the fourth quarter in terms of operational risk management were the evolution of legacy cases, labour claims in Brazil and ongoing legal and regulatory cases. |
| • | In relative terms, levels of losses by Basel categories were higher in those derived from customer claims, while external fraud showed a reduction compared to last year. |
| • | The cumulative impact from PPI claims in the year is EUR 183 million (net of tax), which is higher than last year due to the end of the redress period in August. |
| • | Specific risk-monitoring frameworks continued to be enhanced, such as those for suppliers (focusing on actions to ensure compliance with the EBA Guidelines), the most significant transformation processes (including digitalisation initiatives), as well as the implementation of fraud mitigating measures in the main units (Mexico, the UK and Brazil). |
| • | Cybersecurity, a key area for the Group, continued to improve. Progress continued in the second half of 2019 in our cybersecurity transformation programme in order to strengthen detection, response and protection mechanisms. New policies have been developed and deployed to enhance management and control over critical IT infrastructure and assets. |
| 20 | | January - December 2019 |
GENERAL BACKGROUND
Grupo Santander carried out its business in 2019 in an slowing economic environment (to around 3% estimated vs. 3.6% growth in 2018) due to trade tensions between the US and China and the uncertainty regarding the manner in which the UK would leave the EU. Uncertainty reduced at year end: the US and China reached a trade agreement and the result of the UK elections points to a non-traumatic outcome.
This reduction in uncertainty, together with the expansionary monetary policy measures, allowed activity to stabilise.
| Country | GDP Change1 | Economic performance | |
 | Eurozone | +1.2% | The negative impact from the external environment weakened GDP, driven by cyclical depletion. Inflation remained stagnant at around 1%. The ECB reacted with another set of monetary easing measures, including a cut in interest rates and the resumption of the asset purchase programme. |
 | Spain | +1.9% | Economic expansion continued, although at more moderate rates. The unemployment rate fell again, to around 14%. The economy is not showing inflationary pressures due to the fall in energy prices and a compression of business margins which have offset wage rises. |
 | United Kingdom | +1.2% | Economic performance was very volatile throughout the year, influenced by the attempts to exit the EU. The main element supporting growth was private consumption backed by real wage increases, which were higher as inflation fell (1.3% in December). The unemployment rate (3.8% in Q3'19) remained at historical lows. The base rate remained at 0.75%. |
 | Portugal | +1.9% | The economy moderated its growth supported by private consumption and investment, whose momentum generated an increase in imports that reduced the contribution of the external sector to GDP. The jobless rate continued to fall (6.1%) and inflation stood at just 0.4% in December. |
 | Poland | +4.2% | The economy continued to grow at a good pace, although at more modest rates, backed by domestic demand. The unemployment rate was at a historic low (close to 3%). Inflation increased significantly in December to 3.4%, though this is expected to moderate and as such the central bank held its key interest rate at 1.5%. |
 | United States | +2.3% | GDP decelerated by 60 basis points in the year due to lower global growth, geopolitical uncertainty and the dilution of fiscal stimuli. Unemployment remained low, but with inflation below target, the Fed made an adjustment by cutting interest rate by 75 bps to 1.50-1.75%. |
 | Mexico | -0.1% | Economic growth was stagnant in 2019 due to a fall in investment and fiscal adjustment. Inflation moderated to 2.8%, below the central bank's target (3%), which began to cut its key rate in August (a total of 100 bps in the year) to 7.25%. The recent process on the approval of the trade agreement between Mexico, the US and Canada ended uncertainty about the economic relationship between the three countries. |
 | Brazil | +1.2% | The recovery gained momentum during the year, from private consumption and investment. Inflation rebounded to 4.31%, slightly above the target of 4.25%, but core inflation was lower (3.4%). The central bank cut its benchmark rate by 200 bps to 4.5%. S&P improved the outlook for sovereign rating (at BB-) from stable to positive, given the progress in fiscal consolidation measures. |
 | Chile | +1.1% | The economy was impacted by the social protests that began in mid-October, although the situation has now normalised. Inflation of 3%, coinciding with the central bank's target, who cut the official rate to 1.75% (vs 2.75% at the end of 2018) and established an exchange rate intervention programme to control the peso's volatility. |
 | Argentina | -2.3% | GDP shrank as a result of financial volatility since August, which dampened consumption and investment and caused inflation to rise. The central bank introduced capital controls, which allowed it to cut interest rates in the final few months of the year, reversing the previous rise. |
(1) Estimated year-on-year change 2019.
January - December 2019 | | 21 |
DESCRIPTION OF SEGMENTS
The segment reporting is based on financial information presented to the chief operating decision maker, which excludes certain items included in the statutory results that distort year-on-year comparisons and are not considered for management reporting purposes. This financial information (underlying basis) is computed by adjusting reported results for the effects of certain gains and losses (e.g.: capital gains, write-downs, impairment of goodwill, etc.). These gains and losses are items that management and investors ordinarily identify and consider separately to better understand the underlying trends in the business.
The Group has aligned the information in this operating segment section in a manner consistent with the underlying information used internally for management reporting purposes and with that presented throughout the Group’s other public documents.
The Group executive committee has been determined to be the chief operating decision maker for the Group. The Group’s operating segments reflect the organisational and management structures. The Group executive committee reviews the internal reporting based on these segments in order to assess performance and allocate resources.
The segments are differentiated by the geographic area where profits are earned and by type of business. The financial information of each reportable segment is prepared by aggregating the figures for the Group’s various geographic areas and business units. The information relates to both the accounting data of the units integrated in each segment and that provided by management information systems. In all cases, the same general principles as those used in the Group are applied.
The businesses included in each of the business areas in this report and the accounting principles under which their results are presented here may differ from the businesses included and accounting principles applied in the financial information separately prepared and disclosed by our subsidiaries (some of which are publicly listed) which in name or geographical description may seem to correspond to the business areas covered in this report. Accordingly, the results of operations and trends shown for our business areas in this document may differ materially from those of such subsidiaries.
At the beginning of July 2019, we announced that, starting with the financial information for the first half of 2019, we would carry out a change in our reported segments to reflect our current organisational and management structure.
This change in our reported segments aims to align the segment information to how segments and units are managed and has no impact on accounting figures at the Group level. The main changes, which have been applied to segment information for all periods included in the consolidated financial statements, are the following:
Primary segments
| 1. | Creation of the new geographic segment Europe that includes the existing units under the previous Continental Europe segment (Spain, Portugal, Poland and Santander Consumer Finance) plus the UK (that was previously a segment on its own and is now a unit under the segment Europe). |
| – | The UK is aligned with the ring-fencing structure, including products and services distributed to our retail customers and the majority of our business customers. The businesses excluded are now incorporated in the rest of Europe. |
| – | Spain now includes the Real Estate Activity Spain unit, previously included in the rest of Europe, and it excludes some treasury businesses now reported in the rest of Europe and the online bank Openbank is now incorporated in the new digital segment (Santander Global Platform). |
| – | Rest of Europe, included within the Europe segment, comprises mainly (i) CIB businesses such as Banco Santander, S.A. branches outside of Spain (including the businesses excluded from the UK as a result of ring-fencing) as well as Spain’s treasury business and (ii) Private Banking’s Wealth Management & Insurance businesses in Switzerland, mutual funds in Luxemburg and Insurance in Zurich. |
| 2. | Creation of the new geographic segment North America that comprises the existing units under the previous US segment plus Mexico. |
| 3. | Creation of the new geographic segment South America that comprises the existing units under the previous Latin America segment except for Mexico. |
| 4. | Creation of a new reporting unit segment, Santander Global Platform, which includes our global digital services under a single unit: |
| – | Our fully digital native bank Openbank and Open Digital Services. |
| – | Global Payments Services: payments platform to better serve our customers with value propositions developed globally, including Superdigital, Pago FX and our recently launched global businesses (Global Merchant Services and Global Trade Services). |
| – | Digital Assets: common digital assets and Centres of Digital Expertise which help our banks in their digital transformation. |
Secondary segments
| 5. | The Real Estate Activity Spain unit, that was previously a segment reported on its own, is now included in Retail Banking. |
| 6. | The insurance business, previously included in Retail Banking, is now included in the Wealth Management segment, which was renamed Wealth Management & Insurance. |
| 22 | | January - December 2019 |
| 7. | The new digital segment (Santander Global Platform) is also incorporated as a secondary segment. |
| 8. | Finally, the change in reported segments also includes adjustments of the clients of the Global Customer Relationship Model between Retail Banking and Santander Corporate & Investment Banking and between Retail Banking and Wealth Management & Insurance. |
The changes in the secondary segments have no impact on the primary segments.
To allow better quarter-on-quarter and year-on-year comparability, and as was published in the Relevant Fact on 4 July 2019, the Group has provided the quarterly 2018 and first quarter of 2019 data on a new basis, in accordance with the new structure of the Group.
After these changes, the operating business areas are structured in two levels:
Primary segments
This primary level of segmentation, which is based on the Group’s management structure, comprises five reportable segments: four operating areas plus the Corporate Centre. The operating areas are:
Europe: which comprises all the business activities carried out in the region. Detailed financial information is provided on Spain, Portugal, Poland, Santander Consumer Finance (which incorporates all the region’s business, including the three countries mentioned herewith) and the UK.
North America: which comprises all the business activities carried out in Mexico and the US, which includes the holding company (SHUSA) and the businesses of Santander Bank, Santander Consumer USA, Banco Santander Puerto Rico, the specialised unit Banco Santander International and the New York branch.
South America: includes all the financial activities carried out by the Group through its banks and subsidiary banks in the region. Detailed information is provided on Brazil, Chile, Argentina, Uruguay, Peru and Colombia.
Santander Global Platform: includes Global Payments Services (Global Trade Services, Global Merchant Services, Superdigital, Pago FX), our fully digital bank Openbank and Open Digital Services, and Digital Assets (Centres of Digital Expertise, InnoVentures and Digital Assets).
Secondary segments
At this secondary level of segment reporting, the Group is structured into Retail Banking, Santander Corporate & Investment Banking, Wealth Management & Insurance and Santander Global Platform.
Retail Banking: this covers all customer banking businesses, including consumer finance, except those of corporate banking, which are managed through Santander Corporate & Investment Banking, and asset management, private banking and insurance, which are managed by Wealth Management & Insurance. The results of the hedging positions in each country are also included, conducted within the sphere of each one’s assets and liabilities committee.
Santander Corporate & Investment Banking (SCIB): this business reflects revenue from global corporate banking, investment banking and markets worldwide including treasuries managed globally (always after the appropriate distribution with Retail Banking customers), as well as equity business.
Wealth Management & Insurance: includes the asset management business (Santander Asset Management), the corporate unit of Private Banking and International Private Banking in Miami and Switzerland and the insurance business (Santander Insurance).
Santander Global Platform: includes Global Payments Services (Global Trade Services, Global Merchant Services, Superdigital, Pago FX), our fully digital bank Openbank and Open Digital Services, and Digital Assets (Centres of Digital Expertise, InnoVentures and Digital Assets).
In addition to these operating units, which report by geographic area and businesses, the Group continues to maintain the area of Corporate Centre, that includes the centralised activities relating to equity stakes in financial companies, financial management of the structural exchange rate position, assumed within the sphere of the Group’s assets and liabilities committee, as well as management of liquidity and of shareholders’ equity via issuances.
As the Group’s holding entity, this area manages all capital and reserves and allocations of capital and liquidity with the rest of businesses. It also incorporates amortisation of goodwill but not the costs related to the Group’s central services (charged to the areas), except for corporate and institutional expenses related to the Group’s functioning.
As described on the previous page, the results of our business areas presented below are provided on the basis of underlying results only and including the impact of foreign exchange rate fluctuations. However, for a better understanding of the actual changes in the performance of our business areas, we provide and discuss the year-on-year changes to our results excluding such impact. On the other hand, certain figures contained in this report, including financial information, have been subject to rounding to enhance their presentation. Accordingly, in certain instances, the sum of the numbers in a column or a row in tables contained in this report may not conform exactly to the total figure given for that column or row. |
January - December 2019 | | 23 |
| January-December 2019 | ||||||||||||
| Main items of the underlying income statement | ||||||||||||
| EUR million | ||||||||||||
| Primary segments | Net interest income | Net fee income | Total income | Net operating income | Profit before tax | Underlying attributable profit to the parent | ||||||
| EUROPE | 14,201 | 5,260 | 21,001 | 9,957 | 7,350 | 4,878 | ||||||
| Spain | 3,919 | 2,481 | 7,506 | 3,485 | 2,174 | 1,585 | ||||||
| Santander Consumer Finance | 3,848 | 823 | 4,710 | 2,672 | 2,215 | 1,314 | ||||||
| United Kingdom | 3,788 | 866 | 4,727 | 1,892 | 1,455 | 1,077 | ||||||
| Portugal | 856 | 390 | 1,375 | 751 | 750 | 525 | ||||||
| Poland | 1,171 | 467 | 1,717 | 1,024 | 681 | 349 | ||||||
| Other | 620 | 234 | 966 | 133 | 76 | 28 | ||||||
| NORTH AMERICA | 8,926 | 1,776 | 11,604 | 6,636 | 2,776 | 1,667 | ||||||
| US | 5,769 | 947 | 7,605 | 4,309 | 1,317 | 717 | ||||||
| Mexico | 3,157 | 829 | 3,998 | 2,327 | 1,459 | 950 | ||||||
| SOUTH AMERICA | 13,316 | 4,787 | 18,425 | 11,769 | 7,232 | 3,924 | ||||||
| Brazil | 10,072 | 3,798 | 13,951 | 9,345 | 5,606 | 2,939 | ||||||
| Chile | 1,867 | 404 | 2,539 | 1,508 | 1,129 | 630 | ||||||
| Argentina | 940 | 446 | 1,316 | 554 | 217 | 144 | ||||||
| Other | 437 | 138 | 619 | 362 | 280 | 212 | ||||||
| SANTANDER GLOBAL PLATFORM | 92 | 6 | 81 | (159 | ) | (166 | ) | (120 | ) | |||
| CORPORATE CENTRE | (1,252 | ) | (50 | ) | (1,617 | ) | (1,990 | ) | (2,262 | ) | (2,096 | ) |
| TOTAL GROUP | 35,283 | 11,779 | 49,494 | 26,214 | 14,929 | 8,252 | ||||||
| Secondary segments | ||||||||||||
| RETAIL BANKING | 33,157 | 9,094 | 43,523 | 24,042 | 13,265 | 7,748 | ||||||
| CORPORATE & INVESTMENT BANKING | 2,721 | 1,528 | 5,284 | 3,008 | 2,767 | 1,761 | ||||||
| WEALTH MANAGEMENT & INSURANCE | 565 | 1,201 | 2,223 | 1,312 | 1,325 | 960 | ||||||
| SANTANDER GLOBAL PLATFORM | 92 | 6 | 81 | (159 | ) | (166 | ) | (120 | ) | |||
| CORPORATE CENTRE | (1,252 | ) | (50 | ) | (1,617 | ) | (1,990 | ) | (2,262 | ) | (2,096 | ) |
| TOTAL GROUP | 35,283 | 11,779 | 49,494 | 26,214 | 14,929 | 8,252 | ||||||
| Underlying attributable profit geographic distribution* | Underlying attributable profit 2019. Core markets | |
| 2019 | EUR million. % change YoY in constant euros | |
 | 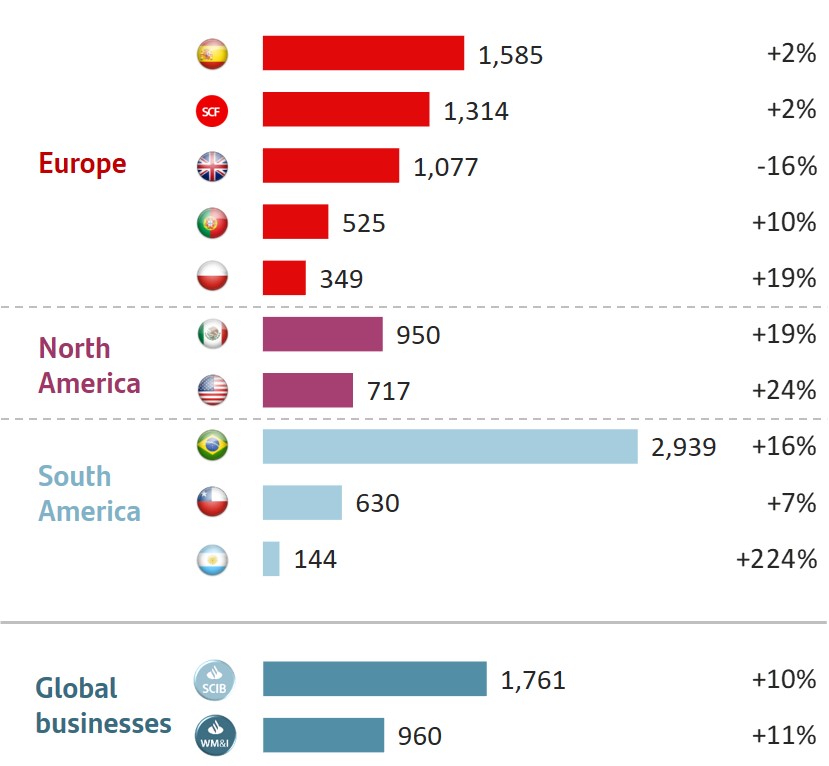 | |
| (*) As a % of operating areas. Excluding Corporate Centre and Santander Global Platform. | ||
| 24 | | January - December 2019 |
| January-December 2018 | ||||||||||||
| Main items of the underlying income statement | ||||||||||||
| EUR million | ||||||||||||
| Primary segments | Net interest income | Net fee income | Total income | Net operating income | Profit before tax | Underlying attributable profit to the parent | ||||||
| EUROPE | 14,204 | 5,435 | 21,257 | 10,091 | 7,491 | 5,048 | ||||||
| Spain | 4,093 | 2,624 | 7,615 | 3,277 | 2,063 | 1,554 | ||||||
| Santander Consumer Finance | 3,723 | 798 | 4,610 | 2,622 | 2,137 | 1,293 | ||||||
| United Kingdom | 4,078 | 912 | 5,132 | 2,295 | 1,803 | 1,272 | ||||||
| Portugal | 858 | 377 | 1,344 | 700 | 686 | 479 | ||||||
| Poland | 996 | 453 | 1,488 | 848 | 552 | 296 | ||||||
| Other | 456 | 272 | 1,068 | 350 | 251 | 154 | ||||||
| NORTH AMERICA | 8,154 | 1,615 | 10,476 | 5,988 | 2,337 | 1,304 | ||||||
| US | 5,391 | 859 | 6,949 | 3,930 | 1,113 | 549 | ||||||
| Mexico | 2,763 | 756 | 3,527 | 2,058 | 1,224 | 755 | ||||||
| SOUTH AMERICA | 12,891 | 4,497 | 17,674 | 11,117 | 6,717 | 3,451 | ||||||
| Brazil | 9,758 | 3,497 | 13,345 | 8,845 | 5,185 | 2,592 | ||||||
| Chile | 1,944 | 424 | 2,535 | 1,488 | 1,118 | 612 | ||||||
| Argentina | 768 | 448 | 1,209 | 458 | 183 | 82 | ||||||
| Other | 421 | 128 | 585 | 326 | 231 | 165 | ||||||
| SANTANDER GLOBAL PLATFORM | 79 | 7 | 74 | (68 | ) | (70 | ) | (54 | ) | |||
| CORPORATE CENTRE | (987 | ) | (69 | ) | (1,057 | ) | (1,483 | ) | (1,699 | ) | (1,686 | ) |
| TOTAL GROUP | 34,341 | 11,485 | 48,424 | 25,645 | 14,776 | 8,064 | ||||||
| Secondary segments | ||||||||||||
| RETAIL BANKING | 32,262 | 8,870 | 42,231 | 22,994 | 12,654 | 7,238 | ||||||
| CORPORATE & INVESTMENT BANKING | 2,461 | 1,534 | 5,077 | 2,975 | 2,680 | 1,691 | ||||||
| WEALTH MANAGEMENT & INSURANCE | 526 | 1,142 | 2,099 | 1,226 | 1,211 | 875 | ||||||
| SANTANDER GLOBAL PLATFORM | 79 | 7 | 74 | (68 | ) | (70 | ) | (54 | ) | |||
| CORPORATE CENTRE | (987 | ) | (69 | ) | (1,057 | ) | (1,483 | ) | (1,699 | ) | (1,686 | ) |
| TOTAL GROUP | 34,341 | 11,485 | 48,424 | 25,645 | 14,776 | 8,064 | ||||||
January - December 2019 | | 25 |
EUROPE
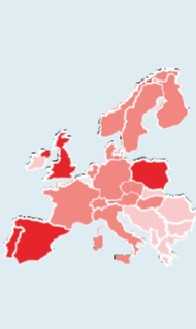 | Highlights (changes in constant euros) • Given the current macroeconomic environment, characterised by lower for longer interest rates, we are working on our franchises to simplify our business model and structures and adapt our technology platforms.• In terms of volumes, in an environment of lower economic growth, gross loans and advances to customers (excluding reverse repos) rose 2% year-on-year and customer funds 4%.• Underlying attributable profit amounted to EUR 4,878 million, down 3% compared to 2018, due to lower gains on financial transactions (markets), net fee income (mainly CIB) and higher provisions (Spain and SCF). Conversely, net interest income remained stable and costs fell 2.4% in real terms, reflecting the optimisation measures. | ||
| EUR | 4,878 | Mn | |
| Underlying attributable profit | |||
Strategy
In Europe, we are developing initiatives to enable the simplification of our business models, shared services and cost saving measures. For example:
| • | Simplification of our business model, reducing the number of products to gain efficiency and agility while maintaining a full value proposition. |
| • | Adaptation of the technological platforms. |
| • | Continued achievement of synergies from the ongoing integration processes (i.e. Spain and Poland). |
Of note by countries:
| • | In Spain, commitment to maintain leadership in the market, strengthening customer loyalty and experience while obtaining additional synergies. |
| • | In Portugal and Poland, improved profitability and efficiency as a result of the successful integrations. |
| • | In the UK, improve efficiency and capital allocation, and in SCF, strengthened relationships with manufacturers and the perimeter of the agreements. |
Business performance
Gross loans and advances to customers (excluding reverse repos) increased by 2%, boosted by SCF (new lending), the UK (mortgages) and Poland. Spain was affected by deleveraging in wholesale banking.
Customer deposits (excluding repos) increased 2% year-on-year with rises in all countries. Mutual funds rose 15% boosting 4% growth in customer funds.
Results
Underlying attributable profit amounted to EUR 4,878 million in 2019, 3% less than the previous year, affected mainly by lower revenue in the UK. By lines:
| • | Net interest income remained stable supported by higher volumes in SCF and Poland and the higher revenue in CIB, which offset the competitive pressures and the fall in SVR volumes in the UK and the impact of low interest rates, smaller ALCO portfolio and IFRS 16 in Spain. Net fee income was down 3% and gains on financial transactions were 7% lower year-on-year due to a very good performance in the markets in the first quarter of 2018. |
| • | Costs decreased 1% (-2.4% in real terms) because of the efficiencies generated and the optimisation processes, mainly in Spain. |
| • | Provisions rose 17%, maintaining a low cost of credit (0.28%). |
In the quarter, profit dropped 5% mainly due to the contribution to the DGF in Spain. Excluding it, profit was 8% higher.
| Customers | ||||||
| December 2019. Thousands | ||||||
| Loyal customers | Digital customers | |||||
 | 9,891 |  | 13,830 | |||
| 36 | % | /active customers | +9 | % | YoY | |
| Activity | ||||||||||
| December 2019. EUR billion and % change in constant euros | ||||||||||
| 0% | ||||||||||
| +1% | QoQ | |||||||||
| QoQ | ||||||||||
| 650.55201084 | 671.0319764 | |||||||||
| +2% | +4% | |||||||||
| YoY | YoY | |||||||||
| Gross loans and advances to customers excl. reverse repos | Customer deposits excl. repos + mutual funds | |||||||||
| Underlying income statement | |||||||||
| EUR million and % change in constant euros | |||||||||
| Q4'19 | /Q3'19 | 2019 | /2018 | ||||||
| Revenue | 5,292 | -1 | % | 21,001 | -1 | % | |||
| Expenses | -2,733 | -1 | % | -11,044 | -1 | % | |||
| LLPs | -498 | 0 | % | -1,839 | +17 | % | |||
| PBT | 1,852 | -6 | % | 7,350 | -2 | % | |||
| Underlying attrib. profit | 1,238 | -5 | % | 4,878 | -3 | % | |||
| 26 | | January - December 2019 |
SPAIN
 | Highlights • We successfully completed the integration of Banco Popular, with the migration of all branches and customers to Santander, and the execution of the branch network optimisation process, obtaining greater costs synergies than expected.• Strong growth in SMEs and corporates, leveraging our strengths as a Group, with focus in value-added products, boosting international business 15% year-on-year.• Underlying attributable profit increased 2% in 2019, mainly due to sustained revenue and lower costs, driven by the efficiencies resulting from Popular’s integration and optimisation efforts. |
| EUR 1,585 Mn | |
| Underlying attributable profit | |
Commercial activity
In the branch network optimisation process of Banco Popular, we closed around 1,150 branches and unified the central services and regional teams.
We continued to update the distribution network. Accordingly, we have already close to 600 Smart Red branches and 6 Work Café branches.
As regards the main loyalty drivers:
| • | Increased customer transactions, with growths of 4% in card turnover (after growing 22% in the last two years) and 8% in point-of-sale terminals. Consumer credit increased 24% driven by pre-concession and digital loans. |
| • | In SMEs, we launched Tresmares Capital, a new independent alternative financing platform for this segment. |
We are working on tailored solutions that favour customer acquisition, loyalty and commercial dynamism, such as Generation 81 for women, SmartBank for young people and Santander Senior for the over 65s.
Lastly, the digital transformation process enabled us to increase the number of digital customers by 10% in the year and the weight of sales made through digital channels to around 29%.
Business performance
Gross loans and advances to customers (excluding reverse repos) fell 6% in the year, impacted by wholesale banking deleveraging and the progress towards a capital efficient model. Additionally, new mortgage lending does not yet offset maturities. However, consumer stock has increased in the last 12 months.
Customer funds increased 3% compared to 2018. Demand deposits rose 4%, which offset the decrease in time deposits (-12%) as a result of the strategy to reduce the cost of funding.
Results
Underlying attributable profit in 2019 amounted to EUR 1,585 million, 2% higher year-on-year. By lines:
| • | NII fell 4%, due to smaller ALCO portfolio, lower institutions volumes and the impact of IFRS 16, partially offset by the improvement in customer spreads. Net fee income declined mainly due to lower activity at SCIB. Gains on financial transactions rose driven by active portfolio management, taking advantage of market movements. |
| • | Operating expenses dropped 7% year-on-year due to the efficiencies resulting from the Popular integration and the optimisation efforts. |
| • | Loan-loss provisions rose 9%. Nevertheless, the NPL ratio improved 38 bps in the year and the cost of credit stood at low levels (43 bps). |
Compared to the third quarter, profit decreased 18% adversely impacted by the DGF contribution. Without this impact, growth was 14% due to the positive performance in costs and provisions.
| Customers | ||||||
| December 2019. Thousands | ||||||
| Loyal customers | Digital customers | |||||
| 2,540 | | 4,721 | |||
| 32 | % | /active customers | +10 | % | YoY | |
| Activity | ||||||||||
December 2019. EUR billion and % change | ||||||||||
| -1% | ||||||||||
| -2% | QoQ | |||||||||
| QoQ | ||||||||||
| 191.28031308 | 309 | |||||||||
| -6% | +3% | |||||||||
| YoY | YoY | |||||||||
| Gross loans and advances to customers excl. reverse repos | Customer deposits excl. repos + mutual funds | |||||||||
| Underlying income statement | |||||||||
| EUR million and % change | |||||||||
| Q4'19 | /Q3'19 | 2019 | /2018 | ||||||
| Revenue | 1,811 | -9 | % | 7,506 | -1 | % | |||
| Expenses | -977 | -2 | % | -4,021 | -7 | % | |||
| LLPs | -176 | -16 | % | -856 | +9 | % | |||
| PBT | 557 | -18 | % | 2,174 | +5 | % | |||
| Underlying attrib. profit | 400 | -18 | % | 1,585 | +2 | % | |||
January - December 2019 | | 27 |
SANTANDER CONSUMER FINANCE
 | Highlights (changes in constant euros) • SCF continues to be the European consumer finance leader, with critical mass and a Top 3 position in the markets in which it operates.• Underlying attributable profit rose 2% both in euros and in constant euros. High profitability (underlying RoTE of more than 15%, RoRWA of 2.3%) and cost of credit remained low for this type of business.• Two strategic deals were carried out this year: the agreement with Hyundai Kia in Germany to acquire 51% of the financial entity and a new agreement with Ford Motor Company in the fourth quarter to acquire Forso AB, their captive finance company in the Nordic countries, to reinforce its position in both markets. |
| EUR 1,314 Mn | |
| Underlying attributable profit | |
Commercial activity
SCF is Europe’s consumer finance leader, with a presence in 15 European countries and more than 130,000 associated points-of-sale. It also has a significant number of finance agreements with auto and motorcycle manufacturers and retail distribution groups.
In 2019, SCF continued to gain market share, underpinned by a solid business model: highly diversified by countries with a critical mass in key products, leader in efficiency and a recovery system that enables it to maintain better credit quality indicators than our competitors.
Additionally, we continued to sign and develop new agreements, both with retail distributors as well as manufacturers, seeking to help them in their commercial transformation processes.
Business performance
The stock of gross loans and advances to customers excluding reverse repurchase agreements and the impact of exchange rates, grew 7%. New lending increased 5% compared to 2018 (significantly better than the performance of new car sales in the European market), with growth in almost all countries. Of note were the rises in Germany, France and Italy.
Customer deposits excluding repos amounted to EUR 39,602 million, a product that sets Santander apart from its competitors.
Results
Underlying attributable profit of EUR 1,314 million in 2019, 2% higher than in 2018:
| • | Total revenue rose 3%, driven by net interest income (+4%) due to higher volumes. Net fee income increased 3%, notably in Germany. |
| • | Costs increased 3%, impacted by the acquisition of Hyundai Kia’s JV in Germany, but below business volume growth, benefiting from the efficiency projects carried out in several units. |
| • | Loan-loss provisions increased 32% mainly due to lending growth, change of product mix in Spain and lower written-off portfolio sales in the Nordic countries. |
| • | Other gains (losses) and provisions amounted to EUR 20 million compared to EUR -124 million in 2018, partly due to lower impairment losses on other assets and transformation costs. |
| • | The largest contribution to the underlying attributable profit came from Germany (EUR 361 million), the Nordic countries (EUR 291 million) and Spain (EUR 235 million). |
Compared to the third quarter of 2019, profit fell 5% affected by fee income seasonality in Germany, higher impairment of intangible assets and the release in the third quarter of other provisions.
| Customer loan distribution | |
| December 2019. | |
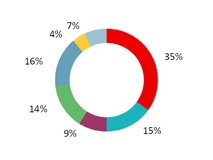
| n | Germany |
| n | Spain |
| n | Italy |
| n | France |
| n | Nordic countries |
| n | Poland |
| n | Other |
| Activity | ||||||||||
| December 2019. EUR billion and % change in constant euros | ||||||||||
| +4% | ||||||||||
| QoQ | -3% | |||||||||
| 105 | QoQ | |||||||||
| +7% | +5% | |||||||||
| YoY | 44 | YoY | ||||||||
| Gross loans and advances to customers excl. reverse repos | New lending | |||||||||
| Underlying income statement | |||||||||
| EUR million and % change in constant euros | |||||||||
| Q4'19 | /Q3'19 | 2019 | /2018 | ||||||
| Revenue | 1,185 | -1 | % | 4,710 | +3 | % | |||
| Expenses | -499 | -1 | % | -2,038 | +3 | % | |||
| LLPs | -148 | +1 | % | -477 | +32 | % | |||
| PBT | 504 | -15 | % | 2,215 | +4 | % | |||
| Underlying attrib. profit | 319 | -5 | % | 1,314 | +2 | % | |||
| 28 | | January - December 2019 |
UNITED KINGDOM
 | Highlights (changes in constant euros) • Good business evolution: strongest mortgage growth for a decade in a highly competitive market, and increases in our retail deposits, both important loyalty drivers.• We remained focused on improving customer service and retention, digital transformation and organisation simplification.• The results reflect ongoing competitive income pressure, delivering savings from the strategic transformation programme and maintaining prudent approach to risk. |
| EUR 1,077 Mn | |
| Underlying attributable profit | |
Commercial activity
We launched a multi-year transformation programme to simplify, digitalise and automate the business, focusing on our operating model, structures and productivity.
We continue to focus on our core mortgage business and also supported a new Fintech, Mortgage Engine, the first technological company to provide multiple decisions-in-principle in the UK market.
For our business customers, we have opened 43,000 1I2I3 Business current accounts since its launch in October 2018. We are continuing to develop our international proposition with the 17 trade corridors we have established, seven new in 2019.
We continued to develop our digital proposition in 2019 to improve customer experience. In the year, we retained 60% of refinanced mortgage loans online, representing a 5 pp increase year-on-year. We also opened 52% of current accounts and 62% of credit cards through digital channels.
Business performance
Gross loans and advances to customers (excluding reverse repos) rose 4%, due to the strongest mortgage growth for a decade, underpinned by our focus on pricing, customer retention and service.
Customer deposits, excluding repurchase agreements and the exchange rate impact, increased 2% year-on-year. Demand deposits were up 2% in the year while time deposits remained stable. Mutual funds grew 3%.
Results
Underlying attributable profit in 2019 of EUR 1,077 million, down 16% year-on-year, mainly due to lower revenue:
| • | Net interest income decreased, driven by competitive pressure on mortgage spreads and SVR (Standard Variable Rate) attrition. Net fee income fell 6%, partly due to lower income from mutual funds and CIB, and regulatory changes in overdrafts. Gains on financial also fell in the year. |
| • | Costs reduced 1% (-2.7% in real terms), with delivery of efficiency savings from our strategic transformation programme. |
| • | Loan-loss provisions increased by 46% from very low levels, maintaining a cost of credit of just 10 bps. The NPL ratio improved to 1.01%. |
In the quarter, underlying attributable profit fell by 4%, mainly due to higher fiscal pressures, as net operating income after LLPs rose 8% favoured by the improved trend in revenue and costs.
| Customers | ||||||
| December 2019. Thousands | ||||||
| Loyal customers | Digital customers | |||||
| 4,562 | | 5,824 | |||
| 32 | % | /active customers | +6 | % | YoY | |
| Activity | ||||||||||
| December 2019. EUR billion and % change in constant euros | ||||||||||
| +2% | +1% | |||||||||
| QoQ | QoQ | |||||||||
| 249 | 219 | |||||||||
| +4% | +2% | |||||||||
| YoY | YoY | |||||||||
| Gross loans and advances to customers excl. reverse repos | Customer deposits excl. repos + mutual funds | |||||||||
| Underlying income statement | |||||||||
| EUR million and % change in constant euros | |||||||||
| Q4'19 | /Q3'19 | 2019 | /2018 | ||||||
| Revenue | 1,220 | +4 | % | 4,727 | -9 | % | |||
| Expenses | -712 | -1 | % | -2,835 | -1 | % | |||
| LLPs | -96 | +22 | % | -253 | +46 | % | |||
| PBT | 345 | +3 | % | 1,455 | -20 | % | |||
| Underlying attrib. profit | 249 | -4 | % | 1,077 | -16 | % | |||
January - December 2019 | | 29 |
PORTUGAL
 | Highlights • The Bank continued its commercial and digital transformation, and making processes and the commercial offering simpler, which has been reflected in greater sales and customer loyalty.• Santander Totta strengthened its position as the country’s largest privately owned bank in terms of assets and domestic loans and advances to customers, with market shares in new lending to companies and mortgages at around 20%.• Underlying attributable profit increased 10% year-on-year due to improved efficiency and low cost of credit. |
| EUR 525 Mn | |
| Underlying attributable profit | |
Commercial activity
The commercial and digital transformation strategy focused on simplifying processes and the product offering continued in 2019, and spurred growth in loyal and digital customers:
| • | Regarding the commercial transformation, two Work Cafés were opened in Lisbon and Coimbra, together with a new Smart Red office at Lisbon’s airport. |
| • | The digital offering was expanded with a number of new initiatives, such as the updated santander.pt website, the review of mortgage origination processes, and the launch of CrediSimples Negocios, which allows companies to take out loans online. |
| • | In terms of customer loyalty, we continued to boost the strategy Mundo 1|2|3, renewing the associated benefits package. |
As a result, the number of loyal and digital customers increased by 3% and 6%, respectively.
Santander Totta maintained the best risk ratings by the rating agencies and was named once again as the best bank in the country by different publications.
Business performance
Activity remained strong in loans and advances to customers in the year driven by new lending to companies and mortgages. Despite this strong activity, the stock of loans and advances to customers excluding reverse repurchase agreements fell 1%, impacted by a market that is still deleveraging.
Customer deposits increased 5% year-on-year, spurred by the growth in demand deposits (+14%) while the cost of deposits continued to decrease. Mutual funds also rose.
Results
Underlying attributable profit in 2019 rose 10% year-on-year to EUR 525 million. By lines:
| • | Total income increased 2%, driven by net fee income (+4%) and gains on financial transactions (ALCO portfolio sales), while net interest income remained stable despite the reduction in the stock of loans and low interest rates. |
| • | Costs fell 3%, reflecting the impacts related to the revision and simplification of internal processes and the optimisation of the branch network. The efficiency ratio improved to 45% (48% in 2018). |
| • | Provisions were slightly positive due to greater recoveries. The cost of credit was almost 0% and the NPL ratio improved significantly to 4.83% (-111 bps year-on-year). |
Compared to the third quarter of 2019, underlying attributable profit was 12% higher due to capital gains resulting from real estate sales recorded in other results and provisions.
| Customers | ||||||
| December 2019. Thousands | ||||||
| Loyal customers | Digital customers | |||||
| 778 | | 775 | |||
| 46 | % | /active customers | +6 | % | YoY | |
| Activity | ||||||||||
December 2019. EUR billion and % change | ||||||||||
| 0% | ||||||||||
| -1% | QoQ | |||||||||
| QoQ | ||||||||||
| 36 | 42 | |||||||||
| -1% | +8% | |||||||||
| YoY | YoY | |||||||||
| Gross loans and advances to customers excl. reverse repos | Customer deposits excl. repos + mutual funds | |||||||||
| Underlying income statement | |||||||||
| EUR million and % change | |||||||||
| Q4'19 | /Q3'19 | 2019 | /2018 | ||||||
| Revenue | 332 | 0 | % | 1,375 | +2 | % | |||
| Expenses | -156 | +1 | % | -623 | -3 | % | |||
| LLPs | -4 | — | 8 | — | |||||
| PBT | 192 | +8 | % | 750 | +9 | % | |||
| Underlying attrib. profit | 140 | +12 | % | 525 | +10 | % | |||
| 30 | | January - December 2019 |
POLAND
 | Highlights (changes in constant euros) • The Group continued to strengthen its position as the second largest bank in Poland in terms of assets and continues to be recognised as one of the leaders in the industry, both in traditional and digital banking.• The main management focus is on customer relationships, maximising business income and obtaining synergies from the acquisition of Deutsche Bank Polska's retail and SME businesses.• Underlying attributable profit rose 19% with improvement in net interest income and efficiency. |
| EUR 349 Mn | |
| Underlying attributable profit | |
Commercial activity
In November 2018, the retail and SMEs businesses were successfully acquired from Deutsche Bank Polska. During 2019, there was ongoing focus on integration of the customer base and achievement of synergies related to acquisition.
The Bank maintained its strategy to become the bank of first choice and continued to expand and modernise its omni-channel strategy through various initiatives, for example, the possibility of making cashless payments through six different methods.
The digital transformation continued during the year with new services such as a single login for individual and business services and the digitalisation of the credit card and loan after-sale services.
In September, we opened the first Work Café in Poland as part of our aim to improve customer experience.
As a result, the number of loyal and digital customers grew 12% and 14%, respectively, in the year and the Bank was named one of the best banks by different publications.
Business performance
Gross loans and advances to customers excluding reverse repurchase agreements grew 5%, backed by the target segments: SMEs , individuals (driven by mortgages and cash loans) and SCIB.
Customer deposits excluding repurchase agreements rose 5% with respect to 2018 boosted by demand deposits (+15%). Time deposits declined 13% due to active liquidity management and the reduction of the cost of deposits (0.89% in 2018 to 0.74% in December 2019).
Results
Underlying attributable profit of EUR 349 million in 2019, 19% more than in the same period in 2018. The year-on-year comparison is favoured by the acquisition of the retail and SME business of Deutsche Bank Polska (2 month of earnings in 2018 vs full year in 2019). By lines:
| • | Revenue increased 16%, driven largely by net interest income (+19%, underpinned by the key segments), and net fee income (+4% from lending and foreign currencies). |
| • | Costs grew less than revenue, despite the domestic wage pressures, improving efficiency to 40% (-3 pp in the year). |
| • | Loan-loss provisions increased were 36% higher mainly due to the larger size of the loan portfolio after the acquisition. The cost of credit stood at 0.72% (0.65% in 2018), while the NPL ratio remained stable and coverage increased to 67%. |
In the quarter, underlying attributable profit rose 9% supported by the positive performance of the main lines: higher revenue and lower costs and provisions.
| Customers | ||||||
| December 2019. Thousands | ||||||
| Loyal customers | Digital customers | |||||
| 2,010 | | 2,510 | |||
| 53 | % | /active customers | +14 | % | YoY | |
| Activity | ||||||||||
| December 2019. EUR billion and % change in constant euros | ||||||||||
| 0% | +4% | |||||||||
| QoQ | QoQ | |||||||||
| 31 | 38 | |||||||||
| +5% | +6% | |||||||||
| YoY | YoY | |||||||||
| Gross loans and advances to customers excl. reverse repos | Customer deposits excl. repos + mutual funds | |||||||||
| Underlying income statement | |||||||||
| EUR million and % change in constant euros | |||||||||
| Q4'19 | /Q3'19 | 2019 | /2018 | ||||||
| Revenue | 459 | +3 | % | 1,717 | +16 | % | |||
| Expenses | -169 | -4 | % | -693 | +9 | % | |||
| LLPs | -51 | -15 | % | -217 | +36 | % | |||
| PBT | 205 | +11 | % | 681 | +24 | % | |||
| Underlying attrib. profit | 104 | +9 | % | 349 | +19 | % | |||
January - December 2019 | | 31 |
NORTH AMERICA
 | Highlights (changes in constant euros) • In North America, the US and Mexico are managed according to their local strategic priorities, while increasing coordination and cooperation between the two units.• In volumes, there was strong year-on-year volume growth, both in gross loans and advances to customers and in customer funds.• In results, underlying attributable profit increased 21% year-on-year, driven mainly by positive revenue performance, improved cost of credit and reduced non-controlling interests, reflecting increased stakes in both countries. |
| EUR 1,667 Mn | |
| Underlying attributable profit | |
Strategy
In the United States, SBNA's strategy focuses on improving profitability reducing costs and continue to improve customer satisfaction. In SC USA, the focus is to manage originations growth and fostering collaboration with other Group entities.
In Mexico, we remained focused on strengthening the distribution network and developing digital channels through the investment plan carried out in the last few years.
Coordination between the countries has increased as we continue to pursue join initiatives, such as:
| • | Continued development of the USMX trade corridor. SCIB and Commercial Banking are working to deepen relationships with existing clients and increase client acquisition in both countries, which is reflected, among others, in corridor revenue growth (SCIB: +41%; Commercial: +23%). |
| • | Launch of a commission-free same-day remittance service from Santander US branches to beneficiaries in Mexico. |
| • | Cooperation between the Technology, HR, Legal and Audit areas to develop joint programmes in order to align policies, improve governance and optimise costs. |
Business performance
Gross loans and advances to customers (excluding reverse repos) increased 10% mainly driven by the US (+12%) due to new lending volumes in SBNA and SC USA. Mexico increased by 5%.
Customer deposits were 5% higher, reflecting growth in SBNA and the New York branch. Mexico dropped slightly, with a strong performance in deposits from individuals while corporate deposits contracted.
Results
In 2019, underlying attributable profit was EUR 1,667 million, up 21% year-on-year, with strong growth in the US and in Mexico. By lines:
| • | Total income increased both in Mexico (+8%) and in the US (+4%, with all P&L lines growing). |
| • | Expenses were 5% higher affected by the investment plan in Mexico. Efficiency remained stable at 43%. |
| • | Provisions rose just 1%, well below volume growth. The NPL ratio improved to 2.20%, the cost of credit to 2.76% and coverage was relatively stable at high levels (153%). |
In the quarter, the underlying attributable profit was lower than that of the third quarter affected by seasonality in the US, but it was 26% higher than the fourth quarter of 2018, mainly due to reduced provisions.
| Customers | ||||||
| December 2019. Thousands | ||||||
| Loyal customers | Digital customers | |||||
| 3,499 | | 5,180 | |||
| 31 | % | /active customers | +35 | % | YoY | |
| Activity | ||||||||||
| December 2019. EUR billion and % change in constant euros | ||||||||||
| +4% | +1% | |||||||||
| QoQ | QoQ | |||||||||
| 131 | 113 | |||||||||
| +10% | +7% | |||||||||
| YoY | YoY | |||||||||
| Gross loans and advances to customers excl. reverse repos | Customer deposits excl. repos + mutual funds | |||||||||
| Underlying income statement | |||||||||
| EUR million and % change in constant euros | |||||||||
| Q4'19 | /Q3'19 | 2019 | /2018 | ||||||
| Revenue | 2,949 | -2 | % | 11,604 | +5 | % | |||
| Expenses | -1,314 | +3 | % | -4,968 | +5 | % | |||
| LLPs | -1,050 | +3 | % | -3,656 | +1 | % | |||
| PBT | 554 | -13 | % | 2,776 | +13 | % | |||
| Underlying attrib. profit | 389 | -1 | % | 1,667 | +21 | % | |||
| 32 | | January - December 2019 |
United States
 | Highlights (changes in constant euros) • SBNA’s strategy remains focused on improving profitability and customer experience while SC USA is focused on deepening relationships with auto manufacturers and dealer groups to improve originations.• In volumes, the improved year-on-year trend in gross loans and advances to customers, excluding reverse repos, continues to drive higher revenue to help offset the impact of rate decreases.• Underlying attributable profit increased 31% in euros, +24% excluding the exchange rate impact, due to a solid top line performance, a better cost of credit and lower weight of non-controlling interests. |
| EUR 717 Mn | |
| Underlying attributable profit | |
Commercial activity
Strategic priorities by main business:
Santander Bank: Focus on digital and branch transformation initiatives centred on customer experience and deepening relationships with commercial clients by leveraging international value proposition. In addition, SBNA aims to improve profitability through disciplined expense management and simplification of processes and organisational structure. SBNA’s partnership with SC USA in auto finance was very successful in 2019, originating over USD 7 billion of prime auto loans in the year.
Santander Consumer USA: Improve profitability by managing origination growth while optimising spreads and promoting collaboration opportunities across the Group. SC USA originated USD 31.3 billion in 2019, helping to strengthen SC USA’s partnership with Fiat Chrysler.
Business performance
Gross loans and advances to customers (excluding reverse repos) improved 12% year-on-year driven by auto origination volumes and commercial lending in CIB.
Customer deposits excluding repurchase agreements were 10% higher compared to 2018, boosted by the strong growth in corporate deposits in the New York Branch and the good performance of SBNA.
Results
Underlying attributable profit in 2019 was 24% higher at EUR 717 million, underpinned largely by SC USA. By line items:
| • | Total revenue up 4% due to net interest income (+2% driven by higher volumes, offsetting the impact of lower interest rates), net fee income (+5% reflecting growth in CIB customer activity), gains on financial transactions (+73%) and other operating income (+15% due to higher income from leasing). |
| • | Costs increased 4% driven by higher technology spend and origination costs due to greater volumes. In real terms, growth was 1.8%. |
| • | Loan-loss provisions rose well below volume growth, significantly improving credit quality ratios: The cost of credit improved to 2.85% vs 3.27% in 2018, NPL ratio of 2.20% was 72 bps better than in 2018 and coverage of 162% (143% in 2018). |
In the quarter, underlying attributable profit was down due to LLPs seasonality in SC USA (however, more moderate growth compared to previous quarters) and higher personnel expenses related to business performance.
| Customers | ||||||
| December 2019. Thousands | ||||||
| Loyal customers | Digital customers | |||||
| 332 | | 1,010 | |||
| 19 | % | /active customers | +6 | % | YoY | |
| Activity | ||||||||||
| December 2019. EUR billion and % change in constant euros | ||||||||||
| +4% | ||||||||||
| QoQ | +2% | |||||||||
| QoQ | ||||||||||
| 96 | 73 | |||||||||
| +12% | +11% | |||||||||
| YoY | YoY | |||||||||
| Gross loans and advances to customers excl. reverse repos | Customer deposits excl. repos + mutual funds | |||||||||
| Underlying income statement | |||||||||
| EUR million and % change in constant euros | |||||||||
| Q4'19 | /Q3'19 | 2019 | /2018 | ||||||
| Revenue | 1,894 | -5 | % | 7,605 | +4 | % | |||
| Expenses | -869 | +2 | % | -3,297 | 4 | % | |||
| LLPs | -828 | +5 | % | -2,792 | +1 | % | |||
| PBT | 158 | -42 | % | 1,317 | +12 | % | |||
| Underlying attrib. profit | 98 | -37 | % | 717 | +24 | % | |||
January - December 2019 | | 33 |
MEXICO
 | Highlights (changes in constant euros) • Our multichannel innovation and the focus on our digital channels have enhanced our value proposition with new products and services and is reflected in greater customer attraction and loyalty.• Following the completion of the optional share buy-back offer of Santander Mexico from minority interests, Santander’s stake in Santander México increased from 74.96% to 91.65%.• Positive trend in profit. Underlying attributable profit rose 19% , driven by the solid performance of net interest income, net fee income and loan-loss provisions. |
| EUR 950 Mn | |
| Underlying attributable profit | |
Commercial activity
As regards the commercial transformation strategy, we completed the three-year investment plan carried out to improve multichannel offering, renew infrastructure and systems, strengthen the distribution model and increase customer attraction and loyalty.
We transformed 541 branches and increased the number of latest generation full function ATMs reaching 1,093, and opened the first Work Café branch in the country. We also inaugurated in partnership with FUNO, Isla Financiera Santander in several shopping centres, a proposal that combines digital banking with personal advice.
In digital strategy, SuperMóvil continued to add new functionalities, such as Santander Tap (instant messaging transfer system) or Mis Metas (a tool to help customers meet their savings goals).
Also of note is the strategic alliance with CONTAQi and InnoHub, Fintech developers specialised in the SME segment, in order to boost our value-added offer and strengthen our leadership in this segment.
Launch of the Legacy credit card for Private Banking customers, where Santander is the country's first bank to have an alliance with American Express.
These measures resulted in the increased loyalty and digitalisation of our customer base (+26% and +45% respectively), notably mobile banking.
Business performance
Gross loans and advances to customers (excluding reverse repos) increased 5% year-on-year, while maintaining the focus on profitability. Rises in both loans to individuals (consumer credit +6%, credit cards +6% and mortgage loans +7%) and corporate loans (companies and government offset the decrease in large corporates).
Customer deposits decreased 3%, reflecting the focus on reducing the cost of deposits. Mutual funds rose 6%
Results
In 2019, underlying attributable profit was 19% higher than in the same period of 2018 at EUR 950 million. By lines:
| • | In total income (+8%), net interest income rose 9%, driven by increased volumes and higher average interest rates. Net fee income grew 4%, mainly from credit cards and insurance. |
| • | Operating expenses increased 8%, in line with the investment plan. |
| • | Loan-loss provisions fell slightly (-1%), providing a significant improvement in cost of credit to 2.49% compared to 2.75% a year ago. The NPL ratio was also lower at 2.19% (2.43% in 2018). |
Compared to the third quarter of 2019, profit rose 23% due to higher gains on financial transactions, improved provisions and reduced non-controlling interests.
| Customers | ||||||
| December 2019. Thousands | ||||||
| Loyal customers | Digital customers | |||||
| 3,168 | | 4,170 | |||
| 33 | % | /active customers | +45 | % | YoY | |
| Activity | ||||||||||
| December 2019. EUR billion and % change in constant euros | ||||||||||
| -1% | ||||||||||
| +3% | QoQ | |||||||||
| QoQ | ||||||||||
| 35 | 41 | |||||||||
| +5% | 0% | |||||||||
| YoY | YoY | |||||||||
| Gross loans and advances to customers excl. reverse repos | Customer deposits excl. repos + mutual funds | |||||||||
| Underlying income statement | |||||||||
| EUR million and % change in constant euros | |||||||||
| Q4'19 | /Q3'19 | 2019 | /2018 | ||||||
| Revenue | 1,054 | +3 | % | 3,998 | +8 | % | |||
| Expenses | -445 | +5 | % | -1,671 | +8 | % | |||
| LLPs | -222 | -2 | % | -863 | -1 | % | |||
| PBT | 395 | +8 | % | 1,459 | +13 | % | |||
| Underlying attrib. profit | 291 | +23 | % | 950 | +19 | % | |||
| 34 | | January - December 2019 |
SOUTH AMERICA
 | Highlights (changes in constant euros) • We are focusing on leveraging our products and services with strong expected medium-term growth. The strategy is focused on the generation of profitable growth, risk control and covering customer needs and demands. Exporting positive experiences (payments and consumer financing) is key to success.• In business volumes, there was a notable growth in the last 12 months with increases in all countries, where we are capturing new business opportunities.• Regarding results, underlying attributable profit increased by 18% year-on-year boosted by the main revenue lines, improved efficiency and cost of credit. |
| EUR 3,924 Mn | |
| Underlying attributable profit | |
Strategy
We continued identifying initiatives that allow the businesses to expand, further leveraging positive experiences in other markets:
| • | In auto financing, we are using our leadership and experience in Brazil to boost growth in other countries. In Colombia, for example, we have signed two alliances with digital vehicle platforms to strengthen our position in this market. |
| • | In terms of financing goods and services, following the good performance in Uruguay, with record sales in insurance and consumer credit, we plan to export this model to other regions. |
| • | Prospera, our micro-credit programme in Brazil, is also being exported to other regions. |
| • | In payment methods, we explored e-commerce strategies, instant domestic and international transfers and the roll-out of Getnet, our acquiring business in Brazil, to the rest of Latin America. As regards Superdigital, we completed the preliminary launch in Chile. |
| • | We further developed the retail franchise through the branch network transformation (opening new Work Café branches in Brazil, Chile and Argentina) and boosting the multi-channel offering. Sales through digital channels already account for a high percentage of the total in Brazil and Argentina, and continued to grow in Chile, driven by the Life model. |
Business performance
Gross loans and advances to customers (excluding reverse repos) increased in all units year-on-year: Uruguay grew 15%, Brazil 8% and Chile 8%.
Customer funds also rose in the last 12 months and in all units. Of note was growth in demand deposits (+21%) and mutual funds (+15%).
Results
Underlying attributable profit in 2019 amounted to EUR 3,924 million (37% of the Group's total operating areas), up 18% year-on-year due to:
| • | Total income increased 11%, underpinned by the sound performance of customer revenue, driven by higher volumes, spread management and increased loyalty. Net interest income rose 9% and net fee income increased by 15%. |
| • | Costs reflect commercial transformation plans, greater digitalisation of the retail network, reviews of collective wage agreements and high inflation in Argentina. Efficiency improved 98 bps to 36.1%. |
| • | Provisions increased at a slower pace than volumes, enabling the cost of credit to improve by 8 bps in the year to 2.92%. In credit quality, the NPL ratio was 4.86% and coverage was 88%. |
In the quarter, underlying attributable profit fell 4% driven by higher costs (Argentina and Brazil) and provisions (Brazil and Chile).
| Customers | ||||||
| December 2019. Thousands | ||||||
| Loyal customers | Digital customers | |||||
| 7,919 | | 17,287 | |||
| 26 | % | /active customers | +15 | % | YoY | |
| Activity | ||||||||||
| December 2019. EUR billion and % change in constant euros | ||||||||||
| +4% | ||||||||||
| +3% | QoQ | |||||||||
| QoQ | ||||||||||
| 131 | 171 | |||||||||
| +9% | +13% | |||||||||
| YoY | YoY | |||||||||
| Gross loans and advances to customers excl. reverse repos | Customer deposits excl. repos + mutual funds | |||||||||
| Underlying income statement | |||||||||
| EUR million and % change in constant euros | |||||||||
| Q4'19 | /Q3'19 | 2019 | /2018 | ||||||
| Revenue | 4,714 | +5 | % | 18,425 | +11 | % | |||
| Expenses | -1,762 | +11 | % | -6,656 | +10 | % | |||
| LLPs | -1,015 | +12 | % | -3,789 | +7 | % | |||
| PBT | 1,688 | -7 | % | 7,232 | +12 | % | |||
| Underlying attrib. profit | 947 | -4 | % | 3,924 | +18 | % | |||
January - December 2019 | | 35 |
BRAZIL
 | Highlights (changes in constant euros) • In 2019, the strategic focus on customer service was reflected in sustainable revenue growth, which, combined with cost control, resulted in the best efficiency ratio of recent years.• The accuracy of our risk models enabled us to maintain credit indicators at controlled levels and to see a profitable increase in market share.• Underlying attributable profit rose 16%, and profitability improved (underlying RoTE of 21.2%) reflecting greater productivity and improved efficiency. |
| EUR 2,939 Mn | |
| Underlying attributable profit | |
Commercial activity
We ended 2019 with a positive performance of volumes and results, thanks to an effective and profitable model that has enabled us to grow sustainably and reach 26 million active customers.
During the year, we carried out various initiatives:
| • | We continued to expand to strategic regions in the country through products such as Agribusiness and Prospera Microfinance. |
| • | In individuals, we launched a mortgage campaign together with a large retailer and we joined the largest group of real estate web portals. In auto finance, we remained leader and we began Santander Auto transactions. In acquiring, we launched SuperGet and strengthened our e-commerce offering. In cards, the Santander Way app expanded its features. |
| • | Additionally, we launched Sim (multi-product platform focused on personal loans) and emDia (debt renegotiation and financial education). Pi and Ben maintained their positive evolution. |
| • | In SMEs, we launched Santander Duo, an offering linking the legal entity and natural person under with a single manager. In SCIB, we were named leaders in some of the sector’s most relevant rankings. |
As a result, we increased the number of loyal customers (10%) year-on-year and digital customers (18%).
Business performance
Gross loans and advances to customers excluding reverse repos grew 8% year-on-year. Of note were the individuals and consumer finance segments.
Customer deposits excluding repos increased 9%, primarily driven by demand deposits (+24%), which was reflected in a market share increase in customer funds.
Results
2019 underlying attributable profit of EUR 2,939 million (+16% year-on-year). Of note:
| • | Net interest income rose 6% year-on-year (due to larger volumes which offset some margin pressures) and net fee income (+12%) with a positive performance in almost all lines. |
| • | Operating expenses increased 5%. The efficiency ratio improved 71 bps at 33.0%, the best of recent years. |
| • | Net loan-loss provisions increased below loan growth, which was reflected in an improvement in the cost of credit (3.93%, from 4.06% in 2018). The NPL ratio remained at around 5.3% and the coverage ratio stood at 100%. |
In the quarter, profit fell 7% driven by higher costs (marketing and technology projects) and provisions (due to portfolio sales in the third quarter and greater loan volumes in the fourth).
| Customers | ||||||
| December 2019. Thousands | ||||||
| Loyal customers | Digital customers | |||||
| 5,743 | | 13,450 | |||
| 22 | % | /active customers | +18 | % | YoY | |
| Activity | ||||||||||
| December 2019. EUR billion and % change in constant euros | ||||||||||
| +5% | ||||||||||
| +4% | QoQ | |||||||||
| QoQ | ||||||||||
| 80 | 122 | |||||||||
| +8% | +12% | |||||||||
| YoY | YoY | |||||||||
| Gross loans and advances to customers excl. reverse repos | Customer deposits excl. repos + mutual funds | |||||||||
| Underlying income statement | |||||||||
| EUR million and % change in constant euros | |||||||||
| Q4'19 | /Q3'19 | 2019 | /2018 | ||||||
| Revenue | 3,565 | +5 | % | 13,951 | +7 | % | |||
| Expenses | -1,242 | +13 | % | -4,606 | +5 | % | |||
| LLPs | -813 | +11 | % | -3,036 | +5 | % | |||
| PBT | 1,305 | -7 | % | 5,606 | +11 | % | |||
| Underlying attrib. profit | 689 | -7 | % | 2,939 | +16 | % | |||
| 36 | | January - December 2019 |
CHILE
 | Highlights (changes in constant euros) • Santander is the leading privately owned bank by assets and customers in the country and continued to focus on enhancing the quality of service, enabling us to improve to second position in NPS and achieve a record rise in account openings.• Business growth with acceleration in some segments, mainly mortgages, consumer finance and corporates.• Underlying attributable profit increased 7% year-on-year, driven by gains on financial transactions, cost control and improved cost of credit. Better performance in net interest income and net fee income in the second half of the year. |
| EUR 630 Mn | |
| Underlying attributable profit | |
Commercial activity
In 2019, we continued to develop our strategy to become the best bank for our customers, boosting loyalty, leading digitalisation and enhancing customer experience. To this end, several measures were launched in the year:
| • | We continued to open more Work Café branches and pilot branches of Work Café 2.0, with good initial results in efficiency and productivity. |
| • | We boosted the Santander Life programme, achieving a record rise in new customers driven by the launch of new products such as Plan Life Latam (which allows accumulation of MéritosLife and Latam air miles) and Cuenta Life (that rewards good savings behaviour). |
| • | We also launched Superhipoteca 40 años, a product aimed at people under the age of 35. |
| • | In digitalisation, we announced the creation of Klare, the first digital open platform for insurance sales in Chile and we completed the soft launch of the Superdigital app. |
| • | The improvement in quality of service was reflected in a significant increase in customer satisfaction. In 2019, we ranked second both in NPS and net satisfaction. |
These initiatives led to a record rise in account openings, capturing over 24% of new account openings in the country, and to increased loyal (+5%) and digital customers (+15%).
Business performance
Gross loans and advances to customers (excluding reverse repos) rose 8% year-on-year, due to mortgages, consumer finance and corporates.
Deposits excluding repurchase agreements grew 11%, due to demand deposits (+19%). Mutual funds rose 15% in a low interest rate environment.
Results
Underlying attributable profit in 2019 of EUR 630 million, 7% higher year-on-year. Of note were:
| • | Gross income increased 4%, driven by a 85% rise in gains on financial transactions due to higher income from customer treasury. Net interest income dropped 1%, dampened by lower inflation and historically low interest rates. Net fee income fell 1%, partly due to wholesale business. |
| • | Costs increased 2%, driven by investments in technology and branches. The efficiency ratio improved 71 bps to 40.6%. |
| • | Loan-loss provisions were 3% lower, with an improvement in cost of credit of 11 bps to 1.08% in the year. The NPL ratio dropped to 4.64% and the coverage ratio was 56%. |
Compared to the third quarter of 2019, underlying attributable profit increased 3% driven by net interest income, receiving an uplift from higher inflation and increased fee income.
| Customers | ||||||
| December 2019. Thousands | ||||||
| Loyal customers | Digital customers | |||||
| 704 | | 1,247 | |||
| 46 | % | /active customers | +15 | % | YoY | |
| Activity | ||||||||||
| December 2019. EUR billion and % change in constant euros | ||||||||||
| +2% | +2% | |||||||||
| QoQ | QoQ | |||||||||
| 40 | 35 | |||||||||
| +8% | +12% | |||||||||
| YoY | YoY | |||||||||
| Gross loans and advances to customers excl. reverse repos | Customer deposits excl. repos + mutual funds | |||||||||
| Underlying income statement | |||||||||
| EUR million and % change in constant euros | |||||||||
| Q4'19 | /Q3'19 | 2019 | /2018 | ||||||
| Revenue | 638 | +5 | % | 2,539 | +4 | % | |||
| Expenses | -246 | +1 | % | -1,031 | +2 | % | |||
| LLPs | -130 | +28 | % | -443 | -3 | % | |||
| PBT | 274 | -1 | % | 1,129 | +5 | % | |||
| Underlying attrib. profit | 157 | +3 | % | 630 | +7 | % | |||
January - December 2019 | | 37 |
ARGENTINA
 | Highlights (changes in constant euros) • In 2019, the Bank announced the change of its commercial brand from Santander Río to Santander.• We continued to focus on our four strategic pillars: selective growth, customer experience, efficiency and transformation.• In an environment of macroeconomic downturn, underlying attributable profit was EUR 144 million. Strong grow across all P&L lines due to the high inflation and interest rates, combined with efficiency improvements. |
| EUR 144 Mn | |
| Underlying attributable profit | |
Commercial activity
The commercial strategy is focused on transactional business and customer service improvements. To this end, we launched several initiatives:
| • | Banca VIP: a subsegment for notable customers in order to offer them a tailored customer care model and exclusive experiences. |
| • | iU: a dedicated proposal for 18 to 31-year-olds which includes financial and non-financial benefits. |
| • | Women, a comprehensive proposition which focuses on female entrepreneurs, owners of SMEs and professionals. |
| • | The institutional campaign Queremos ayudarte whose aim is to strengthen the Bank's relationship with customers. |
While we continue to work on the digital transformation of the main processes and products, we launched the signing-up for digital accounts and packages in branches, a new credit card marketing model and a virtual assistant serving digital customers.
These measures enabled loyal customers to account for 47% of active customers and to increase digital customers 5% year-on-year.
Business performance
Gross loans and advances to customers (excluding reverse repos) rose 40% year-on-year. The peso denominated portfolio increased, driven by inflation-adjusted products (mortgages, auto finance) and by cards, while dollar balances declined in the currency of origin.
Customer deposits (excluding repos) rose 24% in 2019. Local currency deposits grew 58% (demand and time deposits) and foreign currency ones declined. The excess liquidity is placed in central bank notes.
Results
Underlying attributable profit in 2019 of EUR 144 million, 224% more than in 2018. Both years were impacted by the high inflation adjustment. As regards business performance:
| • | Revenue doubled, growing above inflation. Net interest income rose 127%, underpinned by higher interest rates and higher volumes of central bank notes. Net fee income increased 84% driven by foreign currency transactions and income from cash deposits. |
| • | Costs surged 88%, hit by the inflationary environment and the peso’s depreciation. |
| • | Loan-loss provisions increased (+89%) mainly due to the individuals segment. The cost of credit was 5.09% (3.45% in 2018). The NPL ratio stood at 3.39% (3.17% in 2018), and the coverage ratio at 124%. |
In the quarter, underlying attributable profit rose 43% benefiting from the positive impact on tax stemming from the high inflation adjustment.
| Customers | ||||||
| December 2019. Thousands | ||||||
| Loyal customers | Digital customers | |||||
| 1,363 | | 2,196 | |||
| 47 | % | /active customers | +5 | % | YoY | |
| Activity | ||||||||||
| December 2019. EUR billion and % change in constant euros | ||||||||||
| +12% | ||||||||||
| +4% | QoQ | |||||||||
| QoQ | ||||||||||
| 5 | 8 | |||||||||
| +40% | +24% | |||||||||
| YoY | YoY | |||||||||
| Gross loans and advances to customers excl. reverse repos | Customer deposits excl. repos + mutual funds | |||||||||
| Underlying income statement | |||||||||
| EUR million and % change in constant euros | |||||||||
| Q4'19 | /Q3'19 | 2019 | /2018 | ||||||
| Revenue | 359 | +13 | % | 1,316 | +102 | % | |||
| Expenses | -209 | +20 | % | -762 | +88 | % | |||
| LLPs | -53 | -3 | % | -235 | +89 | % | |||
| PBT | 43 | -24 | % | 217 | +121 | % | |||
| Underlying attrib. profit | 47 | +43 | % | 144 | +224 | % | |||
| 38 | | January - December 2019 |
Uruguay
Highlights (changes in constant euros)
| • | Santander Uruguay is the country’s leading privately-owned bank, with a strategy focused on improving efficiency and enhancing the quality of service, through digital transformation and commitment to the community. |
| • | Underlying attributable profit rose 24% year-on-year, spurred by customer revenue and efficiency improvement. RoTE of 30%. |
Commercial activity and business performance
In a worse economic environment, we achieved our financial targets, while improving our market reputation and customer satisfaction. We continued to progress in our technological transformation plan, offering improved products and services to our customers, in an increasingly responsible way to the community.
In line with our strategy of innovation and contributing to people’s progress, we launched Prosperá, which satisfies the demand for microcredits to small businesses and Santander Locker, a proposal that simplifies the delivery of our products.
In addition, the consolidation of our strategy enabled us, both the Bank and our financial entities, to gain market share this year, and to continue to grow customer loyalty, which increased 20% in the year.
Gross loans and advances to customer (excluding reverse repos) grew 15%, driven by growth in the target segments, products and currencies: +12% in consumer credit and cards and +15% in the national currency portfolio. Customer deposits (excluding repos) in pesos grew 14% and foreign currency deposits increased 8% year-on-year.
Results
Underlying attributable profit in 2019 of EUR 150 million, 24% higher year-on-year:
| • | Gross income rose 16%, with increases in both net interest income (+16%) and net fee income (+17%). |
| • | Operating expenses rose at a slower pace than total income, improving the efficiency ratio to 42.0% (-269 bps year-on-year). |
| • | Similar loan-loss provisions year-on-year. High coverage (98%) and cost of credit improved to 2.31% (-49 bps year-on-year). |
Compared to the third quarter of 2019, underlying attributable profit rose 4% due to lower costs and a lower tax burden.
Peru
Highlights (changes in constant euros)
The strategy remained focused on the corporate segment, the country’s large companies and the Group’s global customers.
The auto loan financial entity continued to expand its business within the Group’s strategy of increasing its presence in this business.
In 2019, underlying attributable profit of EUR 48 million (+11% year-on-year) equivalent to an RoTE of 21%. Total income rose 14% underpinned by higher net interest income and gains on financial transactions. The efficiency ratio stood at 32.9% (-18 bps compared to December 2018)
The NPL ratio was 0.78%, coverage was high and the cost of credit only 0.12%.
Colombia
Highlights (changes in constant euros)
Activity in Colombia remained focused on SCIB clients, large companies and corporates, contributing solutions in treasury, risk hedging, foreign trade, confirming, custody and development of investment banking products supporting the country’s infrastructure plan. In 2019, we ranked first in project finance both in terms of volumes and number of transactions, outperforming all local banks and international peers.
We are also working to increase the profitability of auto finance and consolidate our position in this market with digital propositions. We have signed two alliances: the first with Chekar.co, a fully digital platform for buying and selling vehicles, and the second with Tucarro.com of Mercado Libre, where the user can request and have a loan approved in six minutes.
Gross loans and advances to customers (excluding reverse repos) rose 1%. Of note was the fourfold rise in auto finance. Customer deposits (excluding repos) rose 54%.
Underlying attributable profit in 2019 was EUR 16 million (EUR 9 million in 2018). Total income grew 63%, underpinned by net fee income (+92%) and net interest income (+52%).
January - December 2019 | | 39 |
SANTANDER GLOBAL PLATFORM (SGP)
 | Highlights • With the creation of Santander Global Platform we are accelerating our digitalisation process by developing global digital banking solutions with payments at the core for SMEs and individuals.• SGP leverages the Group’s scale, footprint and expertise in payments, financial services and in scaling fintech solutions to build best-in-class services in key, high-growth and large addressable markets in which we already have a strong presence.• In 2019 we made relevant progress on various initiatives under SGP such as the development of the GMS and GTS platforms, the strategic partnership with Ebury, the launch of Superdigital in Chile and Openbank began to open accounts to customers in Germany, the Netherlands and Portugal. |
Strategy
SGP offers digital services based on payment solutions as the main driver of loyalty. The services are being developed based on global platforms to leverage our scale and improve efficiency and customer experience. It should be noted that it offers products and solutions to both our banks (B2C) and third parties (B2B2C). The area continued to advance according to the envisaged schedule.
Bringing best-in-class banking solutions to SMEs:
| • | Global Merchant Services, our global acquiring solution built on the back of Brazil's Getnet and provides online and offline retailers the ability to accept various forms of payment, helping them better manage and grow their businesses. |
We are already a top 10 global acquirer by turnover volume, with more than one million active merchants (local and global) and significant market shares in revenue (Brazil, Mexico and Portugal) and customers (Spain). In Brazil, the market share has doubled in the last five years following Getnet's success with high customer engagement. It is also delivering very high growth, with transaction volumes increasing c.30% annually since 2013.
This platform will be first be rolled out in Mexico in Q1 2020, followed by the rest of our core markets and will be able to provide service to the 4 million merchants that are already Group customers.
| • | Global Trade Services, our single global platform to serve SMEs that want to trade internationally using international payments and FX, trade finance and multi-country accounts. The revenue pool for global transaction banking services is around USD 200 billion. |
To accelerate the development of this opportunity, we announced a strategic investment in Ebury to acquire a 50.1% stake which will shortly be incorporated once the customary closing conditions have been met, including obtaining regulatory approvals. Ebury brings best-in-class technology and, more importantly, a top-notch team.
Ebury's track-record is very solid, with more than 43,000 active companies, covering 17 countries and more than 140 currencies. They are generating high growth transactions (+20% per customer in the last two years) and revenues (+45% in 2019). By combining the strengths and assets of Santander with those of Ebury we will become the leading proposition for international SMEs in Europe and the Americas. We plan to extend GTS to 20 markets in the medium term.
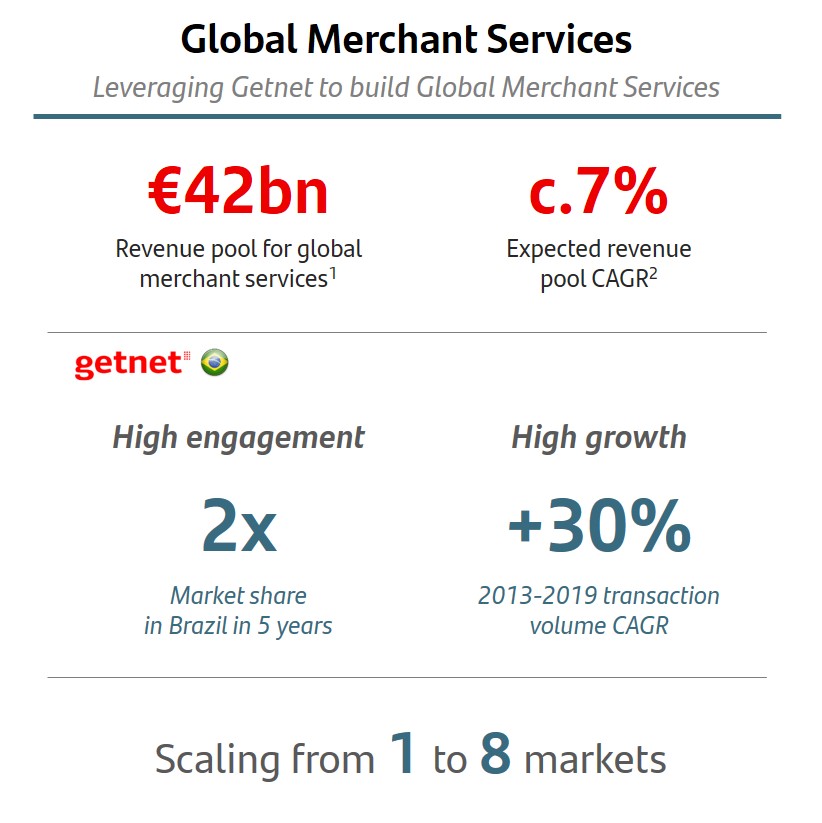 | ||
(1) EMEA + the Americas' revenue pools in merchant acquiring services incl. net MDR & rental terminals
(2) CAGR 2018-2023
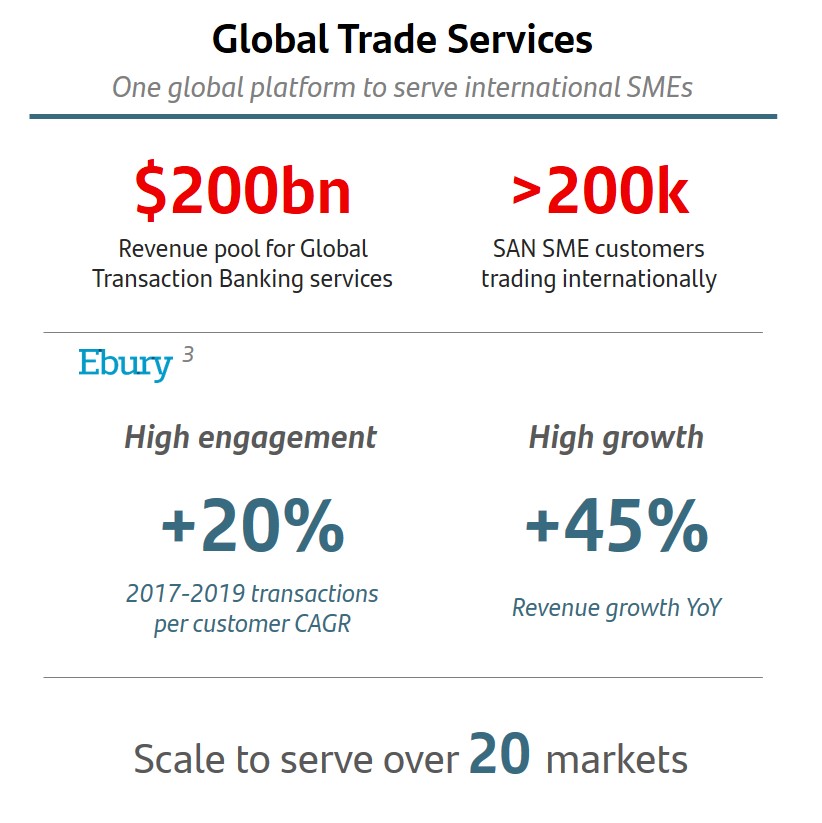 | ||
(3) 50.1% stake; Transaction closing expected in mid-2020 subject to regulatory approvals
| 40 | | January - December 2019 |
Bringing best-in-class digital banking solutions to individuals:
| • | Superdigital, our financial inclusion platform for individuals that require a simple, flexible pre-banking service. It enables us to meet the financial needs of the underserved in a cost-effective way, providing them with basic financial products and a path to access credit, thus serving them responsibly and profitably. |
Superdigital also integrates with GMS for small merchants. With a special focus on LatAm, where there are c.300m unbanked and underbanked consumers, Superdigital is one of the best examples of responsible banking as it delivers profit with purpose.
As of today, Superdigital operates in Brazil, Mexico and Chile and active customers grew at 59% annually and transactions doubled. Our goal is to scale the business to reach over 5 million active customers across 7 markets in the medium term.
| • | Openbank, our global, full-service digital bank with over 115,000 payrolls. Openbank offers a superior experience compared to neobanks with a full suite of products that go beyond those associated with traditional digital current accounts. |
As a consequence, Openbank customers are more engaged and more loyal, using 4.4 products on average. We are seeing very strong growth trends both in deposits and on the asset side, with mortgage sales growing at 134% over the last 12 months.
Openbank is already in Spain and in the fourth quarter, began to open accounts to customers in Germany, the Netherlands and Portugal, and over the medium term we plan to expand into 10 markets, including countries in the Americas.
Other activities
| • | The Centres of Digital Expertise leverage the Group’s scale and ensure all countries and businesses have access to the most innovative technology (our Globile project for mobile platforms, end-to-end blockchain, artificial intelligence and machine learning to foster customer and operational excellence and improve risk management). |
| • | InnoVentures, our venture capital investments in the fintech ecosystem, continued to grow. As at end-December, it had invested more than USD 140 million in 30 companies in 8 countries. |
Results
By collaborating across our regions and leveraging our scale, footprint and expertise in payments and financial services, we can build our own digital assets and fintech solutions once and then scale them across the Group, significantly lowering development costs and time to market.
We expect SGP to not only serve our banks and its customers but also third parties that lack the scale to build best in class payments and digital banking solutions in the open market. This will allow us to expand our addressable market to non-customers and new geographies, generating relevant new revenue opportunities.
Looking at SGP's activity in 2019 in a broad sense, i.e. if, in addition to considering the results generated by the digital platforms, 50% of the results generated by the countries on the products related with the platform (e.g. merchant acquiring, trade finance products, etc.) are also included, estimated pro forma revenue is close to EUR 1 billion in 2019 and pro forma underlying attributable profit is positive at EUR 142 million.
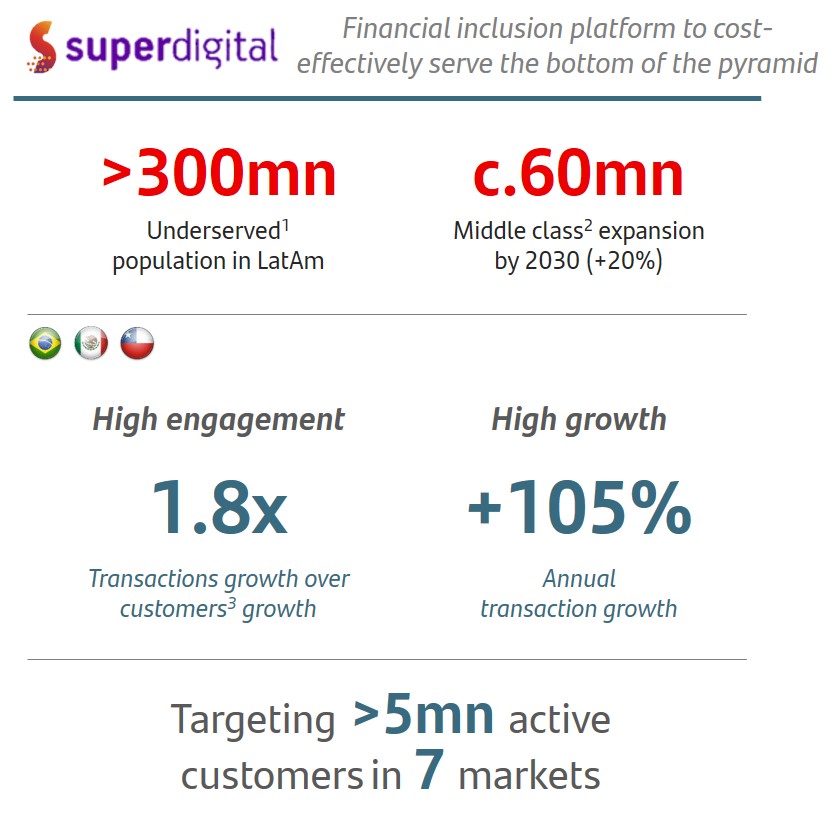 | ||
(1) Including 200 mn+ unbanked and 100 mn+ underbanked
(2) USD 10-50 per capita daily income (PPP); Source: Interamerican Development Bank, 2016
(3) Active customers (30 days)
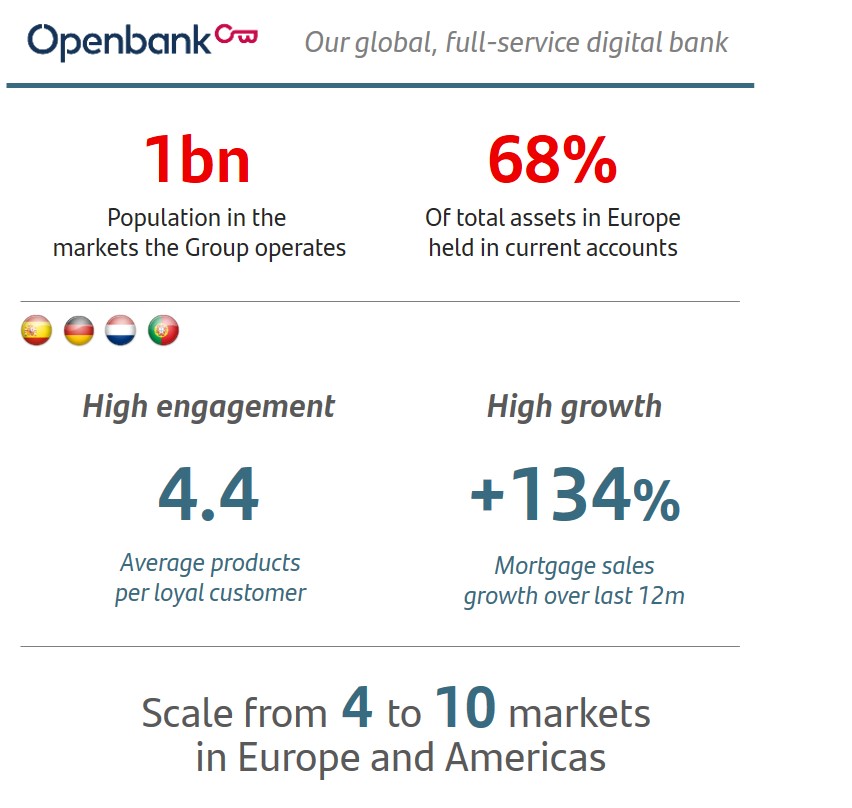 | ||
This is the net result of two components: on the one hand, the investment in building the platforms and, on the other hand, 50% of the profit obtained from commercial relationships with our customers:
| • | The construction of platforms is where most of the investments and costs are concentrated. We are progressing in the development of T&O, in the improvement of processes, in the addition of new services to the platform and in the roll-out to the countries. This has a negative impact of EUR 178 million on the income statement for 2019. |
| • | Profit obtained from commercial relationships with our customers linked to the global SGP platforms, and according to the criteria for allocating the aforementioned results, profit amounted to EUR 320 million in 2019. |
We regularly assess the market valuations of the businesses included in SGP, based on multiples of comparable companies, to ensure our investments in digital are creating value.
January - December 2019 | | 41 |
CORPORATE CENTRE
 | Highlights • The Corporate Centre’s objective is to aid the operating units by contributing value and carrying out the corporate function of oversight and control. It also carries out functions related to financial and capital management.• The underlying attributable loss was higher compared to 2018, mainly due to higher costs related to foreign currency hedging and the increased stock of issuances. | |
| EUR | -2,096 Mn | |
Underlying attributable profit | ||
Strategy and functions
The Corporate Centre contributes value to the Group in various ways:
| • | It makes the Group’s governance more solid, through global control frameworks and supervision. |
| • | Fostering the exchange of best practices in management of costs and generating economies of scale. This enables us to be one of the most efficient banks. |
| • | It contributes to the launch of projects that will be developed by global business areas. |
It also coordinates the relationship with European regulators and develops functions related to financial and capital management, as follows:
| • | Financial Management functions: |
| – | Structural management of liquidity risk associated with funding the Group’s recurring activity, stakes of a financial nature and management of net liquidity related to the needs of some business units. |
| – | This activity is carried out by the different funding sources (issuances and other), always maintaining an adequate profile in volumes, maturities and costs. The price at which these operations are made with other Group units is the market rate plus the premium, which in liquidity terms, the Group supports by immobilising funds during the term of the operation. |
| – | Interest rate risk is also actively managed in order to soften the impact of interest rate changes on net interest income, conducted via high credit quality, very liquid and low capital consumption derivatives. |
| – | Strategic management of the exposure to exchange rates in equity and dynamic in the countervalue of the units’ annual results in euros. Net investments in equity are currently covered by EUR 26,060 million (mainly Brazil, the UK, Mexico, Chile, the US, Poland and Norway) with different instruments (spot, fx, forwards). |
| • | Management of total capital and reserves: efficient capital allocation to each of the units in order to maximise shareholder return. |
Results
In the year underlying attributable loss of EUR 2,096 million, 24% higher than in 2018, largely due to two factors:
| • | Net interest income decreased by EUR 266 million, mainly due to the higher stock of issuances. |
| • | Lower gains on financial transactions at EUR -307 million, driven by the greater cost of foreign currency hedging, the counterpart of which is in the conversion of results to euros in certain countries. |
Operating expenses improved 12% driven by ongoing streamlining and simplification measures, continuing actions taken in previous years, which have resulted in a reduction in the cost base of around 35% over the last five years.
| CORPORATE CENTRE | |||||||||||||
| EUR million | |||||||||||||
| Q4'19 | Q3'19 | Chg. | 2019 | 2018 | Chg. | ||||||||
| Gross income | -381 | -413 | -8 | % | -1,617 | -1,057 | +53 | % | |||||
| Net operating income | -471 | -504 | -7 | % | -1,990 | -1,483 | +34 | % | |||||
| PBT | -529 | -579 | -9 | % | -2,262 | -1,699 | +33 | % | |||||
| Underlying attrib. profit | -459 | -529 | -13 | % | -2,096 | -1,686 | +24 | % | |||||
| 42 | | January - December 2019 |
RETAIL BANKING
 | Highlights (changes in constant euros) • The Group continued to focus on improving customer satisfaction, covering their needs and increasing loyalty. In December, we had 145 million customers, of which more than 21 million are loyal.• Underlying attributable profit of EUR 7,748 million in 2019, 7% higher than in 2018, driven by customer revenue, gains on financial transactions and improved efficiency.• Santander was named the Best Bank in Latin America and the Best SME Bank in Western Europe by Euromoney and the Best Bank in the Americas and the Best Bank in Western Europe by The Banker. |
| EUR 7,748 Mn | |
| Underlying attributable profit | |
Commercial activity
Santander wants to be the reference bank for customers of all income levels, and foster entrepreneurship, helping SMEs and other companies. We launched various commercial initiatives, including:
| • | In individuals, we continued to strengthen our business with new differentiated products. In Chile, for example, we launched new proposals for the mass market segment within the Life strategy. In Argentina we launched Banca VIP, a new customer care model for notable customers. In Spain we launched the Smith Plan, a proposition focused mainly non-residents purchasing a house in Spain. In Mexico, we launched the Legacy credit card for private banking customers. |
| • | In auto finance, we continued to expand the business in certain countries. For example, SCF closed a deal with Hyundai Kia for the acquisition of 51% of the financial entity that both companies own in Germany. New alliances were also made in Colombia to boost our position in the market. |
| • | In the SME segment, we continued to move forward with products such as Prospera in Brazil, which now has close to half a million customers and which was also launched in Uruguay. In Brazil, we also announced Santander Duo, a new product, which combines accounts of legal and natural persons. In Argentina we launched Women, a proposition for female entrepreneurs, owners of SMEs and professionals. |
| • | Of note in corporates were strategies such as those implemented in the US with the Lead Bank project to strengthen our relationships with US companies. We took part in the financing of one of the most important road infrastructure projects in Colombia and we led the consortium of banks for the loan to one of the main state energy companies in Poland. |
In addition, we continued with the conversion of the branch network, with the opening of Work Café branches in almost all our core markets, SMART branches and full function ATMs in Mexico.
All of these measures helped to boost the total number of customers to close to 145 million, as well as increase the number of loyal customers (+9% individuals and +3% corporates year-on-year).
Results
Underlying attributable profit in 2019 was EUR 7,748 million, +7% year-on-year as follows:
| • | Total income increased 4% due to net interest income (+3%), net fee income (+5%) and gains on financial transactions (+31%). |
• Costs increased 3% with an improved efficiency ratio (-79 bps).
| • | LLPs up 7%, primarily due to higher volumes, maintaining good credit quality. |
| Customers | ||||||
| December 2019. Thousands | ||||||
| Loyal customers | Digital customers | |||||
| 21,556 | | 36,817 | |||
| 31 | % | /active customers | +15 | % | YoY | |
| Activity | ||||||||||
| December 2019. EUR billion and % change in constant euros | ||||||||||
| +1% | +1% | |||||||||
| QoQ | QoQ | |||||||||
| 783 | 712 | |||||||||
| +3% | +6% | |||||||||
| YoY | YoY | |||||||||
| Gross loans and advances to customers excl. reverse repos | Customer deposits excl. repos + mutual funds | |||||||||
| Underlying income statement | |||||||||
| EUR million and % change in constant euros | |||||||||
| Q4'19 | /Q3'19 | 2019 | /2018 | ||||||
| Revenue | 10,924 | -1 | % | 43,523 | +4 | % | |||
| Expenses | -4,969 | +3 | % | -19,481 | +3 | % | |||
| LLPs | -2,456 | +1 | % | -9,154 | +7 | % | |||
| PBT | 3,042 | -10 | % | 13,265 | +5 | % | |||
| Underlying attrib. profit | 1,886 | -5 | % | 7,748 | +7 | % | |||
January - December 2019 | | 43 |
CORPORATE & INVESTMENT BANKING
 | Highlights (changes in constant euros) • SCIB maintained its long-term strategy focused on capital optimisation, increasing revenue and disciplined cost management. • Good evolution in Global Transaction Banking (GTB), Global Debt Financing (GDF) and market activity in the Americas. • We continue to execute strategic projects focused on improving internal systems, cost control and talent management. • Underlying attributable profit was 10% higher year-on-year, driven by 7% growth in revenue and lower loan-loss provisions. |
| EUR 1,761 Mn | |
| Underlying attributable profit | |
Commercial activity
| • | Cash management: strong increase in the transactional business as well as in customer funds in our core markets (Europe and Latin America), as a result of the strengthening of our product capabilities in the region, innovating in the digitalisation of the business. |
| • | Export & Agency Finance: double-digit growth in the year, especially in the US and Latin America, consolidating our world leadership position in export financing backed by export credit agencies (ECA). |
| • | Trade & Working Capital Solutions: robust growth in Receivables Finance in the Americas and Europe, and Trade Funding, especially in the Americas, as a result of the continuous improvement of our product offering and the digitalisation of receivables and confirming platforms. |
| • | Corporate Finance: in M&A we strengthened our position as the leader in advising the renewable energy sector, with noteworthy operations in the year in wind farms in Spain and the United Kingdom. Double-digit growth in advisory for share issuances in the primary market, particularly in Brazil. |
| • | Debt Capital Markets: we issued the first end-to-end blockchain bond, an example of Santander's innovation in the capital markets and the first step towards a potential market for mainstream security tokens1. The Group is also a reference for green bond issuances. |
| • | Syndicated Corporate Loans: the volume of operations reduced in the year due to little M&A activity. Santander increased its range of sustainable finance products via green loans and loans linked to sustainable indices. |
| • | Structured Financing: the Group maintained its global leadership position in Project Finance, having more issuances globally than any other bank and was the fifth by volumes. Santander maintained its leadership in Latin America in financial advisory and improved its positioning in Europe. |
| • | Market activity: significant growth in the Americas, compensating lower (albeit growing) volumes in Europe. Good evolution in corporate and institutional sales, with double-digit growth, in particular Brazil, the UK, Mexico and Chile. The books also recorded significant growth, with outstanding results in the UK, Chile, Argentina and the US. |
Results
Underlying attributable profit in 2019 was 10% higher at EUR 1,761 million, underpinned by growth in most businesses, particularly the results of Global Transaction Banking and Global Debt Financing.
Revenue growth and lower provisions absorbed the higher costs in transformational projects.
| 1. | Mainstream security tokens: Financial instruments subject to securities market regulation, which are issued and traded using blockchain. |
| Activity | ||||||||||
| December 2019. EUR billion and % change in constant euros | ||||||||||
| +4% | -5% | |||||||||
| QoQ | QoQ | |||||||||
| 114 | 92 | |||||||||
| +12% | +3% | |||||||||
| YoY | YoY | |||||||||
| Gross loans and advances to customers excl. reverse repos | Customer deposits excl. repos + mutual funds | |||||||||
| Total income breakdown | |
| Constant EUR million | |
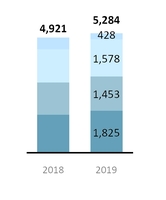
| TOTAL* | +7 | % |
| Capital & Other | -13 | % |
| Global Markets | +12 | % |
| Global Debt Financing | +6 | % |
| Global Transaction Banking | +11 | % |
| (*) In euros: +4% | ||
| Underlying income statement | |||||||||
| EUR million and % change in constant euros | |||||||||
| Q4'19 | /Q3'19 | 2019 | /2018 | ||||||
| Revenue | 1,443 | +15 | % | 5,284 | +7 | % | |||
| Expenses | -606 | +9 | % | -2,276 | +9 | % | |||
| LLPs | -127 | — | -155 | -23 | % | ||||
| PBT | 680 | -3 | % | 2,767 | +9 | % | |||
| Underlying attrib. profit | 425 | -6 | % | 1,761 | +10 | % | |||
| 44 | | January - December 2019 |
WEALTH MANAGEMENT & INSURANCE
 | Highlights (changes in constant euros) • Assets under management in Private Banking and Asset Management reached EUR 395 billion (+13% year-on-year) and the total insurance gross written premiums increased 13%. As such, Santander strengthened its position in these businesses in its 10 core markets. • Total fees generated, including those ceded to the branch network, increased 6% to EUR 3,493 million (30% of the Group's total). • Total contribution (net profit + net fee income) of EUR 2,494 million (+8% year-on-year). |
| EUR 960 Mn | |
| Underlying attributable profit | |
Commercial activity
We continued to progress in our plan to make us the best wealth manager in Europe and Latin America. Some of the most relevant initiatives are:
| • | In Santander Asset Management (SAM): we continued to strengthen our range of products, notably with the global launch of new Santander GO funds, developed with specialist fund managers and the wider range of ESG products. |
| • | In Santander Private Banking (SPB): we launched a global value proposition so clients can access a global platform of products and services that cover their worldwide needs. |
| • | In Insurance: we are completing the value offering with the aim of becoming a leader in all markets, types of insurance and segments. |
Business performance
Total assets under management amounted to EUR 395 billion, 13% higher than in 2018, supported by new sales and the market's performance:
| • | Strong growth in net sales at SAM in 2019 (EUR 5.7 billion), increasing market share in most of our countries, particularly in Spain, Portugal, Chile and Poland. |
| • | Of note in Private Banking was growth in Brazil, Spain and International Private Banking. Loans and advances to customers grew by 5%. |
In Insurance, with 20 million total protected customers, the volume of insurance gross written premiums increased 13% year-on-year, especially in Brazil, Chile and Poland.
Results
Underlying attributable profit in the year was EUR 960 million, 11% more than in 2018:
| • | Higher revenue, from net interest income growth (+8%), driven by increased lending, and fees. Total fees generated, including those ceded to the branch network, increased 6% and represented 30% of the Group's total. Also of note is the increased contribution from the insurance business. |
| • | Operating expenses were 3% higher, due to our investments in platforms. |
| • | Recovery in provisions benefiting from lower doubtful loans in Spain and Portugal. |
The total contribution to the Group (including net profit and total fees generated net of taxes) was EUR 2,494 million, 8% growth year-on-year.
| Total profit contribution | ||||||
| EUR million and % change in constant euros | ||||||
| Q4'19 | 2019 | |||||
 | 662 | | 2,494 | |||
| +6 | % | / Q3'19 | +8 | % | / 2018 | |
| Business performance: SAM and Private Banking | |
| December 2019. EUR billion and % change in constant euros | |
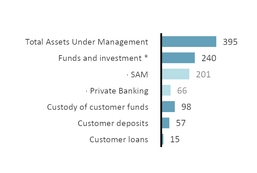
| vs Dec-18 | |
| +13 | % |
| +11 | % |
| +11 | % |
| +11 | % |
| +22 | % |
| +5 | % |
| +5 | % |
Note: Total assets marketed and/or managed in 2019 and 2018
(*) Total adjusted customer funds of private banking managed by SAM. Pro forma including Popular asset management Joint Ventures. The repurchase of the remaining 60% of their stakes is pending regulatory authorisations and other customary conditions.
| Insurance gross written premiums | +13% | |||
| Change in constant euros | / 2018 | |||
| Underlying income statement | |||||||||
| EUR million and % change in constant euros | |||||||||
| Q4'19 | /Q3'19 | 2019 | /2018 | ||||||
| Revenue | 588 | +6 | % | 2,223 | +6 | % | |||
| Expenses | -234 | +5 | % | -911 | +3 | % | |||
| LLPs | 21 | — | 25 | — | |||||
| PBT | 371 | +15 | % | 1,325 | +11 | % | |||
| Underlying attrib. profit | 263 | +9 | % | 960 | +11 | % | |||
January - December 2019 | | 45 |
Responsible banking Corporate governance Santander share | ||||||||
| Responsible banking | ||||||||
RESPONSIBLE BANKING
Santander strives every day to contribute to the progress of people and companies in a Simple, Personal and Fair way in all that we do, to earn the confidence of our employees, customers, shareholders and society.
In order to meet our commitment to be a more responsible bank and help society address the main global issues, we have identified two challenges: adapt to the new business environment and contribute to more inclusive and sustainable growth, with the following goals for the coming years:
 | Santander Responsible banking targets |
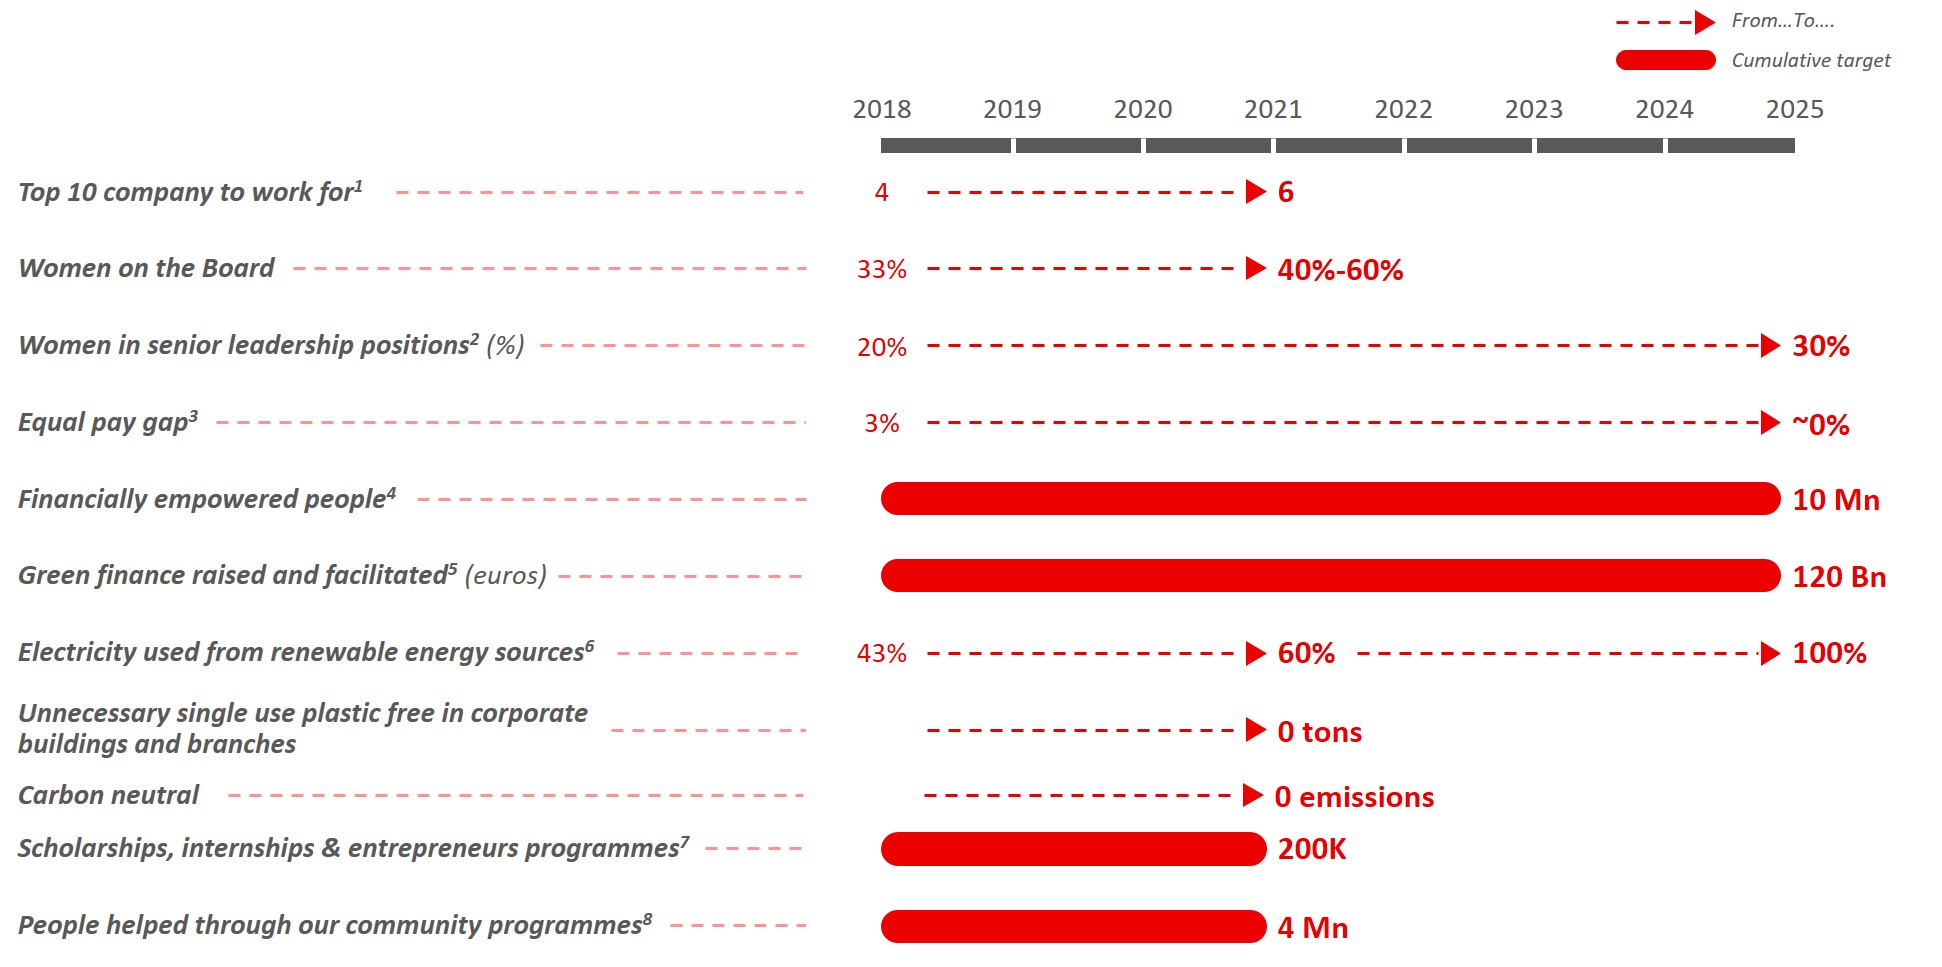
More information on our public commitments in responsible banking can be found on our website.
| 1. | According to a well-known external source in each country (Great Place to Work, Top Employer, Merco, etc.). |
2. Senior positions represent 1% of total workforce.
3. Calculation of equal pay gap compares employees of the same job, level and function.
4. Financially empowered people (mostly unbanked and underbanked), through products and services and social investment initiatives, to get access to the financial system, receive tailored finance and increase their knowledge and resilience through financial education.
5. Includes Santander's overall contribution to green finance: project finance, syndicated loans, green bonds, capital finance, export finance, advisory, structuring and other products to help our clients in the transition to a low carbon economy. Commitment from 2019 to 2030 is EUR 220 billion.
6. In those countries where it is possible to certify renewable sourced electricity for the properties occupied by the Group.
7. People supported through Santander Universities initiative (students who will receive a Santander scholarship, will win an internship at an SME or participate in entrepreneurship programmes supported by the Bank).
8. People helped through our community investment programmes (excluding Santander Universities and financial education initiatives).
| 46 | | January - December 2019 |
Responsible banking Corporate governance Santander share | ||||||||
| Responsible banking | ||||||||
| 2019 highlights |
 | In 2019, there was a strong drive to continue to integrate our culture into all of our stakeholders. |
• The board appreciates the benefits associated with the balanced board composition, and as such has the goal to have 30% of senior management positions held by women by 2025. At the end of 2019, women accounted for 40% of the board and 22% of leadership positions. | |
• Additionally, the Great Place to Work Institute recognised Santander as one of the 10 best companies to work for in five countries. At the Group level, we ranked among the 25 best companies in the world. | |
• We were also named the Leader in Diversity 2020 by the Financial Times in a new index of 700 European companies. We also reaffirmed our commitment to diversity, renewing the EU led Diversity Charter initiative. | |
• For the third consecutive year, Santander obtained the highest score amongst the 325 companies that form part of the Bloomberg Gender-Equality Index. | |
 | Regarding sustainability we have been very active fighting climate change in the year. Examples include: |
• We have supported our customers in their transition towards a low carbon economy. We have mobilised EUR 18 billion in green financing, and we issued our first green bond, EUR 1 billion, under a global strategy of sustainable issuances for the coming years. The funds from this bond will be used to finance solar energy and wind power projects. | |
• We joined the twenty fifth edition of the UN Climate Change Conference (COP25) in Madrid. Santander organised various events and activities aimed at enriching the debate and increasing environmental awareness, and participated in the Eje Castellana Verde agenda. Moreover, during the Conference, we announced our commitment to being carbon neutral in 2020. | |
• Previously in the year at the climate summit in New York, Banco Santander participated as one of the founding members of the Principles for Responsible Banking, in which we committed to strategically aligning our business to the UN’s Sustainable Development Goals. In addition, Santander joined the Group Commitment to Climate Action, along with 30 other banks. | |
• Also of note is the fact that we are the first financial entity in Spain to obtain the Zero Waste certification from AENOR. | |
 | On a different note, we continued fostering financial inclusion and empowerment. |
• Over the year, we financially supported more than 1,600,000 people via our microfinance programmes and granted loans for EUR 277 million. | |
 | We also continued to invest in the communities in which we are present. We helped more than 1,200,000 people via our community investment programmes and supporting higher education with more than 66,000 scholarships granted. |
• Other initiatives include the launch of #SOMOS, a global action for inclusive higher education driven by the UN, or the launch of Fieeld, a device that enables blind people to watch football using their fingertips as part of #FootballCan, Santander's commitment strategy for the positive impact that football has on society. | |
As a result of these efforts, Banco Santander was ranked the world’s most sustainable bank in the Dow Jones Sustainability Index for the first time and was also first in Europe for the second year running. The index evaluates the Group’s performance across economic, environmental and social dimensions. | |
Also, we continue to form part of the various sustainability indices, providing non-financial information to the ESG markets, investors and analysts. | |
 | |
January - December 2019 | | 47 |
Responsible banking Corporate governance Santander share | ||||||||
| Corporate governance | ||||||||
CORPORATE GOVERNANCE
| A responsible bank has a solid governance model with well-defined functions; it manages risks and opportunities prudently and defines its long-term strategy watching out for the interests of all its stakeholders and society in general |  |
à Changes in the board in the fourth quarter
The appointments committee announced on 26 November 2019 the incorporation to the board of Luis Isasi.
Luis Isasi will replace Guillermo de la Dehesa, who has been a board member since 2002. His appointment will become effective when the corresponding approvals have been received, and will be submitted for approval to the next general meeting of shareholders.
Luis Isasi will take the role of non-executive chairman of Santander España, which, to date, had been held by Rodrigo Echenique.
à Changes in the composition of the board committees in the fourth quarter
With effect from 21 October 2019, Henrique de Castro was appointed member of the audit committee.
On 28 October 2019, Carlos Fernández resigned as a director of the Bank, thus ceasing to be a member of the audit committee, the appointments committee and the remuneration committee, appointing in his place Pamela Walkden, Esther Giménez-Salinas and Henrique de Castro, respectively, with effect from 29 October 2019.
à Changes in the organisational structure of the Group's Senior Management in the fourth quarter
Following the proposal from the appointments committee, the board approved that José Luis de Mora, Group Head of Financial Planning and Corporate Development, take on the functions of the consumer finance business, Santander Consumer Finance (SCF), whose previous head, Magdalena Salarich, left the Group on 30 December 2019.
| 48 | | January - December 2019 |
Responsible banking Corporate governance Santander share | ||||||||
| Santander share | ||||||||
SANTANDER SHARE
àShareholder remuneration
In November, shareholders received the first dividend charged to 2019’s earnings, totalling EUR 0.10 per share in cash. This amount is equal to that paid between August 2018 (EUR 0.065) and November 2018 (EUR 0.035).
The Board of Directors of the Bank has resolved to submit to the next annual general shareholders meeting that the second payment of the remuneration against the results of 2019 amounts to EUR 0.13 per share by means of a final dividend in cash of EUR 0.10 per share and a scrip dividend (under the Santander Dividendo Elección scheme) that will entail the payment in cash, for those shareholders who so choose, of EUR 0.03 per share. Santander’s cash dividend would thereby increase to EUR 0.20, a year-on-year increase of c.3%, and the total dividend for 2019 would be EUR 0.23 per share (EUR 0.20 in cash and EUR 0.03 in scrip).
If shareholders approve this proposal, the percentage of 2019 underlying attributable profit applied to shareholder remuneration (payout) will be of 46.3% (within the 40-50% range indicated at the beginning of 2019) and the proportion of cash dividend will be 89.6%1 (thus exceeding that of 2018, also as announced at the beginning of the year).
àShare price performance
The Santander share is listed in five markets, in Spain, Mexico and Poland as an ordinary share, in the UK as a CDI and in the US as an ADR.
The main markets reported gains in the year. In Spain, the Ibex 35 rose 11.8% and, in Europe, the DJ Stoxx 50 rose 23.3%.
The European banking sector, in a context of economic deceleration, was influenced by the change in the stance of monetary policies of the main central banks, mainly the European Central Bank, which delayed interest rate hikes beyond 2020. Optimism regarding a potential trade deal between China and the United States drove share prices at the end of the year.
| Dividends paid in the second half |
| Euro cents / share |
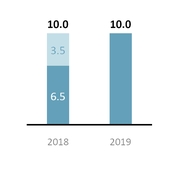
n Cash dividend |
n Scrip dividend |
| Yield*: 5.8% |
(*) Dividends paid in 2019 / average share price 2019
(1). Assuming a ratio of cash options in the Santander Dividendo Elección scheme of 80%.
| Share price | ||||
 |  | |||
START 31/12/2018 | END 31/12/2019 | |||
| €3.973 | €3.730 | |||
 |  | |||
Maximum 17/04/2019 | Minimum 03/09/2019 | |||
| €4.682 | €3.386 | |||
| Comparative share performance |
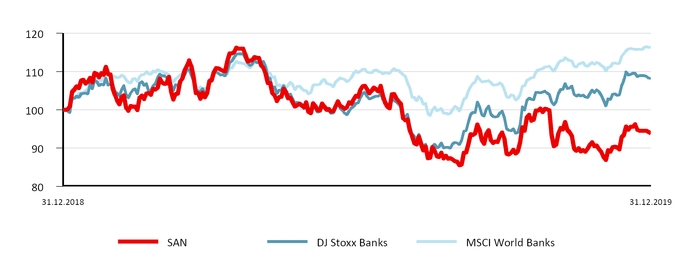
January - December 2019 | | 49 |
Responsible banking Corporate governance Santander share | ||||||||
| Santander share | ||||||||
SANTANDER SHARE
As such, the leading European banking index, DJ Stoxx Banks, increased 8.2% while the MSCI World Banks index rose 16.4%. The Santander share price ended the year at EUR 3.730, 6.1% lower, as it was additionally affected by some uncertainties in regions where Santander operates, such as Argentina following the presidential elections, Chile due to social protests, the UK due to Brexit, and Poland because of the ruling on Swiss franc mortgages.
In terms of total return, the Santander share fell 0.7% in the year, while the DJ Stoxx Banks rose 14.3%.
àMarket capitalisation and trading
As at 31 December 2019, Santander was the second largest bank in the Eurozone by market capitalisation and the 25th in the world among financial entities (EUR 61,986 million).
The share’s weighting in the DJ Stoxx 50 was 1.5% and 7.1% in the DJ Stoxx Banks. In the domestic market, its weight in the Ibex 35 as at end-December was 12.5%.
A total of 19,334 million shares were traded in the year for an effective value of EUR 77,789 million, the largest figure among the shares that comprise the EuroStoxx (liquidity ratio of 118%).
The daily trading volume was 76 million shares with an effective value of EUR 305 million.
àShareholder base
The total number of Santander shareholders at 31 December 2019 was 3,986,093 of which 3,765,375 were European (75.63% of the capital stock) and 204,253 from the Americas (22.97%).
Excluding the board, which holds 1.08% of the Bank’s capital stock, retail shareholders account for 38.53% and institutional shareholders 60.39%.
 | 2nd | Bank in the Eurozone by market capitalisation |
EUR 61,986 million | ||
| The Santander share | ||
| December 2019 | ||
| Shares and trading data | ||
| Shares (number) | 16,618,114,582 | |
| Average daily turnover (number of shares) | 75,819,352 | |
| Share liquidity (%) | 118 | |
| (Number of shares traded during the year / number of shares) | ||
| Stock market indicators | ||
| Price / Tangible book value (X) | 0.86 | |
| P/E ratio (X) | 10.30 | |
| Free float (%) | 99.95 | |
| Share capital distribution by type of shareholder | |
| December 2019 | |

| Institutional |
| 60.39% |
| Board (*) |
| 1.08% |
| Retail |
| 38.53% |
(*) Shares owned or represented by directors.
| Share capital distribution by geographic area | ||
| December 2019 | ||
| The Americas | Europe | Other |
| 22.97% | 75.63% | 1.40% |
 | ||
| 50 | | January - December 2019 |
Financial report January - December 2019
| A P P E N D I X |
u Financial information |
| - Group |
| - Segments |
u Alternative Performance Measures |
u Condensed consolidated financial statements |
u Glossary |
u Important information |
January - December 2019 | | 51 |
| Net fee income. Consolidated | ||||||||||
| EUR million | ||||||||||
| Q4'19 | Q3'19 | Chg. (%) | 2019 | 2018 | Chg. (%) | |||||
| Fees from services | 1,791 | 1,729 | 3.6 | 7,033 | 7,037 | (0.1) | ||||
| Wealth management and marketing of customer funds | 948 | 969 | (2.2) | 3,815 | 3,654 | 4.4 | ||||
| Securities and custody | 222 | 257 | (13.6) | 931 | 794 | 17.3 | ||||
| Net fee income | 2,961 | 2,955 | 0.2 | 11,779 | 11,485 | 2.6 | ||||
| Operating expenses. Consolidated | ||||||||||
| EUR million | ||||||||||
| Q4'19 | Q3'19 | Chg. (%) | 2019 | 2018 | Chg. (%) | |||||
| Staff costs | 3,053 | 3,008 | 1.5 | 12,141 | 11,865 | 2.3 | ||||
| Other general administrative expenses | 2,126 | 1,982 | 7.3 | 8,138 | 8,489 | (4.1) | ||||
| Information technology | 588 | 460 | 27.8 | 2,161 | 1,550 | 39.4 | ||||
| Communications | 128 | 126 | 1.6 | 518 | 527 | (1.6) | ||||
| Advertising | 196 | 164 | 19.5 | 685 | 646 | 6.0 | ||||
| Buildings and premises | 218 | 212 | 2.8 | 859 | 1,846 | (53.5) | ||||
| Printed and office material | 27 | 26 | 3.8 | 116 | 122 | (5.0) | ||||
| Taxes (other than tax on profits) | 132 | 126 | 4.8 | 522 | 557 | (6.3) | ||||
| Other expenses | 837 | 868 | (3.6) | 3,277 | 3,240 | 1.1 | ||||
| Administrative expenses | 5,179 | 4,990 | 3.8 | 20,279 | 20,354 | (0.4) | ||||
| Depreciation and amortisation | 792 | 732 | 8.2 | 3,001 | 2,425 | 23.8 | ||||
| Operating expenses | 5,971 | 5,722 | 4.4 | 23,280 | 22,779 | 2.2 | ||||
(1) In 2019, impact of the IFRS 16 application.
| Operating means. Consolidated | |||||||||||||
| Employees | Branches | ||||||||||||
| Dec-19 | Dec-18 | Var. | Dec-19 | Dec-18 | Var. | ||||||||
| Europe | 86,574 | 93,021 | (6,447 | ) | 5,336 | 6,753 | (1,417 | ) | |||||
| Spain | 27,630 | 31,229 | (3,599 | ) | 3,235 | 4,365 | (1,130 | ) | |||||
| Santander Consumer Finance | 14,448 | 14,865 | (417 | ) | 416 | 438 | (22 | ) | |||||
| United Kingdom | 24,490 | 25,534 | (1,044 | ) | 616 | 755 | (139 | ) | |||||
| Portugal | 6,582 | 6,705 | (123 | ) | 542 | 572 | (30 | ) | |||||
| Poland | 11,049 | 12,515 | (1,466 | ) | 515 | 611 | (96 | ) | |||||
| Other | 2,375 | 2,173 | 202 | 12 | 12 | — | |||||||
| North America | 37,866 | 37,168 | 698 | 2,043 | 2,078 | (35 | ) | ||||||
| US | 17,372 | 17,309 | 63 | 621 | 660 | (39 | ) | ||||||
| Mexico | 20,494 | 19,859 | 635 | 1,422 | 1,418 | 4 | |||||||
| South America | 69,508 | 70,337 | (829 | ) | 4,572 | 4,385 | 187 | ||||||
| Brazil | 46,682 | 46,914 | (232 | ) | 3,656 | 3,438 | 218 | ||||||
| Chile | 11,580 | 12,008 | (428 | ) | 375 | 381 | (6 | ) | |||||
| Argentina | 9,178 | 9,324 | (146 | ) | 438 | 468 | (30 | ) | |||||
| Other | 2,068 | 2,091 | (23 | ) | 103 | 98 | 5 | ||||||
| Santander Global Platform | 820 | 487 | 333 | 1 | 1 | — | |||||||
| Corporate Centre | 1,651 | 1,700 | (49 | ) | |||||||||
| Total Group | 196,419 | 202,713 | (6,294 | ) | 11,952 | 13,217 | (1,265 | ) | |||||
| Impairment or reversal of impairment of financial assets not measured at fair value through profit or loss (net) | ||||||||||||
| EUR million | ||||||||||||
| Q4'19 | Q3'19 | Chg. (%) | 2019 | 2018 | Chg. (%) | |||||||
| Net loan-loss provisions | 2,573 | 2,435 | 5.7 | 9,321 | 8,873 | 5.0 | ||||||
| Non-performing loans | 2,974 | 2,785 | 6.8 | 10,911 | 10,426 | 4.7 | ||||||
| Country-risk | 1 | (4 | ) | — | (4 | ) | 5 | — | ||||
| Recovery of written-off assets | (402 | ) | (346 | ) | 16.2 | (1,586 | ) | (1,558 | ) | 1.8 | ||
| Other impairment | (31 | ) | 7 | (542.9) | 31 | 113 | (127.4) | |||||
| Total | 2,542 | 2,442 | 4.1 | 9,352 | 8,986 | (71.7) | ||||||
| 52 | | January - December 2019 |
| Loans and advances to customers. Consolidated | |||||||||
| EUR million | |||||||||
| Change | |||||||||
| Dec-19 | Dec-18 | Absolute | % | Dec-17 | |||||
| Commercial bills | 37,753 | 33,301 | 4,452 | 13.4 | 29,287 | ||||
| Secured loans | 513,929 | 478,068 | 35,861 | 7.5 | 473,936 | ||||
| Other term loans | 267,138 | 265,696 | 1,442 | 0.5 | 257,441 | ||||
| Finance leases | 35,788 | 30,758 | 5,030 | 16.4 | 28,511 | ||||
| Receivable on demand | 7,714 | 8,794 | (1,080 | ) | (12.3) | 6,721 | |||
| Credit cards receivable | 23,876 | 23,083 | 793 | 3.4 | 21,809 | ||||
| Impaired assets | 32,559 | 34,218 | (1,659 | ) | (4.8) | 36,280 | |||
| Gross loans and advances to customers (excl. reverse repos) | 918,757 | 873,918 | 44,839 | 5.1 | 853,985 | ||||
| Reverse repos | 45,703 | 32,310 | 13,393 | 41.5 | 18,864 | ||||
| Gross loans and advances to customers | 964,460 | 906,228 | 58,232 | 6.4 | 872,849 | ||||
| Loan-loss allowances | 22,242 | 23,307 | (1,065 | ) | (4.6) | 23,934 | |||
| Loans and advances to customers | 942,218 | 882,921 | 59,297 | 6.7 | 848,915 | ||||
| Total funds. Consolidated | |||||||||
| EUR million | |||||||||
| Change | |||||||||
| Dec-19 | Dec-18 | Absolute | % | Dec-17 | |||||
| Demand deposits | 588,534 | 548,711 | 39,823 | 7.3 | 525,072 | ||||
| Time deposits | 196,920 | 199,025 | (2,105 | ) | (1.1) | 199,649 | |||
| Mutual funds | 180,405 | 157,888 | 22,517 | 14.3 | 165,413 | ||||
| Customer funds | 965,859 | 905,624 | 60,235 | 6.7 | 890,134 | ||||
| Pension funds | 15,878 | 15,393 | 485 | 3.2 | 16,166 | ||||
| Managed portfolios | 30,117 | 26,785 | 3,332 | 12.4 | 26,393 | ||||
| Repos | 38,911 | 32,760 | 6,151 | 18.8 | 53,009 | ||||
| Total funds | 1,050,765 | 980,562 | 70,203 | 7.2 | 985,702 | ||||
| Eligible capital (fully loaded) | |||||||||
| EUR million | |||||||||
| Change | |||||||||
| Dec-19* | Dec-18 | Absolute | % | Dec-17 | |||||
| Capital stock and reserves | 118,123 | 114,147 | 3,977 | 3.5 | 111,362 | ||||
| Attributable profit | 6,515 | 7,810 | (1,295 | ) | (16.6) | 6,619 | |||
| Dividends | (3,423 | ) | (3,292 | ) | (131 | ) | 4.0 | (2,998 | ) |
| Other retained earnings | (23,249 | ) | (23,606 | ) | 357 | (1.5) | (23,108 | ) | |
| Minority interests | 6,441 | 6,981 | (540 | ) | (7.7) | 7,228 | |||
| Goodwill and intangible assets | (28,478 | ) | (28,644 | ) | 166 | (0.6) | (28,537 | ) | |
| Other deductions | (5,432 | ) | (6,492 | ) | 1,060 | (16.3) | (5,004 | ) | |
| Core CET1 | 70,497 | 66,904 | 3,594 | 5.4 | 65,563 | ||||
| Preferred shares and other eligible T1 | 8,467 | 8,934 | (467 | ) | (5.2) | 7,730 | |||
| Tier 1 | 78,964 | 75,838 | 3,126 | 4.1 | 73,293 | ||||
| Generic funds and eligible T2 instruments | 11,973 | 11,669 | 305 | 2.6 | 14,295 | ||||
| Eligible capital | 90,937 | 87,506 | 3,431 | 3.9 | 87,588 | ||||
| Risk-weighted assets | 605,244 | 592,319 | 12,925 | 2.2 | 605,064 | ||||
| CET1 capital ratio | 11.65 | 11.30 | 0.35 | 10.84 | |||||
| T1 capital ratio | 13.05 | 12.80 | 0.25 | 12.11 | |||||
| Total capital ratio | 15.02 | 14.77 | 0.25 | 14.48 | |||||
(*) Applying a 50% pay-out in the calculation of the capital ratios.
January - December 2019 | | 53 |
| Financial information by segments | ||||||||
| EUROPE | |||||||||||||
| EUR million | |||||||||||||
| / Q3'19 | / 2018 | ||||||||||||
| Underlying income statement | Q4'19 | % | % excl. FX | 2019 | % | % excl. FX | |||||||
| Net interest income | 3,531 | 0.0 | (1.2) | 14,201 | 0.0 | (0.1) | |||||||
| Net fee income | 1,319 | 0.7 | (0.2) | 5,260 | (3.2) | (3.3) | |||||||
Gains (losses) on financial transactions (1) | 430 | 57.5 | 57.4 | 1,035 | (7.1) | (7.5) | |||||||
| Other operating income | 13 | (93.0) | (93.1) | 505 | 0.2 | 0.0 | |||||||
| Total income | 5,292 | (0.1) | (1.1) | 21,001 | (1.2) | (1.3) | |||||||
| Administrative expenses and amortisations | (2,733 | ) | 0.5 | (0.7) | (11,044 | ) | (1.1) | (1.3) | |||||
| Net operating income | 2,559 | (0.7) | (1.5) | 9,957 | (1.3) | (1.4) | |||||||
| Net loan-loss provisions | (498 | ) | 0.4 | (0.1) | (1,839 | ) | 17.0 | 16.9 | |||||
| Other gains (losses) and provisions | (209 | ) | 60.3 | 58.1 | (768 | ) | (25.2) | (25.3) | |||||
| Profit before tax | 1,852 | (5.0) | (5.9) | 7,350 | (1.9) | (1.9) | |||||||
| Tax on profit | (482 | ) | (9.2) | (9.9) | (1,979 | ) | (2.0) | (2.1) | |||||
| Profit from continuing operations | 1,370 | (3.4) | (4.4) | 5,371 | (1.8) | (1.9) | |||||||
| Net profit from discontinued operations | — | — | — | — | — | — | |||||||
| Consolidated profit | 1,370 | (3.4) | (4.4) | 5,371 | (1.8) | (1.9) | |||||||
| Non-controlling interests | (132 | ) | (0.5) | (1.0) | (493 | ) | 16.4 | 16.7 | |||||
| Underlying attributable profit to the parent | 1,238 | (3.7) | (4.7) | 4,878 | (3.4) | (3.4) | |||||||
| Balance sheet | |||||||||||||
| Loans and advances to customers | 676,904 | 3.5 | 1.7 | 676,904 | 5.8 | 3.6 | |||||||
| Cash, central banks and credit institutions | 180,389 | (2.2) | (3.0) | 180,389 | 4.7 | 3.5 | |||||||
| Debt instruments | 104,382 | (5.6) | (6.7) | 104,382 | (11.7) | (12.8) | |||||||
| Other financial assets | 53,893 | (5.3) | (5.3) | 53,893 | 9.4 | 9.3 | |||||||
| Other asset accounts | 41,471 | (7.0) | (7.9) | 41,471 | 1.2 | (0.1) | |||||||
| Total assets | 1,057,038 | 0.6 | (0.8) | 1,057,038 | 3.6 | 1.8 | |||||||
| Customer deposits | 600,380 | 1.8 | 0.1 | 600,380 | 5.0 | 3.0 | |||||||
| Central banks and credit institutions | 189,792 | 1.3 | 0.8 | 189,792 | (1.5) | (2.3) | |||||||
| Marketable debt securities | 133,544 | 2.4 | 0.3 | 133,544 | 3.1 | 0.3 | |||||||
| Other financial liabilities | 60,807 | (12.2) | (12.4) | 60,807 | 13.3 | 13.0 | |||||||
| Other liabilities accounts | 16,383 | (9.7) | (11.0) | 16,383 | (13.5) | (14.6) | |||||||
| Total liabilities | 1,000,906 | 0.6 | (0.8) | 1,000,906 | 3.5 | 1.8 | |||||||
| Total equity | 56,133 | 0.9 | (0.5) | 56,133 | 3.9 | 2.2 | |||||||
| Memorandum items: | |||||||||||||
Gross loans and advances to customers (2) | 650,552 | 2.4 | 0.7 | 650,552 | 3.9 | 1.9 | |||||||
| Customer funds | 671,032 | 1.3 | (0.1) | 671,032 | 5.7 | 3.9 | |||||||
Customer deposits (3) | 581,395 | 1.0 | (0.5) | 581,395 | 4.4 | 2.4 | |||||||
| Mutual funds | 89,637 | 3.2 | 2.7 | 89,637 | 15.3 | 14.6 | |||||||
| Ratios (%) and operating means | |||||||||||||
| Underlying RoTE | 10.02 | (0.54) | 10.00 | (0.86) | |||||||||
| Efficiency ratio | 51.6 | 0.3 | 52.6 | 0.1 | |||||||||
| NPL ratio | 3.25 | (0.22) | 3.25 | (0.42) | |||||||||
| NPL coverage | 49.8 | 1.6 | 49.8 | (0.3) | |||||||||
| Number of employees | 86,574 | (3.0) | 86,574 | (6.9) | |||||||||
| Number of branches | 5,336 | (11.0) | 5,336 | (21.0) | |||||||||
(1) Includes exchange differences.
(2) Excluding reverse repos.
(3) Excluding repos.
| 54 | | January - December 2019 |
| Financial information by segments | ||||||||
| Spain | |||||||||
| EUR million | |||||||||
| / Q3'19 | / 2018 | ||||||||
| Underlying income statement | Q4'19 | % | 2019 | % | |||||
| Net interest income | 934 | (3.4) | 3,919 | (4.3) | |||||
| Net fee income | 620 | 0.9 | 2,481 | (5.5) | |||||
Gains (losses) on financial transactions (1) | 387 | 18.9 | 1,046 | 48.8 | |||||
| Other operating income | (129 | ) | — | 61 | (68.9) | ||||
| Total income | 1,811 | (8.9) | 7,506 | (1.4) | |||||
| Administrative expenses and amortisations | (977 | ) | (2.1) | (4,021 | ) | (7.3) | |||
| Net operating income | 834 | (15.8) | 3,485 | 6.4 | |||||
| Net loan-loss provisions | (176 | ) | (15.9) | (856 | ) | 8.5 | |||
| Other gains (losses) and provisions | (100 | ) | 0.3 | (455 | ) | 7.1 | |||
| Profit before tax | 557 | (18.1) | 2,174 | 5.4 | |||||
| Tax on profit | (157 | ) | (17.5) | (589 | ) | 15.9 | |||
| Profit from continuing operations | 400 | (18.4) | 1,585 | 1.9 | |||||
| Net profit from discontinued operations | — | — | — | — | |||||
| Consolidated profit | 400 | (18.4) | 1,585 | 1.9 | |||||
| Non-controlling interests | 0 | — | 0 | (89.7 | ) | ||||
| Underlying attributable profit to the parent | 400 | (18.5) | 1,585 | 2.0 | |||||
| Balance sheet | |||||||||
| Loans and advances to customers | 185,179 | (1.6) | 185,179 | (5.6) | |||||
| Cash, central banks and credit institutions | 78,334 | (3.6) | 78,334 | (1.0) | |||||
| Debt instruments | 34,288 | (4.5) | 34,288 | (29.8) | |||||
| Other financial assets | 1,393 | (6.8) | 1,393 | (44.6) | |||||
| Other asset accounts | 23,908 | 4.8 | 23,908 | 6.6 | |||||
| Total assets | 323,102 | (2.0) | 323,102 | (7.4) | |||||
| Customer deposits | 240,427 | (2.3) | 240,427 | 0.9 | |||||
| Central banks and credit institutions | 25,231 | (10.5) | 25,231 | (55.0) | |||||
| Marketable debt securities | 26,855 | 2.2 | 26,855 | 9.0 | |||||
| Other financial liabilities | 8,971 | (7.0) | 8,971 | 44.3 | |||||
| Other liabilities accounts | 5,222 | 21.3 | 5,222 | (41.4) | |||||
| Total liabilities | 306,706 | (2.5) | 306,706 | (8.2) | |||||
| Total equity | 16,396 | 8.3 | 16,396 | 10.7 | |||||
| Memorandum items: | |||||||||
Gross loans and advances to customers (2) | 191,280 | (1.6) | 191,280 | (5.9) | |||||
| Customer funds | 308,747 | (1.3) | 308,747 | 3.3 | |||||
Customer deposits (3) | 240,126 | (2.2) | 240,126 | 1.0 | |||||
| Mutual funds | 68,621 | 1.8 | 68,621 | 12.4 | |||||
| Ratios (%) and operating means | |||||||||
| Underlying RoTE | 10.26 | (2.91) | 10.48 | 0.06 | |||||
| Efficiency ratio | 54.0 | 3.8 | 53.6 | (3.4) | |||||
| NPL ratio | 6.94 | (0.29) | 6.94 | (0.38) | |||||
| NPL coverage | 41.1 | 0.5 | 41.1 | (2.6) | |||||
| Number of employees | 27,630 | (7.0) | 27,630 | (11.5) | |||||
| Number of branches | 3,235 | (16.0) | 3,235 | (25.9) | |||||
(1) Includes exchange differences.
(2) Excluding reverse repos.
(3) Excluding repos.
January - December 2019 | | 55 |
| Financial information by segments | ||||||||
| Santander Consumer Finance | |||||||||||||
| EUR million | |||||||||||||
| / | Q3'19 | / | 2018 | ||||||||||
| Underlying income statement | Q4'19 | % | % excl. FX | 2019 | % | % excl. FX | |||||||
| Net interest income | 960 | (1.6) | (1.3) | 3,848 | 3.4 | 3.9 | |||||||
| Net fee income | 195 | (8.3) | (8.2) | 823 | 3.1 | 3.2 | |||||||
Gains (losses) on financial transactions (1) | (3 | ) | (35.4 | ) | (35.4 | ) | (8 | ) | — | — | |||
| Other operating income | 33 | 67.8 | 67.8 | 47 | 35.7 | 35.2 | |||||||
| Total income | 1,185 | (1.5) | (1.3) | 4,710 | 2.2 | 2.6 | |||||||
| Administrative expenses and amortisations | (499 | ) | (1.0) | (0.8) | (2,038 | ) | 2.5 | 2.9 | |||||
| Net operating income | 686 | (1.9) | (1.6) | 2,672 | 1.9 | 2.3 | |||||||
| Net loan-loss provisions | (148 | ) | 0.9 | 1.2 | (477 | ) | 32.5 | 32.4 | |||||
| Other gains (losses) and provisions | (33 | ) | — | — | 20 | — | — | ||||||
| Profit before tax | 504 | (15.1) | (14.9) | 2,215 | 3.7 | 4.2 | |||||||
| Tax on profit | (110 | ) | (36.8) | (36.6) | (598 | ) | 3.8 | 4.3 | |||||
| Profit from continuing operations | 394 | (6.1) | (5.9) | 1,618 | 3.6 | 4.1 | |||||||
| Net profit from discontinued operations | — | — | — | — | — | — | |||||||
| Consolidated profit | 394 | (6.1) | (5.9) | 1,618 | 3.6 | 4.1 | |||||||
| Non-controlling interests | (76 | ) | (8.3) | (8.3) | (303 | ) | 13.4 | 13.5 | |||||
| Underlying attributable profit to the parent | 319 | (5.6) | (5.3) | 1,314 | 1.6 | 2.2 | |||||||
| Balance sheet | |||||||||||||
| Loans and advances to customers | 102,262 | 4.2 | 4.0 | 102,262 | 7.2 | 7.0 | |||||||
| Cash, central banks and credit institutions | 8,258 | 25.2 | 25.1 | 8,258 | 35.5 | 35.2 | |||||||
| Debt instruments | 3,197 | (3.2) | (3.8) | 3,197 | (3.8) | (4.2) | |||||||
| Other financial assets | 33 | (12.3) | (12.4) | 33 | 5.6 | 5.4 | |||||||
| Other asset accounts | 4,001 | 3.4 | 3.2 | 4,001 | 38.4 | 38.2 | |||||||
| Total assets | 117,750 | 5.2 | 5.0 | 117,750 | 9.3 | 9.1 | |||||||
| Customer deposits | 39,602 | 4.4 | 4.1 | 39,602 | 8.3 | 8.1 | |||||||
| Central banks and credit institutions | 25,159 | 6.2 | 6.1 | 25,159 | 0.8 | 0.6 | |||||||
| Marketable debt securities | 36,776 | 6.4 | 6.3 | 36,776 | 17.6 | 17.4 | |||||||
| Other financial liabilities | 1,413 | 36.2 | 36.0 | 1,413 | 83.2 | 83.1 | |||||||
| Other liabilities accounts | 3,865 | (3.3) | (3.4) | 3,865 | 9.8 | 9.7 | |||||||
| Total liabilities | 106,815 | 5.5 | 5.3 | 106,815 | 10.0 | 9.8 | |||||||
| Total equity | 10,935 | 2.1 | 1.9 | 10,935 | 3.3 | 2.9 | |||||||
| Memorandum items: | |||||||||||||
Gross loans and advances to customers (2) | 104,783 | 4.3 | 4.1 | 104,783 | 7.2 | 7.0 | |||||||
| Customer funds | 39,602 | 4.4 | 4.1 | 39,602 | 8.4 | 8.2 | |||||||
Customer deposits (3) | 39,602 | 4.4 | 4.1 | 39,602 | 8.4 | 8.2 | |||||||
| Mutual funds | — | — | — | — | — | — | |||||||
| Ratios (%) and operating means | |||||||||||||
| Underlying RoTE | 14.62 | (1.19) | 15.26 | (0.57) | |||||||||
| Efficiency ratio | 42.1 | 0.2 | 43.3 | 0.1 | |||||||||
| NPL ratio | 2.30 | 0.05 | 2.30 | 0.01 | |||||||||
| NPL coverage | 106.1 | 1.9 | 106.1 | (0.3) | |||||||||
| Number of employees | 14,448 | (0.3) | 14,448 | (2.8) | |||||||||
| Number of branches | 416 | (2.3) | 416 | (5.0) | |||||||||
(1) Includes exchange differences.
(2) Excluding reverse repos.
(3) Excluding repos.
| 56 | | January - December 2019 |
| Financial information by segments | ||||||||
| United Kingdom | |||||||||||||
| EUR million | |||||||||||||
| / | Q3'19 | / | 2018 | ||||||||||
| Underlying income statement | Q4'19 | % | % excl. FX | 2019 | % | % excl. FX | |||||||
| Net interest income | 961 | 5.8 | 0.8 | 3,788 | (7.1) | (7.9) | |||||||
| Net fee income | 226 | 4.3 | (0.5) | 866 | (5.1) | (5.9) | |||||||
Gains (losses) on financial transactions (1) | 7 | — | — | 12 | (86.9) | (87.0) | |||||||
| Other operating income | 26 | 168.1 | 156.4 | 62 | 16.1 | 15.1 | |||||||
| Total income | 1,220 | 9.0 | 3.8 | 4,727 | (7.9) | (8.7) | |||||||
| Administrative expenses and amortisations | (712 | ) | 4.5 | (0.5) | (2,835 | ) | 0.0 | (0.9) | |||||
| Net operating income | 508 | 16.0 | 10.5 | 1,892 | (17.6) | (18.3) | |||||||
| Net loan-loss provisions | (96 | ) | 25.2 | 21.7 | (253 | ) | 47.5 | 46.2 | |||||
| Other gains (losses) and provisions | (66 | ) | 54.4 | 48.8 | (184 | ) | (42.7) | (43.1) | |||||
| Profit before tax | 345 | 8.6 | 2.8 | 1,455 | (19.3) | (20.0) | |||||||
| Tax on profit | (90 | ) | 35.0 | 27.3 | (355 | ) | (29.8) | (30.4) | |||||
| Profit from continuing operations | 255 | 1.6 | (3.8) | 1,100 | (15.2) | (15.9) | |||||||
| Net profit from discontinued operations | — | — | — | — | — | — | |||||||
| Consolidated profit | 255 | 1.6 | (3.8) | 1,100 | (15.2) | (15.9) | |||||||
| Non-controlling interests | (6 | ) | 10.5 | 5.7 | (22 | ) | (9.7) | (10.5) | |||||
| Underlying attributable profit to the parent | 249 | 1.4 | (4.0) | 1,077 | (15.3) | (16.0) | |||||||
| Balance sheet | |||||||||||||
| Loans and advances to customers | 273,528 | 5.5 | 1.3 | 273,528 | 9.4 | 4.1 | |||||||
| Cash, central banks and credit institutions | 39,314 | 21.0 | 16.2 | 39,314 | 5.6 | 0.4 | |||||||
| Debt instruments | 20,187 | (16.8) | (20.1) | 20,187 | (23.9) | (27.6) | |||||||
| Other financial assets | 943 | (10.5) | (14.0) | 943 | 58.8 | 51.1 | |||||||
| Other asset accounts | 8,498 | (21.1) | (24.3) | 8,498 | (9.9) | (14.3) | |||||||
| Total assets | 342,470 | 4.4 | 0.3 | 342,470 | 5.8 | 0.6 | |||||||
| Customer deposits | 229,361 | 6.8 | 2.6 | 229,361 | 10.2 | 4.8 | |||||||
| Central banks and credit institutions | 25,075 | 5.5 | 1.3 | 25,075 | (2.9) | (7.6) | |||||||
| Marketable debt securities | 64,340 | 0.6 | (3.3) | 64,340 | (4.8) | (9.4) | |||||||
| Other financial liabilities | 2,671 | (7.5) | (11.1) | 2,671 | 27.4 | 21.2 | |||||||
| Other liabilities accounts | 4,409 | (23.1) | (26.2) | 4,409 | 6.8 | 1.6 | |||||||
| Total liabilities | 325,856 | 4.7 | 0.6 | 325,856 | 5.9 | 0.7 | |||||||
| Total equity | 16,614 | (1.0) | (4.9) | 16,614 | 3.8 | (1.2) | |||||||
| Memorandum items: | |||||||||||||
Gross loans and advances to customers (2) | 249,214 | 5.7 | 1.5 | 249,214 | 9.0 | 3.7 | |||||||
| Customer funds | 218,944 | 4.8 | 0.7 | 218,944 | 7.1 | 1.9 | |||||||
Customer deposits (3) | 210,727 | 4.9 | 0.8 | 210,727 | 7.1 | 1.8 | |||||||
| Mutual funds | 8,218 | 2.9 | (1.2) | 8,218 | 8.5 | 3.2 | |||||||
| Ratios (%) and operating means | |||||||||||||
| Underlying RoTE | 6.73 | 0.01 | 7.28 | (2.05) | |||||||||
| Efficiency ratio | 58.4 | (2.5) | 60.0 | 4.7 | |||||||||
| NPL ratio | 1.01 | (0.07) | 1.01 | (0.07 | ) | ||||||||
| NPL coverage | 36.5 | 2.4 | 36.5 | 3.6 | |||||||||
| Number of employees | 24,490 | (2.0) | 24,490 | (4.1) | |||||||||
| Number of branches | 616 | (2.1) | 616 | (18.4) | |||||||||
(1) Includes exchange differences.
(2) Excluding reverse repos.
(3) Excluding repos.
January - December 2019 | | 57 |
| Financial information by segments | ||||||||
| Portugal | |||||||||
| EUR million | |||||||||
| / Q3'19 | / 2018 | ||||||||
| Underlying income statement | Q4'19 | % | 2019 | % | |||||
| Net interest income | 213 | (0.4) | 856 | (0.2) | |||||
| Net fee income | 98 | 2.3 | 390 | 3.6 | |||||
Gains (losses) on financial transactions (1) | 10 | 9.9 | 111 | 47.5 | |||||
| Other operating income | 10 | (17.9 | ) | 17 | (49.0 | ) | |||
| Total income | 332 | 0.0 | 1,375 | 2.3 | |||||
| Administrative expenses and amortisations | (156 | ) | 0.8 | (623 | ) | (3.2) | |||
| Net operating income | 175 | (0.6) | 751 | 7.4 | |||||
| Net loan-loss provisions | (4 | ) | — | 8 | — | ||||
| Other gains (losses) and provisions | 21 | — | (9 | ) | — | ||||
| Profit before tax | 192 | 8.0 | 750 | 9.3 | |||||
| Tax on profit | (52 | ) | (1.3) | (223 | ) | 9.0 | |||
| Profit from continuing operations | 140 | 11.9 | 527 | 9.4 | |||||
| Net profit from discontinued operations | — | — | — | — | |||||
| Consolidated profit | 140 | 11.9 | 527 | 9.4 | |||||
| Non-controlling interests | (1 | ) | 84.5 | (2 | ) | (21.5) | |||
| Underlying attributable profit to the parent | 140 | 11.7 | 525 | 9.6 | |||||
| Balance sheet | |||||||||
| Loans and advances to customers | 35,406 | (0.6) | 35,406 | (0.2) | |||||
| Cash, central banks and credit institutions | 4,675 | 9.8 | 4,675 | 35.4 | |||||
| Debt instruments | 12,580 | (5.0) | 12,580 | 2.3 | |||||
| Other financial assets | 1,695 | (4.8) | 1,695 | (9.7) | |||||
| Other asset accounts | 1,769 | (8.5) | 1,769 | (7.1) | |||||
| Total assets | 56,125 | (1.3) | 56,125 | 2.0 | |||||
| Customer deposits | 39,258 | 0.5 | 39,258 | 5.5 | |||||
| Central banks and credit institutions | 8,003 | 2.4 | 8,003 | (0.1) | |||||
| Marketable debt securities | 3,384 | (0.8) | 3,384 | (20.5) | |||||
| Other financial liabilities | 276 | (8.4) | 276 | 7.7 | |||||
| Other liabilities accounts | 1,516 | (18.0) | 1,516 | 26.7 | |||||
| Total liabilities | 52,438 | 0.0 | 52,438 | 2.9 | |||||
| Total equity | 3,688 | (16.4) | 3,688 | (9.4) | |||||
| Memorandum items: | |||||||||
Gross loans and advances to customers (2) | 36,321 | (0.6) | 36,321 | (0.7) | |||||
| Customer funds | 42,324 | 0.4 | 42,324 | 8.1 | |||||
Customer deposits (3) | 39,258 | 0.5 | 39,258 | 5.5 | |||||
| Mutual funds | 3,066 | (1.7) | 3,066 | 59.2 | |||||
| Ratios (%) and operating means | |||||||||
| Underlying RoTE | 14.31 | 2.71 | 12.80 | 0.77 | |||||
| Efficiency ratio | 47.1 | 0.3 | 45.3 | (2.6) | |||||
| NPL ratio | 4.83 | (0.07) | 4.83 | (1.11) | |||||
| NPL coverage | 52.8 | 1.3 | 52.8 | 2.3 | |||||
| Number of employees | 6,582 | (1.4 | ) | 6,582 | (1.8) | ||||
| Number of branches | 542 | (1.3) | 542 | (5.2) | |||||
(1) Includes exchange differences.
(2) Excluding reverse repos.
(3) Excluding repos.
| 58 | | January - December 2019 |
| Financial information by segments | ||||||||
| Poland | |||||||||||||
| EUR million | |||||||||||||
| / | Q3'19 | / | 2018 | ||||||||||
| Underlying income statement | Q4'19 | % | % excl. FX | 2019 | % | % excl. FX | |||||||
| Net interest income | 307 | 3.0 | 2.3 | 1,171 | 17.6 | 18.6 | |||||||
| Net fee income | 117 | (1.4) | (2.1) | 467 | 3.1 | 4.0 | |||||||
Gains (losses) on financial transactions (1) | 30 | 24.7 | 23.9 | 93 | 112.9 | 114.7 | |||||||
| Other operating income | 5 | — | — | (13 | ) | 218.9 | 221.6 | ||||||
| Total income | 459 | 4.0 | 3.2 | 1,717 | 15.4 | 16.4 | |||||||
| Administrative expenses and amortisations | (169 | ) | (3.0) | (3.7) | (693 | ) | 8.4 | 9.3 | |||||
| Net operating income | 290 | 8.5 | 7.8 | 1,024 | 20.7 | 21.7 | |||||||
| Net loan-loss provisions | (51 | ) | (14.7) | (15.3) | (217 | ) | 34.5 | 35.6 | |||||
| Other gains (losses) and provisions | (34 | ) | 40.2 | 39.0 | (127 | ) | (6.2) | (5.4) | |||||
| Profit before tax | 205 | 11.7 | 11.1 | 681 | 23.3 | 24.3 | |||||||
| Tax on profit | (52 | ) | 17.9 | 17.2 | (170 | ) | 30.1 | 31.2 | |||||
| Profit from continuing operations | 153 | 9.8 | 9.1 | 511 | 21.2 | 22.2 | |||||||
| Net profit from discontinued operations | — | — | — | — | — | — | |||||||
| Consolidated profit | 153 | 9.8 | 9.1 | 511 | 21.2 | 22.2 | |||||||
| Non-controlling interests | (49 | ) | 9.7 | 9.1 | (162 | ) | 28.8 | 29.9 | |||||
| Underlying attributable profit to the parent | 104 | 9.8 | 9.2 | 349 | 17.9 | 18.9 | |||||||
| Balance sheet | |||||||||||||
| Loans and advances to customers | 30,034 | 3.5 | 0.6 | 30,034 | 6.6 | 5.5 | |||||||
| Cash, central banks and credit institutions | 3,398 | 0.2 | (2.6) | 3,398 | 4.2 | 3.1 | |||||||
| Debt instruments | 9,285 | 10.3 | 7.3 | 9,285 | (12.2) | (13.1) | |||||||
| Other financial assets | 630 | (8.6) | (11.1) | 630 | 17.9 | 16.7 | |||||||
| Other asset accounts | 1,341 | 1.9 | (0.9) | 1,341 | 17.6 | 16.4 | |||||||
| Total assets | 44,688 | 4.3 | 1.4 | 44,688 | 2.3 | 1.3 | |||||||
| Customer deposits | 33,485 | 7.1 | 4.1 | 33,485 | 0.2 | (0.8) | |||||||
| Central banks and credit institutions | 2,319 | (13.0) | (15.5) | 2,319 | 7.1 | 6.0 | |||||||
| Marketable debt securities | 2,171 | (1.4) | (4.1) | 2,171 | 21.3 | 20.1 | |||||||
| Other financial liabilities | 762 | (20.1) | (22.3) | 762 | 36.5 | 35.1 | |||||||
| Other liabilities accounts | 923 | (2.7) | (5.4) | 923 | 14.0 | 12.9 | |||||||
| Total liabilities | 39,659 | 4.3 | 1.4 | 39,659 | 2.4 | 1.3 | |||||||
| Total equity | 5,029 | 4.8 | 1.9 | 5,029 | 2.0 | 0.9 | |||||||
| Memorandum items: | |||||||||||||
Gross loans and advances to customers (2) | 30,925 | 3.2 | 0.4 | 30,925 | 6.5 | 5.4 | |||||||
| Customer funds | 37,929 | 7.0 | 4.0 | 37,929 | 6.7 | 5.6 | |||||||
Customer deposits (3) | 33,485 | 7.1 | 4.1 | 33,485 | 6.2 | 5.1 | |||||||
| Mutual funds | 4,444 | 6.4 | 3.4 | 4,444 | 10.8 | 9.6 | |||||||
| Ratios (%) and operating means | |||||||||||||
| Underlying RoTE | 13.33 | 0.81 | 11.23 | 1.00 | |||||||||
| Efficiency ratio | 36.9 | (2.6) | 40.4 | (2.6) | |||||||||
| NPL ratio | 4.31 | (0.04) | 4.31 | 0.03 | |||||||||
| NPL coverage | 66.8 | (2.2) | 66.8 | (0.3) | |||||||||
| Number of employees | 11,049 | 0.2 | 11,049 | (11.7) | |||||||||
| Number of branches | 515 | (1.9) | 515 | (15.7) | |||||||||
(1) Includes exchange differences.
(2) Excluding reverse repos.
(3) Excluding repos.
January - December 2019 | | 59 |
| Financial information by segments | ||||||||
| Other Europe | |||||||||||||
| EUR million | |||||||||||||
| / | Q3'19 | / | 2018 | ||||||||||
| Underlying income statement | Q4'19 | % | % excl. FX | 2019 | % | % excl. FX | |||||||
| Net interest income | 155 | (6.8) | (6.9) | 620 | 35.9 | 35.0 | |||||||
| Net fee income | 63 | 20.5 | 20.4 | 234 | (14.0) | (15.3) | |||||||
Gains (losses) on financial transactions (1) | 0 | (99.6 | ) | (99.3 | ) | (218 | ) | — | — | ||||
| Other operating income | 68 | 18.9 | 18.9 | 331 | 73.6 | 73.0 | |||||||
| Total income | 286 | 35.7 | 35.6 | 966 | (9.5) | (10.5) | |||||||
| Administrative expenses and amortisations | (219 | ) | 6.8 | 6.7 | (833 | ) | 16.0 | 14.6 | |||||
| Net operating income | 66 | 0.0 | 0.0 | 133 | (61.9) | (62.2) | |||||||
| Net loan-loss provisions | (23 | ) | 569.8 | 569.5 | (44 | ) | (25.4) | (25.3) | |||||
| Other gains (losses) and provisions | 4 | 0.0 | 0.0 | (14 | ) | (65.8) | (66.3) | ||||||
| Profit before tax | 48 | — | — | 76 | (69.9) | (70.2) | |||||||
| Tax on profit | (21 | ) | 637.6 | 637.1 | (44 | ) | (52.9) | (53.1) | |||||
| Profit from continuing operations | 27 | — | — | 31 | (80.1) | (80.3) | |||||||
| Net profit from discontinued operations | — | — | — | — | — | — | |||||||
| Consolidated profit | 27 | — | — | 31 | (80.1) | (80.3) | |||||||
| Non-controlling interests | (1 | ) | — | — | (3 | ) | 37.9 | 31.8 | |||||
| Underlying attributable profit to the parent | 26 | — | — | 28 | (81.9) | (82.1) | |||||||
| Balance sheet | |||||||||||||
| Loans and advances to customers | 50,495 | 14.6 | 15.4 | 50,495 | 44.8 | 44.3 | |||||||
| Cash, central banks and credit institutions | 46,410 | (17.7) | (17.8) | 46,410 | 7.6 | 7.5 | |||||||
| Debt instruments | 24,844 | (2.6) | (2.4) | 24,844 | 49.2 | 48.8 | |||||||
| Other financial assets | 49,199 | (5.1) | (5.0) | 49,199 | 12.6 | 12.5 | |||||||
| Other asset accounts | 1,954 | (49.7) | (49.1) | 1,954 | (38.7) | (39.3) | |||||||
| Total assets | 172,903 | (4.8) | (4.6) | 172,903 | 22.1 | 21.9 | |||||||
| Customer deposits | 18,248 | (12.5) | (12.2) | 18,248 | 1.0 | 0.8 | |||||||
| Central banks and credit institutions | 104,004 | 2.7 | 2.9 | 104,004 | 37.5 | 37.2 | |||||||
| Marketable debt securities | 18 | — | — | 18 | (69.8) | (70.5) | |||||||
| Other financial liabilities | 46,713 | (14.2) | (14.1) | 46,713 | 6.7 | 6.7 | |||||||
| Other liabilities accounts | 448 | (65.9) | (65.8) | 448 | 18.2 | 17.7 | |||||||
| Total liabilities | 169,432 | (4.7) | (4.6) | 169,432 | 22.8 | 22.6 | |||||||
| Total equity | 3,471 | (8.5) | (7.3) | 3,471 | (4.0) | (4.6) | |||||||
| Memorandum items: | |||||||||||||
Gross loans and advances to customers (2) | 38,028 | (0.5) | 0.3 | 38,028 | 22.4 | 21.9 | |||||||
| Customer funds | 23,486 | (5.8) | (5.6) | 23,486 | 15.2 | 15.0 | |||||||
Customer deposits (3) | 18,198 | (12.5) | (12.2) | 18,198 | 6.0 | 5.8 | |||||||
| Mutual funds | 5,288 | 27.7 | 27.7 | 5,288 | 64.3 | 64.3 | |||||||
| Resources | |||||||||||||
| Number of employees | 2,375 | 1.4 | 2,375 | 9.3 | |||||||||
(1) Includes exchange differences.
(2) Excluding reverse repos.
(3) Excluding repos.
| 60 | | January - December 2019 |
| Financial information by segments | ||||||||
| NORTH AMERICA | |||||||||||||
| EUR million | |||||||||||||
| / | Q3'19 | / | 2018 | ||||||||||
| Underlying income statement | Q4'19 | % | % excl. FX | 2019 | % | % excl. FX | |||||||
| Net interest income | 2,265 | 0.3 | (0.4) | 8,926 | 9.5 | 3.9 | |||||||
| Net fee income | 427 | (4.7) | (5.5) | 1,776 | 10.0 | 4.4 | |||||||
Gains (losses) on financial transactions (1) | 83 | (3.5) | (4.2) | 230 | 33.0 | 26.3 | |||||||
| Other operating income | 174 | (8.9) | (9.3) | 672 | 25.8 | 19.3 | |||||||
| Total income | 2,949 | (1.2) | (1.9) | 11,604 | 10.8 | 5.1 | |||||||
| Administrative expenses and amortisations | (1,314 | ) | 3.7 | 3.0 | (4,968 | ) | 10.7 | 5.1 | |||||
| Net operating income | 1,634 | (4.8) | (5.5) | 6,636 | 10.8 | 5.2 | |||||||
| Net loan-loss provisions | (1,050 | ) | 4.0 | 3.4 | (3,656 | ) | 6.0 | 0.6 | |||||
| Other gains (losses) and provisions | (31 | ) | (60.7) | (61.4) | (205 | ) | 1.2 | (4.0) | |||||
| Profit before tax | 554 | (11.8) | (12.7) | 2,776 | 18.8 | 12.8 | |||||||
| Tax on profit | (132 | ) | (10.0) | (10.8) | (683 | ) | 14.1 | 8.3 | |||||
| Profit from continuing operations | 422 | (12.4) | (13.3) | 2,092 | 20.4 | 14.3 | |||||||
| Net profit from discontinued operations | — | — | — | — | — | — | |||||||
| Consolidated profit | 422 | (12.4) | (13.3) | 2,092 | 20.4 | 14.3 | |||||||
| Non-controlling interests | (33 | ) | (64.9) | (66.1) | (426 | ) | (1.8) | (6.8) | |||||
| Underlying attributable profit to the parent | 389 | 0.2 | (0.7) | 1,667 | 27.8 | 21.3 | |||||||
| Balance sheet | |||||||||||||
| Loans and advances to customers | 133,726 | 1.7 | 3.8 | 133,726 | 15.1 | 11.7 | |||||||
| Cash, central banks and credit institutions | 22,885 | (1.9) | (0.7) | 22,885 | (20.7) | (23.5) | |||||||
| Debt instruments | 33,746 | (0.1) | 0.9 | 33,746 | 23.6 | 18.8 | |||||||
| Other financial assets | 10,759 | (10.7) | (10.2) | 10,759 | 7.9 | 3.5 | |||||||
| Other asset accounts | 22,741 | 0.5 | 3.0 | 22,741 | 22.3 | 19.2 | |||||||
| Total assets | 223,856 | 0.2 | 2.0 | 223,856 | 11.4 | 7.9 | |||||||
| Customer deposits | 98,915 | (3.5) | (1.8) | 98,915 | 7.6 | 4.1 | |||||||
| Central banks and credit institutions | 38,942 | 25.0 | 26.7 | 38,942 | 49.5 | 44.6 | |||||||
| Marketable debt securities | 44,097 | (0.3) | 2.1 | 44,097 | 0.8 | (1.7) | |||||||
| Other financial liabilities | 11,763 | (19.1) | (18.8) | 11,763 | 3.4 | (1.4) | |||||||
| Other liabilities accounts | 6,237 | 1.3 | 3.0 | 6,237 | 4.5 | 1.1 | |||||||
| Total liabilities | 199,954 | 0.7 | 2.4 | 199,954 | 11.7 | 8.1 | |||||||
| Total equity | 23,902 | (3.1) | (1.2) | 23,902 | 9.3 | 6.2 | |||||||
| Memorandum items: | |||||||||||||
Gross loans and advances to customers (2) | 130,592 | 1.7 | 3.8 | 130,592 | 13.7 | 10.3 | |||||||
| Customer funds | 113,407 | -0.7 | 0.9 | 113,407 | 10.2 | 6.6 | |||||||
Customer deposits (3) | 92,231 | -0.4 | 1.4 | 92,231 | 8.8 | 5.3 | |||||||
| Mutual funds | 21,175 | -2.1 | -1.2 | 21,175 | 17.0 | 12.3 | |||||||
| Ratios (%) and operating means | |||||||||||||
| Underlying RoTE | 7.40 | (0.37) | 8.52 | 0.91 | |||||||||
| Efficiency ratio | 44.6 | 2.1 | 42.8 | 0.0 | |||||||||
| NPL ratio | 2.20 | (0.01) | 2.20 | (0.59) | |||||||||
| NPL coverage | 153.0 | (2.6) | 153.0 | 15.6 | |||||||||
| Number of employees | 37,866 | (0.6) | 37,866 | 1.9 | |||||||||
| Number of branches | 2,043 | (0.7) | 2,043 | (1.7) | |||||||||
(1) Includes exchange differences.
(2) Excluding reverse repos.
(3) Excluding repos.
January - December 2019 | | 61 |
| Financial information by segments | ||||||||
| United States | |||||||||||||
| EUR million | |||||||||||||
| / | Q3'19 | / | 2018 | ||||||||||
| Underlying income statement | Q4'19 | % | % excl. FX | 2019 | % | % excl. FX | |||||||
| Net interest income | 1,449 | (0.8) | (1.2) | 5,769 | 7.0 | 1.5 | |||||||
| Net fee income | 230 | (3.2) | (3.6) | 947 | 10.2 | 4.6 | |||||||
Gains (losses) on financial transactions (1) | 33 | (42.5) | (43.1) | 131 | 82.1 | 72.8 | |||||||
| Other operating income | 182 | (17.5) | (18.1) | 759 | 20.9 | 14.7 | |||||||
| Total income | 1,894 | (4.2) | (4.6) | 7,605 | 9.4 | 3.8 | |||||||
| Administrative expenses and amortisations | (869 | ) | 2.6 | 2.2 | (3,297 | ) | 9.2 | 3.6 | |||||
| Net operating income | 1,025 | (9.2) | (9.7) | 4,309 | 9.6 | 4.0 | |||||||
| Net loan-loss provisions | (828 | ) | 5.3 | 4.9 | (2,792 | ) | 6.6 | 1.2 | |||||
| Other gains (losses) and provisions | (39 | ) | (48.7) | (49.4) | (200 | ) | 0.3 | (4.8) | |||||
| Profit before tax | 158 | (40.8) | (41.6) | 1,317 | 18.3 | 12.2 | |||||||
| Tax on profit | (50 | ) | (30.7) | (31.3) | (370 | ) | 6.9 | 1.4 | |||||
| Profit from continuing operations | 109 | (44.5) | (45.3) | 947 | 23.4 | 17.1 | |||||||
| Net profit from discontinued operations | — | — | — | — | — | — | |||||||
| Consolidated profit | 109 | (44.5) | (45.3) | 947 | 23.4 | 17.1 | |||||||
| Non-controlling interests | (11 | ) | (74.6) | (76.1) | (230 | ) | 5.4 | 0.0 | |||||
| Underlying attributable profit to the parent | 98 | (36.4) | (37.1) | 717 | 30.6 | 23.9 | |||||||
| Balance sheet | |||||||||||||
| Loans and advances to customers | 98,707 | (0.1) | 3.1 | 98,707 | 15.4 | 13.2 | |||||||
| Cash, central banks and credit institutions | 12,829 | 0.2 | 3.4 | 12,829 | (22.0) | (23.4) | |||||||
| Debt instruments | 16,677 | 0.1 | 3.2 | 16,677 | 26.7 | 24.3 | |||||||
| Other financial assets | 4,320 | (11.2) | (8.4) | 4,320 | 0.7 | (1.2) | |||||||
| Other asset accounts | 18,882 | (0.9) | 2.2 | 18,882 | 21.2 | 18.9 | |||||||
| Total assets | 151,415 | (0.5) | 2.6 | 151,415 | 12.1 | 10.0 | |||||||
| Customer deposits | 63,371 | (7.6) | (4.7) | 63,371 | 10.1 | 8.0 | |||||||
| Central banks and credit institutions | 25,126 | 36.2 | 40.5 | 25,126 | 52.2 | 49.3 | |||||||
| Marketable debt securities | 37,132 | (1.1) | 2.0 | 37,132 | (1.1) | (3.0) | |||||||
| Other financial liabilities | 4,146 | (18.8) | (16.2) | 4,146 | 33.9 | 31.3 | |||||||
| Other liabilities accounts | 4,093 | (0.8) | 2.4 | 4,093 | 7.8 | 5.7 | |||||||
| Total liabilities | 133,868 | 0.0 | 3.2 | 133,868 | 12.9 | 10.8 | |||||||
| Total equity | 17,547 | (4.4) | (1.4) | 17,547 | 6.3 | 4.3 | |||||||
| Memorandum items: | |||||||||||||
Gross loans and advances to customers (2) | 95,742 | 1.0 | 4.2 | 95,742 | 14.4 | 12.2 | |||||||
| Customer funds | 72,604 | (1.3) | 1.8 | 72,604 | 13.0 | 10.9 | |||||||
Customer deposits (3) | 62,608 | (1.3) | 1.8 | 62,608 | 11.7 | 9.6 | |||||||
| Mutual funds | 9,996 | (1.6) | 1.5 | 9,996 | 22.3 | 20.0 | |||||||
| Ratios (%) and operating means | |||||||||||||
| Underlying RoTE | 2.49 | (1.49) | 4.78 | 0.69 | |||||||||
| Efficiency ratio | 45.9 | 3.0 | 43.3 | (0.1) | |||||||||
| NPL ratio | 2.20 | 0.02 | 2.20 | (0.72) | |||||||||
| NPL coverage | 161.8 | (4.8) | 161.8 | 19.0 | |||||||||
| Number of employees | 17,372 | (1.2) | 17,372 | 0.4 | |||||||||
| Number of branches | 621 | (0.5) | 621 | (5.9) | |||||||||
(1) Includes exchange differences.
(2) Excluding reverse repos.
(3) Excluding repos.
| 62 | | January - December 2019 |
| Financial information by segments | ||||||||
| Mexico | |||||||||||||
| EUR million | |||||||||||||
| / | Q3'19 | / | 2018 | ||||||||||
| Underlying income statement | Q4'19 | % | % excl. FX | 2019 | % | % excl. FX | |||||||
| Net interest income | 816 | 2.2 | 0.9 | 3,157 | 14.2 | 8.5 | |||||||
| Net fee income | 197 | (6.4) | (7.6) | 829 | 9.7 | 4.2 | |||||||
Gains (losses) on financial transactions (1) | 49 | 79.2 | 78.0 | 99 | (1.7) | (6.7) | |||||||
| Other operating income | (7 | ) | (74.9) | (75.9) | (87 | ) | (7.1) | (11.8) | |||||
| Total income | 1,054 | 4.7 | 3.5 | 3,998 | 13.4 | 7.7 | |||||||
| Administrative expenses and amortisations | (445 | ) | 5.9 | 4.7 | (1,671 | ) | 13.8 | 8.1 | |||||
| Net operating income | 609 | 3.9 | 2.6 | 2,327 | 13.1 | 7.4 | |||||||
| Net loan-loss provisions | (222 | ) | (0.6) | (1.8) | (863 | ) | 3.9 | (1.3) | |||||
| Other gains (losses) and provisions | 8 | — | — | (5 | ) | 49.9 | 42.4 | ||||||
| Profit before tax | 395 | 9.6 | 8.3 | 1,459 | 19.2 | 13.2 | |||||||
| Tax on profit | (82 | ) | 9.6 | 8.3 | (314 | ) | 23.8 | 17.6 | |||||
| Profit from continuing operations | 313 | 9.6 | 8.3 | 1,145 | 18.0 | 12.1 | |||||||
| Net profit from discontinued operations | — | — | — | — | — | — | |||||||
| Consolidated profit | 313 | 9.6 | 8.3 | 1,145 | 18.0 | 12.1 | |||||||
| Non-controlling interests | (22 | ) | (56.9) | (58.2) | (196 | ) | (9.1) | (13.7) | |||||
| Underlying attributable profit to the parent | 291 | 24.2 | 22.9 | 950 | 25.7 | 19.4 | |||||||
| Balance sheet | |||||||||||||
| Loans and advances to customers | 35,019 | 7.0 | 5.9 | 35,019 | 14.3 | 7.9 | |||||||
| Cash, central banks and credit institutions | 10,056 | (4.4) | (5.5) | 10,056 | (18.9) | (23.5) | |||||||
| Debt instruments | 17,069 | (0.3) | (1.4) | 17,069 | 20.7 | 13.9 | |||||||
| Other financial assets | 6,439 | (10.4) | (11.3) | 6,439 | 13.3 | 6.9 | |||||||
| Other asset accounts | 3,859 | 8.0 | 6.8 | 3,859 | 27.9 | 20.7 | |||||||
| Total assets | 72,441 | 1.9 | 0.8 | 72,441 | 10.0 | 3.7 | |||||||
| Customer deposits | 35,544 | 4.8 | 3.6 | 35,544 | 3.5 | (2.3) | |||||||
| Central banks and credit institutions | 13,816 | 8.7 | 7.5 | 13,816 | 44.8 | 36.6 | |||||||
| Marketable debt securities | 6,965 | 4.1 | 3.0 | 6,965 | 12.4 | 6.1 | |||||||
| Other financial liabilities | 7,617 | (19.2) | (20.1) | 7,617 | (8.0) | (13.2) | |||||||
| Other liabilities accounts | 2,144 | 5.4 | 4.2 | 2,144 | (1.1) | (6.7) | |||||||
| Total liabilities | 66,086 | 2.0 | 0.9 | 66,086 | 9.2 | 3.0 | |||||||
| Total equity | 6,355 | 0.5 | (0.6) | 6,355 | 18.5 | 11.8 | |||||||
| Memorandum items: | |||||||||||||
Gross loans and advances to customers (2) | 34,850 | 3.7 | 2.6 | 34,850 | 11.7 | 5.4 | |||||||
| Customer funds | 40,803 | 0.5 | (0.6) | 40,803 | 5.6 | (0.3) | |||||||
Customer deposits (3) | 29,624 | 1.7 | 0.6 | 29,624 | 3.2 | (2.6) | |||||||
| Mutual funds | 11,179 | (2.5) | (3.6) | 11,179 | 12.6 | 6.3 | |||||||
| Ratios (%) and operating means | |||||||||||||
| Underlying RoTE | 21.09 | 0.96 | 20.61 | 0.37 | |||||||||
| Efficiency ratio | 42.2 | 0.5 | 41.8 | 0.1 | |||||||||
| NPL ratio | 2.19 | (0.11) | 2.19 | (0.24) | |||||||||
| NPL coverage | 128.3 | 3.1 | 128.3 | 8.6 | |||||||||
| Number of employees | 20,494 | (0.1) | 20,494 | 3.2 | |||||||||
| Number of branches | 1,422 | (0.8) | 1,422 | 0.3 | |||||||||
(1) Includes exchange differences.
(2) Excluding reverse repos.
(3) Excluding repos.
January - December 2019 | | 63 |
| Financial information by segments | ||||||||
| SOUTH AMERICA | |||||||||||||
| EUR million | |||||||||||||
| / | Q3'19 | / | 2018 | ||||||||||
| Underlying income statement | Q4'19 | % | % excl. FX | 2019 | % | % excl. FX | |||||||
| Net interest income | 3,356 | 1.3 | 3.2 | 13,316 | 3.3 | 9.3 | |||||||
| Net fee income | 1,228 | 2.0 | 3.2 | 4,787 | 6.4 | 14.6 | |||||||
Gains (losses) on financial transactions (1) | 126 | (15.9) | (14.8) | 565 | 13.3 | 38.1 | |||||||
| Other operating income | 4 | — | (94.9) | (243 | ) | 14.4 | 87.4 | ||||||
| Total income | 4,714 | 3.0 | 4.8 | 18,425 | 4.2 | 10.7 | |||||||
| Administrative expenses and amortisations | (1,762 | ) | 11.1 | 11.1 | (6,656 | ) | 1.5 | 10.2 | |||||
| Net operating income | 2,953 | (1.3) | 1.3 | 11,769 | 5.9 | 11.0 | |||||||
| Net loan-loss provisions | (1,015 | ) | 10.8 | 12.3 | (3,789 | ) | 1.4 | 7.4 | |||||
| Other gains (losses) and provisions | (249 | ) | 29.0 | 31.7 | (748 | ) | 12.9 | 19.2 | |||||
| Profit before tax | 1,688 | (10.3) | (7.3) | 7,232 | 7.7 | 12.2 | |||||||
| Tax on profit | (582 | ) | (16.7) | (13.8) | (2,644 | ) | 0.1 | 4.6 | |||||
| Profit from continuing operations | 1,107 | (6.5) | (3.4) | 4,588 | 12.6 | 17.1 | |||||||
| Net profit from discontinued operations | — | — | — | — | — | — | |||||||
| Consolidated profit | 1,107 | (6.5) | (3.4) | 4,588 | 12.6 | 17.1 | |||||||
| Non-controlling interests | (159 | ) | (5.4) | (0.9) | (664 | ) | 6.4 | 9.8 | |||||
| Underlying attributable profit to the parent | 947 | (6.7) | (3.8) | 3,924 | 13.7 | 18.4 | |||||||
| Balance sheet | |||||||||||||
| Loans and advances to customers | 125,122 | 1.0 | 3.3 | 125,122 | 4.3 | 9.4 | |||||||
| Cash, central banks and credit institutions | 51,360 | 9.5 | 10.7 | 51,360 | 6.3 | 12.9 | |||||||
| Debt instruments | 45,619 | (7.1) | (6.7) | 45,619 | 0.9 | 3.6 | |||||||
| Other financial assets | 14,802 | 7.4 | 11.1 | 14,802 | 59.0 | 64.1 | |||||||
| Other asset accounts | 16,901 | (1.6) | (0.2) | 16,901 | 14.9 | 19.8 | |||||||
| Total assets | 253,804 | 1.2 | 2.9 | 253,804 | 6.9 | 11.8 | |||||||
| Customer deposits | 114,817 | 2.7 | 4.8 | 114,817 | 6.1 | 12.5 | |||||||
| Central banks and credit institutions | 41,989 | (2.4) | (1.4) | 41,989 | 8.8 | 12.0 | |||||||
| Marketable debt securities | 29,840 | (5.3) | (3.3) | 29,840 | (5.3) | (1.9) | |||||||
| Other financial liabilities | 34,062 | 8.3 | 10.0 | 34,062 | 19.2 | 23.0 | |||||||
| Other liabilities accounts | 10,613 | 3.9 | 4.9 | 10,613 | 22.0 | 26.3 | |||||||
| Total liabilities | 231,321 | 1.5 | 3.2 | 231,321 | 7.3 | 12.3 | |||||||
| Total equity | 22,483 | (1.7) | (0.2) | 22,483 | 2.8 | 7.2 | |||||||
| Memorandum items: | |||||||||||||
Gross loans and advances to customers (2) | 131,048 | 1.0 | 3.3 | 131,048 | 4.1 | 9.2 | |||||||
| Customer funds | 170,707 | 2.7 | 4.4 | 170,707 | 7.4 | 12.9 | |||||||
Customer deposits (3) | 101,575 | 3.0 | 5.4 | 101,575 | 4.4 | 11.3 | |||||||
| Mutual funds | 69,131 | 2.2 | 2.9 | 69,131 | 12.1 | 15.5 | |||||||
| Ratios (%) and operating means | |||||||||||||
| Underlying RoTE | 19.76 | (1.25) | 20.58 | 1.79 | |||||||||
| Efficiency ratio | 37.4 | 2.7 | 36.1 | (1.0) | |||||||||
| NPL ratio | 4.86 | 0.1 | 4.86 | 0.05 | |||||||||
| NPL coverage | 88.4 | (1.3) | 88.4 | (6.2) | |||||||||
| Number of employees | 69,508 | (2.5) | 69,508 | (1.2) | |||||||||
| Number of branches | 4,572 | (1.4) | 4,572 | 4.3 | |||||||||
(1) Includes exchange differences.
(2) Excluding reverse repos.
(3) Excluding repos.
| 64 | | January - December 2019 |
| Financial information by segments | ||||||||
| Brazil | |||||||||||||
| EUR million | |||||||||||||
| / | Q3'19 | / | 2018 | ||||||||||
| Underlying income statement | Q4'19 | % | % excl. FX | 2019 | % | % sin TC | |||||||
| Net interest income | 2,534 | (1.0) | 2.3 | 10,072 | 3.2 | 6.0 | |||||||
| Net fee income | 974 | 0.4 | 3.7 | 3,798 | 8.6 | 11.5 | |||||||
Gains (losses) on financial transactions (1) | 25 | (34.0) | (30.2) | 167 | 22.7 | 26.0 | |||||||
| Other operating income | 32 | — | — | (86 | ) | 85.7 | 90.8 | ||||||
| Total income | 3,565 | 1.2 | 4.5 | 13,951 | 4.5 | 7.4 | |||||||
| Administrative expenses and amortisations | (1,242 | ) | 9.2 | 12.6 | (4,606 | ) | 2.3 | 5.1 | |||||
| Net operating income | 2,323 | (2.6) | 0.7 | 9,345 | 5.7 | 8.5 | |||||||
| Net loan-loss provisions | (813 | ) | 8.0 | 11.3 | (3,036 | ) | 2.5 | 5.2 | |||||
| Other gains (losses) and provisions | (205 | ) | 15.0 | 18.3 | (704 | ) | 0.9 | 3.6 | |||||
| Profit before tax | 1,305 | (10.2) | (6.9) | 5,606 | 8.1 | 11.0 | |||||||
| Tax on profit | (529 | ) | (10.8) | (7.4) | (2,295 | ) | 1.6 | 4.4 | |||||
| Profit from continuing operations | 777 | (9.9) | (6.6) | 3,311 | 13.1 | 16.2 | |||||||
| Net profit from discontinued operations | — | — | — | — | — | — | |||||||
| Consolidated profit | 777 | (9.9) | (6.6) | 3,311 | 13.1 | 16.2 | |||||||
| Non-controlling interests | (87 | ) | (8.1) | (4.7) | (373 | ) | 11.1 | 14.1 | |||||
| Underlying attributable profit to the parent | 689 | (10.1) | (6.8) | 2,939 | 13.4 | 16.4 | |||||||
| Balance sheet | |||||||||||||
| Loans and advances to customers | 75,618 | 4.6 | 4.3 | 75,618 | 6.7 | 8.5 | |||||||
| Cash, central banks and credit institutions | 37,470 | 5.1 | 4.8 | 37,470 | 1.2 | 2.9 | |||||||
| Debt instruments | 39,611 | (8.4) | (8.6) | 39,611 | (2.7) | (1.1) | |||||||
| Other financial assets | 6,790 | 12.5 | 12.1 | 6,790 | 10.7 | 12.5 | |||||||
| Other asset accounts | 12,545 | (2.4) | (2.7) | 12,545 | 10.8 | 12.6 | |||||||
| Total assets | 172,033 | 1.1 | 0.9 | 172,033 | 3.6 | 5.3 | |||||||
| Customer deposits | 74,745 | 5.4 | 5.1 | 74,745 | 9.4 | 11.2 | |||||||
| Central banks and credit institutions | 30,334 | (4.6) | (4.9) | 30,334 | 1.9 | 3.5 | |||||||
| Marketable debt securities | 18,952 | (5.9) | (6.2) | 18,952 | (10.7) | (9.2) | |||||||
| Other financial liabilities | 23,589 | 2.6 | 2.3 | 23,589 | (2.7) | (1.1) | |||||||
| Other liabilities accounts | 8,631 | 6.0 | 5.7 | 8,631 | 19.3 | 21.2 | |||||||
| Total liabilities | 156,251 | 1.5 | 1.2 | 156,251 | 3.6 | 5.3 | |||||||
| Total equity | 15,782 | (1.9) | (2.2) | 15,782 | 3.4 | 5.1 | |||||||
| Memorandum items: | |||||||||||||
Gross loans and advances to customers (2) | 80,150 | 4.5 | 4.2 | 80,150 | 6.5 | 8.2 | |||||||
| Customer funds | 121,752 | 5.2 | 4.9 | 121,752 | 10.4 | 12.2 | |||||||
Customer deposits (3) | 61,789 | 6.4 | 6.1 | 61,789 | 7.6 | 9.3 | |||||||
| Mutual funds | 59,964 | 3.9 | 3.6 | 59,964 | 13.5 | 15.4 | |||||||
| Ratios (%) and operating means | |||||||||||||
| Underlying RoTE | 19.75 | (1.93) | 21.16 | 1.47 | |||||||||
| Efficiency ratio | 34.8 | 2.5 | 33.0 | (0.7) | |||||||||
| NPL ratio | 5.32 | (0.01) | 5.32 | 0.07 | |||||||||
| NPL coverage | 99.8 | (1.3) | 99.8 | (7.1) | |||||||||
| Number of employees | 46,682 | (3.4) | 46,682 | (0.5) | |||||||||
| Number of branches | 3,656 | (0.8) | 3,656 | 6.3 | |||||||||
(1) Includes exchange differences.
(2) Excluding reverse repos.
(3) Excluding repos.
January - December 2019 | | 65 |
| Financial information by segments | ||||||||
| Chile | |||||||||||||
| EUR million | |||||||||||||
| / | Q3'19 | / | 2018 | ||||||||||
| Underlying income statement | Q4'19 | % | % excl. FX | 2019 | % | % excl. FX | |||||||
| Net interest income | 464 | 0.4 | 6.4 | 1,867 | (4.0) | (0.3) | |||||||
| Net fee income | 102 | 0.4 | 6.2 | 404 | (4.6) | (0.9) | |||||||
Gains (losses) on financial transactions (1) | 72 | (10.1) | (4.8) | 266 | 78.4 | 85.2 | |||||||
| Other operating income | (1) | — | — | 2 | (87.8) | (87.3) | |||||||
| Total income | 638 | (1.2) | 4.6 | 2,539 | 0.2 | 4.0 | |||||||
| Administrative expenses and amortisations | (246 | ) | (5.3) | 0.7 | (1,031 | ) | (1.6) | 2.2 | |||||
| Net operating income | 392 | 1.5 | 7.3 | 1,508 | 1.4 | 5.2 | |||||||
| Net loan-loss provisions | (130 | ) | 22.1 | 28.0 | (443 | ) | (6.3) | (2.8) | |||||
| Other gains (losses) and provisions | 12 | (19.9) | (13.5) | 63 | (38.5) | (36.1) | |||||||
| Profit before tax | 274 | (7.0) | (1.2) | 1,129 | 0.9 | 4.8 | |||||||
| Tax on profit | (45 | ) | (26.0) | (20.5) | (210 | ) | (4.1) | (0.5) | |||||
| Profit from continuing operations | 229 | (2.1) | 3.8 | 919 | 2.2 | 6.1 | |||||||
| Net profit from discontinued operations | — | — | — | — | — | — | |||||||
| Consolidated profit | 229 | (2.1) | 3.8 | 919 | 2.2 | 6.1 | |||||||
| Non-controlling interests | (72 | ) | (0.4) | 5.5 | (289 | ) | 0.7 | 4.6 | |||||
| Underlying attributable profit to the parent | 157 | (2.8) | 3.0 | 630 | 2.9 | 6.8 | |||||||
| Balance sheet | |||||||||||||
| Loans and advances to customers | 38,584 | (4.8) | 1.5 | 38,584 | 1.8 | 8.3 | |||||||
| Cash, central banks and credit institutions | 7,557 | 29.1 | 37.6 | 7,557 | 78.0 | 89.4 | |||||||
| Debt instruments | 5,062 | 27.0 | 35.4 | 5,062 | 63.0 | 73.4 | |||||||
| Other financial assets | 7,856 | 3.0 | 9.9 | 7,856 | 148.3 | 164.2 | |||||||
| Other asset accounts | 3,091 | (5.8) | 0.4 | 3,091 | 24.3 | 32.3 | |||||||
| Total assets | 62,151 | 1.4 | 8.1 | 62,151 | 22.1 | 29.9 | |||||||
| Customer deposits | 27,344 | (2.5) | 4.0 | 27,344 | 5.5 | 12.3 | |||||||
| Central banks and credit institutions | 8,224 | 6.0 | 13.0 | 8,224 | 40.1 | 49.1 | |||||||
| Marketable debt securities | 10,722 | (4.4) | 2.0 | 10,722 | 9.3 | 16.4 | |||||||
| Other financial liabilities | 9,662 | 24.0 | 32.2 | 9,662 | 173.3 | 190.9 | |||||||
| Other liabilities accounts | 1,294 | (9.1) | (3.0) | 1,294 | 40.8 | 49.8 | |||||||
| Total liabilities | 57,246 | 1.8 | 8.6 | 57,246 | 24.3 | 32.3 | |||||||
| Total equity | 4,905 | (3.3) | 3.2 | 4,905 | 0.6 | 7.1 | |||||||
| Memorandum items: | |||||||||||||
Gross loans and advances to customers (2) | 39,640 | (4.8) | 1.6 | 39,640 | 1.6 | 8.1 | |||||||
| Customer funds | 35,095 | (4.2) | 2.2 | 35,095 | 5.5 | 12.2 | |||||||
Customer deposits (3) | 27,060 | (2.3) | 4.2 | 27,060 | 4.6 | 11.4 | |||||||
| Mutual funds | 8,035 | (9.9) | (3.9) | 8,035 | 8.3 | 15.3 | |||||||
| Ratios (%) and operating means | |||||||||||||
| Underlying RoTE | 18.56 | 0.00 | 18.08 | (0.26) | |||||||||
| Efficiency ratio | 38.6 | (1.6) | 40.6 | (0.7) | |||||||||
| NPL ratio | 4.64 | 0.16 | 4.64 | (0.02) | |||||||||
| NPL coverage | 56.0 | (1.3) | 56.0 | (4.6) | |||||||||
| Number of employees | 11,580 | (0.5) | 11,580 | (3.6) | |||||||||
| Number of branches | 375 | (1.3 | ) | 375 | (1.6) | ||||||||
(1) Includes exchange differences.
(2) Excluding reverse repos.
(3) Excluding repos.
| 66 | | January - December 2019 |
| Financial information by segments | ||||||||
| Argentina | |||||||||||||
| EUR million | |||||||||||||
| / | Q3'19 | / | 2018 | ||||||||||
| Underlying income statement | Q4'19 | % | % excl. FX | 2019 | % | % excl. FX | |||||||
| Net interest income | 250 | 38.9 | 6.9 | 940 | 22.4 | 126.7 | |||||||
| Net fee income | 118 | 34.0 | 4.8 | 446 | (0.5) | 84.3 | |||||||
Gains (losses) on financial transactions (1) | 16 | 23.1 | (12.5) | 80 | (52.7) | (12.3) | |||||||
| Other operating income | (24 | ) | (44.3) | (43.8) | (150 | ) | (15.0 | ) | 57.4 | ||||
| Total income | 359 | 51.5 | 12.8 | 1,316 | 8.8 | 101.6 | |||||||
| Administrative expenses and amortisations | (209 | ) | 71.6 | 19.6 | (762 | ) | 1.4 | 87.9 | |||||
| Net operating income | 150 | 30.1 | 4.5 | 554 | 21.0 | 124.1 | |||||||
| Net loan-loss provisions | (53 | ) | 34.1 | (3.2) | (235 | ) | 2.0 | 88.9 | |||||
| Other gains (losses) and provisions | (54 | ) | 91.6 | 87.8 | (101 | ) | 127.3 | 321.2 | |||||
| Profit before tax | 43 | (9.6) | (23.5) | 217 | 19.1 | 120.6 | |||||||
| Tax on profit | 5 | — | (98.3) | (72 | ) | (27.6) | 34.1 | ||||||
| Profit from continuing operations | 47 | 96.8 | 41.3 | 145 | 75.3 | 224.8 | |||||||
| Net profit from discontinued operations | — | — | — | — | — | — | |||||||
| Consolidated profit | 47 | 96.8 | 41.3 | 145 | 75.3 | 224.8 | |||||||
| Non-controlling interests | 0 | (41.8) | (34.3) | (2 | ) | 150.8 | 364.8 | ||||||
| Underlying attributable profit to the parent | 47 | 101.4 | 42.9 | 144 | 74.7 | 223.7 | |||||||
| Balance sheet | |||||||||||||
| Loans and advances to customers | 4,792 | (2.1) | 5.0 | 4,792 | (10.2) | 40.1 | |||||||
| Cash, central banks and credit institutions | 3,911 | 40.3 | 50.5 | 3,911 | (23.3) | 19.7 | |||||||
| Debt instruments | 429 | (63.6) | (61.0) | 429 | (48.0) | (18.9) | |||||||
| Other financial assets | 87 | (12.1) | (5.7) | 87 | — | — | |||||||
| Other asset accounts | 836 | 6.7 | 14.5 | 836 | 12.7 | 75.8 | |||||||
| Total assets | 10,054 | 3.2 | 10.7 | 10,054 | (16.2) | 30.7 | |||||||
| Customer deposits | 7,002 | 3.5 | 11.0 | 7,002 | (20.5) | 24.0 | |||||||
| Central banks and credit institutions | 1,033 | (10.5) | (4.0) | 1,033 | 21.6 | 89.6 | |||||||
| Marketable debt securities | 71 | (8.0) | (1.3) | 71 | (83.2) | (73.9) | |||||||
| Other financial liabilities | 747 | 25.6 | 34.7 | 747 | 0.4 | 56.6 | |||||||
| Other liabilities accounts | 392 | 10.5 | 18.5 | 392 | 27.6 | 99.0 | |||||||
| Total liabilities | 9,244 | 3.4 | 10.8 | 9,244 | (17.0) | 29.5 | |||||||
| Total equity | 810 | 1.8 | 9.2 | 810 | (7.0) | 45.1 | |||||||
| Memorandum items: | |||||||||||||
Gross loans and advances to customers (2) | 4,993 | (2.8) | 4.3 | 4,993 | (10.4) | 39.7 | |||||||
| Customer funds | 8,099 | 4.8 | 12.4 | 8,099 | (20.5) | 24.0 | |||||||
Customer deposits (3) | 7,002 | 3.5 | 11.0 | 7,002 | (20.5) | 24.0 | |||||||
| Mutual funds | 1,097 | 14.0 | 22.2 | 1,097 | (20.6) | 23.8 | |||||||
| Ratios (%) and operating means | |||||||||||||
| Underlying RoTE | 31.67 | 9.70 | 22.20 | 10.58 | |||||||||
| Efficiency ratio | 58.3 | 6.8 | 57.9 | (4.2) | |||||||||
| NPL ratio | 3.39 | (0.25) | 3.39 | 0.22 | |||||||||
| NPL coverage | 124.0 | (10.0) | 124.0 | (11.0) | |||||||||
| Number of employees | 9,178 | (0.3) | 9,178 | (1.6) | |||||||||
| Number of branches | 438 | (6.8) | 438 | (6.4) | |||||||||
(1) Includes exchange differences.
(2) Excluding reverse repos.
(3) Excluding repos.
January - December 2019 | | 67 |
| Financial information by segments | ||||||||
| Other South America | |||||||||||||
| EUR million | |||||||||||||
| / | Q3'19 | / | 2018 | ||||||||||
| Underlying income statement | Q4'19 | % | % excl. FX | 2019 | % | % excl. FX | |||||||
| Net interest income | 108 | (3.2) | 0.1 | 437 | 3.9 | 10.2 | |||||||
| Net fee income | 34 | (22.3) | (19.4) | 138 | 8.2 | 14.4 | |||||||
Gains (losses) on financial transactions (1) | 12 | (31.4) | (29.2) | 52 | 18.6 | 25.0 | |||||||
| Other operating income | (2 | ) | 3.1 | 6.6 | (9 | ) | 9.4 | 19.3 | |||||
| Total income | 153 | (11.1) | (8.0) | 619 | 5.9 | 12.1 | |||||||
| Administrative expenses and amortisations | (64 | ) | (3.3) | 0.0 | (257 | ) | (0.6) | 5.5 | |||||
| Net operating income | 88 | (16.1) | (13.0) | 362 | 11.1 | 17.4 | |||||||
| Net loan-loss provisions | (20 | ) | 12.6 | 16.5 | (75 | ) | 7.3 | 17.1 | |||||
| Other gains (losses) and provisions | (2 | ) | 33.1 | 37.3 | (7 | ) | (71.4) | (71.1) | |||||
| Profit before tax | 66 | (23.0) | (20.2) | 280 | 20.9 | 27.1 | |||||||
| Tax on profit | (12 | ) | (42.5) | (39.8) | (67 | ) | 3.1 | 6.1 | |||||
| Profit from continuing operations | 54 | (16.5) | (13.6) | 213 | 27.9 | 35.6 | |||||||
| Net profit from discontinued operations | — | — | — | — | — | — | |||||||
| Consolidated profit | 54 | (16.5) | (13.6) | 213 | 27.9 | 35.6 | |||||||
| Non-controlling interests | 0 | — | — | (1 | ) | (36.3) | (38.6) | ||||||
| Underlying attributable profit to the parent | 54 | (15.5) | (12.6) | 212 | 28.5 | 36.3 | |||||||
| Balance sheet | |||||||||||||
| Loans and advances to customers | 6,127 | 0.3 | 2.2 | 6,127 | 5.3 | 9.4 | |||||||
| Cash, central banks and credit institutions | 2,422 | (7.6) | (4.4) | 2,422 | 23.6 | 33.4 | |||||||
| Debt instruments | 517 | (28.9) | (27.0) | 517 | (10.3) | (1.9) | |||||||
| Other financial assets | 70 | 177.4 | 179.4 | 70 | 714.4 | 738.3 | |||||||
| Other asset accounts | 429 | 76.5 | 80.7 | 429 | 157.8 | 175.5 | |||||||
| Total assets | 9,565 | (1.7) | 0.7 | 9,565 | 12.1 | 17.9 | |||||||
| Customer deposits | 5,725 | (5.8) | (2.7) | 5,725 | 9.6 | 18.7 | |||||||
| Central banks and credit institutions | 2,398 | 3.5 | 3.5 | 2,398 | 14.5 | 11.7 | |||||||
| Marketable debt securities | 95 | 38.9 | 40.4 | 95 | 66.3 | 60.3 | |||||||
| Other financial liabilities | 64 | 19.0 | 21.6 | 64 | 27.6 | 38.1 | |||||||
| Other liabilities accounts | 297 | 0.9 | 3.9 | 297 | 25.7 | 35.8 | |||||||
| Total liabilities | 8,580 | (2.6) | (0.3) | 8,580 | 12.0 | 17.6 | |||||||
| Total equity | 985 | 7.5 | 10.1 | 985 | 13.7 | 20.8 | |||||||
| Memorandum items: | |||||||||||||
Gross loans and advances to customers (2) | 6,264 | 0.2 | 2.1 | 6,264 | 5.2 | 9.3 | |||||||
| Customer funds | 5,761 | (5.7) | (2.6) | 5,761 | 9.6 | 18.8 | |||||||
Customer deposits (3) | 5,725 | (5.8) | (2.7) | 5,725 | 9.6 | 18.7 | |||||||
| Mutual funds | 36 | 2.2 | 6.7 | 36 | 12.8 | 27.3 | |||||||
| Resources | |||||||||||||
| Number of employees | 2,068 | 0.0 | 2,068 | (1.1) | |||||||||
(1) Includes exchange differences.
(2) Excluding reverse repos.
(3) Excluding repos.
| 68 | | January - December 2019 |
| Financial information by segments | ||||||||
| SANTANDER GLOBAL PLATFORM | |||||||||||||
| EUR million | |||||||||||||
| Underlying income statement | Q4'19 | Q3'19 | % | 2019 | 2018 | % | |||||||
| Net interest income | 23 | 23 | (2.9) | 92 | 79 | 16.3 | |||||||
| Net fee income | 2 | 2 | 2.6 | 6 | 7 | (11.8) | |||||||
Gains (losses) on financial transactions (1) | (3 | ) | 2 | — | (3 | ) | 0 | — | |||||
| Other operating income | (3 | ) | (4) | (12.1) | (14 | ) | (12) | 21.2 | |||||
| Total income | 18 | 24 | (24.1) | 81 | 74 | 8.8 | |||||||
| Administrative expenses and amortisations | (72 | ) | (60) | 20.9 | (240 | ) | (142) | 68.4 | |||||
| Net operating income | (54 | ) | (36) | 51.1 | (159 | ) | (68) | 133.8 | |||||
| Net loan-loss provisions | (0) | (0) | 40.2 | (1) | (0) | 312.2 | |||||||
| Other gains (losses) and provisions | (4 | ) | (1) | 379.5 | (6 | ) | (2) | 165.8 | |||||
| Profit before tax | (58 | ) | (37) | 58.6 | (166 | ) | (70) | 135.5 | |||||
| Tax on profit | 16 | 11 | 39.1 | 46 | 17 | 178.0 | |||||||
| Profit from continuing operations | (43 | ) | (26) | 67.1 | (120 | ) | (54) | 122.4 | |||||
| Net profit from discontinued operations | — | — | — | — | — | — | |||||||
| Consolidated profit | (43 | ) | (26) | 67.1 | (120 | ) | (54) | 122.4 | |||||
| Non-controlling interests | — | — | — | — | — | — | |||||||
| Underlying attributable profit to the parent | (43 | ) | (26) | 67.1 | (120 | ) | (54) | 122.4 | |||||
| Balance sheet | |||||||||||||
| Loans and advances to customers | 702 | 596 | 17.9 | 702 | 337 | 108.4 | |||||||
| Cash, central banks and credit institutions | 9,063 | 8,978 | 0.9 | 9,063 | 8168 | 11.0 | |||||||
| Debt instruments | 10 | 5 | 107.9 | 10 | — | — | |||||||
| Other financial assets | 187 | 172 | 8.8 | 187 | 146 | 27.6 | |||||||
| Other asset accounts | 272 | 147 | 85.7 | 272 | 130 | 109.8 | |||||||
| Total assets | 10,234 | 9,897 | 3.4 | 10,234 | 8781 | 16.5 | |||||||
| Customer deposits | 9,460 | 9,192 | 2.9 | 9,460 | 8284 | 14.2 | |||||||
| Central banks and credit institutions | 82 | 95 | (13.3) | 82 | 111 | (26.1) | |||||||
| Marketable debt securities | — | — | — | — | — | — | |||||||
| Other financial liabilities | 105 | 58 | 81.9 | 105 | 38 | 179.0 | |||||||
| Other liabilities accounts | 112 | 120 | (6.7) | 112 | 59 | 90.0 | |||||||
| Total liabilities | 9,760 | 9,465 | 3.1 | 9,760 | 8492 | 14.9 | |||||||
| Total equity | 474 | 431 | 9.8 | 474 | 289 | 63.8 | |||||||
| Memorandum items: | |||||||||||||
Gross loans and advances to customers (2) | 706 | 599 | 17.9 | 706 | 340 | 107.5 | |||||||
| Customer funds | 9,910 | 9,602 | 3.2 | 9,910 | 8,650 | 14.6 | |||||||
Customer deposits (3) | 9,460 | 9,192 | 2.9 | 9,460 | 8,284 | 14.2 | |||||||
| Mutual funds | 450 | 410 | 9.8 | 450 | 367 | 22.8 | |||||||
| Resources | |||||||||||||
| Number of employees | 820 | 727 | 12.8 | 820 | 487 | 68.4 | |||||||
(1) Includes exchange differences.
(2) Excluding reverse repos.
(3) Excluding repos.
January - December 2019 | | 69 |
| Financial information by segments | ||||||||
| CORPORATE CENTRE | |||||||||||||
| EUR million | |||||||||||||
| Underlying income statement | Q4'19 | Q3'19 | % | 2019 | 2018 | % | |||||||
| Net interest income | (333 | ) | (319) | 4.2 | (1,252 | ) | (987) | 26.9 | |||||
| Net fee income | (15 | ) | (9) | 66.6 | (50 | ) | (69) | (27.8) | |||||
Gains (losses) on financial transactions (1) | (39 | ) | (87) | (54.6) | (297 | ) | 11 | — | |||||
| Other operating income | 5 | 1 | 294.2 | (18 | ) | (12) | 49.5 | ||||||
| Total income | (381 | ) | (413) | (7.8) | (1,617 | ) | (1057) | 53.0 | |||||
| Administrative expenses and amortisations | (89 | ) | (90) | (0.9) | (373 | ) | (426) | (12.5) | |||||
| Net operating income | (471 | ) | (504) | (6.5) | (1,990 | ) | (1483) | 34.2 | |||||
| Net loan-loss provisions | (10 | ) | (14) | (27.7) | (36 | ) | (115) | (68.8) | |||||
| Other gains (losses) and provisions | (49 | ) | (61) | (20.9) | (237 | ) | (101) | 135.3 | |||||
| Profit before tax | (529 | ) | (579) | (8.5) | (2,262 | ) | (1699) | 33.2 | |||||
| Tax on profit | 71 | 50 | 43.4 | 157 | 14 | — | |||||||
| Profit from continuing operations | (458 | ) | (529) | (13.4) | (2,105 | ) | (1685) | 24.9 | |||||
| Net profit from discontinued operations | — | — | — | — | — | — | |||||||
| Consolidated profit | (458 | ) | (529) | (13.4) | (2,105 | ) | (1685) | 24.9 | |||||
| Non-controlling interests | (1 | ) | — | 715.6 | 9 | (1) | — | ||||||
| Underlying attributable profit to the parent | (459 | ) | (529) | (13.2) | (2,096 | ) | (1686) | 24.4 | |||||
| Balance sheet | |||||||||||||
| Loans and advances to customers | 5,764 | 5,799 | (0.6) | 5,764 | 6,509 | (11.4) | |||||||
| Cash, central banks and credit institutions | 32,803 | 30,057 | 9.1 | 32,803 | 39,840 | (17.7) | |||||||
| Debt instruments | 840 | 968 | (13.2) | 840 | 377 | 122.5 | |||||||
| Other financial assets | 2,406 | 2,393 | 0.5 | 2,406 | 2,113 | 13.8 | |||||||
| Other asset accounts | 126,539 | 130,751 | (3.2) | 126,539 | 121,775 | 3.9 | |||||||
| Total assets | 168,352 | 169,968 | (1.0) | 168,352 | 170,614 | (1.3) | |||||||
| Customer deposits | 793 | 908 | (12.6) | 793 | 235 | 238.2 | |||||||
| Central banks and credit institutions | 12,254 | 12,696 | (3.5) | 12,254 | 30,879 | (60.3) | |||||||
| Marketable debt securities | 54,495 | 52,130 | 4.5 | 54,495 | 41,783 | 30.4 | |||||||
| Other financial liabilities | 636 | 3,558 | (82.1) | 636 | 1,334 | (52.3) | |||||||
| Other liabilities accounts | 9,810 | 9,539 | 2.8 | 9,810 | 8,208 | 19.5 | |||||||
| Total liabilities | 77,989 | 78,830 | (1.1) | 77,989 | 82,439 | (5.4) | |||||||
| Total equity | 90,362 | 91,138 | (0.9) | 90,362 | 88,175 | 2.5 | |||||||
| Memorandum items: | |||||||||||||
Gross loans and advances to customers (2) | 5,859 | 5,979 | (2.0) | 5,859 | 6,653 | (11.9) | |||||||
| Customer funds | 804 | 918 | (12.4) | 804 | 244 | 230.0 | |||||||
Customer deposits (3) | 793 | 908 | (12.6) | 793 | 237 | 234.7 | |||||||
| Mutual funds | 11 | 10 | 1.3 | 11 | 7 | 61.6 | |||||||
| Resources | |||||||||||||
| Number of employees | 1,651 | 1,665 | (0.8) | 1,651 | 1,700 | (2.9) | |||||||
(1) Includes exchange differences.
(2) Excluding reverse repos.
(3) Excluding repos.
| 70 | | January - December 2019 |
| Financial information by segments | ||||||||
| RETAIL BANKING | |||||||||||||
| EUR million | |||||||||||||
| / | Q3'19 | / | 2018 | ||||||||||
| Underlying income statement | Q4'19 | % | % excl. FX | 2019 | % | % excl. FX | |||||||
| Net interest income | 8,296 | (0.1) | 0.1 | 33,157 | 2.8 | 3.3 | |||||||
| Net fee income | 2,266 | 1.0 | 1.0 | 9,094 | 2.5 | 4.9 | |||||||
Gains (losses) on financial transactions (1) | 334 | (9.2) | (7.2) | 975 | 28.9 | 31.5 | |||||||
| Other operating income | 28 | (81.7) | (89.2) | 298 | (13.1) | (35.3) | |||||||
| Total income | 10,924 | (1.3) | (1.1) | 43,523 | 3.1 | 3.8 | |||||||
| Administrative expenses and amortisations | (4,969 | ) | 3.5 | 2.9 | (19,481 | ) | 1.3 | 2.6 | |||||
| Net operating income | 5,955 | (5.1) | (4.1) | 24,042 | 4.6 | 4.7 | |||||||
| Net loan-loss provisions | (2,456 | ) | 0.4 | 0.8 | (9,154 | ) | 7.1 | 7.4 | |||||
| Other gains (losses) and provisions | (456 | ) | 20.6 | 21.4 | (1,624 | ) | (9.4) | (8.2) | |||||
| Profit before tax | 3,042 | (11.8) | (10.5) | 13,265 | 4.8 | 4.7 | |||||||
| Tax on profit | (886 | ) | (19.8) | (18.2) | (4,156 | ) | 0.3 | 1.1 | |||||
| Profit from continuing operations | 2,156 | (8.0) | (6.8) | 9,109 | 7.0 | 6.5 | |||||||
| Net profit from discontinued operations | — | — | — | — | — | — | |||||||
| Consolidated profit | 2,156 | (8.0) | (6.8) | 9,109 | 7.0 | 6.5 | |||||||
| Non-controlling interests | (270 | ) | (20.1) | (18.7) | (1,361 | ) | 7.0 | 6.4 | |||||
| Underlying attributable profit to the parent | 1,886 | (6.0) | (4.8) | 7,748 | 7.0 | 6.5 | |||||||
(1) Includes exchange differences.
| CORPORATE & INVESTMENT BANKING | |||||||||||||
| EUR million | |||||||||||||
| / | Q3'19 | / | 2018 | ||||||||||
| Underlying income statement | Q4'19 | % | % excl. FX | 2019 | % | % excl. FX | |||||||
| Net interest income | 712 | 8.6 | 7.1 | 2,721 | 10.6 | 14.0 | |||||||
| Net fee income | 380 | (9.4) | (9.1) | 1,528 | (0.4) | 1.0 | |||||||
Gains (losses) on financial transactions (1) | 289 | 170.3 | 138.1 | 739 | (17.7) | (11.7) | |||||||
| Other operating income | 62 | 17.0 | 16.4 | 295 | 60.7 | 61.5 | |||||||
| Total income | 1,443 | 16.9 | 15.0 | 5,284 | 4.1 | 7.4 | |||||||
| Administrative expenses and amortisations | (606 | ) | 10.2 | 9.4 | (2,276 | ) | 8.3 | 9.4 | |||||
| Net operating income | 836 | 22.2 | 19.4 | 3,008 | 1.1 | 5.9 | |||||||
| Net loan-loss provisions | (127 | ) | — | — | (155 | ) | (21.9) | (23.0) | |||||
| Other gains (losses) and provisions | (28 | ) | 32.8 | 31.5 | (86 | ) | (11.1) | (11.4) | |||||
| Profit before tax | 680 | (1.5) | (2.8) | 2,767 | 3.2 | 8.9 | |||||||
| Tax on profit | (216 | ) | 7.1 | 5.4 | (838 | ) | 0.6 | 6.4 | |||||
| Profit from continuing operations | 464 | (5.0) | (6.2) | 1,929 | 4.4 | 10.0 | |||||||
| Net profit from discontinued operations | — | — | — | — | — | — | |||||||
| Consolidated profit | 464 | (5.0) | (6.2) | 1,929 | 4.4 | 10.0 | |||||||
| Non-controlling interests | (39 | ) | (8.3) | (5.7) | (169 | ) | 7.6 | 9.5 | |||||
| Underlying attributable profit to the parent | 425 | (4.7) | (6.2) | 1,761 | 4.1 | 10.0 | |||||||
(1) Includes exchange differences.
January - December 2019 | | 71 |
| Financial information by segments | ||||||||
| WEALTH MANAGEMENT & INSURANCE | |||||||||||||
| EUR million | |||||||||||||
| / | Q3'19 | / | 2018 | ||||||||||
| Underlying income statement | Q4'19 | % | % excl. FX | 2019 | % | % excl. FX | |||||||
| Net interest income | 143 | 3.3 | 0.4 | 565 | 7.4 | 7.8 | |||||||
| Net fee income | 328 | 9.8 | 9.8 | 1,201 | 5.1 | 5.2 | |||||||
Gains (losses) on financial transactions (1) | 15 | (54.2 | ) | (53.6) | 116 | (11.7) | (11.1) | ||||||
| Other operating income | 102 | 29.3 | 30.3 | 341 | 14.0 | 15.5 | |||||||
| Total income | 588 | 7.0 | 6.4 | 2,223 | 5.9 | 6.3 | |||||||
| Administrative expenses and amortisations | (234 | ) | 5.1 | 4.8 | (911 | ) | 4.3 | 3.3 | |||||
| Net operating income | 355 | 8.3 | 7.5 | 1,312 | 7.0 | 8.5 | |||||||
| Net loan-loss provisions | 21 | — | — | 25 | — | — | |||||||
| Other gains (losses) and provisions | (5 | ) | 54.4 | 55.1 | (12 | ) | 142.9 | 136.8 | |||||
| Profit before tax | 371 | 15.6 | 14.6 | 1,325 | 9.4 | 11.0 | |||||||
| Tax on profit | (93 | ) | 34.7 | 32.5 | (312 | ) | 10.0 | 11.9 | |||||
| Profit from continuing operations | 278 | 10.4 | 9.6 | 1,013 | 9.2 | 10.7 | |||||||
| Net profit from discontinued operations | — | — | — | — | — | — | |||||||
| Consolidated profit | 278 | 10.4 | 9.6 | 1,013 | 9.2 | 10.7 | |||||||
| Non-controlling interests | (15 | ) | 9.2 | 12.5 | (53 | ) | 1.3 | 4.0 | |||||
| Underlying attributable profit to the parent | 263 | 10.4 | 9.5 | 960 | 9.7 | 11.1 | |||||||
(1) Includes exchange differences.
| 72 | | January - December 2019 |
ALTERNATIVE PERFORMANCE MEASURES (APMs)
In addition to the financial information prepared under IFRS, this consolidated directors’ report contains financial measures that constitute alternative performance measures (‘APMs’) to comply with the guidelines on alternative performance measures issued by the European Securities and Markets Authority on 5 October 2015 and non-IFRS measures.
The financial measures contained in this consolidated directors’ report that qualify as APMs and non-IFRS measures have been calculated using the financial information from Santander but are not defined or detailed in the applicable financial information framework or under IFRS and have neither been audited nor reviewed by our auditors.
We use these APMs and non-IFRS measures when planning, monitoring and evaluating our performance. We consider these APMs and non-IFRS financial measures to be useful metrics for management and investors to facilitate operating performance comparisons from period to period. While we believe that these APMs and non-IFRS financial measures are useful in evaluating our business, this information should be considered as supplemental in nature and is not meant as a substitute of IFRS measures. In addition, the way in which Santander defines and calculates these APMs and non-IFRS measures may differ from the calculations and by other companies with similar measures and, therefore, may not be comparable.
The APMs and non-IFRS measures we use in this document can be categorised as follows:
Underlying results
In addition to IFRS results measures, we present some results measures which are non-IFRS measures and which we refer to as underlying measures. These underlying measures allow in our view a better year-on-year comparability as they exclude items outside the ordinary course performance of our business which are grouped in the non-IFRS line net capital gains and provisions and are further detailed on page 12 of this report.
In addition, the results by business areas in the 'Geographic businesses' section are presented only on an underlying basis in accordance with IFRS 8, and reconciled on an aggregate basis to our IFRS consolidated results to the consolidated financial statements, which are set out below.
| Reconciliation of underlying results to statutory results | ||||||
| EUR million | ||||||
| 2019 | ||||||
| Underlying results | Adjustments | Statutory results | ||||
| Net interest income | 35,283 | — | 35,283 | |||
| Net fee income | 11,779 | — | 11,779 | |||
Gains (losses) on financial transactions (1) | 1,531 | — | 1,531 | |||
| Other operating income | 901 | (265 | ) | 636 | ||
| Total income | 49,494 | (265 | ) | 49,229 | ||
| Administrative expenses and amortisations | (23,280 | ) | — | (23,280 | ) | |
| Net operating income | 26,214 | (265 | ) | 25,949 | ||
| Net loan-loss provisions | (9,321 | ) | — | (9,321 | ) | |
| Other gains (losses) and provisions | (1,964 | ) | (2,121 | ) | (4,085 | ) |
| Profit before tax | 14,929 | (2,386 | ) | 12,543 | ||
| Tax on profit | (5,103 | ) | 676 | (4,427 | ) | |
| Profit from continuing operations | 9,826 | (1,710 | ) | 8,116 | ||
| Net profit from discontinued operations | — | — | — | |||
| Consolidated profit | 9,826 | (1,710 | ) | 8,116 | ||
| Non-controlling interests | (1,574 | ) | (27 | ) | (1,601 | ) |
| Attributable profit to the parent | 8,252 | (1,737 | ) | 6,515 | ||
(1) Includes exchange differences.
Explanation of adjustments:
Net capital gains from the sale of our stake in Prisma of EUR 136 million, net capital gains of EUR 693 million related to the agreement with Crédit Agricole S.A. to integrate the custody businesses, net positive results of EUR 551 million due to tax reform in Brazil, deterioration of goodwill ascribed to the UK for a net amount of EUR -1,491 million, net capital losses of EUR -405 million related to real estate assets and stakes (Spain), restructuring costs for a net impact of EUR -864 million, PPI provisions for a net amount of EUR -183 million and net charge of EUR -174 million for intangible assets and other.
January - December 2019 | | 73 |
| Reconciliation of underlying results to statutory results | ||||||
| EUR million | ||||||
| 2018 | ||||||
| Underlying results | Adjustments | Statutory results | ||||
| Net interest income | 34,341 | — | 34,341 | |||
| Net fee income | 11,485 | — | 11,485 | |||
Gains (losses) on financial transactions (1) | 1,797 | — | 1,797 | |||
| Other operating income | 801 | — | 801 | |||
| Total income | 48,424 | — | 48,424 | |||
| Administrative expenses and amortisations | (22,779 | ) | — | (22,779 | ) | |
| Net operating income | 25,645 | — | 25,645 | |||
| Net loan-loss provisions | (8,873 | ) | — | (8,873 | ) | |
| Other gains (losses) and provisions | (1,996 | ) | (575 | ) | (2,571 | ) |
| Profit before tax | 14,776 | (575 | ) | 14,201 | ||
| Tax on profit | (5,230 | ) | 344 | (4,886 | ) | |
| Profit from continuing operations | 9,546 | (231 | ) | 9,315 | ||
| Net profit from discontinued operations | — | — | — | |||
| Consolidated profit | 9,546 | (231 | ) | 9,315 | ||
| Non-controlling interests | (1,482 | ) | (23 | ) | (1,505 | ) |
| Attributable profit to the parent | 8,064 | (254 | ) | 7,810 | ||
(1) Includes exchange differences.
Explanation of adjustments:
Restructuring costs: The net impact of EUR -300 million on profit relates to restructuring costs in connection with the integration of Grupo Banco Popular, as follows: EUR -280 million in Spain, EUR -40 million in Corporate Centre and EUR 20 million in Portugal. Badwill in Poland for the integration of the retail and SME business of Deutsche Bank Polska of EUR 45 million.
Profitability and efficiency ratios
The purpose of the profitability and efficiency ratios is to measure the ratio of profit to capital, to tangible capital, to assets and to risk weighted assets, while the efficiency ratio measures how much general administrative expenses (personnel and other) and amortisation costs are needed to generate revenue.
| Ratio | Formula | Relevance of the metric | ||
| RoE | Attributable profit to the parent | This ratio measures the return that shareholders obtain on the funds invested in the Bank and as such measures the company's ability to pay shareholders. | ||
| (Return on equity) | Average stockholders’ equity (1) (excl. minority interests) | |||
| RoTE | Attributable profit to the parent | This is a very common indicator, used to evaluate the profitability of the company as a percentage of its tangible equity. It's measured as the return that shareholders receive as a percentage of the funds invested in the entity less intangible assets. | ||
| (Return on tangible equity) | Average stockholders' equity (1) (excl. minority interests) - intangible assets | |||
| Underlying RoTE | Attributable profit to the parent | This indicator measures the profitability of the tangible equity of a company arising from ordinary activities, i.e. excluding results from non-recurring operations. | ||
Average stockholders' equity(1) (excl. minority interests) - intangible assets | ||||
| RoA | Consolidated profit | This metric, commonly used by analysts, measures the profitability of a company as a percentage of its total assets. It is an indicator that reflects the efficiency of the company's total funds in generating profit over a given period. | ||
| (Return on assets) | Average total assets | |||
| RoRWA | Consolidated profit | The return adjusted for risk is an derivative of the RoA metric. The difference is that RoRWA measures profit in relation to the bank's risk weighted assets | ||
| (Return on risk weighted assets) | Average risk weighted assets | |||
| Underlying RoRWA | Underlying consolidated profit | This relates the consolidated profit (excluding non-recurring results) to the bank's risk weighted assets. | ||
| Average risk weighted assets | ||||
| Efficiency ratio | Operating expenses (2) | One of the most commonly used indicators when comparing productivity of different financial entities. It measures the amount of funds used to generate the bank's total income. | ||
| Total income | ||||
1. Stockholders’ equity = Capital and Reserves + Accumulated other comprehensive income + Attributable profit to the parent + Dividends.
2. Operating expenses = Administrative expenses + amortisations.
| 74 | | January - December 2019 |
Profitability and efficiency (1) (2) (3) (4) | Q4'19 | Q3'19 | 2019 | 2018 | ||||
| RoE | 9.10 | % | 7.02 | % | 6.62 | % | 8.21 | % |
| Attributable profit to the parent | 8,999 | 6,908 | 6,515 | 7,810 | ||||
| Average stockholders' equity (excluding minority interests) | 98,851 | 98,445 | 98,457 | 95,071 | ||||
| RoTE | 12.62 | % | 9.86 | % | 9.31 | % | 11.70 | % |
| Attributable profit to the parent | 8,999 | 6,908 | 6,515 | 7,810 | ||||
| Average stockholders' equity (excluding minority interests) | 98,851 | 98,445 | 98,457 | 95,071 | ||||
| (-) Average intangible assets | 27,562 | 28,391 | 28,484 | 28,331 | ||||
| Average stockholders' equity (excl. minority interests) - intangible assets | 71,289 | 70,054 | 69,973 | 66,740 | ||||
| Underlying RoTE | 11.63 | % | 12.19 | % | 11.79 | % | 12.08 | % |
| Attributable profit to the parent | 8,999 | 6,908 | 6,515 | 7,810 | ||||
| (-) Net capital gains and provisions | 711 | (1,634 | ) | (1,737 | ) | (254 | ) | |
| Underlying attributable profit to the parent | 8,288 | 8,541 | 8,252 | 8,064 | ||||
| Average stockholders' equity (excl. minority interests) - intangible assets | 71,289 | 70,054 | 69,973 | 66,740 | ||||
| RoA | 0.68 | % | 0.56 | % | 0.54 | % | 0.64 | % |
| Consolidated profit | 10,335 | 8,476 | 8,116 | 9,315 | ||||
| Average total assets | 1,530,761 | 1,515,606 | 1,508,167 | 1,442,861 | ||||
| RoRWA | 1.69 | % | 1.39 | % | 1.33 | % | 1.55 | % |
| Consolidated profit | 10,335 | 8,476 | 8,116 | 9,315 | ||||
| Average risk weighted assets | 612,149 | 611,952 | 609,170 | 598,741 | ||||
| Underlying RoRWA | 1.57 | % | 1.65 | % | 1.61 | % | 1.59 | % |
| Consolidated profit | 10,335 | 8,476 | 8,116 | 9,315 | ||||
| (-) Net capital gains and provisions | 746 | (1,638 | ) | (1,710 | ) | (231 | ) | |
| Underlying consolidated profit | 9,589 | 10,114 | 9,826 | 9,546 | ||||
| Average risk weighted assets | 612,149 | 611,952 | 609,170 | 598,741 | ||||
| Efficiency ratio | 47.4 | % | 45.9 | % | 47.0 | % | 47.0 | % |
| Underlying operating expenses | 5,971 | 5,722 | 23,280 | 22,779 | ||||
| Operating expenses | 5,971 | 5,722 | 23,280 | 22,779 | ||||
| Net capital gains and provisions impacting operating expenses | — | — | — | — | ||||
| Underlying total income | 12,592 | 12,466 | 49,494 | 48,424 | ||||
| Total income | 12,327 | 12,466 | 49,229 | 48,424 | ||||
| Net capital gains and provisions impacting total income | 265 | — | 265 | — | ||||
(1) Averages included in the RoE, RoTE, RoA and RoRWA denominators are calculated using 4 months' worth of data in the case of quarterly figures (from September to December in Q4 and June to September in Q3) and 13 months in the case of annual figures (from December to December).
(2) For periods less than one year, and if there are results in the net capital gains and provisions line, the profit used to calculate RoE and RoTE is the annualised underlying attributable profit to which said results are added without annualising.
(3) For periods less than one year, and if there are results in the net capital gains and provisions line, the profit used to calculate RoA and RoRWA is the annualised underlying consolidated profit, to which said results are added without annualising.
(4) The risk weighted assets included in the denominator of the RoRWA metric are calculated in line with the criteria laid out in the CRR (Capital Requirements Regulation)
| Efficiency ratio | ||||||||||
| 2019 | 2018 | |||||||||
| % | Total income | Operating expenses | % | Total income | Operating expenses | |||||
| Europe | 52.6 | 21,001 | 11,044 | 52.5 | 21,257 | 11,165 | ||||
| Spain | 53.6 | 7,506 | 4,021 | 57.0 | 7,615 | 4,338 | ||||
| Santander Consumer Finance | 43.3 | 4,710 | 2,038 | 43.1 | 4,610 | 1,989 | ||||
| United Kingdom | 60.0 | 4,727 | 2,835 | 55.3 | 5,132 | 2,837 | ||||
| Portugal | 45.3 | 1,375 | 623 | 47.9 | 1,344 | 644 | ||||
| Poland | 40.4 | 1,717 | 693 | 43.0 | 1,488 | 640 | ||||
| North America | 42.8 | 11,604 | 4,968 | 42.8 | 10,476 | 4,488 | ||||
| US | 43.3 | 7,605 | 3,297 | 43.4 | 6,949 | 3,019 | ||||
| Mexico | 41.8 | 3,998 | 1,671 | 41.7 | 3,527 | 1,469 | ||||
| South America | 36.1 | 18,425 | 6,656 | 37.1 | 17,674 | 6,558 | ||||
| Brazil | 33.0 | 13,951 | 4,606 | 33.7 | 13,345 | 4,500 | ||||
| Chile | 40.6 | 2,539 | 1,031 | 41.3 | 2,535 | 1,047 | ||||
| Argentina | 57.9 | 1,316 | 762 | 62.1 | 1,209 | 751 | ||||
January - December 2019 | | 75 |
| Underlying RoTE | ||||||||||
| 2019 | 2018 | |||||||||
| % | Underlying attributable profit to the parent | Average stockholders' equity (excl. minority interests) - intangible assets | % | Underlying attributable profit to the parent | Average stockholders' equity (excl. minority interests) - intangible assets | |||||
| Europe | 10.00 | 4,878 | 48,793 | 10.86 | 5,048 | 46,487 | ||||
| Spain | 10.48 | 1,585 | 15,124 | 10.42 | 1,554 | 14,918 | ||||
| Santander Consumer Finance | 15.26 | 1,314 | 8,611 | 15.83 | 1,293 | 8,168 | ||||
| United Kingdom | 7.28 | 1,077 | 14,795 | 9.33 | 1,272 | 13,624 | ||||
| Portugal | 12.80 | 525 | 4,101 | 12.02 | 479 | 3,982 | ||||
| Poland | 11.23 | 349 | 3,104 | 10.22 | 296 | 2,891 | ||||
| North America | 8.52 | 1,667 | 19,556 | 7.62 | 1,304 | 17,127 | ||||
| US | 4.78 | 717 | 14,997 | 4.10 | 549 | 13,403 | ||||
| Mexico | 20.61 | 950 | 4,607 | 20.24 | 755 | 3,731 | ||||
| South America | 20.58 | 3,924 | 19,065 | 18.79 | 3,451 | 18,371 | ||||
| Brazil | 21.16 | 2,939 | 13,888 | 19.68 | 2,592 | 13,167 | ||||
| Chile | 18.08 | 630 | 3,485 | 18.34 | 612 | 3,339 | ||||
| Argentina | 22.20 | 144 | 647 | 11.62 | 82 | 707 | ||||
Credit risk indicators
The credit risk indicators measure the quality of the credit portfolio and the percentage of non-performing loans covered by provisions.
| Ratio | Formula | Relevance of the metric | ||
NPL ratio (Non-performing loans) | Non-performing loans and advances to customers, customer guarantees and customer commitments granted | The NPL ratio is an important variable regarding financial institutions' activity since it gives an indication of the level of risk the entities are exposed to. It calculates risks that are, in accounting terms, declared to be non-performing as a percentage of the total outstanding amount of customer credit and contingent liabilities. | ||
Total Risk (1) | ||||
| Coverage ratio | Provisions to cover impairment losses on loans and advances to customers, customer guarantees and customer commitments granted | The coverage ratio is a fundamental metric in the financial sector. It reflects the level of provisions as a percentage of the non-performing assets (credit risk). Therefore it is a good indicator of the entity's solvency against client defaults both present and future. | ||
| Non-performing loans and advances to customers, customer guarantees and customer commitments granted | ||||
| Cost of Credit | Allowances for loan-loss provisions over the last 12 months | This ratio quantifies loan-loss provisions arising from credit risk over a defined period of time for a given loan portfolio. As such, it acts as an indicator of credit quality. | ||
| Average loans and advances to customers over the last 12 months | ||||
(1) Total risk = Total loans and advances and guarantees to customers (performing and non-performing) + non-performing contingent liabilities.
| Credit risk | Dec-19 | Sep-19 | Dec-19 | Dec-18 | ||||
| NPL ratio | 3.32 | % | 3.47 | % | 3.32 | % | 3.73 | % |
| Non-performing loans and advances to customers customer guarantees and customer commitments granted | 33,799 | 34,326 | 33,799 | 35,692 | ||||
| Total risk | 1,016,507 | 988,466 | 1,016,507 | 958,153 | ||||
| Coverage ratio | 68 | % | 67 | % | 68 | % | 67 | % |
| Provisions to cover impairment losses on loans and advances to customers, customer guarantees and customer commitments granted | 22,965 | 23,112 | 22,965 | 24,061 | ||||
| Non-performing loans and advances to customers customer guarantees and customer commitments granted | 33,799 | 34,326 | 33,799 | 35,692 | ||||
| Cost of credit | 1.00 | % | 1.00 | % | 1.00 | % | 1.00 | % |
| Allowances for loan-loss provisions over the last 12 months | 9,321 | 9,202 | 9,321 | 8,873 | ||||
| Average loans and advances to customers over the last 12 months | 935,488 | 923,140 | 935,488 | 887,028 | ||||
| 76 | | January - December 2019 |
| NPL ratio | ||||||||||
| Dec-19 | Dec-18 | |||||||||
| % | Non-performing loans and advances to customers customer guarantees and customer commitments granted | Total risk | % | Non-performing loans and advances to customers customer guarantees and customer commitments granted | Total risk | |||||
| Europe | 3.25 | 23,519 | 722,661 | 3.67 | 25,287 | 688,810 | ||||
| Spain | 6.94 | 14,824 | 213,668 | 7.32 | 16,651 | 227,401 | ||||
| Santander Consumer Finance | 2.30 | 2,416 | 105,048 | 2.29 | 2,244 | 97,922 | ||||
| United Kingdom | 1.01 | 2,786 | 275,941 | 1.08 | 2,739 | 252,919 | ||||
| Portugal | 4.83 | 1,834 | 37,978 | 5.94 | 2,279 | 38,340 | ||||
| Poland | 4.31 | 1,447 | 33,566 | 4.28 | 1,317 | 30,783 | ||||
| North America | 2.20 | 3,165 | 143,839 | 2.79 | 3,510 | 125,916 | ||||
| US | 2.20 | 2,331 | 105,792 | 2.92 | 2,688 | 92,152 | ||||
| Mexico | 2.19 | 834 | 38,047 | 2.43 | 822 | 33,764 | ||||
| South America | 4.86 | 6,972 | 143,428 | 4.81 | 6,639 | 138,134 | ||||
| Brazil | 5.32 | 4,727 | 88,893 | 5.25 | 4,418 | 84,212 | ||||
| Chile | 4.64 | 1,947 | 42,000 | 4.66 | 1,925 | 41,268 | ||||
| Argentina | 3.39 | 171 | 5,044 | 3.17 | 179 | 5,631 | ||||
| Coverage ratio | ||||||||||
| Dec-19 | Dec-18 | |||||||||
| % | Provisions to cover impairment losses on loans and advances to customers, customer guarantees and customer commitments granted | Non-performing loans and advances to customers customer guarantees and customer commitments granted | % | Provisions to cover impairment losses on loans and advances to customers, customer guarantees and customer commitments granted | Non-performing loans and advances to customers customer guarantees and customer commitments granted | |||||
| Europe | 49.8 | 11,714 | 23,519 | 50.1 | 12,659 | 25,287 | ||||
| Spain | 41.1 | 6,098 | 14,824 | 43.7 | 7,279 | 16,651 | ||||
| Santander Consumer Finance | 106.1 | 2,563 | 2,416 | 106.4 | 2,387 | 2,244 | ||||
| United Kingdom | 36.5 | 1,018 | 2,786 | 32.9 | 902 | 2,739 | ||||
| Portugal | 52.8 | 969 | 1,834 | 50.5 | 1,151 | 2,279 | ||||
| Poland | 66.8 | 967 | 1,447 | 67.1 | 883 | 1,317 | ||||
| North America | 153.0 | 4,842 | 3,165 | 137.4 | 4,822 | 3,510 | ||||
| US | 161.8 | 3,773 | 2,331 | 142.8 | 3,838 | 2,688 | ||||
| Mexico | 128.3 | 1,069 | 834 | 119.7 | 984 | 822 | ||||
| South America | 88.4 | 6,164 | 6,972 | 94.6 | 6,278 | 6,639 | ||||
| Brazil | 99.8 | 4,717 | 4,727 | 106.9 | 4,724 | 4,418 | ||||
| Chile | 56.0 | 1,090 | 1,947 | 60.6 | 1,166 | 1,925 | ||||
| Argentina | 124.0 | 212 | 171 | 135.0 | 241 | 179 | ||||
January - December 2019 | | 77 |
Other indicators
The market capitalisation indicator provides information on the volume of tangible equity per share. The loan-to-deposit ratio (LTD) identifies the relationship between net customer loans and advances and customer deposits, assessing the proportion of loans and advances granted by the Group that are funded by customer deposits.
The Group also uses gross customer loan magnitudes excluding reverse repurchase agreements (repos) and customer deposits excluding repos. In order to analyse the evolution of the traditional commercial banking business of granting loans and capturing deposits, repos and reverse repos are excluded, as they are mainly treasury business products and highly volatile.
| Ratio | Formula | Relevance of the metric | ||
| TNAV per share | Tangible book value (1) | This is a very commonly used ratio used to measure the company's accounting value per share having deducted the intangible assets. It is useful in evaluating the amount each shareholder would receive if the company were to enter into liquidation and had to sell all the company's tangible assets. | ||
| (Tangible equity net asset value per share) | Number of shares excluding treasury stock | |||
| Price / tangible book value per share (X) | Share price | This is one of the most commonly used ratios by market participants for the valuation of listed companies both in absolute terms and relative to other entities. This ratio measures the relationship between the price paid for a company and its accounting equity value. | ||
| TNAV per share | ||||
| LTD ratio | Net loans and advances to customers | This is an indicator of the bank's liquidity. It measures the total (net) loans and advances to customers as a percentage of customer deposits. | ||
| (Loan-to-deposit) | Customer deposits | |||
| Loans and advances (excl. reverse repos) | Gross loans and advances to customers excluding reverse repos | In order to aid analysis of the commercial banking activity, reverse repos are excluded as they are highly volatile treasury products. | ||
| Deposits (excl. repos) | Customer deposits excluding repos | In order to aid analysis of the commercial banking activity, repos are excluded as they are highly volatile treasury products. | ||
| PAT + After tax fees paid to SAN (in Wealth Management & Insurance) | Net profit + fees paid from Santander Asset Management to Santander, net of taxes, excluding Private Banking customers | Metric to assess Wealth Management & Insurance's total contribution to Grupo Santander profit. | ||
(1) Tangible book value = Stockholders' equity - intangible assets
| Others | Dec-19 | Sep-19 | Dec-19 | Dec-18 | ||||
| TNAV (tangible book value) per share | 4.36 | 4.25 | 4.36 | 4.19 | ||||
| Tangible book value | 72,384 | 70,564 | 72,384 | 67,912 | ||||
| Number of shares excl. treasury stock (million) | 16,610 | 16,612 | 16,610 | 16,224 | ||||
| Price / Tangible book value per share (X) | 0.86 | 0.88 | 0.86 | 0.95 | ||||
| Share price (euros) | 3.730 | 3.737 | 3.730 | 3.973 | ||||
| TNAV (tangible book value) per share | 4.36 | 4.25 | 4.36 | 4.19 | ||||
| Loan-to-deposit ratio | 114 | % | 112 | % | 114 | % | 113 | % |
| Net loans and advances to customers | 942,218 | 916,003 | 942,218 | 882,921 | ||||
| Customer deposits | 824,365 | 814,285 | 824,365 | 780,496 | ||||
| Q4'19 | Q3'19 | 2019 | 2018 | |||||
| PAT + After tax fees paid to SAN (in WM&I) (Constant EUR million) | 662 | 623 | 2,494 | 2,313 | ||||
| Profit after tax | 282 | 257 | 1,013 | 915 | ||||
| Net fee income net of tax | 380 | 366 | 1,481 | 1,398 | ||||
| 78 | | January - December 2019 |
Local currency measures
We make use of certain financial measures in local currency to help in the assessment of our ongoing operating performance. These non-IFRS financial measures include the results of operations of our subsidiary banks located outside the Eurozone, excluding the impact of foreign exchange. Because changes in foreign currency exchange rates do not have an operating impact on the results, we believe that evaluating their performance on a local currency basis provides an additional and meaningful assessment of performance to both management and the company’s investors.
The Group presents, at both the Group level as well as the business unit level, the real changes in the income statement as well as the changes excluding the exchange rate effect, as it considers the latter facilitates analysis, since it enables businesses movements to be identified without taking into account the impact of converting each local currency into euros.
Said variations, excluding the impact of exchange rate movements, are calculated by converting P&L lines for the different business units comprising the Group into our presentation currency, the euro, applying the average exchange rate for 2019 to all periods contemplated in the analysis.
The Group presents, at both the Group level as well as the business unit level, the changes in euros in the balance sheet as well as the changes excluding the exchange rate effect for loans and advances to customers excluding reverse repos and customer funds (which comprise deposits and mutual funds) excluding repos. As with the income statement, the reason is to facilitate analysis by isolating the changes in the balance sheet that are not caused by converting each local currency into euros.
These changes excluding the impact of exchange rate movements are calculated by converting loans and advances to customers excluding reverse repos and customer funds excluding repos, into our presentation currency, the euro, applying the closing exchange rate on the last working day of December 2019 to all periods contemplated in the analysis.
The average and period-end exchange rates for the main currencies in which the Group operates are set out in the table below.
| Exchange rates: 1 euro / currency parity | ||||||
| Average (Income statement) | Period-end (balance sheet) | |||||
| 2019 | 2018 | Dec-19 | Sep-19 | Dec-18 | ||
| US dollar | 1.119 | 1.180 | 1.123 | 1.089 | 1.145 | |
| Pound sterling | 0.877 | 0.885 | 0.851 | 0.886 | 0.895 | |
| Brazilian real | 4.410 | 4.294 | 4.516 | 4.529 | 4.444 | |
| Mexican peso | 21.549 | 22.688 | 21.220 | 21.452 | 22.492 | |
| Chilean peso | 785.558 | 756.661 | 845.673 | 793.002 | 794.630 | |
| Argentine peso | 52.572 | 31.164 | 67.258 | 62.715 | 43.121 | |
| Polish zloty | 4.297 | 4.261 | 4.257 | 4.378 | 4.301 | |
January - December 2019 | | 79 |
| Condensed consolidated financial statements | ||||||||
CONDENSED CONSOLIDATED FINANCIAL STATEMENTS
| • | CONSOLIDATED BALANCE SHEET |
| • | CONSOLIDATED INCOME STATEMENT |
| NOTE: | The following financial information for 2019 and 2018 (attached herewith) corresponds to the condensed consolidated financial statements prepared in accordance with the International Financial Reporting Standards. |
| Condensed consolidated balance sheet | ||||
| EUR million | ||||
| ASSETS | Dec-19 | Dec-18 | ||
| Cash, cash balances at central banks and other deposits on demand | 101,067 | 113,663 | ||
| Financial assets held for trading | 108,230 | 92,879 | ||
| Non-trading financial assets mandatorily at fair value through profit or loss | 4,911 | 10,730 | ||
| Financial assets designated at fair value through profit or loss | 62,069 | 57,460 | ||
| Financial assets at fair value through other comprehensive income | 125,708 | 121,091 | ||
| Financial assets at amortised cost | 995,482 | 946,099 | ||
| Hedging derivatives | 7,216 | 8,607 | ||
| Changes in the fair value of hedged items in portfolio hedges of interest risk | 1,702 | 1,088 | ||
| Investments | 8,772 | 7,588 | ||
| Joint ventures companies | 1,325 | 979 | ||
| Associated entities | 7,447 | 6,609 | ||
| Assets under insurance or reinsurance contracts | 292 | 324 | ||
| Tangible assets | 35,235 | 26,157 | ||
| Property, plant and equipment | 34,262 | 24,594 | ||
| For own-use | 15,041 | 8,150 | ||
| Leased out under an operating lease | 19,221 | 16,444 | ||
| Investment property | 973 | 1,563 | ||
| Of which Leased out under an operating lease | 823 | 1,195 | ||
| Intangible assets | 27,687 | 28,560 | ||
| Goodwill | 24,246 | 25,466 | ||
| Other intangible assets | 3,441 | 3,094 | ||
| Tax assets | 29,585 | 30,251 | ||
| Current tax assets | 6,827 | 6,993 | ||
| Deferred tax assets | 22,758 | 23,258 | ||
| Other assets | 10,138 | 9,348 | ||
| Insurance contracts linked to pensions | 192 | 210 | ||
| Inventories | 5 | 147 | ||
| Other | 9,941 | 8,991 | ||
| Non-current assets held for sale | 4,601 | 5,426 | ||
| TOTAL ASSETS | 1,522,695 | 1,459,271 | ||
January - December 2019 | | 80 |
| Condensed consolidated financial statements | ||||||||
| Condensed consolidated balance sheet | ||||
| EUR million | ||||
| LIABILITIES | Dec-19 | Dec-18 | ||
| Financial liabilities held for trading | 77,139 | 70,343 | ||
| Financial liabilities designated at fair value through profit or loss | 60,995 | 68,058 | ||
| Financial liabilities at amortised cost | 1,230,745 | 1,171,630 | ||
| Hedging derivatives | 6,048 | 6,363 | ||
| Changes in the fair value of hedged items in portfolio hedges of interest rate risk | 269 | 303 | ||
| Liabilities under insurance or reinsurance contracts | 739 | 765 | ||
| Provisions | 13,987 | 13,225 | ||
| Pensions and other post-retirement obligations | 6,358 | 5,558 | ||
| Other long term employee benefits | 1,382 | 1,239 | ||
| Taxes and other legal contingencies | 3,057 | 3,174 | ||
| Contingent liabilities and commitments | 739 | 779 | ||
| Other provisions | 2,451 | 2,475 | ||
| Tax liabilities | 9,322 | 8,135 | ||
| Current tax liabilities | 2,800 | 2,567 | ||
| Deferred tax liabilities | 6,522 | 5,568 | ||
| Other liabilities | 12,792 | 13,088 | ||
| Liabilities associated with non-current assets held for sale | — | — | ||
| TOTAL LIABILITIES | 1,412,036 | 1,351,910 | ||
| EQUITY | ||||
| Shareholders´ equity | 122,103 | 118,613 | ||
| Capital | 8,309 | 8,118 | ||
| Called up paid capital | 8,309 | 8,118 | ||
| Unpaid capital which has been called up | — | — | ||
| Share premium | 52,446 | 50,993 | ||
| Equity instruments issued other than capital | 598 | 565 | ||
| Equity component of the compound financial instrument | — | — | ||
| Other equity instruments issued | 598 | 565 | ||
| Other equity | 146 | 234 | ||
| Accumulated retained earnings | 61,028 | 56,756 | ||
| Revaluation reserves | — | — | ||
| Other reserves | (5,246 | ) | (3,567 | ) |
| (-) Own shares | (31 | ) | (59 | ) |
| Profit attributable to shareholders of the parent | 6,515 | 7,810 | ||
| (-) Interim dividends | (1,662 | ) | (2,237 | ) |
| Other comprehensive income | (22,032 | ) | (22,141 | ) |
| Items not reclassified to profit or loss | (4,288 | ) | (2,936 | ) |
| Items that may be reclassified to profit or loss | (17,744 | ) | (19,205 | ) |
| Non-controlling interest | 10,588 | 10,889 | ||
| Other comprehensive income | (982 | ) | (1,292 | ) |
| Other elements | 11,570 | 12,181 | ||
| TOTAL EQUITY | 110,659 | 107,361 | ||
| TOTAL LIABILITIES AND EQUITY | 1,522,695 | 1,459,271 | ||
| MEMORANDUM ITEMS | ||||
| Loans commitment granted | 241,179 | 218,083 | ||
| Financial guarantees granted | 13,650 | 11,723 | ||
| Other commitments granted | 68,895 | 74,389 | ||
January - December 2019 | | 81 |
| Condensed consolidated financial statements | ||||||||
| Condensed consolidated income statement | ||||
| EUR million | ||||
| 2019 | 2018 | |||
| Interest income | 56,785 | 54,325 | ||
| Financial assets at fair value through other comprehensive income | 3,571 | 4,481 | ||
| Financial assets at amortised cost | 48,552 | 47,560 | ||
| Other interest income | 4,662 | 2,284 | ||
| Interest expense | (21,502 | ) | (19,984 | ) |
| Net interest income | 35,283 | 34,341 | ||
| Dividend income | 533 | 370 | ||
| Share of results of entities accounted for using the equity method | 324 | 737 | ||
| Commission income | 15,349 | 14,664 | ||
| Commission expense | (3,570 | ) | (3,179 | ) |
| Gain or losses on financial assets and liabilities not measured at fair value through profit or loss, net | 1,136 | 604 | ||
| Financial assets at amortised cost | 308 | 39 | ||
| Other financial assets and liabilities | 828 | 565 | ||
| Gain or losses on financial assets and liabilities held for trading, net | 1,349 | 1,515 | ||
| Reclassification of financial assets at fair value through other comprehensive income | — | — | ||
| Reclassification of financial assets at amortised cost | — | — | ||
| Other gains (losses) | 1,349 | 1,515 | ||
| Gains or losses on non-trading financial assets and liabilities mandatorily at fair value through profit or loss | 292 | 331 | ||
| Reclassification of financial assets at fair value through other comprehensive income | — | — | ||
| Reclassification of financial assets at amortised cost | — | — | ||
| Other gains (losses) | 292 | 331 | ||
| Gain or losses on financial assets and liabilities measured at fair value through profit or loss, net | (286 | ) | (57 | ) |
| Gain or losses from hedge accounting, net | (28 | ) | 83 | |
| Exchange differences (profit or loss) net | (932 | ) | (679 | ) |
| Other operating income | 1,797 | 1,643 | ||
| Other operating expenses | (2,138 | ) | (2,000 | ) |
| Income from assets under insurance and reinsurance contracts | 2,534 | 3,175 | ||
| Expenses from liabilities under insurance and reinsurance contracts | (2,414 | ) | (3,124 | ) |
| Total income | 49,229 | 48,424 | ||
| Administrative expenses | (20,279 | ) | (20,354 | ) |
| Staff costs | (12,141 | ) | (11,865 | ) |
| Other general administrative expenses | (8,138 | ) | (8,489 | ) |
| Depreciation and amortisation cost | (3,001 | ) | (2,425 | ) |
| Provisions or reversal of provisions, net | (3,490 | ) | (2,223 | ) |
| Impairment or reversal of impairment at financial assets not measured at fair value through profit or loss and net gains and losses from changes | (9,352 | ) | (8,986 | ) |
| Financial assets at fair value with changes in other comprehensive income | (12 | ) | (1 | ) |
| Financial assets at amortised cost | (9,340 | ) | (8,985 | ) |
| Impairment of investments in subsidiaries, joint ventures and associates, net | — | (17 | ) | |
| Impairment on non-financial assets, net | (1,623 | ) | (190 | ) |
| Tangible assets | (45 | ) | (83 | ) |
| Intangible assets | (1,564 | ) | (117 | ) |
| Others | (14 | ) | 10 | |
| Gain or losses on non financial assets and investments, net | 1,291 | 28 | ||
| Negative goodwill recognised in results | — | 67 | ||
| Gains or losses on non-current assets held for sale not classified as discontinued operations | (232 | ) | (123 | ) |
| Profit or loss before tax from continuing operations | 12,543 | 14,201 | ||
| Tax expense or income from continuing operations | (4,427 | ) | (4,886 | ) |
| Profit for the period from continuing operations | 8,116 | 9,315 | ||
| Profit or loss after tax from discontinued operations | — | — | ||
| Profit for the period | 8,116 | 9,315 | ||
| Profit attributable to non-controlling interests | 1,601 | 1,505 | ||
| Profit attributable to the parent | 6,515 | 7,810 | ||
| Earnings per share | ||||
| Basic | 0.362 | 0.449 | ||
| Diluted | 0.361 | 0.448 | ||
January - December 2019 | | 82 |
GLOSSARY
| • | Active customer: Those customers who comply with the minimum balance, income and/or transactionality requirements as defined according to the business area |
| • | ALCO: Assets and Liabilities Committee |
| • | APM: Alternative Performance Measures |
| • | bps: basis points |
| • | CET1: Core equity tier 1 |
| • | CNMV: Spanish National Securities Market Commission (Comisión Nacional del Mercado de Valores) |
| • | Digital customers: Every consumer of a commercial bank’s services who has logged on to their personal online banking and/or mobile banking in the last 30 days |
| • | EBA: European Banking Authority |
| • | ECB: European Central Bank |
| • | EPS: Earnings per share |
| • | ESG: Environmental, Social and Governance |
| • | ESMA: European Securities and Markets Authority |
| • | Fed: Federal Reserve |
| • | FX: Foreign Exchange |
| • | GDP: Gross Domestic Product |
| • | IFRS 9: International Financial Reporting Standard 9, regarding financial instruments |
| • | IFRS 16: International Financial Reporting Standard 16, regarding leases |
| • | Loyal customers: Active customers who receive most of their financial services from the Group according to the commercial segment that they belong to. Various engaged customer levels have been defined taking profitability into account. |
| • | NPLs: Non-performing loans |
| • | P/E ratio: Price / earnings per share ratio |
| • | PBT: Profit before tax |
| • | pp: percentage points |
| • | PPI: Payment protection insurance |
| • | Repos: Repurchase agreements |
| • | RoA: Return on assets |
| • | RoE: Return on equity |
| • | RoRWA: Return on risk weighted assets |
| • | RoTE: Return on tangible equity |
| • | RWAs: Risk weighted assets |
| • | SAM: Santander Asset Management |
| • | SBNA: Santander Bank N.A. |
| • | SCF: Santander Consumer Finance |
| • | SCIB: Santander Corporate & Investment Banking |
| • | SC USA: Santander Consumer USA |
| • | SEC: Securities and Exchanges Commission |
| • | SGP: Santander Global Platform |
| • | SH USA: Santander Holdings USA, Inc. |
| • | SMEs: Small and medium enterprises |
| • | SPF: Simple, Personal and Fair |
| • | SREP: Supervisory Review and Evaluation Process |
| • | SSM: Single Supervisory Mechanism, the system of banking supervision in Europe. It comprises the ECB and the national supervisory authorities of the participating countries |
| • | T1: Tier 1 |
| • | TLAC: The total loss-absorption capacity requirement which is required to be met under the CRD V package |
| • | TNAV: Tangible net asset value |
| • | TRIM: Targeted review of internal models |
| • | VaR: Value at Risk |
| • | WM&I: Wealth Management & Insurance |
January - December 2019 | | 83 |
Important information
Non-IFRS and alternative performance measures
In addition to the financial information prepared in accordance with International Financial Reporting Standards (“IFRS”), this report contains certain financial measures that constitute alternative performance measures (“APMs”) as defined in the Guidelines on Alternative Performance Measures issued by the European Securities and Markets Authority (ESMA) on 5 October 2015 (ESMA/2015/1415en) and other non-IFRS measures (“Non-IFRS Measures”). The financial measures contained in this report that qualify as APMs and non-IFRS measures have been calculated using the financial information from Santander Group but are not defined or detailed in the applicable financial reporting framework and have neither been audited nor reviewed by our auditors. We use these APMs and non-IFRS measures when planning, monitoring and evaluating our performance. We consider these APMs and non-IFRS measures to be useful metrics for management and investors to facilitate operating performance comparisons from period to period. While we believe that these APMs and non-IFRS measures are useful in evaluating our business, this information should be considered as supplemental in nature and is not meant as a substitute of IFRS measures. In addition, other companies, including companies in our industry, may calculate or use such measures differently, which reduces their usefulness as comparative measures. For further details of the APMs and non-IFRS Measures used, including its definition or a reconciliation between any applicable management indicators and the financial data presented in the consolidated financial statements prepared under IFRS, please see 2018 Annual Financial Report, published in the CNMV on 28 February 2019, our 20-F report for the year ending 31 December 2018 registered with the SEC in the United States as well as the section “Alternative performance measures” of the annex to this report.
The businesses included in each of our geographic segments and the accounting principles under which their results are presented here may differ from the included businesses and local applicable accounting principles of our public subsidiaries in such geographies. Accordingly, the results of operations and trends shown for our geographic segments may differ materially from those of such subsidiaries.
Forward-looking statements
Santander cautions that this report contains statements that constitute “forward-looking statements” within the meaning of the U.S. Private Securities Litigation Reform Act of 1995. Forward-looking statements may be identified by words such as “expect”, “project”, “anticipate”, “should”, “intend”, “probability”, “risk”, “VaR”, “RoRAC”, “RoRWA”, “TNAV”, “target”, “goal”, “objective”, “estimate”, “future” and similar expressions. These forward-looking statements are found in various places throughout this report and include, without limitation, statements concerning our future business development and economic performance and our shareholder remuneration policy. While these forward-looking statements represent our judgment and future expectations concerning the development of our business, a number of risks, uncertainties and other important factors could cause actual developments and results to differ materially from our expectations. The following important factors, in addition to those discussed elsewhere in this report, and in our annual report on Form 20-F for the year ended December 31, 2018, filed with the U.S. Securities and Exchange Commission, could affect our future results and could cause outcomes to differ materially from those anticipated in any forward-looking statement: (1) general economic or industry conditions in areas in which we have significant business activities or investments, including a worsening of the economic environment, increasing in the volatility of the capital markets, inflation or deflation, and changes in demographics, consumer spending, investment or saving habits; (2) exposure to various types of market risks, principally including interest rate risk, foreign exchange rate risk, equity price risk and risks associated with the replacement of benchmark indices; (3) potential losses associated with prepayment of our loan and investment portfolio, declines in the value of collateral securing our loan portfolio, and counterparty risk; (4) political stability in Spain, the UK, other European countries, Latin America and the US (5) changes in laws, regulations or taxes, including changes in regulatory capital and liquidity requirements, including as a result of the UK exiting the European Union and increased regulation in light of the global financial crisis; (6) our ability to integrate successfully our acquisitions and the challenges inherent in diverting management’s focus and resources from other strategic opportunities and from operational matters while we integrate these acquisitions; and (7) changes in our ability to access liquidity and funding on acceptable terms, including as a result of changes in our credit spreads or a downgrade in our credit ratings or those of our more significant subsidiaries. Numerous factors could affect the future results of Santander and could result in those results deviating materially from those anticipated in the forward-looking statements. Other unknown or unpredictable factors could cause actual results to differ materially from those in the forward-looking statements.
Forward-looking statements speak only as of the date of this report and are based on the knowledge, information available and views taken on such date; such knowledge, information and views may change at any time. Santander does not undertake any obligation to update or revise any forward-looking statement, whether as a result of new information, future events or otherwise.
| 84 | | January - December 2019 |
No offer
The information contained in this report is subject to, and must be read in conjunction with, all other publicly available information, including, where relevant any fuller disclosure document published by Santander. Any person at any time acquiring securities must do so only on the basis of such person’s own judgment as to the merits or the suitability of the securities for its purpose and only on such information as is contained in such public information having taken all such professional or other advice as it considers necessary or appropriate in the circumstances and not in reliance on the information contained in this report. No investment activity should be undertaken on the basis of the information contained in this report. In making this report available Santander gives no advice and makes no recommendation to buy, sell or otherwise deal in shares in Santander or in any other securities or investments whatsoever.
Neither this report nor any of the information contained therein constitutes an offer to sell or the solicitation of an offer to buy any securities. No offering of securities shall be made in the United States except pursuant to registration under the U.S. Securities Act of 1933, as amended, or an exemption therefrom. Nothing contained in this report is intended to constitute an invitation or inducement to engage in investment activity for the purposes of the prohibition on financial promotion in the U.K. Financial Services and Markets Act 2000.
Historical performance is not indicative of future results
Statements as to historical performance or financial accretion are not intended to mean that future performance, share price or future earnings (including earnings per share) for any period will necessarily match or exceed those of any prior period. Nothing in this report should be construed as a profit forecast.
| This document is a translation of a document originally issued in Spanish. Should there be any discrepancies between the English and the Spanish versions, only the original Spanish version should be binding. |
January - December 2019 | | 85 |
| Investor Relations | |
| Ciudad Grupo Santander | |
| Edificio Pereda, 2nd floor | |
| Avda de Cantabria s/n | |
| 28660 Boadilla del Monte | |
| Madrid (España) | |
| Tel: +34 91 259 65 14 / +34 91 259 65 20 | |
| Fax: 91 257 02 45 | |
| e-mail: investor@gruposantander.com | |
| Legal Head Office: | |
| Paseo Pereda 9-12, Santander (Spain) | |
| Tel: +34 (942) 20 61 00 | |
| Operational Head Office: | |
| Ciudad Grupo Santander | |
| Avda. de Cantabria s/n | |
| 28660 Boadilla del Monte, Madrid (Spain) | |
| www.santander.com |  |
SIGNATURE
Pursuant to the requirements of the Securities Exchange Act of 1934, the registrant has duly caused this report to be signed on its behalf by the undersigned, thereunto duly authorized.
| Banco Santander, S.A. | ||
| Date: January 29, 2020 | By: | /s/ José García Cantera |
| Name: | José García Cantera | |
| Title: | Chief Financial Officer | |