FORM 6-K
SECURITIES AND EXCHANGE COMMISSION
Washington, D.C. 20549
Report of Foreign Issuer
Pursuant to Rule 13a-16 or 15d-16
of the Securities Exchange Act of 1934
For the month of October, 2020
Commission File Number: 001-12518
Banco Santander, S.A.
(Exact name of registrant as specified in its charter)
Ciudad Grupo Santander
28660 Boadilla del Monte (Madrid) Spain
(Address of principal executive office)
Indicate by check mark whether the registrant files or will file annual reports under cover of Form 20-F or Form 40-F:
Form 20-F ☒ Form 40-F ☐
Indicate by check mark if the registrant is submitting the Form 6-K in paper as permitted by Regulation S-T Rule 101(b)(1):
Yes ☐ No ☒
Indicate by check mark if the registrant is submitting the Form 6-K in paper as permitted by Regulation S-T Rule 101(b)(7):
Yes ☐ No ☒
BANCO SANTANDER, S.A.
________________________
TABLE OF CONTENTS
| Part 1. January - September 2020 Financial Report | |||||
FINANCIAL
REPORT

| Financial Report | 2020 | ||||
| January - September | |||||
Index

This report was approved by the Board of Directors on 26 October 2020, following a favourable report from the Audit Committee. Important information regarding this report can be found on pages 91 and 92.
Key consolidated data
| BALANCE SHEET (EUR million) | Sep-20 | Jun-20 | % | Sep-20 | Sep-19 | % | Dec-19 | |||||||||||||||||||||||||||||||||||||
| Total assets | 1,514,242 | 1,572,881 | (3.7) | 1,514,242 | 1,517,885 | (0.2) | 1,522,695 | |||||||||||||||||||||||||||||||||||||
| Loans and advances to customers | 910,714 | 934,796 | (2.6) | 910,714 | 916,003 | (0.6) | 942,218 | |||||||||||||||||||||||||||||||||||||
| Customer deposits | 842,899 | 846,832 | (0.5) | 842,899 | 814,285 | 3.5 | 824,365 | |||||||||||||||||||||||||||||||||||||
| Total funds | 1,039,608 | 1,039,996 | — | 1,039,608 | 1,035,651 | 0.4 | 1,050,765 | |||||||||||||||||||||||||||||||||||||
| Total equity | 91,310 | 91,859 | (0.6) | 91,310 | 108,526 | (15.9) | 110,659 | |||||||||||||||||||||||||||||||||||||
| Note: Total funds includes customer deposits, mutual funds, pension funds and managed portfolios | ||||||||||||||||||||||||||||||||||||||||||||
| INCOME STATEMENT (EUR million) | Q3'20 | Q2'20 | % | 9M'20 | 9M'19 | % | 2019 | |||||||||||||||||||||||||
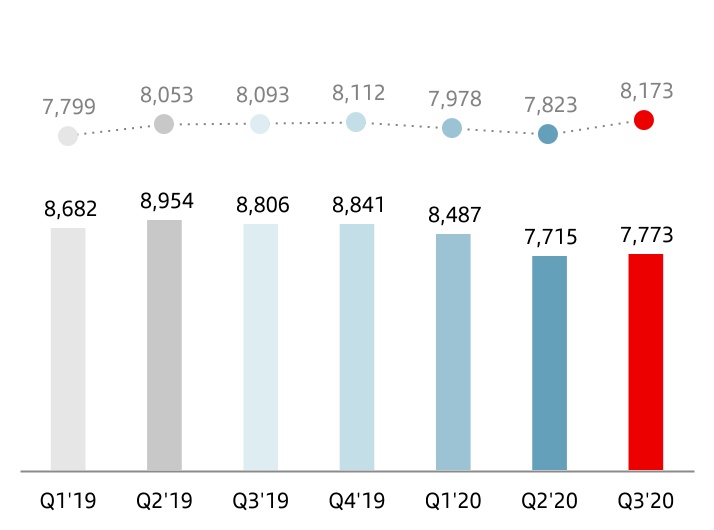
| Net interest income | 7,773 | 7,715 | 0.8 | 23,975 | 26,442 | (9.3) | 35,283 | |||||||||||||||||||||||||
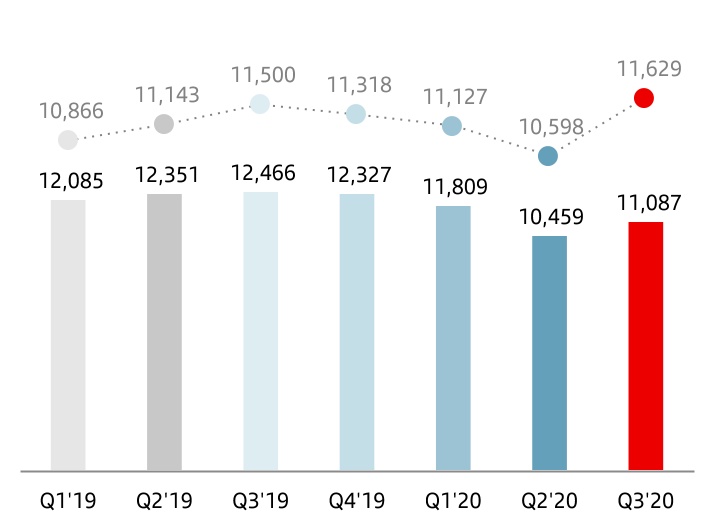
| Total income | 11,087 | 10,459 | 6.0 | 33,355 | 36,902 | (9.6) | 49,229 | |||||||||||||||||||||||||
| Net operating income | 6,008 | 5,341 | 12.5 | 17,569 | 19,593 | (10.3) | 25,949 | |||||||||||||||||||||||||
| Profit before tax | 3,139 | (8,301) | — | (3,271) | 8,712 | — | 12,543 | |||||||||||||||||||||||||
| Attributable profit to the parent | 1,750 | (11,129) | — | (9,048) | 3,732 | — | 6,515 | |||||||||||||||||||||||||
| Changes in constant euros: | ||||||||||||||||||||||||||||||||
| Q3'20 / Q2'20: NII: +4.5%; Total income: +9.7%; Net operating income: +16.8%; Attributable profit: +/- | ||||||||||||||||||||||||||||||||
| 9M'20 / 9M'19: NII: +0.1%; Total income: -0.5%; Net operating income: +0.7%; Attributable profit: +/- | ||||||||||||||||||||||||||||||||
| EPS, PROFITABILITY AND EFFICIENCY (%) | Q3'20 | Q2'20 | % | 9M'20 | 9M'19 | % | 2019 | ||||||||||||||||
| EPS (euros) | 0.097 | (0.679) | — | (0.570) | 0.202 | — | 0.362 | ||||||||||||||||
| RoE | 8.54 | (7.06) | (8.54) | 5.90 | 6.62 | ||||||||||||||||||
| RoTE | 10.58 | 5.19 | 3.30 | 10.48 | 11.44 | ||||||||||||||||||
| RoA | 0.53 | (0.38) | (0.44) | 0.50 | 0.54 | ||||||||||||||||||
| RoRWA | 1.46 | (1.02) | (1.17) | 1.22 | 1.33 | ||||||||||||||||||
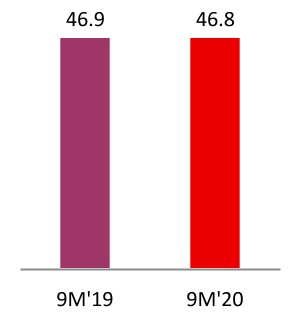
| Efficiency ratio | 45.8 | 47.4 | 46.8 | 46.9 | 47.0 | ||||||||||||||||||
UNDERLYING INCOME STATEMENT (1) (EUR million) | Q3'20 | Q2'20 | % | 9M'20 | 9M'19 | % | 2019 | |||||||||||||||||||||||||
| Net interest income | 7,773 | 7,715 | 0.8 | 23,975 | 26,442 | (9.3) | 35,283 | |||||||||||||||||||||||||
| Total income | 11,087 | 10,704 | 3.6 | 33,605 | 36,902 | (8.9) | 49,494 | |||||||||||||||||||||||||
| Net operating income | 6,014 | 5,628 | 6.9 | 17,879 | 19,593 | (8.7) | 26,214 | |||||||||||||||||||||||||
| Profit before tax | 3,175 | 1,885 | 68.4 | 7,016 | 11,423 | (38.6) | 14,929 | |||||||||||||||||||||||||
| Attributable profit to the parent | 1,750 | 1,531 | 14.3 | 3,658 | 6,180 | (40.8) | 8,252 | |||||||||||||||||||||||||
| Changes in constant euros: | ||||||||||||||||||||||||||||||||
| Q3'20 / Q2'20: NII: +4.5%; Total income: +7.2%; Net operating income: +11.0%; Attributable profit: +18.2% | ||||||||||||||||||||||||||||||||
| 9M'20 / 9M'19: NII: +0.1%; Total income: +0.3%; Net operating income: +2.5%; Attributable profit: -32.9% | ||||||||||||||||||||||||||||||||
UNDERLYING EPS AND PROFITABILITY (1) (%) | Q3'20 | Q2'20 | % | 9M'20 | 9M'19 | % | 2019 | ||||||||||||||||
| Underlying EPS (euros) | 0.097 | 0.084 | 15.8 | 0.195 | 0.352 | (44.5) | 0.468 | ||||||||||||||||
| Underlying RoE | 8.54 | 6.62 | 5.32 | 8.39 | 8.38 | ||||||||||||||||||
| Underlying RoTE | 10.58 | 8.93 | 7.08 | 11.86 | 11.79 | ||||||||||||||||||
| Underlying RoA | 0.53 | 0.43 | 0.38 | 0.66 | 0.65 | ||||||||||||||||||
| Underlying RoRWA | 1.46 | 1.14 | 1.01 | 1.63 | 1.61 | ||||||||||||||||||
SOLVENCY (2) AND NPL RATIOS (%) | Sep-20 | Jun-20 | Sep-20 | Sep-19 | Dec-19 | ||||||||||||||||||
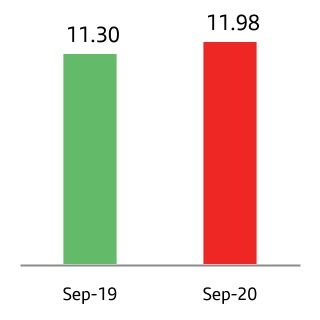
| CET1 | 11.98 | 11.84 | 11.98 | 11.30 | 11.65 | ||||||||||||||||||
| Fully-loaded total capital ratio | 15.59 | 15.46 | 15.59 | 14.68 | 15.02 | ||||||||||||||||||
| NPL ratio | 3.15 | 3.26 | 3.15 | 3.47 | 3.32 | ||||||||||||||||||
| Coverage ratio | 76 | 72 | 76 | 67 | 68 | ||||||||||||||||||
| MARKET CAPITALISATION AND SHARES | Sep-20 | Jun-20 | % | Sep-20 | Sep-19 | % | Dec-19 | ||||||||||||||||
| Shares (millions) | 16,618 | 16,618 | 0.0 | 16,618 | 16,618 | — | 16,618 | ||||||||||||||||
| Share price (euros) | 1.600 | 2.175 | (26.4) | 1.600 | 3.737 | (57.2) | 3.730 | ||||||||||||||||
| Market capitalisation (EUR million) | 26,582 | 36,136 | (26.4) | 26,582 | 62,094 | (57.2) | 61,986 | ||||||||||||||||
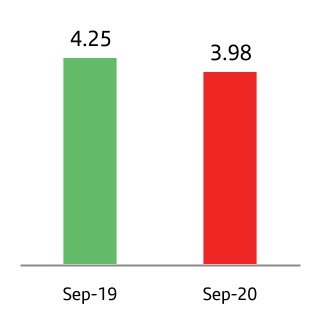
| Tangible book value per share (euros) | 3.98 | 4.00 | 3.98 | 4.25 | 4.36 | ||||||||||||||||||
| Price / Tangible book value per share (X) | 0.40 | 0.54 | 0.40 | 0.88 | 0.86 | ||||||||||||||||||
| OTHER DATA | Sep-20 | Jun-20 | % | Sep-20 | Sep-19 | % | Dec-19 | ||||||||||||||||
| Number of shareholders | 4,103,069 | 4,080,201 | 0.6 | 4,103,069 | 4,025,074 | 1.9 | 3,986,093 | ||||||||||||||||
| Number of employees | 192,578 | 194,284 | (0.9) | 192,578 | 201,017 | (4.2) | 196,419 | ||||||||||||||||
| Number of branches | 11,520 | 11,847 | (2.8) | 11,520 | 12,691 | (9.2) | 11,952 | ||||||||||||||||
| (1) In addition to financial information prepared in accordance with International Financial Reporting Standards (IFRS) and derived from our consolidated financial statements, this report contains certain financial measures that constitute alternative performance measures (APMs) as defined in the Guidelines on Alternative Performance Measures issued by the European Securities and Markets Authority (ESMA) on 5 October 2015 and other non-IFRS measures, including the figures related to “underlying” results, as they are recorded in the separate line of “net capital gains and provisions”, above the line of attributable profit to the parent. Further details are provided on page 13 of this report. For further details of the APMs and non-IFRS measures used, including their definition or a reconciliation between any applicable management indicators and the financial data presented in the consolidated financial statements prepared under IFRS, please see 2019 Annual Financial Report, published in the CNMV on 28 February 2020, our 20-F report for the year ending 31 December 2019 registered with the SEC in the United States as well as the “Alternative performance measures” section of the annex to this report. | ||
| (2) Data applying the IFRS 9 transitional arrangements. | ||
January - September 2020 |  | 3 | ||||||
Response to the COVID-19 crisis | ||||||||||||||||||||||||||
In order to support the global effort being made to combat COVID-19, Grupo Santander is implementing various measures to protect our stakeholders. The most relevant measures are detailed below, focused on six main dimensions:
 | Contingency plan | |||||||
Our main priority is to ensure business while safeguarding the health, well-being and economic interests of our stakeholders, which is only possible through the execution of the Group's and subsidiaries' contingency plans, where the objective of continuing to operate within the same quality standards and in compliance with our regulatory commitments was met. •To this end, the Group carries out periodic simulation exercises, as a tool to raise awareness and as preparation for certain stress situations. •These contingency plans qualify as mitigation tools within the Special Situations Management Framework. This Framework has provided flexibility for the activation of the Corporate Special Situations Committees with the objective of responding preventively to the environment induced by COVID-19, as well as coordinating the countries' responses. At the end of the quarter, the Framework continued to be fully active as a preventive measure, as no financial stress has been recorded. •Our Contingency Plans ensured the operational continuity of business including other measures, such as segregating teams and technological infrastructures, establishing shifts between critical employees and their back-ups, as well as increasing the capacity of systems, carried out by the Technology and Operations area. | ||||||||
 | Health of our employees | |||||||
Our priority was to safeguard the health and safety of our employees: •At the peak of the pandemic, we redefined our way of working, reaching more than 110,000 employees working from home. •We ensured the physical and mental well-being of the employees who continued to work in our offices, or face to face with customers. •Financial well-being was also covered, offering various financial support measures to help employees and making exceptional payments to front line workers during the pandemic. •We continued to gradually return to the usual workplaces in some countries, always following the recommendations of local governments and based on three pillars: development and implementation of health and safety protocols, prioritisation and monitoring the health status of our employees, and tracking and tracing (through health apps). As an example, 90% of the Corporate Centre employees have returned to the office, and an updated measure of the Flexiworking Policy on remote working one or two days a week was implemented. •Additionally, under the #SafeTogether programme, numerous initiatives are being implemented to ensure workplace safety and protect health. | ||||||||
 | Customers | |||||||
Santander has also also implemented measures to ensure the health and safety of its customers and foster their economic resilience during the crisis in all countries. Of note were: •Provide liquidity and credit facilities for businesses facing hardship, as well as facilitate payment deferrals and payment holidays in many of our markets, supporting more than 6 million customers. •Proactive support for vulnerable customers trying to cover their needs. •Temporary reduction and suspension of fees (withdrawals from ATMs, interest free online purchases, bank transfers, etc.), together with specialised teams to advise customers facing financial difficulties. •Ensure COVID-19 health insurance coverage. In addition, we adapted the branch network to each situation, ensuring continuity of service. Currently, around 93% of our branches are open. The countries have adapted to the new demand and introduced measures for referral to other channels and self-service. | ||||||||
| 4 | | January - September 2020 | ||||||
Response to the COVID-19 crisis | ||||||||||||||||||||||||||
 | Business, liquidity and risks | |||||||
In the quarter, business performance showed signs of normalisation. Group loans and advances to customers excluding the exchange rate impact increased 5% and customer funds 8% year-on-year. The recovery of pre-COVID-19 new business levels began at the end of the second quarter in various markets and segments. In the individuals segment (mortgages and consumer finance), growth from the lows in April to reach near pre-pandemic levels. On the other hand, activity in large corporates and companies normalised, following the sharp increase recorded in April, as the need for liquidity decreased. Liquidity has been closely monitored in the parent bank and our subsidiaries, remaining solid at all times. As of September, the Group's LCR ratio was 171%, the parent bank's was 186% and all our subsidiaries stood above 125%. In addition, central banks have adopted measures to provide significant liquidity to the system. Regarding risks, the main indicators are also continuously monitored. As of September, 66% of the total moratoria granted by the Group had expired, a total amount of EUR 75 billion, aligned with our expectations. Only 2% of the total is considered stage 3. In the first nine months of the year, we recorded provisions amounting to EUR 9,562 million, 42% more than in the same period of 2019 (+58% excluding the exchange rate impact). However, provisions dropped 14% in the quarter excluding the FX impact. In addition, due to the deterioration of the economic outlook, the Bank adjusted the valuation of its goodwill ascribed to several subsidiaries and deferred tax assets for EUR 12.6 billion in the first half of the year. This adjustment had no impact on the Bank's liquidity or market and credit risk position, and was neutral in CET1 capital. | ||||||||
 | Society | |||||||
One of our main priorities is to contribute to the well-being of society as a whole. We have implemented actions and mobilised resources together with governments and institutions to help society combat the health crisis. Santander All. Together. Now. is the motto that brings together the Group's collective efforts around the world to stand beside the people who need it the most at this time. This effort has succeeded in mobilising more than EUR 105 million dedicated to solidarity initiatives to fight COVID-19. The main initiatives adopted are: •Creation of a solidarity fund to acquire medical equipment and materials, and to support organisations in the fight against COVID-19. This fund is primarily financed by contributions from senior management, employees and the Group's subsidiaries, as well as contributions from third parties. •Supporting different projects and social initiatives to protect the vulnerable groups most impacted by the effects of the pandemic. •Santander Universidades reallocated funds to support collaboration projects with universities. The Bank also launched Santander X Tomorrow Challenge, with the aim of supporting creativity and the entrepreneurs' capabilities. •Overcome Together, an open and accessible space for individuals and companies, customers and non-customers, which contains information and resources. It is available in Spain, Portugal, Mexico, Brazil, Uruguay, Chile, Poland, Argentina, the UK and Openbank. We will continue to monitor the situation in order to continue to contribute minimising the impact of COVID-19 on society. | ||||||||
 | Information for stakeholders | |||||||
Based on transparency and anticipation, the Group continued to be proactive in keeping our people, customers, shareholders and investors informed at all times. The main measures announced from the beginning of the pandemic can be found on the Group's website (www.santander.com). We continued to develop several initiatives: •To stay close to all our employees, we sent out newsletters in most of our markets including updates on the health crisis. Of note were the eight Ask Ana events held by the Chairman, and the celebration of the 12th edition of Santander Week, a time to enjoy the Group's culture, BeHealthy and show our most caring side. •We continued to issue communications to customers, including the latest digital initiatives, such as our Work Cafés, where we held more than 65 digital meetings regarding different issues, with more than 200,000 viewers. •We kept all channels open to increase the confidence of our shareholders and investors, which was reflected in an increase of more than 100,000 new shareholders since December. •It is also worth highlighting the two Euromoney awards won this year: World’s Best Bank for SMEs, praising the support we provided during the crisis, and Best Bank for Diversity and Inclusion global award. | ||||||||
January - September 2020 | | 5 | ||||||
Business model | Group financial information | Financial information by segments | Responsible banking Corporate governance Santander share | Appendix | ||||||||||||||||||||||
Our business model is based on three pillars
1. Our scale Local scale and global reach | 2. Customer focus Unique personal banking relationships strengthen customer loyalty | 3. Diversification Our geographic and business diversification makes us more resilient under adverse circumstances | ||||||||||||||||||
•Local scale based on three geographic regions, where we maintain a leadership position in our 10 core markets. •Global reach backed by our global businesses, enabling greater collaboration across the Group to generate higher revenue and efficiencies. | •We serve 147 million customers, in markets with a total population of more than one billion people. •We have over 100,000 people talking to our customers every day in our 11,500 branches, digital channels and contact centres. | •Geographic diversification in regions, with a good balance between mature and developing markets. •Global businesses that strengthen our local franchises. •The ongoing customer-centric digital transformation across the Group is the growth engine in all markets, driving our talent and our ability to innovate. | ||||||||||||||||||
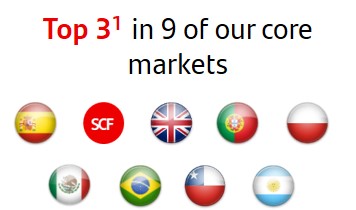 | 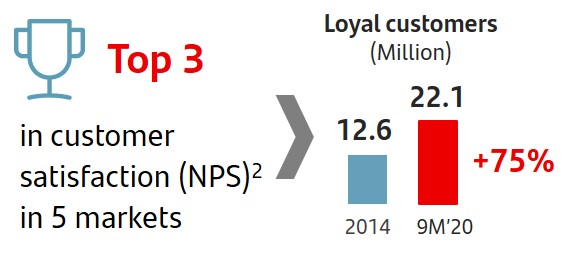 |  | ||||||||||||||||||
| 1. Market share in lending as of June 2020 including only privately-owned banks. UK benchmark refers to the mortgage market. | 2. NPS – Customer Satisfaction internal benchmark of active customers’ experience and satisfaction audited by Stiga / Deloitte. | |||||||||||||||||||
Our corporate culture: Santander Way
The Santander Way reflects our purpose, our aim, and how we do business. It is the bedrock on which we are building a more responsible bank.

| 6 | | January - September 2020 | ||||||
 GROWTH
In the quarter, the Group continued to provide the necessary financial support to customers to help them overcome the consequences of the pandemic
We continued to see signs of normalisation in new lending trends in the quarter, with mortgage and consumer lending recovering and reductions in the SME and corporate segments, due to the sharp growth recorded when the pandemic started and the lower need for liquidity.
In volumes, strong negative exchange rate impact (-6/-7 pp) year-on-year. In constant euros, gross loans and advances to customers (excluding reverse repos) grew 5% and customer funds (excluding repos) rose 8%, both with the 10 core markets growing.
| Activity Sep-20 / Sep-19 | |||||||||||||||||||||||||||||||||||||||||||||||||||||||||||||||||||||||
| % change in constant euros | |||||||||||||||||||||||||||||||||||||||||||||||||||||||||||||||||||||||
| +3% | |||||||||||||||||||||||||||||||||||||||||||||||||||||||||||||||||||||||
| Individuals | |||||||||||||||||||||||||||||||||||||||||||||||||||||||||||||||||||||||
| +12% | |||||||||||||||||||||||||||||||||||||||||||||||||||||||||||||||||||||||
| +10% | Demand | ||||||||||||||||||||||||||||||||||||||||||||||||||||||||||||||||||||||
| SMEs and corporates | |||||||||||||||||||||||||||||||||||||||||||||||||||||||||||||||||||||||
| +5% | -1% | ||||||||||||||||||||||||||||||||||||||||||||||||||||||||||||||||||||||
| +8% | Time | ||||||||||||||||||||||||||||||||||||||||||||||||||||||||||||||||||||||
| +11% | |||||||||||||||||||||||||||||||||||||||||||||||||||||||||||||||||||||||
| CIB and institutions | +1% | ||||||||||||||||||||||||||||||||||||||||||||||||||||||||||||||||||||||
| Mutual funds | |||||||||||||||||||||||||||||||||||||||||||||||||||||||||||||||||||||||
| Gross loans and advances to customers excl. reverse repos | Customer deposits excl. repos + mutual funds | ||||||||||||||||||||||||||||||||||||||||||||||||||||||||||||||||||||||
Digital penetration maintained an upward trend. We have more than 41 million digital customers (+5 million year-on-year), mobile customers reached more than 34 million (+5.9 million in 12 months) and digital sales up to September represented 44% of total sales (36% in 2019).
Loyal customers rose 1 million year-on-year, with growth both in individuals and corporates.
| Digital customers | Digital sales | |||||||||||||||||||||||||||||||||||||||||||||||||||||||||||||||||||||||||||||||
| Millions | % of total sales | |||||||||||||||||||||||||||||||||||||||||||||||||||||||||||||||||||||||||||||||
| 41.4 | ||||||||||||||||||||||||||||||||||||||||||||||||||||||||||||||||||||||||||||||||
| 44 | % | |||||||||||||||||||||||||||||||||||||||||||||||||||||||||||||||||||||||||||||||
| 36.2 | +14% | |||||||||||||||||||||||||||||||||||||||||||||||||||||||||||||||||||||||||||||||
| 36 | % | |||||||||||||||||||||||||||||||||||||||||||||||||||||||||||||||||||||||||||||||
| Sep-19 | Sep-20 | 2019 | 9M'20 | |||||||||||||||||||||||||||||||||||||||||||||||||||||||||||||||||||||||||||||
 PROFITABILITY
Strong profit recovery in the quarter in a still uncertain environment...
In the third quarter, results recorded a positive performance compared to the second quarter, supported by an upturn in revenue, cost control and lower provisions. This improvement was recorded in the three main regions and was reflected in a 14% increase in the Group's underlying attributable profit to EUR 1,750 million (+18% in constant euros).
Attributable profit in the quarter also amounted to EUR 1,750 million, as net capital gains and provisions had no material impact, which compares very favourably with the negative amount of EUR 11,129 million in the second quarter (mainly due to charges related to goodwill adjustments in some countries and deferred tax assets).
Despite the positive performance in the quarter, on a year-on-year basis, results for the first nine months continued to be affected by the economic deterioration arising from the health crisis and by the sharp exchange rate depreciation that distort the year-on-year comparison.
Excluding the exchange rate impact, sound underlying business performance, backed by stable income, cost reduction and strong credit quality ratios.
Total income remained steady year-on-year, as the fall in activity in some segments and lower interest rates were offset by higher volumes, good market volatility management and the reduction in the cost of deposits.
Cost reductions were ahead of plan, reaching the objective announced for the year, due to the optimisation plans carried out in recent years, together with the additional savings measures adopted from the beginning of the crisis.
As a result, the efficiency ratio remained below 47%, one of the best among our peers, and net operating income increased 3% in constant euros to EUR 17,879 million, boosted by South America, SCIB and WM&I.
| Efficiency ratio | ||
| % | ||
January - September 2020 | | 7 | ||||||
PROFITABILITY… and profit year-to-date affected by higher loan-loss provisions and valuation adjustments recorded in the second quarter
Loan-loss provisions rose significantly year-on-year to EUR 9,562 million, driven by lending growth and the expected macro-economic deterioration arising from the pandemic.
In addition, the adjustment of the valuation of the goodwill ascribed to several units and deferred tax assets for a total of EUR -12.600 million, resulted in an attributable loss of EUR 9,048 million in September.
| Attr. profit to the parent | Earnings per share | |||||||||||||
| EUR million | EUR | |||||||||||||
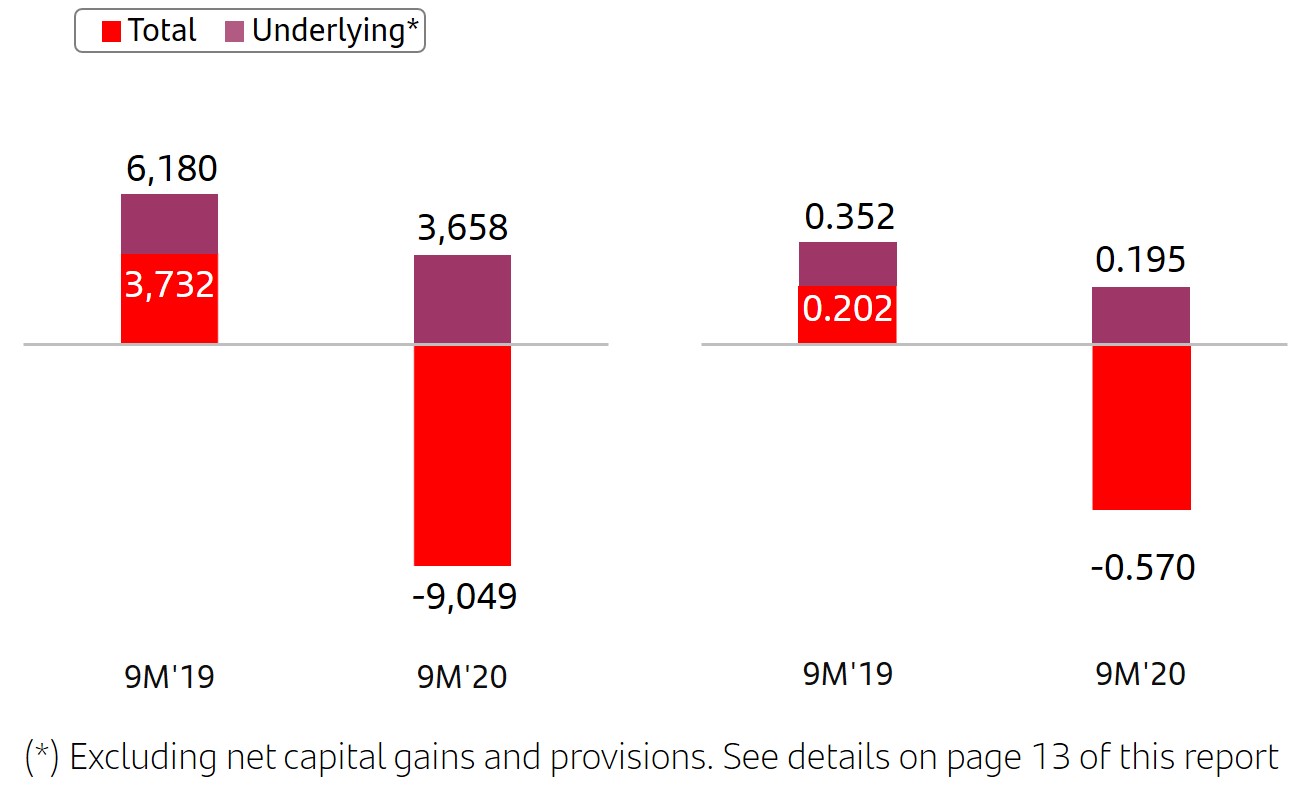 | ||||||||||||||
Before these adjustments and restructuring costs, underlying attributable profit was EUR 3,658 million, 41% lower year-on-year (-33% excluding the exchange rate impact).
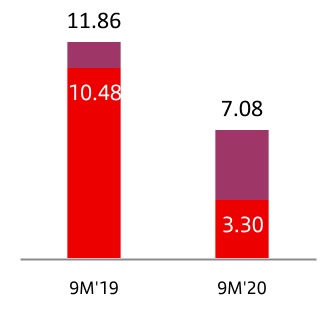
Profitability ratios improved notably compared to the first half of the year: underlying RoTE was 7.08% and underlying RoRWA 1.01%.
| RoTE | |||||||||||||||||
| % | |||||||||||||||||
n Total n Underlying* | |||||||||||||||||
(*) Excluding net capital gains and provisions
 STRENGTH
CET1 ratio stood at 12%, reaching the top end of our target range and the cost of credit is expected to improve to around 130 bps by year-end
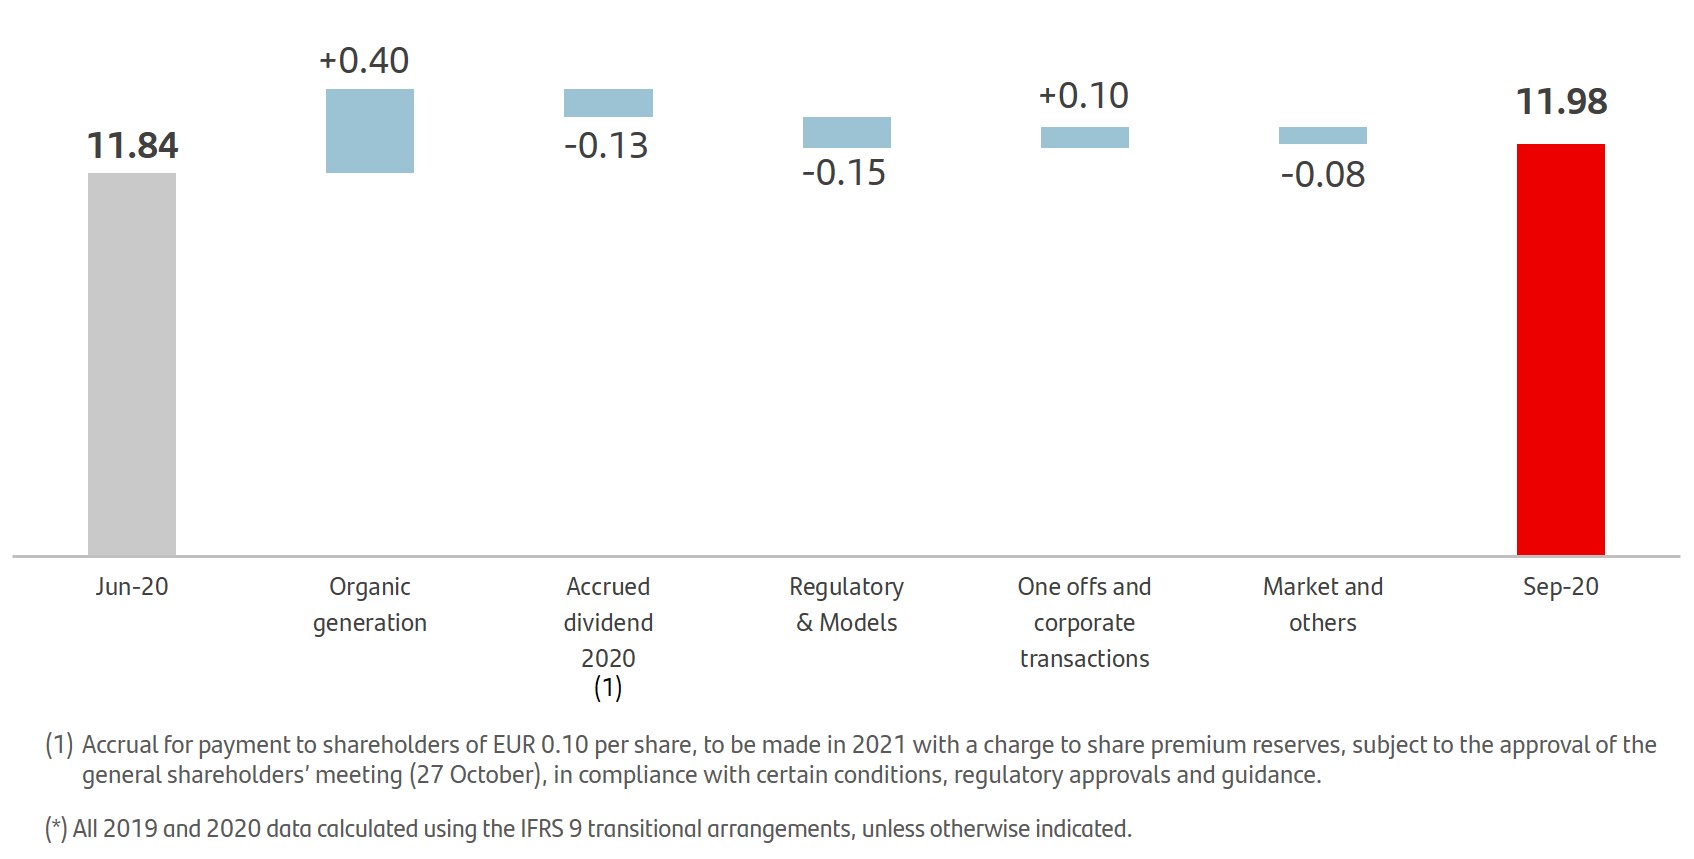
The CET1 ratio increased 14 bps in the quarter to 11.98%, driven by the strong organic generation and after a 13 bps accrual for a payment to shareholders of EUR 0.10 per share, to be made in 2021 with a charge to share premium reserves, subject to the approval of the general shareholders' meeting (27 October), in compliance with certain conditions, regulatory approvals and guidance. This results in a Group CET1 management buffer of 312 bps post- COVID-19 compared to 189 bps pre-COVID-19.
Net tangible equity per share (TNAV) in September 2020 was EUR 3.98, virtually stable since June, due to the impact of currency depreciation, primarily the Brazilian real and the US dollar.
| CET1* | TNAV per share | |||||||
| % | Euros | |||||||
(*) Using the IFRS 9 transitional arrangement
Risk management remained focused on minimising the impacts arising from the health crisis.
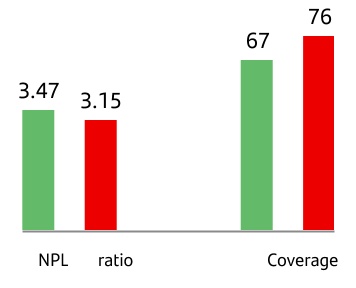
The cost of credit in the first nine months was in line with our new year-end expectation of 130 bps, compared to the previously announced 140-150 bps. Credit quality ratios benefited from mitigation measures, reflected in the 32 bp fall year-on-year (-11 bps in the quarter) of the NPL ratio and higher coverage (76%, +9 pp year-on-year; +4 pp quarter-on-quarter).
| Cost of credit | NPL ratio and coverage | ||||||||||||||||||||||
| % | % | ||||||||||||||||||||||
n Sep-19 n Sep-20 | |||||||||||||||||||||||
| 8 | | January - September 2020 | ||||||
GRUPO SANTANDER RESULTS
•The Group's results were affected by the health crisis caused by the spread of COVID-19, which is reflected in a weaker economic environment, lower interest rates and a sharp depreciation of some currencies. However, revenue and lower provisions boosted recovery in the quarter, increasing attributable profit to EUR 1,750 million.
•As of September, total income fell, affected by lower activity and exchange rates. Excluding their impact, it remained stable as the decrease in activity and lower interest rates were offset by higher volumes, sound management of market volatility and the lower cost of deposits.
•Acceleration in cost reductions, ahead of schedule in the optimisation plans implemented in recent years, along with additional measures adopted since the start of the crisis, reaching the expected savings for the year in Europe in September.
•Greater loan-loss provisions, amounting to EUR 9,562 million due to credit growth, the expected deterioration in economic conditions due to the pandemic and its impact on the deterioration of the portfolio’s credit quality.
•In addition, as a result of the worsening economic outlook, adjustments to the goodwill ascribed to some units and to deferred tax assets were made in the second quarter, totalling EUR 12,600 million, which results in an attributable profit to the Group of negative EUR 9,048 million in the first nine months of 2020.
•Excluding the above adjustments and restructuring costs, attributable profit to the parent of EUR 3,658 million, with net operating income of EUR 17,879 million, 3% more in constant euros than at the end of the first nine months of of 2019.
| Grupo Santander. Summarised income statement | ||||||||||||||||||||||||||||||||||||||||||||||||||
| EUR million | ||||||||||||||||||||||||||||||||||||||||||||||||||
| Change | Change | |||||||||||||||||||||||||||||||||||||||||||||||||
| Q3'20 | Q2'20 | % | % excl. FX | 9M'20 | 9M'19 | % | % excl. FX | |||||||||||||||||||||||||||||||||||||||||||
| Net interest income | 7,773 | 7,715 | 0.8 | 4.5 | 23,975 | 26,442 | (9.3) | 0.1 | ||||||||||||||||||||||||||||||||||||||||||
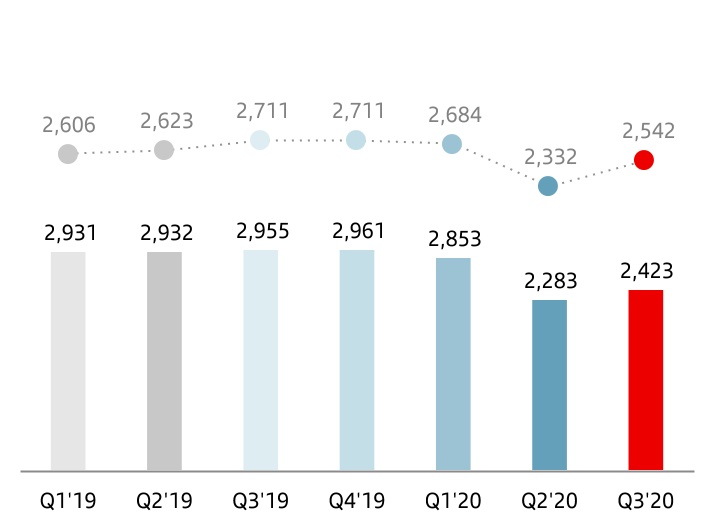
| Net fee income (commission income minus commission expense) | 2,423 | 2,283 | 6.1 | 9.0 | 7,559 | 8,818 | (14.3) | (4.8) | ||||||||||||||||||||||||||||||||||||||||||
| Gains or losses on financial assets and liabilities and exchange differences (net) | 652 | 786 | (17.0) | (11.9) | 1,725 | 935 | 84.5 | 104.5 | ||||||||||||||||||||||||||||||||||||||||||
| Dividend income | 57 | 208 | (72.6) | (72.1) | 322 | 433 | (25.6) | (25.2) | ||||||||||||||||||||||||||||||||||||||||||
| Share of results of entities accounted for using the equity method | 45 | (233) | — | — | (90) | 443 | — | — | ||||||||||||||||||||||||||||||||||||||||||
| Other operating income / expenses | 137 | (300) | — | — | (136) | (169) | (19.5) | 134.8 | ||||||||||||||||||||||||||||||||||||||||||
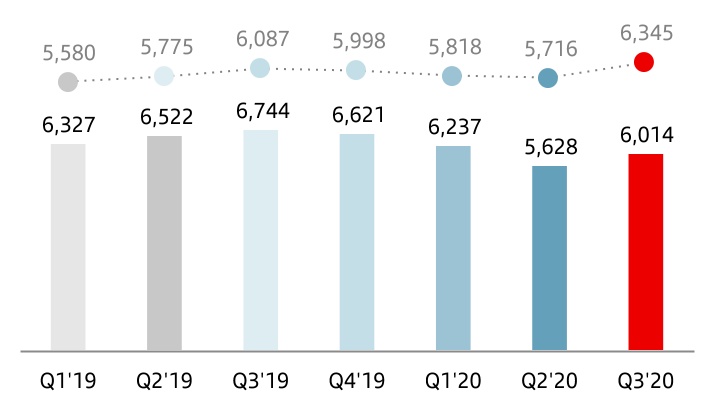
| Total income | 11,087 | 10,459 | 6.0 | 9.7 | 33,355 | 36,902 | (9.6) | (0.5) | ||||||||||||||||||||||||||||||||||||||||||
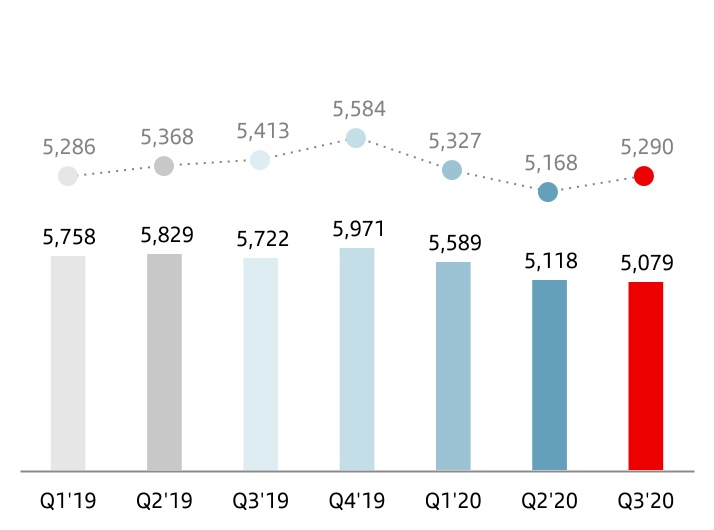
| Operating expenses | (5,079) | (5,118) | (0.8) | 2.4 | (15,786) | (17,309) | (8.8) | (1.8) | ||||||||||||||||||||||||||||||||||||||||||
| Administrative expenses | (4,398) | (4,428) | (0.7) | 2.4 | (13,686) | (15,100) | (9.4) | (2.3) | ||||||||||||||||||||||||||||||||||||||||||
| Staff costs | (2,628) | (2,571) | 2.2 | 5.0 | (8,098) | (9,088) | (10.9) | (4.7) | ||||||||||||||||||||||||||||||||||||||||||
| Other general administrative expenses | (1,770) | (1,857) | (4.7) | (1.2) | (5,588) | (6,012) | (7.1) | 1.3 | ||||||||||||||||||||||||||||||||||||||||||
| Depreciation and amortisation | (681) | (690) | (1.3) | 1.9 | (2,100) | (2,209) | (4.9) | 2.2 | ||||||||||||||||||||||||||||||||||||||||||
| Provisions or reversal of provisions | (400) | (240) | 66.7 | 70.4 | (1,014) | (2,511) | (59.6) | (58.1) | ||||||||||||||||||||||||||||||||||||||||||
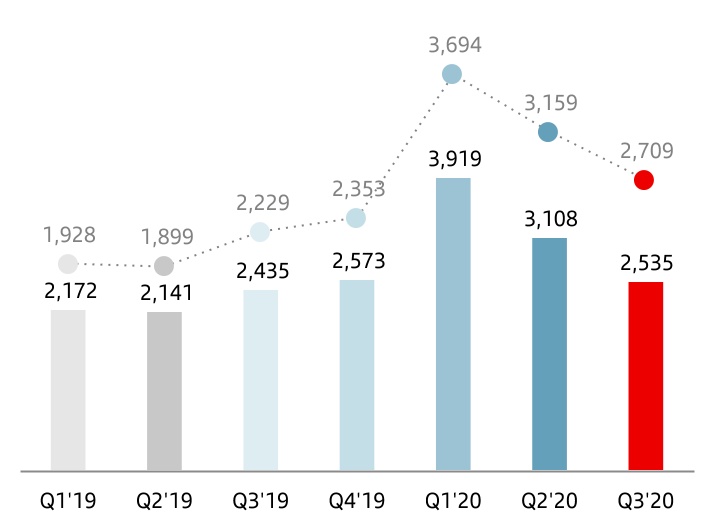
| Impairment or reversal of impairment of financial assets not measured at fair value through profit or loss (net) | (2,508) | (3,096) | (19.0) | (14.5) | (9,538) | (6,810) | 40.1 | 55.9 | ||||||||||||||||||||||||||||||||||||||||||
| o/w: net loan-loss provisions | (2,535) | (3,108) | (18.4) | (14.3) | (9,562) | (6,748) | 41.7 | 57.9 | ||||||||||||||||||||||||||||||||||||||||||
| Impairment on other assets (net) | (15) | (10,227) | (99.9) | (99.9) | (10,256) | (1,547) | 563.0 | 563.0 | ||||||||||||||||||||||||||||||||||||||||||
| Gains or losses on non financial assets and investments, net | 62 | 9 | 588.9 | 588.9 | 89 | 253 | (64.8) | (64.8) | ||||||||||||||||||||||||||||||||||||||||||
| Negative goodwill recognised in results | 3 | 6 | (50.0) | (50.0) | 9 | — | — | — | ||||||||||||||||||||||||||||||||||||||||||
| Gains or losses on non-current assets held for sale not classified as discontinued operations | (11) | (94) | (88.3) | (88.3) | (130) | (266) | (51.1) | (50.8) | ||||||||||||||||||||||||||||||||||||||||||
| Profit or loss before tax from continuing operations | 3,139 | (8,301) | — | — | (3,271) | 8,712 | — | — | ||||||||||||||||||||||||||||||||||||||||||
| Tax expense or income from continuing operations | (1,092) | (2,684) | (59.3) | (57.8) | (5,020) | (3,740) | 34.2 | 55.1 | ||||||||||||||||||||||||||||||||||||||||||
| Profit from the period from continuing operations | 2,047 | (10,985) | — | — | (8,291) | 4,972 | — | — | ||||||||||||||||||||||||||||||||||||||||||
| Profit or loss after tax from discontinued operations | — | — | — | — | — | — | — | — | ||||||||||||||||||||||||||||||||||||||||||
| Profit for the period | 2,047 | (10,985) | — | — | (8,291) | 4,972 | — | — | ||||||||||||||||||||||||||||||||||||||||||
| Attributable profit to non-controlling interests | (297) | (144) | 106.3 | 108.8 | (757) | (1,240) | (39.0) | (32.5) | ||||||||||||||||||||||||||||||||||||||||||
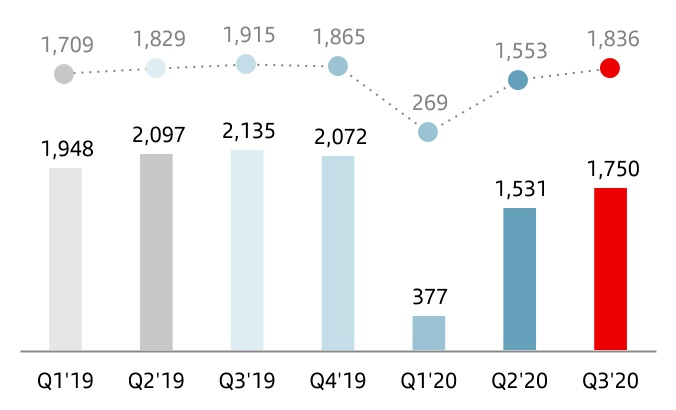
| Attributable profit to the parent | 1,750 | (11,129) | — | — | (9,048) | 3,732 | — | — | ||||||||||||||||||||||||||||||||||||||||||
| EPS (euros) | 0.097 | (0.679) | — | (0.570) | 0.202 | — | ||||||||||||||||||||||||||||||||||||||||||||
| Diluted EPS (euros) | 0.097 | (0.677) | — | (0.569) | 0.201 | — | ||||||||||||||||||||||||||||||||||||||||||||
| Memorandum items: | ||||||||||||||||||||||||||||||||||||||||||||||||||
| Average total assets | 1,541,134 | 1,558,854 | (1.1) | 1,543,361 | 1,500,101 | 2.9 | ||||||||||||||||||||||||||||||||||||||||||||
| Average stockholders' equity | 82,009 | 92,528 | (11.4) | 91,639 | 98,249 | (6.7) | ||||||||||||||||||||||||||||||||||||||||||||
January - September 2020 | | 9 | ||||||
èResults performance compared to the first nine months of 2019
The main lines of the profit and loss account are detailed below.
The Group presents, both at the total level and for each of the business units, the real changes in euros produced in the income statement, as well as variations excluding the exchange rate effect (FX), on the understanding that the latter provide a better analysis of the Group’s management. For the Group as a whole, the exchange rate impact was -9 percentage points in revenue and -7 percentage points in costs.
u Revenue
Revenue totalled EUR 33,355 million in the first nine months, down 10%. If the FX impact is taken out, total income remained resilient, in line with last year, due to the strength that our geographical and business diversification provides. Net interest income and net fee income accounted for around 95% of total revenue. By line:
•Net interest income amounted to EUR 23,975 million, 9% less than in the same period of 2019. Stripping out the exchange rate impact, there was no material change (+0.1%), due to the net effect of the increase in revenue from higher lending and deposit volumes and the lower cost of deposits, and the reduction in revenue from lower interest rates in many markets, regulatory impacts (mainly in Brazil and Poland) and increased liquidity buffer costs.
On the one hand, growth was recorded in Mexico and SCF, due to higher volumes, Chile, due to higher volumes and better funding costs, and Argentina due to the placement of excess liquidity. Brazil and the US remained virtually stable, affected by lower interest rates, which offset average volume growth, and regulatory changes regarding the cheque especial in Brazil.
| Net interest income | ||||||||
| EUR million | ||||||||
 | constant euros | |||||||
On the other hand, overall decreases in Europe: Portugal and Spain due to lower interest rates, on top of the lower average volumes and smaller ALCO portfolio in Spain, the UK, driven by the base rate cut and SVR attrition, and Poland, due to a one-off provision for the CJEU judgement on consumer loans.
•Net fee income fell 14% to EUR 7,559 million. Excluding the exchange rate impact, it was down 5% compared to the first nine months of 2019. This item has been the most affected by the health crisis, reflecting lower customer transactionality. Our strategy remains focused on increasing our customer loyalty and growth in higher value-added services and products.
By business, of note was the 12% growth in Santander Corporate & Investment Banking (GDF and markets) and the 1% increase in Wealth Management & Insurance (the latter including fees ceded to the branch network). Overall, both businesses together now account for 46% of the Group’s total (SCIB: 15%; WM&I: 31%).
By region, there were declines in North America (-1%) mainly driven by the US, as Mexico grew 4%, South America (-3%), with broad-based falls across countries, and particularly Europe (-9%), with generalised declines due to lower activity volumes, along with regulatory changes affecting net fee income in Santander Consumer Finance and the UK. On the other hand, "Other Europe", which includes the wholesale banking business in the region, increased net fee income by 52%.
•Gains on financial transactions, accounted for 5% of total income and stood at EUR 1,725 million, 84% higher than the first nine months of 2019 (+105% excluding the exchange rate effect) due to the favourable impact from foreign currency hedging, portfolio sales and market volatility management.
| Net fee income | ||||||||
| EUR million | ||||||||
| constant euros | |||||||
| 10 | | January - September 2020 | ||||||
•Dividend income was EUR 322 million in the first nine months of 2020, 26% lower than in the same period of 2019 (-25% excluding exchange rate effect). This item was affected by the delay or cancellation of dividend payments by several companies.
•The results of entities accounted for using the equity method reflected the lower contribution from the entities associated to the Group.
•Other operating income recorded a loss of EUR 136 million (loss of EUR 169 million in the first nine months of 2019) due to the higher results from insurance, somewhat mitigated by the greater contribution to the Single Resolution Fund (SRF) in the second quarter.
u Costs
Operating costs amounted to EUR 15,786 million, 9% lower year-on-year. Excluding the exchange rate impact, costs fell 2%.
In real terms (excluding inflation) costs were down 5%, reflecting the successful management over the last three years, as well as the first impacts of additional savings measures adopted from the beginning of the crisis.
The efficiency ratio was 46.8%, in line with last year, which has enabled Santander to remain one of the most efficient global banks in the world.
The Group's objective is still to improve our operational capacity while also managing our costs more efficiently and with a strategy adapted to each region. Therefore, for a better comparison, the trends by region and market are as follows:
| Total income | ||||||||
| EUR million | ||||||||
| constant euros | |||||||
•In Europe, costs strongly reflect the synergies from the recent integrations and additional savings, decreasing 6% in nominal terms and 6.6% in real terms and with falls across all markets: Poland and Spain (-10% each) and Portugal (-6%) due to the optimisation efforts, in the UK (-6%) due to the savings from our transformation programme, and in Santander Consumer Finance (-4%) driven by efficiency projects carried out in several countries and absorbing the perimeter effect.
The cost reduction plan in Europe is ahead of schedule, having already reached the total savings expected for the year as a whole.
•In North America, costs fell 2% in nominal terms, affected by inflation, as in real terms they were down 4%, notably in the US (-6%). Costs in Mexico remained stable (+0.4%). The efficiency ratio in the region improved 89 bps to 41.3%.
•Finally, in South America, the increase in costs was greatly distorted by the very high inflation in Argentina. Excluding it, costs rose 2% in nominal terms but decreased 1% in real terms (Brazil and Chile: -1.5%). Efficiency improved in all markets, 35.3% for the region as a whole (-41 bps).
We believe that this management by region and the lessons learnt from the management of the pandemic will enable us to accelerate our transformation in the future and, consequently, further optimise costs while improving customer experience.
u Provisions or reversal of provisions
Provisions (net of provisions reversals) amounted to EUR 1,014 million (EUR 2,511 million in September 2019). This line item includes charges for restructuring costs.
| Operating expenses | ||||||||
| EUR million | ||||||||
| constant euros | |||||||
January - September 2020 | | 11 | ||||||
u Impairment or reversal of impairment of financial assets not measured at fair value through profit or loss (net)
Impairment or reversal of impairment on financial assets not measured at fair value through profit or loss (net) was EUR 9,538 million, up 40% year-on-year in euros and 56% in constant euros.
Loan-loss provisions included in this item amounted to EUR 9,562 million, 42% more than in the same period last year. Stripping out the effect of exchange rates, the increase was 58%, heavily impacted by the effects of the COVID-19 and growth in volumes. This includes the provisions overlay of EUR 1,600 million which was recorded in the first quarter and which was allocated by business unit in the second.
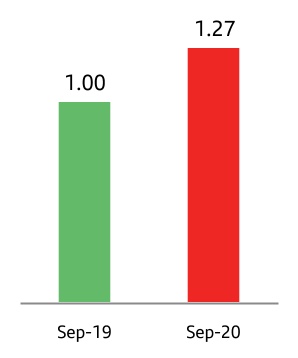
Accordingly, the Group’s cost of credit, calculated as the ratio of loan-loss provisions over the last twelve months to the average investment in the period, stood at 1.27% (1.33% considering the annualised year-to-date provisions, down from 1.46% in June).
u Impairment on other assets (net)
Every year, usually during the last quarter, the Group evaluates whether an adjustment to the goodwill generated in the acquisition of the subsidiaries is necessary. The accounting rules require this analysis to be carried out earlier should any trigger events occur, which happened in the second quarter of this year, given that the global economic environment has been significantly affected by the COVID-19 crisis.
Specifically, the trigger events for this exercise were as follows:
•Changes in the economic environment where a decrease of the GDP is expected in all countries this year and where recovery will take 2 or 3 years.
•A generalised reduction in interest rates, which is expected to last longer than expected before the crisis began.
| Net loan-loss provisions | ||||||||
| EUR million | ||||||||
| constant euros | |||||||
•The increase of discount rates to reflect greater volatility and risk premiums.
This analysis resulted in an adjustment in the valuation of goodwill in the second quarter of 2020 of EUR 10,100 million (Santander UK: EUR 6,101 million; Santander US: EUR 2,330 million; Santander Bank Polska: EUR 1,192 million; Santander Consumer Nordics: 277 million and Other: 200 million). This adjustment does not affect cash generation and has no impact on the Group’s CET1 ratio or tangible net value per share (TNAV).
Consequently, the impairment of other assets (net) in the first nine months of 2020 amounted to EUR 10,256 million. In the first nine months of 2019, this line was EUR 1,547 million.
u Gains or losses on non-financial assets and investments (net)
Net gains on non-financial assets and investments were EUR 89 million in the first nine months of 2020, compared to EUR 253 million in the same period of 2019, when capital gains from the sale of 51% of our stake in Prisma Medios de Pago S.A. and the revaluation of the remaining stake (49%) were recorded.
u Gains or losses on non-current assets held for sale not classified as discontinued operations
This item, which mainly includes impairment of foreclosed assets recorded and the sale of properties acquired upon foreclosure, totalled EUR -130 million in the first nine months of 2020, compared to EUR -266 million in the first nine months of 2019.
u Profit before tax
Profit before tax was EUR -3,271 million, affected by the adjustment in the valuation of goodwill, compared to EUR 8,712 million posted in the first nine months of 2019.
u Income tax
As with goodwill, and due to the impact that the crisis arising from COVID-19 may have on the current and future performance of our businesses, an adjustment of EUR 2,500 million was made to deferred tax assets of the Spanish consolidated fiscal group in the second quarter of 2020. As a result, the total corporate income tax was EUR 5,020 million (EUR 3,740 million in the first nine months of 2019).
u Attributable profit to non-controlling interests
Attributable profit to non-controlling interests amounted to EUR 757 million, down 39% year-on-year (-32% excluding the exchange rate impact), due to lower profit obtained by Group companies, on top of the share buyback in Mexico last year and the increased stake in SC USA.
u Attributable profit to the parent
Profit attributable to the parent amounted to EUR -9,048 million in the first nine months of 2020, compared with EUR 3,732 million in the first nine months of 2019. RoTE stood at 3.30% and earnings per share stood at EUR -0.570.
| 12 | | January - September 2020 | ||||||
u Underlying attributable profit to the parent
The attributable profit to the parent recorded in the first nine months was affected, in 2020 and 2019, by results (net of tax) that are outside the ordinary course performance of our business and distort the year-on-year comparison, and are detailed below:
•In the first nine months of 2020, of note was the valuation adjustment of goodwill ascribed to various Group units of EUR -10,100 million in the second quarter, with the previously detailed breakdown in Impairment on other assets (net), the valuation adjustment to deferred tax assets of the Spanish consolidated fiscal group with an impact of EUR -2,500 million and restructuring costs and other provisions with a net impact of EUR -106 million, of which EUR -46 million were recognised in the first quarter and EUR -100 million in the second quarter. The total amount of these results was EUR -12,706 million.
•In the first nine months of 2019, capital gains from the sale of 51% of our stake in the Argentinian entity Prisma Medios de Pago S.A. and the revaluation of the remaining 49% (EUR 130 million), capital losses related to real estate assets in Spain (EUR -180 million), PPI provisions to cover potential claims in the UK (EUR -183 million) and restructuring costs (EUR -724 million) and the revision of the goodwill ascribed to Santander UK, which resulted in the recording of an impairment of EUR 1,491 million in the third quarter at the Corporate Centre. The combined amount of all these totalled EUR -2,448 million.
Excluding these results from the various P&L lines where they are recorded, and incorporating them separately in the net capital gains and provisions line, the adjusted or underlying attributable profit to the parent was EUR 3,658 million in the first nine months of 2020 and EUR 6,180 million in the first nine months of 2019, 41% lower year-on-year (-33% excluding the FX impact), strongly conditioned by the rise in provisions, mostly related to COVID-19.
Before the recording of loan-loss provisions, net operating income (total income less operating expenses) of Grupo Santander was EUR 17,879 million, a 9% decrease year-on-year, though this becomes a 3% increase excluding the FX impact, with the following performance of the latter by line and region:
By line:
•Total income remained unchanged driven by higher gains on financial transactions, offsetting flat net interest income and the fall in net fee income and other operating income (lower dividends, lower results of entities accounted for by the equity method and greater contribution to the SRF).
•Costs were 2% lower, with broad-based declines across countries, mainly in Europe.
By region:
•Europe decreased 6% with falls in most markets (except SCF and "Other Europe", mainly SCIB).
•In North America, net operating income was 1% higher versus 2019. By country, the US fell 1% and Mexico increased 7%.
•In South America, 6% growth with rises of 4% in Brazil, 3% in Chile and 45% in Argentina.
In the first nine months of 2020, the Group’s underlying RoTE was 7.08%, underlying RoRWA was 1.01% and underlying earnings per share EUR 0.195 (11.86%, 1.63% and EUR 0.352, respectively in the same period of 2019).
| Summarised underlying income statement | ||||||||||||||||||||||||||||||||||||||||||||||||||
| EUR million | Change | Change | ||||||||||||||||||||||||||||||||||||||||||||||||
| Q3'20 | Q2'20 | % | % excl. FX | 9M'20 | 9M'19 | % | % excl. FX | |||||||||||||||||||||||||||||||||||||||||||
| Net interest income | 7,773 | 7,715 | 0.8 | 4.5 | 23,975 | 26,442 | (9.3) | 0.1 | ||||||||||||||||||||||||||||||||||||||||||
| Net fee income | 2,423 | 2,283 | 6.1 | 9.0 | 7,559 | 8,818 | (14.3) | (4.8) | ||||||||||||||||||||||||||||||||||||||||||
Gains (losses) on financial transactions (1) | 652 | 781 | (16.5) | (11.9) | 1,725 | 935 | 84.5 | 104.5 | ||||||||||||||||||||||||||||||||||||||||||
| Other operating income | 239 | (75) | — | — | 346 | 707 | (51.1) | (55.7) | ||||||||||||||||||||||||||||||||||||||||||
| Total income | 11,087 | 10,704 | 3.6 | 7.2 | 33,605 | 36,902 | (8.9) | 0.3 | ||||||||||||||||||||||||||||||||||||||||||
| Administrative expenses and amortisations | (5,073) | (5,076) | (0.1) | 3.1 | (15,726) | (17,309) | (9.1) | (2.1) | ||||||||||||||||||||||||||||||||||||||||||
| Net operating income | 6,014 | 5,628 | 6.9 | 11.0 | 17,879 | 19,593 | (8.7) | 2.5 | ||||||||||||||||||||||||||||||||||||||||||
| Net loan-loss provisions | (2,535) | (3,118) | (18.7) | (14.3) | (9,562) | (6,748) | 41.7 | 57.9 | ||||||||||||||||||||||||||||||||||||||||||
| Other gains (losses) and provisions | (304) | (625) | (51.4) | (49.9) | (1,301) | (1,422) | (8.5) | 0.3 | ||||||||||||||||||||||||||||||||||||||||||
| Profit before tax | 3,175 | 1,885 | 68.4 | 72.6 | 7,016 | 11,423 | (38.6) | (30.5) | ||||||||||||||||||||||||||||||||||||||||||
| Tax on profit | (1,128) | (208) | 442.3 | 431.3 | (2,596) | (3,994) | (35.0) | (26.0) | ||||||||||||||||||||||||||||||||||||||||||
| Profit from continuing operations | 2,047 | 1,677 | 22.1 | 25.9 | 4,420 | 7,429 | (40.5) | (32.9) | ||||||||||||||||||||||||||||||||||||||||||
| Net profit from discontinued operations | — | — | — | — | — | — | — | — | ||||||||||||||||||||||||||||||||||||||||||
| Consolidated profit | 2,047 | 1,677 | 22.1 | 25.9 | 4,420 | 7,429 | (40.5) | (32.9) | ||||||||||||||||||||||||||||||||||||||||||
| Non-controlling interests | (297) | (146) | 103.4 | 106.0 | (762) | (1,249) | (39.0) | (32.6) | ||||||||||||||||||||||||||||||||||||||||||
| Net capital gains and provisions | — | (12,660) | (100.0) | (100.0) | (12,706) | (2,448) | 419.0 | 411.1 | ||||||||||||||||||||||||||||||||||||||||||
| Attributable profit to the parent | 1,750 | (11,129) | — | — | (9,048) | 3,732 | — | — | ||||||||||||||||||||||||||||||||||||||||||
Underlying attributable profit to the parent (2) | 1,750 | 1,531 | 14.3 | 18.2 | 3,658 | 6,180 | (40.8) | (32.9) | ||||||||||||||||||||||||||||||||||||||||||
(1) Includes exchange differences. (2) Excludes net capital gains and provisions, mainly goodwill and DTA impairment.
January - September 2020 | | 13 | ||||||
è Results performance compared to the previous quarter
In the third quarter, there was no impact from the items recorded in the net capital gains and provisions, while the second quarter recorded EUR -12.660 million (mainly due to the aforementioned valuation adjustment of both the goodwill ascribed to various Group units and deferred tax assets of the Spanish consolidated fiscal group).
As a result, attributable profit to the parent in the third quarter of 2020 amounted to EUR 1,750 million compared to EUR -11,129 million in the second quarter including net capital gains and provisions, and EUR 1,531 excluding this impact. Regarding the latter, profit was 14% higher in the quarter (+18% excluding the FX effect, which had a negative impact of 4 percentage points and 3 percentage points in income and costs, respectively). By line:
•Total income surged 7%, underpinned by growth in net interest income (+4%) and net fee income (+9%). On the negative side, there were decreases in dividend income (seasonally higher in the second quarter) and lower gains on financial transactions after an exceptionally high second quarter from SCIB.
• Costs were up 3%, partly affected by the adjustment of collective labour agreements (Argentina, Brazil), technology expenses and greater amortisations.
• Loan-loss provisions fell by 14% due to the high level of provisions relating to the health crisis in the second quarter.
| Net operating income | ||||||||
| EUR million | ||||||||
| constant euros | |||||||
| Underlying attributable profit to the parent* | ||||||||
| EUR million | ||||||||
| constant euros | |||||||
(*) Excluding net capital gains and provisions.
| 14 | | January - September 2020 | ||||||
| Response to the COVID-19 crisis Business model | ||||||||||||||||||||||||||
| Balance sheet | ||||||||||||||||||||||||||
| Grupo Santander. Condensed balance sheet | ||||||||||||||||||||||||||||||||
| EUR million | ||||||||||||||||||||||||||||||||
| Change | ||||||||||||||||||||||||||||||||
| Assets | Sep-20 | Sep-19 | Absolute | % | Dec-19 | |||||||||||||||||||||||||||
| Cash, cash balances at central banks and other demand deposits | 148,175 | 92,601 | 55,574 | 60.0 | 101,067 | |||||||||||||||||||||||||||
| Financial assets held for trading | 117,654 | 115,884 | 1,770 | 1.5 | 108,230 | |||||||||||||||||||||||||||
| Debt securities | 34,107 | 36,172 | (2,065) | (5.7) | 32,041 | |||||||||||||||||||||||||||
| Equity instruments | 7,235 | 10,559 | (3,324) | (31.5) | 12,437 | |||||||||||||||||||||||||||
| Loans and advances to customers | 247 | 480 | (233) | (48.5) | 355 | |||||||||||||||||||||||||||
| Loans and advances to central banks and credit institutions | — | — | — | — | — | |||||||||||||||||||||||||||
| Derivatives | 76,065 | 68,673 | 7,392 | 10.8 | 63,397 | |||||||||||||||||||||||||||
| Financial assets designated at fair value through profit or loss | 67,007 | 71,940 | (4,933) | (6.9) | 66,980 | |||||||||||||||||||||||||||
| Loans and advances to customers | 29,215 | 24,705 | 4,510 | 18.3 | 31,147 | |||||||||||||||||||||||||||
| Loans and advances to central banks and credit institutions | 30,850 | 39,037 | (8,187) | (21.0) | 28,122 | |||||||||||||||||||||||||||
| Other (debt securities an equity instruments) | 6,942 | 8,198 | (1,256) | (15.3) | 7,711 | |||||||||||||||||||||||||||
| Financial assets at fair value through other comprehensive income | 117,461 | 120,659 | (3,198) | (2.7) | 125,708 | |||||||||||||||||||||||||||
| Debt securities | 105,574 | 113,625 | (8,051) | (7.1) | 118,405 | |||||||||||||||||||||||||||
| Equity instruments | 3,075 | 2,695 | 380 | 14.1 | 2,863 | |||||||||||||||||||||||||||
| Loans and advances to customers | 8,812 | 4,298 | 4,514 | 105.0 | 4,440 | |||||||||||||||||||||||||||
| Loans and advances to central banks and credit institutions | — | 41 | (41) | (100.0) | — | |||||||||||||||||||||||||||
| Financial assets measured at amortised cost | 950,571 | 987,750 | (37,179) | (3.8) | 995,482 | |||||||||||||||||||||||||||
| Debt securities | 27,316 | 39,850 | (12,534) | (31.5) | 29,789 | |||||||||||||||||||||||||||
| Loans and advances to customers | 872,440 | 886,520 | (14,080) | (1.6) | 906,276 | |||||||||||||||||||||||||||
| Loans and advances to central banks and credit institutions | 50,815 | 61,380 | (10,565) | (17.2) | 59,417 | |||||||||||||||||||||||||||
| Investments in subsidiaries, joint ventures and associates | 7,679 | 8,346 | (667) | (8.0) | 8,772 | |||||||||||||||||||||||||||
| Tangible assets | 33,277 | 35,399 | (2,122) | (6.0) | 35,235 | |||||||||||||||||||||||||||
| Intangible assets | 15,698 | 27,383 | (11,685) | (42.7) | 27,687 | |||||||||||||||||||||||||||
| Goodwill | 12,359 | 24,109 | (11,750) | (48.7) | 24,246 | |||||||||||||||||||||||||||
| Other intangible assets | 3,339 | 3,274 | 65 | 2.0 | 3,441 | |||||||||||||||||||||||||||
| Other assets | 56,720 | 57,923 | (1,203) | (2.1) | 53,534 | |||||||||||||||||||||||||||
| Total assets | 1,514,242 | 1,517,885 | (3,643) | (0.2) | 1,522,695 | |||||||||||||||||||||||||||
| Liabilities and shareholders' equity | ||||||||||||||||||||||||||||||||
| Financial liabilities held for trading | 88,128 | 85,797 | 2,331 | 2.7 | 77,139 | |||||||||||||||||||||||||||
| Customer deposits | — | — | — | — | — | |||||||||||||||||||||||||||
| Debt securities issued | — | — | — | — | — | |||||||||||||||||||||||||||
| Deposits by central banks and credit institutions | — | — | — | — | — | |||||||||||||||||||||||||||
| Derivatives | 73,044 | 70,119 | 2,925 | 4.2 | 63,016 | |||||||||||||||||||||||||||
| Other | 15,084 | 15,678 | (594) | (3.8) | 14,123 | |||||||||||||||||||||||||||
| Financial liabilities designated at fair value through profit or loss | 59,459 | 68,263 | (8,804) | (12.9) | 60,995 | |||||||||||||||||||||||||||
| Customer deposits | 40,469 | 42,417 | (1,948) | (4.6) | 34,917 | |||||||||||||||||||||||||||
| Debt securities issued | 4,362 | 3,648 | 714 | 19.6 | 3,758 | |||||||||||||||||||||||||||
| Deposits by central banks and credit institutions | 14,628 | 22,073 | (7,445) | (33.7) | 22,194 | |||||||||||||||||||||||||||
| Other | — | 125 | (125) | (100.0) | 126 | |||||||||||||||||||||||||||
| Financial liabilities measured at amortised cost | 1,237,314 | 1,211,114 | 26,200 | 2.2 | 1,230,745 | |||||||||||||||||||||||||||
| Customer deposits | 802,430 | 771,868 | 30,562 | 4.0 | 789,448 | |||||||||||||||||||||||||||
| Debt securities issued | 240,195 | 254,638 | (14,443) | (5.7) | 258,219 | |||||||||||||||||||||||||||
| Deposits by central banks and credit institutions | 169,646 | 151,674 | 17,972 | 11.8 | 152,969 | |||||||||||||||||||||||||||
| Other | 25,043 | 32,934 | (7,891) | (24.0) | 30,109 | |||||||||||||||||||||||||||
| Liabilities under insurance contracts | 970 | 731 | 239 | 32.7 | 739 | |||||||||||||||||||||||||||
| Provisions | 10,118 | 14,364 | (4,246) | (29.6) | 13,987 | |||||||||||||||||||||||||||
| Other liabilities | 26,943 | 29,090 | (2,147) | (7.4) | 28,431 | |||||||||||||||||||||||||||
| Total liabilities | 1,422,932 | 1,409,359 | 13,573 | 1.0 | 1,412,036 | |||||||||||||||||||||||||||
| Shareholders' equity | 114,493 | 121,668 | (7,175) | (5.9) | 124,239 | |||||||||||||||||||||||||||
| Capital stock | 8,309 | 8,309 | — | — | 8,309 | |||||||||||||||||||||||||||
| Reserves | 116,894 | 111,289 | 5,605 | 5.0 | 111,077 | |||||||||||||||||||||||||||
| Attributable profit to the Group | (9,048) | 3,732 | (12,780) | — | 6,515 | |||||||||||||||||||||||||||
| Less: dividends | (1,662) | (1,662) | — | — | (1,662) | |||||||||||||||||||||||||||
| Other comprehensive income | (32,747) | (23,721) | (9,026) | 38.1 | (24,168) | |||||||||||||||||||||||||||
| Minority interests | 9,564 | 10,579 | (1,015) | (9.6) | 10,588 | |||||||||||||||||||||||||||
| Total equity | 91,310 | 108,526 | (17,216) | (15.9) | 110,659 | |||||||||||||||||||||||||||
| Total liabilities and equity | 1,514,242 | 1,517,885 | (3,643) | (0.2) | 1,522,695 | |||||||||||||||||||||||||||
January - September 2020 | | 15 | ||||||
| Response to the COVID-19 crisis Business model | ||||||||||||||||||||||||||
| Balance sheet | ||||||||||||||||||||||||||
GRUPO SANTANDER BALANCE SHEET
•Strong negative exchange rate impact on a year-on-year basis (-6 pp in loans and -7 pp in customer funds).
•Excluding this impact, the following movements were recorded in the quarter:
–Gross loans and advances to customers excluding reverse repos fell 1% driven by the overall decrease in large corporates following the peak in activity at the beginning of the pandemic, the sale of Puerto Rico and a non-performing mortgage portfolio sale in Spain.
–Customer funds increased 1%, with 1% growth in deposits excluding repos and a 5% rise in mutual funds.
•Compared to September 2019:
–Gross loans and advances to customers excluding reverse repos rose 5% year-on-year in constant euros with the 10 core markets growing, particularly in the Americas.
–Customer funds (excluding repos) increased 8% in constant euros, driven by deposits excluding repos, which rose 9%. Growth in our 10 core markets.
è Loans and advances to customers
Gross loans and advances to customers stood at EUR 910,714 million in September 2020. The Group uses gross loans and advances to customers excluding reverse repos for the purpose of analysing traditional commercial banking loans.
•In the quarter, gross loans and advances to customers excluding reverse repos fell 2%. Without the exchange rate impact, they were 1% lower, mostly derived from the reduction of activity in corporates after the sharp increase recorded in the first weeks of the pandemic. This was primarily reflected in "Other Europe", where the majority of wholesale banking is included (-5%). Falls were also recorded in Spain (due to the sale of a non-performing mortgage portfolio) and the US (due to the sale of the retail and commercial bank in Puerto Rico, with an impact of EUR 2.2 billion).
On the other hand, the main increases were recorded in South America, Portugal, and, to a lesser extent, the UK, driven by new mortgage lending and SME and corporate loans boosted by state-guaranteed schemes.
Compared to September 2019, gross loans and advances to customers excluding reverse repos fell 1%. Excluding the exchange rate impact, 5% growth, with the following detail by region:
•In Europe, 3% growth with all markets increasing. Portugal rose 6%, notably SMEs and mortgages, the UK 4%, driven by strong residential mortgage activity and the government programmes for corporate customers. Spain grew 2% strongly backed by ICO programmes though negatively impacted by the aforementioned portfolio sale, SCF increased 2% with rises in the Nordics, Germany and France, which absorbed the falls in Spain. Poland was up 1% and "Other Europe" increased 11%.
•In North America, the US grew 6% driven by auto loans, corporates and SCIB, and Mexico 7% due to corporates and SCIB, leading to a 6% increase in the region.
•Growth in South America was 17%, with Argentina growing 32% driven by SMEs and cards, Brazil +20% with positive performance in all segments and Chile +10% driven by corporates and large corporates. Uruguay rose 15%.
Gross loans and advances to customers excluding reverse repos maintained a balanced structure: individuals (44%), consumer credit (17%), SMEs and corporates (26%) and SCIB (13%).
| Gross loans and advances to customers (excl. reverse repos) | Gross loans and advances to customers (excl. reverse repos) | |||||||||||||||||||
| EUR billion | % operating areas. September 2020 | |||||||||||||||||||
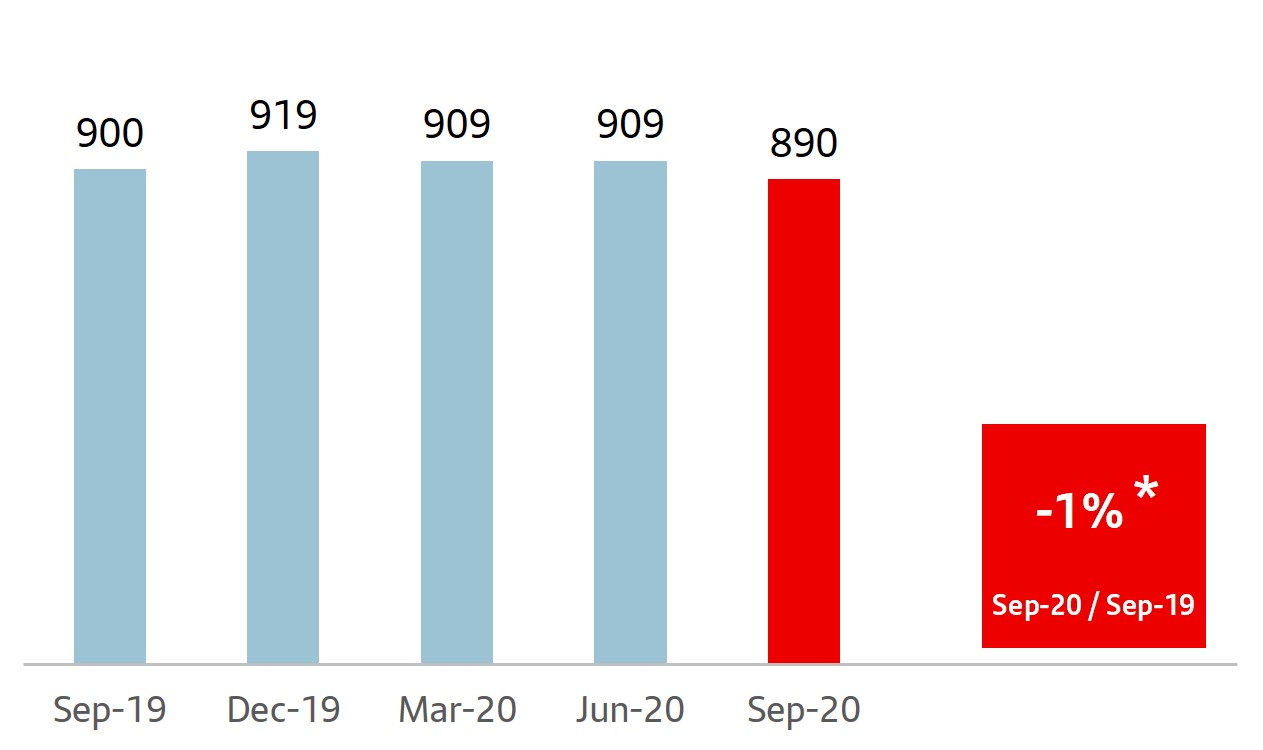 | 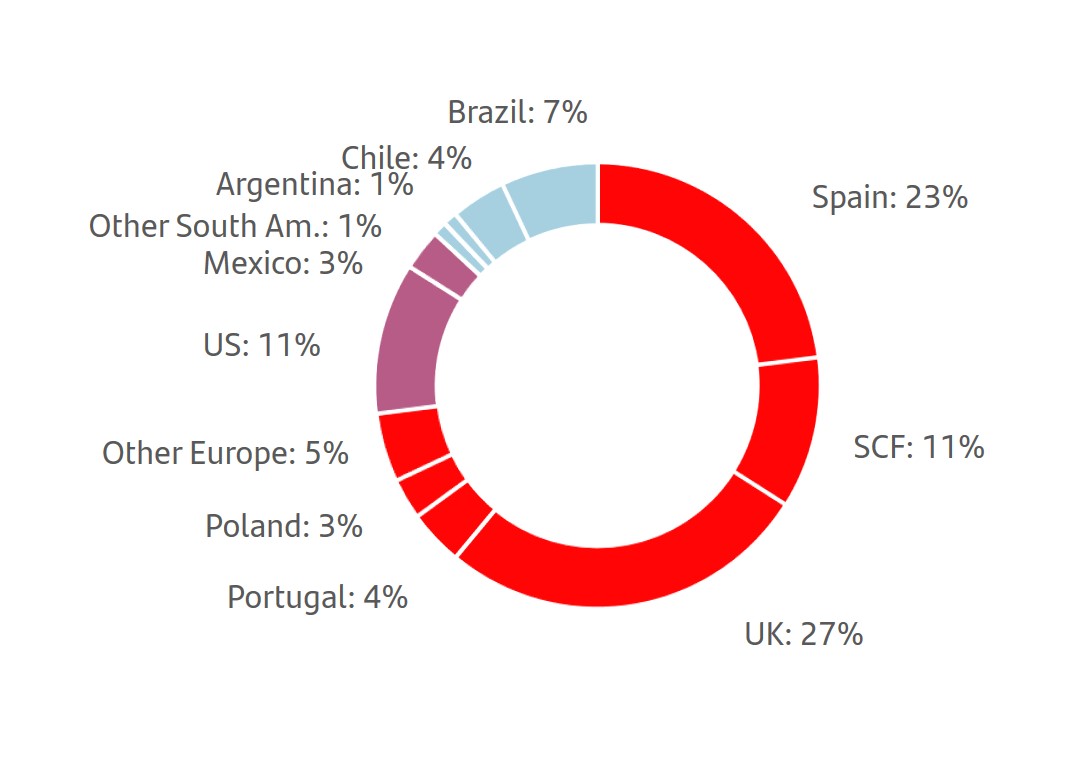 | |||||||||||||||||||
(*) In constant EUR: +5%
| 16 | | January - September 2020 | ||||||
| Response to the COVID-19 crisis Business model | ||||||||||||||||||||||||||
| Balance sheet | ||||||||||||||||||||||||||
è Customer funds
Customer deposits amounted to EUR 842,899 million. The Group uses customer funds (customer deposits excluding repos, plus mutual funds) for the purpose of analysing traditional retail banking funds.
•In the third quarter, customer funds had no material change. Excluding exchange rate impacts, growth was 1%:
–By product: customer deposits excluding repos rose 1% (demand deposits: +1%, time deposits: -2%) whilst mutual funds increased 5%.
–By market: 10% growth in Argentina, 5% in Brazil and 1%-2% growth across all European markets. In remaining countries, Mexico fell 1%, Chile decreased 3% and the US dropped 4% due to the sale of Puerto Rico (c.EUR 3.5 billion). By region, increases in South America (+3%) and Europe(+1%) while North America was down 3% in the quarter.
•Compared to September 2019, customer funds remained stable. Excluding the exchange rate impact, increases of 8%, as follows:
–By product, deposits excluding repos rose 9%. Demand deposits (+12%) increased in the ten core markets and time deposits fell 1% as the strong decrease in all European countries (except the UK) was partially offset by the growth recorded in the Americas except Chile. Mutual funds rose only 1%, heavily conditioned by market volatility in the first quarter of 2020 and part of the second quarter.
–By market, customer funds rose in all of them. Growth in all countries in the Americas with growth rates over 10% (the US: +17%; Mexico: +13%; Brazil: +20%; Chile: +11%; Argentina: +74% y Uruguay: +28%). In Europe, growth ranged between 1% in Spain and 10% in Poland.
With this performance, the weight of demand deposits as a percentage of total customer funds rose 5 pp in the last 12 months to 65%, which resulted in a better cost of deposits.
In addition to capturing customer deposits, Grupo Santander, for strategic reasons, maintains a selective policy of issuing securities in the international fixed income markets and strives to adapt the frequency and volume of its market operations to the structural liquidity needs of each unit, as well as to the receptiveness of each market.
In the first nine months of 2020, the Group issued:
•Medium- and long-term covered bonds placed in the market of EUR 6,481 million and senior debt amounting to EUR 9,099 million.
•There were EUR 12,693 million of securitisations placed in the market and maturities were extended by EUR 1 billion.
•Issuances to meet the TLAC (Total Loss-Absorbing Capacity) requirement amounting to EUR 11,724 million, in order to strengthen the Group’s situation (senior non-preferred: EUR 9,875 million, preferred: EUR 1,500 million, subordinated debt: EUR 349 million), including a EUR 1 billion senior non-preferred green bond issuance.
•Maturities of medium- and long-term debt of EUR 24,493 million.
The net loan-to-deposit ratio was 108% (112% in September 2019). The ratio of deposits plus medium- and long-term funding to the Group’s loans was 117%, underscoring the comfortable funding structure.
The Group's access to wholesale funding markets as well as the cost of issuances depends, in part, on the ratings of the rating agencies.
In 2020, the three main rating agencies reviewed their ratings and outlook for Spain's sovereign debt, the banking system and Banco Santander S.A.'s debt, (for the latter, S&P will review its rating in the fourth quarter). For Banco Santander S.A., Fitch confirmed its ratings (long-term senior non-preferred debt at A- and short-term at F2), while Moody's maintained its ratings at A2 for long term debt and P-1 for short-term. Fitch and S&P changed the outlook from stable to negative due to the economic consequences that the COVID-19 crisis could have on the ratings in the long term. Moody's, on the other hand, maintained its ratings.
| Customer funds | Customer funds | |||||||||||||||||||
| EUR billion | % operating areas. September 2020 | |||||||||||||||||||
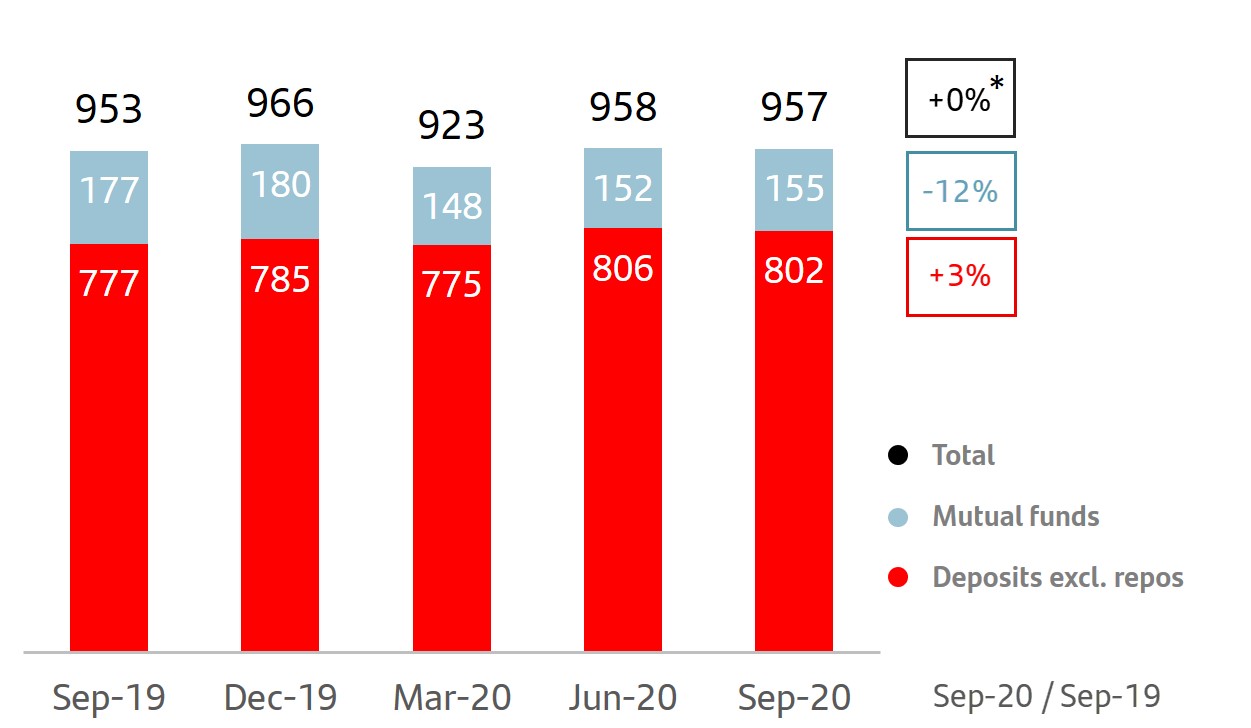 | 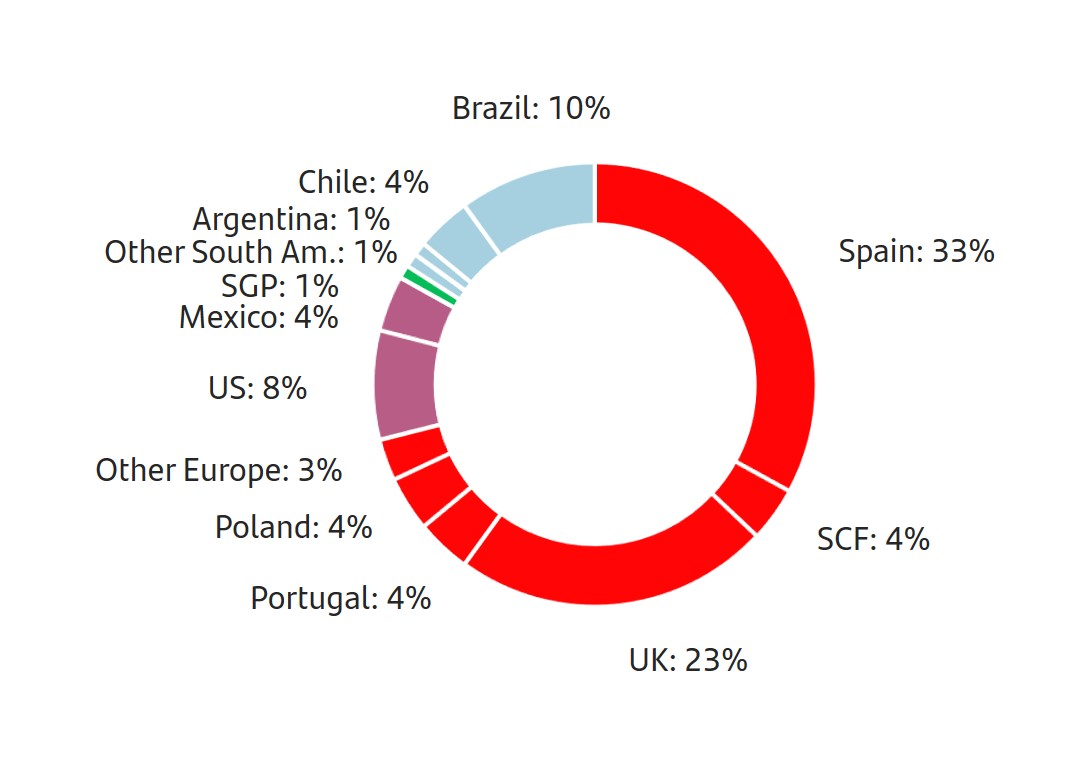 | |||||||||||||||||||
(*) In constant EUR: +8%
January - September 2020 | | 17 | ||||||
SOLVENCY RATIOS
•The CET1 ratio reached the top end of our target range at 11.98%, after increasing 14 bps in the quarter.
•This ratio was obtained after the 19 bps accrual (6 bps in the second quarter and 13 bps in the third quarter) for a payment to shareholders of EUR 0.10 per share1 to be made in 2021.
•Tangible equity per share stood at EUR 3.98, in line with June, impacted by the depreciation of some currencies.
•The fully-loaded leverage ratio was 5.2%.
At the end of the quarter, the total phased-in capital ratio stood at 15.61% and the CET1 ratio (phased-in and fully loaded) at 11.98%, after increasing 14 bps in the quarter. We have a strong capital base, comfortably meeting the minimum levels required by the European Central Bank on a consolidated basis (13.02% for the total capital ratio and 8.86% for the CET1 ratio). This results in a CET1 management buffer of 312 bps, compared to the pre-COVID-19 buffer of 189 bps.
In the quarter, we continued to generate capital organically, increasing 40 bps due to underlying profit and management of risk weighted assets. Additionally, -13 bps for the accrual for a payment to shareholders of EUR 0.10 per share1, to be made in 2021.
These, together with the positive impacts from corporate transactions (mainly related to the share buyback in SC USA and the sale of the bank in Puerto Rico) led to a total increase of 37 bps.
On the other hand, there were several negative impacts recorded in the quarter, of which -15 bps correspond to models in the UK and Spain, and -8 bps to markets and exchange rates.
Had the IFRS 9 transitional arrangement not been applied, the total impact on the CET1 would have been -41 bps.
| Eligible capital. September 2020* | Fully-loaded capital ratio* | |||||||||||||||||||
| EUR million | % | |||||||||||||||||||
| Phased-in | Fully-loaded | 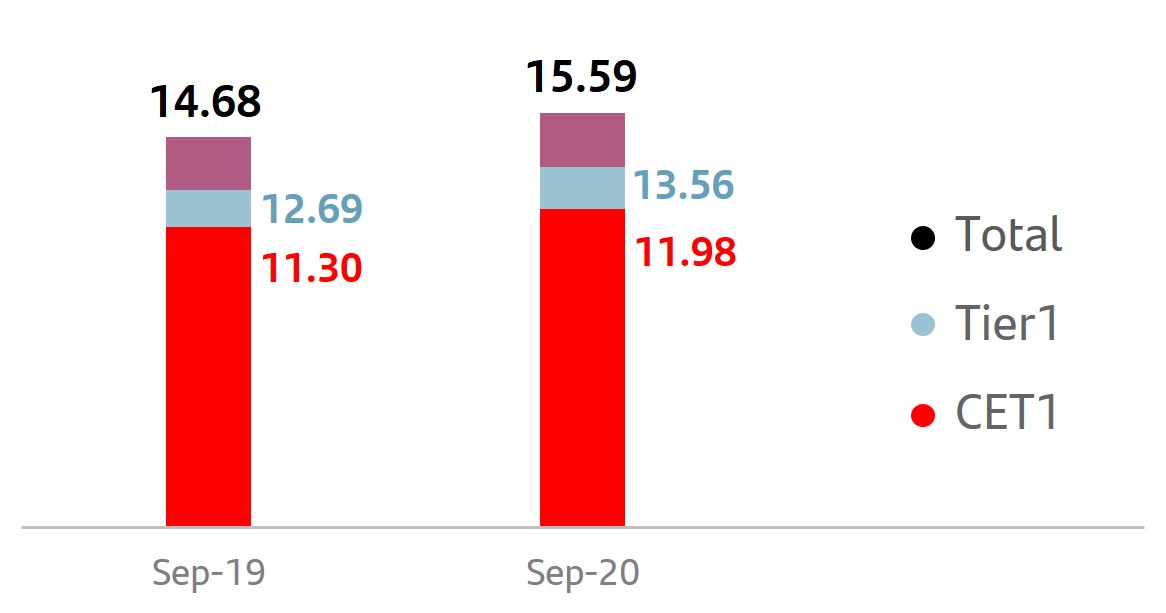 | ||||||||||||||||||
| CET1 | 66,528 | 66,528 | ||||||||||||||||||
| Basic capital | 75,641 | 75,268 | ||||||||||||||||||
| Eligible capital | 86,628 | 86,547 | ||||||||||||||||||
| Risk-weighted assets | 555,122 | 555,122 | ||||||||||||||||||
| CET1 capital ratio | 11.98 | 11.98 | ||||||||||||||||||
| T1 capital ratio | 13.63 | 13.56 | ||||||||||||||||||
| Total capital ratio | 15.61 | 15.59 | ||||||||||||||||||
| CET1 evolution* | ||
| % | ||
 | ||
| 18 | | January - September 2020 | ||||||
RISK MANAGEMENT
•Santander’s Risk management in the third quarter remained focused on protecting all our stakeholders in the current COVID-19 pandemic environment. The Group continued to support and monitor its customers’ performance and payment capacity as well as ensuring that business continuity plans remain effective so that we keep serving our clients under the highest quality standards.
•The NPL ratio decreased to 3.15% (-11 bps in the quarter) at the end of September, mainly due to an NPL portfolio sale in Spain. Cost of credit remained at 1.27% while the NPL coverage rate increased to 76%, a 4 pp increase compared to the previous quarter, driven by the aforementioned reduction of non-performing loans.
•Our market risk exposure maintained its low profile, with stable VaR levels despite the persisting uncertainty stemming from COVID-19.
•The operational risk profile remained stable, with a similar distribution of losses by category as in the previous quarter, despite the exceptional circumstances. In addition to reinforcing existing controls, new operating guidelines have been launched.
u COVID-19 risk management
Santander’s priority continues to be the protection of our employees, customers and shareholders’ health as well as to continue helping to mitigate the economic and financial impact of the health crisis.
In this regard, we are still focused on the identification of vulnerable customers, groups and sectors; close monitoring of their needs; scenario analysis exercises to assess potential impacts; our risk control framework appropriateness under the current ever-evolving environment; and reinforcement of collections & recoveries capabilities in all our geographies.
As mentioned in the previous quarter, the constant interaction and coordination among our local units and the Group has enabled us to share best practices and adapt strategies to each local market, which is a key advantage when addressing the current health crisis across all our geographies.
The additional governance activated, including the Special Situation Committees, remains critical to monitor and address the current situation and its possible effects.
Continuous monitoring of key indicators is regularly updated and reported to the board and senior management, in order to facilitate the decision-making process.
Regarding Santander’s support measures by quarter-end, the Group had provided support to over 6 million customers across our markets:
•By providing liquidity and credit facilities for individuals and businesses through government programmes, which amounted to EUR 34 billion (EUR 9 billion more than the previous quarter), 4% of the loan portfolio.
•As of September, the Group had granted EUR 114 billion in moratoria measures. Circa 60% of this amount are residential mortgages, mainly in the UK, where the portfolio has a low average LTV (<50%). Consumer moratoria are mostly auto loans (63%, EUR 13 billion). The pace of origination of new moratoria slowed down during the quarter.
•A 66% of the total moratoria (EUR 75 billion) have already expired, with only 2% in stage 3.
•The outstanding moratoria totalled EUR 39 billion, of which 62% are residential mortgages, mainly in Europe, and 8% are consumer loans. In SMEs and corporates, moratorias are complemented with liquidity facilities under government guarantees.
•We continuously monitor the evolution of the credit quality of our portfolios. Observed evolution of expired moratoria and the monitoring of the credit quality of our portfolios is driving us to improve our year-end cost of credit estimations to around 130 bps, improving from the previous forecast of 140-150 bps.
January - September 2020 | | 19 | ||||||
u Credit risk management
The Group’s NPL ratio in September decreased by 11 bps in the quarter to 3.15% (-32 bps year-on-year), mainly due to sales of non-performing loans in Spain, together with COVID-19 public and private customer support programmes helping to contain potential credit quality deterioration.
Regarding credit risk performance, non-performing loans amounted to EUR 30,894 million in September, a 5% decrease compared to the previous quarter, in constant euros.
Loan-loss provisions in the third quarter amounted to EUR 2,535 million, 22% higher YoY in constant euros (-14% vs previous quarter). Year-to-date provisions amounted to EUR 9,562 million at the end of September 2020, with an increase of 58% year-on-year in constant euros, mainly explained by:
•Additional provisions reflecting the IFRS 9 forward- looking view, based on a long-term approach, taken into account by regulators and supervisors, towards potential macroeconomic scenarios in the COVID-19 context.
•Collective and individual assessment to reflect expected credit losses for assets where credit risk is deemed to have increased. In particular, the Group is continuously monitoring the sectors that have been most affected by the financial impacts of the pandemic, including those related to leisure and tourism, the automotive industry and the oil & gas sector.
As in all sectors, the Group has a well-diversified portfolio in terms of footprint, which is a mitigating factor even under these circumstances, with the pandemic and its consequences evolving at different paces in the different geographical areas. In addition, governments and central banks have extended specific support measures to companies in these sectors in the most affected countries.
•Year-to-date loan growth stimulated by economic support programmes.
Consequently the Group's cost of credit increased to 1.27% if we consider provisions over the last 12 months (1.33% considering annualised year-to-date provisions, 13 bps lower than in June).
Total loan-loss reserves in the third quarter stood at EUR 23,465 million, with a non-performing loan coverage ratio of 76% due to the previously mentioned reduction in non-performing loans.
It should also be taken into consideration that a significant part of our portfolios in Spain and the UK have real estate collateral, which requires lower coverage levels.
| Credit risk | ||||||||||||||||||||||||||
| EUR million | ||||||||||||||||||||||||||
| Sep-20 | Sep-19 | Chg (%) | Dec-19 | |||||||||||||||||||||||
| Non-performing loans | 30,894 | 34,326 | (10.0) | 33,799 | ||||||||||||||||||||||
| NPL ratio (%) | 3.15 | 3.47 | 3.32 | |||||||||||||||||||||||
| Loan-loss allowances | 23,465 | 23,112 | 1.5 | 22,965 | ||||||||||||||||||||||
| For impaired assets | 13,386 | 14,473 | (7.5) | 14,093 | ||||||||||||||||||||||
| For other assets | 10,079 | 8,639 | 16.7 | 8,872 | ||||||||||||||||||||||
| Coverage ratio (%) | 76 | 67 | 68 | |||||||||||||||||||||||
| Cost of credit (%) | 1.27 | 1.00 | 1.00 | |||||||||||||||||||||||
| NPL and coverage ratios. Total Group | ||
| % | ||
| Key metrics geographic performance. September 2020 | ||||||||||||||||||||||||||
| % | Change (bps) | |||||||||||||||||||||||||
| NPL ratio | QoQ | YoY | Coverage ratio | |||||||||||||||||||||||
| EUROPE | 3.13 | (11) | (34) | 55.8 | ||||||||||||||||||||||
| Spain | 5.98 | (57) | (125) | 46.0 | ||||||||||||||||||||||
| SCF | 2.50 | (2) | 25 | 108.2 | ||||||||||||||||||||||
| United Kingdom | 1.30 | 22 | 22 | 44.5 | ||||||||||||||||||||||
| Portugal | 4.25 | (18) | (65) | 64.3 | ||||||||||||||||||||||
| Poland | 4.58 | 1 | 23 | 70.8 | ||||||||||||||||||||||
| NORTH AMERICA | 1.96 | 23 | (25) | 201.6 | ||||||||||||||||||||||
| USA | 1.85 | 36 | (33) | 228.8 | ||||||||||||||||||||||
| Mexico | 2.33 | (17) | 3 | 132.6 | ||||||||||||||||||||||
| SOUTH AMERICA | 4.40 | (34) | (41) | 97.2 | ||||||||||||||||||||||
| Brazil | 4.64 | (43) | (69) | 114.9 | ||||||||||||||||||||||
| Chile | 4.76 | (23) | 28 | 59.7 | ||||||||||||||||||||||
| Argentina | 2.88 | (27) | (76) | 186.3 | ||||||||||||||||||||||
| GROUP | 3.15 | (11) | (32) | 76.0 | ||||||||||||||||||||||
| 20 | | January - September 2020 | ||||||
| Net loan-loss provisions. Geographic distribution | ||||||||||||||||||||||||||
| EUR million | Q1'20 | Q2'20 | Q3'20 | 9M'20 | ||||||||||||||||||||||
| EUROPE | 1,335 | 877 | 956 | 3,168 | ||||||||||||||||||||||
| Spain | 628 | 313 | 449 | 1,390 | ||||||||||||||||||||||
| Santander Consumer Finance | 317 | 184 | 211 | 712 | ||||||||||||||||||||||
| United Kingdom | 191 | 239 | 189 | 619 | ||||||||||||||||||||||
| Portugal | 80 | 24 | 47 | 152 | ||||||||||||||||||||||
| Poland | 95 | 89 | 65 | 249 | ||||||||||||||||||||||
| Other | 23 | 29 | (5) | 46 | ||||||||||||||||||||||
| NORTH AMERICA | 1,246 | 1,123 | 775 | 3,144 | ||||||||||||||||||||||
| USA | 972 | 832 | 572 | 2,376 | ||||||||||||||||||||||
| Mexico | 273 | 291 | 203 | 767 | ||||||||||||||||||||||
| SOUTH AMERICA | 1,325 | 1,110 | 787 | 3,221 | ||||||||||||||||||||||
| Brazil | 1,066 | 843 | 569 | 2,478 | ||||||||||||||||||||||
| Chile | 163 | 183 | 154 | 500 | ||||||||||||||||||||||
| Argentina | 75 | 57 | 46 | 178 | ||||||||||||||||||||||
| Other | 20 | 26 | 18 | 65 | ||||||||||||||||||||||
| SANTANDER GLOBAL PLATFORM | 0 | 1 | 1 | 2 | ||||||||||||||||||||||
| CORPORATE CENTRE | 3 | 8 | 16 | 27 | ||||||||||||||||||||||
| GROUP | 3,909 | 3,118 | 2,535 | 9,562 | ||||||||||||||||||||||
| Non-performing loans by quarter | |||||||||||||||||||||||||||||||||||||||||
| EUR million | |||||||||||||||||||||||||||||||||||||||||
| Q1'19 | Q2'19 | Q3'19 | Q4'19 | Q1'20 | Q2'20 | Q3'20 | |||||||||||||||||||||||||||||||||||
| Balance at beginning of period | 35,692 | 35,590 | 34,421 | 34,326 | 33,799 | 32,743 | 32,782 | ||||||||||||||||||||||||||||||||||
| Net additions | 2,147 | 2,511 | 3,190 | 2,696 | 2,543 | 2,805 | 1,595 | ||||||||||||||||||||||||||||||||||
| Increase in scope of consolidation | — | — | — | — | — | — | (44) | ||||||||||||||||||||||||||||||||||
| Exchange rate differences and other | 479 | (162) | (110) | (51) | (964) | (353) | (1,673) | ||||||||||||||||||||||||||||||||||
| Write-offs | (2,728) | (3,518) | (3,175) | (3,172) | (2,635) | (2,413) | (1,766) | ||||||||||||||||||||||||||||||||||
| Balance at period-end | 35,590 | 34,421 | 34,326 | 33,799 | 32,743 | 32,782 | 30,894 | ||||||||||||||||||||||||||||||||||
For the purposes of the classification of exposures in the IFRS 9 defined stages, it should be noted that the Group continues to take into account the indications provided by the European Banking Authority (EBA) as regards to the classification of exposures subject to moratoria. Accordingly, these moratoria are not considered to be automatic indicators for identifying these contractual modifications as forbearance measures, nor for classifying them as stage 2.
However, this does not exempt the rigorous application of IFRS 9 in the monitoring of our customers credit quality and, using individual or collective assessment techniques, the timely detection of significant increases in credit risk in certain transactions or groups of transactions. As such, the increase observed since the first quarter of the year in stage 2 assets amounts to around EUR 7.0 billion, mostly driven by the macroeconomic deterioration caused by the pandemic.
A decrease was observed in the quarter due to the impact of exchange rates and the reduction in loan balances mentioned in other sections of this report.
| Stage coverage | ||||||||||||||||||||||||||||||||||||||||||||
| EUR billion | ||||||||||||||||||||||||||||||||||||||||||||
Exposure1 | Coverage | |||||||||||||||||||||||||||||||||||||||||||
| Sep-20 | Jun-20 | Mar-20 | Sep-20 | Jun-20 | Mar-20 | |||||||||||||||||||||||||||||||||||||||
| Stage 1 | 862 | 878 | 891 | 0.6 | % | 0.6 | % | 0.6 | % | |||||||||||||||||||||||||||||||||||
| Stage 2 | 60 | 61 | 53 | 8.8 | % | 7.7 | % | 8.2 | % | |||||||||||||||||||||||||||||||||||
| Stage 3 | 31 | 33 | 33 | 43.3 | % | 41.1 | % | 40.8 | % | |||||||||||||||||||||||||||||||||||
(1) Exposure subject to impairment. Additionally, in September 2020 there are EUR 29 billion in loans and advances to customers not subject to impairment were recorded at mark to market with changes through P&L (EUR 35 billion in June 2020 and EUR 31 in March 2020).
Stage 1: financial instruments for which no significant increase in credit risk is identified since its initial recognition.
Stage 2: if there has been a significant increase in credit risk since the date of initial recognition but the impairment event has not materialised, the financial instrument is classified in Stage 2.
Stage 3: a financial instrument is catalogued in this stage when it shows effective signs of impairment as a result of one or more events that have already occurred resulting in a loss.
January - September 2020 | | 21 | ||||||
u Market risk
The global corporate banking trading activity risk is mainly interest rate driven and is focused on servicing our customers' needs and measured in daily VaR terms at 99%.
In the third quarter, VaR fluctuated around an average value of EUR 10.2 million, very stable, maintaining the trend of the previous quarter despite the remaining uncertainty due to the evolution of COVID-19 health crisis, closing Q3’20 at EUR 10.4 million.
These figures remain low compared to the size of the Group’s balance sheet and activity.
It should be also mentioned that there are other positions classified for accounting purposes as trading (total VaR of EUR 10.6 million at the end of September 2020).
| Trading portfolios*. VaR performance | ||
| EUR million | ||
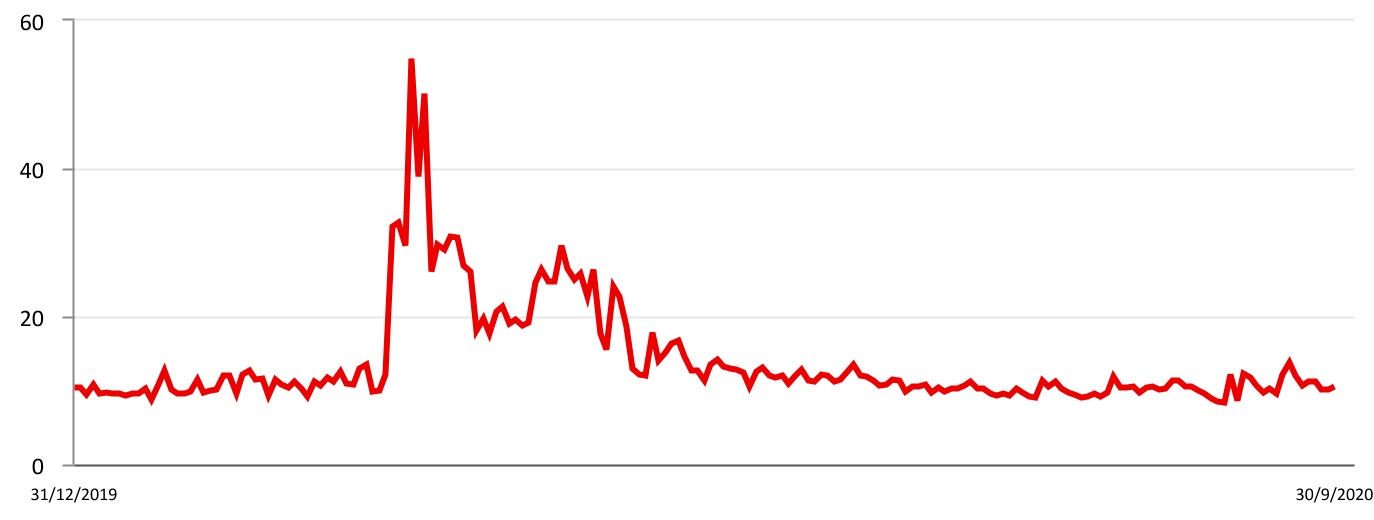
(*) Corporate & Investment Banking performance in financial markets.
Trading portfolios (1). VaR by geographic region | ||||||||||||||||||||||||||
| EUR million | ||||||||||||||||||||||||||
| 2020 | 2019 | |||||||||||||||||||||||||
| Third quarter | Average | Latest | Average | |||||||||||||||||||||||
| Total | 10.2 | 10.4 | 12.9 | |||||||||||||||||||||||
| Europe | 9.0 | 8.9 | 6.0 | |||||||||||||||||||||||
| North America | 6.9 | 7.4 | 3.7 | |||||||||||||||||||||||
| South America | 4.8 | 2.6 | 10.2 | |||||||||||||||||||||||
(1) Activity performance in Santander Corporate & Investment Banking markets.
Trading portfolios (1). VaR by market factor | ||||||||||||||||||||||||||
| EUR million | ||||||||||||||||||||||||||
| Third quarter 2020 | Min. | Avg. | Max. | Last | ||||||||||||||||||||||
| VaR total | 8.3 | 10.2 | 13.7 | 10.4 | ||||||||||||||||||||||
| Diversification effect | (6.8) | (12.1) | (14.8) | (13.3) | ||||||||||||||||||||||
| Interest rate VaR | 6.3 | 7.8 | 9.9 | 8.1 | ||||||||||||||||||||||
| Equity VaR | 2.7 | 3.5 | 4.8 | 4.2 | ||||||||||||||||||||||
| FX VaR | 4.0 | 5.3 | 6.4 | 5.9 | ||||||||||||||||||||||
| Credit spreads VaR | 4.5 | 5.7 | 7.3 | 5.5 | ||||||||||||||||||||||
| Commodities VaR | 0.0 | 0.0 | 0.2 | 0.0 | ||||||||||||||||||||||
(1) Activity performance in Corporate & Investment Banking markets.
NOTE: In the North America, South America and Asia portfolios, VaR corresponding to the credit spreads factor other than sovereign risk is not relevant and is included in the interest rate factor.
| 22 | | January - September 2020 | ||||||
u Structural and liquidity risk
•With regards to structural exchange rate risk, Santander’s CET1 ratio coverage remained around 100% in order to protect it from foreign currency movements.
•In structural interest rate risk, despite support from central banks and governments continued in the quarter, market volatility persisted mainly due to the evolution of the current health crisis, although with a low impact.
•In liquidity risk during the third quarter, the Group maintained a comfortable position, supported by a robust and diversified liquidity buffer, with ratios well above regulatory limits.
u Operational risk
•Overall, operational risk profile continued to be stable, as the Group’s local units have fully implemented the new operating guidelines where this was required. However, we continue closely monitoring the potential COVID-19 impact on our risk profile and the existing control environment.
•The following aspects were considered a management focus during the third quarter:
–IT performance and support, in order to continue ensuring availability and adequate performance of our services, especially in online banking and call centres.
–Transaction processing related to the volume of new loans and multiple changes in existing portfolios derived from government aid programmes and internal policies.
–Third party risk exposure, as critical providers are being closely watched with focus on business continuity capabilities and service level agreements compliance.
–Fraud and cyber risk threats across the industry, and reinforcement of the bank control environment (i.e. patching, browsing control, data protection controls, etc.), as well as heightening monitoring as a preventive measure.
–People risk, following the return to offices and / or work from home situation. Measures have been implemented throughout the Group to ensure a suitable and safe work environment for all employees.
•In terms of the third quarter performance, levels of losses in relative terms by Basel categories were lower than the third quarter of 2019, and are similar to the previous quarter. There have been no major events related to the pandemic.
January - September 2020 | | 23 | ||||||
GENERAL BACKGROUND
Global activity recorded steady gains in the third quarter after the acute stress in the first half of the year. However, the resurgence of the pandemic affected mobility and confidence, so that the bounceback lost momentum. Some economies were more affected than others. Monetary, fiscal and financial policies can be expected to remain unchanged in the coming quarters, although it might be readjusted to boost the sectors with the greatest potential. Risks are tilted towards lower growth because of uncertainty about the intensity of the second outbreak, the development of vaccines and medical treatments, the US elections and the possibility that an agreement will not be reached between the UK and the European Union for their post-Brexit relationship.
| Country | GDP Change1 | Economic performance | |||||||||
 | Eurozone | -14.8% | Economic activity plummeted in Q2'20 as a consequence of lockdowns, although it started to recover in May. Since August, a divergence emerged between the manufacturing sector, which started to recover, and the service sector, which lagged due to the rise in COVID-19 cases. Inflation was negative (-0.3% in September) partly due to VAT cuts and partly to weakness in demand. | ||||||||
 | Spain | -21.5% | Spain is one of the worst affected countries by the pandemic in Europe. The reactivation that had been taking place since May was hampered by the new wave of infections. The unemployment rate rose to 15.3% in Q2'20, although it only partially reflects the deterioration of the economy (masked by the atypical decline in the working population caused by the confinement). Inflation fell to -0.4% year-on-year in September. | ||||||||
 | United Kingdom | -21.5% | Q2'20 GDP recorded the deepest fall since records began. Despite signs of a recovery taking hold following the relaxation of lockdown measures, the threat of a second COVID-19 wave could hamper recovery. Lower inflation (0.5% in September) reflected the subsidies aimed at reactivating consumption and the low demand for some goods. The unemployment rate (4.5% in August) continued to be contained by employment protection schemes. The official interest rate was 0.1%. | ||||||||
 | Portugal | -16.3% | The collapse of the Q2'20 GDP was followed by a moderate recovery. The unemployment rate (5.6%) did not yet reflect the loss of activity while inflation (-0.1% in September) showed the sluggishness of consumption. The government's support plans, as in the rest of Europe, counteract the positive performance of fiscal consolidation and placed the deficit at -4.8% of GDP in August, compared to +0.3% a year ago. | ||||||||
 | Poland | -8.4% | The economy in Q2'20 entered into recession and although the economic upturn in Q3'20 was very intense, the latest indicators point to a loss of steam. The unemployment rate rose to 6.1% in September, although employment is evolving positively. Inflation remained under pressure (3.2% in September) and the official interest rate stood at 0.1%. | ||||||||
 | United States | -9.0% | The rebound started in May and employment recovered half of the jobs lost. The unemployment rate fell to 7.9% and inflation rose to 1.4% in September. The Fed unveiled its new strategic and communication framework, which suggest that interest rates will remain near zero for a prolonged period of time (0-0.25%). | ||||||||
 | Mexico | -18.7% | After the strong contraction between March and May, activity began to recover in June-July due to the reopening of essential activities, although confidence remained at low levels. The central bank continued to cut rates (4.25% vs. 5% in Q2'20) and extended the maturity of measures to support markets and credit. | ||||||||
 | Brazil | -12.4% | Economic growth fell a total of 14.7% between March-April, one of the most moderate in the region, and started to recover in May, thanks to the relaxation of confinement measures, the reopening of activities and the high fiscal and monetary stimuli. Low inflation (3.1% in September vs 4% target) and an expansive monetary policy (with the official rate at 2% vs. 2.25% in Q2'20 and 4.50% at the end of 2019). | ||||||||
 | Chile | -14.1% | The long duration of the lockdown and the cessation of activities explains the late and modest recovery, with a 5.4% increase in GDP in June-August after the 16.2% drop in March-May. Inflation rebounded (3.1% in September) but underlying inflation remained low (2.2%), and the central bank maintained interest rates at 0.5% and the measures to support liquidity and credit. | ||||||||
 | Argentina | -19.1% | Argentina successfully restructured its foreign debt (99% acceptance), extending maturities and lowering the interest burden. The economy has showed signs of gradual improvement since May, after the sharp decline in March-April and inflation has rebounded to 2.5% monthly average in Q3'20 (1.8% in Q2'20). | ||||||||
(1) Year-on-year change Q2'20
| 24 | | January - September 2020 | ||||||
| Response to the COVID-19 crisis Business model | ||||||||||||||||||||||||||
DESCRIPTION OF SEGMENTS
The segment reporting is based on financial information presented to the chief operating decision maker, which excludes certain items included in the statutory results that distort year-on-year comparisons and are not considered for management reporting purposes. This financial information (underlying basis) is computed by adjusting reported results for the effects of certain gains and losses (e.g. capital gains, write-downs, impairment of goodwill, etc.). These gains and losses are items that management and investors ordinarily identify and consider separately to better understand the underlying trends in the business.
The Group has aligned the information in this chapter in a manner consistent with the underlying information used internally for management reporting purposes and with that presented in the Group’s other public documents.
The Group's executive committee has been determined to be the chief operating decision maker for the Group. The Group’s operating segments reflect the organisational and management structures. The Group's executive committee reviews the internal reporting based on these segments in order to assess performance and allocate resources.
The segments are differentiated by the geographic area in which profits are earned and by type of business. The financial information of each reportable segment is prepared by aggregating the figures for the Group’s various geographic areas and business units. The information relates to both the accounting data of the units integrated in each segment and that provided by management information systems. In all cases, the same general principles as those used in the Group are applied.
The businesses included in each of the business areas in this report and the accounting principles under which their results are presented here may differ from the businesses included and accounting principles applied in the financial information separately prepared and disclosed by our subsidiaries (some of which are publicly listed) which in name or geographical description may seem to correspond to the business areas covered in this report. Accordingly, the results of operations and trends shown for our business areas in this document may differ materially from those of such subsidiaries.
In 2020, the Group maintains the general criteria applied in 2019, as well as the business segments with the following exceptions, which only affect the secondary segments:
1. Following the creation of the reporting segment Santander Global Platform in 2019, which comprises our global digital services under a single unit, and its incorporation in both primary and secondary segments, in 2020 for better monitoring of its evolution and contribution to the Group's results, at the secondary segment level in addition to the results generated by the platforms, 50% of the results generated by countries in products linked to these platforms are considered. These results were previously included in Retail Banking.
2. Annual adjustment of the perimeter of the Global Customer Relationship Model between Retail Banking and Santander Corporate & Investment Banking and between Retail Banking and Wealth Management & Insurance.
These changes in the secondary segments have no impact on the primary segments and do not affect the Group’s figures.
To allow better comparability of the secondary segments, 2019 data has been provided on a new basis.
After these changes, the operating business areas are structured in two levels:
Primary segments
This primary level of segmentation, which is based on the Group’s management structure, comprises five reportable segments: four operating areas plus the Corporate Centre. The operating areas are:
Europe: which comprises all the business activities carried out in the region. Detailed financial information is provided on Spain, Portugal, Poland, Santander Consumer Finance (which incorporates all the region’s business, including the three countries mentioned herewith) and the UK.
North America: which comprises all the business activities carried out in Mexico and the US, which includes the holding company (SHUSA) and the businesses of Santander Bank, Santander Consumer USA, the specialised unit Banco Santander International and the New York branch. The sale of Banco Santander Puerto Rico was completed in September 2020, which was previously included in the US.
South America: includes all the financial activities carried out by the Group through its banks and subsidiary banks in the region. Detailed information is provided on Brazil, Chile, Argentina, Uruguay, Peru and Colombia.
Santander Global Platform: which comprises our global digital services under a single unit, includes Global Payments Services (Global Trade Services, Global Merchant Services, Superdigital, Pago FX), our fully digital bank Openbank and Open Digital Services, and Digital Assets (Centres of Digital Expertise, InnoVentures and Digital Assets).
January - September 2020 | | 25 | ||||||
| Response to the COVID-19 crisis Business model | ||||||||||||||||||||||||||
Secondary segments
At this secondary level, the Group is structured into Retail Banking, Santander Corporate & Investment Banking, Wealth Management & Insurance and Santander Global Platform.
Retail Banking: this covers all customer banking businesses, including consumer finance, except those of corporate banking which are managed through Santander Corporate & Investment Banking, asset management, private banking and insurance, which are managed by Wealth Management & Insurance and 50% of the countries’ results generated by digital services, which are included in Santander Global Platform. The results of the hedging positions in each country are also included, conducted within the sphere of each one’s assets and liabilities committee.
Santander Corporate & Investment Banking (SCIB): this business reflects revenue from global corporate banking, investment banking and markets worldwide including treasuries managed globally (always after the appropriate distribution with Retail Banking customers), as well as equity business.
Wealth Management & Insurance: includes the asset management business (Santander Asset Management), the corporate unit of Private Banking and International Private Banking in Miami and Switzerland and the insurance business (Santander Insurance).
Santander Global Platform: which comprises our global digital services under a single unit (breakdown in the primary segment definition), as well as 50% of the results generated by these services in the commercial network.
In addition to these operating units, which report by geographic area and businesses, the Group continues to maintain the area of Corporate Centre, that includes the centralised activities relating to equity stakes in financial companies, financial management of the structural exchange rate position, assumed within the sphere of the Group’s assets and liabilities committee, as well as management of liquidity and of shareholders’ equity via issuances.
As the Group’s holding entity, this area manages all capital and reserves and allocations of capital and liquidity with the rest of businesses. It also incorporates amortisation of goodwill but not the costs related to the Group’s central services (charged to the areas), except for corporate and institutional expenses related to the Group’s functioning.
As described on the previous page, the results of our business areas presented below are provided on the basis of underlying results only and including the impact of foreign exchange rate fluctuations. However, for a better understanding of the actual changes in the performance of our business areas, we provide and discuss the year-on-year changes to our results excluding such impact. On the other hand, certain figures contained in this report, including financial information, have been subject to rounding to enhance their presentation. Accordingly, in certain instances, the sum of the numbers in a column or a row in tables contained in this report may not conform exactly to the total figure given for that column or row. | ||
| 26 | | January - September 2020 | ||||||
| Response to the COVID-19 crisis Business model | ||||||||||||||||||||||||||
| January-September 2020 | ||||||||||||||||||||||||||||||||||||||
| Main items of the underlying income statement | ||||||||||||||||||||||||||||||||||||||
| EUR million | ||||||||||||||||||||||||||||||||||||||
| Primary segments | Net interest income | Net fee income | Total income | Net operating income | Profit before tax | Underlying attributable profit to the parent | ||||||||||||||||||||||||||||||||
| EUROPE | 10,336 | 3,575 | 14,706 | 6,927 | 3,208 | 2,022 | ||||||||||||||||||||||||||||||||
| Spain | 2,890 | 1,740 | 5,150 | 2,417 | 696 | 497 | ||||||||||||||||||||||||||||||||
| Santander Consumer Finance | 2,871 | 551 | 3,462 | 1,995 | 1,337 | 761 | ||||||||||||||||||||||||||||||||
| United Kingdom | 2,745 | 407 | 3,193 | 1,178 | 444 | 318 | ||||||||||||||||||||||||||||||||
| Portugal | 592 | 285 | 979 | 538 | 350 | 243 | ||||||||||||||||||||||||||||||||
| Poland | 794 | 332 | 1,136 | 661 | 303 | 142 | ||||||||||||||||||||||||||||||||
| Other | 444 | 260 | 785 | 138 | 77 | 61 | ||||||||||||||||||||||||||||||||
| NORTH AMERICA | 6,415 | 1,267 | 8,319 | 4,882 | 1,664 | 1,061 | ||||||||||||||||||||||||||||||||
| US | 4,297 | 682 | 5,559 | 3,252 | 820 | 470 | ||||||||||||||||||||||||||||||||
| Mexico | 2,118 | 584 | 2,760 | 1,629 | 844 | 591 | ||||||||||||||||||||||||||||||||
| SOUTH AMERICA | 8,157 | 2,688 | 11,331 | 7,333 | 3,847 | 2,119 | ||||||||||||||||||||||||||||||||
| Brazil | 5,840 | 2,148 | 8,322 | 5,677 | 2,973 | 1,545 | ||||||||||||||||||||||||||||||||
| Chile | 1,293 | 240 | 1,669 | 988 | 500 | 269 | ||||||||||||||||||||||||||||||||
| Argentina | 721 | 202 | 902 | 411 | 185 | 161 | ||||||||||||||||||||||||||||||||
| Other | 304 | 99 | 438 | 257 | 189 | 144 | ||||||||||||||||||||||||||||||||
| SANTANDER GLOBAL PLATFORM | 97 | 55 | 137 | (125) | (135) | (89) | ||||||||||||||||||||||||||||||||
| CORPORATE CENTRE | (1,029) | (26) | (889) | (1,137) | (1,567) | (1,455) | ||||||||||||||||||||||||||||||||
| TOTAL GROUP | 23,975 | 7,559 | 33,605 | 17,879 | 7,016 | 3,658 | ||||||||||||||||||||||||||||||||
| Secondary segments | ||||||||||||||||||||||||||||||||||||||
| RETAIL BANKING | 22,173 | 5,189 | 28,056 | 15,388 | 5,368 | 2,938 | ||||||||||||||||||||||||||||||||
| CORPORATE & INVESTMENT BANKING | 2,172 | 1,172 | 4,123 | 2,584 | 2,230 | 1,493 | ||||||||||||||||||||||||||||||||
| WEALTH MANAGEMENT & INSURANCE | 340 | 888 | 1,566 | 888 | 858 | 622 | ||||||||||||||||||||||||||||||||
| SANTANDER GLOBAL PLATFORM | 318 | 335 | 748 | 157 | 127 | 61 | ||||||||||||||||||||||||||||||||
| CORPORATE CENTRE | (1,029) | (26) | (889) | (1,137) | (1,567) | (1,455) | ||||||||||||||||||||||||||||||||
| TOTAL GROUP | 23,975 | 7,559 | 33,605 | 17,879 | 7,016 | 3,658 | ||||||||||||||||||||||||||||||||
| Underlying attributable profit geographic distribution* | Underlying attributable profit 9M'20. Core markets | |||||||
| January - September 2020 | EUR million. % change YoY in constant euros | |||||||
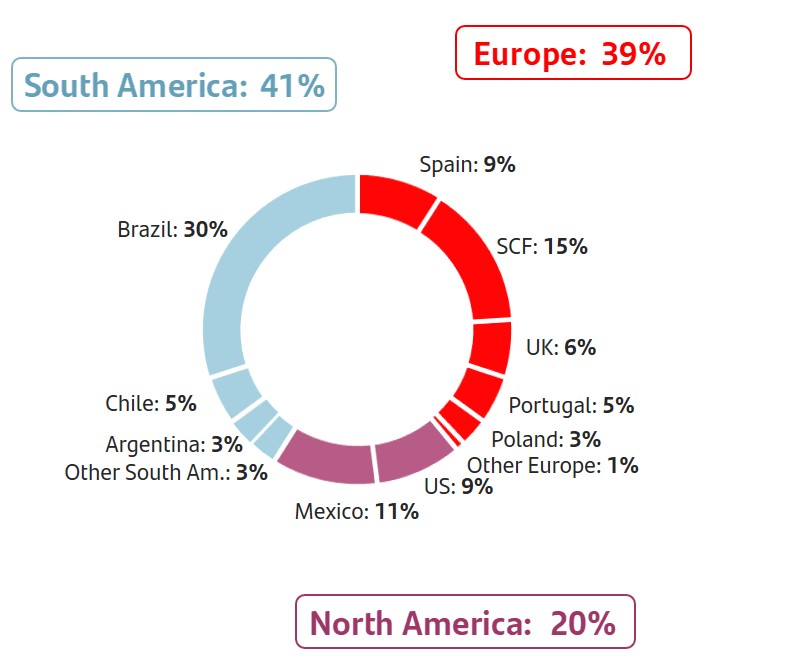 | 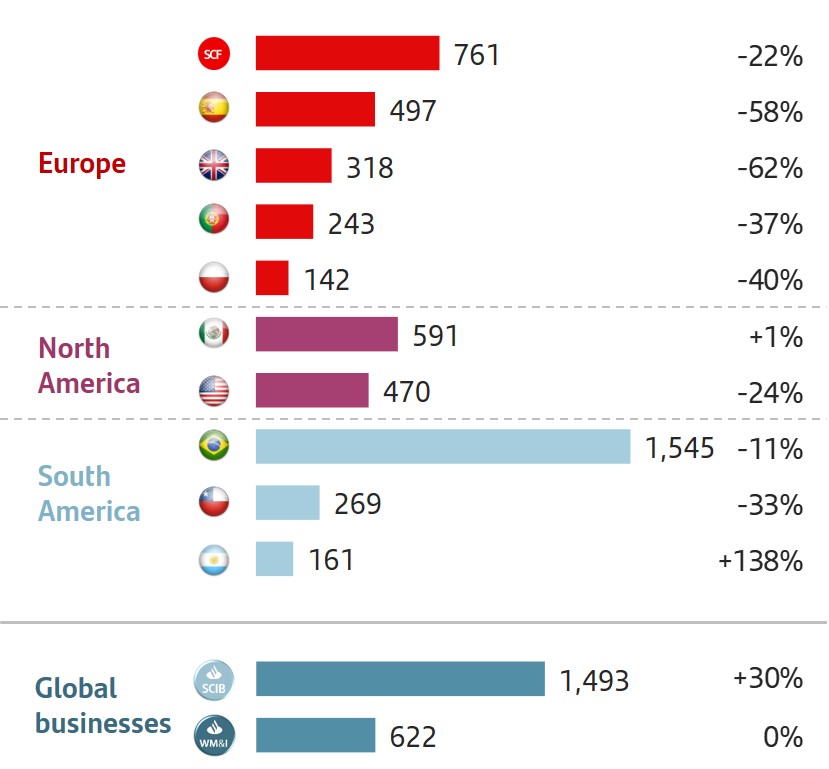 | |||||||
| (*) As a % of operating areas. Excluding Corporate Centre and Santander Global Platform. | ||||||||
January - September 2020 | | 27 | ||||||
| Response to the COVID-19 crisis Business model | ||||||||||||||||||||||||||
| January-September 2019 | ||||||||||||||||||||||||||||||||||||||
| Main items of the underlying income statement | ||||||||||||||||||||||||||||||||||||||
| EUR million | ||||||||||||||||||||||||||||||||||||||
| Primary segments | Net interest income | Net fee income | Total income | Net operating income | Profit before tax | Underlying attributable profit to the parent | ||||||||||||||||||||||||||||||||
| EUROPE | 10,671 | 3,941 | 15,709 | 7,398 | 5,498 | 3,640 | ||||||||||||||||||||||||||||||||
| Spain | 2,985 | 1,861 | 5,695 | 2,652 | 1,617 | 1,185 | ||||||||||||||||||||||||||||||||
| Santander Consumer Finance | 2,888 | 627 | 3,525 | 1,986 | 1,711 | 995 | ||||||||||||||||||||||||||||||||
| United Kingdom | 2,827 | 640 | 3,508 | 1,384 | 1,110 | 828 | ||||||||||||||||||||||||||||||||
| Portugal | 643 | 292 | 1,043 | 576 | 557 | 385 | ||||||||||||||||||||||||||||||||
| Poland | 863 | 349 | 1,258 | 734 | 476 | 245 | ||||||||||||||||||||||||||||||||
| Other | 465 | 171 | 680 | 67 | 28 | 2 | ||||||||||||||||||||||||||||||||
| NORTH AMERICA | 6,661 | 1,349 | 8,655 | 5,002 | 2,222 | 1,278 | ||||||||||||||||||||||||||||||||
| US | 4,320 | 716 | 5,711 | 3,283 | 1,158 | 619 | ||||||||||||||||||||||||||||||||
| Mexico | 2,341 | 633 | 2,944 | 1,718 | 1,064 | 659 | ||||||||||||||||||||||||||||||||
| SOUTH AMERICA | 9,960 | 3,559 | 13,711 | 8,817 | 5,543 | 2,977 | ||||||||||||||||||||||||||||||||
| Brazil | 7,539 | 2,825 | 10,386 | 7,022 | 4,301 | 2,249 | ||||||||||||||||||||||||||||||||
| Chile | 1,402 | 302 | 1,901 | 1,117 | 855 | 473 | ||||||||||||||||||||||||||||||||
| Argentina | 690 | 328 | 957 | 404 | 174 | 97 | ||||||||||||||||||||||||||||||||
| Other | 329 | 104 | 466 | 273 | 214 | 158 | ||||||||||||||||||||||||||||||||
| SANTANDER GLOBAL PLATFORM | 69 | 4 | 63 | (105) | (107) | (77) | ||||||||||||||||||||||||||||||||
| CORPORATE CENTRE | (919) | (35) | (1,236) | (1,519) | (1,733) | (1,637) | ||||||||||||||||||||||||||||||||
| TOTAL GROUP | 26,442 | 8,818 | 36,902 | 19,593 | 11,423 | 6,180 | ||||||||||||||||||||||||||||||||
| Secondary segments | ||||||||||||||||||||||||||||||||||||||
| RETAIL BANKING | 24,633 | 6,420 | 31,889 | 17,790 | 9,964 | 5,722 | ||||||||||||||||||||||||||||||||
| CORPORATE & INVESTMENT BANKING | 2,012 | 1,147 | 3,801 | 2,128 | 2,042 | 1,303 | ||||||||||||||||||||||||||||||||
| WEALTH MANAGEMENT & INSURANCE | 424 | 869 | 1,637 | 926 | 920 | 672 | ||||||||||||||||||||||||||||||||
| SANTANDER GLOBAL PLATFORM | 292 | 417 | 811 | 268 | 231 | 121 | ||||||||||||||||||||||||||||||||
| CORPORATE CENTRE | (919) | (35) | (1,236) | (1,519) | (1,733) | (1,637) | ||||||||||||||||||||||||||||||||
| TOTAL GROUP | 26,442 | 8,818 | 36,902 | 19,593 | 11,423 | 6,180 | ||||||||||||||||||||||||||||||||
| 28 | | January - September 2020 | ||||||
Business model | ||||||||||||||||||||||||||
| Primary segments | ||||||||||||||||||||||||||
| EUROPE | ||||||||
 | Highlights (changes in constant euros) •In a changing environment, impacted not only by the health crisis but also by the profound transformation that the sector is experiencing, we are making progress in our strategy of greater collaboration within the Group, with the creation of One Europe, which will allow us to accelerate business transformation in Europe. •Loans grew 3%, mainly in SMEs and large corporates, which offset the falls in new lending in the consumer and individual segments, which, however, are recovering from the lows in April. •Strong profit growth in the quarter (+50% compared to the second quarter) driven by higher customer revenue and improved efficiency. •Underlying attributable profit decreased year-on-year mainly due to higher provisions. Overall cost improvement across markets. | |||||||
| EUR 2,022 Mn | ||||||||
| Underlying attributable profit | ||||||||
Strategy
With One Europe we want to create a better and different bank where customers and our people feel a deep connection with Santander while delivering sustainable value for shareholders. In order to do this we want to:
•Grow our business by better serving our customers, focusing on capital efficient opportunities including SCIB and WM&I, simplifying our mass market value proposal and improving customer experience and leveraging our global and regional scale.
•Redefine how we interact with our customers, accelerating our digital agenda, automating and digitalising our processes and, at the same time, maintaining the personal relationships through our teams, progressing in our omnichannel strategy.
•Create a common operating model in Europe, serving the business with common technology platforms, leveraging shared services and the benefits of having one aligned team across Europe.
Business performance
Gross loans and advances to customers (excluding reverse repos) increased by 3%, with broad-based growth in all countries. Of note was the UK (mortgages), Spain (ICO guaranteed loans) and SCF (organic growth and new businesses). Positive performance in SCIB (mainly in Other Europe, but in the other countries as well).
Customer deposits (excluding repos) increased 5% year-on-year with rises in all markets. Mutual funds improved slightly in the year, but rose 5% in the quarter driven by the overall positive performance of the Wealth Management & Insurance business.
Results
Underlying attributable profit rose 50% quarter-on-quarter predominantly driven by the sharp growth of total income (+13%) in all revenue lines: net interest income rose 6% (mainly in Spain and the UK), net fee income surged 6% and higher gains on financial transactions and other operating income (the latter affected by the recording in the second quarter of the contribution to the SRF).
Operating expenses remained broadly stable and loan-loss provisions increased 9% compared to the second quarter, albeit with significant improvements in some countries such as the UK and Poland.
In the first nine months of 2020, underlying attributable profit was 44% less than the previous year at EUR 2,022 million, due to the decline in total income (dampened by the health crisis and the low interest rate environment) and higher provisions, partly mitigated by lower costs, stemming from the optimisation processes carried out in previous years and the efficiencies generated since the pandemic started.
| Customers | ||||||||||||||||||||
| September 2020. Thousands | ||||||||||||||||||||
| Loyal customers | Digital customers | |||||||||||||||||||
 | 9,928 |  | 14,941 | |||||||||||||||||
| 36 | % | /active customers | +9 | % | YoY | |||||||||||||||
| Activity | ||||||||||||||||||||||||||||||||||||||||||||||||||||||||||||||
| September 2020. EUR billion and % change in constant euros | ||||||||||||||||||||||||||||||||||||||||||||||||||||||||||||||
| -1% | +1% | |||||||||||||||||||||||||||||||||||||||||||||||||||||||||||||
| QoQ | QoQ | |||||||||||||||||||||||||||||||||||||||||||||||||||||||||||||
| 648 | 682 | |||||||||||||||||||||||||||||||||||||||||||||||||||||||||||||
| +3% | +4% | |||||||||||||||||||||||||||||||||||||||||||||||||||||||||||||
| YoY | YoY | |||||||||||||||||||||||||||||||||||||||||||||||||||||||||||||
| Gross loans and advances to customers excl. reverse repos | Customer deposits excl. repos + mutual funds | |||||||||||||||||||||||||||||||||||||||||||||||||||||||||||||
| Underlying income statement | ||||||||||||||||||||||||||||||||
| EUR million and % change in constant euros | ||||||||||||||||||||||||||||||||
| Q3'20 | / Q2'20 | 9M'20 | / 9M'19 | |||||||||||||||||||||||||||||
| Revenue | 5,155 | +13 | % | 14,706 | -6 | % | ||||||||||||||||||||||||||
| Expenses | -2,542 | +1 | % | -7,779 | -6 | % | ||||||||||||||||||||||||||
| Net operating income | 2,613 | +27 | % | 6,927 | -6 | % | ||||||||||||||||||||||||||
| LLPs | -956 | +9 | % | -3,168 | +138 | % | ||||||||||||||||||||||||||
| PBT | 1,461 | +44 | % | 3,208 | -41 | % | ||||||||||||||||||||||||||
| Underlying attrib. profit | 947 | +50 | % | 2,022 | -44 | % | ||||||||||||||||||||||||||
January - September 2020 | | 29 | ||||||
Business model | ||||||||||||||||||||||||||
| Primary segments | ||||||||||||||||||||||||||
| SPAIN | ||||||||||||||
 | Highlights | |||||||||||||
•In a period that continued to be impacted by the health crisis, we continued to be a part of the solution to the recovery of economic activity, through numerous initiatives to support families, self-employed workers and businesses. We remained leaders in channelling ICO funding, with a 27.5% market share. •We progressed further in our transformation process, optimising costs and strengthening our digital capabilities. Our new app was redesigned to fit individual needs, improving customer experience. •Underlying attributable profit was EUR 497 million, 58% lower than 2019, predominantly affected by higher provisions, which were partly offset by lower costs. In the quarter, profit was 53% higher benefiting from the rebound of net interest income and net fee income. | ||||||||||||||
| EUR 497 Mn | ||||||||||||||
| Underlying attributable profit | ||||||||||||||
Commercial activity
•Since the state of alarm was declared, we have granted EUR 71.7 billion to self-employed workers and corporates, of which more than EUR 27.6 billion was ICO-guaranteed loans and EUR 21.2 billion in commercial paper, mitigating the reduction in transactional related products and management of working capital.
•We granted more than 180,000 payment holidays, both legal and sector, including mortgages, consumer and credit card loans.
•In the third quarter, focus shifted toward reactivating activity, with growth (vs Q3'19) in new residential mortgage lending (+3%), protection insurance (double-digit growth in health, home and burial insurances) and car renting (+51%), offsetting the fall in consumer loans (-44%). In addition, transactional products increased (+3% in card turnover and +1% in POS).
•Our strategic agreement with Correos will enable us to enhance our distribution model (more than 4,600 offices) and improve our financial services in the rural areas of Spain.
•In SCIB, fee income increased 1% year-on-year in the current environment, leading the main league tables.
Business performance
In the quarter, loans dropped due to the sale of a non-performing mortgage portfolio for EUR 1.5 billion, but rose EUR 7.7 billion since January 2020 (+2% year-on-year) strongly driven by self-employed, SMEs and corporates. Mortgage completions and consumer lending remained below 2019 levels, in line with the economic slowdown recorded in the country.
Customer funds (excluding repos) were 1% higher driven by demand deposits (+6% year-on-year). In the quarter, mutual funds grew 4%, favoured by markets and net positive inflows in recent months.
Results
Underlying attributable profit in the first nine months of the year amounted to EUR 497 million, 58% lower year-on-year.
•Total income fell 10%, impacted by net interest income (negative interest rates, smaller ALCO portfolio and lower stock in wholesale banking), lower fee income from reduced transaction volumes and market performance, and reduced income from real estate stakes.
•Costs fell at double-digit rates (-10% year-on-year) as a result of the optimisation processes carried out.
•Higher loan-loss provisions derived from the COVID-19 crisis. Despite the economic recession, the NPL ratio improved 125 bps year-on-year, mainly due to the high level of corporate loans granted and the aforementioned non-performing portfolio sale.
Compared to the second quarter of 2020, profit increased strongly (+53%) driven by NII and net fee income recovery and favoured by the contribution to the SRF recorded in the second quarter.
| Customers | ||||||||||||||||||||
| September 2020. Thousands | ||||||||||||||||||||
| Loyal customers | Digital customers | |||||||||||||||||||
| 2,585 | | 5,125 | |||||||||||||||||
| 33 | % | /active customers | +10 | % | YoY | |||||||||||||||
| Activity | ||||||||||||||||||||||||||||||||||||||||||||||||||||||||||||||
| September 2020. EUR billion and % change | ||||||||||||||||||||||||||||||||||||||||||||||||||||||||||||||
| +2% | ||||||||||||||||||||||||||||||||||||||||||||||||||||||||||||||
| -2% | QoQ | |||||||||||||||||||||||||||||||||||||||||||||||||||||||||||||
| QoQ | ||||||||||||||||||||||||||||||||||||||||||||||||||||||||||||||
| 199 | 317 | |||||||||||||||||||||||||||||||||||||||||||||||||||||||||||||
| +2% | +1% | |||||||||||||||||||||||||||||||||||||||||||||||||||||||||||||
| YoY | YoY | |||||||||||||||||||||||||||||||||||||||||||||||||||||||||||||
| Gross loans and advances to customers excl. reverse repos | Customer deposits excl. repos + mutual funds | |||||||||||||||||||||||||||||||||||||||||||||||||||||||||||||
| Underlying income statement | ||||||||||||||||||||||||||||||||
| EUR million and % change | ||||||||||||||||||||||||||||||||
| Q3'20 | / Q2'20 | 9M'20 | / 9M'19 | |||||||||||||||||||||||||||||
| Revenue | 1,800 | +15 | % | 5,150 | -10 | % | ||||||||||||||||||||||||||
| Expenses | -893 | -0.4 | % | -2,734 | -10 | % | ||||||||||||||||||||||||||
| Net operating income | 907 | +36 | % | 2,417 | -9 | % | ||||||||||||||||||||||||||
| LLPs | -449 | +44 | % | -1,390 | +104 | % | ||||||||||||||||||||||||||
| PBT | 346 | +46 | % | 696 | -57 | % | ||||||||||||||||||||||||||
| Underlying attrib. profit | 246 | +53 | % | 497 | -58 | % | ||||||||||||||||||||||||||
| 30 | | January - September 2020 | ||||||
Business model | ||||||||||||||||||||||||||
| Primary segments | ||||||||||||||||||||||||||
| SANTANDER CONSUMER FINANCE | ||||||||||||||
 | Highlights (changes in constant euros) | |||||||||||||
•During the quarter, SCF continued to manage the COVID-19 impact. Our priorities are still to protect employees’ health, ensure business continuity and service and to support customers and business partners (car manufacturers, dealers and retailers). •As a result of the health crisis, in the first nine months 2020 new business fell 13% year-on-year. However, most markets are showing strong signs of recovery in recent months from the lows seen in April (compared to the previous quarter, new business grew 37%). As such, new business in the third quarter was just 4% below the same quarter in 2019. •Underlying attributable profit in the first nine months fell 22%, greatly affected by increased provisions, as net operating income increased 2% year-on-year driven by a strong start to the year and lower costs, which offset lower volumes. Compared to the previous quarter, underlying profit improved 10%. | ||||||||||||||
| EUR 761 Mn | ||||||||||||||
| Underlying attributable profit | ||||||||||||||
Commercial activity
We continue to focus on remaining the leader in auto finance and increasing consumer finance by boosting digital channels, which is the strategy behind our acquisition of 50% of Sixt Leasing and the joint consumer finance operation launched with Telecom Italia Mobile.
Business performance
Most of SCF’s markets have been significantly affected by the isolation measures related to COVID-19. New lending fell 13% year-on-year, significantly better than European new car sales (-29% as of September). The largest falls were in Southern Europe (c.-29%), which was most affected by isolation measures, whereas Northern European markets were stronger (-6%).
Since reaching its minimum in April (c. 50% of normal levels), new business recovered pre-crisis levels in the third quarter. The stock of credit increased 2% year-on-year and customer deposits excluding repos increased 4%.
On the other hand, in order to compensate lost revenue, several measures are being carried out to reduce risk while supporting customers, such as the strong reductions in operating expenses and income initiatives in pricing, cost of funding and insurance sales.
Results
Underlying attributable profit of EUR 761 million in the first nine months of 2020, 22% lower in constant euros than in the same period of 2019:
•Net interest income increased 1% driven by higher volumes and revenue actions partially offset by the European Court of Justice ruling regarding early repayment of loans and interest rate limitations, especially in Poland. Net fee income continued to decrease due to lower new business.
•Costs decreased 3% mainly due to COVID-19 mitigation actions and continued efficiency projects in several units.
•As a result, efficiency improved by 131 bps and net operating income was 2% above last year.
•LLPs rose significantly driven by COVID-related provisions, portfolio sales and other positive one-offs in 2019. As a result, the cost of credit stood at 0.84% and the NPL ratio at 2.50%, 25 bps higher than September 2019.
•The largest contribution to the underlying attributable profit came from Germany (EUR 235 million), the Nordics (EUR 172 million) and Spain (EUR 91 million).
Compared to the previous quarter, underlying attributable profit grew 10% driven by the recovery in activity supporting top line growth and improving efficiency.
| Customer loan distribution | ||||||||
| September 2020 | ||||||||
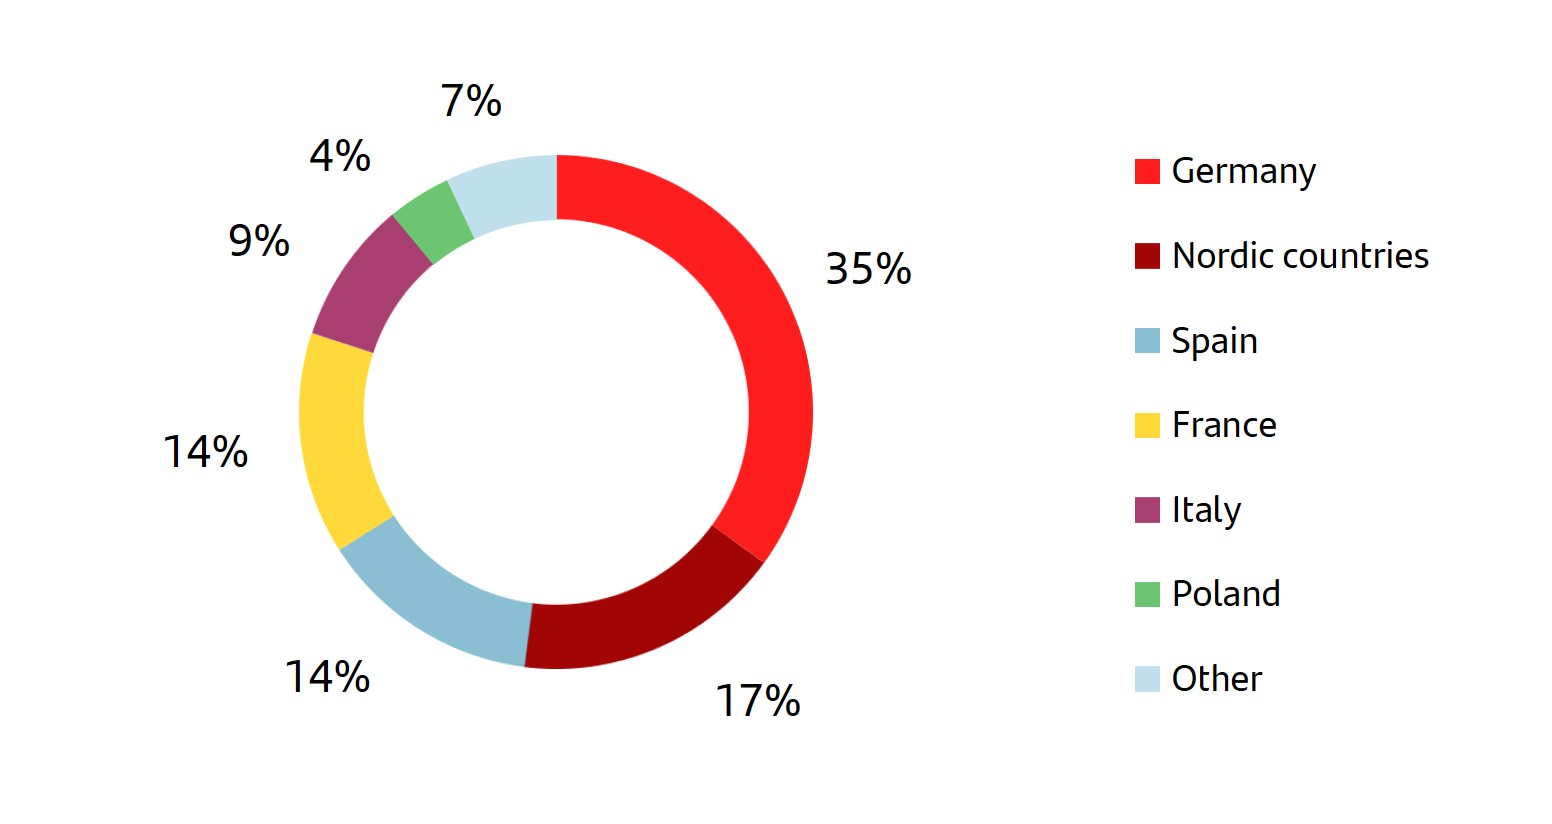 | ||||||||
| Activity | ||||||||||||||||||||||||||||||||||||||||||||||||||||||||||||||
| September 2020. EUR billion and % change in constant euros | ||||||||||||||||||||||||||||||||||||||||||||||||||||||||||||||
| 0% | ||||||||||||||||||||||||||||||||||||||||||||||||||||||||||||||
| QoQ | +37% | |||||||||||||||||||||||||||||||||||||||||||||||||||||||||||||
| 101 | QoQ | |||||||||||||||||||||||||||||||||||||||||||||||||||||||||||||
| +2% | -13% | |||||||||||||||||||||||||||||||||||||||||||||||||||||||||||||
| YoY | 29 | YoY | ||||||||||||||||||||||||||||||||||||||||||||||||||||||||||||
| Gross loans and advances to customers excl. reverse repos | New lending | |||||||||||||||||||||||||||||||||||||||||||||||||||||||||||||
| Underlying income statement | ||||||||||||||||||||||||||||||||
| EUR million and % change in constant euros | ||||||||||||||||||||||||||||||||
| Q3'20 | / Q2'20 | 9M'20 | / 9M'19 | |||||||||||||||||||||||||||||
| Revenue | 1,196 | +9 | % | 3,462 | 0 | % | ||||||||||||||||||||||||||
| Expenses | -483 | +3 | % | -1,467 | -3 | % | ||||||||||||||||||||||||||
| Net operating income | 712 | +13 | % | 1,995 | +2 | % | ||||||||||||||||||||||||||
| LLPs | -211 | +14 | % | -712 | +120 | % | ||||||||||||||||||||||||||
| PBT | 489 | +5 | % | 1,337 | -21 | % | ||||||||||||||||||||||||||
| Underlying attrib. profit | 284 | +10 | % | 761 | -22 | % | ||||||||||||||||||||||||||
January - September 2020 | | 31 | ||||||
Business model | ||||||||||||||||||||||||||
| Primary segments | ||||||||||||||||||||||||||
| UNITED KINGDOM | ||||||||||||||
 | Highlights (changes in constant euros) | |||||||||||||
•Our top priority continued to be the welfare of our people, customers and the communities in which we operate. We are well positioned for recovery post-COVID-19 thanks to decisive management actions, our prudent approach to risk and a resilient balance sheet. •Underlying attributable profit year-to-date was down 62% mainly due to the impact from COVID-19 both in impairment charges and income, partially offset by cost reductions. •Strong growth in underlying profit in the quarter due to an improvement in net interest income driven by the repricing of the 1I2I3 current account portfolio and other deposit portfolios. This resulted in an a 15 bps increase in NIM and 9 pp improvement in efficiency ratio. | ||||||||||||||
| EUR 318 Mn | ||||||||||||||
| Underlying attributable profit | ||||||||||||||
Commercial activity
We continue our focus on building deeper customer relationships and a seamless customer experience. This is reflected in the proportion of loyal customers to active customers and the increase in digital customers, which now exceed 6 million. We are supporting our retail and corporate customers to help them bridge COVID-19 uncertainty. We helped 340,000 retail customers with a payment holiday and over 137,000 small and large business customers through various government lending schemes.
Net mortgage lending of GBP 2.4 bn year-to-date, with strong first and third quarter growth partially offset by limited new mortgage inflows during the second quarter due to the UK market lockdown. Corporate lending was up GBP 3.6 bn, almost exclusively driven by our lending through government schemes.
Our strategic transformation programme, which commenced in 2019 continues with renewed focus and learnings from the COVID-19 crisis, including accelerated customer digital adoption, property strategy, digitalisation and automation.
Business performance
Gross loans and advances to customers (excluding reverse repos) increased 4% compared to September 2019, driven mainly by mortgages and the aforementioned flows in corporates.
Customer funds (excluding repos) were 6% greater year-on-year, with both retail banking and corporate deposits strongly up.
Results
Underlying attributable profit in the first nine months of 2020 of EUR 318 million, down 62% year-on-year (in constant euros):
•Total income was down 9%, impacted by reduced fee income (lower customer activity and regulatory changes to overdrafts). The impact of asset repricing following the base rate cuts in the first quarter was offset by the 50 bps reduction in the 1I2I3 current account in May, and a further 40 bps customer repricing in August.
•Costs reduced 5%, reflecting realised efficiency savings from our transformation programme and lower costs related to commercial activity. This was partially offset by COVID-19 related costs.
•Loan-loss provisions increased significantly due to COVID-related charges, but from a very low base. The cost of credit remained at low levels (27 bps) and the NPL ratio was 1.30%.
In the third quarter of 2020, underlying attributable profit was EUR 179 million, a strong quarterly increase driven by net interest income (+14% benefited from the aforementioned deposit repricing actions and lower wholesale funding costs), net fee income (+23% mainly from SCIB) and a 19% reduction in provisions due to COVID-19 related charges in the second quarter.
| Customers | ||||||||||||||||||||
| September 2020. Thousands | ||||||||||||||||||||
| Loyal customers | Digital customers | |||||||||||||||||||
| 4,476 | | 6,209 | |||||||||||||||||
| 31 | % | /active customers | +7 | % | YoY | |||||||||||||||
| Activity | ||||||||||||||||||||||||||||||||||||||||||||||||||||||||||||||
| September 2020. EUR billion and % change in constant euros | ||||||||||||||||||||||||||||||||||||||||||||||||||||||||||||||
| 0% | +1% | |||||||||||||||||||||||||||||||||||||||||||||||||||||||||||||
| QoQ | QoQ | |||||||||||||||||||||||||||||||||||||||||||||||||||||||||||||
| 238 | 216 | |||||||||||||||||||||||||||||||||||||||||||||||||||||||||||||
| +4% | +6% | |||||||||||||||||||||||||||||||||||||||||||||||||||||||||||||
| YoY | YoY | |||||||||||||||||||||||||||||||||||||||||||||||||||||||||||||
| Gross loans and advances to customers excl. reverse repos | Customer deposits excl. repos + mutual funds | |||||||||||||||||||||||||||||||||||||||||||||||||||||||||||||
| Underlying income statement | ||||||||||||||||||||||||||||||||
| EUR million and % change in constant euros | ||||||||||||||||||||||||||||||||
| Q3'20 | / Q2'20 | 9M'20 | / 9M'19 | |||||||||||||||||||||||||||||
| Revenue | 1,117 | +16 | % | 3,193 | -9 | % | ||||||||||||||||||||||||||
| Expenses | -646 | 0 | % | -2,016 | -5 | % | ||||||||||||||||||||||||||
| Net operating income | 471 | +48 | % | 1,178 | -15 | % | ||||||||||||||||||||||||||
| LLPs | -189 | -19 | % | -619 | +295 | % | ||||||||||||||||||||||||||
| PBT | 246 | +209 | % | 444 | -60 | % | ||||||||||||||||||||||||||
| Underlying attrib. profit | 179 | +229 | % | 318 | -62 | % | ||||||||||||||||||||||||||
| 32 | | January - September 2020 | ||||||
Business model | ||||||||||||||||||||||||||
| Primary segments | ||||||||||||||||||||||||||
| PORTUGAL | ||||||||||||||
 | Highlights | |||||||||||||
•The Bank is on the way back to a new normal, continuing to support its customers and the economy through capital and interest payment holidays on mortgages, consumer and business loans, and the participation in state-guaranteed credit lines for businesses. •New lending market shares of more than 20% in mortgages and 17% in corporate loans. •Santander was named Best Bank in Portugal 2020 by Euromoney, highlighting the improvement of digital channels and the dynamism they provided during the pandemic. •Despite the drop in costs, underlying attributable profit decreased 37% year-on-year, weighed down by the impact of COVID-19 on income and provisions. | ||||||||||||||
| EUR 243 Mn | ||||||||||||||
| Underlying attributable profit | ||||||||||||||
Commercial activity
In the health crisis environment, the Bank maintained its product and service offering adapted to customer needs:
•The commercial network's activity was maintained, as well as the strategy oriented towards the use of digital channels by customers. Digital sales were higher (now account for 39% of the total) and the number of digital customers increased 17% year-on-year.
•The Bank's commercial and digital transformation strategy continued, adapting to the changes accelerated by the pandemic, with Mundo 1|2|3 being the main customer loyalty driver.
•In addition, we continued to provide measures to support our customers, such as payment holidays (which were extended until 30 September 2021 for mortgages and corporate loans), and to participate in credit lines set up by the government to support businesses. We also maintained the ongoing assessment of our customers' needs in the current environment.
Business performance
Gross loans and advances to customers (excluding reverse repos) rose 6% year-on-year, backed by steady growth in corporate loans (underpinned by the state-guaranteed credit lines) and mortgages.
Customer funds (excluding repos) rose 2% mostly due to demand deposits (+21% year-on-year). In the quarter, mutual funds picked up 3%.
Results
The first nine months underlying attributable profit decreased 37% year-on-year to EUR 243 million:
•Total income fell 6%, weighed down by the impact of the pandemic in net interest income (lower interest rates) and net fee income (lower volumes and suspension of fees for digital payments and payment holidays in loans). Growth in gains on financial transactions was offset by reduced insurance activity and the higher contribution to the SRF.
•Costs dropped 5% driven by the ongoing transformation process, enabling the efficiency ratio to stay at 45%.
•Higher provisions for possible future impacts of the pandemic, raising the cost of credit to 0.42%. The NPL ratio fell to 4.25%.
Compared to the previous quarter, underlying attributable profit declined 9% mainly due to increased provisions.
| Customers | ||||||||||||||||||||
| September 2020. Thousands | ||||||||||||||||||||
| Loyal customers | Digital customers | |||||||||||||||||||
| 800 | | 903 | |||||||||||||||||
| 47 | % | /active customers | +17 | % | YoY | |||||||||||||||
| Activity | ||||||||||||||||||||||||||||||||||||||||||||||||||||||||||||||
| September 2020. EUR billion and % change | ||||||||||||||||||||||||||||||||||||||||||||||||||||||||||||||
| +1% | ||||||||||||||||||||||||||||||||||||||||||||||||||||||||||||||
| +1% | QoQ | |||||||||||||||||||||||||||||||||||||||||||||||||||||||||||||
| QoQ | ||||||||||||||||||||||||||||||||||||||||||||||||||||||||||||||
| 39 | 43 | |||||||||||||||||||||||||||||||||||||||||||||||||||||||||||||
| +6% | +2% | |||||||||||||||||||||||||||||||||||||||||||||||||||||||||||||
| YoY | YoY | |||||||||||||||||||||||||||||||||||||||||||||||||||||||||||||
| Gross loans and advances to customers excl. reverse repos | Customer deposits excl. repos + mutual funds | |||||||||||||||||||||||||||||||||||||||||||||||||||||||||||||
| Underlying income statement | ||||||||||||||||||||||||||||||||
| EUR million and % change | ||||||||||||||||||||||||||||||||
| Q3'20 | / Q2'20 | 9M'20 | / 9M'19 | |||||||||||||||||||||||||||||
| Revenue | 312 | -2 | % | 979 | -6 | % | ||||||||||||||||||||||||||
| Expenses | -146 | +1 | % | -442 | -5 | % | ||||||||||||||||||||||||||
| Net operating income | 166 | -4 | % | 538 | -7 | % | ||||||||||||||||||||||||||
| LLPs | -47 | +95 | % | -152 | — | |||||||||||||||||||||||||||
| PBT | 120 | -9 | % | 350 | -37 | % | ||||||||||||||||||||||||||
| Underlying attrib. profit | 83 | -9 | % | 243 | -37 | % | ||||||||||||||||||||||||||
January - September 2020 | | 33 | ||||||
Business model | ||||||||||||||||||||||||||
| Primary segments | ||||||||||||||||||||||||||
| POLAND | ||||||||||||||
 | Highlights (changes in constant euros) | |||||||||||||
•The main management focus is on customer relationships and maximising business income. In the coming months, it will shift toward net fee income (in order to offset the fall in net interest income caused by low interest rates), the sale of more profitable credit products and the repricing of the credit portfolio. •Santander Bank Polska is the third largest bank in Poland in terms of assets1. •Underlying attributable profit was 40% lower year-on-year, impacted by COVID-19 related impairment charges, interest rate cuts and provisions recorded due to regulatory changes after the CJEU rulings. In the quarter, profit surged 34%, receiving an uplift from lower provisions. | ||||||||||||||
| EUR 142 Mn | ||||||||||||||
| Underlying attributable profit | ||||||||||||||
Commercial activity
During the pandemic, the Bank took several actions to protect customers from the economic consequences derived from COVID-19, such as the suspension of capital instalments for cash loans, mortgages and SME loans (which ended in September).
We also introduced new solutions to improve customer experience and loyalty, such as a chatbot on the santander.pl webpage, new value-added products, such as providing medical service for SME customers together with MasterCard & Luxmed, and legal support for Private Banking Clients.
Within the Group's strategy for Responsible Banking, Santander Leasing in Poland launched SolarLease, a product that enables customers to finance photovoltaic systems through leasing or loans. In addition, the Bank set up a promotional offer to finance electric and hybrid vehicles.
SCIB maintained a leading position in corporate finance advisory in Poland, especially in equity capital markets, and participated in the largest initial public offering in history on the Warsaw Stock Exchange in October.
Business performance
Gross loans and advances to customers (excluding reverse repos) increased modestly year-on-year (+1%). By segment, volume growth in individuals (+3%), cash loans (+6%) and SMEs (+4%). On the other hand, corporates fell 5% due to excess liquidity in the market. On a quarterly basis, loans fell 1%.
Deposits grew 12% year-on-year, boosted by SMEs (+48%) and business and commercial banking (+24%). CIB’s deposit base showed an annual decrease of 23%. The Group continued to actively manage deposits to optimise the cost of funding.
Results
Underlying attributable profit in the first nine months was EUR 142 million, 40% lower than in the same period of 2019.
•Total income fell 7% due to lower net interest income (-6%), impacted by interest rates cuts (-140 bps during the year), net fee income (-2%), driven by lower customer transactionality, and higher BFG contribution.
•Costs down 7% year-on-year driven by personnel expenses (-11%) and general and administrative expenses, which were 2% lower.
•Loan-loss provisions increased 54% year-on-year, mainly due to higher charges in the SME and CIB segments, and, to a lesser extent, higher provisions for individuals.
Compared to the previous quarter, underlying profit increased 34% driven by lower LLPs (mainly individuals).
1.As of June 2020
| Customers | ||||||||||||||||||||
| September 2020. Thousands | ||||||||||||||||||||
| Loyal customers | Digital customers | |||||||||||||||||||
| 2,067 | | 2,704 | |||||||||||||||||
| 54 | % | /active customers | +10 | % | YoY | |||||||||||||||
| Activity | ||||||||||||||||||||||||||||||||||||||||||||||||||||||||||||||
| September 2020. EUR billion and % change in constant euros | ||||||||||||||||||||||||||||||||||||||||||||||||||||||||||||||
| -1% | +2% | |||||||||||||||||||||||||||||||||||||||||||||||||||||||||||||
| QoQ | QoQ | |||||||||||||||||||||||||||||||||||||||||||||||||||||||||||||
| 29 | 38 | |||||||||||||||||||||||||||||||||||||||||||||||||||||||||||||
| +1% | +10% | |||||||||||||||||||||||||||||||||||||||||||||||||||||||||||||
| YoY | YoY | |||||||||||||||||||||||||||||||||||||||||||||||||||||||||||||
| Gross loans and advances to customers excl. reverse repos | Customer deposits excl. repos + mutual funds | |||||||||||||||||||||||||||||||||||||||||||||||||||||||||||||
| Underlying income statement | ||||||||||||||||||||||||||||||||
| EUR million and % change in constant euros | ||||||||||||||||||||||||||||||||
| Q3'20 | / Q2'20 | 9M'20 | / 9M'19 | |||||||||||||||||||||||||||||
| Revenue | 394 | +3 | % | 1,136 | -7 | % | ||||||||||||||||||||||||||
| Expenses | -161 | +11 | % | -475 | -7 | % | ||||||||||||||||||||||||||
| Net operating income | 233 | -1 | % | 661 | -7 | % | ||||||||||||||||||||||||||
| LLPs | -65 | -27 | % | -249 | +54 | % | ||||||||||||||||||||||||||
| PBT | 136 | +28 | % | 303 | -34 | % | ||||||||||||||||||||||||||
| Underlying attrib. profit | 68 | +34 | % | 142 | -40 | % | ||||||||||||||||||||||||||
| 34 | | January - September 2020 | ||||||
Business model | ||||||||||||||||||||||||||
| Primary segments | ||||||||||||||||||||||||||
| NORTH AMERICA | ||||||||
 | Highlights (changes in constant euros) •In North America, the US and Mexico are managed according to their local priorities, while increasing coordination and cooperation between the two units. In Mexico, the period to sign up to the Bank's debtor support programme aimed at individuals and SMEs ended in July. In the US, we continued to support our customers while maintaining a strong capital and liquidity position. •In volumes, gross loans and advances to customers rose 6% and customer funds grew 15% year-on-year, boosted by corporate demand. •In the quarter, underlying attributable profit rose strongly driven by higher customer revenue and cost of credit improvement. However, profit dropped 12% in the year impacted by the increase in provisions related to the pandemic. Revenue remained stable and net operating income was 1% higher. | |||||||
| EUR 1,061 Mn | ||||||||
| Underlying attributable profit | ||||||||
Strategy
In the US, SBNA's strategy focuses on improving customer satisfaction through digital channels and branches, while continuing to strengthen its auto finance partnership with SC USA. In SC USA, focus remains on managing the relationship between profitability, through pricing, and risk, while improving the dealer experience. In Mexico, we remained focused on strengthening the distribution network and developing digital channels with the aim to attract customers and increase loyalty.
Coordination between the countries further increased as we continue to pursue join initiatives, such as:
•Continued development of the USMX trade corridor. SCIB and Commercial Banking are working to deepen relationships with existing clients and increase client acquisition in both countries, which is reflected in corridor revenue growth (SCIB: +29%; Commercial: +30%).
•Commission-free same-day remittance service from Santander US branches to any bank in Mexico. At the same time, ongoing development of other payment alternatives for the USMX trade corridor, such as PagoFX.
•Joint technology programmes between the two countries: operations know-how, digitalisation, hubs, front-office and back-office, and addressing common challenges in both countries.
Business performance
Gross loans and advances to customers (excluding reverse repos) increased 6% with similar growth in both countries.
Customer funds (excluding repos) also presented a solid year-on-year performance (+15%) driven by growth in demand deposits in SBNA, corporate deposits in the New York branch and deposits in Mexico. This growth in deposits reflects the high level of liquidity in the system and the positive performance of our customer attraction and loyalty strategy.
Results
In the first nine moths of the year, underlying attributable profit amounted to EUR 1,061 million, 12% lower year-on-year:
•Net interest income remained stable, driven by volume growth, and net fee income declined (-1%) affected by the lower activity in consumer banking.
•Costs decreased, enabling the efficiency ratio to improve to 41.3% despite the increase in amortisations and technology investments. Net operating income rose 1%.
•LLPs grew mainly due to COVID-19 related provisions. The NPL ratio stood at 1.96% and coverage was higher at 202%. The cost of credit stood at 3.07%.
Compared to the second quarter, underlying attributable profit surged 34% through higher customer revenue and lower provisions in both countries, mainly in the US.
| Customers | ||||||||||||||||||||
| September 2020. Thousands | ||||||||||||||||||||
| Loyal customers | Digital customers | |||||||||||||||||||
| 3,760 | | 5,744 | |||||||||||||||||
| 35 | % | /active customers | +19 | % | YoY | |||||||||||||||
| Activity | ||||||||||||||||||||||||||||||||||||||||||||||||||||||||||||||
| September 2020. EUR billion and % change in constant euros | ||||||||||||||||||||||||||||||||||||||||||||||||||||||||||||||
| -3% | ||||||||||||||||||||||||||||||||||||||||||||||||||||||||||||||
| QoQ | -3% | |||||||||||||||||||||||||||||||||||||||||||||||||||||||||||||
| QoQ | ||||||||||||||||||||||||||||||||||||||||||||||||||||||||||||||
| 123 | 117 | |||||||||||||||||||||||||||||||||||||||||||||||||||||||||||||
| +6% | +15% | |||||||||||||||||||||||||||||||||||||||||||||||||||||||||||||
| YoY | YoY | |||||||||||||||||||||||||||||||||||||||||||||||||||||||||||||
| Gross loans and advances to customers excl. reverse repos | Customer deposits excl. repos + mutual funds | |||||||||||||||||||||||||||||||||||||||||||||||||||||||||||||
| Underlying income statement | ||||||||||||||||||||||||||||||||
| EUR million and % change in constant euros | ||||||||||||||||||||||||||||||||
| Q3'20 | / Q2'20 | 9M'20 | / 9M'19 | |||||||||||||||||||||||||||||
| Revenue | 2,678 | +3 | % | 8,319 | 0 | % | ||||||||||||||||||||||||||
| Expenses | -1,097 | +3 | % | -3,438 | -2 | % | ||||||||||||||||||||||||||
| Net operating income | 1,581 | +4 | % | 4,882 | +1 | % | ||||||||||||||||||||||||||
| LLPs | -775 | -26 | % | -3,144 | +24 | % | ||||||||||||||||||||||||||
| PBT | 781 | +82 | % | 1,664 | -21 | % | ||||||||||||||||||||||||||
| Underlying attrib. profit | 444 | +34 | % | 1,061 | -12 | % | ||||||||||||||||||||||||||
January - September 2020 | | 35 | ||||||
Business model | ||||||||||||||||||||||||||
| Primary segments | ||||||||||||||||||||||||||
| UNITED STATES | ||||||||||||||
 | Highlights (changes in constant euros) | |||||||||||||
•Since the start of the COVID-19 pandemic, Santander US has remained focused on using its strong capital and Northeast deposit base to support its consumer and commercial customers. •During the quarter, Santander US supported its net operating income performance through disciplined pricing and expense management. In addition, the company achieved strategic milestones through increased ownership of SC USA and completing the sale of the banking franchise in Puerto Rico. •The year-on-year improvement in customers and deposits continues to support higher revenue and offsetting the significant headwind of lower rates. Year-on-year, loans and customer funds grew 6% and 17%, respectively. •The uncertain macroeconomic environment drove the need for higher provisions. In this context, COVID-19’s impact on provisions pressure 9M’20 underlying attributable profit which was 24% down compared to 9M’19 while net operating income remained virtually stable. In the quarter, profit was 79% higher driven by the positive performance in revenue, costs and provisions. | ||||||||||||||
| EUR 470 Mn | ||||||||||||||
| Underlying attributable profit | ||||||||||||||
Commercial activity
During the COVID-19 crisis, Santander US has continued to support its customers, employees and communities while pursuing its strategic priorities:
•Santander US: remains focused on enhancing customer experience and growing core customers and deposits through digital, branch and commercial transformation initiatives while leveraging its deposit base to support its CRE and CIB businesses as well as strengthening its auto finance partnership.
•The auto business is ideally positioned to benefit from the renewed demand for used vehicles through rigorous risk-adjusted originations through its dealer network, enhancing its partnership with Fiat Chrysler, and disciplined servicing.
Business performance
Gross loans and advances to customers (excluding reverse repos) grew 6% year-on-year driven by lending growth in auto, commercial banking, CIB and originations through the Paycheck Protection Program.
Auto originations, in particular, continued to improve during the third quarter as shelter-in-place mandates were lifted and dealerships returned to normal activity. Prime loans remain elevated versus prior year due to FCA incentive programmes and Santander US's ability to leverage its strong deposit base.
Customer funds (excluding repos) exhibit strong year-on-year growth (+17%) boosted by demand deposits and corporate deposits.
Results
Underlying attributable profit in the first nine months of 2020 was EUR 470 million, down 24% against the same period of 2019, while net operating income is virtually flat:
•Total income down 3% due to lower rate environment, lower lease income, and lower fees impacted by COVID-19, partially offset by lower cost of funds, higher loan volumes, and strong performance in Capital Markets and market making.
•Loan-loss provisions increased 21% due to the COVID-19 impact. Stronger than expected economic recovery drove better performance in the quarter.
Compared to the previous quarter, underlying attributable profit was 79% higher due to the lower cost of debt, better performance on leases as the economy starts to recover, controlled costs and lower provisions.
| Customers | ||||||||||||||||||||
| September 2020. Thousands | ||||||||||||||||||||
| Loyal customers | Digital customers | |||||||||||||||||||
| 352 | | 997 | |||||||||||||||||
| 22 | % | /active customers | +5 | % | YoY | |||||||||||||||
Excluding Puerto Rico disposal impact
| Activity | ||||||||||||||||||||||||||||||||||||||||||||||||||||||||||||||
| September 2020. EUR billion and % change in constant euros | ||||||||||||||||||||||||||||||||||||||||||||||||||||||||||||||
| -4% | ||||||||||||||||||||||||||||||||||||||||||||||||||||||||||||||
| QoQ | -4% | |||||||||||||||||||||||||||||||||||||||||||||||||||||||||||||
| QoQ | ||||||||||||||||||||||||||||||||||||||||||||||||||||||||||||||
| 93 | 79 | |||||||||||||||||||||||||||||||||||||||||||||||||||||||||||||
| +6% | +17% | |||||||||||||||||||||||||||||||||||||||||||||||||||||||||||||
| YoY | YoY | |||||||||||||||||||||||||||||||||||||||||||||||||||||||||||||
| Gross loans and advances to customers excl. reverse repos | Customer deposits excl. repos + mutual funds | |||||||||||||||||||||||||||||||||||||||||||||||||||||||||||||
| Underlying income statement | ||||||||||||||||||||||||||||||||
| EUR million and % change in constant euros | ||||||||||||||||||||||||||||||||
| Q3'20 | / Q2'20 | 9M'20 | / 9M'19 | |||||||||||||||||||||||||||||
| Revenue | 1,830 | +8 | % | 5,559 | -3 | % | ||||||||||||||||||||||||||
| Expenses | -722 | -1 | % | -2,307 | -5 | % | ||||||||||||||||||||||||||
| Net operating income | 1,108 | +15 | % | 3,252 | -1 | % | ||||||||||||||||||||||||||
| LLPs | -572 | -25 | % | -2,376 | +21 | % | ||||||||||||||||||||||||||
| PBT | 515 | +225 | % | 820 | -29 | % | ||||||||||||||||||||||||||
| Underlying attrib. profit | 259 | +79 | % | 470 | -24 | % | ||||||||||||||||||||||||||
| 36 | | January - September 2020 | ||||||
Business model | ||||||||||||||||||||||||||
| Primary segments | ||||||||||||||||||||||||||
| MEXICO | ||||||||||||||
 | Highlights (changes in constant euros) | |||||||||||||
•The period to sign up to the Bank's debtor support programme aimed at individuals and SMEs ended in July. Most branches continued to operate with reduced staff and digital channels and contact centres continued operating normally. •Gross loans and advances to customers (excluding reverse repos) increased 7% year-on-year, particularly CIB, corporates and mortgages. Customer funds rose 13%. •Underlying attributable profit rose 1% year-on-year, backed by the sound performance of net interest income, gains on financial transactions and reduced non-controlling interests, which offset higher provisions. In the quarter, profit increased slightly as well. | ||||||||||||||
| EUR 591 Mn | ||||||||||||||
| Underlying attributable profit | ||||||||||||||
Commercial activity
The commercial strategy continued to focus on improving the distribution model and boosting digital channels to increase customer attraction and loyalty with new and innovative products and services:
•We further developed our distribution model with the transformation of 569 branches and 1,259 full function ATMs.
•Santander Plus reached 7.4 million customers (53% new).
•We maintained a dynamic offering in mortgage loans: we lowered the Hipoteca Plus interest rate to 7.75% and introduced Hipoteca Free, the first commission-free mortgage loan in the country. New mortgage lending reached a record high in August and September.
•In line with our strategy of consolidating our position in the auto finance market, we signed an alliance with Mazda Financial Services to become its main partner in this segment, using a fully digital platform.
•Our strategy to foster the use of digital channels was reflected in a 49% increase in digital monetary transactions and digital sales, which now account for 39% of total sales, thereby increasing customer digital adoption.
Business performance
Gross loans and advances to customers (excluding reverse repos) increased 7% year-on-year. Of note were CIB (+13%) and corporates (+11%). Individuals rose 4%, driven by mortgages (+13%) and consumer credit (+1%). Conversely, credit cards (-4%), continued to be affected by lower activity arising from lockdown measures.
Customer funds (excluding repos) increased 13%. Demand deposits were 17% higher, with growth in individuals (+27%) and time deposits rose 12%. Mutual funds were up 6%.
Results
Underlying attributable profit in the first nine months increased to EUR 591 million (1% higher year-on-year):
•In revenue, net interest income rose 2%, underpinned by higher volumes. Net fee income increased 4% mainly from transactional fees and gains on financial transactions increased driven by volatility management combined with lower activity in the first nine months of 2019.
•Operating expenses were 4% higher, mainly driven by the increase in amortisations and technology investment.
•Loan-loss provisions surged 34% due to COVID-19 related charges and a one-off provision recorded for a corporate customer.
In the quarter, underlying attributable profit rose 1% as lower provisions (-27%) and higher customer revenue (+4%) absorbed the fall in gains on financial transactions (exceptionally high in Q2) and the rise in costs (+10%) driven by the progress made in the implementation of several projects and higher technology costs.
| Customers | ||||||||||||||||||||
| September 2020. Thousands | ||||||||||||||||||||
| Loyal customers | Digital customers | |||||||||||||||||||
| 3,408 | | 4,747 | |||||||||||||||||
| 37 | % | /active customers | +24 | % | YoY | |||||||||||||||
| Activity | ||||||||||||||||||||||||||||||||||||||||||||||||||||||||||||||
| September 2020. EUR billion and % change in constant euros | ||||||||||||||||||||||||||||||||||||||||||||||||||||||||||||||
| -1% | ||||||||||||||||||||||||||||||||||||||||||||||||||||||||||||||
| -2% | QoQ | |||||||||||||||||||||||||||||||||||||||||||||||||||||||||||||
| QoQ | ||||||||||||||||||||||||||||||||||||||||||||||||||||||||||||||
| 30 | 38 | |||||||||||||||||||||||||||||||||||||||||||||||||||||||||||||
| +7% | +13% | |||||||||||||||||||||||||||||||||||||||||||||||||||||||||||||
| YoY | YoY | |||||||||||||||||||||||||||||||||||||||||||||||||||||||||||||
| Gross loans and advances to customers excl. reverse repos | Customer deposits excl. repos + mutual funds | |||||||||||||||||||||||||||||||||||||||||||||||||||||||||||||
| Underlying income statement | ||||||||||||||||||||||||||||||||
| EUR million and % change in constant euros | ||||||||||||||||||||||||||||||||
| Q3'20 | / Q2'20 | 9M'20 | / 9M'19 | |||||||||||||||||||||||||||||
| Revenue | 848 | -5 | % | 2,760 | +5 | % | ||||||||||||||||||||||||||
| Expenses | -375 | +10 | % | -1,130 | +4 | % | ||||||||||||||||||||||||||
| Net operating income | 473 | -14 | % | 1,629 | +7 | % | ||||||||||||||||||||||||||
| LLPs | -203 | -27 | % | -767 | +34 | % | ||||||||||||||||||||||||||
| PBT | 266 | +1 | % | 844 | -11 | % | ||||||||||||||||||||||||||
| Underlying attrib. profit | 185 | +1 | % | 591 | +1 | % | ||||||||||||||||||||||||||
January - September 2020 | | 37 | ||||||
Business model | ||||||||||||||||||||||||||
| Primary segments | ||||||||||||||||||||||||||
| SOUTH AMERICA | ||||||||
 | Highlights (changes in constant euros) •Work protocols continued to be implemented in all countries to protect our employees' safety and customer service, maintaining quality of service and ensuring business continuity. •Broad-based double-digit growth both in loans and advances to customers and customer deposits across countries, with volumes and tansactionality gradually recovering. •We continued to focus on delivering profitable growth backed by operational excellence and cost and risk control. •Underlying attributable profit in the first nine months of the year fell 10% affected by COVID-19 related provisions. However, 15% growth was recorded quarter-on-quarter driven by the positive performance in customer revenue and provisions. | |||||||
| EUR 2,119 Mn | ||||||||
| Underlying attributable profit | ||||||||
Strategy
We continued to identify growth opportunities across business units to capture synergies:
•During the quarter we continued to support our customers, providing liquidity to cover their needs, extending terms and modifying maturity profiles. Each country adapted their support schemes to their local environment, through state-guaranteed loans and credit lines with better rates.
•We continued to expand our consumer finance activity across the region: Argentina launched the Santander Consumer company focused on a fast and agile customer experience. In Colombia, the priority was to make the auto fiance business profitable and to increase customer loyalty through insurance. In recent months, Chile recovered pre-COVID-19 auto finance activity levels.
•In payment methods, Brazil unveiled Santander SX, a financial solution that uses the Central Bank's new instant payment system, in order to increase loyalty through exclusive benefits for customers.
•Regarding the acquiring business, we continued to export Brazil's model to other countries. In Argentina, we already launched Getnet.
•We remained focused on the digital transformation and innovation of our processes and products. In Peru, we acquired a digital platform for auto financing and Uruguay opened SUMO, its mobile branch. In Chile, we continued to drive account openings and prepaid card sales through Santander Life's digital process and Superdigital.
•Prospera, our micro-credit programme in Brazil, continued its expansion in Uruguay while we further study its roll-out to other regions.
Business performance
Gross loans and advances to customers (excluding reverse repos) increased 17% year-on-year, with double-digit growth in all countries.
Customer funds (excluding repos) rose 21%, growing at double-digit rates in all markets.
Results
Underlying attributable profit in the first nine months of 2020 amounted to EUR 2,119 million, down 10% year-on-year:
•Total income increased 6%, underpinned by the sound performance of net interest income (+5%) and gains on financial transactions (+71%).
•Costs rose at a slower pace than income, enabling efficiency to improve 41 bps to 35.3% and net operating income to increase 6%.
•Provisions increased 49% driven by COVID-19 related provisions. In credit quality, the NPL ratio stood at 4.40%, coverage was 97% and cost of credit of 3.50%.
In the quarter, underlying attributable profit was 15% higher driven by customer revenue and lower provisions.
| Customers | ||||||||||||||||||||
| September 2020. Thousands | ||||||||||||||||||||
| Loyal customers | Digital customers | |||||||||||||||||||
| 8,131 | | 19,808 | |||||||||||||||||
| 26 | % | /active customers | +15 | % | YoY | |||||||||||||||
| Activity | ||||||||||||||||||||||||||||||||||||||||||||||||||||||||||||||
| September 2020. EUR billion and % change in constant euros | ||||||||||||||||||||||||||||||||||||||||||||||||||||||||||||||
| +3% | ||||||||||||||||||||||||||||||||||||||||||||||||||||||||||||||
| +3% | QoQ | |||||||||||||||||||||||||||||||||||||||||||||||||||||||||||||
| QoQ | ||||||||||||||||||||||||||||||||||||||||||||||||||||||||||||||
| 114 | 146 | |||||||||||||||||||||||||||||||||||||||||||||||||||||||||||||
| +17% | +21% | |||||||||||||||||||||||||||||||||||||||||||||||||||||||||||||
| YoY | YoY | |||||||||||||||||||||||||||||||||||||||||||||||||||||||||||||
| Gross loans and advances to customers excl. reverse repos | Customer deposits excl. repos + mutual funds | |||||||||||||||||||||||||||||||||||||||||||||||||||||||||||||
| Underlying income statement | ||||||||||||||||||||||||||||||||
| EUR million and % change in constant euros | ||||||||||||||||||||||||||||||||
| Q3'20 | / Q2'20 | 9M'20 | / 9M'19 | |||||||||||||||||||||||||||||
| Revenue | 3,477 | +1 | % | 11,331 | +6 | % | ||||||||||||||||||||||||||
| Expenses | -1,238 | +5 | % | -3,998 | +4 | % | ||||||||||||||||||||||||||
| Net operating income | 2,240 | 0 | % | 7,333 | +6 | % | ||||||||||||||||||||||||||
| LLPs | -787 | -22 | % | -3,221 | +49 | % | ||||||||||||||||||||||||||
| PBT | 1,382 | +17 | % | 3,847 | -12 | % | ||||||||||||||||||||||||||
| Underlying attrib. profit | 736 | +15 | % | 2,119 | -10 | % | ||||||||||||||||||||||||||
| 38 | | January - September 2020 | ||||||
Business model | ||||||||||||||||||||||||||
| Primary segments | ||||||||||||||||||||||||||
| BRAZIL | ||||||||||||||
 | Highlights (changes in constant euros) | |||||||||||||
•Strategy centred on capturing growth opportunities, increasing market share in lower risk products and maintaining high customer service levels (NPS). •Double-digit year-on-year growth in assets and liabilities, maintaining credit quality at controlled levels. •In the first nine months of 2020, underlying attributable profit amounted to EUR 1,545 million (-11% year-on-year), RoTE was 18.4%, positive total income performance and efficiency improved, being the best among peers. Strong profit rebound quarter-on-quarter (+21%). | ||||||||||||||
| EUR 1,545 Mn | ||||||||||||||
| Underlying attributable profit | ||||||||||||||
Commercial activity
We continued to progress in our strategic actions. Of note were:
•In mortgages, we were on the cutting edge for digital portability. New lending to individuals surged 120% in August (vs. July).
•In auto, we reached a new high in new production in September, remaining leaders in individuals with 25% market share. We held the Mega feirão Webmotors, allowing loans to be taken out through a 100% online process, which contributed to the increase in new lending and insurance sales through Santander Auto.
•In cards, revenue grew 30% in the quarter and over 30% of our card base are contactless. In acquiring, we reached 1.8 million POS and we continue to have the lowest cost per transaction.
•In SMEs, we granted BRL 9.9 billion in loans through state-guaranteed programmes. In SCIB, we progressed in our green finance agenda.
•As for digitalisation, we unveiled Santander SX, which brings together the speed and convenience of PIX, the Central Bank’s new payment system, due for release in November.
•Our culture, based on close relationships and communication, enabled us to increase the number of contracts 9% in September (vs. pre-COVID levels) and to maintain a high NPS.
Business performance
Gross loans and advances to customers excluding reverse repos grew 20% year-on-year with increases in all segments. Of note were SMEs, corporates and SCIB.
Customer funds increased 20% year-on-year, boosted by customer deposits excluding repos, and both demand and time deposits rose 47%. Mutual funds dropped 6%.
Results
First nine months underlying attributable profit of EUR 1,545 million (-11% year-on-year). Of note:
•Total income rose 3% boosted by gains on financial transactions. Net interest income remained practically flat as larger volumes offset margin pressures. Net fee income fell 2% affected by the current environment.
•Operating expenses increased less than 2%, which enabled net operating income to rise 4% and the efficiency ratio to improve by 61 bps to under 32%.
•Net loan-loss provisions increased 44%, due to higher provisions related the current situation. Cost of credit of 4.58%, NPL ratio of 4.64% and coverage ratio was high at 115%.
In the quarter, underlying attributable profit rose 21% driven by customer revenue and lower provisions.
| Customers | ||||||||||||||||||||
| September 2020. Thousands | ||||||||||||||||||||
| Loyal customers | Digital customers | |||||||||||||||||||
| 5,963 | | 15,208 | |||||||||||||||||
| 22 | % | /active customers | +13 | % | YoY | |||||||||||||||
| Activity | ||||||||||||||||||||||||||||||||||||||||||||||||||||||||||||||
| September 2020. EUR billion and % change in constant euros | ||||||||||||||||||||||||||||||||||||||||||||||||||||||||||||||
| +5% | ||||||||||||||||||||||||||||||||||||||||||||||||||||||||||||||
| +4% | QoQ | |||||||||||||||||||||||||||||||||||||||||||||||||||||||||||||
| QoQ | ||||||||||||||||||||||||||||||||||||||||||||||||||||||||||||||
| 63 | 96 | |||||||||||||||||||||||||||||||||||||||||||||||||||||||||||||
| +20% | +20% | |||||||||||||||||||||||||||||||||||||||||||||||||||||||||||||
| YoY | YoY | |||||||||||||||||||||||||||||||||||||||||||||||||||||||||||||
| Gross loans and advances to customers excl. reverse repos | Customer deposits excl. repos + mutual funds | |||||||||||||||||||||||||||||||||||||||||||||||||||||||||||||
| Underlying income statement | ||||||||||||||||||||||||||||||||
| EUR million and % change in constant euros | ||||||||||||||||||||||||||||||||
| Q3'20 | / Q2'20 | 9M'20 | / 9M'19 | |||||||||||||||||||||||||||||
| Revenue | 2,534 | +2 | % | 8,322 | +3 | % | ||||||||||||||||||||||||||
| Expenses | -805 | +3 | % | -2,644 | +2 | % | ||||||||||||||||||||||||||
| Net operating income | 1,729 | +2 | % | 5,677 | +4 | % | ||||||||||||||||||||||||||
| LLPs | -569 | -25 | % | -2,478 | +44 | % | ||||||||||||||||||||||||||
| PBT | 1,092 | +22 | % | 2,973 | -11 | % | ||||||||||||||||||||||||||
| Underlying attrib. profit | 550 | +21 | % | 1,545 | -11 | % | ||||||||||||||||||||||||||
January - September 2020 | | 39 | ||||||
Business model | ||||||||||||||||||||||||||
| Primary segments | ||||||||||||||||||||||||||
| CHILE | ||||||||||||||
 | Highlights (changes in constant euros) | |||||||||||||
•During the quarter, several communes in Chile started to adopt de-escalation measures. As of September, 25% of our employees had returned to their workplaces. •Gross loans and advances to customers (excluding reverse repos) rose 10% year-on-year, although at a slower pace in the quarter following the strong growth recorded in the first half of the year. •Sharp year-on-year increase in demand deposits (+47%). Account openings saw continued growth, with record months in Superdigital and Life. •Underlying attributable profit decreased year-on-year primarily due to higher provisions, as total income and net operating income both rose 3%. In the quarter, profit increased 1%. | ||||||||||||||
| EUR 269 Mn | ||||||||||||||
| Underlying attributable profit | ||||||||||||||
Commercial activity
Continued focus on increasing new customer attraction and loyalty, maintaining a strategy aimed at offering attractive returns based on our digital transformation:
•We continued to boost the Santander Life programme, which is centred on promoting good credit behaviour and financial education, reaching 305,000 customers (190,000 customers in June).
•Since its recent launch, Superdigital has exceeded 100,000 customers (70,000 in June) because of its high transactionality and digital platform.
All these measures led to a strong year-on-year increase in digital customers (+23%).
Business performance
Gross loans and advances to customers (excluding reverse repos) increased 10% year-on-year, spurred by corporates and large corporates and the state-guaranteed scheme for SMEs.
Customer funds (excluding repos) reflected a better funding mix. Demand deposits continued to rise strongly across all segments due to increased current account openings driven by the offer of digital channels such as Superdigital and Life. As a result, customer funds grew 11% year-on-year.
Results
First nine months attributable profit amounted to EUR 269 million, 33% lower year-on-year, as follows:
•Total income increased 3% year-on-year backed by loan growth and a better funding costs. Net fee income continued to be dampened by reduced transactionality and economic activity, while the country begins to reopen its economy.
•Costs rose slightly (+1%) driven by higher IT maintenance expenses, offset by lower costs related to commercial activity. This led to a 47 bps efficiency improvement to 40.8%.
•Loan-loss provisions were 86% higher due to COVID-19 related charges, placing the cost of credit at 1.59%. The NPL ratio stood at 4.76%.
Compared to the second quarter of 2020, underlying attributable profit rose 1%, as lower costs and especially lower provisions offset the fall in gains on financial transactions, which recorded an outstanding second quarter.
| Customers | ||||||||||||||||||||
| September 2020. Thousands | ||||||||||||||||||||
| Loyal customers | Digital customers | |||||||||||||||||||
| 727 | | 1,489 | |||||||||||||||||
| 44 | % | /active customers | +23 | % | YoY | |||||||||||||||
| Activity | ||||||||||||||||||||||||||||||||||||||||||||||||||||||||||||||
| September 2020. EUR billion and % change in constant euros | ||||||||||||||||||||||||||||||||||||||||||||||||||||||||||||||
| +1% | -3% | |||||||||||||||||||||||||||||||||||||||||||||||||||||||||||||
| QoQ | QoQ | |||||||||||||||||||||||||||||||||||||||||||||||||||||||||||||
| 39 | 35 | |||||||||||||||||||||||||||||||||||||||||||||||||||||||||||||
| +10% | +11% | |||||||||||||||||||||||||||||||||||||||||||||||||||||||||||||
| YoY | YoY | |||||||||||||||||||||||||||||||||||||||||||||||||||||||||||||
| Gross loans and advances to customers excl. reverse repos | Customer deposits excl. repos + mutual funds | |||||||||||||||||||||||||||||||||||||||||||||||||||||||||||||
| Underlying income statement | ||||||||||||||||||||||||||||||||
| EUR million and % change in constant euros | ||||||||||||||||||||||||||||||||
| Q3'20 | / Q2'20 | 9M'20 | / 9M'19 | |||||||||||||||||||||||||||||
| Revenue | 532 | -8 | % | 1,669 | +3 | % | ||||||||||||||||||||||||||
| Expenses | -223 | -1 | % | -681 | +1 | % | ||||||||||||||||||||||||||
| Net operating income | 310 | -12 | % | 988 | +3 | % | ||||||||||||||||||||||||||
| LLPs | -154 | -15 | % | -500 | +86 | % | ||||||||||||||||||||||||||
| PBT | 169 | 0 | % | 500 | -32 | % | ||||||||||||||||||||||||||
| Underlying attrib. profit | 86 | +1 | % | 269 | -33 | % | ||||||||||||||||||||||||||
| 40 | | January - September 2020 | ||||||
Business model | ||||||||||||||||||||||||||
| Primary segments | ||||||||||||||||||||||||||
| ARGENTINA | ||||||||||||||
 | Highlights (changes in constant euros) | |||||||||||||
•In the global pandemic environment, the Bank maintained protocols to look after the health of customers and employees, while ensuring service quality and investments in digital projects. •We continued to focus on the four strategic pillars: operational excellence, profitable growth, customer-centric strategy and culture and talent. •Underlying attributable profit in the first nine months of the year increased strongly to EUR 161 million, boosted by net interest income growth and efficiency improvement. | ||||||||||||||
| EUR 161 Mn | ||||||||||||||
| Underlying attributable profit | ||||||||||||||
Commercial activity
Santander focused on addressing the needs arising from the pandemic. In this environment, the Bank has granted more than EUR 530 million in loans to SMEs and health organisations. We continued with credit lines for the self-employed, the Cuenta Blanca, aimed at healthcare professionals, and the Cuenta Senior, which offers retired customers preferential service.
As regards the commercial strategy, we remained focused on transactional business and customer service, through the innovation and improvement of the customer care model, while working on the digital transformation. As a result, around 240,000 accounts were opened through fully digital means and the issuance of electronic cheques increased. Digital customers account for 86% of active customers and digital sales for 70% of the total.
In the quarter, the Bank introduced two new credit lines: Súper Préstamo Personal UVA and Súper Préstamo Prendario UVA, with a preferential rate for customers with their salary deposited at the bank.
In addition, the company Santander Consumer, specialised in consumer financing and secured loans, was set up. Getnet, for digital payment solutions, was also launched and the banking license for Openbank Argentina, the Group's fully digital bank, was obtained.
Business performance
Gross loans and advances to customers (excluding reverse repos) rose 32% year-on-year, driven by SME loans and cards. Dollar balances declined in the currency of origin.
Customer deposits (excluding repos) rose 60% year-on-year spurred by local currency deposits (demand and time deposits), as foreign currency balances declined. The excess liquidity is placed in central bank notes.
Results
Underlying attributable profit in the first nine months of EUR 161 million, 138% higher year-on-year. As regards the year-on-year comparison, of note was:
•Revenue grew 34%, underpinned by net interest income (+49%). Net fee income was affected by regulatory impacts and the lower economic activity.
•Costs increased 27%, at a slower pace than total income and inflation, improving the efficiency ratio by 328 bps to 54.5%. Net operating income rose 45%.
•Loan-loss provisions increased 39% due to COVID-19 related provisions. The NPL ratio stood at 2.88% and coverage was 186%.
In the quarter, underlying attributable profit was 8% lower mainly driven by costs related to the collective labour agreement, partly offset by the positive performance of customer revenue.
| Customers | ||||||||||||||||||||
| September 2020. Thousands | ||||||||||||||||||||
| Loyal customers | Digital customers | |||||||||||||||||||
| 1,336 | | 2,690 | |||||||||||||||||
| 43 | % | /active customers | +24 | % | YoY | |||||||||||||||
| Activity | ||||||||||||||||||||||||||||||||||||||||||||||||||||||||||||||
| September 2020. EUR billion and % change in constant euros | ||||||||||||||||||||||||||||||||||||||||||||||||||||||||||||||
| +10% | ||||||||||||||||||||||||||||||||||||||||||||||||||||||||||||||
| +8% | QoQ | |||||||||||||||||||||||||||||||||||||||||||||||||||||||||||||
| QoQ | ||||||||||||||||||||||||||||||||||||||||||||||||||||||||||||||
| 5 | 9 | |||||||||||||||||||||||||||||||||||||||||||||||||||||||||||||
| +32% | +74% | |||||||||||||||||||||||||||||||||||||||||||||||||||||||||||||
| YoY | YoY | |||||||||||||||||||||||||||||||||||||||||||||||||||||||||||||
| Gross loans and advances to customers excl. reverse repos | Customer deposits excl. repos + mutual funds | |||||||||||||||||||||||||||||||||||||||||||||||||||||||||||||
| Underlying income statement | ||||||||||||||||||||||||||||||||
| EUR million and % change in constant euros | ||||||||||||||||||||||||||||||||
| Q3'20 | / Q2'20 | 9M'20 | / 9M'19 | |||||||||||||||||||||||||||||
| Revenue | 274 | +13 | % | 902 | +34 | % | ||||||||||||||||||||||||||
| Expenses | -152 | +24 | % | -491 | +27 | % | ||||||||||||||||||||||||||
| Net operating income | 122 | +1 | % | 411 | +45 | % | ||||||||||||||||||||||||||
| LLPs | -46 | +4 | % | -178 | +39 | % | ||||||||||||||||||||||||||
| PBT | 59 | -4 | % | 185 | +51 | % | ||||||||||||||||||||||||||
| Underlying attrib. profit | 52 | -8 | % | 161 | +138 | % | ||||||||||||||||||||||||||
January - September 2020 | | 41 | ||||||
Business model | ||||||||||||||||||||||||||
| Primary segments | ||||||||||||||||||||||||||
Uruguay
Highlights (changes in constant euros)
•In August, the period granted by the Central Bank of Uruguay to make our customers' payments more flexible ended. 11% of the Bank's portfolio and 30% of the financial entities signed up to these measures.
•Underlying attributable profit rose 11% year-on-year, spurred by increased revenue and improved efficiency.
Commercial activity and business performance
Santander continued to focus on enhancing customer satisfaction and loyalty and making progress in the digital transformation and modernising our channels. Despite the restrictions arising from the pandemic, loyal customers increased 4% year-on-year while transactions via digital channels rose 28% year-on-year.
In line with our strategy of contributing to people’s progress, we continued to expand Prosperá and Santander Locker. We opened the first mobile branch in Uruguay, while strengthening our position to offer in-store discounts to our customers. We also introduced A sola selfie, for personalised loans taken out online and a fully digital payroll advance offering, in order to continue to add digital capabilities.
Regarding volumes, gross loans and advances to customers (excluding reverse repos) grew 15% year-on-year. Customer deposits (excluding repos) grew 28%.
Results
Underlying attributable profit in the first nine months of 2020 of EUR 101 million, 11% higher year-on-year:
•Gross income rose 5%, backed by fee income and the positive performance of gains on financial transactions, due to exchange rate volatility.
•Costs grew at a slower pace than income, improving the efficiency ratio by 140 bps year-on-year. Net operating income increased 8%.
•Loan-loss provisions increased 29% due to two single name cases and extraordinary recoveries recorded in 2019. Coverage remained high (132%) and cost of credit stood at 2.45%.
Compared to the second quarter of 2020, underlying attributable profit was up 4% underpinned by net fee income, gains on financial transactions and lower provisions.
Peru
Highlights (changes in constant euros)
The strategy remained focused on the corporate segment, the country’s large companies and the Group’s global customers. In line with this strategy, we supported our customers by providing greater liquidity and flexibility, as well as through state-guaranteed support programmes. In addition, we continued to drive the digitalisation of our services and internal processes to improve customer experience and operational efficiency.
The auto loan financial entity continued to expand its business within the Group’s strategy of increasing its presence in this business, underpinned by local teams and South America's best practices.
First nine months attributable profit amounted to EUR 37 million (+23% year-on-year). Total income rose 26% mainly due to the positive performance of net interest income, net fee income and higher gains on financial transactions, driven by increased customer and markets activity. Costs increased at a slower pace than income, improving efficiency and increasing net operating income by 31%. The NPL ratio was 0.70%, coverage remained high and cost of credit was 0.36%. In the quarter, underlying attributable profit reached EUR 13 million (+21%).
Colombia
Highlights (changes in constant euros)
Activity in Colombia remained focused on SCIB clients, large companies and corporates, contributing solutions in treasury, risk hedging, foreign trade, confirming, custody and development of investment banking products. Regarding consumer finance, our priority is to make the auto business profitable, through value offerings for customers and manufacturers, the increase in customer loyalty through the insurance business and the digitalisation of processes.
The reactivation of the automotive sector continued, although we recorded a c.35% year-on-year reduction in vehicle sales due to the effects of pandemic. Santander Consumer signed two major agreements in the automotive sector, reaching a market share of 5.18% in loan origination. In addition, the process of renewing and signing new alliances with the main vehicle sales portals in the country continued.
The loan portfolio increased 63%, with growth in all segments and business areas, including consumer (auto loans), corporate and CIB.
Underlying attributable profit in the first nine months of the year was EUR 15 million, in line with September 2019, as the positive performance of net interest income offset higher costs, provisions and non-recurring income from project finance recorded in 2019. In the quarter, profit amounted to EUR 5 million (+54%).
| 42 | | January - September 2020 | ||||||
Business model | ||||||||||||||||||||||||||
| Primary segments | ||||||||||||||||||||||||||
| CORPORATE CENTRE | ||||||||||||||||||||
 | Highlights | |||||||||||||||||||
•In the health crisis environment, the Corporate Centre continued to play a critical role in supporting the Group through the special situation committees. Also, the progressive reincorporation of employees to the workplace began, with a mixture of on-site and remote working, always following government and health authorities recommendations, maintaining a high level of flexibility to meet individual needs. •The Corporate Centre’s objective is to aid the operating units by contributing value and carrying out the corporate function of oversight and control. It also carries out functions related to financial and capital management. •The underlying attributable loss decreased 11% compared to 2019, mainly due to higher gains on financial transactions related to foreign currency hedging. | ||||||||||||||||||||
| EUR | -1,455 Mn | |||||||||||||||||||
| Underlying attributable profit | ||||||||||||||||||||
Strategy and functions
The Corporate Centre contributes value to the Group in various ways:
•Making the Group’s governance more solid, through global control frameworks and supervision.
•Fostering the exchange of best practices in management of costs and generating economies of scale. This enables us to be one of the most efficient banks.
•Contributing to the launch of projects that will be developed by our global businesses that leverage our worldwide presence to develop solutions once that can be used by all business units, generating economies of scale.
It also coordinates the relationship with European regulators and supervisors and develops functions related to financial and capital management, as follows:
•Financial Management functions:
–Structural management of liquidity risk associated with funding the Group’s recurring activity, stakes of a financial nature and management of net liquidity related to the needs of some business units.
–This activity is carried out by the different funding sources (issuances and other), always maintaining an adequate profile in volumes, maturities and costs. The price of these operations with other Group units is the market rate plus the premium which, in liquidity terms, the Group supports by immobilising funds during the term of the operation.
–Interest rate risk is also actively managed in order to soften the impact of interest rate changes on net interest income, conducted via high credit quality, very liquid and low capital consumption derivatives.
–Strategic management of the exposure to exchange rates in equity and dynamic in the countervalue of the units’ annual results in euros. Net investments in equity are currently covered by EUR 22,364 million (mainly Brazil, the UK, Mexico, Chile, the US, Poland and Norway) with different instruments (spot, fx, forwards).
•Management of total capital and reserves: efficient capital allocation to each of the units in order to maximise shareholder return.
Results
First nine months underlying attributable loss of EUR 1,455 million, 11% lower than in the same period of 2019 (EUR -1,637 million).
•Growth of EUR 439 million in gains on financial transactions mainly due to foreign currency hedging.
•On the other hand, the positive trend in operating expenses continued, improving 12% compared to the first nine months of 2019, driven by ongoing streamlining and simplification measures.
•On the other hand, net interest income was impacted by the increase in the liquidity buffer, and other results and provisions increased strongly due to one-off provisions for certain stakes whose value was affected by the crisis.
| Underlying income statement | |||||||||||||||||||||||||||||||||||||||||
| EUR million | |||||||||||||||||||||||||||||||||||||||||
| Q3'20 | Q2'20 | Chg. | 9M'20 | 9M'19 | Chg. | ||||||||||||||||||||||||||||||||||||
| Total income | -271 | -313 | -13 | % | -889 | -1,236 | -28 | % | |||||||||||||||||||||||||||||||||
| Net operating income | -353 | -395 | -10 | % | -1,137 | -1,519 | -25 | % | |||||||||||||||||||||||||||||||||
| PBT | -381 | -773 | -51 | % | -1,567 | -1,733 | -10 | % | |||||||||||||||||||||||||||||||||
| Underlying attrib. profit | -330 | -94 | +249 | % | -1,455 | -1,637 | -11 | % | |||||||||||||||||||||||||||||||||
January - September 2020 | | 43 | ||||||
| Response to the COVID-19 crisis Business model | ||||||||||||||||||||||||||
| Secondary segments | ||||||||||||||||||||||||||
| RETAIL BANKING | ||||||||||||||
 | Highlights (changes in constant euros) | |||||||||||||
��Santander continued to support its customers, corporates and governments in all countries through a series of extraordinary measures to ensure the necessary financial support in the context of the health crisis, while we ensure our usual product and service offering. •We remained committed to the digital transformation and multi-channel strategy. In September, we reached more than 147 million customers, of which more than 22 million are loyal, 41 million are digital and more than 34 million are mobile customers. •Underlying attributable profit of EUR 2,938 million in the first nine months, strongly affected by COVID-19 related provisions. In the quarter, strong uptick in profit (+38%). | ||||||||||||||
| EUR 2,938 Mn | ||||||||||||||
| Underlying attributable profit | ||||||||||||||
Commercial activity
Santander wants to be the reference bank for individuals, SMEs and other companies in the countries where we operate. Our commitment to society has become even more important in the current environment arising from the global pandemic. Therefore, we strengthened our offering by defining a series of measures which ensure the necessary financial support through pre-approved credit lines, payment holidays and special policies.
In addition, this situation has strengthened and accelerated our digital transformation, focusing on our multi-channel strategy and the digitalisation of processes and businesses. The number of digital customers increased strongly, underpinned by measures such as the strategic transformation through digital acceleration in the UK and the expansion in Chile of Superdigital.
On the other hand, we continued to launch different commercial initiatives:
•In individuals, in Spain, focus was on reactivating commercial activity in residential mortgages and protection insurance. We introduced Hipoteca Free in Mexico, the first commission-free mortgage in the country. In Argentina, we launched new products such as Súper Préstamo Personal UVA and Súper Préstamo Prendario UVA, with an special rate for customers.
•In auto finance, SCF continued to focus on remaining the leader in auto finance, which is the strategy behind our acquisition of 50% of Sixt Leasing. In Brazil, we held the Mega feirão Webmotors, offering a 100% online process to take out loans. In Santander US, the auto business is ideally positioned to benefit from the renewed demand for used vehicles, and we signed new alliances in Colombia with the main vehicle sales portals in the country.
•In the SME segment, we continued to move forward with products such as Prospera in Brazil and Uruguay. Euromoney named Santander World's Best Bank for SMEs. In corporates, all countries granted state-guaranteed loans. In SCIB, Poland maintained a leading position in corporate finance advisory and in Brazil we progressed in our green finance agenda.
Results
Underlying attributable profit in the first nine months of 2020 was EUR 2,938 million, strongly affected by COVID-19 related provisions:
•Total income fell 3% impacted by the fall in net fee income and net interest income, partly offset by higher gains on financial transactions.
•Costs decreased 3%.
•Loan-loss provisions were up 54% strongly affected by COVID-19 related provisions. Cost of credit stood at 1.47% and the NPL ratio improved 35 bps to 3.63%.
| Customers | ||||||||||||||||||||
| September 2020. Thousands | ||||||||||||||||||||
| Loyal customers | Digital customers | |||||||||||||||||||
| 22,058 | | 41,365 | |||||||||||||||||
| 31 | % | /active customers | +14 | % | YoY | |||||||||||||||
| Activity | ||||||||||||||||||||||||||||||||||||||||||||||||||||||||||||||
| September 2020. EUR billion and % change in constant euros | ||||||||||||||||||||||||||||||||||||||||||||||||||||||||||||||
| 0% | +1% | |||||||||||||||||||||||||||||||||||||||||||||||||||||||||||||
| QoQ | QoQ | |||||||||||||||||||||||||||||||||||||||||||||||||||||||||||||
| 755 | 691 | |||||||||||||||||||||||||||||||||||||||||||||||||||||||||||||
| +4% | +6% | |||||||||||||||||||||||||||||||||||||||||||||||||||||||||||||
| YoY | YoY | |||||||||||||||||||||||||||||||||||||||||||||||||||||||||||||
| Gross loans and advances to customers excl. reverse repos | Customer deposits excl. repos + mutual funds | |||||||||||||||||||||||||||||||||||||||||||||||||||||||||||||
| Underlying income statement | ||||||||||||||||||||||||||||||||
| EUR million and % change in constant euros | ||||||||||||||||||||||||||||||||
| Q3'20 | / Q2'20 | 9M'20 | / 9M'19 | |||||||||||||||||||||||||||||
| Revenue | 9,226 | +8 | % | 28,056 | -3 | % | ||||||||||||||||||||||||||
| Expenses | -4,058 | +2 | % | -12,669 | -3 | % | ||||||||||||||||||||||||||
| Net operating income | 5,168 | +12 | % | 15,388 | -4 | % | ||||||||||||||||||||||||||
| LLPs | -2,463 | -9 | % | -9,198 | +54 | % | ||||||||||||||||||||||||||
| PBT | 2,438 | +45 | % | 5,368 | -40 | % | ||||||||||||||||||||||||||
| Underlying attrib. profit | 1,322 | +38 | % | 2,938 | -44 | % | ||||||||||||||||||||||||||
| 44 | | January - September 2020 | ||||||
| Response to the COVID-19 crisis Business model | ||||||||||||||||||||||||||
| Secondary segments | ||||||||||||||||||||||||||
| CORPORATE & INVESTMENT BANKING | ||||||||||||||
 | Highlights (changes in constant euros) | |||||||||||||
•The COVID-19 health crisis strongly influenced SCIB's performance in the third quarter, as we continued to support our global clients, providing value-added advisory services and financial support to cover their needs. •The creation of the global Environmental, Social and Governance (ESG) solutions team will increase the support SCIB brings to its clients in the transition towards more sustainable business models. •Underlying attributable profit was 30% higher year-on-year at EUR 1,493 million, driven by double-digit revenue growth and cost reduction, which enabled us to absorb the increase in provisions. In the quarter, profit rose 36% to EUR 565 million. | ||||||||||||||
| EUR 1,493 Mn | ||||||||||||||
| Underlying attributable profit | ||||||||||||||
Commercial activity
•Global markets: greater activity backed by market volatility (although somewhat subdued compared to the second quarter) and we continued to support our clients with structured hedging products.
Of note were sales in Spain, Brazil, Chile, Mexico, the US, the UK and Asia, as well as trading in Brazil, Spain, the US, the UK and most of the business in Latin America.
•Debt Capital Markets: Significant growth boosted by the positive performance in Europe and the US, while activity Latin American markets remained tepid.
Santander continued to focus on activities related to sustainable financing, being a reference for the issuance of green and social bonds, with a strong focus on those aimed at softening the effects of the pandemic.
•Syndicated Corporate Loans: we supported our clients by meeting their funding and liquidity needs by increasing loan volumes and participating in operations backed by government support programmes across Europe.
However, we maintained our responsible banking strategy, increasing our range of sustainable finance products via green loans or loans linked to sustainable indices.
•Structured Financing: Santander consolidated its leadership position in Project Finance, ranking fourth globally in the number of transactions.
In the renewable energy sector, one of the main priorities of our ESG strategy, we are the leader in Latin America, ranked second in Europe and third in the world. As for financial advising, Santander continued to be a global reference in 2020 (first position in Europe and Latin America, and fourth in the world by number of transactions).
•Cash management: transaction volumes saw a notable rise mainly in industries less affected by the crisis and in markets where the economy began to reactivate.
Likewise, we strengthened our position as the transactional bank of choice for our clients, mainly because of our uninterrupted service, our close commercial relationships and digital solutions to face the challenges arising from COVID-19.
•Export & Agency Finance: we continued to support our clients in their export and import activities through structured financing solutions, while being particularly active in programmes to mitigate the impact of COVID-19 implemented by both the Spanish Export Credit Insurance Company (CESCE in the Spanish acronym) and the World Bank through guaranteed loans in Latin America.
•Trade & Working Capital Solutions: strong business growth, especially in the resulting from the new international confirming programmes, receivables through the implementation of global programmes and and trade funding notably in South America, which enabled us to remain leaders in these products.
Commercial activity increased in structured trade as well (particularly in Latin America), helping to gain market share.
•Corporate Finance: despite the challenging environment, we conducted significant operations in the quarter, such as Santander's participation as joint-bookrunner in Cellnex EUR 4 billion capital increase and acted as sole advisor to Aguas Andinas on the disposal of its controlling stake in ESSAL (Chilean water treatment company).
Also noteworthy was the sales advice provided to EDF Renewables, Sener and Masdar on two reference operations in the renewable energy sector in Brazil and Spain, where Santander is the leader.

January - September 2020 | | 45 | ||||||
| Response to the COVID-19 crisis Business model | ||||||||||||||||||||||||||
| Secondary segments | ||||||||||||||||||||||||||
Business performance
The health crisis was virtually the sole conditioning factor in the year, which resulted in a significant increase in SCIB's balance sheet, mainly due to the increase in contingency lines and other financing solutions for our clients. During the third quarter, however, as some economies began to slightly recover, contingency funding needs started to fall.
In the quarter, the volume of loans and advances to customers excluding reverse repos rose to EUR 112,746 million, 8% higher than in December 2019. In the quarter, loans dropped 5%.
Customer deposits excluding repos rose 33% since December to EUR 95,767 million, driven by higher liquidity from our clients.
| Activity | ||||||||||||||||||||||||||||||||||||||||||||||||||||||||||||||
| September 2020. EUR billion and % change in constant euros | ||||||||||||||||||||||||||||||||||||||||||||||||||||||||||||||
| -5% | 0% | |||||||||||||||||||||||||||||||||||||||||||||||||||||||||||||
| QoQ | QoQ | |||||||||||||||||||||||||||||||||||||||||||||||||||||||||||||
| 113 | 105 | |||||||||||||||||||||||||||||||||||||||||||||||||||||||||||||
| +12% | +23% | |||||||||||||||||||||||||||||||||||||||||||||||||||||||||||||
| YoY | YoY | |||||||||||||||||||||||||||||||||||||||||||||||||||||||||||||
| Gross loans and advances to customers excl. reverse repos | Customer deposits excl. repos + mutual funds | |||||||||||||||||||||||||||||||||||||||||||||||||||||||||||||
Results (in constant euros)
First nine months underlying attributable profit was 30% higher at EUR 1,493 million, backed by double-digit growth in the majority of businesses, particularly Global Markets, Corporate Finance and Global Transaction Banking, with Global Debt Financing increasing at slightly more moderate rates but also significantly.
•Total income growth spurred by the strong increase in gains on financial transactions (+89%), net interest income (+19%) and net fee income (+12%).
•Costs fell 2%, which enabled efficiency to improve 8 pp and net operating income to grow 38%.
•Sound revenue performance and prudent cost management was enough to fully absorb provisions growth derived from the general macroeconomic deterioration.
Compared to the previous quarter, underlying attributable profit was rose 36% as the improved performance of net interest income offset the lower net fee income (exceptionally high in the second quarter) and markets results (greater volatility and uncertainty in the second quarter which resulted in higher customer activity). On the other hand, provisions decreased sharply following the COVID-19 related charges recorded in the second quarter.
| Total income breakdown | ||||||||
| Constant EUR million | ||||||||
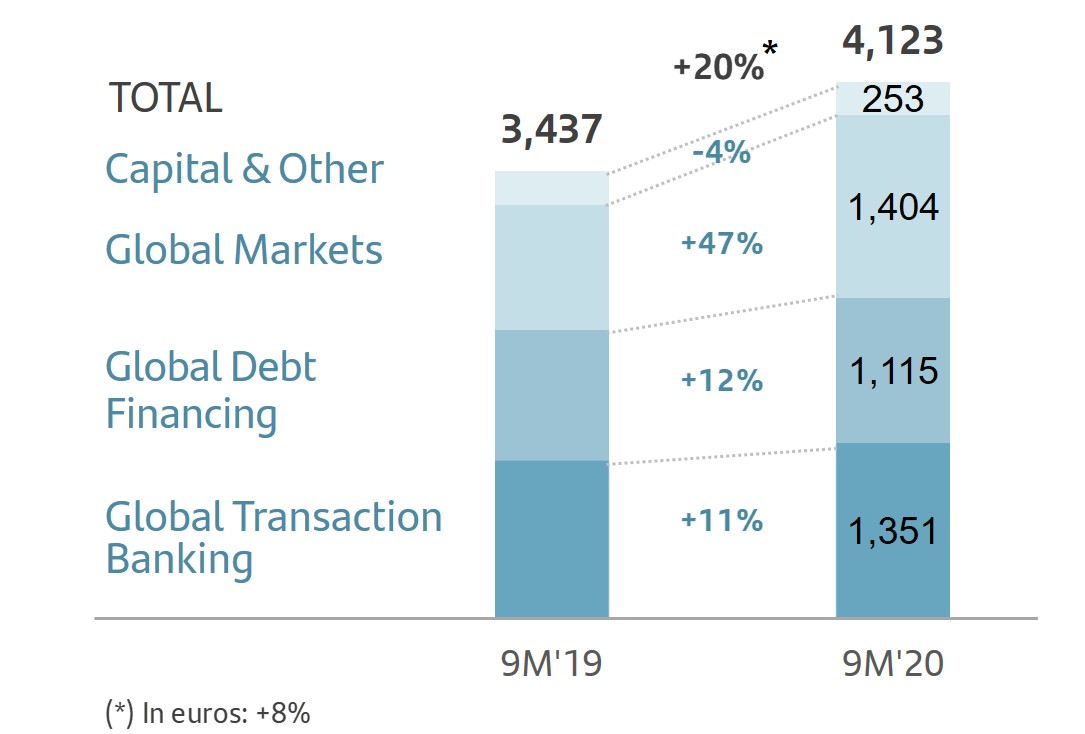 | ||||||||
| Underlying income statement | ||||||||||||||||||||||||||||||||
| EUR million and % change in constant euros | ||||||||||||||||||||||||||||||||
| Q3'20 | / Q2'20 | 9M'20 | / 9M'19 | |||||||||||||||||||||||||||||
| Revenue | 1,397 | +2 | % | 4,123 | +20 | % | ||||||||||||||||||||||||||
| Expenses | -496 | +1 | % | -1,539 | -2 | % | ||||||||||||||||||||||||||
| Net operating income | 901 | +3 | % | 2,584 | +38 | % | ||||||||||||||||||||||||||
| LLPs | -41 | -82 | % | -290 | +830 | % | ||||||||||||||||||||||||||
| PBT | 839 | +36 | % | 2,230 | +25 | % | ||||||||||||||||||||||||||
| Underlying attrib. profit | 565 | +36 | % | 1,493 | +30 | % | ||||||||||||||||||||||||||
| 46 | | January - September 2020 | ||||||
| Response to the COVID-19 crisis Business model | ||||||||||||||||||||||||||
| Secondary segments | ||||||||||||||||||||||||||
| WEALTH MANAGEMENT & INSURANCE | ||||||||||||||
 | Highlights (changes in constant euros) | |||||||||||||
•As part of the Group's 'new normal' plan, some of our employees began to return to their workplaces in almost all countries, always prioritising the safety of our customers and employees. The follow-up and interaction with customers continued during the crisis, fostering communication through digital channels. •Underlying attributable profit remained in line with the first nine months of 2019. •Total fee income generated, including those ceded to the branch network, rose 0.4% year-on-year to EUR 2,330 million and represented 31% of the Group's total. •Assets under management reached EUR 353 billion, 1% lower than September 2019, affected by the difference in custody valuation. Customer fund rose 5% in Private Banking and net sales in SAM recovered from the impact in March, amounting to EUR 1.9 billion. | ||||||||||||||
| EUR 622 Mn | ||||||||||||||
| Underlying attributable profit | ||||||||||||||
Commercial activity
Within the strategy developed with the aim to become the best responsible wealth manager in Europe and Latin America, of note were:
•In Private Banking, the positive trend observed early this year continued, with good sales and business growth rates despite the market situation, as well as the strong reduction of interest rates in the US and the UK.
We continued to complete the value proposition in all our countries, particularly on advisory services. Regarding alternative funds (private equity, private debt, real estate, infrastructures) our value proposition is centred on selecting a range of funds from leading national and international management companies.
To this end, we launched, through our international platform in Ireland, a real estate fund from the US market, a private debt fund and a secondaries private equity fund. In Spain, we continue to offer our clients investment opportunities through local vehicles in renewable energies, global real estate and debt funds.
The total volume of shared business across our markets reached EUR 6,740 million, 36% more than September 2019, mainly driven by the operations in Mexico, Brazil, Chile, Miami and Switzerland.
| Collaboration volumes | |||||||||||||||||||||||
| EUR million | |||||||||||||||||||||||
| 6,740 |  | ||||||||||||||||||||||
•In Santander Asset Management we continued to improve and complete our product offering, which was reflected in the Santander GO range, with a volume of more than EUR 1.5 billion and in the positive performance of our platform in Luxembourg, reaching EUR 7.0 billion. We are also working on the implementation of a new alternative product offering with infrastructure funds and leasing.
Commercial activity picked up pace, with net sales reaching EUR 1.9 billion in the first nine months of the year.
We continued with the operational and technological transformation required for the implementation of the Aladdin platform, which was successfully rolled-out in Europe, despite COVID-19, and will be available in Latin America by year-end.
We also continued to progress in our ESG strategy, becoming a member of the Principles for Responsible Investment (PRI) which places us at the heart of a global community seeking to build a more sustainable financial system.
•In Insurance, our main growth driver continued to be non-credit related business, which has a longer portfolio duration. We continued to increase the number of insurance policies distributed through our digital channels, which now account for 9% of the total sales volume.
In Spain, a new multi-risk insurance proposal for SMEs was launched through our joint venture with Mapfre, as well as an innovative proposal for car insurance through all channels including digital ones. In the UK, we introduced our tailored Home & Life insurance offering based on the use of data (it allows us to price these products without asking our customers for information) and in Poland we have a new fully digital life insurance offer, which had a great response among customers as it enables them to build their own tailored coverage.
In Latin America we continued to enhance customer experience with new versions of Autocompara, our car insurance distribution platform (rolled-out in Brazil, Mexico, Chile and Argentina). In Chile, we launched Klare, our fully digital insurance broker, together with a new insurance proposal for SMEs with a unique digital experience in the market (with a new app that streamlines and tailors the training of our business executives and specialists). In Argentina, we introduced Cartera Protegida, a personal protection product for the open market (customers and non-customers).
January - September 2020 | | 47 | ||||||
| Response to the COVID-19 crisis Business model | ||||||||||||||||||||||||||
| Secondary segments | ||||||||||||||||||||||||||
Business performance
Total assets under management amounted to EUR 353 billion, 1% lower compared to September 2019. In the quarter, growth was 2% and 6% compared to March 2020.
| Business performance: SAM and Private Banking | ||||||||||||||||||||||||||||||||||||||
| September 2020. EUR billion and % change in constant euros | ||||||||||||||||||||||||||||||||||||||
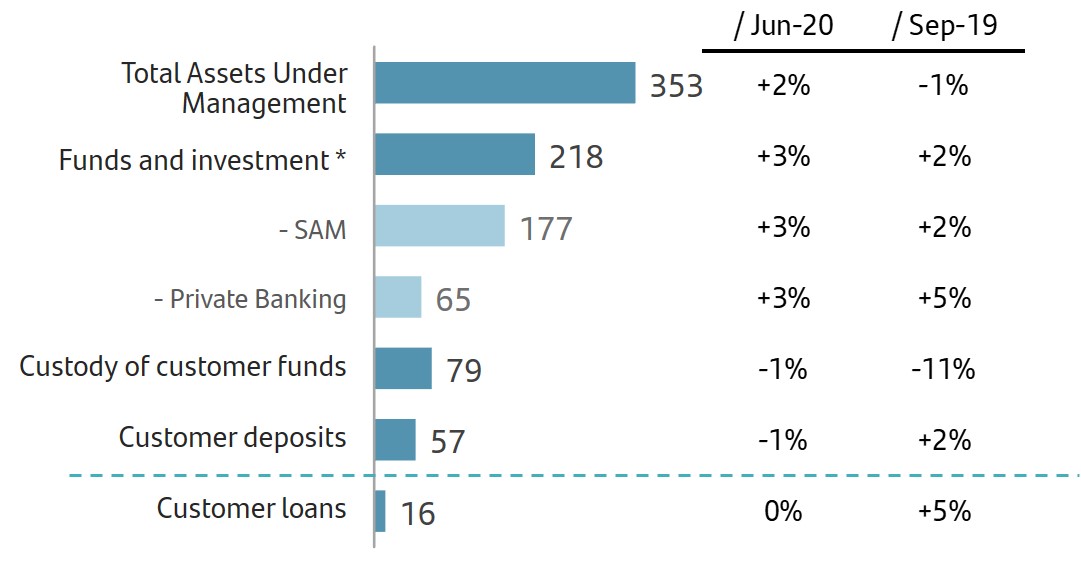 | ||||||||||||||||||||||||||||||||||||||
Note: Total assets marketed and/or managed in 2020 and 2019.
(*) Total adjusted customer funds of private banking managed by SAM. 2019 data Pro forma including Popular asset management Joint Ventures, fully integrated in 2020.
•In Private Banking, the volume of customer assets and liabilities amounted to EUR 216 billion in September 2020, 2% lower year-on-year. This was mainly due to the impact of COVID-19 in markets which especially affected the custody business. However, quarter-on-quarter growth remained stable induced by markets improvement and the strong commercial activity.
Attributable profit to September reached EUR 312 million, up 3% compared to the first nine months of 2019. Of note were Mexico, Poland, Brazil and Miami.
•In SAM, total assets under management increased 2% compared to the same period of 2019, despite the negative impact of markets driven by the COVID-19 crisis. In the third quarter, growth was 3% compared to the previous quarter due to market improvements and the recovery of net sales in the second half of the quarter. The latter rebounded to positive figures, amounting to EUR 1.9 billion in September, mainly in Spain, Chile, Luxembourg, Argentina and Mexico.
Underlying attributable profit was EUR 89 million, 14% lower year-on-year, conditioned by lower average volumes and margins. Of note was the performance in Spain, Portugal, Chile and Argentina. Total contribution to the Group's profit (including ceded fee income) was EUR 370 million.
•In Insurance, the volume of gross written premiums as of September amounted to EUR 5,800 million (-8% year-on-year), affected by lower loan and savings activity derived from the crisis. Of note was the 6% growth of fee income generated by non-credit related protection business.
However, underlying attributable profit generated as of September by the insurance business amounted to EUR 221 million, 3% higher than in the same period of 2019. Total contribution to profit (including ceded fee income) amounted to EUR 889 million.
Results
Underlying attributable profit was EUR 622 million in the first nine months of 2020, stable year-on-year:
•Total income increased mainly driven by net fee income (+8%) due to the greater contribution from private banking and insurance.
•Total fee income generated, including fees ceded to the branch network amounted to EUR 2,330 million and represented 31% of the Group's total.
| Total fee income generated | |||||||||||||||||||||||
| EUR million | |||||||||||||||||||||||
| 2,330 |  | ||||||||||||||||||||||
•Operating expenses were 1% lower, due to the optimisation measures that absorbed the impact of the investments carried out.
•As a result, net operating income increased 4%.
The total contribution to the Group (including net profit and total fees generated net of taxes) was EUR 1,582 million in September 2020, 2% lower than in the same period of 2019.
Underlying attributable profit in the third quarter increased by 8% quarter-on-quarter, reflecting the gradual recovery in activity since the months of strongest impact from the health crisis in the first half of the year.
| Total profit contribution | ||||||||||||||||||||||||||
| EUR million and % change in constant euros | ||||||||||||||||||||||||||
| Q3'20 | 9M'20 | |||||||||||||||||||||||||
 | 524 | | 1,582 | |||||||||||||||||||||||
| +5 | % | / Q2'20 | -2 | % | / 9M'19 | |||||||||||||||||||||
| Underlying income statement | ||||||||||||||||||||||||||||||||
| EUR million and % change in constant euros | ||||||||||||||||||||||||||||||||
| Q3'20 | / Q2'20 | 9M'20 | / 9M'19 | |||||||||||||||||||||||||||||
| Revenue | 498 | +6 | % | 1,566 | +2 | % | ||||||||||||||||||||||||||
| Expenses | -215 | 0 | % | -679 | -1 | % | ||||||||||||||||||||||||||
| Net operating income | 283 | +11 | % | 888 | +4 | % | ||||||||||||||||||||||||||
| LLPs | -10 | +96 | % | -22 | — | |||||||||||||||||||||||||||
| PBT | 269 | +9 | % | 858 | +1 | % | ||||||||||||||||||||||||||
| Underlying attrib. profit | 195 | +8 | % | 622 | 0 | % | ||||||||||||||||||||||||||
| 48 | | January - September 2020 | ||||||
| Response to the COVID-19 crisis Business model | ||||||||||||||||||||||||||
| Secondary segments | ||||||||||||||||||||||||||
| SANTANDER GLOBAL PLATFORM (SGP) | ||||||||
 | Highlights (changes in constant euros) •The ongoing customer-centric digital transformation across the Group is the growth engine in all markets, driving our talent and our ability to innovate. Our growth is backed by the deployment of global payments and financial solutions for SMEs and individuals in high-growth and large addressable markets. •Within the COVID-19 environment, progress in the development of our payment platforms continued to meet its quarterly plans, incorporating new services and functionalities on schedule. •We continued to focus on accelerating growth in three business areas: Merchant Solutions, Trade Solutions and Consumer Solutions. | |||||||
Strategy
Santander is best-in-class in offering global payment solutions, and we aim to continue delivering faster growth and better solutions to customers. These solutions are all being built based on customer experience and as a driver of loyalty. Santander offers these solutions to both our banks (B2C) and to third parties (B2B2C), helping to expand our market to non-customers and new geographic areas, generating significant new revenue opportunities.
The area continued to advance according to the envisaged schedule in three business areas:
Merchant solutions (Global Merchant Services) is an initiative led by Grupo Santander with the aim of creating a single open platform for the global development of the acquiring business through the unique brand Getnet. This business has a high strategic value in the relationship with our customers given the relevance of collections management and value-added services for merchants.
In the third quarter of the year, the total number of active businesses continued to grow, exceeding one million. In addition, the number of transactions recovered pre-COVID-19 levels, mainly due to the improvement in Brazil. We achieved a total income of EUR 349 million in the first nine months of the year excluding SCIB y WM&I, 19% lower than the same period of 2019 in constant euros.
Despite the reopening of physical stores, e-commerce remained strong and the proportion of e-commerce compared to physical stores remained above 20%.
As regards the platform, we continued to include additional functionalities, which enabled us to complete the roll-out for our customers despite the COVID-19 situation. The launch of Getnet in Argentina was a significant milestone, with a solution for the "long tail" that enables payment through mobile devices.

Trade Solutions (Global Trade Services), the Group's strategic project to develop the global platform OneTrade to provide customers and the market the range of services needed to trade internationally: international payments, FX, international treasury management and foreign trade services.
The Group's revenue pool for these services in the first nine months of the year amounted to EUR 948 million, excluding SCIB and WM&I, 8% greater than the first nine months of 2019 in constant euros, a very positive performance considering the current COVID-19 environment.
Santander One Trade continued to progress by including new features, geographic areas and Group customers. In the third quarter, Chile was connected to the platform, after being rolled-out in Brazil, Spain and the UK in previous quarters. With Chile's incorporation more than 150,000 businesses across these countries now have access to an improved offering regarding Santander One Trade services.
For example, the possibility of monitoring the status of expected international payments from anywhere in the world was included in the third quarter. Santander is the first financial entity to offer this service.

January - September 2020 | | 49 | ||||||
| Response to the COVID-19 crisis Business model | ||||||||||||||||||||||||||
| Secondary segments | ||||||||||||||||||||||||||
Consumer Solutions:
•Superdigital, our financial inclusion platform for individuals that offers basic financial services simply and flexibly. It enables us to meet the financial needs of the underserved, providing them with basic financial products and a path to access credit, thus serving them responsibly and profitably.
Superdigital also integrates into GMS for small merchants. It has a special focus on Latin America, where there are c.300 million unbanked and underbanked consumers.
As of September, Superdigital operates in Brazil, Mexico and Chile, with growth in active customers of 39% year-on-year and 72% in transactions value (9M'20 vs. 9M'19). We aim to expand Superdigital to seven countries in Latin America later this year.

Other activities in SGP
•Openbank, our, full-service digital bank offers current accounts and cards offered by neobanks, but successfully sells loans and mortgages, and offers a state-of-the-art robo-advisory and open platform brokerage services.
Currently, Openbank is active in Spain, the Netherlands, Germany and Portugal. In July, it was granted its banking licence to operate in Argentina and is expected to start operations in the first half of 2021.
To September 2020, Openbank increased its loan book of digital mortgages and UPLs by 43% year-on-year, deposits by 11.5% and new customers in the period by 99% compared with the first nine months of 2019. The number of customers with investment products increased by 27% and the number of securities transactions rose by 142%. Loyal customers keep showing a leading industry benchmark engagement ratio of 4.5 products per customer. As a result of the strong business results, fee income increased by 40% year-on-year.
Results
Looking at SGP's activity in the first nine months of the year in a broad sense, i.e. if, in addition to considering the results generated by the digital platforms, 50% of the results generated by the countries on the products related with the platform are also included, revenue of SGP as secondary segment was EUR 748 million in and pro forma underlying attributable profit was positive at EUR 61 million in the first nine months of 2020.
This is the net result of two components: on the one hand, the investment in building the platforms and, on the other hand, 50% of the profit obtained from commercial relationships with our customers:
•The construction of platforms is where most of the spend is concentrated. We are making progress in the development of new solutions and rolling them out in countries.
•Profit obtained from commercial relationships with our customers linked to the global SGP platforms, and according to the criteria for allocating the aforementioned results, resulted in EUR 202 million in the first nine months of the year.
We regularly assess the market valuations of the businesses included in SGP, based on multiples of comparable companies, to ensure our investments in digital are creating value.
| Underlying income statement | ||||||||||||||||||||||||||||||||
| EUR million and % change in constant euros | ||||||||||||||||||||||||||||||||
| Q3'20 | / Q2'20 | 9M'20 | / 9M'19 | |||||||||||||||||||||||||||||
| Revenue | 238 | -1 | % | 748 | +6 | % | ||||||||||||||||||||||||||
| Expenses | -222 | +30 | % | -591 | +19 | % | ||||||||||||||||||||||||||
| Net operating income | 16 | -79 | % | 157 | -25 | % | ||||||||||||||||||||||||||
| LLPs | -5 | -64 | % | -24 | -23 | % | ||||||||||||||||||||||||||
| PBT | 10 | -83 | % | 127 | -27 | % | ||||||||||||||||||||||||||
| Underlying attrib. profit | -3 | — | % | 61 | +6 | % | ||||||||||||||||||||||||||
| 50 | | January - September 2020 | ||||||
RESPONSIBLE BANKING
Santander strives every day to contribute to the progress of people and companies in a Simple, Personal and Fair way in all that we do, to earn the confidence of our employees, customers, shareholders and society.
In order to meet our commitment to be a more responsible bank and help society address the main global issues, we have identified two challenges: adapt to the new business environment and contribute to more inclusive and sustainable growth, with the following goals set in 2019 for the coming years:
 | Santander Responsible Banking targets | ||||
More information on our public commitments in responsible banking can be found on our website.
(*).- Data not audited.
1.According to relevant external indexes in each country (Great Place to Work, Top Employer, Merco, etc.).
2.Senior positions represent 1% of total workforce.
3.Calculation of equal pay gap compares employees of the same job, level and function.
4.People (unbanked, underbanked or financially vulnerable), who are given access to the financial system, receive tailored finance and increase their knowledge and resilience through financial education.
5.Includes Santander overall contribution to green finance: project finance, syndicated loans, green bonds, capital finance, export finance, advisory, structuring and other products to help our clients in the transition to a low carbon economy. Commitment from 2019 to 2030 is EUR 220 bn.
6.In those countries where it is possible to certify renewable sourced electricity for the properties occupied by the Group.
7.People supported through Santander Universities initiative (students who will receive a Santander scholarship, will achieve an internship in an SME or participate in entrepreneurship programmes supported by the bank).
8.Excluded Santander Universities and financial education initiatives.
January - September 2020 | | 51 | ||||||
| First nine months highlights | ||||
 | The Group is supporting its stakeholders in the difficulties they may have as a result of the current pandemic. We have put in place various contingency plans in the countries in which we operate. | |||||||
| We improved our score on the FTSE4Good index in which our contribution to sustainability received a score of 4.3 out of 5. | ||||||||
Santander Asset Management signed UN-supported Principles for Responsible Investment, which demonstrates once again our commitment to responsible investment. In addition, the Group continued to develop responsible banking initiatives in the quarter, in the areas of environmental sustainability, diversity and community support, among others. The most relevant are detailed below. | ||||||||
 | As part of our corporate commitment to the environment, Santander continued financing green alternatives and renewable energies in its different countries. We reached EUR 22 billion of green financing1, bringing us closer to our commitment to reach EUR 120 billion by 2025. We announced a joint plan with Bradesco and Itaú to promote sustainable development of the Amazon. Also in Brazil, we launched an operation worth BRL 620 million for Iguá Saneamento, the first national green bond in the country. As for our environmental footprint, 66% of the energy we consume comes from renewable sources1, progressing towards our commitment to source 100% of electricity from renewable sources by 20252. | |||||||
 | Following our financial inclusion iniciatives, we financially empowered 2.8 million people1, making progress towards our commitment to financially empower 10 million people by 2025. Furthermore, we helped 640,529 micro-entrepreneurs in the first half of the year (+72% year-on-year) for a total amount of EUR 225 million (45% higher than the same period of 2019)3. | |||||||
 | Regarding our diversity and inclusion, Santander received the World’s Best Bank for Diversity and Inclusion award by Euromoney, thanks to our corporate culture policies and initiatives. | |||||||
 | Following our commitment of acting responsibly towards our employees we are one of the five Best Workplaces for Women in Argentina, Santander UK was named as a Top 50 Employer for Gender Equality by The Times, and Banco Santander México ranked ninth among more than 3,000 participants of Super Empresas 2020, "Companies that everyone wants to work for". | |||||||
 | We continued to invest in the communities in which we operate. Santander Universidades has granted 110,000 scholarships since January 20191, bringing us closer to our 200,000 commitment by 2021. Regarding out commitment to help people through our community investment programmes for children's education and social welfare, we helped more than 2.6 million people, progressing towards our aim to help four million people through our community investment programmes in 2021. In addition, our efforts in Santander All. Together. Now. reached EUR 105 million for solidarity initiatives to fight COVID-19. | |||||||
| (1) FY 2019 + H1'2020 data. Non-audited data as of H1'2020. (2) In those countries where it is possible to certify renewable sourced electricity. Non-audited data as of H1'2020. (3) At constant exchange rates with current reference rate. (4) FY 2019 + H1'2020 data (already exceeding 2020 estimates). Non-audited data as of H1'2020. | ||||||||
As a result of these efforts, Banco Santander was ranked the world’s most sustainable bank in the Dow Jones Sustainability Index for the first time and was also first in Europe for the second year running. The index evaluates the Group’s performance across economic, environmental and social dimensions. | ||||||||
| We also continue to be part of several sustainability indices, providing non-financial information to markets, investors and ESG analysts. | ||||||||
 | ||||||||
| 52 | | January - September 2020 | ||||||
| Response to the COVID-19 crisis Business model | Corporate governance | |||||||||||||||||||||||||
CORPORATE GOVERNANCE
| A responsible bank has a solid governance model with well-defined functions, it manages risks and opportunities prudently and defines its long-term strategy looking out for the interests of all its stakeholders and society in general |  | ||||
à General Shareholders' Meeting
On 21 September 2020, the board of directors resolved to call a general shareholders’ meeting to be held on 26 October 2020 (first call), or 27 October 2020 (second call). The following items included in the agenda of the general meeting will be submitted for shareholders’ approval:
•The proposal of application of results obtained during financial year 2019, allocating the Bank's profit for that year to increase the voluntary reserve, except for the amount assigned to the payment of the dividend prior to the General Shareholders' Meeting held on 3 April and the recommendation of the European Central Bank (ECB) on 27 March 2020 regarding the payment of dividends during the COVID-19 pandemic;
•A fully-paid capital increase to enable the distribution of new shares equivalent to EUR 0.10 per share as a complementary payment from 2019 to be made this year.
•A cash payment of EUR 0.10 per share, to be paid in 2021, with a resulting charge to share premium reserves, which will be conditional upon:
–Compliance with relevant European Central Bank (ECB) guidance and approval,
–the Group’s CET1 ratio remaining within or above its target range of 11-12% after distribution, and
–the total amount to be paid not exceeding 50% of the Bank’s 2020 consolidated underlying profit.
•The appointment of Mr Ramón Martín Chávez Márquez as a new independent director.
In order to minimise the need to travel and safeguard the health of its shareholders, employees and those involved in organising the event, the board has decided to relocate the meeting, from Santander to Boadilla del Monte (Madrid). Likewise, the board of directors recommends that shareholders use the different channels and means that the Bank has made available to participate in this ordinary general shareholders’ meeting, thus, avoiding, to the extent possible, attending the meeting physically. All the proposed agreements, relevant administrator reports and the necessary legal documentation were published on the Group’s website (www.santander.com) when the meeting was called.
à Changes in the board
Since the pertinent regulatory authorisations for the appointment were obtained, and if his appointment is approved at the aforementioned Meeting, Mr Ramón Martín Chávez Márquez will join the Board of Directors, replacing Ms Esther Giménez-Salinas.
à Appointments in the organisational structure of the Group's Senior Management
On 28 July 2020, the Bank announced the appointment of Ms Alexandra Brandão as the new global head of Human Resources. She will report to Mr Jaime Pérez Renovales, who will continue to be in charge of the General Secretariat division and as secretary to the board and, until 1 February 2021, as head of Human Resources. Ms Brandão's appointment is subject to regulatory approval.
January - September 2020 | | 53 | ||||||
| Response to the COVID-19 crisis Business model | Santander share | |||||||||||||||||||||||||
SANTANDER SHARE
On 2 April 2020, in view of the ECB’s recommendation in which it asked European banks to refrain from paying dividends with a charge to results from financial years 2019 and 2020, the board decided to cancel the payment of the 2019 final dividend and suspend the dividend policy for 2020. As a result, it withdrew the proposal for the distribution of 2019 results from the agenda of the General Shareholders’ Meeting held on 3 April 2020 and confirmed this would be reviewed at the AGM to be held in October 2020. On 27 July, the ECB extended its recommendation until 1 January 2021.
The board approved to submit to the general shareholders' meeting held on 27 October 2020 the proposal to make a fully-paid capital increase to enable the distribution of new shares equivalent to EUR 0.10 per share, as a complementary payment from 2019 to be made this year. As a result, the equivalent total payment corresponding to 2019 would be equivalent to EUR 0.20 per share.
Furthermore, the board is also asking shareholders to approve a cash payment of EUR 0.10 per share, to be paid in 2021, with a resulting charge to share premium reserves and subject to the European Central Bank (ECB) guidance and approval. It is also conditional upon the Group’s CET1 ratio remaining within or above its target range of 11-12% and the total amount to be paid not exceeding 50% of the Bank’s 2020 consolidated underlying profit.
The Bank had already accrued 6 bps of CET1 capital in June and added a further 13 bps in the third quarter, together with the aforementioned payment proposal to the general shareholders' meeting held on 27 October 2020.
àShareholder remuneration
The Santander share is listed in five markets, in Spain, Mexico and Poland as an ordinary share, in the US as an ADR and in the UK as a CDI.
The measures adopted by governments to contain the health crisis resulting from the fast spread of COVID-19 had a very severe effect on economic activity. The rapid adoption of monetary policy measures by central banks, together with the fiscal stimulus support packages that governments put in place, succeeded to counter the economic slowdown and increase confidence.
The processes of relaxation of confinement measures, which have been taking place in recent months in various countries, enabled the recovery of confidence and economic activity, which, however, is slower than expected. This, together with new outbreaks and the consequent fear of new confinement measures, has increased uncertainty in the stock markets.
Since the beginning of the year, the main markets performed better than the banking sector, the latter being influenced by the ECB's recommendation to not distribute dividends, as well as by the limitations of both the Bank of England and the Fed on dividend distribution and share buyback programmes, together with very low interest rates. In Spain, the Ibex 35 was down 29.7% and, in Europe, the DJ Stoxx 50 was down 14.7%. DJ Banks was down 42.3% and MSCI World Banks was down 33.4%. Santander share price fell 57.1%, to end the quarter at EUR 1.600.
| Share price | ||||||||||||||||||||||||||
 |  | |||||||||||||||||||||||||
START 31/12/2019 | END 30/09/2020 | |||||||||||||||||||||||||
| €3.730 | €1.600 | |||||||||||||||||||||||||
 |  | |||||||||||||||||||||||||
Maximum 17/02/2020 | Minimum 24/09/2020 | |||||||||||||||||||||||||
| €3.964 | €1.502 | |||||||||||||||||||||||||
| Comparative share performance | ||
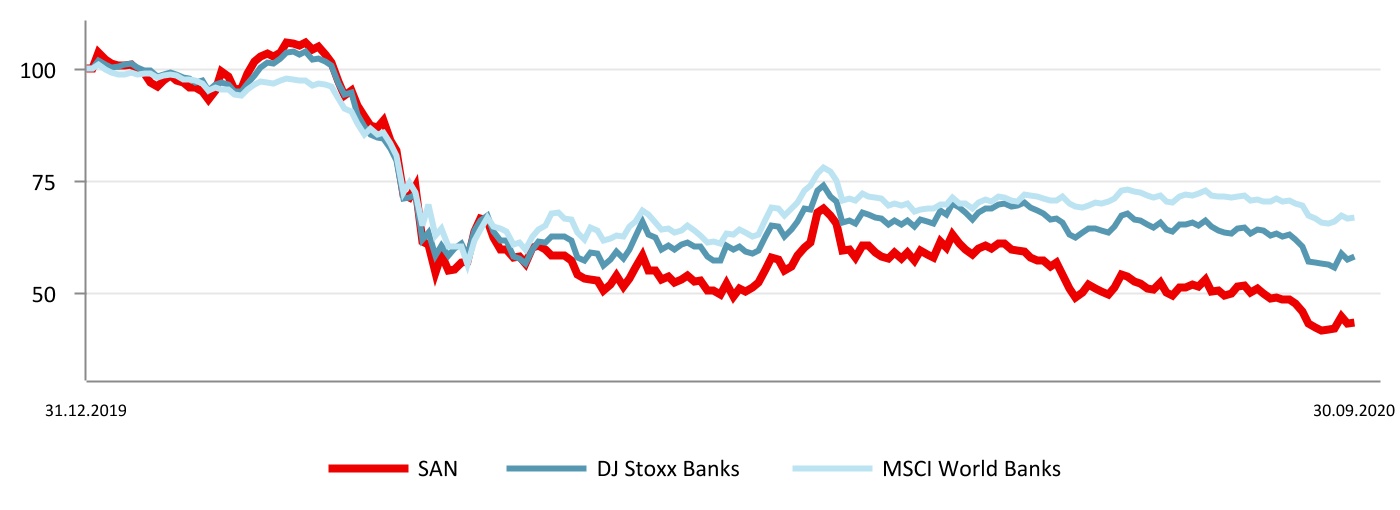
| 54 | | January - September 2020 | ||||||
| Response to the COVID-19 crisis Business model | Santander share | |||||||||||||||||||||||||
SANTANDER SHARE
àMarket capitalisation and trading
As at 30 September 2020, Santander was the third largest bank in the Eurozone by market capitalisation and the 47th in the world among financial entities (EUR 26,582 million).
The share’s weighting in the DJ Stoxx 50 index was 6.0% and 11.5% in the DJ Stoxx Banks. In the domestic market, its weight in the Ibex 35 as at end-September was 7.5%.
A total of 14,213 million shares were traded in the year for an effective value of EUR 34,191 million and a liquidity ratio of 86%.
The daily trading volume was 74 million shares with an effective value of EUR 178 million.
àShareholder base
The total number of Santander shareholders at 30 September 2020 was 4,103,069, of which 3,765,646 were European (77.45% of the capital stock) and 320,039 from the Americas (21.25% of the capital stock).
Excluding the board, which holds 1.10% of the Bank’s capital stock, retail shareholders account for 42.81% and institutional shareholders account for 56.09%.
In a complicated environment derived from the health crisis, the Group has carried out various measures to protect its stakeholders. Our priorities were to protect the health of our employees, ensure the continuity of service to customers and foster their economic resilience, while we kept all channels open with our shareholders and investors to boost their confidence, which is reflected in an increase of almost 100,000 new shareholders since December.
| Share capital distribution by geographic area | ||||||||||||||
| September 2020 | ||||||||||||||
| The Americas | Europe | Other | ||||||||||||
| 21.25% | 77.45% | 1.30% | ||||||||||||
 | ||||||||||||||
 | 3rd | Bank in the Eurozone by market capitalisation | |||||||||
EUR 26,582 million | |||||||||||
| The Santander share | ||||||||
| September 2020 | ||||||||
| Shares and trading data | ||||||||
| Shares (number) | 16,618,114,582 | |||||||
| Average daily turnover (number of shares) | 74,024,320 | |||||||
| Share liquidity (%) | 86 | |||||||
| (Number of shares traded during the year / number of shares) | ||||||||
| Stock market indicators | ||||||||
| Price / Tangible book value (X) | 0.40 | |||||||
| Free float (%) | 99.82 | |||||||
| Share capital distribution by type of shareholder | ||||||||
| September 2020 | ||||||||
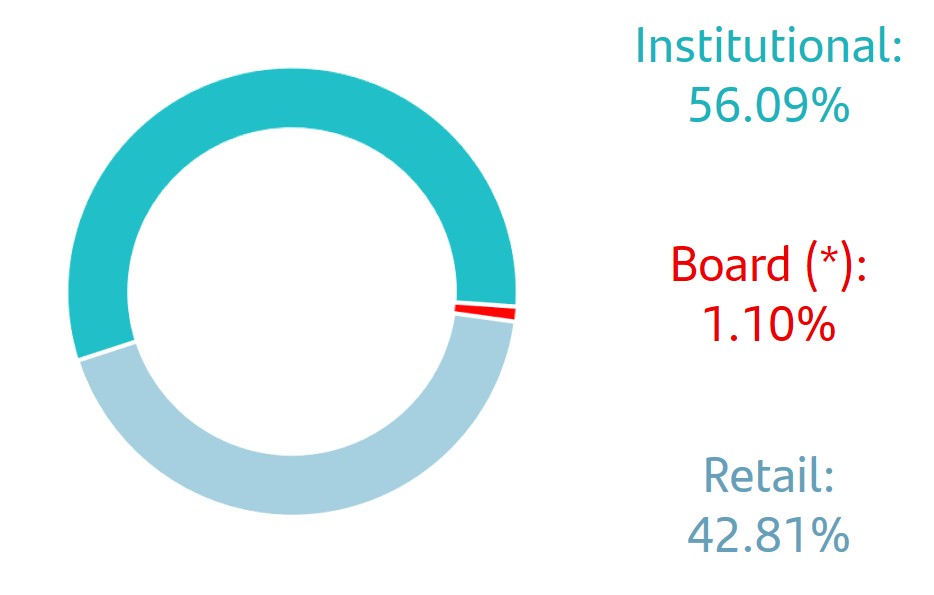 | ||||||||
(*) Shares owned or represented by directors.
January - September 2020 | | 55 | ||||||
Financial report January - September 2020 
| 56 | | January - September 2020 | ||||||
| Response to the COVID-19 crisis Business model | ||||||||||||||||||||||||||
| Group financial information | ||||||||||||||||||||||||||
| Net fee income. Consolidated | ||||||||||||||||||||||||||||||||||||||
| EUR million | ||||||||||||||||||||||||||||||||||||||
| Q3'20 | Q2'20 | Change (%) | 9M'20 | 9M'19 | Change (%) | |||||||||||||||||||||||||||||||||
| Fees from services | 1,349 | 1,216 | 10.9 | 4,270 | 5,242 | (18.5) | ||||||||||||||||||||||||||||||||
| Wealth management and marketing of customer funds | 835 | 780 | 7.1 | 2,543 | 2,867 | (11.3) | ||||||||||||||||||||||||||||||||
| Securities and custody | 239 | 287 | (16.7) | 746 | 709 | 5.2 | ||||||||||||||||||||||||||||||||
| Net fee income | 2,423 | 2,283 | 6.1 | 7,559 | 8,818 | (14.3) | ||||||||||||||||||||||||||||||||
| Operating expenses. Consolidated | ||||||||||||||||||||||||||||||||||||||
| EUR million | ||||||||||||||||||||||||||||||||||||||
| Q3'20 | Q2'20 | Change (%) | 9M'20 | 9M'19 | Change (%) | |||||||||||||||||||||||||||||||||
| Staff costs | 2,628 | 2,568 | 2.3 | 8,095 | 9,088 | (10.9) | ||||||||||||||||||||||||||||||||
| Other general administrative expenses | 1,764 | 1,818 | (3.0) | 5,531 | 6,012 | (8.0) | ||||||||||||||||||||||||||||||||
| Information technology | 530 | 523 | 1.3 | 1,551 | 1,573 | (1.4) | ||||||||||||||||||||||||||||||||
| Communications | 114 | 113 | 0.9 | 360 | 390 | (7.7) | ||||||||||||||||||||||||||||||||
| Advertising | 123 | 123 | — | 382 | 489 | (21.9) | ||||||||||||||||||||||||||||||||
| Buildings and premises | 177 | 174 | 1.7 | 561 | 641 | (12.5) | ||||||||||||||||||||||||||||||||
| Printed and office material | 22 | 28 | (21.4) | 76 | 89 | (14.6) | ||||||||||||||||||||||||||||||||
| Taxes (other than tax on profits) | 134 | 114 | 17.5 | 386 | 390 | (1.0) | ||||||||||||||||||||||||||||||||
| Other expenses | 664 | 743 | (10.6) | 2,215 | 2,440 | (9.2) | ||||||||||||||||||||||||||||||||
| Administrative expenses | 4,392 | 4,386 | 0.1 | 13,626 | 15,100 | (9.8) | ||||||||||||||||||||||||||||||||
| Depreciation and amortisation | 681 | 690 | (1.3) | 2,100 | 2,209 | (4.9) | ||||||||||||||||||||||||||||||||
| Operating expenses | 5,073 | 5,076 | (0.1) | 15,726 | 17,309 | (9.1) | ||||||||||||||||||||||||||||||||
| Operating means. Consolidated | |||||||||||||||||||||||||||||||||||||||||
| Employees | Branches | ||||||||||||||||||||||||||||||||||||||||
| Sep-20 | Sep-19 | Change | Sep-20 | Sep-19 | Change | ||||||||||||||||||||||||||||||||||||
| Europe | 84,876 | 89,255 | (4,379) | 5,058 | 5,993 | (935) | |||||||||||||||||||||||||||||||||||
| Spain | 27,053 | 29,713 | (2,660) | 3,110 | 3,852 | (742) | |||||||||||||||||||||||||||||||||||
| Santander Consumer Finance | 14,374 | 14,496 | (122) | 358 | 426 | (68) | |||||||||||||||||||||||||||||||||||
| United Kingdom | 23,645 | 24,999 | (1,354) | 564 | 629 | (65) | |||||||||||||||||||||||||||||||||||
| Portugal | 6,431 | 6,678 | (247) | 499 | 549 | (50) | |||||||||||||||||||||||||||||||||||
| Poland | 10,698 | 11,026 | (328) | 515 | 525 | (10) | |||||||||||||||||||||||||||||||||||
| Other | 2,675 | 2,343 | 332 | 12 | 12 | — | |||||||||||||||||||||||||||||||||||
| North America | 37,959 | 38,106 | (147) | 2,014 | 2,058 | (44) | |||||||||||||||||||||||||||||||||||
| US | 16,189 | 17,586 | (1,397) | 584 | 624 | (40) | |||||||||||||||||||||||||||||||||||
| Mexico | 21,770 | 20,520 | 1,250 | 1,430 | 1,434 | (4) | |||||||||||||||||||||||||||||||||||
| South America | 66,187 | 71,264 | (5,077) | 4,447 | 4,639 | (192) | |||||||||||||||||||||||||||||||||||
| Brazil | 43,689 | 48,347 | (4,658) | 3,562 | 3,686 | (124) | |||||||||||||||||||||||||||||||||||
| Chile | 11,200 | 11,642 | (442) | 354 | 380 | (26) | |||||||||||||||||||||||||||||||||||
| Argentina | 9,267 | 9,208 | 59 | 427 | 470 | (43) | |||||||||||||||||||||||||||||||||||
| Other | 2,031 | 2,067 | (36) | 104 | 103 | 1 | |||||||||||||||||||||||||||||||||||
| Santander Global Platform | 1,812 | 727 | 1,085 | 1 | 1 | — | |||||||||||||||||||||||||||||||||||
| Corporate Centre | 1,744 | 1,665 | 79 | ||||||||||||||||||||||||||||||||||||||
| Total Group | 192,578 | 201,017 | (8,439) | 11,520 | 12,691 | (1,171) | |||||||||||||||||||||||||||||||||||
| Net loan-loss provisions. Consolidated | ||||||||||||||||||||||||||||||||||||||
| EUR million | ||||||||||||||||||||||||||||||||||||||
| Q3'20 | Q2'20 | Change (%) | 9M'20 | 9M'19 | Change (%) | |||||||||||||||||||||||||||||||||
| Non-performing loans | 2,811 | 3,361 | (16.4) | 10,388 | 7,937 | 30.9 | ||||||||||||||||||||||||||||||||
| Country-risk | 1 | (1) | — | (6) | (5) | 20.0 | ||||||||||||||||||||||||||||||||
| Recovery of written-off assets | (277) | (242) | 14.5 | (820) | (1,184) | (30.7) | ||||||||||||||||||||||||||||||||
| Net loan-loss provisions | 2,535 | 3,118 | (18.7) | 9,562 | 6,748 | 41.7 | ||||||||||||||||||||||||||||||||
January - September 2020 | | 57 | ||||||
| Response to the COVID-19 crisis Business model | ||||||||||||||||||||||||||
| Group financial information | ||||||||||||||||||||||||||
| Loans and advances to customers. Consolidated | ||||||||||||||||||||||||||||||||
| EUR million | ||||||||||||||||||||||||||||||||
| Change | ||||||||||||||||||||||||||||||||
| Sep-20 | Sep-19 | Absolute | % | Dec-19 | ||||||||||||||||||||||||||||
| Commercial bills | 28,454 | 32,690 | (4,236) | (13.0) | 37,753 | |||||||||||||||||||||||||||
| Secured loans | 496,769 | 502,132 | (5,363) | (1.1) | 513,929 | |||||||||||||||||||||||||||
| Other term loans | 272,950 | 266,372 | 6,578 | 2.5 | 267,138 | |||||||||||||||||||||||||||
| Finance leases | 35,751 | 35,669 | 82 | 0.2 | 35,788 | |||||||||||||||||||||||||||
| Receivable on demand | 8,771 | 7,693 | 1,078 | 14.0 | 7,714 | |||||||||||||||||||||||||||
| Credit cards receivable | 17,468 | 22,637 | (5,169) | (22.8) | 23,876 | |||||||||||||||||||||||||||
| Impaired assets | 29,884 | 32,941 | (3,057) | (9.3) | 32,559 | |||||||||||||||||||||||||||
| Gross loans and advances to customers (excl. reverse repos) | 890,047 | 900,134 | (10,087) | (1.1) | 918,757 | |||||||||||||||||||||||||||
| Reverse repos | 43,474 | 38,287 | 5,187 | 13.5 | 45,703 | |||||||||||||||||||||||||||
| Gross loans and advances to customers | 933,521 | 938,421 | (4,900) | (0.5) | 964,460 | |||||||||||||||||||||||||||
| Loan-loss allowances | 22,807 | 22,418 | 389 | 1.7 | 22,242 | |||||||||||||||||||||||||||
| Loans and advances to customers | 910,714 | 916,003 | (5,289) | (0.6) | 942,218 | |||||||||||||||||||||||||||
| Total funds. Consolidated | ||||||||||||||||||||||||||||||||
| EUR million | ||||||||||||||||||||||||||||||||
| Change | ||||||||||||||||||||||||||||||||
| Sep-20 | Sep-19 | Absolute | % | Dec-19 | ||||||||||||||||||||||||||||
| Demand deposits | 621,361 | 574,803 | 46,558 | 8.1 | 588,534 | |||||||||||||||||||||||||||
| Time deposits | 180,571 | 201,865 | (21,294) | (10.5) | 196,920 | |||||||||||||||||||||||||||
| Mutual funds | 155,479 | 176,538 | (21,059) | (11.9) | 180,405 | |||||||||||||||||||||||||||
| Customer funds | 957,411 | 953,206 | 4,205 | 0.4 | 965,859 | |||||||||||||||||||||||||||
| Pension funds | 15,073 | 15,620 | (547) | (3.5) | 15,878 | |||||||||||||||||||||||||||
| Managed portfolios | 26,157 | 29,208 | (3,051) | (10.4) | 30,117 | |||||||||||||||||||||||||||
| Repos | 40,967 | 37,617 | 3,350 | 8.9 | 38,911 | |||||||||||||||||||||||||||
| Total funds | 1,039,608 | 1,035,651 | 3,957 | 0.4 | 1,050,765 | |||||||||||||||||||||||||||
| Eligible capital (fully loaded). Consolidated | ||||||||||||||||||||||||||||||||
| EUR million | ||||||||||||||||||||||||||||||||
| Change | ||||||||||||||||||||||||||||||||
| Sep-20 | Sep-19 | Absolute | % | Dec-19 | ||||||||||||||||||||||||||||
| Capital stock and reserves | 125,333 | 120,475 | 4,858 | 4.0 | 120,260 | |||||||||||||||||||||||||||
| Attributable profit | (9,048) | 3,732 | (12,780) | — | 6,515 | |||||||||||||||||||||||||||
| Dividends | — | (2,612) | 2,612 | (100.0) | (3,423) | |||||||||||||||||||||||||||
| Other retained earnings | (35,383) | (25,234) | (10,149) | 40.2 | (25,385) | |||||||||||||||||||||||||||
| Minority interests | 6,741 | 6,412 | 328 | 5.1 | 6,441 | |||||||||||||||||||||||||||
| Goodwill and intangible assets | (16,692) | (27,340) | 10,649 | (38.9) | (28,478) | |||||||||||||||||||||||||||
| Other deductions | (4,423) | (6,104) | 1,681 | (27.5) | (5,432) | |||||||||||||||||||||||||||
| Core CET1 | 66,528 | 69,330 | (2,802) | (4.0) | 70,497 | |||||||||||||||||||||||||||
| Preferred shares and other eligible T1 | 8,740 | 8,516 | 224 | 2.6 | 8,467 | |||||||||||||||||||||||||||
| Tier 1 | 75,268 | 77,846 | (2,578) | (3.3) | 78,964 | |||||||||||||||||||||||||||
| Generic funds and eligible T2 instruments | 11,279 | 12,251 | (972) | (7.9) | 11,973 | |||||||||||||||||||||||||||
| Eligible capital | 86,547 | 90,097 | (3,549) | (3.9) | 90,937 | |||||||||||||||||||||||||||
| Risk-weighted assets | 555,122 | 613,580 | (58,458) | (9.5) | 605,244 | |||||||||||||||||||||||||||
| CET1 capital ratio | 11.98 | 11.30 | 0.68 | 11.65 | ||||||||||||||||||||||||||||
| T1 capital ratio | 13.56 | 12.69 | 0.87 | 13.05 | ||||||||||||||||||||||||||||
| Total capital ratio | 15.59 | 14.68 | 0.91 | 15.02 | ||||||||||||||||||||||||||||
| 58 | | January - September 2020 | ||||||
| EUROPE | |||||||||||||||||||||||||||||||||||||||||
| EUR million | |||||||||||||||||||||||||||||||||||||||||
| / | Q2'20 | / | 9M'19 | ||||||||||||||||||||||||||||||||||||||
| Underlying income statement | Q3'20 | % | % excl. FX | 9M'20 | % | % excl. FX | |||||||||||||||||||||||||||||||||||
| Net interest income | 3,549 | 5.9 | 6.2 | 10,336 | (3.1) | (2.4) | |||||||||||||||||||||||||||||||||||
| Net fee income | 1,162 | 5.9 | 6.0 | 3,575 | (9.3) | (9.0) | |||||||||||||||||||||||||||||||||||
Gains (losses) on financial transactions (1) | 338 | 56.6 | 57.2 | 696 | 14.9 | 15.3 | |||||||||||||||||||||||||||||||||||
| Other operating income | 106 | — | — | 99 | (79.8) | (79.8) | |||||||||||||||||||||||||||||||||||
| Total income | 5,155 | 12.6 | 12.9 | 14,706 | (6.4) | (5.8) | |||||||||||||||||||||||||||||||||||
| Administrative expenses and amortisations | (2,542) | 0.7 | 1.1 | (7,779) | (6.4) | (5.9) | |||||||||||||||||||||||||||||||||||
| Net operating income | 2,613 | 27.4 | 27.4 | 6,927 | (6.4) | (5.7) | |||||||||||||||||||||||||||||||||||
| Net loan-loss provisions | (956) | 9.0 | 9.3 | (3,168) | 136.3 | 138.0 | |||||||||||||||||||||||||||||||||||
| Other gains (losses) and provisions | (196) | 22.4 | 21.8 | (551) | (1.5) | (0.8) | |||||||||||||||||||||||||||||||||||
| Profit before tax | 1,461 | 44.1 | 44.0 | 3,208 | (41.7) | (41.2) | |||||||||||||||||||||||||||||||||||
| Tax on profit | (406) | 47.7 | 47.6 | (898) | (40.0) | (39.6) | |||||||||||||||||||||||||||||||||||
| Profit from continuing operations | 1,055 | 42.7 | 42.7 | 2,310 | (42.3) | (41.8) | |||||||||||||||||||||||||||||||||||
| Net profit from discontinued operations | — | — | — | — | — | — | |||||||||||||||||||||||||||||||||||
| Consolidated profit | 1,055 | 42.7 | 42.7 | 2,310 | (42.3) | (41.8) | |||||||||||||||||||||||||||||||||||
| Non-controlling interests | (108) | 1.1 | 1.1 | (288) | (20.4) | (19.6) | |||||||||||||||||||||||||||||||||||
| Underlying attributable profit to the parent | 947 | 49.8 | 49.7 | 2,022 | (44.4) | (44.0) | |||||||||||||||||||||||||||||||||||
| Balance sheet | |||||||||||||||||||||||||||||||||||||||||
| Loans and advances to customers | 673,172 | (1.6) | (1.5) | 673,172 | 2.9 | 4.4 | |||||||||||||||||||||||||||||||||||
| Cash, central banks and credit institutions | 227,581 | (11.8) | (11.8) | 227,581 | 23.4 | 24.1 | |||||||||||||||||||||||||||||||||||
| Debt instruments | 88,604 | (2.7) | (2.4) | 88,604 | (19.9) | (19.1) | |||||||||||||||||||||||||||||||||||
| Other financial assets | 53,016 | (2.1) | (2.1) | 53,016 | (6.8) | (6.6) | |||||||||||||||||||||||||||||||||||
| Other asset accounts | 45,423 | 0.5 | 0.6 | 45,423 | 1.9 | 2.9 | |||||||||||||||||||||||||||||||||||
| Total assets | 1,087,796 | (4.0) | (3.9) | 1,087,796 | 3.5 | 4.7 | |||||||||||||||||||||||||||||||||||
| Customer deposits | 612,844 | 0.5 | 0.5 | 612,844 | 3.9 | 5.2 | |||||||||||||||||||||||||||||||||||
| Central banks and credit institutions | 215,775 | (14.2) | (13.9) | 215,775 | 15.1 | 16.1 | |||||||||||||||||||||||||||||||||||
| Marketable debt securities | 126,016 | (2.0) | (2.0) | 126,016 | (3.4) | (1.8) | |||||||||||||||||||||||||||||||||||
| Other financial liabilities | 61,808 | (13.6) | (13.6) | 61,808 | (10.8) | (10.6) | |||||||||||||||||||||||||||||||||||
| Other liabilities accounts | 16,011 | (5.8) | (5.7) | 16,011 | (11.8) | (10.7) | |||||||||||||||||||||||||||||||||||
| Total liabilities | 1,032,454 | (4.3) | (4.2) | 1,032,454 | 3.8 | 4.9 | |||||||||||||||||||||||||||||||||||
| Total equity | 55,342 | 1.5 | 1.8 | 55,342 | (0.5) | 1.1 | |||||||||||||||||||||||||||||||||||
| Memorandum items: | |||||||||||||||||||||||||||||||||||||||||
Gross loans and advances to customers (2) | 647,911 | (1.2) | (1.1) | 647,911 | 2.0 | 3.4 | |||||||||||||||||||||||||||||||||||
| Customer funds | 681,699 | 1.4 | 1.5 | 681,699 | 2.9 | 4.1 | |||||||||||||||||||||||||||||||||||
Customer deposits (3) | 594,364 | 0.9 | 1.0 | 594,364 | 3.3 | 4.5 | |||||||||||||||||||||||||||||||||||
| Mutual funds | 87,335 | 4.6 | 4.7 | 87,335 | 0.5 | 0.9 | |||||||||||||||||||||||||||||||||||
| Ratios (%) and operating means | |||||||||||||||||||||||||||||||||||||||||
| Underlying RoTE | 7.83 | 2.56 | 5.56 | (4.43) | |||||||||||||||||||||||||||||||||||||
| Efficiency ratio | 49.3 | (5.9) | 52.9 | — | |||||||||||||||||||||||||||||||||||||
| NPL ratio | 3.13 | (0.11) | 3.13 | (0.34) | |||||||||||||||||||||||||||||||||||||
| NPL coverage | 55.8 | 2.4 | 55.8 | 7.6 | |||||||||||||||||||||||||||||||||||||
| Number of employees | 84,876 | (0.4) | 84,876 | (4.9) | |||||||||||||||||||||||||||||||||||||
| Number of branches | 5,058 | (4.7) | 5,058 | (15.6) | |||||||||||||||||||||||||||||||||||||
(1) Includes exchange differences.
(2) Excluding reverse repos.
(3) Excluding repos.
January - September 2020 | | 59 | ||||||
| Spain | |||||||||||||||||
| EUR million | |||||||||||||||||
| / Q2'20 | / 9M'19 | ||||||||||||||||
| Underlying income statement | Q3'20 | % | 9M'20 | % | |||||||||||||
| Net interest income | 1,034 | 11.1 | 2,890 | (3.2) | |||||||||||||
| Net fee income | 562 | 5.1 | 1,740 | (6.5) | |||||||||||||
Gains (losses) on financial transactions (1) | 194 | (22.4) | 601 | (8.8) | |||||||||||||
| Other operating income | 10 | — | (80) | — | |||||||||||||
| Total income | 1,800 | 15.3 | 5,150 | (9.6) | |||||||||||||
| Administrative expenses and amortisations | (893) | (0.4) | (2,734) | (10.2) | |||||||||||||
| Net operating income | 907 | 36.4 | 2,417 | (8.9) | |||||||||||||
| Net loan-loss provisions | (449) | 43.6 | (1,390) | 104.4 | |||||||||||||
| Other gains (losses) and provisions | (112) | (2.7) | (331) | (6.8) | |||||||||||||
| Profit before tax | 346 | 45.8 | 696 | (57.0) | |||||||||||||
| Tax on profit | (100) | 30.4 | (200) | (53.8) | |||||||||||||
| Profit from continuing operations | 246 | 53.3 | 496 | (58.1) | |||||||||||||
| Net profit from discontinued operations | — | — | — | — | |||||||||||||
| Consolidated profit | 246 | 53.3 | 496 | (58.1) | |||||||||||||
| Non-controlling interests | — | (40.0) | — | 51.1 | |||||||||||||
| Underlying attributable profit to the parent | 246 | 53.1 | 497 | (58.1) | |||||||||||||
| Balance sheet | |||||||||||||||||
| Loans and advances to customers | 192,894 | (2.3) | 192,894 | 2.6 | |||||||||||||
| Cash, central banks and credit institutions | 112,338 | 3.7 | 112,338 | 38.2 | |||||||||||||
| Debt instruments | 21,766 | (13.3) | 21,766 | (39.4) | |||||||||||||
| Other financial assets | 2,571 | 54.8 | 2,571 | 72.0 | |||||||||||||
| Other asset accounts | 22,727 | (2.1) | 22,727 | (0.3) | |||||||||||||
| Total assets | 352,296 | (1.0) | 352,296 | 6.9 | |||||||||||||
| Customer deposits | 250,369 | 0.9 | 250,369 | 1.8 | |||||||||||||
| Central banks and credit institutions | 47,536 | 1.3 | 47,536 | 68.6 | |||||||||||||
| Marketable debt securities | 26,141 | (4.5) | 26,141 | (0.5) | |||||||||||||
| Other financial liabilities | 7,858 | (36.5) | 7,858 | (18.6) | |||||||||||||
| Other liabilities accounts | 4,012 | (22.2) | 4,012 | (6.8) | |||||||||||||
| Total liabilities | 335,916 | (1.2) | 335,916 | 6.8 | |||||||||||||
| Total equity | 16,380 | 3.2 | 16,380 | 8.2 | |||||||||||||
| Memorandum items: | |||||||||||||||||
Gross loans and advances to customers (2) | 198,951 | (2.4) | 198,951 | 2.3 | |||||||||||||
| Customer funds | 316,597 | 1.5 | 316,597 | 1.2 | |||||||||||||
Customer deposits (3) | 250,369 | 0.9 | 250,369 | 2.0 | |||||||||||||
| Mutual funds | 66,228 | 3.9 | 66,228 | (1.8) | |||||||||||||
| Ratios (%) and operating means | |||||||||||||||||
| Underlying RoTE | 6.13 | 1.94 | 4.21 | (6.38) | |||||||||||||
| Efficiency ratio | 49.6 | (7.8) | 53.1 | (0.4) | |||||||||||||
| NPL ratio | 5.98 | (0.57) | 5.98 | (1.25) | |||||||||||||
| NPL coverage | 46.0 | 2.7 | 46.0 | 5.4 | |||||||||||||
| Number of employees | 27,053 | (0.8) | 27,053 | (9.0) | |||||||||||||
| Number of branches | 3,110 | (3.5) | 3,110 | (19.3) | |||||||||||||
(1) Includes exchange differences.
(2) Excluding reverse repos.
(3) Excluding repos.
| 60 | | January - September 2020 | ||||||
| Santander Consumer Finance | |||||||||||||||||||||||||||||||||||||||||
| EUR million | |||||||||||||||||||||||||||||||||||||||||
| / | Q2'20 | / | 9M'19 | ||||||||||||||||||||||||||||||||||||||
| Underlying income statement | Q3'20 | % | % excl. FX | 9M'20 | % | % excl. FX | |||||||||||||||||||||||||||||||||||
| Net interest income | 945 | (0.2) | (0.8) | 2,871 | (0.6) | 1.1 | |||||||||||||||||||||||||||||||||||
| Net fee income | 205 | 29.4 | 29.1 | 551 | (12.2) | (11.8) | |||||||||||||||||||||||||||||||||||
Gains (losses) on financial transactions (1) | 6 | 35.4 | 43.2 | 2 | — | — | |||||||||||||||||||||||||||||||||||
| Other operating income | 39 | — | — | 38 | 178.2 | 190.8 | |||||||||||||||||||||||||||||||||||
| Total income | 1,196 | 9.2 | 8.7 | 3,462 | (1.8) | (0.3) | |||||||||||||||||||||||||||||||||||
| Administrative expenses and amortisations | (483) | 3.1 | 2.6 | (1,467) | (4.7) | (3.4) | |||||||||||||||||||||||||||||||||||
| Net operating income | 712 | 13.7 | 13.2 | 1,995 | 0.5 | 2.1 | |||||||||||||||||||||||||||||||||||
| Net loan-loss provisions | (211) | 15.1 | 14.4 | (712) | 117.1 | 120.4 | |||||||||||||||||||||||||||||||||||
| Other gains (losses) and provisions | (13) | — | — | 54 | 1.6 | (0.6) | |||||||||||||||||||||||||||||||||||
| Profit before tax | 489 | 4.9 | 4.5 | 1,337 | (21.8) | (20.6) | |||||||||||||||||||||||||||||||||||
| Tax on profit | (133) | 0.9 | 0.7 | (372) | (23.7) | (22.7) | |||||||||||||||||||||||||||||||||||
| Profit from continuing operations | 355 | 6.5 | 6.0 | 965 | (21.1) | (19.8) | |||||||||||||||||||||||||||||||||||
| Net profit from discontinued operations | — | — | — | — | — | — | |||||||||||||||||||||||||||||||||||
| Consolidated profit | 355 | 6.5 | 6.0 | 965 | (21.1) | (19.8) | |||||||||||||||||||||||||||||||||||
| Non-controlling interests | (71) | (5.9) | (6.0) | (204) | (10.5) | (10.3) | |||||||||||||||||||||||||||||||||||
| Underlying attributable profit to the parent | 284 | 10.2 | 9.6 | 761 | (23.5) | (22.1) | |||||||||||||||||||||||||||||||||||
| Balance sheet | |||||||||||||||||||||||||||||||||||||||||
| Loans and advances to customers | 98,604 | (0.7) | (0.4) | 98,604 | 0.5 | 2.0 | |||||||||||||||||||||||||||||||||||
| Cash, central banks and credit institutions | 10,562 | 7.4 | 7.8 | 10,562 | 60.2 | 63.9 | |||||||||||||||||||||||||||||||||||
| Debt instruments | 5,559 | 21.8 | 22.4 | 5,559 | 68.3 | 73.4 | |||||||||||||||||||||||||||||||||||
| Other financial assets | 28 | (7.1) | (6.9) | 28 | (24.4) | (23.4) | |||||||||||||||||||||||||||||||||||
| Other asset accounts | 5,268 | 27.9 | 28.2 | 5,268 | 36.2 | 37.6 | |||||||||||||||||||||||||||||||||||
| Total assets | 120,022 | 1.9 | 2.2 | 120,022 | 7.2 | 8.9 | |||||||||||||||||||||||||||||||||||
| Customer deposits | 38,760 | 1.2 | 1.5 | 38,760 | 2.2 | 4.1 | |||||||||||||||||||||||||||||||||||
| Central banks and credit institutions | 30,568 | 5.1 | 5.3 | 30,568 | 29.0 | 30.5 | |||||||||||||||||||||||||||||||||||
| Marketable debt securities | 34,433 | (0.7) | (0.6) | 34,433 | (0.4) | 0.9 | |||||||||||||||||||||||||||||||||||
| Other financial liabilities | 1,414 | 0.2 | 0.5 | 1,414 | 36.3 | 37.2 | |||||||||||||||||||||||||||||||||||
| Other liabilities accounts | 3,846 | 6.5 | 6.7 | 3,846 | (3.8) | (2.9) | |||||||||||||||||||||||||||||||||||
| Total liabilities | 109,021 | 1.8 | 2.0 | 109,021 | 7.7 | 9.3 | |||||||||||||||||||||||||||||||||||
| Total equity | 11,001 | 2.9 | 3.4 | 11,001 | 2.7 | 5.0 | |||||||||||||||||||||||||||||||||||
| Memorandum items: | |||||||||||||||||||||||||||||||||||||||||
Gross loans and advances to customers (2) | 101,314 | (0.6) | (0.4) | 101,314 | 0.8 | 2.4 | |||||||||||||||||||||||||||||||||||
| Customer funds | 38,760 | 1.2 | 1.5 | 38,760 | 2.2 | 4.1 | |||||||||||||||||||||||||||||||||||
Customer deposits (3) | 38,760 | 1.2 | 1.5 | 38,760 | 2.2 | 4.1 | |||||||||||||||||||||||||||||||||||
| Mutual funds | — | — | — | — | — | — | |||||||||||||||||||||||||||||||||||
| Ratios (%) and operating means | |||||||||||||||||||||||||||||||||||||||||
| Underlying RoTE | 13.31 | 1.27 | 11.76 | (3.73) | |||||||||||||||||||||||||||||||||||||
| Efficiency ratio | 40.4 | (2.4) | 42.4 | (1.3) | |||||||||||||||||||||||||||||||||||||
| NPL ratio | 2.50 | (0.02) | 2.50 | 0.25 | |||||||||||||||||||||||||||||||||||||
| NPL coverage | 108.2 | 2.1 | 108.2 | 4.0 | |||||||||||||||||||||||||||||||||||||
| Number of employees | 14,374 | 4.8 | 14,374 | (0.8) | |||||||||||||||||||||||||||||||||||||
| Number of branches | 358 | (12.0) | 358 | (16.0) | |||||||||||||||||||||||||||||||||||||
(1) Includes exchange differences.
(2) Excluding reverse repos.
(3) Excluding repos.
January - September 2020 | | 61 | ||||||
| United Kingdom | |||||||||||||||||||||||||||||||||||||||||
| EUR million | |||||||||||||||||||||||||||||||||||||||||
| / | Q2'20 | / | 9M'19 | ||||||||||||||||||||||||||||||||||||||
| Underlying income statement | Q3'20 | % | % excl. FX | 9M'20 | % | % excl. FX | |||||||||||||||||||||||||||||||||||
| Net interest income | 976 | 12.1 | 14.1 | 2,745 | (2.9) | (2.7) | |||||||||||||||||||||||||||||||||||
| Net fee income | 117 | 21.8 | 23.2 | 407 | (36.4) | (36.3) | |||||||||||||||||||||||||||||||||||
Gains (losses) on financial transactions (1) | 16 | — | — | 9 | 73.7 | 74.0 | |||||||||||||||||||||||||||||||||||
| Other operating income | 8 | (36.4) | (34.3) | 33 | (8.5) | (8.3) | |||||||||||||||||||||||||||||||||||
| Total income | 1,117 | 14.1 | 16.0 | 3,193 | (9.0) | (8.8) | |||||||||||||||||||||||||||||||||||
| Administrative expenses and amortisations | (646) | (1.6) | 0.5 | (2,016) | (5.1) | (4.9) | |||||||||||||||||||||||||||||||||||
| Net operating income | 471 | 45.9 | 47.6 | 1,178 | (14.9) | (14.8) | |||||||||||||||||||||||||||||||||||
| Net loan-loss provisions | (189) | (21.0) | (18.9) | (619) | 294.7 | 295.4 | |||||||||||||||||||||||||||||||||||
| Other gains (losses) and provisions | (36) | 733.3 | 593.4 | (115) | (2.0) | (1.9) | |||||||||||||||||||||||||||||||||||
| Profit before tax | 246 | 209.0 | 208.9 | 444 | (60.0) | (59.9) | |||||||||||||||||||||||||||||||||||
| Tax on profit | (61) | 236.6 | 236.1 | (108) | (59.4) | (59.4) | |||||||||||||||||||||||||||||||||||
| Profit from continuing operations | 184 | 200.8 | 200.8 | 336 | (60.2) | (60.1) | |||||||||||||||||||||||||||||||||||
| Net profit from discontinued operations | — | — | — | — | — | — | |||||||||||||||||||||||||||||||||||
| Consolidated profit | 184 | 200.8 | 200.8 | 336 | (60.2) | (60.1) | |||||||||||||||||||||||||||||||||||
| Non-controlling interests | (5) | (28.7) | (26.6) | (18) | 10.7 | 10.9 | |||||||||||||||||||||||||||||||||||
| Underlying attributable profit to the parent | 179 | 230.0 | 229.5 | 318 | (61.6) | (61.5) | |||||||||||||||||||||||||||||||||||
| Balance sheet | |||||||||||||||||||||||||||||||||||||||||
| Loans and advances to customers | 259,417 | (0.3) | (0.5) | 259,417 | — | 2.6 | |||||||||||||||||||||||||||||||||||
| Cash, central banks and credit institutions | 46,845 | (2.5) | (2.7) | 46,845 | 44.1 | 47.8 | |||||||||||||||||||||||||||||||||||
| Debt instruments | 13,902 | (18.2) | (18.4) | 13,902 | (42.7) | (41.3) | |||||||||||||||||||||||||||||||||||
| Other financial assets | 1,776 | 20.4 | 20.2 | 1,776 | 68.7 | 72.9 | |||||||||||||||||||||||||||||||||||
| Other asset accounts | 10,106 | (4.1) | (4.3) | 10,106 | (6.2) | (3.9) | |||||||||||||||||||||||||||||||||||
| Total assets | 332,046 | (1.5) | (1.7) | 332,046 | 1.3 | 3.8 | |||||||||||||||||||||||||||||||||||
| Customer deposits | 225,347 | 0.1 | (0.1) | 225,347 | 4.9 | 7.6 | |||||||||||||||||||||||||||||||||||
| Central banks and credit institutions | 25,606 | (12.2) | (12.3) | 25,606 | 7.7 | 10.4 | |||||||||||||||||||||||||||||||||||
| Marketable debt securities | 58,188 | (2.9) | (3.1) | 58,188 | (9.0) | (6.7) | |||||||||||||||||||||||||||||||||||
| Other financial liabilities | 3,123 | 3.0 | 2.8 | 3,123 | 8.2 | 10.9 | |||||||||||||||||||||||||||||||||||
| Other liabilities accounts | 4,540 | (1.7) | (1.8) | 4,540 | (20.9) | (18.9) | |||||||||||||||||||||||||||||||||||
| Total liabilities | 316,803 | (1.6) | (1.8) | 316,803 | 1.8 | 4.4 | |||||||||||||||||||||||||||||||||||
| Total equity | 15,243 | (0.2) | (0.4) | 15,243 | (9.2) | (6.9) | |||||||||||||||||||||||||||||||||||
| Memorandum items: | |||||||||||||||||||||||||||||||||||||||||
Gross loans and advances to customers (2) | 238,148 | 0.2 | 0.1 | 238,148 | 1.0 | 3.5 | |||||||||||||||||||||||||||||||||||
| Customer funds | 216,396 | 1.5 | 1.4 | 216,396 | 3.6 | 6.2 | |||||||||||||||||||||||||||||||||||
Customer deposits (3) | 208,978 | 1.6 | 1.4 | 208,978 | 4.0 | 6.7 | |||||||||||||||||||||||||||||||||||
| Mutual funds | 7,418 | 0.3 | 0.1 | 7,418 | (7.1) | (4.8) | |||||||||||||||||||||||||||||||||||
| Ratios (%) and operating means | |||||||||||||||||||||||||||||||||||||||||
| Underlying RoTE | 5.34 | 3.79 | 3.05 | (4.40) | |||||||||||||||||||||||||||||||||||||
| Efficiency ratio | 57.8 | (9.2) | 63.1 | 2.6 | |||||||||||||||||||||||||||||||||||||
| NPL ratio | 1.30 | 0.22 | 1.30 | 0.22 | |||||||||||||||||||||||||||||||||||||
| NPL coverage | 44.5 | (1.5) | 44.5 | 10.4 | |||||||||||||||||||||||||||||||||||||
| Number of employees | 23,645 | (2.1) | 23,645 | (5.4) | |||||||||||||||||||||||||||||||||||||
| Number of branches | 564 | (8.3) | 564 | (10.3) | |||||||||||||||||||||||||||||||||||||
(1) Includes exchange differences.
(2) Excluding reverse repos.
(3) Excluding repos.
| 62 | | January - September 2020 | ||||||
| Portugal | |||||||||||||||||
| EUR million | |||||||||||||||||
| / Q2'20 | / 9M'19 | ||||||||||||||||
| Underlying income statement | Q3'20 | % | 9M'20 | % | |||||||||||||
| Net interest income | 193 | (2.4) | 592 | (7.9) | |||||||||||||
| Net fee income | 94 | 4.6 | 285 | (2.5) | |||||||||||||
Gains (losses) on financial transactions (1) | 15 | (57.5) | 106 | 4.7 | |||||||||||||
| Other operating income | 10 | — | (3) | — | |||||||||||||
| Total income | 312 | (1.7) | 979 | (6.1) | |||||||||||||
| Administrative expenses and amortisations | (146) | 0.7 | (442) | (5.4) | |||||||||||||
| Net operating income | 166 | (3.6) | 538 | (6.6) | |||||||||||||
| Net loan-loss provisions | (47) | 95.3 | (152) | — | |||||||||||||
| Other gains (losses) and provisions | 1 | — | (36) | 18.4 | |||||||||||||
| Profit before tax | 120 | (9.4) | 350 | (37.2) | |||||||||||||
| Tax on profit | (37) | (10.0) | (107) | (37.5) | |||||||||||||
| Profit from continuing operations | 83 | (9.1) | 243 | (37.0) | |||||||||||||
| Net profit from discontinued operations | — | — | — | — | |||||||||||||
| Consolidated profit | 83 | (9.1) | 243 | (37.0) | |||||||||||||
| Non-controlling interests | — | — | — | (66.9) | |||||||||||||
| Underlying attributable profit to the parent | 83 | (9.2) | 243 | (36.9) | |||||||||||||
| Balance sheet | |||||||||||||||||
| Loans and advances to customers | 37,604 | 1.4 | 37,604 | 5.5 | |||||||||||||
| Cash, central banks and credit institutions | 6,803 | (22.4) | 6,803 | 59.8 | |||||||||||||
| Debt instruments | 11,673 | (0.9) | 11,673 | (11.8) | |||||||||||||
| Other financial assets | 1,491 | (2.6) | 1,491 | (16.3) | |||||||||||||
| Other asset accounts | 1,732 | 4.3 | 1,732 | (10.4) | |||||||||||||
| Total assets | 59,302 | (2.5) | 59,302 | 4.3 | |||||||||||||
| Customer deposits | 40,179 | 0.4 | 40,179 | 2.9 | |||||||||||||
| Central banks and credit institutions | 9,734 | (16.0) | 9,734 | 24.5 | |||||||||||||
| Marketable debt securities | 3,274 | 0.2 | 3,274 | (4.0) | |||||||||||||
| Other financial liabilities | 265 | 3.7 | 265 | (12.1) | |||||||||||||
| Other liabilities accounts | 1,820 | 2.0 | 1,820 | (1.5) | |||||||||||||
| Total liabilities | 55,271 | (2.9) | 55,271 | 5.4 | |||||||||||||
| Total equity | 4,031 | 3.6 | 4,031 | (8.7) | |||||||||||||
| Memorandum items: | |||||||||||||||||
Gross loans and advances to customers (2) | 38,646 | 1.4 | 38,646 | 5.8 | |||||||||||||
| Customer funds | 43,160 | 0.6 | 43,160 | 2.4 | |||||||||||||
Customer deposits (3) | 40,179 | 0.4 | 40,179 | 2.9 | |||||||||||||
| Mutual funds | 2,982 | 3.4 | 2,982 | (4.4) | |||||||||||||
| Ratios (%) and operating means | |||||||||||||||||
| Underlying RoTE | 8.50 | (1.10) | 8.50 | (3.70) | |||||||||||||
| Efficiency ratio | 46.7 | 1.1 | 45.1 | 0.3 | |||||||||||||
| NPL ratio | 4.25 | (0.18) | 4.25 | (0.65) | |||||||||||||
| NPL coverage | 64.3 | 3.4 | 64.3 | 12.8 | |||||||||||||
| Number of employees | 6,431 | (1.2) | 6,431 | (3.7) | |||||||||||||
| Number of branches | 499 | (5.0) | 499 | (9.1) | |||||||||||||
(1) Includes exchange differences.
(2) Excluding reverse repos.
(3) Excluding repos.
January - September 2020 | | 63 | ||||||
| Poland | |||||||||||||||||||||||||||||||||||||||||
| EUR million | |||||||||||||||||||||||||||||||||||||||||
| / | Q2'20 | / | 9M'19 | ||||||||||||||||||||||||||||||||||||||
| Underlying income statement | Q3'20 | % | % excl. FX | 9M'20 | % | % excl. FX | |||||||||||||||||||||||||||||||||||
| Net interest income | 246 | (2.0) | (3.5) | 794 | (8.1) | (5.5) | |||||||||||||||||||||||||||||||||||
| Net fee income | 112 | 8.3 | 6.7 | 332 | (4.9) | (2.2) | |||||||||||||||||||||||||||||||||||
Gains (losses) on financial transactions (1) | 35 | 63.1 | 62.6 | 64 | 1.7 | 4.5 | |||||||||||||||||||||||||||||||||||
| Other operating income | 1 | (40.8) | 199.7 | (54) | 209.9 | 218.5 | |||||||||||||||||||||||||||||||||||
| Total income | 394 | 4.3 | 3.1 | 1,136 | (9.7) | (7.2) | |||||||||||||||||||||||||||||||||||
| Administrative expenses and amortisations | (161) | 12.4 | 10.6 | (475) | (9.3) | (6.8) | |||||||||||||||||||||||||||||||||||
| Net operating income | 233 | (0.6) | (1.5) | 661 | (10.0) | (7.5) | |||||||||||||||||||||||||||||||||||
| Net loan-loss provisions | (65) | (26.3) | (27.2) | (249) | 50.1 | 54.2 | |||||||||||||||||||||||||||||||||||
| Other gains (losses) and provisions | (32) | (21.2) | (21.9) | (108) | 17.2 | 20.5 | |||||||||||||||||||||||||||||||||||
| Profit before tax | 136 | 29.0 | 28.2 | 303 | (36.2) | (34.4) | |||||||||||||||||||||||||||||||||||
| Tax on profit | (36) | 15.0 | 13.7 | (97) | (17.2) | (14.9) | |||||||||||||||||||||||||||||||||||
| Profit from continuing operations | 100 | 34.9 | 34.4 | 206 | (42.5) | (40.9) | |||||||||||||||||||||||||||||||||||
| Net profit from discontinued operations | — | — | — | — | — | — | |||||||||||||||||||||||||||||||||||
| Consolidated profit | 100 | 34.9 | 34.4 | 206 | (42.5) | (40.9) | |||||||||||||||||||||||||||||||||||
| Non-controlling interests | (32) | 35.3 | 34.9 | (65) | (43.2) | (41.6) | |||||||||||||||||||||||||||||||||||
| Underlying attributable profit to the parent | 68 | 34.7 | 34.2 | 142 | (42.1) | (40.5) | |||||||||||||||||||||||||||||||||||
| Balance sheet | |||||||||||||||||||||||||||||||||||||||||
| Loans and advances to customers | 28,217 | (3.3) | (1.4) | 28,217 | (2.8) | 0.6 | |||||||||||||||||||||||||||||||||||
| Cash, central banks and credit institutions | 1,956 | (34.9) | (33.6) | 1,956 | (42.3) | (40.3) | |||||||||||||||||||||||||||||||||||
| Debt instruments | 13,273 | 9.4 | 11.6 | 13,273 | 57.7 | 63.2 | |||||||||||||||||||||||||||||||||||
| Other financial assets | 537 | 5.1 | 7.2 | 537 | (22.0) | (19.2) | |||||||||||||||||||||||||||||||||||
| Other asset accounts | 1,397 | 2.2 | 4.2 | 1,397 | 6.2 | 9.9 | |||||||||||||||||||||||||||||||||||
| Total assets | 45,381 | (1.8) | 0.2 | 45,381 | 5.9 | 9.6 | |||||||||||||||||||||||||||||||||||
| Customer deposits | 33,952 | (1.1) | 0.9 | 33,952 | 8.6 | 12.4 | |||||||||||||||||||||||||||||||||||
| Central banks and credit institutions | 2,600 | (10.2) | (8.5) | 2,600 | (2.5) | 0.9 | |||||||||||||||||||||||||||||||||||
| Marketable debt securities | 1,958 | (4.8) | (2.9) | 1,958 | (11.0) | (8.0) | |||||||||||||||||||||||||||||||||||
| Other financial liabilities | 653 | (3.9) | (2.1) | 653 | (31.5) | (29.1) | |||||||||||||||||||||||||||||||||||
| Other liabilities accounts | 1,138 | (3.8) | (1.9) | 1,138 | 20.0 | 24.2 | |||||||||||||||||||||||||||||||||||
| Total liabilities | 40,301 | (2.0) | (0.1) | 40,301 | 6.0 | 9.6 | |||||||||||||||||||||||||||||||||||
| Total equity | 5,079 | 0.3 | 2.2 | 5,079 | 5.8 | 9.5 | |||||||||||||||||||||||||||||||||||
| Memorandum items: | |||||||||||||||||||||||||||||||||||||||||
Gross loans and advances to customers (2) | 29,205 | (3.1) | (1.2) | 29,205 | (2.5) | 0.9 | |||||||||||||||||||||||||||||||||||
| Customer funds | 37,606 | — | 1.9 | 37,606 | 6.1 | 9.8 | |||||||||||||||||||||||||||||||||||
Customer deposits (3) | 33,952 | (1.0) | 0.9 | 33,952 | 8.6 | 12.4 | |||||||||||||||||||||||||||||||||||
| Mutual funds | 3,653 | 10.0 | 12.2 | 3,653 | (12.6) | (9.5) | |||||||||||||||||||||||||||||||||||
| Ratios (%) and operating means | |||||||||||||||||||||||||||||||||||||||||
| Underlying RoTE | 8.40 | 2.02 | 5.91 | (4.62) | |||||||||||||||||||||||||||||||||||||
| Efficiency ratio | 40.8 | 2.9 | 41.8 | 0.2 | |||||||||||||||||||||||||||||||||||||
| NPL ratio | 4.58 | 0.01 | 4.58 | 0.23 | |||||||||||||||||||||||||||||||||||||
| NPL coverage | 70.8 | 1.8 | 70.8 | 1.8 | |||||||||||||||||||||||||||||||||||||
| Number of employees | 10,698 | (2.5) | 10,698 | (3.0) | |||||||||||||||||||||||||||||||||||||
| Number of branches | 515 | (2.6) | 515 | (1.9) | |||||||||||||||||||||||||||||||||||||
(1) Includes exchange differences.
(2) Excluding reverse repos.
(3) Excluding repos.
| 64 | | January - September 2020 | ||||||
| Other Europe | |||||||||||||||||||||||||||||||||||||||||
| EUR million | |||||||||||||||||||||||||||||||||||||||||
| / | Q2'20 | / | 9M'19 | ||||||||||||||||||||||||||||||||||||||
| Underlying income statement | Q3'20 | % | % excl. FX | 9M'20 | % | % excl. FX | |||||||||||||||||||||||||||||||||||
| Net interest income | 155 | 0.4 | 1.7 | 444 | (4.4) | (4.4) | |||||||||||||||||||||||||||||||||||
| Net fee income | 71 | (37.7) | (36.6) | 260 | 52.4 | 52.4 | |||||||||||||||||||||||||||||||||||
Gains (losses) on financial transactions (1) | 72 | — | — | (85) | (61.0) | (61.0) | |||||||||||||||||||||||||||||||||||
| Other operating income | 38 | (46.9) | (47.1) | 166 | (36.8) | (36.8) | |||||||||||||||||||||||||||||||||||
| Total income | 337 | 36.9 | 38.8 | 785 | 15.5 | 15.5 | |||||||||||||||||||||||||||||||||||
| Administrative expenses and amortisations | (214) | (1.3) | — | (647) | 5.5 | 5.5 | |||||||||||||||||||||||||||||||||||
| Net operating income | 123 | 318.5 | 328.8 | 138 | 106.8 | 106.9 | |||||||||||||||||||||||||||||||||||
| Net loan-loss provisions | 5 | — | — | (46) | 115.6 | 115.6 | |||||||||||||||||||||||||||||||||||
| Other gains (losses) and provisions | (4) | (44.0) | (44.0) | (16) | (12.3) | (12.3) | |||||||||||||||||||||||||||||||||||
| Profit before tax | 124 | — | — | 77 | 175.9 | 176.0 | |||||||||||||||||||||||||||||||||||
| Tax on profit | (38) | — | — | (14) | (38.6) | (38.6) | |||||||||||||||||||||||||||||||||||
| Profit from continuing operations | 86 | 377.1 | 392.1 | 63 | — | — | |||||||||||||||||||||||||||||||||||
| Net profit from discontinued operations | — | — | — | — | — | — | |||||||||||||||||||||||||||||||||||
| Consolidated profit | 86 | 377.0 | 392.0 | 63 | — | — | |||||||||||||||||||||||||||||||||||
| Non-controlling interests | — | (68.5) | (66.9) | (1) | (55.0) | (54.9) | |||||||||||||||||||||||||||||||||||
| Underlying attributable profit to the parent | 86 | 407.5 | 424.2 | 61 | — | — | |||||||||||||||||||||||||||||||||||
| Balance sheet | |||||||||||||||||||||||||||||||||||||||||
| Loans and advances to customers | 56,436 | (8.0) | (7.3) | 56,436 | 28.1 | 30.1 | |||||||||||||||||||||||||||||||||||
| Cash, central banks and credit institutions | 49,076 | (38.7) | (38.6) | 49,076 | (13.0) | (13.1) | |||||||||||||||||||||||||||||||||||
| Debt instruments | 22,432 | 9.6 | 9.7 | 22,432 | (12.0) | (11.6) | |||||||||||||||||||||||||||||||||||
| Other financial assets | 46,612 | (4.8) | (4.8) | 46,612 | (10.1) | (10.0) | |||||||||||||||||||||||||||||||||||
| Other asset accounts | 4,194 | (3.0) | (1.6) | 4,194 | 7.8 | 11.0 | |||||||||||||||||||||||||||||||||||
| Total assets | 178,750 | (16.9) | (16.6) | 178,750 | (1.6) | (1.1) | |||||||||||||||||||||||||||||||||||
| Customer deposits | 24,237 | 0.6 | 1.1 | 24,237 | 16.2 | 17.1 | |||||||||||||||||||||||||||||||||||
| Central banks and credit institutions | 99,731 | (24.3) | (23.9) | 99,731 | (1.5) | (1.0) | |||||||||||||||||||||||||||||||||||
| Marketable debt securities | 2,022 | 61.8 | 61.8 | 2,022 | — | — | |||||||||||||||||||||||||||||||||||
| Other financial liabilities | 48,495 | (9.8) | (9.8) | 48,495 | (10.9) | (10.8) | |||||||||||||||||||||||||||||||||||
| Other liabilities accounts | 656 | 0.8 | 0.9 | 656 | (50.2) | (49.9) | |||||||||||||||||||||||||||||||||||
| Total liabilities | 175,142 | (17.2) | (16.9) | 175,142 | (1.5) | (1.1) | |||||||||||||||||||||||||||||||||||
| Total equity | 3,608 | (3.8) | (2.5) | 3,608 | (4.9) | (2.1) | |||||||||||||||||||||||||||||||||||
| Memorandum items: | |||||||||||||||||||||||||||||||||||||||||
Gross loans and advances to customers (2) | 41,647 | (6.3) | (5.3) | 41,647 | 9.0 | 10.9 | |||||||||||||||||||||||||||||||||||
| Customer funds | 29,180 | 2.3 | 2.7 | 29,180 | 17.0 | 17.7 | |||||||||||||||||||||||||||||||||||
Customer deposits (3) | 22,127 | (1.4) | (0.9) | 22,127 | 6.4 | 7.1 | |||||||||||||||||||||||||||||||||||
| Mutual funds | 7,053 | 15.9 | 15.9 | 7,053 | 70.3 | 70.3 | |||||||||||||||||||||||||||||||||||
| Resources | |||||||||||||||||||||||||||||||||||||||||
| Number of employees | 2,675 | 2.8 | 2,675 | 14.2 | |||||||||||||||||||||||||||||||||||||
(1) Includes exchange differences.
(2) Excluding reverse repos.
(3) Excluding repos.
January - September 2020 | | 65 | ||||||
| NORTH AMERICA | |||||||||||||||||||||||||||||||||||||||||
| EUR million | |||||||||||||||||||||||||||||||||||||||||
| / | Q2'20 | / | 9M'19 | ||||||||||||||||||||||||||||||||||||||
| Underlying income statement | Q3'20 | % | % excl. FX | 9M'20 | % | % excl. FX | |||||||||||||||||||||||||||||||||||
| Net interest income | 2,075 | (0.2) | 4.2 | 6,415 | (3.7) | 0.2 | |||||||||||||||||||||||||||||||||||
| Net fee income | 406 | 1.6 | 5.5 | 1,267 | (6.1) | (1.0) | |||||||||||||||||||||||||||||||||||
Gains (losses) on financial transactions (1) | 33 | (76.1) | (72.0) | 239 | 62.3 | 68.7 | |||||||||||||||||||||||||||||||||||
| Other operating income | 163 | 82.3 | 94.3 | 399 | (19.8) | (21.2) | |||||||||||||||||||||||||||||||||||
| Total income | 2,678 | (1.0) | 3.4 | 8,319 | (3.9) | (0.1) | |||||||||||||||||||||||||||||||||||
| Administrative expenses and amortisations | (1,097) | (1.8) | 2.7 | (3,438) | (5.9) | (2.3) | |||||||||||||||||||||||||||||||||||
| Net operating income | 1,581 | (0.5) | 4.0 | 4,882 | (2.4) | 1.5 | |||||||||||||||||||||||||||||||||||
| Net loan-loss provisions | (775) | (30.9) | (25.9) | (3,144) | 20.6 | 24.0 | |||||||||||||||||||||||||||||||||||
| Other gains (losses) and provisions | (24) | (32.1) | (28.5) | (74) | (57.2) | (56.8) | |||||||||||||||||||||||||||||||||||
| Profit before tax | 781 | 81.5 | 82.3 | 1,664 | (25.1) | (20.9) | |||||||||||||||||||||||||||||||||||
| Tax on profit | (248) | 320.0 | 305.1 | (424) | (23.1) | (19.4) | |||||||||||||||||||||||||||||||||||
| Profit from continuing operations | 533 | 43.6 | 45.6 | 1,240 | (25.8) | (21.4) | |||||||||||||||||||||||||||||||||||
| Net profit from discontinued operations | — | — | — | — | — | — | |||||||||||||||||||||||||||||||||||
| Consolidated profit | 533 | 43.6 | 45.6 | 1,240 | (25.8) | (21.4) | |||||||||||||||||||||||||||||||||||
| Non-controlling interests | (89) | 154.6 | 158.0 | (179) | (54.3) | (52.0) | |||||||||||||||||||||||||||||||||||
| Underlying attributable profit to the parent | 444 | 32.1 | 34.1 | 1,061 | (17.0) | (11.9) | |||||||||||||||||||||||||||||||||||
| Balance sheet | |||||||||||||||||||||||||||||||||||||||||
| Loans and advances to customers | 122,759 | (7.9) | (4.9) | 122,759 | (6.7) | 3.5 | |||||||||||||||||||||||||||||||||||
| Cash, central banks and credit institutions | 28,408 | (8.2) | (5.7) | 28,408 | 21.8 | 38.1 | |||||||||||||||||||||||||||||||||||
| Debt instruments | 36,721 | (1.7) | 0.1 | 36,721 | 8.7 | 24.1 | |||||||||||||||||||||||||||||||||||
| Other financial assets | 17,345 | (14.2) | (13.0) | 17,345 | 44.0 | 66.1 | |||||||||||||||||||||||||||||||||||
| Other asset accounts | 20,812 | (4.7) | (1.2) | 20,812 | (8.0) | 1.0 | |||||||||||||||||||||||||||||||||||
| Total assets | 226,045 | (7.2) | (4.6) | 226,045 | 1.2 | 13.1 | |||||||||||||||||||||||||||||||||||
| Customer deposits | 108,232 | (4.6) | (1.8) | 108,232 | 5.6 | 18.1 | |||||||||||||||||||||||||||||||||||
| Central banks and credit institutions | 29,654 | (16.4) | (14.3) | 29,654 | (4.8) | 7.4 | |||||||||||||||||||||||||||||||||||
| Marketable debt securities | 39,946 | (7.6) | (4.3) | 39,946 | (9.7) | (1.0) | |||||||||||||||||||||||||||||||||||
| Other financial liabilities | 18,569 | (13.2) | (12.1) | 18,569 | 27.7 | 48.2 | |||||||||||||||||||||||||||||||||||
| Other liabilities accounts | 6,376 | (3.1) | (0.6) | 6,376 | 3.5 | 15.8 | |||||||||||||||||||||||||||||||||||
| Total liabilities | 202,777 | (7.9) | (5.3) | 202,777 | 2.1 | 14.2 | |||||||||||||||||||||||||||||||||||
| Total equity | 23,268 | (1.0) | 2.2 | 23,268 | (5.7) | 4.6 | |||||||||||||||||||||||||||||||||||
| Memorandum items: | |||||||||||||||||||||||||||||||||||||||||
Gross loans and advances to customers (2) | 122,634 | (6.5) | (3.4) | 122,634 | (4.5) | 6.1 | |||||||||||||||||||||||||||||||||||
| Customer funds | 117,297 | (6.0) | (3.2) | 117,297 | 2.7 | 15.3 | |||||||||||||||||||||||||||||||||||
Customer deposits (3) | 96,705 | (7.7) | (4.8) | 96,705 | 4.5 | 16.7 | |||||||||||||||||||||||||||||||||||
| Mutual funds | 20,592 | 2.6 | 4.9 | 20,592 | (4.8) | 9.0 | |||||||||||||||||||||||||||||||||||
| Ratios (%) and operating means | |||||||||||||||||||||||||||||||||||||||||
| Underlying RoTE | 8.58 | 2.11 | 6.78 | (2.13) | |||||||||||||||||||||||||||||||||||||
| Efficiency ratio | 41.0 | (0.3) | 41.3 | (0.9) | |||||||||||||||||||||||||||||||||||||
| NPL ratio | 1.96 | 0.23 | 1.96 | (0.25) | |||||||||||||||||||||||||||||||||||||
| NPL coverage | 201.6 | (4.9) | 201.6 | 46.0 | |||||||||||||||||||||||||||||||||||||
| Number of employees | 37,959 | (0.4) | 37,959 | (0.4) | |||||||||||||||||||||||||||||||||||||
| Number of branches | 2,014 | (1.4) | 2,014 | (2.1) | |||||||||||||||||||||||||||||||||||||
(1) Includes exchange differences.
(2) Excluding reverse repos.
(3) Excluding repos.
| 66 | | January - September 2020 | ||||||
| United States | |||||||||||||||||||||||||||||||||||||||||
| EUR million | |||||||||||||||||||||||||||||||||||||||||
| / | Q2'20 | / | 9M'19 | ||||||||||||||||||||||||||||||||||||||
| Underlying income statement | Q3'20 | % | % excl. FX | 9M'20 | % | % excl. FX | |||||||||||||||||||||||||||||||||||
| Net interest income | 1,406 | (1.6) | 4.5 | 4,297 | (0.5) | (0.5) | |||||||||||||||||||||||||||||||||||
| Net fee income | 218 | 1.3 | 7.7 | 682 | (4.7) | (4.7) | |||||||||||||||||||||||||||||||||||
Gains (losses) on financial transactions (1) | 12 | (76.7) | (72.3) | 108 | 10.8 | 10.8 | |||||||||||||||||||||||||||||||||||
| Other operating income | 194 | 80.7 | 89.7 | 472 | (18.1) | (18.1) | |||||||||||||||||||||||||||||||||||
| Total income | 1,830 | 1.6 | 7.9 | 5,559 | (2.7) | (2.6) | |||||||||||||||||||||||||||||||||||
| Administrative expenses and amortisations | (722) | (7.0) | (1.0) | (2,307) | (5.0) | (4.9) | |||||||||||||||||||||||||||||||||||
| Net operating income | 1,108 | 8.1 | 14.6 | 3,252 | (1.0) | (0.9) | |||||||||||||||||||||||||||||||||||
| Net loan-loss provisions | (572) | (31.2) | (25.4) | (2,376) | 21.0 | 21.0 | |||||||||||||||||||||||||||||||||||
| Other gains (losses) and provisions | (20) | (31.0) | (27.2) | (56) | (65.0) | (65.0) | |||||||||||||||||||||||||||||||||||
| Profit before tax | 515 | 215.3 | 225.5 | 820 | (29.2) | (29.2) | |||||||||||||||||||||||||||||||||||
| Tax on profit | (182) | — | — | (218) | (32.0) | (32.0) | |||||||||||||||||||||||||||||||||||
| Profit from continuing operations | 333 | 95.7 | 102.9 | 602 | (28.2) | (28.1) | |||||||||||||||||||||||||||||||||||
| Net profit from discontinued operations | — | — | — | — | — | — | |||||||||||||||||||||||||||||||||||
| Consolidated profit | 333 | 95.7 | 102.9 | 602 | (28.2) | (28.1) | |||||||||||||||||||||||||||||||||||
| Non-controlling interests | (74) | 275.5 | 289.4 | (132) | (39.7) | (39.7) | |||||||||||||||||||||||||||||||||||
| Underlying attributable profit to the parent | 259 | 72.2 | 78.5 | 470 | (24.1) | (24.0) | |||||||||||||||||||||||||||||||||||
| Balance sheet | |||||||||||||||||||||||||||||||||||||||||
| Loans and advances to customers | 93,850 | (8.7) | (4.7) | 93,850 | (5.0) | 2.5 | |||||||||||||||||||||||||||||||||||
| Cash, central banks and credit institutions | 16,680 | (13.2) | (9.4) | 16,680 | 30.3 | 40.5 | |||||||||||||||||||||||||||||||||||
| Debt instruments | 14,479 | (9.5) | (5.6) | 14,479 | (13.1) | (6.3) | |||||||||||||||||||||||||||||||||||
| Other financial assets | 4,988 | (23.0) | (19.6) | 4,988 | 2.5 | 10.6 | |||||||||||||||||||||||||||||||||||
| Other asset accounts | 17,762 | (5.3) | (1.1) | 17,762 | (6.8) | 0.6 | |||||||||||||||||||||||||||||||||||
| Total assets | 147,760 | (9.5) | (5.5) | 147,760 | (2.9) | 4.7 | |||||||||||||||||||||||||||||||||||
| Customer deposits | 73,316 | (5.9) | (1.8) | 73,316 | 6.9 | 15.3 | |||||||||||||||||||||||||||||||||||
| Central banks and credit institutions | 15,665 | (25.4) | (22.1) | 15,665 | (15.1) | (8.4) | |||||||||||||||||||||||||||||||||||
| Marketable debt securities | 32,558 | (9.4) | (5.4) | 32,558 | (13.3) | (6.5) | |||||||||||||||||||||||||||||||||||
| Other financial liabilities | 5,002 | (24.0) | (20.7) | 5,002 | (2.0) | 5.7 | |||||||||||||||||||||||||||||||||||
| Other liabilities accounts | 3,846 | (2.1) | 2.1 | 3,846 | (6.8) | 0.6 | |||||||||||||||||||||||||||||||||||
| Total liabilities | 130,388 | (10.3) | (6.4) | 130,388 | (2.6) | 5.1 | |||||||||||||||||||||||||||||||||||
| Total equity | 17,373 | (2.5) | 1.7 | 17,373 | (5.4) | 2.1 | |||||||||||||||||||||||||||||||||||
| Memorandum items: | |||||||||||||||||||||||||||||||||||||||||
Gross loans and advances to customers (2) | 92,836 | (7.9) | (3.9) | 92,836 | (2.0) | 5.7 | |||||||||||||||||||||||||||||||||||
| Customer funds | 79,492 | (8.3) | (4.3) | 79,492 | 8.0 | 16.5 | |||||||||||||||||||||||||||||||||||
Customer deposits (3) | 68,962 | (9.5) | (5.6) | 68,962 | 8.7 | 17.3 | |||||||||||||||||||||||||||||||||||
| Mutual funds | 10,529 | 0.2 | 4.6 | 10,529 | 3.6 | 11.8 | |||||||||||||||||||||||||||||||||||
| Ratios (%) and operating means | |||||||||||||||||||||||||||||||||||||||||
| Underlying RoTE | 6.51 | 2.72 | 3.99 | (1.57) | |||||||||||||||||||||||||||||||||||||
| Efficiency ratio | 39.5 | (3.7) | 41.5 | (1.0) | |||||||||||||||||||||||||||||||||||||
| NPL ratio | 1.85 | 0.36 | 1.85 | (0.33) | |||||||||||||||||||||||||||||||||||||
| NPL coverage | 228.8 | (24.3) | 228.8 | 62.2 | |||||||||||||||||||||||||||||||||||||
| Number of employees | 16,189 | (6.4) | 16,189 | (7.9) | |||||||||||||||||||||||||||||||||||||
| Number of branches | 584 | (4.9) | 584 | (6.4) | |||||||||||||||||||||||||||||||||||||
(1) Includes exchange differences.
(2) Excluding reverse repos.
(3) Excluding repos.
January - September 2020 | | 67 | ||||||
| Mexico | |||||||||||||||||||||||||||||||||||||||||
| EUR million | |||||||||||||||||||||||||||||||||||||||||
| / | Q2'20 | / | 9M'19 | ||||||||||||||||||||||||||||||||||||||
| Underlying income statement | Q3'20 | % | % excl. FX | 9M'20 | % | % excl. FX | |||||||||||||||||||||||||||||||||||
| Net interest income | 669 | 3.0 | 3.6 | 2,118 | (9.5) | 1.7 | |||||||||||||||||||||||||||||||||||
| Net fee income | 189 | 2.1 | 3.2 | 584 | (7.7) | 3.8 | |||||||||||||||||||||||||||||||||||
Gains (losses) on financial transactions (1) | 21 | (75.8) | (71.8) | 132 | 162.1 | 194.7 | |||||||||||||||||||||||||||||||||||
| Other operating income | (31) | 73.0 | 69.1 | (74) | (7.6) | 3.9 | |||||||||||||||||||||||||||||||||||
| Total income | 848 | (6.3) | (4.8) | 2,760 | (6.3) | 5.4 | |||||||||||||||||||||||||||||||||||
| Administrative expenses and amortisations | (375) | 10.0 | 10.3 | (1,130) | (7.8) | 3.7 | |||||||||||||||||||||||||||||||||||
| Net operating income | 473 | (16.2) | (14.0) | 1,629 | (5.2) | 6.6 | |||||||||||||||||||||||||||||||||||
| Net loan-loss provisions | (203) | (30.3) | (27.2) | (767) | 19.6 | 34.5 | |||||||||||||||||||||||||||||||||||
| Other gains (losses) and provisions | (4) | (37.1) | (34.2) | (18) | 38.3 | 55.6 | |||||||||||||||||||||||||||||||||||
| Profit before tax | 266 | (0.4) | 0.7 | 844 | (20.6) | (10.8) | |||||||||||||||||||||||||||||||||||
| Tax on profit | (66) | 0.5 | 1.7 | (206) | (10.9) | 0.2 | |||||||||||||||||||||||||||||||||||
| Profit from continuing operations | 200 | (0.6) | 0.4 | 638 | (23.4) | (13.8) | |||||||||||||||||||||||||||||||||||
| Net profit from discontinued operations | — | — | — | — | — | — | |||||||||||||||||||||||||||||||||||
| Consolidated profit | 200 | (0.6) | 0.4 | 638 | (23.4) | (13.8) | |||||||||||||||||||||||||||||||||||
| Non-controlling interests | (15) | (2.1) | (0.8) | (47) | (72.8) | (69.4) | |||||||||||||||||||||||||||||||||||
| Underlying attributable profit to the parent | 185 | (0.5) | 0.5 | 591 | (10.3) | 0.8 | |||||||||||||||||||||||||||||||||||
| Balance sheet | |||||||||||||||||||||||||||||||||||||||||
| Loans and advances to customers | 28,909 | (5.4) | (5.4) | 28,909 | (11.7) | 6.9 | |||||||||||||||||||||||||||||||||||
| Cash, central banks and credit institutions | 11,728 | 0.1 | 0.1 | 11,728 | 11.5 | 34.9 | |||||||||||||||||||||||||||||||||||
| Debt instruments | 22,241 | 4.1 | 4.1 | 22,241 | 29.9 | 57.2 | |||||||||||||||||||||||||||||||||||
| Other financial assets | 12,357 | (10.0) | (10.0) | 12,357 | 72.0 | 108.2 | |||||||||||||||||||||||||||||||||||
| Other asset accounts | 3,050 | (1.4) | (1.4) | 3,050 | (14.6) | 3.3 | |||||||||||||||||||||||||||||||||||
| Total assets | 78,285 | (2.7) | (2.7) | 78,285 | 10.1 | 33.2 | |||||||||||||||||||||||||||||||||||
| Customer deposits | 34,916 | (1.7) | (1.7) | 34,916 | 2.9 | 24.6 | |||||||||||||||||||||||||||||||||||
| Central banks and credit institutions | 13,989 | (3.5) | (3.5) | 13,989 | 10.0 | 33.2 | |||||||||||||||||||||||||||||||||||
| Marketable debt securities | 7,388 | 1.1 | 1.2 | 7,388 | 10.4 | 33.7 | |||||||||||||||||||||||||||||||||||
| Other financial liabilities | 13,567 | (8.4) | (8.4) | 13,567 | 43.8 | 74.1 | |||||||||||||||||||||||||||||||||||
| Other liabilities accounts | 2,530 | (4.5) | (4.4) | 2,530 | 24.3 | 50.5 | |||||||||||||||||||||||||||||||||||
| Total liabilities | 72,390 | (3.2) | (3.2) | 72,390 | 11.7 | 35.2 | |||||||||||||||||||||||||||||||||||
| Total equity | 5,895 | 3.6 | 3.6 | 5,895 | (6.8) | 12.8 | |||||||||||||||||||||||||||||||||||
| Memorandum items: | |||||||||||||||||||||||||||||||||||||||||
Gross loans and advances to customers (2) | 29,798 | (1.7) | (1.7) | 29,798 | (11.3) | 7.3 | |||||||||||||||||||||||||||||||||||
| Customer funds | 37,806 | (0.7) | (0.7) | 37,806 | (6.9) | 12.7 | |||||||||||||||||||||||||||||||||||
Customer deposits (3) | 27,743 | (2.7) | (2.7) | 27,743 | (4.8) | 15.2 | |||||||||||||||||||||||||||||||||||
| Mutual funds | 10,063 | 5.2 | 5.2 | 10,063 | (12.3) | 6.2 | |||||||||||||||||||||||||||||||||||
| Ratios (%) and operating means | |||||||||||||||||||||||||||||||||||||||||
| Underlying RoTE | 14.48 | (0.62) | 15.13 | (5.14) | |||||||||||||||||||||||||||||||||||||
| Efficiency ratio | 44.2 | 6.6 | 41.0 | (0.7) | |||||||||||||||||||||||||||||||||||||
| NPL ratio | 2.33 | (0.17) | 2.33 | 0.03 | |||||||||||||||||||||||||||||||||||||
| NPL coverage | 132.6 | 17.7 | 132.6 | 7.4 | |||||||||||||||||||||||||||||||||||||
| Number of employees | 21,770 | 4.6 | 21,770 | 6.1 | |||||||||||||||||||||||||||||||||||||
| Number of branches | 1,430 | 0.1 | 1,430 | (0.3) | |||||||||||||||||||||||||||||||||||||
(1) Includes exchange differences.
(2) Excluding reverse repos.
(3) Excluding repos.
| 68 | | January - September 2020 | ||||||
| SOUTH AMERICA | |||||||||||||||||||||||||||||||||||||||||
| EUR million | |||||||||||||||||||||||||||||||||||||||||
| / | Q2'20 | / | 9M'19 | ||||||||||||||||||||||||||||||||||||||
| Underlying income statement | Q3'20 | % | % excl. FX | 9M'20 | % | % excl. FX | |||||||||||||||||||||||||||||||||||
| Net interest income | 2,486 | (4.6) | 2.6 | 8,157 | (18.1) | 4.6 | |||||||||||||||||||||||||||||||||||
| Net fee income | 841 | 8.7 | 14.8 | 2,688 | (24.5) | (2.8) | |||||||||||||||||||||||||||||||||||
Gains (losses) on financial transactions (1) | 177 | (51.2) | (44.4) | 608 | 38.4 | 71.3 | |||||||||||||||||||||||||||||||||||
| Other operating income | (27) | (47.5) | (34.9) | (122) | (50.7) | (33.2) | |||||||||||||||||||||||||||||||||||
| Total income | 3,477 | (5.8) | 1.4 | 11,331 | (17.4) | 5.5 | |||||||||||||||||||||||||||||||||||
| Administrative expenses and amortisations | (1,238) | (2.9) | 4.6 | (3,998) | (18.3) | 4.5 | |||||||||||||||||||||||||||||||||||
| Net operating income | 2,240 | (7.3) | (0.3) | 7,333 | (16.8) | 6.1 | |||||||||||||||||||||||||||||||||||
| Net loan-loss provisions | (787) | (29.1) | (21.8) | (3,221) | 16.1 | 48.8 | |||||||||||||||||||||||||||||||||||
| Other gains (losses) and provisions | (70) | 35.1 | 36.7 | (264) | (47.0) | (30.2) | |||||||||||||||||||||||||||||||||||
| Profit before tax | 1,382 | 10.3 | 17.3 | 3,847 | (30.6) | (11.9) | |||||||||||||||||||||||||||||||||||
| Tax on profit | (546) | 16.0 | 22.7 | (1,432) | (30.5) | (11.0) | |||||||||||||||||||||||||||||||||||
| Profit from continuing operations | 837 | 6.8 | 14.1 | 2,415 | (30.6) | (12.5) | |||||||||||||||||||||||||||||||||||
| Net profit from discontinued operations | — | — | — | — | — | — | |||||||||||||||||||||||||||||||||||
| Consolidated profit | 837 | 6.8 | 14.1 | 2,415 | (30.6) | (12.5) | |||||||||||||||||||||||||||||||||||
| Non-controlling interests | (101) | 2.6 | 7.0 | (296) | (41.4) | (27.7) | |||||||||||||||||||||||||||||||||||
| Underlying attributable profit to the parent | 736 | 7.4 | 15.1 | 2,119 | (28.8) | (9.8) | |||||||||||||||||||||||||||||||||||
| Balance sheet | |||||||||||||||||||||||||||||||||||||||||
| Loans and advances to customers | 109,049 | (1.8) | 3.1 | 109,049 | (12.0) | 17.5 | |||||||||||||||||||||||||||||||||||
| Cash, central banks and credit institutions | 40,710 | (8.5) | (3.0) | 40,710 | (13.2) | 21.3 | |||||||||||||||||||||||||||||||||||
| Debt instruments | 43,336 | (4.2) | 2.1 | 43,336 | (11.8) | 25.8 | |||||||||||||||||||||||||||||||||||
| Other financial assets | 16,902 | (18.3) | (16.1) | 16,902 | 22.6 | 57.0 | |||||||||||||||||||||||||||||||||||
| Other asset accounts | 15,730 | (5.2) | 0.4 | 15,730 | (8.4) | 27.1 | |||||||||||||||||||||||||||||||||||
| Total assets | 225,728 | (5.2) | (0.1) | 225,728 | (10.0) | 22.7 | |||||||||||||||||||||||||||||||||||
| Customer deposits | 110,459 | (1.9) | 3.7 | 110,459 | (1.2) | 34.2 | |||||||||||||||||||||||||||||||||||
| Central banks and credit institutions | 36,790 | (13.2) | (8.7) | 36,790 | (14.5) | 17.8 | |||||||||||||||||||||||||||||||||||
| Marketable debt securities | 20,728 | (13.5) | (9.8) | 20,728 | (34.2) | (11.9) | |||||||||||||||||||||||||||||||||||
| Other financial liabilities | 31,529 | (2.1) | 2.1 | 31,529 | 0.3 | 37.7 | |||||||||||||||||||||||||||||||||||
| Other liabilities accounts | 7,888 | (4.0) | 2.1 | 7,888 | (22.8) | 8.2 | |||||||||||||||||||||||||||||||||||
| Total liabilities | 207,395 | (5.5) | (0.5) | 207,395 | (9.0) | 24.0 | |||||||||||||||||||||||||||||||||||
| Total equity | 18,333 | (1.5) | 4.0 | 18,333 | (19.9) | 9.9 | |||||||||||||||||||||||||||||||||||
| Memorandum items: | |||||||||||||||||||||||||||||||||||||||||
Gross loans and advances to customers (2) | 113,582 | (1.9) | 3.0 | 113,582 | (12.4) | 17.0 | |||||||||||||||||||||||||||||||||||
| Customer funds | 146,465 | (2.3) | 3.3 | 146,465 | (11.9) | 20.9 | |||||||||||||||||||||||||||||||||||
Customer deposits (3) | 99,498 | (2.4) | 3.0 | 99,498 | 0.9 | 35.8 | |||||||||||||||||||||||||||||||||||
| Mutual funds | 46,966 | (2.1) | 4.1 | 46,966 | (30.6) | (1.9) | |||||||||||||||||||||||||||||||||||
| Ratios (%) and operating means | |||||||||||||||||||||||||||||||||||||||||
| Underlying RoTE | 19.01 | 1.51 | 17.30 | (3.55) | |||||||||||||||||||||||||||||||||||||
| Efficiency ratio | 35.6 | 1.1 | 35.3 | (0.4) | |||||||||||||||||||||||||||||||||||||
| NPL ratio | 4.40 | (0.34) | 4.40 | (0.41) | |||||||||||||||||||||||||||||||||||||
| NPL coverage | 97.2 | 4.2 | 97.2 | 7.5 | |||||||||||||||||||||||||||||||||||||
| Number of employees | 66,187 | (2.2) | 66,187 | (7.1) | |||||||||||||||||||||||||||||||||||||
| Number of branches | 4,447 | (1.0) | 4,447 | (4.1) | |||||||||||||||||||||||||||||||||||||
(1) Includes exchange differences.
(2) Excluding reverse repos.
(3) Excluding repos.
January - September 2020 | | 69 | ||||||
| Brazil | |||||||||||||||||||||||||||||||||||||||||
| EUR million | |||||||||||||||||||||||||||||||||||||||||
| / | Q2'20 | / | 9M'19 | ||||||||||||||||||||||||||||||||||||||
| Underlying income statement | Q3'20 | % | % excl. FX | 9M'20 | % | % excl. FX | |||||||||||||||||||||||||||||||||||
| Net interest income | 1,756 | (3.1) | 3.2 | 5,840 | (22.5) | — | |||||||||||||||||||||||||||||||||||
| Net fee income | 664 | 8.1 | 13.3 | 2,148 | (24.0) | (1.8) | |||||||||||||||||||||||||||||||||||
Gains (losses) on financial transactions (1) | 93 | (62.4) | (55.0) | 353 | 150.4 | 223.4 | |||||||||||||||||||||||||||||||||||
| Other operating income | 21 | — | — | (19) | (84.1) | (79.5) | |||||||||||||||||||||||||||||||||||
| Total income | 2,534 | (4.4) | 2.2 | 8,322 | (19.9) | 3.5 | |||||||||||||||||||||||||||||||||||
| Administrative expenses and amortisations | (805) | (3.6) | 2.9 | (2,644) | (21.4) | 1.5 | |||||||||||||||||||||||||||||||||||
| Net operating income | 1,729 | (4.8) | 1.8 | 5,677 | (19.2) | 4.4 | |||||||||||||||||||||||||||||||||||
| Net loan-loss provisions | (569) | (32.5) | (24.8) | (2,478) | 11.5 | 43.9 | |||||||||||||||||||||||||||||||||||
| Other gains (losses) and provisions | (68) | 115.9 | 89.4 | (226) | (54.6) | (41.4) | |||||||||||||||||||||||||||||||||||
| Profit before tax | 1,092 | 15.9 | 22.5 | 2,973 | (30.9) | (10.7) | |||||||||||||||||||||||||||||||||||
| Tax on profit | (481) | 17.7 | 24.6 | (1,257) | (28.8) | (8.1) | |||||||||||||||||||||||||||||||||||
| Profit from continuing operations | 611 | 14.6 | 20.9 | 1,716 | (32.3) | (12.6) | |||||||||||||||||||||||||||||||||||
| Net profit from discontinued operations | — | — | — | — | — | — | |||||||||||||||||||||||||||||||||||
| Consolidated profit | 611 | 14.6 | 20.9 | 1,716 | (32.3) | (12.6) | |||||||||||||||||||||||||||||||||||
| Non-controlling interests | (61) | 11.1 | 17.8 | (171) | (40.2) | (22.8) | |||||||||||||||||||||||||||||||||||
| Underlying attributable profit to the parent | 550 | 15.0 | 21.2 | 1,545 | (31.3) | (11.3) | |||||||||||||||||||||||||||||||||||
| Balance sheet | |||||||||||||||||||||||||||||||||||||||||
| Loans and advances to customers | 59,820 | (2.8) | 4.2 | 59,820 | (17.3) | 20.8 | |||||||||||||||||||||||||||||||||||
| Cash, central banks and credit institutions | 28,219 | (5.3) | 1.6 | 28,219 | (20.9) | 15.5 | |||||||||||||||||||||||||||||||||||
| Debt instruments | 33,312 | (6.6) | 0.2 | 33,312 | (22.9) | 12.5 | |||||||||||||||||||||||||||||||||||
| Other financial assets | 5,984 | (16.8) | (10.7) | 5,984 | (0.9) | 44.7 | |||||||||||||||||||||||||||||||||||
| Other asset accounts | 11,421 | (4.4) | 2.6 | 11,421 | (11.2) | 29.6 | |||||||||||||||||||||||||||||||||||
| Total assets | 138,757 | (5.1) | 1.8 | 138,757 | (18.4) | 19.1 | |||||||||||||||||||||||||||||||||||
| Customer deposits | 69,485 | 0.4 | 7.7 | 69,485 | (2.0) | 43.1 | |||||||||||||||||||||||||||||||||||
| Central banks and credit institutions | 20,064 | (23.9) | (18.4) | 20,064 | (36.9) | (7.9) | |||||||||||||||||||||||||||||||||||
| Marketable debt securities | 12,047 | (15.2) | (9.0) | 12,047 | (40.2) | (12.7) | |||||||||||||||||||||||||||||||||||
| Other financial liabilities | 19,416 | 8.1 | 15.9 | 19,416 | (15.6) | 23.2 | |||||||||||||||||||||||||||||||||||
| Other liabilities accounts | 6,004 | (4.4) | 2.6 | 6,004 | (26.3) | 7.6 | |||||||||||||||||||||||||||||||||||
| Total liabilities | 127,017 | (5.2) | 1.7 | 127,017 | (17.5) | 20.4 | |||||||||||||||||||||||||||||||||||
| Total equity | 11,740 | (3.2) | 3.9 | 11,740 | (27.0) | 6.5 | |||||||||||||||||||||||||||||||||||
| Memorandum items: | |||||||||||||||||||||||||||||||||||||||||
Gross loans and advances to customers (2) | 62,926 | (3.0) | 4.1 | 62,926 | (18.0) | 19.7 | |||||||||||||||||||||||||||||||||||
| Customer funds | 95,586 | (2.0) | 5.1 | 95,586 | (17.4) | 20.5 | |||||||||||||||||||||||||||||||||||
Customer deposits (3) | 58,571 | (0.3) | 7.0 | 58,571 | 0.9 | 47.2 | |||||||||||||||||||||||||||||||||||
| Mutual funds | 37,015 | (4.7) | 2.2 | 37,015 | (35.9) | (6.4) | |||||||||||||||||||||||||||||||||||
| Ratios (%) and operating means | |||||||||||||||||||||||||||||||||||||||||
| Underlying RoTE | 20.74 | 2.95 | 18.37 | (3.27) | |||||||||||||||||||||||||||||||||||||
| Efficiency ratio | 31.8 | 0.3 | 31.8 | (0.6) | |||||||||||||||||||||||||||||||||||||
| NPL ratio | 4.64 | (0.43) | 4.64 | (0.69) | |||||||||||||||||||||||||||||||||||||
| NPL coverage | 114.9 | 4.7 | 114.9 | 13.8 | |||||||||||||||||||||||||||||||||||||
| Number of employees | 43,689 | (2.8) | 43,689 | (9.6) | |||||||||||||||||||||||||||||||||||||
| Number of branches | 3,562 | (0.6) | 3,562 | (3.4) | |||||||||||||||||||||||||||||||||||||
(1) Includes exchange differences.
(2) Excluding reverse repos.
(3) Excluding repos.
| 70 | | January - September 2020 | ||||||
| Chile | |||||||||||||||||||||||||||||||||||||||||
| EUR million | |||||||||||||||||||||||||||||||||||||||||
| / | Q2'20 | / | 9M'19 | ||||||||||||||||||||||||||||||||||||||
| Underlying income statement | Q3'20 | % | % excl. FX | 9M'20 | % | % excl. FX | |||||||||||||||||||||||||||||||||||
| Net interest income | 420 | (1.1) | (0.2) | 1,293 | (7.8) | 7.8 | |||||||||||||||||||||||||||||||||||
| Net fee income | 74 | (0.4) | 0.4 | 240 | (20.4) | (7.0) | |||||||||||||||||||||||||||||||||||
Gains (losses) on financial transactions (1) | 51 | (44.9) | (43.9) | 156 | (19.7) | (6.1) | |||||||||||||||||||||||||||||||||||
| Other operating income | (12) | 97.5 | 99.2 | (20) | — | — | |||||||||||||||||||||||||||||||||||
| Total income | 532 | (8.9) | (8.0) | 1,669 | (12.2) | 2.6 | |||||||||||||||||||||||||||||||||||
| Administrative expenses and amortisations | (223) | (2.3) | (1.4) | (681) | (13.2) | 1.5 | |||||||||||||||||||||||||||||||||||
| Net operating income | 310 | (13.1) | (12.1) | 988 | (11.5) | 3.5 | |||||||||||||||||||||||||||||||||||
| Net loan-loss provisions | (154) | (16.1) | (15.1) | (500) | 59.3 | 86.3 | |||||||||||||||||||||||||||||||||||
| Other gains (losses) and provisions | 13 | — | — | 12 | (77.7) | (73.9) | |||||||||||||||||||||||||||||||||||
| Profit before tax | 169 | (1.4) | (0.5) | 500 | (41.5) | (31.6) | |||||||||||||||||||||||||||||||||||
| Tax on profit | (43) | 3.0 | 4.1 | (107) | (35.1) | (24.1) | |||||||||||||||||||||||||||||||||||
| Profit from continuing operations | 125 | (2.8) | (2.0) | 393 | (43.1) | (33.4) | |||||||||||||||||||||||||||||||||||
| Net profit from discontinued operations | — | — | — | — | — | — | |||||||||||||||||||||||||||||||||||
| Consolidated profit | 125 | (2.8) | (2.0) | 393 | (43.1) | (33.4) | |||||||||||||||||||||||||||||||||||
| Non-controlling interests | (39) | (8.2) | (7.3) | (124) | (43.0) | (33.3) | |||||||||||||||||||||||||||||||||||
| Underlying attributable profit to the parent | 86 | (0.2) | 0.7 | 269 | (43.1) | (33.5) | |||||||||||||||||||||||||||||||||||
| Balance sheet | |||||||||||||||||||||||||||||||||||||||||
| Loans and advances to customers | 38,360 | 0.8 | 1.1 | 38,360 | (5.4) | 10.3 | |||||||||||||||||||||||||||||||||||
| Cash, central banks and credit institutions | 6,513 | (25.2) | (25.1) | 6,513 | 11.2 | 29.7 | |||||||||||||||||||||||||||||||||||
| Debt instruments | 6,615 | 11.0 | 11.3 | 6,615 | 65.9 | 93.5 | |||||||||||||||||||||||||||||||||||
| Other financial assets | 10,747 | (19.2) | (19.1) | 10,747 | 41.0 | 64.4 | |||||||||||||||||||||||||||||||||||
| Other asset accounts | 3,029 | (8.5) | (8.3) | 3,029 | (7.7) | 7.6 | |||||||||||||||||||||||||||||||||||
| Total assets | 65,265 | (5.9) | (5.7) | 65,265 | 6.5 | 24.2 | |||||||||||||||||||||||||||||||||||
| Customer deposits | 26,835 | (6.0) | (5.8) | 26,835 | (4.3) | 11.6 | |||||||||||||||||||||||||||||||||||
| Central banks and credit institutions | 12,525 | 5.9 | 6.2 | 12,525 | 61.4 | 88.3 | |||||||||||||||||||||||||||||||||||
| Marketable debt securities | 8,553 | (10.8) | (10.7) | 8,553 | (23.7) | (11.1) | |||||||||||||||||||||||||||||||||||
| Other financial liabilities | 11,427 | (15.4) | (15.2) | 11,427 | 46.7 | 71.1 | |||||||||||||||||||||||||||||||||||
| Other liabilities accounts | 1,258 | (1.5) | (1.3) | 1,258 | (11.6) | 3.1 | |||||||||||||||||||||||||||||||||||
| Total liabilities | 60,597 | (6.4) | (6.2) | 60,597 | 7.8 | 25.7 | |||||||||||||||||||||||||||||||||||
| Total equity | 4,668 | 1.6 | 1.8 | 4,668 | (7.9) | 7.4 | |||||||||||||||||||||||||||||||||||
| Memorandum items: | |||||||||||||||||||||||||||||||||||||||||
Gross loans and advances to customers (2) | 39,413 | 0.8 | 1.0 | 39,413 | (5.3) | 10.4 | |||||||||||||||||||||||||||||||||||
| Customer funds | 34,886 | (2.9) | (2.7) | 34,886 | (4.7) | 11.1 | |||||||||||||||||||||||||||||||||||
Customer deposits (3) | 26,788 | (5.6) | (5.4) | 26,788 | (3.3) | 12.8 | |||||||||||||||||||||||||||||||||||
| Mutual funds | 8,098 | 7.6 | 7.8 | 8,098 | (9.2) | 5.9 | |||||||||||||||||||||||||||||||||||
| Ratios (%) and operating means | |||||||||||||||||||||||||||||||||||||||||
| Underlying RoTE | 10.53 | (0.08) | 10.99 | (6.92) | |||||||||||||||||||||||||||||||||||||
| Efficiency ratio | 41.8 | 2.8 | 40.8 | (0.5) | |||||||||||||||||||||||||||||||||||||
| NPL ratio | 4.76 | (0.23) | 4.76 | 0.28 | |||||||||||||||||||||||||||||||||||||
| NPL coverage | 59.7 | 5.0 | 59.7 | 2.4 | |||||||||||||||||||||||||||||||||||||
| Number of employees | 11,200 | (1.8) | 11,200 | (3.8) | |||||||||||||||||||||||||||||||||||||
| Number of branches | 354 | (3.5) | 354 | (6.8) | |||||||||||||||||||||||||||||||||||||
(1) Includes exchange differences.
(2) Excluding reverse repos.
(3) Excluding repos.
January - September 2020 | | 71 | ||||||
| Argentina | |||||||||||||||||||||||||||||||||||||||||
| EUR million | |||||||||||||||||||||||||||||||||||||||||
| / | Q2'20 | / | 9M'19 | ||||||||||||||||||||||||||||||||||||||
| Underlying income statement | Q3'20 | % | % excl. FX | 9M'20 | % | % excl. FX | |||||||||||||||||||||||||||||||||||
| Net interest income | 218 | (16.5) | 7.9 | 721 | 4.4 | 48.9 | |||||||||||||||||||||||||||||||||||
| Net fee income | 70 | 24.3 | 48.3 | 202 | (38.5) | (12.3) | |||||||||||||||||||||||||||||||||||
Gains (losses) on financial transactions (1) | 18 | 83.9 | 98.7 | 51 | (21.6) | 11.9 | |||||||||||||||||||||||||||||||||||
| Other operating income | (32) | 85.6 | 109.4 | (71) | (43.4) | (19.3) | |||||||||||||||||||||||||||||||||||
| Total income | 274 | (11.7) | 12.9 | 902 | (5.8) | 34.4 | |||||||||||||||||||||||||||||||||||
| Administrative expenses and amortisations | (152) | (0.3) | 24.3 | (491) | (11.1) | 26.8 | |||||||||||||||||||||||||||||||||||
| Net operating income | 122 | (22.7) | 1.4 | 411 | 1.5 | 44.9 | |||||||||||||||||||||||||||||||||||
| Net loan-loss provisions | (46) | (20.7) | 4.0 | (178) | (2.6) | 38.9 | |||||||||||||||||||||||||||||||||||
| Other gains (losses) and provisions | (17) | (6.9) | 17.8 | (48) | 1.7 | 45.1 | |||||||||||||||||||||||||||||||||||
| Profit before tax | 59 | (27.7) | (4.3) | 185 | 5.9 | 51.0 | |||||||||||||||||||||||||||||||||||
| Tax on profit | (7) | 4.2 | 28.5 | (23) | (70.5) | (58.0) | |||||||||||||||||||||||||||||||||||
| Profit from continuing operations | 52 | (30.4) | (7.5) | 162 | 65.9 | 136.7 | |||||||||||||||||||||||||||||||||||
| Net profit from discontinued operations | — | — | — | — | — | — | |||||||||||||||||||||||||||||||||||
| Consolidated profit | 52 | (30.4) | (7.5) | 162 | 65.9 | 136.7 | |||||||||||||||||||||||||||||||||||
| Non-controlling interests | — | (8.9) | 15.6 | (1) | 0.1 | 42.8 | |||||||||||||||||||||||||||||||||||
| Underlying attributable profit to the parent | 52 | (30.6) | (7.6) | 161 | 66.7 | 137.9 | |||||||||||||||||||||||||||||||||||
| Balance sheet | |||||||||||||||||||||||||||||||||||||||||
| Loans and advances to customers | 4,502 | (4.6) | 7.6 | 4,502 | (8.0) | 31.3 | |||||||||||||||||||||||||||||||||||
| Cash, central banks and credit institutions | 3,082 | 3.2 | 16.5 | 3,082 | 10.6 | 57.8 | |||||||||||||||||||||||||||||||||||
| Debt instruments | 2,111 | (20.6) | (10.4) | 2,111 | 79.3 | 155.8 | |||||||||||||||||||||||||||||||||||
| Other financial assets | 64 | (6.9) | 5.1 | 64 | (35.6) | (8.2) | |||||||||||||||||||||||||||||||||||
| Other asset accounts | 826 | (1.7) | 10.9 | 826 | 5.4 | 50.4 | |||||||||||||||||||||||||||||||||||
| Total assets | 10,584 | (6.1) | 5.9 | 10,584 | 8.7 | 55.1 | |||||||||||||||||||||||||||||||||||
| Customer deposits | 7,605 | (6.5) | 5.5 | 7,605 | 12.4 | 60.4 | |||||||||||||||||||||||||||||||||||
| Central banks and credit institutions | 982 | (5.9) | 6.2 | 982 | (14.9) | 21.4 | |||||||||||||||||||||||||||||||||||
| Marketable debt securities | 23 | (69.5) | (65.6) | 23 | (69.9) | (57.1) | |||||||||||||||||||||||||||||||||||
| Other financial liabilities | 614 | (5.7) | 6.4 | 614 | 3.3 | 47.5 | |||||||||||||||||||||||||||||||||||
| Other liabilities accounts | 376 | 3.2 | 16.4 | 376 | 6.0 | 51.3 | |||||||||||||||||||||||||||||||||||
| Total liabilities | 9,600 | (6.5) | 5.5 | 9,600 | 7.3 | 53.2 | |||||||||||||||||||||||||||||||||||
| Total equity | 984 | (2.1) | 10.4 | 984 | 23.7 | 76.4 | |||||||||||||||||||||||||||||||||||
| Memorandum items: | |||||||||||||||||||||||||||||||||||||||||
Gross loans and advances to customers (2) | 4,746 | (4.5) | 7.7 | 4,746 | (7.6) | 31.8 | |||||||||||||||||||||||||||||||||||
| Customer funds | 9,421 | (2.6) | 9.9 | 9,421 | 21.9 | 74.0 | |||||||||||||||||||||||||||||||||||
Customer deposits (3) | 7,605 | (6.5) | 5.5 | 7,605 | 12.4 | 60.4 | |||||||||||||||||||||||||||||||||||
| Mutual funds | 1,816 | 18.3 | 33.5 | 1,816 | 88.7 | 169.3 | |||||||||||||||||||||||||||||||||||
| Ratios (%) and operating means | |||||||||||||||||||||||||||||||||||||||||
| Underlying RoTE | 29.87 | (8.53) | 29.23 | 10.35 | |||||||||||||||||||||||||||||||||||||
| Efficiency ratio | 55.7 | 6.4 | 54.5 | (3.3) | |||||||||||||||||||||||||||||||||||||
| NPL ratio | 2.88 | (0.27) | 2.88 | (0.76) | |||||||||||||||||||||||||||||||||||||
| NPL coverage | 186.3 | 20.6 | 186.3 | 52.3 | |||||||||||||||||||||||||||||||||||||
| Number of employees | 9,267 | 0.2 | 9,267 | 0.6 | |||||||||||||||||||||||||||||||||||||
| Number of branches | 427 | (2.5) | 427 | (9.1) | |||||||||||||||||||||||||||||||||||||
(1) Includes exchange differences.
(2) Excluding reverse repos.
(3) Excluding repos.
| 72 | | January - September 2020 | ||||||
| Other South America | |||||||||||||||||||||||||||||||||||||||||
| EUR million | |||||||||||||||||||||||||||||||||||||||||
| / | Q2'20 | / | 9M'19 | ||||||||||||||||||||||||||||||||||||||
| Underlying income statement | Q3'20 | % | % excl. FX | 9M'20 | % | % excl. FX | |||||||||||||||||||||||||||||||||||
| Net interest income | 91 | (14.4) | (8.5) | 304 | (7.7) | 8.3 | |||||||||||||||||||||||||||||||||||
| Net fee income | 33 | 15.2 | 20.2 | 99 | (5.5) | 10.7 | |||||||||||||||||||||||||||||||||||
Gains (losses) on financial transactions (1) | 16 | 9.8 | 15.3 | 48 | 21.6 | 38.9 | |||||||||||||||||||||||||||||||||||
| Other operating income | (3) | (33.2) | (29.6) | (12) | 84.0 | 119.8 | |||||||||||||||||||||||||||||||||||
| Total income | 137 | (5.4) | 0.4 | 438 | (6.0) | 10.0 | |||||||||||||||||||||||||||||||||||
| Administrative expenses and amortisations | (57) | (2.3) | 3.0 | (182) | (5.8) | 10.7 | |||||||||||||||||||||||||||||||||||
| Net operating income | 80 | (7.5) | (1.4) | 257 | (6.1) | 9.5 | |||||||||||||||||||||||||||||||||||
| Net loan-loss provisions | (19) | (30.1) | (24.5) | (66) | 19.4 | 41.5 | |||||||||||||||||||||||||||||||||||
| Other gains (losses) and provisions | 1 | — | — | (1) | (70.1) | (63.7) | |||||||||||||||||||||||||||||||||||
| Profit before tax | 62 | 6.0 | 12.2 | 189 | (11.4) | 2.9 | |||||||||||||||||||||||||||||||||||
| Tax on profit | (15) | 10.9 | 16.7 | (46) | (16.4) | (3.7) | |||||||||||||||||||||||||||||||||||
| Profit from continuing operations | 48 | 4.6 | 10.9 | 144 | (9.7) | 5.2 | |||||||||||||||||||||||||||||||||||
| Net profit from discontinued operations | — | — | — | — | — | — | |||||||||||||||||||||||||||||||||||
| Consolidated profit | 48 | 4.6 | 10.9 | 144 | (9.7) | 5.2 | |||||||||||||||||||||||||||||||||||
| Non-controlling interests | — | (79.3) | (74.0) | — | — | — | |||||||||||||||||||||||||||||||||||
| Underlying attributable profit to the parent | 48 | 4.6 | 10.9 | 144 | (9.0) | 6.1 | |||||||||||||||||||||||||||||||||||
| Balance sheet | |||||||||||||||||||||||||||||||||||||||||
| Loans and advances to customers | 6,368 | (4.5) | 1.4 | 6,368 | 4.2 | 24.9 | |||||||||||||||||||||||||||||||||||
| Cash, central banks and credit institutions | 2,895 | (3.2) | 2.3 | 2,895 | 10.5 | 34.7 | |||||||||||||||||||||||||||||||||||
| Debt instruments | 1,298 | 34.7 | 42.4 | 1,298 | 78.6 | 118.7 | |||||||||||||||||||||||||||||||||||
| Other financial assets | 107 | (4.9) | (1.7) | 107 | 324.8 | 375.8 | |||||||||||||||||||||||||||||||||||
| Other asset accounts | 454 | (9.0) | (6.3) | 454 | 86.8 | 124.3 | |||||||||||||||||||||||||||||||||||
| Total assets | 11,122 | (1.0) | 4.8 | 11,122 | 14.4 | 37.9 | |||||||||||||||||||||||||||||||||||
| Customer deposits | 6,534 | (2.7) | 2.9 | 6,534 | 7.6 | 31.2 | |||||||||||||||||||||||||||||||||||
| Central banks and credit institutions | 3,220 | 2.0 | 8.2 | 3,220 | 38.9 | 62.6 | |||||||||||||||||||||||||||||||||||
| Marketable debt securities | 105 | 8.3 | 14.9 | 105 | 53.7 | 76.3 | |||||||||||||||||||||||||||||||||||
| Other financial liabilities | 71 | (8.0) | (2.7) | 71 | 32.1 | 59.1 | |||||||||||||||||||||||||||||||||||
| Other liabilities accounts | 250 | (14.4) | (9.8) | 250 | (14.9) | 2.1 | |||||||||||||||||||||||||||||||||||
| Total liabilities | 10,181 | (1.5) | 4.2 | 10,181 | 15.6 | 39.3 | |||||||||||||||||||||||||||||||||||
| Total equity | 941 | 5.4 | 11.4 | 941 | 2.6 | 24.1 | |||||||||||||||||||||||||||||||||||
| Memorandum items: | |||||||||||||||||||||||||||||||||||||||||
Gross loans and advances to customers (2) | 6,497 | (4.4) | 1.5 | 6,497 | 3.9 | 24.5 | |||||||||||||||||||||||||||||||||||
| Customer funds | 6,572 | (2.7) | 2.9 | 6,572 | 7.6 | 31.2 | |||||||||||||||||||||||||||||||||||
Customer deposits (3) | 6,534 | (2.7) | 2.9 | 6,534 | 7.6 | 31.2 | |||||||||||||||||||||||||||||||||||
| Mutual funds | 37 | (1.1) | 4.3 | 37 | 7.0 | 33.1 | |||||||||||||||||||||||||||||||||||
| Resources | |||||||||||||||||||||||||||||||||||||||||
| Number of employees | 2,031 | (1.0) | 2,031 | (1.7) | |||||||||||||||||||||||||||||||||||||
(1) Includes exchange differences.
(2) Excluding reverse repos.
(3) Excluding repos.
January - September 2020 | | 73 | ||||||
| SANTANDER GLOBAL PLATFORM (primary segment) | |||||||||||||||||||||||||||||||||||||||||
| EUR million | |||||||||||||||||||||||||||||||||||||||||
| Underlying income statement | Q3'20 | Q2'20 | % | 9M'20 | 9M'19 | % | |||||||||||||||||||||||||||||||||||
| Net interest income | 33 | 32 | 2.8 | 97 | 69 | 39.8 | |||||||||||||||||||||||||||||||||||
| Net fee income | 24 | 18 | 34.5 | 55 | 4 | — | |||||||||||||||||||||||||||||||||||
Gains (losses) on financial transactions (1) | — | — | (18.7) | — | — | — | |||||||||||||||||||||||||||||||||||
| Other operating income | (9) | (6) | 49.8 | (14) | (11) | 24.8 | |||||||||||||||||||||||||||||||||||
| Total income | 48 | 44 | 9.4 | 137 | 63 | 118.2 | |||||||||||||||||||||||||||||||||||
| Administrative expenses and amortisations | (114) | (77) | 48.5 | (262) | (168) | 56.4 | |||||||||||||||||||||||||||||||||||
| Net operating income | (66) | (33) | 100.3 | (125) | (105) | 19.3 | |||||||||||||||||||||||||||||||||||
| Net loan-loss provisions | (1) | (1) | 109.9 | (2) | (1) | 193.8 | |||||||||||||||||||||||||||||||||||
| Other gains (losses) and provisions | (1) | (6) | (84.9) | (8) | (2) | 358.3 | |||||||||||||||||||||||||||||||||||
| Profit before tax | (68) | (40) | 71.6 | (135) | (107) | 26.1 | |||||||||||||||||||||||||||||||||||
| Tax on profit | 20 | 11 | 76.7 | 46 | 31 | 49.5 | |||||||||||||||||||||||||||||||||||
| Profit from continuing operations | (48) | (28) | 69.6 | (90) | (77) | 16.9 | |||||||||||||||||||||||||||||||||||
| Net profit from discontinued operations | — | — | — | — | — | — | |||||||||||||||||||||||||||||||||||
| Consolidated profit | (48) | (28) | 69.6 | (90) | (77) | 16.9 | |||||||||||||||||||||||||||||||||||
| Non-controlling interests | 1 | — | 126.4 | 1 | — | — | |||||||||||||||||||||||||||||||||||
| Underlying attributable profit to the parent | (48) | (28) | 69.1 | (89) | (77) | 15.5 | |||||||||||||||||||||||||||||||||||
| Balance sheet | |||||||||||||||||||||||||||||||||||||||||
| Loans and advances to customers | 907 | 834 | 8.7 | 907 | 596 | 52.2 | |||||||||||||||||||||||||||||||||||
| Cash, central banks and credit institutions | 10,008 | 9,737 | 2.8 | 10,008 | 8,978 | 11.5 | |||||||||||||||||||||||||||||||||||
| Debt instruments | 10 | 10 | (4.2) | 10 | 5 | 102.1 | |||||||||||||||||||||||||||||||||||
| Other financial assets | 213 | 218 | (2.3) | 213 | 172 | 24.2 | |||||||||||||||||||||||||||||||||||
| Other asset accounts | 812 | 766 | 6.0 | 812 | 147 | 454.0 | |||||||||||||||||||||||||||||||||||
| Total assets | 11,949 | 11,566 | 3.3 | 11,949 | 9,897 | 20.7 | |||||||||||||||||||||||||||||||||||
| Customer deposits | 10,290 | 9,998 | 2.9 | 10,290 | 9,192 | 11.9 | |||||||||||||||||||||||||||||||||||
| Central banks and credit institutions | 212 | 171 | 24.4 | 212 | 95 | 124.1 | |||||||||||||||||||||||||||||||||||
| Marketable debt securities | — | — | — | — | — | — | |||||||||||||||||||||||||||||||||||
| Other financial liabilities | 122 | 149 | (17.8) | 122 | 58 | 111.1 | |||||||||||||||||||||||||||||||||||
| Other liabilities accounts | 112 | 103 | 8.6 | 112 | 120 | (7.2) | |||||||||||||||||||||||||||||||||||
| Total liabilities | 10,736 | 10,420 | 3.0 | 10,736 | 9,465 | 13.4 | |||||||||||||||||||||||||||||||||||
| Total equity | 1,212 | 1,146 | 5.8 | 1,212 | 431 | 181.0 | |||||||||||||||||||||||||||||||||||
| Memorandum items: | |||||||||||||||||||||||||||||||||||||||||
Gross loans and advances to customers (2) | 911 | 838 | 8.7 | 911 | 599 | 52.1 | |||||||||||||||||||||||||||||||||||
| Customer funds | 10,860 | 10,534 | 3.1 | 10,860 | 9,602 | 13.1 | |||||||||||||||||||||||||||||||||||
Customer deposits (3) | 10,290 | 9,998 | 2.9 | 10,290 | 9,192 | 11.9 | |||||||||||||||||||||||||||||||||||
| Mutual funds | 570 | 536 | 6.4 | 570 | 410 | 39.2 | |||||||||||||||||||||||||||||||||||
| Resources | |||||||||||||||||||||||||||||||||||||||||
| Number of employees | 1,812 | 1,528 | 18.6 | 1,812 | 727 | 149.2 | |||||||||||||||||||||||||||||||||||
(1) Includes exchange differences.
(2) Excluding reverse repos.
(3) Excluding repos.
| 74 | | January - September 2020 | ||||||
| CORPORATE CENTRE | |||||||||||||||||||||||||||||||||||||||||
| EUR million | |||||||||||||||||||||||||||||||||||||||||
| Underlying income statement | Q3'20 | Q2'20 | % | 9M'20 | 9M'19 | % | |||||||||||||||||||||||||||||||||||
| Net interest income | (371) | (354) | 4.8 | (1,029) | (919) | 11.9 | |||||||||||||||||||||||||||||||||||
| Net fee income | (11) | (6) | 74.5 | (26) | (35) | (26.9) | |||||||||||||||||||||||||||||||||||
Gains (losses) on financial transactions (1) | 104 | 64 | 61.8 | 182 | (257) | — | |||||||||||||||||||||||||||||||||||
| Other operating income | 6 | (18) | — | (17) | (24) | (30.7) | |||||||||||||||||||||||||||||||||||
| Total income | (271) | (313) | (13.3) | (889) | (1,236) | (28.1) | |||||||||||||||||||||||||||||||||||
| Administrative expenses and amortisations | (82) | (82) | 0.5 | (248) | (283) | (12.3) | |||||||||||||||||||||||||||||||||||
| Net operating income | (353) | (395) | (10.5) | (1,137) | (1,519) | (25.1) | |||||||||||||||||||||||||||||||||||
| Net loan-loss provisions | (16) | (8) | 98.5 | (27) | (26) | 3.2 | |||||||||||||||||||||||||||||||||||
| Other gains (losses) and provisions | (12) | (370) | (96.7) | (403) | (188) | 114.2 | |||||||||||||||||||||||||||||||||||
| Profit before tax | (381) | (773) | (50.7) | (1,567) | (1,733) | (9.6) | |||||||||||||||||||||||||||||||||||
| Tax on profit | 52 | 585 | (91.2) | 113 | 86 | 30.9 | |||||||||||||||||||||||||||||||||||
| Profit from continuing operations | (330) | (188) | 75.2 | (1,455) | (1,647) | (11.7) | |||||||||||||||||||||||||||||||||||
| Net profit from discontinued operations | — | — | — | — | — | — | |||||||||||||||||||||||||||||||||||
| Consolidated profit | (330) | (188) | 75.2 | (1,455) | (1,647) | (11.7) | |||||||||||||||||||||||||||||||||||
| Non-controlling interests | — | 94 | — | (1) | 10 | — | |||||||||||||||||||||||||||||||||||
| Underlying attributable profit to the parent | (330) | (94) | 249.2 | (1,455) | (1,637) | (11.1) | |||||||||||||||||||||||||||||||||||
| Balance sheet | |||||||||||||||||||||||||||||||||||||||||
| Loans and advances to customers | 4,827 | 5,205 | (7.3) | 4,827 | 5,799 | (16.8) | |||||||||||||||||||||||||||||||||||
| Cash, central banks and credit institutions | 63,947 | 48,530 | 31.8 | 63,947 | 30,057 | 112.7 | |||||||||||||||||||||||||||||||||||
| Debt instruments | 2,100 | 1,340 | 56.7 | 2,100 | 968 | 117.0 | |||||||||||||||||||||||||||||||||||
| Other financial assets | 2,067 | 2,058 | 0.4 | 2,067 | 2,393 | (13.6) | |||||||||||||||||||||||||||||||||||
| Other asset accounts | 114,295 | 115,304 | (0.9) | 114,295 | 130,751 | (12.6) | |||||||||||||||||||||||||||||||||||
| Total assets | 187,236 | 172,437 | 8.6 | 187,236 | 169,968 | 10.2 | |||||||||||||||||||||||||||||||||||
| Customer deposits | 1,074 | 770 | 39.5 | 1,074 | 908 | 18.3 | |||||||||||||||||||||||||||||||||||
| Central banks and credit institutions | 42,654 | 19,119 | 123.1 | 42,654 | 12,696 | 236.0 | |||||||||||||||||||||||||||||||||||
| Marketable debt securities | 57,866 | 63,010 | (8.2) | 57,866 | 52,130 | 11.0 | |||||||||||||||||||||||||||||||||||
| Other financial liabilities | 1,143 | 1,901 | (39.9) | 1,143 | 3,558 | (67.9) | |||||||||||||||||||||||||||||||||||
| Other liabilities accounts | 7,645 | 8,225 | (7.1) | 7,645 | 9,539 | (19.9) | |||||||||||||||||||||||||||||||||||
| Total liabilities | 110,382 | 93,024 | 18.7 | 110,382 | 78,830 | 40.0 | |||||||||||||||||||||||||||||||||||
| Total equity | 76,854 | 79,412 | (3.2) | 76,854 | 91,138 | (15.7) | |||||||||||||||||||||||||||||||||||
| Memorandum items: | |||||||||||||||||||||||||||||||||||||||||
Gross loans and advances to customers (2) | 5,008 | 5,367 | (6.7) | 5,008 | 5,979 | (16.3) | |||||||||||||||||||||||||||||||||||
| Customer funds | 1,089 | 786 | 38.5 | 1,089 | 918 | 18.6 | |||||||||||||||||||||||||||||||||||
Customer deposits (3) | 1,074 | 770 | 39.5 | 1,074 | 908 | 18.3 | |||||||||||||||||||||||||||||||||||
| Mutual funds | 15 | 17 | (8.6) | 15 | 10 | 44.8 | |||||||||||||||||||||||||||||||||||
| Resources | |||||||||||||||||||||||||||||||||||||||||
| Number of employees | 1,744 | 1,773 | (1.6) | 1,744 | 1,665 | 4.7 | |||||||||||||||||||||||||||||||||||
(1) Includes exchange differences.
(2) Excluding reverse repos.
(3) Excluding repos.
January - September 2020 | | 75 | ||||||
| RETAIL BANKING | |||||||||||||||||||||||||||||||||||||||||
| EUR million | |||||||||||||||||||||||||||||||||||||||||
| / | Q2'20 | / | 9M'19 | ||||||||||||||||||||||||||||||||||||||
| Underlying income statement | Q3'20 | % | % excl. FX | 9M'20 | % | % excl. FX | |||||||||||||||||||||||||||||||||||
| Net interest income | 7,148 | 0.1 | 3.6 | 22,173 | (10.0) | (0.9) | |||||||||||||||||||||||||||||||||||
| Net fee income | 1,671 | 11.8 | 14.6 | 5,189 | (19.2) | (9.8) | |||||||||||||||||||||||||||||||||||
Gains (losses) on financial transactions (1) | 294 | (26.9) | (24.7) | 747 | 33.5 | 32.0 | |||||||||||||||||||||||||||||||||||
| Other operating income | 113 | — | — | (53) | — | — | |||||||||||||||||||||||||||||||||||
| Total income | 9,226 | 4.1 | 7.6 | 28,056 | (12.0) | (3.5) | |||||||||||||||||||||||||||||||||||
| Administrative expenses and amortisations | (4,058) | (0.6) | 2.4 | (12,669) | (10.1) | (2.8) | |||||||||||||||||||||||||||||||||||
| Net operating income | 5,168 | 8.2 | 12.1 | 15,388 | (13.5) | (4.0) | |||||||||||||||||||||||||||||||||||
| Net loan-loss provisions | (2,463) | (13.4) | (8.8) | (9,198) | 38.1 | 54.1 | |||||||||||||||||||||||||||||||||||
| Other gains (losses) and provisions | (267) | 22.4 | 23.2 | (822) | (29.4) | (21.2) | |||||||||||||||||||||||||||||||||||
| Profit before tax | 2,438 | 42.5 | 45.4 | 5,368 | (46.1) | (40.5) | |||||||||||||||||||||||||||||||||||
| Tax on profit | (867) | 61.7 | 64.8 | (1,820) | (42.8) | (35.3) | |||||||||||||||||||||||||||||||||||
| Profit from continuing operations | 1,571 | 33.7 | 36.6 | 3,548 | (47.7) | (42.8) | |||||||||||||||||||||||||||||||||||
| Net profit from discontinued operations | — | — | — | — | — | — | |||||||||||||||||||||||||||||||||||
| Consolidated profit | 1,571 | 33.7 | 36.6 | 3,548 | (47.7) | (42.8) | |||||||||||||||||||||||||||||||||||
| Non-controlling interests | (249) | 28.8 | 31.1 | (610) | (42.5) | (37.3) | |||||||||||||||||||||||||||||||||||
| Underlying attributable profit to the parent | 1,322 | 34.7 | 37.7 | 2,938 | (48.7) | (43.9) | |||||||||||||||||||||||||||||||||||
(1) Includes exchange differences.
| CORPORATE & INVESTMENT BANKING | |||||||||||||||||||||||||||||||||||||||||
| EUR million | |||||||||||||||||||||||||||||||||||||||||
| / | Q2'20 | / | 9M'19 | ||||||||||||||||||||||||||||||||||||||
| Underlying income statement | Q3'20 | % | % excl. FX | 9M'20 | % | % excl. FX | |||||||||||||||||||||||||||||||||||
| Net interest income | 788 | 10.5 | 14.7 | 2,172 | 8.0 | 18.9 | |||||||||||||||||||||||||||||||||||
| Net fee income | 361 | (11.0) | (8.4) | 1,172 | 2.1 | 11.8 | |||||||||||||||||||||||||||||||||||
Gains (losses) on financial transactions (1) | 204 | (21.3) | (11.9) | 628 | 50.8 | 88.9 | |||||||||||||||||||||||||||||||||||
| Other operating income | 44 | (8.5) | (11.4) | 152 | (32.7) | (33.7) | |||||||||||||||||||||||||||||||||||
| Total income | 1,397 | (2.0) | 2.4 | 4,123 | 8.5 | 20.0 | |||||||||||||||||||||||||||||||||||
| Administrative expenses and amortisations | (496) | (2.2) | 0.7 | (1,539) | (8.0) | (1.9) | |||||||||||||||||||||||||||||||||||
| Net operating income | 901 | (1.9) | 3.4 | 2,584 | 21.4 | 38.3 | |||||||||||||||||||||||||||||||||||
| Net loan-loss provisions | (41) | (83.1) | (82.1) | (290) | 972.2 | 830.0 | |||||||||||||||||||||||||||||||||||
| Other gains (losses) and provisions | (20) | (26.6) | (25.2) | (63) | 6.7 | 12.4 | |||||||||||||||||||||||||||||||||||
| Profit before tax | 839 | 29.8 | 36.4 | 2,230 | 9.2 | 25.3 | |||||||||||||||||||||||||||||||||||
| Tax on profit | (242) | 35.0 | 42.0 | (640) | 5.6 | 22.1 | |||||||||||||||||||||||||||||||||||
| Profit from continuing operations | 597 | 27.8 | 34.2 | 1,590 | 10.8 | 26.6 | |||||||||||||||||||||||||||||||||||
| Net profit from discontinued operations | — | — | — | — | — | — | |||||||||||||||||||||||||||||||||||
| Consolidated profit | 597 | 27.8 | 34.2 | 1,590 | 10.8 | 26.6 | |||||||||||||||||||||||||||||||||||
| Non-controlling interests | (32) | 6.1 | 10.8 | (98) | (26.5) | (12.6) | |||||||||||||||||||||||||||||||||||
| Underlying attributable profit to the parent | 565 | 29.3 | 35.8 | 1,493 | 14.6 | 30.4 | |||||||||||||||||||||||||||||||||||
(1) Includes exchange differences.
| 76 | | January - September 2020 | ||||||
| WEALTH MANAGEMENT & INSURANCE | |||||||||||||||||||||||||||||||||||||||||
| EUR million | |||||||||||||||||||||||||||||||||||||||||
| / | Q2'20 | / | 9M'19 | ||||||||||||||||||||||||||||||||||||||
| Underlying income statement | Q3'20 | % | % excl. FX | 9M'20 | % | % excl. FX | |||||||||||||||||||||||||||||||||||
| Net interest income | 104 | 0.7 | 5.1 | 340 | (19.8) | (15.8) | |||||||||||||||||||||||||||||||||||
| Net fee income | 290 | 3.8 | 6.2 | 888 | 2.2 | 8.3 | |||||||||||||||||||||||||||||||||||
Gains (losses) on financial transactions (1) | 17 | (21.2) | (17.1) | 60 | (42.5) | (38.7) | |||||||||||||||||||||||||||||||||||
| Other operating income | 86 | 10.9 | 12.4 | 277 | 16.4 | 29.6 | |||||||||||||||||||||||||||||||||||
| Total income | 498 | 3.1 | 5.9 | 1,566 | (4.3) | 1.9 | |||||||||||||||||||||||||||||||||||
| Administrative expenses and amortisations | (215) | (2.4) | 0.2 | (679) | (4.5) | (0.7) | |||||||||||||||||||||||||||||||||||
| Net operating income | 283 | 7.7 | 10.7 | 888 | (4.1) | 4.0 | |||||||||||||||||||||||||||||||||||
| Net loan-loss provisions | (10) | 92.4 | 96.1 | (22) | — | — | |||||||||||||||||||||||||||||||||||
| Other gains (losses) and provisions | (4) | 31.4 | 30.5 | (8) | 2.4 | 6.6 | |||||||||||||||||||||||||||||||||||
| Profit before tax | 269 | 5.7 | 8.7 | 858 | (6.8) | 1.1 | |||||||||||||||||||||||||||||||||||
| Tax on profit | (65) | 9.0 | 11.3 | (207) | (2.8) | 4.6 | |||||||||||||||||||||||||||||||||||
| Profit from continuing operations | 204 | 4.7 | 7.9 | 651 | (7.9) | 0.1 | |||||||||||||||||||||||||||||||||||
| Net profit from discontinued operations | — | — | — | — | — | — | |||||||||||||||||||||||||||||||||||
| Consolidated profit | 204 | 4.7 | 7.9 | 651 | (7.9) | 0.1 | |||||||||||||||||||||||||||||||||||
| Non-controlling interests | (9) | 7.5 | 10.1 | (30) | (17.2) | 0.2 | |||||||||||||||||||||||||||||||||||
| Underlying attributable profit to the parent | 195 | 4.6 | 7.8 | 622 | (7.4) | 0.1 | |||||||||||||||||||||||||||||||||||
(1) Includes exchange differences.
| SANTANDER GLOBAL PLATFORM (secondary segment) | |||||||||||||||||||||||||||||||||||||||||
| EUR million | |||||||||||||||||||||||||||||||||||||||||
| / | Q2'20 | / | 9M'19 | ||||||||||||||||||||||||||||||||||||||
| Underlying income statement | Q3'20 | % | % excl. FX | 9M'20 | % | % excl. FX | |||||||||||||||||||||||||||||||||||
| Net interest income | 104 | (6.9) | (3.5) | 318 | 8.9 | 23.2 | |||||||||||||||||||||||||||||||||||
| Net fee income | 111 | 2.0 | 6.4 | 335 | (19.6) | (4.7) | |||||||||||||||||||||||||||||||||||
Gains (losses) on financial transactions (1) | 32 | (2.1) | (1.5) | 108 | (3.3) | 3.7 | |||||||||||||||||||||||||||||||||||
| Other operating income | (10) | 118.8 | 109.3 | (14) | 42.8 | 48.8 | |||||||||||||||||||||||||||||||||||
| Total income | 238 | (4.6) | (1.0) | 748 | (7.8) | 6.1 | |||||||||||||||||||||||||||||||||||
| Administrative expenses and amortisations | (222) | 21.5 | 30.4 | (591) | 8.8 | 19.2 | |||||||||||||||||||||||||||||||||||
| Net operating income | 16 | (76.1) | (78.9) | 157 | (41.5) | (25.0) | |||||||||||||||||||||||||||||||||||
| Net loan-loss provisions | (5) | (67.3) | (63.8) | (24) | (29.3) | (23.1) | |||||||||||||||||||||||||||||||||||
| Other gains (losses) and provisions | (2) | (76.1) | (77.8) | (5) | 85.5 | 103.6 | |||||||||||||||||||||||||||||||||||
| Profit before tax | 10 | (78.9) | (83.1) | 127 | (45.0) | (27.3) | |||||||||||||||||||||||||||||||||||
| Tax on profit | (5) | (70.7) | (72.0) | (42) | (48.0) | (29.2) | |||||||||||||||||||||||||||||||||||
| Profit from continuing operations | 5 | (84.0) | (89.8) | 85 | (43.4) | (26.4) | |||||||||||||||||||||||||||||||||||
| Net profit from discontinued operations | — | — | — | — | — | — | |||||||||||||||||||||||||||||||||||
| Consolidated profit | 5 | (84.0) | (89.8) | 85 | (43.4) | (26.4) | |||||||||||||||||||||||||||||||||||
| Non-controlling interests | (7) | (10.8) | (11.0) | (24) | (17.2) | (5.9) | |||||||||||||||||||||||||||||||||||
| Underlying attributable profit to the parent | (3) | — | — | 61 | (49.8) | (32.3) | |||||||||||||||||||||||||||||||||||
(1) Includes exchange differences.
January - September 2020 | | 77 | ||||||
ALTERNATIVE PERFORMANCE MEASURES (APMs)
In addition to the financial information prepared under IFRS, this consolidated directors’ report contains financial measures that constitute alternative performance measures (‘APMs’) to comply with the guidelines on alternative performance measures issued by the European Securities and Markets Authority on 5 October 2015 and non-IFRS measures.
The financial measures contained in this consolidated directors’ report that qualify as APMs and non-IFRS measures have been calculated using the financial information from Santander but are not defined or detailed in the applicable financial information framework or under IFRS and have neither been audited nor reviewed by our auditors.
We use these APMs and non-IFRS measures when planning, monitoring and evaluating our performance. We consider these APMs and non-IFRS financial measures to be useful metrics for management and investors to facilitate operating performance comparisons from period to period. While we believe that these APMs and non-IFRS financial measures are useful in evaluating our business, this information should be considered as supplemental in nature and is not meant as a substitute of IFRS measures. In addition, the way in which Santander defines and calculates these
APMs and non-IFRS measures may differ from the calculations and by other companies with similar measures and, therefore, may not be comparable.
The APMs and non-IFRS measures we use in this document can be categorised as follows:
Underlying results
In addition to IFRS results measures, we present some results measures which are non-IFRS measures and which we refer to as underlying measures. These underlying measures allow in our view a better year-on-year comparability as they exclude items outside the ordinary course performance of our business which are grouped in the non-IFRS line net capital gains and provisions and are further detailed on page 13 of this report.
In addition, in the section "Financial information by segments", relative to the primary and secondary segments, results are presented on an underlying basis in accordance with IFRS 8, and reconciled on an aggregate basis to our IFRS consolidated results to the consolidated financial statements, which are set out below.
| Reconciliation of underlying results to statutory results | ||||||||||||||||||||
| EUR million | ||||||||||||||||||||
| January-September 2020 | ||||||||||||||||||||
| Underlying results | Adjustments | Statutory results | ||||||||||||||||||
| Net interest income | 23,975 | — | 23,975 | |||||||||||||||||
| Net fee income | 7,559 | — | 7,559 | |||||||||||||||||
Gains (losses) on financial transactions (1) | 1,725 | — | 1,725 | |||||||||||||||||
| Other operating income | 346 | (250) | 96 | |||||||||||||||||
| Total income | 33,605 | (250) | 33,355 | |||||||||||||||||
| Administrative expenses and amortisations | (15,726) | (60) | (15,786) | |||||||||||||||||
| Net operating income | 17,879 | (310) | 17,569 | |||||||||||||||||
| Net loan-loss provisions | (9,562) | — | (9,562) | |||||||||||||||||
| Other gains (losses) and provisions | (1,301) | (9,977) | (11,278) | |||||||||||||||||
| Profit before tax | 7,016 | (10,287) | (3,271) | |||||||||||||||||
| Tax on profit | (2,596) | (2,424) | (5,020) | |||||||||||||||||
| Profit from continuing operations | 4,420 | (12,711) | (8,291) | |||||||||||||||||
| Net profit from discontinued operations | — | — | — | |||||||||||||||||
| Consolidated profit | 4,420 | (12,711) | (8,291) | |||||||||||||||||
| Non-controlling interests | (762) | 5 | (757) | |||||||||||||||||
| Attributable profit to the parent | 3,658 | (12,706) | (9,048) | |||||||||||||||||
(1) Includes exchange differences.
Explanation of adjustments:
Adjustment to the valuation of goodwill of EUR -10,100 million, adjustment has been made to deferred tax assets of the Spanish consolidated fiscal group of EUR -2,500 million and restructuring costs and other of EUR -106 million.
| 78 | | January - September 2020 | ||||||
| Reconciliation of underlying results to statutory results | ||||||||||||||||||||
| EUR million | ||||||||||||||||||||
| January-September 2019 | ||||||||||||||||||||
| Underlying results | Adjustments | Statutory results | ||||||||||||||||||
| Net interest income | 26,442 | — | 26,442 | |||||||||||||||||
| Net fee income | 8,818 | — | 8,818 | |||||||||||||||||
Gains (losses) on financial transactions (1) | 935 | — | 935 | |||||||||||||||||
| Other operating income | 707 | — | 707 | |||||||||||||||||
| Total income | 36,902 | — | 36,902 | |||||||||||||||||
| Administrative expenses and amortisations | (17,309) | — | (17,309) | |||||||||||||||||
| Net operating income | 19,593 | — | 19,593 | |||||||||||||||||
| Net loan-loss provisions | (6,748) | — | (6,748) | |||||||||||||||||
| Other gains (losses) and provisions | (1,422) | (2,711) | (4,133) | |||||||||||||||||
| Profit before tax | 11,423 | (2,711) | 8,712 | |||||||||||||||||
| Tax on profit | (3,994) | 254 | (3,740) | |||||||||||||||||
| Profit from continuing operations | 7,429 | (2,457) | 4,972 | |||||||||||||||||
| Net profit from discontinued operations | — | — | — | |||||||||||||||||
| Consolidated profit | 7,429 | (2,457) | 4,972 | |||||||||||||||||
| Non-controlling interests | (1,249) | 9 | (1,240) | |||||||||||||||||
| Attributable profit to the parent | 6,180 | (2,448) | 3,732 | |||||||||||||||||
(1) Includes exchange differences.
Explanation of adjustments:
Net capital gains from the sale of our stake in Prisma of EUR 130 million, net capital losses of EUR -180 million related to real estate assets (Spain), PPI of EUR -183 million, restructuring costs for a net impact of EUR -724 million and the deterioration of goodwill ascribed to the UK for a net amount of EUR -1,491 million.
Profitability and efficiency ratios
The purpose of the profitability and efficiency ratios is to measure the ratio of profit to capital, to tangible capital, to assets and to risk weighted assets, while the efficiency ratio measures how much general administrative expenses (personnel and other) and amortisation costs are needed to generate revenue.
In the second quarter, underlying RoE and underlying RoA ratios were incorporated as we believe they better reflect the underlying business performance. These complement the underlying RoTE and RoRWA measures that were already being presented.
Additionally, the goodwill adjustments have been removed from the RoTE numerator as, since they are not considered in the denominator, we believe this calculation is more correct.
January - September 2020 | | 79 | ||||||
| Ratio | Formula | Relevance of the metric | ||||||||||||
| RoE | Attributable profit to the parent | This ratio measures the return that shareholders obtain on the funds invested in the Bank and as such measures the company's ability to pay shareholders. | ||||||||||||
| (Return on equity) | Average stockholders’ equity 1 (excl. minority interests) | |||||||||||||
| Underlying RoE | Underlying attributable profit to the parent | This ratio measures the return that shareholders obtain on the funds invested in the Bank excluding non-recurring results. | ||||||||||||
Average stockholders’ equity 1 (excl. minority interests) | ||||||||||||||
| RoTE | Attributable profit to the parent2 | This indicator is used to evaluate the profitability of the company as a percentage of its tangible equity. It's measured as the return that shareholders receive as a percentage of the funds invested in the entity less intangible assets. | ||||||||||||
| (Return on tangible equity) | Average stockholders' equity 1 (excl. minority interests) - intangible assets | |||||||||||||
| Underlying RoTE | Underlying attributable profit to the parent | This indicator measures the profitability of the tangible equity of a company arising from ordinary activities, i.e. excluding results from non-recurring operations. | ||||||||||||
Average stockholders' equity 1 (excl. minority interests) - intangible assets | ||||||||||||||
| RoA | Consolidated profit | This metric measures the profitability of a company as a percentage of its total assets. It is an indicator that reflects the efficiency of the company's total funds in generating profit. | ||||||||||||
| (Return on assets) | Average total assets | |||||||||||||
| Underlying RoA | Underlying consolidated profit | This metric measures the profitability of a company as a percentage of its total assets, excluding non-recurring results. It is an indicator that reflects the efficiency of the company's total funds in generating underlying profit. | ||||||||||||
| Average total assets | ||||||||||||||
| RoRWA | Consolidated profit | The return adjusted for risk is an derivative of the RoA metric. The difference is that RoRWA measures profit in relation to the bank's risk weighted assets. | ||||||||||||
| (Return on risk weighted assets) | Average risk weighted assets | |||||||||||||
| Underlying RoRWA | Underlying consolidated profit | This relates the consolidated profit (excluding non-recurring results) to the bank's risk weighted assets. | ||||||||||||
| Average risk weighted assets | ||||||||||||||
| Efficiency ratio | Operating expenses 3 | One of the most commonly used indicators when comparing productivity of different financial entities. It measures the amount of funds used to generate the bank's total income. | ||||||||||||
| Total income | ||||||||||||||
1. Stockholders’ equity = Capital and Reserves + Accumulated other comprehensive income + Attributable profit to the parent + Dividends.
2. Excluding the adjustment to the valuation of goodwill.
3. Operating expenses = Administrative expenses + amortisations.
| 80 | | January - September 2020 | ||||||
Profitability and efficiency(1) (2) (3) (4) | Q3'20 | Q2'20 | 9M'20 | 9M'19 | ||||||||||||||||||||||
| RoE | 8.54 | % | -7.06 | % | -8.54 | % | 5.90 | % | ||||||||||||||||||
| Attributable profit to the parent | 7,000 | -6,536 | -7,829 | 5,792 | ||||||||||||||||||||||
| Average stockholders' equity (excluding minority interests) | 82,009 | 92,528 | 91,639 | 98,249 | ||||||||||||||||||||||
| Underlying RoE | 8.54 | % | 6.62 | % | 5.32 | % | 8.39 | % | ||||||||||||||||||
| Attributable profit to the parent | 7,000 | -6,536 | -7,829 | 5,792 | ||||||||||||||||||||||
| (-) Net capital gains and provisions | — | -12,660 | -12,706 | -2,448 | ||||||||||||||||||||||
| Underlying attributable profit to the parent | 7,000 | 6,124 | 4,877 | 8,240 | ||||||||||||||||||||||
| Average stockholders' equity (excluding minority interests) | 82,009 | 92,528 | 91,639 | 98,249 | ||||||||||||||||||||||
| RoTE | 10.58 | % | 5.19 | % | 3.30 | % | 10.48 | % | ||||||||||||||||||
| Attributable profit to the parent | 7,000 | -6,536 | -7,829 | 5,792 | ||||||||||||||||||||||
| (+) Goodwill impairment | — | -10,100 | -10,100 | -1,491 | ||||||||||||||||||||||
| Attributable profit to the parent (excluding goodwill impairment) | 7,000 | 3,564 | 2,271 | 7,283 | ||||||||||||||||||||||
| Average stockholders' equity (excluding minority interests) | 82,009 | 92,528 | 91,639 | 98,249 | ||||||||||||||||||||||
| (-) Average intangible assets | 15,859 | 23,920 | 22,748 | 28,743 | ||||||||||||||||||||||
| Average stockholders' equity (excl. minority interests) - intangible assets | 66,150 | 68,608 | 68,892 | 69,506 | ||||||||||||||||||||||
| Underlying RoTE | 10.58 | % | 8.93 | % | 7.08 | % | 11.86 | % | ||||||||||||||||||
| Attributable profit to the parent | 7,000 | -6,536 | -7,829 | 5,792 | ||||||||||||||||||||||
| (-) Net capital gains and provisions | — | -12,660 | -12,706 | -2,448 | ||||||||||||||||||||||
| Underlying attributable profit to the parent | 7,000 | 6,124 | 4,877 | 8,240 | ||||||||||||||||||||||
| Average stockholders' equity (excl. minority interests) - intangible assets | 66,150 | 68,608 | 68,892 | 69,506 | ||||||||||||||||||||||
| RoA | 0.53 | % | -0.38 | % | -0.44 | % | 0.50 | % | ||||||||||||||||||
| Consolidated profit | 8,188 | -5,954 | -6,818 | 7,448 | ||||||||||||||||||||||
| Average total assets | 1,541,134 | 1,558,854 | 1,543,361 | 1,500,101 | ||||||||||||||||||||||
| Underlying RoA | 0.53 | % | 0.43 | % | 0.38 | % | 0.66 | % | ||||||||||||||||||
| Consolidated profit | 8,188 | -5,954 | -6,818 | 7,448 | ||||||||||||||||||||||
| (-) Net capital gains and provisions | — | -12,662 | -12,711 | -2,456 | ||||||||||||||||||||||
| Underlying consolidated profit | 8,188 | 6,708 | 5,893 | 9,905 | ||||||||||||||||||||||
| Average total assets | 1,541,134 | 1,558,854 | 1,543,361 | 1,500,101 | ||||||||||||||||||||||
| RoRWA | 1.46 | % | -1.02 | % | -1.17 | % | 1.22 | % | ||||||||||||||||||
| Consolidated profit | 8,188 | -5,954 | -6,818 | 7,448 | ||||||||||||||||||||||
| Average risk weighted assets | 558,940 | 586,210 | 583,448 | 608,419 | ||||||||||||||||||||||
| Underlying RoRWA | 1.46 | % | 1.14 | % | 1.01 | % | 1.63 | % | ||||||||||||||||||
| Consolidated profit | 8,188 | -5,954 | -6,818 | 7,448 | ||||||||||||||||||||||
| (-) Net capital gains and provisions | — | -12,662 | -12,711 | -2,456 | ||||||||||||||||||||||
| Underlying consolidated profit | 8,188 | 6,708 | 5,893 | 9,905 | ||||||||||||||||||||||
| Average risk weighted assets | 558,940 | 586,210 | 583,448 | 608,419 | ||||||||||||||||||||||
| Efficiency ratio | 45.8 | % | 47.4 | % | 46.8 | % | 46.9 | % | ||||||||||||||||||
| Underlying operating expenses | 5,073 | 5,076 | 15,726 | 17,309 | ||||||||||||||||||||||
| Operating expenses | 5,079 | 5,118 | 15,786 | 17,309 | ||||||||||||||||||||||
| Net capital gains and provisions impact in operating expenses | -6 | -42 | -60 | — | ||||||||||||||||||||||
| Underlying total income | 11,087 | 10,704 | 33,605 | 36,902 | ||||||||||||||||||||||
| Total income | 11,087 | 10,459 | 33,355 | 36,902 | ||||||||||||||||||||||
| Net capital gains and provisions impact in total income | — | 245 | 250 | — | ||||||||||||||||||||||
| (1) Averages included in the RoE, RoTE, RoA and RoRWA denominators are calculated using 4 months' worth of data in the case of quarterly figures (from June to September in Q3 and March to June in Q2) and 10 months in the case of annual figures (December to September). | ||||||||||||||||||||||||||
| (2) For periods less than one year, and if there are results in the net capital gains and provisions line, the profit used to calculate RoE and RoTE is the annualised underlying attributable profit to which said results are added without annualising. | ||||||||||||||||||||||||||
| (3) For periods less than one year, and if there are results in the net capital gains and provisions line, the profit used to calculate RoA and RoRWA is the annualised underlying consolidated profit, to which said results are added without annualising. | ||||||||||||||||||||||||||
| (4) The risk weighted assets included in the denominator of the RoRWA metric are calculated in line with the criteria laid out in the CRR (Capital Requirements Regulation). | ||||||||||||||||||||||||||
January - September 2020 | | 81 | ||||||
| Efficiency ratio | ||||||||||||||||||||||||||||||||
| 9M'20 | 9M'19 | |||||||||||||||||||||||||||||||
| % | Total income | Operating expenses | % | Total income | Operating expenses | |||||||||||||||||||||||||||
| Europe | 52.9 | 14,706 | 7,779 | 52.9 | 15,709 | 8,310 | ||||||||||||||||||||||||||
| Spain | 53.1 | 5,150 | 2,734 | 53.4 | 5,695 | 3,043 | ||||||||||||||||||||||||||
| Santander Consumer Finance | 42.4 | 3,462 | 1,467 | 43.7 | 3,525 | 1,539 | ||||||||||||||||||||||||||
| United Kingdom | 63.1 | 3,193 | 2,016 | 60.5 | 3,508 | 2,123 | ||||||||||||||||||||||||||
| Portugal | 45.1 | 979 | 442 | 44.8 | 1,043 | 467 | ||||||||||||||||||||||||||
| Poland | 41.8 | 1,136 | 475 | 41.7 | 1,258 | 524 | ||||||||||||||||||||||||||
| North America | 41.3 | 8,319 | 3,438 | 42.2 | 8,655 | 3,654 | ||||||||||||||||||||||||||
| US | 41.5 | 5,559 | 2,307 | 42.5 | 5,711 | 2,427 | ||||||||||||||||||||||||||
| Mexico | 41.0 | 2,760 | 1,130 | 41.6 | 2,944 | 1,226 | ||||||||||||||||||||||||||
| South America | 35.3 | 11,331 | 3,998 | 35.7 | 13,711 | 4,895 | ||||||||||||||||||||||||||
| Brazil | 31.8 | 8,322 | 2,644 | 32.4 | 10,386 | 3,364 | ||||||||||||||||||||||||||
| Chile | 40.8 | 1,669 | 681 | 41.3 | 1,901 | 785 | ||||||||||||||||||||||||||
| Argentina | 54.5 | 902 | 491 | 57.8 | 957 | 553 | ||||||||||||||||||||||||||
| Underlying RoTE | ||||||||||||||||||||||||||||||||
| 9M'20 | 9M'19 | |||||||||||||||||||||||||||||||
| % | Underlying attributable profit to the parent | Average stockholders' equity (excl. minority interests) - intangible assets | % | Underlying attributable profit to the parent | Average stockholders' equity (excl. minority interests) - intangible assets | |||||||||||||||||||||||||||
| Europe | 5.56 | 2,696 | 48,472 | 9.99 | 4,853 | 48,575 | ||||||||||||||||||||||||||
| Spain | 4.21 | 662 | 15,716 | 10.59 | 1,580 | 14,919 | ||||||||||||||||||||||||||
| Santander Consumer Finance | 11.76 | 1,015 | 8,630 | 15.49 | 1,327 | 8,569 | ||||||||||||||||||||||||||
| United Kingdom | 3.05 | 424 | 13,898 | 7.45 | 1,104 | 14,817 | ||||||||||||||||||||||||||
| Portugal | 8.50 | 324 | 3,810 | 12.21 | 514 | 4,207 | ||||||||||||||||||||||||||
| Poland | 5.91 | 189 | 3,193 | 10.53 | 326 | 3,095 | ||||||||||||||||||||||||||
| North America | 6.78 | 1,414 | 20,868 | 8.90 | 1,704 | 19,135 | ||||||||||||||||||||||||||
| US | 3.99 | 627 | 15,708 | 5.57 | 826 | 14,835 | ||||||||||||||||||||||||||
| Mexico | 15.13 | 787 | 5,205 | 20.27 | 878 | 4,333 | ||||||||||||||||||||||||||
| South America | 17.30 | 2,825 | 16,328 | 20.85 | 3,969 | 19,036 | ||||||||||||||||||||||||||
| Brazil | 18.37 | 2,060 | 11,217 | 21.64 | 2,999 | 13,860 | ||||||||||||||||||||||||||
| Chile | 10.99 | 359 | 3,264 | 17.91 | 631 | 3,520 | ||||||||||||||||||||||||||
| Argentina | 29.23 | 215 | 734 | 18.88 | 129 | 682 | ||||||||||||||||||||||||||
| 82 | | January - September 2020 | ||||||
Credit risk indicators
The credit risk indicators measure the quality of the credit portfolio and the percentage of non-performing loans covered by provisions.
| Ratio | Formula | Relevance of the metric | ||||||||||||
NPL ratio (Non-performing loans) | Non-performing loans and advances to customers, customer guarantees and customer commitments granted | The NPL ratio is an important variable regarding financial institutions' activity since it gives an indication of the level of risk the entities are exposed to. It calculates risks that are, in accounting terms, declared to be non-performing as a percentage of the total outstanding amount of customer credit and contingent liabilities. | ||||||||||||
Total Risk 1 | ||||||||||||||
| Coverage ratio | Provisions to cover impairment losses on loans and advances to customers, customer guarantees and customer commitments granted | The coverage ratio is a fundamental metric in the financial sector. It reflects the level of provisions as a percentage of the non-performing assets (credit risk). Therefore it is a good indicator of the entity's solvency against client defaults both present and future. | ||||||||||||
| Non-performing loans and advances to customers, customer guarantees and customer commitments granted | ||||||||||||||
| Cost of Credit | Allowances for loan-loss provisions over the last 12 months | This ratio quantifies loan-loss provisions arising from credit risk over a defined period of time for a given loan portfolio. As such, it acts as an indicator of credit quality. | ||||||||||||
| Average loans and advances to customers over the last 12 months | ||||||||||||||
(1) Total risk = Total loans and advances and guarantees to customers (performing and non-performing) + non-performing contingent liabilities.
| Credit risk | Sep-20 | Jun-20 | Sep-20 | Sep-19 | ||||||||||
| NPL ratio | 3.15 | % | 3.26 | % | 3.15 | % | 3.47 | % | ||||||
| Non-performing loans and advances to customers customer guarantees and customer commitments granted | 30,894 | 32,782 | 30,894 | 34,326 | ||||||||||
| Total risk | 982,286 | 1,006,796 | 982,286 | 988,466 | ||||||||||
| Coverage ratio | 76 | % | 72 | % | 76 | % | 67 | % | ||||||
| Provisions to cover impairment losses on loans and advances to customers, customer guarantees and customer commitments granted | 23,465 | 23,635 | 23,465 | 23,112 | ||||||||||
| Non-performing loans and advances to customers customer guarantees and customer commitments granted | 30,894 | 32,782 | 30,894 | 34,326 | ||||||||||
| Cost of credit | 1.27 | % | 1.26 | % | 1.27 | % | 1.00 | % | ||||||
| Allowances for loan-loss provisions over the last 12 months | 12,135 | 12,035 | 12,135 | 9,202 | ||||||||||
| Average loans and advances to customers over the last 12 months | 956,416 | 953,470 | 956,416 | 923,140 | ||||||||||
January - September 2020 | | 83 | ||||||
| NPL ratio | ||||||||||||||||||||||||||||||||
| 9M'20 | 9M'19 | |||||||||||||||||||||||||||||||
| % | Non-performing loans and advances to customers customer guarantees and customer commitments granted | Total risk | % | Non-performing loans and advances to customers customer guarantees and customer commitments granted | Total risk | |||||||||||||||||||||||||||
| Europe | 3.13 | 22,508 | 718,100 | 3.47 | 24,302 | 700,470 | ||||||||||||||||||||||||||
| Spain | 5.98 | 13,159 | 220,032 | 7.23 | 15,738 | 217,674 | ||||||||||||||||||||||||||
| Santander Consumer Finance | 2.50 | 2,537 | 101,586 | 2.25 | 2,263 | 100,705 | ||||||||||||||||||||||||||
| United Kingdom | 1.30 | 3,395 | 262,052 | 1.08 | 2,816 | 261,645 | ||||||||||||||||||||||||||
| Portugal | 4.25 | 1,711 | 40,291 | 4.90 | 1,871 | 38,189 | ||||||||||||||||||||||||||
| Poland | 4.58 | 1,452 | 31,711 | 4.35 | 1,385 | 31,868 | ||||||||||||||||||||||||||
| North America | 1.96 | 2,617 | 133,207 | 2.21 | 3,140 | 142,019 | ||||||||||||||||||||||||||
| US | 1.85 | 1,877 | 101,499 | 2.18 | 2,311 | 106,042 | ||||||||||||||||||||||||||
| Mexico | 2.33 | 740 | 31,707 | 2.30 | 829 | 35,976 | ||||||||||||||||||||||||||
| South America | 4.40 | 5,447 | 123,669 | 4.81 | 6,823 | 141,930 | ||||||||||||||||||||||||||
| Brazil | 4.64 | 3,240 | 69,886 | 5.33 | 4,539 | 85,193 | ||||||||||||||||||||||||||
| Chile | 4.76 | 1,976 | 41,483 | 4.48 | 1,970 | 43,934 | ||||||||||||||||||||||||||
| Argentina | 2.88 | 137 | 4,765 | 3.64 | 189 | 5,187 | ||||||||||||||||||||||||||
| Coverage ratio | ||||||||||||||||||||||||||||||||
| 9M'20 | 9M'19 | |||||||||||||||||||||||||||||||
| % | Provisions to cover impairment losses on loans and advances to customers, customer guarantees and customer commitments granted | Non-performing loans and advances to customers customer guarantees and customer commitments granted | % | Provisions to cover impairment losses on loans and advances to customers, customer guarantees and customer commitments granted | Non-performing loans and advances to customers customer guarantees and customer commitments granted | |||||||||||||||||||||||||||
| Europe | 55.8 | 12,567 | 22,508 | 48.2 | 11,713 | 24,302 | ||||||||||||||||||||||||||
| Spain | 46.0 | 6,052 | 13,159 | 40.6 | 6,383 | 15,738 | ||||||||||||||||||||||||||
| Santander Consumer Finance | 108.2 | 2,746 | 2,537 | 104.2 | 2,358 | 2,263 | ||||||||||||||||||||||||||
| United Kingdom | 44.5 | 1,512 | 3,395 | 34.1 | 962 | 2,816 | ||||||||||||||||||||||||||
| Portugal | 64.3 | 1,100 | 1,711 | 51.5 | 965 | 1,871 | ||||||||||||||||||||||||||
| Poland | 70.8 | 1,028 | 1,452 | 69.0 | 955 | 1,385 | ||||||||||||||||||||||||||
| North America | 201.6 | 5,277 | 2,617 | 155.6 | 4,888 | 3,140 | ||||||||||||||||||||||||||
| US | 228.8 | 4,296 | 1,877 | 166.6 | 3,850 | 2,311 | ||||||||||||||||||||||||||
| Mexico | 132.6 | 981 | 740 | 125.2 | 1,038 | 829 | ||||||||||||||||||||||||||
| South America | 97.2 | 5,295 | 5,447 | 89.7 | 6,123 | 6,823 | ||||||||||||||||||||||||||
| Brazil | 114.9 | 3,721 | 3,240 | 101.1 | 4,589 | 4,539 | ||||||||||||||||||||||||||
| Chile | 59.7 | 1,181 | 1,976 | 57.3 | 1,130 | 1,970 | ||||||||||||||||||||||||||
| Argentina | 186.3 | 255 | 137 | 134.0 | 253 | 189 | ||||||||||||||||||||||||||
| 84 | | January - September 2020 | ||||||
Other indicators
The market capitalisation indicator provides information on the volume of tangible equity per share. The loan-to-deposit ratio (LTD) identifies the relationship between net customer loans and advances and customer deposits, assessing the proportion of loans and advances granted by the Group that are funded by customer deposits.
The Group also uses gross customer loan magnitudes excluding reverse repurchase agreements (repos) and customer deposits excluding repos. In order to analyse the evolution of the traditional commercial banking business of granting loans and capturing deposits, repos and reverse repos are excluded, as they are mainly treasury business products and highly volatile.
| Ratio | Formula | Relevance of the metric | ||||||||||||
| TNAV per share | Tangible book value 1 | This is a very commonly used ratio used to measure the company's accounting value per share having deducted the intangible assets. It is useful in evaluating the amount each shareholder would receive if the company were to enter into liquidation and had to sell all the company's tangible assets. | ||||||||||||
| (Tangible equity net asset value per share) | Number of shares excluding treasury stock | |||||||||||||
| Price / tangible book value per share (X) | Share price | This is one of the most commonly used ratios by market participants for the valuation of listed companies both in absolute terms and relative to other entities. This ratio measures the relationship between the price paid for a company and its accounting equity value. | ||||||||||||
| TNAV per share | ||||||||||||||
| LTD ratio | Net loans and advances to customers | This is an indicator of the bank's liquidity. It measures the total (net) loans and advances to customers as a percentage of customer deposits. | ||||||||||||
| (Loan-to-deposit) | Customer deposits | |||||||||||||
| Loans and advances (excl. reverse repos) | Gross loans and advances to customers excluding reverse repos | In order to aid analysis of the commercial banking activity, reverse repos are excluded as they are highly volatile treasury products. | ||||||||||||
| Deposits (excl. repos) | Customer deposits excluding repos | In order to aid analysis of the commercial banking activity, repos are excluded as they are highly volatile treasury products. | ||||||||||||
| PAT + After tax fees paid to SAN (in Wealth Management & Insurance) | Net profit + fees paid from Santander Asset Management and Santander Insurance to Santander, net of taxes, excluding Private Banking customers | Metric to assess Wealth Management & Insurance's total contribution to Grupo Santander profit. | ||||||||||||
(1) Tangible book value = Stockholders' equity - intangible assets
| Others | Sep-20 | Jun-20 | Sep-20 | Sep-19 | ||||||||||
| TNAV (tangible book value) per share | 3.98 | 4.00 | 3.98 | 4.25 | ||||||||||
| Tangible book value | 66,048 | 66,316 | 66,048 | 70,564 | ||||||||||
| Number of shares excl. treasury stock (million) | 16,589 | 16,593 | 16,589 | 16,612 | ||||||||||
| Price / Tangible book value per share (X) | 0.40 | 0.54 | 0.40 | 0.88 | ||||||||||
| Share price (euros) | 1.600 | 2.175 | 1.600 | 3.737 | ||||||||||
| TNAV (tangible book value) per share | 3.98 | 4.00 | 3.98 | 4.25 | ||||||||||
| Loan-to-deposit ratio | 108 | % | 110 | % | 108 | % | 112 | % | ||||||
| Net loans and advances to customers | 910,714 | 934,796 | 910,714 | 916,003 | ||||||||||
| Customer deposits | 842,899 | 846,832 | 842,899 | 814,285 | ||||||||||
| Q3'20 | Q2'20 | 9M'20 | 9M'19 | |||||||||||
| PAT + After tax fees paid to SAN (in WM&I) (Constant EUR million) | 523.96 | 499.45 | 1,582.45 | 1,620.56 | ||||||||||
| Profit after tax | 213.89 | 198.15 | 651.18 | 650.67 | ||||||||||
| Net fee income net of tax | 310.07 | 301.30 | 931.27 | 969.89 | ||||||||||
January - September 2020 | | 85 | ||||||
Local currency measures
We make use of certain financial measures in local currency to help in the assessment of our ongoing operating performance. These non-IFRS financial measures include the results of operations of our subsidiary banks located outside the Eurozone, excluding the impact of foreign exchange. Because changes in foreign currency exchange rates do not have an operating impact on the results, we believe that evaluating their performance on a local currency basis provides an additional and meaningful assessment of performance to both management and the company’s investors.
The Group presents, at both the Group level as well as the business unit level, the real changes in the income statement as well as the changes excluding the exchange rate effect, as it considers the latter facilitates analysis, since it enables businesses movements to be identified without taking into account the impact of converting each local currency into euros.
Said variations, excluding the impact of exchange rate movements, are calculated by converting P&L lines for the different business units comprising the Group into our presentation currency, the euro, applying the average exchange rate for the first nine months of 2020 to all periods contemplated in the analysis.
The Group presents, at both the Group level as well as the business unit level, the changes in euros in the balance sheet as well as the changes excluding the exchange rate effect for loans and advances to customers excluding reverse repos and customer funds (which comprise deposits and mutual funds) excluding repos. As with the income statement, the reason is to facilitate analysis by isolating the changes in the balance sheet that are not caused by converting each local currency into euros.
These changes excluding the impact of exchange rate movements are calculated by converting loans and advances to customers excluding reverse repos and customer funds excluding repos, into our presentation currency, the euro, applying the closing exchange rate on the last working day of September 2020 to all periods contemplated in the analysis.
The average and period-end exchange rates for the main currencies in which the Group operates are set out in the table below.
| Exchange rates: 1 euro / currency parity | |||||||||||||||||||||||||||||
| Average (income statement) | Period-end (balance sheet) | ||||||||||||||||||||||||||||
| 9M'20 | 9M'19 | Sep-20 | Jun-20 | Sep-19 | |||||||||||||||||||||||||
| US dollar | 1.124 | 1.123 | 1.175 | 1.126 | 1.089 | ||||||||||||||||||||||||
| Pound sterling | 0.884 | 0.883 | 0.908 | 0.910 | 0.886 | ||||||||||||||||||||||||
| Brazilian real | 5.632 | 4.362 | 6.610 | 6.161 | 4.529 | ||||||||||||||||||||||||
| Mexican peso | 24.318 | 21.628 | 25.963 | 25.959 | 21.452 | ||||||||||||||||||||||||
| Chilean peso | 900.730 | 770.262 | 924.900 | 922.992 | 793.002 | ||||||||||||||||||||||||
| Argentine peso | 75.359 | 49.245 | 89.483 | 79.304 | 62.715 | ||||||||||||||||||||||||
| Polish zloty | 4.420 | 4.301 | 4.530 | 4.444 | 4.378 | ||||||||||||||||||||||||
| 86 | | January - September 2020 | ||||||
| Response to the COVID-19 crisis Business model | ||||||||||||||||||||||||||
| Interim condensed consolidated financial statements | ||||||||||||||||||||||||||
INTERIM CONDENSED CONSOLIDATED FINANCIAL STATEMENTS
•CONSOLIDATED BALANCE SHEET
•CONSOLIDATED INCOME STATEMENT
NOTE: The following financial information for the first nine months of 2020 and 2019 (attached herewith) corresponds to the condensed consolidated financial statements prepared in accordance with the International Financial Reporting Standards.
| Interim condensed consolidated balance sheet | ||||||||||||||||||||
| EUR million | ||||||||||||||||||||
| ASSETS | Sep-20 | Dec-19 | Sep-19 | |||||||||||||||||
| Cash, cash balances at central banks and other deposits on demand | 148,175 | 101,067 | 92,601 | |||||||||||||||||
| Financial assets held for trading | 117,654 | 108,230 | 115,884 | |||||||||||||||||
| Non-trading financial assets mandatorily at fair value through profit or loss | 4,293 | 4,911 | 5,328 | |||||||||||||||||
| Financial assets designated at fair value through profit or loss | 62,714 | 62,069 | 66,612 | |||||||||||||||||
| Financial assets at fair value through other comprehensive income | 117,461 | 125,708 | 120,659 | |||||||||||||||||
| Financial assets at amortised cost | 950,571 | 995,482 | 987,750 | |||||||||||||||||
| Hedging derivatives | 10,866 | 7,216 | 9,333 | |||||||||||||||||
| Changes in the fair value of hedged items in portfolio hedges of interest risk | 2,155 | 1,702 | 2,288 | |||||||||||||||||
| Investments | 7,679 | 8,772 | 8,346 | |||||||||||||||||
| Joint ventures entities | 1,306 | 1,325 | 1,547 | |||||||||||||||||
| Associated entities | 6,373 | 7,447 | 6,799 | |||||||||||||||||
| Assets under insurance or reinsurance contracts | 1,582 | 292 | 312 | |||||||||||||||||
| Tangible assets | 33,277 | 35,235 | 35,399 | |||||||||||||||||
| Property, plant and equipment | 32,327 | 34,262 | 34,338 | |||||||||||||||||
| For own-use | 13,233 | 15,041 | 14,975 | |||||||||||||||||
| Leased out under an operating lease | 19,094 | 19,221 | 19,363 | |||||||||||||||||
| Investment property | 950 | 973 | 1,061 | |||||||||||||||||
| Of which : Leased out under an operating lease | 821 | 823 | 743 | |||||||||||||||||
| Intangible assets | 15,698 | 27,687 | 27,383 | |||||||||||||||||
| Goodwill | 12,359 | 24,246 | 24,109 | |||||||||||||||||
| Other intangible assets | 3,339 | 3,441 | 3,274 | |||||||||||||||||
| Tax assets | 26,397 | 29,585 | 29,993 | |||||||||||||||||
| Current tax assets | 6,405 | 6,827 | 6,478 | |||||||||||||||||
| Deferred tax assets | 19,992 | 22,758 | 23,515 | |||||||||||||||||
| Other assets | 11,086 | 10,138 | 11,500 | |||||||||||||||||
| Insurance contracts linked to pensions | 186 | 192 | 211 | |||||||||||||||||
| Inventories | 4 | 5 | 12 | |||||||||||||||||
| Other | 10,896 | 9,941 | 11,277 | |||||||||||||||||
| Non-current assets held for sale | 4,634 | 4,601 | 4,497 | |||||||||||||||||
| TOTAL ASSETS | 1,514,242 | 1,522,695 | 1,517,885 | |||||||||||||||||
January - September 2020 | | 87 | ||||||
| Response to the COVID-19 crisis Business model | ||||||||||||||||||||||||||
| Interim condensed consolidated financial statements | ||||||||||||||||||||||||||
| Interim condensed consolidated balance sheet | |||||||||||||||||
| EUR million | |||||||||||||||||
| LIABILITIES | Sep-20 | Dec-19 | Sep-19 | ||||||||||||||
| Financial liabilities held for trading | 88,128 | 77,139 | 85,797 | ||||||||||||||
| Financial liabilities designated at fair value through profit or loss | 59,459 | 60,995 | 68,263 | ||||||||||||||
| Financial liabilities at amortised cost | 1,237,314 | 1,230,745 | 1,211,114 | ||||||||||||||
| Hedging derivatives | 6,099 | 6,048 | 6,580 | ||||||||||||||
| Changes in the fair value of hedged items in portfolio hedges of interest rate risk | 265 | 269 | 317 | ||||||||||||||
| Liabilities under insurance or reinsurance contracts | 970 | 739 | 731 | ||||||||||||||
| Provisions | 10,118 | 13,987 | 14,364 | ||||||||||||||
| Pensions and other post-retirement obligations | 4,034 | 6,358 | 6,407 | ||||||||||||||
| Other long term employee benefits | 1,120 | 1,382 | 1,560 | ||||||||||||||
| Taxes and other legal contingencies | 2,189 | 3,057 | 3,098 | ||||||||||||||
| Contingent liabilities and commitments | 672 | 739 | 720 | ||||||||||||||
| Other provisions | 2,103 | 2,451 | 2,579 | ||||||||||||||
| Tax liabilities | 8,667 | 9,322 | 9,769 | ||||||||||||||
| Current tax liabilities | 2,480 | 2,800 | 2,719 | ||||||||||||||
| Deferred tax liabilities | 6,187 | 6,522 | 7,050 | ||||||||||||||
| Other liabilities | 11,912 | 12,792 | 12,424 | ||||||||||||||
| Liabilities associated with non-current assets held for sale | — | — | — | ||||||||||||||
| TOTAL LIABILITIES | 1,422,932 | 1,412,036 | 1,409,359 | ||||||||||||||
| EQUITY | |||||||||||||||||
| Shareholders' equity | 114,493 | 124,239 | 121,668 | ||||||||||||||
| Capital | 8,309 | 8,309 | 8,309 | ||||||||||||||
| Called up paid capital | 8,309 | 8,309 | 8,309 | ||||||||||||||
| Unpaid capital which has been called up | — | — | — | ||||||||||||||
| Share premium | 52,446 | 52,446 | 52,446 | ||||||||||||||
| Equity instruments issued other than capital | 619 | 598 | 590 | ||||||||||||||
| Equity component of the compound financial instrument | — | — | — | ||||||||||||||
| Other equity instruments issued | 619 | 598 | 590 | ||||||||||||||
| Other equity | 171 | 146 | 143 | ||||||||||||||
| Accumulated retained earnings | 67,230 | 61,028 | 61,044 | ||||||||||||||
| Revaluation reserves | — | — | — | ||||||||||||||
| Other reserves | (3,499) | (3,110) | (2,911) | ||||||||||||||
| (-) Own shares | (73) | (31) | (23) | ||||||||||||||
| Profit attributable to shareholders of the parent | (9,048) | 6,515 | 3,732 | ||||||||||||||
| (-) Interim dividends | (1,662) | (1,662) | (1,662) | ||||||||||||||
| Other comprehensive income (loss) | (32,747) | (24,168) | (23,721) | ||||||||||||||
| Items not reclassified to profit or loss | (5,056) | (4,288) | (3,972) | ||||||||||||||
| Items that may be reclassified to profit or loss | (27,691) | (19,880) | (19,749) | ||||||||||||||
| Non-controlling interest | 9,564 | 10,588 | 10,579 | ||||||||||||||
| Other comprehensive income | (1,905) | (982) | (898) | ||||||||||||||
| Other items | 11,469 | 11,570 | 11,477 | ||||||||||||||
| TOTAL EQUITY | 91,310 | 110,659 | 108,526 | ||||||||||||||
| TOTAL LIABILITIES AND EQUITY | 1,514,242 | 1,522,695 | 1,517,885 | ||||||||||||||
| MEMORANDUM ITEMS: OFF BALANCE SHEET AMOUNTS | |||||||||||||||||
| Loan commitments granted | 235,812 | 241,179 | 240,839 | ||||||||||||||
| Financial guarantees granted | 12,247 | 13,650 | 12,843 | ||||||||||||||
| Other commitments granted | 71,430 | 68,895 | 86,490 | ||||||||||||||
| 88 | | January - September 2020 | ||||||
| Response to the COVID-19 crisis Business model | ||||||||||||||||||||||||||
| Interim condensed consolidated financial statements | ||||||||||||||||||||||||||
| Interim condensed consolidated income statement | ||||||||||||||
| EUR million | ||||||||||||||
| 9M'20 | 9M'19 | |||||||||||||
| Interest income | 35,131 | 42,758 | ||||||||||||
| Financial assets at fair value with changes in other comprehensive income | 2,348 | 2,875 | ||||||||||||
| Financial assets at amortised cost | 30,519 | 36,604 | ||||||||||||
| Other interest income | 2,264 | 3,279 | ||||||||||||
| Interest expense | (11,156) | (16,316) | ||||||||||||
| Interest income/ (charges) | 23,975 | 26,442 | ||||||||||||
| Dividend income | 322 | 433 | ||||||||||||
| Income from companies accounted for using the equity method | (90) | 443 | ||||||||||||
| Commission income | 9,826 | 11,395 | ||||||||||||
| Commission expense | (2,267) | (2,577) | ||||||||||||
| Gain or losses on financial assets and liabilities not measured at fair value through profit or loss, net | 893 | 688 | ||||||||||||
| Financial assets at amortised cost | (23) | 166 | ||||||||||||
| Other financial assets and liabilities | 916 | 522 | ||||||||||||
| Gain or losses on financial assets and liabilities held for trading, net | 4,425 | 713 | ||||||||||||
| Reclassification of financial assets from fair value with changes in other comprehensive income | — | — | ||||||||||||
| Reclassification of financial assets from amortised cost | — | — | ||||||||||||
| Other gains or (-) losses | 4,425 | 713 | ||||||||||||
| Gains or losses on non-trading financial assets and liabilities mandatorily at fair value through profit or loss | 73 | 290 | ||||||||||||
| Reclassification of financial assets from fair value with changes in other comprehensive income | — | — | ||||||||||||
| Reclassification of financial assets from amortised cost | — | — | ||||||||||||
| Other gains or (-) losses | 73 | 290 | ||||||||||||
| Gain or losses on financial assets and liabilities measured at fair value through profit or loss, net | (91) | (251) | ||||||||||||
| Gain or losses from hedge accounting, net | 120 | 2 | ||||||||||||
| Exchange differences, net | (3,695) | (507) | ||||||||||||
| Other operating income | 1,222 | 1,297 | ||||||||||||
| Other operating expenses | (1,527) | (1,501) | ||||||||||||
| Income from assets under insurance and reinsurance contracts | 1,030 | 2,123 | ||||||||||||
| Expenses from liabilities under insurance and reinsurance contracts | (861) | (2,088) | ||||||||||||
| Total income | 33,355 | 36,902 | ||||||||||||
| Administrative expenses | (13,686) | (15,100) | ||||||||||||
| Staff costs | (8,098) | (9,088) | ||||||||||||
| Other general and administrative expenses | (5,588) | (6,012) | ||||||||||||
| Depreciation and amortisation | (2,100) | (2,209) | ||||||||||||
| Provisions or reversal of provisions, net | (1,014) | (2,511) | ||||||||||||
| Impairment or reversal of impairment at financial assets not measured at fair value through profit or loss, net | (9,538) | (6,810) | ||||||||||||
| Financial assets at fair value through other comprehensive income | (7) | (7) | ||||||||||||
| Financial assets at amortised cost | (9,531) | (6,803) | ||||||||||||
| Impairment of investments in subsidiaries, joint ventures and associates, net | — | — | ||||||||||||
| Impairment on non-financial assets, net | (10,256) | (1,547) | ||||||||||||
| Tangible assets | (105) | (27) | ||||||||||||
| Intangible assets | (10,149) | (1,512) | ||||||||||||
| Others | (2) | (8) | ||||||||||||
| Gain or losses on non financial assets and investments, net | 89 | 253 | ||||||||||||
| Negative goodwill recognised in results | 9 | — | ||||||||||||
| Gains or losses on non-current assets held for sale not classified as discontinued operations | (130) | (266) | ||||||||||||
| Operating profit/(loss) before tax | (3,271) | 8,712 | ||||||||||||
| Tax expense or income from continuing operations | (5,020) | (3,740) | ||||||||||||
| Profit for the period from continuing operations | (8,291) | 4,972 | ||||||||||||
| Profit or loss after tax from discontinued operations | — | — | ||||||||||||
| Profit for the period | (8,291) | 4,972 | ||||||||||||
| Profit attributable to non-controlling interests | 757 | 1,240 | ||||||||||||
| Profit attributable to the parent | (9,048) | 3,732 | ||||||||||||
| Earnings per share | ||||||||||||||
| Basic | (0.57) | 0.20 | ||||||||||||
| Diluted | (0.57) | 0.20 | ||||||||||||
January - September 2020 | | 89 | ||||||
GLOSSARY
•Active customer: Those customers who comply with the minimum balance, income and/or transactionality requirements as defined according to the business area
•ADR: American Depositary Receipt
•ALCO: Assets and Liabilities Committee
•APM: Alternative Performance Measures
•bps: basis points
•CBILS: Coronavirus Business Interruption Loan Scheme
•CDI: CREST Depository Interest
•CET1: Core equity tier 1
•CJEU: Court of Justice of the European Union
•CLBILS: Coronavirus Large Business Interruption Loan Scheme
•CNMV: Spanish National Securities Market Commission (Comisión Nacional del Mercado de Valores)
•COVID-19: Corona Virus Disease 19
•Digital customers: Every consumer of a commercial bank’s services who has logged on to their personal online banking and/or mobile banking in the last 30 days
•EBA: European Banking Authority
•ECB: European Central Bank
•EPS: Earnings per share
•ESG: Environmental, Social and Governance
•ESMA: European Securities and Markets Authority
•FCA: Financial Conduct Authority (UK)
•Fed: Federal Reserve
•FX: Foreign Exchange
•GDP: Gross Domestic Product
•GPTW: Great Place to Work
•ICO: Insitituto de Crédito Oficial (Official Credit Institution)
•IFRS 9: International Financial Reporting Standard 9, regarding financial instruments
•IFRS 16: International Financial Reporting Standard 16, regarding leases
•Loyal customers: Active customers who receive most of their financial services from the Group according to the commercial segment that they belong to. Various engaged customer levels have been defined taking profitability into account.
•LCR: Liquidity Coverage Ratio
•NPLs: Non-performing loans
•NPS: Net Promoter Score
•P/E ratio: Price / earnings per share ratio
•PBT: Profit before tax
•POS: Point of Sale
•pp: percentage points
•PPI: Payment protection insurance
•Repos: Repurchase agreements
•RoA: Return on assets
•RoE: Return on equity
•RoRWA: Return on risk weighted assets
•RoTE: Return on tangible equity
•RWAs: Risk weighted assets
•SAM: Santander Asset Management
•SBNA: Santander Bank N.A.
•SCF: Santander Consumer Finance
•SCIB: Santander Corporate & Investment Banking
•SC USA: Santander Consumer USA
•SEC: Securities and Exchanges Commission
•SGP: Santander Global Platform
•SH USA: Santander Holdings USA, Inc.
•SMEs: Small and medium enterprises
•SPF: Simple, Personal and Fair
•SREP: Supervisory Review and Evaluation Process
•SSM: Single Supervisory Mechanism, the system of banking supervision in Europe. It comprises the ECB and the national supervisory authorities of the participating countries
•T1: Tier 1
•TLAC: The total loss-absorption capacity requirement which is required to be met under the CRD V package
•TNAV: Tangible net asset value
•TRIM: Targeted review of internal models
•VaR: Value at Risk
•WM&I: Wealth Management & Insurance
| 90 | | January - September 2020 | ||||||
| Response to the COVID-19 crisis Business model | ||||||||||||||||||||||||||
| Important information | ||||||||||||||||||||||||||
Important information
Non-IFRS and alternative performance measures
In addition to the financial information prepared in accordance with International Financial Reporting Standards (“IFRS”), this report contains certain financial measures that constitute alternative performance measures (“APMs”) as defined in the Guidelines on Alternative Performance Measures issued by the European Securities and Markets Authority (ESMA) on 5 October 2015 (ESMA/2015/1415en) and other non-IFRS measures (“Non-IFRS Measures”). The financial measures contained in this report that qualify as APMs and non-IFRS measures have been calculated using the financial information from Santander Group but are not defined or detailed in the applicable financial reporting framework and have neither been audited nor reviewed by our auditors. We use these APMs and non-IFRS measures when planning, monitoring and evaluating our performance. We consider these APMs and non-IFRS measures to be useful metrics for management and investors to facilitate operating performance comparisons from period to period, as these measures exclude items outside the ordinary course performance of our business, which are grouped in the “management adjustment” line and are further detailed in Section 3.2 of the Economic and Financial Review in our Directors´ Report included in our Annual Report on Form 20-F for the year ended 31 December 2019. While we believe that these APMs and Non-IFRS Measures are useful in evaluating our business, this information should be considered as supplemental in nature and is not meant as a substitute of IFRS measures. In addition, other companies, including companies in our industry, may calculate or use such measures differently, which reduces their usefulness as comparative measures. For further details of the APMs and non-IFRS measures used, including its definition or a reconciliation between any applicable management indicators and the financial data presented in the consolidated financial statements prepared under IFRS, please see the 2019 Annual Report on Form 20-F, filed with the U.S. Securities and Exchange Commission on 6 March 2020, as well as the section “Alternative performance measures” of the annex to this report. Underlying measures, which are included in this report, are non-IFRS measures.
The businesses included in each of the business areas in this report and the accounting principles under which their results are presented here may differ from the businesses included and accounting principles applied in the financial information separately prepared and disclosed by our subsidiaries (some of which are publicly listed) which in name or geographical description may seem to correspond to the business areas covered in this report. Accordingly, the results of operations and trends shown for our business areas in this document may differ materially from those of such subsidiaries.
Forward-looking statements
Banco Santander, S.A. (“Santander”) cautions that this report contains statements that constitute “forward-looking statements” within the meaning of the U.S. Private Securities Litigation Reform Act of 1995. Forward-looking statements may be identified by words such as “expect”, “project”, “anticipate”, “should”, “intend”, “probability”, “risk”, “VaR”, “RoRAC”, “RoRWA”, “TNAV”, “target”, “goal”, “objective”, “estimate”, “future” and similar expressions. These forward-looking statements are found in various places throughout this report and include, without limitation, statements concerning our future business development and economic performance and our shareholder remuneration policy. While these forward-looking statements represent our judgment and future expectations concerning the development of our business, a number of risks, uncertainties and other important factors could cause actual developments and results to differ materially from our expectations. The following important factors, in addition to those discussed elsewhere in this report, and in our annual report on Form 20-F for the year ended 31 December 2019, filed with the U.S. Securities and Exchange Commission, could affect our future results and could cause outcomes to differ materially from those anticipated in any forward-looking statement: (1) general economic or industry conditions in areas in which we have significant business activities or investments, including a worsening of the economic environment, increasing in the volatility of the capital markets, inflation or deflation, changes in demographics, consumer spending, investment or saving habits, and the effects of the COVID-19 pandemic in the global economy; (2) exposure to various types of market risks, principally including interest rate risk, foreign exchange rate risk, equity price risk and risks associated with the replacement of benchmark indices; (3) potential losses associated with prepayment of our loan and investment portfolio, declines in the value of collateral securing our loan portfolio, and counterparty risk; (4) political stability in Spain, the UK, other European countries, Latin America and the US; (5) changes in laws, regulations or taxes, including changes in regulatory capital and liquidity requirements, including as a result of the UK exiting the European Union and increased regulation in light of the global financial crisis; (6) our ability to integrate successfully our acquisitions and the challenges inherent in diverting management’s focus and resources from other strategic opportunities and from operational matters while we integrate these acquisitions; and (7) changes in our ability to access liquidity and funding on acceptable terms, including as a result of changes in our credit spreads or a downgrade in our credit ratings or those of our more significant subsidiaries. Numerous factors could affect the future results of Santander and could result in those results deviating materially from those anticipated in the forward-looking statements. Other unknown or unpredictable factors could cause actual results to differ materially from those in the forward-looking statements.
Forward-looking statements speak only as of the date of this report and are based on the knowledge, information available and views taken on such date; such knowledge, information and views may change at any time. Santander does not undertake any obligation to update or revise any forward-looking statement, whether as a result of new information, future events or otherwise.
January - September 2020 | | 91 | ||||||
| Response to the COVID-19 crisis Business model | ||||||||||||||||||||||||||
| Important information | ||||||||||||||||||||||||||
No offer
The information contained in this report is subject to, and must be read in conjunction with, all other publicly available information, including, where relevant any fuller disclosure document published by Santander. Any person at any time acquiring securities must do so only on the basis of such person’s own judgment as to the merits or the suitability of the securities for its purpose and only on such information as is contained in such public information having taken all such professional or other advice as it considers necessary or appropriate in the circumstances and not in reliance on the information contained in this report. No investment activity should be undertaken on the basis of the information contained in this report. In making this report available Santander gives no advice and makes no recommendation to buy, sell or otherwise deal in shares in Santander or in any other securities or investments whatsoever.
Neither this report nor any of the information contained therein constitutes an offer to sell or the solicitation of an offer to buy any securities. No offering of securities shall be made in the United States except pursuant to registration under the U.S. Securities Act of 1933, as amended, or an exemption therefrom. Nothing contained in this report is intended to constitute an invitation or inducement to engage in investment activity for the purposes of the prohibition on financial promotion in the U.K. Financial Services and Markets Act 2000.
Historical performance is not indicative of future results
Statements as to historical performance or financial accretion are not intended to mean that future performance, share price or future earnings (including earnings per share) for any period will necessarily match or exceed those of any prior period. Nothing in this report should be construed as a profit forecast.
Third Party Information
In particular, regarding the data provided by third parties, neither Santander, nor any of its administrators, directors or employees, either explicitly or implicitly, guarantees that these contents are exact, accurate, comprehensive or complete, nor are they obliged to keep them updated, nor to correct them in the case that any deficiency, error or omission were to be detected. Moreover, in reproducing these contents in by any means, Santander may introduce any changes it deems suitable, may omit partially or completely any of the elements of this document, and in case of any deviation between such a version and this one, Santander assumes no liability for any discrepancy.
| This document is a translation of a document originally issued in Spanish. Should there be any discrepancies between the English and the Spanish versions, only the original Spanish version should be binding. | ||
| 92 | | January - September 2020 | ||||||
SIGNATURE
Pursuant to the requirements of the Securities Exchange Act of 1934, the registrant has duly caused this report to be signed on its behalf by the undersigned, thereunto duly authorized.
| Banco Santander, S.A. | |||||||||||
| Date: 27 October 2020 | By: | /s/ José García Cantera | |||||||||
| Name: | José García Cantera | ||||||||||
| Title: | Chief Financial Officer | ||||||||||