FORM 6-K
SECURITIES AND EXCHANGE COMMISSION
Washington, D.C. 20549
Report of Foreign Issuer
Pursuant to Rule 13a-16 or 15d-16
of the Securities Exchange Act of 1934
For the month of November, 2021
Commission File Number: 001-12518
Banco Santander, S.A.
(Exact name of registrant as specified in its charter)
Ciudad Grupo Santander
28660 Boadilla del Monte (Madrid) Spain
(Address of principal executive office)
Indicate by check mark whether the registrant files or will file annual reports under cover of Form 20-F or Form 40-F:
Form 20-F ☒ Form 40-F ☐
Indicate by check mark if the registrant is submitting the Form 6-K in paper as permitted by Regulation S-T Rule 101(b)(1):
Yes ☐ No ☒
Indicate by check mark if the registrant is submitting the Form 6-K in paper as permitted by Regulation S-T Rule 101(b)(7):
Yes ☐ No ☒
BANCO SANTANDER, S.A.
________________________
TABLE OF CONTENTS
| Part 1. Interim consolidated directors’ report | |||||
| Part 2. Interim unaudited consolidated financial statements | |||||

| January - September | 2021 | ||||
Index

This report was approved by the Board of Directors on 26 October 2021, following a favourable report from the Audit Committee. Important information regarding this report can be found on pages 88 and 89.
Key consolidated data
| BALANCE SHEET (EUR million) | Sep-21 | Jun-21 | % | Sep-21 | Sep-20 | % | Dec-20 | ||||||||||||||||
| Total assets | 1,578,295 | 1,568,636 | 0.6 | 1,578,295 | 1,514,242 | 4.2 | 1,508,250 | ||||||||||||||||
| Loans and advances to customers | 958,311 | 954,518 | 0.4 | 958,311 | 910,714 | 5.2 | 916,199 | ||||||||||||||||
| Customer deposits | 909,034 | 894,127 | 1.7 | 909,034 | 842,899 | 7.8 | 849,310 | ||||||||||||||||
| Total funds | 1,140,322 | 1,121,969 | 1.6 | 1,140,322 | 1,039,608 | 9.7 | 1,056,127 | ||||||||||||||||
| Total equity | 95,624 | 95,745 | (0.1) | 95,624 | 91,310 | 4.7 | 91,322 | ||||||||||||||||
| Note: Total funds includes customer deposits, mutual funds, pension funds and managed portfolios | |||||||||||||||||||||||
| INCOME STATEMENT (EUR million) | Q3'21 | Q2'21 | % | 9M'21 | 9M'20 | % | 2020 | ||||||||||||||||
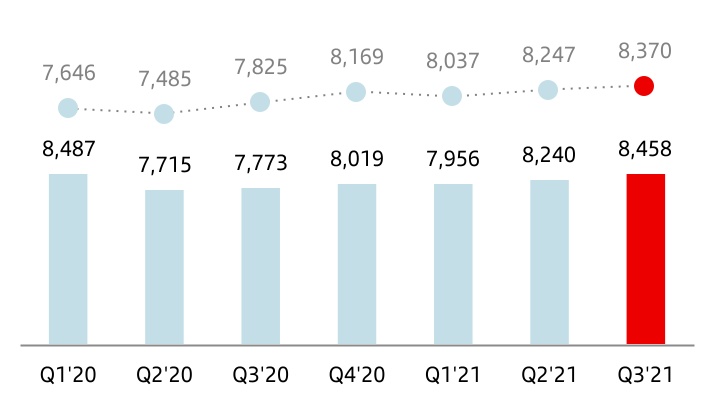
| Net interest income | 8,458 | 8,240 | 2.6 | 24,654 | 23,975 | 2.8 | 31,994 | ||||||||||||||||
| Total income | 11,931 | 11,305 | 5.5 | 34,626 | 33,355 | 3.8 | 44,279 | ||||||||||||||||
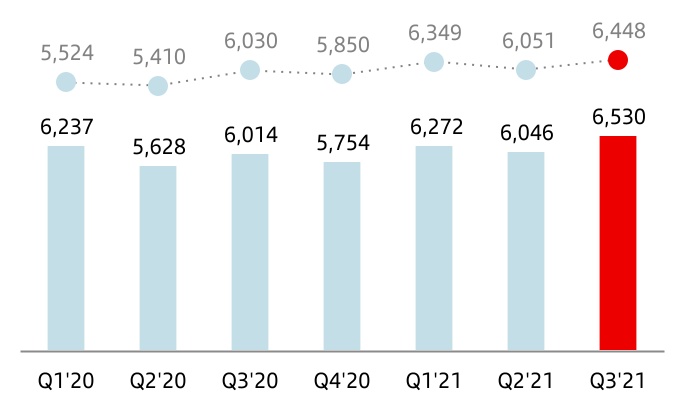
| Net operating income | 6,530 | 6,046 | 8.0 | 18,848 | 17,569 | 7.3 | 23,149 | ||||||||||||||||
| Profit before tax | 3,802 | 3,812 | (0.3) | 10,716 | (3,271) | — | (2,076) | ||||||||||||||||
| Attributable profit to the parent | 2,174 | 2,067 | 5.2 | 5,849 | (9,048) | — | (8,771) | ||||||||||||||||
| Changes in constant euros: | |||||||||||||||||||||||
| Q3'21 / Q2'21: NII: +1.5%; Total income: +4.3%; Net operating income: +6.5%; Profit before tax: -1.9%; Attributable profit: +3.3% | |||||||||||||||||||||||
| 9M'21 / 9M'20: NII: +7.4%; Total income: +8.4%; Net operating income: +13.2%; Profit before tax: -/+; Attributable profit: -/+ | |||||||||||||||||||||||
| EPS, PROFITABILITY AND EFFICIENCY (%) | Q3'21 | Q2'21 | % | 9M'21 | 9M'20 | % | 2020 | ||||||||||||||||
EPS (euros) (2) | 0.117 | 0.112 | 4.4 | 0.313 | (0.546) | — | (0.538) | ||||||||||||||||
| RoE | 10.16 | 9.91 | 9.54 | (8.54) | (9.80) | ||||||||||||||||||
| RoTE | 12.56 | 12.29 | 11.82 | 3.30 | 1.95 | ||||||||||||||||||
| RoA | 0.65 | 0.64 | 0.61 | (0.44) | (0.50) | ||||||||||||||||||
| RoRWA | 1.76 | 1.74 | 1.66 | (1.17) | (1.33) | ||||||||||||||||||
| Efficiency ratio | 45.3 | 46.5 | 45.6 | 46.8 | 47.0 | ||||||||||||||||||
UNDERLYING INCOME STATEMENT (1) (EUR million) | Q3'21 | Q2'21 | % | 9M'21 | 9M'20 | % | 2020 | ||||||||||||||||
| Net interest income | 8,458 | 8,240 | 2.6 | 24,654 | 23,975 | 2.8 | 31,994 | ||||||||||||||||
| Total income | 11,931 | 11,305 | 5.5 | 34,626 | 33,605 | 3.0 | 44,600 | ||||||||||||||||
| Net operating income | 6,530 | 6,046 | 8.0 | 18,848 | 17,879 | 5.4 | 23,633 | ||||||||||||||||
| Profit before tax | 3,804 | 3,815 | (0.3) | 11,432 | 7,016 | 62.9 | 9,674 | ||||||||||||||||
| Attributable profit to the parent | 2,174 | 2,067 | 5.2 | 6,379 | 3,658 | 74.4 | 5,081 | ||||||||||||||||
| Changes in constant euros: | |||||||||||||||||||||||
| Q3'21 / Q2'21: NII: +1.5%; Total income: +4.3%; Net operating income: +6.5%; Profit before tax: -1.9%; Attributable profit: +3.3% | |||||||||||||||||||||||
| 9M'21 / 9M'20: NII: +7.4%; Total income: +7.6%; Net operating income: +11.1%; Profit before tax: +73.6%; Attributable profit: +86.6% | |||||||||||||||||||||||
UNDERLYING EPS AND PROFITABILITY (1) (%) | Q3'21 | Q2'21 | % | 9M'21 | 9M'20 | % | 2020 | ||||||||||||||||
Underlying EPS (euros) (2) | 0.117 | 0.112 | 4.4 | 0.344 | 0.187 | 83.7 | 0.262 | ||||||||||||||||
| Underlying RoE | 10.16 | 9.91 | 10.18 | 5.32 | 5.68 | ||||||||||||||||||
| Underlying RoTE | 12.56 | 12.29 | 12.61 | 7.08 | 7.44 | ||||||||||||||||||
| Underlying RoA | 0.65 | 0.64 | 0.65 | 0.38 | 0.40 | ||||||||||||||||||
| Underlying RoRWA | 1.76 | 1.74 | 1.76 | 1.01 | 1.06 | ||||||||||||||||||
January - September 2021 |  | 3 | ||||||
| SOLVENCY (%) | Sep-21 | Jun-21 | Sep-21 | Sep-20 | Dec-20 | ||||||||||||||||||
| Fully-loaded CET1 ratio | 11.85 | 11.70 | 11.85 | 11.57 | 11.89 | ||||||||||||||||||
| Fully-loaded total capital ratio | 15.82 | 15.42 | 15.82 | 15.15 | 15.73 | ||||||||||||||||||
| CREDIT QUALITY (%) | Q3'21 | Q2'21 | 9M'21 | 9M'20 | 2020 | ||||||||||||||||||
Cost of credit (3) | 0.90 | 0.94 | 0.90 | 1.27 | 1.28 | ||||||||||||||||||
| NPL ratio | 3.18 | 3.22 | 3.18 | 3.15 | 3.21 | ||||||||||||||||||
| Total coverage ratio | 74 | 73 | 74 | 76 | 76 | ||||||||||||||||||
| MARKET CAPITALIZATION AND SHARES | Sep-21 | Jun-21 | % | Sep-21 | Sep-20 | % | Dec-20 | ||||||||||||||||
| Shares (millions) | 17,341 | 17,341 | 0.0 | 17,341 | 16,618 | 4.3 | 17,341 | ||||||||||||||||
Share price (euros) (2) | 3.137 | 3.220 | (2.6) | 3.137 | 1.533 | 104.6 | 2.538 | ||||||||||||||||
| Market capitalization (EUR million) | 54,389 | 55,828 | (2.6) | 54,389 | 26,582 | 104.6 | 44,011 | ||||||||||||||||
Tangible book value per share (euros) (2) | 3.99 | 3.98 | 3.99 | 3.82 | 3.79 | ||||||||||||||||||
Price / Tangible book value per share (X) (2) | 0.79 | 0.81 | 0.79 | 0.40 | 0.67 | ||||||||||||||||||
| CUSTOMERS (thousands) | Q3'21 | Q2'21 | % | 9M'21 | 9M'20 | % | 2020 | ||||||||||||||||
| Total customers | 152,365 | 150,447 | 1.3 | 152,365 | 147,312 | 3.4 | 148,256 | ||||||||||||||||
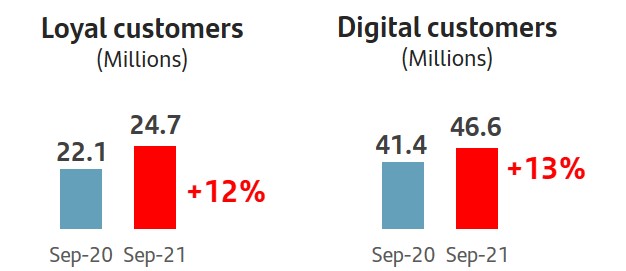
| Loyal customers | 24,687 | 24,169 | 2.1 | 24,687 | 22,058 | 11.9 | 22,838 | ||||||||||||||||
| Loyal retail customers | 22,587 | 22,100 | 2.2 | 22,587 | 20,189 | 11.9 | 20,901 | ||||||||||||||||
| Loyal SME & corporate customers | 2,100 | 2,069 | 1.5 | 2,100 | 1,869 | 12.4 | 1,938 | ||||||||||||||||
| Digital customers | 46,623 | 45,352 | 2.8 | 46,623 | 41,365 | 12.7 | 42,362 | ||||||||||||||||
| Digital sales / Total sales (%) | 57 | 54 | 54 | 44 | 44 | ||||||||||||||||||
| OTHER DATA | Sep-21 | Jun-21 | % | Sep-21 | Sep-20 | % | Dec-20 | ||||||||||||||||
| Number of shareholders | 3,817,454 | 3,879,232 | (1.6) | 3,817,454 | 4,103,069 | (7.0) | 4,018,817 | ||||||||||||||||
| Number of employees | 193,303 | 190,751 | 1.3 | 193,303 | 192,578 | 0.4 | 191,189 | ||||||||||||||||
| Number of branches | 9,904 | 10,073 | (1.7) | 9,904 | 11,520 | (14.0) | 11,236 | ||||||||||||||||
| (1) In addition to financial information prepared in accordance with International Financial Reporting Standards (IFRS) and derived from our consolidated financial statements, this report contains certain financial measures that constitute alternative performance measures (APMs) as defined in the Guidelines on Alternative Performance Measures issued by the European Securities and Markets Authority (ESMA) on 5 October 2015, and other non-IFRS measures, including the figures related to “underlying” results, which do not include the items recorded in the separate line of “net capital gains and provisions”, above the line of attributable profit to the parent. Further details are provided in the “Alternative performance measures” section of the appendix to this report. For further details of the APMs and non-IFRS measures used, including its definition or a reconciliation between any applicable management indicators and the financial data presented in the annual consolidated financial statements prepared under IFRS, please see our 2020 Annual Financial Report, published in the CNMV on 23 February 2021, our 20-F report for the year ending 31 December 2020 filed with the SEC in the United States on 26 February 2021, as updated by the Form 6-K filed with the SEC on 14 April 2021 in order to reflect our new organizational and reporting structure, as well as the “Alternative performance measures” section of the appendix to this report. | ||
| (2) Data adjusted for the capital increase in December 2020. | ||
| (3) Allowances for loan-loss provisions over the last 12 months / Average loans and advances to customers over the last 12 months | ||
| 4 | | January - September 2021 | ||||||
Business model | Group financial information | Financial information by segments | Responsible banking Corporate governance Santander share | Appendix | ||||||||||||||||||||||
Our business model is based on three pillars
1. Our scale Local scale and leadership. Worldwide reach through our global businesses | 2. Customer focus Unique personal banking relationships strengthen customer loyalty | 3. Diversification Our geographic and business diversification makes us more resilient under adverse circumstances | ||||||||||||||||||
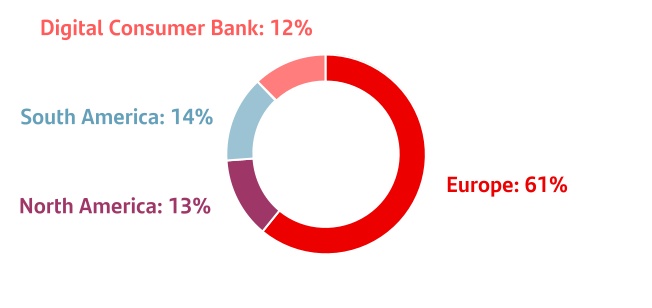
•Geographic diversification3 balanced between mature and emerging markets | ||||||||||||||||||||
 |  | |||||||||||||||||||
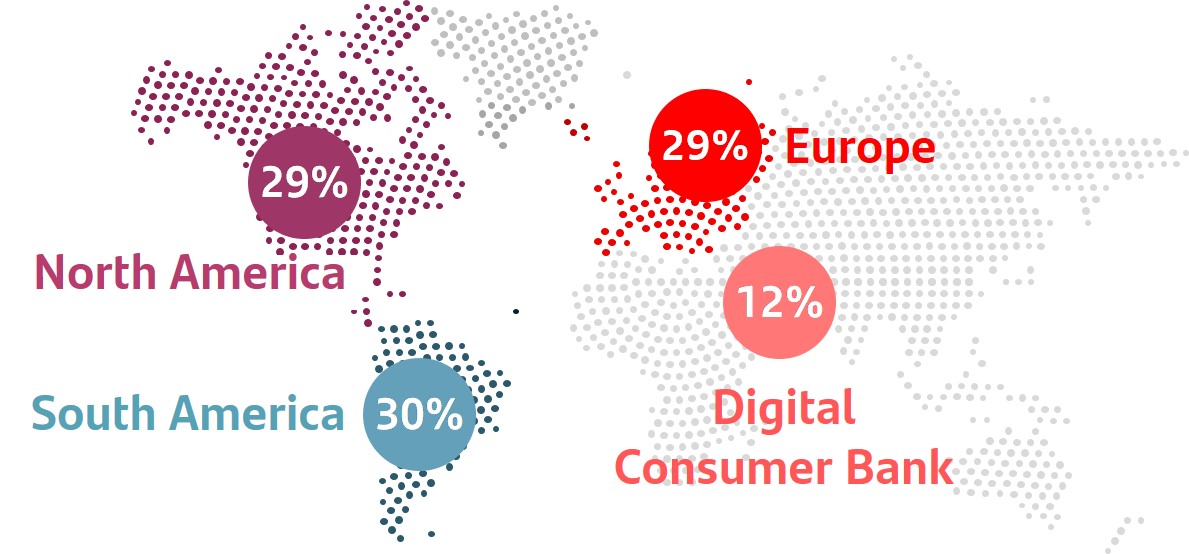 | ||||||||||||||||||||
| total customers in Europe and the Americas | ||||||||||||||||||||
 |  | •Business diversification between customer segments (individuals, SMEs, mid-market companies and large corporates) | ||||||||||||||||||
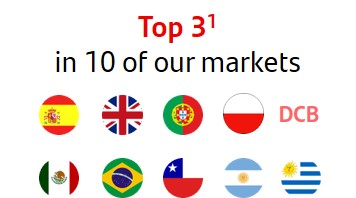
| 1. Market share in lending as of June 2021 including only privately-owned banks. UK benchmark refers to the mortgage market. DCB refers to auto in Europe. | 2. NPS – Customer Satisfaction internal benchmark of active customers’ experience and satisfaction audited by Stiga / Deloitte. | 3. 9M'21 underlying attributable profit by region. Operating areas excluding Corporate Centre. | ||||||||||||||||||
Our corporate culture
The Santander Way remains unchanged to continue to deliver for all our stakeholders.
Our purpose To help people and businesses prosper. |  | ||||||||||
Our aim To be the best open financial services platform, by acting responsibly and earning the lasting loyalty of our people, customers, shareholders and communities. | |||||||||||
Our how Everything we do should be Simple, Personal and Fair. | |||||||||||
January - September 2021 | | 5 | ||||||
 | HIGHLIGHTS OF THE PERIOD | |||||||
u In the quarter, the strength of our model once again enabled us to deliver another strong set of results in an environment marked by the recovery of activity in all regions, following progress in the vaccination process and the gradual lifting of covid-19 measures.
u In view of the lifting of the European Central Bank's (ECB) recommendation that had limited shareholder remuneration until 30 September 2021, the board of directors approved the shareholder remuneration policy to be applied to 2021 results, with the following objectives:
•Total remuneration of 40% of the Group's underlying profit.
•Split in equal parts between cash dividends and share buybacks.
•Two payment cycles: interim distributions around November and, subject to the appropriate corporate and regulatory approvals, a final distribution around May.
In line with this policy, the board decided to make an interim distribution from 2021 earnings amounting to a total value of c. EUR 1.7 billion, equivalent to 40% of underlying profit for the first half of 2021, which will be made in two parts:
•A cash dividend of EUR 4.85 cents per share, to be paid from 2 November 2021.
•A buyback programme that will have a maximum amount of EUR 841 million, equivalent to 20% of the Group's underlying profit in the first half of 2021, already approved by the ECB and included in the inside information disclosed on 6 October 2021.
u In late July, the European Banking Authority (EBA) published the the results of its 2021 EU-wide stress test, which involved the main banks from the EU. According to these results, under the adverse scenario Santander would destroy 240 bps of phased-in CET1 capital compared to the peer average of almost 480 bps and to the average of European banking system of nearly 500 bps. In addition, in the adverse scenario, the cumulative projections of Grupo Santander's income statement show a profit of almost EUR 1 billion. This makes it the only bank among its peers capable of recording a positive accumulated result under this scenario.
 | GROWTH | |||||||
u Digital adoption continued to accelerate: in 9M'21, 54% of sales were made through digital channels (57% in the third quarter) compared to 44% in 9M'20. The number of digital customers increased by more than 1 million in the quarter, reaching 47 million (+13% year-on-year).
u Loyal customers have risen by 2.6 million since September 2020, totalling 25 million, and represented 33% of total active customers.
u Business volumes grew at a good pace in a context of normalization, although high liquidity in the markets continued. In this environment, and excluding the exchange rate impact, loans and advances to customers rose more than EUR 8 billion (+1%) in the quarter and 4% year-on-year. Customer funds were up over EUR 21 billion, +2% in the quarter and +7% year-on-year.
 | PROFITABILITY | |||||||
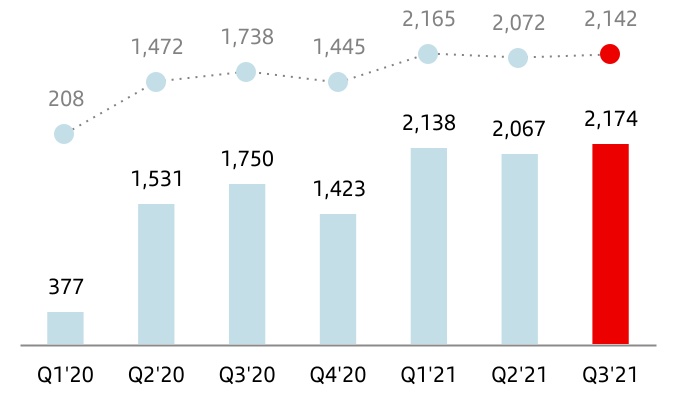
u Attributable profit amounted to EUR 2,174 million in Q3'21, with no net results recorded in the net capital gains and provisions line. Compared to the previous quarter, profit was 5% higher (+3% in constant euros).
u 9M'21 attributable profit was EUR 5,849 million. Excluding the EUR 530 million charge recorded in Q1'21 from bringing forward restructuring costs for the year as a whole, underlying attributable profit stood at EUR 6,379 million, 74% higher than in 9M'20 (+87% in constant euros), underpinned by the positive performance across regions, Digital Consumer Bank (DCB) and the global businesses.
u These results were reflected in higher profitability: underlying RoTE of 12.6% (7.1% in 9M'20), underlying RoRWA was 1.76% (1.01% in 2020) and underlying earnings per share of EUR 0.344 (EUR 0.187 in 2020).
 | STRENGTH | |||||||
u Cost of credit continued to improve reaching 0.90% in 9M'21 (1.28% in FY20 and 0.94% in June 2021). Total loan-loss reserves reached EUR 24.5 bn and total coverage of credit impaired loans increased in the quarter to 74%.
u The fully-loaded CET1 ratio was 11.85%, with an organic generation of 48 bps. On the other hand, it was affected by regulatory impacts and models (-16 bps) and markets and others (-17 bps). On the other hand, the phased-in CET1 ratio rose to 12.26%.
u TNAV per share was EUR 3.99 in September 2021. Including the EUR 2.75 cents dividend paid in May, and the approved in September (EUR 4.85 cents), growth was 1.4% in the quarter and 6.5% year-on-year.
| 6 | | January - September 2021 | ||||||
| GRUPO SANTANDER RESULTS | ||||||||
| Grupo Santander. Summarized income statement | ||||||||||||||||||||||||||
| EUR million | ||||||||||||||||||||||||||
| Change | Change | |||||||||||||||||||||||||
| Q3'21 | Q2'21 | % | % excl. FX | 9M'21 | 9M'20 | % | % excl. FX | |||||||||||||||||||
| Net interest income | 8,458 | 8,240 | 2.6 | 1.5 | 24,654 | 23,975 | 2.8 | 7.4 | ||||||||||||||||||
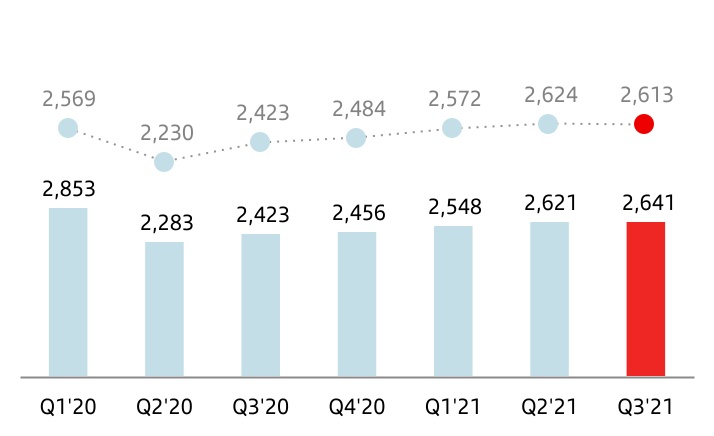
| Net fee income (commission income minus commission expense) | 2,641 | 2,621 | 0.8 | (0.4) | 7,810 | 7,559 | 3.3 | 8.1 | ||||||||||||||||||
| Gains or losses on financial assets and liabilities and exchange differences (net) | 326 | 243 | 34.2 | 31.7 | 1,220 | 1,725 | (29.3) | (26.6) | ||||||||||||||||||
| Dividend income | 95 | 244 | (61.1) | (61.2) | 404 | 322 | 25.5 | 26.2 | ||||||||||||||||||
| Share of results of entities accounted for using the equity method | 132 | 87 | 51.7 | 52.0 | 295 | (90) | — | — | ||||||||||||||||||
| Other operating income / expenses | 279 | (130) | — | — | 243 | (136) | — | — | ||||||||||||||||||
| Total income | 11,931 | 11,305 | 5.5 | 4.3 | 34,626 | 33,355 | 3.8 | 8.4 | ||||||||||||||||||
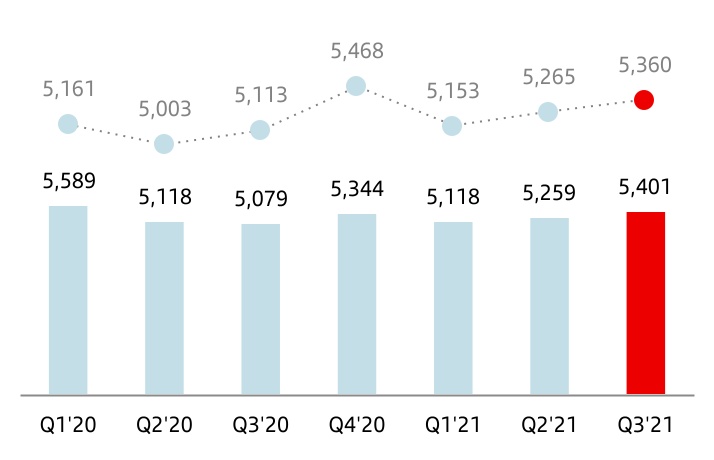
| Operating expenses | (5,401) | (5,259) | 2.7 | 1.8 | (15,778) | (15,786) | (0.1) | 3.3 | ||||||||||||||||||
| Administrative expenses | (4,718) | (4,561) | 3.4 | 2.5 | (13,714) | (13,686) | 0.2 | 3.6 | ||||||||||||||||||
| Staff costs | (2,767) | (2,750) | 0.6 | (0.2) | (8,205) | (8,098) | 1.3 | 4.4 | ||||||||||||||||||
| Other general administrative expenses | (1,951) | (1,811) | 7.7 | 6.7 | (5,509) | (5,588) | (1.4) | 2.4 | ||||||||||||||||||
| Depreciation and amortization | (683) | (698) | (2.1) | (2.9) | (2,064) | (2,100) | (1.7) | 1.4 | ||||||||||||||||||
| Provisions or reversal of provisions | (516) | (531) | (2.8) | (3.4) | (2,006) | (1,014) | 97.8 | 109.5 | ||||||||||||||||||
| Impairment or reversal of impairment of financial assets not measured at fair value through profit or loss (net) | (2,196) | (1,748) | 25.6 | 24.4 | (6,000) | (9,538) | (37.1) | (34.0) | ||||||||||||||||||
| Impairment on other assets (net) | (4) | 8 | — | — | (134) | (10,256) | (98.7) | (98.7) | ||||||||||||||||||
| Gains or losses on non financial assets and investments, net | (9) | 51 | — | — | 43 | 89 | (51.7) | (50.1) | ||||||||||||||||||
| Negative goodwill recognized in results | — | — | — | — | — | 9 | (100.0) | (100.0) | ||||||||||||||||||
| Gains or losses on non-current assets held for sale not classified as discontinued operations | (3) | (14) | (78.6) | (81.9) | (35) | (130) | (73.1) | (73.1) | ||||||||||||||||||
| Profit or loss before tax from continuing operations | 3,802 | 3,812 | (0.3) | (1.9) | 10,716 | (3,271) | — | — | ||||||||||||||||||
| Tax expense or income from continuing operations | (1,251) | (1,331) | (6.0) | (7.7) | (3,725) | (5,020) | (25.8) | (23.6) | ||||||||||||||||||
| Profit from the period from continuing operations | 2,551 | 2,481 | 2.8 | 1.2 | 6,991 | (8,291) | — | — | ||||||||||||||||||
| Profit or loss after tax from discontinued operations | — | — | — | — | — | — | — | — | ||||||||||||||||||
| Profit for the period | 2,551 | 2,481 | 2.8 | 1.2 | 6,991 | (8,291) | — | — | ||||||||||||||||||
| Attributable profit to non-controlling interests | (377) | (414) | (8.9) | (9.3) | (1,142) | (757) | 50.9 | 56.5 | ||||||||||||||||||
| Attributable profit to the parent | 2,174 | 2,067 | 5.2 | 3.3 | 5,849 | (9,048) | — | — | ||||||||||||||||||
EPS (euros) (1) | 0.117 | 0.112 | 4.4 | 0.313 | (0.546) | — | ||||||||||||||||||||
Diluted EPS (euros) (1) | 0.116 | 0.111 | 4.4 | 0.312 | (0.546) | — | ||||||||||||||||||||
| Memorandum items: | ||||||||||||||||||||||||||
| Average total assets | 1,575,975 | 1,557,364 | 1.2 | 1,550,943 | 1,543,361 | 0.5 | ||||||||||||||||||||
| Average stockholders' equity | 85,608 | 83,429 | 2.6 | 83,574 | 91,639 | (8.8) | ||||||||||||||||||||
(1) Data adjusted for the capital increase in December 2020.
January - September 2021 | | 7 | ||||||
| Executive summary | |||||||||||||||||||||||||||||||||||||||||||||||||||||||||||||||||||||||||||||||||||||||||||||||
Profit (9M'21 vs. 9M'20) | Performance (9M'21 vs. 9M'20). In constant euros | ||||||||||||||||||||||||||||||||||||||||||||||||||||||||||||||||||||||||||||||||||||||||||||||
| Strong profit growth across regions and businesses | Higher underlying profit driven by total income, cost control and significantly lower provisions | ||||||||||||||||||||||||||||||||||||||||||||||||||||||||||||||||||||||||||||||||||||||||||||||
| Attributable profit | Underlying attrib. profit | Total income | Costs | Provisions | |||||||||||||||||||||||||||||||||||||||||||||||||||||||||||||||||||||||||||||||||||||||||||
| EUR 5,849 mn | EUR 6,379 mn | ||||||||||||||||||||||||||||||||||||||||||||||||||||||||||||||||||||||||||||||||||||||||||||||
| -EUR 9,048 mn in 9M'20 | EUR 3,658 mn in 9M'20 | +7.6% | +3.7% | -34.5% | |||||||||||||||||||||||||||||||||||||||||||||||||||||||||||||||||||||||||||||||||||||||||||
| Efficiency | Profitability | ||||||||||||||||||||||||||||||||||||||||||||||||||||||||||||||||||||||||||||||||||||||||||||||
| The Group's efficiency ratio improved strongly, mainly driven by Europe | Strong profitability improvement compared to 9M'20 and FY'20. | ||||||||||||||||||||||||||||||||||||||||||||||||||||||||||||||||||||||||||||||||||||||||||||||
| Group | Europe | RoTE | Underlying RoTE | RoRWA | Underlying RoRWA | ||||||||||||||||||||||||||||||||||||||||||||||||||||||||||||||||||||||||||||||||||||||||||
| 45.6% | 50.3% | 11.8% | 12.6% | 1.66% | 1.76% | ||||||||||||||||||||||||||||||||||||||||||||||||||||||||||||||||||||||||||||||||||||||||||
q 1.2 pp vs 9M'20 | q 6.6 pp vs 9M'20 | p 8.5 pp | p 5.5 pp | p 2.8 pp | p 0.8 pp | ||||||||||||||||||||||||||||||||||||||||||||||||||||||||||||||||||||||||||||||||||||||||||
| Changes vs. 9M'20 | |||||||||||||||||||||||||||||||||||||||||||||||||||||||||||||||||||||||||||||||||||||||||||||||
è Results performance compared to 9M'20
The Group presents, both at the total level and for each of the business units, the real changes in euros produced in the income statement, as well as variations excluding the exchange rate effect (FX), on the understanding that the latter provide a better analysis of the Group’s management. For the Group as a whole, exchange rates had a significant impact on revenue (-5 percentage points) and costs (-3 percentage points).
u Total income
Total income of EUR 34,626 million in the first nine months of 2021, up 4% with respect to 9M'20. If the FX impact is excluded, total income increased 8%, with growth in all regions and main countries, except Mexico, showing the strength provided by our geographic and business diversification. Net interest income and net fee income accounted for 94% of total income. By line:
•Net interest income amounted to EUR 24,654 million, 3% higher compared to 9M'20. Stripping out the exchange rate impact, growth was 7%, mainly due to the net effect of higher average lending and deposit volumes and the lower cost of the latter, partly offset by the reduction in revenue from low interest rates, which fell even further in most markets.
| Net interest income | |||||
| EUR million | |||||
 | constant euros | ||||
By country, growth was recorded in the UK (+27%), through decisive management deposit repricing actions (mainly the 1I2I3 current account) as well as higher volumes (especially mortgages), Spain (+4%), driven by margin management; Brazil (+12%), due to greater volumes; and Chile (+12%), due to margin management and inflation.
The US remained flat due to volume pressures mainly due to the disposals made in previous quarters (Puerto Rico and Bluestem portfolio). Excluding these disposals, growth was 7%.
Mexico fell 4%, due to lower average interest rates and a smaller loan portfolio, mainly in corporates.
•Net fee income rose 3% year-on-year to EUR 7,810 million. Excluding the exchange rate impact, they were 8% higher, showing a recovery path from the lows in Q2'20.
Transactional fees continued to be affected by lower activity in early 2021, while those from card turnover and points of sale increased (+25% and +40%, respectively). Asset management and insurance businesses, as well as SCIB, also recorded double-digit growth.
| Net fee income | |||||
| EUR million | |||||
| constant euros | ||||
| 8 | | January - September 2021 | ||||||
Santander Corporate & Investment Banking surged 19% year-on-year driven by strong markets growth and the positive performance in banking businesses. Wealth Management & Insurance rose 11% (including fees ceded to the branch network). Overall, both businesses together accounted for approximately 50% of the Group’s total net fee income (SCIB: 17%; WM&I: 32%).
By region, Europe was up 7%, with generalized increases in all markets except the UK, due to regulatory changes affecting overdrafts since April 2020. North America was stable, affected by the disposals carried out in the US. Excluding them, growth was 7% in the region and 8% in the US. Mexico up 5% driven by transactional fees. South America increased 13% with overall growth in all markets.
•Gains on financial transactions, accounted for 4% of total income and stood at EUR 1,220 million (EUR 1,725 million in the first nine months of 2020), with falls in Spain (-42%), Mexico (-43%), Chile (-31%) and the Corporate Centre. This was due to the favourable impact of foreign exchange hedging, higher portfolio sales and increased market volatility in 2020.
•Dividend income was EUR 404 million, 25% higher than in the same period of 2020 (+26% excluding the exchange rate effect), having recovered several dividend payments, mainly in Europe, following reductions, delays or cancellations last year amid the pandemic.
•The results of entities accounted for using the equity method amounted to EUR 295 million, due to the higher contribution from the entities associated to the Group.
•Other operating income recorded a gain of EUR 243 million compared to a loss of EUR 136 million in the first nine months of 2020 due to higher results from leasing and insurance.
| Total income | |||||
| EUR million | |||||
| constant euros | ||||

u Costs
Operating costs amounted to EUR 15,778 million, in line with the same period last year. Excluding the exchange rate impact, costs rose 4% due to the general upturn in inflation in 2021 and broad-based investments in technology and digital developments, including PagoNxt. Excluding inflation (i.e. in real terms) costs dropped 1%.
The efficiency ratio was 45.6%, improving 1.2 pp versus last year, mainly driven by Europe. This enabled Santander to remain one of the most efficient global banks in the world.
The cost trends by region and market in constant euros were as follows:
•In Europe, costs were 1% lower year-on-year, -3% in real terms (excluding average inflation), making headway in our cost reduction plan. In real terms, falls were recorded in Spain (-9%), the UK (-4%), Portugal (-3%) and Poland rose 1% due to higher personnel expenses. The efficiency ratio in the region stood at 50.3% (-6.6 pp year-on-year).
•In North America, costs rose 8%. In real terms, they were 5% higher driven by digitalization investments, the 5% increase in the US and the 2% fall in Mexico. The efficiency ratio in the region stood at 43.8%.
•In South America, the rise in costs (+9%) was greatly distorted by the very high inflation in Argentina. In real terms, costs reduced 3% in the region: Brazil (-6%), Chile (-1%) and Argentina remained flat. The efficiency ratio in the region stood at 34.6%.
•In Digital Consumer Bank, costs increased 4% due to perimeter and digital transformation investments. In real terms, costs rose 2%. The efficiency ratio stood at 45.4%.
| Operating expenses | |||||
| EUR million | |||||
| constant euros | ||||
January - September 2021 | | 9 | ||||||
u Provisions or reversal of provisions
Provisions (net of provisions reversals) rose to EUR 2,006 million (EUR 1,014 million in 9M'20). This line item includes the charges for restructuring costs, as well as charges related to CHF mortgages in Poland and Digital Consumer Bank (EUR 185 million in 9M'21).
u Impairment or reversal of impairment of financial assets not measured at fair value through profit or loss (net)
Impairment or reversal of impairment on financial assets not measured at fair value through profit or loss (net) was EUR 6,000 million, down 37% year-on-year in euros and 34% in constant euros, mainly from additional provisions recorded in 2020 based on the IFRS 9 forward-looking view and the collective and individual assessments to reflect expected credit losses arising from covid-19.
u Impairment on other assets (net)
Impairment on other assets (net) stood at EUR 134 million. In 9M'20, this line item was EUR 10,256 million due to the valuation adjustment of goodwill of -EUR 10,100 million recorded in the second quarter.
| Net loan-loss provisions | |||||
| EUR million | |||||
| constant euros | ||||
u Gains or losses on non-financial assets and investments (net)
This line item recorded EUR 43 million in the first nine months of 2021, compared to EUR 89 million in the same period of 2020.
u Negative goodwill recognized in results
This line item recorded EUR 0 million in 9M'21 (EUR 9 million in 9M'20).
u Gains or losses on non-current assets held for sale not classified as discontinued operations
This line item, which mainly includes impairment of foreclosed assets recorded and the sale of properties acquired upon foreclosure, totalled -EUR 35 million in the first nine months of 2021, compared to -EUR 130 million in the same period of 2020.
u Profit before tax
Profit before tax amounted to EUR 10,716 million in the first nine months of 2021, increasing from -EUR 3,271 million in the same period of 2020, spurred by growth in total income and lower provisions in 2021 and the valuation adjustment of goodwill in 2020.
u Income tax
Total corporate income tax was EUR 3,725 million (EUR 5,020 million in the first nine months of 2020, which recorded the EUR 2,500 million valuation adjustment to deferred tax assets).
u Attributable profit to non-controlling interests
Attributable profit to non-controlling interests amounted to EUR 1,142 million, up 51% year-on-year (+56% excluding the exchange rate impact).
u Attributable profit to the parent
Attributable profit to the parent amounted to EUR 5,849 million in 9M'21, compared with a loss of EUR 9,048 million in 9M'20.
RoTE stood at 11.8% (3.3% in 9M'20), RoRWA of 1.66% (-1.17% in 9M'20) and earnings per share stood at EUR 0.313 (-EUR 0.546 in 9M'20).
| 10 | | January - September 2021 | ||||||
u Underlying attributable profit to the parent
Attributable profit to the parent recorded in the first nine months of 2021 and 2020 was affected by results that are outside the ordinary course of our business and distort the year-on-year comparison, and are detailed below:
•In 9M'21, these results totalled -EUR 530 million for restructuring costs, fully recorded in Q1'21, as follows: -EUR 293 million in the UK, -EUR 165 million in Portugal, -EUR 16 million in Digital Consumer Bank and -EUR 56 million in the Corporate Centre.
•In 9M'20, these results amounted to -EUR 12,706 million from the valuation adjustment of goodwill ascribed to various Group units (-EUR 10,100 million) and the valuation adjustment to deferred tax assets of the Spanish consolidated fiscal group with an impact of -EUR 2,500 million. In addition, restructuring costs and other provisions had a net impact of -EUR 106 million.
For further information see the 'Alternative performance measures' section of this report.
Excluding these results from the various P&L lines where they are recorded, and incorporating them separately in the net capital gains and provisions line, the adjusted or underlying attributable profit to the parent was EUR 6,379 million in the first nine months of 2021 and EUR 3,658 million in the same period last year.
The Group’s cost of credit (considering the last 12 months) stood at 0.90%.
Considering the first nine months of the year, it was 0.83%, performing better than expected, due to lower provisions in most markets, mainly in the US, Digital Consumer Bank, Brazil and Chile, together with the net releases in the UK.
Before the recording of loan-loss provisions, the Group's underlying net operating income (total income less operating expenses) was EUR 18,848 million, a 5% increase year-on-year +11% excluding the FX impact, with the following performance of the latter by line and region:
By line:
•Total income up primarily driven by net interest income (+7%) and net fee income (+8%), which continued on the path of recovery.
•Costs grew driven by the upturn in inflation. In real terms, broad-based declines across markets except Poland and the US.
By region:
•In Europe, net operating income increased 29% with rises in all markets.
•In North America, net operating income dropped 1%, with a 6% increase in the US and a 10% fall in Mexico. Excluding the disposals mentioned in other sections of this report, growth was 17% in the US and +5% in the region.
•In South America, growth was 12% with rises in Brazil (+14%), Chile (+11%) and Argentina (+17%).
•In Digital Consumer Bank, net operating income increased 4%.
In the first nine months of 2021, the Group’s underlying RoTE was 12.6% (7.1% in 9M'20), underlying RoRWA was 1.76% (1.01% in 9M'20) and underlying earnings per share EUR 0.344 (EUR 0.187 in 9M'20).
| Summarized underlying income statement | ||||||||||||||||||||||||||
| EUR million | Change | Change | ||||||||||||||||||||||||
| Q3'21 | Q2'21 | % | % excl. FX | 9M'21 | 9M'20 | % | % excl. FX | |||||||||||||||||||
| Net interest income | 8,458 | 8,240 | 2.6 | 1.5 | 24,654 | 23,975 | 2.8 | 7.4 | ||||||||||||||||||
| Net fee income | 2,641 | 2,621 | 0.8 | (0.4) | 7,810 | 7,559 | 3.3 | 8.1 | ||||||||||||||||||
Gains (losses) on financial transactions (1) | 326 | 243 | 34.2 | 31.7 | 1,220 | 1,725 | (29.3) | (26.6) | ||||||||||||||||||
| Other operating income | 506 | 201 | 151.7 | 149.8 | 942 | 346 | 172.3 | 178.7 | ||||||||||||||||||
| Total income | 11,931 | 11,305 | 5.5 | 4.3 | 34,626 | 33,605 | 3.0 | 7.6 | ||||||||||||||||||
| Administrative expenses and amortizations | (5,401) | (5,259) | 2.7 | 1.8 | (15,778) | (15,726) | 0.3 | 3.7 | ||||||||||||||||||
| Net operating income | 6,530 | 6,046 | 8.0 | 6.5 | 18,848 | 17,879 | 5.4 | 11.1 | ||||||||||||||||||
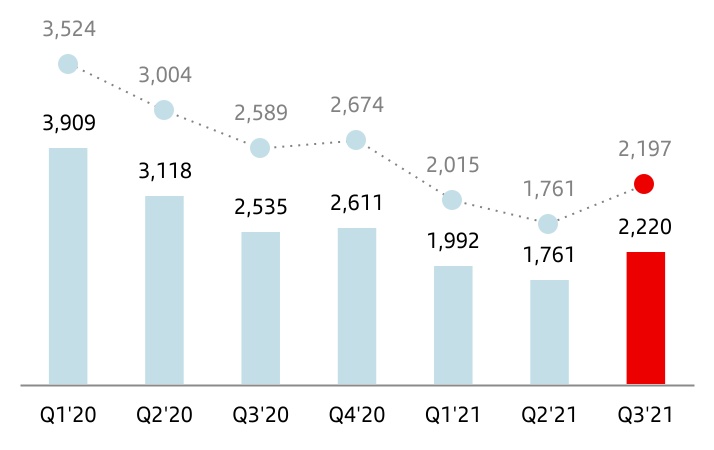
| Net loan-loss provisions | (2,220) | (1,761) | 26.1 | 24.8 | (5,973) | (9,562) | (37.5) | (34.5) | ||||||||||||||||||
| Other gains (losses) and provisions | (506) | (470) | 7.7 | 7.1 | (1,443) | (1,301) | 10.9 | 14.5 | ||||||||||||||||||
| Profit before tax | 3,804 | 3,815 | (0.3) | (1.9) | 11,432 | 7,016 | 62.9 | 73.6 | ||||||||||||||||||
| Tax on profit | (1,253) | (1,334) | (6.1) | (7.7) | (3,911) | (2,596) | 50.7 | 60.8 | ||||||||||||||||||
| Profit from continuing operations | 2,551 | 2,481 | 2.8 | 1.2 | 7,521 | 4,420 | 70.2 | 81.1 | ||||||||||||||||||
| Net profit from discontinued operations | — | — | — | — | — | — | — | (100.0) | ||||||||||||||||||
| Consolidated profit | 2,551 | 2,481 | 2.8 | 1.2 | 7,521 | 4,420 | 70.2 | 81.1 | ||||||||||||||||||
| Non-controlling interests | (377) | (414) | (8.9) | (9.7) | (1,142) | (762) | 49.9 | 55.4 | ||||||||||||||||||
| Net capital gains and provisions | — | — | — | (36.1) | (530) | (12,706) | (95.8) | (95.8) | ||||||||||||||||||
| Attributable profit to the parent | 2,174 | 2,067 | 5.2 | 3.3 | 5,849 | (9,048) | — | — | ||||||||||||||||||
Underlying attributable profit to the parent (2) | 2,174 | 2,067 | 5.2 | 3.3 | 6,379 | 3,658 | 74.4 | 86.6 | ||||||||||||||||||
(1) Includes exchange differences.
(2) Excludes net capital gains and provisions.
January - September 2021 | | 11 | ||||||
è Results performance compared to the previous quarter
In the third quarter, attributable profit to the parent amounted to EUR 2,174 million, with no net results recorded in the net capital gains and provisions line.
Attributable profit to the parent recorded a 5% increase in euros (+3% in constant euros) compared to the second quarter.
Attributable profit to the parent and underlying attributable profit, both in the second and third quarters, recorded the same amount as there were no items recorded outside the ordinary performance of our business.
The performance of the main lines of the income statement in constant euros was as follows:
•Total income was 4% higher quarter-on-quarter driven by the positive performance by line.
Net interest income grew 1%, maintaining its upward trend; net fee income remained broadly stable, affected by some seasonality; gains on financial increased mainly driven by SCIB; and other operating income rose benefitting from the SRF contribution recorded in the second quarter.
| Net operating income | |||||
| EUR million | |||||
| constant euros | ||||
•Continued rigorous expense management. However, the continued upturn in inflation in Q3 (especially in North and South America), and the signing and update of collective labour agreements in Brazil and Argentina, led to a 2% rise in the Group. In Europe, decreases were recorded in Spain, Portugal and the UK, on the back of the ongoing efficiency programmes.
•Net loan-loss provisions increased 25% mainly due to the US (positive net charge-offs recorded in Q2), the UK, which registered releases in the second quarter, and Brazil, due to higher volumes and growth in retail.
•Other gains (losses) and provisions recorded a -EUR 31 million charge related to CHF mortgages in Poland and Digital Consumer Bank.
| Underlying attributable profit to the parent* | |||||
| EUR million | |||||
| constant euros | ||||
(*) Excluding net capital gains and provisions.
| 12 | | January - September 2021 | ||||||
| Grupo Santander. Condensed balance sheet | |||||||||||||||||
| EUR million | |||||||||||||||||
| Change | |||||||||||||||||
| Assets | Sep-21 | Sep-20 | Absolute | % | Dec-20 | ||||||||||||
| Cash, cash balances at central banks and other demand deposits | 191,035 | 148,175 | 42,860 | 28.9 | 153,839 | ||||||||||||
| Financial assets held for trading | 122,967 | 117,654 | 5,313 | 4.5 | 114,945 | ||||||||||||
| Debt securities | 30,834 | 34,107 | (3,273) | (9.6) | 37,894 | ||||||||||||
| Equity instruments | 14,586 | 7,235 | 7,351 | 101.6 | 9,615 | ||||||||||||
| Loans and advances to customers | 3,651 | 247 | 3,404 | — | 296 | ||||||||||||
| Loans and advances to central banks and credit institutions | 17,246 | — | 17,246 | — | 3 | ||||||||||||
| Derivatives | 56,650 | 76,065 | (19,415) | (25.5) | 67,137 | ||||||||||||
| Financial assets designated at fair value through profit or loss | 42,126 | 67,007 | (24,881) | (37.1) | 53,203 | ||||||||||||
| Loans and advances to customers | 22,930 | 29,215 | (6,285) | (21.5) | 24,673 | ||||||||||||
| Loans and advances to central banks and credit institutions | 11,876 | 30,850 | (18,974) | (61.5) | 21,617 | ||||||||||||
| Other (debt securities an equity instruments) | 7,320 | 6,942 | 378 | 5.4 | 6,913 | ||||||||||||
| Financial assets at fair value through other comprehensive income | 109,570 | 117,461 | (7,891) | (6.7) | 120,953 | ||||||||||||
| Debt securities | 98,016 | 105,574 | (7,558) | (7.2) | 108,903 | ||||||||||||
| Equity instruments | 2,690 | 3,075 | (385) | (12.5) | 2,783 | ||||||||||||
| Loans and advances to customers | 8,864 | 8,812 | 52 | 0.6 | 9,267 | ||||||||||||
| Loans and advances to central banks and credit institutions | — | — | — | — | — | ||||||||||||
| Financial assets measured at amortised cost | 1,011,994 | 950,571 | 61,423 | 6.5 | 958,378 | ||||||||||||
| Debt securities | 34,079 | 27,316 | 6,763 | 24.8 | 26,078 | ||||||||||||
| Loans and advances to customers | 922,867 | 872,440 | 50,427 | 5.8 | 881,963 | ||||||||||||
| Loans and advances to central banks and credit institutions | 55,048 | 50,815 | 4,233 | 8.3 | 50,337 | ||||||||||||
| Investments in subsidiaries, joint ventures and associates | 7,684 | 7,679 | 5 | 0.1 | 7,622 | ||||||||||||
| Tangible assets | 32,446 | 33,277 | (831) | (2.5) | 32,735 | ||||||||||||
| Intangible assets | 16,246 | 15,698 | 548 | 3.5 | 15,908 | ||||||||||||
| Goodwill | 12,645 | 12,359 | 286 | 2.3 | 12,471 | ||||||||||||
| Other intangible assets | 3,601 | 3,339 | 262 | 7.8 | 3,437 | ||||||||||||
| Other assets | 44,227 | 56,720 | (12,493) | (22.0) | 50,667 | ||||||||||||
| Total assets | 1,578,295 | 1,514,242 | 64,053 | 4.2 | 1,508,250 | ||||||||||||
| Liabilities and shareholders' equity | |||||||||||||||||
| Financial liabilities held for trading | 80,147 | 88,128 | (7,981) | (9.1) | 81,167 | ||||||||||||
| Customer deposits | 4,809 | — | 4,809 | — | — | ||||||||||||
| Debt securities issued | — | — | — | — | — | ||||||||||||
| Deposits by central banks and credit institutions | 5,350 | — | 5,350 | — | — | ||||||||||||
| Derivatives | 55,086 | 73,044 | (17,958) | (24.6) | 64,469 | ||||||||||||
| Other | 14,902 | 15,084 | (182) | (1.2) | 16,698 | ||||||||||||
| Financial liabilities designated at fair value through profit or loss | 47,900 | 59,459 | (11,559) | (19.4) | 48,038 | ||||||||||||
| Customer deposits | 36,694 | 40,469 | (3,775) | (9.3) | 34,343 | ||||||||||||
| Debt securities issued | 5,401 | 4,362 | 1,039 | 23.8 | 4,440 | ||||||||||||
| Deposits by central banks and credit institutions | 5,805 | 14,628 | (8,823) | (60.3) | 9,255 | ||||||||||||
| Other | — | — | — | — | — | ||||||||||||
| Financial liabilities measured at amortized cost | 1,317,759 | 1,237,314 | 80,445 | 6.5 | 1,248,188 | ||||||||||||
| Customer deposits | 867,531 | 802,430 | 65,101 | 8.1 | 814,967 | ||||||||||||
| Debt securities issued | 238,882 | 240,195 | (1,313) | (0.5) | 230,829 | ||||||||||||
| Deposits by central banks and credit institutions | 180,221 | 169,646 | 10,575 | 6.2 | 175,424 | ||||||||||||
| Other | 31,125 | 25,043 | 6,082 | 24.3 | 26,968 | ||||||||||||
| Liabilities under insurance contracts | 779 | 970 | (191) | (19.7) | 910 | ||||||||||||
| Provisions | 9,815 | 10,118 | (303) | (3.0) | 10,852 | ||||||||||||
| Other liabilities | 26,271 | 26,943 | (672) | (2.5) | 27,773 | ||||||||||||
| Total liabilities | 1,482,671 | 1,422,932 | 59,739 | 4.2 | 1,416,928 | ||||||||||||
| Shareholders' equity | 118,380 | 114,493 | 3,887 | 3.4 | 114,620 | ||||||||||||
| Capital stock | 8,670 | 8,309 | 361 | 4.3 | 8,670 | ||||||||||||
| Reserves | 104,702 | 116,894 | (12,192) | (10.4) | 114,721 | ||||||||||||
| Attributable profit to the Group | 5,849 | (9,048) | 14,897 | — | (8,771) | ||||||||||||
| Less: dividends | (841) | (1,662) | 821 | (49.4) | — | ||||||||||||
| Other comprehensive income | (32,992) | (32,747) | (245) | 0.7 | (33,144) | ||||||||||||
| Minority interests | 10,236 | 9,564 | 672 | 7.0 | 9,846 | ||||||||||||
| Total equity | 95,624 | 91,310 | 4,314 | 4.7 | 91,322 | ||||||||||||
| Total liabilities and equity | 1,578,295 | 1,514,242 | 64,053 | 4.2 | 1,508,250 | ||||||||||||
January - September 2021 | | 13 | ||||||
| GRUPO SANTANDER BALANCE SHEET | ||||||||
| Executive summary * | ||||||||||||||||||||||||||||||||||||||||||||||||||||||||||||||||||||||||||||||||
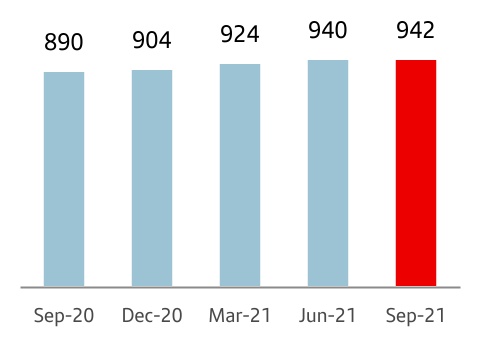
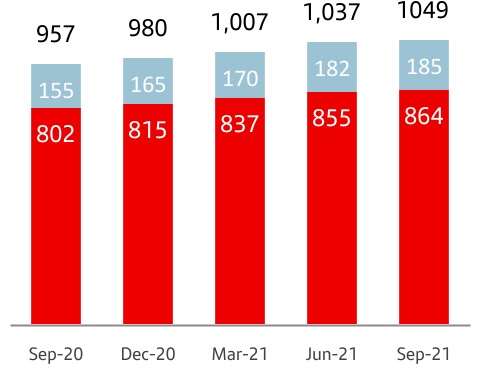
Loans and advances to customers (excl. reverse repos) | Customer funds (deposits excl. repos + mutual funds) | |||||||||||||||||||||||||||||||||||||||||||||||||||||||||||||||||||||||||||||||
| Credit normalization following the uptick at the beginning of the pandemic, due to high liquidity in the system | Strong increase in customer funds benefiting from the higher propensity to save derived from the health crisis | |||||||||||||||||||||||||||||||||||||||||||||||||||||||||||||||||||||||||||||||
| 942 | p 1% QoQ | p 4% YoY | 1,049 | p 2% QoQ | p 7% YoY | |||||||||||||||||||||||||||||||||||||||||||||||||||||||||||||||||||||||||||
| billion | billion | |||||||||||||||||||||||||||||||||||||||||||||||||||||||||||||||||||||||||||||||
è By segment (YoY change): | è By product (YoY change): | |||||||||||||||||||||||||||||||||||||||||||||||||||||||||||||||||||||||||||||||
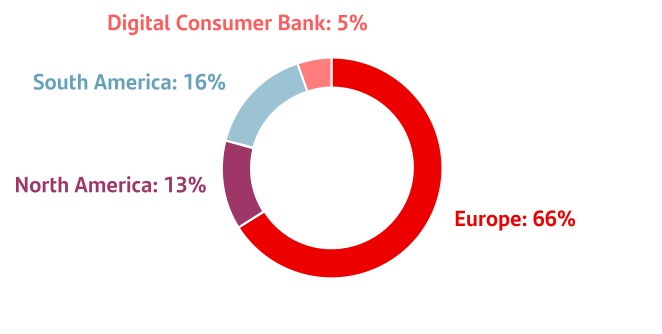
| Growth backed by individuals and large corporates | Of note were demand deposits (which account for 66% of customer funds) and mutual funds | |||||||||||||||||||||||||||||||||||||||||||||||||||||||||||||||||||||||||||||||
| Individuals | SMEs and corporates | CIB and institutions | Demand | Time | Mutual funds | |||||||||||||||||||||||||||||||||||||||||||||||||||||||||||||||||||||||||||
| +4% | -2% | +9% | +10% | -9% | +17% | |||||||||||||||||||||||||||||||||||||||||||||||||||||||||||||||||||||||||||
| (*) Changes in constant euros | ||||||||||||||||||||||||||||||||||||||||||||||||||||||||||||||||||||||||||||||||
è Loans and advances to customers
Loans and advances to customers stood at EUR 958,311 million in September, virtually unchanged in the quarter and 5% higher year-on-year.
The Group uses gross loans and advances to customers excluding reverse repos (EUR 941,739 million) for the purpose of analyzing traditional commercial banking loans. In addition, in order to facilitate the analysis of the Group's management, the comments below do not include the exchange rate impact.
In the third quarter, gross loans and advances to customers excluding reverse repos and without the exchange rate impact, increased 1%, as follows:
•In Europe Portugal and Poland increased while Spain and the UK had no material change. The region as a whole increased 1%.
•North America volumes remained flat both in the US and Mexico.
•South America growth of 3% with all markets increasing, notably Argentina and Uruguay (+5% each) and Chile (+3%).
•Digital Consumer Bank (DCB) was 1% lower, due to lower new auto lending. Openbank grew 10%.
Compared to September 2020, gross loans and advances to customers (excluding reverse repos and the FX impact) grew 4%, as follows:
•In Europe, 3% growth with all markets increasing except for Spain that remained flat. Rises were recorded in Portugal (+4%), driven by mortgages and SMEs, Poland (+4%) due to mortgages, SMEs and CIB, and the UK (+1%), driven by residential mortgage activity. Growth was also recorded in SCIB branches.
•In North America, Mexico decreased 2% weighed down by the fall in corporates, partly offset by the increase in individuals (mainly mortgages). Balances in the US increased 1%, even with the impact of the Bluestem portfolio disposal (+2% excluding this impact). The region as a whole recorded no material change (+1% excluding the aforementioned disposal).
•Growth in South America was 10%. Argentina was up 33% mainly driven by SMEs and cards, Brazil +13% with positive performance in all segments and Uruguay rose 12%. Chile remained largely stable, as growth in mortgages was offset by the fall in corporates and consumer lending.
•Digital Consumer Bank dropped 1% affected by the lower activity at the begining of the year due to the lockdown measures. Mixed performance across countries, with growth recorded in the UK, France and Italy. Openbank increased 41%.
As of September 2021, gross loans and advances to customers excluding reverse repos maintained a balanced structure: individuals (62%), SMEs and corporates (22%) and CIB (15%).
| Gross loans and advances to customers (excl. reverse repos) | |||||
| EUR billion | |||||
| Gross loans and advances to customers (excl. reverse repos) | ||
| % operating areas. September 2021 | ||
| +6 | % | * | |||
| Sep-21 / Sep-20 | |||||
 (*) In constant EUR: +4%
| 14 | | January - September 2021 | ||||||
è Customer funds
Customer deposits amounted to EUR 909,034 million in September 2021, increasing 2% quarter-on-quarter and 8% year-on-year.
The Group uses customer funds (customer deposits excluding repos, plus mutual funds) for the purpose of analyzing traditional retail banking funds, which amounted to EUR 1,049,188 million.
•In the quarter, customer funds increased 2%, with the following performance excluding exchange rate impacts:
–By product, rises were recorded in demand deposits (+2%), time deposits (+1%) and mutual funds (+3%).
–By primary segment, customer funds increased in all regions and most countries, notably in Argentina (+15%), Chile (+3%) and the US (+2%). Digital Consumer Bank rose 1%.
•Compared to September 2020, customer funds were up 7%, excluding the exchange rate impact:
–By product, deposits excluding repos rose 6%. Demand deposits grew 10% with rises in all markets, and time deposits fell 9%, with broad-based declines except Brazil, Chile and Argentina. Mutual funds surged 17% underpinned by net inflows and markets recovery.
–By country, customer funds increased in all regions and countries. Of note was double-digit growth in Argentina (+53%), Chile (+17%), the US and Uruguay (both +13%) and Poland (+11%). More moderate growth was recorded in Portugal (+7%), Spain (+6%), Mexico (+5%), the UK and Brazil (+3% each).
–Positive performance also in DCB, which rose 11%. Openbank increased 27%.
With this performance, the weight of demand deposits as a percentage of total customer funds rose 1 pp in the last 12 months to 66%, which resulted in a better cost of deposits.
In addition to capturing customer deposits, the Group, for strategic reasons, maintains a selective policy of issuing securities in the international fixed income markets and strives to adapt the frequency and volume of its market operations to the structural liquidity needs of each unit, as well as to the receptiveness of each market.
In the first nine months of 2021, the Group issued:
•Medium- and long-term senior debt amounting to EUR 9,369 million and EUR 178 million of covered bonds placed in the market.
•There were EUR 16,433 million of securitizations placed in the market.
•In order to strengthen the Group’s situation, issuances to meet the TLAC requirement amounting to EUR 12,259 million (EUR 9,676 million of senior non-preferred; EUR 2,583 million of preferred).
•Maturities of medium- and long-term debt of EUR 20,516 million.
The net loan-to-deposit ratio was 105% (108% in September 2020). The ratio of deposits plus medium- and long-term funding to the Group’s loans was 117%, underscoring the comfortable funding structure.
The Group's access to wholesale funding markets as well as the cost of issuances depends, in part, on the ratings of the rating agencies.
The ratings of Banco Santander, S.A. by the main rating agencies were: Fitch (long-term senior non-preferred debt at A- and short-term at F2), Moody's (A2 for long term debt and P-1 for short-term), Standard & Poor’s (A for long term debt and A-1 for short term) and DBRS (A high for long term debt and R-1 Middle for short-term), in all cases with a stable outlook. During the year, Moody's and DBRS confirmed their outlook, while Fitch and Standard & Poor's upgraded their outlooks from negative to stable.
While sometimes the methodology applied by the agencies limits a bank's rating to the sovereign rating assigned to the country where it is headquartered. Banco Santander, S.A. is still rated above the sovereign debt rating of the Kingdom of Spain by Moody’s and DBRS and at the same level by Fitch and S&P, which demonstrates our financial strength and diversification.
| Customer funds | ||
| EUR billion | ||
| Customer funds | ||
| % operating areas. September 2021 | ||
| +10 | % | * | ||||||
| +19 | % | |||||||
| +8 | % | |||||||
•Total | ||||||||
•Mutual funds | ||||||||
•Deposits exc. repos | ||||||||
| Sep-21 / Sep-20 | ||||||||
(*) In constant EUR: +7%
January - September 2021 | | 15 | ||||||
| SOLVENCY RATIOS | ||||||||
| Executive summary | ||||||||||||||||||||||||||||||||||||||||||||||||||||||||||||||||||||||||||||||||||||||||||||||||||
| Fully-loaded capital ratio | Fully-loaded CET1 ratio | |||||||||||||||||||||||||||||||||||||||||||||||||||||||||||||||||||||||||||||||||||||||||||||||||
| The fully-loaded CET1 ratio was at the top of our 11-12% target range, following a strong quarterly increase | In the quarter, strong organic generation driven by profit and RWA management | |||||||||||||||||||||||||||||||||||||||||||||||||||||||||||||||||||||||||||||||||||||||||||||||||
 | Organic generation | +48 bps | ||||||||||||||||||||||||||||||||||||||||||||||||||||||||||||||||||||||||||||||||||||||||||||||||
| TNAV per share | ||||||||||||||||||||||||||||||||||||||||||||||||||||||||||||||||||||||||||||||||||||||||||||||||||
TNAV per share was EUR 3.99, 1.4% higher quarter-on-quarter and +6.5% year-on-year including dividends | ||||||||||||||||||||||||||||||||||||||||||||||||||||||||||||||||||||||||||||||||||||||||||||||||||
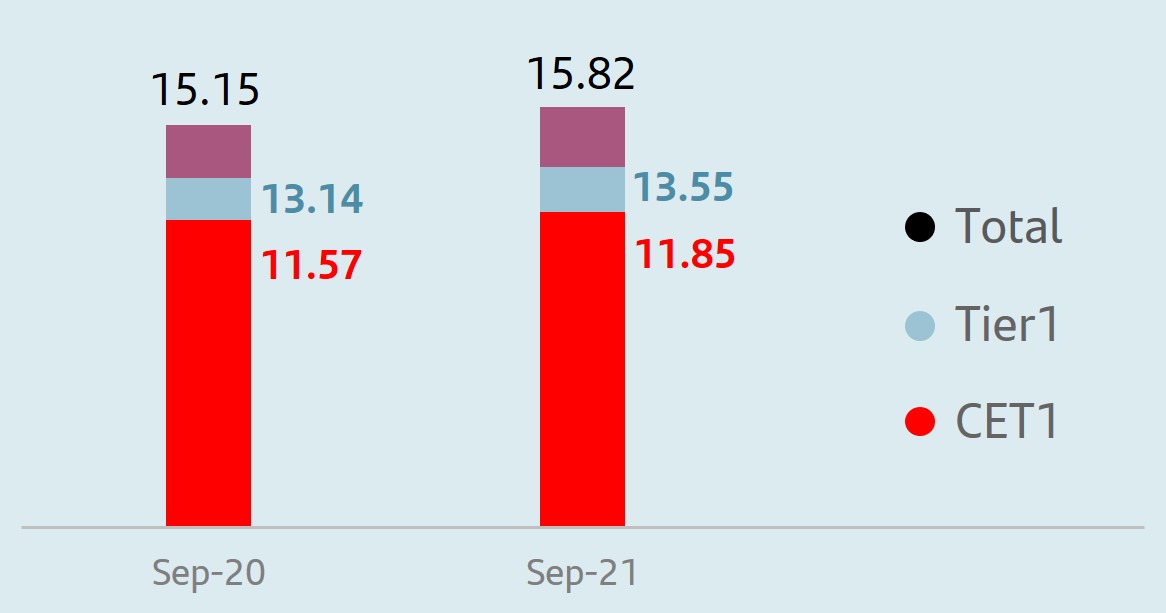
At the end of the quarter, the total fully-loaded capital ratio stood at 15.82% and the fully-loaded CET1 ratio at 11.85%, having increased 15 pp in the quarter.
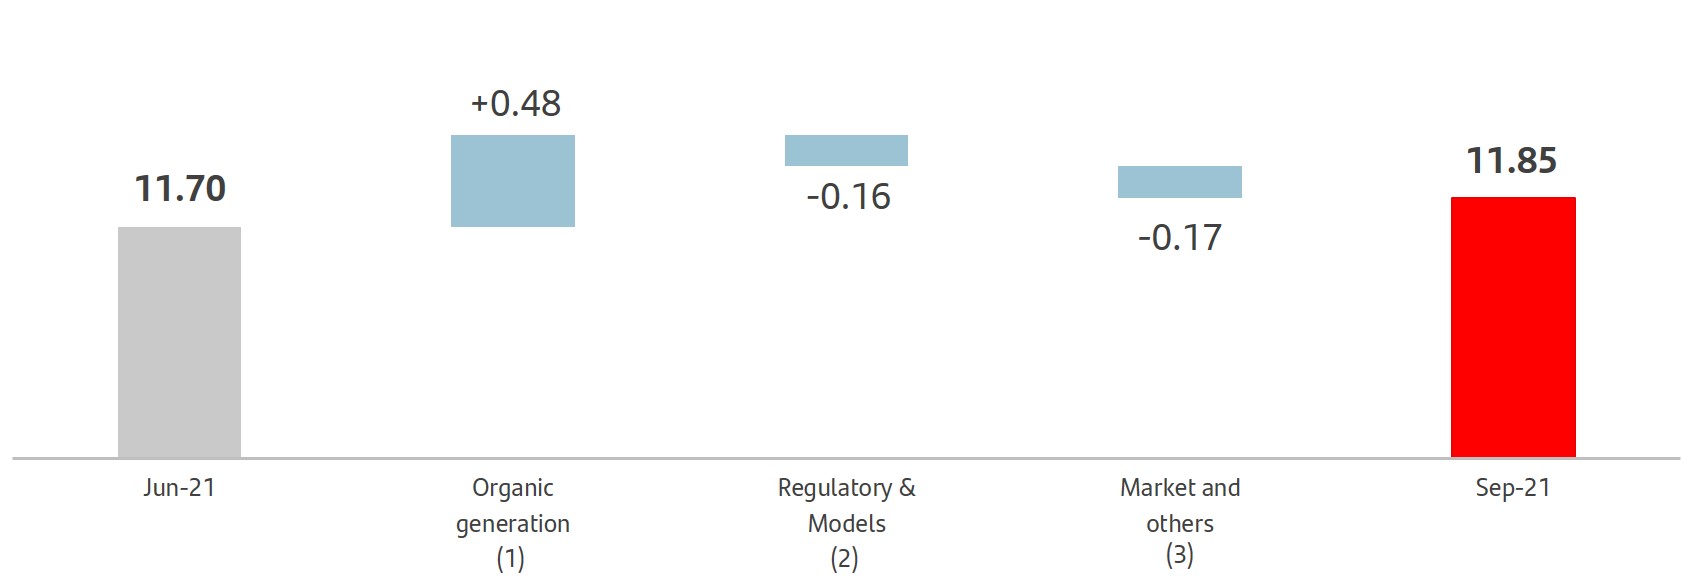
This growth is driven by strong organic generation (+48 bps), due to the profit in the quarter and a 11 bp uplift from the decrease in risk-weighted assets (increased securitizations and optimization exercises).
Additionally in the quarter there was a 16 bp reduction stemming from regulatory and model impacts (market risk, NPL backstop, New Default Definition anticipation) and -17 bps from other concepts, mainly market performance.
Applying the IFRS 9 transitional arrangements, the phased-in CET1 ratio was 12.26% and the total phased-in capital ratio was 16.20%. We have a strong capital base, comfortably meeting the minimum levels required by the European Central Bank on a consolidated basis (13.01% for the total capital ratio and 8.86% for the CET1 ratio). This results in a CET1 management buffer of 340 bps, compared to the pre-covid-19 buffer of 189 bps.
The fully-loaded leverage ratio stood at 5.05%, and the phased-in at 5.20%.
Finally, the TNAV per share in Q3'21 was EUR 3.99, a 1.4% increase quarter-on-quarter and a 6.5% increase year-on-year. These growth rates include the EUR 4.85 cent dividend to be paid in November, but which has already been deducted from shareholder's equity in September, and the EUR 2.75 cents paid last May.
| Eligible capital. September 2021 | ||||||||
| EUR million | ||||||||
| Fully-loaded | Phased-in* | |||||||
| CET1 | 68,467 | 70,787 | ||||||
| Basic capital | 78,264 | 80,897 | ||||||
| Eligible capital | 91,423 | 93,537 | ||||||
| Risk-weighted assets | 577,790 | 577,209 | ||||||
| CET1 capital ratio | 11.85 | 12.26 | ||||||
| Tier 1 capital ratio | 13.55 | 14.02 | ||||||
| Total capital ratio | 15.82 | 16.20 | ||||||
| Fully-loaded CET1 ratio performance | ||
| % | ||
 | ||
1.No net impact from shareholder remuneration in Q3 as the dividend accrual in September (corresponding to 20% of 9M’21 underlying profit plus the total amount of the first share buyback already approved) is equivalent to the accrual made in H1'21 (50% of H1’21 underlying profit).
2.Market risk, NPL backstop, New Default Definition anticipation.
3.Mainly HTC&S.
(*) The phased-in ratio includes the transitory treatment of IFRS 9, calculated in accordance with article 473 bis of the Capital Requirements Regulation (CRR) and subsequent modifications introduced by Regulation 2020/873 of the European Union. Total phased-in capital ratios include the transitory treatment according to chapter 2, title 1, part 10 of the CRR.
| 16 | | January - September 2021 | ||||||
| STRESS TEST | ||||||||
u In late July, the European Banking Authority (EBA) published the results of its 2021 EU-wide stress test, which involved the main banks from the EU.
This exercise assesses the resilience of these banks' main balance sheet and income statement items under two different macroeconomic scenarios (baseline and adverse).
To this end, the balance sheets at the end of 2020 were taken as a starting point and the expected behaviour of business models was compared in order to gauge the expected losses and the ability of the balance sheet to withstand such losses without requiring external support.
On this occasion, as with previous exercises, there was no minimum capital threshold to meet. Instead, results will be taken into account when determining the SREP requirements.
The baseline scenario assumes the most likely economic performance according to the models used by the EBA. On the other hand, the very unlikely adverse scenario assumes a severe deterioration in both macroeconomic and global financial market conditions.
This year, the scenarios used to project the evolution of the Group's main businesses were as follows:
| Gross Domestic Product (GDP) | |||||||||||||||||||||||||||||||||||||||||||||||
| Change (%) | |||||||||||||||||||||||||||||||||||||||||||||||
 | Eurozone |  | UK |  | US |  | Brazil | ||||||||||||||||||||||||||||||||||||||||
| 2021 | 2021-23 | 2021 | 2021-23 | 2021 | 2021-23 | 2021 | 2021-23 | ||||||||||||||||||||||||||||||||||||||||
| Baseline scenario | 3.9 | % | 11.0 | % | 5.9 | % | 11.0 | % | 3.1 | % | 8.0 | % | 2.8 | % | 8.0 | % | |||||||||||||||||||||||||||||||
| Adverse scenario | -1.5 | % | -4.0 | % | -3.6 | % | -4.0 | % | -3.5 | % | -4.0 | % | -5.2 | % | -5.0 | % | |||||||||||||||||||||||||||||||
 | Santander: resilience of our income statement was reflected in greater capital stability | ||||
In the last thirteen years, the Group has been submitted to eight stress tests, in all of which it has demonstrated the strength of its business model and, consequently, that its solvency levels would be sufficient to face the most severe macroeconomic scenarios.
Our geographic and business diversification enables us to have more stable and non-interrelated sources of income, so that even if the macroeconomic situation were to deteriorate globally, we would be capable of generating profit for our shareholders and thereby ensure an adequate capital position in line with regulatory requirements.
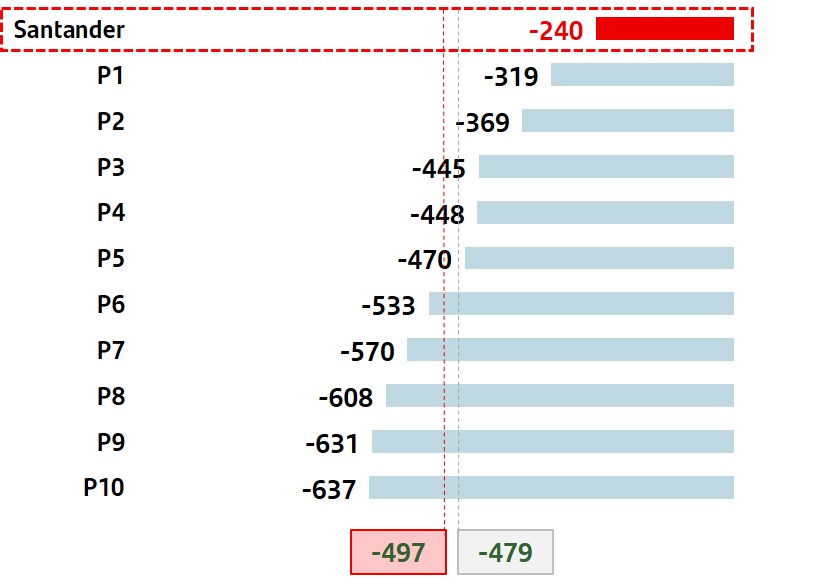
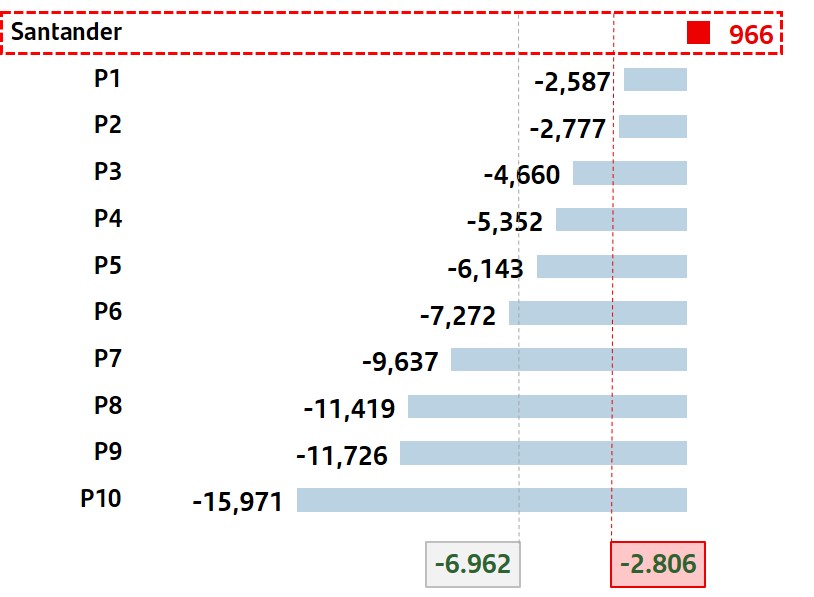
According to the results obtained in this stress test, under the adverse scenario Santander would destroy 240 bps of phased-in
CET1 capital compared to the peer average of almost 480 bps and to the average of European banking system of nearly 500 bps.
This implies that, in terms of legal enforceability, the Group would have a solvency position 30 bps better than the average of its European peers.
It is also worth noting that even in the adverse scenario, the cumulative projections of the Group's income statement show a profit of almost EUR 1 billion. This makes it the only bank among its peers capable of avoiding a negative accumulated result under this scenario.
| Phased-in CET1 ratio 2020 vs. 2023 | |||||
| Adverse scenario. Basis points | |||||
| Profit after tax (accumulated 3 years) | |||||
| Adverse scenario. EUR million | |||||
| Peer average | System | ||||||||||||||||||||||
January - September 2021 | | 17 | ||||||
| RISK MANAGEMENT | ||||||||
| Executive summary | ||||||||||||||||||||||||||||||||||||||||||||||||||
| Credit risk | Market risk | |||||||||||||||||||||||||||||||||||||||||||||||||
| Credit quality indicators maintained the positive trend of the first half of the year | Market risk profile remained low, with stable VaR in a context of economic recovery amid increased volatility | |||||||||||||||||||||||||||||||||||||||||||||||||
Cost of credit2 | NPL ratio | Coverage ratio | ||||||||||||||||||||||||||||||||||||||||||||||||
| 0.90% | 3.18% | 74% | Q3'21 | Average VaR | EUR 10.6 million | |||||||||||||||||||||||||||||||||||||||||||||
q 4 bps vs Q2'21 | q 4 bps vs Q2'21 | p 1 pp vs Q2'21 | ||||||||||||||||||||||||||||||||||||||||||||||||
| Structural and liquidity risk | Operational risk | |||||||||||||||||||||||||||||||||||||||||||||||||
| Robust and diversified liquidity buffer, with ratios well above regulatory limits | Losses continued to be within expected levels and were lower than Q2'21 in relative terms by Basel categories | |||||||||||||||||||||||||||||||||||||||||||||||||
LCR 164% 0 pp vs Q2'21 | ||||||||||||||||||||||||||||||||||||||||||||||||||
u Credit risk management
As of September 2021, Grupo Santander’s NPL ratio stood at 3.18%, a 4 bp decrease compared to June 2021 and a 3 bp increase year-on-year. The reduction in the quarter was mainly due to the positive performance in Europe with a reduction in its NPL ratio of 16 bps vs. Q2'21. This was partially offset by the increases in North and South America, as their NPL ratio increased by 27 bps and 2 bps, respectively, vs. the previous quarter.
Credit impaired loans amounted to EUR 33,046 million, in line with the previous quarter (in constant euros), while our loan book grew by 1% quarter-on-quarter.
Regarding loan-loss provisions, they amounted to EUR 2,220 million in the third quarter, a 25% increase vs. Q2’21 in constant euros, mainly explained by seasonality and normalization trends after stimulus policies deployed by governments to fight the effects of the pandemic, especially in the US, which are gradually starting to recede.
Considering the first nine months of the year, loan-loss provisions amounted to EUR 5,973 million, a 34% increase in constant euros, on a year-on-year basis, explained by provisions made in 2020 to cover the potential additional losses that could arise as a result of the covid-19 pandemic.
The Group's cost of credit stood at 0.90%, a 4 bp reduction compared to the previous quarter, and -37 bps year-on-year, supported by the good performance of the portfolio and the previously explained additional provisions in 2020.
Total loan-loss reserves in the third quarter stood at EUR 24,462 million, a 2% increase, in constant euros, compared to the previous quarter, with the total coverage of credit impaired loans at 74%, a 1 pp increase compared to the previous quarter.
A significant part of our portfolios in Spain and the UK has real estate collateral, which requires lower coverage levels.
| Key metrics performance by geographic area | |||||||||||||||||||||||||||||||||||||||||
Loan-loss provisions 1 | Cost of credit (%) 2 | NPL ratio (%) | Total coverage ratio (%) | ||||||||||||||||||||||||||||||||||||||
| 9M'21 | Chg (%) / 9M'20 | 9M'21 | Chg (bps) / 9M'20 | 9M'21 | Chg (bps) / 9M'20 | 9M'21 | Chg (pp) / 9M'20 | ||||||||||||||||||||||||||||||||||
| Europe | 1,877 | (22.5) | 0.48 | 0 | 3.15 | (14) | 51.1 | 2.4 | |||||||||||||||||||||||||||||||||
| Spain | 1,390 | 0.0 | 1.01 | 21 | 5.99 | 1 | 48.8 | 2.8 | |||||||||||||||||||||||||||||||||
| United Kingdom | (67) | — | 0.01 | (25) | 1.27 | (6) | 36.6 | (5.1) | |||||||||||||||||||||||||||||||||
| Portugal | 95 | (37.6) | 0.35 | (7) | 3.44 | (81) | 75.5 | 11.3 | |||||||||||||||||||||||||||||||||
| Poland | 161 | (33.7) | 0.82 | (17) | 4.34 | (24) | 74.6 | 3.8 | |||||||||||||||||||||||||||||||||
| North America | 1,095 | (63.6) | 1.46 | (161) | 2.56 | 59 | 139.3 | (62.3) | |||||||||||||||||||||||||||||||||
| USA | 450 | (79.8) | 1.06 | (202) | 2.36 | 51 | 161.5 | (67.3) | |||||||||||||||||||||||||||||||||
| Mexico | 645 | (16.9) | 2.69 | (28) | 3.14 | 80 | 90.1 | (42.5) | |||||||||||||||||||||||||||||||||
| South America | 2,384 | (17.8) | 2.52 | (97) | 4.38 | (2) | 98.8 | 1.5 | |||||||||||||||||||||||||||||||||
| Brazil | 1,980 | (9.7) | 3.60 | (98) | 4.72 | 8 | 111.8 | (3.1) | |||||||||||||||||||||||||||||||||
| Chile | 266 | (48.0) | 0.89 | (69) | 4.36 | (40) | 64.1 | 4.4 | |||||||||||||||||||||||||||||||||
| Argentina | 88 | (36.4) | 3.51 | (203) | 3.85 | 98 | 149.3 | (37.0) | |||||||||||||||||||||||||||||||||
| Digital Consumer Bank | 449 | (40.7) | 0.57 | (22) | 2.15 | (14) | 112.8 | 2.3 | |||||||||||||||||||||||||||||||||
| TOTAL GROUP | 5,973 | (34.5) | 0.90 | (37) | 3.18 | 3 | 74.0 | (1.9) | |||||||||||||||||||||||||||||||||
| (1) EUR million and % change in constant euros | |||||||||||||||||||||||||||||||||||||||||
| (2) Allowances for loan-loss provisions over the last 12 months / Average loans and advances to customers over the last 12 months | |||||||||||||||||||||||||||||||||||||||||
| 18 | | January - September 2021 | ||||||
Regarding moratoria programmes, which were put in place to tackle the effects of covid-19, 99% of the total amount granted had already expired by the end of the third quarter, showing a payment performance aligned with expectations, with 6% classified in stage 3 (IFRS 9).
The outstanding moratoria at the end of the quarter amounted to EUR 1.3 billion (mainly Spain), the majority of which will expire next quarter, following the expiration of a significant volume of operations in Portugal in Q3.
Regarding IFRS 9 stages evolution:
•Stage 1 exposures increased by 1% vs. the previous quarter, mainly due to new loan originations in Europe and South America.
•Exposures in stage 2 decreased by 3% in the quarter, in line with the normalization trend observed after the increase recorded last year, which was mostly driven by macroeconomic deterioration caused by the pandemic.
•Stage 3 remained stable in the quarter.
| Coverage ratio by stage | |||||||||||||||||||||||
| EUR billion | |||||||||||||||||||||||
Exposure1 | Coverage | ||||||||||||||||||||||
| Sep-21 | Jun-21 | Sep-20 | Sep-21 | Jun-21 | Sep-20 | ||||||||||||||||||
| Stage 1 | 912 | 904 | 862 | 0.5 | % | 0.5 | % | 0.6 | % | ||||||||||||||
| Stage 2 | 67 | 70 | 60 | 8.6 | % | 8.2 | % | 8.8 | % | ||||||||||||||
| Stage 3 | 33 | 33 | 31 | 43.0 | % | 42.2 | % | 43.3 | % | ||||||||||||||
(1) Exposure subject to impairment. Additionally, in September 2021 there are EUR 27 billion in loans and advances to customers not subject to impairment recorded at mark to market with changes through P&L (EUR 26 billion in June 2021 and EUR 29 in September 2020).
Stage 1: financial instruments for which no significant increase in credit risk is identified since its initial recognition.
Stage 2: if there has been a significant increase in credit risk since the date of initial recognition but the impairment event has not materialized, the financial instrument is classified in Stage 2.
Stage 3: a financial instrument is catalogued in this stage when it shows effective signs of impairment as a result of one or more events that have already occurred resulting in a loss.
| Credit impaired loans and loan-loss allowances | |||||||||||
| EUR million | |||||||||||
| Change (%) | |||||||||||
| Q3'21 | QoQ | YoY | |||||||||
| Balance at beginning of period | 33,266 | 2.4 | 1.5 | ||||||||
| Net additions | 2,188 | (14.6) | 37.2 | ||||||||
| Increase in scope of consolidation | — | — | (100.0) | ||||||||
| Exchange rate differences and other | (368) | — | (78.0) | ||||||||
| Write-offs | (2,040) | (3.7) | 15.5 | ||||||||
| Balance at period-end | 33,046 | (0.7) | 7.0 | ||||||||
| Loan-loss allowances | 24,462 | 0.9 | 4.2 | ||||||||
| For impaired assets | 14,205 | 1.25 | 6.12 | ||||||||
| For other assets | 10,257 | 0.47 | 1.77 | ||||||||
u Market risk
The global corporate banking trading activity risk is mainly interest rate driven, focused on servicing our customer's needs and measured in daily VaR terms at 99%.
In the third quarter, VaR fluctuated around an average value of EUR 10.6 million, increasing slightly at the end of September after market volatility increased over concerns around a potential slowdown in global growth in H2’21, mainly due to supply chain disruptions and the surge in energy prices. The quarter’s closing VaR was EUR 14.9 million. These figures remain low compared to the size of the Group’s balance sheet and activity.
Trading portfolios (1). VaR by geographic region | ||||||||||||||
| EUR million | ||||||||||||||
| 2021 | 2020 | |||||||||||||
| Third quarter | Average | Latest | Average | |||||||||||
| Total | 10.6 | 14.9 | 10.2 | |||||||||||
| Europe | 9.9 | 13.7 | 9.0 | |||||||||||
| North America | 2.6 | 2.0 | 6.9 | |||||||||||
| South America | 5.9 | 6.1 | 4.8 | |||||||||||
(1) Activity performance in Santander Corporate & Investment Banking markets.
Trading portfolios (1). VaR by market factor | ||||||||||||||
| EUR million | ||||||||||||||
| Third quarter | Min. | Avg. | Max. | Last | ||||||||||
| VaR total | 7.8 | 10.6 | 15.2 | 14.9 | ||||||||||
| Diversification effect | (10.1) | (13.8) | (17.3) | (13.8) | ||||||||||
| Interest rate VaR | 7.1 | 9.9 | 14.1 | 12.6 | ||||||||||
| Equity VaR | 2.2 | 3.3 | 6.5 | 3.3 | ||||||||||
| FX VaR | 2.4 | 3.3 | 6.2 | 4.5 | ||||||||||
| Credit spreads VaR | 2.9 | 6.0 | 7.9 | 7.2 | ||||||||||
| Commodities VaR | 1.1 | 1.9 | 3.5 | 1.1 | ||||||||||
(1) Activity performance in Santander Corporate & Investment Banking markets.
NOTE: In the North America, South America and Asia portfolios, VaR corresponding to the credit spreads factor other than sovereign risk is not relevant and is included in the interest rate factor.
January - September 2021 | | 19 | ||||||
Trading portfolios1. VaR performance | ||
| EUR million | ||
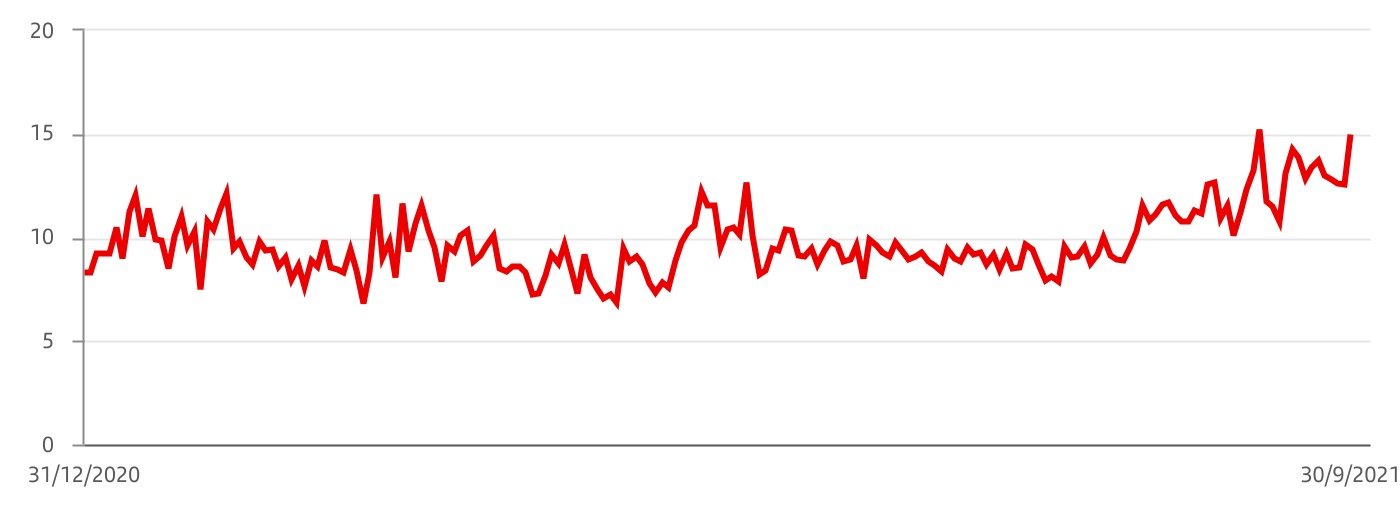 (1) Corporate & Investment Banking performance in financial markets.
u Structural and liquidity risk
•Regarding structural exchange rate risk, it is mainly driven by transactions in foreign currencies related to permanent financial investments, their results and related hedges. Our dynamic management of this risk seeks to limit the impact on the core capital ratio of foreign exchange rate movements. In the quarter, the ratio’s hedging stayed close to 100%.
•In terms of structural interest rate risk, inflation pressures continued globally, leading to expectations of earlier interest rate hikes than previously thought. This, coupled with continued political instability in Latin America, added volatility to the markets, although no material events were detected and risk levels remained at comfortable levels.
•In liquidity risk during the third quarter, the Group maintained a comfortable position, supported by a robust and diversified liquidity buffer, with ratios well above regulatory limits.
u Operational risk
•Overall, our operational risk profile continued to be stable during the third quarter of 2021. The following aspects were closely monitored during this period:
–Fraud and cyber risk threats across the financial industry, that lead to the reinforcement of the control environment (i.e., patching, browsing control, data protection controls, etc.), as well as reinforcing monitoring as a preventive measure. Development of the external fraud plans in our different country units.
–Third party risk exposure, maintaining close oversight on critical providers, with focus on business continuity capabilities and compliance with service level agreements.
–IT risk, mainly related to transformation plans, new system releases, as well as challenges related to IT services outsourcing.
–People risk, due to our employees returning to offices and/or work from home situations. Measures have been implemented to ensure a suitable and safe working environment across our subsidiaries.
–Regulatory compliance, due to increasing regulatory requirements (such as ESG, operational resilience, crypto-assets and others) across the Group.
•As the situation continues to evolve, we are also monitoring the changes in the environment as well as the transition to digital banking in order to identify potential risk exposures and anticipate actions to reduce their impact.
•In terms of the third quarter performance, level of losses in relative terms by Basel categories were lower than in the previous quarter.
| 20 | | January - September 2021 | ||||||
| GENERAL BACKGROUND | ||||||||
Grupo Santander conducted its business in the third quarter of 2021 in an environment marked by significant economic dynamism and progress in vaccination, but at the same time by a pronounced impact from the Delta variant and higher-than-expected inflation. The trend in pricing was the most relevant risk factor. The most likely scenario is a temporary rise that, in general, will not call for a tightening of monetary policy, although countries such as Mexico and especially Brazil and Chile have raised interest rates. The general tone of economic policy continued to be expansionary although uneven - more so in the mature economies - which, together with the adjustments the Chinese economy is going through, could lead to a more differentiated economic performance in the coming quarters.
| Country | GDP Change1 | Economic performance | |||||||||
| Eurozone | +6.0% | The reopening of economic activities restricted by the pandemic continued to boost GDP growth, which could return to pre-crisis levels by the end of 2021. The unemployment rate fell to 7.5% in August. Inflation rose to 3.4% in September due to temporary factors. The ECB insists that it will maintain loose funding conditions to consolidate the economic recovery. | ||||||||
 | Spain | +5.6% | Restrictions to economic activity continued to ease, driving GDP growth. Inflation (4% in September) picked up due to the impact of energy prices and the normalization of some prices that had fallen due to the pandemic. Employment rose, bringing back to work a significant amount of employees who had been on the temporary workforce reduction scheme (ERTE) and reducing the unemployment rate (to 15.3% in Q2'21). | ||||||||
| United Kingdom | +7.3% | UK economic recovery stalled in July amid worker shortages and bottlenecks. The labour market continued to improve (unemployment was 4.5% in August). Inflation (3.1% in September) exceeded the BoE's target, which kept interest rates stable (0.1%) and maintained the bond-buying target, although it expressed its willingness to bring forward monetary policy normalization. | ||||||||
 | Portugal | +4.3% | The reopening of the economy, supported by a high vaccination rate (83% of the population) has enabled economic growth to progress towards pre-pandemic levels (still 5.8% below Q4'19), with private consumption as the main driver. The labour market improved (unemployment rate at 6.7% in Q2'21) and inflation picked up (1.5% in September), but without showing a clear acceleration pattern. | ||||||||
 | Poland | +5.1% | The economy started to return to normal in Q2'21, with rapid GDP growth supported by domestic demand, especially consumption, but accompanied by high inflation (5.9% in September). The labour market remained solid (unemployment rate at 3.5%). In this context, the central bank raised Poland's official interest rate by 40 bps to 0.50% in early October. | ||||||||
| United States | +6.1% | GDP continued to grow strongly in Q2'21, thanks to the fiscal impulse and the reopening of the economy. Inflation rebounded (5.4% in September) due to higher prices in the areas most affected by the pandemic and supply-side problems. The spike in covid-19 cases in the summer somewhat delayed the recovery of the labour market, but the Fed considers this improvement to be sufficient and will start to tighten monetary policy with the announcement of tapering this year. | ||||||||
 | Mexico | +6.9% | Economic growth gained momentum in Q2'21, driven by the reopening of the services sector and exports, but with some weakness in industry. Inflation rebounded sharply (6.0% in September), with widespread pressure on the prices of goods and services, leading the central bank to continue raising Mexico's official interest rate (+50 bps in Q3'21 to 4.75%). | ||||||||
| Brazil | +6.4% | Economic recovery continued to be driven by the reopening of the services sector, thanks to progress in vaccination and improved mobility, but international supply problems dampened growth in the industry. Inflation continued to pick up (10.25% in August) and the central bank continued to raise Brazil's interest rate, by 200 bps in Q3'21 (6.25%), and indicated that the hikes will continue. | ||||||||
 | Chile | +8.8% | Strong GDP growth in H1'21 driven by progress in vaccination and high fiscal impulses and liquidity (via partial withdrawals of savings from pension plans). Inflation picked up (5.3% in September) and the central bank started to raise the official interest rate in Q3'21, increasing it by 100 bps to 1.5%, and in October by 125 bps to 2.75%. | ||||||||
 | Argentina | +10.3% | After starting Q2'21 with a slight relapse due to the tighter restrictions imposed in the second wave of covid-19, economic growth resumed its recovery in the last few months, boosted by progress in vaccination and increased mobility. Inflation remains high (3.5% in September). | ||||||||
(1) Year-on-year change H1'21
January - September 2021 | | 21 | ||||||
| DESCRIPTION OF SEGMENTS | ||||||||
We base segment reporting on financial information presented to the chief operating decision maker, which excludes certain statutory results items that distort year-on-year comparisons and are not considered for management reporting. This financial information (underlying basis) is computed by adjusting reported results for the effects of certain gains and losses (e.g. capital gains, write-downs, impairment of goodwill, etc.). These gains and losses are items that management and investors ordinarily identify and consider separately to better understand the underlying trends in the business.
Grupo Santander has aligned the information in this chapter with the underlying information used internally for management reporting and with that presented in Grupo Santander's other public documents.
Grupo Santander's executive committee has been selected to be its chief operating decision maker. Grupo Santander's operating segments reflect its organizational and managerial structures. The executive committee reviews internal reporting based on these segments to assess performance and allocate resources.
The segments are split by geographic area in which profits are earned and by type of business. We prepare the information by aggregating the figures for Grupo Santander’s various geographic areas and business units, relating it to both the accounting data of the business units integrated in each segment and that provided by management information systems. The general principles applied are the same as those used in Grupo Santander.
On 9 April 2021, we announced that, starting and effective with the financial information for the first quarter of 2021, we would carry out a change in our reportable segments to reflect our new organizational and management structure.
These changes in the reportable segments aim to align the segment information with their management and have no impact on the group’s accounting figures.
a.Main changes in the composition of Grupo Santander's segments
The main changes, which have been applied to management information for all periods included in the consolidated financial statements, are the following:
Primary segments
1.Creation of the new Digital Consumer Bank (DCB) segment, which includes:
•Santander Consumer Finance (SCF), previously included in the Europe segment, and the consumer finance business in the United Kingdom, previously recorded in the country.
•Our fully digital bank Openbank and the Open Digital Services (ODS) platform, which were previously included in the Santander Global Platform segment.
2.Santander Global Platform (SGP), which incorporated our global digital services under a single unit, is no longer a primary segment. Its activities have been distributed as follows:
•Openbank and Open Digital Services (ODS), which, as mentioned above, are now included under the new Digital Consumer Bank reporting segment.
•The business recorded in Global Payment Services (Merchant Solutions -GMS-, Trade Solutions -GTS- and Consumer Solutions -Superdigital and Pago FX-) has been allocated to the three main geographic segments, Europe, North America and South America, with no impact on the information reported for each country.
Secondary segments
1.Creation of the PagoNxt segment, which incorporates simple and accessible digital payment solutions to drive customer loyalty and allows us to combine our most disruptive payment businesses into a single autonomous company, providing global technology solutions for our banks and new customers in the open market, and which has been structured into three businesses, previously included in SGP:
•Merchant Solutions: acquiring solutions for merchants.
•Trade Solutions: solutions for SMEs and companies operating internationally.
•Consumer Solutions: payment solutions for individuals, including the Superdigital platform, aimed at underbanked populations, and PagoFX, an international payment service in the open market.
2.Annual adjustment of the perimeter of the Global Customer Relationship Model between Retail Banking and Santander Corporate & Investment Banking and between Retail Banking and Wealth Management & Insurance.
3.Elimination of the Santander Global Platform reporting segment:
•Openbank and ODS are now recorded in the Retail Banking segment.
•Merchant Solutions, Trade Solutions, Superdigital and PagoFX form the new PagoNxt reporting segment.
The Group recasted the corresponding information of earlier periods considering the changes included in this section. As stated above, group consolidated figures remain unchanged.
| 22 | | January - September 2021 | ||||||
b. Current composition of Grupo Santander segments
Primary segments
This primary level of segmentation, which is based on the Group’s management structure, comprises five reportable segments: four operating areas plus the Corporate Centre. The operating areas are:
Europe: which comprises all business activity carried out in the region, except that included in Digital Consumer Bank. Detailed financial information is provided on Spain, the UK, Portugal and Poland.
North America: which comprises all the business activities carried out in Mexico and the US, which includes the holding company (SHUSA) and the businesses of Santander Bank, Santander Consumer USA, the specialized business unit Banco Santander International, Santander Investment Securities (SIS) and the New York branch.
South America: includes all the financial activities carried out by Grupo Santander through its banks and subsidiary banks in the region. Detailed information is provided on Brazil, Chile, Argentina, Uruguay, Peru and Colombia.
Digital Consumer Bank: includes Santander Consumer Finance, which incorporates the entire consumer finance business in Europe, Openbank and ODS.
Secondary segments
At this secondary level, Grupo Santander is structured into Retail Banking, Santander Corporate & Investment Banking (SCIB), Wealth Management & Insurance (WM&I) and PagoNxt.
Retail Banking: this covers all customer banking businesses, including consumer finance, except those of corporate banking which are managed through Santander Corporate & Investment Banking, asset management, private banking and insurance, which are managed by Wealth Management & Insurance. The results of the hedging positions in each country are also included, conducted within the sphere of their respective assets and liabilities committees.
Santander Corporate & Investment Banking (SCIB): this business reflects revenue from global corporate banking, investment banking and markets worldwide including treasuries managed globally (always after the appropriate distribution with Retail Banking customers), as well as equity business.
Wealth Management & Insurance: includes the asset management business (Santander Asset Management), the corporate unit of Private Banking and International Private Banking in Miami and Switzerland and the insurance business (Santander Insurance).
PagoNxt: this includes digital payment solutions, providing global technology solutions for our banks and new customers in the open market. It is structured in three businesses: Merchant Solutions, Trade Solutions and Consumer Solutions.
In addition to these operating units, both primary and secondary segments, the Group continues to maintain the area of Corporate Centre, that includes the centralized activities relating to equity stakes in financial companies, financial management of the structural exchange rate position, assumed within the sphere of the Group’s assets and liabilities committee, as well as management of liquidity and of shareholders’ equity via issuances.
As the Group’s holding entity, this area manages all capital and reserves and allocations of capital and liquidity with the rest of businesses. It also incorporates amortization of goodwill but not the costs related to the Group’s central services (charged to the areas), except for corporate and institutional expenses related to the Group’s functioning.
The businesses included in each of the segments and business areas in this report and the accounting principles under which their results are presented here may differ from the businesses included and accounting principles applied in the financial information separately prepared and disclosed by our subsidiaries (some of which are publicly listed) which in name or geographical description may seem to correspond to the business areas covered in this report. Accordingly, the results of operations and trends shown for our business areas in this document may differ materially from those of such subsidiaries. As described on the previous page, the results of our business areas presented below are provided on the basis of underlying results only and including the impact of foreign exchange rate fluctuations. However, for a better understanding of the actual changes in the performance of our business areas, we provide and discuss the year-on-year changes to our results excluding such impact. On the other hand, certain figures contained in this report, including financial information, have been subject to rounding to enhance their presentation. Accordingly, in certain instances, the sum of the numbers in a column or a row in tables contained in this report may not conform exactly to the total figure given for that column or row. | ||
January - September 2021 | | 23 | ||||||
| January-September 2021 | ||||||||||||||||||||
| Main items of the underlying income statement | ||||||||||||||||||||
| EUR million | ||||||||||||||||||||
| Primary segments | Net interest income | Net fee income | Total income | Net operating income | Profit before tax | Underlying attributable profit to the parent | ||||||||||||||
| Europe | 8,140 | 3,236 | 12,299 | 6,108 | 3,377 | 2,293 | ||||||||||||||
| Spain | 3,009 | 1,821 | 5,359 | 2,822 | 995 | 730 | ||||||||||||||
| United Kingdom | 3,268 | 352 | 3,625 | 1,688 | 1,623 | 1,145 | ||||||||||||||
| Portugal | 569 | 325 | 1,042 | 613 | 492 | 339 | ||||||||||||||
| Poland | 741 | 386 | 1,179 | 696 | 281 | 125 | ||||||||||||||
| Other | 553 | 354 | 1,095 | 289 | (14) | (46) | ||||||||||||||
| North America | 6,085 | 1,247 | 8,266 | 4,649 | 3,504 | 2,288 | ||||||||||||||
| US | 4,022 | 606 | 5,586 | 3,240 | 2,784 | 1,788 | ||||||||||||||
| Mexico | 2,063 | 617 | 2,662 | 1,485 | 828 | 602 | ||||||||||||||
| Other | 0 | 24 | 18 | (77) | (108) | (102) | ||||||||||||||
| South America | 8,254 | 2,726 | 11,302 | 7,386 | 4,691 | 2,471 | ||||||||||||||
| Brazil | 5,782 | 2,027 | 8,085 | 5,719 | 3,526 | 1,762 | ||||||||||||||
| Chile | 1,476 | 294 | 1,834 | 1,125 | 857 | 463 | ||||||||||||||
| Argentina | 708 | 272 | 929 | 375 | 193 | 180 | ||||||||||||||
| Other | 289 | 133 | 454 | 167 | 115 | 65 | ||||||||||||||
| Digital Consumer Bank | 3,207 | 616 | 3,975 | 2,170 | 1,602 | 935 | ||||||||||||||
| Corporate Centre | (1,033) | (15) | (1,216) | (1,465) | (1,741) | (1,607) | ||||||||||||||
| TOTAL GROUP | 24,654 | 7,810 | 34,626 | 18,848 | 11,432 | 6,379 | ||||||||||||||
| Secondary segments | ||||||||||||||||||||
| Retail Banking | 23,206 | 5,208 | 29,520 | 16,780 | 9,759 | 5,750 | ||||||||||||||
| Corporate & Investment Banking | 2,207 | 1,335 | 4,352 | 2,709 | 2,640 | 1,744 | ||||||||||||||
| Wealth Management & Insurance | 275 | 933 | 1,637 | 969 | 966 | 698 | ||||||||||||||
| PagoNxt | (2) | 349 | 334 | (145) | (191) | (206) | ||||||||||||||
| Corporate Centre | (1,033) | (15) | (1,216) | (1,465) | (1,741) | (1,607) | ||||||||||||||
| TOTAL GROUP | 24,654 | 7,810 | 34,626 | 18,848 | 11,432 | 6,379 | ||||||||||||||
| Underlying attributable profit to the parent distribution* | ||
| 9M'21 | ||
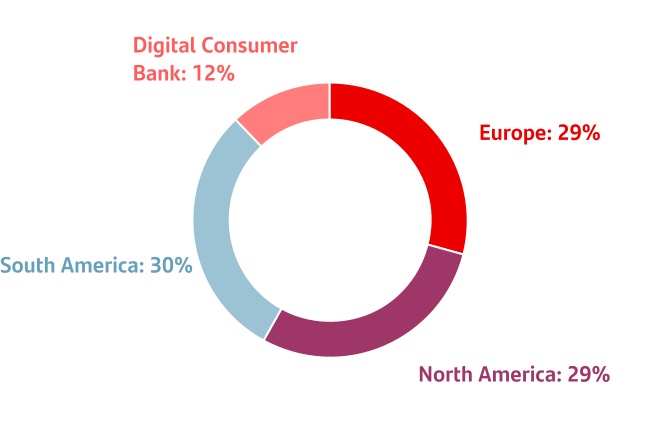
(*) As a % of operating areas. Excluding the Corporate Centre.
| Underlying attributable profit to the parent. 9M'21 | ||
| EUR million. % change YoY in constant euros | ||
| Europe |  | |||||||
 | ||||||||
 | ||||||||
 | ||||||||
| North America |  | |||||||
 | ||||||||
| South America |  | |||||||
 | ||||||||
 | ||||||||
| Digital Consumer Bank | DCB | |||||||
| Global businesses |  | |||||||
 | ||||||||
 | ||||||||
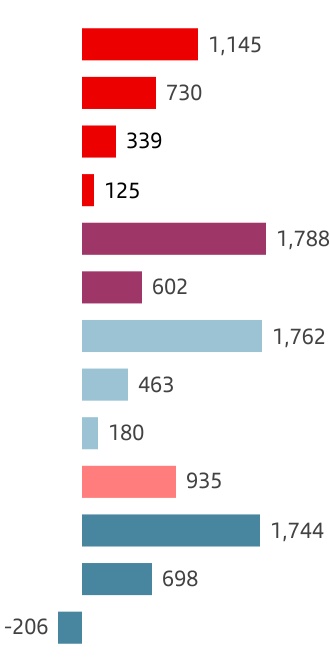
| +407 | % | |
| +47 | % | |
| +39 | % | |
| -9 | % | |
| +305 | % | |
| +1 | % | |
| +29 | % | |
| +68 | % | |
| +43 | % | |
| +17 | % | |
| +26 | % | |
| +24 | % | |
| n.a. | ||
| 24 | | January - September 2021 | ||||||
| January-September 2020 | ||||||||||||||||||||
| Main items of the underlying income statement | ||||||||||||||||||||
| EUR million | ||||||||||||||||||||
| Primary segments | Net interest income | Net fee income | Total income | Net operating income | Profit before tax | Underlying attributable profit to the parent | ||||||||||||||
| Europe | 7,241 | 3,032 | 10,998 | 4,739 | 1,724 | 1,157 | ||||||||||||||
| Spain | 2,890 | 1,740 | 5,150 | 2,417 | 696 | 497 | ||||||||||||||
| United Kingdom | 2,521 | 398 | 2,932 | 994 | 308 | 220 | ||||||||||||||
| Portugal | 592 | 285 | 979 | 538 | 350 | 243 | ||||||||||||||
| Poland | 794 | 332 | 1,136 | 661 | 303 | 142 | ||||||||||||||
| Other | 445 | 276 | 801 | 129 | 66 | 56 | ||||||||||||||
| North America | 6,415 | 1,282 | 8,335 | 4,873 | 1,653 | 1,055 | ||||||||||||||
| US | 4,297 | 682 | 5,559 | 3,252 | 820 | 470 | ||||||||||||||
| Mexico | 2,118 | 584 | 2,760 | 1,629 | 844 | 591 | ||||||||||||||
| Other | 0 | 16 | 15 | (9) | (11) | (6) | ||||||||||||||
| South America | 8,157 | 2,704 | 11,346 | 7,324 | 3,836 | 2,113 | ||||||||||||||
| Brazil | 5,840 | 2,148 | 8,322 | 5,677 | 2,973 | 1,545 | ||||||||||||||
| Chile | 1,293 | 240 | 1,669 | 988 | 500 | 269 | ||||||||||||||
| Argentina | 721 | 202 | 902 | 411 | 185 | 161 | ||||||||||||||
| Other | 304 | 114 | 454 | 248 | 178 | 138 | ||||||||||||||
| Digital Consumer Bank | 3,190 | 566 | 3,814 | 2,081 | 1,371 | 787 | ||||||||||||||
| Corporate Centre | (1,029) | (26) | (889) | (1,137) | (1,567) | (1,455) | ||||||||||||||
| TOTAL GROUP | 23,975 | 7,559 | 33,605 | 17,879 | 7,016 | 3,658 | ||||||||||||||
| Secondary segments | ||||||||||||||||||||
| Retail Banking | 22,557 | 5,301 | 28,673 | 15,667 | 5,620 | 3,108 | ||||||||||||||
| Corporate & Investment Banking | 2,153 | 1,167 | 4,079 | 2,564 | 2,217 | 1,482 | ||||||||||||||
| Wealth Management & Insurance | 294 | 857 | 1,486 | 830 | 801 | 584 | ||||||||||||||
| PagoNxt | 0 | 259 | 256 | (45) | (55) | (61) | ||||||||||||||
| Corporate Centre | (1,029) | (26) | (889) | (1,137) | (1,567) | (1,455) | ||||||||||||||
| TOTAL GROUP | 23,975 | 7,559 | 33,605 | 17,879 | 7,016 | 3,658 | ||||||||||||||
January - September 2021 | | 25 | ||||||
Business model | ||||||||||||||||||||||||||
| Primary segments | ||||||||||||||||||||||||||
 | EUROPE | Underlying attributable profit | ||||||
| EUR 2,293 mn | ||||||||
Executive summary (changes in constant euros) → We are accelerating our One Santander business transformation in Europe to achieve superior growth and a more efficient operating model that should allow us to progress towards our medium-term underlying RoTE target of 10-12%1. → Positive P&L performance, with higher revenue (+12%) and lower costs (-1%) and provisions (-23%), which led to an underlying attributable profit of EUR 2,293 million (+98% year-on-year). → Volume growth in the last 12 months in almost all markets: loans grew 3% and deposits rose 4%, with positive trends since the beginning of the year. | ||||||||
Unless otherwise indicated, changes in the region and in countries with currencies other than the euro are reported at constant exchange rates. The balance sheet and P&L ratios, together with the changes at current exchange rates, are included in the appendix.
Strategy
Our goal with One Santander in Europe is to create a better bank where customers and our people feel a deep connection while delivering sustainable value for our shareholders. We aim to deliver a c.10-12% underlying RoTE in the medium term1 and make progress in the business transformation through our action plan, defined around three main blocks:
•Grow our business by better serving our customers, focusing on capital efficient opportunities, which include SCIB and WM&I, simplifying our mass market value proposition, improving customer experience and engaging with PagoNxt.
•Redefine how we interact with our customers, accelerating our digital agenda with one common mobile experience, re-imagining our branch network and transforming our contact centres, building a common solution for the region.
•Create a common operating model, to serve our businesses through a common technology platform and automated operations, leveraging shared services and with one aligned team across Europe.
The key areas of progress by country in the quarter were:
Loyal customers. September 2021 | ||||||||||||||||||||
| Thousands. % loyal / active customers | ||||||||||||||||||||
| 37 | % | / active customers | 36 | % | 31% | 50% | 55% | |||||||||||||
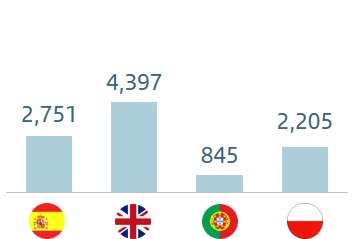 | ||||||||||||||||||||
 | 10,197 | |||||||||||||||||||
•Spain: our priorities are to strengthen our customer base, increase customer satisfaction, simplify our offering to achieve profitable growth, and actively manage credit risk in the current market environment. We continued to improve our digital services, for which were named by Global Banking & Finance Review as Best Bank in Digital Services and Most Innovative Retail Banking app in Spain in 2021 .
•United Kingdom: we continued to increase our digital customer base and foster mass market simplification through our customer journey. Customer margin management and better operational efficiency, backed by our Transformation for Success programme, helped to deliver strong profit growth.
•Portugal: launch of OneApp just five months into the project; a big step forward in building One Santander in Europe. Our IT transformation programme continued its path. Although Q3 was still affected by the covid-19 pandemic, the end of moratoria did not have significant impacts due to proactive management supported by data and digital tools. In short, the Bank maintains its solid commitment to the transformation plan, aiming to provide the best customer experience in the market.
Digital customers. September 2021 | ||||||||||||||||||||
| Thousands. YoY % change | ||||||||||||||||||||
| +6 | % | YoY | +3 | % | +5% | +9% | +8% | |||||||||||||
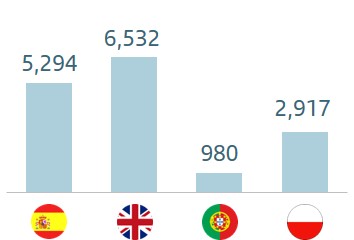 | ||||||||||||||||||||
 | 15,884 | |||||||||||||||||||
1.Medium-term goals for underlying RoTE do not represent guidance. The actual underlying RoTE may vary materially in the medium term.
| 26 | | January - September 2021 | ||||||
Business model | ||||||||||||||||||||||||||
| Primary segments | ||||||||||||||||||||||||||
•Poland: we continued to progress in our business and strategic transformation to become a simpler, faster, more efficient and more costumer centric organization. Our recent achievements include: maintaining our top 3 position in NPS among Polish banks; 16% growth in active mobile customers to 2.1 million; and the launching of new solutions and functionalities, such as online and mobile loan applications, Santander Future Wealth and a new website for brokerage customers with an enhanced UX.
We incorporate ESG management in our strategy and day-to-day activities: in Environment, by supporting the green transition and aiming to become a leader in Green Finance; in Social by building a more diverse and inclusive society and in Governance by performing our business responsibly.
In the first nine months of the year, we have focused on green buildings (prioritizing funding for houses with highest energy efficiency and we were the first mortgage provider in the UK to launch EnergyFact, a free home energy report) and supporting agribusinesses transition towards more sustainable use of resources (e.g. financing for irrigation modernization, machinery renewals).
Business performance
Gross loans and advances to customers excluding reverse repurchase agreements were 3% higher year-on-year, backed by the mortgage business, mainly in the UK and retail banking in Poland, Portugal and Spain. We had a very strong third quarter, despite usual seasonality, achieving very high levels of mortgage and UPL originations. Corporate activity slowed down as a result of government aid programmes and lower demand in recent months.
Customer deposits excluding repurchase agreements grew 4% year-on-year, with broad-based increases in all countries. Mutual funds +20%.
Results
Underlying attributable profit in the first nine months was EUR 2,293 million, 98% higher than in the same period of 2020, with the following detail:
•Higher total income (+12%) spurred by a very positive NII performance in mortgages in the UK, sharp net fee income growth in Poland, strong results in SCIB and a solid management of funding costs.
Business performance. September 2021 | ||||||||||||||||||||||||||||||||||||||
| EUR billion and YoY % change in constant euros | ||||||||||||||||||||||||||||||||||||||
| 567 | +3% | | 695 | +6% | |||||||||||||||||||||||||||||||||
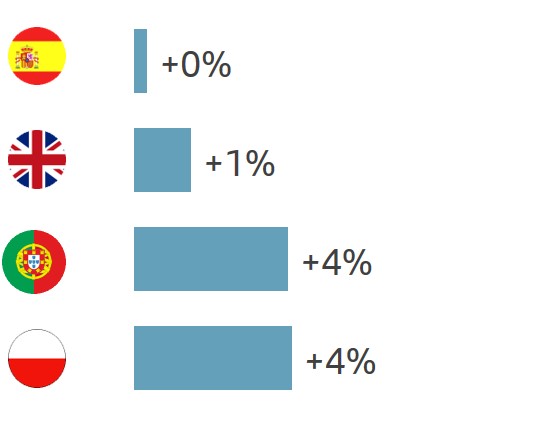 | 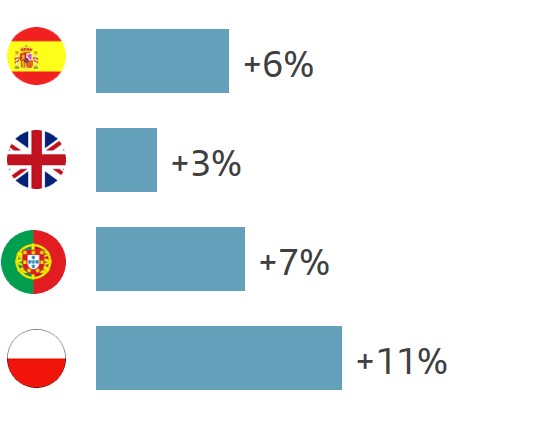 | |||||||||||||||||||||||||||||||||||||
| Gross loans and advances to customers excl. reverse repos | Customer deposits excl. repos + mutual funds | |||||||||||||||||||||||||||||||||||||
•Costs decreased 1.5% as a result of the ongoing optimization plans in all countries, aligned with our savings targets for the region and after absorbing costs related to the development of technology platforms.
•Loan-loss provisions dropped 23% compared to the first nine months of 2020, which was strongly affected by covid-19 related provisions.
By country:
•Spain: underlying attributable profit in the first nine months surged 47% year-on-year, predominantly driven by the strong cost reductions. Total income rose 4% driven by effective NII management and net fee income (transactional, insurance and mutual funds), although they slowed in the quarter.
•United Kingdom: underlying attributable profit was five times that of the same period of 2020, reflecting the benefits from provision releases, lower cost of deposits and greater mortgage and SME volumes.
•Portugal: underlying attributable profit rose 39% compared to the previous year, driven by ALCO portfolio sales, lower costs and improved cost of credit performance, which remained solid despite the end of moratoria programmes.
•Poland: underlying attributable profit was affected by interest rate cuts and charges related to CHF-indexed and based mortgages. These impacts were partially mitigated by net fee income growth, dividends and lower loan-loss provisions.
•Other Europe: SCIB had an excellent performance in the first nine months of the year, on the back of strong Markets results (which started to normalize in recent months due to reduced market volatility).
In the quarter, underlying attributable profit increased 44%, primarily driven by continued cost savings, in line with our restructuring plan and the increase in total income, partly due to the contribution to the SRF recorded in Q2'21.
| Europe. Underlying income statement | ||||||||||||||||||||||||||
| EUR million and % change | ||||||||||||||||||||||||||
| / | Q2'21 | / | 9M'20 | |||||||||||||||||||||||
| Q3'21 | % | excl. FX | 9M'21 | % | excl. FX | |||||||||||||||||||||
| Revenue | 4,208 | +7 | +7 | 12,299 | +12 | +12 | ||||||||||||||||||||
| Expenses | -2,048 | -1 | -1 | -6,191 | -1 | -1 | ||||||||||||||||||||
| Net operating income | 2,160 | +16 | +15 | 6,108 | +29 | +29 | ||||||||||||||||||||
| LLPs | -676 | +11 | +12 | -1,877 | -22 | -23 | ||||||||||||||||||||
| PBT | 1,227 | +33 | +33 | 3,377 | +96 | +96 | ||||||||||||||||||||
| Underlying attrib. profit | 867 | +45 | +44 | 2,293 | +98 | +98 | ||||||||||||||||||||
January - September 2021 | | 27 | ||||||
Business model | ||||||||||||||||||||||||||
| Primary segments | ||||||||||||||||||||||||||
| Spain | Underlying attributable profit | ||||||
| EUR 730 mn | ||||||||
Commercial activity and business performance
The pick up of activity in individuals was consolidated in the third quarter. Of note was new residential mortgage lending, where we once again exceeded the highest monthly new business volumes of the past 3 years, and consumer lending, which exceeded pre-pandemic levels. As a result, by July we had doubled our new business market share in both of these markets compared to the previous year. In addition, the good commercial dynamism in protection insurance was maintained and of note was the increase in cards turnover (+16%), transfers (+13%) and direct debits (+6%).
Regarding the self-employed, SMEs and corporates, positive working capital trends were also maintained (+12% in the quarter) while the slowdown in the demand for loans continued, mainly due to corporates.
In transactional products, we continued to grow in PoS with significant market share and customer base expansion, which was reflected in a 40% increase in turnover compared to the previous year.
Loans and advances to customers excluding reverse repos remained stable both quarter-on-quarter and year-on-year, with growth in individuals, institutions and private banking.
Customer deposits excluding repos increased 3% compared to the same period of 2020. Mutual funds were 18% higher, driven by sustained net positive inflows in the last 6 quarters.
Results
Underlying attributable profit in the first nine months amounted to EUR 730 million, 47% higher year-on-year. By line:
•Total income increased 4% year-on-year, underpinned by net interest income (+4%) and net fee income (+5%) on the back of insurance, mutual funds and transactional fees.
•We continued our cost reduction efforts (-7% year-on-year), on the back of the transformation of our operating model, which enabled net operating income to grow 17%.
•Loan-loss provisions remained stable compared to the same period of 2020, after the start of an upward trend in the third quarter.
Compared to the second quarter, underlying attributable profit more than doubled due to the contribution to the SRF recorded in Q2, further efficiency improvements and lower loan-loss provisions.
| Spain. Underlying income statement | ||||||||||||||||||||
| EUR million and % change | ||||||||||||||||||||
| Q3'21 | / Q2'21 | 9M'21 | / 9M'20 | |||||||||||||||||
| Revenue | 1,881 | +11 | 5,359 | +4 | ||||||||||||||||
| Expenses | -818 | -4 | -2,537 | -7 | ||||||||||||||||
| Net operating income | 1,063 | +26 | 2,822 | +17 | ||||||||||||||||
| LLPs | -449 | -9 | -1,390 | 0 | ||||||||||||||||
| PBT | 453 | +124 | 995 | +43 | ||||||||||||||||
| Underlying attrib. profit | 340 | +130 | 730 | +47 | ||||||||||||||||
| United Kingdom | Underlying attributable profit | ||||||
| EUR 1,145 mn | ||||||||
Commercial activity and business performance
We continue our focus on building deeper customer relationships and a seamless customer experience. Our priorities are aligned to the One Santander strategy, which include accelerated customer digital adoption, reshaping of our property footprint and faster digitalization and automation.
Our strategic transformation programme continues. We have closed 111 branches this year, reflecting the shift by customers towards online and mobile banking. This shift was also evidenced by further gains in digital and mobile customers (+5% and +11%, respectively), continued increases in digital transactions (+17%) and digital sales accounting for nearly 85% of all sales. We also confirmed a 40% reduction in head office space.
Gross loans excluding reverse repos grew 1% since September 2020, reflecting growth in our residential mortgage portfolio from strong application volumes and GBP 30 bn of gross lending. This was partially offset by lower Corporate and CIB lending.
Customer funds excluding repos increased 3% year-on-year following strong growth in retail banking, retail savings and corporate deposits, mainly driven by lower consumer spending patterns during the covid-19 pandemic. This growth was partially offset by lower CIB deposits.
Results
Underlying attributable profit in the first nine months of 2021 of EUR 1,145 million, five times that of the same period in 2020. By line as follows:
•Total income was up 21%, with increased net interest income driven by the repricing of deposits (1I2I3 Current Account), higher customer balances, higher mortgage and SME volumes. This was partly offset by base rate cuts, back-book mortgage margin pressure and regulatory changes to overdrafts that took effect in April 2020.
•Costs reduced 2%, continuing to reflect efficiency savings from our transformation programme, partly offset by technology investments. As a result, the efficiency ratio improved significantly (-12.7 pp) to 53.4%.
•Releases in loan-loss provisions totalling EUR 67 million in the first nine months of 2021, reflecting the improved economic forecast and the reduction in covid-19-related provisioning.
•Cost of credit remained close to 0% and the NPL ratio was 1.27%.
Against Q2'21, underlying attributable profit increased 12% driven by higher NII (higher mortgage volumes) and further efficiency improvements, driven by higher revenue and an acceleration in cost reduction.
| United Kingdom. Underlying income statement | ||||||||||||||||||||||||||
| EUR million and % change | ||||||||||||||||||||||||||
| / | Q2'21 | / | 9M'20 | |||||||||||||||||||||||
| Q3'21 | % | excl. FX | 9M'21 | % | excl. FX | |||||||||||||||||||||
| Revenue | 1,303 | +8 | +7 | 3,625 | +24 | +21 | ||||||||||||||||||||
| Expenses | -638 | -2 | -2 | -1,937 | 0 | -2 | ||||||||||||||||||||
| Net operating income | 665 | +18 | +17 | 1,688 | +70 | +66 | ||||||||||||||||||||
| LLPs | -1 | — | — | 67 | — | — | ||||||||||||||||||||
| PBT | 625 | +6 | +6 | 1,623 | +426 | +414 | ||||||||||||||||||||
| Underlying attrib. profit | 452 | +13 | +12 | 1,145 | +420 | +407 | ||||||||||||||||||||
| 28 | | January - September 2021 | ||||||
Business model | ||||||||||||||||||||||||||
| Primary segments | ||||||||||||||||||||||||||
| Portugal | Underlying attributable profit | ||||||
| EUR 339 mn | ||||||||
Commercial activity and business performance
We continued with our transformation strategy, simplifying our processes and commercial proposition, in order to provide the best customer service:
•Positive business activity and volume performance, in line with economic recovery. New mortgage lending reached record levels.
•The end of private moratoria (for individuals) had no impact on credit quality. Further NPL improvements.
•The number of digital customers increased 9% year-on-year and digital sales now account for 58% of the total (+19 pp year-on-year).
Loans and advances to customers excluding reverse repos increased 4% year-on-year, backed by positive new lending performance in the quarter (preserving 20% market shares in new mortgage and SMEs lending in a growing market).
Customer funds excluding repos rose 7%. Of note was the increase in mutual funds, reflecting our diversification strategy towards off-balance sheet funds.
Results
Underlying attributable profit in the first nine months was 39% higher year-on-year at EUR 339 million, driven by:
•Customer revenue increased 2% as net fee income (+14%) more than offset the impact of low interest rates on NII. Total income rose 6% year-on-year driven by ALCO portfolio sales and despite the higher SRF contribution.
•Costs dropped 3% favoured by the ongoing transformation process, which resulted in a 3.9 pp efficiency improvement to 41.2%.
•Loan-loss provisions declined 38% year-on-year. Credit quality indicators improved: the cost of credit down 7 bps to 0.35%, the NPL ratio fell 81 bps to 3.44% and coverage was higher.
Compared to the previous quarter, underlying attributable profit was 27% higher, due to higher net fee income, lower costs and provisions, and the SRF contribution in Q2.
| Portugal. Underlying income statement | ||||||||||||||||||||
| EUR million and % change | ||||||||||||||||||||
| Q3'21 | / Q2'21 | 9M'21 | / 9M'20 | |||||||||||||||||
| Revenue | 312 | +3 | 1,042 | +6 | ||||||||||||||||
| Expenses | -140 | -2 | -429 | -3 | ||||||||||||||||
| Net operating income | 172 | +7 | 613 | +14 | ||||||||||||||||
| LLPs | -25 | -28 | -95 | -38 | ||||||||||||||||
| PBT | 145 | +27 | 492 | +41 | ||||||||||||||||
| Underlying attrib. profit | 100 | +27 | 339 | +39 | ||||||||||||||||
| Poland | Underlying attributable profit | ||||||
| EUR 125 mn | ||||||||
Commercial activity and business performance
Retail and SME banking activity continued to recover in the quarter, reflected in new customer acquisition, record mortgage loan sales (more than doubling the same quarter in 2020) and positive trends in personal accounts, bancassurance and leasing.
In Business Corporate Banking, there were positive performances in the corporate treasury and FX businesses in the context of customer activity. Additionally, CIB maintained its leading position in the Polish market.
Our responsible banking commitments continue to be a priority and we look to participate in green energy projects. For example, we financed a solar farm portfolio (>PLN 200 million) in the quarter.
Loans and advances to customers excluding reverse repos increased 4% year-on-year driven by solid growth in mortgages (+4%), SMEs (+5%) and SCIB (+19%), while cash loans and business banking were practically stable.
Customer deposits excluding repos were up 8% year-on-year with a marked increase in demand deposits (+20%) as our strategy to optimize funding costs continued. In particular, there was double-digit growth in individuals, SMEs and business banking. Mutual funds also jumped, up 33%.
Results
In the first nine months of 2021, underlying attributable profit was EUR 125 million, 9% lower year-on-year as results continued to be impacted by charges relating to Swiss franc mortgages (EUR 148 million) as net operating income after loan-loss provisions was up 34%:
•Total income was 7% higher YoY as a surge in net fee income (+19%, transactional and asset management), was enough to more than offset NII pressure (-4%) stemming from several central bank rate cuts.
•Total operating expenses were higher by 5% than last year, mainly driven by staff costs but also higher general and administrative costs due to the rebound in activity in 2021.
•Loan-loss provisions decreased by 34% YoY, spread across all segments.
Compared to the previous quarter, underlying attributable profit doubled, mainly as a result of higher customer revenue, lower CHF mortgage related charges and cost control.
| Poland. Underlying income statement | ||||||||||||||||||||||||||
| EUR million and % change | ||||||||||||||||||||||||||
| / | Q2'21 | / | 9M'20 | |||||||||||||||||||||||
| Q3'21 | % | excl. FX | 9M'21 | % | excl. FX | |||||||||||||||||||||
| Revenue | 405 | -3 | -2 | 1,179 | +4 | +7 | ||||||||||||||||||||
| Expenses | -162 | -1 | 0 | -483 | +2 | +5 | ||||||||||||||||||||
| Net operating income | 243 | -4 | -4 | 696 | +5 | +8 | ||||||||||||||||||||
| LLPs | -47 | +4 | +5 | -161 | -36 | -34 | ||||||||||||||||||||
| PBT | 140 | +69 | +70 | 281 | -7 | -5 | ||||||||||||||||||||
| Underlying attrib. profit | 70 | +109 | +110 | 125 | -12 | -9 | ||||||||||||||||||||
January - September 2021 | | 29 | ||||||
Business model | ||||||||||||||||||||||||||
| Primary segments | ||||||||||||||||||||||||||
 | NORTH AMERICA | Underlying attributable profit | ||||||
| EUR 2,288 mn | ||||||||
Executive summary (changes in constant euros) → In North America, the Group's strategy is to accelerate profitable growth in the US, increase collaboration between countries and implementing local priorities. → In activity, customer funds surged 10% boosted by higher retail and corporate deposits in the US and mutual funds. Loans and advances to customers increased 1% (excluding the Bluestem portfolio disposal) driven by mortgage lending in Mexico and auto in the US. → Underlying attributable profit surged 122% year-on-year, driven largely by higher revenue in the US and lower LLPs in the region. | ||||||||
Unless otherwise indicated, changes in the region and countries are reported at constant exchange rates. The balance sheet and P&L ratios, together with the changes at current exchange rates, are included in the appendix.
Strategy
In line with our strategy to deploy capital to the most profitable businesses, in the quarter:
•On 24 August, Santander Holdings USA, Inc. (SHUSA) and SC USA entered into a definitive agreement pursuant to which SHUSA will acquire all outstanding shares of common stock of SC USA that it does not own through a tender offer for USD 41.50 per share. SHUSA currently owns approximately 80% of SC USA's outstanding shares, and, once the transaction is completed, SC USA will become a wholly owned subsidiary of SHUSA. This transaction is subject to, among other customary conditions, Federal Reserve approval and is expected to close in the fourth quarter of 2021.
•On 15 July, Banco Santander announced that SHUSA had reached an agreement to acquire Amherst Pierpont Securities, through the acquisition of its parent holding company, Pierpont Capital Holdings LLC, for a total consideration of c. USD 600 million. This acquisition is expected to be c.1% accretive to group EPS and generate a return on invested capital of c.11% by year 3 (post-synergies). The transaction is expected to have a -9 bp impact on Group capital at closing expected by the end of Q1'22, subject to regulatory approvals and customary closing conditions.
Regarding our regional strategy, synergies across countries are backed by joint initiatives that include:
•Further development of the USMX trade corridor. SCIB and Commercial Banking continued to work to deepen relationships with existing customers, which was reflected in revenue growth.
Loyal customers. September 2021 | ||||||||||||||||||||
| Thousands. % loyal / active customers | ||||||||||||||||||||
| 38 | % | / active customers | 23% | 40% | ||||||||||||||||
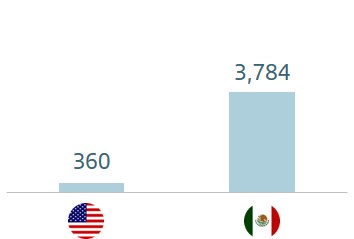 | ||||||||||||||||||||
| 4,144 | |||||||||||||||||||
•Boost customer attraction and retention through loyalty strategies (such as initiatives to attract payrolls) and broadening our tailored service and product proposition for a better and simpler customer experience. At the same time, we are working on the development of payment alternatives for the USMX trade corridor and we are leveraging our global digital platform PagoNxt.
•Improve customer interaction through improved segmentation. In the US, we set up a value proposition for affluent customers: Select and Private, and, in Mexico, we designed a service model for high-income customers, with the aim of differentiating the value proposition to its three segments: Select Black, Select and Evolution for young customers.
•Drive cultural transformation and share best practices to improve customer and employee experience, such as the success in implementing loyalty programmes in Mexico and the Consumer Banking transformation programme at Santander Bank (SBNA), as well as SC USA's experience in the auto business.
To this end, we are consolidating IT functions in North America: operations know-how, digitalization, hubs, front-office and back-office, and addressing common challenges, together with the integration of the regional IT platform (MEXUS).
Digital customers. September 2021 | ||||||||||||||||||||
Thousands. YoY % change1 | ||||||||||||||||||||
| +11 | % | YoY | +4% | +11% | ||||||||||||||||
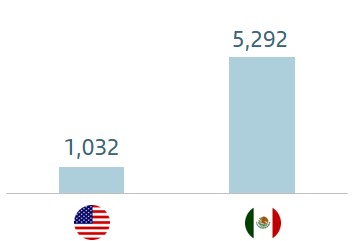 | ||||||||||||||||||||
| 6,485 | |||||||||||||||||||
(1) Excluding Puerto Rico disposal impact
| 30 | | January - September 2021 | ||||||
Business model | ||||||||||||||||||||||||||
| Primary segments | ||||||||||||||||||||||||||
In addition, in terms of their local priorities:
United States
As the covid-19 crisis moves though different stages, we remain focused on customer experience and growing core customers and deposits through commercial, branch and digital transformation initiatives while continuing to leverage our deposit base to support our profitable growth in auto finance, CRE and CIB businesses.
The auto business, in particular, is ideally positioned to capture significant growth from the sustained demand for used vehicles and the strength of SC USA through its national dealer network.
Mexico
The multichannel innovation and boost to digital channels continued to strengthen our value proposition with new products and services, allowing us to make headway with our customer attraction and loyalty strategy.
In line with our goal to enhance customer experience and the distribution model, we continued to run projects to generate synergies between all commercial areas. Of note was the project to increase branch profitability by attracting new payrolls and portability. In addition, we improved the value proposition of our collections and payments business by including new commercial alliances with the main convenience store chains, with more than 28,000 points of service, which allow us to increase our capacity to receive payments and deposits from our customers.
We continued to promote the use of digital channels through campaigns and incentive programmes to boost the activation of the electronic signature and the use of digital cards with the launch of Like U, a credit card with a fully online contracting process, immediately available for use. It allows customers to make online purchases, tailor its benefits and support social causes.
In mortgages, we continued with the consolidation of the Hipoteca Online platform, with more than 96% of transactions processed through digital channels in the quarter.
In payroll loans, we remained focused on renewal offerings, with open term options for customers to choose the one that best suits their needs.
Business performance. September 2021 | ||||||||||||||||||||||||||||||||||||||
EUR billion and YoY % change in constant euros1 | ||||||||||||||||||||||||||||||||||||||
| 127 | +1% | | 134 | +10% | |||||||||||||||||||||||||||||||||
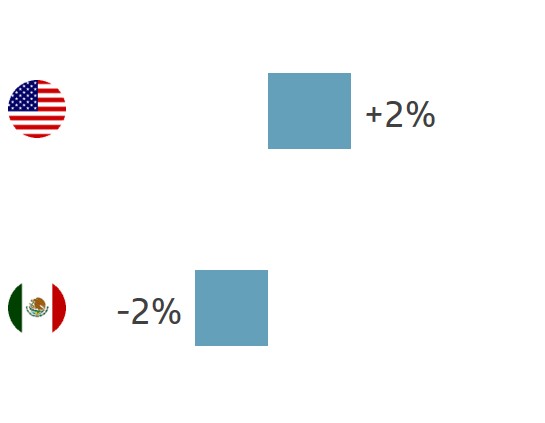 | 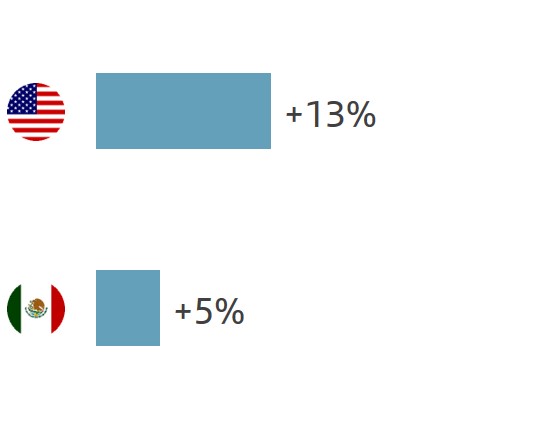 | |||||||||||||||||||||||||||||||||||||
| Gross loans and advances to customers excl. reverse repos | Customer deposits excl. repos + mutual funds | |||||||||||||||||||||||||||||||||||||
(1) Excluding Puerto Rico and Bluestem portfolio disposal impact
In SMEs, the digital strategy and customer-centric approach continue to be relevant levers for customer attraction through the partnership with Contpaqi and the ISOS strategy for POS placement. In addition, we signed commercial alliances with the country's main business chambers through the Oferta Integral Pyme. Moreover, we introduced the TDC Agro offer, providing financing with payment schemes adapted to the production cycles of this sector.
Business performance
Gross loans and advances to customers excluding reverse repos were 1% higher year-on-year boosted by mortgages in Mexico and lending growth in auto in the US. Considering the impact of Bluestem portfolio disposal, loans remained flat.
Solid year-on-year growth in customer funds (+10%) mainly driven by retail and corporate deposits in the US and the positive performance in mutual funds in both countries.
Results
In the first nine months of 2021, underlying attributable profit was 122% higher year-on-year at EUR 2,288 million (29% of the Group’s total operating areas). On a like-for-like basis, excluding the impact of Bluestem portfolio and Puerto Rico disposals, growth of 125%, as follows:
•Total income increased 7%. Net interest income grew 3% as price management and hedging in the US more than offset lower net interest income in Mexico due to the contraction in lending and the negative impact of lower interest rates. Lease income increased 72% and net fee income grew 7%.
•Costs rose 11%, primarily due to inflation and investments in digitalization. The efficiency ratio stood around 44%.
•Loan-loss provisions plummeted by 61%. The cost of credit improved to 1.46%, the NPL ratio stood at 2.56% and coverage was 139%.
Compared to the previous quarter, underlying attributable profit decreased 25% primarily due to seasonality in LLPs in the US.
| North America. Underlying income statement | ||||||||||||||||||||||||||
| EUR million and % change | ||||||||||||||||||||||||||
| / | Q2'21 | / | 9M'20 | |||||||||||||||||||||||
| Q3'21 | % | excl. FX | 9M'21 | % | excl. FX | |||||||||||||||||||||
| Revenue | 2,779 | +2 | 0 | 8,266 | -1 | +3 | ||||||||||||||||||||
| Expenses | -1,275 | +7 | +5 | -3,617 | +4 | +8 | ||||||||||||||||||||
| Net operating income | 1,504 | -1 | -4 | 4,649 | -5 | -1 | ||||||||||||||||||||
| LLPs | -506 | +160 | +157 | -1,095 | -65 | -64 | ||||||||||||||||||||
| PBT | 959 | -28 | -30 | 3,504 | +112 | 117 | ||||||||||||||||||||
| Underlying attrib. profit | 661 | -23 | -25 | 2,288 | +117 | +122 | ||||||||||||||||||||
January - September 2021 | | 31 | ||||||
Business model | ||||||||||||||||||||||||||
| Primary segments | ||||||||||||||||||||||||||
| United States | Underlying attributable profit | ||||||
| EUR 1,788 mn | ||||||||
Commercial activity and business performance
Santander US remains focused on supporting its customers and advancing its strategic initiatives, centred on improving customer experience and accretive capital allocation across its different businesses.
The work conducted over the last several years, the resilience of its core business lines, and the strength of its balance sheet has allowed Santander US to be uniquely positioned to benefit from current market conditions.
Auto originations increased 16% versus 9M'20 as Santander US continues to leverage its strong deposit base to support originations across the full credit spectrum.
Gross loans and advances excluding reverse repos and the impact of Bluestem portfolio disposal grew 2% year-on-year as lending growth in auto more than offset tepid corporate demand. Considering the Bluestem portfolio disposal impact, loans increased 1%.
Customer funds excluding repos again exhibited a strong performance, growing 13% year-on-year boosted by both retail and corporate deposits.
Results
Underlying attributable profit in the first nine months of 2021 was EUR 1,788 million (4x 9M'20 profit), supported by the 17% year-on-year increase in net operating income excluding the impact of Bluestem portfolio and Puerto Rico disposals (+6% considering them) and significantly improved cost of credit. By line, on a like-for-like basis:
•Total income up 14%. Net interest income growth was 7% due to price management and hedging. Net fee income increased 8%. Other operating income improved 93%, primarily due to outstanding auto leasing results.
•Expenses increased 12% because of higher activity and investments to execute strategic initiatives, including digital transformation, as well as a USD 50 million donation to our community foundation.
•Loan-loss provisions decreased 79%, driven by the decrease in net charge-offs, as the improved macroeconomic outlook, customer loan relief and strong used car prices led to credit growth on a like-for-like basis.
Q3’21 underlying attributable profit was 28% lower QoQ, primarily driven by sequential normalization in CIB fees and auto leasing income, higher provisions in the quarter (releases in Q2) and the USD 50 million donation to our community foundation.
| United States. Underlying income statement | ||||||||||||||||||||||||||
| EUR million and % change | ||||||||||||||||||||||||||
| / | Q2'21 | / | 9M'20 | |||||||||||||||||||||||
| Q3'21 | % | excl. FX | 9M'21 | % | excl. FX | |||||||||||||||||||||
| Revenue | 1,849 | 1 | -2 | 5,586 | 0 | +7 | ||||||||||||||||||||
| Expenses | -815 | +4 | +2 | -2,346 | +2 | +8 | ||||||||||||||||||||
| Net operating income | 1,034 | -2 | -4 | 3,240 | 0 | +6 | ||||||||||||||||||||
| LLPs | -294 | — | — | -450 | -81 | -80 | ||||||||||||||||||||
| PBT | 734 | -32 | -34 | 2,784 | +240 | +261 | ||||||||||||||||||||
| Underlying attrib. profit | 498 | -26 | -28 | 1,788 | +280 | +305 | ||||||||||||||||||||
| Mexico | Underlying attributable profit | ||||||
| EUR 602 mn | ||||||||
Commercial activity and business performance
Gross loans and advances to customers, excluding reverse repurchase agreements, were down 2% year-on-year, driven by the reduction in corporate loans, somewhat offset by the 11% increase in individuals. Within individuals, cards fell 7%, although there seems to be a recent positive shift in trend and mortgages continued to increase strongly (+14%).
In this segment, we have innovative products and services such as Hipoteca Plus, which rewards customer relationships and reduces interest rates if they meet certain requirements, and Hipoteca Free, Mexico's first commission-, appraisal- and insurance-free mortgage. We were the first bank in Mexico to offer a tailored interest rate based on the customer’s profile, making us one of the top mortgage lenders in the market.
Customer deposits excluding repos were 4% higher year-on year, propelled by demand deposits (+11%). Mutual funds were up 7%.
Results
Underlying attributable profit in the first nine months of 2021 of EUR 602 million, 1% higher year-on-year. By line:
•Total income was 5% lower impacted by the falls observed in gains on financial transactions (ALCO portfolio sales in 2020) and net interest income (-4%), the latter as a result of interest rate cuts and lower portfolio volumes. Net fee income was up 5% mainly from transactional fees.
•Operating expenses increased 3% in nominal terms, mainly driven by technology costs and the increase in amortizations. In real terms, costs fell 2%.
•Loan-loss provisions dropped 17% due to higher covid-19 related charges in 2020.
Against the previous quarter, underlying attributable profit increased 3% driven by the upturn in net interest income and gains on financial transactions, which offset the rise in costs, which were affected by IT projects and the insourcing of employees.
| Mexico. Underlying income statement | ||||||||||||||||||||||||||
| EUR million and % change | ||||||||||||||||||||||||||
| / | Q2'21 | / | 9M'20 | |||||||||||||||||||||||
| Q3'21 | % | excl. FX | 9M'21 | % | excl. FX | |||||||||||||||||||||
| Revenue | 919 | +5 | +2 | 2,662 | -4 | -5 | ||||||||||||||||||||
| Expenses | -425 | +12 | +10 | -1,177 | +4 | +3 | ||||||||||||||||||||
| Net operating income | 494 | -1 | -3 | 1,485 | -9 | -10 | ||||||||||||||||||||
| LLPs | -213 | +4 | +2 | -645 | -16 | -17 | ||||||||||||||||||||
| PBT | 280 | -3 | -5 | 828 | -2 | -3 | ||||||||||||||||||||
| Underlying attrib. profit | 215 | +5 | +3 | 602 | +2 | +1 | ||||||||||||||||||||
| 32 | | January - September 2021 | ||||||
Business model | ||||||||||||||||||||||||||
| Primary segments | ||||||||||||||||||||||||||
 | SOUTH AMERICA | Underlying attributable profit | ||||||
| EUR 2,471 mn | ||||||||
Executive summary (changes in constant euros) → We continued with our strategy to strengthen connectivity across the region and enable the exportation of positive experiences across units, capturing new business opportunities. → We remain focused on delivering profitable growth, increasing loyalty and customer attraction, and controlling costs, amid high inflation, and risks. → Double-digit growth year-on-year in both gross loans and advances to customers and customer deposits, underpinned by innovation in our product and service proposition. In addition, we are expanding ESG initiatives in the region. → Underlying attributable profit increased 31% year-on-year backed by positive customer revenue performance, improved efficiency and lower provisions. | ||||||||
Unless otherwise indicated, changes in the region and countries are reported at constant exchange rates. The balance sheet and P&L ratios, together with the changes at current exchange rates, are included in the appendix.
Strategy
South America is a region with great growth potential and opportunities for banking penetration and progress in financial inclusion. In this environment, we remained focused on growing the number of customers leveraging business opportunities, exchanging positive experiences across countries and enhancing digitalization and customer loyalty.
We maintained our strategy of capturing synergies across business units:
•In consumer finance, Santander Brasil exported its new and used vehicle financing platform to other countries, as well as Cockpit, a platform to streamline management of car dealerships, is being rolled out in Argentina and Peru. These two countries also made progress in expanding the digital strategy for financing consumer loans and used vehicles. Santander Chile achieved favourable results in insurance sales and Colombia and Uruguay recorded strong activity in vehicle financing.
•In payment methods, we are focused on e-commerce strategies and on providing immediate national and international transfers. We continued to consolidate Getnet in several countries, based on Santander Brasil's successful model. For example, in Chile, we reached a 15% market share in PoS in just seven months and in Brazil, we issued more than 650,000 cards per month, focusing on digital (99% through this channel).
Loyal customers. September 2021 | ||||||||||||||||||||
| Thousands. % loyal / active customers | ||||||||||||||||||||
| 29 | % | / active customers | 26% | 41% | 52% | 23% | ||||||||||||||
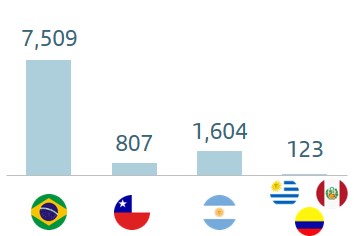 | ||||||||||||||||||||
| 10,043 | |||||||||||||||||||
We continued to make headway in the development of joint initiatives between SCIB and corporates to deepen relationships with multinational clients, boosting loyalty and customer acquisition in all countries, especially in Chile and Argentina.
We continued to promote inclusive and sustainable businesses, such as Prospera, our micro-credit programme in Brazil (with 667,000 active customers), Uruguay and Colombia (present in 110 municipalities), and with the launch of Surgir in Peru, a microfinance entity. In Chile, we launched the green SME product and in Uruguay we rolled out the first vehicle loan that seeks to neutralize emissions by acquiring neutral carbon credits. As a result, we were named the Best Bank for Sustainable Finance in Latin America by Euromoney and Santander Chile and Santander México were both recognized by Global Finance as Outstanding Leader in Sustainable Finance in Latin America.
The main initiatives by country were:
•Brazil: we continued to significantly grow our customer base, gaining more than 1.5 million customers in the last quarter, and increased loyalty. Record customer acquisition and turnover in cards, and we established an important alliance with American Express focused on the high income segment. We maintained the strong growth rate of mortgage business and were leaders in the home equity segment with a 25% market share in new lending. Our digital business continued to grow and digital transactions already account for 90% of the total. In addition, Gente, an artificial intelligence channel, registered more than 18 million interactions per month.
Digital customers. September 2021 | ||||||||||||||||||||
| Thousands. YoY % change | ||||||||||||||||||||
| +18 | % | YoY | +20% | +30% | +1% | +13% | ||||||||||||||
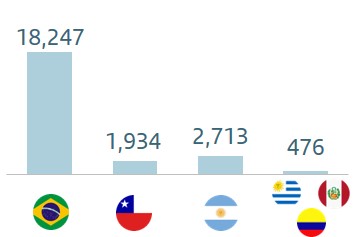 | ||||||||||||||||||||
| 23,531 | |||||||||||||||||||
January - September 2021 | | 33 | ||||||
Business model | ||||||||||||||||||||||||||
| Primary segments | ||||||||||||||||||||||||||
On the other hand, our leadership in the wholesale sector consolidates our position as one of the best corporate banks, thanks to our experience as a global bank (being the largest bank in FX transactions for the last eight years), in infrastructure, in agribusiness (the largest agricultural commodities desk in the country) and equities.
•Chile: we remained focused on digital banking and enhancing customer service. As a result, growth in current account openings doubled that of the Chilean financial system in the last twelve months, strongly supported by Santander Life. Superdigital also recorded strong growth in customer acquisition. In the acquiring business, we continued with Getnet's expansion. Also of note was the increase of Autocompara, reaching a 17% market share.
•Argentina: we continued to improve our customer care model through digital transformation. Our app was rated as the best on iOS and Android, and, in addition, we launched Superdigital. Santander Consumer launched a 100% online platform to boost access to credit and consumption and Getnet continued to expand in the country.
•Uruguay: we strengthened our position as the country's leading privately-owned bank while making headway in our technological transformation through measures such as market disruptive instant credit card issuances, and the roll-out of Soy Santander, a fully digital customer loyalty proposition for individuals. Our financial entities continued their positive performance, ranking first in consumer finance in the country.
•Peru: we continued to progress on the digitalization of our services and internal processes; 86% of transactions are processed digitally through our office banking platform and Nexus, and introduced initiatives such as the digital onboarding of customers and the purchase of a digital platform for consumer and used vehicle financing.
•Colombia: we continued to conduct infrastructure-related transactions, where we ranked top 5 in the market. We made progress in joint initiatives between SCIB and Corporates, with a particular focus on customer attraction and loyalty. In consumer finance, we hit an all-time record in new auto lending, with portfolio growth of 50% year-on-year.
Business performance. September 2021 | ||||||||||||||||||||||||||||||||||||||
| EUR billion and YoY % change in constant euros | ||||||||||||||||||||||||||||||||||||||
| 126 | +10% | | 163 | +10% | |||||||||||||||||||||||||||||||||
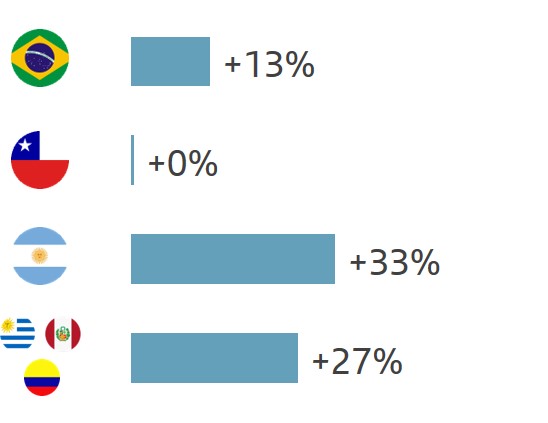 | 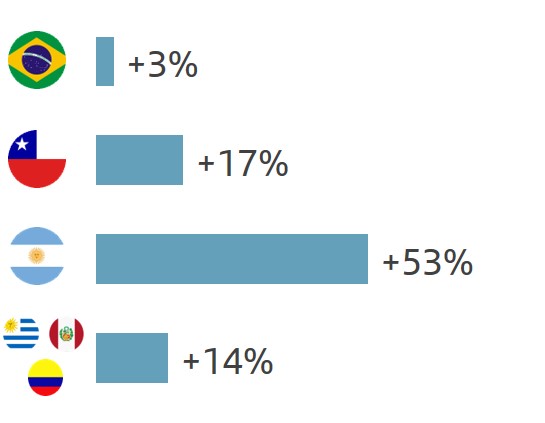 | |||||||||||||||||||||||||||||||||||||
| Gross loans and advances to customers excl. reverse repos | Customer deposits excl. repos + mutual funds | |||||||||||||||||||||||||||||||||||||
Business performance
Gross loans and advances to customers (excluding reverse repos) increased 10% year-on-year, with double-digit rises in all country units except Chile, which remained stable.
Customer deposits excluding repos grew 11% boosted by demand deposits (+16%) and, to a lesser extent, time deposits (+7%). Mutual funds rose 7%.
Results
Underlying attributable profit in the first nine months of 2021 amounted to EUR 2,471 million, up 31% year-on-year, as follows:
•Total income increased 11% underpinned by net interest income (+13%) and net fee income (+13%).
•Costs rose at a slower pace than total income, pushed up mainly by Argentina (affected by inflation). Of note was cost management in Brazil and Chile (+1% and +2%, respectively in nominal terms; -6% and -1% in real terms). The efficiency ratio improved 81 bps year-on-year to 34.6% enabling net operating income to increase 12%.
•Loan-loss provisions dropped by 18% driven by covid-19 related provisions recorded in 2020. In credit quality, the NPL ratio fell to 4.38%, coverage increased to 99% and the cost of credit improved to 2.52%.
By country, double-digit underlying attributable profit growth in constant euros in all countries (except Uruguay), due to the positive performance in total income and lower provisions (except Peru and Colombia, which recorded increases). In Uruguay, the fall in profit was primarily due to lower net interest income (interest rate cuts).
Compared to the second quarter, underlying attributable profit dropped 7%, dampened by the rise in costs, partly driven by higher inflation, collective labour agreements in Brazil and wage adjustments in Argentina, and higher provisions, somewhat mitigated by positive NII performance and gains on financial transactions.
| South America. Underlying income statement | ||||||||||||||||||||||||||
| EUR million and % change | ||||||||||||||||||||||||||
| / | Q2'21 | / | 9M'20 | |||||||||||||||||||||||
| Q3'21 | % | excl. FX | 9M'21 | % | excl. FX | |||||||||||||||||||||
| Revenue | 3,991 | +6 | +4 | 11,302 | 0 | +11 | ||||||||||||||||||||
| Expenses | -1,398 | +8 | +6 | -3,916 | -3 | +9 | ||||||||||||||||||||
| Net operating income | 2,593 | +5 | +3 | 7,386 | +1 | +12 | ||||||||||||||||||||
| LLPs | -892 | +10 | +8 | -2,384 | -26 | -18 | ||||||||||||||||||||
| PBT | 1,577 | -2 | -4 | 4,691 | +22 | +36 | ||||||||||||||||||||
| Underlying attrib. profit | 826 | -5 | -7 | 2,471 | +17 | +31 | ||||||||||||||||||||
| 34 | | January - September 2021 | ||||||
Business model | ||||||||||||||||||||||||||
| Primary segments | ||||||||||||||||||||||||||
| Brazil | Underlying attributable profit | ||||||
| EUR 1,762 mn | ||||||||
Commercial activity and business performance
We continued to make headway with our commercial strategy:
•In auto, we continued to develop a platform focused on end-to-end customer experience. As a result, we reached 20% market share in vehicles, including individuals and companies, and Santander Auto began to sell insurance to the corporate segment, achieving a penetration of 19%.
•In cards, we reached a record high in customer acquisition, remaining third in terms of market share.
•In mortgages, new lending to individuals continued to grow at a strong pace, +74% year-on-year, and we acquired a company to accelerate the development of integrated solutions for all customers. We remained leaders in the home-equity segment, with Usecasa.
•Within the ESG sphere, we are the leader in sustainable solutions. We channelled BRL 33 billion into social and environmental businesses and continued to make progress on Plano Amazônia, in collaboration with the two other largest private-sector banks in Brazil. In addition, we created a new business unit in the region, which has already channelled BRL 270 mn. As a result, GPTW put Santander Brasil as the 8th best company to work for in Latin America.
As for volumes, gross loans and advances to customers excluding reverse repos grew 13% year-on-year. We saw positive performances in individuals and SMEs.
Customer deposits excluding repos increased 3%, driven by the increase in time deposits (+4%). Mutual funds were 4% higher.
Results
First nine months underlying attributable profit amounted to EUR 1,762 million (+29% year-on-year). Of note:
•Total income rose 10% benefiting from the positive performance of net interest income (+12%, supported by larger volumes) and net fee income (+7%, driven by insurance and capital markets).
•Costs fell 1%, well below inflation, which enabled net operating income to rise 14% and the efficiency ratio to improve by 2.5 pp year-on-year to 29.3%.
•Net loan-loss provisions dropped 10%, due to higher provisions recorded in 2020 related to the pandemic. Cost of credit improved to 3.60%, the NPL ratio to 4.72% and coverage remained high at 112%.
Compared to the second quarter, underlying attributable profit was 9% lower as seasonally higher costs (collective labour agreements), higher inflation and increased provisions were only partially offset by the rise in NII and gains on financial transactions.
| Brazil. Underlying income statement | ||||||||||||||||||||||||||
| EUR million and % change | ||||||||||||||||||||||||||
| / | Q2'21 | / | 9M'20 | |||||||||||||||||||||||
| Q3'21 | % | excl. FX | 9M'21 | % | excl. FX | |||||||||||||||||||||
| Revenue | 2,882 | 7 | +4 | 8,085 | -3 | +10 | ||||||||||||||||||||
| Expenses | -864 | +11 | +7 | -2,366 | -11 | +1 | ||||||||||||||||||||
| Net operating income | 2,019 | +6 | +3 | 5,719 | +1 | +14 | ||||||||||||||||||||
| LLPs | -757 | +12 | +9 | -1,980 | -20 | -10 | ||||||||||||||||||||
| PBT | 1,172 | -2 | -6 | 3,526 | +19 | +34 | ||||||||||||||||||||
| Underlying attrib. profit | 582 | -6 | -9 | 1,762 | +14 | +29 | ||||||||||||||||||||
| Chile | Underlying attributable profit | ||||||
| EUR 463 mn | ||||||||
Commercial activity and business performance
We remained focused on gaining new customers, increasing loyalty and offering attractive returns:
•Getnet's success enabled us to install more than 46,000 PoS. SMEs account for 94% of its customers, and 65% were sold digitally.
•Santander Life continues to revolutionize the market with its proposition and digital onboarding, reaching 797,000 customers.
•Superdigital continued to steadily increase the number of current account openings and has more than 208,000 customers.
•In terms of ESG, Santander Chile became the first local bank to obtain the Iguala Conciliación Seal of Ministry of Women and Gender Equality.
•All these measures led to a year-on-year increase in loyal (+11%) and digital customers (+30%), and we ended the quarter with the best NPS in the country.
In volumes, gross loans and advances to customers excluding reverse repurchase agreements had no material change (+0.5 year-on-year), as growth in mortgages matched the fall in corporates and CIB.
Customer deposits excluding repurchase agreements surged 20%, primarily driven by growth in demand deposits (+25%). Mutual funds increased 9%. In the quarter, there was a change in the funding mix as the rise in interest rates led to a 10% increase in time deposits, while demand deposits decreased slightly.
Results
Underlying attributable profit in the first nine months of 2021 amounted to EUR 463 million, 68% higher year-on-year, as follows:
•Total income increased 8% driven by the 12% jump in net interest income (margin management and inflation) and the 20% increase in net fee income, propelled by transactional and insurance fees.
•Costs rose 2%, at a slower pace than inflation, through efficient cost management. The efficiency ratio improved to 38.7% (-2.1 pp year-on-year).
•Loan-loss provisions were 48% lower due to covid-19 related charges in 2020. Cost of credit improved to 0.89% and the NPL ratio to 4.36%.
In the quarter, profit declined 11% as the increase in net fee income did not offset the drop in net interest income due to higher cost of funding, lower gains on financial transactions (from highs in the second quarter) and greater provisions.
| Chile. Underlying income statement | ||||||||||||||||||||||||||
| EUR million and % change | ||||||||||||||||||||||||||
| / | Q2'21 | / | 9M'20 | |||||||||||||||||||||||
| Q3'21 | % | excl. FX | 9M'21 | % | excl. FX | |||||||||||||||||||||
| Revenue | 583 | -9 | -3 | 1,834 | +10 | +8 | ||||||||||||||||||||
| Expenses | -229 | -7 | -2 | -710 | +4 | +2 | ||||||||||||||||||||
| Net operating income | 354 | -10 | -5 | 1,125 | +14 | +11 | ||||||||||||||||||||
| LLPs | -84 | +3 | +8 | -266 | -47 | -48 | ||||||||||||||||||||
| PBT | 265 | -16 | -11 | 857 | +72 | +68 | ||||||||||||||||||||
| Underlying attrib. profit | 142 | -16 | -11 | 463 | +72 | +68 | ||||||||||||||||||||
January - September 2021 | | 35 | ||||||
Business model | ||||||||||||||||||||||||||
| Primary segments | ||||||||||||||||||||||||||
| Argentina | Underlying attributable profit | ||||||
| EUR 180 mn | ||||||||
Commercial activity and business performance
We remained focused on transactional business and customer service through initiatives in innovation, an enhanced customer care model, and the digital transformation of processes and products.
In addition, we continued to progress in the development of our open financial services platform:
•We rolled out Superdigital, to contribute towards improving the lives of people who do not have access to the traditional financial system, which offers, in this first stage, a fully digital and free account and a prepaid Mastercard card.
•We enhanced Getnet's value proposition, reaching 40,000 active merchants since its launch in October 2020.
•In the consumer segment, we launched Todo en Cuotas, a 100% online platform that seeks to promote access to credit and consumption, while we continued with the implementation of the CRM Cockpit system in dealerships.
•MODO, the payment solution that promotes digital payments and financial inclusion, reached more than 2 million customers.
The sharp changes in volumes are affected by inflation, which is also reflected in the P&L variations. Gross loans and advances to customers excluding reverse repurchase agreements rose 33% year-on-year, driven by loans to corporates and cards. Dollar balances declined in the currency of origin.
Customer deposits excluding repurchase agreements rose 49% spurred on by both demand and time deposits. Mutual funds were 71% higher. Excess liquidity is placed in central bank notes.
Results
Underlying attributable profit in the first nine months was EUR 180 million, 43% higher compared tot he same period of 2020. By line:
•Total income grew 32%, underpinned by net interest income, the strong upturn in net fee income, with significant increases in transactional fees, and gains on financial transactions, which more than offset the higher impact from the inflation adjustment.
•Costs rose 44%, affected by inflation and the salary agreement. Net operating income soared 17%.
•Loan-loss provisions fell 36% following additional covid-19 related provisioning in 2020. The cost of credit improved to 3.51%, the NPL ratio was 3.85% and coverage 149%.
In the quarter, profit was 15% higher, damped by tax normalization, as PBT surged 60% driven by positive revenue performance.
| Argentina. Underlying income statement | ||||||||||||||||||||||||||
| EUR million and % change | ||||||||||||||||||||||||||
| / | Q2'21 | / | 9M'20 | |||||||||||||||||||||||
| Q3'21 | % | excl. FX | 9M'21 | % | excl. FX | |||||||||||||||||||||
| Revenue | 365 | 21 | +19 | 929 | +3 | +32 | ||||||||||||||||||||
| Expenses | -204 | +14 | +12 | -554 | +13 | +44 | ||||||||||||||||||||
| Net operating income | 161 | +32 | +30 | 375 | -9 | +17 | ||||||||||||||||||||
| LLPs | -40 | +15 | +15 | -88 | -50 | -36 | ||||||||||||||||||||
| PBT | 92 | +63 | +60 | 193 | +4 | +33 | ||||||||||||||||||||
| Underlying attrib. profit | 73 | +16 | +15 | 180 | +12 | +43 | ||||||||||||||||||||
| Other South America |  |  |  | ||||||||
Uruguay
Gross loans and advances to customers, excluding reverse repurchase agreements were up 12%. Customer deposits excluding repos rose 13% primarily from demand deposits (+19%).
Underlying attributable profit in the first nine months of EUR 80 million, down 13% year-on-year, as follows:
•Total income declined 5% mainly driven by the fall in net interest income (significant drop in interest rates) and lower gains on financial transactions. Conversely, positive net fee income performance (+13%), in line with business recovery.
•Costs grew 9%, heavily affected by inflation.
•Loan-loss provisions decreased 45%, the cost of credit improved to 1.39% and coverage was 121%.
Compared to the previous quarter, underlying attributable profit rose 13% driven by the positive performance of the main revenue lines and lower provisions.
Peru
Gross loans and advances to customers excluding reverse repos rose 26% year-on-year and customer deposits excluding repos were 17% higher on the back of demand deposits.
In the first nine months of 2021 underlying attributable profit amounted to EUR 43 million, 37% higher year-on-year, as follows:
•Total income rose 39%, mainly led by customer revenue. Costs rose at a slower pace than income, improving the efficiency ratio to 28.9%.
•Loan-loss provisions rose due to pre-emptive impairments. The NPL ratio was 0.84%, cost of credit was 0.85% and coverage stood at 178%.
Colombia
Gross loans and advances to customers excluding reverse repos were 51% higher year-on-year. Customer deposits excluding repos rose 16% due to demand deposits.
In the first nine months of 2021, underlying attributable profit of EUR 17 million, 25% higher year-on-year, due to:
•Total income growth of 22% (driven by net interest income and net fee income), outpacing the 14% rise in costs.
•Higher loan-loss provisions but maintaining good credit quality: the NPL ratio was 0.37%, cost of credit of 0.72% and coverage remained high (236%).
| Other South America. Underlying income statement | ||||||||||||||||||||||||||
| EUR million and % change | ||||||||||||||||||||||||||
| Net operating income | Underlying attrib. profit | |||||||||||||||||||||||||
| / | 9M'20 | / | 9M'20 | |||||||||||||||||||||||
| 9M'21 | % | excl. FX | 9M'21 | % | excl. FX | |||||||||||||||||||||
| Uruguay | 132 | -24 | -15 | 80 | -21 | -13 | ||||||||||||||||||||
| Peru | 77 | +20 | +42 | 43 | +16 | +37 | ||||||||||||||||||||
| Colombia | 34 | +23 | +31 | 17 | +17 | +25 | ||||||||||||||||||||
| 36 | | January - September 2021 | ||||||
Business model | ||||||||||||||||||||||||||
| Primary segments | ||||||||||||||||||||||||||
| DCB | DIGITAL CONSUMER BANK | Underlying attributable profit | ||||||
| EUR 935 mn | ||||||||
Executive summary (changes in constant euros) → Ongoing execution of the strategic operations defined in 2020, aimed at increasing our business capabilities and generating significant growth. → New lending stood well above 9M'20 (+11% year-on-year), despite lockdowns in early 2021. Activity in the quarter was dampened by global production issues in the new auto market while used vehicle volumes were broadly flat. Conversely, consumer new lending increased. → Underlying attributable profit was EUR 935 million, improving 17% year-on-year, favoured by revenue growth (+4% year-on-year) and cost of credit improvement. Underlying RoTE rose to 13%, and RoRWA was 2.2% in SCF. | ||||||||
Unless otherwise indicated, changes are reported at constant exchange rates. In the tables below and in the appendix, these changes are included together with the changes at current exchange rates.
Strategy
Digital Consumer Bank is the leading consumer finance bank in Europe, created through the combination of Santander Consumer Finance's (SCF) scale and leadership in in consumer finance in Europe, and Openbank’s digital capabilities.
SCF is Europe's consumer finance leader, present in 18 countries (16 in Europe including the recent launch in Greece, China and Canada) and works through more than 130,000 associated points of sale (mainly auto dealers and retail merchants). In addition, it has a growing number of agreements with OEMs and retail distribution groups.
Openbank is the largest 100% digital bank in Europe. It offers current accounts, cards, loans, mortgages, a state-of-the-art robo-advisor service and open platform brokerage services. Openbank is currently active in Spain, the Netherlands, Germany and Portugal, and we are working on its expansion across Europe and the Americas.
The aim of Digital Consumer Bank is to generate synergies for both businesses:
| Digital Consumer Bank. Loan distribution | |||||
| September 2021 | |||||
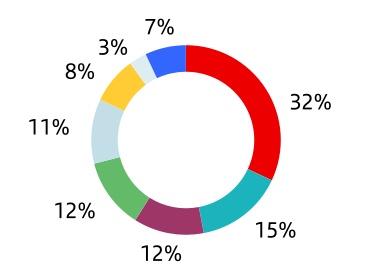
| Germany | ||||||||
| Nordics | ||||||||
| Spain | ||||||||
| France | ||||||||
| The UK | ||||||||
| Italy | ||||||||
| Poland | ||||||||
| Others | ||||||||
•SCF will leverage Openbank's IT capabilities to further improve its digital operating system and provide a better service to its customers and partners (OEMs, car dealers, retailers and individuals) at a lower cost.
•Openbank will be able to offer retail banking products to SCF's large customer base to expand retail capabilities across Europe with lower acquisition costs.
Our main priorities for 2021 are to:
•Auto: strengthen our auto financing leadership position, reinforce the leasing business and develop subscription services across our footprint. SCF is focusing on providing advanced digital financing capabilities to its partners, OEMs and dealers in order to help their sales growth strategy. We also generated almost 1.5 million new contracts to customers in 9M’21 and had an EUR 87 billion loan book at the end of September.
•Consumer Non-Auto: gain market share in consumer financing solutions, leveraging our position to grow in e-commerce, checkout lending and Buy Now Pay Later (BNPL), serving customers through 55,000 physical and digital points of sale. We generated more than 4 million new contracts in 9M’21 and had a loan book of EUR 19 billion in September.
•Retail: improve digital capabilities to increase customer loyalty among our 3.6 million customers (Openbank and SC Germany Retail), boosting digital banking activity, which currently has EUR 37.8 billion in customer funds.
•Cost reduction and simplification: accelerate digitalization to transform the business and improve efficiency. The main drivers are:
–Organizational simplification: transition from banking licenses to branches in the Western hub.
–Streamlining IT: leveraging technology and data capabilities with Digital Banking apps (APIs) and a SaaS (Software as a Service) model.
January - September 2021 | | 37 | ||||||
Business model | ||||||||||||||||||||||||||
| Primary segments | ||||||||||||||||||||||||||
Thanks to all these initiatives, we have great potential to enhance our business through our 19 million active customers, by creating stronger customer relationships while integrating Santander ESG criteria. We want to serve our current and future customers with a positive environmental impact by developing business solutions, such as: financing electric vehicles, carbon compensation services (already available in all countries); financing of electric chargers, solar panels, green heating systems, etc.
Business performance
In the first nine months of the year, new lending increased 11% year-on-year, absorbing the impacts of heavy lockdowns in some countries where Digital Consumer Bank operates at the beginning of the year.
In early 2021, restrictions arising from the pandemic affected commercial activity mainly in Central Europe, which recovered to pre-covid-19 levels in Q2 (positive performance in Germany and the Nordics). The third quarter was affected by the semiconductor shortage in the new auto market. Despite this, activity in September exceeded pre-covid-19 levels and was the highest monthly total income so far this year. SCF continues to gain market share across most auto markets.
Of note in 2021 was the enhancement of our pan-European leasing proposition and the deployment of the new consumer finance solution (for mobiles and modems) via the more than 2,500 retail points of sale in Italy, thanks to the creation of the TIMFIN joint venture. Also of note was the set-up of the new Western Hub's operating structure as we transition from banking licenses to branches in order to improve efficiency, and our focus in digitalization.
In the quarter, SCF acquired a 14.7% stake in Vinturas Holding, a company that offers a blockchain-based technology solution that allows manufacturers to digitally track vehicles throughout the entire logistics process.
| Activity | ||||||||||||||||||||||||||||||||
| September 2021. EUR billion and % change in constant euros | ||||||||||||||||||||||||||||||||
| -1% | ||||||||||||||||||||||||||||||||
| QoQ | +1% | |||||||||||||||||||||||||||||||
| QoQ | ||||||||||||||||||||||||||||||||
| 114 | ||||||||||||||||||||||||||||||||
| -1% | 57 | +11% | ||||||||||||||||||||||||||||||
| YoY | YoY | |||||||||||||||||||||||||||||||
| Gross loans and advances to customers excl. reverse repos | Customer deposits excl. repos + mutual funds | |||||||||||||||||||||||||||||||
In addition, in order to compensate lost revenue during lockdowns in Q1'21, several measures were carried out, including expense reductions and income initiatives in pricing and cost of funding.
The stock of loans and advances to customers excluding reverse repos was EUR 114 billion, slightly lower than the same period of 2020, due to the impact from covid-19 previously mentioned isolation measures.
Results
Underlying attributable profit in the first nine months was EUR 935 million, 17% higher year-on-year. By line:
•Total income increased 4% compared to 9M'20 driven by growth in net fee income (+9% due to increased volumes) and leasing. Net interest income decreased slightly.
•Costs increased 4% due to perimeter (Sixt and TIMFIN) and our digital transformation investments. The efficiency ratio improved slightly to 45.4% and net operating income grew 4%. Excluding perimeter effects, costs were flat year-on-year and 1% lower than 2019.
•Loan-loss provisions dropped 41% driven by covid-19 provisioning in 2020. Positive credit quality performance, with a cost of credit of 0.57% and an NPL ratio of 2.15% (-22 bps and -14 bps year-on-year, respectively).
•By country, the largest contribution to underlying attributable profit came from Germany (EUR 292 million), the UK (205 million), the Nordic countries (EUR 168 million) and France (EUR 111 million).
Compared to the previous quarter, underlying attributable profit increased 32% mainly due to net fee income (+7%), continued cost reductions (-3%) and the contribution to the SRF in Q2.
| Digital Consumer Bank. Underlying income statement | ||||||||||||||||||||||||||
| EUR million and % change | ||||||||||||||||||||||||||
| / | Q2'21 | / | 9M'20 | |||||||||||||||||||||||
| Q3'21 | % | excl. FX | 9M'21 | % | excl. FX | |||||||||||||||||||||
| Revenue | 1,369 | +5 | +5 | 3,975 | +4 | +4 | ||||||||||||||||||||
| Expenses | -591 | -4 | -3 | -1,805 | +4 | +4 | ||||||||||||||||||||
| Net operating income | 778 | +13 | +13 | 2,170 | +4 | +4 | ||||||||||||||||||||
| LLPs | -141 | -1 | — | -449 | -40 | -41 | ||||||||||||||||||||
| PBT | 594 | +18 | +19 | 1,602 | +17 | +16 | ||||||||||||||||||||
| Underlying attrib. profit | 366 | +32 | +32 | 935 | +19 | +17 | ||||||||||||||||||||
| 38 | | January - September 2021 | ||||||
Business model | ||||||||||||||||||||||||||
| Primary segments | ||||||||||||||||||||||||||
 | Corporate Centre | Underlying attributable profit | ||||||
| EUR -1,607 mn | ||||||||
Executive summary → In the current environment, the Corporate Centre continued to play its role supporting the Group and has gradually returned employees to the workplace, with a mixture of on-site and remote working, maintaining a high level of flexibility to meet individuals' needs. → The Corporate Centre’s objective is to aid the operating units by contributing value and carrying out the corporate function of oversight and control. It also carries out functions related to financial and capital management. → Underlying attributable loss increased 10% compared to the first nine months of 2020, mainly due to lower gains on financial transactions due to exchange rate differences from the hedging of the main units' results, as costs remained flat and other results and provisions decreased year-on-year. | ||||||||
Strategy and functions
The Corporate Centre contributes value to the Group in various ways:
•Making the Group’s governance more solid, through global control frameworks and supervision.
•Fostering the exchange of best practices in management of costs and generating economies of scale. This enables us to be one of the most efficient banks.
•Contributing to the launch of projects that will be developed by our global businesses aimed at leveraging our worldwide presence to generate economies of scale.
It also coordinates the relationship with European regulators and supervisors and develops functions related to financial and capital management, as follows:
•Financial Management functions:
–Structural management of liquidity risk associated with funding the Group’s recurring activity and stakes of a financial nature.
–This activity is carried out by the different funding sources (issuances and other), always maintaining an adequate profile in volumes, maturities and costs. The price of these operations with other Group units is the market rate plus the premium which, in liquidity terms, the Group supports by immobilizing funds during the term of the operation.
–Interest rate risk is also actively managed in order to soften the impact of interest rate changes on net interest income, conducted via high credit quality, very liquid and low capital consumption derivatives.
–Strategic management of the exposure to exchange rates in equity and dynamic in the countervalue of the units’ annual results in euros. Net investments in equity are currently covered by EUR 23,118 million (mainly Brazil, the UK, Mexico, Chile, the US, Poland and Norway) with different instruments (spot, fx, forwards).
•Management of total capital and reserves: efficient capital allocation to each of the units in order to maximize shareholder return.
Results
First nine months underlying attributable loss of EUR 1,607 million, 10% higher than in 9M'20, as follows:
•Gains on financial transactions were lower (EUR 327 million lower than in 2020) dampened by negative foreign currency hedging results in 2021 and positive results in 2020.
•On the other hand, net interest income remained stable, as well as operating expenses, driven by ongoing streamlining and simplification measures.
•Lastly, other results and provisions were lower than in 2020, due to one-off provisions recorded in 2020 for certain stakes whose value was affected by the crisis.
| Corporate centre. Underlying income statement | ||||||||||||||||||||||||||
| EUR million | ||||||||||||||||||||||||||
| Q3'21 | Q2'21 | Chg. | 9M'21 | 9M'20 | Chg. | |||||||||||||||||||||
| Total income | -416 | -430 | -3% | -1,216 | -889 | +37% | ||||||||||||||||||||
| Net operating income | -505 | -511 | -1% | -1,465 | -1,137 | +29% | ||||||||||||||||||||
| PBT | -553 | -553 | 0% | -1,741 | -1,567 | +11% | ||||||||||||||||||||
| Underlying attrib. profit | -545 | -535 | +2% | -1,607 | -1,455 | +10% | ||||||||||||||||||||
January - September 2021 | | 39 | ||||||
| Retail Banking | Underlying attributable profit | ||||||
| EUR 5,750 mn | ||||||||
| Executive summary | |||||||||||||||||||||||||||||||||||||||||||||||||||||
Results. (9M'21 vs. 9M'20). % change in constant euros | Business performance. EUR bn. % change in constant euros | ||||||||||||||||||||||||||||||||||||||||||||||||||||
| Profit growth driven by higher volumes and total income, improving the efficiency ratio and cost of credit | Loans and advances to customers rose 2% and customer funds increased 7% year-on-year | ||||||||||||||||||||||||||||||||||||||||||||||||||||
| Total income | Costs | Provisions | Loans and advances to customers | Customer funds | |||||||||||||||||||||||||||||||||||||||||||||||||
| +7% | +1% | -35% | 791 | p 2% YoY | 773 | p 7% YoY | |||||||||||||||||||||||||||||||||||||||||||||||
| Customers | |||||||||||||||||||||||||||||||||||||||||||||||||||||
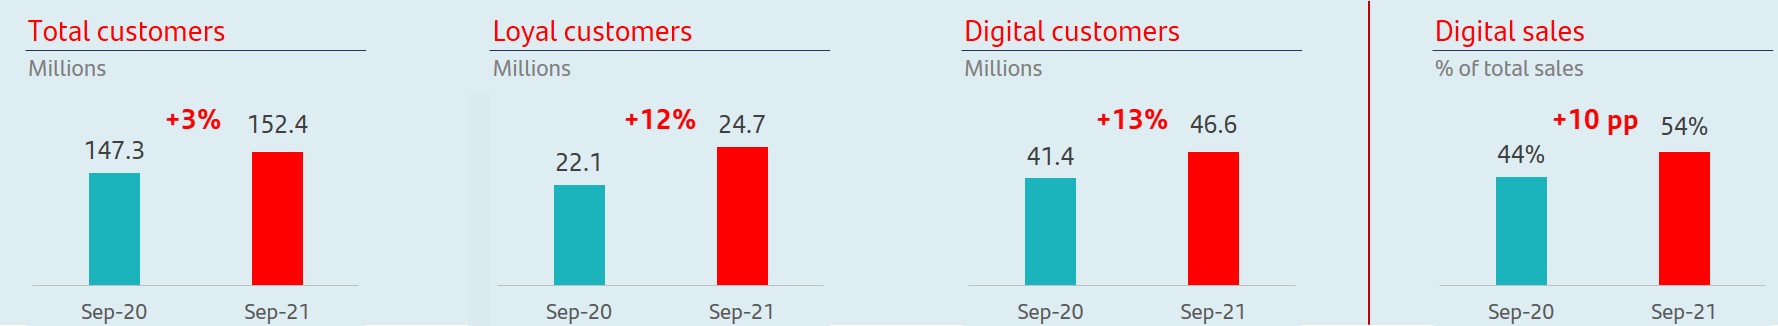 | |||||||||||||||||||||||||||||||||||||||||||||||||||||
Unless otherwise indicated, changes are reported at constant exchange rates. In the tables below and in the appendix, these changes are included together with the changes at current exchange rates.
Commercial activity
The economic and social impacts arising from the global health crisis led us to further strengthen our commitment to our customers and society, seeking to become a key part of the business and economic recovery in the countries where we operate.
This situation has accelerated the implementation and development of our digital transformation strategy, focusing on our multi-channel strategy and the digitalization of processes and businesses. We are adapting channels to new business trends under a hybrid model that prioritizes digital customer service, and combines it with the activity carried out by physical branches, which are well equipped to handle the more complex operations and those that require greater service from our professionals.
This personalized support, tailored to the needs of each customer, also responds to one of our main goals, which is the continuous improvement of customer care and service. This orientation enabled us to rank top 3 in customer satisfaction, measured by NPS, in seven of our markets.
Our efforts to improve customer care and services, be one of the leaders of the digitalization process in the banking sector and meet our customers' needs, allowed us to exceed 152 million customers.
The number of loyal customers increased 12% year-on-year, with growth in both individuals (+12%) and corporates (+12%). Digital customers rose 13% year-on-year, an increase of more than 5 million compared to the previous year, while transactions through digital channels grew 39% year-on-year and digital sales accounted for 54% of total transactions.
Results
Underlying attributable profit in the first nine months of 2021 was EUR 5,750 million, 92% higher than in the first nine months of 2020. By line:
•Total income grew 7% driven by positive customer revenue performance, which more than offset the fall in gains on financial transactions.
•Costs increased sightly, well below total income, which enabled the efficiency ratio to improve 2.2 pp year-on-year to 43.2%.
•Loan-loss provisions plummeted by 35%, as the previous year was strongly affected by covid-19 related provisions.
| Retail Banking. Underlying income statement | ||||||||||||||||||||||||||
| EUR million and % change | ||||||||||||||||||||||||||
| / | Q2'21 | / | 9M'20 | |||||||||||||||||||||||
| Q3'21 | % | excl. FX | 9M'21 | % | excl. FX | |||||||||||||||||||||
| Revenue | 10,173 | +4 | +3 | 29,520 | +3 | +7 | ||||||||||||||||||||
| Expenses | -4,336 | +2 | +1 | -12,740 | -2 | +1 | ||||||||||||||||||||
| Net operating income | 5,837 | +5 | +4 | 16,780 | +7 | +12 | ||||||||||||||||||||
| LLPs | -2,199 | +27 | +26 | -5,708 | -38 | -35 | ||||||||||||||||||||
| PBT | 3,194 | -5 | -7 | 9,759 | +74 | +82 | ||||||||||||||||||||
| Underlying attrib. profit | 1,960 | 0 | -1 | 5,750 | +85 | +92 | ||||||||||||||||||||
| 40 | | January - September 2021 | ||||||
| Santander Corporate & Investment Banking | Underlying attributable profit | ||||||
| EUR 1,744 mn | ||||||||
| Executive summary | ||||||||||||||||||||||||||||||||||||||||||||||||||||||||||||||||||||
Results (9M'21 vs 9M'20). % change in constant euros | Our strategic pillars | |||||||||||||||||||||||||||||||||||||||||||||||||||||||||||||||||||
| Strong profit and profitability improvement backed by total income growth across businesses and countries |  | |||||||||||||||||||||||||||||||||||||||||||||||||||||||||||||||||||
| Total income | Underlying profit | RoRWA | ||||||||||||||||||||||||||||||||||||||||||||||||||||||||||||||||||
| +12% | +26% | 2.4% | ||||||||||||||||||||||||||||||||||||||||||||||||||||||||||||||||||
| Revenue growth by business and region* | Other highlights in the quarter | |||||||||||||||||||||||||||||||||||||||||||||||||||||||||||||||||||
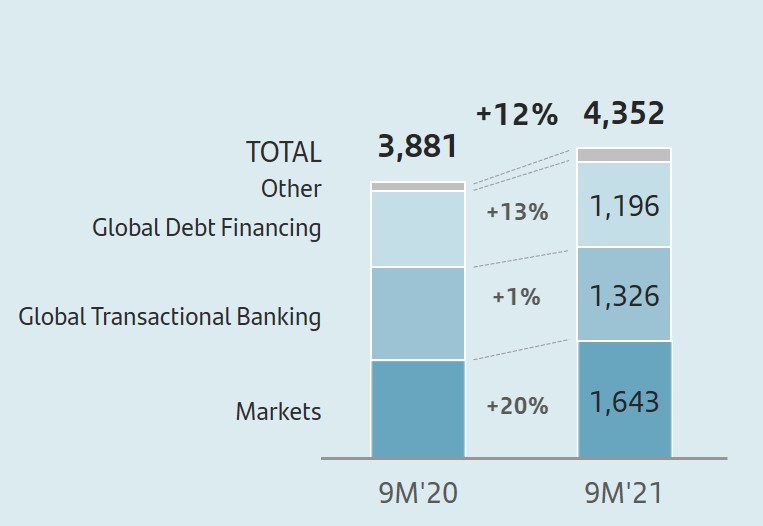 | | +19% | Leading positions in the rankings of different products |  | ||||||||||||||||||||||||||||||||||||||||||||||||||||||||||||||||
| -8% | Structured finance | Debt capital markets (DCM) | Equity capital markets (ECM) | ||||||||||||||||||||||||||||||||||||||||||||||||||||||||||||||||
| +13% |  | | | | | | | ||||||||||||||||||||||||||||||||||||||||||||||||||||||||||||
| Green Global | ||||||||||||||||||||||||||||||||||||||||||||||||||||||||||||||||||||
| (*) EUR million and % change in constant euros | ||||||||||||||||||||||||||||||||||||||||||||||||||||||||||||||||||||
Unless otherwise indicated, changes are reported at constant exchange rates. In the tables below and in the appendix, these changes are included together with the changes at current exchange rates.
Strategy
SCIB continued to make headway in the execution of its strategy to strengthen its position as our clients' strategic advisor of choice, boosting specialized high value-added products and services, which enabled us to optimize the return on capital.
In line with this strategy, SCIB is focused on high growth potential sectors that require a high degree of specialization.
In 2020, SCIB created the global Environmental, Social and Governance (ESG) solutions team to support our clients in their business transformation towards more sustainable alternatives, such as renewable energies, zero carbon transition, etc.
Since its creation, the ESG team has been involved in a number of transactions in different sectors and markets. Of note in the third quarter of 2021 was the Vineyard Wind 1 operation, a landmark transaction for the US renewable industry, as it is the first large-scale offshore wind farm built in the country. SCIB acted as Sole Financial Advisor in the structuring and execution of the transaction, coordinator of the Green Loan, joint lead arranger and agent for the joint venture between Avangrid Renewables (Iberdrola) and Copenhagen Infrastructure Partners.
Also of note in the quarter was that Santander Argentina led the country's first Sustainability Linked Bond, issued by San Miguel.
The DSG (Digital Solutions Group) team, which was created in Q1'21 to support the development and digital transformation of our current and potential customer base, participated in several operations, such as the IPO of Robinhood in the US. It is one of the most relevant operations of the year on the NASDAQ.
In addition, the European Investment Bank first digital bond issue, which took place in the first half of 2021 and in which Santander acted as Joint Lead Manager, was recognized by the Euromoney Global Awards for Excellence 2021 with the Financial Innovation of the Year award.

We continued to back our geographic diversification by accelerating growth in the US with the acquisition of broker-dealer Amherst Pierpont, a market-leading franchise in fixed income and structured products. This acquisition, which is subject to regulatory approvals and customary closing conditions, will strengthen our product offering, value proposition and distribution capabilities in the US while boosting our global business through the incorporation of 230 experienced employees serving more than 1,300 institutional clients in New York, Chicago, San Francisco and other US locations.
Regarding product positioning, SCIB held leading positions in different rankings:
•In Structured Finance, SCIB ranked first in Latin America and Europe by number of transactions, promoting renewable energies, the cornerstone of the ESG strategy.
•In DCM (Debt Capital Markets) we are the market leaders in Spain and ranked top 5 by volume of corporate debt placed in Europe and in Latin America.
•In ECM (Equity Capital Markets) we ranked top 3 in Spain, Mexico and Poland.
January - September 2021 | | 41 | ||||||
In the quarter, SCIB received numerous awards in several categories, including Global Finance and Euromoney.

Results
Underlying attributable profit in 9M'21 amounted to EUR 1,744 million, 26% more than in the same period of 2020. Total income rose 12% to EUR 4,352 million, backed by higher gains on financial transactions, driven by strong growth in markets, Corporate Finance and the positive performance of Banking businesses.
Revenue performance by business was as follows (in constant euros):
•Markets: significant revenue growth (+20% vs 9M'20) underscored by market volatility and the higher volume of client business, which we continued to support with the structuring of hedging products.
Positive performance of market results, with growth in most geographic areas, particularly the contribution of the sales business in Iberia, Brazil and Chile, as well as the books of Iberia, Argentina and Asia.
The first market products with an ESG approach were developed, such as the ESG Linked Derivatives, in which the price is linked to the KPI compliance of the corporate ESG programmes of the bank and its customers, and the first ESG Impact Derivatives, in which Santander uses part of its revenue to develop environmental projects.
•GDF (Global Debt Financing): Santander continued to support its clients in accessing liquidity sources, which was reflected in a substantial increase in funding volumes in the quarter, particularly indirect financing (distribution to other banks and institutional investors). As a result, total income was 13% higher year-on-year.
We consolidated our sustainable financing proposition through green and sustainability-linked loans and bonds. Of note was the sharp rise recorded in debt capital markets (DCM) compared to the overall decrease recorded in the global market.
Santander continued to be a global benchmark in structured finance, ranking first in Latin America and Europe.
•GTB (Global Transactional banking): income from customer balance management decreased by low interest rates in our core geographies, being partially offset by volume growth in the Export & Agency Finance and Working Capital Solutions businesses.
•CF (Corporate Finance): total income was up 42% versus 9M'20 driven by an increase in mergers and acquisitions (M&A) and equity capital markets (ECM) activity, particularly in Europe and Brazil.
The third quarter was marked by strong M&A activity in the telecommunications and technology sectors. Santander acted as Global Coordinator in the IPO of Brisanet in Brazil, a deal worth BRL 1.4 billion, as Telefónica's sole financial advisor in the creation of a FiberCo in Colombia. In the technology area, Santander acted as Joint Bookrunner in the IPO of Clearsale, which raised BRL 1.1 billion, and also as Joint Bookrunner in the follow-on of Totvs, for BRL 1.4 billion.
In the energy sector, Santander advised the Brazilian company Compass on the purchase of 51% of Gaspetro (Petrobras Gas) for USD 400 million.
In ECM, SCIB continued to consolidate its leading position in Spain as bookrunner in the IPO of Acciona Energia, and as advisor in the dissemination of Masmovil's takeover bid over Euskaltel.
In the rest of Europe, SCIB participated in the GBP 1.25 billion capital increase of the British airline easyJet. Santander also participated as advisor to Vivendi in the listing of Universal Media Group.
In Brazil, Santander completed 9 share offerings (7 IPOs and 2 follow-ons), including the IPOs of Armac Logistica (BRL 1,533 million) and Brisanet, where we were lead-left bookrunner.
Operating expenses increased 12% compared to the first nine months of 2020 due to investments in products and franchises under development. However, efficiency improved year-on-year and remained a benchmark in the sector (37.7%).
Sharp improvement in loan-loss provisions compared to 9M'20, due to the significant increases recorded in 2020 related to the widespread macroeconomic deterioration caused by the pandemic.
Compared to the previous quarter, underlying attributable profit grew 10%, mainly driven by the increase in total income and lower provisions, which offset the rise in costs.
| SCIB. Underlying income statement | ||||||||||||||||||||||||||
| EUR million and % change | ||||||||||||||||||||||||||
| / | Q2'21 | / | 9M'20 | |||||||||||||||||||||||
| Q3'21 | % | excl. FX | 9M'21 | % | excl. FX | |||||||||||||||||||||
| Revenue | 1,414 | +10 | +9 | 4,352 | +7 | +12 | ||||||||||||||||||||
| Expenses | -574 | +6 | +5 | -1,642 | +8 | +12 | ||||||||||||||||||||
| Net operating income | 840 | +13 | +12 | 2,709 | +6 | +12 | ||||||||||||||||||||
| LLPs | -7 | -65 | -66 | -75 | -74 | -73 | ||||||||||||||||||||
| PBT | 832 | +11 | +10 | 2,640 | +19 | +28 | ||||||||||||||||||||
| Underlying attrib. profit | 547 | +11 | +10 | 1,744 | +18 | +26 | ||||||||||||||||||||
| 42 | | January - September 2021 | ||||||
| Wealth Management & Insurance | Underlying attributable profit | ||||||
| EUR 698 mn | ||||||||
| Executive summary | ||||||||||||||||||||||||||||||||||||||||||||||||||||||||||||||||||||||||||||||||||||||
Results (9M'21 vs. 9M'20). % change in constant euros | Growth drivers 9M'21 | |||||||||||||||||||||||||||||||||||||||||||||||||||||||||||||||||||||||||||||||||||||
| Solid performance across our three businesses |  |  |  | |||||||||||||||||||||||||||||||||||||||||||||||||||||||||||||||||||||||||||||||||||
| Total fee income generated | Total contribution to profit | Assets under management | RoRWA | Net new money | Net sales | Gross written premiums | ||||||||||||||||||||||||||||||||||||||||||||||||||||||||||||||||||||||||||||||||
| +11% | +16% | +12% | 7.7% | EUR 7.9 bn | EUR 6.3 bn | +5% | ||||||||||||||||||||||||||||||||||||||||||||||||||||||||||||||||||||||||||||||||
| vs 9M'20 | ||||||||||||||||||||||||||||||||||||||||||||||||||||||||||||||||||||||||||||||||||||||
| Total contribution to profit by business | Other highlights in the period | |||||||||||||||||||||||||||||||||||||||||||||||||||||||||||||||||||||||||||||||||||||
| Constant EUR million (incl. fee income ceded to the Group) | Private Banking |  | SAM |  | Insurance |  | ||||||||||||||||||||||||||||||||||||||||||||||||||||||||||||||||||||||||||||||||
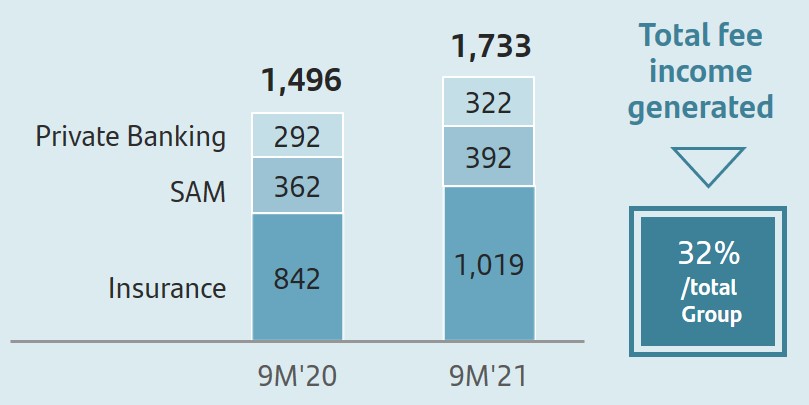 | ||||||||||||||||||||||||||||||||||||||||||||||||||||||||||||||||||||||||||||||||||||||
Customer growth +13% vs. 9M'20 | ESG AUM EUR 9,600 mn +75% vs. Sept. 20 | Fee income EUR 1,090 mn +14% vs. 9M'20 | ||||||||||||||||||||||||||||||||||||||||||||||||||||||||||||||||||||||||||||||||||||
 | ||||||||||||||||||||||||||||||||||||||||||||||||||||||||||||||||||||||||||||||||||||||
Unless otherwise indicated, changes are reported at constant exchange rates. In the tables below and in the appendix, these changes are included together with the changes at current exchange rates.
Commercial activity
We maintain our objective to become the best responsible Wealth & Protection Manager in Europe and Latin America, with it being one of the Group's growth drivers:
•In Private Baking, we continued to renew our product offering, with a particular focus on sustainable (ESG), alternative and thematic products. We also continued to grow our discretionary advisory service, to offer our clients value-added solutions tailored to their specific investment needs and risk profiles. These platforms recorded a 13% growth in the period.
As regards the ESG investment range, through both SAM and third-party products, assets under management amounted to more than EUR 2 billion, integrating a wide range of sustainability strategies.
Santander Future Wealth is our range of thematic funds and structured products, launched with the aim of bringing customers closer to investing in innovation and disruptive technologies. This joint initiative with SAM has reached EUR 4.2 billion of investment funds alone since its launch. On the other hand, the range of alternative products (private equity, infrastructure, real estate, debt and multi-asset) exceeded EUR 1.5 billion in both SAM and third-party funds.
Total volume of shared business across our markets stood at EUR 9,450 million, 43% more than in the same period of 2020, mainly driven by operations in Mexico, Brazil, the US, the UK, Portugal and Switzerland, reflecting the success of our global platform.
| Collaboration volumes | ||||||||||||||||||||
| Constant EUR million | ||||||||||||||||||||
| 9,450 | ||||||||||||||||||||
| u | +43% | |||||||||||||||||||
| / Sep 20 | ||||||||||||||||||||
•In Santander Asset Management, we continued to improve and complete our local and global product proposition. Of note was the launch of Santander ON, a range of solutions aimed at covering the different investment needs of our clients. This range follows a systematic and quantitative management methodology, including different investment themes and our ESG integration model.
The Santander GO range continued to increase strongly, reaching EUR 3.7 billion and the platform in Luxembourg amounted to more than EUR 11 billion.
The Future Wealth fund has exceeded EUR 1 billion since its launch, attracting customers mainly in Spain, International Private Banking, Chile, Portugal and Mexico.
We made further headway in our ESG strategy, offering over 23 ESG products globally, and assets under management exceeded EUR 9.6 billion.
The range of alternative products aimed primarily at our institutional clients is becoming increasingly robust, with 3 funds already launched and several more planned for Q4'21.
As for operational and technological transformation, this year we fully implemented the Aladdin platform in all our countries.
•In Insurance, we maintained a positive rate of growth in premiums (+5% year-on-year) and our main growth driver continued to be the non-credit related business. Of note were the increases in net fee income in Brazil (+11%), Spain (+30%) and Argentina (+52%), recording an overall net fee income growth of 14%.
Regarding our digital strategy, we strongly increased the number of insurance policies distributed through our digital channels, which doubled and now account for 16% of the total sales volumes.
January - September 2021 | | 43 | ||||||
Also noteworthy was the progress in the agreement with Allianz in Poland (subject to regulatory approval and other customary conditions for this type of operation), through which we expect to strengthen our position in this market.
Of note in the Americas was the good performance of Autocompara across the region, with more than 1.7 million vehicles insured and strong revenue growth (+35% compared to the same period last year), as well as Santander Auto in Brazil, which grew at double-digit rates.
Business performance
Total assets under management amounted to EUR 396 billion, 12% higher year-on-year in constant euros, driven by the gradual recovery of activity since the months most affected by the health crisis in 2020.
| Business performance: SAM and Private Banking | ||||||||||||||||||||
| Constant EUR billion | ||||||||||||||||||||
| Total Assets Under Management | ||
| Funds and investment * | ||
| SAM | ||
| Private Banking | ||
| Custody of customer funds | ||
| Customer deposits | ||
| Customer loans | ||
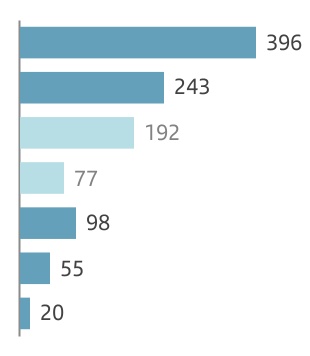
| / Jun-21 | / Sep-20 | ||||
| +2 | % | +12 | % | ||
| +2 | % | +10 | % | ||
| +2 | % | +7 | % | ||
| +1 | % | +18 | % | ||
| +2 | % | +23 | % | ||
| +2 | % | +3 | % | ||
| +5 | % | +25 | % | ||
Note: Total assets marketed and/or managed in 2021 and 2020.
(*) Total adjusted customer funds of private banking managed by SAM.
•In Private Banking, the volume of customer assets and liabilities grew 17% year-on-year to EUR 250 billion, boosted by market improvement and continued strong commercial activity. Net new money amounted to EUR 7.9 billion in 9M'21 (3.2% of total volume), and of note were the EUR 3.7 billion reached in funds.
Net profit in the first nine months was EUR 322 million, up 10% compared to the same period of 2020, primarily backed by growth in net fee income (15%). Private Banking customers rose 13%.
•In SAM, total assets under management increased 7% compared to September 2020 to EUR 192 billion. Cumulative net sales YTD remained at record highs at EUR 6.3 billion (3.3% of the total), mainly in Spain, Mexico, Chile, Luxembourg and Poland.
Total contribution to the Group's profit (including ceded fee income) was EUR 392 million, 8% higher year-on-year, mainly due to greater volumes and the gradual recovery of margins.
•In Insurance, the volume of gross written premiums in the first nine months amounted to EUR 6.4 billion (+5% year-on-year), despite lower loan activity stemming from the crisis. Net fee income grew 14% with 16% growth in non-credit related protection business. Total contribution to profit (including ceded fee income) increased 21% year-on-year to EUR 1,019 million.
Results
Underlying attributable profit was EUR 698 million in the first nine months of 2021, up 24% year-on-year:
•Total income increased 14% mainly driven by the higher volume of assets under management, net fee income growth, and greater insurance protection activity, notably non-credit related business.
•Total fee income generated, including fees ceded to the branch network amounted to EUR 2,494 million (+11% year-on-year) and represented 32% of the Group's total.
| Total fee income generated | ||||||||||||||||||||||||||||||||
| EUR million | ||||||||||||||||||||||||||||||||
| 2,494 | ||||||||||||||||||||||||||||||||
| u | 11% | 32% | ||||||||||||||||||||||||||||||
| vs 9M'20 | / total Group | |||||||||||||||||||||||||||||||
•Operating expenses were 5% higher than in 9M'20, due to the investments carried out together with higher costs related to increased commercial activity.
The total contribution to the Group (including net profit and total fees generated net of tax) was EUR 1,733 million in the first nine months, 16% higher than in 9M'20.
Compared to the previous quarter, underlying attributable profit rose 38%, primarily driven by the positive performance in total income.
| Total contribution to profit | ||||||||||||||
| EUR million and % change in constant euros | ||||||||||||||
| Q3'21 | 9M'21 | |||||||||||||
 | 644 | | 1,733 | |||||||||||
| +15 | % | / Q2'21 | +16 | % | / 9M'20 | |||||||||
| WM&I. Underlying income statement | ||||||||||||||||||||||||||
| EUR million and % change | ||||||||||||||||||||||||||
| / | Q2'21 | / | 9M'20 | |||||||||||||||||||||||
| Q3'21 | % | excl. FX | 9M'21 | % | excl. FX | |||||||||||||||||||||
| Revenue | 616 | +19 | +18 | 1,637 | +10 | +14 | ||||||||||||||||||||
| Expenses | -221 | -2 | -3 | -668 | +2 | +5 | ||||||||||||||||||||
| Net operating income | 395 | +35 | +34 | 969 | +17 | +21 | ||||||||||||||||||||
| LLPs | -6 | +114 | +114 | -14 | -39 | -39 | ||||||||||||||||||||
| PBT | 405 | +40 | +40 | 966 | +21 | +25 | ||||||||||||||||||||
| Underlying attrib. profit | 292 | +39 | +38 | 698 | +20 | +24 | ||||||||||||||||||||
| 44 | | January - September 2021 | ||||||
| Underlying attributable profit | |||||||
| EUR -206 mn | ||||||||
| Executive summary | |||||||||||||||||||||||||||||||||||||||||||||||||||||||||||||||||||||||||||||
| PagoNxt | Merchant Solutions | ||||||||||||||||||||||||||||||||||||||||||||||||||||||||||||||||||||||||||||
| Combining our most innovative payments businesses into a single, autonomous company: | Through the expansion of our Getnet platform to become a leading global acquirer | ||||||||||||||||||||||||||||||||||||||||||||||||||||||||||||||||||||||||||||
 | SME customers in LatAm and Europe | Active merchants | Total Payments Volume | ||||||||||||||||||||||||||||||||||||||||||||||||||||||||||||||||||||||||||
> 4 million | 1.19 mn +11% YoY | EUR 81.2 bn +53% vs. 9M'20* | |||||||||||||||||||||||||||||||||||||||||||||||||||||||||||||||||||||||||||
| Trade Solutions | Consumer Solutions | ||||||||||||||||||||||||||||||||||||||||||||||||||||||||||||||||||||||||||||
| For SMEs & Corporates who operate internationally and want state-of-the-art digital solutions | Delivering engaging payment solutions for individuals in emerging and developed markets | ||||||||||||||||||||||||||||||||||||||||||||||||||||||||||||||||||||||||||||
| SME customers who operate internationally | Active customers Superdigital in Brazil | ||||||||||||||||||||||||||||||||||||||||||||||||||||||||||||||||||||||||||||
| 220,000 | +13% YoY | ||||||||||||||||||||||||||||||||||||||||||||||||||||||||||||||||||||||||||||
| (*) % change in constant EUR | |||||||||||||||||||||||||||||||||||||||||||||||||||||||||||||||||||||||||||||
Unless otherwise indicated, changes are reported at constant exchange rates. In the tables below and in the appendix, these changes are included together with the changes at current exchange rates.
Strategy
PagoNxt is an autonomous company within the Group, with the talent, processes, and corporate governance that provide the needed base for faster growth and achieve our ambition to build a leadership position, both in the Americas and Europe. It comprises three businesses which deliver simple and accessible digital payment solutions to drive loyalty across consumers and corporate customers.
In its early stage, PagoNxt has been deploying its initiatives within our Banks, enabling better solutions for Santander customers. We are now beginning a new phase of our journey to turn PagoNxt into a growth engine in all our markets.
Digitalization of customers' payments and accessibility to our services are at the core of PagoNxt's strategy, embracing Santander's goals as a responsible bank. Our wide range of merchant and trade solutions will contribute to the development of all type of businesses, helping them digitalize their operations and payments, and our consumer solutions will benefit the lives of our customers through financial inclusion.
PagoNxt leverages Santander's deep local knowledge of the markets where it operates, customizing its global offerings to fulfil local needs. Merchant, trade and consumer solutions are provided in partnership with Santander local banks, leveraging our customer base of 152 million individual and corporate customers.
Additionally, PagoNxt will directly pursue open market opportunities and revenue pools with new customer segments and in new geographic areas, leveraging the Group's scale.
Commercial activity
The roll-out of PagoNxt platforms by country continues to progress, as the three businesses expand their footprint:
Merchant solutions
PagoNxt Merchant solutions 2021 strategy is focused on enhancing our global acquiring platform, leveraging the Wirecard assets acquisition, and also on expanding the platform to additional countries in LatAm and Europe.
PagoNxt Merchant solutions, through its global franchise Getnet, is already one of the top 3 acquirers in Latin America. Its global strategy leverages Getnet's capabilities to enable efficient processing of in-store and e-commerce payments and provides best-in-class value added services, not only to Santander customers but also in the open market.
The Getnet franchise continues to deliver growth: despite pandemic-related challenges, the number of active merchants and total payments volume grew across all geographies, and revenue growth accelerated in the last few months in spite of margin pressures.
We continued to expand our global franchise and product offerings during the quarter and made further progress on our global merchant platform through product development across our technology hubs in Porto Alegre, Munich, Chennai and Dubai, and through selective acquisitions. In Brazil, for example, we are developing new services for large e-commerce retailers, which will provide a single integration point to operate in different markets. We acquired a majority stake in a tech company called MIT (Mercadotecnia, Ideas y Tecnología) in Mexico and a payments provider called NAD (New Age Data) in Uruguay.
Our franchise in Brazil, Getnet Brazil, has recorded very significant market share gains in the country (16% and > 30% in e-commerce).

January - September 2021 | | 45 | ||||||
In Europe, Getnet incorporated Santander España Merchant Services (SEMS) and continued with the integration of Wirecard's technology assets and talent acquired last January. Europe opened a branch in Munich, which will support the provision of our integrated offerings for European customers.
| Merchant solutions | ||||||||||||||||||||||||||||||||||||||||||||
| Active merchants | Total Payments Volumes | |||||||||||||||||||||||||||||||||||||||||||
| Millions | EUR billion | |||||||||||||||||||||||||||||||||||||||||||
| 1.19 | ||||||||||||||||||||||||||||||||||||||||||||
| 1.07 | +11% | 81.2 | ||||||||||||||||||||||||||||||||||||||||||
| +53% | ||||||||||||||||||||||||||||||||||||||||||||
| 53.0 | ||||||||||||||||||||||||||||||||||||||||||||
| Sep-20 | Sep-21 | 9M'20 | 9M'21 | |||||||||||||||||||||||||||||||||||||||||
Trade solutions
PagoNxt Trade delivers digital, simple and integrated trade, international payments and FX solutions for businesses of all sizes, supporting them in their international expansion.
Santander is an experienced player in payments services, with a strong customer base of 220,000 companies trading internationally, and 3.4 million international payments processed in 2020.
Our priorities for Trade Solutions in 2021 are connecting additional Santander customers to the platform, covering our entire footprint, deploying new core functionalities in all transactional services (payments, FX and trade finance), and reaching customers beyond Santander's customer base.
| Active corporate / business clients | ||||||||||||||
| September 2021 | ||||||||||||||
 | 7,300 | |||||||||||||
To this end, we are leveraging our experience to develop a new global technology platform that incorporates innovative new services, bringing Santander international flows into a single platform operating under the global brand of One Trade. This platform is being connected to all our banks, and existing clients are seamlessly accessing these new services, which will also be available for new, open market customers.
The global roll-out of our One Trade platform is well underway. As of September, platform adoption grew steadily in eight countries (Brazil, Mexico, Spain, the UK, Chile, Portugal, Colombia and Poland) and active corporate and business clients increased from 4,100 in March to 7,300 in September.
Consumer solutions
PagoNxt Consumer is focused on delivering economic inclusion across Latin America, allowing underbanked customers to have access to digital financial services.
Superdigital's plan is to launch its global multi-country platform in all Santander countries in LatAm. We began to operate in Argentina in Q3.
In the year ahead, Superdigital will continue to promote financial inclusion, focusing on rolling out the platform across seven countries in the region, combining geographical expansion and efficiency
improvement across its operations, and expanding its banking services in the platform. We will continue to test new alternative payment models that enable us to offer unique solutions to our clients.
In line with its financial inclusion agenda, Superdigital joined the Regional Alliance for the Digitalization of Women in Latin America and the Caribbean, to support a significant customer base through digital skill development.

PagoNxt Results
In the first nine months of 2021, underlying attributable profit decreased year-on-year to -EUR 206 million (-EUR 61 million in 9M'20).
This fall was driven by investments in project developments and platforms, mainly in Trade, together with the integration of Wirecard's assets into Merchant solutions in January 2021.
On the other hand, total income increased 41% year-on-year, boosted by the strong jump in net fee income (+45% at constant exchange rates).
| PagoNxt. Revenue performance | ||||||||||||||||||||||||||||||||||||||||||||
| Constant EUR million | ||||||||||||||||||||||||||||||||||||||||||||
| 334 | ||||||||||||||||||||||||||||||||||||||||||||
| 237 | +41% | +49% | 142 | |||||||||||||||||||||||||||||||||||||||||
| 95 | ||||||||||||||||||||||||||||||||||||||||||||
| 9M'20 | 9M'21 | H1'21* | Q3'21 | |||||||||||||||||||||||||||||||||||||||||
(*) H1'21 quarterly average
This performance was backed by the recovery of activity in last two quarters, with volumes exceeding pre-pandemic levels, mainly in Merchant Solutions (strong increase in the number of transactions, merchants and Total Payments Volume in most of the countries).
| PagoNxt. Underlying income statement | ||||||||||||||||||||||||||
| EUR million and % change | ||||||||||||||||||||||||||
| / | Q2'21 | / | 9M'20 | |||||||||||||||||||||||
| Q3'21 | % | excl. FX | 9M'21 | % | excl. FX | |||||||||||||||||||||
| Revenue | 144 | +18 | +15 | 334 | +30 | +41 | ||||||||||||||||||||
| Expenses | -181 | +11 | +10 | -479 | +59 | +67 | ||||||||||||||||||||
| Net operating income | -36 | -8 | -4 | -145 | +225 | +191 | ||||||||||||||||||||
| LLPs | -2 | +1 | -2 | -7 | -32 | -23 | ||||||||||||||||||||
| PBT | -73 | +61 | +65 | -191 | +248 | +220 | ||||||||||||||||||||
| Underlying attrib. profit | -79 | +42 | +44 | -206 | +237 | +223 | ||||||||||||||||||||
| 46 | | January - September 2021 | ||||||
| RESPONSIBLE BANKING | ||||||||
Santander strives every day to contribute to the progress of people and companies in a Simple, Personal and Fair way in all that we do, to earn the confidence of our employees, customers, shareholders and society.
In order to meet our commitment to be a more responsible bank and help society address the main global challenges, we are incorporating social, environmental and good governance surrounding business decision making criteria to respond to two challenges: adapt to the new business environment and contribute to more inclusive and sustainable growth. In 2019 we set clear and ambitious goals on which we made progress in 2020 and have continued to do so during 2021. We achieved carbon neutrality in our own operations in 2020 and met our 2021 commitments a year ahead of schedule. In doing so, we continue to contribute to the achievement of the Sustainable Development Goals.
In 2021, we continued to progress towards our goals:
 | Santander Responsible Banking targets | ||||
More information on our goals in responsible banking can be found on our website.
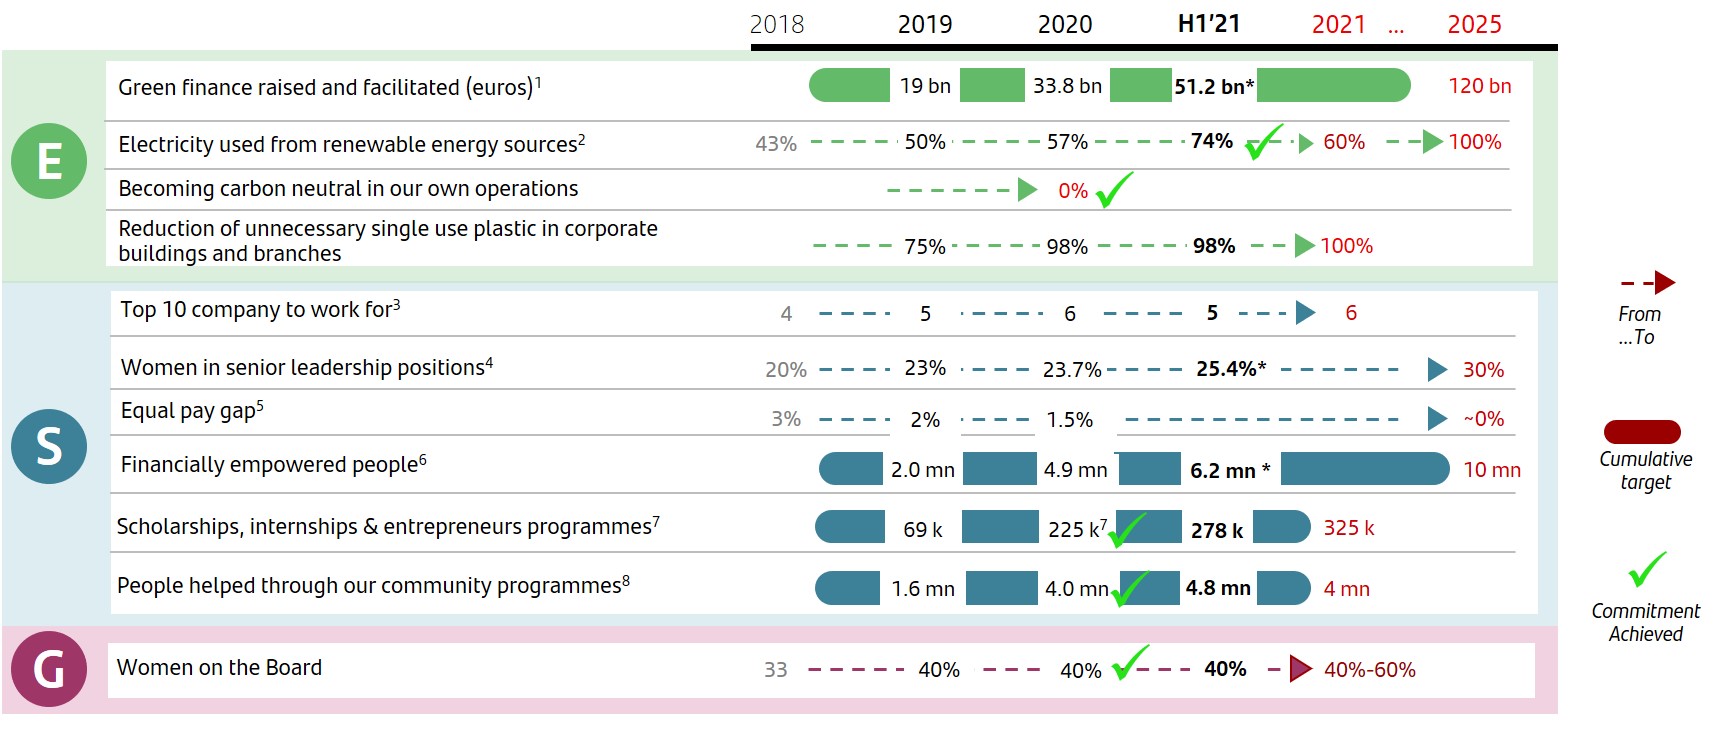
Note: H1’21 data not audited
* 9M’21 provisional and not audited data
1.Includes Santander overall contribution to green finance: project finance, syndicated loans, green bonds, capital finance, export finance, advisory, structuring and other products to help our clients in the transition to a low carbon economy. Commitment from 2019 to 2030 is EUR 220 bn.
2.In those countries where it is possible to certify renewable sourced electricity for the properties occupied by the Group.
3.According to relevant external indices in each country (Great Place to Work, Top Employer, Merco, etc.).
4.Senior positions represent 1% of total workforce.
5.Calculation of equal pay gap compares employees of the same job, level and function. Data reported annually.
6.People (unbanked, underbanked or financially vulnerable), who are given access to the financial system, receive tailored finance and increase their knowledge and resilience through financial education.
7.People supported through Santander Universities initiative (students who will receive a Santander scholarship, will achieve an internship in an SME or participate in entrepreneurship programmes supported by the bank). Commitment refreshed after early completion in 2020 (200k).
8.People helped through our community investment programmes (excluded Santander Universities and financial education initiatives).
January - September 2021 | | 47 | ||||||
| 9M'21 highlights | ||||
☑ Euromoney recognized Santander as the World’s Best Bank for Financial Inclusion and Best Bank for Sustainable Finance in Latin America. In addition, we were named the most innovative entity in digital banking by The Banker for our financial inclusion initiatives. In this regard, Global Finance also singled out Santander as the leading bank in Sustainable Finance in Latin America; recognizing SCIB at the Sustainable Finance Awards for its global and regional leadership.
☑ Santander Brasil was named by Great Place to Work as one of the four best places to work for women, and included Santander UK in the list of the best companies for women to work for in the super large category.
☑ We continued to contribute to the public debate on climate change at the Santander International Banking Conference 2021 and to incorporate ESG aspects into our operations.
The main initiatives are set out below:
 | Environmental | ||||
♣ As part of its commitment to the transition to a green economy, Santander continued to finance green alternatives and renewable energy. We reached EUR 51 billion in green finance1 (of which EUR 17 billion in 9M'21), making progress towards our commitment to reach EUR 120 billion by 2025.
♣ SCIB acted as sole financial advisor in the merger of Enel Green Power Colombia, and its mainland energy subsidiaries, and Grupo de Empresas de Bogotá. In addition, Santander México launched its first sustainable fund with a global approach; an equity fund that invests in companies with strong ESG standards and high growth potential.
♣ Santander Argentina also led the first issuance and placement of a sustainability-linked corporate bond for more than USD 50 million. SCIB Chile executed, for the first time in Latin America, a sustainability-linked swap with the shipping company Ultranav.
♣ Lastly, Santander Uruguay launched its first carbon-neutral car loan.
 | Social | ||||
Ü Thanks to Santander Finance for All, Santander's response to support financial inclusion and empowerment, we have empowered 6.2 million people1. Under this framework, Santander Perú launched Surgir, its microcredit programme to provide access to finance for micro-entrepreneurs in the country, and Santander México signed an agreement with Soriana, and now offers around 30,000 access points to banking services to its customers where they can carry out simple transactions. Superdigital joined the 'Regional Alliance for the Digitalization of Women in Latin America and the Caribbean' seeking to provide a virtual educational platform that boosts women's digital skills. Santander US joined the Financial Literacy for All initiative, a group comprising US companies that aim to promote financial inclusion.
Ü We continued to invest in the communities where we operate. Santander México introduced the new LikeU credit card, which allows customers to personalize benefits according to their needs, and promotes support for social causes, such as reforestation or the fight against breast cancer. Santander Universidades launched the Santander Skills | Upskill your talent scholarships to develop soft skills, the Santander Technology | Digital Experience Amazon Web Services initiative, which provides 1,000 scholarships to boost digital skills, and the Santander Languages Scholarships | English to boost your career together with the University of Pennsylvania.
Ü Banco Santander joined the Spanish Ministry of Equality's Punto Violeta initiative against gender violence and in favour of equality, awareness and social inclusion of victims.
We also continue to be part of several sustainability indices, providing non-financial information to markets, investors and ESG analysts.

(1) Aggregated data 2019-9M'21. Unaudited 9M'21 provisional monitoring data.
| 48 | | January - September 2021 | ||||||
| CORPORATE GOVERNANCE | ||||||||
| A responsible bank has a solid governance model with well-defined functions, it manages risks and opportunities prudently and defines its long-term strategy looking out for the interests of all its stakeholders and society in general |  | ||||
à Changes in the organizational structure of Grupo Santander's Senior Management
Mr Javier San Félix has taken the position of Chief Executive Officer of PagoNxt, an independent digital payments entity within Grupo Santander, and has left his senior management functions at Banco Santander as Head of Santander Global Payments.
à Amendment of the Rules and regulations of the board
On 27 July, the board of directors approved the amendment of the Rules and regulations of the board to adapt them to the new provisions introduced by Law 5/2021, of 12 April, amending the Companies Act.
The main amendments related to:
–the update of the regimen for the approval and supervision of related-party transactions and the establishment of a procedure for periodic information and control of those transactions whose approval has been delegated by the board, in accordance with the provisions of the new law; and
–the directors' remuneration regimen, introducing technical updates regarding the content of the directors' remuneration policy and the annual report.
The amendment was registered in the Commercial Registry of Cantabria on 16 August 2021 and submitted to the National Securities Market Commission.
January - September 2021 | | 49 | ||||||
| SANTANDER SHARE | ||||||||
Banco Santander approved its shareholder remuneration policy for 2021. The updated policy targets a total shareholder remuneration of approximately 40% of the group’s underlying profit, split in equal parts between cash dividends and share buybacks. According to the revised policy, interim distributions will be made around November and final distributions around May following the bank’s annual shareholder meeting.
The board of Banco Santander announced its decision to make an interim distribution from 2021 earnings through a cash dividend and share buyback amounting to a total value c. EUR 1.7 billion - equivalent to 40% of underlying profit for the first half of 2021. The board’s decision has been taken in view of the lifting of the European Central Bank's (ECB) recommendation that had limited shareholder remuneration until 30 September 2021.
Shareholder remuneration will be made in two parts:
•A cash dividend of EUR 4.85 cents per share, which will be paid from 2 November 2021.
•A buyback programme that will have a maximum amount of EUR 841 million, equivalent to 20% of the Group's underlying profit in the first half of 2021, already approved by the ECB and included in the inside information disclosed on 6 October 2021.
The repurchase programme will have the following characteristics:
•Expected duration from 6 October 2021 to 17 December 2021, however, the Bank reserves the right to terminate the buyback programme if, prior to its expiry date, the maximum monetary amount is reached or if any other circumstances so advise.
•The average purchase price of shares will not exceed EUR 3.98, corresponding to the tangible book value per share at 30 June 2021.
•The maximum number of shares that may be acquired will depend on the average price at which they are acquired, but will not exceed 9.7% of the Bank’s share capital.
The bank plans to announce a further and final remuneration from 2021 earnings in the first quarter of 2022, subject to the appropriate corporate and regulatory approvals.
à Share price performance
The Santander share is listed in five markets, in Spain, Mexico and Poland as an ordinary share, in the US as an ADR and in the UK as a CDI. The global economy continued to recover, despite the Delta variant spreading across the board, in a context of excess liquidity and expansionary fiscal policies. This positive performance favoured the rise in commodity prices in recent months and increased inflationary pressures, which rebounded in the US and the Eurozone to the highest levels in a decade. These price increases could be transitory, and driven by supply constraints, associated with the end of the pandemic, rather than being a consequence of excess demand.
In this environment, the Federal Reserve (Fed) could announce the reduction of stimulus (tapering) soon, and, if the environment allows it, it might start raising interest rates once the tapering process concludes, around H2'22. On the other hand, the European Central Bank, after increasing its growth forecast for 2021 and estimating a return to the pre-pandemic levels by 2023, announced that it would moderately reduce its asset purchases under the pandemic programme (PEPP), maintaining its expansionary policy.
The main global equity markets ended September with significant aggregate gains in the first nine months of the year. The banking sector recorded an overall better performance, the DJ Stoxx Banks rose 30.1% while the MSCI World Banks rose 21.6%, compared to the Ibex 35 9.0% increase and the DJ Stoxx 50 12.6% growth. Santander recorded a rise of 23.6%.
| Share price | ||||||||||||||
 |  | |||||||||||||
START 31/12/2020 | END 30/09/2021 | |||||||||||||
| €2.538 | €3.137 | |||||||||||||
 |  | |||||||||||||
Maximum 03/06/2021 | Minimum 28/01/2021 | |||||||||||||
| €3.509 | €2.375 | |||||||||||||
| Comparative share performance | ||
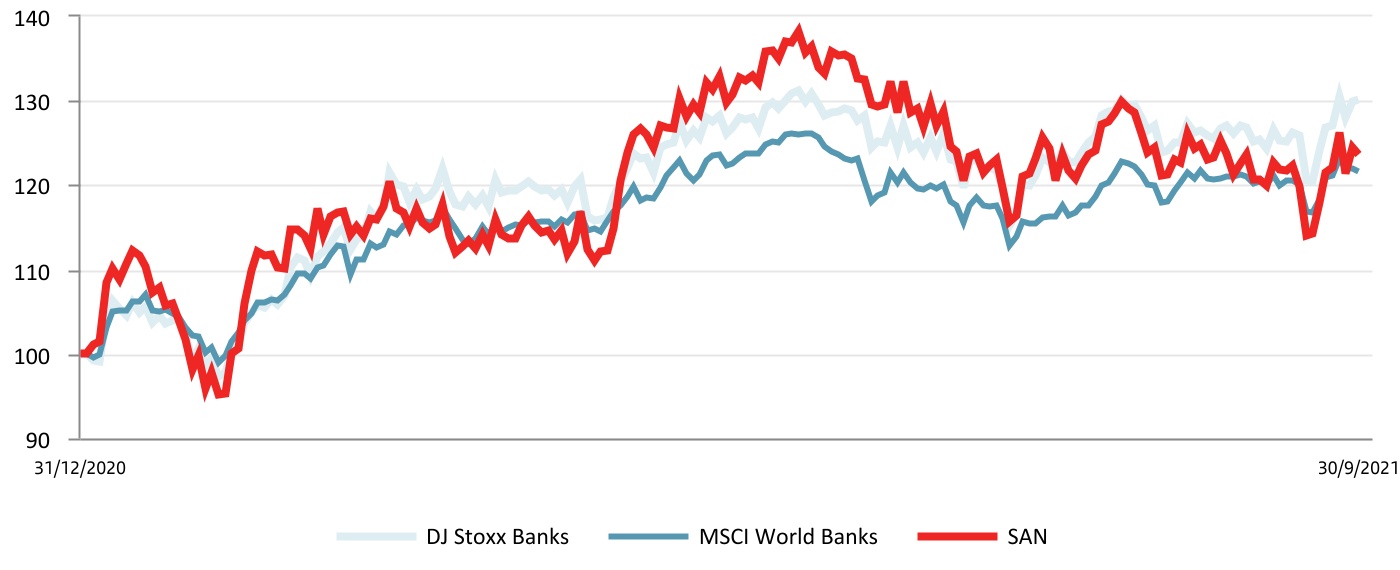
| 50 | | January - September 2021 | ||||||
àMarket capitalization and trading
As at 30 September 2021, Santander was the second largest bank in the Eurozone by market capitalization and the 30th in the world among financial entities (EUR 54,389 million).
The share’s weighting in the DJ Stoxx Banks index was 7.2% and 11.7% in the DJ Euro Stoxx Banks. In the domestic market, its weight in the Ibex 35 as at end September was 11.3%.
A total of 9,283 million shares were traded in the period for an effective value of EUR 28,060 million and a liquidity ratio of 54%.
The daily trading volume was 48 million shares with an effective value of EUR 146 million.
àShareholder base
The total number of Santander shareholders at 30 September 2021 was 3,817,454, of which 3,529,544 were European (75.27% of the capital stock) and 276,578 from the Americas (23.17% of the capital stock).
Excluding the board, which holds 1.05% of the Bank’s capital stock, retail shareholders account for 39.63% and institutional shareholders account for 59.32%.
| Share capital distribution by geographic area | ||||||||
| September 2021 | ||||||||
| The Americas | Europe | Other | ||||||
| 23.17% | 75.27% | 1.56% | ||||||
 | ||||||||
 | 2nd | Bank in the Eurozone by market capitalization | ||||||
EUR 54,389 million | ||||||||
| The Santander share | |||||
| September 2021 | |||||
| Shares and trading data | |||||
| Shares (number) | 17,340,641,302 | ||||
| Average daily turnover (number of shares) | 48,347,400 | ||||
| Share liquidity (%) | 54 | ||||
| (Number of shares traded during the year / number of shares) | |||||
| Stock market indicators | |||||
| Price / Tangible book value (X) | 0.79 | ||||
| Free float (%) | 99.95 | ||||
| Share capital distribution by type of shareholder | |||||
| September 2021 | |||||
| Institutions | |||||
| 59.32% | |||||
| Board * | |||||
| 1.05% | |||||
| Retail | |||||
| 39.63% | |||||
(*) Shares owned or represented by directors.
January - September 2021 | | 51 | ||||||
2021 A P P E N D I X

| 52 | | January - September 2021 | ||||||
| Net fee income. Consolidated | ||||||||||||||||||||
| EUR million | ||||||||||||||||||||
| Q3'21 | Q2'21 | Change (%) | 9M'21 | 9M'20 | Change (%) | |||||||||||||||
| Fees from services | 1,412 | 1,429 | (1.2) | 4,255 | 4,270 | (0.4) | ||||||||||||||
| Wealth management and marketing of customer funds | 968 | 931 | 4.0 | 2,751 | 2,543 | 8.2 | ||||||||||||||
| Securities and custody | 261 | 261 | — | 804 | 746 | 7.8 | ||||||||||||||
| Net fee income | 2,641 | 2,621 | 0.8 | 7,810 | 7,559 | 3.3 | ||||||||||||||
| Underlying operating expenses. Consolidated | ||||||||||||||||||||
| EUR million | ||||||||||||||||||||
| Q3'21 | Q2'21 | Change (%) | 9M'21 | 9M'20 | Change (%) | |||||||||||||||
| Staff costs | 2,767 | 2,750 | 0.6 | 8,205 | 8,095 | 1.4 | ||||||||||||||
| Other general administrative expenses | 1,951 | 1,811 | 7.7 | 5,509 | 5,531 | (0.4) | ||||||||||||||
| Information technology | 548 | 553 | (0.9) | 1,596 | 1,551 | 2.9 | ||||||||||||||
| Communications | 100 | 102 | (2.0) | 299 | 360 | (16.9) | ||||||||||||||
| Advertising | 131 | 115 | 13.9 | 364 | 382 | (4.7) | ||||||||||||||
| Buildings and premises | 187 | 168 | 11.3 | 519 | 561 | (7.5) | ||||||||||||||
| Printed and office material | 24 | 23 | 4.3 | 66 | 76 | (13.2) | ||||||||||||||
| Taxes (other than tax on profits) | 130 | 124 | 4.8 | 394 | 386 | 2.1 | ||||||||||||||
| Other expenses | 831 | 726 | 14.5 | 2,271 | 2,215 | 2.5 | ||||||||||||||
| Administrative expenses | 4,718 | 4,561 | 3.4 | 13,714 | 13,626 | 0.6 | ||||||||||||||
| Depreciation and amortization | 683 | 698 | (2.1) | 2,064 | 2,100 | (1.7) | ||||||||||||||
| Operating expenses | 5,401 | 5,259 | 2.7 | 15,778 | 15,726 | 0.3 | ||||||||||||||
| Operating means. Consolidated | |||||||||||||||||||||||
| Employees | Branches | ||||||||||||||||||||||
| Sep-21 | Sep-20 | Change | Sep-21 | Sep-20 | Change | ||||||||||||||||||
| Europe | 62,577 | 69,928 | (7,351) | 3,265 | 4,700 | (1,435) | |||||||||||||||||
| Spain | 23,038 | 27,053 | (4,015) | 1,948 | 3,110 | (1,162) | |||||||||||||||||
| United Kingdom | 20,008 | 22,741 | (2,733) | 450 | 564 | (114) | |||||||||||||||||
| Portugal | 5,716 | 6,431 | (715) | 397 | 499 | (102) | |||||||||||||||||
| Poland | 9,776 | 10,698 | (922) | 458 | 515 | (57) | |||||||||||||||||
| Other | 4,039 | 3,005 | 1,034 | 12 | 12 | — | |||||||||||||||||
| North America | 43,135 | 38,289 | 4,846 | 1,888 | 2,014 | (126) | |||||||||||||||||
| US | 15,484 | 16,189 | (705) | 514 | 584 | (70) | |||||||||||||||||
| Mexico | 27,027 | 21,770 | 5,257 | 1,374 | 1,430 | (56) | |||||||||||||||||
| Other | 624 | 330 | 294 | — | — | — | |||||||||||||||||
| South America | 69,961 | 66,517 | 3,444 | 4,443 | 4,447 | (4) | |||||||||||||||||
| Brazil | 47,877 | 43,689 | 4,188 | 3,591 | 3,562 | 29 | |||||||||||||||||
| Chile | 10,570 | 11,200 | (630) | 332 | 354 | (22) | |||||||||||||||||
| Argentina | 8,715 | 9,267 | (552) | 408 | 427 | (19) | |||||||||||||||||
| Other | 2,799 | 2,361 | 438 | 112 | 104 | 8 | |||||||||||||||||
| Digital Consumer Bank | 15,920 | 16,101 | (181) | 308 | 359 | (51) | |||||||||||||||||
| Corporate Centre | 1,710 | 1,743 | (33) | ||||||||||||||||||||
| Total Group | 193,303 | 192,578 | 725 | 9,904 | 11,520 | (1,616) | |||||||||||||||||
| Underlying net loan-loss provisions. Consolidated | ||||||||||||||||||||
| EUR million | ||||||||||||||||||||
| Q3'21 | Q2'21 | Change (%) | 9M'21 | 9M'20 | Change (%) | |||||||||||||||
| Non-performing loans | 2,548 | 2,054 | 24.1 | 6,901 | 10,388 | (33.6) | ||||||||||||||
| Country-risk | — | — | — | (1) | (6) | (83.3) | ||||||||||||||
| Recovery of written-off assets | (328) | (293) | 11.9 | (927) | (820) | 13.0 | ||||||||||||||
| Net loan-loss provisions | 2,220 | 1,761 | 26.1 | 5,973 | 9,562 | (37.5) | ||||||||||||||
January - September 2021 | | 53 | ||||||
| Loans and advances to customers. Consolidated | |||||||||||||||||
| EUR million | |||||||||||||||||
| Change | |||||||||||||||||
| Sep-21 | Sep-20 | Absolute | % | Dec-20 | |||||||||||||
| Commercial bills | 42,316 | 28,454 | 13,862 | 48.7 | 37,459 | ||||||||||||
| Secured loans | 525,118 | 496,769 | 28,349 | 5.7 | 503,014 | ||||||||||||
| Other term loans | 276,474 | 272,961 | 3,513 | 1.3 | 269,143 | ||||||||||||
| Finance leases | 38,083 | 35,751 | 2,332 | 6.5 | 36,251 | ||||||||||||
| Receivable on demand | 9,549 | 8,771 | 778 | 8.9 | 7,903 | ||||||||||||
| Credit cards receivable | 18,570 | 17,468 | 1,102 | 6.3 | 19,507 | ||||||||||||
| Impaired assets | 31,629 | 29,873 | 1,756 | 5.9 | 30,815 | ||||||||||||
| Gross loans and advances to customers (excl. reverse repos) | 941,739 | 890,047 | 51,692 | 5.8 | 904,092 | ||||||||||||
| Reverse repos | 40,358 | 43,474 | (3,116) | (7.2) | 35,702 | ||||||||||||
| Gross loans and advances to customers | 982,097 | 933,521 | 48,576 | 5.2 | 939,794 | ||||||||||||
| Loan-loss allowances | 23,786 | 22,807 | 979 | 4.3 | 23,595 | ||||||||||||
| Loans and advances to customers | 958,311 | 910,714 | 47,597 | 5.2 | 916,199 | ||||||||||||
| Total funds. Consolidated | |||||||||||||||||
| EUR million | |||||||||||||||||
| Change | |||||||||||||||||
| Sep-21 | Sep-20 | Absolute | % | Dec-20 | |||||||||||||
| Demand deposits | 697,371 | 621,361 | 76,010 | 12.2 | 642,897 | ||||||||||||
| Time deposits | 167,035 | 180,571 | (13,536) | (7.5) | 171,939 | ||||||||||||
| Mutual funds | 184,782 | 155,479 | 29,303 | 18.8 | 164,802 | ||||||||||||
| Customer funds | 1,049,188 | 957,411 | 91,777 | 9.6 | 979,638 | ||||||||||||
| Pension funds | 15,828 | 15,073 | 755 | 5.0 | 15,577 | ||||||||||||
| Managed portfolios | 30,678 | 26,157 | 4,521 | 17.3 | 26,438 | ||||||||||||
| Repos | 44,628 | 40,967 | 3,661 | 8.9 | 34,474 | ||||||||||||
| Total funds | 1,140,322 | 1,039,608 | 100,714 | 9.7 | 1,056,127 | ||||||||||||
Eligible capital (phased in) 1. Consolidated | |||||||||||||||||
| EUR million | |||||||||||||||||
| Change | |||||||||||||||||
| Sep-21 | Sep-20 | Absolute | % | Dec-20 | |||||||||||||
| Capital stock and reserves | 115,063 | 125,333 | (10,271) | (8.2) | 125,449 | ||||||||||||
| Attributable profit | 5,849 | (9,048) | 14,897 | — | (8,771) | ||||||||||||
| Dividends | (1,276) | — | (1,276) | — | (478) | ||||||||||||
| Other retained earnings | (34,968) | (35,383) | 415 | (1.2) | (35,345) | ||||||||||||
| Minority interests | 6,658 | 6,741 | (82) | (1.2) | 6,669 | ||||||||||||
| Goodwill and intangible assets | (15,781) | (16,692) | 910 | (5.5) | (15,711) | ||||||||||||
| Other deductions | (4,757) | (4,423) | (334) | 7.6 | (2,415) | ||||||||||||
| Core CET1 | 70,787 | 66,528 | 4,259 | 6.4 | 69,399 | ||||||||||||
| Preferred shares and other eligible T1 | 10,110 | 8,963 | 1,147 | 12.8 | 9,102 | ||||||||||||
| Tier 1 | 80,897 | 75,492 | 5,406 | 7.2 | 78,501 | ||||||||||||
| Generic funds and eligible T2 instruments | 12,639 | 10,987 | 1,652 | 15.0 | 12,514 | ||||||||||||
| Eligible capital | 93,537 | 86,479 | 7,058 | 8.2 | 91,015 | ||||||||||||
| Risk-weighted assets | 577,209 | 555,122 | 22,086 | 4.0 | 562,580 | ||||||||||||
| CET1 capital ratio | 12.26 | 11.98 | 0.28 | 12.34 | |||||||||||||
| T1 capital ratio | 14.02 | 13.60 | 0.42 | 13.95 | |||||||||||||
| Total capital ratio | 16.20 | 15.58 | 0.63 | 16.18 | |||||||||||||
(1) The phased-in ratio includes the transitory treatment of IFRS 9, calculated in accordance with article 473 bis of the Regulation on Capital Requirements (CRR) and subsequent amendments introduced by Regulation 2020/873 of the European Union. Additionally, the Tier 1 and total phased-in capital ratios include the transitory treatment according to chapter 2, title 1, part 10 of the aforementioned CRR.
| 54 | | January - September 2021 | ||||||
| EUROPE | |||||||||||||||||||||||
| EUR million | |||||||||||||||||||||||
| / | Q2'21 | / | 9M'20 | ||||||||||||||||||||
| Underlying income statement | Q3'21 | % | % excl. FX | 9M'21 | % | % excl. FX | |||||||||||||||||
| Net interest income | 2,744 | (0.2) | (0.5) | 8,140 | 12.4 | 11.9 | |||||||||||||||||
| Net fee income | 1,079 | (0.6) | (0.6) | 3,236 | 6.7 | 6.9 | |||||||||||||||||
Gains (losses) on financial transactions (1) | 101 | 20.3 | 15.9 | 569 | (18.4) | (18.0) | |||||||||||||||||
| Other operating income | 284 | — | — | 354 | — | — | |||||||||||||||||
| Total income | 4,208 | 6.8 | 6.5 | 12,299 | 11.8 | 11.5 | |||||||||||||||||
| Administrative expenses and amortizations | (2,048) | (1.2) | (1.3) | (6,191) | (1.1) | (1.5) | |||||||||||||||||
| Net operating income | 2,160 | 15.5 | 15.2 | 6,108 | 28.9 | 28.8 | |||||||||||||||||
| Net loan-loss provisions | (676) | 11.4 | 11.6 | (1,877) | (22.3) | (22.5) | |||||||||||||||||
| Other gains (losses) and provisions | (258) | (25.0) | (25.2) | (854) | 42.7 | 42.6 | |||||||||||||||||
| Profit before tax | 1,227 | 33.4 | 32.8 | 3,377 | 95.9 | 96.5 | |||||||||||||||||
| Tax on profit | (328) | 8.3 | 8.2 | (1,033) | 106.1 | 106.7 | |||||||||||||||||
| Profit from continuing operations | 899 | 45.7 | 44.8 | 2,344 | 91.7 | 92.2 | |||||||||||||||||
| Net profit from discontinued operations | — | — | — | — | — | — | |||||||||||||||||
| Consolidated profit | 899 | 45.7 | 44.8 | 2,344 | 91.7 | 92.2 | |||||||||||||||||
| Non-controlling interests | (31) | 80.4 | 71.3 | (51) | (21.8) | (19.1) | |||||||||||||||||
| Underlying attributable profit to the parent | 867 | 44.7 | 44.0 | 2,293 | 98.1 | 98.3 | |||||||||||||||||
| Balance sheet | |||||||||||||||||||||||
| Loans and advances to customers | 590,822 | 1.0 | 1.1 | 590,822 | 4.8 | 2.3 | |||||||||||||||||
| Cash, central banks and credit institutions | 247,362 | 1.5 | 1.4 | 247,362 | 14.1 | 12.6 | |||||||||||||||||
| Debt instruments | 70,762 | (8.7) | (8.4) | 70,762 | (14.8) | (15.4) | |||||||||||||||||
| Other financial assets | 48,326 | (2.2) | (2.2) | 48,326 | (8.9) | (9.1) | |||||||||||||||||
| Other asset accounts | 30,408 | (6.9) | (6.9) | 30,408 | (22.8) | (23.8) | |||||||||||||||||
| Total assets | 987,681 | 0.0 | 0.0 | 987,681 | 3.3 | 1.4 | |||||||||||||||||
| Customer deposits | 608,939 | 1.6 | 1.7 | 608,939 | 6.3 | 4.0 | |||||||||||||||||
| Central banks and credit institutions | 194,697 | (1.3) | (1.5) | 194,697 | 10.1 | 9.4 | |||||||||||||||||
| Marketable debt securities | 75,468 | (4.5) | (4.5) | 75,468 | (16.2) | (19.2) | |||||||||||||||||
| Other financial liabilities | 51,041 | (7.0) | (7.0) | 51,041 | (15.3) | (15.5) | |||||||||||||||||
| Other liabilities accounts | 11,208 | (6.3) | (6.2) | 11,208 | (6.7) | (8.5) | |||||||||||||||||
| Total liabilities | 941,353 | (0.1) | (0.1) | 941,353 | 3.2 | 1.3 | |||||||||||||||||
| Total equity | 46,328 | 1.7 | 1.8 | 46,328 | 6.1 | 4.2 | |||||||||||||||||
| Memorandum items: | |||||||||||||||||||||||
Gross loans and advances to customers (2) | 567,283 | 0.9 | 0.9 | 567,283 | 5.9 | 3.5 | |||||||||||||||||
| Customer funds | 694,670 | 1.9 | 2.0 | 694,670 | 8.2 | 6.2 | |||||||||||||||||
Customer deposits (3) | 589,067 | 1.8 | 1.9 | 589,067 | 6.2 | 4.0 | |||||||||||||||||
| Mutual funds | 105,603 | 2.9 | 2.9 | 105,603 | 20.9 | 20.4 | |||||||||||||||||
| Ratios (%), operating means and customers | |||||||||||||||||||||||
| Underlying RoTE | 8.35 | 2.39 | 7.63 | 3.70 | |||||||||||||||||||
| Efficiency ratio | 48.7 | (3.9) | 50.3 | (6.6) | |||||||||||||||||||
| NPL ratio | 3.15 | (0.16) | 3.15 | (0.14) | |||||||||||||||||||
| Total coverage ratio | 51.06 | 2.7 | 51.1 | 2.4 | |||||||||||||||||||
| Number of employees | 62,577 | (2.7) | 62,577 | (10.5) | |||||||||||||||||||
| Number of branches | 3,265 | (4.0) | 3,265 | (30.5) | |||||||||||||||||||
| Number of loyal customers (thousands) | 10,197 | 0.2 | 10,197 | 2.7 | |||||||||||||||||||
| Number of digital customers (thousands) | 15,884 | 1.3 | 15,884 | 5.6 | |||||||||||||||||||
(1) Includes exchange differences.
(2) Excluding reverse repos.
(3) Excluding repos.
January - September 2021 | | 55 | ||||||
| Spain | |||||||||||||||||
| EUR million | |||||||||||||||||
| / Q2'21 | / 9M'20 | ||||||||||||||||
| Underlying income statement | Q3'21 | % | 9M'21 | % | |||||||||||||
| Net interest income | 975 | (3.9) | 3,009 | 4.1 | |||||||||||||
| Net fee income | 616 | (0.1) | 1,821 | 4.6 | |||||||||||||
Gains (losses) on financial transactions (1) | 95 | (22.6) | 351 | (41.5) | |||||||||||||
| Other operating income | 194 | — | 178 | — | |||||||||||||
| Total income | 1,881 | 11.1 | 5,359 | 4.1 | |||||||||||||
| Administrative expenses and amortizations | (818) | (4.0) | (2,537) | (7.2) | |||||||||||||
| Net operating income | 1,063 | 26.3 | 2,822 | 16.8 | |||||||||||||
| Net loan-loss provisions | (449) | (8.7) | (1,390) | 0.0 | |||||||||||||
| Other gains (losses) and provisions | (162) | 9.8 | (438) | 32.4 | |||||||||||||
| Profit before tax | 453 | 123.7 | 995 | 42.9 | |||||||||||||
| Tax on profit | (113) | 104.9 | (265) | 32.7 | |||||||||||||
| Profit from continuing operations | 340 | 130.7 | 730 | 47.1 | |||||||||||||
| Net profit from discontinued operations | — | — | — | — | |||||||||||||
| Consolidated profit | 340 | 130.7 | 730 | 47.1 | |||||||||||||
| Non-controlling interests | — | (93.7) | — | (15.7) | |||||||||||||
| Underlying attributable profit to the parent | 340 | 130.5 | 730 | 47.0 | |||||||||||||
| Balance sheet | |||||||||||||||||
| Loans and advances to customers | 193,129 | 0.2 | 193,129 | 0.1 | |||||||||||||
| Cash, central banks and credit institutions | 133,062 | 3.5 | 133,062 | 18.4 | |||||||||||||
| Debt instruments | 15,869 | (15.9) | 15,869 | (27.1) | |||||||||||||
| Other financial assets | 2,459 | (1.5) | 2,459 | (4.4) | |||||||||||||
| Other asset accounts | 17,644 | 0.3 | 17,644 | (22.4) | |||||||||||||
| Total assets | 362,161 | 0.5 | 362,161 | 2.8 | |||||||||||||
| Customer deposits | 257,488 | 1.7 | 257,488 | 2.8 | |||||||||||||
| Central banks and credit institutions | 50,581 | 0.7 | 50,581 | 6.4 | |||||||||||||
| Marketable debt securities | 25,840 | (3.1) | 25,840 | (1.2) | |||||||||||||
| Other financial liabilities | 8,604 | (20.3) | 8,604 | 9.5 | |||||||||||||
| Other liabilities accounts | 4,046 | 5.1 | 4,046 | 0.9 | |||||||||||||
| Total liabilities | 346,559 | 0.5 | 346,559 | 3.2 | |||||||||||||
| Total equity | 15,602 | 1.0 | 15,602 | (4.7) | |||||||||||||
| Memorandum items: | |||||||||||||||||
Gross loans and advances to customers (2) | 199,614 | 0.3 | 199,614 | 0.3 | |||||||||||||
| Customer funds | 335,646 | 1.9 | 335,646 | 6.0 | |||||||||||||
Customer deposits (3) | 257,488 | 1.7 | 257,488 | 2.8 | |||||||||||||
| Mutual funds | 78,158 | 2.5 | 78,158 | 18.0 | |||||||||||||
| Ratios (%), operating means and customers | |||||||||||||||||
| Underlying RoTE | 9.01 | 5.08 | 6.48 | 2.27 | |||||||||||||
| Efficiency ratio | 43.5 | (6.8) | 47.3 | (5.7) | |||||||||||||
| NPL ratio | 5.99 | (0.23) | 5.99 | 0.01 | |||||||||||||
| Total coverage ratio | 48.8 | 2.8 | 48.8 | 2.8 | |||||||||||||
| Number of employees | 23,038 | (2.7) | 23,038 | (14.8) | |||||||||||||
| Number of branches | 1,948 | 0.1 | 1,948 | (37.4) | |||||||||||||
| Number of loyal customers (thousands) | 2,751 | (0.3) | 2,751 | 6.4 | |||||||||||||
| Number of digital customers (thousands) | 5,294 | (0.1) | 5,294 | 3.3 | |||||||||||||
(1) Includes exchange differences.
(2) Excluding reverse repos.
(3) Excluding repos.
| 56 | | January - September 2021 | ||||||
| United Kingdom | |||||||||||||||||||||||
| EUR million | |||||||||||||||||||||||
| / | Q2'21 | / | 9M'20 | ||||||||||||||||||||
| Underlying income statement | Q3'21 | % | % excl. FX | 9M'21 | % | % excl. FX | |||||||||||||||||
| Net interest income | 1,168 | 6.2 | 5.4 | 3,268 | 29.6 | 26.6 | |||||||||||||||||
| Net fee income | 114 | (2.9) | (3.7) | 352 | (11.7) | (13.8) | |||||||||||||||||
Gains (losses) on financial transactions (1) | 18 | — | — | 2 | (85.0) | (85.4) | |||||||||||||||||
| Other operating income | 3 | — | — | 3 | — | — | |||||||||||||||||
| Total income | 1,303 | 7.6 | 6.8 | 3,625 | 23.6 | 20.7 | |||||||||||||||||
| Administrative expenses and amortizations | (638) | (1.5) | (2.3) | (1,937) | 0.0 | (2.4) | |||||||||||||||||
| Net operating income | 665 | 18.1 | 17.3 | 1,688 | 69.8 | 65.8 | |||||||||||||||||
| Net loan-loss provisions | (1) | — | — | 67 | — | — | |||||||||||||||||
| Other gains (losses) and provisions | (39) | (38.1) | (38.9) | (132) | 24.8 | 21.9 | |||||||||||||||||
| Profit before tax | 625 | 6.5 | 5.6 | 1,623 | 426.4 | 413.9 | |||||||||||||||||
| Tax on profit | (174) | (7.5) | (8.3) | (478) | 443.5 | 430.6 | |||||||||||||||||
| Profit from continuing operations | 452 | 13.0 | 12.2 | 1,145 | 419.6 | 407.3 | |||||||||||||||||
| Net profit from discontinued operations | — | — | — | — | — | — | |||||||||||||||||
| Consolidated profit | 452 | 13.0 | 12.2 | 1,145 | 419.6 | 407.3 | |||||||||||||||||
| Non-controlling interests | — | — | — | — | (100.0) | (100.0) | |||||||||||||||||
| Underlying attributable profit to the parent | 452 | 13.0 | 12.2 | 1,145 | 419.6 | 407.3 | |||||||||||||||||
| Balance sheet | |||||||||||||||||||||||
| Loans and advances to customers | 261,841 | 0.3 | 0.2 | 261,841 | 5.4 | (0.4) | |||||||||||||||||
| Cash, central banks and credit institutions | 60,317 | (3.9) | (3.9) | 60,317 | 29.5 | 22.4 | |||||||||||||||||
| Debt instruments | 8,032 | (3.1) | (3.2) | 8,032 | (42.2) | (45.4) | |||||||||||||||||
| Other financial assets | 541 | (40.7) | (40.7) | 541 | (69.5) | (71.1) | |||||||||||||||||
| Other asset accounts | 6,163 | (18.0) | (18.0) | 6,163 | (32.5) | (36.2) | |||||||||||||||||
| Total assets | 336,894 | (1.1) | (1.1) | 336,894 | 5.3 | (0.4) | |||||||||||||||||
| Customer deposits | 242,678 | (0.4) | (0.4) | 242,678 | 8.2 | 2.2 | |||||||||||||||||
| Central banks and credit institutions | 30,699 | 0.3 | 0.3 | 30,699 | 79.0 | 69.1 | |||||||||||||||||
| Marketable debt securities | 41,830 | (6.0) | (6.0) | 41,830 | (26.2) | (30.3) | |||||||||||||||||
| Other financial liabilities | 2,895 | 7.6 | 7.5 | 2,895 | (1.9) | (7.3) | |||||||||||||||||
| Other liabilities accounts | 3,213 | (13.1) | (13.1) | 3,213 | (26.5) | (30.5) | |||||||||||||||||
| Total liabilities | 321,314 | (1.2) | (1.2) | 321,314 | 5.2 | (0.6) | |||||||||||||||||
| Total equity | 15,580 | 0.5 | 0.5 | 15,580 | 9.3 | 3.3 | |||||||||||||||||
| Memorandum items: | |||||||||||||||||||||||
Gross loans and advances to customers (2) | 243,757 | 0.5 | 0.4 | 243,757 | 7.4 | 1.5 | |||||||||||||||||
| Customer funds | 234,041 | (0.7) | (0.8) | 234,041 | 8.7 | 2.7 | |||||||||||||||||
Customer deposits (3) | 225,411 | (0.8) | (0.8) | 225,411 | 8.4 | 2.4 | |||||||||||||||||
| Mutual funds | 8,630 | 0.4 | 0.4 | 8,630 | 16.3 | 9.9 | |||||||||||||||||
| Ratios (%), operating means and customers | |||||||||||||||||||||||
| Underlying RoTE | 13.18 | 1.08 | 11.53 | 9.29 | |||||||||||||||||||
| Efficiency ratio | 48.9 | (4.5) | 53.4 | (12.7) | |||||||||||||||||||
| NPL ratio | 1.27 | (0.03) | 1.27 | (0.06) | |||||||||||||||||||
| Total coverage ratio | 36.6 | (0.8) | 36.6 | (5.1) | |||||||||||||||||||
| Number of employees | 20,008 | (4.1) | 20,008 | (12.0) | |||||||||||||||||||
| Number of branches | 450 | (18.6) | 450 | (20.2) | |||||||||||||||||||
| Number of loyal customers (thousands) | 4,397 | (0.5) | 4,397 | (1.8) | |||||||||||||||||||
| Number of digital customers (thousands) | 6,532 | 2.1 | 6,532 | 5.2 | |||||||||||||||||||
(1) Includes exchange differences.
(2) Excluding reverse repos.
(3) Excluding repos.
January - September 2021 | | 57 | ||||||
| Portugal | |||||||||||||||||
| EUR million | |||||||||||||||||
| / Q2'21 | / 9M'20 | ||||||||||||||||
| Underlying income statement | Q3'21 | % | 9M'21 | % | |||||||||||||
| Net interest income | 185 | (3.5) | 569 | (3.9) | |||||||||||||
| Net fee income | 115 | 4.3 | 325 | 13.9 | |||||||||||||
Gains (losses) on financial transactions (1) | (2) | — | 151 | 43.2 | |||||||||||||
| Other operating income | 14 | — | (3) | 2.2 | |||||||||||||
| Total income | 312 | 3.0 | 1,042 | 6.3 | |||||||||||||
| Administrative expenses and amortizations | (140) | (2.0) | (429) | (2.8) | |||||||||||||
| Net operating income | 172 | 7.5 | 613 | 13.9 | |||||||||||||
| Net loan-loss provisions | (25) | (27.8) | (95) | (37.6) | |||||||||||||
| Other gains (losses) and provisions | (2) | (84.7) | (26) | (28.2) | |||||||||||||
| Profit before tax | 145 | 27.4 | 492 | 40.5 | |||||||||||||
| Tax on profit | (45) | 27.2 | (153) | 43.0 | |||||||||||||
| Profit from continuing operations | 100 | 27.5 | 339 | 39.4 | |||||||||||||
| Net profit from discontinued operations | — | — | — | — | |||||||||||||
| Consolidated profit | 100 | 27.5 | 339 | 39.4 | |||||||||||||
| Non-controlling interests | — | 32.9 | (1) | 78.3 | |||||||||||||
| Underlying attributable profit to the parent | 100 | 27.5 | 339 | 39.3 | |||||||||||||
| Balance sheet | |||||||||||||||||
| Loans and advances to customers | 39,168 | 1.0 | 39,168 | 4.2 | |||||||||||||
| Cash, central banks and credit institutions | 9,177 | 5.2 | 9,177 | 34.9 | |||||||||||||
| Debt instruments | 8,752 | (3.0) | 8,752 | (25.0) | |||||||||||||
| Other financial assets | 1,566 | 7.8 | 1,566 | 5.1 | |||||||||||||
| Other asset accounts | 1,329 | (3.9) | 1,329 | (23.3) | |||||||||||||
| Total assets | 59,992 | 1.0 | 59,992 | 1.2 | |||||||||||||
| Customer deposits | 41,817 | 0.9 | 41,817 | 4.1 | |||||||||||||
| Central banks and credit institutions | 9,487 | 0.0 | 9,487 | (2.5) | |||||||||||||
| Marketable debt securities | 2,651 | 6.8 | 2,651 | (19.0) | |||||||||||||
| Other financial liabilities | 218 | (0.2) | 218 | (17.8) | |||||||||||||
| Other liabilities accounts | 1,671 | (1.3) | 1,671 | (8.2) | |||||||||||||
| Total liabilities | 55,844 | 0.9 | 55,844 | 1.0 | |||||||||||||
| Total equity | 4,148 | 2.8 | 4,148 | 2.9 | |||||||||||||
| Memorandum items: | |||||||||||||||||
Gross loans and advances to customers (2) | 40,204 | 0.9 | 40,204 | 4.0 | |||||||||||||
| Customer funds | 45,982 | 1.3 | 45,982 | 6.5 | |||||||||||||
Customer deposits (3) | 41,817 | 0.9 | 41,817 | 4.1 | |||||||||||||
| Mutual funds | 4,165 | 5.7 | 4,165 | 39.7 | |||||||||||||
| Ratios (%), operating means and customers | |||||||||||||||||
| Underlying RoTE | 9.79 | 1.92 | 11.19 | 2.68 | |||||||||||||
| Efficiency ratio | 44.9 | (2.3) | 41.2 | (3.9) | |||||||||||||
| NPL ratio | 3.44 | (0.27) | 3.44 | (0.81) | |||||||||||||
| Total coverage ratio | 75.5 | 2.6 | 75.5 | 11.3 | |||||||||||||
| Number of employees | 5,716 | (5.5) | 5,716 | (11.1) | |||||||||||||
| Number of branches | 397 | (5.0) | 397 | (20.4) | |||||||||||||
| Number of loyal customers (thousands) | 845 | 1.2 | 845 | 5.5 | |||||||||||||
| Number of digital customers (thousands) | 980 | (0.1) | 980 | 8.6 | |||||||||||||
(1) Includes exchange differences.
(2) Excluding reverse repos.
(3) Excluding repos.
| 58 | | January - September 2021 | ||||||
| Poland | |||||||||||||||||||||||
| EUR million | |||||||||||||||||||||||
| / | Q2'21 | / | 9M'20 | ||||||||||||||||||||
| Underlying income statement | Q3'21 | % | % excl. FX | 9M'21 | % | % excl. FX | |||||||||||||||||
| Net interest income | 251 | 0.4 | 1.3 | 741 | (6.7) | (4.0) | |||||||||||||||||
| Net fee income | 133 | 4.9 | 5.7 | 386 | 16.2 | 19.5 | |||||||||||||||||
Gains (losses) on financial transactions (1) | 22 | 4.4 | 5.3 | 63 | (1.5) | 1.3 | |||||||||||||||||
| Other operating income | (1) | — | — | (11) | (80.1) | (79.6) | |||||||||||||||||
| Total income | 405 | (3.0) | (2.2) | 1,179 | 3.8 | 6.7 | |||||||||||||||||
| Administrative expenses and amortizations | (162) | (0.8) | 0.0 | (483) | 1.7 | 4.6 | |||||||||||||||||
| Net operating income | 243 | (4.4) | (3.7) | 696 | 5.3 | 8.3 | |||||||||||||||||
| Net loan-loss provisions | (47) | 4.2 | 5.3 | (161) | (35.5) | (33.7) | |||||||||||||||||
| Other gains (losses) and provisions | (56) | (55.7) | (55.2) | (254) | 134.7 | 141.4 | |||||||||||||||||
| Profit before tax | 140 | 68.6 | 69.6 | 281 | (7.3) | (4.7) | |||||||||||||||||
| Tax on profit | (37) | 10.4 | 11.3 | (104) | 6.8 | 9.9 | |||||||||||||||||
| Profit from continuing operations | 103 | 108.9 | 109.9 | 177 | (14.0) | (11.6) | |||||||||||||||||
| Net profit from discontinued operations | — | — | — | — | — | — | |||||||||||||||||
| Consolidated profit | 103 | 108.9 | 109.9 | 177 | (14.0) | (11.6) | |||||||||||||||||
| Non-controlling interests | (32) | 107.9 | 108.8 | (52) | (18.7) | (16.4) | |||||||||||||||||
| Underlying attributable profit to the parent | 70 | 109.3 | 110.3 | 125 | (11.9) | (9.4) | |||||||||||||||||
| Balance sheet | |||||||||||||||||||||||
| Loans and advances to customers | 28,925 | 0.1 | 1.9 | 28,925 | 2.5 | 4.1 | |||||||||||||||||
| Cash, central banks and credit institutions | 1,746 | (7.5) | (5.9) | 1,746 | (10.7) | (9.4) | |||||||||||||||||
| Debt instruments | 14,595 | (3.8) | (2.1) | 14,595 | 10.0 | 11.6 | |||||||||||||||||
| Other financial assets | 824 | 5.9 | 7.8 | 824 | 53.2 | 55.6 | |||||||||||||||||
| Other asset accounts | 1,277 | (0.8) | 1.0 | 1,277 | (8.6) | (7.2) | |||||||||||||||||
| Total assets | 47,367 | (1.4) | 0.4 | 47,367 | 4.4 | 6.0 | |||||||||||||||||
| Customer deposits | 36,247 | 0.6 | 2.4 | 36,247 | 6.8 | 8.4 | |||||||||||||||||
| Central banks and credit institutions | 2,008 | (11.8) | (10.2) | 2,008 | (22.8) | (21.6) | |||||||||||||||||
| Marketable debt securities | 1,944 | (21.1) | (19.7) | 1,944 | (0.7) | 0.8 | |||||||||||||||||
| Other financial liabilities | 885 | 4.8 | 6.7 | 885 | 35.6 | 37.6 | |||||||||||||||||
| Other liabilities accounts | 1,210 | (2.5) | (0.7) | 1,210 | 6.3 | 7.9 | |||||||||||||||||
| Total liabilities | 42,293 | (1.3) | 0.5 | 42,293 | 4.9 | 6.5 | |||||||||||||||||
| Total equity | 5,074 | (2.0) | (0.3) | 5,074 | (0.1) | 1.4 | |||||||||||||||||
| Memorandum items: | |||||||||||||||||||||||
Gross loans and advances to customers (2) | 29,955 | 0.2 | 2.0 | 29,955 | 2.6 | 4.1 | |||||||||||||||||
| Customer funds | 41,042 | 0.7 | 2.5 | 41,042 | 9.1 | 10.8 | |||||||||||||||||
Customer deposits (3) | 36,247 | 0.6 | 2.4 | 36,247 | 6.8 | 8.4 | |||||||||||||||||
| Mutual funds | 4,795 | 1.0 | 2.8 | 4,795 | 31.2 | 33.2 | |||||||||||||||||
| Ratios (%), operating means and customers | |||||||||||||||||||||||
| Underlying RoTE | 8.60 | 4.50 | 5.10 | (0.82) | |||||||||||||||||||
| Efficiency ratio | 40.0 | 0.9 | 41.0 | (0.8) | |||||||||||||||||||
| NPL ratio | 4.34 | (0.24) | 4.34 | (0.24) | |||||||||||||||||||
| Total coverage ratio | 74.6 | 2.1 | 74.6 | 3.8 | |||||||||||||||||||
| Number of employees | 9,776 | (1.6) | 9,776 | (8.6) | |||||||||||||||||||
| Number of branches | 458 | (2.8) | 458 | (11.1) | |||||||||||||||||||
| Number of loyal customers (thousands) | 2,205 | 1.8 | 2,205 | 6.7 | |||||||||||||||||||
| Number of digital customers (thousands) | 2,917 | 2.4 | 2,917 | 7.9 | |||||||||||||||||||
(1) Includes exchange differences.
(2) Excluding reverse repos.
(3) Excluding repos.
January - September 2021 | | 59 | ||||||
| Other Europe | |||||||||||||||||||||||
| EUR million | |||||||||||||||||||||||
| / | Q2'21 | / | 9M'20 | ||||||||||||||||||||
| Underlying income statement | Q3'21 | % | % excl. FX | 9M'21 | % | % excl. FX | |||||||||||||||||
| Net interest income | 165 | (15.2) | (15.2) | 553 | 24.3 | 25.8 | |||||||||||||||||
| Net fee income | 101 | (11.9) | (12.5) | 354 | 28.2 | 30.2 | |||||||||||||||||
Gains (losses) on financial transactions (1) | (33) | (47.3) | (43.1) | 2 | — | — | |||||||||||||||||
| Other operating income | 74 | 4.9 | 7.4 | 187 | 13.0 | 12.6 | |||||||||||||||||
| Total income | 307 | (3.3) | (4.1) | 1,095 | 36.7 | 38.8 | |||||||||||||||||
| Administrative expenses and amortizations | (290) | 8.9 | 9.1 | (806) | 20.0 | 21.5 | |||||||||||||||||
| Net operating income | 17 | (66.7) | (69.7) | 289 | 123.4 | 129.4 | |||||||||||||||||
| Net loan-loss provisions | (153) | 26.8 | 26.4 | (299) | 548.0 | 549.4 | |||||||||||||||||
| Other gains (losses) and provisions | — | — | — | (4) | (79.8) | (80.4) | |||||||||||||||||
| Profit before tax | (136) | 103.4 | 105.5 | (14) | — | — | |||||||||||||||||
| Tax on profit | 41 | 342.2 | 296.8 | (34) | 259.1 | 295.4 | |||||||||||||||||
| Profit from continuing operations | (95) | 65.2 | 70.5 | (47) | — | — | |||||||||||||||||
| Net profit from discontinued operations | — | — | — | — | — | — | |||||||||||||||||
| Consolidated profit | (95) | 65.2 | 70.5 | (47) | — | — | |||||||||||||||||
| Non-controlling interests | 1 | — | — | 2 | — | — | |||||||||||||||||
| Underlying attributable profit to the parent | (94) | 58.2 | 60.4 | (46) | — | — | |||||||||||||||||
| Balance sheet | |||||||||||||||||||||||
| Loans and advances to customers | 67,760 | 7.1 | 6.6 | 67,760 | 20.0 | 19.8 | |||||||||||||||||
| Cash, central banks and credit institutions | 43,060 | 2.9 | 2.6 | 43,060 | (12.4) | (12.5) | |||||||||||||||||
| Debt instruments | 23,514 | (10.0) | (10.0) | 23,514 | 4.8 | 4.8 | |||||||||||||||||
| Other financial assets | 42,937 | (1.9) | (1.9) | 42,937 | (8.0) | (8.0) | |||||||||||||||||
| Other asset accounts | 3,995 | (18.0) | (18.3) | 3,995 | (9.4) | (9.8) | |||||||||||||||||
| Total assets | 181,266 | 0.8 | 0.5 | 181,266 | 1.2 | 1.1 | |||||||||||||||||
| Customer deposits | 30,709 | 22.5 | 22.2 | 30,709 | 26.6 | 26.5 | |||||||||||||||||
| Central banks and credit institutions | 101,922 | (2.6) | (2.9) | 101,922 | 2.2 | 2.0 | |||||||||||||||||
| Marketable debt securities | 3,203 | 10.3 | 10.3 | 3,203 | 58.4 | 58.4 | |||||||||||||||||
| Other financial liabilities | 38,440 | (4.6) | (4.7) | 38,440 | (20.8) | (20.8) | |||||||||||||||||
| Other liabilities accounts | 1,069 | (28.2) | (28.2) | 1,069 | 59.7 | 59.6 | |||||||||||||||||
| Total liabilities | 175,343 | 0.5 | 0.3 | 175,343 | 0.1 | 0.0 | |||||||||||||||||
| Total equity | 5,923 | 9.4 | 8.7 | 5,923 | 50.5 | 50.0 | |||||||||||||||||
| Memorandum items: | |||||||||||||||||||||||
Gross loans and advances to customers (2) | 53,754 | 5.8 | 5.2 | 53,754 | 29.0 | 28.6 | |||||||||||||||||
| Customer funds | 37,959 | 26.7 | 26.5 | 37,959 | 30.0 | 29.9 | |||||||||||||||||
Customer deposits (3) | 28,104 | 35.3 | 34.8 | 28,104 | 26.9 | 26.8 | |||||||||||||||||
| Mutual funds | 9,855 | 7.5 | 7.5 | 9,855 | 39.7 | 39.7 | |||||||||||||||||
| Resources | |||||||||||||||||||||||
| Number of employees | 4,039 | 7.2 | 4,039 | 34.4 | |||||||||||||||||||
(1) Includes exchange differences.
(2) Excluding reverse repos.
(3) Excluding repos.
| 60 | | January - September 2021 | ||||||
| NORTH AMERICA | |||||||||||||||||||||||
| EUR million | |||||||||||||||||||||||
| / | Q2'21 | / | 9M'20 | ||||||||||||||||||||
| Underlying income statement | Q3'21 | % | % excl. FX | 9M'21 | % | % excl. FX | |||||||||||||||||
| Net interest income | 2,070 | 3.0 | 0.7 | 6,085 | (5.1) | (1.5) | |||||||||||||||||
| Net fee income | 386 | (5.7) | (8.0) | 1,247 | (2.8) | — | |||||||||||||||||
Gains (losses) on financial transactions (1) | 70 | 120.1 | 116.1 | 200 | (16.3) | (14.5) | |||||||||||||||||
| Other operating income | 252 | (5.6) | (7.8) | 734 | 84.2 | 98.7 | |||||||||||||||||
| Total income | 2,779 | 2.2 | (0.1) | 8,266 | (0.8) | 3.0 | |||||||||||||||||
| Administrative expenses and amortizations | (1,275) | 6.8 | 4.5 | (3,617) | 4.5 | 8.5 | |||||||||||||||||
| Net operating income | 1,504 | (1.4) | (3.8) | 4,649 | (4.6) | (1.0) | |||||||||||||||||
| Net loan-loss provisions | (506) | 159.8 | 156.6 | (1,095) | (65.2) | (63.6) | |||||||||||||||||
| Other gains (losses) and provisions | (38) | — | — | (50) | (34.8) | (31.9) | |||||||||||||||||
| Profit before tax | 959 | (28.3) | (30.4) | 3,504 | 112.0 | 117.4 | |||||||||||||||||
| Tax on profit | (187) | (42.3) | (44.3) | (808) | 93.1 | 98.3 | |||||||||||||||||
| Profit from continuing operations | 772 | (23.8) | (25.9) | 2,696 | 118.4 | 123.8 | |||||||||||||||||
| Net profit from discontinued operations | — | — | — | — | — | — | |||||||||||||||||
| Consolidated profit | 772 | (23.8) | (25.9) | 2,696 | 118.4 | 123.8 | |||||||||||||||||
| Non-controlling interests | (112) | (29.8) | (31.8) | (408) | 127.7 | 137.6 | |||||||||||||||||
| Underlying attributable profit to the parent | 661 | (22.7) | (24.8) | 2,288 | 116.9 | 121.5 | |||||||||||||||||
| Balance sheet | |||||||||||||||||||||||
| Loans and advances to customers | 128,339 | 1.6 | 0.1 | 128,339 | 4.5 | 1.4 | |||||||||||||||||
| Cash, central banks and credit institutions | 37,244 | 0.5 | (0.8) | 37,244 | 30.7 | 25.1 | |||||||||||||||||
| Debt instruments | 37,367 | 5.2 | 4.7 | 37,367 | 1.8 | (4.0) | |||||||||||||||||
| Other financial assets | 10,919 | 0.5 | 0.4 | 10,919 | (37.3) | (41.3) | |||||||||||||||||
| Other asset accounts | 21,040 | 0.4 | (1.3) | 21,040 | 0.1 | (2.3) | |||||||||||||||||
| Total assets | 234,911 | 1.8 | 0.6 | 234,911 | 3.7 | (0.2) | |||||||||||||||||
| Customer deposits | 122,906 | 6.8 | 5.4 | 122,906 | 13.5 | 9.4 | |||||||||||||||||
| Central banks and credit institutions | 25,336 | (17.3) | (18.0) | 25,336 | (14.6) | (18.6) | |||||||||||||||||
| Marketable debt securities | 40,025 | 4.5 | 2.7 | 40,025 | 0.2 | (2.5) | |||||||||||||||||
| Other financial liabilities | 13,249 | (6.7) | (6.6) | 13,249 | (28.7) | (33.3) | |||||||||||||||||
| Other liabilities accounts | 6,059 | 0.7 | (0.4) | 6,059 | (5.2) | (9.1) | |||||||||||||||||
| Total liabilities | 207,575 | 1.6 | 0.4 | 207,575 | 2.3 | (1.6) | |||||||||||||||||
| Total equity | 27,335 | 3.1 | 1.7 | 27,335 | 15.9 | 12.3 | |||||||||||||||||
| Memorandum items: | |||||||||||||||||||||||
Gross loans and advances to customers (2) | 127,113 | 1.2 | (0.3) | 127,113 | 3.6 | 0.5 | |||||||||||||||||
| Customer funds | 133,978 | 3.0 | 1.8 | 133,978 | 14.2 | 10.1 | |||||||||||||||||
Customer deposits (3) | 108,528 | 3.2 | 1.9 | 108,528 | 12.2 | 8.4 | |||||||||||||||||
| Mutual funds | 25,450 | 2.1 | 1.4 | 25,450 | 23.6 | 17.7 | |||||||||||||||||
| Ratios (%), operating means and customers | |||||||||||||||||||||||
| Underlying RoTE | 11.03 | (3.81) | 13.39 | 6.71 | |||||||||||||||||||
| Efficiency ratio | 45.9 | 2.0 | 43.8 | 2.2 | |||||||||||||||||||
| NPL ratio | 2.56 | 0.27 | 2.56 | 0.59 | |||||||||||||||||||
| Total coverage ratio | 139.3 | (13.0) | 139.3 | (62.3) | |||||||||||||||||||
| Number of employees | 43,135 | 3.5 | 43,135 | 12.7 | |||||||||||||||||||
| Number of branches | 1,888 | (1.7) | 1,888 | (6.3) | |||||||||||||||||||
| Number of loyal customers (thousands) | 4,144 | 1.3 | 4,144 | 10.2 | |||||||||||||||||||
| Number of digital customers (thousands) | 6,485 | 2.9 | 6,485 | 11.0 | |||||||||||||||||||
(1) Includes exchange differences.
(2) Excluding reverse repos.
(3) Excluding repos.
January - September 2021 | | 61 | ||||||
| United States | |||||||||||||||||||||||
| EUR million | |||||||||||||||||||||||
| / | Q2'21 | / | 9M'20 | ||||||||||||||||||||
| Underlying income statement | Q3'21 | % | % excl. FX | 9M'21 | % | % excl. FX | |||||||||||||||||
| Net interest income | 1,359 | 2.5 | 0.1 | 4,022 | (6.4) | (0.4) | |||||||||||||||||
| Net fee income | 174 | (9.2) | (11.7) | 606 | (11.2) | (5.5) | |||||||||||||||||
Gains (losses) on financial transactions (1) | 34 | 67.5 | 62.6 | 124 | 14.8 | 22.2 | |||||||||||||||||
| Other operating income | 282 | (5.1) | (7.3) | 834 | 76.5 | 87.8 | |||||||||||||||||
| Total income | 1,849 | 0.7 | (1.6) | 5,586 | 0.5 | 6.9 | |||||||||||||||||
| Administrative expenses and amortizations | (815) | 4.0 | 1.7 | (2,346) | 1.7 | 8.2 | |||||||||||||||||
| Net operating income | 1,034 | (1.7) | (4.1) | 3,240 | (0.4) | 6.0 | |||||||||||||||||
| Net loan-loss provisions | (294) | — | — | (450) | (81.1) | (79.8) | |||||||||||||||||
| Other gains (losses) and provisions | (6) | — | — | (6) | (89.8) | (89.1) | |||||||||||||||||
| Profit before tax | 734 | (31.7) | (33.7) | 2,784 | 239.6 | 261.3 | |||||||||||||||||
| Tax on profit | (141) | (45.5) | (47.3) | (634) | 191.7 | 210.4 | |||||||||||||||||
| Profit from continuing operations | 593 | (27.4) | (29.4) | 2,150 | 256.8 | 279.7 | |||||||||||||||||
| Net profit from discontinued operations | — | — | — | — | — | — | |||||||||||||||||
| Consolidated profit | 593 | (27.4) | (29.4) | 2,150 | 256.8 | 279.7 | |||||||||||||||||
| Non-controlling interests | (96) | (33.2) | (35.1) | (361) | 173.4 | 190.9 | |||||||||||||||||
| Underlying attributable profit to the parent | 498 | (26.2) | (28.2) | 1,788 | 280.3 | 304.6 | |||||||||||||||||
| Balance sheet | |||||||||||||||||||||||
| Loans and advances to customers | 95,953 | 2.4 | 0.1 | 95,953 | 2.2 | 0.9 | |||||||||||||||||
| Cash, central banks and credit institutions | 27,322 | 7.4 | 5.0 | 27,322 | 63.8 | 61.7 | |||||||||||||||||
| Debt instruments | 16,025 | 0.6 | (1.6) | 16,025 | 10.7 | 9.2 | |||||||||||||||||
| Other financial assets | 4,039 | 12.9 | 10.4 | 4,039 | (19.0) | (20.1) | |||||||||||||||||
| Other asset accounts | 17,458 | 1.2 | (1.1) | 17,458 | (1.7) | (3.0) | |||||||||||||||||
| Total assets | 160,798 | 3.1 | 0.8 | 160,798 | 8.8 | 7.4 | |||||||||||||||||
| Customer deposits | 87,316 | 10.0 | 7.5 | 87,316 | 19.1 | 17.6 | |||||||||||||||||
| Central banks and credit institutions | 11,675 | (32.8) | (34.3) | 11,675 | (25.5) | (26.4) | |||||||||||||||||
| Marketable debt securities | 33,838 | 5.3 | 3.0 | 33,838 | 3.9 | 2.6 | |||||||||||||||||
| Other financial liabilities | 4,058 | 4.1 | 1.8 | 4,058 | (18.9) | (19.9) | |||||||||||||||||
| Other liabilities accounts | 3,938 | 1.5 | (0.8) | 3,938 | 2.4 | 1.1 | |||||||||||||||||
| Total liabilities | 140,825 | 3.1 | 0.7 | 140,825 | 8.0 | 6.6 | |||||||||||||||||
| Total equity | 19,973 | 3.6 | 1.3 | 19,973 | 15.0 | 13.5 | |||||||||||||||||
| Memorandum items: | |||||||||||||||||||||||
Gross loans and advances to customers (2) | 95,318 | 1.9 | (0.4) | 95,318 | 2.7 | 1.3 | |||||||||||||||||
| Customer funds | 90,837 | 4.2 | 1.8 | 90,837 | 14.3 | 12.8 | |||||||||||||||||
Customer deposits (3) | 77,141 | 4.2 | 1.8 | 77,141 | 11.9 | 10.4 | |||||||||||||||||
| Mutual funds | 13,696 | 4.2 | 1.8 | 13,696 | 30.1 | 28.4 | |||||||||||||||||
| Ratios (%), operating means and customers | |||||||||||||||||||||||
| Underlying RoTE | 11.27 | (4.90) | 14.31 | 10.31 | |||||||||||||||||||
| Efficiency ratio | 44.1 | 1.4 | 42.0 | 0.5 | |||||||||||||||||||
| NPL ratio | 2.36 | 0.36 | 2.36 | 0.51 | |||||||||||||||||||
| Total coverage ratio | 161.5 | (24.2) | 161.5 | (67.3) | |||||||||||||||||||
| Number of employees | 15,484 | (0.8) | 15,484 | (4.4) | |||||||||||||||||||
| Number of branches | 514 | (5.5) | 514 | (12.0) | |||||||||||||||||||
| Number of loyal customers (thousands) | 360 | (4.7) | 360 | 2.1 | |||||||||||||||||||
| Number of digital customers (thousands) | 1,032 | 0.7 | 1,032 | 3.5 | |||||||||||||||||||
(1) Includes exchange differences.
(2) Excluding reverse repos.
(3) Excluding repos.
| 62 | | January - September 2021 | ||||||
| Mexico | |||||||||||||||||||||||
| EUR million | |||||||||||||||||||||||
| / | Q2'21 | / | 9M'20 | ||||||||||||||||||||
| Underlying income statement | Q3'21 | % | % excl. FX | 9M'21 | % | % excl. FX | |||||||||||||||||
| Net interest income | 711 | 3.9 | 1.7 | 2,063 | (2.6) | (3.6) | |||||||||||||||||
| Net fee income | 203 | (3.6) | (5.8) | 617 | 5.7 | 4.6 | |||||||||||||||||
Gains (losses) on financial transactions (1) | 37 | 211.9 | 211.4 | 76 | (41.9) | (42.5) | |||||||||||||||||
| Other operating income | (31) | 11.1 | 8.8 | (94) | 27.8 | 26.4 | |||||||||||||||||
| Total income | 919 | 4.7 | 2.4 | 2,662 | (3.5) | (4.5) | |||||||||||||||||
| Administrative expenses and amortizations | (425) | 12.2 | 9.9 | (1,177) | 4.1 | 3.0 | |||||||||||||||||
| Net operating income | 494 | (1.0) | (3.2) | 1,485 | (8.8) | (9.8) | |||||||||||||||||
| Net loan-loss provisions | (213) | 4.1 | 1.9 | (645) | (16.0) | (16.9) | |||||||||||||||||
| Other gains (losses) and provisions | (1) | (78.1) | (80.0) | (13) | (29.7) | (30.4) | |||||||||||||||||
| Profit before tax | 280 | (3.0) | (5.2) | 828 | (1.9) | (2.9) | |||||||||||||||||
| Tax on profit | (49) | (27.5) | (29.7) | (179) | (13.0) | (13.9) | |||||||||||||||||
| Profit from continuing operations | 231 | 4.5 | 2.3 | 649 | 1.7 | 0.6 | |||||||||||||||||
| Net profit from discontinued operations | — | — | — | — | — | — | |||||||||||||||||
| Consolidated profit | 231 | 4.5 | 2.3 | 649 | 1.7 | 0.6 | |||||||||||||||||
| Non-controlling interests | (16) | (0.4) | (2.6) | (47) | (1.1) | (2.1) | |||||||||||||||||
| Underlying attributable profit to the parent | 215 | 4.9 | 2.7 | 602 | 1.9 | 0.9 | |||||||||||||||||
| Balance sheet | |||||||||||||||||||||||
| Loans and advances to customers | 32,368 | (0.8) | 0.2 | 32,368 | 12.0 | 2.8 | |||||||||||||||||
| Cash, central banks and credit institutions | 9,682 | (15.2) | (14.3) | 9,682 | (17.4) | (24.2) | |||||||||||||||||
| Debt instruments | 21,343 | 8.9 | 10.1 | 21,343 | (4.0) | (11.9) | |||||||||||||||||
| Other financial assets | 6,880 | (5.6) | (4.6) | 6,880 | (44.3) | (48.9) | |||||||||||||||||
| Other asset accounts | 3,300 | (3.8) | (2.8) | 3,300 | 8.2 | (0.7) | |||||||||||||||||
| Total assets | 73,572 | (1.0) | 0.0 | 73,572 | (6.0) | (13.8) | |||||||||||||||||
| Customer deposits | 35,581 | (0.4) | 0.6 | 35,581 | 1.9 | (6.5) | |||||||||||||||||
| Central banks and credit institutions | 13,625 | 2.8 | 3.8 | 13,625 | (2.6) | (10.6) | |||||||||||||||||
| Marketable debt securities | 6,187 | 0.4 | 1.4 | 6,187 | (16.3) | (23.1) | |||||||||||||||||
| Other financial liabilities | 9,144 | (10.9) | (10.0) | 9,144 | (32.6) | (38.1) | |||||||||||||||||
| Other liabilities accounts | 2,077 | (1.6) | (0.6) | 2,077 | (17.9) | (24.7) | |||||||||||||||||
| Total liabilities | 66,615 | (1.3) | (0.3) | 66,615 | (8.0) | (15.5) | |||||||||||||||||
| Total equity | 6,957 | 1.8 | 2.8 | 6,957 | 18.0 | 8.3 | |||||||||||||||||
| Memorandum items: | |||||||||||||||||||||||
Gross loans and advances to customers (2) | 31,777 | (1.0) | 0.0 | 31,777 | 6.6 | (2.1) | |||||||||||||||||
| Customer funds | 43,132 | 0.6 | 1.6 | 43,132 | 14.1 | 4.7 | |||||||||||||||||
Customer deposits (3) | 31,377 | 0.9 | 1.9 | 31,377 | 13.1 | 3.8 | |||||||||||||||||
| Mutual funds | 11,754 | (0.1) | 0.9 | 11,754 | 16.8 | 7.2 | |||||||||||||||||
| Ratios (%), operating means and customers | |||||||||||||||||||||||
| Underlying RoTE | 14.06 | 0.15 | 13.56 | (1.57) | |||||||||||||||||||
| Efficiency ratio | 46.2 | 3.1 | 44.2 | 3.2 | |||||||||||||||||||
| NPL ratio | 3.14 | 0.03 | 3.14 | 0.80 | |||||||||||||||||||
| Total coverage ratio | 90.1 | (0.5) | 90.1 | (42.5) | |||||||||||||||||||
| Number of employees | 27,027 | 5.8 | 27,027 | 24.1 | |||||||||||||||||||
| Number of branches | 1,374 | (0.1) | 1,374 | (3.9) | |||||||||||||||||||
| Number of loyal customers (thousands) | 3,784 | 1.9 | 3,784 | 11.0 | |||||||||||||||||||
| Number of digital customers (thousands) | 5,292 | 3.4 | 5,292 | 11.5 | |||||||||||||||||||
(1) Includes exchange differences.
(2) Excluding reverse repos.
(3) Excluding repos.
January - September 2021 | | 63 | ||||||
| Other North America | |||||||||||||||||||||||
| EUR million | |||||||||||||||||||||||
| / | Q2'21 | / | 9M'20 | ||||||||||||||||||||
| Underlying income statement | Q3'21 | % | % excl. FX | 9M'21 | % | % excl. FX | |||||||||||||||||
| Net interest income | — | 75.7 | 75.7 | — | (29.2) | (29.2) | |||||||||||||||||
| Net fee income | 9 | 22.9 | 22.9 | 24 | 49.4 | 49.4 | |||||||||||||||||
Gains (losses) on financial transactions (1) | — | — | — | — | (82.6) | (82.6) | |||||||||||||||||
| Other operating income | 1 | — | — | (6) | — | — | |||||||||||||||||
| Total income | 10 | 92.9 | 92.9 | 18 | 14.7 | 14.7 | |||||||||||||||||
| Administrative expenses and amortizations | (35) | 10.7 | 10.7 | (94) | 285.7 | 285.7 | |||||||||||||||||
| Net operating income | (25) | (6.1) | (6.1) | (77) | 751.2 | 751.2 | |||||||||||||||||
| Net loan-loss provisions | — | — | — | — | — | — | |||||||||||||||||
| Other gains (losses) and provisions | (31) | — | — | (31) | — | — | |||||||||||||||||
| Profit before tax | (55) | 106.6 | 106.6 | (108) | 870.0 | 870.0 | |||||||||||||||||
| Tax on profit | 3 | 53.9 | 53.9 | 6 | 10.1 | 10.1 | |||||||||||||||||
| Profit from continuing operations | (52) | 110.6 | 110.6 | (102) | — | — | |||||||||||||||||
| Net profit from discontinued operations | — | — | — | — | — | — | |||||||||||||||||
| Consolidated profit | (52) | 110.6 | 110.6 | (102) | — | — | |||||||||||||||||
| Non-controlling interests | — | (77.7) | (77.7) | — | (21.3) | (21.3) | |||||||||||||||||
| Underlying attributable profit to the parent | (52) | 111.1 | 111.1 | (102) | — | — | |||||||||||||||||
| Balance sheet | |||||||||||||||||||||||
| Loans and advances to customers | 18 | 2.0 | 2.0 | 18 | 53.8 | 53.8 | |||||||||||||||||
| Cash, central banks and credit institutions | 240 | 12.3 | 12.3 | 240 | 145.2 | 145.2 | |||||||||||||||||
| Debt instruments | — | — | — | — | (100.0) | (100.0) | |||||||||||||||||
| Other financial assets | 1 | (59.4) | (59.4) | 1 | (99.2) | (99.2) | |||||||||||||||||
| Other asset accounts | 282 | 6.3 | 6.3 | 282 | 30.0 | 30.0 | |||||||||||||||||
| Total assets | 541 | 8.5 | 8.5 | 541 | 34.9 | 34.9 | |||||||||||||||||
| Customer deposits | 9 | (9.6) | (9.6) | 9 | (37.8) | (37.8) | |||||||||||||||||
| Central banks and credit institutions | 36 | 124.7 | 124.7 | 36 | 32.9 | 32.9 | |||||||||||||||||
| Marketable debt securities | — | — | — | — | — | — | |||||||||||||||||
| Other financial liabilities | 46 | (0.4) | (0.4) | 46 | 158.6 | 158.6 | |||||||||||||||||
| Other liabilities accounts | 44 | 94.7 | 94.7 | 44 | 219.7 | 219.7 | |||||||||||||||||
| Total liabilities | 136 | 42.3 | 42.3 | 136 | 83.4 | 83.4 | |||||||||||||||||
| Total equity | 406 | 0.5 | 0.5 | 406 | 24.0 | 24.0 | |||||||||||||||||
| Memorandum items: | |||||||||||||||||||||||
Gross loans and advances to customers (2) | 18 | (1.3) | (1.3) | 18 | 51.1 | 51.1 | |||||||||||||||||
| Customer funds | 9 | (9.6) | (9.6) | 9 | (37.8) | (37.8) | |||||||||||||||||
Customer deposits (3) | 9 | (9.6) | (9.6) | 9 | (37.8) | (37.8) | |||||||||||||||||
| Mutual funds | — | — | — | — | — | — | |||||||||||||||||
| Resources | |||||||||||||||||||||||
| Number of employees | 624 | 20.7 | 624 | 89.1 | |||||||||||||||||||
(1) Includes exchange differences.
(2) Excluding reverse repos.
(3) Excluding repos.
| 64 | | January - September 2021 | ||||||
| SOUTH AMERICA | |||||||||||||||||||||||
| EUR million | |||||||||||||||||||||||
| / | Q2'21 | / | 9M'20 | ||||||||||||||||||||
| Underlying income statement | Q3'21 | % | % excl. FX | 9M'21 | % | % excl. FX | |||||||||||||||||
| Net interest income | 2,920 | 5.8 | 4.2 | 8,254 | 1.2 | 12.8 | |||||||||||||||||
| Net fee income | 956 | 3.1 | 0.8 | 2,726 | 0.8 | 13.2 | |||||||||||||||||
Gains (losses) on financial transactions (1) | 206 | 16.3 | 15.8 | 589 | (3.0) | 6.4 | |||||||||||||||||
| Other operating income | (92) | (0.7) | (1.4) | (267) | 118.5 | 156.5 | |||||||||||||||||
| Total income | 3,991 | 5.8 | 4.0 | 11,302 | (0.4) | 11.0 | |||||||||||||||||
| Administrative expenses and amortizations | (1,398) | 7.6 | 6.1 | (3,916) | (2.7) | 8.6 | |||||||||||||||||
| Net operating income | 2,593 | 4.8 | 2.9 | 7,386 | 0.9 | 12.4 | |||||||||||||||||
| Net loan-loss provisions | (892) | 10.3 | 8.0 | (2,384) | (26.0) | (17.8) | |||||||||||||||||
| Other gains (losses) and provisions | (124) | 123.8 | 119.9 | (312) | 17.2 | 36.2 | |||||||||||||||||
| Profit before tax | 1,577 | (2.0) | (3.7) | 4,691 | 22.3 | 36.3 | |||||||||||||||||
| Tax on profit | (613) | 3.0 | 0.6 | (1,807) | 26.6 | 41.8 | |||||||||||||||||
| Profit from continuing operations | 964 | (4.9) | (6.1) | 2,883 | 19.7 | 33.1 | |||||||||||||||||
| Net profit from discontinued operations | — | — | — | — | — | — | |||||||||||||||||
| Consolidated profit | 964 | (4.9) | (6.1) | 2,883 | 19.7 | 33.1 | |||||||||||||||||
| Non-controlling interests | (138) | (3.2) | (2.1) | (413) | 39.8 | 48.6 | |||||||||||||||||
| Underlying attributable profit to the parent | 826 | (5.2) | (6.8) | 2,471 | 16.9 | 30.8 | |||||||||||||||||
| Balance sheet | |||||||||||||||||||||||
| Loans and advances to customers | 121,133 | (2.9) | 3.3 | 121,133 | 11.1 | 10.0 | |||||||||||||||||
| Cash, central banks and credit institutions | 47,010 | (6.8) | (1.3) | 47,010 | 15.2 | 13.7 | |||||||||||||||||
| Debt instruments | 51,730 | 3.6 | 9.8 | 51,730 | 19.4 | 16.5 | |||||||||||||||||
| Other financial assets | 16,326 | 31.1 | 40.9 | 16,326 | (3.8) | (4.3) | |||||||||||||||||
| Other asset accounts | 15,777 | (2.9) | 2.9 | 15,777 | (1.1) | (3.0) | |||||||||||||||||
| Total assets | 251,976 | (0.7) | 5.5 | 251,976 | 11.4 | 9.9 | |||||||||||||||||
| Customer deposits | 121,470 | (2.4) | 3.4 | 121,470 | 10.0 | 8.8 | |||||||||||||||||
| Central banks and credit institutions | 45,869 | 2.5 | 9.1 | 45,869 | 24.6 | 23.2 | |||||||||||||||||
| Marketable debt securities | 22,810 | (0.7) | 6.4 | 22,810 | 10.0 | 7.8 | |||||||||||||||||
| Other financial liabilities | 33,881 | 6.8 | 13.9 | 33,881 | 7.4 | 5.3 | |||||||||||||||||
| Other liabilities accounts | 8,066 | (11.8) | (6.4) | 8,066 | 2.1 | (0.3) | |||||||||||||||||
| Total liabilities | 232,096 | (0.4) | 5.8 | 232,096 | 11.9 | 10.4 | |||||||||||||||||
| Total equity | 19,881 | (4.4) | 1.3 | 19,881 | 6.5 | 5.1 | |||||||||||||||||
| Memorandum items: | |||||||||||||||||||||||
Gross loans and advances to customers (2) | 126,335 | (2.9) | 3.4 | 126,335 | 11.2 | 10.1 | |||||||||||||||||
| Customer funds | 162,588 | (3.4) | 2.5 | 162,588 | 11.0 | 9.6 | |||||||||||||||||
Customer deposits (3) | 111,092 | (3.9) | 1.9 | 111,092 | 11.6 | 10.9 | |||||||||||||||||
| Mutual funds | 51,496 | (2.4) | 3.8 | 51,496 | 9.6 | 6.7 | |||||||||||||||||
| Ratios (%), operating means and customers | |||||||||||||||||||||||
| Underlying RoTE | 19.58 | (1.54) | 20.13 | 3.07 | |||||||||||||||||||
| Efficiency ratio | 35.0 | 0.6 | 34.6 | (0.8) | |||||||||||||||||||
| NPL ratio | 4.38 | 0.02 | 4.38 | (0.02) | |||||||||||||||||||
| Total coverage ratio | 98.8 | 0.6 | 98.8 | 1.5 | |||||||||||||||||||
| Number of employees | 69,961 | 4.1 | 69,961 | 5.2 | |||||||||||||||||||
| Number of branches | 4,443 | 0.1 | 4,443 | (0.1) | |||||||||||||||||||
| Number of loyal customers (thousands) | 10,043 | 4.5 | 10,043 | 23.5 | |||||||||||||||||||
| Number of digital customers (thousands) | 23,531 | 3.8 | 23,531 | 18.2 | |||||||||||||||||||
(1) Includes exchange differences.
(2) Excluding reverse repos.
(3) Excluding repos.
January - September 2021 | | 65 | ||||||
| Brazil | |||||||||||||||||||||||
| EUR million | |||||||||||||||||||||||
| / | Q2'21 | / | 9M'20 | ||||||||||||||||||||
| Underlying income statement | Q3'21 | % | % excl. FX | 9M'21 | % | % excl. FX | |||||||||||||||||
| Net interest income | 2,083 | 8.5 | 5.1 | 5,782 | (1.0) | 11.9 | |||||||||||||||||
| Net fee income | 696 | (0.2) | (3.7) | 2,027 | (5.6) | 6.7 | |||||||||||||||||
Gains (losses) on financial transactions (1) | 122 | 55.7 | 53.0 | 328 | (7.3) | 4.8 | |||||||||||||||||
| Other operating income | (19) | 34.4 | 31.1 | (52) | 177.0 | 213.2 | |||||||||||||||||
| Total income | 2,882 | 7.5 | 4.0 | 8,085 | (2.8) | 9.8 | |||||||||||||||||
| Administrative expenses and amortizations | (864) | 10.8 | 7.3 | (2,366) | (10.5) | 1.1 | |||||||||||||||||
| Net operating income | 2,019 | 6.1 | 2.7 | 5,719 | 0.7 | 13.9 | |||||||||||||||||
| Net loan-loss provisions | (757) | 12.4 | 8.9 | (1,980) | (20.1) | (9.7) | |||||||||||||||||
| Other gains (losses) and provisions | (89) | 215.8 | 222.5 | (214) | (5.6) | 6.7 | |||||||||||||||||
| Profit before tax | 1,172 | (2.3) | (5.8) | 3,526 | 18.6 | 34.1 | |||||||||||||||||
| Tax on profit | (517) | 0.3 | (3.2) | (1,563) | 24.3 | 40.6 | |||||||||||||||||
| Profit from continuing operations | 655 | (4.3) | (7.7) | 1,963 | 14.4 | 29.3 | |||||||||||||||||
| Net profit from discontinued operations | — | — | — | — | — | — | |||||||||||||||||
| Consolidated profit | 655 | (4.3) | (7.7) | 1,963 | 14.4 | 29.3 | |||||||||||||||||
| Non-controlling interests | (73) | 12.0 | 8.6 | (201) | 17.9 | 33.3 | |||||||||||||||||
| Underlying attributable profit to the parent | 582 | (6.0) | (9.5) | 1,762 | 14.0 | 28.9 | |||||||||||||||||
| Balance sheet | |||||||||||||||||||||||
| Loans and advances to customers | 70,737 | (4.0) | 1.8 | 70,737 | 18.2 | 12.7 | |||||||||||||||||
| Cash, central banks and credit institutions | 29,913 | (8.3) | (2.8) | 29,913 | 6.0 | 1.0 | |||||||||||||||||
| Debt instruments | 38,036 | 1.0 | 7.1 | 38,036 | 14.2 | 8.8 | |||||||||||||||||
| Other financial assets | 6,178 | 3.7 | 10.0 | 6,178 | 3.2 | (1.6) | |||||||||||||||||
| Other asset accounts | 11,084 | (5.5) | 0.2 | 11,084 | (3.0) | (7.5) | |||||||||||||||||
| Total assets | 155,948 | (3.5) | 2.3 | 155,948 | 12.4 | 7.1 | |||||||||||||||||
| Customer deposits | 73,772 | (3.7) | 2.1 | 73,772 | 6.2 | 1.2 | |||||||||||||||||
| Central banks and credit institutions | 27,768 | (3.7) | 2.2 | 27,768 | 38.4 | 31.9 | |||||||||||||||||
| Marketable debt securities | 14,160 | 4.4 | 10.8 | 14,160 | 17.5 | 12.0 | |||||||||||||||||
| Other financial liabilities | 22,303 | (0.6) | 5.4 | 22,303 | 14.9 | 9.5 | |||||||||||||||||
| Other liabilities accounts | 5,126 | (22.8) | (18.2) | 5,126 | (14.6) | (18.6) | |||||||||||||||||
| Total liabilities | 143,129 | (3.3) | 2.5 | 143,129 | 12.7 | 7.4 | |||||||||||||||||
| Total equity | 12,819 | (5.7) | 0.0 | 12,819 | 9.2 | 4.1 | |||||||||||||||||
| Memorandum items: | |||||||||||||||||||||||
Gross loans and advances to customers (2) | 74,431 | (3.8) | 2.1 | 74,431 | 18.3 | 12.7 | |||||||||||||||||
| Customer funds | 103,765 | (5.1) | 0.7 | 103,765 | 8.6 | 3.5 | |||||||||||||||||
Customer deposits (3) | 63,422 | (6.4) | (0.7) | 63,422 | 8.3 | 3.2 | |||||||||||||||||
| Mutual funds | 40,343 | (2.9) | 2.9 | 40,343 | 9.0 | 3.9 | |||||||||||||||||
| Ratios (%), operating means and customers | |||||||||||||||||||||||
| Underlying RoTE | 20.56 | (2.17) | 21.64 | 3.27 | |||||||||||||||||||
| Efficiency ratio | 30.0 | 0.9 | 29.3 | (2.5) | |||||||||||||||||||
| NPL ratio | 4.72 | 0.17 | 4.72 | 0.08 | |||||||||||||||||||
| Total coverage ratio | 111.8 | (0.5) | 111.8 | (3.1) | |||||||||||||||||||
| Number of employees | 47,877 | 6.1 | 47,877 | 9.6 | |||||||||||||||||||
| Number of branches | 3,591 | — | 3,591 | 0.8 | |||||||||||||||||||
| Number of loyal customers (thousands) | 7,509 | 5.1 | 7,509 | 25.9 | |||||||||||||||||||
| Number of digital customers (thousands) | 18,247 | 4.5 | 18,247 | 20.0 | |||||||||||||||||||
(1) Includes exchange differences.
(2) Excluding reverse repos.
(3) Excluding repos.
| 66 | | January - September 2021 | ||||||
| Chile | |||||||||||||||||||||||
| EUR million | |||||||||||||||||||||||
| / | Q2'21 | / | 9M'20 | ||||||||||||||||||||
| Underlying income statement | Q3'21 | % | % excl. FX | 9M'21 | % | % excl. FX | |||||||||||||||||
| Net interest income | 467 | (8.7) | (3.5) | 1,476 | 14.1 | 11.8 | |||||||||||||||||
| Net fee income | 104 | 8.5 | 14.0 | 294 | 22.5 | 20.0 | |||||||||||||||||
Gains (losses) on financial transactions (1) | 29 | (39.8) | (35.9) | 110 | (29.5) | (31.0) | |||||||||||||||||
| Other operating income | (17) | (3.7) | 0.6 | (45) | 130.8 | 126.0 | |||||||||||||||||
| Total income | 583 | (8.6) | (3.5) | 1,834 | 9.9 | 7.6 | |||||||||||||||||
| Administrative expenses and amortizations | (229) | (6.7) | (1.6) | (710) | 4.2 | 2.1 | |||||||||||||||||
| Net operating income | 354 | (9.7) | (4.7) | 1,125 | 13.8 | 11.5 | |||||||||||||||||
| Net loan-loss provisions | (84) | 2.5 | 8.5 | (266) | (46.9) | (48.0) | |||||||||||||||||
| Other gains (losses) and provisions | (5) | — | — | (2) | — | — | |||||||||||||||||
| Profit before tax | 265 | (15.9) | (11.1) | 857 | 71.5 | 67.9 | |||||||||||||||||
| Tax on profit | (59) | (15.7) | (11.1) | (183) | 71.4 | 67.9 | |||||||||||||||||
| Profit from continuing operations | 206 | (16.0) | (11.2) | 674 | 71.5 | 68.0 | |||||||||||||||||
| Net profit from discontinued operations | — | — | — | — | — | — | |||||||||||||||||
| Consolidated profit | 206 | (16.0) | (11.2) | 674 | 71.5 | 68.0 | |||||||||||||||||
| Non-controlling interests | (64) | (16.3) | (11.5) | (211) | 70.4 | 66.9 | |||||||||||||||||
| Underlying attributable profit to the parent | 142 | (15.9) | (11.0) | 463 | 72.0 | 68.5 | |||||||||||||||||
| Balance sheet | |||||||||||||||||||||||
| Loans and advances to customers | 37,851 | (5.2) | 3.4 | 37,851 | (1.3) | 0.4 | |||||||||||||||||
| Cash, central banks and credit institutions | 9,573 | (18.5) | (11.2) | 9,573 | 47.0 | 49.5 | |||||||||||||||||
| Debt instruments | 9,682 | 16.4 | 26.9 | 9,682 | 46.4 | 48.9 | |||||||||||||||||
| Other financial assets | 9,901 | 57.3 | 71.5 | 9,901 | (7.9) | (6.3) | |||||||||||||||||
| Other asset accounts | 3,011 | 4.4 | 13.9 | 3,011 | (0.6) | 1.2 | |||||||||||||||||
| Total assets | 70,017 | 1.2 | 10.4 | 70,017 | 7.3 | 9.2 | |||||||||||||||||
| Customer deposits | 31,509 | (5.4) | 3.1 | 31,509 | 17.4 | 19.5 | |||||||||||||||||
| Central banks and credit institutions | 12,903 | 10.6 | 20.6 | 12,903 | 3.0 | 4.8 | |||||||||||||||||
| Marketable debt securities | 8,323 | (8.4) | (0.1) | 8,323 | (2.7) | (1.0) | |||||||||||||||||
| Other financial liabilities | 10,683 | 25.5 | 36.8 | 10,683 | (6.5) | (4.9) | |||||||||||||||||
| Other liabilities accounts | 2,230 | 19.2 | 29.9 | 2,230 | 77.3 | 80.4 | |||||||||||||||||
| Total liabilities | 65,648 | 1.9 | 11.1 | 65,648 | 8.3 | 10.2 | |||||||||||||||||
| Total equity | 4,370 | (7.3) | 1.1 | 4,370 | (6.4) | (4.7) | |||||||||||||||||
| Memorandum items: | |||||||||||||||||||||||
Gross loans and advances to customers (2) | 38,927 | (5.3) | 3.2 | 38,927 | (1.2) | 0.5 | |||||||||||||||||
| Customer funds | 40,165 | (5.1) | 3.5 | 40,165 | 15.1 | 17.1 | |||||||||||||||||
Customer deposits (3) | 31,480 | (5.4) | 3.1 | 31,480 | 17.5 | 19.6 | |||||||||||||||||
| Mutual funds | 8,684 | (3.8) | 4.8 | 8,684 | 7.2 | 9.1 | |||||||||||||||||
| Ratios (%), operating means and customers | |||||||||||||||||||||||
| Underlying RoTE | 18.23 | (1.68) | 18.46 | 7.47 | |||||||||||||||||||
| Efficiency ratio | 39.3 | 0.8 | 38.7 | (2.1) | |||||||||||||||||||
| NPL ratio | 4.36 | (0.20) | 4.36 | (0.40) | |||||||||||||||||||
| Total coverage ratio | 64.1 | 0.3 | 64.1 | 4.4 | |||||||||||||||||||
| Number of employees | 10,570 | (0.5) | 10,570 | (5.6) | |||||||||||||||||||
| Number of branches | 332 | — | 332 | (6.2) | |||||||||||||||||||
| Number of loyal customers (thousands) | 807 | 3.8 | 807 | 11.0 | |||||||||||||||||||
| Number of digital customers (thousands) | 1,934 | 3.6 | 1,934 | 29.9 | |||||||||||||||||||
(1) Includes exchange differences.
(2) Excluding reverse repos.
(3) Excluding repos.
January - September 2021 | | 67 | ||||||
| Argentina | |||||||||||||||||||||||
| EUR million | |||||||||||||||||||||||
| / | Q2'21 | / | 9M'20 | ||||||||||||||||||||
| Underlying income statement | Q3'21 | % | % excl. FX | 9M'21 | % | % excl. FX | |||||||||||||||||
| Net interest income | 268 | 13.9 | 11.7 | 708 | (1.8) | 25.6 | |||||||||||||||||
| Net fee income | 110 | 26.3 | 23.8 | 272 | 34.6 | 72.2 | |||||||||||||||||
Gains (losses) on financial transactions (1) | 43 | 26.6 | 23.6 | 108 | 113.3 | 172.9 | |||||||||||||||||
| Other operating income | (56) | 0.5 | (1.2) | (159) | 122.6 | 184.8 | |||||||||||||||||
| Total income | 365 | 21.3 | 18.9 | 929 | 3.0 | 31.8 | |||||||||||||||||
| Administrative expenses and amortizations | (204) | 14.2 | 11.6 | (554) | 12.7 | 44.2 | |||||||||||||||||
| Net operating income | 161 | 31.8 | 29.6 | 375 | (8.7) | 16.9 | |||||||||||||||||
| Net loan-loss provisions | (40) | 15.1 | 15.0 | (88) | (50.3) | (36.4) | |||||||||||||||||
| Other gains (losses) and provisions | (29) | (7.4) | (9.7) | (94) | 94.8 | 149.3 | |||||||||||||||||
| Profit before tax | 92 | 63.4 | 60.3 | 193 | 4.3 | 33.5 | |||||||||||||||||
| Tax on profit | (19) | — | — | (11) | (50.7) | (36.9) | |||||||||||||||||
| Profit from continuing operations | 73 | 16.4 | 14.8 | 182 | 12.0 | 43.3 | |||||||||||||||||
| Net profit from discontinued operations | — | — | — | — | — | — | |||||||||||||||||
| Consolidated profit | 73 | 16.4 | 14.8 | 182 | 12.0 | 43.3 | |||||||||||||||||
| Non-controlling interests | — | 18.0 | 16.5 | (1) | (0.6) | 27.2 | |||||||||||||||||
| Underlying attributable profit to the parent | 73 | 16.4 | 14.8 | 180 | 12.1 | 43.4 | |||||||||||||||||
| Balance sheet | |||||||||||||||||||||||
| Loans and advances to customers | 4,652 | 4.4 | 5.2 | 4,652 | 3.3 | 32.2 | |||||||||||||||||
| Cash, central banks and credit institutions | 4,101 | 27.9 | 29.0 | 4,101 | 33.1 | 70.3 | |||||||||||||||||
| Debt instruments | 2,394 | 9.4 | 10.4 | 2,394 | 13.4 | 45.1 | |||||||||||||||||
| Other financial assets | 79 | 2.9 | 3.7 | 79 | 24.7 | 59.6 | |||||||||||||||||
| Other asset accounts | 865 | 3.5 | 4.4 | 865 | 4.8 | 34.0 | |||||||||||||||||
| Total assets | 12,092 | 12.3 | 13.3 | 12,092 | 14.2 | 46.2 | |||||||||||||||||
| Customer deposits | 8,860 | 13.8 | 14.7 | 8,860 | 16.5 | 49.1 | |||||||||||||||||
| Central banks and credit institutions | 834 | 1.3 | 2.1 | 834 | (15.0) | 8.8 | |||||||||||||||||
| Marketable debt securities | 63 | (0.8) | 0.1 | 63 | 172.0 | 248.1 | |||||||||||||||||
| Other financial liabilities | 762 | 12.9 | 13.9 | 762 | 24.0 | 58.7 | |||||||||||||||||
| Other liabilities accounts | 356 | 13.7 | 14.7 | 356 | (5.3) | 21.2 | |||||||||||||||||
| Total liabilities | 10,875 | 12.6 | 13.5 | 10,875 | 13.3 | 45.0 | |||||||||||||||||
| Total equity | 1,216 | 10.3 | 11.3 | 1,216 | 23.6 | 58.1 | |||||||||||||||||
| Memorandum items: | |||||||||||||||||||||||
Gross loans and advances to customers (2) | 4,928 | 4.6 | 5.4 | 4,928 | 3.8 | 32.9 | |||||||||||||||||
| Customer funds | 11,285 | 14.0 | 15.0 | 11,285 | 19.8 | 53.3 | |||||||||||||||||
Customer deposits (3) | 8,860 | 13.8 | 14.7 | 8,860 | 16.5 | 49.1 | |||||||||||||||||
| Mutual funds | 2,425 | 15.0 | 15.9 | 2,425 | 33.5 | 70.9 | |||||||||||||||||
| Ratios (%), operating means and customers | |||||||||||||||||||||||
| Underlying RoTE | 27.64 | 0.62 | 25.33 | (3.90) | |||||||||||||||||||
| Efficiency ratio | 55.9 | (3.5) | 59.6 | 5.1 | |||||||||||||||||||
| NPL ratio | 3.85 | 0.52 | 3.85 | 0.98 | |||||||||||||||||||
| Total coverage ratio | 149.3 | (18.3) | 149.3 | (37.0) | |||||||||||||||||||
| Number of employees | 8,715 | (1.1) | 8,715 | (6.0) | |||||||||||||||||||
| Number of branches | 408 | — | 408 | (4.4) | |||||||||||||||||||
| Number of loyal customers (thousands) | 1,604 | 2.3 | 1,604 | 20.1 | |||||||||||||||||||
| Number of digital customers (thousands) | 2,713 | (0.1) | 2,713 | 0.9 | |||||||||||||||||||
(1) Includes exchange differences.
(2) Excluding reverse repos.
(3) Excluding repos.
| 68 | | January - September 2021 | ||||||
| Other South America | |||||||||||||||||||||||
| EUR million | |||||||||||||||||||||||
| / | Q2'21 | / | 9M'20 | ||||||||||||||||||||
| Underlying income statement | Q3'21 | % | % excl. FX | 9M'21 | % | % excl. FX | |||||||||||||||||
| Net interest income | 102 | 9.5 | 8.3 | 289 | (5.1) | 6.2 | |||||||||||||||||
| Net fee income | 45 | (2.2) | (2.9) | 133 | 16.0 | 27.0 | |||||||||||||||||
Gains (losses) on financial transactions (1) | 13 | (26.5) | (25.6) | 44 | (8.7) | 2.2 | |||||||||||||||||
| Other operating income | 1 | — | — | (11) | (10.7) | (4.9) | |||||||||||||||||
| Total income | 161 | 5.6 | 4.8 | 454 | 0.0 | 11.4 | |||||||||||||||||
| Administrative expenses and amortizations | (101) | 5.8 | 4.8 | (287) | 38.9 | 52.1 | |||||||||||||||||
| Net operating income | 60 | 5.2 | 4.6 | 167 | (32.4) | (23.6) | |||||||||||||||||
| Net loan-loss provisions | (11) | (39.9) | (39.3) | (50) | (24.1) | (15.3) | |||||||||||||||||
| Other gains (losses) and provisions | (1) | 9.7 | 5.4 | (3) | (20.0) | (15.9) | |||||||||||||||||
| Profit before tax | 47 | 27.9 | 26.7 | 115 | (35.7) | (26.9) | |||||||||||||||||
| Tax on profit | (18) | 12.2 | 12.0 | (50) | 22.6 | 39.8 | |||||||||||||||||
| Profit from continuing operations | 30 | 39.4 | 37.4 | 65 | (52.9) | (46.4) | |||||||||||||||||
| Net profit from discontinued operations | — | — | — | — | — | — | |||||||||||||||||
| Consolidated profit | 30 | 39.4 | 37.4 | 65 | (52.9) | (46.4) | |||||||||||||||||
| Non-controlling interests | — | (54.3) | (53.1) | — | 2.9 | 2.9 | |||||||||||||||||
| Underlying attributable profit to the parent | 30 | 39.0 | 36.9 | 65 | (52.7) | (46.3) | |||||||||||||||||
| Balance sheet | |||||||||||||||||||||||
| Loans and advances to customers | 7,893 | 17.5 | 17.6 | 7,893 | 23.7 | 28.3 | |||||||||||||||||
| Cash, central banks and credit institutions | 3,423 | 20.0 | 17.3 | 3,423 | 14.4 | 17.2 | |||||||||||||||||
| Debt instruments | 1,618 | (9.2) | (10.1) | 1,618 | 24.4 | 24.8 | |||||||||||||||||
| Other financial assets | 168 | 31.7 | 35.2 | 168 | (5.5) | (2.0) | |||||||||||||||||
| Other asset accounts | 817 | 2.5 | 2.4 | 817 | 21.9 | 22.6 | |||||||||||||||||
| Total assets | 13,919 | 13.4 | 12.7 | 13,919 | 20.8 | 24.2 | |||||||||||||||||
| Customer deposits | 7,329 | 8.0 | 5.8 | 7,329 | 11.9 | 14.1 | |||||||||||||||||
| Central banks and credit institutions | 4,363 | 27.6 | 30.5 | 4,363 | 34.4 | 40.6 | |||||||||||||||||
| Marketable debt securities | 264 | 1.2 | 0.7 | 264 | 151.1 | 185.1 | |||||||||||||||||
| Other financial liabilities | 133 | 21.5 | 21.4 | 133 | 48.5 | 53.9 | |||||||||||||||||
| Other liabilities accounts | 354 | 10.2 | 9.6 | 354 | 34.4 | 36.5 | |||||||||||||||||
| Total liabilities | 12,444 | 14.2 | 13.5 | 12,444 | 21.3 | 24.9 | |||||||||||||||||
| Total equity | 1,476 | 6.9 | 6.3 | 1,476 | 16.5 | 18.7 | |||||||||||||||||
| Memorandum items: | |||||||||||||||||||||||
Gross loans and advances to customers (2) | 8,048 | 17.1 | 17.2 | 8,048 | 23.6 | 28.2 | |||||||||||||||||
| Customer funds | 7,373 | 8.0 | 5.8 | 7,373 | 11.9 | 14.1 | |||||||||||||||||
Customer deposits (3) | 7,329 | 8.0 | 5.8 | 7,329 | 11.9 | 14.1 | |||||||||||||||||
| Mutual funds | 44 | 1.6 | (2.4) | 44 | 16.7 | 16.3 | |||||||||||||||||
| Resources | |||||||||||||||||||||||
| Number of employees | 2,799 | 6.0 | 2,799 | 18.6 | |||||||||||||||||||
(1) Includes exchange differences.
(2) Excluding reverse repos.
(3) Excluding repos.
January - September 2021 | | 69 | ||||||
| DIGITAL CONSUMER BANK | |||||||||||||||||||||||
| EUR million | |||||||||||||||||||||||
| / | Q2'21 | / | 9M'20 | ||||||||||||||||||||
| Underlying income statement | Q3'21 | % | % excl. FX | 9M'21 | % | % excl. FX | |||||||||||||||||
| Net interest income | 1,077 | 0.2 | 0.5 | 3,207 | 0.5 | (0.1) | |||||||||||||||||
| Net fee income | 222 | 7.4 | 7.5 | 616 | 8.8 | 8.8 | |||||||||||||||||
Gains (losses) on financial transactions (1) | (3) | — | — | 7 | — | — | |||||||||||||||||
| Other operating income | 73 | 263.5 | 261.0 | 144 | 144.8 | 140.2 | |||||||||||||||||
| Total income | 1,369 | 5.2 | 5.4 | 3,975 | 4.2 | 3.6 | |||||||||||||||||
| Administrative expenses and amortizations | (591) | (3.6) | (3.4) | (1,805) | 4.1 | 3.7 | |||||||||||||||||
| Net operating income | 778 | 13.0 | 13.3 | 2,170 | 4.3 | 3.6 | |||||||||||||||||
| Net loan-loss provisions | (141) | (1.1) | (0.4) | (449) | (40.4) | (40.7) | |||||||||||||||||
| Other gains (losses) and provisions | (43) | (3.0) | (2.4) | (119) | — | — | |||||||||||||||||
| Profit before tax | 594 | 18.4 | 18.5 | 1,602 | 16.8 | 16.0 | |||||||||||||||||
| Tax on profit | (132) | 1.3 | 1.6 | (398) | 10.0 | 9.5 | |||||||||||||||||
| Profit from continuing operations | 462 | 24.4 | 24.5 | 1,204 | 19.3 | 18.3 | |||||||||||||||||
| Net profit from discontinued operations | — | — | — | — | (100.0) | (100.0) | |||||||||||||||||
| Consolidated profit | 462 | 24.4 | 24.5 | 1,204 | 19.3 | 18.3 | |||||||||||||||||
| Non-controlling interests | (96) | 2.6 | 2.5 | (269) | 21.4 | 21.4 | |||||||||||||||||
| Underlying attributable profit to the parent | 366 | 31.8 | 31.9 | 935 | 18.7 | 17.5 | |||||||||||||||||
| Balance sheet | |||||||||||||||||||||||
| Loans and advances to customers | 111,667 | (0.9) | (1.0) | 111,667 | 1.1 | (0.5) | |||||||||||||||||
| Cash, central banks and credit institutions | 29,690 | 4.4 | 4.3 | 29,690 | 44.6 | 43.0 | |||||||||||||||||
| Debt instruments | 5,117 | (10.8) | (10.7) | 5,117 | (7.9) | (8.4) | |||||||||||||||||
| Other financial assets | 46 | 10.4 | 10.3 | 46 | 37.6 | 35.5 | |||||||||||||||||
| Other asset accounts | 6,700 | 3.4 | 3.3 | 6,700 | 4.7 | 3.2 | |||||||||||||||||
| Total assets | 153,221 | (0.1) | (0.2) | 153,221 | 7.1 | 5.6 | |||||||||||||||||
| Customer deposits | 54,396 | 0.7 | 0.6 | 54,396 | 8.8 | 7.4 | |||||||||||||||||
| Central banks and credit institutions | 46,553 | (3.0) | (3.0) | 46,553 | 18.9 | 16.6 | |||||||||||||||||
| Marketable debt securities | 34,259 | 1.5 | 1.5 | 34,259 | (4.6) | (5.6) | |||||||||||||||||
| Other financial liabilities | 1,447 | (0.5) | (0.5) | 1,447 | (12.6) | (13.5) | |||||||||||||||||
| Other liabilities accounts | 4,335 | 3.0 | 3.0 | 4,335 | 6.0 | 5.1 | |||||||||||||||||
| Total liabilities | 140,990 | (0.3) | (0.4) | 140,990 | 7.8 | 6.3 | |||||||||||||||||
| Total equity | 12,231 | 1.8 | 1.7 | 12,231 | 0.1 | (1.8) | |||||||||||||||||
| Memorandum items: | |||||||||||||||||||||||
Gross loans and advances to customers (2) | 114,420 | (1.0) | (1.0) | 114,420 | 1.0 | (0.6) | |||||||||||||||||
| Customer funds | 56,628 | 0.8 | 0.7 | 56,628 | 12.0 | 10.6 | |||||||||||||||||
Customer deposits (3) | 54,396 | 0.7 | 0.6 | 54,396 | 8.8 | 7.4 | |||||||||||||||||
| Mutual funds | 2,232 | 3.9 | 3.9 | 2,232 | 291.4 | 291.4 | |||||||||||||||||
| Ratios (%), operating means and customers | |||||||||||||||||||||||
| Underlying RoTE | 15.73 | 3.7 | 13.23 | 2.27 | |||||||||||||||||||
| Efficiency ratio | 43.2 | (3.9) | 45.4 | 0.0 | |||||||||||||||||||
| NPL ratio | 2.15 | — | 2.15 | (0.14) | |||||||||||||||||||
| Total coverage ratio | 112.8 | 0.9 | 112.8 | 2.3 | |||||||||||||||||||
| Number of employees | 15,920 | 0.5 | 15,920 | (1.1) | |||||||||||||||||||
| Number of branches | 308 | (1.9) | 308 | (14.2) | |||||||||||||||||||
| Number of total customers (thousands) | 19,120 | (1.6) | 19,120 | (4.5) | |||||||||||||||||||
(1) Includes exchange differences.
(2) Excluding reverse repos.
(3) Excluding repos.
| 70 | | January - September 2021 | ||||||
| CORPORATE CENTRE | |||||||||||||||||||||||
| EUR million | |||||||||||||||||||||||
| Underlying income statement | Q3'21 | Q2'21 | % | 9M'21 | 9M'20 | % | |||||||||||||||||
| Net interest income | (354) | (355) | (0.5) | (1,033) | (1,029) | 0.4 | |||||||||||||||||
| Net fee income | (2) | (8) | (76.4) | (15) | (26) | (40.6) | |||||||||||||||||
Gains (losses) on financial transactions (1) | (49) | (52) | (4.5) | (145) | 182 | — | |||||||||||||||||
| Other operating income | (11) | (15) | (27.2) | (23) | (17) | 38.4 | |||||||||||||||||
| Total income | (416) | (430) | (3.4) | (1,216) | (889) | 36.8 | |||||||||||||||||
| Administrative expenses and amortizations | (89) | (81) | 11.0 | (249) | (248) | 0.2 | |||||||||||||||||
| Net operating income | (505) | (511) | (1.1) | (1,465) | (1,137) | 28.8 | |||||||||||||||||
| Net loan-loss provisions | (6) | (9) | (37.3) | (168) | (27) | 522.5 | |||||||||||||||||
| Other gains (losses) and provisions | (43) | (33) | 27.9 | (108) | (403) | (73.1) | |||||||||||||||||
| Profit before tax | (553) | (553) | 0.0 | (1,741) | (1,567) | 11.1 | |||||||||||||||||
| Tax on profit | 8 | 19 | (59.0) | 135 | 113 | 20.1 | |||||||||||||||||
| Profit from continuing operations | (545) | (534) | 2.1 | (1,606) | (1,454) | 10.4 | |||||||||||||||||
| Net profit from discontinued operations | — | — | — | — | — | — | |||||||||||||||||
| Consolidated profit | (545) | (534) | 2.1 | (1,606) | (1,454) | 10.4 | |||||||||||||||||
| Non-controlling interests | — | (1) | (94.3) | (1) | (1) | 116.7 | |||||||||||||||||
| Underlying attributable profit to the parent | (545) | (535) | 1.9 | (1,607) | (1,455) | 10.5 | |||||||||||||||||
| Balance sheet | |||||||||||||||||||||||
| Loans and advances to customers | 6,350 | 5,832 | 8.9 | 6,350 | 4,827 | 31.5 | |||||||||||||||||
| Cash, central banks and credit institutions | 81,150 | 71,908 | 12.9 | 81,150 | 63,947 | 26.9 | |||||||||||||||||
| Debt instruments | 1,423 | 1,605 | (11.3) | 1,423 | 2,100 | (32.2) | |||||||||||||||||
| Other financial assets | 2,157 | 2,016 | 7.0 | 2,157 | 2,067 | 4.4 | |||||||||||||||||
| Other asset accounts | 116,606 | 118,374 | (1.5) | 116,606 | 114,295 | 2.0 | |||||||||||||||||
| Total assets | 207,687 | 199,736 | 4.0 | 207,687 | 187,236 | 10.9 | |||||||||||||||||
| Customer deposits | 1,324 | 1,017 | 30.2 | 1,324 | 1,074 | 23.3 | |||||||||||||||||
| Central banks and credit institutions | 46,173 | 38,914 | 18.7 | 46,173 | 42,654 | 8.3 | |||||||||||||||||
| Marketable debt securities | 71,720 | 69,217 | 3.6 | 71,720 | 57,866 | 23.9 | |||||||||||||||||
| Other financial liabilities | 1,495 | 534 | 179.9 | 1,495 | 1,143 | 30.8 | |||||||||||||||||
| Other liabilities accounts | 7,197 | 8,009 | (10.1) | 7,197 | 7,645 | (5.9) | |||||||||||||||||
| Total liabilities | 127,909 | 117,691 | 8.7 | 127,909 | 110,382 | 15.9 | |||||||||||||||||
| Total equity | 79,778 | 82,044 | (2.8) | 79,778 | 76,854 | 3.8 | |||||||||||||||||
| Memorandum items: | |||||||||||||||||||||||
Gross loans and advances to customers (2) | 6,589 | 6,138 | 7.4 | 6,589 | 5,008 | 31.6 | |||||||||||||||||
| Customer funds | 1,324 | 1,021 | 29.6 | 1,324 | 1,089 | 21.6 | |||||||||||||||||
Customer deposits (3) | 1,324 | 1,017 | 30.2 | 1,324 | 1,074 | 23.3 | |||||||||||||||||
| Mutual funds | — | 4 | (90.0) | — | 15 | (97.1) | |||||||||||||||||
| Resources | |||||||||||||||||||||||
| Number of employees | 1,710 | 1,743 | 1,710 | 1,743 | |||||||||||||||||||
(1) Includes exchange differences.
(2) Excluding reverse repos.
(3) Excluding repos.
January - September 2021 | | 71 | ||||||
| RETAIL BANKING | |||||||||||||||||||||||
| EUR million | |||||||||||||||||||||||
| / | Q2'21 | / | 9M'20 | ||||||||||||||||||||
| Underlying income statement | Q3'21 | % | % excl. FX | 9M'21 | % | % excl. FX | |||||||||||||||||
| Net interest income | 7,968 | 2.6 | 1.5 | 23,206 | 2.9 | 7.2 | |||||||||||||||||
| Net fee income | 1,746 | (0.4) | (1.5) | 5,208 | (1.8) | 3.1 | |||||||||||||||||
Gains (losses) on financial transactions (1) | 216 | 26.0 | 22.8 | 633 | (27.8) | (27.5) | |||||||||||||||||
| Other operating income | 243 | 100.8 | 97.2 | 472 | — | — | |||||||||||||||||
| Total income | 10,173 | 3.7 | 2.5 | 29,520 | 3.0 | 7.3 | |||||||||||||||||
| Administrative expenses and amortizations | (4,336) | 2.1 | 1.2 | (12,740) | (2.0) | 1.3 | |||||||||||||||||
| Net operating income | 5,837 | 4.9 | 3.5 | 16,780 | 7.1 | 12.3 | |||||||||||||||||
| Net loan-loss provisions | (2,199) | 27.4 | 26.1 | (5,708) | (38.1) | (34.9) | |||||||||||||||||
| Other gains (losses) and provisions | (445) | (3.9) | (4.8) | (1,312) | 58.3 | 66.3 | |||||||||||||||||
| Profit before tax | 3,194 | (5.4) | (6.8) | 9,759 | 73.6 | 81.6 | |||||||||||||||||
| Tax on profit | (905) | (14.4) | (16.1) | (3,010) | 60.8 | 70.7 | |||||||||||||||||
| Profit from continuing operations | 2,288 | (1.3) | (2.7) | 6,749 | 80.1 | 86.9 | |||||||||||||||||
| Net profit from discontinued operations | — | — | — | — | — | (57.7) | |||||||||||||||||
| Consolidated profit | 2,288 | (1.3) | (2.7) | 6,749 | 80.1 | 86.9 | |||||||||||||||||
| Non-controlling interests | (329) | (9.6) | (10.4) | (999) | 56.0 | 60.6 | |||||||||||||||||
| Underlying attributable profit to the parent | 1,960 | 0.3 | (1.2) | 5,750 | 85.0 | 92.4 | |||||||||||||||||
(1) Includes exchange differences.
| CORPORATE & INVESTMENT BANKING | |||||||||||||||||||||||
| EUR million | |||||||||||||||||||||||
| / | Q2'21 | / | 9M'20 | ||||||||||||||||||||
| Underlying income statement | Q3'21 | % | % excl. FX | 9M'21 | % | % excl. FX | |||||||||||||||||
| Net interest income | 747 | 1.1 | 0.0 | 2,207 | 2.5 | 7.5 | |||||||||||||||||
| Net fee income | 435 | 0.2 | (0.8) | 1,335 | 14.4 | 19.0 | |||||||||||||||||
Gains (losses) on financial transactions (1) | 144 | 42.7 | 42.6 | 656 | 7.8 | 18.6 | |||||||||||||||||
| Other operating income | 87 | 888.7 | 928.7 | 154 | 2.0 | 0.8 | |||||||||||||||||
| Total income | 1,414 | 10.2 | 9.2 | 4,352 | 6.7 | 12.1 | |||||||||||||||||
| Administrative expenses and amortizations | (574) | 5.7 | 4.9 | (1,642) | 8.4 | 11.8 | |||||||||||||||||
| Net operating income | 840 | 13.5 | 12.4 | 2,709 | 5.7 | 12.3 | |||||||||||||||||
| Net loan-loss provisions | (7) | (65.1) | (66.0) | (75) | (73.5) | (73.5) | |||||||||||||||||
| Other gains (losses) and provisions | (1) | — | — | 6 | — | — | |||||||||||||||||
| Profit before tax | 832 | 10.9 | 9.7 | 2,640 | 19.1 | 27.8 | |||||||||||||||||
| Tax on profit | (245) | 13.8 | 12.3 | (779) | 21.8 | 31.5 | |||||||||||||||||
| Profit from continuing operations | 587 | 9.8 | 8.7 | 1,861 | 17.9 | 26.3 | |||||||||||||||||
| Net profit from discontinued operations | — | — | — | — | — | — | |||||||||||||||||
| Consolidated profit | 587 | 9.8 | 8.7 | 1,861 | 17.9 | 26.3 | |||||||||||||||||
| Non-controlling interests | (40) | (1.9) | (2.0) | (117) | 22.1 | 32.0 | |||||||||||||||||
| Underlying attributable profit to the parent | 547 | 10.7 | 9.5 | 1,744 | 17.7 | 25.9 | |||||||||||||||||
(1) Includes exchange differences.
| 72 | | January - September 2021 | ||||||
| WEALTH MANAGEMENT & INSURANCE | |||||||||||||||||||||||
| EUR million | |||||||||||||||||||||||
| / | Q2'21 | / | 9M'20 | ||||||||||||||||||||
| Underlying income statement | Q3'21 | % | % excl. FX | 9M'21 | % | % excl. FX | |||||||||||||||||
| Net interest income | 96 | 4.9 | 3.8 | 275 | (6.6) | (2.4) | |||||||||||||||||
| Net fee income | 321 | 1.8 | 0.8 | 933 | 8.9 | 11.9 | |||||||||||||||||
Gains (losses) on financial transactions (1) | 17 | (24.6) | (25.4) | 77 | 33.2 | 40.8 | |||||||||||||||||
| Other operating income | 181 | 102.9 | 102.4 | 351 | 27.2 | 30.4 | |||||||||||||||||
| Total income | 616 | 18.6 | 17.7 | 1,637 | 10.2 | 13.6 | |||||||||||||||||
| Administrative expenses and amortizations | (221) | (2.4) | (3.4) | (668) | 1.9 | 4.7 | |||||||||||||||||
| Net operating income | 395 | 34.8 | 34.0 | 969 | 16.7 | 20.7 | |||||||||||||||||
| Net loan-loss provisions | (6) | 113.9 | 114.2 | (14) | (39.4) | (39.1) | |||||||||||||||||
| Other gains (losses) and provisions | 16 | — | — | 12 | — | — | |||||||||||||||||
| Profit before tax | 405 | 40.3 | 39.5 | 966 | 20.7 | 24.9 | |||||||||||||||||
| Tax on profit | (105) | 49.2 | 48.5 | (242) | 27.6 | 31.3 | |||||||||||||||||
| Profit from continuing operations | 300 | 37.5 | 36.7 | 724 | 18.5 | 22.9 | |||||||||||||||||
| Net profit from discontinued operations | — | — | — | — | — | — | |||||||||||||||||
| Consolidated profit | 300 | 37.5 | 36.7 | 724 | 18.5 | 22.9 | |||||||||||||||||
| Non-controlling interests | (8) | (2.7) | (1.9) | (26) | (3.5) | 1.6 | |||||||||||||||||
| Underlying attributable profit to the parent | 292 | 39.2 | 38.2 | 698 | 19.5 | 23.9 | |||||||||||||||||
(1) Includes exchange differences.
| PAGONXT | |||||||||||||||||||||||
| EUR million | |||||||||||||||||||||||
| / | Q2'21 | / | 9M'20 | ||||||||||||||||||||
| Underlying income statement | Q3'21 | % | % excl. FX | 9M'21 | % | % excl. FX | |||||||||||||||||
| Net interest income | — | — | — | (2) | 396.4 | 847.6 | |||||||||||||||||
| Net fee income | 141 | 10.5 | 8.0 | 349 | 34.5 | 45.4 | |||||||||||||||||
Gains (losses) on financial transactions (1) | (2) | 228.8 | 221.9 | (1) | (4.1) | (13.4) | |||||||||||||||||
| Other operating income | 5 | — | — | (13) | 548.1 | 588.5 | |||||||||||||||||
| Total income | 144 | 17.7 | 15.1 | 334 | 30.3 | 40.9 | |||||||||||||||||
| Administrative expenses and amortizations | (181) | 11.4 | 10.4 | (479) | 59.2 | 67.0 | |||||||||||||||||
| Net operating income | (36) | (8.1) | (4.2) | (145) | 224.9 | 191.3 | |||||||||||||||||
| Net loan-loss provisions | (2) | 1.0 | (2.5) | (7) | (31.7) | (23.4) | |||||||||||||||||
| Other gains (losses) and provisions | (34) | 889.8 | 884.9 | (39) | — | — | |||||||||||||||||
| Profit before tax | (73) | 60.8 | 64.9 | (191) | 247.7 | 220.5 | |||||||||||||||||
| Tax on profit | (6) | (44.6) | (49.7) | (15) | 110.6 | 198.9 | |||||||||||||||||
| Profit from continuing operations | (79) | 41.6 | 43.3 | (207) | 231.8 | 218.8 | |||||||||||||||||
| Net profit from discontinued operations | — | — | — | — | — | — | |||||||||||||||||
| Consolidated profit | (79) | 41.6 | 43.3 | (207) | 231.8 | 218.8 | |||||||||||||||||
| Non-controlling interests | — | — | — | — | (57.6) | (57.6) | |||||||||||||||||
| Underlying attributable profit to the parent | (79) | 42.0 | 43.7 | (206) | 236.9 | 223.4 | |||||||||||||||||
(1) Includes exchange differences.
January - September 2021 | | 73 | ||||||
| ALTERNATIVE PERFORMANCE MEASURES (APMs) | ||||||||
In addition to the financial information prepared under IFRS, this consolidated directors’ report contains financial measures that constitute alternative performance measures (‘APMs’) to comply with the guidelines on alternative performance measures issued by the European Securities and Markets Authority on 5 October 2015 and non-IFRS measures.
The financial measures contained in this consolidated directors’ report that qualify as APMs and non-IFRS measures have been calculated using the financial information from Santander but are not defined or detailed in the applicable financial information framework or under IFRS and have neither been audited nor reviewed by our auditors.
We use these APMs and non-IFRS measures when planning, monitoring and evaluating our performance. We consider these APMs and non-IFRS financial measures to be useful metrics for management and investors to facilitate operating performance comparisons from period to period. While we believe that these APMs and non-IFRS financial measures are useful in evaluating our business, this information should be considered as supplemental in nature and is not meant as a substitute of IFRS measures. In addition, the way in which Santander defines and calculates these
APMs and non-IFRS measures may differ from the calculations and by other companies with similar measures and, therefore, may not be comparable.
The APMs and non-IFRS measures we use in this document can be categorised as follows:
Underlying results
In addition to IFRS results measures, we present some results measures which are non-IFRS measures and which we refer to as underlying measures. These underlying measures allow in our view a better year-on-year comparability as they exclude items outside the ordinary performance of our business which are grouped in the non-IFRS line net capital gains and provisions and are further detailed on page 11 of this report.
In addition, in the section "Financial information by segments", relative to the primary and secondary segments, results are presented on an underlying basis in accordance with IFRS 8, and reconciled on an aggregate basis to our IFRS consolidated results to the consolidated financial statements, which are set out below.
| Reconciliation of underlying results to statutory results | |||||||||||
| EUR million | |||||||||||
| January-September 2021 | |||||||||||
| Underlying results | Adjustments | Statutory results | |||||||||
| Net interest income | 24,654 | — | 24,654 | ||||||||
| Net fee income | 7,810 | — | 7,810 | ||||||||
Gains (losses) on financial transactions (1) | 1,220 | — | 1,220 | ||||||||
| Other operating income | 942 | — | 942 | ||||||||
| Total income | 34,626 | — | 34,626 | ||||||||
| Administrative expenses and amortizations | (15,778) | — | (15,778) | ||||||||
| Net operating income | 18,848 | — | 18,848 | ||||||||
| Net loan-loss provisions | (5,973) | — | (5,973) | ||||||||
| Other gains (losses) and provisions | (1,443) | (716) | (2,159) | ||||||||
| Profit before tax | 11,432 | (716) | 10,716 | ||||||||
| Tax on profit | (3,911) | 186 | (3,725) | ||||||||
| Profit from continuing operations | 7,521 | (530) | 6,991 | ||||||||
| Net profit from discontinued operations | — | — | — | ||||||||
| Consolidated profit | 7,521 | (530) | 6,991 | ||||||||
| Non-controlling interests | (1,142) | — | (1,142) | ||||||||
| Attributable profit to the parent | 6,379 | (530) | 5,849 | ||||||||
(1) Includes exchange differences.
Explanation of adjustments:
Restructuring costs for a net impact of -EUR 530 million: -EUR 293 million in the UK, -EUR 165 million in Portugal, -EUR 16 million in Digital Consumer Bank and -EUR 56 million in the Corporate Centre.
| 74 | | January - September 2021 | ||||||
| Reconciliation of underlying results to statutory results | |||||||||||
| EUR million | |||||||||||
| January-September 2020 | |||||||||||
| Underlying results | Adjustments | Statutory results | |||||||||
| Net interest income | 23,975 | — | 23,975 | ||||||||
| Net fee income | 7,559 | — | 7,559 | ||||||||
Gains (losses) on financial transactions (1) | 1,725 | — | 1,725 | ||||||||
| Other operating income | 346 | (250) | 96 | ||||||||
| Total income | 33,605 | (250) | 33,355 | ||||||||
| Administrative expenses and amortizations | (15,726) | (60) | (15,786) | ||||||||
| Net operating income | 17,879 | (310) | 17,569 | ||||||||
| Net loan-loss provisions | (9,562) | — | (9,562) | ||||||||
| Other gains (losses) and provisions | (1,301) | (9,977) | (11,278) | ||||||||
| Profit before tax | 7,016 | (10,287) | (3,271) | ||||||||
| Tax on profit | (2,596) | (2,424) | (5,020) | ||||||||
| Profit from continuing operations | 4,420 | (12,711) | (8,291) | ||||||||
| Net profit from discontinued operations | — | — | — | ||||||||
| Consolidated profit | 4,420 | (12,711) | (8,291) | ||||||||
| Non-controlling interests | (762) | 5 | (757) | ||||||||
| Attributable profit to the parent | 3,658 | (12,706) | (9,048) | ||||||||
(1) Includes exchange differences.
Explanation of adjustments:
Adjustment to the valuation of goodwill of EUR -10,100 million, adjustment has been made to deferred tax assets of the Spanish consolidated fiscal group of EUR -2,500 million and restructuring costs and other for a net impact of EUR -106 million.
January - September 2021 | | 75 | ||||||
Profitability and efficiency ratios
The purpose of the profitability and efficiency ratios is to measure the ratio of profit to capital, to tangible capital, to assets and to risk weighted assets, while the efficiency ratio measures how much general administrative expenses (personnel and other) and amortization costs are needed to generate revenue.
Additionally, the goodwill adjustments have been removed from the RoTE numerator as, since they are not considered in the denominator, we believe this calculation is more correct.
| Ratio | Formula | Relevance of the metric | ||||||||||||
| RoE | Attributable profit to the parent | This ratio measures the return that shareholders obtain on the funds invested in the Bank and as such measures the company's ability to pay shareholders. | ||||||||||||
| (Return on equity) | Average stockholders’ equity 1 (excl. minority interests) | |||||||||||||
| Underlying RoE | Underlying attributable profit to the parent | This ratio measures the return that shareholders obtain on the funds invested in the Bank excluding items outside the ordinary performance of our business. | ||||||||||||
Average stockholders’ equity 1 (excl. minority interests) | ||||||||||||||
| RoTE | Attributable profit to the parent2 | This indicator is used to evaluate the profitability of the company as a percentage of its tangible equity. It's measured as the return that shareholders receive as a percentage of the funds invested in the entity less intangible assets. | ||||||||||||
| (Return on tangible equity) | Average stockholders' equity 1 (excl. minority interests) - intangible assets | |||||||||||||
| Underlying RoTE | Underlying attributable profit to the parent | This indicator measures the profitability of the tangible equity of a company arising from ordinary activities, i.e. excluding items outside the ordinary performance of our business. | ||||||||||||
Average stockholders' equity 1 (excl. minority interests) - intangible assets | ||||||||||||||
| RoA | Consolidated profit | This metric measures the profitability of a company as a percentage of its total assets. It is an indicator that reflects the efficiency of the company's total funds in generating profit. | ||||||||||||
| (Return on assets) | Average total assets | |||||||||||||
| Underlying RoA | Underlying consolidated profit | This metric measures the profitability of a company as a percentage of its total assets, excluding non-recurring results. It is an indicator that reflects the efficiency of the company's total funds in generating underlying profit. | ||||||||||||
| Average total assets | ||||||||||||||
| RoRWA | Consolidated profit | The return adjusted for risk is a derivative of the RoA metric. The difference is that RoRWA measures profit in relation to the bank's risk-weighted assets. | ||||||||||||
| (Return on risk weighted assets) | Average risk-weighted assets | |||||||||||||
| Underlying RoRWA | Underlying consolidated profit | This relates the consolidated profit (excluding items outside the ordinary performance of our business) to the bank's risk-weighted assets. | ||||||||||||
| Average risk-weighted assets | ||||||||||||||
| Efficiency ratio | Operating expenses 3 | One of the most commonly used indicators when comparing productivity of different financial entities. It measures the amount of funds used to generate the bank's total income. | ||||||||||||
| Total income | ||||||||||||||
1. Stockholders’ equity = Capital and Reserves + Accumulated other comprehensive income + Attributable profit to the parent + Dividends.
2. Excluding the adjustment to the valuation of goodwill.
3. Operating expenses = Administrative expenses + amortizations.
| 76 | | January - September 2021 | ||||||
Profitability and efficiency (1) (2) (3) (4) | Q3'21 | Q2'21 | 9M'21 | 9M'20 | ||||||||||
| RoE | 10.16 | % | 9.91 | % | 9.54 | % | -8.54 | % | ||||||
| Attributable profit to the parent | 8,696 | 8,268 | 7,975 | -7,829 | ||||||||||
| Average stockholders' equity (excluding minority interests) | 85,608 | 83,429 | 83,574 | 91,639 | ||||||||||
| Underlying RoE | 10.16 | % | 9.91 | % | 10.18 | % | 5.32 | % | ||||||
| Attributable profit to the parent | 8,696 | 8,268 | 7,975 | -7,829 | ||||||||||
| (-) Net capital gains and provisions | — | — | -530 | -12,706 | ||||||||||
| Underlying attributable profit to the parent | 8,696 | 8,268 | 8,505 | 4,877 | ||||||||||
| Average stockholders' equity (excluding minority interests) | 85,608 | 83,429 | 83,574 | 91,639 | ||||||||||
| RoTE | 12.56 | % | 12.29 | % | 11.82 | % | 3.30 | % | ||||||
| Attributable profit to the parent | 8,696 | 8,268 | 7,975 | -7,829 | ||||||||||
| (+) Goodwill impairment | — | — | — | -10,100 | ||||||||||
| Attributable profit to the parent (excluding goodwill impairment) | 8,696 | 8,268 | 7,975 | 2,271 | ||||||||||
| Average stockholders' equity (excluding minority interests) | 85,608 | 83,429 | 83,574 | 91,639 | ||||||||||
| (-) Average intangible assets | 16,366 | 16,131 | 16,109 | 22,748 | ||||||||||
| Average stockholders' equity (excl. minority interests) - intangible assets | 69,243 | 67,298 | 67,466 | 68,892 | ||||||||||
| Underlying RoTE | 12.56 | % | 12.29 | % | 12.61 | % | 7.08 | % | ||||||
| Attributable profit to the parent | 8,696 | 8,268 | 7,975 | -7,829 | ||||||||||
| (-) Net capital gains and provisions | — | — | -530 | -12,706 | ||||||||||
| Underlying attributable profit to the parent | 8,696 | 8,268 | 8,505 | 4,877 | ||||||||||
| Average stockholders' equity (excl. minority interests) - intangible assets | 69,243 | 67,298 | 67,466 | 68,892 | ||||||||||
| RoA | 0.65 | % | 0.64 | % | 0.61 | % | -0.44 | % | ||||||
| Consolidated profit | 10,204 | 9,924 | 9,498 | -6,818 | ||||||||||
| Average total assets | 1,575,975 | 1,557,364 | 1,550,943 | 1,543,361 | ||||||||||
| Underlying RoA | 0.65 | % | 0.64 | % | 0.65 | % | 0.38 | % | ||||||
| Consolidated profit | 10,204 | 9,924 | 9,498 | -6,818 | ||||||||||
| (-) Net capital gains and provisions | — | — | -530 | -12,711 | ||||||||||
| Underlying consolidated profit | 10,204 | 9,924 | 10,028 | 5,893 | ||||||||||
| Average total assets | 1,575,975 | 1,557,364 | 1,550,943 | 1,543,361 | ||||||||||
| RoRWA | 1.76 | % | 1.74 | % | 1.66 | % | -1.17 | % | ||||||
| Consolidated profit | 10,204 | 9,924 | 9,498 | -6,818 | ||||||||||
| Average risk weighted-assets | 580,226 | 570,828 | 570,653 | 583,448 | ||||||||||
| Underlying RoRWA | 1.76 | % | 1.74 | % | 1.76 | % | 1.01 | % | ||||||
| Consolidated profit | 10,204 | 9,924 | 9,498 | -6,818 | ||||||||||
| (-) Net capital gains and provisions | — | — | -530 | -12,711 | ||||||||||
| Underlying consolidated profit | 10,204 | 9,924 | 10,028 | 5,893 | ||||||||||
| Average risk-weighted assets | 580,226 | 570,828 | 570,653 | 583,448 | ||||||||||
| Efficiency ratio | 45.3 | % | 46.5 | % | 45.6 | % | 46.8 | % | ||||||
| Underlying operating expenses | 5,401 | 5,259 | 15,778 | 15,726 | ||||||||||
| Operating expenses | 5,401 | 5,259 | 15,778 | 15,786 | ||||||||||
| Net capital gains and provisions impact in operating expenses | — | — | — | -60 | ||||||||||
| Underlying total income | 11,931 | 11,305 | 34,626 | 33,605 | ||||||||||
| Total income | 11,931 | 11,305 | 34,626 | 33,355 | ||||||||||
| Net capital gains and provisions impact in total income | — | — | — | 250 | ||||||||||
| (1) Averages included in the RoE, RoTE, RoA and RoRWA denominators are calculated using 4 months' worth of data in the case of quarterly figures (from June to September in Q3 and March to June in Q2) and 10 months in the case of annual figures (December to September). | ||||||||||||||
| (2) For periods less than one year, and if there are results in the net capital gains and provisions line, the profit used to calculate RoE and RoTE is the annualized underlying attributable profit to which said results are added without annualizing. | ||||||||||||||
| (3) For periods less than one year, and if there are results in the net capital gains and provisions line, the profit used to calculate RoA and RoRWA is the annualized underlying consolidated profit, to which said results are added without annualizing. | ||||||||||||||
| (4) The risk weighted assets included in the denominator of the RoRWA metric are calculated in line with the criteria laid out in the CRR (Capital Requirements Regulation). | ||||||||||||||
January - September 2021 | | 77 | ||||||
| Efficiency ratio | ||||||||||||||||||||
| 9M'21 | 9M'20 | |||||||||||||||||||
| % | Total income | Operating expenses | % | Total income | Operating expenses | |||||||||||||||
| Europe | 50.3 | 12,299 | 6,191 | 56.9 | 10,998 | 6,259 | ||||||||||||||
| Spain | 47.3 | 5,359 | 2,537 | 53.1 | 5,150 | 2,734 | ||||||||||||||
| United Kingdom | 53.4 | 3,625 | 1,937 | 66.1 | 2,932 | 1,938 | ||||||||||||||
| Portugal | 41.2 | 1,042 | 429 | 45.1 | 979 | 442 | ||||||||||||||
| Poland | 41.0 | 1,179 | 483 | 41.8 | 1,136 | 475 | ||||||||||||||
| North America | 43.8 | 8,266 | 3,617 | 41.5 | 8,335 | 3,462 | ||||||||||||||
| US | 42.0 | 5,586 | 2,346 | 41.5 | 5,559 | 2,307 | ||||||||||||||
| Mexico | 44.2 | 2,662 | 1,177 | 41.0 | 2,760 | 1,130 | ||||||||||||||
| South America | 34.6 | 11,302 | 3,916 | 35.5 | 11,346 | 4,023 | ||||||||||||||
| Brazil | 29.3 | 8,085 | 2,366 | 31.8 | 8,322 | 2,644 | ||||||||||||||
| Chile | 38.7 | 1,834 | 710 | 40.8 | 1,669 | 681 | ||||||||||||||
| Argentina | 59.6 | 929 | 554 | 54.5 | 902 | 491 | ||||||||||||||
| Digital Consumer Bank | 45.4 | 3,975 | 1,805 | 45.4 | 3,814 | 1,733 | ||||||||||||||
| Underlying RoTE | ||||||||||||||||||||
| 9M'21 | 9M'20 | |||||||||||||||||||
| % | Underlying attributable profit to the parent | Average stockholders' equity (excl. minority interests) - intangible assets | % | Underlying attributable profit to the parent | Average stockholders' equity (excl. minority interests) - intangible assets | |||||||||||||||
| Europe | 7.63 | 3,057 | 40,079 | 3.93 | 1,543 | 39,242 | ||||||||||||||
| Spain | 6.48 | 973 | 15,021 | 4.21 | 662 | 15,716 | ||||||||||||||
| United Kingdom | 11.53 | 1,527 | 13,239 | 2.24 | 294 | 13,121 | ||||||||||||||
| Portugal | 11.19 | 452 | 4,036 | 8.50 | 324 | 3,810 | ||||||||||||||
| Poland | 5.10 | 166 | 3,264 | 5.91 | 189 | 3,193 | ||||||||||||||
| North America | 13.39 | 3,051 | 22,787 | 6.68 | 1,407 | 21,054 | ||||||||||||||
| US | 14.31 | 2,385 | 16,668 | 3.99 | 627 | 15,708 | ||||||||||||||
| Mexico | 13.56 | 802 | 5,918 | 15.13 | 787 | 5,205 | ||||||||||||||
| South America | 20.13 | 3,294 | 16,361 | 17.06 | 2,818 | 16,514 | ||||||||||||||
| Brazil | 21.64 | 2,349 | 10,856 | 18.37 | 2,060 | 11,217 | ||||||||||||||
| Chile | 18.46 | 617 | 3,344 | 10.99 | 359 | 3,264 | ||||||||||||||
| Argentina | 25.33 | 240 | 949 | 29.23 | 215 | 734 | ||||||||||||||
| Digital Consumer Bank | 13.23 | 1,246 | 9,419 | 10.96 | 1,050 | 9,580 | ||||||||||||||
| 78 | | January - September 2021 | ||||||
Credit risk indicators
The credit risk indicators measure the quality of the credit portfolio and the percentage of non-performing loans covered by provisions.
| Ratio | Formula | Relevance of the metric | ||||||||||||
NPL ratio (Non-performing loans) | Credit impaired loans and advances to customers, customer guarantees and customer commitments granted | The NPL ratio is an important variable regarding financial institutions' activity since it gives an indication of the level of risk the entities are exposed to. It calculates risks that are, in accounting terms, declared to be credit impaired as a percentage of the total outstanding amount of customer credit and contingent liabilities. | ||||||||||||
Total Risk 1 | ||||||||||||||
| Total coverage ratio | Total allowances to cover impairment losses on loans and advances to customers, customer guarantees and customer commitments granted | The total coverage ratio is a fundamental metric in the financial sector. It reflects the level of provisions as a percentage of the credit impaired assets. Therefore it is a good indicator of the entity's solvency against client defaults both present and future. | ||||||||||||
| Credit impaired loans and advances to customers, customer guarantees and customer commitments granted | ||||||||||||||
| Cost of credit | Allowances for loan-loss provisions over the last 12 months | This ratio quantifies loan-loss provisions arising from credit risk over a defined period of time for a given loan portfolio. As such, it acts as an indicator of credit quality. | ||||||||||||
| Average loans and advances to customers over the last 12 months | ||||||||||||||
(1) Total risk = Total loans and advances and guarantees to customers (including credit impaired assets) + contingent liabilities granted that are credit impaired
| Credit risk (I) | Sep-21 | Jun-21 | Sep-21 | Sep-20 | ||||||||||
| NPL ratio | 3.18 | % | 3.22 | % | 3.18 | % | 3.15 | % | ||||||
| Credit impaired loans and advances to customers, customer guarantees and customer commitments granted | 33,046 | 33,266 | 33,046 | 30,894 | ||||||||||
| Gross loans and advances to customers registered under the headings “financial assets measured at amortized cost” and "financial assets designated at fair value through profit or loss" classified in stage 3 (OCI), excluding POCI (Purchased or Originated Credit Impaired) that is currently impaired | 31,237 | 31,705 | 31,237 | 29,298 | ||||||||||
| POCI exposure (Purchased or Originated Credit Impaired) that is currently impaired | 392 | 431 | 392 | 563 | ||||||||||
| Customer guarantees and customer commitments granted classified in stage 3 | 1,409 | 1,122 | 1,409 | 1,022 | ||||||||||
| Doubtful exposure of loans and advances to customers at fair value through profit or loss | 8 | 8 | 8 | 11 | ||||||||||
| Total risk | 1,038,796 | 1,032,084 | 1,038,796 | 982,286 | ||||||||||
| Impaired and non-impaired gross loans and advances to customers | 982,097 | 978,096 | 982,097 | 933,509 | ||||||||||
| Impaired and non-impaired customer guarantees and customer commitments granted | 56,699 | 53,988 | 56,699 | 48,777 | ||||||||||
January - September 2021 | | 79 | ||||||
| Credit risk (II) | Sep-21 | Jun-21 | Sep-21 | Sep-20 | ||||||||||
| Total coverage ratio | 74 | % | 73 | % | 74 | % | 76 | % | ||||||
| Total allowances to cover impairment losses on loans and advances to customers, customer guarantees and customer commitments granted | 24,462 | 24,239 | 24,462 | 23,465 | ||||||||||
| Total allowances to cover impairment losses on loans and advances to customers measured at amortised cost and designated at fair value through OCI | 23,786 | 23,577 | 23,786 | 22,797 | ||||||||||
| Total allowances to cover impairment losses on customer guarantees and customer commitments granted | 676 | 662 | 676 | 668 | ||||||||||
| Credit impaired loans and advances to customers, customer guarantees and customer commitments granted | 33,046 | 33,266 | 33,046 | 30,894 | ||||||||||
| Gross loans and advances to customers registered under the headings “financial assets measured at amortized cost” and "financial assets designated at fair value through profit or loss" classified in stage 3 (OCI), excluding POCI (Purchased or Originated Credit Impaired) that is currently impaired | 31,237 | 31,705 | 31,237 | 29,298 | ||||||||||
| POCI exposure (Purchased or Originated Credit Impaired) that is currently impaired | 392 | 431 | 392 | 563 | ||||||||||
| Customer guarantees and customer commitments granted classified in stage 3 | 1,409 | 1,122 | 1,409 | 1,022 | ||||||||||
| Doubtful exposure of loans and advances to customers at fair value through profit or loss | 8 | 8 | 8 | 11 | ||||||||||
| Cost of credit | 0.90 | % | 0.94 | % | 0.90 | % | 1.27 | % | ||||||
| Underlying allowances for loan-loss provisions over the last 12 months | 8,584 | 8,899 | 8,584 | 12,135 | ||||||||||
| Average loans and advances to customers over the last 12 months | 956,925 | 948,351 | 956,925 | 956,416 | ||||||||||
| NPL ratio | ||||||||||||||||||||
| 9M'21 | 9M'20 | |||||||||||||||||||
| % | Credit impaired loans and advances to customers, customer guarantees and customer commitments granted | Total risk | % | Credit impaired loans and advances to customers, customer guarantees and customer commitments granted | Total risk | |||||||||||||||
| Europe | 3.15 | 20,088 | 638,207 | 3.29 | 19,914 | 605,380 | ||||||||||||||
| Spain | 5.99 | 13,283 | 221,787 | 5.98 | 13,159 | 220,032 | ||||||||||||||
| United Kingdom | 1.27 | 3,354 | 263,747 | 1.33 | 3,339 | 250,906 | ||||||||||||||
| Portugal | 3.44 | 1,437 | 41,833 | 4.25 | 1,711 | 40,291 | ||||||||||||||
| Poland | 4.34 | 1,415 | 32,586 | 4.58 | 1,452 | 31,711 | ||||||||||||||
| North America | 2.56 | 3,588 | 140,314 | 1.96 | 2,617 | 133,219 | ||||||||||||||
| US | 2.36 | 2,474 | 104,794 | 1.85 | 1,877 | 101,499 | ||||||||||||||
| Mexico | 3.14 | 1,114 | 35,520 | 2.33 | 740 | 31,707 | ||||||||||||||
| South America | 4.38 | 6,095 | 139,167 | 4.40 | 5,447 | 123,682 | ||||||||||||||
| Brazil | 4.72 | 3,947 | 83,610 | 4.64 | 3,240 | 69,886 | ||||||||||||||
| Chile | 4.36 | 1,801 | 41,278 | 4.76 | 1,976 | 41,483 | ||||||||||||||
| Argentina | 3.85 | 191 | 4,951 | 2.88 | 137 | 4,765 | ||||||||||||||
| Digital Consumer Bank | 2.15 | 2,469 | 114,781 | 2.29 | 2,599 | 113,607 | ||||||||||||||
| 80 | | January - September 2021 | ||||||
| Total coverage ratio | ||||||||||||||||||||
| 9M'21 | 9M'20 | |||||||||||||||||||
| % | Total allowances to cover impairment losses on loans and advances to customers, customer guarantees and customer commitments granted | Credit impaired loans and advances to customers, customer guarantees and customer commitments granted | % | Total allowances to cover impairment losses on loans and advances to customers, customer guarantees and customer commitments granted | Credit impaired loans and advances to customers, customer guarantees and customer commitments granted | |||||||||||||||
| Europe | 51.1 | 10,258 | 20,088 | 48.7 | 9,699 | 19,914 | ||||||||||||||
| Spain | 48.8 | 6,486 | 13,283 | 46.0 | 6,052 | 13,159 | ||||||||||||||
| United Kingdom | 36.6 | 1,226 | 3,354 | 41.6 | 1,389 | 3,339 | ||||||||||||||
| Portugal | 75.5 | 1,086 | 1,437 | 64.3 | 1,100 | 1,711 | ||||||||||||||
| Poland | 74.6 | 1,055 | 1,415 | 70.8 | 1,028 | 1,452 | ||||||||||||||
| North America | 139.3 | 4,999 | 3,588 | 201.6 | 5,277 | 2,617 | ||||||||||||||
| US | 161.5 | 3,994 | 2,474 | 228.8 | 4,296 | 1,877 | ||||||||||||||
| Mexico | 90.1 | 1,004 | 1,114 | 132.6 | 981 | 740 | ||||||||||||||
| South America | 98.8 | 6,019 | 6,095 | 97.2 | 5,295 | 5,447 | ||||||||||||||
| Brazil | 111.8 | 4,412 | 3,947 | 114.9 | 3,721 | 3,240 | ||||||||||||||
| Chile | 64.1 | 1,155 | 1,801 | 59.7 | 1,181 | 1,976 | ||||||||||||||
| Argentina | 149.3 | 285 | 191 | 186.3 | 255 | 137 | ||||||||||||||
| Digital Consumer Bank | 112.8 | 2,785 | 2,469 | 110.6 | 2,873 | 2,599 | ||||||||||||||
| Cost of credit | ||||||||||||||||||||
| 9M'21 | 9M'20 | |||||||||||||||||||
| % | Underlying allowances for loan-loss provisions over the last 12 months | Average loans and advances to customers over the last 12 months | % | Underlying allowances for loan-loss provisions over the last 12 months | Average loans and advances to customers over the last 12 months | |||||||||||||||
| Europe | 0.48 | 2,805 | 585,485 | 0.48 | 2,761 | 578,190 | ||||||||||||||
| Spain | 1.01 | 2,000 | 198,956 | 0.80 | 1,566 | 196,460 | ||||||||||||||
| United Kingdom | 0.01 | 30 | 216,521 | 0.26 | 670 | 256,439 | ||||||||||||||
| Portugal | 0.35 | 136 | 39,473 | 0.42 | 156 | 37,315 | ||||||||||||||
| Poland | 0.82 | 241 | 29,586 | 0.99 | 300 | 30,354 | ||||||||||||||
| North America | 1.46 | 1,868 | 128,061 | 3.07 | 4,193 | 136,521 | ||||||||||||||
| US | 1.06 | 1,011 | 95,385 | 3.08 | 3,204 | 103,905 | ||||||||||||||
| Mexico | 2.69 | 856 | 31,829 | 2.97 | 989 | 33,285 | ||||||||||||||
| South America | 2.52 | 3,086 | 122,237 | 3.50 | 4,237 | 121,097 | ||||||||||||||
| Brazil | 3.60 | 2,519 | 70,034 | 4.58 | 3,291 | 71,837 | ||||||||||||||
| Chile | 0.89 | 360 | 40,279 | 1.59 | 629 | 39,660 | ||||||||||||||
| Argentina | 3.51 | 137 | 3,897 | 5.54 | 231 | 4,164 | ||||||||||||||
| Digital Consumer Bank | 0.57 | 653 | 115,012 | 0.79 | 908 | 114,757 | ||||||||||||||
January - September 2021 | | 81 | ||||||
Other indicators
The market capitalization indicator provides information on the volume of tangible equity per share. The loan-to-deposit ratio (LTD) identifies the relationship between net customer loans and advances and customer deposits, assessing the proportion of loans and advances granted by the Group that are funded by customer deposits.
The Group also uses gross customer loan magnitudes excluding reverse repurchase agreements (repos) and customer deposits excluding repos. In order to analyze the evolution of the traditional commercial banking business of granting loans and capturing deposits, repos and reverse repos are excluded, as they are mainly treasury business products and highly volatile.
| Ratio | Formula | Relevance of the metric | ||||||||||||
| TNAV per share | Tangible book value 1 | This is a very commonly used ratio used to measure the company's accounting value per share having deducted the intangible assets. It is useful in evaluating the amount each shareholder would receive if the company were to enter into liquidation and had to sell all the company's tangible assets. | ||||||||||||
| (Tangible equity net asset value per share) | Number of shares excluding treasury stock | |||||||||||||
| Price / tangible book value per share (X) | Share price | This is one of the most commonly used ratios by market participants for the valuation of listed companies both in absolute terms and relative to other entities. This ratio measures the relationship between the price paid for a company and its accounting equity value. | ||||||||||||
| TNAV per share | ||||||||||||||
| LTD ratio | Net loans and advances to customers | This is an indicator of the bank's liquidity. It measures the total (net) loans and advances to customers as a percentage of customer deposits. | ||||||||||||
| (Loan-to-deposit) | Customer deposits | |||||||||||||
| Loans and advances (excl. reverse repos) | Gross loans and advances to customers excluding reverse repos | In order to aid analysis of the commercial banking activity, reverse repos are excluded as they are highly volatile treasury products. | ||||||||||||
| Deposits (excl. repos) | Customer deposits excluding repos | In order to aid analysis of the commercial banking activity, repos are excluded as they are highly volatile treasury products. | ||||||||||||
| PAT + After tax fees paid to SAN (in Wealth Management & Insurance) | Net profit + fees paid from Santander Asset Management and Santander Insurance to Santander, net of taxes, excluding Private Banking customers | Metric to assess Wealth Management & Insurance's total contribution to Grupo Santander profit. | ||||||||||||
(1) Tangible book value = Stockholders' equity - intangible assets
| Others | Sep-21 | Jun-21 | Sep-21 | Sep-20 | ||||||||||
TNAV (tangible book value) per share (2) | 3.99 | 3.98 | 3.99 | 3.82 | ||||||||||
| Tangible book value | 69,142 | 68,917 | 69,142 | 66,048 | ||||||||||
Number of shares excl. treasury stock (million) (2) | 17,331 | 17,306 | 17,331 | 17,310 | ||||||||||
| Price / Tangible book value per share (X) | 0.79 | 0.81 | 0.79 | 0.40 | ||||||||||
Share price (euros) (2) | 3.137 | 3.220 | 3.137 | 1.533 | ||||||||||
TNAV (tangible book value) per share (2) | 3.99 | 3.98 | 3.99 | 3.82 | ||||||||||
| Loan-to-deposit ratio | 105 | % | 107 | % | 105 | % | 108 | % | ||||||
| Net loans and advances to customers | 958,311 | 954,518 | 958,311 | 910,714 | ||||||||||
| Customer deposits | 909,034 | 894,127 | 909,034 | 842,899 | ||||||||||
| Q3'21 | Q2'21 | 9M'21 | 9M'20 | |||||||||||
| PAT + After tax fees paid to SAN (in WM&I) (Constant EUR million) | 644 | 561 | 1,733 | 1,496 | ||||||||||
| Profit after tax | 299 | 219 | 724 | 589 | ||||||||||
| Net fee income net of tax | 345 | 342 | 1,008 | 906 | ||||||||||
(2) September 2020 data adjusted for the capital increase in December 2020.
| 82 | | January - September 2021 | ||||||
Local currency measures
We make use of certain financial measures in local currency to help in the assessment of our ongoing operating performance. These non-IFRS financial measures include the results of operations of our subsidiary banks located outside the Eurozone, excluding the impact of foreign exchange. Because changes in foreign currency exchange rates do not have an operating impact on the results, we believe that evaluating their performance on a local currency basis provides an additional and meaningful assessment of performance to both management and the company’s investors.
The Group presents, at both the Group level as well as the business unit level, the real changes in the income statement as well as the changes excluding the exchange rate effect, as it considers the latter facilitates analysis, since it enables businesses movements to be identified without taking into account the impact of converting each local currency into euros.
Said variations, excluding the impact of exchange rate movements, are calculated by converting P&L lines for the different business units comprising the Group into our presentation currency, the euro, applying the average exchange rate for the first nine months of 2021 to all periods contemplated in the analysis.
The Group presents, at both the Group level as well as the business unit level, the changes in euros in the balance sheet as well as the changes excluding the exchange rate effect for loans and advances to customers excluding reverse repos and customer funds (which comprise deposits and mutual funds) excluding repos. As with the income statement, the reason is to facilitate analysis by isolating the changes in the balance sheet that are not caused by converting each local currency into euros.
These changes excluding the impact of exchange rate movements are calculated by converting loans and advances to customers excluding reverse repos and customer funds excluding repos, into our presentation currency, the euro, applying the closing exchange rate on the last working day of September 2021 to all periods contemplated in the analysis.
The average and period-end exchange rates for the main currencies in which the Group operates are set out in the table below.
| Exchange rates: 1 euro / currency parity | ||||||||||||||||||||
| Average (income statement) | Period-end (balance sheet) | |||||||||||||||||||
| 9M'21 | 9M'20 | Sep-21 | Jun-21 | Sep-20 | ||||||||||||||||
| US dollar | 1.196 | 1.124 | 1.160 | 1.186 | 1.175 | |||||||||||||||
| Pound sterling | 0.863 | 0.884 | 0.858 | 0.858 | 0.908 | |||||||||||||||
| Brazilian real | 6.367 | 5.632 | 6.300 | 5.941 | 6.610 | |||||||||||||||
| Mexican peso | 24.069 | 24.318 | 23.826 | 23.587 | 25.963 | |||||||||||||||
| Chilean peso | 882.025 | 900.730 | 941.091 | 863.161 | 924.900 | |||||||||||||||
| Argentine peso | 111.546 | 75.359 | 114.500 | 113.539 | 89.483 | |||||||||||||||
| Polish zloty | 4.547 | 4.420 | 4.599 | 4.519 | 4.530 | |||||||||||||||
January - September 2021 | | 83 | ||||||
| Condensed consolidated financial statements | ||||||||||||||||||||||||||
| INTERIM CONDENSED CONSOLIDATED FINANCIAL STATEMENTS | ||||||||
•CONSOLIDATED BALANCE SHEET
•CONSOLIDATED INCOME STATEMENT
NOTE: The following financial information for the first nine months of 2021 and 2020 (attached herewith) corresponds to the condensed consolidated financial statements prepared in accordance with the International Financial Reporting Standards.
| Interim condensed consolidated balance sheet | |||||||||||
| EUR million | |||||||||||
| ASSETS | Sep-21 | Dec-20 | Sep-20 | ||||||||
| Cash, cash balances at central banks and other deposits on demand | 191,035 | 153,839 | 148,175 | ||||||||
| Financial assets held for trading | 122,967 | 114,945 | 117,654 | ||||||||
| Non-trading financial assets mandatorily at fair value through profit or loss | 5,156 | 4,486 | 4,293 | ||||||||
| Financial assets designated at fair value through profit or loss | 36,970 | 48,717 | 62,714 | ||||||||
| Financial assets at fair value through other comprehensive income | 109,570 | 120,953 | 117,461 | ||||||||
| Financial assets at amortized cost | 1,011,994 | 958,378 | 950,571 | ||||||||
| Hedging derivatives | 5,404 | 8,325 | 10,866 | ||||||||
| Changes in the fair value of hedged items in portfolio hedges of interest risk | 991 | 1,980 | 2,155 | ||||||||
| Investments | 7,684 | 7,622 | 7,679 | ||||||||
| Joint ventures entities | 1,669 | 1,492 | 1,306 | ||||||||
| Associated entities | 6,015 | 6,130 | 6,373 | ||||||||
| Assets under insurance or reinsurance contracts | 257 | 261 | 1,582 | ||||||||
| Tangible assets | 32,446 | 32,735 | 33,277 | ||||||||
| Property, plant and equipment | 31,515 | 31,772 | 32,327 | ||||||||
| For own-use | 12,619 | 13,213 | 13,233 | ||||||||
| Leased out under an operating lease | 18,896 | 18,559 | 19,094 | ||||||||
| Investment property | 931 | 963 | 950 | ||||||||
| Of which : Leased out under an operating lease | 821 | 793 | 821 | ||||||||
| Intangible assets | 16,246 | 15,908 | 15,698 | ||||||||
| Goodwill | 12,645 | 12,471 | 12,359 | ||||||||
| Other intangible assets | 3,601 | 3,437 | 3,339 | ||||||||
| Tax assets | 24,544 | 24,586 | 26,397 | ||||||||
| Current tax assets | 5,008 | 5,340 | 6,405 | ||||||||
| Deferred tax assets | 19,536 | 19,246 | 19,992 | ||||||||
| Other assets | 8,745 | 11,070 | 11,086 | ||||||||
| Insurance contracts linked to pensions | 157 | 174 | 186 | ||||||||
| Inventories | 4 | 5 | 4 | ||||||||
| Other | 8,584 | 10,891 | 10,896 | ||||||||
| Non-current assets held for sale | 4,286 | 4,445 | 4,634 | ||||||||
| TOTAL ASSETS | 1,578,295 | 1,508,250 | 1,514,242 | ||||||||
| 84 | | January - September 2021 | ||||||
| Condensed consolidated financial statements | ||||||||||||||||||||||||||
| Interim condensed consolidated balance sheet | |||||||||||
| EUR million | |||||||||||
| LIABILITIES | Sep-21 | Dec-20 | Sep-20 | ||||||||
| Financial liabilities held for trading | 80,147 | 81,167 | 88,128 | ||||||||
| Financial liabilities designated at fair value through profit or loss | 47,900 | 48,038 | 59,459 | ||||||||
| Financial liabilities at amortized cost | 1,317,759 | 1,248,188 | 1,237,314 | ||||||||
| Hedging derivatives | 5,821 | 6,869 | 6,099 | ||||||||
| Changes in the fair value of hedged items in portfolio hedges of interest rate risk | 402 | 286 | 265 | ||||||||
| Liabilities under insurance or reinsurance contracts | 779 | 910 | 970 | ||||||||
| Provisions | 9,815 | 10,852 | 10,118 | ||||||||
| Pensions and other post-retirement obligations | 3,337 | 3,976 | 4,034 | ||||||||
| Other long term employee benefits | 1,298 | 1,751 | 1,120 | ||||||||
| Taxes and other legal contingencies | 2,025 | 2,200 | 2,189 | ||||||||
| Contingent liabilities and commitments | 674 | 700 | 672 | ||||||||
| Other provisions | 2,481 | 2,225 | 2,103 | ||||||||
| Tax liabilities | 8,516 | 8,282 | 8,667 | ||||||||
| Current tax liabilities | 2,269 | 2,349 | 2,480 | ||||||||
| Deferred tax liabilities | 6,247 | 5,933 | 6,187 | ||||||||
| Other liabilities | 11,532 | 12,336 | 11,912 | ||||||||
| Liabilities associated with non-current assets held for sale | — | — | — | ||||||||
| TOTAL LIABILITIES | 1,482,671 | 1,416,928 | 1,422,932 | ||||||||
| EQUITY | |||||||||||
| Shareholders' equity | 118,380 | 114,620 | 114,493 | ||||||||
| Capital | 8,670 | 8,670 | 8,309 | ||||||||
| Called up paid capital | 8,670 | 8,670 | 8,309 | ||||||||
| Unpaid capital which has been called up | — | — | — | ||||||||
| Share premium | 47,979 | 52,013 | 52,446 | ||||||||
| Equity instruments issued other than capital | 650 | 627 | 619 | ||||||||
| Equity component of the compound financial instrument | — | — | — | ||||||||
| Other equity instruments issued | 650 | 627 | 619 | ||||||||
| Other equity | 165 | 163 | 171 | ||||||||
| Accumulated retained earnings | 60,273 | 65,583 | 67,230 | ||||||||
| Revaluation reserves | — | — | — | ||||||||
| Other reserves | (4,336) | (3,596) | (3,499) | ||||||||
| (-) Own shares | (29) | (69) | (73) | ||||||||
| Profit attributable to shareholders of the parent | 5,849 | (8,771) | (9,048) | ||||||||
| (-) Interim dividends | (841) | — | (1,662) | ||||||||
| Other comprehensive income (loss) | (32,992) | (33,144) | (32,747) | ||||||||
| Items not reclassified to profit or loss | (4,522) | (5,328) | (5,056) | ||||||||
| Items that may be reclassified to profit or loss | (28,470) | (27,816) | (27,691) | ||||||||
| Non-controlling interest | 10,236 | 9,846 | 9,564 | ||||||||
| Other comprehensive income | (2,120) | (1,800) | (1,905) | ||||||||
| Other items | 12,356 | 11,646 | 11,469 | ||||||||
| TOTAL EQUITY | 95,624 | 91,322 | 91,310 | ||||||||
| TOTAL LIABILITIES AND EQUITY | 1,578,295 | 1,508,250 | 1,514,242 | ||||||||
| MEMORANDUM ITEMS: OFF BALANCE SHEET AMOUNTS | |||||||||||
| Loan commitments granted | 252,301 | 241,230 | 235,812 | ||||||||
| Financial guarantees granted | 12,069 | 12,377 | 12,247 | ||||||||
| Other commitments granted | 78,730 | 64,538 | 71,430 | ||||||||
January - September 2021 | | 85 | ||||||
| Condensed consolidated financial statements | ||||||||||||||||||||||||||
| Interim condensed consolidated income statement | ||||||||
| EUR million | ||||||||
| 9M'21 | 9M'20 | |||||||
| Interest income | 33,629 | 35,131 | ||||||
| Financial assets at fair value through other comprehensive income | 2,023 | 2,348 | ||||||
| Financial assets at amortized cost | 29,397 | 30,519 | ||||||
| Other interest income | 2,209 | 2,264 | ||||||
| Interest expense | (8,975) | (11,156) | ||||||
| Interest income/ (charges) | 24,654 | 23,975 | ||||||
| Dividend income | 404 | 322 | ||||||
| Income from companies accounted for using the equity method | 295 | (90) | ||||||
| Commission income | 10,132 | 9,826 | ||||||
| Commission expense | (2,322) | (2,267) | ||||||
| Gain or losses on financial assets and liabilities not measured at fair value through profit or loss, net | 482 | 893 | ||||||
| Financial assets at amortized cost | 95 | (23) | ||||||
| Other financial assets and liabilities | 387 | 916 | ||||||
| Gain or losses on financial assets and liabilities held for trading, net | 729 | 4,425 | ||||||
| Reclassification of financial assets at fair value through other comprehensive income | — | — | ||||||
| Reclassification of financial assets from amortized cost | — | — | ||||||
| Other gains (losses) | 729 | 4,425 | ||||||
| Gains or losses on non-trading financial assets and liabilities mandatorily at fair value through profit or loss | 11 | 73 | ||||||
| Reclassification of financial assets at fair value through other comprehensive income | — | — | ||||||
| Reclassification of financial assets from amortized cost | — | — | ||||||
| Other gains (losses) | 11 | 73 | ||||||
| Gain or losses on financial assets and liabilities measured at fair value through profit or loss, net | 296 | (91) | ||||||
| Gain or losses from hedge accounting, net | 91 | 120 | ||||||
| Exchange differences, net | (389) | (3,695) | ||||||
| Other operating income | 1,735 | 1,222 | ||||||
| Other operating expenses | (1,706) | (1,527) | ||||||
| Income from assets under insurance and reinsurance contracts | 1,114 | 1,030 | ||||||
| Expenses from liabilities under insurance and reinsurance contracts | (900) | (861) | ||||||
| Total income | 34,626 | 33,355 | ||||||
| Administrative expenses | (13,714) | (13,686) | ||||||
| Staff costs | (8,205) | (8,098) | ||||||
| Other general and administrative expenses | (5,509) | (5,588) | ||||||
| Depreciation and amortization | (2,064) | (2,100) | ||||||
| Provisions or reversal of provisions, net | (2,006) | (1,014) | ||||||
| Impairment or reversal of impairment of financial assets not measured at fair value through profit or loss and net gains and losses from changes | (6,000) | (9,538) | ||||||
| Financial assets at fair value through other comprehensive income | (27) | (7) | ||||||
| Financial assets at amortized cost | (5,973) | (9,531) | ||||||
| Impairment of investments in subsidiaries, joint ventures and associates, net | — | — | ||||||
| Impairment on non-financial assets, net | (134) | (10,256) | ||||||
| Tangible assets | (116) | (105) | ||||||
| Intangible assets | (15) | (10,149) | ||||||
| Others | (3) | (2) | ||||||
| Gain or losses on non financial assets and investments, net | 43 | 89 | ||||||
| Negative goodwill recognized in results | — | 9 | ||||||
| Gains or losses on non-current assets held for sale not classified as discontinued operations | (35) | (130) | ||||||
| Operating profit/(loss) before tax | 10,716 | (3,271) | ||||||
| Tax expense or income from continuing operations | (3,725) | (5,020) | ||||||
| Profit/(loss) for the period from continuing operations | 6,991 | (8,291) | ||||||
| Profit/( loss) after tax from discontinued operations | — | — | ||||||
| Profit/(loss) for the period | 6,991 | (8,291) | ||||||
| Profit attributable to non-controlling interests | 1,142 | 757 | ||||||
| Profit/(loss) attributable to the parent | 5,849 | (9,048) | ||||||
| Earnings/(losses) per share | ||||||||
| Basic | 0.31 | (0.55) | ||||||
| Diluted | 0.31 | (0.55) | ||||||
| 86 | | January - September 2021 | ||||||
| GLOSSARY | ||||||||
•Active customer: Those customers who comply with the minimum balance, income and/or transactionality requirements as defined according to the business area
•ADR: American Depositary Receipt
•ALCO: Assets and Liabilities Committee
•APM: Alternative Performance Measures
•bps: basis points
•CDI: CREST Depository Interest
•CET1: Core equity tier 1
•CIB: Corporate & Investment Banking
•CNMV: Spanish National Securities Market Commission (Comisión Nacional del Mercado de Valores)
•DCB: Digital Consumer Bank
•DGF: Deposit guarantee fund
•Digital customers: Every consumer of a commercial bank’s services who has logged on to their personal online banking and/or mobile banking in the last 30 days
•EBA: European Banking Authority
•ECB: European Central Bank
•EPS: Earnings per share
•ESG: Environmental, Social and Governance
•ESMA: European Securities and Markets Authority
•Fed: Federal Reserve
•FX: Foreign Exchange
•GDP: Gross Domestic Product
•GPTW: Great Place to Work
•ICO: Insitituto de Crédito Oficial (Official Credit Institution)
•IFRS 9: International Financial Reporting Standard 9, regarding financial instruments
•IMF: International Monetary Fund
•Loyal customers: Active customers who receive most of their financial services from the Group according to the commercial segment that they belong to. Various engaged customer levels have been defined taking profitability into account.
•LCR: Liquidity Coverage Ratio
•NPLs: Non-performing loans
•NPS: Net Promoter Score
•P/E ratio: Price / earnings per share ratio
•PBT: Profit before tax
•POS: Point of Sale
•pp: percentage points
•PPI: Payment protection insurance
•Repos: Repurchase agreements
•RoA: Return on assets
•RoE: Return on equity
•RoRWA: Return on risk weighted assets
•RoTE: Return on tangible equity
•RWAs: Risk weighted assets
•SAM: Santander Asset Management
•SBNA: Santander Bank N.A.
•SCF: Santander Consumer Finance
•SCIB: Santander Corporate & Investment Banking
•SC USA: Santander Consumer USA
•SEC: Securities and Exchanges Commission
•SGP: Santander Global Platform
•SH USA: Santander Holdings USA, Inc.
•SMEs: Small and medium enterprises
•SPF: Simple, Personal and Fair
•SRF: Single resolution fund
•T1: Tier 1
•TLAC: The total loss-absorption capacity requirement which is required to be met under the CRD V package
•TLTRO: Targeted longer-term refinancing operations
•TNAV: Tangible net asset value
•UX: User experience
•VaR: Value at Risk
•WM&I: Wealth Management & Insurance
January - September 2021 | | 87 | ||||||
| IMPORTANT INFORMATION | ||||||||
Non-IFRS and alternative performance measures
This report contains, in addition to the financial information prepared in accordance with International Financial Reporting Standards (“IFRS”) and derived from our financial statements, alternative performance measures (“APMs”) as defined in the Guidelines on Alternative Performance Measures issued by the European Securities and Markets Authority (ESMA) on 5 October 2015 (ESMA/2015/1415en) and other non-IFRS measures (“Non-IFRS Measures”). These financial measures that qualify as APMs and non-IFRS measures have been calculated with information from Santander Group; however those financial measures are not defined or detailed in the applicable financial reporting framework nor have been audited or reviewed by our auditors. We use these APMs and non-IFRS measures when planning, monitoring and evaluating our performance. We consider these APMs and non-IFRS measures to be useful metrics for our management and investors to compare operating performance between accounting periods, as these measures exclude items outside the ordinary course performance of our business, which are grouped in the “management adjustment” line and are further detailed in Section 3.2 of the Economic and Financial Review in our Directors’ Report included in our Annual Report on Form 20-F for the year ended 31 December 2020. Nonetheless, these APMs and non-IFRS measures should be considered supplemental information to, and are not meant to substitute IFRS measures. Furthermore, companies in our industry and others may calculate or use APMs and non-IFRS measures differently, thus making them less useful for comparison purposes. For further details on APMs and Non-IFRS Measures, including its definition or a reconciliation between any applicable management indicators and the financial data presented in the consolidated financial statements prepared under IFRS, please see the 2020 Annual Report on Form 20-F filed with the U.S. Securities and Exchange Commission (the “SEC”) on 26 February 2021, as updated by the Form 6-K filed with the SEC on 14 April 2021 in order to reflect our new organizational and reporting structure, as well as the section “Alternative performance measures” of the annex to this Banco Santander, S.A. (“Santander”) Q3 2021 Financial Report, published as Inside Information on 27 October 2021. These documents are available on Santander’s website (www.santander.com). Underlying measures, which are included in this report, are non-IFRS measures.
The businesses included in each of our geographic segments and the accounting principles under which their results are presented here may differ from the included businesses and local applicable accounting principles of our public subsidiaries in such geographies. Accordingly, the results of operations and trends shown for our geographic segments may differ materially from those of such subsidiaries.
Forward-looking statements
Banco Santander, S.A. (“Santander”) advises that this report contains “forward-looking statements” as per the meaning of the U.S. Private Securities Litigation Reform Act of 1995. These statements may be identified by words like “expect”, “project”, “anticipate”, “should”, “intend”, “probability”, “risk”, “VaR”, “RoRAC”, “RoRWA”, “TNAV”, “target”, “goal”, “objective”, “estimate”, “future” and similar expressions. Found throughout this report, they include (but are not limited to) statements on our future business development, economic performance and shareholder remuneration policy. However, a number of risks, uncertainties and other important factors may cause actual developments and results to differ materially from our expectations. The following important factors, in addition to others discussed elsewhere in this report, could affect our future results and could cause materially different outcomes from those anticipated in forward-looking statements: (1) general economic or industry conditions of areas where we have significant operations or investments (such as a worse economic environment; higher volatility in the capital markets; inflation or deflation; changes in demographics, consumer spending, investment or saving habits; and the effects of the COVID-19 pandemic in the global economy); (2) exposure to various market risks (particularly interest rate risk, foreign exchange rate risk, equity price risk and risks associated with the replacement of benchmark indices); (3) potential losses from early repayments on our loan and investment portfolio, declines in value of collateral securing our loan portfolio, and counterparty risk; (4) political stability in Spain, the United Kingdom, other European countries, Latin America and the US (5) changes in legislation, regulations, taxes, including regulatory capital and liquidity requirements, especially in view of the UK exit of the European Union and increased regulation in response to financial crisis; (6) our ability to integrate successfully our acquisitions and related challenges that result from the inherent diversion of management’s focus and resources from other strategic opportunities and operational matters; and (7) changes in our access to liquidity and funding on acceptable terms, in particular if resulting from credit spreads shifts or downgrade in credit ratings for the entire group or significant subsidiaries.
Numerous factors could affect our future results and could cause those results deviating from those anticipated in the forward-looking statements. Other unknown or unpredictable factors could cause actual results to differ materially from those in the forward-looking statements.
Forward-looking statements speak only as of the date of this report and are informed by the knowledge, information and views available on such date. Santander is not required to update or revise any forward-looking statements, regardless of new information, future events or otherwise.
No offer
The information contained in this report is subject to, and must be read in conjunction with, all other publicly available information, including, where relevant any fuller disclosure document published by Santander. Any person at any time acquiring securities must do so only on the basis of such person’s own judgment as to the merits or the suitability of the securities for its purpose and only on such information as is contained in such public information having taken all such professional or other advice as it considers necessary or
| 88 | | January - September 2021 | ||||||
appropriate in the circumstances and not in reliance on the information contained in this report. No investment activity should be undertaken on the basis of the information contained in this report. In making this report available Santander gives no advice and makes no recommendation to buy, sell or otherwise deal in shares in Santander or in any other securities or investments whatsoever.
Neither this report nor any of the information contained therein constitutes an offer to sell or the solicitation of an offer to buy any securities. No offering of securities shall be made in the United States except pursuant to registration under the U.S. Securities Act of 1933, as amended, or an exemption therefrom. Nothing contained in this report is intended to constitute an invitation or inducement to engage in investment activity for the purposes of the prohibition on financial promotion in the U.K. Financial Services and Markets Act 2000.
Historical performance is not indicative of future results
Statements about historical performance or accretion must not be construed to indicate that future performance, share price or future (including earnings per share) in any future period will necessarily match or exceed those of any prior period. Nothing in this report should be taken as a profit forecast.
Third Party Information
In particular, regarding the data provided by third parties, neither Santander, nor any of its administrators, directors or employees, either explicitly or implicitly, guarantees that these contents are exact, accurate, comprehensive or complete, nor are they obliged to keep them updated, nor to correct them in the case that any deficiency, error or omission were to be detected. Moreover, in reproducing these contents in by any means, Santander may introduce any changes it deems suitable, may omit partially or completely any of the elements of this document, and in case of any deviation between such a version and this one, Santander assumes no liability for any discrepancy.
| This document is a translation of a document originally issued in Spanish. Should there be any discrepancies between the English and the Spanish versions, only the original Spanish version should be binding. | ||
January - September 2021 | | 89 | ||||||
| INTERIM UNAUDITED CONDENSED CONSOLIDATED FINANCIAL STATEMENTS | |||||
January - September 2021 | | 91 | ||||||
Banco Santander, S.A.
and companies composing
Santander Group
Interim Condensed Consolidated
Financial Statements for the
nine-month
period ended 30 September 2021
Translation of interim condensed consolidated financial statements originally issued in Spanish and prepared in accordance with the regulatory financial reporting framework applicable to the Group in Spain (see Notes 1 and 17). In the event of a discrepancy, the Spanish-language version prevails.
Translation of interim condensed consolidated financial statements originally issued in Spanish and prepared in accordance with the regulatory financial reporting framework applicable to the Group in Spain (see Notes 1 and 17). In the event of a discrepancy, the Spanish-language version prevails.
GRUPO SANTANDER
CONDENSED CONSOLIDATED BALANCE SHEETS AS AT 30 SEPTEMBER 2021 AND 31 DECEMBER 2020
(EUR million)
| ASSETS | Note | 30-09-2021 | 31-12-2020 (*) | ||||||||
| CASH, CASH BALANCES AT CENTRAL BANKS AND OTHER DEPOSITS ON DEMAND | 191,035 | 153,839 | |||||||||
| FINANCIAL ASSETS HELD FOR TRADING | 5 | 122,967 | 114,945 | ||||||||
| NON-TRADING FINANCIAL ASSETS MANDATORILY AT FAIR VALUE THROUGH PROFIT OR LOSS | 5 | 5,156 | 4,486 | ||||||||
| FINANCIAL ASSETS DESIGNATED AT FAIR VALUE THROUGH PROFIT OR LOSS | 5 | 36,970 | 48,717 | ||||||||
| FINANCIAL ASSETS AT FAIR VALUE THROUGH OTHER COMPREHENSIVE INCOME | 5 | 109,570 | 120,953 | ||||||||
| FINANCIAL ASSETS AT AMORTISED COST | 5 | 1,011,994 | 958,378 | ||||||||
| HEDGING DERIVATIVES | 5,404 | 8,325 | |||||||||
| CHANGES IN THE FAIR VALUE OF HEDGED ITEMS IN PORTFOLIO HEDGES OF INTEREST RISK | 991 | 1,980 | |||||||||
| INVESTMENTS | 7,684 | 7,622 | |||||||||
| Joint venture entities | 1,669 | 1,492 | |||||||||
| Associated entities | 6,015 | 6,130 | |||||||||
| ASSETS UNDER INSURANCE OR REINSURANCE CONTRACTS | 257 | 261 | |||||||||
| TANGIBLE ASSETS | 7 | 32,446 | 32,735 | ||||||||
| Property, plant and equipment | 31,515 | 31,772 | |||||||||
| For own-use | 12,619 | 13,213 | |||||||||
| Leased out under an operating lease | 18,896 | 18,559 | |||||||||
| Investment properties | 931 | 963 | |||||||||
| Of which : Leased out under an operating lease | 821 | 793 | |||||||||
| INTANGIBLE ASSETS | 8 | 16,246 | 15,908 | ||||||||
| Goodwill | 12,645 | 12,471 | |||||||||
| Other intangible assets | 3,601 | 3,437 | |||||||||
| TAX ASSETS | 24,544 | 24,586 | |||||||||
| Current tax assets | 5,008 | 5,340 | |||||||||
| Deferred tax assets | 19,536 | 19,246 | |||||||||
| OTHER ASSETS | 8,745 | 11,070 | |||||||||
| Insurance contracts linked to pensions | 157 | 174 | |||||||||
| Inventories | 4 | 5 | |||||||||
| Other | 8,584 | 10,891 | |||||||||
| NON-CURRENT ASSETS HELD FOR SALE | 6 | 4,286 | 4,445 | ||||||||
| TOTAL ASSETS | 1,578,295 | 1,508,250 | |||||||||
(*)Presented for comparison purposes only (see note 1.e).
The accompanying explanatory Notes 1 to 17 are an integral part of the condensed consolidated balance sheet as at 30 September 2021.
January - September 2021 | | 93 | ||||||
Translation of interim condensed consolidated financial statements originally issued in Spanish and prepared in accordance with the regulatory financial reporting framework applicable to the Group in Spain (see Notes 1 and 17). In the event of a discrepancy, the Spanish-language version prevails.
GRUPO SANTANDER
CONDENSED CONSOLIDATED BALANCE SHEETS AS AT 30 SEPTEMBER 2021 AND 31 DECEMBER 2020
(EUR million)
| LIABILITIES | Note | 30-09-2021 | 31-12-2020 (*) | ||||||||
| FINANCIAL LIABILITIES HELD FOR TRADING | 9 | 80,147 | 81,167 | ||||||||
| FINANCIAL LIABILITIES DESIGNATED AT FAIR VALUE THROUGH PROFIT OR LOSS | 9 | 47,900 | 48,038 | ||||||||
| FINANCIAL LIABILITIES AT AMORTISED COST | 9 | 1,317,759 | 1,248,188 | ||||||||
| HEDGING DERIVATIVES | 5,821 | 6,869 | |||||||||
| CHANGES IN THE FAIR VALUE OF HEDGED ITEMS IN PORTFOLIO HEDGES OF INTEREST RATE RISK | 402 | 286 | |||||||||
| LIABILITIES UNDER INSURANCE OR REINSURANCE CONTRACTS | 779 | 910 | |||||||||
| PROVISIONS | 9,815 | 10,852 | |||||||||
| Pension and other post-retirement obligations | 10 | 3,337 | 3,976 | ||||||||
| Other long term employee benefits | 10 | 1,298 | 1,751 | ||||||||
| Taxes and other legal contingencies | 10 | 2,025 | 2,200 | ||||||||
| Contingent liabilities and commitments | 14 | 674 | 700 | ||||||||
| Other provisions | 10 | 2,481 | 2,225 | ||||||||
| TAX LIABILITIES | 8,516 | 8,282 | |||||||||
| Current tax liabilities | 2,269 | 2,349 | |||||||||
| Deferred tax liabilities | 6,247 | 5,933 | |||||||||
| OTHER LIABILITIES | 11,532 | 12,336 | |||||||||
| LIABILITIES ASSOCIATED WITH NON-CURRENT ASSETS HELD FOR SALE | — | — | |||||||||
| TOTAL LIABILITIES | 1,482,671 | 1,416,928 | |||||||||
| SHAREHOLDERS´ EQUITY | 118,380 | 114,620 | |||||||||
| CAPITAL | 11 | 8,670 | 8,670 | ||||||||
| Called up paid capital | 8,670 | 8,670 | |||||||||
| Unpaid capital which has been called up | — | — | |||||||||
| SHARE PREMIUM | 47,979 | 52,013 | |||||||||
| EQUITY INSTRUMENTS ISSUED OTHER THAN CAPITAL | 650 | 627 | |||||||||
| Equity component of the compound financial instrument | — | — | |||||||||
| Other equity instruments issued | 650 | 627 | |||||||||
| OTHER EQUITY | 165 | 163 | |||||||||
| ACCUMULATED RETAINED EARNINGS | 60,273 | 65,583 | |||||||||
| REVALUATION RESERVES | — | — | |||||||||
| OTHER RESERVES | (4,336) | (3,596) | |||||||||
| (-) OWN SHARES | (29) | (69) | |||||||||
| PROFIT ATTRIBUTABLE TO SHAREHOLDERS OF THE PARENT | 3 | 5,849 | (8,771) | ||||||||
| (-) INTERIM DIVIDENDS | (841) | — | |||||||||
| OTHER COMPREHENSIVE INCOME (LOSS) | (32,992) | (33,144) | |||||||||
| ITEMS NOT RECLASSIFIED TO PROFIT OR LOSS | 11 | (4,522) | (5,328) | ||||||||
| ITEMS THAT MAY BE RECLASSIFIED TO PROFIT OR LOSS | 11 | (28,470) | (27,816) | ||||||||
| NON-CONTROLLING INTEREST | 10,236 | 9,846 | |||||||||
| Other comprehensive income | (2,120) | (1,800) | |||||||||
| Other items | 12,356 | 11,646 | |||||||||
| TOTAL EQUITY | 95,624 | 91,322 | |||||||||
| TOTAL LIABILITIES AND EQUITY | 1,578,295 | 1,508,250 | |||||||||
| MEMORANDUM ITEMS: OFF BALANCE SHEET AMOUNTS | 14 | ||||||||||
| Loan commitments granted | 252,301 | 241,230 | |||||||||
| Financial guarantees granted | 12,069 | 12,377 | |||||||||
| Other commitments granted | 78,730 | 64,538 | |||||||||
(*)Presented for comparison purposes only (see note 1.e).
The accompanying explanatory Notes 1 to 17 are an integral part of the condensed consolidated balance sheet as at 30 September 2021.
| 94 | | January - September 2021 | ||||||
Translation of interim condensed consolidated financial statements originally issued in Spanish and prepared in accordance with the regulatory financial reporting framework applicable to the Group in Spain (see Notes 1 and 17). In the event of a discrepancy, the Spanish-language version prevails.
GRUPO SANTANDER
CONDENSED CONSOLIDATED INCOME STATEMENTS
FOR THE FIRST NINE MONTHS ENDED 30 SEPTEMBER 2021 AND 2020
(EUR million)
| Debit (Credit) | |||||||||||
| Note | 01-01-2021 to 30-09-2021 | 01-01-2020 to 30-09-2020 (*) | |||||||||
| Interest income | 33,629 | 35,131 | |||||||||
| Financial assets at fair value through other comprehensive income | 2,023 | 2,348 | |||||||||
| Financial assets at amortised cost | 29,397 | 30,519 | |||||||||
| Other interest income | 2,209 | 2,264 | |||||||||
| Interest expense | (8,975) | (11,156) | |||||||||
| Interest income/ (charges) | 24,654 | 23,975 | |||||||||
| Dividend income | 404 | 322 | |||||||||
| Income from companies accounted for using the equity method | 295 | (90) | |||||||||
| Commission income | 10,132 | 9,826 | |||||||||
| Commission expense | (2,322) | (2,267) | |||||||||
| Gain or losses on financial assets and liabilities not measured at fair value through profit or loss, net | 482 | 893 | |||||||||
| Financial assets at amortised cost | 95 | (23) | |||||||||
| Other financial assets and liabilities | 387 | 916 | |||||||||
| Gain or losses on financial assets and liabilities held for trading, net | 729 | 4,425 | |||||||||
| Reclassification of financial assets at fair value through other comprehensive income | — | — | |||||||||
| Reclassification of financial assets at amortized cost | — | — | |||||||||
| Other gains (losses) | 729 | 4,425 | |||||||||
| Gains or losses on non-trading financial assets and liabilities mandatorily at fair value through profit or loss | 11 | 73 | |||||||||
| Reclassification of financial assets at fair value through other comprehensive income | — | — | |||||||||
| Reclassification of financial assets at amortized cost | — | — | |||||||||
| Other gains (losses) | 11 | 73 | |||||||||
| Gain or losses on financial assets and liabilities measured at fair value through profit or loss, net | 296 | (91) | |||||||||
| Gain or losses from hedge accounting, net | 91 | 120 | |||||||||
| Exchange differences, net | (389) | (3,695) | |||||||||
| Other operating income | 1,735 | 1,222 | |||||||||
| Other operating expenses | (1,706) | (1,527) | |||||||||
| Income from assets under insurance and reinsurance contracts | 1,114 | 1,030 | |||||||||
| Expenses from liabilities under insurance and reinsurance contracts | (900) | (861) | |||||||||
| Total income | 34,626 | 33,355 | |||||||||
| Administrative expenses | (13,714) | (13,686) | |||||||||
| Staff costs | (8,205) | (8,098) | |||||||||
| Other general and administrative expenses | (5,509) | (5,588) | |||||||||
| Depreciation and amortisation cost | (2,064) | (2,100) | |||||||||
| Provisions or reversal of provisions, net | (2,006) | (1,014) | |||||||||
| Impairment or reversal of impairment of financial assets not measured at fair value through profit or loss and net gains and losses from changes | (6,000) | (9,538) | |||||||||
| Financial assets at fair value through other comprehensive income | (27) | (7) | |||||||||
| Financial assets at amortised cost | 5 | (5,973) | (9,531) | ||||||||
| Impairment of investments in subsidiaries, joint ventures and associates, net | — | — | |||||||||
| Impairment on non-financial assets, net | (134) | (10,256) | |||||||||
| Tangible assets | 7 | (116) | (105) | ||||||||
| Intangible assets | (15) | (10,149) | |||||||||
| Others | (3) | (2) | |||||||||
| Gain or losses on non financial assets and investments, net | 43 | 89 | |||||||||
| Negative goodwill recognised in results | — | 9 | |||||||||
| Gains or losses on non-current assets held for sale not classified as discontinued operations | 6 | (35) | (130) | ||||||||
| Operating profit/(loss) before tax | 10,716 | (3,271) | |||||||||
| Tax expense or income from continuing operations | (3,725) | (5,020) | |||||||||
| Profit/(loss) for the period from continuing operations | 6,991 | (8,291) | |||||||||
| Profit/( loss) after tax from discontinued operations | — | — | |||||||||
| Profit/(loss) for the period | 6,991 | (8,291) | |||||||||
| Profit attributable to non-controlling interests | 1,142 | 757 | |||||||||
| Profit/(loss) attributable to the parent | 5,849 | (9,048) | |||||||||
| Earnings/(losses) per share | 3 | ||||||||||
| Basic | 0.31 | (0.55) | |||||||||
| Diluted | 0.31 | (0.55) | |||||||||
(*)Presented for comparison purposes only (see note 1.e).
The accompanying explanatory Notes 1 to 17 are an integral part of the condensed consolidated income statement for the first nine months ended 30 September 2021.
January - September 2021 | | 95 | ||||||
Translation of interim condensed consolidated financial statements originally issued in Spanish and prepared in accordance with the regulatory financial reporting framework applicable to the Group in Spain (see Notes 1 and 17). In the event of a discrepancy, the Spanish-language version prevails.
GRUPO SANTANDER
CONDENSED CONSOLIDATED STATEMENTS OF RECOGNISED INCOME AND EXPENSE
FOR THE FIRST NINE MONTHS ENDED 30 SEPTEMBER 2021 AND 2020
(EUR million)
| Note | 01-01-2021 to 30-09-2021 | 01-01-2020 to 30-09-2020 (*) | |||||||||
| CONSOLIDATED PROFIT/(LOSS) FOR THE PERIOD | 6,991 | (8,291) | |||||||||
| OTHER RECOGNISED INCOME AND EXPENSE | (584) | (9,502) | |||||||||
| Items that will not be reclassified to profit or loss | 11 | 416 | (741) | ||||||||
| Actuarial gains and losses on defined benefit pension plans | 1,016 | 218 | |||||||||
| Non-current assets held for sale | — | — | |||||||||
| Other recognised income and expense of investments in subsidiaries, joint ventures and associates | (6) | (6) | |||||||||
| Changes in the fair value of equity instruments measured at fair value through other comprehensive income | (131) | (885) | |||||||||
| Gains or losses resulting from the accounting for hedges of equity instruments measured at fair value through other comprehensive income, net | — | — | |||||||||
| Changes in the fair value of equity instruments measured at fair value through other comprehensive income (hedged item) | 79 | 5 | |||||||||
| Changes in the fair value of equity instruments measured at fair value through other comprehensive income (hedging instrument) | (79) | (5) | |||||||||
| Changes in the fair value of financial liabilities at fair value through profit or loss attributable to changes in credit risk | (125) | 62 | |||||||||
| Income tax relating to items that will not be reclassified | (338) | (130) | |||||||||
| Items that may be reclassified to profit or loss | 11 | (1,000) | (8,761) | ||||||||
| Hedges of net investments in foreign operations (effective portion) | 11 | (771) | 2,853 | ||||||||
| Revaluation gains (losses) | (771) | 2,853 | |||||||||
| Amounts transferred to income statement | — | — | |||||||||
| Other reclassifications | — | — | |||||||||
| Exchange differences | 11 | 1,895 | (11,674) | ||||||||
| Revaluation gains (losses) | 1,895 | (11,674) | |||||||||
| Amounts transferred to income statement | — | — | |||||||||
| Other reclassifications | — | — | |||||||||
| Cash flow hedges (effective portion) | (593) | 393 | |||||||||
| Revaluation gains (losses) | (830) | 2,161 | |||||||||
| Amounts transferred to income statement | 237 | (1,768) | |||||||||
| Transferred to initial carrying amount of hedged items | — | — | |||||||||
| Other reclassifications | — | — | |||||||||
| Hedging instruments (items not designated) | — | — | |||||||||
| Revaluation gains (losses) | — | — | |||||||||
| Amounts transferred to income statement | — | — | |||||||||
| Other reclassifications | — | — | |||||||||
| Debt instruments at fair value with changes in other comprehensive income | (2,564) | (380) | |||||||||
| Revaluation gains (losses) | (2,169) | 173 | |||||||||
| Amounts transferred to income statement | (395) | (926) | |||||||||
| Other reclassifications | — | 373 | |||||||||
| Non-current assets held for sale | — | — | |||||||||
| Revaluation gains (losses) | — | — | |||||||||
| Amounts transferred to income statement | — | — | |||||||||
| Other reclassifications | — | — | |||||||||
| Share of other recognised income and expense of investments | 14 | (172) | |||||||||
| Income tax relating to items that may be reclassified to profit or loss | 1,019 | 219 | |||||||||
| Total recognised income and expenses for the year | 6,407 | (17,793) | |||||||||
| Attributable to non-controlling interests | 828 | (166) | |||||||||
| Attributable to the parent | 5,579 | (17,627) | |||||||||
(*)Presented for comparison purposes only (see note 1.e).
The accompanying explanatory Notes 1 to 17 are an integral part of the condensed consolidated statement of recognised income and expense for the first nine months ended 30 September 2021.
| 96 | | January - September 2021 | ||||||
Translation of interim condensed consolidated financial statements originally issued in Spanish and prepared in accordance with the regulatory financial reporting framework applicable to the Group in Spain (see Notes 1 and 17). In the event of a discrepancy, the Spanish-language version prevails.
GRUPO SANTANDER
CONDENSED CONSOLIDATED STATEMENTS OF CHANGES IN TOTAL EQUITY
FOR THE FIRST NINE MONTHS ENDED 30 SEPTEMBER 2021 AND 2020
FOR THE FIRST NINE MONTHS ENDED 30 SEPTEMBER 2021 AND 2020
(EUR million)
| Capital | Share premium | Equity instruments issued (not capital) | Other equity instruments | Accumulated retained earnings | Revaluation reserves | Other reserves | (-) Own shares | Profit Attributable to shareholders of the parent | (-) Interim dividends | Other comprehensive income | Non-Controlling interest | Total | ||||||||||||||||||||||||||||||||
| Other comprehensive income | Other items | |||||||||||||||||||||||||||||||||||||||||||
| Balance as at 31-12-2020 (*) | 8,670 | 52,013 | 627 | 163 | 65,583 | — | (3,596) | (69) | (8,771) | — | (33,144) | (1,800) | 11,646 | 91,322 | ||||||||||||||||||||||||||||||
| Adjustments due to errors | — | — | — | — | — | — | — | — | — | — | — | — | — | — | ||||||||||||||||||||||||||||||
| Adjustments due to changes in accounting policies | — | — | — | — | — | — | — | — | — | — | — | — | — | — | ||||||||||||||||||||||||||||||
| Opening balance as at 01-01-2021 (*) | 8,670 | 52,013 | 627 | 163 | 65,583 | — | (3,596) | (69) | (8,771) | — | (33,144) | (1,800) | 11,646 | 91,322 | ||||||||||||||||||||||||||||||
| Total recognised income and expense | — | — | — | — | — | — | — | — | 5,849 | — | (270) | (314) | 1,142 | 6,407 | ||||||||||||||||||||||||||||||
| Other changes in equity | — | (4,034) | 23 | 2 | (5,310) | — | (740) | 40 | 8,771 | (841) | 422 | (6) | (432) | (2,105) | ||||||||||||||||||||||||||||||
| Issuance of ordinary shares | — | — | — | — | — | — | — | — | — | — | — | — | 17 | 17 | ||||||||||||||||||||||||||||||
| Issuance of preferred shares | — | — | — | — | — | — | — | — | — | — | — | — | — | — | ||||||||||||||||||||||||||||||
| Issuance of other financial instruments | — | — | — | — | — | — | — | — | — | — | — | — | — | — | ||||||||||||||||||||||||||||||
| Maturity of other financial instruments | — | — | — | — | — | — | — | — | — | — | — | — | — | — | ||||||||||||||||||||||||||||||
| Conversion of financial liabilities into equity | — | — | — | — | — | — | — | — | — | — | — | — | — | — | ||||||||||||||||||||||||||||||
| Capital reduction | — | — | — | — | — | — | — | — | — | — | — | — | — | — | ||||||||||||||||||||||||||||||
| Dividends | — | (477) | — | — | — | — | — | — | — | (841) | — | — | (458) | (1,776) | ||||||||||||||||||||||||||||||
| Purchase of equity instruments | — | — | — | — | — | — | — | (550) | — | — | — | — | — | (550) | ||||||||||||||||||||||||||||||
| Disposal of equity instruments | — | — | — | — | — | — | 18 | 590 | — | — | — | — | — | 608 | ||||||||||||||||||||||||||||||
| Transfer from equity to liabilities | — | — | — | — | — | — | — | — | — | — | — | — | — | — | ||||||||||||||||||||||||||||||
| Transfer from liabilities to equity | — | — | — | — | — | — | — | — | — | — | — | — | — | — | ||||||||||||||||||||||||||||||
| Transfers between equity items | — | (3,557) | — | — | (5,310) | — | (326) | — | 8,771 | — | 422 | (6) | 6 | — | ||||||||||||||||||||||||||||||
| Increases (decreases) due to business combinations | — | — | — | — | — | — | — | — | — | — | — | — | — | — | ||||||||||||||||||||||||||||||
| Share-based payment | — | — | — | (55) | — | — | — | — | — | — | — | — | — | (55) | ||||||||||||||||||||||||||||||
| Others increases or (-) decreases of the equity | — | — | 23 | 57 | — | — | (432) | — | — | — | — | — | 3 | (349) | ||||||||||||||||||||||||||||||
| Balance as at 30-09-2021 | 8,670 | 47,979 | 650 | 165 | 60,273 | — | (4,336) | (29) | 5,849 | (841) | (32,992) | (2,120) | 12,356 | 95,624 | ||||||||||||||||||||||||||||||
(*)Presented for comparison purposes only (see note 1.e).
The accompanying explanatory Notes 1 to 17 are an integral part of the condensed consolidated statement of changes in total equity
for the first nine months ended 30 September 2021.
January - September 2021 | | 97 | ||||||
Translation of interim condensed consolidated financial statements originally issued in Spanish and prepared in accordance with the regulatory financial reporting framework applicable to the Group in Spain (see Notes 1 and 17). In the event of a discrepancy, the Spanish-language version prevails.
GRUPO SANTANDER
CONDENSED CONSOLIDATED STATEMENTS OF CHANGES IN TOTAL EQUITY
FOR THE FIRST NINE MONTHS ENDED 30 SEPTEMBER 2021 AND 2020
(EUR million)
| Capital | Share premium | Equity instruments issued (not capital) | Other equity instruments | Accumulated retained earnings | Revaluation reserves | Other reserves | (-) Own shares | Profit Attributable to shareholders of the parent | (-) Interim dividends | Other comprehensive income | Non-Controlling interest | Total | ||||||||||||||||||||||||||||||||
| Other comprehensive income | Other items | |||||||||||||||||||||||||||||||||||||||||||
| Balance as at 31-12-2019 (*) | 8,309 | 52,446 | 598 | 146 | 61,028 | — | (3,110) | (31) | 6,515 | (1,662) | (24,168) | (982) | 11,570 | 110,659 | ||||||||||||||||||||||||||||||
| Adjustments due to errors | — | — | — | — | — | — | — | — | — | — | — | — | — | — | ||||||||||||||||||||||||||||||
| Adjustments due to changes in accounting policies | — | — | — | — | — | — | — | — | — | — | — | — | — | — | ||||||||||||||||||||||||||||||
| Opening balance as at 01-01-2020 (*) | 8,309 | 52,446 | 598 | 146 | 61,028 | — | (3,110) | (31) | 6,515 | (1,662) | (24,168) | (982) | 11,570 | 110,659 | ||||||||||||||||||||||||||||||
| Total recognised income and expense | — | — | — | — | — | — | — | — | (9,048) | — | (8,579) | (923) | 757 | (17,793) | ||||||||||||||||||||||||||||||
| Other changes in equity | — | — | 21 | 25 | 6,202 | — | (389) | (42) | (6,515) | — | — | — | (858) | (1,556) | ||||||||||||||||||||||||||||||
| Issuance of ordinary shares | — | — | — | — | — | — | — | — | — | — | — | — | — | — | ||||||||||||||||||||||||||||||
| Issuance of preferred shares | — | — | — | — | — | — | — | — | — | — | — | — | — | — | ||||||||||||||||||||||||||||||
| Issuance of other financial instruments | — | — | — | — | — | — | — | — | — | — | — | — | — | — | ||||||||||||||||||||||||||||||
| Maturity of other financial instruments | — | — | — | — | — | — | — | — | — | — | — | — | — | — | ||||||||||||||||||||||||||||||
| Conversion of financial liabilities into equity | — | — | — | — | — | — | — | — | — | — | — | — | — | — | ||||||||||||||||||||||||||||||
| Capital reduction | — | — | — | — | — | — | — | — | — | — | — | |||||||||||||||||||||||||||||||||
| Dividends | — | — | — | — | — | — | — | — | — | — | — | — | (322) | (322) | ||||||||||||||||||||||||||||||
| Purchase of equity instruments | — | — | — | — | — | — | — | (556) | — | — | — | — | — | (556) | ||||||||||||||||||||||||||||||
| Disposal of equity instruments | — | — | — | — | — | — | 1 | 514 | — | — | — | — | — | 515 | ||||||||||||||||||||||||||||||
| Transfer from equity to liabilities | — | — | — | — | — | — | — | — | — | — | — | — | — | — | ||||||||||||||||||||||||||||||
| Transfer from liabilities to equity | — | — | — | — | — | — | — | — | — | — | — | — | — | — | ||||||||||||||||||||||||||||||
| Transfers between equity items | — | — | — | — | 6,202 | — | 313 | — | (6,515) | — | — | — | — | — | ||||||||||||||||||||||||||||||
| Increases (decreases) due to business combinations | — | — | — | — | — | — | — | — | — | — | — | — | (53) | (53) | ||||||||||||||||||||||||||||||
| Share-based payment | — | — | — | (56) | — | — | — | — | — | — | — | — | — | (56) | ||||||||||||||||||||||||||||||
| Others increases or (-) decreases of the equity | — | — | 21 | 81 | — | — | (703) | — | — | — | — | — | (483) | (1,084) | ||||||||||||||||||||||||||||||
| Balance as at 30-09-2020 (*) | 8,309 | 52,446 | 619 | 171 | 67,230 | — | (3,499) | (73) | (9,048) | (1,662) | (32,747) | (1,905) | 11,469 | 91,310 | ||||||||||||||||||||||||||||||
(*)Presented for comparison purposes only (see note 1.e).
The accompanying explanatory Notes 1 to 17 are an integral part of the condensed consolidated statement of changes in total equity
for the first nine months ended 30 September 2021.
| 98 | | January - September 2021 | ||||||
Translation of interim condensed consolidated financial statements originally issued in Spanish and prepared in accordance with the regulatory financial reporting framework applicable to the Group in Spain (see Notes 1 and 17). In the event of a discrepancy, the Spanish-language version prevails.
GRUPO SANTANDER
CONDENSED CONSOLIDATED STATEMENTS OF CASH FLOWS
FOR THE FIRST NINE MONTHS ENDED 30 SEPTEMBER 2021 AND 2020
FOR THE FIRST NINE MONTHS ENDED 30 SEPTEMBER 2021 AND 2020
(EUR million)
| Note | 30-09-2021 | 30-09-2020 (*) | |||||||||
| A. CASH FLOWS FROM OPERATING ACTIVITIES | 37,026 | 59,779 | |||||||||
| Profit/(loss) for the period | 6,991 | (8,291) | |||||||||
| Adjustments made to obtain the cash flows from operating activities | 16,447 | 30,614 | |||||||||
| Depreciation and amortisation cost | 2,064 | 2,100 | |||||||||
| Other adjustments | 14,383 | 28,514 | |||||||||
| Net increase/(decrease) in operating assets | 27,907 | 68,783 | |||||||||
| Financial assets held-for-trading | 8,060 | 16,794 | |||||||||
| Non-trading financial assets mandatorily at fair value through profit or loss | 593 | (494) | |||||||||
| Financial assets at fair value through profit or loss | (11,707) | 3,871 | |||||||||
| Financial assets at fair value through other comprehensive income | (8,342) | 4,727 | |||||||||
| Financial assets at amortised cost | 45,475 | 38,833 | |||||||||
| Other operating assets | (6,172) | 5,052 | |||||||||
| Net increase/(decrease) in operating liabilities | 43,994 | 107,759 | |||||||||
| Financial liabilities held-for-trading | (744) | 16,016 | |||||||||
| Financial liabilities designated at fair value through profit or loss | 820 | 1,078 | |||||||||
| Financial liabilities at amortised cost | 50,102 | 94,330 | |||||||||
| Other operating liabilities | (6,184) | (3,665) | |||||||||
| Income tax recovered/(paid) | (2,499) | (1,520) | |||||||||
| B. CASH FLOWS FROM INVESTING ACTIVITIES | (2,381) | (5,901) | |||||||||
| Payments | 5,854 | 9,775 | |||||||||
| Tangible assets | 7 | 4,846 | 5,584 | ||||||||
| Intangible assets | 879 | 783 | |||||||||
| Investments | 58 | 478 | |||||||||
| Subsidiaries and other business units | 2 | 71 | 2,930 | ||||||||
| Non-current assets held for sale and associated liabilities | — | — | |||||||||
| Other payments related to investing activities | — | — | |||||||||
| Proceeds | 3,473 | 3,874 | |||||||||
| Tangible assets | 7 | 2,520 | 1,495 | ||||||||
| Intangible assets | — | — | |||||||||
| Investments | 317 | 74 | |||||||||
| Subsidiaries and other business units | 4 | 1,775 | |||||||||
| Non-current assets held for sale and associated liabilities | 6 | 632 | 530 | ||||||||
| Other proceeds related to investing activities | — | — | |||||||||
| C. CASH FLOW FROM FINANCING ACTIVITIES | (1,187) | (2,317) | |||||||||
| Payments | 4,413 | 4,936 | |||||||||
| Dividends | 3 | 477 | — | ||||||||
| Subordinated liabilities | 2,357 | 2,270 | |||||||||
| Redemption of own equity instruments | — | — | |||||||||
| Acquisition of own equity instruments | 550 | 556 | |||||||||
| Other payments related to financing activities | 1,029 | 2,110 | |||||||||
| Proceeds | 3,226 | 2,619 | |||||||||
| Subordinated liabilities | 2,583 | 1,853 | |||||||||
| Issuance of own equity instruments | 11 | — | — | ||||||||
| Disposal of own equity instruments | 615 | 516 | |||||||||
| Other proceeds related to financing activities | 28 | 250 | |||||||||
| D. EFFECT OF FOREIGN EXCHANGE RATE DIFFERENCES | 3,738 | (4,453) | |||||||||
| E. NET INCREASE/(DECREASE) IN CASH AND CASH EQUIVALENTS | 37,196 | 47,108 | |||||||||
| F. CASH AND CASH EQUIVALENTS AT BEGINNING OF PERIOD | 153,839 | 101,067 | |||||||||
| G. CASH AND CASH EQUIVALENTS AT END OF PERIOD | 191,035 | 148,175 | |||||||||
| COMPONENTS OF CASH AND CASH EQUIVALENTS AT END OF PERIOD | |||||||||||
| Cash | 7,242 | 6,591 | |||||||||
| Cash equivalents at central banks | 169,381 | 126,022 | |||||||||
| Other financial assets | 14,412 | 15,562 | |||||||||
| Less: Bank overdrafts refundable on demand | — | — | |||||||||
| TOTAL CASH AND CASH EQUIVALENTS AT END OF PERIOD | 191,035 | 148,175 | |||||||||
| In which: restricted cash | — | — | |||||||||
(*)Presented for comparison purposes only (see note 1.e).
The accompanying explanatory Notes 1 to 17 are an integral part of the condensed consolidated statement of cash flows for the first nine months ended 30 September 2021.
January - September 2021 | | 99 | ||||||
Banco Santander, S.A. and Companies composing Grupo Santander
Explanatory notes to the interim condensed consolidated financial statements for he first nine months ended 30 September 2021.
1. Introduction, basis of presentation of the interim condensed consolidated financial statements and other information
a) Introduction
Banco Santander, S.A. ('the parent' or 'Banco Santander') is a private-law entity subject to the rules and regulations applicable to banks operating in Spain. The Bylaws and other public information of the Bank can be consulted at its registered office at Paseo de Pereda 9-12, Santander.
In addition to the operations carried on directly by it, Banco Santander is the head of a group of subsidiaries that engage in various business activities and which compose, together with it, Grupo Santander ('Santander' or 'The Group').
Grupo Santander's interim condensed consolidated financial statements for the nine-month period ended 30 September 2021 ('interim financial statements') were authorised and approved by Grupo Santander's directors at the board of directors meeting held on 26 October 2021. Grupo Santander's consolidated annual accounts for year 2020 were approved by shareholders at Banco Santander annual general meeting on 26 March 2021.
b) Basis of presentation of the interim financial statements
Under Regulation (EC) n.º 1606/2002 of the European Parliament and of the Council of 19 July 2002 all companies governed by the law of an EU Member State and whose securities are admitted to trading on a regulated market of any Member State must prepare their consolidated financial statements for the years beginning on or after 1 January, 2005 in conformity with the International Financial Reporting Standards ('IFRS') previously adopted by the European Union ('EU-IFRS'). In order to adapt the accounting system of Spanish credit institutions with the principles and criteria established by the IFRS adopted by the European Union ('EU-IFRS'), the Bank of Spain published circular 4/2017, dated 27 November 2017, and subsequent changes, on Public and Confidential Financial Reporting Standards and Financial Statement Formats.
The consolidated annual accounts for 2020 were approved at the board of directors meeting on 22 February 2021 in compliance with International Financial Reporting Standards as adopted by the European Union, taking into account Bank of Spain Circular 4/2017, and subsequent modifications, using the basis of consolidation, accounting policies and measurement bases described in note 2 to the aforementioned consolidated annual accounts and, accordingly, they presented fairly Grupo Santander’s consolidated equity and consolidated financial position at 31 December 2020 and the consolidated results of its operations, and the consolidated cash flows in 2020. The aforementioned consolidated annual accounts, which are included in Grupo Santander’s Form 20-F filed with the U.S. Securities and Exchange Commission on 14 April 2021, and these interim financial statements are also in compliance with International Financial Reporting Standards as issued by the International Accounting Standards Board ('IFRS-IASB', and together with EU-IFRS, 'IFRS').
These interim financial statements were prepared and are presented in accordance with International Accounting Standard (IAS 34), Interim Financial Reporting, for the preparation of interim condensed financial statements and contain disclosures relating to the nine-month period ended on 30 September 2021.
In accordance with IAS 34, the interim financial statements are intended only to provide an update on the content of the latest consolidated annual accounts authorised for issue, focusing on new activities, events and circumstances occurring during the first nine months, and does not duplicate information previously reported in the latest consolidated annual accounts. Consequently, these interim financial statements do not include all the information that would be required for a complete set of consolidated annual accounts prepared in accordance with IFRS and, accordingly, for a proper comprehension of the information included in these interim financial statements, they should be read together with Grupo Santander’s consolidated annual accounts for the year ended 31 December 2020.
Grupo Santander policies include presenting the interim financial statements for its use in the different markets using the Euro as its presentation currency. The amounts held in other currencies and the balances of entities whose functional currency is not the Euro, have been translated to the presentation currency in accordance with the criteria indicated in Note 2.a to the consolidated annual accounts for 2020. As indicated in that Note, for practical reasons, the balance sheet amount has been converted to the closing exchange rate, the equity to the historical type, and the income and expenses have been converted by applying the average exchange rate of the period; the application of such exchange rate or that corresponding to the date of each transaction does not lead to significant differences in the interim financial statements of Grupo Santander.
| 100 | | January - September 2021 | ||||||
The accounting policies and methods used in preparing these interim financial statements are the same as those applied in the consolidated annual accounts for 2020 taking into account the standards and interpretations that became applicable during the first nine months of 2021, which are detailed below:
- Amendment to IFRS 4 Insurance Contracts, which is aimed at extending the expiry date of the temporary exemption from applying IFRS 9 by two years (from 1 January 2021 to 1 January 2023) for entities whose activities are predominantly insurance-related. This achieves alignment with the effective date of IFRS 17 Insurance Contracts (1 January 2023). It applies from 1 January 2021.
–Amendment IFRS 16 Leases: as a result of the covid-19 pandemic, IFRS 16 is amended to allow the lessee to apply a practical expedient and not consider the rental concessions a lease modification whenever the following requirements are met: the revised consideration is the same or less than the consideration prior to the change, the affected payments are prior to 30 June 2021, and there are no substantial changes in the rest of the lease conditions. On 31 March 2021, the IASB published an additional amendment to extend the scope of the practical expedient to 30 June 2022. It applies from 1 April 2021.
The aforementioned amendments to accounting standards have not had a significant effect on Grupo Santander’s financial statements.
All accounting policies and measurement bases with a material effect on the interim financial statements for 30 September 2021 were applied in their preparation.
By the time of the preparation and authorisation of these interim financial statements, there were no standards to be adopted by the European Union for the current year whose effective date of implementation by the IASB is after 1 January 2021.
IBOR Reform
Since 2015, central banks and regulators in several major jurisdictions have promoted the transition to suitable replacements for some existing IBOR (Interbank Offered Rates) benchmarks such as Euro Overnight Index Average (EONIA) and London Interbank Offered Rates (LIBORs).
On 27 July 2017, the Chief Executive of the U.K. Financial Conduct Authority (the FCA), which regulates the LIBOR, announced that the FCA will no longer persuade or compel banks to submit rates for the calculation of the LIBOR benchmarks after 2021.
Additionally, on 13 September 2018 the WG euro RFR recommended that the Euro Short Term Rate (€STR) shall replace EONIA. Since 2 October 2019, the date on which the €STR became available, EONIA changed its methodology to be calculated as the €STR plus a spread of 8.5 basis points. This change in EONIA’s methodology is intended to facilitate the market’s transition from EONIA to €STR, with the former expected to be discontinued by the 3 January 2022.
On October 2020, the International Swaps and Derivatives Association (ISDA) launched the IBOR Fallbacks Protocol, which become effective on 25 January 2021, and provide derivatives market participants with new IBOR fallbacks for legacy and new derivatives contracts. Additionally, in August 2021, ISDA launched the protocol for collateral agreements for EONIA, and provides derivatives market participants with new EONIA fallbacks for CSA collateral agreements. Banco Santander S.A. and several subsidiaries have adhered to these protocols.
On December 2020, the European Union Council endorsed new rules amending of the European Union Benchmark Regulation (BMR). The aim of the amendments to the Benchmark Regulation is to make sure that a statutory replacement benchmark can be established by the regulators by the time a systemically important benchmark is no longer in use, and thus protect financial stability on European Union markets. The new rules give the Commission the power to replace so-called 'critical benchmarks', which could affect the stability of financial markets in Europe, and other relevant benchmarks, if their termination would result in a significant disruption in the functioning of financial markets in the European Union. The Commission will also be able to replace third country benchmarks if their cessation would result in a significant disruption in the functioning of financial markets or pose a systemic risk for the financial system in the European Union.
In March 2021, the FCA announced the final dates for the cessation of LIBORs:
–31 December 2021 will see the cessation of publication of USD LIBOR (1-week and 2-month terms), CHF LIBOR (all terms), GBP LIBOR (overnight, 1-week, 2-month and 12-month terms), JPY LIBOR (overnight, 1-week, 2-month, and 12-month terms) and EUR LIBOR (all terms).
–On 31 December 2021 the calculation methodology for some LIBORs will be reformed and will become non-representative: GBP LIBOR (1 month, 3 months and 6 months), JPY LIBOR (1 month, 3 months and 6 months).
–On 30 June 2023 the publication of USD LIBOR (overnight, 12-month and 12-month maturities) will cease and the calculation methodology for USD LIBOR (1-month, 3-month and 6-month maturities) will be reformed and become non-representative.
January - September 2021 | | 101 | ||||||
Interest rate benchmarks have an extended footprint in a significant number of contracts that Santander Group is holding and are used in multiple processes. The most relevant interest rate benchmarks for Santander are EURIBOR, EONIA, USD-LIBOR, GBP-LIBOR, and CHF-LIBOR. Santander Group uses these benchmarks as the reference rate not only for derivatives, but also for loans, discounting products, deposits, collateral agreements and floating rate notes, among others.
The main risks to which Santander is exposed arising from financial instruments because of the transition are: (i) legal risks arising from potential changes required to documentation for new and existing transactions; (ii) risk management, financial and accounting risks arising from market risk models and from valuation, hedging, discontinuation and recognition of financial instruments linked to benchmark rates; (iii) business risk of a decrease in revenues of products linked to indices that will be replaced; (iv) pricing risks arising from how changes to benchmark indices could impact pricing mechanisms on some instruments; (v) operational risks arising from the potential requirement to adapt IT systems, trade reporting infrastructure and operational processes; (vi) conduct risks arising from the potential impact of communication with customers and engagement during the transition period and (vii) litigation risks regarding our existing products and services, which could adversely impact our profitability.
In order to monitor the risks and address the challenges of the transition, Santander launched the IBOR Transition Programme in 2019. This programme has a group wide scope and reports on a regular basis to Executive Management involving statutory committees. Its main objective is to ensure a smooth operational transition and to anticipate and address any potential customer and conduct related issues that could arise from the IBOR transition. It also aims to ensure that all impacted areas, business units and geographies understand the risks associated with the transition in a homogeneous way and can take appropriate measures to mitigate them.
This IBOR Transition Programme is aligned with the recommendations, guidance and milestones defined by regulators and working groups of different jurisdictions and is structured around the following areas: Technology & Operations, Legal, Client Outreach, Risk Management & Models, Conduct & Communications and Accounting & Finance.
Additionally, Grupo Santander participates in the public and private sector initiatives related to the reform of the interest rate benchmarks.
c) Use of critical estimates
The consolidated results and the determination of the consolidated equity are sensitive to the accounting principles and policies, valuation criteria and estimates used by the directors of Banco Santander in preparing the interim financial statements. The main accounting principles, policies, and valuation criteria are indicated in Note 2 of the consolidated annual accounts of the year 2020, except for those indicated in these interim financial statements due to the rules that have come into effect during the first nine months of the year 2021.
The interim financial statements contain estimates made by the senior management of Banco Santander and of the consolidated entities in order to quantify certain of the assets, liabilities, income, expenses and obligations reported in the consolidated entities. These estimates, which were made on the basis of the best information available, relate mainly to the following:
1.The income tax expense, which, in accordance with IAS 34, is recognised in interim periods based on the best estimate of the weighted average tax rate expected by Grupo Santander for the full financial year;
2.The impairment losses on certain assets – Financial assets at fair value through other comprehensive income, financial assets at amortised cost, non-current assets held for sale, investments in subsidiaries, joint ventures and associates, tangible assets and intangible assets;
3.The assumptions used in the calculation of the post-employment benefit liabilities and commitments and other obligations;
4.The useful life of the tangible and intangible assets;
5.The measurement of goodwill impairment arising on consolidation;
6.The calculation of provisions and the consideration of contingent liabilities;
7.The fair value of certain unquoted assets and liabilities;
8.The recoverability of deferred tax assets; and
9.The fair value of the identifiable assets acquired and the liabilities assumed in business combinations in accordance with IFRS 3.
In order to update the estimates described above, Grupo Santander's management took into account the current situation as a result of covid-19, which significantly affects economic activity worldwide and, consequently, Grupo Santander's operations and financial results, as well as generating uncertainty in the estimates made. As a result, Group management has made an assessment of the current situation based on the best information available to date, identifying potential impacts of covid-19 on the main estimates made since the start of the pandemic, as well as for the first nine months ended 30 September 2021. For estimates that have not changed during the first nine months of this year, details are provided in note 1.c of the consolidated financial statements for 2020.
| 102 | | January - September 2021 | ||||||
From the results of this evaluation, the following aspects stand out:
–Credit risk:
i.Covid-19 management and customer support:
In order to minimize the medium- and long-term economic impacts of the efforts made to contain the covid-19 pandemic, Grupo Santander implemented a set of customer relief measures in full compliance with regulatory and supervisory recommendations. Santander continued to support its customers in the first nine months of 2021, fostering their economic resilience in all the Group's geographies.
Regarding moratorium measures granted, the amount at 30 September 2021 was around EUR 97,600 million. Of these, around EUR 66,400 million corresponded to residential mortgages, mainly in the UK where the portfolio has a low average loan to value (LTV) (<50%). The moratoriums granted in consumer lending operations (around EUR 14,300 million, or 6% of the total portfolio) were mainly car loans.
99% of the total moratoriums (about EUR 96,300 million) have already matured by the end of September 2021, showing good performance, with 6% of them being classified as stage 3 in accordance with IFRS 9. Loans subject to moratorium and not overdue amounted to EUR 1,300 million (mainly in Spain), after the expiration of a significant volume of transactions in Portugal. Most of these moratoria that are still active will expire by the end of the year.
The continuous interaction and coordination with subsidiaries has been a key asset in the management of this crisis. The experience gained in the fight against the health crisis and its financial consequences in the different geographies has allowed us to share the best practices identified and to implement in an agile and efficient manner those strategies and specific actions that have been most successful, adapted to the local reality of each market.
ii. Estimation of expected loss:
The quantification of potential additional expected losses in the different credit portfolios due to the economic and financial impacts arising from the covid-19 pandemic was carried out by analysing the losses under IFRS 9 in accordance with the recommendations of the different accounting, regulatory and supervisory bodies. These highlighted the uncertainties surrounding the economic effects of the covid-19 health crisis, which were also evident in the frequent updates of macroeconomic forecasts with different perspectives as to the depth and duration of the crisis. Thus, the general recommendation (including IASB, ESMA, EBA and ECB) was to not mechanistically apply the usual techniques for calculating expected losses under IFRS 9 to prevent that the variability on macroeconomic expectations resulted in undesired volatility of outcomes, which could also imply potential pro-cyclical effects on the economy.
When estimating the expected loss, Grupo Santander analyses losses under IFRS 9 taking into account 3 types of elements:
1.Continuous monitoring of clients:
•We continue to monitor and provide solutions to those Group customers whose moratoriums have expired and facilitate the restructuring of their debt for those customers with loans subject to government guarantee programmes in case they need it. Strict classification and loss recognition criteria are always applied in accordance with our internal rules, current regulations and supervisory recommendations.
•The processes of assessing and classifying our customers at the individual and sectorial level continued. To this end, the behaviour of customers and the collective analyses performed are continuously monitored, identifying and classifying on an individual basis those customers showing signs of impairment. As some of the uncertainties generated by the pandemic are cleared up, the individualised identification of deterioration is expected to keep progressing.
2. Foresight
•In this regard, when estimating the impact of macroeconomic information on the calculation of provisions under IFRS 9, Grupo Santander used macroeconomic scenarios based on the structural deterioration of the economy, following the guidance of supervisors and regulators in terms of a long-run view in the generation of scenarios. This structural view was generated through a more stable long-term outlook, reflecting the structural deterioration caused by the pandemic. For this purpose, for each geography, the point at which the economy, as represented by GDP and other relevant variants, recovers its potential growth trend was analysed, taking into account seasonal factors applicable to each of them.
January - September 2021 | | 103 | ||||||
3. Additional elements
•Whenever they were necessary because they were not captured under the two previous elements, they included, among others, the collective analysis including review of the sectors most affected by the pandemic, whenever their impacts had not been sufficiently captured by the macroeconomic scenarios. Also collective impairment assessment, whenever the potential deterioration in a group of customers could not be identified individually.
With the elements indicated above, the Group assesses the evolution of the credit quality of its customers in each of the geographical areas, for the purposes of their classification in phases in accordance with IFRS 9 and consequently the calculation of the expected loss.
iii. Quantification of additional provisions by covid-19:
Numerous international authorities and supervisors noted the importance of cautiously adapting and applying accounting and prudential policies to the containment measures put in place to deal with the effects of the covid-19 health crisis.
Considering these guidelines, Grupo Santander accounted for potential expected losses based on long-term stable macroeconomic forecasts, once the structural deterioration of the economy has materialised, through a subsequent overlay of the model, complemented by a collective and/or individual assessment in order to reflect a more accurate situation, specifically to recognise expected credit losses on assets that may have suffered a significant increase in credit risk (SICR). Also, following the collective impairment assessment when the impairment cannot be assessed individually.
Such an overlay was considered the best option to recognise the increase in expected loss, as a mechanical application of the expected credit loss (ECL) methodology in the current context could have led to undesired volatility or unexpected results due to the lack of reliable information. Therefore, the additional provisions associated with different macroeconomic scenarios have been calculated using internal models; however, the above-mentioned overlay to the monthly IFRS 9 calculation has been considered to improve the control and monitoring of the accuracy of the expected credit loss estimation.
The Group monitors the macroeconomic evolution in each of the geographies where it is present, and the adequacy of the provisions set up as indicated in the previous sections to the observed and expected impairment of its portfolios. As the relationship between the macroeconomic evolution, the models and the resulting provisions normalizes, the different units of the Group will progressively return in the coming quarters to the application of the IFRS 9 calculation processes in place prior to the outbreak of the pandemic.
–Market risk:
The evolution of financial markets during the first nine months of 2021 has maintained the trend of previous quarters, with a normalisation of conditions after the tensions experienced during the previous year. No significant increases in volatility, reductions in liquidity or reduced access to price sources and real market transactions for an appropriate valuation of our portfolios have been observed in the main risk factors present in our portfolios. Nor have we seen greater dispersion among the various price contributors and credit spreads have maintained their downward trend in a macroeconomic environment confident of economic recovery after the crisis of the last year.
As a result, there has been no significant impact on the fair value hierarchy and most markets, underlying and maturities have maintained their classification, in line with our observability and significance criteria. Reclassifications between levels have been concentrated and not significant on specific positions for which there may have been a change in observability conditions or a change in access to reliable valuation sources.
Nevertheless, the evolution of the markets, their liquidity and the observability conditions of the valuation inputs continue to be rigorously and exhaustively monitored in order to apply the criteria established in Grupo Santander for the classification of assets and liabilities measured at fair value and to anticipate any possible changes in current market conditions.
The levels of risk measured in terms of VaR in all the Grupo Santander's units remain at low levels. During the first nine months of the year, positions in the portfolio remained low, with low use of the authorised risk limits. Grupo Santander's treasury activity continued to be focused on low complexity instruments and on providing services to our corporate clients, mainly in interest rate and FX risk factors. Although in the time window used to calculate VaR (2 years) levels the high volatility scenarios observed last year due to the covid-19 crisis are maintained, exposure to risk is at reduced levels, approximately EUR 15 million (VaR 1d 99%) at the end of the quarter.
| 104 | | January - September 2021 | ||||||
–Tax matters:
In Spain, in June the tax assessments for corporate income tax financial years 2012-2015 were partially signed in disagreement. Banco Santander, S.A., as the parent of the Consolidated Tax Group, considers that these assessments should not have a significant impact on the consolidated financial statements or on capital, as there are sound defensive arguments in the appeals that will be filed.
During the first nine months ended 30 September 2021, there have been no additional significant changes in the estimates made at the end of 2020, other than those indicated in this interim financial information.
d) Contingent assets and liabilities
Note 2.o to Grupo Santander's consolidated annual accounts for the year ended 31 December 2020 includes information on the contingent assets and liabilities at that date. There were no significant changes in Grupo Santander's contingent assets and liabilities from 31 December 2020 to the date of formal preparation of these interim financial statements.
e) Comparative information
The information for the year 2020 contained in these interim financial statements is only presented for comparison purposes with the information relating to the first nine months ended 30 September 2021.
The information in Note 3.b regarding the outstanding shares on September 2020 has been restated due to the capital increase described in Note 31.a of the consolidated annual accounts for year 2020 in accordance with IAS 33 Earnings per share.
Additionally, the segment information corresponding to the period ended 30 September 2020 were restated for comparative purposes in accordance with the Group's new organizational structure, as required by IFRS 8 (see note 12).
In order to interpret the changes in the balances with respect to 31 December 2020, it is necessary to take into consideration the exchange rate effect arising from the volume of foreign currency balances held by the Group in view of its geographic diversity (Note 50.b to the consolidated annual accounts for the year ended 31 December 2020) and the impact of the appreciation/depreciation of the various currencies against the euro in the first nine months of 2021: Mexican peso (2.57%), US dollar (5.82%), Brazilian real (1.16%), Argentine peso (-9.9%), Pound sterling (4.65%), Chilean peso (-7.36%) and Polish zloty (-0.87%); as well as the evolution of the average exchange rates between comparable periods: Mexican peso (1.03%), US dollar (-6.02%), Brazilian real (-11.54%), Argentine peso (-32.44%), Pound sterling (2.43%), Chilean peso (2.12%) and Polish zloty (-2.77%).
f) Seasonality of the Grupo Santander’s transactions
The business activities carried on by Grupo Santander entities, and their transactions are not cyclical or seasonal in nature. Therefore, no specific disclosures are included in these explanatory notes to the interim financial statements for the first nine months ended 30 September 2021.
g) Materiality
In determining the note disclosures to be made on the various items in the interim financial statements or other matters, Grupo Santander, in accordance with IAS 34, took into account their materiality in relation to the interim financial statements for the first nine months ended 30 September 2021.
h) Events after the reporting period
From 1 October 2021 until the date of approval of the interim financial statements for the first nine months ended 30 September 2021, there have been no significant events other than those disclosed in the interim financial statements.
2. Santander Group
Appendices I, II and III to the consolidated annual accounts for the year ended 31 December 2020 provide relevant information on Grupo Santander companies at that date and on the companies accounted for under the equity method.
Also, Note 3 to the aforementioned consolidated annual accounts includes a description of the most significant acquisitions and disposals of companies performed by Grupo Santander in 2020, 2019 and 2018.
January - September 2021 | | 105 | ||||||
The most significant transactions carried out during the first nine months of 2021 or pending execution at 30 September 2021 are described below:
Tender offer for shares of Banco Santander México, S.A., Institución de Banca Múltiple, Grupo Financiero Santander Mexico
On 26 March, Banco Santander, S.A. announced its intention to make a tender offer for all shares of Banco Santander Mexico, S.A., Institución de Banca Múltiple, Grupo Financiero Santander México ('Santander México') that are not owned by Grupo Santander, representing approximately 8.3% of the share capital of Santander México. On 8 June, Banco Santander, S.A. announced that, in order to provide a liquidity window for those investors who would like to exit their positions in the short term at the offered price, it intends to launch the Tender Offer as a voluntary tender offer pursuant to article 97 of the Mexican Securities Market Law, instead of a delisting tender offer, as previously announced. As a result, the Tender Offer will cease to be a delisting tender offer and, therefore, will no longer be subject to the approval of at least 95% of the existing capital of Santander México.
The expected consideration for shareholders accepting the offer will be MXN 24 (approximately EUR 1) for each Santander Mexico share (and its equivalent for each American Depositary Share, securities listed on the New York Stock Exchange). If all the shares held by minority shareholders accept the offer, considering the currently envisaged, the acquisition of 8.3% would imply an investment by Banco Santander, S.A. of approximately MXN 13,190 million (approximately EUR 550 million).
The transaction is expected to close during the fourth quarter of 2021. The commencement of the offer and the offer itself will be subject to customary regulatory conditions and approvals.
Tender offer for shares of Santander Consumer USA Holdings by Santander Holdings USA, Inc
On July 2, Santander Holdings USA, Inc ('SHUSA', the parent company that groups Grupo Santander's businesses in the United States) announced an offer to acquire all the shares of Santander Consumer USA Holdings, Inc ('SC') that it does not currently own at a price of USD 39 per share. At the time of the announcement Santander Holdings USA, Inc owned 80% of Santander Consumer USA. Subsequently, on 24 August, Banco Santander, S.A. announced the agreement signed between SHUSA and SC whereby the acquisition by SHUSA of the common shares of SC that it does not already own will ultimately be completed at a price of USD 41.50 per SC common share. The merger will then be completed in which a wholly-owned subsidiary of SHUSA will be absorbed by SC. SC will be the merged entity and will become a wholly owned subsidiary of SHUSA. The ordinary shares of SC that have not tendered in the Offer will be converted into the right to receive the offer price in cash. The transaction will result in a cash outlay to the Group of USD 2,510 million (equivalent to approximately EUR 2,165 million).
Agreement for the acquisition of Amherst Pierpoint Securities by Santander Holdings USA, Inc
On July 15, Grupo Santander announced that its subsidiary Santander Holdings USA, Inc (the parent company that groups the Group's businesses in the US) has reached an agreement to acquire independent fixed income broker Amherst Pierpoint Securities through the purchase of its parent Pierpoint Capital Holdings LLC for a total amount of approximately USD 600 million (around EUR 500 million). The transaction, subject to regulatory approvals and customary closing conditions, is expected to be completed by the end of the first quarter of 2022.
3. Shareholder remuneration system and earnings per share
a) Shareholder remuneration system
The cash remuneration paid by Banco Santander to its shareholders in the first nine months of 2021 and 2020 was as follows:
| 30-09-2021 | 30-09-2020 | |||||||||||||||||||
| % of par value | Euros per share | Amount (EUR million) | % of par value | Euros per share | Amount (EUR million) | |||||||||||||||
| Ordinary shares | 5.50 | % | 0.0275 | 477 | — | — | — | |||||||||||||
| Other shares (without vote, redeemable, etc.) | — | — | — | — | — | — | ||||||||||||||
| Total remuneration paid | 5.50 | % | 0.0275 | 477 | — | — | — | |||||||||||||
| Dividend paid out of profit | — | — | — | — | — | — | ||||||||||||||
| Dividend paid with a charge to reserves or share premium | 5.50 | % | 0.0275 | 477 | — | — | — | |||||||||||||
| Dividend in kind | — | — | — | — | — | — | ||||||||||||||
| Flexible payment | — | — | — | — | — | — | ||||||||||||||
| 106 | | January - September 2021 | ||||||
In May 2021, the Bank paid a dividend of EUR 2.75 cents per share in cash for the 2020 financial year against share premium of EUR 477 million (see condensed consolidated statements of change in total equity and note 11), which is the maximum amount allowed under the limit set by the European Central Bank's recommendation of 15 December 2020. This payment was made in execution of the premium distribution resolution approved at the Bank's General Meeting of Shareholders held on 27 October 2020.
On 28 September 2021, the board of directors has approved the payment of an interim cash dividend against 2021 results of EUR 4.85 cents per share (see condensed consolidated statements of change in total equity and note 11), which will be paid from 2 November 2021.
In addition, the board of directors has agreed to implement a share repurchase programme for an amount equivalent to 20% of the Group's underlying profit in the first half of 2021 (approximately EUR 841 million), for which Banco Santander has received approval from the European Central Bank.
b) Earnings per share from continuing and discontinued operations
i. Basic earnings per share
Basic earnings per share for the period are calculated by dividing the net profit attributable to Grupo Santander for the first nine months adjusted by the after-tax amount relating to the remuneration of contingently convertible preference shares recognised in equity by the weighted average number of ordinary shares outstanding during the period, excluding the average number of treasury shares held in the period.
Accordingly:
| 30-09-2021 | 30-09-2020 | |||||||
| Profit attributable to the Parent (EUR million) | 5,849 | (9,048) | ||||||
| Remuneration of contingently convertible preferred securities (CCPS) (EUR million) | (425) | (416) | ||||||
| 5,424 | (9,464) | |||||||
| Of which: | ||||||||
| Profit or Loss from discontinued operations (non controlling interest net) (EUR million) | — | — | ||||||
| Profit or Loss from continuing operations (CCPS net) (EUR million) | 5,424 | (9,464) | ||||||
| Weighted average number of shares outstanding | 17,316,750,865 | 16,596,036,147 | ||||||
| Impact factor correction (a) | Not applicable | 721,566,789 | ||||||
| Adjusted number of shares | 17,316,750,865 | 17,317,602,936 | ||||||
| Basic earnings per share (euros) | 0.31 | (0.55) | ||||||
| Of which: from discontinued operations (euros) | — | — | ||||||
| from continuing operations (euros) | 0.31 | (0.55) | ||||||
(a) Correction factor for the capital increase on 3 December 2020 (see note 1.e).
ii. Diluted earnings per share
Diluted earnings per share for the period are calculated by dividing the net profit attributable to Grupo Santander for the first nine months adjusted by the after-tax amount relating to the remuneration of contingently convertible preference shares recognised in equity and of perpetual liabilities contingently amortisable in their case by the weighted average number of ordinary shares outstanding during the period, excluding the average number of treasury shares and adjusted for all the dilutive effects inherent to potential ordinary shares (share options, warrants and convertible debt instruments).
January - September 2021 | | 107 | ||||||
Accordingly, diluted earnings per share were determined as follows:
| 30-09-2021 | 30-09-2020 | |||||||
| Profit attributable to the Parent (EUR million) | 5,849 | (9,048) | ||||||
| Remuneration of contingently convertible preferred securities (CCPS) (EUR million) | (425) | (416) | ||||||
| 5,424 | (9,464) | |||||||
| Of which: | ||||||||
| Profit or Loss from discontinued operations (non controlling interest net) (EUR million) | — | — | ||||||
| Profit or Loss from continuing operations (CCPS net) (EUR million) | 5,424 | (9,464) | ||||||
| Weighted average number of shares outstanding | 17,316,750,865 | 16,596,036,147 | ||||||
| Dilutive effect of options/receipt of shares | 48,972,497 | Not applicable | ||||||
| Impact factor correction (a) | Not applicable | 721,566,789 | ||||||
| Adjusted number of shares | 17,365,723,362 | 17,317,602,936 | ||||||
| Diluted earnings per share (euros) | 0.31 | (0.55) | ||||||
| Of which: from discontinued operations (euros) | — | — | ||||||
| from continuing operations (euros) | 0.31 | (0.55) | ||||||
(a) Correction factor for the capital increase on 3 December 2020 (see note 1.e).
4. Remuneration and other benefits paid to Banco Santander’s directors and senior managers
Note 5 to Grupo Santander’s consolidated annual accounts for the year ended 31 December 2020 details the remuneration and other benefits to members of Banco Santander’s Board of Directors and senior management in 2020.
Following is a summary of the most significant data on the remunerations and benefits for the first nine months ended 30 September 2021 and 2020:
Remuneration of members of the board of directors (1)
| EUR thousand | ||||||||
| 30-09-2021 | 30-09-2020 | |||||||
| Members of the board of directors: (2)(3)(4)(5)(6)(7)(8)(9) | ||||||||
| Remuneration concept | ||||||||
| Fixed salary remuneration of executive directors | 4,760 | 4,197 | ||||||
| Variable salary remuneration of executive directors | — | — | ||||||
| Directors fees | 795 | 839 | ||||||
| Bylaw-stipulated emoluments (annual emolument) | 2,787 | 2,338 | ||||||
| Other (except insurance premiums) | 1,553 | 3,566 | ||||||
| Sub-total | 9,895 | 10,940 | ||||||
| Transactions with shares and/or other financial instruments | — | — | ||||||
| 9,895 | 10,940 | |||||||
(1)The Notes to the consolidated annual accounts for 2021 will contain detailed and complete information on the remuneration paid to all the directors, including executive directors.
(2)Mr Rodrigo Echenique ceased to be a non-executive director on 22 December 2020.
(3)Mr Sergio Rial was appointed as executive director since 30 May 2020.
(4)Mr Luis Isasi was appointed as director since 19 May 2020.
(5)Mr Guillermo de la Dehesa ceased to be a director on 3 April 2020.
(6)Mr Ignacio Benjumea ceased to be a director on 5 May 2020.
(7)Ms Esther Giménez-Salinas ceased to be a director on 27 October 2020.
(8)Ms Gina Díez was appointed as director since 22 December 2020.
(9)Mr Ramón Martín Chávez was appointed as director since 27 October 2020.
| 108 | | January - September 2021 | ||||||
Other benefits of members of the board of directors
| EUR thousand | ||||||||
| 30-09-2021 | 30-09-2020 | |||||||
| Members of the board of directors | ||||||||
| Other benefits | ||||||||
| Advances | — | — | ||||||
| Loans granted | 142 | 50 | ||||||
| Pension funds and plans: Endowments and/or contributions (1) | 1,369 | 1,515 | ||||||
| Pension funds and plans: Accumulated rights (2) | 67,594 | 66,398 | ||||||
| Life insurance premiums | 677 | 896 | ||||||
| Guarantees provided for directors | — | — | ||||||
(1) These correspond to the endowments and/or contributions made during first nine months of 2021 and 2020 in respect of retirement pensions and complementary benefits for widowhood, orphanhood and permanent disability.
(2) Corresponds to the rights accrued by the directors in matters of pensions. Additionally, former members of the board had at 30 September 2021 and 30 September 2020 rights accrued for this concept for EUR 49,228 thousand and EUR 52,381 thousand, respectively.
Remuneration of senior management (1)(2)
The table below includes the corresponding amounts related to remunerations of senior management at 30 September 2021 and 2020, excluding the executive directors:
| EUR thousand | ||||||||
| 30-09-2021 | 30-09-2020 | |||||||
| Senior management (1) | ||||||||
| Total remuneration of senior management (2) | 19,259 | 20,139 | ||||||
(1) Remunerations received during the first nine months by members of the senior management who ceased in their functions by 30 September 2021, amounted to EUR 2,690 thousand (EUR 3,688 thousand at 30 September 2020).
(2) The number of members of Banco Santander's senior management, excluding executive directors, is 16 as at 30 September 2021 (30 September 2020: 17).
The variable annual remuneration (or bonuses) received for fiscal year 2020, both for directors and the rest of senior management, were included in the information on remuneration included in the annual report for that year. Similarly, the variable remuneration attributable to the 2021 results, which will be submitted for approval by the Board of Directors at the appropriate time, will be included in the financial statements for the current year.
Funds and pension plans of senior management
| EUR thousand | ||||||||
| 30-09-2021 | 30-09-2020 | |||||||
| Senior management (1) | ||||||||
| Pension funds: Endowments and / or contributions (2) | 4,407 | 4,432 | ||||||
| Pension funds: Accumulated rights (3) | 58,472 | 55,996 | ||||||
(1)Remunerations received as endowments and/or contributions to pension funds during the first nine months by members of the senior management who ceased in their functions by 30 September 2021, amounted to EUR 195 thousand (EUR 324 thousand at 30 September 2020).
(2)Corresponds to the allocations and/or contributions made during the first nine months of 2021 and 2020 as retirement pensions.
(3)Corresponds to the rights accrued by members of senior management in the area of pensions. In addition, former members of senior management had at 30 September 2021 and 30 September 2020 rights accumulated for this same concept for EUR 132,048 thousand and EUR 158,217 thousand, respectively.
January - September 2021 | | 109 | ||||||
5. Financial assets
a) Breakdown
The detail, by nature and category for measurement purposes, of Grupo Santander's financial assets, other than the balances relating to Cash, cash balances at central banks and other deposits on demand and Hedging derivatives, at 30 September 2021 and 31 December 2020 is as follows, presented by the nature and categories for valuation purposes:
| EUR million | |||||||||||||||||
| 30-09-2021 | |||||||||||||||||
| Financial assets held for trading | Non-trading financial assets mandatorily at fair value through profit or loss | Financial assets designated at fair value through profit or loss | Financial assets at fair value through other comprehensive income | Financial assets at amortised cost | |||||||||||||
| Derivatives | 56,650 | ||||||||||||||||
| Equity instruments | 14,586 | 3,849 | 2,690 | ||||||||||||||
| Debt instruments | 30,834 | 853 | 2,618 | 98,016 | 34,079 | ||||||||||||
| Loans and advances | 20,897 | 454 | 34,352 | 8,864 | 977,915 | ||||||||||||
| Central Banks | 5,131 | — | — | — | 13,400 | ||||||||||||
| Credit institutions | 12,115 | — | 11,876 | — | 41,648 | ||||||||||||
| Customers | 3,651 | 454 | 22,476 | 8,864 | 922,867 | ||||||||||||
| Total | 122,967 | 5,156 | 36,970 | 109,570 | 1,011,994 | ||||||||||||
| EUR million | |||||||||||||||||
| 31-12-2020 | |||||||||||||||||
| Financial assets held for trading | Non-trading financial assets mandatorily at fair value through profit or loss | Financial assets designated at fair value through profit or loss | Financial assets at fair value through other comprehensive income | Financial assets at amortised cost | |||||||||||||
| Derivatives | 67,137 | ||||||||||||||||
| Equity instruments | 9,615 | 3,234 | 2,783 | ||||||||||||||
| Debt instruments | 37,894 | 700 | 2,979 | 108,903 | 26,078 | ||||||||||||
| Loans and advances | 299 | 552 | 45,738 | 9,267 | 932,300 | ||||||||||||
| Central Banks | — | — | 9,481 | — | 12,499 | ||||||||||||
| Credit institutions | 3 | — | 12,136 | — | 37,838 | ||||||||||||
| Customers | 296 | 552 | 24,121 | 9,267 | 881,963 | ||||||||||||
| Total | 114,945 | 4,486 | 48,717 | 120,953 | 958,378 | ||||||||||||
| 110 | | January - September 2021 | ||||||
Following is the gross exposure of financial assets subject to impairment stages at 30 September 2021 and 31 December 2020:
| EUR million | ||||||||||||||||||||||||||
| 30-09-2021 | 31-12-2020 | |||||||||||||||||||||||||
| Gross amount | Gross amount | |||||||||||||||||||||||||
| Stage 1 | Stage 2 | Stage 3 | Total | Stage 1 | Stage 2 | Stage 3 | Total | |||||||||||||||||||
| Financial assets at fair value through other comprehensive income | 106,811 | 29 | 103 | 106,943 | 118,150 | 6 | 50 | 118,206 | ||||||||||||||||||
| Debt instruments | 98,021 | 1 | 6 | 98,028 | 108,903 | 6 | 6 | 108,915 | ||||||||||||||||||
| Loans and advances | 8,790 | 28 | 97 | 8,915 | 9,247 | — | 44 | 9,291 | ||||||||||||||||||
| Central Banks | — | — | — | — | — | — | — | — | ||||||||||||||||||
| Credit institutions | — | — | — | — | — | — | — | — | ||||||||||||||||||
| Customers | 8,790 | 28 | 97 | 8,915 | 9,247 | — | 44 | 9,291 | ||||||||||||||||||
| Financial assets at amortised cost | 939,766 | 64,221 | 31,565 | 1,035,552 | 884,892 | 66,170 | 30,670 | 981,732 | ||||||||||||||||||
| Debt instruments | 33,817 | 118 | 425 | 34,360 | 25,889 | 66 | 395 | 26,350 | ||||||||||||||||||
| Loans and advances | 905,949 | 64,103 | 31,140 | 1,001,192 | 859,003 | 66,104 | 30,275 | 955,382 | ||||||||||||||||||
| Central Banks | 13,400 | — | — | 13,400 | 12,499 | — | — | 12,499 | ||||||||||||||||||
| Credit institutions | 41,653 | 1 | — | 41,654 | 37,845 | — | 1 | 37,846 | ||||||||||||||||||
| Customers | 850,896 | 64,102 | 31,140 | 946,138 | 808,659 | 66,104 | 30,274 | 905,037 | ||||||||||||||||||
| Total | 1,046,577 | 64,250 | 31,668 | 1,142,495 | 1,003,042 | 66,176 | 30,720 | 1,099,938 | ||||||||||||||||||
On 30 September 2021, Grupo Santander has EUR 464 million (EUR 497 million on 31 December 2020) of exposure in impaired assets purchased with impairment, of which 392 million still show signs of impairment, which mainly correspond to the business combinations carried out by Grupo Santander.
b) Impairment allowances of financial assets at amortised cost portfolio
The following is the movement that has taken place, during the first nine months ended 30 September 2021 and 2020, in the balance of provisions that cover losses due to impairment of assets which comprise the heading balance of the financial assets at amortised cost:
| EUR million | ||||||||
| 30-09-2021 | 30-09-2020 | |||||||
| Balance as at beginning of period | 23,849 | 22,713 | ||||||
| Impairment losses charged to income for the period | 6,900 | 10,226 | ||||||
| Of which: | ||||||||
| Impairment losses charged to income | 14,125 | 16,912 | ||||||
| Impairment losses reversed with a credit to income | (7,225) | (6,686) | ||||||
| Write-off of impaired balances against recorded impairment allowance | (6,398) | (6,936) | ||||||
| Exchange differences and other | (329) | (2,938) | ||||||
| Balance as at end of period | 24,022 | 23,065 | ||||||
| Of which, relating to: | ||||||||
| Impaired assets | 14,263 | 13,485 | ||||||
| Other assets | 9,759 | 9,580 | ||||||
| Of which: | ||||||||
| Individually calculated | 3,080 | 3,058 | ||||||
| Collectively calculated | 20,942 | 20,007 | ||||||
January - September 2021 | | 111 | ||||||
Following is the movement of the loan loss provision broken down by impairment stage of loans and advances to customers recognised under 'Financial assets at amortised cost' as at 30 September 2021 and 30 September 2020:
| EUR million | ||||||||||||||
| 30-09-2021 | ||||||||||||||
| Stage 1 | Stage 2 | Stage 3 | Total | |||||||||||
| Impairment allowance as at beginning of period | 4,252 | 5,672 | 13,647 | 23,571 | ||||||||||
| Transfers between stages | (556) | 940 | 3,241 | 3,625 | ||||||||||
| Variation due to credit risk | 563 | (998) | 3,701 | 3,266 | ||||||||||
| Write-offs | — | — | (6,392) | (6,392) | ||||||||||
| Exchange differences and other | (141) | (7) | (187) | (335) | ||||||||||
| Carrying amount at end of period | 4,118 | 5,607 | 14,010 | 23,735 | ||||||||||
| EUR million | ||||||||||||||
| 30-09-2020 | ||||||||||||||
| Stage 1 | Stage 2 | Stage 3 | Total | |||||||||||
| Impairment allowance as at beginning of period | 3,830 | 4,473 | 13,933 | 22,236 | ||||||||||
| Transfers between stages | (642) | 761 | 2,956 | 3,075 | ||||||||||
| Variation due to credit risk | 1,831 | 294 | 4,967 | 7,092 | ||||||||||
| Write-offs | — | — | (6,814) | (6,814) | ||||||||||
| Exchange differences and other | (515) | (477) | (1,800) | (2,792) | ||||||||||
| Carrying amount at end of period | 4,504 | 5,051 | 13,242 | 22,797 | ||||||||||
Previously written-off assets recovered during the first nine months of 2021 and 2020 amount to EUR 927 million and to EUR 820 million, respectively. In addition, during the first nine months of 2021 no amount was recognized in the income statement due to renegotiation or contractual modifications (EUR 125 million during the first nine months of 2020). Considering these amounts, the recorded impairment of financial assets at amortised cost is EUR 5,973 million and EUR 9,531 million during the first nine months of 2021 and 2020, respectively.
c) Impaired assets of financial assets at amortised cost portfolio
The movement during the first nine months ended 30 September 2021 and 2020, in the balance of financial assets classified at amortised cost and considered impaired by reason for the credit risk is as follows:
| EUR million | ||||||||||||||
| 30-09-2021 | 30-09-2020 | |||||||||||||
| Balance as at beginning of period | 31,168 | 33,184 | ||||||||||||
| Net additions | 6,759 | 7,250 | ||||||||||||
| Written-off assets | (6,398) | (6,936) | ||||||||||||
| Exchange differences and other | 428 | (3,208) | ||||||||||||
| Balance at end of period | 31,957 | 30,290 | ||||||||||||
This amount, after deducting the related allowances, represents Grupo Santander's best estimate of the discounted value of the flows that are expected to be recovered from the impaired assets.
| 112 | | January - September 2021 | ||||||
d) Fair value of financial assets not measured at fair value
Following is a comparison of the carrying amounts of Grupo Santander’s financial assets measured at other than fair value and their respective fair values at 30 September 2021 and 31 December 2020:
| EUR million | ||||||||||||||
| 30-09-2021 | 31-12-2020 | |||||||||||||
| Carrying amount | Fair value | Carrying amount | Fair value | |||||||||||
| Loans and advances | 977,915 | 983,434 | 932,300 | 940,258 | ||||||||||
| Debt instruments | 34,079 | 34,220 | 26,078 | 26,532 | ||||||||||
| ASSETS | 1,011,994 | 1,017,654 | 958,378 | 966,790 | ||||||||||
The main valuation methods and inputs used in the estimation of the fair value of the financial assets of the previous table are detailed in Note 50.c of the consolidated annual accounts for the year 2020.
6. Non-current assets held for sale
The detail, by nature, of Grupo Santander’s non-current assets held for sale at 30 September 2021 and 31 December 2020 is as follows presented by nature:
| EUR million | ||||||||
| 30-09-2021 | 31-12-2020 | |||||||
| Tangible assets | 4,273 | 4,445 | ||||||
| Of which: | ||||||||
| Foreclosed assets | 3,882 | 4,081 | ||||||
| Of which: Property assets in Spain | 3,300 | 3,485 | ||||||
| Other tangible assets held for sale | 391 | 364 | ||||||
| Other assets | 13 | — | ||||||
| 4,286 | 4,445 | |||||||
On 30 September 2021, the allowance recognised for the non-current tangible assets held for sale represented 47.4% (31 December 2020: 48.0%). The charges recorded in the first nine months of 2021 and 2020 amounted to EUR 123 million and EUR 192 million, respectively, and the recoveries undergone during those periods amount to EUR 19 million and EUR 23 million, respectively.
7. Tangible assets
a) Changes in the period
In the first nine months of 2021 and 2020, tangible assets (rights of use are not included) were acquired for EUR 4,846 million and EUR 5,584 million, respectively.
Also, in the first nine months of 2021 and 2020 tangible asset items were disposed of with a carrying amount of EUR 2,477 million and EUR 1,447 million respectively, giving rise to a net gain of EUR 43 million and EUR 48 million, respectively.
b) Property, plant and equipment purchase commitments
At 30 September 2021 and 2020, Grupo Santander did not have any significant commitments to purchase property, plant and equipment items.
c) Leasing rights
As of 30 September 2021, Grupo Santander has tangible assets under lease for the amount of EUR 2,668 million (EUR 2,837 million at 31 December 2020).
d) Tangible asset impairment
During the first nine months of 2021, EUR 116 million million of tangible asset impairment was recognised in the tangible asset impairment line.
January - September 2021 | | 113 | ||||||
8. Intangible assets
The detail of Intangible Assets - Goodwill at 30 September 2021 and 31 December 2020, based on the cash-generating units giving rise thereto, is as follows:
| EUR million | ||||||||
| 30-09-2021 | 31-12-2020 | |||||||
| Banco Santander (Brazil) | 3,195 | 3,109 | ||||||
| SAM Investment Holdings Limited | 1,444 | 1,444 | ||||||
| Santander Consumer Germany | 1,315 | 1,314 | ||||||
| Santander Bank Polska | 1,095 | 1,104 | ||||||
| Santander Portugal | 1,040 | 1,040 | ||||||
| Santander España | 1,027 | 1,027 | ||||||
| Santander Consumer USA | 957 | 904 | ||||||
| Santander Bank National Association | 628 | 594 | ||||||
| Santander UK | 619 | 592 | ||||||
| Banco Santander Chile | 529 | 571 | ||||||
| Grupo Financiero Santander (Mexico) | 423 | 399 | ||||||
| Santander Consumer Nordics | 222 | 216 | ||||||
| Other entities | 151 | 157 | ||||||
| Total Goodwill | 12,645 | 12,471 | ||||||
During the first nine months of 2021 there has been an increase in goodwill of EUR 174 million, mainly due to exchange differences (Note 11), which, in accordance with current regulations, have been recognised with a credit to Other comprehensive income - Items that may be reclassified to profit or loss - Foreign currency translation in equity through the condensed consolidated statement of recognised income and expense.
Note 17 of the consolidated annual accounts for the year ended 31 December 2020 includes detailed information on the procedures followed by Grupo Santander to analyse the potential impairment of the goodwill recognised with the respect to its recoverable amount and to recognise the related impairment losses, where appropriate.
The accounting standard (IAS 36) requires that a cash‑generating unit to which goodwill has been allocated is tested for impairment annually, and whenever there is an indication that the unit may be impaired.
Accordingly, based on the analysis performed of the available information on the performance of the various cash-generating units which might evidence the existence of indicators of impairment, Grupo Santander's directors concluded that in the first nine months of 2021 there were no impairment losses which required recognition (see note 1.c).
| 114 | | January - September 2021 | ||||||
9. Financial liabilities
a) Breakdown
The following is a breakdown of Grupo Santander's financial liabilities, other than the balances corresponding to the Derivatives - hedge accounting heading, as of 30 September 2021 and 31 December 2020, presented by nature and categories for valuation purposes:
| EUR million | ||||||||||||||||||||
| 30-09-2021 | 31-12-2020 | |||||||||||||||||||
| Financial liabilities held for trading | Financial liabilities designated at fair value through profit or loss | Financial liabilities at amortised cost | Financial liabilities held for trading | Financial liabilities designated at fair value through profit or loss | Financial liabilities at amortised cost | |||||||||||||||
| Derivatives | 55,086 | 64,469 | ||||||||||||||||||
| Short Positions | 14,902 | 16,698 | ||||||||||||||||||
| Deposits | 10,159 | 42,499 | 1,047,752 | — | 43,598 | 990,391 | ||||||||||||||
| Central banks | 2,790 | 1,017 | 123,732 | — | 2,490 | 112,804 | ||||||||||||||
| Credit institutions | 2,560 | 4,788 | 56,489 | — | 6,765 | 62,620 | ||||||||||||||
| Customer | 4,809 | 36,694 | 867,531 | — | 34,343 | 814,967 | ||||||||||||||
| Debt instruments | — | 5,401 | 238,882 | — | 4,440 | 230,829 | ||||||||||||||
| Other financial liabilities | — | — | 31,125 | — | — | 26,968 | ||||||||||||||
| Total | 80,147 | 47,900 | 1,317,759 | 81,167 | 48,038 | 1,248,188 | ||||||||||||||
b) Information on issues, repurchases or redemptions of debt instruments issued
The detail of the balance of debt instruments issued according to their nature is:
| EUR million | ||||||||
| 30-09-2021 | 31-12-2020 | |||||||
| Bonds and debentures outstanding | 195,154 | 191,577 | ||||||
| Subordinated | 23,000 | 21,686 | ||||||
| Promissory notes and other securities | 26,129 | 22,006 | ||||||
| Total debt instruments issued | 244,283 | 235,269 | ||||||
The detail, at 30 September 2021 and 2020, of the outstanding balance of the debt instruments, excluding promissory notes, which at these dates had been issued by Banco Santander or any other Group entity is disclosed below. Also included is the detail of the changes in this balance in the first nine months of 2021 and 2020:
| EUR million | ||||||||||||||||||||
| 30-09-2021 | ||||||||||||||||||||
| Opening balance at 01-01-21 | Perimeter | Issuances or placements | Repurchases or redemptions | Exchange rate and other adjustments | Closing balance at 30-09-21 | |||||||||||||||
| Bonds and debentures outstanding | 191,577 | — | 46,073 | (45,292) | 2,796 | 195,154 | ||||||||||||||
| Subordinated | 21,686 | — | 2,575 | (1,500) | 239 | 23,000 | ||||||||||||||
| Bonds and debentures outstanding and subordinated liabilities issued | 213,263 | — | 48,648 | (46,792) | 3,035 | 218,154 | ||||||||||||||
| EUR million | ||||||||||||||||||||
| 30-09-2020 | ||||||||||||||||||||
| Opening balance at 01-01-20 | Perimeter | Issuances or placements | Repurchases or redemptions | Exchange rate and other adjustments | Closing balance at 30-09-20 | |||||||||||||||
| Bonds and debentures outstanding | 208,455 | 785 | 46,681 | (48,129) | (8,864) | 198,928 | ||||||||||||||
| Subordinated | 20,878 | — | 1,853 | (1,613) | (857) | 20,261 | ||||||||||||||
| Bonds and debentures outstanding and subordinated liabilities issued | 229,333 | 785 | 48,534 | (49,742) | (9,721) | 219,189 | ||||||||||||||
January - September 2021 | | 115 | ||||||
At 21 September 2021, Banco Santander carried out a placement of contingently convertible preference shares into newly issued ordinary shares of the Bank ('PPCCs'), for a nominal amount of EUR 1,000 million.
The Issue was carried out at par and the remuneration of the PPCCs, the payment of which is subject to certain conditions and is also discretionary, has been set at 3.625% per annum for the first eight years, revised every five years thereafter by applying a margin of 376 basis points over the 5-year Mid-Swap Rate.
At 11 September 2021, Banco Santander proceeded to redeem early and voluntarily the entire outstanding Tier 1 Contingently Convertible Preferred Shares ('PPCC') with ISIN code XS1107291541 and common code 110729154, and traded on the Irish Stock Exchange market "Global Exchange Market", for a total nominal amount of EUR 1,500 million.
At 12 May 2021, Banco Santander placed the issue contingently convertible preference shares into newly issued ordinary shares of the Bank, previously announced, for a total nominal amount of EUR 1,578 million, issued in a US Dollar Series of USD 1,000 million (EUR 828 million at the exchange rate on the day of the issue) and a Euro Series of EUR 750 million.
The issuance is carried out at par and the remuneration of PPCCs, whose payment is subject to certain conditions and is also discretionary, has been fixed (i) for the Dollar Series at 4.750% per annum for the first six years, revised every five years thereafter by applying a margin of 375.3 basis points over the 5-year UST rate (5-year UST) and (ii) for the Euro Series at 4.125% per annum for the first seven years, revised every five years thereafter by applying a margin of 431.1 basis points over the applicable 5-year Euro mid-swap.
At 12 March 2020, Banco Santander proceeded to redeem early and voluntarily the entire outstanding issue of Tier 1 Contingently Convertible Preferred Participations Series I/2014, for a total nominal amount of EUR 1,500 million.
In January 2020, Banco Santander carried out a placement of contingently convertible preferred participations into newly issued ordinary shares of Banco Santander (the 'PPCCs'), excluding the pre-emptive subscription rights of its shareholders and for a nominal amount of EUR 1,500 million (the 'Issue' and the 'PPCCs').
The Issue was made at par and the remuneration of the PPCCs, the payment of which is subject to certain conditions and is also discretionary, was set at 4.375% per annum for the first six years, revised every five years thereafter by applying a margin of 453.4 basis points over the 5-year Mid-Swap Rate .
c) Other issues guaranteed by Grupo Santander
At 30 September 2021 and 2020, there were no debt instruments issued by associates or non-Group third parties (unrelated) that had been guaranteed by Banco Santander or any other Group entity.
d) Fair value of financial liabilities not measured at fair value
Following is a comparison between the value by which Grupo Santander’s financial liabilities are recorded that are measured using criteria other than fair value and their corresponding fair value at 30 September 2021 and 31 December 2020:
| EUR million | ||||||||||||||
| 30-09-2021 | 31-12-2020 | |||||||||||||
| Carrying amount | Fair value | Carrying amount | Fair value | |||||||||||
| Deposits | 1,047,752 | 1,046,027 | 990,391 | 990,807 | ||||||||||
| Debt instruments | 238,882 | 246,426 | 230,829 | 241,174 | ||||||||||
| Liabilities | 1,286,634 | 1,292,453 | 1,221,220 | 1,231,981 | ||||||||||
Additionally, other financial liabilities are accounted for EUR 31,125 million and EUR 26,968 million as of 30 September 2021 and 31 December 2020, respectively.
The main valuation methods and inputs used in the estimation of the fair value of the financial liabilities in the previous table are detailed in note 50.c of the consolidated annual accounts for 2020, other than those mentioned in these interim financial statements.
10. Provisions
a) Provisions for Pensions and other post-retirements obligations and Other long term employee benefits
The variation experienced by the balance of the Pensions and other post-retirements obligations and other long-term employee benefits from 31 December 2020 to 30 September 2021, is mainly due to lower net actuarial losses as a result of changes in actuarial assumptions (see note 11.d).
| 116 | | January - September 2021 | ||||||
b) Provisions for taxes and other legal contingencies and Other provisions
Set forth below is the detail, by type of provision, of the balances at 30 September 2021 and at 31 December 2020 of Provisions for taxes and other legal contingencies and Other provisions. The types of provision were determined by grouping together items of a similar nature:
| EUR million | ||||||||
| 30-09-2021 | 31-12-2020 | |||||||
| Provisions for taxes | 546 | 600 | ||||||
| Provisions for employment-related proceedings (Brazil) | 412 | 437 | ||||||
| Provisions for other legal proceedings | 1,067 | 1,163 | ||||||
| Provision for customer remediation | 628 | 395 | ||||||
| Regulatory framework-related provisions | 11 | 69 | ||||||
| Provision for restructuring | 965 | 810 | ||||||
| Other | 877 | 951 | ||||||
| 4,506 | 4,425 | |||||||
Relevant information is set forth below in relation to each type of provision shown in the preceding table:
The provisions for taxes include provisions for tax-related proceedings.
The provisions for employment-related proceedings (Brazil) relate to claims filed by trade unions, associations, the prosecutor's office and ex-employees claiming employment rights to which, in their view, they are entitled, particularly the payment of overtime and other employment rights, including litigation concerning retirement benefits. The number and nature of these proceedings, which are common for banks in Brazil, justify the classification of these provisions in a separate category or as a separate type from the rest. The Group calculates the provisions associated with these claims in accordance with past experience of payments made in relation to claims for similar items. When claims do not fall within these categories, a case-by-case assessment is performed and the amount of the provision is calculated in accordance with the status of each proceeding and the risk assessment carried out by the legal advisers.
The provisions for other legal proceedings include provisions for court, arbitration or administrative proceedings (other than those included in other categories or types of provisions disclosed separately) brought against Santander Group companies.
The provisions for customer remediation include mainly the estimated cost of payments to remedy errors relating to the sale of certain products in the UK, the estimated cost of the Banco Popular Español, S.A.U. floor clauses and the estimated cost claim's cost made on CHF index-linked loan contracts in Poland. To calculate the provision for customer remediation, the best estimate of the provision made by management is used, which is generally based on the estimated number of claims to be received and, of these, the number that will be accepted, as well as the estimated average payment per case.
The regulatory framework-related provisions include mainly the provisions for the extraordinary contribution to Financial Services Compensation Scheme (FSCS) and the Bank Levy in the UK, and those relating to Banking Tax in Poland.
The provisions for restructuring include only the direct costs arising from restructuring processes by the various Group companies.
Qualitative information on the main litigation is provided in note 10.c.
Our general policy is to record provisions for tax and legal proceedings in which we assess the chances of loss to be probable and we do not record provisions when the chances of loss are possible or remote. We determine the amounts to be provided for as our best estimate of the expenditure required to settle the corresponding claim based, among other factors, on a case-by-case analysis of the facts and the legal opinion of internal and external counsel or by considering the historical average amount of the loss incurred in claims of the same nature. The definitive date of the outflow of resources embodying economic benefits for the Group depends on each obligation. In certain cases, the obligations do not have a fixed settlement term and, in others, they depend on legal proceedings in progress.
The changes in provisions arising from civil contingencies and legal nature are disclosed in this note.
The main changes in provisions in the first nine months of 2021 are as follows:
Regarding the provisions for labour processes and others of a legal nature, Brazil has charged EUR 136 million and EUR 92 million, respectively, making payments of EUR 191 million and EUR 172 million, respectively.
Regarding the provisions arising for customer remediation Poland has registered EUR 185 million in the first nine months of the year in order to cover the mortgage portfolio in CHF.
Regarding in provisions constituted by regulatory framework, in the first nine months of 2021 in United Kingdom EUR 59 million have been used (Bank Levy). In addition, EUR 97 million have been charged and paid in the first nine months of 2021 in Poland.
In addition, the restructuring provision includes the provisions made mainly in the United Kingdom and Portugal, as well as the payments made by the Group in the first nine months of 2021.
January - September 2021 | | 117 | ||||||
c) Litigation and other matters
i. Tax-related litigation
At 30 September 2021 the main tax-related proceedings concerning the Group were as follows:
•Legal actions filed by Banco Santander (Brasil) S.A. and other Group entities to avoid the application of Law 9.718/98, which modifies the basis to calculate PIS and COFINS social contribution, extending it to all the entities income, and not only to the income from the provision of services. In relation of Banco Santander (Brasil) S.A. process, in May 2015 the Federal Supreme Court (FSC) admitted the extraordinary appeal filed by the Federal Union regarding PIS, and dismissed the extraordinary appeal lodged by the Brazilian Public Prosecutor's Office regarding COFINS contribution, confirming the decision of Federal Regional Court favourable to Banco Santander (Brasil) S.A. of August 2007. The appeals filed by the other entities before the Federal Supreme Court, both for PIS and COFINS, are still pending. These claims are fully provisioned.
•Banco Santander (Brasil) S.A. and other Group companies in Brazil have appealed against the assessments issued by the Brazilian tax authorities questioning the deduction of loan losses in their income tax returns (IRPJ and CSLL) in relation to different administrative processes of various years on the ground that the requirements under the applicable legislation were not met. The appeals are pending decision in CARF. No provision was recognised in connection with the amount considered to be a contingent liability.
•Banco Santander (Brasil) S.A. and other Group companies in Brazil are involved in administrative and legal proceedings against several municipalities that demand payment of the Service Tax on certain items of income from transactions not classified as provisions of services. There are several cases in different judicial instances. A provision was recognised in connection with the amount of the estimated loss.
•Banco Santander (Brasil) S.A. and other Group companies in Brazil are involved in administrative and legal proceedings against the tax authorities in connection with the taxation for social security purposes of certain items which are not considered to be employee remuneration. There are several cases in different judicial instances. A provision was recognised in connection with the amount of the estimated loss.
•In May 2003 the Brazilian tax authorities issued separate infringement notices against Santander Distribuidora de Títulos e Valores Mobiliarios Ltda. (DTVM, actually Santander Brasil Tecnología S.A.) and Banco Santander (Brasil) S.A. in relation to the Provisional Tax on Financial Movements (CPMF) of the years 2000 to 2002. The administrative discussion ended unfavourably for both companies, and on July 3, 2015, filed a lawsuit requesting the cancellation of both tax assessments. The lawsuit was judged unfavourably in first instance. Therefore, both plaintiffs appealed to the court of second instance. On December 2020, the appeal was decided unfavourably. Against the judgment, the bank filed a motion for clarification which has not been accepted. Currently it is appealed to higher courts. There is a provision recognized for the estimated loss.
•In December 2010 the Brazilian tax authorities issued an infringement notice against Santander Seguros S.A. (Brazil), currently Zurich Santander Brasil Seguros e Previdência S.A., as the successor by merger to ABN AMRO Brasil dois Participações S.A., in relation to income tax (IRPJ and CSLL) for 2005, questioning the tax treatment applied to a sale of shares of Real Seguros, S.A. The administrative discussion ended unfavourably, and the CARF decision has been appealed at the Federal Justice. As the former parent of Santander Seguros S.A. (Brasil), Banco Santander (Brasil) S.A. is liable in the event of any adverse outcome of this proceeding. No provision was recognised in connection with this proceeding as it is considered to be a contingent liability.
•In November 2014 the Brazilian tax authorities issued an infringement notice against Banco Santander (Brasil) S.A. in relation to corporate income tax (IRPJ and CSLL) for 2009 questioning the tax-deductibility of the amortisation of the goodwill of Banco ABN AMRO Real S.A. performed prior to the absorption of this bank by Banco Santander (Brasil) S.A., but accepting the amortisation performed after the merger. Actually it is appealed before the Higher Chamber of CARF. No provision was recognised in connection with this proceeding as it was considered to be a contingent liability.
•Banco Santander (Brasil) S.A. has also appealed against infringement notices issued by the tax authorities questioning the tax deductibility of the amortisation of the goodwill arising on the acquisition of Banco Comercial e de Investimento Sudameris S.A from years 2007 to 2012. No provision was recognised in connection with this matter as it was considered to be a contingent liability.
•Banco Santander (Brasil) S.A. and other companies of the Group in Brazil are undergoing administrative and judicial procedures against Brazilian tax authorities for not admitting tax compensation with credits derived from other tax concepts, not having registered a provision for such amount since it is considered to be a contingent liability.
•Banco Santander (Brasil) S.A. is involved in appeals in relation to infringement notices initiated by tax authorities regarding the offsetting of tax losses in the CSLL (‘Social Contribution on Net Income’) of year 2009. The appeal is pending decision in CARF. No provision was recognised in connection with this matter as it is considered to be a contingent liability.
| 118 | | January - September 2021 | ||||||
•Brazilian tax authorities have issued infringement notices against Getnet Adquirência e Serviços para Meios de Pagamentos S.A and Banco Santander (Brasil) S.A. as jointly liable in relation to corporate income tax (IRPJ and CSLL) for 2014 to 2018 questioning the tax-deductibility of the amortization of the goodwill from the acquisition of Getnet Tecnologia Proces S.A., considering that the company would not have complied with the legal requirements for such amortization. A defense against the tax assessment notices were submitted, and the appeal is pending decision in CARF. No provision was recognized as it is considered to be a contingent liability.
The total amount for the aforementioned Brazil lawsuits that are fully provisioned is EUR 844 million, and for lawsuits that qualify as contingent liabilities is EUR 3,469 million.
•Legal action brought by Sovereign Bancorp, Inc. (currently Santander Holdings USA, Inc.) claiming its right to take a foreign tax credit for taxes paid outside the United States in fiscal years 2003 to 2005 as well as the related issuance and financing costs. On 17 July 2018, the District Court finally ruled against Santander Holdings USA, Inc. On September 5, 2019 the Federal District Court in Massachusetts entered a judgement resolving the Company’s tax liability for fiscal years 2003 to 2005, which had no effect on income. The Company has agreed to resolve the treatment of the same transactions for 2006 and 2007, consistent with the September 5, 2019 judgment. The Congressional Joint Committee on Taxation has completed its review of the proposed resolution of the 2006 and 2007 tax years, with no objection. The IRS finalized its administrative process to close-out the issue, which resulted in no impact on net income.
•Banco Santander appealed before European Courts the Decisions 2011/5/CE of 28 October 2009 (First Decision), and 2011/282/UE of 12 January 2011 (Second Decision) of the European Commission, ruling that the deduction of the financial goodwill regulated pursuant to Article 12.5 of the Corporate Income Tax Law constituted illegal State aid. On October 2021 the Court of Justice has definitively confirmed these Decisions. The dismissal of the appeal, that only affects these two decisions, has no effect on equity.
At the date of approval of these interim financial statements certain other less significant tax-related proceedings are also in progress.
ii. Non-tax-related proceedings
At 30 September 2021 the main non-tax-related proceedings concerning the Group were as follows:
• Payment Protection Insurance (PPI): claims associated with the sale by Santander UK plc of payment protection insurance or PPI to its customers. At 30 September 2021, the remaining provision for PPI redress and related costs was GBP 32.5 million (EUR 37.9 million) (2020: GBP 76 million – EUR 87 million). There was no additional provision in the first nine months ended 30 September 2021.
At 30 September 2021, the outstanding activities which drive the ongoing provision requirement relate to the commercial settlement with the Official Receiver, and customer litigation concerning the historical sale of PPI. Although the deadline for bringing complaints has passed, customers can still commence litigation for PPI mis-selling. Provision has been made for the best estimate of any obligation to pay compensation in respect of current stock and estimated future claim. There are ongoing factual issues to be resolved regarding such litigation which may have legal consequences including the volume and quality of future litigation claims. As a result, the extent of the potential liability and amount of any compensation to be paid continues to have a significant uncertainty component.
In relation to a specific PPI portfolio of complaints, there is a legal dispute regarding allocation of liability for pre-2005 PPI policies underwritten by two affiliates (Axa France) that Axa Group acquired from Genworth Financial International Holdings, Inc. in September 2015. The dispute involves a Santander Cards UK Limited (formerly known as GE Capital Bank Limited which was acquired by Banco Santander, S.A. from GE Capital group in 2008) which was the distributor of the refer pre-2005 PPI policies and Santander Insurance Services UK Limited (the Santander Entities).
In July 2017, the Santander Entities notified Axa France that they did not accept liability for losses on PPI policies relating to this period. Santander UK plc entered in a Complaints Handling Agreement –that included a standstill agreement- agreeing to handle complaints on Axa affiliates behalf, paying these latter companies redress assessed to be due to relevant policyholders on a without prejudice basis.
After the termination of the Complaints Handling Agreement, on 30 December 2020 Axa France has provided written notice to the Santander Entities to terminate the standstill agreement. On 5 March 2021, the Santander Entities were served with a Claim Form and Brief Details of Claim by AXA France, claiming that the Santander Entities are liable to reimburse AXA France for pre-2005 PPI mis-selling losses, currently estimated at GBP 636 million (EUR 739 million). On 22 March 2021, the Santander Entities acknowledged service of the claim and notified the court of their intention to defend the claim in full and have now issued an application for Axa Frances’s claim to be struck out/summarily dismissed. This dispute is at an early stage and there are ongoing factual issues to be resolved which may have legal consequences including in relation to liability. These issues create uncertainties which mean that it is difficult to reliably predict the outcome or the timing of the resolution of the matter. The regulatory and other provision includes our best estimate of the Santander UK’s liability to PPI and portfolio claims.
January - September 2021 | | 119 | ||||||
•Delforca: dispute arising from equity swaps entered into by Gaesco (now Delforca 2008, S.A.) on shares of Inmobiliaria Colonial, S.A. Banco Santander, S.A. is claiming to Delforca before the Court of Barcelona in charge of the bankruptcy proceedings, a total of EUR 66 million from the liquidation resulting from the early termination of financial transactions due to Delforca's non-payment of the equity swaps. In the same bankruptcy proceedings, Delforca and Mobiliaria Monesa have in turn claimed the Bank to repay EUR 57 million, which the Bank received for the enforcement of the agreed guarantee, as a result of the aforementioned liquidation. On 16 September 2021 the Commercial Court #10 of Barcelona has ordered Delforca to pay the Bank EUR 66 million plus EUR 11 million in interest and has dismissed the claims filed by Delforca, within the same procedure, against the Bank. This decision can be appealed.
In 2009, Mobiliaria Monesa, S.A. (parent of Delforca) filed a civil procedure with the Courts of Santander against the Bank claiming damages that have not been specified to date. The procedure is suspended.
•Former employees of Banco do Estado de São Paulo S.A., Santander Banespa, Cia. de Arrendamiento Mercantil: a claim was filed in 1998 by the association of retired Banespa employees (AFABESP) requesting the payment of a half-yearly bonus contemplated in the by-laws of Banespa in the event that Banespa obtained a profit and that the distribution of this profit were approved by the Board of Directors. The bonus was not paid in 1994 and 1995 since Banespa had not made a profit during those years. Partial payments were made from 1996 to 2000, as approved by the Board of Directors. The relevant clause was eliminated in 2001. The Regional Labour Court and the High Employment Court (TST) ordered Santander Brasil, as successor to Banespa, to pay this half-yearly bonus for the period from 1996 to the present. On 20 March 2019, the Supreme Federal Court (STF) rejected the extraordinary appeal filed by Banco Santander Brasil.
The Bank filed a rescissory action to nullify the decisions of the main proceedings and suspend the execution of the judgment, which was deemed inadmissible, therefore its execution was suspended. The rescissory action was dismissed and a motion for clarification was filed, due to the absence of an explicit argument to deny the rescissory action filed by the Bank. After the decision of the motion for clarification, the Bank filled an extraordinary appeal in the rescissory action in February 2021, which was denied in an interlocutory decision in June 2021 by the TST. As the Bank understands that there is a conflict between the TST decision and the doctrine set by the STF, the Bank has appealed this decision. In August 2021, a first instance court has ruled that the enforcement of the TST decision shall be carried out individually, at the correspondent jurisdiction of each person. AFABESP has appealed this decision.
At this moment we have the legal opinion of the bank's external advisers, who have classified the risk as probable. The recorded provisions are considered sufficient to cover the risks associated with the legal claims that are being substantiated as of today.
•'Planos Económicos': like the rest of the banking system in Brasil, Santander Brasil has been the target of customer complaints and collective civil suits stemming from legislative changes and its application to bank deposits, fundamentally ('economic plans'). At the end of 2017, there was an agreement between regulatory entities and the Brazilian Federation of Banks (Febraban), already approved by the Supremo Tribunal Federal, with the purpose of closing the lawsuits. Discussions focused on specifying the amount to be paid to each affected client according to the balance in their notebook at the time of the Plan. Finally, the total value of the payments will depend on the number of endorsements they have made and the number of savers who have demonstrated the existence of the account and its balance on the date the indexes were changed. In November 2018, the STF ordered the suspension of all economic plan processes for two years from May 2018. On 29 May 2020, the Supremo Tribunal Federal approved the extension of the agreement for 5 additional years starting from 3 June 2020. Condition for this extension was to include in the agreement actions related to the “Collor I Plan”. The provisions recorded for the economic plan processes are considered to be sufficient.
•Floor clauses: in consequence of the acquisition of Banco Popular Español, S.A.U, the Group has been exposed to a material number of transactions with floor clauses. The so-called "floor clauses" or minimum clauses are those under which the borrower accepts a minimum interest rate to be paid to the lender, regardless of the applicable reference interest rate. Banco Popular Español, S.A.U. included "floor clauses" in certain asset transactions with customers. In relation to this type of clauses, and after several rulings made by the Court of Justice of the European Union and the Spanish Supreme Court, and the extrajudicial process established by the Spanish Royal Decree-Law 1/2017, of 2 January, Banco Popular Español, S.A.U. made extraordinary provisions that were updated in order to cover the effect of the potential return of the excess interest charged for the application of the floor clauses between the contract date of the corresponding mortgage loans and May 2013. The Group considered that the maximum risk associated with the floor clauses applied in its contracts with consumers, in the most severe and not probable scenario, would amount to approximately EUR 900 million, as initially measured and without considering the returns performed. At 30 September 2021, after having processed most of the customer requests, the potential residual loss associated with ongoing court proceedings is estimated at EUR 49 million, amount which is fully covered by provisions.
•Banco Popular´s acquisition: considering the declaration setting out the resolution of Banco Popular Español, S.A.U., the redemption and conversion of its capital instruments and the subsequent transfer to Banco Santander, S.A. of the shares resulting from this conversion in exercise of the resolution instrument involving the sale of the institution's business, in the application accordance with the single resolution framework regulation referred to in Note 3 of the 2018 consolidated annual accounts, some investors have filed claims against the EU’s Single Resolution Board decision, the FROB's resolution executed in accordance to the aforementioned decision, and claims have been filed and may be filed in the future against Banco Santander, S.A. or other Santander Group companies deriving from or related to the acquisition of Banco Popular Español, S.A.U..
| 120 | | January - September 2021 | ||||||
At this stage, it is not possible to foresee the total number of claims that could be filed by the former holders of shares and capital instruments (arising from the acquisition by investors of such shares and capital instruments of Banco Popular prior to resolution, including in particular, without limitation, the shares acquired in the context of the capital increase with pre-emptive subscription rights carried out in 2016), and their economic implications (especially considering that the decision to resolve in application of the new regulation has no precedent, and that it may be possible that future claims do not specify a specific amount, put forward new legal interpretations or involve a large number of parties).
In this respect, on 2 September 2020, the Provincial Court of La Coruña has referred a preliminary ruling to the Court of Justice of the European Union (“CJEU”) asking for the correct interpretation of Article 60(2) of Directive 2014/59/EU of the European Parliament and of the Council, dated 15 May 2014, which establishes a framework for the restructuring and resolution of credit institutions and investment firms. This article establishes that, in cases of redemption of capital instruments in a bank resolution, no liability shall remain in relation to the amount of the instrument that has been redeemed. The judgement given by the CJEU in this case is likely to condition the outcome on the judicial proceedings that are currently open.
The estimated cost of any compensation to shareholders and bondholders of Banco Popular recognized in the 2017 accounts amounted to EUR 680 million, of which EUR 535 million were applied to the commercial loyalty program. The provisions recorded are considered sufficient to cover the risks associated with the court claims that can be estimated to date. However, if additional amounts have to be paid for claims already raised with an undetermined economic interest or for new claims, this could have a significant adverse effect on the Santander Group's results and financial situation.
Likewise, the Central Court of Instruction 4 is currently conducting preliminary proceedings 42/2017, in which, amongst other things, is being investigated the following: (i) the accuracy of the prospectus for the capital increase with pre-emptive subscription rights carried out by Banco Popular in 2016; and (ii) the alleged manipulation of the share price of Banco Popular until the resolution of the bank, in June 2017. During the course of the proceedings, on 30 April 2019, the Spanish National Court, ruled in favour of Banco Santander, S.A. declaring that Banco Santander, S.A. cannot inherit Banco Popular’s potential criminal liability. This ruling was appealed before the Supreme Court who have rejected the appeal. In this procedure, Banco Santander has the status of possible subsidiary civil liability.
•German shares investigation: the Cologne Public Prosecution Office is conducting an investigation against the Bank, and other group entities based in UK - Santander UK plc, Santander Financial Services Plc and Cater Allen International Limited -, in relation to a particular type of tax dividend linked transactions known as cum-ex transactions.
The Group is cooperating with the German authorities. According to the state of the investigations, the result and the effects for the Group, which may potentially include the imposition of financial penalties, cannot be anticipated. For this reason, the Bank has not recognized any provisions in relation to the potential imposition of financial penalties.
•IRPH Index: a portion of our Spanish mortgage loan portfolio bears interest at a rate indexed to the “Índice de Referencia de Préstamos Hipotecarios” known as “IRPH,” which, at the time the contracts were entered into, served as reference rate for many mortgage loan agreements in Spain and was published by the Bank of Spain. Consumers in Spain have brought lawsuits against most of the Spanish banking sector alleging that the use and related disclosures of such rate did not comply with the transparency requirements of European regulation. On 14 December 2017, the Supreme Court of Spain ruled that these clauses were valid, as the IRPH is an official rate and therefore non-subject to transparency requirements. The matter was referred to the Court of Justice of the European Union through a preliminary ruling procedure. On 3 March 2020 the CJEU rendered its decision.
The CJEU ruled that, being the IRPH a valid index, national courts are entitled to examine its use on each particular contract in order to verify whether the transparency requirements have been met. When carrying out the transparency control, national courts have to take into account all the circumstances surrounding the conclusion of the particular contract, including whether essential information relating to the calculation of that rate was easily accessible and the provision of data relating to past fluctuations of the index. Finally, with regards to the effects of nullity of an IRPH index clause, the CJUE entitles national courts to substitute it with another statutory index, thus not declaring the nullity of the whole contract.
On 12 November 2020, the Supreme Court has issued four judgments applying the doctrine established by the CJUE that resolve individual appeals in which the validity of the IRPH clauses was questioned. The Court understands that in those cases there is a lack of transparency because the financial institutions had not been able to prove the delivery to the client of the information on the evolution of the index in the two years prior to the contract. However, the Supreme Court reminds that the lack of transparency does not automatically imply the invalidity of the clause, but rather it is necessary to analyze whether this lack of transparency generates abusiveness. The Supreme Court resolves that in the case of the IRPH, that specific lack of transparency does not mean that the clause is abusive to the detriment of the client, so the clause is valid and fully applicable.
Currently, the balance of the relevant mortgage indexed to IRPH loans held by the Group, equals approximately EUR 2.7 billion.
•Banco Santander, S.A. has been sued in a legal proceeding in which the plaintiff alleges that a contract was concluded whereby he would be entrusted with the functions of CEO of the Bank. In the complaint, the claimant mainly requests a declaratory ruling that affirms the validity and conclusion of such contract and its enforcement together with the payment of certain amounts. If the main request is not granted, the claimant seeks compensation for a total amount of approximately EUR 112 million or, an alternative relief for other minor amounts. Banco Santander, S.A. has answered to the complaint. In this answer, it is stated that the conditions to which the appointment was subject to were not met and that the contract required by law was not concluded. The trial took place on 19 May 2021. The claimant waived specific performance of the alleged contract. The trial was suspended because of two witnesses' failure to appear. The trial was resumed on 20 October 2021 and, once the parties submit their written conclusions, it will be ready for judgment in first instance.
January - September 2021 | | 121 | ||||||
•Universalpay Entidad de Pago, S.L. has filed a lawsuit against Banco Santander, S.A. for breach of the marketing alliance agreement (MAA) and in claim of quantity. The claim is processed in the Court of First Instance no. 81 of Madrid, ordinary procedure 156/2021. The MAA was originally subscribed by Banco Popular Español, S.A.U. and its purpose is the business of acquiring services for businesses in the Spanish market. The lawsuit is mainly based on the potential breach of clause 6 of the MAA, which establishes certain obligations of exclusivity, non-competition and customer reference. The claim is at a very early stage, and there are factual issues pending resolution, which may have legal consequences and affect eventual liability. This uncertainty makes it impossible to reliably predict the resolution of the issue, the timing or the significance of the potential impact. The Bank has answered the complaint. The pretrial hearing is scheduled for 16 December 2021.
•CHF Polish Mortgage Loans: On 3 October 2019, the Court of Justice of the European Union (CJEU) rendered its decision in relation to a lawsuit against an unrelated bank in Poland, with regards to unfair contractual clauses in consumer agreements, specifically the consequences of potentially unfair contractual clauses in CHF-indexed loan agreements. The CJEU has left to Polish courts the decision on whether the whole contract can be maintained once the abusive terms have been removed, which should in turn decide whether the effects of the annulment of the contract are prejudicial to the consumer. In that case, the court may only integrate the contract with default provisions of national law and decide, in accordance with those provisions, on the applicable rate.
In December 2020, the Chairman of the Financial Supervision Authority announced a high-level proposal for voluntary settlements between banks and borrowers under which active loans based on Swiss francs would be converted into PLN loans with interest at the WIBOR rate and an appropriate margin. No details of the proposal, or legal or tax considerations, were provided as at the date of publication of these financial statements. This proposal is currently under analysis within the Bank, as well as by representatives of the financial sector in consultation with the competent authorities. Depending on the results of this analysis, the Bank will decide whether to adhere to this proposal and will proceed to include additional scenarios in the models for calculating provisions and reflect the estimated impact on their level. The Group considers that the maximum risk associated to this proposal, assuming that 100% of customers choose to convert their active loans as proposed, would amount to approximately PLN 3.5 billion (EUR 768 million).
On 2 September 2021, the Supreme Court was expected to take a position regarding the key issues in disputes concerning loans based on foreign currency, clarifying the discrepancies and unifying the court jurisprudence. The resolution was not adopted, the Supreme Court referred questions to the CJEU on the constitutional issues of the Polish judiciary system. No new date of session was set (no expectation of a comprehensive decision by the Supreme Court on CHF issues in the near future). In the absence of a comprehensive position of the Supreme Court, it is currently difficult to expect a full unification of judicial decisions, and decisions of the Supreme Court and CJEU issued on particular issues may be important for shaping further case law on CHF matters.
While the above referred events could lead to significant changes in the level of expected provisions, in the opinion of the Management Board, as at the date of these financial statements it is not possible to reliably estimate the value of their impact on the financial position of the Group.
As of 30 September 2021, Santander Bank Polska and Santander Consumer Bank Poland have a portfolio of mortgage loans denominated in, or indexed to, CHF of approximately PLN 9,159 million (EUR 1,991 million). On the same date, the provision registered is PLN 1,444 million (EUR 314 million), being the provision charged to the first nine months of 2021 results. This provision represents the best estimate to date given the difficulty to predict the financial impact, as it is for national courts to decide the relevant issues and the process of analyzing and deciding on the proposal described above has not yet been completed. Santander Bank Polska and Santander Consumer Bank Poland will continue to monitor and assess appropriateness of those provisions in the upcoming reporting periods.
•Banco Santander Mexico. Dispute regarding a testamentary trust constituted in 1994 by Mr. Roberto Garza Sada in Banca Serfin (currently Santander Mexico) in favor of his four sons in which he affected shares of Alfa, S.A.B. de C.V. (respectively, "Alfa" and the "Trust"). During 1999, Mr. Roberto Garza Sada instructed Santander México in its capacity as trustee to transfer 36,700,000 shares from the Trust's assets to his sons and daughters and himself. These instructions were ratified in 2004 by Mr. Roberto Garza Sada before a Notary Public.
Mr. Roberto Garza Sada, passed away on August 14, 2010 and subsequently, in 2012, the daughters of the deceased sued Santander Mexico alleging negligence within its trustee activities. The lawsuit was dismissed at first instance in April 2017 and on appeal in 2018. In May 2018, the plaintiffs filed an appeal proceeding before the First Collegiate Court of the Fourth Circuit based in Nuevo León, which ruled in favor of the plaintiffs on May 7, 2021, condemning Santander Mexico to the benefits claimed, consisting of the recovery of the amount of 36,700,000 Alfa shares, together with dividends, interest, damages and losses.
On June 7, 2021 Santander Mexico filed an appeal for review before the Federal Supreme Court of Justice, which was denied on October 1, 2021. Against this decision, Santander México has filed a complaint appeal before the Supreme Court itself in order for this matter to be reviewed by the First Chamber of the Supreme Court of Justice of the Nation.
Santander México believes that the appeal should be admitted and the decision against it should be reversed. However, given the procedural stage of the case, Santander México has classified this risk as possible. The impact of a potential unfavorable resolution for Santander México will be determined in a subsequent proceeding and will also depend on the additional actions that Santander México may take in its defense, so it is not possible to determine it at this time.
| 122 | | January - September 2021 | ||||||
Banco Santander and the other Group companies are subject to claims and, therefore, are party to certain legal proceedings incidental to the normal course of their business including those in connection with lending activities, relationships with employees and other commercial or tax matters.
With the information available to it, the Group considers that, at 30 September 2021, it had reliably estimated the obligations associated with each proceeding and had recognized, where necessary, sufficient provisions to cover reasonably any liabilities that may arise as a result of these tax and legal risks. Disputes in which provisions have been registered but are not disclosed is justified on the basis that it would be prejudicial to the proper defense of the Group. Subject to the qualifications made, it also believes that any liability arising from such claims and proceedings will not have, overall, a material adverse effect on the Group’s business, financial position, or results of operations.
11. Equity
In the first nine month periods ended 30 September 2021 and 2020 there were no quantitative or qualitative changes in Grupo Santander's equity other than those indicated in the condensed consolidated statements of changes in total equity.
a) Capital
As of 30 September 2021 and 31 December 2020, the Bank's capital stock was represented by 17,340,641,302 shares, with a nominal amount of EUR 8,670 million, in both dates.
b) Share premium
The decreased produced in the first nine months of 2021 for an amount of EUR 4,034 million has been the consequence of applying the result obtained by Banco Santander during the financial year 2020, consisting of losses of EUR 3,557 million, as reflected in the consolidated statements of changes in total equity, and the charge of the dividend for fiscal year 2020 for an amount of EUR 477 million (note 3 and consolidated statements of changes in total equity).
c) Breakdown of other comprehensive income - Items not reclassified to profit or loss and Items that may be reclassified to profit or loss
| EUR million | ||||||||
| 30-09-2021 | 31-12-2020 | |||||||
| Other comprehensive income accumulated | (32,992) | (33,144) | ||||||
| Items not reclassified to profit or loss | (4,522) | (5,328) | ||||||
| Actuarial gains or losses on defined benefit pension plans | (4,336) | (5,002) | ||||||
| Non-current assets held for sale | — | — | ||||||
| Share in other income and expenses recognised in investments, joint ventures and associates | (8) | (2) | ||||||
| Other valuation adjustments | — | — | ||||||
| Changes in the fair value of equity instruments measured at fair value with changes in other comprehensive income | (73) | (308) | ||||||
| Inefficacy of fair value hedges of equity instruments measured at fair value with changes in other comprehensive income | — | — | ||||||
| Changes in the fair value of equity instruments measured at fair value with changes in other comprehensive income (hedged item) | 238 | 159 | ||||||
| Changes in the fair value of equity instruments measured at fair value with changes in other comprehensive income (hedging instrument) | (238) | (159) | ||||||
| Changes in the fair value of financial liabilities measured at fair value through profit or loss attributable to changes in credit risk | (105) | (16) | ||||||
| Items that may be reclassified to profit or loss | (28,470) | (27,816) | ||||||
| Hedge of net investments in foreign operations (effective portion) | (3,894) | (3,124) | ||||||
| Exchange differences | (24,965) | (26,911) | ||||||
| Hedging derivatives (effective portion) | (46) | 295 | ||||||
| Changes in the fair value of debt instruments measured at fair value with changes in other comprehensive income | 908 | 2,411 | ||||||
| Hedging instruments (items not designated) | — | — | ||||||
| Non-current assets held for sale | — | — | ||||||
| Share in other income and expenses recognised in investments, joint ventures and associates | (473) | (487) | ||||||
d) Other comprehensive income - Items not reclassified to profit or loss - Actuarial gains or losses on defined benefit pension plans
The changes in the balance of Other comprehensive income - Items not reclassified to profit or loss - Actuarial gains or losses on defined benefit pension plans include the actuarial gains or losses generated in the period and the return on plan assets, excluding amounts included in net interest on the net defined benefit liability (asset), less the administrative expenses and taxes inherent to the plan, and any change in the effect of the asset ceiling. Its variation is shown in the condensed consolidated statement of recognised income and expense.
January - September 2021 | | 123 | ||||||
During the first nine months of 2021, the amount of actuarial losses (net of actuarial gains) has decreased by EUR 1,016 million. The main impacts are:
•Decrease of EUR 965 million in the accrued actuarial losses relating to Grupo Santander's businesses in the United Kingdom, mainly due to the change in the discount rate (increase from 1.28% to 2.07%), partially offset by the change in the inflation rate (increase from 2.95% to 3.42%) and the change in assets.
•Decrease of EUR 42 million in accumulated actuarial losses for the Group's businesses in Brazil, due to the change in the discount rate (increase from 3.46% to 4.20% for pension plans and from 3.77% to 4.31% for medical plans).
•Decrease of EUR 40 million in the accrued actuarial losses relating to Grupo Santander's businesses in Spain, mainly due to the change in the discount rate (increase from 0.60% to 0.90%).
•Decrease of EUR 21 million in the accrued actuarial losses relating to Grupo Santander's businesses in the Germany, due to the change in the discount rate (increase from 1.17% to 1.43%).
The remaining variation in the accrued actuarial gains and losses heading represents an increase of EUR 52 million, as a result of the evolution of exchange rates, mainly the appreciation of the pound.
e) Other comprehensive income - Items not reclassified to profit or loss – Changes in the fair value of equity instruments measured at fair value with changes in other comprehensive income
Includes the net amount of unrealised fair value changes in equity instruments at fair value with changes in other comprehensive income.
Below is a breakdown of the composition of the balance as of 30 September 2021 and 31 December 2020 under 'Other comprehensive income - Items not reclassified to profit or loss - Changes in the fair value of equity instruments measured at fair value with changes in other global result depending on the geographical origin of the issuer':
| EUR million | ||||||||||||||||||||||||||
| 30-09-2021 | 31-12-2020 | |||||||||||||||||||||||||
| Revaluation gains | Revaluation losses | Net revaluation gains/(losses) | Fair value | Revaluation gains | Revaluation losses | Net revaluation gains/(losses) | Fair value | |||||||||||||||||||
| Equity instruments | ||||||||||||||||||||||||||
| Domestic | ||||||||||||||||||||||||||
| Spain | 25 | (675) | (650) | 760 | 28 | (849) | (821) | 1,032 | ||||||||||||||||||
| International | ||||||||||||||||||||||||||
| Rest of Europe | 120 | (75) | 45 | 412 | 65 | (76) | (11) | 314 | ||||||||||||||||||
| United States | 12 | (4) | 8 | 31 | 7 | (4) | 3 | 25 | ||||||||||||||||||
| Latin America and rest | 530 | (6) | 524 | 1,487 | 525 | (4) | 521 | 1,412 | ||||||||||||||||||
| 687 | (760) | (73) | 2,690 | 625 | (933) | (308) | 2,783 | |||||||||||||||||||
| Of which: | ||||||||||||||||||||||||||
| Listed | 535 | (36) | 499 | 1,518 | 525 | (31) | 494 | 1,424 | ||||||||||||||||||
| Unlisted | 152 | (724) | (572) | 1,172 | 100 | (902) | (802) | 1,359 | ||||||||||||||||||
f) Other comprehensive income - Items that may be reclassified to profit or loss – Hedges of net investments in foreign operations (effective portion) and exchange differences
Other comprehensive income - Items that may be reclassified to profit or loss - Hedges of net investments in foreign operations (effective portion) includes the net amount of the changes in value of hedging instruments in hedges of net investments in foreign operations, in respect of the portion of these changes considered to be effective hedges.
Other comprehensive income - Items that may be reclassified to profit or loss - Exchange differences includes the net amount of exchange differences arising on non-monetary items whose fair value is adjusted against equity and the differences arising on the translation to euros of the balances of the consolidated entities whose functional currency is not the euro.
The net variation of both headings recognised during the first nine months of 2021, recorded in the statement of income and expenses reflects the impact of the currencies' appreciation during the year, reflecting the appreciation of the Brazilian real, pound sterling, US dollar and Mexican peso, mainly (see Note 1.e).
Of this variation, EUR 121 million correspond to the valuation at the closing exchange rate of goodwill for the first nine months of the year (see note 8).
| 124 | | January - September 2021 | ||||||
g) Other comprehensive income – Items that may be reclassified to profit or loss – Changes in the fair value of debt instruments measured at fair value through other comprehensive income
Includes the net amount of unrealised fair value changes in debt instruments at fair value through other comprehensive income.
Below is a breakdown of the composition of the balance as of 30 September 2021 and 31 December 2020 under Other comprehensive income - Items that may be reclassified to profit or loss - Changes in the fair value of debt instruments measured at fair value through other comprehensive income depending on the type of instrument and the geographical origin of the issuer:
| EUR million | ||||||||||||||||||||||||||
| 30-09-2021 | 31-12-2020 | |||||||||||||||||||||||||
| Revaluation gains | Revaluation losses | Net revaluation gains/(losses) | Fair value | Revaluation gains | Revaluation losses | Net revaluation gains/(losses) | Fair value | |||||||||||||||||||
| Debt instruments | ||||||||||||||||||||||||||
| Government and central banks debt instruments | ||||||||||||||||||||||||||
| Spain | 379 | — | 379 | 13,136 | 693 | — | 693 | 19,314 | ||||||||||||||||||
| Rest of Europe | 665 | (39) | 626 | 21,663 | 915 | (69) | 846 | 23,116 | ||||||||||||||||||
| Latin America and rest of the world | 425 | (556) | (131) | 48,264 | 785 | (73) | 712 | 51,026 | ||||||||||||||||||
| Private-sector debt instruments | 112 | (78) | 34 | 23,817 | 181 | (21) | 160 | 24,714 | ||||||||||||||||||
| 1,581 | (673) | 908 | 106,880 | 2,574 | (163) | 2,411 | 118,170 | |||||||||||||||||||
12. Segment information (Primary segment)
Grupo Santander has aligned the information in this note with the underlying information used internally for management reporting and with that presented in Grupo Santander's other public documents.
Grupo Santander executive committee has been determined to be the chief operating decision maker. Grupo Santander's operating segments reflect its organizational and managerial structures. Grupo Santander's executive committee reviews internal reporting based on these segments to assess performance and allocate resources.
The segments are split by geographic area in which profits are earned and type of business. Grupo Santander prepares the information by aggregating the figures for Grupo Santander’s various geographic areas and business units, relating it to both the accounting data of the units integrated in each segment and that provided by management information systems. The general principles applied are the same as those used in Grupo Santander.
On 9 April 2021, Grupo Santander has announced that, starting and effective with the financial information for the first quarter of 2021, a change was made to the reportable segments to reflect the new reporting structure.
For Grupo Santander management purposes, the primary level of segmentation, which is based on Grupo Santander's management structure, comprises five reportable segments: four operating areas plus the Corporate Centre. The operating areas are: Europe, North America, South America and Digital Consumer Bank. The operating areas of the main level segmentation are:
•Europe: which comprises all the business activities carried out in the region, except for the business included in Digital Consumer Bank. Mainly in Spain, the United Kingdom, Portugal and Poland.
•North America: which comprises all the business activities carried out in Mexico and the US, which includes the holding company (SHUSA) and the businesses of Santander Bank, Santander Consumer USA, the specialized unit Banco Santander International, Santander Investment Securities (SIS) and the New York branch.
•South America: includes all the financial activities carried out by Grupo Santander through its banks in the region, mainly in Brazil, Chile and Argentina.
•Digital Consumer Bank: includes Santander Consumer Finance, which incorporates the entire consumer finance business in Europe, Openbank and ODS.
Following is the breakdown of revenue that is deemed to be recognised under Dividend income, Commission income, Gain or losses on financial assets and liabilities not measured at fair value through profit or loss, net, Gain or losses on financial assets and liabilities held for trading, net, Gain or losses on non-trading financial assets and liabilities mandatorily at fair value through profit or loss, Gain or losses on financial assets and liabilities measured at fair value through profit or loss, net, Gain or losses from hedge accounting, net, Other operating income and Income from assets under insurance and reinsurance contracts in the accompanying consolidated income statements for the first nine months ended 30 September 2021 and 2020.
January - September 2021 | | 125 | ||||||
In addition to these operating units, which report by geographic area and businesses, Grupo Santander continues to maintain the area of Corporate Centre, that includes the centralized activities relating to equity stakes in financial companies, financial management of the structural exchange rate position, assumed within the sphere of Grupo Santander's assets and liabilities committee, as well as management of liquidity and of shareholders' equity via issuances.
This financial information ('underlying basis') is computed by adjusting reported results for the effects of certain gains and losses (e.g.: capital gains, write-downs, etc.). These gains and losses are items that management and investors ordinarily identify and consider separately to understand better the underlying trends in the business.
Following is the reconciliation between the adjusted profit and the statutory profit corresponding to the first nine months ended 30 September 2021 and 2020:
| EUR million | ||||||||||||||||||||
| Revenue from ordinary activities | Profit before taxes | Profit | ||||||||||||||||||
| Segment | 30-09-2021 | 30-09-2020 | 30-09-2021 | 30-09-2020 | 30-09-2021 | 30-09-2020 | ||||||||||||||
| Europe | 16,207 | 15,893 | 3,377 | 1,724 | 2,292 | 1,158 | ||||||||||||||
| North America | 10,976 | 12,059 | 3,503 | 1,653 | 2,288 | 1,055 | ||||||||||||||
| South America | 16,796 | 19,942 | 4,690 | 3,836 | 2,471 | 2,113 | ||||||||||||||
| Digital Consumer Bank | 4,902 | 4,723 | 1,602 | 1,371 | 935 | 788 | ||||||||||||||
| Corporate Centre | (257) | 334 | (1,741) | (1,567) | (1,607) | (1,455) | ||||||||||||||
| Underlying Profit | 48,624 | 52,951 | 11,431 | 7,017 | 6,379 | 3,659 | ||||||||||||||
| Adjustments | — | — | (715) | (10,288) | (530) | (12,707) | ||||||||||||||
| Statutory Profit | 48,624 | 52,951 | 10,716 | (3,271) | 5,849 | (9,048) | ||||||||||||||
Explanation of adjustments:
In the first nine months of 2021, the impact of restructuring costs of EUR 530 million was mainly in the United Kingdom and Portugal.
In the first nine months of 2020, an adjustment to goodwill arising from the Group´s acquisitions of EUR -10,100 million was included together with the valuation of tax assets adjustment of EUR -2,500 million, as well as restructuring and other costs of EUR -106 million: EUR -55 million in the United Kingdom, EUR -28 million in Santander Consumer Finance, EUR -10 million in Poland and EUR -13 million in Other Europe.
| 126 | | January - September 2021 | ||||||
13. Related parties
The parties related to Grupo Santander are deemed to include, in addition to its subsidiaries, associates and jointly controlled entities, Banco Santander’s key management personnel (the members of its board of directors and the executive vice presidents, together with their close family members) and the entities over which the key management personnel may exercise significant influence or control.
Following is a detail of the transactions performed by Grupo Santander with its related parties in the first nine months of 2021 and 2020, distinguishing between significant shareholders, members of Banco Santander’s board of directors, Banco Santander’s executive vice presidents, Grupo Santander entities and other related parties. Related party transactions were made on terms equivalent to those that prevail in arm’s-length transactions or, when this was not the case, the related compensation in kind was recognised:
| EUR million | |||||||||||||||||
| 30-09-2021 | |||||||||||||||||
| Expenses and income | Significant shareholders | Directors and executives | Group companies or entities | Other related parties | Total | ||||||||||||
| Expenses | |||||||||||||||||
| Finance costs | — | — | 9 | — | 9 | ||||||||||||
| Leases | — | — | — | — | — | ||||||||||||
| Services received | — | — | — | — | — | ||||||||||||
| Purchases of stocks | — | — | — | — | — | ||||||||||||
| Other expenses | — | — | 56 | — | 56 | ||||||||||||
| — | — | 65 | — | 65 | |||||||||||||
| Income | |||||||||||||||||
| Finance income | — | — | 73 | 1 | 74 | ||||||||||||
| Dividends received | — | — | — | — | — | ||||||||||||
| Services rendered | — | — | — | — | — | ||||||||||||
| Sale of stocks | — | — | — | — | — | ||||||||||||
| Other income | — | — | 937 | — | 937 | ||||||||||||
| — | — | 1,010 | 1 | 1,011 | |||||||||||||
| EUR million | |||||||||||||||||
| 30-09-2021 | |||||||||||||||||
| Other transactions | Significant shareholders | Directors and executives | Group companies or entities | Other related parties | Total | ||||||||||||
| Financing agreements: loans and capital contributions (lender) | — | 1 | 826 | (30) | 797 | ||||||||||||
| Financing agreements: loans and capital contributions (borrower) | — | 1 | (423) | 4 | (418) | ||||||||||||
| Guarantees provided | — | — | (1) | — | (1) | ||||||||||||
| Guarantees received | — | — | — | — | — | ||||||||||||
| Commitments acquired | — | — | 93 | 4 | 97 | ||||||||||||
| Dividends and other distributed profit | — | 1 | — | 5 | 6 | ||||||||||||
| Other transactions | — | — | (46) | — | (46) | ||||||||||||
January - September 2021 | | 127 | ||||||
| EUR million | |||||||||||||||||
| 30-09-2021 | |||||||||||||||||
| Balance closing period | Significant shareholders | Directors and executives | Group companies or entities | Other related parties | Total | ||||||||||||
| Debt balances: | |||||||||||||||||
| Customers and commercial debtors | — | — | — | — | — | ||||||||||||
| Loans and credits granted | — | 22 | 8,323 | 23 | 8,368 | ||||||||||||
| Other collection rights | — | — | 922 | — | 922 | ||||||||||||
| — | 22 | 9,245 | 23 | 9,290 | |||||||||||||
| Credit balances: | |||||||||||||||||
| Suppliers and creditors granted | — | — | — | — | — | ||||||||||||
| Loans and credits received | — | 18 | 3,078 | 159 | 3,255 | ||||||||||||
| Other payment obligations | — | — | 84 | — | 84 | ||||||||||||
| — | 18 | 3,162 | 159 | 3,339 | |||||||||||||
| EUR million | |||||||||||||||||
| 30-09-2020 | |||||||||||||||||
| Expenses and income | Significant shareholders | Directors and executives | Group companies or entities | Other related parties | Total | ||||||||||||
| Expenses | |||||||||||||||||
| Finance costs | — | — | 6 | — | 6 | ||||||||||||
| Leases | — | — | — | — | — | ||||||||||||
| Services received | — | — | — | — | — | ||||||||||||
| Purchases of stocks | — | — | — | — | — | ||||||||||||
| Other expenses | — | — | 9 | — | 9 | ||||||||||||
| — | — | 15 | — | 15 | |||||||||||||
| Income | |||||||||||||||||
| Finance income | — | — | 86 | 1 | 87 | ||||||||||||
| Dividends received | — | — | — | — | — | ||||||||||||
| Services rendered | — | — | — | — | — | ||||||||||||
| Sale of stocks | — | — | — | — | — | ||||||||||||
| Other income | — | — | 872 | — | 872 | ||||||||||||
| — | — | 958 | 1 | 959 | |||||||||||||
| 128 | | January - September 2021 | ||||||
| EUR million | |||||||||||||||||
| 30-09-2020 | |||||||||||||||||
| Other transactions | Significant shareholders | Directors and executives | Group companies or entities | Other related parties | Total | ||||||||||||
| Financing agreements: loans and capital contributions (lender) | — | — | (301) | (53) | (354) | ||||||||||||
| Financing agreements: loans and capital contributions (borrower) | — | (5) | 462 | 5 | 462 | ||||||||||||
| Guarantees provided | — | — | (5) | — | (5) | ||||||||||||
| Guarantees received | — | — | — | — | — | ||||||||||||
| Commitments acquired | — | (1) | 216 | 8 | 223 | ||||||||||||
| Dividends and other distributed profit | — | — | — | — | — | ||||||||||||
| Other transactions | — | — | 554 | — | 554 | ||||||||||||
| EUR million | |||||||||||||||||
| 31-12-2020 | |||||||||||||||||
| Balance closing period | Significant shareholders | Directors and executives | Group companies or entities | Other related parties | Total | ||||||||||||
| Debt balances: | |||||||||||||||||
| Customers and commercial debtors | — | — | — | — | — | ||||||||||||
| Loans and credits granted | — | 24 | 7,497 | 95 | 7,616 | ||||||||||||
| Other collection rights | — | — | 976 | — | 976 | ||||||||||||
| — | 24 | 8,473 | 95 | 8,592 | |||||||||||||
| Credit balances: | |||||||||||||||||
| Suppliers and creditors granted | — | — | — | — | — | ||||||||||||
| Loans and credits received | — | 20 | 3,501 | 159 | 3,680 | ||||||||||||
| Other payment obligations | — | — | 92 | — | 92 | ||||||||||||
| — | 20 | 3,593 | 159 | 3,772 | |||||||||||||
January - September 2021 | | 129 | ||||||
14. Off-balance-sheet exposures
The off-balance-sheet exposures related to balances representing loans commitments, financial guarantees and other commitments granted (recoverables and non recoverables).
Financial guarantees granted include financial guarantees contracts such as financial bank guarantees, credit derivatives, and risks arising from derivatives granted to third parties; non-financial guarantees include other guarantees and irrevocable documentary credits.
Loan and other commitments granted include all off-balance-sheet exposures, which are not classified as guarantees provided, including loans commitment granted.
| EUR million | ||||||||
| 30-09-2021 | 31-12-2020 | |||||||
| Loan commitments granted | 252,301 | 241,230 | ||||||
| Of which impaired | 534 | 274 | ||||||
| Financial guarantees granted | 12,069 | 12,377 | ||||||
| Of which impaired | 168 | 124 | ||||||
| Bank sureties | 12,026 | 12,358 | ||||||
| Credit derivatives sold | 43 | 19 | ||||||
| Other commitments granted | 78,730 | 64,538 | ||||||
| Of which impaired | 711 | 548 | ||||||
| Other granted guarantees | 40,045 | 33,526 | ||||||
| Other | 38,685 | 31,012 | ||||||
The breakdown of the off-balance sheet exposure and impairment on 30 September 2021 and 31 December 2020 by impairment stages is EUR 332,775 million and EUR 310,435 million of exposure and EUR 322 million and EUR 377 million of impairment in stage 1, EUR 8,912 million and EUR 6,764 million of exposure and EUR 202 million and EUR 182 million of impairment in stage 2, and EUR 1,413 million and EUR 946 million of exposure and EUR 150 million and EUR 141 million of impairment in stage 3, respectively.
15. Average headcount and number of branches
The average number of employees at Banco Santander and Grupo Santander, by gender, in the first nine months ended 30 September 2021 and 2020 is as follows:
| Average headcount | ||||||||||||||
| Bank | Group | |||||||||||||
| 30-09-2021 | 30-09-2020 | 30-09-2021 | 30-09-2020 | |||||||||||
| Men | 12,190 | 13,674 | 87,606 | 88,381 | ||||||||||
| Women | 11,624 | 12,924 | 103,460 | 106,172 | ||||||||||
| 23,814 | 26,598 | 191,066 | 194,553 | |||||||||||
The number of branches at 30 September 2021 and 31 December 2020 is as follow:
| Number of branches | ||||||||
| Group | ||||||||
| 30-09-2021 | 31-12-2020 | |||||||
| Spain | 1,998 | 2,989 | ||||||
| Group | 7,906 | 8,247 | ||||||
| 9,904 | 11,236 | |||||||
| 130 | | January - September 2021 | ||||||
16. Other disclosures
The following table shows a summary of the fair values, at 30 September 2021 and 31 December 2020, of the financial assets and liabilities indicated below, classified on the basis of the various measurement methods used by Grupo Santander to determine their fair value:
| EUR million | ||||||||||||||||||||
| 30-09-2021 | 31-12-2020 | |||||||||||||||||||
| Published price quotations in active markets (Level 1) | Internal models (Levels 2 and 3) | Total | Published price quotations in active markets (Level 1) | Internal models (Levels 2 and 3) | Total | |||||||||||||||
| Financial assets held for trading | 44,110 | 78,857 | 122,967 | 46,379 | 68,566 | 114,945 | ||||||||||||||
| Non-trading financial assets mandatorily at fair value through profit or loss | 2,278 | 2,878 | 5,156 | 1,756 | 2,730 | 4,486 | ||||||||||||||
| Financial assets at fair value through profit and loss | 2,189 | 34,781 | 36,970 | 2,509 | 46,208 | 48,717 | ||||||||||||||
| Financial assets at fair value through other comprehensive income | 79,968 | 29,602 | 109,570 | 91,771 | 29,182 | 120,953 | ||||||||||||||
| Hedging derivatives (assets) | — | 5,404 | 5,404 | — | 8,325 | 8,325 | ||||||||||||||
| Financial liabilities held for trading | 11,325 | 68,822 | 80,147 | 9,863 | 71,304 | 81,167 | ||||||||||||||
| Financial liabilities designated at fair value through profit or loss | 3,508 | 44,392 | 47,900 | 2,118 | 45,920 | 48,038 | ||||||||||||||
| Hedging derivatives (liabilities) | — | 5,821 | 5,821 | — | 6,869 | 6,869 | ||||||||||||||
| Liabilities under insurance contracts | — | 779 | 779 | — | 910 | 910 | ||||||||||||||
Financial instruments at fair value, determined on the basis of published price quotations in active markets (level 1), include government debt instruments, private-sector debt instruments, derivatives traded in organised markets, securitised assets, shares, short positions and fixed-income securities issued. In cases where price quotations cannot be observed, management makes its best estimate of the price that the market would set, using its own internal models. In most cases, these internal models use data based on observable market parameters as significant inputs (level 2) and, in some cases, they use significant inputs not observable in market data (level 3).
In order to make these estimates, various techniques are employed, including the extrapolation of observable market data. The best evidence of the fair value of a financial instrument on initial recognition is the transaction price, unless the fair value of the instrument can be obtained from other market transactions performed with the same or similar instruments or can be measured by using a valuation technique in which the variables used include only observable market data, mainly interest rates.
During the first nine months of 2020 and 2021, Grupo Santander did not make any material transfers of financial instruments between measurement levels other than the transfers included in level 3 table.
Grupo Santander has developed a formal process for the systematic valuation and management of financial instruments, which has been implemented worldwide across all Grupo Santander's units. The governance scheme for this process distributes responsibilities between two independent divisions: Treasury (development, marketing and daily management of financial products and market data) and Risk (on a periodic basis, validation of pricing models and market data, computation of risk metrics, new transaction approval policies, management of market risk and implementation of fair value adjustment policies). The approval of new products follows a sequence of steps (request, development, validation, integration in corporate systems and quality assurance) before the product is brought into production. This process ensures that pricing systems have been properly reviewed and are stable before they are used.
The most important products and families of derivatives, and the related valuation techniques and inputs, by asset class, are detailed in the consolidated annual accounts as at 31 December 2020.
As of 30 September 2021, the CVA (Credit Valuation Adjustment) accounted for was EUR 237.7 million (a reduction of 30.7% compared to 31 December 2020) and adjustments of DVA (Debt Valuation Adjustment) was EUR 162.2 million (a reduction of 17.3% compared to 31 December 2020). The reduction is due to the continuous improvement in the credit markets and the decrease in the levels of exposure due to the evolution in the calculation models compared to year-end.
Currently the CVA and DVA are at similar levels compared to the beginning of the pandemic.
January - September 2021 | | 131 | ||||||
Set forth below are the financial instruments at fair value whose measurement was based on internal models (levels 2 and 3) at 30 September 2021 and 31 December 2020:
| EUR million | EUR million | |||||||||||||||||||
| Fair values calculated using internal models at 30-09-2021(*) | Fair values calculated using internal models at 31-12-2020 (*) | |||||||||||||||||||
| Level 2 | Level 3 | Level 2 | Level 3 | Valuation techniques | Main inputs | |||||||||||||||
| ASSETS | 142,813 | 8,709 | 146,468 | 8,543 | ||||||||||||||||
| Financial assets held for trading | 78,078 | 779 | 67,826 | 740 | ||||||||||||||||
| Central banks | 5,131 | — | — | — | Present value method | Yield curves, FX market prices | ||||||||||||||
| Credit institutions | 12,115 | — | 3 | — | Present value method | Yield curves, FX market prices | ||||||||||||||
| Customers (**) | 3,651 | — | 296 | — | Present value method | Yield curves, FX market prices | ||||||||||||||
| Debt instruments and equity instruments | 1,634 | 24 | 1,453 | 10 | Present value method | Yield curves, FX market prices | ||||||||||||||
| Derivatives | 55,547 | 755 | 66,074 | 730 | ||||||||||||||||
| Swaps | 45,651 | 217 | 54,488 | 272 | Present value method, Gaussian Copula (***) | Yield curves, FX market prices, HPI, Basis, Liquidity | ||||||||||||||
| Exchange rate options | 547 | 47 | 696 | 22 | Black-Scholes Model | Yield curves, Volatility surfaces, FX market prices, Liquidity | ||||||||||||||
| Interest rate options | 2,212 | 163 | 3,129 | 241 | Black's Model, multifactorial advanced models interest rate | Yield curves, Volatility surfaces, FX market prices, Liquidity | ||||||||||||||
| Interest rate futures | 452 | — | 1,069 | — | Present value method | Yield curves, FX market prices | ||||||||||||||
| Index and securities options | 632 | 72 | 554 | 94 | Black’s Model, multifactorial advanced models interest rate | Yield curves, Volatility surfaces, FX & EQ market prices, Dividends, Liquidity. | ||||||||||||||
| Other | 6,053 | 256 | 6,138 | 101 | Present value method, Advanced stochastic volatility models and other | Yield curves, Volatility surfaces, FX and EQ market prices, Dividends, Liquidity, Dividends, Correlation, HPI, Credit, Others. | ||||||||||||||
| Hedging derivatives | 5,404 | — | 8,325 | — | ||||||||||||||||
| Swaps | 4,852 | — | 6,998 | — | Present value method | Yield curves, FX market prices, Basis | ||||||||||||||
| Interest rate options | 10 | — | 25 | — | Black-Scholes Model | Yield curves, FX market prices, Volatility surfaces | ||||||||||||||
| Other | 542 | — | 1,302 | — | Present value method, Advanced stochastic volatility models and other | Yield curves, Volatility surfaces, FX market prices, Credit, Liquidity, Others | ||||||||||||||
| Non-trading financial assets mandatorily at fair value through profit or loss | 1,270 | 1,608 | 1,796 | 934 | ||||||||||||||||
| Equity instruments | 428 | 1,145 | 984 | 505 | Present value method | Market price, Yield curves, Dividends and Others | ||||||||||||||
| Debt instruments | 665 | 186 | 555 | 134 | Present value method | Yield curves | ||||||||||||||
| Loans and receivables (**) | 177 | 277 | 257 | 295 | Present value method, swap asset model & CDS | Yield curves and Credit curves | ||||||||||||||
| Financial assets designated at fair value through profit or loss | 34,340 | 441 | 45,559 | 649 | ||||||||||||||||
| Central banks | — | — | 9,481 | — | Present value method | Yield curves, FX market prices | ||||||||||||||
| Credit institutions | 11,877 | — | 11,973 | 163 | Present value method | Yield curves, FX market prices | ||||||||||||||
| Customers (****) | 22,459 | 16 | 24,102 | 19 | Present value method | Yield curves, FX market prices, HPI | ||||||||||||||
| Debt instruments | 4 | 425 | 3 | 467 | Present value method | Yield curves, FX market prices | ||||||||||||||
| Financial assets at fair value through other comprehensive income | 23,721 | 5,881 | 22,962 | 6,220 | ||||||||||||||||
| Equity instruments | 73 | 1,060 | 75 | 1,223 | Present value method | Market price, Yield curves, Dividends and Others | ||||||||||||||
| Debt instruments | 19,414 | 191 | 18,410 | 206 | Present value method | Yield curves, FX market prices | ||||||||||||||
| Loans and receivables | 4,234 | 4,630 | 4,477 | 4,791 | Present value method | Yield curves, FX market prices and Credit curves | ||||||||||||||
| LIABILITIES | 119,104 | 710 | 124,098 | 905 | ||||||||||||||||
| Financial liabilities held for trading | 68,450 | 372 | 71,009 | 295 | ||||||||||||||||
| Central banks | 2,791 | — | — | — | Present value method | Yield curves, FX market prices | ||||||||||||||
| Credit institutions | 2,560 | — | — | — | Present value method | Yield curves, FX market prices | ||||||||||||||
| Customers | 4,809 | — | — | — | Present value method | Yield curves, FX market prices | ||||||||||||||
| Derivatives | 54,368 | 372 | 63,920 | 295 | ||||||||||||||||
| Swaps | 44,004 | 48 | 51,584 | 81 | Present value method, Gaussian Copula (***) | Yield curves, FX market prices, Basis, Liquidity, HPI | ||||||||||||||
| Exchange rate options | 676 | 26 | 724 | 1 | Black-Scholes Model | Yield curves, Volatility surfaces, FX market prices, Liquidity | ||||||||||||||
| Interest rate options | 2,782 | 37 | 4,226 | 49 | Black Model, multifactorial advanced models interest rate | Yield curves, Volatility surfaces, FX market prices, Liquidity | ||||||||||||||
| Index and securities options | 664 | 73 | 456 | 97 | Black-Scholes Model | Yield curves, FX market prices | ||||||||||||||
| Interest rate and equity futures | 218 | — | 1,054 | 2 | Present value method | Yield curves, Volatility surfaces, FX & EQ market prices, Dividends, Correlation | ||||||||||||||
| Other | 6,024 | 188 | 5,876 | 65 | Present value method, volatility models | Yield curves, Volatility surfaces, FX & EQ market prices, Dividends, Correlation, HPI, Credit, Others | ||||||||||||||
| Short positions | 3,922 | — | 7,089 | — | Present value method | Yield curves ,FX & EQ market prices, Equity | ||||||||||||||
| Hedging derivatives | 5,821 | — | 6,869 | — | ||||||||||||||||
| Swaps | 4,897 | — | 5,821 | — | Present value method | Yield curves ,FX market prices, Basis | ||||||||||||||
| Interest rate options | — | — | 13 | — | Black's Model | Yield curves , Volatility surfaces, FX market prices, Liquidity | ||||||||||||||
| Other | 924 | — | 1,035 | — | Present value method, Advanced stochastic volatility models and other | Yield curves , Volatility surfaces, FX market prices, Credit, Liquidity, Other | ||||||||||||||
| Financial liabilities designated at fair value through profit or loss | 44,054 | 338 | 45,310 | 610 | Present value method | Yield curves, FX market prices | ||||||||||||||
| Liabilities under insurance contracts | 779 | — | 910 | — | Present Value Method with actuarial techniques | Mortality tables and interest rate curves | ||||||||||||||
| 132 | | January - September 2021 | ||||||
(*) The internal models of level 2 implement figures based on the parameters observed in the market, while Level 3 internal models uses significant inputs that are not observable in market data.
(**) Includes mainly short-term loans and reverse repurchase agreements with corporate customers (mainly brokerage and investment companies).
(***) Includes credit risk derivatives with a negative net fair value of EUR -2 and EUR -4 million recognised in the interim condensed consolidated balance sheet 30 September 2021 and 31 December 2020. These assets and liabilities are measured using the Standard Gaussian Copula Model.
(****) Includes residential mortgages to financial institutions in the United Kingdom (which are regulated and partly financed by the Government). The fair value of these loans has been obtained using observable market variables, including current market transactions of similar amount and guarantees provided by the UK Housing Association. Given that the Government is involved in these entities, credit risk spreads have remained stable and homogeneous in this sector. The results arising from the valuation model are contrasted against current market transactions.
The measurements obtained using the internal models might have been different had other methods or assumptions been used with respect to interest rate risk, to credit risk, market risk and foreign currency risk spreads, or to their related correlations and volatilities. Nevertheless, Banco Santander’s directors consider that the fair value of the financial assets and liabilities recognised in the consolidated balance sheet and the gains and losses arising from these financial instruments are reasonable.
Level 3 financial instruments
Set forth below are Grupo Santander's main financial instruments measured using unobservable market data that constitute significant inputs of the internal models (level 3):
- Instruments in Santander UK's portfolio (loans, debt instruments and derivatives) linked to the House Price Index (HPI). Even if the valuation techniques used for these instruments may be the same as those used to value similar products (present value in the case of loans and debt instruments, and the Black-Scholes model for derivatives), the main factors used in the valuation of these instruments are the HPI spot rate, the growth rate of that rate, its volatility and mortality rates, which are not always observable in the market and, accordingly, these instruments are considered illiquid:
•The HPI spot rate: for some instruments the NSA HPI spot rate, which is directly observable and published on a monthly basis, is used. For other instruments where regional HPI rates must be used (published quarterly), adjustments are made to reflect the different composition of the rates and adapt them to the regional composition of Santander UK's portfolio.
•HPI growth rate: this is not always directly observable in the market, especially for long maturities, and is estimated in accordance with existing quoted prices. To reflect the uncertainty implicit in these estimates, adjustments are made based on an analysis of the historical volatility of the HPI, incorporating reversion to the mean.
•HPI volatility: the long-term volatility is not directly observable in the market but is estimated on the basis of more short-term quoted prices and by making an adjustment to reflect the existing uncertainty, based on the standard deviation of historical volatility over various time periods.
•Mortality rates: these are based on published official tables and adjusted to reflect the composition of the customer portfolio for this type of product at Santander UK.
- Callable interest rate trading derivatives (Bermudan style options) where the main unobservable input is mean reversion of interest rates.
- Derivatives of negotiation on interest rates, taking asset securitisations and with the redemption rate (CPR) as the main unobservable input as an underlying asset.
- Derivatives from trading on inflation in Spain, where volatility is not observable in the market.
- Derivatives on long-term interest rate volatility and FX where volatility is not observable in the market at the indicated term.
- Equity volatility derivatives, specifically indices and equities, where volatility is not observable in the long term.
- Derivatives on long-term interest rate and FX in some Latam units (mainly Brazil), where for certain underlyings it is not possible to demonstrate observability to these terms.
- Debt instruments in Latam units linked to certain illiquid interest rates, for which there is no reasonable market observability.
- Illiquid equity in non-trading portfolios, classified at fair value through profit or loss and at fair value through equity.
- Syndicated loans with the HTC&S business model (Hold to collect and sale) and classified in the fair value category with changes in other accumulated global result, is not directly observable in the market, as well as the prepayment option in favour of the borrower.
The net amount recorded in the results of the first nine months of 2021 resulting from the aforementioned valuation models which main inputs are unobservable market data (level 3) amounts to EUR 60 million loss approximately (EUR 242 million profit in the first nine months of 2020).
January - September 2021 | | 133 | ||||||
The table below shows the effect, at 30 September 2021, on the fair value of the main financial instruments classified as Level 3 of a reasonable change in the assumptions used in the valuation. This effect was determined by applying the probable valuation ranges of the main unobservable inputs detailed in the following table:
| Portfolio/Instrument | Valuation technique | Main unobservable inputs | Range | Weighted average | Impacts (EUR million) | |||||||||||||||
| (Level 3) | Unfavourable scenario | Favourable scenario | ||||||||||||||||||
| Financial assets held for trading | ||||||||||||||||||||
| Derivatives | ||||||||||||||||||||
| Cap&Floor | Volatility option model | Volatility | 10% - 90% | 33.23% | (0.08) | 0.06 | ||||||||||||||
| CCS | Discounted Cash Flows | Interest rate | -0.8% - 0.8% | 0.80% | (0.16) | 0.16 | ||||||||||||||
| CCS | Forward stimation | Interest rate | (TIIE 28 -3)pb - (TIIE 28 +3)pb | n.a. | (0.03) | 0.03 | ||||||||||||||
| Convertibility curve - inputs: NDFs Offshore | Forward stimation | Price | 0% - 2% | 0.61% | (0.69) | 0.30 | ||||||||||||||
| EQ Options | EQ option pricing model | Volatility | 0% - 90% | 61.20% | (0.3) | 0.65 | ||||||||||||||
| EQ Options | Local volatility | Volatility | 10% - 90% | 40.00% | (10.88) | 10.88 | ||||||||||||||
| FRAs | Asset Swap model | Interest rate | 0% - 4% | 1.78% | (0.79) | 0.63 | ||||||||||||||
| FX Options | FX option pricing model | Volatility | 0.1% - 48.8% | 31.25% | (0.36) | 0.65 | ||||||||||||||
| Inflation Derivatives | Asset Swap model | Inflation Swap Rate | -100% - 50% | 83.33% | (0.66) | 0.33 | ||||||||||||||
| Inflation Derivatives | Volatility option model | Volatility | 0% - 40% | 13.29% | (0.42) | 0.21 | ||||||||||||||
| IR Futures | Asset Swap model | Interest rate | 0% - 15% | 5.91% | (0.95) | 0.62 | ||||||||||||||
| IR Options | IR option pricing model | Volatility | 0% - 100% | 60.47% | (0.26) | 0.39 | ||||||||||||||
| IRS | Asset Swap model | Interest rate | -6% - 12.8% | 10.36% | (0.07) | 0.13 | ||||||||||||||
| IRS | Discounted Cash Flows | Credit spread | 33.1pb - 90.9pb | 0.05pb | (2.42) | 0.88 | ||||||||||||||
| IRS | Discounted Cash Flows | Inflation Swap Rate | 10% - 90% | 16.22% | (0.07) | 0.03 | ||||||||||||||
| IRS | Discounted Cash Flows | Swap Rate | 7.4% - 7.9% | 2.73% | (0.18) | 0.08 | ||||||||||||||
| IRS | Forward stimation | Interest rate | (TIIE 28 -3 TIIE 91 -8)pb - (TIIE 28 +3 TIIE 91 +7)pb | n.a. | (0.03) | 0.03 | ||||||||||||||
| IRS | Others | Others | n.a. | n.a. | (0.62) | 0.52 | ||||||||||||||
| IRS | Prepayment modelling | Prepayment rate | 2.5% - 6.2% | 0.61% | (0.12) | 0.06 | ||||||||||||||
| Property derivatives | Option pricing model | Growth rate | 0% - 5% | 8.04% | (8.04) | 8.04 | ||||||||||||||
| Swaptions | IR option pricing model | Volatility | 0% - 40% | 26.67% | (0.15) | 0.30 | ||||||||||||||
| Debt securities | ||||||||||||||||||||
| Corporate debt | Price based | Market price | 45.8% - 62% | 8.08% | — | — | ||||||||||||||
| Financial assets designated at fair value through profit or loss | ||||||||||||||||||||
| Loans and advances to customers | ||||||||||||||||||||
| Loans | Discounted Cash Flows | Credit spreads | 0.1% - 1.4% | 0.67% | (0.25) | 0.25 | ||||||||||||||
| Mortgage portfolio | Black Scholes model | Growth rate | 0% - 5% | 2.50% | (1.98) | 1.98 | ||||||||||||||
| Debt securities | ||||||||||||||||||||
| Corporate debt | Discounted Cash Flows | Credit spread | 0% - 10% | 4.94% | (1.32) | 1.29 | ||||||||||||||
| Government debt | Discounted Cash Flows | Discount curve | 0% - 10% | 8.33% | (4.4) | 22.01 | ||||||||||||||
| Other debt securities | Others | Inflation Swap Rate | 0% - 10% | 4.74% | (5.82) | 5.24 | ||||||||||||||
| Property securities | Probability weighting | Growth rate | 0% - 5% | 2.50% | (1.17) | 1.17 | ||||||||||||||
| 134 | | January - September 2021 | ||||||
| Portfolio/Instrument | Valuation technique | Main unobservable inputs | Range | Weighted average | Impacts (EUR million) | |||||||||||||||
| (Level 3) | Unfavourable scenario | Favourable scenario | ||||||||||||||||||
| Non-trading financial assets mandatorily at fair value through profit or loss | ||||||||||||||||||||
| Loans and advances to customers | ||||||||||||||||||||
| Loans | Discounted Cash Flows | Margin of a reference portfolio | -1n.a. - 1n.a. | 1.00% | (12.69) | 13.54 | ||||||||||||||
| Debt securities | ||||||||||||||||||||
| Corporate debt | Discounted Cash Flows | Margin of a reference portfolio | -1pb - 1pb | 1pb | (0.56) | 0.60 | ||||||||||||||
| Corporate debt | Price based | Others | 5% - 15% | 5.00% | (1.38) | 1.38 | ||||||||||||||
| Equity instruments | ||||||||||||||||||||
| Equities | Price Based | Price | 90% - 110% | 10.00% | (114.72) | 114.72 | ||||||||||||||
| Financial assets at fair value through other comprenhensive income | ||||||||||||||||||||
| Loans and advances to customers | ||||||||||||||||||||
| Loans | Discounted Cash Flows | Credit spread | 0% - 0.4% | — | (6.1) | 0.01 | ||||||||||||||
| Loans | Discounted Cash Flows | Interest rate curve | -0.1% - 0.1% | 0.12% | (0.07) | 0.07 | ||||||||||||||
| Debt securities | ||||||||||||||||||||
| Government debt | Discounted Cash Flows | Interest rate | 0.6% - 0.8% | 0.10% | (0.01) | 0.01 | ||||||||||||||
| Equity instruments | ||||||||||||||||||||
| Equities | Price Based | Price | 0.9% - 1.1% | 0.10% | (77.9) | 77.90 | ||||||||||||||
| Financial liabilities held for trading | ||||||||||||||||||||
| Derivatives | ||||||||||||||||||||
| Property derivatives | Option pricing model | Growth rate | 0% - 5% | 2.50% | (2.68) | 2.68 | ||||||||||||||
(a) The valuation technique, the unobservable inputs described in the column 'Main observable inputs´' under probable scenarios, range of variation, average value and impact resulting from valuing the position in the maximum and minimum range established are shown for each instrument.
(b) The breakdown of impacts is shown by type of instrument and unobservable inputs.
(c) The range of variation of the unobservable inputs was estimated taking into account plausible movements of these parameters depending on the type of instrument.
(d) Null impacts from fully hedged or back-to-back operations have not been included in this exercise.
January - September 2021 | | 135 | ||||||
Lastly, the changes in the financial instruments classified as Level 3 in the first nine months of 2021 were as follows:
| 01-01-2021 | Changes | 30-09-2021 | ||||||||||||||||||||||||
| EUR million | Fair value calculated using internal models (Level 3) | Purchases/Settlements | Sales/Amortisation | Changes in fair value recognized in profit or loss | Changes in fair value recognised in equity | Level reclassifications | Other | Fair value calculated using internal models (Level 3) | ||||||||||||||||||
| Financial assets held for trading | 740 | 134 | (95) | 36 | — | (38) | 2 | 779 | ||||||||||||||||||
| Debt instruments | 7 | 18 | (2) | (2) | — | — | (1) | 20 | ||||||||||||||||||
| Equity instruments | 3 | — | (1) | 2 | — | — | — | 4 | ||||||||||||||||||
| Trading derivatives | 730 | 116 | (92) | 36 | — | (38) | 3 | 755 | ||||||||||||||||||
| Swaps | 272 | 5 | (12) | (76) | — | 30 | (2) | 217 | ||||||||||||||||||
| Exchange rate options | 22 | 14 | (27) | 38 | — | — | — | 47 | ||||||||||||||||||
| Interest rate options | 241 | 7 | (39) | (46) | — | — | — | 163 | ||||||||||||||||||
| Index and securities options | 94 | 18 | (4) | 30 | — | (67) | 1 | 72 | ||||||||||||||||||
| Other | 101 | 72 | (10) | 90 | — | (1) | 4 | 256 | ||||||||||||||||||
| Trading financial assets at fair value through profit or loss | 649 | 72 | (130) | 7 | — | (163) | 6 | 441 | ||||||||||||||||||
| Credit institutions | 163 | — | — | — | — | (163) | — | — | ||||||||||||||||||
| Loans and advances to customers | 19 | — | (3) | — | — | — | — | 16 | ||||||||||||||||||
| Debt instruments | 467 | 72 | (127) | 7 | — | — | 6 | 425 | ||||||||||||||||||
| Non-trading financial assets mandatorily at fair value through profit or loss | 934 | 272 | (184) | 33 | — | 528 | 25 | 1,608 | ||||||||||||||||||
| Loans and advances to customers | 295 | 104 | (110) | (14) | — | — | 2 | 277 | ||||||||||||||||||
| Debt instruments | 134 | 27 | (18) | 22 | — | 12 | 9 | 186 | ||||||||||||||||||
| Equity instruments | 505 | 141 | (56) | 25 | — | 516 | 14 | 1,145 | ||||||||||||||||||
| Financial assets at fair value through other comprehensive income | 6,220 | 4,546 | (4,443) | — | (175) | (262) | (5) | 5,881 | ||||||||||||||||||
| Loans and advances to customers | 4,791 | 4,480 | (4,411) | — | (27) | (194) | (9) | 4,630 | ||||||||||||||||||
| Debt instruments | 206 | 64 | (14) | — | 1 | (68) | 2 | 191 | ||||||||||||||||||
| Equity instruments | 1,223 | 2 | (18) | — | (149) | — | 2 | 1,060 | ||||||||||||||||||
| TOTAL ASSETS | 8,543 | 5,024 | (4,852) | 76 | (175) | 65 | 28 | 8,709 | ||||||||||||||||||
| Financial liabilities held for trading | 295 | 57 | (67) | 119 | — | (33) | 1 | 372 | ||||||||||||||||||
| Trading derivatives | 295 | 57 | (67) | 119 | — | (33) | 1 | 372 | ||||||||||||||||||
| Swaps | 81 | 4 | (3) | (31) | — | (1) | (2) | 48 | ||||||||||||||||||
| Exchange rate options | 1 | 2 | — | 23 | — | — | — | 26 | ||||||||||||||||||
| Interest rate options | 49 | 11 | (13) | (10) | — | — | — | 37 | ||||||||||||||||||
| Index and securities options | 97 | 21 | (43) | 29 | — | (32) | 1 | 73 | ||||||||||||||||||
| Interest rate and equity futures | 2 | — | (2) | — | — | — | — | — | ||||||||||||||||||
| Others | 65 | 19 | (6) | 108 | — | — | 2 | 188 | ||||||||||||||||||
| Financial liabilities designated at fair value through profit or loss | 610 | — | — | 17 | — | (289) | — | 338 | ||||||||||||||||||
| TOTAL LIABILITIES | 905 | 57 | (67) | 136 | — | (322) | 1 | 710 | ||||||||||||||||||
| 136 | | January - September 2021 | ||||||
17. Explanation added for translation to English
These interim condensed consolidated financial statements are presented on the basis of the regulatory financial reporting framework applicable to Grupo Santander in Spain (see note 1.b).
January - September 2021 | | 137 | ||||||
SIGNATURE
Pursuant to the requirements of the Securities Exchange Act of 1934, the registrant has duly caused this report to be signed on its behalf by the undersigned, thereunto duly authorized.
| Banco Santander, S.A. | ||||||||
| Date: 15 November 2021 | By: | /s/ José García Cantera | ||||||
| Name: | José García Cantera | |||||||
| Title: | Chief Financial Officer | |||||||