FORM 6-K
SECURITIES AND EXCHANGE COMMISSION
Washington, D.C. 20549
Report of Foreign Issuer
Pursuant to Rule 13a-16 or 15d-16
of the Securities Exchange Act of 1934
For the month of April, 2023
Commission File Number: 001-12518
Banco Santander, S.A.
(Exact name of registrant as specified in its charter)
Ciudad Grupo Santander
28660 Boadilla del Monte (Madrid) Spain
(Address of principal executive office)
Indicate by check mark whether the registrant files or will file annual reports under cover of Form 20-F or Form 40-F:
Form 20-F ☒ Form 40-F ☐
Indicate by check mark if the registrant is submitting the Form 6-K in paper as permitted by Regulation S-T Rule 101(b)(1):
Yes ☐ No ☒
Indicate by check mark if the registrant is submitting the Form 6-K in paper as permitted by Regulation S-T Rule 101(b)(7):
Yes ☐ No ☒
BANCO SANTANDER, S.A.
________________________
TABLE OF CONTENTS
| Item 1. January - March 2023 Financial Report | |||||

| January - March | 2023 | ||||
Index

This report was approved by the board of directors on 24 April 2023, following a favourable report from the audit committee. Important information regarding this report can be found on pages 91 and 92.
Key consolidated data
| BALANCE SHEET (EUR million) | Mar-23 | Dec-22 | % | Mar-22 | % | Dec-22 | |||||||||||||||||
| Total assets | 1,749,402 | 1,734,659 | 0.8 | 1,666,012 | 5.0 | 1,734,659 | |||||||||||||||||
| Loans and advances to customers | 1,041,388 | 1,036,004 | 0.5 | 1,011,497 | 3.0 | 1,036,004 | |||||||||||||||||
| Customer deposits | 998,949 | 1,009,722 | (1.1) | 941,081 | 6.1 | 1,009,722 | |||||||||||||||||
| Total funds | 1,237,015 | 1,239,981 | (0.2) | 1,179,805 | 4.8 | 1,239,981 | |||||||||||||||||
| Total equity | 99,490 | 97,585 | 2.0 | 99,378 | 0.1 | 97,585 | |||||||||||||||||
| Note: total funds includes customer deposits, mutual funds, pension funds and managed portfolios. | |||||||||||||||||||||||
| INCOME STATEMENT (EUR million) | Q1'23 | Q4'22 | % | Q1'22 | % | 2022 | |||||||||||||||||
| Net interest income | 10,396 | 10,159 | 2.3 | 8,855 | 17.4 | 38,619 | |||||||||||||||||
| Total income | 13,922 | 13,523 | 3.0 | 12,305 | 13.1 | 52,117 | |||||||||||||||||
| Net operating income | 7,777 | 7,215 | 7.8 | 6,770 | 14.9 | 28,214 | |||||||||||||||||
| Profit before tax | 3,832 | 3,489 | 9.8 | 4,171 | (8.1) | 15,250 | |||||||||||||||||
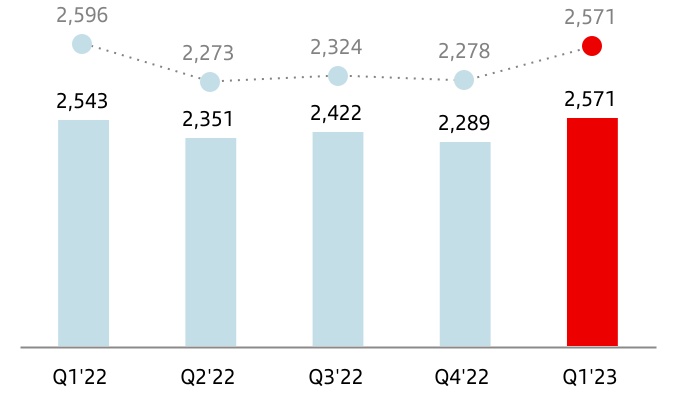
| Profit attributable to the parent | 2,571 | 2,289 | 12.3 | 2,543 | 1.1 | 9,605 | |||||||||||||||||
| Changes in constant euros: | |||||||||||||||||||||||
| Q1'23 / Q4'22: NII: +2.0%; Total income: +3.2%; Net operating income: +9.1%; Profit before tax: +10.4%; Attributable profit: +12.9%. | |||||||||||||||||||||||
| Q1'23 / Q1'22: NII: +16.3%; Total income: +11.7%; Net operating income: +12.6%; Profit before tax: -10.0%; Attributable profit: -1.0%. | |||||||||||||||||||||||
| EPS, PROFITABILITY AND EFFICIENCY (%) | Q1'23 | Q4'22 | % | Q1'22 | % | 2022 | |||||||||||||||||
| EPS (euros) | 0.15 | 0.13 | 15.3 | 0.14 | 6.4 | 0.54 | |||||||||||||||||
| RoE | 11.38 | 10.11 | 11.49 | 10.67 | |||||||||||||||||||
| RoTE | 14.38 | 12.76 | 14.21 | 13.37 | |||||||||||||||||||
| RoA | 0.66 | 0.57 | 0.71 | 0.63 | |||||||||||||||||||
| RoRWA | 1.86 | 1.64 | 1.95 | 1.77 | |||||||||||||||||||
| Efficiency ratio | 44.1 | 46.6 | 45.0 | 45.8 | |||||||||||||||||||
UNDERLYING INCOME STATEMENT 1 (EUR million) | Q1'23 | Q4'22 | % | Q1'22 | % | 2022 | |||||||||||||||||
| Net interest income | 10,185 | 10,159 | 0.3 | 8,855 | 15.0 | 38,619 | |||||||||||||||||
| Total income | 13,935 | 13,525 | 3.0 | 12,305 | 13.2 | 52,154 | |||||||||||||||||
| Net operating income | 7,790 | 7,217 | 7.9 | 6,770 | 15.1 | 28,251 | |||||||||||||||||
| Profit before tax | 4,095 | 3,489 | 17.4 | 4,171 | (1.8) | 15,250 | |||||||||||||||||
| Profit attributable to the parent | 2,571 | 2,289 | 12.3 | 2,543 | 1.1 | 9,605 | |||||||||||||||||
| Changes in constant euros: | |||||||||||||||||||||||
| Q1'23 / Q4'22: NII: -0.1%; Total income: +3.1%; Net operating income: +8.7%; Profit before tax: +18.0%; Attributable profit: +12.9%. | |||||||||||||||||||||||
| Q1'23 / Q1'22: NII: +13.9%; Total income: +11.9%; Net operating income: +12.8%; Profit before tax: -3.8%; Attributable profit: -1.0%. | |||||||||||||||||||||||
| SOLVENCY (%) | Mar-23 | Dec-22 | Mar-22 | Dec-22 | |||||||||||||||||||
| Fully-loaded CET1 ratio | 12.2 | 12.0 | 12.1 | 12.0 | |||||||||||||||||||
| Fully-loaded total capital ratio | 15.8 | 15.8 | 16.2 | 15.8 | |||||||||||||||||||
| CREDIT QUALITY (%) | Q1'23 | Q4'22 | Q1'22 | 2022 | |||||||||||||||||||
Cost of risk2 | 1.05 | 0.99 | 0.77 | 0.99 | |||||||||||||||||||
| NPL ratio | 3.05 | 3.08 | 3.26 | 3.08 | |||||||||||||||||||
| NPL coverage ratio | 68 | 68 | 69 | 68 | |||||||||||||||||||
January - March 2023 |  | 3 | ||||||
| MARKET CAPITALIZATION AND SHARES | Mar-23 | Dec-22 | % | Mar-22 | % | Dec-22 | |||||||||||||||||
| Shares (millions) | 16,454 | 16,794 | (2.0) | 17,341 | (5.1) | 16,794 | |||||||||||||||||
| Share price (euros) | 3.426 | 2.803 | 22.2 | 3.100 | 10.5 | 2.803 | |||||||||||||||||
| Market capitalization (EUR million) | 56,371 | 47,066 | 19.8 | 53,756 | 4.9 | 47,066 | |||||||||||||||||
| Tangible book value per share (euros) | 4.41 | 4.26 | 4.29 | 4.26 | |||||||||||||||||||
| Price / Tangible book value per share (X) | 0.78 | 0.66 | 0.72 | 0.66 | |||||||||||||||||||
| CUSTOMERS (thousands) | Q1'23 | Q4'22 | % | Q1'22 | % | 2022 | |||||||||||||||||
| Total customers | 161,155 | 159,844 | 0.8 | 152,492 | 5.7 | 159,844 | |||||||||||||||||
| Active customers | 99,261 | 99,190 | 0.1 | 96,901 | 2.4 | 99,190 | |||||||||||||||||
| Loyal customers | 27,464 | 27,456 | 0.0 | 25,953 | 5.8 | 27,456 | |||||||||||||||||
| Digital customers | 51,919 | 51,471 | 0.9 | 49,159 | 5.6 | 51,471 | |||||||||||||||||
| Digital sales / Total sales (%) | 54.7 | 54.0 | 56.4 | 55.1 | |||||||||||||||||||
| OTHER DATA | Mar-23 | Dec-22 | % | Mar-22 | % | Dec-22 | |||||||||||||||||
| Number of shareholders | 3,881,758 | 3,915,388 | (0.9) | 3,975,210 | (2.4) | 3,915,388 | |||||||||||||||||
| Number of employees | 210,169 | 206,462 | 1.8 | 200,294 | 4.9 | 206,462 | |||||||||||||||||
| Number of branches | 8,993 | 9,019 | (0.3) | 9,248 | (2.8) | 9,019 | |||||||||||||||||
| 1. | In addition to financial information prepared in accordance with International Financial Reporting Standards (IFRS) and derived from our consolidated financial statements, this report contains certain financial measures that constitute alternative performance measures (APMs) as defined in the Guidelines on Alternative Performance Measures issued by the European Securities and Markets Authority (ESMA) on 5 October 2015, and other non-IFRS measures, including the figures related to “underlying” results, which do not include factors that are outside the ordinary course of our business, or have been reclassified within the underlying income statement. Further details are provided in the “Alternative performance measures” section of the appendix to this report. For further details on the APMs and non-IFRS measures used, including their definition or a reconciliation between any applicable management indicators and the financial data presented in the annual consolidated financial statements prepared under IFRS, please see our 2022 Annual Financial Report, published in the CNMV on 28 February 2023, our 20-F report for the year ending 31 December 2022 filed with the SEC in the United States on 1 March 2023 as well as the “Alternative performance measures” section of the appendix to this report. | ||||
| 2. | Allowances for loan-loss provisions over the last 12 months / Average loans and advances to customers over the last 12 months. | ||||
| 4 | | January - March 2023 | ||||||
Investor Day | Group financial information | Financial information by segment | Responsible banking Corporate governance Santander share | Appendix | ||||||||||||||||||||||
Our business model is based on three pillars
| 01. Customer focus | 02. Our scale | 03. Diversification | ||||||||||||||||||||||||
Digital bank with branches | Local and global scale | Geographic and business diversification. Solid and diversified balance sheet | ||||||||||||||||||||||||
| Transform our business and operating model through our global technology initiatives to build a digital bank with branches that provides access to financial services for our customers through several channels. | In-market scale in each of our core markets in volumes combined with our global scale support greater profitability and provide a competitive advantage over local peers. | Our well balanced diversification between developing and mature markets, as well as between business and customer segments, delivers recurrent pre-provision profit with low volatility. | ||||||||||||||||||||||||
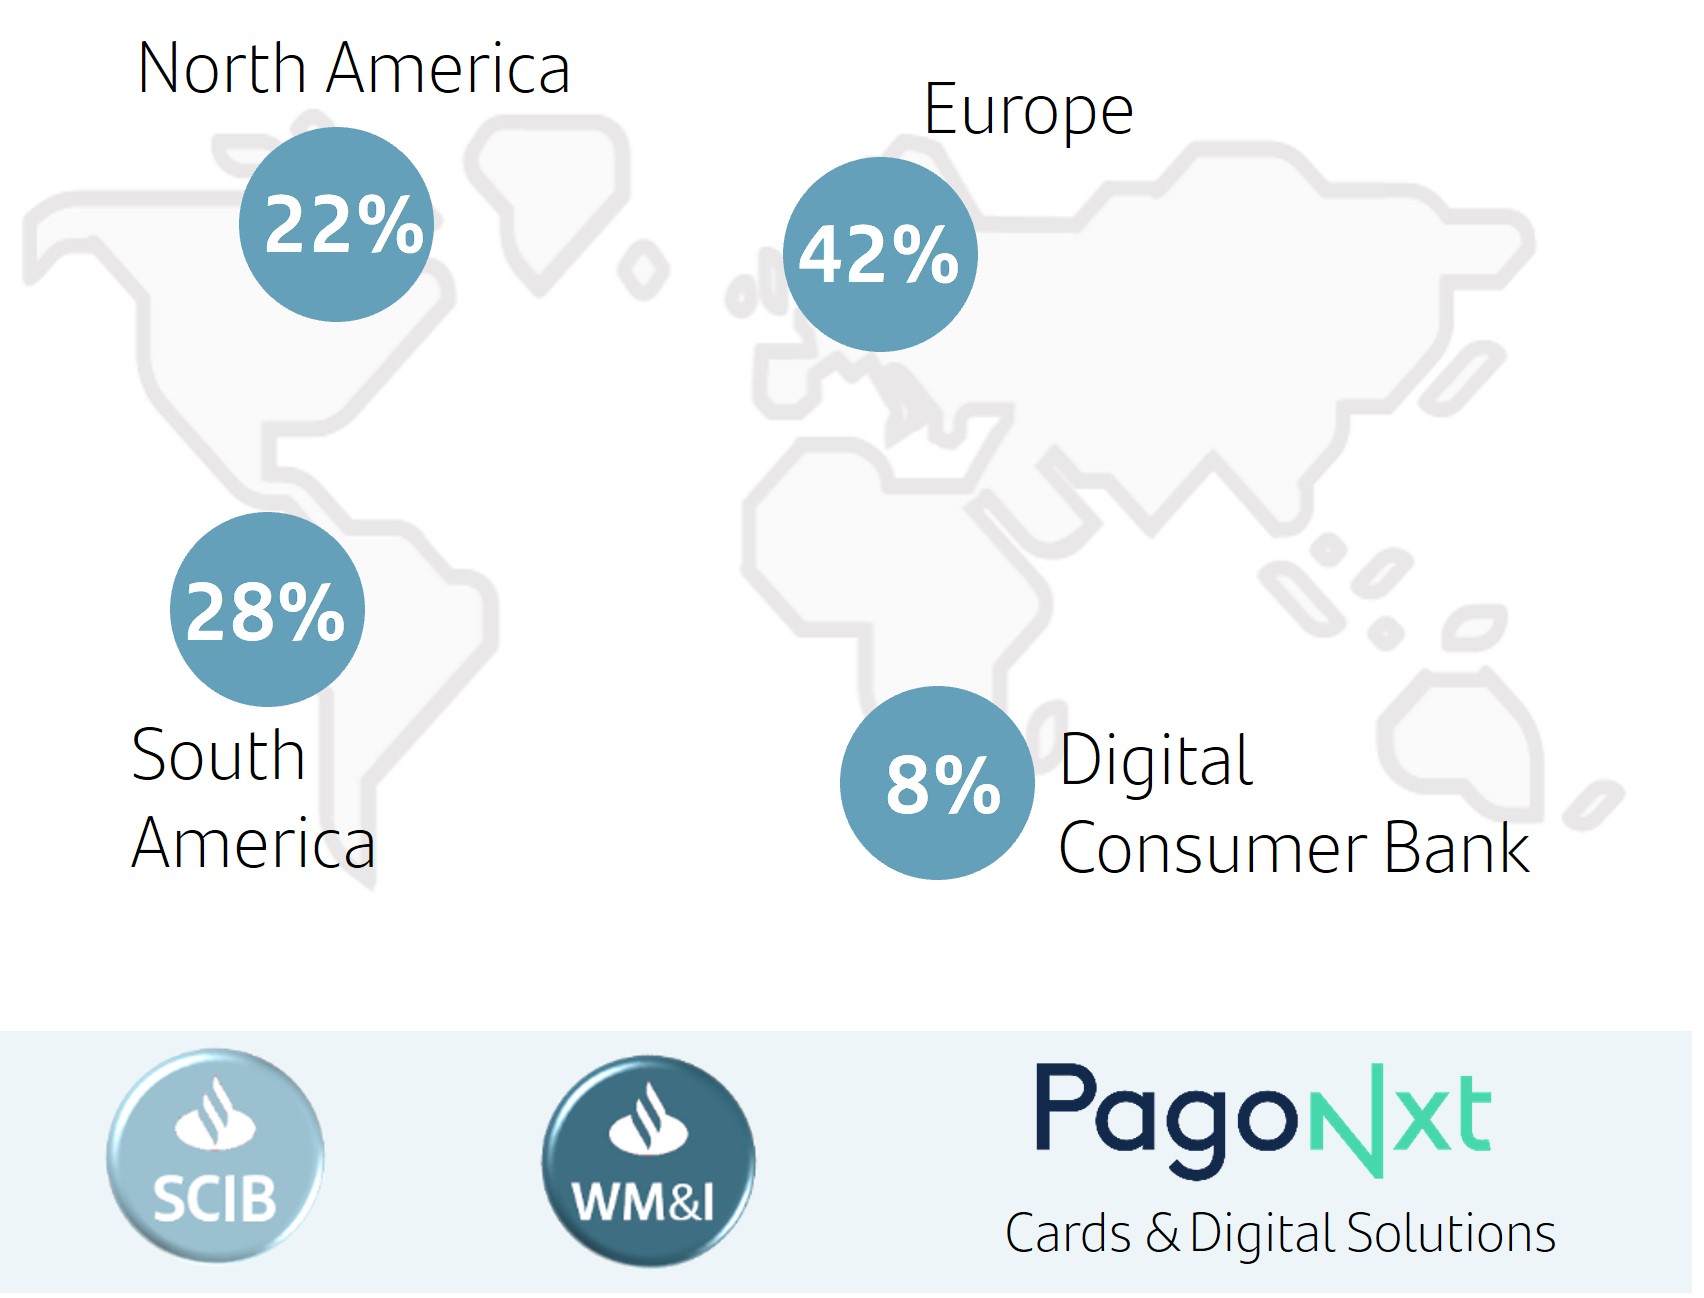
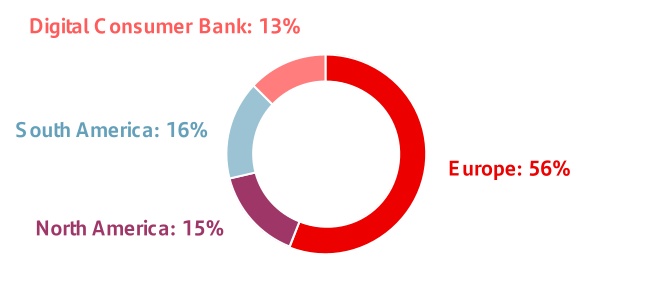
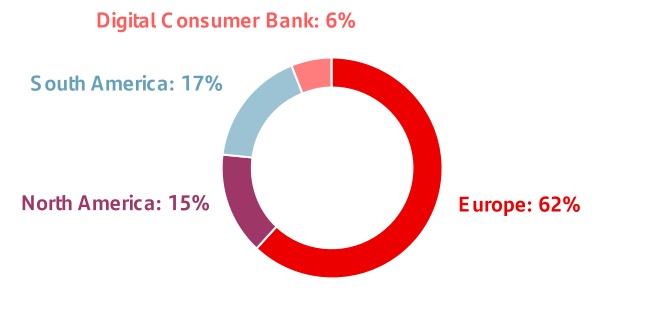
 | Top 3 NPS1 in 8 markets | Top 3 in lending2 in 10 of our markets | Contribution to Group profit3 | |||||||||||||||||||||||
 | ||||||||||||||||||||||||||
 | 161 mn total customers |  | ||||||||||||||||||||||||
99 mn active customers | ||||||||||||||||||||||||||
| Our business model remains a source of great strength and resilience | ||||||||||||||||||||||||||
Our corporate culture
The Santander Way remains unchanged to continue to deliver for all our stakeholders
Our purpose To help people and businesses prosper. | 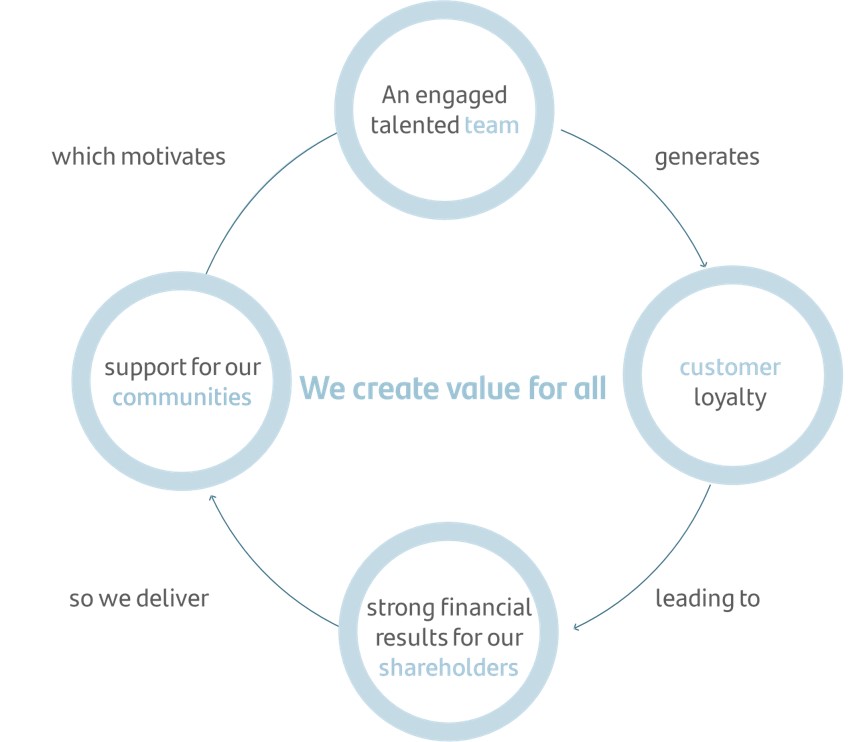 | ||||||||||
Our aim To be the best open financial services platform, by acting responsibly and earning the lasting loyalty of our people, customers, shareholders and communities. | |||||||||||
Our how Everything we do should be Simple, Personal and Fair. | |||||||||||
1.NPS – internal benchmark of individual customers' satisfaction audited by Stiga/Deloitte in H2'22.
2.Market share in lending as of December 2022 including only privately-owned banks. UK benchmark refers to the mortgage market. Digital Consumer Bank (DCB) refers to auto in Europe.
3.Q1'23 attributable profit by region. Operating areas excluding the Corporate Centre.
January - March 2023 | | 5 | ||||||
Investor Day
| Grupo Santander held an Investor Day on 28 February in London, where part of the management team reviewed the progress made in the last three years and announced the new medium-term Strategic Plan, explaining our current strengths, challenges and opportunities. | ||||||||||||||
The Group's strategy and medium-term objectives announced are part of our aim to be the best bank in each of the countries in which we operate. We have designed a plan that will enable us to improve our local banks' businesses. Our value creation model is based on becoming a digital bank with branches.
Santander's medium-term Strategic Plan is based on five pillars for increasing profitability:
 | Customer centric | Aim: | ||||||||||||
| We aim to increase the number of total customers by 40 million to 200 million and active customers by 26 million to around 125 million. This growth should contribute towards a 7-8% revenue increase per year on average between 2023-2025 in constant euros. | ||||||||||||||
| How: | ||||||||||||||
| c. 200 million | Total customers | By optimizing the product portfolio to have a simpler and more attractive offer. And, by taking advantage of the local and global scale to continue building a digital bank with branches, making 100% of the products and services available to customers on our websites and applications, leaving the branch network as a powerful complement to the digital customer service and sales channel. | ||||||||||||
| c. 125 million | Active customers | |||||||||||||
 | Simplification & automation | Aim: | ||||||||||||
| Accelerate simplification and automation of products and processes, improving user experience and overall service, rolling out new technology and fully automating operations. Our goal as a Group is to be among the most efficient banks compared to our peers, with an efficiency ratio of 42% by 2025. | ||||||||||||||
| How: | ||||||||||||||
| By optimizing products and processes while increasing automation to avoid human error and improve customer experience. This will be done by making better use of available data through artificial intelligence development. And, by intensifying efforts to reduce unit costs and capture the value of economies of scale through the use of global technology and proprietary software. | ||||||||||||||
| c. 42% | Efficiency ratio | |||||||||||||
 | Network contribution | Aim: | ||||||||||||
Increase contribution from global businesses, generating higher revenue at lower cost, which should be reflected in higher profitability: •SCIB: achieve an annual revenue growth rate of over 5% in Europe, 10% in South America and 15% in North America, between 2022 and 2025. •WM&I: annual revenue growth rate around or above 10% in Private Banking, SAM and Insurance in the next 3 years, in addition to being the preferred retail network fund partner. •Payments: 15% annual growth in the number of transactions between 2022 and 2025 in PagoNxt. In Cards, reach 115 million cards and achieve 25% cost savings by 2025. •Auto: increase market share in loans and strengthen the leasing business. | ||||||||||||||
| How: | ||||||||||||||
•SCIB: by reinforcing global presence and being a product 'factory' for the Group. •WM&I: by building global platforms and increasing presence in different markets. •Payments: by integrating the payments business in all units and expanding the Cards platform worldwide (already implemented in Brazil). •Auto: by expanding collaboration agreements with OEMs to all markets. | ||||||||||||||
| >40% | Contribution to total revenue | |||||||||||||
| >50% | Contribution to total fees | |||||||||||||
Note: 2025 targets.
| 6 | | January - March 2023 | ||||||
 | Customer activity | Aim: | ||||||||||||
| The Group has one of the largest branch networks in the international banking sector (more than 9,000 branches). At the same time, it continues to invest in digital banking capabilities, evolving traditional branches with innovative and highly successful banking solutions. The goal is to improve the service provided and increase number of transactions. | ||||||||||||||
| How: | ||||||||||||||
| By increasing customer base penetration through simplification strategies and product innovation which translates into greater activity per customer. On the corporate side, the focus is to provide multiregional coverage to increase collaboration between units. | ||||||||||||||
| c. +8% CAGR | transactions per customer1 2022-2025 | |||||||||||||
| 1. Includes merchant acquiring, cards and number of electronic A2A transactions. | ||||||||||||||
 | Capital | Aim: | ||||||||||||
Maintain a fully-loaded CET1 capital ratio above 12%, absorbing the impact of the Basel III final implementation, focusing on efficient capital allocation and asset rotation. Increase RWAs offering returns above the cost of capital from 80% at the end of 2022 to 85% in 2025. | ||||||||||||||
| How: | ||||||||||||||
By maintaining strict pricing on new business, aiming to ensure that everything we add to our balance sheet has adequate levels (2.6% RoRWA). Increasing RWA mobilization, as we have done in recent years, with the target of reaching 12% of our RWAs in 2025. | ||||||||||||||
| 85% | RWAs with RoRWA > CoE | |||||||||||||
| Note: 2025 targets. | ||||||||||||||
In conclusion, we are entering a new phase of shareholder value creation, driven by the unique combination of leadership in local markets, coupled with our global scale and disciplined approach to capital allocation. The Group has the right strategy and the vision of where it wants to go, with the following 2025 targets: | ||||||||||||||
 | ||
1.Target payout is c.50% of Group reported profit (excluding non-cash, non-capital ratios impact items), distributed approximately 50% in cash dividends and 50% in share buybacks (SBB). Execution of the shareholder remuneration policy is subject to future corporate and regulatory decisions and approvals.
January - March 2023 | | 7 | ||||||
Highlights of the period
 | PROFIT | |||||||
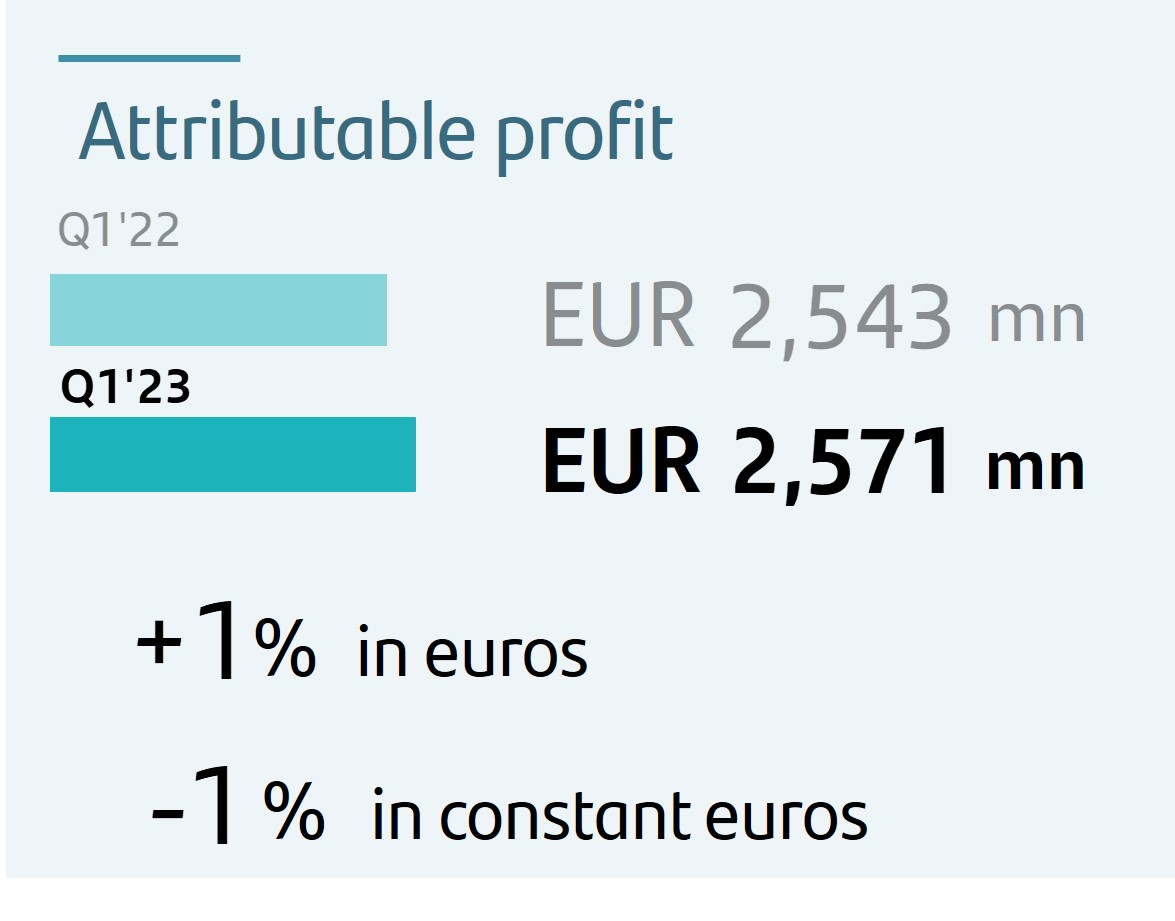 | u | In Q1 2023, attributable profit amounted to EUR 2,571 million, 1% higher than the same period of 2022. In constant euros, it decreased 1%. | |||||||||
| u | The results in the quarter were affected by the EUR 224 million charge due to the temporary levy on revenue obtained in Spain (EUR 202 million in Spain and EUR 22 million in DCB). Excluding this impact, the profit would have been EUR 2,795 million, 10% higher than the first quarter of 2022 (+8% in constant euros)1. | ||||||||||
| u | Some items were reclassified in the underlying income statement of Brazil, with no impact on profit, to better understand business trends. These items are: (i) reversal of tax liabilities amounted to EUR 261 million; and (ii) provisions to strengthen Brazil's balance sheet, which net of tax was EUR 261 million (EUR 474 million gross)1. | ||||||||||
 | u | Sustained earnings per share growth, which rose 6% compared to Q1 2022 to EUR 15.0 cents, boosted by the share buybacks in the last 12 months. | |||||||||
 | VALUE CREATION | |||||||
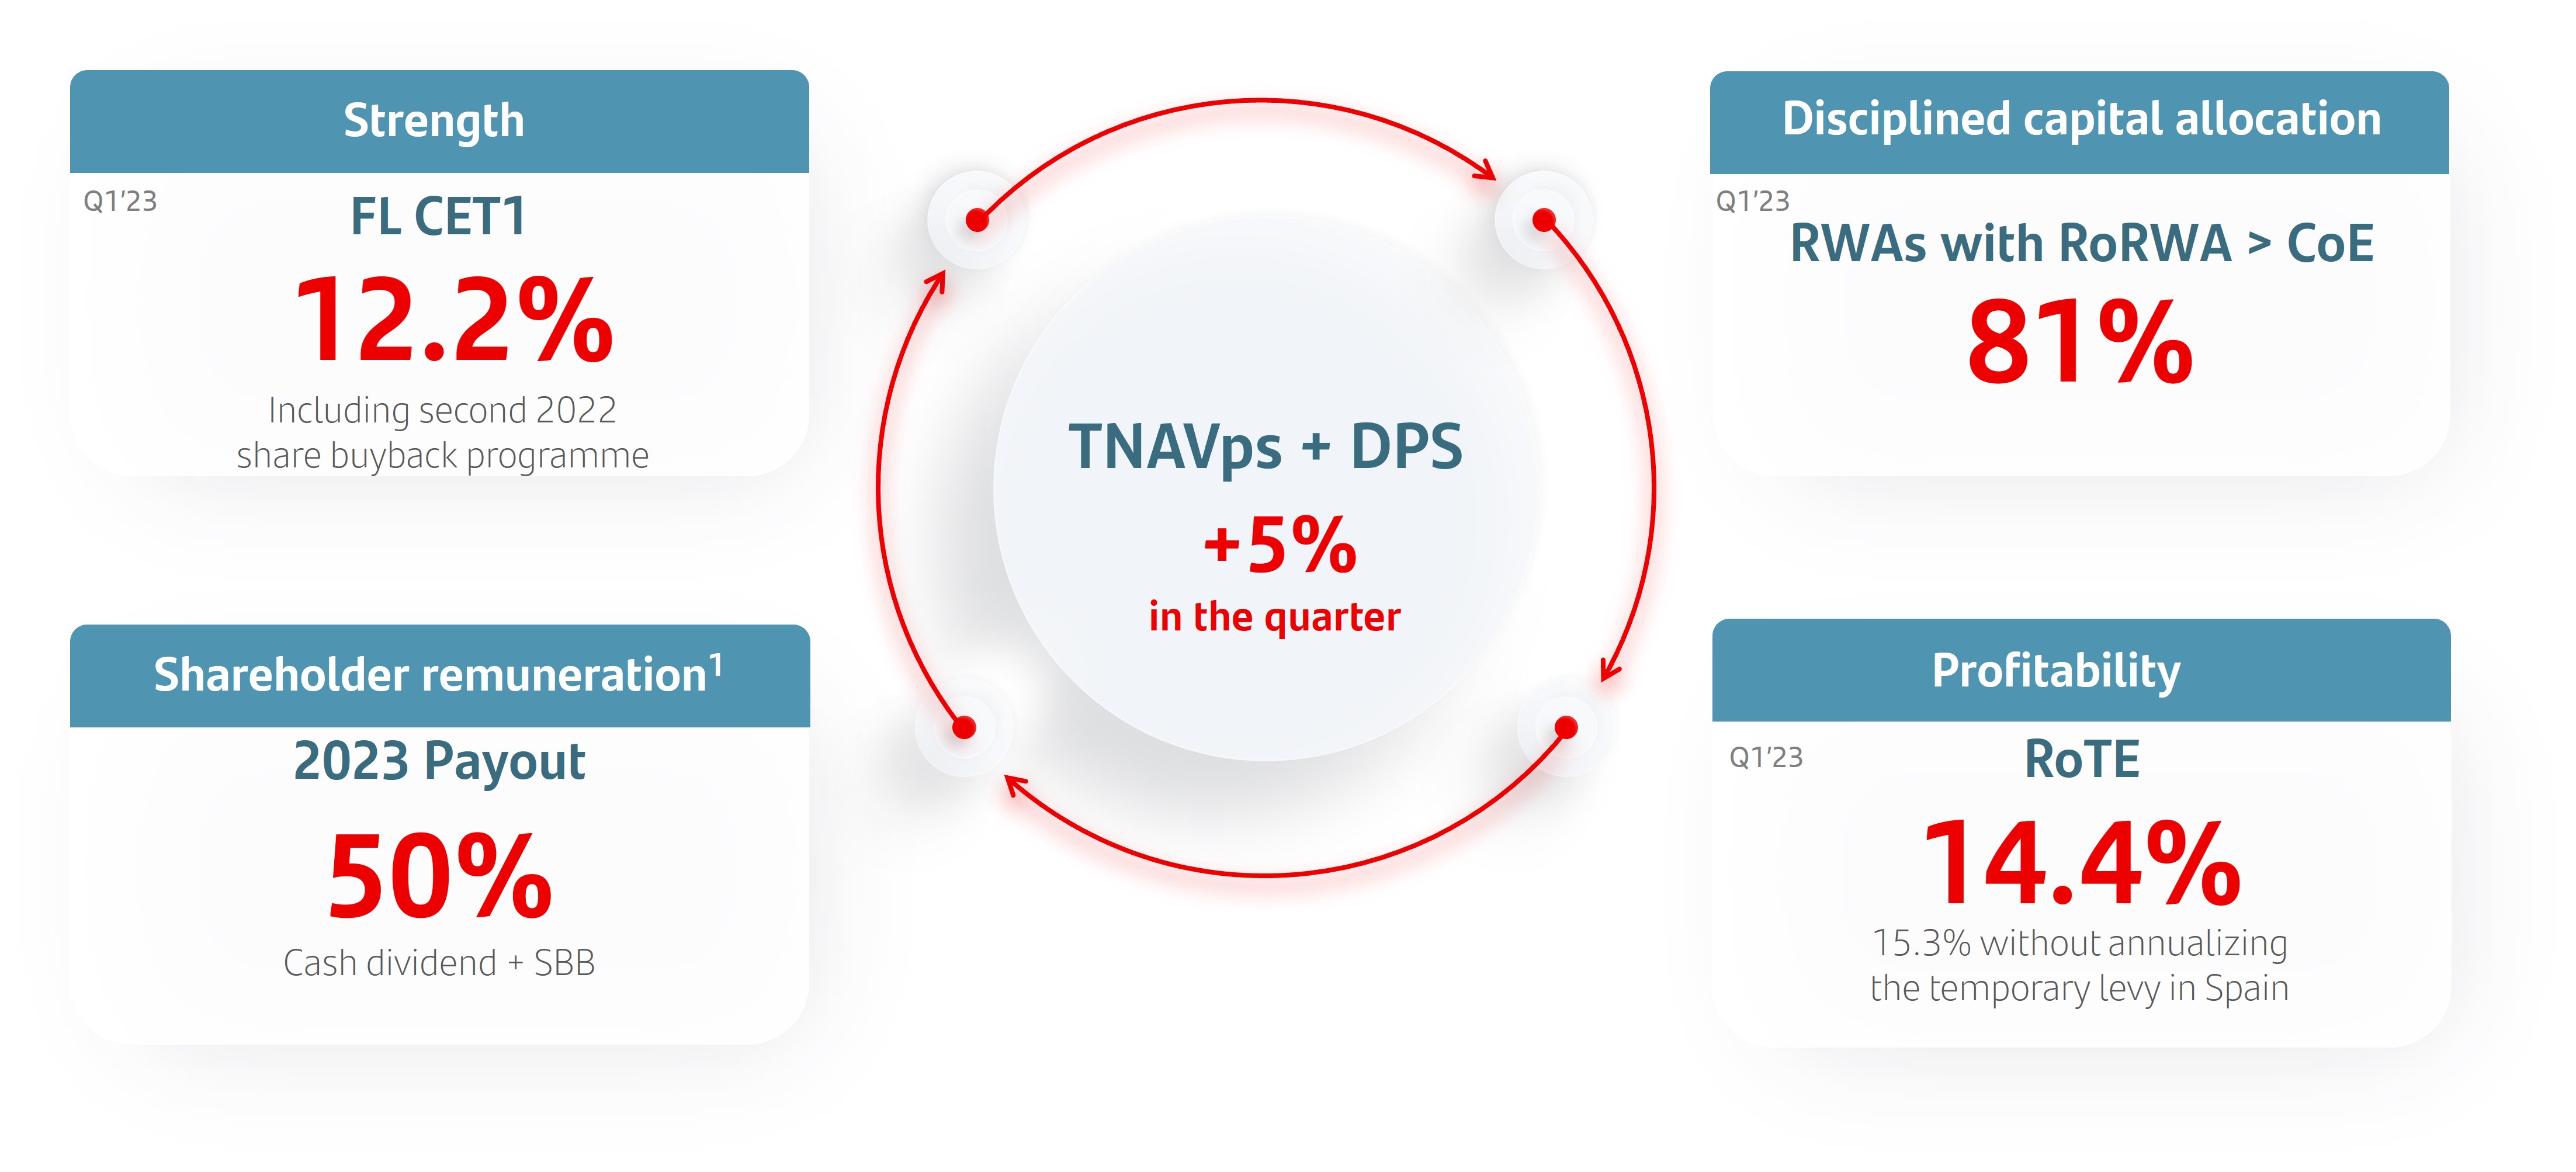
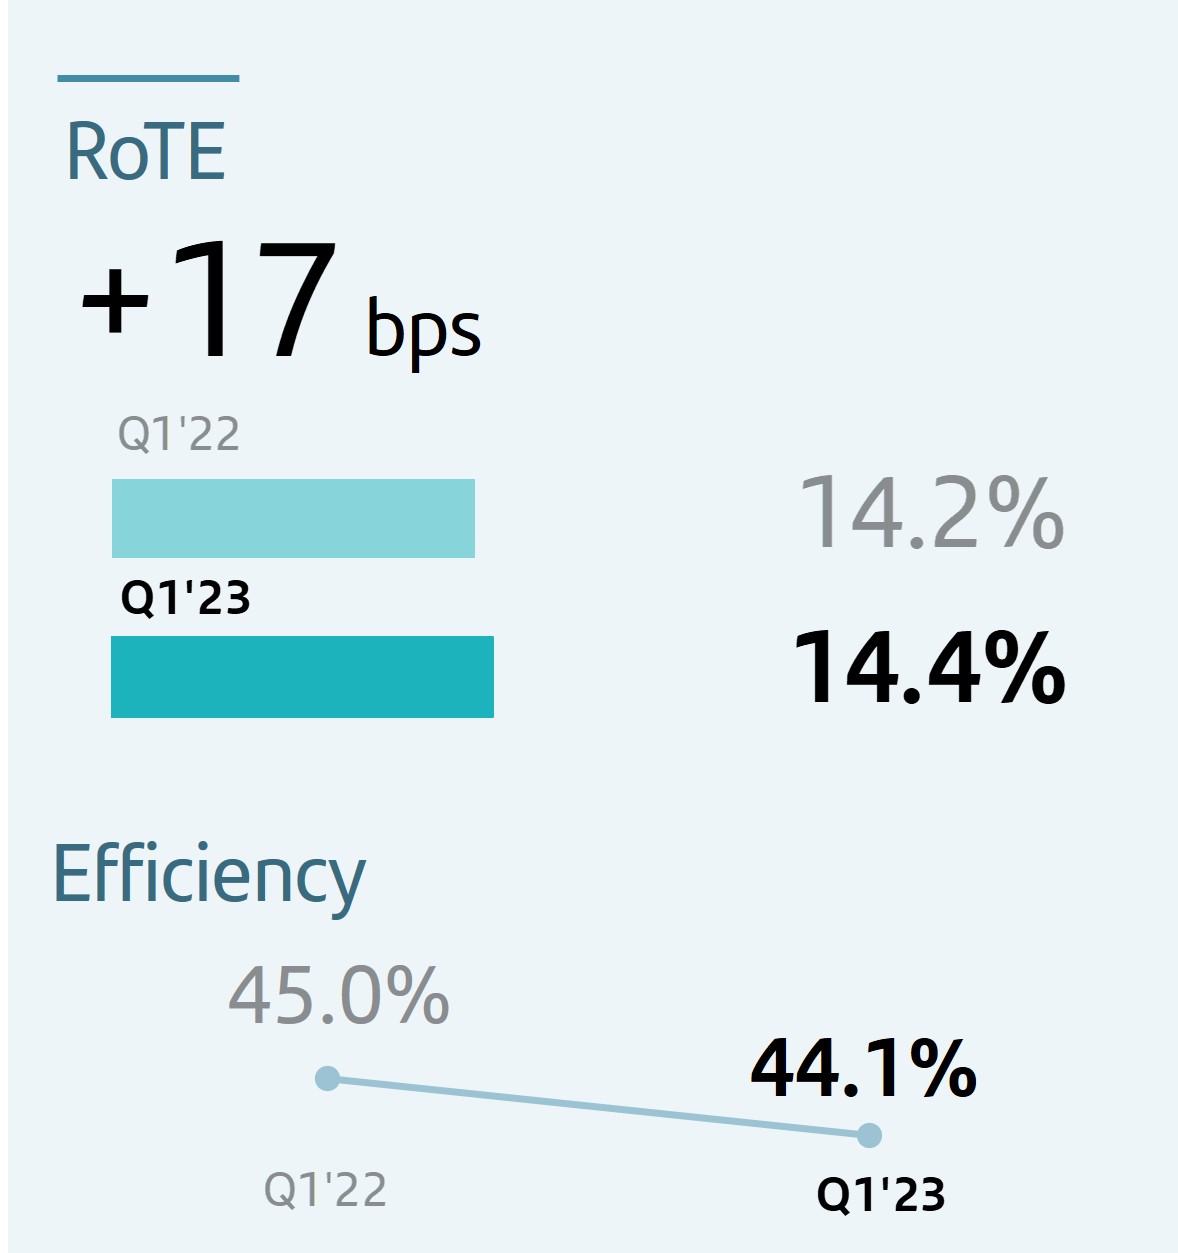 | u | RoTE was 14.4% (15.3%, not annualizing the temporary levy), compared to 14.2% in first quarter of 2022. | |||||||||
| u | Our cost base decreased 1% in real terms, thanks to our operating model transformation which more than offset both inflationary pressures and investments in technology and digitalization. The decrease is mainly in Europe, as inflation in Latin America is more automatically passed on to costs. | ||||||||||
| u | The efficiency ratio improved 0.9 pp compared to Q1 2022, driven mainly by Europe which decreased 6 pp. | ||||||||||
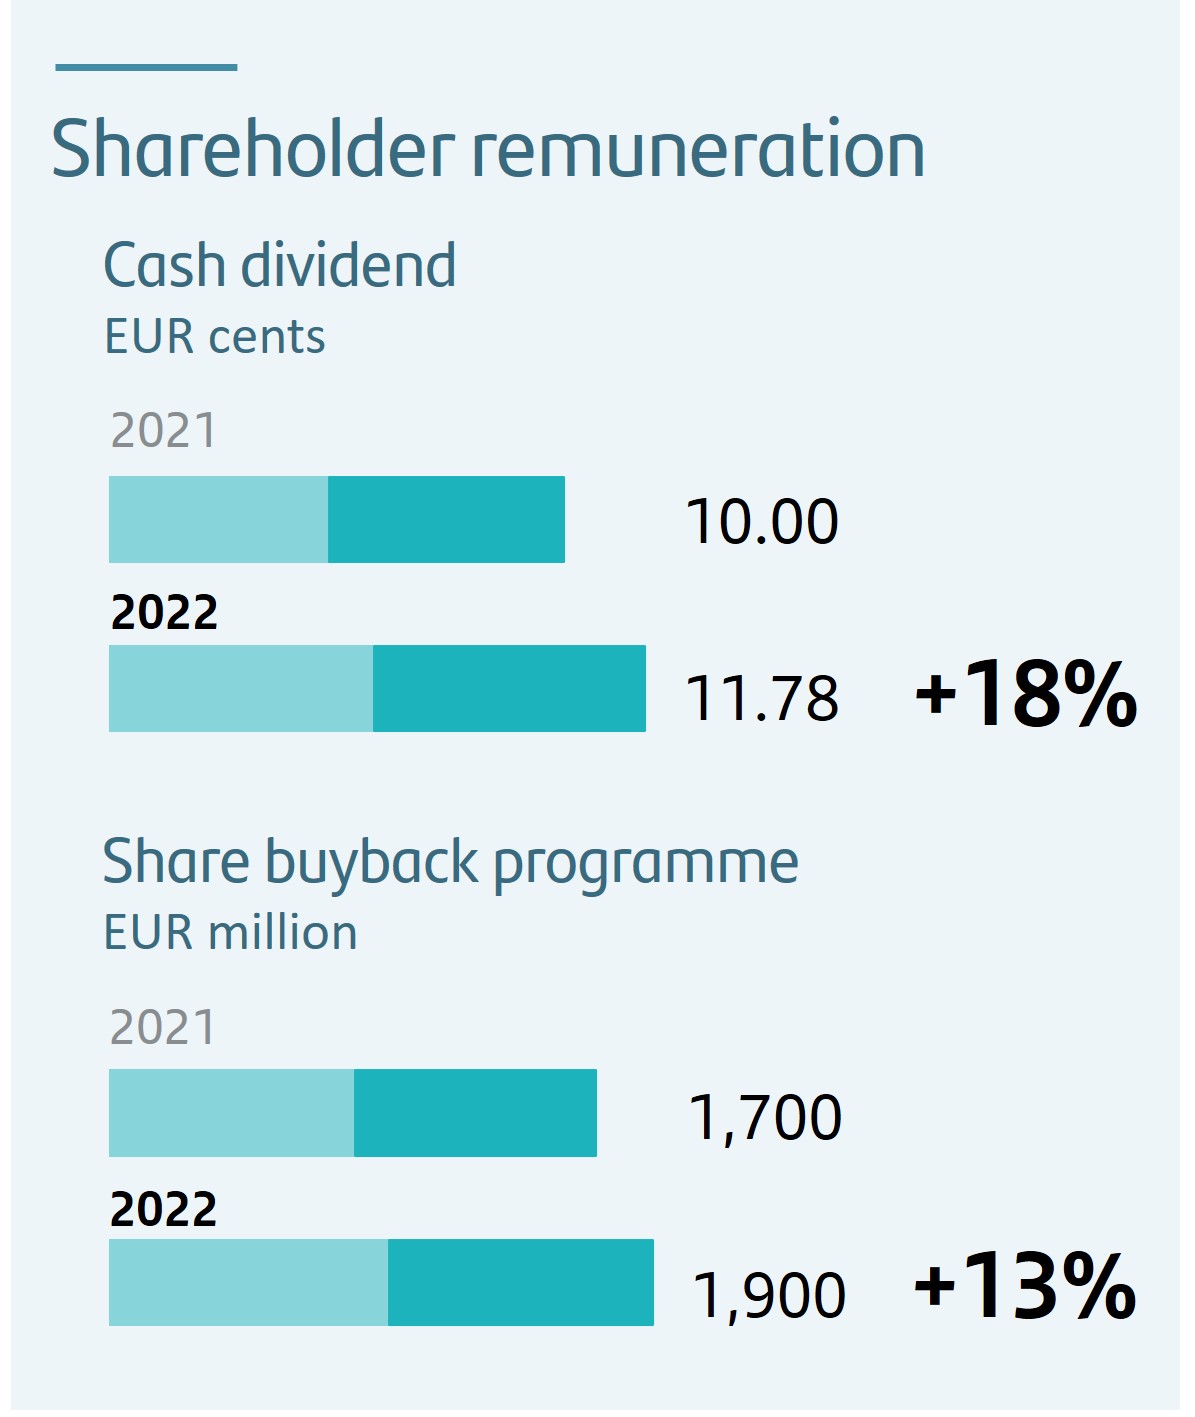 | u | The AGM approved a final cash dividend of EUR 5.95 cents per share, payable from 2 May 2023. The total cash dividend against 2022 results will be EUR 11.78 cents per share, 18% more than in 2021. This payment is complemented by two already completed share buyback programmes amounting to EUR 1.9 billion. With this, the bank has repurchased close to 7% of outstanding shares since November 2021. | |||||||||
| u | Together, the shareholder remuneration against 2022 results totals EUR 3,842 million2. This is equivalent to approximately 40% of the underlying profit in 2022. | ||||||||||
| u | The board approved the new shareholder remuneration policy, increasing payout from 40% to 50% of the attributable profit3 in 2023. | ||||||||||
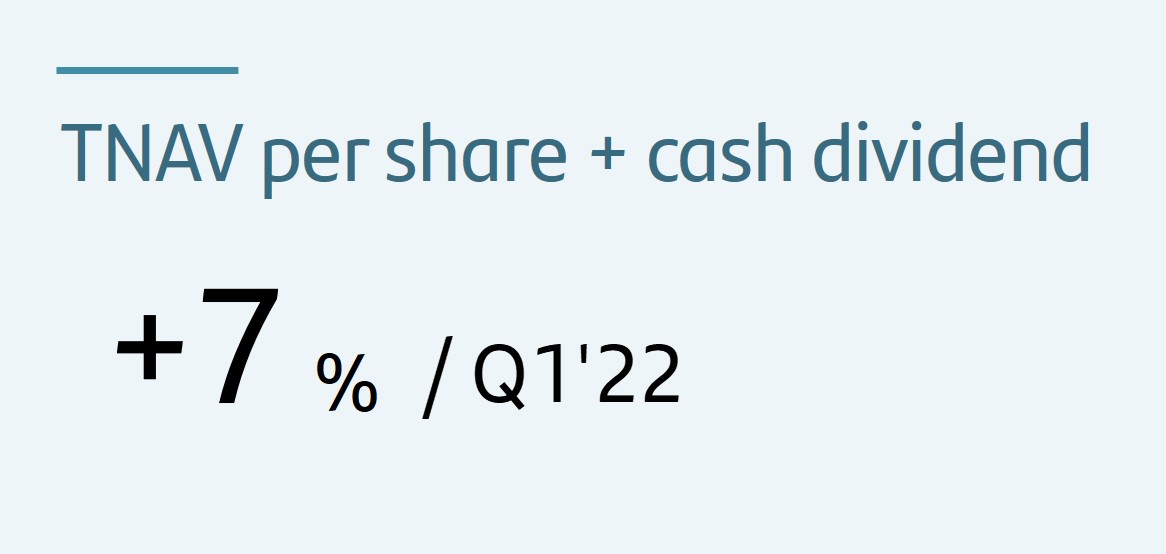 | u | As of March 2023, TNAV was EUR 4.41. Including the second cash dividend against 2022 results (EUR 5.95 cents), TNAV + dividend per share increased 5% in the quarter. | |||||||||
2.Including the cash dividend and the share buyback programmes.
3.Target payout is c.50% of Group reported profit (excluding non-cash, non-capital ratios impact items), distributed approximately 50% in cash dividends and 50% in share buybacks. Execution of the shareholder remuneration policy is subject to future corporate and regulatory decisions and approvals.
| 8 | | January - March 2023 | ||||||
 | GROWTH | |||||||
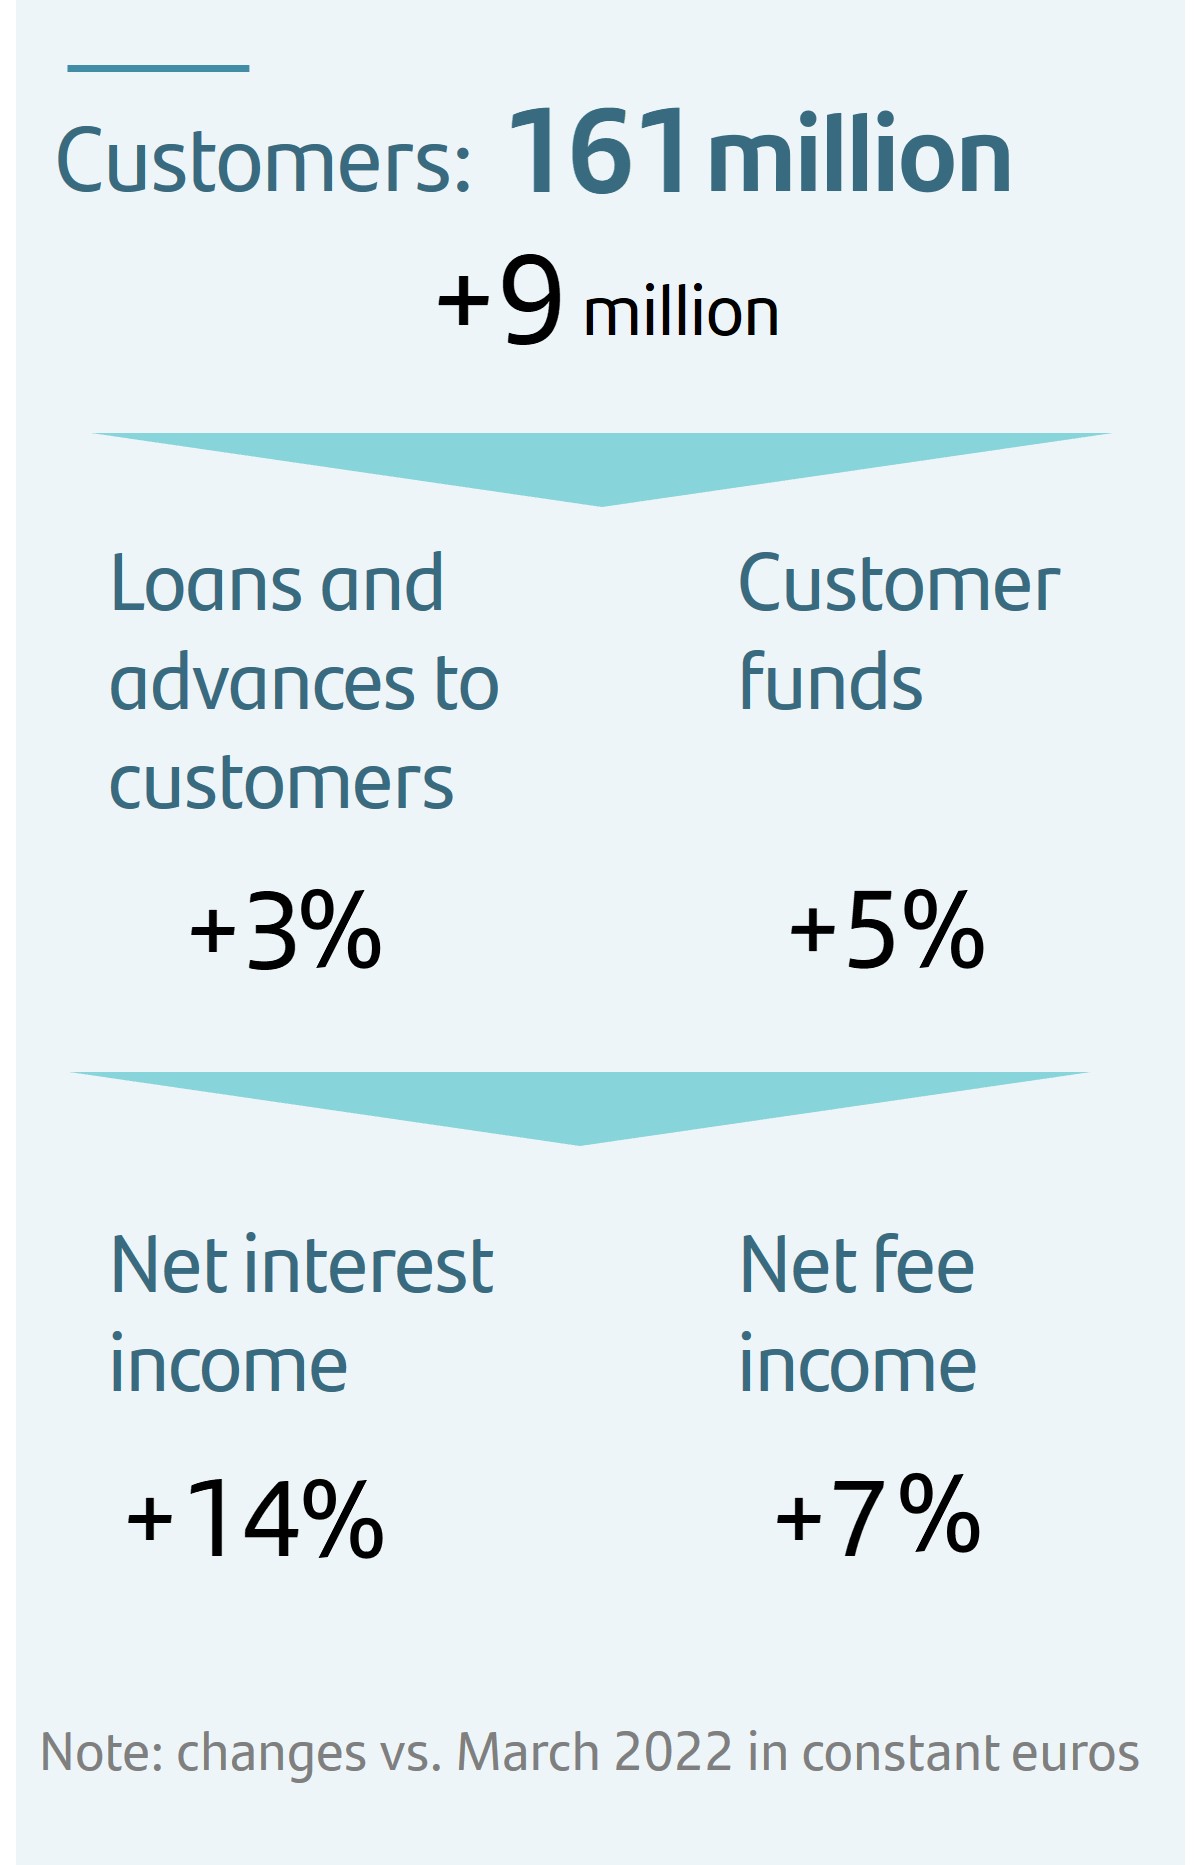 | u | Total customers amounted to 161 million, 9 million more than in March 2022. | |||||||||
| u | Active customers reached 99 million, increasing by more than 2 million in the last 12 months. | ||||||||||
| u | Digital adoption continued to be key, and we now have 52 million digital customers, a 6% increase year-on-year. In Q1 2023, 83% of transactions were made through digital channels. | ||||||||||
| u | Business volumes continued to grow in the last 12 months. Loans and advances to customers increased 2% year-on-year (+3% in constant euros). Customer funds rose 4% year-on-year (+5% in constant euros). | ||||||||||
| u | Greater activity, together with higher interest rates and margin management, were reflected in the 15% rise in net interest income and 8% increase in net fee income (+14% and +7%, respectively, in constant euros). | ||||||||||
| u | Global businesses, PagoNxt and Auto accounted for 39% of revenue in the quarter. | ||||||||||
 | STRENGTH | |||||||
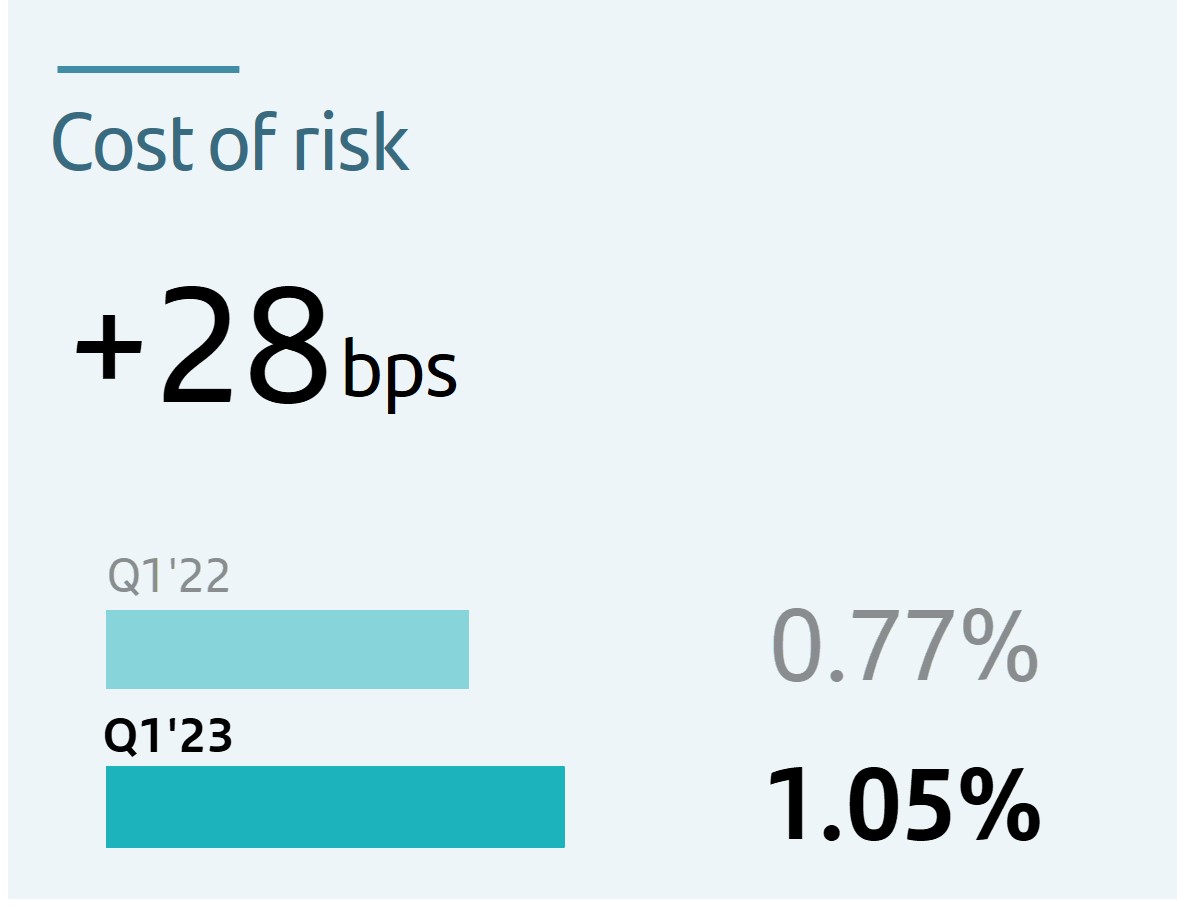 | u | Regarding credit quality, the cost of risk stood at 1.05% (0.77% in Q1'22 and 0.99% in FY'22). This increase was mainly driven by the LLP normalization process in the US, greater coverage of the Swiss franc mortgage portfolio in Poland and increased provisioning in Brazil, primarily in the individuals portfolio. | |||||||||
| u | The NPL ratio stood at 3.05%, 21 bps lower than Q1 2022, mainly due to the good performance in Europe, Mexico and Digital Consumer Bank. | ||||||||||
| u | Total loan-loss reserves reached EUR 23,388 million, resulting in a total coverage ratio of impaired assets of 68%. | ||||||||||
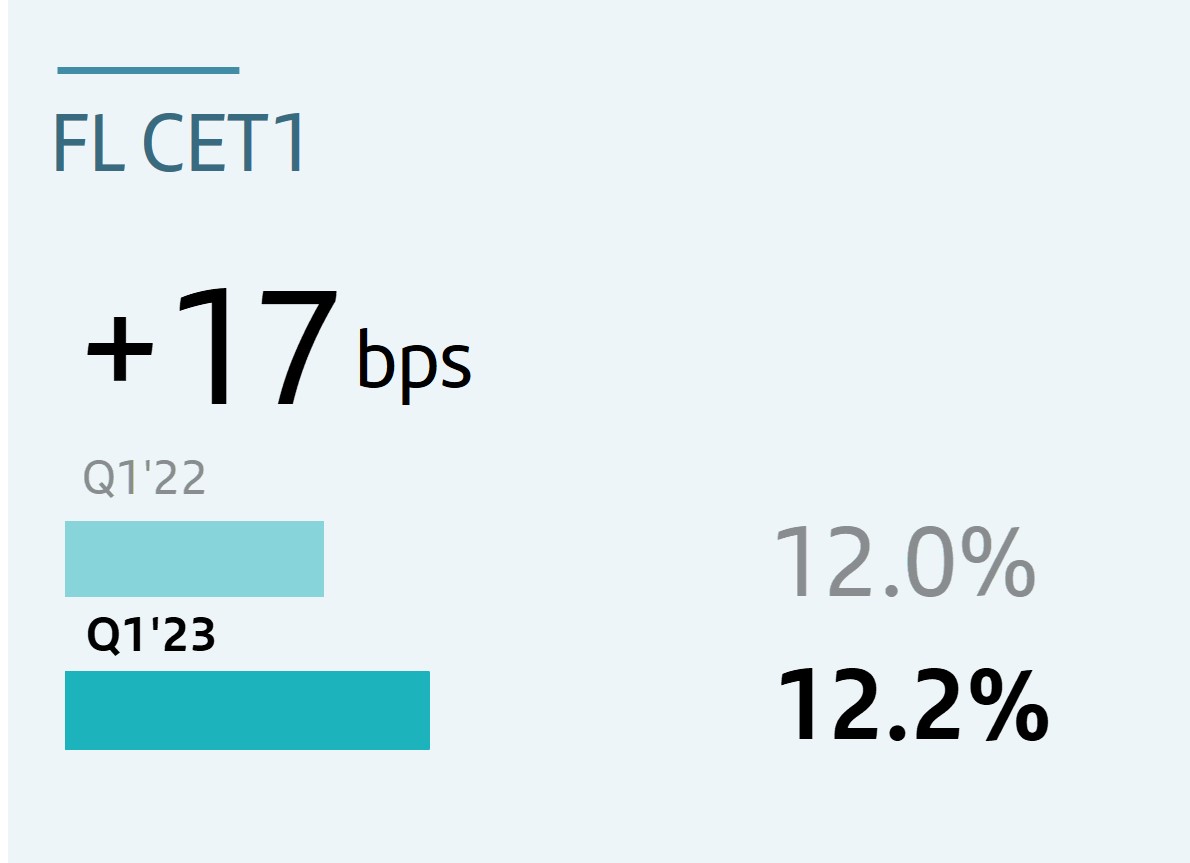 | u | The fully-loaded CET1 ratio was 12.2%. In the quarter, there were 24 bps of gross organic generation (after absorbing the negative 4 bp impact due to the temporary levy in Spain) and a 25 bp charge for future cash dividend payment against the first quarter of 2023 results1 (10 bps) and for the impact of the second 2022 share buyback programme (15 bps). | |||||||||
 | LIQUIDITY | |||||||
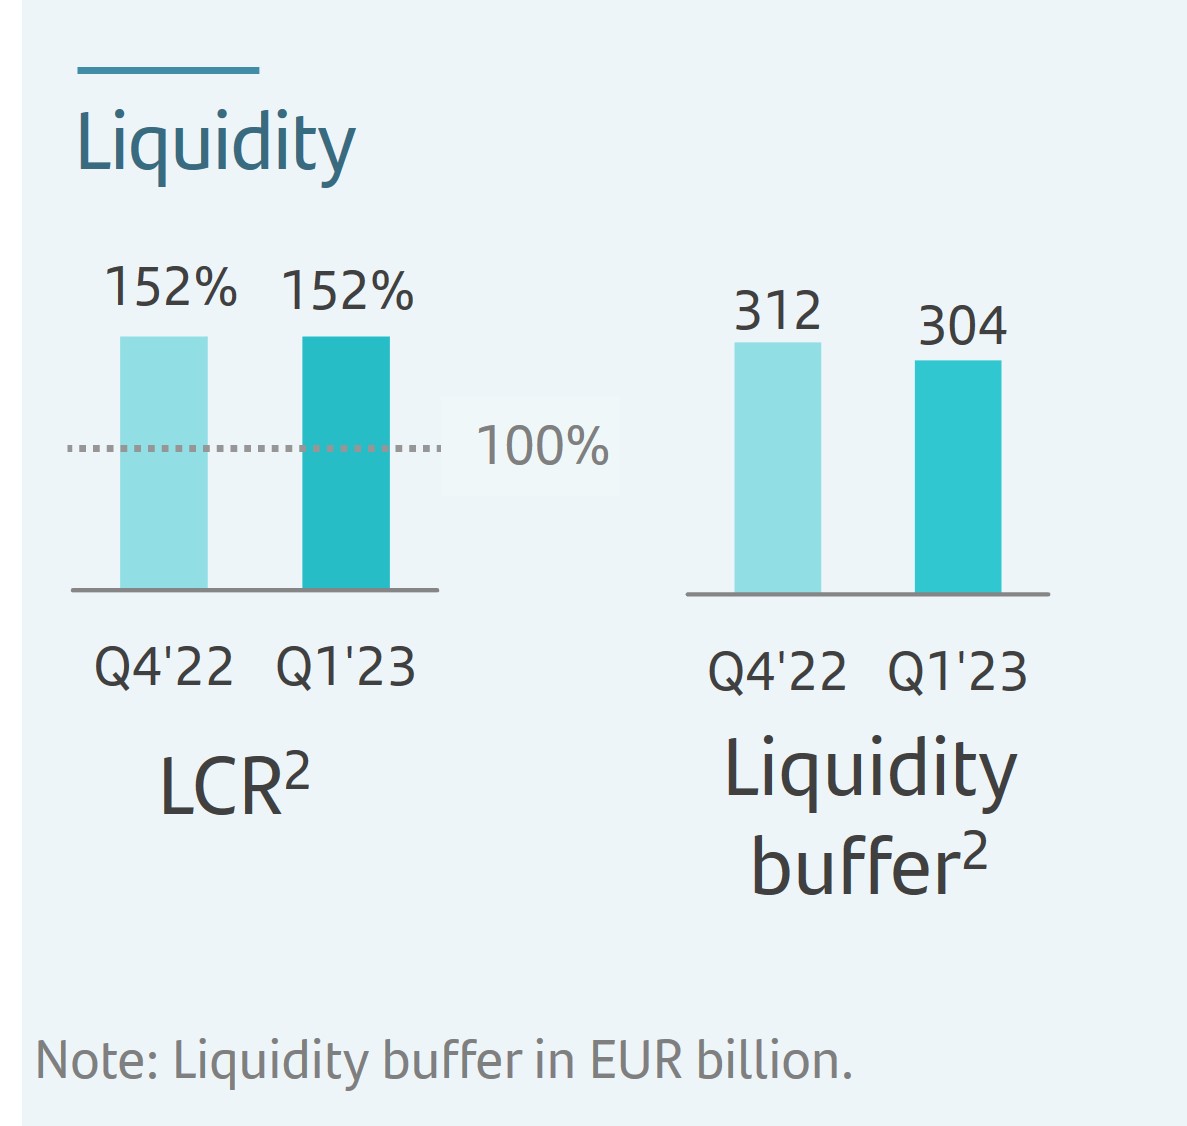 | u | Solid liquidity position with regulatory ratios well above the 100% minimum requirement. The Group liquidity coverage ratio (LCR) in the first quarter remained stable at 152%. | |||||||||
| u | The liquidity buffer, comprising high quality liquid assets (HQLAs), exceeded EUR 300 billion in March 2023, of which 97% were level 1. EUR 194 billion of the total liquidity buffer was in cash3, equivalent to 20% of our deposit base. | ||||||||||
| 1. The implementation of the shareholder remuneration policy is subject to future corporate and regulatory decisions and approvals. | |||||||||||
| 2. Provisional data. | |||||||||||
| 3. Cash, central banks reserves and deposit facility. | |||||||||||
January - March 2023 | | 9 | ||||||
| GRUPO SANTANDER RESULTS | ||||||||
| Grupo Santander. Summarized income statement | ||||||||||||||||||||||||||
| EUR million | ||||||||||||||||||||||||||
| Change | Change | |||||||||||||||||||||||||
| Q1'23 | Q4'22 | % | % excl. FX | Q1'22 | % | % excl. FX | ||||||||||||||||||||
| Net interest income | 10,396 | 10,159 | 2.3 | 2.0 | 8,855 | 17.4 | 16.3 | |||||||||||||||||||
Net fee income1 | 3,043 | 2,923 | 4.1 | 2.8 | 2,812 | 8.2 | 7.2 | |||||||||||||||||||
Gains or losses on financial assets and liabilities and exchange differences2 | 715 | 538 | 32.9 | 26.2 | 387 | 84.8 | 90.2 | |||||||||||||||||||
| Dividend income | 63 | 66 | (4.5) | (4.2) | 68 | (7.4) | (8.2) | |||||||||||||||||||
| Share of results of entities accounted for using the equity method | 126 | 201 | (37.3) | (36.7) | 133 | (5.3) | (7.1) | |||||||||||||||||||
Other operating income/expenses3 | (421) | (364) | 15.7 | (15.1) | 50 | — | — | |||||||||||||||||||
| Total income | 13,922 | 13,523 | 3.0 | 3.2 | 12,305 | 13.1 | 11.7 | |||||||||||||||||||
| Operating expenses | (6,145) | (6,308) | (2.6) | (3.3) | (5,535) | 11.0 | 10.7 | |||||||||||||||||||
| Administrative expenses | (5,356) | (5,558) | (3.6) | (4.2) | (4,831) | 10.9 | 10.5 | |||||||||||||||||||
| Staff costs | (3,245) | (3,422) | (5.2) | (5.4) | (2,863) | 13.3 | 12.7 | |||||||||||||||||||
| Other general administrative expenses | (2,111) | (2,136) | (1.2) | (2.3) | (1,968) | 7.3 | 7.2 | |||||||||||||||||||
| Depreciation and amortization | (789) | (750) | 5.2 | 3.1 | (704) | 12.1 | 12.2 | |||||||||||||||||||
| Provisions or reversal of provisions | (642) | (576) | 11.5 | 12.4 | (455) | 41.1 | 46.7 | |||||||||||||||||||
| Impairment or reversal of impairment of financial assets not measured at fair value through profit or loss (net) | (3,301) | (3,027) | 9.1 | 10.8 | (2,123) | 55.5 | 50.8 | |||||||||||||||||||
| Impairment on other assets (net) | (22) | (153) | (85.6) | (84.2) | (35) | (37.1) | (38.1) | |||||||||||||||||||
| Gains or losses on non-financial assets and investments, net | 26 | 10 | 160.0 | 128.2 | 2 | — | — | |||||||||||||||||||
| Negative goodwill recognized in results | — | — | — | — | — | — | — | |||||||||||||||||||
| Gains or losses on non-current assets held for sale not classified as discontinued operations | (6) | 20 | — | — | 12 | — | — | |||||||||||||||||||
| Profit or loss before tax from continuing operations | 3,832 | 3,489 | 9.8 | 10.4 | 4,171 | (8.1) | (10.0) | |||||||||||||||||||
| Tax expense or income from continuing operations | (967) | (948) | 2.0 | 3.0 | (1,302) | (25.7) | (27.3) | |||||||||||||||||||
| Profit from the period from continuing operations | 2,865 | 2,541 | 12.8 | 13.2 | 2,869 | (0.1) | (2.1) | |||||||||||||||||||
| Profit or loss after tax from discontinued operations | — | — | — | — | — | — | — | |||||||||||||||||||
| Profit for the period | 2,865 | 2,541 | 12.8 | 13.2 | 2,869 | (0.1) | (2.1) | |||||||||||||||||||
| Profit attributable to non-controlling interests | (294) | (252) | 16.7 | 15.9 | (326) | (9.8) | (11.4) | |||||||||||||||||||
| Profit attributable to the parent | 2,571 | 2,289 | 12.3 | 12.9 | 2,543 | 1.1 | (1.0) | |||||||||||||||||||
| EPS (euros) | 0.15 | 0.13 | 15.3 | 0.14 | 6.4 | |||||||||||||||||||||
| Diluted EPS (euros) | 0.15 | 0.13 | 15.3 | 0.14 | 6.3 | |||||||||||||||||||||
| Memorandum items: | ||||||||||||||||||||||||||
| Average total assets | 1,742,316 | 1,789,313 | (2.6) | 1,624,930 | 7.2 | |||||||||||||||||||||
| Average stockholders' equity | 90,353 | 90,574 | (0.2) | 88,532 | 2.1 | |||||||||||||||||||||
| NOTE: The summarized income statement groups some lines of the consolidated income statement on page 89 as follows: | |||||
1.‘Commission income’ and ‘Commission expense’. | |||||
2.‘Gain or losses on financial assets and liabilities not measured at fair value through profit or loss, net’; ‘Gain or losses on financial assets and liabilities held for trading, net’; ‘Gains or losses on non-trading financial assets and liabilities mandatorily at fair value through profit or loss’; ‘Gain or losses on financial assets and liabilities measured at fair value through profit or loss, net’; ‘Gain or losses from hedge accounting, net’; and ‘Exchange differences, net’. | |||||
3.‘Other operating income’; ‘Other operating expenses’;’ Income from assets under insurance and reinsurance contracts’; and ‘Expenses from liabilities under insurance and reinsurance contracts’. | |||||
| 10 | | January - March 2023 | ||||||
| Executive summary | |||||||||||||||||||||||||||||||||||||||||||||||||||||||||||||||||||||||||||||||||||||||||||||||
| Profit | Performance | |||||||||||||||||||
| Positive start to the year after absorbing the temporary levy on revenue in Spain | Trends seen at 2022 year-end continued: revenue growth, improved efficiency and controlled cost of risk | |||||||||||||||||||
| Attributable profit | Total income | Costs | Provisions | |||||||||||||||||
| EUR 2,571 mn | 1% in euros | +13% | +11% | +37% | in euros | |||||||||||||||
| -1% in constant euros | +12% | +11% | +33% | in constant euros | ||||||||||||||||
| Efficiency | Profitability | |||||||||||||||||||
| The Group's efficiency ratio improved driven by Europe | Profitability continued to improve | |||||||||||||||||||
| Group | Europe | RoTE1 | RoRWA1 | |||||||||||||||||
| 44.1% | 41.9% | 14.4% | 1.86% | |||||||||||||||||
| -0.9 pp | -5.9 pp | +0.2 pp | -0.09 pp | |||||||||||||||||
| Changes vs. Q1 2022. | 1. Not annualizing the temporary levy in Spain, RoTE would be 15.3% and RoRWA 1.97%. | |||||||||||||||||||
Results performance compared to Q1 2022
The Group presents, both at the total Group level and for each of the business units, the changes in euros produced in the income statement, as well as variations excluding the exchange rate effect (FX), on the understanding that the latter provide a better analysis of the Group’s management of the country units. For the Group as a whole, exchange rates had a positive impact of 1 pp in revenue and were neutral in costs.
Total income
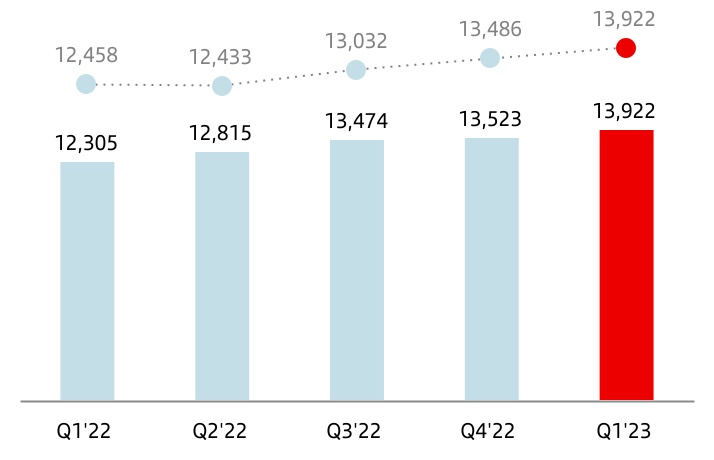
Total income amounted to EUR 13,922 million in 2023, up 13% year-on-year. In constant euros, total income increased 12%. Net interest income and net fee income accounted more than 95% of total income. By line:
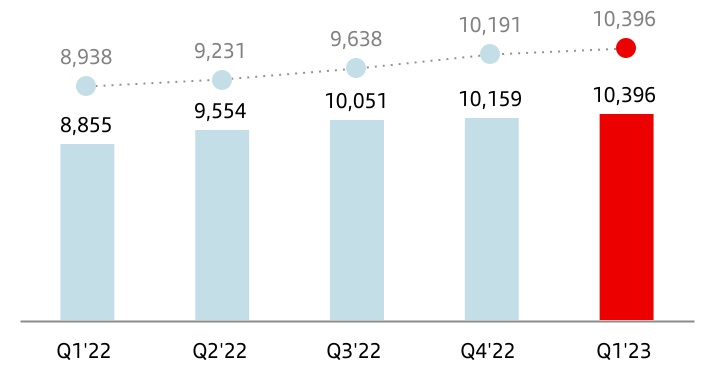
•Net interest income amounted to EUR 10,396 million, 17% higher than Q1 2022. Stripping out the exchange rate impact, growth was 16%, mainly due to greater volumes and higher interest rates.
In constant euros, of note was the net interest income growth across Europe (+30%), due to the strong positive sensitivity to interest rate rises in our balance sheet in euros. By country: +46% in Spain, +14% in the UK, +54% in Portugal and +47% in Poland.
NII increased 6% in North America, driven mainly by Mexico (+14%) but also the US (+2%).
| Net interest income | |||||
| EUR million | |||||
 | constant euros | ||||
It was up 4% in South America. Double-digit increases in volumes and higher interest rates were not reflected in growth in all countries due to the negative sensitivity to rate rises in Brazil and Chile.
NII increased 3% at DCB and the Corporate Centre recorded lower losses due to higher remuneration of the liquidity buffer.
In addition, NII included a positive impact of EUR 211 million from the reversal of tax liabilities in Brazil.
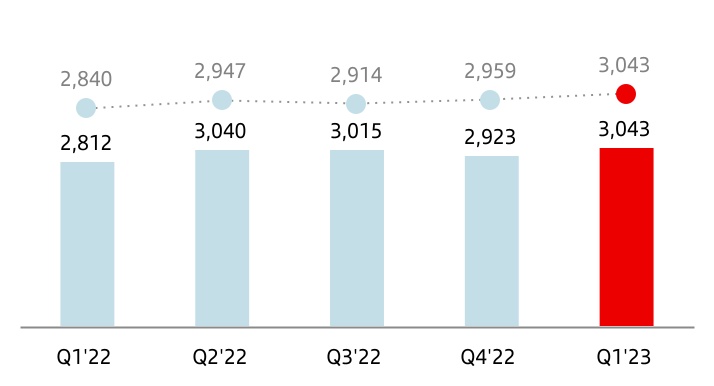
•Net fee income increased 8% compared to Q1 2022, reaching EUR 3,043 million. In constant euros, it was 7% higher.
Our scale and global businesses (SCIB and WM&I), together with our financing capabilities in auto and payments, generated greater activity for our country units and the Group, which was reflected in higher volumes and net fee income growth.
In Santander Corporate & Investment Banking (SCIB), net fee income increased 16%, with widespread growth across its core businesses.
In Wealth Management & Insurance (WM&I), total fee income generated (including ceded to the commercial network) increased 2% year-on-year, with a good performance in insurance and private banking.
| Net fee income | |||||
| EUR million | |||||
| constant euros | ||||
January - March 2023 | | 11 | ||||||
Net fee income from payments was also strong, increasing 31% in PagoNxt, with point of sale turnover increasing 27% year-on-year.
In Auto, net fee income increased 4% driven by the good performance of Brazil and Mexico, which offset the regulatory change in Germany.
These businesses represent 43% of the Group's fee income.
By region, net fee income in North America and South America was up 7% and 16%, respectively. It increased 2% in Europe due to lower loan volumes and commercial campaigns.
•Gains on financial transactions stood at EUR 715 million (EUR 387 million in the first quarter of 2022), improving in Europe, South America, DCB and the Corporate Centre, the latter driven by higher negative results from the FX hedge in Q1 2022.
•Dividend income was EUR 63 million, (EUR 68 million in Q1 2022).
•The results of entities accounted for using the equity method was EUR 126 million (EUR 133 million in Q1 2022), down year-on-year due to the lower contribution from the Group's associated entities in Europe.
•Other operating income recorded a loss of EUR 421 million (compared to a gain of EUR 50 million in Q1 2022), owing to the hyperinflation adjustment in Argentina and lower leasing income in the US. This line was affected by the EUR 224 million charge related to the temporary levy in Spain and DCB.
In summary, total income increased in all regions, DCB and global businesses. The Corporate Centre also increased, due to the higher rates on the liquidity buffer and the lower negative impact from the FX hedge.
| Total income | |||||
| EUR million | |||||
| constant euros | ||||
Costs
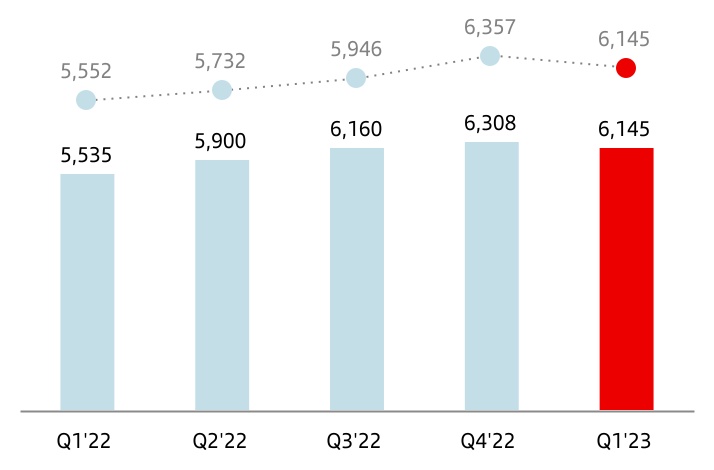
Operating expenses increased 11% year-on-year, both in euros and in constant euros, to EUR 6,145 million, due to the increase in inflation. In real terms (excluding the impact of average inflation), costs fell 1% in constant euros.
Our cost management continued to focus on improving the efficiency ratio, and as a result we remained among the most efficient banks in the world. The efficiency ratio stood at 44.1% at the end of Q1 2023, a 0.9 pp improvement on the first quarter of 2022 and 1.7 pp better than full-year 2022.
Our transformation plan continued to progress across our footprint, reflected in greater operating productivity, with better business dynamics and improved customer service and satisfaction.
The trends by region and market in constant euros were as follows:
•In Europe, costs were up 7%. In real terms, costs decreased 2%, with falls in the UK (-4%), Spain (-3%) and Portugal (-3%), whereas costs increased 5% in Poland due to the very competitive labour market and the investment impact in digitalization. The region's efficiency ratio stood at 41.9%, improving more than 5 pp both year-on-year and compared to full year 2022.
•In North America, costs increased 10%. In real terms, they were up 3%, due to digitalization and technology investments, and other transformation initiatives. The efficiency ratio stood at 47.7%.
•In South America, the rise in costs (+19%) was significantly distorted by soaring average inflation in the region (20% due to 83% inflation in Argentina) which was reflected in salary increases, directly linked to inflation. In real terms, costs decreased 1%. The efficiency ratio was 39.1%, maintaining our position as leader in the sector.
•Digital Consumer Bank's costs were 4% higher affected by inflation, strategic investments, transformational costs and business growth. In real terms, costs fell 5%. The efficiency ratio stood at 49.1%.
| Operating expenses | |||||
| EUR million | |||||
| constant euros | ||||
| 12 | | January - March 2023 | ||||||
Provisions or reversal of provisions
Provisions (net of provisions reversals) amounted to EUR 642 million (EUR 455 million in Q1 2022) mainly in the UK and Brazil.
Impairment or reversal of impairment of financial assets not measured at fair value through profit or loss (net)
Impairment or reversal of impairment on financial assets not measured at fair value through profit or loss (net) was EUR 3,301 million (EUR 2,123 million Q1 2022).
This comparison was mainly affected by the provisions resulting from the charges in Poland for CHF mortgages, the increase in the US (due to normalization) and higher provisions recorded in Brazil.
Impairment on other assets (net)
The impairment of other assets (net) stood at -EUR 22 million, compared to -EUR 35 million in Q1 2022.
Gains or losses on non-financial assets and investments (net)
Net gains on non-financial assets and investments were EUR 26 million in Q1 2023 (EUR 2 million in Q1 2022).
| Net loan-loss provisions | |||||
| EUR million | |||||
| constant euros | ||||
Negative goodwill recognized in results
No negative goodwill was recorded in the first quarter of 2023 or 2022.
Gains or losses on non-current assets held for sale not classified as discontinued operations
This item mainly includes impairment of foreclosed assets recorded and the sale of properties acquired upon foreclosure. It totalled -EUR 6 million in Q1 2023 (+EUR 12 million in Q1 2022).
Profit before tax
Profit before tax was EUR 3,832 million in Q1 2023, -8% year-on-year. In constant euros, it decreased 10%, affected by higher loan-loss provisions and impairments and the temporary levy, offsetting the good top line performance.
Income tax
Total income tax was EUR 967 million (EUR 1,302 million in Q1 2022), partially driven by lower tax related to aforementioned reversal of tax liabilities.
Profit attributable to non-controlling interests
Profit attributable to non-controlling interests decreased 10% year-on-year (-11% in constant euros) to EUR 294 million, due to South America and DCB.
Profit attributable to the parent
Profit attributable to the parent amounted to EUR 2,571 million in Q1 2023, compared to EUR 2,543 million in Q1 2022. These results do not fully reflect the profit performance due to the temporary levy mention in other sections of the report.
RoTE stood at 14.4% (14.2% in Q1 2022), RoRWA at 1.86% (1.95% in Q1 2022) and earnings per share at EUR 0.150 (EUR 0.141 in Q1 2022).
Without annualizing the temporary levy, RoTE would be 15.3%, RoRWA 1.97%.
January - March 2023 | | 13 | ||||||
Underlying profit attributable to the parent
Profit attributable to the parent and underlying profit were the same in the first quarter of 2023 (EUR 2,571 million), as profit was not affected by results that fall outside the ordinary course of our business, but there was a reclassification of certain items under some headings of the underlying income statement to better understand the business trends. These items are:
•The temporary levy on revenue in Spain totalling EUR 224 million, which was moved from total income to other gains (losses) and provisions.
•Results in Brazil related to reversal of tax liabilities amounted to EUR 261 million (EUR 211 million recorded in NII and a positive impact of EUR 50 million in tax) and provisions to strengthen the balance sheet, which net of tax totalled EUR 261 million (EUR 474 million recorded in net loan-loss provisions and a positive impact of EUR 213 million in tax). As the impact from these movements on profit was zero, we have netted them from the underlying account lines to facilitate comparison with previous quarters and to better understand business trends.
In the first quarter of 2022, profit attributable to the parent and underlying profit were also the same (EUR 2,543 million), as profit was not affected by results that fall outside the ordinary course of our business.
For more details, see 'Alternative Performance Measures' section in the appendix of this report.
Attributable profit and underlying profit increased 1% (-1% in constant euros) compared to the first quarter of 2022.
On a like-for-like basis (excluding the temporary levy in Spain), profit increased 10% (+8% in constant euros).
This growth was mainly boosted by the solid revenue performance, which increased 13% (+12% in constant euros) compared to the first quarter of 2022, and the efficiency improvement, which stood at 44.1%.
Santander's net operating income was EUR 7,790 million, 15% higher year-on-year. In constant euros, it rose 13% as follows:
•In Europe, net operating income increased 36% with better performance in all markets.
•In North America, net operating income fell 1%. It decreased 14% in the US (mainly due to lower leasing income and higher costs) and was up 20% in Mexico, owing to stronger net interest income and net fee income.
•In South America, net operating income decreased 3%, driven by further falls in net interest income in both Brazil and Chile. Net interest income increased strongly in Argentina and Uruguay.
•In Digital Consumer Bank, net operating income increased 5%, driven by higher net interest income and trading gains.
•In the Corporate Centre, net operating income increased EUR 169 million, driven by the improvement of net interest income and gains on financial transactions.
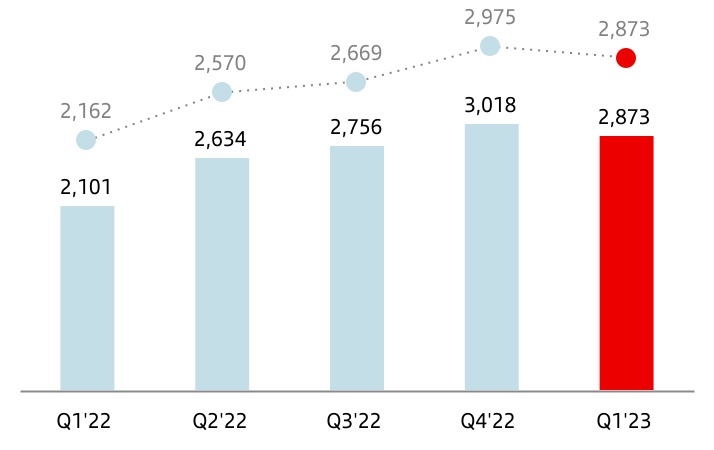
Net loan-loss provisions continued the normalization that began last year, rising 37% (+33% in constant euros). This growth was reflected in an increase in the cost of risk to 1.05%, in line with the Group's target for the year.
| Summarized underlying income statement | ||||||||||||||||||||||||||
| EUR million | Change | Change | ||||||||||||||||||||||||
| Q1'23 | Q4'22 | % | % excl. FX | Q1'22 | % | % excl. FX | ||||||||||||||||||||
| Net interest income | 10,185 | 10,159 | 0.3 | (0.1) | 8,855 | 15.0 | 13.9 | |||||||||||||||||||
| Net fee income | 3,043 | 2,923 | 4.1 | 2.8 | 2,812 | 8.2 | 7.2 | |||||||||||||||||||
Gains (losses) on financial transactions 1 | 715 | 538 | 32.9 | 26.2 | 387 | 84.8 | 90.2 | |||||||||||||||||||
| Other operating income | (8) | (95) | (91.6) | (95.9) | 251 | — | — | |||||||||||||||||||
| Total income | 13,935 | 13,525 | 3.0 | 3.1 | 12,305 | 13.2 | 11.9 | |||||||||||||||||||
| Administrative expenses and amortizations | (6,145) | (6,308) | (2.6) | (3.3) | (5,535) | 11.0 | 10.7 | |||||||||||||||||||
| Net operating income | 7,790 | 7,217 | 7.9 | 8.7 | 6,770 | 15.1 | 12.8 | |||||||||||||||||||
| Net loan-loss provisions | (2,873) | (3,018) | (4.8) | (3.4) | (2,101) | 36.7 | 32.9 | |||||||||||||||||||
| Other gains (losses) and provisions | (822) | (710) | 15.8 | 14.2 | (498) | 65.1 | 69.1 | |||||||||||||||||||
| Profit before tax | 4,095 | 3,489 | 17.4 | 18.0 | 4,171 | (1.8) | (3.8) | |||||||||||||||||||
| Tax on profit | (1,230) | (948) | 29.7 | 30.9 | (1,302) | (5.5) | (7.6) | |||||||||||||||||||
| Profit from continuing operations | 2,865 | 2,541 | 12.8 | 13.2 | 2,869 | (0.1) | (2.1) | |||||||||||||||||||
| Net profit from discontinued operations | — | — | — | — | — | — | — | |||||||||||||||||||
| Consolidated profit | 2,865 | 2,541 | 12.8 | 13.2 | 2,869 | (0.1) | (2.1) | |||||||||||||||||||
| Non-controlling interests | (294) | (252) | 16.7 | 15.9 | (326) | (9.8) | (11.4) | |||||||||||||||||||
| Profit attributable to the parent | 2,571 | 2,289 | 12.3 | 12.9 | 2,543 | 1.1 | (1.0) | |||||||||||||||||||
1. Includes exchange differences.
| 14 | | January - March 2023 | ||||||
Underlying results performance compared to the previous quarter
As was the case in Q1 2023, underlying profit attributable to the parent and profit attributable to the parent in Q4 2022 were the same (EUR 2,289 million), as profit was not affected by results outside the ordinary course of our business. However, there was a reclassification of certain items, mainly related to mortgage payment holiday charges in Poland.
As such, quarter-on-quarter profit growth was 12%.
In constant euros, profit increased 13%. The performance of the main lines of the income statement was as follows:
•Total income rose in the quarter (+3%) due to good dynamics in Europe, mainly in Spain and Portugal, and the Corporate Centre, offsetting the declines in North America, South America and DCB. Positive performance in SCIB and WM&I:
–Net interest income growth was virtually flat, impacted by the lower day count impact of approximately EUR 200 million. Excluding this impact, net interest income rose approximately 2%. By region: increased in Europe and DCB, with falls in North America and South America.
| Net operating income | |||||
| EUR million | |||||
| constant euros | ||||

–Net fee income rose 3% driven by the good performance in Europe and North America, which offset the decreases in South America (where the fourth quarter is seasonally higher), and DCB affected by the new fee regulation in Germany.
–Gains on financial transactions increased 26%, due to the good performance in Europe and the Corporate Centre. The favourable comparison of other income was partially boosted by the Deposit Guarantee Fund contribution in the fourth quarter.
•Operating expenses declined 3%, decreasing in Europe, North America and South America. Of note were the falls in Spain, Mexico, Brazil and Argentina.
•Net loan-loss provisions decreased 3%, mainly due to the UK, Poland, the US and Brazil.
•Other gains (losses) and provisions recorded a negative result of EUR 822 million, which included the temporary levy charge of EUR 224 million. In the fourth quarter of 2022, the loss was EUR 710 million, which included EUR 127 million from the settlement agreed with the FCA regarding Anti-Money Laundering (AML) controls prior to 2017 in the UK.
| Profit attributable to the parent | |||||
| EUR million | |||||
| constant euros | ||||
January - March 2023 | | 15 | ||||||
| Grupo Santander. Condensed balance sheet | |||||||||||||||||
| EUR million | |||||||||||||||||
| Change | |||||||||||||||||
| Assets | Mar-23 | Mar-22 | Absolute | % | Dec-22 | ||||||||||||
| Cash, cash balances at central banks and other demand deposits | 203,359 | 198,501 | 4,858 | 2.4 | 223,073 | ||||||||||||
| Financial assets held for trading | 172,889 | 148,472 | 24,417 | 16.4 | 156,118 | ||||||||||||
| Debt securities | 46,295 | 37,256 | 9,039 | 24.3 | 41,403 | ||||||||||||
| Equity instruments | 13,704 | 12,736 | 968 | 7.6 | 10,066 | ||||||||||||
| Loans and advances to customers | 10,512 | 13,597 | (3,085) | (22.7) | 9,550 | ||||||||||||
| Loans and advances to central banks and credit institutions | 36,150 | 26,719 | 9,431 | 35.3 | 28,097 | ||||||||||||
| Derivatives | 66,228 | 58,164 | 8,064 | 13.9 | 67,002 | ||||||||||||
Financial assets designated at fair value through profit or loss1 | 15,411 | 18,191 | (2,780) | (15.3) | 14,702 | ||||||||||||
| Loans and advances to customers | 6,979 | 8,239 | (1,260) | (15.3) | 6,642 | ||||||||||||
| Loans and advances to central banks and credit institutions | 647 | 2,153 | (1,506) | (69.9) | 673 | ||||||||||||
| Other (debt securities an equity instruments) | 7,785 | 7,799 | (14) | (0.2) | 7,387 | ||||||||||||
| Financial assets at fair value through other comprehensive income | 84,214 | 97,894 | (13,680) | (14.0) | 85,239 | ||||||||||||
| Debt securities | 73,406 | 86,152 | (12,746) | (14.8) | 75,083 | ||||||||||||
| Equity instruments | 1,997 | 2,370 | (373) | (15.7) | 1,941 | ||||||||||||
| Loans and advances to customers | 8,510 | 9,372 | (862) | (9.2) | 8,215 | ||||||||||||
| Loans and advances to central banks and credit institutions | 301 | — | 301 | — | — | ||||||||||||
| Financial assets measured at amortized cost | 1,165,387 | 1,096,679 | 68,708 | 6.3 | 1,147,044 | ||||||||||||
| Debt securities | 83,928 | 50,391 | 33,537 | 66.6 | 73,554 | ||||||||||||
| Loans and advances to customers | 1,015,387 | 980,289 | 35,098 | 3.6 | 1,011,597 | ||||||||||||
| Loans and advances to central banks and credit institutions | 66,072 | 65,999 | 73 | 0.1 | 61,893 | ||||||||||||
| Investments in subsidiaries, joint ventures and associates | 7,668 | 7,829 | (161) | (2.1) | 7,615 | ||||||||||||
| Tangible assets | 33,989 | 33,781 | 208 | 0.6 | 34,073 | ||||||||||||
| Intangible assets | 18,880 | 17,450 | 1,430 | 8.2 | 18,645 | ||||||||||||
| Goodwill | 13,870 | 13,470 | 400 | 3.0 | 13,741 | ||||||||||||
| Other intangible assets | 5,010 | 3,980 | 1,030 | 25.9 | 4,904 | ||||||||||||
Other assets2 | 47,605 | 47,215 | 390 | 0.8 | 48,150 | ||||||||||||
| Total assets | 1,749,402 | 1,666,012 | 83,390 | 5.0 | 1,734,659 | ||||||||||||
| Liabilities and shareholders' equity | |||||||||||||||||
| Financial liabilities held for trading | 123,716 | 97,866 | 25,850 | 26.4 | 115,185 | ||||||||||||
| Customer deposits | 14,139 | 12,708 | 1,431 | 11.3 | 12,226 | ||||||||||||
| Debt securities issued | — | — | — | — | — | ||||||||||||
| Deposits by central banks and credit institutions | 24,066 | 13,032 | 11,034 | 84.7 | 15,553 | ||||||||||||
| Derivatives | 63,070 | 55,908 | 7,162 | 12.8 | 64,891 | ||||||||||||
| Other | 22,441 | 16,218 | 6,223 | 38.4 | 22,515 | ||||||||||||
| Financial liabilities designated at fair value through profit or loss | 37,096 | 22,039 | 15,057 | 68.3 | 40,268 | ||||||||||||
| Customer deposits | 28,441 | 12,546 | 15,895 | 126.7 | 31,143 | ||||||||||||
| Debt securities issued | 5,726 | 5,902 | (176) | (3.0) | 5,427 | ||||||||||||
| Deposits by central banks and credit institutions | 2,929 | 3,591 | (662) | (18.4) | 3,698 | ||||||||||||
| Other | — | — | — | — | — | ||||||||||||
| Financial liabilities measured at amortized cost | 1,429,788 | 1,389,315 | 40,473 | 2.9 | 1,423,858 | ||||||||||||
| Customer deposits | 956,369 | 915,827 | 40,542 | 4.4 | 966,353 | ||||||||||||
| Debt securities issued | 281,033 | 241,908 | 39,125 | 16.2 | 274,912 | ||||||||||||
| Deposits by central banks and credit institutions | 152,446 | 194,581 | (42,135) | (21.7) | 145,534 | ||||||||||||
| Other | 39,940 | 36,999 | 2,941 | 7.9 | 37,059 | ||||||||||||
| Liabilities under insurance contracts | 17,274 | 17,551 | (277) | (1.6) | 16,426 | ||||||||||||
| Provisions | 8,089 | 9,239 | (1,150) | (12.4) | 8,149 | ||||||||||||
Other liabilities3 | 33,949 | 30,624 | 3,325 | 10.9 | 33,188 | ||||||||||||
| Total liabilities | 1,649,912 | 1,566,634 | 83,278 | 5.3 | 1,637,074 | ||||||||||||
| Shareholders' equity | 125,061 | 121,368 | 3,693 | 3.0 | 124,732 | ||||||||||||
| Capital stock | 8,227 | 8,670 | (443) | (5.1) | 8,397 | ||||||||||||
Reserves (including treasury stock)4 | 114,263 | 110,991 | 3,272 | 2.9 | 107,709 | ||||||||||||
| Profit attributable to the Group | 2,571 | 2,543 | 28 | 1.1 | 9,605 | ||||||||||||
| Less: dividends | — | (836) | 836 | (100.0) | (979) | ||||||||||||
| Other comprehensive income | (34,498) | (30,978) | (3,520) | 11.4 | (35,628) | ||||||||||||
| Minority interests | 8,927 | 8,988 | (61) | (0.7) | 8,481 | ||||||||||||
| Total equity | 99,490 | 99,378 | 112 | 0.1 | 97,585 | ||||||||||||
| Total liabilities and equity | 1,749,402 | 1,666,012 | 83,390 | 5.0 | 1,734,659 | ||||||||||||
| NOTE: The condensed balance sheet groups some lines of the consolidated balance sheet on pages 87 and 88 as follows: | ||
1.'Non-trading financial assets mandatorily at fair value through profit or loss' and 'Financial assets designated at fair value through profit or loss'. | ||
2.‘Hedging derivatives’; ‘Changes in the fair value of hedged items in portfolio hedges of interest risk’; 'Assets under insurance or reinsurance contracts'; ‘Tax assets’; ‘Other assets’; and Non-current assets held for sale’. | ||
3.‘Hedging derivatives’; ‘Changes in the fair value of hedged items in portfolio hedges of interest rate risk’; ‘Tax liabilities’; ‘Other liabilities’; and ‘Liabilities associated with non-current assets held for sale‘. | ||
4.‘Share premium’; ‘Equity instruments issued other than capital’; ‘Other equity’; ‘Accumulated retained earnings’; ‘Revaluation reserves’; ‘Other reserves’; and ‘Own shares (-)’. | ||
| 16 | | January - March 2023 | ||||||
| GRUPO SANTANDER BALANCE SHEET | ||||||||
| Executive summary | ||||||||||||||||||||||||||||||||||||||
Loans and advances to customers (excl. reverse repos) | Customer funds (deposits excl. repos + mutual funds) | |||||||||||||||||||
| Volumes decreased in the quarter affected by mortgage prepayments | Customer funds continued to grow year-on-year. Quarter affected by the drop in wholesale loans in January | |||||||||||||||||||
Loans and advances to customers (excl. reverse repos) | Customer funds (deposits excl. repos + mutual funds) | |||||||||||||||||||
| 1,015 | -1% QoQ | 1,118 | -2% QoQ | |||||||||||||||||
| EUR billion | +3% YoY | EUR billion | +5% YoY | |||||||||||||||||
è By segment: | è By product: | |||||||||||||||||||
| Growth backed by individuals and large corporates | Deposits increased 6% due to a sharp increase in time deposits driven by higher interest rates | |||||||||||||||||||
| Individuals | SMEs and corporates | CIB | Demand | Time | Mutual funds | |||||||||||||||
| +4% | 0% | +1% | -5% | +49% | +1% | |||||||||||||||
| Note: changes vs. March 2022 in constant euros. | ||||||||||||||||||||
Loans and advances to customers
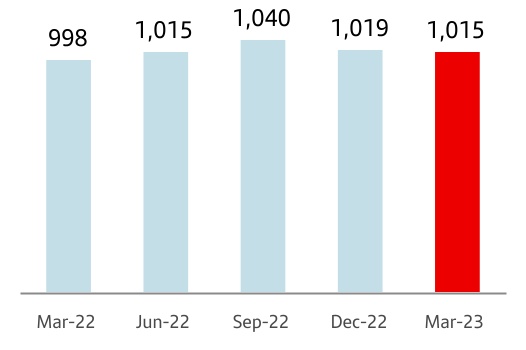
Loans and advances to customers stood at EUR 1,041,388 million as at 31 March 2023, a 1% increase in the quarter and +3% year-on-year.
For the purpose of analysing traditional commercial banking loans, the Group uses gross loans and advances to customers excluding reverse repos (EUR 1,015,343 million). Additionally, to facilitate the analysis of the Group's management, the comments below do not include the exchange rate impact.
In the quarter, gross loans and advances to customers, excluding reverse repos, decreased 1%, as follows:
•3% decline in Europe with falls across all countries, due to higher interest rates, higher prepayment volumes and lower loans in SCIB.
•Loans in North America remained practically stable, both in the US (+0.3%) and Mexico (-0.4%).
•In South America, loans increased 2%, up 2% in Brazil and Chile, +24% in Argentina and -3% in Uruguay.
•Loans at Digital Consumer Bank (DCB) rose 2%, with a 2% increase in Openbank also.
| Gross loans and advances to customers (excl. reverse repos) | |||||
| EUR billion | |||||
| +2 | % | 1a | |||
| Mar-23 / Mar-22 | |||||
1. In constant EUR: +3%.
Compared to March 2022, gross loans and advances to customers (excluding reverse repos and in constant euros) grew 3%, as follows:
•In Europe, volumes decreased 2% with falls in Spain (-3%) and Portugal (-2%), mainly due to lower corporate loans and mortgage prepayments, while in the UK and Poland they remained stable.
•Loans rose 6% in North America. In the US they increased 7% propelled by auto financing, Multifamily and SCIB, while Mexico was up 3% driven by the increase in loans to individuals.
•Growth in South America was 12%. In Argentina, lending increased 91% driven by consumer lending, SMEs, corporates and SCIB. In Brazil, it climbed 10% driven by the positive performance in corporates and institutions and secured loans to individuals. In Chile, loans increased 9% backed by mortgages and SCIB. In Uruguay, they rose 13%.
•At DCB, volumes increased 11%, with good performance in all countries. Openbank loans rose 22%.
As at March 2023, gross loans and advances to customers excluding reverse repos maintained a balanced structure: individuals (62%), SMEs and corporates (24%) and SCIB (14%).
| Gross loans and advances to customers (excl. reverse repos) | ||
| % operating areas. March 2023 | ||
January - March 2023 | | 17 | ||||||
Customer funds
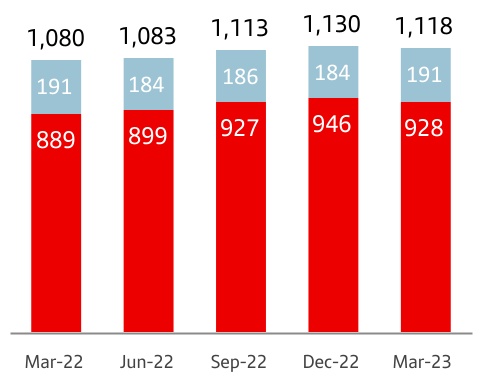
Customer deposits amounted to EUR 998,949 million in March 2023, decreasing 1% quarter-on-quarter and increasing 6% year-on-year.
The Group uses customer funds (customer deposits excluding repos, plus mutual funds) for the purpose of analysing traditional retail banking funds, which amounted to EUR 1,118,155 million in March 2023. The comments below do not include the exchange rate impact.
•In the first quarter, customer funds decreased 2%, as follows:
–By product, customer deposits excluding repos declined 2% and mutual funds increased 3%.
–By primary segment, customer funds rose in South America and DCB, slightly increased in North America and decreased in Europe. By country, customer funds increased in all units in South America, Mexico, and decreased in the US and all European units (except Poland) driven by the fall in lending, in part due to the prepayment of loans and the seasonal increase in SCIB at the end of the year.
•Compared to March 2022, customer funds were up 5% in constant euros:
–By product, customer deposits excluding repos were up 6%. Strong increase in time deposits (+49%), growing significantly across all markets (except in Portugal) to the detriment of demand deposits which fell 5% with declines in most countries. Mutual funds increased 1%.
–Customer funds increased 11% in South America (+7% in Brazil; +4% in Chile; +113% in Argentina) and rose 8% in North America (+9% in the US; +7% in Mexico). They rose 2% in Europe due to the increases in Spain (+5%), Poland (+4%), that more than offset the 5% decrease in Portugal. In the UK, they remained stable.
–Positive performance also in DCB, whose funds increased 10%.
With this performance, the weight of demand deposits as a percentage of total customer funds was 61%, while time deposits accounted for 22% of the total and mutual funds 17%.
| Customer funds | ||
| EUR billion | ||
| +4 | % | 1a | ||||||
| 0 | % | |||||||
| +4 | % | |||||||
•Total | ||||||||
• Mutual funds | ||||||||
•Deposits exc. repos | ||||||||
| Mar-23 / Mar-22 | ||||||||
1. In constant EUR: +5%.
In addition to capturing customer deposits, the Group, for strategic reasons, maintains a selective policy of issuing securities in the international fixed income markets and strives to adapt the frequency and volume of its market operations to the structural liquidity needs of each unit, as well as to the receptiveness of each market.
In the first quarter of 2023, the Group issued:
•Medium- and long-term covered bonds amounting to EUR 6,324 million (including the first ECA covered bond placed in market) and EUR 7,864 million in senior debt placed in the market.
•There were EUR 2,600 million of securitizations placed in the market.
•Issuances to meet the TLAC requirement amounted to EUR 2,500 million, entirely senior non-preferred.
•Maturities of medium- and long-term debt totalled EUR 8,076 million.
The net loan-to-deposit ratio was 104% (107% in March 2022). The ratio of deposits plus medium- and long-term funding to the Group’s loans was 120%, underscoring the comfortable funding structure. The liquidity coverage ratio (LCR) was an estimated 152% in March (157% in March 2022)
The Group's access to wholesale funding markets as well as the cost of issuances depends, in part, on the ratings of the rating agencies.
The ratings of Banco Santander, S.A. by the main rating agencies were: Fitch A- senior non-preferred debt, A senior long-term and F2/F1 senior short-term; Moody's A2 long-term and P-1 short-term; Standard & Poor's (S&P) A+ long-term rating and A-1 short-term rating; and DBRS A High and R-1 Medium short-term. Moody's, DBRS and Fitch maintained their stable outlooks, above the sovereign's outlook, while S&P also maintained its outlook but in line with the sovereign's.
Sometimes the methodology applied by the agencies limits a bank's rating to the sovereign rating of the country where it is headquartered. Banco Santander, S.A. is still rated above the sovereign debt rating of the Kingdom of Spain by Moody’s, DBRS and S&P and at the same level by Fitch, which demonstrates our financial strength and diversification.
| Customer funds | ||
| % operating areas. March 2023 | ||
| 18 | | January - March 2023 | ||||||
| SOLVENCY RATIOS | ||||||||
| Executive summary | ||||||||||||||||||||||||||||||||||||||
| Fully-loaded capital ratio | Fully-loaded CET1 ratio | |||||||||||||||||||
| Fully-loaded CET1 ratio exceeded 12% at the end of March 2023 | We continued to generate capital organically in the quarter, backed by profit and RWA management | |||||||||||||||||||
| Fully-loaded CET1 performance | Gross organic generation | +24 bps | ||||||||||||||||||
 | ||||||||||||||||||||
Cash dividend accrual1 | -25 bps | |||||||||||||||||||
| TNAV per share | ||||||||||||||||||||
TNAV per share was EUR 4.41, increasing 5% in the quarter including the dividend approved in March | ||||||||||||||||||||
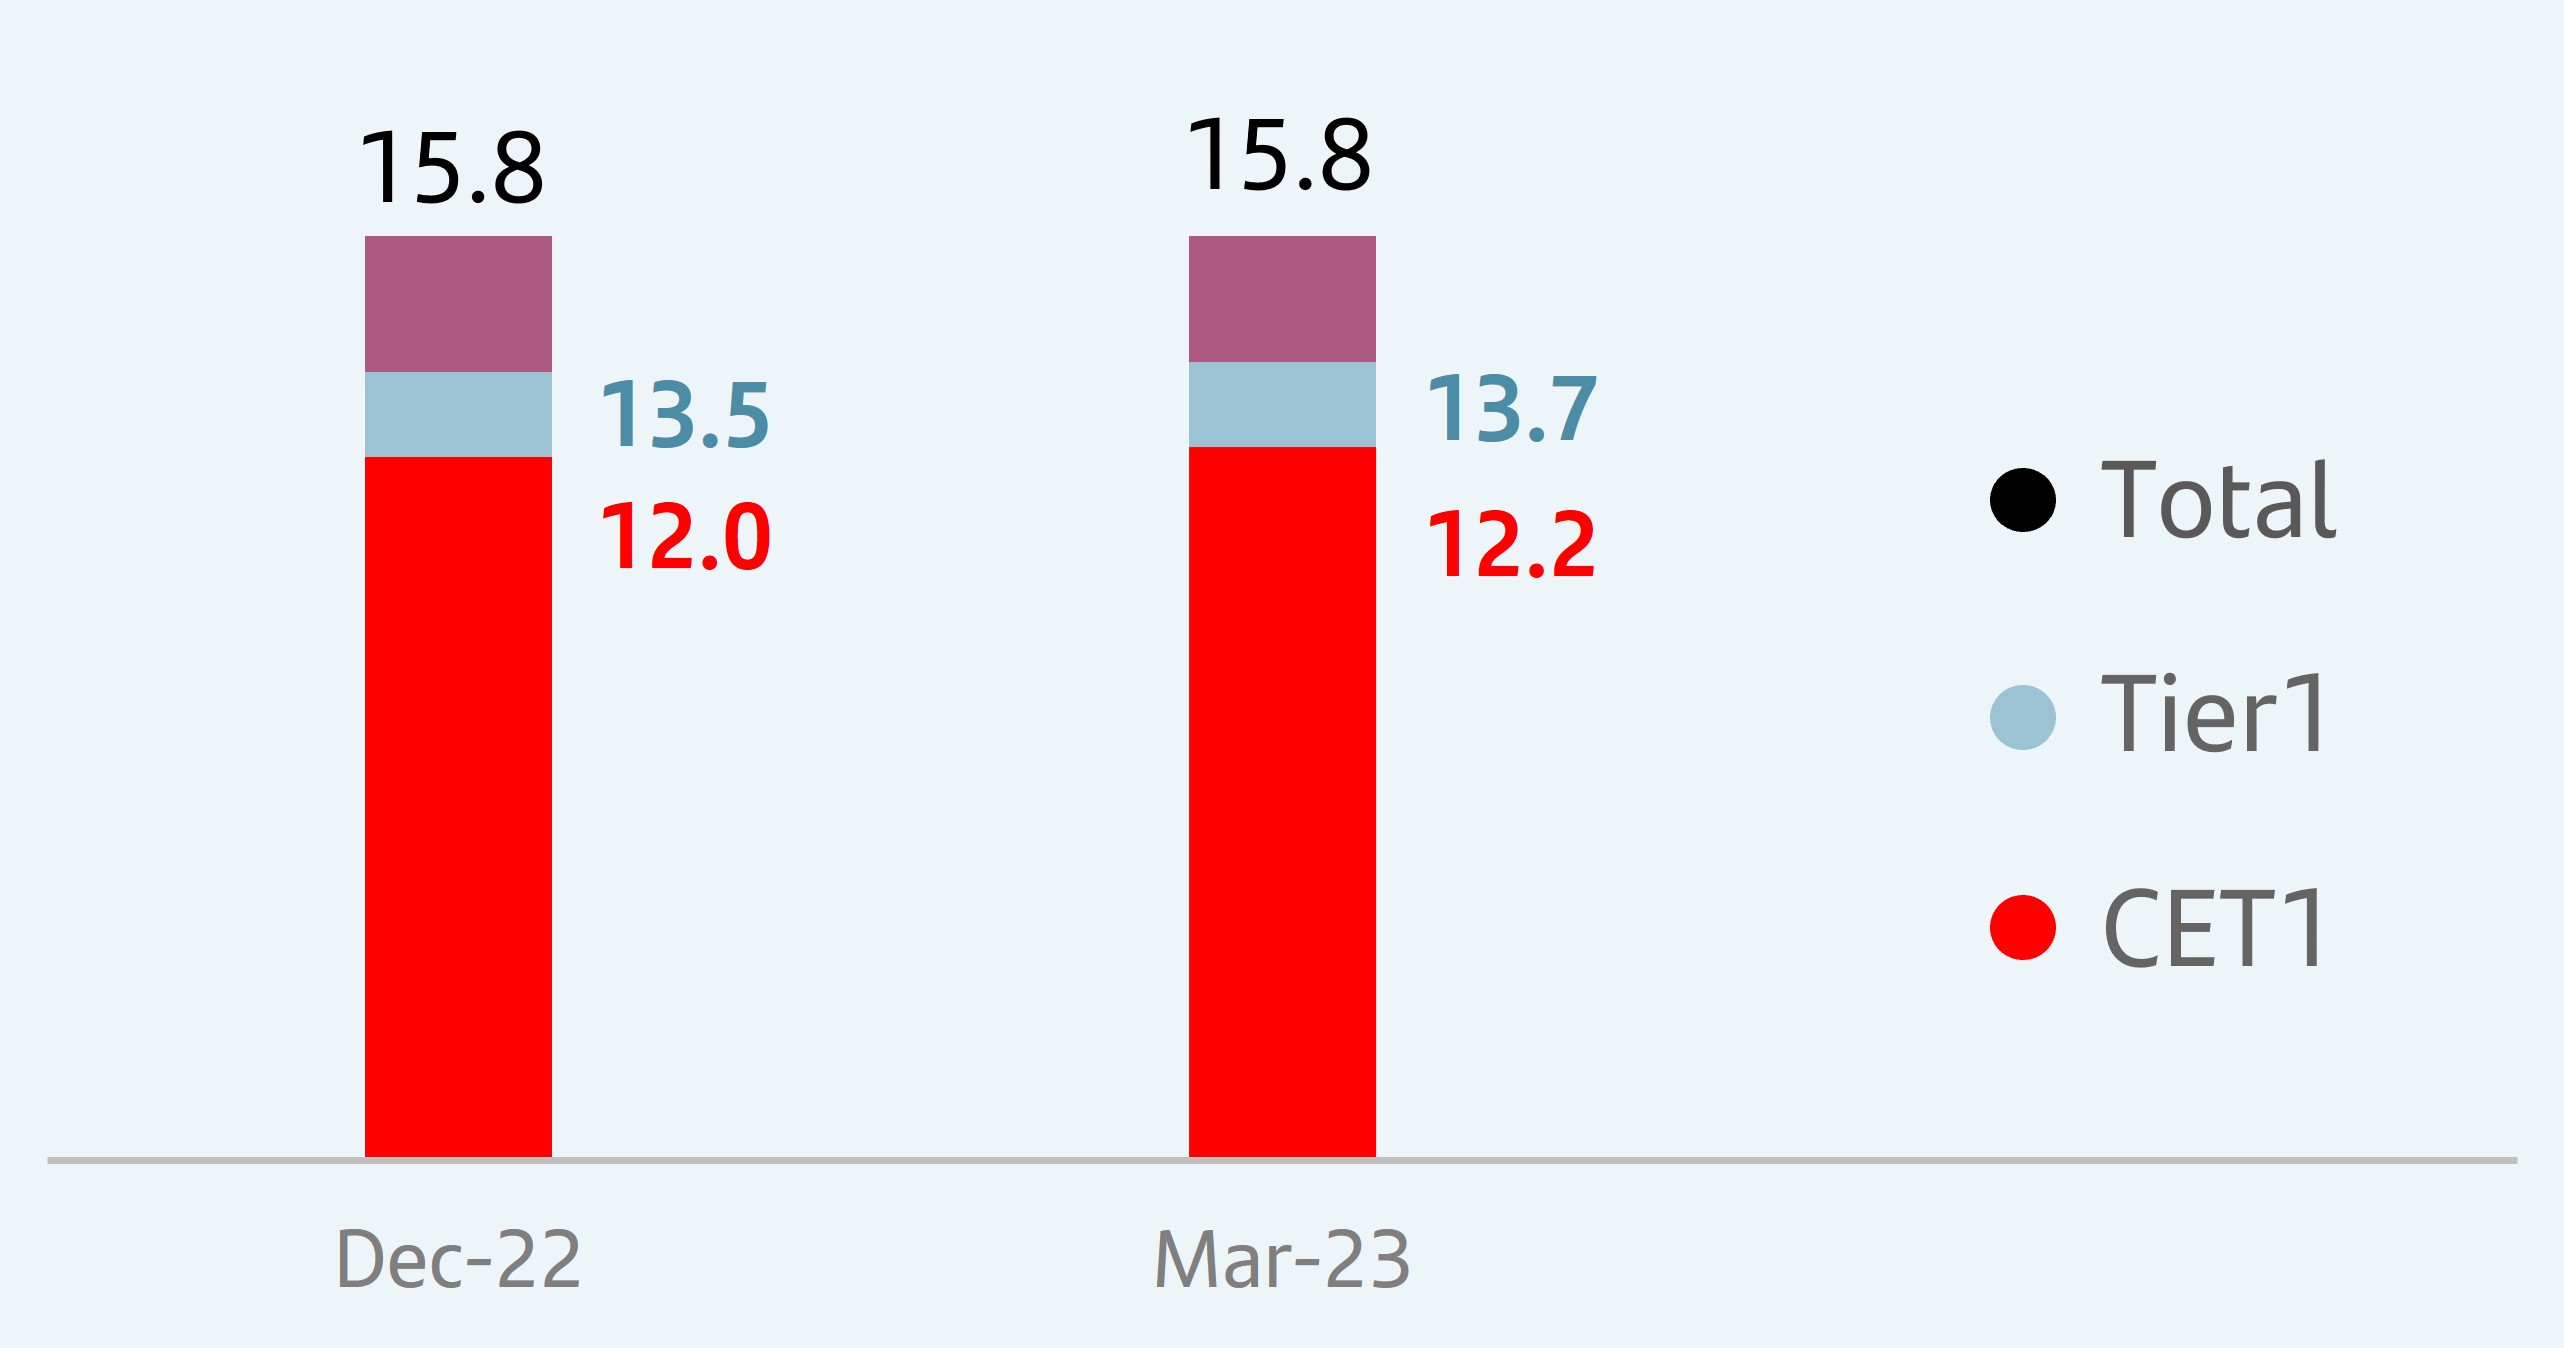
At the end of March 2023, the total phased-in capital ratio (applying the IFRS 9 transitional arrangements) stood at 15.9% and the phased-in CET1 ratio at 12.3%. We comfortably meet the levels required by the European Central Bank on a consolidated basis (13.3% for the total capital ratio and 9.1% for the CET1 ratio). This results in a distance to the maximum distributable amount (MDA) of 263 bps and a CET1 management buffer of 319 bps.
The total fully-loaded capital ratio stood at 15.8% and the fully-loaded CET1 ratio at 12.2%.
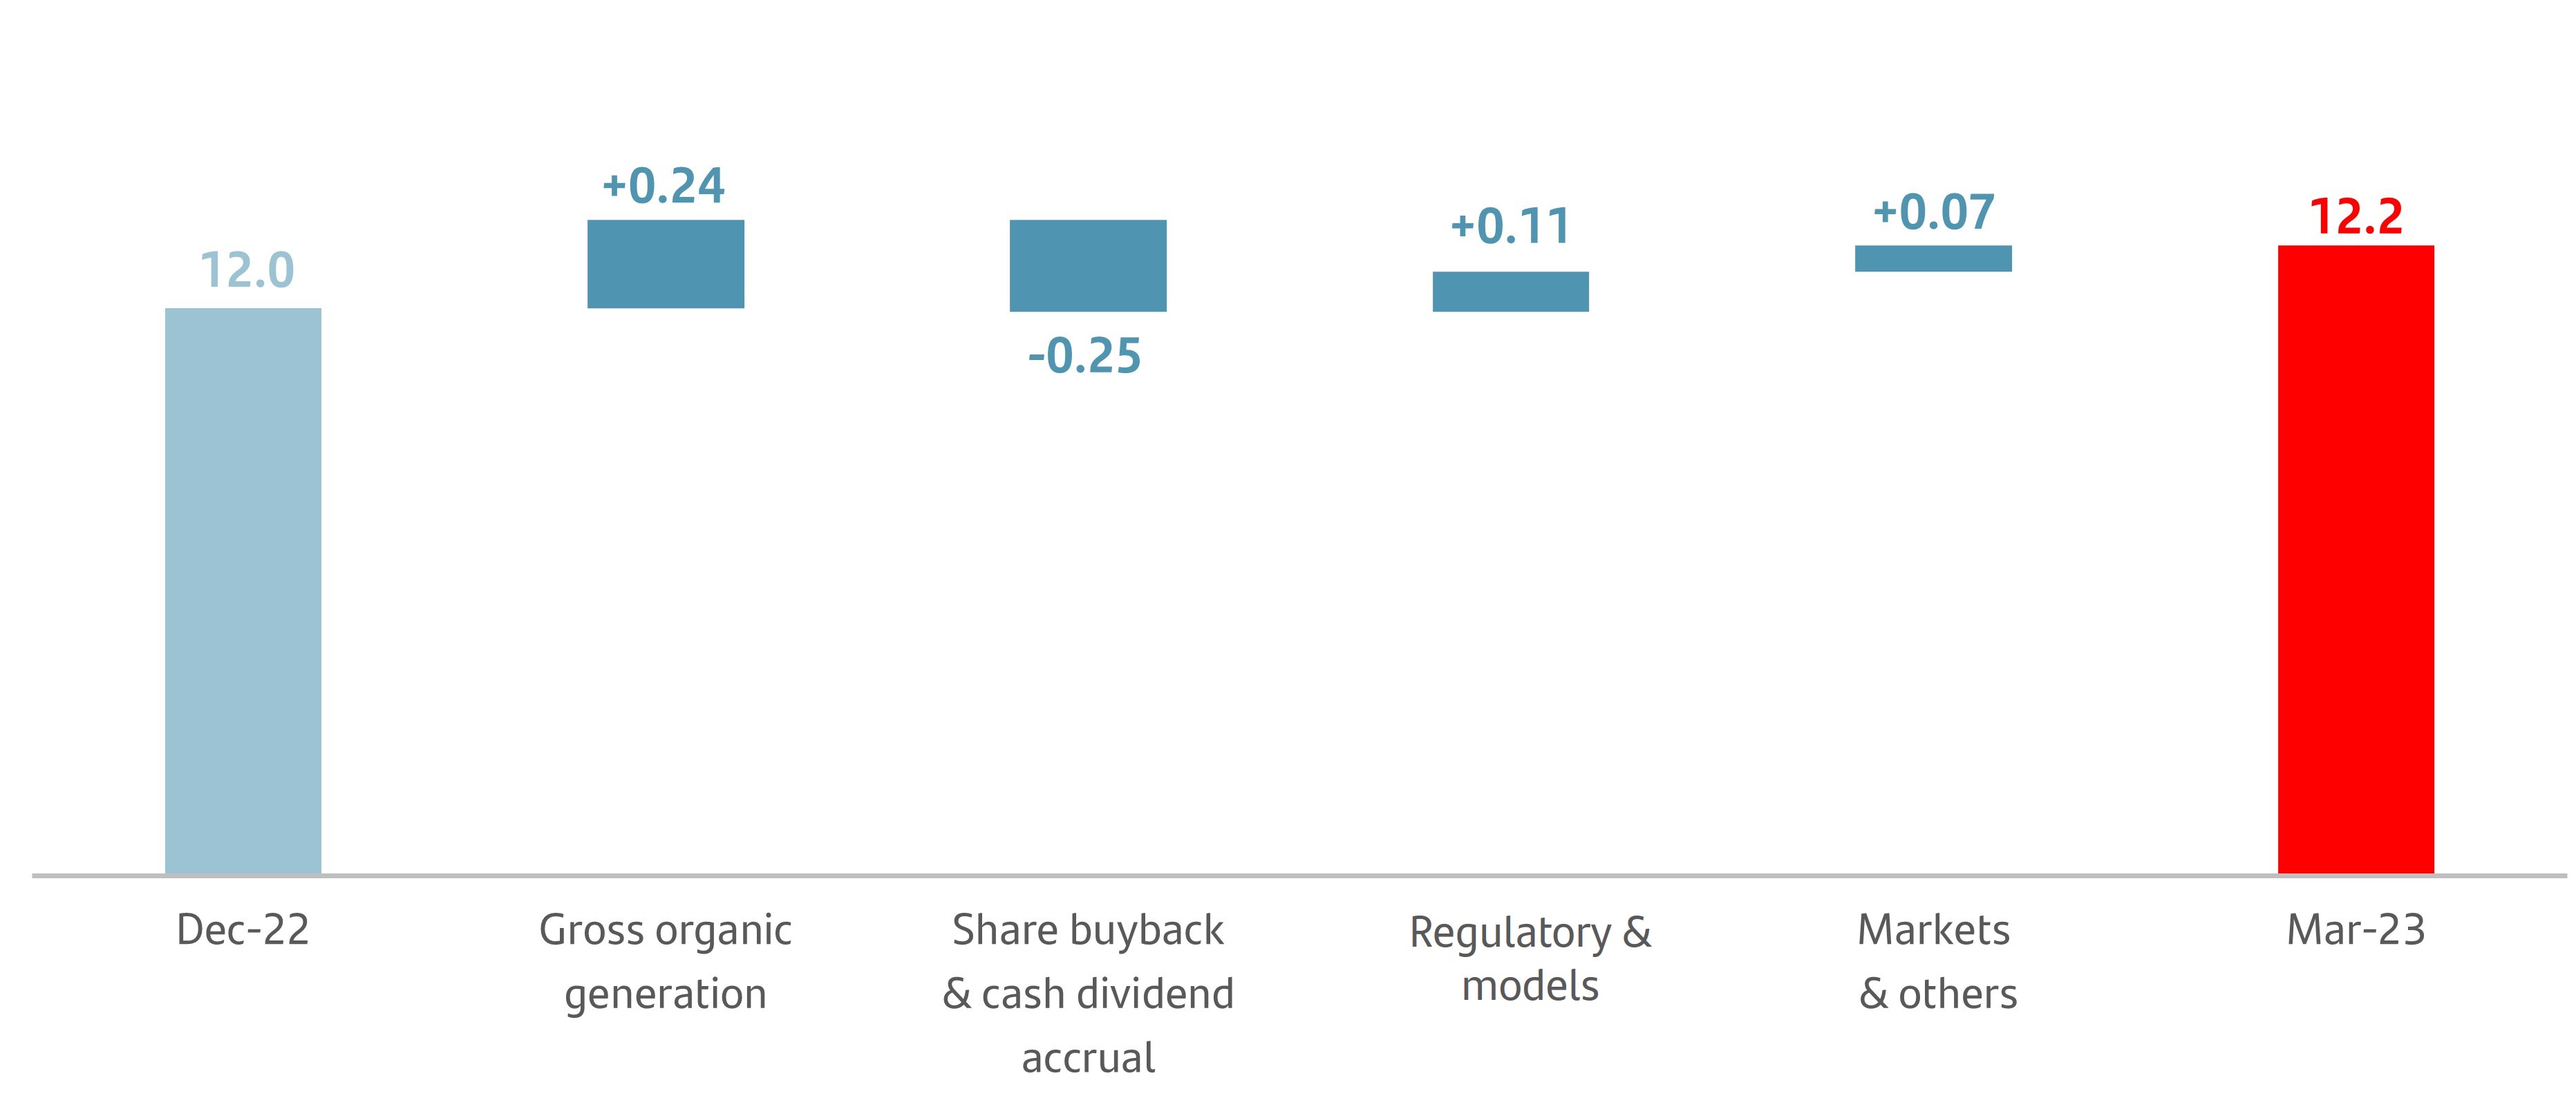
In the quarter, there were 24 bps of gross organic generation (after absorbing the negative 4 bp impact from the temporary levy in Spain) and a 25 bp charge for a future cash dividend payment against the first quarter of 2023 results1 (10 bps) and for the impact of the second 2022 share buyback programme (15 bps).
There was a positive effect (11 bps) from regulatory requirements and models (mainly related to the treatment of exchange differences related to minority interests), and +7 bps from markets (mainly in HTC&S portfolios)
The fully-loaded leverage ratio stood at 4.82%, and the phased-in at 4.84%.
Lastly, the TNAV per share ended March 2023 at EUR 4.41. If we include the cash dividend paid in 2022 (EUR 5.95 cents) approved in March, TNAV plus cash dividend per share increased 5% in the quarter.
| Eligible capital. March 2023 | ||||||||
| EUR million | ||||||||
| Fully-loaded | Phased-in | |||||||
| CET1 | 75,849 | 76,136 | ||||||
| Basic capital | 84,799 | 85,085 | ||||||
| Eligible capital | 98,165 | 98,655 | ||||||
| Risk-weighted assets | 621,001 | 620,801 | ||||||
| % | % | |||||||
| CET1 capital ratio | 12.2 | 12.3 | ||||||
| Tier 1 capital ratio | 13.7 | 13.7 | ||||||
| Total capital ratio | 15.8 | 15.9 | ||||||
| Fully-loaded CET1 ratio performance | ||
| % | ||
 | ||
Note: The phased-in ratio includes the transitory treatment of IFRS 9, calculated in accordance with article 473 bis of the Capital Requirements Regulation (CRR2) and subsequent modifications introduced by Regulation 2020/873 of the European Union. Total phased-in capital ratios include the transitory treatment according to chapter 4, title 1, part 10 of the CRR2.
1.The implementation of the shareholder remuneration policy is subject to future corporate and regulatory decisions and approvals.
January - March 2023 | | 19 | ||||||
| RISK MANAGEMENT | ||||||||
| Executive summary | ||||||||||||||||||||||||||||||||||||||
| Credit risk | Market risk | |||||||||||||||||||
| Credit quality indicators remain within expected levels, supported by a preventive portfolio management in the current complex environment | Our risk profile remains stable, despite a slight up tick in VaR at the end of the period | |||||||||||||||||||
| Cost of risk | NPL ratio | Coverage ratio | Average VaR | |||||||||||||||||
| 1.05% | 3.05% | 68% | Q1'23 | EUR 11 million | ||||||||||||||||
| +6 bps vs. Q4'22 | -3 bps vs. Q4'22 | 0 pp vs. Q4'22 | ||||||||||||||||||
| Structural and liquidity risk | Operational risk | |||||||||||||||||||
| Robust and diversified liquidity buffer, with ratios well above regulatory requirements | Our risk profile remained stable in the quarter, despite the materialization of some past legal cases | |||||||||||||||||||
Liquidity Coverage Ratio (LCR) 2 | ||||||||||||||||||||
| 152 | % | 0 pp vs. Q4'22 | ||||||||||||||||||
The challenges derived from the current inflationary scenario, Silicon Valley Bank's (SVB) bankruptcy and the doubts surrounding Credit Suisse, generated great market uncertainty. However, the specific problems of those banks do not apply to most banks and in particular, not to Grupo Santander as:
•We have funding sources and assets that are highly diversified across countries and businesses.
•More than 80% of our deposits come from retail banking customers, with whom we have a stable business relationship. Around 80% of deposits from individuals are covered by deposit guarantee funds.
•Our liquidity reserves, which exceed EUR 300 billion, are mostly in cash and central bank deposits and enable us to meet our customers' liquidity needs.
Our risk management, based on our customer knowledge, analysis of affected sectors, the review of our internal control mechanisms, geographic diversification and sound balance sheet management with a customer focus, among others, is essential to maintaining a medium-low risk profile, even in the current environment. Moreover, Santander has no exposure to SVB and exposure to Credit Suisse is immaterial.
Credit risk management1
In the first quarter of 2023, credit impaired loans decreased slightly compared to the previous quarter, down to EUR 34,445 million, mainly driven by the portfolio performance in Brazil (-3%) and Spain (-5%), and despite the normalization in North America. Total risk was EUR 1,128,501 million, up slightly compared to with the previous quarter, having decreased in Europe but risen in the other regions.
The NPL ratio was 3.05%, lower than both 2022 year-end (3.08%) and March 2022 (3.26%).
Loan-loss provisions amounted to EUR 2,873 million in the quarter, 3% down quarter-on-quarter, but 33% more than in March 2022. This year-on-year comparison was affected by the provisions resulting from the charges in Poland for CHF mortgages, the increase in provisions in the US (due to normalization) and increased provisioning in Brazil. The cost of risk stood at 1.05%, in line with expectations.
| Key metrics performance by geographic area | ||||||||||||||||||||||||||||||||||||||
Loan-loss provisions2 | Cost of risk (%)3 | NPL ratio (%) | Total coverage ratio (%) | |||||||||||||||||||||||||||||||||||
| Q1'23 | Chg (%) / Q1'22 | Q1'23 | Chg (bps) / Q1'22 | Q1'23 | Chg (bps) / Q1'22 | Q1'23 | Chg (pp) / Q1'22 | |||||||||||||||||||||||||||||||
| Europe | 642 | 26 | 0.42 | 5 | 2.35 | (66) | 51.2 | 2.2 | ||||||||||||||||||||||||||||||
| North America | 808 | 69 | 1.62 | 69 | 2.95 | 12 | 94.9 | (15.6) | ||||||||||||||||||||||||||||||
| South America | 1,232 | 20 | 3.39 | 66 | 5.99 | 94 | 76.3 | (15.9) | ||||||||||||||||||||||||||||||
| Digital Consumer Bank | 193 | 34 | 0.48 | 4 | 2.05 | (22) | 93.5 | (5.9) | ||||||||||||||||||||||||||||||
| TOTAL GROUP | 2,873 | 33 | 1.05 | 28 | 3.05 | (21) | 67.9 | (1.6) | ||||||||||||||||||||||||||||||
| 1. To show actual figures without the exchange rate effect, changes are calculated in constant euros while figures are shown at end-period exchange rates. | ||||||||||||||||||||||||||||||||||||||
2. EUR million and % change in constant euros. | ||||||||||||||||||||||||||||||||||||||
3.Provisions to cover losses due to impairment of loans in the last 12 months / average customer loans and advances of the last 12 months. | ||||||||||||||||||||||||||||||||||||||
For more detailed information regarding the countries, please see the Alternative Performance Measures section. | ||||||||||||||||||||||||||||||||||||||
| 20 | | January - March 2023 | ||||||
Total loans-loss reserves were in line with the fourth quarter of 2022, at EUR 23,388 million, resulting in a total coverage of credit impaired loans of 68%, in line with December 2022.
60% of the portfolio is secured, and the mortgage portfolios in Spain and the UK in particular require lower coverage levels.
The Group closely monitors the government liquidity programmes that were launched during the pandemic (mainly concentrated in Spain) as the grace periods expire, with no worrying signs of deterioration to date.
The Group is closely following the measures launched by the governments in Spain, Portugal and Poland, aimed at relieving the mortgage payment burden for vulnerable customers after the increase in interest rates.
IFRS 9 stages evolution: the distribution of the portfolio remained stable in the quarter.
| Coverage ratio by stage | |||||||||||||||||||||||
| EUR billion | |||||||||||||||||||||||
Exposure1 | Coverage | ||||||||||||||||||||||
| Mar-23 | Dec-22 | Mar-22 | Mar-23 | Dec-22 | Mar-22 | ||||||||||||||||||
| Stage 1 | 1,005 | 1,004 | 967 | 0.4 | % | 0.4 | % | 0.5 | % | ||||||||||||||
| Stage 2 | 72 | 69 | 68 | 7.4 | % | 7.7 | % | 8.0 | % | ||||||||||||||
| Stage 3 | 34 | 35 | 36 | 40.1 | % | 40.8 | % | 41.0 | % | ||||||||||||||
1. Exposure subject to impairment. Additionally, in March 2023 there was EUR 17 billion in loans and advances to customers not subject to impairment recorded at mark to market with changes through P&L (EUR 16 billion in December 2022 and EUR 22 billion in March 2022).
Stage 1: financial instruments for which no significant increase in credit risk has been identified since its initial recognition.
Stage 2: if there has been a significant increase in credit risk since the date of initial recognition but the impairment event has not materialized, the financial instrument is classified in Stage 2.
Stage 3: a financial instrument is catalogued in this stage when it shows effective signs of impairment as a result of one or more events that have already occurred resulting in a loss.
| Credit impaired loans and loan-loss allowances | |||||||||||
| EUR million | |||||||||||
| Change (%) | |||||||||||
| Q1'23 | QoQ | YoY | |||||||||
| Balance at beginning of period | 34,673 | (2.6) | 4.3 | ||||||||
| Net additions | 3,228 | (11.9) | (14.5) | ||||||||
| Increase in scope of consolidation | — | — | — | ||||||||
| Exchange rate differences and other | 284 | — | (73.3) | ||||||||
| Write-offs | (3,740) | 1.2 | 55.6 | ||||||||
| Balance at period-end | 34,445 | (0.7) | (3.4) | ||||||||
| Loan-loss allowances | 23,388 | (0.1) | (5.6) | ||||||||
| For impaired assets | 13,802 | (2.4) | (5.5) | ||||||||
| For other assets | 9,586 | 3.4 | (5.7) | ||||||||
Market risk
The risk associated with global corporate banking trading activity is mainly interest rate driven, focused on servicing our customers' needs and measured in daily VaR terms at 99%.
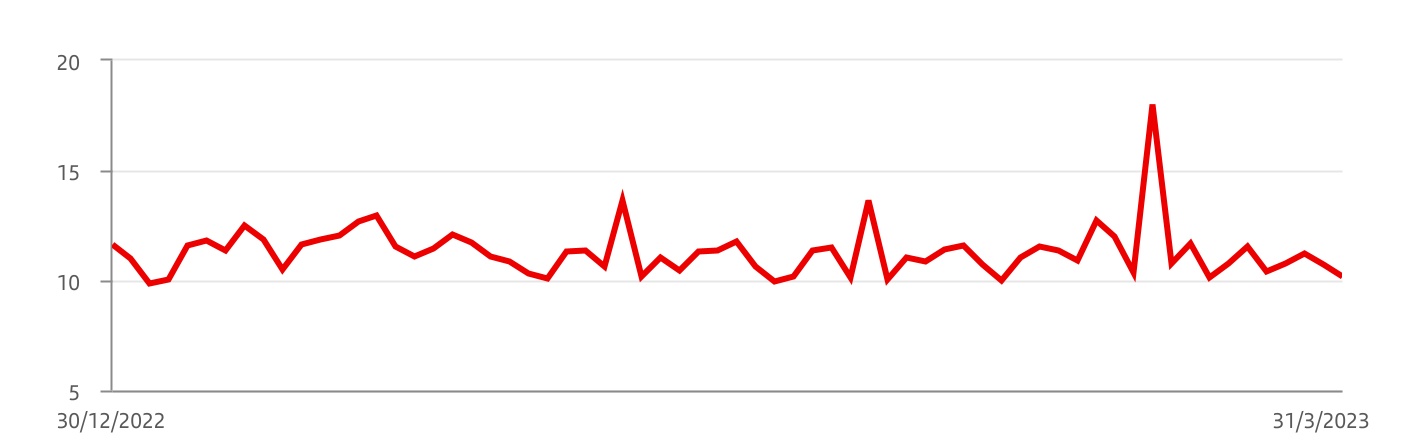
In the first quarter, VaR fluctuated around an average value of EUR 11 million. It increased moderately and temporarily at the end of the quarter as a result of the events related to some regional banks in the US and Credit Suisse in Europe. VaR continued to be mainly impacted by interest rate risk. These figures remain low compared to the size of the Group's balance sheet and activity.
Trading portfolios.1 VaR by geographic region | ||||||||||||||
| EUR million | ||||||||||||||
| 2023 | 2022 | |||||||||||||
| First quarter | Average | Latest | Average | |||||||||||
| Total | 11.3 | 10.1 | 13.8 | |||||||||||
| Europe | 9.0 | 8.4 | 11.1 | |||||||||||
| North America | 2.7 | 2.3 | 2.5 | |||||||||||
| South America | 6.6 | 6.0 | 8.3 | |||||||||||
1. Activity performance in Santander Corporate & Investment Banking markets.
Trading portfolios.1 VaR by market factor | ||||||||||||||
| EUR million | ||||||||||||||
| First quarter 2023 | Min. | Avg. | Max. | Last | ||||||||||
| VaR total | 9.8 | 11.3 | 18.0 | 10.1 | ||||||||||
| Diversification effect | (8.1) | (14.3) | (23.8) | (13.0) | ||||||||||
| Interest rate VaR | 8.9 | 11.4 | 20.3 | 10.5 | ||||||||||
| Equity VaR | 2.6 | 4.7 | 7.3 | 2.9 | ||||||||||
| FX VaR | 2.4 | 4.1 | 5.9 | 5.5 | ||||||||||
| Credit spreads VaR | 3.3 | 4.2 | 6.2 | 3.3 | ||||||||||
| Commodities VaR | 0.7 | 1.3 | 2.0 | 0.9 | ||||||||||
1.Activity performance in Santander Corporate & Investment Banking markets.
Note: In the North America, South America and Asia portfolios, VaR corresponding to the credit spreads factor other than sovereign risk is not relevant and is included in the interest rate factor.
January - March 2023 | | 21 | ||||||
Trading portfolios1. VaR performance | ||
| EUR million | ||
 1. Corporate & Investment Banking performance in financial markets.
Structural and liquidity risk
Structural exchange rate risk: mainly driven by transactions in foreign currencies related to permanent financial investments, their results and related hedges. Our dynamic management of this risk seeks to limit the impact of foreign exchange rate movements on the Group's core capital ratio. In the first quarter, hedging of currencies impacting this ratio remained close to 100%.
Structural interest rate risk: even if inflation levels are still far from the central banks' targets, they are beginning to correct in some economies, reducing some of the pressure on interest rates in the markets. The turbulence at the end of the period significantly increased market volatility, raising expectations of an end to the tightening cycle of central banks' restrictive policies sooner than initially expected. In this context, our structural debt portfolios performed positively. Despite high market volatility during the period, risk remained at comfortable levels.
Liquidity risk: the Group maintained its comfortable liquidity risk position, supported by a robust and diversified liquidity buffer, with ratios well above regulatory limits.
Operational risk
Our operational risk profile remained stable in the first quarter of 2023. The following aspects were closely monitored during this period:
•IT risks arising from transformation plans related to business strategy and development of digital capabilities, as well as proactive management of obsolete technology and IT services provided by third parties, in order to ensure availability of services and operations.
•Regulatory compliance due to increasing regulatory requirements (such as ESG, operational resilience, data management regulations) across the Group.
•External fraud, mainly in online banking transactions (e.g. customer fraud) and in the loans admissions processes (e.g. identity theft).
•Financial Crime Compliance monitoring and compliance with international financial measures and sanctions due to the war in Ukraine, and programme updates in some subsidiaries.
•Cyber threats across the financial industry focused on alerts derived from the war in Ukraine, strengthening the bank's monitoring and control environment mechanisms.
•Third party risk exposure, maintaining close oversight of critical providers, focusing on their control environment including business continuity capabilities, supply chains, cyber risk management and compliance with service level agreements.
Finally, as regards the results for the first quarter of 2023, Basel's category losses have decreased compared to the previous quarter, and are mostly related to legal cases.
| 22 | | January - March 2023 | ||||||
| GENERAL BACKGROUND | ||||||||
Grupo Santander conducted its business in the first quarter of 2023 in an environment marked by market volatility, slowly declining, but still high inflation and continuing geopolitical tensions. In response, the major central banks continued to raise interest rates to try to contain inflationary pressures and anchor medium-term expectations in line with their respective targets. We expect this process to gradually decelerate global activity during 2023, while restoring inflation levels to paths compatible with official targets.
| Country | GDP Change1 | Economic performance | |||||||||
 | Eurozone | +3.5% | Lower energy prices and the normalization in the international supply chains led to an improvement in confidence indicators during Q1'23, resulting in positive GDP growth in the quarter. Inflation eased slightly (6.9% in March), but core tensions remained a concern. The ECB therefore raised the deposit facility rate to 3% in March. | ||||||||
 | Spain | +5.5% | Q1'23 indicators showed an improvement in domestic demand (PMIs, retail sales). Social security enrolment data for the quarter pointed to a strong start to the year for employment and supported positive GDP growth in the quarter. Year-on-year inflation slowed in March due to the March 2022 base effect, and core inflation remained very high (7.5% in March) mainly driven by food prices, which are growing at double-digits. | ||||||||
 | United Kingdom | +4.1% | The economy appears to be more resilient than initially expected, as retail sales and consumer confidence recovered and PMIs were consistent with expansion in Q1'23. This, coupled with a tight labour market, indicates the need for contractionary demand-side policies to contain high inflation (10.1% in March). The BoE raised interest rates to 4.25% in March. | ||||||||
 | Portugal | +6.7% | Activity indicators pointed to a slight moderation in domestic demand, due to the household consumption basket adjustment as a result of rising prices (7.4% in March) and interest rates. The labour market remained tight, with the unemployment rate below the full employment rate. Wages continued to rise, but below inflation. | ||||||||
 | Poland | +4.9% | The economy appears to be decelerating, with industrial production slowing down, retail sales falling sharply (except for vehicles), with construction performing better than expected due to infrastructure but real estate underperforming. Inflation remained very high (16.1% in March) but even so the central bank maintained interest rates at 6.75%. | ||||||||
 | United States | +2.1% | In Q1'23, indicators showed that private consumption remained fairly firm and the labour market remained very solid. Inflation is falling back but still high, especially core inflation (5.6% in March). The Federal Reserve raised official rates by another 50 basis points in the quarter and expects tighter credit conditions for businesses and households. | ||||||||
 | Mexico | +3.1% | The start of 2023 continued to surprise on the upside, with strong growth in investment, services consumption and exports. Inflation has begun to ease (both headline and core), though it remains elevated, and the central bank again raised the policy rate to 11.25% in February (10.5% at the end of 2022). | ||||||||
 | Brazil | +2.9% | Economic indicators at the beginning of the year show the consolidation of the economic slowdown in Q4'22, though with some resilience in the services sector and employment (the unemployment rate remained at historic lows). Inflation continued to soften (4.7% in March). The central bank maintained the official rate at 13.75%, indicating it would remain there for a long period of time, to ensure inflation converges towards the central bank target. | ||||||||
 | Chile | +2.4% | The economy continued on its adjustment path, although the latest industry and services data were surprisingly resilient. Inflation remained high, but slowing decreasing (11.1% in March), and the central bank maintained the official rate at 11.25% (stable since October). The fiscal balance closed 2022 with a surplus, the first in ten years. | ||||||||
 | Argentina | +5.2% | By the end of 2022, Argentina had met all quantitative targets agreed with the IMF, which allowed the disbursement of the new loan tranche in Q1'23. However, the economy weakened as inflation remained high (average monthly inflation rate of 6.8% in the quarter). | ||||||||
1. Year-on-year average change for 2022.
January - March 2023 | | 23 | ||||||
| DESCRIPTION OF SEGMENTS | ||||||||
We base segment reporting on financial information presented to the chief operating decision maker, which excludes certain statutory result items considered outside the ordinary course of our business (e.g. capital gains, write-downs, impairment of goodwill) or reclassifies certain items under some headings of the underlying (or "adjusted") income statement to better understand the underlying business trends.
Santander has aligned the information in this chapter with the information used internally for management reporting and with that presented in the Group's other public documents.
Santander's executive committee has been selected to be its chief operating decision maker. The Group's operating segments reflect its organizational and managerial structures. The executive committee reviews internal reporting based on these segments to assess performance and allocate resources.
The segments are split by geographic area in which profits are earned or by type of business. We prepare the information by aggregating the figures for Santander’s various geographic areas and business units, relating it to both the accounting data of the business units integrated in each segment and information provided by management information systems. The same general principles as those used in the Group are applied.
In 2023, Santander maintained the criteria applied in 2022, with two exceptions.
In the secondary segments: usual annual perimeter adjustment of the Global Customer Relationship Model between Commercial Banking and Santander Corporate & Investment Banking and between Commercial Banking and Wealth Management & Insurance.
In the Group's financial statements: as a result of the implementation from 1 January 2023 of the amendments to IFRS 17 (new general accounting standard for insurance contracts), the Group has performed retrospectively a reclassification in the balance sheet to 'Liabilities under insurance or reinsurance contracts', related to the different treatment established by this new standard for the components of an insurance contract. This reclassification was made in the corresponding segments.
For comparative purposes, the 2022 data has been restated to include these changes.
In terms of the operating segment structure, the Group maintained the two levels of segmentation applied in 2022.
Primary segments
This primary level of segmentation, which is based on the Group’s management structure, comprises five reportable segments: four operating areas plus the Corporate Centre. The operating areas are:
Europe: comprises all business activity carried out in the region, except that included in Digital Consumer Bank. Detailed financial information is provided on Spain, the UK, Portugal and Poland.
North America: comprises all the business activities carried out in Mexico and the US, which includes the holding company (SHUSA) and the businesses of Santander Bank, Santander Consumer USA (SC USA), the specialized business unit Banco Santander International, the New York branch and Santander US Capital Markets (SanCap), following the merger of Santander Investment Securities and Amherst Pierpont Securities.
South America: includes all the financial activities carried out by Grupo Santander through its banks and subsidiary banks in the region. Detailed information is provided on Brazil, Chile, Argentina, Uruguay, Peru and Colombia.
Digital Consumer Bank: includes Santander Consumer Finance, which incorporates the entire consumer finance business in Europe, Openbank and Open Digital Services (ODS).
| 24 | | January - March 2023 | ||||||
Secondary segments
At this secondary level, Grupo Santander is structured into Retail Banking, Santander Corporate & Investment Banking (SCIB), Wealth Management & Insurance (WM&I) and PagoNxt.
Retail Banking: this covers all customer banking businesses, including consumer finance, except those of corporate banking which are managed through Santander Corporate & Investment Banking and asset management, private banking and insurance, which are managed by Wealth Management & Insurance. The results of the hedging positions in each country are also included, conducted within the sphere of their respective assets and liabilities committees.
Santander Corporate & Investment Banking: this business includes global corporate banking, investment banking and markets worldwide including treasuries managed globally (always after the appropriate distribution with Retail Banking customers), as well as equity business.
Wealth Management & Insurance: includes the asset management business (Santander Asset Management), the corporate unit of Private Banking and International Private Banking in Miami and Switzerland (Santander Private Banking) and the insurance business (Santander Insurance).
PagoNxt: this includes digital payment solutions, providing global technology solutions for our banks and new customers in the open market. It is structured into four businesses: Merchant, International Trade, Payments and Consumer.
In addition to these operating units, both primary and secondary segments, the Group continues to maintain the Corporate Centre, which includes the centralized activities relating to equity stakes in financial companies, financial management of the structural exchange rate position, assumed within the sphere of the Group’s assets and liabilities committee, as well as management of liquidity and shareholders’ equity via issuances.
As the Group’s holding entity, this area manages all capital and reserves and allocations of capital and liquidity with the other businesses. It does not incorporate the costs related to the Group’s central services (charged to the areas), except for corporate and institutional expenses related to the Group’s functioning.
The businesses included in each of the segments in this report and the accounting principles under which their results are presented here may differ from the businesses included and accounting principles applied in the financial information separately prepared and disclosed by our subsidiaries (some of which are publicly listed) which in name or geographical description may seem to correspond to the business areas covered in this report. Accordingly, the results of operations and trends shown for our business areas in this document may differ materially from those of such subsidiaries. The results of our business areas presented below are provided on the basis of underlying results only and including the impact of foreign exchange rate fluctuations. However, for a better understanding of the changes in the performance of our business areas, we also provide and discuss the year-on-year changes to our results excluding such exchange rate impacts. Certain figures contained in this report, have been subject to rounding to enhance their presentation. Accordingly, in certain instances, the sum of the numbers in a column or a row in tables contained in this report may not conform exactly to the total figure given for that column or row. | ||
January - March 2023 | | 25 | ||||||
| January-March 2023 | ||||||||||||||||||||
| Main items of the underlying income statement | ||||||||||||||||||||
| EUR million | ||||||||||||||||||||
| Primary segments | Net interest income | Net fee income | Total income | Net operating income | Profit before tax | Profit attributable to the parent | ||||||||||||||
| Europe | 3,597 | 1,168 | 5,171 | 3,004 | 1,846 | 1,189 | ||||||||||||||
| Spain | 1,460 | 752 | 2,547 | 1,533 | 739 | 466 | ||||||||||||||
| United Kingdom | 1,283 | 83 | 1,368 | 694 | 542 | 395 | ||||||||||||||
| Portugal | 261 | 124 | 405 | 273 | 261 | 180 | ||||||||||||||
| Poland | 586 | 145 | 729 | 531 | 336 | 167 | ||||||||||||||
| Other | 7 | 65 | 122 | (28) | (32) | (19) | ||||||||||||||
| North America | 2,448 | 521 | 3,141 | 1,641 | 815 | 627 | ||||||||||||||
| US | 1,465 | 190 | 1,827 | 915 | 346 | 300 | ||||||||||||||
| Mexico | 983 | 320 | 1,300 | 760 | 504 | 359 | ||||||||||||||
| Other | 0 | 12 | 14 | (33) | (35) | (32) | ||||||||||||||
| South America | 3,163 | 1,166 | 4,404 | 2,680 | 1,247 | 790 | ||||||||||||||
| Brazil | 2,105 | 817 | 3,057 | 1,977 | 765 | 469 | ||||||||||||||
| Chile | 371 | 153 | 606 | 352 | 245 | 150 | ||||||||||||||
| Argentina | 532 | 137 | 501 | 251 | 179 | 139 | ||||||||||||||
| Other | 154 | 59 | 239 | 100 | 59 | 31 | ||||||||||||||
| Digital Consumer Bank | 1,029 | 191 | 1,343 | 684 | 447 | 244 | ||||||||||||||
| Corporate Centre | (52) | (3) | (124) | (219) | (260) | (279) | ||||||||||||||
| TOTAL GROUP | 10,185 | 3,043 | 13,935 | 7,790 | 4,095 | 2,571 | ||||||||||||||
| Secondary segments | ||||||||||||||||||||
| Retail Banking | 8,977 | 1,901 | 10,779 | 6,024 | 2,409 | 1,552 | ||||||||||||||
| Corporate & Investment Banking | 838 | 619 | 2,206 | 1,468 | 1,460 | 976 | ||||||||||||||
| Wealth Management & Insurance | 413 | 309 | 830 | 551 | 529 | 377 | ||||||||||||||
| PagoNxt | 9 | 218 | 244 | (34) | (43) | (55) | ||||||||||||||
| Corporate Centre | (52) | (3) | (124) | (219) | (260) | (279) | ||||||||||||||
| TOTAL GROUP | 10,185 | 3,043 | 13,935 | 7,790 | 4,095 | 2,571 | ||||||||||||||
Profit attributable to the parent distribution1 | ||
| Q1 2023 | ||
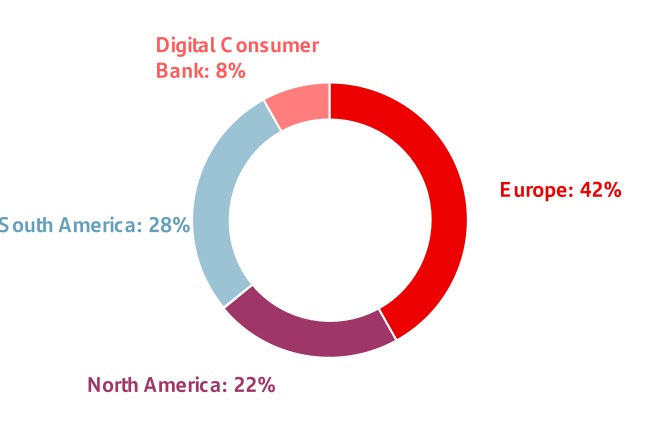
1. As a % of operating areas. Excluding the Corporate Centre.
| Profit attributable to the parent. Q1 2023 | ||
| EUR million. % change YoY | ||
| Flags | |||||||||||
| Europe | | ||||||||||
| |||||||||||
| |||||||||||
| |||||||||||
| North America | | ||||||||||
| |||||||||||
| South America | | ||||||||||
| |||||||||||
| |||||||||||
| Digital Consumer Bank | DCB | ||||||||||
| Global businesses |  | ||||||||||
 | |||||||||||
 | |||||||||||
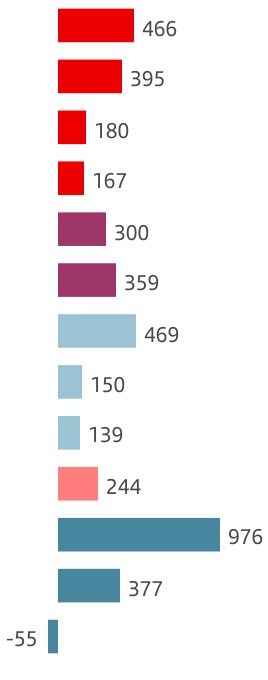
| Var | Var2 | ||||
| +28 | % | +28 | % | ||
| +5 | % | +11 | % | ||
| +21 | % | +21 | % | ||
| +49 | % | +51 | % | ||
| -49 | % | -51 | % | ||
| +44 | % | +26 | % | ||
| -25 | % | -29 | % | ||
| -20 | % | -23 | % | ||
| +135 | % | +332 | % | ||
| -14 | % | -12 | % | ||
| +28 | % | +30 | % | ||
| +64 | % | +62 | % | ||
| +3 | % | +8 | % | ||
| 26 | | January - March 2023 | ||||||
| January-March 2022 | ||||||||||||||||||||
| Main items of the underlying income statement | ||||||||||||||||||||
| EUR million | ||||||||||||||||||||
| Primary segments | Net interest income | Net fee income | Total income | Net operating income | Profit before tax | Profit attributable to the parent | ||||||||||||||
| Europe | 2,839 | 1,154 | 4,305 | 2,245 | 1,494 | 1,018 | ||||||||||||||
| Spain | 998 | 745 | 2,021 | 1,049 | 519 | 365 | ||||||||||||||
| United Kingdom | 1,192 | 92 | 1,291 | 620 | 503 | 375 | ||||||||||||||
| Portugal | 170 | 122 | 333 | 207 | 215 | 148 | ||||||||||||||
| Poland | 407 | 138 | 511 | 345 | 236 | 112 | ||||||||||||||
| Other | 72 | 56 | 149 | 24 | 22 | 17 | ||||||||||||||
| North America | 2,131 | 443 | 2,795 | 1,535 | 1,050 | 806 | ||||||||||||||
| US | 1,378 | 197 | 1,811 | 1,013 | 738 | 583 | ||||||||||||||
| Mexico | 753 | 245 | 982 | 549 | 340 | 249 | ||||||||||||||
| Other | 0 | 1 | 2 | (28) | (28) | (26) | ||||||||||||||
| South America | 3,037 | 1,013 | 4,195 | 2,711 | 1,561 | 900 | ||||||||||||||
| Brazil | 2,143 | 743 | 3,019 | 2,089 | 1,123 | 627 | ||||||||||||||
| Chile | 483 | 112 | 650 | 416 | 322 | 188 | ||||||||||||||
| Argentina | 300 | 121 | 364 | 147 | 71 | 59 | ||||||||||||||
| Other | 111 | 38 | 162 | 59 | 45 | 25 | ||||||||||||||
| Digital Consumer Bank | 1,020 | 206 | 1,312 | 667 | 502 | 282 | ||||||||||||||
| Corporate Centre | (172) | (3) | (301) | (388) | (437) | (462) | ||||||||||||||
| TOTAL GROUP | 8,855 | 2,812 | 12,305 | 6,770 | 4,171 | 2,543 | ||||||||||||||
| Secondary segments | ||||||||||||||||||||
| Retail Banking | 8,112 | 1,807 | 10,103 | 5,711 | 3,180 | 2,064 | ||||||||||||||
| Corporate & Investment Banking | 783 | 529 | 1,768 | 1,149 | 1,141 | 765 | ||||||||||||||
| Wealth Management & Insurance | 131 | 322 | 573 | 325 | 317 | 230 | ||||||||||||||
| PagoNxt | 2 | 157 | 162 | (28) | (31) | (54) | ||||||||||||||
| Corporate Centre | (172) | (3) | (301) | (388) | (437) | (462) | ||||||||||||||
| TOTAL GROUP | 8,855 | 2,812 | 12,305 | 6,770 | 4,171 | 2,543 | ||||||||||||||
January - March 2023 | | 27 | ||||||
 | EUROPE | Attributable profit | ||||||
| EUR 1,189 mn | ||||||||
Executive summary → We continue to accelerate our business transformation to achieve higher growth and a more efficient operating model. This should allow us to further improve profitability and increase RoTE. → Loans decreased slightly compared to the first quarter of 2022. We continued to grow in mortgages and consumer, partially offsetting the fall in corporate loans. Deposits grew 3% year-on-year backed by higher savings accounts, time deposits from individuals and wholesale banking. → Attributable profit reached EUR 1,189 million, driven by strong revenue growth, mainly from net interest income, which offset the increase in costs, affected by high inflation, and the temporary levy on revenue in Spain. | ||||||||
Strategy
We maintain our aim of creating a better bank, that our customers and employees feel a deep connection with while creating value for shareholders and society, and continued to contribute to the achievement of the Group's strategy and results.
Last year we made significant progress in our financial results and transformation projects. This year, we will accelerate this further with the aim of becoming the best bank in each country leveraging the combination of our local leadership with our pan-European and global businesses. We will focus on the following pillars:
•Customer centric and activity: grow our active customer base through better customer service and experience.
•Simplification and automation: enhance efficiency through a common operating model in the region.
•Network contribution: grow our global business revenue by increasing connectivity across the region.
•Customer activity: improving loyalty through a value proposition for individuals and SMEs.
•Disciplined capital allocation: improve pricing discipline and risk management.
This should enable us to achieve sustainable growth and greater profitability and shareholder value creation.
Key developments by country:
•Spain: we focused on profitable and sustainable growth, increasing the customer base. We improved the service quality, further automated and digitalized processes, and developed a simpler value proposition for individuals focused on high-value segments. We maintained a proactive risk management in an complex macroeconomic environment.
•United Kingdom: we focused on managing the spread between assets and liabilities. Our transformation programme continued to provide efficiency improvements through the simplification and digitalization of processes.
•Portugal: we continued to execute our strategy to grow in the most profitable segments. We increased our active and digital customers and improved our service quality.
•Poland: we remained focused on improving our market position, especially in corporates, investment funds and CIB. We continued to develop our digital capabilities to improve our customer and employee experience, simplifying our processes and boosting customer attraction, sales and, consequently, profitable growth.
| Spain | UK | Portugal | Poland | |||||||||||||||||||||||||||||||
 | Thousands | 45,758 | 14,486 | 22,404 | 2,907 | 5,747 | |||||||||||||||||||||||||||||
| Total customers | YoY change | +2% | +5% | +1% | -3% | +4% | |||||||||||||||||||||||||||||
 | Thousands | 28,217 | 7,972 | 13,945 | 1,786 | 4,347 | |||||||||||||||||||||||||||||
| Active customers | YoY change | +2% | +5% | 0% | +4% | +5% | |||||||||||||||||||||||||||||
| 28 | | January - March 2023 | ||||||
In the quarter, we continued to make progress in our ONE Transformation project. On the front end, we launched Home Planner in Portugal, a European home-buying solution, which was already live in Spain, and developed a version of My Business, the common European value proposition for the self-employed. On the back end, we progressed in the creation of shared service centres, especially in the development of a European ESG Panel, which is already analysing the operations in Spain, Portugal and Poland from an ESG perspective.
Business performance
Total customers increased more than 1 million year-on-year. 62% of this growth was due to the increase in active customers, which were up in all countries. Of note was the good performance in Spain in both total customers (736,000 more year-on-year) and active customers, which increased 5%, close to 8 million.
Commercial activity, especially in the mortgage segment, was affected by a macroeconomic environment characterized by rising interest rates. However, mortgage balances continued to grow year-on-year in the UK, Portugal and slightly in Spain, and loans to individuals rose in Poland. The SME portfolio shrank, partly due to the sales of doubtful loan portfolios in Spain at the end of 2022. Thus, loans and advances to customers fell 4% year-on-year. In gross terms, excluding reverse repos and in constant euros, they fell 2%.
Customer deposits increased 2% year-on-year. Excluding repos and in constant euros, they rose 3%, supported by strong growth in the wholesale banking, especially in Spain, and in retail deposits in the UK, mainly as a result of the savings products launched at the end of 2022. This performance, combined with lower loan originations, led to an improvement in the already comfortable liquidity position.
Mutual funds decreased 6% compared to March 2022 in constant euros, mainly affected by market volatility and higher interest rates. In the first three months of 2023, we began to see a slight recovery in sales of this type of products, reflected in a 2% increase in balances under management since December.
Europe. Business performance. March 2023 | ||||||||||||||||||||||||||||||||||||||
| EUR billion and YoY % change in constant euros | ||||||||||||||||||||||||||||||||||||||
| 566 | -2% | | 694 | +2% | |||||||||||||||||||||||||||||||||
| ||
| ||
| ||
| ||
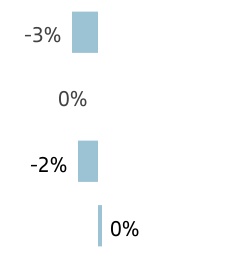 aaaaa
aaaaa | ||
| ||
| ||
| ||
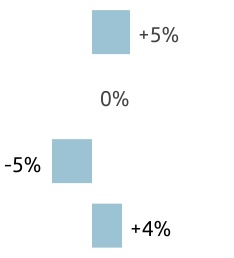
| Gross loans and advances to customers excl. reverse repos | Customer deposits excl. repos + mutual funds | |||||||||||||||||||||||||||||||||||||
Results
Attributable profit in the first quarter of 2023 was EUR 1,189 million, 17% higher than in the same period of 2022. In constant euros, it rose 19%, as follows:
•Total income grew 22% mainly driven by net interest income which rose 30%, reflecting margin management and positive balance sheet sensitivity to higher interest rates.
Net fee income remained relatively flat as the increase in CIB and payments was offset by lower fees in funds and accounts.
•Costs increased 7%, below inflation, mainly due to investments in IT. As a result, net operating income rose 36% and efficiency improved by 5.9 percentage points.
•Net loan-loss provisions increased 26% driven by higher provisions in Poland due to the CHF mortgage portfolio and the macroeconomic deterioration. Underlying credit quality performance remained robust and the cost of risk remained around 40 basis points.
•Other gains (losses) and provisions included the temporary levy on revenue in Spain. For 2023, it totalled EUR 202 million and was charged in full in the first quarter. Excluding this impact, the profit increased 40%.
In the quarter, the attributable profit increased 22% in euros, +23% in constant euros, driven by widening customer margins, net fee income and lower costs. In the quarter-on-quarter comparison, the impact of the temporary levy in Spain was offset by contributions to the Deposit Guarantee Fund and the bank levy in the previous quarter.
| Europe. Underlying income statement | ||||||||||||||||||||||||||
| EUR million and % change | ||||||||||||||||||||||||||
| / | Q4'22 | / | Q1'22 | |||||||||||||||||||||||
| Q1'23 | % | excl. FX | % | excl. FX | ||||||||||||||||||||||
| Revenue | 5,171 | +9 | +9 | +20 | +22 | |||||||||||||||||||||
| Expenses | -2,167 | -3 | -2 | +5 | +7 | |||||||||||||||||||||
| Net operating income | 3,004 | +19 | +19 | +34 | +36 | |||||||||||||||||||||
| LLPs | -642 | +1 | +1 | +25 | +26 | |||||||||||||||||||||
| PBT | 1,846 | +31 | +32 | +23 | +26 | |||||||||||||||||||||
| Attributable profit | 1,189 | +22 | +23 | +17 | +19 | |||||||||||||||||||||
January - March 2023 | | 29 | ||||||
| Spain | Attributable profit | ||||||
| EUR 466 mn | ||||||||
Commercial activity and business performance
Despite the ongoing uncertain macroeconomic environment, we continued to grow our customer base, having achieved 19 consecutive months of net customer growth. Active customers increased 354,000 year-on-year.
In individuals, increases in interest rates and high levels of inflation caused lending activity to slow down both in mortgages and consumer loans, but we gained market share in payrolls and pensions. In corporate lending, the commercial portfolio and international business continued to grow year-on-year, while long-term financing continued to contract. In transactional products, PoS and cards grew above the market (+22%, +24% turnover growth respectively).
Loans and advances to customers fell 3% year-on-year. In gross terms and excluding reverse repurchase agreements, they decreased 3%, in line with the market, mainly affected by mortgage prepayments and the lower demand for long-term financing from businesses.
Customer deposits increased 8% year-on-year. In gross terms, excluding reverse repos, growth was 7%, boosted by time deposits. Off-balance sheet funds fell 4%, however, there is a growth trend with positive net new money in the quarter in savings funds and insurance.
Results
Attributable profit in the first quarter of 2023 amounted to EUR 466 million, 28% higher than Q1 2022. By line:
•Total income was up 26% propelled by growth in net interest income, reflecting higher interest rates. Net fee income increased strongly in payments and CIB, and decreased in asset management.
•Costs increased 4% affected by high inflation. In real terms, costs decreased 3% and the efficiency ratio improved 8.3 percentage points to 39.8%.
•Net loan-loss provisions rose 6% due to the more uncertain macroeconomic environment.
•Additionally, results were impacted by the temporary levy (EUR 202 million).
Compared to the fourth quarter 2022, attributable profit increased 2%, as the temporary levy in Q1 2023 offset the contribution to the Deposit Guarantee Fund in Q4 2022. Net interest income plus net fee income grew 8%, costs declined 4% and LLPs rose 6%.
| Spain. Underlying income statement | ||||||||||||||||||||
| EUR million and % change | ||||||||||||||||||||
| Q1'23 | / Q4'22 | / Q1'22 | ||||||||||||||||||
| Revenue | 2,547 | +17 | +26 | |||||||||||||||||
| Expenses | -1,014 | -4 | +4 | |||||||||||||||||
| Net operating income | 1,533 | +37 | +46 | |||||||||||||||||
| LLPs | -415 | +6 | +6 | |||||||||||||||||
| PBT | 739 | +27 | +42 | |||||||||||||||||
| Attributable profit | 466 | +2 | +28 | |||||||||||||||||
| United Kingdom | Attributable profit | ||||||
| EUR 395 mn | ||||||||
Commercial activity and business performance
Our transformation programme continues to deliver efficiency improvements through the simplification and digitalization of key processes.
The use of digital channels continued to grow: 81% of refinanced mortgage loans were processed online, 92% of new current accounts were opened through digital channels and digital transactions increased. We proactively continued to support our customers, especially those most affected by the increase in the cost of living, for which we improved our offer in savings products, especially ISAs, providing more attractive rates of return.
Loans and advances to customers were 4% lower year-on-year. In gross terms, excluding reverse repurchase agreements and in constant euros they were flat. This was mainly due to high new business in 2022, which was more limited in Q1 2023 as a result of margin management in an environment of rising interest rates and high inflation.
Customer deposits fell 3%. Excluding repurchase agreements and in constant euros, they were unchanged. We saw lower balances in current accounts offset by higher customer savings accounts. Mutual funds decreased 12%.
Results
In the first quarter of 2023, attributable profit was EUR 395 million, increasing 5% versus Q1 2022. In constant euros +11%, by line:
•Total income was up 12%, driven by strong net interest income benefitting from high portfolio volumes and margin management in a rising interest rate environment.
•Costs rose 6% due to high inflation. In real terms, cost decreased 4%. The efficiency ratio was 49.3%, improving 2.7 percentage points.
•Net loan-loss provisions totalled EUR 59 million. Credit fundamentals remained stable and cost of risk remained at 12 basis points.
In the quarter, attributable profit rose 55% due to cost management and lower provisions (-26%) and the charges recorded in the previous quarter (settlement agreed with the FCA and the bank levy). Total income was affected by the increase in deposit remuneration and net fee income by the switcher campaign.
| United Kingdom. Underlying income statement | ||||||||||||||||||||||||||
| EUR million and % change | ||||||||||||||||||||||||||
| / | Q4'22 | / | Q1'22 | |||||||||||||||||||||||
| Q1'23 | % | excl. FX | % | excl. FX | ||||||||||||||||||||||
| Revenue | 1,368 | -1 | 0 | +6 | +12 | |||||||||||||||||||||
| Expenses | -674 | 0 | +1 | 0 | +6 | |||||||||||||||||||||
| Net operating income | 694 | -2 | -1 | +12 | +18 | |||||||||||||||||||||
| LLPs | -59 | -27 | -26 | +16 | +22 | |||||||||||||||||||||
| PBT | 542 | +49 | +50 | +8 | +14 | |||||||||||||||||||||
| Attributable profit | 395 | +54 | +55 | +5 | +11 | |||||||||||||||||||||
| 30 | | January - March 2023 | ||||||
| Portugal | Attributable profit | ||||||
| EUR 180 mn | ||||||||
Commercial activity and business performance
We continued to execute our growth strategy supported by our transformation process which is already underway and based on customer focus and the continuous improvement of the service offered. The number of active and digital customers (+4% and +12%, respectively) increased, while we remained one of the best banks in the country in terms of NPS.
Loans and advances to customers fell 2% (both net and in gross terms, excluding reverse repos). Some customers reacted to the interest rate increases by amortizing their loans early, especially in mortgages and corporate loans. However, we maintained our market share in the mortgage segment.
Customer deposits (both, including and excluding repos) fell 5% year-on-year, due to the aforementioned early loan amortizations. Mutual funds decreased 8% driven by market conditions.
Results
Attributable profit in the first quarter of 2023 was EUR 180 million, 21% more year-on-year.
•Total income increased strongly (+22%) driven by net interest income, reflecting higher interest rates, and net fee income stability despite the drop in new lending.
•High inflation put upward pressure on costs, however they continued to fall in real terms. The efficiency ratio improved, reaching 32.6%, 5.0 percentage points lower than in the same period last year, reflecting the transformation plan implemented in recent years.
•Credit quality remained strong. The NPL ratio continued to fall to 3.0%, coverage reached 80% and the cost of risk remained low, with net loan-loss provisions close to zero.
Compared to the previous quarter, profit increased 3% supported by strong NII growth, which absorbed higher costs and the slight increase in LLPs.
| Portugal. Underlying income statement | ||||||||||||||||||||
| EUR million and % change | ||||||||||||||||||||
| Q1'23 | / Q4'22 | / Q1'22 | ||||||||||||||||||
| Revenue | 405 | +12 | +22 | |||||||||||||||||
| Expenses | -132 | +5 | +6 | |||||||||||||||||
| Net operating income | 273 | +15 | +32 | |||||||||||||||||
| LLPs | -14 | +75 | +73 | |||||||||||||||||
| PBT | 261 | +4 | +21 | |||||||||||||||||
| Attributable profit | 180 | +3 | +21 | |||||||||||||||||
| Poland | Attributable profit | ||||||
| EUR 167 mn | ||||||||
Commercial activity and business performance
We focused on continuing to simplify our products and processes with the goal of growing our total and active customer base, increasing sales, and improving the customer and employee experience. We are on track to meet these objectives.
We achieved high sales volumes in personal loans and mutual funds and strengthened our market position in corporate and wholesale banking.
Loans and advances to customers were flat (both including and excluding repos, in gross terms and in constant euros). Lower mortgage demand was offset by growth in consumer credit and wholesale banking.
Customer deposits increased 4%, +5% excluding repos and in constant euros, supported by higher volumes in companies and large corporates. Deposits from individuals fell slightly, affected by competitors' pricing. We remained focused on containing the cost of funding. Mutual funds dropped 5%, as a result of higher deposit remuneration in the market.
Results
Attributable profit in the first quarter of 2023 amounted to EUR 167 million. Compared to the same period of 2022, profit grew 49%. In constant euros, it rose 51%, as follows:
•Total revenue was 45% higher driven by NII (+47%) on the back of better customer spreads and cost of deposit management. Net fee income increased 7%.
•Costs increased 21% in a high inflation environment (16%), due to personnel expenses (very competitive labour market) and investment in digitalization. The efficiency ratio improved by 5.4 percentage points to 27.1%.
•Net loan-loss provisions grew sharply (+143%) due to the CHF mortgage provisions, resulting in a cost of risk of 1.71% but the credit fundamentals remained solid.
Profit compared to the previous quarter increased 24% in constant euros, as strong revenue performance and the provisioning in the previous quarter for the government approved mortgage payment holidays offset the contribution to the Deposit Guarantee Fund and the higher personnel expenses in the quarter.
| Poland. Underlying income statement | ||||||||||||||||||||||||||
| EUR million and % change | ||||||||||||||||||||||||||
| / | Q4'22 | / | Q1'22 | |||||||||||||||||||||||
| Q1'23 | % | excl. FX | % | excl. FX | ||||||||||||||||||||||
| Revenue | 729 | +5 | +5 | +43 | +45 | |||||||||||||||||||||
| Expenses | -197 | +8 | +8 | +19 | +21 | |||||||||||||||||||||
| Net operating income | 531 | +4 | +4 | +54 | +57 | |||||||||||||||||||||
| LLPs | -151 | +1 | +1 | +138 | +143 | |||||||||||||||||||||
| PBT | 336 | +21 | +21 | +43 | +45 | |||||||||||||||||||||
| Attributable profit | 167 | +24 | +24 | +49 | +51 | |||||||||||||||||||||
January - March 2023 | | 31 | ||||||
 | NORTH AMERICA | Attributable profit | ||||||
| EUR 627 mn | ||||||||
Executive summary → In North America, we continue to target segments with proven competitive advantages and strong Group network contributions in Mexico and the US while rationalizing businesses and products with limited scale and profitability to generate efficiencies and profitable growth. → Loans and advances to customers increased 6% in constant euros driven by growth in both the US and Mexico. Customer funds rose 8% in constant euros, boosted by higher time deposits. → Attributable profit amounted to EUR 627 million in the quarter, down 22% year-on-year (-28% in constant euros) mainly due to LLP normalization in the US, which more than offset the positive performance in Mexico. | ||||||||
Strategy
We further increased synergies across the two countries as we continue to pursue regional cooperation that brings value to both markets, including:
•Boosting sustainable profitability levels by increasing customer attraction and retention through loyalty strategies, refining our tailored service and product proposition for a better customer experience. We continue to improve interactions to drive customer loyalty and NPS.
•Leverage network contributions of both countries and the Group. Through our MEXUS initiative, we are consolidating T&O: operations know-how, digitalization, hubs, front-office and back-office, among others:
–US: we are modernizing depository platform to build a digital-first omnichannel experience.
–Mexico: gain market share through multichannel innovation and customer attraction.
Additionally, and in line with our global responsible banking agenda and public commitments, we are focusing on expanding and implementing sustainable finance opportunities within our businesses. For example, in Mexico:
•CIB closed a deal for the issuance of sustainability-linked bond certificates with one of the main players in Mexico's airport sector.
•We announced our initiative with Mastercard to replace all our debit cards and LikeU credit cards with sustainable models (made from recycled PVC and the first to be made accessible for the visually impaired).
In line with our strategy to deploy capital to the most profitable businesses, in Q1 2023:
•We completed the Amherst Pierpont Securities (APS) and Santander Investment Securities (SIS) merger in the US, creating SanCap. This company expands the structuring and advisory capabilities in the US and self-clearing capabilities for fixed income securities globally.
•In February, the Group launched the cash tender offer to acquire all outstanding shares and ADS of Santander México that it did not own (3.76% of its outstanding share capital). Following the tender offer, Santander México intends to delist them from the Mexican and New York Stock Exchanges. The offer ended on 10 April, with Banco Santander, S.A. having repurchased 3.6% of the share capital, increasing its shareholding in Santander México to 99.8%.
•Santander US continued dividend payouts, distributing USD 250 million in Q1 2023.
In terms of their local priorities:
United States
In the US, we are not focusing on being a universal bank but rather targeting segments with proven competitive advantages and strong Group network contributions. Our business model is focused on four core segments (Consumer, Commercial, CIB and Wealth Management) in which we continue to simplify and integrate the Group’s connectivity.
Our strategy for Santander US is anchored on four key pillars:
| United States | Mexico | |||||||||||||||||||||
| Thousands | 24,952 | 4,457 | 20,284 | |||||||||||||||||||
| Total customers | YoY change | +4% | -6% | +7% | |||||||||||||||||||
| Thousands | 14,085 | 4,082 | 9,839 | |||||||||||||||||||
| Active customers | YoY change | 0% | -6% | +3% | |||||||||||||||||||
| 32 | | January - March 2023 | ||||||
•Simplification: rationalize businesses and products with limited scale and profitability and exit non-core commercial portfolios.
•Transformation: leverage Group digital and data capabilities to modernize, drive scalability and lower cost to serve.
•Network contribution: leverage the Group's network to drive top line growth and achieve scale synergies.
•Profitable growth: deploy capital to support core growth businesses while maintaining focus on capital efficiency.
The key highlights for each of the business lines include:
•Consumer: continued transformation towards more digital capabilities and upgraded depository platform. Delinquency in auto stabilized while used car prices remained stable.
•Commercial: positive growth and profitability in the quarter while maintaining strong credit underwriting and performance.
•CIB: launched SanCap creating a competitive structuring and distribution platform across multiple asset classes.
•WM: assets under management remained stable despite market volatility in the quarter.
Mexico
We continue to focus on multi-channel innovation, promoting digital channels and strengthening our value proposition. This was reflected in more than one million new customers year-on-year.
In cards, we maintained the momentum of the LikeU credit card and rolled out Unique Rewards, a loyalty programme for the high income segment that provides improved customer experience through its new platform, value proposition and benefits.
In consumer, we continued to explore unattended segments and enhanced communication through digital channels. We have begun to offer a digital account opening process for payroll loans, engaging our customers right from the start.
In mortgages, we continued to digitalize our processes. Hipoteca Online processed 98% of the mortgages formalized.
In auto, we closed an agreement with BYD, a leading global new-energy vehicle company, to offer accessible financing for sustainable vehicles. We also increased pre-owned vehicle financing through alliances with leading automotive dealers and websites, which accounted for 10% of our monthly new auto business.
North America. Business performance. March 2023 | ||||||||||||||||||||||||||||||||||||||
| EUR billion and YoY % change in constant euros | ||||||||||||||||||||||||||||||||||||||
| 157 | +6% | | 167 | +8% | |||||||||||||||||||||||||||||||||
| ||
| ||
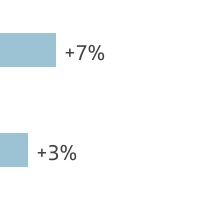
| ||
| ||
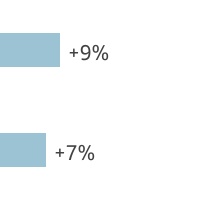
| Gross loans and advances to customers excl. reverse repos | Customer deposits excl. repos + mutual funds | |||||||||||||||||||||||||||||||||||||
In SMEs, we have strategic alliances through tailored offers focused on business chambers and specialized trade associations. We continued to promote our main acquiring products (G-Mini, G-Advance, G-Smart and G-Store).
Business performance
Loans and advances to customers grew 22% year-on-year. In gross terms, excluding reverse repurchase agreements and in constant euros, they rose 6% boosted by auto, credit cards, payroll loans and mortgages in Mexico and auto, SCIB and Multifamily in the US.
Customer deposits grew 24% year-on-year. Excluding repos and in constant euros, growth was 9%. This was driven by flows into interest-bearing deposits as we incentivized time deposits with competitive interest rates to attract new customers and deposits, fostering customer loyalty.
Mutual funds continued to see inflows (+3% year-on-year in constant euros).
Results
Attributable profit in the first quarter of 2023 was EUR 627 million. Compared to Q1 2022, profit decreased 22%. It was down 28% in constant euros, by line:
•Total income increased 4%, driven by net interest income (+6%, supported by the higher interest rate environment and loan growth) and net fee income (+7%, mainly driven by credit cards and insurance in Mexico). Other operating income fell due to lower leasing income in the US.
•Costs grew 10%, impacted by inflation, investments in technology and digitalization and higher personnel costs.
•Net loan-loss provisions grew 69% as the operating environment continues to normalize, though the LLP performance was better than initially expected in both countries.
Compared to Q4 2022, attributable profit increased 7% in constant euros due to higher net fee income (+4%) and lower LLPs and costs.
| North America. Underlying income statement | ||||||||||||||||||||||||||
| EUR million and % change | ||||||||||||||||||||||||||
| / | Q4'22 | / | Q1'22 | |||||||||||||||||||||||
| Q1'23 | % | excl. FX | % | excl. FX | ||||||||||||||||||||||
| Revenue | 3,141 | -5 | -2 | +12 | +4 | |||||||||||||||||||||
| Expenses | -1,500 | -8 | -6 | +19 | +10 | |||||||||||||||||||||
| Net operating income | 1,641 | -1 | +1 | +7 | -1 | |||||||||||||||||||||
| LLPs | -808 | -7 | -5 | +84 | +69 | |||||||||||||||||||||
| PBT | 815 | +4 | +7 | -22 | -28 | |||||||||||||||||||||
| Attributable profit | 627 | +3 | +7 | -22 | -28 | |||||||||||||||||||||
January - March 2023 | | 33 | ||||||
| United States | Attributable profit | ||||||
| EUR 300 mn | ||||||||
Commercial activity and business performance
We continue to focus on delivering profitable growth in our business while transforming and simplifying our businesses across the US.
Loans and advances to customers increased 23% compared to Q1 2022. In gross terms, excluding reverse repurchase agreements and in constant euros they grew 7% mainly driven by Auto, Multifamily and SCIB.
Customer deposits increased 26% over the same period, driven by time deposits (both retail and SCIB). Excluding repurchase agreements and in constant euros, customer deposits grew 9%.
After recent events in the industry, it is important to note that SBNA has a stable and diversified retail-oriented deposit base. Around 61% of deposits are from retail and small businesses and approximately 65% are FDIC insured. Moreover, the deposit base is highly diversified with limited concentrations, liquidity is conservatively managed with risk management standards in line with G-SIBs and our capital ratios are some of the highest among peers.
Results
Attributable profit in the first quarter of 2023 was EUR 300 million (49% lower than Q1 2022) largely due to higher funding costs in Auto and the expected normalization in credit performance. In constant euros, it fell 51%:
•Total income decreased 4% driven by lower activity in capital markets, lower gains on lease disposition and home lending exit. NII increased 2% due to the continued boost from higher loan balances and interest rates, partially offset by rising wholesale funding costs.
•Costs rose 9%, heavily impacted by inflation. In real terms, they were up less than 2% as investments in SCIB and Wealth Management were largely offset by savings from transformation initiatives.
•Net loan-loss provisions increased sharply due to the continued normalization.
In the quarter, attributable profit rose 10% supported by stronger net fee and leasing income and lower LLPs due to seasonal effects. NII was down 3% due to auto mix shift and higher funding costs.
| United States. Underlying income statement | ||||||||||||||||||||||||||
| EUR million and % change | ||||||||||||||||||||||||||
| / | Q4'22 | / | Q1'22 | |||||||||||||||||||||||
| Q1'23 | % | excl. FX | % | excl. FX | ||||||||||||||||||||||
| Revenue | 1,827 | -7 | -2 | +1 | -4 | |||||||||||||||||||||
| Expenses | -912 | -5 | -1 | +14 | +9 | |||||||||||||||||||||
| Net operating income | 915 | -8 | -3 | -10 | -14 | |||||||||||||||||||||
| LLPs | -567 | -11 | -7 | +122 | +112 | |||||||||||||||||||||
| PBT | 346 | -2 | +5 | -53 | -55 | |||||||||||||||||||||
| Attributable profit | 300 | +2 | +10 | -49 | -51 | |||||||||||||||||||||
| Mexico | Attributable profit | ||||||
| EUR 359 mn | ||||||||
Commercial activity and business performance
We strengthened our position in value-added products to increase customer loyalty. We maintained a solid performance in our individual loans portfolio.
Our continued focus on individuals is reflected in our consolidated position in auto, remaining the third largest player in the market with a 16% market share, while in credit cards and payroll loans, we continue to post double-digit year-on-year growth.
Loans and advances to customers increased 20% year-on-year. In gross terms, excluding reverse repos and in constant euros they increased 3%, driven by loans to individuals (auto +36%, credit cards +23%, payroll +20% and +9% mortgages). Lending to corporates and institutions rose 1%, with a 9% decline in SMEs and 12% in SCIB.
Customer deposits grew 19% year-on-year. Excluding repos and in constant euros they increased 9%, driven by term deposits on the back of a higher interest rate environment. Mutual funds increased slightly (+1%).
Results
Attributable profit in the first quarter of 2023 was EUR 359 million, 44% higher than the same period in 2022. In constant euros, it increased 26%, as follows:
•Total income rose 15%, boosted by net fee income (+13%) and net interest income (+14%) as the result of higher volumes and interest rates, and gains on financial transactions (+64%).
•Costs increased 9%, mainly due to the rise in supply costs (affected by inflation at 8%), investments in digitalization, obsolescence elimination payment systems technology improvement and ATM acquisition.
•Net loan-loss provisions were up 14% reflecting loan portfolio growth.
Compared to the previous quarter, attributable profit increased 5% driven by higher net fee income, lower costs and stability in LLPs.
| Mexico. Underlying income statement | ||||||||||||||||||||||||||
| EUR million and % change | ||||||||||||||||||||||||||
| / | Q4'22 | / | Q1'22 | |||||||||||||||||||||||
| Q1'23 | % | excl. FX | % | excl. FX | ||||||||||||||||||||||
| Revenue | 1,300 | -1 | -2 | +32 | +15 | |||||||||||||||||||||
| Expenses | -540 | -11 | -12 | +25 | +9 | |||||||||||||||||||||
| Net operating income | 760 | +8 | +8 | +38 | +20 | |||||||||||||||||||||
| LLPs | -239 | +3 | +2 | +31 | +14 | |||||||||||||||||||||
| PBT | 504 | +8 | +7 | +48 | +29 | |||||||||||||||||||||
| Attributable profit | 359 | +6 | +5 | +44 | +26 | |||||||||||||||||||||
| 34 | | January - March 2023 | ||||||
 | SOUTH AMERICA | Attributable profit | ||||||
| EUR 790 mn | ||||||||
Executive summary → We continued with our strategy to strengthen connectivity in the region, share best practices across countries and execute our digital transformation agenda to promote synergies and improve efficiency and profitability. → We have a solid customer base (70.6 million), having increased 6.2 million year-on-year backed by better customer experience and higher transactionally, while strengthening our risk and cost management models. → Year-on-year growth in both gross loans and advances to customers and customer deposits, and we promoted inclusive and sustainable business for society through our ambitious ESG agenda. → Attributable profit decreased 12% year-on-year (-14% in constant euros) to EUR 790 million due to the increase in costs and LLPs, which offset revenue growth. | ||||||||
Strategy
We maintained our strategy of capturing synergies across business units:
•In consumer finance, we remained focused on exchanging positive experiences across countries such as the platform for new and used vehicle financing in Brazil. In Uruguay, consumer credit grew further, as a result of our market positioning and the recovery in commercial activity. We continued to expand our digital strategy for consumer credit and used auto financing in Peru. Good year-on-year performance in consumer credit in Chile.
•In payment methods, we advanced in our e-commerce strategies and in immediate domestic and international transfers. We consolidated Getnet, our Brazilian acquiring model, in other countries in the region. For example, in Chile it is already one of our most known and popular brands in the market and in Argentina, we are the second largest payment processing company. In Uruguay, Getnet for SMEs enabled us to gain a greater presence in the payments market.
•We continued to make headway in the development of joint initiatives between SCIB and corporates to deepen relationships with multinational clients, boosting loyalty and customer acquisition. In the Multi-Latinas business, revenue grew 53% year-on-year.
•We continued to promote inclusive and sustainable businesses, such as our micro-credit offer through Prospera in Colombia, which is present in 610 municipalities, and in Brazil where we reached 910,000 active customers. In Peru, Surgir, our micro-credit company, has more than 65,000 customers. In
Argentina, we have partnerships to support companies with their green transitions and to help SMEs grow in the international export market. In Chile, we maintained our leadership in green finance, and in Brazil, we achieved our objective of using 100% renewable energies, well ahead of our 2025 target. We were top in the Great Place to Work ranking in Uruguay.
The main initiatives by country were:
•Brazil: our strategy is based on four pillars:
•Customer focus, offering simple, complete and tailor-made solutions to improve customer experience and satisfaction.
•Invest in strategic businesses, especially in WM&I, where we maintained our investment expansion plan and we continued to develop insurance ecosystem. In Corporates, we progressed in the development of a best-in-class platform. In Payments, we signed an agreement with Google Pay and in Auto we continued to expand the platform in a market where we are already leaders.
•Sales channels, with an omnichannel strategy and higher channel integration, focused on both sales and after-sales that allow us to serve customers through physical, digital and remote channels.
•A unique horizontal culture that promotes empowerment, diversity and meritocracy, and prioritizes sustainable businesses that support the transition to a low-carbon economy.
 | Brazil | Chile | Argentina | Other South America | |||||||||||||||||||||||||||||||
| Thousands | 70,616 | 60,962 | 3,720 | 4,446 | 1,488 | |||||||||||||||||||||||||||||
| Total customers | YoY change | +10% | +11% | -11% | +5% | +27% | |||||||||||||||||||||||||||||
| Thousands | 38,228 | 31,728 | 2,175 | 3,158 | 1,167 | |||||||||||||||||||||||||||||
| Active customers | YoY change | +4% | +4% | +6% | +1% | +11% | |||||||||||||||||||||||||||||
January - March 2023 | | 35 | ||||||
•Chile: we remained focused on digital banking and enhancing customer service. In payment methods, we continued to develop e-commerce and our domestic and international transfer business. We continued to offer our corporate customers integrated financing, cash management and treasury solutions, which resulted in significant increases in revenue and results in these segments. In financial inclusion, we helped micro-entrepreneurs to develop their business through an integrated banking offer aimed at small startup companies.
•Argentina: we continued to improve our customer service, loyalty and digitalization, which enabled us to be #1 in NPS for customer satisfaction in individuals. Our app remained one of the best rated among banks on iOS and Android, and we made progress in building our open financial services platform by strengthening Getnet's value offering. We continued to develop MODO, a solution that promotes digital payments and financial inclusion in the country.
•Uruguay: we remained the country's leading privately-owned bank. We continued our digital expansion, with the consolidation of Soy Santander, a fully-digital loyalty proposition for individuals, and F1RST, an innovative solution country focused on innovation and security, and we rolled out the new MiAuto offer, a financial institution through which we will channel vehicle sales.
•Peru: we developed new business through joint initiatives between SCIB and Corporates. We are in the top 3 investment banks and leaders in Debt Capital Markets and corporate derivatives. In addition, our specialized auto finance company achieved a 32% market share and our NeoAuto platform, a digital marketplace for new and used auto financing, continued to expand. Surgir, our microfinance company, covers 101 districts through a 100% digital service model.
•Colombia: we continued to offer sustainable and inclusive financial solutions, maintaining our participation in the most relevant operations for the country's development, with joint offers for SCIB and Corporate. We also continued to grant loans to entrepreneurs. In consumer finance, we consolidated our position in new and used auto loans, with a 78% increase year-on-year in the portfolio.
South America. Business performance. March 2023 | ||||||||||||||||||||||||||||||||||||||
| EUR billion and YoY % change in constant euros | ||||||||||||||||||||||||||||||||||||||
| 160 | +12% | | 193 | +11% | |||||||||||||||||||||||||||||||||
| ||
| ||
| ||
 | ||
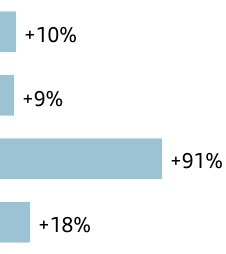
| ||
| ||
| ||
| ||

| Gross loans and advances to customers excl. reverse repos | Customer deposits excl. repos + mutual funds | |||||||||||||||||||||||||||||||||||||
Business performance
Loans and advances to customers rose 7% year-on-year. Gross loans and advances to customers (excluding reverse repos and in constant euros) increased 12% year-on-year, with rises in all countries.
Customer deposits were 5% higher year-on-year. Excluding the exchange rate impact and repos, customer deposits rose 10%, backed by time deposits (+22% year-on-year) which more than offset the decrease in demand deposits (-5%). Mutual funds were up 11% (in constant euros).
Results
Attributable profit in the first quarter of 2023 amounted to EUR 790 million, down 12% year-on-year. In constant euros, it decreased 14%, as follows:
•Total income increased 4%, driven by net interest income and net fee income (+4% and +16%, respectively) and the rise in gains on financial transactions.
•Costs were 19% higher, below inflation. In real terms, they decreased 1%, due to cost management efforts made in the period.
•Net loan-loss provisions increased 20%, with rises recorded in all countries, partly related to volume growth. The cost of risk was 3.39% (3.32% in December 2022).
By country, attributable profit grew in most markets in the region, offset by the decreases in Brazil and Chile, still affected by the impact on margins (due to negative sensitivity to interest rate rises) and provisions. These effects were partly offset by lower tax burden. net fee income growth and good cost management in Chile and Brazil.
Compared to the fourth quarter of 2022, profit remained stable in constant euros, as the drop in revenue and higher tax burden were offset by lower costs and provisions (mainly in Brazil).
| South America. Underlying income statement | ||||||||||||||||||||||||||
| EUR million and % change | ||||||||||||||||||||||||||
| / | Q4'22 | / | Q1'22 | |||||||||||||||||||||||
| Q1'23 | % | excl. FX | % | excl. FX | ||||||||||||||||||||||
| Revenue | 4,404 | 0 | -3 | +5 | +4 | |||||||||||||||||||||
| Expenses | -1,723 | -1 | -6 | +16 | +19 | |||||||||||||||||||||
| Net operating income | 2,680 | 0 | 0 | -1 | -3 | |||||||||||||||||||||
| LLPs | -1,232 | -13 | -11 | +23 | +20 | |||||||||||||||||||||
| PBT | 1,247 | +13 | +11 | -20 | -22 | |||||||||||||||||||||
| Attributable profit | 790 | +2 | 0 | -12 | -14 | |||||||||||||||||||||
| 36 | | January - March 2023 | ||||||
| Brazil | Attributable profit | ||||||
| EUR 469 mn | ||||||||
Commercial activity and business performance
In Brazil, we have a culture focused on growth and profitability, with a strategy centred around the customer to meet their needs and increase their loyalty. This was reflected in an increase of more than 6 million customers year-on-year.
We continued investing in strategic businesses such as WM&I, where we made progress with the AAA (Associate Allocation Advisor) expansion plan, which has 896 advisors, and with Toro consolidation, our digital investment platform. In insurance, premiums amounted to BRL 2.5 billion (increasing 3% year-on-year).
We opened 45,000 SME accounts per month. In cards, turnover reached BRL 82 billion and we continued with the strategy of acquiring customers with a better risk profile. In auto, we remained leaders in auto lending to individuals, with a 22% market share. In payrolls, new lending increased 78% year-on-year.
Loans and advances to customers rose 5% year-on-year. Gross loans and advances to customers, excluding reverse repos and in constant euros grew 10%, mainly due to corporates and institutions and secured loans to individuals.
Customer deposits rose 5% year-on-year. Excluding the exchange rate impact and repos, they were up 9% driven by time deposits (+16%) which more than offset the 11% fall in demand deposits. Mutual funds increased 4% in constant euros and as a result, customer funds rose 7% in constant euros.
Results
In the first quarter of 2023, attributable profit amounted to EUR 469 million, -25% year-on-year. In constant euros, profit decreased 29%, as follows:
•The good performance in net fee income (+5%) was not able to compensate the fall in net interest income (-6%) as higher volumes were not enough to offset the negative sensitivity to interest rate rises and the change in mix towards lower risk products. As a result, total income decreased 3%.
•Costs rose 11%, strongly impacted by inflation. In real terms, costs increased 3% and the efficiency ratio remained at good levels (35.3%).
•Net loan-loss provisions increased 16%, mainly driven by loan portfolio growth, bringing the cost of risk to 4.84% and the NPL ratio to 7.34%.
Compared to the previous quarter, profit decreased 5% as lower costs and LLPs were not enough to compensate the fall in net interest income (-2%) and higher tax burden.
| Brazil. Underlying income statement | ||||||||||||||||||||||||||
| EUR million and % change | ||||||||||||||||||||||||||
| / | Q4'22 | / | Q1'22 | |||||||||||||||||||||||
| Q1'23 | % | excl. FX | % | excl. FX | ||||||||||||||||||||||
| Revenue | 3,057 | -6 | -2 | +1 | -3 | |||||||||||||||||||||
| Expenses | -1,080 | -8 | -4 | +16 | +11 | |||||||||||||||||||||
| Net operating income | 1,977 | -4 | -1 | -5 | -10 | |||||||||||||||||||||
| LLPs | -1,034 | -17 | -14 | +21 | +16 | |||||||||||||||||||||
| PBT | 765 | +4 | +8 | -32 | -35 | |||||||||||||||||||||
| Attributable profit | 469 | -9 | -5 | -25 | -29 | |||||||||||||||||||||
| Chile | Attributable profit | ||||||
| EUR 150 mn | ||||||||
Commercial activity and business performance
We remained focused on improving customer satisfaction through the transformation of our commercial network and our digital banking proposition. We expanded Santander Life, which has more than one million customers and extended its commercial offer to SMEs and micro-entrepreneurs. Getnet continued to attract new customers and has already sold more than 177,000 terminals.
In Q1 2023, we launched three innovative initiatives: i) Más Lucas, an interest-free demand account for the mass segment, a clear sign of Santander Chile's commitment to financial inclusion; ii) the launch of WorkCafé Expresso, new transactional centres that include cashier services, among others; and iii) the new specialized business service model, with a special focus on the agricultural, automotive and Multi-Latina industries.
Latin Trade named us as one of the five Most sustainable Companies in Latin America.
In volumes, loans and advances to customers increased 10% year-on-year. Gross loans and advances to customers excluding reverse repurchase agreements and in constant euros, were 9% higher, boosted by mortgages and SCIB.
Customer deposits rose 1% year-on-year. Excluding the exchange rate impact and repurchase agreements, customer deposits decreased 1% due to demand deposits (-18%). Time deposits saw inflows (+28%) due to higher interest rates. Mutual funds rose 20% and total customer funds increased 4%.
Results
Attributable profit in the first quarter of 2023 was EUR 150 million, 20% lower year-on-year. In constant euros, profit decreased 23%, as follows:
•Total income fell 10% driven by the drop in net interest income (-26%), linked to the negative sensitivity to interest rate rises. This decline was partially offset by the good performance of gains on financial transactions (+20%) and net fee income, which grew 31% driven by the increase in loyalty and transactionality.
•Costs rose 4%, well below average inflation (12%) and the efficiency ratio was 41.9%.
•Net loan-loss provisions rose 19%, with the cost of risk below 1% (0.95%).
In the quarter, profit increased 11% in constant euros, driven by the good performance of net interest income, net fee income, gains on financial transactions and cost management, which strongly offset the greater tax burden.
| Chile. Underlying income statement | ||||||||||||||||||||||||||
| EUR million and % change | ||||||||||||||||||||||||||
| / | Q4'22 | / | Q1'22 | |||||||||||||||||||||||
| Q1'23 | % | excl. FX | % | excl. FX | ||||||||||||||||||||||
| Revenue | 606 | +18 | +10 | -7 | -10 | |||||||||||||||||||||
| Expenses | -254 | +4 | -2 | +9 | +4 | |||||||||||||||||||||
| Net operating income | 352 | +30 | +20 | -15 | -19 | |||||||||||||||||||||
| LLPs | -117 | +8 | +2 | +24 | +19 | |||||||||||||||||||||
| PBT | 245 | +42 | +31 | -24 | -27 | |||||||||||||||||||||
| Attributable profit | 150 | +19 | +11 | -20 | -23 | |||||||||||||||||||||
January - March 2023 | | 37 | ||||||
| Argentina | Attributable profit | ||||||
| EUR 139 mn | ||||||||
Commercial activity and business performance
We remained focused on improving our customer experience, promoting innovation, improving customer service models and digital transformation. All of this resulted in more loyal and digital customers.
In Consumer, we promoted consumer credit we continued to be leaders in auto, with a 21% market share.
In ESG, Santander closed partnerships with EnelX to support companies in their green transition, and with Latindyl to help SMEs grow in the international export market.
Loans and advances to customers were up 5% year-on-year. In gross terms, excluding reverse repos and the exchange rate impact, they rose 91% year-on-year, driven by consumer credit, SMEs and SCIB. We ranked second among privately-owned banks in loans.
Customer deposits increased 9% year-on-year. Excluding repos and the exchange rate impact, customer deposits rose 101% with growth in demand (+91%) and in time (+119%) deposits. Mutual funds were 146% higher. As a result, total customer funds increased 113% in constant euros.
These high growth rates, as well as results, are impacted by high inflation in the country.
Results
Attributable profit in the first quarter of 2023 was EUR 139 million, 135% higher year-on-year. In constant euros, profit was 332% higher. By line:
•Total income grew 154%, underpinned by net interest income (+227%), net fee income (+109%, mainly driven by transactional and mutual funds fees) and gains on financial transactions (+205%). This performance more than offset the greater negative effect from the hyperinflation adjustment.
•Costs increased below revenue. The efficiency ratio stood at 49.8%, improving 9.7 pp year-on-year, and net operating income rose 215%.
•Net loan-loss provisions increased 102%, virtually in line with loan growth. The cost of risk stood at 2.97%, 33 bps lower than in March 2022.
In the fourth quarter, profit increased 15% in constant euros, due to the solid performance in costs and in lower half of the P&L, which more than offset the fall in revenue impacted by the change in year in hyperinflation accounting.
| Argentina. Underlying income statement | ||||||||||||||||||||||||||
| EUR million and % change | ||||||||||||||||||||||||||
| / | Q4'22 | / | Q1'22 | |||||||||||||||||||||||
| Q1'23 | % | excl. FX | % | excl. FX | ||||||||||||||||||||||
| Revenue | 501 | +19 | -20 | +38 | +154 | |||||||||||||||||||||
| Expenses | -250 | +40 | -19 | +15 | +112 | |||||||||||||||||||||
| Net operating income | 251 | +4 | -22 | +71 | +215 | |||||||||||||||||||||
| LLPs | -43 | +63 | — | +10 | +102 | |||||||||||||||||||||
| PBT | 179 | +36 | +5 | +153 | +366 | |||||||||||||||||||||
| Attributable profit | 139 | +53 | +15 | +135 | +332 | |||||||||||||||||||||
| Other South America |  |  |  | ||||||||
Uruguay
Gross loans and advances to customers, excluding reverse repurchase agreements and in constant euros were up 13% year-on-year. Customer deposits excluding repos fell 3% in constant euros driven by demand deposits (-10%).
Attributable profit in the first quarter of 2023 was EUR 40 million, up 39% year-on-year and +21% in constant euros, as follows:
•Total income was up 31% boosted by net interest income (following interest rate rises), net fee income and gains on financial transactions.
•Costs rose 8% compared to 9% average inflation. As a result, the efficiency ratio stood at 38.5% (8.1 pp better year-on-year).
•Net loan-loss provisions rose, as the normalization that began in previous quarters continued rising from low levels in previous years. The cost of risk remained low (1.75%) and the NPL ratio stood at 2.93%.
Compared to the previous quarter, attributable profit was practically stable in constant euros (-1%) as the increase in revenue was offset by higher provisions.
Peru
Gross loans and advances to customers excluding reverse repos and the exchange rate impact rose 13% year-on-year and customer deposits (excluding repos and in constant euros) also increased 13%, mainly driven by demand deposits (+24%).
In the first quarter of 2023, attributable profit was EUR 19 million, 15% higher year-on-year. In constant euros, growth was 10%, as follows:
•Total income rose 35%, mainly boosted by net interest income. Costs rose 22%, mostly driven by the launch of new businesses and inflation.
•Net loan-loss provisions increased, though the cost of risk remained low (0.94%).
Colombia
Gross loans and advances to customers (excluding reverse repos and in constant euros) were 32% higher year-on-year. Customer deposits (excluding repos) rose 58% in constant euros due to time deposits (+117%).
In the first quarter of 2023, attributable profit was EUR 6 million, 11% lower year-on-year. In constant euros, profit was 4% higher:
•Total income grew 22% (net fee income and gains on financial transactions) and costs rose 37% due to inflation and the development of new business lines.
•Net loan-loss provisions were 69% higher, due to the growth in Auto and Prospera businesses. The cost of risk remained low (0.39%).
| Other South America. Underlying income statement | ||||||||||||||||||||||||||
| EUR million and % change | ||||||||||||||||||||||||||
| Net operating income | Attributable profit | |||||||||||||||||||||||||
| / | Q1'22 | / | Q1'22 | |||||||||||||||||||||||
| Q1'23 | % | excl. FX | Q1'23 | % | excl. FX | |||||||||||||||||||||
| Uruguay | 85 | +73 | +50 | 40 | +39 | +21 | ||||||||||||||||||||
| Peru | 38 | +50 | +44 | 19 | +15 | +10 | ||||||||||||||||||||
| Colombia | 12 | -11 | +4 | 6 | -11 | +4 | ||||||||||||||||||||
| 38 | | January - March 2023 | ||||||
 | DIGITAL CONSUMER BANK | Attributable profit | ||||||
| EUR 244 mn | ||||||||
Executive summary → We are still facing a complex environment in 2023 as supply chain disruptions remain and geopolitical tensions are denting consumer confidence. In this context, new lending rose 7% year-on-year in constant euros. → We continued to reinforce our auto leadership with new strategic alliances, leasing and subscription. We completed the agreement with Stellantis in April, continued upscaling our BNPL business and saw >20% in new leasing contracts. → Attributable profit amounted to EUR 244 million, a 14% fall year-on-year (-12% in constant euros) driven by negative sensitivity to interest rate rises and the temporary levy on revenue in Spain. To offset these impacts, we are focusing on new business pricing and profitability, increasing customer deposits, operating efficiency and cost of risk. | ||||||||
Strategy
Digital Consumer Bank (DCB) is the leading consumer finance bank in Europe in scale and profitability as it leverages Santander Consumer Finance's (SCF) auto and non-auto consumer finance footprint in Europe, and Openbank’s technology stack.
SCF is Europe's consumer finance leader, present in 18 countries (16 in Europe plus China and Canada) and works through more than 130,000 associated points of sale. It provides value propositions to its customers and partners to enhance their sales capacity by financing their products and developing advanced technologies to give them a competitive edge.
SCF aims to become the best-in-class auto financing and digital mobility service provider in Europe.
Openbank is the largest 100% digital bank in Europe. It offers current accounts, cards, loans, mortgages, a state-of-the-art robo-advisor service and open platform brokerage services. Openbank is currently active in Spain, the Netherlands, Germany and Portugal, and we are working on its expansion across Europe and the Americas.
Openbank's new tech stack and product building capabilities deployed in Zinia should allow us to deliver on our targets and exceed our customers' expectations.
Our strategy in 2023 is focused on accelerating transformation to boost future growth. The main priorities for 2023 are to:
| Digital Consumer Bank. Loan distribution | |||||
| March 2023 | |||||
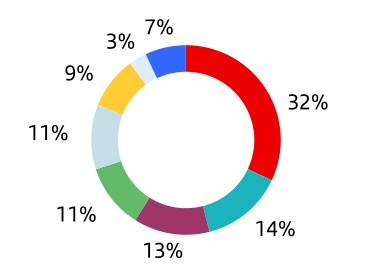
| Germany | ||||||||
| Nordics | ||||||||
| France | ||||||||
| Spain | ||||||||
| UK | ||||||||
| Italy | ||||||||
| Poland | ||||||||
| Others | ||||||||
•Secure leadership in global digital consumer lending by:
–Auto: continuing to progress with strategic initiatives to build a world-class digital offering in mobility; aid OEMs' transformation journeys with online lending, leasing, renting and subscription offerings; and provide our partners with innovative finance and sale solutions on dealer websites and in auto marketplaces.
–Consumer (Non-Auto): gaining market share though specialization and with tech platforms that build on our leadership in Europe through Zinia, our buy now, pay later (BNPL) service, checkout lending, credit cards and direct loans.
–Digital Bank: continuing to increase loyalty among our Openbank and SC Germany retail customers and boosting digital banking.
•Continue the transformation of our operating model to defend our best-in-class efficiency through: (i) single IT platforms, (ii) a simpler legal and operational structure, and (iii) automation and process redesign.
•Reduce sensitivity to rising interest rates with greater deposit acquisition and faster loan repricing. Moreover, we are driving an originate-to-distribute model to increase balance sheet mobilization and make the business more capital light.
•Growth by progressing in transformational projects. In auto: our new Stellantis partnership, the acquisition of MCE Bank Germany and capturing opportunities with OEMs in addition to launch of our new digital leasing platform. In consumer: fully transition to Zinia tech stack and branding, execute pan-European agreements, boost growth through integrators and sign flagship deals with major global tech companies.
We continue to support the green transformation of European mobility. In 2023, we aim to exceed the 150k new battery electric vehicles financed in 2022, while developing other new initiatives that are quickly spreading across Europe: electric chargers, solar panels, green heating systems, e-bikes, etc.
We were recognized as a Top Employer or Great Place to Work (GPTW) in four countries.
January - March 2023 | | 39 | ||||||
Business performance
After a difficult 2022, with supply chain disruptions (covid-19, chips shortage and the war in Ukraine) and geopolitical tensions, DCB is still facing a complex environment in 2023. Some of the impacts include (i) the change of TLTRO contractual conditions, (ii) rising interest rates temporarily compressing margins while our loan book reprices, and (iii) normalization from a very low cost of risk towards the average across the cycle.
However, new lending volumes are starting to pick up in Europe following a very weak 2022. For example, car transactions in Europe were up 17% in our footprint. DCB's new lending increased 7% year-on-year (+8% in auto), having achieved significant growth in 2022 despite a shrinking market.
In Auto, our leasing solutions and commercial focus generated a greater than 20% year-on-year increase in the number of leasing contracts. We continued to develop our proprietary digital leasing platform for Europe with the ambition of disrupting the market by building organic capabilities with our new Santander Auto Engineering Team.
Our Auto Subscription Service offers flexible subscriptions from one month and up. Our platform based business has two models: (i) Wabi, our direct to consumer owned brand, which is already live in Spain, Norway and Germany and will expand to other countries in the coming years; and (ii) Ulity, a white label solution for OEMs and Service Car companies launched in June 2022. Through Ulity we have already entered into relevant agreements with pan-European ride-hailing players and OEMs.
In Q1, we renewed our partnership with Stellantis in Europe, which will allow us to consolidate our position as their main financing partner. We aim to grow our Stellantis brand portfolio by c.30% to EUR 40 billion by 2026.
In BNPL, Zinia continues to achieve outstanding results with more than 4.7 million contracts since its launch and around 44,000 retail merchants connected. Zinia is a key driver in achieving growth in number of merchants and contracts and executing game changing deals on the horizon.
The TIMFin joint venture is a strategic alliance with the leading Italian Telco and a new vertical for DCB. The company has more than 1.7 million contracts since launch as well as >5,800 active points of sale and >2,500 connected merchants.
| Activity | ||||||||||||||||||||||||||||||||
| EUR billion and % change in constant euros | ||||||||||||||||||||||||||||||||
| +2% | ||||||||||||||||||||||||||||||||
| QoQ | +5% | |||||||||||||||||||||||||||||||
| QoQ | ||||||||||||||||||||||||||||||||
| 127 | ||||||||||||||||||||||||||||||||
| +11% | 64 | +10% | ||||||||||||||||||||||||||||||
| YoY | YoY | |||||||||||||||||||||||||||||||
| Gross loans and advances to customers excl. reverse repos | Customer deposits excl. repos + mutual funds | |||||||||||||||||||||||||||||||
The stock of loans and advances to customers increased 9% year on-year. In gross terms, excluding reverse repos and in constant euros they rose 11% year-on-year to EUR 127 billion (76% is auto).
Customer deposits increased 7% in euros, +9% excluding repos and in constant euros to EUR 61 billion, having launched several initiatives to accelerate customer deposit growth. Our recourse to wholesale funding remained strong and diversified.
Results
Attributable profit in the first quarter was EUR 244 million, 14% down year-on-year in euros. In constant euros, profit fell 12% (-4% excluding the impact from the temporary levy in Spain), by line:
•Total income increased 4% and net interest income rose 3% despite higher interest rates which are eroding our margins. To neutralize the negative sensitivity to rising rates, we are repricing loans, focusing on the most profitable segments and increasing customer deposits to become our main funding source.
Additionally, net fee income declined 7% impacted by new regulation in Germany while other operating income (mainly leasing revenue) increased 10%.
•Costs increased 4%, affected by inflation, strategic transformation investments and business growth. In real terms costs fell 5%. Consequently net operating income rose 5% and the efficiency ratio was stable at 49%.
•Credit quality remained robust. The cost of risk remains low (0.48%) but is normalizing and the NPL ratio improved to 2.05%. Net loan-loss provisions increased 34%, coming from a low base in 2022.
•By country, the largest contribution to attributable profit came from Germany (EUR 61 million), the UK (EUR 53 million), the Nordic countries (EUR 49 million) and France (EUR 39 million).
Compared to the previous quarter, attributable profit fell 38%, affected by higher funding costs, greater LLPs (portfolio sales in Q4'22) and costs.
| Digital Consumer Bank. Underlying income statement | ||||||||||||||||||||||||||
| EUR million and % change | ||||||||||||||||||||||||||
| / | Q4'22 | / | Q1'22 | |||||||||||||||||||||||
| Q1'23 | % | excl. FX | % | excl. FX | ||||||||||||||||||||||
| Revenue | 1,343 | -3 | -2 | +2 | +4 | |||||||||||||||||||||
| Expenses | -659 | +8 | +8 | +2 | +4 | |||||||||||||||||||||
| Net operating income | 684 | -12 | -10 | +3 | +5 | |||||||||||||||||||||
| LLPs | -193 | +69 | +67 | +30 | +34 | |||||||||||||||||||||
| PBT | 447 | -32 | -31 | -11 | -9 | |||||||||||||||||||||
| Attributable profit | 244 | -39 | -38 | -14 | -12 | |||||||||||||||||||||
| 40 | | January - March 2023 | ||||||
 | Corporate Centre | Attributable profit | ||||||
| -EUR 279 mn | ||||||||
Executive summary → The Corporate Centre developed its role supporting the Group. → The Corporate Centre’s objective is to define, develop and coordinate the Group's strategy and aid the operating units by contributing value and carrying out the corporate oversight and control function. It also carries out functions related to financial and capital management. → Negative attributable profit improved compared to Q1 2022 due to higher liquidity buffer remuneration and lower negative impact of the foreign currency hedging results. | ||||||||
Strategy and functions
The Corporate Centre contributes value to the Group in various ways:
•Through global control frameworks and supervision.
•Fostering the exchange of best practices in cost management, which enables us to be one of the most efficient banks.
•Contributing to the launch of projects that will be developed by our global businesses aimed at leveraging our worldwide presence to generate economies of scale.
It also coordinates the relationship with European regulators and supervisors and develops functions related to financial and capital management, as follows:
•Financial Management functions:
–Structural management of liquidity risk associated with funding the Group’s recurring activity and stakes of a financial nature. In March 2023, the liquidity buffer exceeded EUR 300 billion.
This activity is carried out by the diversification of funding sources (issuances and other), always maintaining an adequate profile in volumes, maturities and costs. The price of these operations with other Group units is the market rate that includes all liquidity concepts (which the Group supports by immobilizing funds during the term of the operation) and regulatory requirements (TLAC/MREL).
–Interest rate risk is also actively managed in order to dampen the impact of interest rate changes on net interest income, conducted via high credit quality, very liquid and low capital consumption derivatives.
–Strategic management of exposure to exchange rates in equity and dynamic on the countervalue of the units’ next twelve months results in euros. Net investments in equity are currently hedged, EUR 21,350 million (mainly in Mexico, Brazil, the UK and Poland) with different FX instruments (spot or forwards).
•Management of total capital and reserves: efficient capital allocation to each of the units in order to maximize shareholder return.
Results
In the first quarter of 2023, attributable loss of EUR 279 million was 40% lower than in Q1 2022 (-EUR 462 million) because:
•Net interest income improved, driven by higher liquidity buffer remuneration as a result of rising interest rates.
•Higher gains on financial transactions (EUR 64 million more than in Q1 2022), due to lower negative FX hedging impacts.
•Lastly, other results and provisions were down slightly.
| Corporate Centre. Underlying income statement | ||||||||||||||||||||||||||
| EUR million | ||||||||||||||||||||||||||
| Q1'23 | Q4'22 | Chg. | Q1'22 | Chg. | ||||||||||||||||||||||
| Total income | -124 | -322 | -61% | -301 | -59% | |||||||||||||||||||||
| Net operating income | -219 | -422 | -48% | -388 | -44% | |||||||||||||||||||||
| PBT | -260 | -465 | -44% | -437 | -40% | |||||||||||||||||||||
| Attributable profit | -279 | -466 | -40% | -462 | -40% | |||||||||||||||||||||
January - March 2023 | | 41 | ||||||
 | Retail Banking | Attributable profit | ||||||
| EUR 1,552 mn | ||||||||
| Executive summary | ||||||||||||||||||||||||||||||||||||||
Results. (Q1'23 vs. Q1'22). % change in constant euros | Business performance. EUR bn. % change in constant euros | ||||||||||||||||||||||
| Profit decreased as the increase in revenue was offset by higher costs and provisions | Continued growth in asset and liability volumes | ||||||||||||||||||||||
| Total income | Costs | Provisions | Loans and advances to customers | Customer funds | |||||||||||||||||||
| +5% | +8% | +33% | 849 | +3% YoY | 813 | +2% YoY | |||||||||||||||||
| Customers | |||||||||||||||||||||||
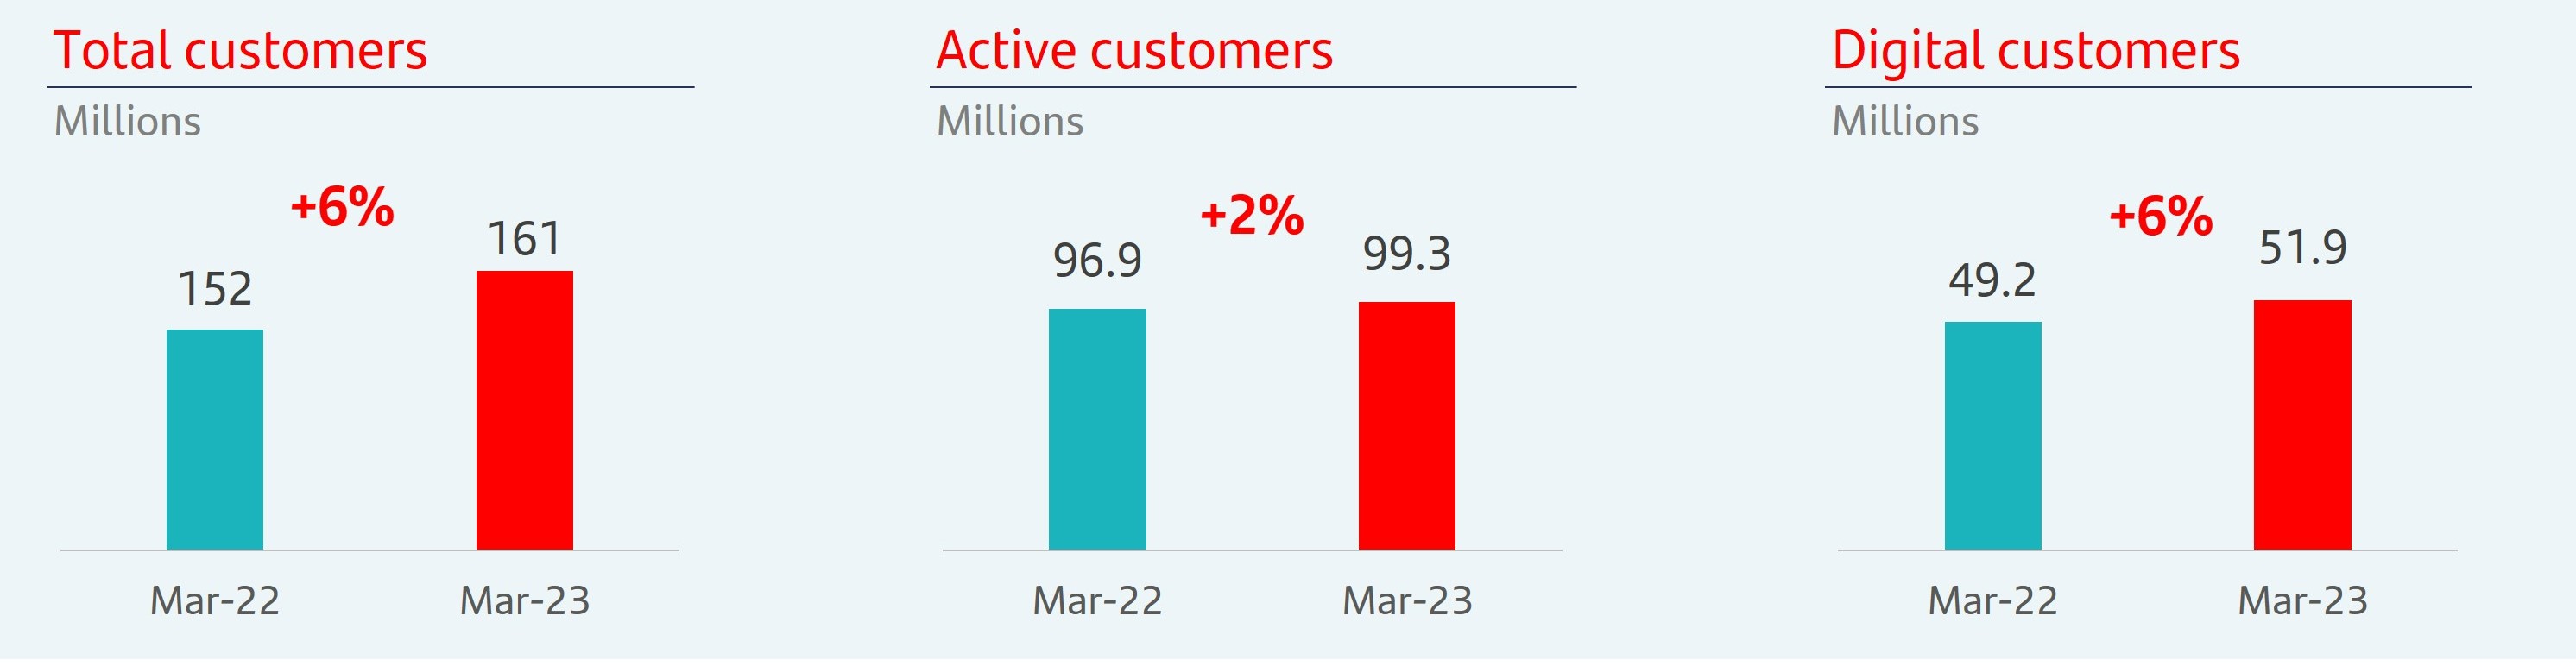 | |||||||||||||||||||||||
Commercial activity
In the last few years, we initiated our operating and business model transformation, focused on process digitalization and product simplification. Our goal is to guarantee personalized and tailored support, in order to respond to one of our main priorities; the continuous improvement of our service.
This transformation of our operating and business model is aimed at becoming a digital bank with branches, where customers are at the centre of our strategy.
Increasing digitalization will allow us to simplify our offering and automate our front-end (what the customer uses) and back-end (i.e. the bank's operating systems) operations. This will allow us to reduce the cost to serve while improving customer experience.
This improvement allows our teams in the offices to dedicate more time to offer a more personalized service, especially for those financial decisions that are more important or require more advice from our professionals.
These service quality, digitalization and multichannel initiatives enabled us to reach 161 million customers in the Group, having increased by 9 million in the last 12 months. Active and digital customers grew by more than 2 million.
Gross loans and advances to customers excluding reverse repos and the exchange rate impact rose 3% year-on-year and customer funds (excluding repos and in constant euros) increased 2%.
Results
Attributable profit in the first quarter of 2023 was EUR 1,552 million, 25% lower year-on-year. In constant euros, it decreased 27%, as follows:
•Total income grew 5% driven by higher net interest income (+10%) and net fee income (+5%) which offset losses on financial transactions in North and South America.
•Costs increased 8%, impacted by inflation. Net operating income grew 3% and efficiency stood at 44.1%.
•Net loan-loss provisions rose 33%, mainly driven by the increases in North and South America.
•The quarter recorded an impact from the temporary levy on revenue in Spain.
| Retail Banking. Underlying income statement | ||||||||||||||||||||||||||
| EUR million and % change | ||||||||||||||||||||||||||
| / | Q4'22 | / | Q1'22 | |||||||||||||||||||||||
| Q1'23 | % | excl. FX | % | excl. FX | ||||||||||||||||||||||
| Revenue | 10,779 | -2 | -2 | +7 | +5 | |||||||||||||||||||||
| Expenses | -4,755 | 0 | -1 | +8 | +8 | |||||||||||||||||||||
| Net operating income | 6,024 | -3 | -2 | +5 | +3 | |||||||||||||||||||||
| LLPs | -2,898 | +5 | +7 | +37 | +33 | |||||||||||||||||||||
| PBT | 2,409 | -16 | -15 | -24 | -26 | |||||||||||||||||||||
| Attributable profit | 1,552 | -22 | -20 | -25 | -27 | |||||||||||||||||||||
| 42 | | January - March 2023 | ||||||
 | Santander Corporate & Investment Banking | Attributable profit | ||||||
| EUR 976 mn | ||||||||
| Executive summary | ||||||||||||||||||||||||||||||||||||||
Results. (Q1'23 vs. Q1'22). % change in constant euros | Our aim and strategic priorities | |||||||||||||||||||||||||
| Strong profit growth underpinned by our geographic and business diversification | 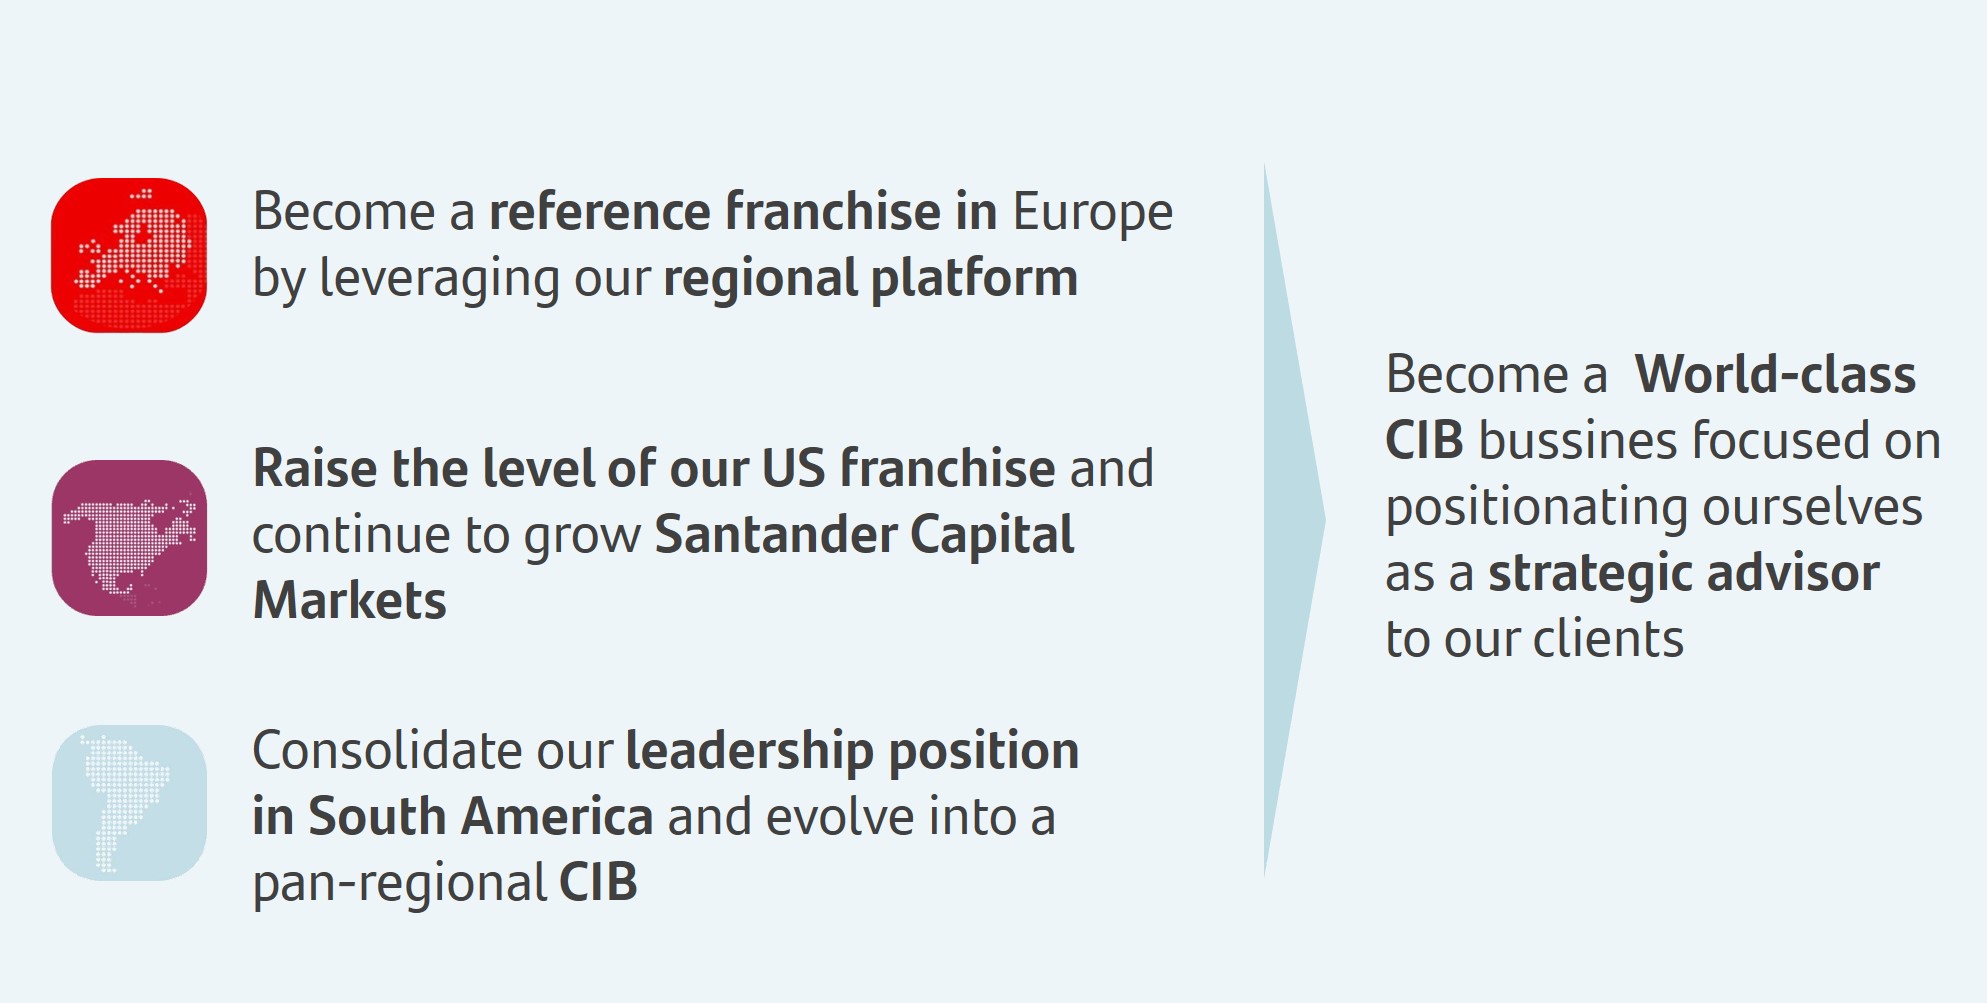 | |||||||||||||||||||||||||
| Total income | Attributable profit | |||||||||||||||||||||||||
| +25% | +30% | |||||||||||||||||||||||||
| Efficiency ratio | RoTE | |||||||||||||||||||||||||
| 33.5% | 30.5% | |||||||||||||||||||||||||
| Revenue growth by business and region | Other highlights in the quarter | |||||||||||||||||||||||||
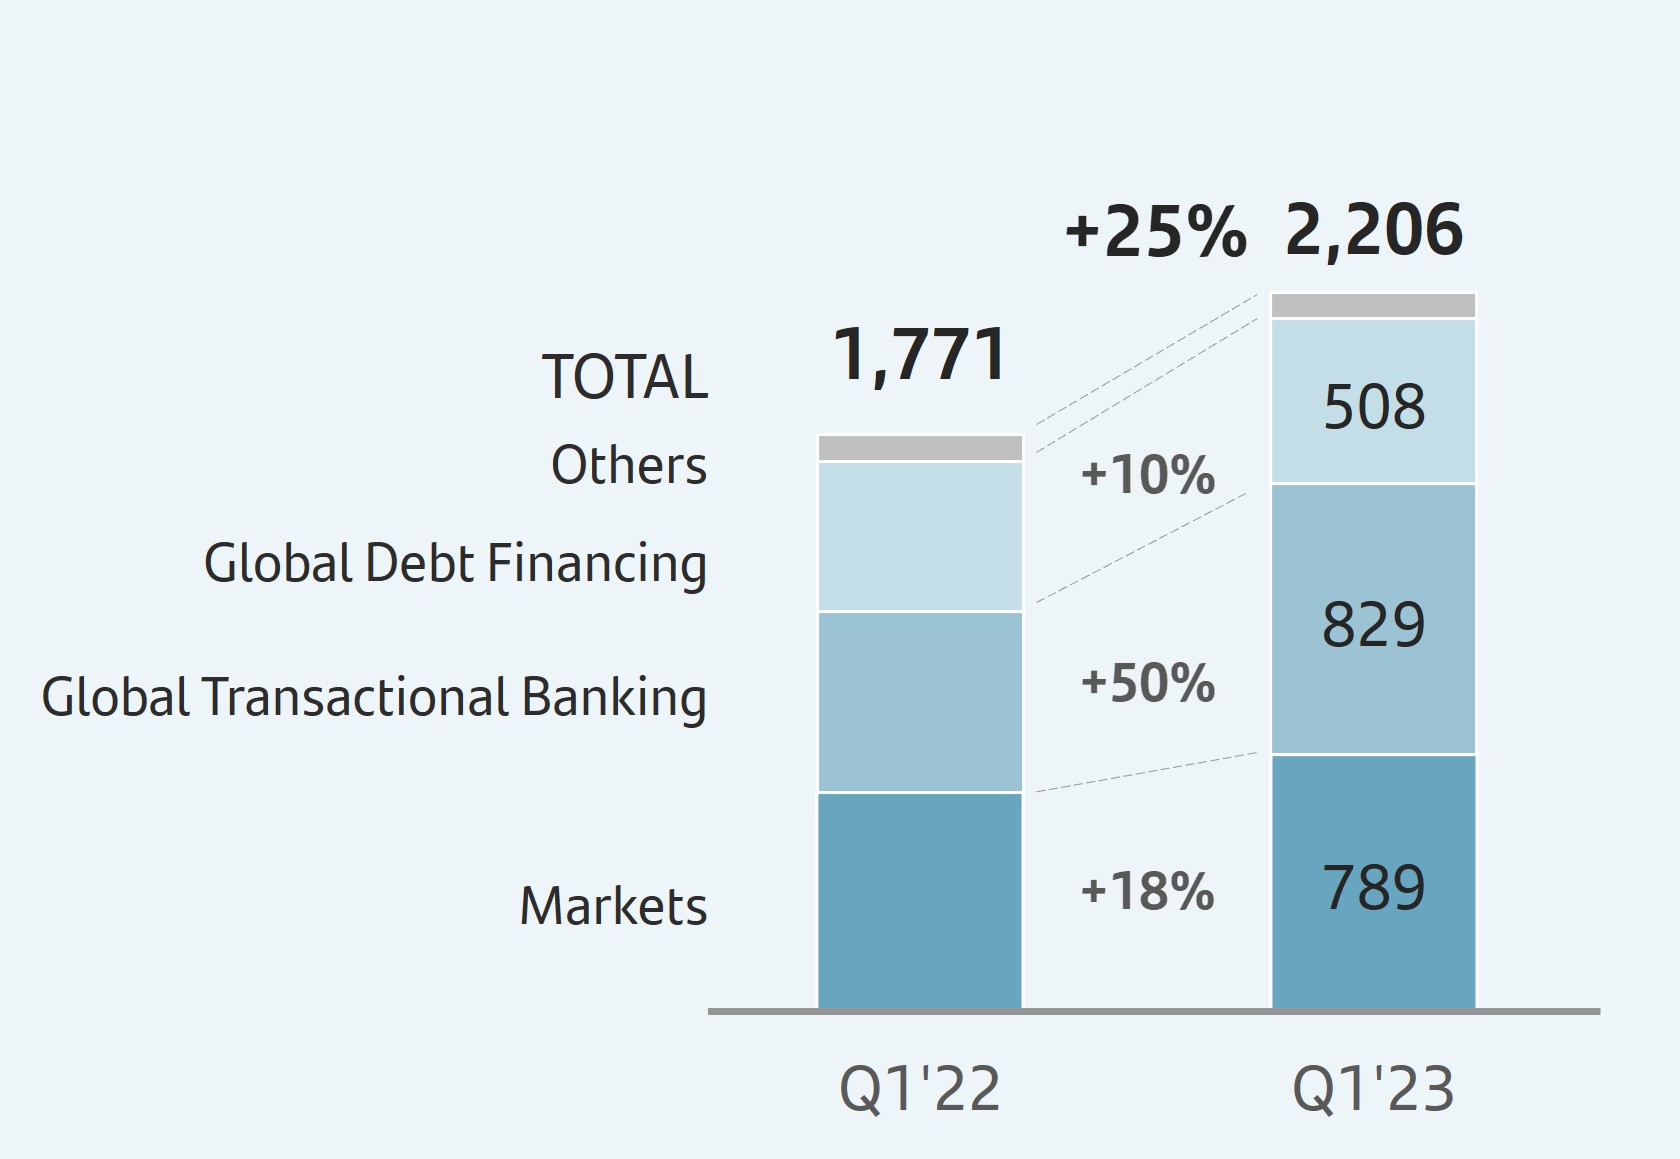 |  | +23% | 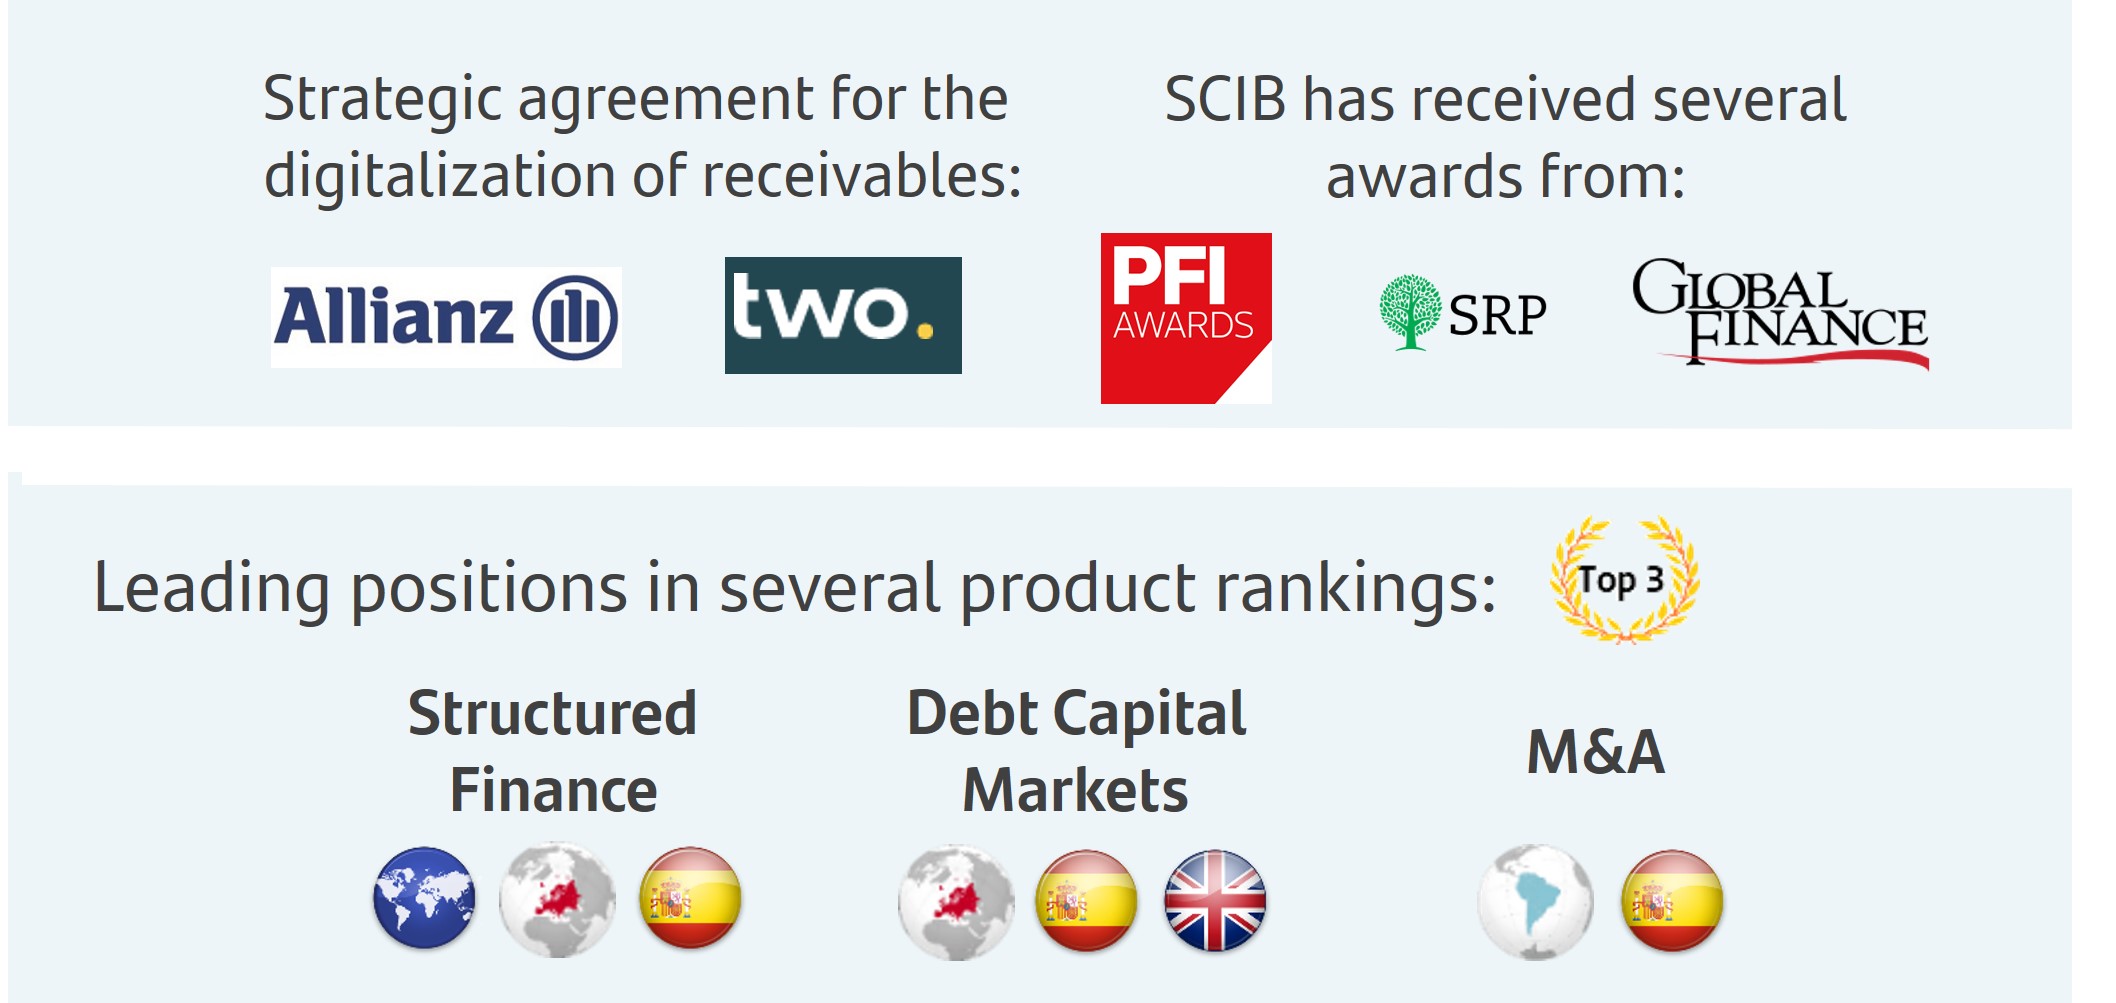 | |||||||||||||||||||||||
| +36% | |||||||||||||||||||||||||
| +21% | |||||||||||||||||||||||||
Strategy
2022 was characterized by an exceptionally challenging macroeconomic and geopolitical environment and 2023 began with instability in the financial sector caused by the difficulties faced by some financial institutions in the US and Europe. SCIB's priorities in this environment are to continue to support its clients, ensure compliance with restrictions and sanctions related to the war in Ukraine, guarantee the Group's liquidity, and maintain tight control over the division's credit exposures.
In this context, SCIB has continued to make progress in implementing its strategy to transform its business and position itself as the strategic advisor to its clients, offering high value-added, specialized products and services with a particular focus on energy transition and digital transformation.
Our objectives are: to become one of the leading investment banks in Europe by leveraging our pan-European platform; to consolidate our regional leadership in Latin America and transition to a pan-regional business; and to continue to accelerate business in the US, leveraging the Group's strengths.
During the first quarter of the year, SCIB completed the merger of Amherst Pierpont Securities (APS) and Santander Investment Securities (SIS). The new entity, named Santander US Capital Markets LLC (SanCap), is a key element in the reorganization and globalization of SCIB's Markets business and in the franchise's growth in the US. Also of note was the Santander Annual Latin America Conference, which was held after a three-year pause due to the pandemic. In its twenty-seventh edition, the event was attended by more than 600 participants who were able to discuss the macroeconomic situation, the energy crisis, the transition to a more sustainable economy and the impact of these factors on the day-to-day lives of clients over the course of three days.
In terms of relevant transactions in the first quarter, in ESG the refinancing of the Rookery South EfW plant, owned by Encyclis and Veolia, whose activity is focused on processing waste, generating up to 60MW of power per year with low carbon dioxide emissions. Also, SCIB supported the Spanish photovoltaic generation company Bruc Energy with a EUR 200 million Equity Bridge Loan. Finally, of note are SCIB's mandates to structure financing for hydrogen and sustainable aviation fuel (SAF) projects.
Global Transaction Banking (GTB) closed a syndicated sustainable-linked loan for a company specializing in the rental, leasing, repair and maintenance of trailers. It also provided Structured Secured Inventory Finance to one of its clients whose objective was to invest in renewable photovoltaic projects in Spain. The Export Finance team acted as financial advisor for the development of two gigafactories for battery manufacturing in Europe and the US.
In digital transformation, during this quarter SCIB created a partnership with Allianz Trade (an insurer) and Two (a B2B e-commerce payments platform fintech) to offer our clients a new receivables solution. This pioneering alliance will allow customers to maintain their 30 or 60-day B2B invoice payment habits within the e-commerce environment, replicating the extended Buy Now, Pay Later retail model.
In the digital arena, of note were the Digital Solutions Group (DSG) team's roles in Vinci Partners' acquisition of a stake in Arklok, as well as the GBP 2 billion placement for the London Stock Exchange Group and USD 414 million for Alight.
January - March 2023 | | 43 | ||||||

Results
Attributable profit in the first quarter of 2023 amounted to EUR 976 million (34% of the Group's total operating areas), 30% higher than in Q1 2022 in constant euros, backed by double-digit growth across core businesses, notably Global Transactional Banking, Global Debt Finance and Markets.
In Q1 2023, revenue amounted to EUR 2,206 million and grew 25% year-on-year. In constant euros, revenue also rose 25% (with rises across all regions: +23% in Europe; +36% in North America; +21% in South America), by business as follows:
•Global markets: revenue was 18% higher year-on-year with a solid first quarter driven by good management of market volatility.
Europe and Asia performed well. Securities Finance, Credit and Equity Derivatives were the top performers. Higher interest rates increased the demand for hedging solutions from corporate clients.
In Latin America, sales activity grew at double-digit rates, with a particularly strong performance in Chile and Brazil. ESG activity is growing on the back of WayCarbon and its agreement for the development of carbon projects in the Amazon.
In the US, with the focus on SanCap, the first quarter closed with good results driven by market volatility and interest rate increases, which benefited the activity of Securities Finance and Exchange Trade Derivatives.
•Global Debt Financing: total income was 10% higher than in Q1 2022. Debt Capital Markets started the year in positive numbers with volatility slightly down, however, it is still unclear how the macroeconomic environment and the impact of SVB and Credit Suisse will affect the market, particularly institutional client issuance. SCIB continued to gain market share in Europe and the US, with a focus on ESG and digital bond issuances.
In Structured Finance, Santander maintained its global leadership position with a revenue improvement over last year, driven mainly by relevant syndication transactions in the infrastructure space and in energy transition projects.
•Global Transactional Banking increased revenue by 50% year-on-year. Cash Management continued last year's upward trend, both in terms of transactionality and liability revenue. This is due to the greater economic activity in most of SCIB's footprint, as well as the rise in interest rates, especially in Europe and the Americas.
Trade & Working Capital Solutions continued with double-digit growth, consolidating its trajectory over the last few years and consolidating its role as a strategic partner thanks to the strength, experience and scale of the division.
In Export Finance, SCIB maintained the leadership it achieved in 2022 in the global ECA financing market (according to Dealogic). In the first quarter of 2023, we closed numerous transactions with a focus on providing financing services that minimize political and commercial risks for environmental projects and with a positive social impact.
•Corporate Finance: solid performance of Mergers and Acquisitions (M&A), which grew at double digits, offsetting the low activity of Equity Capital Markets due to the closure of the global equity placement market.
SCIB continued to be very active in the Telecommunication, Media, Technology industry. In the quarter, SCIB sold Lyntia Networks for EUR 2 billion to Swiss Life Asset Managers, Axa IM Alts and Morisson & Co, and advised Global Infrastructure Partners on its acquisition of Vantage Towers for EUR 16 billion.
In Energy, SCIB advised Enel on the divestment of two thermal generation plants in Argentina, Costanera and Dock Sud, in one of the largest transactions in the electricity sector in the country. SCIB also strengthened its presence in the solar energy sector in its role as advisor in the sale of a 136MW portfolio of photovoltaic plants to Sonnedix.
In Consumer Retail Healthcare, SCIB continued to grow its franchise through the most important transactions in the sector. Of note were the advisory services provided to Heineken in the minority acquisition of Poland's Grupa Zywiec, the BRL 4.1 billion acquisition of Assai in Brazil, and the PLN 1.5 billion acquisition of ABB and Pepco in Poland.
SCIB continued to be a benchmark player in Infrastructure, both in Europe and Latin America. This quarter, SCIB advised the Mexican pension fund CKD IM on the acquisition of a stake in the infrastructure assets of the Mexican company Coconal.
Operating expenses increased 18% year-on-year due to investments in products and franchises under development. However, at 33.5%, efficiency was better than the previous year (-1.5 pp) and well below the sector.
Loan-loss provisions recorded releases again as in the first quarter of 2022.
Compared to the previous quarter, revenue increased 19% and attributable profit rose 95% in constant euros.
| SCIB. Underlying income statement | ||||||||||||||||||||||||||
| EUR million and % change | ||||||||||||||||||||||||||
| / | Q4'22 | / | Q1'22 | |||||||||||||||||||||||
| Q1'23 | % | excl. FX | % | excl. FX | ||||||||||||||||||||||
| Revenue | 2,206 | +22 | +19 | +25 | +25 | |||||||||||||||||||||
| Expenses | -738 | -14 | -14 | +19 | +18 | |||||||||||||||||||||
| Net operating income | 1,468 | +55 | +49 | +28 | +28 | |||||||||||||||||||||
| LLPs | 28 | — | — | +90 | +101 | |||||||||||||||||||||
| PBT | 1,460 | +131 | +115 | +28 | +29 | |||||||||||||||||||||
| Attributable profit | 976 | +114 | +95 | +28 | +30 | |||||||||||||||||||||
| 44 | | January - March 2023 | ||||||
 | Wealth Management & Insurance | Attributable profit | ||||||
| EUR 377 mn | ||||||||
| Executive summary | ||||||||||||||||||||||||||||||||||||||
Results. (Q1'23 vs. Q1'22). % change in constant euros |  |  |  | ||||||||||||||||||||
| Revenue | Fee income as % of total Group 1 | AuMs | RoTE | Net new money | Net sales | Fee income | |||||||||||||||||
| +43% | 29% | +5% | 81% | EUR 2,769 mn | EUR 1,664 mn | EUR 416 mn | |||||||||||||||||
| CAL: EUR 274 bn | AuMs: EUR 195 bn | +8% vs. March 2022 | |||||||||||||||||||||
| Total contribution to profit by business | Other highlights of the period | ||||||||||||||||||||||
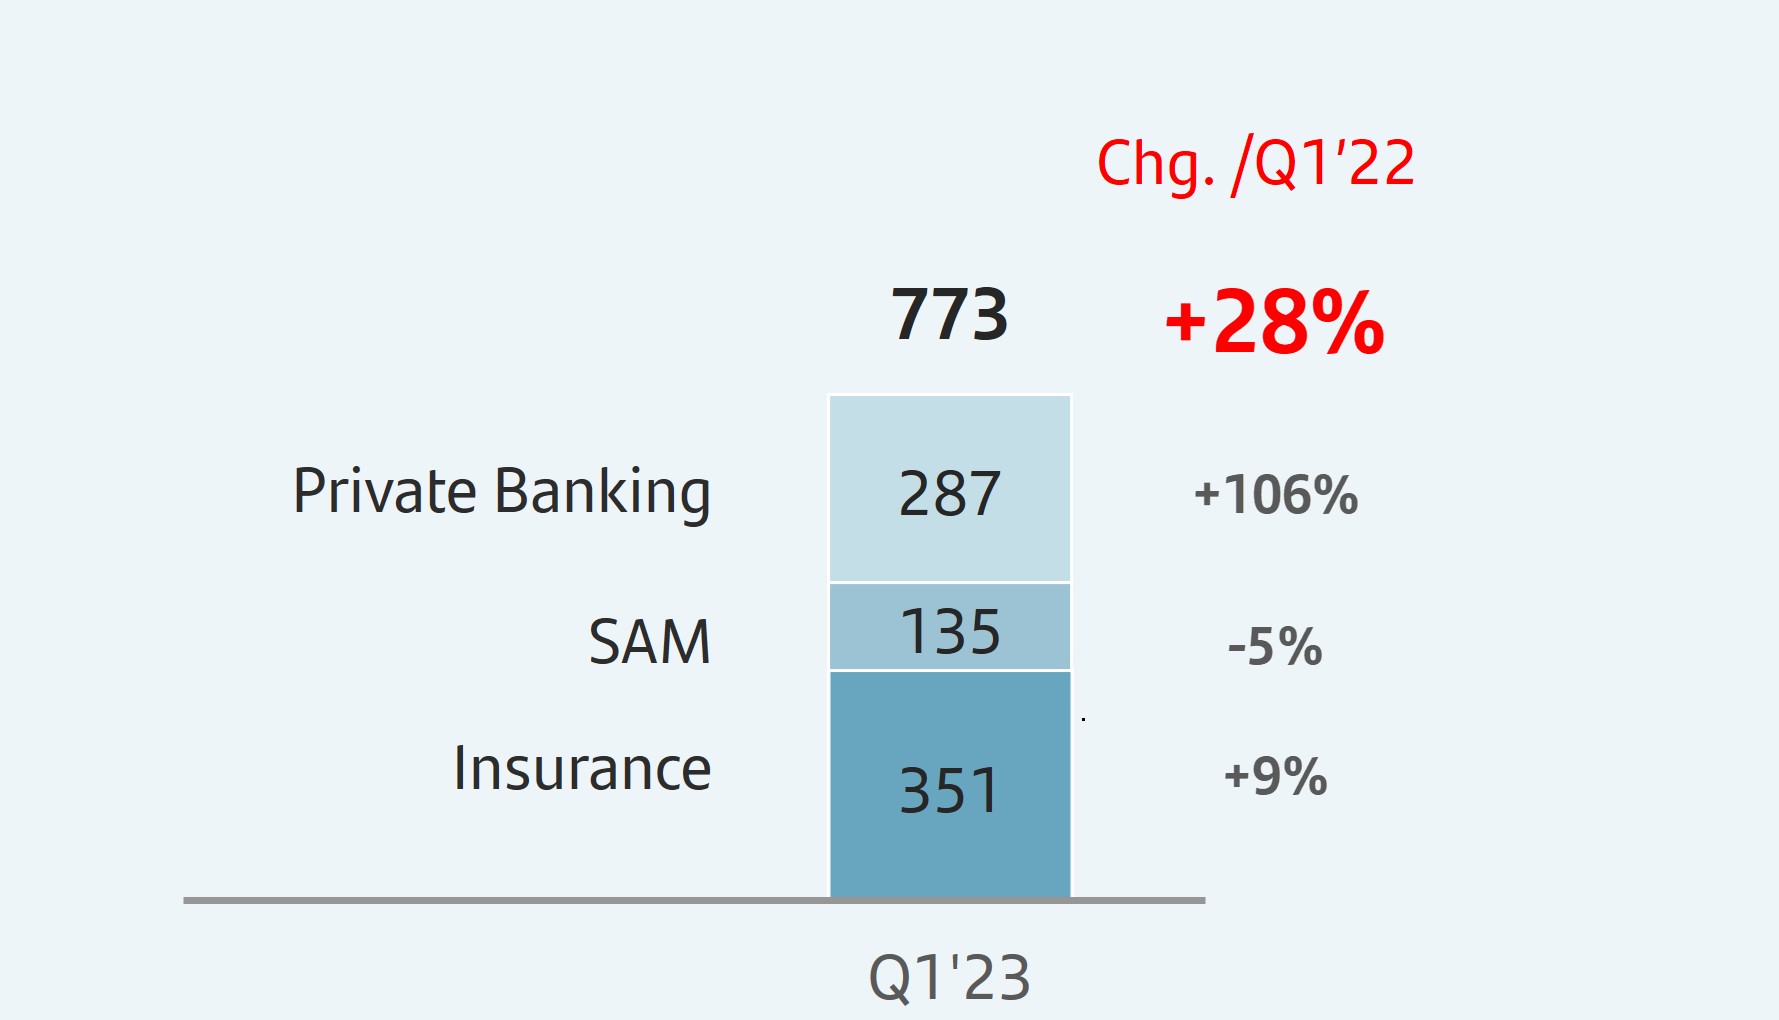 | PB customers | SRI2 AuMs | Gross written premiums | ||||||||||||||||||||
| +8% vs. March 2022 | EUR 58.1 bn +115% | EUR 2.9 bn | |||||||||||||||||||||
| PB Network AuMs | |||||||||||||||||||||||
EUR 50.9 bn +5% | +24% | ||||||||||||||||||||||
 | |||||||||||||||||||||||
| 1. Including fee income ceded to commercial network. | 2. Socially Responsible Investments. | ||||||||||||||||||||||
Commercial activity
We continued to work to become the best responsible Wealth & Protection Manager in Europe and the Americas, being one of the Group's growth drivers with 28% growth year-on-year in the contribution to Group profit.
•In Private Banking, following the growth achieved in 2022, we continued to leverage our global platform to enable clients to benefit from our scale and international presence by providing tailored solutions, making it easy for them to move from one region of the Group to another. In terms of collaboration, we remained leaders in investment flow between Latin America, Europe and the US, managing network business volumes (cross-border business between markets) of EUR 50.9 billion.
Our collaboration business with SCIB continued to increase, especially in Spain, Brazil and Mexico. In the first quarter, it generated EUR 39 million of revenue, 2% higher year-on-year.
We continued to widen our value proposition and innovating in our product range. We had a particular focus on alternative products (more than EUR 2,753 million), structured products, collateralized lending and socially responsible products (ESG).
Our discretionary advisory service accounted for 11% of total assets under management (AuMs), increasing EUR 664 million in the quarter, mainly in Spain and Portugal.
In the first quarter we launched four alternative funds (marketed in Spain, Miami, Geneva and Chile). In Spain, Santander launched Santander Global Real Assets, which provides global access to real estate and infrastructure assets, managed by KKR and Blackstone. In Miami and Geneva, we launched Berilo II, which gives our clients access to one of the best private debt funds, managed by one of the most prestigious managers in this asset class, Bain Capital.
Our real estate investment service, which is capturing a large part of investment flows between Latin America, Europe and the US,
reached a total volume of EUR 95 million in transactions in the quarter.
Our work was recognized by Euromoney as the Best Private Bank in Latin America, as well as the Best International Private Bank in seven countries, in addition to the Funds People Spain 2023 awards for Best Private Banking Manager in a Spanish Banking Group, Best Fund Selector and Best Investment Manager. The scope of these awards demonstrates the value of the combination of Santander Private Banking's global platform with local knowledge and presence in each of the markets in which it operates.
•In Santander Asset Management (SAM), we started to see the first signs of recovery in commercial activity, following market instability in 2022. We continued to be the global product platform of choice for our retail banks, with more than EUR 273 million in total distribution fees generated, EUR 172 million of which was generated by the network, in line with the previous year despite the complex environment.
The range of alternative products aimed primarily at our institutional clients and family offices is becoming increasingly robust. In the alternatives business, we launched 22 vehicles globally, with EUR 2 billion committed. Our main strategies include Private Debt, Infrastructure, Trade Finance and Real Estate, including Santander Alternative Leasing fund, named among the three most profitable alternative funds in Spain in 2022.
We made further headway with our ESG strategy. We offer 99 ESG products globally and our assets under management (integrating sustainable strategies) amounted to EUR 39.2 billion. We managed to position ourselves in the top 5 fund managers that improved the most between 2020 and 2022 in the ShareAction ranking of responsible investment, and we were the only Spanish fund manager in it. In addition, Mexico recently joined Spain, Portugal, the UK, Germany, Chile and BPI in launching the Santander Prosperity fund in partnership with RED (an NGO founded to fight against global health crises with the help of the world's best brands).
January - March 2023 | | 45 | ||||||
Our efforts to continue improving and offering the best investment solutions were recognized through several awards, for example in Chile, where we were the fund manager that received the most recognitions at the Salmón awards.
•In Insurance, we maintained a healthy growth rate in premiums (+24%), mainly in the savings business.
Savings insurance sales were particularly strong in Europe, mainly as a result of the good commercial activity of unit-linked insurance in Spain. Of note was also the launch of Planeta Seguros, a free and flexible insurance grouping service that allows customers to obtain discounts based on the number of insurance contracts and premium volumes.
In the Americas, the diversification of the non-credit insurance business continued strongly with growth in new sales. We launched cybersecurity insurance for SMEs in Mexico and the new micro-mobility insurance in Chile. The transformation of the Protection business in Brazil was reinforced with the launch of HelpS, an innovative offer in assistance services for individuals. We focused also on improving the digital offerings and customer campaigns.
The motor vehicle insurance business grew 23%. Our Autocompara platform, in Argentina, Brazil, Chile, Mexico and Uruguay reached 1.4 million active policies. In SMEs, fees grew 13%, having strengthened our offering in Europe and the Americas with new products such as credit insurance in Spain and cybersecurity in Mexico and Portugal.
Business performance
Total assets under management amounted to EUR 421 billion, 5% higher year-on-year, driven by positive net new money and despite the market situation in 2022.
| Business performance: SAM and Private Banking | ||||||||||||||||||||
| Constant EUR billion | ||||||||||||||||||||
| Total assets under management | ||
| Funds and investment* | ||
| - SAM | ||
| - Private Banking | ||
| Custody of customer funds | ||
| Customer deposits | ||
| Customer loans | ||
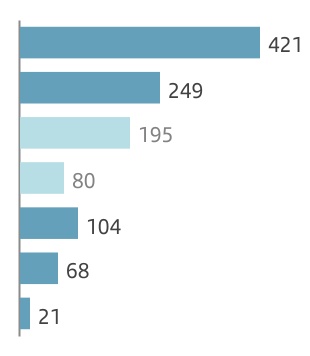
| / Dec-22 | / Mar-22 | ||||
| +4 | % | +5 | % | ||
| +2 | % | 0 | % | ||
| +3 | % | 0 | % | ||
| +3 | % | 0 | % | ||
| +10 | % | +15 | % | ||
| +2 | % | +10 | % | ||
| -1 | % | +1 | % | ||
Note: Total assets marketed and/or managed in 2023 and 2022.
* Total adjusted private banking customer funds managed by SAM.
•In Private Banking, the momentum achieved in 2022 continued at the beginning of the year, particularly in Europe. The volume of customer assets and liabilities (CAL) stood at EUR 274 billion, 8% higher than in March 2022. Net new money amounted to EUR 2,769 million. Net profit in Q1 2023 was EUR 287 million, twice that of the same period in 2022, primarily backed by total income. Threshold Private Banking clients increased 4% to more than 112,000.
•SAM's total assets under management stood at EUR 195 billion in line with March 2022, due to the market environment last year. Net sales were positive in the quarter at EUR 1,664 million (annualized net sales represented 3% of total AuMs), reversing the trend of the end of 2022. SAM’s contribution to the Group's profit (including ceded fee income) was EUR 135 million, -4% year-on-year, due to lower average volumes as a result of the market conditions in 2022.
•In Insurance, the volume of gross written premiums in Q1 2023 amounted to EUR 2.9 billion (+24% year-on-year). Total fee income rose 8% and net fee income from protection insurance was 4% higher. The total contribution to profit stood at EUR 351 million, +9% year-on-year.
Results
Attributable profit in the first quarter of 2023 was EUR 377 million, up 64% year-on-year. In constant euros, it was 62% higher:
•Total income increased 43% as a result of improved margins and net fee income.
•Total fee income generated, including ceded to the commercial network, amounted to EUR 892 million and represented 29% of the Group's total fee income, a 2% increase year-on-year, despite the market impact on volumes.
| Total fee income generated | ||||||||||||||||||||||||||||||||
| Constant EUR million | ||||||||||||||||||||||||||||||||
| 892 | 〉 | 2% | 29% | |||||||||||||||||||||||||||||
| vs. Q1'22 | / total Group | |||||||||||||||||||||||||||||||
•Operating expenses were 10% higher year-on-year, due to the investments and higher costs related to increased commercial activity.
The total contribution to the Group (including net profit and total fees generated net of tax) was EUR 773 million, 28% higher than in Q1 2022.
Compared to the previous quarter, underlying attributable profit rose 10% driven by the positive performance in total income.
To sum up, a very positive quarter in which we continued to grow at double-digit rates on a consolidated basis despite the macroeconomic environment.
| Total contribution to profit | ||||||||||||||
| EUR million and % change in constant euros | ||||||||||||||
| Q1'23 | Q1'23 | |||||||||||||
 | 773 | | 773 | |||||||||||
| -1 | % | / Q4'22 | +28 | % | / Q1'22 | |||||||||
| WM&I. Underlying income statement | ||||||||||||||||||||||||||
| EUR million and % change | ||||||||||||||||||||||||||
| / | Q4'22 | / | Q1'22 | |||||||||||||||||||||||
| Q1'23 | % | excl. FX | % | excl. FX | ||||||||||||||||||||||
| Revenue | 830 | +10 | +10 | +45 | +43 | |||||||||||||||||||||
| Expenses | -278 | -1 | 0 | +12 | +10 | |||||||||||||||||||||
| Net operating income | 551 | +16 | +16 | +70 | +68 | |||||||||||||||||||||
| LLPs | 1 | -43 | -43 | +82 | +51 | |||||||||||||||||||||
| PBT | 529 | +14 | +14 | +67 | +65 | |||||||||||||||||||||
| Attributable profit | 377 | +10 | +10 | +64 | +62 | |||||||||||||||||||||
| 46 | | January - March 2023 | ||||||
| Attributable profit | |||||||
| -EUR 55 mn | ||||||||
| Executive summary | ||||||||||||||||||||||||||||||||||||||
| Revenue performance | Our business | ||||||||||||||||||||||
Solid revenue growth1 | Merchants | International Trade | Payments | ||||||||||||||||||||
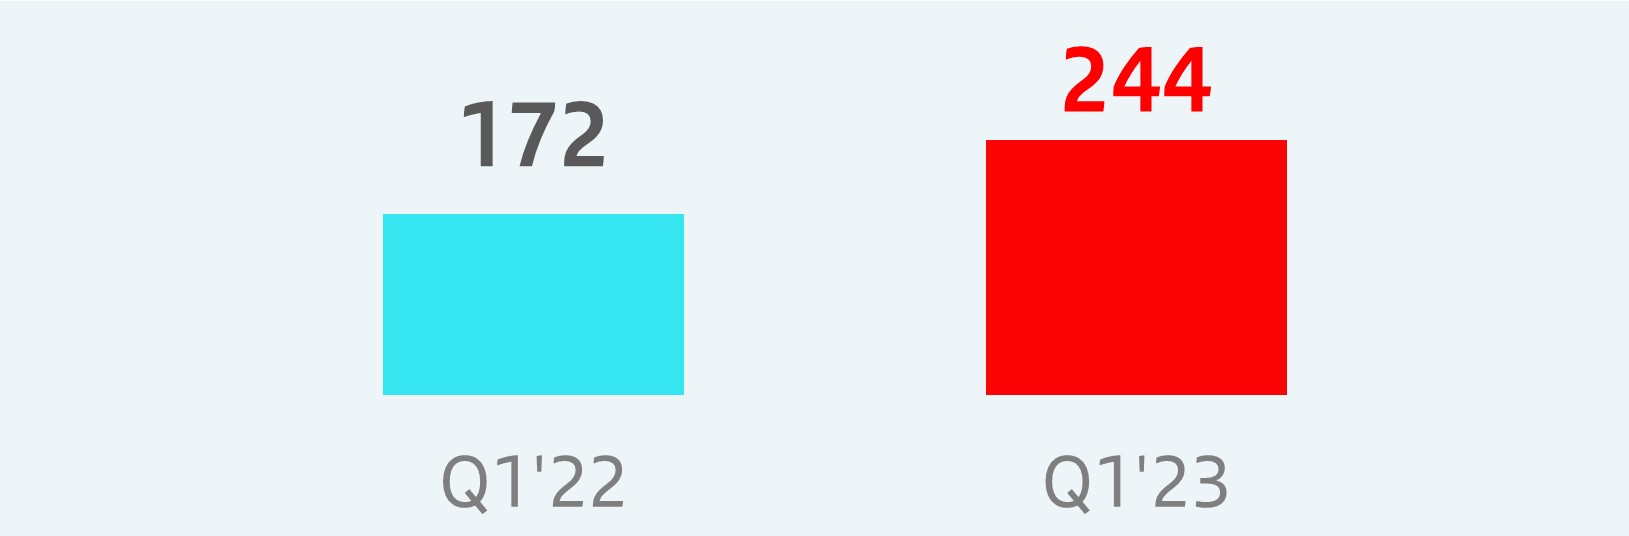 | +41% Q1'23 vs. Q1'22 | Global payments solutions for all merchant segments | International trading solutions for business | Wholesale account-to-account payment solutions | |||||||||||||||||||
| Our main strategic priorities | Main growth drivers | ||||||||||||||||||||||
•Scaling up our global technology platform •Accelerating our commercial growth •Pursuing the open market opportunity | Merchants Total Payments Volume1 | Merchant number of transactions | |||||||||||||||||||||
+27% vs. Q1'22 | +32% vs. Q1'22 | ||||||||||||||||||||||
| 1. Constant EUR million. | |||||||||||||||||||||||
Strategy
PagoNxt aims to achieve a global leadership position in payments through our distinctive, holistic and customer-centric value proposition. We are a one-of-a-kind paytech business providing customers with a wide range of innovative payments and integrated value-added services.
We focus on several strategic and high-growth business segments:
•Merchants: providing global and integrated acquiring, processing and value-added solutions for physical and e-commerce merchants.

•International Trade: delivering specialized cross-border trading solutions (payments, FX, cash management, trade finance) for businesses, in a large and global market yet to be fully digitalized.


•Payments: providing wholesale account-to-account payments processing and instant connectivity to schemes in multiple geographic areas through a highly scalable model.

PagoNxt's technology platform and specialist teams serve Grupo Santander's payments needs and additionally cater for open market opportunities beyond Santander's business, delivering complete solutions for millions of businesses and individuals.
PagoNxt runs an efficient global operating model, extending across three core regions (Europe, South America and North America) and adopting bank-grade security and compliance embedded in our customer products.
PagoNxt's strategy is anchored on the following key levers:
•Scaling up our global, cloud-native, secure and efficient platform. We operate a connected, real-time, flexible and highly scalable technology platform that is fully cloud and API based to ensure access to PagoNxt's features through a single integration. We process and generate insights to help our customers and their businesses leverage the full power of data and make data-driven decisions.
•Accelerating commercial growth by continuing to strengthen our international commerce and trade ecosystem, offerings and distribution through Santander's commercial platforms, with a focus on SMEs.
•Maximizing the open market opportunity through direct commercialization and distribution partnerships (with integrated software vendors and others), increasing our market penetration in Europe, South America and North America and extending our footprint to additional strategic countries.
January - March 2023 | | 47 | ||||||
Business performance
Our global franchise, PagoNxt Merchant Solutions, reached EUR 45.8 billion Total Payments Volume (TPV)in Q1 2023, 27% higher than Q1 2022 (in constant euros).
During the quarter, our merchant platform added innovative value-added services (e.g. working capital in Mexico), deployed new global e-commerce capabilities (e.g. Diners & Discover in Europe), and further developed specialized vertical solutions sharing them across countries (e.g. travel agencies from our European capabilities exported to Mexico).
Highlights from our Q1'23 by market were:
•Getnet Brazil´s TPV increased 16% versus previous year enabled by our prepayments and strong value-added services from both our SMEs and large accounts through tailor-made solutions and new verticals. We are pursuing our pipeline in all our strategic channels, and reinforcing our open market sales through partnerships, direct sales and digital channels.
•Getnet Europe, our pan-European acquirer´s TPV increased 35% year-on-year, due to the positive dynamics in both Spain and Portugal. A strong open market pipeline is ready to be progressively reached during the year. During the quarter, we launched our Go-To-Market with Santander in Portugal and added new functionalities in the platform such as Diners & Discover in e-commerce.
•Getnet Mexico continued its strong growth path with TPV increasing by 39% in Q1 2023 versus Q1 2022. The growth was driven by both Santander and the strong performance of our open market distribution channels. Full migration of volumes from Elavon into our platform was successfully completed. The platform continues to be enhanced with new value added services such as working capital features and airline industry capabilities. In addition, we have launched with Pacto an all-in-one pilot solution for restaurants.
•Getnet commercial activity in other Latin American countries is ramping up. We have launched our Go-To-Market in Argentina together with Santander and added new functionalities such as instalments in the region. We are also further penetrating the markets in Chile and Uruguay.
Ebury continued to show strong performance in its B2B offerings targeting the open market, driven mainly by FX services. Volumes grew c.30% year-on-year.
Our One Trade platform, which offers international services (including payments, FX and trade finance) for Santander customers, replacing the local systems with a single, common and interconnected technology solution, also continued to show increased activity. At the beginning of this year, the first phase of providing international payments financed in Spain was fully rolled out reaching c. 8,000 active customers.
| Merchants | ||||||||||||||||||||||||||||||||||||||||||||
| Number of Transactions | Total Payments Volume | |||||||||||||||||||||||||||||||||||||||||||
| Millions | Constant EUR billion | |||||||||||||||||||||||||||||||||||||||||||
| +32% | 2,132 | +27% | 45.8 | |||||||||||||||||||||||||||||||||||||||||
| 1,613 | ||||||||||||||||||||||||||||||||||||||||||||
| 36.0 | ||||||||||||||||||||||||||||||||||||||||||||
| Q1'22 | Q1'23 | Q1'22 | Q1'23 | |||||||||||||||||||||||||||||||||||||||||
One Trade will continue to expand its international payments offering to all Santander corporate customers. In the open market business, regulated through an Electronic Money Institution, an initial group of customers were already onboarded to receive instant pay-in and pay-out capabilities with embedded FX, as well as virtual accounts and reconciliation services.
PagoNxt made significant progress in Q1 2023 in its roadmap to become Santander´s wholesale payments processing provider, centralizing all types of payments (except cards). As of end of Q1'23, the volume managed by the Payments Hub operation is more than one billion transactions on an annual basis, covering the European, North American and APAC regions. In the quarter, the global platform was adapted to operate under the new SWIFT messaging standard ISO 20022, providing customers with data-enhanced capabilities, advanced reconciliation and cross border inter-operability.
Results
Attributable profit in the first quarter of 2023 amounted to -EUR 55 million, compared to -EUR 54 million in the first quarter of 2022.
Total income was EUR 244 million, a 50% increase year-on-year (+41% in constant euros), backed by the increase in business activity and volumes across regions especially in our Merchant (Getnet) and Trade (Ebury) businesses.
| PagoNxt. Revenue performance | ||||||||||||||||||||
| Constant EUR million | ||||||||||||||||||||
| 244 | ||||||||||||||||||||
| +41% | ||||||||||||||||||||
| 172 | ||||||||||||||||||||
| Q1'22 | Q1'23 | |||||||||||||||||||
In the period, costs reflected the ongoing investment plans to develop and implement global technology.
Compared to the fourth quarter, profit performance was impacted by seasonally higher revenue recorded in the last quarter, achieving a profit of -EUR 42 million.
| PagoNxt. Underlying income statement | ||||||||||||||||||||||||||
| EUR million and % change | ||||||||||||||||||||||||||
| / | Q4'22 | / | Q1'22 | |||||||||||||||||||||||
| Q1'23 | % | excl. FX | % | excl. FX | ||||||||||||||||||||||
| Revenue | 244 | -18 | -17 | +50 | +41 | |||||||||||||||||||||
| Expenses | -278 | -6 | -6 | +46 | +42 | |||||||||||||||||||||
| Net operating income | -34 | 0 | 0 | +22 | +47 | |||||||||||||||||||||
| LLPs | -6 | -68 | -68 | +139 | +128 | |||||||||||||||||||||
| PBT | -43 | +58 | +46 | +36 | +59 | |||||||||||||||||||||
| Attributable profit | -55 | +31 | +27 | +3 | +8 | |||||||||||||||||||||
| 48 | | January - March 2023 | ||||||
| RESPONSIBLE BANKING | ||||||||
| TARGETS | ||
We continue to make progress in our ESG agenda, working towards the fulfilment of our public targets:
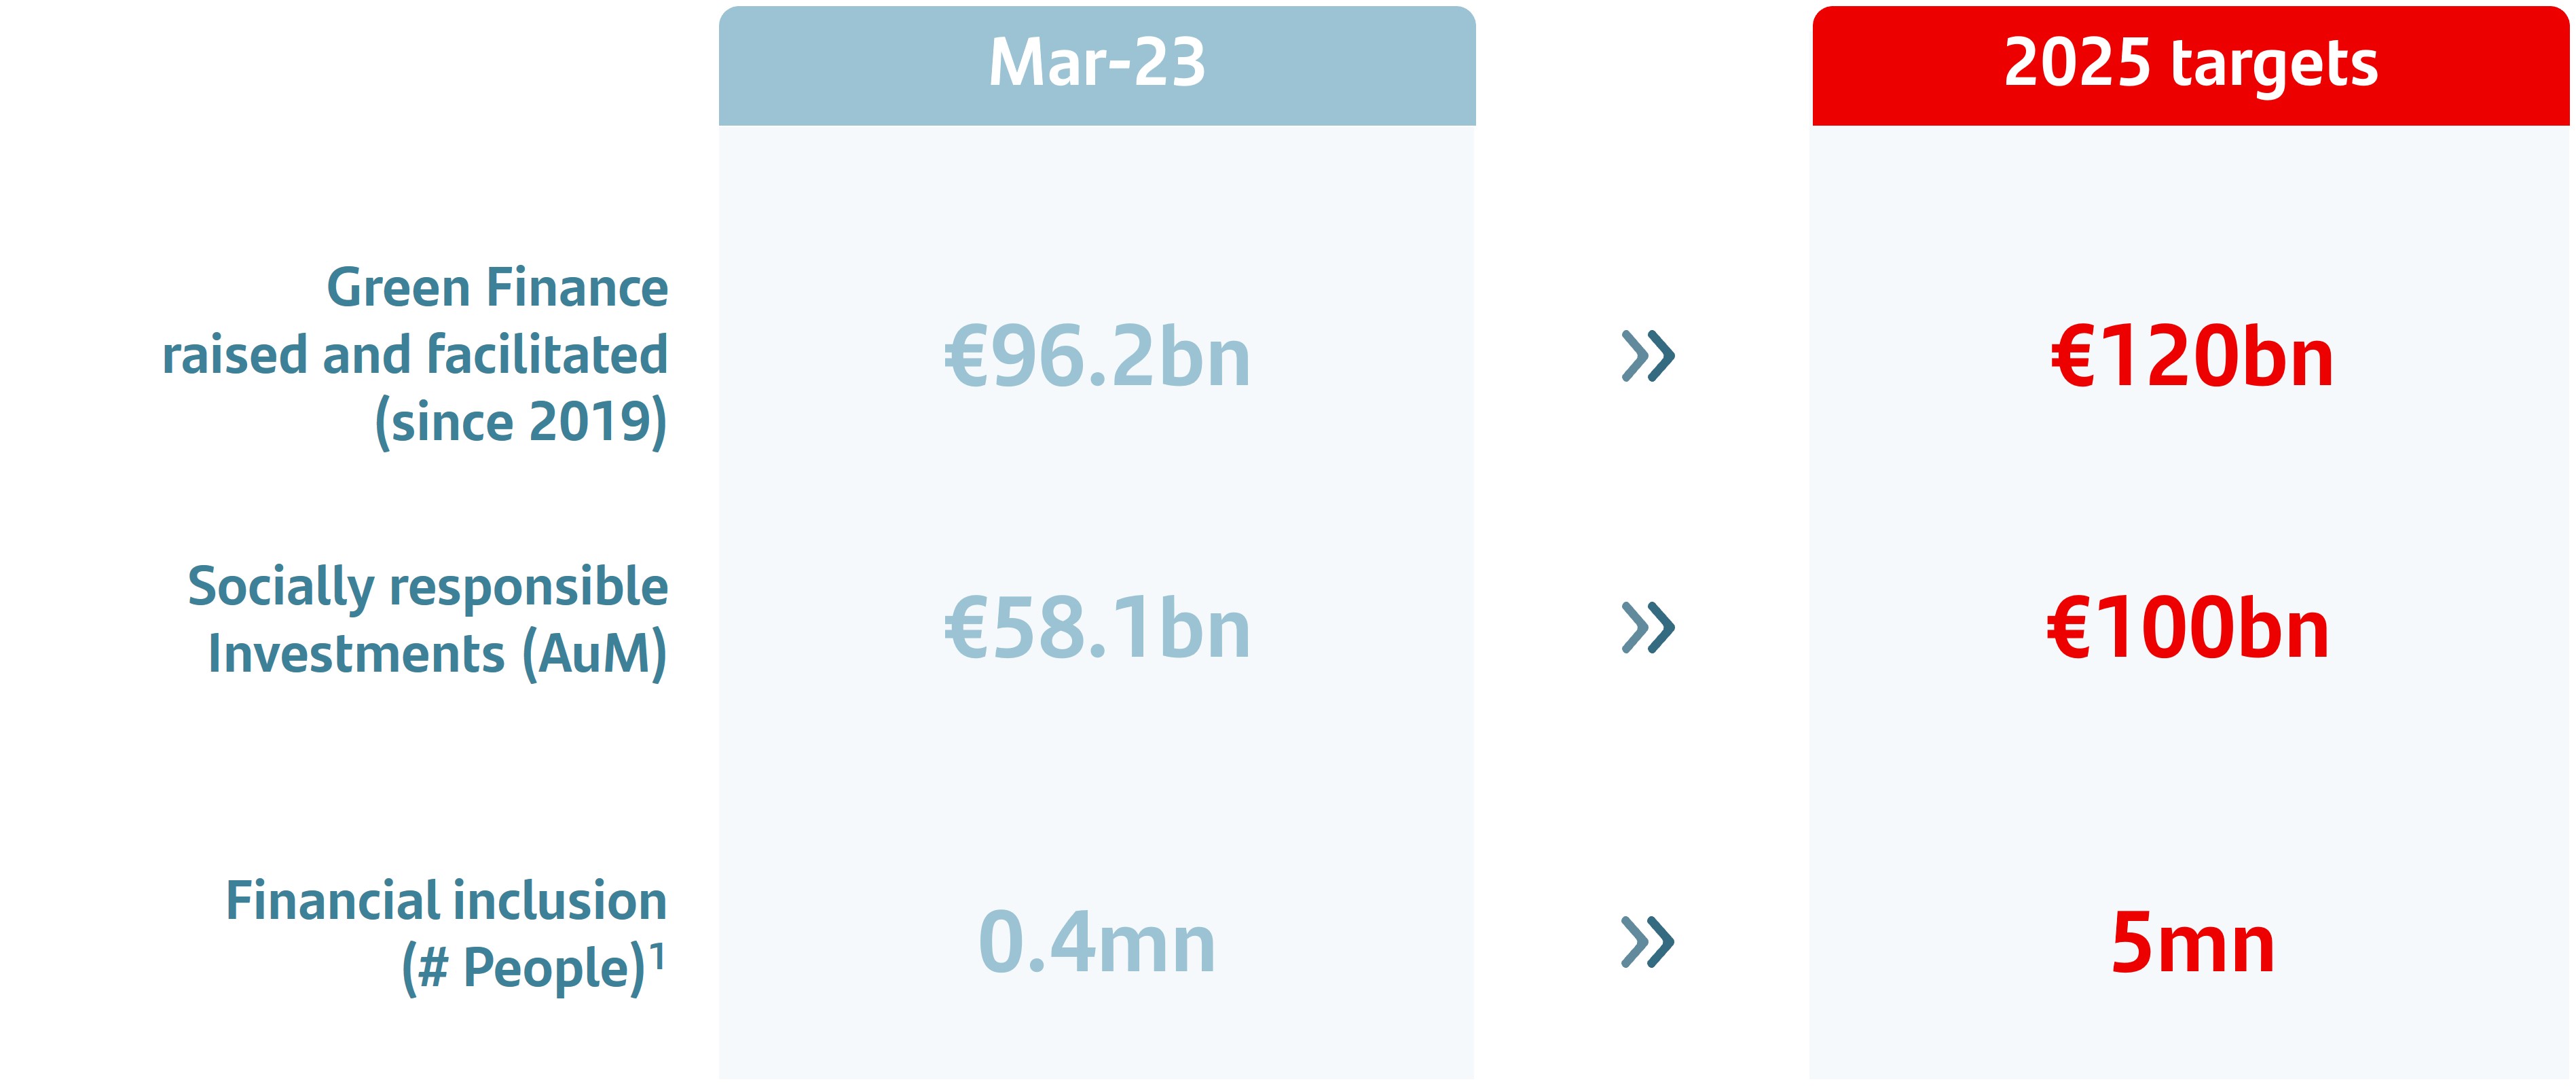
More information available at www.santander.com/en/our-approach.
Note: Not taxonomy. Mar-23 data not audited.
1.Starting Jan-23. Does not include financial education.
| HIGHLIGHTS | ||
•We updated our ESG targets at the Investor Day held on 28 February. In particular:
◦Increased the women in senior positions target from 30% to 35% by 2025.
◦Financial inclusion to 5 million more people in 2023-2025, through Access and Financing initiatives.
We continued working towards our goals of mobilizing EUR 120 billion to green finance projects, investing EUR 100 billion in socially responsible investments (SRI AuMs) and eliminating the equal pay gap.
•We published the 2022 Annual Report in which the Responsible Banking chapter responds to the Statement of Non-Financial Information.
•We updated our Sustainable Finance Classification System (SFCS) methodology to classify financial products and services that meet green, social or sustainability-related criteria.
•Best financial institution and second best company in the world in the Bloomberg 2023 Gender Equality Index, increasing our score from 90.26 to 92.87.
•S&P included us in the Sustainability Yearbook 2023, recognizing us among the top 5% most sustainable companies.
Of note among the implemented ESG initiatives were:
| E | Environmental | ||||
•In line with our target to facilitate EUR 120 billion in green finance by 2025 and EUR 220 billion by 2030, we have mobilized EUR 96 billion in green finance since 2019.
•The volume of AuMs in socially responsible investments was EUR 58.1 billion.
•This quarter, through our role as intermediaries, we participated in the issuance of different green bonds in Mexico, for Grupo Aeroportuario Centro Norte (OMA) and Fibra Uno (FUNO).
•In Portugal, we collaborated with the European Investment Fund (EIF) to provide EUR 250 million in financing to local SMEs with the aim of making their businesses more sustainable. In Spain, we participated in the placement of a EUR 1 billion sustainable bond.
•We established partnerships with public institutions and local governments to contribute to the fight against climate change:
◦In Brazil, we joined the IFACC (Innovative Finance for the Amazon, Cerrado and Chaco) initiative to accelerate the mobilization of credit and investment for beef and soybean production in these regions.
January - March 2023 | | 49 | ||||||
◦In Spain, we collaborated with the Valencian Community in the planting of 5,000 trees and also participated in other autonomous communities such as Extremadura, Galicia and Asturias to help with reforestation.
| S | Social | ||||
•We continued to strengthen our financial inclusion proposition. In the first quarter, we continued supporting microentrepreneurs through our Tuiio and Prospera programmes in Latin America.
•We kept working on our commitment with projects related to entrepreneurship and education:
◦In Poland, we launched 10 grants to the best businesses at the Empowered in Business gala in collaboration with the Entrepreneurship Foundation in Poland.
◦In Spain, we organized cybersecurity sessions at our headquarters for nearly 200 university students.
•We work to focus on the customer in the most transparent way as possible, and were recognized in the UK by the British Standards Institute (BSI) for our inclusive services and protection of vulnerable customers.
•We signed, with union representatives, the new Equality Plan for Banco Santander, S.A. to reinforce our commitment to our employees and to defend the principle of equal opportunities.
| G | Governance | ||||
•The long-term incentive scheme (2023-2025), which includes 20% weighting in ESG metrics, was approved at the AGM.
•Locally, some of our subsidiaries published annual reports with a responsible banking section, which can be found on the corporate website.
| Q1 2023 AWARDS | ||
•We were named a Top Employer 2023 in Poland, Chile, Peru and Uruguay for our high standards of HR management and contribution to the development of our employees.
•Santander Portugal was once again named the Most Responsible Bank according to the Merco ESG Responsibility 2022 ranking.
•In Mexico, we were included in the S&P Sustainability Yearbook 2023 for the third consecutive year for our progress in ESG. In Brazil, we were also included in the B3's Corporate Sustainability Index (ISE B3) for the thirteenth consecutive year and in the Carbon Efficient Index (ICO2 B3).
•In Poland, our ESG reports received the highest score of all listed companies in the WIG20.
•In Uruguay, we participated in the distribution of a bond linked to sustainability that was recognized as the Best Bond in Latin America 2022 according to the International Financing Review.
•Euromoney recognized Santander and Openbank in Spain and Poland as a leading bank in ESG criteria, highlighting our commitment to integrating these criteria into our strategic priorities.

| 50 | | January - March 2023 | ||||||
| CORPORATE GOVERNANCE | ||||||||
 | ||||||||
| → | Clear and robust corporate governance to ensure a long-term sustainable business model | |||||||
| → | High shareholder participation and engagement at our general meeting | |||||||
| 2023 ordinary general shareholders’ meeting. | ||||||||
On 1 February, the board of directors reduced the Bank's share capital in the amount of EUR 170,203,286 by cancelling 340,406,572 of its own shares acquired in the buyback programme carried out between November 2022 and January 2023 as part of the shareholder remuneration charged against 2022 results. The capital reduction, which was approved by the general shareholders' meeting on 1 April 2022, obtained the required ECB’s regulatory approval on 15 March and was registered in the Commercial Registry of Cantabria on 20 March.
Consequently, Article 5 of the Bylaws was amended to reflect that the Bank's share capital has been set at EUR 8,226,997,506, comprising 16,453,995,012 shares that have a nominal value of EUR 0.50 per share, belonging to the same class and accord the same rights.
2023 Ordinary general shareholders’ meeting
On 31 March 2023, Banco Santander held its ordinary general shareholders’ meeting on second call at Centro de Formación El Solaruco (Ciudad Grupo Santander), in Boadilla del Monte. Shareholders were able to attend in person and by telematic means.
630,041 shareholders, owning 67.564% of share capital, attended the general meeting in person or by proxy.
The proposed resolutions submitted by the board at the general meeting passed with an average of 98.08% votes in favour. The Bank’s management during the 2022 financial year was approved by 99.72% of voting shareholders. Shareholders confirmed, among others, the appointment of the Group's top executives upon re-electing Executive Chair, Ana Botín, and ratifying the appointment Héctor Grisi as CEO.
Full information on the resolutions that passed at the general meeting can be found on corporate website (www.santander.com).
Changes in board committees
Gina Díez Barroso joined the responsible banking, sustainability and culture committee on 31 January.
January - March 2023 | | 51 | ||||||
| SANTANDER SHARE | ||||||||
In application of the shareholder remuneration policy for 2022, the AGM approved, following a favourable report from the board of directors, the payment of a final cash dividend of EUR 5.95 cents per share (pre-tax) charged against 2022 results, that will be paid from 2 May 2023.
Likewise, and in application of the shareholder remuneration policy for 2022, last February, the board of directors approved a second share buyback programme of up to EUR 921 million, executed between 1 March 2023 and 21 April 2023. Once finalized, and in application of the 31 March 2023 AGM resolutions, on 24 April 2023 the board of directors resolved to reduce, subject to the required regulatory authorization from the ECB, the share capital in the amount of EUR 134,924,476.50 by cancelling the 269,848,953 shares repurchased in the above mentioned buyback programme, representing 1.64% of the share capital. Once the required regulatory authorization is obtained, Banco Santander, S.A.'s share capital will be EUR 8,092,073,029.50 represented by 16,184,146,059 shares.
After carrying out both actions, total shareholder remuneration against 2022 results was EUR 3,842 million (approximately 40% of 2022 underlying profit) split approximately equally between cash dividend (EUR 1,942 million) and buyback programmes (EUR 1,900 million).
In addition, the shareholder remuneration policy the board approved for the 2023 results is a payout of approximately 50% of the Group's net reported profit (excluding non-cash, non-capital ratios impact items), distributed approximately as 50% in cash dividend and 50% in share buybacks.
The execution of the shareholder remuneration policy is subject to future corporate and regulatory approvals.
Share price performance
Santander's shares are listed in five markets; in Spain, Mexico, Poland and the US as ADRs and in the UK as a CDI.
The first quarter of 2023 was characterized by inflationary pressures, which, despite the drop in energy prices, required a
monetary policy tightening (interest rate increases) by the main central banks due to its persistence. Also, the improved 2023 economic outlook and the end of zero-covid policies in China may provide an additional boost to the global economic growth.
The quarter was impacted by the turbulence in the financial markets, first in the US, due to the collapse of Silicon Valley Bank (SVB) and Signature Bank, and later in Europe, due to the volatility derived from the Credit Suisse case. However, central banks acted swiftly to prevent any further spreading.
In this context, the financial sector started the year with a favourable stock market due to the interest rate rises and the potential impact on margins. However, the instability in the markets in recent weeks had an impact on share prices due to the potential risks of contagion and the possible implications for the economic performance.
The Santander share price ended the quarter with a return of 22.2%, well above all banking indices. The eurozone’s main banking index, EuroStoxx Banks, was up 7.2% and DJ Stoxx Banks increased 5.5% while MSCI World Banks decreased 2.9%. The other main indices closed up, Ibex 35 +12.8% and DJ Stoxx 50 +8.9%.
| Share price | ||||||||||||||
 |  | |||||||||||||
START 30/12/2022 | END 31/03/2023 | |||||||||||||
| €2.803 | €3.426 | |||||||||||||
 |  | |||||||||||||
Maximum 07/03/2023 | Minimum 03/01/2023 | |||||||||||||
| €3.873 | €2.812 | |||||||||||||
| Comparative share performance | ||
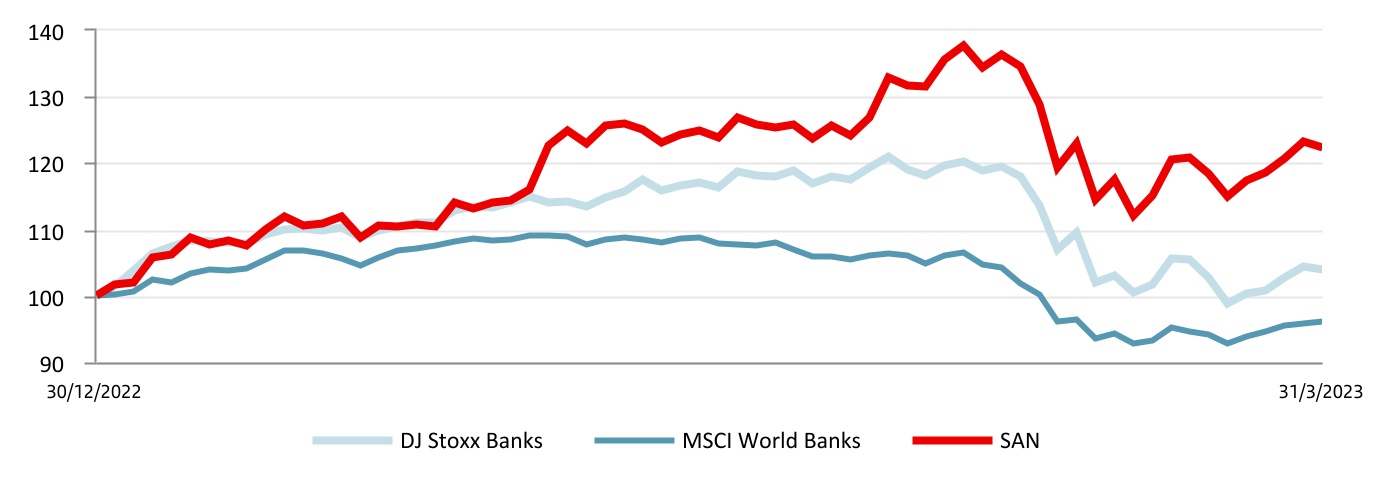
| 52 | | January - March 2023 | ||||||
Market capitalization and trading
As at 31 March 2023, Banco Santander’s market capitalization of EUR 56,371 million was the second largest in the eurozone and 25th largest in the world among financial institutions.
The share’s weighting in the DJ Stoxx Banks index was 7.3% and 12.5% in the DJ Euro Stoxx Banks. In the domestic market, its weight in the Ibex 35 as at end March was 11.5%.
A total of 3,708 million shares were traded in the period for an effective value of EUR 12,372 million and a liquidity ratio of 22%.
The daily trading volume was 57 million shares with an effective value of EUR 190 million.
Shareholder base
The total number of Santander shareholders at 31 March 2023 was 3,881,758, of which 3,363,276 were European (74.08% of the capital stock) and 507,228 from the Americas (24.80% of the capital stock).
Excluding the board, which holds 1.13% of the bank’s capital stock, retail shareholders accounted for 42.04% and institutional shareholders accounted for 56.83%.
| Share capital distribution by geographic area | ||||||||
| March 2023 | ||||||||
| The Americas | Europe | Other | ||||||
| 24.80% | 74.08% | 1.12% | ||||||
 | ||||||||
| Source: Banco Santander, S.A Shareholder register. | ||||||||
 | 2nd | Bank in the eurozone by market capitalization | ||||||
EUR 56,371 million | ||||||||
| The Santander share | |||||
| March 2023 | |||||
| Shares and trading data | |||||
| Shares (number) | 16,453,995,012 | ||||
| Average daily turnover (number of shares) | 57,051,133 | ||||
| Share liquidity (%) | 22 | ||||
| (Number of shares traded during the year / number of shares) | |||||
| Stock market indicators | |||||
| Price / Tangible book value (X) | 0.78 | ||||
| Free float (%) | 98.86 | ||||
| Share capital distribution by type of shareholder | |||||
| March 2023 | |||||
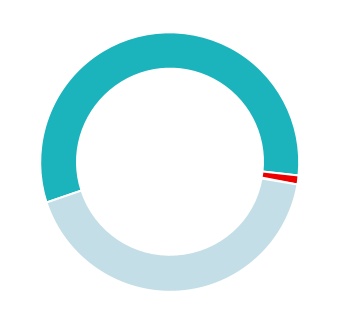
| Institutions | |||||
| 56.83% | |||||
| Board * | |||||
| 1.13% | |||||
| Retail | |||||
| 42.04% | |||||
* Shares owned or represented by directors.
January - March 2023 | | 53 | ||||||
2023 A P P E N D I X
| 54 | | January - March 2023 | ||||||
| Net fee income. Consolidated | ||||||||||||||||||||
| EUR million | ||||||||||||||||||||
| Q1'23 | Q4'22 | Change (%) | Q1'22 | Change (%) | ||||||||||||||||
| Fees from services | 1,844 | 1,632 | 13.0 | 1,597 | 15.5 | |||||||||||||||
| Wealth management and marketing of customer funds | 924 | 1,041 | (11.2) | 923 | 0.1 | |||||||||||||||
| Securities and custody | 275 | 250 | 10.0 | 292 | (5.8) | |||||||||||||||
| Net fee income | 3,043 | 2,923 | 4.1 | 2,812 | 8.2 | |||||||||||||||
| Underlying operating expenses. Consolidated | ||||||||||||||||||||
| EUR million | ||||||||||||||||||||
| Q1'23 | Q4'22 | Change (%) | Q1'22 | Change (%) | ||||||||||||||||
| Staff costs | 3,245 | 3,422 | (5.2) | 2,863 | 13.3 | |||||||||||||||
| Other general administrative expenses | 2,111 | 2,136 | (1.2) | 1,968 | 7.3 | |||||||||||||||
| Information technology | 642 | 650 | (1.2) | 565 | 13.6 | |||||||||||||||
| Communications | 103 | 99 | 4.0 | 100 | 3.0 | |||||||||||||||
| Advertising | 136 | 152 | (10.5) | 121 | 12.4 | |||||||||||||||
| Buildings and premises | 177 | 151 | 17.2 | 167 | 6.0 | |||||||||||||||
| Printed and office material | 20 | 26 | (23.1) | 23 | (13.0) | |||||||||||||||
| Taxes (other than tax on profits) | 149 | 132 | 12.9 | 141 | 5.7 | |||||||||||||||
| Other expenses | 884 | 926 | (4.5) | 851 | 3.9 | |||||||||||||||
| Administrative expenses | 5,356 | 5,558 | (3.6) | 4,831 | 10.9 | |||||||||||||||
| Depreciation and amortization | 789 | 750 | 5.2 | 704 | 12.1 | |||||||||||||||
| Operating expenses | 6,145 | 6,308 | (2.6) | 5,535 | 11.0 | |||||||||||||||
| Operating means. Consolidated | |||||||||||||||||||||||
Employees1 | Branches2 | ||||||||||||||||||||||
| Mar-23 | Mar-22 | Change | Mar-23 | Mar-22 | Change | ||||||||||||||||||
| Europe | 66,668 | 63,033 | 3,635 | 3,133 | 3,217 | (84) | |||||||||||||||||
| Spain | 27,047 | 26,095 | 952 | 1,909 | 1,950 | (41) | |||||||||||||||||
| United Kingdom | 21,860 | 20,231 | 1,629 | 446 | 450 | (4) | |||||||||||||||||
| Portugal | 4,957 | 5,009 | (52) | 377 | 389 | (12) | |||||||||||||||||
| Poland | 10,618 | 10,312 | 306 | 393 | 420 | (27) | |||||||||||||||||
| Other | 2,186 | 1,386 | 800 | 8 | 8 | — | |||||||||||||||||
| North America | 45,170 | 43,874 | 1,296 | 1,844 | 1,859 | (15) | |||||||||||||||||
| US | 14,491 | 15,544 | (1,053) | 473 | 488 | (15) | |||||||||||||||||
| Mexico | 29,619 | 27,794 | 1,825 | 1,371 | 1,371 | — | |||||||||||||||||
| Other | 1,060 | 536 | 524 | — | — | — | |||||||||||||||||
| South America | 79,749 | 75,784 | 3,965 | 3,653 | 3,801 | (148) | |||||||||||||||||
| Brazil | 56,701 | 53,865 | 2,836 | 2,846 | 2,956 | (110) | |||||||||||||||||
| Chile | 10,110 | 10,235 | (125) | 275 | 314 | (39) | |||||||||||||||||
| Argentina | 8,301 | 8,549 | (248) | 382 | 407 | (25) | |||||||||||||||||
| Other | 4,637 | 3,135 | 1,502 | 150 | 124 | 26 | |||||||||||||||||
| Digital Consumer Bank | 16,642 | 15,856 | 786 | 363 | 371 | (8) | |||||||||||||||||
| Corporate Centre | 1,940 | 1,747 | 193 | ||||||||||||||||||||
| Total Group | 210,169 | 200,294 | 9,875 | 8,993 | 9,248 | (255) | |||||||||||||||||
1. UK and Poland figures have been changed to headcount to align with the other units.
2. Branch data for Brazil has been adjusted to physical branches rather than operating units.
| Underlying net loan-loss provisions. Consolidated | ||||||||||||||||||||
| EUR million | ||||||||||||||||||||
| Q1'23 | Q4'22 | Change (%) | Q1'22 | Change (%) | ||||||||||||||||
| Non-performing loans | 3,223 | 3,478 | (7.3) | 2,409 | 33.8 | |||||||||||||||
| Country-risk | (1) | 1 | — | 1 | — | |||||||||||||||
| Recovery of written-off assets | (349) | (461) | (24.3) | (309) | 12.9 | |||||||||||||||
| Net loan-loss provisions | 2,873 | 3,018 | (4.8) | 2,101 | 36.7 | |||||||||||||||
January - March 2023 | | 55 | ||||||
| Loans and advances to customers. Consolidated | |||||||||||||||||
| EUR million | |||||||||||||||||
| Change | |||||||||||||||||
| Mar-23 | Mar-22 | Absolute | % | Dec-22 | |||||||||||||
| Commercial bills | 51,420 | 51,291 | 129 | 0.3 | 56,688 | ||||||||||||
| Secured loans | 565,455 | 555,672 | 9,783 | 1.8 | 565,609 | ||||||||||||
| Other term loans | 291,184 | 287,025 | 4,159 | 1.4 | 290,031 | ||||||||||||
| Finance leases | 40,441 | 39,063 | 1,378 | 3.5 | 39,833 | ||||||||||||
| Receivable on demand | 11,715 | 10,229 | 1,486 | 14.5 | 11,435 | ||||||||||||
| Credit cards receivable | 22,474 | 21,429 | 1,045 | 4.9 | 22,704 | ||||||||||||
| Impaired assets | 32,654 | 33,781 | (1,127) | (3.3) | 32,888 | ||||||||||||
| Gross loans and advances to customers (excl. reverse repos) | 1,015,343 | 998,490 | 16,853 | 1.7 | 1,019,188 | ||||||||||||
| Reverse repos | 48,653 | 37,033 | 11,620 | 31.4 | 39,500 | ||||||||||||
| Gross loans and advances to customers | 1,063,996 | 1,035,523 | 28,473 | 2.7 | 1,058,688 | ||||||||||||
| Loan-loss allowances | 22,608 | 24,026 | (1,418) | (5.9) | 22,684 | ||||||||||||
| Loans and advances to customers | 1,041,388 | 1,011,497 | 29,891 | 3.0 | 1,036,004 | ||||||||||||
| Total funds. Consolidated | ||||||||||||||||||||
| EUR million | ||||||||||||||||||||
| Change | ||||||||||||||||||||
| Mar-23 | Mar-22 | Absolute | % | Dec-22 | ||||||||||||||||
| Demand deposits | 680,904 | 721,056 | (40,152) | (5.6) | 710,232 | |||||||||||||||
| Time deposits | 246,614 | 168,279 | 78,335 | 46.6 | 236,099 | |||||||||||||||
| Mutual funds | 190,637 | 190,940 | (303) | (0.2) | 184,054 | |||||||||||||||
| Customer funds | 1,118,155 | 1,080,275 | 37,880 | 3.5 | 1,130,385 | |||||||||||||||
| Pension funds | 14,240 | 15,266 | (1,026) | (6.7) | 14,021 | |||||||||||||||
| Managed portfolios | 33,189 | 32,518 | 671 | 2.1 | 32,184 | |||||||||||||||
| Repos | 71,431 | 51,746 | 19,685 | 38.0 | 63,391 | |||||||||||||||
| Total funds | 1,237,015 | 1,179,805 | 57,210 | 4.8 | 1,239,981 | |||||||||||||||
Eligible capital (phased-in) 1. Consolidated | |||||||||||||||||
| EUR million | |||||||||||||||||
| Change | |||||||||||||||||
| Mar-23 | Mar-22 | Absolute | % | Dec-22 | |||||||||||||
| Capital stock and reserves | 122,723 | 119,514 | 3,209 | 2.7 | 116,956 | ||||||||||||
| Attributable profit | 2,571 | 2,543 | 28 | 1.1 | 9,605 | ||||||||||||
| Dividends | (643) | (509) | (134) | 26.4 | (1,921) | ||||||||||||
| Other retained earnings | (32,868) | (31,322) | (1,546) | 4.9 | (35,068) | ||||||||||||
| Minority interests | 7,388 | 7,252 | 136 | 1.9 | 7,416 | ||||||||||||
| Goodwill and intangible assets | (17,437) | (16,624) | (813) | 4.9 | (17,182) | ||||||||||||
| Other deductions | (5,598) | (7,038) | 1,440 | (20.5) | (5,604) | ||||||||||||
| Core CET1 | 76,136 | 73,817 | 2,319 | 3.1 | 74,202 | ||||||||||||
| Preferred shares and other eligible tier 1 | 8,949 | 9,101 | (151) | (1.7) | 8,831 | ||||||||||||
| Tier 1 | 85,085 | 82,917 | 2,168 | 2.6 | 83,033 | ||||||||||||
| Generic funds and eligible tier 2 instruments | 13,569 | 15,213 | (1,643) | (10.8) | 14,359 | ||||||||||||
| Eligible capital | 98,655 | 98,130 | 525 | 0.5 | 97,392 | ||||||||||||
| Risk-weighted assets | 620,801 | 598,789 | 22,012 | 3.7 | 609,266 | ||||||||||||
| CET1 capital ratio | 12.3 | 12.3 | (0.1) | 12.2 | |||||||||||||
| Tier 1 capital ratio | 13.7 | 13.8 | (0.1) | 13.6 | |||||||||||||
| Total capital ratio | 15.9 | 16.4 | (0.5) | 16.0 | |||||||||||||
1. The phased-in ratio includes the transitory treatment of IFRS 9, calculated in accordance with article 473 bis of the Capital Requirements Regulation (CRR2) and subsequent modifications introduced by Regulation 2020/873 of the European Union. Total phased-in capital ratios include the transitory treatment according to chapter 4, title 1, part 10 of the CRR2.
| 56 | | January - March 2023 | ||||||
| EUROPE | |||||||||||||||||||||||
| EUR million | |||||||||||||||||||||||
| / | Q4'22 | / | Q1'22 | ||||||||||||||||||||
| Underlying income statement | Q1'23 | % | % excl. FX | % | % excl. FX | ||||||||||||||||||
| Net interest income | 3,597 | 0.8 | 1.5 | 26.7 | 29.8 | ||||||||||||||||||
| Net fee income | 1,168 | 11.1 | 11.4 | 1.2 | 1.8 | ||||||||||||||||||
Gains (losses) on financial transactions 1 | 347 | 56.1 | 56.1 | 74.1 | 74.0 | ||||||||||||||||||
| Other operating income | 58 | — | — | (48.1) | (48.5) | ||||||||||||||||||
| Total income | 5,171 | 8.7 | 9.3 | 20.1 | 22.2 | ||||||||||||||||||
| Administrative expenses and amortizations | (2,167) | (2.7) | (2.1) | 5.2 | 7.1 | ||||||||||||||||||
| Net operating income | 3,004 | 18.7 | 19.3 | 33.8 | 36.1 | ||||||||||||||||||
| Net loan-loss provisions | (642) | 0.9 | 1.1 | 24.8 | 25.7 | ||||||||||||||||||
| Other gains (losses) and provisions | (516) | 5.7 | 7.2 | 118.8 | 122.9 | ||||||||||||||||||
| Profit before tax | 1,846 | 31.3 | 31.7 | 23.5 | 26.0 | ||||||||||||||||||
| Tax on profit | (577) | 57.0 | 57.6 | 36.9 | 39.4 | ||||||||||||||||||
| Profit from continuing operations | 1,269 | 22.3 | 22.6 | 18.2 | 20.7 | ||||||||||||||||||
| Net profit from discontinued operations | — | — | — | — | — | ||||||||||||||||||
| Consolidated profit | 1,269 | 22.3 | 22.6 | 18.2 | 20.7 | ||||||||||||||||||
| Non-controlling interests | (80) | 23.5 | 23.6 | 45.1 | 47.9 | ||||||||||||||||||
| Profit attributable to the parent | 1,189 | 22.2 | 22.5 | 16.8 | 19.2 | ||||||||||||||||||
| Balance sheet | |||||||||||||||||||||||
| Loans and advances to customers | 581,352 | (1.7) | (2.0) | (3.5) | (1.9) | ||||||||||||||||||
| Cash, central banks and credit institutions | 195,599 | (9.6) | (9.8) | (13.2) | (12.2) | ||||||||||||||||||
| Debt instruments | 85,571 | 12.1 | 12.0 | 26.5 | 27.2 | ||||||||||||||||||
| Other financial assets | 48,288 | 1.2 | 1.2 | 8.3 | 8.3 | ||||||||||||||||||
| Other asset accounts | 26,759 | 0.7 | 0.7 | (9.0) | (8.4) | ||||||||||||||||||
| Total assets | 937,568 | (2.2) | (2.5) | (3.3) | (2.0) | ||||||||||||||||||
| Customer deposits | 620,412 | (3.6) | (4.0) | 2.2 | 3.8 | ||||||||||||||||||
| Central banks and credit institutions | 116,686 | 3.9 | 3.8 | (30.0) | (29.3) | ||||||||||||||||||
| Marketable debt securities | 76,167 | 6.2 | 5.6 | 8.2 | 10.6 | ||||||||||||||||||
| Other financial liabilities | 53,584 | (10.7) | (10.7) | 7.0 | 7.2 | ||||||||||||||||||
| Other liabilities accounts | 29,386 | 7.6 | 7.6 | 5.4 | 5.8 | ||||||||||||||||||
| Total liabilities | 896,235 | (2.1) | (2.4) | (2.8) | (1.4) | ||||||||||||||||||
| Total equity | 41,333 | (4.0) | (4.2) | (13.4) | (12.3) | ||||||||||||||||||
| Memorandum items: | |||||||||||||||||||||||
Gross loans and advances to customers 2 | 565,954 | (2.3) | (2.7) | (3.2) | (1.5) | ||||||||||||||||||
| Customer funds | 693,881 | (3.7) | (4.0) | 0.6 | 2.0 | ||||||||||||||||||
Customer deposits 3 | 598,850 | (4.6) | (4.9) | 1.9 | 3.5 | ||||||||||||||||||
| Mutual funds | 95,031 | 1.9 | 1.8 | (6.8) | (6.5) | ||||||||||||||||||
| Ratios (%), operating means and customers | |||||||||||||||||||||||
| RoTE | 12.79 | 3.07 | 3.13 | ||||||||||||||||||||
| Efficiency ratio | 41.9 | (4.9) | (5.9) | ||||||||||||||||||||
| NPL ratio | 2.35 | (0.02) | (0.66) | ||||||||||||||||||||
| NPL coverage ratio | 51.2 | (0.6) | 2.2 | ||||||||||||||||||||
| Number of employees | 66,668 | 1.7 | 5.8 | ||||||||||||||||||||
| Number of branches | 3,133 | (0.5) | (2.6) | ||||||||||||||||||||
| Number of total customers (thousands) | 45,758 | 0.4 | 2.3 | ||||||||||||||||||||
| Number of active customers (thousands) | 28,217 | 0.3 | 2.3 | ||||||||||||||||||||
1. Includes exchange differences.
2. Excluding reverse repos.
3. Excluding repos.
January - March 2023 | | 57 | ||||||
| Spain | |||||||||||||||||
| EUR million | |||||||||||||||||
| / Q4'22 | / Q1'22 | ||||||||||||||||
| Underlying income statement | Q1'23 | % | % | ||||||||||||||
| Net interest income | 1,460 | 4.0 | 46.4 | ||||||||||||||
| Net fee income | 752 | 16.4 | 0.8 | ||||||||||||||
Gains (losses) on financial transactions 1 | 260 | 13.3 | 99.8 | ||||||||||||||
| Other operating income | 75 | — | (49.4) | ||||||||||||||
| Total income | 2,547 | 17.1 | 26.0 | ||||||||||||||
| Administrative expenses and amortizations | (1,014) | (4.1) | 4.3 | ||||||||||||||
| Net operating income | 1,533 | 37.2 | 46.2 | ||||||||||||||
| Net loan-loss provisions | (415) | 6.4 | 6.0 | ||||||||||||||
| Other gains (losses) and provisions | (379) | 158.5 | 173.7 | ||||||||||||||
| Profit before tax | 739 | 27.1 | 42.4 | ||||||||||||||
| Tax on profit | (273) | 117.9 | 77.0 | ||||||||||||||
| Profit from continuing operations | 466 | 2.2 | 27.8 | ||||||||||||||
| Net profit from discontinued operations | — | — | — | ||||||||||||||
| Consolidated profit | 466 | 2.2 | 27.8 | ||||||||||||||
| Non-controlling interests | — | (52.5) | (59.5) | ||||||||||||||
| Profit attributable to the parent | 466 | 2.2 | 27.7 | ||||||||||||||
| Balance sheet | |||||||||||||||||
| Loans and advances to customers | 248,586 | (3.0) | (3.2) | ||||||||||||||
| Cash, central banks and credit institutions | 108,769 | (15.8) | (22.2) | ||||||||||||||
| Debt instruments | 49,288 | 17.3 | 56.9 | ||||||||||||||
| Other financial assets | 44,647 | 2.5 | 9.3 | ||||||||||||||
| Other asset accounts | 17,928 | (0.4) | (3.3) | ||||||||||||||
| Total assets | 469,218 | (4.1) | (3.7) | ||||||||||||||
| Customer deposits | 310,954 | (5.6) | 7.9 | ||||||||||||||
| Central banks and credit institutions | 44,953 | 4.3 | (49.3) | ||||||||||||||
| Marketable debt securities | 27,481 | 16.1 | 5.2 | ||||||||||||||
| Other financial liabilities | 46,992 | (11.1) | 6.5 | ||||||||||||||
| Other liabilities accounts | 21,690 | 10.7 | 14.6 | ||||||||||||||
| Total liabilities | 452,069 | (3.5) | (3.0) | ||||||||||||||
| Total equity | 17,149 | (15.9) | (19.5) | ||||||||||||||
| Memorandum items: | |||||||||||||||||
Gross loans and advances to customers 2 | 241,511 | (3.3) | (2.5) | ||||||||||||||
| Customer funds | 374,991 | (5.0) | 4.9 | ||||||||||||||
Customer deposits 3 | 301,250 | (6.5) | 7.4 | ||||||||||||||
| Mutual funds | 73,741 | 1.9 | (4.0) | ||||||||||||||
| Ratios (%), operating means and customers | |||||||||||||||||
| RoTE | 11.09 | 1.93 | 3.71 | ||||||||||||||
| Efficiency ratio | 39.8 | (8.8) | (8.3) | ||||||||||||||
| NPL ratio | 3.19 | (0.08) | (1.28) | ||||||||||||||
| NPL coverage ratio | 50.2 | (0.7) | (0.1) | ||||||||||||||
| Number of employees | 27,047 | 0.8 | 3.6 | ||||||||||||||
| Number of branches | 1,909 | (0.2) | (2.1) | ||||||||||||||
| Number of total customers (thousands) | 14,486 | 1.2 | 5.4 | ||||||||||||||
| Number of active customers (thousands) | 7,972 | 1.5 | 4.7 | ||||||||||||||
1. Includes exchange differences.
2. Excluding reverse repos.
3. Excluding repos.
| 58 | | January - March 2023 | ||||||
| United Kingdom | |||||||||||||||||||||||
| EUR million | |||||||||||||||||||||||
| / | Q4'22 | / | Q1'22 | ||||||||||||||||||||
| Underlying income statement | Q1'23 | % | % excl. FX | % | % excl. FX | ||||||||||||||||||
| Net interest income | 1,283 | (1.1) | 0.5 | 7.6 | 13.6 | ||||||||||||||||||
| Net fee income | 83 | (12.8) | (11.5) | (10.4) | (5.4) | ||||||||||||||||||
Gains (losses) on financial transactions 1 | — | — | — | (92.3) | (91.9) | ||||||||||||||||||
| Other operating income | 2 | (52.6) | (51.1) | 75.2 | 84.9 | ||||||||||||||||||
| Total income | 1,368 | (1.4) | 0.2 | 6.0 | 11.8 | ||||||||||||||||||
| Administrative expenses and amortizations | (674) | (0.5) | 1.1 | 0.4 | 6.0 | ||||||||||||||||||
| Net operating income | 694 | (2.3) | (0.7) | 12.0 | 18.2 | ||||||||||||||||||
| Net loan-loss provisions | (59) | (27.2) | (26.0) | 16.0 | 22.5 | ||||||||||||||||||
| Other gains (losses) and provisions | (92) | (65.0) | (64.0) | 40.2 | 48.0 | ||||||||||||||||||
| Profit before tax | 542 | 48.6 | 49.8 | 7.9 | 13.9 | ||||||||||||||||||
| Tax on profit | (147) | 35.8 | 37.3 | 15.5 | 21.9 | ||||||||||||||||||
| Profit from continuing operations | 395 | 54.1 | 55.0 | 5.3 | 11.1 | ||||||||||||||||||
| Net profit from discontinued operations | — | — | — | — | — | ||||||||||||||||||
| Consolidated profit | 395 | 54.1 | 55.0 | 5.3 | 11.1 | ||||||||||||||||||
| Non-controlling interests | — | — | — | — | — | ||||||||||||||||||
| Profit attributable to the parent | 395 | 54.1 | 55.0 | 5.3 | 11.1 | ||||||||||||||||||
| Balance sheet | |||||||||||||||||||||||
| Loans and advances to customers | 251,917 | — | (0.9) | (4.0) | (0.2) | ||||||||||||||||||
| Cash, central banks and credit institutions | 66,481 | 0.8 | (0.2) | (2.8) | 1.1 | ||||||||||||||||||
| Debt instruments | 8,094 | 11.0 | 9.9 | 22.5 | 27.3 | ||||||||||||||||||
| Other financial assets | 423 | (29.7) | (30.3) | (4.4) | (0.6) | ||||||||||||||||||
| Other asset accounts | 3,699 | 12.3 | 11.3 | (34.5) | (31.9) | ||||||||||||||||||
| Total assets | 330,614 | 0.5 | (0.5) | (3.8) | — | ||||||||||||||||||
| Customer deposits | 229,838 | (0.4) | (1.4) | (3.0) | 0.8 | ||||||||||||||||||
| Central banks and credit institutions | 38,478 | 3.9 | 2.9 | (14.7) | (11.3) | ||||||||||||||||||
| Marketable debt securities | 44,340 | 0.6 | (0.4) | 8.9 | 13.2 | ||||||||||||||||||
| Other financial liabilities | 3,636 | 2.4 | 1.5 | 12.9 | 17.4 | ||||||||||||||||||
| Other liabilities accounts | 1,382 | (11.0) | (11.8) | (30.8) | (28.1) | ||||||||||||||||||
| Total liabilities | 317,674 | 0.2 | (0.8) | (3.2) | 0.7 | ||||||||||||||||||
| Total equity | 12,940 | 7.8 | 6.8 | (17.0) | (13.7) | ||||||||||||||||||
| Memorandum items: | |||||||||||||||||||||||
Gross loans and advances to customers 2 | 241,879 | (1.2) | (2.1) | (3.8) | — | ||||||||||||||||||
| Customer funds | 225,405 | (1.6) | (2.5) | (3.8) | — | ||||||||||||||||||
Customer deposits 3 | 218,153 | (1.7) | (2.6) | (3.4) | 0.5 | ||||||||||||||||||
| Mutual funds | 7,252 | 2.0 | 1.0 | (15.0) | (11.6) | ||||||||||||||||||
| Ratios (%), operating means and customers | |||||||||||||||||||||||
| RoTE | 13.56 | 4.91 | 2.69 | ||||||||||||||||||||
| Efficiency ratio | 49.3 | 0.5 | (2.7) | ||||||||||||||||||||
| NPL ratio | 1.27 | 0.06 | (0.16) | ||||||||||||||||||||
| NPL coverage ratio | 33.1 | (0.6) | 7.0 | ||||||||||||||||||||
| Number of employees | 21,860 | 3.2 | 8.1 | ||||||||||||||||||||
| Number of branches | 446 | (0.7) | (0.9) | ||||||||||||||||||||
| Number of total customers (thousands) | 22,404 | — | 0.9 | ||||||||||||||||||||
| Number of active customers (thousands) | 13,945 | (0.4) | 0.1 | ||||||||||||||||||||
1. Includes exchange differences.
2. Excluding reverse repos.
3. Excluding repos.
January - March 2023 | | 59 | ||||||
| Portugal | |||||||||||||||||
| EUR million | |||||||||||||||||
| / Q4'22 | / Q1'22 | ||||||||||||||||
| Underlying income statement | Q1'23 | % | % | ||||||||||||||
| Net interest income | 261 | 13.0 | 53.6 | ||||||||||||||
| Net fee income | 124 | 5.0 | 1.6 | ||||||||||||||
Gains (losses) on financial transactions 1 | 9 | 342.6 | (69.6) | ||||||||||||||
| Other operating income | 11 | 1.7 | 0.9 | ||||||||||||||
| Total income | 405 | 11.8 | 21.8 | ||||||||||||||
| Administrative expenses and amortizations | (132) | 5.2 | 5.5 | ||||||||||||||
| Net operating income | 273 | 15.4 | 31.7 | ||||||||||||||
| Net loan-loss provisions | (14) | 75.3 | 72.8 | ||||||||||||||
| Other gains (losses) and provisions | 1 | (94.2) | (91.5) | ||||||||||||||
| Profit before tax | 261 | 3.6 | 21.3 | ||||||||||||||
| Tax on profit | (81) | 4.3 | 21.5 | ||||||||||||||
| Profit from continuing operations | 180 | 3.3 | 21.2 | ||||||||||||||
| Net profit from discontinued operations | — | — | — | ||||||||||||||
| Consolidated profit | 180 | 3.3 | 21.2 | ||||||||||||||
| Non-controlling interests | — | (60.9) | (57.7) | ||||||||||||||
| Profit attributable to the parent | 180 | 3.5 | 21.4 | ||||||||||||||
| Balance sheet | |||||||||||||||||
| Loans and advances to customers | 38,336 | (2.0) | (2.0) | ||||||||||||||
| Cash, central banks and credit institutions | 9,698 | 0.7 | (3.3) | ||||||||||||||
| Debt instruments | 7,959 | 0.9 | (6.8) | ||||||||||||||
| Other financial assets | 1,128 | 3.0 | (21.3) | ||||||||||||||
| Other asset accounts | 1,350 | (8.9) | 7.8 | ||||||||||||||
| Total assets | 58,471 | (1.3) | (3.2) | ||||||||||||||
| Customer deposits | 37,311 | (3.1) | (4.9) | ||||||||||||||
| Central banks and credit institutions | 9,617 | 4.7 | 4.1 | ||||||||||||||
| Marketable debt securities | 3,251 | (1.1) | 24.1 | ||||||||||||||
| Other financial liabilities | 304 | (32.2) | 19.3 | ||||||||||||||
| Other liabilities accounts | 4,642 | 3.9 | (11.4) | ||||||||||||||
| Total liabilities | 55,125 | (1.4) | (2.6) | ||||||||||||||
| Total equity | 3,346 | 0.4 | (12.0) | ||||||||||||||
| Memorandum items: | |||||||||||||||||
Gross loans and advances to customers 2 | 39,294 | (1.9) | (2.1) | ||||||||||||||
| Customer funds | 41,095 | (2.5) | (5.1) | ||||||||||||||
Customer deposits 3 | 37,311 | (3.1) | (4.9) | ||||||||||||||
| Mutual funds | 3,784 | 4.5 | (7.6) | ||||||||||||||
| Ratios (%), operating means and customers | |||||||||||||||||
| RoTE | 20.89 | (0.64) | 5.90 | ||||||||||||||
| Efficiency ratio | 32.6 | (2.1) | (5.0) | ||||||||||||||
| NPL ratio | 3.05 | 0.06 | (0.37) | ||||||||||||||
| NPL coverage ratio | 80.3 | 0.9 | 7.4 | ||||||||||||||
| Number of employees | 4,957 | 0.1 | (1.0) | ||||||||||||||
| Number of branches | 377 | (1.6) | (3.1) | ||||||||||||||
| Number of total customers (thousands) | 2,907 | (0.5) | (3.3) | ||||||||||||||
| Number of active customers (thousands) | 1,786 | 0.1 | 4.3 | ||||||||||||||
1. Includes exchange differences.
2. Excluding reverse repos.
3. Excluding repos.
| 60 | | January - March 2023 | ||||||
| Poland | |||||||||||||||||||||||
| EUR million | |||||||||||||||||||||||
| / | Q4'22 | / | Q1'22 | ||||||||||||||||||||
| Underlying income statement | Q1'23 | % | % excl. FX | % | % excl. FX | ||||||||||||||||||
| Net interest income | 586 | 6.2 | 6.0 | 43.8 | 46.6 | ||||||||||||||||||
| Net fee income | 145 | 15.8 | 15.4 | 5.0 | 7.1 | ||||||||||||||||||
Gains (losses) on financial transactions 1 | 26 | 141.7 | 138.1 | 101.9 | 105.9 | ||||||||||||||||||
| Other operating income | (28) | — | — | (40.8) | (39.7) | ||||||||||||||||||
| Total income | 729 | 4.9 | 4.8 | 42.7 | 45.5 | ||||||||||||||||||
| Administrative expenses and amortizations | (197) | 8.2 | 8.0 | 19.0 | 21.3 | ||||||||||||||||||
| Net operating income | 531 | 3.8 | 3.6 | 54.1 | 57.1 | ||||||||||||||||||
| Net loan-loss provisions | (151) | 0.7 | 0.7 | 138.1 | 142.7 | ||||||||||||||||||
| Other gains (losses) and provisions | (44) | (47.8) | (48.3) | (3.1) | (1.2) | ||||||||||||||||||
| Profit before tax | 336 | 21.2 | 21.3 | 42.5 | 45.3 | ||||||||||||||||||
| Tax on profit | (88) | 15.0 | 14.9 | 28.6 | 31.1 | ||||||||||||||||||
| Profit from continuing operations | 247 | 23.6 | 23.7 | 48.3 | 51.1 | ||||||||||||||||||
| Net profit from discontinued operations | — | — | — | — | — | ||||||||||||||||||
| Consolidated profit | 247 | 23.6 | 23.7 | 48.3 | 51.1 | ||||||||||||||||||
| Non-controlling interests | (81) | 22.9 | 23.0 | 47.7 | 50.5 | ||||||||||||||||||
| Profit attributable to the parent | 167 | 24.0 | 24.1 | 48.6 | 51.4 | ||||||||||||||||||
| Balance sheet | |||||||||||||||||||||||
| Loans and advances to customers | 30,021 | 1.2 | 1.1 | 0.2 | 0.9 | ||||||||||||||||||
| Cash, central banks and credit institutions | 8,725 | (1.9) | (2.1) | 131.4 | 133.1 | ||||||||||||||||||
| Debt instruments | 11,557 | (2.6) | (2.7) | (18.8) | (18.2) | ||||||||||||||||||
| Other financial assets | 501 | (20.2) | (20.3) | (28.4) | (27.8) | ||||||||||||||||||
| Other asset accounts | 1,626 | 0.7 | 0.5 | 2.1 | 2.8 | ||||||||||||||||||
| Total assets | 52,431 | (0.4) | (0.6) | 4.3 | 5.1 | ||||||||||||||||||
| Customer deposits | 39,409 | 0.3 | 0.1 | 3.9 | 4.7 | ||||||||||||||||||
| Central banks and credit institutions | 3,898 | (21.6) | (21.7) | (7.6) | (7.0) | ||||||||||||||||||
| Marketable debt securities | 1,095 | 60.7 | 60.5 | 18.5 | 19.3 | ||||||||||||||||||
| Other financial liabilities | 1,075 | (8.8) | (9.0) | 2.4 | 3.2 | ||||||||||||||||||
| Other liabilities accounts | 1,399 | 1.5 | 1.3 | 11.1 | 11.9 | ||||||||||||||||||
| Total liabilities | 46,876 | (1.3) | (1.5) | 3.3 | 4.1 | ||||||||||||||||||
| Total equity | 5,555 | 7.7 | 7.5 | 13.5 | 14.4 | ||||||||||||||||||
| Memorandum items: | |||||||||||||||||||||||
Gross loans and advances to customers 2 | 30,764 | 0.8 | 0.6 | (0.2) | 0.5 | ||||||||||||||||||
| Customer funds | 42,759 | 0.9 | 0.8 | 3.1 | 3.9 | ||||||||||||||||||
Customer deposits 3 | 39,406 | 0.3 | 0.1 | 3.9 | 4.7 | ||||||||||||||||||
| Mutual funds | 3,353 | 9.2 | 9.0 | (5.4) | (4.7) | ||||||||||||||||||
| Ratios (%), operating means and customers | |||||||||||||||||||||||
| RoTE | 19.54 | 2.40 | 4.57 | ||||||||||||||||||||
| Efficiency ratio | 27.1 | 0.8 | (5.4) | ||||||||||||||||||||
| NPL ratio | 3.66 | (0.14) | 0.16 | ||||||||||||||||||||
| NPL coverage ratio | 75.2 | 1.2 | (3.4) | ||||||||||||||||||||
| Number of employees | 10,618 | 0.8 | 3.0 | ||||||||||||||||||||
| Number of branches | 393 | (0.5) | (6.4) | ||||||||||||||||||||
| Number of total customers (thousands) | 5,747 | 0.9 | 3.8 | ||||||||||||||||||||
| Number of active customers (thousands) | 4,347 | 0.7 | 4.8 | ||||||||||||||||||||
1. Includes exchange differences.
2. Excluding reverse repos.
3. Excluding repos.
January - March 2023 | | 61 | ||||||
| Other Europe | ||||||||||||||||||||||||||
| EUR million | ||||||||||||||||||||||||||
| / | Q4'22 | / | Q1'22 | |||||||||||||||||||||||
| Underlying income statement | Q1'23 | % | % excl. FX | % | % excl. FX | |||||||||||||||||||||
| Net interest income | 7 | (91.8) | (91.6) | (90.6) | (90.8) | |||||||||||||||||||||
| Net fee income | 65 | (3.6) | (1.3) | 15.9 | 12.9 | |||||||||||||||||||||
Gains (losses) on financial transactions 1 | 51 | — | — | 146.7 | 139.0 | |||||||||||||||||||||
| Other operating income | (2) | 30.9 | 39.1 | — | — | |||||||||||||||||||||
| Total income | 122 | (11.5) | (8.5) | (18.5) | (20.5) | |||||||||||||||||||||
| Administrative expenses and amortizations | (150) | (19.0) | (17.7) | 19.7 | 17.5 | |||||||||||||||||||||
| Net operating income | (28) | (41.0) | (42.9) | — | — | |||||||||||||||||||||
| Net loan-loss provisions | (3) | (52.5) | (52.5) | 196.8 | 206.4 | |||||||||||||||||||||
| Other gains (losses) and provisions | (1) | (92.7) | (92.6) | (1.5) | (1.3) | |||||||||||||||||||||
| Profit before tax | (32) | (53.6) | (54.4) | — | — | |||||||||||||||||||||
| Tax on profit | 12 | (41.1) | (42.0) | — | — | |||||||||||||||||||||
| Profit from continuing operations | (20) | (58.8) | (59.5) | — | — | |||||||||||||||||||||
| Net profit from discontinued operations | — | — | — | — | — | |||||||||||||||||||||
| Consolidated profit | (20) | (58.8) | (59.5) | — | — | |||||||||||||||||||||
| Non-controlling interests | 1 | (23.2) | (23.2) | — | — | |||||||||||||||||||||
| Profit attributable to the parent | (19) | (60.0) | (60.7) | — | — | |||||||||||||||||||||
| Balance sheet | ||||||||||||||||||||||||||
| Loans and advances to customers | 12,490 | (12.1) | (10.7) | (12.0) | (13.8) | |||||||||||||||||||||
| Cash, central banks and credit institutions | 1,927 | (28.7) | (27.9) | (43.4) | (44.5) | |||||||||||||||||||||
| Debt instruments | 8,674 | 19.4 | 19.5 | 27.0 | 26.7 | |||||||||||||||||||||
| Other financial assets | 1,588 | (14.5) | (13.2) | 37.3 | 34.3 | |||||||||||||||||||||
| Other asset accounts | 2,156 | (1.1) | (0.4) | (9.7) | (10.6) | |||||||||||||||||||||
| Total assets | 26,835 | (4.9) | (3.8) | (4.1) | (5.5) | |||||||||||||||||||||
| Customer deposits | 2,901 | (50.2) | (49.4) | (35.4) | (36.7) | |||||||||||||||||||||
| Central banks and credit institutions | 19,741 | 9.8 | 10.8 | 1.4 | — | |||||||||||||||||||||
| Marketable debt securities | — | — | — | — | — | |||||||||||||||||||||
| Other financial liabilities | 1,578 | (19.4) | (18.2) | 9.5 | 7.4 | |||||||||||||||||||||
| Other liabilities accounts | 273 | (9.5) | (9.3) | (38.0) | (38.1) | |||||||||||||||||||||
| Total liabilities | 24,492 | (6.0) | (5.0) | (5.2) | (6.7) | |||||||||||||||||||||
| Total equity | 2,342 | 8.8 | 10.3 | 9.8 | 8.0 | |||||||||||||||||||||
| Memorandum items: | ||||||||||||||||||||||||||
Gross loans and advances to customers 2 | 12,506 | (12.1) | (10.7) | (11.9) | (13.8) | |||||||||||||||||||||
| Customer funds | 9,631 | (24.4) | (23.8) | (27.5) | (28.0) | |||||||||||||||||||||
Customer deposits 3 | 2,730 | (51.7) | (50.9) | (36.7) | (38.0) | |||||||||||||||||||||
| Mutual funds | 6,901 | (2.6) | (2.6) | (23.2) | (23.2) | |||||||||||||||||||||
| Resources | ||||||||||||||||||||||||||
| Number of employees | 2,186 | 5.5 | 57.7 | |||||||||||||||||||||||
1. Includes exchange differences.
2. Excluding reverse repos.
3. Excluding repos.
| 62 | | January - March 2023 | ||||||
| NORTH AMERICA | |||||||||||||||||||||||
| EUR million | |||||||||||||||||||||||
| / | Q4'22 | / | Q1'22 | ||||||||||||||||||||
| Underlying income statement | Q1'23 | % | % excl. FX | % | % excl. FX | ||||||||||||||||||
| Net interest income | 2,448 | (5.9) | (3.4) | 14.9 | 6.1 | ||||||||||||||||||
| Net fee income | 521 | 2.6 | 4.2 | 17.7 | 6.8 | ||||||||||||||||||
Gains (losses) on financial transactions 1 | 69 | (13.2) | (11.9) | (14.5) | (19.5) | ||||||||||||||||||
| Other operating income | 103 | (2.0) | 4.7 | (26.5) | (28.2) | ||||||||||||||||||
| Total income | 3,141 | (4.7) | (2.2) | 12.4 | 3.9 | ||||||||||||||||||
| Administrative expenses and amortizations | (1,500) | (8.1) | (5.9) | 19.0 | 10.2 | ||||||||||||||||||
| Net operating income | 1,641 | (1.3) | 1.5 | 7.0 | (1.3) | ||||||||||||||||||
| Net loan-loss provisions | (808) | (7.3) | (5.0) | 84.2 | 69.2 | ||||||||||||||||||
| Other gains (losses) and provisions | (19) | 175.4 | 274.6 | (59.5) | (63.4) | ||||||||||||||||||
| Profit before tax | 815 | 3.9 | 6.9 | (22.4) | (28.2) | ||||||||||||||||||
| Tax on profit | (175) | 5.7 | 8.6 | (25.8) | (31.5) | ||||||||||||||||||
| Profit from continuing operations | 640 | 3.4 | 6.5 | (21.5) | (27.3) | ||||||||||||||||||
| Net profit from discontinued operations | — | — | — | — | — | ||||||||||||||||||
| Consolidated profit | 640 | 3.4 | 6.5 | (21.5) | (27.3) | ||||||||||||||||||
| Non-controlling interests | (13) | 4.6 | 3.6 | 51.1 | 31.3 | ||||||||||||||||||
| Profit attributable to the parent | 627 | 3.3 | 6.5 | (22.2) | (27.9) | ||||||||||||||||||
| Balance sheet | |||||||||||||||||||||||
| Loans and advances to customers | 177,944 | 3.7 | 3.6 | 22.0 | 16.2 | ||||||||||||||||||
| Cash, central banks and credit institutions | 42,441 | 19.2 | 17.2 | 15.3 | 8.7 | ||||||||||||||||||
| Debt instruments | 47,317 | 7.4 | 5.0 | 20.7 | 11.3 | ||||||||||||||||||
| Other financial assets | 15,432 | 5.2 | 1.9 | 36.2 | 25.6 | ||||||||||||||||||
| Other asset accounts | 22,607 | (0.6) | (0.5) | 2.6 | (1.4) | ||||||||||||||||||
| Total assets | 305,741 | 5.9 | 5.1 | 19.8 | 13.3 | ||||||||||||||||||
| Customer deposits | 173,363 | 2.7 | 2.4 | 24.2 | 17.9 | ||||||||||||||||||
| Central banks and credit institutions | 36,378 | 43.8 | 39.0 | 28.7 | 18.9 | ||||||||||||||||||
| Marketable debt securities | 38,941 | (5.2) | (5.1) | 1.7 | (2.4) | ||||||||||||||||||
| Other financial liabilities | 24,577 | 17.7 | 14.3 | 63.0 | 48.9 | ||||||||||||||||||
| Other liabilities accounts | 6,783 | (2.3) | (3.7) | 5.5 | (0.2) | ||||||||||||||||||
| Total liabilities | 280,041 | 6.5 | 5.6 | 23.0 | 16.3 | ||||||||||||||||||
| Total equity | 25,701 | 0.1 | (0.7) | (6.9) | (11.5) | ||||||||||||||||||
| Memorandum items: | |||||||||||||||||||||||
Gross loans and advances to customers 2 | 157,186 | 0.4 | 0.1 | 11.2 | 5.8 | ||||||||||||||||||
| Customer funds | 166,648 | 1.4 | 0.6 | 14.2 | 8.0 | ||||||||||||||||||
Customer deposits 3 | 137,227 | 0.9 | 0.5 | 14.9 | 9.0 | ||||||||||||||||||
| Mutual funds | 29,421 | 3.4 | 1.2 | 11.2 | 3.4 | ||||||||||||||||||
| Ratios (%), operating means and customers | |||||||||||||||||||||||
| RoTE | 10.45 | 0.94 | (2.06) | ||||||||||||||||||||
| Efficiency ratio | 47.7 | (1.8) | 2.7 | ||||||||||||||||||||
| NPL ratio | 2.95 | (0.08) | 0.12 | ||||||||||||||||||||
| NPL coverage ratio | 94.9 | 1.6 | (15.6) | ||||||||||||||||||||
| Number of employees | 45,170 | 1.5 | 3.0 | ||||||||||||||||||||
| Number of branches | 1,844 | (0.5) | (0.8) | ||||||||||||||||||||
| Number of total customers (thousands) | 24,952 | (0.1) | 3.9 | ||||||||||||||||||||
| Number of active customers (thousands) | 14,085 | 0.5 | (0.2) | ||||||||||||||||||||
1. Includes exchange differences.
2. Excluding reverse repos.
3. Excluding repos.
January - March 2023 | | 63 | ||||||
| United States | |||||||||||||||||||||||
| EUR million | |||||||||||||||||||||||
| / | Q4'22 | / | Q1'22 | ||||||||||||||||||||
| Underlying income statement | Q1'23 | % | % excl. FX | % | % excl. FX | ||||||||||||||||||
| Net interest income | 1,465 | (8.1) | (3.4) | 6.3 | 1.7 | ||||||||||||||||||
| Net fee income | 190 | 3.4 | 9.1 | (3.6) | (7.8) | ||||||||||||||||||
Gains (losses) on financial transactions 1 | 46 | (19.0) | (15.7) | (32.2) | (35.2) | ||||||||||||||||||
| Other operating income | 127 | 2.9 | 8.8 | (24.9) | (28.2) | ||||||||||||||||||
| Total income | 1,827 | (6.6) | (1.8) | 0.9 | (3.5) | ||||||||||||||||||
| Administrative expenses and amortizations | (912) | (5.3) | (0.7) | 14.3 | 9.3 | ||||||||||||||||||
| Net operating income | 915 | (7.9) | (3.0) | (9.7) | (13.7) | ||||||||||||||||||
| Net loan-loss provisions | (567) | (10.9) | (7.4) | 121.9 | 112.2 | ||||||||||||||||||
| Other gains (losses) and provisions | (2) | (26.1) | (19.0) | (90.5) | (90.9) | ||||||||||||||||||
| Profit before tax | 346 | (2.3) | 5.5 | (53.2) | (55.2) | ||||||||||||||||||
| Tax on profit | (46) | (23.0) | (15.4) | (70.5) | (71.8) | ||||||||||||||||||
| Profit from continuing operations | 300 | 1.9 | 9.6 | (48.6) | (50.8) | ||||||||||||||||||
| Net profit from discontinued operations | — | — | — | — | — | ||||||||||||||||||
| Consolidated profit | 300 | 1.9 | 9.6 | (48.6) | (50.8) | ||||||||||||||||||
| Non-controlling interests | — | — | — | — | — | ||||||||||||||||||
| Profit attributable to the parent | 300 | 1.9 | 9.6 | (48.6) | (50.8) | ||||||||||||||||||
| Balance sheet | |||||||||||||||||||||||
| Loans and advances to customers | 134,069 | 2.8 | 4.6 | 22.7 | 19.9 | ||||||||||||||||||
| Cash, central banks and credit institutions | 20,632 | 3.2 | 4.9 | (12.1) | (14.1) | ||||||||||||||||||
| Debt instruments | 23,410 | 8.2 | 10.1 | 39.1 | 36.0 | ||||||||||||||||||
| Other financial assets | 4,999 | (4.6) | (3.0) | 4.4 | 2.0 | ||||||||||||||||||
| Other asset accounts | 17,313 | (2.9) | (1.3) | (3.7) | (5.9) | ||||||||||||||||||
| Total assets | 200,423 | 2.7 | 4.5 | 16.3 | 13.7 | ||||||||||||||||||
| Customer deposits | 125,593 | 1.1 | 2.9 | 26.0 | 23.1 | ||||||||||||||||||
| Central banks and credit institutions | 15,940 | 85.9 | 89.2 | 28.2 | 25.3 | ||||||||||||||||||
| Marketable debt securities | 29,468 | (9.8) | (8.3) | (5.9) | (8.0) | ||||||||||||||||||
| Other financial liabilities | 9,289 | 11.3 | 13.2 | 86.6 | 82.4 | ||||||||||||||||||
| Other liabilities accounts | 3,779 | (8.2) | (6.6) | (13.5) | (15.4) | ||||||||||||||||||
| Total liabilities | 184,069 | 3.5 | 5.2 | 20.5 | 17.8 | ||||||||||||||||||
| Total equity | 16,354 | (4.8) | (3.2) | (16.5) | (18.4) | ||||||||||||||||||
| Memorandum items: | |||||||||||||||||||||||
Gross loans and advances to customers 2 | 113,591 | (1.4) | 0.3 | 9.1 | 6.6 | ||||||||||||||||||
| Customer funds | 109,472 | (3.0) | (1.3) | 11.1 | 8.6 | ||||||||||||||||||
Customer deposits 3 | 94,663 | (3.7) | (2.1) | 11.4 | 8.9 | ||||||||||||||||||
| Mutual funds | 14,809 | 2.1 | 3.8 | 8.9 | 6.4 | ||||||||||||||||||
| Ratios (%), operating means and customers | |||||||||||||||||||||||
| RoTE | 7.49 | 1.07 | (4.95) | ||||||||||||||||||||
| Efficiency ratio | 49.9 | 0.7 | 5.9 | ||||||||||||||||||||
| NPL ratio | 3.13 | (0.12) | 0.38 | ||||||||||||||||||||
| NPL coverage ratio | 91.5 | 1.2 | (30.7) | ||||||||||||||||||||
| Number of employees | 14,491 | (0.8) | (6.8) | ||||||||||||||||||||
| Number of branches | 473 | (2.5) | (3.1) | ||||||||||||||||||||
| Number of total customers (thousands) | 4,457 | (1.5) | (6.3) | ||||||||||||||||||||
| Number of active customers (thousands) | 4,082 | (1.3) | (6.4) | ||||||||||||||||||||
1. Includes exchange differences.
2. Excluding reverse repos.
3. Excluding repos.
| 64 | | January - March 2023 | ||||||
| Mexico | |||||||||||||||||||||||
| EUR million | |||||||||||||||||||||||
| / | Q4'22 | / | Q1'22 | ||||||||||||||||||||
| Underlying income statement | Q1'23 | % | % excl. FX | % | % excl. FX | ||||||||||||||||||
| Net interest income | 983 | (2.6) | (3.4) | 30.5 | 13.6 | ||||||||||||||||||
| Net fee income | 320 | 3.6 | 3.1 | 30.3 | 13.4 | ||||||||||||||||||
Gains (losses) on financial transactions 1 | 24 | 1.9 | (2.3) | 88.4 | 64.0 | ||||||||||||||||||
| Other operating income | (26) | (14.5) | (14.5) | (11.6) | (23.0) | ||||||||||||||||||
| Total income | 1,300 | (0.8) | (1.6) | 32.5 | 15.3 | ||||||||||||||||||
| Administrative expenses and amortizations | (540) | (11.2) | (12.1) | 25.1 | 8.9 | ||||||||||||||||||
| Net operating income | 760 | 8.3 | 7.6 | 38.3 | 20.4 | ||||||||||||||||||
| Net loan-loss provisions | (239) | 2.7 | 1.6 | 30.6 | 13.6 | ||||||||||||||||||
| Other gains (losses) and provisions | (17) | 518.6 | — | (36.9) | (45.1) | ||||||||||||||||||
| Profit before tax | 504 | 8.1 | 7.3 | 48.3 | 29.1 | ||||||||||||||||||
| Tax on profit | (131) | 14.6 | 13.8 | 59.0 | 38.4 | ||||||||||||||||||
| Profit from continuing operations | 373 | 5.9 | 5.2 | 44.9 | 26.1 | ||||||||||||||||||
| Net profit from discontinued operations | — | — | — | — | — | ||||||||||||||||||
| Consolidated profit | 373 | 5.9 | 5.2 | 44.9 | 26.1 | ||||||||||||||||||
| Non-controlling interests | (14) | 10.2 | 9.2 | 63.7 | 42.5 | ||||||||||||||||||
| Profit attributable to the parent | 359 | 5.8 | 5.0 | 44.2 | 25.5 | ||||||||||||||||||
| Balance sheet | |||||||||||||||||||||||
| Loans and advances to customers | 43,831 | 6.7 | 0.5 | 20.0 | 6.1 | ||||||||||||||||||
| Cash, central banks and credit institutions | 21,491 | 40.9 | 32.8 | 63.5 | 44.7 | ||||||||||||||||||
| Debt instruments | 23,908 | 6.6 | 0.5 | 6.8 | (5.5) | ||||||||||||||||||
| Other financial assets | 10,313 | 11.4 | 5.0 | 57.7 | 39.6 | ||||||||||||||||||
| Other asset accounts | 4,997 | 8.1 | 1.9 | 32.2 | 17.0 | ||||||||||||||||||
| Total assets | 104,539 | 12.8 | 6.3 | 26.9 | 12.3 | ||||||||||||||||||
| Customer deposits | 47,568 | 7.4 | 1.2 | 19.3 | 5.6 | ||||||||||||||||||
| Central banks and credit institutions | 20,283 | 22.3 | 15.2 | 28.6 | 13.8 | ||||||||||||||||||
| Marketable debt securities | 9,473 | 13.1 | 6.6 | 35.9 | 20.3 | ||||||||||||||||||
| Other financial liabilities | 15,161 | 22.5 | 15.5 | 50.6 | 33.3 | ||||||||||||||||||
| Other liabilities accounts | 2,939 | 6.3 | 0.2 | 43.8 | 27.2 | ||||||||||||||||||
| Total liabilities | 95,425 | 13.0 | 6.5 | 27.7 | 13.0 | ||||||||||||||||||
| Total equity | 9,114 | 10.9 | 4.5 | 18.7 | 5.1 | ||||||||||||||||||
| Memorandum items: | |||||||||||||||||||||||
Gross loans and advances to customers 2 | 43,543 | 5.6 | (0.4) | 16.9 | 3.4 | ||||||||||||||||||
| Customer funds | 56,975 | 11.0 | 4.6 | 20.5 | 6.6 | ||||||||||||||||||
Customer deposits 3 | 42,363 | 13.3 | 6.8 | 23.0 | 8.9 | ||||||||||||||||||
| Mutual funds | 14,612 | 4.8 | (1.3) | 13.6 | 0.5 | ||||||||||||||||||
| Ratios (%), operating means and customers | |||||||||||||||||||||||
| RoTE | 17.98 | (0.06) | 3.26 | ||||||||||||||||||||
| Efficiency ratio | 41.6 | (4.9) | (2.5) | ||||||||||||||||||||
| NPL ratio | 2.39 | 0.07 | (0.71) | ||||||||||||||||||||
| NPL coverage ratio | 108.5 | 1.9 | 29.0 | ||||||||||||||||||||
| Number of employees | 29,619 | 2.7 | 6.6 | ||||||||||||||||||||
| Number of branches | 1,371 | 0.1 | — | ||||||||||||||||||||
| Number of total customers (thousands) | 20,284 | 0.2 | 6.6 | ||||||||||||||||||||
| Number of active customers (thousands) | 9,839 | 1.3 | 2.8 | ||||||||||||||||||||
1. Includes exchange differences.
2. Excluding reverse repos.
3. Excluding repos.
January - March 2023 | | 65 | ||||||
| Other North America | |||||||||||||||||||||||
| EUR million | |||||||||||||||||||||||
| / | Q4'22 | / | Q1'22 | ||||||||||||||||||||
| Underlying income statement | Q1'23 | % | % excl. FX | % | % excl. FX | ||||||||||||||||||
| Net interest income | — | 87.7 | 87.7 | 23.8 | 23.8 | ||||||||||||||||||
| Net fee income | 12 | (25.1) | (25.1) | — | — | ||||||||||||||||||
Gains (losses) on financial transactions 1 | (1) | 99.3 | 99.3 | — | — | ||||||||||||||||||
| Other operating income | 2 | (87.1) | (87.1) | — | — | ||||||||||||||||||
| Total income | 14 | (51.4) | (51.4) | 675.0 | 675.0 | ||||||||||||||||||
| Administrative expenses and amortizations | (47) | (21.4) | (21.4) | 57.6 | 57.4 | ||||||||||||||||||
| Net operating income | (33) | 5.0 | 5.0 | 19.0 | 18.9 | ||||||||||||||||||
| Net loan-loss provisions | (2) | (25.7) | (25.7) | — | — | ||||||||||||||||||
| Other gains (losses) and provisions | — | (95.7) | (95.7) | 35.2 | 35.2 | ||||||||||||||||||
| Profit before tax | (35) | (1.5) | (1.5) | 25.8 | 25.6 | ||||||||||||||||||
| Tax on profit | 2 | (74.1) | (74.1) | 16.8 | 16.2 | ||||||||||||||||||
| Profit from continuing operations | (33) | 20.8 | 20.8 | 26.4 | 26.3 | ||||||||||||||||||
| Net profit from discontinued operations | — | — | — | — | — | ||||||||||||||||||
| Consolidated profit | (33) | 20.8 | 20.8 | 26.4 | 26.3 | ||||||||||||||||||
| Non-controlling interests | 1 | 146.7 | 146.7 | — | — | ||||||||||||||||||
| Profit attributable to the parent | (32) | 18.4 | 18.5 | 22.2 | 22.0 | ||||||||||||||||||
| Balance sheet | |||||||||||||||||||||||
| Loans and advances to customers | 44 | (8.1) | (8.1) | 567.2 | 567.2 | ||||||||||||||||||
| Cash, central banks and credit institutions | 318 | (10.0) | (10.0) | 66.9 | 66.9 | ||||||||||||||||||
| Debt instruments | — | (100.0) | (100.0) | — | — | ||||||||||||||||||
| Other financial assets | 120 | (29.1) | (29.1) | — | — | ||||||||||||||||||
| Other asset accounts | 297 | 5.3 | 5.3 | 11.2 | 11.2 | ||||||||||||||||||
| Total assets | 779 | (8.7) | (8.7) | 67.7 | 67.7 | ||||||||||||||||||
| Customer deposits | 201 | (12.4) | (12.4) | — | — | ||||||||||||||||||
| Central banks and credit institutions | 155 | 18.8 | 18.8 | 190.9 | 190.8 | ||||||||||||||||||
| Marketable debt securities | — | — | — | — | — | ||||||||||||||||||
| Other financial liabilities | 126 | (22.5) | (22.5) | 296.4 | 296.4 | ||||||||||||||||||
| Other liabilities accounts | 64 | 0.7 | 0.7 | 230.9 | 230.9 | ||||||||||||||||||
| Total liabilities | 547 | (6.8) | (6.8) | 370.9 | 370.8 | ||||||||||||||||||
| Total equity | 232 | (12.7) | (12.7) | (33.4) | (33.3) | ||||||||||||||||||
| Memorandum items: | |||||||||||||||||||||||
Gross loans and advances to customers 2 | 53 | (4.6) | (4.6) | 663.9 | 663.9 | ||||||||||||||||||
| Customer funds | 201 | (12.4) | (12.4) | — | — | ||||||||||||||||||
Customer deposits 3 | 201 | (12.4) | (12.4) | — | — | ||||||||||||||||||
| Mutual funds | — | — | — | — | — | ||||||||||||||||||
| Resources | |||||||||||||||||||||||
| Number of employees | 1,060 | (1.3) | 97.8 | ||||||||||||||||||||
1. Includes exchange differences.
2. Excluding reverse repos.
3. Excluding repos.
| 66 | | January - March 2023 | ||||||
| SOUTH AMERICA | |||||||||||||||||||||||
| EUR million | |||||||||||||||||||||||
| / | Q4'22 | / | Q1'22 | ||||||||||||||||||||
| Underlying income statement | Q1'23 | % | % excl. FX | % | % excl. FX | ||||||||||||||||||
| Net interest income | 3,163 | 0.7 | (3.4) | 4.1 | 4.2 | ||||||||||||||||||
| Net fee income | 1,166 | — | (3.8) | 15.1 | 16.4 | ||||||||||||||||||
Gains (losses) on financial transactions 1 | 322 | 7.7 | (2.1) | 42.9 | 54.1 | ||||||||||||||||||
| Other operating income | (247) | 27.8 | (12.6) | 207.9 | 747.6 | ||||||||||||||||||
| Total income | 4,404 | (0.2) | (2.8) | 5.0 | 4.4 | ||||||||||||||||||
| Administrative expenses and amortizations | (1,723) | (0.9) | (6.4) | 16.1 | 19.2 | ||||||||||||||||||
| Net operating income | 2,680 | 0.3 | (0.4) | (1.1) | (3.3) | ||||||||||||||||||
| Net loan-loss provisions | (1,232) | (12.5) | (11.1) | 23.4 | 19.8 | ||||||||||||||||||
| Other gains (losses) and provisions | (201) | 29.0 | 14.8 | 32.9 | 43.8 | ||||||||||||||||||
| Profit before tax | 1,247 | 12.5 | 10.6 | (20.1) | (22.2) | ||||||||||||||||||
| Tax on profit | (349) | 43.7 | 43.5 | (31.3) | (33.8) | ||||||||||||||||||
| Profit from continuing operations | 898 | 3.8 | 1.5 | (14.7) | (16.5) | ||||||||||||||||||
| Net profit from discontinued operations | — | — | — | — | — | ||||||||||||||||||
| Consolidated profit | 898 | 3.8 | 1.5 | (14.7) | (16.5) | ||||||||||||||||||
| Non-controlling interests | (108) | 18.5 | 16.4 | (29.4) | (32.4) | ||||||||||||||||||
| Profit attributable to the parent | 790 | 2.0 | (0.3) | (12.2) | (13.7) | ||||||||||||||||||
| Balance sheet | |||||||||||||||||||||||
| Loans and advances to customers | 152,304 | 5.2 | 2.4 | 7.2 | 11.5 | ||||||||||||||||||
| Cash, central banks and credit institutions | 59,115 | 12.9 | 10.9 | 18.4 | 24.6 | ||||||||||||||||||
| Debt instruments | 59,547 | 4.3 | 2.9 | (1.2) | 5.0 | ||||||||||||||||||
| Other financial assets | 21,190 | 6.7 | 2.0 | 10.7 | 11.7 | ||||||||||||||||||
| Other asset accounts | 18,891 | 0.5 | (1.4) | 3.8 | 9.5 | ||||||||||||||||||
| Total assets | 311,047 | 6.2 | 3.8 | 7.4 | 12.3 | ||||||||||||||||||
| Customer deposits | 143,378 | 4.2 | 2.4 | 5.0 | 10.9 | ||||||||||||||||||
| Central banks and credit institutions | 47,262 | 10.1 | 7.0 | 3.9 | 7.4 | ||||||||||||||||||
| Marketable debt securities | 38,669 | 10.3 | 6.6 | 20.9 | 24.1 | ||||||||||||||||||
| Other financial liabilities | 44,320 | 6.9 | 3.5 | 6.8 | 10.6 | ||||||||||||||||||
| Other liabilities accounts | 11,799 | 4.2 | 1.2 | 12.5 | 17.4 | ||||||||||||||||||
| Total liabilities | 285,429 | 6.3 | 3.8 | 7.3 | 12.1 | ||||||||||||||||||
| Total equity | 25,618 | 4.5 | 2.8 | 8.2 | 14.1 | ||||||||||||||||||
| Memorandum items: | |||||||||||||||||||||||
Gross loans and advances to customers 2 | 159,987 | 5.0 | 2.2 | 7.4 | 11.7 | ||||||||||||||||||
| Customer funds | 192,587 | 5.5 | 3.8 | 4.5 | 10.6 | ||||||||||||||||||
Customer deposits 3 | 129,645 | 5.1 | 3.5 | 4.4 | 10.5 | ||||||||||||||||||
| Mutual funds | 62,942 | 6.3 | 4.4 | 4.7 | 10.8 | ||||||||||||||||||
| Ratios (%), operating means and customers | |||||||||||||||||||||||
| RoTE | 15.27 | 0.18 | (4.56) | ||||||||||||||||||||
| Efficiency ratio | 39.1 | (0.3) | 3.8 | ||||||||||||||||||||
| NPL ratio | 5.99 | (0.21) | 0.94 | ||||||||||||||||||||
| NPL coverage ratio | 76.3 | 0.3 | (15.9) | ||||||||||||||||||||
| Number of employees | 79,749 | 1.9 | 5.2 | ||||||||||||||||||||
| Number of branches | 3,653 | — | (3.9) | ||||||||||||||||||||
| Number of total customers (thousands) | 70,616 | 1.5 | 9.6 | ||||||||||||||||||||
| Number of active customers (thousands) | 38,228 | (0.4) | 3.7 | ||||||||||||||||||||
1. Includes exchange differences.
2. Excluding reverse repos.
3. Excluding repos.
January - March 2023 | | 67 | ||||||
| Brazil | |||||||||||||||||||||||
| EUR million | |||||||||||||||||||||||
| / | Q4'22 | / | Q1'22 | ||||||||||||||||||||
| Underlying income statement | Q1'23 | % | % excl. FX | % | % excl. FX | ||||||||||||||||||
| Net interest income | 2,105 | (5.5) | (1.9) | (1.7) | (6.4) | ||||||||||||||||||
| Net fee income | 817 | (7.6) | (4.1) | 10.0 | 4.8 | ||||||||||||||||||
Gains (losses) on financial transactions 1 | 127 | (31.7) | (29.0) | 40.5 | 33.9 | ||||||||||||||||||
| Other operating income | 8 | — | — | (80.9) | (81.8) | ||||||||||||||||||
| Total income | 3,057 | (5.6) | (2.0) | 1.3 | (3.5) | ||||||||||||||||||
| Administrative expenses and amortizations | (1,080) | (7.8) | (4.3) | 16.2 | 10.7 | ||||||||||||||||||
| Net operating income | 1,977 | (4.4) | (0.6) | (5.4) | (9.8) | ||||||||||||||||||
| Net loan-loss provisions | (1,034) | (17.4) | (14.3) | 21.4 | 15.7 | ||||||||||||||||||
| Other gains (losses) and provisions | (178) | 125.4 | 133.6 | 56.2 | 48.9 | ||||||||||||||||||
| Profit before tax | 765 | 3.6 | 8.3 | (31.9) | (35.1) | ||||||||||||||||||
| Tax on profit | (249) | 43.6 | 50.9 | (41.2) | (44.0) | ||||||||||||||||||
| Profit from continuing operations | 517 | (8.6) | (4.7) | (26.2) | (29.7) | ||||||||||||||||||
| Net profit from discontinued operations | — | — | — | — | — | ||||||||||||||||||
| Consolidated profit | 517 | (8.6) | (4.7) | (26.2) | (29.7) | ||||||||||||||||||
| Non-controlling interests | (47) | (0.9) | 3.6 | (34.9) | (38.0) | ||||||||||||||||||
| Profit attributable to the parent | 469 | (9.3) | (5.5) | (25.2) | (28.7) | ||||||||||||||||||
| Balance sheet | |||||||||||||||||||||||
| Loans and advances to customers | 90,396 | 4.9 | 2.2 | 4.9 | 9.3 | ||||||||||||||||||
| Cash, central banks and credit institutions | 44,566 | 9.1 | 6.3 | 23.6 | 28.9 | ||||||||||||||||||
| Debt instruments | 39,816 | 6.5 | 3.7 | (9.9) | (6.0) | ||||||||||||||||||
| Other financial assets | 6,348 | 11.7 | 8.8 | (21.3) | (17.9) | ||||||||||||||||||
| Other asset accounts | 14,014 | (0.2) | (2.7) | 7.0 | 11.6 | ||||||||||||||||||
| Total assets | 195,141 | 6.0 | 3.2 | 4.0 | 8.5 | ||||||||||||||||||
| Customer deposits | 92,085 | 2.4 | (0.3) | 5.3 | 9.8 | ||||||||||||||||||
| Central banks and credit institutions | 26,988 | 15.0 | 12.0 | (4.9) | (0.9) | ||||||||||||||||||
| Marketable debt securities | 26,699 | 11.3 | 8.4 | 21.3 | 26.4 | ||||||||||||||||||
| Other financial liabilities | 27,794 | 8.1 | 5.3 | (2.4) | 1.7 | ||||||||||||||||||
| Other liabilities accounts | 5,609 | 2.4 | (0.2) | (3.5) | 0.6 | ||||||||||||||||||
| Total liabilities | 179,176 | 6.3 | 3.5 | 4.1 | 8.5 | ||||||||||||||||||
| Total equity | 15,965 | 2.7 | 0.1 | 3.5 | 7.9 | ||||||||||||||||||
| Memorandum items: | |||||||||||||||||||||||
Gross loans and advances to customers 2 | 96,362 | 4.5 | 1.8 | 5.4 | 9.9 | ||||||||||||||||||
| Customer funds | 125,961 | 4.2 | 1.5 | 2.8 | 7.2 | ||||||||||||||||||
Customer deposits 3 | 78,703 | 3.9 | 1.2 | 4.5 | 9.0 | ||||||||||||||||||
| Mutual funds | 47,258 | 4.7 | 2.0 | — | 4.3 | ||||||||||||||||||
| Ratios (%), operating means and customers | |||||||||||||||||||||||
| RoTE | 14.11 | (0.91) | (6.87) | ||||||||||||||||||||
| Efficiency ratio | 35.3 | (0.8) | 4.5 | ||||||||||||||||||||
| NPL ratio | 7.34 | (0.23) | 1.66 | ||||||||||||||||||||
| NPL coverage ratio | 79.5 | — | (21.6) | ||||||||||||||||||||
| Number of employees | 56,701 | 1.3 | 5.3 | ||||||||||||||||||||
| Number of branches | 2,846 | — | (3.7) | ||||||||||||||||||||
| Number of total customers (thousands) | 60,962 | 1.4 | 11.2 | ||||||||||||||||||||
| Number of active customers (thousands) | 31,728 | (0.3) | 3.6 | ||||||||||||||||||||
1. Includes exchange differences.
2. Excluding reverse repos.
3. Excluding repos.
| 68 | | January - March 2023 | ||||||
| Chile | |||||||||||||||||||||||
| EUR million | |||||||||||||||||||||||
| / | Q4'22 | / | Q1'22 | ||||||||||||||||||||
| Underlying income statement | Q1'23 | % | % excl. FX | % | % excl. FX | ||||||||||||||||||
| Net interest income | 371 | 11.7 | 3.7 | (23.2) | (26.2) | ||||||||||||||||||
| Net fee income | 153 | 20.7 | 12.9 | 36.8 | 31.4 | ||||||||||||||||||
Gains (losses) on financial transactions 1 | 81 | 28.6 | 20.3 | 24.9 | 20.0 | ||||||||||||||||||
| Other operating income | 1 | — | — | — | — | ||||||||||||||||||
| Total income | 606 | 17.8 | 9.7 | (6.7) | (10.4) | ||||||||||||||||||
| Administrative expenses and amortizations | (254) | 4.4 | (2.4) | 8.6 | 4.3 | ||||||||||||||||||
| Net operating income | 352 | 29.9 | 20.5 | (15.4) | (18.7) | ||||||||||||||||||
| Net loan-loss provisions | (117) | 8.5 | 1.5 | 23.9 | 19.0 | ||||||||||||||||||
| Other gains (losses) and provisions | 10 | 6.1 | 1.7 | 604.1 | 576.4 | ||||||||||||||||||
| Profit before tax | 245 | 42.0 | 31.3 | (24.2) | (27.2) | ||||||||||||||||||
| Tax on profit | (33) | — | 819.9 | (40.4) | (42.7) | ||||||||||||||||||
| Profit from continuing operations | 212 | 25.1 | 15.9 | (20.8) | (24.0) | ||||||||||||||||||
| Net profit from discontinued operations | — | — | — | — | — | ||||||||||||||||||
| Consolidated profit | 212 | 25.1 | 15.9 | (20.8) | (24.0) | ||||||||||||||||||
| Non-controlling interests | (61) | 41.4 | 30.5 | (23.0) | (26.0) | ||||||||||||||||||
| Profit attributable to the parent | 150 | 19.4 | 10.8 | (19.9) | (23.1) | ||||||||||||||||||
| Balance sheet | |||||||||||||||||||||||
| Loans and advances to customers | 46,290 | 6.8 | 1.1 | 10.4 | 8.7 | ||||||||||||||||||
| Cash, central banks and credit institutions | 7,406 | 16.7 | 10.5 | (5.4) | (6.8) | ||||||||||||||||||
| Debt instruments | 13,051 | 9.0 | 3.2 | 30.1 | 28.1 | ||||||||||||||||||
| Other financial assets | 14,479 | 4.2 | (1.4) | 31.9 | 29.9 | ||||||||||||||||||
| Other asset accounts | 2,956 | 3.0 | (2.5) | (4.7) | (6.2) | ||||||||||||||||||
| Total assets | 84,182 | 7.3 | 1.6 | 14.0 | 12.2 | ||||||||||||||||||
| Customer deposits | 31,718 | 9.2 | 3.4 | 1.1 | (0.5) | ||||||||||||||||||
| Central banks and credit institutions | 14,792 | 6.4 | 0.7 | 21.5 | 19.6 | ||||||||||||||||||
| Marketable debt securities | 11,254 | 8.1 | 2.3 | 18.7 | 16.9 | ||||||||||||||||||
| Other financial liabilities | 15,225 | 3.9 | (1.6) | 27.8 | 25.8 | ||||||||||||||||||
| Other liabilities accounts | 5,146 | 6.5 | 0.8 | 43.0 | 40.8 | ||||||||||||||||||
| Total liabilities | 78,136 | 7.3 | 1.5 | 14.0 | 12.2 | ||||||||||||||||||
| Total equity | 6,046 | 8.4 | 2.6 | 13.6 | 11.8 | ||||||||||||||||||
| Memorandum items: | |||||||||||||||||||||||
Gross loans and advances to customers 2 | 47,631 | 6.8 | 1.1 | 10.4 | 8.7 | ||||||||||||||||||
| Customer funds | 41,475 | 9.1 | 3.3 | 5.1 | 3.5 | ||||||||||||||||||
Customer deposits 3 | 31,407 | 8.7 | 2.9 | 0.8 | (0.8) | ||||||||||||||||||
| Mutual funds | 10,068 | 10.3 | 4.4 | 21.5 | 19.6 | ||||||||||||||||||
| Ratios (%), operating means and customers | |||||||||||||||||||||||
| RoTE | 14.7 | 0.8 | (6.7) | ||||||||||||||||||||
| Efficiency ratio | 41.9 | (5.4) | 5.9 | ||||||||||||||||||||
| NPL ratio | 4.7 | (0.2) | — | ||||||||||||||||||||
| NPL coverage ratio | 59.2 | 2.8 | (1.6) | ||||||||||||||||||||
| Number of employees | 10,110 | 3.4 | (1.2) | ||||||||||||||||||||
| Number of branches | 275 | (2.8) | (12.4) | ||||||||||||||||||||
| Number of total customers (thousands) | 3,720 | 4.0 | (11.1) | ||||||||||||||||||||
| Number of active customers (thousands) | 2,175 | (1.0) | 5.6 | ||||||||||||||||||||
1. Includes exchange differences.
2. Excluding reverse repos.
3. Excluding repos.
January - March 2023 | | 69 | ||||||
| Argentina | |||||||||||||||||||||||
| EUR million | |||||||||||||||||||||||
| / | Q4'22 | / | Q1'22 | ||||||||||||||||||||
| Underlying income statement | Q1'23 | % | % excl. FX | % | % excl. FX | ||||||||||||||||||
| Net interest income | 532 | 23.5 | (14.7) | 77.4 | 226.5 | ||||||||||||||||||
| Net fee income | 137 | 41.7 | (18.4) | 13.6 | 109.2 | ||||||||||||||||||
Gains (losses) on financial transactions (1) | 86 | 245.5 | 46.7 | 65.6 | 204.9 | ||||||||||||||||||
| Other operating income | (254) | 91.8 | 14.0 | 133.5 | 329.8 | ||||||||||||||||||
| Total income | 501 | 19.4 | (20.1) | 37.8 | 153.6 | ||||||||||||||||||
| Administrative expenses and amortizations | (250) | 40.4 | (18.7) | 15.3 | 112.3 | ||||||||||||||||||
| Net operating income | 251 | 3.9 | (21.5) | 70.9 | 214.5 | ||||||||||||||||||
| Net loan-loss provisions | (43) | 63.4 | 0.3 | 9.9 | 102.3 | ||||||||||||||||||
| Other gains (losses) and provisions | (30) | (64.4) | (71.9) | (20.5) | 46.2 | ||||||||||||||||||
| Profit before tax | 179 | 35.9 | 4.6 | 153.4 | 366.4 | ||||||||||||||||||
| Tax on profit | (39) | (3.3) | (20.2) | 258.6 | 560.1 | ||||||||||||||||||
| Profit from continuing operations | 140 | 53.2 | 14.5 | 134.2 | 331.1 | ||||||||||||||||||
| Net profit from discontinued operations | — | — | — | — | — | ||||||||||||||||||
| Consolidated profit | 140 | 53.2 | 14.5 | 134.2 | 331.1 | ||||||||||||||||||
| Non-controlling interests | — | (11.1) | (25.0) | 37.7 | 153.5 | ||||||||||||||||||
| Profit attributable to the parent | 139 | 53.4 | 14.6 | 134.5 | 331.7 | ||||||||||||||||||
| Balance sheet | |||||||||||||||||||||||
| Loans and advances to customers | 5,767 | 3.2 | 23.9 | 5.2 | 93.7 | ||||||||||||||||||
| Cash, central banks and credit institutions | 4,349 | 44.0 | 72.8 | 56.5 | 188.0 | ||||||||||||||||||
| Debt instruments | 4,281 | (19.5) | (3.4) | (0.7) | 82.7 | ||||||||||||||||||
| Other financial assets | 64 | (13.6) | 3.8 | 112.7 | 291.5 | ||||||||||||||||||
| Other asset accounts | 940 | (7.6) | 11.0 | (9.8) | 66.1 | ||||||||||||||||||
| Total assets | 15,400 | 2.6 | 23.1 | 12.9 | 107.8 | ||||||||||||||||||
| Customer deposits | 10,844 | 2.8 | 23.4 | 9.6 | 101.8 | ||||||||||||||||||
| Central banks and credit institutions | 895 | (17.1) | (0.5) | 71.1 | 215.0 | ||||||||||||||||||
| Marketable debt securities | 149 | (3.1) | 16.3 | (18.1) | 50.7 | ||||||||||||||||||
| Other financial liabilities | 906 | 11.7 | 34.1 | (2.2) | 79.9 | ||||||||||||||||||
| Other liabilities accounts | 485 | (5.6) | 13.3 | (17.0) | 52.8 | ||||||||||||||||||
| Total liabilities | 13,279 | 1.3 | 21.6 | 9.7 | 101.8 | ||||||||||||||||||
| Total equity | 2,121 | 11.1 | 33.3 | 38.2 | 154.4 | ||||||||||||||||||
| Memorandum items: | |||||||||||||||||||||||
Gross loans and advances to customers 2 | 5,954 | 3.0 | 23.6 | 3.6 | 90.7 | ||||||||||||||||||
| Customer funds | 15,437 | 6.5 | 27.8 | 15.5 | 112.6 | ||||||||||||||||||
Customer deposits 3 | 10,804 | 2.4 | 23.0 | 9.2 | 101.0 | ||||||||||||||||||
| Mutual funds | 4,633 | 17.2 | 40.7 | 33.5 | 145.7 | ||||||||||||||||||
| Ratios (%), operating means and customers | |||||||||||||||||||||||
| RoTE | 29.82 | (5.09) | 11.49 | ||||||||||||||||||||
| Efficiency ratio | 49.8 | 7.5 | (9.7) | ||||||||||||||||||||
| NPL ratio | 2.08 | (0.01) | (1.13) | ||||||||||||||||||||
| NPL coverage ratio | 169.4 | (11.0) | 7.7 | ||||||||||||||||||||
| Number of employees | 8,301 | 0.6 | (2.9) | ||||||||||||||||||||
| Number of branches | 382 | 1.9 | (6.1) | ||||||||||||||||||||
| Number of total customers (thousands) | 4,446 | 1.4 | 5.1 | ||||||||||||||||||||
| Number of active customers (thousands) | 3,158 | (1.4) | 1.0 | ||||||||||||||||||||
1. Includes exchange differences.
2. Excluding reverse repos.
3. Excluding repos.
| 70 | | January - March 2023 | ||||||
| Other South America | |||||||||||||||||||||||
| EUR million | |||||||||||||||||||||||
| / | Q4'22 | / | Q1'22 | ||||||||||||||||||||
| Underlying income statement | Q1'23 | % | % excl. FX | % | % excl. FX | ||||||||||||||||||
| Net interest income | 154 | 3.3 | 5.7 | 38.9 | 28.2 | ||||||||||||||||||
| Net fee income | 59 | 2.4 | 3.8 | 56.7 | 46.7 | ||||||||||||||||||
Gains (losses) on financial transactions 1 | 28 | 10.1 | 15.8 | 54.4 | 51.4 | ||||||||||||||||||
| Other operating income | (3) | — | — | (47.2) | (50.1) | ||||||||||||||||||
| Total income | 239 | 0.5 | 2.8 | 47.3 | 37.2 | ||||||||||||||||||
| Administrative expenses and amortizations | (139) | (5.4) | (3.7) | 34.4 | 28.0 | ||||||||||||||||||
| Net operating income | 100 | 10.2 | 13.7 | 70.0 | 52.5 | ||||||||||||||||||
| Net loan-loss provisions | (38) | 70.2 | 75.5 | 188.8 | 162.3 | ||||||||||||||||||
| Other gains (losses) and provisions | (3) | 55.6 | 60.9 | 230.4 | 176.4 | ||||||||||||||||||
| Profit before tax | 59 | (11.3) | (8.4) | 31.9 | 18.0 | ||||||||||||||||||
| Tax on profit | (29) | 8.2 | 10.6 | 47.1 | 39.0 | ||||||||||||||||||
| Profit from continuing operations | 30 | (24.4) | (21.4) | 20.0 | 3.1 | ||||||||||||||||||
| Net profit from discontinued operations | — | — | — | — | — | ||||||||||||||||||
| Consolidated profit | 30 | (24.4) | (21.4) | 20.0 | 3.1 | ||||||||||||||||||
| Non-controlling interests | 1 | 134.7 | 135.0 | 983.1 | 977.9 | ||||||||||||||||||
| Profit attributable to the parent | 31 | (22.3) | (19.2) | 24.4 | 6.9 | ||||||||||||||||||
| Balance sheet | |||||||||||||||||||||||
| Loans and advances to customers | 9,851 | 1.7 | 1.1 | 16.5 | 17.8 | ||||||||||||||||||
| Cash, central banks and credit institutions | 2,793 | 30.8 | 30.4 | (14.6) | (17.5) | ||||||||||||||||||
| Debt instruments | 2,399 | (1.0) | (1.4) | 34.6 | 31.3 | ||||||||||||||||||
| Other financial assets | 299 | 49.6 | 49.7 | 289.7 | 303.4 | ||||||||||||||||||
| Other asset accounts | 981 | 12.6 | 12.4 | 2.0 | 1.1 | ||||||||||||||||||
| Total assets | 16,324 | 6.6 | 6.1 | 12.2 | 11.7 | ||||||||||||||||||
| Customer deposits | 8,730 | 7.6 | 7.1 | 11.8 | 7.5 | ||||||||||||||||||
| Central banks and credit institutions | 4,587 | 2.9 | 2.1 | 4.2 | 11.7 | ||||||||||||||||||
| Marketable debt securities | 567 | 14.0 | 13.9 | 88.5 | 78.2 | ||||||||||||||||||
| Other financial liabilities | 396 | 49.4 | 49.2 | 140.5 | 140.6 | ||||||||||||||||||
| Other liabilities accounts | 558 | 10.9 | 10.6 | 15.1 | 12.1 | ||||||||||||||||||
| Total liabilities | 14,838 | 7.2 | 6.7 | 12.7 | 12.3 | ||||||||||||||||||
| Total equity | 1,485 | 0.3 | 0.1 | 7.2 | 5.5 | ||||||||||||||||||
| Memorandum items: | |||||||||||||||||||||||
Gross loans and advances to customers 2 | 10,040 | 1.7 | 1.1 | 16.4 | 17.7 | ||||||||||||||||||
| Customer funds | 9,714 | 6.5 | 6.2 | 9.0 | 4.3 | ||||||||||||||||||
Customer deposits 3 | 8,730 | 7.7 | 7.3 | 11.8 | 7.5 | ||||||||||||||||||
| Mutual funds | 984 | (2.7) | (3.0) | (10.8) | (17.4) | ||||||||||||||||||
| Resources | |||||||||||||||||||||||
| Number of employees | 4,637 | 9.0 | 47.9 | ||||||||||||||||||||
1. Includes exchange differences.
2. Excluding reverse repos.
3. Excluding repos.
January - March 2023 | | 71 | ||||||
| DIGITAL CONSUMER BANK | |||||||||||||||||||||||
| EUR million | |||||||||||||||||||||||
| / | Q4'22 | / | Q1'22 | ||||||||||||||||||||
| Underlying income statement | Q1'23 | % | % excl. FX | % | % excl. FX | ||||||||||||||||||
| Net interest income | 1,029 | 4.0 | 4.8 | 0.9 | 3.0 | ||||||||||||||||||
| Net fee income | 191 | (11.1) | (10.9) | (7.3) | (6.9) | ||||||||||||||||||
Gains (losses) on financial transactions 1 | 30 | (17.5) | (17.1) | — | — | ||||||||||||||||||
| Other operating income | 93 | (34.0) | (33.0) | 8.2 | 10.1 | ||||||||||||||||||
| Total income | 1,343 | (2.8) | (2.0) | 2.4 | 4.2 | ||||||||||||||||||
| Administrative expenses and amortizations | (659) | 8.3 | 8.4 | 2.3 | 3.9 | ||||||||||||||||||
| Net operating income | 684 | (11.5) | (10.4) | 2.5 | 4.5 | ||||||||||||||||||
| Net loan-loss provisions | (193) | 68.5 | 67.4 | 30.4 | 34.1 | ||||||||||||||||||
| Other gains (losses) and provisions | (43) | — | — | 151.8 | 161.5 | ||||||||||||||||||
| Profit before tax | 447 | (31.7) | (30.6) | (10.8) | (9.3) | ||||||||||||||||||
| Tax on profit | (111) | (35.3) | (34.2) | — | 1.3 | ||||||||||||||||||
| Profit from continuing operations | 337 | (30.5) | (29.4) | (13.9) | (12.4) | ||||||||||||||||||
| Net profit from discontinued operations | — | — | — | — | — | ||||||||||||||||||
| Consolidated profit | 337 | (30.5) | (29.4) | (13.9) | (12.4) | ||||||||||||||||||
| Non-controlling interests | (93) | 10.5 | 10.6 | (14.8) | (14.3) | ||||||||||||||||||
| Profit attributable to the parent | 244 | (39.1) | (37.9) | (13.5) | (11.6) | ||||||||||||||||||
| Balance sheet | |||||||||||||||||||||||
| Loans and advances to customers | 124,108 | 1.2 | 2.0 | 8.7 | 11.2 | ||||||||||||||||||
| Cash, central banks and credit institutions | 15,689 | 27.4 | 29.2 | (11.0) | (9.1) | ||||||||||||||||||
| Debt instruments | 6,935 | (9.3) | (8.9) | 31.1 | 32.9 | ||||||||||||||||||
| Other financial assets | 176 | (7.2) | (7.3) | 76.8 | 78.8 | ||||||||||||||||||
| Other asset accounts | 8,991 | 8.8 | 8.9 | 22.6 | 24.2 | ||||||||||||||||||
| Total assets | 155,899 | 3.2 | 4.0 | 7.9 | 10.2 | ||||||||||||||||||
| Customer deposits | 60,670 | 3.6 | 4.6 | 6.6 | 8.7 | ||||||||||||||||||
| Central banks and credit institutions | 40,586 | 3.6 | 4.1 | 10.0 | 12.8 | ||||||||||||||||||
| Marketable debt securities | 35,194 | 4.3 | 5.0 | 10.0 | 12.0 | ||||||||||||||||||
| Other financial liabilities | 1,711 | (6.0) | (5.9) | 11.4 | 12.8 | ||||||||||||||||||
| Other liabilities accounts | 4,976 | 5.8 | 6.4 | 11.3 | 12.7 | ||||||||||||||||||
| Total liabilities | 143,136 | 3.7 | 4.5 | 8.6 | 10.8 | ||||||||||||||||||
| Total equity | 12,763 | (2.0) | (0.8) | 0.3 | 3.7 | ||||||||||||||||||
| Memorandum items: | |||||||||||||||||||||||
Gross loans and advances to customers 2 | 126,512 | 1.2 | 2.0 | 8.3 | 10.8 | ||||||||||||||||||
| Customer funds | 63,914 | 3.7 | 4.6 | 7.8 | 9.8 | ||||||||||||||||||
Customer deposits 3 | 60,670 | 3.6 | 4.6 | 6.6 | 8.7 | ||||||||||||||||||
| Mutual funds | 3,243 | 5.3 | 5.3 | 36.1 | 36.1 | ||||||||||||||||||
| Ratios (%), operating means and customers | |||||||||||||||||||||||
| RoTE | 9.89 | (6.59) | (2.71) | ||||||||||||||||||||
| Efficiency ratio | 49.1 | 5.0 | (0.1) | ||||||||||||||||||||
| NPL ratio | 2.05 | (0.01) | (0.22) | ||||||||||||||||||||
| NPL coverage ratio | 93.5 | 0.7 | (5.9) | ||||||||||||||||||||
| Number of employees | 16,642 | 2.8 | 5.0 | ||||||||||||||||||||
| Number of branches | 363 | (0.3) | (2.2) | ||||||||||||||||||||
| Number of total customers (thousands) | 19,829 | 0.4 | 2.5 | ||||||||||||||||||||
1. Includes exchange differences.
2. Excluding reverse repos.
3. Excluding repos.
| 72 | | January - March 2023 | ||||||
| CORPORATE CENTRE | |||||||||||||||||||||||
| EUR million | |||||||||||||||||||||||
| / | Q4'22 | / | Q1'22 | ||||||||||||||||||||
| Underlying income statement | Q1'23 | Q4'22 | % | Q1'22 | % | ||||||||||||||||||
| Net interest income | (52) | (142) | (63.6) | (172) | (69.9) | ||||||||||||||||||
| Net fee income | (3) | (16) | (78.8) | (3) | 8.7 | ||||||||||||||||||
Gains (losses) on financial transactions 1 | (54) | (100) | (45.6) | (119) | (54.2) | ||||||||||||||||||
| Other operating income | (15) | (63) | (76.5) | (7) | 111.6 | ||||||||||||||||||
| Total income | (124) | (322) | (61.3) | (301) | (58.7) | ||||||||||||||||||
| Administrative expenses and amortizations | (95) | (100) | (5.2) | (87) | 8.8 | ||||||||||||||||||
| Net operating income | (219) | (422) | (48.0) | (388) | (43.5) | ||||||||||||||||||
| Net loan-loss provisions | 3 | 13 | (77.5) | (1) | — | ||||||||||||||||||
| Other gains (losses) and provisions | (44) | (56) | (21.9) | (48) | (8.2) | ||||||||||||||||||
| Profit before tax | (260) | (465) | (44.0) | (437) | (40.5) | ||||||||||||||||||
| Tax on profit | (19) | (1) | — | (25) | (26.3) | ||||||||||||||||||
| Profit from continuing operations | (279) | (466) | (40.2) | (462) | (39.7) | ||||||||||||||||||
| Net profit from discontinued operations | — | — | — | — | — | ||||||||||||||||||
| Consolidated profit | (279) | (466) | (40.2) | (462) | (39.7) | ||||||||||||||||||
| Non-controlling interests | — | — | (82.3) | — | — | ||||||||||||||||||
| Profit attributable to the parent | (279) | (466) | (40.2) | (462) | (39.7) | ||||||||||||||||||
| Balance sheet | |||||||||||||||||||||||
| Loans and advances to customers | 5,680 | 5,785 | (1.8) | 6,901 | (17.7) | ||||||||||||||||||
| Cash, central banks and credit institutions | 94,047 | 123,230 | (23.7) | 87,582 | 7.4 | ||||||||||||||||||
| Debt instruments | 8,105 | 8,588 | (5.6) | 5,000 | 62.1 | ||||||||||||||||||
| Other financial assets | 783 | 273 | 187.1 | 2,261 | (65.4) | ||||||||||||||||||
| Other asset accounts | 129,786 | 124,343 | 4.4 | 132,306 | (1.9) | ||||||||||||||||||
| Total assets | 238,400 | 262,217 | (9.1) | 234,051 | 1.9 | ||||||||||||||||||
| Customer deposits | 1,127 | 895 | 25.9 | 1,193 | (5.5) | ||||||||||||||||||
| Central banks and credit institutions | 38,891 | 71,226 | (45.4) | 57,936 | (32.9) | ||||||||||||||||||
| Marketable debt securities | 97,787 | 98,733 | (1.0) | 75,134 | 30.2 | ||||||||||||||||||
| Other financial liabilities | 1,259 | 308 | 309.5 | 947 | 33.0 | ||||||||||||||||||
| Other liabilities accounts | 6,367 | 7,489 | (15.0) | 8,162 | (22.0) | ||||||||||||||||||
| Total liabilities | 145,431 | 178,650 | (18.6) | 143,371 | 1.4 | ||||||||||||||||||
| Total equity | 92,969 | 83,567 | 11.3 | 90,679 | 2.5 | ||||||||||||||||||
| Memorandum items: | |||||||||||||||||||||||
Gross loans and advances to customers 2 | 5,704 | 5,779 | (1.3) | 6,962 | (18.1) | ||||||||||||||||||
| Customer funds | 1,127 | 895 | 25.9 | 1,193 | (5.5) | ||||||||||||||||||
Customer deposits 3 | 1,127 | 895 | 25.9 | 1,193 | (5.5) | ||||||||||||||||||
| Mutual funds | — | — | — | — | — | ||||||||||||||||||
| Resources | |||||||||||||||||||||||
| Number of employees | 1,940 | 1,899 | 2.2 | 1,747 | 11.0 | ||||||||||||||||||
1. Includes exchange differences.
2. Excluding reverse repos.
3. Excluding repos.
January - March 2023 | | 73 | ||||||
| RETAIL BANKING | |||||||||||||||||||||||
| EUR million | |||||||||||||||||||||||
| / | Q4'22 | / | Q1'22 | ||||||||||||||||||||
| Underlying income statement | Q1'23 | % | % excl. FX | % | % excl. FX | ||||||||||||||||||
| Net interest income | 8,977 | (0.8) | (0.7) | 10.7 | 9.5 | ||||||||||||||||||
| Net fee income | 1,901 | 0.2 | (1.4) | 5.2 | 4.6 | ||||||||||||||||||
Gains (losses) on financial transactions 1 | (29) | — | — | — | — | ||||||||||||||||||
| Other operating income | (70) | (58.7) | (70.5) | — | — | ||||||||||||||||||
| Total income | 10,779 | (1.9) | (1.6) | 6.7 | 5.3 | ||||||||||||||||||
| Administrative expenses and amortizations | (4,755) | (0.4) | (1.5) | 8.3 | 8.3 | ||||||||||||||||||
| Net operating income | 6,024 | (3.1) | (1.7) | 5.5 | 3.1 | ||||||||||||||||||
| Net loan-loss provisions | (2,898) | 5.5 | 6.9 | 37.2 | 33.4 | ||||||||||||||||||
| Other gains (losses) and provisions | (717) | 22.8 | 20.5 | 71.7 | 76.9 | ||||||||||||||||||
| Profit before tax | 2,409 | (16.5) | (14.6) | (24.3) | (26.3) | ||||||||||||||||||
| Tax on profit | (645) | (5.9) | (4.3) | (24.9) | (26.7) | ||||||||||||||||||
| Profit from continuing operations | 1,763 | (19.8) | (17.8) | (24.0) | (26.1) | ||||||||||||||||||
| Net profit from discontinued operations | — | — | — | — | — | ||||||||||||||||||
| Consolidated profit | 1,763 | (19.8) | (17.8) | (24.0) | (26.1) | ||||||||||||||||||
| Non-controlling interests | (212) | 5.5 | 5.2 | (17.6) | (19.2) | ||||||||||||||||||
| Profit attributable to the parent | 1,552 | (22.3) | (20.2) | (24.8) | (27.0) | ||||||||||||||||||
1. Includes exchange differences.
| CORPORATE & INVESTMENT BANKING | |||||||||||||||||||||||
| EUR million | |||||||||||||||||||||||
| / | Q4'22 | / | Q1'22 | ||||||||||||||||||||
| Underlying income statement | Q1'23 | % | % excl. FX | % | % excl. FX | ||||||||||||||||||
| Net interest income | 838 | (8.8) | (12.7) | 7.0 | 7.2 | ||||||||||||||||||
| Net fee income | 619 | 33.4 | 31.8 | 17.0 | 16.4 | ||||||||||||||||||
Gains (losses) on financial transactions 1 | 774 | 94.5 | 83.3 | 82.9 | 88.0 | ||||||||||||||||||
| Other operating income | (24) | — | 398.6 | — | — | ||||||||||||||||||
| Total income | 2,206 | 22.4 | 19.5 | 24.8 | 24.6 | ||||||||||||||||||
| Administrative expenses and amortizations | (738) | (13.8) | (13.9) | 19.4 | 18.0 | ||||||||||||||||||
| Net operating income | 1,468 | 55.1 | 48.5 | 27.7 | 28.1 | ||||||||||||||||||
| Net loan-loss provisions | 28 | — | — | 89.8 | 101.3 | ||||||||||||||||||
| Other gains (losses) and provisions | (36) | (28.0) | (27.4) | 58.1 | 53.1 | ||||||||||||||||||
| Profit before tax | 1,460 | 131.2 | 114.6 | 27.9 | 28.5 | ||||||||||||||||||
| Tax on profit | (418) | 194.2 | 188.6 | 29.0 | 26.5 | ||||||||||||||||||
| Profit from continuing operations | 1,041 | 112.8 | 94.6 | 27.5 | 29.3 | ||||||||||||||||||
| Net profit from discontinued operations | — | — | — | — | — | ||||||||||||||||||
| Consolidated profit | 1,041 | 112.8 | 94.6 | 27.5 | 29.3 | ||||||||||||||||||
| Non-controlling interests | (65) | 101.9 | 95.3 | 25.0 | 23.4 | ||||||||||||||||||
| Profit attributable to the parent | 976 | 113.6 | 94.5 | 27.6 | 29.7 | ||||||||||||||||||
1. Includes exchange differences.
| 74 | | January - March 2023 | ||||||
| WEALTH MANAGEMENT & INSURANCE | |||||||||||||||||||||||
| EUR million | |||||||||||||||||||||||
| / | Q4'22 | / | Q1'22 | ||||||||||||||||||||
| Underlying income statement | Q1'23 | % | % excl. FX | % | % excl. FX | ||||||||||||||||||
| Net interest income | 413 | 28.3 | 28.5 | 216.3 | 217.8 | ||||||||||||||||||
| Net fee income | 309 | (0.2) | (0.8) | (4.1) | (5.4) | ||||||||||||||||||
Gains (losses) on financial transactions 1 | 31 | (10.8) | (12.8) | 4.6 | 6.9 | ||||||||||||||||||
| Other operating income | 77 | (12.4) | (8.4) | (15.3) | (19.1) | ||||||||||||||||||
| Total income | 830 | 10.0 | 10.3 | 44.8 | 42.9 | ||||||||||||||||||
| Administrative expenses and amortizations | (278) | (0.8) | (0.1) | 12.2 | 10.2 | ||||||||||||||||||
| Net operating income | 551 | 16.5 | 16.4 | 69.6 | 68.2 | ||||||||||||||||||
| Net loan-loss provisions | 1 | (43.2) | (43.1) | 82.1 | 50.6 | ||||||||||||||||||
| Other gains (losses) and provisions | (23) | 130.0 | 131.0 | 175.7 | 176.9 | ||||||||||||||||||
| Profit before tax | 529 | 13.8 | 13.7 | 66.9 | 65.3 | ||||||||||||||||||
| Tax on profit | (133) | 24.2 | 23.6 | 86.4 | 85.4 | ||||||||||||||||||
| Profit from continuing operations | 396 | 10.7 | 10.8 | 61.1 | 59.5 | ||||||||||||||||||
| Net profit from discontinued operations | — | — | — | — | — | ||||||||||||||||||
| Consolidated profit | 396 | 10.7 | 10.8 | 61.1 | 59.5 | ||||||||||||||||||
| Non-controlling interests | (18) | 20.5 | 19.7 | 21.3 | 19.0 | ||||||||||||||||||
| Profit attributable to the parent | 377 | 10.2 | 10.4 | 63.8 | 62.2 | ||||||||||||||||||
1. Includes exchange differences.
| PAGONXT | |||||||||||||||||||||||
| EUR million | |||||||||||||||||||||||
| / | Q4'22 | / | Q1'22 | ||||||||||||||||||||
| Underlying income statement | Q1'23 | % | % excl. FX | % | % excl. FX | ||||||||||||||||||
| Net interest income | 9 | (13.8) | (11.0) | 432.4 | 416.3 | ||||||||||||||||||
| Net fee income | 218 | (19.2) | (18.2) | 38.8 | 30.7 | ||||||||||||||||||
Gains (losses) on financial transactions 1 | (7) | (12.0) | (12.5) | — | — | ||||||||||||||||||
| Other operating income | 23 | (10.1) | (9.1) | 994.8 | 825.2 | ||||||||||||||||||
| Total income | 244 | (18.4) | (17.3) | 50.3 | 41.5 | ||||||||||||||||||
| Administrative expenses and amortizations | (278) | (6.1) | (5.8) | 46.2 | 42.2 | ||||||||||||||||||
| Net operating income | (34) | — | — | 22.3 | 47.3 | ||||||||||||||||||
| Net loan-loss provisions | (6) | (68.4) | (67.7) | 139.2 | 127.8 | ||||||||||||||||||
| Other gains (losses) and provisions | (2) | (76.7) | (75.3) | 131.8 | 122.8 | ||||||||||||||||||
| Profit before tax | (43) | 57.6 | 46.4 | 35.7 | 58.6 | ||||||||||||||||||
| Tax on profit | (15) | 25.0 | 33.3 | (30.8) | (36.0) | ||||||||||||||||||
| Profit from continuing operations | (57) | 47.7 | 42.8 | 8.9 | 15.0 | ||||||||||||||||||
| Net profit from discontinued operations | — | — | — | — | — | ||||||||||||||||||
| Consolidated profit | (57) | 47.7 | 42.8 | 8.9 | 15.0 | ||||||||||||||||||
| Non-controlling interests | 2 | — | — | — | — | ||||||||||||||||||
| Profit attributable to the parent | (55) | 30.6 | 26.7 | 3.0 | 8.4 | ||||||||||||||||||
1. Includes exchange differences.
January - March 2023 | | 75 | ||||||
| ALTERNATIVE PERFORMANCE MEASURES (APMs) | ||||||||
In addition to the financial information prepared under IFRS, this consolidated directors’ report contains financial measures that constitute alternative performance measures (APMs) to comply with the guidelines on alternative performance measures issued by the European Securities and Markets Authority on 5 October 2015 and non-IFRS measures.
The financial measures contained in this consolidated directors’ report that qualify as APMs and non-IFRS measures have been calculated using the financial information from Santander but are not defined or detailed in the applicable financial information framework or under IFRS and therefore have neither been audited nor are susceptible to being fully audited.
We use these APMs and non-IFRS measures when planning, monitoring and evaluating our performance. We consider these APMs and non-IFRS financial measures to be useful metrics for management and investors to facilitate operating performance comparisons from period to period. While we believe that these APMs and non-IFRS financial measures are useful in evaluating our business, this information should be considered as supplemental in nature and is not meant as a substitute of IFRS measures. In addition, the way in which Santander defines and calculates these APMs and non-IFRS measures may differ from the calculations by
other companies with similar measures and, therefore, may not be comparable.
The APMs and non-IFRS measures we use in this document can be categorized as follows:
Underlying results
In addition to IFRS results measures, we present some results measures which are non-IFRS and which we refer to as underlying measures. These measures allow in our view a better year-on-year comparability given that they exclude items outside the ordinary performance of our business (e.g. capital gains, write-downs, impairment of goodwill) or certain line items have been reclassified in the underlying ("adjusted") income statement, as their impact on profit is zero, to facilitate comparisons with prior quarters and better understand the trends in the business.
In addition, in the section "Financial information by segment", relative to the primary and secondary segments, results are only presented on an underlying basis in accordance with IFRS 8, and reconciled on an aggregate basis to our IFRS consolidated results to the consolidated financial statements, which are set out below.
| Reconciliation of underlying results to statutory results | |||||||||||
| EUR million | |||||||||||
| January-March 2023 | |||||||||||
| Statutory results | Adjustments | Underlying results | |||||||||
| Net interest income | 10,396 | (211) | 10,185 | ||||||||
| Net fee income | 3,043 | — | 3,043 | ||||||||
Gains (losses) on financial transactions 1 | 715 | — | 715 | ||||||||
| Other operating income | (232) | 224 | (8) | ||||||||
| Total income | 13,922 | 13 | 13,935 | ||||||||
| Administrative expenses and amortizations | (6,145) | — | (6,145) | ||||||||
| Net operating income | 7,777 | 13 | 7,790 | ||||||||
| Net loan-loss provisions | (3,347) | 474 | (2,873) | ||||||||
| Other gains (losses) and provisions | (598) | (224) | (822) | ||||||||
| Profit before tax | 3,832 | 263 | 4,095 | ||||||||
| Tax on profit | (967) | (263) | (1,230) | ||||||||
| Profit from continuing operations | 2,865 | — | 2,865 | ||||||||
| Net profit from discontinued operations | — | — | — | ||||||||
| Consolidated profit | 2,865 | — | 2,865 | ||||||||
| Non-controlling interests | (294) | — | (294) | ||||||||
| Profit attributable to the parent | 2,571 | — | 2,571 | ||||||||
1. Includes exchange differences.
| Explanation of adjustments: | |||||
| 1. | Temporary levy on revenue in Spain amounted to EUR 224 million, which was moved from total income to other gains (losses) and provisions. Considering the temporary nature of the levy, if we eliminate its impact to provide a like-for-like comparison with last year’s results, attributable profit would have been EUR 2,795 million. | ||||
| 2. | Income in Brazil related to the reversal of tax liabilities amounted to EUR 261 million (EUR 211 million recorded in NII and a positive impact of EUR 50 million in tax) and provisions to strengthen the balance sheet, which net of tax was EUR 261 million (EUR 474 million recorded in net loan-loss provisions and a positive impact of EUR 213 million in tax). | ||||
| 76 | | January - March 2023 | ||||||
| Reconciliation of underlying results to statutory results | |||||||||||
| EUR million | |||||||||||
| January-March 2022 | |||||||||||
| Statutory results | Adjustments | Underlying results | |||||||||
| Net interest income | 8,855 | — | 8,855 | ||||||||
| Net fee income | 2,812 | — | 2,812 | ||||||||
Gains (losses) on financial transactions 1 | 387 | — | 387 | ||||||||
| Other operating income | 251 | — | 251 | ||||||||
| Total income | 12,305 | — | 12,305 | ||||||||
| Administrative expenses and amortizations | (5,535) | — | (5,535) | ||||||||
| Net operating income | 6,770 | — | 6,770 | ||||||||
| Net loan-loss provisions | (2,101) | — | (2,101) | ||||||||
| Other gains (losses) and provisions | (498) | — | (498) | ||||||||
| Profit before tax | 4,171 | — | 4,171 | ||||||||
| Tax on profit | (1,302) | — | (1,302) | ||||||||
| Profit from continuing operations | 2,869 | — | 2,869 | ||||||||
| Net profit from discontinued operations | — | — | — | ||||||||
| Consolidated profit | 2,869 | — | 2,869 | ||||||||
| Non-controlling interests | (326) | — | (326) | ||||||||
| Profit attributable to the parent | 2,543 | — | 2,543 | ||||||||
1. Includes exchange differences.
January - March 2023 | | 77 | ||||||
Profitability and efficiency ratios
The purpose of the profitability and efficiency ratios is to measure the ratio of profit to capital, to tangible capital, to assets and to risk- weighted assets, while the efficiency ratio measures how much general administrative expenses (personnel and other) and amortization costs are needed to generate revenue.
Additionally, the goodwill adjustments have been removed from the RoTE numerator as, since they are not considered in the denominator, we believe this calculation is more correct.
| Ratio | Formula | Relevance of the metric | ||||||||||||
| RoE | Profit attributable to the parent | This ratio measures the return that shareholders obtain on the funds invested in the bank and as such measures the company's ability to pay shareholders. | ||||||||||||
| (Return on equity) | Average stockholders’ equity 1 (excl. minority interests) | |||||||||||||
| RoTE | Profit attributable to the parent2 | This indicator is used to evaluate the profitability of the company as a percentage of its tangible equity. It's measured as the return that shareholders receive as a percentage of the funds invested in the entity less intangible assets. | ||||||||||||
| (Return on tangible equity) | Average stockholders' equity 1 (excl. minority interests) - intangible assets | |||||||||||||
| RoA | Consolidated profit | This metric measures the profitability of a company as a percentage of its total assets. It is an indicator that reflects the efficiency of the company's total funds in generating profit. | ||||||||||||
| (Return on assets) | Average total assets | |||||||||||||
| RoRWA | Consolidated profit | The return adjusted for risk is a derivative of the RoA metric. The difference is that RoRWA measures profit in relation to the bank's risk-weighted assets. | ||||||||||||
| (Return on risk weighted assets) | Average risk-weighted assets | |||||||||||||
| Efficiency ratio | Operating expenses 3 | One of the most commonly used indicators when comparing productivity of different financial entities. It measures the amount of funds used to generate the bank's total income. | ||||||||||||
| Total income | ||||||||||||||
1. Stockholders’ equity = Capital and Reserves + Accumulated other comprehensive income + Profit attributable to the parent + Dividends.
2. Excluding the adjustment to the valuation of goodwill.
3. Operating expenses = Administrative expenses + amortizations.
| 78 | | January - March 2023 | ||||||
Profitability and efficiency (1) (2) | Q1'23 | Q4'22 | Q1'22 | |||||||||||
| (EUR million and %) | ||||||||||||||
| RoE | 11.38 | % | 10.11 | % | 11.49 | % | ||||||||
| Profit attributable to the parent | 10,284 | 9,155 | 10,173 | |||||||||||
| Average stockholders' equity (excluding minority interests) | 90,353 | 90,574 | 88,532 | |||||||||||
| RoTE | 14.38 | % | 12.76 | % | 14.21 | % | ||||||||
| Profit attributable to the parent | 10,284 | 9,155 | 10,173 | |||||||||||
| (+) Goodwill impairment | — | — | — | |||||||||||
| Profit attributable to the parent (excluding goodwill impairment) | 10,284 | 9,155 | 10,173 | |||||||||||
| Average stockholders' equity (excluding minority interests) | 90,353 | 90,574 | 88,532 | |||||||||||
| (-) Average intangible assets | 18,821 | 18,811 | 16,959 | |||||||||||
| Average stockholders' equity (excl. minority interests) - intangible assets | 71,532 | 71,763 | 71,573 | |||||||||||
| RoA | 0.66 | % | 0.57 | % | 0.71 | % | ||||||||
| Consolidated profit | 11,458 | 10,163 | 11,476 | |||||||||||
| Average total assets | 1,742,316 | 1,789,313 | 1,624,930 | |||||||||||
| RoRWA | 1.86 | % | 1.64 | % | 1.95 | % | ||||||||
| Consolidated profit | 11,458 | 10,163 | 11,476 | |||||||||||
| Average risk-weighted assets | 617,054 | 618,071 | 588,776 | |||||||||||
| Efficiency ratio | 44.1 | % | 46.6 | % | 45.0 | % | ||||||||
| Underlying operating expenses | 6,145 | 6,308 | 5,535 | |||||||||||
| Operating expenses | 6,145 | 6,308 | 5,535 | |||||||||||
| Net capital gains and provisions impact on operating expenses | — | — | — | |||||||||||
| Underlying total income | 13,935 | 13,525 | 12,305 | |||||||||||
| Total income | 13,922 | 13,523 | 12,305 | |||||||||||
| Net capital gains and provisions impact on total income | 13 | 2 | — | |||||||||||
1.Averages included in the RoE, RoTE, RoA and RoRWA denominators are calculated using the monthly average over the period, which we believe should not differ materially from using daily balances. | ||||||||||||||
2.The risk-weighted assets included in the denominator of the RoRWA metric are calculated in line with the criteria laid out in the CRR (Capital Requirements Regulation). | ||||||||||||||
January - March 2023 | | 79 | ||||||
| Efficiency ratio | ||||||||||||||||||||
| (EUR million and %) | ||||||||||||||||||||
| Q1'23 | Q1'22 | |||||||||||||||||||
| % | Operating expenses | Total income | % | Operating expenses | Total income | |||||||||||||||
| Europe | 41.9 | 2,167 | 5,171 | 47.8 | 2,060 | 4,305 | ||||||||||||||
| Spain | 39.8 | 1,014 | 2,547 | 48.1 | 972 | 2,021 | ||||||||||||||
| United Kingdom | 49.3 | 674 | 1,368 | 52.0 | 672 | 1,291 | ||||||||||||||
| Portugal | 32.6 | 132 | 405 | 37.7 | 125 | 333 | ||||||||||||||
| Poland | 27.1 | 197 | 729 | 32.5 | 166 | 511 | ||||||||||||||
| North America | 47.7 | 1,500 | 3,141 | 45.1 | 1,260 | 2,795 | ||||||||||||||
| US | 49.9 | 912 | 1,827 | 44.1 | 798 | 1,811 | ||||||||||||||
| Mexico | 41.6 | 540 | 1,300 | 44.0 | 432 | 982 | ||||||||||||||
| South America | 39.1 | 1,723 | 4,404 | 35.4 | 1,484 | 4,195 | ||||||||||||||
| Brazil | 35.3 | 1,080 | 3,057 | 30.8 | 930 | 3,019 | ||||||||||||||
| Chile | 41.9 | 254 | 606 | 36.0 | 234 | 650 | ||||||||||||||
| Argentina | 49.8 | 250 | 501 | 59.6 | 217 | 364 | ||||||||||||||
| Digital Consumer Bank | 49.1 | 659 | 1,343 | 49.2 | 645 | 1,312 | ||||||||||||||
| RoTE | ||||||||||||||||||||
| (EUR million and %) | ||||||||||||||||||||
| Q1'23 | Q1'22 | |||||||||||||||||||
| % | Profit attributable to the parent | Average stockholders' equity (excl. minority interests) - intangible assets | % | Profit attributable to the parent | Average stockholders' equity (excl. minority interests) - intangible assets | |||||||||||||||
| Europe | 12.79 | 4,755 | 37,167 | 9.66 | 4,071 | 42,135 | ||||||||||||||
| Spain | 11.09 | 1,866 | 16,830 | 7.38 | 1,461 | 19,805 | ||||||||||||||
| United Kingdom | 13.56 | 1,581 | 11,662 | 10.87 | 1,501 | 13,816 | ||||||||||||||
| Portugal | 20.89 | 719 | 3,440 | 14.99 | 592 | 3,948 | ||||||||||||||
| Poland | 19.54 | 666 | 3,410 | 14.98 | 449 | 2,996 | ||||||||||||||
| North America | 10.45 | 2,508 | 23,995 | 12.51 | 3,224 | 25,772 | ||||||||||||||
| US | 7.49 | 1,199 | 16,015 | 12.44 | 2,333 | 18,756 | ||||||||||||||
| Mexico | 17.98 | 1,435 | 7,985 | 14.71 | 995 | 6,766 | ||||||||||||||
| South America | 15.27 | 3,160 | 20,695 | 19.83 | 3,598 | 18,144 | ||||||||||||||
| Brazil | 14.11 | 1,876 | 13,299 | 20.98 | 2,509 | 11,963 | ||||||||||||||
| Chile | 14.66 | 601 | 4,101 | 21.36 | 751 | 3,514 | ||||||||||||||
| Argentina | 29.82 | 557 | 1,869 | 18.33 | 238 | 1,296 | ||||||||||||||
| Digital Consumer Bank | 9.89 | 975 | 9,864 | 12.60 | 1,128 | 8,952 | ||||||||||||||
| 80 | | January - March 2023 | ||||||
Credit risk indicators
The credit risk indicators measure the quality of the credit portfolio and the percentage of non-performing loans covered by provisions.
| Ratio | Formula | Relevance of the metric | ||||||||||||
NPL ratio (Non-performing loans) | Credit impaired loans and advances to customers, customer guarantees and customer commitments granted | The NPL ratio is an important variable regarding financial institutions' activity since it gives an indication of the level of risk the entities are exposed to. It calculates risks that are, in accounting terms, declared to be credit impaired as a percentage of the total outstanding amount of customer credit and contingent liabilities. | ||||||||||||
Total Risk 1 | ||||||||||||||
| Total coverage ratio | Total allowances to cover impairment losses on loans and advances to customers, customer guarantees and customer commitments granted | The total coverage ratio is a fundamental metric in the financial sector. It reflects the level of provisions as a percentage of the credit impaired assets. Therefore it is a good indicator of the entity's solvency against customer defaults both present and future. | ||||||||||||
| Credit impaired loans and advances to customers, customer guarantees and customer commitments granted | ||||||||||||||
| Cost of risk | Allowances for loan-loss provisions over the last 12 months | This ratio quantifies loan-loss provisions arising from credit risk over a defined period of time for a given loan portfolio. As such, it acts as an indicator of credit quality. | ||||||||||||
| Average loans and advances to customers over the last 12 months | ||||||||||||||
1. Total risk = Total loans and advances and guarantees to customers (including credit impaired assets) + contingent liabilities granted that are credit impaired.
| Credit risk (I) | Mar-23 | Dec-22 | Mar-22 | |||||||||||
| (EUR million and %) | ||||||||||||||
| NPL ratio | 3.05 | % | 3.08 | % | 3.26 | % | ||||||||
| Credit impaired loans and advances to customers, customer guarantees and customer commitments granted | 34,445 | 34,673 | 35,670 | |||||||||||
| Gross loans and advances to customers registered under the headings “financial assets measured at amortized cost” and "financial assets designated at fair value through profit or loss" classified in stage 3 (OCI), excluding POCI (Purchased or Originated Credit Impaired) that is currently impaired | 32,353 | 32,617 | 33,447 | |||||||||||
| POCI exposure (Purchased or Originated Credit Impaired) that is currently impaired | 301 | 271 | 334 | |||||||||||
| Customer guarantees and customer commitments granted classified in stage 3 | 1,783 | 1,776 | 1,879 | |||||||||||
| Doubtful exposure of loans and advances to customers at fair value through profit or loss | 8 | 9 | 10 | |||||||||||
| Total risk | 1,128,501 | 1,124,121 | 1,093,023 | |||||||||||
| Impaired and non-impaired gross loans and advances to customers | 1,063,996 | 1,058,688 | 1,035,523 | |||||||||||
| Impaired and non-impaired customer guarantees and customer commitments granted | 64,505 | 65,433 | 57,500 | |||||||||||
January - March 2023 | | 81 | ||||||
| Credit risk (II) | Mar-23 | Dec-22 | Mar-22 | |||||||||||
| (EUR million and %) | ||||||||||||||
| Total coverage ratio | 68 | % | 68 | % | 69 | % | ||||||||
| Total allowances to cover impairment losses on loans and advances to customers, customer guarantees and customer commitments granted | 23,388 | 23,418 | 24,778 | |||||||||||
| Total allowances to cover impairment losses on loans and advances to customers measured at amortized cost and designated at fair value through OCI | 22,608 | 22,684 | 24,025 | |||||||||||
| Total allowances to cover impairment losses on customer guarantees and customer commitments granted | 780 | 734 | 753 | |||||||||||
| Credit impaired loans and advances to customers, customer guarantees and customer commitments granted | 34,445 | 34,673 | 35,670 | |||||||||||
| Gross loans and advances to customers registered under the headings “financial assets measured at amortized cost” and "financial assets designated at fair value through profit or loss" classified in stage 3 (OCI), excluding POCI (Purchased or Originated Credit Impaired) that is currently impaired | 32,353 | 32,617 | 33,447 | |||||||||||
| POCI exposure (Purchased or Originated Credit Impaired) that is currently impaired | 301 | 271 | 334 | |||||||||||
| Customer guarantees and customer commitments granted classified in stage 3 | 1,783 | 1,776 | 1,879 | |||||||||||
| Doubtful exposure of loans and advances to customers at fair value through profit or loss | 8 | 9 | 10 | |||||||||||
| Cost of risk | 1.05 | % | 0.99 | % | 0.77 | % | ||||||||
| Underlying allowances for loan-loss provisions over the last 12 months | 11,281 | 10,509 | 7,545 | |||||||||||
| Allowances for loan-loss provisions over the last 12 months | 11,755 | 10,836 | 7,545 | |||||||||||
| Net capital gains and provisions impact in allowances for loan-loss provisions | -474 | -327 | — | |||||||||||
| Average loans and advances to customers over the last 12 months | 1,070,927 | 1,059,972 | 985,401 | |||||||||||
| NPL ratio | ||||||||||||||||||||
| (EUR million and %) | ||||||||||||||||||||
| Q1'23 | Q1'22 | |||||||||||||||||||
| % | Credit impaired loans and advances to customers, customer guarantees and customer commitments granted | Total risk | % | Credit impaired loans and advances to customers, customer guarantees and customer commitments granted | Total risk | |||||||||||||||
| Europe | 2.35 | 14,818 | 630,359 | 3.01 | 19,486 | 648,236 | ||||||||||||||
| Spain | 3.19 | 9,099 | 284,854 | 4.47 | 13,103 | 293,082 | ||||||||||||||
| United Kingdom | 1.27 | 3,210 | 253,513 | 1.42 | 3,760 | 264,012 | ||||||||||||||
| Portugal | 3.05 | 1,251 | 41,029 | 3.42 | 1,432 | 41,837 | ||||||||||||||
| Poland | 3.66 | 1,247 | 34,054 | 3.50 | 1,175 | 33,584 | ||||||||||||||
| North America | 2.95 | 5,669 | 192,181 | 2.83 | 4,490 | 158,440 | ||||||||||||||
| US | 3.13 | 4,511 | 144,038 | 2.75 | 3,260 | 118,655 | ||||||||||||||
| Mexico | 2.39 | 1,147 | 48,091 | 3.09 | 1,230 | 39,777 | ||||||||||||||
| South America | 5.99 | 10,397 | 173,449 | 5.05 | 8,192 | 162,088 | ||||||||||||||
| Brazil | 7.34 | 7,680 | 104,680 | 5.68 | 5,705 | 100,434 | ||||||||||||||
| Chile | 4.75 | 2,397 | 50,465 | 4.70 | 2,152 | 45,767 | ||||||||||||||
| Argentina | 2.08 | 125 | 6,014 | 3.21 | 185 | 5,777 | ||||||||||||||
| Digital Consumer Bank | 2.05 | 2,601 | 126,872 | 2.27 | 2,658 | 117,190 | ||||||||||||||
| 82 | | January - March 2023 | ||||||
| NPL coverage ratio | ||||||||||||||||||||
| (EUR million and %) | ||||||||||||||||||||
| Q1'23 | Q1'22 | |||||||||||||||||||
| % | Total allowances to cover impairment losses on loans and advances to customers, customer guarantees and customer commitments granted | Credit impaired loans and advances to customers, customer guarantees and customer commitments granted | % | Total allowances to cover impairment losses on loans and advances to customers, customer guarantees and customer commitments granted | Credit impaired loans and advances to customers, customer guarantees and customer commitments granted | |||||||||||||||
| Europe | 51.2 | 7,594 | 14,818 | 49.1 | 9,559 | 19,486 | ||||||||||||||
| Spain | 50.2 | 4,570 | 9,099 | 50.4 | 6,601 | 13,103 | ||||||||||||||
| United Kingdom | 33.1 | 1,063 | 3,210 | 26.1 | 983 | 3,760 | ||||||||||||||
| Portugal | 80.3 | 1,004 | 1,251 | 72.8 | 1,043 | 1,432 | ||||||||||||||
| Poland | 75.2 | 937 | 1,247 | 78.5 | 923 | 1,175 | ||||||||||||||
| North America | 94.9 | 5,379 | 5,669 | 110.5 | 4,962 | 4,490 | ||||||||||||||
| US | 91.5 | 4,126 | 4,511 | 122.2 | 3,984 | 3,260 | ||||||||||||||
| Mexico | 108.5 | 1,245 | 1,147 | 79.5 | 978 | 1,230 | ||||||||||||||
| South America | 76.3 | 7,935 | 10,397 | 92.2 | 7,552 | 8,192 | ||||||||||||||
| Brazil | 79.5 | 6,105 | 7,680 | 101.1 | 5,768 | 5,705 | ||||||||||||||
| Chile | 59.2 | 1,418 | 2,397 | 60.7 | 1,307 | 2,152 | ||||||||||||||
| Argentina | 169.4 | 211 | 125 | 161.7 | 299 | 185 | ||||||||||||||
| Digital Consumer Bank | 93.5 | 2,432 | 2,601 | 99.4 | 2,642 | 2,658 | ||||||||||||||
| Cost of risk | ||||||||||||||||||||
| (EUR million and %) | ||||||||||||||||||||
| Q1'23 | Q1'22 | |||||||||||||||||||
| % | Underlying allowances for loan-loss provisions over the last 12 months | Average loans and advances to customers over the last 12 months | % | Underlying allowances for loan-loss provisions over the last 12 months | Average loans and advances to customers over the last 12 months | |||||||||||||||
| Europe | 0.42 | 2,524 | 607,772 | 0.37 | 2,212 | 596,899 | ||||||||||||||
| Spain | 0.62 | 1,641 | 263,457 | 0.88 | 2,239 | 253,847 | ||||||||||||||
| United Kingdom | 0.12 | 324 | 260,954 | (0.08) | (212) | 255,668 | ||||||||||||||
| Portugal | 0.06 | 23 | 40,158 | 0.03 | 11 | 40,030 | ||||||||||||||
| Poland | 1.71 | 528 | 30,771 | 0.65 | 195 | 30,085 | ||||||||||||||
| North America | 1.62 | 2,907 | 179,088 | 0.93 | 1,255 | 135,676 | ||||||||||||||
| US | 1.52 | 2,055 | 135,196 | 0.49 | 509 | 103,050 | ||||||||||||||
| Mexico | 1.98 | 844 | 42,641 | 2.22 | 746 | 33,660 | ||||||||||||||
| South America | 3.39 | 5,275 | 155,695 | 2.73 | 3,566 | 130,860 | ||||||||||||||
| Brazil | 4.84 | 4,599 | 94,925 | 3.94 | 3,018 | 76,591 | ||||||||||||||
| Chile | 0.95 | 421 | 44,324 | 0.83 | 335 | 40,465 | ||||||||||||||
| Argentina | 2.97 | 136 | 4,571 | 3.31 | 165 | 4,997 | ||||||||||||||
| Digital Consumer Bank | 0.48 | 589 | 121,862 | 0.44 | 509 | 115,407 | ||||||||||||||
January - March 2023 | | 83 | ||||||
Other indicators
The market capitalization indicator provides information on the volume of tangible equity per share. The loan-to-deposit ratio (LTD) identifies the relationship between net customer loans and advances and customer deposits, assessing the proportion of loans and advances granted by the Group that are funded by customer deposits.
The Group also uses gross customer loan magnitudes excluding reverse repurchase agreements (repos) and customer deposits excluding repos. In order to analyse the evolution of the traditional commercial banking business of granting loans and capturing deposits, repos and reverse repos are excluded, as they are mainly treasury business products and highly volatile.
| Ratio | Formula | Relevance of the metric | ||||||||||||
| TNAV per share | Tangible book value 1 | This is a very commonly used ratio used to measure the company's accounting value per share having deducted the intangible assets. It is useful in evaluating the amount each shareholder would receive if the company were to enter into liquidation and had to sell all the company's tangible assets. | ||||||||||||
| (Tangible equity net asset value per share) | Number of shares excluding treasury stock | |||||||||||||
| Price / tangible book value per share (X) | Share price | This is one of the most commonly used ratios by market participants for the valuation of listed companies both in absolute terms and relative to other entities. This ratio measures the relationship between the price paid for a company and its accounting equity value. | ||||||||||||
| TNAV per share | ||||||||||||||
| LTD ratio | Net loans and advances to customers | This is an indicator of the bank's liquidity. It measures the total (net) loans and advances to customers as a percentage of customer deposits. | ||||||||||||
| (Loan-to-deposit) | Customer deposits | |||||||||||||
| Loans and advances (excl. reverse repos) | Gross loans and advances to customers excluding reverse repos | In order to aid analysis of the commercial banking activity, reverse repos are excluded as they are highly volatile treasury products. | ||||||||||||
| Deposits (excl. repos) | Customer deposits excluding repos | In order to aid analysis of the commercial banking activity, repos are excluded as they are highly volatile treasury products. | ||||||||||||
| PAT + After tax fees paid to SAN (in Wealth Management & Insurance) | Net profit + fees paid from Santander Asset Management and Santander Insurance to Santander, net of taxes, excluding Private Banking customers | Metric to assess Wealth Management & Insurance's total contribution to Grupo Santander profit. | ||||||||||||
1. Tangible book value = Stockholders' equity (excl. minority interests) - intangible assets.
| Others | Mar-23 | Dec-22 | Mar-22 | |||||||||||
| (EUR million and %) | ||||||||||||||
| TNAV (tangible book value) per share | 4.41 | 4.26 | 4.29 | |||||||||||
| Tangible book value | 71,683 | 70,459 | 72,940 | |||||||||||
| Number of shares excl. treasury stock (million) | 16,266 | 16,551 | 17,008 | |||||||||||
| Price / Tangible book value per share (X) | 0.78 | 0.66 | 0.72 | |||||||||||
| Share price (euros) | 3.426 | 2.803 | 3.100 | |||||||||||
| TNAV (tangible book value) per share | 4.41 | 4.26 | 4.29 | |||||||||||
| Loan-to-deposit ratio | 104 | % | 103 | % | 107 | % | ||||||||
| Net loans and advances to customers | 1,041,388 | 1,036,004 | 1,011,497 | |||||||||||
| Customer deposits | 998,949 | 1,009,722 | 941,081 | |||||||||||
| Q1'23 | Q4'22 | Q1'22 | ||||||||||||
| PAT + After tax fees paid to SAN (in WM&I) (Constant EUR million) | 773 | 778 | 602 | |||||||||||
| Profit after tax | 396 | 357 | 248 | |||||||||||
| Net fee income net of tax | 377 | 421 | 354 | |||||||||||
| 84 | | January - March 2023 | ||||||
Local currency measures
We make use of certain financial measures in local currency to help in the assessment of our ongoing operating performance. These non-IFRS financial measures include the results of operations of our subsidiary banks located outside the eurozone, excluding the impact of foreign exchange. Because changes in foreign currency exchange rates do not have an operating impact on the results, we believe that evaluating their performance on a local currency basis provides an additional and meaningful assessment of performance to both management and the company’s investors.
The Group presents, at both the Group level as well as the business unit level, the real changes in the income statement as well as the changes excluding the exchange rate effect, as it considers the latter facilitates analysis, since it enables businesses movements to be identified without taking into account the impact of converting each local currency into euros.
Said variations, excluding the impact of exchange rate movements, are calculated by converting income statement lines for the different business units comprising the Group into our presentation currency, the euro, applying the average exchange rate for Q1 2023 to all periods contemplated in the analysis.
The Group presents, at both the Group level as well as the business unit level, the changes in euros in the balance sheet as well as the changes excluding the exchange rate effect for loans and advances to customers excluding reverse repos and customer funds (which comprise deposits and mutual funds) excluding repos. As with the income statement, the reason is to facilitate analysis by isolating the changes in the balance sheet that are not caused by converting each local currency into euros.
These changes excluding the impact of exchange rate movements are calculated by converting loans and advances to customers excluding reverse repos and customer funds excluding repos, into our presentation currency, the euro, applying the closing exchange rate on the last working day of March 2023 to all periods contemplated in the analysis.
The average and period-end exchange rates for the main currencies in which the Group operates are set out in the table below.
| Exchange rates: 1 euro / currency parity | ||||||||||||||||||||
| Average (income statement) | Period-end (balance sheet) | |||||||||||||||||||
| Q1'23 | Q1'22 | Mar-23 | Dec-22 | Mar-22 | ||||||||||||||||
| US dollar | 1.073 | 1.122 | 1.086 | 1.068 | 1.111 | |||||||||||||||
| Pound sterling | 0.883 | 0.837 | 0.878 | 0.887 | 0.845 | |||||||||||||||
| Brazilian real | 5.572 | 5.847 | 5.504 | 5.650 | 5.280 | |||||||||||||||
| Mexican peso | 20.019 | 23.002 | 19.606 | 20.805 | 22.157 | |||||||||||||||
| Chilean peso | 870.048 | 905.715 | 860.680 | 909.200 | 874.158 | |||||||||||||||
| Argentine peso | 206.220 | 119.644 | 226.979 | 189.116 | 123.315 | |||||||||||||||
| Polish zloty | 4.709 | 4.619 | 4.677 | 4.684 | 4.644 | |||||||||||||||
January - March 2023 | | 85 | ||||||
| ESG indicators | ||||||||||||||||||||
| Metric | Definition | Mar-23 | ||||||||||||||||||
| Green finance raised and facilitated (EUR mn) | Nominal amount of PF, PF Advisory, PF bonds, Green bonds, ECA, M&A, ECM transactions classified by SCFS panel and reported in the League Tables since the beginning of the exercise. | 96,226 | ||||||||||||||||||
| SRI AuMs (EUR mn) | Volume of assets under management classified as article 8 - promoting ESG objectives - and 9 - with explicit sustainability objectives - of the SFDR regulation (EU Reg. 2019/2088). Includes assets managed by Santander Asset Management (SAM), third-party funds and SAM funds managed with equivalent criteria in those geographies where SFDR does not apply (mainly Latin America). | 58,093 | ||||||||||||||||||
Note: Not taxonomy. Data not audited.
| 86 | | January - March 2023 | ||||||
| Condensed consolidated financial statements | ||||||||||||||||||||||||||
| CONDENSED CONSOLIDATED FINANCIAL STATEMENTS | ||||||||
•CONSOLIDATED BALANCE SHEET
•CONSOLIDATED INCOME STATEMENT
| NOTE: | The following financial information for the first three months of 2023 and 2022 (attached herewith) corresponds to the condensed consolidated financial statements prepared in accordance with the International Financial Reporting Standards. | ||||
| As a result of the implementation from 1 January 2023 of the amendments to IFRS 17 (new general accounting standard for insurance contracts), the Group has performed retrospectively a reclassification in the balance sheet to 'Liabilities under insurance or reinsurance contracts', related to the different treatment established by this new standard for the components of an insurance contract. | |||||
| Interim condensed consolidated balance sheet | |||||||||||
| EUR million | |||||||||||
| ASSETS | Mar-23 | Dec-22 | Mar-22 | ||||||||
| Cash, cash balances at central banks and other deposits on demand | 203,359 | 223,073 | 198,501 | ||||||||
| Financial assets held for trading | 172,889 | 156,118 | 148,472 | ||||||||
| Non-trading financial assets mandatorily at fair value through profit or loss | 5,670 | 5,713 | 5,798 | ||||||||
| Financial assets designated at fair value through profit or loss | 9,741 | 8,989 | 12,393 | ||||||||
| Financial assets at fair value through other comprehensive income | 84,214 | 85,239 | 97,894 | ||||||||
| Financial assets at amortized cost | 1,165,387 | 1,147,044 | 1,096,679 | ||||||||
| Hedging derivatives | 6,969 | 8,069 | 4,460 | ||||||||
| Changes in the fair value of hedged items in portfolio hedges of interest risk | (3,038) | (3,749) | (968) | ||||||||
| Investments | 7,668 | 7,615 | 7,829 | ||||||||
| Joint ventures entities | 2,011 | 1,981 | 1,870 | ||||||||
| Associated entities | 5,657 | 5,634 | 5,959 | ||||||||
| Assets under insurance or reinsurance contracts | 260 | 308 | 301 | ||||||||
| Tangible assets | 33,989 | 34,073 | 33,781 | ||||||||
| Property, plant and equipment | 32,940 | 33,044 | 32,836 | ||||||||
| For own-use | 13,617 | 13,489 | 13,548 | ||||||||
| Leased out under an operating lease | 19,323 | 19,555 | 19,288 | ||||||||
| Investment property | 1,049 | 1,029 | 945 | ||||||||
| Of which : Leased out under an operating lease | 894 | 804 | 809 | ||||||||
| Intangible assets | 18,880 | 18,645 | 17,450 | ||||||||
| Goodwill | 13,870 | 13,741 | 13,470 | ||||||||
| Other intangible assets | 5,010 | 4,904 | 3,980 | ||||||||
| Tax assets | 29,708 | 29,987 | 27,532 | ||||||||
| Current tax assets | 9,147 | 9,200 | 7,202 | ||||||||
| Deferred tax assets | 20,561 | 20,787 | 20,330 | ||||||||
| Other assets | 10,411 | 10,082 | 11,896 | ||||||||
| Insurance contracts linked to pensions | 101 | 104 | 127 | ||||||||
| Inventories | 12 | 11 | 7 | ||||||||
| Other | 10,298 | 9,967 | 11,762 | ||||||||
| Non-current assets held for sale | 3,295 | 3,453 | 3,994 | ||||||||
| TOTAL ASSETS | 1,749,402 | 1,734,659 | 1,666,012 | ||||||||
January - March 2023 | | 87 | ||||||
| Condensed consolidated financial statements | ||||||||||||||||||||||||||
| Interim condensed consolidated balance sheet | |||||||||||
| EUR million | |||||||||||
| LIABILITIES | Mar-23 | Dec-22 | Mar-22 | ||||||||
| Financial liabilities held for trading | 123,716 | 115,185 | 97,866 | ||||||||
| Financial liabilities designated at fair value through profit or loss | 37,096 | 40,268 | 22,039 | ||||||||
| Financial liabilities at amortized cost | 1,429,788 | 1,423,858 | 1,389,315 | ||||||||
| Hedging derivatives | 9,363 | 9,228 | 8,078 | ||||||||
| Changes in the fair value of hedged items in portfolio hedges of interest rate risk | (139) | (117) | (38) | ||||||||
| Liabilities under insurance or reinsurance contracts | 17,274 | 16,426 | 17,551 | ||||||||
| Provisions | 8,089 | 8,149 | 9,239 | ||||||||
| Pensions and other post-retirement obligations | 2,198 | 2,392 | 3,013 | ||||||||
| Other long term employee benefits | 898 | 950 | 1,105 | ||||||||
| Taxes and other legal contingencies | 2,226 | 2,074 | 2,269 | ||||||||
| Contingent liabilities and commitments | 780 | 734 | 753 | ||||||||
| Other provisions | 1,987 | 1,999 | 2,099 | ||||||||
| Tax liabilities | 9,528 | 9,468 | 9,618 | ||||||||
| Current tax liabilities | 2,675 | 3,040 | 2,713 | ||||||||
| Deferred tax liabilities | 6,853 | 6,428 | 6,905 | ||||||||
| Other liabilities | 15,197 | 14,609 | 12,966 | ||||||||
| Liabilities associated with non-current assets held for sale | — | — | — | ||||||||
| TOTAL LIABILITIES | 1,649,912 | 1,637,074 | 1,566,634 | ||||||||
| EQUITY | |||||||||||
| Shareholders' equity | 125,061 | 124,732 | 121,368 | ||||||||
| Capital | 8,227 | 8,397 | 8,670 | ||||||||
| Called up paid capital | 8,227 | 8,397 | 8,670 | ||||||||
| Unpaid capital which has been called up | — | — | — | ||||||||
| Share premium | 45,294 | 46,273 | 47,979 | ||||||||
| Equity instruments issued other than capital | 697 | 688 | 662 | ||||||||
| Equity component of the compound financial instrument | — | — | — | ||||||||
| Other equity instruments issued | 697 | 688 | 662 | ||||||||
| Other equity | 175 | 175 | 152 | ||||||||
| Accumulated retained earnings | 74,115 | 66,702 | 68,463 | ||||||||
| Revaluation reserves | — | — | — | ||||||||
| Other reserves | (5,383) | (5,454) | (5,197) | ||||||||
| (-) Own shares | (635) | (675) | (1,068) | ||||||||
| Profit attributable to shareholders of the parent | 2,571 | 9,605 | 2,543 | ||||||||
| (-) Interim dividends | — | (979) | (836) | ||||||||
| Other comprehensive income (loss) | (34,498) | (35,628) | (30,978) | ||||||||
| Items not reclassified to profit or loss | (4,485) | (4,635) | (3,611) | ||||||||
| Items that may be reclassified to profit or loss | (30,013) | (30,993) | (27,367) | ||||||||
| Non-controlling interest | 8,927 | 8,481 | 8,988 | ||||||||
| Other comprehensive income | (1,682) | (1,856) | (1,818) | ||||||||
| Other items | 10,609 | 10,337 | 10,806 | ||||||||
| TOTAL EQUITY | 99,490 | 97,585 | 99,378 | ||||||||
| TOTAL LIABILITIES AND EQUITY | 1,749,402 | 1,734,659 | 1,666,012 | ||||||||
| MEMORANDUM ITEMS: OFF BALANCE SHEET AMOUNTS | |||||||||||
| Loan commitments granted | 278,586 | 274,075 | 279,232 | ||||||||
| Financial guarantees granted | 13,132 | 12,856 | 11,053 | ||||||||
| Other commitments granted | 98,418 | 92,672 | 86,308 | ||||||||
| 88 | | January - March 2023 | ||||||
| Condensed consolidated financial statements | ||||||||||||||||||||||||||
| Interim condensed consolidated income statement | ||||||||
| EUR million | ||||||||
| Q1'23 | Q1'22 | |||||||
| Interest income | 23,889 | 13,972 | ||||||
| Financial assets at fair value through other comprehensive income | 1,788 | 1,077 | ||||||
| Financial assets at amortized cost | 18,132 | 11,852 | ||||||
| Other interest income | 3,969 | 1,043 | ||||||
| Interest expense | (13,493) | (5,117) | ||||||
| Interest income/ (charges) | 10,396 | 8,855 | ||||||
| Dividend income | 63 | 68 | ||||||
| Income from companies accounted for using the equity method | 126 | 133 | ||||||
| Commission income | 4,152 | 3,747 | ||||||
| Commission expense | (1,109) | (935) | ||||||
| Gain or losses on financial assets and liabilities not measured at fair value through profit or loss, net | 18 | 29 | ||||||
| Financial assets at amortized cost | 15 | 36 | ||||||
| Other financial assets and liabilities | 3 | (7) | ||||||
| Gain or losses on financial assets and liabilities held for trading, net | 802 | 1,801 | ||||||
| Reclassification of financial assets at fair value through other comprehensive income | — | — | ||||||
| Reclassification of financial assets from amortized cost | — | — | ||||||
| Other gains (losses) | 802 | 1,801 | ||||||
| Gains or losses on non-trading financial assets and liabilities mandatorily at fair value through profit or loss | (13) | 43 | ||||||
| Reclassification of financial assets at fair value through other comprehensive income | — | — | ||||||
| Reclassification of financial assets from amortized cost | — | — | ||||||
| Other gains (losses) | (13) | 43 | ||||||
| Gain or losses on financial assets and liabilities measured at fair value through profit or loss, net | (266) | 292 | ||||||
| Gain or losses from hedge accounting, net | 10 | 95 | ||||||
| Exchange differences, net | 164 | (1,873) | ||||||
| Other operating income | 329 | 438 | ||||||
| Other operating expenses | (759) | (460) | ||||||
| Income from assets under insurance and reinsurance contracts | 203 | 390 | ||||||
| Expenses from liabilities under insurance and reinsurance contracts | (194) | (318) | ||||||
| Total income | 13,922 | 12,305 | ||||||
| Administrative expenses | (5,356) | (4,831) | ||||||
| Staff costs | (3,245) | (2,863) | ||||||
| Other general and administrative expenses | (2,111) | (1,968) | ||||||
| Depreciation and amortization | (789) | (704) | ||||||
| Provisions or reversal of provisions, net | (642) | (455) | ||||||
| Impairment or reversal of impairment of financial assets not measured at fair value through profit or loss and net gains and losses from modifications | (3,301) | (2,123) | ||||||
| Financial assets at fair value through other comprehensive income | 2 | (9) | ||||||
| Financial assets at amortized cost | (3,303) | (2,114) | ||||||
| Impairment of investments in subsidiaries, joint ventures and associates, net | — | — | ||||||
| Impairment on non-financial assets, net | (22) | (35) | ||||||
| Tangible assets | (16) | (4) | ||||||
| Intangible assets | (1) | (28) | ||||||
| Others | (5) | (3) | ||||||
| Gain or losses on non-financial assets and investments, net | 26 | 2 | ||||||
| Negative goodwill recognized in results | — | — | ||||||
| Gains or losses on non-current assets held for sale not classified as discontinued operations | (6) | 12 | ||||||
| Operating profit/(loss) before tax | 3,832 | 4,171 | ||||||
| Tax expense or income from continuing operations | (967) | (1,302) | ||||||
| Profit/(loss) for the period from continuing operations | 2,865 | 2,869 | ||||||
| Profit/( loss) after tax from discontinued operations | — | — | ||||||
| Profit/(loss) for the period | 2,865 | 2,869 | ||||||
| Profit attributable to non-controlling interests | 294 | 326 | ||||||
| Profit/(loss) attributable to the parent | 2,571 | 2,543 | ||||||
| Earnings/(losses) per share | ||||||||
| Basic | 0.15 | 0.14 | ||||||
| Diluted | 0.15 | 0.14 | ||||||
January - March 2023 | | 89 | ||||||
| GLOSSARY | ||||||||
•Active customer: Those customers who comply with the minimum balance, income and/or transactionality requirements as defined according to the business area
•ADR: American Depositary Receipt
•ALCO: Assets and Liabilities Committee
•APIs: Application Programming Interface
•APM: Alternative Performance Measures
•APS: Amherst Pierpont Securities
•AuMs: Assets under management
•bn: Billion
•BNPL: Buy now, pay later
•bps: basis points
•CDI: CREST Depository Interest
•CET1: Common Equity Tier 1
•CHF: Swiss francs
•CIB: Corporate & Investment Banking
•CNMV: Spanish National Securities Market Commission (Comisión Nacional del Mercado de Valores)
•DCB: Digital Consumer Bank
•DGF: Deposit guarantee fund
•Digital customers: Every consumer of a commercial bank’s services who has logged on to their personal online banking and/or mobile banking in the last 30 days
•ECB: European Central Bank
•EPS: Earnings per share
•ESG: Environmental, Social and Governance
•ESMA: European Securities and Markets Authority
•Fed: Federal Reserve
•Financial inclusion: Number of people who are unbanked, underbanked, in financial difficulty, with difficulties in accessing credit or with limited financial literacy who, through the Group's products, services and social investment initiatives, are able to access the financial system, receive tailored finance. Financially underserved groups are defined as people who do not have a current account, or who have an account but obtained alternative (non-bank) financial services in the last 12 months. Beneficiaries of various programs are included in the quantification process only once in the entire period.
•FX: Foreign Exchange
•GDP: Gross Domestic Product
•IFRS 9: International Financial Reporting Standard 9, regarding financial instruments
•IMF: International Monetary Fund
•IPO: Initial Public Offering
•LCR: Liquidity Coverage Ratio
•LLPs: Loan-loss provisions
•Loyal customers: Active customers who receive most of their financial services from the Group according to the commercial segment that they belong to. Various engaged customer levels have been defined taking profitability into account
•MDA: Maximum Distribution Amount
•mn: Million
•NII: Net Interest Income
•NPLs: Non-performing loans
•NPS: Net Promoter Score
•PBT: Profit before tax
•PoS: Point of Sale
•pp: percentage points
•QoQ: Quarter-on- quarter
•Repos: Repurchase agreements
•RoA: Return on assets
•RoE: Return on equity
•RoRWA: Return on risk-weighted assets
•RoTE: Return on tangible equity
•RWAs: Risk-weighted assets
•SAM: Santander Asset Management
•SBNA: Santander Bank N.A.
•SCF: Santander Consumer Finance
•SCIB: Santander Corporate & Investment Banking
•SC USA: Santander Consumer USA
•SEC: Securities and Exchanges Commission
•SMEs: Small and medium enterprises
•SRF: Single resolution fund
•TLAC: The total loss-absorption capacity requirement which is required to be met under the CRD V package
•TLTRO: Targeted longer-term refinancing operations
•TNAV: Tangible net asset value
•VaR: Value at Risk
•WM&I: Wealth Management & Insurance
•YoY: Year-on-year
| 90 | | January - March 2023 | ||||||
| IMPORTANT INFORMATION | ||||||||
Non-IFRS and alternative performance measures
This report contains financial information prepared according to International Financial Reporting Standards (IFRS) and taken from our consolidated financial statements, as well as alternative performance measures (APMs) as defined in the Guidelines on Alternative Performance Measures issued by the European Securities and Markets Authority (ESMA) on 5 October 2015, and other non-IFRS measures. The APMs and non-IFRS measures were calculated with information from Grupo Santander; however, they are neither defined or detailed in the applicable financial reporting framework nor audited or reviewed by our auditors. We use these APMs and non-IFRS measures when planning, monitoring and evaluating our performance. We consider them to be useful metrics for our management and investors to compare operating performance between periods. Nonetheless, the APMs and non-IFRS measures are supplemental information; their purpose is not to substitute IFRS measures. Furthermore, companies in our industry and others may calculate or use APMs and non-IFRS measures differently, thus making them less useful for comparison purposes. APMs with ESG content have not been calculated in accordance with the Taxonomy Regulation or with the indicators for principal adverse impact in SFDR. For further details on APMs and Non-IFRS Measures, including their definition or a reconciliation between any applicable management indicators and the financial data presented in the consolidated financial statements prepared under IFRS, please see the 2022 Annual Report on Form 20-F filed with the U.S. Securities and Exchange Commission (the SEC) on 1 March 2023, as well as the section “Alternative performance measures” of this Banco Santander, S.A. (Santander) Q1 2023 Financial Report, published on 25 April 2023. These documents are available on Santander’s website (www.santander.com). Underlying measures, which are included in this report, are non-IFRS measures.
The businesses included in each of our geographic segments and the accounting principles under which their results are presented here may differ from the businesses included and local applicable accounting principles of our public subsidiaries in such geographies. Accordingly, the results of operations and trends shown for our geographic segments may differ materially from those of such subsidiaries.
Non-financial information
This report contains, in addition to financial information, non-financial information (NFI), including environmental, social and governance-related metrics, statements, goals, commitments and opinions.
NFI is included to comply with Spanish Act 11/2018 on non-financial information and diversity and to provide a broader view of our impact. NFI is not audited nor, save as expressly indicated under ‘Auditors’ review’, reviewed by an external auditor. NFI is prepared following various external and internal frameworks, reporting guidelines and measurement, collection and verification methods and practices, which are materially different from those applicable to financial information and are in many cases emerging and evolving. NFI is based on various materiality thresholds, estimates, assumptions, judgments and underlying data derived internally and from third parties. NFI is thus subject to significant measurement uncertainties, may not be comparable to NFI of other companies or over time or across periods and its inclusion is not meant to imply that the information is fit for any particular purpose or that it is material to us under mandatory reporting standards. NFI is for informational purposes only and without any liability being accepted in connection with it except where such liability cannot be limited under overriding provisions of applicable law.
Forward-looking statements
Santander hereby warns that this report contains “forward-looking statements” as per the meaning of the U.S. Private Securities Litigation Reform Act of 1995. Such statements can be understood through words and expressions like “expect”, “project”, “anticipate”, “should”, “intend”, “probability”, “risk”, “VaR”, “RoRAC”, “RoRWA”, “TNAV”, “target”, “goal”, “objective”, “estimate”, “future”, “commitment”, “commit”, “focus”, “pledge” and similar expressions. They include (but are not limited to) statements on future business development, shareholder remuneration policy and NFI. However, risks, uncertainties and other important factors may lead to developments and results to differ materially from those anticipated, expected, projected or assumed in forward-looking statements. The following important factors (and others described elsewhere in this report and other risk factors, uncertainties or contingencies detailed in our most recent Form 20-F and subsequent 6-Ks filed with, or furnished to, the SEC), as well as other unknown or unpredictable factors, could affect our future development and results and could lead to outcomes materially different from what our forward-looking statements anticipate, expect, project or assume: (1) general economic or industry conditions (e.g., an economic downturn; higher volatility in the capital markets; inflation; deflation; changes in demographics, consumer spending, investment or saving habits; and the effects of the war in Ukraine or the COVID-19 pandemic in the global economy) in areas where we have significant operations or investments; (2) climate-related conditions, regulations, targets and weather events; (3) exposure to various market risks (e.g., risks from interest rates, foreign exchange rates, equity prices and new benchmark indices); (4) potential losses from early loan repayment, collateral depreciation or counterparty risk; (5) political instability in Spain, the UK, other European countries, Latin America and the US; (6) legislative, regulatory or tax changes (including regulatory capital and liquidity requirements), especially in view of the UK´s exit from the European Union and increased regulation prompted by financial crises; (7) acquisition integration challenges arising from deviating management’s resources and attention from other strategic opportunities and operational matters; (8) uncertainty over the scope of actions that may be required by us, governments and others to achieve goals relating to climate, environmental and social matters, as well as the evolving nature of underlying science and industry and governmental standards and regulations; and (9) changes affecting our access to liquidity and funding on acceptable terms, especially due to credit spread shifts or credit rating downgrades for the entire group or core subsidiaries.
Forward looking statements are based on current expectations and future estimates about Santander’s and third-parties’ operations and businesses and address matters that are uncertain to varying degrees, including, but not limited to developing standards that may change in the future; plans, projections, expectations, targets, objectives, strategies and goals relating to environmental, social, safety and
January - March 2023 | | 91 | ||||||
governance performance, including expectations regarding future execution of Santander’s and third-parties’ energy and climate strategies, and the underlying assumptions and estimated impacts on Santander’s and third-parties’ businesses related thereto; Santander’s and third-parties’ approach, plans and expectations in relation to carbon use and targeted reductions of emissions; changes in operations or investments under existing or future environmental laws and regulations; and changes in government regulations and regulatory requirements, including those related to climate-related initiatives.
Forward-looking statements are aspirational, should be regarded as indicative, preliminary and for illustrative purposes only, speak only as of the date of this report, are informed by the knowledge, information and views available on such date and are subject to change without notice. Santander is not required to update or revise any forward-looking statements, regardless of new information, future events or otherwise, except as required by applicable law.
Not a securities offer
This report and the information it contains does not constitute an offer to sell nor the solicitation of an offer to buy any securities.
Past performance does not indicate future outcomes
Statements about historical performance or growth rates must not be construed as suggesting that future performance, share price or results (including earnings per share) will necessarily be the same or higher than in a previous period. Nothing in this report should be taken as a profit and loss forecast.
Third Party Information
In this report, Santander relies on and refers to certain information and statistics obtained from publicly-available information and third-party sources, which it believes to be reliable. Neither Santander nor its directors, officers and employees have independently verified the accuracy or completeness of any such publicly-available and third-party information, make any representation or warranty as to the quality, fitness for a particular purpose, non-infringement, accuracy or completeness of such information or undertake any obligation to update such information after the date of this report. In no event shall Santander be liable for any use by any party of, for any decision made or action taken by any party in reliance upon, or for inaccuracies or errors in, or omission from, such publicly-available and third-party information contained herein. Any sources of publicly-available information and third-party information referred or contained herein retain all rights with respect to such information and use of such information herein shall not be deemed to grant a license to any third party.
| This document is a translation of a document originally issued in Spanish. Should there be any discrepancies between the English and the Spanish versions, only the original Spanish version should be binding. | ||
| 92 | | January - March 2023 | ||||||
SIGNATURE
Pursuant to the requirements of the Securities Exchange Act of 1934, the registrant has duly caused this report to be signed on its behalf by the undersigned, thereunto duly authorized.
| Banco Santander, S.A. | ||||||||
| Date: 25 April 2023 | By: | /s/ José García Cantera | ||||||
| Name: | José García Cantera | |||||||
| Title: | Chief Financial Officer | |||||||