FORM 6-K
SECURITIES AND EXCHANGE COMMISSION
Washington, D.C. 20549
Report of Foreign Issuer
Pursuant to Rule 13a-16 or 15d-16
of the Securities Exchange Act of 1934
For the month of October, 2023
Commission File Number: 001-12518
Banco Santander, S.A.
(Exact name of registrant as specified in its charter)
Ciudad Grupo Santander
28660 Boadilla del Monte (Madrid) Spain
(Address of principal executive office)
Indicate by check mark whether the registrant files or will file annual reports under cover of Form 20-F or Form 40-F:
Form 20-F ☒ Form 40-F ☐
BANCO SANTANDER, S.A.
________________________
TABLE OF CONTENTS
| Item 1. January - September 2023 Financial Report | |||||

| January - September | 2023 | ||||
Index

This report was approved by the board of directors on 24 October 2023, following a favourable report from the audit committee. Important information regarding this report can be found on pages 90 and 91.
Key consolidated data
| BALANCE SHEET (EUR million) | Sep-23 | Jun-23 | % | Sep-23 | Sep-22 | % | Dec-22 | ||||||||||||||||
| Total assets | 1,816,844 | 1,780,493 | 2.0 | 1,816,844 | 1,815,792 | 0.1 | 1,734,659 | ||||||||||||||||
| Loans and advances to customers | 1,039,172 | 1,045,044 | (0.6) | 1,039,172 | 1,067,466 | (2.7) | 1,036,004 | ||||||||||||||||
| Customer deposits | 1,034,885 | 1,013,778 | 2.1 | 1,034,885 | 993,065 | 4.2 | 1,009,722 | ||||||||||||||||
| Total funds | 1,288,547 | 1,255,783 | 2.6 | 1,288,547 | 1,225,813 | 5.1 | 1,239,981 | ||||||||||||||||
| Total equity | 102,897 | 102,044 | 0.8 | 102,897 | 99,312 | 3.6 | 97,585 | ||||||||||||||||
| Note: total funds includes customer deposits, mutual funds, pension funds and managed portfolios. | |||||||||||||||||||||||
| INCOME STATEMENT (EUR million) | Q3'23 | Q2'23 | % | 9M'23 | 9M'22 | % | 2022 | ||||||||||||||||
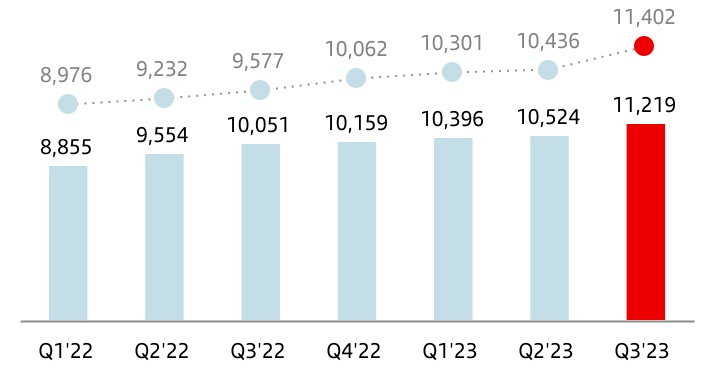
| Net interest income | 11,219 | 10,524 | 6.6 | 32,139 | 28,460 | 12.9 | 38,619 | ||||||||||||||||
| Total income | 14,861 | 14,088 | 5.5 | 42,871 | 38,594 | 11.1 | 52,117 | ||||||||||||||||
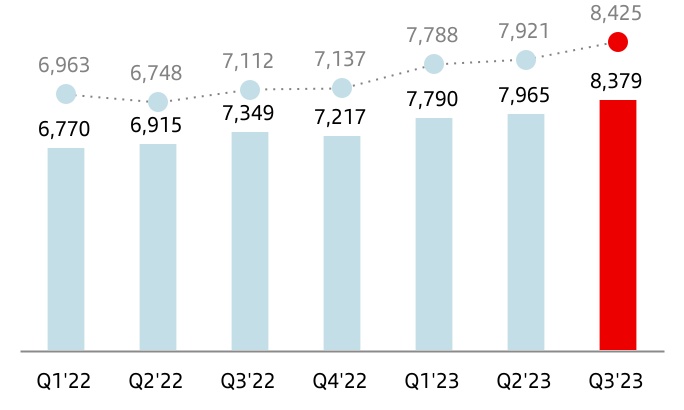
| Net operating income | 8,379 | 7,754 | 8.1 | 23,910 | 20,999 | 13.9 | 28,214 | ||||||||||||||||
| Profit before tax | 4,447 | 4,258 | 4.4 | 12,537 | 11,761 | 6.6 | 15,250 | ||||||||||||||||
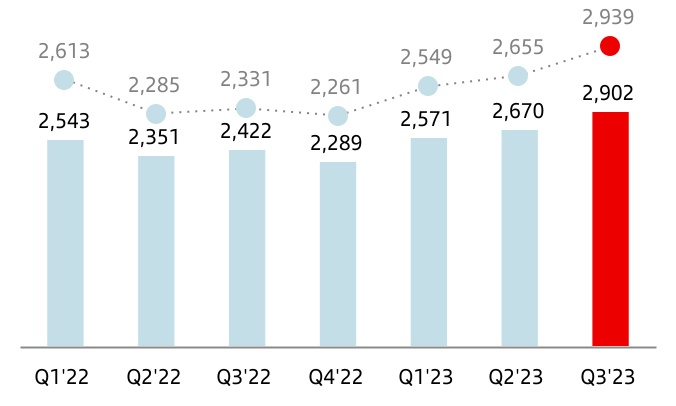
| Profit attributable to the parent | 2,902 | 2,670 | 8.7 | 8,143 | 7,316 | 11.3 | 9,605 | ||||||||||||||||
| Changes in constant euros: | |||||||||||||||||||||||
| Q3'23 / Q2'23: NII: +9.3%; Total income: +7.0%; Net operating income: +9.3%; Profit before tax: +5.6%; Attributable profit: +10.7%. | |||||||||||||||||||||||
| 9M'23 / 9M'22: NII: +15.7%; Total income: +12.8%; Net operating income: +14.8%; Profit before tax: +7.5%; Attributable profit: +12.6%. | |||||||||||||||||||||||
| EPS, PROFITABILITY AND EFFICIENCY (%) | Q3'23 | Q2'23 | % | 9M'23 | 9M'22 | % | 2022 | ||||||||||||||||
| EPS (euros) | 0.17 | 0.16 | 8.5 | 0.48 | 0.41 | 17.3 | 0.54 | ||||||||||||||||
| RoE | 12.28 | 11.56 | 11.75 | 10.86 | 10.67 | ||||||||||||||||||
| RoTE | 15.49 | 14.61 | 14.83 | 13.57 | 13.37 | ||||||||||||||||||
| RoA | 0.71 | 0.67 | 0.68 | 0.64 | 0.63 | ||||||||||||||||||
| RoRWA | 2.02 | 1.90 | 1.93 | 1.82 | 1.77 | ||||||||||||||||||
| Efficiency ratio | 43.6 | 44.3 | 44.0 | 45.5 | 45.8 | ||||||||||||||||||
UNDERLYING INCOME STATEMENT 1 (EUR million) | Q3'23 | Q2'23 | % | 9M'23 | 9M'22 | % | 2022 | ||||||||||||||||
| Net interest income | 11,219 | 10,735 | 4.5 | 32,139 | 28,460 | 12.9 | 38,619 | ||||||||||||||||
| Total income | 14,861 | 14,299 | 3.9 | 43,095 | 38,629 | 11.6 | 52,154 | ||||||||||||||||
| Net operating income | 8,379 | 7,965 | 5.2 | 24,134 | 21,034 | 14.7 | 28,251 | ||||||||||||||||
| Profit before tax | 4,447 | 4,234 | 5.0 | 12,776 | 11,761 | 8.6 | 15,250 | ||||||||||||||||
| Profit attributable to the parent | 2,902 | 2,670 | 8.7 | 8,143 | 7,316 | 11.3 | 9,605 | ||||||||||||||||
| Changes in constant euros: | |||||||||||||||||||||||
| Q3'23 / Q2'23: NII: +7.1%; Total income: +5.4%; Net operating income: +6.4%; Profit before tax: +6.4%; Attributable profit: +10.7%. | |||||||||||||||||||||||
| 9M'23 / 9M'22: NII: +15.7%; Total income: +13.4%; Net operating income: +15.9%; Profit before tax: +9.6%; Attributable profit: +12.6%. | |||||||||||||||||||||||
| SOLVENCY (%) | Sep-23 | Jun-23 | Sep-23 | Sep-22 | Dec-22 | ||||||||||||||||||
| Fully-loaded CET1 ratio | 12.3 | 12.2 | 12.3 | 12.1 | 12.0 | ||||||||||||||||||
| Fully-loaded total capital ratio | 16.2 | 15.9 | 16.2 | 16.0 | 15.8 | ||||||||||||||||||
| CREDIT QUALITY (%) | Q3'23 | Q2'23 | 9M'23 | 9M'22 | 2022 | ||||||||||||||||||
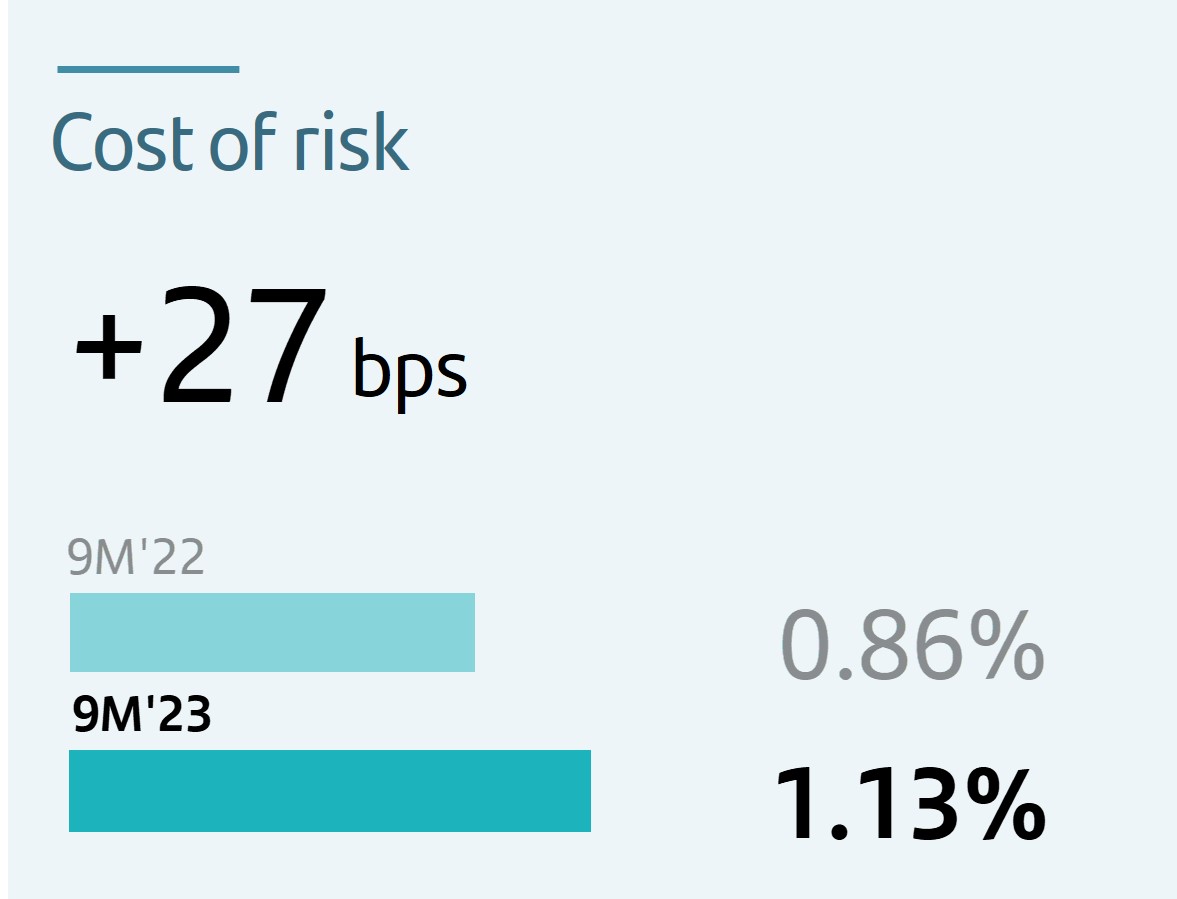
Cost of risk2 | 1.13 | 1.08 | 1.13 | 0.86 | 0.99 | ||||||||||||||||||
| NPL ratio | 3.13 | 3.07 | 3.13 | 3.08 | 3.08 | ||||||||||||||||||
| NPL coverage ratio | 68 | 68 | 68 | 70 | 68 | ||||||||||||||||||
January - September 2023 |  | 3 | ||||||
| MARKET CAPITALIZATION AND SHARES | Sep-23 | Jun-23 | % | Sep-23 | Sep-22 | % | Dec-22 | ||||||||||||||||
| Shares (millions) | 16,184 | 16,184 | 0.0 | 16,184 | 16,794 | (3.6) | 16,794 | ||||||||||||||||
| Share price (euros) | 3.619 | 3.385 | 6.9 | 3.619 | 2.398 | 50.9 | 2.803 | ||||||||||||||||
| Market capitalization (EUR million) | 58,562 | 54,783 | 6.9 | 58,562 | 40,265 | 45.4 | 47,066 | ||||||||||||||||
| Tangible book value per share (euros) | 4.61 | 4.57 | 4.61 | 4.31 | 4.26 | ||||||||||||||||||
| Price / Tangible book value per share (X) | 0.79 | 0.74 | 0.79 | 0.56 | 0.66 | ||||||||||||||||||
| CUSTOMERS (thousands) | Q3'23 | Q2'23 | % | 9M'23 | 9M'22 | % | 2022 | ||||||||||||||||
| Total customers | 166,250 | 163,756 | 1.5 | 166,250 | 156,820 | 6.0 | 159,844 | ||||||||||||||||
| Active customers | 100,614 | 99,472 | 1.1 | 100,614 | 98,477 | 2.2 | 99,190 | ||||||||||||||||
| Loyal customers | 28,470 | 27,948 | 1.9 | 28,470 | 26,824 | 6.1 | 27,456 | ||||||||||||||||
| Digital customers | 53,568 | 52,517 | 2.0 | 53,568 | 50,452 | 6.2 | 51,471 | ||||||||||||||||
| Digital sales / Total sales (%) | 56.7 | 56.0 | 55.8 | 55.5 | 55.1 | ||||||||||||||||||
| OTHER DATA | Sep-23 | Jun-23 | % | Sep-23 | Sep-22 | % | Dec-22 | ||||||||||||||||
| Number of shareholders | 3,703,401 | 3,802,161 | (2.6) | 3,703,401 | 3,928,568 | (5.7) | 3,915,388 | ||||||||||||||||
| Number of employees | 212,219 | 212,409 | (0.1) | 212,219 | 203,376 | 4.3 | 206,462 | ||||||||||||||||
| Number of branches | 8,652 | 8,823 | (1.9) | 8,652 | 9,134 | (5.3) | 9,019 | ||||||||||||||||
| 1. | In addition to financial information prepared in accordance with International Financial Reporting Standards (IFRS) and derived from our consolidated financial statements, this report contains certain financial measures that constitute alternative performance measures (APMs) as defined in the Guidelines on Alternative Performance Measures issued by the European Securities and Markets Authority (ESMA) on 5 October 2015, and other non-IFRS measures, including the figures related to “underlying” results, which do not include factors that are outside the ordinary course of our business, or have been reclassified within the underlying income statement. Further details are provided in the “Alternative performance measures” section of the appendix to this report. For further details on the APMs and non-IFRS measures used, including their definition or a reconciliation between any applicable management indicators and the financial data presented in the annual consolidated financial statements prepared under IFRS, please see our 2022 Annual Financial Report, published in the CNMV on 28 February 2023, our 20-F report for the year ending 31 December 2022 filed with the SEC in the United States on 1 March 2023 as well as the “Alternative performance measures” section of the appendix to this report. | ||||
| 2. | Allowances for loan-loss provisions over the last 12 months / Average loans and advances to customers over the last 12 months. | ||||
| 4 | | January - September 2023 | ||||||
| Group financial information | Financial information by segment | Responsible banking Corporate governance Santander share | Appendix | |||||||||||||||||||||||
Our business model is based on three pillars
| 01. Customer focus | 02. Our scale | 03. Diversification | ||||||||||||||||||||||||
Digital bank with branches | Local and global scale | Geographic and business diversification. Solid and diversified balance sheet | ||||||||||||||||||||||||
| Transform our business and operating model through our global technology initiatives to build a digital bank with branches that provides access to financial services for our customers through several channels. | In-market scale in each of our core markets in volumes combined with our global scale support greater profitability and provide a competitive advantage over local peers. | Our well-balanced diversification between developing and mature markets, as well as between business and customer segments, delivers recurrent pre-provision profit with low volatility. | ||||||||||||||||||||||||
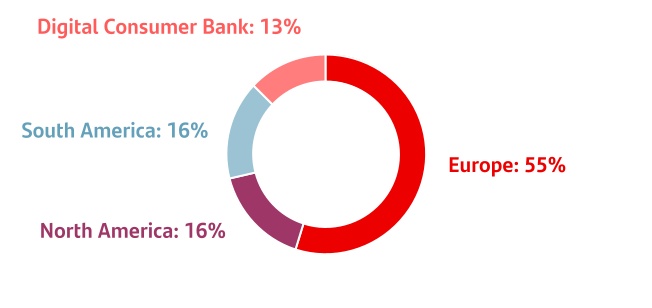
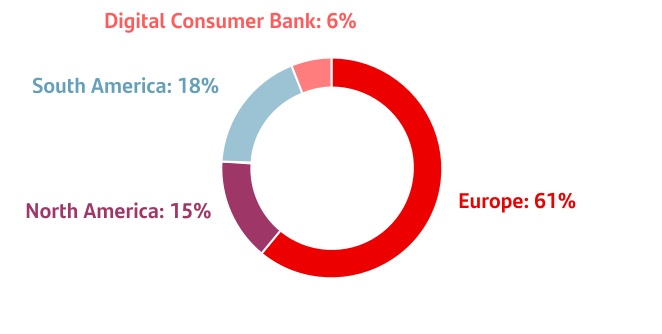
 | Top 3 NPS1 | Top 3 in lending2 in 9 of our markets | Contribution to Group profit3 | |||||||||||||||||||||||
| in 5 markets | 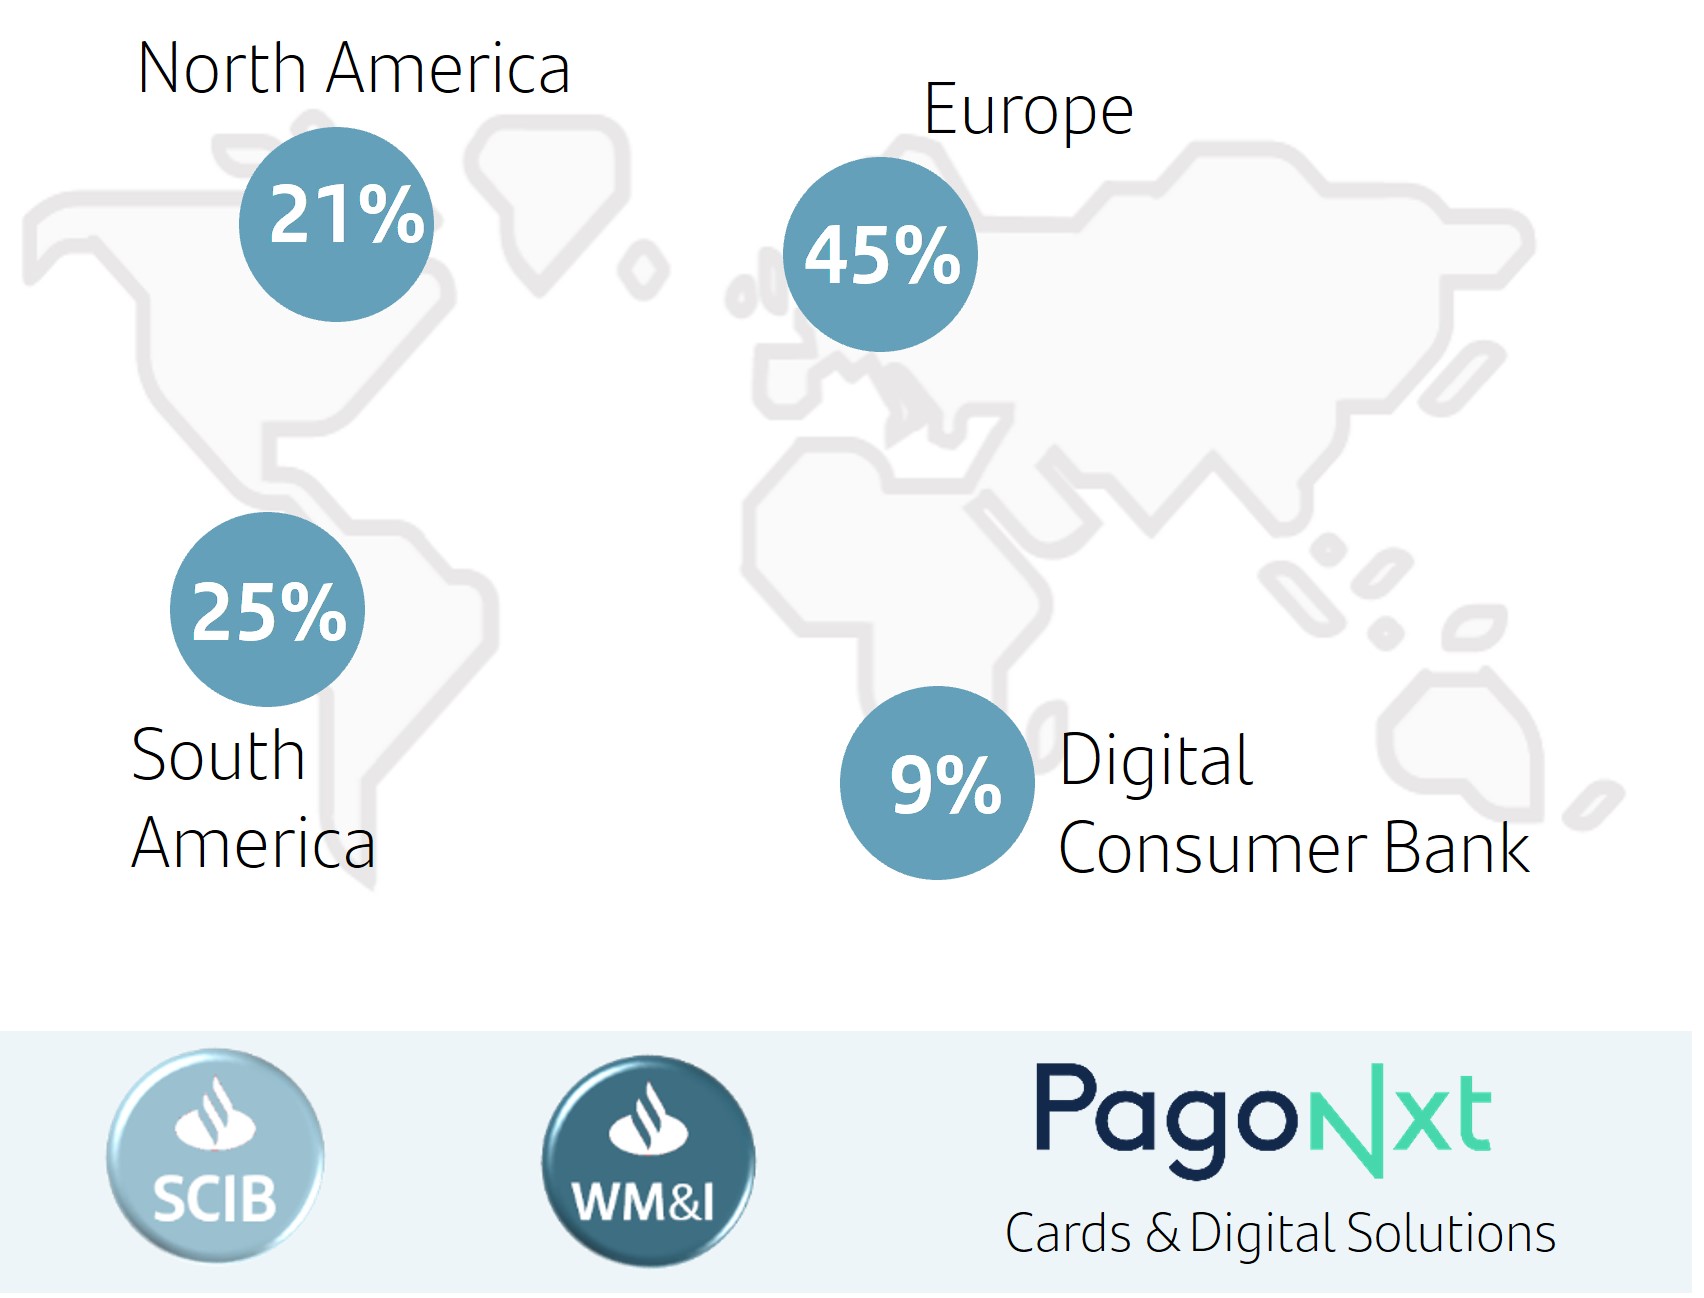 | |||||||||||||||||||||||||
 | 166 mn total customers |  | ||||||||||||||||||||||||
101 mn active customers | ||||||||||||||||||||||||||
| Our business model remains a source of great strength and resilience | ||||||||||||||||||||||||||
Our corporate culture
The Santander Way remains unchanged to continue to deliver for all our stakeholders
Our purpose To help people and businesses prosper. | 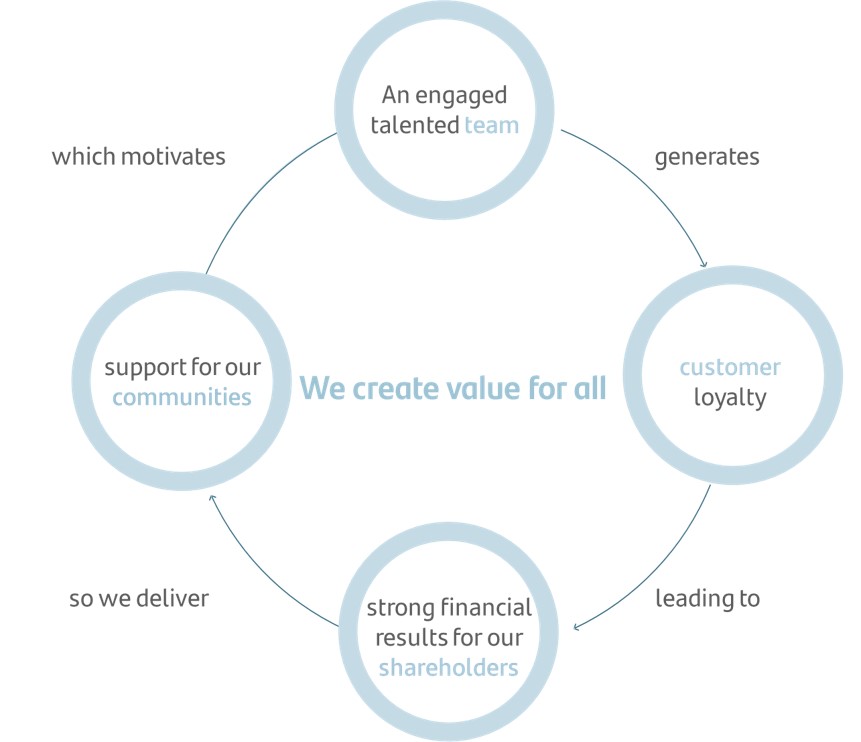 | ||||||||||
Our aim To be the best open financial services platform, by acting responsibly and earning the lasting loyalty of our people, customers, shareholders and communities. | |||||||||||
Our how Everything we do should be Simple, Personal and Fair. | |||||||||||
1.NPS – internal benchmark of individual customers' satisfaction audited by Stiga/Deloitte in H1'23.
2.Market share in lending as of June 2023 including only privately-owned banks. Digital Consumer Bank (DCB) refers to auto in Europe.
3.9M'23 attributable profit by region. Operating areas excluding the Corporate Centre.
January - September 2023 | | 5 | ||||||
Highlights of the period
 | PROFIT | |||||||
 | u | In Q3 2023, attributable profit amounted to EUR 2,902 million, 9% more than in the previous quarter (+11% in constant euros) and 20% more than in Q3 2022 (+26% in constant euros). | |||||||||
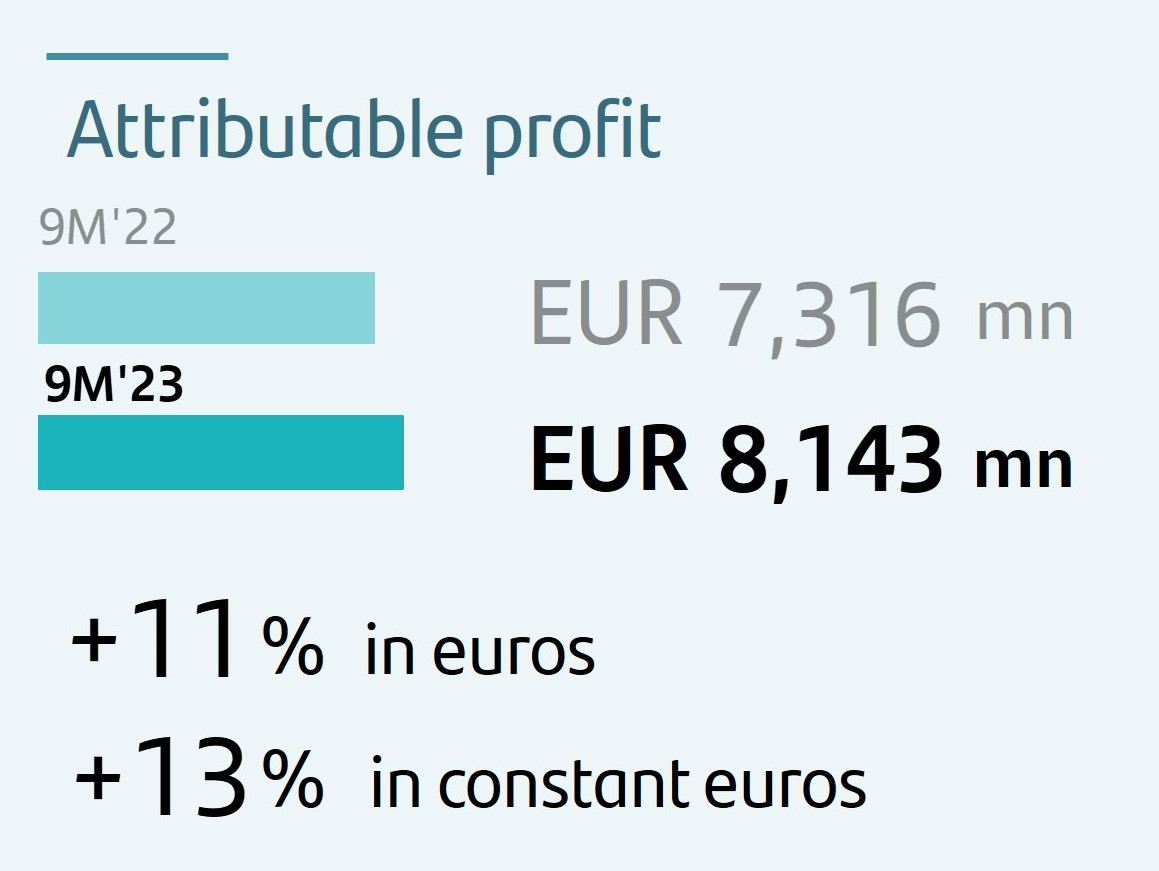
| u | In 9M 2023, attributable profit was EUR 8,143 million, 11% higher than in the same period in 2022 (+13% in constant euros) and 14% and 16% higher respectively if we exclude the temporary levy on revenue obtained in Spain and DCB in Q1 2023. | ||||||||||
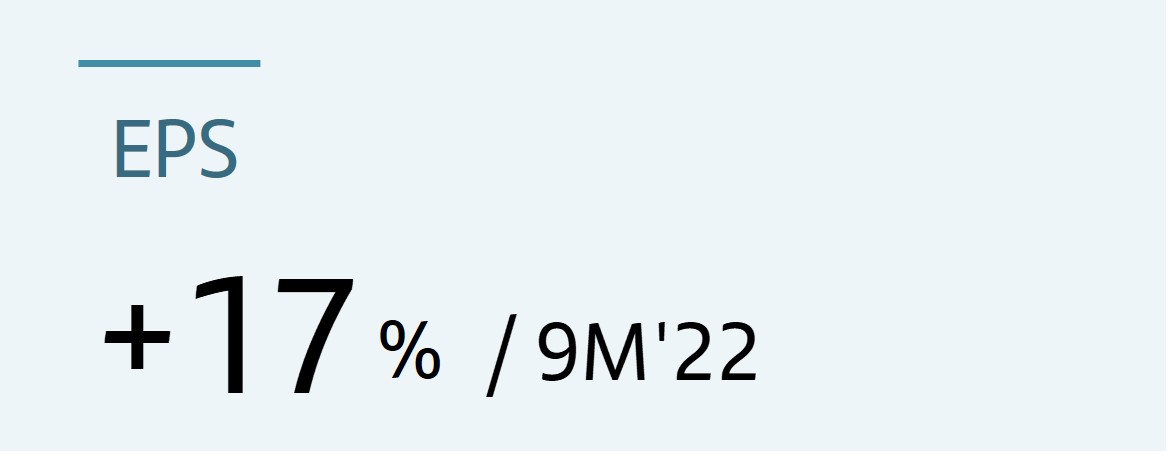 | u | Sustained earnings per share growth, which rose 17% compared to 9M 2022 to EUR 47.9 cents, boosted by the share buybacks in the last 12 months. | |||||||||
 | VALUE CREATION | |||||||
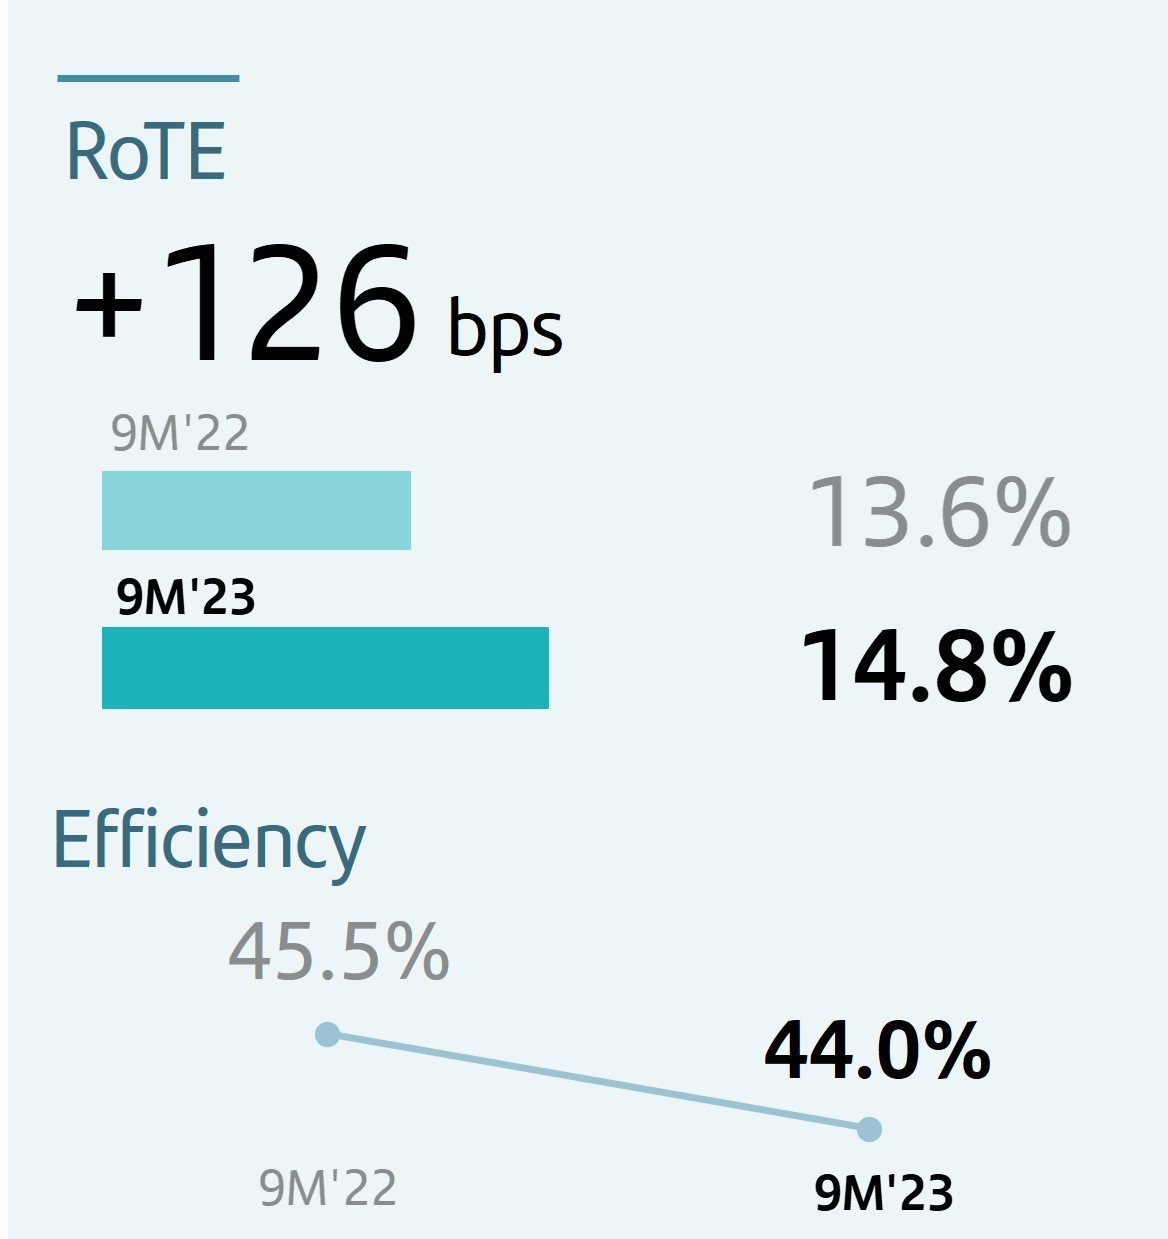 | u | Profitability improved in the quarter and year-on-year and RoTE reached 14.8%, compared to 13.6% in the same period of 2022, supported by double-digit revenue growth. | |||||||||
| u | The acceleration of structural changes towards a simpler and more integrated model through One Transformation, which we are expanding across the Group, is driving efficiency gains and profitable growth. | ||||||||||
| u | The efficiency ratio was 44.0%, improving 1.5 pp compared to 9M 2022, driven mainly by Europe where it decreased 6.3 pp. | ||||||||||
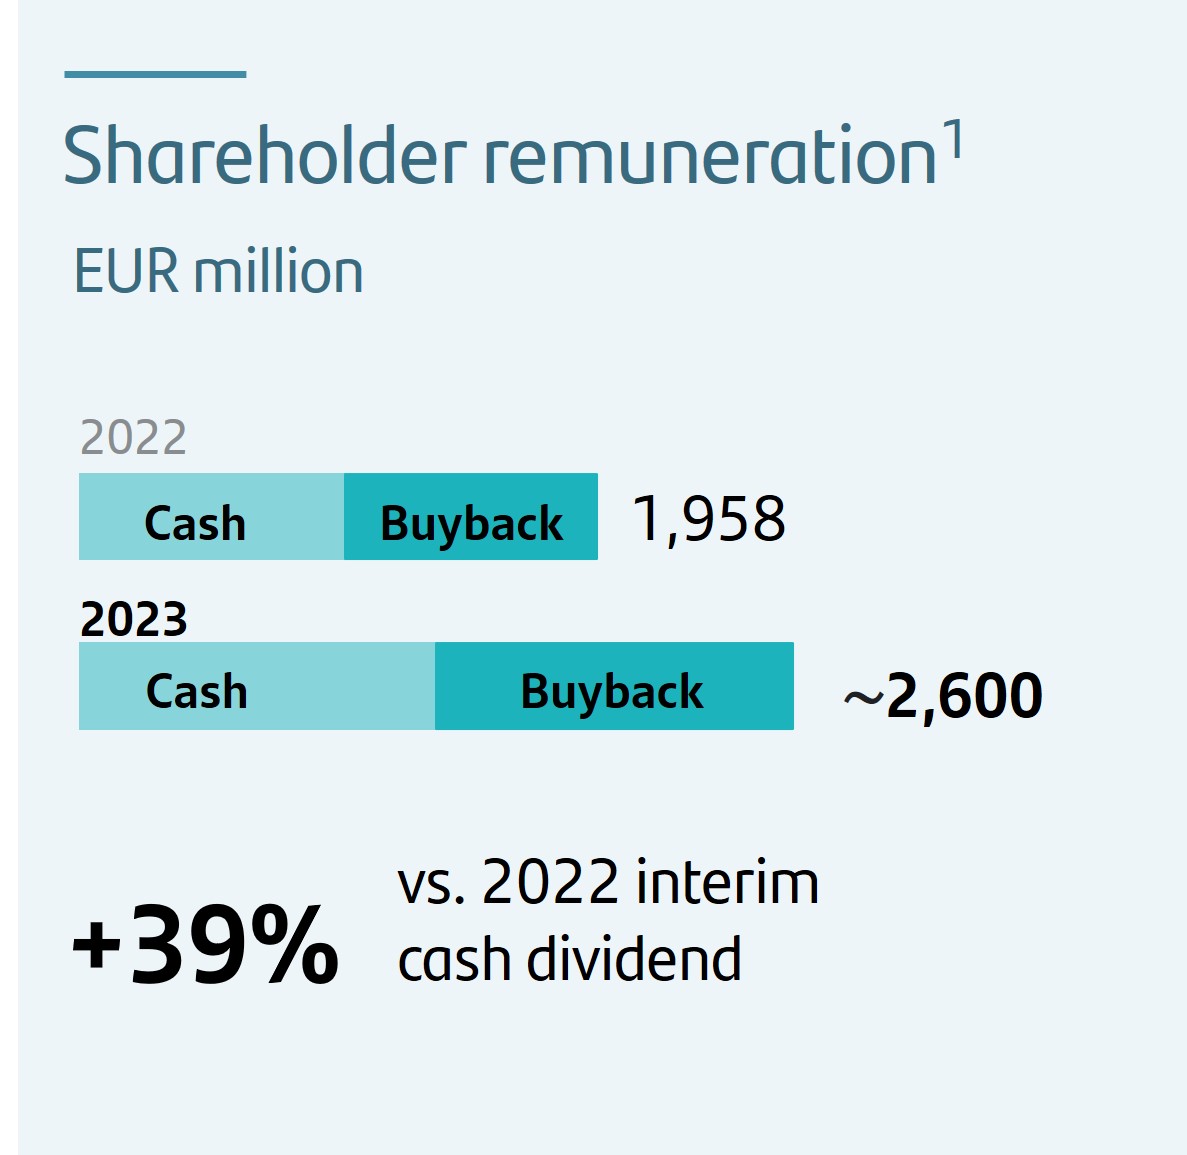 | u | In applying the shareholder remuneration policy for 2023, the board of directors approved an interim distribution against 2023 results, which will be made in two parts: •A cash dividend of EUR 8.10 cents per share (pre-tax) against 2023 results, 39% higher than the equivalent in 2022, to be paid from 2 November 2023. •A share buyback programme of up to EUR 1,310 million, which commenced on 28 September, once the applicable regulatory approval was obtained, as announced in the Inside Information disclosed on 27 September 2023. | |||||||||
| u | Together, the shareholder remuneration2 against H1 2023 results was EUR 2,620 million, 34% higher than the equivalent in 2022. The amount is approximately 50% of the attributable profit in H1 20233. | ||||||||||
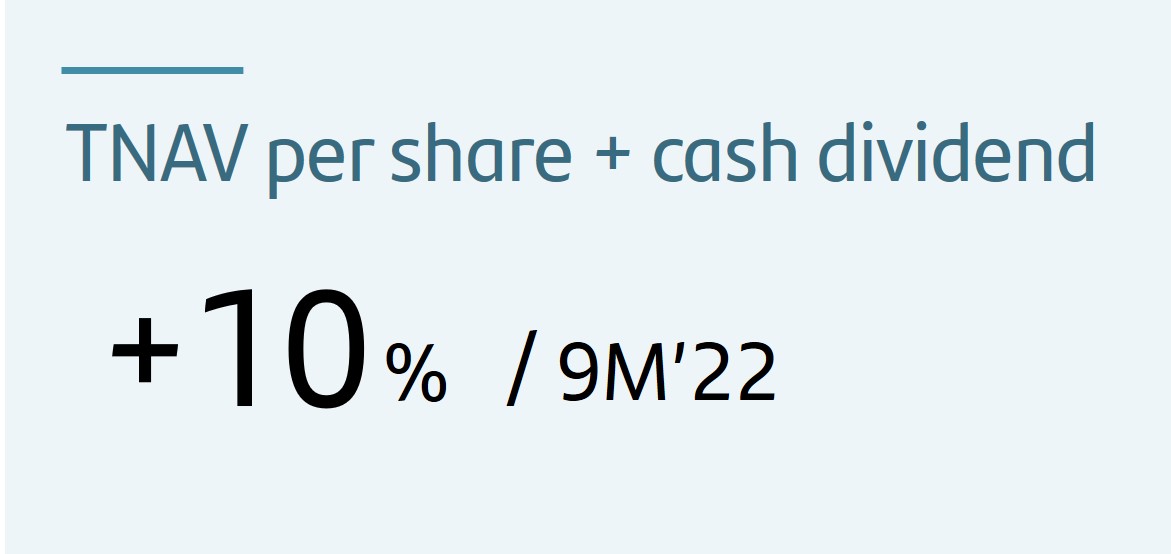 | u | As of September 2023, TNAV per share was EUR 4.61. Including the last two cash dividends against 2023 results (EUR 5.95 cents paid in May and EUR 8.10 cents that will be paid in November), TNAV + dividend per share increased 10% year-on-year (+3% quarter-on-quarter). | |||||||||
1.Interim distribution.
2.Including the cash dividend and the share buyback programmes.
3.Target payout is c.50% of Group reported profit (excluding non-cash, non-capital ratios impact items), distributed approximately 50% in cash dividends and 50% in share buybacks. Execution of the shareholder remuneration policy is subject to future corporate and regulatory decisions and approvals.
| 6 | | January - September 2023 | ||||||
 | GROWTH | |||||||
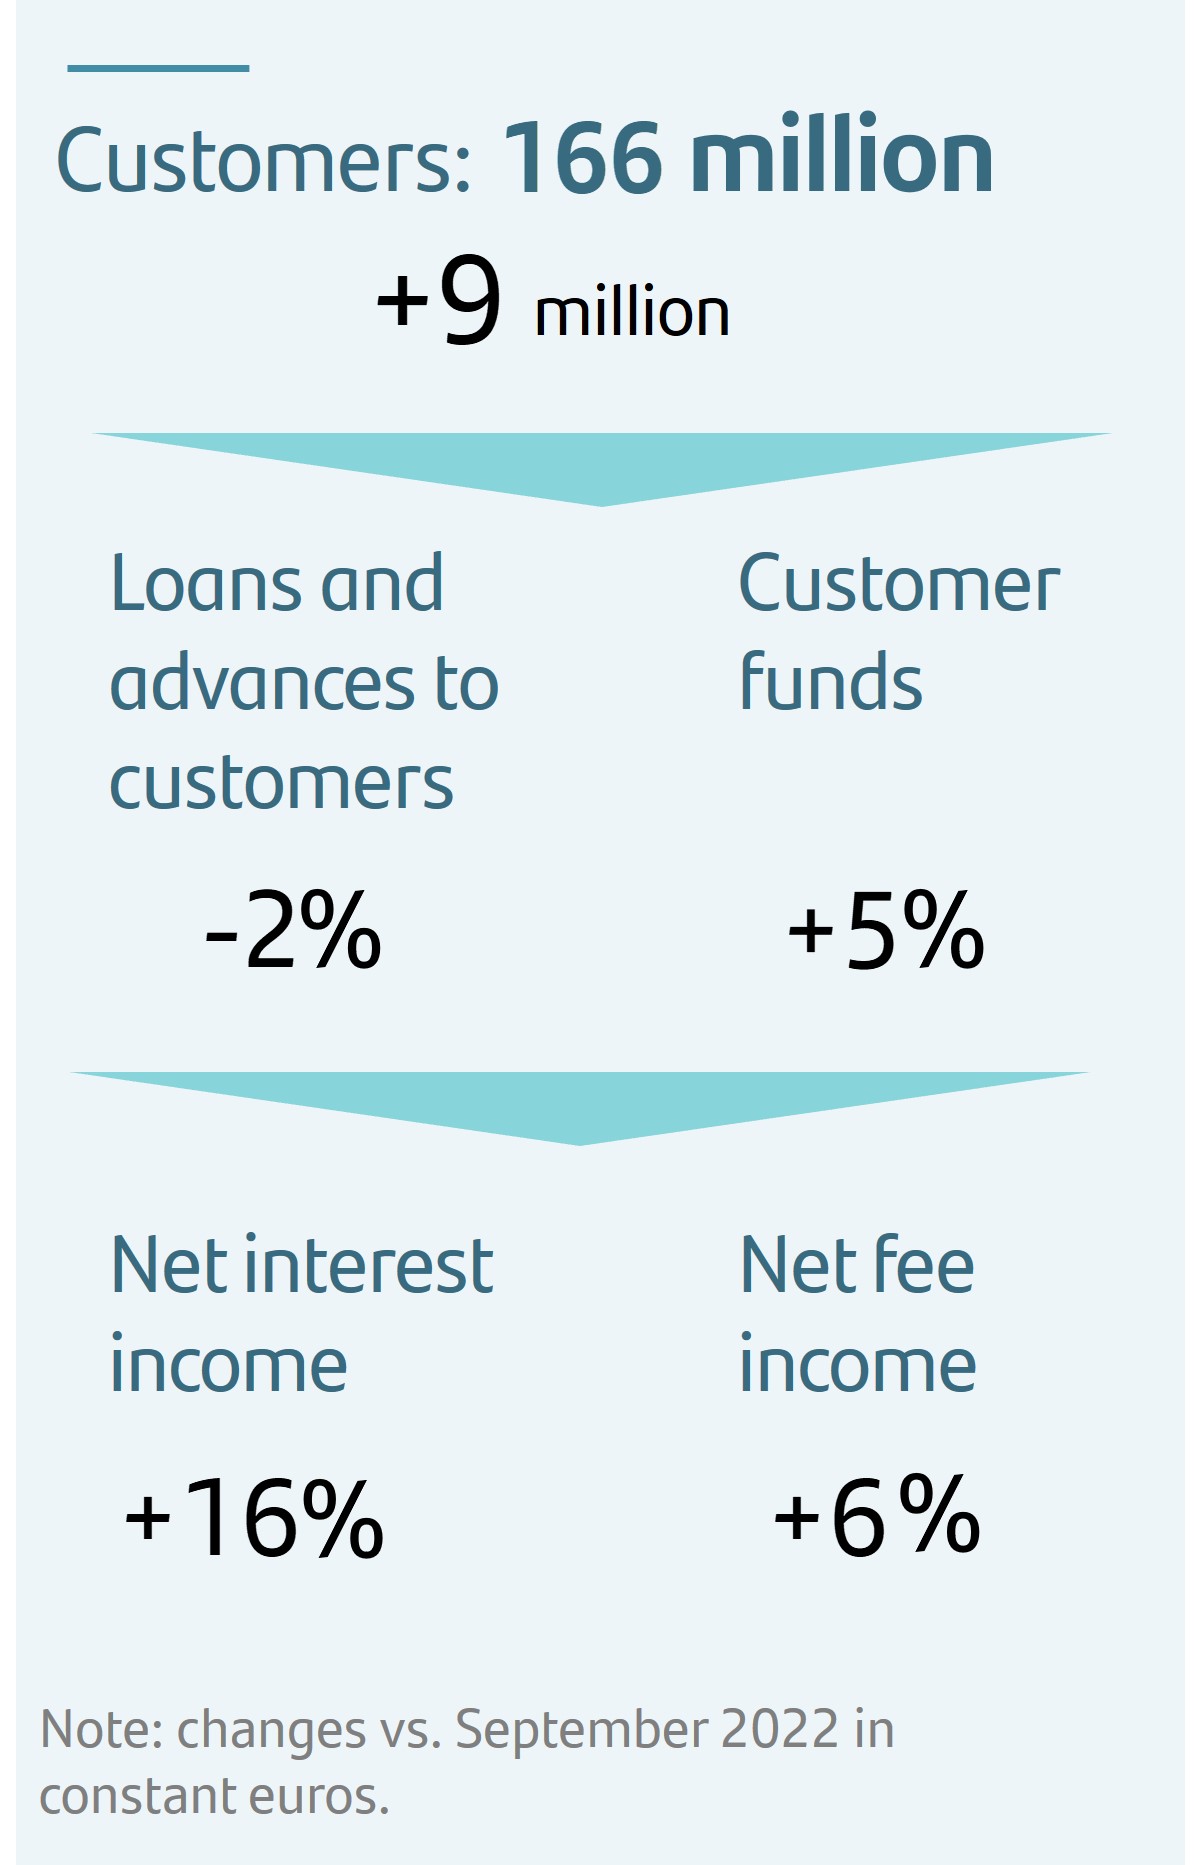 | u | Total customers amounted to 166 million, 9 million more than in September 2022. | |||||||||
| u | Active customers reached 101 million, increasing more than 2 million in the last 12 months. We have 53.6 million digital customers, 6% increase year-on-year. | ||||||||||
| u | Business volumes reflect the impact that the economic and interest rate environment are having on customer behaviour. Loans and advances to customers decreased 2% year-on-year. In constant euros, they also fell 2% as the increases in North America, South America and DCB were offset by the reduction in Europe (lower business demand and mortgage prepayments). Customer funds rose 4% year-on-year in euros (+5% in constant euros), having increased EUR 32,800 million in the last quarter). Deposits increased both in individuals and SCIB, with a stable structure where approximately 75% are transactional1. | ||||||||||
| u | Positive sensitivity to higher interest rates, margin management and higher customer activity were reflected in the 13% rise in net interest income and the 4% increase in net fee income (+16% and +6%, respectively, in constant euros). | ||||||||||
| u | Global businesses, PagoNxt and Auto accounted for 38% of total Group revenue and 42% of net fee income. | ||||||||||
 | STRENGTH | |||||||
 | u | Credit quality remained robust, driven by the good performance in employment in most regions. The NPL ratio was 3.13%, +5 bps than September 2022. Total loan-loss reserves reached EUR 24,019 million, resulting in a total coverage ratio of impaired assets of 68%. | |||||||||
| u | The Group's cost of risk stood at 1.13% (1.08% in June 2023 and 0.86% in September 2022). The CoR in the UK (0.12%), DCB (0.60%) and Mexico (2.34%) were up from low levels, Poland was impacted year-on-year by CHF mortgages, it rose in the US (1.77%) due to normalization in the auto portfolio in line with expectations, while CoR in Brazil (4.67%) decreased in for the second consecutive quarter. | ||||||||||
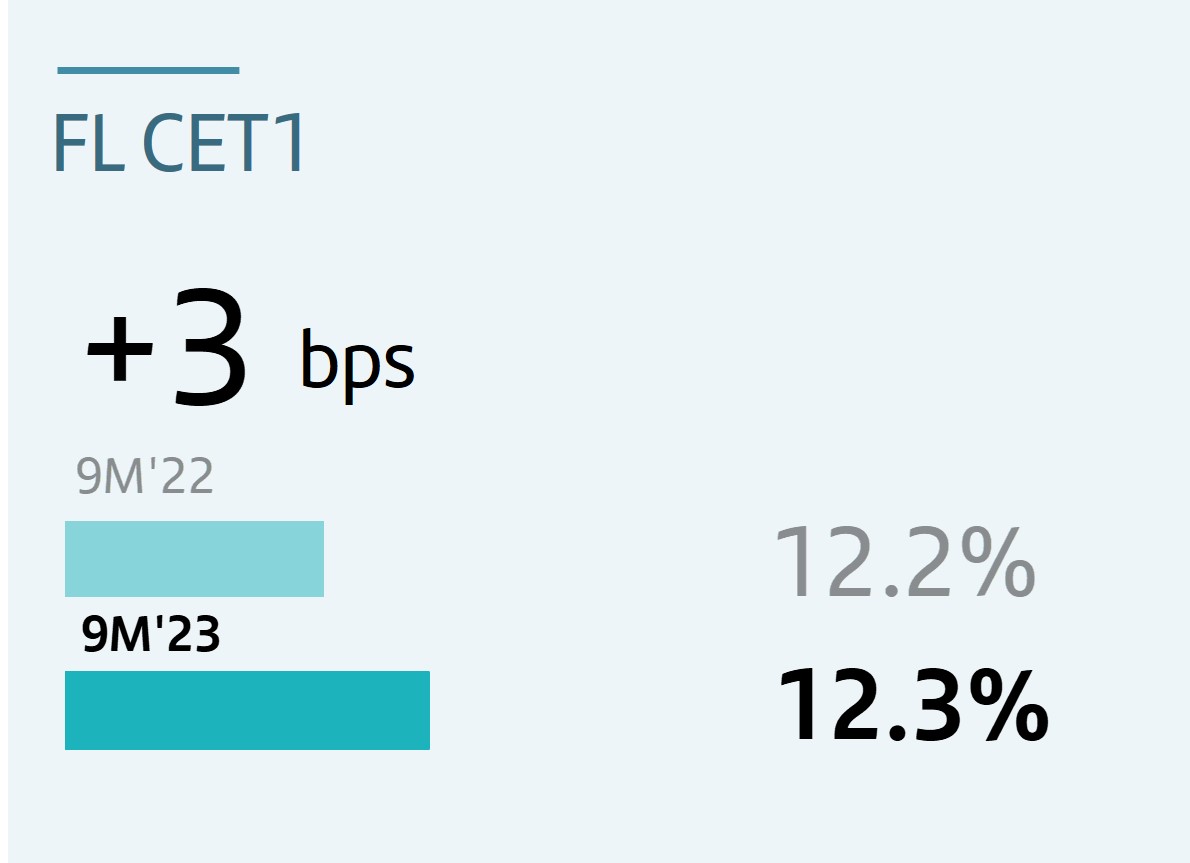 | u | The fully-loaded CET1 ratio ended the quarter at 12.3%. In the quarter, there were 45 bps of gross organic generation and a 33 bp charge for a future cash dividend payment against the profit achieved in the third quarter of 2023 (in line with the 50% payout target2) and the impact of the first share buyback programme, while we invest in profitable growth opportunities. In addition, new lending had an RoRWA equivalent to an RoTE above 15%. | |||||||||
 | LIQUIDITY | |||||||
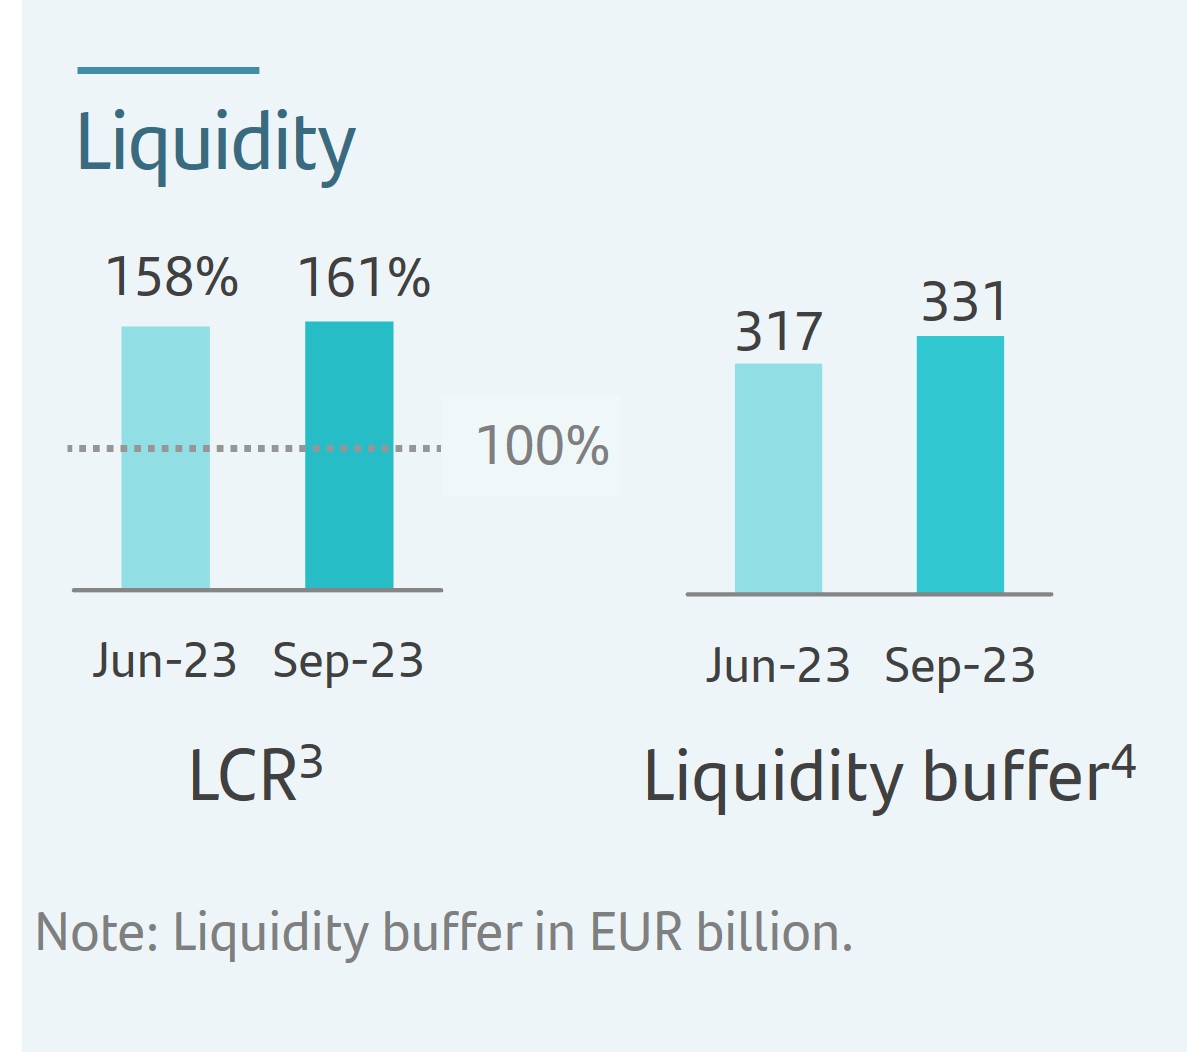 | u | Solid liquidity position with regulatory ratios well above the 100% minimum requirement. The Group liquidity coverage ratio (LCR) in the third quarter increased slightly to 161%. | |||||||||
| u | The liquidity buffer, comprising high quality liquid assets (HQLAs), exceeded EUR 331 billion in September 2023, of which 97% were level 1. EUR 210 billion of the total liquidity buffer was in cash4, equivalent to more than 20% of our deposit base. | ||||||||||
| 1. Deposits from individuals and SMEs plus other operational corporate deposits. | |||||||||||
| 2. The implementation of the shareholder remuneration policy is subject to future corporate and regulatory decisions and approvals. | |||||||||||
| 3. Provisional data. | |||||||||||
| 4. Cash, central banks reserves and deposit facility with central banks. | |||||||||||
January - September 2023 | | 7 | ||||||
| GRUPO SANTANDER RESULTS | ||||||||
| Grupo Santander. Summarized income statement | ||||||||||||||||||||||||||
| EUR million | ||||||||||||||||||||||||||
| Change | Change | |||||||||||||||||||||||||
| Q3'23 | Q2'23 | % | % excl. FX | 9M'23 | 9M'22 | % | % excl. FX | |||||||||||||||||||
| Net interest income | 11,219 | 10,524 | 6.6 | 9.3 | 32,139 | 28,460 | 12.9 | 15.7 | ||||||||||||||||||
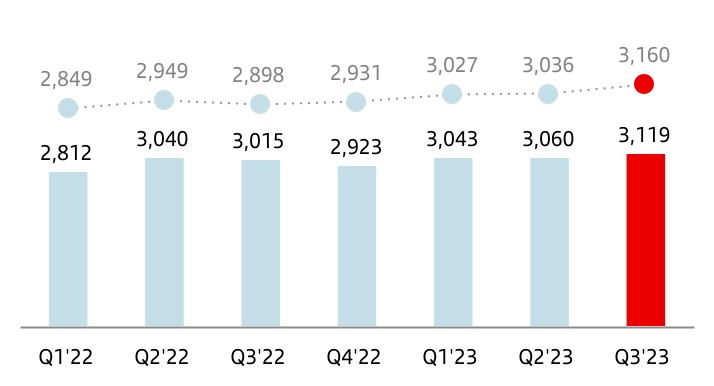
Net fee income1 | 3,119 | 3,060 | 1.9 | 4.1 | 9,222 | 8,867 | 4.0 | 6.0 | ||||||||||||||||||
Gains or losses on financial assets and liabilities and exchange differences2 | 667 | 587 | 13.6 | 24.4 | 1,969 | 1,115 | 76.6 | 96.5 | ||||||||||||||||||
| Dividend income | 92 | 319 | (71.2) | (71.3) | 474 | 422 | 12.3 | 12.5 | ||||||||||||||||||
| Share of results of entities accounted for using the equity method | 166 | 170 | (2.4) | (3.2) | 462 | 501 | (7.8) | (8.7) | ||||||||||||||||||
Other operating income/expenses3 (net) | (402) | (572) | (29.7) | 3.2 | (1,395) | (771) | 80.9 | 237.4 | ||||||||||||||||||
| Total income | 14,861 | 14,088 | 5.5 | 7.0 | 42,871 | 38,594 | 11.1 | 12.8 | ||||||||||||||||||
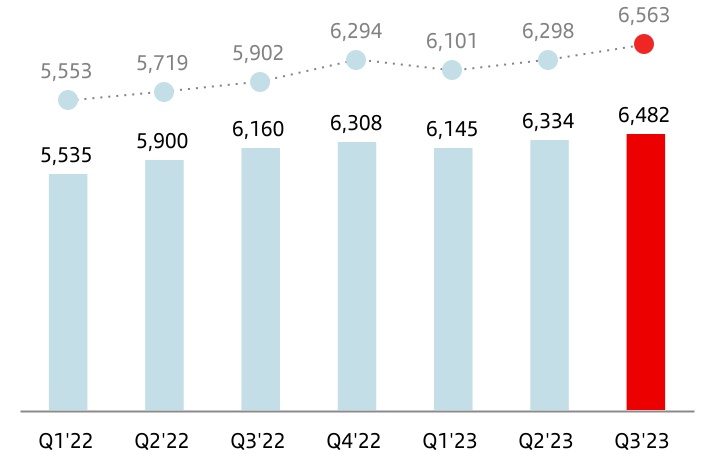
| Operating expenses | (6,482) | (6,334) | 2.3 | 4.2 | (18,961) | (17,595) | 7.8 | 10.4 | ||||||||||||||||||
| Administrative expenses | (5,683) | (5,517) | 3.0 | 4.8 | (16,556) | (15,360) | 7.8 | 10.3 | ||||||||||||||||||
| Staff costs | (3,477) | (3,358) | 3.5 | 5.2 | (10,080) | (9,125) | 10.5 | 12.7 | ||||||||||||||||||
| Other general administrative expenses | (2,206) | (2,159) | 2.2 | 4.2 | (6,476) | (6,235) | 3.9 | 6.8 | ||||||||||||||||||
| Depreciation and amortization | (799) | (817) | (2.2) | 0.2 | (2,405) | (2,235) | 7.6 | 11.1 | ||||||||||||||||||
| Provisions or reversal of provisions | (659) | (688) | (4.2) | (2.6) | (1,989) | (1,305) | 52.4 | 62.4 | ||||||||||||||||||
| Impairment or reversal of impairment of financial assets not measured at fair value through profit or loss (net) | (3,240) | (2,936) | 10.4 | 10.9 | (9,477) | (7,836) | 20.9 | 20.9 | ||||||||||||||||||
| Impairment on other assets (net) | (37) | (70) | (47.1) | (31.0) | (129) | (86) | 50.0 | 53.1 | ||||||||||||||||||
| Gains or losses on non-financial assets and investments, net | 3 | 251 | (98.8) | (99.6) | 280 | 2 | — | — | ||||||||||||||||||
| Negative goodwill recognized in results | — | — | — | — | — | — | — | — | ||||||||||||||||||
| Gains or losses on non-current assets held for sale not classified as discontinued operations | 1 | (53) | — | (101.9) | (58) | (13) | 346.2 | 359.8 | ||||||||||||||||||
| Profit or loss before tax from continuing operations | 4,447 | 4,258 | 4.4 | 5.6 | 12,537 | 11,761 | 6.6 | 7.5 | ||||||||||||||||||
| Tax expense or income from continuing operations | (1,271) | (1,314) | (3.3) | (3.5) | (3,552) | (3,538) | 0.4 | 1.1 | ||||||||||||||||||
| Profit from the period from continuing operations | 3,176 | 2,944 | 7.9 | 9.7 | 8,985 | 8,223 | 9.3 | 10.3 | ||||||||||||||||||
| Profit or loss after tax from discontinued operations | — | — | — | — | — | — | — | — | ||||||||||||||||||
| Profit for the period | 3,176 | 2,944 | 7.9 | 9.7 | 8,985 | 8,223 | 9.3 | 10.3 | ||||||||||||||||||
| Profit attributable to non-controlling interests | (274) | (274) | — | 0.1 | (842) | (907) | (7.2) | (8.4) | ||||||||||||||||||
| Profit attributable to the parent | 2,902 | 2,670 | 8.7 | 10.7 | 8,143 | 7,316 | 11.3 | 12.6 | ||||||||||||||||||
| EPS (euros) | 0.17 | 0.16 | 8.5 | 0.48 | 0.41 | 17.3 | ||||||||||||||||||||
| Diluted EPS (euros) | 0.17 | 0.16 | 8.4 | 0.48 | 0.41 | 17.1 | ||||||||||||||||||||
| Memorandum items: | ||||||||||||||||||||||||||
| Average total assets | 1,784,465 | 1,766,099 | 1.0 | 1,764,293 | 1,702,210 | 3.6 | ||||||||||||||||||||
| Average stockholders' equity | 94,527 | 92,383 | 2.3 | 92,421 | 89,854 | 2.9 | ||||||||||||||||||||
| NOTE: The summarized income statement groups some lines of the consolidated income statement on page 88 as follows: | |||||
1.‘Commission income’ and ‘Commission expense’. | |||||
2.‘Gain or losses on financial assets and liabilities not measured at fair value through profit or loss, net’; ‘Gain or losses on financial assets and liabilities held for trading, net’; ‘Gains or losses on non-trading financial assets and liabilities mandatorily at fair value through profit or loss’; ‘Gain or losses on financial assets and liabilities measured at fair value through profit or loss, net’; ‘Gain or losses from hedge accounting, net’; and ‘Exchange differences, net’. | |||||
3.‘Other operating income’; ‘Other operating expenses’; ’Income from assets under insurance and reinsurance contracts’; and ‘Expenses from liabilities under insurance and reinsurance contracts’. | |||||
| 8 | | January - September 2023 | ||||||
| Executive summary | |||||||||||||||||||||||||||||||||||||||||||||||||||||||||||||||||||||||||||||||||||||||||||||||
| Profit | Performance | |||||||||||||||||||
| Record profit for the first nine months of a year, after another quarter of strong growth | Trends seen during the year continued: revenue growth, improved efficiency and controlled cost of risk | |||||||||||||||||||
| Attributable profit | Total income | Costs | Provisions | |||||||||||||||||
| EUR 8,143 mn | +11% in euros | +12% | +8% | +21% | in euros | |||||||||||||||
| +13% in constant euros | +13% | +10% | +21% | in constant euros | ||||||||||||||||
| Efficiency | Profitability | |||||||||||||||||||
| The Group's efficiency ratio improved driven by Europe | Profitability continued to improve | |||||||||||||||||||
| Group | Europe | RoTE | RoRWA | |||||||||||||||||
| 44.0% | 41.1% | 14.8% | 1.93% | |||||||||||||||||
| -1.5 pp | -6.3 pp | +1.3 pp | +0.11 pp | |||||||||||||||||
| Changes vs. 9M 2022. | ||||||||||||||||||||
Results performance compared to 9M 2022
The Group presents, both at the total Group level and for each of the business units, the changes in euros registered in the income statement, as well as variations excluding the exchange rate effect (FX), on the understanding that the latter provide a better analysis of the Group’s management of the country units. For the Group, exchange rates had a negative impact of 2 pp in revenue and 3 pp in costs.
Total income
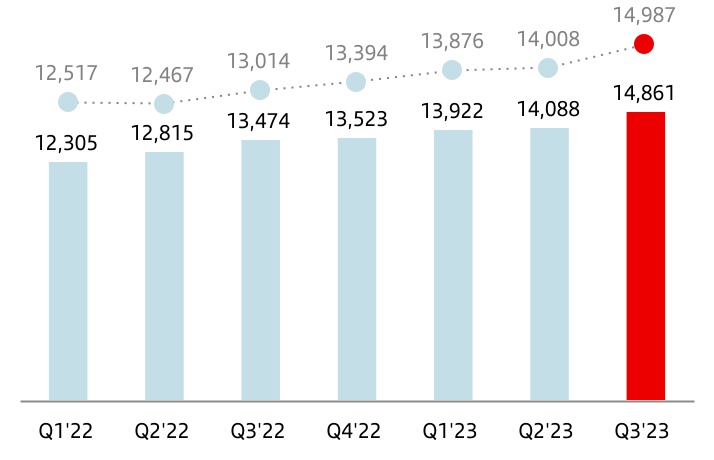
Total income amounted to EUR 42,871 million, up 11% compared to 9M 2022. In constant euros, total income increased 13%. Net interest income and net fee income accounted for 96% of total income. By line:
•Net interest income amounted to EUR 32,139 million, 13% higher than 9M 2022. Stripping out the exchange rate impact, growth was 16%, mainly due to greater volumes in some countries, higher interest rates and margin management.
By region and in constant euros, of note was the net interest income growth across Europe (+32%), due to the strong positive sensitivity to interest rate rises in our balance sheet in euros. By country: +56% in Spain, +9% in the UK, +97% in Portugal and +29% in Poland.
NII increased 3% in North America, driven mainly by Mexico (+13%) while it decreased 3% in the US.
| Net interest income | |||||
| EUR million | |||||
 | constant euros | ||||
Total income rose 8% in South America, supported by growth in all its lines, although net interest income was still affected by the negative sensitivity to the rate rises in Brazil and Chile.
NII increased 5% in DCB, as higher volumes offset the initial negative impact from higher interest rates, and the Corporate Centre recorded lower losses due to higher remuneration of the liquidity buffer.
•Net fee income increased 4% compared to 9M 2022, reaching EUR 9,222 million. In constant euros, it was 6% higher.
By region, net fee income rose 7% in North America and 18% in South America. It decreased 3% in Europe due to lower credit volumes and commercial campaigns.
Our scale and global businesses, together with our financing capabilities in auto and payments, generated greater activity for our country units and the Group, which was reflected in net fee income growth. These businesses represented 42% of the Group's total net fee income.
In Santander Corporate & Investment Banking (SCIB), net fee income increased 15%, with widespread growth across its core businesses.
| Net fee income | |||||
| EUR million | |||||
| constant euros | ||||
January - September 2023 | | 9 | ||||||
Net fee income from payments was also strong, increasing 12% in PagoNxt, with total payments volumes increasing 24% year-on-year.
In Wealth Management & Insurance (WM&I), total net fee income generated (including fees ceded to the commercial network) increased 1%, supported by Private Banking and the third consecutive quarter of growth in net sales in SAM, partially offset by a change in mix in AuMs.
In Auto, net fee income increased 5%, driven by the good performance in the US and Mexico partially offset by the regulatory change capping fees in Germany.
•Gains on financial transactions stood at EUR 1,969 million (EUR 1,115 million in the first nine months of 2022), driven mainly by customer activity in SCIB and lower losses in the Corporate Centre (driven by higher negative results from the FX hedge in 9M 2022).
•Dividend income was EUR 474 million (EUR 422 million in 9M 2022).
•The results of entities accounted for using the equity method also remained stable (EUR 462 million compared to EUR 501 million in 9M 2022).
•Other operating income recorded a loss of EUR 1,395 million (compared to a EUR 771 million loss in 9M 2022), owing to the hyperinflation adjustment in Argentina and lower leasing income in the US. This line was also affected by the EUR 224 million charge related to the temporary levy in Spain and DCB recorded in Q1 2023.
In summary, total income increased in all regions, DCB and global businesses. The Corporate Centre also increased, due to the higher liquidity buffer remuneration and the lower negative impact from the FX hedge.
| Total income | |||||
| EUR million | |||||
| constant euros | ||||
Costs
Operating expenses amounted to EUR 18,961 million, 8% higher than 9M 2022 (+10% in constant euros), due to the increase in inflation. In real terms (excluding the impact of average inflation), costs decreased 0.5%.
Our cost management continued to focus on improving the efficiency ratio, and as a result, we remained among the most efficient banks in the world. The efficiency ratio stood at 44.0% at the end of 9M 2023, a 1.5 pp improvement on the first nine months of 2022 and 1.8 pp better than full-year 2022.
Our business transformation plan, One Transformation, continued to progress across our footprint, reflected in greater operating productivity and better business dynamics.
The cost trends by region and market in constant euros were as follows:
•In Europe, costs were up 7%. In real terms, they were flat, with falls in the UK (-4%), whereas costs in real terms increased in Spain and Poland (2% and 5%, respectively) and costs in Portugal remained stable. The region's efficiency ratio stood at 41.1%, improving 6.3 pp year-on-year.
•In North America, costs increased 8%. In real terms, they were up 2%, due to investments in digitalization and technology and other transformation initiatives underway. The efficiency ratio stood at 48.0%.
•In South America, costs rose 19%. In real terms, they were down 2%, despite the salary increases directly linked to inflation. The efficiency ratio was 39.1%, maintaining our position as a leader in the sector.
•Digital Consumer Bank's costs rose 8%, +1% in real terms, due to strategic transformational investments and business growth and impacted by the incorporation of MCE Bank Germany. The efficiency ratio stood at 48.3%.
| Operating expenses | |||||
| EUR million | |||||
| constant euros | ||||
| 10 | | January - September 2023 | ||||||
Provisions or reversal of provisions
Provisions (net of provisions reversals) amounted to EUR 1,989 million (EUR 1,305 million in 9M 2022) mainly driven by Poland, the US, Mexico and Brazil.
Impairment or reversal of impairment of financial assets not measured at fair value through profit or loss (net)
Impairment or reversal of impairment on financial assets not measured at fair value through profit or loss (net) was EUR 9,477 million (EUR 7,836 million in 9M 2022).
This comparison was mainly affected by the provisions resulting from the charges in Poland for CHF mortgages, the increase in the US (due to normalization) and higher provisions recorded in Brazil, in line with credit portfolio growth.
Impairment on other assets (net)
The impairment on other assets (net) was EUR 129 million, compared to an impairment of EUR 86 million in 9M 2022.
Gains or losses on non-financial assets and investments (net)
Net gains on non-financial assets and investments were EUR 280 million in 9M 2023 (gain of EUR 2 million in the same period of 2022).
| Net loan-loss provisions | |||||
| EUR million | |||||
| constant euros | ||||
Negative goodwill recognized in results
No negative goodwill was recorded in the first nine months of 2023 or 2022.
Gains or losses on non-current assets held for sale not classified as discontinued operations
This item, which mainly includes impairment of foreclosed assets recorded and the sale of properties acquired upon foreclosure, recorded a EUR 58 million loss in 9M 2023 (EUR 13 million loss in 9M 2022).
Profit before tax
Profit before tax was EUR 12,537 million in 9M 2023, +7% year-on-year and +8% in constant euros, affected by higher loan-loss provisions and impairments and the temporary levy. This partially offset the good top line performance (double-digit growth in total income minus costs).
Income tax
Total income tax was EUR 3,552 million (EUR 3,538 million in 9M 2022).
Profit attributable to non-controlling interests
Profit attributable to non-controlling interests amounted to EUR 842 million, down 7% year-on-year (-8% in constant euros), due to South America and DCB.
Profit attributable to the parent
Profit attributable to the parent amounted to EUR 8,143 million in 9M 2023, compared to EUR 7,316 million in 9M 2022. These results do not fully reflect profit performance due to the temporary levy mentioned in other sections of the report.
RoTE stood at 14.8% (13.6% in 9M 2022), RoRWA at 1.93% (1.82% in 9M 2022) and earnings per share stood at EUR 0.48 (EUR 0.41 in 9M 2022).
January - September 2023 | | 11 | ||||||
Underlying profit attributable to the parent
Profit attributable to the parent and underlying profit were the same in the first nine months of 2023 (EUR 8,143 million), as profit was not affected by results that fell outside the ordinary course of our business, but there was a reclassification of certain items under some headings of the underlying income statement to better understand the business trends. These items recorded are:
•The temporary levy on revenue in Spain in the first quarter of 2023, totalling EUR 224 million, which was moved from total income to other gains (losses) and provisions.
•Provisions to strengthen the balance sheet in Brazil in the first quarter of 2023, totalling EUR 235 million, net of tax and minority interests.
In the first nine months of 2022, profit attributable to the parent and underlying profit were also the same (EUR 7,316 million), as profit was not affected by results that fell outside the ordinary course of our business, but there was also a reclassification of certain items under some headings of the underlying income statement.
For more details, see the 'Alternative Performance Measures' section in the appendix of this report.
Attributable profit and underlying profit increased 11% in euros and 13% in constant euros compared to 9M 2022.
This growth was mainly boosted by solid revenue performance, which increased 12% in euros and 13% in constant euros compared to the first nine months of 2022, and the efficiency improvement, which stood at 44.0%.
Santander's net operating income was EUR 24,134 million, 15% higher year-on-year. In constant euros, it rose 16% as follows:
•In Europe, net operating income increased 38% with strong improvements in all markets, boosted by revenue growth (+23%) and efficiency gains.
•In North America, net operating income rose 3%. It decreased 8% in the US (mainly due to higher funding costs and an increase in expenses) and was up 20% in Mexico, owing to stronger net interest income and net fee income.
•In South America, net operating income decreased 1%, driven by further falls in net interest income in both Brazil and Chile. Net interest income increased strongly in Argentina and Uruguay.
•In Digital Consumer Bank, net operating income increased 5%. Revenue growth was driven net interest income and higher leasing income and gains on financial transactions. Costs rose due to strategic transformation investments and business growth, as already mentioned.
•In the Corporate Centre, net operating income increased EUR 503 million, driven by the improvement of net interest income (higher liquidity buffer remuneration) and gains on financial transactions (FX hedge costs in 2022).
Net loan-loss provisions continued with the normalization that began last year, rising 21% (+21% also in constant euros). This growth was reflected in an increase in the cost of risk to 1.13%, in line with the Group's target for the year.
| Summarized underlying income statement | ||||||||||||||||||||||||||
| EUR million | Change | Change | ||||||||||||||||||||||||
| Q3'23 | Q2'23 | % | % excl. FX | 9M'23 | 9M'22 | % | % excl. FX | |||||||||||||||||||
| Net interest income | 11,219 | 10,735 | 4.5 | 7.1 | 32,139 | 28,460 | 12.9 | 15.7 | ||||||||||||||||||
| Net fee income | 3,119 | 3,060 | 1.9 | 4.1 | 9,222 | 8,867 | 4.0 | 6.0 | ||||||||||||||||||
Gains (losses) on financial transactions 1 | 667 | 587 | 13.6 | 24.4 | 1,969 | 1,115 | 76.6 | 96.5 | ||||||||||||||||||
| Other operating income | (144) | (83) | 73.5 | 695.2 | (235) | 187 | — | — | ||||||||||||||||||
| Total income | 14,861 | 14,299 | 3.9 | 5.4 | 43,095 | 38,629 | 11.6 | 13.4 | ||||||||||||||||||
| Administrative expenses and amortizations | (6,482) | (6,334) | 2.3 | 4.2 | (18,961) | (17,595) | 7.8 | 10.4 | ||||||||||||||||||
| Net operating income | 8,379 | 7,965 | 5.2 | 6.4 | 24,134 | 21,034 | 14.7 | 15.9 | ||||||||||||||||||
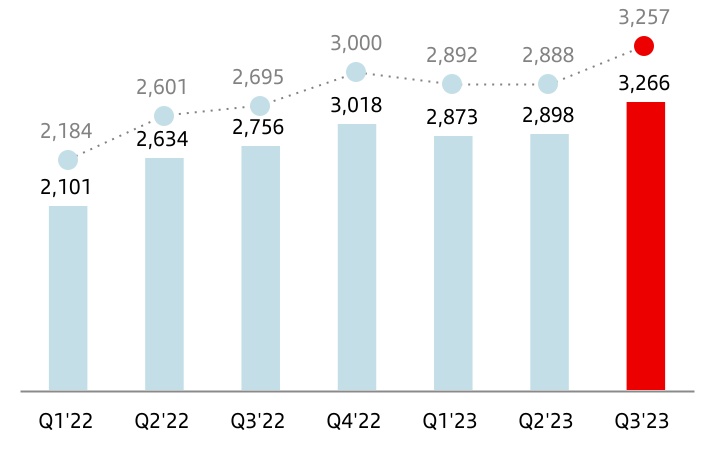
| Net loan-loss provisions | (3,266) | (2,898) | 12.7 | 12.8 | (9,037) | (7,491) | 20.6 | 20.8 | ||||||||||||||||||
| Other gains (losses) and provisions | (666) | (833) | (20.0) | (16.4) | (2,321) | (1,782) | 30.2 | 38.0 | ||||||||||||||||||
| Profit before tax | 4,447 | 4,234 | 5.0 | 6.4 | 12,776 | 11,761 | 8.6 | 9.6 | ||||||||||||||||||
| Tax on profit | (1,271) | (1,264) | 0.6 | 0.7 | (3,765) | (3,538) | 6.4 | 7.2 | ||||||||||||||||||
| Profit from continuing operations | 3,176 | 2,970 | 6.9 | 8.8 | 9,011 | 8,223 | 9.6 | 10.6 | ||||||||||||||||||
| Net profit from discontinued operations | — | — | — | — | — | — | — | — | ||||||||||||||||||
| Consolidated profit | 3,176 | 2,970 | 6.9 | 8.8 | 9,011 | 8,223 | 9.6 | 10.6 | ||||||||||||||||||
| Non-controlling interests | (274) | (300) | (8.7) | (8.2) | (868) | (907) | (4.3) | (5.5) | ||||||||||||||||||
| Profit attributable to the parent | 2,902 | 2,670 | 8.7 | 10.7 | 8,143 | 7,316 | 11.3 | 12.6 | ||||||||||||||||||
1. Includes exchange differences.
| 12 | | January - September 2023 | ||||||
Underlying results performance compared to the previous quarter
Underlying profit attributable to the parent and profit attributable to the parent were the same (EUR 2,902 million) in Q3 2023, as profit was not affected by results outside the ordinary course of our business.
Profit increased 9% quarter-on-quarter. Profit in the second quarter included the EUR 205 million (net of tax) contribution to the Single Resolution Fund (SRF), which is usually recorded in the second quarter in Spain, Portugal, Digital Consumer Bank and the Corporate Centre and the banking tax in Portugal (EUR 38 million).
In constant euros, profit increased 11%. The performance of the main lines of the income statement was as follows:
•Total income rose in the quarter (+5%):
–Net interest income was up 7%, impacted by the positive sensitivity to higher interest rates in our balance sheet in the recent months, especially in Europe. NII rose 6% Europe, with increases in all countries, and 3% in North America, driven by Mexico. NII in South America increased 12%, backed by Brazil and Argentina.
| Net operating income | |||||
| EUR million | |||||
| constant euros | ||||
–Net fee income rose 4%, mainly driven by the UK, Brazil and Argentina.
–In other income, gains on financial transactions increased, dividend earnings decreased and other operating income was impacted by the higher hyperinflation adjustment in Argentina.
•Operating expenses increased 4%, mainly due to Spain, Mexico and Argentina.
•Net loan-loss provisions increased in the quarter, particularly in North America, where normalization continued in the US.
| Profit attributable to the parent | |||||
| EUR million | |||||
| constant euros | ||||
January - September 2023 | | 13 | ||||||
| Grupo Santander. Condensed balance sheet | |||||||||||||||||
| EUR million | |||||||||||||||||
| Change | |||||||||||||||||
| Assets | Sep-23 | Sep-22 | Absolute | % | Dec-22 | ||||||||||||
| Cash, cash balances at central banks and other demand deposits | 217,057 | 246,533 | (29,476) | (12.0) | 223,073 | ||||||||||||
| Financial assets held for trading | 201,226 | 179,775 | 21,451 | 11.9 | 156,118 | ||||||||||||
| Debt securities | 55,987 | 37,655 | 18,332 | 48.7 | 41,403 | ||||||||||||
| Equity instruments | 12,320 | 9,271 | 3,049 | 32.9 | 10,066 | ||||||||||||
| Loans and advances to customers | 13,434 | 14,131 | (697) | (4.9) | 9,550 | ||||||||||||
| Loans and advances to central banks and credit institutions | 49,340 | 35,480 | 13,860 | 39.1 | 28,097 | ||||||||||||
| Derivatives | 70,145 | 83,238 | (13,093) | (15.7) | 67,002 | ||||||||||||
Financial assets designated at fair value through profit or loss1 | 15,754 | 15,462 | 292 | 1.9 | 14,702 | ||||||||||||
| Loans and advances to customers | 6,798 | 7,306 | (508) | (7.0) | 6,642 | ||||||||||||
| Loans and advances to central banks and credit institutions | 621 | 618 | 3 | 0.5 | 673 | ||||||||||||
| Other (debt securities an equity instruments) | 8,335 | 7,538 | 797 | 10.6 | 7,387 | ||||||||||||
| Financial assets at fair value through other comprehensive income | 86,029 | 87,915 | (1,886) | (2.1) | 85,239 | ||||||||||||
| Debt securities | 76,199 | 78,117 | (1,918) | (2.5) | 75,083 | ||||||||||||
| Equity instruments | 1,796 | 2,030 | (234) | (11.5) | 1,941 | ||||||||||||
| Loans and advances to customers | 7,737 | 7,768 | (31) | (0.4) | 8,215 | ||||||||||||
| Loans and advances to central banks and credit institutions | 297 | — | 297 | — | — | ||||||||||||
| Financial assets measured at amortized cost | 1,187,206 | 1,173,274 | 13,932 | 1.2 | 1,147,044 | ||||||||||||
| Debt securities | 101,404 | 68,727 | 32,677 | 47.5 | 73,554 | ||||||||||||
| Loans and advances to customers | 1,011,203 | 1,038,261 | (27,058) | (2.6) | 1,011,597 | ||||||||||||
| Loans and advances to central banks and credit institutions | 74,599 | 66,286 | 8,313 | 12.5 | 61,893 | ||||||||||||
| Investments in subsidiaries, joint ventures and associates | 7,819 | 7,805 | 14 | 0.2 | 7,615 | ||||||||||||
| Tangible assets | 34,449 | 35,662 | (1,213) | (3.4) | 34,073 | ||||||||||||
| Intangible assets | 19,635 | 18,789 | 846 | 4.5 | 18,645 | ||||||||||||
| Goodwill | 14,072 | 14,138 | (66) | (0.5) | 13,741 | ||||||||||||
| Other intangible assets | 5,563 | 4,651 | 912 | 19.6 | 4,904 | ||||||||||||
Other assets2 | 47,669 | 50,577 | (2,908) | (5.7) | 48,150 | ||||||||||||
| Total assets | 1,816,844 | 1,815,792 | 1,052 | 0.1 | 1,734,659 | ||||||||||||
| Liabilities and shareholders' equity | |||||||||||||||||
| Financial liabilities held for trading | 143,986 | 132,563 | 11,423 | 8.6 | 115,185 | ||||||||||||
| Customer deposits | 21,745 | 12,451 | 9,294 | 74.6 | 12,226 | ||||||||||||
| Debt securities issued | — | — | — | — | — | ||||||||||||
| Deposits by central banks and credit institutions | 32,193 | 18,792 | 13,401 | 71.3 | 15,553 | ||||||||||||
| Derivatives | 64,708 | 82,505 | (17,797) | (21.6) | 64,891 | ||||||||||||
| Other | 25,340 | 18,815 | 6,525 | 34.7 | 22,515 | ||||||||||||
| Financial liabilities designated at fair value through profit or loss | 39,602 | 28,864 | 10,738 | 37.2 | 40,268 | ||||||||||||
| Customer deposits | 30,854 | 20,259 | 10,595 | 52.3 | 31,143 | ||||||||||||
| Debt securities issued | 5,618 | 5,442 | 176 | 3.2 | 5,427 | ||||||||||||
| Deposits by central banks and credit institutions | 3,130 | 3,163 | (33) | (1.0) | 3,698 | ||||||||||||
| Other | — | — | — | — | — | ||||||||||||
| Financial liabilities measured at amortized cost | 1,468,719 | 1,493,298 | (24,579) | (1.6) | 1,423,858 | ||||||||||||
| Customer deposits | 982,286 | 960,355 | 21,931 | 2.3 | 966,353 | ||||||||||||
| Debt securities issued | 295,650 | 279,591 | 16,059 | 5.7 | 274,912 | ||||||||||||
| Deposits by central banks and credit institutions | 145,855 | 214,164 | (68,309) | (31.9) | 145,534 | ||||||||||||
| Other | 44,928 | 39,188 | 5,740 | 14.6 | 37,059 | ||||||||||||
| Liabilities under insurance contracts | 17,177 | 16,512 | 665 | 4.0 | 16,426 | ||||||||||||
| Provisions | 8,369 | 8,341 | 28 | 0.3 | 8,149 | ||||||||||||
Other liabilities3 | 36,094 | 36,902 | (808) | (2.2) | 33,188 | ||||||||||||
| Total liabilities | 1,713,947 | 1,716,480 | (2,533) | (0.1) | 1,637,074 | ||||||||||||
| Shareholders' equity | 128,718 | 123,340 | 5,378 | 4.4 | 124,732 | ||||||||||||
| Capital stock | 8,092 | 8,397 | (305) | (3.6) | 8,397 | ||||||||||||
Reserves (including treasury stock)4 | 113,794 | 108,606 | 5,188 | 4.8 | 107,709 | ||||||||||||
| Profit attributable to the Group | 8,143 | 7,316 | 827 | 11.3 | 9,605 | ||||||||||||
| Less: dividends | (1,311) | (979) | (332) | 33.9 | (979) | ||||||||||||
| Other comprehensive income | (34,522) | (32,316) | (2,206) | 6.8 | (35,628) | ||||||||||||
| Minority interests | 8,701 | 8,288 | 413 | 5.0 | 8,481 | ||||||||||||
| Total equity | 102,897 | 99,312 | 3,585 | 3.6 | 97,585 | ||||||||||||
| Total liabilities and equity | 1,816,844 | 1,815,792 | 1,052 | 0.1 | 1,734,659 | ||||||||||||
| NOTE: The condensed balance sheet groups some lines of the consolidated balance sheet on pages 86 and 87 as follows: | ||
1.'Non-trading financial assets mandatorily at fair value through profit or loss' and 'Financial assets designated at fair value through profit or loss'. | ||
2.‘Hedging derivatives’; ‘Changes in the fair value of hedged items in portfolio hedges of interest risk’; 'Assets under insurance or reinsurance contracts'; ‘Tax assets’; ‘Other assets’; and 'Non-current assets held for sale’. | ||
3.‘Hedging derivatives’; ‘Changes in the fair value of hedged items in portfolio hedges of interest rate risk’; ‘Tax liabilities’; ‘Other liabilities’; and ‘Liabilities associated with non-current assets held for sale‘. | ||
4.‘Share premium’; ‘Equity instruments issued other than capital’; ‘Other equity’; ‘Accumulated retained earnings’; ‘Revaluation reserves’; ‘Other reserves’; and ‘Own shares (-)’. | ||
| 14 | | January - September 2023 | ||||||
| GRUPO SANTANDER BALANCE SHEET | ||||||||
| Executive summary | ||||||||||||||||||||||||||||||||||||||
Gross loans and advances to customers (excl. reverse repos) | Customer funds (deposits excl. repos + mutual funds) | |||||||||||||||||||
| Credit performance reflects the impact of the macroeconomic environment and rising interest rates on customer behaviour | Customer funds continued to grow year-on-year. Stable quarter with a recovery in wholesale volumes | |||||||||||||||||||
Gross loans and advances to customers (excl. reverse repos) | Customer funds (deposits excl. repos + mutual funds) | |||||||||||||||||||
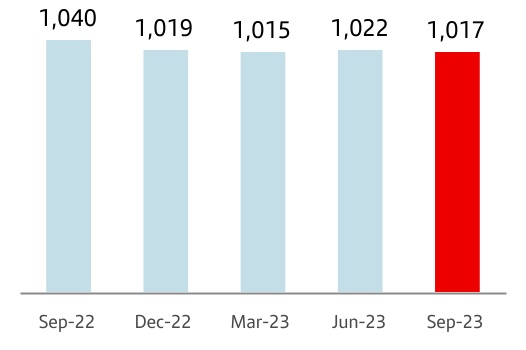
| 1,017 | 0.0% QoQ | 1,160 | +2.9% QoQ | |||||||||||||||||
| EUR billion | -1.6% YoY | EUR billion | +5.2% YoY | |||||||||||||||||
è By segment: | è By product: | |||||||||||||||||||
| Year-on-year decline in corporate demand, while individuals remained stable | Deposits increased 4% year-on-year due to a sharp increase in time deposits driven by higher interest rates | |||||||||||||||||||
| Individuals | SMEs and corporates | CIB | Demand | Time | Mutual funds | |||||||||||||||
| +1% | -2% | -11% | -7% | +42% | +11% | |||||||||||||||
| Note: changes in constant euros. | ||||||||||||||||||||
Loans and advances to customers
Loans and advances to customers stood at EUR 1,039,172 million as at 30 September 2023, having decreased 0.6% in the quarter and risen 3% in the last 12 months.
For the purpose of analysing traditional commercial banking loans, the Group uses gross loans and advances to customers excluding reverse repos (EUR 1,017,169 million). Additionally, to facilitate the analysis of the Group's management, the comments below do not include the exchange rate impact.
In the quarter, gross loans and advances to customers, excluding reverse repos, remained flat, as follows:
•1% decline in Europe with falls across all countries, except Poland, due to rising interest rates, higher prepayment volumes and lower loans in CIB.
•Loans in North America increased 1%, driven by Mexico (+3%), while they remained stable in the US.
•In South America, loans increased 2%, up 32% in Argentina,+2% in Chile, +1% in Brazil and +3% in Uruguay.
•Loans at Digital Consumer Bank (DCB) increased 3%, growing at Santander Consumer Finance (+3%) and Openbank (+2%).
| Gross loans and advances to customers (excl. reverse repos) | |||||
| EUR billion | |||||
| -2 | % | 1a | |||
| Sep-23 / Sep-22 | |||||
1. In constant EUR: -2%.
Compared to September 2022, gross loans and advances to customers (excluding reverse repos and in constant euros) declined 2%, as follows:
•In Europe, volumes decreased 7% due to falls in most countries: -10% in Spain and -7% in Portugal, mainly due to lower corporate loans and mortgage prepayments, and -5% in the UK, affected by the impact of high interest rates on the mortgage market. They increased 2% in Poland driven by corporates.
•Loans rose 4% in North America. In the US, they increased 4% propelled by CIB, Multifamily and auto financing, while Mexico was up 5% driven by the increase in loans to individuals.
•Growth in South America was 5%. In Argentina, loans rose 150% underpinned by CIB, cards, SMEs and corporates. In Brazil, they climbed 3% driven by the positive performance in individuals and SMEs. In Chile, they increased 2%, boosted by individuals and CIB and in Uruguay, they rose 9%.
•At DCB, volumes increased 9%, with generalized growth across countries. Openbank loans rose 13%.
As at September 2023, gross loans and advances to customers excluding reverse repos maintained a balanced structure between individuals (63%), SMEs and corporates (24%) and CIB (13%).
| Gross loans and advances to customers (excl. reverse repos) | ||
| % operating areas. September 2023 | ||
January - September 2023 | | 15 | ||||||
Customer funds
Customer deposits amounted to EUR 1,035,885 million in September 2023, +2% compared to Q2'23 and +4% year-on-year.
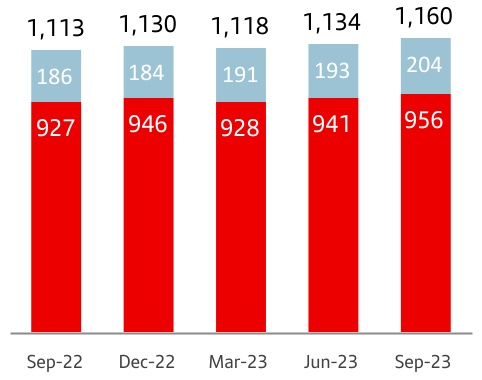
The Group uses customer funds (customer deposits excluding repos, plus mutual funds) for the purpose of analysing traditional retail banking funds, which amounted to EUR 1,160,032 million in September 2023. The comments below do not include the exchange rate impact.
•In the quarter, customer funds increased EUR 32.8 billion in constant euros, as follows:
–By product, customer deposits excluding repos increased EUR 20.8 billion and mutual funds rose EUR 12.0 billion.
–By primary segment, customer funds grew in Europe, South America and DCB, increasing in all countries except Portugal. They declined in North America, due to the US, while they rose in Mexico.
•Compared to September 2022, customer funds were up 5% in constant euros:
–By product, customer deposits excluding repos were up 4%. There was a strong increase in time deposits (+42%), growing significantly across all markets (except in Portugal) to the detriment of demand deposits which fell 7% with declines in most countries, except in Mexico and Argentina. Mutual funds increased 11%, with broad-based growth across countries, except in the US.
–By region, customer funds increased 15% in South America (+136% in Argentina, +14% in Brazil and +2% in Chile), 8% in North America (+6% in the US and +12% in Mexico) and 1% in Europe driven by the increase in Poland (+12%) and Spain (+1%), which offset the fall in Portugal (-8%). Customer funds in the UK remained stable.
–Positive performance in DCB, whose funds increased 18%.
With this performance, the weight of demand deposits as a percentage of total customer funds was 57%, while time deposits accounted for 25% of the total and mutual funds 18%.
| Customer funds | ||
| EUR billion | ||
| +4 | % | 1a | ||||||
| +10 | % | |||||||
| +3 | % | |||||||
•Total | ||||||||
• Mutual funds | ||||||||
•Deposits exc. repos | ||||||||
| Sep-23 / Sep-22 | ||||||||
1. In constant EUR: +5%.
In addition to capturing customer deposits, the Group, for strategic reasons, maintains a selective policy of issuing securities in the international fixed income markets and strives to adapt the frequency and volume of its market operations to the structural liquidity needs of each unit, as well as to the receptiveness of each market.
In the first nine months of 2023, the Group issued:
•Medium- and long-term senior debt placed in the market of EUR 16,027 million and covered bonds amounting to EUR 8,618 million (including the first ECA covered bond placed in the market).
•There were EUR 12,419 million of securitizations placed in the market.
•TLAC eligible instruments issued amounted to EUR 6,871 million (of which EUR 3,527 million was senior non-preferred and EUR 3,344 million was subordinated debt).
•Maturities of medium- and long-term debt totalled EUR 16,390 million.
The net loan-to-deposit ratio was 100% (108% in September 2022). The ratio of deposits plus medium- and long-term funding to the Group’s loans was 125%, underscoring the comfortable funding structure. The liquidity coverage ratio (LCR) was an estimated 161% in June (158% in June 2023).
The Group's access to wholesale funding markets as well as the cost of issuances depends, in part, on the ratings of the rating agencies.
The ratings of Banco Santander, S.A. by the main rating agencies were: Fitch A- senior non-preferred debt, A senior long-term and F2/F1 senior short-term (confirmed in September); Moody's confirmed its A2 long-term and P-1 short-term ratings in July and maintained its stable outlook above the rating of the Kingdom of Spain; Standard & Poor's (S&P) A+ long-term rating and A-1 short-term rating; and DBRS A High and R-1 Medium short-term. DBRS and Fitch maintained their stable outlooks, above the sovereign's outlook, while S&P also maintained its outlook but in line with the sovereign.
Sometimes the methodology applied by the agencies limits a bank's rating to the sovereign rating of the country where it is headquartered. Banco Santander, S.A. is still rated above the sovereign debt rating of the Kingdom of Spain by Moody’s, DBRS and S&P and at the same level by Fitch, which demonstrates our financial strength and diversification.
| Customer funds | ||
| % operating areas. September 2023 | ||
| 16 | | January - September 2023 | ||||||
| SOLVENCY RATIOS | ||||||||
| Executive summary | ||||||||||||||||||||||||||||||||||||||
| Fully-loaded capital ratio | Fully-loaded CET1 ratio | |||||||||||||||||||
| Fully-loaded CET1 ratio exceeded 12% at the end of September | We continued to generate capital organically in the quarter, backed by profit | |||||||||||||||||||
| Fully-loaded CET1 performance (%) | Gross organic generation | +45 bps | ||||||||||||||||||
 | ||||||||||||||||||||
Shareholder remuneration1 | 33 bps | |||||||||||||||||||
| TNAV per share | ||||||||||||||||||||
TNAV per share was EUR 4.61, increasing 10% year-on-year including both cash dividends per share paid in November 2022 and May 20231. | ||||||||||||||||||||
At the end of September 2023, the total phased-in capital ratio (applying the IFRS 9 transitional arrangements) stood at 16.3% and the phased-in CET1 ratio at 12.3%. We comfortably meet the levels required by the European Central Bank on a consolidated basis (estimated 13.5% for the total capital ratio and 9.3% for the CET1 ratio)2. This results in a distance to the maximum distributable amount (MDA) of 268 bps and a CET1 management buffer of 306 bps.
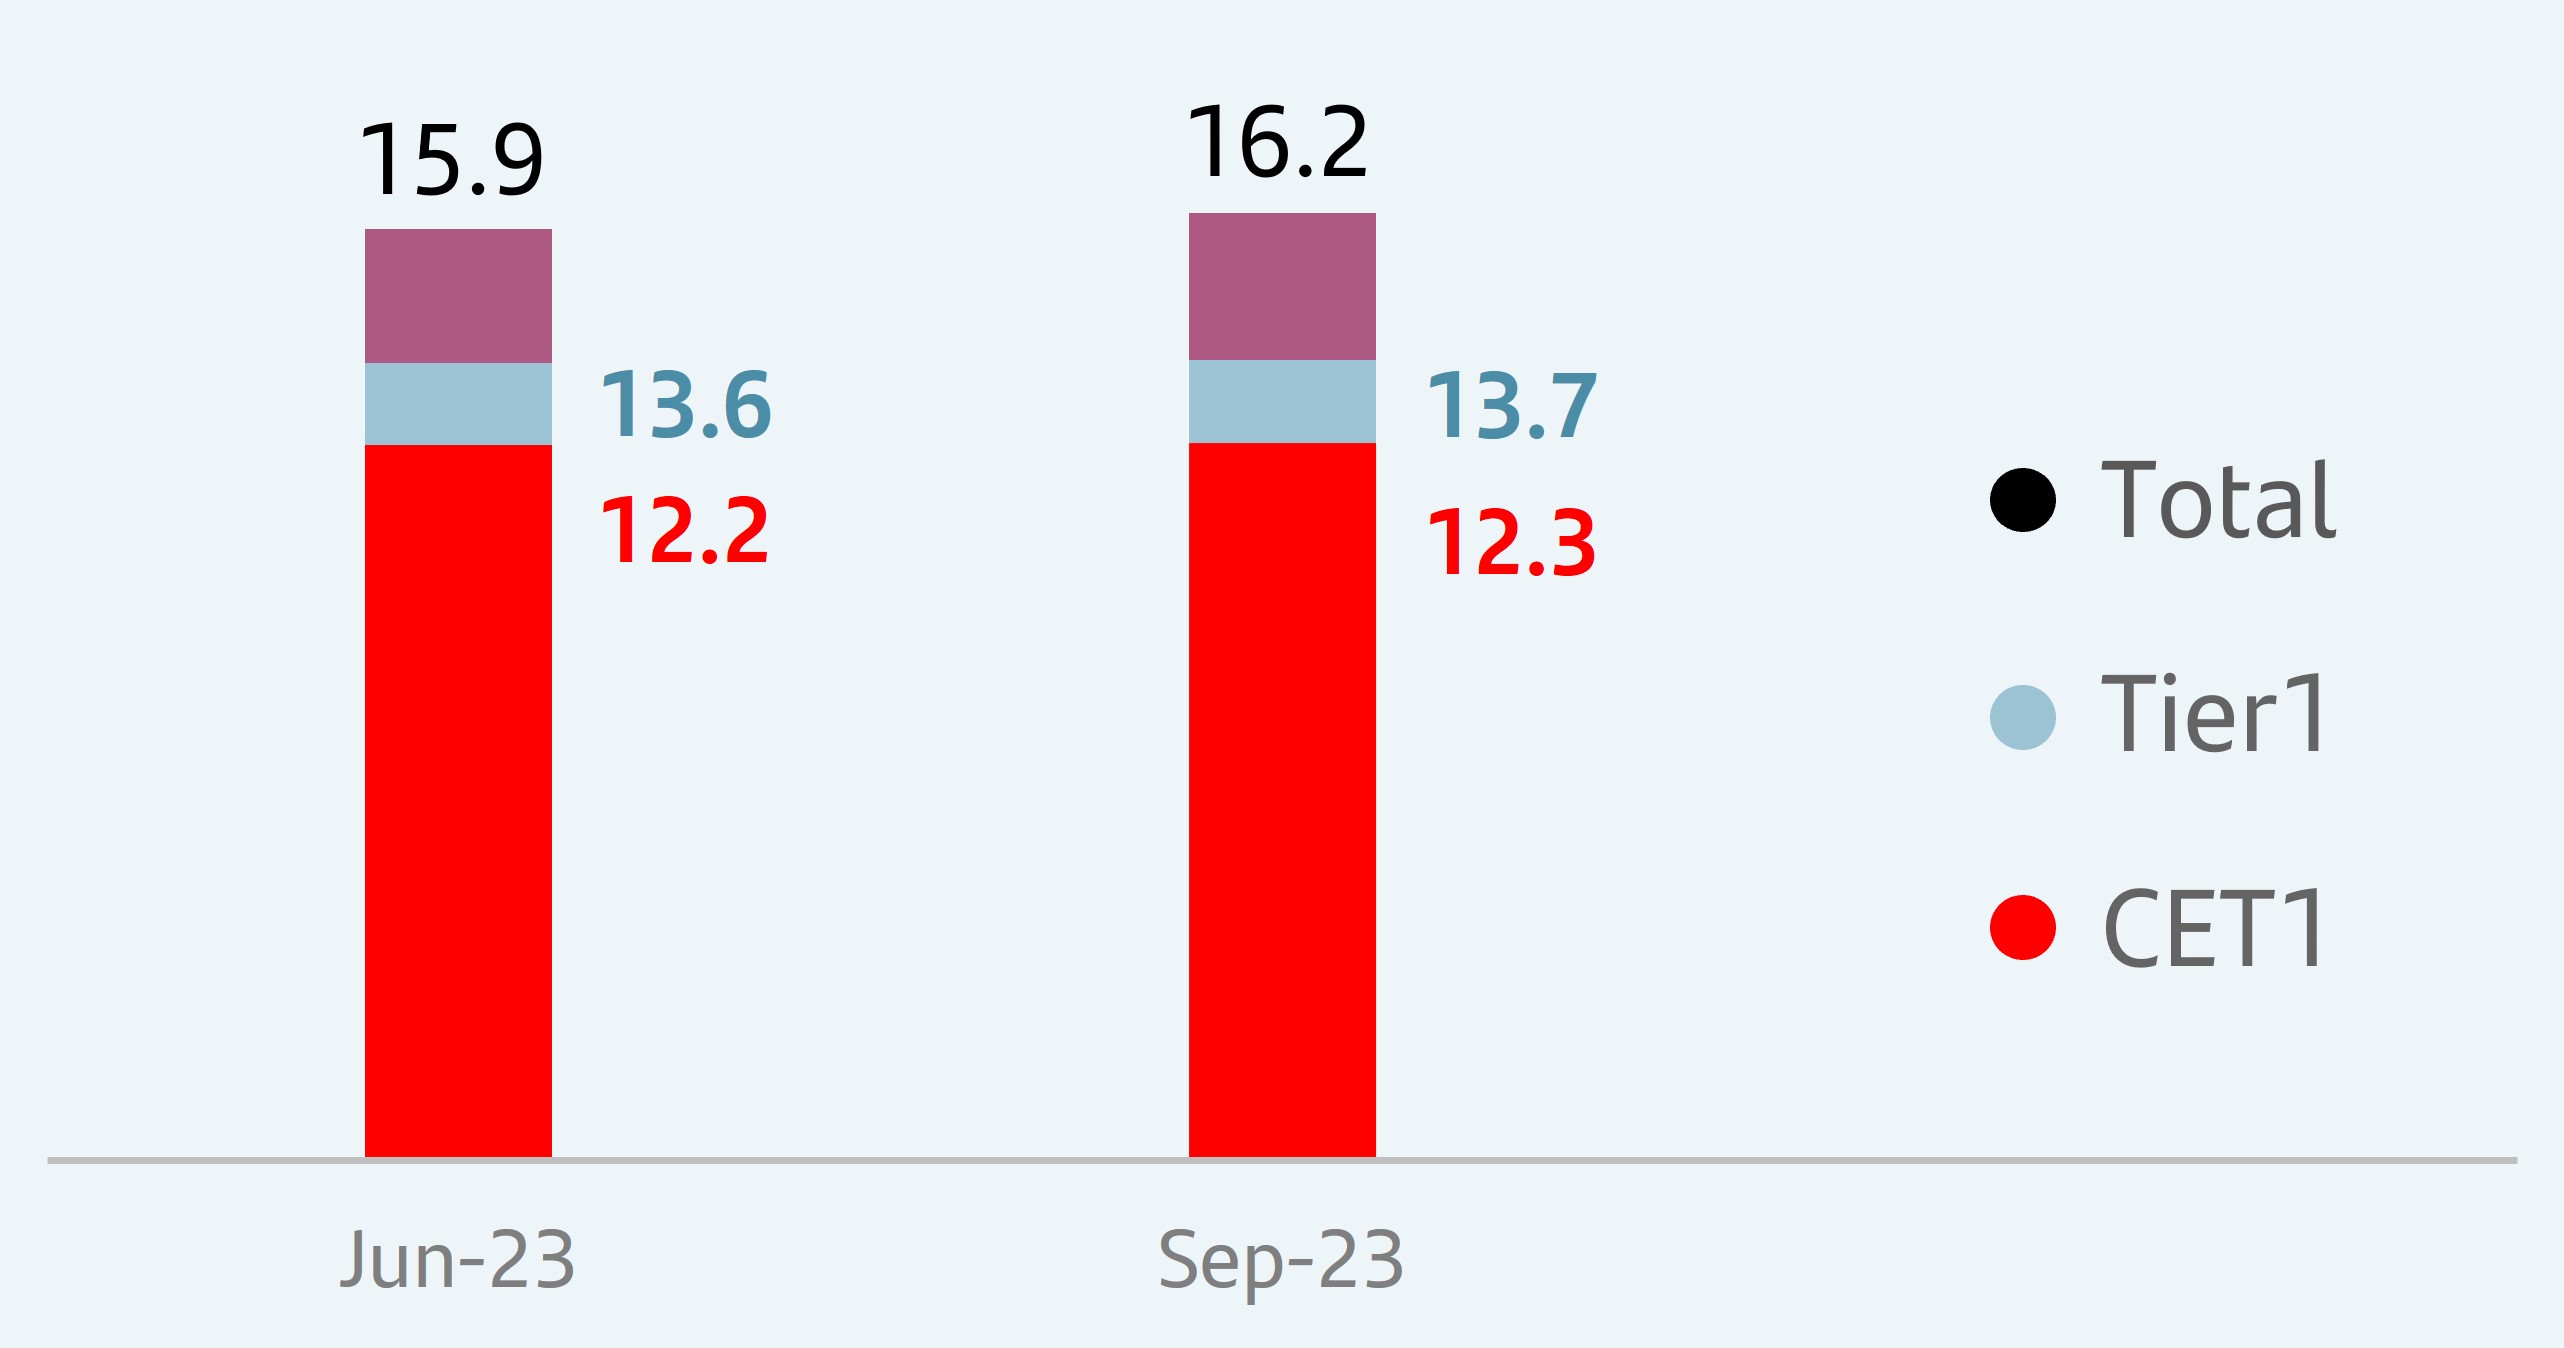
The total fully-loaded capital ratio stood at 16.2% and the fully-loaded CET1 ratio at 12.3%.
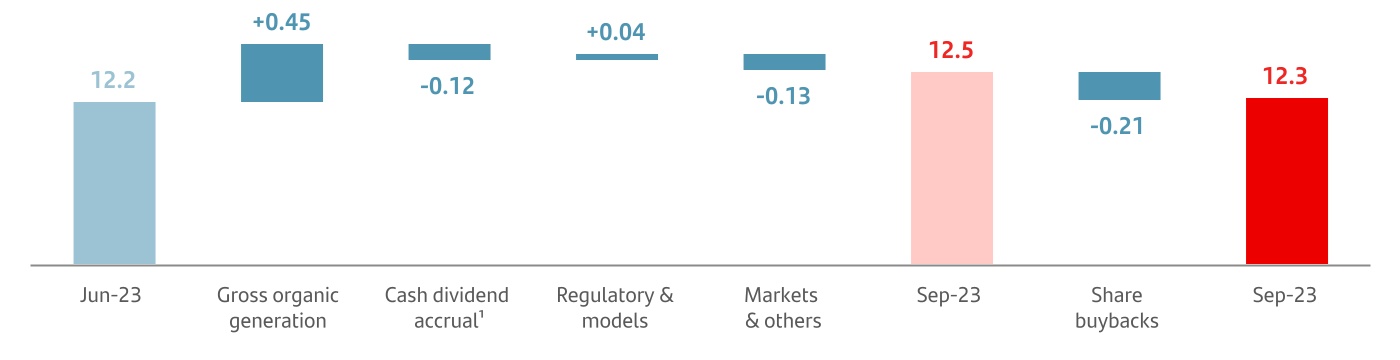
In the quarter, there were 45 bps of gross organic generation and a 33 bp charge for a future cash dividend payment, of which 12 bps correspond to a future cash dividend against profit achieved in the third quarter of 2023 (in line with our 50% payout target1) and 21 bps to the share buyback programme.
We remain focused on profitable growth, reflected in an average front book RoTE above 15% in the first nine months of the year.
There was a negative 13 bp impact, mainly from intangible assets, adjustments in the value of the available-for-sale portfolio and deferred tax asset. These impacts were partially
offset by the positive effect of the UK internal models approval (+4 bps).
Lastly, the TNAV per share ended September 2023 at EUR 4.61. If we include the two cash dividends paid against 2023 results (EUR 5.95 cents paid in May and EUR 8.10 cents that will be paid in November), TNAV plus cash dividend per share increased 10% in the last twelve months (+3% in the quarter).
Lastly, the fully-loaded leverage ratio stood at 4.71%, and the phased-in at 4.74%.
| Eligible capital. September 2023 | ||||||||
| EUR million | ||||||||
| Fully-loaded | Phased-in | |||||||
| CET1 | 77,193 | 77,658 | ||||||
| Basic capital | 86,125 | 86,591 | ||||||
| Eligible capital | 101,943 | 102,617 | ||||||
| Risk-weighted assets | 628,873 | 629,012 | ||||||
| % | % | |||||||
| CET1 capital ratio | 12.3 | 12.3 | ||||||
| Tier 1 capital ratio | 13.7 | 13.8 | ||||||
| Total capital ratio | 16.2 | 16.3 | ||||||
| Fully-loaded CET1 ratio performance | ||
| % | ||
Note: The phased-in ratio includes the transitory treatment of IFRS 9, calculated in accordance with article 473 bis of the Capital Requirements Regulation (CRR2) and subsequent modifications introduced by Regulation 2020/873 of the European Union. Total phased-in capital ratios include the transitory treatment according to chapter 4, title 1, part 10 of the CRR2.
1.The implementation of the shareholder remuneration policy is subject to future corporate and regulatory decisions and approvals.
2.According to a recent resolution from Banco de España, our D-SIB buffer will increase from 1% to 1.25% from January 2024 following a change in methodology. Institutions must hold capital at the consolidated level for the higher of the G-SIB and D-SIB requirements. Santander currently applies a 1% CET1 surcharge, globally (G-SIB) and locally (D-SIB), as they are both set at 1%.
January - September 2023 | | 17 | ||||||
| STRESS TEST | ||||||||
u In late July, the European Banking Authority (EBA) published the results of its 2023 EU-wide stress test, which involved the main banks from the EU.
This exercise assesses the resilience of these banks' main balance sheet and income statement items under two different macroeconomic scenarios (baseline and adverse).
To this end, the balance sheets at the end of 2022 were taken as a starting point and the expected behaviour of business models was compared in order to gauge the expected losses and the ability of the balance sheet to withstand such losses without requiring external support.
On this occasion, as with previous exercises, there was no minimum capital threshold to meet. Instead, results will be taken into account when determining the SREP requirements.
The baseline scenario assumes the most likely economic performance according to the models used by the supervisor. On the other hand, the very unlikely adverse scenario assumes a severe deterioration in both macroeconomic and global financial market conditions.
This year, the scenarios used to project the evolution of the Group's main businesses were as follows:
| Gross Domestic Product (GDP) | |||||||||||||||||||||||||||||||||||||||||||||||||||||
| Change (%) | |||||||||||||||||||||||||||||||||||||||||||||||||||||
| Spain | UK | US | Mexico | Brazil | Chile | ||||||||||||||||||||||||||||||||||||||||||||||||
| 2023 | 2023-25 | 2023 | 2023-25 | 2023 | 2023-25 | 2023 | 2023-25 | 2023 | 2023-25 | 2023 | 2023-25 | ||||||||||||||||||||||||||||||||||||||||||
| Baseline scenario | 1.3 | 6.1 | 0.3 | 3.2 | 1.0 | 4.0 | 1.2 | 5.1 | 1.0 | 4.9 | -1.0 | 3.3 | |||||||||||||||||||||||||||||||||||||||||
| Adverse scenario | -2.6 | -5.4 | -4.8 | -8.5 | -5.7 | -4.5 | -4.6 | -6.8 | -4.0 | -5.5 | -7.0 | -7.9 | |||||||||||||||||||||||||||||||||||||||||
 | Santander: resilience of our income statement was reflected in greater capital strength | ||||
In the last 15 years, the Group has been submitted to nine stress tests, in all of which it has demonstrated the strength of its business model and, consequently, that its solvency levels would be sufficient to face the most severe macroeconomic scenarios.
Our geographic and business diversification enables us to have more stable and non-interrelated sources of income, so that even if the macroeconomic situation were to deteriorate globally, we would be capable of generating profit for our shareholders and thereby ensure an adequate capital position in line with regulatory requirements.
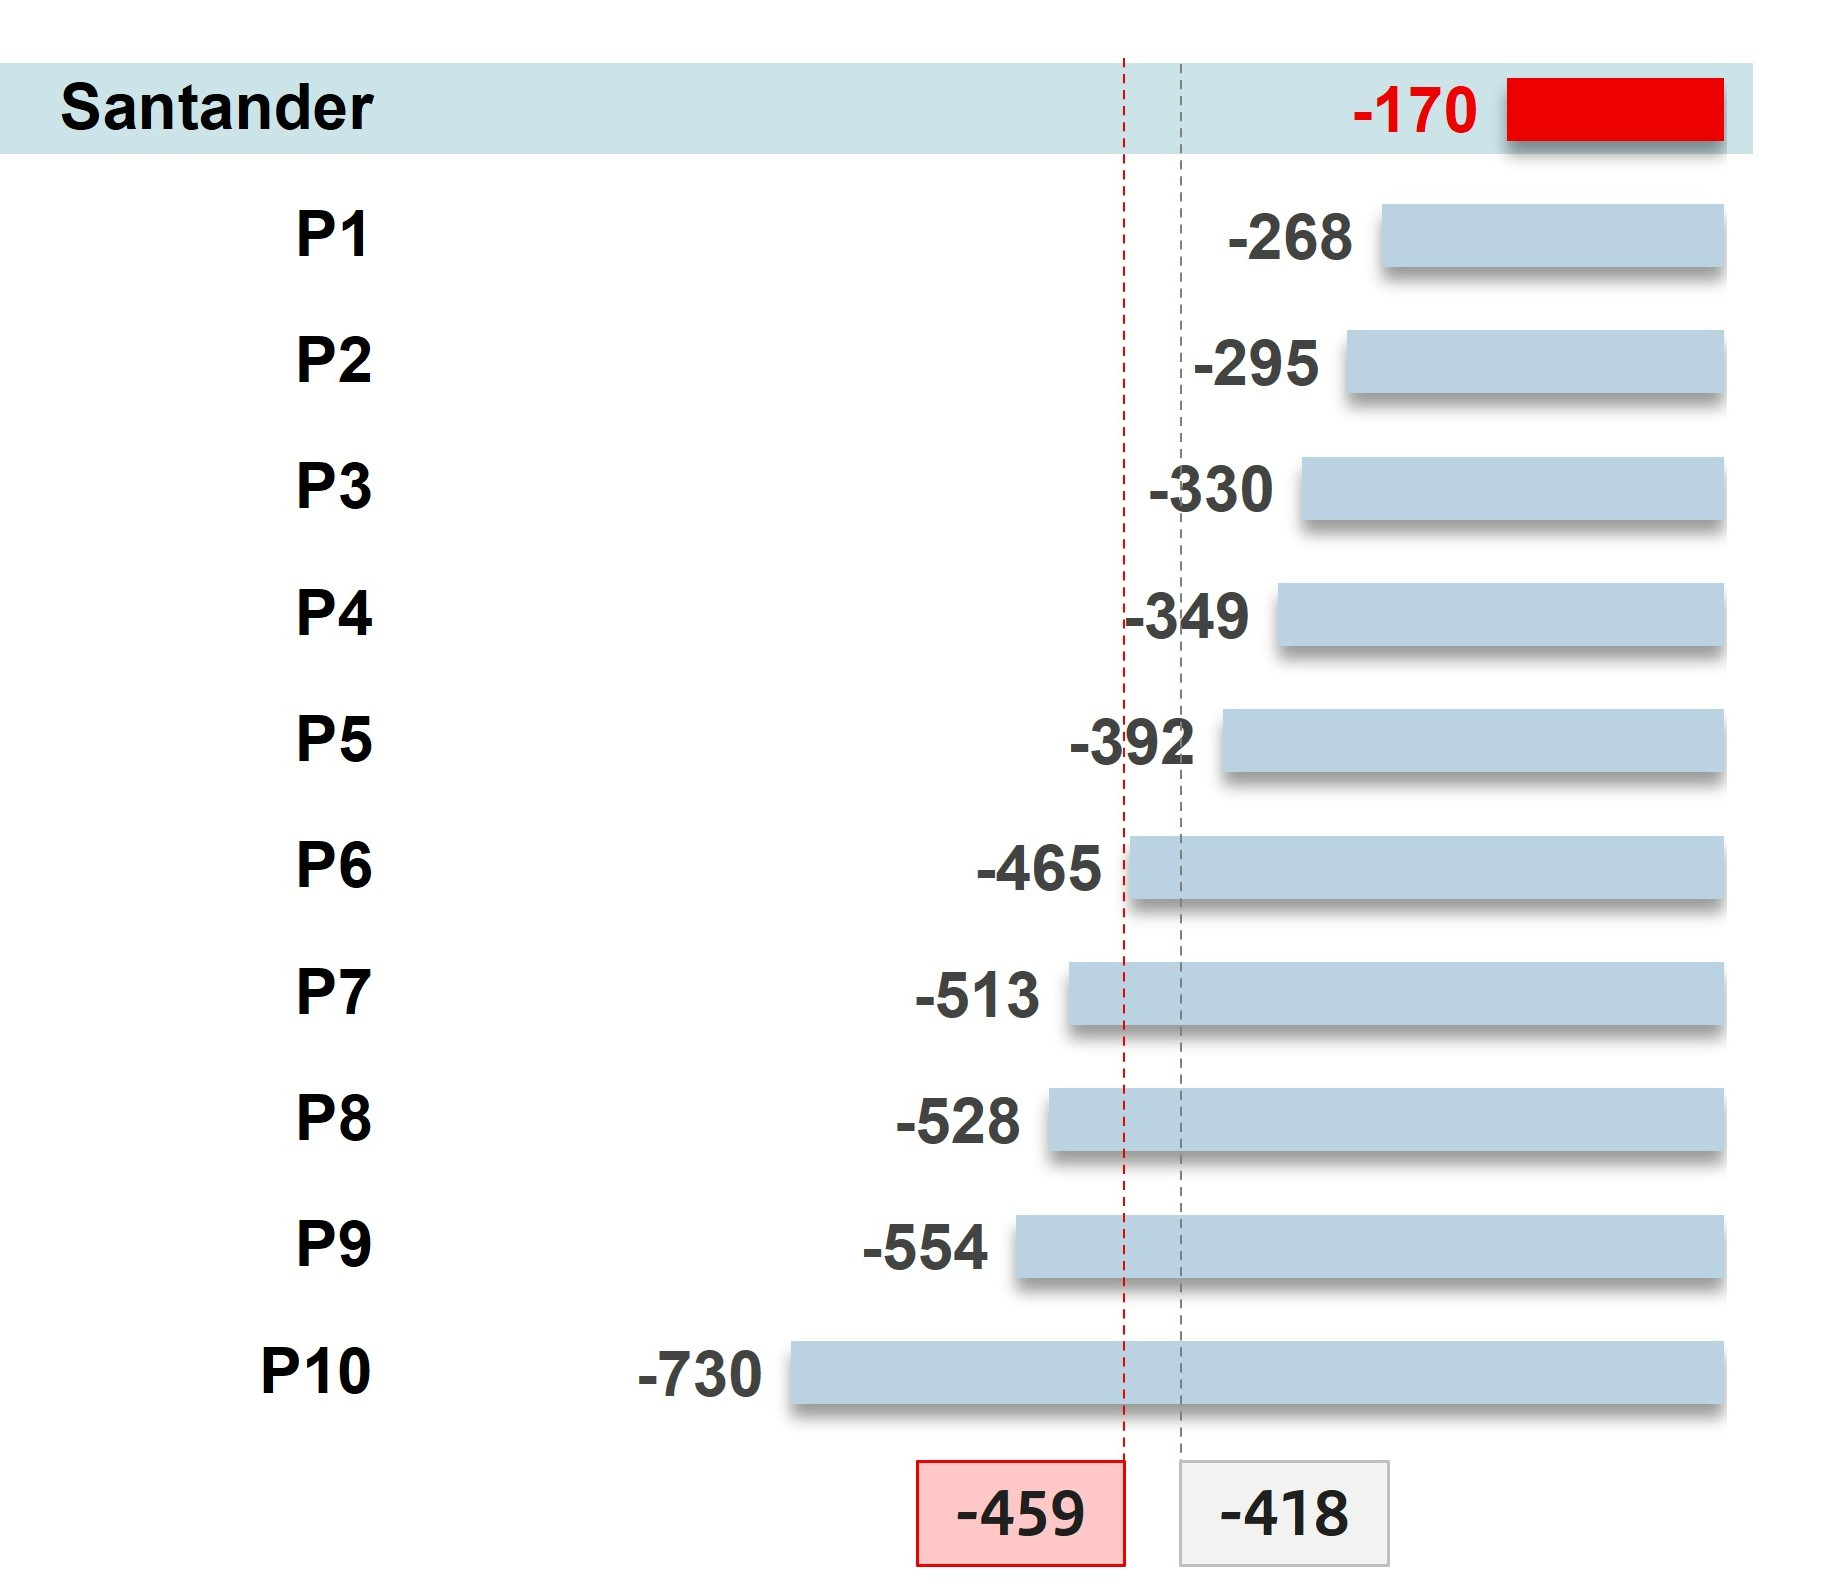
According to the results obtained in this stress test, under the adverse scenario Santander would destroy 170 bps of fully loaded
CET1 capital compared to the peer average of 418 bps and to the average of European banking system of nearly 500 bps.
This implies that, in absolute terms, the Group at the end of the stressed horizon, would have a fully-loaded CET 1 ratio 30 bps better than the average of its European peers.
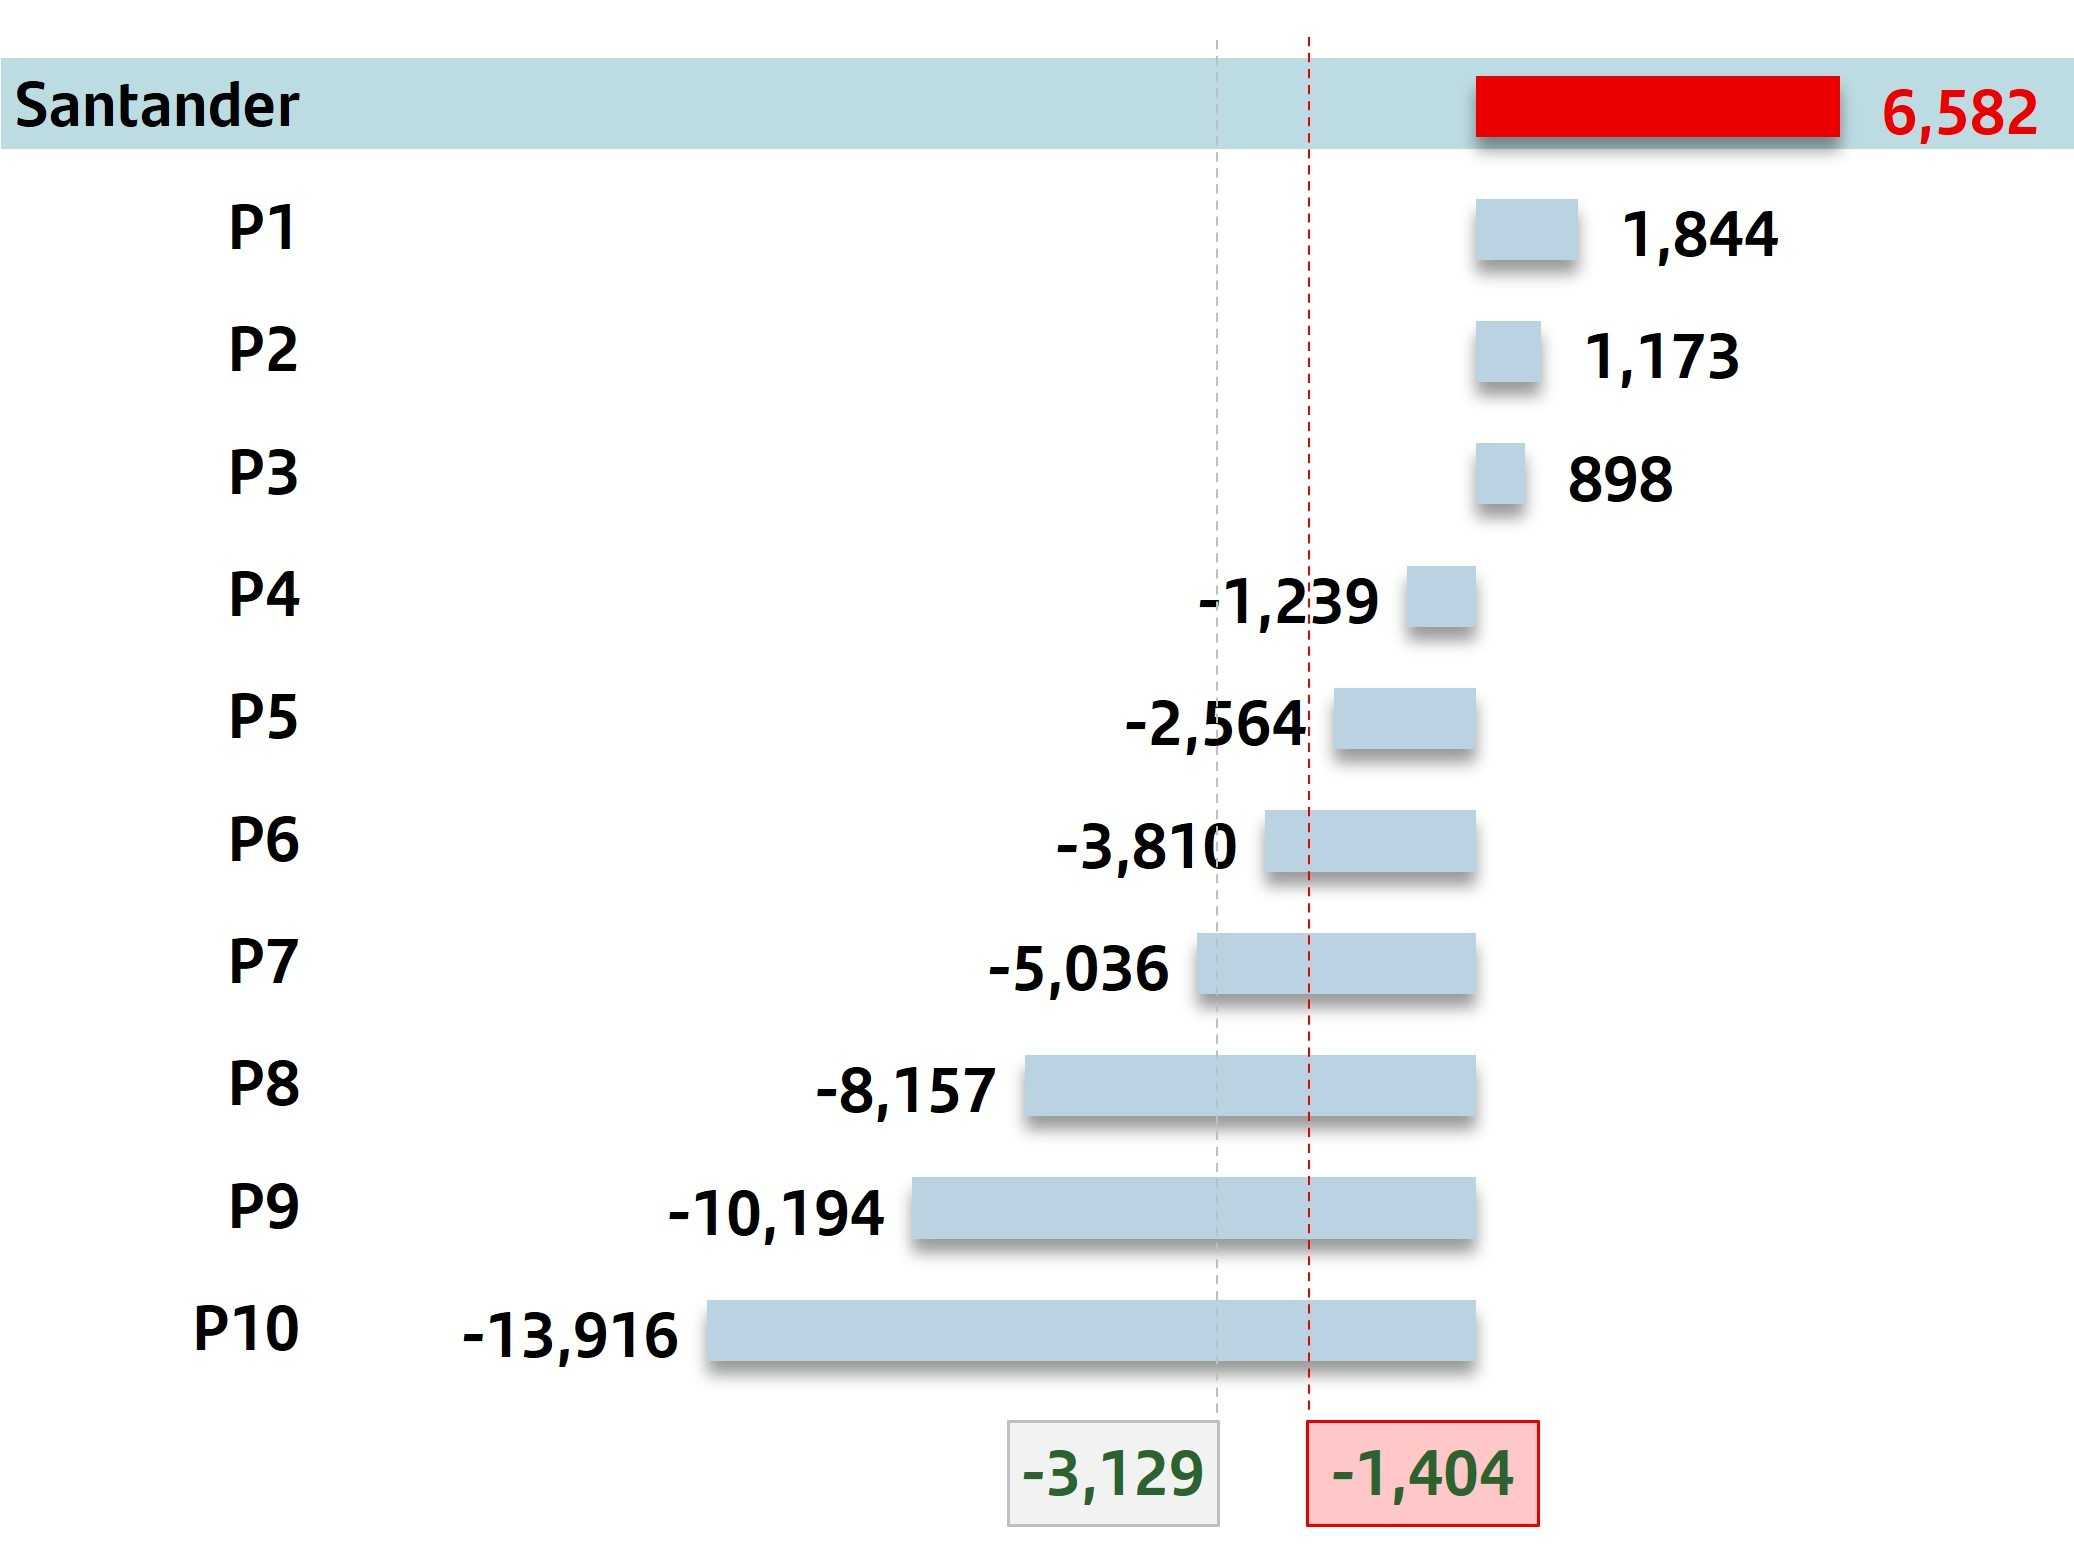
It is also worth noting that, even in the adverse scenario, the cumulative projections of the Group's income statement show a profit of EUR 6,582 million, well above its peers and system, on average they would include losses of EUR 3,129 million and EUR 1,404 million, respectively.
| Fully loaded CET1 ratio 2025 vs. 2022 | |||||
| Adverse scenario. Basis points | |||||
| Profit after tax (accumulated 3 years) | |||||
| Adverse scenario. EUR million | |||||
 |  | ||||||||||||||||||||||
| Peer average | System | |||||||||||||||||||||||||
| 18 | | January - September 2023 | ||||||
| RISK MANAGEMENT | ||||||||
| Executive summary | ||||||||||||||||||||||||||||||||||||||
| Credit risk | Market risk | |||||||||||||||||||
| Credit quality indicators follow the trend of the previous quarter due to the macroeconomic environment, although in line with expected levels | Our risk profile remained stable. VaR remained at moderate levels despite the current macroeconomic uncertainties (inflation, growth, among others) | |||||||||||||||||||
| Cost of risk | NPL ratio | Coverage ratio | Average VaR | |||||||||||||||||
| 1.13% | 3.13% | 68% | Q3'23 | EUR 11 million | ||||||||||||||||
| +5 bps vs. Q2'23 | +6 bps vs. Q2'23 | 0 pp vs. Q2'23 | ||||||||||||||||||
| Structural and liquidity risk | Operational risk | |||||||||||||||||||
| Robust and diversified liquidity buffer, with ratios well above regulatory requirements | Although losses recorded in the third quarter were lower than those of the previous quarter, our operational risk profile remained stable | |||||||||||||||||||
| Liquidity Coverage Ratio (LCR) | ||||||||||||||||||||
| 161 | % | +3 pp vs. Q2'23 | ||||||||||||||||||
During the third quarter, the macroeconomic environment remained marked by inflation, geopolitical tensions and the latest interest rate hikes by some central banks, while in some countries rates have stabilized or started to decline (Poland, Brazil and Chile).
In general terms, the recovery of the economy continued to be gradual while inflation began to respond to the monetary policies with a slowdown in price growth, though differently across countries.
Credit risk management1
In the third quarter 2023, credit impaired loans increased slightly compared to the previous quarter, to EUR 35,558 million, mainly due to increases in the portfolios of the UK and the US, offset by reductions in Brazil, Portugal and Spain. However, year-on-year, balances remained stable.
Total risk stood at EUR 1,135,383 million, in line with the same period in 2022 and the previous quarter, where the decreased in Europe was offset by the increases in South America and DCB.
The NPL ratio stood at 3.13%, in line with expectations given the current environment.
Loan-loss provisions amounted to EUR 3,266 million in the quarter. In the first nine months of the year, they amounted to EUR 9,037 million, +21% year-on-year, driven by the provisions made in the US (due to the normalization of delinquencies and losses), DCB (due to portfolio growth), Mexico (partly by the growth of the individual credit portfolio) and in Poland (related to CHF mortgages). The cost of risk stood at 1.13%, performing in line with our target.
Total loans-loss reserves reached EUR 24,019 million, flat compared to the previous quarter, maintaining the total coverage of credit impaired loans at 68%. In addition, 60% of the Group's portfolio is secured, and the mortgage portfolios in Spain and the UK, in particular, require lower coverage levels.
| Key metrics performance by geographic area | ||||||||||||||||||||||||||||||||||||||
Loan-loss provisions2 | Cost of risk (%)3 | NPL ratio (%) | Total coverage ratio (%) | |||||||||||||||||||||||||||||||||||
| 9M'23 | Chg (%) / 9M'22 | 9M'23 | Chg (bps) / 9M'22 | 9M'23 | Chg (bps) / 9M'22 | 9M'23 | Chg (p.p.) / 9M'22 | |||||||||||||||||||||||||||||||
| Europe | 1,951 | 11 | 0.44 | 8 | 2.32 | (26) | 51.1 | 1.4 | ||||||||||||||||||||||||||||||
| North America | 2,608 | 53 | 1.91 | 79 | 3.83 | 105 | 78.8 | (23.9) | ||||||||||||||||||||||||||||||
| South America | 3,841 | 7 | 3.30 | 19 | 5.71 | 17 | 78.0 | (6.7) | ||||||||||||||||||||||||||||||
| Digital Consumer Bank | 640 | 53 | 0.60 | 17 | 2.08 | (11) | 92.2 | (3.4) | ||||||||||||||||||||||||||||||
| TOTAL GROUP | 9,037 | 21 | 1.13 | 27 | 3.13 | 5 | 67.5 | (2.2) | ||||||||||||||||||||||||||||||
1. Changes in constant euros.
2.EUR million and % change in constant euros.
3.Provisions to cover losses due to impairment of loans in the last 12 months / average customer loans and advances of the last 12 months.
For more detailed information regarding the countries, please see the Alternative Performance Measures section.
January - September 2023 | | 19 | ||||||
The Group continuously monitors the government liquidity programs that were launched during the pandemic, where Spain constitutes the majority. 99% of the grace periods have expired, showing positive behaviour with no signs of deterioration.
The Group continues to closely follow the measures adopted by the governments of Spain, Portugal, Poland and the UK, aimed at providing mortgage payment relief for vulnerable customers following the increase in interest rates.
IFRS 9 stages evolution: the distribution of the portfolio remained stable in the quarter in percentage terms.
| Coverage ratio by stage | |||||||||||||||||||||||
| EUR billion | |||||||||||||||||||||||
Exposure1 | Coverage | ||||||||||||||||||||||
| Sep-23 | Jun-23 | Sep-22 | Sep-23 | Jun-23 | Sep-22 | ||||||||||||||||||
| Stage 1 | 1,002 | 1,011 | 1,030 | 0.4 | % | 0.4 | % | 0.5 | % | ||||||||||||||
| Stage 2 | 77 | 75 | 70 | 7.0 | % | 7.2 | % | 7.7 | % | ||||||||||||||
| Stage 3 | 36 | 35 | 36 | 40.4 | % | 41.0 | % | 41.0 | % | ||||||||||||||
1. Exposure subject to impairment. Additionally, in September 2023 there was EUR 20 billion in loans and advances to customers not subject to impairment recorded at mark to market with changes through P&L (EUR 18 billion in June 2023 and EUR 21 billion in September 2022).
Stage 1: financial instruments for which no significant increase in credit risk has been identified since its initial recognition.
Stage 2: if there has been a significant increase in credit risk since the date of initial recognition but the impairment event has not materialized, the financial instrument is classified in Stage 2.
Stage 3: a financial instrument is catalogued in this stage when it shows effective signs of impairment as a result of one or more events that have already occurred resulting in a loss.
| Credit impaired loans and loan-loss allowances | |||||||||||
| EUR million | |||||||||||
| Change (%) | |||||||||||
| Q3'23 | QoQ | YoY | |||||||||
| Balance at beginning of period | 34,949 | 1.5 | 2.0 | ||||||||
| Net additions | 4,009 | 27.5 | 8.3 | ||||||||
| Increase in scope of consolidation | (14) | (68.9) | — | ||||||||
| Exchange rate differences and other | (140) | — | — | ||||||||
| Write-offs | (3,246) | 6.0 | 13.6 | ||||||||
| Balance at period-end | 35,558 | 1.7 | (0.1) | ||||||||
| Loan-loss allowances | 24,019 | 0.5 | (3.2) | ||||||||
| For impaired assets | 14,356 | 0.2 | (1.7) | ||||||||
| For other assets | 9,663 | 0.9 | (5.4) | ||||||||
Market risk
The risk associated with global corporate banking trading activity is focused on serving the needs of our customers. It is measured in terms of daily VaR at 99% and is mainly produced by possible interest rate movements.
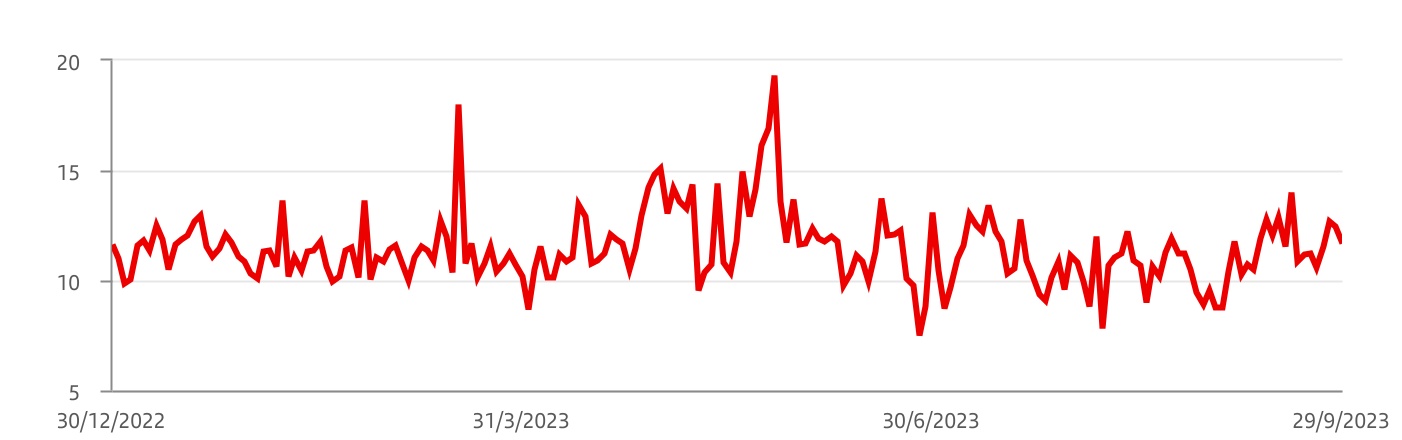
In the third quarter, average VaR was EUR 11 million. Although uncertainty continues regarding the inflation performance and its final impact on economic growth, less volatility was observed in the markets than in the first half of 2023 (marked by several events, such as those related to some regional banks in the US and Europe, or the negotiation of the debt ceiling in the US). By market factor, VaR continued to be driven mainly by interest rate risk. These risk figures remain low compared to the size of the Group's balance sheet and activity.
Trading portfolios.1 VaR by geographic region | ||||||||||||||
| EUR million | ||||||||||||||
| 2023 | 2022 | |||||||||||||
| Third quarter | Average | Last | Average | |||||||||||
| Total | 10.9 | 11.7 | 14.6 | |||||||||||
| Europe | 8.2 | 9.4 | 14.1 | |||||||||||
| North America | 4.5 | 5.5 | 2.0 | |||||||||||
| South America | 7.2 | 7.5 | 7.7 | |||||||||||
1. Activity performance in Santander Corporate & Investment Banking markets.
Trading portfolios.1 VaR by market factor | ||||||||||||||
| EUR million | ||||||||||||||
| Third quarter 2023 | Min. | Avg. | Max. | Last | ||||||||||
| VaR total | 7.8 | 10.9 | 14.0 | 11.7 | ||||||||||
| Diversification effect | (10.9) | (15.7) | (24.0) | (14.6) | ||||||||||
| Interest rate VaR | 9.6 | 12.6 | 16.4 | 12.6 | ||||||||||
| Equity VaR | 1.4 | 2.2 | 3.7 | 2.8 | ||||||||||
| FX VaR | 3.7 | 5.7 | 9.4 | 5.3 | ||||||||||
| Credit spreads VaR | 3.1 | 4.3 | 5.3 | 4.3 | ||||||||||
| Commodities VaR | 0.9 | 1.8 | 3.2 | 1.3 | ||||||||||
1.Activity performance in Santander Corporate & Investment Banking markets.
Note: In the North America, South America and Asia portfolios, VaR corresponding to the credit spreads factor other than sovereign risk is not relevant and is included in the interest rate factor.
| 20 | | January - September 2023 | ||||||
Trading portfolios1. VaR performance | ||
| EUR million | ||
 1. Corporate & Investment Banking performance in financial markets.
Structural and liquidity risk
Structural exchange rate risk: mainly driven by transactions in foreign currencies related to permanent financial investments, their results and related hedges. Our dynamic management of this risk seeks to limit the impact of foreign exchange rate movements on the Group's CET1 ratio. In the quarter, hedging of currencies impacting this ratio remained close to 100%.
Structural interest rate risk: in the third quarter of the year, inflation continues at high levels according to the Central Banks objectives, although in a declining trend. Despite the end of Central Bank’s adjustment cycle regarding restrictive policies is considered to be near, the expectation is that interest rates could remain at high levels for a longer period. In this context, our structural debt portfolios performed negatively. However, the risk remained at comfortable levels during the period.
Liquidity risk: the Group maintained its comfortable liquidity risk position in the third quarter, supported by a robust and diversified liquidity buffer, with ratios well above regulatory limits.
Operational risk
Our operational risk profile remained stable in the third quarter of 2023. In terms of results, operational risk losses decreased compared to the previous quarter. The Group continuously monitors the evolution of specific legal cases, as well as external fraud, two of the main components of operational risk losses.
During this period the following aspects were closely monitored:
•IT risks arising from transformation plans related to business strategy and development of digital capabilities, as well as proactive management of obsolete technology and IT services provided by third parties, in order to ensure availability of services and operations.
•Regulatory compliance due to increasing regulatory requirements (such as ESG, operational resilience, data management regulations) as well as increasing supervisory activity.
•External fraud, mainly in online banking transactions (i.e. customer fraud) and in the loans admissions processes (i.e. identity theft).
•Financial Crime Compliance monitoring and compliance with international financial measures and sanctions, also including prevention programmes upgrades in certain subsidiaries.
•Cyber threats across the financial industry, focused on alerts derived from the war in Ukraine, strengthening the bank's monitoring and control environment mechanisms.
•Third party risk exposure, maintaining close oversight of critical providers, and focusing on their control environment including business continuity capabilities, supply chains, cyber risk management and compliance with service level agreements.
January - September 2023 | | 21 | ||||||
| GENERAL BACKGROUND | ||||||||
Grupo Santander conducted its business in the third quarter of 2023 in an environment in which inflation is starting to respond to monetary policies. Some countries, mainly in Latin America, started to cut rates in the quarter while mature countries started to pause their rate hikes. All this in an environment of geopolitical tension. As a result, we expect the macroeconomic environment to slow down moderately, with slight rises in unemployment and with inflation declining but still resilient, so we could expect interest rates at contractionary levels for longer than initially expected.
| Country | GDP Change1 | Economic performance | |||||||||
 | Eurozone | +0.5% | The economy maintained its positive growth in Q2 2023, while the unemployment rate fell to a record low (6.4%). However, as the months progressed, business and consumer confidence began to soften, showing that economic growth was losing steam. Inflation declined (4.3% in September), although it remained far from the ECB's price stability target (2%), which continued to raise interest rates to 4% (deposit facility rate). | ||||||||
 | Spain | +2.2% | GDP grew faster than in the euro area supported by strong service exports and tourism. Employment growth started to slow down although the unemployment rate fell to 11.6% despite the increase in the labour force. September inflation increased (3.5%) driven by energy prices, but pressures on core inflation decreased. | ||||||||
 | United Kingdom | +0.6% | The economy performed better than expected and continued to show great resilience so far this year. Lower labour demand and the increase in the labour force is allowing more slack in the labour market (unemployment rate rose to 4.3% in July), reducing wage pressures and moderating inflation (6.7% in September) and underpins the pause in the Bank of England's interest rate hike cycle at current the 5.25%. | ||||||||
 | Portugal | +2.5% | Economic activity slowed. Household consumption weakened, affected by inflation (3.6% in September) and higher interest rates, despite the strength of the labour market (unemployment rate at 6.1% and wage growth at 6.7% in Q2 2023) and government support. Corporate demand for credit for investment declined. The slowdown is expected to continue in 2023. | ||||||||
 | Poland | -0.6% | Economic indicators point to a gradual improvement in activity driven by consumer demand, which will be supported by expansionary policies, the credit impulse and the growing dynamics of labour income and social benefits. The labour market remained solid (unemployment rate was at 5% in August) and inflation (8.2% in September) is expected to continue to decline in 2023, leading the National Bank of Poland to lower interest rates further (currently at 5.75%). | ||||||||
 | United States | +2.4% | The economic growth in Q2 2023 was above expectations, and indicators point to solid growth in Q3 2023, with strong private consumption. The labour market is slowly rebalancing and core inflation is falling back, but remains at high levels (4.1% in September) and the Fed has not ruled out further hikes, although it is possibly at or near terminal rates. | ||||||||
 | Mexico | +3.6% | The economy continued to surprise in Q2 2023 due to solid growth in investment, private consumption and employment. Inflation is moderating faster than anticipated, although service prices are proving to be stickier. The central bank held rates at 11.25%, and indicated rates would be stable for a long period of time, to ensure inflation converges to its target. | ||||||||
 | Brazil | +3.4% | The economy continued to show strength in Q2 2023, driven by industry and services and resilient employment. Inflation picked up (5.2% in September) due to higher energy prices, but core inflation continued to fall. The central bank began lowering rates in Q3 2023, with two 50 bp Selic rate cuts to 12.75% and indicated that the pace of cuts is expected to continue in the coming meetings. | ||||||||
 | Chile | -1.1% | The economy continued to adjust after the strong growth experienced in previous years, concentrated mainly in private consumption, which helped to moderate inflation (5.1% in September) and anchor expectations to the central bank's 3% target. This allowed the central banks started to start to cutting interest rates, with two reductions in Q3 2023 (-175 bps to 9.5%) and further cuts are expected. | ||||||||
 | Argentina | -4.9% | The economy shrank in Q2 2023 due to severe droughts, which reduced agricultural production and soybean exports, with a large weight in GDP. The exchange rate of the Argentine peso depreciated 22% in August, which had an upward effect on inflation, which accelerated (12.7% monthly in September), a milestone that led the central bank to raise the official rate to 133% in October. | ||||||||
1. Year-on-year changes for Q2 2023.
| 22 | | January - September 2023 | ||||||
| DESCRIPTION OF SEGMENTS | ||||||||
We base segment reporting on financial information presented to the chief operating decision maker, which excludes certain statutory result items considered outside the ordinary course of our business (e.g. capital gains, write-downs, impairment of goodwill) or reclassifies certain items under some headings of the underlying (or "adjusted") income statement to better understand the underlying business trends.
Santander has aligned the information in this chapter with the information used internally for management reporting and with that presented in the Group's other public documents.
Santander's executive committee has been selected to be its chief operating decision maker. The Group's operating segments reflect its organizational and managerial structures. The executive committee reviews internal reporting based on these segments to assess performance and allocate resources.
The segments are split by geographic area in which profits are earned or by type of business. We prepare the information by aggregating the figures for Santander’s various geographic areas and business units, relating it to both the accounting data of the business units integrated in each segment and information provided by management information systems. The same general principles as those used in the Group are applied.
In 2023, Santander maintained the criteria applied in 2022, with two exceptions.
In the secondary segments: usual annual perimeter adjustment of the Global Customer Relationship Model between Commercial Banking and Santander Corporate & Investment Banking and between Commercial Banking and Wealth Management & Insurance.
In the Group's financial statements: as a result of the implementation from 1 January 2023 of the amendments to IFRS 17 (new general accounting standard for insurance contracts), the Group retrospectively performed a reclassification in the balance sheet to 'Liabilities under insurance or reinsurance contracts', related to the different treatment established by this new standard for the components of an insurance contract. This reclassification was made in the corresponding segments.
For comparative purposes, the 2022 data has been restated to include these changes.
In terms of the operating segment structure, the Group maintained the two levels of segmentation applied in 2022.
Primary segments
This primary level of segmentation, which is based on the Group’s management structure, comprises five reportable segments: four operating areas plus the Corporate Centre. The operating areas are:
Europe: comprises all business activity carried out in the region, except that included in Digital Consumer Bank. Detailed financial information is provided on Spain, the UK, Portugal and Poland.
North America: comprises all the business activities carried out in Mexico and the US, which includes the holding company (SHUSA) and the businesses of Santander Bank, Santander Consumer USA (SC USA), the specialized business unit Banco Santander International, the New York branch and Santander US Capital Markets (SanCap), following the merger of Santander Investment Securities and Amherst Pierpont Securities.
South America: includes all the financial activities carried out by Grupo Santander through its banks and subsidiary banks in the region. Detailed information is provided on Brazil, Chile, Argentina, Uruguay, Peru and Colombia.
Digital Consumer Bank: includes Santander Consumer Finance, which incorporates the entire consumer finance business in Europe, Openbank and Open Digital Services (ODS).
January - September 2023 | | 23 | ||||||
Secondary segments
At this secondary level, Grupo Santander is structured into Retail Banking, Santander Corporate & Investment Banking (SCIB), Wealth Management & Insurance (WM&I) and PagoNxt.
Retail Banking: this covers all customer banking businesses, including consumer finance, except those of corporate banking which are managed through Santander Corporate & Investment Banking and asset management, private banking and insurance, which are managed by Wealth Management & Insurance. The results of the hedging positions in each country are also included, conducted within the sphere of their respective assets and liabilities committees.
Santander Corporate & Investment Banking: this business includes global corporate banking, investment banking and markets worldwide including treasuries managed globally (always after the appropriate distribution with Retail Banking customers), as well as equity business.
Wealth Management & Insurance: includes the asset management business (Santander Asset Management), the corporate unit of Private Banking and International Private Banking in Miami and Switzerland (Santander Private Banking) and the insurance business (Santander Insurance).
PagoNxt: this includes digital payment solutions, providing global technology solutions for our banks and new customers in the open market. It is structured into four businesses: Merchant, International Trade, Payments and Consumer.
In addition to these operating units, both primary and secondary segments, the Group continues to maintain the Corporate Centre, which includes the centralized activities relating to equity stakes in financial companies, financial management of the structural exchange rate position, assumed within the sphere of the Group’s assets and liabilities committee, as well as management of liquidity and shareholders’ equity via issuances.
As the Group’s holding entity, this area manages all capital and reserves and allocations of capital and liquidity with the other businesses. It does not incorporate the costs related to the Group’s central services (charged to the areas), except for corporate and institutional expenses related to the Group’s functioning.
The businesses included in each of the segments in this report and the accounting principles under which their results are presented here may differ from the businesses included and accounting principles applied in the financial information separately prepared and disclosed by our subsidiaries (some of which are publicly listed) which in name or geographical description may seem to correspond to the business areas covered in this report. Accordingly, the results of operations and trends shown for our business areas in this document may differ materially from those of such subsidiaries. As explained on the previous page, the results of our business areas presented below are provided on the basis of underlying results only and include the impact of foreign exchange rate fluctuations. However, for a better understanding of the changes in the performance of our business areas, we also provide and discuss the year-on-year changes to our results excluding such exchange rate impacts. Certain figures contained in this report, have been subject to rounding to enhance their presentation. Accordingly, in certain instances, the sum of the numbers in a column or a row in tables contained in this report may not conform exactly to the total figure given for that column or row. On 18 September 2023, the Bank announced a new organizational structure, which consolidates its retail and commercial and consumer businesses in each market under two new global businesses: Retail & Commercial and Digital Consumer Bank to help the bank achieve the strategic goals outlined at its Investor Day in February. The bank will concentrate operations in five global business areas which will become the bank's primary reporting segments. The Group will align the way it reports its financial results to this new model from January 2024, once it is fully implemented. These areas are: Retail & Commercial, Digital Consumer Bank, Corporate & Investment Banking, Wealth Management & Insurance and Payments. | ||
| 24 | | January - September 2023 | ||||||
| January-September 2023 | ||||||||||||||||||||
| Main items of the underlying income statement | ||||||||||||||||||||
| EUR million | ||||||||||||||||||||
| Primary segments | Net interest income | Net fee income | Total income | Net operating income | Profit before tax | Profit attributable to the parent | ||||||||||||||
| Europe | 11,787 | 3,328 | 16,228 | 9,555 | 6,339 | 4,176 | ||||||||||||||
| Spain | 4,903 | 2,047 | 7,791 | 4,664 | 2,692 | 1,854 | ||||||||||||||
| United Kingdom | 3,927 | 264 | 4,245 | 2,198 | 1,712 | 1,243 | ||||||||||||||
| Portugal | 1,014 | 352 | 1,398 | 997 | 890 | 604 | ||||||||||||||
| Poland | 1,871 | 437 | 2,344 | 1,722 | 1,082 | 529 | ||||||||||||||
| Other | 73 | 228 | 450 | (26) | (37) | (54) | ||||||||||||||
| North America | 7,533 | 1,637 | 9,807 | 5,100 | 2,368 | 1,900 | ||||||||||||||
| US | 4,314 | 579 | 5,442 | 2,728 | 881 | 865 | ||||||||||||||
| Mexico | 3,213 | 1,019 | 4,318 | 2,473 | 1,594 | 1,163 | ||||||||||||||
| Other | 5 | 38 | 47 | (102) | (107) | (128) | ||||||||||||||
| South America | 9,833 | 3,659 | 13,641 | 8,310 | 3,667 | 2,329 | ||||||||||||||
| Brazil | 6,612 | 2,577 | 9,616 | 6,271 | 2,264 | 1,426 | ||||||||||||||
| Chile | 968 | 449 | 1,694 | 922 | 671 | 417 | ||||||||||||||
| Argentina | 1,767 | 446 | 1,572 | 791 | 543 | 406 | ||||||||||||||
| Other | 486 | 187 | 759 | 326 | 189 | 80 | ||||||||||||||
| Digital Consumer Bank | 3,110 | 604 | 4,069 | 2,103 | 1,437 | 823 | ||||||||||||||
| Corporate Centre | (124) | (6) | (650) | (933) | (1,034) | (1,084) | ||||||||||||||
| TOTAL GROUP | 32,139 | 9,222 | 43,095 | 24,134 | 12,776 | 8,143 | ||||||||||||||
| Secondary segments | ||||||||||||||||||||
| Retail Banking | 28,323 | 5,878 | 33,857 | 19,220 | 8,138 | 5,397 | ||||||||||||||
| Corporate & Investment Banking | 2,562 | 1,704 | 6,479 | 4,105 | 3,997 | 2,680 | ||||||||||||||
| Wealth Management & Insurance | 1,323 | 944 | 2,591 | 1,746 | 1,721 | 1,251 | ||||||||||||||
| PagoNxt | 55 | 701 | 820 | (4) | (45) | (101) | ||||||||||||||
| Corporate Centre | (124) | (6) | (650) | (933) | (1,034) | (1,084) | ||||||||||||||
| TOTAL GROUP | 32,139 | 9,222 | 43,095 | 24,134 | 12,776 | 8,143 | ||||||||||||||
Profit attributable to the parent distribution1 | ||
| 9M 2023 | ||
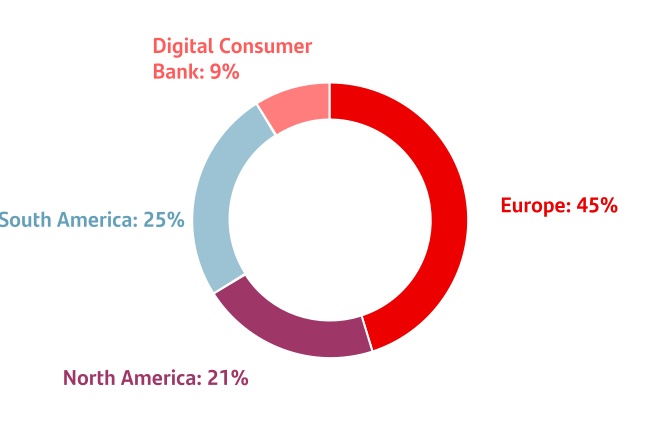
1. As a % of operating areas. Excluding the Corporate Centre.
| Profit attributable to the parent. 9M 2023 | ||
| EUR million. % change YoY | ||
| Flags | |||||||||||
| Europe | | ||||||||||
| |||||||||||
| |||||||||||
| |||||||||||
| North America | | ||||||||||
| |||||||||||
| South America | | ||||||||||
| |||||||||||
| |||||||||||
| Digital Consumer Bank | DCB | ||||||||||
| Global businesses |  | ||||||||||
 | |||||||||||
 | |||||||||||
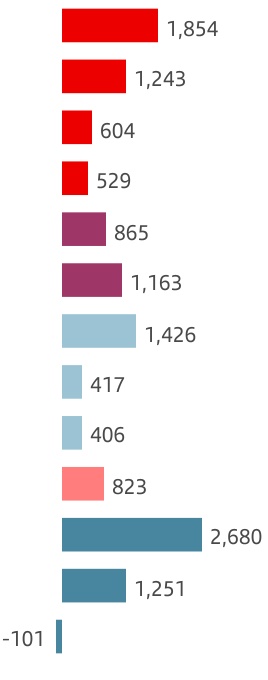
| Var | Var2 | ||||
| +68 | % | +68 | % | ||
| +9 | % | +12 | % | ||
| +68 | % | +68 | % | ||
| +131 | % | +126 | % | ||
| -42 | % | -41 | % | ||
| +33 | % | +19 | % | ||
| -30 | % | -30 | % | ||
| -24 | % | -26 | % | ||
| +74 | % | +346 | % | ||
| -9 | % | -8 | % | ||
| +14 | % | +22 | % | ||
| +61 | % | +62 | % | ||
| -42 | % | -39 | % | ||
January - September 2023 | | 25 | ||||||
| January-September 2022 | ||||||||||||||||||||
| Main items of the underlying income statement | ||||||||||||||||||||
| EUR million | ||||||||||||||||||||
| Primary segments | Net interest income | Net fee income | Total income | Net operating income | Profit before tax | Profit attributable to the parent | ||||||||||||||
| Europe | 8,998 | 3,441 | 13,273 | 6,977 | 4,076 | 2,837 | ||||||||||||||
| Spain | 3,134 | 2,172 | 6,058 | 3,118 | 1,497 | 1,104 | ||||||||||||||
| United Kingdom | 3,695 | 295 | 4,031 | 2,023 | 1,535 | 1,138 | ||||||||||||||
| Portugal | 516 | 366 | 933 | 557 | 524 | 360 | ||||||||||||||
| Poland | 1,424 | 403 | 1,780 | 1,270 | 512 | 229 | ||||||||||||||
| Other | 229 | 205 | 471 | 10 | 8 | 5 | ||||||||||||||
| North America | 7,102 | 1,450 | 9,021 | 4,782 | 3,005 | 2,271 | ||||||||||||||
| US | 4,546 | 588 | 5,667 | 3,032 | 1,908 | 1,489 | ||||||||||||||
| Mexico | 2,556 | 831 | 3,312 | 1,845 | 1,198 | 874 | ||||||||||||||
| Other | 0 | 31 | 42 | (95) | (101) | (92) | ||||||||||||||
| South America | 9,838 | 3,350 | 13,613 | 8,677 | 4,656 | 2,884 | ||||||||||||||
| Brazil | 6,672 | 2,412 | 9,671 | 6,661 | 3,316 | 2,027 | ||||||||||||||
| Chile | 1,440 | 341 | 1,934 | 1,197 | 889 | 551 | ||||||||||||||
| Argentina | 1,347 | 445 | 1,413 | 604 | 312 | 234 | ||||||||||||||
| Other | 378 | 152 | 594 | 215 | 138 | 72 | ||||||||||||||
| Digital Consumer Bank | 3,032 | 629 | 3,887 | 2,034 | 1,581 | 908 | ||||||||||||||
| Corporate Centre | (510) | (3) | (1,165) | (1,437) | (1,558) | (1,583) | ||||||||||||||
| TOTAL GROUP | 28,460 | 8,867 | 38,629 | 21,034 | 11,761 | 7,316 | ||||||||||||||
| Secondary segments | ||||||||||||||||||||
| Retail Banking | 25,805 | 5,758 | 31,683 | 17,907 | 8,901 | 5,935 | ||||||||||||||
| Corporate & Investment Banking | 2,629 | 1,517 | 5,575 | 3,529 | 3,466 | 2,359 | ||||||||||||||
| Wealth Management & Insurance | 525 | 984 | 1,881 | 1,108 | 1,066 | 777 | ||||||||||||||
| PagoNxt | 11 | 611 | 655 | (74) | (114) | (172) | ||||||||||||||
| Corporate Centre | (510) | (3) | (1,165) | (1,437) | (1,558) | (1,583) | ||||||||||||||
| TOTAL GROUP | 28,460 | 8,867 | 38,629 | 21,034 | 11,761 | 7,316 | ||||||||||||||
| 26 | | January - September 2023 | ||||||
 | EUROPE | Underlying attributable profit | ||||||
| EUR 4,176 mn | ||||||||
Executive summary → We continue to accelerate our business transformation to achieve higher growth and a more efficient operating model which should allow us to further improve profitability and increase RoTE. → Loans and advances to customers decreased 7% year-on-year, with lower demand in corporates and CIB, and mortgage lending decreased in an environment of economic slowdown, higher interest rates and inflation. Customer deposits remained virtually flat year-on-year, as increased volumes in time products offset lower demand deposits. → Underlying attributable profit (EUR 4,176 million) rose 47% (+49% in constant euros), with strong revenue growth, mainly from net interest income, which was able to absorb higher costs, the temporary levy on revenue earned in Spain and higher provisions in Poland due to the CHF portfolio. | ||||||||
Strategy
We maintain our aim of creating a better bank, that our customers and employees feel a deep connection with while creating value for shareholders and society, and continued to contribute to the achievement of the Group's strategy and results.
In the first nine months of the year, we made significant progress in accelerating our financial results and transformation projects with the aim of becoming the best bank in each country by leveraging the combination of our local leadership with our pan-European and global businesses. We are focusing on the following pillars:
•Customer centric: grow our active customer base through better customer service and experience.
•Simplification and automation: enhance efficiency through a common operating model in the region.
•Network contribution: grow our global business revenue by increasing connectivity across the region.
•Customer activity: improving loyalty through a value proposition for individuals and SMEs.
•Disciplined capital allocation: improve pricing discipline and risk management.
This enables us to achieve sustainable growth and greater profitability and shareholder value creation.
Key developments by country:
•Spain: we focused on profitable and sustainable growth and increasing the customer base. We further improved the service quality, automating and digitalizing processes, and developed a simpler value proposition for retail and specialized for high-value segments, boosting collaboration between segments at both the local and global level. We maintained our proactive risk management in a complex macroeconomic environment.
•United Kingdom: we focused on managing the spread between assets and liabilities, especially in customer deposits. Our transformation programme continues to provide efficiency improvements through process simplification and digitalization. The loan portfolio remains low risk, as it mainly comprises mortgages with an average LTV of 51% and with only 6% of the portfolio with an LTV above 80%.
•Portugal: we continued to execute our strategy to grow in the most profitable segments. We increased our active and digital customers and improved our service quality.
•Poland: we remained focused on improving our market position in all segments, especially in corporates, investment funds and CIB. We continued to develop our digital capabilities, simplify our processes and boost customer attraction and sales. Strong revenue growth and the improvement in efficiency allowed us to absorb the higher Swiss franc mortgage provisions and maintain profitable growth.
| Spain | UK | Portugal | Poland | |||||||||||||||||||||||||||||||
 | Thousands | 46,374 | 14,891 | 22,506 | 2,903 | 5,858 | |||||||||||||||||||||||||||||
| Total customers | YoY change | +2% | +5% | +1% | -5% | +3% | |||||||||||||||||||||||||||||
 | Thousands | 28,534 | 8,229 | 13,906 | 1,811 | 4,427 | |||||||||||||||||||||||||||||
| Active customers | YoY change | +2% | +6% | 0% | +3% | +4% | |||||||||||||||||||||||||||||
January - September 2023 | | 27 | ||||||
Business model | Group financial information | Financial information by segment | Responsible banking Corporate governance Santander share | Appendix | ||||||||||||||||||||||
| Primary segments | ||||||||||||||||||||||||||
Additionally, we continued to make progress in our regional transformation, advancing across the five value creation pillars, in line with the Group's strategy, through the following projects:
•OneApp: Our common app already live in Spain, Portugal and Poland (where we have recently begun to migrate customers from the old app). A pilot version is available, in the UK.
•OneWeb: Design development of our common web.
•One Platform: Building a technological platform which reinforces our data governance model.
•Shared services: Operational convergence, through shared services development, where we continue to make progress in existing service centres (e.g. cyber risk, ESG, FCC, costs, One App) and defining new ones for operations.
•Multi-Europeans: Continue growing our Multi-Europeans business (total revenue in the first eight months of the year increased by 49% YoY).
•SME model: New business model definition for SMEs, to be adopted at Group level.
Business performance
Total customers increased nearly by 1 million year-on-year. 62% of this growth was due to the increase in active customers. Of note was the good performance in Spain in both total (more than 744,000 year-on-year) and active customers, which increased 5% to more than 8 million and with significant increase in payroll accounts.
Commercial activity has partially recovered in recent months, driven by more dynamic new mortgage lending and stability in the origination of unsecured personal loans, but activity levels are still well below 2022 levels, in a macro environment that is reducing the demand for mortgages and long-term corporate loans. As a result, loans and advances to customers fell 6% year-on-year. In gross terms, excluding reverse repurchase agreements and in constant euros, they fell 7%.
Customer deposits increased 2% year-on-year. Excluding repos and in constant euros, they remained virtually flat, as the increase in time deposits was offset by lower demand deposits in the current interest rate environment. Our liquidity management capabilities allow us to keep funding costs well under control, especially in Spain, Portugal and Poland.
Europe. Business performance. September 2023 | ||||||||||||||||||||||||||||||||||||||
| EUR billion and YoY % change in constant euros | ||||||||||||||||||||||||||||||||||||||
| 552 | -7% | | 710 | +1% | |||||||||||||||||||||||||||||||||
| ||
| ||
| ||
| ||
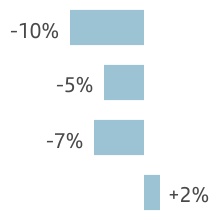
| ||
| ||
| ||
| ||
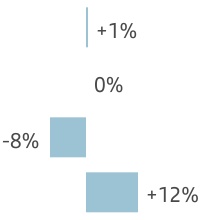
| Gross loans and advances to customers excl. reverse repos | Customer deposits excl. repos + mutual funds | |||||||||||||||||||||||||||||||||||||
Mutual funds increased 9% compared to September 2022 in constant euros, mainly driven by strong growth in Portugal and Poland, where we increased our market share. We also began to see a recovery in sales of this type of product in the few last quarters with positive net new money, offering customers a range of profitable investment products.
Results
Attributable profit in the first nine months of 2023 was EUR 4,176 million, 47% higher than in the same period of 2022. In constant euros, it rose 49%, as follows:
•Total income grew 23% driven by higher net interest income, which rose 32% reflecting margin management and positive balance sheet sensitivity to higher interest rates, and good CIB performance.
•Costs increased 7%, impacted by high inflation rates and investments in technology and digitalization. In real terms, costs remained stable. The efficiency ratio improved by 6.3 pp to 41.1%.
•Net loan-loss provisions increased 11% mainly driven by higher provisions in Poland related to the CHF mortgage portfolio. Underlying credit quality performance remained robust in the region and the cost of risk was steady (44 bps).
•Other gains (losses) and provisions included the temporary levy on revenue earned in Spain (EUR 202 million for the full year) and was recorded in its entirety in the first quarter. Excluding this impact, profit increased 56% in constant euros.
In the quarter, attributable profit increased 21% in constant euros, driven mainly by improvement in net interest income and good credit risk management. Additionally, there was a positive effect from having recorded the contributions to the Single Resolution Fund in Spain and Portugal in the previous quarter.
| Europe. Underlying income statement | ||||||||||||||||||||||||||
| EUR million and % change | ||||||||||||||||||||||||||
| / | Q2'23 | / | 9M'22 | |||||||||||||||||||||||
| Q3'23 | % | excl. FX | 9M'23 | % | excl. FX | |||||||||||||||||||||
| Revenue | 5,765 | +9 | +8 | 16,228 | +22 | +23 | ||||||||||||||||||||
| Expenses | -2,291 | +3 | +3 | -6,673 | +6 | +7 | ||||||||||||||||||||
| Net operating income | 3,474 | +13 | +12 | 9,555 | +37 | +38 | ||||||||||||||||||||
| LLPs | -662 | +2 | +2 | -1,951 | +11 | +11 | ||||||||||||||||||||
| PBT | 2,451 | +20 | +20 | 6,339 | +55 | +57 | ||||||||||||||||||||
| Attributable profit | 1,640 | +22 | +21 | 4,176 | +47 | +49 | ||||||||||||||||||||
| 28 | | January - September 2023 | ||||||
| Spain | Underlying attributable profit | ||||||
| EUR 1,854 mn | ||||||||
Commercial activity and business performance
We consolidated the growth of our customer base (+571k in the year to date), both in individuals and corporates, having achieved more than two consecutive years of positive monthly net growth. We continued to grow above market in transactionality in payroll, pensions and PoS terminals.
Short-term financing and housing mortgages continued to grow compared to the previous quarter. Long-term financing slowed, however, impacted mainly by consumer and loans to developers due to the rising interest rates and inflation. We focused on active risk management, bringing our NPL ratio below the sector average.
Loans and advances to customers fell 10% year-on-year, with the same performance in gross terms and excluding reverse repurchase agreements, in line with the market, mainly affected by lower demand and prepayments in mortgages.
Customer deposits increased 2% year-on-year. In gross terms, excluding repos, they remained flat, with a change of mix from demand to time. Off-balance sheet funds consolidated their positive trend this year with 5% growth in the quarter, driven by positive inflows into mutual funds and pension plans.
Results
Attributable profit in the first nine months of 2023 amounted to EUR 1,854 million, 68% higher than the same period of 2022. By line:
•Total income was up 29% propelled by growth in net interest income, the result of higher interest rates. Net fee income decreased in asset management due to change of mix with higher demand for fixed income products and lower average volumes. On the other hand, net fee income rose significantly in payments and CIB.
•Costs increased 6% affected by high inflation, however, in real terms, costs rose only 2% and the efficiency ratio improved 8.4 pp compared to 9M 2022, reaching 40.1%.
•Net loan-loss provisions decreased 4%, supported by active risk management in both retail and wholesale banking.
Compared to the second quarter of 2023, attributable profit increased 8%, supported by net interest income growth, gains on financial transactions and lower LLPs, which offset higher costs. Additionally, we recorded the contribution to the Single Resolution Fund (EUR 131 million before tax) in the second quarter.
| Spain. Underlying income statement | ||||||||||||||||||||
| EUR million and % change | ||||||||||||||||||||
| Q3'23 | / Q2'23 | 9M'23 | / 9M'22 | |||||||||||||||||
| Revenue | 2,678 | +4 | 7,791 | +29 | ||||||||||||||||
| Expenses | -1,088 | +6 | -3,127 | +6 | ||||||||||||||||
| Net operating income | 1,591 | +3 | 4,664 | +50 | ||||||||||||||||
| LLPs | -377 | -3 | -1,180 | -4 | ||||||||||||||||
| PBT | 1,013 | +8 | 2,692 | +80 | ||||||||||||||||
| Attributable profit | 722 | +8 | 1,854 | +68 | ||||||||||||||||
| United Kingdom | Underlying attributable profit | ||||||
| EUR 1,243 mn | ||||||||
Commercial activity and business performance
Our transformation programme continues to deliver efficiency improvements through the simplification and digitalization of key processes.
We are increasing the use of digital channels with 77% of refinanced mortgage loans processed online and 92% of new current accounts opened through digital channels.
We have helped mortgage holders manage higher payments with our support for the Mortgage Charter. In addition to the launch of Edge Up in June offering cashback and interest, we launched an easy saver with an attractive yield for customers. This demonstrates our ongoing commitment to improving the products we offer to our customers.
Loans and advances to customers were 3% lower year-on-year. In gross terms, excluding reverse repurchase agreements and in constant euros they decreased 5%, with a reduction in mortgage demand impacted by higher customer rates.
Customer deposits grew 2% year-on-year. In gross terms, excluding repurchase agreements and in constant euros they remained broadly flat. We continue to see lower balances in current accounts offset by higher customer savings accounts as customers look for higher yield. Mutual funds were up 1% year-on-year.
Results
In the nine months ending September 2023, attributable profit was EUR 1,243 million, increasing 9% versus the same period of 2022. In constant euros, profit rose 12%, by line:
•Total income was up 8%, driven by strong net interest income from margin management in a rising interest rate environment.
•Costs rose 5% impacted by inflation, though in real terms costs decreased. The efficiency ratio improved by 1.6 pp versus the same period of 2022 reaching 48.2%.
•Net loan-loss provisions totalled EUR 229 million, broadly in line with the prior year. Cost of risk was 12 basis points, in line with the average of recent years.
Compared to the second quarter of 2023, net operating income increased 13% in constant euros, boosted by higher revenue, which was not reflected in profit (-1%) due to higher provisions, after absorbing the impact of worsened outlook for housing market prices.
| United Kingdom. Underlying income statement | ||||||||||||||||||||||||||
| EUR million and % change | ||||||||||||||||||||||||||
| / | Q2'23 | / | 9M'22 | |||||||||||||||||||||||
| Q3'23 | % | excl. FX | 9M'23 | % | excl. FX | |||||||||||||||||||||
| Revenue | 1,486 | +7 | +6 | 4,245 | +5 | +8 | ||||||||||||||||||||
| Expenses | -684 | -1 | -2 | -2,047 | +2 | +5 | ||||||||||||||||||||
| Net operating income | 803 | +14 | +13 | 2,198 | +9 | +12 | ||||||||||||||||||||
| LLPs | -126 | +187 | +186 | -229 | -2 | +1 | ||||||||||||||||||||
| PBT | 585 | 0 | -1 | 1,712 | +12 | +15 | ||||||||||||||||||||
| Attributable profit | 425 | +1 | -1 | 1,243 | +9 | +12 | ||||||||||||||||||||
January - September 2023 | | 29 | ||||||
Business model | Group financial information | Financial information by segment | Responsible banking Corporate governance Santander share | Appendix | ||||||||||||||||||||||
| Primary segments | ||||||||||||||||||||||||||
| Portugal | Underlying attributable profit | ||||||
| EUR 604 mn | ||||||||
Commercial activity and business performance
We continued to execute our profitable growth strategy supported by our business model transformation and focusing on customer satisfaction. The number of loyal and digital customers grew further, while we remained focused on growing in the most profitable segments.
Business dynamics observed in the first nine months of 2023 were very conditioned by the rising interest rate environment, the impacts of which have varied throughout the year. At the beginning of the year, there was a concentrated period of early mortgage repayments. In the second and third quarters, new lending stabilized and the pace of loan originations began to recover, both in mortgages and in corporates.
Loans to customers fell 7% year-on-year in both net and gross terms excluding reverse repos, with falls across segments.
Customer deposits (both, including and excluding repos) fell 10% year-on-year, mainly due to demand deposits (-16%), which does not jeopardize our comfortable liquidity position. Mutual funds continued to perform positively, rising 10% year-on-year.
Results
Attributable profit in the first nine months of 2023 reached EUR 604 million, 68% more year-on-year.
•Total income increased 50%, driven by the recovery in net interest income (+97%) associated with higher interest rates. Net fee income fell 4% year-on-year, affected by lower volumes and the regulatory change on charging fees on the amortization of mortgages.
•Operating expenses rose 7%, affected by high inflation rates. In real terms, costs remained stable. However, the efficiency ratio improved 11.6 pp, to 28.7%.
•Credit quality remained solid, with the NPL ratio falling to 2.5% (-0.5 pp), while the cost of risk remained under control at 17 bps.
Compared to the previous quarter, profit doubled, with 31% growth in net interest income plus net fee income and the accounting of regulatory costs in the second quarter (SRF, banking sector contribution and the banking sector solidarity tax).
| Portugal. Underlying income statement | ||||||||||||||||||||
| EUR million and % change | ||||||||||||||||||||
| Q3'23 | / Q2'23 | 9M'23 | / 9M'22 | |||||||||||||||||
| Revenue | 575 | +37 | 1,398 | +50 | ||||||||||||||||
| Expenses | -137 | +3 | -401 | +7 | ||||||||||||||||
| Net operating income | 438 | +53 | 997 | +79 | ||||||||||||||||
| LLPs | -25 | +21 | -59 | +532 | ||||||||||||||||
| PBT | 406 | +82 | 890 | +70 | ||||||||||||||||
| Attributable profit | 283 | +100 | 604 | +68 | ||||||||||||||||
| Poland | Underlying attributable profit | ||||||
| EUR 529 mn | ||||||||
Commercial activity and business performance
We continue to focus on our strategic priorities: total experience (customers and employees) delivering substantial growth in active customers in all segments, improve digital transformation and simplification, and profitable business growth.
With respect to the digitalization of our bank, in September we launched a new mobile app. Our transformation programme continues in digitalization (iBiznes24), improving credit process (CLP platform) and developing a cloud-based CRM. In CIB, we improved our innovative products and solutions with the development of One Trade Portal (e.g. with the introduction of International Instant Payments) and participated in relevant market transactions, including some in the renewable energy sector. We remain focused on solid business growth supported by strong customer activity and a well-diversified model. In corporates, we achieved 5% growth in the number of transactions and increased the number of loyal customers.
Loans and advances to customers grew 7% year-on-year. In gross terms, excluding reverse repurchase agreements and FX impact, growth was 2% as greater demand in consumer lending, SMEs and corporates was partially offset by lower mortgage volumes, despite the latest pick up in new lending.
Customer deposits increased 16%, and 10% excluding repos and in constant euros, supported by higher deposits from individuals, corporates and CIB in term deposits, offsetting lower volumes in demand deposits. Mutual funds increased 33%.
Results
Attributable profit in the first nine months of 2023 amounted to EUR 529 million. Compared to the same period in 2022, profit grew 131% and 126% in constant euros as follows:
•Total revenue was 29% higher, primarily due to the increase in NII (+29%) driven by strict cost of funding management and good credit pricing management in a context of higher interest rates. Net fee income increased 6%.
•Costs remained under pressure due to a highly inflationary environment, tight labour market, investments in digitalization, following years of reducing expenses in real terms. All in all, costs increased by 20%, but just 5% in real terms. Additionally, efficiency improved to 26.5%, delivering 33% growth in net operating income.
•Net loan-loss provisions grew 61% impacted by higher provisions to increase coverage of the CHF mortgage portfolio.
Profit compared to the previous quarter increased 34% in constant euros, on the back of higher revenue, lower LLPs and reduced legal charges from CHF mortgage claims.
| Poland. Underlying income statement | ||||||||||||||||||||||||||
| EUR million and % change | ||||||||||||||||||||||||||
| / | Q2'23 | / | 9M'22 | |||||||||||||||||||||||
| Q3'23 | % | excl. FX | 9M'23 | % | excl. FX | |||||||||||||||||||||
| Revenue | 835 | +7 | +6 | 2,344 | +32 | +29 | ||||||||||||||||||||
| Expenses | -217 | +5 | +4 | -622 | +22 | +20 | ||||||||||||||||||||
| Net operating income | 617 | +8 | +7 | 1,722 | +36 | +33 | ||||||||||||||||||||
| LLPs | -132 | -31 | -32 | -475 | +64 | +61 | ||||||||||||||||||||
| PBT | 425 | +33 | +32 | 1,082 | +111 | +107 | ||||||||||||||||||||
| Attributable profit | 208 | +34 | +34 | 529 | +131 | +126 | ||||||||||||||||||||
| 30 | | January - September 2023 | ||||||
 | NORTH AMERICA | Underlying attributable profit | ||||||
| EUR 1,900 mn | ||||||||
Executive summary → In North America, we continue leveraging our own local strengths and capabilities while promoting strong Group network contributions in Mexico and the US and, at the same time, we are rationalizing businesses and products with limited scale and profitability to generate efficiencies and profitable growth. → Loans and advances to customers increased 4% year-on-year in constant euros driven by growth in both the US and Mexico. Customer funds rose 8% in constant euros, boosted by higher time deposits. → Underlying attributable profit in the first nine months of 2023 reached EUR 1,900 million, down 16% year-on-year (-19% in constant euros) mainly due to LLP normalization in the US, which more than offset the good performance in Mexico. | ||||||||
Strategy
We increased synergies across the region to optimize cooperation and bring value to both markets, by:
•Providing a compelling value proposition by taking advantage of our global connectivity, adopting best practices and maximizing the benefits of our global platforms.
•Boosting sustainable profitability levels through loyalty strategies and a refined tailored service and product proposition for a better customer experience.
•Leveraging network contributions of both countries and the Group. Through MEXUS, we are consolidating T&O know-how, digitalization, hubs, front-office and back-office, among others:
–US: we are modernizing platforms to build a digital-first omnichannel experience and simplifying product offerings.
–Mexico: we are simplifying the bank by streamlining our products and processes while strengthening our digital capabilities to better compete with the best-in-class.
Additionally, in line with our strategy to deploy capital to the most profitable businesses, in Q3 2023:
•Santander US distributed an additional USD 250 million of dividends, bringing the total distributed during 2023 to date to USD 1.5 billion. SHUSA’s regulatory Stress Capital Buffer (SCB) and initial analysis of proposed new capital rules allow for more efficient capital management and the continuation of planned capital actions.
In line with our focus on expanding and implementing sustainable finance opportunities within our businesses:
•Santander US Commercial Bank executed a USD 250 million asset-based revolving credit facility on behalf of Wind Turbine & Energy Cables Corp (WTEC). Santander acted as administrative agent, joint lead arranger and joint bookrunner on the credit facility and is one of eight international and US-based banks providing financing to support WTEC’s production, logistics, fleet management and day-to-day operations.
•Tuiio, Santander México’s financial inclusion initiative, and the Ministry of Economy and Labour of Chiapas signed an agreement to offer financing schemes, providing access to financial services and education to women, native groups and artisans that generate social impact and wellbeing.
In terms of local priorities:
United States
In the US, we continue to focus on a complementary mix of scalable businesses that deliver profitable growth and have strong Group network contributions, such as Auto and CIB. Our business model is focused on four core segments (Consumer, Commercial, CIB and Wealth Management) and four key pillars:
•Simplification: rationalize businesses and products with limited scale and profitability and exit non-core portfolios.
•Transformation: leverage Group digital and data capabilities to modernize, drive scalability and lower cost to serve.
| United States | Mexico | |||||||||||||||||||||
| Thousands | 25,056 | 4,356 | 20,488 | |||||||||||||||||||
| Total customers | YoY change | +2% | -5% | +4% | |||||||||||||||||||
| Thousands | 14,293 | 3,996 | 10,140 | |||||||||||||||||||
| Active customers | YoY change | +2% | -5% | +5% | |||||||||||||||||||
January - September 2023 | | 31 | ||||||
Business model | Group financial information | Financial information by segment | Responsible banking Corporate governance Santander share | Appendix | ||||||||||||||||||||||
| Primary segments | ||||||||||||||||||||||||||
•Network contribution: leverage the Group's network to drive top line growth and achieve synergies.
•Profitable growth: support growth across businesses while maintaining disciplined capital management.
In Consumer, deposits balances remained stable and we continue to simplify products, processes and services as part of our transformation initiative. In Auto, we entered numerous new lending agreements with auto OEMs including preferred lender relationships with INEOS and Lotus.
In Commercial, revenue was up year-on-year with profitable loan growth centred on Multifamily. Commercial deposit balances remained stable year to date. Focus remains on credit, expense management and capital discipline to drive an improvement in returns.
CIB outperformed expectations in Q3 driven by Global Transactional Banking and Structured Finance, where the renewables sector remains highly active.
There were record volumes in WM on the back of strong commercial activity and favourable market trends.
Mexico
Our transformation plan is ongoing, with the ambition to become the best bank in terms of customer experience, double the bank´s revenue and triple net income in the coming years supported by: (i) customer acquisition, (ii) simplification and automation, (iii) investment in talent and (iv) enhanced digital offering.
We are improving our app to offer the best customer experience, by incorporating new functionalities. These include, among others: sending/receiving money with the mobile number, blocking and requesting replacement cards and transferring to a new bank account with no waiting time.
We are implementing a new disruptive branch model and so we opened the first-of-its-kind multi-bank branch in Mexico, which generates synergies and better serves our customers in different segments. We also opened the fourth Work Café.
In cards, we created innovative solutions with 100% digital products (LikeU and Samsung cards) and a differentiated value proposition, such as Cashback, exclusive pre-sales with high-profile artists and our Unique Rewards loyalty programme.
In consumer, we continue to drive customer loyalty and are promoting early customer engagement through digital payroll.
North America. Business performance. September 2023 | ||||||||||||||||||||||||||||||||||||||
| EUR billion and YoY % change in constant euros | ||||||||||||||||||||||||||||||||||||||
| 165 | +4% | | 172 | +8% | |||||||||||||||||||||||||||||||||
| ||
| ||
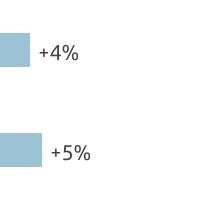
| ||
| ||
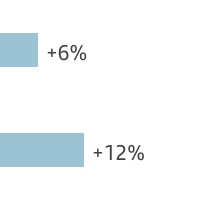
| Gross loans and advances to customers excl. reverse repos | Customer deposits excl. repos + mutual funds | |||||||||||||||||||||||||||||||||||||
loans when opening an account and more agile processes in pre-approved campaigns.
In mortgages, we launched the first green mortgage in the country, offering attractive financial conditions to customers who purchase a home with a sustainable construction certificate.
In auto, we increased our financing participation with our main partners (Mazda, Suzuki and Honda). Pre-owned car financing continues well and accounted for 11% of total placements.
In SMEs, we added additional services to our main acquiring products (G-Mini, G-Smart, G-Store and G-Advance) such as paying bills, topping up minutes or data for mobiles and remote payments.
Business performance
Loans and advances to customers declined 3% year-on-year. In gross terms, excluding reverse repos and in constant euros, they rose 4% boosted by mortgages, credit cards, auto and payroll loans in Mexico and by CIB, Multifamily and Auto in the US.
Customer deposits grew 5% year-on-year. Excluding repos and in constant euros, they rose 10% driven by time deposits that were incentivized by competitive interest rates to attract new customers and volumes and foster customer loyalty.
Results
Attributable profit during the first nine months of 2023 was EUR 1,900 million, down 16%. In constant euros, profit fell 19%:
•Total income increased 5%, driven by net interest income (supported by the interest rate environment and loan growth), net fee income (mainly credit cards and insurance in Mexico) and strong gains on financial transactions. Other operating income fell due to lower leasing income in the US.
•Costs grew 8%, impacted by inflation and investments in technology, digitalization and transformation initiatives.
•Net loan-loss provisions rose 53% as normalization of the retail portfolios continues. Asset quality remains robust in both countries.
Compared to Q2 2023, attributable profit declined 25% in constant euros as higher revenue was offset by higher costs in both countries and LLPs in the US (in part reflecting seasonality in the US where provisions are higher in H2).
| North America. Underlying income statement | ||||||||||||||||||||||||||
| EUR million and % change | ||||||||||||||||||||||||||
| / | Q2'23 | / | 9M'22 | |||||||||||||||||||||||
| Q3'23 | % | excl. FX | 9M'23 | % | excl. FX | |||||||||||||||||||||
| Revenue | 3,391 | +4 | +2 | 9,807 | +9 | +5 | ||||||||||||||||||||
| Expenses | -1,648 | +6 | +4 | -4,707 | +11 | +8 | ||||||||||||||||||||
| Net operating income | 1,743 | +2 | 0 | 5,100 | +7 | +3 | ||||||||||||||||||||
| LLPs | -1,077 | +49 | +47 | -2,608 | +57 | +53 | ||||||||||||||||||||
| PBT | 629 | -32 | -34 | 2,368 | -21 | -24 | ||||||||||||||||||||
| Attributable profit | 554 | -23 | -25 | 1,900 | -16 | -19 | ||||||||||||||||||||
| 32 | | January - September 2023 | ||||||
| United States | Underlying attributable profit | ||||||
| EUR 865 mn | ||||||||
Commercial activity and business performance
We remain focused on profitability, Group network benefits and capital stewardship. Our new preferred auto lending relationships with INEOS and Lotus, among others, support our strategy to forge deep, multi-geographic relationships with OEMs while catering to customers across the credit spectrum.
Loans and advances to customers fell 7% compared to September 2022. In gross terms, excluding reverse repurchase agreements and in constant euros, they grew 4% driven by accretive portfolios such as CIB, Multifamily and Auto.
Customer deposits fell 1% year-on-year, however excluding repos and in constant euros they rose 8% driven by strong growth in time deposits (both retail and CIB). Our retail deposit base at SBNA remained stable and there were some declines in corporate deposits in Q3 resulting from deliberate pricing adjustments. We continue to have a high percentage of FDIC insured deposits at SBNA (c.66%). Deposit costs continued to rise as expected and in-line with industry.
Results
Attributable profit in the first nine months 2023 was EUR 865 million (42% lower than 9M 2022). In constant euros, profit fell 41% due to higher funding costs and the anticipated LLP normalization:
•Total income decreased 2% driven by NII (higher funding costs partially mitigated by loan growth and disciplined pricing actions) and lower gains on lease disposition, offset by higher gains on financial transactions.
•Costs rose 5% year-on-year or 3% like-for-like when normalizing for three full quarters of our APS acquisition. Our transformation initiatives are allowing us to contain costs as we start investing in to up-tier our CIB presence in the US.
•Net loan-loss provisions increased 63% as credit continues to normalize. For Auto, provisions rose due to higher balances and the anticipated used car price normalization. However, late-stage delinquency payments remain favourable and the cost of risk remains below 2%.
In the third quarter specifically, attributable profit fell 46% mainly due to higher funding costs, investments in transformation and up-tiering our CIB presence and LLPs (compared to a seasonally lower second quarter), partially offset by leveraging the electric vehicle tax incentive.
| United States. Underlying income statement | ||||||||||||||||||||||||||
| EUR million and % change | ||||||||||||||||||||||||||
| / | Q2'23 | / | 9M'22 | |||||||||||||||||||||||
| Q3'23 | % | excl. FX | 9M'23 | % | excl. FX | |||||||||||||||||||||
| Revenue | 1,818 | +1 | +1 | 5,442 | -4 | -2 | ||||||||||||||||||||
| Expenses | -915 | +3 | +3 | -2,714 | +3 | +5 | ||||||||||||||||||||
| Net operating income | 903 | -1 | -1 | 2,728 | -10 | -8 | ||||||||||||||||||||
| LLPs | -764 | +74 | +74 | -1,769 | +60 | +63 | ||||||||||||||||||||
| PBT | 119 | -72 | -71 | 881 | -54 | -53 | ||||||||||||||||||||
| Attributable profit | 198 | -46 | -46 | 865 | -42 | -41 | ||||||||||||||||||||
| Mexico | Underlying attributable profit | ||||||
| EUR 1,163 mn | ||||||||
Commercial activity and business performance
We further strengthened our position in value-added products to increase customer loyalty.
In individuals, we maintained a solid performance with double-digit year-on-year growth. We increased our market share in credit cards (+62 bps) and payroll loans (+84 bps) while remaining the third largest player in the auto market with a 17% market share.
Loans and advances to customers increased 10% year-on-year. In gross terms, excluding reverse repos and in constant euros they rose 5% driven by loans to individuals (mortgages +6%, credit cards +26%, auto +35% and payroll +22%). In corporates (companies and institutions), loans increased 5%, though declined 2% in SMEs and 17% in CIB, in line with our profitability focus and risk appetite.
Customer deposits grew 22% year-on-year. Excluding repos and in constant euros, they were 17% higher driven by term deposit growth (+40%) where we gained 142 bps of market share over the last 12 months. Mutual funds increased 2%.
Results
Attributable profit in the first nine months of the year was EUR 1,163 million, 33% higher than the same period in 2022. In constant euros, it rose 19% as follows:
•Total income rose 17%, driven by net interest income (+13%), supported by higher volumes and interest rates, net fee income (+10%) and higher gains on financial transactions.
•Costs increased 13%, reflecting investments in technology and digitalization related to the transformation plan. Still, the efficiency ratio improved by 1.6 percentage points to 42.7%.
•Net loan-loss provisions were up 34% mainly reflecting portfolio growth in lending to individuals.
Compared to the previous quarter, attributable profit fell 3% due to lower gains on financial transactions (from high levels in the second quarter) and higher costs and LLPs, partially offset by the good net interest income performance.
| Mexico. Underlying income statement | ||||||||||||||||||||||||||
| EUR million and % change | ||||||||||||||||||||||||||
| / | Q2'23 | / | 9M'22 | |||||||||||||||||||||||
| Q3'23 | % | excl. FX | 9M'23 | % | excl. FX | |||||||||||||||||||||
| Revenue | 1,555 | +6 | +3 | 4,318 | +30 | +17 | ||||||||||||||||||||
| Expenses | -681 | +9 | +6 | -1,845 | +26 | +13 | ||||||||||||||||||||
| Net operating income | 874 | +4 | 0 | 2,473 | +34 | +20 | ||||||||||||||||||||
| LLPs | -312 | +10 | +6 | -834 | +50 | +34 | ||||||||||||||||||||
| PBT | 546 | +1 | -3 | 1,594 | +33 | +19 | ||||||||||||||||||||
| Attributable profit | 403 | 0 | -3 | 1,163 | +33 | +19 | ||||||||||||||||||||
January - September 2023 | | 33 | ||||||
Business model | Group financial information | Financial information by segment | Responsible banking Corporate governance Santander share | Appendix | ||||||||||||||||||||||
| Primary segments | ||||||||||||||||||||||||||
 | SOUTH AMERICA | Underlying attributable profit | ||||||
| EUR 2,329 mn | ||||||||
Executive summary → We are focused on increasing the value we bring to the Group and moving forward to become the most profitable bank in each of the countries in which we operate in the region while promoting synergies across our global and regional businesses. → We have a solid customer base (74.8 million), having increased 7.5 million year-on-year backed by higher transactionality, while strengthening our risk model in a complex environment which is starting to show signs of improvement. → Year-on-year growth in both gross loans and advances to customers and customer deposits, while we seek to become the leading bank in inclusive and sustainable businesses through differential value propositions. → Underlying attributable profit decreased 19% year-on-year (-16% in constant euros) to EUR 2,329 million due to the increase in costs and LLPs. | ||||||||
Strategy
We remained focused on accelerating our global business growth:
•In individuals, we pursued optimization through a common focus on technology and data, simplification and automation, reducing service costs and delivering an excellent customer experience.
•In consumer finance, we continued to strengthen our leadership position in the region by reinforcing partnerships with OEMs and developing new agreements by leveraging existing ones globally.
•In payment methods, we aim to increase market share through the benefits derived from Getnet and One Trade. We are increasing cooperation in trade finance, through new international solutions, such as Ebury's expansion in Brazil. We will also make the most of the single global platform to expand our portfolio and improve customer experience.
•In CIB, we want to become the leading wholesale banking operator in most countries and products, consolidating our pan-regional offer, implementing a regional hub in Markets that will allow us to benefit from cross-country flows.
•In regional businesses, we continue to strengthen the differentiated value offer for companies through the Multi-Latin business and we are working with other countries in the Group to reinforce synergies in multinational corporates.
•In ESG, we achieved significant growth through investment in commercial teams and systems and expect ambitious future growth, making sustainable finance an important growth driver for the region.
The main initiatives by country were:
In Brazil, we continued our customer-centric strategy, through technological improvements to provide tailored offers and more integrated channels. We want to become the primary bank for our customers in their financial decisions and transactions.
We are focused on:
•Growing in our strategic businesses to diversify our portfolio and increase quality and profitability. In WM&I, where we maintained our investment expansion plan with Associate Allocation Advisor (AAA) and Toro expansion. In Corporates, we progressed in the development of a best-in-class platform and continued to perform well in other products such as Agro, Auto, Payroll and Cards.
•Continuing to develop a technological culture to drive our growth and generate operational efficiencies.
•Continuing with our customer-centric strategy, which enabled us to increase our customer satisfaction in all our channels. In Select, we increased revenue from loyal customers by 39% in the last two years and we are close to achieving our one million customer target.
 | Brazil | Chile | Argentina | Other South America | |||||||||||||||||||||||||||||||
| Thousands | 74,830 | 64,593 | 3,907 | 4,757 | 1,573 | |||||||||||||||||||||||||||||
| Total customers | YoY change | +11% | +12% | -3% | +9% | +27% | |||||||||||||||||||||||||||||
| Thousands | 39,007 | 32,027 | 2,264 | 3,491 | 1,226 | |||||||||||||||||||||||||||||
| Active customers | YoY change | +3% | +2% | +4% | +9% | +10% | |||||||||||||||||||||||||||||
| 34 | | January - September 2023 | ||||||
Chile: we remained focused on becoming a digital bank with branches. In payment methods, we have become one of the leaders in the acquiring market, with 148,000 PoS with Getnet. We grew our SME customer base and expanded services offered to auto, agriculture and Multi-Latin customers. In Middle-market, we launched a new commercial service model, focused especially on agricultural, auto and Multi-Latin businesses, based on two pillars: expert advice and tailored-made financial solutions.
Argentina: we continued to improve our value offering and level of service, which allowed us to maintain our first place in customer satisfaction in terms of NPS. We strengthened our position as the leading privately-owned bank in terms of business share, particularly in deposits, auto and commercial loans, cards and payments processing, through Getnet, where we brought in more than 54,000 new customers in the year. In ESG, we participated in the issuance of two provincial green bonds and placed USD 126 million in corporate green bonds.
Uruguay: we continued to consolidate our leadership with good dynamics in all products, increasing our market share compared to private banks in loans and deposits. We strengthened our offer to individuals with the SOY account campaign, reaching record levels in new accounts opened (more than 10,000 in Q3). Of note was also the good performance of the Mi Auto portfolio. In SMEs, we continued to consolidate our offer with Getnet, expanding payments with SOY points with QR codes to more businesses.
Peru: we accelerated growth in global businesses, which accounted for 60% of total income. We remained among the top 3 investment banks and are leaders in syndicated loans, Debt Capital Markets and auto loans (35% market share). We progressed in our digital strategy, with the expansion of NeoAuto, a digital marketplace for financing new and used vehicles. Through Surgir, we have already helped more than 100,000 entrepreneurs since 2021 (95% of whom are women) with a 100% digital service model.
Colombia: we continued to offer sustainable and inclusive financial solutions, consolidating our position as leaders in Global Debt Financing (top 5 in the country) and Markets, and we maintained our participation in the most relevant operations for the country's development, with joint CIB and Corporate offerings.
South America. Business performance. September 2023 | ||||||||||||||||||||||||||||||||||||||
| EUR billion and YoY % change in constant euros | ||||||||||||||||||||||||||||||||||||||
| 162 | +5% | | 207 | +15% | |||||||||||||||||||||||||||||||||
| ||
| ||
| ||
 | ||
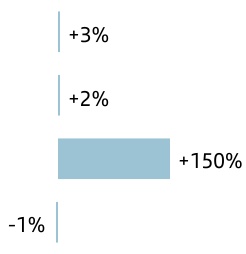
| ||
| ||
| ||
| ||
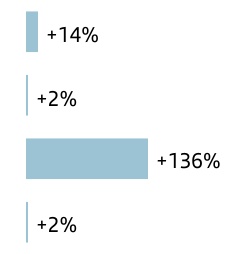
| Gross loans and advances to customers excl. reverse repos | Customer deposits excl. repos + mutual funds | |||||||||||||||||||||||||||||||||||||
We also continued to grant loans to entrepreneurs, of note was Prospera, our microcredit business, which is present in 639 municipalities. In consumer finance, we consolidated our position in new and used auto loans, with a focus on digitalization (through Fast Track tool) and risk control.
Business performance
Loans and advances to customers rose 3% year-on-year. Gross loans and advances to customers (excluding reverse repos and in constant euros) increased 5% year-on-year, with rises in Brazil, Chile and Uruguay.
Customer deposits were 7% higher year-on-year. Excluding the exchange rate impact and repos, customer deposits rose 12%, backed by time deposits (+18% year-on-year). Mutual funds were up 21% in constant euros.
Results
Attributable profit in the first nine months of 2023 amounted to EUR 2,329 million, down 19% year-on-year. In constant euros, it decreased 16%, as follows:
•Total income increased 6%, as the good performance in net interest income (+8%), net fee income (+18%) and gains on financial transactions (+30%), more than offset the negative results owing to the hyperinflation adjustment in Argentina.
•Costs increased 19%, impacted by inflation. In real terms costs decreased 2%.
•Net loan-loss provisions increased 7%, in part due to portfolio growth. The cost of risk was 3.30% (in line with recent quarters).
By country, of note was the strong attributable profit growth in Argentina, Uruguay, Peru and Colombia, which were not able to fully offset the decreases in Brazil and Chile, affected by the impact on margins (due to the negative sensitivity to interest rate rises) and higher costs and provisions in Brazil. These falls were partly mitigated by net fee income growth in both countries, gains on financial transactions and lower LLPs in Chile.
Compared to the second quarter, underlying profit increased 42% in constant euros driven by the good performance of the main lines of the income statement and lower negative charges in other provisions and results, mainly in Brazil.
| South America. Underlying income statement | ||||||||||||||||||||||||||
| EUR million and % change | ||||||||||||||||||||||||||
| / | Q2'23 | / | 9M'22 | |||||||||||||||||||||||
| Q3'23 | % | excl. FX | 9M'23 | % | excl. FX | |||||||||||||||||||||
| Revenue | 4,604 | -1 | +6 | 13,641 | 0 | +6 | ||||||||||||||||||||
| Expenses | -1,798 | -1 | +8 | -5,332 | +8 | +19 | ||||||||||||||||||||
| Net operating income | 2,806 | -1 | +4 | 8,310 | -4 | -1 | ||||||||||||||||||||
| LLPs | -1,301 | -1 | +1 | -3,841 | +6 | +7 | ||||||||||||||||||||
| PBT | 1,291 | +14 | +22 | 3,667 | -21 | -19 | ||||||||||||||||||||
| Attributable profit | 871 | +30 | +42 | 2,329 | -19 | -16 | ||||||||||||||||||||
January - September 2023 | | 35 | ||||||
Business model | Group financial information | Financial information by segment | Responsible banking Corporate governance Santander share | Appendix | ||||||||||||||||||||||
| Primary segments | ||||||||||||||||||||||||||
| Brazil | Underlying attributable profit | ||||||
| EUR 1,426 mn | ||||||||
Commercial activity and business performance
Our strategy remains focused on the customer, digital transformation and expanding our business.
•In SAM, AuMs performed better than the market, and in Private Banking we had record results in net new money. Toro (digital investment platform) continued to grow strongly.
•In Corporates, we focused on becoming the leading platform in financial services. In SMEs, we increased our revenue by more than 52% in the last two years supported by our transactional approach, 45,000 accounts opened per month and progress in Open Finance. In wholesale, we remained leaders in trade finance.
•In retail, we grew in cards, with more frequent use by our customers. In Auto, we remained focused on profitability and asset quality and on developing strategic alliances. In payrolls, new lending outgrew the market and in agro, our portfolio continued to grow.
Loans and advances to customers rose 4% year-on-year. Gross loans and advances to customers, excluding reverse repos and in constant euros grew 3%, due to individuals and SMEs.
Customer deposits increased 13% year-on-year. Excluding the exchange rate impact and repos, they were up 12% driven by time deposits (+16%). Mutual funds decreased 16% in constant euros and as a result, customer funds rose 14% in constant euros.
Results
In the first nine months of 2023, attributable profit amounted to EUR 1,426 million, -30% year-on-year. In constant euros, profit also decreased 30%, as follows:
•In total income, of note was the net fee income performance (+6% from transactionality and insurance) and the net interest income recovery, still decreasing year-on-year but rising in the quarter. Total income decreased slightly due to lower gains on financial transactions (lower market activity).
•Costs rose 11%, impacted by salary agreements, expenses related to higher business growth and technology investments. The efficiency ratio was 34.8%.
•Net loan-loss provisions increased 3%, in line with loan portfolio growth, bringing the cost of risk to 4.67%, following a second consecutive quarterly improvement.
Compared to the previous quarter, profit rose 70% in constant euros driven by the increase in net interest income and in net fee income due to higher activity, lower costs and provisions and the negative impact recorded in the previous quarter (reversal in of a tax liability release recorded in Q1 2023).
| Brazil. Underlying income statement | ||||||||||||||||||||||||||
| EUR million and % change | ||||||||||||||||||||||||||
| / | Q2'23 | / | 9M'22 | |||||||||||||||||||||||
| Q3'23 | % | excl. FX | 9M'23 | % | excl. FX | |||||||||||||||||||||
| Revenue | 3,336 | +3 | +2 | 9,616 | -1 | -1 | ||||||||||||||||||||
| Expenses | -1,138 | +1 | -1 | -3,345 | +11 | +11 | ||||||||||||||||||||
| Net operating income | 2,197 | +5 | +3 | 6,271 | -6 | -6 | ||||||||||||||||||||
| LLPs | -1,121 | -1 | -2 | -3,284 | +4 | +3 | ||||||||||||||||||||
| PBT | 854 | +32 | +31 | 2,264 | -32 | -32 | ||||||||||||||||||||
| Attributable profit | 603 | +71 | +70 | 1,426 | -30 | -30 | ||||||||||||||||||||
| Chile | Underlying attributable profit | ||||||
| EUR 417 mn | ||||||||
Commercial activity and business performance
In Chile, we pursued our goal of being a digital bank with branches, through a constant innovation process, such as the launch of WorkCafé Expresso, where our customers can carry out their monetary transactions, with a more efficient and secure service. We continued our commercial network transformation, through new WorkCafés, bringing the total to 76).
In addition, to complement our Life offering, we continued to develop Más Lucas, a new demand and savings account, which should allow us to increase our presence in the mass-market segments. We also made progress in improving our digital channels to increase our service quality.
Consumer credit grew faster than the industry, driven by credit card business. In corporate lending, we achieved significant growth in our SME customer base, driven by the joint offer with Getnet. Finally, in ESG, we continued to make progress in Green Finance loans.
Loans and advances to customers increased 2% year-on-year. Gross loans and advances to customers, excluding reverse repurchase agreements and in constant euros, were 2% higher, boosted by individuals (+7%) and CIB (+8%), offsetting the fall in SMEs and corporates.
Customer deposits decreased 2% year-on-year. Excluding the exchange rate impact and repurchase agreements, customer deposits also fell 2%, due to the decrease in demand deposits (-11%) which was partially offset by the growth in time deposits (+8%). Mutual funds rose 16%. Total customer funds increased 2% in constant euros.
Results
Attributable profit in the first nine months of 2023 was EUR 417 million, 24% lower year-on-year. In constant euros, profit fell 26%, as follows:
•Total income fell 15% driven by the drop in net interest income (-34%) linked to the negative sensitivity to interest rate rises. This decline was partially offset by the excellent performance of net fee income, which grew 28% driven (of note payments and insurance) and gains on financial transactions (+49%).
•Costs rose 2%, well below average inflation (-8% in real terms) and the efficiency ratio was 45.5%.
•Net loan-loss provisions decreased 4% and cost of risk was just 0.87%.
Compared to the previous quarter, profit decreased 47% in constant euros, driven by the continued decline in net interest income and lower net fee income (high levels in the second quarter).
| Chile. Underlying income statement | ||||||||||||||||||||||||||
| EUR million and % change | ||||||||||||||||||||||||||
| / | Q2'23 | / | 9M'22 | |||||||||||||||||||||||
| Q3'23 | % | excl. FX | 9M'23 | % | excl. FX | |||||||||||||||||||||
| Revenue | 465 | -25 | -20 | 1,694 | -12 | -15 | ||||||||||||||||||||
| Expenses | -251 | -6 | 0 | -771 | +5 | +2 | ||||||||||||||||||||
| Net operating income | 214 | -40 | -35 | 922 | -23 | -25 | ||||||||||||||||||||
| LLPs | -84 | -3 | +4 | -287 | -1 | -4 | ||||||||||||||||||||
| PBT | 140 | -51 | -46 | 671 | -25 | -26 | ||||||||||||||||||||
| Attributable profit | 87 | -52 | -47 | 417 | -24 | -26 | ||||||||||||||||||||
| 36 | | January - September 2023 | ||||||
| Argentina | Underlying attributable profit | ||||||
| EUR 406 mn | ||||||||
Commercial activity and business performance
In the quarter, management focused on increasing the country's contribution to the Group, mainly through our global businesses.
We continued to improve our customer service and our value proposition, which enabled us to remain in first place in customer satisfaction in terms of NPS.
In payments, we are the second largest company as measured by payments processing and added more than 54,000 new customers so far this year. We strengthened our market share leadership among privately-owned banks in deposits and in auto, commercial and credit card loans. In ESG, we expanded our value proposition, with notable partnerships to support companies in their green transition.
Loans and advances to customers were down 2% year-on-year. In gross terms and excluding reverse repos they increased 150% year-on-year, driven by CIB, cards, SMEs and corporates.
Customer deposits decreased 16% year-on-year. Excluding repos, customer deposits rose 114%, increasing both time and demand deposits. Mutual funds were 194% higher. As a result, total customer funds increased 136%.
These growth rates (also seen in results), are strongly impacted by the high inflation in the country.
Results
Attributable profit in the first nine months of 2023 was EUR 406 million, 74% higher year-on-year. In constant euros, profit increased 346%. By line:
•Total income grew 185%, well above inflation, driven by the good performance in net interest income, net fee income and gains on financial transactions. All of these more than offset the greater negative effect from the hyperinflation adjustment in other operating income.
•Costs increased below inflation. The efficiency ratio stood at 49.7%, improving 7.6 pp year-on-year, and net operating income rose 235%.
•Net loan-loss provisions increased, rising from low levels in the previous period. The cost of risk stood at 4.09%.
Compared to the previous quarter, profit increased 105%, driven by the solid performance in the main revenue lines.
| Argentina. Underlying income statement | ||||||||||||||||||||||||||
| EUR million and % change | ||||||||||||||||||||||||||
| / | Q2'23 | / | 9M'22 | |||||||||||||||||||||||
| Q3'23 | % | excl. FX | 9M'23 | % | excl. FX | |||||||||||||||||||||
| Revenue | 543 | +3 | +69 | 1,572 | +11 | +185 | ||||||||||||||||||||
| Expenses | -260 | -4 | +60 | -781 | -3 | +147 | ||||||||||||||||||||
| Net operating income | 283 | +10 | +77 | 791 | +31 | +235 | ||||||||||||||||||||
| LLPs | -47 | -13 | +50 | -143 | +35 | +246 | ||||||||||||||||||||
| PBT | 236 | +83 | +153 | 543 | +74 | +346 | ||||||||||||||||||||
| Attributable profit | 154 | +36 | +105 | 406 | +74 | +346 | ||||||||||||||||||||
| Other South America |  |  |  | ||||||||
Uruguay
Gross loans and advances to customers were up 9% year-on-year, excluding reverse repurchase agreements and in constant euros. Customer deposits (excluding repos and exchange rate impacts) fell 2% due to demand deposits.
Attributable profit in the first nine months of 2023 was EUR 131 million, up 36% year-on-year and +29% in constant euros, as follows:
•Total income was up 26% boosted by net interest income (following interest rate rises) and net fee income.
•Costs rose (impacted by inflation) well below revenue. As a result, the efficiency ratio improved 4.8 pp to 38.6%.
•Net loan-loss provisions rose, as the normalization that began in previous quarters continued, rising from low levels in previous years. The cost of risk stood at 2.05% and the NPL ratio at 2.56%.
Compared to the previous quarter, attributable profit increased 3% at constant exchange rates, as higher gains on financial transactions and a lower tax burden offset the fall in net interest income and the increase in costs and provisions.
Peru
Gross loans and advances to customers excluding reverse repos and the exchange rate impact decreased 6% year-on-year and customer deposits (excluding repos and the exchange rate) increased 11%, driven by demand and time deposits.
In the first nine months of 2023, attributable profit was EUR 62 million, 19% higher year-on-year. In constant euros, profit also increased 19%, as follows:
•Total income rose 26%, boosted by the good performance of our core business lines. Costs rose 18%, impacted by the launch of new businesses and inflation but the efficiency ratio improved 2.2 pp to 34.1%.
•Net loan-loss provisions increased, although the cost of risk remained low (1.10%).
Colombia
Gross loans and advances to customers (excluding reverse repos and in constant euros) decreased 9% year-on-year. Deposits (excluding repos) rose 26% in constant euros due to time and demand deposits.
In the first nine months of 2023, attributable profit was EUR 22 million, 1% higher year-on-year. In constant euros, profit was 11% higher:
•Total income grew 26% (due to net fee income and gains on financial transactions) and costs rose 19% due to inflation and the development of new business lines.
•Net loan-loss provisions were 162% higher, due to the growth in Auto and Prospera businesses. However, the cost of risk remained low (0.79%).
| Other South America. Underlying income statement | ||||||||||||||||||||||||||
| EUR million and % change | ||||||||||||||||||||||||||
| Net operating income | Attributable profit | |||||||||||||||||||||||||
| / | 9M'22 | / | 9M'22 | |||||||||||||||||||||||
| 9M'23 | % | excl. FX | 9M'23 | % | excl. FX | |||||||||||||||||||||
| Uruguay | 265 | +44 | +37 | 131 | +36 | +29 | ||||||||||||||||||||
| Peru | 121 | +31 | +30 | 62 | +19 | +19 | ||||||||||||||||||||
| Colombia | 49 | +22 | +34 | 22 | +1 | +11 | ||||||||||||||||||||
January - September 2023 | | 37 | ||||||
Business model | Group financial information | Financial information by segment | Responsible banking Corporate governance Santander share | Appendix | ||||||||||||||||||||||
| Primary segments | ||||||||||||||||||||||||||
 | DIGITAL CONSUMER BANK | Underlying attributable profit | ||||||
| EUR 823 mn | ||||||||
Executive summary → Although the operating environment remains complex, as inflation and rising interest rates are denting consumer appetite, new lending rose 5% year-on-year in constant euros (+7% in auto). → Continue reinforcing our auto leadership through strategic alliances, leasing (+17% active contracts year-to-date) and subscription. In non-auto, we keep upscaling our buy now, pay later (BNPL) business. → Underlying attributable profit amounted to EUR 823 million, a 9% fall year-on-year (-8% in constant euros) as the revenue increase (despite negative NII sensitivity to interest rate rises) did not offset higher costs (strategic investments), LLPs normalization and the temporary levy on revenue earned in Spain. → In this environment, we are focusing on new business pricing and profitability over volumes, increasing customer deposits, improving operating efficiency and maintaining cost of risk under control. | ||||||||
Strategy
Digital Consumer Bank (DCB) is the leading consumer finance bank in Europe in scale and profitability as it leverages Santander Consumer Finance's (SCF) auto and non-auto consumer finance footprint in Europe and Openbank’s technology stack.
SCF is Europe's consumer finance leader, present in 18 countries (16 in Europe plus China and Canada) and works through more than 130,000 associated points of sale. It provides value propositions to its customers and partners to enhance their sales capacity by financing their products and developing advanced technologies to give them a competitive edge.
SCF aims to become the best-in-class auto financing and digital mobility service provider in Europe.
Openbank is the largest 100% digital bank in Europe. It offers current accounts, cards, loans, mortgages, a state-of-the-art robo-advisor service and open platform brokerage services. Openbank is currently active in Spain, the Netherlands, Germany and Portugal, and we are working on its expansion across Europe and the Americas.
Openbank's tech stack and product building capabilities, such as Zinia, our buy now, pay later (BNPL) service, should allow us to exceed our customers' expectations.
DCB’s vision is to offer competitive financing solutions to maintain our European leadership in profitability and scale in Auto & Consumer Lending by leveraging the advantage of our proprietary platforms in mobility and BNPL. Our strategy in 2023 is focused on accelerating transformation to boost future growth.
| Digital Consumer Bank. Loan distribution | |||||
| September 2023 | |||||
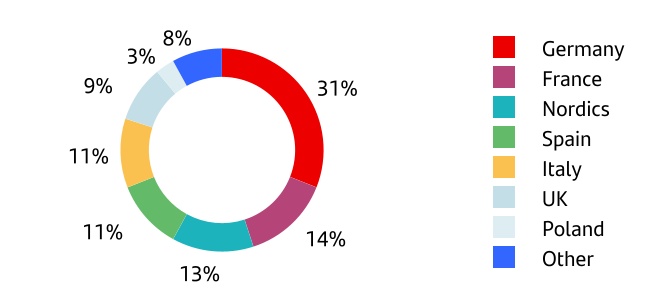
Our main priorities for 2023 are to:
•Secure leadership in global digital consumer lending by:
–Auto: progressing with strategic initiatives to build a world-class digital offering in mobility; aid OEMs' transformation journeys with online lending, leasing (both financial and operational) and subscription offerings; and providing our partners with innovative finance and sale solutions on dealer websites and in auto marketplaces.
–Consumer (Non-Auto): gaining market share through specialization and development of tech platforms that build on our leadership in Europe through Zinia (BNPL), checkout lending, credit cards and direct loans.
–Digital Bank: increasing loyalty among our Openbank and SC Germany retail customers and boosting digital banking.
•Continue the transformation of our operating model to defend our best-in-class efficiency through: (i) single IT platforms, (ii) a simpler operational structure, and (iii) automation and process redesign.
•Growth by progressing in transformational projects. In Auto, through our new Stellantis partnership, the acquisition of MCE Bank Germany, opportunities with OEMs in addition to the launch of our new leasing platform. In Consumer, through the full transition to Zinia tech stack and branding, and the execution of pan-European agreements, with integrators and with global tech companies.
•Reduce sensitivity to rising interest rates with greater deposit acquisition and faster loan repricing. Moreover, we are driving an originate-to-distribute model to increase balance sheet mobilization and make the business more capital light.
We continue to support the green transformation of European mobility. In 2023, we aim to exceed the 150k new battery electric vehicles financed in 2022, while developing other new initiatives that are quickly spreading across Europe: electric chargers, solar panels, green heating systems, e-bikes, etc.
We were recognized as a Top Employer or Great Place to Work (GPTW) in four countries.
| 38 | | January - September 2023 | ||||||
Business performance
After a difficult environment in 2022, DCB is still facing a complex 2023. Some of the impacts include: (i) the change of TLTRO contractual conditions, (ii) rising interest rates temporarily compressing margins while our loan book reprices, and (iii) normalization from a very low cost of risk towards the average across the cycle and additional provisioning for the CHF mortgage portfolio in Poland.
In Europe, new lending volumes are starting to pick up following a very weak 2022. DCB's new lending continued increasing 5% year-on-year (+7% in auto), after the significant growth already registered in 2022 despite a shrinking market.
In Auto, our leasing solutions and commercial focus generated a greater than 17% rise year-to-date in the number of active contracts. We continued to develop our proprietary leasing platform for Europe with the ambition of disrupting the market through our organic capabilities.
Our Auto subscription service offers flexible subscriptions across two models: (i) Wabi, our direct-to-consumer own brand, is already live in Spain, Norway and Germany and will expand to other countries in the coming years, and (ii) Ulity, a white label solution for OEMs and Service Car companies launched in June 2022. Through Ulity we have already entered into relevant agreements with pan-European ride-hailing services and OEMs.
Earlier this year, we renewed our partnership with Stellantis in Europe, which will allow us to consolidate our position as their main financing partner. We aim to grow our Stellantis brand portfolio to c.EUR 40 billion by 2026.
In BNPL, Zinia continues to achieve outstanding results with 5.5 million contracts since its launch and more than 56,000 retail merchants connected.
The joint venture (JV) with TIMFin, the leading Italian telecommunication company, has more than 2.1 million contracts since launch as well as >5,800 active points of sale and >2,500 connected merchants.
Activity. September 2023 | ||||||||||||||||||||||||||||||||
| EUR billion and % change in constant euros | ||||||||||||||||||||||||||||||||
| +3% | ||||||||||||||||||||||||||||||||
| QoQ | +6% | |||||||||||||||||||||||||||||||
| QoQ | ||||||||||||||||||||||||||||||||
| 131 | ||||||||||||||||||||||||||||||||
| +9% | 70 | +18% | ||||||||||||||||||||||||||||||
| YoY | YoY | |||||||||||||||||||||||||||||||
| Gross loans and advances to customers excl. reverse repos | Customer deposits excl. repos + mutual funds | |||||||||||||||||||||||||||||||
The stock of loans and advances to customers increased 9% year-on-year. In gross terms, excluding reverse repos and in constant euros also rose 9% year-on-year to EUR 131 billion (76% is Auto).
Customer deposits increased 16% in euros. Excluding repos and in constant euros, they also rose 16% to more than EUR 66 billion. We have launched several initiatives to accelerate customer deposit growth, resulting in a more than EUR 9.3 billion increase (in constant euros), even after selling the joint venture with Stellantis in Germany in Q2 2023 (EUR 1.8 billion in deposits).
Our recourse to wholesale funding remained strong and diversified.
Results
Attributable profit in the first nine months was EUR 823 million, 9% down year-on-year in euros. In constant euros, profit fell 8% (-5% excluding the impact of the temporary levy in Spain in Q1):
•Total income increased 6%. To neutralize the negative sensitivity to rising rates we are actively repricing loans, focusing on the most profitable segments and increasing customer deposits so that they become the main funding source. As a result NII, rose 5%.
Net fee income declined 4%, impacted by insurance regulation capping fees in Germany. Gains on financial transactions considerably increased along with other operating income, supported by leasing income.
•Costs increased 8%, mainly affected by strategic transformation investments, business growth and inflation. In real terms costs grew 1%. Net operating income increased 5% and the efficiency ratio stood at 48.3%.
•Net loan-loss provisions increased 53%, coming from a low base in 2022. Credit quality remained robust. The cost of risk remains low (0.60%) but is normalizing and the NPL ratio improved 11 bps, down to 2.08%.
•By country, the largest contribution to attributable profit came from Nordic countries (EUR 182 million), Germany (EUR 153 million), the UK (EUR 143 million) and France (EUR 111 million).
Compared to the previous quarter, attributable profit increased 8% in constant euros, driven by higher NII and net fee income. Additionally, in Q2 we recorded the contribution to the SRF.
| Digital Consumer Bank. Underlying income statement | ||||||||||||||||||||||||||
| EUR million and % change | ||||||||||||||||||||||||||
| / | Q2'23 | / | 9M'22 | |||||||||||||||||||||||
| Q3'23 | % | excl. FX | 9M'23 | % | excl. FX | |||||||||||||||||||||
| Revenue | 1,411 | +7 | +7 | 4,069 | +5 | +6 | ||||||||||||||||||||
| Expenses | -652 | 0 | -1 | -1,967 | +6 | +8 | ||||||||||||||||||||
| Net operating income | 759 | +15 | +15 | 2,103 | +3 | +5 | ||||||||||||||||||||
| LLPs | -225 | +1 | +1 | -640 | +49 | +53 | ||||||||||||||||||||
| PBT | 509 | +6 | +6 | 1,437 | -9 | -8 | ||||||||||||||||||||
| Attributable profit | 302 | +9 | +8 | 823 | -9 | -8 | ||||||||||||||||||||
January - September 2023 | | 39 | ||||||
Business model | Group financial information | Financial information by segment | Responsible banking Corporate governance Santander share | Appendix | ||||||||||||||||||||||
| Primary segments | ||||||||||||||||||||||||||
 | Corporate Centre | Underlying attributable profit | ||||||
| -EUR 1,084 mn | ||||||||
Executive summary → The Corporate Centre continued to support the Group. → The Corporate Centre’s objective is to define, develop and coordinate the Group's strategy and aid the operating units by contributing value and carrying out the corporate oversight and control function. It also carries out functions related to financial and capital management. → Lower underlying attributable loss compared to 9M 2022 due to higher liquidity buffer remuneration and lower negative impact from foreign currency hedging. | ||||||||
Strategy and functions
The Corporate Centre contributes value to the Group, through the following functions, among others:
•Through global control frameworks and supervision.
•Fostering the exchange of best practices in cost management, which enables us to be one of the most efficient banks.
•Collaborating in the definition and execution of the global strategy, competitive development operations and projects that ensure we meet the business plan.
•Contributing to the launch of projects that will be developed by our global businesses aimed at leveraging our worldwide presence to generate economies of scale.
•Ensuring open and constructive communication with shareholders, analysts, investors, bondholders, rating agencies and other market players.
•Adding value to countries and divisions by encouraging the exchange of best practices, driving and managing innovative global initiatives and defining corporate policies, all in the communication, marketing and sustainability fields.
It also coordinates the relationship with European regulators and supervisors and develops functions related to financial and capital management, as follows:
•Financial Management functions:
–Structural management of liquidity risk associated with funding the Group’s recurring activity and stakes of a financial nature. At the end of September 2023, the liquidity buffer exceeded EUR 331 billion.
This activity is carried out by the diversification of funding sources (issuances and other), maintaining an adequate profile in volumes, maturities and costs.
The price of these transactions with other Group units is the market rate that includes all liquidity concepts (which the Group supports by immobilizing funds during the term of the transaction) and regulatory requirements (TLAC/MREL).
–Interest rate risk is also actively managed in order to dampen the impact of interest rate changes on net interest income, conducted via high credit quality, very liquid and low capital consumption derivatives.
–Strategic management of exposure to exchange rates in equity and dynamic management of the FX hedge countervalue related to the units’ next twelve months results in euros. The net investments in equity currently hedged totalled EUR 15,324 million (mainly in Mexico, the UK and the US) with different FX instruments (spot or forwards).
•Management of total capital and reserves: team responsible for the Group's capital analysis, adequacy and management. Its functions include: coordination with subsidiaries, monitoring returns to maximize shareholder returns, setting solvency targets and capital contributions, and monitoring the capital ratio in both regulatory and economic terms, and efficient capital allocation to the units.
Results
In the first nine months of 2023, the attributable loss was EUR 1,084 million, 32% lower than in the same period in 2022 (EUR 1,583 million loss), driven by:
•Net interest income which improved by EUR 386 million, due to higher liquidity buffer remuneration as a result of rising interest rates.
•Higher gains on financial transactions (EUR 151 million better), due to lower negative FX hedging impacts.
•Lastly, other results and provisions were down slightly compared to 2022.
| Corporate Centre. Underlying income statement | ||||||||||||||||||||||||||
| EUR million and % change | ||||||||||||||||||||||||||
| Q3'23 | Q2'23 | Chg. | 9M'23 | 9M'22 | Chg. | |||||||||||||||||||||
| Total income | -308 | -218 | +42% | -650 | -1,165 | -44% | ||||||||||||||||||||
| Net operating income | -402 | -312 | +29% | -933 | -1,437 | -35% | ||||||||||||||||||||
| PBT | -433 | -341 | +27% | -1,034 | -1,558 | -34% | ||||||||||||||||||||
| Attributable profit | -464 | -341 | +36% | -1,084 | -1,583 | -32% | ||||||||||||||||||||
| 40 | | January - September 2023 | ||||||
 | Retail Banking | Underlying attributable profit | ||||||
| EUR 5,397 mn | ||||||||
| Executive summary | ||||||||||||||||||||||||||||||||||||||
Results. (9M'23 vs. 9M'22). % change in constant euros | Business performance. EUR bn. % change in constant euros | ||||||||||||||||||||||
| Profit decreased as revenue growth was offset by higher costs and provisions | Assets remained stable YoY and continued growth in liabilities | ||||||||||||||||||||||
| Total income | Costs | Provisions | Loans and advances to customers | Customer funds | |||||||||||||||||||
| +8% | +9% | +22% | 855 | 0% YoY | 840 | +5% YoY | |||||||||||||||||
| Customers | |||||||||||||||||||||||
| Total customers | Active customers | Digital customers | ||||||||||||||||||
| Millions | Millions | Millions | ||||||||||||||||||
| +6% | +2% | +6% | ||||||||||||||||||
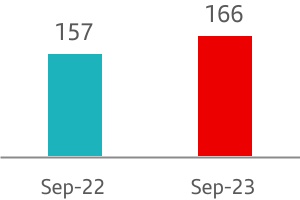
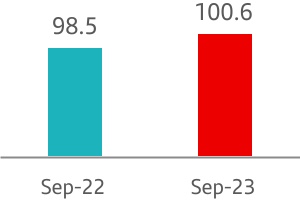
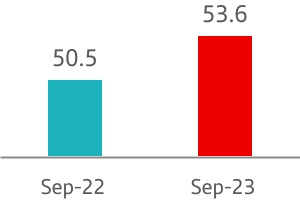
Commercial activity
In the last few years, we initiated our operating and business model transformation, focused on process digitalization and product simplification. Our goal is to guarantee personalized and tailored support, in order to respond to one of our main priorities; the continuous improvement of our service.
This transformation of our operating and business model is aimed at becoming a digital bank with branches, where customers are at the centre of our strategy.
Increasing digitalization allows us to simplify our offering and automate our operations and improve the front-end (what the customer uses) and back-end (i.e. the bank's operating systems) operations. This will allow us to reduce the cost to serve while improving customer experience.
This improvement allows our teams in the offices to dedicate more time to offer a more personalized service, especially for those financial decisions that are more important or require more advice from our professionals.
The outstanding work carried out for the SME segment, coupled with personalized service and financial and non-financial support, was recognized by Euromoney, which named Santander as the World's Best Bank for SMEs.
These service quality, digitalization and multichannel initiatives enabled us to reach 166 million customers in the Group, having increased by more than 9 million in the last 12 months. Active customers grew 2% and digital customers +6%.
Gross loans and advances to customers (excluding reverse repos and the exchange rate impact) remained practically stable and customer funds (excluding repos and in constant euros) increased 5%.
Results
Attributable profit in the first nine months of 2023 was EUR 5,397 million, 9% lower year-on-year. In constant euros, it decreased 10%, as follows:
•Total income grew 8% driven by higher net interest income (+12%), mainly in Europe.
•Costs increased 9%, impacted by inflation. Net operating income grew 8% and the efficiency ratio stood at 43.2%.
•Net loan-loss provisions rose 22%, mainly driven by the increases related to expected cost of risk normalization in North America.
•Impact of the temporary levy on revenue in Spain recorded in the first quarter.
| Retail Banking. Underlying income statement | ||||||||||||||||||||||||||
| EUR million and % change | ||||||||||||||||||||||||||
| / | Q2'23 | / | 9M'22 | |||||||||||||||||||||||
| Q3'23 | % | excl. FX | 9M'23 | % | excl. FX | |||||||||||||||||||||
| Revenue | 11,871 | +6 | +7 | 33,857 | +7 | +8 | ||||||||||||||||||||
| Expenses | -4,990 | +2 | +4 | -14,636 | +6 | +9 | ||||||||||||||||||||
| Net operating income | 6,881 | +9 | +9 | 19,220 | +7 | +8 | ||||||||||||||||||||
| LLPs | -3,303 | +15 | +15 | -9,079 | +22 | +22 | ||||||||||||||||||||
| PBT | 3,046 | +14 | +13 | 8,138 | -9 | -9 | ||||||||||||||||||||
| Attributable profit | 2,128 | +24 | +23 | 5,397 | -9 | -10 | ||||||||||||||||||||
January - September 2023 | | 41 | ||||||
 | Santander Corporate & Investment Banking | Underlying attributable profit | ||||||
| EUR 2,680 mn | ||||||||
| Executive summary | ||||||||||||||||||||||||||||||||||||||
Results. (9M'23 vs. 9M'22). % change in constant euros | Our aim and strategic priorities | |||||||||||||||||||||||||
| Strong profit growth underpinned by our geographic and business diversification | 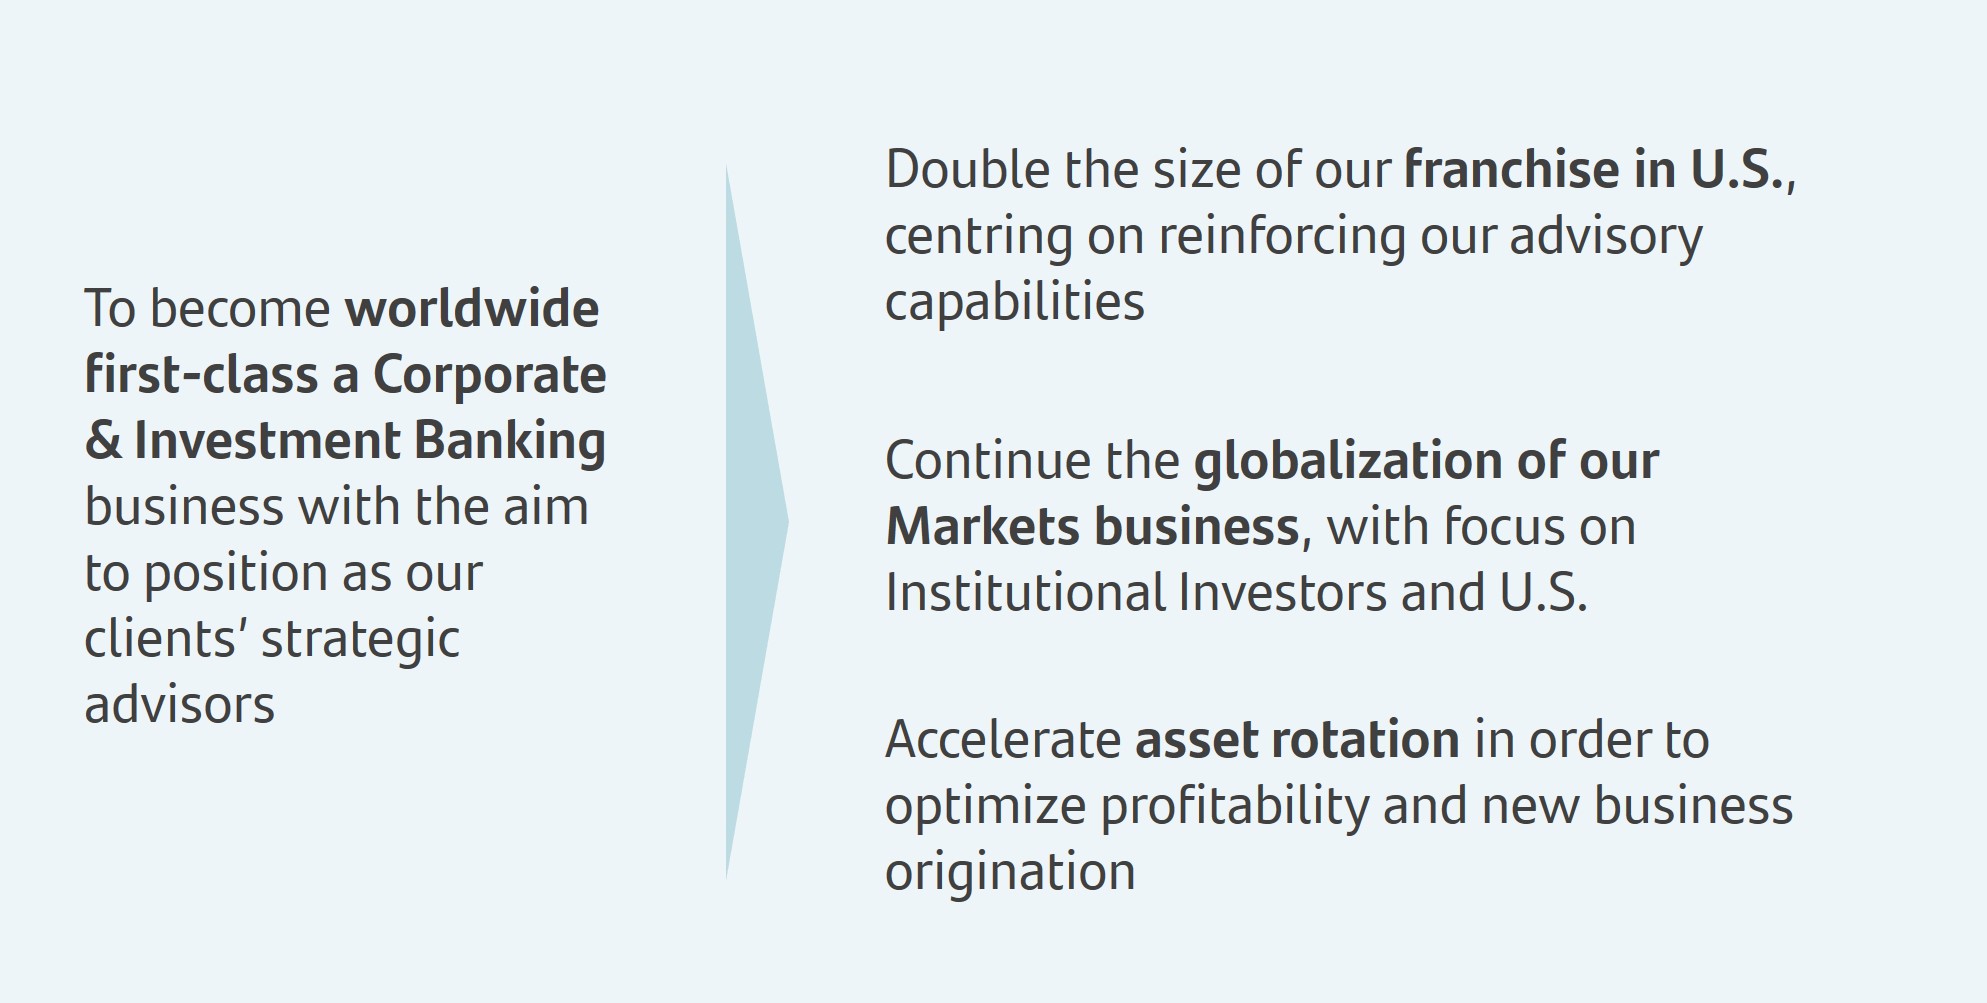 | |||||||||||||||||||||||||
| Total income | Underlying attributable profit | |||||||||||||||||||||||||
| +21% | +22% | |||||||||||||||||||||||||
| Efficiency ratio | RoTE | |||||||||||||||||||||||||
| 36.6% | 28% | |||||||||||||||||||||||||
Revenue growth1 by business and region | Other highlights in the quarter | |||||||||||||||||||||||||
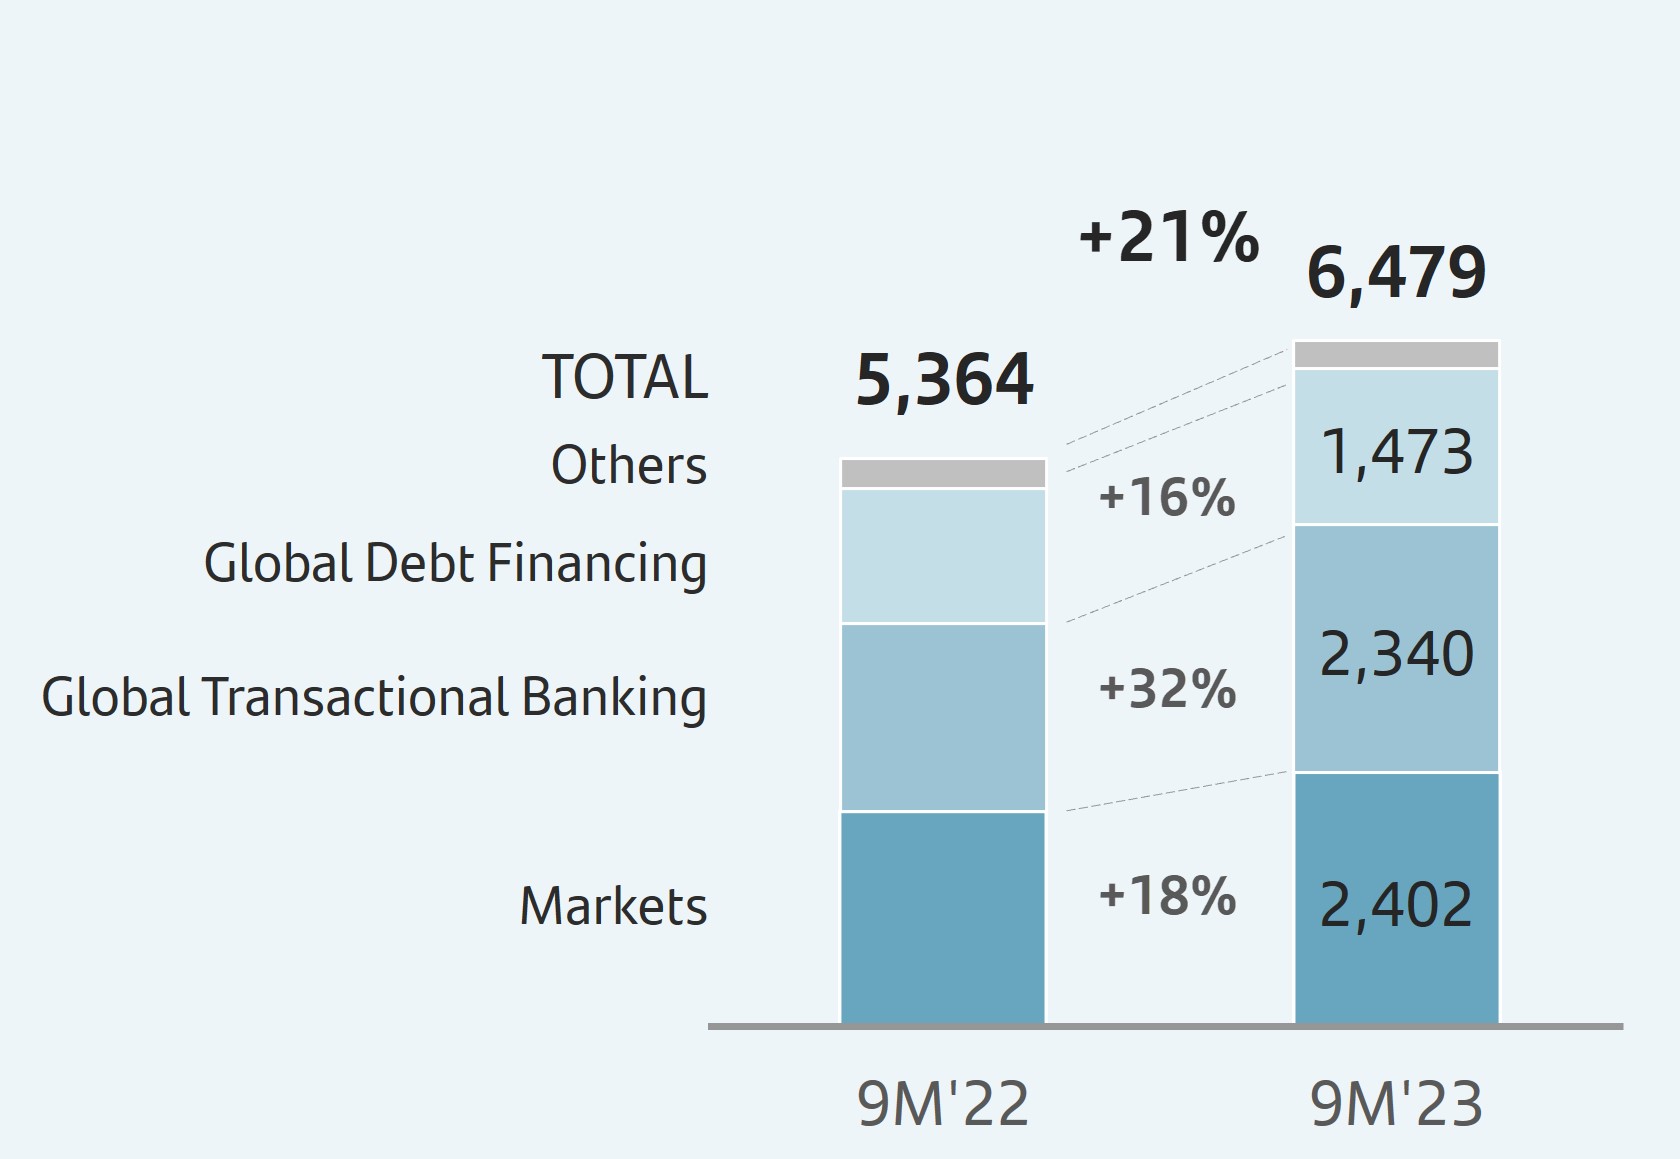 |  | +12% | 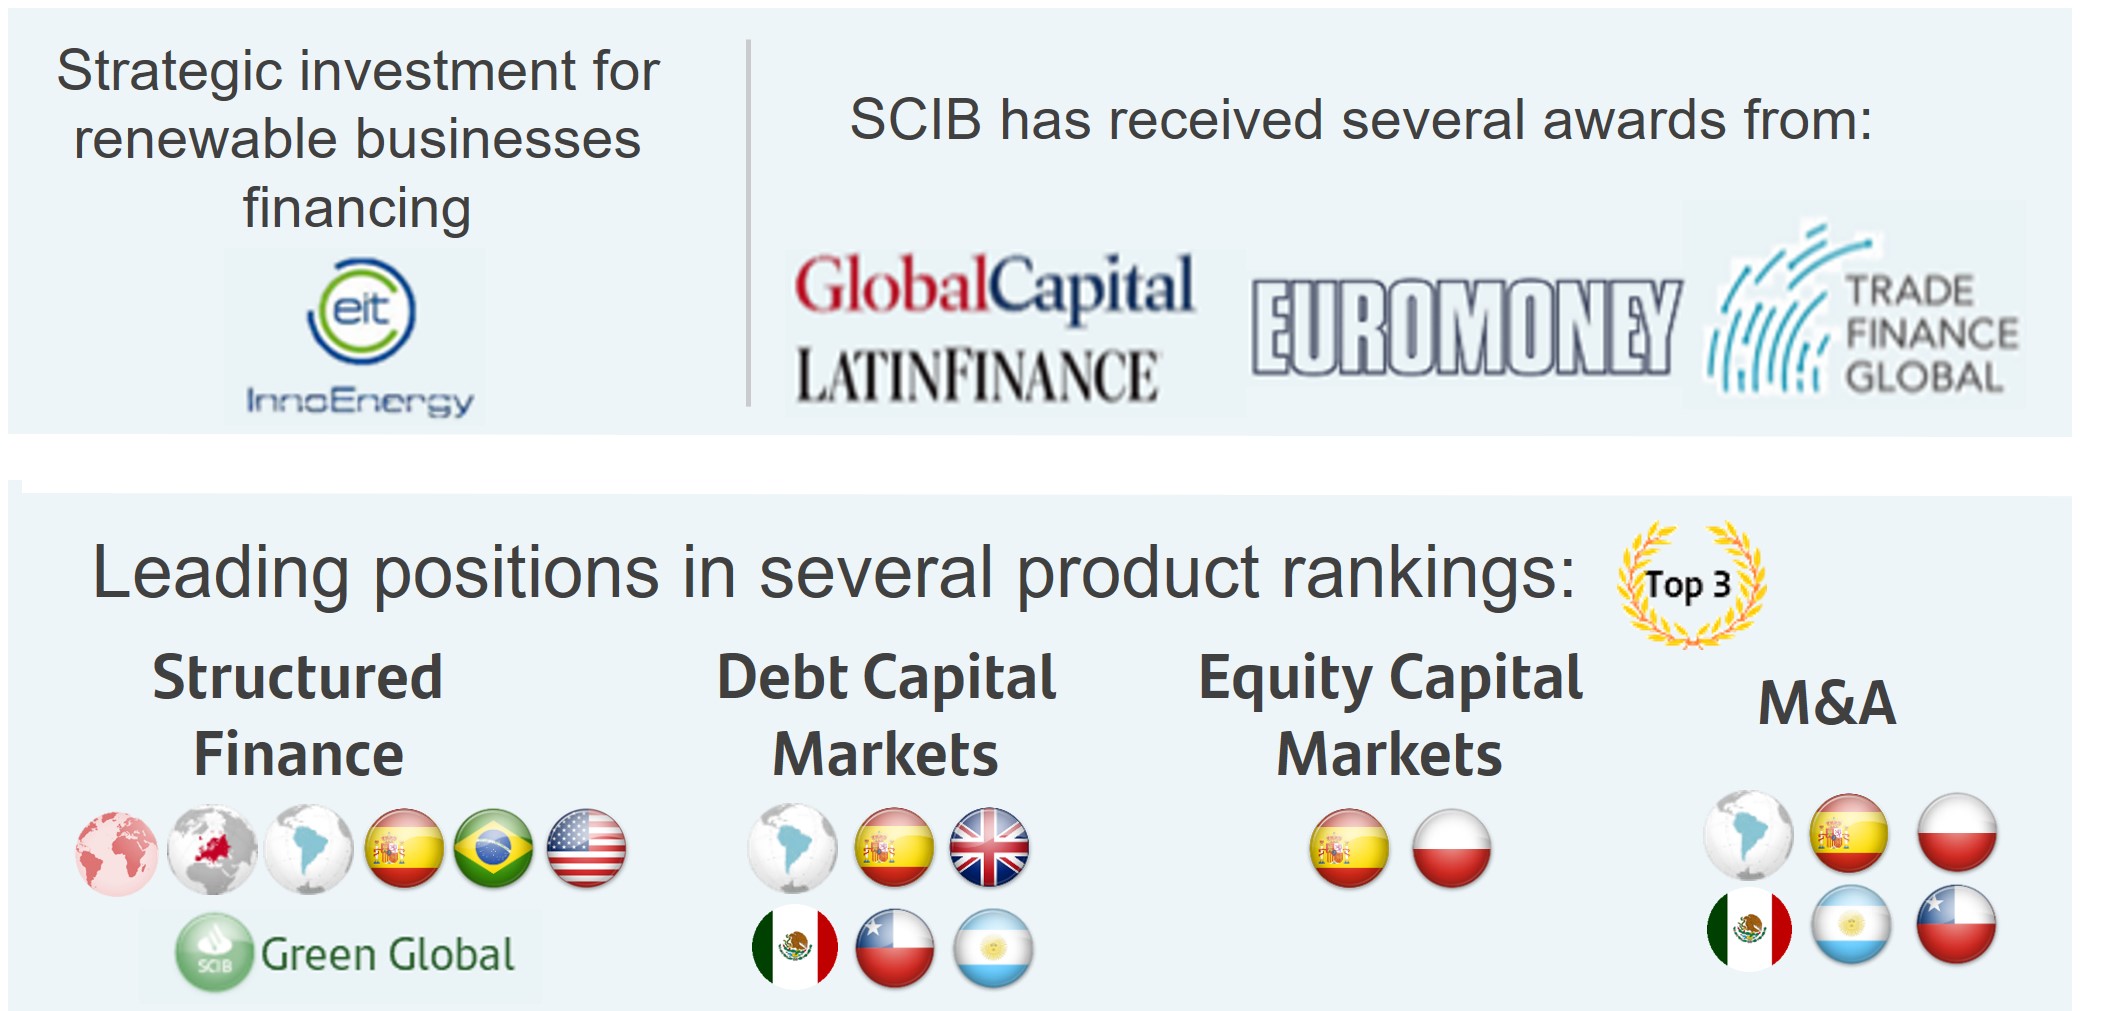 | |||||||||||||||||||||||
| +29% | |||||||||||||||||||||||||
| +28% | |||||||||||||||||||||||||
| 1. In constant euros. | ||||||||||||||||||||||||||
Strategy
The end of 2023 will experience high volatility in the markets, largely due to the monetary policy implemented by central banks. The drop in inflation might mean that the cycle of interest rate hikes is coming to an end.
However, the lower decrease in core inflation (especially in services) and low unemployment rates might mean that central banks will have to keep their interest rates high for several months.
The beginning of rate cuts in Latin American countries, where rate hikes took place earlier, will serve as a reference to analyse the impact. We should also keep an eye on the Chinese economy, geopolitical risks, and energy and other commodity prices.
In this context, in SCIB we continue to make progress in implementing our strategy to transform the business and position ourselves as strategic advisor to our clients, offering high value-added, specialized products and services with a particular focus on energy transition and digital transformation.
Our strategic priorities are: i) to double the size of our US franchise focusing on strengthening our advisory capabilities, mainly in sectors with the greatest growth potential such as energy transition, technology or healthcare, which will have a positive impact on the entire business globally; ii) continue the globalization of the Markets business with focus on institutional investors and, in the US, on improving our global platform for FX and Over-the-Counter (OTC) derivatives in the main commodity markets; and iii) accelerate asset rotation to optimize profitability and to generate new business.
In the ESG Sustainable Tech area, the quarter was very active, highlighting the performance as joint advisor to EIT InnoEnergy to raise more than EUR 140 million in a private capital increase. In this transaction, we have taken a stake in InnoEnergy's, as a financial group and leading global advisor in ClimateTech, which demonstrated our commitment to the sustainable development goals.
SCIB participated in several relevant ESG bond transactions, especially in the banking, transportation and energy sectors, sustainability-linked bond transaction of the Republic of Chile, as well as the issuance of a social bond for a project of Sacyr Concesiones in Colombia.
In terms of the most relevant ESG recognitions: i) the MacIntyre Wind Farm transaction won the Renewable Energy Deal of the Year category at the TXF Export Finance Deals of the Year 2022 awards, for the construction in Australia of the largest wind farm in the southern hemisphere where SCIB Export & Agency Finance team acted as lender and facility agent; and ii) recognized in Debt Capital Markets as The Most Impressive Bank for ESG Capital Markets in Latin America at the GlobalCapital Bond 2023 awards.
In Digital Solutions & Tech Investment, the most relevant transactions have been, advising BCN Visuals in the sale of a minority stake to Nazca Capital in Spain and participating in the public-private acquisition by Silver Lake of Software AG, in Germany. In addition, SCIB acted as joint global coordinator in the accelerated sale of shares by TCV in Pracuj's Group and as joint bookrunner in the English company ARM's IPO on the Nasdaq.
| 42 | | January - September 2023 | ||||||

Results
Attributable profit in the first nine months of 2023 amounted to EUR 2,680 million (29% of the Group's total operating areas), 14% higher than in 9M 2022, +22% in constant euros, with significant growth across core businesses and gaining market share.
Revenue amounted to EUR 6,479 million, up 16% compared to the same period in 2022. Excluding the exchange rate impact, revenue rose 21%, due to strong double-digit growth in all regions, with North America standing out with an increase of 29%. In constant euros, out main businesses performed as follows:
•Global Transaction Banking (GTB) continued to post strong revenue increases, +32% year-on-year.
In Cash Management, we continued to grow, both in terms of transactions and liability income, and we continued to develop our capabilities in Cash Nexus.
In Trade & Working Capital Solutions, we continued to strengthen our global and distribution capabilities, and were selected as agent bank for major international transactions, such as a EUR 5 billion confirming programme covering Europe, Asia and the Americas.
In Trade Finance, Santander was recognized as the Best Trade Finance Bank and Best Receivables Finance Provider by the Trade Finance Global platform in cooperation with the Bankers Association for Finance and Trade (BAFT). In Export Finance, we maintained our leadership in the global ECA financing market and closed many transactions focused on minimizing political and commercial risks.
•Global Debt Financing (GDF) maintained the good dynamics of the year, growing 16% year-on-year.
In Structured Finance, revenue continued to rise with double-digit growth. We led the renewables ranking in Europe and globally and we also ranked first as mandated lead arranger (MLA) in Europe, and second globally. On the distribution side, we completed the syndication of important transactions and there continues to be significant appetite for this asset class.
In Debt Capital Markets (DCM), activity continued to increase, especially in the US, Brazil and Argentina.
In Securitizations, total income increased at a high rate, continuing the upward trend seen since the beginning of the year.
•Markets showed a solid growth of 18% year-on-year, as a result of good management of market volatility.
In Europe, where clients continued to be active, and global sales revenue continued to increase, achieving another quarter of strong growth, especially in the United Kingdom. By product, we achieved good results in Securities Financing, Equity Derivatives and Credit.
In Latin America, activity accelerated in the third quarter, resulting in good growth year-on-year. Mexico, Chile, Colombia and Uruguay continued to show strong performances, with Commodities, Cash Equity, FI Rates and FX products standing out.
In the US, activity grew 43% year-on-year, despite the macroeconomic challenges faced by some businesses. Securities Financing, Exchange Traded Derivatives and Rates products stood out. We continued to capture the synergies and efficiencies related to the creation of SanCap. On the other hand, activity with corporate clients also stood out, since we closed several relevant transactions in FX and Rates.
•Corporate Finance, there were important M&A transactions stand out in the energy sector, advising on the divestment of several wind farms.
In Consumer, Retail & Healthcare, the advisory services provided in the spin-off of Grupo Éxito stand out, followed by others in Brazil (Viveo, Via Varejo), where the capital market has reopened.
This year we have shown our global leadership in environmental transactions related to waste treatment, as well as our strength in TMT in Latin America, advising Telefónica on the sale of a majority stake in its fibre optic network to KKR.
Takeover bids have significantly increased in the Spanish market, where we maintain a leading position. Moreover, we have participated in large international transactions, such as the IPO of the technological company ARM on Wall Street or the secondary placements of London Stock Exchange Group.
Operating expenses increased 16% year-on-year (+18% in constant euros) due to investments in products and development of franchises. However, the efficiency ratio stood at 36.6% (36.7% in the same period in 2022), remaining below the sector.
In loan-loss provisions, the good performance in South America offset the increase in Europe.
Compared to the previous quarter, profit decreased 3% in constant euros mainly impacted by higher costs in the quarter.
| SCIB. Underlying income statement | ||||||||||||||||||||||||||
| EUR million and % change | ||||||||||||||||||||||||||
| / | Q2'23 | / | 9M'22 | |||||||||||||||||||||||
| Q3'23 | % | excl. FX | 9M'23 | % | excl. FX | |||||||||||||||||||||
| Revenue | 2,126 | -1 | +3 | 6,479 | +16 | +21 | ||||||||||||||||||||
| Expenses | -864 | +12 | +14 | -2,374 | +16 | +18 | ||||||||||||||||||||
| Net operating income | 1,262 | -8 | -3 | 4,105 | +16 | +22 | ||||||||||||||||||||
| LLPs | 49 | — | — | 46 | +191 | +124 | ||||||||||||||||||||
| PBT | 1,217 | -8 | -3 | 3,997 | +15 | +21 | ||||||||||||||||||||
| Attributable profit | 804 | -11 | -3 | 2,680 | +14 | +22 | ||||||||||||||||||||
January - September 2023 | | 43 | ||||||
 | Wealth Management & Insurance | Underlying attributable profit | ||||||
| EUR 1,251 mn | ||||||||
| Executive summary | ||||||||||||||||||||||||||||||||||||||
Results. (9M'23 vs. 9M'22). % change in constant euros |  |  |  | ||||||||||||||||||||
Revenue1 | Fee income as % of total Group 2 | AuMs | RoTE | Net new money | Net sales | Fee income | |||||||||||||||||
| +22% | 30% | +12% | 92% | EUR 8,694 mn | EUR 6,402 mn | EUR 1,325 mn | |||||||||||||||||
| CAL: EUR 289 bn | AuMs: EUR 210 bn | +6% vs. September 2022 | |||||||||||||||||||||
| Total contribution to profit by business | Other highlights of the period | ||||||||||||||||||||||
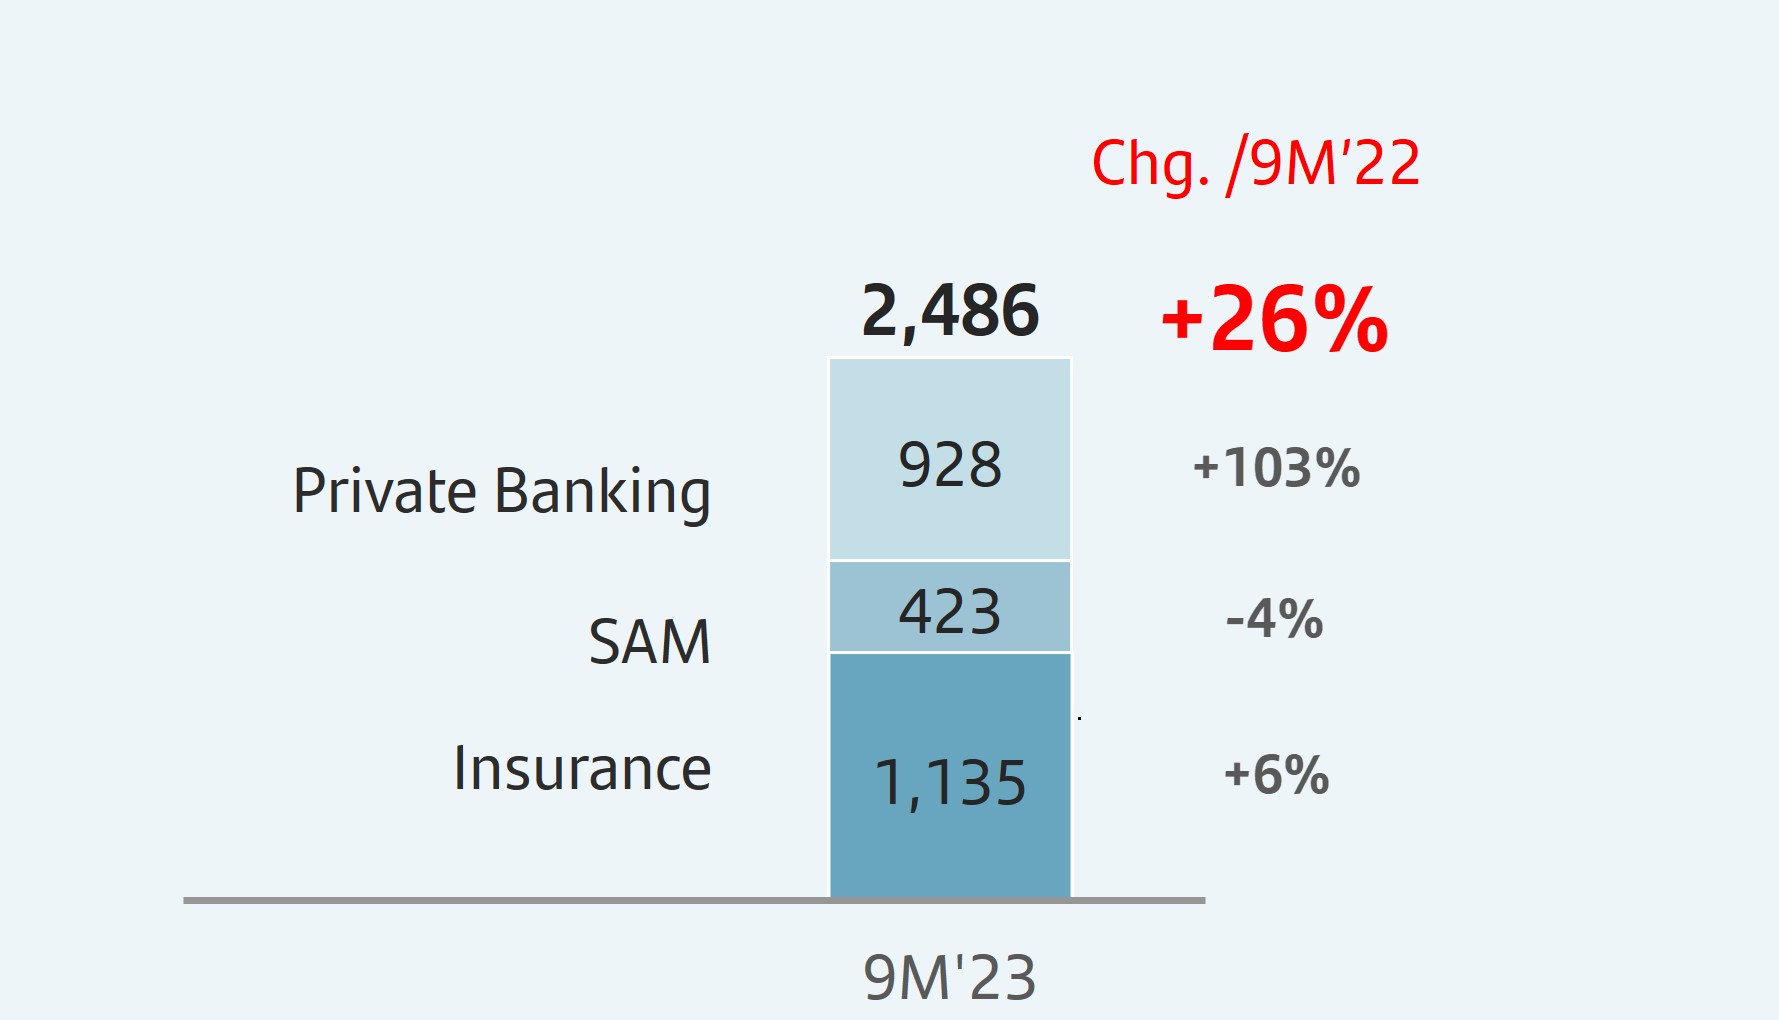 | PB customers | SRI3 AuMs | Gross written premiums | ||||||||||||||||||||
| +10% vs. Sep-22 | EUR 64.0 bn | EUR 9.2 bn | |||||||||||||||||||||
| PB Network AuMs | |||||||||||||||||||||||
| EUR 52.2 bn +12% | +20% | +5% | |||||||||||||||||||||
 | |||||||||||||||||||||||
| 1. Including fees generated by Asset Management and Insurance ceded to the commercial network. If not included, +39%. | 3. Socially Responsible Investments. | ||||||||||||||||||||||
| 2. Including fee income ceded to commercial network. | |||||||||||||||||||||||
Commercial activity
We continued to work to become the best responsible Wealth & Insurance Manager in Europe and the Americas, being one of the Group's growth drivers with 26% growth year-on-year in the contribution to Group profit. In July, Euromoney recognized us as Latin America's Best Bank for Wealth Management.
•In Private Banking, we continued to leverage our global platform to enable customers to benefit from our scale and international presence and providing tailored solutions, making it easy for them to move from one region of the Group to another. In terms of collaboration, we remained leaders in investment flows between Latin America, Europe and the US, managing network business volumes (cross-border business between markets) of EUR 52.2 billion.
Our collaboration business with SCIB continued to increase, especially in Spain, Brazil and Mexico. In the first nine months, it generated EUR 125 million of revenue, 11% higher year-on-year.
We continued to widen our value proposition and to innovate in our product range. We had a particular focus on alternatives, structured products, secured lending and socially responsible products (ESG).
In alternatives, we have close to EUR 3 billion in total committed lines. We expanded our product range, seeking opportunities for our customers using the most suitable products in each region. For example, we launched Santander Innoenergy venture capital fund, which invests in innovative startups in the field of energy transition. Also, we launched a new fund of funds in our Irish ICAV, Laurion Secondaries, offering a diversified Private Equity portfolio with secondary transactions.
Our discretionary portfolio management offering reached EUR 22.9 billion of total assets under management (AuMs),
Our real estate investment service, which is capturing a large part of investment flows between Latin America, Europe and the US, reached a total volume of EUR 140 million in transactions in the third quarter.
Our work was recognized by Euromoney as the Best Private Bank in Latin America, as well as the Best International Private Bank in Mexico, Argentina, Brazil, Peru, Uruguay, Poland and Portugal. In addition to the Best Global Private Bank in Cybersecurity and Digital Portfolio Management in Europe by the Professional Wealth Management magazine, a Financial Times publication.
•In Santander Asset Management (SAM), commercial activity recovered, with three quarters of positive flows, very concentrated in fixed income due to the interest rate environment. We continued to be the global product platform of choice for our retail banks, with EUR 831 million in total fees generated, in line with the previous year.
In Spain, we developed the discretionary portfolio management model and launched two new funds whose advisory services are delegated to entities such as BlackRock (US equities) and Fidelity (Asia), which are being complemented by our GO range in Luxembourg (Global Equity ESG and Asian Equity). Santander Pensiones was also one of the five entities awarded the contract to participate in the Publicly Promoted Employment Pension Fund in Spain (FPEPP), created to promote collective savings.
The range of alternative products aimed primarily at our institutional clients and family offices is becoming increasingly robust. In the alternatives business, we now have 22 vehicles globally, with EUR 2.2 billion in committed lines. Our main strategies include Private Debt, Infrastructure, Trade Finance and Real Estate, with the notable launch of Santander Global Real Assets fund of funds, for private banking clients.
| 44 | | January - September 2023 | ||||||
We made further headway with our ESG strategy, as assets under management amounted to EUR 45.7 billion. Together with RED, we have launched the Santander Prosperity fund in sever countries and it was named the Best Product Innovation in The Global Private Banker Innovation Awards 2023.
Our efforts to continue improving and offering the best investment solutions were recognized through several awards in the period, for example, in Europe Pan Finance magazine named us the Most Innovative Investment Manager 2023 in September. Also, we won Best Fixed Income Manager in Spain and the Best Multi-Asset Manager in the UK. In Chile, we were the fund manager that received the most recognitions at the Salmón awards.
•In Insurance, we maintained a healthy growth rate in premiums (+5%), mainly in the savings business.
Non-credit insurance sales were particularly strong in Europe. In Portugal, the SME offer was completed with the launch of the new car insurance for leasing, and we redesigned the digital marketing strategy with the Cashback Fightback campaign in the UK.
In the Americas, the diversification of the non-credit insurance business continued strongly with growth in new sales. In Brazil, of note was the launch of new products for life, home and personal accidents, which offer discounts and payment flexibility to customers. In Chile, a BeCo (behavioural economics) model was implemented to improve the purchase process and provide personalized offers.
The motor vehicle insurance business grew 19%. Our Autocompara platform, operative in Argentina, Brazil, Chile, Mexico and Uruguay, reached 1.4 million active policies. In SMEs, fees grew 13%.
| Business performance: SAM and Private Banking | ||||||||||||||||||||
| Constant EUR billion | ||||||||||||||||||||
| Total assets under management | ||
| Funds and investment* | ||
| - SAM | ||
| - Private Banking | ||
| Custody of customer funds | ||
| Customer deposits | ||
| Customer loans | ||
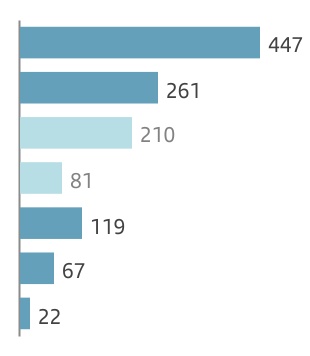
| / Jun-23 | / Sep-22 | ||||
| +2 | % | +12 | % | ||
| +3 | % | +7 | % | ||
| +3 | % | +10 | % | ||
| +3 | % | +7 | % | ||
| +3 | % | +32 | % | ||
| -3 | % | 0 | % | ||
| 0 | % | -1 | % | ||
Note: Total assets marketed and/or managed in 2023 and 2022.
* Total adjusted private banking customer funds managed by SAM.
Business performance
Total assets under management amounted to EUR 447 billion, 12% higher year-on-year, driven by intense commercial activity.
•In Private Banking, the volume of customer assets and liabilities (CAL) stood at EUR 289 billion, 14% higher than in September 2022. Net new money amounted to EUR 8,694 million. Net profit in 9M 2023 was EUR 928 million, twice that of the same period in 2022, primarily backed by net interest income and commercial activity improvement. Clients increased 10% year-on-year.
•SAM's total assets under management was EUR 210 billion, up 10% compared to September 2022. Net sales were positive in the period reaching EUR 6.4 billion, reversing the 2022 trend. SAM’s contribution to the Group's profit was EUR 423 million, -4% year-on-year, due to lower margins as a result of a shift towards fixed income products.
•In Insurance, the volume of gross written premiums in 9M 2023 amounted to EUR 9,250 million (+5% year-on-year). Total fee income rose 6%. The total contribution to profit stood at EUR 1,135 million, +6% year-on-year.
Results
The total contribution to the Group this year (including net profit and total fees generated net of tax) was EUR 2,486 million, up 26% year-on-year (+26% in constant euros).
Attributable profit in the first nine months of 2023 was EUR 1,251 million, 61% higher year-on-year. In constant euros, it was 62% higher:
•Total income increased 39%, mainly driven by higher net interest income.
•Total fee income generated, including ceded to the commercial network, amounted to EUR 2,776 million, a 1% increase year-on-year, and represented 30% of the Group's total fee income.
| Total fee income generated | ||||||||||||||||||||||||||||||||
| Constant EUR million | ||||||||||||||||||||||||||||||||
| 2,776 | 〉 | +1% | 30% | |||||||||||||||||||||||||||||
| vs. 9M'22 | / total Group | |||||||||||||||||||||||||||||||
•Operating expenses were 10% higher year-on-year, due to investments and higher costs related to increased commercial activity.
Compared to the previous quarter, underlying attributable profit remained practically stable in constant euros, compared with an extraordinary performance in the second quarter.
Overall, the third quarter was very positive as we continued to grow at double-digit rates.
| Total contribution to profit | ||||||||||||||
| EUR million and % change in constant euros | ||||||||||||||
| Q3'23 | 9M'23 | |||||||||||||
 | 854 | | 2,486 | |||||||||||
| -1 | % | / Q2'23 | +26 | % | / 9M'22 | |||||||||
| WM&I. Underlying income statement | ||||||||||||||||||||||||||
| EUR million and % change | ||||||||||||||||||||||||||
| / | Q2'23 | / | 9M'22 | |||||||||||||||||||||||
| Q3'23 | % | excl. FX | 9M'23 | % | excl. FX | |||||||||||||||||||||
| Revenue | 874 | -1 | 0 | 2,591 | +38 | +39 | ||||||||||||||||||||
| Expenses | -284 | 0 | +1 | -845 | +9 | +10 | ||||||||||||||||||||
| Net operating income | 590 | -2 | -1 | 1,746 | +58 | +59 | ||||||||||||||||||||
| LLPs | 0 | -99 | -100 | 16 | — | — | ||||||||||||||||||||
| PBT | 585 | -4 | -2 | 1,721 | +61 | +63 | ||||||||||||||||||||
| Attributable profit | 432 | -2 | -1 | 1,251 | +61 | +62 | ||||||||||||||||||||
January - September 2023 | | 45 | ||||||
| Underlying attributable profit | |||||||
| -EUR 101 mn | ||||||||
| Executive summary | ||||||||||||||||||||||||||||||||||||||
| Revenue performance | Our business | ||||||||||||||||||||||
Solid revenue growth1 | Merchants | International Trade | Payments | ||||||||||||||||||||
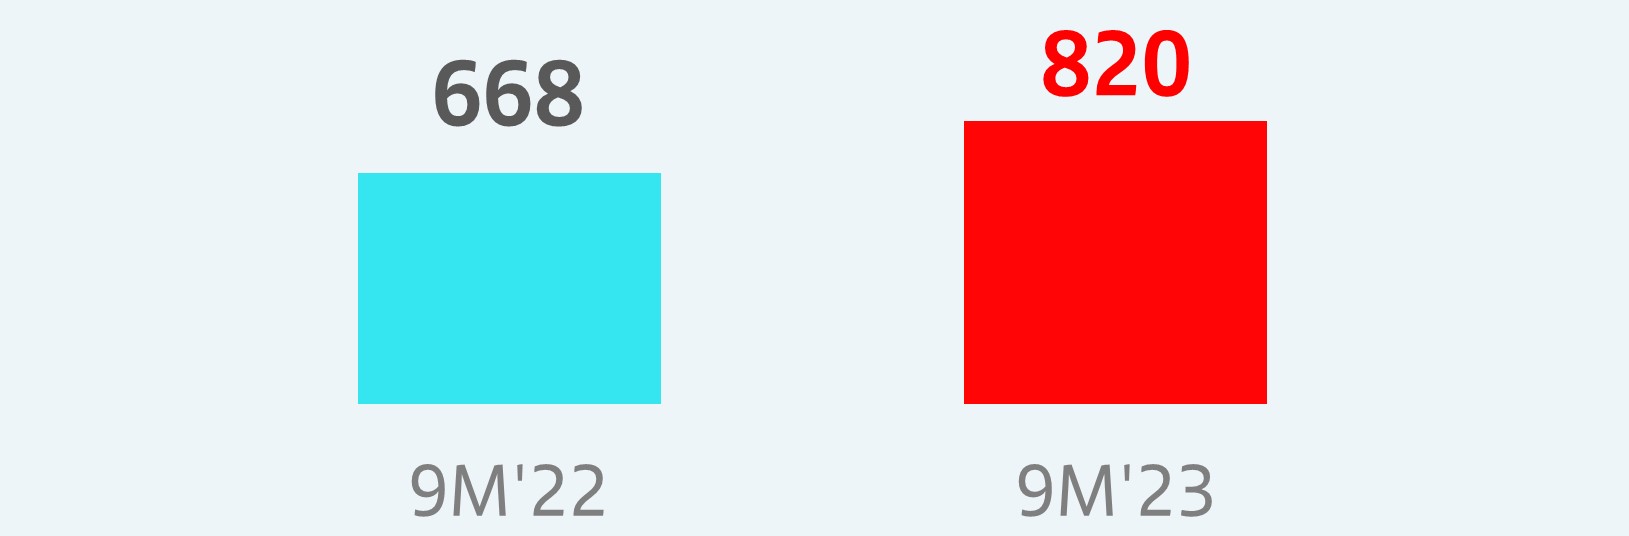 | +23% 9M'23 vs. 9M'22 | Global payments solutions for all merchant segments | International trade solutions for business | Wholesale account-to-account payment solutions | |||||||||||||||||||
| Our main strategic priorities | Main growth drivers | ||||||||||||||||||||||
•Scaling up our global technology platform •Accelerating our commercial growth •Pursuing the open market opportunity | Merchants Total Payments Volume1 | Merchant number of transactions | |||||||||||||||||||||
+24% vs. 9M'22 | +32% vs. 9M'22 | ||||||||||||||||||||||
| 1. Constant EUR million. | |||||||||||||||||||||||
Strategy
PagoNxt aims to achieve a global leadership position in payments through our distinctive, holistic and customer-centric value proposition. We are a one-of-a-kind paytech business providing customers with a wide range of innovative payments and integrated value-added services.
We focus on several strategic and high-growth business segments:
•Merchants: providing global and integrated acquiring, processing and value-added solutions for physical and e-commerce merchants.

•International Trade: delivering specialized cross-border trade solutions (payments, FX, cash management, trade finance) for businesses, in a large and global market yet to be fully digitalized.

•Payments: providing wholesale account-to-account (A2A) payments processing and instant connectivity to schemes in multiple countries areas through a highly scalable model.
PagoNxt's technology platform and specialist teams serve Grupo Santander's payments needs and additionally cater for open market opportunities beyond Santander's business, delivering complete solutions for millions of businesses and individuals.
PagoNxt runs an efficient global operating model, extending across three core regions (Europe, South America and North America) and adopting bank-grade security and compliance embedded in our customer products.
PagoNxt's strategy is anchored on the following key levers:
•Scaling up our global, cloud-native, secure and efficient platform. We operate a connected, real-time, flexible and highly scalable technology platform that is fully cloud and API based to ensure access to PagoNxt's features through a single integration. We process and generate insights to help our customers and their businesses leverage the full power of data and make data-driven decisions.
•Accelerating commercial growth by continuing to strengthen our international commerce and trade ecosystem, offerings and distribution through Santander's commercial platforms, with a focus on SMEs.
•Maximizing the open market opportunity through direct commercialization and distribution partnerships (with integrated software vendors and others), increasing our market penetration in Europe, South America and North America and extending our footprint to additional strategic countries.
| 46 | | January - September 2023 | ||||||
Business performance
Our global Merchant franchise, under the Getnet brand, reached a Total Payments Volume (TPV) of EUR 149 billion in 9M 2023, 27% higher than 9M 2022 (+24% in constant euros). Revenue grew 17% year-on-year (+15% in constant euros).
The growth in TPV was spread across our main regions, increasing above market and resulting in market share gains. Getnet Brazil's TPV increased 15% in 9M 2023 versus previous year enabled by our propositions for SMEs and tailor-made solutions for large accounts and new verticals. Getnet Mexico's TPV grew 27% in 9M 2023 leveraging our new global platform which we continue to enhance with new value added services. Getnet Europe showed year-on-year TPV growth of 33% due to positive commercial dynamics both in the Spanish and Portuguese markets.
In the last quarter, we continued to make progress in our journey to consolidate Getnet as a fully-licensed acquirer across Europe and Latin America by offering e-commerce and PoS solutions and value-added services, developing propositions for SMEs and multinationals and building a deep understanding of the banking channel and experience in partnerships.
Some highlights in 9M 2023 were:
•Delivery of new global solutions (e.g. working capital in Mexico, tap-on-phone piloting in Mexico and Spain), new vertical specific propositions (e.g. airlines processing capabilities in Mexico and Europe) and Brazilian Digital PIX and Boleto available on the global merchant platform.
•Continued deployment of the franchise as the FCA granted Getnet UK a payment institution licence.
•Commercial development through the Santander channel with continuous growth in the SME segment in our core markets of Mexico, Brazil and Spain, actively targeting strategic partnerships in the open market expanding our distribution channels beyond Santander networks and through the addition of multinational merchants operating across the Getnet franchise.
| Merchants | ||||||||||||||||||||||||||||||||||||||||||||
| Number of Transactions | Total Payments Volume | |||||||||||||||||||||||||||||||||||||||||||
| Billions | Constant EUR billion | |||||||||||||||||||||||||||||||||||||||||||
| +32% | +24% | |||||||||||||
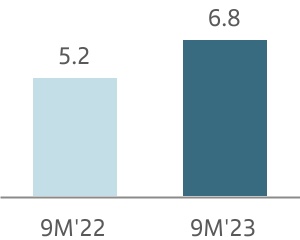
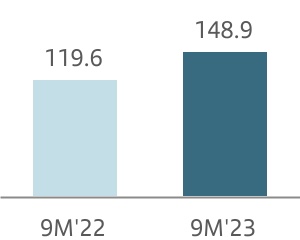
Ebury continues to make great progress in delivering its strategy of becoming the world´s leading cross-border payments platform for SMEs. It has continued to show strong performance in its B2B offerings targeting an untapped and expanding revenue opportunity, driven by a comprehensive range of solutions for cross-border trading. Ebury´s management priorities are continuing to enhance its customer value proposition (e.g. developing strong capabilities around verticals like payroll and new product developments to deepen client relationships) and expanding into new areas and countries (e.g. acquisition of Bexs in Brazil and Prime Financial Markets in South Africa already completed).
Our OneTrade platform, which offers international services (including payments, FX and trade finance) for Santander customers through a single platform, also continued to show increased activity. All key services are now operational: OneTradeView (a solution that allows customers easy and secure access to all Santander accounts regardless of location), International Payments (fully rolled out in Spain and already reached 10,000 active customers), FX (i.e. digital service for SMEs to handle FX trade flows, already available in three core countries) and Trade Finance solution. Additionally, a new direct offering of pay-in and pay-out capabilities through an e-money regulated vehicle was launched focusing on the open market.
PagoNxt continues executing its roadmap to become one of the largest A2A payments processors in the world, developing our proprietary cloud-based platform. In the first nine months of 2023, we migrated significant volumes of all types of A2A payments in the Eurozone, UK and our global CIB branches to our global platform.
Results
Attributable loss in the first nine months of 2023 of EUR 101 million, compared to a EUR 172 million loss in the same period of 2022.
Total income was EUR 820 million, a 25% increase year-on-year (+23% in constant euros), backed by the increase in business activity and volumes across regions especially in our Merchant (Getnet) and Trade (Ebury) businesses.
| PagoNxt. Revenue performance | ||||||||||||||||||||
| Constant EUR million | ||||||||||||||||||||
| +23% | ||||||||||||||
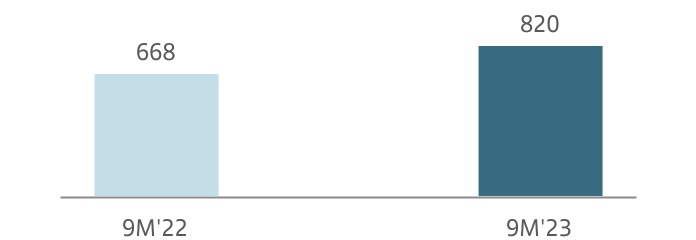
In the period, costs reflected the ongoing investment plans to develop and implement global technology.
Compared to the second quarter, profit improved to EUR 3 million a from EUR 48 million loss in Q2.
| PagoNxt. Underlying income statement | ||||||||||||||||||||||||||
| EUR million and % change | ||||||||||||||||||||||||||
| / | Q2'23 | / | 9M'22 | |||||||||||||||||||||||
| Q3'23 | % | excl. FX | 9M'23 | % | excl. FX | |||||||||||||||||||||
| Revenue | 298 | +8 | +7 | 820 | +25 | +23 | ||||||||||||||||||||
| Expenses | -251 | -15 | -15 | -823 | +13 | +12 | ||||||||||||||||||||
| Net operating income | 48 | — | — | -4 | -95 | -94 | ||||||||||||||||||||
| LLPs | -10 | +70 | +68 | -23 | -5 | -6 | ||||||||||||||||||||
| PBT | 31 | — | — | -45 | -60 | -57 | ||||||||||||||||||||
| Attributable profit | 3 | — | — | -101 | -42 | -39 | ||||||||||||||||||||
January - September 2023 | | 47 | ||||||
Business model | Responsible banking | |||||||||||||||||||||||||
| RESPONSIBLE BANKING | ||||||||
| TARGETS | ||
We continue to make progress in our ESG agenda, working towards the fulfilment of our public targets:

More information available at www.santander.com/en/our-approach.
Definitions in Alternative Performance Measures chapter and Glossary.
Note: Not taxonomy.
1.Starting Jan-23. Does not include financial education. Data not audited.
Of note among the implemented ESG initiatives were:
| E | Environmental | ||||
•In line with our target to facilitate EUR 120 billion in green finance by 2025 and EUR 220 billion by 2030, we have mobilized EUR 105.9 billion in green finance since we set our target in 2019.
•The volume of AuMs in socially responsible investments was EUR 64 billion.
•In Spain, we set up a credit line of up to EUR 5 billion to support the agricultural sector affected by the drought. In addition, we continued to recycle expired or damaged cards, 769,000 so far this year, transforming them into street furniture, clear commitment to the circular economy. For the whole year, we expect to save more than 22 tonnes of single-use plastic and 360 tonnes of CO2 equivalent to issuing more than 4.5 million cards made from sustainable materials.
•We launched the Santander Green Mortgage in Mexico, the first mortgage that rewards customers for taking care of the planet and acquiring a home with sustainable construction certification.
•We signed agreements with the EIB Group (European Investment Bank and European Investment Fund) to (i) allocate EUR 990 million to the real economy, of which up to EUR 300 million will go to green projects, (ii) with the EIF to provide a EUR 200 million guarantee, of which EUR 135 million used to support the green transition of the InvestEU programme, and (iii) with the EIB, through our subsidiary in Brazil, EUR 300 million to promote the use of renewable energy in the South American country as part of the EU's Global Gateway investment project.
•We continued to support our customers in their transition through initiatives such as:
–Led the execution of a EUR 150 million sustainable syndicated factoring contract for Cunext Copper Industries.
–Provided a syndicated line of sustainable guarantees to Haizea Wind Group for the development of two offshore wind farms in the North Sea for an amount of EUR 140 million.
–Participated in EIT InnoEnergy's round of EUR 140 million, which brought in new strategic partners. This investment will accelerate innovation in the field of clean energy by supporting startups in the InnoEnergy portfolio.
•We co-sponsored the European roundtable of the United Nations Environment Programme Finance Initiative (UNEP FI) which took place in Madrid on 12 and 13 September and was opened by our executive chair.
| 48 | | January - September 2023 | ||||||
Business model | Responsible banking | |||||||||||||||||||||||||
| S | Social | ||||
•We further strengthened our financial inclusion proposition. Since January, we have supported 1,330,000 people in relation to our goal of reaching 5 million between 2023 and 2025.
•We set up a EUR 100 million fund to support startups in Spain with a complete range of solutions to boost their development, in collaboration with Inveready Asset Management. We plan to sign collaboration agreements with the main agents, associations, innovation centres, incubators and venture builders, with access to a total of 7,000 startups.
•In response to the earthquake emergency in Morocco and the floods in Libya, we temporarily waived international transfer fees for individuals making payments to these two countries, and we approved a donation to the Red Cross to support the provision of basic necessities to victims in both countries.
•Through Universia, we joined forces with CEOE, Fundación Telefónica, KPMG, LinkedIn and Microsoft to boost employability and talent in Spain. In addition, together with INCIBE, we organized 60 Cyberskills Scholarships to train people with disabilities in cybersecurity.
•Through Universia, more than 1,900 young people accessed the labour market in Spain.
| G | Governance | ||||
•Our asset manager, Santander Asset Management, joined the Code of Best Practices for Institutional Investors, Asset Managers and Proxy Advisors of the Spanish Securities Market Commission (CNMV).
•Together with BBVA and Caixabank, we agreed to collaborate in the fight against financial fraud by working with tools to exchange relevant information and data to help prevent it.
•This quarter, we published the half-yearly ESG report in the and the first Social, Environmental and Climate Risks and Opportunities report in Brazil.
| Q3 2023 AWARDS | ||
•We won the award for Most Impressive Bank for ESG Capital Markets in Latin America at the Bond Awards 2023, organized by GlobalCapital.
•We were included in Fortune's list of 50 companies that are changing the world. We are the top bank in the 2023 ranking as a result of the work done by Santander Universidades over the past 27 years in supporting education, entrepreneurship and employability.
•In Spain, we obtained the Sello de Oro a la Excelencia Europea EFQM 600+ awarded by the Excellence in Management Club. This is the highest European recognition and certifies that Santander has a high degree of excellence in its management model.
•In the UK, we were in The Times's Top 50 Employer for Gender Equality list for the fourth year in a row.
•In the US, we received a community partnership award from the Boston Business Journal (BBJ).

January - September 2023 | | 49 | ||||||
Business model | Corporate governance | |||||||||||||||||||||||||
| CORPORATE GOVERNANCE | ||||||||
On 26 September, the board of directors appointed Glenn Hutchins Vice Chair and Lead Independent Director, effective on 1 October, to succeed Bruce Carnegie-Brown, who will remain in the board up to the 2024 Annual General Meeting.
Changes to the board committees
Likewise, on 26 September, Glenn Hutchins was appointed chair of the remuneration committee to replace Bruce Carnegie-Brown, who remains a committee member and chair of the nomination committee but steps down from the executive committee and the innovation and technology committee effective on 1 October.
Changes to the organizational structure of the Group's Senior Management
On 18 September, the bank announced a new organizational structure, which consolidates its retail and commercial and consumer businesses in each market under two new global businesses: Retail & Commercial and Digital Consumer Bank to help the bank achieve the strategic goals outlined at its Investor Day in February. The bank will consolidate operations in five global business areas1 which will become the bank's primary reporting segments. The Group will align the way it reports its financial results to this new model from January 2024, once it is fully implemented:
•Retail & Commercial: will combine all the Group’s retail and business banking and be led Daniel Barriuso, Group Chief Transformation Officer.
•Digital Consumer Bank: will incorporate the Group's consumer finance activities and be headed by José Luis de Mora.
•Corporate & Investment Banking: headed by José María Linares.
•Wealth Management & Insurance: headed by Víctor Matarranz.
•Payments: includes PagoNxt, led by Javier San Félix, and Global Cards, led by Matías Sánchez.
Under this new structure, global heads will define the common business and operating model, and regional heads will drive the implementation of the model and convergence across the markets.
Amendment of the Rules and regulations of the board
On 25 July, the board of directors amended the Rules and regulations of the board of directors with the purpose, among other technical improvements, of:
•adapt it to the new provisions introduced by Law 2/2023 of 20 February on the protection of persons who report violations of the law and the fight against corruption, to and outline the responsibility of the board for implementing an internal system and of the audit and risk supervision, regulation and compliance committees for overseeing it;
•align it with the EBA guidelines on improving resolvability for institutions and resolution authorities, which will apply from January 2024, to outline the board's supervision of crisis management planning, with support from the risk supervision, regulation and compliance committee; and
•update the board’s and the committees’ operation in line with the current circumstances and make them more effective in their functions.
On 2 August, the amendments to the Rules and regulations of the board of directors were registered in the Commercial Registry of Cantabria and submitted to the National Securities Market Commission.
Changes to the international advisory board’s composition
On 26 September, Juan Ignacio Gallardo Thurlow joined Banco Santander's international advisory board. Mr Gallardo is the Chair of Organización Cultiba, Grupo Azucarero México and Grupo GEPP (PepsiCo bottling company in Mexico) is well-versed in the Latin American region, one of the Group's strategic markets.
1. Appointments subject to regulatory approvals where applicable.
| 50 | | January - September 2023 | ||||||
| SANTANDER SHARE | ||||||||
In application of the shareholder remuneration policy for 20231, the board of directors approved an interim cash dividend of EUR 8.10 cents per share charged against 2023 results to be paid from 2 November 2023. This represents a 39% increase compared to the equivalent cash dividend payment in 2022.
Additionally, the board approved a share buyback programme of up to EUR 1,310 million, which commenced on 28 September once the applicable regulatory approval was obtained, as announced in the Inside Information disclosed on 27 September 2023.
As a result, the total remuneration of this interim distribution charged against 2023 results exceeds EUR 2.6 billion (+34% compared to its equivalent of 2022) and represents approximately 50% of the H1 2023 attributable profit (25% dividend payment and 25% share buyback).
The bank plans to announce a final remuneration against 2023 earnings in the first quarter of 2024, subject to the appropriate corporate and regulatory approvals.
Share price performance
Santander's shares are listed in 5 markets, in Spain, Mexico, Poland, the US (as an ADR) and the UK (as a CDI).
Global economic activity experienced a gradual slowdown in the third quarter of the year, with labour markets that remained solid, although with different trends across countries. The focus was on China, given the difficulties faced by the real estate sector, which if aggravated could have a negative impact on global growth, already affected by monetary restrictions in many countries.
Inflation rates globally continued to decline gradually, mainly due to lower food and energy contributions. However, upward movements in oil and natural gas prices, as a result of several negative supply shocks, raised concerns among central banks.
In this context, the main central banks of advanced countries continued to tighten monetary policy. The Federal Reserve (US federal funds) and the Bank of England raised rates to 5.50% and 5.25%, respectively, however at their last meetings in September they proceeded cautiously and left rates unchanged. The European Central Bank, opted to raise rates by 25 basis points to 4%, in what could be the last rate hike of the current cycle.
Central banks in Latin America, such as Chile, Brazil and Uruguay, have already started to lower interest rates.
In this environment, the Santander share price ended the quarter with a positive return of 29.1%, outperforming the market. In the banking sector, EuroStoxx Banks was up 16.7%, DJ Stoxx Banks increased 15.0% and MSCI World Banks decreased 1.6%. The other main indices closed up, Ibex 35 +14.6% and DJ Stoxx 50 +7.3%.
| Share price | ||||||||||||||
 |  | |||||||||||||
START 30/12/2022 | END 29/09/2023 | |||||||||||||
| €2.803 | €3.619 | |||||||||||||
 |  | |||||||||||||
Maximum 07/03/2023 | Minimum 03/01/2023 | |||||||||||||
| €3.873 | €2.812 | |||||||||||||
| Comparative share performance | ||
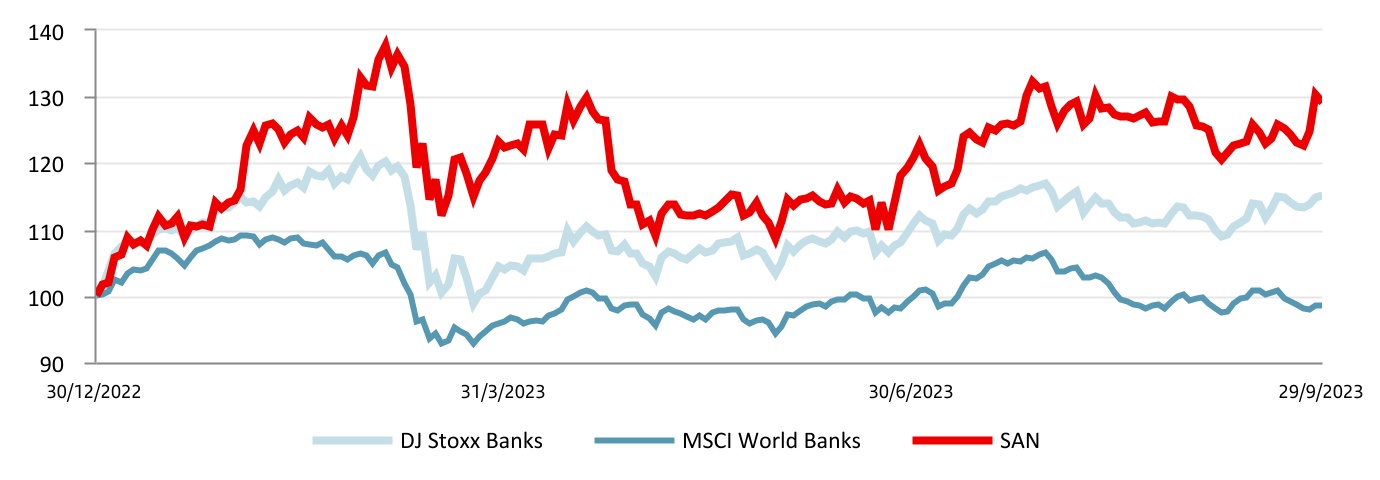
1. Target payout is c.50% of Group reported profit (excluding non-cash, non-capital ratios impact items), distributed approximately 50% in cash dividends and 50% in share buybacks. Execution of the shareholder remuneration policy is subject to future corporate and regulatory decisions and approvals.
January - September 2023 | | 51 | ||||||
Market capitalization and trading
As at 29 September 2023, Banco Santander’s market capitalization of EUR 58,562 million was the second largest in the eurozone and 26th largest in the world among financial institutions.
The share’s weighting in the DJ Stoxx Banks index was 6.9% and 11.8% in the DJ Euro Stoxx Banks. In the domestic market, its weight in the Ibex 35 as at end September was 12.0%.
A total of 8,410 million shares were traded in the period for an effective value of EUR 28,302 million and a liquidity ratio of 51%.
The daily trading volume was 43.8 million shares with an effective value of EUR 147 million.
Shareholder base
The total number of Santander shareholders at 29 September 2023 was 3,703,401, of which 3,297,329 were European (73.44% of the capital stock) and 394,561 from the Americas (25.26% of the capital stock).
Excluding the board, which holds 1.15% of the bank’s capital stock, retail shareholders accounted for 41.63% and institutional shareholders accounted for 57.22%.
| Share capital distribution by geographic area | ||||||||
| September 2023 | ||||||||
| The Americas | Europe | Other | ||||||
| 25.26% | 73.44% | 1.30% | ||||||
 | ||||||||
| Source: Banco Santander, S.A. Shareholder register. | ||||||||
 | 2nd | Bank in the eurozone by market capitalization | ||||||
EUR 58,562 million | ||||||||
| The Santander share | |||||
| September 2023 | |||||
| Shares and trading data | |||||
| Shares (number) | 16,184,146,059 | ||||
| Average daily turnover (number of shares) | 43,804,333 | ||||
| Share liquidity (%) | 51 | ||||
| (Number of shares traded during the year / number of shares) | |||||
| Stock market indicators | |||||
| Price / Tangible book value (X) | 0.79 | ||||
| Free float (%) | 99.95 | ||||
| Share capital distribution by type of shareholder | |||||
| September 2023 | |||||
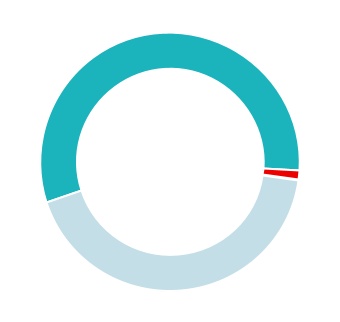
| Institutions | |||||
| 57.22% | |||||
| Board * | |||||
| 1.15% | |||||
| Retail | |||||
| 41.63% | |||||
* Shares owned or represented by directors.
| 52 | | January - September 2023 | ||||||
2023 A P P E N D I X
January - September 2023 | | 53 | ||||||
Business model | ||||||||||||||||||||||||||
| Group financial information | ||||||||||||||||||||||||||
| Net fee income. Consolidated | ||||||||||||||||||||
| EUR million | ||||||||||||||||||||
| Q3'23 | Q2'23 | Change (%) | 9M'23 | 9M'22 | Change (%) | |||||||||||||||
| Fees from services | 1,828 | 1,747 | 4.6 | 5,419 | 5,140 | 5.4 | ||||||||||||||
| Wealth management and marketing of customer funds | 1,026 | 1,032 | (0.6) | 2,982 | 2,991 | (0.3) | ||||||||||||||
| Securities and custody | 265 | 281 | (5.7) | 821 | 736 | 11.5 | ||||||||||||||
| Net fee income | 3,119 | 3,060 | 1.9 | 9,222 | 8,867 | 4.0 | ||||||||||||||
| Underlying operating expenses. Consolidated | ||||||||||||||||||||
| EUR million | ||||||||||||||||||||
| Q3'23 | Q2'23 | Change (%) | 9M'23 | 9M'22 | Change (%) | |||||||||||||||
| Staff costs | 3,477 | 3,358 | 3.5 | 10,080 | 9,125 | 10.5 | ||||||||||||||
| Other general administrative expenses | 2,206 | 2,159 | 2.2 | 6,476 | 6,235 | 3.9 | ||||||||||||||
| Information technology | 614 | 605 | 1.5 | 1,861 | 1,823 | 2.1 | ||||||||||||||
| Communications | 107 | 105 | 1.9 | 315 | 311 | 1.3 | ||||||||||||||
| Advertising | 158 | 163 | (3.1) | 457 | 407 | 12.3 | ||||||||||||||
| Buildings and premises | 192 | 196 | (2.0) | 565 | 557 | 1.4 | ||||||||||||||
| Printed and office material | 24 | 27 | (11.1) | 71 | 70 | 1.4 | ||||||||||||||
| Taxes (other than tax on profits) | 147 | 146 | 0.7 | 442 | 427 | 3.5 | ||||||||||||||
| Other expenses | 964 | 917 | 5.1 | 2,765 | 2,640 | 4.7 | ||||||||||||||
| Administrative expenses | 5,683 | 5,517 | 3.0 | 16,556 | 15,360 | 7.8 | ||||||||||||||
| Depreciation and amortization | 799 | 817 | (2.2) | 2,405 | 2,235 | 7.6 | ||||||||||||||
| Operating expenses | 6,482 | 6,334 | 2.3 | 18,961 | 17,595 | 7.8 | ||||||||||||||
| Operating means. Consolidated | |||||||||||||||||||||||
| Employees | Branches | ||||||||||||||||||||||
| Sep-23 | Sep-22 | Change | Sep-23 | Sep-22 | Change | ||||||||||||||||||
| Europe | 67,151 | 64,925 | 2,226 | 3,095 | 3,163 | (68) | |||||||||||||||||
| Spain | 26,819 | 26,674 | 145 | 1,881 | 1,914 | (33) | |||||||||||||||||
| United Kingdom | 22,204 | 20,818 | 1,386 | 444 | 449 | (5) | |||||||||||||||||
| Portugal | 4,982 | 4,953 | 29 | 376 | 385 | (9) | |||||||||||||||||
| Poland | 10,721 | 10,502 | 219 | 386 | 407 | (21) | |||||||||||||||||
| Other | 2,425 | 1,978 | 447 | 8 | 8 | — | |||||||||||||||||
| North America | 45,834 | 44,500 | 1,334 | 1,789 | 1,852 | (63) | |||||||||||||||||
| US | 13,971 | 14,705 | (734) | 420 | 484 | (64) | |||||||||||||||||
| Mexico | 30,704 | 28,783 | 1,921 | 1,369 | 1,368 | 1 | |||||||||||||||||
| Other | 1,159 | 1,012 | 147 | — | — | — | |||||||||||||||||
| South America | 80,497 | 76,028 | 4,469 | 3,407 | 3,754 | (347) | |||||||||||||||||
| Brazil | 57,722 | 53,699 | 4,023 | 2,662 | 2,903 | (241) | |||||||||||||||||
| Chile | 9,828 | 9,798 | 30 | 249 | 301 | (52) | |||||||||||||||||
| Argentina | 8,168 | 8,452 | (284) | 337 | 403 | (66) | |||||||||||||||||
| Other | 4,779 | 4,079 | 700 | 159 | 147 | 12 | |||||||||||||||||
| Digital Consumer Bank | 16,806 | 16,066 | 740 | 361 | 365 | (4) | |||||||||||||||||
| Corporate Centre | 1,931 | 1,857 | 74 | ||||||||||||||||||||
| Total Group | 212,219 | 203,376 | 8,843 | 8,652 | 9,134 | (482) | |||||||||||||||||
.
| Underlying net loan-loss provisions. Consolidated | ||||||||||||||||||||
| EUR million | ||||||||||||||||||||
| Q3'23 | Q2'23 | Change (%) | 9M'23 | 9M'22 | Change (%) | |||||||||||||||
| Non-performing loans | 3,589 | 3,412 | 5.2 | 10,224 | 8,490 | 20.4 | ||||||||||||||
| Country-risk | — | 1 | (100.0) | — | — | — | ||||||||||||||
| Recovery of written-off assets | (323) | (515) | (37.3) | (1,187) | (999) | 18.8 | ||||||||||||||
| Net loan-loss provisions | 3,266 | 2,898 | 12.7 | 9,037 | 7,491 | 20.6 | ||||||||||||||
| 54 | | January - September 2023 | ||||||
Business model | ||||||||||||||||||||||||||
| Group financial information | ||||||||||||||||||||||||||
| Loans and advances to customers. Consolidated | |||||||||||||||||
| EUR million | |||||||||||||||||
| Change | |||||||||||||||||
| Sep-23 | Sep-22 | Absolute | % | Dec-22 | |||||||||||||
| Commercial bills | 49,592 | 55,936 | (6,344) | (11.3) | 56,688 | ||||||||||||
| Secured loans | 561,610 | 576,932 | (15,322) | (2.7) | 565,609 | ||||||||||||
| Other term loans | 297,746 | 300,343 | (2,597) | (0.9) | 290,031 | ||||||||||||
| Finance leases | 37,725 | 38,998 | (1,273) | (3.3) | 39,833 | ||||||||||||
| Receivable on demand | 12,650 | 12,128 | 522 | 4.3 | 11,435 | ||||||||||||
| Credit cards receivable | 23,876 | 22,394 | 1,482 | 6.6 | 22,704 | ||||||||||||
| Impaired assets | 33,971 | 33,727 | 244 | 0.7 | 32,888 | ||||||||||||
| Gross loans and advances to customers (excl. reverse repos) | 1,017,170 | 1,040,458 | (23,288) | (2.2) | 1,019,188 | ||||||||||||
| Reverse repos | 45,244 | 51,093 | (5,849) | (11.4) | 39,500 | ||||||||||||
| Gross loans and advances to customers | 1,062,414 | 1,091,551 | (29,137) | (2.7) | 1,058,688 | ||||||||||||
| Loan-loss allowances | 23,242 | 24,085 | (843) | (3.5) | 22,684 | ||||||||||||
| Loans and advances to customers | 1,039,172 | 1,067,466 | (28,294) | (2.7) | 1,036,004 | ||||||||||||
| Total funds. Consolidated | |||||||||||||||||
| EUR million | |||||||||||||||||
| Change | |||||||||||||||||
| Sep-23 | Sep-22 | Absolute | % | Dec-22 | |||||||||||||
| Demand deposits | 661,279 | 716,428 | (55,149) | (7.7) | 710,232 | ||||||||||||
| Time deposits | 294,952 | 211,002 | 83,950 | 39.8 | 236,099 | ||||||||||||
| Mutual funds | 203,801 | 185,855 | 17,946 | 9.7 | 184,054 | ||||||||||||
| Customer funds | 1,160,032 | 1,113,285 | 46,747 | 4.2 | 1,130,385 | ||||||||||||
| Pension funds | 14,149 | 13,840 | 309 | 2.2 | 14,021 | ||||||||||||
| Managed portfolios | 35,712 | 33,053 | 2,659 | 8.0 | 32,184 | ||||||||||||
| Repos | 78,654 | 65,635 | 13,019 | 19.8 | 63,391 | ||||||||||||
| Total funds | 1,288,547 | 1,225,813 | 62,734 | 5.1 | 1,239,981 | ||||||||||||
Eligible capital (phased-in) 1. Consolidated | |||||||||||||||||
| EUR million | |||||||||||||||||
| Change | |||||||||||||||||
| Sep-23 | Sep-22 | Absolute | % | Dec-22 | |||||||||||||
| Capital stock and reserves | 121,503 | 117,231 | 4,272 | 3.6 | 116,956 | ||||||||||||
| Attributable profit | 8,143 | 7,316 | 827 | 11.3 | 9,605 | ||||||||||||
| Dividends | (2,036) | (1,463) | (573) | 39.1 | (1,921) | ||||||||||||
| Other retained earnings | (32,937) | (31,705) | (1,232) | 3.9 | (35,068) | ||||||||||||
| Minority interests | 7,183 | 7,289 | (105) | (1.4) | 7,416 | ||||||||||||
| Goodwill and intangible assets | (18,046) | (17,464) | (582) | 3.3 | (17,182) | ||||||||||||
| Other deductions | (6,153) | (5,705) | (447) | 7.8 | (5,604) | ||||||||||||
| Core CET1 | 77,658 | 75,499 | 2,159 | 2.9 | 74,202 | ||||||||||||
| Preferred shares and other eligible tier 1 | 8,933 | 9,015 | (82) | (0.9) | 8,831 | ||||||||||||
| Tier 1 | 86,591 | 84,513 | 2,077 | 2.5 | 83,033 | ||||||||||||
| Generic funds and eligible tier 2 instruments | 16,026 | 15,260 | 766 | 5.0 | 14,359 | ||||||||||||
| Eligible capital | 102,617 | 99,773 | 2,844 | 2.9 | 97,392 | ||||||||||||
| Risk-weighted assets | 629,012 | 616,738 | 12,273 | 2.0 | 609,266 | ||||||||||||
| CET1 capital ratio | 12.3 | 12.2 | 0.1 | 12.2 | |||||||||||||
| Tier 1 capital ratio | 13.8 | 13.7 | 0.1 | 13.6 | |||||||||||||
| Total capital ratio | 16.3 | 16.2 | 0.1 | 16.0 | |||||||||||||
1. The phased-in ratio includes the transitory treatment of IFRS 9, calculated in accordance with article 473 bis of the Capital Requirements Regulation (CRR2) and subsequent modifications introduced by Regulation 2020/873 of the European Union. Total phased-in capital ratios include the transitory treatment according to chapter 4, title 1, part 10 of the CRR2.
January - September 2023 | | 55 | ||||||
Business model | ||||||||||||||||||||||||||
| Financial information by segment | ||||||||||||||||||||||||||
| EUROPE | |||||||||||||||||||||||
| EUR million | |||||||||||||||||||||||
| / | Q2'23 | / | 9M'22 | ||||||||||||||||||||
| Underlying income statement | Q3'23 | % | % excl. FX | 9M'23 | % | % excl. FX | |||||||||||||||||
| Net interest income | 4,222 | 6.4 | 5.9 | 11,787 | 31.0 | 32.1 | |||||||||||||||||
| Net fee income | 1,084 | 0.7 | 0.5 | 3,328 | (3.3) | (3.2) | |||||||||||||||||
Gains (losses) on financial transactions 1 | 367 | 182.6 | 183.1 | 844 | 41.1 | 41.1 | |||||||||||||||||
| Other operating income | 91 | (23.3) | (23.6) | 269 | 14.4 | 15.6 | |||||||||||||||||
| Total income | 5,765 | 8.9 | 8.5 | 16,228 | 22.3 | 23.0 | |||||||||||||||||
| Administrative expenses and amortizations | (2,291) | 3.4 | 2.9 | (6,673) | 6.0 | 6.8 | |||||||||||||||||
| Net operating income | 3,474 | 12.9 | 12.5 | 9,555 | 37.0 | 37.6 | |||||||||||||||||
| Net loan-loss provisions | (662) | 2.4 | 2.0 | (1,951) | 10.8 | 10.9 | |||||||||||||||||
| Other gains (losses) and provisions | (361) | (7.2) | (7.6) | (1,266) | 11.0 | 10.8 | |||||||||||||||||
| Profit before tax | 2,451 | 20.0 | 19.6 | 6,339 | 55.5 | 56.8 | |||||||||||||||||
| Tax on profit | (698) | 13.7 | 13.3 | (1,889) | 67.9 | 69.1 | |||||||||||||||||
| Profit from continuing operations | 1,753 | 22.8 | 22.3 | 4,450 | 50.8 | 52.1 | |||||||||||||||||
| Net profit from discontinued operations | — | — | — | — | — | — | |||||||||||||||||
| Consolidated profit | 1,753 | 22.8 | 22.3 | 4,450 | 50.8 | 52.1 | |||||||||||||||||
| Non-controlling interests | (113) | 39.1 | 38.6 | (274) | 138.8 | 134.3 | |||||||||||||||||
| Profit attributable to the parent | 1,640 | 21.8 | 21.3 | 4,176 | 47.2 | 48.7 | |||||||||||||||||
| Balance sheet | |||||||||||||||||||||||
| Loans and advances to customers | 571,470 | (1.8) | (1.2) | 571,470 | (6.1) | (6.7) | |||||||||||||||||
| Cash, central banks and credit institutions | 202,956 | 3.8 | 4.3 | 202,956 | (18.5) | (18.9) | |||||||||||||||||
| Debt instruments | 107,734 | 11.2 | 11.8 | 107,734 | 58.6 | 57.3 | |||||||||||||||||
| Other financial assets | 50,633 | (1.1) | (1.1) | 50,633 | (7.0) | (6.7) | |||||||||||||||||
| Other asset accounts | 26,590 | 5.7 | 5.9 | 26,590 | (5.7) | (5.9) | |||||||||||||||||
| Total assets | 959,384 | 0.9 | 1.4 | 959,384 | (4.8) | (5.3) | |||||||||||||||||
| Customer deposits | 636,381 | 1.1 | 1.8 | 636,381 | 2.2 | 1.5 | |||||||||||||||||
| Central banks and credit institutions | 111,882 | (3.5) | (3.2) | 111,882 | (37.6) | (37.6) | |||||||||||||||||
| Marketable debt securities | 79,116 | 4.8 | 5.5 | 79,116 | 8.7 | 7.8 | |||||||||||||||||
| Other financial liabilities | 61,773 | 3.9 | 4.0 | 61,773 | (1.7) | (1.6) | |||||||||||||||||
| Other liabilities accounts | 28,126 | (3.3) | (3.1) | 28,126 | 3.6 | 3.2 | |||||||||||||||||
| Total liabilities | 917,277 | 0.9 | 1.4 | 917,277 | (4.9) | (5.4) | |||||||||||||||||
| Total equity | 42,107 | 0.8 | 1.6 | 42,107 | (3.4) | (4.0) | |||||||||||||||||
| Memorandum items: | |||||||||||||||||||||||
Gross loans and advances to customers 2 | 552,358 | (2.1) | (1.4) | 552,358 | (6.4) | (7.0) | |||||||||||||||||
| Customer funds | 710,106 | 1.0 | 1.6 | 710,106 | 1.6 | 1.0 | |||||||||||||||||
Customer deposits 3 | 608,921 | 0.9 | 1.5 | 608,921 | 0.5 | (0.2) | |||||||||||||||||
| Mutual funds | 101,185 | 1.6 | 1.7 | 101,185 | 9.0 | 8.8 | |||||||||||||||||
| Ratios (%), operating means and customers | |||||||||||||||||||||||
| RoTE | 17.28 | 3.07 | 14.77 | 5.63 | |||||||||||||||||||
| Efficiency ratio | 39.7 | (2.1) | 41.1 | (6.3) | |||||||||||||||||||
| NPL ratio | 2.32 | (0.04) | 2.32 | (0.26) | |||||||||||||||||||
| NPL coverage ratio | 51.1 | 0.0 | 51.1 | 1.4 | |||||||||||||||||||
| Number of employees | 67,151 | 0.5 | 67,151 | 3.4 | |||||||||||||||||||
| Number of branches | 3,095 | (0.3) | 3,095 | (2.1) | |||||||||||||||||||
| Number of total customers (thousands) | 46,374 | 0.9 | 46,374 | 2.1 | |||||||||||||||||||
| Number of active customers (thousands) | 28,534 | 0.6 | 28,534 | 2.2 | |||||||||||||||||||
1. Includes exchange differences.
2. Excluding reverse repos.
3. Excluding repos.
| 56 | | January - September 2023 | ||||||
Business model | ||||||||||||||||||||||||||
| Financial information by segment | ||||||||||||||||||||||||||
| Spain | |||||||||||||||||
| EUR million | |||||||||||||||||
| / Q2'23 | / 9M'22 | ||||||||||||||||
| Underlying income statement | Q3'23 | % | 9M'23 | % | |||||||||||||
| Net interest income | 1,741 | 2.4 | 4,903 | 56.4 | |||||||||||||
| Net fee income | 635 | (4.0) | 2,047 | (5.7) | |||||||||||||
Gains (losses) on financial transactions 1 | 225 | 213.1 | 557 | 45.6 | |||||||||||||
| Other operating income | 77 | (41.4) | 284 | (23.3) | |||||||||||||
| Total income | 2,678 | 4.4 | 7,791 | 28.6 | |||||||||||||
| Administrative expenses and amortizations | (1,088) | 6.1 | (3,127) | 6.3 | |||||||||||||
| Net operating income | 1,591 | 3.3 | 4,664 | 49.6 | |||||||||||||
| Net loan-loss provisions | (377) | (3.1) | (1,180) | (3.9) | |||||||||||||
| Other gains (losses) and provisions | (201) | (5.0) | (792) | 101.9 | |||||||||||||
| Profit before tax | 1,013 | 7.7 | 2,692 | 79.8 | |||||||||||||
| Tax on profit | (291) | 6.0 | (838) | 113.2 | |||||||||||||
| Profit from continuing operations | 722 | 8.5 | 1,854 | 67.9 | |||||||||||||
| Net profit from discontinued operations | — | — | — | — | |||||||||||||
| Consolidated profit | 722 | 8.5 | 1,854 | 67.9 | |||||||||||||
| Non-controlling interests | 0 | — | 0 | (96.5) | |||||||||||||
| Profit attributable to the parent | 722 | 8.4 | 1,854 | 68.0 | |||||||||||||
| Balance sheet | |||||||||||||||||
| Loans and advances to customers | 242,251 | (1.6) | 242,251 | (9.9) | |||||||||||||
| Cash, central banks and credit institutions | 121,709 | 8.8 | 121,709 | (22.4) | |||||||||||||
| Debt instruments | 63,389 | 9.7 | 63,389 | 81.7 | |||||||||||||
| Other financial assets | 46,483 | 0.4 | 46,483 | (4.2) | |||||||||||||
| Other asset accounts | 17,938 | 2.2 | 17,938 | (3.0) | |||||||||||||
| Total assets | 491,769 | 2.5 | 491,769 | (6.8) | |||||||||||||
| Customer deposits | 322,432 | 2.9 | 322,432 | 2.3 | |||||||||||||
| Central banks and credit institutions | 50,404 | 4.2 | 50,404 | (46.5) | |||||||||||||
| Marketable debt securities | 27,767 | 2.4 | 27,767 | 16.5 | |||||||||||||
| Other financial liabilities | 54,033 | 2.2 | 54,033 | (2.0) | |||||||||||||
| Other liabilities accounts | 20,169 | (2.8) | 20,169 | 6.4 | |||||||||||||
| Total liabilities | 474,806 | 2.7 | 474,806 | (6.4) | |||||||||||||
| Total equity | 16,963 | (0.9) | 16,963 | (16.5) | |||||||||||||
| Memorandum items: | |||||||||||||||||
Gross loans and advances to customers 2 | 231,179 | (2.7) | 231,179 | (10.2) | |||||||||||||
| Customer funds | 381,026 | 2.0 | 381,026 | 0.6 | |||||||||||||
Customer deposits 3 | 305,745 | 2.3 | 305,745 | (0.5) | |||||||||||||
| Mutual funds | 75,281 | 0.4 | 75,281 | 5.3 | |||||||||||||
| Ratios (%), operating means and customers | |||||||||||||||||
| RoTE | 17.42 | 1.64 | 14.75 | 7.29 | |||||||||||||
| Efficiency ratio | 40.6 | 0.6 | 40.1 | (8.4) | |||||||||||||
| NPL ratio | 3.06 | (0.05) | 3.06 | (0.62) | |||||||||||||
| NPL coverage ratio | 51.2 | 0.5 | 51.2 | 1.8 | |||||||||||||
| Number of employees | 26,819 | 0.5 | 26,819 | 0.5 | |||||||||||||
| Number of branches | 1,881 | (0.2) | 1,881 | (1.7) | |||||||||||||
| Number of total customers (thousands) | 14,891 | 1.4 | 14,891 | 5.3 | |||||||||||||
| Number of active customers (thousands) | 8,229 | 1.2 | 8,229 | 6.0 | |||||||||||||
1. Includes exchange differences.
2. Excluding reverse repos.
3. Excluding repos.
January - September 2023 | | 57 | ||||||
Business model | ||||||||||||||||||||||||||
| Financial information by segment | ||||||||||||||||||||||||||
| United Kingdom | |||||||||||||||||||||||
| EUR million | |||||||||||||||||||||||
| / | Q2'23 | / | 9M'22 | ||||||||||||||||||||
| Underlying income statement | Q3'23 | % | % excl. FX | 9M'23 | % | % excl. FX | |||||||||||||||||
| Net interest income | 1,344 | 3.4 | 2.2 | 3,927 | 6.3 | 9.3 | |||||||||||||||||
| Net fee income | 97 | 14.7 | 13.6 | 264 | (10.6) | (8.1) | |||||||||||||||||
Gains (losses) on financial transactions 1 | 42 | 533.6 | 529.1 | 49 | 24.0 | 27.4 | |||||||||||||||||
| Other operating income | 4 | — | — | 5 | 257.1 | 267.0 | |||||||||||||||||
| Total income | 1,486 | 6.9 | 5.7 | 4,245 | 5.3 | 8.3 | |||||||||||||||||
| Administrative expenses and amortizations | (684) | (0.8) | (2.0) | (2,047) | 1.9 | 4.8 | |||||||||||||||||
| Net operating income | 803 | 14.4 | 13.3 | 2,198 | 8.7 | 11.7 | |||||||||||||||||
| Net loan-loss provisions | (126) | 186.8 | 186.5 | (229) | (2.2) | 0.6 | |||||||||||||||||
| Other gains (losses) and provisions | (92) | 26.6 | 25.5 | (257) | 1.5 | 4.3 | |||||||||||||||||
| Profit before tax | 585 | 0.0 | (1.2) | 1,712 | 11.5 | 14.6 | |||||||||||||||||
| Tax on profit | (160) | (1.5) | (2.7) | (469) | 18.0 | 21.3 | |||||||||||||||||
| Profit from continuing operations | 425 | 0.5 | (0.6) | 1,243 | 9.2 | 12.3 | |||||||||||||||||
| Net profit from discontinued operations | — | — | — | — | — | — | |||||||||||||||||
| Consolidated profit | 425 | 0.5 | (0.6) | 1,243 | 9.2 | 12.3 | |||||||||||||||||
| Non-controlling interests | — | — | — | — | — | — | |||||||||||||||||
| Profit attributable to the parent | 425 | 0.5 | (0.6) | 1,243 | 9.2 | 12.3 | |||||||||||||||||
| Balance sheet | |||||||||||||||||||||||
| Loans and advances to customers | 248,059 | (2.2) | (1.2) | 248,059 | (3.4) | (4.7) | |||||||||||||||||
| Cash, central banks and credit institutions | 65,857 | 1.8 | 2.9 | 65,857 | (3.9) | (5.2) | |||||||||||||||||
| Debt instruments | 9,568 | 9.8 | 11.0 | 9,568 | 50.8 | 48.9 | |||||||||||||||||
| Other financial assets | 356 | (66.9) | (66.6) | 356 | (59.3) | (59.8) | |||||||||||||||||
| Other asset accounts | 3,300 | 39.7 | 41.2 | 3,300 | (21.6) | (22.6) | |||||||||||||||||
| Total assets | 327,140 | (1.0) | 0.0 | 327,140 | (2.9) | (4.1) | |||||||||||||||||
| Customer deposits | 231,085 | (1.1) | 0.0 | 231,085 | 2.3 | 1.0 | |||||||||||||||||
| Central banks and credit institutions | 32,753 | (8.8) | (7.8) | 32,753 | (32.4) | (33.3) | |||||||||||||||||
| Marketable debt securities | 45,304 | 4.7 | 5.8 | 45,304 | 1.6 | 0.3 | |||||||||||||||||
| Other financial liabilities | 4,029 | 29.6 | 31.0 | 4,029 | 24.9 | 23.3 | |||||||||||||||||
| Other liabilities accounts | 1,176 | (41.5) | (40.9) | 1,176 | (23.2) | (24.2) | |||||||||||||||||
| Total liabilities | 314,347 | (1.1) | (0.1) | 314,347 | (2.9) | (4.1) | |||||||||||||||||
| Total equity | 12,794 | 1.7 | 2.8 | 12,794 | (3.3) | (4.5) | |||||||||||||||||
| Memorandum items: | |||||||||||||||||||||||
Gross loans and advances to customers 2 | 238,316 | (1.6) | (0.5) | 238,316 | (4.1) | (5.3) | |||||||||||||||||
| Customer funds | 227,538 | (1.0) | 0.0 | 227,538 | 1.4 | 0.1 | |||||||||||||||||
Customer deposits 3 | 220,487 | (1.0) | 0.1 | 220,487 | 1.4 | 0.1 | |||||||||||||||||
| Mutual funds | 7,051 | (2.5) | (1.5) | 7,051 | 1.9 | 0.6 | |||||||||||||||||
| Ratios (%), operating means and customers | |||||||||||||||||||||||
| RoTE | 14.26 | 0.08 | 14.00 | 2.69 | |||||||||||||||||||
| Efficiency ratio | 46.0 | (3.6) | 48.2 | (1.6) | |||||||||||||||||||
| NPL ratio | 1.42 | 0.10 | 1.42 | 0.26 | |||||||||||||||||||
| NPL coverage ratio | 31.9 | 0.0 | 31.9 | (0.5) | |||||||||||||||||||
| Number of employees | 22,204 | 0.2 | 22,204 | 6.7 | |||||||||||||||||||
| Number of branches | 444 | (0.2) | 444 | (1.1) | |||||||||||||||||||
| Number of total customers (thousands) | 22,506 | 0.6 | 22,506 | 0.8 | |||||||||||||||||||
| Number of active customers (thousands) | 13,906 | 0.2 | 13,906 | (0.5) | |||||||||||||||||||
1. Includes exchange differences.
2. Excluding reverse repos.
3. Excluding repos.
| 58 | | January - September 2023 | ||||||
Business model | ||||||||||||||||||||||||||
| Financial information by segment | ||||||||||||||||||||||||||
| Portugal | |||||||||||||||||
| EUR million | |||||||||||||||||
| / Q2'23 | / 9M'22 | ||||||||||||||||
| Underlying income statement | Q3'23 | % | 9M'23 | % | |||||||||||||
| Net interest income | 439 | 40.0 | 1,014 | 96.6 | |||||||||||||
| Net fee income | 117 | 5.3 | 352 | (3.7) | |||||||||||||
Gains (losses) on financial transactions 1 | 8 | 175.2 | 20 | (62.6) | |||||||||||||
| Other operating income | 10 | 0.0 | 12 | 0.0 | |||||||||||||
| Total income | 575 | 37.2 | 1,398 | 49.9 | |||||||||||||
| Administrative expenses and amortizations | (137) | 3.2 | (401) | 6.7 | |||||||||||||
| Net operating income | 438 | 52.9 | 997 | 79.1 | |||||||||||||
| Net loan-loss provisions | (25) | 20.7 | (59) | 532.4 | |||||||||||||
| Other gains (losses) and provisions | (7) | (84.0) | (48) | 103.6 | |||||||||||||
| Profit before tax | 406 | 81.9 | 890 | 70.0 | |||||||||||||
| Tax on profit | (123) | 50.5 | (285) | 75.5 | |||||||||||||
| Profit from continuing operations | 284 | 99.9 | 606 | 67.5 | |||||||||||||
| Net profit from discontinued operations | — | — | — | — | |||||||||||||
| Consolidated profit | 284 | 99.9 | 606 | 67.5 | |||||||||||||
| Non-controlling interests | (1) | 68.1 | (1) | 30.9 | |||||||||||||
| Profit attributable to the parent | 283 | 100.0 | 604 | 67.6 | |||||||||||||
| Balance sheet | |||||||||||||||||
| Loans and advances to customers | 37,027 | (2.0) | 37,027 | (6.6) | |||||||||||||
| Cash, central banks and credit institutions | 6,433 | (30.6) | 6,433 | (42.5) | |||||||||||||
| Debt instruments | 11,779 | 49.0 | 11,779 | 51.4 | |||||||||||||
| Other financial assets | 1,111 | (2.7) | 1,111 | (16.4) | |||||||||||||
| Other asset accounts | 1,238 | (9.8) | 1,238 | (19.7) | |||||||||||||
| Total assets | 57,587 | 0.2 | 57,587 | (6.3) | |||||||||||||
| Customer deposits | 35,524 | (2.9) | 35,524 | (10.0) | |||||||||||||
| Central banks and credit institutions | 8,545 | 0.2 | 8,545 | (17.4) | |||||||||||||
| Marketable debt securities | 4,893 | 22.8 | 4,893 | 46.7 | |||||||||||||
| Other financial liabilities | 376 | 21.9 | 376 | (15.4) | |||||||||||||
| Other liabilities accounts | 4,581 | 0.9 | 4,581 | (2.6) | |||||||||||||
| Total liabilities | 53,919 | (0.1) | 53,919 | (7.5) | |||||||||||||
| Total equity | 3,668 | 5.0 | 3,668 | 15.6 | |||||||||||||
| Memorandum items: | |||||||||||||||||
Gross loans and advances to customers 2 | 37,811 | (2.4) | 37,811 | (6.8) | |||||||||||||
| Customer funds | 39,596 | (2.4) | 39,596 | (8.3) | |||||||||||||
Customer deposits 3 | 35,524 | (2.9) | 35,524 | (10.0) | |||||||||||||
| Mutual funds | 4,072 | 3.0 | 4,072 | 10.3 | |||||||||||||
| Ratios (%), operating means and customers | |||||||||||||||||
| RoTE | 31.56 | 15.03 | 23.12 | 9.93 | |||||||||||||
| Efficiency ratio | 23.8 | (7.8) | 28.7 | (11.6) | |||||||||||||
| NPL ratio | 2.48 | (0.61) | 2.48 | (0.55) | |||||||||||||
| NPL coverage ratio | 84.6 | 2.8 | 84.6 | 8.3 | |||||||||||||
| Number of employees | 4,982 | 0.1 | 4,982 | 0.6 | |||||||||||||
| Number of branches | 376 | (0.3) | 376 | (2.3) | |||||||||||||
| Number of total customers (thousands) | 2,903 | 0.5 | 2,903 | (4.6) | |||||||||||||
| Number of active customers (thousands) | 1,811 | 0.6 | 1,811 | 3.5 | |||||||||||||
1. Includes exchange differences.
2. Excluding reverse repos.
3. Excluding repos.
January - September 2023 | | 59 | ||||||
Business model | ||||||||||||||||||||||||||
| Financial information by segment | ||||||||||||||||||||||||||
| Poland | |||||||||||||||||||||||
| EUR million | |||||||||||||||||||||||
| / | Q2'23 | / | 9M'22 | ||||||||||||||||||||
| Underlying income statement | Q3'23 | % | % excl. FX | 9M'23 | % | % excl. FX | |||||||||||||||||
| Net interest income | 662 | 6.2 | 5.3 | 1,871 | 31.3 | 28.8 | |||||||||||||||||
| Net fee income | 148 | 2.7 | 1.9 | 437 | 8.3 | 6.2 | |||||||||||||||||
Gains (losses) on financial transactions 1 | 31 | 640.5 | 722.3 | 62 | (24.7) | (26.2) | |||||||||||||||||
| Other operating income | (6) | — | — | (25) | (80.6) | (81.0) | |||||||||||||||||
| Total income | 835 | 6.9 | 6.0 | 2,344 | 31.7 | 29.2 | |||||||||||||||||
| Administrative expenses and amortizations | (217) | 4.8 | 3.9 | (622) | 22.0 | 19.7 | |||||||||||||||||
| Net operating income | 617 | 7.7 | 6.8 | 1,722 | 35.6 | 33.0 | |||||||||||||||||
| Net loan-loss provisions | (132) | (30.9) | (32.2) | (475) | 63.9 | 60.8 | |||||||||||||||||
| Other gains (losses) and provisions | (60) | (1.8) | (3.0) | (166) | (64.7) | (65.4) | |||||||||||||||||
| Profit before tax | 425 | 32.5 | 32.0 | 1,082 | 111.3 | 107.2 | |||||||||||||||||
| Tax on profit | (107) | 25.5 | 25.0 | (280) | 64.4 | 61.3 | |||||||||||||||||
| Profit from continuing operations | 319 | 35.0 | 34.6 | 802 | 134.6 | 130.1 | |||||||||||||||||
| Net profit from discontinued operations | — | — | — | — | — | — | |||||||||||||||||
| Consolidated profit | 319 | 35.0 | 34.6 | 802 | 134.6 | 130.1 | |||||||||||||||||
| Non-controlling interests | (111) | 36.4 | 35.8 | (273) | 142.4 | 137.7 | |||||||||||||||||
| Profit attributable to the parent | 208 | 34.3 | 33.9 | 529 | 130.8 | 126.4 | |||||||||||||||||
| Balance sheet | |||||||||||||||||||||||
| Loans and advances to customers | 31,375 | (2.4) | 1.7 | 31,375 | 7.1 | 2.2 | |||||||||||||||||
| Cash, central banks and credit institutions | 9,264 | 4.9 | 9.3 | 9,264 | 13.3 | 8.1 | |||||||||||||||||
| Debt instruments | 14,323 | 7.4 | 11.8 | 14,323 | 25.0 | 19.2 | |||||||||||||||||
| Other financial assets | 613 | (0.7) | 3.5 | 613 | (35.8) | (38.7) | |||||||||||||||||
| Other asset accounts | 1,897 | 7.9 | 12.4 | 1,897 | 8.4 | 3.4 | |||||||||||||||||
| Total assets | 57,473 | 1.4 | 5.6 | 57,473 | 11.3 | 6.2 | |||||||||||||||||
| Customer deposits | 42,227 | 0.2 | 4.4 | 42,227 | 15.5 | 10.2 | |||||||||||||||||
| Central banks and credit institutions | 4,614 | 1.4 | 5.7 | 4,614 | (29.1) | (32.4) | |||||||||||||||||
| Marketable debt securities | 1,152 | 1.5 | 5.7 | 1,152 | 12.4 | 7.2 | |||||||||||||||||
| Other financial liabilities | 1,396 | 13.4 | 18.1 | 1,396 | 10.1 | 5.0 | |||||||||||||||||
| Other liabilities accounts | 1,786 | 20.8 | 25.8 | 1,786 | 17.0 | 11.6 | |||||||||||||||||
| Total liabilities | 51,175 | 1.3 | 5.5 | 51,175 | 9.2 | 4.1 | |||||||||||||||||
| Total equity | 6,298 | 2.4 | 6.7 | 6,298 | 32.6 | 26.5 | |||||||||||||||||
| Memorandum items: | |||||||||||||||||||||||
Gross loans and advances to customers 2 | 32,273 | (2.2) | 1.9 | 32,273 | 7.3 | 2.4 | |||||||||||||||||
| Customer funds | 46,347 | 0.5 | 4.7 | 46,347 | 17.3 | 11.9 | |||||||||||||||||
Customer deposits 3 | 42,227 | 0.2 | 4.4 | 42,227 | 15.5 | 10.2 | |||||||||||||||||
| Mutual funds | 4,120 | 3.5 | 7.8 | 4,120 | 39.1 | 32.8 | |||||||||||||||||
| Ratios (%), operating means and customers | |||||||||||||||||||||||
| RoTE | 20.79 | 4.39 | 18.94 | 8.81 | |||||||||||||||||||
| Efficiency ratio | 26.0 | (0.5) | 26.5 | (2.1) | |||||||||||||||||||
| NPL ratio | 3.63 | (0.11) | 3.63 | 0.00 | |||||||||||||||||||
| NPL coverage ratio | 76.5 | 2.5 | 76.5 | 1.7 | |||||||||||||||||||
| Number of employees | 10,721 | 0.4 | 10,721 | 2.1 | |||||||||||||||||||
| Number of branches | 386 | (0.8) | 386 | (5.2) | |||||||||||||||||||
| Number of total customers (thousands) | 5,858 | 1.2 | 5,858 | 3.3 | |||||||||||||||||||
| Number of active customers (thousands) | 4,427 | 1.0 | 4,427 | 3.5 | |||||||||||||||||||
1. Includes exchange differences.
2. Excluding reverse repos.
3. Excluding repos.
| 60 | | January - September 2023 | ||||||
Business model | ||||||||||||||||||||||||||
| Financial information by segment | ||||||||||||||||||||||||||
| Other Europe | ||||||||||||||||||||||||||
| EUR million | ||||||||||||||||||||||||||
| / | Q2'23 | / | 9M'22 | |||||||||||||||||||||||
| Underlying income statement | Q3'23 | % | % excl. FX | 9M'23 | % | % excl. FX | ||||||||||||||||||||
| Net interest income | 36 | 19.8 | 19.5 | 73 | (68.2) | (67.9) | ||||||||||||||||||||
| Net fee income | 87 | 16.0 | 16.0 | 228 | 11.1 | 12.1 | ||||||||||||||||||||
Gains (losses) on financial transactions 1 | 61 | 38.1 | 38.0 | 157 | 284.4 | 292.6 | ||||||||||||||||||||
| Other operating income | 7 | — | — | (7) | 98.4 | 108.0 | ||||||||||||||||||||
| Total income | 191 | 39.3 | 39.1 | 450 | (4.5) | (3.4) | ||||||||||||||||||||
| Administrative expenses and amortizations | (166) | 2.8 | 2.8 | (476) | 3.1 | 3.9 | ||||||||||||||||||||
| Net operating income | 26 | — | — | (26) | — | — | ||||||||||||||||||||
| Net loan-loss provisions | (3) | 18.2 | 18.9 | (8) | — | — | ||||||||||||||||||||
| Other gains (losses) and provisions | (1) | (11.3) | (11.4) | (3) | 20.5 | 20.4 | ||||||||||||||||||||
| Profit before tax | 22 | — | — | (37) | — | — | ||||||||||||||||||||
| Tax on profit | (19) | 62.3 | 62.0 | (18) | 614.3 | 787.6 | ||||||||||||||||||||
| Profit from continuing operations | 4 | — | — | (55) | — | — | ||||||||||||||||||||
| Net profit from discontinued operations | — | — | — | — | — | — | ||||||||||||||||||||
| Consolidated profit | 4 | — | — | (55) | — | — | ||||||||||||||||||||
| Non-controlling interests | (1) | — | — | 1 | — | — | ||||||||||||||||||||
| Profit attributable to the parent | 3 | — | — | (54) | — | — | ||||||||||||||||||||
| Balance sheet | ||||||||||||||||||||||||||
| Loans and advances to customers | 12,759 | 2.8 | (0.1) | 12,759 | (7.9) | (0.9) | ||||||||||||||||||||
| Cash, central banks and credit institutions | (307) | — | — | (307) | — | — | ||||||||||||||||||||
| Debt instruments | 8,676 | (5.7) | (6.1) | 8,676 | 16.2 | 17.2 | ||||||||||||||||||||
| Other financial assets | 2,071 | (0.4) | (2.9) | 2,071 | (24.3) | (19.1) | ||||||||||||||||||||
| Other asset accounts | 2,217 | 4.4 | 3.0 | 2,217 | 0.3 | 3.9 | ||||||||||||||||||||
| Total assets | 25,415 | (5.1) | (6.8) | 25,415 | (17.1) | (12.7) | ||||||||||||||||||||
| Customer deposits | 5,112 | 40.9 | 36.1 | 5,112 | (8.9) | (2.7) | ||||||||||||||||||||
| Central banks and credit institutions | 15,566 | (16.0) | (17.1) | 15,566 | (21.2) | (17.4) | ||||||||||||||||||||
| Marketable debt securities | — | — | — | — | — | — | ||||||||||||||||||||
| Other financial liabilities | 1,939 | 2.0 | (0.7) | 1,939 | (29.7) | (24.9) | ||||||||||||||||||||
| Other liabilities accounts | 414 | 35.2 | 34.1 | 414 | (4.9) | (4.1) | ||||||||||||||||||||
| Total liabilities | 23,031 | (5.5) | (7.1) | 23,031 | (19.3) | (15.1) | ||||||||||||||||||||
| Total equity | 2,385 | (1.3) | (3.5) | 2,385 | 12.3 | 19.4 | ||||||||||||||||||||
| Memorandum items: | ||||||||||||||||||||||||||
Gross loans and advances to customers 2 | 12,780 | 2.8 | (0.1) | 12,780 | (7.8) | (0.9) | ||||||||||||||||||||
| Customer funds | 15,599 | 20.7 | 18.7 | 15,599 | 19.7 | 23.0 | ||||||||||||||||||||
Customer deposits 3 | 4,938 | 43.0 | 37.9 | 4,938 | (7.6) | (0.9) | ||||||||||||||||||||
| Mutual funds | 10,660 | 12.5 | 11.5 | 10,660 | 38.6 | 38.6 | ||||||||||||||||||||
| Resources | ||||||||||||||||||||||||||
| Number of employees | 2,425 | 4.6 | 2,425 | 22.6 | ||||||||||||||||||||||
1. Includes exchange differences.
2. Excluding reverse repos.
3. Excluding repos.
January - September 2023 | | 61 | ||||||
Business model | ||||||||||||||||||||||||||
| Financial information by segment | ||||||||||||||||||||||||||
| NORTH AMERICA | |||||||||||||||||||||||
| EUR million | |||||||||||||||||||||||
| / | Q2'23 | / | 9M'22 | ||||||||||||||||||||
| Underlying income statement | Q3'23 | % | % excl. FX | 9M'23 | % | % excl. FX | |||||||||||||||||
| Net interest income | 2,602 | 4.8 | 3.2 | 7,533 | 6.1 | 3.0 | |||||||||||||||||
| Net fee income | 560 | 0.9 | (1.4) | 1,637 | 12.9 | 6.6 | |||||||||||||||||
Gains (losses) on financial transactions 1 | 147 | (8.4) | (10.4) | 377 | 202.9 | 203.6 | |||||||||||||||||
| Other operating income | 81 | 6.1 | 6.6 | 261 | (24.3) | (19.8) | |||||||||||||||||
| Total income | 3,391 | 3.5 | 1.8 | 9,807 | 8.7 | 5.5 | |||||||||||||||||
| Administrative expenses and amortizations | (1,648) | 5.6 | 4.1 | (4,707) | 11.1 | 8.0 | |||||||||||||||||
| Net operating income | 1,743 | 1.6 | (0.3) | 5,100 | 6.6 | 3.3 | |||||||||||||||||
| Net loan-loss provisions | (1,077) | 49.2 | 47.4 | (2,608) | 56.6 | 52.6 | |||||||||||||||||
| Other gains (losses) and provisions | (37) | (46.7) | (47.1) | (124) | 11.8 | 2.3 | |||||||||||||||||
| Profit before tax | 629 | (32.0) | (34.1) | 2,368 | (21.2) | (23.8) | |||||||||||||||||
| Tax on profit | (73) | (64.3) | (66.7) | (453) | (35.5) | (37.8) | |||||||||||||||||
| Profit from continuing operations | 555 | (22.8) | (24.8) | 1,915 | (16.8) | (19.5) | |||||||||||||||||
| Net profit from discontinued operations | — | — | — | — | — | — | |||||||||||||||||
| Consolidated profit | 555 | (22.8) | (24.8) | 1,915 | (16.8) | (19.5) | |||||||||||||||||
| Non-controlling interests | (2) | 123.0 | 185.4 | (15) | (51.1) | (56.3) | |||||||||||||||||
| Profit attributable to the parent | 554 | (22.9) | (25.0) | 1,900 | (16.4) | (19.0) | |||||||||||||||||
| Balance sheet | |||||||||||||||||||||||
| Loans and advances to customers | 178,736 | 2.1 | (0.6) | 178,736 | (2.9) | 1.1 | |||||||||||||||||
| Cash, central banks and credit institutions | 41,038 | (2.8) | (5.1) | 41,038 | 2.1 | 1.7 | |||||||||||||||||
| Debt instruments | 50,177 | 1.6 | (0.8) | 50,177 | 12.0 | 12.3 | |||||||||||||||||
| Other financial assets | 13,784 | 6.9 | 4.5 | 13,784 | (18.7) | (19.9) | |||||||||||||||||
| Other asset accounts | 23,749 | 4.6 | 1.8 | 23,749 | (5.5) | (1.0) | |||||||||||||||||
| Total assets | 307,484 | 1.7 | (0.9) | 307,484 | (1.2) | 1.5 | |||||||||||||||||
| Customer deposits | 176,230 | 1.0 | (1.6) | 176,230 | 4.6 | 8.6 | |||||||||||||||||
| Central banks and credit institutions | 38,152 | 2.8 | 0.5 | 38,152 | 4.2 | 1.7 | |||||||||||||||||
| Marketable debt securities | 37,007 | (2.4) | (5.1) | 37,007 | (20.0) | (16.4) | |||||||||||||||||
| Other financial liabilities | 22,778 | 11.6 | 9.0 | 22,778 | (7.3) | (8.1) | |||||||||||||||||
| Other liabilities accounts | 7,130 | 8.8 | 6.2 | 7,130 | (3.8) | (1.5) | |||||||||||||||||
| Total liabilities | 281,297 | 1.8 | (0.9) | 281,297 | (0.7) | 1.9 | |||||||||||||||||
| Total equity | 26,187 | 1.3 | (1.2) | 26,187 | (5.6) | (2.6) | |||||||||||||||||
| Memorandum items: | |||||||||||||||||||||||
Gross loans and advances to customers 2 | 165,443 | 3.4 | 0.7 | 165,443 | 0.4 | 4.1 | |||||||||||||||||
| Customer funds | 171,587 | 2.2 | (0.5) | 171,587 | 4.9 | 7.8 | |||||||||||||||||
Customer deposits 3 | 142,679 | 2.0 | (0.7) | 142,679 | 6.8 | 10.5 | |||||||||||||||||
| Mutual funds | 28,909 | 2.9 | 0.6 | 28,909 | (3.5) | (3.6) | |||||||||||||||||
| Ratios (%), operating means and customers | |||||||||||||||||||||||
| RoTE | 8.98 | (2.71) | 10.37 | (1.17) | |||||||||||||||||||
| Efficiency ratio | 48.6 | 1.0 | 48.0 | 1.0 | |||||||||||||||||||
| NPL ratio | 3.83 | 0.60 | 3.83 | 1.05 | |||||||||||||||||||
| NPL coverage ratio | 78.8 | (11.2) | 78.8 | (23.9) | |||||||||||||||||||
| Number of employees | 45,834 | 0.4 | 45,834 | 3.0 | |||||||||||||||||||
| Number of branches | 1,789 | (1.4) | 1,789 | (3.4) | |||||||||||||||||||
| Number of total customers (thousands) | 25,056 | 0.4 | 25,056 | 1.9 | |||||||||||||||||||
| Number of active customers (thousands) | 14,293 | 1.2 | 14,293 | 1.6 | |||||||||||||||||||
1. Includes exchange differences.
2. Excluding reverse repos.
3. Excluding repos.
| 62 | | January - September 2023 | ||||||
Business model | ||||||||||||||||||||||||||
| Financial information by segment | ||||||||||||||||||||||||||
| United States | |||||||||||||||||||||||
| EUR million | |||||||||||||||||||||||
| / | Q2'23 | / | 9M'22 | ||||||||||||||||||||
| Underlying income statement | Q3'23 | % | % excl. FX | 9M'23 | % | % excl. FX | |||||||||||||||||
| Net interest income | 1,414 | (1.5) | (1.5) | 4,314 | (5.1) | (3.2) | |||||||||||||||||
| Net fee income | 189 | (5.4) | (5.4) | 579 | (1.5) | 0.5 | |||||||||||||||||
Gains (losses) on financial transactions 1 | 100 | 42.9 | 43.0 | 215 | 98.9 | 102.8 | |||||||||||||||||
| Other operating income | 116 | 27.2 | 26.8 | 334 | (21.4) | (19.9) | |||||||||||||||||
| Total income | 1,818 | 1.2 | 1.2 | 5,442 | (4.0) | (2.0) | |||||||||||||||||
| Administrative expenses and amortizations | (915) | 3.2 | 3.2 | (2,714) | 3.0 | 5.1 | |||||||||||||||||
| Net operating income | 903 | (0.8) | (0.8) | 2,728 | (10.0) | (8.2) | |||||||||||||||||
| Net loan-loss provisions | (764) | 74.5 | 73.8 | (1,769) | 59.8 | 63.0 | |||||||||||||||||
| Other gains (losses) and provisions | (21) | (62.1) | (61.7) | (78) | 356.2 | 365.4 | |||||||||||||||||
| Profit before tax | 119 | (71.6) | (71.2) | 881 | (53.8) | (52.9) | |||||||||||||||||
| Tax on profit | 80 | — | — | (16) | (96.2) | (96.1) | |||||||||||||||||
| Profit from continuing operations | 198 | (46.0) | (45.8) | 865 | (41.9) | (40.8) | |||||||||||||||||
| Net profit from discontinued operations | — | — | — | — | — | — | |||||||||||||||||
| Consolidated profit | 198 | (46.0) | (45.8) | 865 | (41.9) | (40.8) | |||||||||||||||||
| Non-controlling interests | — | — | — | — | — | — | |||||||||||||||||
| Profit attributable to the parent | 198 | (46.0) | (45.8) | 865 | (41.9) | (40.8) | |||||||||||||||||
| Balance sheet | |||||||||||||||||||||||
| Loans and advances to customers | 130,594 | 0.8 | (2.2) | 130,594 | (7.0) | 0.3 | |||||||||||||||||
| Cash, central banks and credit institutions | 20,129 | (3.6) | (6.6) | 20,129 | 9.1 | 17.7 | |||||||||||||||||
| Debt instruments | 23,617 | 4.3 | 1.1 | 23,617 | 2.8 | 10.8 | |||||||||||||||||
| Other financial assets | 6,063 | 8.6 | 5.3 | 6,063 | (5.1) | 2.3 | |||||||||||||||||
| Other asset accounts | 17,574 | 2.2 | (0.9) | 17,574 | (12.6) | (5.7) | |||||||||||||||||
| Total assets | 197,977 | 1.1 | (2.0) | 197,977 | (5.0) | 2.5 | |||||||||||||||||
| Customer deposits | 123,660 | 1.2 | (1.9) | 123,660 | (1.4) | 6.3 | |||||||||||||||||
| Central banks and credit institutions | 15,373 | (5.5) | (8.3) | 15,373 | 32.5 | 42.9 | |||||||||||||||||
| Marketable debt securities | 28,693 | (2.2) | (5.2) | 28,693 | (22.0) | (15.8) | |||||||||||||||||
| Other financial liabilities | 10,132 | 15.7 | 12.2 | 10,132 | (1.6) | 6.2 | |||||||||||||||||
| Other liabilities accounts | 3,932 | 9.5 | 6.2 | 3,932 | (18.6) | (12.3) | |||||||||||||||||
| Total liabilities | 181,790 | 0.9 | (2.2) | 181,790 | (3.8) | 3.8 | |||||||||||||||||
| Total equity | 16,187 | 3.3 | 0.1 | 16,187 | (16.6) | (10.0) | |||||||||||||||||
| Memorandum items: | |||||||||||||||||||||||
Gross loans and advances to customers 2 | 116,523 | 2.7 | (0.4) | 116,523 | (3.9) | 3.7 | |||||||||||||||||
| Customer funds | 108,905 | 1.1 | (2.0) | 108,905 | (2.2) | 5.5 | |||||||||||||||||
Customer deposits 3 | 96,740 | 1.2 | (1.9) | 96,740 | 0.0 | 7.8 | |||||||||||||||||
| Mutual funds | 12,165 | 0.2 | (2.9) | 12,165 | (16.4) | (9.8) | |||||||||||||||||
| Ratios (%), operating means and customers | |||||||||||||||||||||||
| RoTE | 5.26 | (4.20) | 7.42 | (2.89) | |||||||||||||||||||
| Efficiency ratio | 50.3 | 1.0 | 49.9 | 3.4 | |||||||||||||||||||
| NPL ratio | 4.24 | 0.79 | 4.24 | 1.32 | |||||||||||||||||||
| NPL coverage ratio | 73.1 | (12.5) | 73.1 | (29.7) | |||||||||||||||||||
| Number of employees | 13,971 | (2.0) | 13,971 | (5.0) | |||||||||||||||||||
| Number of branches | 420 | (5.2) | 420 | (13.2) | |||||||||||||||||||
| Number of total customers (thousands) | 4,356 | (1.2) | 4,356 | (5.3) | |||||||||||||||||||
| Number of active customers (thousands) | 3,996 | (0.9) | 3,996 | (4.9) | |||||||||||||||||||
1. Includes exchange differences.
2. Excluding reverse repos.
3. Excluding repos.
January - September 2023 | | 63 | ||||||
Business model | ||||||||||||||||||||||||||
| Financial information by segment | ||||||||||||||||||||||||||
| Mexico | |||||||||||||||||||||||
| EUR million | |||||||||||||||||||||||
| / | Q2'23 | / | 9M'22 | ||||||||||||||||||||
| Underlying income statement | Q3'23 | % | % excl. FX | 9M'23 | % | % excl. FX | |||||||||||||||||
| Net interest income | 1,186 | 13.5 | 9.8 | 3,213 | 25.7 | 12.5 | |||||||||||||||||
| Net fee income | 356 | 3.4 | (0.3) | 1,019 | 22.6 | 9.8 | |||||||||||||||||
Gains (losses) on financial transactions 1 | 48 | (47.7) | (50.8) | 162 | 935.2 | 826.6 | |||||||||||||||||
| Other operating income | (34) | 108.7 | 106.5 | (77) | (15.9) | (24.7) | |||||||||||||||||
| Total income | 1,555 | 6.3 | 2.6 | 4,318 | 30.4 | 16.7 | |||||||||||||||||
| Administrative expenses and amortizations | (681) | 9.4 | 5.6 | (1,845) | 25.7 | 12.6 | |||||||||||||||||
| Net operating income | 874 | 4.0 | 0.3 | 2,473 | 34.1 | 20.0 | |||||||||||||||||
| Net loan-loss provisions | (312) | 9.8 | 6.1 | (834) | 50.2 | 34.5 | |||||||||||||||||
| Other gains (losses) and provisions | (16) | 21.1 | 17.6 | (45) | (50.5) | (55.7) | |||||||||||||||||
| Profit before tax | 546 | 0.6 | (3.2) | 1,594 | 33.0 | 19.1 | |||||||||||||||||
| Tax on profit | (143) | 1.0 | (2.8) | (415) | 41.6 | 26.8 | |||||||||||||||||
| Profit from continuing operations | 404 | 0.4 | (3.3) | 1,179 | 30.2 | 16.6 | |||||||||||||||||
| Net profit from discontinued operations | — | — | — | — | — | — | |||||||||||||||||
| Consolidated profit | 404 | 0.4 | (3.3) | 1,179 | 30.2 | 16.6 | |||||||||||||||||
| Non-controlling interests | (1) | (17.7) | (25.9) | (16) | (48.8) | (54.2) | |||||||||||||||||
| Profit attributable to the parent | 403 | 0.5 | (3.3) | 1,163 | 33.1 | 19.1 | |||||||||||||||||
| Balance sheet | |||||||||||||||||||||||
| Loans and advances to customers | 48,077 | 5.8 | 3.9 | 48,077 | 10.4 | 3.2 | |||||||||||||||||
| Cash, central banks and credit institutions | 20,591 | (2.0) | (3.7) | 20,591 | (3.9) | (10.2) | |||||||||||||||||
| Debt instruments | 26,560 | (0.7) | (2.4) | 26,560 | 21.7 | 13.7 | |||||||||||||||||
| Other financial assets | 7,590 | 5.8 | 4.0 | 7,590 | (26.7) | (31.5) | |||||||||||||||||
| Other asset accounts | 5,850 | 12.5 | 10.5 | 5,850 | 22.7 | 14.7 | |||||||||||||||||
| Total assets | 108,669 | 2.9 | 1.1 | 108,669 | 6.6 | (0.4) | |||||||||||||||||
| Customer deposits | 52,352 | 0.7 | (1.1) | 52,352 | 22.2 | 14.2 | |||||||||||||||||
| Central banks and credit institutions | 22,592 | 9.4 | 7.4 | 22,592 | (9.2) | (15.1) | |||||||||||||||||
| Marketable debt securities | 8,314 | (3.1) | (4.8) | 8,314 | (12.7) | (18.4) | |||||||||||||||||
| Other financial liabilities | 12,519 | 8.6 | 6.7 | 12,519 | (11.0) | (16.8) | |||||||||||||||||
| Other liabilities accounts | 3,130 | 8.1 | 6.2 | 3,130 | 24.1 | 16.0 | |||||||||||||||||
| Total liabilities | 98,907 | 3.4 | 1.6 | 98,907 | 5.4 | (1.5) | |||||||||||||||||
| Total equity | 9,762 | (1.5) | (3.2) | 9,762 | 20.4 | 12.5 | |||||||||||||||||
| Memorandum items: | |||||||||||||||||||||||
Gross loans and advances to customers 2 | 48,845 | 5.1 | 3.3 | 48,845 | 12.3 | 5.0 | |||||||||||||||||
| Customer funds | 62,465 | 4.1 | 2.3 | 62,465 | 20.0 | 12.2 | |||||||||||||||||
Customer deposits 3 | 45,721 | 3.8 | 2.0 | 45,721 | 24.8 | 16.7 | |||||||||||||||||
| Mutual funds | 16,744 | 5.0 | 3.2 | 16,744 | 8.7 | 1.6 | |||||||||||||||||
| Ratios (%), operating means and customers | |||||||||||||||||||||||
| RoTE | 17.06 | (0.74) | 17.60 | 1.01 | |||||||||||||||||||
| Efficiency ratio | 43.8 | 1.2 | 42.7 | (1.6) | |||||||||||||||||||
| NPL ratio | 2.72 | 0.12 | 2.72 | 0.38 | |||||||||||||||||||
| NPL coverage ratio | 102.7 | (3.5) | 102.7 | 0.0 | |||||||||||||||||||
| Number of employees | 30,704 | 1.4 | 30,704 | 6.7 | |||||||||||||||||||
| Number of branches | 1,369 | (0.1) | 1,369 | 0.1 | |||||||||||||||||||
| Number of total customers (thousands) | 20,488 | 0.7 | 20,488 | 3.6 | |||||||||||||||||||
| Number of active customers (thousands) | 10,140 | 2.1 | 10,140 | 4.6 | |||||||||||||||||||
1. Includes exchange differences.
2. Excluding reverse repos.
3. Excluding repos.
| 64 | | January - September 2023 | ||||||
Business model | ||||||||||||||||||||||||||
| Financial information by segment | ||||||||||||||||||||||||||
| Other North America | |||||||||||||||||||||||
| EUR million | |||||||||||||||||||||||
| / | Q2'23 | / | 9M'22 | ||||||||||||||||||||
| Underlying income statement | Q3'23 | % | % excl. FX | 9M'23 | % | % excl. FX | |||||||||||||||||
| Net interest income | 2 | (23.5) | (23.5) | 5 | — | — | |||||||||||||||||
| Net fee income | 15 | 35.1 | 35.1 | 38 | 24.2 | 24.2 | |||||||||||||||||
Gains (losses) on financial transactions 1 | 0 | 196.2 | 196.2 | (1) | — | — | |||||||||||||||||
| Other operating income | — | — | — | 4 | (65.0) | (65.0) | |||||||||||||||||
| Total income | 17 | 5.4 | 5.4 | 47 | 10.6 | 10.6 | |||||||||||||||||
| Administrative expenses and amortizations | (51) | 1.0 | 1.0 | (148) | 8.3 | 8.3 | |||||||||||||||||
| Net operating income | (34) | (1.1) | (1.1) | (102) | 7.2 | 7.3 | |||||||||||||||||
| Net loan-loss provisions | (2) | 256.4 | 256.4 | (4) | 37.5 | 37.5 | |||||||||||||||||
| Other gains (losses) and provisions | 0 | (78.9) | (78.9) | (1) | (72.5) | (72.4) | |||||||||||||||||
| Profit before tax | (36) | 1.7 | 1.7 | (107) | 5.9 | 5.9 | |||||||||||||||||
| Tax on profit | (10) | (27.7) | (27.2) | (22) | — | — | |||||||||||||||||
| Profit from continuing operations | (47) | (6.7) | (6.6) | (129) | 39.5 | 39.5 | |||||||||||||||||
| Net profit from discontinued operations | — | — | — | — | — | — | |||||||||||||||||
| Consolidated profit | (47) | (6.7) | (6.6) | (129) | 39.5 | 39.5 | |||||||||||||||||
| Non-controlling interests | (1) | — | — | 1 | 87.6 | 87.6 | |||||||||||||||||
| Profit attributable to the parent | (47) | (4.5) | (4.4) | (128) | 39.2 | 39.2 | |||||||||||||||||
| Balance sheet | |||||||||||||||||||||||
| Loans and advances to customers | 64 | 17.2 | 17.2 | 64 | 12.9 | 12.9 | |||||||||||||||||
| Cash, central banks and credit institutions | 318 | (6.4) | (6.4) | 318 | (1.6) | (1.6) | |||||||||||||||||
| Debt instruments | 0 | (46.8) | (46.8) | 0 | (20.7) | (20.7) | |||||||||||||||||
| Other financial assets | 132 | (2.6) | (2.6) | 132 | (39.1) | (39.1) | |||||||||||||||||
| Other asset accounts | 325 | 6.8 | 6.8 | 325 | 29.1 | 29.1 | |||||||||||||||||
| Total assets | 838 | 0.6 | 0.6 | 838 | (1.1) | (1.1) | |||||||||||||||||
| Customer deposits | 218 | 8.9 | 8.9 | 218 | (4.6) | (4.6) | |||||||||||||||||
| Central banks and credit institutions | 187 | 3.4 | 3.1 | 187 | 48.2 | 48.4 | |||||||||||||||||
| Marketable debt securities | — | — | — | — | — | — | |||||||||||||||||
| Other financial liabilities | 127 | (4.6) | (4.6) | 127 | (37.7) | (37.7) | |||||||||||||||||
| Other liabilities accounts | 67 | 2.6 | 2.6 | 67 | 11.8 | 11.8 | |||||||||||||||||
| Total liabilities | 600 | 3.4 | 3.3 | 600 | (3.2) | (3.1) | |||||||||||||||||
| Total equity | 238 | (5.9) | (5.7) | 238 | 4.5 | 4.5 | |||||||||||||||||
| Memorandum items: | |||||||||||||||||||||||
Gross loans and advances to customers 2 | 74 | 17.0 | 17.0 | 74 | 19.8 | 19.8 | |||||||||||||||||
| Customer funds | 218 | 8.9 | 8.9 | 218 | (4.6) | (4.6) | |||||||||||||||||
Customer deposits 3 | 218 | 8.9 | 8.9 | 218 | (4.6) | (4.6) | |||||||||||||||||
| Mutual funds | 0 | — | — | 0 | — | — | |||||||||||||||||
| Resources | |||||||||||||||||||||||
| Number of employees | 1,159 | 2.8 | 1,159 | 14.5 | |||||||||||||||||||
1. Includes exchange differences.
2. Excluding reverse repos.
3. Excluding repos.
January - September 2023 | | 65 | ||||||
Business model | ||||||||||||||||||||||||||
| Financial information by segment | ||||||||||||||||||||||||||
| SOUTH AMERICA | |||||||||||||||||||||||
| EUR million | |||||||||||||||||||||||
| / | Q2'23 | / | 9M'22 | ||||||||||||||||||||
| Underlying income statement | Q3'23 | % | % excl. FX | 9M'23 | % | % excl. FX | |||||||||||||||||
| Net interest income | 3,356 | 1.3 | 11.7 | 9,833 | 0.0 | 8.2 | |||||||||||||||||
| Net fee income | 1,264 | 2.9 | 9.5 | 3,659 | 9.2 | 18.1 | |||||||||||||||||
Gains (losses) on financial transactions 1 | 418 | 3.3 | 19.8 | 1,145 | 15.4 | 30.0 | |||||||||||||||||
| Other operating income | (435) | 38.5 | 114.3 | (996) | 75.7 | 355.9 | |||||||||||||||||
| Total income | 4,604 | (0.6) | 5.7 | 13,641 | 0.2 | 6.2 | |||||||||||||||||
| Administrative expenses and amortizations | (1,798) | (0.7) | 8.0 | (5,332) | 8.0 | 19.1 | |||||||||||||||||
| Net operating income | 2,806 | (0.6) | 4.3 | 8,310 | (4.2) | (0.7) | |||||||||||||||||
| Net loan-loss provisions | (1,301) | (0.6) | 0.7 | (3,841) | 5.7 | 7.0 | |||||||||||||||||
| Other gains (losses) and provisions | (214) | (44.5) | (37.4) | (802) | 106.2 | 189.9 | |||||||||||||||||
| Profit before tax | 1,291 | 14.4 | 22.4 | 3,667 | (21.2) | (18.6) | |||||||||||||||||
| Tax on profit | (335) | 2.1 | 5.1 | (1,013) | (22.4) | (20.0) | |||||||||||||||||
| Profit from continuing operations | 956 | 19.5 | 29.7 | 2,653 | (20.8) | (18.1) | |||||||||||||||||
| Net profit from discontinued operations | — | — | — | — | — | — | |||||||||||||||||
| Consolidated profit | 956 | 19.5 | 29.7 | 2,653 | (20.8) | (18.1) | |||||||||||||||||
| Non-controlling interests | (85) | (35.7) | (33.5) | (324) | (30.4) | (31.3) | |||||||||||||||||
| Profit attributable to the parent | 871 | 30.3 | 42.3 | 2,329 | (19.2) | (15.8) | |||||||||||||||||
| Balance sheet | |||||||||||||||||||||||
| Loans and advances to customers | 154,600 | (1.4) | 2.2 | 154,600 | 2.5 | 5.4 | |||||||||||||||||
| Cash, central banks and credit institutions | 73,105 | 21.9 | 25.1 | 73,105 | 29.8 | 34.4 | |||||||||||||||||
| Debt instruments | 66,786 | (1.8) | 2.1 | 66,786 | 12.5 | 19.3 | |||||||||||||||||
| Other financial assets | 22,818 | 6.1 | 11.7 | 22,818 | (15.6) | (15.1) | |||||||||||||||||
| Other asset accounts | 19,652 | 3.3 | 6.4 | 19,652 | (0.1) | 3.8 | |||||||||||||||||
| Total assets | 336,961 | 3.6 | 7.3 | 336,961 | 7.6 | 11.3 | |||||||||||||||||
| Customer deposits | 154,661 | 5.3 | 9.3 | 154,661 | 7.3 | 12.9 | |||||||||||||||||
| Central banks and credit institutions | 57,024 | 7.6 | 11.2 | 57,024 | 20.1 | 21.9 | |||||||||||||||||
| Marketable debt securities | 40,608 | (2.0) | 0.6 | 40,608 | 16.9 | 17.6 | |||||||||||||||||
| Other financial liabilities | 46,645 | 0.8 | 4.3 | 46,645 | (6.7) | (5.3) | |||||||||||||||||
| Other liabilities accounts | 12,185 | 4.4 | 9.1 | 12,185 | 2.0 | 5.0 | |||||||||||||||||
| Total liabilities | 311,123 | 4.0 | 7.7 | 311,123 | 7.9 | 11.4 | |||||||||||||||||
| Total equity | 25,838 | (0.9) | 3.1 | 25,838 | 4.0 | 9.9 | |||||||||||||||||
| Memorandum items: | |||||||||||||||||||||||
Gross loans and advances to customers 2 | 162,251 | (1.5) | 2.0 | 162,251 | 2.3 | 5.1 | |||||||||||||||||
| Customer funds | 207,324 | 5.6 | 9.8 | 207,324 | 8.7 | 14.6 | |||||||||||||||||
Customer deposits 3 | 137,018 | 2.2 | 6.3 | 137,018 | 5.5 | 11.6 | |||||||||||||||||
| Mutual funds | 70,307 | 13.0 | 17.1 | 70,307 | 15.5 | 20.9 | |||||||||||||||||
| Ratios (%), operating means and customers | |||||||||||||||||||||||
| RoTE | 16.47 | 3.79 | 14.81 | (5.23) | |||||||||||||||||||
| Efficiency ratio | 39.1 | 0.0 | 39.1 | 2.8 | |||||||||||||||||||
| NPL ratio | 5.71 | (0.17) | 5.71 | 0.17 | |||||||||||||||||||
| NPL coverage ratio | 78.0 | 0.2 | 78.0 | (6.7) | |||||||||||||||||||
| Number of employees | 80,497 | (1.1) | 80,497 | 5.9 | |||||||||||||||||||
| Number of branches | 3,407 | (3.8) | 3,407 | (9.2) | |||||||||||||||||||
| Number of total customers (thousands) | 74,830 | 2.3 | 74,830 | 11.1 | |||||||||||||||||||
| Number of active customers (thousands) | 39,007 | 1.5 | 39,007 | 2.5 | |||||||||||||||||||
1. Includes exchange differences.
2. Excluding reverse repos.
3. Excluding repos.
| 66 | | January - September 2023 | ||||||
Business model | ||||||||||||||||||||||||||
| Financial information by segment | ||||||||||||||||||||||||||
| Brazil | |||||||||||||||||||||||
| EUR million | |||||||||||||||||||||||
| / | Q2'23 | / | 9M'22 | ||||||||||||||||||||
| Underlying income statement | Q3'23 | % | % excl. FX | 9M'23 | % | % excl. FX | |||||||||||||||||
| Net interest income | 2,327 | 6.7 | 5.3 | 6,612 | (0.9) | (1.3) | |||||||||||||||||
| Net fee income | 902 | 5.1 | 3.6 | 2,577 | 6.8 | 6.5 | |||||||||||||||||
Gains (losses) on financial transactions 1 | 122 | (28.1) | (29.9) | 418 | (24.2) | (24.4) | |||||||||||||||||
| Other operating income | (15) | — | — | 10 | (73.2) | (73.3) | |||||||||||||||||
| Total income | 3,336 | 3.5 | 2.0 | 9,616 | (0.6) | (0.9) | |||||||||||||||||
| Administrative expenses and amortizations | (1,138) | 1.0 | (0.5) | (3,345) | 11.2 | 10.8 | |||||||||||||||||
| Net operating income | 2,197 | 4.8 | 3.3 | 6,271 | (5.9) | (6.2) | |||||||||||||||||
| Net loan-loss provisions | (1,121) | (0.8) | (2.3) | (3,284) | 3.7 | 3.4 | |||||||||||||||||
| Other gains (losses) and provisions | (223) | (30.8) | (32.6) | (724) | 302.5 | 301.1 | |||||||||||||||||
| Profit before tax | 854 | 32.5 | 31.4 | 2,264 | (31.7) | (32.0) | |||||||||||||||||
| Tax on profit | (191) | (17.6) | (19.1) | (672) | (36.6) | (36.8) | |||||||||||||||||
| Profit from continuing operations | 663 | 60.5 | 59.9 | 1,592 | (29.5) | (29.7) | |||||||||||||||||
| Net profit from discontinued operations | — | — | — | — | — | — | |||||||||||||||||
| Consolidated profit | 663 | 60.5 | 59.9 | 1,592 | (29.5) | (29.7) | |||||||||||||||||
| Non-controlling interests | (59) | 0.5 | (1.1) | (166) | (28.0) | (28.3) | |||||||||||||||||
| Profit attributable to the parent | 603 | 70.5 | 70.1 | 1,426 | (29.6) | (29.9) | |||||||||||||||||
| Balance sheet | |||||||||||||||||||||||
| Loans and advances to customers | 95,078 | 0.3 | 1.0 | 95,078 | 3.6 | 3.8 | |||||||||||||||||
| Cash, central banks and credit institutions | 60,076 | 25.2 | 26.1 | 60,076 | 41.5 | 41.7 | |||||||||||||||||
| Debt instruments | 46,433 | (1.0) | (0.2) | 46,433 | 16.5 | 16.6 | |||||||||||||||||
| Other financial assets | 8,597 | 11.8 | 12.6 | 8,597 | 8.7 | 8.9 | |||||||||||||||||
| Other asset accounts | 14,532 | 2.1 | 2.9 | 14,532 | 2.7 | 2.9 | |||||||||||||||||
| Total assets | 224,715 | 6.2 | 7.0 | 224,715 | 14.5 | 14.7 | |||||||||||||||||
| Customer deposits | 106,720 | 9.8 | 10.7 | 106,720 | 13.5 | 13.7 | |||||||||||||||||
| Central banks and credit institutions | 34,427 | 9.4 | 10.2 | 34,427 | 31.7 | 31.9 | |||||||||||||||||
| Marketable debt securities | 28,942 | (1.3) | (0.5) | 28,942 | 19.5 | 19.7 | |||||||||||||||||
| Other financial liabilities | 30,648 | (0.2) | 0.5 | 30,648 | 4.6 | 4.8 | |||||||||||||||||
| Other liabilities accounts | 7,153 | 15.6 | 16.5 | 7,153 | 15.3 | 15.5 | |||||||||||||||||
| Total liabilities | 207,891 | 6.7 | 7.5 | 207,891 | 15.6 | 15.7 | |||||||||||||||||
| Total equity | 16,824 | 0.2 | 1.0 | 16,824 | 3.4 | 3.5 | |||||||||||||||||
| Memorandum items: | |||||||||||||||||||||||
Gross loans and advances to customers 2 | 101,096 | 0.0 | 0.8 | 101,096 | 3.1 | 3.3 | |||||||||||||||||
| Customer funds | 143,335 | 9.4 | 10.2 | 143,335 | 13.4 | 13.5 | |||||||||||||||||
Customer deposits 3 | 89,369 | 5.6 | 6.4 | 89,369 | 11.8 | 12.0 | |||||||||||||||||
| Mutual funds | 53,966 | 16.2 | 17.1 | 53,966 | 16.0 | 16.2 | |||||||||||||||||
| Ratios (%), operating means and customers | |||||||||||||||||||||||
| RoTE | 17.07 | 7.05 | 13.72 | (6.93) | |||||||||||||||||||
| Efficiency ratio | 34.1 | (0.8) | 34.8 | 3.7 | |||||||||||||||||||
| NPL ratio | 6.71 | (0.28) | 6.71 | 0.08 | |||||||||||||||||||
| NPL coverage ratio | 83.0 | 0.2 | 83.0 | (6.3) | |||||||||||||||||||
| Number of employees | 57,722 | (1.3) | 57,722 | 7.5 | |||||||||||||||||||
| Number of branches | 2,662 | (4.0) | 2,662 | (8.3) | |||||||||||||||||||
| Number of total customers (thousands) | 64,593 | 2.0 | 64,593 | 11.9 | |||||||||||||||||||
| Number of active customers (thousands) | 32,027 | 0.5 | 32,027 | 1.5 | |||||||||||||||||||
1. Includes exchange differences.
2. Excluding reverse repos.
3. Excluding repos.
January - September 2023 | | 67 | ||||||
Business model | ||||||||||||||||||||||||||
| Financial information by segment | ||||||||||||||||||||||||||
| Chile | |||||||||||||||||||||||
| EUR million | |||||||||||||||||||||||
| / | Q2'23 | / | 9M'22 | ||||||||||||||||||||
| Underlying income statement | Q3'23 | % | % excl. FX | 9M'23 | % | % excl. FX | |||||||||||||||||
| Net interest income | 241 | (32.5) | (26.9) | 968 | (32.8) | (34.5) | |||||||||||||||||
| Net fee income | 133 | (18.5) | (12.8) | 449 | 31.7 | 28.4 | |||||||||||||||||
Gains (losses) on financial transactions 1 | 94 | (3.5) | 2.3 | 273 | 52.5 | 48.7 | |||||||||||||||||
| Other operating income | (3) | — | — | 4 | — | — | |||||||||||||||||
| Total income | 465 | (25.3) | (19.7) | 1,694 | (12.4) | (14.6) | |||||||||||||||||
| Administrative expenses and amortizations | (251) | (5.9) | 0.1 | (771) | 4.6 | 2.0 | |||||||||||||||||
| Net operating income | 214 | (39.9) | (34.6) | 922 | (22.9) | (24.9) | |||||||||||||||||
| Net loan-loss provisions | (84) | (2.7) | 4.2 | (287) | (1.1) | (3.6) | |||||||||||||||||
| Other gains (losses) and provisions | 9 | (40.4) | (35.8) | 35 | — | — | |||||||||||||||||
| Profit before tax | 140 | (51.1) | (46.3) | 671 | (24.6) | (26.5) | |||||||||||||||||
| Tax on profit | (29) | (13.6) | (7.8) | (96) | (6.7) | (9.1) | |||||||||||||||||
| Profit from continuing operations | 111 | (56.1) | (51.4) | 575 | (26.9) | (28.8) | |||||||||||||||||
| Net profit from discontinued operations | — | — | — | — | — | — | |||||||||||||||||
| Consolidated profit | 111 | (56.1) | (51.4) | 575 | (26.9) | (28.8) | |||||||||||||||||
| Non-controlling interests | (24) | (66.9) | (62.4) | (158) | (32.8) | (34.5) | |||||||||||||||||
| Profit attributable to the parent | 87 | (51.8) | (47.0) | 417 | (24.4) | (26.3) | |||||||||||||||||
| Balance sheet | |||||||||||||||||||||||
| Loans and advances to customers | 42,874 | (6.0) | 1.7 | 42,874 | 1.6 | 2.2 | |||||||||||||||||
| Cash, central banks and credit institutions | 7,840 | 19.8 | 29.5 | 7,840 | (1.7) | (1.1) | |||||||||||||||||
| Debt instruments | 12,681 | (5.8) | 1.9 | 12,681 | 11.3 | 12.0 | |||||||||||||||||
| Other financial assets | 13,651 | 1.8 | 10.1 | 13,651 | (27.3) | (26.9) | |||||||||||||||||
| Other asset accounts | 2,979 | 6.9 | 15.6 | 2,979 | (14.4) | (13.8) | |||||||||||||||||
| Total assets | 80,025 | (2.2) | 5.8 | 80,025 | (4.5) | (3.9) | |||||||||||||||||
| Customer deposits | 28,843 | (6.3) | 1.3 | 28,843 | (2.2) | (1.6) | |||||||||||||||||
| Central banks and credit institutions | 16,331 | 6.4 | 15.1 | 16,331 | 6.6 | 7.2 | |||||||||||||||||
| Marketable debt securities | 10,889 | (4.2) | 3.6 | 10,889 | 10.6 | 11.3 | |||||||||||||||||
| Other financial liabilities | 14,652 | 3.8 | 12.3 | 14,652 | (24.5) | (24.0) | |||||||||||||||||
| Other liabilities accounts | 3,846 | (12.4) | (5.3) | 3,846 | (18.3) | (17.8) | |||||||||||||||||
| Total liabilities | 74,561 | (1.9) | 6.1 | 74,561 | (5.4) | (4.8) | |||||||||||||||||
| Total equity | 5,464 | (5.5) | 2.2 | 5,464 | 8.2 | 8.9 | |||||||||||||||||
| Memorandum items: | |||||||||||||||||||||||
Gross loans and advances to customers 2 | 44,104 | (6.0) | 1.7 | 44,104 | 1.6 | 2.2 | |||||||||||||||||
| Customer funds | 39,001 | (4.9) | 2.8 | 39,001 | 1.5 | 2.1 | |||||||||||||||||
Customer deposits 3 | 28,552 | (6.7) | 0.9 | 28,552 | (2.8) | (2.2) | |||||||||||||||||
| Mutual funds | 10,449 | 0.5 | 8.7 | 10,449 | 15.7 | 16.4 | |||||||||||||||||
| Ratios (%), operating means and customers | |||||||||||||||||||||||
| RoTE | 9.34 | (8.99) | 14.05 | (7.50) | |||||||||||||||||||
| Efficiency ratio | 53.9 | 11.2 | 45.5 | 7.4 | |||||||||||||||||||
| NPL ratio | 4.90 | (0.04) | 4.9 | 0.3 | |||||||||||||||||||
| NPL coverage ratio | 55.6 | (0.6) | 55.6 | (4.7) | |||||||||||||||||||
| Number of employees | 9,828 | (1.0) | 9,828 | 0.3 | |||||||||||||||||||
| Number of branches | 249 | (3.9) | 249 | (17.3) | |||||||||||||||||||
| Number of total customers (thousands) | 3,907 | 4.6 | 3,907 | (2.9) | |||||||||||||||||||
| Number of active customers (thousands) | 2,264 | 3.5 | 2,264 | 4.1 | |||||||||||||||||||
1. Includes exchange differences.
2. Excluding reverse repos.
3. Excluding repos.
| 68 | | January - September 2023 | ||||||
Business model | ||||||||||||||||||||||||||
| Financial information by segment | ||||||||||||||||||||||||||
| Argentina | |||||||||||||||||||||||
| EUR million | |||||||||||||||||||||||
| / | Q2'23 | / | 9M'22 | ||||||||||||||||||||
| Underlying income statement | Q3'23 | % | % excl. FX | 9M'23 | % | % excl. FX | |||||||||||||||||
| Net interest income | 629 | 3.8 | 69.8 | 1,767 | 31.1 | 236.0 | |||||||||||||||||
| Net fee income | 164 | 13.2 | 80.3 | 446 | 0.2 | 156.6 | |||||||||||||||||
Gains (losses) on financial transactions 1 | 161 | 47.6 | 120.1 | 356 | 84.0 | 371.5 | |||||||||||||||||
| Other operating income | (411) | 24.0 | 93.1 | (997) | 74.1 | 346.1 | |||||||||||||||||
| Total income | 543 | 2.7 | 68.5 | 1,572 | 11.2 | 185.0 | |||||||||||||||||
| Administrative expenses and amortizations | (260) | (4.5) | 60.4 | (781) | (3.5) | 147.3 | |||||||||||||||||
| Net operating income | 283 | 10.4 | 77.1 | 791 | 30.9 | 235.5 | |||||||||||||||||
| Net loan-loss provisions | (47) | (13.1) | 50.3 | (143) | 35.2 | 246.4 | |||||||||||||||||
| Other gains (losses) and provisions | (1) | (99.3) | (57.0) | (104) | (44.0) | 43.4 | |||||||||||||||||
| Profit before tax | 236 | 82.8 | 152.5 | 543 | 74.2 | 346.3 | |||||||||||||||||
| Tax on profit | (81) | 414.0 | 439.4 | (136) | 74.8 | 347.9 | |||||||||||||||||
| Profit from continuing operations | 155 | 36.6 | 104.9 | 407 | 74.0 | 345.8 | |||||||||||||||||
| Net profit from discontinued operations | — | — | — | — | — | — | |||||||||||||||||
| Consolidated profit | 155 | 36.6 | 104.9 | 407 | 74.0 | 345.8 | |||||||||||||||||
| Non-controlling interests | (1) | 66.8 | 141.7 | (1) | 108.4 | 434.0 | |||||||||||||||||
| Profit attributable to the parent | 154 | 36.5 | 104.8 | 406 | 73.9 | 345.6 | |||||||||||||||||
| Balance sheet | |||||||||||||||||||||||
| Loans and advances to customers | 6,197 | (0.2) | 32.1 | 6,197 | (1.9) | 151.4 | |||||||||||||||||
| Cash, central banks and credit institutions | 2,554 | (12.3) | 16.0 | 2,554 | (15.5) | 116.4 | |||||||||||||||||
| Debt instruments | 4,897 | (2.6) | 28.9 | 4,897 | (8.6) | 134.3 | |||||||||||||||||
| Other financial assets | 73 | 83.6 | 142.9 | 73 | 22.0 | 212.6 | |||||||||||||||||
| Other asset accounts | 1,041 | 1.9 | 34.8 | 1,041 | (8.4) | 134.8 | |||||||||||||||||
| Total assets | 14,762 | (2.9) | 28.4 | 14,762 | (7.1) | 138.0 | |||||||||||||||||
| Customer deposits | 9,363 | (5.6) | 24.9 | 9,363 | (16.4) | 114.2 | |||||||||||||||||
| Central banks and credit institutions | 1,908 | 9.8 | 45.3 | 1,908 | 91.8 | 391.4 | |||||||||||||||||
| Marketable debt securities | 153 | 3.4 | 36.7 | 153 | (7.2) | 137.7 | |||||||||||||||||
| Other financial liabilities | 927 | (3.4) | 27.7 | 927 | 0.5 | 157.5 | |||||||||||||||||
| Other liabilities accounts | 509 | (1.8) | 29.9 | 509 | 2.8 | 163.5 | |||||||||||||||||
| Total liabilities | 12,860 | (3.1) | 28.1 | 12,860 | (6.7) | 139.1 | |||||||||||||||||
| Total equity | 1,902 | (1.4) | 30.4 | 1,902 | (9.9) | 130.8 | |||||||||||||||||
| Memorandum items: | |||||||||||||||||||||||
Gross loans and advances to customers 2 | 6,369 | (0.4) | 31.8 | 6,369 | (2.6) | 149.6 | |||||||||||||||||
| Customer funds | 14,249 | (0.4) | 31.7 | 14,249 | (7.8) | 136.2 | |||||||||||||||||
Customer deposits 3 | 9,362 | (5.6) | 24.9 | 9,362 | (16.4) | 114.1 | |||||||||||||||||
| Mutual funds | 4,887 | 11.2 | 47.1 | 4,887 | 14.9 | 194.4 | |||||||||||||||||
| Ratios (%), operating means and customers | |||||||||||||||||||||||
| RoTE | 52.95 | 21.58 | 39.48 | 17.66 | |||||||||||||||||||
| Efficiency ratio | 47.8 | (3.6) | 49.7 | (7.6) | |||||||||||||||||||
| NPL ratio | 1.91 | (0.02) | 1.91 | (0.23) | |||||||||||||||||||
| NPL coverage ratio | 158.3 | (4.8) | 158.3 | (20.7) | |||||||||||||||||||
| Number of employees | 8,168 | (0.8) | 8,168 | (3.4) | |||||||||||||||||||
| Number of branches | 337 | (6.9) | 337 | (16.4) | |||||||||||||||||||
| Number of total customers (thousands) | 4,757 | 4.2 | 4,757 | 8.7 | |||||||||||||||||||
| Number of active customers (thousands) | 3,491 | 10.0 | 3,491 | 9.0 | |||||||||||||||||||
1. Includes exchange differences.
2. Excluding reverse repos.
3. Excluding repos.
January - September 2023 | | 69 | ||||||
Business model | ||||||||||||||||||||||||||
| Financial information by segment | ||||||||||||||||||||||||||
| Other South America | |||||||||||||||||||||||
| EUR million | |||||||||||||||||||||||
| / | Q2'23 | / | 9M'22 | ||||||||||||||||||||
| Underlying income statement | Q3'23 | % | % excl. FX | 9M'23 | % | % excl. FX | |||||||||||||||||
| Net interest income | 160 | (7.1) | (9.2) | 486 | 28.7 | 26.0 | |||||||||||||||||
| Net fee income | 65 | 4.7 | 1.9 | 187 | 23.0 | 21.5 | |||||||||||||||||
Gains (losses) on financial transactions 1 | 42 | 43.2 | 39.2 | 99 | 42.8 | 43.5 | |||||||||||||||||
| Other operating income | (6) | 44.1 | 38.4 | (13) | 175.0 | 171.1 | |||||||||||||||||
| Total income | 261 | 0.5 | (1.9) | 759 | 27.7 | 25.7 | |||||||||||||||||
| Administrative expenses and amortizations | (149) | 3.0 | 1.1 | (434) | 14.4 | 13.4 | |||||||||||||||||
| Net operating income | 111 | (2.6) | (5.7) | 326 | 51.4 | 47.0 | |||||||||||||||||
| Net loan-loss provisions | (50) | 24.0 | 21.0 | (128) | 78.8 | 74.9 | |||||||||||||||||
| Other gains (losses) and provisions | 0 | (95.7) | (96.5) | (9) | 61.0 | 56.3 | |||||||||||||||||
| Profit before tax | 62 | (10.0) | (13.4) | 189 | 36.8 | 32.4 | |||||||||||||||||
| Tax on profit | (34) | (27.7) | (29.2) | (110) | 64.3 | 61.2 | |||||||||||||||||
| Profit from continuing operations | 28 | 28.9 | 20.9 | 79 | 10.9 | 6.0 | |||||||||||||||||
| Net profit from discontinued operations | — | — | — | — | — | — | |||||||||||||||||
| Consolidated profit | 28 | 28.9 | 20.9 | 79 | 10.9 | 6.0 | |||||||||||||||||
| Non-controlling interests | (1) | — | — | 1 | 76.6 | 76.5 | |||||||||||||||||
| Profit attributable to the parent | 27 | 23.1 | 15.4 | 80 | 11.4 | 6.6 | |||||||||||||||||
| Balance sheet | |||||||||||||||||||||||
| Loans and advances to customers | 10,450 | 2.5 | 1.2 | 10,450 | (0.6) | (1.3) | |||||||||||||||||
| Cash, central banks and credit institutions | 2,636 | 4.9 | 3.8 | 2,636 | (8.2) | (8.4) | |||||||||||||||||
| Debt instruments | 2,775 | 6.2 | 5.5 | 2,775 | 2.0 | 1.4 | |||||||||||||||||
| Other financial assets | 497 | 41.0 | 38.1 | 497 | 76.7 | 77.0 | |||||||||||||||||
| Other asset accounts | 1,101 | 10.7 | 10.5 | 1,101 | 21.5 | 21.4 | |||||||||||||||||
| Total assets | 17,459 | 4.7 | 3.6 | 17,459 | 1.0 | 0.4 | |||||||||||||||||
| Customer deposits | 9,735 | 8.5 | 7.7 | 9,735 | 3.2 | 2.8 | |||||||||||||||||
| Central banks and credit institutions | 4,357 | (2.0) | (4.0) | 4,357 | (13.1) | (14.1) | |||||||||||||||||
| Marketable debt securities | 624 | (0.6) | (0.5) | 624 | 19.3 | 19.7 | |||||||||||||||||
| Other financial liabilities | 418 | (11.8) | (13.4) | 418 | 13.7 | 12.6 | |||||||||||||||||
| Other liabilities accounts | 677 | 18.3 | 18.2 | 677 | 24.6 | 24.6 | |||||||||||||||||
| Total liabilities | 15,810 | 4.8 | 3.6 | 15,810 | (0.4) | (1.1) | |||||||||||||||||
| Total equity | 1,649 | 4.2 | 3.5 | 1,649 | 16.9 | 16.6 | |||||||||||||||||
| Memorandum items: | |||||||||||||||||||||||
Gross loans and advances to customers 2 | 10,682 | 2.6 | 1.4 | 10,682 | (0.3) | (1.0) | |||||||||||||||||
| Customer funds | 10,740 | 7.6 | 6.8 | 10,740 | 2.8 | 2.4 | |||||||||||||||||
Customer deposits 3 | 9,735 | 8.5 | 7.7 | 9,735 | 3.8 | 3.4 | |||||||||||||||||
| Mutual funds | 1,005 | (0.7) | (0.9) | 1,005 | (5.6) | (5.9) | |||||||||||||||||
| Resources | |||||||||||||||||||||||
| Number of employees | 4,779 | 0.7 | 4,779 | 17.2 | |||||||||||||||||||
1. Includes exchange differences.
2. Excluding reverse repos.
3. Excluding repos.
| 70 | | January - September 2023 | ||||||
Business model | ||||||||||||||||||||||||||
| Financial information by segment | ||||||||||||||||||||||||||
| DIGITAL CONSUMER BANK | |||||||||||||||||||||||
| EUR million | |||||||||||||||||||||||
| / | Q2'23 | / | 9M'22 | ||||||||||||||||||||
| Underlying income statement | Q3'23 | % | % excl. FX | 9M'23 | % | % excl. FX | |||||||||||||||||
| Net interest income | 1,069 | 5.7 | 5.3 | 3,110 | 2.6 | 4.6 | |||||||||||||||||
| Net fee income | 210 | 3.5 | 3.4 | 604 | (3.9) | (3.5) | |||||||||||||||||
Gains (losses) on financial transactions 1 | 18 | (32.5) | (32.7) | 76 | 224.7 | 227.3 | |||||||||||||||||
| Other operating income | 114 | 54.2 | 53.6 | 280 | 37.4 | 37.6 | |||||||||||||||||
| Total income | 1,411 | 7.3 | 7.0 | 4,069 | 4.7 | 6.4 | |||||||||||||||||
| Administrative expenses and amortizations | (652) | (0.4) | (0.7) | (1,967) | 6.1 | 8.1 | |||||||||||||||||
| Net operating income | 759 | 14.9 | 14.5 | 2,103 | 3.4 | 4.8 | |||||||||||||||||
| Net loan-loss provisions | (225) | 1.3 | 0.7 | (640) | 49.2 | 52.6 | |||||||||||||||||
| Other gains (losses) and provisions | (25) | — | — | (25) | 6.2 | 5.5 | |||||||||||||||||
| Profit before tax | 509 | 6.0 | 5.7 | 1,437 | (9.1) | (8.0) | |||||||||||||||||
| Tax on profit | (134) | 15.1 | 15.0 | (360) | (4.9) | (4.1) | |||||||||||||||||
| Profit from continuing operations | 376 | 3.1 | 2.8 | 1,077 | (10.5) | (9.3) | |||||||||||||||||
| Net profit from discontinued operations | — | — | — | — | — | — | |||||||||||||||||
| Consolidated profit | 376 | 3.1 | 2.8 | 1,077 | (10.5) | (9.3) | |||||||||||||||||
| Non-controlling interests | (74) | (15.3) | (15.3) | (254) | (13.9) | (13.7) | |||||||||||||||||
| Profit attributable to the parent | 302 | 8.8 | 8.5 | 823 | (9.4) | (7.8) | |||||||||||||||||
| Balance sheet | |||||||||||||||||||||||
| Loans and advances to customers | 128,891 | 2.7 | 2.6 | 128,891 | 9.1 | 9.6 | |||||||||||||||||
| Cash, central banks and credit institutions | 18,786 | 13.2 | 12.8 | 18,786 | 44.8 | 45.9 | |||||||||||||||||
| Debt instruments | 5,215 | (0.5) | (0.1) | 5,215 | (32.1) | (32.2) | |||||||||||||||||
| Other financial assets | 136 | (16.7) | (16.6) | 136 | (31.3) | (31.4) | |||||||||||||||||
| Other asset accounts | 9,763 | 5.5 | 5.5 | 9,763 | 22.6 | 22.9 | |||||||||||||||||
| Total assets | 162,791 | 3.9 | 3.7 | 162,791 | 10.8 | 11.3 | |||||||||||||||||
| Customer deposits | 66,375 | 7.1 | 6.9 | 66,375 | 15.8 | 16.4 | |||||||||||||||||
| Central banks and credit institutions | 33,234 | (13.8) | (13.8) | 33,234 | (17.7) | (17.6) | |||||||||||||||||
| Marketable debt securities | 42,510 | 17.6 | 17.4 | 42,510 | 40.6 | 41.2 | |||||||||||||||||
| Other financial liabilities | 2,144 | (7.7) | (7.5) | 2,144 | 31.6 | 31.3 | |||||||||||||||||
| Other liabilities accounts | 5,452 | 6.8 | 6.7 | 5,452 | 14.6 | 15.1 | |||||||||||||||||
| Total liabilities | 149,715 | 3.9 | 3.7 | 149,715 | 11.5 | 11.9 | |||||||||||||||||
| Total equity | 13,076 | 3.7 | 3.5 | 13,076 | 3.8 | 4.5 | |||||||||||||||||
| Memorandum items: | |||||||||||||||||||||||
Gross loans and advances to customers 2 | 131,400 | 2.7 | 2.6 | 131,400 | 9.0 | 9.4 | |||||||||||||||||
| Customer funds | 69,775 | 6.7 | 6.4 | 69,775 | 17.2 | 17.8 | |||||||||||||||||
Customer deposits 3 | 66,375 | 7.1 | 6.9 | 66,375 | 15.8 | 16.4 | |||||||||||||||||
| Mutual funds | 3,400 | (1.8) | (1.8) | 3,400 | 53.1 | 53.1 | |||||||||||||||||
| Ratios (%), operating means and customers | |||||||||||||||||||||||
| RoTE | 12.46 | 0.72 | 11.35 | (1.36) | |||||||||||||||||||
| Efficiency ratio | 46.2 | (3.6) | 48.3 | 0.7 | |||||||||||||||||||
| NPL ratio | 2.08 | 0.05 | 2.08 | (0.11) | |||||||||||||||||||
| NPL coverage ratio | 92.2 | (2.3) | 92.2 | (3.4) | |||||||||||||||||||
| Number of employees | 16,806 | 1.1 | 16,806 | 4.6 | |||||||||||||||||||
| Number of branches | 361 | (0.6) | 361 | (1.1) | |||||||||||||||||||
| Number of total customers (thousands) | 19,990 | 1.4 | 19,990 | 2.6 | |||||||||||||||||||
1. Includes exchange differences.
2. Excluding reverse repos.
3. Excluding repos.
January - September 2023 | | 71 | ||||||
Business model | ||||||||||||||||||||||||||
| Financial information by segment | ||||||||||||||||||||||||||
| CORPORATE CENTRE | |||||||||||||||||||||||
| EUR million | |||||||||||||||||||||||
| Underlying income statement | Q3'23 | Q2'23 | % | 9M'23 | 9M'22 | % | |||||||||||||||||
| Net interest income | (30) | (42) | (27.4) | (124) | (510) | (75.7) | |||||||||||||||||
| Net fee income | 1 | (3) | — | (6) | (3) | 104.5 | |||||||||||||||||
Gains (losses) on financial transactions 1 | (284) | (135) | 110.3 | (473) | (624) | (24.2) | |||||||||||||||||
| Other operating income | 4 | (37) | — | (48) | (29) | 68.2 | |||||||||||||||||
| Total income | (308) | (218) | 41.7 | (650) | (1,165) | (44.2) | |||||||||||||||||
| Administrative expenses and amortizations | (94) | (95) | (1.0) | (283) | (272) | 4.0 | |||||||||||||||||
| Net operating income | (402) | (312) | 28.7 | (933) | (1,437) | (35.0) | |||||||||||||||||
| Net loan-loss provisions | (1) | 1 | — | 3 | (4) | — | |||||||||||||||||
| Other gains (losses) and provisions | (30) | (30) | 1.4 | (104) | (117) | (11.3) | |||||||||||||||||
| Profit before tax | (433) | (341) | 26.8 | (1,034) | (1,558) | (33.6) | |||||||||||||||||
| Tax on profit | (32) | — | — | (50) | (25) | 97.4 | |||||||||||||||||
| Profit from continuing operations | (464) | (341) | 36.2 | (1,084) | (1,583) | (31.5) | |||||||||||||||||
| Net profit from discontinued operations | — | — | — | — | — | — | |||||||||||||||||
| Consolidated profit | (464) | (341) | 36.2 | (1,084) | (1,583) | (31.5) | |||||||||||||||||
| Non-controlling interests | — | — | — | — | — | — | |||||||||||||||||
| Profit attributable to the parent | (464) | (341) | 36.2 | (1,084) | (1,583) | (31.5) | |||||||||||||||||
| Balance sheet | |||||||||||||||||||||||
| Loans and advances to customers | 5,474 | 5,583 | (2.0) | 5,474 | 6,104 | (10.3) | |||||||||||||||||
| Cash, central banks and credit institutions | 120,548 | 107,118 | 12.5 | 120,548 | 141,112 | (14.6) | |||||||||||||||||
| Debt instruments | 7,743 | 7,827 | (1.1) | 7,743 | 8,194 | (5.5) | |||||||||||||||||
| Other financial assets | 1,161 | 1,003 | 15.8 | 1,161 | 1 | — | |||||||||||||||||
| Other asset accounts | 124,803 | 127,867 | (2.4) | 124,803 | 129,286 | (3.5) | |||||||||||||||||
| Total assets | 259,730 | 249,398 | 4.1 | 259,730 | 284,696 | (8.8) | |||||||||||||||||
| Customer deposits | 1,239 | 1,181 | 4.9 | 1,239 | 538 | 130.0 | |||||||||||||||||
| Central banks and credit institutions | 55,404 | 45,181 | 22.6 | 55,404 | 83,271 | (33.5) | |||||||||||||||||
| Marketable debt securities | 102,027 | 100,538 | 1.5 | 102,027 | 100,982 | 1.0 | |||||||||||||||||
| Other financial liabilities | 1,636 | 1,284 | 27.4 | 1,636 | 1,491 | 9.7 | |||||||||||||||||
| Other liabilities accounts | 8,747 | 8,042 | 8.8 | 8,747 | 10,483 | (16.6) | |||||||||||||||||
| Total liabilities | 169,052 | 156,226 | 8.2 | 169,052 | 196,766 | (14.1) | |||||||||||||||||
| Total equity | 90,677 | 93,172 | (2.7) | 90,677 | 87,931 | 3.1 | |||||||||||||||||
| Memorandum items: | |||||||||||||||||||||||
Gross loans and advances to customers 2 | 5,717 | 5,623 | 1.7 | 5,717 | 6,107 | (6.4) | |||||||||||||||||
| Customer funds | 1,239 | 1,181 | 4.9 | 1,239 | 538 | 130.0 | |||||||||||||||||
Customer deposits 3 | 1,239 | 1,181 | 4.9 | 1,239 | 538 | 130.0 | |||||||||||||||||
| Mutual funds | — | — | — | — | — | — | |||||||||||||||||
| Resources | |||||||||||||||||||||||
| Number of employees | 1,931 | 1,896 | 1.8 | 1,931 | 1,857 | 4.0 | |||||||||||||||||
1. Includes exchange differences.
2. Excluding reverse repos.
3. Excluding repos.
| 72 | | January - September 2023 | ||||||
Business model | ||||||||||||||||||||||||||
| Financial information by segment | ||||||||||||||||||||||||||
| RETAIL BANKING | |||||||||||||||||||||||
| EUR million | |||||||||||||||||||||||
| / | Q2'23 | / | 9M'22 | ||||||||||||||||||||
| Underlying income statement | Q3'23 | % | % excl. FX | 9M'23 | % | % excl. FX | |||||||||||||||||
| Net interest income | 9,822 | 3.1 | 5.2 | 28,323 | 9.8 | 11.9 | |||||||||||||||||
| Net fee income | 2,013 | 2.5 | 4.8 | 5,878 | 2.1 | 4.5 | |||||||||||||||||
Gains (losses) on financial transactions 1 | 239 | — | — | 135 | (42.6) | (44.1) | |||||||||||||||||
| Other operating income | (203) | (1.8) | 69.8 | (480) | 318.7 | — | |||||||||||||||||
| Total income | 11,871 | 5.9 | 7.0 | 33,857 | 6.9 | 8.3 | |||||||||||||||||
| Administrative expenses and amortizations | (4,990) | 2.0 | 4.1 | (14,636) | 6.2 | 9.3 | |||||||||||||||||
| Net operating income | 6,881 | 9.0 | 9.2 | 19,220 | 7.3 | 7.6 | |||||||||||||||||
| Net loan-loss provisions | (3,303) | 14.8 | 15.0 | (9,079) | 21.6 | 21.8 | |||||||||||||||||
| Other gains (losses) and provisions | (532) | (29.6) | (26.1) | (2,003) | 29.9 | 39.0 | |||||||||||||||||
| Profit before tax | 3,046 | 13.6 | 12.8 | 8,138 | (8.6) | (9.3) | |||||||||||||||||
| Tax on profit | (711) | (4.5) | (4.9) | (2,102) | (7.2) | (6.8) | |||||||||||||||||
| Profit from continuing operations | 2,335 | 20.5 | 19.7 | 6,036 | (9.0) | (10.1) | |||||||||||||||||
| Net profit from discontinued operations | — | — | — | — | — | — | |||||||||||||||||
| Consolidated profit | 2,335 | 20.5 | 19.7 | 6,036 | (9.0) | (10.1) | |||||||||||||||||
| Non-controlling interests | (207) | (5.9) | (5.3) | (639) | (8.9) | (10.1) | |||||||||||||||||
| Profit attributable to the parent | 2,128 | 23.9 | 22.8 | 5,397 | (9.1) | (10.1) | |||||||||||||||||
1. Includes exchange differences.
| CORPORATE & INVESTMENT BANKING | |||||||||||||||||||||||
| EUR million | |||||||||||||||||||||||
| / | Q2'23 | / | 9M'22 | ||||||||||||||||||||
| Underlying income statement | Q3'23 | % | % excl. FX | 9M'23 | % | % excl. FX | |||||||||||||||||
| Net interest income | 950 | 22.7 | 33.3 | 2,562 | (2.5) | 4.1 | |||||||||||||||||
| Net fee income | 531 | (4.0) | (1.8) | 1,704 | 12.3 | 14.8 | |||||||||||||||||
Gains (losses) on financial transactions 1 | 675 | (11.7) | (5.1) | 2,213 | 55.9 | 69.5 | |||||||||||||||||
| Other operating income | (30) | — | — | — | — | — | |||||||||||||||||
| Total income | 2,126 | (1.0) | 3.0 | 6,479 | 16.2 | 20.8 | |||||||||||||||||
| Administrative expenses and amortizations | (864) | 12.0 | 14.1 | (2,374) | 16.0 | 18.3 | |||||||||||||||||
| Net operating income | 1,262 | (8.2) | (3.3) | 4,105 | 16.3 | 22.3 | |||||||||||||||||
| Net loan-loss provisions | 49 | — | — | 46 | 190.7 | 124.3 | |||||||||||||||||
| Other gains (losses) and provisions | (94) | 278.3 | 286.9 | (155) | 94.1 | 89.8 | |||||||||||||||||
| Profit before tax | 1,217 | (7.8) | (2.7) | 3,997 | 15.3 | 21.2 | |||||||||||||||||
| Tax on profit | (364) | 1.3 | 2.0 | (1,141) | 19.4 | 21.0 | |||||||||||||||||
| Profit from continuing operations | 853 | (11.2) | (4.4) | 2,855 | 13.8 | 21.3 | |||||||||||||||||
| Net profit from discontinued operations | — | — | — | — | — | — | |||||||||||||||||
| Consolidated profit | 853 | (11.2) | (4.4) | 2,855 | 13.8 | 21.3 | |||||||||||||||||
| Non-controlling interests | (49) | (20.5) | (18.9) | (175) | 16.8 | 15.6 | |||||||||||||||||
| Profit attributable to the parent | 804 | (10.5) | (3.4) | 2,680 | 13.6 | 21.7 | |||||||||||||||||
1. Includes exchange differences.
January - September 2023 | | 73 | ||||||
Business model | ||||||||||||||||||||||||||
| Financial information by segment | ||||||||||||||||||||||||||
| WEALTH MANAGEMENT & INSURANCE | |||||||||||||||||||||||
| EUR million | |||||||||||||||||||||||
| / | Q2'23 | / | 9M'22 | ||||||||||||||||||||
| Underlying income statement | Q3'23 | % | % excl. FX | 9M'23 | % | % excl. FX | |||||||||||||||||
| Net interest income | 454 | (0.5) | 0.5 | 1,323 | 152.1 | 159.1 | |||||||||||||||||
| Net fee income | 319 | 0.6 | 3.7 | 944 | (4.0) | (2.3) | |||||||||||||||||
Gains (losses) on financial transactions 1 | 35 | (5.1) | 5.4 | 104 | 17.3 | 23.2 | |||||||||||||||||
| Other operating income | 66 | (13.7) | (20.6) | 220 | (22.5) | (27.4) | |||||||||||||||||
| Total income | 874 | (1.4) | 0.0 | 2,591 | 37.8 | 39.0 | |||||||||||||||||
| Administrative expenses and amortizations | (284) | 0.5 | 1.4 | (845) | 9.4 | 10.4 | |||||||||||||||||
| Net operating income | 590 | (2.3) | (0.7) | 1,746 | 57.6 | 59.0 | |||||||||||||||||
| Net loan-loss provisions | 0 | (98.9) | (99.6) | 16 | — | — | |||||||||||||||||
| Other gains (losses) and provisions | (5) | (57.4) | (56.1) | (40) | 54.4 | 55.0 | |||||||||||||||||
| Profit before tax | 585 | (3.6) | (2.0) | 1,721 | 61.5 | 62.9 | |||||||||||||||||
| Tax on profit | (140) | (3.9) | (2.0) | (419) | 73.4 | 77.1 | |||||||||||||||||
| Profit from continuing operations | 446 | (3.5) | (2.0) | 1,303 | 58.0 | 58.9 | |||||||||||||||||
| Net profit from discontinued operations | — | — | — | — | — | — | |||||||||||||||||
| Consolidated profit | 446 | (3.5) | (2.0) | 1,303 | 58.0 | 58.9 | |||||||||||||||||
| Non-controlling interests | (14) | (28.1) | (27.3) | (52) | 8.9 | 7.1 | |||||||||||||||||
| Profit attributable to the parent | 432 | (2.4) | (0.9) | 1,251 | 61.0 | 62.1 | |||||||||||||||||
1. Includes exchange differences.
| PAGONXT | |||||||||||||||||||||||
| EUR million | |||||||||||||||||||||||
| / | Q2'23 | / | 9M'22 | ||||||||||||||||||||
| Underlying income statement | Q3'23 | % | % excl. FX | 9M'23 | % | % excl. FX | |||||||||||||||||
| Net interest income | 24 | 8.3 | 6.7 | 55 | 397.0 | 396.2 | |||||||||||||||||
| Net fee income | 255 | 11.8 | 11.1 | 701 | 14.8 | 12.4 | |||||||||||||||||
Gains (losses) on financial transactions 1 | 1 | — | — | (10) | 98.1 | 91.2 | |||||||||||||||||
| Other operating income | 18 | (42.3) | (42.2) | 73 | 92.1 | 88.9 | |||||||||||||||||
| Total income | 298 | 7.6 | 6.9 | 820 | 25.2 | 22.6 | |||||||||||||||||
| Administrative expenses and amortizations | (251) | (15.0) | (14.6) | (823) | 13.1 | 12.2 | |||||||||||||||||
| Net operating income | 48 | — | — | (4) | (94.8) | (94.1) | |||||||||||||||||
| Net loan-loss provisions | (10) | 70.0 | 68.3 | (23) | (5.4) | (5.6) | |||||||||||||||||
| Other gains (losses) and provisions | (6) | (38.9) | (40.0) | (19) | 17.9 | 16.1 | |||||||||||||||||
| Profit before tax | 31 | — | — | (45) | (60.0) | (57.0) | |||||||||||||||||
| Tax on profit | (25) | 78.4 | 77.3 | (54) | 5.3 | 1.8 | |||||||||||||||||
| Profit from continuing operations | 6 | — | — | (99) | (39.8) | (37.4) | |||||||||||||||||
| Net profit from discontinued operations | — | — | — | — | — | — | |||||||||||||||||
| Consolidated profit | 6 | — | — | (99) | (39.8) | (37.4) | |||||||||||||||||
| Non-controlling interests | (3) | — | — | (2) | (78.8) | (79.4) | |||||||||||||||||
| Profit attributable to the parent | 3 | — | — | (101) | (41.5) | (39.5) | |||||||||||||||||
1. Includes exchange differences.
| 74 | | January - September 2023 | ||||||
Business model | ||||||||||||||||||||||||||
| Alternative performance measures | ||||||||||||||||||||||||||
| ALTERNATIVE PERFORMANCE MEASURES (APMs) | ||||||||
In addition to the financial information prepared under IFRS, this consolidated directors’ report contains financial measures that constitute alternative performance measures (APMs) to comply with the guidelines on alternative performance measures issued by the European Securities and Markets Authority on 5 October 2015 and non-IFRS measures.
The financial measures contained in this consolidated directors’ report that qualify as APMs and non-IFRS measures have been calculated using the financial information from Santander but are not defined or detailed in the applicable financial information framework or under IFRS and therefore have neither been audited nor are susceptible to being fully audited.
We use these APMs and non-IFRS measures when planning, monitoring and evaluating our performance. We consider these APMs and non-IFRS financial measures to be useful metrics for management and investors to facilitate operating performance comparisons from period to period. While we believe that these APMs and non-IFRS financial measures are useful in evaluating our business, this information should be considered as supplemental in nature and is not meant as a substitute of IFRS measures. In addition, the way in which Santander defines and calculates these APMs and non-IFRS measures may differ from the calculations by
other companies with similar measures and, therefore, may not be comparable.
The APMs and non-IFRS measures we use in this document can be categorized as follows:
Underlying results
In addition to IFRS results measures, we present some results measures which are non-IFRS and which we refer to as underlying measures. These measures allow in our view a better year-on-year comparability given that they exclude items outside the ordinary performance of our business (e.g. capital gains, write-downs, impairment of goodwill) or certain line items have been reclassified in the underlying ("adjusted") income statement, as their impact on profit is zero, to facilitate comparisons with prior quarters and better understand the trends in the business.
In addition, in the section "Financial information by segment", relative to the primary and secondary segments, results are only presented on an underlying basis in accordance with IFRS 8, and reconciled on an aggregate basis to our IFRS consolidated results to the consolidated financial statements, which are set out below.
| Reconciliation of underlying results to statutory results | |||||||||||
| EUR million | |||||||||||
| January-September 2023 | |||||||||||
| Statutory results | Adjustments | Underlying results | |||||||||
| Net interest income | 32,139 | — | 32,139 | ||||||||
| Net fee income | 9,222 | — | 9,222 | ||||||||
Gains (losses) on financial transactions 1 | 1,969 | — | 1,969 | ||||||||
| Other operating income | (459) | 224 | (235) | ||||||||
| Total income | 42,871 | 224 | 43,095 | ||||||||
| Administrative expenses and amortizations | (18,961) | — | (18,961) | ||||||||
| Net operating income | 23,910 | 224 | 24,134 | ||||||||
| Net loan-loss provisions | (9,511) | 474 | (9,037) | ||||||||
| Other gains (losses) and provisions | (1,862) | (459) | (2,321) | ||||||||
| Profit before tax | 12,537 | 239 | 12,776 | ||||||||
| Tax on profit | (3,552) | (213) | (3,765) | ||||||||
| Profit from continuing operations | 8,985 | 26 | 9,011 | ||||||||
| Net profit from discontinued operations | — | — | — | ||||||||
| Consolidated profit | 8,985 | 26 | 9,011 | ||||||||
| Non-controlling interests | (842) | (26) | (868) | ||||||||
| Profit attributable to the parent | 8,143 | — | 8,143 | ||||||||
1. Includes exchange differences.
| Explanation of adjustments: | |||||
| 1. | Temporary levy on revenue in Spain in the first quarter, totalling EUR 224 million, which was moved from total income to other gains (losses) and provisions. | ||||
| 2. | Provisions to strengthen the balance sheet in Brazil in the first quarter, totalling EUR 235 million, net of tax and non-controlling interests (EUR 474 million recorded in net loan-loss provisions, EUR 213 million positive impact in tax and EUR 26 million in non-controlling interests). | ||||
January - September 2023 | | 75 | ||||||
Business model | ||||||||||||||||||||||||||
| Alternative performance measures | ||||||||||||||||||||||||||
| Reconciliation of underlying results to statutory results | |||||||||||
| EUR million | |||||||||||
| January-September 2022 | |||||||||||
| Statutory results | Adjustments | Underlying results | |||||||||
| Net interest income | 28,460 | — | 28,460 | ||||||||
| Net fee income | 8,867 | — | 8,867 | ||||||||
Gains (losses) on financial transactions 1 | 1,115 | — | 1,115 | ||||||||
| Other operating income | 152 | 35 | 187 | ||||||||
| Total income | 38,594 | 35 | 38,629 | ||||||||
| Administrative expenses and amortizations | (17,595) | — | (17,595) | ||||||||
| Net operating income | 20,999 | 35 | 21,034 | ||||||||
| Net loan-loss provisions | (7,778) | 287 | (7,491) | ||||||||
| Other gains (losses) and provisions | (1,460) | (322) | (1,782) | ||||||||
| Profit before tax | 11,761 | — | 11,761 | ||||||||
| Tax on profit | (3,538) | — | (3,538) | ||||||||
| Profit from continuing operations | 8,223 | — | 8,223 | ||||||||
| Net profit from discontinued operations | — | — | — | ||||||||
| Consolidated profit | 8,223 | — | 8,223 | ||||||||
| Non-controlling interests | (907) | — | (907) | ||||||||
| Profit attributable to the parent | 7,316 | — | 7,316 | ||||||||
1. Includes exchange differences.
Explanation of adjustments:
Mainly, payment holidays in Poland.
| 76 | | January - September 2023 | ||||||
Business model | ||||||||||||||||||||||||||
| Alternative performance measures | ||||||||||||||||||||||||||
Profitability and efficiency ratios
The purpose of the profitability and efficiency ratios is to measure the ratio of profit to capital, to tangible capital, to assets and to risk- weighted assets, while the efficiency ratio measures how much general administrative expenses (personnel and other) and amortization costs are needed to generate revenue.
Additionally, goodwill adjustments have been removed from the RoTE numerator as, since they are not considered in the denominator, we believe this calculation is more correct.
| Ratio | Formula | Relevance of the metric | ||||||||||||
| RoE | Profit attributable to the parent | This ratio measures the return that shareholders obtain on the funds invested in the bank and as such measures the company's ability to pay shareholders. | ||||||||||||
| (Return on equity) | Average stockholders’ equity 1 (excl. minority interests) | |||||||||||||
| RoTE | Profit attributable to the parent2 | This indicator is used to evaluate the profitability of the company as a percentage of its tangible equity. It's measured as the return that shareholders receive as a percentage of the funds invested in the entity less intangible assets. | ||||||||||||
| (Return on tangible equity) | Average stockholders' equity 1 (excl. minority interests) - intangible assets | |||||||||||||
| RoA | Consolidated profit | This metric measures the profitability of a company as a percentage of its total assets. It is an indicator that reflects the efficiency of the company's total funds in generating profit. | ||||||||||||
| (Return on assets) | Average total assets | |||||||||||||
| RoRWA | Consolidated profit | The return adjusted for risk is a derivative of the RoA metric. The difference is that RoRWA measures profit in relation to the bank's risk-weighted assets. | ||||||||||||
| (Return on risk-weighted assets) | Average risk-weighted assets | |||||||||||||
| Efficiency ratio | Operating expenses 3 | One of the most commonly used indicators when comparing productivity of different financial entities. It measures the amount of funds used to generate the bank's total income. | ||||||||||||
| Total income | ||||||||||||||
1. Stockholders’ equity = Capital and Reserves + Accumulated other comprehensive income + Profit attributable to the parent + Dividends.
2. Excluding the adjustment to the valuation of goodwill.
3. Operating expenses = Administrative expenses + amortizations.
January - September 2023 | | 77 | ||||||
Business model | ||||||||||||||||||||||||||
| Alternative performance measures | ||||||||||||||||||||||||||
Profitability and efficiency 1, 2 | Q3'23 | Q2'23 | 9M'23 | 9M'22 | ||||||||||
| (EUR million and %) | ||||||||||||||
| RoE | 12.28 | % | 11.56 | % | 11.75 | % | 10.86 | % | ||||||
| Profit attributable to the parent | 11,609 | 10,680 | 10,858 | 9,755 | ||||||||||
| Average stockholders' equity (excluding minority interests) | 94,527 | 92,383 | 92,421 | 89,854 | ||||||||||
| RoTE | 15.49 | % | 14.61 | % | 14.83 | % | 13.57 | % | ||||||
| Profit attributable to the parent | 11,609 | 10,680 | 10,858 | 9,755 | ||||||||||
| (+) Goodwill impairment | — | — | — | — | ||||||||||
| Profit attributable to the parent (excluding goodwill impairment) | 11,609 | 10,680 | 10,858 | 9,755 | ||||||||||
| Average stockholders' equity (excluding minority interests) | 94,527 | 92,383 | 92,421 | 89,854 | ||||||||||
| (-) Average intangible assets | 19,576 | 19,282 | 19,226 | 17,967 | ||||||||||
| Average stockholders' equity (excl. minority interests) - intangible assets | 74,951 | 73,101 | 73,195 | 71,887 | ||||||||||
| RoA | 0.71 | % | 0.67 | % | 0.68 | % | 0.64 | % | ||||||
| Consolidated profit | 12,702 | 11,883 | 12,014 | 10,964 | ||||||||||
| Average total assets | 1,784,465 | 1,766,099 | 1,764,293 | 1,702,210 | ||||||||||
| RoRWA | 2.02 | % | 1.90 | % | 1.93 | % | 1.82 | % | ||||||
| Consolidated profit | 12,702 | 11,883 | 12,014 | 10,964 | ||||||||||
| Average risk-weighted assets | 630,034 | 624,529 | 623,352 | 603,483 | ||||||||||
| Efficiency ratio | 43.6 | % | 44.3 | % | 44.0 | % | 45.5 | % | ||||||
| Underlying operating expenses | 6,482 | 6,334 | 18,961 | 17,595 | ||||||||||
| Operating expenses | 6,482 | 6,334 | 18,961 | 17,595 | ||||||||||
| Net capital gains and provisions impact on operating expenses | — | — | — | — | ||||||||||
| Underlying total income | 14,861 | 14,299 | 43,095 | 38,629 | ||||||||||
| Total income | 14,861 | 14,088 | 42,871 | 38,594 | ||||||||||
| Net capital gains and provisions impact on total income | — | 211 | 224 | 35 | ||||||||||
1.Averages included in the RoE, RoTE, RoA and RoRWA denominators are calculated using the monthly average over the period, which we believe should not differ materially from using daily balances. | ||||||||||||||
2.The risk-weighted assets included in the denominator of the RoRWA metric are calculated in line with the criteria laid out in the CRR (Capital Requirements Regulation). | ||||||||||||||
| 78 | | January - September 2023 | ||||||
Business model | ||||||||||||||||||||||||||
| Alternative performance measures | ||||||||||||||||||||||||||
| Efficiency ratio | ||||||||||||||||||||
| (EUR million and %) | ||||||||||||||||||||
| 9M'23 | 9M'22 | |||||||||||||||||||
| % | Operating expenses | Total income | % | Operating expenses | Total income | |||||||||||||||
| Europe | 41.1 | 6,673 | 16,228 | 47.4 | 6,296 | 13,273 | ||||||||||||||
| Spain | 40.1 | 3,127 | 7,791 | 48.5 | 2,941 | 6,058 | ||||||||||||||
| United Kingdom | 48.2 | 2,047 | 4,245 | 49.8 | 2,008 | 4,031 | ||||||||||||||
| Portugal | 28.7 | 401 | 1,398 | 40.3 | 376 | 933 | ||||||||||||||
| Poland | 26.5 | 622 | 2,344 | 28.6 | 510 | 1,780 | ||||||||||||||
| North America | 48.0 | 4,707 | 9,807 | 47.0 | 4,239 | 9,021 | ||||||||||||||
| US | 49.9 | 2,714 | 5,442 | 46.5 | 2,635 | 5,667 | ||||||||||||||
| Mexico | 42.7 | 1,845 | 4,318 | 44.3 | 1,467 | 3,312 | ||||||||||||||
| South America | 39.1 | 5,332 | 13,641 | 36.3 | 4,935 | 13,613 | ||||||||||||||
| Brazil | 34.8 | 3,345 | 9,616 | 31.1 | 3,009 | 9,671 | ||||||||||||||
| Chile | 45.5 | 771 | 1,694 | 38.1 | 737 | 1,934 | ||||||||||||||
| Argentina | 49.7 | 781 | 1,572 | 57.3 | 809 | 1,413 | ||||||||||||||
| Digital Consumer Bank | 48.3 | 1,967 | 4,069 | 47.7 | 1,853 | 3,887 | ||||||||||||||
| RoTE | ||||||||||||||||||||
| (EUR million and %) | ||||||||||||||||||||
| 9M'23 | 9M'22 | |||||||||||||||||||
| % | Profit attributable to the parent | Average stockholders' equity (excl. minority interests) - intangible assets | % | Profit attributable to the parent | Average stockholders' equity (excl. minority interests) - intangible assets | |||||||||||||||
| Europe | 14.77 | 5,568 | 37,690 | 9.15 | 3,783 | 41,351 | ||||||||||||||
| Spain | 14.75 | 2,472 | 16,764 | 7.46 | 1,472 | 19,731 | ||||||||||||||
| United Kingdom | 14.00 | 1,658 | 11,838 | 11.31 | 1,517 | 13,414 | ||||||||||||||
| Portugal | 23.12 | 806 | 3,484 | 13.20 | 481 | 3,642 | ||||||||||||||
| Poland | 18.94 | 705 | 3,724 | 10.12 | 306 | 3,018 | ||||||||||||||
| North America | 10.37 | 2,533 | 24,421 | 11.54 | 3,028 | 26,237 | ||||||||||||||
| US | 7.42 | 1,153 | 15,545 | 10.31 | 1,986 | 19,259 | ||||||||||||||
| Mexico | 17.60 | 1,551 | 8,808 | 16.59 | 1,165 | 7,022 | ||||||||||||||
| South America | 14.81 | 3,106 | 20,973 | 20.04 | 3,845 | 19,191 | ||||||||||||||
| Brazil | 13.72 | 1,902 | 13,856 | 20.65 | 2,703 | 13,085 | ||||||||||||||
| Chile | 14.05 | 556 | 3,953 | 21.56 | 735 | 3,410 | ||||||||||||||
| Argentina | 39.48 | 542 | 1,372 | 21.82 | 311 | 1,428 | ||||||||||||||
| Digital Consumer Bank | 11.35 | 1,097 | 9,666 | 12.71 | 1,210 | 9,522 | ||||||||||||||
January - September 2023 | | 79 | ||||||
Business model | ||||||||||||||||||||||||||
| Alternative performance measures | ||||||||||||||||||||||||||
Credit risk indicators
The credit risk indicators measure the quality of the credit portfolio and the percentage of non-performing loans covered by provisions.
| Ratio | Formula | Relevance of the metric | ||||||||||||
NPL ratio (Non-performing loans) | Credit impaired loans and advances to customers, customer guarantees and customer commitments granted | The NPL ratio is an important variable regarding financial institutions' activity since it gives an indication of the level of risk the entities are exposed to. It calculates risks that are, in accounting terms, declared to be credit impaired as a percentage of the total outstanding amount of customer credit and contingent liabilities. | ||||||||||||
Total Risk 1 | ||||||||||||||
| Total coverage ratio | Total allowances to cover impairment losses on loans and advances to customers, customer guarantees and customer commitments granted | The total coverage ratio is a fundamental metric in the financial sector. It reflects the level of provisions as a percentage of the credit impaired assets. Therefore it is a good indicator of the entity's solvency against customer defaults both present and future. | ||||||||||||
| Credit impaired loans and advances to customers, customer guarantees and customer commitments granted | ||||||||||||||
| Cost of risk | Allowances for loan-loss provisions over the last 12 months | This ratio quantifies loan-loss provisions arising from credit risk over a defined period of time for a given loan portfolio. As such, it acts as an indicator of credit quality. | ||||||||||||
| Average loans and advances to customers over the last 12 months | ||||||||||||||
1. Total risk = Total loans and advances and guarantees to customers (including credit impaired assets) + contingent liabilities granted that are credit impaired.
| Credit risk (I) | Sep-23 | Jun-23 | Sep-22 | |||||||||||
| (EUR million and %) | ||||||||||||||
| NPL ratio | 3.13 | % | 3.07 | % | 3.08 | % | ||||||||
| Credit impaired loans and advances to customers, customer guarantees and customer commitments granted | 35,558 | 34,949 | 35,600 | |||||||||||
| Gross loans and advances to customers registered under the headings “financial assets measured at amortized cost” and "financial assets designated at fair value through profit or loss" classified in stage 3 (OCI), excluding POCI (Purchased or Originated Credit Impaired) | 33,682 | 33,045 | 33,468 | |||||||||||
| POCI exposure (Purchased or Originated Credit Impaired) that is additionally impaired | 288 | 251 | 258 | |||||||||||
| Customer guarantees and customer commitments granted classified in stage 3 | 1,577 | 1,643 | 1,865 | |||||||||||
| Doubtful exposure of loans and advances to customers at fair value through profit or loss | 11 | 10 | 9 | |||||||||||
| Total risk | 1,135,383 | 1,137,823 | 1,156,548 | |||||||||||
| Impaired and non-impaired gross loans and advances to customers | 1,062,413 | 1,068,190 | 1,091,551 | |||||||||||
| Impaired and non-impaired customer guarantees and customer commitments granted | 72,970 | 69,633 | 64,997 | |||||||||||
| 80 | | January - September 2023 | ||||||
Business model | ||||||||||||||||||||||||||
| Alternative performance measures | ||||||||||||||||||||||||||
| Credit risk (II) | Sep-23 | Jun-23 | Sep-22 | |||||||||||
| (EUR million and %) | ||||||||||||||
| Total coverage ratio | 68 | % | 68 | % | 70 | % | ||||||||
| Total allowances to cover impairment losses on loans and advances to customers, customer guarantees and customer commitments granted | 24,019 | 23,902 | 24,813 | |||||||||||
| Total allowances to cover impairment losses on loans and advances to customers measured at amortized cost and designated at fair value through OCI | 23,242 | 23,146 | 24,084 | |||||||||||
| Total allowances to cover impairment losses on customer guarantees and customer commitments granted | 777 | 756 | 729 | |||||||||||
| Credit impaired loans and advances to customers, customer guarantees and customer commitments granted | 35,558 | 34,949 | 35,600 | |||||||||||
| Gross loans and advances to customers registered under the headings “financial assets measured at amortized cost” and "financial assets designated at fair value through profit or loss" classified in stage 3 (OCI), excluding POCI (Purchased or Originated Credit Impaired) | 33,682 | 33,045 | 33,468 | |||||||||||
| POCI exposure (Purchased or Originated Credit Impaired) that is additionally impaired | 288 | 251 | 258 | |||||||||||
| Customer guarantees and customer commitments granted classified in stage 3 | 1,577 | 1,643 | 1,865 | |||||||||||
| Doubtful exposure of loans and advances to customers at fair value through profit or loss | 11 | 10 | 9 | |||||||||||
| Cost of risk | 1.13 | % | 1.08 | % | 0.86 | % | ||||||||
| Underlying allowances for loan-loss provisions over the last 12 months | 12,055 | 11,545 | 8,954 | |||||||||||
| Allowances for loan-loss provisions over the last 12 months | 12,529 | 12,019 | 9,241 | |||||||||||
| Net capital gains and provisions impact in allowances for loan-loss provisions | -474 | -474 | -287 | |||||||||||
| Average loans and advances to customers over the last 12 months | 1,064,199 | 1,070,729 | 1,037,288 | |||||||||||
| NPL ratio | ||||||||||||||||||||
| (EUR million and %) | ||||||||||||||||||||
| 9M'23 | 9M'22 | |||||||||||||||||||
| % | Credit impaired loans and advances to customers, customer guarantees and customer commitments granted | Total risk | % | Credit impaired loans and advances to customers, customer guarantees and customer commitments granted | Total risk | |||||||||||||||
| Europe | 2.32 | 14,490 | 625,391 | 2.58 | 16,918 | 656,979 | ||||||||||||||
| Spain | 3.06 | 8,602 | 280,849 | 3.69 | 11,251 | 305,299 | ||||||||||||||
| United Kingdom | 1.42 | 3,540 | 249,715 | 1.16 | 3,000 | 258,402 | ||||||||||||||
| Portugal | 2.48 | 983 | 39,620 | 3.03 | 1,281 | 42,267 | ||||||||||||||
| Poland | 3.63 | 1,334 | 36,743 | 3.63 | 1,190 | 32,795 | ||||||||||||||
| North America | 3.83 | 7,481 | 195,162 | 2.79 | 5,541 | 198,786 | ||||||||||||||
| US | 4.24 | 6,025 | 142,048 | 2.92 | 4,416 | 150,986 | ||||||||||||||
| Mexico | 2.72 | 1,443 | 53,039 | 2.34 | 1,118 | 47,738 | ||||||||||||||
| South America | 5.71 | 10,140 | 177,479 | 5.54 | 9,627 | 173,642 | ||||||||||||||
| Brazil | 6.71 | 7,472 | 111,283 | 6.63 | 7,168 | 108,078 | ||||||||||||||
| Chile | 4.90 | 2,299 | 46,901 | 4.63 | 2,147 | 46,367 | ||||||||||||||
| Argentina | 1.91 | 122 | 6,391 | 2.13 | 141 | 6,607 | ||||||||||||||
| Digital Consumer Bank | 2.08 | 2,746 | 131,780 | 2.20 | 2,659 | 121,028 | ||||||||||||||
January - September 2023 | | 81 | ||||||
Business model | ||||||||||||||||||||||||||
| Alternative performance measures | ||||||||||||||||||||||||||
| NPL coverage ratio | ||||||||||||||||||||
| (EUR million and %) | ||||||||||||||||||||
| 9M'23 | 9M'22 | |||||||||||||||||||
| % | Total allowances to cover impairment losses on loans and advances to customers, customer guarantees and customer commitments granted | Credit impaired loans and advances to customers, customer guarantees and customer commitments granted | % | Total allowances to cover impairment losses on loans and advances to customers, customer guarantees and customer commitments granted | Credit impaired loans and advances to customers, customer guarantees and customer commitments granted | |||||||||||||||
| Europe | 51.1 | 7,405 | 14,490 | 49.7 | 8,409 | 16,918 | ||||||||||||||
| Spain | 51.2 | 4,401 | 8,602 | 49.3 | 5,549 | 11,251 | ||||||||||||||
| United Kingdom | 31.9 | 1,130 | 3,540 | 32.4 | 973 | 3,000 | ||||||||||||||
| Portugal | 84.6 | 831 | 983 | 76.3 | 977 | 1,281 | ||||||||||||||
| Poland | 76.5 | 1,021 | 1,334 | 74.8 | 890 | 1,190 | ||||||||||||||
| North America | 78.8 | 5,895 | 7,481 | 102.7 | 5,691 | 5,541 | ||||||||||||||
| US | 73.1 | 4,403 | 6,025 | 102.8 | 4,537 | 4,416 | ||||||||||||||
| Mexico | 102.7 | 1,482 | 1,443 | 102.7 | 1,149 | 1,118 | ||||||||||||||
| South America | 78.0 | 7,913 | 10,140 | 84.7 | 8,154 | 9,627 | ||||||||||||||
| Brazil | 83.0 | 6,199 | 7,472 | 89.2 | 6,395 | 7,168 | ||||||||||||||
| Chile | 55.6 | 1,279 | 2,299 | 60.3 | 1,295 | 2,147 | ||||||||||||||
| Argentina | 158.3 | 193 | 122 | 179.0 | 252 | 141 | ||||||||||||||
| Digital Consumer Bank | 92.2 | 2,532 | 2,746 | 95.6 | 2,543 | 2,659 | ||||||||||||||
| Cost of risk | ||||||||||||||||||||
| (EUR million and %) | ||||||||||||||||||||
| 9M'23 | 9M'22 | |||||||||||||||||||
| % | Underlying allowances for loan-loss provisions over the last 12 months | Average loans and advances to customers over the last 12 months | % | Underlying allowances for loan-loss provisions over the last 12 months | Average loans and advances to customers over the last 12 months | |||||||||||||||
| Europe | 0.44 | 2,587 | 590,431 | 0.36 | 2,176 | 609,518 | ||||||||||||||
| Spain | 0.62 | 1,570 | 252,210 | 0.71 | 1,861 | 263,016 | ||||||||||||||
| United Kingdom | 0.12 | 311 | 254,207 | 0.02 | 56 | 274,222 | ||||||||||||||
| Portugal | 0.17 | 66 | 39,191 | -0.12 | -48 | 40,279 | ||||||||||||||
| Poland | 1.98 | 625 | 31,536 | 1.07 | 329 | 30,605 | ||||||||||||||
| North America | 1.91 | 3,480 | 182,400 | 1.12 | 1,780 | 158,691 | ||||||||||||||
| US | 1.77 | 2,406 | 136,256 | 0.87 | 1,076 | 123,021 | ||||||||||||||
| Mexico | 2.34 | 1,067 | 45,640 | 1.86 | 702 | 37,782 | ||||||||||||||
| South America | 3.30 | 5,250 | 159,098 | 3.11 | 4,500 | 144,807 | ||||||||||||||
| Brazil | 4.67 | 4,535 | 97,153 | 4.46 | 3,900 | 87,517 | ||||||||||||||
| Chile | 0.87 | 395 | 45,537 | 0.87 | 366 | 41,884 | ||||||||||||||
| Argentina | 4.09 | 169 | 4,143 | 2.88 | 158 | 5,497 | ||||||||||||||
| Digital Consumer Bank | 0.60 | 755 | 126,125 | 0.43 | 507 | 117,554 | ||||||||||||||
| 82 | | January - September 2023 | ||||||
Business model | ||||||||||||||||||||||||||
| Alternative performance measures | ||||||||||||||||||||||||||
Other indicators
The market capitalization indicator provides information on the volume of tangible equity per share. The loan-to-deposit ratio (LTD) identifies the relationship between net customer loans and advances and customer deposits, assessing the proportion of loans and advances granted by the Group that are funded by customer deposits.
The Group also uses gross customer loan magnitudes excluding reverse repurchase agreements (repos) and customer deposits excluding repos. In order to analyse the evolution of the traditional commercial banking business of granting loans and capturing deposits, repos and reverse repos are excluded, as they are mainly treasury business products and highly volatile.
| Ratio | Formula | Relevance of the metric | ||||||||||||
| TNAV per share | Tangible book value 1 | This is a very commonly used ratio used to measure the company's accounting value per share having deducted the intangible assets. It is useful in evaluating the amount each shareholder would receive if the company were to enter into liquidation and had to sell all the company's tangible assets. | ||||||||||||
| (Tangible equity net asset value per share) | Number of shares excluding treasury stock | |||||||||||||
| Price / tangible book value per share (X) | Share price | This is one of the most commonly used ratios by market participants for the valuation of listed companies both in absolute terms and relative to other entities. This ratio measures the relationship between the price paid for a company and its accounting equity value. | ||||||||||||
| TNAV per share | ||||||||||||||
| LTD ratio | Net loans and advances to customers | This is an indicator of the bank's liquidity. It measures the total (net) loans and advances to customers as a percentage of customer deposits. | ||||||||||||
| (Loan-to-deposit) | Customer deposits | |||||||||||||
| Loans and advances (excl. reverse repos) | Gross loans and advances to customers excluding reverse repos | In order to aid analysis of the commercial banking activity, reverse repos are excluded as they are highly volatile treasury products. | ||||||||||||
| Deposits (excl. repos) | Customer deposits excluding repos | In order to aid analysis of the commercial banking activity, repos are excluded as they are highly volatile treasury products. | ||||||||||||
| PAT + After tax fees paid to SAN (in Wealth Management & Insurance) | Net profit + fees paid from Santander Asset Management and Santander Insurance to Santander, net of taxes, excluding Private Banking customers | Metric to assess Wealth Management & Insurance's total contribution to Grupo Santander profit. | ||||||||||||
1. Tangible book value = Stockholders' equity (excl. minority interests) - intangible assets.
| Others | Sep-23 | Jun-23 | Sep-23 | Sep-22 | ||||||||||
| (EUR million and %) | ||||||||||||||
| TNAV (tangible book value) per share | 4.61 | 4.57 | 4.31 | |||||||||||
| Tangible book value | 74,561 | 73,941 | 72,235 | |||||||||||
| Number of shares excl. treasury stock (million) | 16,176 | 16,170 | 16,773 | |||||||||||
| Price / Tangible book value per share (X) | 0.79 | 0.74 | 0.56 | |||||||||||
| Share price (euros) | 3.619 | 3.385 | 2.398 | |||||||||||
| TNAV (tangible book value) per share | 4.61 | 4.57 | 4.31 | |||||||||||
| Loan-to-deposit ratio | 100 | % | 103 | % | 107 | % | ||||||||
| Net loans and advances to customers | 1,039,172 | 1,045,044 | 1,067,466 | |||||||||||
| Customer deposits | 1,034,885 | 1,013,778 | 993,065 | |||||||||||
| Q3'23 | Q2'23 | 9M'23 | 9M'22 | |||||||||||
| PAT + After tax fees paid to SAN (in WM&I) (Constant EUR million) | 854 | 861 | 2,486 | 1,966 | ||||||||||
| Profit after tax | 450 | 459 | 1,303 | 820 | ||||||||||
| Net fee income net of tax | 404 | 402 | 1,183 | 1,146 | ||||||||||
January - September 2023 | | 83 | ||||||
Business model | ||||||||||||||||||||||||||
| Alternative performance measures | ||||||||||||||||||||||||||
Local currency measures
We make use of certain financial measures in local currency to help in the assessment of our ongoing operating performance. These non-IFRS financial measures include the results of operations of our subsidiary banks located outside the eurozone, excluding the impact of foreign exchange. Because changes in foreign currency exchange rates do not have an operating impact on the results, we believe that evaluating their performance on a local currency basis provides an additional and meaningful assessment of performance to both management and the company’s investors.
The Group presents, at both the Group level as well as the business unit level, the real changes in the income statement as well as the changes excluding the exchange rate effect, as it considers the latter facilitates analysis, since it enables businesses movements to be identified without taking into account the impact of converting each local currency into euros.
Said variations, excluding the impact of exchange rate movements, are calculated by converting income statement lines for the different business units comprising the Group into our presentation currency, the euro, applying the average exchange rate for 9M 2023 to all periods contemplated in the analysis.
The Group presents, at both the Group level as well as the business unit level, the changes in euros in the balance sheet as well as the changes excluding the exchange rate effect for loans and advances to customers excluding reverse repos and customer funds (which comprise deposits and mutual funds) excluding repos. As with the income statement, the reason is to facilitate analysis by isolating the changes in the balance sheet that are not caused by converting each local currency into euros.
These changes excluding the impact of exchange rate movements are calculated by converting loans and advances to customers excluding reverse repos and customer funds excluding repos, into our presentation currency, the euro, applying the closing exchange rate on the last working day of September 2023 to all periods contemplated in the analysis.
The average and period-end exchange rates for the main currencies in which the Group operates are set out in the table below.
| Exchange rates: 1 euro / currency parity | ||||||||||||||||||||
| Average (income statement) | Period-end (balance sheet) | |||||||||||||||||||
| 9M'23 | 9M'22 | Sep-23 | Jun-23 | Sep-22 | ||||||||||||||||
| US dollar | 1.083 | 1.062 | 1.058 | 1.091 | 0.981 | |||||||||||||||
| Pound sterling | 0.870 | 0.847 | 0.867 | 0.858 | 0.878 | |||||||||||||||
| Brazilian real | 5.420 | 5.440 | 5.295 | 5.255 | 5.286 | |||||||||||||||
| Mexican peso | 19.251 | 21.506 | 18.392 | 18.719 | 19.678 | |||||||||||||||
| Chilean peso | 889.030 | 911.870 | 945.192 | 874.022 | 939.402 | |||||||||||||||
| Argentine peso | 254.654 | 126.972 | 370.374 | 279.984 | 144.538 | |||||||||||||||
| Polish zloty | 4.581 | 4.670 | 4.621 | 4.436 | 4.843 | |||||||||||||||
Impact of inflation rate on the variations of operating expenses
Santander presents, for both the Group and the business units included in the primary segments, the changes in operating expenses, as well as the changes excluding the exchange rate effect, and the changes of the latter excluding the effect of average inflation over the last twelve months. The reason is that the two latter facilitate analysis for management purposes.
Inflation is calculated as the arithmetic average of the last twelve months for each country and, for the regions, as the weighted average of each country comprising the region's inflation rate, weighted by each country's operating expenses in the region. The table below shows the cost changes in constant euros, the average inflation rates calculated as indicated and the cost changes in real terms, i.e. in constant euros and excluding average inflation of the last twelve months.
| Operating expenses: % change year-on-year | ||||||||||||||
| In constant EUR | Average inflation last 12 months | In real terms | ||||||||||||
| Europe | 6.8 | 7.0 | -0.2 | |||||||||||
| Spain | 6.3 | 4.4 | 1.9 | |||||||||||
| United Kingdom | 4.8 | 9.0 | -4.2 | |||||||||||
| Portugal | 6.7 | 6.4 | 0.3 | |||||||||||
| Poland | 19.7 | 14.3 | 5.4 | |||||||||||
| North America | 8.0 | 5.7 | 2.3 | |||||||||||
| US | 5.1 | 5.1 | 0.0 | |||||||||||
| Mexico | 12.6 | 6.5 | 6.1 | |||||||||||
| South America | 19.1 | 21.4 | -2.2 | |||||||||||
| Brazil | 10.8 | 4.9 | 5.8 | |||||||||||
| Chile | 2.0 | 9.8 | -7.8 | |||||||||||
| Argentina | 147.3 | 108.0 | 39.3 | |||||||||||
| Digital Consumer Bank | 8.1 | 7.3 | 0.8 | |||||||||||
| Total Group | 10.4 | 10.9 | -0.5 | |||||||||||
| 84 | | January - September 2023 | ||||||
Business model | ||||||||||||||||||||||||||
| Alternative performance measures | ||||||||||||||||||||||||||
| ESG indicators | ||||||||||||||||||||
| Metric | Definition | Sep-23 | ||||||||||||||||||
| Green finance raised and facilitated (EUR mn) | Nominal amount of PF, PF Advisory, PF bonds, Green bonds, ECA, M&A, ECM transactions classified by SCFS panel and reported in the League Tables since the beginning of the exercise. | 105,900 | ||||||||||||||||||
| Sustainable Responsible Investments AuMs (EUR mn) | Volume of assets under management classified as article 8 - promoting ESG objectives - and 9 - with explicit sustainability objectives - of the SFDR regulation (EU Reg. 2019/2088). Includes assets managed by Santander Asset Management (SAM), third-party funds and SAM funds managed with equivalent criteria in those countries where SFDR does not apply (mainly Latin America). | 64,000 | ||||||||||||||||||
Note: Not taxonomy.
January - September 2023 | | 85 | ||||||
Business model | ||||||||||||||||||||||||||
| Condensed consolidated financial statements | ||||||||||||||||||||||||||
| CONDENSED CONSOLIDATED FINANCIAL STATEMENTS | ||||||||
•CONSOLIDATED BALANCE SHEET
•CONSOLIDATED INCOME STATEMENT
| NOTE: | The following financial information for the first nine months of 2023 and 2022 (attached herewith) corresponds to the condensed consolidated financial statements prepared in accordance with the International Financial Reporting Standards. | ||||
| As a result of the implementation from 1 January 2023 of the amendments to IFRS 17 (new general accounting standard for insurance contracts), the Group has performed retrospectively a reclassification in the balance sheet to 'Liabilities under insurance or reinsurance contracts', related to the different treatment established by this new standard for the components of an insurance contract. | |||||
| Interim condensed consolidated balance sheet | |||||||||||
| EUR million | |||||||||||
| ASSETS | Sep-23 | Dec-22 | Sep-22 | ||||||||
| Cash, cash balances at central banks and other deposits on demand | 217,057 | 223,073 | 246,533 | ||||||||
| Financial assets held for trading | 201,226 | 156,118 | 179,775 | ||||||||
| Non-trading financial assets mandatorily at fair value through profit or loss | 6,104 | 5,713 | 5,788 | ||||||||
| Financial assets designated at fair value through profit or loss | 9,650 | 8,989 | 9,674 | ||||||||
| Financial assets at fair value through other comprehensive income | 86,029 | 85,239 | 87,915 | ||||||||
| Financial assets at amortized cost | 1,187,206 | 1,147,044 | 1,173,274 | ||||||||
| Hedging derivatives | 7,234 | 8,069 | 11,586 | ||||||||
| Changes in the fair value of hedged items in portfolio hedges of interest risk | (3,151) | (3,749) | (5,510) | ||||||||
| Investments | 7,819 | 7,615 | 7,805 | ||||||||
| Joint ventures entities | 2,026 | 1,981 | 2,055 | ||||||||
| Associated entities | 5,793 | 5,634 | 5,750 | ||||||||
| Assets under insurance or reinsurance contracts | 233 | 308 | 307 | ||||||||
| Tangible assets | 34,449 | 34,073 | 35,662 | ||||||||
| Property, plant and equipment | 33,395 | 33,044 | 34,553 | ||||||||
| For own-use | 13,575 | 13,489 | 13,613 | ||||||||
| Leased out under an operating lease | 19,820 | 19,555 | 20,940 | ||||||||
| Investment property | 1,054 | 1,029 | 1,109 | ||||||||
| Of which : Leased out under an operating lease | 889 | 804 | 848 | ||||||||
| Intangible assets | 19,635 | 18,645 | 18,789 | ||||||||
| Goodwill | 14,072 | 13,741 | 14,138 | ||||||||
| Other intangible assets | 5,563 | 4,904 | 4,651 | ||||||||
| Tax assets | 30,646 | 29,987 | 29,517 | ||||||||
| Current tax assets | 9,620 | 9,200 | 8,222 | ||||||||
| Deferred tax assets | 21,026 | 20,787 | 21,295 | ||||||||
| Other assets | 9,615 | 10,082 | 10,971 | ||||||||
| Insurance contracts linked to pensions | 90 | 104 | 109 | ||||||||
| Inventories | 8 | 11 | 8 | ||||||||
| Other | 9,517 | 9,967 | 10,854 | ||||||||
| Non-current assets held for sale | 3,092 | 3,453 | 3,706 | ||||||||
| TOTAL ASSETS | 1,816,844 | 1,734,659 | 1,815,792 | ||||||||
| 86 | | January - September 2023 | ||||||
Business model | ||||||||||||||||||||||||||
| Condensed consolidated financial statements | ||||||||||||||||||||||||||
| Interim condensed consolidated balance sheet | |||||||||||
| EUR million | |||||||||||
| LIABILITIES | Sep-23 | Dec-22 | Sep-22 | ||||||||
| Financial liabilities held for trading | 143,986 | 115,185 | 132,563 | ||||||||
| Financial liabilities designated at fair value through profit or loss | 39,602 | 40,268 | 28,864 | ||||||||
| Financial liabilities at amortized cost | 1,468,719 | 1,423,858 | 1,493,298 | ||||||||
| Hedging derivatives | 8,758 | 9,228 | 11,372 | ||||||||
| Changes in the fair value of hedged items in portfolio hedges of interest rate risk | (217) | (117) | (110) | ||||||||
| Liabilities under insurance or reinsurance contracts | 17,177 | 16,426 | 16,512 | ||||||||
| Provisions | 8,369 | 8,149 | 8,341 | ||||||||
| Pensions and other post-retirement obligations | 2,232 | 2,392 | 2,469 | ||||||||
| Other long term employee benefits | 795 | 950 | 991 | ||||||||
| Taxes and other legal contingencies | 2,637 | 2,074 | 2,086 | ||||||||
| Contingent liabilities and commitments | 777 | 734 | 729 | ||||||||
| Other provisions | 1,928 | 1,999 | 2,066 | ||||||||
| Tax liabilities | 10,586 | 9,468 | 10,441 | ||||||||
| Current tax liabilities | 4,180 | 3,040 | 3,330 | ||||||||
| Deferred tax liabilities | 6,406 | 6,428 | 7,111 | ||||||||
| Other liabilities | 16,967 | 14,609 | 15,199 | ||||||||
| Liabilities associated with non-current assets held for sale | — | — | — | ||||||||
| TOTAL LIABILITIES | 1,713,947 | 1,637,074 | 1,716,480 | ||||||||
| EQUITY | |||||||||||
| Shareholders' equity | 128,718 | 124,732 | 123,340 | ||||||||
| Capital | 8,092 | 8,397 | 8,397 | ||||||||
| Called up paid capital | 8,092 | 8,397 | 8,397 | ||||||||
| Unpaid capital which has been called up | — | — | — | ||||||||
| Share premium | 44,373 | 46,273 | 46,273 | ||||||||
| Equity instruments issued other than capital | 712 | 688 | 681 | ||||||||
| Equity component of the compound financial instrument | — | — | — | ||||||||
| Other equity instruments issued | 712 | 688 | 681 | ||||||||
| Other equity | 196 | 175 | 176 | ||||||||
| Accumulated retained earnings | 74,115 | 66,702 | 66,701 | ||||||||
| Revaluation reserves | — | — | — | ||||||||
| Other reserves | (5,574) | (5,454) | (5,171) | ||||||||
| (-) Own shares | (28) | (675) | (54) | ||||||||
| Profit attributable to shareholders of the parent | 8,143 | 9,605 | 7,316 | ||||||||
| (-) Interim dividends | (1,311) | (979) | (979) | ||||||||
| Other comprehensive income (loss) | (34,522) | (35,628) | (32,316) | ||||||||
| Items not reclassified to profit or loss | (4,974) | (4,635) | (3,999) | ||||||||
| Items that may be reclassified to profit or loss | (29,548) | (30,993) | (28,317) | ||||||||
| Non-controlling interest | 8,701 | 8,481 | 8,288 | ||||||||
| Other comprehensive income | (1,692) | (1,856) | (1,958) | ||||||||
| Other items | 10,393 | 10,337 | 10,246 | ||||||||
| TOTAL EQUITY | 102,897 | 97,585 | 99,312 | ||||||||
| TOTAL LIABILITIES AND EQUITY | 1,816,844 | 1,734,659 | 1,815,792 | ||||||||
| MEMORANDUM ITEMS: OFF BALANCE SHEET AMOUNTS | |||||||||||
| Loan commitments granted | 289,742 | 274,075 | 292,313 | ||||||||
| Financial guarantees granted | 15,605 | 12,856 | 13,071 | ||||||||
| Other commitments granted | 112,854 | 92,672 | 95,887 | ||||||||
January - September 2023 | | 87 | ||||||
Business model | ||||||||||||||||||||||||||
| Condensed consolidated financial statements | ||||||||||||||||||||||||||
| Interim condensed consolidated income statement | ||||||||
| EUR million | ||||||||
| 9M'23 | 9M'22 | |||||||
| Interest income | 78,142 | 50,318 | ||||||
| Financial assets at fair value through other comprehensive income | 5,418 | 3,211 | ||||||
| Financial assets at amortized cost | 57,973 | 42,381 | ||||||
| Other interest income | 14,751 | 4,726 | ||||||
| Interest expense | (46,003) | (21,858) | ||||||
| Interest income/ (charges) | 32,139 | 28,460 | ||||||
| Dividend income | 474 | 422 | ||||||
| Income from companies accounted for using the equity method | 462 | 501 | ||||||
| Commission income | 12,447 | 11,886 | ||||||
| Commission expense | (3,225) | (3,019) | ||||||
| Gain or losses on financial assets and liabilities not measured at fair value through profit or loss, net | 88 | 326 | ||||||
| Financial assets at amortized cost | — | 7 | ||||||
| Other financial assets and liabilities | 88 | 319 | ||||||
| Gain or losses on financial assets and liabilities held for trading, net | 555 | 1,151 | ||||||
| Reclassification of financial assets at fair value through other comprehensive income | — | — | ||||||
| Reclassification of financial assets from amortized cost | — | — | ||||||
| Other gains (losses) | 555 | 1,151 | ||||||
| Gains or losses on non-trading financial assets and liabilities mandatorily at fair value through profit or loss | 38 | 1 | ||||||
| Reclassification of financial assets at fair value through other comprehensive income | — | — | ||||||
| Reclassification of financial assets from amortized cost | — | — | ||||||
| Other gains (losses) | 38 | 1 | ||||||
| Gain or losses on financial assets and liabilities measured at fair value through profit or loss, net | 287 | 965 | ||||||
| Gain or losses from hedge accounting, net | 96 | 102 | ||||||
| Exchange differences, net | 905 | (1,430) | ||||||
| Other operating income | 587 | 1,068 | ||||||
| Other operating expenses | (2,012) | (1,981) | ||||||
| Income from assets under insurance and reinsurance contracts | 542 | 2,081 | ||||||
| Expenses from liabilities under insurance and reinsurance contracts | (512) | (1,939) | ||||||
| Total income | 42,871 | 38,594 | ||||||
| Administrative expenses | (16,556) | (15,360) | ||||||
| Staff costs | (10,080) | (9,125) | ||||||
| Other general and administrative expenses | (6,476) | (6,235) | ||||||
| Depreciation and amortization | (2,405) | (2,235) | ||||||
| Provisions or reversal of provisions, net | (1,989) | (1,305) | ||||||
| Impairment or reversal of impairment of financial assets not measured at fair value through profit or loss and net gains and losses from modifications | (9,477) | (7,836) | ||||||
| Financial assets at fair value through other comprehensive income | (20) | (6) | ||||||
| Financial assets at amortized cost | (9,457) | (7,830) | ||||||
| Impairment of investments in subsidiaries, joint ventures and associates, net | — | — | ||||||
| Impairment on non-financial assets, net | (129) | (86) | ||||||
| Tangible assets | (77) | (35) | ||||||
| Intangible assets | (40) | (39) | ||||||
| Others | (12) | (12) | ||||||
| Gain or losses on non-financial assets and investments, net | 280 | 2 | ||||||
| Negative goodwill recognized in results | — | — | ||||||
| Gains or losses on non-current assets held for sale not classified as discontinued operations | (58) | (13) | ||||||
| Operating profit/(loss) before tax | 12,537 | 11,761 | ||||||
| Tax expense or income from continuing operations | (3,552) | (3,538) | ||||||
| Profit/(loss) for the period from continuing operations | 8,985 | 8,223 | ||||||
| Profit/( loss) after tax from discontinued operations | — | — | ||||||
| Profit/(loss) for the period | 8,985 | 8,223 | ||||||
| Profit attributable to non-controlling interests | 842 | 907 | ||||||
| Profit/(loss) attributable to the parent | 8,143 | 7,316 | ||||||
| Earnings/(losses) per share | ||||||||
| Basic | 0.48 | 0.41 | ||||||
| Diluted | 0.48 | 0.41 | ||||||
| 88 | | January - September 2023 | ||||||
| GLOSSARY | ||||||||
•Active customer: Those customers who comply with the minimum balance, income and/or transactionality requirements as defined according to the business area
•ADR: American Depositary Receipt
•ALCO: Assets and Liabilities Committee
•APIs: Application Programming Interface
•APM: Alternative Performance Measures
•APS: Amherst Pierpont Securities
•AuMs: Assets under management
•bn: Billion
•BNPL: Buy now, pay later
•bps: basis points
•CDI: CREST Depository Interest
•CET1: Common Equity Tier 1
•CHF: Swiss francs
•CIB: Corporate & Investment Banking
•CNMV: Spanish National Securities Market Commission (Comisión Nacional del Mercado de Valores)
•Costs in real terms: variations excluding the effect of average inflation over the last twelve months
•DCB: Digital Consumer Bank
•DGF: Deposit guarantee fund
•Digital customers: Every consumer of a commercial bank’s services who has logged on to their personal online banking and/or mobile banking in the last 30 days
•ECB: European Central Bank
•EPS: Earnings per share
•ESG: Environmental, Social and Governance
•ESMA: European Securities and Markets Authority
•Fed: Federal Reserve
•Financial inclusion: Number of people who are unbanked, underbanked, in financial difficulty, with difficulties in accessing credit who, through the Group's products and services, are able to access the financial system or receive tailored finance. Financially underserved groups are defined as people who do not have a current account, or who have an account but obtained alternative (non-bank) financial services in the last 12 months. Beneficiaries of various programmes are included in the quantification process only once in the entire period. Only new empowered people are counted, taking as a base year those existing since 2019.
•FX: Foreign Exchange
•GDP: Gross Domestic Product
•IFRS 9: International Financial Reporting Standard 9, regarding financial instruments
•IMF: International Monetary Fund
•IPO: Initial Public Offering
•LCR: Liquidity Coverage Ratio
•LLPs: Loan-loss provisions
•Loyal customers: Active customers who receive most of their financial services from the Group according to the commercial segment that they belong to. Various engaged customer levels have been defined taking profitability into account
•MDA: Maximum Distributable Amount
•mn: Million
•NII: Net Interest Income
•NPLs: Non-performing loans
•NPS: Net Promoter Score
•PBT: Profit before tax
•PoS: Point of Sale
•pp: percentage points
•QoQ: Quarter-on-quarter
•Repos: Repurchase agreements
•RoA: Return on assets
•RoE: Return on equity
•RoRWA: Return on risk-weighted assets
•RoTE: Return on tangible equity
•RWAs: Risk-weighted assets
•SAM: Santander Asset Management
•SBNA: Santander Bank N.A.
•SCF: Santander Consumer Finance
•SCIB: Santander Corporate & Investment Banking
•SC USA: Santander Consumer USA
•SEC: Securities and Exchanges Commission
•SHUSA: Santander Holdings USA, Inc.
•SMEs: Small and medium enterprises
•SRF: Single resolution fund
•TLAC: The total loss-absorbing capacity requirement which is required to be met under the CRD V package
•TLTRO: Targeted longer-term refinancing operations
•TNAV: Tangible net asset value
•TPV: Total payments volume
•VaR: Value at Risk
•WM&I: Wealth Management & Insurance
•YoY: Year-on-year
January - September 2023 | | 89 | ||||||
Business model | ||||||||||||||||||||||||||
| Important Information | ||||||||||||||||||||||||||
| IMPORTANT INFORMATION | ||||||||
Non-IFRS and alternative performance measures
This report contains financial information prepared according to International Financial Reporting Standards (IFRS) and taken from our consolidated financial statements, as well as alternative performance measures (APMs) as defined in the Guidelines on Alternative Performance Measures issued by the European Securities and Markets Authority (ESMA) on 5 October 2015, and other non-IFRS measures. The APMs and non-IFRS measures were calculated with information from Grupo Santander; however, they are neither defined or detailed in the applicable financial reporting framework nor audited or reviewed by our auditors. We use these APMs and non-IFRS measures when planning, monitoring and evaluating our performance. We consider them to be useful metrics for our management and investors to compare operating performance between periods. APMs we use are presented unless otherwise specified on a constant FX basis, which is computed by adjusting comparative period reported data for the effects of foreign currency translation differences, which distort period-on-period comparisons. Nonetheless, the APMs and non-IFRS measures are supplemental information; their purpose is not to substitute IFRS measures. Furthermore, companies in our industry and others may calculate or use APMs and non-IFRS measures differently, thus making them less useful for comparison purposes. APMs using ESG labels have not been calculated in accordance with the Taxonomy Regulation or with the indicators for principal adverse impact in SFDR. For further details on APMs and Non-IFRS Measures, including their definition or a reconciliation between any applicable management indicators and the financial data presented in the consolidated financial statements prepared under IFRS, please see the 2022 Annual Report on Form 20-F filed with the U.S. Securities and Exchange Commission (the SEC) on 1 March 2023 (https://www.santander.com/content/dam/santander-com/en/documentos/informacion-sobre-resultados-semestrales-y-anuales-suministrada-a-la-sec/2023/sec-2022-annual-20-f-2022-en.pdf), as well as the section “Alternative performance measures” of this Banco Santander, S.A. (Santander) Q3 2023 Financial Report, published on 25 October 2023 (https://www.santander.com/en/shareholders-and-investors/financial-and-economic-information#quarterly-results). Underlying measures, which are included in this document, are non-IFRS measures.
The businesses included in each of our geographic segments and the accounting principles under which their results are presented here may differ from the businesses included and local applicable accounting principles of our public subsidiaries in such geographies. Accordingly, the results of operations and trends shown for our geographic segments may differ materially from those of such subsidiaries.
Non-financial information
This report contains, in addition to financial information, non-financial information (NFI), including environmental, social and governance-related metrics, statements, goals, commitments and opinions.
NFI is included to comply with Spanish Act 11/2018 on non-financial information and diversity and to provide a broader view of our impact. NFI is not audited nor reviewed by an external auditor. NFI is prepared following various external and internal frameworks, reporting guidelines and measurement, collection and verification methods and practices, which are materially different from those applicable to financial information and are in many cases emerging and evolving. NFI is based on various materiality thresholds, estimates, assumptions, judgments and underlying data derived internally and from third parties. NFI is thus subject to significant measurement uncertainties, may not be comparable to NFI of other companies or over time or across periods and its inclusion is not meant to imply that the information is fit for any particular purpose or that it is material to us under mandatory reporting standards. NFI is for informational purposes only and without any liability being accepted in connection with it except where such liability cannot be limited under overriding provisions of applicable law.
Forward-looking statements
Santander hereby warns that this report contains “forward-looking statements” as per the meaning of the U.S. Private Securities Litigation Reform Act of 1995. Such statements can be understood through words and expressions like “expect”, “project”, “anticipate”, “should”, “intend”, “probability”, “risk”, “VaR”, “RoRAC”, “RoRWA”, “TNAV”, “target”, “goal”, “objective”, “estimate”, “future”, “commitment”, “commit”, “focus”, “pledge” and similar expressions. They include (but are not limited to) statements on future business development, shareholder remuneration policy and NFI. However, risks, uncertainties and other important factors may lead to developments and results to differ materially from those anticipated, expected, projected or assumed in forward-looking statements. The following important factors (and others described elsewhere in this report and other risk factors, uncertainties or contingencies detailed in our most recent Form 20-F and subsequent 6-Ks filed with, or furnished to, the SEC), as well as other unknown or unpredictable factors, could affect our future development and results and could lead to outcomes materially different from what our forward-looking statements anticipate, expect, project or assume: (1) general economic or industry conditions (e.g., an economic downturn; higher volatility in the capital markets; inflation; deflation; changes in demographics, consumer spending, investment or saving habits; and the effects of the war in Ukraine or the COVID-19 pandemic in the global economy) in areas where we have significant operations or investments; (2) climate-related conditions, regulations, policies, targets and weather events; (3) exposure to various market risks (e.g., risks from interest rates, foreign exchange rates, equity prices and new benchmark indices); (4) potential losses from early loan repayment, collateral depreciation or counterparty risk; (5) political instability in Spain, the UK, other European countries, Latin America and the US; (6) legislative, regulatory or tax changes (including regulatory capital and liquidity requirements), especially in view of the UK´s exit from the European Union and increased regulation prompted by financial crises; (7) acquisition integration challenges arising from deviating management’s resources and attention from other strategic opportunities and operational matters; (8) our own decisions and actions including those affecting or changing our practices, operations, priorities, strategies, policies or procedures; (9) uncertainty over the scope of actions that may be required by us, governments and others to achieve goals relating to climate, environmental and social matters, as well as the evolving nature of underlying science and industry and governmental standards and regulations; and (10) changes affecting our access to liquidity
| 90 | | January - September 2023 | ||||||
Business model | ||||||||||||||||||||||||||
| Important Information | ||||||||||||||||||||||||||
and funding on acceptable terms, especially due to credit spread shifts or credit rating downgrades for the entire group or core subsidiaries.
Forward looking statements are based on current expectations and future estimates about Santander’s and third-parties’ operations and businesses and address matters that are uncertain to varying degrees, including, but not limited to developing standards that may change in the future; plans, projections, expectations, targets, objectives, strategies and goals relating to environmental, social, safety and governance performance, including expectations regarding future execution of Santander’s and third-parties’ energy and climate strategies, and the underlying assumptions and estimated impacts on Santander’s and third-parties’ businesses related thereto; Santander’s and third-parties’ approach, plans and expectations in relation to carbon use and targeted reductions of emissions; changes in operations or investments under existing or future environmental laws and regulations; and changes in government regulations, regulatory requirements and internal policies, including those related to climate-related initiatives.
Forward-looking statements are aspirational, should be regarded as indicative, preliminary and for illustrative purposes only, speak only as of the date of this report, are informed by the knowledge, information and views available on such date and are subject to change without notice. Santander is not required to update or revise any forward-looking statements, regardless of new information, future events or otherwise, except as required by applicable law.
Not a securities offer
This report and the information it contains does not constitute an offer to sell nor the solicitation of an offer to buy any securities.
Past performance does not indicate future outcomes
Statements about historical performance or growth rates must not be construed as suggesting that future performance, share price or results (including earnings per share) will necessarily be the same or higher than in a previous period. Nothing in this report should be taken as a profit and loss forecast.
Third Party Information
In this report, Santander relies on and refers to certain information and statistics obtained from publicly-available information and third-party sources, which it believes to be reliable. Neither Santander nor its directors, officers and employees have independently verified the accuracy or completeness of any such publicly-available and third-party information, make any representation or warranty as to the quality, fitness for a particular purpose, non-infringement, accuracy or completeness of such information or undertake any obligation to update such information after the date of this report. In no event shall Santander be liable for any use by any party of, for any decision made or action taken by any party in reliance upon, or for inaccuracies or errors in, or omission from, such publicly-available and third-party information contained herein. Any sources of publicly-available information and third-party information referred or contained herein retain all rights with respect to such information and use of such information herein shall not be deemed to grant a license to any third party.
| This document is a translation of a document originally issued in Spanish. Should there be any discrepancies between the English and the Spanish versions, only the original Spanish version should be binding. | ||
January - September 2023 | | 91 | ||||||
SIGNATURE
Pursuant to the requirements of the Securities Exchange Act of 1934, the registrant has duly caused this report to be signed on its behalf by the undersigned, thereunto duly authorized.
| Banco Santander, S.A. | ||||||||
| Date: 25 October 2023 | By: | /s/ José García Cantera | ||||||
| Name: | José García Cantera | |||||||
| Title: | Chief Financial Officer | |||||||