FORM 6-K
SECURITIES AND EXCHANGE COMMISSION
Washington, D.C. 20549
Report of Foreign Issuer
Pursuant to Rule 13a-16 or 15d-16
of the Securities Exchange Act of 1934
For the month of January, 2024
Commission File Number: 001-12518
Banco Santander, S.A.
(Exact name of registrant as specified in its charter)
Ciudad Grupo Santander
28660 Boadilla del Monte (Madrid) Spain
(Address of principal executive office)
Indicate by check mark whether the registrant files or will file annual reports under cover of Form 20-F or Form 40-F:
Form 20-F ☒ Form 40-F ☐
BANCO SANTANDER, S.A.
________________________
TABLE OF CONTENTS
| Item 1. January - December 2023 Financial Report | |||||

| January - December | 2023 | ||||
Index

This report was approved by the board of directors on 30 January 2024, following a favourable report from the audit committee. Important information regarding this report can be found on pages 89 and 90.
Key consolidated data
| BALANCE SHEET (EUR million) | Dec-23 | Sep-23 | % | Dec-23 | Dec-22 | % | Dec-21 | ||||||||||||||||
| Total assets | 1,797,062 | 1,816,844 | (1.1) | 1,797,062 | 1,734,659 | 3.6 | 1,595,835 | ||||||||||||||||
| Loans and advances to customers | 1,036,349 | 1,039,172 | (0.3) | 1,036,349 | 1,036,004 | 0.0 | 972,682 | ||||||||||||||||
| Customer deposits | 1,047,169 | 1,034,885 | 1.2 | 1,047,169 | 1,009,722 | 3.7 | 900,554 | ||||||||||||||||
| Total funds | 1,306,942 | 1,288,547 | 1.4 | 1,306,942 | 1,239,981 | 5.4 | 1,135,866 | ||||||||||||||||
| Total equity | 104,241 | 102,897 | 1.3 | 104,241 | 97,585 | 6.8 | 97,053 | ||||||||||||||||
| Note: total funds includes customer deposits, mutual funds, pension funds and managed portfolios. | |||||||||||||||||||||||
| INCOME STATEMENT (EUR million) | Q4'23 | Q3'23 | % | 2023 | 2022 | % | 2021 | ||||||||||||||||
| Net interest income | 11,122 | 11,219 | (0.9) | 43,261 | 38,619 | 12.0 | 33,370 | ||||||||||||||||
| Total income | 14,552 | 14,861 | (2.1) | 57,423 | 52,117 | 10.2 | 46,404 | ||||||||||||||||
| Net operating income | 8,088 | 8,379 | (3.5) | 31,998 | 28,214 | 13.4 | 24,989 | ||||||||||||||||
| Profit before tax | 3,922 | 4,447 | (11.8) | 16,459 | 15,250 | 7.9 | 14,547 | ||||||||||||||||
| Profit attributable to the parent | 2,933 | 2,902 | 1.1 | 11,076 | 9,605 | 15.3 | 8,124 | ||||||||||||||||
| Changes in constant euros: | |||||||||||||||||||||||
| Q4'23 / Q3'23: NII: +11.1%; Total income: +5.9%; Net operating income: +3.7%; Profit before tax: -2.0%; Attributable profit: +12.1%. | |||||||||||||||||||||||
| 2023 / 2022: NII: +15.8%; Total income: +12.8%; Net operating income: +15.4%; Profit before tax: +9.7%; Attributable profit: +17.7%. | |||||||||||||||||||||||
| EPS, PROFITABILITY AND EFFICIENCY (%) | Q4'23 | Q3'23 | % | 2023 | 2022 | % | 2021 | ||||||||||||||||
| EPS (euros) | 0.18 | 0.17 | 2.2 | 0.65 | 0.54 | 21.5 | 0.44 | ||||||||||||||||
| RoE | 12.36 | 12.28 | 11.91 | 10.67 | 9.66 | ||||||||||||||||||
| RoTE | 15.64 | 15.49 | 15.06 | 13.37 | 11.96 | ||||||||||||||||||
| RoA | 0.71 | 0.71 | 0.69 | 0.63 | 0.62 | ||||||||||||||||||
| RoRWA | 2.04 | 2.02 | 1.96 | 1.77 | 1.69 | ||||||||||||||||||
| Efficiency ratio | 44.4 | 43.6 | 44.1 | 45.8 | 46.2 | ||||||||||||||||||
UNDERLYING INCOME STATEMENT 1 (EUR million) | Q4'23 | Q3'23 | % | 2023 | 2022 | % | 2021 | ||||||||||||||||
| Net interest income | 11,122 | 11,219 | (0.9) | 43,261 | 38,619 | 12.0 | 33,370 | ||||||||||||||||
| Total income | 14,552 | 14,861 | (2.1) | 57,647 | 52,154 | 10.5 | 46,404 | ||||||||||||||||
| Net operating income | 8,088 | 8,379 | (3.5) | 32,222 | 28,251 | 14.1 | 24,989 | ||||||||||||||||
| Profit before tax | 3,922 | 4,447 | (11.8) | 16,698 | 15,250 | 9.5 | 15,260 | ||||||||||||||||
| Profit attributable to the parent | 2,933 | 2,902 | 1.1 | 11,076 | 9,605 | 15.3 | 8,654 | ||||||||||||||||
| Changes in constant euros: | |||||||||||||||||||||||
| Q4'23 / Q3'23: NII: +11.1%; Total income: +5.9%; Net operating income: +3.7%; Profit before tax: -2.0%; Attributable profit: +12.1%. | |||||||||||||||||||||||
| 2023 / 2022: NII: +15.8%; Total income: +13.1%; Net operating income: +16.1%; Profit before tax: +11.3%; Attributable profit: +17.7%. | |||||||||||||||||||||||
UNDERLYING EPS AND PROFITABILITY 1 (%) | Q4'23 | Q3'23 | % | 2023 | 2022 | % | 2021 | ||||||||||||||||
| Underlying EPS (euros) | 0.18 | 0.17 | 2.2 | 0.65 | 0.54 | 21.5 | 0.47 | ||||||||||||||||
| Underlying RoE | 12.36 | 12.28 | 11.91 | 10.67 | 10.29 | ||||||||||||||||||
| Underlying RoTE | 15.64 | 15.49 | 15.06 | 13.37 | 12.73 | ||||||||||||||||||
| Underlying RoA | 0.71 | 0.71 | 0.69 | 0.63 | 0.65 | ||||||||||||||||||
| Underlying RoRWA | 2.04 | 2.02 | 1.96 | 1.77 | 1.78 | ||||||||||||||||||
January - December 2023 |  | 3 | ||||||
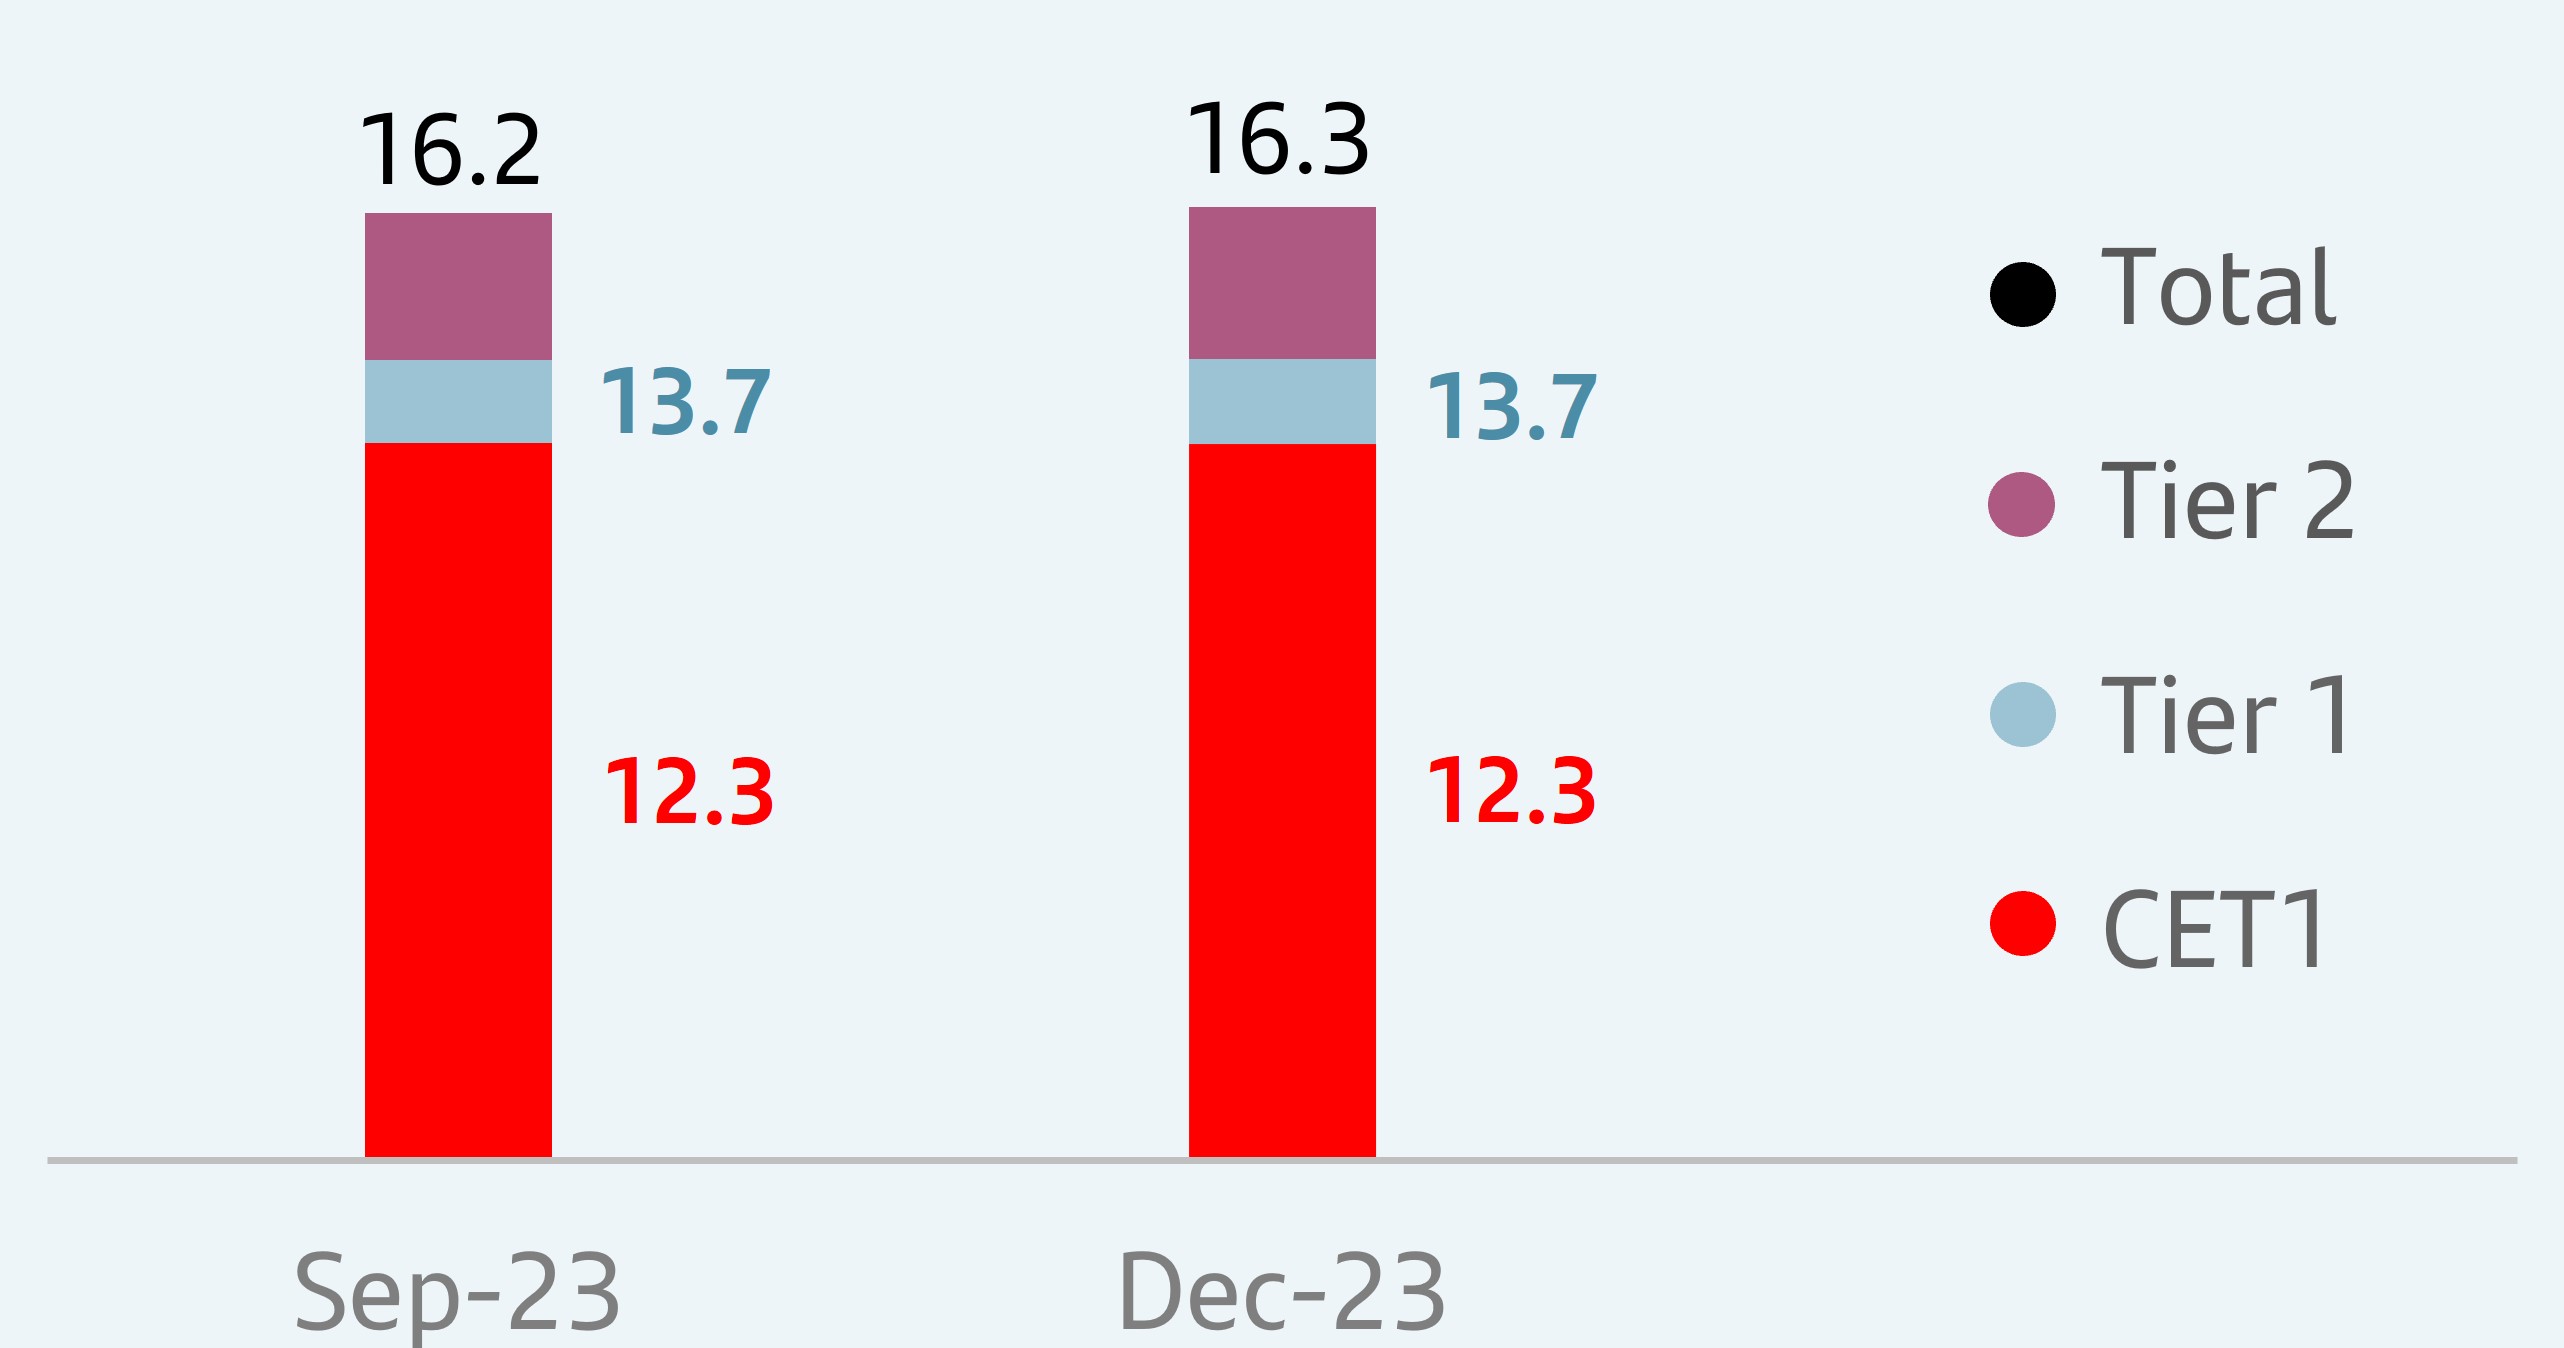
| SOLVENCY (%) | Dec-23 | Sep-23 | Dec-23 | Dec-22 | Dec-21 | ||||||||||||||||||
| Fully-loaded CET1 ratio | 12.3 | 12.3 | 12.3 | 12.0 | 12.1 | ||||||||||||||||||
| Fully-loaded total capital ratio | 16.3 | 16.2 | 16.3 | 15.8 | 16.4 | ||||||||||||||||||
| CREDIT QUALITY (%) | Q4'23 | Q3'23 | 2023 | 2022 | 2021 | ||||||||||||||||||
Cost of risk2 | 1.18 | 1.13 | 1.18 | 0.99 | 0.77 | ||||||||||||||||||
| NPL ratio | 3.14 | 3.13 | 3.14 | 3.08 | 3.16 | ||||||||||||||||||
| NPL coverage ratio | 66 | 68 | 66 | 68 | 71 | ||||||||||||||||||
| MARKET CAPITALIZATION AND SHARES | Dec-23 | Sep-23 | % | Dec-23 | Dec-22 | % | Dec-21 | ||||||||||||||||
| Shares (millions) | 16,184 | 16,184 | 0.0 | 16,184 | 16,794 | (3.6) | 17,341 | ||||||||||||||||
| Share price (euros) | 3.780 | 3.619 | 4.4 | 3.780 | 2.803 | 34.9 | 2.941 | ||||||||||||||||
| Market capitalization (EUR million) | 61,168 | 58,562 | 4.4 | 61,168 | 47,066 | 30.0 | 50,990 | ||||||||||||||||
| Tangible book value per share (euros) | 4.76 | 4.61 | 4.76 | 4.26 | 4.12 | ||||||||||||||||||
| Price / Tangible book value per share (X) | 0.79 | 0.79 | 0.79 | 0.66 | 0.71 | ||||||||||||||||||
| CUSTOMERS (thousands) | Q4'23 | Q3'23 | % | 2023 | 2022 | % | 2021 | ||||||||||||||||
| Total customers | 164,542 | 166,250 | (1.0) | 164,542 | 159,844 | 2.9 | 152,943 | ||||||||||||||||
| Active customers | 99,503 | 100,614 | (1.1) | 99,503 | 99,190 | 0.3 | 96,887 | ||||||||||||||||
| Loyal customers | 29,286 | 28,470 | 2.9 | 29,286 | 27,456 | 6.7 | 25,548 | ||||||||||||||||
| Digital customers | 54,161 | 53,568 | 1.1 | 54,161 | 51,471 | 5.2 | 47,489 | ||||||||||||||||
| Digital sales / Total sales (%) | 57.7 | 56.7 | 56.3 | 55.1 | 54.4 | ||||||||||||||||||
| OTHER DATA | Dec-23 | Sep-23 | % | Dec-23 | Dec-22 | % | Dec-21 | ||||||||||||||||
| Number of shareholders | 3,662,377 | 3,703,401 | (1.1) | 3,662,377 | 3,915,388 | (6.5) | 3,936,922 | ||||||||||||||||
| Number of employees | 212,764 | 212,219 | 0.3 | 212,764 | 206,462 | 3.1 | 199,177 | ||||||||||||||||
| Number of branches | 8,518 | 8,652 | (1.5) | 8,518 | 9,019 | (5.6) | 9,229 | ||||||||||||||||
| 1. | In addition to financial information prepared in accordance with International Financial Reporting Standards (IFRS) and derived from our consolidated financial statements, this report contains certain financial measures that constitute alternative performance measures (APMs) as defined in the Guidelines on Alternative Performance Measures issued by the European Securities and Markets Authority (ESMA) on 5 October 2015, and other non-IFRS measures, including the figures related to “underlying” results, which do not include factors that are outside the ordinary course of our business, or have been reclassified within the underlying income statement. Further details are provided in the “Alternative performance measures” section of the appendix to this report. For further details on the APMs and non-IFRS measures used, including their definition or a reconciliation between any applicable management indicators and the financial data presented in the annual consolidated financial statements prepared under IFRS, please see our 2022 Annual Financial Report, published in the CNMV on 28 February 2023, our 20-F report for the year ending 31 December 2022 filed with the SEC in the United States on 1 March 2023 as well as the “Alternative performance measures” section of the appendix to this report. | ||||
| 2. | Allowances for loan-loss provisions over the last 12 months / Average loans and advances to customers over the last 12 months. | ||||
| 4 | | January - December 2023 | ||||||
| Group financial information | Financial information by segment | Responsible banking Corporate governance Santander share | Appendix | |||||||||||||||||||||||
Our business model is based on three pillars
| 01. Customer focus | 02. Our scale | 03. Diversification | ||||||||||||||||||||||||
Digital bank with branches | Local and global scale | Geographic and business diversification. Solid and diversified balance sheet | ||||||||||||||||||||||||
| Transform our business and operating model through our global technology initiatives to build a digital bank with branches that provides access to financial services for our customers through several channels. | In-market scale in each of our core markets in volumes combined with our global scale support greater profitability and provide a competitive advantage over local peers. | Our well-balanced diversification between developing and mature markets, as well as between business and customer segments, delivers recurrent pre-provision profit with low volatility. | ||||||||||||||||||||||||
 | Top 3 NPS1 | Top 3 in lending2 in 9 of our markets | Contribution to Group profit3 | |||||||||||||||||||||||
| in 7 markets | 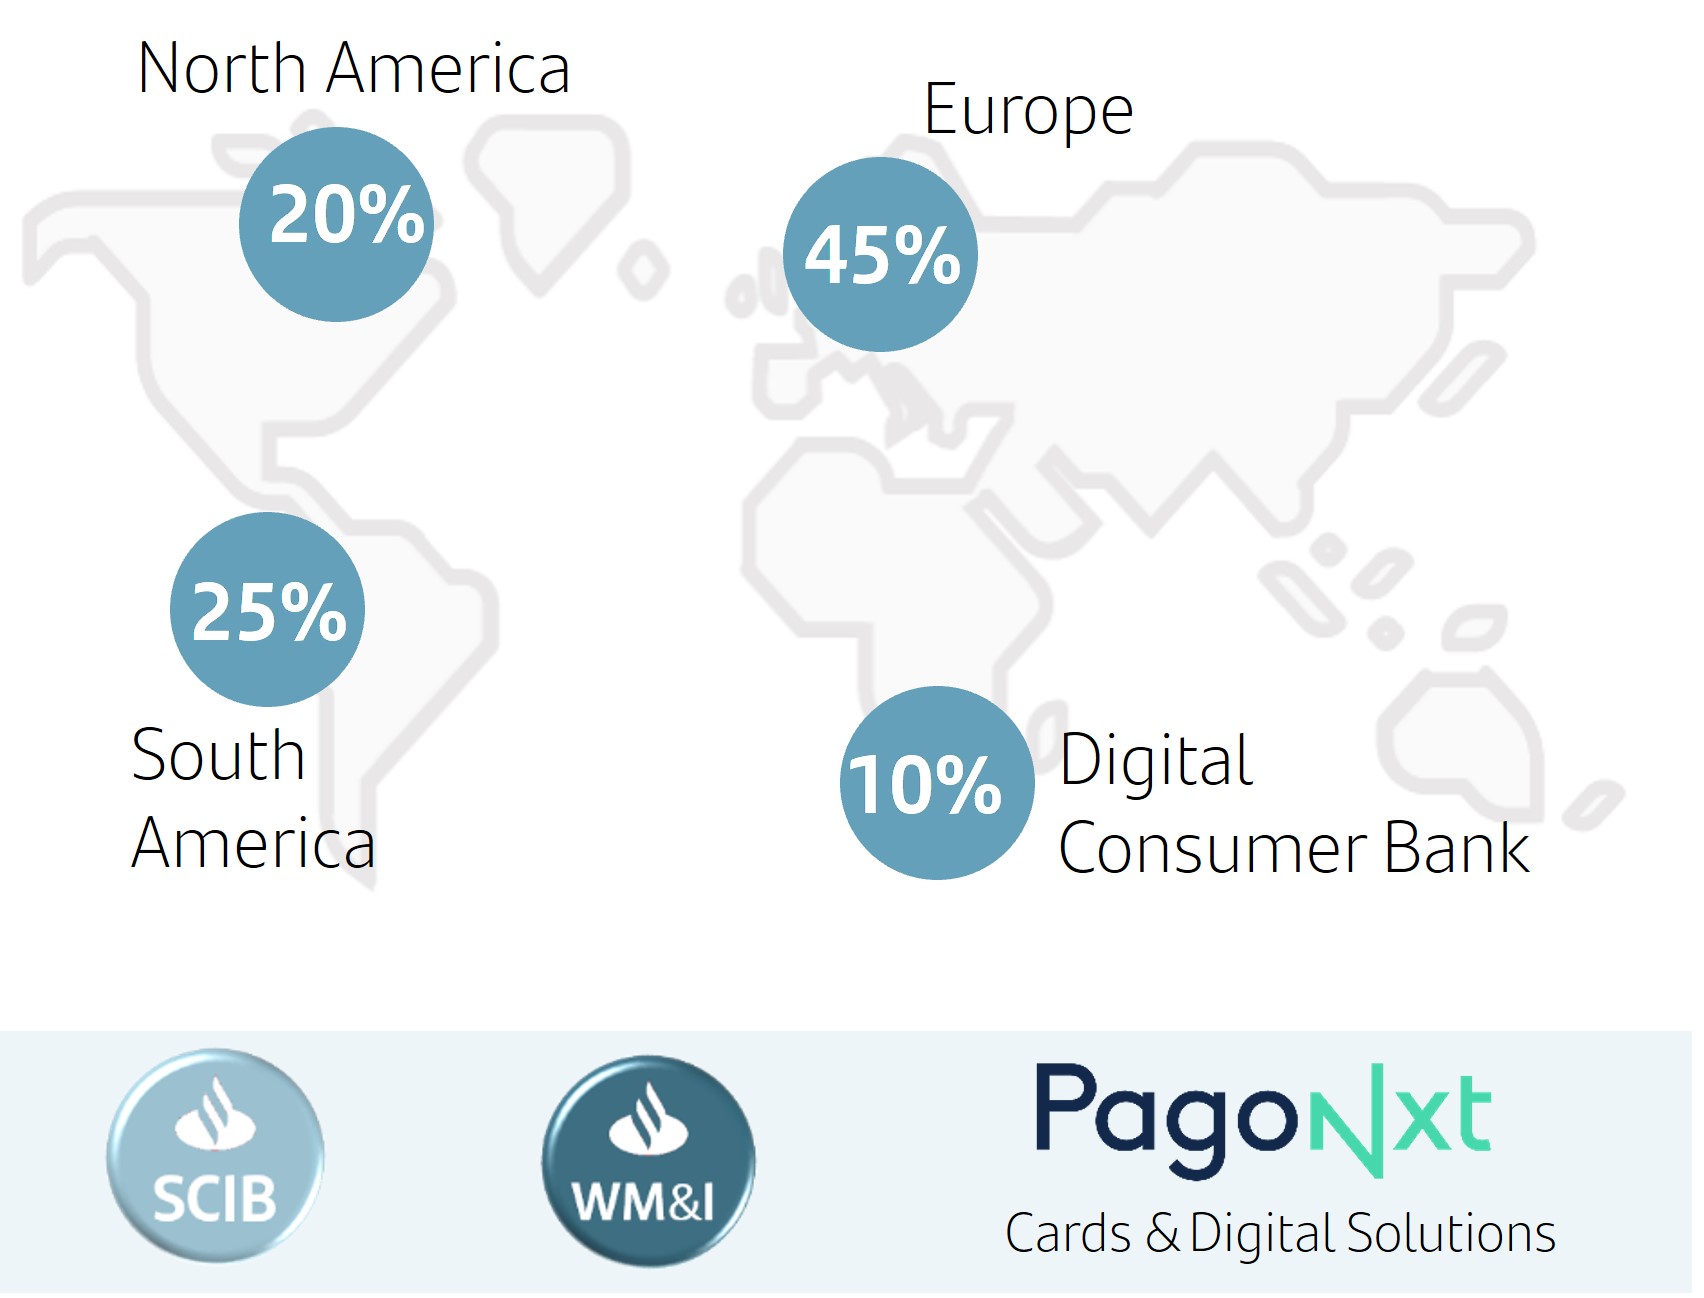 | |||||||||||||||||||||||||
 | 165 mn total customers |  | ||||||||||||||||||||||||
100 mn active customers | ||||||||||||||||||||||||||
| Our business model remains a source of great strength and resilience | ||||||||||||||||||||||||||
Our corporate culture
The Santander Way remains unchanged to continue to deliver for all our stakeholders
Our purpose To help people and businesses prosper. |  | ||||||||||
Our aim To be the best open financial services platform, by acting responsibly and earning the lasting loyalty of our people, customers, shareholders and communities. | |||||||||||
Our how Everything we do should be Simple, Personal and Fair. | |||||||||||
1.NPS – internal benchmark of individual customers' satisfaction audited by Stiga/Deloitte in H2'23.
2.Market share in lending as of September 2023 including only privately-owned banks. Digital Consumer Bank (DCB) refers to auto in Europe.
3.FY'23 attributable profit by region, as a percentage of total operating areas excluding the Corporate Centre.
January - December 2023 | | 5 | ||||||
Highlights of the period
 | PROFIT | |||||||
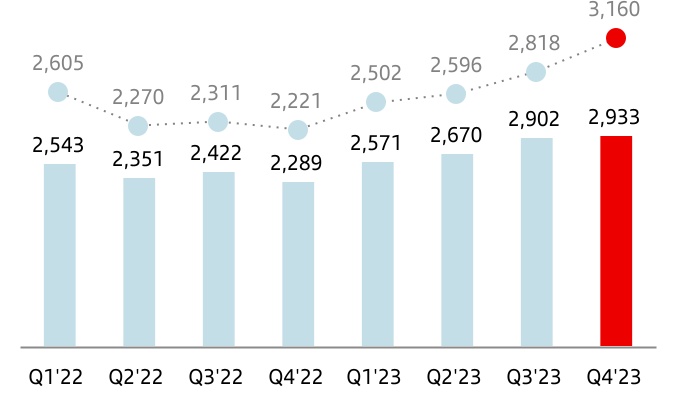
 | u | In Q4 2023, attributable profit amounted to EUR 2,933 million, 1% more than in the previous quarter (+12% in constant euros) and 28% more than in Q4 2022 (+42% in constant euros). | |||||||||
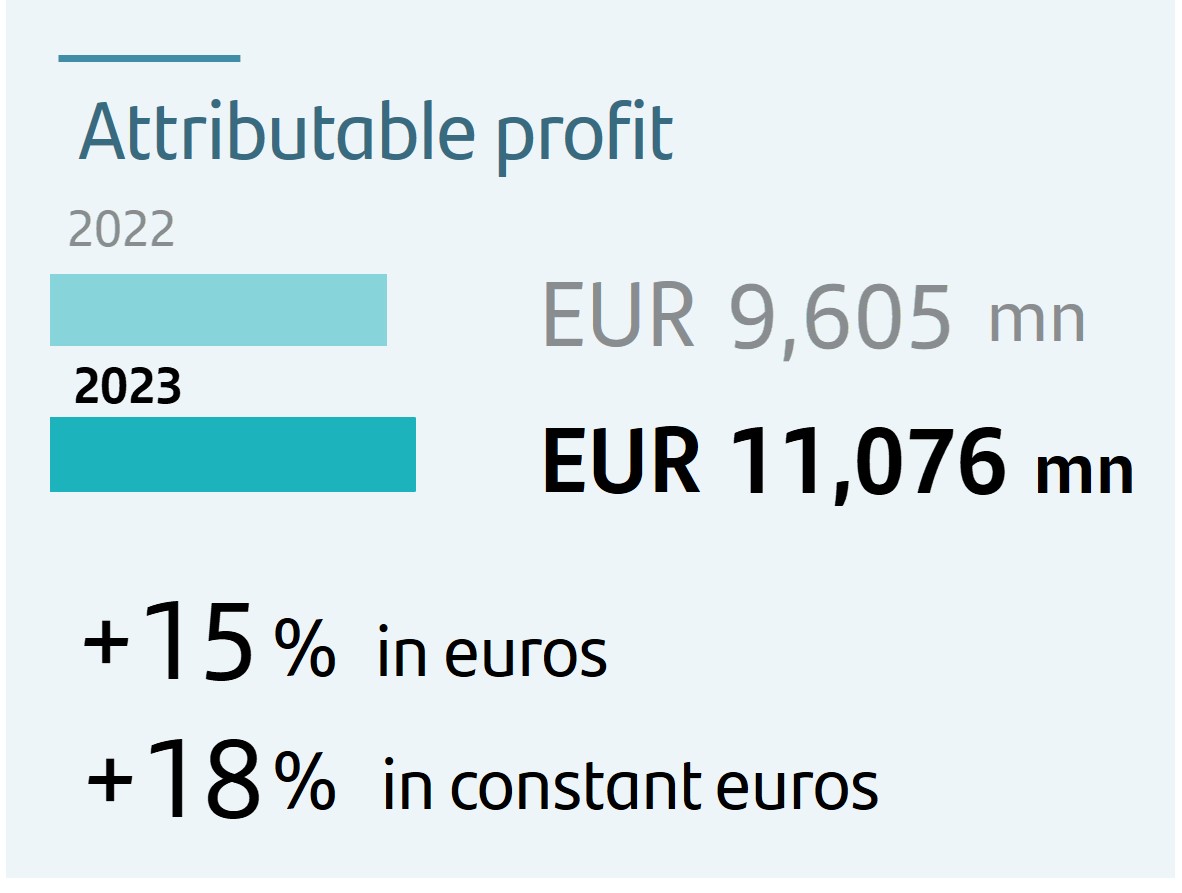
| u | In 2023, attributable profit was EUR 11,076 million, 15% higher than in 2022 (+18% in constant euros) and 18% and 20% higher, respectively, if we exclude the temporary levy on revenue obtained in Spain and DCB in Q1 2023. | ||||||||||
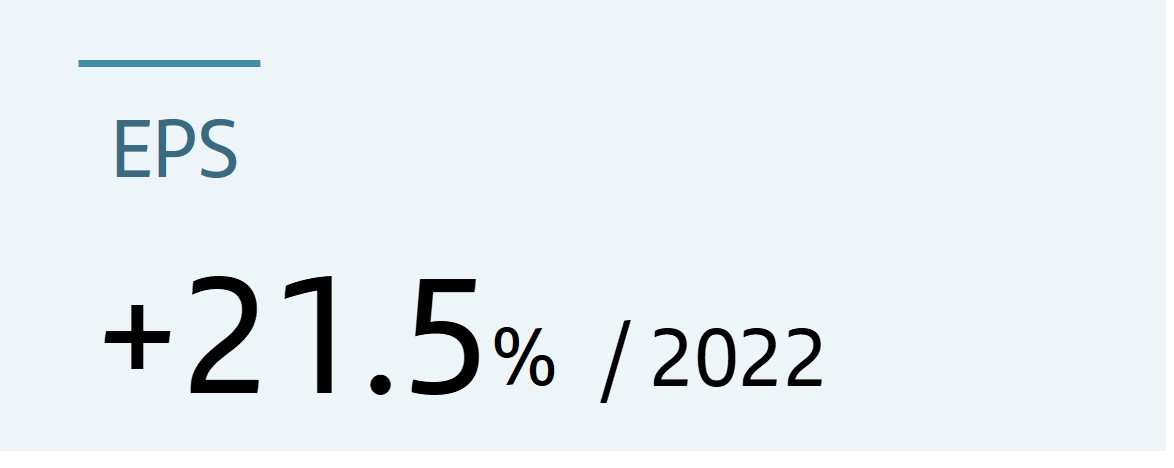 | u | Sustained earnings per share growth, which rose 21.5% compared to 2022 to EUR 65.4 cents, boosted by higher profit and share buybacks in the last 12 months. | |||||||||
 | VALUE CREATION | |||||||
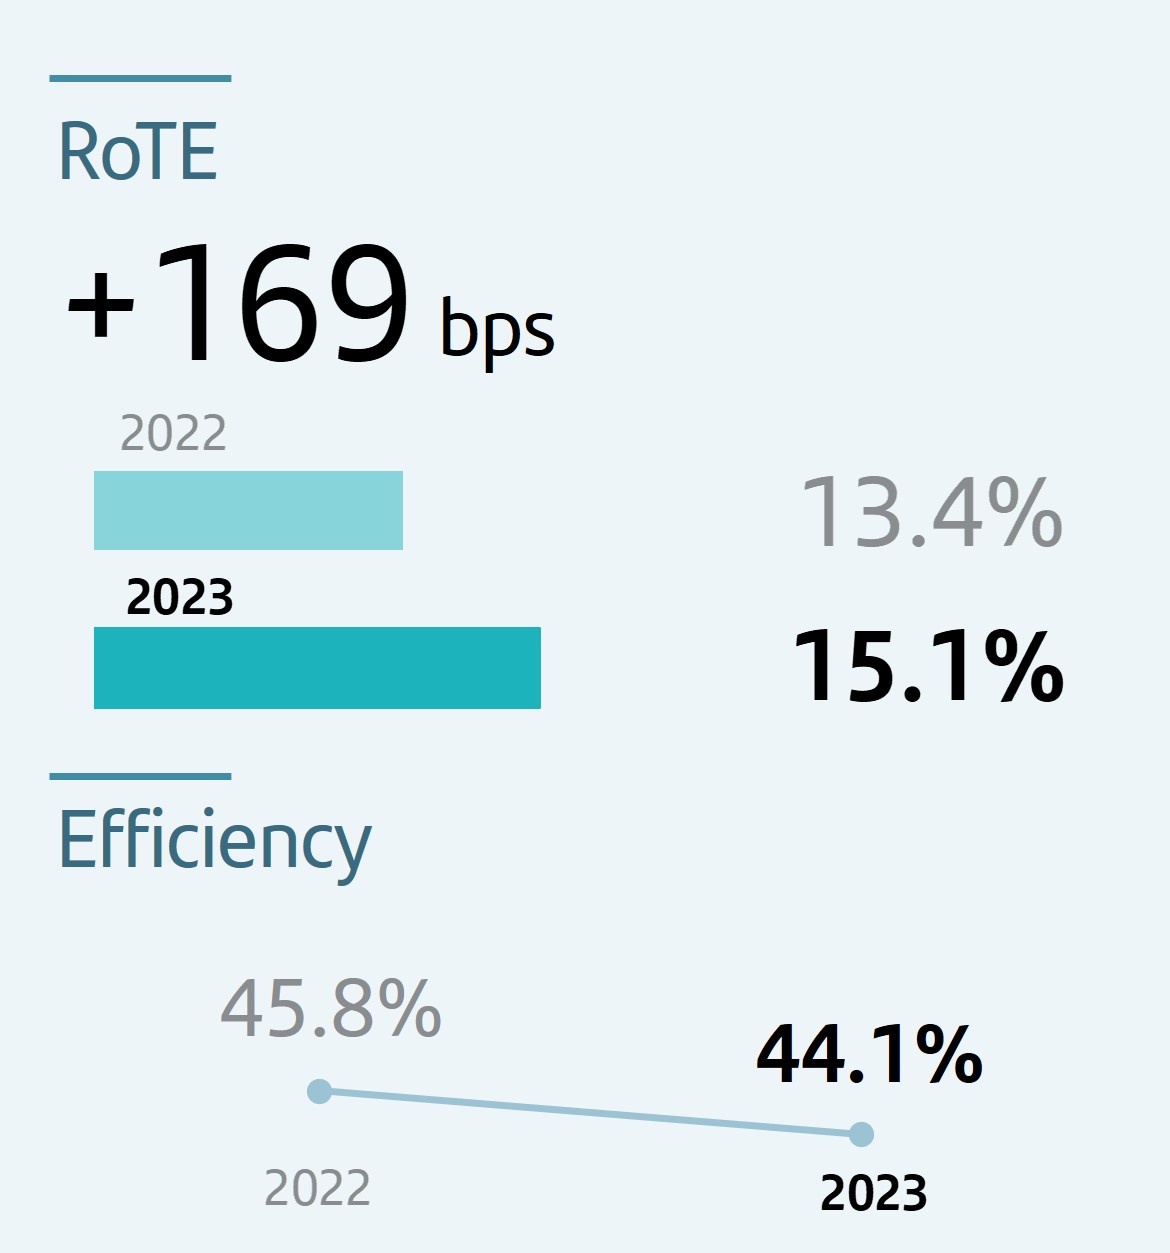 | u | Profitability improved both in the quarter and year-on-year and RoTE reached 15.1%, compared to 13.4% in 2022, supported by double-digit revenue growth. | |||||||||
| u | The acceleration of structural changes towards a simpler and more integrated model through One Transformation, which we are expanding across the Group, is driving efficiency gains and profitable growth. | ||||||||||
| u | The efficiency ratio was 44.1%, improving 1.7 pp compared to 2022, driven mainly by Europe where it decreased 5.2 pp. | ||||||||||
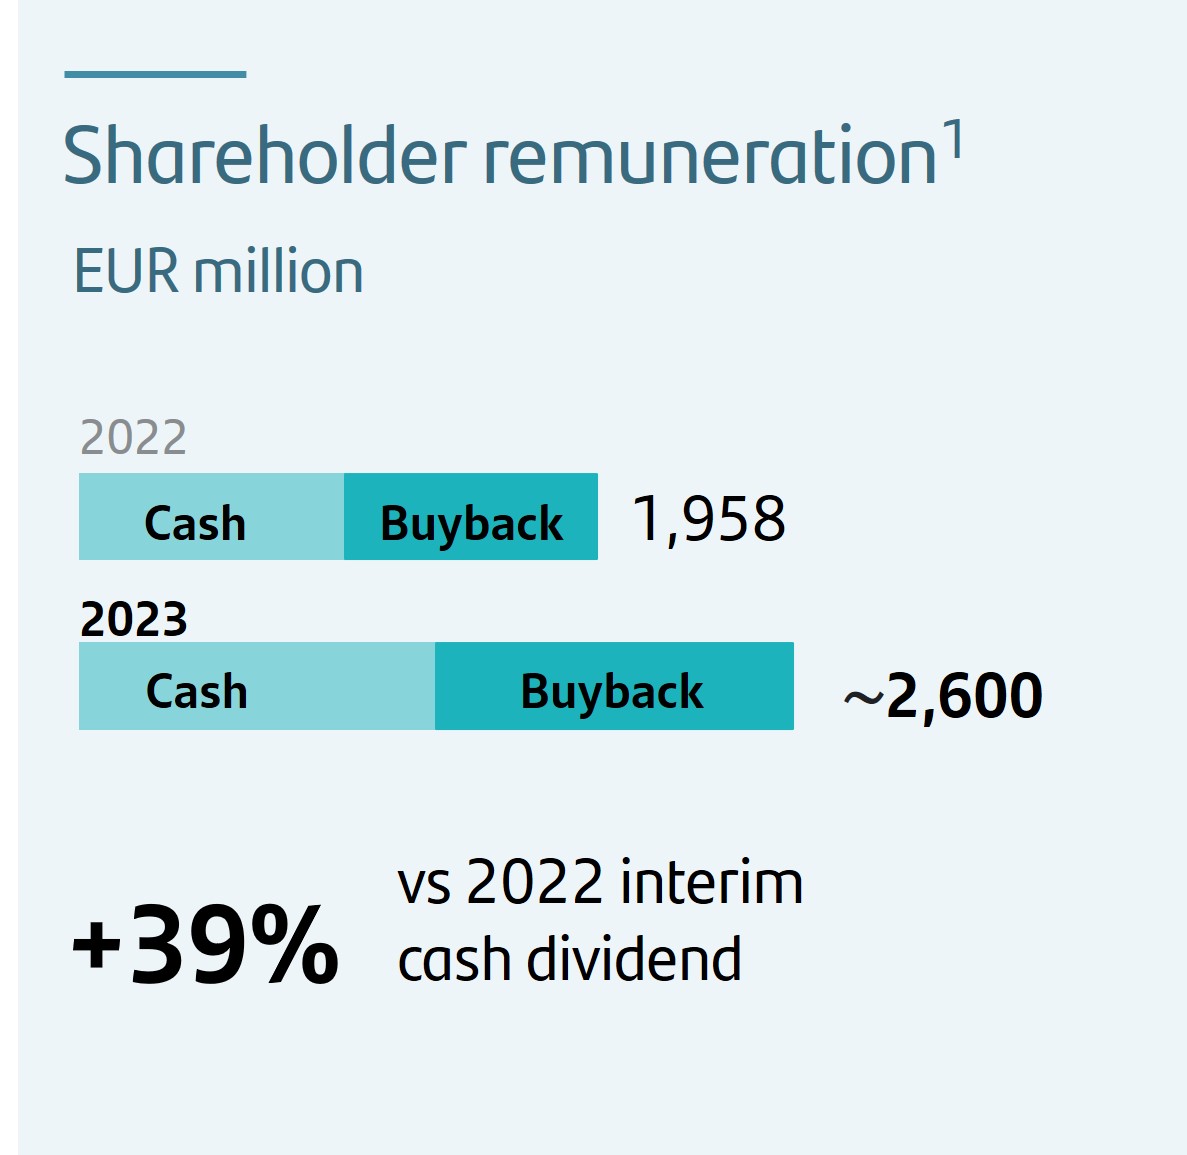 | u | In November, in accordance with the 2023 shareholder remuneration policy, the bank paid an interim cash dividend against 2023 results of EUR 8.10 cents per share. | |||||||||
| u | In addition, between 28 September 2023 and 25 January 2024 we repurchased EUR 1,310 million shares through a share buyback programme. | ||||||||||
| u | The bank's board is expected to propose to the AGM and disclose on the date of the meeting the approval of the final cash dividend, in line with the current shareholder remuneration policy2 of approximately 50% of the Group reported profit (excluding non-cash impacts and direct effect on capital ratios), divided approximately equally between cash dividends and share buybacks. The cash dividend per share paid against 2023 results is expected to be approximately 50% higher than the one paid against 2022. | ||||||||||
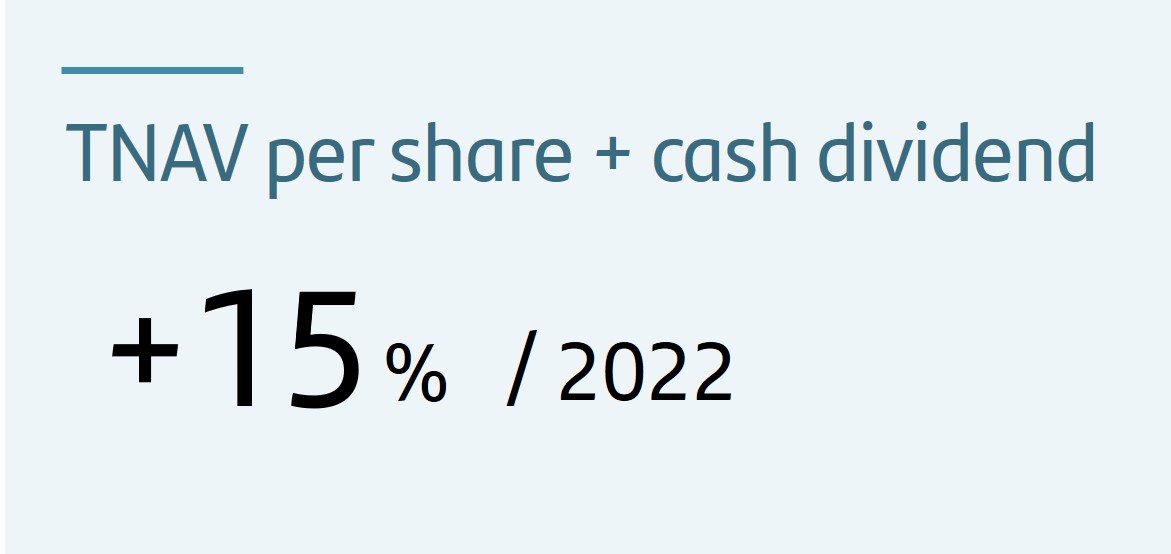 | u | As of December 2023, TNAV per share was EUR 4.76, increasing 3% in the quarter and 12% compared to December 2022. Including the two cash dividends paid in 2023 (EUR 5.95 cents paid in May and EUR 8.10 cents paid in November), TNAV per share + dividend per share increased 15% year-on-year. | |||||||||
1.Interim distribution.
2.The implementation of the shareholder remuneration policy is subject to future corporate and regulatory decisions and approvals.
| 6 | | January - December 2023 | ||||||
 | GROWTH | |||||||
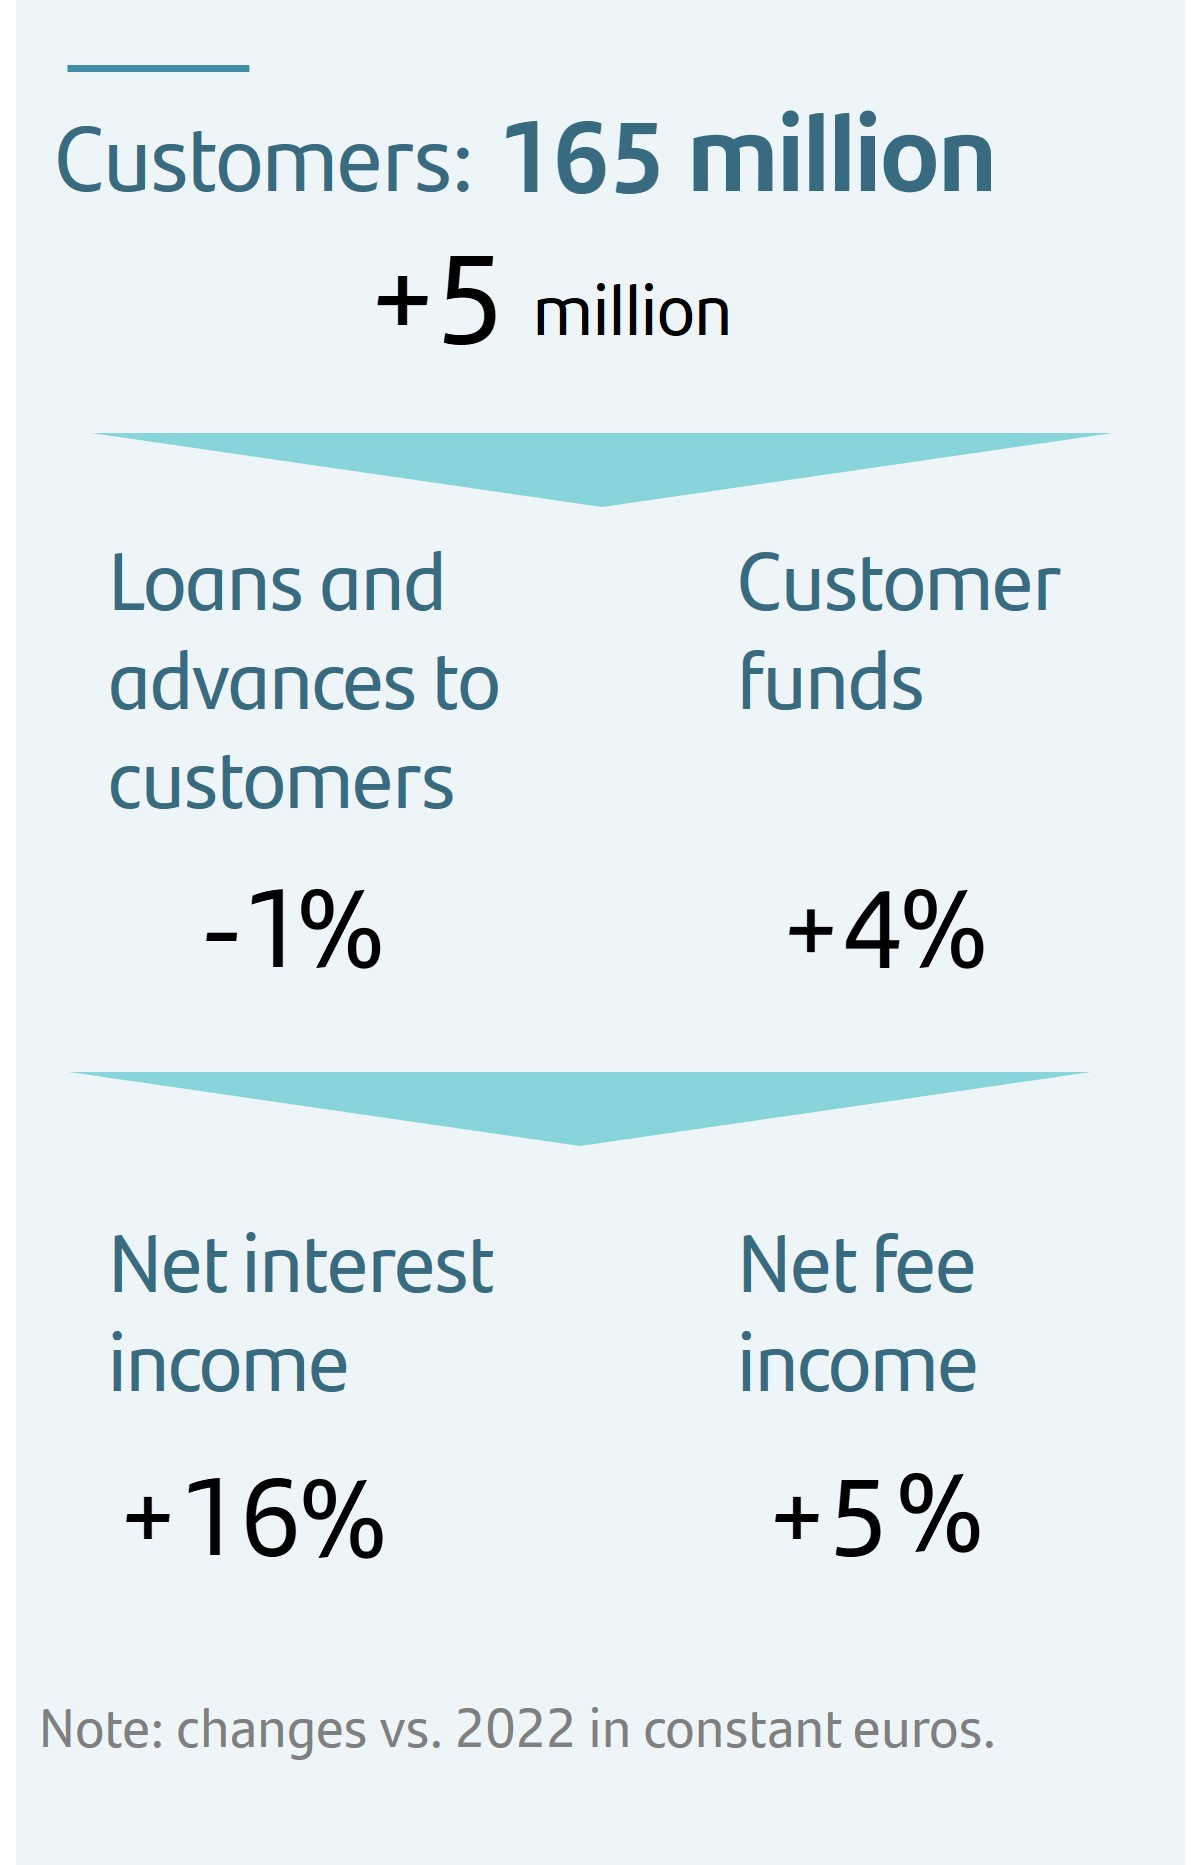 | u | Total customers amounted to 165 million, 5 million more than in 2022. | |||||||||
| u | Active customers reached 100 million (99 million in 2022). We have 54 million digital customers, a 5% increase year-on-year. | ||||||||||
| u | Business volumes reflect the impact that the economic and interest rate environment is having on customer behaviour. Even so, loans and advances to customers remained stable. In constant euros, they fell 1% as growth in North America, South America and DCB were offset by the reduction in Europe (lower business demand and mortgage prepayments). Customer funds rose 4% year-on-year in euros (also up 4% in constant euros), having increased EUR 31.3 billion in the last quarter). Deposits rose both in individuals and corporates, maintaining their stable structure where approximately 75% are transactional1. | ||||||||||
| u | Positive sensitivity to higher interest rates, margin management and higher customer activity were reflected in the 12% rise in net interest income and the 2% increase in net fee income (+16% and +5%, respectively, in constant euros). | ||||||||||
| u | SCIB, WM&I, PagoNxt and Auto businesses accounted for 37% of total Group revenue and 42% of net fee income. | ||||||||||
 | STRENGTH | |||||||
 | u | Credit quality remained robust, driven by strong employment in most regions. The NPL ratio was 3.14%, 6 bps higher than 2022. Total loan-loss reserves reached EUR 23,490 million, resulting in a total coverage ratio of impaired assets of 66%. | |||||||||
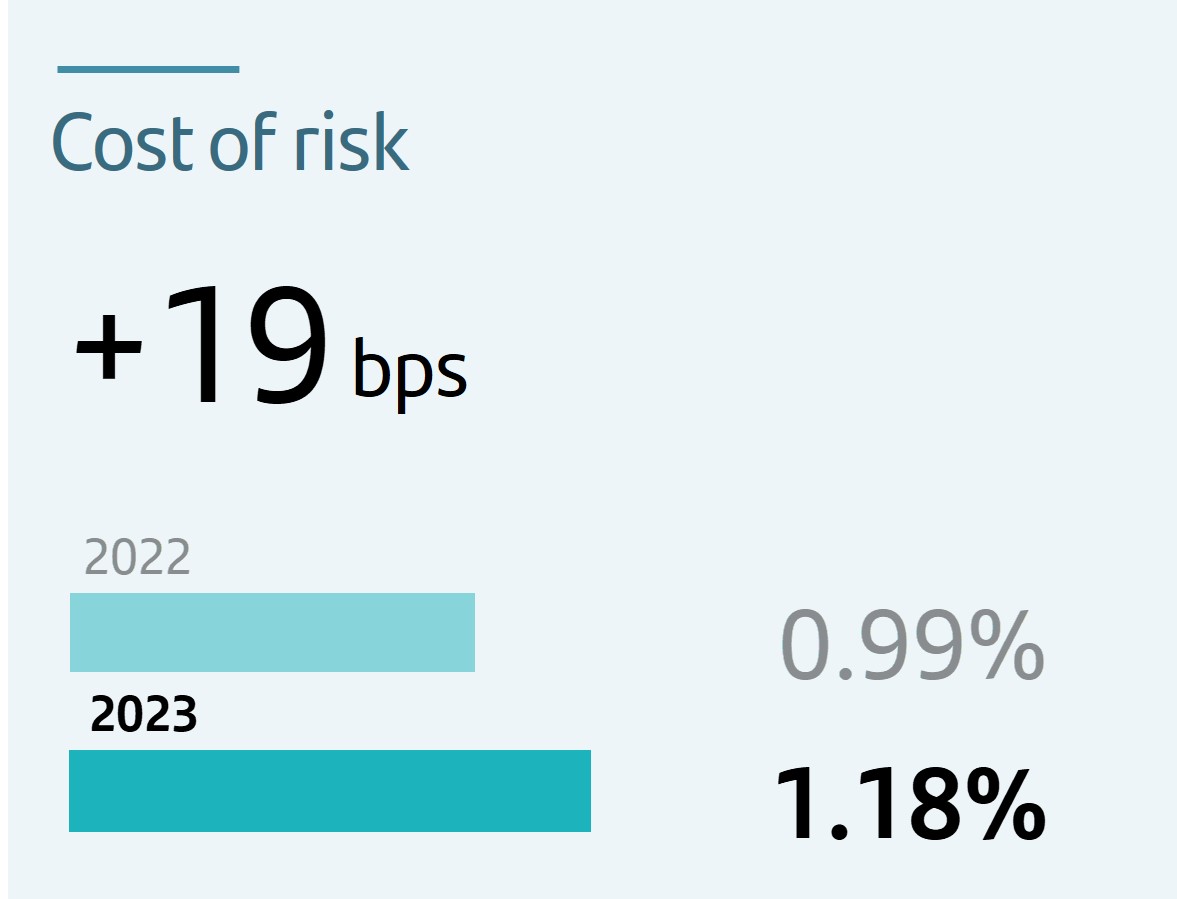
| u | The Group's cost of risk stood at 1.18% (1.13% in September 2023 and 0.99% in December 2022), in line with expectations. The CoR in DCB (0.62%) and Mexico (2.43%) were up from low levels and remained at comfortable levels. Cost of risk in Poland (2.08%) was impacted year-on-year by CHF mortgages. In the US, it rose to 1.92% due to normalization in the auto portfolio in line with expectations, while CoR in Brazil (4.77%) decreased slightly in the year. | ||||||||||
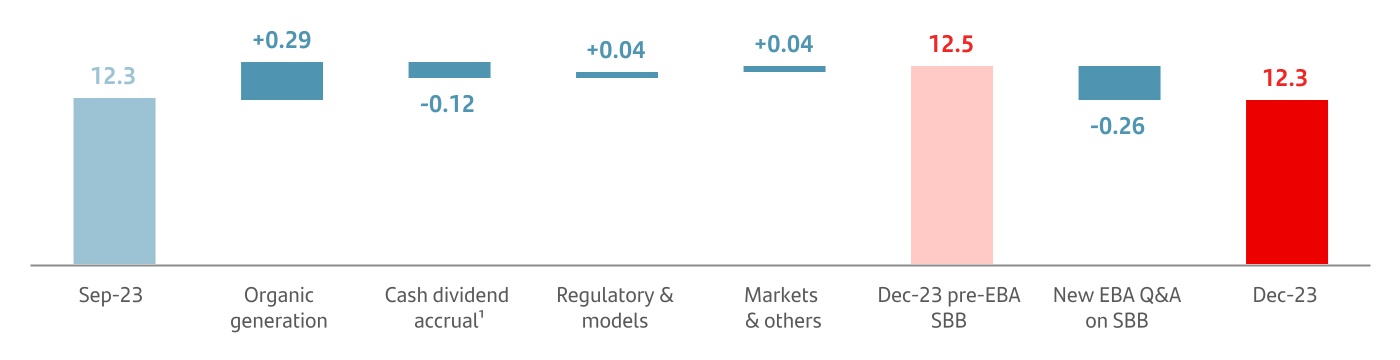
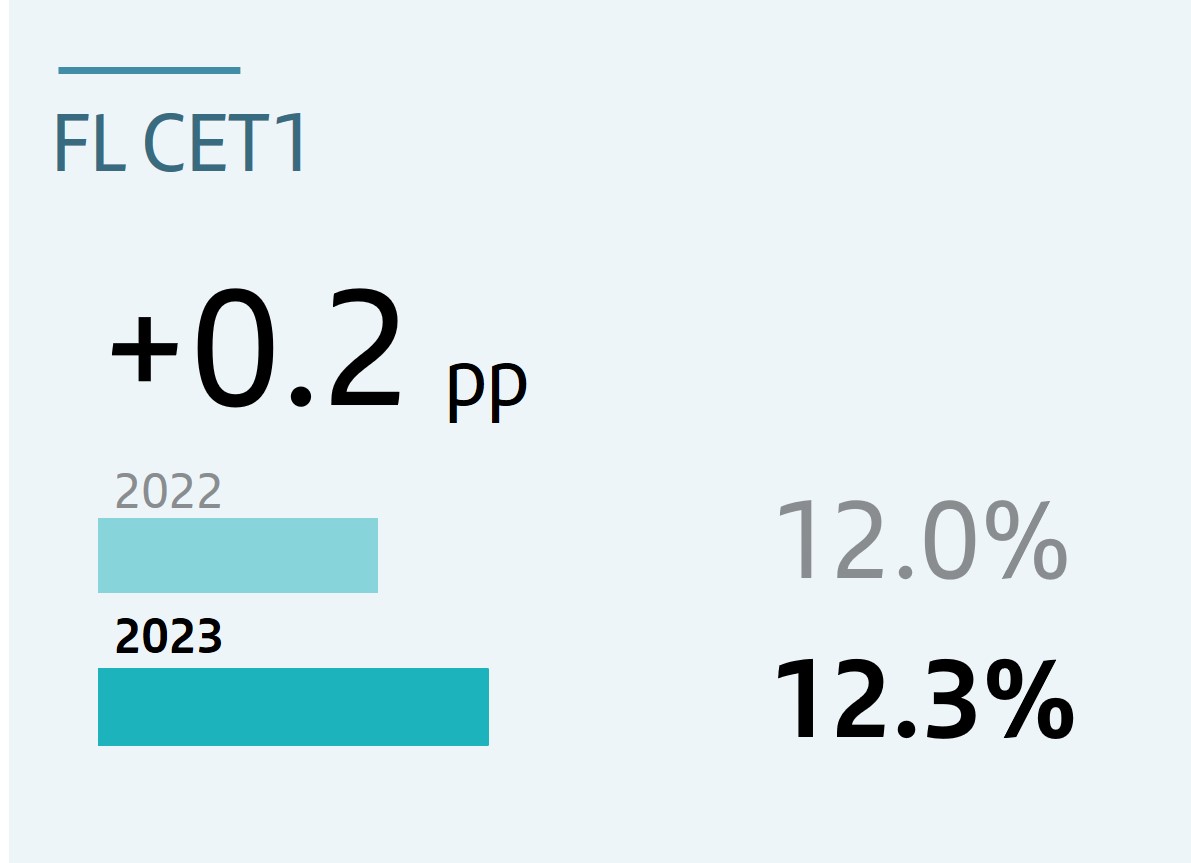 | u | The fully-loaded CET1 ratio ended the year at 12.3%. In the quarter, there were 29 bps of organic generation and a 12 bp charge for a future cash dividend payment against the profit achieved in the fourth quarter of 2023 (in line with the 50% payout target2). Additionally, there was a -26 bp impact relating to the second share buyback programme charged against 2023 results following the publication in Q4 of the EBA's Q&A 2023_6887 on the deduction of share buybacks included in distribution policies. Excluding this impact, the fully-loaded CET1 ratio would have been 12.5%. | |||||||||
 | LIQUIDITY | |||||||
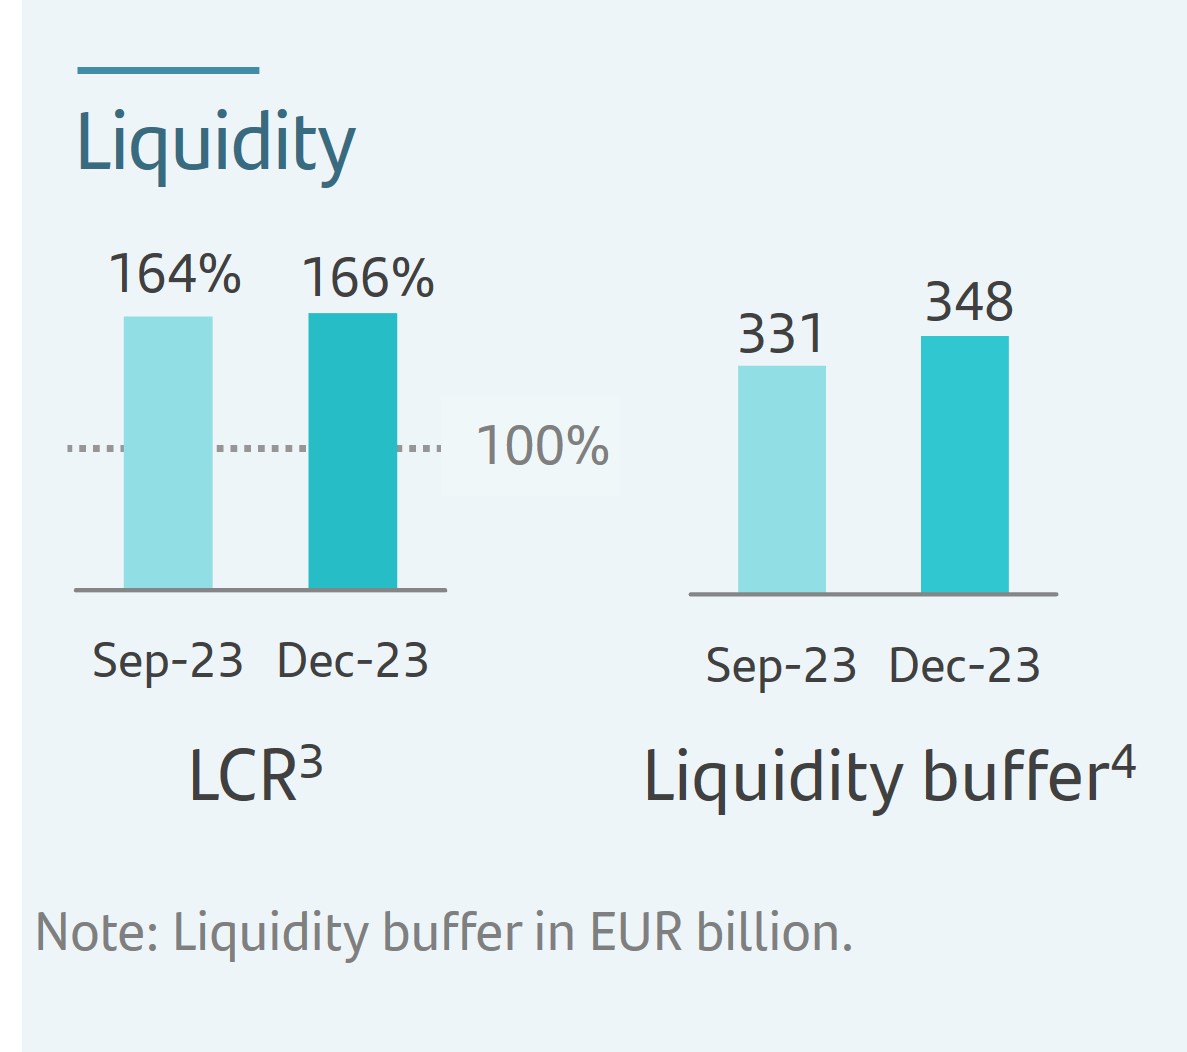 | u | Solid liquidity position with regulatory ratios well above the 100% minimum requirement. The Group liquidity coverage ratio (LCR) increased slightly to 166%. | |||||||||
| u | The liquidity buffer, comprising high quality liquid assets (HQLAs), totalled EUR 348 billion in December 2023, of which 97% were level 1. EUR 218 billion of the total liquidity buffer was in cash4, equivalent to more than 20% of our deposit base. | ||||||||||
| 1. Deposits from individuals and SMEs plus other operational corporate deposits. | |||||||||||
| 2. The implementation of the shareholder remuneration policy is subject to future corporate and regulatory decisions and approvals. | |||||||||||
| 3. Provisional data. | |||||||||||
| 4. Cash, central banks reserves and deposit facility with central banks. | |||||||||||
January - December 2023 | | 7 | ||||||
| GRUPO SANTANDER RESULTS | ||||||||
| Grupo Santander. Summarized income statement | ||||||||||||||||||||||||||
| EUR million | ||||||||||||||||||||||||||
| Change | Change | |||||||||||||||||||||||||
| Q4'23 | Q3'23 | % | % excl. FX | 2023 | 2022 | % | % excl. FX | |||||||||||||||||||
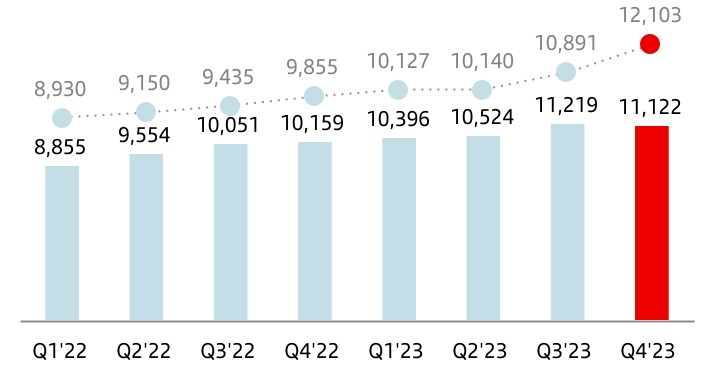
| Net interest income | 11,122 | 11,219 | (0.9) | 11.1 | 43,261 | 38,619 | 12.0 | 15.8 | ||||||||||||||||||
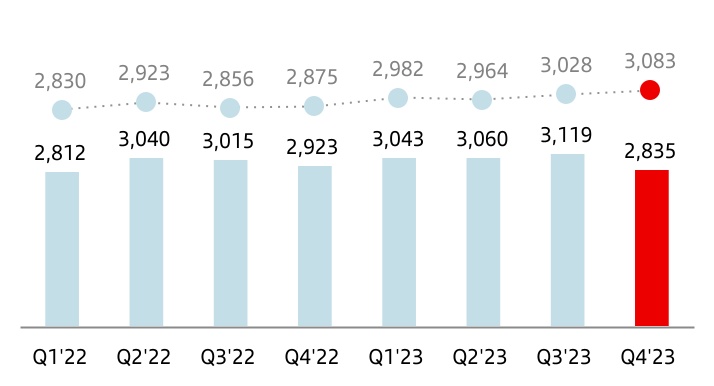
Net fee income1 | 2,835 | 3,119 | (9.1) | 1.8 | 12,057 | 11,790 | 2.3 | 5.0 | ||||||||||||||||||
Gains or losses on financial assets and liabilities and exchange differences2 | 664 | 667 | (0.4) | 48.2 | 2,633 | 1,653 | 59.3 | 77.1 | ||||||||||||||||||
| Dividend income | 97 | 92 | 5.4 | 6.4 | 571 | 488 | 17.0 | 17.4 | ||||||||||||||||||
| Share of results of entities accounted for using the equity method | 151 | 166 | (9.0) | (8.9) | 613 | 702 | (12.7) | (13.3) | ||||||||||||||||||
Other operating income/expenses3 (net) | (317) | (402) | (21.1) | 312.0 | (1,712) | (1,135) | 50.8 | 177.9 | ||||||||||||||||||
| Total income | 14,552 | 14,861 | (2.1) | 5.9 | 57,423 | 52,117 | 10.2 | 12.8 | ||||||||||||||||||
| Operating expenses | (6,464) | (6,482) | (0.3) | 8.8 | (25,425) | (23,903) | 6.4 | 9.6 | ||||||||||||||||||
| Administrative expenses | (5,685) | (5,683) | — | 8.9 | (22,241) | (20,918) | 6.3 | 9.4 | ||||||||||||||||||
| Staff costs | (3,646) | (3,477) | 4.9 | 13.0 | (13,726) | (12,547) | 9.4 | 12.2 | ||||||||||||||||||
| Other general administrative expenses | (2,039) | (2,206) | (7.6) | 2.3 | (8,515) | (8,371) | 1.7 | 5.2 | ||||||||||||||||||
| Depreciation and amortization | (779) | (799) | (2.5) | 8.1 | (3,184) | (2,985) | 6.7 | 11.2 | ||||||||||||||||||
| Provisions or reversal of provisions | (689) | (659) | 4.6 | 17.6 | (2,678) | (1,881) | 42.4 | 55.2 | ||||||||||||||||||
| Impairment or reversal of impairment of financial assets not measured at fair value through profit or loss (net) | (3,479) | (3,240) | 7.4 | 10.5 | (12,956) | (10,863) | 19.3 | 19.6 | ||||||||||||||||||
| Impairment on other assets (net) | (108) | (37) | 191.9 | 88.7 | (237) | (239) | (0.8) | 33.1 | ||||||||||||||||||
| Gains or losses on non-financial assets and investments, net | 33 | 3 | — | — | 313 | 12 | — | — | ||||||||||||||||||
| Negative goodwill recognized in results | 39 | — | — | — | 39 | — | — | — | ||||||||||||||||||
| Gains or losses on non-current assets held for sale not classified as discontinued operations | 38 | 1 | — | — | (20) | 7 | — | — | ||||||||||||||||||
| Profit or loss before tax from continuing operations | 3,922 | 4,447 | (11.8) | (2.0) | 16,459 | 15,250 | 7.9 | 9.7 | ||||||||||||||||||
| Tax expense or income from continuing operations | (724) | (1,271) | (43.0) | (34.6) | (4,276) | (4,486) | (4.7) | (3.3) | ||||||||||||||||||
| Profit from the period from continuing operations | 3,198 | 3,176 | 0.7 | 10.8 | 12,183 | 10,764 | 13.2 | 15.1 | ||||||||||||||||||
| Profit or loss after tax from discontinued operations | — | — | — | — | — | — | — | — | ||||||||||||||||||
| Profit for the period | 3,198 | 3,176 | 0.7 | 10.8 | 12,183 | 10,764 | 13.2 | 15.1 | ||||||||||||||||||
| Profit attributable to non-controlling interests | (265) | (274) | (3.3) | (2.7) | (1,107) | (1,159) | (4.5) | (5.5) | ||||||||||||||||||
| Profit attributable to the parent | 2,933 | 2,902 | 1.1 | 12.1 | 11,076 | 9,605 | 15.3 | 17.7 | ||||||||||||||||||
| EPS (euros) | 0.18 | 0.17 | 2.2 | 0.65 | 0.54 | 21.5 | ||||||||||||||||||||
| Diluted EPS (euros) | 0.17 | 0.17 | 2.1 | 0.65 | 0.54 | 21.3 | ||||||||||||||||||||
| Memorandum items: | ||||||||||||||||||||||||||
| Average total assets | 1,799,535 | 1,784,465 | 0.8 | 1,773,103 | 1,720,273 | 3.1 | ||||||||||||||||||||
| Average stockholders' equity | 94,877 | 94,527 | 0.4 | 93,035 | 89,986 | 3.4 | ||||||||||||||||||||
| NOTE: The summarized income statement groups some lines of the consolidated income statement on page 87 as follows: | |||||
1.‘Commission income’ and ‘Commission expense’. | |||||
2.‘Gain or losses on financial assets and liabilities not measured at fair value through profit or loss, net’; ‘Gain or losses on financial assets and liabilities held for trading, net’; ‘Gains or losses on non-trading financial assets and liabilities mandatorily at fair value through profit or loss’; ‘Gain or losses on financial assets and liabilities measured at fair value through profit or loss, net’; ‘Gain or losses from hedge accounting, net’; and ‘Exchange differences, net’. | |||||
3.‘Other operating income’; ‘Other operating expenses’; ’Income from assets under insurance and reinsurance contracts’; and ‘Expenses from liabilities under insurance and reinsurance contracts’. | |||||
| 8 | | January - December 2023 | ||||||
| Executive summary | |||||||||||||||||||||||||||||||||||||||||||||||||||||||||||||||||||||||||||||||||||||||||||||||
| Profit | Performance | |||||||||||||||||||
| Record profit for 2023, after another quarter of strong growth | Trends seen throughout the year continued: revenue growth, improved efficiency and controlled cost of risk | |||||||||||||||||||
| Attributable profit | Total income | Costs | Provisions | |||||||||||||||||
| EUR 11,076 mn | +15% in euros | +11% | +6% | +19% | in euros | |||||||||||||||
| +18% in constant euros | +13% | +10% | +19% | in constant euros | ||||||||||||||||
| Efficiency | Profitability | |||||||||||||||||||
| The Group's efficiency ratio improved driven by Europe | Profitability continued to improve | |||||||||||||||||||
| Group | Europe | RoTE | RoRWA | |||||||||||||||||
| 44.1% | 42.1% | 15.1% | 1.96% | |||||||||||||||||
| -1.7 pp | -5.2 pp | +1.7 pp | +0.19 pp | |||||||||||||||||
| Changes vs. 2022. | ||||||||||||||||||||
Results performance compared to 2022
The Group presents, both at the total Group level and for each of the business units, the changes in euros registered in the income statement, as well as variations excluding the exchange rate effect (FX), understanding that the latter provide a better analysis of the Group’s management of the country units. For the Group, exchange rates had a negative impact of 3 pp in both revenue and costs.
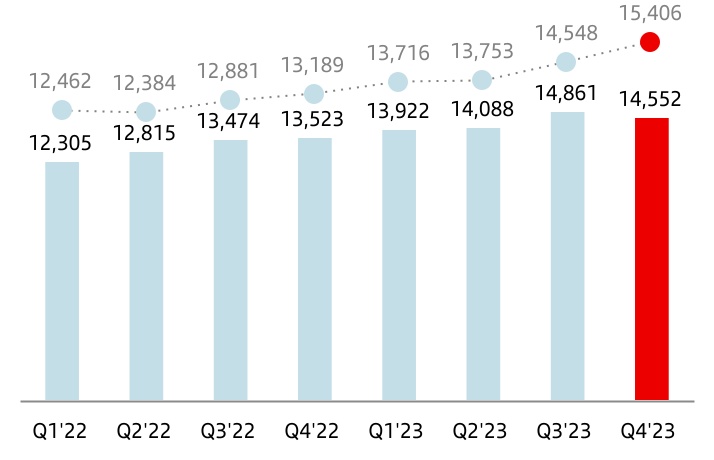
Total income
Total income amounted to EUR 57,423 million, double digit growth compared to 2022. In constant euros, total income increased 13% year-on-year. Net interest income and net fee income accounted for 96% of total income. By line:
•Net interest income amounted to EUR 43,261 million, 12% higher than 2022. Stripping out the exchange rate impact, growth was 16%, mainly due to greater volumes in some countries, higher interest rates and margin management.
By region and in constant euros: net interest income in Europe rose 27%, due to the strong positive sensitivity to interest rate rises in our balance sheet in euros. By country: +46% in Spain, +5% in the UK, +96% in Portugal and +25% in Poland.
In North America, it increased 3%, driven mainly by Mexico (+12%) while it decreased 4% in the US.
| Net interest income | |||||
| EUR million | |||||
 | constant euros | ||||
Net interest income in South America rose 12%, despite the impact from negative sensitivity to interest rate rises during most of the year in Chile (-23%) and Brazil (+2%).
In DCB, net interest income increased 6%, supported by actively repricing loans and customer deposit growth.
The Corporate Centre recorded lower losses due to higher liquidity buffer remuneration as a result of rising interest rates.
•Net fee income increased 2% compared to 2022, reaching EUR 12,057 million. In constant euros, it was 5% higher.
By region, net fee income rose 7% in North America and 14% in South America. It decreased 2% in Europe due to lower credit volumes and customer attraction campaigns.
Our scale and global businesses, generated greater activity for our country units and the Group, which was reflected in net fee income growth, particularly in Santander Corporate & Investment Banking (SCIB) and PagoNxt.
In SCIB, there was double-digit net fee income growth spread across its core businesses.
| Net fee income | |||||
| EUR million | |||||
| constant euros | ||||
January - December 2023 | | 9 | ||||||
Net fee income growth was also strong in PagoNxt with double-digit growth year-on-year in total payments volumes.
•Gains on financial transactions stood at EUR 2,633 million (EUR 1,653 million in 2022), driven mainly by customer activity in SCIB and lower losses in the Corporate Centre (driven by higher negative results from the FX hedge in 2022).
•Dividend income was EUR 571 million (EUR 488 million in 2022).
•The income from companies accounted for by the equity method reached EUR 613 million compared to EUR 702 million in 2022.
•Other operating income recorded a loss of EUR 1,712 million (compared to a EUR 1,135 million loss in 2022), owing to the hyperinflation adjustment in Argentina and lower leasing income in the US. This line was also affected by the EUR 224 million charge related to the temporary levy in Spain and DCB recorded in Q1 2023.
In summary, total income increased in all regions, DCB and global businesses. The Corporate Centre also improved, due to the higher liquidity buffer remuneration and the lower negative impact from the FX hedge.
| Total income | |||||
| EUR million | |||||
| constant euros | ||||
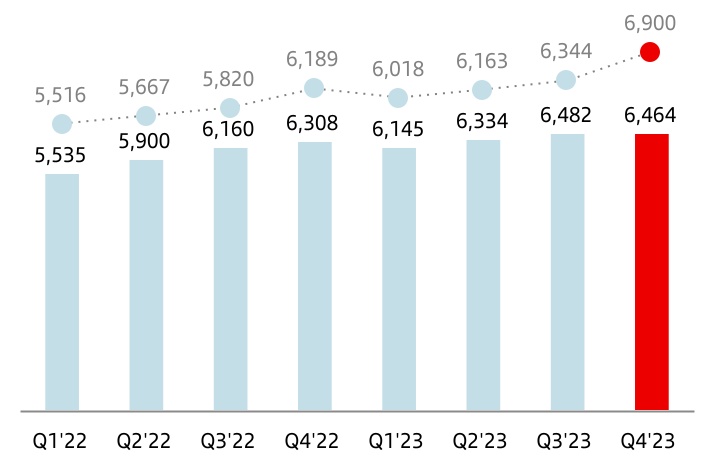
Costs
Operating expenses amounted to EUR 25,425 million, 6% more than 2022 (+10% in constant euros), due to higher inflation. In real terms (excluding the impact of average inflation), costs increased 0.4%.
Our cost management continued to focus on improving the efficiency ratio, and as a result, we remained among the most efficient banks in the world. The efficiency ratio stood at 44.1% at the end of 2023, 1.7 pp better than 2022.
Our business transformation plan, One Transformation, continued to progress across our footprint, reflected in greater operating productivity and better business dynamics.
In constant euros, operating expenses by region and market performed as follows:
•In Europe, costs were up 6%. In real terms, they rose 1%, due to increases in Spain, Poland and Portugal, which were partially offset by the fall in the UK (-3%). The region's efficiency ratio stood at 42.1%, improving 5.2 pp year-on-year.
•In North America, costs increased 8%. In real terms, they were up 3%, due to investments in digitalization and technology and other transformation initiatives underway. The efficiency ratio stood at 49.1%.
•In South America, costs rose 17%. In real terms, they were down 3%, despite the salary increases directly linked to inflation. The efficiency ratio stood at 38.5%.
•Digital Consumer Bank's costs increased 8%, +3% in real terms, due to inflation, strategic and transformation investments in leasing and BNPL platforms and business growth. The efficiency ratio stood at 47.6%.
| Operating expenses | |||||
| EUR million | |||||
| constant euros | ||||
| 10 | | January - December 2023 | ||||||
Provisions or reversal of provisions
Provisions (net of provisions reversals) amounted to EUR 2,678 million (EUR 1,881 million in 2022) mainly driven by Spain and Brazil.
Impairment or reversal of impairment of financial assets not measured at fair value through profit or loss (net)
Impairment or reversal of impairment on financial assets not measured at fair value through profit or loss (net) was EUR 12,956 million (EUR 10,863 million in 2022).
This comparison was mainly affected by the provisions resulting from the charges in Poland for CHF mortgages, the increase in the US (due to normalization) and higher provisions recorded in Brazil, in line with credit portfolio growth.
Impairment on other assets (net)
The impairment on other assets (net) was EUR 237 million, compared to an impairment of EUR 239 million in 2022.
Gains or losses on non-financial assets and investments (net)
Net gains on non-financial assets and investments were EUR 313 million in 2023 (gain of EUR 12 million in 2022).
Negative goodwill recognized in results
Negative goodwill of EUR 39 million was recorded in 2023. No negative goodwill was recorded in 2022.
Gains or losses on non-current assets held for sale not classified as discontinued operations
This item, which mainly includes impairment of foreclosed assets recorded and the sale of properties acquired upon foreclosure, recorded a EUR 20 million loss in 2023 (EUR 7 million gain in 2022).
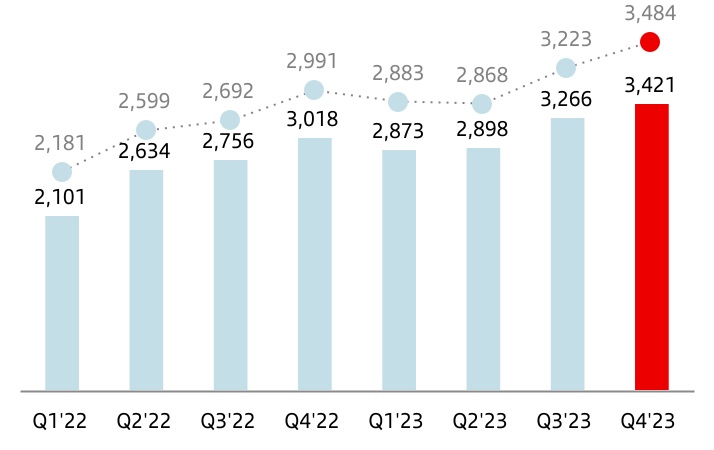
| Net loan-loss provisions | |||||
| EUR million | |||||
| constant euros | ||||
Profit before tax
Profit before tax was EUR 16,459 million in 2023, +8% year-on-year and +10% in constant euros. Good top line performance (double-digit growth in total income minus costs) was partially offset by higher loan-loss provisions and impairments and the temporary levy.
Income tax
Total income tax was EUR 4,276 million (EUR 4,486 million in 2022).
Profit attributable to non-controlling interests
Profit attributable to non-controlling interests amounted to EUR 1,107 million, down 4% year-on-year (-6% in constant euros), due to lower profit in Brazil and DCB as well as the increase in February of the Group's shareholding in Banco Santander México.
Profit attributable to the parent
Profit attributable to the parent amounted to EUR 11,076 million in 2023, compared to EUR 9,605 million in 2022. These results do not fully reflect profit performance due to the temporary levy in Spain mentioned in other sections of the report.
RoTE stood at 15.1% (13.4% in 2022), RoRWA at 1.96% (1.77% in 2022) and earnings per share stood at EUR 0.65 (EUR 0.54 in 2022).
January - December 2023 | | 11 | ||||||
Underlying profit attributable to the parent
Profit attributable to the parent and underlying profit were the same in 2023 (EUR 11,076 million), as profit was not affected by results that fell outside the ordinary course of our business, but there was a reclassification of certain items under some headings of the underlying income statement to better understand the business trends. These items recorded are:
•The temporary levy on revenue in Spain in the first quarter of 2023, totalling EUR 224 million, which was moved from total income to other gains (losses) and provisions.
•Provisions to strengthen the balance sheet in Brazil in the first quarter of 2023, totalling EUR 235 million, net of tax and minority interests.
In 2022, profit attributable to the parent and underlying profit were also the same (EUR 9,605 million), as profit was not affected by results that fell outside the ordinary course of our business, but there was also a reclassification of certain items under some headings of the underlying income statement.
For more details, see the 'Alternative Performance Measures' section in the appendix of this report.
Attributable profit and underlying profit increased 15% in euros and 18% in constant euros compared to 2022.
This growth was mainly boosted by solid revenue performance, which increased 11% in euros and 13% in constant euros year-on-year, and the efficiency improvement (down to 44.1%).
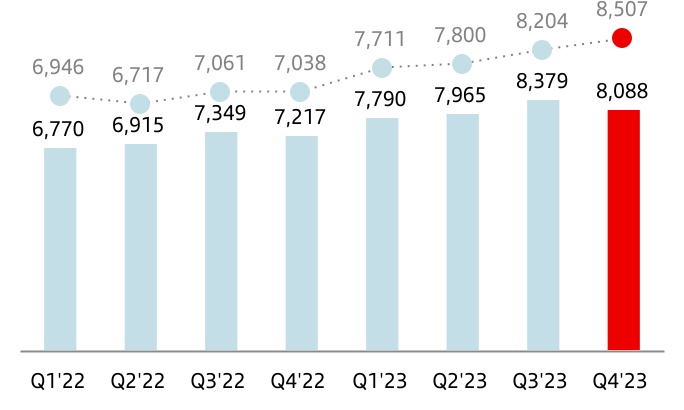
Santander's net operating income was EUR 32,222 million, 14% higher year-on-year. In constant euros, it rose 16% as follows:
•In Europe, net operating income increased 31% with strong improvements in all markets, boosted by 19% growth in total income (mainly due to net interest income in a context of higher interest rates) and costs increasing in line with inflation, resulting in efficiency gains.
•In North America, net operating income rose 2%. In Mexico, it was up 18%, supported by a strong total income growth which more than offset higher transformation costs. In the US, it decreased 10% affected by higher funding costs, investments in building up our CIB and Wealth Management businesses and LLP normalization.
•In South America, net operating income increased 3%, driven by total income growth.
•In Digital Consumer Bank, net operating income increased 4% driven by total income growth (higher net interest income, leasing income and gains on financial transactions). Operating expenses rose due to strategic transformation investments and business growth, as already mentioned.
•In the Corporate Centre, net operating income improved EUR 1,029 million, driven by the improvement of net interest income (higher liquidity buffer remuneration) and gains on financial transactions (FX hedge costs in 2022).
Net loan-loss provisions rose 19% (+19% also in constant euros) mainly due to the normalization in the US and Mexico, CHF mortgage provisions in Poland and portfolio growth in Brazil. This growth was reflected in an increase in the cost of risk to 1.18%, in line with the Group's target for the year.
| Summarized underlying income statement | ||||||||||||||||||||||||||
| EUR million | Change | Change | ||||||||||||||||||||||||
| Q4'23 | Q3'23 | % | % excl. FX | 2023 | 2022 | % | % excl. FX | |||||||||||||||||||
| Net interest income | 11,122 | 11,219 | (0.9) | 11.1 | 43,261 | 38,619 | 12.0 | 15.8 | ||||||||||||||||||
| Net fee income | 2,835 | 3,119 | (9.1) | 1.8 | 12,057 | 11,790 | 2.3 | 5.0 | ||||||||||||||||||
Gains (losses) on financial transactions 1 | 664 | 667 | (0.4) | 48.2 | 2,633 | 1,653 | 59.3 | 77.1 | ||||||||||||||||||
| Other operating income | (69) | (144) | (52.1) | — | (304) | 92 | — | — | ||||||||||||||||||
| Total income | 14,552 | 14,861 | (2.1) | 5.9 | 57,647 | 52,154 | 10.5 | 13.1 | ||||||||||||||||||
| Administrative expenses and amortizations | (6,464) | (6,482) | (0.3) | 8.8 | (25,425) | (23,903) | 6.4 | 9.6 | ||||||||||||||||||
| Net operating income | 8,088 | 8,379 | (3.5) | 3.7 | 32,222 | 28,251 | 14.1 | 16.1 | ||||||||||||||||||
| Net loan-loss provisions | (3,421) | (3,266) | 4.7 | 8.1 | (12,458) | (10,509) | 18.5 | 19.1 | ||||||||||||||||||
| Other gains (losses) and provisions | (745) | (666) | 11.9 | 19.3 | (3,066) | (2,492) | 23.0 | 33.5 | ||||||||||||||||||
| Profit before tax | 3,922 | 4,447 | (11.8) | (2.0) | 16,698 | 15,250 | 9.5 | 11.3 | ||||||||||||||||||
| Tax on profit | (724) | (1,271) | (43.0) | (34.6) | (4,489) | (4,486) | 0.1 | 1.5 | ||||||||||||||||||
| Profit from continuing operations | 3,198 | 3,176 | 0.7 | 10.8 | 12,209 | 10,764 | 13.4 | 15.4 | ||||||||||||||||||
| Net profit from discontinued operations | — | — | — | — | — | — | — | — | ||||||||||||||||||
| Consolidated profit | 3,198 | 3,176 | 0.7 | 10.8 | 12,209 | 10,764 | 13.4 | 15.4 | ||||||||||||||||||
| Non-controlling interests | (265) | (274) | (3.3) | (2.7) | (1,133) | (1,159) | (2.2) | (3.4) | ||||||||||||||||||
| Profit attributable to the parent | 2,933 | 2,902 | 1.1 | 12.1 | 11,076 | 9,605 | 15.3 | 17.7 | ||||||||||||||||||
1. Includes exchange differences.
| 12 | | January - December 2023 | ||||||
Underlying results performance compared to the previous quarter
Underlying profit attributable to the parent and profit attributable to the parent were the same (EUR 2,933 million) in Q4 2023, as profit was not affected by results outside the ordinary course of our business.
Profit increased 1% quarter-on-quarter. Profit in the fourth quarter included a negative EUR 200 million (net of tax) impact relating to the contribution to the Deposit Guarantee Fund (DGF) and the Bank Levy in the UK.
In constant euros, profit increased 12%. The performance of the main lines of the income statement was as follows:
Total income rose 6% in the quarter, driven by the good performance of the top line:
•Net interest income was up 11%, as follows:
–Good NII performance in South America (+38%), backed by the positive impact from lower interest rates in the quarter in Brazil and Chile (the latter benefitting from higher inflation growth in the quarter) and the impact from inflation in Argentina.
–Net interest income in North America rose 1%, driven by Mexico while it remained stable in the US.
–In Europe, net interest income decreased 2%, affected by pressure on liability remuneration in the UK, which was partially offset by growth in Portugal, while Spain and Poland remained stable.
| Net operating income | |||||
| EUR million | |||||
| constant euros | ||||
–Net fee income rose 2%, mainly driven by growth in Spain, Mexico and Argentina.
–In other income, gains on financial transactions increased, dividend earnings decreased and other operating income was impacted by the higher hyperinflation adjustment in Argentina.
•Operating expenses increased 9%, mainly due to inflation.
•Net loan-loss provisions increased, due to the normalization in the US, the increase in Mexico, in line with our expectations, and in Brazil, affected by single names in SCIB portfolio.
| Profit attributable to the parent | |||||
| EUR million | |||||
| constant euros | ||||
January - December 2023 | | 13 | ||||||
| Grupo Santander. Condensed balance sheet | |||||||||||||||||
| EUR million | |||||||||||||||||
| Change | |||||||||||||||||
| Assets | Dec-23 | Dec-22 | Absolute | % | Dec-21 | ||||||||||||
| Cash, cash balances at central banks and other demand deposits | 220,342 | 223,073 | (2,731) | (1.2) | 210,689 | ||||||||||||
| Financial assets held for trading | 176,921 | 156,118 | 20,803 | 13.3 | 116,953 | ||||||||||||
| Debt securities | 62,124 | 41,403 | 20,721 | 50.0 | 26,750 | ||||||||||||
| Equity instruments | 15,057 | 10,066 | 4,991 | 49.6 | 15,077 | ||||||||||||
| Loans and advances to customers | 11,634 | 9,550 | 2,084 | 21.8 | 6,829 | ||||||||||||
| Loans and advances to central banks and credit institutions | 31,778 | 28,097 | 3,681 | 13.1 | 14,005 | ||||||||||||
| Derivatives | 56,328 | 67,002 | (10,674) | (15.9) | 54,292 | ||||||||||||
Financial assets designated at fair value through profit or loss1 | 15,683 | 14,702 | 981 | 6.7 | 21,493 | ||||||||||||
| Loans and advances to customers | 7,201 | 6,642 | 559 | 8.4 | 10,826 | ||||||||||||
| Loans and advances to central banks and credit institutions | 459 | 673 | (214) | (31.8) | 3,152 | ||||||||||||
| Other (debt securities an equity instruments) | 8,023 | 7,387 | 636 | 8.6 | 7,515 | ||||||||||||
| Financial assets at fair value through other comprehensive income | 83,308 | 85,239 | (1,931) | (2.3) | 108,038 | ||||||||||||
| Debt securities | 73,565 | 75,083 | (1,518) | (2.0) | 97,922 | ||||||||||||
| Equity instruments | 1,761 | 1,941 | (180) | (9.3) | 2,453 | ||||||||||||
| Loans and advances to customers | 7,669 | 8,215 | (546) | (6.6) | 7,663 | ||||||||||||
| Loans and advances to central banks and credit institutions | 313 | — | 313 | — | — | ||||||||||||
| Financial assets measured at amortized cost | 1,191,403 | 1,147,044 | 44,359 | 3.9 | 1,037,898 | ||||||||||||
| Debt securities | 103,559 | 73,554 | 30,005 | 40.8 | 35,708 | ||||||||||||
| Loans and advances to customers | 1,009,845 | 1,011,597 | (1,752) | (0.2) | 947,364 | ||||||||||||
| Loans and advances to central banks and credit institutions | 77,999 | 61,893 | 16,106 | 26.0 | 54,826 | ||||||||||||
| Investments in subsidiaries, joint ventures and associates | 7,646 | 7,615 | 31 | 0.4 | 7,525 | ||||||||||||
| Tangible assets | 33,882 | 34,073 | (191) | (0.6) | 33,321 | ||||||||||||
| Intangible assets | 19,871 | 18,645 | 1,226 | 6.6 | 16,584 | ||||||||||||
| Goodwill | 14,017 | 13,741 | 276 | 2.0 | 12,713 | ||||||||||||
| Other intangible assets | 5,854 | 4,904 | 950 | 19.4 | 3,871 | ||||||||||||
Other assets2 | 48,006 | 48,150 | (144) | (0.3) | 43,334 | ||||||||||||
| Total assets | 1,797,062 | 1,734,659 | 62,403 | 3.6 | 1,595,835 | ||||||||||||
| Liabilities and shareholders' equity | |||||||||||||||||
| Financial liabilities held for trading | 122,270 | 115,185 | 7,085 | 6.2 | 79,469 | ||||||||||||
| Customer deposits | 19,837 | 12,226 | 7,611 | 62.3 | 6,141 | ||||||||||||
| Debt securities issued | — | — | — | — | — | ||||||||||||
| Deposits by central banks and credit institutions | 25,670 | 15,553 | 10,117 | 65.0 | 7,526 | ||||||||||||
| Derivatives | 50,589 | 64,891 | (14,302) | (22.0) | 53,566 | ||||||||||||
| Other | 26,174 | 22,515 | 3,659 | 16.3 | 12,236 | ||||||||||||
| Financial liabilities designated at fair value through profit or loss | 40,367 | 40,268 | 99 | 0.2 | 14,943 | ||||||||||||
| Customer deposits | 32,052 | 31,143 | 909 | 2.9 | 7,818 | ||||||||||||
| Debt securities issued | 5,371 | 5,427 | (56) | (1.0) | 5,454 | ||||||||||||
| Deposits by central banks and credit institutions | 2,944 | 3,698 | (754) | (20.4) | 1,671 | ||||||||||||
| Other | — | — | — | — | — | ||||||||||||
| Financial liabilities measured at amortized cost | 1,468,703 | 1,423,858 | 44,845 | 3.1 | 1,349,169 | ||||||||||||
| Customer deposits | 995,280 | 966,353 | 28,927 | 3.0 | 886,595 | ||||||||||||
| Debt securities issued | 303,208 | 274,912 | 28,296 | 10.3 | 240,709 | ||||||||||||
| Deposits by central banks and credit institutions | 130,028 | 145,534 | (15,506) | (10.7) | 191,992 | ||||||||||||
| Other | 40,187 | 37,059 | 3,128 | 8.4 | 29,873 | ||||||||||||
| Liabilities under insurance contracts | 17,799 | 16,426 | 1,373 | 8.4 | 18,560 | ||||||||||||
| Provisions | 8,441 | 8,149 | 292 | 3.6 | 9,583 | ||||||||||||
Other liabilities3 | 35,241 | 33,188 | 2,053 | 6.2 | 27,058 | ||||||||||||
| Total liabilities | 1,692,821 | 1,637,074 | 55,747 | 3.4 | 1,498,782 | ||||||||||||
| Shareholders' equity | 130,443 | 124,732 | 5,711 | 4.6 | 119,649 | ||||||||||||
| Capital stock | 8,092 | 8,397 | (305) | (3.6) | 8,670 | ||||||||||||
Reserves (including treasury stock)4 | 112,573 | 107,709 | 4,864 | 4.5 | 103,691 | ||||||||||||
| Profit attributable to the Group | 11,076 | 9,605 | 1,471 | 15.3 | 8,124 | ||||||||||||
| Less: dividends | (1,298) | (979) | (319) | 32.6 | (836) | ||||||||||||
| Other comprehensive income | (35,020) | (35,628) | 608 | (1.7) | (32,719) | ||||||||||||
| Minority interests | 8,818 | 8,481 | 337 | 4.0 | 10,123 | ||||||||||||
| Total equity | 104,241 | 97,585 | 6,656 | 6.8 | 97,053 | ||||||||||||
| Total liabilities and equity | 1,797,062 | 1,734,659 | 62,403 | 3.6 | 1,595,835 | ||||||||||||
| Note: The condensed balance sheet groups some lines of the consolidated balance sheet on pages 85 and 86 as follows: | ||
1.'Non-trading financial assets mandatorily at fair value through profit or loss' and 'Financial assets designated at fair value through profit or loss'. | ||
2.‘Hedging derivatives’; ‘Changes in the fair value of hedged items in portfolio hedges of interest risk’; 'Assets under insurance or reinsurance contracts'; ‘Tax assets’; ‘Other assets’; and 'Non-current assets held for sale’. | ||
3.‘Hedging derivatives’; ‘Changes in the fair value of hedged items in portfolio hedges of interest rate risk’; ‘Tax liabilities’; ‘Other liabilities’; and ‘Liabilities associated with non-current assets held for sale‘. | ||
4.‘Share premium’; ‘Equity instruments issued other than capital’; ‘Other equity’; ‘Accumulated retained earnings’; ‘Revaluation reserves’; ‘Other reserves’; and ‘Own shares (-)’. | ||
| 14 | | January - December 2023 | ||||||
| GRUPO SANTANDER BALANCE SHEET | ||||||||
| Executive summary | ||||||||||||||||||||||||||||||||||||||
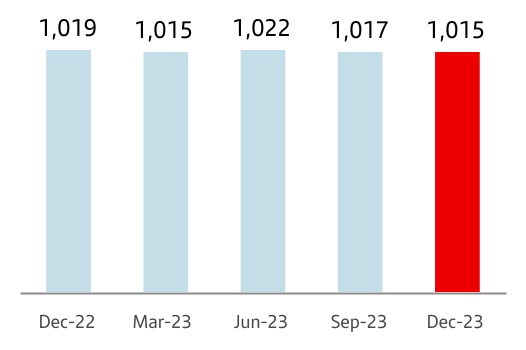
Gross loans and advances to customers (excl. reverse repos) | Customer funds (deposits excl. repos + mutual funds) | |||||||||||||||||||
| Credit performance reflects the impact of the macroeconomic environment and rising interest rates on customer behaviour | Customer funds continued to grow year-on-year | |||||||||||||||||||
Gross loans and advances to customers (excl. reverse repos) | Customer funds (deposits excl. repos + mutual funds) | |||||||||||||||||||
| 1,015 | +0.8% QoQ | 1,177 | +2.7% QoQ | |||||||||||||||||
| EUR billion | -1.0% YoY | EUR billion | +3.9% YoY | |||||||||||||||||
è By segment: | è By product: | |||||||||||||||||||
| Year-on-year decline in corporates, while individuals remained stable | Increase in time deposits and mutual funds shifting away from demand deposits | |||||||||||||||||||
| Individuals | SMEs and corporates | CIB | Demand | Time | Mutual funds | |||||||||||||||
| 0% | -1% | -6% | -7% | +30% | +13% | |||||||||||||||
| Note: changes in constant euros. | ||||||||||||||||||||
Loans and advances to customers
Loans and advances to customers stood at EUR 1,036,349 million as at 31 December 2023, stable during the quarter and in the last 12 months.
For the purpose of analysing traditional commercial banking loans, the Group uses gross loans and advances to customers excluding reverse repos (EUR 1,014,953 million). Additionally, the comments below do not include the exchange rate impact.
In the quarter, gross loans and advances to customers, excluding reverse repos, increased 1%, as follows:
•Flat in Europe with slight falls in Spain, the UK and Portugal, due to rising interest rates, offset by growth in Poland (boosted by CIB).
•Loans in North America increased 1%, driven by 1% growth both in the US and Mexico.
•In South America, loans increased 3%, up 47% in Argentina, +6% in Uruguay, +3% in Brazil and +1% in Chile.
•Loans at Digital Consumer Bank (DCB) increased 3%, growing at Santander Consumer Finance (+3%) and Openbank (+6%).
| Gross loans and advances to customers (excl. reverse repos) | |||||
| EUR billion | |||||
| 0 | % | 1a | |||
| Dec-23 / Dec-22 | |||||
1. In constant EUR: -1%.
Compared to December 2022, gross loans and advances to customers (excluding reverse repos and in constant euros) declined 1%, as follows:
•In Europe volumes decreased 6%, with falls in almost all markets impacted by higher interest rates. Volumes fell 8% in Spain, 6% in Portugal and 6% in the UK. On the other hand, volumes in Poland increased 5%, mainly due to double digit growth in CIB.
•In North America, growth was 3%. In the US, lending grew 1% propelled by CIB and Multifamily, while lending in Mexico was up 6% with widespread rises across segments (except CIB).
•Growth in South America was 7%. In Argentina, lending increased 217% driven by SMEs, corporates and individuals. In Brazil, it climbed 6% owing to positive performance in SMEs, corporates and individuals. In Chile, loans increased 4% backed by individuals, CIB and consumer finance. In Uruguay, they rose 12% mainly driven by consumer and corporates.
•At DCB, volumes increased 8%, with generalized growth across countries (except the UK). Openbank's loans rose 16%.
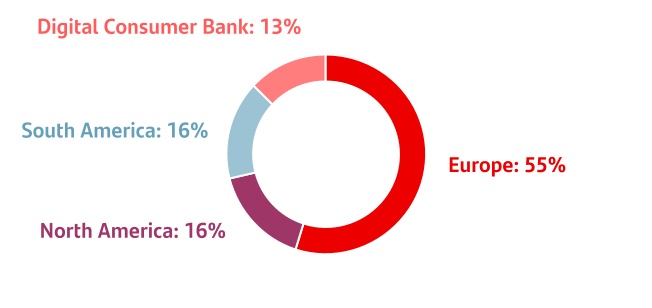
As at December 2023, gross loans and advances to customers excluding reverse repos maintained a balanced structure between individuals (63%), SMEs and corporates (24%) and CIB (13%).
| Gross loans and advances to customers (excl. reverse repos) | ||
| % operating areas. December 2023 | ||
January - December 2023 | | 15 | ||||||
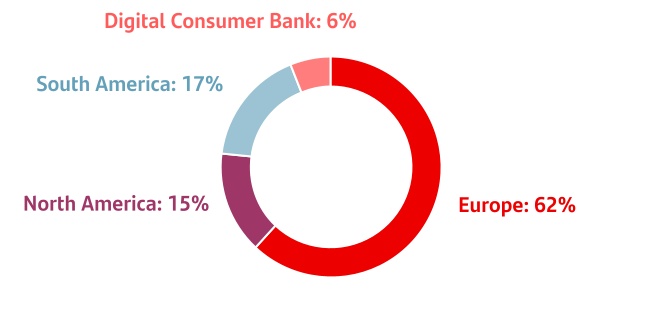
Customer funds
Customer deposits amounted to EUR 1,047,169 million in December 2023, +1% compared to Q3 2023 and +4% year-on-year.
The Group uses customer funds (customer deposits excluding repos, plus mutual funds) for the purpose of analysing traditional retail banking funds, which amounted to EUR 1,176,875 million in December 2023. The comments below do not include the exchange rate impact.
•In the quarter, customer funds increased EUR 31.3 billion in constant euros, as follows:
–By product, customer deposits excluding repos increased EUR 22.1 billion and mutual funds rose EUR 9.2 billion.
–By primary segment, customer funds grew in all regions and DCB, increasing in all countries (except Uruguay).
•Compared to December 2022, customer funds were up 4% in constant euros:
–By product, customer deposits excluding repurchase agreements rose 2%, as higher interest rates resulted in a notable increase in time deposits (+30%), which grew significantly in all markets, to the detriment of demand deposits, which fell 7%. Mutual funds increased (+13%) in all markets (except the US).
–Customer funds increased 17% in South America with growth in all markets (Argentina: +235%; Brazil: +14%; and Chile: +12%), +3% in North America (the US: -1% and Mexico: +10%), and fell 1% in Europe due to the decreases in Portugal (-4%), Spain (-2%), and the UK (-1%), offset by the growth in Poland (+8%).
–Positive performance in DCB, as customer funds increased 19%.
–By secondary segment, there was a solid performance across businesses, particularly Retail Banking and Wealth Management & Insurance.
The weight of demand deposits as a percentage of total customer funds was 56%, while time deposits accounted for 26% of the total and mutual funds for 18%.
| Customer funds | ||
| EUR billion | ||

| +4 | % | 1a | ||||||
| +13 | % | |||||||
| +2 | % | |||||||
•Total | ||||||||
• Mutual funds | ||||||||
•Deposits exc. repos | ||||||||
| Dec-23 / Dec-22 | ||||||||
1. In constant EUR: +4%.
In addition to capturing customer deposits, the Group, for strategic reasons, maintains a selective policy of issuing securities in the international fixed income markets and strives to adapt the frequency and volume of its market operations to the structural liquidity needs of each unit, as well as to the receptiveness of each market.
In 2023, the Group issued:
•Medium- and long-term senior debt placed in the market of EUR 21,784 million and covered bonds amounting to EUR 8,706 million (including the first ECA covered bond placed in the market).
•There were EUR 19,942 million of securitizations and other similar transactions placed in the market.
•TLAC eligible instruments issued amounted to EUR 13,987 million to strengthen the Group's position, of which EUR 7,217 million was senior non-preferred, EUR 4,458 million was subordinated debt and EUR 2,313 million was AT1.
•Maturities of medium- and long-term debt totalled EUR 28,929 million.
The net loan-to-deposit ratio was 99% (101% in December 2022). The ratio of deposits plus medium- and long-term funding to the Group’s loans was 127%, underscoring the comfortable funding structure. The liquidity coverage ratio (LCR) was an estimated 166% in December (164% in September 2023).
The Group's access to wholesale funding markets as well as the cost of issuances depends, in part, on the ratings of the rating agencies.
The ratings of Banco Santander, S.A. by the main rating agencies were: Fitch A- senior non-preferred debt, A senior long-term and A/F1 senior short-term; Moody's confirmed its A2 long-term and P-1 short-term ratings in July and maintained its stable outlook above the rating of the Kingdom of Spain; Standard & Poor's (S&P) A+ long-term rating and A-1 short-term rating; and DBRS A High and R-1 Medium short-term. DBRS and Fitch maintained their stable outlooks, above the sovereign's outlook, while S&P also maintained its outlook but in line with the sovereign.
Sometimes the methodology applied by the agencies limits a bank's rating to the sovereign rating of the country where it is headquartered. Banco Santander, S.A. is still rated above the sovereign debt rating of the Kingdom of Spain by Moody’s, DBRS and S&P and at the same level by Fitch, which demonstrates our financial strength and diversification.
| Customer funds | ||
| % operating areas. December 2023 | ||
| 16 | | January - December 2023 | ||||||
| SOLVENCY RATIOS | ||||||||
| Executive summary | ||||||||||||||||||||||||||||||||||||||
| Fully-loaded capital ratio | Fully-loaded CET1 ratio | |||||||||||||||||||
| Fully-loaded CET1 ratio exceeded 12% at the end of December | We continued to generate capital organically in the quarter, backed by profit growth | |||||||||||||||||||
| Fully-loaded CET1 performance (%) | Organic generation | +29 bps | ||||||||||||||||||
 | ||||||||||||||||||||
Accrual for shareholder remuneration1 | -38 bps | |||||||||||||||||||
| TNAV per share | ||||||||||||||||||||
TNAV per share was EUR 4.76, increasing 15% year-on-year including the cash dividends paid in May 2023 and November 2023 | ||||||||||||||||||||
As of end December 2023, the total phased-in capital ratio (applying the IFRS 9 transitional arrangements) stood at 16.4% and the phased-in CET1 ratio at 12.3%. We comfortably meet the levels required by the European Central Bank on a consolidated basis (estimated 13.5% for the total capital ratio and 9.3% for the CET1 ratio)2. This results in a distance to the maximum distributable amount (MDA) of 269 bps and a CET1 management buffer of 304 bps.
The total fully-loaded capital ratio stood at 16.3% and the fully-loaded fully-loaded CET1 ratio at 12.3%.
In the quarter, we generated 29 bps organically and recorded a 12 bp charge for a future cash dividend payment against profit achieved in the fourth quarter of 2023 (in line with our 50% payout target1). There were also positive impacts totalling 8 bps, mainly relating to available-for-sale portfolio valuations, bringing the fully-loaded CET1 ratio to 12.5% at year end.
However, in accordance with the EBA's Q&A 2023_6887 on the deduction of share buybacks included in distribution policies published in Q4, we recorded a -26 bp impact relating to the second share buyback programme charged against 2023 results. As a result, the fully-loaded CET1 ratio stood at 12.3%.
Lastly, the TNAV per share ended December 2023 at EUR 4.76. If we include the last two cash dividends (EUR 5.95 cents paid in May and EUR 8.10 cents paid in November), TNAV plus cash dividend per share increased 15% in the last twelve months (+3% in the quarter).
Lastly, the fully-loaded leverage ratio stood at 4.69%, and the phased-in at 4.71%.
| Eligible capital. December 2023 | ||||||||
| EUR million | ||||||||
| Fully-loaded | Phased-in | |||||||
| CET1 | 76,448 | 76,741 | ||||||
| Basic capital | 85,450 | 85,742 | ||||||
| Eligible capital | 101,747 | 102,240 | ||||||
| Risk-weighted assets | 623,652 | 623,731 | ||||||
| % | % | |||||||
| CET1 capital ratio | 12.3 | 12.3 | ||||||
| Tier 1 capital ratio | 13.7 | 13.8 | ||||||
| Total capital ratio | 16.3 | 16.4 | ||||||
| Fully-loaded CET1 ratio performance | ||
| % | ||
Note: The phased-in ratio includes the transitory treatment of IFRS 9, calculated in accordance with article 473 bis of the Capital Requirements Regulation (CRR2) and subsequent modifications introduced by Regulation 2020/873 of the European Union. Total phased-in capital ratios include the transitory treatment according to chapter 4, title 1, part 10 of the CRR2.
1.The implementation of the shareholder remuneration policy is subject to future corporate and regulatory decisions and approvals.
2.According to a recent resolution from Banco de España, our D-SIB buffer will increase from 1% to 1.25% from January 2024 following a change in methodology. Institutions must hold capital at the consolidated level for the higher of the G-SIB and D-SIB requirements. As at year end 2023 Santander applies a 1% CET1 surcharge, globally (G-SIB) and locally (D-SIB), as they are both set at 1%. Additionally, the ECB revised Banco Santander, S.A.'s P2R requirement establishing a minimum of 1.74% applicable from 1 January 2024.
January - December 2023 | | 17 | ||||||
| RISK MANAGEMENT | ||||||||
| Executive summary | ||||||||||||||||||||||||||||||||||||||
| Credit risk | Market risk | |||||||||||||||||||
| The current macroeconomic environment is putting pressure on credit quality indicators; however, our proactive risk management is keeping them within expected levels | Our risk profile was stable. VaR remained at moderate levels in an economic environment with inflation still at high levels and greater geopolitical risk | |||||||||||||||||||
| Cost of risk | NPL ratio | Coverage ratio | Average VaR | |||||||||||||||||
| 1.18% | 3.14% | 66% | Q4'23 | EUR 13 million | ||||||||||||||||
| +4 bps vs. Q3'23 | +1 bp vs. Q3'23 | -2 pp vs. Q3'23 | ||||||||||||||||||
| Structural and liquidity risk | Operational risk | |||||||||||||||||||
| Robust and diversified liquidity buffer, with ratios well above regulatory requirements | Our operational risk profile remained stable and losses in the quarter were higher than in Q3 2023 | |||||||||||||||||||
| Liquidity Coverage Ratio (LCR) | ||||||||||||||||||||
| 166 | % | +2 pp vs. Q3'23 | ||||||||||||||||||
Our geographical diversification, together with our proactive risk management, based on extensive analytics and model-based decisions focused on product suitability and comprehensive portfolio management, are essential to maintaining a medium-low risk profile, even in the current macroeconomic and geopolitical context.
Credit risk management1
During the Q4 2023, credit impaired loans increased slightly compared to the third quarter, reaching EUR 35,620 million. Year-on-year, they increased 2%, mainly due to rises in in the UK, the US and Mexico, that were partially offset by the decreases in Spain, Portugal and Brazil.
Total risk stood at EUR 1,133,898 million, increasing slightly quarter-on-quarter (+1%) and relatively stable year-on-year, where the increases in South America and DCB were offset by the decline in Europe.
The NPL ratio stood at 3.14%, in line with expectations given the current environment.
Loan-loss provisions amounted to EUR 3,421 million in the quarter and EUR 12,458 million (+19%) in the year, driven by the provisions in the US (normalization of the auto portfolio), DCB (portfolio growth), Mexico (the normalization of provisions and solid growth in loans to individuals) and Poland (related to CHF mortgages). The cost of risk stood at 1.18%, performing in line with expectations.
Total loans-loss reserves reached EUR 23,490 million, flat compared to 2022. The total coverage of credit impaired loans decreased slightly to 66%, but remained at comfortable levels since nearly 68% of the Group's portfolio is secured and the mortgage portfolios in Spain and the UK, in particular, require lower coverage levels.
| Key metrics performance by geographic area | ||||||||||||||||||||||||||||||||||||||
Loan-loss provisions2 | Cost of risk (%)3 | NPL ratio (%) | Total coverage ratio (%) | |||||||||||||||||||||||||||||||||||
| 2023 | Chg (%) / 2022 | 2023 | Chg (bps) / 2022 | 2023 | Chg (bps) / 2022 | 2023 | Chg (p.p.) / 2022 | |||||||||||||||||||||||||||||||
| Europe | 2,533 | 5 | 0.44 | 4 | 2.32 | (5) | 49.3 | (2.5) | ||||||||||||||||||||||||||||||
| North America | 3,733 | 45 | 2.05 | 56 | 4.09 | 106 | 73.8 | (19.4) | ||||||||||||||||||||||||||||||
| South America | 5,401 | 9 | 3.36 | 4 | 5.72 | (49) | 78.4 | 2.4 | ||||||||||||||||||||||||||||||
| Digital Consumer Bank | 792 | 48 | 0.62 | 16 | 2.12 | 6 | 88.0 | (4.8) | ||||||||||||||||||||||||||||||
| TOTAL GROUP | 12,458 | 19 | 1.18 | 18 | 3.14 | 6 | 65.9 | (1.6) | ||||||||||||||||||||||||||||||
1. Changes in constant euros.
2.EUR million and % change in constant euros.
3.Provisions to cover losses due to impairment of loans in the last 12 months / average customer loans and advances of the last 12 months.
For more detailed information on metrics and countries, please see the Alternative Performance Measures section.
| 18 | | January - December 2023 | ||||||
The Group continuously monitors the government liquidity programmes that were launched during the pandemic, where Spain constitutes the majority. 99% of the grace periods have expired, showing no signs of deterioration.
IFRS 9 stages: the distribution of the portfolio remained stable in the quarter in percentage terms.
| Coverage ratio by stage | |||||||||||||||||||||||
| EUR billion | |||||||||||||||||||||||
Exposure1 | Coverage | ||||||||||||||||||||||
| Dec-23 | Sep-23 | Dec-22 | Dec-23 | Sep-23 | Dec-22 | ||||||||||||||||||
| Stage 1 | 1,000 | 1,002 | 1,004 | 0.4 | % | 0.4 | % | 0.4 | % | ||||||||||||||
| Stage 2 | 80 | 77 | 69 | 6.4 | % | 7.0 | % | 7.7 | % | ||||||||||||||
| Stage 3 | 36 | 36 | 35 | 40.6 | % | 40.4 | % | 40.8 | % | ||||||||||||||
1. Exposure subject to impairment. Additionally, in December 2023 there was EUR 19 billion in loans and advances to customers not subject to impairment recorded at mark to market with changes through P&L (EUR 20 billion in September 2023 and EUR 16 billion in December 2022).
Stage 1: financial instruments for which no significant increase in credit risk has been identified since its initial recognition.
Stage 2: if there has been a significant increase in credit risk since the date of initial recognition but the impairment event has not materialized, the financial instrument is classified in Stage 2.
Stage 3: a financial instrument is catalogued in this stage when it shows effective signs of impairment as a result of one or more events that have already occurred resulting in a loss.
| Credit impaired loans and loan-loss allowances | |||||||||||
| EUR million | |||||||||||
| Change (%) | |||||||||||
| Q4'23 | QoQ | YoY | |||||||||
| Balance at beginning of period | 35,558 | 1.7 | (0.1) | ||||||||
| Net additions | 4,276 | 6.7 | 16.7 | ||||||||
| Increase in scope of consolidation | — | (100.0) | — | ||||||||
| Exchange rate differences and other | (414) | 195.7 | (53.7) | ||||||||
| Write-offs | (3,800) | 17.1 | 2.8 | ||||||||
| Balance at period-end | 35,620 | 0.2 | 2.7 | ||||||||
| Loan-loss allowances | 23,490 | (2.2) | 0.3 | ||||||||
| For impaired assets | 14,464 | 0.8 | 2.2 | ||||||||
| For other assets | 9,026 | (6.6) | (2.7) | ||||||||
Market risk
The market risk associated with global corporate banking trading activity is focused on serving the needs of our customers. It is measured in terms of daily VaR at 99% and is mainly produced by possible interest rate movements.
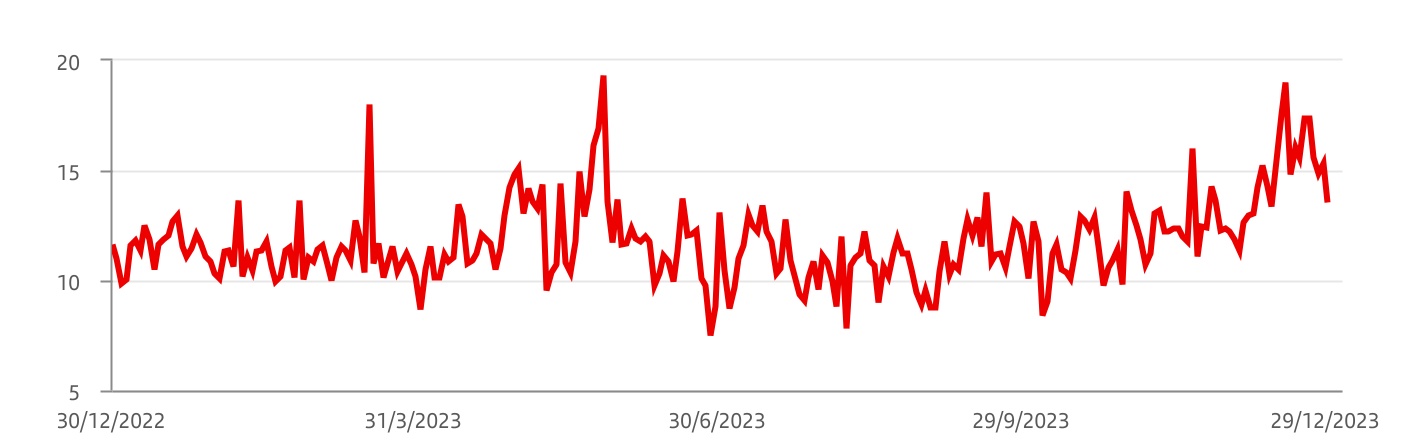
In the fourth quarter, the average VaR was EUR 13 million. Despite the increase of the geopolitical risk as a result of the conflict in the Middle East, market volatility remained moderate given the signs of resilience of the economies in an environment with still high, but improving, inflation. Towards the end of the quarter, volatility ticked up slightly coinciding with the last meetings of the year of the main central banks.
By market factor, VaR evolution continued to be driven mainly by interest rate risk. These risk figures remain low compared to the size of the Group's balance sheet and activity.
Trading portfolios.1 VaR by geographic region | ||||||||||||||
| EUR million | ||||||||||||||
| 2023 | 2022 | |||||||||||||
| Fourth quarter | Average | Last | Average | |||||||||||
| Total | 12.7 | 13.5 | 14.7 | |||||||||||
| Europe | 10.9 | 11.8 | 13.4 | |||||||||||
| North America | 5.3 | 5.0 | 2.7 | |||||||||||
| South America | 6.8 | 7.0 | 8.2 | |||||||||||
1. Activity performance in Santander Corporate & Investment Banking markets.
Trading portfolios.1 VaR by market factor | ||||||||||||||
| EUR million | ||||||||||||||
| Fourth quarter 2023 | Min. | Avg. | Max. | Last | ||||||||||
| VaR total | 8.4 | 12.7 | 19.0 | 13.5 | ||||||||||
| Diversification effect | (11.1) | (15.9) | (22.3) | (17.1) | ||||||||||
| Interest rate VaR | 9.2 | 12.3 | 17.5 | 11.1 | ||||||||||
| Equity VaR | 1.4 | 3.0 | 6.2 | 6.0 | ||||||||||
| FX VaR | 3.6 | 5.8 | 8.6 | 4.8 | ||||||||||
| Credit spreads VaR | 4.1 | 5.4 | 6.4 | 6.1 | ||||||||||
| Commodities VaR | 1.2 | 2.1 | 2.6 | 2.6 | ||||||||||
1.Activity performance in Santander Corporate & Investment Banking markets.
Note: In the North America, South America and Asia portfolios, VaR corresponding to the credit spreads factor other than sovereign risk is not relevant and is included in the interest rate factor.
January - December 2023 | | 19 | ||||||
Trading portfolios1. VaR performance | ||
| EUR million | ||
1. Corporate & Investment Banking performance in financial markets.
Structural and liquidity risk
Structural exchange rate risk: mainly driven by transactions in foreign currencies related to permanent financial investments, their results and related hedges. Our dynamic management of this risk seeks to limit the impact of foreign exchange rate movements on the CET1 ratio. In the quarter, hedging of currencies impacting this ratio remained close to 100%.
Structural interest rate risk: in the fourth quarter of the year, although inflation continued at high levels, its gradual correction reduced pressure on market interest rates. The markets consider that the central banks have finished this cycle of monetary policy tightening following several consecutive meetings keeping official rates stable. In this context, our structural debt portfolios performed positively and risk remained at comfortable levels during the period.
Liquidity risk: the Group maintained its comfortable liquidity risk position in the fourth quarter, supported by a robust and diversified liquidity buffer, with ratios well above regulatory limits.
Operational risk
Our operational risk profile remained stable in the fourth quarter of 2023 but, operational risk losses increased compared to the previous quarter.
The Group continuously monitors the evolution of specific legal cases, as well as external fraud, two of the main components of operational risk losses.
During the fourth quarter, the following aspects were closely monitored:
•IT risks arising from transformation plans related to business strategy and development of digital capabilities, as well as proactive management of obsolete technology and IT services provided by third parties, to ensure availability of services and operations.
•Regulatory compliance across the Group (such as ESG or operational resilience), as well as increasing supervisory activity.
•External fraud, mainly in online banking transactions (e.g. customer fraud) and in the loans admissions processes (e.g. identity theft).
•Financial Crime Compliance monitoring, compliance with international financial measures and sanctions and prevention programme upgrades in certain subsidiaries.
•Cyber threats across the financial industry, focused on alerts derived from the war in Ukraine and the Middle East, strengthening the bank's monitoring and control environment mechanisms.
•Third party risk exposure, maintaining close oversight of critical suppliers and focusing on their control environment (business continuity capabilities, supply chains, cyber risk management and compliance with service level agreements).
| 20 | | January - December 2023 | ||||||
| GENERAL BACKGROUND | ||||||||
In 2023, Santander operated in an environment dominated by higher interest rates as central banks looked to contain inflation, which gradually eased during the year. The world's major economies withstood monetary policy tightening well, although activity levels have been falling slowly. Labour markets were also resilient, with unemployment rates at or close to full employment in most of Santander's footprint.
| Country | GDP Change1 | Economic performance | |||||||||
 | Eurozone | +0.5% | The positive start to the year, supported by the normalization of global supply chains and reduced uncertainty around energy supply, lost momentum in the second half of the year as interest rates rose, industry struggled to adjust to higher energy costs and households remained cautious about consumption. Inflation eased (2.9% in December) after the ECB raised its interest rates by 450 basis points in this monetary cycle. | ||||||||
 | Spain | +2.4% | During the first half of the year, GDP growth was driven by the external sector, especially tourism. In the second half of the year, private consumption took over as the main growth driver. Solid labour market, with a record number of people registered in Social Security. Inflation closed the year at 3.1% (3.6% on average) with a decline in all components and a greater-than-expected moderation in core inflation (3.8%). | ||||||||
 | United Kingdom | +0.5% | Economic growth remained practically flat. The labour market remained tight, putting pressure on inflation from the cost side. However, inflation eased during the year and it stood at 4% in December, far from the 11.1% peak in October 2022. The Bank of England paused rate hikes at 5.25%, unchanged since August. | ||||||||
 | Portugal | +2.1% | Growth decelerated throughout the year as demand in the rest of the European Union continued to cool. Despite this, the labour market remained at full employment (6.1% in Q3'23) and inflation moderated rapidly (1.4% in December). Moody's upgraded the sovereign's rating to A3, supported by economic and fiscal reforms. | ||||||||
 | Poland | +0.6% | Economic growth picked up during the year backed by domestic demand. Consumption was supported by a strong labour market, with full employment, and a marked increase in real household income driven by double-digit wage growth coupled with inflation falling to 6.2% in December. In response, the central bank paused its monetary easing, leaving the official rate at 5.75%. | ||||||||
 | United States | +2.5% | The economy grew more than expected, particularly private consumption. The labour market tensions eased slightly but remains very solid. Inflation moderated significantly (3.4% in December), which led the Fed to suggest that interest rate hikes are over (the federal funds target range to 5.25%-5.5%). | ||||||||
 | Mexico | +3.5% | Economic growth was surprisingly robust, driven by construction, linked to both nearshoring and infrastructure projects and the resilience of services. Inflation fell significantly to 4.7% (7.8% in the previous year). The central bank's official rate has been stable at 11.25% since the first quarter of the year and it suggested a possible first cut in early 2024. | ||||||||
 | Brazil | +2.8% | The economy grew well, driven by agricultural, mining and services, but showed signs of a slowdown in the second half of the year. Inflation continued to fall (4.6% in December, 5.8% average in the year), allowing the central bank to begin to cut official rates in August, from 13.75% in December 2022 to 11.75% at year end. | ||||||||
 | Chile | 0.0% | The economy completed the adjustment process initiated at the end of 2022. The second half of the year showed signs of recovery, supported by household consumption and exports. Inflation fell back sharply (3.9% vs. 12.8% in 2022) which enabled the central bank to begin to reduce rates in July, with a total reduction of 200 bps, ending the year at 8.25%. | ||||||||
 | Argentina | -1.5% | The economy contracted due to the severe droughts, which reduced agricultural production and soybean exports (which have a large weight in GDP). Inflation accelerated, fuelled by the depreciation of the Argentine peso. On 10 December, a new government took office and presented an IMF-backed stabilization plan focused on correcting imbalances. | ||||||||
1. Estimated year-on-year changes for 2023.
January - December 2023 | | 21 | ||||||
| DESCRIPTION OF SEGMENTS | ||||||||
We base segment reporting on financial information presented to the chief operating decision maker, which excludes certain statutory result items considered outside the ordinary course of our business (e.g. capital gains, write-downs, impairment of goodwill) or reclassifies certain items under some headings of the underlying (or "adjusted") income statement to better understand the underlying business trends.
Santander has aligned the information in this chapter with the information used internally for management reporting and with that presented in the Group's other public documents.
Santander's executive committee has been selected to be its chief operating decision maker. The Group's operating segments reflect its organizational and managerial structures. The executive committee reviews internal reporting based on these segments to assess performance and allocate resources.
The segments are split by geographic area in which profits are earned or by type of business. We prepare the information by aggregating the figures for Santander’s various geographic areas and business units, relating it to both the accounting data of the business units integrated in each segment and information provided by management information systems. The same general principles as those used in the Group are applied.
In 2023, Santander maintained the criteria applied in 2022, with two exceptions:
•In the secondary segments: usual annual customer perimeter adjustment between Retail Banking and Santander Corporate & Investment Banking and between Retail Banking and Wealth Management & Insurance.
•In the Group's financial statements: as a result of the implementation from 1 January 2023 of the amendments to IFRS 17 (new general accounting standard for insurance contracts), the Group retrospectively performed a reclassification in the balance sheet to 'Liabilities under insurance or reinsurance contracts', related to the different treatment established by this new standard for the components of an insurance contract. This reclassification was made in the corresponding segments.
For comparative purposes, the 2022 data has been restated to include these changes.
In terms of the operating segment structure, the Group maintained the two levels of segmentation applied in 2022.
Primary segments
This primary level of segmentation, which is based on the Group’s management structure, comprises five reportable segments: four operating areas plus the Corporate Centre. The operating areas are:
Europe: comprises all business activity carried out in the region, except that included in Digital Consumer Bank. Detailed financial information is provided on Spain, the UK, Portugal and Poland.
North America: comprises all the business activities carried out in Mexico and the US, which includes the holding company (SHUSA) and the businesses of Santander Bank, Santander Consumer USA (SC USA), the specialized business unit Banco Santander International, the New York branch and Santander US Capital Markets (SanCap).
South America: includes all the financial activities carried out by Grupo Santander through its banks and subsidiary banks in the region. Detailed information is provided on Brazil, Chile, Argentina, Uruguay, Peru and Colombia.
Digital Consumer Bank: includes Santander Consumer Finance, which incorporates the entire consumer finance business in Europe, Openbank and Open Digital Services (ODS).
| 22 | | January - December 2023 | ||||||
Secondary segments
At this secondary level, Grupo Santander is structured into Retail Banking, Santander Corporate & Investment Banking (SCIB), Wealth Management & Insurance (WM&I) and PagoNxt.
Retail Banking: this covers all customer banking businesses, including consumer finance, except those of corporate banking which are managed through Santander Corporate & Investment Banking and asset management, private banking and insurance, which are managed by Wealth Management & Insurance. The results of the hedging positions in each country are also included, conducted within the sphere of their respective assets and liabilities committees.
Santander Corporate & Investment Banking: this business includes global corporate banking, investment banking and markets worldwide including treasuries managed globally, as well as equity business.
Wealth Management & Insurance: includes the asset management business (Santander Asset Management), the corporate unit of Private Banking and International Private Banking in Miami and Switzerland (Santander Private Banking) and the insurance business (Santander Insurance).
PagoNxt: this includes digital payment solutions, providing global technology solutions for our banks and new customers in the open market. It is structured into four businesses: Merchant, International Trade, Payments and Consumer.
In addition to these operating units, both primary and secondary segments, the Group continues to maintain the Corporate Centre, which includes the centralized activities relating to equity stakes in financial companies, financial management of the structural exchange rate position, assumed within the sphere of the Group’s assets and liabilities committee, as well as management of liquidity and shareholders’ equity via issuances.
As the Group’s holding entity, this area manages all capital and reserves and allocations of capital and liquidity with the other businesses. It does not incorporate the costs related to the Group’s central services (charged to the areas), except for corporate and institutional expenses related to the Group’s functioning.
| The businesses included in each of the segments in this report and the accounting principles under which their results are presented here may differ from the businesses included and accounting principles applied in the financial information separately prepared and disclosed by our subsidiaries (some of which are publicly listed) which in name or geographical description may seem to correspond to the business areas covered in this report. Accordingly, the results of operations and trends shown for our business areas in this document may differ materially from those of such subsidiaries. As explained on the previous page, the results of our business areas presented below are provided on the basis of underlying results only and include the impact of foreign exchange rate fluctuations. However, for a better understanding of the changes in the performance of our business areas, we also provide and discuss the year-on-year changes to our results excluding such exchange rate impacts. Certain figures contained in this report, have been subject to rounding to enhance their presentation. Accordingly, in certain instances, the sum of the numbers in a column or a row in tables contained in this report may not conform exactly to the total figure given for that column or row. On 18 September 2023, the bank announced a new organizational structure, which consolidates its retail and commercial and consumer businesses in each market under two new global businesses: Retail & Commercial Banking and Digital Consumer Bank to help the bank achieve the strategic goals outlined at its Investor Day in February. The bank will concentrate operations in five global business areas which will become the bank's primary reporting segments. The Group will align the way it reports its financial results to this new model from January 2024, once it is fully implemented, in line with the information published on 20 December 2023. These areas are: Retail & Commercial Banking, Digital Consumer Bank, Corporate & Investment Banking, Wealth Management & Insurance and Payments. Regions and countries will continue to be reported publicly, but as secondary segments. | ||
January - December 2023 | | 23 | ||||||
| January-December 2023 | ||||||||||||||||||||
| Main items of the underlying income statement | ||||||||||||||||||||
| EUR million | ||||||||||||||||||||
| Primary segments | Net interest income | Net fee income | Total income | Net operating income | Profit before tax | Profit attributable to the parent | ||||||||||||||
| Europe | 15,910 | 4,399 | 21,439 | 12,409 | 8,195 | 5,482 | ||||||||||||||
| Spain | 6,641 | 2,699 | 10,132 | 5,905 | 3,399 | 2,371 | ||||||||||||||
| United Kingdom | 5,152 | 338 | 5,525 | 2,779 | 2,107 | 1,545 | ||||||||||||||
| Portugal | 1,465 | 464 | 1,982 | 1,440 | 1,314 | 896 | ||||||||||||||
| Poland | 2,543 | 589 | 3,182 | 2,320 | 1,392 | 674 | ||||||||||||||
| Other | 109 | 309 | 618 | (35) | (17) | (3) | ||||||||||||||
| North America | 10,159 | 2,192 | 13,174 | 6,708 | 2,837 | 2,354 | ||||||||||||||
| US | 5,742 | 766 | 7,209 | 3,531 | 863 | 932 | ||||||||||||||
| Mexico | 4,408 | 1,374 | 5,899 | 3,311 | 2,119 | 1,560 | ||||||||||||||
| Other | 8 | 52 | 66 | (133) | (145) | (138) | ||||||||||||||
| South America | 13,040 | 4,684 | 17,971 | 11,050 | 4,608 | 3,038 | ||||||||||||||
| Brazil | 9,116 | 3,462 | 13,104 | 8,574 | 2,911 | 1,921 | ||||||||||||||
| Chile | 1,383 | 572 | 2,285 | 1,265 | 951 | 582 | ||||||||||||||
| Argentina | 1,879 | 396 | 1,544 | 769 | 505 | 386 | ||||||||||||||
| Other | 662 | 254 | 1,038 | 441 | 241 | 150 | ||||||||||||||
| Digital Consumer Bank | 4,193 | 796 | 5,502 | 2,884 | 2,019 | 1,199 | ||||||||||||||
| Corporate Centre | (41) | (13) | (439) | (829) | (961) | (998) | ||||||||||||||
| TOTAL GROUP | 43,261 | 12,057 | 57,647 | 32,222 | 16,698 | 11,076 | ||||||||||||||
| Secondary segments | ||||||||||||||||||||
| Retail Banking | 37,985 | 7,661 | 45,254 | 25,858 | 10,872 | 7,436 | ||||||||||||||
| Corporate & Investment Banking | 3,485 | 2,190 | 8,296 | 4,905 | 4,570 | 3,078 | ||||||||||||||
| Wealth Management & Insurance | 1,739 | 1,265 | 3,396 | 2,240 | 2,235 | 1,637 | ||||||||||||||
| PagoNxt | 93 | 954 | 1,140 | 49 | (17) | (77) | ||||||||||||||
| Corporate Centre | (41) | (13) | (439) | (829) | (961) | (998) | ||||||||||||||
| TOTAL GROUP | 43,261 | 12,057 | 57,647 | 32,222 | 16,698 | 11,076 | ||||||||||||||
Profit attributable to the parent distribution1 | ||
| January - December 2023 | ||
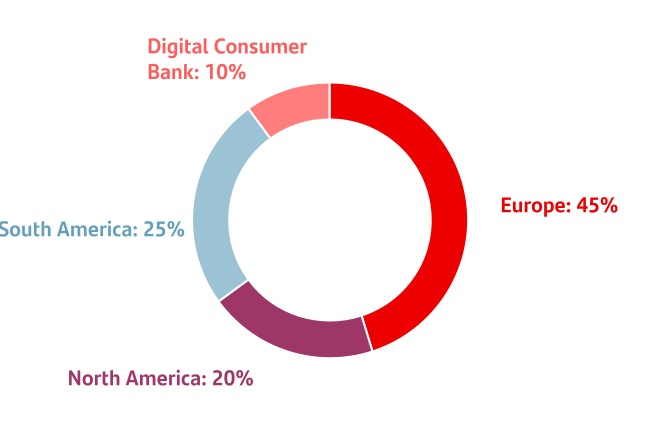
1. As a % of operating areas. Excluding the Corporate Centre.
| Profit attributable to the parent. 2023 | ||
| EUR million. % change YoY | ||
| Flags | |||||||||||
| Europe | | ||||||||||
| |||||||||||
| |||||||||||
| |||||||||||
| North America | | ||||||||||
| |||||||||||
| South America | | ||||||||||
| |||||||||||
| |||||||||||
| Digital Consumer Bank | DCB | ||||||||||
| Global businesses |  | ||||||||||
 | |||||||||||
 | |||||||||||
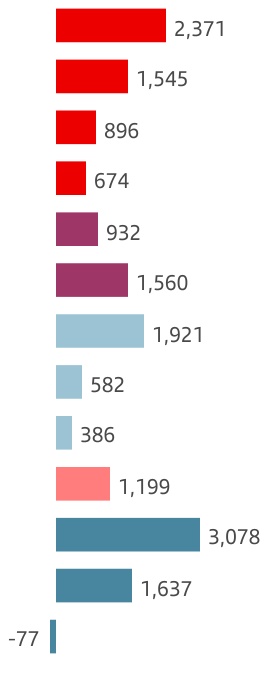
| Var | Var2 | ||||
| +52 | % | +52 | % | ||
| +11 | % | +13 | % | ||
| +68 | % | +68 | % | ||
| +85 | % | +80 | % | ||
| -48 | % | -46 | % | ||
| +29 | % | +17 | % | ||
| -25 | % | -25 | % | ||
| -14 | % | -15 | % | ||
| +19 | % | +462 | % | ||
| -8 | % | -7 | % | ||
| +9 | % | +20 | % | ||
| +46 | % | +48 | % | ||
| -64 | % | -63 | % | ||
| 24 | | January - December 2023 | ||||||
| January-December 2022 | ||||||||||||||||||||
| Main items of the underlying income statement | ||||||||||||||||||||
| EUR million | ||||||||||||||||||||
| Primary segments | Net interest income | Net fee income | Total income | Net operating income | Profit before tax | Profit attributable to the parent | ||||||||||||||
| Europe | 12,565 | 4,493 | 18,030 | 9,507 | 5,482 | 3,810 | ||||||||||||||
| Spain | 4,539 | 2,818 | 8,233 | 4,236 | 2,079 | 1,560 | ||||||||||||||
| United Kingdom | 4,992 | 390 | 5,418 | 2,733 | 1,900 | 1,395 | ||||||||||||||
| Portugal | 747 | 484 | 1,295 | 793 | 775 | 534 | ||||||||||||||
| Poland | 1,976 | 528 | 2,474 | 1,782 | 789 | 364 | ||||||||||||||
| Other | 312 | 273 | 609 | (38) | (61) | (42) | ||||||||||||||
| North America | 9,705 | 1,958 | 12,316 | 6,445 | 3,790 | 2,878 | ||||||||||||||
| US | 6,140 | 771 | 7,623 | 4,025 | 2,261 | 1,784 | ||||||||||||||
| Mexico | 3,565 | 1,140 | 4,623 | 2,547 | 1,665 | 1,213 | ||||||||||||||
| Other | 0 | 47 | 70 | (126) | (137) | (119) | ||||||||||||||
| South America | 12,979 | 4,515 | 18,025 | 11,350 | 5,764 | 3,658 | ||||||||||||||
| Brazil | 8,901 | 3,296 | 12,910 | 8,730 | 4,055 | 2,544 | ||||||||||||||
| Chile | 1,772 | 468 | 2,449 | 1,468 | 1,062 | 677 | ||||||||||||||
| Argentina | 1,778 | 542 | 1,833 | 846 | 443 | 324 | ||||||||||||||
| Other | 527 | 210 | 832 | 306 | 205 | 112 | ||||||||||||||
| Digital Consumer Bank | 4,022 | 843 | 5,269 | 2,807 | 2,237 | 1,308 | ||||||||||||||
| Corporate Centre | (652) | (19) | (1,487) | (1,858) | (2,022) | (2,049) | ||||||||||||||
| TOTAL GROUP | 38,619 | 11,790 | 52,154 | 28,251 | 15,250 | 9,605 | ||||||||||||||
| Secondary segments | ||||||||||||||||||||
| Retail Banking | 34,855 | 7,654 | 42,674 | 24,123 | 11,785 | 7,933 | ||||||||||||||
| Corporate & Investment Banking | 3,548 | 1,981 | 7,378 | 4,476 | 4,097 | 2,817 | ||||||||||||||
| Wealth Management & Insurance | 847 | 1,293 | 2,635 | 1,581 | 1,531 | 1,119 | ||||||||||||||
| PagoNxt | 22 | 881 | 953 | (71) | (141) | (215) | ||||||||||||||
| Corporate Centre | (652) | (19) | (1,487) | (1,858) | (2,022) | (2,049) | ||||||||||||||
| TOTAL GROUP | 38,619 | 11,790 | 52,154 | 28,251 | 15,250 | 9,605 | ||||||||||||||
January - December 2023 | | 25 | ||||||
| Key consolidated data Business model | Group financial information | Financial information by segment | Responsible banking Corporate governance Santander share | Appendix | ||||||||||||||||||||||
| Primary segments | ||||||||||||||||||||||||||
 | EUROPE | Underlying attributable profit | ||||||
| EUR 5,482 mn | ||||||||
Executive summary → We continue to accelerate our business transformation to achieve higher growth and a more efficient operating model which should allow us to further improve profitability and increase RoTE. → As a result of our active credit risk management, loans and advances to customers declined 6% year-on-year, mainly in mortgages. Customer deposits fell 2% affected by mortgage prepayments, however, time deposits increased strongly. Mutual funds rose 12%. → Underlying attributable profit (EUR 5,482 million) rose 44% (+45% in constant euros), with strong revenue growth, mainly from net interest income, which was able to absorb higher costs, the temporary levy on revenue earned in Spain and higher provisions in Poland due to the CHF mortgage portfolio. | ||||||||
Strategy
In 2023, we consolidated our transformation by providing more than 16 million customers with access to our common app (full migration in Poland and available in the UK), by making the shared services operating model more robust and by increasing our ambition to work together with the launch of a new digital value proposition for sole traders.
Our aim is to create a better bank in Europe, that our customers and employees will feel a close connection with and to deliver sustainable value to shareholders and society. We aim to:
•Improve our customer experience making headway with our omnichannel strategy and adding value to our customer interactions, towards our vision of becoming a digital bank with branches.
•Grow our business supported by the best Group assets and leveraging our unique position, as a result of our scale and geographical diversification.
•Increase efficiency by implementing a common operating model based on simplification, exploiting the Group's global scale through common platforms and services and becoming a more agile organization.
•Maximize business value and sustainable growth focused on capital-efficient opportunities and risk management.
Key developments by country:
•Spain: we remain focused on growing our customer base in both individuals and corporates and on increasing customer loyalty. We led the market in capturing investment funds and transactions, almost tripling the market growth in payroll and pensions. We continued to improve customer experience, evolving towards simple, digital and omnichannel processes, enabling us to provide services more efficiently.
•United Kingdom: we are focused on managing the spread between assets and liabilities, especially funding costs. Our clear strategy and prudent approach to risk enable us to continue to support our customers overcome future economic challenges.
•Portugal: we continued to execute our commercial and digital transformation strategy, focused on selective growth, service quality and profitability, which enabled us to rank second in NPS in both individuals and businesses. At the same time, loyal and digital customers increased.
•Poland: we continued to work primarily in the area of improving employee and customer experience. We also increased the digital accessibility of our products and services, and of our sales and aftersales processes. As a result, we were among the top 3 banks in the Polish market in terms of NPS and we won several awards in different categories.
| Spain | UK | Portugal | Poland | |||||||||||||||||||||||||||||||
 | Thousands | 46,293 | 15,023 | 22,481 | 2,908 | 5,877 | |||||||||||||||||||||||||||||
| Total customers | YoY change | +2% | +5% | 0% | -1% | +3% | |||||||||||||||||||||||||||||
 | Thousands | 28,538 | 8,367 | 13,864 | 1,838 | 4,465 | |||||||||||||||||||||||||||||
| Active customers | YoY change | +1% | +7% | -1% | +3% | +3% | |||||||||||||||||||||||||||||
| 26 | | January - December 2023 | ||||||
| Key consolidated data Business model | Group financial information | Financial information by segment | Responsible banking Corporate governance Santander share | Appendix | ||||||||||||||||||||||
| Primary segments | ||||||||||||||||||||||||||
As a result of these actions, we have achieved our targets for the year, including:
•Sustainable business growth, increasing customer loyalty.
•Price management and efficient balance sheet in an environment of rising interest rates.
•Strong cost discipline which led to a better efficiency ratio, despite the inflationary environment.
•Solid risk management which allowed us to keep the cost of risk under control.
•Greater shareholder value, with an RoTE of 14.5% (up from 9.3% in 2022).
In addition, this quarter we continued to work on our transformation, supporting our countries with their local processes and acting as a bridge to global functions, while continuing to make progress in the following projects:
•One Platform: build a global common technological platform for the Group, which provides a global business and operational model.
•OneApp: our common app already live in Spain, Portugal and Poland. A pilot version is available in the UK.
•OneWeb: our common web project, where the first developments have already been launched.
•Shared services: operational convergence, through the consolidation of our shared services in Europe and their expansion to other Group countries beyond the European perimeter.
•Multi-Europeans: continue growing our Multi-Europeans business, collaborating with other Group regions.
Business performance
We focused on continuing to grow our customer base, both total and active, as well as improving revenue per customer. We also continued to develop our digitalization and customer loyalty programmes to ensure sustainable future growth.
As a result of our active management of credit risk and capital allocation, loans and advances to customers declined 4% year-on-year. Excluding reverse repurchase agreements and in constant euros, they declined 6% year-on-year, across all segments, particularly in mortgages due to prepayments as customers increasingly look to reduce indebtedness given the interest rate environment.
Europe. Business performance. December 2023 | ||||||||||||||||||||||||||||||||||||||
| EUR billion and YoY % change in constant euros | ||||||||||||||||||||||||||||||||||||||
| 552 | -6% | | 725 | -1% | |||||||||||||||||||||||||||||||||
| ||
| ||
| ||
| ||
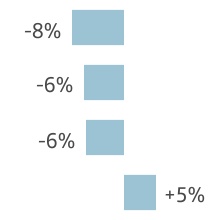
| ||
| ||
| ||
| ||
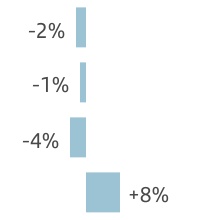
| Gross loans and advances to customers excl. reverse repos | Customer deposits excl. repos + mutual funds | |||||||||||||||||||||||||||||||||||||
Customer deposits remained flat compared to 2022. Excluding repurchase agreements and in constant euros, they fell 2%. Of note, the change in product mix, with an increase in time deposits. Also, mutual funds increased 12%, driven by the improvement in business dynamics and market recovery.
Results
Attributable profit was EUR 5,482 million, up 44% year-on-year. In constant euros profit rose 45%, as follows:
•Total income grew 19% mainly driven by net interest income which rose 27%, due to the good price and balance sheet management in a context of higher interest rates. Gains on financial transactions increased 26% driven by greater activity and growth in CIB.
•Net operating income rose 31%, driven by strict cost control keeping growth below inflation even as we continued to invest in transformation to improve efficiency in the future.
•Net loan-loss provisions increased 5% mainly driven by CHF mortgage charges in Poland, but were partially offset by the positive performance in Spain and the UK.
In the quarter, attributable profit decreased 20% in constant euros, affected by the Deposit Guarantee Fund contribution in Spain and bank levy in the UK. NII decreased as some liabilities repriced. Additionally, there were higher costs (mainly personnel) and higher provisioning, primarily for the CHF portfolio in Poland.
| Europe. Underlying income statement | ||||||||||||||||||||||||||
| EUR million and % change | ||||||||||||||||||||||||||
| / | Q3'23 | / | 2022 | |||||||||||||||||||||||
| Q4'23 | % | excl. FX | 2023 | % | excl. FX | |||||||||||||||||||||
| Revenue | 5,211 | -10 | -10 | 21,439 | +19 | +19 | ||||||||||||||||||||
| Expenses | -2,357 | +3 | +3 | -9,030 | +6 | +6 | ||||||||||||||||||||
| Net operating income | 2,854 | -18 | -18 | 12,409 | +31 | +31 | ||||||||||||||||||||
| LLPs | -582 | -12 | -12 | -2,533 | +6 | +5 | ||||||||||||||||||||
| PBT | 1,856 | -24 | -24 | 8,195 | +50 | +50 | ||||||||||||||||||||
| Attributable profit | 1,306 | -20 | -20 | 5,482 | +44 | +45 | ||||||||||||||||||||
January - December 2023 | | 27 | ||||||
| Key consolidated data Business model | Group financial information | Financial information by segment | Responsible banking Corporate governance Santander share | Appendix | ||||||||||||||||||||||
| Primary segments | ||||||||||||||||||||||||||
| Spain | Underlying attributable profit | ||||||
| EUR 2,371 mn | ||||||||
Commercial activity and business performance
2023 was marked by a complex and highly uncertain environment that accelerated the deleveraging of the economy. In this context, our priority was to remain close to our customers, reflected in 28 consecutive months of net growth in active customers.
In Retail Banking, we continued to grow in short-term funding, while demand for long-term funding decreased in the year, impacted by the environment of rising interest rates and inflation. However, in the fourth quarter, new business rebounded, mainly in corporates and mortgages. We continued to gain market share in payrolls and PoS and in CIB, we consolidated our leadership in the main league tables.
Loans and advances to customers fell 7%. In gross terms and excluding reverse repurchase agreements, they decreased 8%.
Customer deposits fell 2% year-on-year. Excluding repurchase agreements, the decrease was 4%, with a change of mix towards time deposits. In addition, we led the market in mutual funds, with 8% growth year-on-year.
Results
Attributable profit for the year totalled EUR 2,371 million, 52% higher than in 2022. By line:
•Total income was up 23% propelled by net interest income, as a result of higher interest rates and customer base growth. Net fee income decreased in asset management due to change of mix towards fixed income products and lower average volumes. Net fee income rose significantly in payments and CIB.
•Costs increased 6%, affected by inflation. However, our efficiency ratio improved 7 pp to 41.7%.
•Net loan-loss provisions decreased 6% and the NPL ratio improved 21 bps to 3.06%.
Compared to the third quarter of 2023, attributable profit decreased 28%, as lower provisions were more than offset by the Deposit Guarantee Fund contribution (EUR 247 million, EUR 173 million net of tax), lower trading income and slightly higher costs.
| Spain. Underlying income statement | ||||||||||||||||||||
| EUR million and % change | ||||||||||||||||||||
| Q4'23 | / Q3'23 | 2023 | / 2022 | |||||||||||||||||
| Revenue | 2,341 | -13 | 10,132 | +23 | ||||||||||||||||
| Expenses | -1,100 | +1 | -4,227 | +6 | ||||||||||||||||
| Net operating income | 1,241 | -22 | 5,905 | +39 | ||||||||||||||||
| LLPs | -342 | -9 | -1,522 | -6 | ||||||||||||||||
| PBT | 707 | -30 | 3,399 | +64 | ||||||||||||||||
| Attributable profit | 516 | -28 | 2,371 | +52 | ||||||||||||||||
| United Kingdom | Underlying attributable profit | ||||||
| EUR 1,545 mn | ||||||||
Commercial activity and business performance
Our transformation programme continues to deliver efficiency improvements through the simplification and digitalization of key processes. We are promoting the use of digital channels with 77% of refinanced mortgage loans processed online and 92% of new current accounts opened through digital channels. The launch of our competitive Edge Up current account and broadening of our savings proposition has demonstrated our continued commitment to providing value for individuals.
Loans and advances to customers were 2% lower year-on-year. In gross terms, excluding reverse repurchase agreements and in constant euros they decreased 6% impacted by cost-of-living pressures and higher customer rates, which resulted in lower new business volumes as we carefully manage our net interest margin.
Customer deposits grew 1%. Excluding repurchase agreements and in constant euros, both customer deposits and total customer funds decreased 1%. We saw lower balances in current accounts offset by higher in savings accounts. Mutual funds remained flat.
Results
Attributable profit was EUR 1,545 million, 11% higher than 2022. In constant euros, underlying profit grew 13%. By line:
•Total income was up 4%, driven by strong net interest income, in an environment of higher interest rates and despite greater cost of funding.
•Costs rose 4% impacted by inflation, though costs decreased in real terms. The efficiency ratio was stable below 50%.
•Loan-loss provisions decreased 20%. Cost of risk was 10 basis points, slightly better than in 2022.
Compared to the third quarter of 2023, profit decreased 29% driven by lower revenue on the back of margin pressures on margins from liabilities repricing, increased personnel costs and the bank levy, which was partially offset by lower provisions.
| United Kingdom. Underlying income statement | ||||||||||||||||||||||||||
| EUR million and % change | ||||||||||||||||||||||||||
| / | Q3'23 | / | 2022 | |||||||||||||||||||||||
| Q4'23 | % | excl. FX | 2023 | % | excl. FX | |||||||||||||||||||||
| Revenue | 1,280 | -14 | -13 | 5,525 | +2 | +4 | ||||||||||||||||||||
| Expenses | -698 | +2 | +3 | -2,745 | +2 | +4 | ||||||||||||||||||||
| Net operating income | 581 | -28 | -27 | 2,779 | +2 | +4 | ||||||||||||||||||||
| LLPs | -18 | -86 | -86 | -247 | -22 | -20 | ||||||||||||||||||||
| PBT | 396 | -32 | -32 | 2,107 | +11 | +13 | ||||||||||||||||||||
| Attributable profit | 301 | -29 | -29 | 1,545 | +11 | +13 | ||||||||||||||||||||
| 28 | | January - December 2023 | ||||||
| Key consolidated data Business model | Group financial information | Financial information by segment | Responsible banking Corporate governance Santander share | Appendix | ||||||||||||||||||||||
| Primary segments | ||||||||||||||||||||||||||
| Portugal | Underlying attributable profit | ||||||
| EUR 896 mn | ||||||||
Commercial activity and business performance
We executed our growth strategy supported by commercial and digital transformation processes, focused on improving service quality and profitability based on selective growth and greater customer loyalty.
Higher interest rates have caused households and corporates to deleverage, which influenced both new business and the stock of mortgages as a large number of prepayments were made at the beginning of the year. As a result, loans and advances to customers fell 6% year-on-year, both in net terms and in gross terms excluding reverse repurchase agreements.
Customer deposits (with and without repurchase agreements) fell 6%, as customers took advantage of their liquidity to prepay their loans. Mutual funds continued to perform positively, up 17% year-on-year, supported by our growth strategy in higher value-added segments.
Results
Attributable profit reached EUR 896 million, 68% higher than in 2022:
•Total income increased 53%, reflecting recovery in net interest income (+96%) supported by higher interest rates and good liability cost management. Net fee income fell slightly, impacted by lower volumes and regulatory changes affecting certain mortgage-related transactions.
•Costs rose 8%, affected by inflation. However, the efficiency ratio improved 11 pp to 27.3%.
•Net loan-loss provisions rose from the low levels registered in 2022, bringing cost of risk to 20 bps. Credit quality remained solid as the NPL ratio fell 39 bps to 2.59%.
Compared to the previous quarter, profit was 3% up supported by the continued increase of NII and lower provisions.
| Portugal. Underlying income statement | ||||||||||||||||||||
| EUR million and % change | ||||||||||||||||||||
| Q4'23 | / Q3'23 | 2023 | / 2022 | |||||||||||||||||
| Revenue | 584 | +2 | 1,982 | +53 | ||||||||||||||||
| Expenses | -141 | +3 | -542 | +8 | ||||||||||||||||
| Net operating income | 443 | +1 | 1,440 | +82 | ||||||||||||||||
| LLPs | -18 | -26 | -77 | +354 | ||||||||||||||||
| PBT | 423 | +4 | 1,314 | +69 | ||||||||||||||||
| Attributable profit | 292 | +3 | 896 | +68 | ||||||||||||||||
| Poland | Underlying attributable profit | ||||||
| EUR 674 mn | ||||||||
Commercial activity and business performance
In 2023, we advanced significantly with our strategy. We improved service quality and regained our top 3 NPS position. We accelerated our digitalization programme, implementing our new mobile application, as we successfully migrated our customers to OneApp and simplified several processes and products.
Loans and advances to customers were 14% up in the year. In gross terms, excluding reverse repurchase agreements and in constant euros, especially, they grew 5%. We saw growth in all our products, but especially in the corporate segment, with double-digit growth in CIB. Lending to individuals increased in both mortgages and consumer.
Customer deposits increased 13%, +5% excluding repurchase agreements and in constant euros, with strong growth in time deposits. Mutual funds increased by 48%, gaining market share, based on improved customer satisfaction.
Results
Attributable profit was EUR 674 million, up 85% year-on-year. In constant euros, it grew 80% as follows:
•Total revenue was 25% higher driven by NII on the back of higher average interest rates and strict control of the cost of funding. Net fee income also performed well.
•Costs increased 21%, mainly driven by a tight labour market as well as some lagged effects from high inflation in 2022. The efficiency ratio improved to 27.1%.
•Loan-loss provisions grew 48%, reflecting the increased coverage of the CHF mortgage portfolio and higher volumes.
Profit compared to the previous quarter decreased 32% in constant euros, impacted by asset repricing following interest rate reductions, higher personnel costs and greater provisions to increase CHF portfolio coverage.
| Poland. Underlying income statement | ||||||||||||||||||||||||||
| EUR million and % change | ||||||||||||||||||||||||||
| / | Q3'23 | / | 2022 | |||||||||||||||||||||||
| Q4'23 | % | excl. FX | 2023 | % | excl. FX | |||||||||||||||||||||
| Revenue | 838 | 0 | -1 | 3,182 | +29 | +25 | ||||||||||||||||||||
| Expenses | -240 | +11 | +9 | -862 | +25 | +21 | ||||||||||||||||||||
| Net operating income | 598 | -3 | -5 | 2,320 | +30 | +26 | ||||||||||||||||||||
| LLPs | -199 | +51 | +50 | -674 | +53 | +48 | ||||||||||||||||||||
| PBT | 310 | -27 | -29 | 1,392 | +76 | +71 | ||||||||||||||||||||
| Attributable profit | 145 | -30 | -32 | 674 | +85 | +80 | ||||||||||||||||||||
January - December 2023 | | 29 | ||||||
| Key consolidated data Business model | Group financial information | Financial information by segment | Responsible banking Corporate governance Santander share | Appendix | ||||||||||||||||||||||
| Primary segments | ||||||||||||||||||||||||||
 | NORTH AMERICA | Underlying attributable profit | ||||||
| EUR 2,354 mn | ||||||||
Executive summary → We are leveraging the strength of our global businesses to accelerate our transformation in the US and Mexico while refining our tailored service and product suite for a better customer experience. → Loans and advances to customers increased 3% year-on-year in constant euros driven by growth in both the US and Mexico. Customer funds rose 3% in constant euros, boosted by higher time deposits. → Underlying attributable profit in 2023 reached EUR 2,354 million, down 18% year-on-year (-20% in constant euros) mainly due to LLP normalization in the US, which more than offset the good performance in Mexico. | ||||||||
Strategy
We continued to pursue business transformation across the US and Mexico leveraging our global and regional scale. We:
•Accelerated the transformation of our Retail Banking and Consumer businesses in both countries, by simplifying our product portfolio, streamlining our operations and adopting global technology platforms to deliver an excellent digital experience.
•Continued to develop our profitable CIB and Wealth Management & Insurance businesses, with targeted investments to further complete our global businesses capabilities and strengthen growth levers.
•Strengthened our regional operating model in Technology & Operations to consolidate know-how, digitalization, digital hubs, front- and back-office automation driving more effective and efficient operations.
In line with our focus on profitable growth, in Q4 2023 the Federal Deposit Insurance Corporation (FDIC) selected Santander US to partner in a joint venture that will manage USD 9 billion of Signature Bank’s Multifamily portfolio. We acquired a 20% equity stake and will service 100% of the assets.
Additionally, in the year, Santander US distributed dividends totalling USD 3 billion.
In line with our global responsible banking agenda and public commitments, in 2023 we:
•launched our Community Plan, a USD 13.6 billion, three-year commitment in the US including commitments for community development lending and investments, small businesses, sustainable finance, philanthropy and supplier diversity.
•executed a USD 250 million asset-based revolving credit facility on behalf of Wind Turbine & Energy Cables Corp in the US.
•announced our initiative in Mexico with Mastercard to replace all our debit cards and LikeU credit cards with sustainable, accessible models.
•through Tuiio, Santander México’s financial inclusion initiative, signed several important agreements to provide basic financial education for inmates and access to financial services and education to women, native groups and artisans.
•partnered with the International Finance Corporation (IFC) to promote sustainable construction practices in Mexico and launched a first-of-its-kind Green Mortgage in Mexico for buildings with sustainable construction certifications.
In terms of local priorities:
United States
Our model, focused on four core segments (Consumer, Commercial, CIB and Wealth Management), reflects the prioritization of businesses that benefit from the Group’s connectivity, or competitive advantages that allow us to achieve the scale necessary to ensure attractive returns. Our transformation was anchored on three key pillars:
•Simplification: rationalize businesses and products with limited scale and profitability and exit non-core portfolios. For example, in 2023 we reduced retail products on offer by 52%.
| United States | Mexico | |||||||||||||||||||||
| Thousands | 25,027 | 4,510 | 20,517 | |||||||||||||||||||
| Total customers | YoY change | 0% | 0% | +1% | |||||||||||||||||||
| Thousands | 14,486 | 4,223 | 10,263 | |||||||||||||||||||
| Active customers | YoY change | +3% | +2% | +6% | |||||||||||||||||||
| 30 | | January - December 2023 | ||||||
| Key consolidated data Business model | Group financial information | Financial information by segment | Responsible banking Corporate governance Santander share | Appendix | ||||||||||||||||||||||
| Primary segments | ||||||||||||||||||||||||||
•Transformation and Network contributions: leverage Group digital and data capabilities to advance in our journey to becoming a 'digital bank with branches' in the US, drive scalability and lower cost to serve.
•Profitable growth: drive growth across target businesses while maintaining disciplined capital management.
In Consumer, we expanded our partnership with Mitsubishi and signed new preferred auto lending relationships with INEOS and Lotus, among others.
In Commercial, we consolidated our position as a top 10 multifamily real estate bank lender in the US market, boosted by the aforementioned joint venture with the FDIC.
In CIB, we continued to build up our business with the development of additional capabilities including significantly enhanced infrastructure, products and services.
In Wealth Management, assets under management and revenue continue to rise, supported by strong commercial activity and the higher rate environment.
Mexico
In 2023, we launched a transformation plan with the aim to become the best bank in terms of customer experience, double our revenue and triple profit in the coming years, focused on:
•Customer acquisition: During the year we significantly improved our app to offer the best customer experience by incorporating several new functionalities. Active customers grew 6% year-on-year.
•Simplification and automation: We began to implement our new branch model, opening the first multi-segment branch that enhances synergies. We also opened our fourth Work Café.
•Continuous innovation: We created 100% digital card offerings (LikeU and Samsung cards) and launched new features in Cashback, exclusive pre-sales with high profile artists and our Unique Rewards loyalty programme. In auto, we increased personalized attention and sped up formalization times.
•Enhanced digital offerings: We continued to promote early customer engagement through digital payroll loans and faster processes. All mortgage products, launches and offers are now digitally processed. We launched Cuenta Digital Lite, a digital checking account that can be opened in five minutes.
North America. Business performance. December 2023 | ||||||||||||||||||||||||||||||||||||||
| EUR billion and YoY % change in constant euros | ||||||||||||||||||||||||||||||||||||||
| 161 | +3% | | 171 | +3% | |||||||||||||||||||||||||||||||||
| ||
| ||
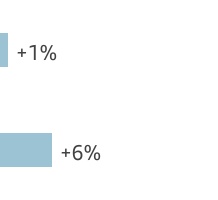
| ||
| ||
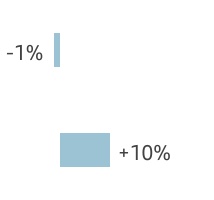
| Gross loans and advances to customers excl. reverse repos | Customer deposits excl. repos + mutual funds | |||||||||||||||||||||||||||||||||||||
Business performance
Loans and advances to customers rose 2% year-on-year. In gross terms, excluding reverse repurchase agreements and in constant euros, they were 3% higher driven by mortgages, credit cards, auto and payroll loans in Mexico and by Corporate & Investment Banking and Multifamily in the US.
Customer deposits grew 4% compared to 2022. Excluding repurchase agreements and in constant euros, they also rose 4% driven by flows into time deposits that were incentivized by competitive interest rates, to attract new customers and volumes and foster customer loyalty.
Mutual funds were flat in constant euros, as growth in Mexico was offset by a decline in the US.
Results
Attributable profit in 2023 was EUR 2,354 million, a fall of 18% year-on-year. In constant euros, profit declined 20%, by line:
•Total income increased 5% year-on-year. Net interest income growth (+3%) was mainly driven by Mexico, supported by the higher interest rate environment and greater loan volumes. Net fee income rose 7% driven mainly by credit cards and insurance in Mexico and CIB in the US. Gains on financial transactions more than doubled, driven by excellent results in CIB in both countries.
Other operating income declined due to leasing in the US where there was an increased proportion of vehicle repurchases at dealerships and growth in electric vehicles leases which obtain a fiscal benefit (recorded upfront in the tax line) that was partially passed through to customer rates.
•Costs were 8% higher impacted by inflation and investments in technology, digitalization and transformation initiatives.
•Net loan-loss provisions rose 45% reflecting the normalization in retail portfolios in both countries, performing in line with expectations at the beginning of the year.
Compared to Q3 2023, attributable profit declined 18% as gains in net interest income slowed and were not enough to offset lower gains on financial transactions (high in Q3), a new one-off FDIC charge, higher LLPs (seasonality in the US) and rising costs.
| North America. Underlying income statement | ||||||||||||||||||||||||||
| EUR million and % change | ||||||||||||||||||||||||||
| / | Q3'23 | / | 2022 | |||||||||||||||||||||||
| Q4'23 | % | excl. FX | 2023 | % | excl. FX | |||||||||||||||||||||
| Revenue | 3,366 | -1 | -1 | 13,174 | +7 | +5 | ||||||||||||||||||||
| Expenses | -1,758 | +7 | +7 | -6,465 | +10 | +8 | ||||||||||||||||||||
| Net operating income | 1,608 | -8 | -8 | 6,708 | +4 | +2 | ||||||||||||||||||||
| LLPs | -1,126 | +4 | +4 | -3,733 | +47 | +45 | ||||||||||||||||||||
| PBT | 469 | -25 | -25 | 2,837 | -25 | -27 | ||||||||||||||||||||
| Attributable profit | 454 | -18 | -18 | 2,354 | -18 | -20 | ||||||||||||||||||||
January - December 2023 | | 31 | ||||||
| Key consolidated data Business model | Group financial information | Financial information by segment | Responsible banking Corporate governance Santander share | Appendix | ||||||||||||||||||||||
| Primary segments | ||||||||||||||||||||||||||
| United States | Underlying attributable profit | ||||||
| EUR 932 mn | ||||||||
Commercial activity and business performance
We progressed with our initiative to increase the percentage of our auto portfolio funded with retail deposits. We also signed new preferred auto lending relationships which support our strategy to forge deep, multi-geographic relationships with OEMs while catering to customers across the credit spectrum.
Loans and advances to customers were 3% lower than in December 2022. In gross terms, excluding reverse repos and in constant euros, they were 1% up year-on-year driven by CIB and Multifamily.
Customer deposits fell 2% year-on-year. Excluding repos and in constant euros, they grew 1%. Our retail deposit base at SBNA remained stable year-on-year where we continue to have a high percentage of more stable FDIC insured deposits (c.66%). Mutual funds declined 12% as Wealth Management customers moved funds into higher yielding investment portfolios.
Results
Attributable profit in the year was EUR 932 million, a 48% decline year-on-year. In constant euros, profit fell 46%:
•Total income decreased 3%. Higher funding costs drove down net interest income (partially mitigated by loan growth and disciplined pricing actions) and leasing income declined due to higher dealer repurchases and increased electric vehicle mix. Also, there was a one-time special assessment impacting all FDIC insured banks.
On the other hand, both net fee income and gains on financial transactions performed well, supported by higher activity in CIB and the APS acquisition.
•Costs were 5% higher as investments to build-up our CIB franchise and in Wealth Management were partially offset by savings from transformation initiatives.
•Net loan-loss provisions continued to normalize in line with expectations. However, late-stage delinquency payments remain favourable and the cost of risk remains below 2%.
•Tax on profit was positive in the year due to tax incentives relating to electric vehicle leasing.
In the fourth quarter, attributable profit fell 67% mainly impacted by the FDIC charge and seasonality in provisions.
| United States. Underlying income statement | ||||||||||||||||||||||||||
| EUR million and % change | ||||||||||||||||||||||||||
| / | Q3'23 | / | 2022 | |||||||||||||||||||||||
| Q4'23 | % | excl. FX | 2023 | % | excl. FX | |||||||||||||||||||||
| Revenue | 1,767 | -3 | -4 | 7,209 | -5 | -3 | ||||||||||||||||||||
| Expenses | -964 | +5 | +4 | -3,679 | +2 | +5 | ||||||||||||||||||||
| Net operating income | 802 | -11 | -12 | 3,531 | -12 | -10 | ||||||||||||||||||||
| LLPs | -824 | +8 | +7 | -2,593 | +49 | +53 | ||||||||||||||||||||
| PBT | -18 | — | — | 863 | -62 | -61 | ||||||||||||||||||||
| Attributable profit | 67 | -66 | -67 | 932 | -48 | -46 | ||||||||||||||||||||
| Mexico | Underlying attributable profit | ||||||
| EUR 1,560 mn | ||||||||
Commercial activity and business performance
In individuals, we maintained a solid performance with double-digit growth year-on-year. We increased our market share in payroll loans (+61 bps) while we consolidated our third position in credit cards and auto (14% and 17% market shares, respectively).
Loans and advances to customers increased 17% year-on-year. In gross terms, excluding reverse repos and in constant euros, loans rose 6% driven by loans to individuals (mortgages +7%, credit cards +18% and consumer +14%). In corporates, loans increased 7% along with a 2% increase in SMEs. CIB loans fell 18%, in line with our profitability focus and risk appetite.
Customer deposits grew 21% year-on-year. Excluding repos and in constant euros, they rose 10% driven by time deposit growth (+24%) on the back of successful customer acquisition campaigns. Mutual funds increased 10% following a decline in Q4 2022 when funds were channelled into time deposits.
Results
Attributable profit in 2023 was EUR 1,560 million, 29% higher year-on-year. In constant euros, it increased 17%. By line:
•Total income rose 16%, boosted by net interest income (+12%), supported by the expansion of the retail business and interest rates, net fee income (+9%) and higher gains on financial transactions.
•Costs increased 13%, reflecting investments in technology and digitalization related to our transformation plan and talent attraction and retention. However, the efficiency ratio improved by 104 bps to 43.9%.
•Net loan-loss provisions were up 31%, due to the normalization of provisions and solid growth in loans to individuals. Asset quality remains healthy and with manageable credit risk.
Compared to the previous quarter, attributable profit was flat as 3% growth in revenue and a 2% improvement in LLPs were offset by rising costs reflecting personnel costs and technology expenses to support our transformation strategy.
| Mexico. Underlying income statement | ||||||||||||||||||||||||||
| EUR million and % change | ||||||||||||||||||||||||||
| / | Q3'23 | / | 2022 | |||||||||||||||||||||||
| Q4'23 | % | excl. FX | 2023 | % | excl. FX | |||||||||||||||||||||
| Revenue | 1,581 | +2 | +3 | 5,899 | +28 | +16 | ||||||||||||||||||||
| Expenses | -743 | +9 | +11 | -2,588 | +25 | +13 | ||||||||||||||||||||
| Net operating income | 838 | -4 | -3 | 3,311 | +30 | +18 | ||||||||||||||||||||
| LLPs | -301 | -3 | -2 | -1,135 | +44 | +31 | ||||||||||||||||||||
| PBT | 525 | -4 | -2 | 2,119 | +27 | +15 | ||||||||||||||||||||
| Attributable profit | 397 | -1 | 0 | 1,560 | +29 | +17 | ||||||||||||||||||||
| 32 | | January - December 2023 | ||||||
| Key consolidated data Business model | Group financial information | Financial information by segment | Responsible banking Corporate governance Santander share | Appendix | ||||||||||||||||||||||
| Primary segments | ||||||||||||||||||||||||||
 | SOUTH AMERICA | Underlying attributable profit | ||||||
| EUR 3,038 mn | ||||||||
Executive summary → We are focused on increasing the value we bring to the Group and moving forward to become the most profitable bank in each of our countries across the region while promoting synergies in our global and regional businesses. → We have a solid customer base (73 million), increased 3.5 million year-on-year backed by higher transactionality, while strengthening our risk model. → Year-on-year growth in both gross loans and advances to customers and customer deposits, while we seek to become the leading bank in inclusive and sustainable businesses through differential value propositions. → Attributable profit in 2023 decreased 17% year-on-year (-11% in constant euros) to EUR 3,038 million due to the increase in costs and LLPs. | ||||||||
Strategy
We remained focused on accelerating our global business growth:
•In consumer finance, we strengthened our leadership position, reinforcing partnerships with OEMs and developing new agreements by leveraging existing ones globally. In Peru, for example, we signed nine agreements with new manufacturers. In Uruguay, we launched the Mi Auto offer, which enabled us to nearly triple the number of vehicles financed. We continued to develop models in the region that speed up the approval of transactions, in addition to improving user experience.
•In payment methods, we aim to increase our market share through One Trade and Getnet, which continued to grow. In Argentina, we expanded our offering, focusing on e-commerce and Host-to-Host solutions for large merchants. We also increased our trade finance activity through new international solutions, such as the expansion of Ebury's services in Brazil. In addition, we are building a unique global platform, already launched in Brazil.
•In CIB and corporates, we continued to work on the development and implementation of joint initiatives to deepen relationships with multinational clients. Our goal is to become the leading wholesale banking operator in most countries and products. To consolidate the offering in all regions, we are launching a regional Markets hub. For corporates, we are reinforcing the differential value offering through Multi-Latins.
•In ESG, we developed business plans in such relevant sectors as agro, green energy or electromobility. We continued to support our microcredit business, through our Prospera and Surgir programmes, with 50% portfolio growth year-on-year. This business already provides service to more than 1.2 million customers throughout the region.
The main initiatives by country were:
In Brazil, we are focused on:
•Growing our strategic businesses, to diversify portfolios, improve our service quality and increase profitability. In WM&I, we continued our retail investment plan. In Private Banking, we achieved a record year in results and we are redesigning our service model in SMEs, to continue to growth. In CIB, we remained leaders in trade finance and performed well in other products such as cards, auto, agro and payrolls.
•Continuing to foster a technological culture to drive growth and generate operational efficiencies. Our technology teams are integrated within the business and we have a digital system that allows data flows and processing to improve customer experience.
•Maintaining our customer focus strategy, to become our customers' main bank, which has allowed us to improve customer satisfaction in our channels and increase loyalty. In Select, we surpassed our 1 million customer goal, reaching 1.2 million (+51% year-on-year).
 | Brazil | Chile | Argentina | Other South America | |||||||||||||||||||||||||||||||
| Thousands | 73,028 | 62,804 | 4,052 | 4,771 | 1,400 | |||||||||||||||||||||||||||||
| Total customers | YoY change | +5% | +4% | +13% | +9% | -5% | |||||||||||||||||||||||||||||
| Thousands | 37,517 | 30,460 | 2,399 | 3,562 | 1,096 | |||||||||||||||||||||||||||||
| Active customers | YoY change | -2% | -4% | +9% | +11% | -5% | |||||||||||||||||||||||||||||
January - December 2023 | | 33 | ||||||
| Key consolidated data Business model | Group financial information | Financial information by segment | Responsible banking Corporate governance Santander share | Appendix | ||||||||||||||||||||||
| Primary segments | ||||||||||||||||||||||||||
Chile: we remained focused on becoming a digital bank with branches. In payment methods, we continued developing e-commerce and the domestic and international transfer business. In corporates, we developed our offer of comprehensive financing, cash management and treasury solutions for our customers. We advanced in the initiatives launched this year, (e.g. Más Lucas, strengthening the use of our new branch format, WorkCafé Expresso, etc) and developing the new service model for specialized businesses, which focuses on the agricultural, auto and Multi-Latin businesses.
Argentina: we are the leading privately-owned bank in banking business, payment methods, transactional services and foreign trade. We acquired BNP Paribas`s Asset Management business in the country. Getnet ranked third in terms of market share in the acquiring segment. Additionally, we acquired an unregulated consumer finance company.
Uruguay: we consolidated our position as the country's leading privately-owned bank, with a business model that allows us to continue growing our customer base and expanding our loan portfolio. We continued to improve digitalization, offering more products online, reinforcing the SOY Santander offer for individuals and Getnet for corporates, to achieve greater customer loyalty. We continued to make progress in initiatives launched this year, such as Mi Auto and F1RST.
Peru: In CIB, we have ranked among the top three investment banks in the country for the last three years. We maintained our leadership in auto financing through our digital platform NeoAuto and we stand out as the main financial inclusion entity, through our microfinance business Surgir, supporting more than 100,000 entrepreneurs since 2021 (95% women).
Colombia: we continued offering sustainable and inclusive financial solutions, notably in Global Debt Financing in CIB, where we maintained our participation in the most relevant transactions for the country's development, with joint CIB and Corporate offerings, and we also strengthened the Multi-Latin business.
South America. Business performance. December 2023 | ||||||||||||||||||||||||||||||||||||||
| EUR billion and YoY % change in constant euros | ||||||||||||||||||||||||||||||||||||||
| 161 | +7% | | 206 | +17% | |||||||||||||||||||||||||||||||||
| ||
| ||
| ||
 | ||
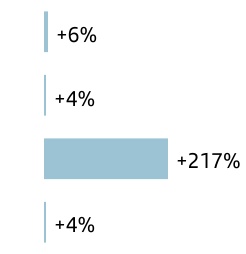
| ||
| ||
| ||
| ||
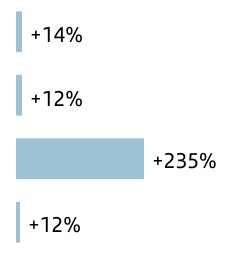
| Gross loans and advances to customers excl. reverse repos | Customer deposits excl. repos + mutual funds | |||||||||||||||||||||||||||||||||||||
Business performance
Loans and advances to customers climbed 6% year-on-year. Excluding reverse repurchase agreements and in constant euros, gross loans were 7% higher, with increases in all countries, except Colombia.
Customer deposits rose 13% year-on-year. Excluding repurchase agreements and in constant euros, they rose 15%, backed by time deposits (+18% year-on-year). Mutual funds were up 21% (in constant euros).
Results
Attributable profit in 2023 was EUR 3,038 million, 17% less than in 2022. In constant euros, profit declined 11% as follows:
•Total income rose 8% due to the good performance in net interest income (+12%), net fee income (+14%) and gains on financial transactions (+14%). This growth more than offset the negative operating income results, affected by the hyperinflation adjustment in Argentina.
•Costs increased 17%, heavily impacted by inflation. In real terms, they fell 3% due to cost management efforts.
•Net loan-loss provisions rose by 9%, largely explained by lending growth. Cost of risk was practically unchanged at 3.36% (3.32% in December 2022).
By country, of note was the strong attributable profit growth in Argentina, Uruguay, Peru and Colombia, which were not able to fully offset the decreases in Brazil and Chile, which were affected by weak revenue in both countries, mainly due to the impact on NII in the first half of the year, caused by negative sensitivity to interest rate rises, and due to higher costs and provisions in Brazil. This impact was partly mitigated by the good performance of net fee income in both countries and higher gains on financial transactions and lower LLPs in Chile.
In the quarter, underlying profit increased 18% in constant euros driven by the good performance in NII (strong growth in Brazil and Chile driven by interest rates cuts), net fee income and lower tax burden.
| South America. Underlying income statement | ||||||||||||||||||||||||||
| EUR million and % change | ||||||||||||||||||||||||||
| / | Q3'23 | / | 2022 | |||||||||||||||||||||||
| Q4'23 | % | excl. FX | 2023 | % | excl. FX | |||||||||||||||||||||
| Revenue | 4,329 | -6 | +21 | 17,971 | 0 | +8 | ||||||||||||||||||||
| Expenses | -1,589 | -12 | +22 | -6,920 | +4 | +17 | ||||||||||||||||||||
| Net operating income | 2,741 | -2 | +20 | 11,050 | -3 | +3 | ||||||||||||||||||||
| LLPs | -1,560 | +20 | +29 | -5,401 | +7 | +9 | ||||||||||||||||||||
| PBT | 942 | -27 | +7 | 4,608 | -20 | -15 | ||||||||||||||||||||
| Attributable profit | 709 | -19 | +18 | 3,038 | -17 | -11 | ||||||||||||||||||||
| 34 | | January - December 2023 | ||||||
| Key consolidated data Business model | Group financial information | Financial information by segment | Responsible banking Corporate governance Santander share | Appendix | ||||||||||||||||||||||
| Primary segments | ||||||||||||||||||||||||||
| Brazil | Underlying attributable profit | ||||||
| EUR 1,921 mn | ||||||||
Commercial activity and business performance
We continued to expand our strategic businesses:
•In WM&I, we make further progress in our investment expansion plan, with a particular focus on retail, which grew significantly, and we expanded the number of AAA advisors (Associate Allocation Advisor). In CIB, we continued to be leaders in trade finance and we are the largest bank in foreign exchange management and the second largest commodities desk in Brazil.
•In Auto, we maintained our leadership in the individuals market and continued strengthening our strategic alliances. In Cards, we reached BRL 238 billion in turnover, with increased card issuances in the second half of the year, remaining within our risk limits. We also continued to significantly increase our Agro portfolio.
Loans and advances to customers rose 12% year-on-year. Gross loans and advances to customers, excluding reverse repos and in constant euros grew 6%, due to individuals, SMEs and corporates.
Customer deposits increased 22% year-on-year. Excluding the exchange rate impact and repos, they were up 13% driven by time deposits (+16%). Mutual funds decreased 15% in constant euros and as a result, customer funds rose 14% in constant euros.
Results
Attributable profit amounted to EUR 1,921 million in 2023, 25% lower year-on-year. In constant euros, profit also decreased 25%, as follows:
•Total income increased by 1%, driven by the good performance of net fee income (+5%) and the recovery of net interest income (+2%), which, in the first half of the year, had been affected by the negative sensitivity to interest rates rises. In the second half of the year, net interest income grew due to higher volumes and lower interest rates. This good performance in customer revenue offset the drop in gains on financial transactions due to lower market activity.
•Costs increased 8% (+3% in real terms), impacted by salary agreements, expenses related to higher business growth and technology investments. The efficiency ratio was 34.6%.
•Net loan-loss provisions increased 6%, in line with loan portfolio growth. The LLPs for both 2022 and 2023 include additional provisions for one-off cases in the CIB portfolio. The cost of risk was 4.77%, slightly below that of December 2022 (4.79%).
In the quarter, total income increased by 5% in constant euros, driven by the good performance in net interest income (+8% due to higher volumes and lower interest rates), which led to a 5% increase in net operating income. However, this is not reflected in attributable profit (-18%), due to higher provisions, impacted by one-off cases in the CIB portfolio.
| Brazil. Underlying income statement | ||||||||||||||||||||||||||
| EUR million and % change | ||||||||||||||||||||||||||
| / | Q3'23 | / | 2022 | |||||||||||||||||||||||
| Q4'23 | % | excl. FX | 2023 | % | excl. FX | |||||||||||||||||||||
| Revenue | 3,487 | +5 | +5 | 13,104 | +1 | +1 | ||||||||||||||||||||
| Expenses | -1,184 | +4 | +4 | -4,529 | +8 | +8 | ||||||||||||||||||||
| Net operating income | 2,303 | +5 | +5 | 8,574 | -2 | -2 | ||||||||||||||||||||
| LLPs | -1,417 | +26 | +27 | -4,701 | +6 | +6 | ||||||||||||||||||||
| PBT | 648 | -24 | -24 | 2,911 | -28 | -29 | ||||||||||||||||||||
| Attributable profit | 494 | -18 | -18 | 1,921 | -25 | -25 | ||||||||||||||||||||
| Chile | Underlying attributable profit | ||||||
| EUR 582 mn | ||||||||
Commercial activity and business performance
We continued improving the bank's digitalization and customer service, which has allowed us to maintain our first position in NPS. The following initiatives stand out:
•We continue strengthening our position in the mass segment, with products such as Life and Más Lucas, a no-cost, interest-bearing demand account.
•In payments, we continued Getnet´s expansion and launched a new way of making international transfers, including nine more countries in Europe. In corporates, we launched a new specialized commercial service model in the corporate and institutional segment, with a special focus on agricultural, auto and Multi-Latin companies.
Loans and advances to customers decreased 2% year-on-year. Excluding reverse repurchase agreements and in constant euros, gross loans and advances to customers rose 4% driven by individuals (+7%), consumer (+6%) and CIB (+6%), which more than offset the fall in corporates.
Customer deposits increased 2% year-on-year. Excluding repurchase agreements and in constant euros they rose 8%, underpinned by time deposits (+23%), which more than offset the decreases in demand deposits (-5%). Mutual funds grew 25% in constant euros. Total customer funds increased 12% in constant euros.
Results
Attributable profit in 2023 was EUR 582 million, 14% lower year-on-year. In constant euros, profit fell 15%, as follows:
•Total income fell 8% driven by the drop in net interest income (-23%) linked to the negative sensitivity to interest rate rises. This decline was partially offset by the excellent performance of net fee income, which grew 21% (especially payments and insurance) and gains on financial transactions (+31%).
•Costs rose 3%, well below average inflation (-5% in real terms) and the efficiency ratio was 44.6%.
•Net loan-loss provisions decreased 9% and cost of risk was just 0.80% (improving 13 bps year-on-year). The NPL ratio remained flat (5.01%).
In the quarter, profit rose 89% in constant euros, driven by the recovery in net interest income (due to higher inflation and lower interest rates in the quarter) and the decrease in provisions.
| Chile. Underlying income statement | ||||||||||||||||||||||||||
| EUR million and % change | ||||||||||||||||||||||||||
| / | Q3'23 | / | 2022 | |||||||||||||||||||||||
| Q4'23 | % | excl. FX | 2023 | % | excl. FX | |||||||||||||||||||||
| Revenue | 591 | +27 | +30 | 2,285 | -7 | -8 | ||||||||||||||||||||
| Expenses | -249 | -1 | +3 | -1,020 | +4 | +3 | ||||||||||||||||||||
| Net operating income | 343 | +60 | +61 | 1,265 | -14 | -15 | ||||||||||||||||||||
| LLPs | -78 | -7 | -3 | -365 | -8 | -9 | ||||||||||||||||||||
| PBT | 281 | +101 | +99 | 951 | -10 | -11 | ||||||||||||||||||||
| Attributable profit | 165 | +90 | +89 | 582 | -14 | -15 | ||||||||||||||||||||
January - December 2023 | | 35 | ||||||
| Key consolidated data Business model | Group financial information | Financial information by segment | Responsible banking Corporate governance Santander share | Appendix | ||||||||||||||||||||||
| Primary segments | ||||||||||||||||||||||||||
| Argentina | Underlying attributable profit | ||||||
| EUR 386 mn | ||||||||
Commercial activity and business performance
During the quarter, we focused on increasing the country's contribution to the Group, mainly through global businesses. We continued to improve customer experience and our value offering, which allowed us to maintain the top spot in NPS for individuals.
In the quarter, we acquired BNP Paribas`s Asset Management business in Argentina, consolidating our leadership position in the market. Additionally, we acquired an unregulated consumer finance company, with more than 30 points of sale in the Buenos Aires metropolitan area.
Loans and advances to customers decreased 33% year-on-year. Excluding reverse repurchase agreements and in constant euros, gross loans and advances to customers were 217% higher driven by SMEs, corporates and individuals.
Customer deposits decreased 39% year-on-year. Excluding repurchase agreements and in constant euros, deposits grew 190%, mainly driven by demand deposits, and mutual funds rose 355%. Customer funds rose 235% in constant euros.
In the fourth quarter, results and changes in current euros were strongly impacted by the devaluation of the peso in December. Also, growth in volumes and results in constant euros were strongly impacted by the high inflation in the country.
Results
Attributable profit was EUR 386 million in 2023, 19% higher year-on-year. In constant euros, it rose 462%:
•Total income grew 298%, well above inflation, underpinned by the good performance in net interest income, net fee income and gains on financial transactions. All of these more than offset the greater negative effect from the hyperinflation adjustment in other operating income.
•Costs increased below revenue, resulting in a 3.7pp year-on-year improvement in efficiency to 50.2% and net operating income rose 330%.
•Net loan-loss provisions rose from low levels in 2022 and cost of risk stood at 6.64%.
Compared to the previous quarter, profit increased 144% in constant euros, driven by the solid performance in the main revenue lines, which more than offset the increase in costs and provisions.
| Argentina. Underlying income statement | ||||||||||||||||||||||||||
| EUR million and % change | ||||||||||||||||||||||||||
| % | / | 2022 | ||||||||||||||||||||||||
| Q4'23 | Q3'23 | 2023 | % | excl. FX | ||||||||||||||||||||||
| Revenue | -27 | 543 | — | 1,544 | -16 | +298 | ||||||||||||||||||||
| Expenses | 6 | -260 | — | -775 | -21 | +271 | ||||||||||||||||||||
| Net operating income | -21 | 283 | — | 769 | -9 | +330 | ||||||||||||||||||||
| LLPs | -7 | -47 | -85 | -150 | +14 | +437 | ||||||||||||||||||||
| PBT | -39 | 236 | — | 505 | +14 | +438 | ||||||||||||||||||||
| Attributable profit | -20 | 154 | — | 386 | +19 | +462 | ||||||||||||||||||||
| Other South America |  |  |  | ||||||||
Uruguay
Loans and advances to customers, excluding reverse repurchase agreements and in constant euros, rose 12% year-on-year. Customer deposits in constant euros and excluding repurchase agreements rose 2% driven by time deposits.
Attributable profit in 2023 was EUR 187 million, 36% higher year-on-year. In constant euros, it increased 32% as follows:
•Total income increased 27% boosted by double-digit growth in net interest income, net fee income and gains on financial transactions.
•Costs rose, impacted by inflation, but less than revenue. The efficiency ratio stood at 38.5%, improving 4.4 pp year-on-year.
•Net loan-loss provisions increased, from the low levels recorded in 2022. Cost of risk stood at 2.70% and the NPL ratio at 2.50%.
Compared to the previous quarter, attributable profit increased 24% in constant euros, driven by higher net interest income (+20%) due to higher volumes and good liquidity management.
Peru
Gross loans and advances to customers excluding reverse repos and the exchange rate impact increased 3% year-on-year and customer deposits (excluding repos and the exchange rate) increased 36%, mainly driven by demand deposits.
Attributable profit was EUR 84 million in 2023, 14% higher year-on-year. In constant euros, profit also increased 14%, as follows:
•Total income rose 20%, boosted by the good performance in the main revenue lines. Costs rose 23%, impacted by the launch of new businesses and inflation. The efficiency ratio stood at 36.6%.
•Net loan-loss provisions increased, although the cost of risk remained low (1.15%).
Colombia
Gross loans and advances to customers (excluding reverse repos and in constant euros) decreased 5% year-on-year. Deposits (excluding repos) rose 18% in constant euros due to time and demand deposits.
Attributable profit was EUR 28 million in 2023, 5% higher year-on-year. In constant euros, profit was 10% higher:
•Total income grew 32% (driven by net fee income and gains on financial transactions) and costs rose 23% due to inflation and the development of new business lines.
•Net loan-loss provisions increased due to the growth in Auto and Prospera businesses. These portfolios rose 47% and 158% year-on-year, respectively. However, the cost of risk remained low (1.07%).
| Other South America. Underlying income statement | ||||||||||||||||||||||||||
| EUR million and % change | ||||||||||||||||||||||||||
| Net operating income | Attributable profit | |||||||||||||||||||||||||
| / | 2022 | / | 2022 | |||||||||||||||||||||||
| 2023 | % | excl. FX | 2023 | % | excl. FX | |||||||||||||||||||||
| Uruguay | 365 | +41 | +37 | 187 | +36 | +32 | ||||||||||||||||||||
| Peru | 155 | +18 | +19 | 84 | +14 | +14 | ||||||||||||||||||||
| Colombia | 67 | +37 | +43 | 28 | +5 | +10 | ||||||||||||||||||||
| 36 | | January - December 2023 | ||||||
| Key consolidated data Business model | Group financial information | Financial information by segment | Responsible banking Corporate governance Santander share | Appendix | ||||||||||||||||||||||
| Primary segments | ||||||||||||||||||||||||||
 | DIGITAL CONSUMER BANK | Underlying attributable profit | ||||||
| EUR 1,199 mn | ||||||||
Executive summary → New lending rose 3% YoY in constant euros (+6% in auto), in an environment which remains complex and tends to reduce consumption. Deposits grew 19% YoY, compensating part of the negative sensitivity to interest rate rises. → Continue reinforcing our auto leadership through strategic alliances, leasing (+15% active contracts year-on-year) and subscription. In non-auto, we continue to upscale our buy now, pay later (BNPL) business. → Underlying attributable profit amounted to EUR 1,199 million, an 8% fall year-on-year (-7% in constant euros) due to the impact of higher interest rates on NII, cost of risk normalization, temporary bank levy on revenue earned in Spain and CHF provisions in Poland. → In this context, we prioritized profitability over volumes in new business, and focused on increasing customer deposits, improving operating efficiency and keeping cost of risk under control. | ||||||||
Strategy
Digital Consumer Bank (DCB) is the leading consumer finance bank in Europe in scale and profitability as it leverages Santander Consumer Finance's (SCF) auto and non-auto consumer finance footprint in Europe and Openbank’s technology stack.
SCF is Europe's consumer finance leader, present in 18 countries (16 in Europe plus China and Canada) and works through more than 130,000 associated points of sale. It provides its customers and partners with a value proposition to enhance their sales capabilities by financing products and developing advanced technologies to grant them a competitive edge. SCF aims to become the best-in-class auto financing and digital mobility service provider in Europe.
Openbank is Europe's largest 100% digital bank. It offers current accounts, cards, loans, mortgages, a state-of-the-art roboadvisor service and open platform brokerage. It is currently active in Spain, the Netherlands, Germany and Portugal, and working on the expansion across Europe and the Americas.
DCB’s vision is to offer competitive financing solutions to maintain our European leadership in profitability and scale in auto & consumer lending by leveraging the advantages our proprietary platforms in mobility, leasing, subscription and BNPL provide.
| Digital Consumer Bank. Loan distribution | |||||
| December 2023 | |||||
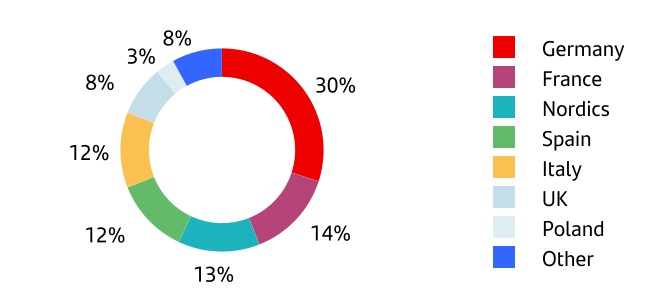
In 2023, DCB focused on accelerating transformation to drive future growth. Management's main priorities were to:
•Secure leadership positions in global digital consumer lending, both auto and non-auto (consumer).
•Continue with the transformation of our operating model in Europe, to defend our best-in-class efficiency through: i) single IT platforms, ii) a simpler operational structure, and iii) automation and processes redesign.
•Grow by progressing in transformational projects in Europe, with new OEM partnerships and leasing platform in auto and through the full transition to Zinia tech stack in consumer.
•Reduce sensitivity to interest rate rises by increasing deposit acquisition (deposits are already our primary funding source) and by actively repricing loans to offset higher funding costs. Also, promote an originate-to-distribute model to increase balance sheet mobilization and make the business more capital light.
Business performance
After a difficult environment in 2022, 2023 was also a complex year. Some of the headwinds are: i) the change of TLTRO contractual conditions, ii) rising interest rates that put pressure on consumer finance monoliners' margins, compressing them while loan books reprice, added to a time when Auto and Consumer industries are transforming towards a more sustainable businesses (from a mobility and consumption perspective), iii) provisioning for the CHF mortgage portfolio in Poland and iv) normalization from a very low cost of risk towards the average across the cycle.
In this context, we managed to increase our new lending 3% year-on-year. After a 2022 where new market registrations in Europe fell 4% vs. 2021 and -29% vs. 2019, in 2023 they grew 14% vs. 2022. Our new business volumes were up 16% in new cars but fell 5% in used cars, year-on-year, slightly below market transactions in our footprint as we prioritized profitability over volume. We are also actively repricing our new business to offset higher funding costs from rising interest rates in the year.
In 2023, we continued to expand our business reach in Europe with new products, services, platforms and by signing new agreements with retail distributors and manufacturers.
January - December 2023 | | 37 | ||||||
| Key consolidated data Business model | Group financial information | Financial information by segment | Responsible banking Corporate governance Santander share | Appendix | ||||||||||||||||||||||
| Primary segments | ||||||||||||||||||||||||||
To secure our leadership in Auto, we need to evolve our model to build a world-class digital proposition in mobility and capture today’s market growth opportunity to make our already strong franchise global. Our priorities included:
•In leasing, we continued to develop our proprietary digital leasing platform for Europe with the ambition of disrupting the market. We see it as an entire “new” business to be run, building customer loyalty through our direct relationships, providing them with innovative features throughout the value chain (key control of the asset and user: from first proposal to hand back).
•In subscription, where we are already a European leader, we continued to expand Wabi, our consumer subscription platform and Ulity, our platform for vehicle subscription-based solutions for companies.
•In mobility, we created one digital front that connects all of our partners to enhance their experience: OEMs, digital dealers and third party marketplaces.
•We are also developing our own digital channel with leading proprietary marketplaces and car advising value-added services.
•We continued our pursuit of future market share gains while also addressing new segments and accelerating growth in high potential markets.
In 2023, we renewed our partnership with Stellantis in Europe, which will allow us to consolidate our position as their main financing partner.
Moreover, we continued to support the green transformation of European mobility, having financed more than 200k new electric vehicles (EV), with a market share of EV sales of more than 10% in Europe.
We were also recognized as a Top Employer or Great Place to Work (GPTW) in four countries.
The stock of loans and advances to customers increased 8% year on-year. Excluding reverse repurchase agreements and in constant euros they rose 8% year-on-year to EUR 135 billion. We will continue to closely and proactively monitor our portfolios to prevent the impact of any deterioration in our activity.
Activity. December 2023 | ||||||||||||||||||||||||||||||||
| EUR billion and % change in constant euros | ||||||||||||||||||||||||||||||||
| +3% | ||||||||||||||||||||||||||||||||
| QoQ | +4% | |||||||||||||||||||||||||||||||
| QoQ | ||||||||||||||||||||||||||||||||
| 135 | ||||||||||||||||||||||||||||||||
| +8% | 73 | +19% | ||||||||||||||||||||||||||||||
| YoY | YoY | |||||||||||||||||||||||||||||||
| Gross loans and advances to customers excl. reverse repos | Customer deposits excl. repos + mutual funds | |||||||||||||||||||||||||||||||
Customer deposits increased 18%, 19% excluding repurchase agreements and in constant euros, to EUR 69 billion. Mutual funds increased 18% in constant euros. Our recourse to wholesale funding markets remained strong and diversified.
Results
Attributable profit in 2023 was EUR 1,199 million, 8% down year-on-year. In constant euros, attributable profit fell 7% (-5% excluding the impact of the temporary levy in Spain).
•Total income was up 6%. To neutralize the negative sensitivity to interest rate rises we are actively repricing loans, focusing on the most profitable segments and increasing customer deposits which are structurally our primary funding source. As a result, NII rose 6%.
•Net fee income declined 5%, impacted by the insurance regulation in Germany, capping fees. Gains on financial transactions considerably increased along with other operating income, supported by leasing income.
•Costs increased 8% (+3% in real terms), mainly affected by inflation, strategic and transformation investments in leasing and BNPL platforms and business growth. Net operating income increased 4% and the efficiency ratio stood at 47.6%.
•Credit quality normalized in the period. Net loan-loss provisions increased 48%, but still at comfortable levels coming from a low base in 2022. Cost of risk remains low, at 0.62% but also normalizing, and the NPL ratio stood at 2.12%.
•Negative contribution in other results and provisions was due to the temporary levy on revenue in Spain and regulatory charges in Poland, among others.
•By country, the largest contribution to underlying attributable profit came from the Nordic countries (EUR 241 million), Germany (EUR 235 million), the UK (EUR 177 million), France (EUR 145 million) and Spain (EUR 119 million).
Compared to the previous quarter, attributable profit rose 25% supported by the increase in net interest income and higher gains on financial transactions, as well as good cost control and lower loan provisions, due to higher portfolio sales in the fourth quarter.
| Digital Consumer Bank. Underlying income statement | ||||||||||||||||||||||||||
| EUR million and % change | ||||||||||||||||||||||||||
| / | Q3'23 | / | 2022 | |||||||||||||||||||||||
| Q4'23 | % | excl. FX | 2023 | % | excl. FX | |||||||||||||||||||||
| Revenue | 1,433 | +2 | +2 | 5,502 | +4 | +6 | ||||||||||||||||||||
| Expenses | -652 | 0 | 0 | -2,618 | +6 | +8 | ||||||||||||||||||||
| Net operating income | 781 | +3 | +3 | 2,884 | +3 | +4 | ||||||||||||||||||||
| LLPs | -152 | -32 | -32 | -792 | +46 | +48 | ||||||||||||||||||||
| PBT | 582 | +14 | +15 | 2,019 | -10 | -9 | ||||||||||||||||||||
| Attributable profit | 376 | +25 | +25 | 1,199 | -8 | -7 | ||||||||||||||||||||
| 38 | | January - December 2023 | ||||||
| Key consolidated data Business model | Group financial information | Financial information by segment | Responsible banking Corporate governance Santander share | Appendix | ||||||||||||||||||||||
| Primary segments | ||||||||||||||||||||||||||
 | Corporate Centre | Underlying attributable profit | ||||||
| -EUR 998 mn | ||||||||
Executive summary → The Corporate Centre continued to support the Group. → The Corporate Centre’s objective is to define, develop and coordinate the Group's strategy and aid the operating units by contributing value and carrying out the corporate oversight and control function. It also carries out functions related to financial and capital management. → Lower underlying attributable loss compared to 2022 due to higher liquidity buffer remuneration and lower negative impact from foreign currency hedging. | ||||||||
Strategy and functions
The Corporate Centre contributes value to the Group, through the following functions, among others:
•Through global control frameworks and supervision.
•Fostering the exchange of best practices in cost management, which enables us to be one of the most efficient banks.
•Collaborating in the definition and execution of the global strategy, competitive development operations and projects that ensure we meet the business plan.
•Contributing to the launch of projects that will be developed by our global businesses aimed at leveraging our worldwide presence to generate economies of scale.
•Ensuring open and constructive communication with shareholders, analysts, investors, bondholders, rating agencies and other market players.
•Adding value to countries and divisions by encouraging the exchange of best practices, driving and managing innovative global initiatives and defining corporate policies, all in the communication, marketing and sustainability fields.
It also coordinates the relationship with European regulators and supervisors and develops functions related to financial and capital management, as follows:
•Financial Management functions:
–Structural management of liquidity risk associated with funding the Group’s recurring activity and stakes of a financial nature. At the end of December 2023, the liquidity buffer exceeded EUR 348 billion.
This activity is carried out by the diversification of funding sources (issuances and other), maintaining an adequate profile in volumes, maturities and costs.
The price of these transactions with other Group units is the market rate that includes all liquidity concepts (which the Group supports by immobilizing funds during the term of the transaction) and regulatory requirements (TLAC/MREL).
–Interest rate risk is also actively managed in order to dampen the impact of interest rate changes on net interest income, conducted via high credit quality, very liquid and low capital consumption derivatives.
–Strategic management of exposure to exchange rates in equity and dynamic management of the FX hedge countervalue related to the units’ next twelve months results in euros. The net investments in equity currently hedged totalled EUR 12,396 million (mainly in the UK and Mexico) with different FX instruments (spot or forwards).
•Management of total capital and reserves: team responsible for the Group's capital analysis, adequacy and management. Its functions include: coordination with subsidiaries, monitoring returns to maximize shareholder returns, setting solvency targets and capital contributions, and monitoring the capital ratio in both regulatory and economic terms, and efficient capital allocation to the units.
Results
In 2023, the underlying attributable loss was EUR 998 million, 51% lower than in 2022 (EUR 2,049 million loss), driven by:
•Net interest income which improved by EUR 612 million, due to higher liquidity buffer remuneration as a result of rising interest rates.
•Higher gains on financial transactions (EUR 422 million better), due to lower negative FX hedging impacts.
•Lastly, other results and provisions were down slightly compared to 2022.
| Corporate Centre. Underlying income statement | ||||||||||||||||||||||||||
| EUR million and % change | ||||||||||||||||||||||||||
| Q4'23 | Q3'23 | Chg. | 2023 | 2022 | Chg. | |||||||||||||||||||||
| Total income | 212 | -308 | — | -439 | -1,487 | -70% | ||||||||||||||||||||
| Net operating income | 104 | -402 | — | -829 | -1,858 | -55% | ||||||||||||||||||||
| PBT | 73 | -433 | — | -961 | -2,022 | -52% | ||||||||||||||||||||
| Attributable profit | 87 | -464 | — | -998 | -2,049 | -51% | ||||||||||||||||||||
January - December 2023 | | 39 | ||||||
 | Retail Banking | Underlying attributable profit | ||||||
| EUR 7,436 mn | ||||||||
| Executive summary | ||||||||||||||||||||||||||||||||||||||
Results. (2023 vs. 2022). % change in constant euros | Business performance. EUR bn. % change in constant euros | ||||||||||||||||||||||
| Profit decreased as revenue growth was offset by higher costs and provisions | Assets remained stable YoY. Continued growth in liabilities | ||||||||||||||||||||||
| Total income | Costs | Provisions | Loans and advances to customers | Customer funds | |||||||||||||||||||
| +8% | +8% | +21% | 849 | 0% YoY | 847 | +4% YoY | |||||||||||||||||
| Customers | |||||||||||||||||||||||
| Total customers | Active customers | Digital customers | ||||||||||||||||||
| Millions | Millions | Millions | ||||||||||||||||||
| +3% | 0% | +5% | ||||||||||||||||||
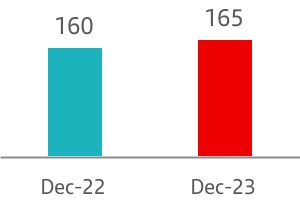
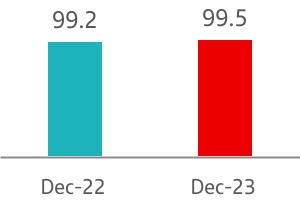
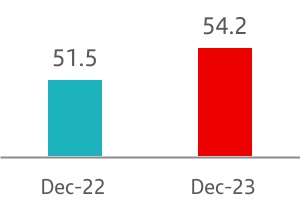
Commercial activity
In recent years, one of the Group's main priorities has been to intensify our transformation strategy, focusing on the simplification and digitalization of products, services and processes. As part of this strategy, in 2022 we launched the One Transformation programme, which seeks to accelerate this structural model change. We launched it in three countries (Spain, Mexico and the US) to simplify, automate and improve our retail service. During 2023, we have made great progress:
•In terms of simplification, we reduced the number of products by 16% year-on-year.
•We increased digitalization and automation of processes, which has allowed us to reduce the transactions carried out in branches, focusing more on value-added tasks that require advice and personalized attention.
•We made progress in our digital self-service model, which has allowed us, for example, to reduce the use of our contact centres by 16%. In Mexico, we digitalized the entire onboarding process.
•We continued to roll out a common operating model and technology for the segment in all countries.
Additionally, and as a final step in our One Santander strategy, in September we announced the consolidation of commercial banking activities into a new global area, Retail & Commercial Banking, which, as of January 2024, will be reported as a primary segment together with four other global businesses.
These efforts enabled us to reach 165 million customers in the Group, having increased almost 5 million in the last 12 months. Active customers grew to 100 million and digital customers rose 5%.
Gross loans and advances to customers (excluding reverse repos and the exchange rate impact) remained practically stable and customer funds (excluding repos and in constant euros) increased 5%.
Results
Attributable profit in 2023 was EUR 7,436 million, 6% lower year-on-year. In constant euros, it decreased 7%, as follows:
•Total income grew 8% driven by higher net interest income (+12%), mainly in Europe and in Mexico.
•Costs increased 8%, impacted by inflation. Net operating income also grew 8% and the efficiency ratio stood at 42.9%.
•Net loan-loss provisions rose 21%, mainly driven by the increase in North America in line with expectations and higher provisions in South America.
•Additionally, profit in 2023 was impacted by the temporary levy on revenue in Spain recorded in the first quarter and other provisions, mainly in Brazil.
| Retail Banking. Underlying income statement | ||||||||||||||||||||||||||
| EUR million and % change | ||||||||||||||||||||||||||
| / | Q3'23 | / | 2022 | |||||||||||||||||||||||
| Q4'23 | % | excl. FX | 2023 | % | excl. FX | |||||||||||||||||||||
| Revenue | 11,397 | -4 | +2 | 45,254 | +6 | +8 | ||||||||||||||||||||
| Expenses | -4,760 | -5 | +5 | -19,396 | +5 | +8 | ||||||||||||||||||||
| Net operating income | 6,637 | -4 | 0 | 25,858 | +7 | +8 | ||||||||||||||||||||
| LLPs | -3,216 | -3 | +1 | -12,295 | +20 | +21 | ||||||||||||||||||||
| PBT | 2,734 | -10 | -8 | 10,872 | -8 | -8 | ||||||||||||||||||||
| Attributable profit | 2,039 | -4 | -4 | 7,436 | -6 | -7 | ||||||||||||||||||||
| 40 | | January - December 2023 | ||||||
 | Santander Corporate & Investment Banking | Underlying attributable profit | ||||||
| EUR 3,078 mn | ||||||||
| Executive summary | ||||||||||||||||||||||||||||||||||||||
Results. (2023 vs. 2022). % change in constant euros | Our aim and strategic priorities | |||||||||||||||||||||||||
| Strong profit growth underpinned by our geographic and business diversification |  | |||||||||||||||||||||||||
| Total income | Underlying attributable profit | |||||||||||||||||||||||||
| +18% | +20% | |||||||||||||||||||||||||
| Efficiency ratio | RoTE | |||||||||||||||||||||||||
| 40.9% | 25% | |||||||||||||||||||||||||
Revenue growth1 by business and region | Other highlights in the quarter | |||||||||||||||||||||||||
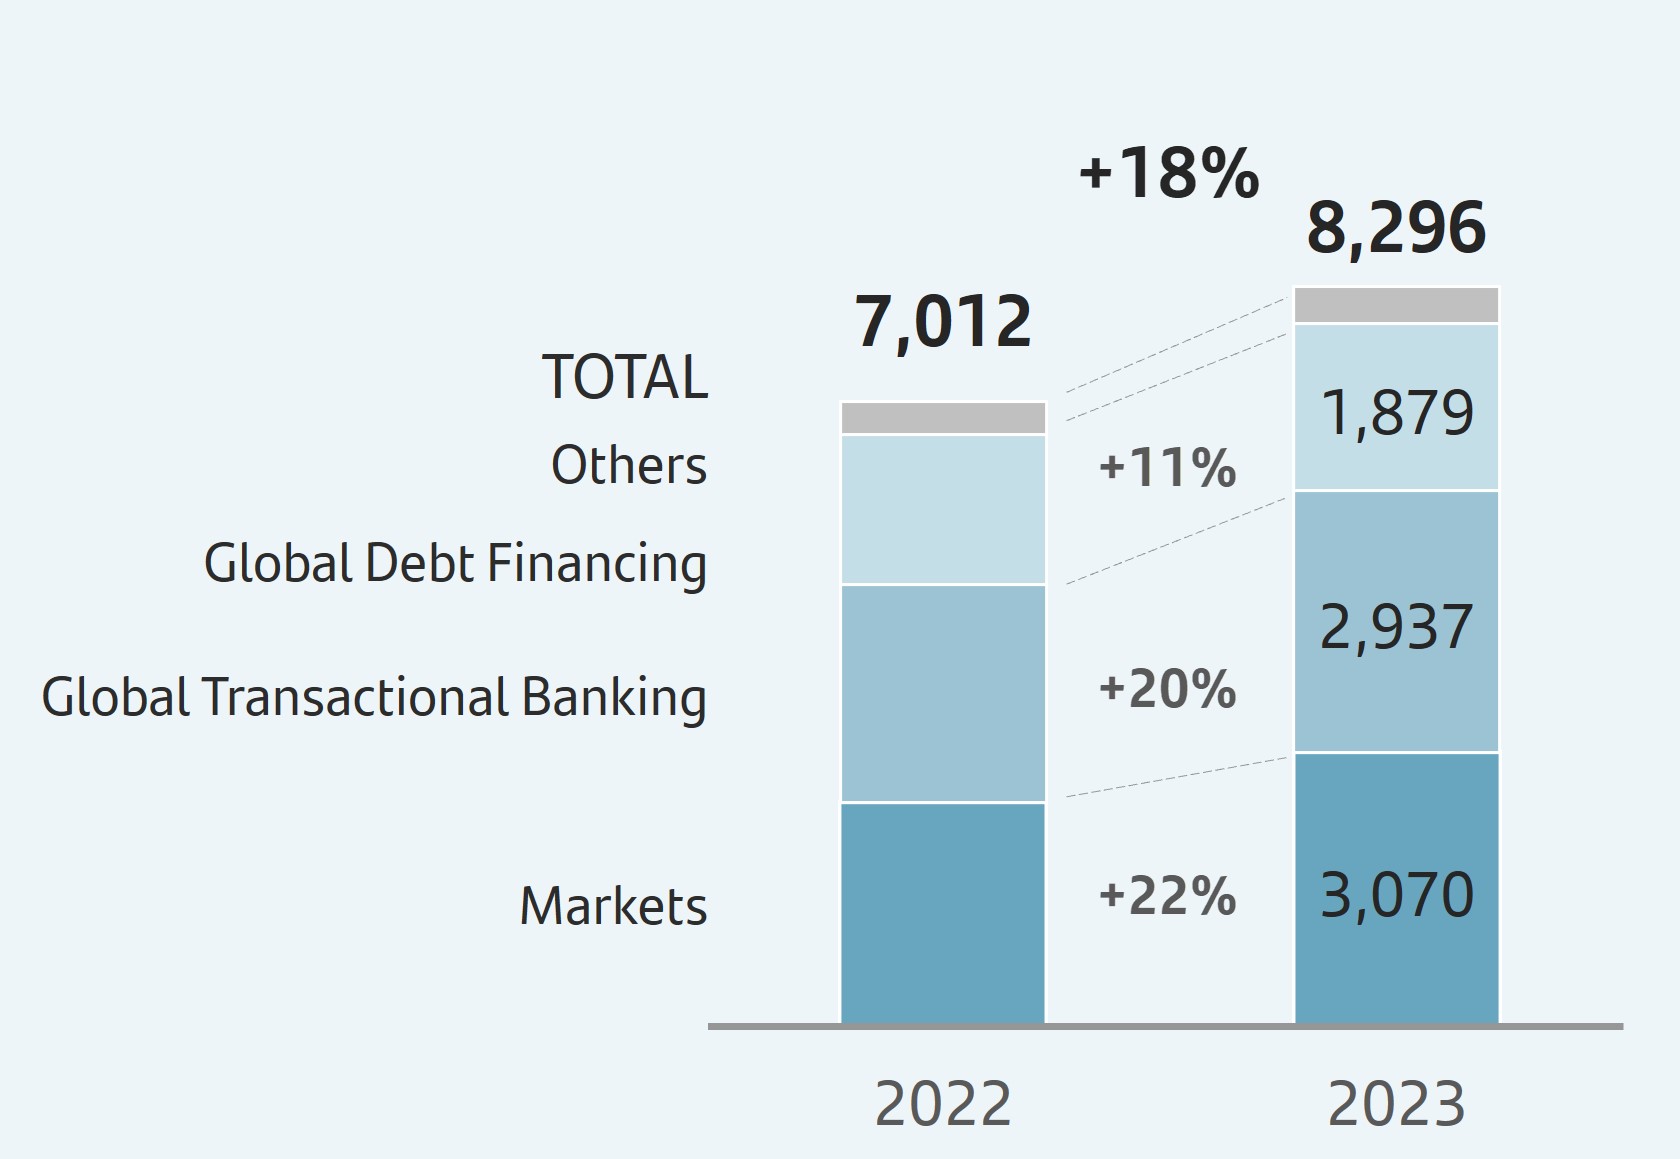 |  | +9% | 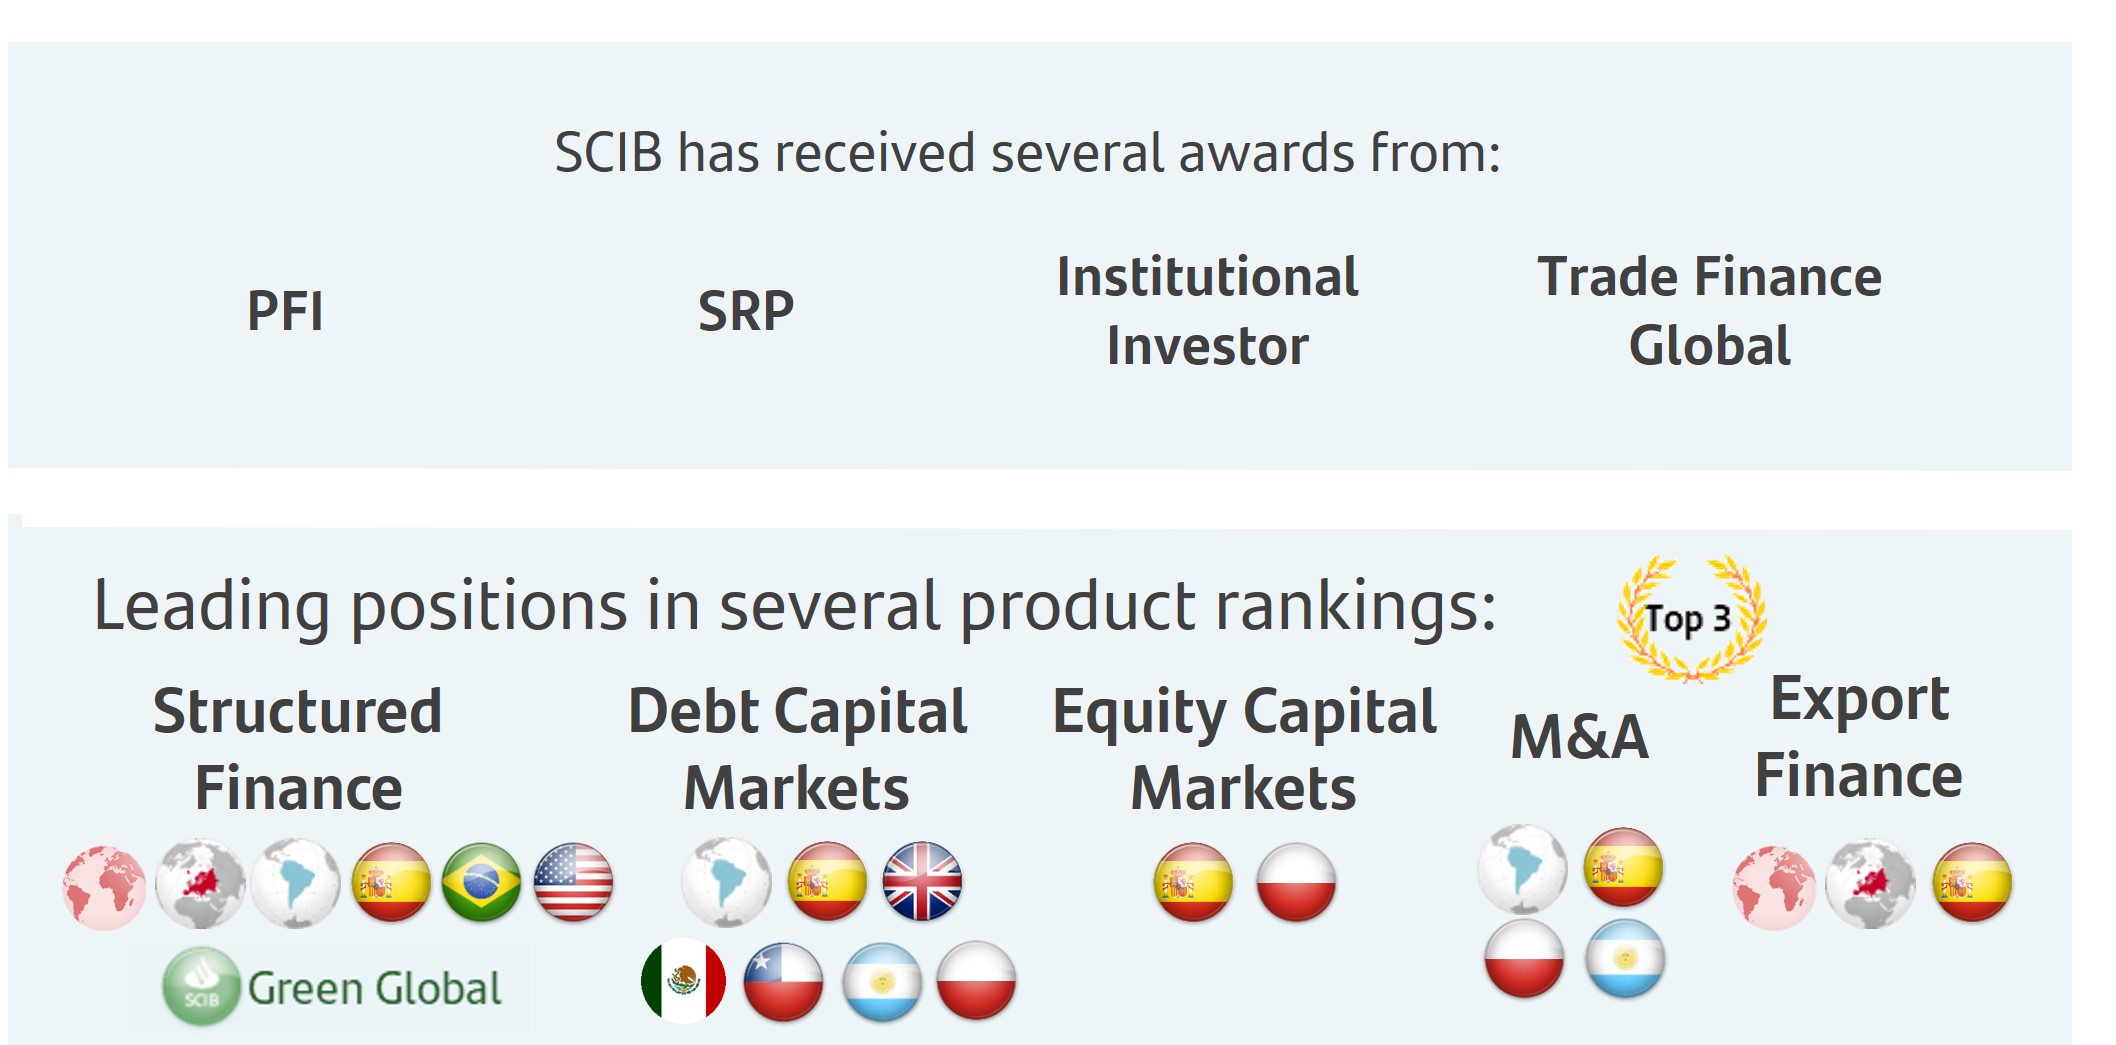 | |||||||||||||||||||||||
| +27% | |||||||||||||||||||||||||
| +26% | |||||||||||||||||||||||||
| 1. In constant euros. | ||||||||||||||||||||||||||
Strategy
At SCIB, we continue advancing in the execution of our strategy to transform the business and position as our clients' strategic advisor, by offering specialized products and services, focusing on the energy and digital transition.
The goal of this transformation is to continue to grow sustainably and profitably, with the aim of becoming one of the leading investment banks in our areas of expertise.
In the year, we:
•Took the SCIB US franchise to the next level, focusing on accelerating advisory capabilities, maximizing the value of synergies with Santander Capital Markets and expanding our client and product capabilities, primarily in sectors with the highest growth potential.
•Continued the globalization of the Markets area to increase activity focusing on corporate clients and institutional investors, enhancing our global FX and Over-the-Counter (OTC) derivatives platform in major commodity markets.
•Accelerated asset rotation to optimize profitability and increase new assets origination capacity.
•Increased collaboration with the Group's other global businesses to capture business opportunities, leveraging our extensive commercial network.
Some of the key highlights in 2023 include:
•The merger of Amherst Pierpont Securities (APS) and Santander Investment Securities (SIS) to create Santander US Capital Markets (SanCap), a key element in the reorganization and globalization process of the Markets area and the growth of the US franchise.
•Continued investment in talent, highlighting the acceleration in building our US advisory capabilities, complementing existing capabilities to carry out new business opportunities.
•Focusing on digital transformation, SCIB formed a partnership with the insurance firm Allianz Trade and the fintech Two (B2B e-commerce payments platform) to offer a new receivables solution that replicates the Buy Now, Pay Later (BNPL) model available in the retail segment.
•In ESG, Santander has entered InnoEnergy's capital acting as a joint advisor in the capital increase, which confirms our commitment to sustainable development objectives and our leadership position in climate tech.
January - December 2023 | | 41 | ||||||
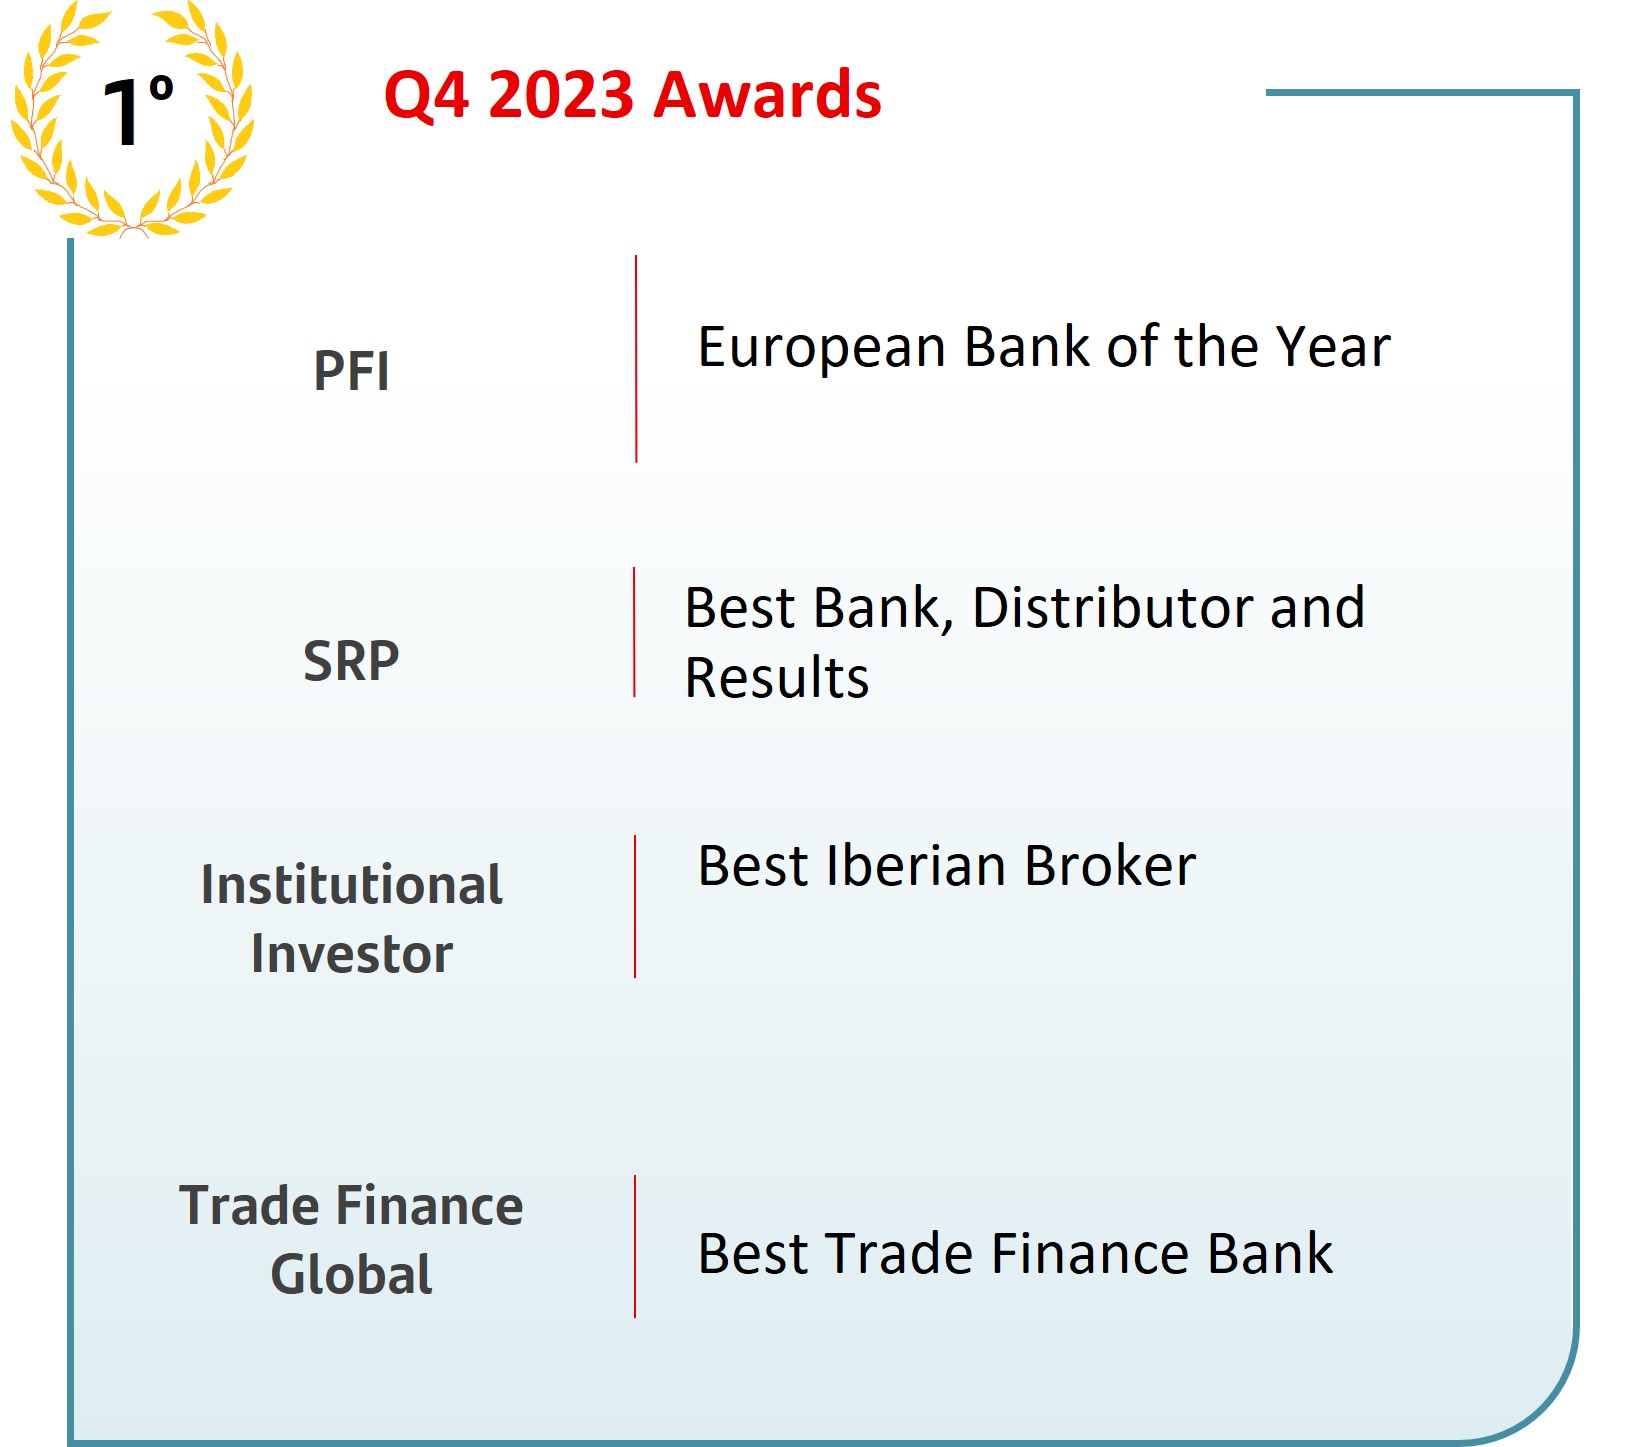
Business performance
In a challenging macroeconomic and geopolitical environment, our priority has been to support our clients with our advisory and high-value-added solutions. In this context, revenue stood at EUR 8,296 million, growing 12% year-on-year. In constant euros, revenue rose 18%, backed by relevant growth across core businesses:
•Markets showed a solid growth of 22% year-on-year, as a result of managing well market volatility.
In Europe, sales revenue continued to increase, both to corporate and institutional clients, achieving another year of strong growth, especially in the UK.
In Latin America, there was good year-on-year growth, particularly in Mexico, Chile, Colombia and Uruguay. In Brazil, the electricity and commodities desks stood out.
In the US, activity grew 30% year-on-year. Despite the macroeconomic challenges faced by some businesses, we continued to capture the synergies and efficiencies related to the creation of SanCap.
•Global Transaction Banking (GTB): we increased our revenue by 20% year-on-year.
Cash Management had another year of significant growth, both in terms of transactionality, with a greater number of clients and operations, and in terms of liability income, with higher volumes and benefits from high interest rates.
Trade & Working Capital Solutions continued to strengthen its global and distribution capabilities, consolidating its positive trend in recent years.
Export Finance maintained its leadership in the ECA financing market, participating in the most relevant transactions at a global level.
•Global Debt Financing (GDF): closed the year with significant growth in revenue (+11%). The growth in non-financial fees was particularly strong (+23% year-on-year), as well as the efficient use of capital.
For Debt Capital Markets (DCM), 2023 was a year of recovery in the global debt and loan markets. In this context, Santander was the leader in bond issuances in Latin America and achieved a significant increase in market share globally, with revenue growing at 27% year-on-year.
In Structured Finance, Santander ended the year in second place worldwide and was the leader in Renewables, driving revenue above the EUR 900 million mark for the first time, growing 16% year-on-year. We are positioning ourselves towards new energy transition assets (electric vehicle charging, huge factories, green hydrogen, etc.) with several mandates executed or under execution.
In Securitizations, we continued to rapidly expand our capabilities. Revenue grew 31% year-on-year and we lead the European ranking.
•In Corporate Finance (CF), despite the generalized stagnation of the market, there were some signs of recovery in Q4 2023. There were relevant M&A transactions in Energy, advising on the divestment of wind farms.
Results
Underlying attributable profit in 2023 increased 9% year-on-year to EUR 3,078 million. Excluding the impact of exchange rates, income increased by 20%. By lines:
•Total income rose 18% to EUR 8,296 million, with strong increases in all regions, especially North America which rose 27%.
•Costs increased 20% year-on-year, as a result of the investment in products and development of new capabilities in the US. The efficiency ratio stood at 40.9% and remained at lower levels than the rest of the sector.
•Lower loan-loss provisions, which decreased by 34% compared to the previous year, together with adequate capital management, contributed to an RoTE of 25%.
Compared to the previous quarter, attributable profit decreased 19% as the continuous increase in interest income could not offset lower gains on financial transactions and higher costs.
| SCIB. Underlying income statement | ||||||||||||||||||||||||||
| EUR million and % change | ||||||||||||||||||||||||||
| / | Q3'23 | / | 2022 | |||||||||||||||||||||||
| Q4'23 | % | excl. FX | 2023 | % | excl. FX | |||||||||||||||||||||
| Revenue | 1,817 | -15 | +4 | 8,296 | +12 | +18 | ||||||||||||||||||||
| Expenses | -1,017 | +18 | +26 | -3,391 | +17 | +20 | ||||||||||||||||||||
| Net operating income | 800 | -37 | -11 | 4,905 | +10 | +17 | ||||||||||||||||||||
| LLPs | -208 | — | — | -162 | -35 | -34 | ||||||||||||||||||||
| PBT | 573 | -53 | -28 | 4,570 | +12 | +20 | ||||||||||||||||||||
| Attributable profit | 398 | -51 | -19 | 3,078 | +9 | +20 | ||||||||||||||||||||
| 42 | | January - December 2023 | ||||||
 | Wealth Management & Insurance | Underlying attributable profit | ||||||
| EUR 1,637 mn | ||||||||
| Executive summary | ||||||||||||||||||||||||||||||||||||||
Results. (2023 vs. 2022). % change in constant euros |  |  |  | ||||||||||||||||||||
Revenue1 | Fee income as % of total Group 2 | AuMs | RoTE | Net new money | Net sales | Fee income | |||||||||||||||||
| +17% | 31% | +14% | 90% | EUR 13,700 mn | EUR 9,017 mn | EUR 1,772 mn | |||||||||||||||||
| CAL: EUR 300.4 bn | AuMs: EUR 217.1 bn | +2% vs. December 2022 | |||||||||||||||||||||
| Total contribution to profit by business | Other highlights of the period | ||||||||||||||||||||||
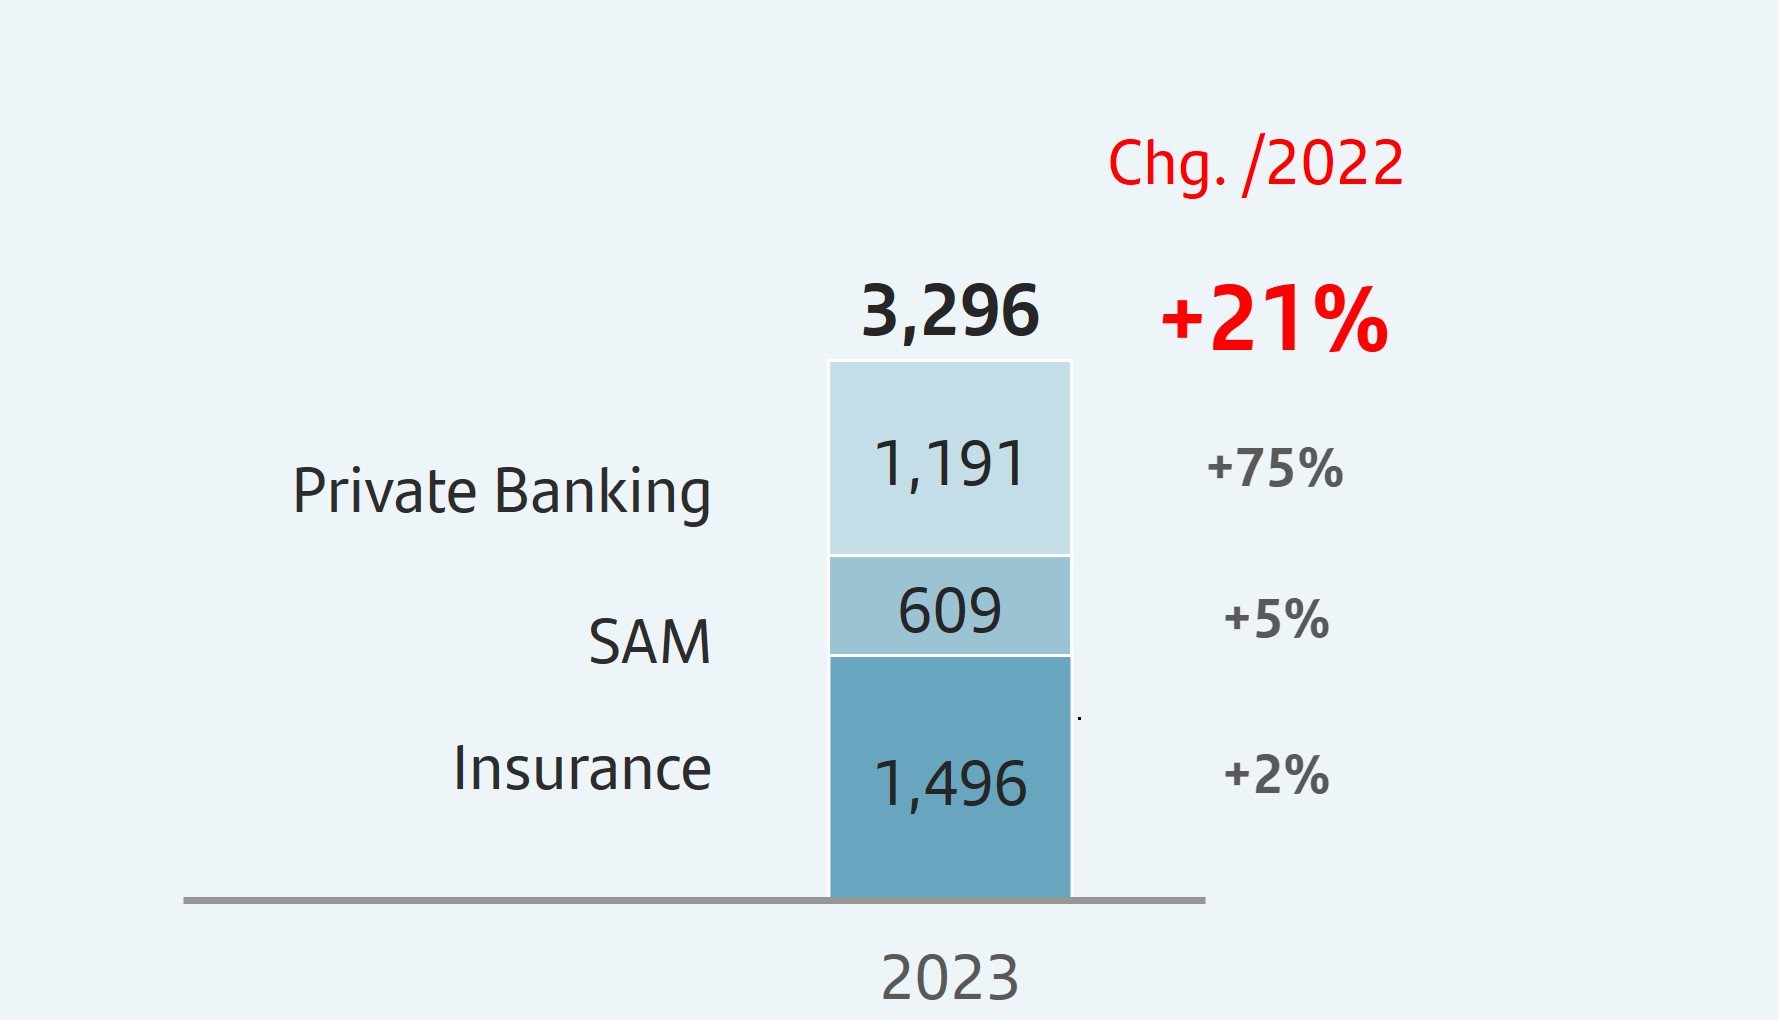 | PB customers | SRI3 AuMs | Gross written premiums | ||||||||||||||||||||
| +9% vs. 2022 | EUR 67.7 bn | EUR 13.1 bn | |||||||||||||||||||||
| PB Network AuMs | |||||||||||||||||||||||
| EUR 53.9 bn +15% | +27% | +12% | |||||||||||||||||||||
 | |||||||||||||||||||||||
| 1. Including fees generated by Asset Management and Insurance ceded to the commercial network. | 3. Socially Responsible Investments. | ||||||||||||||||||||||
| 2. Including fee income ceded to commercial network. | |||||||||||||||||||||||
Commercial activity
In 2023, we continued to work to become the best responsible Wealth and Insurance Manager in Europe and the Americas. WM&I was one of the Group's growth drivers with a record year of 21% growth in contribution to Group profit. During the year, we were named Latin America's Best Bank for Wealth Management by Euromoney.
•In Private Banking, we continued to leverage our global platform so our clients can benefit from our scale and international presence, making it easy for them to move from one region of the Group to another. In terms of collaboration, we remained leaders in investment flows between Latin America, Europe and the US, managing network business volumes (cross-border business between markets) of EUR 53.9 billion (+15% year-on-year).
Our collaboration business with SCIB continued to increase, especially in Brazil, Chile and BPI. In 2023, revenue reached EUR 189 million, 8% higher year-on-year.
During 2023, we continued to widen our value proposition and to innovate across our product range, seeking the best opportunities for our clients. We had a particular focus on alternatives, structured products, secured lending and socially responsible products (ESG).
In alternatives, we had almost EUR 3 billion in total capital commitments at the end of the year. In collaboration with Santander Alternative Investments, we launched Santander Innoenergy, a venture capital fund that invests in innovative startups in the field of energy transition. We launched a new fund of funds in our Irish ICAV, Laurion Secondaries, offering a diversified Private Equity portfolio with secondary transactions.
Our offering in discretionary portfolio management and advisory mandates exceeded EUR 48 billion of total assets in 2023.
Our real estate investment service, which is capturing a large part of investment flows between Latin America, Europe and the US, reached a total volume of EUR 240 million in transactions in 2023.
During 2023, Euromoney named us the Best Private Bank in Latin America, as well as the Best International Private Bank in Mexico, Argentina, Brazil, Peru, Uruguay, Poland and Portugal. Additionally, we received the prize for the Best Global Private Bank in Cybersecurity and Digital Portfolio Management in Europe by the Professional Wealth Management magazine, a Financial Times publication.
•In Santander Asset Management (SAM), we had a record year in net sales (EUR 9.0 billion), driven by the adaptation of our value proposition to current market conditions. We are gaining market share in almost all our markets, reaching EUR 1,128 million in total fees generated, in line with those of the previous year.
In Spain, we are developing the discretionary portfolio management model and launched two new funds whose advisory services are delegated to top managers like BlackRock (US equities) or Fidelity (Asia). Additionally, we continue to complement our GO range in Luxembourg with two new strategies (Global Equity ESG and Asian Equity).
We also adapted our value proposition for institutional clients and implemented a new coverage model expanding our business beyond our existing footprint. Total net inflows for institutional clients in 2023 surpassed EUR 3 billion.
The range of alternative products is becoming increasingly robust, with 22 vehicles globally and EUR 2.5 billion in total commitments. Our main strategies include Private Debt, Infrastructure, Trade Finance and Real Estate.
We made further headway in terms of our ESG strategy, with assets under management around EUR 48 billion. Together with RED, we launched Santander Prosperity fund in seven countries and were awarded the Best Product Innovation in The Global Private Banker Innovation Awards 2023.
We were recognized through several other awards in the period, both globally (Most Innovative Investment Manager in Europe by
January - December 2023 | | 43 | ||||||
Pan Finance magazine) and at a local level (Best Fixed Income Manager in Spain, Best Multi-Asset Manager in the UK, Best Money Market Manager in Brazil and Most Awarded Asset Manager in Chile, just to name a few).
•In Insurance, we continue delivering growth in gross written premiums, mainly driven by non-related and savings businesses. The credit-related business was slightly affected by the lower demand for credit in general.
In Europe, non-credit related insurance sales were particularly strong. During 2023, we reinforced our value proposition for SMEs and Health, launching a leasing insurance product in Portugal and a new partnership with BUPA in the UK. More recently in Q4, we reinforced our Savings value offer in Portugal with a new five-year product, offering yields until maturity.
In the Americas, new sales in non-credit related insurance business continued with strong growth, especially in savings. In 2023, we completed our Savings offer in Mexico offering USD unit linked products for Private Banking and “Plan Futuro” funds for Select segment.
The motor vehicle insurance business grew 10% year-on-year. Our Autocompara platform, with presence in Argentina, Brazil, Chile, Mexico and Uruguay, reached 1.4 million active policies and we added new companies in Brazil such as Porto Seguro (market leader in Auto segment) and Azul to further strengthen our competitive position.
Our digital strategy continued to drive growth in new sales through digital channels, now representing 20% of total sales.
| Business performance: SAM and Private Banking | ||||||||||||||||||||
| Constant EUR billion | ||||||||||||||||||||
| Total assets under management | ||
| Funds and investment* | ||
| - SAM | ||
| - Private Banking | ||
| Custody of customer funds | ||
| Customer deposits | ||
| Customer loans | ||
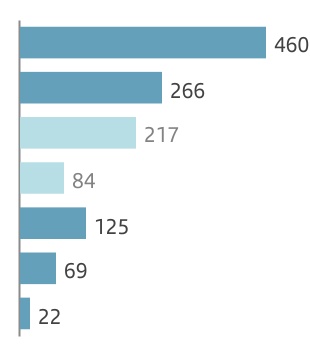
| / Sep-23 | / Dec-22 | ||||
| +5 | % | +14 | % | ||
| +4 | % | +10 | % | ||
| +5 | % | +15 | % | ||
| +6 | % | +10 | % | ||
| +7 | % | +31 | % | ||
| +5 | % | +4 | % | ||
| +1 | % | +2 | % | ||
Note: Total assets marketed and/or managed in 2023 and 2022.
* Total adjusted private banking customer funds managed by SAM.
Business performance
Total assets under management amounted to EUR 460.3 billion, +14% higher year-on-year, driven by intense commercial activity.
•In Private Banking the volume of customer assets and liabilities (CAL) reached EUR 300.4 billion, 15% higher than in 2022. Net new money amounted to EUR 13.7 billion (4.6% of total volume). PAT was EUR 1,191 million, 75% higher than in 2022 in constant euros, primarily backed by interest income and improved commercial activity. Clients increased 9% to 260,000.
•SAM's total assets under management increased 15% year-on-year to EUR 217.1 billion. We had a record year in net sales with more than EUR 9.0 billion (4.2% of total AuMs) with almost all countries gaining market share. SAM’s contribution to Group's profit (including ceded to commercial network) was EUR 609 million, +5% year-on-year.
•In Insurance, gross written premiums amounted to EUR 13.1 billion (up 12% year-on-year) and fee income rose 2%. The total contribution to profit reached EUR 1,496 million, +2% year-on-year.
Results
The total contribution to the Group this year (including net profit and total fees generated net of tax) was EUR 3,296 million, up 20% year-on-year (+21% in constant euros).
Underlying attributable profit in 2023 was EUR 1,637 million, 46% higher year-on-year. In constant euros, it was 48% higher:
•Total income increased 31%, mainly driven by higher net interest income, supported by strong trading activity and rising interest rates.
•Total fee income generated, including ceded to the commercial network, amounted to EUR 3,725 million, +1% year-on-year, and represented 31% of the Group's total fee income.
| Total fee income generated | ||||||||||||||||||||||||||||||||
| Constant EUR million | ||||||||||||||||||||||||||||||||
| 3,725 | 〉 | +1% | 31% | |||||||||||||||||||||||||||||
| vs. 2022 | / total Group | |||||||||||||||||||||||||||||||
•Operating expenses were 12% higher year-on-year, due to investments and higher costs related to increased commercial activity.
Compared to the previous quarter, underlying attributable profit decreased slightly (-2%), due to the lower net interest income in Private Banking in Q4 and some seasonal effects such as the Deposit Guarantee Fund contribution.
| Total contribution to profit | ||||||||||||||
| EUR million and % change in constant euros | ||||||||||||||
| Q4'23 | 2023 | |||||||||||||
 | 850 | | 3,296 | |||||||||||
| +2 | % | / Q3'23 | +21 | % | / 2022 | |||||||||
| WM&I. Underlying income statement | ||||||||||||||||||||||||||
| EUR million and % change | ||||||||||||||||||||||||||
| / | Q3'23 | / | 2022 | |||||||||||||||||||||||
| Q4'23 | % | excl. FX | 2023 | % | excl. FX | |||||||||||||||||||||
| Revenue | 804 | -8 | -1 | 3,396 | +29 | +31 | ||||||||||||||||||||
| Expenses | -311 | +9 | +13 | -1,156 | +10 | +12 | ||||||||||||||||||||
| Net operating income | 494 | -16 | -9 | 2,240 | +42 | +44 | ||||||||||||||||||||
| LLPs | 5 | — | — | 21 | — | — | ||||||||||||||||||||
| PBT | 513 | -12 | -5 | 2,235 | +46 | +48 | ||||||||||||||||||||
| Attributable profit | 386 | -11 | -2 | 1,637 | +46 | +48 | ||||||||||||||||||||
| 44 | | January - December 2023 | ||||||
| Underlying attributable profit | |||||||
| -EUR 77 mn | ||||||||
| Executive summary | ||||||||||||||||||||||||||||||||||||||
| Revenue performance | Our business | ||||||||||||||||||||||
Solid revenue growth1 | Merchants | International Trade | Payments | ||||||||||||||||||||
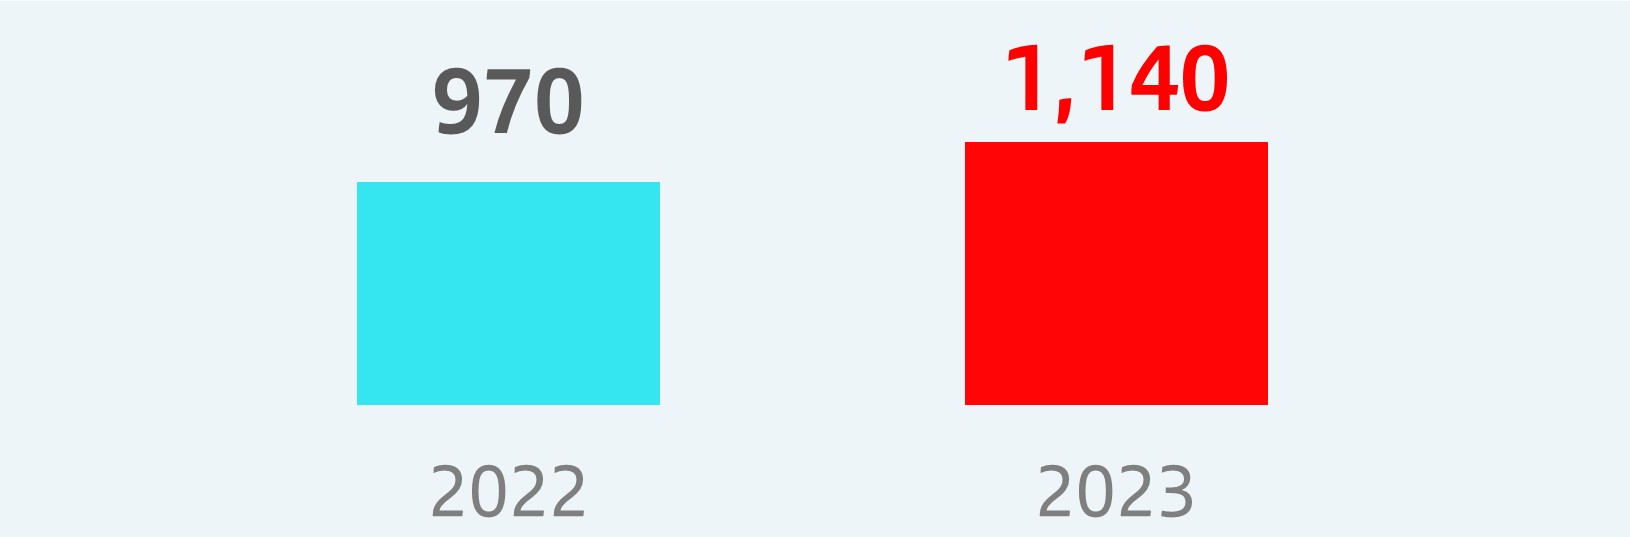 | +17% 2023 vs. 2022 | Global payments solutions for all merchant segments | International trade solutions for business | Wholesale account-to-account payment solutions | |||||||||||||||||||
| Our main strategic priorities | Main growth drivers | ||||||||||||||||||||||
•Scaling up our global technology platform •Accelerating our commercial growth •Pursuing the open market opportunity | Merchants Total Payments Volume1 | Merchant number of transactions | |||||||||||||||||||||
+22% 2023 vs. 2022 | +29% 2023 vs. 2022 | ||||||||||||||||||||||
| 1. Constant EUR million. | |||||||||||||||||||||||
Strategy
PagoNxt aims at global leadership in payments through a distinct, holistic and customer-centric value proposition. We are a one-of-a-kind paytech business which provides customers with a wide range of innovative payments and integrated value-added solutions.
Since 2020, PagoNxt has been built through the combination of several strategic and high-growth business segments (i.e. Merchant acquiring, International Trade and Payments Hub).
Already existing businesses, like Merchant acquiring in core Santander countries like Brazil, Mexico and Spain, have been combined with newly internally developed global technology platforms (e.g. Merchant Solutions, OneTrade and Account To Account Payments) and a limited number of inorganic acquisitions (e.g. Ebury).
PagoNxt's technology platforms and specialist teams serve the payments needs of Grupo Santander's customers and cater to open market opportunities beyond Santander's footprint with in-depth solutions for millions of businesses and people.
PagoNxt runs an efficient global operating model, that covers three core regions (Europe, South America and North America) with bank-grade security and compliance embedded in our customer products.
PagoNxt's strategy for the next few years is anchored on 3 key levers:
•scaling up our global, cloud-native, secure and efficient platform, which is interconnected and API-based to ensure customer access through a single integration. We process and generate insights to help our customers and their businesses harness the full power of data to make decisions.
•accelerating commercial growth by further strengthening our commerce and trade ecosystem and our distribution through Santander commercial platforms with a focus on SMEs.
•maximizing the open market opportunity through direct commercialization and distribution partnerships (with integrated software vendors (ISV), Financial Institutions (FI) and Non-Banking Financial Institutions (NBFI)), increasing our market penetration in Europe, South America and North America and extending our footprint to other strategic countries.
This strategy is fully aligned with PagoNxt's short and medium-term targets, namely, delivering sustained and diversified revenue growth, growing the open market business and ensuring operational leverage for improved scale-driven margins and bottom-line profitability.
Business performance
Getnet, our end-to-end Merchant acquiring business with presence in Latin America (Brazil, Mexico, Argentina, Chile and Uruguay) and Europe (pan-European activity with active merchants in 15 countries), continued consolidating its franchise and market position and growing above market in most regions. Getnet improved its position in Merchant acquiring to second in Latin America and 17th globally, according to the Nilson reports based on number of transactions.
In 2023, Getnet's Total Payments Volume (TPV) reached EUR 206 billion, 25% higher than 2022 (+22% in constant euros). This growth was accompanied by margin expansion due to increasing scale and the roll out of innovative value-added services, global e-commerce capabilities and further developed specialized vertical solutions which it shares across countries. Highlights by market were:
•Getnet Brazil's TPV increased 14% year-on-year. Brazil's focus has been on profitable growth through higher penetration in SMEs, our pre-payments products, and value-added services. We are pursuing opportunities across all sales channels and enhancing open market sales through partnership with banks and ISVs, direct sales and digital channels.
•Getnet Europe, our pan-European acquirer, grew significantly in the year. TPV increased 31% year-on-year, mainly driven by the Spanish and Portuguese markets. In the UK, we are currently operating with a reduced number of customers under our UK FCA licence. We continue enhancing our platform capabilities, with new payment methods, a vertical solution for airlines and a stronger value-added proposition for SMEs, which allow us to progress on our open market strategy with merchants operating in 15 countries.
January - December 2023 | | 45 | ||||||
•Getnet Mexico's activity remained strong, with TPV increasing 23% year-on-year, driven by higher SME penetration and the strong performance of our open market distribution channels, which include several partnerships with payments facilitators, ISVs and payment ecosystems. We launched several innovative value-added services such as tap-on-phone, DCC and dynamic working capital.
•We are ramping up Getnet commercial activity in other Latin American countries. Our acquiring businesses in Argentina and Uruguay launched in 2022 are showing strong growth as they start penetrating Santander's merchant base. Chile, with 80% year-on-year TPV growth, is accelerating its penetration in the Chilean market through Santander and the open market, which already represents c. 50% of new onboardings.
PagoNxt OneTrade platform comprises two different activities: one which offers a range of international business services delivered to our banks and their customers as a Banking-as-a-Service proposition, and another service delivered to open market customers through an Electronic Money Institution.
The Banking-as-a-Service proposition allows Grupo Santander to replace multiple investments in local solutions with a single global one, accelerating implementation while reducing operational and maintenance costs.
In 2023, we achieved significant progress and all core interconnected services are fully operational. Some of the services which have already been rolled out across core markets like Spain, Mexico and Chile are: OneTrade FX, a digital FX service facilitating currency trading, International Payments, aimed at fostering Corporate and SME business and TradeNxt, a trade finance platform supporting import/export activities.
We expect to ramp up OneTrade open market activities in the first half of 2024 by scaling up our correspondent banking offering (cross-border payout and FX services) targeted at Financial Institutions (FI), Non-Banking Financial Institutions (NBFI) and other entities in need of cross-border payments optimization.
PagoNxt continued to accelerate its roadmap to be Santander's wholesale payments processing provider, centralizing all types of payments (except cards). In 2023, we continued the development of our product capability around five core areas (Instant Payments, Credit Transfers, Bulk Credit Transfers, Direct Debits and International Payments) and implemented functionality across multiple countries and businesses (SCIB, Openbank, Spain, Portugal, Germany, the UK and Mexico). Significant volumes of payments have already been migrated onto the new payments platform reaching an annualized volume of 700 million transactions.
Ebury continued to deliver organic top-line growth, with double-digit growth in total income. The business continued to enhance its B2B offerings and recently completed the acquisition of Bexs, the Brazilian cross border payments and FX transactions specialist.
Results
Attributable loss of 2023 of EUR 77 million, a marked improvement versus a loss of EUR 215 million in 2022.
Total income continued its upward momentum in 2023 and reached EUR 1,140 million, a 17% increase year-on-year in constant euros, backed by increased activity and volumes, especially in our Merchant and Trade businesses (Getnet and Ebury).
| PagoNxt. Revenue performance | ||||||||||||||||||||
| Constant EUR million | ||||||||||||||||||||
| +17% | ||||||||||||||
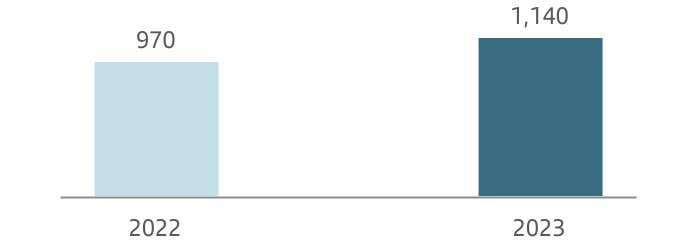
In 2023, costs grew by 6% year-on-year in constant euros and reflected inflation pressures and the ongoing investment plans to develop and implement global technology.
In the fourth quarter, profit improved to EUR 24 million from EUR 3 million in the third quarter.
| PagoNxt. Underlying income statement | ||||||||||||||||||||||||||
| EUR million and % change | ||||||||||||||||||||||||||
| / | Q3'23 | / | 2022 | |||||||||||||||||||||||
| Q4'23 | % | excl. FX | 2023 | % | excl. FX | |||||||||||||||||||||
| Revenue | 320 | +7 | +10 | 1,140 | +20 | +17 | ||||||||||||||||||||
| Expenses | -268 | +7 | +11 | -1,091 | +7 | +6 | ||||||||||||||||||||
| Net operating income | 53 | +11 | +3 | 49 | — | ��� | ||||||||||||||||||||
| LLPs | -1 | -87 | -88 | -24 | -46 | -46 | ||||||||||||||||||||
| PBT | 29 | -8 | -20 | -17 | -88 | -87 | ||||||||||||||||||||
| Attributable profit | 24 | +787 | +506 | -77 | -64 | -63 | ||||||||||||||||||||
| 46 | | January - December 2023 | ||||||
Business model | Responsible banking | |||||||||||||||||||||||||
| RESPONSIBLE BANKING | ||||||||
| TARGETS | ||
We continue to make progress in our ESG agenda, working towards the fulfilment of our public targets:
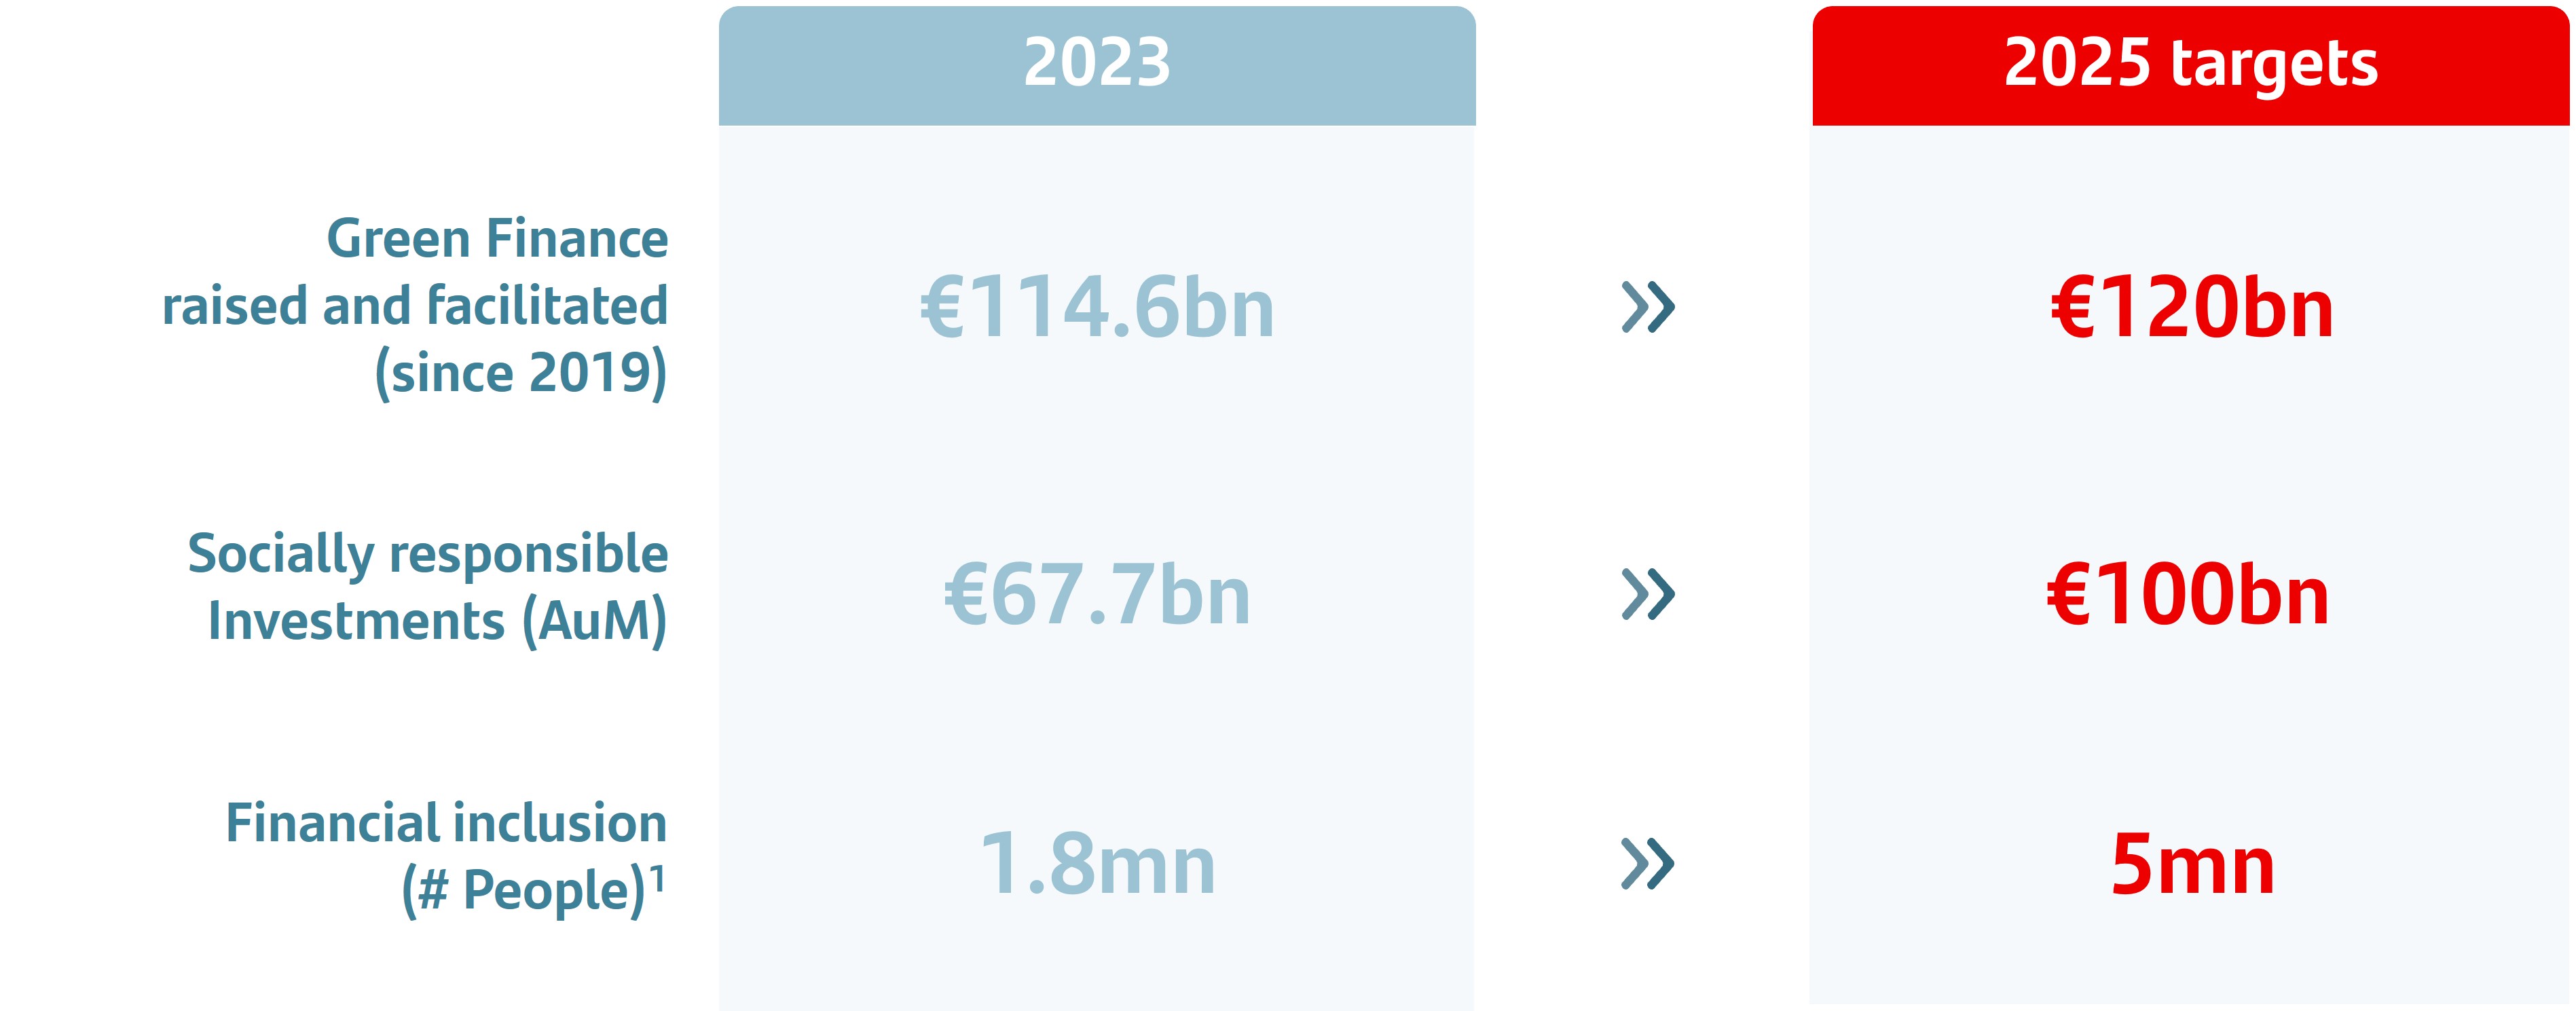 | ||
More information available at www.santander.com/en/our-approach.
Definitions in Alternative Performance Measures chapter and Glossary.
Note: Not taxonomy. Not audited.
1.Starting Jan-23. Does not include financial education.
| HIGHLIGHTS | ||
In 2023 we updated our objectives, our public targets now are to:
•Reach 35% of women in leadership positions in 2025.
•Financially include 5 million people between 2023-2025.
•Invest EUR 400 million between 2023-2026 to promote education, employability and entrepreneurship.
Of note among the implemented ESG initiatives were:
| E | Environmental | ||||
•In line with our target to facilitate EUR 120 billion in green finance by 2025 and EUR 220 billion by 2030, together with SCIB, we have mobilized EUR 114.6 billion in green finance since we set our target in 2019 (EUR 20.1 billion in 2023).
•WM&I continued to increase its socially responsible investment (SRI) product offering, advancing towards our target of reaching EUR 100 billion in SRI in 2025. At the end of 2023, the volume of AuMs in socially responsible investments was EUR 67.7 billion, of which EUR 48.1 billion are in SAM and EUR 19.6 billion from third party funds in Private Banking.
•In Digital Consumer Bank, we financed more than 208,000 new electric vehicles (EV), with volume of over EUR 6.4 billion. This represents a >10% market share in Europe EV sales. Our offering now includes a wide range of green solutions including the financing of electric vehicles, electric chargers, solar panels and electric bicycles.
•In Retail, we strengthened our green product offering, which includes renewable energy, water and waste management and mobility, with new solutions for all customers. We signed solar panel financing agreements with 10 partners in 3 regions and 7 countries.
•In Global Cards, we acquired 27 million cards made from sustainable materials in 2023.
January - December 2023 | | 47 | ||||||
Business model | Responsible banking | |||||||||||||||||||||||||
| S | Social | ||||
•In 2023, we financially included 1.8 million people, of which more than 0.9 million were through access initiatives and c.0.9 million were through finance initiatives.
•We support microentrepreneurs through our Prospera and Tuiio propositions - present in 4 countries - in which we raised EUR 1,172 million (+23% YoY) and have more than 1.3 million active customers.
•Our financial education programmes have helped 11.7 million people to improve financial health and decision-making.
•To help our communities prosper we:
–continued with our strong and long-standing (more than 27 years) commitment to driving progress in education, employability and entrepreneurship. This sets us apart from other financial institutions in the world. The Group has allocated more than EUR 105 million and supported more than 498,000 people and companies through agreements with more than 1,238 universities in 26 countries.
–We have helped more than 3 million people by investing EUR 70 million in communities.
•Diversity, Equity and Inclusion (DEI) continued to be our strategic priority. In gender equality, we have 31.4% of women in leadership positions, exceeding the 30% 2025 target. We increased this target to 35% for 2025 in our last Investor Day. The equal pay gap was close to 0%.
| G | Governance | ||||
•ESG is included in short-term incentives applied to all employees, and in the long-term incentives applied to senior executives.
•Our board of directors has a balanced presence of men and women (60%-40%) and the majority are independent directors (66.67%).
•We updated our Code of Conduct to include environmental protection and it continues to be a tool to promote values such as equal opportunities, diversity and non-discrimination, prohibition of any kind of harassment (sexual or workplace) respect for people, work-life balance and respect for collective rights.
•We carried out a double materiality assessment based on Corporate Sustainability Reporting Directive (CSDR), identifying impacts, risks and opportunities in sustainability. This will be published in the 2023 Annual report.
•We worked on drawing up and implementing a new ESG approval methodology to classify our suppliers according to risk, including a criticality assessment.
•The sustainability reports of our subsidiaries have been published and are available on the corporate website.
| 2023 AWARDS | ||
•Santander remained in the Dow Jones Sustainability World Index 2023 and we upgraded to low risk in Sustainalytics, as well as our FTSE and Moody's Vigeo scores.
•Euromoney has named us World's Best Bank for Financial Inclusion three years in a row. Also, Santander has been named the Best Bank in the World for SMEs and for Emerging Markets, winning three global categories at the Euromoney Awards for Excellence in 2023.
•Santander was included in the Fortune list of 50 companies that are changing the world. We are the first bank in the ranking thanks to our work over the past 27 years in supporting education, entrepreneurship and employability.

| 48 | | January - December 2023 | ||||||
Business model | Corporate governance | |||||||||||||||||||||||||
| CORPORATE GOVERNANCE | ||||||||
Changes to the board committees
Belén Romana joined the nomination committee on 1 January 2024.
January - December 2023 | | 49 | ||||||
| SANTANDER SHARE | ||||||||
In application of the shareholder remuneration policy for 2023, in November, the bank paid a cash dividend of EUR 8.10 cents per share (pre-tax) charged to 2023 results.
In addition, on 26 September 2023, the board approved a share buyback programme against 2023 results for EUR 1,310 million that was executed between 28 September 2023 and 25 January 2024. Under the authorization from the AGM of 31 March 2023, on 30 January 2024 the board resolved to reduce the share capital in the amount of EUR 179,283,744 by cancelling the 358,567,487 shares repurchased in the above mentioned share buyback programme, representing 2.22% of the share capital. The share capital will become EUR 7,912,789,286 represented by 15,825,578,572 shares.
The bank's board is expected to propose to the AGM and disclose on the date of the meeting the approval of a final cash dividend, in line with the current shareholder remuneration policy1 of approximately 50% of the Group's underlying profit (excluding non-cash impacts and direct effect on capital ratios), divided approximately equally between cash dividends and share repurchases. As a result, the cash dividend per share paid against 2023 results is expected to be approximately 50% higher than the one paid against 2022.
Share price performance
Santander's shares are listed in five markets: in Spain, Mexico, Poland, the US (as an ADR) and the UK (as a CDI). In addition, until 28 December 2023, Banco Santander's shares were listed on the traditional listing of the Mexican Stock Exchange (BMV). However, since 29 December 2023, they have been listed only on the International Quotation System (SIC) of the BMV.
Global economic activity experienced a gradual slowdown in the year, labour markets remained solid, but with different trends across countries. In the economic and geopolitical sphere, focus remained on the Middle East, although uncertainty reduced gradually, mitigating the risk of another energy price shock.
Inflation rates globally continued to decline gradually, mainly due to lower food and energy contributions.
In Q4 2023, the fall in inflation and the economic slowdown generated expectations of rate cuts: markets went from being "high for longer" to re-evaluating the likely downward path. The Federal Reserve, the Bank of England and the European Central Bank have held interest rates since September. Central banks in Latin America, such as Chile, Brazil and Uruguay, have already started to lower interest rates, joined by the Central Bank of Poland, which has lowered its reference rate one percentage point since September.
In this environment, the Santander's share price ended the year with a positive return of 34.9%, outperforming the market. In the banking sector, EuroStoxx Banks was up 23.5%, DJ Stoxx Banks increased 20.3% and MSCI World Banks rose 10.4%. The other main indices closed up, Ibex 35 +22.8% and DJ Stoxx 50 +12.1%.
| Share price | ||||||||||||||
 |  | |||||||||||||
START 30/12/2022 | END 29/12/2023 | |||||||||||||
| €2.803 | €3.780 | |||||||||||||
 |  | |||||||||||||
Maximum 06/12/2023 | Minimum 03/01/2023 | |||||||||||||
| €3.970 | €2.812 | |||||||||||||
| Comparative share performance | ||
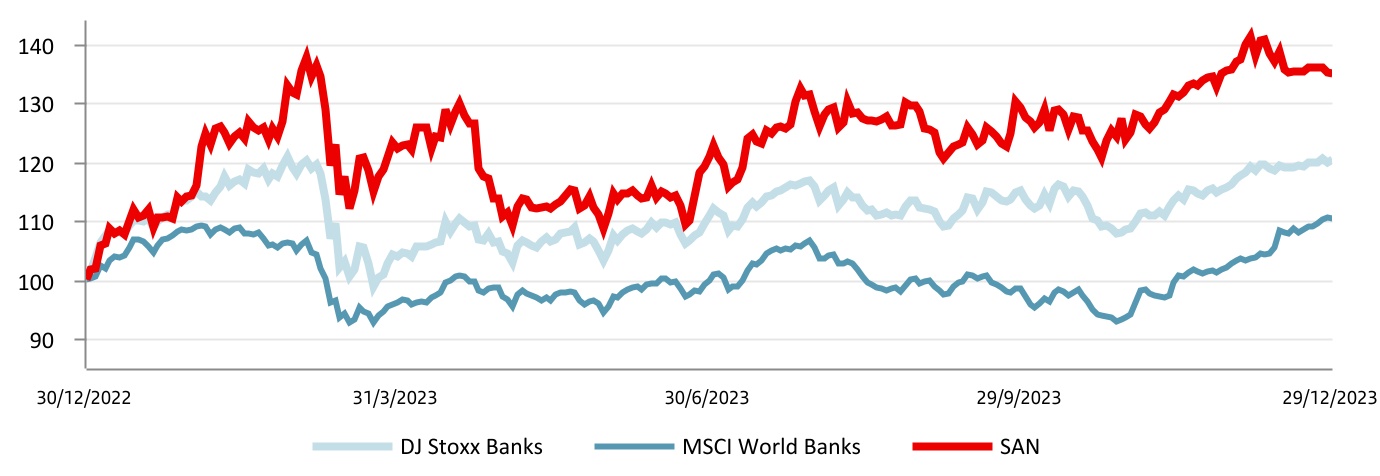
1. Execution of the shareholder remuneration policy is subject to future corporate and regulatory decisions and approvals.
| 50 | | January - December 2023 | ||||||
Market capitalization and trading
As at 29 December 2023, Banco Santander’s market capitalization of EUR 61,168 million was the second largest in the eurozone and 21st largest in the world among financial institutions.
The share’s weighting in the DJ Stoxx Banks index was 6.94% and 11.76% in the DJ Euro Stoxx Banks. In the domestic market, its weight in the Ibex 35 as at end December was 11.75%.
A total of 11,132 million shares were traded in the period for an effective value of EUR 38,144 million and a liquidity ratio of 68%.
The daily trading volume was 43.7 million shares with an effective value of EUR 150 million.
Shareholder base
The total number of Santander shareholders at 29 December 2023 was 3,662,377, of which 3,259,810 were European (73.07% of the capital stock) and 391,327 from the Americas (25.26% of the capital stock).
Excluding the board, which holds 1.19% of the bank’s capital stock, retail shareholders accounted for 40.05% and institutional shareholders accounted for 58.76%.
| Share capital distribution by geographic area | ||||||||
| December 2023 | ||||||||
| The Americas | Europe | Other | ||||||
| 25.26% | 73.07% | 1.67% | ||||||
 | ||||||||
| Source: Banco Santander, S.A. Shareholder register. | ||||||||
 | 2nd | Bank in the eurozone by market capitalization | ||||||
EUR 61,168 million | ||||||||
| The Santander share | |||||
| December 2023 | |||||
| Shares and trading data | |||||
| Shares (number) | 16,184,146,059 | ||||
| Average daily turnover (number of shares) | 43,656,260 | ||||
| Share liquidity (%) | 68 | ||||
| (Number of shares traded during the year / number of shares) | |||||
| Stock market indicators | |||||
| Price / Tangible book value (X) | 0.79 | ||||
| Free float (%) | 98.16 | ||||
| Share capital distribution by type of shareholder | |||||
| December 2023 | |||||
| Institutions | |||||
| 58.76% | |||||
| Board * | |||||
| 1.19% | |||||
| Retail | |||||
| 40.05% | |||||
* Shares owned or represented by directors.
January - December 2023 | | 51 | ||||||
2023 A P P E N D I X
| 52 | | January - December 2023 | ||||||
Business model | ||||||||||||||||||||||||||
| Group financial information | ||||||||||||||||||||||||||
| Net fee income. Consolidated | ||||||||||||||||||||
| EUR million | ||||||||||||||||||||
| Q4'23 | Q3'23 | Change (%) | 2023 | 2022 | Change (%) | |||||||||||||||
| Fees from services | 1,585 | 1,828 | (13.3) | 7,004 | 6,772 | 3.4 | ||||||||||||||
| Wealth management and marketing of customer funds | 985 | 1,026 | (4.0) | 3,967 | 4,032 | (1.6) | ||||||||||||||
| Securities and custody | 265 | 265 | 0.0 | 1,086 | 986 | 10.1 | ||||||||||||||
| Net fee income | 2,835 | 3,119 | (9.1) | 12,057 | 11,790 | 2.3 | ||||||||||||||
| Underlying operating expenses. Consolidated | ||||||||||||||||||||
| EUR million | ||||||||||||||||||||
| Q4'23 | Q3'23 | Change (%) | 2023 | 2022 | Change (%) | |||||||||||||||
| Staff costs | 3,646 | 3,477 | 4.9 | 13,726 | 12,547 | 9.4 | ||||||||||||||
| Other general administrative expenses | 2,039 | 2,206 | (7.6) | 8,515 | 8,371 | 1.7 | ||||||||||||||
| Information technology | 610 | 614 | (0.7) | 2,471 | 2,473 | (0.1) | ||||||||||||||
| Communications | 99 | 107 | (7.5) | 414 | 410 | 1.0 | ||||||||||||||
| Advertising | 146 | 158 | (7.6) | 603 | 559 | 7.9 | ||||||||||||||
| Buildings and premises | 156 | 192 | (18.8) | 721 | 708 | 1.8 | ||||||||||||||
| Printed and office material | 26 | 24 | 8.3 | 97 | 96 | 1.0 | ||||||||||||||
| Taxes (other than tax on profits) | 128 | 147 | (12.9) | 570 | 559 | 2.0 | ||||||||||||||
| Other expenses | 874 | 964 | (9.3) | 3,639 | 3,566 | 2.0 | ||||||||||||||
| Administrative expenses | 5,685 | 5,683 | 0.0 | 22,241 | 20,918 | 6.3 | ||||||||||||||
| Depreciation and amortization | 779 | 799 | (2.5) | 3,184 | 2,985 | 6.7 | ||||||||||||||
| Operating expenses | 6,464 | 6,482 | (0.3) | 25,425 | 23,903 | 6.4 | ||||||||||||||
| Operating means. Consolidated | |||||||||||||||||||||||
| Employees | Branches | ||||||||||||||||||||||
| Dec-23 | Dec-22 | Change | Dec-23 | Dec-22 | Change | ||||||||||||||||||
| Europe | 67,457 | 65,581 | 1,876 | 3,083 | 3,148 | (65) | |||||||||||||||||
| Spain | 26,834 | 26,839 | (5) | 1,874 | 1,913 | (39) | |||||||||||||||||
| United Kingdom | 22,280 | 21,185 | 1,095 | 444 | 449 | (5) | |||||||||||||||||
| Portugal | 4,945 | 4,952 | (7) | 376 | 383 | (7) | |||||||||||||||||
| Poland | 10,822 | 10,532 | 290 | 381 | 395 | (14) | |||||||||||||||||
| Other | 2,576 | 2,073 | 503 | 8 | 8 | 0 | |||||||||||||||||
| North America | 45,593 | 44,518 | 1,075 | 1,784 | 1,854 | (70) | |||||||||||||||||
| US | 13,489 | 14,610 | (1,121) | 415 | 485 | (70) | |||||||||||||||||
| Mexico | 30,876 | 28,834 | 2,042 | 1,369 | 1,369 | 0 | |||||||||||||||||
| Other | 1,228 | 1,074 | 154 | — | — | — | |||||||||||||||||
| South America | 80,997 | 78,271 | 2,726 | 3,309 | 3,653 | (344) | |||||||||||||||||
| Brazil | 57,775 | 55,993 | 1,782 | 2,580 | 2,847 | (267) | |||||||||||||||||
| Chile | 9,948 | 9,773 | 175 | 248 | 283 | (35) | |||||||||||||||||
| Argentina | 8,455 | 8,251 | 204 | 322 | 375 | (53) | |||||||||||||||||
| Other | 4,819 | 4,254 | 565 | 159 | 148 | 11 | |||||||||||||||||
| Digital Consumer Bank | 16,795 | 16,193 | 602 | 342 | 364 | (22) | |||||||||||||||||
| Corporate Centre | 1,922 | 1,899 | 23 | ||||||||||||||||||||
| Total Group | 212,764 | 206,462 | 6,302 | 8,518 | 9,019 | (501) | |||||||||||||||||
.
| Underlying net loan-loss provisions. Consolidated | ||||||||||||||||||||
| EUR million | ||||||||||||||||||||
| Q4'23 | Q3'23 | Change (%) | 2023 | 2022 | Change (%) | |||||||||||||||
| Non-performing loans | 3,824 | 3,589 | 6.5 | 14,048 | 11,968 | 17.4 | ||||||||||||||
| Country-risk | 2 | 0 | — | 2 | 1 | 100.0 | ||||||||||||||
| Recovery of written-off assets | (405) | (323) | 25.4 | (1,592) | (1,460) | 9.0 | ||||||||||||||
| Net loan-loss provisions | 3,421 | 3,266 | 4.7 | 12,458 | 10,509 | 18.5 | ||||||||||||||
January - December 2023 | | 53 | ||||||
Business model | ||||||||||||||||||||||||||
| Group financial information | ||||||||||||||||||||||||||
| Loans and advances to customers. Consolidated | |||||||||||||||||
| EUR million | |||||||||||||||||
| Change | |||||||||||||||||
| Dec-23 | Dec-22 | Absolute | % | Dec-21 | |||||||||||||
| Commercial bills | 55,628 | 56,688 | (1,060) | (1.9) | 49,603 | ||||||||||||
| Secured loans | 554,375 | 565,609 | (11,234) | (2.0) | 542,404 | ||||||||||||
| Other term loans | 295,485 | 290,031 | 5,454 | 1.9 | 269,526 | ||||||||||||
| Finance leases | 38,723 | 39,833 | (1,110) | (2.8) | 38,503 | ||||||||||||
| Receivable on demand | 12,277 | 11,435 | 842 | 7.4 | 10,304 | ||||||||||||
| Credit cards receivable | 24,371 | 22,704 | 1,667 | 7.3 | 20,397 | ||||||||||||
| Impaired assets | 34,094 | 32,888 | 1,206 | 3.7 | 31,645 | ||||||||||||
| Gross loans and advances to customers (excl. reverse repos) | 1,014,953 | 1,019,188 | (4,235) | (0.4) | 962,382 | ||||||||||||
| Reverse repos | 44,184 | 39,500 | 4,684 | 11.9 | 33,264 | ||||||||||||
| Gross loans and advances to customers | 1,059,137 | 1,058,688 | 449 | — | 995,646 | ||||||||||||
| Loan-loss allowances | 22,788 | 22,684 | 104 | 0.5 | 22,964 | ||||||||||||
| Loans and advances to customers | 1,036,349 | 1,036,004 | 345 | — | 972,682 | ||||||||||||
| Total funds. Consolidated | |||||||||||||||||
| EUR million | |||||||||||||||||
| Change | |||||||||||||||||
| Dec-23 | Dec-22 | Absolute | % | Dec-21 | |||||||||||||
| Demand deposits | 661,262 | 710,232 | (48,970) | (6.9) | 717,728 | ||||||||||||
| Time deposits | 307,085 | 236,099 | 70,986 | 30.1 | 146,469 | ||||||||||||
| Mutual funds | 208,528 | 184,054 | 24,474 | 13.3 | 188,096 | ||||||||||||
| Customer funds | 1,176,875 | 1,130,385 | 46,490 | 4.1 | 1,052,293 | ||||||||||||
| Pension funds | 14,831 | 14,021 | 810 | 5.8 | 16,078 | ||||||||||||
| Managed portfolios | 36,414 | 32,184 | 4,230 | 13.1 | 31,138 | ||||||||||||
| Repos | 78,822 | 63,391 | 15,431 | 24.3 | 36,357 | ||||||||||||
| Total funds | 1,306,942 | 1,239,981 | 66,961 | 5.4 | 1,135,866 | ||||||||||||
Eligible capital (phased-in) 1. Consolidated | |||||||||||||||||
| EUR million | |||||||||||||||||
| Change | |||||||||||||||||
| Dec-23 | Dec-22 | Absolute | % | Dec-21 | |||||||||||||
| Capital stock and reserves | 121,185 | 116,956 | 4,230 | 3.6 | 114,806 | ||||||||||||
| Attributable profit | 11,076 | 9,605 | 1,471 | 15.3 | 8,124 | ||||||||||||
| Dividends | (2,769) | (1,921) | (848) | 44.1 | (1,731) | ||||||||||||
| Other retained earnings | (34,484) | (35,068) | 584 | (1.7) | (34,395) | ||||||||||||
| Minority interests | 6,899 | 7,416 | (518) | (7.0) | 6,736 | ||||||||||||
| Goodwill and intangible assets | (17,220) | (17,182) | (38) | 0.2 | (16,064) | ||||||||||||
| Other deductions | (7,946) | (5,604) | (2,342) | 41.8 | (5,076) | ||||||||||||
| Core CET1 | 76,741 | 74,202 | 2,539 | 3.4 | 72,402 | ||||||||||||
| Preferred shares and other eligible tier 1 | 9,002 | 8,831 | 171 | 1.9 | 10,050 | ||||||||||||
| Tier 1 | 85,742 | 83,033 | 2,709 | 3.3 | 82,452 | ||||||||||||
| Generic funds and eligible tier 2 instruments | 16,497 | 14,359 | 2,138 | 14.9 | 14,865 | ||||||||||||
| Eligible capital | 102,240 | 97,392 | 4,848 | 5.0 | 97,317 | ||||||||||||
| Risk-weighted assets | 623,731 | 609,266 | 14,465 | 2.4 | 578,930 | ||||||||||||
| CET1 capital ratio | 12.3 | 12.2 | 0.1 | 12.5 | |||||||||||||
| Tier 1 capital ratio | 13.7 | 13.6 | 0.1 | 14.2 | |||||||||||||
| Total capital ratio | 16.4 | 16.0 | 0.4 | 16.8 | |||||||||||||
1. The phased-in ratio includes the transitory treatment of IFRS 9, calculated in accordance with article 473 bis of the Capital Requirements Regulation (CRR2) and subsequent modifications introduced by Regulation 2020/873 of the European Union. Total phased-in capital ratios include the transitory treatment according to chapter 4, title 1, part 10 of the CRR2.
| 54 | | January - December 2023 | ||||||
Business model | ||||||||||||||||||||||||||
| Financial information by segment | ||||||||||||||||||||||||||
| EUROPE | |||||||||||||||||||||||
| EUR million | |||||||||||||||||||||||
| / | Q3'23 | / | 2022 | ||||||||||||||||||||
| Underlying income statement | Q4'23 | % | % excl. FX | 2023 | % | % excl. FX | |||||||||||||||||
| Net interest income | 4,123 | (2.4) | (2.4) | 15,910 | 26.6 | 27.0 | |||||||||||||||||
| Net fee income | 1,071 | (1.2) | (1.4) | 4,399 | (2.1) | (2.2) | |||||||||||||||||
Gains (losses) on financial transactions 1 | 189 | (48.5) | (48.7) | 1,033 | 25.9 | 25.8 | |||||||||||||||||
| Other operating income | (172) | — | — | 97 | (35.8) | (34.2) | |||||||||||||||||
| Total income | 5,211 | (9.6) | (9.7) | 21,439 | 18.9 | 19.2 | |||||||||||||||||
| Administrative expenses and amortizations | (2,357) | 2.9 | 3.0 | (9,030) | 5.9 | 6.4 | |||||||||||||||||
| Net operating income | 2,854 | (17.9) | (18.1) | 12,409 | 30.5 | 30.5 | |||||||||||||||||
| Net loan-loss provisions | (582) | (12.0) | (12.4) | (2,533) | 5.7 | 5.4 | |||||||||||||||||
| Other gains (losses) and provisions | (415) | 15.0 | 14.9 | (1,681) | 3.2 | 2.8 | |||||||||||||||||
| Profit before tax | 1,856 | (24.3) | (24.5) | 8,195 | 49.5 | 49.9 | |||||||||||||||||
| Tax on profit | (482) | (30.9) | (31.1) | (2,371) | 58.9 | 59.2 | |||||||||||||||||
| Profit from continuing operations | 1,374 | (21.6) | (21.9) | 5,824 | 46.0 | 46.4 | |||||||||||||||||
| Net profit from discontinued operations | — | — | — | — | — | — | |||||||||||||||||
| Consolidated profit | 1,374 | (21.6) | (21.9) | 5,824 | 46.0 | 46.4 | |||||||||||||||||
| Non-controlling interests | (68) | (39.9) | (41.9) | (342) | 90.6 | 84.7 | |||||||||||||||||
| Profit attributable to the parent | 1,306 | (20.4) | (20.5) | 5,482 | 43.9 | 44.6 | |||||||||||||||||
| Balance sheet | |||||||||||||||||||||||
| Loans and advances to customers | 570,067 | (0.2) | (0.5) | 570,067 | (3.6) | (4.8) | |||||||||||||||||
| Cash, central banks and credit institutions | 198,451 | (2.2) | (2.5) | 198,451 | (8.3) | (9.1) | |||||||||||||||||
| Debt instruments | 115,428 | 7.1 | 6.3 | 115,428 | 51.2 | 49.1 | |||||||||||||||||
| Other financial assets | 44,538 | (12.0) | (12.0) | 44,538 | (6.7) | (6.7) | |||||||||||||||||
| Other asset accounts | 26,860 | 1.0 | 0.7 | 26,860 | 1.1 | 0.5 | |||||||||||||||||
| Total assets | 955,344 | (0.4) | (0.7) | 955,344 | (0.3) | (1.4) | |||||||||||||||||
| Customer deposits | 644,921 | 1.3 | 1.0 | 644,921 | 0.2 | (1.1) | |||||||||||||||||
| Central banks and credit institutions | 104,164 | (6.9) | (6.9) | 104,164 | (7.2) | (7.9) | |||||||||||||||||
| Marketable debt securities | 79,095 | 0.0 | (0.1) | 79,095 | 10.3 | 8.7 | |||||||||||||||||
| Other financial liabilities | 53,361 | (13.6) | (13.6) | 53,361 | (11.1) | (11.2) | |||||||||||||||||
| Other liabilities accounts | 29,633 | 5.4 | 4.9 | 29,633 | 8.5 | 8.0 | |||||||||||||||||
| Total liabilities | 911,173 | (0.7) | (0.9) | 911,173 | (0.4) | (1.5) | |||||||||||||||||
| Total equity | 44,171 | 4.9 | 4.1 | 44,171 | 2.6 | 1.2 | |||||||||||||||||
| Memorandum items: | |||||||||||||||||||||||
Gross loans and advances to customers 2 | 551,722 | (0.1) | (0.4) | 551,722 | (4.8) | (6.0) | |||||||||||||||||
| Customer funds | 725,417 | 2.2 | 1.8 | 725,417 | 0.6 | (0.5) | |||||||||||||||||
Customer deposits 3 | 620,299 | 1.9 | 1.5 | 620,299 | (1.2) | (2.4) | |||||||||||||||||
| Mutual funds | 105,118 | 3.9 | 3.8 | 105,118 | 12.7 | 12.2 | |||||||||||||||||
| Ratios (%), operating means and customers | |||||||||||||||||||||||
| RoTE | 13.52 | (3.76) | 14.47 | 5.19 | |||||||||||||||||||
| Efficiency ratio | 45.2 | 5.5 | 42.1 | (5.2) | |||||||||||||||||||
| NPL ratio | 2.32 | 0.00 | 2.32 | (0.05) | |||||||||||||||||||
| NPL coverage ratio | 49.3 | (1.8) | 49.3 | (2.5) | |||||||||||||||||||
| Number of employees | 67,457 | 0.5 | 67,457 | 2.9 | |||||||||||||||||||
| Number of branches | 3,083 | (0.4) | 3,083 | (2.1) | |||||||||||||||||||
| Number of total customers (thousands) | 46,293 | (0.2) | 46,293 | 1.6 | |||||||||||||||||||
| Number of active customers (thousands) | 28,538 | 0.0 | 28,538 | 1.5 | |||||||||||||||||||
1. Includes exchange differences.
2. Excluding reverse repos.
3. Excluding repos.
January - December 2023 | | 55 | ||||||
Business model | ||||||||||||||||||||||||||
| Financial information by segment | ||||||||||||||||||||||||||
| Spain | |||||||||||||||||
| EUR million | |||||||||||||||||
| / Q3'23 | / 2022 | ||||||||||||||||
| Underlying income statement | Q4'23 | % | 2023 | % | |||||||||||||
| Net interest income | 1,738 | (0.2) | 6,641 | 46.3 | |||||||||||||
| Net fee income | 652 | 2.7 | 2,699 | (4.2) | |||||||||||||
Gains (losses) on financial transactions 1 | 131 | (42.0) | 688 | 12.3 | |||||||||||||
| Other operating income | (179) | — | 105 | (60.4) | |||||||||||||
| Total income | 2,341 | (12.6) | 10,132 | 23.1 | |||||||||||||
| Administrative expenses and amortizations | (1,100) | 1.2 | (4,227) | 5.7 | |||||||||||||
| Net operating income | 1,241 | (22.0) | 5,905 | 39.4 | |||||||||||||
| Net loan-loss provisions | (342) | (9.1) | (1,522) | (5.9) | |||||||||||||
| Other gains (losses) and provisions | (191) | (4.9) | (984) | 82.4 | |||||||||||||
| Profit before tax | 707 | (30.2) | 3,399 | 63.5 | |||||||||||||
| Tax on profit | (191) | (34.3) | (1,029) | 98.5 | |||||||||||||
| Profit from continuing operations | 516 | (28.5) | 2,371 | 51.9 | |||||||||||||
| Net profit from discontinued operations | — | — | — | — | |||||||||||||
| Consolidated profit | 516 | (28.5) | 2,371 | 51.9 | |||||||||||||
| Non-controlling interests | 0 | 80.8 | 0 | (26.2) | |||||||||||||
| Profit attributable to the parent | 516 | (28.5) | 2,371 | 51.9 | |||||||||||||
| Balance sheet | |||||||||||||||||
| Loans and advances to customers | 239,214 | (1.3) | 239,214 | (6.7) | |||||||||||||
| Cash, central banks and credit institutions | 116,317 | (4.4) | 116,317 | (9.9) | |||||||||||||
| Debt instruments | 70,072 | 10.5 | 70,072 | 66.8 | |||||||||||||
| Other financial assets | 40,926 | (12.0) | 40,926 | (6.0) | |||||||||||||
| Other asset accounts | 17,075 | (4.8) | 17,075 | (5.1) | |||||||||||||
| Total assets | 483,603 | (1.7) | 483,603 | (1.1) | |||||||||||||
| Customer deposits | 324,099 | 0.5 | 324,099 | (1.6) | |||||||||||||
| Central banks and credit institutions | 44,802 | (11.1) | 44,802 | 3.9 | |||||||||||||
| Marketable debt securities | 28,486 | 2.6 | 28,486 | 20.3 | |||||||||||||
| Other financial liabilities | 46,532 | (13.9) | 46,532 | (12.0) | |||||||||||||
| Other liabilities accounts | 22,264 | 10.4 | 22,264 | 13.6 | |||||||||||||
| Total liabilities | 466,184 | (1.8) | 466,184 | (0.5) | |||||||||||||
| Total equity | 17,419 | 2.7 | 17,419 | (14.6) | |||||||||||||
| Memorandum items: | |||||||||||||||||
Gross loans and advances to customers 2 | 229,803 | (0.6) | 229,803 | (8.0) | |||||||||||||
| Customer funds | 386,810 | 1.5 | 386,810 | (2.0) | |||||||||||||
Customer deposits 3 | 308,745 | 1.0 | 308,745 | (4.2) | |||||||||||||
| Mutual funds | 78,065 | 3.7 | 78,065 | 7.8 | |||||||||||||
| Ratios (%), operating means and customers | |||||||||||||||||
| RoTE | 12.38 | (5.03) | 14.16 | 6.27 | |||||||||||||
| Efficiency ratio | 47.0 | 6.4 | 41.7 | (6.8) | |||||||||||||
| NPL ratio | 3.06 | 0.00 | 3.06 | (0.21) | |||||||||||||
| NPL coverage ratio | 49.1 | (2.1) | 49.1 | (1.9) | |||||||||||||
| Number of employees | 26,834 | 0.1 | 26,834 | — | |||||||||||||
| Number of branches | 1,874 | (0.4) | 1,874 | (2.0) | |||||||||||||
| Number of total customers (thousands) | 15,023 | 0.9 | 15,023 | 4.9 | |||||||||||||
| Number of active customers (thousands) | 8,367 | 1.7 | 8,367 | 6.6 | |||||||||||||
1. Includes exchange differences.
2. Excluding reverse repos.
3. Excluding repos.
| 56 | | January - December 2023 | ||||||
Business model | ||||||||||||||||||||||||||
| Financial information by segment | ||||||||||||||||||||||||||
| United Kingdom | |||||||||||||||||||||||
| EUR million | |||||||||||||||||||||||
| / | Q3'23 | / | 2022 | ||||||||||||||||||||
| Underlying income statement | Q4'23 | % | % excl. FX | 2023 | % | % excl. FX | |||||||||||||||||
| Net interest income | 1,225 | (8.9) | (8.1) | 5,152 | 3.2 | 5.3 | |||||||||||||||||
| Net fee income | 74 | (23.3) | (22.8) | 338 | (13.3) | (11.5) | |||||||||||||||||
Gains (losses) on financial transactions 1 | (19) | — | — | 29 | (4.6) | (2.7) | |||||||||||||||||
| Other operating income | 0 | — | — | 5 | (7.2) | (5.3) | |||||||||||||||||
| Total income | 1,280 | (13.9) | (13.3) | 5,525 | 2.0 | 4.0 | |||||||||||||||||
| Administrative expenses and amortizations | (698) | 2.1 | 3.0 | (2,745) | 2.2 | 4.3 | |||||||||||||||||
| Net operating income | 581 | (27.6) | (27.1) | 2,779 | 1.7 | 3.7 | |||||||||||||||||
| Net loan-loss provisions | (18) | (85.6) | (85.7) | (247) | (21.7) | (20.1) | |||||||||||||||||
| Other gains (losses) and provisions | (168) | 81.9 | 83.6 | (425) | (17.9) | (16.3) | |||||||||||||||||
| Profit before tax | 396 | (32.3) | (31.8) | 2,107 | 10.9 | 13.1 | |||||||||||||||||
| Tax on profit | (94) | (40.9) | (40.5) | (563) | 11.4 | 13.6 | |||||||||||||||||
| Profit from continuing operations | 301 | (29.1) | (28.6) | 1,545 | 10.8 | 13.0 | |||||||||||||||||
| Net profit from discontinued operations | — | — | — | — | — | — | |||||||||||||||||
| Consolidated profit | 301 | (29.1) | (28.6) | 1,545 | 10.8 | 13.0 | |||||||||||||||||
| Non-controlling interests | — | — | — | — | — | — | |||||||||||||||||
| Profit attributable to the parent | 301 | (29.1) | (28.6) | 1,545 | 10.8 | 13.0 | |||||||||||||||||
| Balance sheet | |||||||||||||||||||||||
| Loans and advances to customers | 245,743 | (0.9) | (0.9) | 245,743 | (2.4) | (4.5) | |||||||||||||||||
| Cash, central banks and credit institutions | 62,387 | (5.3) | (5.2) | 62,387 | (5.4) | (7.5) | |||||||||||||||||
| Debt instruments | 10,234 | 7.0 | 7.0 | 10,234 | 40.3 | 37.3 | |||||||||||||||||
| Other financial assets | 289 | (18.8) | (18.8) | 289 | (52.0) | (53.0) | |||||||||||||||||
| Other asset accounts | 4,363 | 32.2 | 32.3 | 4,363 | 32.5 | 29.7 | |||||||||||||||||
| Total assets | 323,016 | (1.3) | (1.2) | 323,016 | (1.8) | (3.9) | |||||||||||||||||
| Customer deposits | 233,453 | 1.0 | 1.1 | 233,453 | 1.1 | (1.0) | |||||||||||||||||
| Central banks and credit institutions | 28,202 | (13.9) | (13.8) | 28,202 | (23.8) | (25.5) | |||||||||||||||||
| Marketable debt securities | 43,850 | (3.2) | (3.1) | 43,850 | (0.5) | (2.7) | |||||||||||||||||
| Other financial liabilities | 3,434 | (14.8) | (14.7) | 3,434 | (3.2) | (5.3) | |||||||||||||||||
| Other liabilities accounts | 1,704 | 44.8 | 44.9 | 1,704 | 9.7 | 7.4 | |||||||||||||||||
| Total liabilities | 310,642 | (1.2) | (1.1) | 310,642 | (2.0) | (4.1) | |||||||||||||||||
| Total equity | 12,373 | (3.3) | (3.2) | 12,373 | 3.1 | 0.9 | |||||||||||||||||
| Memorandum items: | |||||||||||||||||||||||
Gross loans and advances to customers 2 | 235,111 | (1.3) | (1.3) | 235,111 | (4.0) | (6.0) | |||||||||||||||||
| Customer funds | 231,667 | 1.8 | 1.9 | 231,667 | 1.2 | (1.0) | |||||||||||||||||
Customer deposits 3 | 224,396 | 1.8 | 1.8 | 224,396 | 1.1 | (1.0) | |||||||||||||||||
| Mutual funds | 7,272 | 3.1 | 3.2 | 7,272 | 2.3 | 0.1 | |||||||||||||||||
| Ratios (%), operating means and customers | |||||||||||||||||||||||
| RoTE | 10.05 | (4.21) | 13.01 | 2.31 | |||||||||||||||||||
| Efficiency ratio | 54.6 | 8.6 | 49.7 | 0.1 | |||||||||||||||||||
| NPL ratio | 1.42 | 0.0 | 1.42 | 0.22 | |||||||||||||||||||
| NPL coverage ratio | 30.3 | (1.6) | 30.3 | (3.4) | |||||||||||||||||||
| Number of employees | 22,280 | 0.3 | 22,280 | 5.2 | |||||||||||||||||||
| Number of branches | 444 | 0.0 | 444 | (1.1) | |||||||||||||||||||
| Number of total customers (thousands) | 22,481 | (0.1) | 22,481 | 0.3 | |||||||||||||||||||
| Number of active customers (thousands) | 13,864 | (0.3) | 13,864 | (0.9) | |||||||||||||||||||
1. Includes exchange differences.
2. Excluding reverse repos.
3. Excluding repos.
January - December 2023 | | 57 | ||||||
Business model | ||||||||||||||||||||||||||
| Financial information by segment | ||||||||||||||||||||||||||
| Portugal | |||||||||||||||||
| EUR million | |||||||||||||||||
| / Q3'23 | / 2022 | ||||||||||||||||
| Underlying income statement | Q4'23 | % | 2023 | % | |||||||||||||
| Net interest income | 451 | 2.7 | 1,465 | 96.2 | |||||||||||||
| Net fee income | 111 | (5.1) | 464 | (4.2) | |||||||||||||
Gains (losses) on financial transactions 1 | 13 | 56.5 | 33 | (41.0) | |||||||||||||
| Other operating income | 9 | (12.3) | 21 | 152.5 | |||||||||||||
| Total income | 584 | 1.6 | 1,982 | 53.1 | |||||||||||||
| Administrative expenses and amortizations | (141) | 3.0 | (542) | 8.1 | |||||||||||||
| Net operating income | 443 | 1.2 | 1,440 | 81.6 | |||||||||||||
| Net loan-loss provisions | (18) | (25.6) | (77) | 353.6 | |||||||||||||
| Other gains (losses) and provisions | (1) | (82.8) | (49) | — | |||||||||||||
| Profit before tax | 423 | 4.2 | 1,314 | 69.4 | |||||||||||||
| Tax on profit | (131) | 6.6 | (416) | 73.2 | |||||||||||||
| Profit from continuing operations | 293 | 3.2 | 898 | 67.8 | |||||||||||||
| Net profit from discontinued operations | — | — | — | — | |||||||||||||
| Consolidated profit | 293 | 3.2 | 898 | 67.8 | |||||||||||||
| Non-controlling interests | (1) | (17.2) | (2) | 38.9 | |||||||||||||
| Profit attributable to the parent | 292 | 3.2 | 896 | 67.9 | |||||||||||||
| Balance sheet | |||||||||||||||||
| Loans and advances to customers | 36,864 | (0.4) | 36,864 | (5.8) | |||||||||||||
| Cash, central banks and credit institutions | 8,084 | 25.7 | 8,084 | (16.1) | |||||||||||||
| Debt instruments | 10,991 | (6.7) | 10,991 | 39.4 | |||||||||||||
| Other financial assets | 1,078 | (2.9) | 1,078 | (1.6) | |||||||||||||
| Other asset accounts | 1,279 | 3.3 | 1,279 | (13.7) | |||||||||||||
| Total assets | 58,297 | 1.2 | 58,297 | (1.6) | |||||||||||||
| Customer deposits | 36,366 | 2.4 | 36,366 | (5.6) | |||||||||||||
| Central banks and credit institutions | 9,237 | 8.1 | 9,237 | 0.6 | |||||||||||||
| Marketable debt securities | 4,813 | (1.6) | 4,813 | 46.4 | |||||||||||||
| Other financial liabilities | 319 | (15.2) | 319 | (28.8) | |||||||||||||
| Other liabilities accounts | 3,725 | (18.7) | 3,725 | (16.6) | |||||||||||||
| Total liabilities | 54,460 | 1.0 | 54,460 | (2.6) | |||||||||||||
| Total equity | 3,837 | 4.6 | 3,837 | 15.1 | |||||||||||||
| Memorandum items: | |||||||||||||||||
Gross loans and advances to customers 2 | 37,658 | (0.4) | 37,658 | (6.0) | |||||||||||||
| Customer funds | 40,618 | 2.6 | 40,618 | (3.6) | |||||||||||||
Customer deposits 3 | 36,366 | 2.4 | 36,366 | (5.6) | |||||||||||||
| Mutual funds | 4,252 | 4.4 | 4,252 | 17.4 | |||||||||||||
| Ratios (%), operating means and customers | |||||||||||||||||
| RoTE | 34.58 | 3.02 | 25.92 | 10.89 | |||||||||||||
| Efficiency ratio | 24.1 | 0.3 | 27.3 | (11.4) | |||||||||||||
| NPL ratio | 2.59 | 0.11 | 2.59 | (0.39) | |||||||||||||
| NPL coverage ratio | 82.7 | (1.8) | 82.7 | 3.4 | |||||||||||||
| Number of employees | 4,945 | (0.7) | 4,945 | (0.1) | |||||||||||||
| Number of branches | 376 | 0.0 | 376 | (1.8) | |||||||||||||
| Number of total customers (thousands) | 2,908 | 0.2 | 2,908 | (0.5) | |||||||||||||
| Number of active customers (thousands) | 1,838 | 1.5 | 1,838 | 3.0 | |||||||||||||
1. Includes exchange differences.
2. Excluding reverse repos.
3. Excluding repos.
| 58 | | January - December 2023 | ||||||
Business model | ||||||||||||||||||||||||||
| Financial information by segment | ||||||||||||||||||||||||||
| Poland | |||||||||||||||||||||||
| EUR million | |||||||||||||||||||||||
| / | Q3'23 | / | 2022 | ||||||||||||||||||||
| Underlying income statement | Q4'23 | % | % excl. FX | 2023 | % | % excl. FX | |||||||||||||||||
| Net interest income | 673 | 1.6 | (0.3) | 2,543 | 28.7 | 24.7 | |||||||||||||||||
| Net fee income | 153 | 3.3 | 1.4 | 589 | 11.6 | 8.1 | |||||||||||||||||
Gains (losses) on financial transactions 1 | 5 | (84.0) | (85.9) | 67 | (28.2) | (30.4) | |||||||||||||||||
| Other operating income | 8 | — | — | (17) | (85.8) | (86.3) | |||||||||||||||||
| Total income | 838 | 0.4 | (1.5) | 3,182 | 28.6 | 24.6 | |||||||||||||||||
| Administrative expenses and amortizations | (240) | 10.7 | 8.9 | (862) | 24.6 | 20.7 | |||||||||||||||||
| Net operating income | 598 | (3.2) | (5.2) | 2,320 | 30.1 | 26.1 | |||||||||||||||||
| Net loan-loss provisions | (199) | 51.0 | 49.8 | (674) | 53.2 | 48.5 | |||||||||||||||||
| Other gains (losses) and provisions | (88) | 46.4 | 44.8 | (253) | (54.2) | (55.6) | |||||||||||||||||
| Profit before tax | 310 | (27.0) | (29.1) | 1,392 | 76.4 | 71.0 | |||||||||||||||||
| Tax on profit | (97) | (8.7) | (10.6) | (377) | 52.7 | 47.9 | |||||||||||||||||
| Profit from continuing operations | 213 | (33.2) | (35.3) | 1,015 | 87.3 | 81.5 | |||||||||||||||||
| Net profit from discontinued operations | — | — | — | — | — | — | |||||||||||||||||
| Consolidated profit | 213 | (33.2) | (35.3) | 1,015 | 87.3 | 81.5 | |||||||||||||||||
| Non-controlling interests | (68) | (38.6) | (40.7) | (342) | 91.2 | 85.3 | |||||||||||||||||
| Profit attributable to the parent | 145 | (30.3) | (32.4) | 674 | 85.3 | 79.6 | |||||||||||||||||
| Balance sheet | |||||||||||||||||||||||
| Loans and advances to customers | 33,850 | 7.9 | 1.4 | 33,850 | 14.1 | 5.8 | |||||||||||||||||
| Cash, central banks and credit institutions | 9,289 | 0.3 | (5.8) | 9,289 | 4.4 | (3.2) | |||||||||||||||||
| Debt instruments | 15,070 | 5.2 | (1.1) | 15,070 | 27.0 | 17.8 | |||||||||||||||||
| Other financial assets | 733 | 19.5 | 12.3 | 733 | 16.8 | 8.3 | |||||||||||||||||
| Other asset accounts | 1,974 | 4.0 | (2.2) | 1,974 | 22.2 | 13.3 | |||||||||||||||||
| Total assets | 60,916 | 6.0 | (0.4) | 60,916 | 15.7 | 7.2 | |||||||||||||||||
| Customer deposits | 44,500 | 5.4 | (1.0) | 44,500 | 13.2 | 5.0 | |||||||||||||||||
| Central banks and credit institutions | 4,623 | 0.2 | (5.8) | 4,623 | (7.0) | (13.7) | |||||||||||||||||
| Marketable debt securities | 1,945 | 68.8 | 58.6 | 1,945 | 185.6 | 164.8 | |||||||||||||||||
| Other financial liabilities | 1,706 | 22.2 | 14.9 | 1,706 | 44.7 | 34.2 | |||||||||||||||||
| Other liabilities accounts | 1,687 | (5.5) | (11.2) | 1,687 | 22.4 | 13.5 | |||||||||||||||||
| Total liabilities | 54,462 | 6.4 | 0.0 | 54,462 | 14.6 | 6.3 | |||||||||||||||||
| Total equity | 6,454 | 2.5 | (3.7) | 6,454 | 25.1 | 16.0 | |||||||||||||||||
| Memorandum items: | |||||||||||||||||||||||
Gross loans and advances to customers 2 | 34,729 | 7.6 | 1.1 | 34,729 | 13.8 | 5.5 | |||||||||||||||||
| Customer funds | 49,371 | 6.5 | 0.1 | 49,371 | 16.5 | 8.0 | |||||||||||||||||
Customer deposits 3 | 44,462 | 5.3 | (1.0) | 44,462 | 13.1 | 4.9 | |||||||||||||||||
| Mutual funds | 4,909 | 19.2 | 12.0 | 4,909 | 59.9 | 48.2 | |||||||||||||||||
| Ratios (%), operating means and customers | |||||||||||||||||||||||
| RoTE | 14.11 | (6.68) | 17.68 | 5.75 | |||||||||||||||||||
| Efficiency ratio | 28.7 | 2.7 | 27.1 | (0.9) | |||||||||||||||||||
| NPL ratio | 3.55 | (0.08) | 3.55 | (0.25) | |||||||||||||||||||
| NPL coverage ratio | 73.3 | (3.2) | 73.3 | (0.6) | |||||||||||||||||||
| Number of employees | 10,822 | 0.9 | 10,822 | 2.8 | |||||||||||||||||||
| Number of branches | 381 | (1.3) | 381 | (3.5) | |||||||||||||||||||
| Number of total customers (thousands) | 5,877 | 0.3 | 5,877 | 3.2 | |||||||||||||||||||
| Number of active customers (thousands) | 4,465 | 0.8 | 4,465 | 3.4 | |||||||||||||||||||
1. Includes exchange differences.
2. Excluding reverse repos.
3. Excluding repos.
January - December 2023 | | 59 | ||||||
Business model | ||||||||||||||||||||||||||
| Financial information by segment | ||||||||||||||||||||||||||
| Other Europe | ||||||||||||||||||||||||||
| EUR million | ||||||||||||||||||||||||||
| / | Q3'23 | / | 2022 | |||||||||||||||||||||||
| Underlying income statement | Q4'23 | % | % excl. FX | 2023 | % | % excl. FX | ||||||||||||||||||||
| Net interest income | 36 | 1.2 | (0.3) | 109 | (65.0) | (64.4) | ||||||||||||||||||||
| Net fee income | 81 | (7.3) | (7.7) | 309 | 13.2 | 14.7 | ||||||||||||||||||||
Gains (losses) on financial transactions 1 | 60 | (1.8) | (2.2) | 217 | 641.1 | 685.2 | ||||||||||||||||||||
| Other operating income | (9) | — | — | (16) | 249.6 | 266.1 | ||||||||||||||||||||
| Total income | 168 | (12.2) | (12.7) | 618 | 1.6 | 3.2 | ||||||||||||||||||||
| Administrative expenses and amortizations | (177) | 6.9 | 6.5 | (653) | 1.1 | 2.1 | ||||||||||||||||||||
| Net operating income | (9) | — | — | (35) | (6.5) | (14.4) | ||||||||||||||||||||
| Net loan-loss provisions | (4) | 64.3 | 64.7 | (12) | 112.3 | 112.2 | ||||||||||||||||||||
| Other gains (losses) and provisions | 33 | — | — | 30 | — | — | ||||||||||||||||||||
| Profit before tax | 20 | (11.4) | (13.1) | (17) | (71.5) | (72.8) | ||||||||||||||||||||
| Tax on profit | 31 | — | — | 13 | (28.5) | (31.7) | ||||||||||||||||||||
| Profit from continuing operations | 50 | — | — | (5) | (89.1) | (89.6) | ||||||||||||||||||||
| Net profit from discontinued operations | 0 | — | — | — | — | — | ||||||||||||||||||||
| Consolidated profit | 50 | — | — | (5) | (89.1) | (89.6) | ||||||||||||||||||||
| Non-controlling interests | 1 | — | — | 2 | 103.7 | 103.7 | ||||||||||||||||||||
| Profit attributable to the parent | 52 | — | — | (3) | (93.7) | (94.0) | ||||||||||||||||||||
| Balance sheet | ||||||||||||||||||||||||||
| Loans and advances to customers | 14,397 | 12.8 | 17.6 | 14,397 | 1.3 | 4.7 | ||||||||||||||||||||
| Cash, central banks and credit institutions | 2,374 | — | — | 2,374 | (12.2) | (10.3) | ||||||||||||||||||||
| Debt instruments | 9,060 | 4.4 | 5.1 | 9,060 | 24.7 | 24.9 | ||||||||||||||||||||
| Other financial assets | 1,512 | (27.0) | (24.3) | 1,512 | (18.6) | (16.1) | ||||||||||||||||||||
| Other asset accounts | 2,170 | (2.1) | (0.3) | 2,170 | (0.5) | 1.1 | ||||||||||||||||||||
| Total assets | 29,512 | 16.1 | 19.1 | 29,512 | 4.6 | 6.9 | ||||||||||||||||||||
| Customer deposits | 6,503 | 27.2 | 33.3 | 6,503 | 11.6 | 15.4 | ||||||||||||||||||||
| Central banks and credit institutions | 17,300 | 11.1 | 13.0 | 17,300 | (3.7) | (2.1) | ||||||||||||||||||||
| Marketable debt securities | — | — | — | — | — | — | ||||||||||||||||||||
| Other financial liabilities | 1,369 | (29.4) | (26.6) | 1,369 | (30.1) | (28.0) | ||||||||||||||||||||
| Other liabilities accounts | 253 | (38.9) | (38.4) | 253 | (16.3) | (15.9) | ||||||||||||||||||||
| Total liabilities | 25,425 | 10.4 | 13.2 | 25,425 | (2.4) | (0.3) | ||||||||||||||||||||
| Total equity | 4,087 | 71.4 | 76.8 | 4,087 | 89.9 | 95.2 | ||||||||||||||||||||
| Memorandum items: | ||||||||||||||||||||||||||
Gross loans and advances to customers 2 | 14,420 | 12.8 | 17.6 | 14,420 | 1.4 | 4.7 | ||||||||||||||||||||
| Customer funds | 16,951 | 8.7 | 11.4 | 16,951 | 33.1 | 35.1 | ||||||||||||||||||||
Customer deposits 3 | 6,330 | 28.2 | 34.6 | 6,330 | 11.9 | 15.8 | ||||||||||||||||||||
| Mutual funds | 10,621 | (0.4) | 1.0 | 10,621 | 50.0 | 50.0 | ||||||||||||||||||||
| Resources | ||||||||||||||||||||||||||
| Number of employees | 2,576 | 6.2 | 2,576 | 24.3 | ||||||||||||||||||||||
1. Includes exchange differences.
2. Excluding reverse repos.
3. Excluding repos.
| 60 | | January - December 2023 | ||||||
Business model | ||||||||||||||||||||||||||
| Financial information by segment | ||||||||||||||||||||||||||
| NORTH AMERICA | |||||||||||||||||||||||
| EUR million | |||||||||||||||||||||||
| / | Q3'23 | / | 2022 | ||||||||||||||||||||
| Underlying income statement | Q4'23 | % | % excl. FX | 2023 | % | % excl. FX | |||||||||||||||||
| Net interest income | 2,626 | 0.9 | 1.0 | 10,159 | 4.7 | 2.6 | |||||||||||||||||
| Net fee income | 555 | (0.9) | (0.2) | 2,192 | 11.9 | 6.7 | |||||||||||||||||
Gains (losses) on financial transactions 1 | 128 | (13.0) | (12.8) | 505 | 147.3 | 147.9 | |||||||||||||||||
| Other operating income | 57 | (29.5) | (30.9) | 318 | (29.1) | (24.4) | |||||||||||||||||
| Total income | 3,366 | (0.7) | (0.6) | 13,174 | 7.0 | 4.7 | |||||||||||||||||
| Administrative expenses and amortizations | (1,758) | 6.7 | 6.7 | (6,465) | 10.1 | 8.0 | |||||||||||||||||
| Net operating income | 1,608 | (7.7) | (7.6) | 6,708 | 4.1 | 1.7 | |||||||||||||||||
| Net loan-loss provisions | (1,126) | 4.5 | 4.3 | (3,733) | 47.1 | 45.2 | |||||||||||||||||
| Other gains (losses) and provisions | (14) | (61.7) | (62.3) | (138) | 17.4 | 9.0 | |||||||||||||||||
| Profit before tax | 469 | (25.5) | (25.1) | 2,837 | (25.1) | (27.2) | |||||||||||||||||
| Tax on profit | (14) | (80.2) | (82.0) | (468) | (46.1) | (47.9) | |||||||||||||||||
| Profit from continuing operations | 454 | (18.2) | (17.9) | 2,369 | (18.9) | (21.1) | |||||||||||||||||
| Net profit from discontinued operations | — | — | — | — | — | — | |||||||||||||||||
| Consolidated profit | 454 | (18.2) | (17.9) | 2,369 | (18.9) | (21.1) | |||||||||||||||||
| Non-controlling interests | — | — | — | (15) | (64.9) | (68.3) | |||||||||||||||||
| Profit attributable to the parent | 454 | (18.0) | (17.6) | 2,354 | (18.2) | (20.3) | |||||||||||||||||
| Balance sheet | |||||||||||||||||||||||
| Loans and advances to customers | 174,780 | (2.2) | 1.4 | 174,780 | 1.9 | 1.8 | |||||||||||||||||
| Cash, central banks and credit institutions | 35,969 | (12.4) | (9.7) | 35,969 | 1.0 | (1.9) | |||||||||||||||||
| Debt instruments | 50,311 | 0.3 | 3.2 | 50,311 | 14.2 | 9.7 | |||||||||||||||||
| Other financial assets | 10,937 | (20.7) | (18.4) | 10,937 | (25.4) | (29.6) | |||||||||||||||||
| Other asset accounts | 22,829 | (3.9) | (0.3) | 22,829 | 0.4 | 0.8 | |||||||||||||||||
| Total assets | 294,827 | (4.1) | (0.8) | 294,827 | 2.2 | 0.8 | |||||||||||||||||
| Customer deposits | 175,958 | (0.2) | 3.4 | 175,958 | 4.3 | 3.8 | |||||||||||||||||
| Central banks and credit institutions | 34,723 | (9.0) | (6.5) | 34,723 | 37.3 | 29.2 | |||||||||||||||||
| Marketable debt securities | 35,133 | (5.1) | (1.5) | 35,133 | (14.4) | (14.1) | |||||||||||||||||
| Other financial liabilities | 18,606 | (18.3) | (16.0) | 18,606 | (10.9) | (15.4) | |||||||||||||||||
| Other liabilities accounts | 6,764 | (5.1) | (2.2) | 6,764 | (2.6) | (5.0) | |||||||||||||||||
| Total liabilities | 271,183 | (3.6) | (0.3) | 271,183 | 3.1 | 1.8 | |||||||||||||||||
| Total equity | 23,644 | (9.7) | (6.7) | 23,644 | (7.9) | (9.1) | |||||||||||||||||
| Memorandum items: | |||||||||||||||||||||||
Gross loans and advances to customers 2 | 161,401 | (2.4) | 1.1 | 161,401 | 3.1 | 2.6 | |||||||||||||||||
| Customer funds | 171,310 | (0.2) | 3.2 | 171,310 | 4.2 | 3.0 | |||||||||||||||||
Customer deposits 3 | 141,863 | (0.6) | 2.9 | 141,863 | 4.3 | 3.7 | |||||||||||||||||
| Mutual funds | 29,447 | 1.9 | 4.7 | 29,447 | 3.5 | (0.3) | |||||||||||||||||
| Ratios (%), operating means and customers | |||||||||||||||||||||||
| RoTE | 7.74 | (1.24) | 9.76 | (1.30) | |||||||||||||||||||
| Efficiency ratio | 52.2 | 3.6 | 49.1 | 1.4 | |||||||||||||||||||
| NPL ratio | 4.09 | 0.26 | 4.09 | 1.06 | |||||||||||||||||||
| NPL coverage ratio | 73.8 | (5.0) | 73.8 | (19.4) | |||||||||||||||||||
| Number of employees | 45,593 | (0.5) | 45,593 | 2.4 | |||||||||||||||||||
| Number of branches | 1,784 | (0.3) | 1,784 | (3.8) | |||||||||||||||||||
| Number of total customers (thousands) | 25,027 | (0.1) | 25,027 | 0.2 | |||||||||||||||||||
| Number of active customers (thousands) | 14,486 | 1.4 | 14,486 | 3.3 | |||||||||||||||||||
1. Includes exchange differences.
2. Excluding reverse repos.
3. Excluding repos.
January - December 2023 | | 61 | ||||||
Business model | ||||||||||||||||||||||||||
| Financial information by segment | ||||||||||||||||||||||||||
| United States | |||||||||||||||||||||||
| EUR million | |||||||||||||||||||||||
| / | Q3'23 | / | 2022 | ||||||||||||||||||||
| Underlying income statement | Q4'23 | % | % excl. FX | 2023 | % | % excl. FX | |||||||||||||||||
| Net interest income | 1,428 | 1.0 | (0.2) | 5,742 | (6.5) | (3.8) | |||||||||||||||||
| Net fee income | 187 | (1.3) | (2.4) | 766 | (0.6) | 2.2 | |||||||||||||||||
Gains (losses) on financial transactions 1 | 79 | (20.3) | (21.0) | 294 | 79.2 | 84.3 | |||||||||||||||||
| Other operating income | 72 | (37.3) | (38.2) | 406 | (25.9) | (23.8) | |||||||||||||||||
| Total income | 1,767 | (2.8) | (4.0) | 7,209 | (5.4) | (2.7) | |||||||||||||||||
| Administrative expenses and amortizations | (964) | 5.4 | 4.2 | (3,679) | 2.2 | 5.1 | |||||||||||||||||
| Net operating income | 802 | (11.2) | (12.2) | 3,531 | (12.3) | (9.8) | |||||||||||||||||
| Net loan-loss provisions | (824) | 7.9 | 7.0 | (2,593) | 48.7 | 52.9 | |||||||||||||||||
| Other gains (losses) and provisions | 4 | — | — | (74) | 278.1 | 288.9 | |||||||||||||||||
| Profit before tax | (18) | — | — | 863 | (61.8) | (60.7) | |||||||||||||||||
| Tax on profit | 85 | 6.5 | 6.6 | 69 | — | — | |||||||||||||||||
| Profit from continuing operations | 67 | (66.2) | (67.2) | 932 | (47.7) | (46.3) | |||||||||||||||||
| Net profit from discontinued operations | — | — | — | — | — | — | |||||||||||||||||
| Consolidated profit | 67 | (66.2) | (67.2) | 932 | (47.7) | (46.3) | |||||||||||||||||
| Non-controlling interests | — | — | — | — | — | — | |||||||||||||||||
| Profit attributable to the parent | 67 | (66.2) | (67.2) | 932 | (47.7) | (46.3) | |||||||||||||||||
| Balance sheet | |||||||||||||||||||||||
| Loans and advances to customers | 126,843 | (2.9) | 1.5 | 126,843 | (2.7) | 0.7 | |||||||||||||||||
| Cash, central banks and credit institutions | 21,215 | 5.4 | 10.1 | 21,215 | 6.1 | 9.8 | |||||||||||||||||
| Debt instruments | 22,686 | (3.9) | 0.3 | 22,686 | 4.8 | 8.5 | |||||||||||||||||
| Other financial assets | 4,075 | (32.8) | (29.8) | 4,075 | (22.3) | (19.5) | |||||||||||||||||
| Other asset accounts | 16,307 | (7.2) | (3.1) | 16,307 | (8.6) | (5.4) | |||||||||||||||||
| Total assets | 191,126 | (3.5) | 0.8 | 191,126 | (2.0) | 1.4 | |||||||||||||||||
| Customer deposits | 121,782 | (1.5) | 2.9 | 121,782 | (2.0) | 1.5 | |||||||||||||||||
| Central banks and credit institutions | 17,411 | 13.3 | 18.3 | 17,411 | 103.1 | 110.3 | |||||||||||||||||
| Marketable debt securities | 27,059 | (5.7) | (1.5) | 27,059 | (17.2) | (14.3) | |||||||||||||||||
| Other financial liabilities | 7,276 | (28.2) | (25.0) | 7,276 | (12.8) | (9.7) | |||||||||||||||||
| Other liabilities accounts | 3,119 | (20.7) | (17.2) | 3,119 | (24.2) | (21.6) | |||||||||||||||||
| Total liabilities | 176,646 | (2.8) | 1.5 | 176,646 | (0.7) | 2.8 | |||||||||||||||||
| Total equity | 14,480 | (10.5) | (6.6) | 14,480 | (15.7) | (12.7) | |||||||||||||||||
| Memorandum items: | |||||||||||||||||||||||
Gross loans and advances to customers 2 | 112,671 | (3.3) | 1.0 | 112,671 | (2.2) | 1.2 | |||||||||||||||||
| Customer funds | 108,062 | (0.8) | 3.6 | 108,062 | (4.2) | (0.9) | |||||||||||||||||
Customer deposits 3 | 95,697 | (1.1) | 3.3 | 95,697 | (2.7) | 0.7 | |||||||||||||||||
| Mutual funds | 12,364 | 1.6 | 6.2 | 12,364 | (14.8) | (11.8) | |||||||||||||||||
| Ratios (%), operating means and customers | |||||||||||||||||||||||
| RoTE | 1.78 | (3.47) | 6.07 | (3.33) | |||||||||||||||||||
| Efficiency ratio | 54.6 | 4.3 | 51.0 | 3.8 | |||||||||||||||||||
| NPL ratio | 4.57 | 0.33 | 4.57 | 1.32 | |||||||||||||||||||
| NPL coverage ratio | 67.7 | (5.4) | 67.7 | (22.6) | |||||||||||||||||||
| Number of employees | 13,489 | (3.5) | 13,489 | (7.7) | |||||||||||||||||||
| Number of branches | 415 | (1.2) | 415 | (14.4) | |||||||||||||||||||
| Number of total customers (thousands) | 4,510 | 3.5 | 4,510 | (0.3) | |||||||||||||||||||
| Number of active customers (thousands) | 4,223 | 5.7 | 4,223 | 2.1 | |||||||||||||||||||
1. Includes exchange differences.
2. Excluding reverse repos.
3. Excluding repos.
| 62 | | January - December 2023 | ||||||
Business model | ||||||||||||||||||||||||||
| Financial information by segment | ||||||||||||||||||||||||||
| Mexico | |||||||||||||||||||||||
| EUR million | |||||||||||||||||||||||
| / | Q3'23 | / | 2022 | ||||||||||||||||||||
| Underlying income statement | Q4'23 | % | % excl. FX | 2023 | % | % excl. FX | |||||||||||||||||
| Net interest income | 1,195 | 0.8 | 2.3 | 4,408 | 23.7 | 12.1 | |||||||||||||||||
| Net fee income | 355 | (0.3) | 1.5 | 1,374 | 20.5 | 9.3 | |||||||||||||||||
Gains (losses) on financial transactions 1 | 48 | 1.7 | 4.5 | 211 | 435.2 | 385.2 | |||||||||||||||||
| Other operating income | (18) | (48.4) | (48.5) | (94) | (22.6) | (29.8) | |||||||||||||||||
| Total income | 1,581 | 1.6 | 3.3 | 5,899 | 27.6 | 15.7 | |||||||||||||||||
| Administrative expenses and amortizations | (743) | 9.0 | 10.8 | (2,588) | 24.7 | 13.0 | |||||||||||||||||
| Net operating income | 838 | (4.1) | (2.5) | 3,311 | 30.0 | 17.9 | |||||||||||||||||
| Net loan-loss provisions | (301) | (3.3) | (1.9) | (1,135) | 44.1 | 30.6 | |||||||||||||||||
| Other gains (losses) and provisions | (12) | (23.0) | (22.0) | (57) | (39.1) | (44.7) | |||||||||||||||||
| Profit before tax | 525 | (4.0) | (2.3) | 2,119 | 27.2 | 15.4 | |||||||||||||||||
| Tax on profit | (126) | (11.3) | (9.8) | (541) | 32.9 | 20.5 | |||||||||||||||||
| Profit from continuing operations | 398 | (1.5) | 0.4 | 1,577 | 25.4 | 13.7 | |||||||||||||||||
| Net profit from discontinued operations | — | — | — | — | — | — | |||||||||||||||||
| Consolidated profit | 398 | (1.5) | 0.4 | 1,577 | 25.4 | 13.7 | |||||||||||||||||
| Non-controlling interests | (1) | 12.7 | 49.4 | (17) | (61.0) | (64.7) | |||||||||||||||||
| Profit attributable to the parent | 397 | (1.5) | 0.3 | 1,560 | 28.6 | 16.6 | |||||||||||||||||
| Balance sheet | |||||||||||||||||||||||
| Loans and advances to customers | 47,905 | (0.4) | 1.3 | 47,905 | 16.6 | 4.8 | |||||||||||||||||
| Cash, central banks and credit institutions | 14,088 | (31.6) | (30.5) | 14,088 | (7.6) | (17.0) | |||||||||||||||||
| Debt instruments | 27,624 | 4.0 | 5.7 | 27,624 | 23.2 | 10.7 | |||||||||||||||||
| Other financial assets | 6,723 | (11.4) | (10.0) | 6,723 | (27.4) | (34.8) | |||||||||||||||||
| Other asset accounts | 6,156 | 5.2 | 6.9 | 6,156 | 33.2 | 19.6 | |||||||||||||||||
| Total assets | 102,496 | (5.7) | (4.1) | 102,496 | 10.6 | (0.6) | |||||||||||||||||
| Customer deposits | 53,703 | 2.6 | 4.2 | 53,703 | 21.2 | 8.9 | |||||||||||||||||
| Central banks and credit institutions | 17,047 | (24.5) | (23.3) | 17,047 | 2.7 | (7.7) | |||||||||||||||||
| Marketable debt securities | 8,074 | (2.9) | (1.3) | 8,074 | (3.6) | (13.4) | |||||||||||||||||
| Other financial liabilities | 11,189 | (10.6) | (9.2) | 11,189 | (9.6) | (18.8) | |||||||||||||||||
| Other liabilities accounts | 3,579 | 14.3 | 16.2 | 3,579 | 29.5 | 16.4 | |||||||||||||||||
| Total liabilities | 93,592 | (5.4) | (3.8) | 93,592 | 10.9 | (0.4) | |||||||||||||||||
| Total equity | 8,904 | (8.8) | (7.3) | 8,904 | 8.3 | (2.7) | |||||||||||||||||
| Memorandum items: | |||||||||||||||||||||||
Gross loans and advances to customers 2 | 48,688 | (0.3) | 1.3 | 48,688 | 18.1 | 6.1 | |||||||||||||||||
| Customer funds | 62,775 | 0.5 | 2.1 | 62,775 | 22.3 | 9.9 | |||||||||||||||||
Customer deposits 3 | 45,693 | (0.1) | 1.6 | 45,693 | 22.2 | 9.8 | |||||||||||||||||
| Mutual funds | 17,082 | 2.0 | 3.7 | 17,082 | 22.5 | 10.0 | |||||||||||||||||
| Ratios (%), operating means and customers | |||||||||||||||||||||||
| RoTE | 17.98 | 0.92 | 17.70 | 0.77 | |||||||||||||||||||
| Efficiency ratio | 47.0 | 3.2 | 43.9 | (1.0) | |||||||||||||||||||
| NPL ratio | 2.82 | 0.10 | 2.82 | 0.50 | |||||||||||||||||||
| NPL coverage ratio | 100.0 | (2.8) | 100.0 | (6.6) | |||||||||||||||||||
| Number of employees | 30,876 | 0.6 | 30,876 | 7.1 | |||||||||||||||||||
| Number of branches | 1,369 | 0.0 | 1,369 | — | |||||||||||||||||||
| Number of total customers (thousands) | 20,517 | 0.1 | 20,517 | 1.4 | |||||||||||||||||||
| Number of active customers (thousands) | 10,263 | 1.2 | 10,263 | 5.7 | |||||||||||||||||||
1. Includes exchange differences.
2. Excluding reverse repos.
3. Excluding repos.
January - December 2023 | | 63 | ||||||
Business model | ||||||||||||||||||||||||||
| Financial information by segment | ||||||||||||||||||||||||||
| Other North America | |||||||||||||||||||||||
| EUR million | |||||||||||||||||||||||
| / | Q3'23 | / | 2022 | ||||||||||||||||||||
| Underlying income statement | Q4'23 | % | % excl. FX | 2023 | % | % excl. FX | |||||||||||||||||
| Net interest income | 3 | 39.5 | 39.5 | 8 | — | — | |||||||||||||||||
| Net fee income | 13 | (11.0) | (11.0) | 52 | 10.0 | 10.0 | |||||||||||||||||
Gains (losses) on financial transactions 1 | 0 | — | — | (1) | — | — | |||||||||||||||||
| Other operating income | 3 | — | — | 6 | (71.7) | (71.7) | |||||||||||||||||
| Total income | 19 | 12.7 | 12.7 | 66 | (6.1) | (6.1) | |||||||||||||||||
| Administrative expenses and amortizations | (51) | (0.4) | (0.4) | (199) | 1.3 | 1.4 | |||||||||||||||||
| Net operating income | (32) | (6.9) | (6.9) | (133) | 5.4 | 5.5 | |||||||||||||||||
| Net loan-loss provisions | 0 | (79.7) | (79.7) | (5) | (15.2) | (15.2) | |||||||||||||||||
| Other gains (losses) and provisions | (6) | — | — | (7) | 52.0 | 52.5 | |||||||||||||||||
| Profit before tax | (38) | 5.3 | 5.3 | (145) | 6.1 | 6.1 | |||||||||||||||||
| Tax on profit | 27 | — | — | 5 | (70.6) | (70.6) | |||||||||||||||||
| Profit from continuing operations | (11) | (76.7) | (76.9) | (140) | 16.8 | 16.8 | |||||||||||||||||
| Net profit from discontinued operations | — | — | — | — | — | — | |||||||||||||||||
| Consolidated profit | (11) | (76.7) | (76.9) | (140) | 16.8 | 16.8 | |||||||||||||||||
| Non-controlling interests | 1 | — | — | 2 | 103.7 | 103.7 | |||||||||||||||||
| Profit attributable to the parent | (10) | (79.4) | (79.5) | (138) | 16.0 | 16.1 | |||||||||||||||||
| Balance sheet | |||||||||||||||||||||||
| Loans and advances to customers | 32 | (50.1) | (50.1) | 32 | (33.3) | (33.3) | |||||||||||||||||
| Cash, central banks and credit institutions | 666 | 109.8 | 109.8 | 666 | 88.5 | 88.5 | |||||||||||||||||
| Debt instruments | 2 | — | — | 2 | — | — | |||||||||||||||||
| Other financial assets | 139 | 5.5 | 5.5 | 139 | (18.0) | (18.0) | |||||||||||||||||
| Other asset accounts | 366 | 12.6 | 12.6 | 366 | 29.8 | 29.8 | |||||||||||||||||
| Total assets | 1,205 | 43.7 | 43.7 | 1,205 | 41.2 | 41.2 | |||||||||||||||||
| Customer deposits | 473 | 116.9 | 116.9 | 473 | 105.9 | 105.9 | |||||||||||||||||
| Central banks and credit institutions | 265 | 41.6 | 42.7 | 265 | 103.1 | 103.1 | |||||||||||||||||
| Marketable debt securities | — | — | — | — | — | — | |||||||||||||||||
| Other financial liabilities | 141 | 10.9 | 10.9 | 141 | (13.2) | (13.2) | |||||||||||||||||
| Other liabilities accounts | 66 | (2.4) | (2.4) | 66 | 2.9 | 2.9 | |||||||||||||||||
| Total liabilities | 945 | 57.5 | 57.9 | 945 | 61.1 | 61.1 | |||||||||||||||||
| Total equity | 259 | 8.8 | 8.1 | 259 | (2.6) | (2.6) | |||||||||||||||||
| Memorandum items: | |||||||||||||||||||||||
Gross loans and advances to customers 2 | 41 | (44.3) | (44.3) | 41 | (24.8) | (24.8) | |||||||||||||||||
| Customer funds | 473 | 116.9 | 116.9 | 473 | 105.9 | 105.9 | |||||||||||||||||
Customer deposits 3 | 473 | 116.9 | 116.9 | 473 | 105.9 | 105.9 | |||||||||||||||||
| Mutual funds | 0 | — | — | 0 | — | — | |||||||||||||||||
| Resources | |||||||||||||||||||||||
| Number of employees | 1,228 | 6.0 | 1,228 | 14.3 | |||||||||||||||||||
1. Includes exchange differences.
2. Excluding reverse repos.
3. Excluding repos.
| 64 | | January - December 2023 | ||||||
Business model | ||||||||||||||||||||||||||
| Financial information by segment | ||||||||||||||||||||||||||
| SOUTH AMERICA | |||||||||||||||||||||||
| EUR million | |||||||||||||||||||||||
| / | Q3'23 | / | 2022 | ||||||||||||||||||||
| Underlying income statement | Q4'23 | % | % excl. FX | 2023 | % | % excl. FX | |||||||||||||||||
| Net interest income | 3,206 | (4.5) | 37.7 | 13,040 | 0.5 | 12.0 | |||||||||||||||||
| Net fee income | 1,025 | (18.9) | 8.3 | 4,684 | 3.7 | 14.0 | |||||||||||||||||
Gains (losses) on financial transactions 1 | 135 | (67.8) | 1.1 | 1,280 | (0.9) | 13.8 | |||||||||||||||||
| Other operating income | (36) | (91.6) | 144.6 | (1,033) | 35.8 | 403.0 | |||||||||||||||||
| Total income | 4,329 | (6.0) | 20.6 | 17,971 | (0.3) | 7.8 | |||||||||||||||||
| Administrative expenses and amortizations | (1,589) | (11.6) | 21.6 | (6,920) | 3.7 | 16.7 | |||||||||||||||||
| Net operating income | 2,741 | (2.3) | 19.9 | 11,050 | (2.6) | 2.9 | |||||||||||||||||
| Net loan-loss provisions | (1,560) | 19.9 | 29.1 | (5,401) | 7.1 | 8.9 | |||||||||||||||||
| Other gains (losses) and provisions | (239) | 11.4 | 34.8 | (1,041) | 91.1 | 212.9 | |||||||||||||||||
| Profit before tax | 942 | (27.1) | 7.2 | 4,608 | (20.1) | (15.4) | |||||||||||||||||
| Tax on profit | (108) | (67.9) | (35.6) | (1,121) | (27.7) | (23.4) | |||||||||||||||||
| Profit from continuing operations | 834 | (12.7) | 21.1 | 3,487 | (17.3) | (12.5) | |||||||||||||||||
| Net profit from discontinued operations | — | — | — | — | — | — | |||||||||||||||||
| Consolidated profit | 834 | (12.7) | 21.1 | 3,487 | (17.3) | (12.5) | |||||||||||||||||
| Non-controlling interests | (125) | 47.5 | 49.2 | (449) | (19.4) | (19.9) | |||||||||||||||||
| Profit attributable to the parent | 709 | (18.6) | 18.1 | 3,038 | (16.9) | (11.2) | |||||||||||||||||
| Balance sheet | |||||||||||||||||||||||
| Loans and advances to customers | 153,244 | (0.9) | 3.2 | 153,244 | 5.8 | 7.2 | |||||||||||||||||
| Cash, central banks and credit institutions | 67,410 | (7.8) | (4.5) | 67,410 | 28.7 | 30.1 | |||||||||||||||||
| Debt instruments | 64,352 | (3.6) | 2.3 | 64,352 | 12.7 | 18.7 | |||||||||||||||||
| Other financial assets | 20,796 | (8.9) | (7.1) | 20,796 | 4.7 | 7.8 | |||||||||||||||||
| Other asset accounts | 19,247 | (2.1) | 2.5 | 19,247 | 2.4 | 3.6 | |||||||||||||||||
| Total assets | 325,049 | (3.5) | 0.6 | 325,049 | 11.0 | 13.3 | |||||||||||||||||
| Customer deposits | 155,448 | 0.5 | 5.9 | 155,448 | 12.9 | 17.3 | |||||||||||||||||
| Central banks and credit institutions | 48,898 | (14.3) | (11.2) | 48,898 | 13.9 | 14.1 | |||||||||||||||||
| Marketable debt securities | 39,603 | (2.5) | (0.7) | 39,603 | 12.9 | 11.2 | |||||||||||||||||
| Other financial liabilities | 42,438 | (9.0) | (6.5) | 42,438 | 2.4 | 2.7 | |||||||||||||||||
| Other liabilities accounts | 12,768 | 4.8 | 9.2 | 12,768 | 12.7 | 16.8 | |||||||||||||||||
| Total liabilities | 299,155 | (3.8) | 0.1 | 299,155 | 11.5 | 13.6 | |||||||||||||||||
| Total equity | 25,894 | 0.2 | 6.4 | 25,894 | 5.7 | 10.1 | |||||||||||||||||
| Memorandum items: | |||||||||||||||||||||||
Gross loans and advances to customers 2 | 160,987 | (0.8) | 3.2 | 160,987 | 5.6 | 6.9 | |||||||||||||||||
| Customer funds | 205,675 | (0.8) | 5.0 | 205,675 | 12.7 | 17.3 | |||||||||||||||||
Customer deposits 3 | 135,342 | (1.2) | 4.6 | 135,342 | 9.8 | 15.3 | |||||||||||||||||
| Mutual funds | 70,333 | 0.04 | 5.8 | 70,333 | 18.7 | 21.3 | |||||||||||||||||
| Ratios (%), operating means and customers | |||||||||||||||||||||||
| RoTE | 13.21 | (3.26) | 14.43 | (4.33) | |||||||||||||||||||
| Efficiency ratio | 36.7 | (2.4) | 38.5 | 1.5 | |||||||||||||||||||
| NPL ratio | 5.72 | 0.00 | 5.72 | (0.49) | |||||||||||||||||||
| NPL coverage ratio | 78.4 | 0.3 | 78.4 | 2.4 | |||||||||||||||||||
| Number of employees | 80,997 | 0.6 | 80,997 | 3.5 | |||||||||||||||||||
| Number of branches | 3,309 | (2.9) | 3,309 | (9.4) | |||||||||||||||||||
| Number of total customers (thousands) | 73,028 | (2.4) | 73,028 | 5.0 | |||||||||||||||||||
| Number of active customers (thousands) | 37,517 | (3.8) | 37,517 | (2.2) | |||||||||||||||||||
1. Includes exchange differences.
2. Excluding reverse repos.
3. Excluding repos.
January - December 2023 | | 65 | ||||||
Business model | ||||||||||||||||||||||||||
| Financial information by segment | ||||||||||||||||||||||||||
| Brazil | |||||||||||||||||||||||
| EUR million | |||||||||||||||||||||||
| / | Q3'23 | / | 2022 | ||||||||||||||||||||
| Underlying income statement | Q4'23 | % | % excl. FX | 2023 | % | % excl. FX | |||||||||||||||||
| Net interest income | 2,504 | 7.6 | 8.0 | 9,116 | 2.4 | 2.0 | |||||||||||||||||
| Net fee income | 885 | (1.8) | (1.5) | 3,462 | 5.0 | 4.6 | |||||||||||||||||
Gains (losses) on financial transactions 1 | 65 | (46.6) | (46.9) | 483 | (34.5) | (34.7) | |||||||||||||||||
| Other operating income | 33 | — | — | 43 | — | — | |||||||||||||||||
| Total income | 3,487 | 4.5 | 5.0 | 13,104 | 1.5 | 1.1 | |||||||||||||||||
| Administrative expenses and amortizations | (1,184) | 4.0 | 4.5 | (4,529) | 8.3 | 7.9 | |||||||||||||||||
| Net operating income | 2,303 | 4.8 | 5.2 | 8,574 | (1.8) | (2.2) | |||||||||||||||||
| Net loan-loss provisions | (1,417) | 26.5 | 27.3 | (4,701) | 6.4 | 6.0 | |||||||||||||||||
| Other gains (losses) and provisions | (239) | 7.0 | 7.8 | (963) | 272.0 | 270.4 | |||||||||||||||||
| Profit before tax | 648 | (24.2) | (24.3) | 2,911 | (28.2) | (28.5) | |||||||||||||||||
| Tax on profit | (104) | (45.4) | (45.6) | (776) | (37.0) | (37.3) | |||||||||||||||||
| Profit from continuing operations | 543 | (18.0) | (18.2) | 2,135 | (24.3) | (24.7) | |||||||||||||||||
| Net profit from discontinued operations | — | — | — | — | — | — | |||||||||||||||||
| Consolidated profit | 543 | (18.0) | (18.2) | 2,135 | (24.3) | (24.7) | |||||||||||||||||
| Non-controlling interests | (49) | (17.6) | (17.6) | (215) | (22.9) | (23.2) | |||||||||||||||||
| Profit attributable to the parent | 494 | (18.1) | (18.2) | 1,921 | (24.5) | (24.8) | |||||||||||||||||
| Balance sheet | |||||||||||||||||||||||
| Loans and advances to customers | 96,399 | 1.4 | 2.7 | 96,399 | 11.8 | 6.2 | |||||||||||||||||
| Cash, central banks and credit institutions | 53,618 | (10.7) | (9.6) | 53,618 | 31.2 | 24.6 | |||||||||||||||||
| Debt instruments | 47,325 | 1.9 | 3.3 | 47,325 | 26.6 | 20.2 | |||||||||||||||||
| Other financial assets | 8,161 | (5.1) | (3.8) | 8,161 | 43.6 | 36.4 | |||||||||||||||||
| Other asset accounts | 14,590 | 0.4 | 1.7 | 14,590 | 3.9 | (1.3) | |||||||||||||||||
| Total assets | 220,093 | (2.1) | (0.8) | 220,093 | 19.5 | 13.5 | |||||||||||||||||
| Customer deposits | 110,162 | 3.2 | 4.6 | 110,162 | 22.5 | 16.3 | |||||||||||||||||
| Central banks and credit institutions | 28,333 | (17.7) | (16.6) | 28,333 | 20.7 | 14.6 | |||||||||||||||||
| Marketable debt securities | 27,976 | (3.3) | (2.1) | 27,976 | 16.6 | 10.7 | |||||||||||||||||
| Other financial liabilities | 28,625 | (6.6) | (5.4) | 28,625 | 11.3 | 5.7 | |||||||||||||||||
| Other liabilities accounts | 7,938 | 11.0 | 12.4 | 7,938 | 44.9 | 37.6 | |||||||||||||||||
| Total liabilities | 203,035 | (2.3) | (1.0) | 203,035 | 20.4 | 14.3 | |||||||||||||||||
| Total equity | 17,058 | 1.4 | 2.7 | 17,058 | 9.8 | 4.2 | |||||||||||||||||
| Memorandum items: | |||||||||||||||||||||||
Gross loans and advances to customers 2 | 102,583 | 1.5 | 2.8 | 102,583 | 11.3 | 5.7 | |||||||||||||||||
| Customer funds | 145,044 | 1.2 | 2.5 | 145,044 | 20.0 | 13.9 | |||||||||||||||||
Customer deposits 3 | 90,297 | 1.0 | 2.4 | 90,297 | 19.2 | 13.2 | |||||||||||||||||
| Mutual funds | 54,747 | 1.4 | 2.8 | 54,747 | 21.3 | 15.2 | |||||||||||||||||
| Ratios (%), operating means and customers | |||||||||||||||||||||||
| RoTE | 13.75 | (3.32) | 13.73 | (5.50) | |||||||||||||||||||
| Efficiency ratio | 33.9 | (0.2) | 34.6 | 2.2 | |||||||||||||||||||
| NPL ratio | 6.56 | (0.15) | 6.56 | (1.00) | |||||||||||||||||||
| NPL coverage ratio | 84.7 | 1.8 | 84.7 | 5.2 | |||||||||||||||||||
| Number of employees | 57,775 | 0.1 | 57,775 | 3.2 | |||||||||||||||||||
| Number of branches | 2,580 | (3.1) | 2,580 | (9.4) | |||||||||||||||||||
| Number of total customers (thousands) | 62,804 | (2.8) | 62,804 | 4.5 | |||||||||||||||||||
| Number of active customers (thousands) | 30,460 | (4.9) | 30,460 | (4.3) | |||||||||||||||||||
1. Includes exchange differences.
2. Excluding reverse repos.
3. Excluding repos.
| 66 | | January - December 2023 | ||||||
Business model | ||||||||||||||||||||||||||
| Financial information by segment | ||||||||||||||||||||||||||
| Chile | |||||||||||||||||||||||
| EUR million | |||||||||||||||||||||||
| / | Q3'23 | / | 2022 | ||||||||||||||||||||
| Underlying income statement | Q4'23 | % | % excl. FX | 2023 | % | % excl. FX | |||||||||||||||||
| Net interest income | 415 | 72.4 | 72.9 | 1,383 | (22.0) | (22.9) | |||||||||||||||||
| Net fee income | 122 | (8.0) | (4.3) | 572 | 22.2 | 20.8 | |||||||||||||||||
Gains (losses) on financial transactions 1 | 47 | (50.0) | (45.5) | 320 | 32.2 | 30.7 | |||||||||||||||||
| Other operating income | 7 | — | — | 11 | — | — | |||||||||||||||||
| Total income | 591 | 27.3 | 29.9 | 2,285 | (6.7) | (7.7) | |||||||||||||||||
| Administrative expenses and amortizations | (249) | (0.9) | 2.7 | (1,020) | 4.0 | 2.8 | |||||||||||||||||
| Net operating income | 343 | 60.2 | 60.9 | 1,265 | (13.8) | (14.8) | |||||||||||||||||
| Net loan-loss provisions | (78) | (7.0) | (3.2) | (365) | (8.5) | (9.5) | |||||||||||||||||
| Other gains (losses) and provisions | 16 | 64.9 | 66.2 | 51 | — | — | |||||||||||||||||
| Profit before tax | 281 | 100.7 | 98.6 | 951 | (10.4) | (11.4) | |||||||||||||||||
| Tax on profit | (40) | 36.4 | 38.9 | (135) | 28.5 | 27.0 | |||||||||||||||||
| Profit from continuing operations | 241 | 117.6 | 113.7 | 816 | (14.7) | (15.6) | |||||||||||||||||
| Net profit from discontinued operations | — | — | — | — | — | — | |||||||||||||||||
| Consolidated profit | 241 | 117.6 | 113.7 | 816 | (14.7) | (15.6) | |||||||||||||||||
| Non-controlling interests | (76) | 215.9 | 200.6 | (234) | (16.0) | (16.9) | |||||||||||||||||
| Profit attributable to the parent | 165 | 90.3 | 88.7 | 582 | (14.1) | (15.1) | |||||||||||||||||
| Balance sheet | |||||||||||||||||||||||
| Loans and advances to customers | 42,616 | (0.6) | 1.5 | 42,616 | (1.7) | 4.4 | |||||||||||||||||
| Cash, central banks and credit institutions | 6,373 | (18.7) | (17.0) | 6,373 | 0.5 | 6.6 | |||||||||||||||||
| Debt instruments | 13,273 | 4.7 | 6.9 | 13,273 | 10.8 | 17.6 | |||||||||||||||||
| Other financial assets | 12,159 | (10.9) | (9.0) | 12,159 | (12.5) | (7.1) | |||||||||||||||||
| Other asset accounts | 2,746 | (7.8) | (5.9) | 2,746 | (4.3) | 1.6 | |||||||||||||||||
| Total assets | 77,167 | (3.6) | (1.5) | 77,167 | (1.6) | 4.5 | |||||||||||||||||
| Customer deposits | 29,578 | 2.5 | 4.7 | 29,578 | 1.8 | 8.1 | |||||||||||||||||
| Central banks and credit institutions | 14,808 | (9.3) | (7.4) | 14,808 | 6.5 | 13.0 | |||||||||||||||||
| Marketable debt securities | 10,775 | (1.0) | 1.0 | 10,775 | 3.5 | 9.8 | |||||||||||||||||
| Other financial liabilities | 12,624 | (13.8) | (12.0) | 12,624 | (13.8) | (8.5) | |||||||||||||||||
| Other liabilities accounts | 3,733 | (2.9) | (0.9) | 3,733 | (22.7) | (18.0) | |||||||||||||||||
| Total liabilities | 71,518 | (4.1) | (2.1) | 71,518 | (1.8) | 4.2 | |||||||||||||||||
| Total equity | 5,648 | 3.4 | 5.6 | 5,648 | 1.2 | 7.5 | |||||||||||||||||
| Memorandum items: | |||||||||||||||||||||||
Gross loans and advances to customers 2 | 43,823 | (0.6) | 1.5 | 43,823 | (1.7) | 4.3 | |||||||||||||||||
| Customer funds | 40,098 | 2.8 | 5.0 | 40,098 | 5.5 | 12.0 | |||||||||||||||||
Customer deposits 3 | 29,337 | 2.8 | 4.9 | 29,337 | 1.6 | 7.8 | |||||||||||||||||
| Mutual funds | 10,761 | 3.0 | 5.2 | 10,761 | 17.9 | 25.2 | |||||||||||||||||
| Ratios (%), operating means and customers | |||||||||||||||||||||||
| RoTE | 17.01 | 7.67 | 14.82 | (4.65) | |||||||||||||||||||
| Efficiency ratio | 42.0 | (11.9) | 44.6 | 4.6 | |||||||||||||||||||
| NPL ratio | 5.01 | 0.11 | 5.01 | 0.02 | |||||||||||||||||||
| NPL coverage ratio | 52.7 | (2.9) | 52.7 | (3.6) | |||||||||||||||||||
| Number of employees | 9,948 | 1.2 | 9,948 | 1.8 | |||||||||||||||||||
| Number of branches | 248 | (0.4) | 248 | (12.4) | |||||||||||||||||||
| Number of total customers (thousands) | 4,052 | 3.7 | 4,052 | 13.3 | |||||||||||||||||||
| Number of active customers (thousands) | 2,399 | 6.0 | 2,399 | 9.2 | |||||||||||||||||||
1. Includes exchange differences.
2. Excluding reverse repos.
3. Excluding repos.
January - December 2023 | | 67 | ||||||
Business model | ||||||||||||||||||||||||||
| Financial information by segment | ||||||||||||||||||||||||||
| Argentina | |||||||||||||||||||||||
| EUR million | |||||||||||||||||||||||
| / | 2022 | ||||||||||||||||||||||
| Underlying income statement | Q4'23 | Q3'23 | % | 2023 | % | % excl. FX | |||||||||||||||||
| Net interest income | 112 | 629 | (82.2) | 1,879 | 5.7 | 399.4 | |||||||||||||||||
| Net fee income | (50) | 164 | — | 396 | (26.9) | 245.2 | |||||||||||||||||
Gains (losses) on financial transactions 1 | (15) | 161 | — | 341 | 56.0 | 637.0 | |||||||||||||||||
| Other operating income | (74) | (411) | (81.9) | (1,071) | 51.9 | 617.8 | |||||||||||||||||
| Total income | (27) | 543 | — | 1,544 | (15.8) | 298.1 | |||||||||||||||||
| Administrative expenses and amortizations | 6 | (260) | — | (775) | (21.5) | 271.0 | |||||||||||||||||
| Net operating income | (21) | 283 | — | 769 | (9.1) | 329.7 | |||||||||||||||||
| Net loan-loss provisions | (7) | (47) | (85.4) | (150) | 13.6 | 436.9 | |||||||||||||||||
| Other gains (losses) and provisions | (10) | (1) | — | (114) | (57.7) | 99.8 | |||||||||||||||||
| Profit before tax | (39) | 236 | — | 505 | 13.8 | 437.9 | |||||||||||||||||
| Tax on profit | 19 | (81) | — | (117) | (1.4) | 366.1 | |||||||||||||||||
| Profit from continuing operations | (19) | 155 | — | 388 | 19.4 | 464.1 | |||||||||||||||||
| Net profit from discontinued operations | — | — | — | — | — | — | |||||||||||||||||
| Consolidated profit | (19) | 155 | — | 388 | 19.4 | 464.1 | |||||||||||||||||
| Non-controlling interests | (1) | (1) | 88.6 | (2) | 154.0 | — | |||||||||||||||||
| Profit attributable to the parent | (20) | 154 | — | 386 | 19.0 | 462.3 | |||||||||||||||||
| Balance sheet | |||||||||||||||||||||||
| Loans and advances to customers | 3,767 | 6,197 | (39.2) | 3,767 | (32.6) | 218.7 | |||||||||||||||||
| Cash, central banks and credit institutions | 4,548 | 2,554 | 78.1 | 4,548 | 50.6 | 611.4 | |||||||||||||||||
| Debt instruments | 1,368 | 4,897 | (72.1) | 1,368 | (74.3) | 21.6 | |||||||||||||||||
| Other financial assets | 11 | 73 | (85.5) | 11 | (85.8) | (32.7) | |||||||||||||||||
| Other asset accounts | 776 | 1,041 | (25.4) | 776 | (23.7) | 260.6 | |||||||||||||||||
| Total assets | 10,470 | 14,762 | (29.1) | 10,470 | (30.3) | 229.5 | |||||||||||||||||
| Customer deposits | 6,478 | 9,363 | (30.8) | 6,478 | (38.6) | 190.2 | |||||||||||||||||
| Central banks and credit institutions | 1,271 | 1,908 | (33.4) | 1,271 | 17.6 | 455.9 | |||||||||||||||||
| Marketable debt securities | 148 | 153 | (2.8) | 148 | (3.4) | 356.6 | |||||||||||||||||
| Other financial liabilities | 638 | 927 | (31.1) | 638 | (21.3) | 272.0 | |||||||||||||||||
| Other liabilities accounts | 455 | 509 | (10.6) | 455 | (11.5) | 318.4 | |||||||||||||||||
| Total liabilities | 8,990 | 12,860 | (30.1) | 8,990 | (31.4) | 224.2 | |||||||||||||||||
| Total equity | 1,479 | 1,902 | (22.2) | 1,479 | (22.6) | 266.0 | |||||||||||||||||
| Memorandum items: | |||||||||||||||||||||||
Gross loans and advances to customers 2 | 3,878 | 6,369 | (39.1) | 3,878 | (32.9) | 217.0 | |||||||||||||||||
| Customer funds | 10,288 | 14,249 | (27.8) | 10,288 | (29.0) | 235.3 | |||||||||||||||||
Customer deposits 3 | 6,478 | 9,362 | (30.8) | 6,478 | (38.6) | 190.2 | |||||||||||||||||
| Mutual funds | 3,810 | 4,887 | (22.0) | 3,810 | (3.6) | 355.5 | |||||||||||||||||
| Ratios (%), operating means and customers | |||||||||||||||||||||||
| RoTE | 81.25 | 52.95 | 55.60 | 29.36 | |||||||||||||||||||
| Efficiency ratio | 21.8 | 47.8 | 50.2 | (3.7) | |||||||||||||||||||
| NPL ratio | 1.99 | 1.91 | 1.99 | (0.10) | |||||||||||||||||||
| NPL coverage ratio | 165.7 | 158.3 | 165.7 | (14.7) | |||||||||||||||||||
| Number of employees | 8,455 | 8,168 | 8,455 | 2.5 | |||||||||||||||||||
| Number of branches | 322 | 337 | 322 | (14.1) | |||||||||||||||||||
| Number of total customers (thousands) | 4,771 | 4,757 | 4,771 | 8.8 | |||||||||||||||||||
| Number of active customers (thousands) | 3,562 | 3,491 | 3,562 | 11.2 | |||||||||||||||||||
1. Includes exchange differences.
2. Excluding reverse repos.
3. Excluding repos.
| 68 | | January - December 2023 | ||||||
Business model | ||||||||||||||||||||||||||
| Financial information by segment | ||||||||||||||||||||||||||
| Other South America | |||||||||||||||||||||||
| EUR million | |||||||||||||||||||||||
| / | Q3'23 | / | 2022 | ||||||||||||||||||||
| Underlying income statement | Q4'23 | % | % excl. FX | 2023 | % | % excl. FX | |||||||||||||||||
| Net interest income | 176 | 10.1 | 12.7 | 662 | 25.6 | 24.1 | |||||||||||||||||
| Net fee income | 67 | 2.7 | 4.5 | 254 | 21.2 | 20.2 | |||||||||||||||||
Gains (losses) on financial transactions 1 | 38 | (8.6) | (8.2) | 137 | 44.5 | 45.1 | |||||||||||||||||
| Other operating income | (3) | (48.8) | (49.2) | (16) | — | — | |||||||||||||||||
| Total income | 278 | 6.6 | 8.8 | 1,038 | 24.6 | 23.5 | |||||||||||||||||
| Administrative expenses and amortizations | (163) | 8.8 | 10.2 | (596) | 13.2 | 12.7 | |||||||||||||||||
| Net operating income | 116 | 3.8 | 6.8 | 441 | 44.3 | 42.1 | |||||||||||||||||
| Net loan-loss provisions | (58) | 17.6 | 19.4 | (186) | 98.4 | 96.1 | |||||||||||||||||
| Other gains (losses) and provisions | (6) | — | — | (15) | 95.0 | 92.8 | |||||||||||||||||
| Profit before tax | 52 | (15.9) | (12.6) | 241 | 17.7 | 15.7 | |||||||||||||||||
| Tax on profit | 17 | — | — | (93) | (0.8) | (1.9) | |||||||||||||||||
| Profit from continuing operations | 69 | 150.7 | 165.0 | 148 | 33.3 | 30.4 | |||||||||||||||||
| Net profit from discontinued operations | — | — | — | — | — | — | |||||||||||||||||
| Consolidated profit | 69 | 150.7 | 165.0 | 148 | 33.3 | 30.4 | |||||||||||||||||
| Non-controlling interests | 1 | — | — | 2 | 96.8 | 96.8 | |||||||||||||||||
| Profit attributable to the parent | 70 | 161.2 | 176.4 | 150 | 33.9 | 31.0 | |||||||||||||||||
| Balance sheet | |||||||||||||||||||||||
| Loans and advances to customers | 10,463 | 0.1 | 3.4 | 10,463 | 8.0 | 3.6 | |||||||||||||||||
| Cash, central banks and credit institutions | 2,870 | 8.9 | 12.5 | 2,870 | 34.4 | 31.9 | |||||||||||||||||
| Debt instruments | 2,386 | (14.0) | (9.6) | 2,386 | (1.6) | (1.2) | |||||||||||||||||
| Other financial assets | 466 | (6.4) | (5.8) | 466 | 133.3 | 133.1 | |||||||||||||||||
| Other asset accounts | 1,135 | 3.1 | 5.1 | 1,135 | 30.2 | 28.9 | |||||||||||||||||
| Total assets | 17,320 | (0.8) | 2.6 | 17,320 | 13.1 | 9.8 | |||||||||||||||||
| Customer deposits | 9,230 | (5.2) | (1.1) | 9,230 | 13.7 | 12.5 | |||||||||||||||||
| Central banks and credit institutions | 4,486 | 2.9 | 4.2 | 4,486 | 0.6 | (6.6) | |||||||||||||||||
| Marketable debt securities | 703 | 12.8 | 18.8 | 703 | 41.3 | 43.8 | |||||||||||||||||
| Other financial liabilities | 550 | 31.8 | 33.7 | 550 | 107.8 | 105.7 | |||||||||||||||||
| Other liabilities accounts | 641 | (5.2) | (1.6) | 641 | 27.4 | 27.1 | |||||||||||||||||
| Total liabilities | 15,611 | (1.3) | 2.1 | 15,611 | 12.8 | 9.4 | |||||||||||||||||
| Total equity | 1,709 | 3.6 | 7.3 | 1,709 | 15.5 | 14.1 | |||||||||||||||||
| Memorandum items: | |||||||||||||||||||||||
Gross loans and advances to customers 2 | 10,703 | 0.2 | 3.5 | 10,703 | 8.4 | 4.1 | |||||||||||||||||
| Customer funds | 10,246 | (4.6) | (0.3) | 10,246 | 12.4 | 11.5 | |||||||||||||||||
Customer deposits 3 | 9,230 | (5.2) | (1.1) | 9,230 | 13.9 | 12.6 | |||||||||||||||||
| Mutual funds | 1,016 | 1.1 | 7.2 | 1,016 | 0.5 | 2.5 | |||||||||||||||||
| Resources | |||||||||||||||||||||||
| Number of employees | 4,819 | 0.8 | 4,819 | 13.3 | |||||||||||||||||||
1. Includes exchange differences.
2. Excluding reverse repos.
3. Excluding repos.
January - December 2023 | | 69 | ||||||
Business model | ||||||||||||||||||||||||||
| Financial information by segment | ||||||||||||||||||||||||||
| DIGITAL CONSUMER BANK | |||||||||||||||||||||||
| EUR million | |||||||||||||||||||||||
| / | Q3'23 | / | 2022 | ||||||||||||||||||||
| Underlying income statement | Q4'23 | % | % excl. FX | 2023 | % | % excl. FX | |||||||||||||||||
| Net interest income | 1,083 | 1.3 | 1.5 | 4,193 | 4.3 | 6.1 | |||||||||||||||||
| Net fee income | 192 | (8.8) | (8.8) | 796 | (5.6) | (5.3) | |||||||||||||||||
Gains (losses) on financial transactions 1 | 41 | 126.7 | 127.1 | 117 | 95.5 | 94.8 | |||||||||||||||||
| Other operating income | 116 | 2.3 | 2.5 | 396 | 15.1 | 15.3 | |||||||||||||||||
| Total income | 1,433 | 1.5 | 1.7 | 5,502 | 4.4 | 5.9 | |||||||||||||||||
| Administrative expenses and amortizations | (652) | (0.1) | — | (2,618) | 6.4 | 8.1 | |||||||||||||||||
| Net operating income | 781 | 3.0 | 3.1 | 2,884 | 2.7 | 3.9 | |||||||||||||||||
| Net loan-loss provisions | (152) | (32.5) | (32.5) | (792) | 45.7 | 47.8 | |||||||||||||||||
| Other gains (losses) and provisions | (47) | 91.6 | 91.7 | (72) | 169.9 | 167.0 | |||||||||||||||||
| Profit before tax | 582 | 14.3 | 14.6 | 2,019 | (9.7) | (8.7) | |||||||||||||||||
| Tax on profit | (133) | (0.7) | (0.5) | (493) | (10.3) | (9.5) | |||||||||||||||||
| Profit from continuing operations | 449 | 19.7 | 19.9 | 1,526 | (9.5) | (8.4) | |||||||||||||||||
| Net profit from discontinued operations | — | — | — | — | — | — | |||||||||||||||||
| Consolidated profit | 449 | 19.7 | 19.9 | 1,526 | (9.5) | (8.4) | |||||||||||||||||
| Non-controlling interests | (73) | (1.0) | (1.0) | (327) | (13.7) | (13.7) | |||||||||||||||||
| Profit attributable to the parent | 376 | 24.7 | 25.1 | 1,199 | (8.4) | (6.9) | |||||||||||||||||
| Balance sheet | |||||||||||||||||||||||
| Loans and advances to customers | 132,692 | 2.9 | 2.7 | 132,692 | 8.2 | 8.5 | |||||||||||||||||
| Cash, central banks and credit institutions | 18,636 | (0.8) | (0.9) | 18,636 | 51.4 | 52.7 | |||||||||||||||||
| Debt instruments | 5,387 | 3.3 | 2.1 | 5,387 | (29.5) | (29.8) | |||||||||||||||||
| Other financial assets | 135 | (0.3) | (0.4) | 135 | (28.8) | (29.0) | |||||||||||||||||
| Other asset accounts | 9,945 | 1.9 | 1.7 | 9,945 | 20.4 | 20.3 | |||||||||||||||||
| Total assets | 166,796 | 2.5 | 2.2 | 166,796 | 10.4 | 10.7 | |||||||||||||||||
| Customer deposits | 69,334 | 4.5 | 4.1 | 69,334 | 18.4 | 19.0 | |||||||||||||||||
| Central banks and credit institutions | 31,965 | (3.8) | (4.0) | 31,965 | (18.4) | (18.5) | |||||||||||||||||
| Marketable debt securities | 44,605 | 4.9 | 4.8 | 44,605 | 32.2 | 32.7 | |||||||||||||||||
| Other financial liabilities | 2,218 | 3.4 | 3.1 | 2,218 | 21.9 | 21.4 | |||||||||||||||||
| Other liabilities accounts | 5,233 | (4.0) | (4.2) | 5,233 | 11.2 | 11.6 | |||||||||||||||||
| Total liabilities | 153,355 | 2.4 | 2.2 | 153,355 | 11.1 | 11.4 | |||||||||||||||||
| Total equity | 13,441 | 2.8 | 2.3 | 13,441 | 3.2 | 3.6 | |||||||||||||||||
| Memorandum items: | |||||||||||||||||||||||
Gross loans and advances to customers 2 | 135,202 | 2.9 | 2.6 | 135,202 | 8.2 | 8.4 | |||||||||||||||||
| Customer funds | 72,963 | 4.6 | 4.2 | 72,963 | 18.4 | 18.9 | |||||||||||||||||
Customer deposits 3 | 69,334 | 4.5 | 4.1 | 69,334 | 18.4 | 19.0 | |||||||||||||||||
| Mutual funds | 3,629 | 6.7 | 6.7 | 3,629 | 17.8 | 17.8 | |||||||||||||||||
| Ratios (%), operating means and customers | |||||||||||||||||||||||
| RoTE | 15.22 | 2.77 | 12.33 | (1.32) | |||||||||||||||||||
| Efficiency ratio | 45.5 | (0.8) | 47.6 | 0.9 | |||||||||||||||||||
| NPL ratio | 2.12 | 0.04 | 2.12 | 0.06 | |||||||||||||||||||
| NPL coverage ratio | 88.0 | (4.2) | 88.0 | (4.8) | |||||||||||||||||||
| Number of employees | 16,795 | (0.1) | 16,795 | 3.7 | |||||||||||||||||||
| Number of branches | 342 | (5.3) | 342 | (6.0) | |||||||||||||||||||
| Number of total customers (thousands) | 20,193 | 1.0 | 20,193 | 2.3 | |||||||||||||||||||
1. Includes exchange differences.
2. Excluding reverse repos.
3. Excluding repos.
| 70 | | January - December 2023 | ||||||
Business model | ||||||||||||||||||||||||||
| Financial information by segment | ||||||||||||||||||||||||||
| CORPORATE CENTRE | |||||||||||||||||||||||
| EUR million | |||||||||||||||||||||||
| Underlying income statement | Q4'23 | Q3'23 | % | 2023 | 2022 | % | |||||||||||||||||
| Net interest income | 83 | (30) | — | (41) | (652) | (93.8) | |||||||||||||||||
| Net fee income | (8) | 1 | — | (13) | (19) | (30.8) | |||||||||||||||||
Gains (losses) on financial transactions 1 | 171 | (284) | — | (302) | (724) | (58.3) | |||||||||||||||||
| Other operating income | (35) | 4 | — | (83) | (92) | (9.0) | |||||||||||||||||
| Total income | 212 | (308) | — | (439) | (1,487) | (70.5) | |||||||||||||||||
| Administrative expenses and amortizations | (108) | (94) | 15.4 | (391) | (372) | 5.2 | |||||||||||||||||
| Net operating income | 104 | (402) | — | (829) | (1,858) | (55.4) | |||||||||||||||||
| Net loan-loss provisions | (1) | (1) | 36.6 | 2 | 9 | (77.3) | |||||||||||||||||
| Other gains (losses) and provisions | (30) | (30) | 0.1 | (134) | (173) | (22.7) | |||||||||||||||||
| Profit before tax | 73 | (433) | — | (961) | (2,022) | (52.5) | |||||||||||||||||
| Tax on profit | 14 | (32) | — | (36) | (27) | 36.9 | |||||||||||||||||
| Profit from continuing operations | 87 | (464) | — | (998) | (2,049) | (51.3) | |||||||||||||||||
| Net profit from discontinued operations | — | — | — | — | — | — | |||||||||||||||||
| Consolidated profit | 87 | (464) | — | (998) | (2,049) | (51.3) | |||||||||||||||||
| Non-controlling interests | — | — | — | — | — | — | |||||||||||||||||
| Profit attributable to the parent | 87 | (464) | — | (998) | (2,049) | (51.3) | |||||||||||||||||
| Balance sheet | |||||||||||||||||||||||
| Loans and advances to customers | 5,565 | 5,474 | 1.7 | 5,565 | 5,785 | (3.8) | |||||||||||||||||
| Cash, central banks and credit institutions | 119,279 | 120,548 | (1.1) | 119,279 | 123,230 | (3.2) | |||||||||||||||||
| Debt instruments | 7,726 | 7,743 | (0.2) | 7,726 | 8,588 | (10.0) | |||||||||||||||||
| Other financial assets | 808 | 1,161 | (30.4) | 808 | 273 | 196.6 | |||||||||||||||||
| Other asset accounts | 121,327 | 124,803 | (2.8) | 121,327 | 124,343 | (2.4) | |||||||||||||||||
| Total assets | 254,705 | 259,730 | (1.9) | 254,705 | 262,217 | (2.9) | |||||||||||||||||
| Customer deposits | 1,508 | 1,239 | 21.7 | 1,508 | 895 | 68.5 | |||||||||||||||||
| Central banks and credit institutions | 47,747 | 55,404 | (13.8) | 47,747 | 71,226 | (33.0) | |||||||||||||||||
| Marketable debt securities | 110,144 | 102,027 | 8.0 | 110,144 | 98,733 | 11.6 | |||||||||||||||||
| Other financial liabilities | 326 | 1,636 | (80.1) | 326 | 308 | 6.1 | |||||||||||||||||
| Other liabilities accounts | 7,084 | 8,747 | (19.0) | 7,084 | 7,489 | (5.4) | |||||||||||||||||
| Total liabilities | 166,809 | 169,052 | (1.3) | 166,809 | 178,650 | (6.6) | |||||||||||||||||
| Total equity | 87,896 | 90,677 | (3.1) | 87,896 | 83,567 | 5.2 | |||||||||||||||||
| Memorandum items: | |||||||||||||||||||||||
Gross loans and advances to customers 2 | 5,640 | 5,717 | (1.4) | 5,640 | 5,779 | (2.4) | |||||||||||||||||
| Customer funds | 1,508 | 1,239 | 21.7 | 1,508 | 895 | 68.5 | |||||||||||||||||
Customer deposits 3 | 1,508 | 1,239 | 21.7 | 1,508 | 895 | 68.5 | |||||||||||||||||
| Mutual funds | — | — | — | — | — | — | |||||||||||||||||
| Resources | |||||||||||||||||||||||
| Number of employees | 1,922 | 1,931 | (0.5) | 1,922 | 1,899 | 1.2 | |||||||||||||||||
1. Includes exchange differences.
2. Excluding reverse repos.
3. Excluding repos.
January - December 2023 | | 71 | ||||||
Business model | ||||||||||||||||||||||||||
| Financial information by segment | ||||||||||||||||||||||||||
| RETAIL BANKING | |||||||||||||||||||||||
| EUR million | |||||||||||||||||||||||
| / | Q3'23 | / | 2022 | ||||||||||||||||||||
| Underlying income statement | Q4'23 | % | % excl. FX | 2023 | % | % excl. FX | |||||||||||||||||
| Net interest income | 9,662 | (1.6) | 8.2 | 37,985 | 9.0 | 11.9 | |||||||||||||||||
| Net fee income | 1,783 | (11.4) | 0.7 | 7,661 | 0.1 | 3.3 | |||||||||||||||||
Gains (losses) on financial transactions 1 | 79 | (66.9) | (57.1) | 214 | (52.3) | (54.0) | |||||||||||||||||
| Other operating income | (127) | (37.5) | 542.0 | (606) | 114.2 | — | |||||||||||||||||
| Total income | 11,397 | (4.0) | 2.0 | 45,254 | 6.0 | 8.1 | |||||||||||||||||
| Administrative expenses and amortizations | (4,760) | (4.6) | 5.2 | (19,396) | 4.6 | 8.1 | |||||||||||||||||
| Net operating income | 6,637 | (3.5) | (0.3) | 25,858 | 7.2 | 8.1 | |||||||||||||||||
| Net loan-loss provisions | (3,216) | (2.7) | 0.5 | (12,295) | 20.4 | 20.9 | |||||||||||||||||
| Other gains (losses) and provisions | (688) | 29.4 | 38.2 | (2,691) | 26.6 | 39.3 | |||||||||||||||||
| Profit before tax | 2,734 | (10.3) | (8.0) | 10,872 | (7.8) | (8.1) | |||||||||||||||||
| Tax on profit | (484) | (32.0) | (24.4) | (2,586) | (12.3) | (11.5) | |||||||||||||||||
| Profit from continuing operations | 2,250 | (3.7) | (3.2) | 8,286 | (6.2) | (7.0) | |||||||||||||||||
| Net profit from discontinued operations | — | — | — | — | — | — | |||||||||||||||||
| Consolidated profit | 2,250 | (3.7) | (3.2) | 8,286 | (6.2) | (7.0) | |||||||||||||||||
| Non-controlling interests | (211) | 1.8 | 1.3 | (849) | (5.8) | (6.9) | |||||||||||||||||
| Profit attributable to the parent | 2,039 | (4.2) | (3.6) | 7,436 | (6.3) | (7.0) | |||||||||||||||||
1. Includes exchange differences.
| CORPORATE & INVESTMENT BANKING | |||||||||||||||||||||||
| EUR million | |||||||||||||||||||||||
| / | Q3'23 | / | 2022 | ||||||||||||||||||||
| Underlying income statement | Q4'23 | % | % excl. FX | 2023 | % | % excl. FX | |||||||||||||||||
| Net interest income | 923 | (2.9) | 36.1 | 3,485 | (1.8) | 7.5 | |||||||||||||||||
| Net fee income | 486 | (8.6) | 1.2 | 2,190 | 10.5 | 13.6 | |||||||||||||||||
Gains (losses) on financial transactions 1 | 368 | (45.5) | (10.7) | 2,581 | 42.0 | 57.0 | |||||||||||||||||
| Other operating income | 41 | — | — | 41 | 30.8 | (79.5) | |||||||||||||||||
| Total income | 1,817 | (14.5) | 4.4 | 8,296 | 12.5 | 18.3 | |||||||||||||||||
| Administrative expenses and amortizations | (1,017) | 17.7 | 26.4 | (3,391) | 16.8 | 20.4 | |||||||||||||||||
| Net operating income | 800 | (36.6) | (11.5) | 4,905 | 9.6 | 17.0 | |||||||||||||||||
| Net loan-loss provisions | (208) | — | — | (162) | (35.0) | (33.7) | |||||||||||||||||
| Other gains (losses) and provisions | (19) | (79.5) | (77.4) | (174) | 34.0 | 33.9 | |||||||||||||||||
| Profit before tax | 573 | (52.9) | (28.2) | 4,570 | 11.5 | 19.6 | |||||||||||||||||
| Tax on profit | (139) | (61.9) | (49.9) | (1,280) | 16.6 | 19.7 | |||||||||||||||||
| Profit from continuing operations | 434 | (49.1) | (18.9) | 3,290 | 9.7 | 19.6 | |||||||||||||||||
| Net profit from discontinued operations | — | — | — | — | — | — | |||||||||||||||||
| Consolidated profit | 434 | (49.1) | (18.9) | 3,290 | 9.7 | 19.6 | |||||||||||||||||
| Non-controlling interests | (37) | (24.4) | (22.7) | (212) | 16.3 | 15.1 | |||||||||||||||||
| Profit attributable to the parent | 398 | (50.6) | (18.6) | 3,078 | 9.3 | 19.9 | |||||||||||||||||
1. Includes exchange differences.
| 72 | | January - December 2023 | ||||||
Business model | ||||||||||||||||||||||||||
| Financial information by segment | ||||||||||||||||||||||||||
| WEALTH MANAGEMENT & INSURANCE | |||||||||||||||||||||||
| EUR million | |||||||||||||||||||||||
| / | Q3'23 | / | 2022 | ||||||||||||||||||||
| Underlying income statement | Q4'23 | % | % excl. FX | 2023 | % | % excl. FX | |||||||||||||||||
| Net interest income | 416 | (8.4) | (3.5) | 1,739 | 105.4 | 112.1 | |||||||||||||||||
| Net fee income | 321 | 0.7 | 12.8 | 1,265 | (2.1) | 0.5 | |||||||||||||||||
Gains (losses) on financial transactions 1 | 45 | 28.0 | 78.4 | 149 | 20.8 | 29.5 | |||||||||||||||||
| Other operating income | 22 | (66.6) | (88.7) | 242 | (34.8) | (39.3) | |||||||||||||||||
| Total income | 804 | (8.0) | (1.5) | 3,396 | 28.9 | 31.0 | |||||||||||||||||
| Administrative expenses and amortizations | (311) | 9.3 | 13.4 | (1,156) | 9.7 | 11.6 | |||||||||||||||||
| Net operating income | 494 | (16.4) | (8.8) | 2,240 | 41.6 | 43.9 | |||||||||||||||||
| Net loan-loss provisions | 5 | — | — | 21 | — | — | |||||||||||||||||
| Other gains (losses) and provisions | 15 | — | — | (26) | (28.6) | (28.0) | |||||||||||||||||
| Profit before tax | 513 | (12.3) | (4.7) | 2,235 | 46.0 | 48.3 | |||||||||||||||||
| Tax on profit | (109) | (22.1) | (15.9) | (528) | 51.2 | 55.5 | |||||||||||||||||
| Profit from continuing operations | 404 | (9.2) | (1.1) | 1,707 | 44.4 | 46.2 | |||||||||||||||||
| Net profit from discontinued operations | — | — | — | — | — | — | |||||||||||||||||
| Consolidated profit | 404 | (9.2) | (1.1) | 1,707 | 44.4 | 46.2 | |||||||||||||||||
| Non-controlling interests | (19) | 32.0 | 33.7 | (71) | 11.8 | 9.9 | |||||||||||||||||
| Profit attributable to the parent | 386 | (10.6) | (2.3) | 1,637 | 46.3 | 48.4 | |||||||||||||||||
1. Includes exchange differences.
| PAGONXT | |||||||||||||||||||||||
| EUR million | |||||||||||||||||||||||
| / | Q3'23 | / | 2022 | ||||||||||||||||||||
| Underlying income statement | Q4'23 | % | % excl. FX | 2023 | % | % excl. FX | |||||||||||||||||
| Net interest income | 38 | 57.9 | 58.9 | 93 | 325.2 | 320.8 | |||||||||||||||||
| Net fee income | 253 | (1.0) | 1.1 | 954 | 8.3 | 6.3 | |||||||||||||||||
Gains (losses) on financial transactions 1 | 1 | (49.9) | (47.8) | (10) | (29.4) | (32.0) | |||||||||||||||||
| Other operating income | 29 | 61.9 | 70.0 | 102 | 59.9 | 58.7 | |||||||||||||||||
| Total income | 320 | 7.4 | 9.7 | 1,140 | 19.6 | 17.5 | |||||||||||||||||
| Administrative expenses and amortizations | (268) | 6.7 | 10.9 | (1,091) | 6.6 | 6.0 | |||||||||||||||||
| Net operating income | 53 | 11.0 | 3.3 | 49 | — | — | |||||||||||||||||
| Net loan-loss provisions | (1) | (87.4) | (87.7) | (24) | (45.6) | (45.8) | |||||||||||||||||
| Other gains (losses) and provisions | (23) | 265.0 | 269.6 | (42) | 62.3 | 66.1 | |||||||||||||||||
| Profit before tax | 29 | (7.5) | (20.3) | (17) | (88.1) | (87.0) | |||||||||||||||||
| Tax on profit | (5) | (78.2) | (73.0) | (59) | (5.6) | (9.8) | |||||||||||||||||
| Profit from continuing operations | 23 | 285.0 | 178.2 | (76) | (62.7) | (60.9) | |||||||||||||||||
| Net profit from discontinued operations | — | — | — | — | — | — | |||||||||||||||||
| Consolidated profit | 23 | 285.0 | 178.2 | (76) | (62.7) | (60.9) | |||||||||||||||||
| Non-controlling interests | — | — | — | (1) | (87.8) | (88.2) | |||||||||||||||||
| Profit attributable to the parent | 24 | 787.4 | 506.2 | (77) | (64.0) | (62.5) | |||||||||||||||||
1. Includes exchange differences.
January - December 2023 | | 73 | ||||||
Business model | ||||||||||||||||||||||||||
| Alternative performance measures | ||||||||||||||||||||||||||
| ALTERNATIVE PERFORMANCE MEASURES (APMs) | ||||||||
In addition to the financial information prepared under IFRS, this consolidated directors’ report contains financial measures that constitute alternative performance measures (APMs) to comply with the guidelines on alternative performance measures issued by the European Securities and Markets Authority on 5 October 2015 and non-IFRS measures.
The financial measures contained in this consolidated directors’ report that qualify as APMs and non-IFRS measures have been calculated using the financial information from Santander but are not defined or detailed in the applicable financial information framework or under IFRS and therefore have neither been audited nor are susceptible to being fully audited.
We use these APMs and non-IFRS measures when planning, monitoring and evaluating our performance. We consider these APMs and non-IFRS financial measures to be useful metrics for management and investors to facilitate operating performance comparisons from period to period. While we believe that these APMs and non-IFRS financial measures are useful in evaluating our business, this information should be considered as supplemental in nature and is not meant as a substitute of IFRS measures. In addition, the way in which Santander defines and calculates these APMs and non-IFRS measures may differ from the calculations by
other companies with similar measures and, therefore, may not be comparable.
The APMs and non-IFRS measures we use in this document can be categorized as follows:
Underlying results
In addition to IFRS results measures, we present some results measures which are non-IFRS and which we refer to as underlying measures. These measures allow in our view a better year-on-year comparability given that they exclude items outside the ordinary performance of our business (e.g. capital gains, write-downs, impairment of goodwill) or certain line items have been reclassified in the underlying ("adjusted") income statement, as their impact on profit is zero, to facilitate comparisons with prior quarters and better understand the trends in the business.
In addition, in the section "Financial information by segment", relative to the primary and secondary segments, results are only presented on an underlying basis in accordance with IFRS 8, and reconciled on an aggregate basis to our IFRS consolidated results to the consolidated financial statements, which are set out below.
| Reconciliation of underlying results to statutory results | |||||||||||
| EUR million | |||||||||||
| January-December 2023 | |||||||||||
| Statutory results | Adjustments | Underlying results | |||||||||
| Net interest income | 43,261 | — | 43,261 | ||||||||
| Net fee income | 12,057 | — | 12,057 | ||||||||
Gains (losses) on financial transactions 1 | 2,633 | — | 2,633 | ||||||||
| Other operating income | (528) | 224 | (304) | ||||||||
| Total income | 57,423 | 224 | 57,647 | ||||||||
| Administrative expenses and amortizations | (25,425) | — | (25,425) | ||||||||
| Net operating income | 31,998 | 224 | 32,222 | ||||||||
| Net loan-loss provisions | (12,932) | 474 | (12,458) | ||||||||
| Other gains (losses) and provisions | (2,607) | (459) | (3,066) | ||||||||
| Profit before tax | 16,459 | 239 | 16,698 | ||||||||
| Tax on profit | (4,276) | (213) | (4,489) | ||||||||
| Profit from continuing operations | 12,183 | 26 | 12,209 | ||||||||
| Net profit from discontinued operations | — | — | — | ||||||||
| Consolidated profit | 12,183 | 26 | 12,209 | ||||||||
| Non-controlling interests | (1,107) | (26) | (1,133) | ||||||||
| Profit attributable to the parent | 11,076 | — | 11,076 | ||||||||
1. Includes exchange differences.
| Explanation of adjustments: | |||||
| 1. | Temporary levy on revenue in Spain in the first quarter, totalling EUR 224 million, which was moved from total income to other gains (losses) and provisions. | ||||
| 2. | Provisions to strengthen the balance sheet in Brazil in the first quarter, totalling EUR 235 million, net of tax and non-controlling interests (EUR 474 million recorded in net loan-loss provisions, EUR 213 million positive impact in tax and EUR 26 million in non-controlling interests). | ||||
| 74 | | January - December 2023 | ||||||
Business model | ||||||||||||||||||||||||||
| Alternative performance measures | ||||||||||||||||||||||||||
| Reconciliation of underlying results to statutory results | |||||||||||
| EUR million | |||||||||||
| January-December 2022 | |||||||||||
| Statutory results | Adjustments | Underlying results | |||||||||
| Net interest income | 38,619 | — | 38,619 | ||||||||
| Net fee income | 11,790 | — | 11,790 | ||||||||
Gains (losses) on financial transactions 1 | 1,653 | — | 1,653 | ||||||||
| Other operating income | 55 | 37 | 92 | ||||||||
| Total income | 52,117 | 37 | 52,154 | ||||||||
| Administrative expenses and amortizations | (23,903) | — | (23,903) | ||||||||
| Net operating income | 28,214 | 37 | 28,251 | ||||||||
| Net loan-loss provisions | (10,836) | 327 | (10,509) | ||||||||
| Other gains (losses) and provisions | (2,128) | (364) | (2,492) | ||||||||
| Profit before tax | 15,250 | — | 15,250 | ||||||||
| Tax on profit | (4,486) | — | (4,486) | ||||||||
| Profit from continuing operations | 10,764 | — | 10,764 | ||||||||
| Net profit from discontinued operations | — | — | — | ||||||||
| Consolidated profit | 10,764 | — | 10,764 | ||||||||
| Non-controlling interests | (1,159) | — | (1,159) | ||||||||
| Profit attributable to the parent | 9,605 | — | 9,605 | ||||||||
1. Includes exchange differences.
Explanation of adjustments:
Mainly, payment holidays in Poland.
January - December 2023 | | 75 | ||||||
Business model | ||||||||||||||||||||||||||
| Alternative performance measures | ||||||||||||||||||||||||||
Profitability and efficiency ratios
The purpose of the profitability and efficiency ratios is to measure the ratio of profit to capital, to tangible capital, to assets and to risk- weighted assets, while the efficiency ratio measures how much general administrative expenses (personnel and other) and amortization costs are needed to generate revenue.
Additionally, goodwill adjustments have been removed from the RoTE numerator as, since they are not considered in the denominator, we believe this calculation is more correct.
| Ratio | Formula | Relevance of the metric | ||||||||||||
| RoE | Profit attributable to the parent | This ratio measures the return that shareholders obtain on the funds invested in the bank and as such measures the company's ability to pay shareholders. | ||||||||||||
| (Return on equity) | Average stockholders’ equity 1 (excl. minority interests) | |||||||||||||
| RoTE | Profit attributable to the parent2 | This indicator is used to evaluate the profitability of the company as a percentage of its tangible equity. It's measured as the return that shareholders receive as a percentage of the funds invested in the entity less intangible assets. | ||||||||||||
| (Return on tangible equity) | Average stockholders' equity 1 (excl. minority interests) - intangible assets | |||||||||||||
| RoA | Consolidated profit | This metric measures the profitability of a company as a percentage of its total assets. It is an indicator that reflects the efficiency of the company's total funds in generating profit. | ||||||||||||
| (Return on assets) | Average total assets | |||||||||||||
| RoRWA | Consolidated profit | The return adjusted for risk is a derivative of the RoA metric. The difference is that RoRWA measures profit in relation to the bank's risk-weighted assets. | ||||||||||||
| (Return on risk-weighted assets) | Average risk-weighted assets | |||||||||||||
| Efficiency ratio | Operating expenses 3 | One of the most commonly used indicators when comparing productivity of different financial entities. It measures the amount of funds used to generate the bank's total income. | ||||||||||||
| Total income | ||||||||||||||
1. Stockholders’ equity = Capital and Reserves + Accumulated other comprehensive income + Profit attributable to the parent + Dividends.
2. Excluding the adjustment to the valuation of goodwill.
3. Operating expenses = Administrative expenses + amortizations.
| 76 | | January - December 2023 | ||||||
Business model | ||||||||||||||||||||||||||
| Alternative performance measures | ||||||||||||||||||||||||||
Profitability and efficiency 1, 2 | Q4'23 | Q3'23 | 2023 | 2022 | ||||||||||
| (EUR million and %) | ||||||||||||||
| RoE | 12.36 | % | 12.28 | % | 11.91 | % | 10.67 | % | ||||||
| Profit attributable to the parent | 11,730 | 11,609 | 11,076 | 9,605 | ||||||||||
| Average stockholders' equity (excluding minority interests) | 94,877 | 94,527 | 93,035 | 89,986 | ||||||||||
| RoTE | 15.64 | % | 15.49 | % | 15.06 | % | 13.37 | % | ||||||
| Profit attributable to the parent | 11,730 | 11,609 | 11,076 | 9,605 | ||||||||||
| (+) Goodwill impairment | -20 | — | -20 | — | ||||||||||
| Profit attributable to the parent (excluding goodwill impairment) | 11,750 | 11,609 | 11,096 | 9,605 | ||||||||||
| Average stockholders' equity (excluding minority interests) | 94,877 | 94,527 | 93,035 | 89,986 | ||||||||||
| (-) Average intangible assets | 19,764 | 19,576 | 19,361 | 18,164 | ||||||||||
| Average stockholders' equity (excl. minority interests) - intangible assets | 75,114 | 74,951 | 73,675 | 71,822 | ||||||||||
| RoA | 0.71 | % | 0.71 | % | 0.69 | % | 0.63 | % | ||||||
| Consolidated profit | 12,793 | 12,702 | 12,209 | 10,764 | ||||||||||
| Average total assets | 1,799,535 | 1,784,465 | 1,773,103 | 1,720,273 | ||||||||||
| RoRWA | 2.04 | % | 2.02 | % | 1.96 | % | 1.77 | % | ||||||
| Consolidated profit | 12,793 | 12,702 | 12,209 | 10,764 | ||||||||||
| Average risk-weighted assets | 626,973 | 630,034 | 624,031 | 606,952 | ||||||||||
| Efficiency ratio | 44.4 | % | 43.6 | % | 44.1 | % | 45.8 | % | ||||||
| Underlying operating expenses | 6,464 | 6,482 | 25,425 | 23,903 | ||||||||||
| Operating expenses | 6,464 | 6,482 | 25,425 | 23,903 | ||||||||||
| Net capital gains and provisions impact on operating expenses | — | — | — | — | ||||||||||
| Underlying total income | 14,552 | 14,861 | 57,647 | 52,154 | ||||||||||
| Total income | 14,552 | 14,861 | 57,423 | 52,117 | ||||||||||
| Net capital gains and provisions impact on total income | — | — | 224 | 37 | ||||||||||
1.Averages included in the RoE, RoTE, RoA and RoRWA denominators are calculated using the monthly average over the period, which we believe should not differ materially from using daily balances. | ||||||||||||||
2.The risk-weighted assets included in the denominator of the RoRWA metric are calculated in line with the criteria laid out in the CRR (Capital Requirements Regulation). | ||||||||||||||
January - December 2023 | | 77 | ||||||
Business model | ||||||||||||||||||||||||||
| Alternative performance measures | ||||||||||||||||||||||||||
| Efficiency ratio | ||||||||||||||||||||
| (EUR million and %) | ||||||||||||||||||||
| 2023 | 2022 | |||||||||||||||||||
| % | Operating expenses | Total income | % | Operating expenses | Total income | |||||||||||||||
| Europe | 42.1 | 9,030 | 21,439 | 47.3 | 8,523 | 18,030 | ||||||||||||||
| Spain | 41.7 | 4,227 | 10,132 | 48.6 | 3,998 | 8,233 | ||||||||||||||
| United Kingdom | 49.7 | 2,745 | 5,525 | 49.6 | 2,685 | 5,418 | ||||||||||||||
| Portugal | 27.3 | 542 | 1,982 | 38.7 | 502 | 1,295 | ||||||||||||||
| Poland | 27.1 | 862 | 3,182 | 28.0 | 692 | 2,474 | ||||||||||||||
| North America | 49.1 | 6,465 | 13,174 | 47.7 | 5,871 | 12,316 | ||||||||||||||
| US | 51.0 | 3,679 | 7,209 | 47.2 | 3,599 | 7,623 | ||||||||||||||
| Mexico | 43.9 | 2,588 | 5,899 | 44.9 | 2,076 | 4,623 | ||||||||||||||
| South America | 38.5 | 6,920 | 17,971 | 37.0 | 6,675 | 18,025 | ||||||||||||||
| Brazil | 34.6 | 4,529 | 13,104 | 32.4 | 4,180 | 12,910 | ||||||||||||||
| Chile | 44.6 | 1,020 | 2,285 | 40.1 | 981 | 2,449 | ||||||||||||||
| Argentina | 50.2 | 775 | 1,544 | 53.9 | 987 | 1,833 | ||||||||||||||
| Digital Consumer Bank | 47.6 | 2,618 | 5,502 | 46.7 | 2,462 | 5,269 | ||||||||||||||
| RoTE | ||||||||||||||||||||
| (EUR million and %) | ||||||||||||||||||||
| 2023 | 2022 | |||||||||||||||||||
| % | Profit attributable to the parent (excluding goodwill impairment) | Average stockholders' equity (excl. minority interests) - intangible assets | % | Profit attributable to the parent (excluding goodwill impairment) | Average stockholders' equity (excl. minority interests) - intangible assets | |||||||||||||||
| Europe | 14.47 | 5,489 | 37,931 | 9.28 | 3,810 | 41,054 | ||||||||||||||
| Spain | 14.16 | 2,371 | 16,742 | 7.89 | 1,560 | 19,786 | ||||||||||||||
| United Kingdom | 13.01 | 1,545 | 11,874 | 10.70 | 1,395 | 13,038 | ||||||||||||||
| Portugal | 25.92 | 896 | 3,458 | 15.03 | 534 | 3,553 | ||||||||||||||
| Poland | 17.68 | 674 | 3,810 | 11.93 | 364 | 3,047 | ||||||||||||||
| North America | 9.76 | 2,360 | 24,183 | 11.06 | 2,878 | 26,025 | ||||||||||||||
| US | 6.07 | 932 | 15,355 | 9.40 | 1,784 | 18,968 | ||||||||||||||
| Mexico | 17.70 | 1,560 | 8,814 | 16.92 | 1,213 | 7,168 | ||||||||||||||
| South America | 14.43 | 3,045 | 21,097 | 18.77 | 3,658 | 19,491 | ||||||||||||||
| Brazil | 13.73 | 1,921 | 13,987 | 19.23 | 2,544 | 13,232 | ||||||||||||||
| Chile | 14.82 | 582 | 3,925 | 19.47 | 677 | 3,479 | ||||||||||||||
| Argentina | 55.60 | 386 | 694 | 26.23 | 324 | 1,237 | ||||||||||||||
| Digital Consumer Bank | 12.33 | 1,199 | 9,721 | 13.65 | 1,308 | 9,583 | ||||||||||||||
| 78 | | January - December 2023 | ||||||
Business model | ||||||||||||||||||||||||||
| Alternative performance measures | ||||||||||||||||||||||||||
Credit risk indicators
The credit risk indicators measure the quality of the credit portfolio and the percentage of non-performing loans covered by provisions.
| Ratio | Formula | Relevance of the metric | ||||||||||||
NPL ratio (Non-performing loans) | Credit impaired loans and advances to customers, customer guarantees and customer commitments granted | The NPL ratio is an important variable regarding financial institutions' activity since it gives an indication of the level of risk the entities are exposed to. It calculates risks that are, in accounting terms, declared to be credit impaired as a percentage of the total outstanding amount of customer credit and contingent liabilities. | ||||||||||||
Total Risk 1 | ||||||||||||||
| Total coverage ratio | Total allowances to cover impairment losses on loans and advances to customers, customer guarantees and customer commitments granted | The total coverage ratio is a fundamental metric in the financial sector. It reflects the level of provisions as a percentage of the credit impaired assets. Therefore it is a good indicator of the entity's solvency against customer defaults both present and future. | ||||||||||||
| Credit impaired loans and advances to customers, customer guarantees and customer commitments granted | ||||||||||||||
| Cost of risk | Allowances for loan-loss provisions over the last 12 months | This ratio quantifies loan-loss provisions arising from credit risk over a defined period of time for a given loan portfolio. As such, it acts as an indicator of credit quality. | ||||||||||||
| Average loans and advances to customers over the last 12 months | ||||||||||||||
1. Total risk = Total loans and advances and guarantees to customers (including credit impaired assets) + contingent liabilities granted that are credit impaired.
| Credit risk (I) | Dec-23 | Sep-23 | Dec-22 | |||||||||||
| (EUR million and %) | ||||||||||||||
| NPL ratio | 3.14 | % | 3.13 | % | 3.08 | % | ||||||||
| Credit impaired loans and advances to customers, customer guarantees and customer commitments granted | 35,620 | 35,558 | 34,673 | |||||||||||
| Gross loans and advances to customers registered under the headings “financial assets measured at amortized cost” and "financial assets designated at fair value through profit or loss" classified in stage 3 (OCI), excluding POCI (Purchased or Originated Credit Impaired) | 33,821 | 33,682 | 32,617 | |||||||||||
| POCI exposure (Purchased or Originated Credit Impaired) that is additionally impaired | 273 | 288 | 271 | |||||||||||
| Customer guarantees and customer commitments granted classified in stage 3 | 1,517 | 1,577 | 1,776 | |||||||||||
| Doubtful exposure of loans and advances to customers at fair value through profit or loss | 9 | 11 | 9 | |||||||||||
| Total risk | 1,133,898 | 1,135,383 | 1,124,121 | |||||||||||
| Impaired and non-impaired gross loans and advances to customers | 1,059,135 | 1,062,413 | 1,058,688 | |||||||||||
| Impaired and non-impaired customer guarantees and customer commitments granted | 74,763 | 72,970 | 65,433 | |||||||||||
January - December 2023 | | 79 | ||||||
Business model | ||||||||||||||||||||||||||
| Alternative performance measures | ||||||||||||||||||||||||||
| Credit risk (II) | Dec-23 | Sep-23 | Dec-22 | |||||||||||
| (EUR million and %) | ||||||||||||||
| Total coverage ratio | 66 | % | 68 | % | 68 | % | ||||||||
| Total allowances to cover impairment losses on loans and advances to customers, customer guarantees and customer commitments granted | 23,490 | 24,019 | 23,418 | |||||||||||
| Total allowances to cover impairment losses on loans and advances to customers measured at amortized cost and designated at fair value through OCI | 22,788 | 23,242 | 22,684 | |||||||||||
| Total allowances to cover impairment losses on customer guarantees and customer commitments granted | 702 | 777 | 734 | |||||||||||
| Credit impaired loans and advances to customers, customer guarantees and customer commitments granted | 35,620 | 35,558 | 34,673 | |||||||||||
| Gross loans and advances to customers registered under the headings “financial assets measured at amortized cost” and "financial assets designated at fair value through profit or loss" classified in stage 3 (OCI), excluding POCI (Purchased or Originated Credit Impaired) | 33,821 | 33,682 | 32,617 | |||||||||||
| POCI exposure (Purchased or Originated Credit Impaired) that is additionally impaired | 273 | 288 | 271 | |||||||||||
| Customer guarantees and customer commitments granted classified in stage 3 | 1,517 | 1,577 | 1,776 | |||||||||||
| Doubtful exposure of loans and advances to customers at fair value through profit or loss | 9 | 11 | 9 | |||||||||||
| Cost of risk | 1.18 | % | 1.13 | % | 0.99 | % | ||||||||
| Underlying allowances for loan-loss provisions over the last 12 months | 12,458 | 12,055 | 10,509 | |||||||||||
| Allowances for loan-loss provisions over the last 12 months | 12,932 | 12,529 | 10,836 | |||||||||||
| Net capital gains and provisions impact in allowances for loan-loss provisions | -474 | -474 | -327 | |||||||||||
| Average loans and advances to customers over the last 12 months | 1,059,566 | 1,064,199 | 1,059,972 | |||||||||||
| NPL ratio | ||||||||||||||||||||
| (EUR million and %) | ||||||||||||||||||||
| 2023 | 2022 | |||||||||||||||||||
| % | Credit impaired loans and advances to customers, customer guarantees and customer commitments granted | Total risk | % | Credit impaired loans and advances to customers, customer guarantees and customer commitments granted | Total risk | |||||||||||||||
| Europe | 2.32 | 14,495 | 624,696 | 2.37 | 15,186 | 639,996 | ||||||||||||||
| Spain | 3.06 | 8,529 | 278,569 | 3.27 | 9,598 | 293,197 | ||||||||||||||
| United Kingdom | 1.42 | 3,518 | 247,360 | 1.21 | 3,059 | 253,455 | ||||||||||||||
| Portugal | 2.59 | 1,024 | 39,503 | 2.99 | 1,247 | 41,755 | ||||||||||||||
| Poland | 3.55 | 1,397 | 39,329 | 3.80 | 1,268 | 33,350 | ||||||||||||||
| North America | 4.09 | 7,805 | 190,720 | 3.03 | 5,629 | 185,614 | ||||||||||||||
| US | 4.57 | 6,303 | 137,893 | 3.25 | 4,571 | 140,452 | ||||||||||||||
| Mexico | 2.82 | 1,489 | 52,785 | 2.32 | 1,047 | 45,107 | ||||||||||||||
| South America | 5.72 | 10,142 | 177,380 | 6.20 | 10,381 | 167,348 | ||||||||||||||
| Brazil | 6.56 | 7,479 | 113,937 | 7.57 | 7,705 | 101,801 | ||||||||||||||
| Chile | 5.01 | 2,332 | 46,565 | 4.99 | 2,384 | 47,811 | ||||||||||||||
| Argentina | 1.99 | 78 | 3,903 | 2.08 | 122 | 5,844 | ||||||||||||||
| Digital Consumer Bank | 2.12 | 2,877 | 135,608 | 2.06 | 2,583 | 125,339 | ||||||||||||||
| 80 | | January - December 2023 | ||||||
Business model | ||||||||||||||||||||||||||
| Alternative performance measures | ||||||||||||||||||||||||||
| NPL coverage ratio | ||||||||||||||||||||
| (EUR million and %) | ||||||||||||||||||||
| 2023 | 2022 | |||||||||||||||||||
| % | Total allowances to cover impairment losses on loans and advances to customers, customer guarantees and customer commitments granted | Credit impaired loans and advances to customers, customer guarantees and customer commitments granted | % | Total allowances to cover impairment losses on loans and advances to customers, customer guarantees and customer commitments granted | Credit impaired loans and advances to customers, customer guarantees and customer commitments granted | |||||||||||||||
| Europe | 49.3 | 7,147 | 14,495 | 51.8 | 7,871 | 15,186 | ||||||||||||||
| Spain | 49.1 | 4,185 | 8,529 | 51.0 | 4,890 | 9,598 | ||||||||||||||
| United Kingdom | 30.3 | 1,066 | 3,518 | 33.8 | 1,033 | 3,059 | ||||||||||||||
| Portugal | 82.7 | 847 | 1,024 | 79.3 | 990 | 1,247 | ||||||||||||||
| Poland | 73.3 | 1,024 | 1,397 | 74.0 | 938 | 1,268 | ||||||||||||||
| North America | 73.8 | 5,763 | 7,805 | 93.3 | 5,250 | 5,629 | ||||||||||||||
| US | 67.7 | 4,265 | 6,303 | 90.3 | 4,127 | 4,571 | ||||||||||||||
| Mexico | 100.0 | 1,489 | 1,489 | 106.6 | 1,116 | 1,047 | ||||||||||||||
| South America | 78.4 | 7,948 | 10,142 | 76.0 | 7,886 | 10,381 | ||||||||||||||
| Brazil | 84.7 | 6,338 | 7,479 | 79.5 | 6,128 | 7,705 | ||||||||||||||
| Chile | 52.7 | 1,230 | 2,332 | 56.3 | 1,343 | 2,384 | ||||||||||||||
| Argentina | 165.7 | 128 | 78 | 180.4 | 220 | 122 | ||||||||||||||
| Digital Consumer Bank | 88.0 | 2,532 | 2,877 | 92.8 | 2,397 | 2,583 | ||||||||||||||
| Cost of risk | ||||||||||||||||||||
| (EUR million and %) | ||||||||||||||||||||
| 2023 | 2022 | |||||||||||||||||||
| % | Underlying allowances for loan-loss provisions over the last 12 months | Average loans and advances to customers over the last 12 months | % | Underlying allowances for loan-loss provisions over the last 12 months | Average loans and advances to customers over the last 12 months | |||||||||||||||
| Europe | 0.44 | 2,533 | 582,256 | 0.39 | 2,396 | 612,142 | ||||||||||||||
| Spain | 0.62 | 1,522 | 246,660 | 0.61 | 1,618 | 265,051 | ||||||||||||||
| United Kingdom | 0.10 | 247 | 251,362 | 0.12 | 316 | 262,973 | ||||||||||||||
| Portugal | 0.20 | 77 | 38,546 | 0.04 | 17 | 40,286 | ||||||||||||||
| Poland | 2.08 | 674 | 32,385 | 1.43 | 440 | 30,721 | ||||||||||||||
| North America | 2.05 | 3,733 | 182,037 | 1.49 | 2,538 | 169,980 | ||||||||||||||
| US | 1.92 | 2,593 | 135,190 | 1.35 | 1,744 | 128,834 | ||||||||||||||
| Mexico | 2.43 | 1,135 | 46,729 | 1.95 | 788 | 40,348 | ||||||||||||||
| South America | 3.36 | 5,401 | 160,644 | 3.32 | 5,041 | 151,705 | ||||||||||||||
| Brazil | 4.77 | 4,701 | 98,555 | 4.79 | 4,417 | 92,188 | ||||||||||||||
| Chile | 0.80 | 365 | 45,637 | 0.93 | 399 | 42,953 | ||||||||||||||
| Argentina | 6.64 | 150 | 2,262 | 2.91 | 132 | 4,541 | ||||||||||||||
| Digital Consumer Bank | 0.62 | 792 | 128,583 | 0.45 | 544 | 119,524 | ||||||||||||||
January - December 2023 | | 81 | ||||||
Business model | ||||||||||||||||||||||||||
| Alternative performance measures | ||||||||||||||||||||||||||
Other indicators
The market capitalization indicator provides information on the volume of tangible equity per share. The loan-to-deposit ratio (LTD) identifies the relationship between net customer loans and advances and customer deposits, assessing the proportion of loans and advances granted by the Group that are funded by customer deposits.
The Group also uses gross customer loan magnitudes excluding reverse repurchase agreements (repos) and customer deposits excluding repos. In order to analyse the evolution of the traditional commercial banking business of granting loans and capturing deposits, repos and reverse repos are excluded, as they are mainly treasury business products and highly volatile.
| Ratio | Formula | Relevance of the metric | ||||||||||||
| TNAV per share | Tangible book value 1 | This is a very commonly used ratio used to measure the company's accounting value per share having deducted the intangible assets. It is useful in evaluating the amount each shareholder would receive if the company were to enter into liquidation and had to sell all the company's tangible assets. | ||||||||||||
| (Tangible equity net asset value per share) | Number of shares excluding treasury stock | |||||||||||||
| Price / tangible book value per share (X) | Share price | This is one of the most commonly used ratios by market participants for the valuation of listed companies both in absolute terms and relative to other entities. This ratio measures the relationship between the price paid for a company and its accounting equity value. | ||||||||||||
| TNAV per share | ||||||||||||||
| LTD ratio | Net loans and advances to customers | This is an indicator of the bank's liquidity. It measures the total (net) loans and advances to customers as a percentage of customer deposits. | ||||||||||||
| (Loan-to-deposit) | Customer deposits | |||||||||||||
| Loans and advances (excl. reverse repos) | Gross loans and advances to customers excluding reverse repos | In order to aid analysis of the commercial banking activity, reverse repos are excluded as they are highly volatile treasury products. | ||||||||||||
| Deposits (excl. repos) | Customer deposits excluding repos | In order to aid analysis of the commercial banking activity, repos are excluded as they are highly volatile treasury products. | ||||||||||||
| PAT + After tax fees paid to SAN (in Wealth Management & Insurance) | Net profit + fees paid from Santander Asset Management and Santander Insurance to Santander, net of taxes, excluding Private Banking customers | Metric to assess Wealth Management & Insurance's total contribution to Grupo Santander profit. | ||||||||||||
1. Tangible book value = Stockholders' equity (excl. minority interests) - intangible assets.
| Others | Dec-23 | Sep-23 | Dec-23 | Dec-22 | ||||||||||
| (EUR million and %) | ||||||||||||||
| TNAV (tangible book value) per share | 4.76 | 4.61 | 4.26 | |||||||||||
| Tangible book value | 75,552 | 74,561 | 70,459 | |||||||||||
| Number of shares excl. treasury stock (million) | 15,886 | 16,176 | 16,551 | |||||||||||
| Price / Tangible book value per share (X) | 0.79 | 0.79 | 0.66 | |||||||||||
| Share price (euros) | 3.780 | 3.619 | 2.803 | |||||||||||
| TNAV (tangible book value) per share | 4.76 | 4.61 | 4.26 | |||||||||||
| Loan-to-deposit ratio | 99 | % | 100 | % | 103 | % | ||||||||
| Net loans and advances to customers | 1,036,349 | 1,039,172 | 1,036,004 | |||||||||||
| Customer deposits | 1,047,169 | 1,034,885 | 1,009,722 | |||||||||||
| Q4'23 | Q3'23 | 2023 | 2022 | |||||||||||
| PAT + After tax fees paid to SAN (in WM&I) (Constant EUR million) | 850 | 833 | 3,296 | 2,730 | ||||||||||
| Profit after tax | 430 | 435 | 1,707 | 1,167 | ||||||||||
| Net fee income net of tax | 420 | 398 | 1,589 | 1,563 | ||||||||||
| 82 | | January - December 2023 | ||||||
Business model | ||||||||||||||||||||||||||
| Alternative performance measures | ||||||||||||||||||||||||||
Local currency measures
We make use of certain financial measures in local currency to help in the assessment of our ongoing operating performance. These non-IFRS financial measures include the results of operations of our subsidiary banks located outside the eurozone, excluding the impact of foreign exchange. Because changes in foreign currency exchange rates do not have an operating impact on the results, we believe that evaluating their performance on a local currency basis provides an additional and meaningful assessment of performance to both management and the company’s investors.
The Group presents, at both the Group level as well as the business unit level, the real changes in the income statement as well as the changes excluding the exchange rate effect, as it considers the latter facilitates analysis, since it enables businesses movements to be identified without taking into account the impact of converting each local currency into euros.
Said variations, excluding the impact of exchange rate movements, are calculated by converting income statement lines for the different business units comprising the Group into our presentation currency, the euro, applying the average exchange rate for the 2023 to all periods contemplated in the analysis.
The Group presents, at both the Group level as well as the business unit level, the changes in euros in the balance sheet as well as the changes excluding the exchange rate effect for loans and advances to customers excluding reverse repos and customer funds (which comprise deposits and mutual funds) excluding repos. As with the income statement, the reason is to facilitate analysis by isolating the changes in the balance sheet that are not caused by converting each local currency into euros.
These changes excluding the impact of exchange rate movements are calculated by converting loans and advances to customers excluding reverse repos and customer funds excluding repos, into our presentation currency, the euro, applying the closing exchange rate on the last working day of December 2023 to all periods contemplated in the analysis.
The average and period-end exchange rates for the main currencies in which the Group operates are set out in the table below.
| Exchange rates: 1 euro / currency parity | ||||||||||||||||||||
| Average (income statement) | Period-end (balance sheet) | |||||||||||||||||||
| 2023 | 2022 | Dec-23 | Sep-23 | Dec-22 | ||||||||||||||||
| US dollar | 1.081 | 1.051 | 1.105 | 1.058 | 1.068 | |||||||||||||||
| Pound sterling | 0.870 | 0.853 | 0.868 | 0.867 | 0.887 | |||||||||||||||
| Brazilian real | 5.397 | 5.421 | 5.365 | 5.295 | 5.650 | |||||||||||||||
| Mexican peso | 19.158 | 21.131 | 18.691 | 18.392 | 20.805 | |||||||||||||||
| Chilean peso | 906.417 | 916.688 | 965.192 | 945.192 | 909.200 | |||||||||||||||
| Argentine peso | 282.765 | 134.786 | 893.635 | 370.374 | 189.116 | |||||||||||||||
| Polish zloty | 4.538 | 4.683 | 4.343 | 4.621 | 4.684 | |||||||||||||||
Impact of inflation rate on the variations of operating expenses
Santander presents, for both the Group and the business units included in the primary segments, the changes in operating expenses, as well as the changes excluding the exchange rate effect, and the changes of the latter excluding the effect of average inflation over the last twelve months. The reason is that the two latter facilitate analysis for management purposes.
Inflation is calculated as the arithmetic average of the last twelve months for each country and, for the regions, as the weighted average of each country comprising the region's inflation rate, weighted by each country's operating expenses in the region. The table below shows the cost changes in constant euros, the average inflation rates calculated as indicated and the cost changes in real terms, i.e. in constant euros and excluding average inflation of the last twelve months.
| Operating expenses: % change year-on-year | ||||||||||||||
| In constant EUR | Average inflation last 12 months | In real terms | ||||||||||||
| Europe | 6.4 | 5.7 | 0.7 | |||||||||||
| Spain | 5.7 | 3.6 | 2.2 | |||||||||||
| United Kingdom | 4.3 | 7.4 | -3.1 | |||||||||||
| Portugal | 8.1 | 4.4 | 3.7 | |||||||||||
| Poland | 20.7 | 11.6 | 9.2 | |||||||||||
| North America | 8.0 | 4.7 | 3.3 | |||||||||||
| US | 5.1 | 4.2 | 1.0 | |||||||||||
| Mexico | 13.0 | 5.6 | 7.5 | |||||||||||
| South America | 16.7 | 19.5 | -2.7 | |||||||||||
| Brazil | 7.9 | 4.6 | 3.3 | |||||||||||
| Chile | 2.8 | 7.7 | -4.9 | |||||||||||
| Argentina | 271.0 | 127.9 | 143.0 | |||||||||||
| Digital Consumer Bank | 8.1 | 5.5 | 2.6 | |||||||||||
| Total Group | 9.6 | 9.3 | 0.4 | |||||||||||
January - December 2023 | | 83 | ||||||
Business model | ||||||||||||||||||||||||||
| Alternative performance measures | ||||||||||||||||||||||||||
| ESG indicators | ||||||||||||||||||||
| Metric | Definition | Dec-23 | ||||||||||||||||||
| Green finance raised and facilitated (EUR mn) | Nominal amount of PF, PF Advisory, PF bonds, Green bonds, ECA, M&A, ECM transactions classified by SCFS panel and reported in the League Tables since the beginning of the exercise. | 114,630 | ||||||||||||||||||
| Sustainable Responsible Investments AuMs (EUR mn) | Volume of assets under management classified as article 8 - promoting ESG objectives - and 9 - with explicit sustainability objectives - of the SFDR regulation (EU Reg. 2019/2088). Includes assets managed by Santander Asset Management (SAM), third-party funds and SAM funds managed with equivalent criteria in those countries where SFDR does not apply (mainly Latin America). | 67,690 | ||||||||||||||||||
Note: Not taxonomy.
| 84 | | January - December 2023 | ||||||
Business model | ||||||||||||||||||||||||||
| Condensed consolidated financial statements | ||||||||||||||||||||||||||
| CONDENSED CONSOLIDATED FINANCIAL STATEMENTS | ||||||||
•CONSOLIDATED BALANCE SHEET
•CONSOLIDATED INCOME STATEMENT
| NOTE: | The following financial information for the 2023 and 2022 (attached herewith) corresponds to the condensed consolidated financial statements prepared in accordance with the International Financial Reporting Standards. | ||||
| As a result of the implementation from 1 January 2023 of the amendments to IFRS 17 (new general accounting standard for insurance contracts), the Group has performed retrospectively a reclassification in the balance sheet to 'Liabilities under insurance or reinsurance contracts', related to the different treatment established by this new standard for the components of an insurance contract. | |||||
| Condensed consolidated balance sheet | ||||||||
| EUR million | ||||||||
| ASSETS | Dec-23 | Dec-22 | ||||||
| Cash, cash balances at central banks and other deposits on demand | 220,342 | 223,073 | ||||||
| Financial assets held for trading | 176,921 | 156,118 | ||||||
| Non-trading financial assets mandatorily at fair value through profit or loss | 5,910 | 5,713 | ||||||
| Financial assets designated at fair value through profit or loss | 9,773 | 8,989 | ||||||
| Financial assets at fair value through other comprehensive income | 83,308 | 85,239 | ||||||
| Financial assets at amortized cost | 1,191,403 | 1,147,044 | ||||||
| Hedging derivatives | 5,297 | 8,069 | ||||||
| Changes in the fair value of hedged items in portfolio hedges of interest risk | (788) | (3,749) | ||||||
| Investments | 7,646 | 7,615 | ||||||
| Joint ventures entities | 1,964 | 1,981 | ||||||
| Associated entities | 5,682 | 5,634 | ||||||
| Assets under insurance contracts | 237 | 308 | ||||||
| Tangible assets | 33,882 | 34,073 | ||||||
| Property, plant and equipment | 32,926 | 33,044 | ||||||
| For own-use | 13,408 | 13,489 | ||||||
| Leased out under an operating lease | 19,518 | 19,555 | ||||||
| Investment property | 956 | 1,029 | ||||||
| Of which : Leased out under an operating lease | 851 | 804 | ||||||
| Intangible assets | 19,871 | 18,645 | ||||||
| Goodwill | 14,017 | 13,741 | ||||||
| Other intangible assets | 5,854 | 4,904 | ||||||
| Tax assets | 31,390 | 29,987 | ||||||
| Current tax assets | 10,623 | 9,200 | ||||||
| Deferred tax assets | 20,767 | 20,787 | ||||||
| Other assets | 8,856 | 10,082 | ||||||
| Insurance contracts linked to pensions | 93 | 104 | ||||||
| Inventories | 7 | 11 | ||||||
| Other | 8,756 | 9,967 | ||||||
| Non-current assets held for sale | 3,014 | 3,453 | ||||||
| TOTAL ASSETS | 1,797,062 | 1,734,659 | ||||||
January - December 2023 | | 85 | ||||||
Business model | ||||||||||||||||||||||||||
| Condensed consolidated financial statements | ||||||||||||||||||||||||||
| Interim condensed consolidated balance sheet | ||||||||
| EUR million | ||||||||
| LIABILITIES | Dec-23 | Dec-22 | ||||||
| Financial liabilities held for trading | 122,270 | 115,185 | ||||||
| Financial liabilities designated at fair value through profit or loss | 40,367 | 40,268 | ||||||
| Financial liabilities at amortized cost | 1,468,703 | 1,423,858 | ||||||
| Hedging derivatives | 7,656 | 9,228 | ||||||
| Changes in the fair value of hedged items in portfolio hedges of interest rate risk | 55 | (117) | ||||||
| Liabilities under insurance contracts | 17,799 | 16,426 | ||||||
| Provisions | 8,441 | 8,149 | ||||||
| Pensions and other post-retirement obligations | 2,225 | 2,392 | ||||||
| Other long term employee benefits | 880 | 950 | ||||||
| Taxes and other legal contingencies | 2,715 | 2,074 | ||||||
| Contingent liabilities and commitments | 702 | 734 | ||||||
| Other provisions | 1,919 | 1,999 | ||||||
| Tax liabilities | 9,932 | 9,468 | ||||||
| Current tax liabilities | 3,846 | 3,040 | ||||||
| Deferred tax liabilities | 6,086 | 6,428 | ||||||
| Other liabilities | 17,598 | 14,609 | ||||||
| Liabilities associated with non-current assets held for sale | — | — | ||||||
| TOTAL LIABILITIES | 1,692,821 | 1,637,074 | ||||||
| EQUITY | ||||||||
| Shareholders' equity | 130,443 | 124,732 | ||||||
| Capital | 8,092 | 8,397 | ||||||
| Called up paid capital | 8,092 | 8,397 | ||||||
| Unpaid capital which has been called up | — | — | ||||||
| Share premium | 44,373 | 46,273 | ||||||
| Equity instruments issued other than capital | 720 | 688 | ||||||
| Equity component of the compound financial instrument | — | — | ||||||
| Other equity instruments issued | 720 | 688 | ||||||
| Other equity | 195 | 175 | ||||||
| Accumulated retained earnings | 74,114 | 66,702 | ||||||
| Revaluation reserves | — | — | ||||||
| Other reserves | (5,751) | (5,454) | ||||||
| (-) Own shares | (1,078) | (675) | ||||||
| Profit attributable to shareholders of the parent | 11,076 | 9,605 | ||||||
| (-) Interim dividends | (1,298) | (979) | ||||||
| Other comprehensive income (loss) | (35,020) | (35,628) | ||||||
| Items not reclassified to profit or loss | (5,212) | (4,635) | ||||||
| Items that may be reclassified to profit or loss | (29,808) | (30,993) | ||||||
| Non-controlling interest | 8,818 | 8,481 | ||||||
| Other comprehensive income | (1,559) | (1,856) | ||||||
| Other items | 10,377 | 10,337 | ||||||
| TOTAL EQUITY | 104,241 | 97,585 | ||||||
| TOTAL LIABILITIES AND EQUITY | 1,797,062 | 1,734,659 | ||||||
| MEMORANDUM ITEMS: OFF BALANCE SHEET AMOUNTS | ||||||||
| Loan commitments granted | 279,589 | 274,075 | ||||||
| Financial guarantees granted | 15,435 | 12,856 | ||||||
| Other commitments granted | 113,273 | 92,672 | ||||||
| 86 | | January - December 2023 | ||||||
Business model | ||||||||||||||||||||||||||
| Condensed consolidated financial statements | ||||||||||||||||||||||||||
| Condensed consolidated income statement | ||||||||
| EUR million | ||||||||
| 2023 | 2022 | |||||||
| Interest income | 105,252 | 71,430 | ||||||
| Financial assets at fair value through other comprehensive income | 5,995 | 5,479 | ||||||
| Financial assets at amortized cost | 77,701 | 59,214 | ||||||
| Other interest income | 21,556 | 6,737 | ||||||
| Interest expense | (61,991) | (32,811) | ||||||
| Interest income/ (charges) | 43,261 | 38,619 | ||||||
| Dividend income | 571 | 488 | ||||||
| Income from companies accounted for using the equity method | 613 | 702 | ||||||
| Commission income | 16,321 | 15,867 | ||||||
| Commission expense | (4,264) | (4,077) | ||||||
| Gain or losses on financial assets and liabilities not measured at fair value through profit or loss, net | 96 | 149 | ||||||
| Financial assets at amortized cost | (3) | 34 | ||||||
| Other financial assets and liabilities | 99 | 115 | ||||||
| Gain or losses on financial assets and liabilities held for trading, net | 2,322 | 842 | ||||||
| Reclassification of financial assets at fair value through other comprehensive income | — | — | ||||||
| Reclassification of financial assets from amortized cost | — | — | ||||||
| Other gains (losses) | 2,322 | 842 | ||||||
| Gains or losses on non-trading financial assets and liabilities mandatorily at fair value through profit or loss | 204 | 162 | ||||||
| Reclassification of financial assets at fair value through other comprehensive income | — | — | ||||||
| Reclassification of financial assets from amortized cost | — | — | ||||||
| Other gains (losses) | 204 | 162 | ||||||
| Gain or losses on financial assets and liabilities measured at fair value through profit or loss, net | (93) | 968 | ||||||
| Gain or losses from hedge accounting, net | 63 | 74 | ||||||
| Exchange differences, net | 41 | (542) | ||||||
| Other operating income | 1,104 | 1,510 | ||||||
| Other operating expenses | (2,827) | (2,803) | ||||||
| Income from assets under insurance contracts | 460 | 2,698 | ||||||
| Expenses from liabilities under insurance contracts | (449) | (2,540) | ||||||
| Total income | 57,423 | 52,117 | ||||||
| Administrative expenses | (22,241) | (20,918) | ||||||
| Staff costs | (13,726) | (12,547) | ||||||
| Other general and administrative expenses | (8,515) | (8,371) | ||||||
| Depreciation and amortization | (3,184) | (2,985) | ||||||
| Provisions or reversal of provisions, net | (2,678) | (1,881) | ||||||
| Impairment or reversal of impairment of financial assets not measured at fair value through profit or loss and net gains and losses from modifications | (12,956) | (10,863) | ||||||
| Financial assets at fair value through other comprehensive income | (44) | (7) | ||||||
| Financial assets at amortized cost | (12,912) | (10,856) | ||||||
| Impairment of investments in subsidiaries, joint ventures and associates, net | — | — | ||||||
| Impairment on non-financial assets, net | (237) | (239) | ||||||
| Tangible assets | (136) | (140) | ||||||
| Intangible assets | (73) | (75) | ||||||
| Others | (28) | (24) | ||||||
| Gain or losses on non-financial assets and investments, net | 313 | 12 | ||||||
| Negative goodwill recognized in results | 39 | — | ||||||
| Gains or losses on non-current assets held for sale not classified as discontinued operations | (20) | 7 | ||||||
| Operating profit/(loss) before tax | 16,459 | 15,250 | ||||||
| Tax expense or income from continuing operations | (4,276) | (4,486) | ||||||
| Profit/(loss) for the period from continuing operations | 12,183 | 10,764 | ||||||
| Profit/( loss) after tax from discontinued operations | — | — | ||||||
| Profit/(loss) for the period | 12,183 | 10,764 | ||||||
| Profit attributable to non-controlling interests | 1,107 | 1,159 | ||||||
| Profit/(loss) attributable to the parent | 11,076 | 9,605 | ||||||
| Earnings/(losses) per share | ||||||||
| Basic | 0.65 | 0.54 | ||||||
| Diluted | 0.65 | 0.54 | ||||||
January - December 2023 | | 87 | ||||||
| GLOSSARY | ||||||||
•Active customer: Those customers who comply with the minimum balance, income and/or transactionality requirements as defined according to the business area
•ADR: American Depositary Receipt
•ALCO: Assets and Liabilities Committee
•APIs: Application Programming Interface
•APM: Alternative Performance Measures
•APS: Amherst Pierpont Securities
•AuMs: Assets under management
•bn: Billion
•BNPL: Buy now, pay later
•bps: basis points
•CDI: CREST Depository Interest
•CET1: Common Equity Tier 1
•CHF: Swiss francs
•CIB: Corporate & Investment Banking
•CNMV: Spanish National Securities Market Commission (Comisión Nacional del Mercado de Valores)
•Costs in real terms: variations excluding the effect of average inflation over the last twelve months
•DCB: Digital Consumer Bank
•DGF: Deposit guarantee fund
•Digital customers: Every consumer of a commercial bank’s services who has logged on to their personal online banking and/or mobile banking in the last 30 days
•ECB: European Central Bank
•EPS: Earnings per share
•ESG: Environmental, Social and Governance
•ESMA: European Securities and Markets Authority
•Fed: Federal Reserve
•Financial inclusion: Number of people who are unbanked, underbanked, in financial difficulty, with difficulties in accessing credit who, through the Group's products and services, are able to access the financial system or receive tailored finance. Financially underserved groups are defined as people who do not have a current account, or who have an account but obtained alternative (non-bank) financial services in the last 12 months. Beneficiaries of various programmes are included in the quantification process only once in the entire period. Only new empowered people are counted, taking as a base year those existing since 2019.
•FX: Foreign Exchange
•GDP: Gross Domestic Product
•IFRS 9: International Financial Reporting Standard 9, regarding financial instruments
•IMF: International Monetary Fund
•IPO: Initial Public Offering
•LCR: Liquidity Coverage Ratio
•LLPs: Loan-loss provisions
•Loyal customers: Active customers who receive most of their financial services from the Group according to the commercial segment that they belong to. Various engaged customer levels have been defined taking profitability into account
•MDA: Maximum Distributable Amount
•mn: Million
•NII: Net Interest Income
•NPLs: Non-performing loans
•NPS: Net Promoter Score
•PBT: Profit before tax
•PoS: Point of Sale
•pp: percentage points
•QoQ: Quarter-on-quarter
•Repos: Repurchase agreements
•RoA: Return on assets
•RoE: Return on equity
•RoRWA: Return on risk-weighted assets
•RoTE: Return on tangible equity
•RWAs: Risk-weighted assets
•SAM: Santander Asset Management
•SBNA: Santander Bank N.A.
•SCF: Santander Consumer Finance
•SCIB: Santander Corporate & Investment Banking
•SC USA: Santander Consumer USA
•SEC: Securities and Exchanges Commission
•SHUSA: Santander Holdings USA, Inc.
•SMEs: Small and medium enterprises
•SRF: Single resolution fund
•TLAC: The total loss-absorbing capacity requirement which is required to be met under the CRD V package
•TLTRO: Targeted longer-term refinancing operations
•TNAV: Tangible net asset value
•TPV: Total payments volume
•VaR: Value at Risk
•WM&I: Wealth Management & Insurance
•YoY: Year-on-year
| 88 | | January - December 2023 | ||||||
Business model | ||||||||||||||||||||||||||
| Important Information | ||||||||||||||||||||||||||
| IMPORTANT INFORMATION | ||||||||
Non-IFRS and alternative performance measures
This report contains financial information prepared according to International Financial Reporting Standards (IFRS) and taken from our consolidated financial statements, as well as alternative performance measures (APMs) as defined in the Guidelines on Alternative Performance Measures issued by the European Securities and Markets Authority (ESMA) on 5 October 2015, and other non-IFRS measures. The APMs and non-IFRS measures were calculated with information from Grupo Santander; however, they are neither defined or detailed in the applicable financial reporting framework nor audited or reviewed by our auditors. We use these APMs and non-IFRS measures when planning, monitoring and evaluating our performance. We consider them to be useful metrics for our management and investors to compare operating performance between periods. APMs we use are presented unless otherwise specified on a constant FX basis, which is computed by adjusting comparative period reported data for the effects of foreign currency translation differences, which distort period-on-period comparisons. Nonetheless, the APMs and non-IFRS measures are supplemental information; their purpose is not to substitute IFRS measures. Furthermore, companies in our industry and others may calculate or use APMs and non-IFRS measures differently, thus making them less useful for comparison purposes. APMs using ESG labels have not been calculated in accordance with the Taxonomy Regulation or with the indicators for principal adverse impact in SFDR. For further details on APMs and Non-IFRS Measures, including their definition or a reconciliation between any applicable management indicators and the financial data presented in the consolidated financial statements prepared under IFRS, please see the 2022 Annual Report on Form 20-F filed with the U.S. Securities and Exchange Commission (the SEC) on 1 March 2023 (https://www.santander.com/content/dam/santander-com/en/documentos/informacion-sobre-resultados-semestrales-y-anuales-suministrada-a-la-sec/2023/sec-2022-annual-20-f-2022-en.pdf), as well as the section “Alternative performance measures” of this Banco Santander, S.A. (Santander) Q4 2023 Financial Report, published on 31 January 2024 (https://www.santander.com/en/shareholders-and-investors/financial-and-economic-information#quarterly-results). Underlying measures, which are included in this report, are non-IFRS measures.
The businesses included in each of our geographic segments and the accounting principles under which their results are presented here may differ from the businesses included and local applicable accounting principles of our public subsidiaries in such geographies. Accordingly, the results of operations and trends shown for our geographic segments may differ materially from those of such subsidiaries.
Non-financial information
This report contains, in addition to financial information, non-financial information (NFI), including environmental, social and governance-related metrics, statements, goals, commitments and opinions.
NFI is included to comply with Spanish Act 11/2018 on non-financial information and diversity and to provide a broader view of our impact. NFI is not audited nor reviewed by an external auditor. NFI is prepared following various external and internal frameworks, reporting guidelines and measurement, collection and verification methods and practices, which are materially different from those applicable to financial information and are in many cases emerging and evolving. NFI is based on various materiality thresholds, estimates, assumptions, judgments and underlying data derived internally and from third parties. NFI is thus subject to significant measurement uncertainties, may not be comparable to NFI of other companies or over time or across periods and its inclusion is not meant to imply that the information is fit for any particular purpose or that it is material to us under mandatory reporting standards. NFI is for informational purposes only and without any liability being accepted in connection with it except where such liability cannot be limited under overriding provisions of applicable law.
Forward-looking statements
Santander hereby warns that this report contains “forward-looking statements” as per the meaning of the U.S. Private Securities Litigation Reform Act of 1995. Such statements can be understood through words and expressions like “expect”, “project”, “anticipate”, “should”, “intend”, “probability”, “risk”, “VaR”, “RoRAC”, “RoRWA”, “TNAV”, “target”, “goal”, “objective”, “estimate”, “future”, “commitment”, “commit”, “focus”, “pledge” and similar expressions. They include (but are not limited to) statements on future business development, shareholder remuneration policy and NFI.
While these forward-looking statements represent our judgement and future expectations concerning our business developments and results may differ materially from those anticipated, expected, projected or assumed in forward-looking statements.
In particular, forward looking statements are based on current expectations and future estimates about Santander’s and third-parties’ operations and businesses and address matters that are uncertain to varying degrees and may change, including, but not limited to (a) expectations, targets, objectives, strategies and goals relating to environmental, social, safety and governance performance, including expectations regarding future execution of Santander’s and third-parties’ (including governments and other public actors) energy and climate strategies, and the underlying assumptions and estimated impacts on Santander’s and third-parties’ businesses related thereto; (b) Santander’s and third-parties’ approach, plans and expectations in relation to carbon use and targeted reductions of emissions, which may be affected by conflicting interests such as energy security; (c) changes in operations or investments under existing or future environmental laws and regulations; (d) changes in rules and regulations, regulatory requirements and internal policies, including those related to climate-related initiatives; (e) our own decisions and actions including those affecting or changing our practices, operations, priorities, strategies, policies or procedures; and (f) the uncertainty over the scope of actions that may be required by us, governments and others to achieve goals relating to climate, environmental and social matters, as well as the evolving nature of underlying science and industry and governmental standards and regulations.
January - December 2023 | | 89 | ||||||
Business model | ||||||||||||||||||||||||||
| Important Information | ||||||||||||||||||||||||||
In addition, the important factors described in this report and other risk factors, uncertainties or contingencies detailed in our most recent Form 20-F and subsequent 6-Ks filed with, or furnished to, the SEC, as well as other unknown or unpredictable factors, could affect our future development and results and could lead to outcomes materially different from what our forward-looking statements anticipate, expect, project or assume.
Forward-looking statements are therefore aspirational, should be regarded as indicative, preliminary and for illustrative purposes only, speak only as of the date of this report, are informed by the knowledge, information and views available on such date and are subject to change without notice. Santander is not required to update or revise any forward-looking statements, regardless of new information, future events or otherwise, except as required by applicable law. Santander does not accept any liability in connection with forward-looking statements except where such liability cannot be limited under overriding provisions of applicable law.
Not a securities offer
This report and the information it contains does not constitute an offer to sell nor the solicitation of an offer to buy any securities.
Past performance does not indicate future outcomes
Statements about historical performance or growth rates must not be construed as suggesting that future performance, share price or results (including earnings per share) will necessarily be the same or higher than in a previous period. Nothing in this report should be taken as a profit and loss forecast.
Third Party Information
In this report, Santander relies on and refers to certain information and statistics obtained from publicly-available information and third-party sources, which it believes to be reliable. Neither Santander nor its directors, officers and employees have independently verified the accuracy or completeness of any such publicly-available and third-party information, make any representation or warranty as to the quality, fitness for a particular purpose, non-infringement, accuracy or completeness of such information or undertake any obligation to update such information after the date of this report. In no event shall Santander be liable for any use by any party of, for any decision made or action taken by any party in reliance upon, or for inaccuracies or errors in, or omission from, such publicly-available and third-party information contained herein. Any sources of publicly-available information and third-party information referred or contained herein retain all rights with respect to such information and use of such information herein shall not be deemed to grant a license to any third party.
| This document is a translation of a document originally issued in Spanish. Should there be any discrepancies between the English and the Spanish versions, only the original Spanish version should be binding. | ||
| 90 | | January - December 2023 | ||||||
SIGNATURE
Pursuant to the requirements of the Securities Exchange Act of 1934, the registrant has duly caused this report to be signed on its behalf by the undersigned, thereunto duly authorized.
| Banco Santander, S.A. | ||||||||
| Date: 31 January 2024 | By: | /s/ José García Cantera | ||||||
| Name: | José García Cantera | |||||||
| Title: | Chief Financial Officer | |||||||