Table of Contents
FORM6-K
SECURITIES AND EXCHANGE COMMISSION
Washington, D.C. 20549
Report of Foreign Issuer
Pursuant to Rule13a-16 or15d-16 of
the Securities Exchange Act of 1934
For the month of October, 2019
Commission File Number:001-12518
Banco Santander, S.A.
(Exact name of registrant as specified in its charter)
Ciudad Grupo Santander
28660 Boadilla del Monte (Madrid) Spain
(Address of principal executive office)
Indicate by check mark whether the registrant files or will file annual reports under cover of Form20-F or Form40-F:
Form20-F ☒ Form40-F ☐
Indicate by check mark if the registrant is submitting the Form6-K in paper as permitted by RegulationS-T Rule 101(b)(1):
Yes ☐ No ☒
Indicate by check mark if the registrant is submitting the Form6-K in paper as permitted by RegulationS-T Rule 101(b)(7):
Yes ☐ No ☒
Table of Contents
Table of Contents

Santander earns €3,732m in attributable profit during the first
nine months of the year, after €2,448m in charges relating to the UK
goodwill impairment and restructuring costs already announced
Excluding these charges, the profit increased to €6,180 million for the period, up 2%
Madrid, 30 October 2019 - PRESS RELEASE
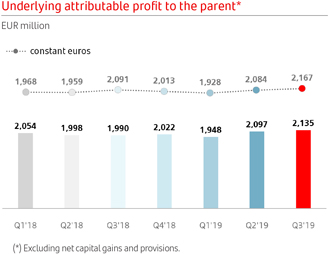
| ∎ | In the third quarter alone, underlying profit increased to €2,135 million (+7%year-on-year) - its highest level since Q2 2010. Attributable profit for the quarter was €501 million after charges of €1,634 million primarily relating to the UK goodwill impairment announced in September. |
| ∎ | The Group confirmed in September that it will pay a first dividend against 2019 earnings of €0.10 per share from 1 November 2019, in line with its targeted dividendpay-out ratio of40-50% of underlying attributable profit. |
| ∎ | In the first nine months of the year Santander generated total revenues of €36,902 million, as the bank added almost six million additional customers since Q3 2018. Santander now serves 144 million customers in total – more than any other bank in Europe and the Americas. |
| ∎ | The increase in customers supported solid growth in business volumes, with loans and customer funds increasing by 4% and 6% respectivelyyear-on-year in constant euros (i.e. applying constant exchange rates). |
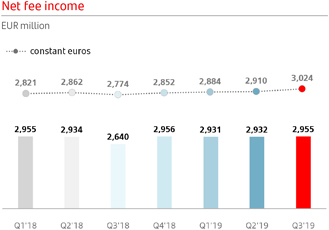
| ∎ | Credit quality remained very strong with the Group’snon-performing loan ratio falling by 40 basis pointsyear-on-year to 3.47%, while cost of credit remained broadly stable at 1%. |
| ∎ | The number of digital customers increased by 6.1 million since Q3 2018 to 36.2 million, as investment in technology continued to drive strong adoption of digital services. |
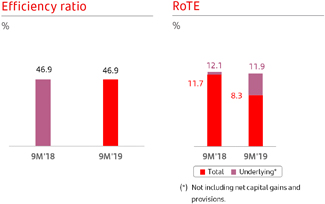
| ∎ | This progress in our digital transformation, combined with savings generated through leveraging the Group’s scale across the regions, helped improve efficiency further, with thecost-to-income ratio reducing by 50 basis points in the quarter to 46.9%. |
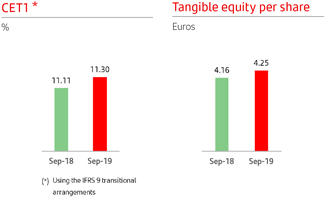
| ∎ | The Group generated 19 basis points of capital through organic growth in the quarter, offsetting various regulatory effects. As a result, the Group’s CET1 ratio stood at 11.30%. Excluding the regulatory demands applied since December 2018, the Group’s CET1 ratio would be 11.83%. |
Banco Santander Group Executive Chairman, Ana Botín, said:
“We have achieved the strongest underlying performance in almost a decade this quarter, building on the momentum from the first half of the year, despite some significant external headwinds. This reflects the strength of our model, and the progress we are making in leveraging the new regional organisational structure implemented in April.
Our diversification across Europe and the Americas is one of the defining characteristics that stands Santander apart from our peers. And because of this, we have continued to deliver predictable, profitable growth, and a sustainable dividend through the cycle.
Our global scale and local leadership, combined with a more agile organisation led by our first-rate team, provides a unique foundation and significant opportunities for further growth. I am confident we will achieve our medium-term targets, including reaching a RoTE of13-15%.”
| Corporate Communications |  | |||
| Ciudad Grupo Santander, edificio Arrecife, planta 2 | 1 | |||
| 28660 Boadilla del Monte (Madrid). Tel. +34 91 2895211 | ||||
| comunicacion@gruposantander.com | ||||
| www.santander.com - Twitter: @bancosantander |
Table of Contents
Results Summary (9M19 v 9M18 unless otherwise stated)
Q319 (m)
| Q319 v Q318
| Q319 v Q318 (EX FX)
| 9M19 (m)
| 9M19 v 9M18
| 9M19 v 9M18 (EX FX)
| |||||||||
| Total income | €12,466 | +6% | +4% | €36,902 | +3% | +3% | ||||||||
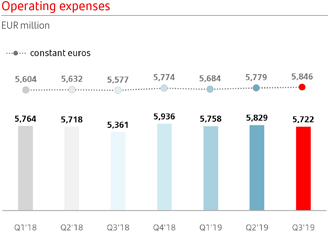
| Operating expenses | (€5,722) | +7% | +5% | (€17,309) | +3% | +3% | ||||||||
| Net operating income | €6,744 | +6% | +3% | €19,593 | +3% | +3% | ||||||||
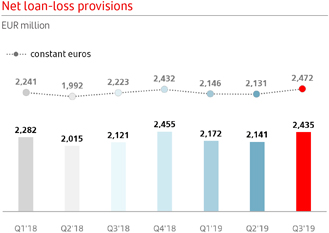
| Net loan-loss provisions | (€2,435) | +15% | +11% | (€6,748) | +5% | +5% | ||||||||
| Profit before tax | €3,844 | +3% | 0% | €11,423 | +2% | +2% | ||||||||
| Tax | (€1,315) | -6% | -7% | (€3,994) | -1% | -1% | ||||||||
| Underlying profit | €2,135 | +7% | +4% | €6,180 | +2% | +3% | ||||||||
| Net capital gains and provisions | (€1,634) | - | - | (€2,448) | - | - | ||||||||
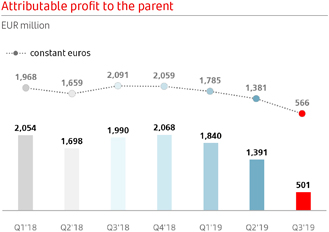
| Attributable Profit | €501 | -75% | -73% | €3,732 | -35% | -35% | ||||||||
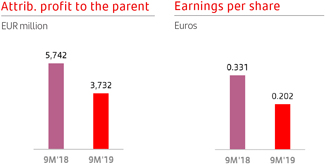
The Group achieved an attributable profit of €3,732 million during the first nine months of 2019 after charges of €2,448 million relating primarily to the UK goodwill impairment announced on 24 September 2019 (€1,491 million), as well as a further provision for PPI (€103 million) and other charges (€40 million). This, in addition to the net charge of €814 million announced for the first half, which related primarily to planned restructuring costs in Spain and the UK, led to a fall in attributable profit for the first nine months of 35%year-on-year (YoY).
Excluding these charges, profit in the first nine months increased to €6,180 million, up 2% YoY (+3% in constant euros, i.e. applying constant exchange rates), driven by further growth in customers and business volumes.
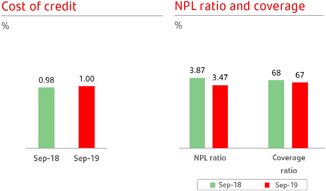
In the third quarter alone, underlying profit increased to its highest level since the second quarter of 2010 at €2,135 million (up 7% YoY) with an underlying return on tangible equity (RoTE), a key measure of profitability, remaining among the highest of our peer group at 12.2% (11.9% for the first nine months of the year).
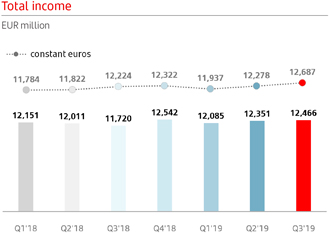
Santander’s commercial and digital transformation continued to improve the quality and recurrence of its revenues, with net interest income increasing by 5% YoY to €26,442 million and total income increasing by 3% YoY to €36,902 million.
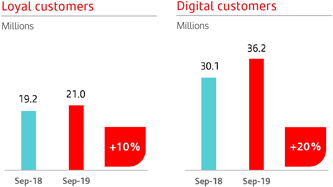
The bank added almost six million customers since Q3 2018, taking the total number of customers it serves to 144 million – more than any bank in Europe and the Americas. The number of loyal customers (customers using Santander as their primary bank) has increased by 10% YoY to 21 million, while loans and customer funds increasing by 4% and 6% respectively YoY in constant euros.
The rapid growth in digital adoption continued, with the number of customers using internet banking or mobile increasing by 6.1 million since September 2018 to 36.2 million – 51% of total active customers. During the quarter the bank announced the launch of Openbank in Germany and began a pilot of Superdigital in Chile, as well as making a number of new investments through its venture capital arm Santander InnoVentures in areas of identity verification, digital debt platforms, blockchain for issuing securities, etc. Furthermore, in September the bank launched the firstend-to-end blockchain bond in the world.
| Corporate Communications | 2 | | ||
| Ciudad Grupo Santander, edificio Arrecife, planta 2 | ||||
| 28660 Boadilla del Monte (Madrid). Tel. +34 91 2895211 | ||||
| comunicacion@gruposantander.com | ||||
| www.santander.com - Twitter: @bancosantander |
Table of Contents
This acceleration in digital adoption, combined with growth in customer revenue and targeted cost management, allowed the bank to maintain a‘best-in-class’cost-to-income ratio of 46.9%, with operating expenses falling by 1% YoY in real terms (without inflation) in constant euros.
Credit quality improved further in the quarter, with thenon-performing loan ratio falling by four bps in the quarter to 3.47%. Cost of credit (the rate at which the bank needs to provision when lending money) also remained broadly stable at 1%.
The Group continued to generate capital organically in the quarter, adding 19 bps which offset the impact of various regulatory effects. As a result, the Group’s CET1 ratio stood at 11.30%, in line with its medium-term target of11-12%.
The Group confirmed in September a first dividend against 2019 earnings of €0.10 per share, which will be paid from 1 November 2019 and ratified its intention to maintain apay-out ratio of40-50% of underlying attributable profit, with the proportion of cash dividend per share at least that of last year.
Markets Summary (9M19 v 9M18)
To better reflect the local performance of each market, theyear-on-year percentage changes provided below are presented in constant exchange euros. Variations in current euros are available in the financial report.
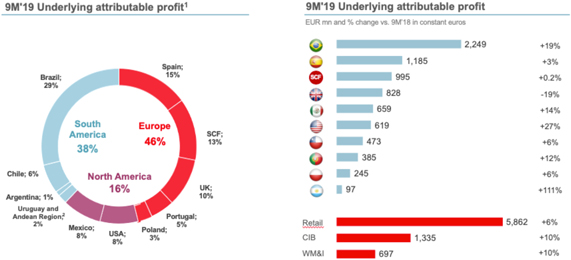
(1) Excluding Corporate Centre (EUR-1,637 mn) and Santander Global Platform.
(2) Uruguay and Andean Region underlying profit (EUR 159 mn).
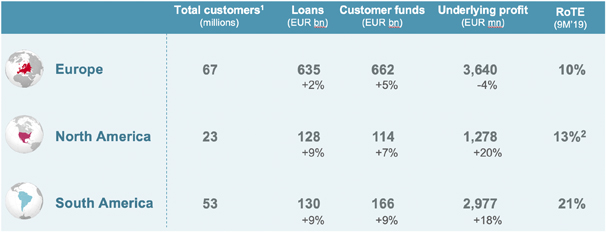
The Group’s scale and presence across both developed and high growth markets is a key point of differentiation for Santander among its peers, with European franchises contributing 46% of group underlying profit, South America contributing 38% and North America contributing 16%. Brazil remained the largest contributor with 29% of total Group underlying profit, followed by Spain (15%), Santander Consumer Finance (13%), the UK (10%), Mexico (8%) and the US (8%).
Europe. Underlying profit amounted to €3,640 million, 4% lower than in the same period last year. Costs decreased by 1%(-2.5% in real terms) reflecting the first savings from the bank’s optimisation programme, announced at its investor day in April 2019. As a result, underlying RoTE was 10%. Gross loans increased by 2%, while customer funds increased by 5%. Digital customers grew 12% to 13.7 million, while loyal customers reached 9.8 million.
| Corporate Communications | 3 | | ||
| Ciudad Grupo Santander, edificio Arrecife, planta 2 | ||||
| 28660 Boadilla del Monte (Madrid). Tel. +34 91 2895211 | ||||
| comunicacion@gruposantander.com | ||||
| www.santander.com - Twitter: @bancosantander |
Table of Contents
| ∎ | InSpain, underlying profit was 3% higher at €1,185 million, mainly due to lower costs, which reduced by 7% thanks to the efficiencies resulting from the Banco Popular integration. After the successful migration of all offices and customers to the Santander platform, the bank is focusing on optimising the commercial network, and the bank increased profitability in all segments and products. Lending was down 6% due to the deleveraging of large corporates and a drop in the stock of mortgages. Consumer credit rose 24% YoY, driven bypre-concession and digital subscriptions. Demand deposits increased by €12,780 million. Digital customers grew 20% to 4.7 million. The bank’s contact centre was rated the best of any industry and in the financial sector. |
| ∎ | InSantander Consumer Finance, underlying profit was €995 million, in line with same period last year. Total income increased 3%, largely due to growth in net interest income and net fee income, combined with good cost control. The largest profits were generated by Germany (EUR 248 million), the Nordic countries (EUR 224 million) and Spain (EUR 170 million). New lending rose 5% YoY, underpinned by commercial agreements in several countries with particularly good growth in Italy (+13%), France (+9%) and Spain (+6%). |
| ∎ | In theUK, underlying profit stood at €828 million, down 19%, reflecting the continued competitive pressure on mortgage margins. Costs reduced by 1%, reflecting the first cost savings from the bank’s transformation programme, while the cost of credit remained at very low levels (8 basis points). Business activity remained robust with a further increase in mortgages, digital and loyal customers as well as improved customer experience. |
| ∎ | InPortugal, underlying profit increased by 12% to €385 million, as costs declined further. Loans were 1% lower YoY, with market shares in new lending to companies and mortgages remaining around 20%, in a market that is still deleveraging, while customer funds increased by 8%. |
| ∎ | InPoland, underlying attributable profit was €245 million, up 6%, with strong growth in gross loans (+26%), mainly due to the integration of Deutsche Bank Polska’s retail and SME business. Customer funds also increased strongly (+21%). In the last quarter, the bank opened in the country its first Work Café, an innovative space for clients andnon-customers which brings a bank,co-working area and coffee house together in a single place. |
North America. Underlying profit in North America, which includes Mexico and the US, was €1,278 million, up 20% YoY. There was good performance in total income at both units, with growth driven by both net interest income (+7%) and net fee income (+5%). Income grew at a faster rate than expenses, resulting in an improvedcost-to-income ratio of 42%. Gross loans and customer funds increased by 9% and 7% respectively, digital customers grew 40% to 4.8 million, while the number of loyal customers increased to 3.3 million.
| ∎ | In theUS, underlying profit was €619 million, up 27% YoY. Total income increased by 8% while costs increased by only 3%. Loans grew 10% due to growth in lending in retail banking (auto) and commercial banking, while customer funds were up 12%. New loans increased 11% at Santander Consumer USA, primarily driven by Chrysler Capital loans (+52%). Digital customers increased by 9% to just over 1 million. |
| Corporate Communications | 4 | | ||
| Ciudad Grupo Santander, edificio Arrecife, planta 2 | ||||
| 28660 Boadilla del Monte (Madrid). Tel. +34 91 2895211 | ||||
| comunicacion@gruposantander.com | ||||
| www.santander.com - Twitter: @bancosantander |
Table of Contents
| ∎ | InMexico, underlying profit was €659 million, up 14%. Loans to individuals rose 7% with notable growth in payroll loans (+11%), mortgages (+7%) and credit cards (+7%). The distribution model strategy continued to progress, with the transformation of 475 branches and the number of latest generation full function ATMs reaching almost 1,000. Digital customers grew 51% to 3.8 million. |
South America. Underlying profit in South America was €2,977 million, up 18%. Total income increased 9%, underpinned by the sound performance of commercial revenue, driven by higher volumes, spread management and increased loyalty. Net interest income rose 8% and net fee income increased by 15%. As a result, underlying RoTE was 21%. Gross loans and customers funds both increased by 9% year on year, while credit quality improved with cost of credit falling by 10 basis points to 2.90% and NPL ratio falling by 2 basis points to 4.81%. Digital customers grew 23% to 17.2 million, while loyal customers are now 7.7 million.
| ∎ | InBrazil, underlying profit was €2,249 million, up 19%. Net interest income rose by 6% and net fee income by 12%. Costs increased at a slower pace than income, which helped improve the efficiency ratio to 32%. As a result, underlying RoTE was 22% in the period, versus 20% in September 2018. Gross loans grew by 8%, with profitable gains in market share. The bank continued to be the leader in the auto segment, with 25% market share. The bank was a pioneer in launching a solution that enables point of sale users with Bluetooth in the market to take advantage of the Getnet offer, the card payments business, without having to acquire a new terminal. |
| ∎ | InChile, underlying profit was €473 million, up 6%. Gross loans increased by 7%, while customer funds rose 17%. The bank continued to focus on the commercial and digital transformation launching new products which achieved a record rise in new customers in the quarter. |
| ∎ | InArgentina, underlying profit was €97 million, up 111% after an inflation adjustment last year. Loans grew 17% and customer funds, 10%. |
| ∎ | In therest of South America, which includes, Uruguay, Peru and Colombia, underlying profit increased to €159 million (+22%). |
Note: YoY change in constant euros. Loans excluding reverse repos. Customer funds: deposits excluding repos. Underlying RoTE (1) Additionally, 1 million customers in SGP. (2) Adjusted for excess of capital in the US. Otherwise 9%. |
About Banco Santander
Banco Santander is the largest bank in the euro zone with a market capitalisation of over €66,000 million. It has a strong and focused presence in ten core markets across Europe and the Americas with more than 4 million shareholders and 200,000 employees serving 144 million customers.
| Corporate Communications | 5 | | ||
| Ciudad Grupo Santander, edificio Arrecife, planta 2 | ||||
| 28660 Boadilla del Monte (Madrid). Tel. +34 91 2895211 | ||||
| comunicacion@gruposantander.com | ||||
| www.santander.com - Twitter: @bancosantander |
Table of Contents
Key consolidated data (from Q3 2019 financial report)
| BALANCE SHEET(EUR million) | Sep-19 | Jun-19 | % | Sep-19 | Sep-18 | % | Dec-18 | |||||||||||||||||||||
Total assets | 1,517,885 | 1,512,096 | 0.4 | 1,517,885 | 1,444,687 | 5.1 | 1,459,271 | |||||||||||||||||||||
Loans and advances to customers | 916,003 | 908,235 | 0.9 | 916,003 | 866,226 | 5.7 | 882,921 | |||||||||||||||||||||
Customer deposits | 814,285 | 814,751 | (0.1 | ) | 814,285 | 778,751 | 4.6 | 780,496 | ||||||||||||||||||||
Total funds | 1,035,651 | 1,032,769 | 0.3 | 1,035,651 | 986,199 | 5.0 | 980,562 | |||||||||||||||||||||
Total equity | 108,526 | 109,985 | (1.3 | ) | 108,526 | 105,668 | 2.7 | 107,361 | ||||||||||||||||||||
Note: Total funds includes customer deposits, mutual funds, pension funds and managed portfolios.
|
| |||||||||||||||||||||||||||
| INCOME STATEMENT(EUR million) | Q3’19 | Q2’19 | % | 9M’19 | 9M’18 | % | 2018 | |||||||||||||||||||||
Net interest income | 8,806 | 8,954 | (1.7 | ) | 26,442 | 25,280 | 4.6 | 34,341 | ||||||||||||||||||||
Total income | 12,466 | 12,351 | 0.9 | 36,902 | 35,882 | 2.8 | 48,424 | |||||||||||||||||||||
Net operating income | 6,744 | 6,522 | 3.4 | 19,593 | 19,039 | 2.9 | 25,645 | |||||||||||||||||||||
Profit before tax | 2,181 | 2,929 | (25.5 | ) | 8,712 | 10,586 | (17.7 | ) | 14,201 | |||||||||||||||||||
Attributable profit to the parent | 501 | 1,391 | (64.0 | ) | 3,732 | 5,742 | (35.0 | ) | 7,810 | |||||||||||||||||||
Changes in constant euros: Q3’19/ Q2’19: NII: +0.8%; Total income: +3.3%; Net operating income: + 5.3%; Attributable profit: -59. 0% 9M’19/9M’18: NII: +4.6%; Total income: +3.0%; Net operating income: +3.0%; Attributable profit: -34.7%
|
| |||||||||||||||||||||||||||
UNDERLYING INCOME STATEMENT(1) (EUR million) | Q3’19 | Q2’19 | % | 9M’19 | 9M’18 | % | 2018 | |||||||||||||||||||||
Net interest income | 8,806 | 8,954 | (1.7 | ) | 26,442 | 25,280 | 4.6 | 34,341 | ||||||||||||||||||||
Total income | 12,466 | 12,351 | 0.9 | 36,902 | 35,882 | 2.8 | 48,424 | |||||||||||||||||||||
Net operating income | 6,744 | 6,522 | 3.4 | 19,593 | 19,039 | 2.9 | 25,645 | |||||||||||||||||||||
Profit before tax | 3,844 | 3,895 | (1.3 | ) | 11,423 | 11,230 | 1.7 | 14,776 | ||||||||||||||||||||
Attributable profit to the parent | 2,135 | 2,097 | 1.8 | 6,180 | 6,042 | 2.3 | 8,064 | |||||||||||||||||||||
Variations in constant euros: Q3’19/Q2’19: NII: +0.8%; Total income: +3.3%; Net operating income: +5.3%; Attributable profit: +4.0% 9M’19/9M’18: NII: +4.6%; Total income: +3.0%; Net operating income: +3.0%; Attributable profit : +2.7%
|
| |||||||||||||||||||||||||||
| EPS, PROFITABILITY AND EFFICIENCY (%) | Q3’19 | Q2’19 | % | 9M’19 | 9M’18 | % | 2018 | |||||||||||||||||||||
EPS (euro) | 0.021 | 0.076 | (72.7 | ) | 0.202 | 0.331 | (39.0 | ) | 0.449 | |||||||||||||||||||
Underlying EPS (euros)(1) | 0.121 | 0.120 | 1.0 | 0.352 | 0.349 | 0.8 | 0.465 | |||||||||||||||||||||
RoE | 7.02 | 7.79 | 5.90 | 8.20 | 8.21 | |||||||||||||||||||||||
RoTE | 9.86 | 11.02 | 8.33 | 11.69 | 11.70 | |||||||||||||||||||||||
Underlying RoTE(1) | 12.19 | 12.03 | 11.86 | 12.14 | 12.08 | |||||||||||||||||||||||
RoA | 0.56 | 0.63 | 0.50 | 0.65 | 0.64 | |||||||||||||||||||||||
RoRWA | 1.39 | 1.56 | 1.22 | 1.55 | 1.55 | |||||||||||||||||||||||
Underlying RoRWA(1) | 1.65 | 1.67 | 1.63 | 1.60 | 1.59 | |||||||||||||||||||||||
Efficiency ratio | 45.9 | 47.2 | 46.9 | 46.9 | 47.0 | |||||||||||||||||||||||
| SOLVENCY AND NPL RATIOS (%) | Sep-19 | Jun-19 | % | Sep-19 | Sep-18 | % | Dec-18 | |||||||||||||||||||||
CET1(2) | 11.30 | 11.30 | 11.30 | 11.11 | 11.30 | |||||||||||||||||||||||
Fully loaded Total ratio(2) | 14.68 | 14.80 | 14.68 | 14.58 | 14.77 | |||||||||||||||||||||||
NPL ratio | 3.47 | 3.51 | 3.47 | 3.87 | 3.73 | |||||||||||||||||||||||
Coverage ratio | 67 | 68 | 67 | 68 | 67 | |||||||||||||||||||||||
| MARKET CAPITALISATION AND SHARES | Sep-19 | Jun-19 | % | Sep-19 | Sep-18 | % | Dec-18 | |||||||||||||||||||||
Shares (millions) | 16,618 | 16,237 | 2.3 | 16,618 | 16,136 | 3.0 | 16,237 | |||||||||||||||||||||
Share price (euros) | 3.737 | 4.081 | (8.4 | ) | 3.737 | 4.336 | (13.8 | ) | 3.973 | |||||||||||||||||||
Market capitalisation (EUR million) | 62,094 | 66,253 | (6.3 | ) | 62,094 | 69,958 | (11.2 | ) | 64,508 | |||||||||||||||||||
Tangible book value per share (euros) | 4.25 | 4.30 | 4.25 | 4.16 | 4.19 | |||||||||||||||||||||||
Price / Tangible book value per share (X) | 0.88 | 0.95 | 0.88 | 1.04 | 0.95 | |||||||||||||||||||||||
P/E ratio (X) | 13.90 | 11.29 | 13.90 | 9.83 | 8.84 | |||||||||||||||||||||||
| OTHER DATA | Sep-19 | Jun-19 | % | Sep-19 | Sep-18 | % | Dec-18 | |||||||||||||||||||||
Number of shareholders | 4,025,074 | 4,054,208 | (0.7 | ) | 4,025,074 | 4,190,808 | (4.0 | ) | 4,131,489 | |||||||||||||||||||
Number of employees | 201,017 | 201,804 | (0.4 | ) | 201,017 | 201,101 | (0.0 | ) | 202,713 | |||||||||||||||||||
Number of branches | 12,691 | 13,081 | (3.0 | ) | 12,691 | 13,414 | (5.4 | ) | 13,217 | |||||||||||||||||||
| (1) | In addition to financial information prepared in accordance with International Financial Reporting Standards (IFRS) and derived from our consolidated financials statements, this report contains certain financial measures that constitute alternative performance measures (APMs) as defined in the Guidelines on Alternative Performance Measures issued by the European Securities and Markets Authority (ESMA) on 5 October 2015 and othernon-IFRS measures, including the figures related to “underlying” results, as they are recorded in the separate line of “net capital gains and provisions”, above the line of attributable profit to the parent. Further details are provided on page 12 of this report. |
For further details of the APMs andnon-IFRS measures used, including its definition or a reconciliation between any applicable management indicators and the financial data presented in the consolidated financial statements prepared under IFRS, please see 2018 Annual Financial Report, published in the CNMV on 28 February 2019, our20-F report for the year ending 31 December 2018 registered with the SEC in the United States as well as the “Alternative performance measures” section of the annex to this report. |
| (2) | 2018 and 2019 data applying the IFRS 9 transitional arrangements. As indicated by the consolidating supervisor a pay-out of 50%, the maximum within the target range (40%-50%), was applied for the calculation of the capital ratios in 2019. Previously the average cash pay-out for the last three years was considered. |
| Corporate Communications | 6 | | ||
| Ciudad Grupo Santander, edificio Arrecife, planta 2 | ||||
| 28660 Boadilla del Monte (Madrid). Tel. +34 91 2895211 | ||||
| comunicacion@gruposantander.com | ||||
| www.santander.com - Twitter: @bancosantander |
Table of Contents
IMPORTANT INFORMATION
Non-IFRS and alternative performance measures
In addition to the financial information prepared in accordance with International Financial Reporting Standards (“IFRS”), this press release contains certain financial measures that constitute alternative performance measures (“APMs”) as defined in the Guidelines on Alternative Performance Measures issued by the European Securities and Markets Authority (ESMA) on 5 October 2015 (ESMA/2015/1415en) and othernon-IFRS measures(“Non-IFRS Measures”). The financial measures contained in this press release that qualify as APMs andnon-IFRS measures have been calculated using the financial information from Santander Group but are not defined or detailed in the applicable financial reporting framework and have neither been audited nor reviewed by our auditors. We use these APMs andnon-IFRS measures when planning, monitoring and evaluating our performance. We consider these APMs andnon-IFRS measures to be useful metrics for management and investors to facilitate operating performance comparisons from period to period. While we believe that these APMs andnon-IFRS measures are useful in evaluating our business, this information should be considered as supplemental in nature and is not meant as a substitute of IFRS measures. In addition, other companies, including companies in our industry, may calculate or use such measures differently, which reduces their usefulness as comparative measures. For further details of the APMs andNon-IFRS Measures used, including its definition or a reconciliation between any applicable management indicators and the financial data presented in the consolidated financial statements prepared under IFRS, please see 2018 Annual Financial Report, published as Relevant Fact on 28 February 2019, as well as the section “Alternative performance measures” of the annex to the Santander 2019 3Q Financial Report, published as Relevant Fact on 30 October 2019. These documents are available on Santander’s website (www.santander.com).
The businesses included in each of our geographic segments and the accounting principles under which their results are presented here may differ from the included businesses and local applicable accounting principles of our public subsidiaries in such geographies. Accordingly, the results of operations and trends shown for our geographic segments may differ materially from those of such subsidiaries
Forward-looking statements
Santander cautions that this press release contains statements that constitute “forward-looking statements” within the meaning of the U.S. Private Securities Litigation Reform Act of 1995. Forward-looking statements may be identified by words such as “expect”, “project”, “anticipate”, “should”, “intend”, “probability”, “risk”, “VaR”, “RoRAC”, “RoRWA”, “TNAV”, “target”, “goal”, “objective”, “estimate”, “future” and similar expressions. These forward-looking statements are found in various places throughout this press release and include, without limitation, statements concerning our future business development and economic performance and our shareholder remuneration policy. While these forward-looking statements represent our judgment and future expectations concerning the development of our business, a number of risks, uncertainties and other important factors could cause actual developments and results to differ materially from our expectations. The following important factors, in addition to those discussed elsewhere in this press release and in our annual report on Form20-F for the year ended December 31, 2018, filed with the U.S. Securities and Exchange Commission, could affect our future results and could cause outcomes to differ materially from those anticipated in any forward-looking statement: (1) general economic or industry conditions in areas in which we have significant business activities or investments, including a worsening of the economic environment, increasing in the volatility of the capital markets, inflation or deflation, and changes in demographics, consumer spending, investment or saving habits; (2) exposure to various types of market risks, principally including interest rate risk, foreign exchange rate risk, equity price risk and risks associated with the replacement of benchmark indices; (3) potential losses associated with prepayment of our loan and investment portfolio, declines in the value of collateral securing our loan portfolio, and counterparty risk; (4) political stability in Spain, the UK, other European countries, Latin America and the US (5) changes in laws, regulations or taxes, including changes in regulatory capital and liquidity requirements, including as a result of the UK exiting the European Union and increased regulation in light of the global financial crisis; (6) our ability to integrate successfully our acquisitions and the challenges inherent in diverting management’s focus and resources from other strategic opportunities and from operational matters while we integrate these acquisitions; and (7) changes in our ability to access liquidity and funding on acceptable terms, including as a result of changes in our credit spreads or a downgrade in our credit ratings or those of our more significant subsidiaries. Numerous factors could affect the future results of Santander and could result in those results deviating materially from those anticipated in the forward-looking statements. Other unknown or unpredictable factors could cause actual results to differ materially from those in the forward-looking statements.
Forward-looking statements speak only as of the date of this press release and are based on the knowledge, information available and views taken on such date; such knowledge, information and views may change at any time. Santander does not undertake any obligation to update or revise any forward-looking statement, whether as a result of new information, future events or otherwise.
No offer
The information contained in this press release is subject to, and must be read in conjunction with, all other publicly available information, including, where relevant any fuller disclosure document published by Santander. Any person at any time acquiring securities must do so only on the basis of such person’s own judgment as to the merits or the suitability of the securities for its purpose and only on such information as is contained in such public information having taken all such professional or other advice as it considers necessary or appropriate in the circumstances and not in reliance on the information contained in this press release. No investment activity should be undertaken on the basis of the information contained in this press release. In making this press release available Santander gives no advice and makes no recommendation to buy, sell or otherwise deal in shares in Santander or in any other securities or investments whatsoever.
Neither this press release nor any of the information contained therein constitutes an offer to sell or the solicitation of an offer to buy any securities. No offering of securities shall be made in the United States except pursuant to registration under the U.S. Securities Act of 1933, as amended, or an exemption therefrom. Nothing contained in this press release is intended to constitute an invitation or inducement to engage in investment activity for the purposes of the prohibition on financial promotion in the U.K. Financial Services and Markets Act 2000.
Historical performance is not indicative of future results
Statements as to historical performance or financial accretion are not intended to mean that future performance, share price or future earnings (including earnings per share) for any period will necessarily match or exceed those of any prior period. Nothing in this press release should be construed as a profit forecast.
| Corporate Communications | 7 | | ||
| Ciudad Grupo Santander, edificio Arrecife, planta 2 | ||||
| 28660 Boadilla del Monte (Madrid). Tel. +34 91 2895211 | ||||
| comunicacion@gruposantander.com | ||||
| www.santander.com - Twitter: @bancosantander |
Table of Contents
Table of Contents
Financial report January-September 2019 KEY CONSOLIDATED DATA 3 SANTANDER AIM AND CORPORATE CULTURE 4 GROUP FINANCIAL INFORMATION 6 Group performance 6 Income statement and balance sheet 8 Solvency ratios 17 Risk management 18 FINANCIAL INFORMATION BY SEGMENTS 22 Primary segments 26 Secondary segments 43 RESPONSIBLE BANKING 46 CORPORATE GOVERNANCE 48 THE SANTANDER SHARE 49 APPENDIX 51 Financial information 52 Alternative Performance Measures 73 Interim condensed consolidated financial statements 80 Glossary 83 Important information 84 can use Santander’s communication channels in All customers, shareholders and the general public all the countries in which the Bank operates. This report was approved by the Board of Directors on 29 October 2019, following a favourable report from the Audit Committee. Important information regarding this report can be found on pages 84 and 85.
Table of Contents
Responsible banking | ||||||||||||||||
Santander vision and | Group financial | Financial information | Corporate governance | |||||||||||||
corporate culture |
| information |
| by segments |
| Santander share |
| Appendix | ||||||||
|
|
|
|
|
Key consolidated data
| BALANCE SHEET (EUR million) | Sep-19 | Jun-19 | % | Sep-19 | Sep-18 | % | Dec-18 | |||||||||||||||||||||
Total assets | 1,517,885 | 1,512,096 | 0.4 | 1,517,885 | 1,444,687 | 5.1 | 1,459,271 | |||||||||||||||||||||
Loans and advances to customers | 916,003 | 908,235 | 0.9 | 916,003 | 866,226 | 5.7 | 882,921 | |||||||||||||||||||||
Customer deposits | 814,285 | 814,751 | (0.1) | 814,285 | 778,751 | 4.6 | 780,496 | |||||||||||||||||||||
Total funds | 1,035,651 | 1,032,769 | 0.3 | 1,035,651 | 986,199 | 5.0 | 980,562 | |||||||||||||||||||||
Total equity | 108,526 | 109,985 | (1.3) | 108,526 | 105,668 | 2.7 | 107,361 | |||||||||||||||||||||
| Note: Total funds includes customer deposits, mutual funds, pension funds and managed portfolios. |
| |||||||||||||||||||||||||||
| INCOME STATEMENT (EUR million) | Q3’19 | Q2’19 | % | 9M’19 | 9M’18 | % | 2018 | |||||||||||||||||||||
Net interest income | 8,806 | 8,954 | (1.7) | 26,442 | 25,280 | 4.6 | 34,341 | |||||||||||||||||||||
Total income | 12,466 | 12,351 | 0.9 | 36,902 | 35,882 | 2.8 | 48,424 | |||||||||||||||||||||
Net operating income | 6,744 | 6,522 | 3.4 | 19,593 | 19,039 | 2.9 | 25,645 | |||||||||||||||||||||
Profit before tax | 2,181 | 2,929 | (25.5) | 8,712 | 10,586 | (17.7) | 14,201 | |||||||||||||||||||||
Attributable profit to the parent | 501 | 1,391 | (64.0) | 3,732 | 5,742 | (35.0) | 7,810 | |||||||||||||||||||||
| Changes in constant euros: Q3’19 / Q2’19: NII: +0.8%; Total income: +3.3%; Net operating income: +5.3%; Attributable profit:-59.0% |
| |||||||||||||||||||||||||||
| 9M’19 / 9M’18: NII: +4.6%; Total income: +3.0%; Net operating income: +3.0%; Attributable profit:-34.7% |
| |||||||||||||||||||||||||||
| UNDERLYING INCOME STATEMENT(1)(EUR million) | Q3’19 | Q2’19 | % | 9M’19 | 9M’18 | % | 2018 | |||||||||||||||||||||
Net interest income | 8,806 | 8,954 | (1.7) | 26,442 | 25,280 | 4.6 | 34,341 | |||||||||||||||||||||
Total income | 12,466 | 12,351 | 0.9 | 36,902 | 35,882 | 2.8 | 48,424 | |||||||||||||||||||||
Net operating income | 6,744 | 6,522 | 3.4 | 19,593 | 19,039 | 2.9 | 25,645 | |||||||||||||||||||||
Profit before tax | 3,844 | 3,895 | (1.3) | 11,423 | 11,230 | 1.7 | 14,776 | |||||||||||||||||||||
Attributable profit to the parent | 2,135 | 2,097 | 1.8 | 6,180 | 6,042 | 2.3 | 8,064 | |||||||||||||||||||||
| Variations in constant euros: Q3’19 / Q2’19: NII: +0.8%; Total income: +3.3%; Net operating income: +5.3%; Attributable profit: +4.0% |
| |||||||||||||||||||||||||||
| 9M’19 / 9M’18: NII: +4.6%; Total income: +3.0%; Net operating income: +3.0%; Attributable profit: +2.7% |
| |||||||||||||||||||||||||||
| EPS, PROFITABILITY AND EFFICIENCY (%) | Q3’19 | Q2’19 | % | 9M’19 | 9M’18 | % | 2018 | |||||||||||||||||||||
EPS (euro) | 0.021 | 0.076 | (72.7) | 0.202 | 0.331 | (39.0) | 0.449 | |||||||||||||||||||||
Underlying EPS (euros)(1) | 0.121 | 0.120 | 1.0 | 0.352 | 0.349 | 0.8 | 0.465 | |||||||||||||||||||||
RoE | 7.02 | 7.79 | 5.90 | 8.20 | 8.21 | |||||||||||||||||||||||
RoTE | 9.86 | 11.02 | 8.33 | 11.69 | 11.70 | |||||||||||||||||||||||
Underlying RoTE(1) | 12.19 | 12.03 | 11.86 | 12.14 | 12.08 | |||||||||||||||||||||||
RoA | 0.56 | 0.63 | 0.50 | 0.65 | 0.64 | |||||||||||||||||||||||
RoRWA | 1.39 | 1.56 | 1.22 | 1.55 | 1.55 | |||||||||||||||||||||||
Underlying RoRWA(1) | 1.65 | 1.67 | 1.63 | 1.60 | 1.59 | |||||||||||||||||||||||
Efficiency ratio | 45.9 | 47.2 | 46.9 | 46.9 | 47.0 | |||||||||||||||||||||||
| SOLVENCY AND NPL RATIOS (%) | Sep-19 | Jun-19 | % | Sep-19 | Sep-18 | % | Dec-18 | |||||||||||||||||||||
CET1(2) | 11.30 | 11.30 | 11.30 | 11.11 | 11.30 | |||||||||||||||||||||||
Fully loaded Total ratio(2) | 14.68 | 14.80 | 14.68 | 14.58 | 14.77 | |||||||||||||||||||||||
NPL ratio | 3.47 | 3.51 | 3.47 | 3.87 | 3.73 | |||||||||||||||||||||||
Coverage ratio | 67 | 68 | 67 | 68 | 67 | |||||||||||||||||||||||
| MARKET CAPITALISATION AND SHARES | Sep-19 | Jun-19 | % | Sep-19 | Sep-18 | % | Dec-18 | |||||||||||||||||||||
Shares (millions) | 16,618 | 16,237 | 2.3 | 16,618 | 16,136 | 3.0 | 16,237 | |||||||||||||||||||||
Share price (euros) | 3.737 | 4.081 | (8.4) | 3.737 | 4.336 | (13.8) | 3.973 | |||||||||||||||||||||
Market capitalisation (EUR million) | 62,094 | 66,253 | (6.3) | 62,094 | 69,958 | (11.2) | 64,508 | |||||||||||||||||||||
Tangible book value per share (euros) | 4.25 | 4.30 | 4.25 | 4.16 | 4.19 | |||||||||||||||||||||||
Price / Tangible book value per share (X) | 0.88 | 0.95 | 0.88 | 1.04 | 0.95 | |||||||||||||||||||||||
P/E ratio (X) | 13.90 | 11.29 | 13.90 | 9.83 | 8.84 | |||||||||||||||||||||||
| OTHER DATA | Sep-19 | Jun-19 | % | Sep-19 | Sep-18 | % | Dec-18 | |||||||||||||||||||||
Number of shareholders | 4,025,074 | 4,054,208 | (0.7) | 4,025,074 | 4,190,808 | (4.0) | 4,131,489 | |||||||||||||||||||||
Number of employees | 201,017 | 201,804 | (0.4) | 201,017 | 201,101 | (0.0) | 202,713 | |||||||||||||||||||||
Number of branches | 12,691 | 13,081 | (3.0) | 12,691 | 13,414 | (5.4) | 13,217 | |||||||||||||||||||||
(1) In addition to financial information prepared in accordance with International Financial Reporting Standards (IFRS) and derived from our consolidated financial statements, this report contains certain financial measures that constitute alternative performance measures (APMs) as defined in the Guidelines on Alternative Performance Measures issued by the European Securities and Markets Authority (ESMA) on 5 October 2015 and othernon-IFRS measures, including the figures related to “underlying” results, as they are recorded in the separate line of “net capital gains and provisions”, above the line of attributable profit to the parent. Further details are provided on page 12 of this report.
For further details of the APMs andnon-IFRS measures used, including its definition or a reconciliation between any applicable management indicators and the financial
data presented in the consolidated financial statements prepared under IFRS, please see 2018 Annual Financial Report, published in the CNMV on 28 February 2019, our20-F report for the year ending 31 December 2018 registered with the SEC in the United States as well as the “Alternative performance measures” section of the appendix to this report.
(2) 2018 and 2019 data applying the IFRS 9 transitional arrangements. As indicated by the consolidating supervisor apay-out of 50%, the maximum within the target range (40%- 50%), was applied for the calculation of the capital ratios in 2019. Previously, the average cashpay-out for the last three years was considered.
January - September 2019  3
3
Table of Contents
Responsible banking | ||||||||||||||||
Santander vision and | Group financial | Financial information | Corporate governance | |||||||||||||
corporate culture |
| information |
| by segments |
| Santander share |
| Appendix | ||||||||
|
|
|
|
|
SANTANDER VISION AND CORPORATE CULTURE
| Our success is based on a clear purpose, aim and approach to business. | A digital Santander. To continue growing in a sustainable and profitable way and to accelerate execution, we will remain focused on our digital transformation. | |
We are building a more responsible bank |

Strong corporate culture.
TheSantander Way is our global culture, fully aligned to our corporate strategy. It includes our purpose, our aim, and how we do business.

4 January - September 2019
Table of Contents
Responsible banking | ||||||||||||||||
Santander vision and | Group financial | Financial information | Corporate governance | |||||||||||||
corporate culture |
| information |
| by segments |
| Santander share |
| Appendix | ||||||||
|
|
|
|
|
Generating confidence and operating responsibly, we contribute value to all ourstakeholders
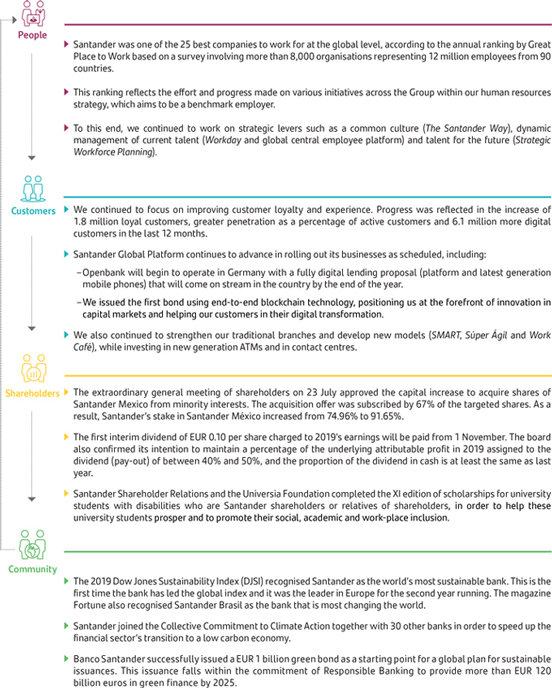
Santander was one of the 25 best companies to work for at the global level, according to the annual ranking by Great Place to Work based on a survey involving more than 8,000 organisations representing 12 million employees from 90 countries. This ranking reflects the effort and progress made on various initiatives across the Group within our human resources strategy, which aims to be a benchmark employer. To this end, we continued to work on strategic levers such as a common culture (The Santander Way), dynamic management of current talent (Workday and global central employee platform) and talent for the future (Strategic Workforce Planning). Customers We continued to focus on improving customer loyalty and experience. Progress was reflected in the increase of 1.8 million loyal customers, greater penetration as a percentage of active customers and 6.1 million more digital customers in the last 12 months. Santander Global Platform continues to advance in rolling out its businesses as scheduled, including: – Openbank will begin to operate in Germany with a fully digital lending proposal (platform and latest generation mobile phones) that will come on stream in the country by the end of the year. – We issued the first bond usingend-to-end blockchain technology, positioning us at the forefront of innovation in capital markets and helping our customers in their digital transformation. We also continued to strengthen our traditional branches and develop new models (SMART, Súper Ágil and Work Café), while investing in new generation ATMs and in contact centres. Shareholders The extraordinary general meeting of shareholders on 23 July approved the capital increase to acquire shares of Santander Mexico from minority interests. The acquisition offer was subscribed by 67% of the targeted shares. As a result, Santander’s stake in Santander México increased from 74.96% to 91.65% . The first interim dividend of EUR 0.10 per share charged to 2019’s earnings will be paid from 1 November. The board also confirmed its intention to maintain a percentage of the underlying attributable profit in 2019 assigned to the dividend(pay-out) of between 40% and 50%, and the proportion of the dividend in cash is at least the same as last year. Santander Shareholder Relations and the Universia Foundation completed the XI edition of scholarships for university students with disabilities who are Santander shareholders or relatives of shareholders, in order to help these university students prosper and to promote their social, academic and work-place inclusion. Community The 2019 Dow Jones Sustainability Index (DJSI) recognised Santander as the world’s most sustainable bank. This is the first time the bank has led the global index and it was the leader in Europe for the second year running. The magazine Fortune also recognised Santander Brasil as the bank that is most changing the world. Santander joined the Collective Commitment to Climate Action together with 30 other banks in order to speed up the financial sector’s transition to a low carbon economy. Banco Santander successfully issued a EUR 1 billion green bond as a starting point for a global plan for sustainable issuances. This issuance falls within the commitment of Responsible Banking to provide more than EUR 120 billion euros in green finance by 2025.
January - September 2019 5
Table of Contents
Responsible banking | ||||||||||||||||
Santander vision and | Group financial | Financial information | Corporate governance | |||||||||||||
corporate culture |
| information |
| by segments |
| Santander share |
| Appendix | ||||||||
|
|
|
|
|
GROUP PERFORMANCE

“Our diversification across Europe and the Americas is one of the defining characteristics that stands Santander apart from our peers. And because of this, we continue to deliver predictable, profitable growth, and a sustainable dividend through the cycle”

“In a slowing economy, we have grown volumes, increased profit in almost all the markets in which we operate, and maintained high returns for our shareholders”

The Group’s strategy is driving growth in loyal and digital customers and is reflected in greater activity in almost all markets
Santander’s strategy continued to focus on boosting the loyalty of our customers. Their number rose again in the third quarter and reached 21 million, 1.8 million more than September 2018 (+10%), with individuals up 10% and companies 5%.
The faster pace of digitalisation is producing notable growth in digital customers, whose number increased by 6.1 million (+20%) in the last 12 months to more than 36 million. There was also strong growth in the number of online and mobile phone accesses in the first nine months to 5,742 million (+27%year-on-year) and in monetary and voluntary transactions to 1,634 million (+25%).
As regards volumes, gross loans and advances to customers (excluding reverse repos) and customer funds were stable in the third quarter, both in euros and in constant euros.
Compared to September 2018 (at constant exchange rates), gross loans and advances to customers (excluding reverse repos) grew 4% and increased in eight of the 10 core markets. Customer funds (+6%year-on-year) rose in nine of them. Growth in demand and time deposits as well as mutual funds.
Solid funding structure and liquidity: netloan-to-deposit ratio of 112% (111% in September 2018).

6 January - September 2019
Table of Contents
Responsible banking | ||||||||||||||||
Santander vision and | Group financial | Financial information | Corporate governance | |||||||||||||
corporate culture |
| information |
| by segments |
| Santander share |
| Appendix | ||||||||
|
|
|
|
|
GROUP PERFORMANCE

Solid business model based on profitability, efficiency and innovation, which has enabled us to obtain profits on a recurring basis
In a context of lower growth and interest rates, customer revenue remained solid, costs continued to reflect synergies in some countries and provisions increased in line with volumes.
Third quarter attributable profit of EUR 501 million, affected by EUR 1,634 million of net charges, mainly related to the impairment determined by the review of goodwill ascribed to Santander UK (EUR 1,491 million). Excluding these charges, underlying attributable profit was EUR 2,135 million, up 2%quarter-on-quarter and 7% up on the third quarter of 2018 (both 4% higher in constant euros).

Santander is strengthening its capital ratios and improving credit quality while maintaining a high level of profitability
The CET1 ratio stood at 11.30% after organically generating 19 basis points in the third quarter and 48 since the beginning of the year, This, combined with a favourable portfolio evolution, enabled regulatory impacts and restructuring costs to be absorbed(-66 bps).
Net tangible equity per share (TNAV) was EUR 4.25, 2% higher than September 2018. In addition, and in terms of value creation per shareholder, the recording between the two dates of the dividend remuneration should be taken into account. Including it, the TNAV per share increased 8% in the last 12 months (+1% in the quarter).
First nine months attributable profit of EUR 3,732 million, affected by net charges of EUR 2,448 million in capital gains and provisions (see page 12). Excluding them, underlying attributable profit (EUR 6,180 million) was 2% higher (+3% in constant euros), after absorbing the markets’ negative performance, interest rate reduction, higher costs for foreign currency hedging and the impact of implementing IFRS 16. By countries, underlying attributable profit rose in eight of the 10 core markets.
The efficiency ratio improvedquarter-on-quarter and stood below 47%, one of the best among our peers. Underlying RoTE was 11.9% and underlying RoRWA 1.63%.
Credit quality continued to improve: the NPL ratio dropped for the ninth consecutive quarter(-4 bps in the third quarter and-40 bps since September 2018) and coverage remained around 67%.
The cost of credit stood at 1% in September, similar to the previous quarter and to the third quarter of 2018.
January - September 2019 7
Table of Contents
Responsible banking | ||||||||||||||||
Santander vision and | Group financial | Financial information | Corporate governance | |||||||||||||
corporate culture |
| information |
| by segments |
| Santander share |
| Appendix | ||||||||
|
Income statement |
|
|
|
GRUPO SANTANDER RESULTS
| Third quarter attributable profit to the parent of EUR 501 million, affected by net charges of EUR 1,634 million that are outside the ordinary course performance of our business, mainly the impairment of goodwill ascribed to Santander UK (EUR 1,491 million). Excluding these charges, underlying attributable profit was 2% higher than the second quarter of 2019 and 7% more than the third quarter of 2018 at EUR 2,135 million (+4% in both periods in constant euros).
First nine months attributable profit of EUR 3,732 million, after recording net charges that are outside the ordinary course performance of our business amounting to EUR 2,448 million in 2019 (EUR 300 million in 2018). Excluding these results, the underlying attributable profit was EUR 6,180 million, 2% more than in the same period of 2018 (+3% in constant euros).
At the end of September 2019, the results continued to reflect a solid underlying trend. Customer revenue increased and costs began to show the synergies obtained in various units. The efficiency ratio continued to be one of the best in the sector (46.9%).
In addition, the cost of credit remained at very low levels (1.00%) and profitability ratios were high: underlying RoTE of 11.9% and underlying RoRWA of 1.63%. |

Grupo Santander. Summarised income statement
EUR million
| Change | Change | |||||||||||||||||||||||||||||||
| Q3’19 | Q2’19 | % | % excl. FX | 9M’19 | 9M’18 | % | % excl. FX | |||||||||||||||||||||||||
| Net interest income | 8,806 | 8,954 | (1.7) | 0.8 | 26,442 | 25,280 | 4.6 | 4.6 | ||||||||||||||||||||||||
| Net fee income (commission income minus commission expense) | 2,955 | 2,932 | 0.8 | 3.9 | 8,818 | 8,529 | 3.4 | 4.3 | ||||||||||||||||||||||||
| Gains or losses on financial assets and liabilities and exchange differences (net) | 424 | 234 | 81.2 | 89.0 | 935 | 1,359 | (31.2) | (29.7) | ||||||||||||||||||||||||
| Dividend income | 72 | 295 | (75.6) | (75.4) | 433 | 292 | 48.3 | 48.2 | ||||||||||||||||||||||||
| Share of results of entities accounted for using the equity method | 137 | 153 | (10.5) | (8.0) | 443 | 532 | (16.7) | (15.9) | ||||||||||||||||||||||||
| Other operating income / expenses | 72 | (217) | — | — | (169) | (110) | 53.6 | 188.7 | ||||||||||||||||||||||||
| Total income | 12,466 | 12,351 | 0.9 | 3.3 | 36,902 | 35,882 | 2.8 | 3.0 | ||||||||||||||||||||||||
| Operating expenses | (5,722) | (5,829) | (1.8) | 1.1 | (17,309) | (16,843) | 2.8 | 2.9 | ||||||||||||||||||||||||
Administrative expenses | (4,990) | (5,099) | (2.1) | 0.8 | (15,100) | (15,069) | 0.2 | 0.4 | ||||||||||||||||||||||||
Staff costs | (3,008) | (3,074) | (2.1) | 0.3 | (9,088) | (8,797) | 3.3 | 3.4 | ||||||||||||||||||||||||
Other general administrative expenses | (1,982) | (2,025) | (2.1) | 1.4 | (6,012) | (6,272) | (4.1) | (3.9) | ||||||||||||||||||||||||
Depreciation and amortisation | (732) | (730) | 0.3 | 3.9 | (2,209) | (1,774) | 24.5 | 25.0 | ||||||||||||||||||||||||
| Impairment or reversal of impairment of financial assets not measured at fair value through profit or loss (net) | (2,442) | (2,122) | 15.1 | 17.4 | (6,810) | (6,473) | 5.2 | 4.6 | ||||||||||||||||||||||||
o/w: net loan-loss provisions | (2,435) | (2,141) | 13.7 | 16.0 | (6,748) | (6,418) | 5.1 | 4.5 | ||||||||||||||||||||||||
| Impairment on other assets (net) | (1,520) | (7) | — | — | (1,547) | (121) | — | — | ||||||||||||||||||||||||
| Provisions or reversal of provisions | (595) | (1,451) | (59.0) | (58.5) | (2,511) | (1,725) | 45.6 | 46.5 | ||||||||||||||||||||||||
| Gain or losses onnon-financial assets and investments, net | 3 | 31 | (90.3) | (90.3) | 253 | 24 | — | — | ||||||||||||||||||||||||
| Negative goodwill recognised in results | — | — | — | — | — | — | — | — | ||||||||||||||||||||||||
| Gains or losses onnon-current assets held for sale not classified as discontinued operations | (9) | (44) | (79.5) | (77.8) | (266) | (158) | 68.4 | 67.5 | ||||||||||||||||||||||||
| Profit or loss before tax from continuing operations | 2,181 | 2,929 | (25.5) | (21.7) | 8,712 | 10,586 | (17.7) | (17.3) | ||||||||||||||||||||||||
| Tax expense or income from continuing operations | (1,291) | (1,092) | 18.2 | 21.7 | (3,740) | (3,709) | 0.8 | 1.7 | ||||||||||||||||||||||||
| Profit from the period from continuing operations | 890 | 1,837 | (51.6) | (47.6) | 4,972 | 6,877 | (27.7) | (27.5) | ||||||||||||||||||||||||
| Profit or loss after tax from discontinued operations | — | — | — | — | — | — | — | — | ||||||||||||||||||||||||
| Profit for the period | 890 | 1,837 | (51.6) | (47.6) | 4,972 | 6,877 | (27.7) | (27.5) | ||||||||||||||||||||||||
| Attributable profit tonon-controlling interests | (389) | (446) | (12.8) | (12.3) | (1,240) | (1,135) | 9.3 | 8.4 | ||||||||||||||||||||||||
| Attributable profit to the parent | 501 | 1,391 | (64.0) | (59.0) | 3,732 | 5,742 | (35.0) | (34.7) | ||||||||||||||||||||||||
| EPS (euros) | 0.021 | 0.076 | (72.7) | 0.202 | 0.331 | (39.0) | ||||||||||||||||||||||||||
| Diluted EPS (euros) | 0.021 | 0.076 | (72.7) | 0.201 | 0.330 | (39.0) | ||||||||||||||||||||||||||
| Memorandum items: | ||||||||||||||||||||||||||||||||
Average total assets | 1,515,606 | 1,500,703 | 1.0 | 1,500,101 | 1,436,286 | 4.4 | ||||||||||||||||||||||||||
Average stockholders’ equity | 98,445 | 98,659 | (0.2) | 98,249 | 94,615 | 3.8 | ||||||||||||||||||||||||||
8 January - September 2019
Table of Contents
Responsible banking | ||||||||||||||||
Santander vision and | Group financial | Financial information | Corporate governance | |||||||||||||
corporate culture |
| information |
| by segments |
| Santander share |
| Appendix | ||||||||
|
Income statement |
|
|
|
 Evolution of results compared to the first nine months of 2018
The underlying trends of the P&L remained solid compared to the first nine months of 2018, with customer revenue growing, both net interest income and net fee income, costs reflecting the synergies obtained in various units and a cost of credit remained close to historically low levels.
This good performance, however, is not fully reflected in the attributable profit to the parent because of the recording of a net negative amount of EUR 2,448 million for charges that are outside the ordinary course performance of our business, mainly from the revision of the goodwill ascribed to the UK (EUR-1,491 million), and which have no impact on capital ratios, and restructuring costs for ongoing integrations (EUR-724 million), as set out on page 12 of this report. In addition, the comparison is also affected by the markets’ negative performance, interest rate reduction, higher costs for foreign currency hedging and the impact of implementing IFRS 16.
This performance is explained in detail below:
 Revenue
| • | Our revenue structure, where net interest income and net fee income generate more than 95% of total income in 2019, well above the average of our competitors, enables us to grow consistently, limiting the impact that bouts of high volatility could have on our results from financial operations. Total income grew 3% in euros and without the FX impact, with eight of the 10 core markets growing. By lines: |
| – | Net interest income rose 5%. Excluding the FX impact, growth was also 5% due to greater lending and deposits, mainly in developing countries, and management of spreads in a lower interest rate environment in many countries in the last 12 months, with particularly low levels in Europe. There was also a negative impact of EUR 208 million from IFRS 16 application. |
By markets, the main rises in local currency terms were in Mexico, Uruguay, Poland and Argentina, which increased at double-digit rates, and Brazil and the US, which grew by around 6%. Falls in the UK affected by the pressure of spreads in new mortgage loans and SVR balances (Standard Variable Rate); in Spain and Portugal, due to low interest rates, reduced volumes and the impact of ALCO portfolio sales; and Chile because of lower inflation. |
| – | Net fee income rose 3%. The increase without the FX impact was 4%, reflecting the greater customer loyalty combined with the growth strategy in higher value-added services and products. Of note was the growth in the most transactional businesses from cards, insurance, foreign currency and cheques and transfers. On the other hand, decline in net fee income from advising operations and guarantees, affected by reduced activity in the markets. |
| – | Gains on financial transactions and other operating income (dividends, equity method income and others), which accounted for less than 5% of total income, fell 21% compared to 2018 when the first quarter of that year was very good in the markets, combined with a higher cost of foreign currency hedging this year. |

January - September 2019 9
Table of Contents
Responsible banking | ||||||||||||||||
Santander vision and | Group financial | Financial information | Corporate governance | |||||||||||||
corporate culture |
| information |
| by segments |
| Santander share |
| Appendix | ||||||||
|
Income statement |
|
|
|
Costs
| • | Costs grew 3% in euros and without the FX impact, as a result of investments in transformation and digitalisation, the improvements made to the distribution networks, the slight perimeter impact from the integration of the retail and SME businesses acquired from Deutsche Bank Polska and the impact on Argentina of high inflation. |
| • | In real terms (excluding inflation), costs were 1% lower excluding the FX impact. The Group’s aim is to improve our operational capacity and at the same time manage our costs more efficiently adapted to each area, via an exemplary execution of the integrations currently underway and fostering the use of shared services, mainly in Europe, where costs are beginning to reflect the first synergies of integrations, and fell 2.5% in real terms. Of note was the decrease in Spain(-8%) and to a lesser extent, the UK(-3%) and Portugal(-4%). Of note among other countries were Brazil and Chile with flat costs in real terms, despite the ongoing investment to improve the distribution capacity. |
The efficiency ratio continued to be a reference in the sector at 46.9%, virtually unchanged from the first nine months of 2018.
Impairment or reversal of impairment of financial assets not measured at fair value through profit or loss (net)
| • | The impairment or reversal of impairment of financial assets not measured at fair value through profit or loss (net) amounted to EUR 6,810 million, 5% moreyear-on-year both in euros and without the FX impact. |
| • | As part of this item, loan-loss provisions were 5% higher in both euros and without the FX impact. By markets, Mexico, Portugal and Chile fell, while those that increased are linked mainly to countries with stronger growth in volumes. |
| • | The cost of credit remained stable (0.98% in September 2018 and 1.00% in September 2019). Inyear-on-year terms all main units improved or remained stable, except for the US and Argentina. |
Impairment on other assets (net)
| • | The impairment on other assets (net) was EUR 1,547 million (EUR 121 million in the same period of 2018), impacted by the impairment of goodwill ascribed to the UK of EUR 1,491 million. |
10 January - September 2019
Table of Contents
Responsible banking | ||||||||||||||||
Santander vision and | Group financial | Financial information | Corporate governance | |||||||||||||
corporate culture |
| information |
| by segments |
| Santander share |
| Appendix | ||||||||
|
Income Statement |
|
|
|
Provisions or reversal of provisions
| • | Provisions (net of reversal of provisions) amounted to EUR 2,511 million in the first nine months of 2019 (EUR 1,725 million in the same period of 2018). The increase was mainly due to restructuring charges in Spain, the UK and Poland, which are set out on page 12 of this report. |
Gains or losses onnon-financial assets and investments (net)
| • | This item reflects a profit of EUR 253 million in 2019 (EUR 24 million in the first nine months of 2018). The increase was mainly due to the recording of capital gains from the sale of 51% our stake in Prisma Medios de Pago S.A. and the revaluation of the rest of the stake (49%), with a positive net tax impact in the first nine months of 2019 of EUR 130 million. |
Gains or losses onnon-current assets held for sale not classified as discontinued operations
| • | This item, which mainly includes the sale and deterioration of foreclosed assets, recorded a loss of EUR 266 million in the first nine months of the year (EUR-158 million in the same period of 2018). The difference was mainly due to the recording of capital losses from the sale of a portfolio of real estate assets in the first quarter of 2019. |
Profit before tax
| • | First nine months profit before tax was EUR 8,712 million, 18% loweryear-on-year. Excluding the FX impact, the fall was 17%, largely due to thenon-recurring charges already mentioned. |
Income tax
| • | Income tax was EUR 3,740 million, in line with the same period of 2018. |
Attributable profit tonon-controlling interests
| • | This amounted to EUR 1,240 million, 9% moreyear-on-year. Excluding the FX impact, it was 8% higher, mainly due to Brazil, the US and Santander Consumer Finance. The acquisition of minority interests in Mexico had a favourable impact of only one month (around EUR 10 million) but will fully impact the fourth quarter. |
Attributable profit to the parent
| • | Profit attributed to the parent was EUR 3,732 million, 35% less than in the first nine months of 2018, both in euros and excluding the FX impact. |
| • | RoE was 5.9%, RoTE 8.3% and RoRWA 1.22% (8.2%, 11.7% and 1.55%, respectively, in the first nine months of 2018). Earnings per share were EUR 0.202 (EUR 0.331 in the first nine months of 2018). |
January - September 2019 11
Table of Contents
Responsible banking | ||||||||||||||||
Santander vision and | Group financial | Financial information | Corporate governance | |||||||||||||
corporate culture |
| information |
| by segments |
| Santander share |
| Appendix | ||||||||
|
Income statement |
|
|
|
Underlying attributable profit to the parent
| • | Profit attributed to the parent was affected in 2019 and 2018 by the following net results, which are outside the ordinary course performance of our business and which distortyear-on-year comparisons: |
First nine months of 2019:
| 1. | As part of our annual planning and in accordance with accounting rules, we reviewed the goodwill ascribed to Santander UK, which resulted in the recording of an impairment of EUR 1,491 million in the third quarter at the Corporate Centre. |
| 2. | Restructuring costs in Spain under the plan for integrating the commercial networks of Banco Popular for a net amount of EUR 600 million, materialised in the second quarter. |
| 3. | Net charges in the UK of EUR 287 million were recorded, of which EUR 104 million were restructuring costs related to the optimisation plan (EUR 66 million in the first quarter, EUR 26 million in the second and EUR 12 million in the third) and EUR 183 million for PPI provisions (EUR 80 million in the second quarter and EUR 103 million in the third). |
| 4. | Net capital losses of EUR 180 million for the sale of real estate assets in the first quarter. |
| 5. | We also recorded restructuring costs of EUR 20 million for the integration process in Poland (EUR 12 million in the first quarter and EUR 8 million in the third). |
| 6. | Lastly, capital gains from the sale of 51% of our stake in the Argentinian entity Prisma Medios de Pago S.A. and the revaluation of the remaining 49%, generating a capital gain of EUR 130 million (EUR 150 million in the first quarter and an adjustment of EUR-20 million in the third because of the peso’s depreciation). |
First nine months 2018
| 1. | Positive results from the integration in Portugal (EUR 20 million), recorded in the second quarter. |
| 2. | Charges for restructuring costs: EUR 280 million in Spain and EUR 40 million in the Corporate Centre, both related to Popular’s integration, recorded in the second quarter. |
Excluding these results from the various P&L lines where they are recorded, and incorporating them separately in the line ‘net capital gains and provisions’,underlying attributable profit to the parent was EUR 6,180 million in the first nine months of 2019, 3% higheryear-on-year without the FX impact.
Eight of the 10 core markets increased in their local currencies, and at double digit rates in Brazil, Mexico, the US, Portugal and Argentina.
The only decrease was in the UK, mainly because of competitive pressure on revenue.
As a result, the Group’s underlying RoTE was 11.9%, the underlying RoRWA 1.63% and underlying earnings per share EUR 0.352 (EUR 0.349 in the first nine months of 2018).
Summarised underlying income statement (EUR million)
| Change | Change | |||||||||||||||||||||||||||||||
| Q3’19 | Q2’19 | % | % excl. FX | 9M’19 | 9M’18 | % | % excl. FX | |||||||||||||||||||||||||
Net interest income | 8,806 | 8,954 | (1.7) | 0.8 | 26,442 | 25,280 | 4.6 | 4.6 | ||||||||||||||||||||||||
Net fee income | 2,955 | 2,932 | 0.8 | 3.9 | 8,818 | 8,529 | 3.4 | 4.3 | ||||||||||||||||||||||||
Gains (losses) on financial transactions(1) | 424 | 234 | 81.2 | 89.0 | 935 | 1,359 | (31.2) | (29.7) | ||||||||||||||||||||||||
Other operating income | 281 | 231 | 21.6 | 7.7 | 707 | 714 | (1.0) | (7.0) | ||||||||||||||||||||||||
Total income | 12,466 | 12,351 | 0.9 | 3.3 | 36,902 | 35,882 | 2.8 | 3.0 | ||||||||||||||||||||||||
Administrative expenses and amortisations | (5,722) | (5,829) | (1.8) | 1.1 | (17,309) | (16,843) | 2.8 | 2.9 | ||||||||||||||||||||||||
Net operating income | 6,744 | 6,522 | 3.4 | 5.3 | 19,593 | 19,039 | 2.9 | 3.0 | ||||||||||||||||||||||||
Net loan-loss provisions | (2,435) | (2,141) | 13.7 | 16.0 | (6,748) | (6,418) | 5.1 | 4.5 | ||||||||||||||||||||||||
Other gains (losses) and provisions | (465) | (486) | (4.3) | (3.4) | (1,422) | (1,391) | 2.2 | 3.3 | ||||||||||||||||||||||||
Profit before tax | 3,844 | 3,895 | (1.3) | 0.5 | 11,423 | 11,230 | 1.7 | 2.1 | ||||||||||||||||||||||||
Tax on profit | (1,315) | (1,353) | (2.8) | (1.1) | (3,994) | (4,053) | (1.5) | (0.7) | ||||||||||||||||||||||||
Profit from continuing operations | 2,529 | 2,542 | (0.5) | 1.3 | 7,429 | 7,177 | 3.5 | 3.7 | ||||||||||||||||||||||||
Net profit from discontinued operations | — | — | — | — | — | — | — | — | ||||||||||||||||||||||||
Consolidated profit | 2,529 | 2,542 | (0.5) | 1.3 | 7,429 | 7,177 | 3.5 | 3.7 | ||||||||||||||||||||||||
Non-controlling interests | (394) | (445) | (11.5) | (11.1) | (1,249) | (1,135) | 10.0 | 9.3 | ||||||||||||||||||||||||
Underlying attributable profit to the parent | 2,135 | 2,097 | 1.8 | 4.0 | 6,180 | 6,042 | 2.3 | 2.7 | ||||||||||||||||||||||||
Net capital gains and provisions | (1,634) | (706) | 131.4 | 127.8 | (2,448) | (300) | 716.0 | 716.0 | ||||||||||||||||||||||||
Attributable profit to the parent | 501 | 1,391 | (64.0) | (59.0) | 3,732 | 5,742 | (35.0) | (34.7) | ||||||||||||||||||||||||
(1) Includes exchange differences.
12 January - September 2019
Table of Contents
Responsible banking | ||||||||||||||||
Santander vision and | Group financial | Financial information | Corporate governance | |||||||||||||
corporate culture |
| information |
| by segments |
| Santander share |
| Appendix | ||||||||
|
Income statement |
|
|
|
Third quarter results compared to the second quarter of 2019
The third quarter’s attributable profit to the parent is very conditioned by those amounts that are outside the ordinary course performance of our business, which are explained in previous pages.
Excluding these results, underlying attributable profit to the parent was 2% higherquarter-on-quarter in euros and 4% higher without the FX impact, as follows:
•Total incomeincreased 3% due to growth in customer revenue in most of the markets.
| – | This was due to the recovery in net fee income (+4%), following a good performance in South America, notably in Brazil, and wholesale business. Net interest income was 1% higher, absorbing the further falls in interest rates. |
| – | Gains on financial transactions and other operating income increased after recording in the second quarter the contribution to the Single Resolution Fund and higher income in the third quarter from portfolio sales. |
| • | Operating expenses rose 1% driven by North America and South America (partly due to high inflation in Argentina and the salary review in Brazil), while they continued to fall in Europe, mainly in Spain and Santander Consumer Finance. |
| • | Loan-loss provisions rose 16% as they normalised following a second quarter when they were low due to the seasonality of SC USA and SCF’s portfolio sales. |
January - September 2019 13
Table of Contents
Responsible banking | ||||||||||||||||
Santander vision and | Group financial | Financial information | Corporate governance | |||||||||||||
corporate culture |
| information |
| by segments |
| Santander share |
| Appendix | ||||||||
|
Balance sheet |
|
|
|
Grupo Santander. Condensed balance sheet
EUR million
| ||||||||||||||||||||
| Assets | Sep-19 | Sep-18 | Absolute change | % | Dec-18 | |||||||||||||||
| Cash, cash balances at central banks and other demand deposits | 92,601 | 111,704 | (19,103) | (17.1) | 113,663 | |||||||||||||||
| Financial assets held for trading | 115,884 | 98,448 | 17,436 | 17.7 | 92,879 | |||||||||||||||
Debt securities | 36,172 | 28,230 | 7,942 | 28.1 | 27,800 | |||||||||||||||
Equity instruments | 10,559 | 17,239 | (6,680) | (38.7) | 8,938 | |||||||||||||||
Loans and advances to customers | 480 | 239 | 241 | 100.8 | 202 | |||||||||||||||
Loans and advances to central banks and credit institutions | — | 63 | (63) | (100.0) | — | |||||||||||||||
Derivatives | 68,673 | 52,677 | 15,996 | 30.4 | 55,939 | |||||||||||||||
| Financial assets designated at fair value through profit or loss | 71,940 | 70,573 | 1,367 | 1.9 | 68,190 | |||||||||||||||
Loans and advances to customers | 24,705 | 24,318 | 387 | 1.6 | 23,796 | |||||||||||||||
Loans and advances to central banks and credit institutions | 39,037 | 37,401 | 1,636 | 4.4 | 32,325 | |||||||||||||||
Other (debt securities an equity instruments) | 8,198 | 8,854 | (656) | (7.4) | 12,069 | |||||||||||||||
| Financial assets at fair value through other comprehensive income | 120,659 | 116,356 | 4,303 | 3.7 | 121,091 | |||||||||||||||
Debt securities | 113,625 | 112,288 | 1,337 | 1.2 | 116,819 | |||||||||||||||
Equity instruments | 2,695 | 2,771 | (76) | (2.7) | 2,671 | |||||||||||||||
Loans and advances to customers | 4,298 | 1,297 | 3,001 | 231.4 | 1,601 | |||||||||||||||
Loans and advances to central banks and credit institutions | 41 | — | 41 | — | — | |||||||||||||||
| Financial assets measured at amortised cost | 987,750 | 931,411 | 56,339 | 6.0 | 946,099 | |||||||||||||||
Debt securities | 39,850 | 40,089 | (239) | (0.6) | 37,696 | |||||||||||||||
Loans and advances to customers | 886,520 | 840,373 | 46,147 | 5.5 | 857,322 | |||||||||||||||
Loans and advances to central banks and credit institutions | 61,380 | 50,949 | 10,431 | 20.5 | 51,081 | |||||||||||||||
| Investments in subsidiaries, joint ventures and associates | 8,346 | 9,371 | (1,025) | (10.9) | 7,588 | |||||||||||||||
| Tangible assets | 35,399 | 24,727 | 10,672 | 43.2 | 26,157 | |||||||||||||||
| Intangible assets | 27,383 | 27,855 | (472) | (1.7) | 28,560 | |||||||||||||||
Goodwill | 24,109 | 24,956 | (847) | (3.4) | 25,466 | |||||||||||||||
Other intangible assets | 3,274 | 2,899 | 375 | 12.9 | 3,094 | |||||||||||||||
| Other assets | 57,923 | 54,242 | 3,681 | 6.8 | 55,044 | |||||||||||||||
| Total assets | 1,517,885 | 1,444,687 | 73,198 | 5.1 | 1,459,271 | |||||||||||||||
| Liabilities and shareholders’ equity | ||||||||||||||||||||
| Financial liabilities held for trading | 85,797 | 66,805 | 18,992 | 28.4 | 70,343 | |||||||||||||||
Customer deposits | — | — | — | — | — | |||||||||||||||
Debt securities issued | — | — | — | — | — | |||||||||||||||
Deposits by central banks and credit institutions | — | — | — | — | — | |||||||||||||||
Derivatives | 70,119 | 51,775 | 18,344 | 35.4 | 55,341 | |||||||||||||||
Other | 15,678 | 15,030 | 648 | 4.3 | 15,002 | |||||||||||||||
| Financial liabilities designated at fair value through profit or loss | 68,263 | 92,182 | (23,919) | (25.9) | 68,058 | |||||||||||||||
Customer deposits | 42,417 | 55,154 | (12,737) | (23.1) | 39,597 | |||||||||||||||
Debt securities issued | 3,648 | 2,323 | 1,325 | 57.0 | 2,305 | |||||||||||||||
Deposits by central banks and credit institutions | 22,073 | 34,293 | (12,220) | (35.6) | 25,707 | |||||||||||||||
Other | 125 | 412 | (287) | (69.7) | 449 | |||||||||||||||
| Financial liabilities measured at amortized cost | 1,211,114 | 1,139,066 | 72,048 | 6.3 | 1,171,630 | |||||||||||||||
Customer deposits | 771,868 | 723,597 | 48,271 | 6.7 | 740,899 | |||||||||||||||
Debt securities issued | 254,638 | 231,708 | 22,930 | 9.9 | 244,314 | |||||||||||||||
Deposits by central banks and credit institutions | 151,674 | 155,446 | (3,772) | (2.4) | 162,202 | |||||||||||||||
Other | 32,934 | 28,315 | 4,619 | 16.3 | 24,215 | |||||||||||||||
| Liabilities under insurance contracts | 731 | 810 | (79) | (9.8) | 765 | |||||||||||||||
| Provisions | 14,364 | 13,269 | 1,095 | 8.3 | 13,225 | |||||||||||||||
| Other liabilities | 29,090 | 26,887 | 2,203 | 8.2 | 27,889 | |||||||||||||||
| Total liabilities | 1,409,359 | 1,339,019 | 70,340 | 5.3 | 1,351,910 | |||||||||||||||
| Shareholders’ equity | 119,543 | 119,793 | (250) | (0.2) | 118,613 | |||||||||||||||
Capital stock | 8,309 | 8,068 | 241 | 3.0 | 8,118 | |||||||||||||||
Reserves | 109,164 | 107,032 | 2,132 | 2.0 | 104,922 | |||||||||||||||
Attributable profit to the Group | 3,732 | 5,742 | (2,010) | (35.0) | 7,810 | |||||||||||||||
Less: dividends | (1,662) | (1,049) | (613) | 58.4 | (2,237) | |||||||||||||||
| Other comprehensive income | (21,596) | (24,816) | 3,220 | (13.0) | (22,141) | |||||||||||||||
| Minority interests | 10,579 | 10,691 | (112) | (1.0) | 10,889 | |||||||||||||||
| Total equity | 108,526 | 105,668 | 2,858 | 2.7 | 107,361 | |||||||||||||||
| Total liabilities and equity | 1,517,885 | 1,444,687 | 73,198 | 5.1 | 1,459,271 | |||||||||||||||
14 January - September 2019
Table of Contents
Responsible banking | ||||||||||||||||
Santander vision and | Group financial | Financial information | Corporate governance | |||||||||||||
corporate culture |
| information |
| by segments |
| Santander share |
| Appendix | ||||||||
|
Balance sheet |
|
|
|
GRUPO SANTANDER BALANCE SHEET
| Compared to September 2018, both gross loans and advances to customers (excluding reverse repos) as well as customer funds increased.
Gross loans and advances to customers excluding reverse repos rose 4%year-on-year in euros and in constant euros, with eight of the 10 core countries growing, particularly developing markets (+10% overall).
Customer funds increased 6%year-on-year both in euros and constant euros, with rises in nine of the 10 core countries. Widespread growth in deposits (excluding repos) and mutual funds, the latter due to the better performance in recent months (+12% in constant euros since December 2018). |

 Loans and advances to customers
Gross loans and advances to customers rose to EUR 916,003 million in September 2019, 6% growthyear-on-year.
The Group usesgross loans and advances to customers excluding reverse repos for the purpose of analysing traditional commercial banking loans.
| • | Compared to September 2018, gross loans and advances to customers excluding reverse repos and the exchange rate impact increased 4%, with the following evolution by countries: |
| – | Increase in eight of the 10 core units, particularly all developing countries, which overall grew 10%: Poland (+26%), partly because of the increased perimeter, Argentina (+17%), due to peso balances as well as the impact of the currency’s depreciation on dollar balances, Brazil (+8%), Chile (+7%) and Mexico (+4%). |
| – | As regards mature markets, where overall growth was 2%, notable growth in the United States (+10%, with growth in SC USA and SBNA) and Santander Consumer Finance (+7%), with rises in all countries that comprise it. The UK’s balances increased 2%, as mortgage and other retail loan growth was offset by the reduction of commercial real estate exposures. |
| – | The only declines were in Portugal and Spain, markets that continued to deleverage and where gross loans and advances to customers excluding reverse repos fell by 1% and 6%, respectively. Portugal was affected by the sale ofnon-productive portfolios, and Spain by lower wholesale balances and with institutions. |
| • | Quarter-on-quarter, gross loans and advances to customers, excluding reverse repos and the exchange rate impact, were stable. Growth of 14% in Argentina due to the peso’s depreciation(-12% in euros), 4% in Chile, 3% in Brazil and 2% in Poland, while the remaining countries almost maintained their balances, except for Spain which declined 3% because of lower wholesale balances. |
| • | Loans and advances to customers maintained a balanced structure at the end of the third quarter: individuals (47%), consumer credit (17%), SMEs and companies (24%) and SCIB (12%). |
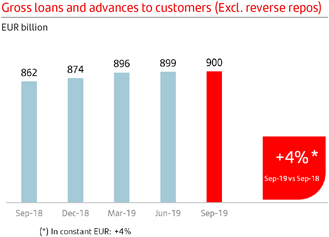
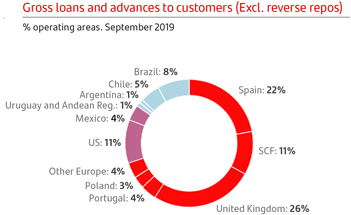
January - September 2019 15
Table of Contents
Responsible banking | ||||||||||||||||
Santander vision and | Group financial | Financial information | Corporate governance | |||||||||||||
corporate culture |
| information |
| by segments |
| Santander share |
| Appendix | ||||||||
|
Balance sheet |
|
|
|
Customer funds
Customer depositsamounted to EUR 814,285 million, 5% growth in the last 12 months (in euros).
The Group usescustomer funds (customer deposits excluding repos, and including mutual funds) for the purpose of analysing traditional retail banking funds.
| • | Compared to September 2018, customer funds increased 6%. Excluding the exchange rate impact, growth was also 6%, as follows: |
| – | By markets, funds rose in all of them, except for Mexico(-1%) as it is focused on improving the cost of funding. Of note were Poland (+21%), Chile (+17%), the US (+12%) and Argentina (+10%). More moderate growth in Spain and the UK (+3%) and Santander Consumer Finance (+4%). |
| – | By products, demand deposits rose 6% and time deposits 5%. The former in all units except Mexico and the latter in eight countries, notably the US, Argentina and the UK. Mutual funds rose 7%, with rises in all units except the UK. |
| • | In the third quarter,customer funds remained virtually stable, both in euros and excluding exchange rate impacts, with stable balances and growing in most of the 10 core units: |
| – | By products, demand deposits were stable as the decline in Spain and Mexico offset the growth in other countries. Time deposits rose 1%, while mutual funds grew 3%, particularly in Chile and Portugal. |
| – | Customer funds continued to be well diversified by products: 60% are demand deposits, 21% time deposits and 19% mutual funds. |
As well as capturing customer deposits, Grupo Santander, for strategic reasons, maintains a selective policy of issuing securities in the international fixed income markets and strives to adapt the frequency and volume of its market operations to the structural liquidity needs of each unit, as well as to the receptiveness of each market.
• In the first nine months, the Group issued:
| – | Medium- and long-term senior debt amounting to EUR 15,203 million and covered bonds placed in the market of EUR 6,031 million. |
| – | There were EUR 13,108 million of securitisations placed in the market. |
| – | Issuances to meet the TLAC (Total Loss-Absorbing Capacity) requirement amounting to EUR 2,599 million, in order to strengthen the Group’s situation (seniornon-preferred: EUR 1,531 million, preferred: EUR 1,068 million). |
| – | Maturities of medium- and long-term debt of EUR 19,963 million. |
| • | The netloan-to-deposit ratio was 112% (111% in September 2018). The ratio of deposits plus medium- and long-term funding to the Group’s loans was 114%, underscoring the comfortable funding structure. |
| • | Special mention must also be made of the EUR 1 billion green bond issued in October to start the Bank’s global sustainable debt issuance plan, through this seven-year senior preferred debt bond. The spread was midswap plus 0.65%, thanks to strong demand (5.5 times the amount to be issued), and the large number of investors. |
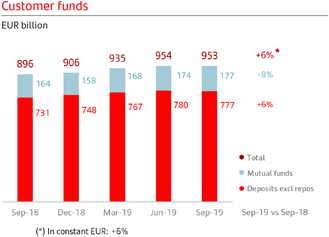
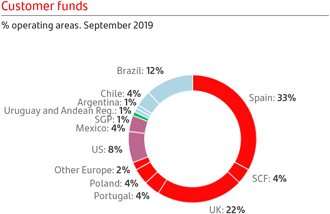
16 January - September 2019
Table of Contents
Responsible banking | ||||||||||||||||
Santander vision and | Group financial | Financial information | Corporate governance | |||||||||||||
corporate culture |
| information |
| by segments |
| Santander share |
| Appendix | ||||||||
|
Solvency ratios |
|
|
|
SOLVENCY RATIOS
| The CET1 ratio reached 11.30% following the organic generation of 19 bps in the quarter and continued to absorb regulatory impacts.
Tangible equity per share was EUR 4.25, 2% higher than September 2018 (+8% including the dividend recorded and announced between both dates).
The fully loaded leverage ratio was stable at 5.05% in the third quarter. |

At the end of September 2019, the totalphased-in capital ratio stood at 14.71% and the CET1 ratio(phased-in and fully loaded) at 11.30%, comfortably meeting the minimum levels required by the European Central Bank on a consolidated basis (13.178% for the total capital ratio and 9.678% for the CET1 ratio).
In the quarter, we continued to generate capital organically, +19 bps, as a result of underlying profit and the active management of risk weighted assets. As such, the organic generation in the year was 48 basis points.
This organic generation, together with favourable market movements benefiting from the held to collect and sell portfolios (due to falling interest rates), a slight positive perimeter impact (sale of Prisma and the acquisition of minority interests in Mexico) as well as the negative 13 bps impact from restructuring costs.
As a result, the fully loaded CET1 ratio would have been 11.83% before the accounting and regulatory impacts recorded in this period(-53 bps, mainly because of the IFRS 16 application and TRIMs).
Had the IFRS 9 transitional arrangement not been applied, the total impact on the CET1 would have been-23 bps.
In April 2019, the European Central Bank published the aggregate result of its Supervisory Review and Evaluation Process (SREP) carried out in 2018. Santander has lower capital requirements than the average of SSM banks. This positive differential was wider in 2018 than in 2017.
Eligible capital. September 2019*
EUR million
| Phased-in | Fully loaded | |||||||
| CET1 | 69,330 | 69,330 | ||||||
| Basic capital | 78,521 | 77,846 | ||||||
| Eligible capital | 90,231 | 90,097 | ||||||
| Risk-weighted assets | 613,580 | 613,580 | ||||||
| CET1 capital ratio | 11.30 | 11.30 | ||||||
| T1 capital ratio | 12.80 | 12.69 | ||||||
| Total capital ratio | 14.71 | 14.68 | ||||||
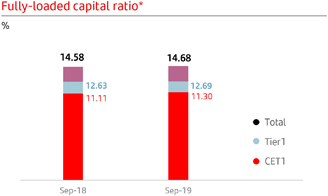
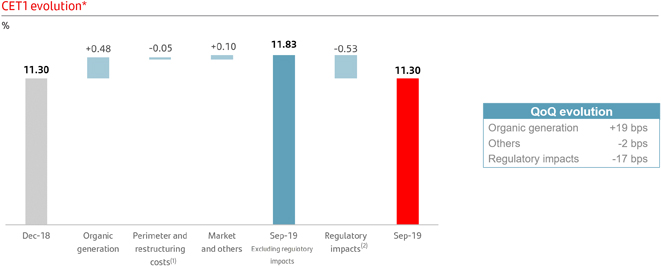
| (1) | Restructuring costs (-13 bps); Prisma (+2 bps); Share buyback Mexico (+4 bps), Other (+2 bps). |
| (2) | IFRS 16 (-19 bps); models and TRIM (-28 bps); Other (-6 bps). |
| (*) | All 2018 and 2019 data was calculated using the IFRS 9 transitional arrangements, unless otherwise indicated. As indicated by the consolidating supervisor, a pay-out of 50%, the maximum within the target range (40%-50%), was applied for the calculation of the capital ratios in September 2019. Previously, the average cash pay-out for the last three years was considered. |
January - September 2019 17
Table of Contents
Responsible banking | ||||||||||||||||
Santander vision and | Group financial | Financial information | Corporate governance | |||||||||||||
corporate culture |
| information |
| by segments |
| Santander share |
| Appendix | ||||||||
|
Risk management |
|
|
|
RISK MANAGEMENT
| Santander maintained itsmedium-low risk profile in the third quarter with steady credit quality, low risk market activity focused on servicing our customers and limited exposure to operational events.
The NPL ratio decreased to 3.47%, while cost of credit remained at 1% levels. Coverage remained virtually stable at 67%.
Despite increased uncertainty and volatility in the geopolitical scenario, our market risk exposure remained at low levels.
The operational risk profile remained stable with a similar distribution of losses by category in the quarter. |

Credit risk management
The positive trend in credit quality remained stable during the third quarter, supported by the positiveyear-on-year evolution of the NPL ratio, and stable coverage and cost of credit.
Non-performing loans amounted to EUR 34,326 million, similar to the second quarter. Excluding the exchange-rate impact, the volume of NPLs was also steady, with a slight increase in Brazil, Poland and Argentina offset by the US and the UK.
The Group’s NPL ratio decreased slightly to 3.47%(-4 bps QoQ and-40 bps YoY). Significant reductions were observed in Portugal, the US, Chile and Spain on a year on year basis. The ratio increased in Brazil, Poland motivated by Deutsche Bank Polska’s retail and SME business portfolio integration process, and Argentina due to the country’s complex economic situation.
Loan-loss provisions made in the third quarter amounted to EUR 2,435 million, 14% greater than in the second quarter, mainly driven by seasonality in SC USA and extraordinary sales ofcharged-off portfolios in SCF in the second quarter.
Cumulative loan-loss provisions also increasedyear-on-year adding up to EUR 6,748 million (+5%), mainly led by the US portfolio growth and Argentina, as well as lower recoveries from portfolio sales in SCF.
The cost of credit remained at similar levels compared to the previous quarter and on ayear-on-year basis reflecting the stability of the loan portfolio’s credit quality.
Credit risk |
| |||||||||||||||
EUR million | ||||||||||||||||
| Sep-19 | Sep-18 | Chg. % | Dec-18 | |||||||||||||
Non-performing loans | 34,326 | 36,332 | (5.5) | 35,692 | ||||||||||||
NPL ratio (%) | 3.47 | 3.87 | 3.73 | |||||||||||||
Loan-loss allowances | 23,112 | 24,685 | (6.4) | 24,061 | ||||||||||||
For impaired assets | 14,473 | 15,513 | (6.7) | 15,148 | ||||||||||||
For other assets | 8,639 | 9,172 | (5.8) | 8,913 | ||||||||||||
Coverage ratio (%) | 67 | 68 | 67 | |||||||||||||
Cost of credit (%) | 1.00 | 0.98 | 1.00 | |||||||||||||
Key metrics geographic performance. September 2019 | ||||||||
% | ||||||||||||||||
| NPL | Change (bps) | Coverage | ||||||||||||||
| ratio | QoQ | YoY | ratio | |||||||||||||
Spain | 7.23 | 21 | (32) | 41 | ||||||||||||
SCF | 2.25 | 1 | (20) | 104 | ||||||||||||
United Kingdom | 1.08 | (5) | (4) | 34 | ||||||||||||
Portugal | 4.90 | (10) | (253) | 52 | ||||||||||||
Poland | 4.35 | 14 | 12 | 69 | ||||||||||||
USA | 2.18 | (14) | (82) | 167 | ||||||||||||
Mexico | 2.30 | 9 | (11) | 125 | ||||||||||||
Brazil | 5.33 | 6 | 7 | 101 | ||||||||||||
Chile | 4.48 | (4) | (30) | 57 | ||||||||||||
Argentina | 3.64 | (15) | 117 | 134 | ||||||||||||
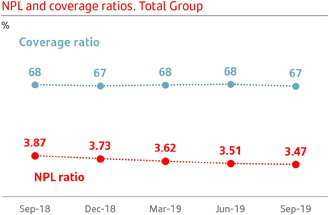
18 January - September 2019
Table of Contents
Responsible banking | ||||||||||||||||
Santander vision and | Group financial | Financial information | Corporate governance | |||||||||||||
corporate culture |
| information |
| by segments |
| Santander share |
| Appendix | ||||||||
|
Risk management |
|
|
|
Total loan-loss reserves amounted to EUR 23,112 million. Coverage at the end of September 2019 was 67% for the Group. It should be taken into account that in Spain and the UK, a large part of their portfolios has real estate collateral and therefore require lower coverage levels.
The Group’s coverage by IFRS 9 stages remained stable on ayear-on-year basis, with no significant movements.
Coverage ratio by stage |
| |||||||||||||||
EUR billion | ||||||||||||||||
| Exposure* | Coverage | |||||||||||||||
| Sep-19 | Sep-19 | Sep-18 | ||||||||||||||
Stage 1 | 874 | 0.5% | 0.5% | |||||||||||||
Stage 2 | 55 | 8.2% | 8.9% | |||||||||||||
Stage 3 | 34 | 42.2% | 42.7% | |||||||||||||
| (*) | Exposure subject to impairment. Additionally, there are EUR 25 billion in loans and advances to customers not subject to impairment recorded at mark to market with changes through P&L. |
| Non-performing loans by quarter | ||||||||||||||||||||||||||||
| EUR million | ||||||||||||||||||||||||||||
| Q1’18 | Q2’18 | Q3’18 | Q4’18 | Q1’19 | Q2’19 | Q3’19 | ||||||||||||||||||||||
Balance at beginning of period | 37,596 | 37,407 | 36,654 | 36,332 | 35,692 | 35,590 | 34,421 | |||||||||||||||||||||
Net addition | 2,340 | 2,906 | 2,528 | 3,136 | 2,147 | 2,511 | 3,190 | |||||||||||||||||||||
Increase in scope of consolidation | — | — | — | 177 | — | — | — | |||||||||||||||||||||
Exchange rate differences and other | 361 | (409) | (140) | (130) | 479 | (162) | (110) | |||||||||||||||||||||
Write-offs | (2,890) | (3,250) | (2,710) | (3,823) | (2,728) | (3,518) | (3,175) | |||||||||||||||||||||
Balance atperiod-end | 37,407 | 36,654 | 36,332 | 35,692 | 35,590 | 34,421 | 34,326 | |||||||||||||||||||||
Market risk
The global corporate banking trading activity risk is mainly interest rate driven, focused on servicing our customer’s needs and measured in daily VaR terms at 99%. In the third quarter, VaR fluctuated around an average value of EUR 12.9 million and reached EUR 20.2 million, mainly as a result of the market volatility
and the exposure to interest rate risk in Brazil, always within the established limits. These figures are low compared to the size of the Group’s balance sheet and activity. In addition, there are other positions classified for accounting purposes as trading (total VaR of EUR 13 million at the end of September 2019).
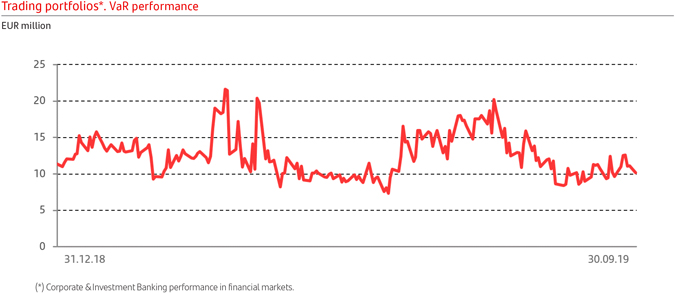
January - September 2019 19
Table of Contents
Responsible banking | ||||||||||||||||
Santander vision and | Group financial | Financial information | Corporate governance | |||||||||||||
corporate culture |
| information |
| by segments |
| Santander share |
| Appendix | ||||||||
|
Risk management |
|
|
|
Trading portfolio*. VaR by geographic region |
| |||||||||||||||
EUR million | ||||||||||||||||
| 2019 | 2018 | |||||||||||||||
| Third quarter | Average | Latest | Average | |||||||||||||
Total | 12.9 | 10.2 | 7.9 | |||||||||||||
Europe | 6.0 | 5.9 | 4.7 | |||||||||||||
North America | 3.7 | 3.7 | 5.1 | |||||||||||||
South America | 10.2 | 8.5 | 6.1 | |||||||||||||
(*) Activity performance in Santander Corporate & Investment Banking markets.
| Trading portfolio*. VaR by market factor |
| |||||||||||||||
| EUR million | ||||||||||||||||
| Third quarter 2019 | Min. | Avg. | Max. | Last | ||||||||||||
Total VaR | 8.4 | 12.9 | 20.2 | 10.2 | ||||||||||||
Diversification effect | (4.8) | (7.7) | (11.8) | (11.1) | ||||||||||||
Interest rate VaR | 6.9 | 9.6 | 13.8 | 9.6 | ||||||||||||
Equity VaR | 2.6 | 3.4 | 5.6 | 3.9 | ||||||||||||
FX VaR | 2.7 | 4.7 | 8.4 | 4.3 | ||||||||||||
Credit spreads VaR | 2.1 | 3.0 | 3.7 | 3.4 | ||||||||||||
Commodities VaR | 0.0 | 0.0 | 0.0 | 0.0 | ||||||||||||
(*) Activity performance in Corporate & Investment Banking markets.
NOTE: In the Latin America, United States and Asia portfolios, VaR corresponding to the credit spreads factor other than sovereign risk is not relevant and is included in the interest rate factor.
Structural and liquidity risk
| • | With regards to structural exchange rate risk, Santander’s CET1 ratio coverage remained around 100% in order to protect it from foreign currency movements. |
| • | In structural interest rate risk, during the third quarter, despite being a period of high volatility, mainly due to theUS-China trade disputes, political situations in Italy and Argentina, Brexit and greater tensions in the Middle East, no relevant impact was generated in the ALCO activity. |
| • | In liquidity risk during the third quarter, the Group kept a comfortable position, supported by a strong and diversified liquidity buffer, with ratios remaining well above regulatory limits. |
Operational risk
| • | The operational risk profile remained stable in the third quarter, although the volume of claims related to legacy Payment Protection Insurance (PPI) cases in the UK increased, at the deadline of the redress process. The cumulative impact from PPI claims in the year is EUR 183 million, which is higher than in the same period of last year, although this impact is lower than those announced by other competitors. |
| • | In relative terms, levels of losses by Basel categories were similar, with those derived from civil claims with customers and external fraud representing the main proportion. |
| • | Specific risk-monitoring frameworks continued to improve such as those for suppliers (focusing in actions to ensure compliance with the EBA Guidelines), the most significant change management processes (including digitalisation initiatives), as well as the implementation of fraud mitigating measures in the main units (Mexico, the UK and Brazil). |
| • | Cybersecurity, a key area for the Group, continues to improve. Progress continued in the second half of 2019 in our cybersecurity transformation programme in order to strengthen detection, response and protection mechanisms. New policies have been developed and deployed to enhance management and control over critical IT infrastructure and assets. |
20 January - September 2019
Table of Contents
Responsible banking | ||||||||||||||||
Santander vision and | Group financial | Financial information | Corporate governance | |||||||||||||
corporate culture |
| information |
| by segments |
| Santander share |
| Appendix | ||||||||
|
|
|
|
|
GENERAL BACKGROUND
Economic activity slowed in the third quarter of 2019, particularly in mature economies, due again to trade negotiations, the uncertainty over Brexit and geopolitical uncertainties. The forecast for global growth is 2.9% (3.6% in 2018).
Slower growth was accompanied by a downward revision of inflation expectations. The balance of risks remains inclining toward lower growth, particularly due to the aforementioned political economy factors. In these circumstances, central banks put into effect more expansive policies. The central banks of the US, the Eurozone, Brazil, Mexico and Chile cut interest rates and maintain a downward bias.
| Country | GDP change 1 | Economic performance | ||||
| Eurozone | +1.2% | The economy slowed because of lower growth in world trade and the uncertainty over the trade war and Brexit. Business expectations in the third quarter did not indicate improvements. The annual rate of inflation came down to 0.8% in September. The ECB took new monetary softening measures.
| |||
| Spain | +2.1% | The National Statistics Institute’s review showed that the economy was not as strong as first estimated. Growth decelerated a little in the second quarter and in the third job creation weakened. Inflation slipped to 0.1% in September because of lower oil prices.
| |||
| Poland | +4.6% | Growth was slower in the second quarter. Domestic demand continued to be the main engine of growth. The unemployment rate remained at historic lows (3.2% in the second quarter). Inflation in September (2.6%) was still above target (2.5%). The benchmark interest rate, however, was held at 1.5%.
| |||
| Portugal | +2.0% | The economy lost a little steam in the second quarter and is expected to lose more because of the high external exposure (exports represent 48% of GDP). The jobless rate declined further to 6.3%. Inflation was negative for the third month running(-0.1% in September).
| |||
| United Kingdom | +1.7% | The economy contracted in the second quarter after growing strongly in the first due to the stock building in the face of a possible no deal Brexit. This performance could be repeated in the third quarter. Inflation in September fell to 1.7% and the unemployment rate dropped to 3.8% in the second quarter. The base rate remained at 0.75%.
| |||
| Brazil | +0.7% | The economy surprised upwards in the second quarter (+0.4%), driven by construction. Although the third quarter indicators are modest, they continued to reflect a gradual recovery. Inflation was still low (2.9% in September) and expectations below the target of 4.25%. The central bank cut its benchmark rate in the third quarter by 100 bps to 5.50% and intimated there would be further cuts.
| |||
| Mexico | +0.2% | Growth stagnated in the second quarter, due to lower investment and external demand’s positive contribution. The central bank lowered its benchmark rate in the third quarter by 50 bps to 7.75%, the first cut in five years. Further cuts are expected in the coming quarters in an environment of moderate inflation (3.0% in September) and relative exchange rate stability.
| |||
| Chile | +1.8% | Growth accelerated in the second quarter, driven by investment in construction but lower exports. The central bank cut its benchmark rate by 50 bps in the second quarter to 2% (100 bps so far this year) and suggested more cuts. Inflation remained low (2.1% in September), below the 3% target.
| |||
| Argentina | -2.5% | The economy showed signs of improvement (+0.6% vs.-5.8% in the first quarter), but the financial volatility since August makes consolidation difficult. Inflation rose in the third quarter, following the moderation shown since April and the central bank raised interest rates and introduced capital controls.
| |||
| United States | +2.5% | GDP growth slowed in the second quarter due to the fall in investment and lower global growth. The unemployment rate remained close to its historic low (3.5% in September) but inflation (measured by the underlying private consumption deflator) was below the target of the Fed (1.8% in August), which cut its funds rate by 50 bps in the third quarter to1.75-2%.
| |||


(1)Year-on-year change H1’19.
January - September 2019 21
Table of Contents
Responsible banking | ||||||||||||||||
Santander vision and | Group financial | Financial information | Corporate governance | |||||||||||||
corporate culture |
| information |
| by segments |
| Santander share |
| Appendix | ||||||||
|
|
|
|
|
DESCRIPTION OF SEGMENTS
The segment reporting is based on financial information presented to the chief operating decision maker, which excludes certain items included in the statutory results that distortyear-on-year comparisons and are not considered for management reporting purposes. This financial information (underlying basis) is computed by adjusting reported results for the effects of certain gains and losses (e.g.: capital gains, write-downs, impairment of goodwill, etc.). These gains and losses are items that management and investors ordinarily identify and consider separately to better understand the underlying trends in the business.
The Group has aligned the information in this operating segment section in a manner consistent with the underlying information used internally for management reporting purposes and with that presented throughout the Group’s other public documents.
The Group executive committee has been determined to be the chief operating decision maker for the Group. The Group’s operating segments reflect the organisational and management structures. The Group executive committee reviews the internal reporting based on these segments in order to assess performance and allocate resources.
The segments are differentiated by the geographic area where profits are earned, and by type of business. The financial information of each reportable segment is prepared by aggregating the figures for the Group’s various geographic areas and business units. The information relates to both the accounting data of the units integrated in each segment and that provided by management information systems. In all cases, the same general principles as those used in the Group are applied.
The businesses included in each of the business areas in this report and the accounting principles under which their results are presented here may differ from the businesses included and accounting principles applied in the financial information separately prepared and disclosed by our subsidiaries (some of which are publicly listed) which in name or geographical description may seem to correspond to the business areas covered in this report. Accordingly, the results of operations and trends shown for our business areas in this document may differ materially from those of such subsidiaries.
At the beginning of July 2019, we announced that, starting with the financial information for the first half of 2019, we would carry out a change in our reported segments to reflect our current organisational and management structure.
This change in our reported segments aims to align the segment information to how segments and units are managed and has no impact on accounting figures at the Group level. The main changes, which have been applied to segment information for all periods included in the consolidated financial statements, are the following:
Primary segments
| 1. | Creation of the new geographic segment Europe that includes the existing units under the previous Continental Europe segment (Spain, Portugal, Poland and Santander Consumer Finance) plus the UK (that was previously a segment on its own and is now a unit under the segment Europe). |
| – | The UK is aligned with the ring-fencing structure, including products and services distributed to our retail customers and the majority of our business customers. The businesses excluded are now incorporated in the rest of Europe. |
| – | Spain now includes the Real Estate Activity Spain unit, previously included in the rest of Europe, and it excludes some treasury businesses now reported in the rest of Europe and the online bank Openbank is now incorporated in the new digital segment (Santander Global Platform). |
| – | Rest of Europe, included within the Europe segment, comprises mainly (i) CIB businesses such as Banco Santander, S.A. branches outside of Spain (including the businesses excluded from the UK as a result of ring-fencing) as well as Spain’s treasury business and (ii) Private Banking’s Wealth Management & Insurance businesses in Switzerland, mutual funds in Luxemburg and Insurance in Zurich. |
| 2. | Creation of the new geographic segment North America that comprises the existing units under the previous US segment plus Mexico. |
| 3. | Creation of the new geographic segment South America that comprises the existing units under the previous Latin America segment except for Mexico. |
| 4. | Creation of a new reporting unit segment, Santander Global Platform, which includes our global digital services under a single unit: |
| – | Our fully digital bank Openbank and Open Digital Services. |
| – | Global Payments Services: payments platform to better serve our customers with value propositions developed globally, including Superdigital, Pago FX and our recently launched global businesses (Global Merchant Services and Global Trade Services). |
| – | Digital Assets: common digital assets and Centres of Digital Expertise which help our banks in their digital transformation. |
Secondary segments
| 5. | The Real Estate Activity Spain unit, that was previously a segment reported on its own, is now included in Retail Banking. |
| 6. | The insurance business, previously included in Retail Banking, is now included in the Wealth Management segment, which was renamed Wealth Management & Insurance. |
22 January - September 2019
Table of Contents
Responsible banking | ||||||||||||||||
Santander vision and | Group financial | Financial information | Corporate governance | |||||||||||||
corporate culture |
| information |
| by segments |
| Santander share |
| Appendix | ||||||||
|
|
|
|
|
| 7. | The new digital segment (Santander Global Platform) is also incorporated as a secondary segment. |
| 8. | Finally, the change in reported segments also includes adjustments of the clients of the Global Customer Relationship Model between Retail Banking and Santander Corporate & Investment Banking and between Retail Banking and Wealth Management & Insurance. |
The changes in the secondary segments have no impact on the primary segments.
To allow betterquarter-on-quarter andyear-on-year comparability, and as was published in the Relevant Fact in July 2019, the Group has provided the quarterly 2018 and first quarter of 2019 data on a new basis, in accordance with the new structure of the Group.
After these changes, the operating business areas are structured in two levels:
Primary segments
This primary level of segmentation, which is based on the Group’s management structure, comprises five reportable segments: four operating areas plus the Corporate Centre. The operating areas are:
Europe: which comprises all the business activities carried out in the region. Detailed financial information is provided on Spain, Portugal, Poland, Santander Consumer Finance (which incorporates all the region’s business, including the three countries mentioned herewith) and the UK.
North America: which comprises all the business activities carried out in Mexico and the US, which includes the holding company (SHUSA) and the businesses of Santander Bank, Santander Consumer USA, Banco Santander Puerto Rico, the specialised unit Banco Santander International and the New York branch.
South America: includes all the financial activities carried out by the Group through its banks and subsidiary banks in the region. Detailed information is provided on Brazil, Chile, Argentina, Uruguay, Peru and Colombia.
Santander Global Platform: includes our fully digital bank Openbank and Open Digital Services, Global Payments Services (Superdigital, Pago FX, Global Merchant Services, Global Trade Services) and Digital Assets (Centres of Digital Expertise, InnoVentures and Digital Assets).
Secondary segments
At this secondary level of segment reporting, the Group is structured into Retail Banking, Santander Corporate & Investment Banking, Wealth Management & Insurance and Santander Global Platform.
Retail Banking: this covers all customer banking businesses, including consumer finance, except those of corporate banking, which are managed through Santander Corporate & Investment Banking, and asset management, private banking and insurance, which are managed by Wealth Management & Insurance. The results of the hedging positions in each country are also included, conducted within the sphere of each one’s assets and liabilities committee.
Santander Corporate & Investment Banking (SCIB): This business reflects revenue from global corporate banking, investment banking and markets worldwide including treasuries managed globally (always after the appropriate distribution with Retail Banking customers), as well as equity business.
Wealth Management & Insurance: Includes the asset management business (Santander Asset Management), the corporate unit of Private Banking and International Private Banking in Miami and Switzerland and the insurance business (Santander Insurance).
Santander Global Platform: includes our fully digital bank Openbank and Open Digital Services, Global Payments Services (Superdigital, Pago FX, Global Merchant Services, Global Trade Services) and Digital Assets (Centres of Digital Expertise, InnoVentures and Digital Assets).
In addition to these operating units, which report by geographic area and businesses, the Group continues to maintain the area ofCorporate Centre, that includes the centralised activities relating to equity stakes in financial companies, financial management of the structural exchange rate position, assumed within the sphere of the Group’s assets and liabilities committee, as well as management of liquidity and of shareholders’ equity via issuances.
As the Group’s holding entity, this area manages all capital and reserves and allocations of capital and liquidity with the rest of businesses. It also incorporates amortisation of goodwill but not the costs related to the Group’s central services (charged to the areas), except for corporate and institutional expenses related to the Group’s functioning.
As described on the previous page, the results of our business areas presented below are provided on the basis of underlying results only and including the impact of foreign exchange rate fluctuations. However, for a better understanding of the actual changes in the performance of our business areas, we provide and discuss theyear-on-year changes to our results excluding such impact. |
On the other hand, certain figures contained in this report, including financial information, have been subject to rounding to enhance their presentation. Accordingly, in certain instances, the sum of the numbers in a column or a row in tables contained in this report may not conform exactly to the total figure given for that column or row. |
January - September 2019 23
Table of Contents
Responsible banking | ||||||||||||||||
Santander vision and | Group financial | Financial information | Corporate governance | |||||||||||||
corporate culture |
| information |
| by segments |
| Santander share |
| Appendix | ||||||||
|
|
|
|
|
January-September 2019.
Main items of the underlying income statement
EUR million
| Primary segments | Net interest income | Net fee income | Total income | Net operating income | Profit before tax | Underlying attributable profit to the parent | ||||||||||||||||||
EUROPE | 10,671 | 3,941 | 15,709 | 7,398 | 5,498 | 3,640 | ||||||||||||||||||
Spain | 2,985 | 1,861 | 5,695 | 2,652 | 1,617 | 1,185 | ||||||||||||||||||
Santander Consumer Finance | 2,888 | 627 | 3,525 | 1,986 | 1,711 | 995 | ||||||||||||||||||
United Kingdom | 2,827 | 640 | 3,508 | 1,384 | 1,110 | 828 | ||||||||||||||||||
Portugal | 643 | 292 | 1,043 | 576 | 557 | 385 | ||||||||||||||||||
Poland | 863 | 349 | 1,258 | 734 | 476 | 245 | ||||||||||||||||||
Other | 465 | 171 | 680 | 67 | 28 | 2 | ||||||||||||||||||
NORTH AMERICA | 6,661 | 1,349 | 8,655 | 5,002 | 2,222 | 1,278 | ||||||||||||||||||
US | 4,320 | 716 | 5,711 | 3,283 | 1,158 | 619 | ||||||||||||||||||
Mexico | 2,341 | 633 | 2,944 | 1,718 | 1,064 | 659 | ||||||||||||||||||
SOUTH AMERICA | 9,960 | 3,559 | 13,711 | 8,817 | 5,543 | 2,977 | ||||||||||||||||||
Brazil | 7,539 | 2,825 | 10,386 | 7,022 | 4,301 | 2,249 | ||||||||||||||||||
Chile | 1,402 | 302 | 1,901 | 1,117 | 855 | 473 | ||||||||||||||||||
Argentina | 690 | 328 | 957 | 404 | 174 | 97 | ||||||||||||||||||
Other | 329 | 104 | 466 | 273 | 214 | 158 | ||||||||||||||||||
SANTANDER GLOBAL PLATFORM | 69 | 4 | 63 | (105) | (107) | (77) | ||||||||||||||||||
CORPORATE CENTRE | (919) | (35) | (1,236) | (1,519) | (1,733) | (1,637) | ||||||||||||||||||
TOTAL GROUP | 26,442 | 8,818 | 36,902 | 19,593 | 11,423 | 6,180 | ||||||||||||||||||
| Secondary segments | ||||||||||||||||||||||||
RETAIL BANKING | 24,861 | 6,827 | 32,599 | 18,088 | 10,223 | 5,862 | ||||||||||||||||||
CORPORATE & INVESTMENT BANKING | 2,009 | 1,149 | 3,841 | 2,172 | 2,087 | 1,335 | ||||||||||||||||||
WEALTH MANAGEMENT & INSURANCE | 422 | 873 | 1,635 | 957 | 953 | 697 | ||||||||||||||||||
SANTANDER GLOBAL PLATFORM | 69 | 4 | 63 | (105) | (107) | (77) | ||||||||||||||||||
CORPORATE CENTRE | (919) | (35) | (1,236) | (1,519) | (1,733) | (1,637) | ||||||||||||||||||
TOTAL GROUP | 26,442 | 8,818 | 36,902 | 19,593 | 11,423 | 6,180 | ||||||||||||||||||
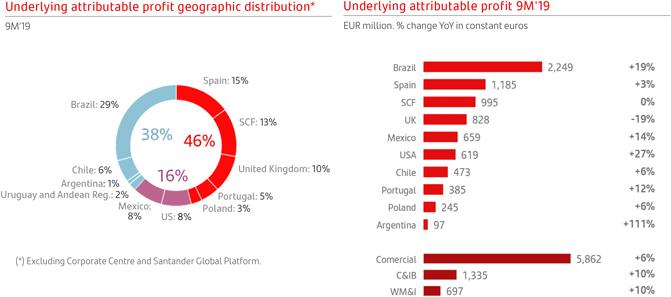
24 January - September 2019
Table of Contents
Responsible banking | ||||||||||||||||
Santander vision and | Group financial | Financial information | Corporate governance | |||||||||||||
corporate culture |
| information |
| by segments |
| Santander share |
| Appendix | ||||||||
|
|
|
|
|
January-September 2018.
Main items of the underlying income statement
EUR million
| Primary segments | Net interest income | Net fee income | Total income | Net operating income | Profit before tax | Underlying profit to the parent | ||||||||||||||||||
EUROPE | 10,573 | 4,108 | 15,943 | 7,541 | 5,683 | 3,805 | ||||||||||||||||||
Spain | 3,040 | 1,991 | 5,811 | 2,540 | 1,526 | 1,146 | ||||||||||||||||||
Santander Consumer Finance | 2,780 | 609 | 3,423 | 1,929 | 1,657 | 998 | ||||||||||||||||||
United Kingdom | 3,068 | 688 | 3,890 | 1,753 | 1,458 | 1,023 | ||||||||||||||||||
Portugal | 646 | 281 | 1,010 | 528 | 491 | 343 | ||||||||||||||||||
Poland | 730 | 338 | 1,098 | 624 | 430 | 235 | ||||||||||||||||||
Other | 309 | 201 | 711 | 167 | 120 | 60 | ||||||||||||||||||
NORTH AMERICA | 5,868 | 1,216 | 7,612 | 4,298 | 1,846 | 1,009 | ||||||||||||||||||
US | 3,838 | 641 | 4,983 | 2,759 | 943 | 458 | ||||||||||||||||||
Mexico | 2,030 | 575 | 2,630 | 1,539 | 903 | 551 | ||||||||||||||||||
SOUTH AMERICA | 9,509 | 3,243 | 13,034 | 8,320 | 5,065 | 2,594 | ||||||||||||||||||
Brazil | 7,283 | 2,568 | 9,949 | 6,644 | 3,909 | 1,933 | ||||||||||||||||||
Chile | 1,466 | 329 | 1,914 | 1,125 | 844 | 459 | ||||||||||||||||||
Argentina | 442 | 256 | 737 | 310 | 125 | 66 | ||||||||||||||||||
Other | 318 | 90 | 435 | 241 | 187 | 136 | ||||||||||||||||||
SANTANDER GLOBAL PLATFORM | 59 | 4 | 53 | (40) | (42) | (32) | ||||||||||||||||||
CORPORATE CENTRE | (728) | (42) | (760) | (1,080) | (1,322) | (1,334) | ||||||||||||||||||
TOTAL GROUP | 25,280 | 8,529 | 35,882 | 19,039 | 11,230 | 6,042 | ||||||||||||||||||
| Secondary segments | ||||||||||||||||||||||||
RETAIL BANKING | 23,818 | 6,553 | 31,298 | 17,073 | 9,740 | 5,525 | ||||||||||||||||||
CORPORATE & INVESTMENT BANKING | 1,743 | 1,154 | 3,747 | 2,198 | 1,976 | 1,245 | ||||||||||||||||||
WEALTH MANAGEMENT & INSURANCE | 388 | 860 | 1,545 | 888 | 878 | 638 | ||||||||||||||||||
SANTANDER GLOBAL PLATFORM | 59 | 4 | 53 | (40) | (42) | (32) | ||||||||||||||||||
CORPORATE CENTRE | (728) | (42) | (760) | (1,080) | (1,322) | (1,334) | ||||||||||||||||||
TOTAL GROUP | 25,280 | 8,529 | 35,882 | 19,039 | 11,230 | 6,042 | ||||||||||||||||||
January - September 2019 25
Table of Contents
Responsible banking | ||||||||||||||||
Santander vision and | Group financial | Financial information | Corporate governance | |||||||||||||
corporate culture |
| information |
| by segments |
| Santander share |
| Appendix | ||||||||
|
|
Primary segments |
|
|
| EUROPE
| |||
| Highlights(changes in constant euros)
Given the current macroeconomic environment characterised by lower for longer interest rates, we are working on our franchise to simplify our business model and structures and operate in a more integrated way in the medium-term.
In terms of volumes, in an environment of lower economic growth, gross loans and advances to customers (excluding reverse repos) rose 2%year-on-year and customer funds 5%.
Underlying attributable profit for the period amounted to EUR 3,640 million, down 4% compared to the first nine months of 2018, due to lower gains on financial transactions (markets) and net fee income (mainly CIB) and higher provisions. Conversely, net interest income increased and costs fell. | |||
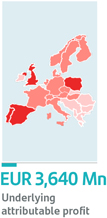

Strategy
Santander’s subsidiaries in Europe are managed according to their local priorities. At the same time, initiatives are being considered to enable greater integration of businesses, shared services and cost saving measures. For example:
| • | Integration of the different technological platforms and acceleration of the Bank’s digital transformation, to help improve the customer experience and expand the distribution channels for our products and services. |
| • | Continued obtention of additional synergies from the ongoing integration processes, especially in the case of Popular in Spain and the retail and SME business of Deutsche Bank Polska in Poland. |
| • | And finally, simplification of our business model, reducing the number of products to gain efficiency and agility, but maintaining a full value proposition that is capable of meeting the daily needs of our individual customers and offering tailored solutions for SMEs and large companies. |
All of this, with the medium-term objective to obtain EUR 1 billion of additional savings, based on our global capabilities to strengthen operational efficiency in the region.
Business performance
Gross loans and advances to customers (excluding reverse repos) increased by 2%, driven by strong organic growth in SCF (France, Spain and Nordic countries) and the integration of Deutsche Bank Polska’s retail and SME business in Poland.
Customer funds increased by 5% mainly due to higher retail deposits in Spain, and the inclusion of balances of the retail and SME business from Deutsche Bank Polska in Poland.
Results
Underlying attributable profit amounted to EUR 3,640 million inthe first nine months of 2019, 4% less than in the same period of the previous year. By lines:
| • | Revenue was down 1%. In an environment very low interest rates, net interest income increased by 1%, supported by higher volumes in SCF, the increase in Poland and the CIB business. This increase is offset by lower gains on financial transactions (markets) and net fee income (mainly CIB). |
| • | Costs decreased 1%(-2.5% in real terms) reflecting the first savings from our optimisation processes. |
| • | Higher provisions due to the integration in Poland and lower levels of SCF portfolio sales. Cost of credit remained at very low levels (0.25%). |
Compared to the previous quarter, underlying attributable profit rose 9% due to higher gains on financial transactions, net fee income recovery and the contribution to the Single Resolution Fund (SRF) recorded in the second quarter. Costs continued to fall.
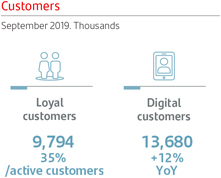
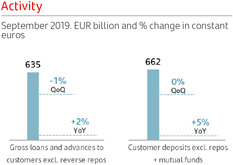
Underlying income statement
EUR million and % change in constant euros
| Q3’19 | /Q2’19 | 9M’19 | /9M’18 | |||||||||||||
Revenue
| 5,295 | +3% | 15,709 | -1% | ||||||||||||
Expenses
| -2,719 | -2% | -8,310 | -1% | ||||||||||||
LLPs
| -497 | +29% | -1,340 | +6% | ||||||||||||
PBT
| 1,949 | +10% | 5,498 | -3% | ||||||||||||
Underlying attrib. profit
| 1,286 | +9% | 3,640 | -4% | ||||||||||||
Detailed financial information on page 54
26 January - September 2019
Table of Contents
Responsible banking | ||||||||||||||||
Santander vision and | Group financial | Financial information | Corporate governance | |||||||||||||
corporate culture |
| information |
| by segments |
| Santander share |
| Appendix | ||||||||
|
|
Primary segments |
|
|
| Spain
| |||
| Highlights
After the successful integration of Banco Popular with the migration of all offices and customers to the Santander platform, we are focusing on optimising the commercial network.
Further improvement in customer spreads (+23 bps vs. Q1’18), due to the effect of lower cost of funds (+20 bps) and the better yield on loans (+3 bps).
Sustained reduction in costs quarter after quarter(-7%year-on-year), meeting the efficiencies committed with the integration of Popular.
The first nine months underlying attributable profit was 3% higheryear-on-year at EUR 1,185 million, mainly due to lower costs. |


Commercial activity
Sustained commercial dynamism withyear-on-year growth in business combined with increased profitability in all segments and products.
We are taking advantage of Santander’s capabilities and the positive commercial dynamism in companies (focusing on value-added products), which was reflected in the 11% growthyear-on-year in international business activity. Consumer credit rose 24%year-on-year, driven bypre-concession and digital subscriptions.
The main drivers of loyalty continued to grow, increasing customer transactions. Growth in cards turnover andpoint-of-sale terminals was 13% and 9%, respectively, and 5% in new insurance premiums, once this business was reorganised with the new joint ventures of Mapfre1and Aegon.
For the second year running, we were rated the best contact centre of any sector, and for the fifth year running the best in the financial sector.
The fourthWork Caféwas opened in Madrid, strengthening our bid for a new commercial model focused on capturing business in the office and maximising digitalisation (80% of customers are digital).
Business performance
Gross loans and advances to customers (excluding reverse repos) were affected by the deleveraging in wholesale banking due to the market environment and the move toward a capital efficient model, while new mortgages do not yet offset maturities. The stock of consumer loans, however, increased in the year.
Customer funds increased by EUR 8,825 million in the year, mutual funds grew by EUR 1,455 million and demand deposits by EUR 12,780 million, partially offset by lower time deposits.
Results
The first nine months underlying attributable profit was 3% higheryear-on-year at EUR 1,185 million. By lines:
| • | In a low interest rate environment, net interest income fell 2%, due to decreased volumes and the impact of IFRS 16, partially offset by the improvement in customer spreads. Excluding the IFRS 16 impact, net interest income rose 1%. |
| • | Net fee income fell 7%, due to lower activity at SCIB and moving toward more conservative mutual funds. Gains on financial transactions rose 24%, due to active portfolio management, taking advantage of market movements. |
| • | Operating expenses continued to fall strongly(-7%year-on-year) due to the efficiencies resulting from Popular’s integration and the optimisation efforts. |
Compared to the second quarter, the third quarter underlying attributable profit was 45% higher because of lower costs and loan-loss provisions, active portfolio management and the recording in the second quarter of the SRF contribution.
These results do not include restructuring costs from the integration of Banco Popular.
(1) Operation pending regulatory authorisations and other usual conditions.

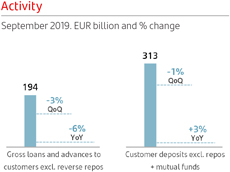
Underlying income statement
EUR million and % change
| Q3’19 | /Q2’19 | 9M’19 | /9M’18 | |||||||||||||
Revenue
| 1,989 | +8% | 5,695 | -2% | ||||||||||||
Expenses
| -999 | -2% | -3,043 | -7% | ||||||||||||
LLPs
| -210 | -8% | -680 | +5% | ||||||||||||
PBT
| 681 | +49% | 1,617 | +6% | ||||||||||||
Underlying attrib. profit
|
| 491
|
| +45%
|
| 1,185
|
|
| +3%
|
| ||||||
Detailed financial information on page 55
January - September 2019 27
Table of Contents
Responsible banking | ||||||||||||||||
Santander vision and | Group financial | Financial information | Corporate governance | |||||||||||||
corporate culture |
| information |
| by segments |
| Santander share |
| Appendix | ||||||||
|
|
Primary segments |
|
|
 | Santander Consumer Finance
| |||
| Highlights(changes in constant euros)
SCF continues to be the European consumer finance leader, with critical mass and among the Top 3 in its markets in Europe. Gross loans and advances to customers (excluding reverse repos) rose 7% and new lending 5%year-on-year.
Total income increased 3%year-on-year, largely due to net interest income and net fee income which, together with cost control, pushed up net operating income by 3%.
Underlying attributable profit for the first nine months was EUR 995 million (virtually unchangedyear-on- year). Good performance of revenue and the cost of credit still at low levels for this business.
Continued high profitability: RoTE above 15% and RoRWA of more than 2%. | |||

Commercial activity
SCF continued its growth based on its solid business model, enabling it to confront new market trends: diversification by country, scale, leadership in efficiency and risk and recovery systems that allow it to maintain a better performance than its European competitors in the key metrics.
Management continued to focus on boosting auto finance and increasing consumer finance through strengthening digital channels.
The auto business in SCF continued to grow despite the fall in car sales in Europe(-2% in the first nine months), due to the good performance of the brands with which SCF operates, via more than 115 captive agreements.
Business performance
New lending rose 5%year-on-year, underpinned by commercial agreements in several countries. Of note: Italy (+13%), France (+9%) and Spain (+6%).
Customer deposits (excluding repos) amounted to almost EUR 38,000 million and continues to be a factor that differentiated us from our competitors. Balances rose 1% in the quarter, due to various measures taken to complete the digital transformation plan.
Recourse to wholesale funding amounted to EUR 12,968 million. Customer deposits (excluding repos), issuances and securitisations covered 74% of net loans.
Results
First nine monthsunderlying attributable profit of EUR 995 million, in line with that of the same period of 2018:
| • | Net interest income rose 4% due to higher volumes and net fee income (+3%). |
| • | Costs rose at a slower pace (+3%) with an efficiency ratio of 44%, in line with that of the previous year, benefiting from efficiency projects in several units. |
| • | The cost of credit remained at low levels (0.38%), reflecting a conservative risk appetite and a solid credit management policy. The NPL ratio was 2.25%, 20 bps lower than in the first nine months of 2018. |
| • | The largest profits were generated by Germany (EUR 248 million), the Nordic countries (EUR 224 million) and Spain (EUR 170 million). |
Compared to the second quarter of 2019, underlying attributable profit was 2% higher despite the rise in loan-loss provisions driven by lower portfolio sales in the quarter, driven by higher income and lower costs.
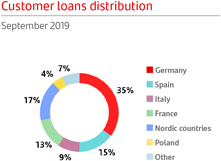
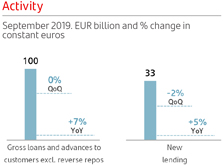
Underlying income statement
EUR million and % change in constant euros
| Q3’19 | /Q2’19 | 9M’19 | /9M’18 | |||||||||||||||
Revenue
| 1,203 | +5% | 3,525 | +3% | ||||||||||||||
Expenses
| -504 | -4% | -1,539 | +3% | ||||||||||||||
LLPs
| -147 | +148% | -328 | +5% | ||||||||||||||
PBT
| 594 | +7% | 1,711 | +4% | ||||||||||||||
Underlying attrib. profit
|
| 338
|
|
| +2%
|
|
| 995
|
|
| 0%
|
| ||||||
Detailed financial information on page 56
28 January - September 2019
Table of Contents
Responsible banking | ||||||||||||||||
Santander vision and | Group financial | Financial information | Corporate governance | |||||||||||||
corporate culture |
| information |
| by segments |
| Santander share |
| Appendix | ||||||||
|
|
Primary segments |
|
|
| United Kingdom
| |||
| Highlights(changes in constant euros)
Business activity remained robust with a further increase in mortgages, digital and loyal customers as well as improved customer experience.
Mortgage lending continued to grow as we carry on supporting our customers and strengthening our franchise in a very competitive market. Customer funds increased driven by a successful retail savings campaign, the1|2|3 Business Current Accountand higher deposit inflows in CIB.
Underlying attributable profit was 19% lower than the first nine months of 2018, reflecting the continued competitive pressure on mortgage margins and SVR volumes attrition.
| |||


Commercial activity
We continue to focus on building stronger customer relationships and a seamless customer experience. This has allowed us to significantly improve customer satisfaction in the last 3 years.
The number of loyal customers continued to growyear-on-year with individual customers +5%, SMEs and corporates +8%. Loyal customers as a percentage of total active customers rose 2 pp to 32%.
Digital innovation and adoption continues to drive change in the organisation. We have attracted 383,000 digital customers in the last 12 months (+7%), retained 60% of refinanced mortgage loans online (+5 ppyear-on-year), and 52% of current accounts (+8 pp) and 63% of credit cards (+2 pp) were opened through digital channels.
Our multi-year strategic transformation programme, announced earlier in the year, has predominantly focused on the restructure of the retail branch network and reshaping our corporate business.
Business performance
Gross loans and advances to customers (excluding reverse repos) increased over the last 12 months. Growth in mortgage lending was partially offset by managed reduction in CRE lending.
Customer funds increased 3%, backed by higher retail savings and corporate deposits.
Results
Underlying attributable profit inthe first nine months of EUR 828 million, down 19%year-on-year (excluding FX impacts):
| • | Total revenue 10% lower due to continued competitive pressure on mortgage margins and SVR attrition, net fee income reduction, due to overdraft and insurance, and lower gains on financial transactions. |
| • | Costs reduced 1%, reflecting the first cost savings from our transformation programme. In real terms (excluding inflation), costs were 3% lower. |
| • | Loan-loss provisions increased by 22%, partly due to releases in 2018, although the cost of credit remained at very low levels (8 basis points) and the NPL ratio decreased to 1.08%, supported by prudent approach to risk management. |
Compared to thesecond quarter of 2019, underlying attributable profit fell by 22%, as higher provisions and lower trading gains were partially offset by improved net fee income (following a weak second quarter), flat costs and lower tax rate.
These underlying results do not include the impact of the transformation programme and additional PPI charges related to legacy cases ahead of the deadline of the redress process (together totalling EUR 115 million in the quarter, EUR 287 million in the year).
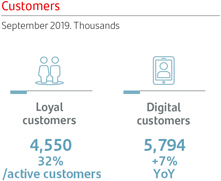
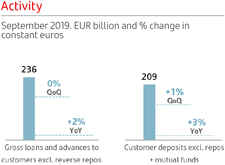
Underlying income statement
EUR million and % change in constant euros
| Q3’19 | /Q2’19 | 9M’19 | /9M’18 | |||||||||||||||
Revenue
|
| 1,119
|
|
| -2%
|
|
| 3,508
|
|
| -10%
|
| ||||||
Expenses
| -681 | +0% | -2,123 | -1% | ||||||||||||||
LLPs
| -77 | +301% | -157 | +22% | ||||||||||||||
PBT
| 318 | -24% | 1,110 | -24% | ||||||||||||||
Underlying attrib. profit
|
| 246
|
|
| -22%
|
|
| 828
|
|
| -19%
|
| ||||||
Detailed financial information on page 57
January - September 2019 29
Table of Contents
Responsible banking | ||||||||||||||||
Santander vision and | Group financial | Financial information | Corporate governance | |||||||||||||
corporate culture |
| information |
| by segments |
| Santander share |
| Appendix | ||||||||
|
|
Primary segments |
|
|
| Portugal
| |||
| Highlights
The Bank continued its commercial and digital transformation, marketing new products for companies, SMEs and university students, and making the granting of new mortgages simpler and faster.
Market shares in new lending to companies and mortgages remained around 20%, in a market that is still deleveraging.
Underlying attributable profit increased 12%year-on-year, due to lower costs from optimising the structure and a very low cost of credit. | |||


Commercial activity
The Bank continued its strategy to tailor products and services to customers’ needs, focusing on increasing the number of customers and their loyalty:
| • | The commercial transformation continued, with a competitive offer of cards for university students, renewed benefits inMundo 1|2|3 and a strengthened presence in the agrifood and tourism segments. As a result of this strategy, loyal customers already account for 45% of active customers. |
| • | We also continued to transform the branch network, focused more on the customer experience, with twoWork Cafés opened in Lisbon and Coimbra, and a new Smart Red office at Lisbon’s airport. |
| • | The Bank continued its policy of local proximity and offeringnon-financial solutions (Santander Advance Empresas). Events includedBox Santander Advance, management courses for company executives and the scholarship programme. |
Business performance
Gross loans and advances to customers (excluding reverse repos) were 1% lower than a year ago, although they remained stable this year because of more new mortgages and loans to companies.
Customer funds excluding repos increased 8%year-on-year, spurred by the growth in deposits and mutual funds.
Results
The first nine months underlying attributable profit rose 12%year-on-year to EUR 385 million. By lines:
| • | Total income increased 3%, driven by net fee income (+4%) and gains on financial transactions because of ALCO portfolio sales, while net interest income fell 1%, in line with theyear-on-year dynamic of the stock of credit and low interest rates. |
| • | Costs declined further, enabling net operating income to rise 9% and the efficiency ratio to improve 2.9 pp to 44.8%. |
| • | Provisions were slightly positive due to greater recoveries, mainly in the first quarter of 2019. The NPL ratio improved significantly to 4.90% from 7.43% in September 2018, and the cost of credit was 0%. |
Compared to the second quarter of 2019, underlying attributable profit was slightly lower mainly because of reduced gains on financial transactions due to higher ALCO portfolio sales in the second quarter.
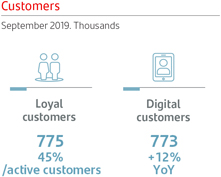
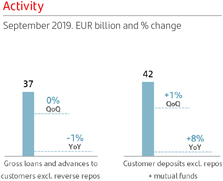
Underlying income statement
EUR million and % change
| Q3’19 | /Q2’19 | 9M’19 | /9M’18 | |||||||||||||||
Revenue
| 331 | -6% | 1,043 | +3% | ||||||||||||||
Expenses
| -155 | +0% | -467 | -3% | ||||||||||||||
LLPs | 0 | -66% | 12 | — | ||||||||||||||
PBT
| 178 | -4% | 557 | +14% | ||||||||||||||
Underlying attrib. profit
|
| 125
|
|
| -0%
|
|
| 385
|
|
| +12%
|
| ||||||
Detailed financial information on page 58
30 January - September 2019
Table of Contents
Responsible banking | ||||||||||||||||
Santander vision and | Group financial | Financial information | Corporate governance | |||||||||||||
corporate culture |
| information |
| by segments |
| Santander share |
| Appendix | ||||||||
|
|
Primary segments |
|
|
| Poland
| |||
| Highlights(changes in constant euros)
Santander is the second largest bank in Poland in terms of assets. The main management focus is on improving customer relationships, maximising business income and obtaining synergies.
Loans and advances to customers (excluding reverse repos) grew 5% in the year to September and customer funds 1% driven by active liquidity management and the cost of deposits.
In the first nine months of the year, underlying attributable profit was boosted by the Deutsche Bank Polska acquisition and faster growth in revenue than in costs, though it was negatively impacted by the greater BFG and Banking Tax contributions. | |||


Commercial activity
The Bank is focused on synergy achievement and improving customer relationships:
| • | We opened the firstWork Café in the country, expanding this new customer relationship model, which drives increased attraction and loyalty, into Poland. |
| • | Since its launch in September 2017, more than 1.75 millionAs I Want It accounts have been opened providing flexibility and responding to customer needs. |
| • | As part of the Group’s sustainability objectives, aSantander-led consortium of 5 banks signed a PLN 2 billion ESG (Environmental, Social and Governance) loan with one of Poland’s main energy utilities. It was the first transaction of this type in Poland and Eastern Europe. |
| • | In September 2019 Santander Bank Polska was ranked at the first position in theNewsweek’s Friendly Bank ranking in the Traditional Banking category and the second position in the Internet Banking category. Additionally, we were named the Best Investment Bank in Poland inEuromoney Awards for Excellence 2019 in the quarter. |
Business performance
Year-on-year, loans and advances to customers excluding reverse repos grew strongly, mainly due to the integration of the retail and SME businesses of Deutsche Bank Polska. In the year to September (a period not affected by the acquisition), loans increased 5%. The third quarter had record cash loan sales, with volumes doubling those of Q3’18. As such market share in new sales increased to 13%.
There was similarly strongyear-on-year growth (+22%) in deposits favoured by the acquisition. In the year to date, customer funds increased less than credit, +1%, due to active liquidity management relating and cost of deposit optimisation.
Results
Underlying attributable profit of EUR 245 million inthe first 9 months of 2019, 6% more than in the same period in 2018:
| • | Positive top line growth, benefiting from the integration of Deutsche Bank Polska’s retail and SME business, where gross income increased 16% and efficiency improved 2 pp. |
| • | Loan-loss provisions increased by almost 40%year-on-year, in line with the Bank’s expectations, mainly due to the larger portfolio. |
| • | Other income was affected by the higher BFG and Banking Tax contributions, the latter adding to fiscal pressures as it isnon-deductible. |
Compared to the second quarter of 2019, underlying attributable profit was up 8%, driven by positive NII (due to repricing of deposits since June) and net fee income growth, flat costs and lower LLPs. This positive evolution was partially offset by the higher dividend income that is seasonally recorded in the second quarter.
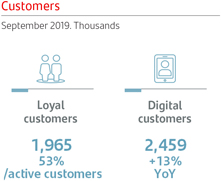
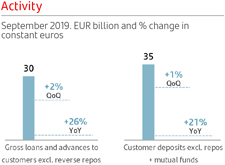
Underlying income statement
EUR million and % change in constant euros
| Q3’19 | /Q2’19 | 9M’19 | /9M’18 | |||||||||||||||
Revenue
| 442 | +1% | 1,258 | +16% | ||||||||||||||
Expenses
| -175 | -0% | -524 | +12% | ||||||||||||||
LLPs
| -59 | -6% | -166 | +40% | ||||||||||||||
PBT
| 183 | +11% | 476 | +12% | ||||||||||||||
Underlying attrib. profit
|
| 95
|
|
| +8%
|
|
| 245
|
|
| +6%
|
| ||||||
Detailed financial information on page 59
January - September 2019 31
Table of Contents
Responsible banking | ||||||||||||||||
Santander vision and | Group financial | Financial information | Corporate governance | |||||||||||||
corporate culture |
| information |
| by segments |
| Santander share |
| Appendix | ||||||||
|
|
Primary segments |
|
|
| NORTH AMERICA
| |||
 | Highlights(changes in constant euros)
In North America, the US and Mexico are managed according to their local strategic priorities, while increasing coordination and cooperation between the two units.
In volumes, there wasyear-on-year growth both in gross loans and advances to customers and in customer funds.
In results, underlying attributable profit increased 20%year-on-year, driven mainly by customer revenue and the continued improvement in efficiency. | |||
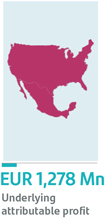
Strategy
In the United States, SBNA’s strategy focuses on improving customer satisfaction through our digital channels and branches and continuing to pursue our LeadBank initiatives in Commercial Banking. In SC USA, the focus is to drive originations growth and improve profitability via pricing and risk management. In addition, SC USA started a stock repurchase programme.
In Mexico, the main objectives are to improve the distribution network and develop digital channels to attract new customers and increase their loyalty.
Coordination between the units has increased. We continue to pursue join initiatives, such as:
| • | Continued development of the USMX trade corridor. SCIB and Commercial Banking are working to deepen relationships with existing clients and increase client acquisition in both countries, which is reflected, among others, in corridor revenue growth (SCIB: +39%; Commercial: +19%). |
| • | Launch of asame-day remittance service from Santander US branches to beneficiaries in Mexico in the fourth quarter. |
| • | Joint technology initiatives between the countries. |
Business performance
Gross loans and advances to customers (excluding reverse repos) increased 9%year-on-year, driven by strong growth in the US (+10%). More moderate growthquarter-on-quarter.
Solid trend in customer funds (excluding repos), up 7%year-on-year, mainly due to the growth in time deposits at SBNA and corporate deposits at the New York branch. Mutual funds increased by 6%.
Results
In the first nine months of the year, underlying attributable profit was EUR 1,278 million (16% of the Group’s total operating areas), up 20%year-on-year.
| • | Good performance in total income at both units, driven by both net interest income (+7%) and net fee income (+5%). |
| • | Expenses grew less than revenue, resulting in an improvement in the efficiency ratio to 42% (1 pp better than in the same period 2018). Cost control in the US, (+0.9% in real terms) and increases in Mexico relating to the investment plan. |
| • | Provisions were up 7%, principally as a result of increased volumes in the US. The NPL ratio was fell to 2.21% and coverage rose to 156%. The cost of credit remained virtually unchanged at 2.93%. |
In the quarter, the underlying attributable profit decreased 23% affected by the increased provisions in the US, which are seasonally lower in the second quarter.
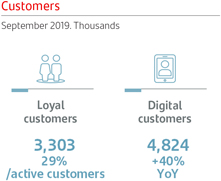
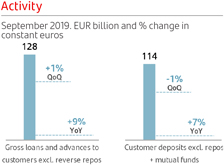
Underlying income statement
EUR million and % change in constant euros
| Q3’19 | /Q2’19 | 9M’19 | /9M’18 | |||||||||||||||||
Revenue
| 2,983 | +2% | 8,655 | +7% | ||||||||||||||||
Expenses
| -1,267 | +4% | -3,654 | +4% | ||||||||||||||||
LLPs
|
| -1,009
|
|
| +27%
|
| -2,606 |
| +7%
|
| ||||||||||
PBT
| 628 | -29% | 2,222 | +14% | ||||||||||||||||
Underlying attrib. profit
|
| 388
|
|
| -23%
|
|
| 1,278
|
|
| +20%
|
| ||||||||
Detailed financial information on page 61
32 January - September 2019
Table of Contents
Responsible banking | ||||||||||||||||
Santander vision and | Group financial | Financial information | Corporate governance | |||||||||||||
corporate culture |
| information |
| by segments |
| Santander share |
| Appendix | ||||||||
|
|
Primary segments |
|
|
| United States
| |||
| Highlights(changes in constant euros)
The strategy is focused on improving customer satisfaction at SBNA and at SC USA on deepening relationships with auto manufacturers and dealer groups to increase originations.
In volumes, the improvedyear-on-year trend in gross loans and advances to customers excluding reverse repos continues to drive higher revenue to help offset the impact of rate decreases.
Underlying attributable profit increased 27% in the first nine months of the year compared to the same period of 2018, due to a strong top line performance, with total revenue up 8% resulting in an improved efficiency ratio. | |||


Commercial activity
In 2019, Santander US remains focused on the following strategic priorities:
| • | Santander Bank: Retail Banking’s digital and branch transformation initiatives remain key to enhancing customer experience and growing customers and deposits. Commercial Banking continues to see gains from its “Lead Bank” strategy, winning relationships with US companies that Santander can serve uniquely. SBNA’s joint initiative with SC USA in auto finance continues to generate high volumes, having originated USD 5 billion in the first three quarters of the year. |
| • | Santander Consumer USA: The key levers to drive profitability remain increasing originations and management of credit risk and pricing. In Q2, the agreement with Fiat Chrysler was amended, strengthening SC USA’s partnership and establishing an operating framework through 2023. In addition, SC USA has begun the repurchase of USD 1.1 billion of common stock in the market since August 2019. |
Business performance
Gross loans and advances to customers (excluding reverse repos) improved 10%year-on-year (+1% in the quarter) due to lending growth in retail banking (auto) and commercial banking. Originations increased 11%year-on-year at SC USA, mainly driven by Chrysler capital loans (+52%).
Customer funds increased slightlyquarter-on-quarter though strong growthyear-on-year (+12%) boosted by time deposits at SBNA and corporate deposits at the New York branch.
Results
Underlying attributable profitin the first three quarters of 2019 of EUR 619 million, is 27% more than in the same period of 2018. Theyear-on-year comparison of net interest income and provisions is affected by methodological changes in the accrual of TDRs* made at the end of 2018, though with almost no impact on bottom line results.
| • | Total revenue up 8% (+5% ex. TDRs*) due to higher loan and leasing volumes. |
| • | Costs increased 3% driven by higher Personnel and Technology spend, though the efficiency ratio is 2 percentage points better than in 2018. |
| • | Loan-loss provisions were up 10% (+2% ex. TDRs*) driven mainly by the higher loan balances across the portfolio. |
Compared to the previous quarter, underlying attributable profit declined due to higher provisions at SC USA (due to seasonally low provisions in the second quarter).
(*) TDR: Troubled debt restructuring
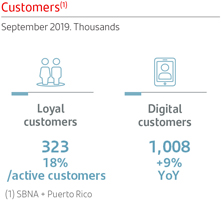
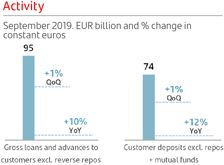
Underlying income statement
EUR million and % change in constant euros
| Q3’19 | /Q2’19 | 9M’19 | /9M’18 | |||||||||||||||||
Revenue
|
| 1,977
|
|
| +2%
|
|
| 5,711
|
|
| +8%
|
| ||||||||
Expenses
| -847 | +4% | -2,427 | +3% | ||||||||||||||||
LLPs
| -786 | +37% | -1,965 | +10% | ||||||||||||||||
PBT
| 267 | -50% | 1,158 | +16% | ||||||||||||||||
Underlying attrib. profit
|
| 154
|
|
| -47%
|
|
| 619
|
|
| +27%
|
| ||||||||
Detailed financial information on page 62
January - September 2019 33
Table of Contents
Responsible banking | ||||||||||||||||
Santander vision and | Group financial | Financial information | Corporate governance | |||||||||||||
corporate culture |
| information |
| by segments |
| Santander share |
| Appendix | ||||||||
|
|
Primary segments |
|
|
| Mexico
| |||
| Highlights(changes in constant euros)
The digital and operational transformation strategy together with an innovative value offer is reflected in greater customer attraction and increased loyalty.
Gross loans and advances to customers (excluding reverse repos) increased, notably payroll, mortgages and credit cards. Customer funds fell 1% due to the management of spreads, although growth in deposits from individuals and SMEs continued.
Underlying attributable profit was up 14%year-on-year, underpinned by the good performance of customer revenue income and loan-loss provisions, which more than offset the rise in costs. | |||


Commercial activity
The commercial strategy remained focused on improving the distribution model and boosting the use of digital channels in order to attract new customers with new products and services:
| • | The distribution model strategy continued to progress, with the transformation of 475 branches and the number of latest generation full function ATMs reaching 981. |
| • | TheSantander Plus programme has captured more than 6.7 million customers, 52% of them new ones. |
| • | We also launchedGastos Médicos Santander in alliance with GNP Seguros, the first insurance of this kind in Mexico, offered directly in bank branches. |
| • | In digital strategy: |
| - | SúperMóvilhas the new functionality of cardless cash withdrawals from ATMs simply, safely and free of commissions. |
| - | We inauguratedIsla Financiera Santander in several shopping centres, an innovative proposal that combines digital banking with personal advice. |
| - | Strategic alliance with CONTAQi and InnoHub, fintech developers specialised in the SME segment, that will boost our value-added offer and strengthen our leadership in this segment. |
Strongyear-on-year growth of digital (+51%) and mobile banking customers (+69%).
Business performance
Gross loans and advances to customers (excluding reverse repos) increased 4%year-on-year, while maintaining the focus on profitability. Loans to individuals rose 7% with notable growth in payroll loans (+11%), mortgages (+7%) and credit cards (+7%). Large corporate loans increased 5% and SMEs 2%.
Customer funds decreased 1%, as time deposits, which grew 6%, did not offset the fall in demand deposits impacted by increased interest rates. Those of individuals were up 9%, reflecting the good performance of the strategy of attracting and retaining customers.
Results
The first nine monthsunderlying attributable profit was 14% higher than in the same period of 2018 at EUR 659 million. By lines:
| • | Net interest income rose 10%, driven by increased volumes and higher average interest rates. Net fee income grew 5%, mainly from cards and insurance, and gains on financial transactions fell because of weak activity in the markets. |
| • | Operating expenses increased 7%, reflecting the ongoing investment plans. |
| • | Loan-loss provisions fell 1%, with good credit quality in all metrics. |
Compared to the second quarter of 2019, profit was 7% higher due to the good performance of net interest income and lower provisions.
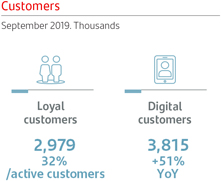
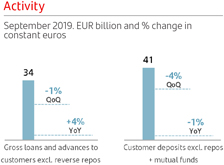
Underlying income statement
EUR million and % change in constant euros
| Q3’19 | /Q2’19 | 9M’19 | /9M’18 | |||||||||||||||
Revenue
| 1,007 | +1% | 2,944 | +7% | ||||||||||||||
Expenses
| -420 | +3% | -1,226 | +7% | ||||||||||||||
LLPs
| -223 | -1% | -642 | -1% | ||||||||||||||
PBT
| 361 | +1% | 1,064 | +12% | ||||||||||||||
Underlying attrib. profit
|
| 234
|
|
| +7%
|
|
| 659
|
|
| +14%
|
| ||||||
Detailed financial information on page 63
34 January - September 2019
Table of Contents
Responsible banking | ||||||||||||||||
Santander vision and | Group financial | Financial information | Corporate governance | |||||||||||||
corporate culture |
| information |
| by segments |
| Santander share |
| Appendix | ||||||||
|
|
Primary segments |
|
|
| SOUTH AMERICA
| |||
| Highlights(changes in constant euros)
In South America, the focus is to accelerate profitable growth and lead the retail financial industry. To this end, we have a strategy that seeks to strengthen a more connected regional network and facilitate the expansion of successful businesses to other countries in the region.
In activity, there was a volume growth in the last 12 months. Increases in all countries, where we are capturing new business opportunities.
Regarding results, underlying attributable profit increased by 18%year-on-year, boosted by revenue. | |||
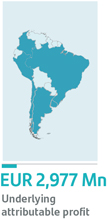

Strategy
The units in the region continued identifying initiatives that allow the businesses to expand, further leveraging positive experiences in other markets, for example:
| • | Inauto financing, we are using the Group’s experience and the development of this business in Brazil to boost growth in other countries. In Colombia, for example, we have signed two alliances with digital vehicle platforms to strengthen our position. In terms offinancing goods and services, we plan to export Uruguay’s successful model to Brazil and to other regions. |
| • | Inpayment methods, where Santander is one of the largest credit card issuers and merchant acquirers in the region, we are exploringe-commerce strategies, instant domestic and international transfers and theroll-out ofGetnet, our acquiring business in Brazil, to the rest of Latin America. We also launchedSuperdigital in Chile, following our expansion strategy to other regions. |
| • | Further developed theretail franchise, in particular the mass market segment, through increased penetration of new channels. Sales through digital channels already account for a high percentage of the total in Brazil and Argentina, and continued growing in Chile, driven by the new offers launched in theLifemodel. TheWork Caféexperience is being developed further, with the opening of new branches in Chile, Argentina and Brazil in the quarter. |
Business performance
Gross loans and advances to customers (excluding reverse repos) increased in all units. With regard to September 2018, Uruguay grew 15%, Brazil 8% and Chile 7%. Colombia and Peru present very high growth rates but from smaller bases.
Customer funds also rose in the last 12 months and in all units. Demand deposits (+14%), time deposits (+4%) and mutual funds (+10%) increasedyear-on-year.
Results
Underlying attributable profitin the first nine months of the yearamounted to EUR 2,977 million (38% of the Group’s total operating areas), up 18%year-on-year due to:
| • | Total income increased 9%, underpinned by the sound performance by commercial revenue, driven by higher volumes, spread management and increased loyalty. Net interest income rose 8% and net fee income increased by 15%. |
| • | Costs reflect commercial transformation plans, greater digitalisation of the retail network, reviews of collective wage agreements and high inflation in Argentina. |
| • | Loan-loss provisions increased at a slower pace than credit, enabling the cost of credit to improve by 10 bps in the last twelve months to 2.90%. In credit quality, the NPL ratio was 4.81% and coverage was 90%. |
In the quarter, underlying attributable profit rose 2% driven by customer revenue and gains on financial transactions.

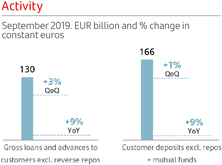
Underlying income statement
EUR million and % change in constant euros
| Q3’19 | /Q2’19 | 9M’19 | /9M’18 | |||||||||||||||
Revenue
| 4,577 | +4% | 13,711 | +9% | ||||||||||||||
Expenses
| -1,586 | +5% | -4,895 | +9% | ||||||||||||||
LLPs
| -916 | +1% | -2,775 | +4% | ||||||||||||||
PBT
| 1,882 | +3% | 5,543 | +13% | ||||||||||||||
Underlying attrib. profit
|
| 1,016
|
|
| +2%
|
| 2,977 |
| +18%
|
| ||||||||
Detailed financial information on page 64
January - September 2019 35
Table of Contents
Responsible banking | ||||||||||||||||
Santander vision and | Group financial | Financial information | Corporate governance | |||||||||||||
corporate culture |
| information |
| by segments |
| Santander share |
| Appendix | ||||||||
|
|
Primary segments |
|
|
| Brazil
| |||
| Highlights(changes in constant euros)
The focus on customer service combined with an efficient and profitable model enabled us to keep on growing in the current environment.
Increased volumes with loans gaining selective market share while the cost of credit declined in the last 12 months.
Strong revenue growth, underpinned by increased volumes, combined with controlled costs were reflected in a notable improvement in the efficiency ratio to 32%.
Sustainable quarterly underlying attributable profit growth to EUR 2,249 million in the first nine months (+19%year-on-year), with RoTE of 22%. | |||


Commercial activity
We continued to progress in our strategic actions, including:
| • | We were recognised as the Best Bank in Brazil and the Best Bank in Latin America byEuromoney2019 and as the bank that is most changing the world byFortune. |
| • | We were also chosen as one of the Best Companies to Work For in Brazil for the fourth year running by GPTW (Great Place to Work). |
| • | We continued to expand our shops specialised in agribusiness and microcredits to strategic regions in the centre of the country where we have less presence. This was reflected in an increase in agribusiness volumes market share and the strong expansion ofProspera customers, which almost doubled to close to half a million. |
| • | We continued to be the leader in the auto segment, with a 25% market share in loans to individuals. |
| • | We were pioneers in launching a solution that enables POS users with Bluetooth in the market to take advantage of theGetnet offer without having to acquire a new POS. We also launched thePOS SuperGet Mobile. |
| • | In cards, we launched new functions in theApp Way, such as instantaneous P2P transfers, division of accounts between mobile phone contacts and payments via QR code, which increased the transaction capacity of the more than 7 million active users. |
Business performance
Loans grew 8%year-on-year, with profitable gains in market share. Of note was the performance in the individuals (+16%) and consumer finance (+16%) segments.
Customer funds rose 6%year-on-year. Deposits increased 4%, driven by demand deposits (+12%).
Results
First nine months underlying attributable profit of EUR 2,249 million (+19%year-on-year). Of note:
| • | Net interest income rose 6%year-on-year, with better spreads from credit and liabilities, partly offset by lower market margins. |
| • | Net fee income grew 12%year-on-year, with rises in almost all lines. Of note: cards (+11%) and insurance (+18%). |
| • | Operating expenses increased 4%, less than revenue, which helped improve the efficiency ratio to 32.4%(-82 bpsyear-on-year). |
| • | Our solid risk management is reflected in stable provisions. The cost of credit dropped to 3.85%(-32 bps), the NPL ratio was 5.33% and coverage 101%. |
Compared to the second quarter of 2019, underlying attributable profit rose spurred by higher customer revenue and lower provisions.
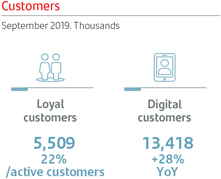
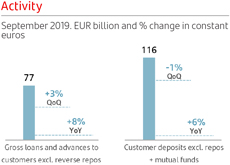
Underlying income statement
EUR million and % change in constant euros
| Q3’19 | /Q2’19 | 9M’19 | /9M’18 | |||||||||||||||
Revenue
| 3,522 | +2% | 10,386 | +6% | ||||||||||||||
Expenses
| -1,137 | +3% | -3,364 | +4% | ||||||||||||||
LLPs
|
| -753
|
|
| -1%
|
|
| -2,223
|
|
| +1%
|
| ||||||
PBT
| 1,454 | +1% | 4,301 | +12% | ||||||||||||||
Underlying attrib. profit
|
| 767
|
|
| +1%
|
| 2,249 |
| +19%
|
| ||||||||
Detailed financial information on page 65
36 January - September 2019
Table of Contents
Responsible banking | ||||||||||||||||
Santander vision and | Group financial | Financial information | Corporate governance | |||||||||||||
corporate culture |
| information |
| by segments |
| Santander share |
| Appendix | ||||||||
|
|
Primary segments |
|
|
| Chile
| |||
| Highlights(changes in constant euros)
We continued to focus on the commercial and digital transformation in order to attract new customers and boost loyalty, launching new products which achieved a record rise in new customers in the quarter.
Business growth with acceleration in some segments, mainly individuals.
First nine months underlying attributable profit increased 6%year-on-year, benefiting from the performance of markets and lower provisions.
| |||

Commercial activity
We continued the strategy focused on offering an attractive profitability backed by our digital transformation:
| • | We continued to transform the network, opening moreWork Café branches in the quarter and continuing with the pilot ofWork Café 2.0, with good initial results in efficiency and productivity. |
| • | The satisfactory evolution of theSantander Life products produced a strong riseyear-on-year in newLife customers. Of note are the latest offers such asCuenta Life (a digital demand account) and the new credit card associated with theMeritolife programme which allows accumulation of Latam air miles. |
| • | In June, we presentedSúperHipoteca, a differential mortgage that offers a maturity of more than 30 years and is aimed at individuals under the age of 35. |
| • | In July, we completed the soft launch ofSuperdigital and made subsequent improvements to the platform. The hard launch is set for the fourth quarter. |
All these measures led to a record rise in new customers in the third quarter, doubling the number of an average quarter.
Business performance
Gross loans and advances to customers (excluding reverse repos) rose 7%year-on-year, underpinned by mortgages (+11%), consumer finance (+10%) and large corporates (+5%). Loans to SMEs rose 3%.
Customer funds rose 17%, with 19% growth in demand deposits and 30% in mutual funds.
Results
First nine months underlying attributable profit of EUR 473 million, 6% higheryear-on-year. Of note were:
| • | Gross income increased 2%, driven by a 94% rise in gains on financial transactions (due to the results of customer treasury and ALCO portfolios). Net interest income was impacted by lower inflation than in 2018 and the repricing of operations to lower interest rates. Net fee income fell 6% partly because of wholesale business. |
| • | Operating expenses rose because of investments in technology and branches. |
| • | Loan-loss provisions were 9% lower and the cost of credit improved to 1.06%(-12 bps). The NPL ratio decreased to 4.48% and coverage was 57%. |
Compared to the second quarter of 2019, underlying attributable profit increased slightly, as higher gains on financial transactions and lower costs more than offset the fall in net interest income due to lower inflation.
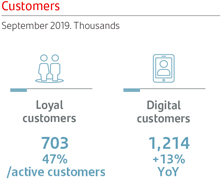
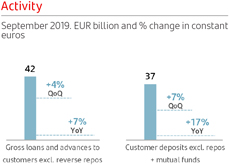
Underlying income statement
EUR million and % change in constant euros
| Q3’19 | /Q2’19 | 9M’19 | /9M’18 | |||||||||||||||
Revenue
| 646 | +1% | 1,901 | +2% | ||||||||||||||
Expenses
| -260 | -1% | -785 | +2% | ||||||||||||||
LLPs
| -106 | +3% | -314 | -9% | ||||||||||||||
PBT
| 295 | +7% | 855 | +4% | ||||||||||||||
Underlying attrib. profit
|
| 162
|
|
| +1%
|
|
| 473
|
|
| +6%
|
| ||||||
Detailed financial information on page 66
January - September 2019 37
Table of Contents
Responsible banking | ||||||||||||||||
Santander vision and | Group financial | Financial information | Corporate governance | |||||||||||||
corporate culture |
| information |
| by segments |
| Santander share |
| Appendix | ||||||||
|
|
Primary segments |
|
|
| Argentina
| |||
| Highlights(changes in constant euros)
Since August, the Argentinian economy has been suffering from a relative weakening of the local currency and an increase in the risk premium, against a backdrop of a downward revision to the macroeconomic outlook.
We continued to focus on our four strategic pillars: selective growth, customer experience, efficiency and transformation.
Santander is the largest privately-owned bank in Argentina by business volume (loans + deposits + mutual funds).
First nine months underlying attributable profit of EUR 97 million. Theyear-on-year comparison is favoured by high interest rates and impacted by a greater monetary adjustment for inflation than in 2018.
| |||

Commercial activity
The commercial strategy is focused on transactional business and customer service improvements. Of note were the following in the third quarter:
| • | Launch of iU: a dedicated proposal for 18 to31-year-olds which includes financial andnon-financial benefits, such as mentoring, scholarships to study and an online platform for distance learning, among others. |
| • | VIP banking: a subsegment for the Bank’s notable customers in order to offer them a tailored customer care model and exclusive experiences. |
In addition, we continued to advance in the digital transformation of the main processes and products. Loyal customers accounted for 47% of active customers and digital ones 75% (+4%year-on-year).
Business performance
Gross loans and advances to customers (excluding reverse repos) were impacted by recession and higher interest rates, with growth of 17%year-on-year, below inflation in this period. The peso denominated portfolio increased, driven by inflation-adjusted products (mortgages, auto finance) and by cards, while dollar balances declined in the currency of origin.
Customer deposits (excluding repos) rose 11%. Local currency deposits grew 28% (backed by demand and time deposits) and foreign currency ones declined(-6%;-33% in currency of origin, in line with the financial sector dynamics). The excess liquidity is placed in central bank notes.
Results
First nine months underlying attributable profit of EUR 97 million, 111% more than in the same period of 2018, including a greater negative impact from the high inflation adjustment than in 2018.
As regards the main income statement lines:
| • | Revenue rose 86%, growing above inflation. Net interest income rose 123%, underpinned by higher interest rates and higher volumes of central bank notes. Net fee income increased 83% driven by greater foreign currency transactions and income from accounts and cash deposits. |
| • | Costs surged 85%, hit by the inflationary environment and the peso’s depreciation. |
| • | Loan-loss provisions amounted to EUR 182 million, with an NPL ratio of 3.64% affected by the environment and higher provisions in the individuals segment. Coverage remained high at 134%. |

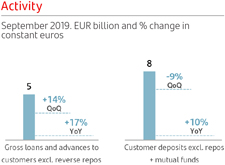
Underlying income statement
EUR million and % change in constant euros
| Q3’19 | /Q2’19 | 9M’19 | /9M’18 | |||||||||||||||
Revenue
| 237 | +32% | 957 | +86% | ||||||||||||||
Expenses
| -122 | +24% | -553 | +85% | ||||||||||||||
LLPs
| -39 | +31% | -182 | +98% | ||||||||||||||
PBT
| 47 | +6% | 174 | +99% | ||||||||||||||
Underlying attrib. profit
|
| 23
|
|
| -17%
|
|
| 97
|
|
| +111%
|
| ||||||
Detailed financial information on page 67
38 January - September 2019
Table of Contents
Responsible banking | ||||||||||||||||
Santander vision and | Group financial | Financial information | Corporate governance | |||||||||||||
corporate culture |
| information |
| by segments |
| Santander share |
| Appendix | ||||||||
|
|
Primary segments |
|
|
| Highlights(changes in constant euros)
The Group is the country’s leading privately-owned bank, doing business with all segments and with a strategy focused on retail banking, improving efficiency and enhancing the quality of service.
Underlying attributable profit rose 16%, spurred by the good performance of customer revenue and improved efficiency. |
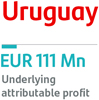

Commercial activity and business performance
Santander continued to focus on improving customer satisfaction and increasing loyalty. Loyal customers rose 23% and now account for 25% of active customers.
We continued to advance in our digital transformation strategy and in modernising channels. The number of digital customers increased 8% (digital penetration of 48%, up from 45% in September 2018), while transactions via digital channels rose 34%year-on-year.
The Group’s consumer finance companies lead the local market, with a market share of more than 22%, driven by the commercial activity. In line with our strategy of innovation and contributing to people’s progress, we launchedProsperá, which satisfies the demand for microcredits to small businesses.
Gross loans and advances to customer (excluding reverse repos) grew in target segments, products and currencies: +12% in consumer credit and cards and +15% in the national currency portfolio. Customer deposits (excluding repos) in pesos grew 14% and foreign currency deposits increased 8%year-on-year.
Results
First nine months underlying attributable profit of EUR 111 million, 16% higheryear-on-year:
| • | Gross income rose 16%, with increases in both net interest income and net fee income. |
| • | Operating expenses rose at a slower pace than total income, improving the efficiency ratio to 42.6%(-106 bpsyear-on-year). |
| • | Similar loan-loss provisionsyear-on-year. High coverage (110%) and cost of credit at 2.39%. |
Compared to the second quarter of 2019, underlying attributable profit rose 13%, backed by net interest income and gains on financial transactions.
PeruHighlights(changes in constant euros)
The strategy remained focused on the corporate segment, the country’s large companies and the Group’s global customers.
The auto loan financial entity continued to expand its business within the Group’s strategy of increasing its presence in this business.
First nine months underlying attributable profit of EUR 31 million (+6%year-on-year). Total income rose 20% underpinned by higher net interest income and gains on financial transactions. The efficiency ratio improved to 33.0%(-1.9 ppyear-on-year).
The NPL ratio was 0.77%, coverage was very high and the cost of credit only 0.33%.
ColombiaHighlights(changes in constant euros)
Activity in Colombia remained focused on SCIB clients, large companies and corporates, contributing solutions in treasury, risk hedging, foreign trade, confirming, custody and development of investment banking products supporting the country’s infrastructure plan. In line with this objective, we closed the financing of one of the most important road infrastructure projects in August; an8-year USD 575 million loan, participated by development institutions, commercial banks and institutional investors.
We are also working to increase the profitability of auto finance and consolidate our position in this market with digital propositions. We have signed two alliances: the first withChekar.co, a fully digital platform for buying and selling vehicles, and the second withTucarro.com ofMercado Libre, where the user can request and have a loan approved in six minutes. The origination share reached 2.3% (+72 bps in 12 months).
Gross loans and advances to customers (excluding reverse repos) rose 40%, with growth in all business segments. Of note was the fourfold rise in auto finance. Customer deposits (excluding repos) rose 33%.
The first nine months underlying attributable profit was EUR 17 million (EUR 5 million in the same period of 2018). Total income grew 106%, underpinned by net interest income and fee income from the financing of the road infrastructure. Excluding this, revenue would have grown 53%.
January - September 2019 39
Table of Contents
Responsible banking | ||||||||||||||||
Santander vision and | Group financial | Financial information | Corporate governance | |||||||||||||
corporate culture |
| information |
| by segments |
| Santander share |
| Appendix | ||||||||
|
|
Primary segments |
|
|
| SANTANDER GLOBAL PLATFORM (SGP)
| |||
| Highlights
Santander Global Platform continued to progress in its digital transformation objectives, launching and developing various initiatives according to the envisaged schedule.
Our goal is to extend the benefits of the talent and scale of the Group to the payment and digital businesses with higher growth, building platforms only once for all of our banks which allow us to offer the best digital services aimed at retail customers, merchants, SMEs and corporates.
Of note in the third quarter was the launch of Openbank in Germany with the support of Open Digital Services, as well as theTrade Club Alliance platform within the strategy of Global Trade Services.
| |||


Strategy
Our goal is to extend the benefits of the talent and scale of the Group to the payment and digital businesses with higher growth, building platforms only once for all of our banks which allow us to offer the best digital services aimed at retail customers, merchants, SMEs and corporates.
The area continued to advance in the following priorities according to schedule:
| • | Openbank (our digital bank) and Open Digital Services (ODS): |
| – | In Spain, Openbank continued its good rate of activity with a large customer base and with volumes and the number of transactions growing at double-digit rates. This business growth goes hand in hand with high levels of transactionality and productivity per customer and employee. |
| – | Open Digital Services (ODS) is creating a new banking platform with a complete range of products, which will be used for Openbank’s international expansion. |
ODS has enabled the launching of Openbank in Germany, where it will operate with a very complete value proposition from the beginning, including a current account and an associated debit card with access to all the main systems of mobile payments.
In the same way, we plan to roll out to the Netherlands and Portugal in 2019 and in Argentina and Mexico in 2020.
Openbank is the first bank in the world to provide customers with a free password and data manager, with the highest security standards, as well as an option that enables users to restrict the use of their cards in various channels and countries and for certain periods of time.
It also makes available to its customers in Germany its automated investment platform (Roboadvisor, investments based on objectives and micro-investments).
Additionally of note is that Openbank is also developing its position as a responsible bank via the products offered. When users use their cards, they can donate money to charities, and also be able to incorporate socially responsible investment vehicles to their portfolios of managed funds.
| • | Global Payments Services: |
| – | Superdigital is aimed at the unbanked population, and already has more than 600,000 active users. It was launched in Chile with the same technology as in Brazil. |
| – | Pago FX, aims to create an app for the open market and has already requested a licence to operate in the UK and a European passport. |
| – | Global Merchant Services, a global acquiring solution, taking advantage ofGetnet’scapabilities, continues to advance in developing a unique open technological platform in the cloud. With more than one million merchants, it will be rolled out in a first phase in Mexico, followed by the rest of Latin America. |
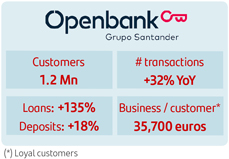

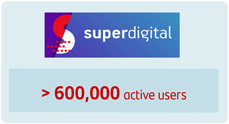
40 January - September 2019
Table of Contents
Responsible banking | ||||||||||||||||
Santander vision and | Group financial | Financial information | Corporate governance | |||||||||||||
corporate culture |
| information |
| by segments |
| Santander share |
| Appendix | ||||||||
|
|
Primary segments |
|
|
| – | Global Trade Services, aimed at more than 200,000 companies with international activity, is also progressing in its development androll-out in the first quarter in 2020, and aims to be operating in all the Group’s countries next year. |
As part of the plans of the Global Trade Services platform, we launched, along with 13 other global banks, theTrade Club Alliance in October. This alliance came out of theSantander Trade Club, launched by Santander in 2015 to create a digital platform to connect companies between Europe and Latin America.
TheTrade Club Alliance is an exclusive global network of banks which aims to strengthen and simplify international trade. It offers an innovative digital platform that provides SMEs and corporate customers with full information on international trade in more than 180 countries, including analysis of currencies, market trends, legal and regulatory context, information on sectors, logistical requirements, etc. It also gives buyers and sellers the opportunity to connect with trusted partners throughout the world.
In short, this digital platform will foster the international growth of companies. By 2022, it is expected to include more than 90% of global trade corridors and support more than one million companies worldwide.
| • | Digital Assets: |
| – | The Centres of Digital Expertise continue leveraging the Group’s scale and ensuring all countries and businesses have access to the most innovative technologies. Examples in the third quarter were: |
| • | We issued the first bond of the market usingend-to-end blockchain technology. The USD 20 million bond opens the door to a new disruptive technology that will make business more efficient and simple, positioning us at the forefront of innovation in capital markets and allowing us to help our customers in their digital transformation. |
| • | Focused on creating more personalised customer experiences, fostering operational excellence and improving risk management, through the use of artificial intelligence and machine learning, priority use cases have been identified and are being implemented across countries. As of end of the third quarter, those priority use cases are being deployed across 8 countries (including Brazil, Spain, Poland and Mexico) as well as across businesses such as SCIB. |
| – | InnoVentures, our venture capital investments in the fintech ecosystem, continued to grow. As atend-September, it had invested more than USD 100 million in 28 companies. The latest investments are: |
| • | Trulioo, a global provider of identity verification based in Canada. |
| • | Securitize, a USstart-up that helps to issue and manage digital assets with blockchain. |
| • | Klar, a Mexican company specialised in financial services solutions to improve the current conditions of credit and debit cards. |
| – | Lastly, in the rest of Digital Assets, we continued to advance in theGlobile mobile platforms, as well asOpen Platform to develop corporate projects. |


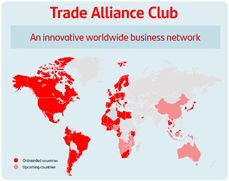
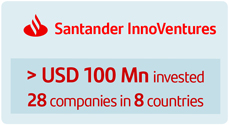
Detailed financial information on page 69
January - September 2019 41
Table of Contents
Responsible banking | ||||||||||||||||
Santander vision and | Group financial | Financial information | Corporate governance | |||||||||||||
corporate culture |
| information |
| by segments |
| Santander share |
| Appendix | ||||||||
|
|
Primary segments |
|
|
| CORPORATE CENTRE | |||
| Highlights
The Corporate Centre’s objective is to aid the operating units by contributing value and carrying out the corporate function of oversight and control. It also carries out functions related to financial and capital management.
The underlying attributable loss was higher compared to the first nine months of 2018, mainly due to higher costs related to foreign currency hedging and increased stock of issuances.
| |||


Strategy and functions
The Corporate Centre contributes value to the Group in various ways:
| • | It makes the Group’s governance more solid, through global control frameworks and supervision. |
| • | Fostering the exchange of best practices in management of costs and generating economies of scale. This enables us to be one of the most efficient banks. |
| • | It contributes to the launch of projects that will be developed by global business areas. |
It also coordinates the relationship with European regulators and develops functions related to financial and capital management, as follows:
| • | Financial Management functions: |
| – | Structural management of liquidity risk associated with funding the Group’s recurring activity, stakes of a financial nature and management of net liquidity related to the needs of some business units. |
| – | This activity is carried out by the different funding sources (issuances and other), always maintaining an adequate profile in volumes, maturities and costs. The price at which these operations are made with other Group units is the market rate plus the premium, which in liquidity terms, the Group supports by immobilising funds during the term of the operation. |
| – | Interest rate risk is also actively managed in order to soften the impact of interest rate changes on net interest income, conducted via high credit quality, very liquid and low capital consumption derivatives. |
| – | Strategic management of the exposure to exchange rates in equity and dynamic in the countervalue of the units’ annual results in euros. Net investments in equity are currently covered by EUR 27,023 million (mainly Brazil, the UK, Mexico, Chile, the US, Poland and Norway) with different instruments (spot, fx, forwards). |
| • | Management of total capital and reserves: efficient capital allocation to each of the units in order to maximise shareholder’s return. |
Results
First nine monthsunderlying attributable loss of EUR 1,637 million, 23% higher than in the same period of 2018, largely because of three factors: the higher costs related to foreign currency hedging, the higher stock of issuances and, to a lesser extent, IFRS 16.
Operating expenses were 11% lower driven by ongoing streamlining and simplification measures.
Corporate Centre
EUR million
| Q3’19 | Q2’19 | Chg. | 9M’19 | 9M’18 | Chg. | |||||||
Gross income | -413 | -423 | -2% | -1,236 | -760 | +63% | ||||||
Net operating income | -504 | -519 | -3% | -1,519 | -1,080 | +41% | ||||||
PBT | -579 | -595 | -3% | -1,733 | -1,322 | +31% | ||||||
Underlying attrib. profit | -529 | -592 | -11% | -1,637 | -1,334 | +23% |
Detailed financial information on page 70
42 January - September 2019
Table of Contents
Responsible banking | ||||||||||||||||
Santander vision and | Group financial | Financial information | Corporate governance | |||||||||||||
corporate culture |
| information |
| by segments |
| Santander share |
| Appendix | ||||||||
|
|
Secondary segments |
|
|
| RETAIL BANKING | |||
| Highlights(changes in constant euros)
The Group continued to focus on enhancing customer satisfaction, covering their needs and boosting loyalty. At end of September 2019, the Group had nearly 144 million customers, of which 21 million are loyal.
Underlying attributable profit of EUR 5,862 million in the first nine months, 6% higher than in the same period of 2018 due to customer revenue and improved efficiency.
Santander was named the Best Bank in Latin America and the Best SME Bank in Western Europe byEuromoney. | |||
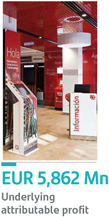

Commercial activity
Santander wants to be the reference bank for customers of all income levels, offering them the services and products that best meet their needs. Furthermore, we are fostering entrepreneurship, helping SMEs and other companies via loans andnon-financial support. We launched various commercial initiatives in the third quarter, including:
| • | In individuals, we continued to strengthen our business with new differentiated products. In Chile, for example, we launched new proposals for the mass market segment within theLife strategy, enabling us to significantly increase the number of new customers. In Argentina we launchedBanca VIP, a new customer care model for this subsegment. |
| • | In auto finance, we continued to expand the business in some countries. For example in Colombia, via new alliances to boost our position in the market. |
| • | In the segment of SMEs, we continued to move forward with products such asProsperain Brazil, a microfinance and loan programme for entrepreneurs which now has close to half a million customers, almost twice that of last year. This programme was also launched in Uruguay to satisfy the demand of small businesses. |
| • | Of note in companies were strategies such as those implemented in the US with the Lead Bank project to strengthen our relationships with US companies. We also formed part of the financing of one of the most important road infrastructure projects in Colombia and we led the consortium of banks for the loan to one of the main state energy companies in Poland. In addition, we contributednon-financial solutions, such asSantander Advance Empresas in Portugal, offering management courses for executives and a programme of scholarships. |
These initiatives are part of our strategy focused on improving customer satisfaction and experience, and we continue with the branch network transformation through the opening of newWork Café branches (new openings in Chile, Portugal, the UK and Poland in the quarter),Smart Redbranches and full function ATMs in Mexico.
All of these measures helped to boost the number of total customers to nearly 144 million, as well as increase the number of loyal customers (+10% individuals and +5% companiesyear-on-year).
Results
The first nine months underlying attributable profit rose 6%, driven by the good dynamics in customer revenue (+5%) and improved efficiency. Of note was the performance of North America and South America (+20% and +16%, respectively, in underlying attributable profit).
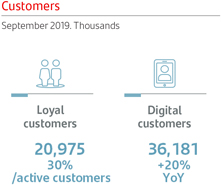
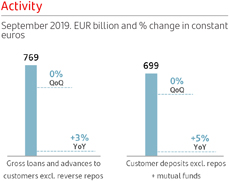
Underlying income statement
EUR million and % change in constant euros
| Q3’19 | /Q2’19 | 9M’19 | /9M’18 | |||||||||||||||
Revenue
| 11,071 | +4% | 32,599 | +4% | ||||||||||||||
Expenses
| -4,799 | +2% | -14,512 | +2% | ||||||||||||||
LLPs
| -2,446 | +19% | -6,697 | +8% | ||||||||||||||
PBT
| 3,448 | -2% | 10,223 | +5% | ||||||||||||||
Underlying attrib. profit
|
| 2,006
|
|
| -3%
|
|
| 5,862
|
|
| +6%
|
| ||||||
Detailed financial information on page 71
January - September 2019 43
Table of Contents
Responsible banking | ||||||||||||||||
Santander vision and | Group financial | Financial information | Corporate governance | |||||||||||||
corporate culture |
| information |
| by segments |
| Santander share |
| Appendix | ||||||||
|
|
Secondary segments |
|
|
| CORPORATE & INVESTMENT BANKING
| |||
| Highlights(changes in constant euros)
We continued to grow strongly in the US, Europe, Mexico, Chile and the Andean region.
The strength of our value-added products (Cash Management, Trade Finance, Debt Capital Markets and Project Finance), more than offset interest rate declines. In Global Markets, diversification in America partly offsets the lower dynamism in Europe.
Underlying attributable profit was 10% higheryear-on-year, driven by growth in revenue and lower loan-loss provisions. | |||


Commercial activity
| • | Cash management: we kept the focus on growing in our main markets (Europe and Latin America), innovating in the digitalisation of businesses, both in the origination and the development of products. |
| • | Export & Agency Finance: double-digit growthyear-on-year, particularly in Latin America and Europe. |
| • | Trade & Working Capital Solutions: strong growth in all products, particularly in receivables finance, structured trade and trade funding. Of note was the positive evolution in the US and Asia. |
| • | Corporate Finance: in M&A we strengthened our position as the leader in advising the renewable energy sector, with operations such as advising Iberdrola on the sale of 40% of East Anglia 1, the UK’s largest offshore wind farm, and advising Blackrock on the sale of its investments in wind farms in Spain. |
| • | Debt Capital Markets: we issued the firstend-to-end blockchain bond, an example of Santander’s innovation in the capital markets and the first step towards a potential secondary market for mainstream security tokens1. The Group maintained its leadershipin Latin America and remained in the upper part of the issuance tables for European corporates, and is also a reference for green bond issuances. |
| • | Syndicated Corporate Loans: in line with our responsible banking strategy, Santander is increasing its range of sustainable finance products via green loans and loans linked to sustainable indices such as loans to Carrefour and Acciona. |
| • | Structured Financing: the Group held its global leadership position in Project Bonds, having issued more globally than any other bank and was the third by volumes. The focus on the renewable energy sector needs to be highlighted: more than 25 financings during 2019. Santander is the leader in Latin America in financial advice, both in terms of numbers and volumes. |
| • | Higher contributionyear-on-year frommarkets’ activity: the positive evolution of markets in the Americas partially offset the reduced business activity in Europe. Good sales performance in Brazil, Chile, and the US, particularly in corporate segments, as well as in management of books in Argentina, Chile and the US. |
Results
The first nine months underlying attributable profit was 10% higher at EUR 1,335 million, underpinned by growth in most businesses, particularly the results of Global Transaction Banking and Global Debt Financing.
Revenue growth and lower provisions absorbed the higher costs in transformational projects.
| (1) | Mainstream security tokens:Financial instruments subject to securities market regulation, which are issued and traded using blockchain. |
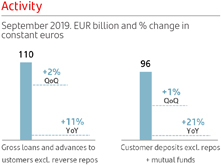
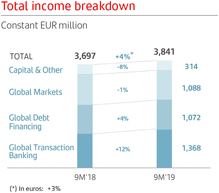
Underlying income statement
EUR million and % change in constant euros
| Q3’19 | /Q2’19 | 9M’19 | /9M’18 | |||||||||||||
Revenue
| 1,235 | -0% | 3,841 | +4% | ||||||||||||
Expenses
| -550 | +1% | -1,669 | +8% | ||||||||||||
LLPs
| 28 | — | -27 | -84% | ||||||||||||
PBT
| 691 | +9% | 2,087 | +8% | ||||||||||||
Underlying attrib. profit
|
| 446
|
| +13%
|
| 1,335
|
|
| +10%
|
| ||||||
Detailed financial information on page 71
44 January - September 2019
Table of Contents
Responsible banking | ||||||||||||||||
Santander vision and | Group financial | Financial information | Corporate governance | |||||||||||||
corporate culture |
| information |
| by segments |
| Santander share |
| Appendix | ||||||||
|
|
Secondary segments |
|
|
| WEALTH MANAGEMENT & INSURANCE
| |||
| Highlights (changes in constant euros)
Assets under management reached EUR 383,000 million (+6%year-on-year).
Underlying attributable profit was 10% higher than in the first nine months of 2018.
Total contribution (net profit + net fee income) of EUR 1,843 million (+8%year-on-year). | |||


Commercial activity
We continued to progress in our plan to make us the best wealth manager in Europe and Latin America. Some of the most relevant initiatives in the quarter are:
| • | InSantander Asset Management (SAM): we continued to strengthen our range of products, notably with the global launch of new Santander GO funds, which offer clients strategies of specialist managers. |
| • | InPrivate Banking: we launched a global value proposition so clients can access a global platform of products and services that cover their global needs. We also continued to focus on developing digital tools. |
| • | InInsurance: we completed the value offer with the objective of becoming a leader in all markets, types of insurance and segments. For example, we launchedGastos Médicos Santander in Mexico, the first insurance of its kind in Mexico sold via banking branches. |
Business performance
Total assets under management grew to EUR 383,000 million, 6% more than in September 2018 and with rises in Private Banking as well as at SAM:
| • | Strong growth in net sales at SAM in 2019 (EUR 5,250 million), increasing market share in most of our countries, particularly in Spain, Portugal, Chile and Poland. |
| • | Of note in Private Banking was growth in Brazil (+11%) and Chile (+10%). Customer loans grew by 5%. |
In Insurance, the volume of premiums in the first nine months increased 9%year-on-year, especially in Brazil and Poland.
Results
Underlying attributable profit was EUR 697 million for the first nine months, 10% growthyear-on-year:
| • | Higher revenue, from both the growth in net interest income, in line with the rise in lending, as well as the higher contribution from insurance. |
| • | Total fee income generated by the area grew by 5% and accounted for 29% of the Group’s total. |
| • | Operating expenses were 2% higher, due to our investments in platforms. |
| • | Recovery of provisions from the fall in doubtful loan positions in Spain and Portugal. |
The total contribution to the Group(including net profit and total fees generated net of taxes) was EUR 1,843 million, 8% growthyear-on-year.
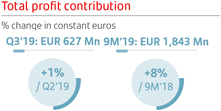
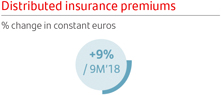
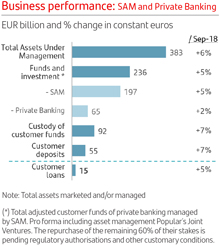
Underlying income statement
EUR million and % change in constant euros
| Q3’19 | /Q2’19 | 9M’19 | /9M’18 | |||||||||||||
Revenue
| 550 | +1% | 1,635 | +6% | ||||||||||||
Expenses
| -222 | -1% | -677 | +2% | ||||||||||||
LLPs
| -3 | — | 3 | — | ||||||||||||
PBT
| 321 | 0% | 953 | +9% | ||||||||||||
Underlying attrib. profit
|
| 238
|
| +2%
|
| 697
|
|
| +10%
|
| ||||||
Detailed financial information on page 72
January - September 2019 45
Table of Contents
Responsible banking | ||||||||||||||||
Santander vision and | Group financial | Financial information | Corporate governance | |||||||||||||
corporate culture |
| information |
| by segments |
| Santander share |
| Appendix | ||||||||
|
|
|
Responsible banking |
|
RESPONSIBLE BANKING
Santander strives every day to contribute to the progress of people and companies in a Simple, Personal and Fair way in all that we do and to earn the confidence of our employees, customers, shareholders and society.
In order to meet our commitment to be a more responsible bank and help society address the main global issues, we have identified two challenges: adapt to the new business environment and contribute to more inclusive and sustainable growth, with the following goals for the coming years:
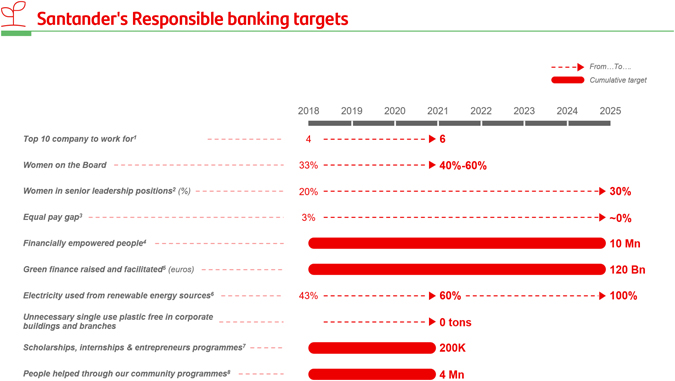
More information on our public commitments in responsible banking can be found on our website.
| 1. | According to a well-known external source in each country (Great Place to Work, Top Employer, Merco, etc.). |
| 2. | Senior positions represent 1% of total workforce. |
| 3. | Calculation of equal pay gap compares employees of the same job, level and function. |
| 4. | Financially empowered people (mostly unbanked and underbanked), through products and services and social investment initiatives, to get access to the financial system, receive tailored finance and increase their knowledge and resilience through financial education. |
| 5. | Includes Santander’s overall contribution to green finance: project finance, syndicated loans, green bonds, capital finance, export finance, advisory, structuring and other products to help our clients in the transition to a low carbon economy. Commitment from 2019 to 2030 is EUR 220 billion. |
| 6. | In those countries where it is possible to certify renewable sourced electricity for the properties occupied by the Group. |
| 7. | People supported through Santander Universities initiative (students who will receive a Santander scholarship, will achieve an internship in an SME or participate in entrepreneurship programmes supported by the bank). |
| 8. | People helped through our community investment programmes (excluded Santander Universities and financial education initiatives). |
46 January - September 2019
Table of Contents
Responsible banking | ||||||||||||||||
Santander vision and | Group financial | Financial information | Corporate governance | |||||||||||||
corporate culture |
| information |
| by segments |
| Santander share |
| Appendix | ||||||||
|
|
|
Responsible banking |
|
Third quarter highlights
| ||
| Banco Santander is ranked the world’s most sustainable bank in the Dow Jones Sustainability Index. This is the first time the reference index in the international sphere has put Santander as the world leader and was also first in Europe for the second year running. The index evaluates the Group’s performance in the economic, environmental and social dimensions. | |
| Banco Santander is one of the founding members of the Principles for Responsible Banking, signed in September at the climate summit in New York. The signatories of these principles are committed to strategically aligning their business to the UN’s Sustainable Development Goals and to the Paris Agreement on climate change. | |
| Santander and the 30 other banks who signed the principles also announced a Collective Commitment to Climate Action, setting out specific objectives to align their activity to the Paris Agreement. | |
| In October, Banco Santander issued a EUR 1 billion green bond for the first time, under a global strategy of sustainable issues for the coming years. The funds from this bond will be used to finance solar energy and wind power projects. | |
| Great Place to Work Institute recognised Santander as one of the best companies to work for in the world, ranking it 24th in the 25 best companies. | |
| Following the appointment of Pamela Walkden as an independent director to Santander’s board in September, we will have 40% women directors, in line with our long term goal of40-60% represented by either gender. This appointment is subject to the corresponding authorisations. | |
| In addition, and aligned with our responsible banking commitments, we have financially empowered more than 470,000 million people through our microfinance programmes and helped more than 800,000 through our community investment programmes in the first half of the year. | |


We also continued to form part of various sustainability indices, facilitatingnon-financial information to the markets, investors and ESG analysts.

January - September 2019 47
Table of Contents
Responsible banking | ||||||||||||||||
Santander vision and | Group financial | Financial information | Corporate governance | |||||||||||||
corporate culture |
| information |
| by segments |
| Santander share |
| Appendix | ||||||||
|
|
|
Corporate governance |
|
CORPORATE GOVERNANCE
A responsible bank has a solid governance model with well-defined functions, it manages risks and opportunities prudently and defines its long-term strategy watching out for the interests of all its stakeholders and society in general

| Capital increase. Change toby-laws |
Once the period of the public offer to acquire all the shares representing the capital stock of Banco Santander México, S.A., Institución de Banca Múltiple, Grupo Financiero Santander México not owned by Grupo Santander ended, 67% of the shares accepted the offer.
In order to meet the exchange, Banco Santander proceeded, by virtue of what was agreed at the extraordinary general meeting of shareholders on 23 July 2019, to issue 381,540,640 new shares of EUR 0.50 nominal value each, which meant an increase in the Bank’s capital stock of EUR 190,770,320 (approximately 2.35% of Banco Santander’s capital stock before the increase).
After this, Banco Santander’s capital stock amounted to EUR 8,309,057,291, represented by 16,618,114,582 shares of EUR 0.50 nominal value each, having changed Article 5 of theby-laws regarding the capital stock.
| Changes in the board in the third quarter |
The appointments committee announced on 24 September 2019 the incorporation to the board of Pamela Walkden as an independent director.
Pamela Walkden will take the place of Carlos Fernández, who had been an independent director since 2015. Her appointment will become effective when the corresponding approvals have been received, and will be submitted for ratification at the next general meeting of shareholders.
| Changes in the organisational structure of the Group’s senior management in the third quarter |
The board approved the appointment of Marjolein van Hellemondt-Gerdingh as the Group’s chief compliance officer, which will be effective when the regulatory approvals have been obtained.
Marjolein van Hellemondt-Gerdingh, who will report to Keiran Foad, the chief risk officer, replaces MónicaLópez-Monís who was recently appointed head of supervisory and regulatory relations.
EVENTS AFTER QUARTER END
On 21 October, the agreement to sell Grupo Santander’s retail and commercial banking franchise in Puerto Rico to FirstBank Puerto Rico for approximately USD 1.1 billion was announced. The sale includes Santander’s 27 bank branches in Puerto Rico and total assets of USD 6.2 billion. The transaction is expected to close in the middle of 2020, subject to regulatory approvals. The consummation of the transaction will lead to an increase in the Group’s CET1 capital of5-6 basis points and immaterial impact on Santander Group attributable profit.
48 January - September 2019
Table of Contents
Responsible banking | ||||||||||||||||
Santander vision and | Group financial | Financial information | Corporate governance | |||||||||||||
corporate culture |
| information |
| by segments |
| Santander share |
| Appendix | ||||||||
|
|
|
Santander share |
|
SANTANDER SHARE
Shareholder remuneration
The board approved the first dividend in of EUR 0.10 per share to be paid from 1 November. The amount is equal to that paid a year ago between August (EUR 0.065) and November (EUR 0.035).
As announced in 2018, as of this year shareholders will receive the dividend in two payments instead of the previous four.
The board also confirmed its intention to maintain a percentage of the underlying attributable profit in 2019 assigned to the dividend(pay-out) of between 40% and 50%, and the proportion of the dividend in cash is at least the same as last year.
Share price performance
The Santander share is listed in five markets, in Spain, Mexico and Poland as an ordinary share, in the UK as a CDI and in the US as an ADR.
The main markets reported gains in the first nine months of the year. In Spain, the Ibex 35 rose 8.3% and in Europe, the Stoxx 50 rose 18.0%.
The European banking sector, in a context of economic deceleration, was influenced by the change in the stance of monetary policies of the main central banks, mainly the European Central Bank, which delayed interest rate hikes beyond 2020. The leading European banking index, DJ Stoxx Banks fell 0.4%, while the MSCI World Banks index rose 6.6%.
The Santander share price ended September at EUR 3.737, 6% lower, as it was additionally affected by some uncertainties in regions where Santander operates, such as Argentina, pending the presidential elections, the UK due to Brexit, and Poland because of the ruling on Swiss franc mortgages.
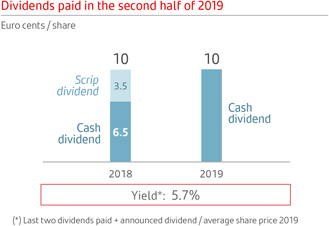
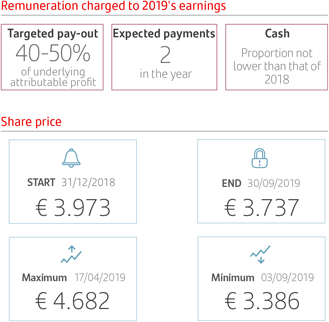
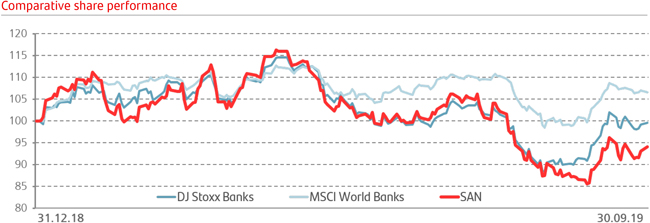
January - September 2019 49
Table of Contents
Responsible banking | ||||||||||||||||
Santander vision and | Group financial | Financial information | Corporate governance | |||||||||||||
corporate culture |
| information |
| by segments |
| Santander share |
| Appendix | ||||||||
|
|
|
Santander share |
|
SANTANDER SHARE
In terms of total return, the Santander share fell 3.1% in the first nine months, while the DJ Stoxx Banks rose 4.6%.
The share price as we went to press was EUR 3.979, +6.5% in the last month.
Market capitalisation and trading
At 30 September 2019, Santander was the largest bank in the Eurozone by market capitalisation and the 23rd in the world among financial entities (EUR 62,094 million).
The share’s weighting in the DJ Stoxx 50 was 1.6%, 7.6% in the DJ Stoxx Banks and 12.9% in the Ibex 35.
A total of 13,719 million shares were traded in the first nine months for an effective value of EUR 56,671 million, the largest figure among the shares that comprise the EuroStoxx (liquidity ratio of 84%).
The daily trading volume was 72 million shares with an effective value of EUR 297 million.
Shareholder base
The total number of Santander shareholders at 30 September was 4,025,074, of which 3,803,049 were European (75.5% of the capital stock) and 205,533 from the Americas (23.1%).
Excluding the board, which holds 1.11% of the Bank’s capital stock, retail shareholders account for 38.96% and institutional shareholders 59.93%.

The Santander share | ||||
September 2019 | ||||
Shares and trading data | ||||
Shares (number) | 16,618,114,582 | |||
Average daily turnover (number of shares) | 71,825,015 | |||
Share liquidity (%) | 84 | |||
(Number of shares traded during the year / number of shares) |
| |||
Stock market indicators | ||||
Price / Tangible book value (X) | 0.88 | |||
P/E ratio (X) | 13.90 | |||
Free float (%) | 99.96 | |||
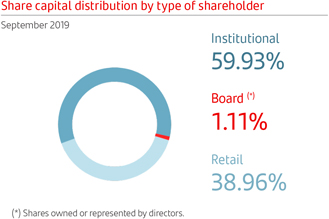
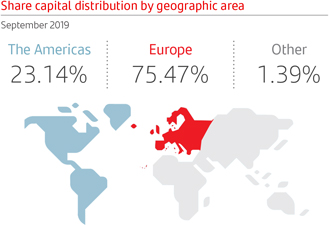
50 January - September 2019
Table of Contents
Responsible banking | ||||||||||||||||
Santander vision and | Group financial | Financial information | Corporate governance | |||||||||||||
corporate culture |
| information |
| by segments |
| Santander share |
| Appendix | ||||||||
|
|
|
|
|
January - September 2019 51
Table of Contents
Responsible banking | ||||||||||||||||
Santander vision and | Group financial | Financial information | Corporate governance | |||||||||||||
corporate culture |
| information |
| by segments |
| Santander share |
| Appendix | ||||||||
|
|
|
|
Group financial information |
Net fee income. Consolidated | ||||||||||||||||||||||||
EUR million | ||||||||||||||||||||||||
| Q3’19 | Q2’19 | Chg.% | 9M’19 | 9M’18 | Chg.% | |||||||||||||||||||
Fees from services | 1,729 | 1,734 | (0.3) | 5,242 | 5,208 | 0.7 | ||||||||||||||||||
Wealth management and marketing of customer funds | 969 | 962 | 0.7 | 2,867 | 2,714 | 5.6 | ||||||||||||||||||
Securities and custody | 257 | 236 | 8.9 | 709 | 607 | 16.8 | ||||||||||||||||||
Net fee income | 2,955 | 2,932 | 0.8 | 8,818 | 8,529 | 3.4 | ||||||||||||||||||
Operating expenses. Consolidated | ||||||||||||||||||||||||
EUR million | ||||||||||||||||||||||||
| Q3’19 | Q2’19 | Chg.% | 9M’19 | 9M’18 | Chg.% | |||||||||||||||||||
Staff costs | 3,008 | 3,074 | (2.1) | 9,088 | 8,797 | 3.3 | ||||||||||||||||||
Other general administrative expenses | 1,982 | 2,025 | (2.1) | 6,012 | 6,272 | (4.1) | ||||||||||||||||||
Information technology | 460 | 562 | (18.1) | 1,573 | 1,109 | 41.8 | ||||||||||||||||||
Communications | 126 | 132 | (4.5) | 390 | 382 | 2.1 | ||||||||||||||||||
Advertising | 164 | 168 | (2.4) | 489 | 453 | 7.9 | ||||||||||||||||||
Buildings and premises(1) | 212 | 218 | (2.8) | 641 | 1,354 | (52.7) | ||||||||||||||||||
Printed and office material | 26 | 31 | (16.1) | 89 | 89 | (0.2) | ||||||||||||||||||
Taxes (other than tax on profits) | 126 | 138 | (8.7) | 390 | 405 | (3.7) | ||||||||||||||||||
Other expenses | 868 | 776 | 11.9 | 2,440 | 2,479 | (1.6) | ||||||||||||||||||
Administrative expenses | 4,990 | 5,099 | (2.1) | 15,100 | 15,069 | 0.2 | ||||||||||||||||||
Depreciation and amortisation(1) | 732 | 730 | 0.3 | 2,209 | 1,774 | 24.5 | ||||||||||||||||||
Operating expenses | 5,722 | 5,829 | (1.8) | 17,309 | 16,843 | 2.8 | ||||||||||||||||||
(1) In 9M’19, impact of the IFRS 16 application.
Operating means. Consolidated | ||||||||||||||||||||||||||||
| Employees | Branches | |||||||||||||||||||||||||||
| Sep-19 | Sep-18 | Chg. | Sep-19 | Sep-18 | Chg. | |||||||||||||||||||||||
Europe | 89,255 | 91,996 | (2,741) | 5,993 | 6,801 | (808) | ||||||||||||||||||||||
Spain | 29,713 | 31,361 | (1,648) | 3,852 | 4,397 | (545) | ||||||||||||||||||||||
Santander Consumer Finance | 14,496 | 14,861 | (365) | 426 | 441 | (15) | ||||||||||||||||||||||
United Kingdom | 24,999 | 25,488 | (489) | 629 | 766 | (137) | ||||||||||||||||||||||
Portugal | 6,678 | 6,910 | (232) | 549 | 667 | (118) | ||||||||||||||||||||||
Poland | 11,026 | 11,283 | (257) | 525 | 519 | 6 | ||||||||||||||||||||||
Other | 2,343 | 2,093 | 250 | 12 | 11 | 1 | ||||||||||||||||||||||
North America | 38,106 | 36,786 | 1,320 | 2,058 | 2,074 | (16) | ||||||||||||||||||||||
US | 17,586 | 17,303 | 283 | 624 | 664 | (40) | ||||||||||||||||||||||
Mexico | 20,520 | 19,483 | 1,037 | 1,434 | 1,410 | 24 | ||||||||||||||||||||||
South America | 71,264 | 70,104 | 1,160 | 4,639 | 4,538 | 101 | ||||||||||||||||||||||
Brazil | 48,347 | 46,663 | 1,684 | 3,686 | 3,552 | 134 | ||||||||||||||||||||||
Chile | 11,642 | 12,003 | (361) | 380 | 408 | (28) | ||||||||||||||||||||||
Argentina | 9,208 | 9,362 | (154) | 470 | 481 | (11) | ||||||||||||||||||||||
Other | 2,067 | 2,076 | (9) | 103 | 97 | 6 | ||||||||||||||||||||||
Santander Global Platform | 727 | 464 | 263 | 1 | 1 | — | ||||||||||||||||||||||
Corporate Centre | 1,665 | 1,751 | (86) | |||||||||||||||||||||||||
Total Group | 201,017 | 201,101 | (84) | 12,691 | 13,414 | (723) | ||||||||||||||||||||||
Impairment or reversal of impairment of financial assets not measured at fair value through profit or loss (net) |
| |||||||||||||||||||||||
EUR million | ||||||||||||||||||||||||
| Q3’19 | Q2’19 | Chg.% | 9M’19 | 9M’18 | Chg.% | |||||||||||||||||||
Net loan-loss provisions | 2,435 | 2,141 | 13.7 | 6,748 | 6,418 | 5.1 | ||||||||||||||||||
Non-performing loans | 2,785 | 2,637 | 5.6 | 7,937 | 7,507 | 5.7 | ||||||||||||||||||
Country-risk | (4) | (2) | 100.0 | (5) | 10 | — | ||||||||||||||||||
Recovery ofwritten-off assets | (346) | (494) | (30.0) | (1,184) | (1,098) | 7.8 | ||||||||||||||||||
Other impairment | 7 | (19) | (136.8) | 62 | 55 | (87.2) | ||||||||||||||||||
Total | 2,442 | 2,122 | 15.1 | 6,810 | 6,473 | (62.3) | ||||||||||||||||||
52 January - September 2019
Table of Contents
Responsible banking | ||||||||||||||||
Santander vision and | Group financial | Financial information | Corporate governance | |||||||||||||
corporate culture |
| information |
| by segments |
| Santander share |
| Appendix | ||||||||
|
|
|
|
Group financial information |
Loans and advances to customers. Consolidated | ||||||||||||||||||||
EUR million | ||||||||||||||||||||
| Change | ||||||||||||||||||||
| Sep-19 | Sep-18 | Absolute | % | Dec-18 | ||||||||||||||||
Commercial bills | 32,690 | 29,416 | 3,274 | 11.1 | 33,301 | |||||||||||||||
Secured loans | 502,132 | 472,298 | 29,834 | 6.3 | 478,068 | |||||||||||||||
Other term loans | 266,372 | 265,751 | 621 | 0.2 | 265,696 | |||||||||||||||
Finance leases | 35,669 | 30,386 | 5,283 | 17.4 | 30,758 | |||||||||||||||
Receivable on demand | 7,693 | 8,515 | (822) | (9.7) | 8,794 | |||||||||||||||
Credit cards receivable | 22,637 | 20,535 | 2,102 | 10.2 | 23,083 | |||||||||||||||
Impaired assets | 32,941 | 34,983 | (2,042) | (5.8) | 34,218 | |||||||||||||||
Gross loans and advances to customers (excl. reverse repos) | 900,134 | 861,884 | 38,250 | 4.4 | 873,918 | |||||||||||||||
Reverse repos | 38,287 | 28,223 | 10,064 | 35.7 | 32,310 | |||||||||||||||
Gross loans and advances to customers | 938,421 | 890,107 | 48,314 | 5.4 | 906,228 | |||||||||||||||
Loan-loss allowances | 22,418 | 23,881 | (1,463) | (6.1) | 23,307 | |||||||||||||||
Loans and advances to customers | 916,003 | 866,226 | 49,777 | 5.7 | 882,921 | |||||||||||||||
Total funds. Consolidated | ||||||||||||||||||||
EUR million | ||||||||||||||||||||
| Change | ||||||||||||||||||||
| Sep-19 | Sep-18 | Absolute | % | Dec-18 | ||||||||||||||||
Demand deposits | 574,803 | 540,098 | 34,705 | 6.4 | 548,711 | |||||||||||||||
Time deposits | 201,865 | 191,312 | 10,553 | 5.5 | 199,025 | |||||||||||||||
Mutual funds | 176,538 | 164,221 | 12,317 | 7.5 | 157,888 | |||||||||||||||
Customer funds | 953,206 | 895,631 | 57,575 | 6.4 | 905,624 | |||||||||||||||
Pension funds | 15,620 | 15,797 | (177) | (1.1) | 15,393 | |||||||||||||||
Managed portfolios | 29,208 | 27,430 | 1,778 | 6.5 | 26,785 | |||||||||||||||
Repos | 37,617 | 47,341 | (9,724) | (20.5) | 32,760 | |||||||||||||||
Total funds | 1,035,651 | 986,199 | 49,452 | 5.0 | 980,562 | |||||||||||||||
Eligible capital (fully loaded) | ||||||||||||||||||||
EUR million | ||||||||||||||||||||
| Change | ||||||||||||||||||||
| Sep-19* | Sep-18 | Absolute | % | Dec-18 | ||||||||||||||||
Capital stock and reserves | 118,350 | 116,238 | 2,112 | 1.8 | 114,147 | |||||||||||||||
Attributable profit | 3,732 | 5,742 | (2,009) | (35.0) | 7,810 | |||||||||||||||
Dividends | (2,612) | (2,454) | (157) | 6.4 | (3,292) | |||||||||||||||
Other retained earnings | (23,109) | (26,001) | 2,892 | (11.1) | (23,606) | |||||||||||||||
Minority interests | 6,412 | 6,752 | (340) | (5.0) | 6,981 | |||||||||||||||
Goodwill and intangible assets | (27,340) | (28,648) | 1,307 | (4.6) | (28,644) | |||||||||||||||
Other deductions | (6,104) | (6,292) | 188 | (3.0) | (6,492) | |||||||||||||||
Core CET1 | 69,330 | 65,337 | 3,993 | 6.1 | 66,904 | |||||||||||||||
Preferred shares and other eligible T1 | 8,516 | 8,911 | (395) | (4.4) | 8,934 | |||||||||||||||
Tier 1 | 77,846 | 74,248 | 3,597 | 4.8 | 75,838 | |||||||||||||||
Generic funds and eligible T2 instruments | 12,251 | 11,499 | 752 | 6.5 | 11,669 | |||||||||||||||
Eligible capital | 90,097 | 85,748 | 4,349 | 5.1 | 87,506 | |||||||||||||||
Risk-weighted assets | 613,580 | 588,074 | 25,506 | 4.3 | 592,319 | |||||||||||||||
| ||||||||||||||||||||
CET1 capital ratio | 11.30 | 11.11 | 0.19 | 11.30 | ||||||||||||||||
T1 capital ratio | 12.69 | 12.63 | 0.06 | 12.80 | ||||||||||||||||
Total capital ratio | 14.68 | 14.58 | 0.10 | 14.77 | ||||||||||||||||
(*) Applying a 50%pay-out in the calculation of the capital ratios.
January - September 2019 53
Table of Contents
Responsible banking | ||||||||||||||||
Santander vision and | Group financial | Financial information | Corporate governance | |||||||||||||
corporate culture |
| information |
| by segments |
| Santander share |
| Appendix | ||||||||
|
|
|
|
Financial information by segments |
EUROPE |  | |||||||||||||||||||||||
EUR million | ||||||||||||||||||||||||
| /Q2’19 | /9M’18 | |||||||||||||||||||||||
| Underlying income statement | Q3’19 | % | % excl. FX | 9M’19 | % | % excl. FX | ||||||||||||||||||
Net interest income | 3,530 | (1.4) | (0.4) | 10,671 | 0.9 | 1.1 | ||||||||||||||||||
Net fee income | 1,310 | 0.5 | 1.1 | 3,941 | (4.1) | (4.1) | ||||||||||||||||||
Gains (losses) on financial transactions(1) | 273 | 86.5 | 86.9 | 605 | (26.5) | (26.7) | ||||||||||||||||||
Other operating income | 182 | 15.3 | 15.6 | 492 | 11.9 | 11.7 | ||||||||||||||||||
Total income | 5,295 | 2.1 | 2.9 | 15,709 | (1.5) | (1.4) | ||||||||||||||||||
Administrative expenses and amortisations | (2,719) | (2.5) | (1.6) | (8,310) | (1.1) | (1.1) | ||||||||||||||||||
Net operating income | 2,576 | 7.4 | 8.2 | 7,398 | (1.9) | (1.8) | ||||||||||||||||||
Net loan-loss provisions | (497) | 28.4 | 28.7 | (1,340) | 5.9 | 6.1 | ||||||||||||||||||
Other gains (losses) and provisions | (130) | (43.7) | (43.2) | (560) | (5.7) | (5.6) | ||||||||||||||||||
Profit before tax | 1,949 | 9.4 | 10.4 | 5,498 | (3.2) | (3.1) | ||||||||||||||||||
Tax on profit | (531) | 11.8 | 12.6 | (1,497) | (3.4) | (3.3) | ||||||||||||||||||
Profit from continuing operations | 1,418 | 8.6 | 9.5 | 4,001 | (3.2) | (3.0) | ||||||||||||||||||
Net profit from discontinued operations | — | — | — | — | — | — | ||||||||||||||||||
Consolidated profit | 1,418 | 8.6 | 9.5 | 4,001 | (3.2) | (3.0) | ||||||||||||||||||
Non-controlling interests | (133) | 14.6 | 15.1 | (361) | 10.5 | 11.0 | ||||||||||||||||||
Underlying attributable profit to the parent | 1,286 | 8.0 | 9.0 | 3,640 | (4.4) | (4.2) | ||||||||||||||||||
| Balance sheet | ||||||||||||||||||||||||
Loans and advances to customers | 654,243 | 0.6 | 0.3 | 654,243 | 3.6 | 3.7 | ||||||||||||||||||
Cash, central banks and credit institutions | 184,427 | (8.2) | (8.4) | 184,427 | 4.7 | 4.6 | ||||||||||||||||||
Debt instruments | 110,618 | (2.8) | (2.9) | 110,618 | (5.7) | (5.5) | ||||||||||||||||||
Other financial assets | 56,880 | 10.4 | 10.4 | 56,880 | 3.7 | 3.6 | ||||||||||||||||||
Other asset accounts | 44,591 | 3.8 | 3.5 | 44,591 | (2.7) | (2.9) | ||||||||||||||||||
Total assets | 1,050,758 | (0.8) | (1.1) | 1,050,758 | 2.5 | 2.5 | ||||||||||||||||||
Customer deposits | 589,907 | 0.1 | (0.2) | 589,907 | 3.5 | 3.6 | ||||||||||||||||||
Central banks and credit institutions | 187,414 | (8.5) | (8.7) | 187,414 | (6.0) | (6.2) | ||||||||||||||||||
Marketable debt securities | 130,394 | 0.6 | 0.1 | 130,394 | 3.9 | 4.0 | ||||||||||||||||||
Other financial liabilities | 69,262 | 9.7 | 9.6 | 69,262 | 17.0 | 17.0 | ||||||||||||||||||
Other liabilities accounts | 18,151 | 3.9 | 3.8 | 18,151 | (5.3) | (5.2) | ||||||||||||||||||
Total liabilities | 995,127 | (0.9) | (1.2) | 995,127 | 2.3 | 2.3 | ||||||||||||||||||
Total equity | 55,631 | 1.8 | 1.7 | 55,631 | 6.3 | 6.5 | ||||||||||||||||||
Memorandum items: | ||||||||||||||||||||||||
Gross loans and advances to customers(2) | 635,474 | (0.4) | (0.7) | 635,474 | 2.2 | 2.2 | ||||||||||||||||||
Customer funds | 662,253 | 0.6 | 0.4 | 662,253 | 4.9 | 5.0 | ||||||||||||||||||
Customer deposits(3) | 575,393 | 0.3 | 0.1 | 575,393 | 5.1 | 5.2 | ||||||||||||||||||
Mutual funds | 86,860 | 2.3 | 2.4 | 86,860 | 3.9 | 4.0 | ||||||||||||||||||
| Ratios (%) and operating means | ||||||||||||||||||||||||
Underlying RoTE | 10.56 | 0.76 | 9.99 | (0.97) | ||||||||||||||||||||
Efficiency ratio | 51.4 | (2.4) | 52.9 | 0.2 | ||||||||||||||||||||
NPL ratio | 3.47 | (0.01) | 3.47 | (0.43) | ||||||||||||||||||||
NPL coverage | 48.2 | (1.7) | 48.2 | (3.9) | ||||||||||||||||||||
Number of employees | 89,255 | (2.4) | 89,255 | (3.0) | ||||||||||||||||||||
Number of branches | 5,993 | (6.8) | 5,993 | (11.9) | ||||||||||||||||||||
(1) Includes exchange differences.
(2) Excluding reverse repos.
(3) Excluding repos.
54 January - September 2019
Table of Contents
Responsible banking | ||||||||||||||||
Santander vision and | Group financial | Financial information | Corporate governance | |||||||||||||
corporate culture |
| information |
| by segments |
| Santander share |
| Appendix | ||||||||
|
|
|
|
Financial information by segments |
Spain | | |||||||||||||||
EUR million | ||||||||||||||||
| /Q2’19 | /9M’18 | |||||||||||||||
| Underlying income statement | Q3’19 | % | 9M’19 | % | ||||||||||||
Net interest income | 967 | (4.2) | 2,985 | (1.8) | ||||||||||||
Net fee income | 614 | (1.6) | 1,861 | (6.5) | ||||||||||||
Gains (losses) on financial transactions(1) | 326 | 52.3 | 659 | 24.3 | ||||||||||||
Other operating income | 83 | — | 190 | (24.2) | ||||||||||||
Total income | 1,989 | 7.6 | 5,695 | (2.0) | ||||||||||||
Administrative expenses and amortisations | (999) | (2.1) | (3,043) | (7.0) | ||||||||||||
Net operating income | 990 | 19.4 | 2,652 | 4.4 | ||||||||||||
Net loan-loss provisions | (210) | (8.0) | (680) | 4.8 | ||||||||||||
Other gains (losses) and provisions | (100) | (30.3) | (355) | (2.7) | ||||||||||||
Profit before tax | 681 | 48.7 | 1,617 | 5.9 | ||||||||||||
Tax on profit | (190) | 57.9 | (432) | 14.0 | ||||||||||||
Profit from continuing operations | 491 | 45.4 | 1,184 | 3.3 | ||||||||||||
Net profit from discontinued operations | — | — | — | — | ||||||||||||
Consolidated profit | 491 | 45.4 | 1,184 | 3.3 | ||||||||||||
Non-controlling interests | (0) | — | 0 | — | ||||||||||||
Underlying attributable profit to the parent | 491 | 45.3 | 1,185 | 3.3 | ||||||||||||
| Balance sheet | ||||||||||||||||
Loans and advances to customers | 188,095 | (3.3) | 188,095 | (4.6) | ||||||||||||
Cash, central banks and credit institutions | 81,273 | (6.8) | 81,273 | 2.9 | ||||||||||||
Debt instruments | 35,906 | (8.6) | 35,906 | (28.1) | ||||||||||||
Other financial assets | 1,495 | 1.7 | 1,495 | (45.1) | ||||||||||||
Other asset accounts | 22,806 | 1.5 | 22,806 | (16.1) | ||||||||||||
Total assets | 329,576 | (4.4) | 329,576 | (7.4) | ||||||||||||
Customer deposits | 246,017 | (2.4) | 246,017 | 3.1 | ||||||||||||
Central banks and credit institutions | 28,188 | (25.8) | 28,188 | (53.8) | ||||||||||||
Marketable debt securities | 26,281 | 5.8 | 26,281 | 11.7 | ||||||||||||
Other financial liabilities | 9,649 | 9.1 | 9,649 | 4.5 | ||||||||||||
Other liabilities accounts | 4,306 | (29.3) | 4,306 | (51.8) | ||||||||||||
Total liabilities | 314,441 | (4.7) | 314,441 | (7.9) | ||||||||||||
Total equity | 15,135 | 0.9 | 15,135 | 3.8 | ||||||||||||
Memorandum items: | ||||||||||||||||
Gross loans and advances to customers(2) | 194,485 | (3.3) | 194,485 | (5.9) | ||||||||||||
Customer funds | 312,918 | (1.3) | 312,918 | 2.9 | ||||||||||||
Customer deposits(3) | 245,483 | (2.3) | 245,483 | 3.1 | ||||||||||||
Mutual funds | 67,434 | 2.2 | 67,434 | 2.2 | ||||||||||||
| Ratios (%) and operating means | ||||||||||||||||
Underlying RoTE | 13.18 | 4.19 | 10.59 | 0.43 | ||||||||||||
Efficiency ratio | 50.2 | (4.9) | 53.4 | (2.8) | ||||||||||||
NPL ratio | 7.23 | 0.21 | 7.23 | (0.32) | ||||||||||||
NPL coverage | 40.6 | (2.3) | 40.6 | (5.8) | ||||||||||||
Number of employees | 29,713 | (3.2) | 29,713 | (5.3) | ||||||||||||
Number of branches | 3,852 | (9.3) | 3,852 | (12.4) | ||||||||||||
(1) Includes exchange differences.
(2) Excluding reverse repos.
(3) Excluding repos.
January - September 2019 55
Table of Contents
Responsible banking | ||||||||||||||||
Santander vision and | Group financial | Financial information | Corporate governance | |||||||||||||
corporate culture |
| information |
| by segments |
| Santander share |
| Appendix | ||||||||
|
|
|
|
Financial information by segments |
Santander Consumer Finance | | |||||||||||||||||||||||
EUR million | ||||||||||||||||||||||||
| /Q2’19 | /9M’18 | |||||||||||||||||||||||
| Underlying income statement | Q3’19 | % | % excl. FX | 9M’19 | % | % excl. FX | ||||||||||||||||||
Net interest income | 977 | 0.6 | 0.9 | 2,888 | 3.9 | 4.3 | ||||||||||||||||||
Net fee income | 213 | 5.9 | 6.0 | 627 | 3.0 | 3.1 | ||||||||||||||||||
Gains (losses) on financial transactions(1) | (5) | — | — | (4) | — | — | ||||||||||||||||||
Other operating income | 20 | — | — | 14 | 2.2 | 1.5 | ||||||||||||||||||
Total income | 1,203 | 4.3 | 4.6 | 3,525 | 3.0 | 3.3 | ||||||||||||||||||
Administrative expenses and amortisations | (504) | (4.3) | (4.0) | (1,539) | 3.0 | 3.4 | ||||||||||||||||||
Net operating income | 699 | 11.5 | 11.8 | 1,986 | 2.9 | 3.3 | ||||||||||||||||||
Net loan-loss provisions | (147) | 148.4 | 147.8 | (328) | 4.8 | 5.0 | ||||||||||||||||||
Other gains (losses) and provisions | 42 | — | — | 54 | 30.3 | 29.4 | ||||||||||||||||||
Profit before tax | 594 | 6.9 | 7.3 | 1,711 | 3.2 | 3.6 | ||||||||||||||||||
Tax on profit | (174) | 12.6 | 12.9 | (488) | 7.5 | 7.8 | ||||||||||||||||||
Profit from continuing operations | 420 | 4.7 | 5.1 | 1,223 | 1.6 | 2.0 | ||||||||||||||||||
Net profit from discontinued operations | — | — | — | — | — | — | ||||||||||||||||||
Consolidated profit | 420 | 4.7 | 5.1 | 1,223 | 1.6 | 2.0 | ||||||||||||||||||
Non-controlling interests | (82) | 22.7 | 22.8 | (228) | 10.9 | 11.1 | ||||||||||||||||||
Underlying attributable profit to the parent | 338 | 1.1 | 1.5 | 995 | (0.3) | 0.2 | ||||||||||||||||||
| Balance sheet | ||||||||||||||||||||||||
Loans and advances to customers | 98,143 | (0.3) | 0.1 | 98,143 | 6.6 | 7.3 | ||||||||||||||||||
Cash, central banks and credit institutions | 6,594 | (3.0) | (2.6) | 6,594 | 14.0 | 15.1 | ||||||||||||||||||
Debt instruments | 3,303 | 0.5 | 1.5 | 3,303 | (4.1) | (3.0) | ||||||||||||||||||
Other financial assets | 38 | (0.3) | (0.0) | 38 | 88.8 | 90.7 | ||||||||||||||||||
Other asset accounts | 3,869 | (5.7) | (5.4) | 3,869 | 25.4 | 26.0 | ||||||||||||||||||
Total assets | 111,946 | (0.6) | (0.2) | 111,946 | 7.2 | 8.0 | ||||||||||||||||||
Customer deposits | 37,944 | 0.1 | 0.6 | 37,944 | 3.4 | 4.3 | ||||||||||||||||||
Central banks and credit institutions | 23,689 | (5.6) | (5.4) | 23,689 | (6.0) | (5.6) | ||||||||||||||||||
Marketable debt securities | 34,571 | 1.8 | 2.2 | 34,571 | 25.6 | 26.5 | ||||||||||||||||||
Other financial liabilities | 1,037 | (25.7) | (25.5) | 1,037 | 18.7 | 19.0 | ||||||||||||||||||
Other liabilities accounts | 3,997 | 2.3 | 2.6 | 3,997 | 5.7 | 6.2 | ||||||||||||||||||
Total liabilities | 101,238 | (1.0) | (0.6) | 101,238 | 7.6 | 8.3 | ||||||||||||||||||
Total equity | 10,708 | 3.2 | 3.8 | 10,708 | 3.7 | 4.6 | ||||||||||||||||||
Memorandum items: | ||||||||||||||||||||||||
Gross loans and advances to customers(2) | 100,463 | (0.3) | 0.1 | 100,463 | 6.3 | 7.0 | ||||||||||||||||||
Customer funds | 37,944 | 0.1 | 0.6 | 37,944 | 3.6 | 4.4 | ||||||||||||||||||
Customer deposits(3) | 37,944 | 0.1 | 0.6 | 37,944 | 3.6 | 4.4 | ||||||||||||||||||
Mutual funds | — | — | — | — | — | — | ||||||||||||||||||
| Ratios (%) and operating means | ||||||||||||||||||||||||
Underlying RoTE | 15.81 | (0.02) | 15.49 | (1.11) | ||||||||||||||||||||
Efficiency ratio | 41.9 | (3.8) | 43.7 | 0.0 | ||||||||||||||||||||
NPL ratio | 2.25 | 0.01 | 2.25 | (0.20) | ||||||||||||||||||||
NPL coverage | 104.2 | (1.7) | 104.2 | (2.2) | ||||||||||||||||||||
Number of employees | 14,496 | 0.0 | 14,496 | (2.5) | ||||||||||||||||||||
Number of branches | 426 | 0.5 | 426 | (3.4) | ||||||||||||||||||||
(1) Includes exchange differences.
(2) Excluding reverse repos.
(3) Excluding repos.
56 January - September 2019
Table of Contents
Responsible banking | ||||||||||||||||
Santander vision and | Group financial | Financial information | Corporate governance | |||||||||||||
corporate culture |
| information |
| by segments |
| Santander share |
| Appendix | ||||||||
|
|
|
|
Financial information by segments |
United Kingdom | | |||||||||||||||||||||||
EUR million | ||||||||||||||||||||||||
| /Q2’19 | /9M’18 | |||||||||||||||||||||||
| Underlying income statement | Q3’19 | % | % excl. FX | 9M’19 | % | % excl. FX | ||||||||||||||||||
Net interest income | 908 | (3.8) | (0.6) | 2,827 | (7.9) | (8.0) | ||||||||||||||||||
Net fee income | 217 | 4.6 | 7.8 | 640 | (7.0) | (7.1) | ||||||||||||||||||
Gains (losses) on financial transactions(1) | (15) | — | — | 5 | (95.2) | (95.2) | ||||||||||||||||||
Other operating income | 10 | (18.0) | (14.8) | 36 | 13.8 | 13.7 | ||||||||||||||||||
Total income | 1,119 | (5.4) | (2.2) | 3,508 | (9.8) | (9.9) | ||||||||||||||||||
Administrative expenses and amortisations | (681) | (3.1) | 0.1 | (2,123) | (0.6) | (0.8) | ||||||||||||||||||
Net operating income | 438 | (8.6) | (5.6) | 1,384 | (21.0) | (21.1) | ||||||||||||||||||
Net loan-loss provisions | (77) | 294.1 | 301.5 | (157) | 21.9 | 21.7 | ||||||||||||||||||
Other gains (losses) and provisions | (43) | 73.2 | 78.0 | (118) | (29.0) | (29.1) | ||||||||||||||||||
Profit before tax | 318 | (26.9) | (24.1) | 1,110 | (23.9) | (24.0) | ||||||||||||||||||
Tax on profit | (67) | (34.8) | (32.0) | (265) | (36.2) | (36.3) | ||||||||||||||||||
Profit from continuing operations | 252 | (24.4) | (21.7) | 844 | (19.0) | (19.1) | ||||||||||||||||||
Net profit from discontinued operations | — | — | — | — | — | — | ||||||||||||||||||
Consolidated profit | 252 | (24.4) | (21.7) | 844 | (19.0) | (19.1) | ||||||||||||||||||
Non-controlling interests | (6) | 2.0 | 5.1 | (16) | (16.7) | (16.8) | ||||||||||||||||||
Underlying attributable profit to the parent | 246 | (24.9) | (22.2) | 828 | (19.1) | (19.2) | ||||||||||||||||||
| Balance sheet | ||||||||||||||||||||||||
Loans and advances to customers | 259,304 | 3.1 | 1.8 | 259,304 | 4.2 | 4.0 | ||||||||||||||||||
Cash, central banks and credit institutions | 32,502 | (19.8) | (20.8) | 32,502 | (14.9) | (15.1) | ||||||||||||||||||
Debt instruments | 24,260 | 2.8 | 1.5 | 24,260 | 1.4 | 1.2 | ||||||||||||||||||
Other financial assets | 1,053 | (3.6) | (4.7) | 1,053 | (89.2) | (89.2) | ||||||||||||||||||
Other asset accounts | 10,777 | 4.3 | 3.1 | 10,777 | 20.1 | 19.9 | ||||||||||||||||||
Total assets | 327,896 | 0.2 | (1.0) | 327,896 | (0.5) | (0.7) | ||||||||||||||||||
Customer deposits | 214,782 | 1.8 | 0.6 | 214,782 | 0.1 | (0.1) | ||||||||||||||||||
Central banks and credit institutions | 23,771 | (3.1) | (4.2) | 23,771 | 3.4 | 3.2 | ||||||||||||||||||
Marketable debt securities | 63,937 | (2.0) | (3.2) | 63,937 | (5.8) | (6.0) | ||||||||||||||||||
Other financial liabilities | 2,887 | (40.8) | (41.5) | 2,887 | (41.9) | (42.0) | ||||||||||||||||||
Other liabilities accounts | 5,736 | 28.3 | 26.8 | 5,736 | 49.0 | 48.7 | ||||||||||||||||||
Total liabilities | 311,114 | 0.3 | (0.9) | 311,114 | (1.0) | (1.2) | ||||||||||||||||||
Total equity | 16,782 | (1.2) | (2.4) | 16,782 | 9.1 | 8.9 | ||||||||||||||||||
Memorandum items: | ||||||||||||||||||||||||
Gross loans and advances to customers(2) | 235,831 | 1.6 | 0.4 | 235,831 | 2.4 | 2.2 | ||||||||||||||||||
Customer funds | 208,839 | 1.8 | 0.6 | 208,839 | 2.7 | 2.5 | ||||||||||||||||||
Customer deposits(3) | 200,852 | 2.0 | 0.8 | 200,852 | 3.0 | 2.8 | ||||||||||||||||||
Mutual funds | 7,986 | (1.9) | (3.1) | 7,986 | (4.6) | (4.8) | ||||||||||||||||||
| Ratios (%) and operating means | ||||||||||||||||||||||||
Underlying RoTE | 6.72 | (1.96) | 7.45 | (2.61) | ||||||||||||||||||||
Efficiency ratio | 60.9 | 1.4 | 60.5 | 5.6 | ||||||||||||||||||||
NPL ratio | 1.08 | (0.05) | 1.08 | (0.04) | ||||||||||||||||||||
NPL coverage | 34.1 | 2.2 | 34.1 | 1.1 | ||||||||||||||||||||
Number of employees | 24,999 | (3.0) | 24,999 | (1.9) | ||||||||||||||||||||
Number of branches | 629 | (4.6) | 629 | (17.9) | ||||||||||||||||||||
(1) Includes exchange differences.
(2) Excluding reverse repos.
(3) Excluding repos.
January - September 2019 57
Table of Contents
Responsible banking | ||||||||||||||||
Santander vision and | Group financial | Financial information | Corporate governance | |||||||||||||
corporate culture |
| information |
| by segments |
| Santander share |
| Appendix | ||||||||
|
|
|
|
Financial information |
Portugal | | |||||||||||||||
EUR million | ||||||||||||||||
| /Q2’19 | /9M’18 | |||||||||||||||
| Underlying income statement | Q3’19 | % | 9M’19 | % | ||||||||||||
Net interest income | 214 | 0.3 | 643 | (0.5) | ||||||||||||
Net fee income | 96 | (3.3) | 292 | 4.1 | ||||||||||||
Gains (losses) on financial transactions(1) | 9 | (77.6) | 101 | 59.3 | ||||||||||||
Other operating income | 13 | — | 7 | (64.2) | ||||||||||||
Total income | 331 | (6.4) | 1,043 | 3.3 | ||||||||||||
Administrative expenses and amortisations | (155) | 0.5 | (467) | (3.1) | ||||||||||||
Net operating income | 176 | (11.7) | 576 | 9.0 | ||||||||||||
Net loan-loss provisions | (0) | (66.3) | 12 | — | ||||||||||||
Other gains (losses) and provisions | 2 | — | (30) | 67.9 | ||||||||||||
Profit before tax | 178 | (4.2) | 557 | 13.6 | ||||||||||||
Tax on profit | (53) | (12.2) | (171) | 17.4 | ||||||||||||
Profit from continuing operations | 125 | (0.4) | 386 | 12.0 | ||||||||||||
Net profit from discontinued operations | — | — | — | — | ||||||||||||
Consolidated profit | 125 | (0.4) | 386 | 12.0 | ||||||||||||
Non-controlling interests | (0) | (32.6) | (1) | (30.9) | ||||||||||||
Underlying attributable profit to the parent | 125 | (0.3) | 385 | 12.2 | ||||||||||||
| Balance sheet | ||||||||||||||||
Loans and advances to customers | 35,631 | (0.3) | 35,631 | 0.1 | ||||||||||||
Cash, central banks and credit institutions | 4,257 | 5.8 | 4,257 | 33.4 | ||||||||||||
Debt instruments | 13,236 | (0.0) | 13,236 | 11.6 | ||||||||||||
Other financial assets | 1,781 | (1.6) | 1,781 | (8.3) | ||||||||||||
Other asset accounts | 1,934 | (0.4) | 1,934 | (15.9) | ||||||||||||
Total assets | 56,838 | 0.2 | 56,838 | 3.5 | ||||||||||||
Customer deposits | 39,048 | 0.2 | 39,048 | 5.1 | ||||||||||||
Central banks and credit institutions | 7,816 | (3.1) | 7,816 | (0.0) | ||||||||||||
Marketable debt securities | 3,411 | (0.4) | 3,411 | (20.8) | ||||||||||||
Other financial liabilities | 302 | (7.3) | 302 | 24.4 | ||||||||||||
Other liabilities accounts | 1,848 | 8.6 | 1,848 | 33.7 | ||||||||||||
Total liabilities | 52,425 | (0.1) | 52,425 | 3.0 | ||||||||||||
Total equity | 4,413 | 3.7 | 4,413 | 10.0 | ||||||||||||
Memorandum items: | ||||||||||||||||
Gross loans and advances to customers(2) | 36,536 | (0.4) | 36,536 | (1.5) | ||||||||||||
Customer funds | 42,167 | 0.9 | 42,167 | 7.6 | ||||||||||||
Customer deposits(3) | 39,048 | 0.2 | 39,048 | 5.1 | ||||||||||||
Mutual funds | 3,119 | 11.0 | 3,119 | 52.5 | ||||||||||||
| Ratios (%) and operating means | ||||||||||||||||
Underlying RoTE | 11.60 | (0.37) | 12.21 | 0.66 | ||||||||||||
Efficiency ratio | 46.8 | 3.2 | 44.8 | (2.9) | ||||||||||||
NPL ratio | 4.90 | (0.10) | 4.90 | (2.53) | ||||||||||||
NPL coverage | 51.5 | (1.4) | 51.5 | (1.9) | ||||||||||||
Number of employees | 6,678 | (0.9) | 6,678 | (3.4) | ||||||||||||
Number of branches | 549 | (0.7) | 549 | (17.7) | ||||||||||||
(1) Includes exchange differences.
(2) Excluding reverse repos.
(3) Excluding repos.
58 January - September 2019
Table of Contents
Responsible banking | ||||||||||||||||
Santander vision and | Group financial | Financial information | Corporate governance | |||||||||||||
corporate culture |
| information |
| by segments |
| Santander share |
| Appendix | ||||||||
|
|
|
|
Financial information by segments |
Poland | | |||||||||||||||||||||||
EUR million | ||||||||||||||||||||||||
| /Q2’19 | /9M’18 | |||||||||||||||||||||||
| Underlying income statement | Q3’19 | % | % excl. FX | 9M’19 | % | % excl. FX | ||||||||||||||||||
Net interest income | 298 | 5.1 | 5.9 | 863 | 18.2 | 19.7 | ||||||||||||||||||
Net fee income | 119 | 2.2 | 3.0 | 349 | 3.4 | 4.7 | ||||||||||||||||||
Gains (losses) on financial transactions(1) | 24 | 15.1 | 15.9 | 63 | 84.1 | 86.4 | ||||||||||||||||||
Other operating income | 0 | (98.6) | (98.8) | (17) | 303.2 | 308.2 | ||||||||||||||||||
Total income | 442 | 0.4 | 1.2 | 1,258 | 14.6 | 16.0 | ||||||||||||||||||
Administrative expenses and amortisations | (175) | (1.0) | (0.1) | (524) | 10.5 | 11.9 | ||||||||||||||||||
Net operating income | 267 | 1.4 | 2.1 | 734 | 17.7 | 19.1 | ||||||||||||||||||
Net loan-loss provisions | (59) | (6.6) | (5.9) | (166) | 38.5 | 40.2 | ||||||||||||||||||
Other gains (losses) and provisions | (24) | (28.4) | (27.6) | (92) | 25.0 | 26.6 | ||||||||||||||||||
Profit before tax | 183 | 10.6 | 11.3 | 476 | 10.6 | 12.0 | ||||||||||||||||||
Tax on profit | (44) | 22.8 | 23.7 | (118) | 21.9 | 23.4 | ||||||||||||||||||
Profit from continuing operations | 139 | 7.2 | 7.9 | 358 | 7.4 | 8.7 | ||||||||||||||||||
Net profit from discontinued operations | — | — | — | — | — | — | ||||||||||||||||||
Consolidated profit | 139 | 7.2 | 7.9 | 358 | 7.4 | 8.7 | ||||||||||||||||||
Non-controlling interests | (44) | 7.6 | 8.3 | (114) | 14.7 | 16.1 | ||||||||||||||||||
Underlying attributable profit to the parent | 95 | 7.0 | 7.7 | 245 | 4.3 | 5.6 | ||||||||||||||||||
| Balance sheet | ||||||||||||||||||||||||
Loans and advances to customers | 29,024 | (1.1) | 1.9 | 29,024 | 22.8 | 25.7 | ||||||||||||||||||
Cash, central banks and credit institutions | 3,391 | 13.5 | 17.0 | 3,391 | 59.4 | 63.1 | ||||||||||||||||||
Debt instruments | 8,416 | (18.8) | (16.4) | 8,416 | (13.4) | (11.4) | ||||||||||||||||||
Other financial assets | 689 | 21.8 | 25.5 | 689 | 48.5 | 52.0 | ||||||||||||||||||
Other asset accounts | 1,315 | (0.8) | 2.2 | 1,315 | 21.5 | 24.4 | ||||||||||||||||||
Total assets | 42,836 | (3.9) | (1.0) | 42,836 | 15.7 | 18.4 | ||||||||||||||||||
Customer deposits | 31,266 | (4.6) | (1.7) | 31,266 | 11.6 | 14.2 | ||||||||||||||||||
Central banks and credit institutions | 2,666 | (17.8) | (15.3) | 2,666 | 62.4 | 66.2 | ||||||||||||||||||
Marketable debt securities | 2,201 | 5.3 | 8.4 | 2,201 | 44.2 | 47.6 | ||||||||||||||||||
Other financial liabilities | 953 | 17.1 | 20.7 | 953 | 108.4 | 113.3 | ||||||||||||||||||
Other liabilities accounts | 948 | 6.0 | 9.2 | 948 | 29.3 | 32.3 | ||||||||||||||||||
Total liabilities | 38,035 | (4.4) | (1.5) | 38,035 | 17.4 | 20.2 | ||||||||||||||||||
Total equity | 4,801 | 0.2 | 3.2 | 4,801 | 3.3 | 5.8 | ||||||||||||||||||
Memorandum items: | ||||||||||||||||||||||||
Gross loans and advances to customers(2) | 29,955 | (1.1) | 1.9 | 29,955 | 23.0 | 25.9 | ||||||||||||||||||
Customer funds | 35,445 | (1.7) | 1.3 | 35,445 | 18.1 | 20.9 | ||||||||||||||||||
Customer deposits(3) | 31,266 | (1.9) | 1.1 | 31,266 | 19.3 | 22.1 | ||||||||||||||||||
Mutual funds | 4,178 | (0.4) | 2.7 | 4,178 | 10.0 | 12.6 | ||||||||||||||||||
| Ratios (%) and operating means | ||||||||||||||||||||||||
Underlying RoTE | 12.52 | 1.08 | 10.53 | (0.46) | ||||||||||||||||||||
Efficiency ratio | 39.5 | (0.6) | 41.7 | (1.5) | ||||||||||||||||||||
NPL ratio | 4.35 | 0.14 | 4.35 | 0.12 | ||||||||||||||||||||
NPL coverage | 69.0 | (0.7) | 69.0 | (2.6) | ||||||||||||||||||||
Number of employees | 11,026 | (4.0) | 11,026 | (2.3) | ||||||||||||||||||||
Number of branches | 525 | (1.3) | 525 | 1.2 | ||||||||||||||||||||
(1) Includes exchange differences.
(2) Excluding reverse repos.
(3) Excluding repos.
January - September 2019 59
Table of Contents
Responsible banking | ||||||||||||||||
Santander vision and | Group financial | Financial information | Corporate governance | |||||||||||||
corporate culture |
| information |
| by segments |
| Santander share |
| Appendix | ||||||||
|
|
|
|
Financial information by segments |
Other Europe | | |||||||||||||||||||||||
EUR million | ||||||||||||||||||||||||
| /Q2’19 | /9M’18 | |||||||||||||||||||||||
| Underlying income statement | Q3’19 | % | % excl. FX | 9M’19 | % | % excl. FX | ||||||||||||||||||
Net interest income | 166 | 4.3 | 4.2 | 465 | 50.6 | 49.2 | ||||||||||||||||||
Net fee income | 52 | (7.1) | (7.4) | 171 | (15.1) | (16.6) | ||||||||||||||||||
Gains (losses) on financial transactions(1) | (65) | (56.3) | (56.1) | (218) | — | — | ||||||||||||||||||
Other operating income | 57 | (59.7) | (59.7) | 263 | 104.3 | 103.4 | ||||||||||||||||||
Total income | 211 | 1.0 | 0.7 | 680 | (4.3) | (5.6) | ||||||||||||||||||
Administrative expenses and amortisations | (205) | (1.3) | (1.5) | (613) | 12.7 | 11.2 | ||||||||||||||||||
Net operating income | 5 | — | — | 67 | (59.9) | (60.5) | ||||||||||||||||||
Net loan-loss provisions | (3) | (78.3) | (78.3) | (21) | (39.6) | (39.6) | ||||||||||||||||||
Other gains (losses) and provisions | (7) | 74.1 | 74.1 | (18) | 53.7 | 47.1 | ||||||||||||||||||
Profit before tax | (5) | (72.7) | (72.1) | 28 | (76.7) | (77.1) | ||||||||||||||||||
Tax on profit | (3) | 85.6 | 84.7 | (23) | (60.4) | (60.8) | ||||||||||||||||||
Profit from continuing operations | (8) | (61.1) | (60.5) | 5 | (92.6) | (92.8) | ||||||||||||||||||
Net profit from discontinued operations | — | — | — | — | — | — | ||||||||||||||||||
Consolidated profit | (8) | (61.1) | (60.5) | 5 | (92.6) | (92.8) | ||||||||||||||||||
Non-controlling interests | 0 | — | — | (3) | 265.8 | 225.1 | ||||||||||||||||||
Underlying attributable profit to the parent | (8) | (64.0) | (63.6) | 2 | (97.0) | (97.1) | ||||||||||||||||||
| Balance sheet | ||||||||||||||||||||||||
Loans and advances to customers | 44,046 | 8.4 | 7.4 | 44,046 | 29.9 | 28.6 | ||||||||||||||||||
Cash, central banks and credit institutions | 56,410 | (4.9) | (5.0) | 56,410 | 17.9 | 17.3 | ||||||||||||||||||
Debt instruments | 25,496 | 6.0 | 5.7 | 25,496 | 38.8 | 38.3 | ||||||||||||||||||
Other financial assets | 51,825 | 11.4 | 11.4 | 51,825 | 29.6 | 29.5 | ||||||||||||||||||
Other asset accounts | 3,889 | 38.8 | 35.6 | 3,889 | 21.0 | 17.7 | ||||||||||||||||||
Total assets | 181,666 | 4.8 | 4.5 | 181,666 | 26.7 | 26.1 | ||||||||||||||||||
Customer deposits | 20,850 | 23.5 | 22.9 | 20,850 | 41.4 | 40.3 | ||||||||||||||||||
Central banks and credit institutions | 101,282 | (4.3) | (4.6) | 101,282 | 25.6 | 24.9 | ||||||||||||||||||
Marketable debt securities | (8) | — | — | (8) | — | — | ||||||||||||||||||
Other financial liabilities | 54,434 | 16.0 | 16.0 | 54,434 | 25.4 | 25.3 | ||||||||||||||||||
Other liabilities accounts | 1,316 | 224.8 | 221.8 | 1,316 | 174.9 | 172.0 | ||||||||||||||||||
Total liabilities | 177,873 | 4.6 | 4.2 | 177,873 | 27.1 | 26.5 | ||||||||||||||||||
Total equity | 3,793 | 17.5 | 15.3 | 3,793 | 13.2 | 10.5 | ||||||||||||||||||
Memorandum items: | ||||||||||||||||||||||||
Gross loans and advances to customers(2) | 38,204 | 2.4 | 1.4 | 38,204 | 31.9 | 30.3 | ||||||||||||||||||
Customer funds | 24,941 | 21.5 | 21.0 | 24,941 | 39.0 | 38.1 | ||||||||||||||||||
Customer deposits(3) | 20,800 | 23.9 | 23.3 | 20,800 | 43.1 | 41.9 | ||||||||||||||||||
Mutual funds | 4,142 | 10.8 | 10.8 | 4,142 | 21.5 | 21.5 | ||||||||||||||||||
| Resources | ||||||||||||||||||||||||
Number of employees | 2,343 | 0.7 | 2,343 | 11.9 | ||||||||||||||||||||
(1) Includes exchange differences.
(2) Excluding reverse repos.
(3) Excluding repos.
60 January - September 2019
Table of Contents
Responsible banking | ||||||||||||||||
Santander vision and | Group financial | Financial information | Corporate governance | |||||||||||||
corporate culture |
| information |
| by segments |
| Santander share |
| Appendix | ||||||||
|
|
|
|
Financial information by segments |
NORTH AMERICA | | |||||||||||||||||||||||
EUR million | ||||||||||||||||||||||||
| /Q2’19 | /9M’18 | |||||||||||||||||||||||
| Underlying income statement | Q3’19 | % | % excl. FX | 9M’19 | % | % excl. FX | ||||||||||||||||||
Net interest income | 2,259 | 1.3 | 0.7 | 6,661 | 13.5 | 7.3 | ||||||||||||||||||
Net fee income | 448 | (3.3) | (3.7) | 1,349 | 10.9 | 5.0 | ||||||||||||||||||
Gains (losses) on financial transactions(1) | 86 | 71.8 | 71.0 | 147 | (7.9) | (12.7) | ||||||||||||||||||
Other operating income | 191 | 8.7 | 7.4 | 497 | 35.0 | 26.8 | ||||||||||||||||||
Total income | 2,983 | 2.2 | 1.6 | 8,655 | 13.7 | 7.4 | ||||||||||||||||||
Administrative expenses and amortisations | (1,267) | 4.4 | 3.8 | (3,654) | 10.2 | 4.1 | ||||||||||||||||||
Net operating income | 1,716 | 0.7 | 0.1 | 5,002 | 16.4 | 10.0 | ||||||||||||||||||
Net loan-loss provisions | (1,009) | 27.2 | 26.6 | (2,606) | 13.8 | 7.5 | ||||||||||||||||||
Other gains (losses) and provisions | (79) | 156.1 | 156.2 | (174) | 7.1 | 0.9 | ||||||||||||||||||
Profit before tax | 628 | (28.7) | (29.2) | 2,222 | 20.4 | 13.9 | ||||||||||||||||||
Tax on profit | (147) | (32.5) | (33.1) | (551) | 12.2 | 6.1 | ||||||||||||||||||
Profit from continuing operations | 481 | (27.4) | (27.9) | 1,671 | 23.3 | 16.7 | ||||||||||||||||||
Net profit from discontinued operations | — | — | — | — | — | — | ||||||||||||||||||
Consolidated profit | 481 | (27.4) | (27.9) | 1,671 | 23.3 | 16.7 | ||||||||||||||||||
Non-controlling interests | (93) | (42.1) | (42.7) | (393) | 13.4 | 7.3 | ||||||||||||||||||
Underlying attributable profit to the parent | 388 | (22.8) | (23.2) | 1,278 | 26.7 | 20.0 | ||||||||||||||||||
| Balance sheet | ||||||||||||||||||||||||
Loans and advances to customers | 131,515 | 4.0 | 0.2 | 131,515 | 18.1 | 12.5 | ||||||||||||||||||
Cash, central banks and credit institutions | 23,329 | (8.0) | (10.9) | 23,329 | (9.4) | (13.1) | ||||||||||||||||||
Debt instruments | 33,786 | 26.4 | 22.5 | 33,786 | 17.2 | 13.0 | ||||||||||||||||||
Other financial assets | 12,049 | 27.1 | 23.5 | 12,049 | 13.1 | 9.0 | ||||||||||||||||||
Other asset accounts | 22,624 | 5.5 | 1.4 | 22,624 | 28.9 | 22.2 | ||||||||||||||||||
Total assets | 223,302 | 6.6 | 2.9 | 223,302 | 15.0 | 9.9 | ||||||||||||||||||
Customer deposits | 102,513 | 4.2 | 0.7 | 102,513 | 10.0 | 5.2 | ||||||||||||||||||
Central banks and credit institutions | 31,162 | 11.0 | 7.3 | 31,162 | 26.9 | 21.9 | ||||||||||||||||||
Marketable debt securities | 44,250 | 5.8 | 1.7 | 44,250 | 19.7 | 13.5 | ||||||||||||||||||
Other financial liabilities | 14,539 | 22.0 | 18.8 | 14,539 | 23.9 | 19.9 | ||||||||||||||||||
Other liabilities accounts | 6,160 | 4.7 | 1.2 | 6,160 | 5.3 | 0.7 | ||||||||||||||||||
Total liabilities | 198,624 | 6.8 | 3.1 | 198,624 | 15.3 | 10.2 | ||||||||||||||||||
Total equity | 24,678 | 5.2 | 1.4 | 24,678 | 13.0 | 7.6 | ||||||||||||||||||
Memorandum items: | ||||||||||||||||||||||||
Gross loans and advances to customers(2) | 128,359 | 4.5 | 0.7 | 128,359 | 14.1 | 8.7 | ||||||||||||||||||
Customer funds | 114,194 | 2.4 | (1.1) | 114,194 | 11.5 | 6.8 | ||||||||||||||||||
Customer deposits(3) | 92,567 | 2.2 | (1.3) | 92,567 | 11.9 | 7.0 | ||||||||||||||||||
Mutual funds | 21,627 | 2.9 | (0.0) | 21,627 | 9.9 | 6.1 | ||||||||||||||||||
| Ratios (%) and operating means | ||||||||||||||||||||||||
Underlying RoTE | 7.76 | (2.80) | 8.90 | 0.97 | ||||||||||||||||||||
Efficiency ratio | 42.5 | 0.9 | 42.2 | (1.3) | ||||||||||||||||||||
NPL ratio | 2.21 | (0.08) | 2.21 | (0.62) | ||||||||||||||||||||
NPL coverage | 155.6 | 5.3 | 155.6 | 16.2 | ||||||||||||||||||||
Number of employees | 38,106 | 3.2 | 38,106 | 3.6 | ||||||||||||||||||||
Number of branches | 2,058 | (0.2) | 2,058 | (0.8) | ||||||||||||||||||||
(1) Includes exchange differences.
(2) Excluding reverse repos.
(3) Excluding repos.
January - September 2019 61
Table of Contents
Responsible banking | ||||||||||||||||
Santander vision and | Group financial | Financial information | Corporate governance | |||||||||||||
corporate culture |
| information |
| by segments |
| Santander share |
| Appendix | ||||||||
|
|
|
|
Financial information by segments |
United States | | |||||||||||||||||||||||
EUR million | ||||||||||||||||||||||||
| /Q2’19 | /9M’18 | |||||||||||||||||||||||
| Underlying income statement | Q3’19 | % | % excl. FX | 9M’19 | % | % excl. FX | ||||||||||||||||||
Net interest income | 1,460 | 0.5 | (0.6) | 4,320 | 12.6 | 6.0 | ||||||||||||||||||
Net fee income | 238 | (2.8) | (3.9) | 716 | 11.7 | 5.1 | ||||||||||||||||||
Gains (losses) on financial transactions(1) | 58 | 149.9 | 148.6 | 97 | 60.3 | 50.9 | ||||||||||||||||||
Other operating income | 220 | 10.7 | 9.6 | 577 | 30.5 | 22.8 | ||||||||||||||||||
Total income | 1,977 | 3.0 | 1.8 | 5,711 | 14.6 | 7.9 | ||||||||||||||||||
Administrative expenses and amortisations | (847) | 5.2 | 4.1 | (2,427) | 9.2 | 2.8 | ||||||||||||||||||
Net operating income | 1,130 | 1.3 | 0.2 | 3,283 | 19.0 | 12.0 | ||||||||||||||||||
Net loan-loss provisions | (786) | 38.5 | 37.4 | (1,965) | 17.4 | 10.5 | ||||||||||||||||||
Other gains (losses) and provisions | (76) | 193.8 | 193.9 | (161) | 13.1 | 6.4 | ||||||||||||||||||
Profit before tax | 267 | (48.7) | (49.7) | 1,158 | 22.8 | 15.6 | ||||||||||||||||||
Tax on profit | (72) | (48.1) | (49.2) | (320) | 7.2 | 0.9 | ||||||||||||||||||
Profit from continuing operations | 196 | (48.9) | (49.9) | 838 | 30.0 | 22.4 | ||||||||||||||||||
Net profit from discontinued operations | — | — | — | — | — | — | ||||||||||||||||||
Consolidated profit | 196 | (48.9) | (49.9) | 838 | 30.0 | 22.4 | ||||||||||||||||||
Non-controlling interests | (42) | (58.1) | (59.2) | (219) | 17.2 | 10.3 | ||||||||||||||||||
Underlying attributable profit to the parent | 154 | (45.7) | (46.7) | 619 | 35.2 | 27.3 | ||||||||||||||||||
| Balance sheet | ||||||||||||||||||||||||
Loans and advances to customers | 98,792 | 6.1 | 1.5 | 98,792 | 23.6 | 16.3 | ||||||||||||||||||
Cash, central banks and credit institutions | 12,806 | (7.1) | (11.1) | 12,806 | (10.4) | (15.8) | ||||||||||||||||||
Debt instruments | 16,668 | 20.4 | 15.2 | 16,668 | 25.8 | 18.3 | ||||||||||||||||||
Other financial assets | 4,866 | 24.4 | 19.0 | 4,866 | (4.6) | (10.3) | ||||||||||||||||||
Other asset accounts | 19,052 | 6.5 | 1.9 | 19,052 | 30.1 | 22.4 | ||||||||||||||||||
Total assets | 152,183 | 6.7 | 2.1 | 152,183 | 19.6 | 12.5 | ||||||||||||||||||
Customer deposits | 68,588 | 6.5 | 2.0 | 68,588 | 16.4 | 9.5 | ||||||||||||||||||
Central banks and credit institutions | 18,447 | 5.4 | 0.9 | 18,447 | 40.2 | 31.9 | ||||||||||||||||||
Marketable debt securities | 37,561 | 6.5 | 1.9 | 37,561 | 22.3 | 15.0 | ||||||||||||||||||
Other financial liabilities | 5,106 | 19.4 | 14.2 | 5,106 | 15.7 | 8.8 | ||||||||||||||||||
Other liabilities accounts | 4,125 | 10.8 | 6.0 | 4,125 | 8.0 | 1.6 | ||||||||||||||||||
Total liabilities | 133,827 | 7.0 | 2.3 | 133,827 | 20.6 | 13.4 | ||||||||||||||||||
Total equity | 18,355 | 5.2 | 0.7 | 18,355 | 13.4 | 6.7 | ||||||||||||||||||
Memorandum items: | ||||||||||||||||||||||||
Gross loans and advances to customers(2) | 94,753 | 5.7 | 1.1 | 94,753 | 17.4 | 10.5 | ||||||||||||||||||
Customer funds | 73,585 | 5.2 | 0.6 | 73,585 | 18.7 | 11.6 | ||||||||||||||||||
Customer deposits(3) | 63,426 | 4.9 | 0.4 | 63,426 | 18.4 | 11.4 | ||||||||||||||||||
Mutual funds | 10,159 | 7.0 | 2.4 | 10,159 | 20.2 | 13.1 | ||||||||||||||||||
| Ratios (%) and operating means | ||||||||||||||||||||||||
Underlying RoTE | 3.99 | (3.66) | 5.57 | 0.95 | ||||||||||||||||||||
Efficiency ratio | 42.8 | 0.9 | 42.5 | (2.1) | ||||||||||||||||||||
NPL ratio | 2.18 | (0.14) | 2.18 | (0.82) | ||||||||||||||||||||
NPL coverage | 166.6 | 8.2 | 166.6 | 21.1 | ||||||||||||||||||||
Number of employees | 17,586 | 1.2 | 17,586 | 1.6 | ||||||||||||||||||||
Number of branches | 624 | (3.4) | 624 | (6.0) | ||||||||||||||||||||
(1) Includes exchange differences.
(2) Excluding reverse repos.
(3) Excluding repos.
62 January - September 2019
Table of Contents
Responsible banking | ||||||||||||||||
Santander vision and | Group financial | Financial information | Corporate governance | |||||||||||||
corporate culture |
| information |
| by segments |
| Santander share |
| Appendix | ||||||||
|
|
|
|
Financial information by segments |
Mexico | | |||||||||||||||||||||||
EUR million | ||||||||||||||||||||||||
| /Q2’19 | /9M’18 | |||||||||||||||||||||||
| Underlying income statement | Q3’19 | % | % excl. FX | 9M’19 | % | % excl. FX | ||||||||||||||||||
Net interest income | 798 | 2.8 | 3.2 | 2,341 | 15.3 | 9.8 | ||||||||||||||||||
Net fee income | 210 | (3.8) | (3.4) | 633 | 10.1 | 4.8 | ||||||||||||||||||
Gains (losses) on financial transactions(1) | 27 | 3.3 | 3.0 | 50 | (49.5) | (51.9) | ||||||||||||||||||
Other operating income | (29) | 25.8 | 26.6 | (80) | 7.8 | 2.6 | ||||||||||||||||||
Total income | 1,007 | 0.8 | 1.2 | 2,944 | 12.0 | 6.6 | ||||||||||||||||||
Administrative expenses and amortisations | (420) | 2.8 | 3.3 | (1,226) | 12.4 | 7.0 | ||||||||||||||||||
Net operating income | 586 | (0.6) | (0.2) | 1,718 | 11.7 | 6.3 | ||||||||||||||||||
Net loan-loss provisions | (223) | (1.1) | (0.8) | (642) | 4.2 | (0.8) | ||||||||||||||||||
Other gains (losses) and provisions | (3) | (44.1) | (43.8) | (13) | (35.0) | (38.1) | ||||||||||||||||||
Profit before tax | 361 | 0.3 | 0.7 | 1,064 | 17.8 | 12.2 | ||||||||||||||||||
Tax on profit | (75) | (5.2) | (4.8) | (231) | 20.0 | 14.2 | ||||||||||||||||||
Profit from continuing operations | 286 | 1.9 | 2.3 | 832 | 17.2 | 11.6 | ||||||||||||||||||
Net profit from discontinued operations | — | — | — | — | — | — | ||||||||||||||||||
Consolidated profit | 286 | 1.9 | 2.3 | 832 | 17.2 | 11.6 | ||||||||||||||||||
Non-controlling interests | (51) | (16.0) | (15.7) | (174) | 9.0 | 3.7 | ||||||||||||||||||
Underlying attributable profit to the parent | 234 | 6.9 | 7.3 | 659 | 19.6 | 13.9 | ||||||||||||||||||
| Balance sheet | ||||||||||||||||||||||||
Loans and advances to customers | 32,723 | (1.9) | (3.5) | 32,723 | 4.1 | 2.5 | ||||||||||||||||||
Cash, central banks and credit institutions | 10,523 | (9.0) | (10.5) | 10,523 | (8.2) | (9.6) | ||||||||||||||||||
Debt instruments | 17,118 | 32.8 | 30.6 | 17,118 | 9.8 | 8.2 | ||||||||||||||||||
Other financial assets | 7,183 | 29.0 | 26.8 | 7,183 | 29.5 | 27.5 | ||||||||||||||||||
Other asset accounts | 3,572 | 0.3 | (1.4) | 3,572 | 22.9 | 21.0 | ||||||||||||||||||
Total assets | 71,119 | 6.3 | 4.5 | 71,119 | 6.2 | 4.6 | ||||||||||||||||||
Customer deposits | 33,925 | (0.2) | (1.9) | 33,925 | (1.1) | (2.6) | ||||||||||||||||||
Central banks and credit institutions | 12,715 | 20.2 | 18.2 | 12,715 | 11.5 | 9.9 | ||||||||||||||||||
Marketable debt securities | 6,689 | 1.9 | 0.2 | 6,689 | 7.1 | 5.5 | ||||||||||||||||||
Other financial liabilities | 9,433 | 23.5 | 21.5 | 9,433 | 28.8 | 26.9 | ||||||||||||||||||
Other liabilities accounts | 2,035 | (5.9) | (7.4) | 2,035 | 0.4 | (1.2) | ||||||||||||||||||
Total liabilities | 64,796 | 6.4 | 4.6 | 64,796 | 5.7 | 4.1 | ||||||||||||||||||
Total equity | 6,323 | 5.3 | 3.5 | 6,323 | 11.9 | 10.3 | ||||||||||||||||||
Memorandum items: | ||||||||||||||||||||||||
Gross loans and advances to customers(2) | 33,606 | 1.1 | (0.6) | 33,606 | 5.5 | 3.9 | ||||||||||||||||||
Customer funds | 40,609 | (2.3) | (4.0) | 40,609 | 0.5 | (1.0) | ||||||||||||||||||
Customer deposits(3) | 29,141 | (3.1) | (4.7) | 29,141 | (0.1) | (1.6) | ||||||||||||||||||
Mutual funds | 11,468 | (0.4) | (2.1) | 11,468 | 2.1 | 0.6 | ||||||||||||||||||
| Ratios (%) and operating means | ||||||||||||||||||||||||
Underlying RoTE | 20.13 | (0.58) | 20.27 | 0.41 | ||||||||||||||||||||
Efficiency ratio | 41.8 | 0.8 | 41.6 | 0.1 | ||||||||||||||||||||
NPL ratio | 2.30 | 0.09 | 2.30 | (0.11) | ||||||||||||||||||||
NPL coverage | 125.2 | (1.7) | 125.2 | 4.7 | ||||||||||||||||||||
Number of employees | 20,520 | 5.0 | 20,520 | 5.3 | ||||||||||||||||||||
Number of branches | 1,434 | 1.3 | 1,434 | 1.7 | ||||||||||||||||||||
(1) Includes exchange differences.
(2) Excluding reverse repos.
(3) Excluding repos.
January - September 2019 63
Table of Contents
Responsible banking | ||||||||||||||||
Santander vision and | Group financial | Financial information | Corporate governance | |||||||||||||
corporate culture |
| information |
| by segments |
| Santander share |
| Appendix | ||||||||
|
|
|
|
Financial information by segments |
SOUTH AMERICA | | |||||||||||||||||||||||
EUR million | ||||||||||||||||||||||||
| /Q2’19 | /9M’18 | |||||||||||||||||||||||
| Underlying income statement | Q3’19 | % | % excl. FX | 9M’19 | % | % excl. FX | ||||||||||||||||||
Net interest income | 3,314 | (3.3) | 2.5 | 9,960 | 4.7 | 8.5 | ||||||||||||||||||
Net fee income | 1,204 | 2.2 | 9.6 | 3,559 | 9.8 | 14.7 | ||||||||||||||||||
Gains (losses) on financial transactions(1) | 150 | 15.5 | 28.3 | 439 | 21.8 | 36.8 | ||||||||||||||||||
Other operating income | (90) | 6.2 | 46.4 | (247) | 217.0 | 339.8 | ||||||||||||||||||
Total income | 4,577 | (1.5) | 4.3 | 13,711 | 5.2 | 9.3 | ||||||||||||||||||
Administrative expenses and amortisations | (1,586) | (4.7) | 4.8 | (4,895) | 3.8 | 9.0 | ||||||||||||||||||
Net operating income | 2,991 | 0.3 | 4.0 | 8,817 | 6.0 | 9.4 | ||||||||||||||||||
Net loan-loss provisions | (916) | (4.2) | 1.2 | (2,775) | 0.2 | 3.8 | ||||||||||||||||||
Other gains (losses) and provisions | (193) | 27.6 | 29.3 | (499) | 2.6 | 7.9 | ||||||||||||||||||
Profit before tax | 1,882 | 0.3 | 3.4 | 5,543 | 9.4 | 12.6 | ||||||||||||||||||
Tax on profit | (699) | 4.0 | 7.0 | (2,062) | 2.6 | 5.6 | ||||||||||||||||||
Profit from continuing operations | 1,184 | (1.7) | 1.4 | 3,481 | 13.9 | 17.2 | ||||||||||||||||||
Net profit from discontinued operations | — | — | — | — | — | — | ||||||||||||||||||
Consolidated profit | 1,184 | (1.7) | 1.4 | 3,481 | 13.9 | 17.2 | ||||||||||||||||||
Non-controlling interests | (168) | (0.6) | 0.4 | (505) | 9.3 | 11.8 | ||||||||||||||||||
Underlying attributable profit to the parent | 1,016 | (1.9) | 1.6 | 2,977 | 14.8 | 18.2 | ||||||||||||||||||
| Balance sheet | ||||||||||||||||||||||||
Loans and advances to customers | 123,850 | (0.9) | 3.4 | 123,850 | 7.9 | 9.0 | ||||||||||||||||||
Cash, central banks and credit institutions | 46,924 | (6.1) | (0.6) | 46,924 | 2.2 | 2.6 | ||||||||||||||||||
Debt instruments | 49,118 | 1.9 | 6.3 | 49,118 | 23.2 | 21.1 | ||||||||||||||||||
Other financial assets | 13,786 | 19.8 | 24.2 | 13,786 | 71.7 | 70.9 | ||||||||||||||||||
Other asset accounts | 17,167 | 4.3 | 9.4 | 17,167 | 24.6 | 23.8 | ||||||||||||||||||
Total assets | 250,845 | (0.1) | 4.5 | 250,845 | 12.8 | 13.1 | ||||||||||||||||||
Customer deposits | 111,766 | (4.3) | 0.7 | 111,766 | 3.7 | 4.8 | ||||||||||||||||||
Central banks and credit institutions | 43,037 | 13.6 | 18.3 | 43,037 | 28.3 | 27.6 | ||||||||||||||||||
Marketable debt securities | 31,512 | (1.5) | 2.1 | 31,512 | 10.0 | 9.8 | ||||||||||||||||||
Other financial liabilities | 31,439 | 0.2 | 4.5 | 31,439 | 31.1 | 29.8 | ||||||||||||||||||
Other liabilities accounts | 10,216 | (1.0) | 3.6 | 10,216 | 29.3 | 28.2 | ||||||||||||||||||
Total liabilities | 227,969 | (0.1) | 4.5 | 227,969 | 12.9 | 13.2 | ||||||||||||||||||
Total equity | 22,876 | 0.2 | 4.8 | 22,876 | 11.4 | 11.2 | ||||||||||||||||||
Memorandum items: | ||||||||||||||||||||||||
Gross loans and advances to customers(2) | 129,722 | (0.9) | 3.3 | 129,722 | 8.0 | 9.0 | ||||||||||||||||||
Customer funds | 166,239 | (4.1) | 0.7 | 166,239 | 8.2 | 8.6 | ||||||||||||||||||
Customer deposits(3) | 98,608 | (6.4) | (1.4) | 98,608 | 5.9 | 7.6 | ||||||||||||||||||
Mutual funds | 67,631 | (0.5) | 3.8 | 67,631 | 11.8 | 10.1 | ||||||||||||||||||
| Ratios (%) and operating means | ||||||||||||||||||||||||
Underlying RoTE | 21.02 | (0.97) | 20.85 | 1.87 | ||||||||||||||||||||
Efficiency ratio | 34.6 | (1.2) | 35.7 | (0.5) | ||||||||||||||||||||
NPL ratio | 4.81 | — | 4.81 | (0.02) | ||||||||||||||||||||
NPL coverage | 89.7 | (3.3) | 89.7 | (4.4) | ||||||||||||||||||||
Number of employees | 71,264 | 0.1 | 71,264 | 1.7 | ||||||||||||||||||||
Number of branches | 4,639 | 1.0 | 4,639 | 2.2 | ||||||||||||||||||||
(1) Includes exchange differences.
(2) Excluding reverse repos.
(3) Excluding repos.
64 January - September 2019
Table of Contents
Responsible banking | ||||||||||||||||
Santander vision and | Group financial | Financial information | Corporate governance | |||||||||||||
corporate culture |
| information |
| by segments |
| Santander share |
| Appendix | ||||||||
|
|
|
|
Financial information by segments |
Brazil | | |||||||||||||||||||||||
| EUR million | ||||||||||||||||||||||||
| /Q2’19 | /9M’18 | |||||||||||||||||||||||
| Underlying income statement | Q3’19 | % | % excl. FX | 9M’19 | % | % excl. FX | ||||||||||||||||||
Net interest income | 2,560 | 1.6 | 1.6 | 7,539 | 3.5 | 5.5 | ||||||||||||||||||
Net fee income | 970 | 5.0 | 4.9 | 2,825 | 10.0 | 12.2 | ||||||||||||||||||
Gains (losses) on financial transactions(1) | 39 | (14.2) | (14.3) | 141 | 23.5 | 25.9 | ||||||||||||||||||
Other operating income | (46) | 28.3 | 28.0 | (118) | 591.5 | 605.1 | ||||||||||||||||||
Total income | 3,522 | 2.0 | 2.0 | 10,386 | 4.4 | 6.5 | ||||||||||||||||||
Administrative expenses and amortisations | (1,137) | 3.1 | 3.1 | (3,364) | 1.8 | 3.8 | ||||||||||||||||||
Net operating income | 2,385 | 1.5 | 1.5 | 7,022 | 5.7 | 7.8 | ||||||||||||||||||
Net loan-loss provisions | (753) | (1.1) | (1.0) | (2,223) | (0.6) | 1.4 | ||||||||||||||||||
Other gains (losses) and provisions | (178) | 16.8 | 16.5 | (498) | (0.1) | 1.9 | ||||||||||||||||||
Profit before tax | 1,454 | 1.2 | 1.2 | 4,301 | 10.0 | 12.2 | ||||||||||||||||||
Tax on profit | (593) | 2.0 | 2.0 | (1,766) | 2.1 | 4.1 | ||||||||||||||||||
Profit from continuing operations | 862 | 0.6 | 0.7 | 2,535 | 16.3 | 18.6 | ||||||||||||||||||
Net profit from discontinued operations | — | — | — | — | — | — | ||||||||||||||||||
Consolidated profit | 862 | 0.6 | 0.7 | 2,535 | 16.3 | 18.6 | ||||||||||||||||||
Non-controlling interests | (95) | 0.6 | 0.6 | (285) | 15.9 | 18.2 | ||||||||||||||||||
Underlying attributable profit to the parent | 767 | 0.6 | 0.7 | 2,249 | 16.4 | 18.7 | ||||||||||||||||||
| Balance sheet | ||||||||||||||||||||||||
Loans and advances to customers | 72,302 | (1.2) | 2.8 | 72,302 | 11.2 | 8.2 | ||||||||||||||||||
Cash, central banks and credit institutions | 35,662 | (5.3) | (1.4) | 35,662 | (0.7) | (3.4) | ||||||||||||||||||
Debt instruments | 43,227 | 1.1 | 5.3 | 43,227 | 23.5 | 20.1 | ||||||||||||||||||
Other financial assets | 6,037 | (11.5) | (7.9) | 6,037 | 16.5 | 13.3 | ||||||||||||||||||
Other asset accounts | 12,859 | 3.1 | 7.3 | 12,859 | 15.4 | 12.3 | ||||||||||||||||||
Total assets | 170,086 | (1.6) | 2.4 | 170,086 | 11.7 | 8.7 | ||||||||||||||||||
Customer deposits | 70,893 | (5.1) | (1.2) | 70,893 | 2.7 | (0.1) | ||||||||||||||||||
Central banks and credit institutions | 31,807 | 10.0 | 14.5 | 31,807 | 27.7 | 24.3 | ||||||||||||||||||
Marketable debt securities | 20,151 | (2.1) | 1.9 | 20,151 | 10.9 | 8.0 | ||||||||||||||||||
Other financial liabilities | 22,999 | (4.8) | (0.9) | 22,999 | 17.8 | 14.6 | ||||||||||||||||||
Other liabilities accounts | 8,144 | (5.5) | (1.7) | 8,144 | 28.8 | 25.3 | ||||||||||||||||||
Total liabilities | 153,993 | (1.9) | 2.1 | 153,993 | 11.6 | 8.6 | ||||||||||||||||||
Total equity | 16,093 | 1.1 | 5.3 | 16,093 | 12.6 | 9.5 | ||||||||||||||||||
Memorandum items: | ||||||||||||||||||||||||
Gross loans and advances to customers(2) | 76,714 | (1.4) | 2.6 | 76,714 | 10.9 | 7.9 | ||||||||||||||||||
Customer funds | 115,781 | (4.7) | (0.8) | 115,781 | 8.6 | 5.7 | ||||||||||||||||||
Customer deposits(3) | 58,065 | (8.4) | (4.7) | 58,065 | 6.7 | 3.8 | ||||||||||||||||||
Mutual funds | 57,716 | (0.6) | 3.5 | 57,716 | 10.6 | 7.6 | ||||||||||||||||||
| Ratios (%) and operating means | ||||||||||||||||||||||||
Underlying RoTE | 21.69 | (0.72) | 21.64 | 1.77 | ||||||||||||||||||||
Efficiency ratio | 32.3 | 0.4 | 32.4 | (0.8) | ||||||||||||||||||||
NPL ratio | 5.33 | 0.06 | 5.33 | 0.07 | ||||||||||||||||||||
NPL coverage | 101.1 | (4.4) | 101.1 | (8.0) | ||||||||||||||||||||
Number of employees | 48,347 | 0.5 | 48,347 | 3.6 | ||||||||||||||||||||
Number of branches | 3,686 | 1.2 | 3,686 | 3.8 | ||||||||||||||||||||
(1) Includes exchange differences.
(2) Excluding reverse repos.
(3) Excluding repos.
January - September 2019 65
Table of Contents
Responsible banking | ||||||||||||||||
Santander vision and | Group financial | Financial information | Corporate governance | |||||||||||||
corporate culture |
| information |
| by segments |
| Santander share |
| Appendix | ||||||||
|
|
|
|
Financial information by segments |
| Chile | | |||||||||||||||||||||||
EUR million | ||||||||||||||||||||||||
| /Q2’19 | /9M’18 | |||||||||||||||||||||||
| Underlying income statement | Q3’19 | % | % excl. FX | 9M’19 | % | % excl. FX | ||||||||||||||||||
Net interest income | 462 | (7.5) | (5.3) | 1,402 | (4.3) | (1.8) | ||||||||||||||||||
Net fee income | 102 | 5.2 | 7.5 | 302 | (8.1) | (5.7) | ||||||||||||||||||
Gains (losses) on financial transactions(1) | 80 | 36.9 | 39.2 | 194 | 88.7 | 93.7 | ||||||||||||||||||
Other operating income | 1 | 239.4 | 235.9 | 3 | (78.9) | (78.3) | ||||||||||||||||||
Total income | 646 | (1.5) | 0.7 | 1,901 | (0.6) | 2.0 | ||||||||||||||||||
Administrative expenses and amortisations | (260) | (3.4) | (1.2) | (785) | (0.5) | 2.1 | ||||||||||||||||||
Net operating income | 386 | (0.2) | 2.0 | 1,117 | (0.7) | 1.9 | ||||||||||||||||||
Net loan-loss provisions | (106) | 0.8 | 3.0 | (314) | (11.2) | (8.8) | ||||||||||||||||||
Other gains (losses) and provisions | 15 | — | — | 52 | (28.9) | (27.1) | ||||||||||||||||||
Profit before tax | 295 | 5.1 | 7.3 | 855 | 1.3 | 3.9 | ||||||||||||||||||
Tax on profit | (61) | 41.3 | 43.6 | (165) | (3.5) | (1.0) | ||||||||||||||||||
Profit from continuing operations | 234 | (1.6) | 0.6 | 690 | 2.5 | 5.2 | ||||||||||||||||||
Net profit from discontinued operations | — | — | — | — | — | — | ||||||||||||||||||
Consolidated profit | 234 | (1.6) | 0.6 | 690 | 2.5 | 5.2 | ||||||||||||||||||
Non-controlling interests | (72) | (2.9) | (0.7) | (217) | 1.4 | 4.1 | ||||||||||||||||||
Underlying attributable profit to the parent | 162 | (0.9) | 1.3 | 473 | 2.9 | 5.7 | ||||||||||||||||||
| Balance sheet | ||||||||||||||||||||||||
Loans and advances to customers | 40,545 | 1.2 | 3.7 | 40,545 | 4.0 | 7.8 | ||||||||||||||||||
Cash, central banks and credit institutions | 5,855 | 23.5 | 26.5 | 5,855 | 52.9 | 58.5 | ||||||||||||||||||
Debt instruments | 3,986 | 0.9 | 3.4 | 3,986 | 6.0 | 9.8 | ||||||||||||||||||
Other financial assets | 7,624 | 67.5 | 71.7 | 7,624 | 171.0 | 180.8 | ||||||||||||||||||
Other asset accounts | 3,282 | 14.0 | 16.8 | 3,282 | 76.3 | 82.7 | ||||||||||||||||||
Total assets | 61,293 | 9.1 | 11.7 | 61,293 | 19.6 | 24.0 | ||||||||||||||||||
Customer deposits | 28,034 | 3.4 | 5.9 | 28,034 | 10.2 | 14.2 | ||||||||||||||||||
Central banks and credit institutions | 7,759 | 38.9 | 42.3 | 7,759 | 25.4 | 30.0 | ||||||||||||||||||
Marketable debt securities | 11,215 | 1.3 | 3.8 | 11,215 | 11.6 | 15.6 | ||||||||||||||||||
Other financial liabilities | 7,791 | 21.4 | 24.4 | 7,791 | 107.4 | 114.9 | ||||||||||||||||||
Other liabilities accounts | 1,423 | 38.8 | 42.2 | 1,423 | 34.5 | 39.3 | ||||||||||||||||||
Total liabilities | 56,222 | 9.8 | 12.5 | 56,222 | 21.0 | 25.3 | ||||||||||||||||||
Total equity | 5,071 | 1.9 | 4.4 | 5,071 | 6.7 | 10.5 | ||||||||||||||||||
Memorandum items: | ||||||||||||||||||||||||
Gross loans and advances to customers(2) | 41,619 | 1.1 | 3.6 | 41,619 | 3.7 | 7.5 | ||||||||||||||||||
Customer funds | 36,622 | 4.0 | 6.6 | 36,622 | 12.8 | 16.8 | ||||||||||||||||||
Customer deposits(3) | 27,704 | 2.7 | 5.3 | 27,704 | 9.1 | 13.0 | ||||||||||||||||||
Mutual funds | 8,918 | 8.1 | 10.7 | 8,918 | 25.9 | 30.5 | ||||||||||||||||||
| Ratios (%) and operating means | ||||||||||||||||||||||||
Underlying RoTE | 18.56 | (0.20) | 17.91 | (0.49) | ||||||||||||||||||||
Efficiency ratio | 40.3 | (0.8) | 41.3 | 0.0 | ||||||||||||||||||||
NPL ratio | 4.48 | (0.04) | 4.48 | (0.30) | ||||||||||||||||||||
NPL coverage | 57.3 | (1.8) | 57.3 | (2.3) | ||||||||||||||||||||
Number of employees | 11,642 | (1.3) | 11,642 | (3.0) | ||||||||||||||||||||
Number of branches | 380 | — | 380 | (6.9) | ||||||||||||||||||||
(1) Includes exchange differences.
(2) Excluding reverse repos.
(3) Excluding repos.
66 January - September 2019
Table of Contents
Responsible banking | ||||||||||||||||
Santander vision and | Group financial | Financial information | Corporate governance | |||||||||||||
corporate culture |
| information |
| by segments |
| Santander share |
| Appendix | ||||||||
|
|
|
|
Financial information by segments |
| Argentina | | |||||||||||||||||||||||
| EUR million | ||||||||||||||||||||||||
| /Q2’19 | /9M’18 | |||||||||||||||||||||||
| Underlying income statement | Q3’19 | % | % excl. FX | 9M’19 | % | % excl. FX | ||||||||||||||||||
Net interest income | 180 | (39.6) | 28.1 | 690 | 56.3 | 123.5 | ||||||||||||||||||
Net fee income | 88 | (29.7) | 46.4 | 328 | 28.0 | 83.0 | ||||||||||||||||||
Gains (losses) on financial transactions(1) | 13 | (10.0) | 115.5 | 65 | (41.4) | (16.3) | ||||||||||||||||||
Other operating income | (44) | (8.0) | 69.4 | (126) | 76.9 | 152.9 | ||||||||||||||||||
Total income | 237 | (39.2) | 32.3 | 957 | 29.9 | 85.6 | ||||||||||||||||||
Administrative expenses and amortisations | (122) | (46.7) | 23.6 | (553) | 29.4 | 84.9 | ||||||||||||||||||
Net operating income | 115 | (28.5) | 44.6 | 404 | 30.6 | 86.6 | ||||||||||||||||||
Net loan-loss provisions | (39) | (43.9) | 31.2 | (182) | 38.8 | 98.4 | ||||||||||||||||||
Other gains (losses) and provisions | (28) | — | — | (47) | (10.9) | 27.3 | ||||||||||||||||||
Profit before tax | 47 | (49.3) | 5.7 | 174 | 39.5 | 99.5 | ||||||||||||||||||
Tax on profit | (23) | (23.5) | 49.9 | (77) | 30.6 | 86.7 | ||||||||||||||||||
Profit from continuing operations | 24 | (61.8) | (15.8) | 98 | 47.5 | 110.8 | ||||||||||||||||||
Net profit from discontinued operations | — | — | — | — | — | — | ||||||||||||||||||
Consolidated profit | 24 | (61.8) | (15.8) | 98 | 47.5 | 110.8 | ||||||||||||||||||
Non-controlling interests | (1) | 203.9 | 336.7 | (1) | 64.7 | 135.5 | ||||||||||||||||||
Underlying attributable profit to the parent | 23 | (62.9) | (17.2) | 97 | 47.3 | 110.5 | ||||||||||||||||||
| Balance sheet | ||||||||||||||||||||||||
Loans and advances to customers | 4,893 | (15.0) | 10.4 | 4,893 | (17.9) | 8.1 | ||||||||||||||||||
Cash, central banks and credit institutions | 2,787 | (46.4) | (30.4) | 2,787 | (31.0) | (9.1) | ||||||||||||||||||
Debt instruments | 1,178 | 28.5 | 66.9 | 1,178 | 146.2 | 224.1 | ||||||||||||||||||
Other financial assets | 99 | (21.1) | 2.5 | 99 | 507.3 | 699.6 | ||||||||||||||||||
Other asset accounts | 783 | (13.8) | 12.0 | 783 | 32.6 | 74.6 | ||||||||||||||||||
Total assets | 9,740 | (24.5) | (2.0) | 9,740 | (12.1) | 15.7 | ||||||||||||||||||
Customer deposits | 6,764 | (27.9) | (6.4) | 6,764 | (16.0) | 10.6 | ||||||||||||||||||
Central banks and credit institutions | 1,153 | 16.3 | 51.0 | 1,153 | 7.7 | 41.8 | ||||||||||||||||||
Marketable debt securities | 77 | (70.1) | (61.1) | 77 | (79.5) | (73.1) | ||||||||||||||||||
Other financial liabilities | 594 | (21.9) | 1.4 | 594 | (10.6) | 17.8 | ||||||||||||||||||
Other liabilities accounts | 355 | (14.4) | 11.2 | 355 | 34.5 | 77.1 | ||||||||||||||||||
Total liabilities | 8,944 | (24.3) | (1.6) | 8,944 | (14.2) | 12.9 | ||||||||||||||||||
Total equity | 796 | (27.3) | (5.5) | 796 | 22.7 | 61.5 | ||||||||||||||||||
Memorandum items: | ||||||||||||||||||||||||
Gross loans and advances to customers(2) | 5,136 | (12.3) | 13.9 | 5,136 | (11.4) | 16.6 | ||||||||||||||||||
Customer funds | 7,726 | (30.0) | (9.0) | 7,726 | (16.7) | 9.7 | ||||||||||||||||||
Customer deposits(3) | 6,764 | (27.9) | (6.4) | 6,764 | (16.0) | 10.6 | ||||||||||||||||||
Mutual funds | 962 | (41.6) | (24.1) | 962 | (20.9) | 4.1 | ||||||||||||||||||
| Ratios (%) and operating means | ||||||||||||||||||||||||
Underlying RoTE | 21.97 | (5.12) | 18.88 | 2.69 | ||||||||||||||||||||
Efficiency ratio | 51.5 | (7.2) | 57.8 | (0.2) | ||||||||||||||||||||
NPL ratio | 3.64 | (0.15) | 3.64 | 1.17 | ||||||||||||||||||||
NPL coverage | 134.0 | 7.6 | 134.0 | 10.0 | ||||||||||||||||||||
Number of employees | 9,208 | 0.3 | 9,208 | (1.6) | ||||||||||||||||||||
Number of branches | 470 | 0.2 | 470 | (2.3) | ||||||||||||||||||||
(1) Includes exchange differences.
(2) Excluding reverse repos.
(3) Excluding repos.
January - September 2019 67
Table of Contents
Responsible banking | ||||||||||||||||
Santander vision and | Group financial | Financial information | Corporate governance | |||||||||||||
corporate culture |
| information |
| by segments |
| Santander share |
| Appendix | ||||||||
|
|
|
|
Financial information by segments |
| Other South America | ||||||||||||||||||||||||
EUR million | ||||||||||||||||||||||||
| /Q2’19 | /9M’18 | |||||||||||||||||||||||
| Underlying income statement | Q3’19 | % | % excl. FX | 9M’19 | % | % excl. FX | ||||||||||||||||||
Net interest income | 112 | 3.7 | 5.0 | 329 | 3.6 | 9.1 | ||||||||||||||||||
Net fee income | 44 | 39.3 | 40.5 | 104 | 16.2 | 22.6 | ||||||||||||||||||
Gains (losses) on financial transactions(1) | 18 | 52.5 | 53.5 | 40 | 19.3 | 25.2 | ||||||||||||||||||
Other operating income | (2) | (9.0) | (7.2) | (7) | 13.2 | 22.5 | ||||||||||||||||||
Total income | 172 | 15.3 | 16.5 | 466 | 7.3 | 12.9 | ||||||||||||||||||
Administrative expenses and amortisations | (67) | 4.5 | 5.9 | (193) | (0.4) | 5.0 | ||||||||||||||||||
Net operating income | 105 | 23.4 | 24.5 | 273 | 13.4 | 19.3 | ||||||||||||||||||
Net loan-loss provisions | (18) | (10.9) | (9.4) | (55) | 16.1 | 26.4 | ||||||||||||||||||
Other gains (losses) and provisions | (2) | 65.2 | 64.9 | (5) | (30.5) | (28.1) | ||||||||||||||||||
Profit before tax | 86 | 33.1 | 34.1 | 214 | 14.3 | 19.2 | ||||||||||||||||||
Tax on profit | (21) | 28.7 | 29.7 | (54) | 9.6 | 12.1 | ||||||||||||||||||
Profit from continuing operations | 64 | 34.7 | 35.6 | 159 | 16.0 | 21.8 | ||||||||||||||||||
Net profit from discontinued operations | — | — | — | — | — | — | ||||||||||||||||||
Consolidated profit | 64 | 34.7 | 35.6 | 159 | 16.0 | 21.8 | ||||||||||||||||||
Non-controlling interests | (0) | 17.5 | 17.0 | (1) | 19.0 | 14.3 | ||||||||||||||||||
Underlying attributable profit to the parent | 64 | 34.8 | 35.8 | 158 | 16.0 | 21.9 | ||||||||||||||||||
| Balance sheet | ||||||||||||||||||||||||
Loans and advances to customers | 6,110 | 2.9 | 3.1 | 6,110 | 25.8 | 29.5 | ||||||||||||||||||
Cash, central banks and credit institutions | 2,620 | 9.4 | 9.2 | 2,620 | 22.4 | 26.2 | ||||||||||||||||||
Debt instruments | 727 | 21.0 | 21.5 | 727 | 18.2 | 24.8 | ||||||||||||||||||
Other financial assets | 25 | 148.7 | 150.3 | 25 | 102.1 | 110.1 | ||||||||||||||||||
Other asset accounts | 243 | 26.0 | 26.0 | 243 | 36.3 | 40.6 | ||||||||||||||||||
Total assets | 9,725 | 6.4 | 6.6 | 9,725 | 24.7 | 28.6 | ||||||||||||||||||
Customer deposits | 6,075 | 9.8 | 9.8 | 6,075 | 16.0 | 20.0 | ||||||||||||||||||
Central banks and credit institutions | 2,318 | (2.8) | (2.4) | 2,318 | 67.0 | 70.6 | ||||||||||||||||||
Marketable debt securities | 68 | 2.4 | 0.7 | 68 | 27.4 | 22.9 | ||||||||||||||||||
Other financial liabilities | 54 | 18.1 | 18.5 | 54 | 57.3 | 64.8 | ||||||||||||||||||
Other liabilities accounts | 294 | 13.0 | 12.7 | 294 | 15.6 | 18.8 | ||||||||||||||||||
Total liabilities | 8,809 | 6.2 | 6.3 | 8,809 | 26.4 | 30.4 | ||||||||||||||||||
Total equity | 917 | 8.6 | 8.7 | 917 | 10.2 | 13.6 | ||||||||||||||||||
Memorandum items: | ||||||||||||||||||||||||
Gross loans and advances to customers(2) | 6,253 | 2.9 | 3.1 | 6,253 | 25.5 | 29.2 | ||||||||||||||||||
Customer funds | 6,110 | 9.7 | 9.7 | 6,110 | 15.9 | 20.0 | ||||||||||||||||||
Customer deposits(3) | 6,075 | 9.8 | 9.8 | 6,075 | 16.0 | 20.0 | ||||||||||||||||||
Mutual funds | 35 | 7.7 | 7.7 | 35 | 12.0 | 17.5 | ||||||||||||||||||
| Resources | ||||||||||||||||||||||||
Number of employees | 2,067 | 0.3 | 2,067 | (0.4) | ||||||||||||||||||||
(1) Includes exchange differences.
(2) Excluding reverse repos.
(3) Excluding repos.
68 January - September 2019
Table of Contents
Responsible banking | ||||||||||||||||
Santander vision and | Group financial | Financial information | Corporate governance | |||||||||||||
corporate culture |
| information |
| by segments |
| Santander share |
| Appendix | ||||||||
|
|
|
|
Financial information by segments |
| SANTANDER GLOBAL PLATFORM | | |||||||||||||||||||||||
EUR million | ||||||||||||||||||||||||
| Underlying income statement | Q3’19 | Q2’19 | % | 9M’19 | 9M’18 | % | ||||||||||||||||||
Net interest income | 23 | 23 | (0.7) | 69 | 59 | 17.8 | ||||||||||||||||||
Net fee income | 2 | 1 | 165.3 | 4 | 4 | 18.8 | ||||||||||||||||||
Gains (losses) on financial transactions(1) | 2 | (0) | — | 0 | 0 | 37.9 | ||||||||||||||||||
Other operating income | (4) | (4) | (0.1) | (11) | (10) | 14.2 | ||||||||||||||||||
Total income | 24 | 20 | 18.7 | 63 | 53 | 18.7 | ||||||||||||||||||
Administrative expenses and amortisations | (60) | (67) | (10.8) | (168) | (93) | 79.8 | ||||||||||||||||||
Net operating income | (36) | (47) | (23.5) | (105) | (40) | 160.2 | ||||||||||||||||||
Net loan-loss provisions | (0) | (0) | (8.0) | (1) | (0) | — | ||||||||||||||||||
Other gains (losses) and provisions | (1) | (0) | 209.6 | (2) | (2) | 1.0 | ||||||||||||||||||
Profit before tax | (37) | (47) | (22.0) | (107) | (42) | 155.0 | ||||||||||||||||||
Tax on profit | 11 | 7 | 56.7 | 31 | 10 | 208.0 | ||||||||||||||||||
Profit from continuing operations | (26) | (40) | (36.0) | (77) | (32) | 138.7 | ||||||||||||||||||
Net profit from discontinued operations | — | — | — | — | — | — | ||||||||||||||||||
Consolidated profit | (26) | (40) | (36.0) | (77) | (32) | 138.7 | ||||||||||||||||||
Non-controlling interests | — | — | — | — | — | — | ||||||||||||||||||
Underlying attributable profit to the parent | (26) | (40) | (36.0) | (77) | (32) | 138.7 | ||||||||||||||||||
| Balance sheet | ||||||||||||||||||||||||
Loans and advances to customers | 596 | 515 | 15.8 | 596 | 252 | 136.4 | ||||||||||||||||||
Cash, central banks and credit institutions | 8,978 | 8,938 | 0.4 | 8,978 | 7,778 | 15.4 | ||||||||||||||||||
Debt instruments | 5 | — | — | 5 | — | — | ||||||||||||||||||
Other financial assets | 172 | 147 | 16.5 | 172 | 133 | 28.9 | ||||||||||||||||||
Other asset accounts | 147 | 132 | 11.1 | 147 | 110 | 33.5 | ||||||||||||||||||
Total assets | 9,897 | 9,732 | 1.7 | 9,897 | 8,273 | 19.6 | ||||||||||||||||||
Customer deposits | 9,192 | 9,106 | 0.9 | 9,192 | 7,767 | 18.3 | ||||||||||||||||||
Central banks and credit institutions | 95 | 130 | (27.2) | 95 | 66 | 43.1 | ||||||||||||||||||
Marketable debt securities | — | — | — | — | — | — | ||||||||||||||||||
Other financial liabilities | 58 | 67 | (13.5) | 58 | 33 | 75.6 | ||||||||||||||||||
Other liabilities accounts | 120 | 81 | 48.6 | 120 | 131 | (8.0) | ||||||||||||||||||
Total liabilities | 9,465 | 9,384 | 0.9 | 9,465 | 7,997 | 18.4 | ||||||||||||||||||
Total equity | 431 | 348 | 24.1 | 431 | 276 | 56.6 | ||||||||||||||||||
Memorandum items: | ||||||||||||||||||||||||
Gross loans and advances to customers(2) | 599 | 518 | 15.7 | 599 | 255 | 134.9 | ||||||||||||||||||
Customer funds | 9,602 | 9,500 | 1.1 | 9,602 | 8,170 | 17.5 | ||||||||||||||||||
Customer deposits(3) | 9,192 | 9,106 | 0.9 | 9,192 | 7,767 | 18.3 | ||||||||||||||||||
Mutual funds | 410 | 394 | 4.1 | 410 | 403 | 1.7 | ||||||||||||||||||
| Resources | ||||||||||||||||||||||||
Number of employees | 727 | 597 | 21.8 | 727 | 464 | 56.7 | ||||||||||||||||||
(1) Includes exchange differences.
(2) Excluding reverse repos.
(3) Excluding repos.
January - September 2019 69
Table of Contents
Responsible banking | ||||||||||||||||
Santander vision and | Group financial | Financial information | Corporate governance | |||||||||||||
corporate culture |
| information |
| by segments |
| Santander share |
| Appendix | ||||||||
|
|
|
|
Financial information by segments |
CORPORATE CENTRE | | |||||||||||||||||||||||
EUR million | ||||||||||||||||||||||||
| Underlying income statement | Q3’19 | Q2’19 | % | 9M’19 | 9M’18 | % | ||||||||||||||||||
Net interest income | (319) | (304) | 5.0 | (919) | (728) | 26.4 | ||||||||||||||||||
Net fee income | (9) | (13) | (31.4) | (35) | (42) | (14.9) | ||||||||||||||||||
Gains (losses) on financial transactions(1) | (87) | (92) | (5.4) | (257) | 15 | — | ||||||||||||||||||
Other operating income | 1 | (14) | — | (24) | (6) | 277.5 | ||||||||||||||||||
Total income | (413) | (423) | (2.2) | (1,236) | (760) | 62.5 | ||||||||||||||||||
Administrative expenses and amortisations | (90) | (96) | (5.8) | (283) | (319) | (11.3) | ||||||||||||||||||
Net operating income | (504) | (519) | (2.9) | (1,519) | (1,080) | 40.7 | ||||||||||||||||||
Net loan-loss provisions | (14) | (5) | 182.6 | (26) | (95) | (72.3) | ||||||||||||||||||
Other gains (losses) and provisions | (61) | (72) | (14.6) | (188) | (147) | 27.5 | ||||||||||||||||||
Profit before tax | (579) | (595) | (2.8) | (1,733) | (1,322) | 31.1 | ||||||||||||||||||
Tax on profit | 50 | 3 | — | 86 | (12) | — | ||||||||||||||||||
Profit from continuing operations | (529) | (592) | (10.6) | (1,647) | (1,334) | 23.5 | ||||||||||||||||||
Net profit from discontinued operations | — | — | — | — | — | — | ||||||||||||||||||
Consolidated profit | (529) | (592) | (10.6) | (1,647) | (1,334) | 23.5 | ||||||||||||||||||
Non-controlling interests | (0) | 1 | — | 10 | 0 | — | ||||||||||||||||||
Underlying attributable profit to the parent | (529) | (592) | (10.5) | (1,637) | (1,334) | 22.8 | ||||||||||||||||||
| Balance sheet | ||||||||||||||||||||||||
Loans and advances to customers | 5,799 | 6,231 | (6.9) | 5,799 | 8,627 | (32.8) | ||||||||||||||||||
Cash, central banks and credit institutions | 30,057 | 31,895 | (5.8) | 30,057 | 37,010 | (18.8) | ||||||||||||||||||
Debt instruments | 968 | 952 | 1.6 | 968 | 330 | 193.6 | ||||||||||||||||||
Other financial assets | 2,393 | 2,446 | (2.2) | 2,393 | 2,185 | 9.5 | ||||||||||||||||||
Other asset accounts | 130,751 | 132,086 | (1.0) | 130,751 | 117,833 | 11.0 | ||||||||||||||||||
Total assets | 169,968 | 173,610 | (2.1) | 169,968 | 165,986 | 2.4 | ||||||||||||||||||
Customer deposits | 908 | 953 | (4.8) | 908 | 216 | 321.1 | ||||||||||||||||||
Central banks and credit institutions | 12,696 | 14,650 | (13.3) | 12,696 | 24,661 | (48.5) | ||||||||||||||||||
Marketable debt securities | 52,130 | 51,326 | 1.6 | 52,130 | 42,948 | 21.4 | ||||||||||||||||||
Other financial liabilities | 3,558 | 2,617 | 35.9 | 3,558 | 593 | 499.5 | ||||||||||||||||||
Other liabilities accounts | 9,539 | 9,743 | (2.1) | 9,539 | 7,923 | 20.4 | ||||||||||||||||||
Total liabilities | 78,830 | 79,290 | (0.6) | 78,830 | 76,341 | 3.3 | ||||||||||||||||||
Total equity | 91,138 | 94,320 | (3.4) | 91,138 | 89,645 | 1.7 | ||||||||||||||||||
Memorandum items: | ||||||||||||||||||||||||
Gross loans and advances to customers(2) | 5,979 | 6,330 | (5.5) | 5,979 | 7,002 | (14.6) | ||||||||||||||||||
Customer funds | 918 | 964 | (4.8) | 918 | 222 | 313.4 | ||||||||||||||||||
Customer deposits(3) | 908 | 953 | (4.8) | 908 | 216 | 321.1 | ||||||||||||||||||
Mutual funds | 10 | 11 | (2.9) | 10 | 7 | 60.5 | ||||||||||||||||||
| Resources | ||||||||||||||||||||||||
Number of employees | 1,665 | 1,644 | 1.3 | 1,665 | 1,751 | (4.9) | ||||||||||||||||||
(1) Includes exchange differences.
(2) Excluding reverse repos.
(3) Excluding repos.
70 January - September 2019
Table of Contents
Responsible banking | ||||||||||||||||
Santander vision and | Group financial | Financial information | Corporate governance | |||||||||||||
corporate culture |
| information |
| by segments |
| Santander share |
| Appendix | ||||||||
|
|
|
|
Financial information by segments |
RETAIL BANKING | | |||||||||||||||||||||||||||
EUR million | ||||||||||||||||||||||||||||
| /Q2’19 | /9M’18 | |||||||||||||||||||||||||||
| Underlying income statement | Q3’19 | % | % excl. FX | 9M’19 | % | % excl. FX | ||||||||||||||||||||||
Net interest income | 8,308 | (1.0) | 1.1 | 24,861 | 4.4 | 4.3 | ||||||||||||||||||||||
Net fee income | 2,244 | (1.1) | 2.4 | 6,827 | 4.2 | 5.3 | ||||||||||||||||||||||
Gains (losses) on financial transactions(1) | 368 | 104.6 | 94.6 | 641 | 21.6 | 22.9 | ||||||||||||||||||||||
Other operating income | 151 | 258.9 | 143.4 | 270 | (32.5) | (39.7) | ||||||||||||||||||||||
Total income | 11,071 | 1.7 | 3.6 | 32,599 | 4.2 | 4.2 | ||||||||||||||||||||||
Administrative expenses and amortisations | (4,799) | (1.7) | 1.5 | (14,512) | 2.0 | 2.3 | ||||||||||||||||||||||
Net operating income | 6,272 | 4.5 | 5.3 | 18,088 | 5.9 | 5.8 | ||||||||||||||||||||||
Net loan-loss provisions | (2,446) | 17.0 | 19.3 | (6,697) | 8.8 | 8.2 | ||||||||||||||||||||||
Other gains (losses) and provisions | (378) | (4.7) | (3.6) | (1,167) | (1.0) | 0.3 | ||||||||||||||||||||||
Profit before tax | 3,448 | (1.8) | (1.9) | 10,223 | 5.0 | 4.9 | ||||||||||||||||||||||
Tax on profit | (1,105) | 3.0 | 3.1 | (3,270) | 1.1 | 1.5 | ||||||||||||||||||||||
Profit from continuing operations | 2,343 | (4.0) | (4.2) | 6,953 | 6.9 | 6.6 | ||||||||||||||||||||||
Net profit from discontinued operations | — | — | — | — | — | — | ||||||||||||||||||||||
Consolidated profit | 2,343 | (4.0) | (4.2) | 6,953 | 6.9 | 6.6 | ||||||||||||||||||||||
Non-controlling interests | (337) | (12.6) | (12.4) | (1,091) | 11.2 | 10.1 | ||||||||||||||||||||||
Underlying attributable profit to the parent | 2,006 | (2.3) | (2.6) | 5,862 | 6.1 | 5.9 | ||||||||||||||||||||||
(1) Includes exchange differences.
CORPORATE & INVESTMENT BANKING | | |||||||||||||||||||||||||||
EUR million | ||||||||||||||||||||||||||||
| /Q2’19 | /9M’18 | |||||||||||||||||||||||||||
| Underlying income statement | Q3’19 | % | % excl. FX | 9M’19 | % | % excl. FX | ||||||||||||||||||||||
Net interest income | 655 | (6.5) | (0.9) | 2,009 | 15.3 | 16.7 | ||||||||||||||||||||||
Net fee income | 419 | 11.2 | 13.6 | 1,149 | (0.5) | 0.0 | ||||||||||||||||||||||
Gains (losses) on financial transactions(1) | 107 | (5.0) | 22.2 | 450 | (39.0) | (37.0) | ||||||||||||||||||||||
Other operating income | 53 | (56.9) | (56.5) | 233 | 107.6 | 108.7 | ||||||||||||||||||||||
Total income | 1,235 | (6.0) | (0.1) | 3,841 | 2.5 | 3.9 | ||||||||||||||||||||||
Administrative expenses and amortisations | (550) | (1.6) | 1.1 | (1,669) | 7.8 | 7.8 | ||||||||||||||||||||||
Net operating income | 684 | (9.3) | (1.0) | 2,172 | (1.2) | 1.1 | ||||||||||||||||||||||
Net loan-loss provisions | 28 | — | — | (27) | (83.6) | (83.7) | ||||||||||||||||||||||
Other gains (losses) and provisions | (21) | 37.4 | 39.2 | (58) | 3.3 | 2.8 | ||||||||||||||||||||||
Profit before tax | 691 | (0.4) | 8.6 | 2,087 | 5.6 | 8.4 | ||||||||||||||||||||||
Tax on profit | (202) | (4.8) | 3.9 | (622) | 1.2 | 4.1 | ||||||||||||||||||||||
Profit from continuing operations | 489 | 1.6 | 10.7 | 1,465 | 7.6 | 10.3 | ||||||||||||||||||||||
Net profit from discontinued operations | — | — | — | — | — | — | ||||||||||||||||||||||
Consolidated profit | 489 | 1.6 | 10.7 | 1,465 | 7.6 | 10.3 | ||||||||||||||||||||||
Non-controlling interests | (42) | (9.3) | (8.0) | (130) | 11.5 | 12.6 | ||||||||||||||||||||||
Underlying attributable profit to the parent | 446 | 2.8 | 12.8 | 1,335 | 7.2 | 10.1 | ||||||||||||||||||||||
(1) Includes exchange differences.
January - September 2019 71
Table of Contents
Responsible banking | ||||||||||||||||
Santander vision and | Group financial | Financial information | Corporate governance | |||||||||||||
corporate culture |
| information |
| by segments |
| Santander share |
| Appendix | ||||||||
|
|
|
|
Financial information by segments |
| WEALTH MANAGEMENT & INSURANCE | | |||||||||||||||||||||||
EUR million | ||||||||||||||||||||||||
| /Q2’19 | /9M’18 | |||||||||||||||||||||||
| Underlying income statement | Q3’19 | % | % excl. FX | 9M’19 | % | % excl. FX | ||||||||||||||||||
Net interest income | 139 | (3.7) | 2.8 | 422 | 8.8 | 8.3 | ||||||||||||||||||
Net fee income | 299 | 0.1 | 1.4 | 873 | 1.5 | 1.3 | ||||||||||||||||||
Gains (losses) on financial transactions(1) | 34 | 0.4 | 1.3 | 101 | 27.4 | 28.0 | ||||||||||||||||||
Other operating income | 79 | (5.9) | (4.7) | 239 | 9.6 | 10.1 | ||||||||||||||||||
Total income | 550 | (1.8) | 0.8 | 1,635 | 5.8 | 5.6 | ||||||||||||||||||
Administrative expenses and amortisations | (222) | (1.4) | (0.6) | (677) | 3.1 | 2.2 | ||||||||||||||||||
Net operating income | 327 | (2.0) | 1.8 | 957 | 7.8 | 8.2 | ||||||||||||||||||
Net loan-loss provisions | (3) | — | — | 3 | — | — | ||||||||||||||||||
Other gains (losses) and provisions | (3) | 129.1 | 122.4 | (7) | 3.9 | 3.5 | ||||||||||||||||||
Profit before tax | 321 | (3.4) | 0.4 | 953 | 8.6 | 8.9 | ||||||||||||||||||
Tax on profit | (69) | (12.1) | (7.9) | (219) | 7.8 | 8.4 | ||||||||||||||||||
Profit from continuing operations | 252 | (0.7) | 2.9 | 735 | 8.8 | 9.1 | ||||||||||||||||||
Net profit from discontinued operations | — | — | — | — | — | — | ||||||||||||||||||
Consolidated profit | 252 | (0.7) | 2.9 | 735 | 8.8 | 9.1 | ||||||||||||||||||
Non-controlling interests | (14) | 10.6 | 11.9 | (38) | 0.6 | 2.4 | ||||||||||||||||||
Underlying attributable profit to the parent | 238 | (1.3) | 2.5 | 697 | 9.3 | 9.5 | ||||||||||||||||||
(1) Includes exchange differences.
72 January - September 2019
Table of Contents
Responsible banking | ||||||||||||||||
Santander vision and | Group financial | Financial information | Corporate governance | |||||||||||||
corporate culture |
| information |
| by segments |
| Santander share |
| Appendix | ||||||||
|
|
|
|
Alternative performance measures |
ALTERNATIVE PERFORMANCE MEASURES (APM)
In addition to the financial information prepared under IFRS, this consolidated directors’ report contains financial measures that constitute alternative performance measures (‘APMs’) to comply with the guidelines on alternative performance measures issued by the European Securities and Markets Authority on 5 October 2015 andnon-IFRS measures.
The financial measures contained in this consolidated directors’ report that qualify as APMs andnon-IFRS measures have been calculated using the financial information from Santander but are not defined or detailed in the applicable financial information framework or under IFRS and have neither been audited nor reviewed by our auditors.
We use these APMs andnon-IFRS measures when planning, monitoring and evaluating our performance. We consider these APMs andnon-IFRS financial measures to be useful metrics for management and investors to facilitate operating performance comparisons from period to period. While we believe that these APMs andnon-IFRS financial measures are useful in evaluating our business, this information should be considered as supplemental in nature and is not meant as a substitute of IFRS measures. In
addition, other companies, including companies in our industry, may calculate such measures differently, which reduces their usefulness as comparative measures.
The APMs andnon-IFRS measures we use in this document can be categorised as follows:
Underlying results
In addition to IFRS results measures, we present some results measures which arenon-IFRS measures and which we refer to as underlying measures. These underlying measures allow in our view a betteryear-on-year comparability as they exclude items outside the ordinary course performance of our business which are grouped in thenon-IFRS line management adjustments and are further detailed on page 12 of this report.
In addition, the results by business areas in the ‘Geographic businesses’ section are presented only on an underlying basis in accordance with IFRS 8, and reconciled on an aggregate basis to our IFRS consolidated results to the consolidated financial statements.
Reconciliation of underlying results to statutory results
EUR million
| January-September 2019 | ||||||||||||
| Underlying results | Adjustments | Statutory results | ||||||||||
Net interest income | 26,442 | — | 26,442 | |||||||||
Net fee income | 8,818 | — | 8,818 | |||||||||
Gains (losses) on financial transactions(1) | 935 | — | 935 | |||||||||
Other operating income | 707 | — | 707 | |||||||||
Total income | 36,902 | — | 36,902 | |||||||||
Administrative expenses and amortisations | (17,309) | — | (17,309) | |||||||||
Net operating income | 19,593 | — | 19,593 | |||||||||
Net loan-loss provisions | (6,748) | — | (6,748) | |||||||||
Other gains (losses) and provisions | (1,422) | (2,711) | (4,133) | |||||||||
Profit before tax | 11,423 | (2,711) | 8,712 | |||||||||
Tax on profit | (3,994) | 254 | (3,740) | |||||||||
Profit from continuing operations | 7,429 | (2,457) | 4,972 | |||||||||
Net profit from discontinued operations | — | — | — | |||||||||
Consolidated profit | 7,429 | (2,457) | 4,972 | |||||||||
Non-controlling interests | (1,249) | 9 | (1,240) | |||||||||
Attributable profit to the parent | 6,180 | (2,448) | 3,732 | |||||||||
| (1) | Includes exchange differences. |
Explanation of adjustments:
Net capital gains from the sale of our stake in Prisma of EUR 130 million, net capital losses of EUR-180 million for the sale of real estate assets, restructuring costs in the United Kingdom, Poland and Spain for a net impact of EUR-724 million, PPI provisions for a net amount of EUR-183 million and the deterioration of goodwill ascribed to the UK for a net amount of EUR-1,491 million.
January - September 2019 73
Table of Contents
Responsible banking | ||||||||||||||||
Santander vision and | Group financial | Financial information | Corporate governance | |||||||||||||
corporate culture |
| information |
| by segments |
| Santander share |
| Appendix | ||||||||
|
|
|
|
Alternative performance measures |
Reconciliation of underlying results to statutory results
EUR million
| January-September 2018 | ||||||||||||
| Underlying results | Adjustments | Statutory results | ||||||||||
Net interest income | 25,280 | — | 25,280 | |||||||||
Net fee income | 8,529 | — | 8,529 | |||||||||
Gains (losses) on financial transactions(1) | 1,359 | — | 1,359 | |||||||||
Other operating income | 714 | — | 714 | |||||||||
Total income | 35,882 | — | 35,882 | |||||||||
Administrative expenses and amortisations | (16,843) | — | (16,843) | |||||||||
Net operating income | 19,039 | — | 19,039 | |||||||||
Net loan-loss provisions | (6,418) | — | (6,418) | |||||||||
Other gains (losses) and provisions | (1,391) | (644) | (2,035) | |||||||||
Profit before tax | 11,230 | (644) | 10,586 | |||||||||
Tax on profit | (4,053) | 344 | (3,709) | |||||||||
Profit from continuing operations | 7,177 | (300) | 6,877 | |||||||||
Net profit from discontinued operations | — | — | — | |||||||||
Consolidated profit | 7,177 | (300) | 6,877 | |||||||||
Non-controlling interests | (1,135) | — | (1,135) | |||||||||
Attributable profit to the parent | 6,042 | (300) | 5,742 | |||||||||
(1) Includes exchange differences. | ||||||||||||
Explanation of adjustments:
Restructuring costs: The net impact of EUR-300 million on profit relates to restructuring costs in connection with the integration of Grupo Banco Popular, as follows: EUR-280 million in Spain, EUR-40 million in the Corporate Centre and EUR 20 million in Portugal.
Profitability and efficiency ratios
The purpose of the profitability and efficiency ratios is to measure the ratio of profit to capital, to tangible capital, to assets and to risk weighted assets, while the efficiency ratio measures how much general administrative expenses (personnel and other) and amortisation costs are needed to generate revenue.
Ratio | Formula | Relevance of the metric | ||
RoE (Return on equity) | Attributable profit to the parent Average stockholders’ equity(1)(excl. minority interests) | This ratio measures the return that shareholders obtain on the funds invested in the entity and as such measures the company’s ability to pay shareholders. | ||
RoTE (Return on tangible equity) | Attributable profit to the parent Average stockholders’ equity(1)(excl. minority interests) - intangible assets | This is a very common indicator, used to evaluate the profitability of the company as a percentage of its tangible equity. It’s measured as the return that shareholders receive as a percentage of the funds invested in the entity less intangible assets. | ||
Underlying RoTE | Attributable profit to the parent Average stockholders’ equity(1)(excl. minority interests) - intangible assets | This indicator measures the profitability of the tangible equity of a company arising from ordinary activities, i.e. excluding results fromnon-recurring operations. | ||
RoA (Return on assets) | Consolidated profit Average total assets | This metric, commonly used by analysts, measures the profitability of a company as a percentage of its total assets. It is an indicator that reflects the efficiency of the company’s total funds in generating profit over a given period. | ||
RoRWA (Return on risk weighted assets) | Consolidated profit Average risk weighted assets | The return adjusted for risk is an derivative of the RoA metric. The difference is that RoRWA measures profit in relation to the bank’s risk weighted assets. | ||
Underlying RoRWA | Underlying consolidated profit Average risk weighted assets | This relates the underlying attributable profit (excluding non-recurring results) to the bank’s risk weighted assets. | ||
Efficiency ratio | Operating expenses(2) Total income | One of the most commonly used indicators when comparing productivity of different financial entities. It measures the amount of funds used to generate the bank’s total income. | ||
| (1) | Stockholders’ equity = Capital and Reserves + Accumulated other comprehensive income + Attributable profit to the parent + Dividends. |
| (2) | Operating expenses = Administrative expenses + amortisations. |
74 January - September 2019
Table of Contents
Responsible banking | ||||||||||||||||
Santander vision and | Group financial | Financial information | Corporate governance | |||||||||||||
corporate culture |
| information |
| by segments |
| Santander share |
| Appendix | ||||||||
|
|
|
|
Alternative performance measures |
| Profitability and efficiency(1)(2) (3) (4) | Q3’19 | Q2’19 | 9M’19 | 9M’18 | ||||||||||||
RoE | 7.02 | % | 7.79 | % | 5.90 | % | 8.20 | % | ||||||||
Attributable profit to the parent | 6,908 | 7,681 | 5,792 | 7,756 | ||||||||||||
Average stockholders’ equity (excluding minority interests) | 98,445 | 98,659 | 98,249 | 94,615 | ||||||||||||
RoTE | 9.86 | % | 11.02 | % | 8.33 | % | 11.69 | % | ||||||||
Attributable profit to the parent | 6,908 | 7,681 | 5,792 | 7,756 | ||||||||||||
Average stockholders’ equity (excluding minority interests) | 98,445 | 98,659 | 98,249 | 94,615 | ||||||||||||
(-) Average intangible assets | 28,391 | 28,965 | 28,743 | 28,266 | ||||||||||||
Average stockholders’ equity (excl. minority interests) - intangible assets | 70,054 | 69,694 | 69,506 | 66,348 | ||||||||||||
Underlying RoTE | 12.19 | % | 12.03 | % | 11.86 | % | 12.14 | % | ||||||||
Attributable profit to the parent | 6,908 | 7,681 | 5,792 | 7,756 | ||||||||||||
(-) Management adjustments | (1,634) | (706) | (2,448) | (300) | ||||||||||||
Underlying attributable profit to the parent | 8,541 | 8,387 | 8,240 | 8,056 | ||||||||||||
Average stockholders’ equity (excl. minority interests) - intangible assets | 70,054 | 69,694 | 69,506 | 66,348 | ||||||||||||
RoA | 0.56 | % | 0.63 | % | 0.50 | % | 0.65 | % | ||||||||
Consolidated profit | 8,476 | 9,464 | 7,448 | 9,269 | ||||||||||||
Average total assets | 1,515,606 | 1,500,703 | 1,500,101 | 1,436,286 | ||||||||||||
RoRWA | 1.39 | % | 1.56 | % | 1.22 | % | 1.55 | % | ||||||||
Consolidated profit | 8,476 | 9,464 | 7,448 | 9,269 | ||||||||||||
Average risk weighted assets | 611,952 | 608,697 | 608,419 | 599,746 | ||||||||||||
Underlying RoRWA | 1.65 | % | 1.67 | % | 1.63 | % | 1.60 | % | ||||||||
Consolidated profit | 8,476 | 9,464 | 7,448 | 9,269 | ||||||||||||
(-) Management adjustments | (1,638) | (706) | (2,456) | (300) | ||||||||||||
Underlying consolidated profit | 10,114 | 10,170 | 9,905 | 9,569 | ||||||||||||
Average risk weighted assets | 611,952 | 608,697 | 608,419 | 599,746 | ||||||||||||
Efficiency ratio | 45.9 | % | 47.2 | % | 46.9 | % | 46.9 | % | ||||||||
Underlying operating expenses | 5,722 | 5,829 | 17,309 | 16,843 | ||||||||||||
Operating expenses | 5,722 | 5,829 | 17,309 | 16,843 | ||||||||||||
Management adjustments impact in operating expenses | — | — | — | — | ||||||||||||
Underlying total income | 12,466 | 12,351 | 36,902 | 35,882 | ||||||||||||
Total income | 12,466 | 12,351 | 36,902 | 35,882 | ||||||||||||
Management adjustments impact in total income | — | — | — | — | ||||||||||||
| (1) | Averages included in the RoE, RoTE, RoA and RoRWA denominators are calculated using 4 months’ worth of data in the case of quarterly figures (from June to September in Q3 and March to June in Q2) and 10 months in the case of 9M data (from December to September). |
| (2) | For periods less than one year, and if there are results in the net capital gains and provisions line, the profit used to calculate RoE and RoTE is the annualised underlying attributable profit to which said results are added without annualising. |
| (3) | For periods less than one year, and if there are results in the net capital gains and provisions line, the profit used to calculate RoA and RoRWA is the annualised underlying consolidated profit, to which said results are added without annualising. |
| (4) | The risk weighted assets included in the denominator of the RoRWA metric are calculated in line with the criteria laid out in the CRR (Capital Requirements Regulation). |
Efficiency ratio |
| |||||||||||||||||||||||
| 9M’19 | 9M’18 | |||||||||||||||||||||||
| % | Total income | Operating expenses | % | Total income | Operating expenses | |||||||||||||||||||
Europe | 52.9 | 15,709 | 8,310 | 52.7 | 15,943 | 8,402 | ||||||||||||||||||
Spain | 53.4 | 5,695 | 3,043 | 56.3 | 5,811 | 3,271 | ||||||||||||||||||
Santander Consumer Finance | 43.7 | 3,525 | 1,539 | 43.6 | 3,423 | 1,494 | ||||||||||||||||||
United Kingdom | 60.5 | 3,508 | 2,123 | 54.9 | 3,890 | 2,137 | ||||||||||||||||||
Portugal | 44.8 | 1,043 | 467 | 47.7 | 1,010 | 482 | ||||||||||||||||||
Poland | 41.7 | 1,258 | 524 | 43.2 | 1,098 | 474 | ||||||||||||||||||
North America | 42.2 | 8,655 | 3,654 | 43.5 | 7,612 | 3,315 | ||||||||||||||||||
US | 42.5 | 5,711 | 2,427 | 44.6 | 4,983 | 2,223 | ||||||||||||||||||
Mexico | 41.6 | 2,944 | 1,226 | 41.5 | 2,630 | 1,091 | ||||||||||||||||||
South America | 35.7 | 13,711 | 4,895 | 36.2 | 13,034 | 4,714 | ||||||||||||||||||
Brazil | 32.4 | 10,386 | 3,364 | 33.2 | 9,949 | 3,304 | ||||||||||||||||||
Chile | 41.3 | 1,901 | 785 | 41.2 | 1,914 | 789 | ||||||||||||||||||
Argentina | 57.8 | 957 | 553 | 58.0 | 737 | 427 | ||||||||||||||||||
January - September 2019 75
Table of Contents
Responsible banking | ||||||||||||||||
Santander vision and | Group financial | Financial information | Corporate governance | |||||||||||||
corporate culture |
| information |
| by segments |
| Santander share |
| Appendix | ||||||||
|
|
|
|
Alternative performance measures |
Underlying RoTE |
| |||||||||||||||||||||||
| 9M’19 | 9M’18 | |||||||||||||||||||||||
| % | Underlying attributable profit to the parent | Average stockholders’ equity (excl. minority interests) - intangible assets | % | Underlying attributable profit to the parent | Average stockholders’ equity (excl. minority interests) - intangible assets | |||||||||||||||||||
Europe | 9.99 | 4,853 | 48,575 | 10.96 | 5,074 | 46,281 | ||||||||||||||||||
Spain | 10.59 | 1,580 | 14,919 | 10.16 | 1,529 | 15,041 | ||||||||||||||||||
Santander Consumer Finance | 15.49 | 1,327 | 8,569 | 16.60 | 1,331 | 8,018 | ||||||||||||||||||
United Kingdom | 7.45 | 1,104 | 14,817 | 10.06 | 1,364 | 13,558 | ||||||||||||||||||
Portugal | 12.21 | 514 | 4,207 | 11.54 | 458 | 3,964 | ||||||||||||||||||
Poland | 10.53 | 326 | 3,095 | 10.99 | 313 | 2,845 | ||||||||||||||||||
North America | 8.90 | 1,704 | 19,135 | 7.93 | 1,345 | 16,947 | ||||||||||||||||||
US | 5.57 | 826 | 14,835 | 4.61 | 611 | 13,239 | ||||||||||||||||||
Mexico | 20.27 | 878 | 4,333 | 19.86 | 734 | 3,697 | ||||||||||||||||||
South America | 20.85 | 3,969 | 19,036 | 18.98 | 3,458 | 18,219 | ||||||||||||||||||
Brazil | 21.64 | 2,999 | 13,860 | 19.87 | 2,577 | 12,969 | ||||||||||||||||||
Chile | 17.91 | 631 | 3,520 | 18.40 | 613 | 3,329 | ||||||||||||||||||
Argentina | 18.88 | 129 | 682 | 16.19 | 87 | 540 | ||||||||||||||||||
Credit risk indicators
The credit risk indicators measure the quality of the credit portfolio and the percentage ofnon-performing loans covered by provisions.
Ratio | Formula | Relevance of the metric | ||
NPL ratio (Non-performing loans) | Non-performing loans and advances to customers, customer guarantees and customer commitments granted Total Risk(1) | The NPL ratio is an important variable regarding financial institutions’ activity since it gives an indication of the level of risk the entities are exposed to. It calculates risks that are, in accounting terms, declared to benon-performing as a percentage of the total outstanding amount of customer credit and contingent liabilities. | ||
Coverage ratio | Provisions to cover impairment losses on loans and advances to customers, customer guarantees and customer commitments granted Non-performing loans and advances to customers, customer guarantees and customer commitments granted | The coverage ratio is a fundamental metric in the financial sector. It reflects the level of provisions as a percentage of thenon-performing assets (credit risk). Therefore it is a good indicator of the entity’s solvency against client defaults both present and future. | ||
Cost of Credit | Allowances for loan-loss provisions over the last 12 months Average loans and advances to customers over the last 12 months | This ratio quantifies loan-loss provisions arising from credit risk over a defined period of time for a given loan portfolio. As such, it acts as an indicator of credit quality. | ||
| (1) | Total risk = Total loans and advances and guarantees to customers (performing andnon-performing) +non-performing contingent liabilities. |
| Credit risk | Sep-19 | Jun-19 | Sep-19 | Sep-18 | ||||||||||||
NPL ratio | 3.47 | % | 3.51 | % | 3.47 | % | 3.87 | % | ||||||||
Non-performing loans and advances to customers customer guarantees and customer commitments granted | 34,326 | 34,421 | 34,326 | 36,332 | ||||||||||||
Total risk | 988,466 | 980,885 | 988,466 | 939,685 | ||||||||||||
Coverage ratio | 67 | % | 68 | % | 67 | % | 68 | % | ||||||||
Provisions to cover impairment losses on loans and advances to customers, customer guarantees and customer commitments granted | 23,112 | 23,432 | 23,112 | 24,685 | ||||||||||||
Non-performing loans and advances to customers customer guarantees and customer commitments granted | 34,326 | 34,421 | 34,326 | 36,332 | ||||||||||||
Cost of credit | 1.00 | % | 0.98 | % | 1.00 | % | 0.98 | % | ||||||||
Allowances for loan-loss provisions over the last 12 months | 9,202 | 8,889 | 9,202 | 8,600 | ||||||||||||
Average loans and advances to customers over the last 12 months | 923,140 | 910,753 | 923,140 | 879,772 | ||||||||||||
76 January - September 2019
Table of Contents
Responsible banking | ||||||||||||||||
Santander vision and | Group financial | Financial information | Corporate governance | |||||||||||||
corporate culture |
| information |
| by segments |
| Santander share |
| Appendix | ||||||||
|
|
|
|
Alternative performance measures |
| NPL ratio | ||||||||||||||||||||||||
| Sep-19 | Sep-18 | |||||||||||||||||||||||
| % | Non- performing loans and advances to customers customer guarantees and customer commitments granted | Total risk | % | Non- performing loans and advances to customers customer guarantees and customer commitments granted | Total risk | |||||||||||||||||||
Europe | 3.47 | 24,302 | 700,470 | 3.90 | 26,525 | 680,610 | ||||||||||||||||||
Spain | 7.23 | 15,738 | 217,674 | 7.55 | 17,332 | 229,631 | ||||||||||||||||||
Santander Consumer Finance | 2.25 | 2,263 | 100,705 | 2.45 | 2,320 | 94,685 | ||||||||||||||||||
United Kingdom | 1.08 | 2,816 | 261,645 | 1.12 | 2,810 | 251,777 | ||||||||||||||||||
Portugal | 4.90 | 1,871 | 38,189 | 7.43 | 2,886 | 38,837 | ||||||||||||||||||
Poland | 4.35 | 1,385 | 31,868 | 4.23 | 1,094 | 25,844 | ||||||||||||||||||
North America | 2.21 | 3,140 | 142,019 | 2.83 | 3,390 | 119,846 | ||||||||||||||||||
US | 2.18 | 2,311 | 106,042 | 3.00 | 2,559 | 85,359 | ||||||||||||||||||
Mexico | 2.30 | 829 | 35,976 | 2.41 | 831 | 34,486 | ||||||||||||||||||
South America | 4.81 | 6,823 | 141,930 | 4.83 | 6,379 | 132,209 | ||||||||||||||||||
Brazil | 5.33 | 4,539 | 85,193 | 5.26 | 4,096 | 77,813 | ||||||||||||||||||
Chile | 4.48 | 1,970 | 43,934 | 4.78 | 2,025 | 42,363 | ||||||||||||||||||
Argentina | 3.64 | 189 | 5,187 | 2.47 | 153 | 6,212 | ||||||||||||||||||
| Coverage ratio | ||||||||||||||||||||||||
| Sep-19 | Sep-18 | |||||||||||||||||||||||
| % | Provisions to cover | Non- performing loans and advances to customers customer guarantees and customer commitments granted | % | Provisions to cover | Non- performing loans and advances to customers customer guarantees and customer commitments granted | |||||||||||||||||||
Europe | 48.2 | 11,713 | 24,302 | 52.1 | 13,817 | 26,525 | ||||||||||||||||||
Spain | 40.6 | 6,383 | 15,738 | 46.4 | 8,044 | 17,332 | ||||||||||||||||||
Santander Consumer Finance | 104.2 | 2,358 | 2,263 | 106.4 | 2,467 | 2,320 | ||||||||||||||||||
United Kingdom | 34.1 | 962 | 2,816 | 33.0 | 927 | 2,810 | ||||||||||||||||||
Portugal | 51.5 | 965 | 1,871 | 53.4 | 1,542 | 2,886 | ||||||||||||||||||
Poland | 69.0 | 955 | 1,385 | 71.6 | 783 | 1,094 | ||||||||||||||||||
North America | 155.6 | 4,888 | 3,140 | 139.4 | 4,725 | 3,390 | ||||||||||||||||||
US | 166.6 | 3,850 | 2,311 | 145.5 | 3,724 | 2,559 | ||||||||||||||||||
Mexico | 125.2 | 1,038 | 829 | 120.5 | 1,002 | 831 | ||||||||||||||||||
South America | 89.7 | 6,123 | 6,823 | 94.1 | 6,001 | 6,379 | ||||||||||||||||||
Brazil | 101.1 | 4,589 | 4,539 | 109.1 | 4,468 | 4,096 | ||||||||||||||||||
Chile | 57.3 | 1,130 | 1,970 | 59.6 | 1,208 | 2,025 | ||||||||||||||||||
Argentina | 134.0 | 253 | 189 | 124.0 | 190 | 153 | ||||||||||||||||||
January - September 2019 77
Table of Contents
Responsible banking | ||||||||||||||||
Santander vision and | Group financial | Financial information | Corporate governance | |||||||||||||
corporate culture |
| information |
| by segments |
| Santander share |
| Appendix | ||||||||
|
|
|
|
Alternative performance measures |
Other indicators
The market capitalisation indicator provides information on the volume of tangible equity per share. Theloan-to-deposit ratio (LTD) identifies the relationship between net customer loans and advances and customer deposits, assessing the proportion of loans and advances granted by the Group that are funded by customer deposits.
The Group also uses gross customer loan magnitudes excluding reverse repurchase agreements (repos) and customer deposits excluding repos. In order to analyse the evolution of the traditional commercial banking business of granting loans and capturing deposits, repos and reverse repos are excluded, as they are mainly treasury business products and highly volatile.
Ratio | Formula | Relevance of the metric | ||
|
|
| ||
TNAV per share (Tangible equity net asset value per share) | Tangible book value(1) Number of shares excluding treasury stock | This is a very commonly used ratio used to measure the company’s accounting value per share having deducted the intangible assets. It is useful in evaluating the amount each shareholder would receive if the company were to enter into liquidation and had to sell all the company’s tangible assets. | ||
| Price / tangible book value per share (X) | Share price TNAV per share | Is one of the most commonly used ratios by market participants for the valuation of listed companies both in absolute terms and relative to other entities. This ratio measures the relationship between the price paid for a company and its accounting equity value. | ||
| LTD ratio(Loan-to-deposit) | Net loans and advances to customers Customer deposits | This is an indicator of the bank’s liquidity. It measures the total (net) loans and advances to customers as a percentage of customer funds. | ||
| Loans and advances (excl. reverse repos) | Gross loans and advances to customers excluding reverse repos | In order to aid analysis of the commercial banking activity, reverse repos are excluded as they are highly volatile treasury products. | ||
| Deposits (excl. repos) | Customer deposits excluding repos | In order to aid analysis of the commercial banking activity, repos are excluded as they are highly volatile treasury products. | ||
| PAT + After tax fees paid to SAN (in Wealth Management & Insurance) | Net profit + fees paid from Santander Asset Management to Santander, net of taxes, excluding Private Banking customers | Metric to assess Wealth Management & Insurance’s total contribution to Grupo Santander profit. | ||
| (1) | Tangible book value = Stockholders’ equity - intangible assets |
| Others | Sep-19 | Jun-19 | Sep-19 | Sep-18 | ||||||||||||
TNAV (tangible book value) per share | 4.25 | 4.30 | 4.25 | 4.16 | ||||||||||||
Tangible book value | 70,564 | 69,835 | 70,564 | 67,122 | ||||||||||||
Number of shares excl. treasury stock (million) | 16,612 | 16,233 | 16,612 | 16,125 | ||||||||||||
Price / Tangible book value per share (X) | 0.88 | 0.95 | 0.88 | 1.04 | ||||||||||||
Share price (euros) | 3.74 | 4.08 | 3.74 | 4.34 | ||||||||||||
TNAV (tangible book value) per share | 4.25 | 4.30 | 4.25 | 4.16 | ||||||||||||
Loan-to-deposit ratio | 112 | % | 111 | % | 112 | % | 111 | % | ||||||||
Net loans and advances to customers | 916,003 | 908,235 | 916,003 | 866,226 | ||||||||||||
Customer deposits | 814,285 | 814,751 | 814,285 | 778,751 | ||||||||||||
| Q3’19 | Q2’19 | 9M’19 | 9M’18 | |||||||||||||
PAT + After tax fees paid to SAN (in WM&I) (Constant EUR million) | 627 | 622 | 1,843 | 1,708 | ||||||||||||
Profit after tax | 258 | 251 | 735 | 674 | ||||||||||||
Net fee income net of tax | 368 | 371 | 1,108 | 1,034 | ||||||||||||
78 January - September 2019
Table of Contents
Responsible banking | ||||||||||||||||
Santander vision and | Group financial | Financial information | Corporate governance | |||||||||||||
corporate culture |
| information |
| by segments |
| Santander share |
| Appendix | ||||||||
|
|
|
|
Alternative performance measures |
Local currency measures
We make use of certain financial measures in local currency to help in the assessment of our ongoing operating performance. Thesenon-IFRS financial measures include the results of operations of our subsidiary banks located outside the Eurozone, excluding the impact of foreign exchange. Because changes in foreign currency exchange rates do not have an operating impact on the results, we believe that evaluating their performance on a local currency basis provides an additional and meaningful assessment of performance to both management and the company’s investors.
The Group presents, at both the Group level as well as the business unit level,the real changes in the income statement as well as the changes excluding the exchange rate effect, as it considers the latter facilitates analysis, since it enables businesses movements to be identified without taking into account the impact of converting each local currency into euros.
Said variations, excluding the impact of exchange rate movements, are calculated by converting P&L lines for the different business units comprising the Group into our presentation currency, the euro, applying the average exchange rate for the first nine months of 2019 to all periods contemplated in the analysis.
The Group presents, at both the Group level as well as the business unit level,the changes in euros in the balance sheet as well as the changes excluding the exchange rate effect for loans and advances to customers excluding reverse repos and customer funds (which comprise deposits and mutual funds) excluding repos. As with the income statement, the reason is to facilitate analysis by isolating the changes in the balance sheet that are not caused by converting each local currency into euros.
These changes excluding the impact of exchange rate movements are calculated by converting loans and advances to customers excluding reverse repos and customer funds excluding repos, into our presentation currency, the euro, applying the closing exchange rate on the last working day of September 2019 to all periods contemplated in the analysis.
The average andperiod-end exchange rates for the main currencies in which the Group operates are set out in the table below.
| Exchange rates: 1 euro / currency parity | ||||||||||||||||||||||||
| Average (Income statement) | Period-end (balance sheet) | |||||||||||||||||||||||
| 9M’19 | 9M’18 | Sep-19 | Jun-19 | Sep-18 | ||||||||||||||||||||
US dollar | 1.123 | 1.194 | 1.089 | 1.138 | 1.158 | |||||||||||||||||||
Pound sterling | 0.883 | 0.884 | 0.886 | 0.897 | 0.887 | |||||||||||||||||||
Brazilian real | 4.362 | 4.278 | 4.529 | 4.351 | 4.654 | |||||||||||||||||||
Mexican peso | 21.628 | 22.720 | 21.452 | 21.820 | 21.780 | |||||||||||||||||||
Chilean peso | 770.262 | 750.447 | 793.002 | 773.897 | 765.301 | |||||||||||||||||||
Argentine peso | 49.245 | 28.609 | 62.715 | 48.291 | 47.635 | |||||||||||||||||||
Polish zloty | 4.301 | 4.248 | 4.378 | 4.250 | 4.277 | |||||||||||||||||||
January - September 2019 79
Table of Contents
Responsible banking | ||||||||||||||||
Santander vision and | Group financial | Financial information | Corporate governance | |||||||||||||
corporate culture |
| information |
| by segments |
| Santander share |
| Appendix | ||||||||
|
|
|
|
interim condensed consolidated financial statements |
INTERIM CONDENSED CONSOLIDATED FINANCIAL STATEMENTS
CONSOLIDATED BALANCE SHEET
CONSOLIDATED INCOME STATEMENT
| NOTE: | The following financial information for the first nine months of 2019 and 2018 (attached herewith) corresponds to the condensed consolidated interim financial statements prepared in accordance with the consolidated public statements required by the Bank of Spain. |
Interim condensed consolidated balance sheet
EUR million
| Assets | Sep-19 | Dec-18 | Sep-18 | |||||||||
Cash, cash balances at central banks and other deposits on demand | 92,601 | 113,663 | 111,704 | |||||||||
Financial assets held for trading | 115,884 | 92,879 | 98,448 | |||||||||
Non-trading financial assets mandatorily at fair value through profit or loss | 5,328 | 10,730 | 6,752 | |||||||||
Financial assets designated at fair value through profit or loss | 66,612 | 57,460 | 63,821 | |||||||||
Financial assets at fair value through other comprehensive income | 120,659 | 121,091 | 116,356 | |||||||||
Financial assets at amortised cost | 987,750 | 946,099 | 931,411 | |||||||||
Hedging derivatives | 9,333 | 8,607 | 7,912 | |||||||||
Changes in the fair value of hedged items in portfolio hedges of interest risk | 2,288 | 1,088 | 929 | |||||||||
Investments | 8,346 | 7,588 | 9,371 | |||||||||
Joint ventures companies | 1,547 | 979 | 2,052 | |||||||||
Associated entities | 6,799 | 6,609 | 7,319 | |||||||||
Assets under insurance or reinsurance contracts | 312 | 324 | 342 | |||||||||
Tangible assets | �� | 35,399 | 26,157 | 24,727 | ||||||||
Property, plant and equipment | 34,338 | 24,594 | 23,102 | |||||||||
Forown-use | 14,975 | 8,150 | 7,777 | |||||||||
Leased out under an operating lease | 19,363 | 16,444 | 15,325 | |||||||||
Investment property | 1,061 | 1,563 | 1,625 | |||||||||
Of which Leased out under an operating lease | 743 | 1,195 | 1,237 | |||||||||
Intangible assets | 27,383 | 28,560 | 27,855 | |||||||||
Goodwill | 24,109 | 25,466 | 24,956 | |||||||||
Other intangible assets | 3,274 | 3,094 | 2,899 | |||||||||
Tax assets | 29,993 | 30,251 | 29,901 | |||||||||
Current tax assets | 6,478 | 6,993 | 6,386 | |||||||||
Deferred tax assets | 23,515 | 23,258 | 23,515 | |||||||||
Other assets | 11,500 | 9,348 | 9,713 | |||||||||
Insurance contracts linked to pensions | 211 | 210 | 218 | |||||||||
Inventories | 12 | 147 | 153 | |||||||||
Other | 11,277 | 8,991 | 9,342 | |||||||||
Non-current assets held for sale | 4,497 | 5,426 | 5,445 | |||||||||
TOTAL ASSETS | 1,517,885 | 1,459,271 | 1,444,687 | |||||||||
80 January - September 2019
Table of Contents
Responsible banking | ||||||||||||||||
Santander vision and | Group financial | Financial information | Corporate governance | |||||||||||||
corporate culture |
| information |
| by segments |
| Santander share |
| Appendix | ||||||||
|
|
|
|
Interim condensed consolidated financial statements |
Interim condensed consolidated balance sheet
EUR million
| Liabilities | Sep-19 | Dec-18 | Sep-18 | |||||||||
Financial liabilities held for trading | 85,797 | 70,343 | 66,805 | |||||||||
Financial liabilities designated at fair value through profit or loss | 68,263 | 68,058 | 92,182 | |||||||||
Financial liabilities at amortised cost | 1,211,114 | 1,171,630 | 1,139,066 | |||||||||
Hedging derivatives | 6,580 | 6,363 | 6,110 | |||||||||
Changes in the fair value of hedged items in portfolio hedges of interest rate risk | 317 | 303 | 311 | |||||||||
Liabilities under insurance or reinsurance contracts | 731 | 765 | 810 | |||||||||
Provisions | 14,364 | 13,225 | 13,269 | |||||||||
Pensions and other post-retirement obligations | 6,407 | 5,558 | 5,394 | |||||||||
Other long term employee benefits | 1,560 | 1,239 | 1,417 | |||||||||
Taxes and other legal contingencies | 3,098 | 3,174 | 3,032 | |||||||||
Contingent liabilities and commitments | 720 | 779 | 828 | |||||||||
Other provisions | 2,579 | 2,475 | 2,598 | |||||||||
Tax liabilities | 9,769 | 8,135 | 7,953 | |||||||||
Current tax liabilities | 2,719 | 2,567 | 2,655 | |||||||||
Deferred tax liabilities | 7,050 | 5,568 | 5,298 | |||||||||
Other liabilities | 12,424 | 13,088 | 12,513 | |||||||||
Liabilities associated withnon-current assets held for sale | — | — | — | |||||||||
TOTAL LIABILITIES | 1,409,359 | 1,351,910 | 1,339,019 | |||||||||
EQUITY | ||||||||||||
Shareholders’ equity | 119,543 | 118,613 | 119,793 | |||||||||
Capital | 8,309 | 8,118 | 8,068 | |||||||||
Called up paid capital | 8,309 | 8,118 | 8,068 | |||||||||
Unpaid capital which has been called up | — | — | — | |||||||||
Share premium | 52,446 | 50,993 | 51,053 | |||||||||
Equity instruments issued other than capital | 590 | 565 | 549 | |||||||||
Equity component of the compound financial instrument | — | — | — | |||||||||
Other equity instruments issued | 590 | 565 | 549 | |||||||||
Other equity | 143 | 234 | 217 | |||||||||
Accumulated retained earnings | 61,044 | 56,756 | 56,965 | |||||||||
Revaluation reserves | — | — | — | |||||||||
Other reserves | (5,036) | (3,567) | (1,696) | |||||||||
(-) Own shares | (23) | (59) | (56) | |||||||||
Profit attributable to shareholders of the parent | 3,732 | 7,810 | 5,742 | |||||||||
(-) Interim dividends | (1,662) | (2,237) | (1,049) | |||||||||
Other comprehensive income | (21,596) | (22,141) | (24,816) | |||||||||
Items not reclassified to profit or loss | (3,972) | (2,936) | (2,668) | |||||||||
Items that may be reclassified to profit or loss | (17,624) | (19,205) | (22,148) | |||||||||
Non-controlling interest | 10,579 | 10,889 | 10,691 | |||||||||
Other comprehensive income | (898) | (1,292) | (1,335) | |||||||||
Other items | 11,477 | 12,181 | 12,026 | |||||||||
TOTAL EQUITY | 108,526 | 107,361 | 105,668 | |||||||||
TOTAL LIABILITIES AND EQUITY | 1,517,885 | 1,459,271 | 1,444,687 | |||||||||
MEMORANDUM ITEMS | ||||||||||||
Loans commitment granted | 240,839 | 218,083 | 212,115 | |||||||||
Financial guarantees granted | 12,843 | 11,723 | 12,634 | |||||||||
Other commitments granted | 86,490 | 74,389 | 73,433 | |||||||||
January - September 2019 81
Table of Contents
Responsible banking | ||||||||||||||||
Santander vision and | Group financial | Financial information | Corporate governance | |||||||||||||
corporate culture |
| information |
| by segments |
| Santander share |
| Appendix | ||||||||
|
|
|
|
Interim condensed consolidated financial statements |
Interim condensed consolidated income statement
EUR million
| 9M’19 | 9M’18 | |||||||
Interest income | 42,758 | 39,902 | ||||||
Financial assets at fair value through other comprehensive income | 2,875 | 3,213 | ||||||
Financial assets at amortised cost | 36,604 | 34,077 | ||||||
Other interest income | 3,279 | 2,612 | ||||||
Interest expense | (16,316) | (14,622) | ||||||
Net interest income | 26,442 | 25,280 | ||||||
Dividend income | 433 | 292 | ||||||
Share of results of entities accounted for using the equity method | 443 | 532 | ||||||
Commission income | 11,395 | 10,834 | ||||||
Commission expense | (2,577) | (2,305) | ||||||
Gain or losses on financial assets and liabilities not measured at fair value through profit or loss, net | 688 | 576 | ||||||
Financial assets at amortised cost | 166 | 40 | ||||||
Other financial assets and liabilities | 522 | 536 | ||||||
Gain or losses on financial assets and liabilities held for trading, net | 713 | 1,532 | ||||||
Reclassification of financial assets at fair value through other comprehensive income | — | — | ||||||
Reclassification of financial assets at amortised cost | — | — | ||||||
Other gains (losses) | 713 | 1,532 | ||||||
Gains or losses onnon-trading financial assets and liabilities mandatorily at fair value through profit or loss | 290 | 109 | ||||||
Reclassification of financial assets at fair value through other comprehensive income | — | — | ||||||
Reclassification of financial assets at amortised cost | — | — | ||||||
Other gains (losses) | 290 | 109 | ||||||
Gain or losses on financial assets and liabilities measured at fair value through profit or loss, net | (251) | 146 | ||||||
Gain or losses from hedge accounting, net | 2 | 5 | ||||||
Exchange differences, net | (507) | (1,009) | ||||||
Other operating income | 1,297 | 1,179 | ||||||
Other operating expenses | (1,501) | (1,347) | ||||||
Income from assets under insurance and reinsurance contracts | 2,123 | 2,395 | ||||||
Expenses from liabilities under insurance and reinsurance contracts | (2,088) | (2,337) | ||||||
Total income | 36,902 | 35,882 | ||||||
Administrative expenses | (15,100) | (15,069) | ||||||
Staff costs | (9,088) | (8,797) | ||||||
Other general administrative expenses | (6,012) | (6,272) | ||||||
Depreciation and amortisation cost | (2,209) | (1,774) | ||||||
Provisions or reversal of provisions, net | (2,511) | (1,725) | ||||||
Impairment or reversal of impairment at financial assets not measured at fair value through profit or loss, net | (6,810) | (6,473) | ||||||
Financial assets at fair value with changes in other comprehensive income | (7) | (4) | ||||||
Financial assets at amortised cost | (6,803) | (6,469) | ||||||
Impairment of investments in subsidiaries, joint ventures and associates, net | — | — | ||||||
Impairment onnon-financial assets, net | (1,547) | (121) | ||||||
Tangible assets | (27) | (45) | ||||||
Intangible assets | (1,512) | (77) | ||||||
Others | (8) | 1 | ||||||
Gain or losses onnon-financial assets and investments, net | 253 | 24 | ||||||
Negative goodwill recognised in results | — | — | ||||||
Gains or losses onnon-current assets held for sale not classified as discontinued operations | (266) | (158) | ||||||
Profit or loss before tax from continuing operations | 8,712 | 10,586 | ||||||
Tax expense or income from continuing operations | (3,740) | (3,709) | ||||||
Profit for the period from continuing operations | 4,972 | 6,877 | ||||||
Profit or loss after tax from discontinued operations | — | — | ||||||
Profit for the period | 4,972 | 6,877 | ||||||
Profit attributable tonon-controlling interests | 1,240 | 1,135 | ||||||
Profit attributable to the parent | 3,732 | 5,742 | ||||||
Earnings per share | ||||||||
Basic | 0.202 | 0.331 | ||||||
Diluted | 0.201 | 0.330 | ||||||
82 January - September 2019
Table of Contents
Responsible banking | ||||||||||||||||
Santander vision and | Group financial | Financial information | Corporate governance | |||||||||||||
corporate culture |
| information |
| by segments |
| Santander share |
| Appendix | ||||||||
|
|
|
|
Glossary |
GLOSSARY
| • | Active customer:Those customers who comply with balance, income and/or transactionality demanded minima defined according to the business area |
| • | ALCO:Assets and Liabilities Committee |
| • | APM:Alternative Performance Measures |
| • | bps: basis points |
| • | CET1: Core equity tier 1 |
| • | CNMV:Spanish National Securities Market Commission (Comisión Nacional del Mercado de Valores) |
| • | Digital customers: Every consumer of a commercial bank’s services who has logged on to their personal online banking and/or mobile banking in the last 30 days |
| • | EBA:European Banking Authority |
| • | ECB: European Central Bank |
| • | EPS: Earnings Per Share |
| • | ESG: Environmental, Social and Governance |
| • | ESMA: European Securities and Markets Authority |
| • | Fed: Federal Reserve |
| • | FX: Foreign Exchange |
| • | GDP: Gross Domestic Product |
| • | IFRS 9: International Financial Reporting Standard 9, regarding financial instruments |
| • | IFRS 16: International Financial Reporting Standard 16, regarding leases |
| • | Loyal customers:Active customers who receive most of their financial services from the Group according to the commercial segment that they belong to. Various engaged customer levels have been defined taking profitability into account. |
| • | NPLs:Non-performing loans |
| • | P/E ratio:Price / earnings per share ratio |
| • | PBT:Profit before tax |
| • | pp:percentage points |
| • | PPI:Payment protection insurance |
| • | Repos:Repurchase agreements |
| • | RoA: Return on assets |
| • | RoE: Return on equity |
| • | RoRWA: Return on risk weighted assets |
| • | RoTE: Return on tangible equity |
| • | RWAs: Risk weighted assets |
| • | SAM: Santander Asset Management |
| • | SBNA: Santander Bank N.A. |
| • | SCF: Santander Consumer Finance |
| • | SCIB: Santander Corporate & Investment Banking |
| • | SC USA: Santander Consumer USA |
| • | SEC: Securities and Exchanges Commission |
| • | SGP: Santander Global Platform |
| • | SH USA: Santander Holdings USA, Inc. |
| • | SMEs: Small or medium enterprises |
| • | SRF: Single Resolution Fund |
| • | SREP: Supervisory Review and Evaluation Process |
| • | SSM: Single Supervisory Mechanism, the system of banking supervision in Europe. It comprises the ECB and the national supervisory authorities of the participating countries |
| • | T1: Tier 1 |
| • | TDR: Troubled debt restructuring |
| • | TLAC: The total loss absorption capacity requirement which is required to be met under the CRD V package |
| • | TNAV: Tangible net asset value |
| • | TRIM: Targeted review of internal models |
| • | VaR: Value at Risk |
| • | WM&I: Wealth Management & Insurance |
January - September 2019 83
Table of Contents
Responsible banking | ||||||||||||||||
Santander vision and | Group financial | Financial information | Corporate governance | |||||||||||||
corporate culture |
| information |
| by segments |
| Santander share |
| Appendix | ||||||||
|
|
|
|
Important information |
| Important information |

Non-IFRS and alternative performance measures
In addition to the financial information prepared in accordance with International Financial Reporting Standards (“IFRS”), this report contains certain financial measures that constitute alternative performance measures (“APMs”) as defined in the Guidelines on Alternative Performance Measures issued by the European Securities and Markets Authority (ESMA) on 5 October 2015 (ESMA/2015/1415en) and othernon-IFRS measures(“Non-IFRS Measures”). The financial measures contained in this report that qualify as APMs andnon-IFRS measures have been calculated using the financial information from Santander Group but are not defined or detailed in the applicable financial reporting framework and have neither been audited nor reviewed by our auditors. We use these APMs andnon-IFRS measures when planning, monitoring and evaluating our performance. We consider these APMs andnon-IFRS measures to be useful metrics for management and investors to facilitate operating performance comparisons from period to period. While we believe that these APMs andnon-IFRS measures are useful in evaluating our business, this information should be considered as supplemental in nature and is not meant as a substitute of IFRS measures. In addition, other companies, including companies in our industry, may calculate or use such measures differently, which reduces their usefulness as comparative measures. For further details of the APMs andnon-IFRS Measures used, including its definition or a reconciliation between any applicable management indicators and the financial data presented in the consolidated financial statements prepared under IFRS, please see 2018 Annual Financial Report, published in the CNMV on 28 February 2019, our20-F report for the year ending 31 December 2018 registered with the SEC in the United States as well as the section “Alternative performance measures” of the annex to this report.
The businesses included in each of our geographic segments and the accounting principles under which their results are presented here may differ from the included businesses and local applicable accounting principles of our public subsidiaries in such geographies. Accordingly, the results of operations and trends shown for our geographic segments may differ materially from those of such subsidiaries.
Forward-looking statements
Santander cautions that this report contains statements that constitute “forward-looking statements” within the meaning of the U.S. Private Securities Litigation Reform Act of 1995. Forward-looking statements may be identified by words such as “expect”, “project”, “anticipate”, “should”, “intend”, “probability”, “risk”, “VaR”, “RoRAC”, “RoRWA”, “TNAV”, “target”, “goal”, “objective”, “estimate”, “future” and similar expressions. These forward-looking statements are found in various places throughout this report and include, without limitation, statements concerning our future business development and economic performance and our shareholder remuneration policy. While these forward-looking statements represent our judgment and future expectations concerning the development of our business, a number of risks, uncertainties and other important factors could cause actual developments and results to differ materially from our expectations. The following important factors, in addition to those discussed elsewhere in this report, and in our annual report on Form20-F for the year ended December 31, 2018, filed with the U.S. Securities and Exchange Commission, could affect our future results and could cause outcomes to differ materially from those anticipated in any forward-looking statement: (1) general economic or industry conditions in areas in which we have significant business activities or investments, including a worsening of the economic environment, increasing in the volatility of the capital markets, inflation or deflation, and changes in demographics, consumer spending, investment or saving habits; (2) exposure to various types of market risks, principally including interest rate risk, foreign exchange rate risk, equity price risk and risks associated with the replacement of benchmark indices; (3) potential losses associated with prepayment of our loan and investment portfolio, declines in the value of collateral securing our loan portfolio, and counterparty risk; (4) political stability in Spain, the UK, other European countries, Latin America and the US (5) changes in laws, regulations or taxes, including changes in regulatory capital and liquidity requirements, including as a result of the UK exiting the European Union and increased regulation in light of the global financial crisis; (6) our ability to integrate successfully our acquisitions and the challenges inherent in diverting management’s focus and resources from other strategic opportunities and from operational matters while we integrate these acquisitions; and (7) changes in our ability to access liquidity and funding on acceptable terms, including as a result of changes in our credit spreads or a downgrade in our credit ratings or those of our more significant subsidiaries. Numerous factors could affect the future results of Santander and could result in those results deviating materially from those anticipated in the forward-looking statements. Other unknown or unpredictable factors could cause actual results to differ materially from those in the forward-looking statements.
Forward-looking statements speak only as of the date of this report and are based on the knowledge, information available and views taken on such date; such knowledge, information and views may change at any time. Santander does not undertake any obligation to update or revise any forward-looking statement, whether as a result of new information, future events or otherwise.
84 January - September 2019
Table of Contents
Responsible banking | ||||||||||||||||
Santander vision and | Group financial | Financial information | Corporate governance | |||||||||||||
corporate culture |
| information |
| by segments |
| Santander share |
| Appendix | ||||||||
|
|
|
|
Important information |
No offer
The information contained in this report is subject to, and must be read in conjunction with, all other publicly available information, including, where relevant any fuller disclosure document published by Santander. Any person at any time acquiring securities must do so only on the basis of such person’s own judgment as to the merits or the suitability of the securities for its purpose and only on such information as is contained in such public information having taken all such professional or other advice as it considers necessary or appropriate in the circumstances and not in reliance on the information contained in this report. No investment activity should be undertaken on the basis of the information contained in this report. In making this report available Santander gives no advice and makes no recommendation to buy, sell or otherwise deal in shares in Santander or in any other securities or investments whatsoever.
Neither this report nor any of the information contained therein constitutes an offer to sell or the solicitation of an offer to buy any securities. No offering of securities shall be made in the United States except pursuant to registration under the U.S. Securities Act of 1933, as amended, or an exemption therefrom. Nothing contained in this report is intended to constitute an invitation or inducement to engage in investment activity for the purposes of the prohibition on financial promotion in the U.K. Financial Services and Markets Act 2000.
Historical performance is not indicative of future results
Statements as to historical performance or financial accretion are not intended to mean that future performance, share price or future earnings (including earnings per share) for any period will necessarily match or exceed those of any prior period. Nothing in this report should be construed as a profit forecast.
This document is a translation of a document originally issued in Spanish. Should there be any discrepancies between the English and the Spanish versions, only the original Spanish version should be binding.
| ||||||
January - September 2019 85
Table of Contents
Investor Relations
Ciudad Grupo Santander Edificio Pereda, 2nd floor Avda de Cantabria s/n 28660 Boadilla del Monte Madrid (Spain) Tel: +34 91 259 65 14 / +34 91 259 65 20 Fax: +34 91 257 02 45 e-mail: investor@gruposantander.com
Legal Head Office: Paseo Pereda9-12, Santander (Spain) Tel: +34 (942) 20 61 00 | ||||||
Operational Head Office: Ciudad Grupo Santander Avda. de Cantabria s/n 28660 Boadilla del Monte, Madrid (Spain)
| ||||||

www.santander.com | ||||

Table of Contents

30 October 2019 9M’19 Earnings Presentation Here to help you prosper
Table of Contents
Important InformationNon-IFRS and alternative performance measures In addition to the financial information prepared in accordance with International Financial Reporting Standards (“IFRS”) and derived from our financial statements, this presentation contains certain financial measures that constitute alternative performance measures (“APMs”) as defined in the Guidelines on Alternative Performance Measures issued by the European Securities and Markets Authority (ESMA) on 5 October 2015 (ESMA/2015/1415en) and othernon-IFRS measures(“Non-IFRS Measures”). The financial measures contained in this presentation that qualify as APMs andnon-IFRS measures have been calculated using the financial information from Santander Group but are not defined or detailed in the applicable financial reporting framework and have neither been audited nor reviewed by our auditors. We use these APMs andnon-IFRS measures when planning, monitoring and evaluating our performance. We consider these APMs andnon-IFRS measures to be useful metrics for management and investors to facilitate operating performance comparisons from period to period. While we believe that these APMs andnon-IFRS measures are useful in evaluating our business, this information should be considered as supplemental in nature and is not meant as a substitute of IFRS measures. In addition, other companies, including companies in our industry, may calculate or use such measures differently, which reduces their usefulness as comparative measures. For further details of the APMs andNon-IFRS Measures used, including its definition or a reconciliation between any applicable management indicators and the financial data presented in the consolidated financial statements prepared under IFRS, please see the 2018 Annual Financial Report, filed with the Comisión Nacional del Mercado de Valores of Spain (CNMV) on 28 February 2019, as well as the section “Alternative performance measures” of the annex to the Banco Santander, S.A. (“Santander”) 2019 3Q Financial Report, published as Relevant Fact on 30 October 2019. These documents are available on Santander’s website (www.santander.com). The businesses included in each of our geographic segments and the accounting principles under which their results are presented here may differ from the included businesses and local applicable accounting principles of our public subsidiaries in such geographies. Accordingly, the results of operations and trends shown for our geographic segments may differ materially from those of such subsidiaries Forward-looking statements Santander cautions that this presentation contains statements that constitute “forward-looking statements” within the meaning of the U.S. Private Securities Litigation Reform Act of 1995. Forward-looking statements may be identified by words such as “expect”, “project”, “anticipate”, “should”, “intend”, “probability”, “risk”, “VaR”, “RoRAC”, “RoRWA”, “TNAV”, “target”, “goal”, “objective”, “estimate”, “future” and similar expressions. These forward-looking statements are found in various places throughout this presentation and include, without limitation, statements concerning our future business development and economic performance and our shareholder remuneration policy. While these forward-looking statements represent our judgment and future expectations concerning the development of our business, a number of risks, uncertainties and other important factors could cause actual developments and results to differ materially from our expectations. The following important factors, in addition to those discussed elsewhere in this presentation, could affect our future results and could cause outcomes to differ materially from those anticipated in any forward-looking statement: (1) general economic or industry conditions in areas in which we have significant business activities or investments, including a worsening of the economic environment, increasing in the volatility of the capital markets, inflation or deflation, and changes in demographics, consumer spending, investment or saving habits; (2) exposure to various types of market risks, principally including interest rate risk, foreign exchange rate risk, equity price risk and risks associated with the replacement of benchmark indices; (3) potential losses associated with prepayment of our loan and investment portfolio, declines in the value of collateral securing our loan portfolio, and counterparty risk; (4) political stability in Spain, the UK, other European countries, Latin America and the US (5) changes in laws, regulations or taxes, including changes in regulatory capital and liquidity requirements, including as a result of the UK exiting the European Union and increased regulation in light of the global financial crisis; (6) our ability to integrate successfully our acquisitions and the challenges inherent in diverting management’s focus and resources from other strategic opportunities and from operational matters while we integrate these acquisitions; and (7) changes in our ability to access liquidity and funding on acceptable terms, including as a result of changes in our credit spreads or a downgrade in our credit ratings or those of our more significant subsidiaries. Numerous factors could affect the future results of Santander and could result in those results deviating materially from those anticipated in the forward-looking statements. Other unknown or unpredictable factors could cause actual results to differ materially from those in the forward-looking statements. 2
Table of Contents
Important Information Forward-looking statements speak only as of the date of this presentation and are based on the knowledge, information available and views taken on such date; such knowledge, information and views may change at any time. Santander does not undertake any obligation to update or revise any forward-looking statement, whether as a result of new information, future events or otherwise. No offer The information contained in this presentation is subject to, and must be read in conjunction with, all other publicly available information, including, where relevant any fuller disclosure document published by Santander. Any person at any time acquiring securities must do so only on the basis of such person’s own judgment as to the merits or the suitability of the securities for its purpose and only on such information as is contained in such public information having taken all such professional or other advice as it considers necessary or appropriate in the circumstances and not in reliance on the information contained in this presentation. No investment activity should be undertaken on the basis of the information contained in this presentation. In making this presentation available Santander gives no advice and makes no recommendation to buy, sell or otherwise deal in shares in Santander or in any other securities or investments whatsoever. Neither this presentation nor any of the information contained therein constitutes an offer to sell or the solicitation of an offer to buy any securities. No offering of securities shall be made in the United States except pursuant to registration under the U.S. Securities Act of 1933, as amended, or an exemption therefrom. Nothing contained in this presentation is intended to constitute an invitation or inducement to engage in investment activity for the purposes of the prohibition on financial promotion in the U.K. Financial Services and Markets Act 2000. Historical performance is not indicative of future results Statements as to historical performance or financial accretion are not intended to mean that future performance, share price or future earnings (including earnings per share) for any period will necessarily match or exceed those of any prior period. Nothing in this presentation should be construed as a profit forecast. Third Party Information In particular, regarding the data provided by third parties, neither Santander, nor any of its administrators, directors or employees, either explicitly or implicitly, guarantees that these contents are exact, accurate, comprehensive or complete, nor are they obliged to keep them updated, nor to correct them in the case that any deficiency, error or omission were to be detected. Moreover, in reproducing these contents in by any means, Santander may introduce any changes it deems suitable, may omit partially or completely any of the elements of this presentation, and in case of any deviation between such a version and this one, Santander assumes no liability for any discrepancy. 3
Table of Contents
Index 1. Group performance 9M’19 2. Business areas performance 9M’19 3. Concluding remarks 4. Appendix 5. Glossary 4
Table of Contents
Group performance 9M’19 01
Table of Contents
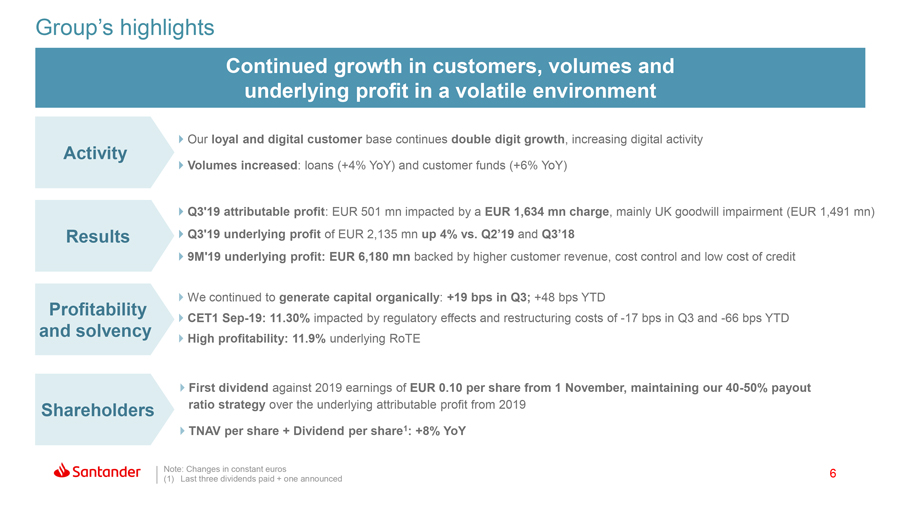
Group’s highlights Continued growth in customers, volumes and underlying profit in a volatile environment Activity4Our loyal and digital customer base continues double digit growth, increasing digital activity4Volumes increased: loans (+4% YoY) and customer funds (+6% YoY) 4Q3’19 attributable profit: EUR 501 mn impacted by a EUR 1,634 mn charge, mainly UK goodwill impairment (EUR 1,491 mn) Results4Q3’19 underlying profit of EUR 2,135 mn up 4% vs. Q2’19 and Q3’18 49M’19 underlying profit: EUR 6,180 mn backed by higher customer revenue, cost control and low cost of credit 4We continued to generate capital organically: +19 bps in Q3; +48 bps YTD Profitability 4CET1Sep-19: 11.30% impacted by regulatory effects and restructuring costs of-17 bps in Q3 and-66 bps YTD and solvency 4High profitability: 11.9% underlying RoTE 4First dividend against 2019 earnings of EUR 0.10 per share from 1 November, maintaining our40-50% payout Shareholders ratio strategy over the underlying attributable profit from 2019 4TNAV per share + Dividend per share1: +8% YoY Note: Changes in constant euros 6 (1) Last three dividends paid + one announced
Table of Contents
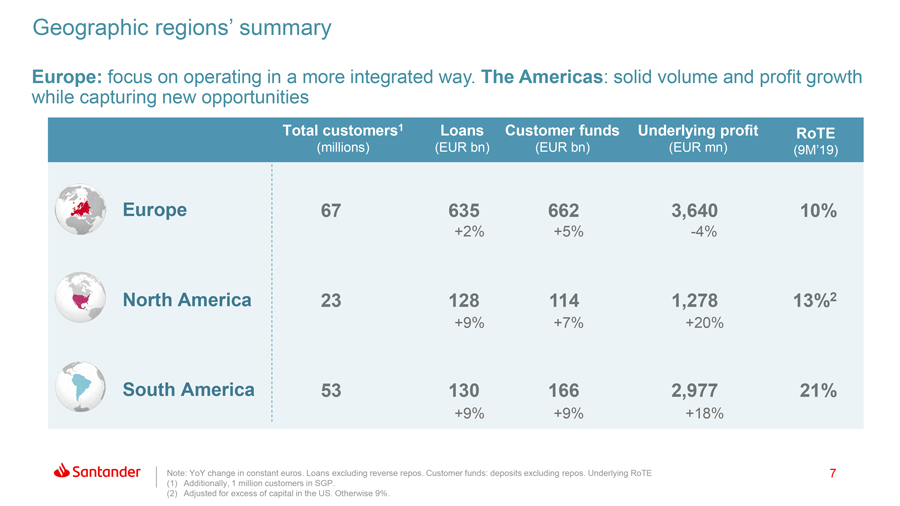
Geographic regions’ summary Europe: focus on operating in a more integrated way. The Americas: solid volume and profit growth while capturing new opportunities Total customers1 Loans Customer funds Underlying profit RoTE (millions) (EUR bn) (EUR bn) (EUR mn) (9M’19) Europe 67 635 662 3,640 10% +2% +5%-4% North America 23 128 114 1,278 13%2 +9% +7% +20% South America 53 130 166 2,977 21% +9% +9% +18% Note: YoY change in constant euros. Loans excluding reverse repos. Customer funds: deposits excluding repos. Underlying RoTE 7 (1) Additionally, 1 million customers in SGP. (2) Adjusted for excess of capital in the US. Otherwise 9%.
Table of Contents

Customers and digital activity 8
Table of Contents
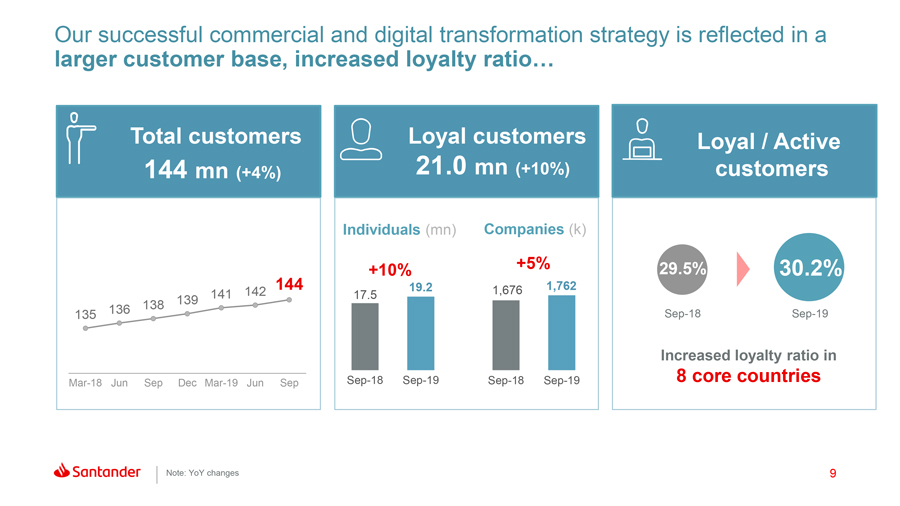
Our successful commercial and digital transformation strategy is reflected in a larger customer base, increased loyalty ratio… Total customers Loyal customers Loyal / Active 144 mn (+4%) 21.0 mn (+10%) customers Individuals (mn) Companies (k) +10% +5% 29.5% 30.2% 142 144 19.2 1,676 1,762 141 17.5 138 139 135 136Sep-18Sep-19 Increased loyalty ratio inMar-18 Jun Sep DecMar-19 Jun SepSep-18Sep-19Sep-18Sep-19 8 core countries Note: YoY changes 9
Table of Contents
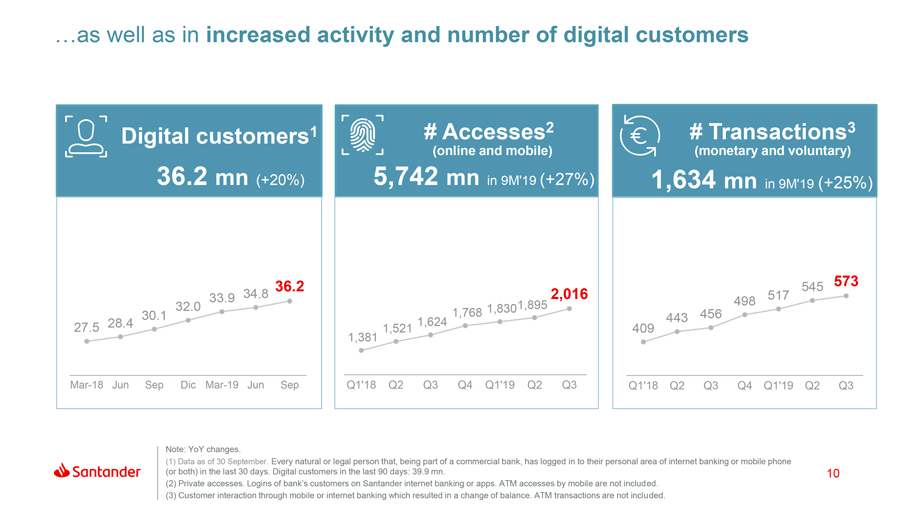
…as well as in increased activity and number of digital customers Digital customers1 # Accesses2 # Transactions3 (online and mobile) (monetary and voluntary) 36.2 mn (+20%) 5,742 mn in 9M’19 (+27%) 1,634 mn in 9M’19 (+25%) 36.2 545 573 33.9 34.8 2,016 517 32.0 1,8301,895 498 1,768 456 30.1 443 27.5 28.4 1,624 409 1,381 1,521Mar-18 Jun Sep DicMar-19 Jun Sep Q1’18 Q2 Q3 Q4 Q1’19 Q2 Q3 Q1’18 Q2 Q3 Q4 Q1’19 Q2 Q3 Note: YoY changes. (1) Data as of 30 September. Every natural or legal person that, being part of a commercial bank, has logged in to their personal area of internet banking or mobile phone (or both) in the last 30 days. Digital customers in the last 90 days: 39.9 mn. 10 (2) Private accesses. Logins of bank’s customers on Santander internet banking or apps. ATM accesses by mobile are not included. (3) Customer interaction through mobile or internet banking which resulted in a change of balance. ATM transactions are not included.
Table of Contents
Results, profitability and solvency 11
Table of Contents
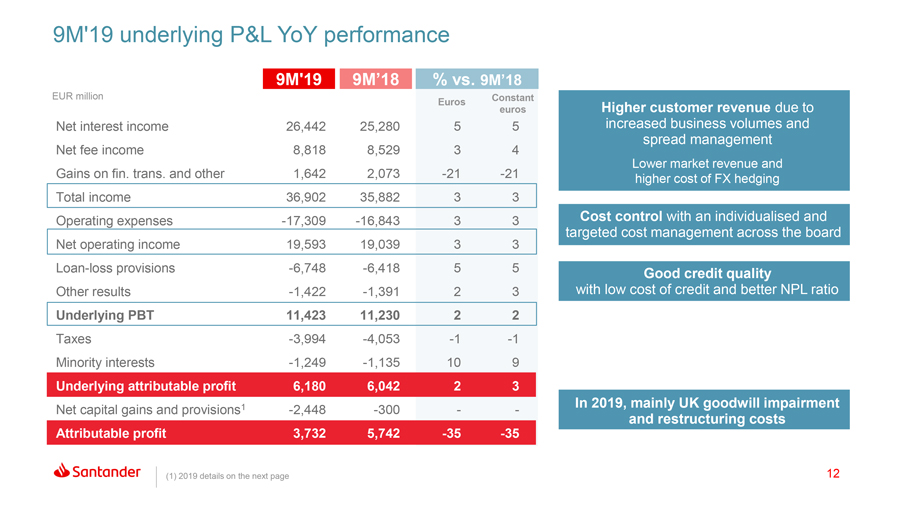
9M’19 underlying P&L YoY performance 9M’19 9M’18 % vs. 9M’18 EUR million Constant Euros Higher customer revenue due to euros Net interest income 26,442 25,280 5 5 increased business volumes and spread management Net fee income 8,818 8,529 3 4 Lower market revenue and Gains on fin. trans. and other 1,642 2,073-21-21 higher cost of FX hedging Total income 36,902 35,882 3 3 Operating expenses-17,309-16,843 3 3 Cost control with an individualised and Net operating income 19,593 19,039 3 3 targeted cost management across the board Loan-loss provisions-6,748-6,418 5 5 Good credit quality Other results-1,422-1,391 2 3 with low cost of credit and better NPL ratio Underlying PBT 11,423 11,230 2 2 Taxes-3,994-4,053-1-1 Minority interests-1,249-1,135 10 9 Underlying attributable profit 6,180 6,042 2 3 1 In 2019, mainly UK goodwill impairment Net capital gains and provisions-2,448-300 —and restructuring costs Attributable profit 3,732 5,742-35-35 (1) 2019 details on the next page 12
Table of Contents
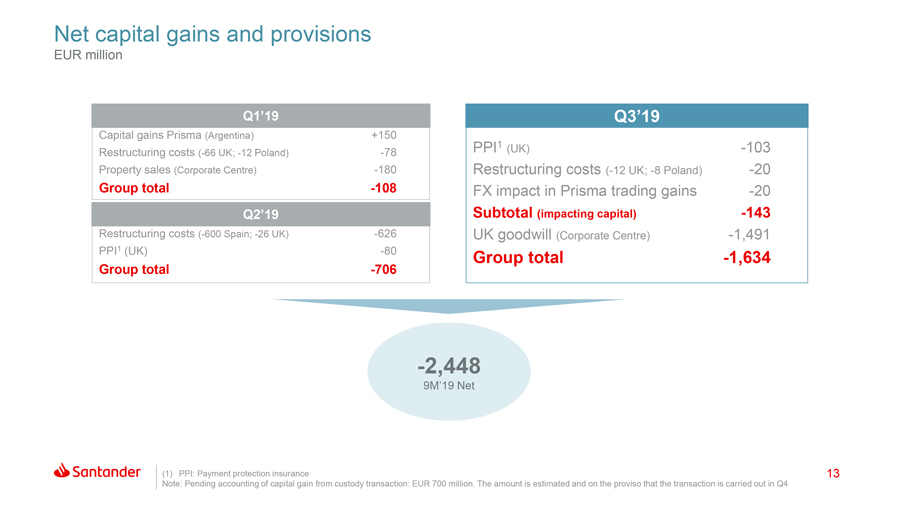
Net capital gains and provisions EUR million Q1’19 Q3’19 Capital gains Prisma (Argentina) +150 1 Restructuring costs(-66 UK;-12 Poland) -78 PPI (UK) -103 Property sales (Corporate Centre) -180 Restructuring costs(-12 UK;-8 Poland) -20 Group total-108 FX impact in Prisma trading gains-20 Q2’19 Subtotal (impacting capital) -143 Restructuring costs(-600 Spain;-26 UK) -626 UK goodwill (Corporate Centre) -1,491 PPI1 (UK)-80 Group total-1,634 Group total-706 -2,448 9M’19 Net (1) PPI: Payment protection insurance 13 Note: Pending accounting of capital gain from custody transaction: EUR 700 million. The amount is estimated and on the proviso that the transaction is carried out in Q4
Table of Contents
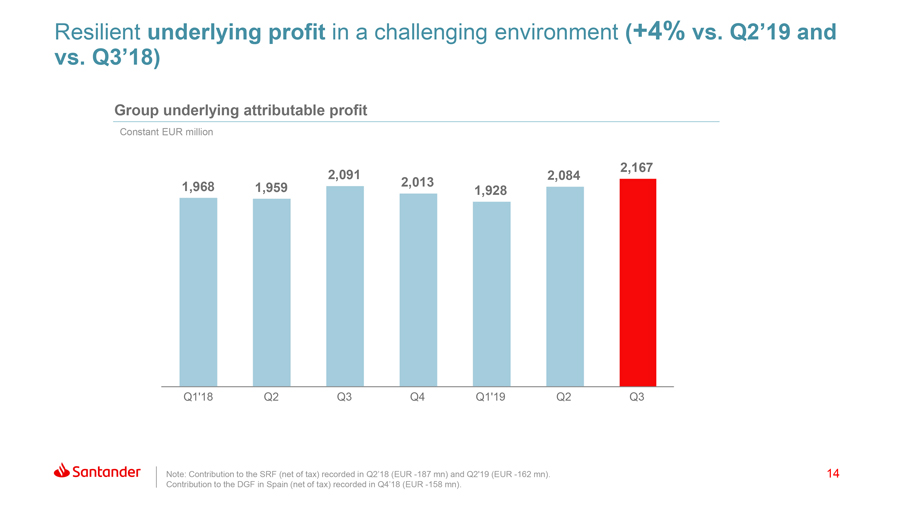
Resilient underlying profit in a challenging environment (+4% vs. Q2’19 and vs. Q3’18) Group underlying attributable profit Constant EUR million 2,167 2,091 2,084 1,968 1,959 2,013 1,928 Q1’18 Q2 Q3 Q4 Q1’19 Q2 Q3 Note: Contribution to the SRF (net of tax) recorded in Q2’18 (EUR-187 mn) and Q2’19 (EUR-162 mn). 14 Contribution to the DGF in Spain (net of tax) recorded in Q4’18 (EUR-158 mn).
Table of Contents
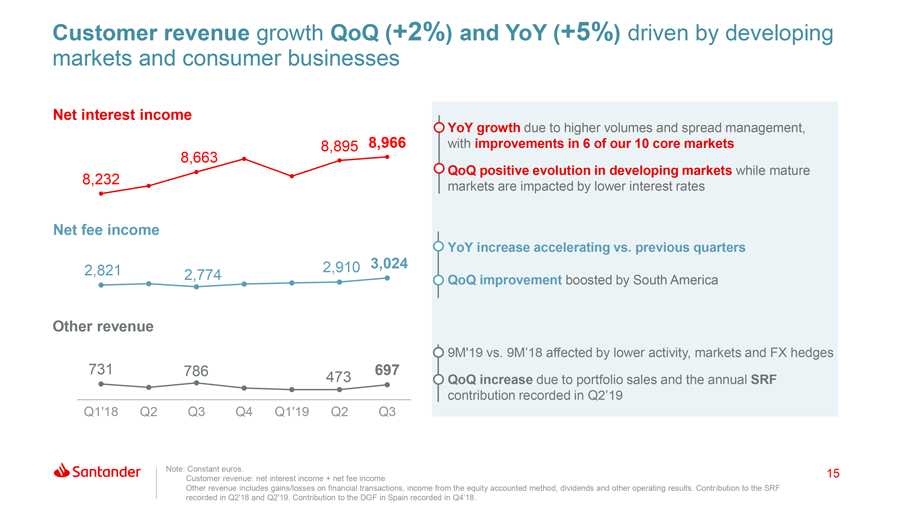
Customer revenue growth QoQ (+2%) and YoY (+5%) driven by developing markets and consumer businesses Net interest income YoY growth due to higher volumes and spread management, 8,895 8,966 with improvements in 6 of our 10 core markets 8,663 QoQ positive evolution in developing markets while mature 8,232 markets are impacted by lower interest rates Net fee income YoY increase accelerating vs. previous quarters 2,910 3,024 2,821 2,774 QoQ improvement boosted by South America Other revenue 9M’19 vs. 9M’18 affected by lower activity, markets and FX hedges 731 786 697 473 QoQ increase due to portfolio sales and the annual SRF contribution recorded in Q2’19 Q1’18 Q2 Q3 Q4 Q1’19 Q2 Q3 Note: Constant euros. 15 Customer revenue: net interest income + net fee income Other revenue includes gains/losses on financial transactions, income from the equity accounted method, dividends and other operating results. Contribution to the SRF recorded in Q2’18 and Q2’19. Contribution to the DGF in Spain recorded in Q4’18.
Table of Contents
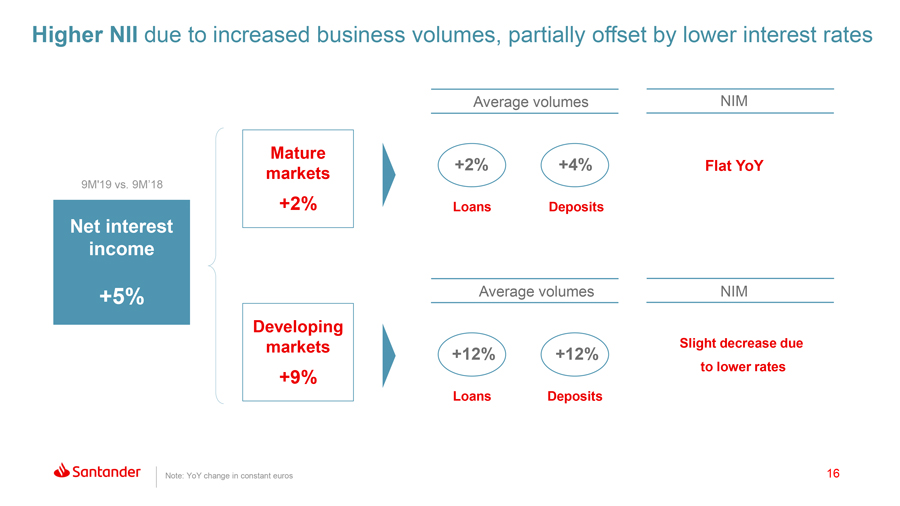
Higher NII due to increased business volumes, partially offset by lower interest rates Average volumes NIM Mature +2% +4% Flat YoY 9M’19 vs. 9M’18 markets +2% Loans Deposits Net interest income +5% Average volumes NIM Developing markets Slight decrease due +12% +12% to lower rates +9% Loans Deposits Note: YoY change in constant euros 16
Table of Contents
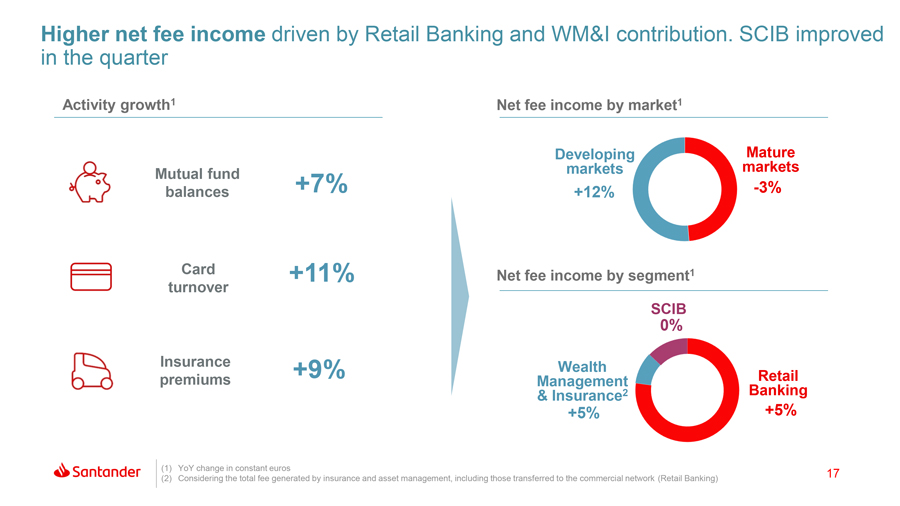
Higher net fee income driven by Retail Banking and WM&I contribution. SCIB improved in the quarter Activity growth1 Net fee income by market1 Developing Mature markets markets Mutual fund +7% -3% balances +12% Card +11% Net fee income by segment1 turnover SCIB 0% Insurance +9% Wealth premiums Management Retail & Insurance2 Banking +5% +5% (1) YoY change in constant euros 17 (2) Considering the total fee generated by insurance and asset management, including those transferred to the commercial network (Retail Banking)
Table of Contents
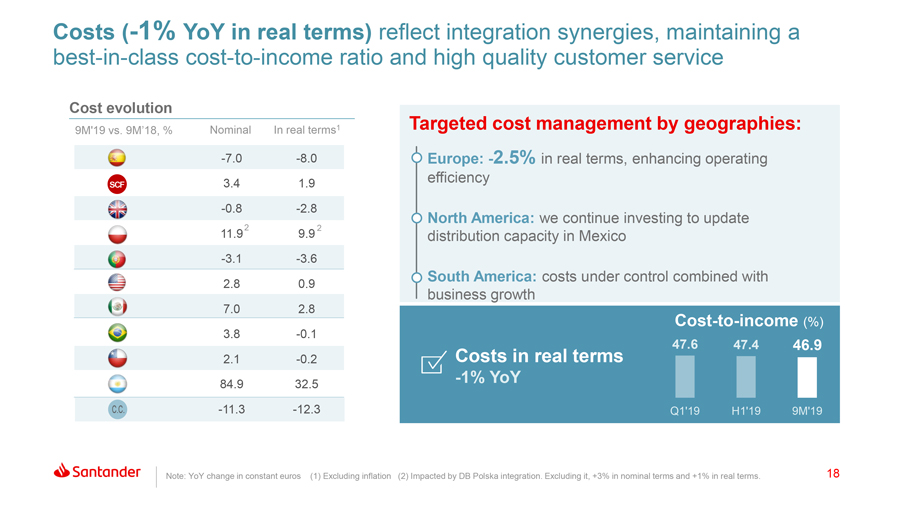
Costs (-1% YoY in real terms) reflect integration synergies, maintaining abest-in-classcost-to-income ratio and high quality customer service Cost evolution Targeted cost management by geographies: 9M’19 vs. 9M’18, % Nominal In real terms1 -7.0-8.0 Europe: -2.5% in real terms, enhancing operating 3.4 1.9 efficiency SCF -0.8-2.8 2 North America: we continue investing to update 11.9 9.9 2 distribution capacity in Mexico -3.1-3.6 South America: costs under control combined with 2.8 0.9 business growth 7.0 2.8Cost-to-income (%) 3.8-0.1 47.6 47.4 46.9 2.1-0.2 Costs in real terms -1% YoY 84.9 32.5-11.3-12.3 Q1’19 H1’19 9M’19 Note: YoY change in constant euros(1) Excluding inflation (2) Impacted by DB Polska integration. Excluding it, +3% in nominal terms and +1% in real terms. 18
Table of Contents
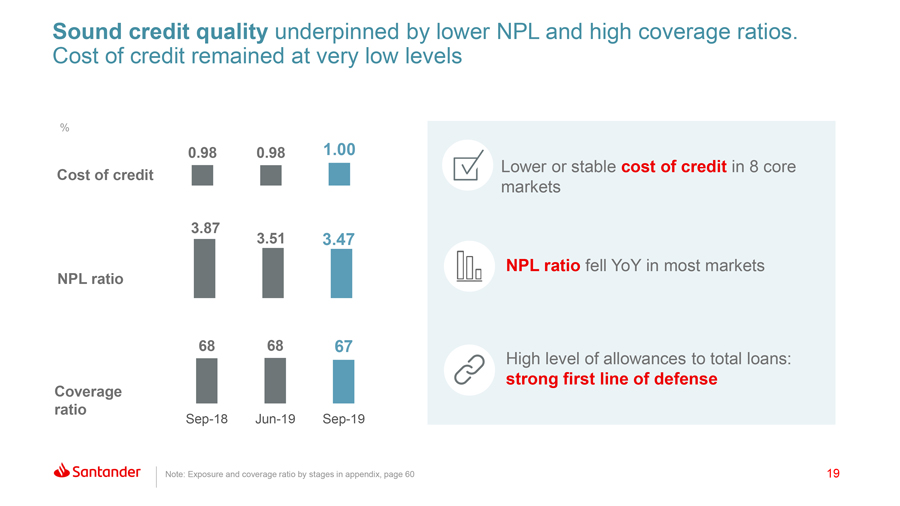
Sound credit quality underpinned by lower NPL and high coverage ratios. Cost of credit remained at very low levels % 0.98 0.98 1.00 Lower or stable cost of credit in 8 core Cost of credit markets 3.87 3.51 3.47 NPL ratio NPL ratio fell YoY in most markets 68 68 67 High level of allowances to total loans: strong first line of defense Coverage ratioSep-18Jun-19Sep-19 Note: Exposure and coverage ratio by stages in appendix, page 60 19
Table of Contents
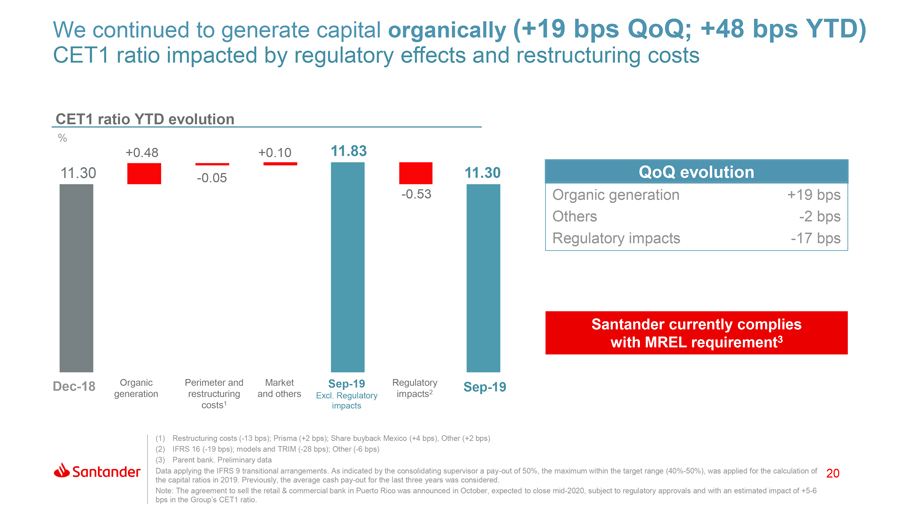
We continued to generate capital organically (+19 bps QoQ; +48 bps YTD) CET1 ratio impacted by regulatory effects and restructuring costs CET1 ratio YTD evolution % +0.48 +0.10 11.83 11.30 -0.05 11.30 QoQ evolution -0.53 Organic generation +19 bps Others-2 bps Regulatory impacts-17 bps Santander currently complies with MREL requirement3Dec-18 Organic Perimeter and MarketSep-19 RegulatorySep-19 generation restructuring and others Excl. Regulatory impacts2 costs1 impacts (1) Restructuring costs(-13 bps); Prisma (+2 bps); Share buyback Mexico (+4 bps), Other (+2 bps) (2) IFRS 16(-19 bps); models and TRIM(-28 bps); Other(-6 bps) (3) Parent bank. Preliminary data Data applying the IFRS 9 transitional arrangements. As indicated by the consolidating supervisor apay-out of 50%, the maximum within the target range(40%-50%), was applied for the calculation of 20 the capital ratios in 2019. Previously, the average cashpay-out for the last three years was considered. Note: The agreement to sell the retail & commercial bank in Puerto Rico was announced in October, expected to closemid-2020, subject to regulatory approvals and with an estimated impact of+5-6 bps in the Group’s CET1 ratio.
Table of Contents
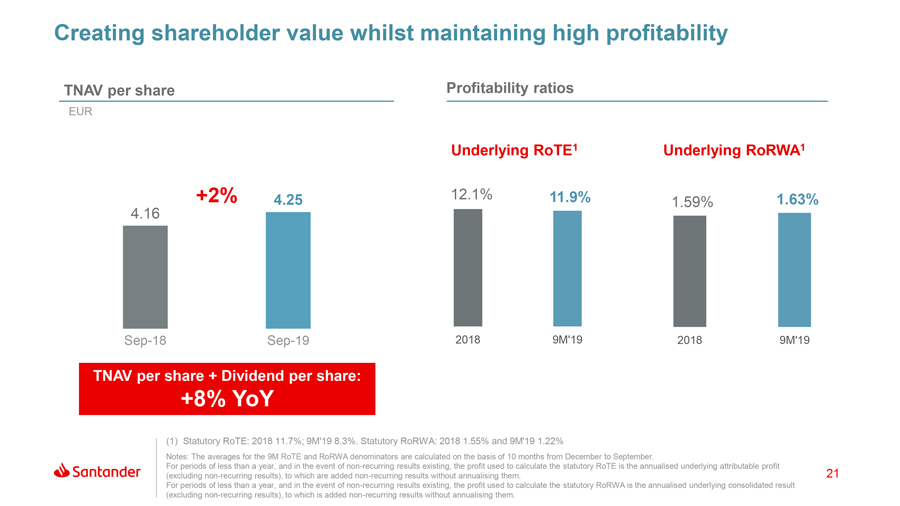
Creating shareholder value whilst maintaining high profitability TNAV per share Profitability ratios EUR Underlying RoTE1 Underlying RoRWA1 +2% 4.25 12.1% 11.9% 1.63% 1.59% 4.16Sep-18Sep-19 2018 9M’19 2018 9M’19 TNAV per share + Dividend per share: +8% YoY (1) Statutory RoTE: 2018 11.7%; 9M’19 8.3% . Statutory RoRWA: 2018 1.55% and 9M’19 1.22% Notes: The averages for the 9M RoTE and RoRWA denominators are calculated on the basis of 10 months from December to September. For periods of less than a year, and in the event ofnon-recurring results existing, the profit used to calculate the statutory RoTE is the annualised underlying attributable profit (excludingnon-recurring results), to which are addednon-recurring results without annualising them. 21 For periods of less than a year, and in the event ofnon-recurring results existing, the profit used to calculate the statutory RoRWA is the annualised underlying consolidated result (excludingnon-recurring results), to which is addednon-recurring results without annualising them.
Table of Contents
Business areas performance 9M’19 02
Table of Contents
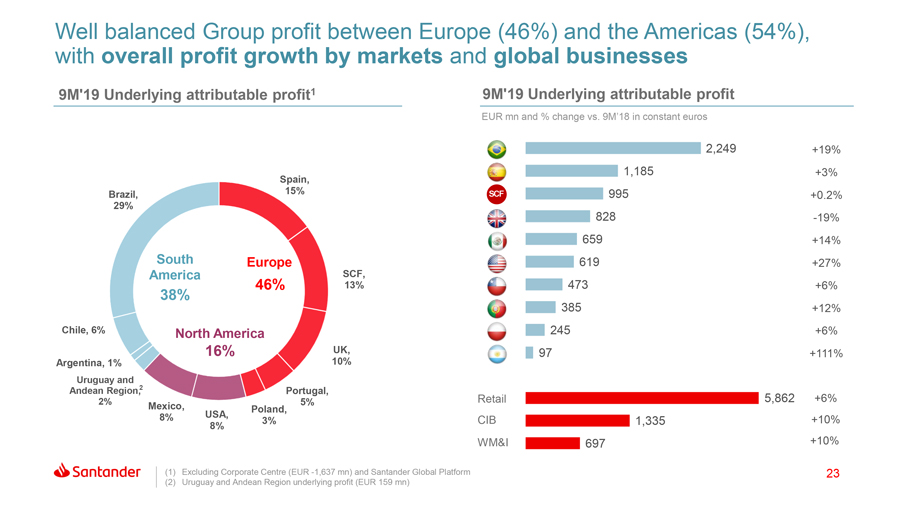
Well balanced Group profit between Europe (46%) and the Americas (54%), with overall profit growth by markets and global businesses 9M’19 Underlying attributable profit1 9M’19 Underlying attributable profit EUR mn and % change vs. 9M’18 in constant euros 2,249 +19% 1,185 +3% Spain, Brazil, 15% SCF 995 +0.2% 29% 828 -19% 659 +14% South Europe 619 +27% America SCF, 46% 13% 473 +6% 38% 385 +12% Chile, 6% North America 245 +6% 16% UK, 97 +111% Argentina, 1% 10% Uruguay and Andean Region,2 Portugal, 2% 5% Retail 5,862 +6% Mexico, USA, Poland, 8% 8% 3% CIB 1,335 +10% WM&I 697 +10% (1) Excluding Corporate Centre (EUR-1,637 mn) and Santander Global Platform 23 (2) Uruguay and Andean Region underlying profit (EUR 159 mn)
Table of Contents
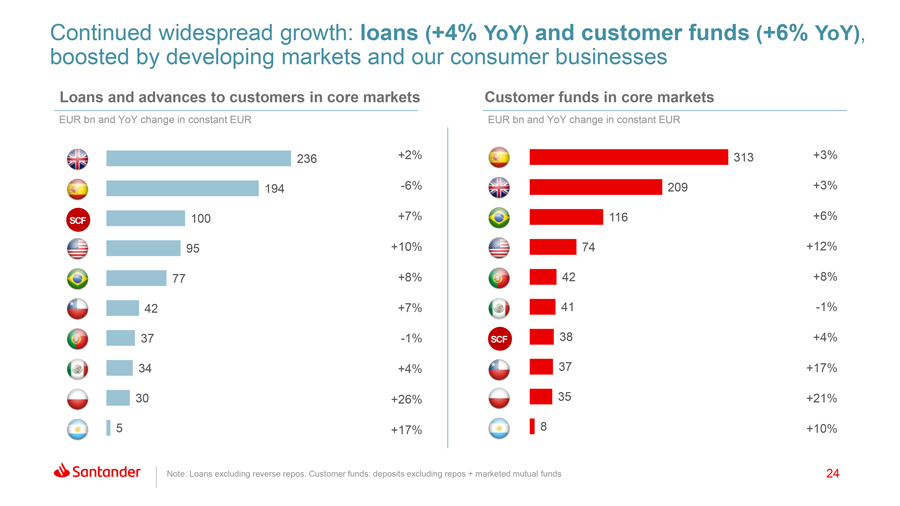
Continued widespread growth: loans (+4% YoY) and customer funds (+6% YoY), boosted by developing markets and our consumer businesses Loans and advances to customers in core markets Customer funds in core markets EUR bn and YoY change in constant EUR EUR bn and YoY change in constant EUR 236 +2% 313 +3% 194-6% 209 +3% SCF 100 +7% 116 +6% 95 +10% 74 +12% 77 +8% 42 +8% 42 +7% 41-1% 37-1% SCF 38 +4% 34 +4% 37 +17% 30 +26% 35 +21% 5 +17% 8 +10% Note: Loans excluding reverse repos. Customer funds: deposits excluding repos + marketed mutual funds 24
Table of Contents
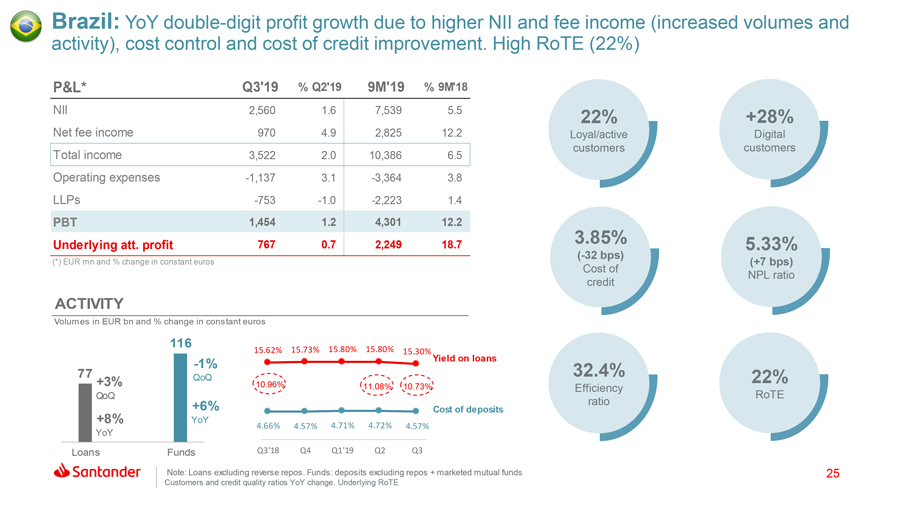
Brazil: YoY double-digit profit growth due to higher NII and fee income (increased volumes and activity), cost control and cost of credit improvement. High RoTE (22%) P&L* Q3’19 % Q2’19 9M’19 % 9M’18 NII 2,560 1.6 7,539 5.5 22% +28% Net fee income 970 4.9 2,825 12.2 Loyal/active Digital customers customers Total income 3,522 2.0 10,386 6.5 Operating expenses -1,137 3.1-3,364 3.8 LLPs -753-1.0-2,223 1.4 PBT 1,454 1.2 4,301 12.2 Underlying att. profit 767 0.7 2,249 18.7 3.85% 5.33%(-32 bps) (*) EUR mn and % change in constant euros (+7 bps) Cost of NPL ratio credit ACTIVITY Volumes in EUR bn and % change in constant euros 116 15.62% 15.73% 15.80% 15.80% 15.30% -1% Yield on loans 77 32.4% +3% QoQ 22% 10.96% 11.08% 10.73% Efficiency QoQ RoTE +6% ratio Cost of deposits +8% YoY YoY 4.66% 4.57% 4.71% 4.72% 4.57% Loans Funds Q3’18 Q4 Q1’19 Q2 Q3 Note: Loans excluding reverse repos. Funds: deposits excluding repos + marketed mutual funds 25 Customers and credit quality ratios YoY change. Underlying RoTE
Table of Contents
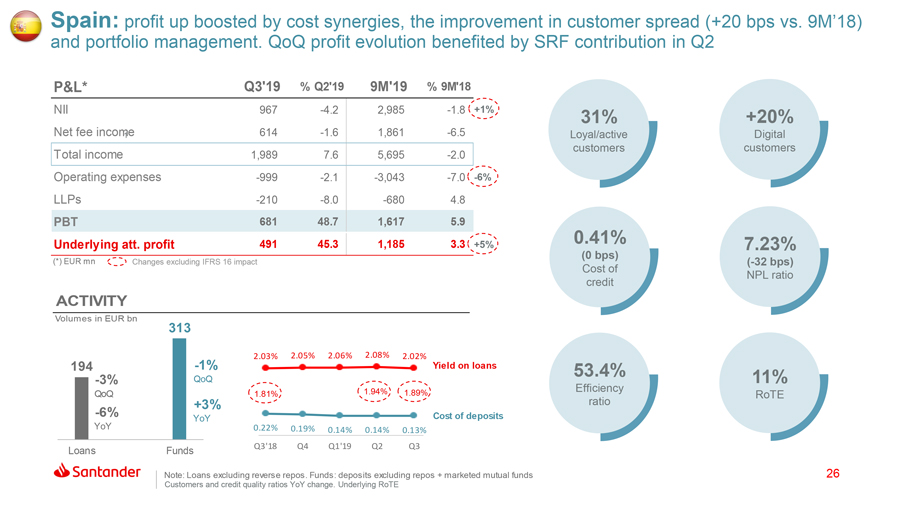
Spain: profit up boosted by cost synergies, the improvement in customer spread (+20 bps vs. 9M’18) and portfolio management. QoQ profit evolution benefited by SRF contribution in Q2 P&L* Q3’19 % Q2’19 9M’19 % 9M’18 NII 967-4.2 2,985-1.8 +1% 31% +20% Net fee income 1 614-1.6 1,861-6.5 Loyal/active Digital customers customers Total income 1,989 7.6 5,695-2.0 Operating expenses -999-2.1-3,043-7.0 -6% LLPs -210-8.0-680 4.8 PBT 681 48.7 1,617 5.9 Underlying att. profit 491 45.3 1,185 3.3 +5% 0.41% 7.23% (0 bps) (*) EUR mn Changes excluding IFRS 16 impact(-32 bps) Cost of NPL ratio credit ACTIVITY Volumes in EUR bn 313 2.03% 2.05% 2.06% 2.08% 2.02% 194 -1% Yield on loans 53.4% -3% QoQ Efficiency 11% QoQ 1.81% 1.94% 1.89% RoTE -6% +3% ratio YoY Cost of deposits YoY 0.22% 0.19% 0.14% 0.14% 0.13% Loans Funds Q3’18 Q4 Q1’19 Q2 Q3 Note: Loans excluding reverse repos. Funds: deposits excluding repos + marketed mutual funds 26 Customers and credit quality ratios YoY change. Underlying RoTE
Table of Contents
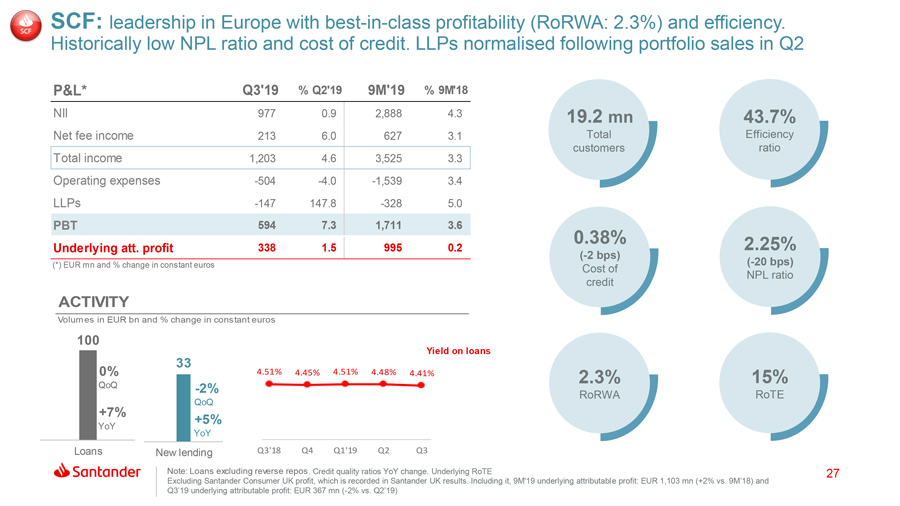
SCF: leadership in Europe withbest-in-class profitability (RoRWA: 2.3%) and efficiency. Historically low NPL ratio and cost of credit. LLPs normalised following portfolio sales in Q2 P&L* Q3’19 % Q2’19 9M’19 % 9M’18 NII 977 0.9 2,888 4.3 19.2 mn 43.7% Net fee income 213 6.0 627 3.1 Total Efficiency customers ratio Total income 1,203 4.6 3,525 3.3 Operating expenses -504-4.0-1,539 3.4 LLPs -147 147.8-328 5.0 PBT 594 7.3 1,711 3.6 0.38% 2.25% Underlying att. profit 338 1.5 995 0.2(-2 bps) (*) EUR mn and % change in constant euros(-20 bps) Cost of NPL ratio credit ACTIVITY Volumes in EUR bn and % change in constant euros 100 Yield on loans 33 4.51% 4.51% 0% 4.45% 4.48% 4.41% 2.3% 15% QoQ -2% RoRWA RoTE +7% QoQ +5% YoY YoY Loans New lending Q3’18 Q4 Q1’19 Q2 Q3 Note: Loans excluding reverse repos. Credit quality ratios YoY change. Underlying RoTE 27 Excluding Santander Consumer UK profit, which is recorded in Santander UK results. Including it, 9M’19 underlying attributable profit: EUR 1,103 mn (+2% vs. 9M’18) and Q3’19 underlying attributable profit: EUR 367 mn(-2% vs. Q2’19)
Table of Contents
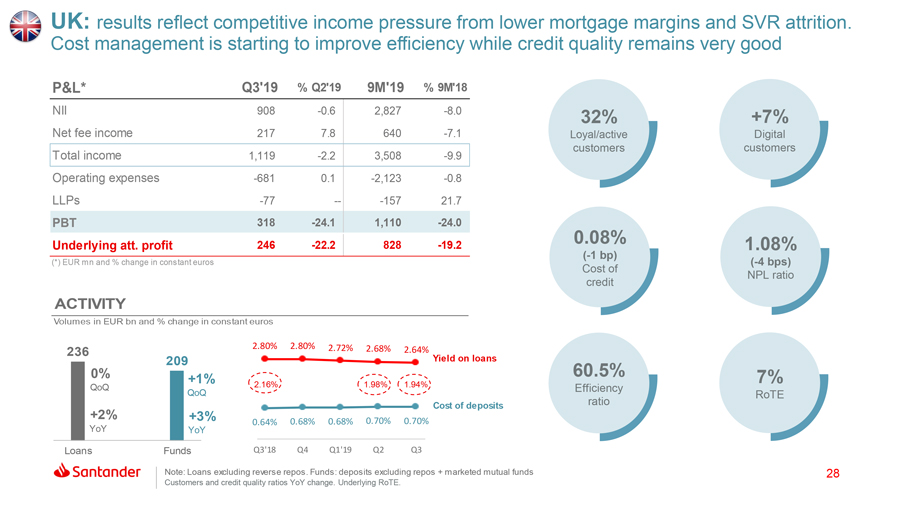
UK: results reflect competitive income pressure from lower mortgage margins and SVR attrition. Cost management is starting to improve efficiency while credit quality remains very good P&L* Q3’19 % Q2’19 9M’19 % 9M’18 NII 908-0.6 2,827-8.0 32% +7% Net fee income 217 7.8 640-7.1 Loyal/active Digital customers customers Total income 1,119-2.2 3,508-9.9 Operating expenses -681 0.1-2,123-0.8 LLPs -77 —-157 21.7 PBT 318-24.1 1,110-24.0 0.08% Underlying att. profit 246-22.2 828-19.2(-1 bp) 1.08% (*) EUR mn and % change in constant euros(-4 bps) Cost of NPL ratio credit ACTIVITY Volumes in EUR bn and % change in constant euros 2.80% 2.80% 2.72% 2.68% 236 2.64% 209 Yield on loans 0% 60.5% 7% +1% QoQ 2.16% 1.98% 1.94% Efficiency QoQ RoTE Cost of deposits ratio +2% +3% YoY 0.64% 0.68% 0.68% 0.70% 0.70% YoY Loans Funds Q3’18 Q4 Q1’19 Q2 Q3 Note: Loans excluding reverse repos. Funds: deposits excluding repos + marketed mutual funds 28 Customers and credit quality ratios YoY change. Underlying RoTE.
Table of Contents
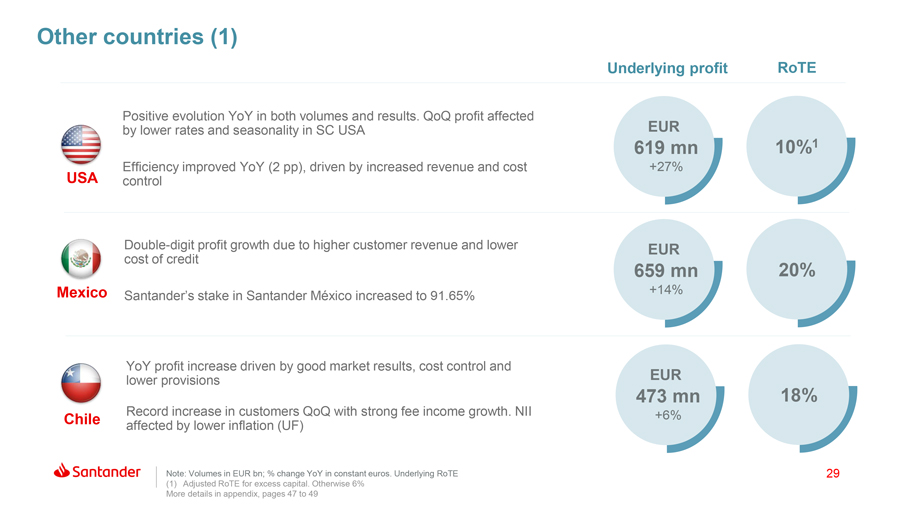
Other countries (1) Underlying profit RoTE Positive evolution YoY in both volumes and results. QoQ profit affected by lower rates and seasonality in SC USA EUR 619 mn 10%1 Efficiency improved YoY (2 pp), driven by increased revenue and cost +27% USA control Double-digit profit growth due to higher customer revenue and lower EUR cost of credit 659 mn 20% Mexico +14% Santander’s stake in Santander México increased to 91.65% YoY profit increase driven by good market results, cost control and lower provisions EUR 473 mn 18% Record increase in customers QoQ with strong fee income growth. NII +6% Chile affected by lower inflation (UF) Note: Volumes in EUR bn; % change YoY in constant euros. Underlying RoTE 29 (1) Adjusted RoTE for excess capital. Otherwise 6% More details in appendix, pages 47 to 49
Table of Contents
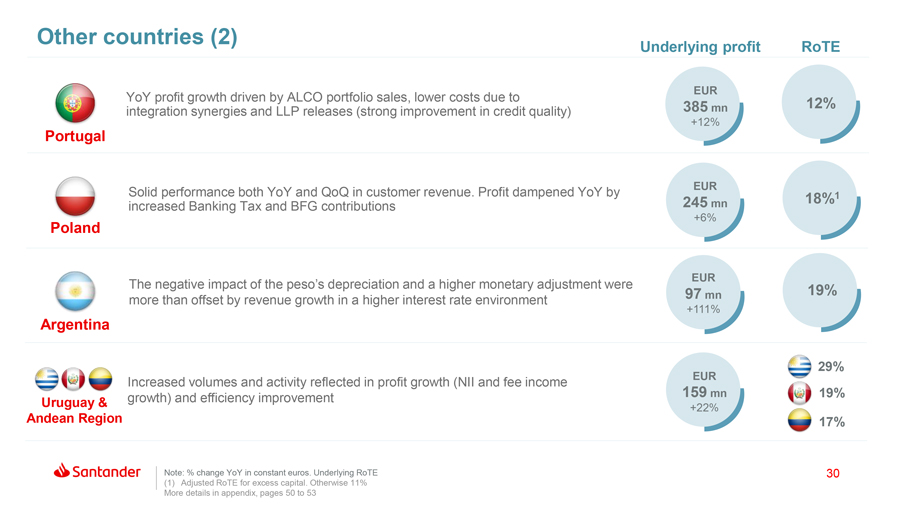
Other countries (2) Underlying profit RoTE EUR YoY profit growth driven by ALCO portfolio sales, lower costs due to mn 12% integration synergies and LLP releases (strong improvement in credit quality) 385 +12% Portugal Solid performance both YoY and QoQ in customer revenue. Profit dampened YoY by EUR 18%1 increased Banking Tax and BFG contributions 245 mn +6% Poland EUR The negative impact of the peso’s depreciation and a higher monetary adjustment were 19% more than offset by revenue growth in a higher interest rate environment 97 mn +111% Argentina 29% Increased volumes and activity reflected in profit growth (NII and fee income EUR growth) and efficiency improvement 159 mn 19% Uruguay & +22% Andean Region 17% Note: % change YoY in constant euros. Underlying RoTE 30 (1) Adjusted RoTE for excess capital. Otherwise 11% More details in appendix, pages 50 to 53
Table of Contents
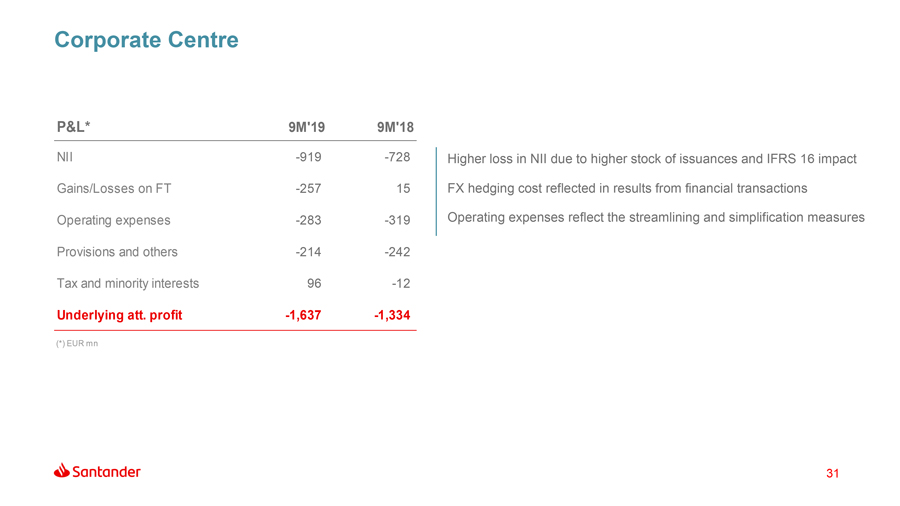
Corporate Centre P&L* 9M’19 9M’18 NII-919-728 Higher loss in NII due to higher stock of issuances and IFRS 16 impact Gains/Losses on FT-257 15 FX hedging cost reflected in results from financial transactions Operating expenses-283-319 Operating expenses reflect the streamlining and simplification measures Provisions and others-214-242 Tax and minority interests 96-12 Underlying att. profit-1,637-1,334 (*) EUR mn 31
Table of Contents
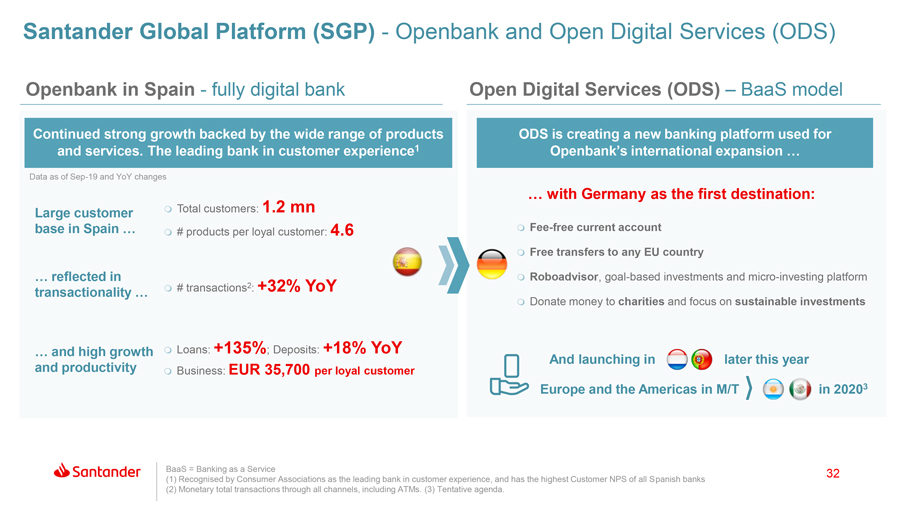
Santander Global Platform (SGP) - Openbank and Open Digital Services (ODS) Openbank in Spain - fully digital bank Open Digital Services (ODS) – BaaS model Continued strong growth backed by the wide range of products ODS is creating a new banking platform used for and services. The leading bank in customer experience1 Openbank’sinternational expansion … Data as ofSep-19 and YoY changes … with Germany as the first destination: Large customer ï Total customers: 1.2 mn base in Spain … # products per loyal customer: 4.6ïFee-free current account ï ï Free transfers to any EU country … reflected in ï Roboadvisor, goal-based investments and micro-investing platformï # transactions2: +32% YoY transactionality … ï Donate money to charities and focus on sustainable investments … and high growth ï Loans: +135%; Deposits: +18% YoY And launching in later this year and productivityï Business: EUR 35,700 per loyal customer Europe and the Americas in M/T in 20203 BaaS = Banking as a Service 32 (1) Recognised by Consumer Associations as the leading bank in customer experience, and has the highest Customer NPS of all Spanish banks (2) Monetary total transactions through all channels, including ATMs. (3) Tentative agenda.
Table of Contents
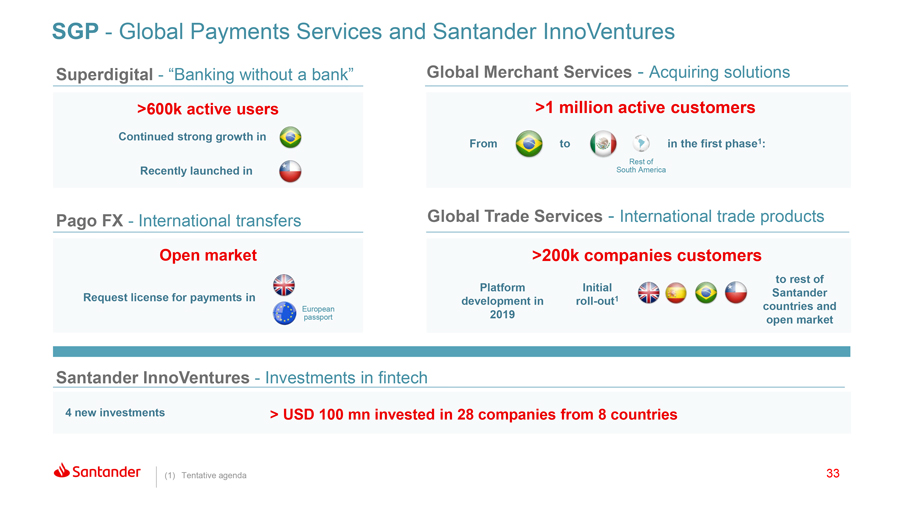
SGP - Global Payments Services and Santander InnoVentures Superdigital - “Banking without a bank” Global Merchant Services - Acquiring solutions >600k active users >1 million active customers Continued strong growth in From to in the first phase1: Rest of Recently launched in South America Pago FX - International transfers Global Trade Services - International trade products Open market >200k companies customers to rest of Platform Initial Request license for payments in Santander development inroll-out1 European countries and passport 2019 open market Santander InnoVentures - Investments in fintech 4 new investments > USD 100 mn invested in 28 companies from 8 countries (1) Tentative agenda 33
Table of Contents
Concluding remarks 03
Table of Contents
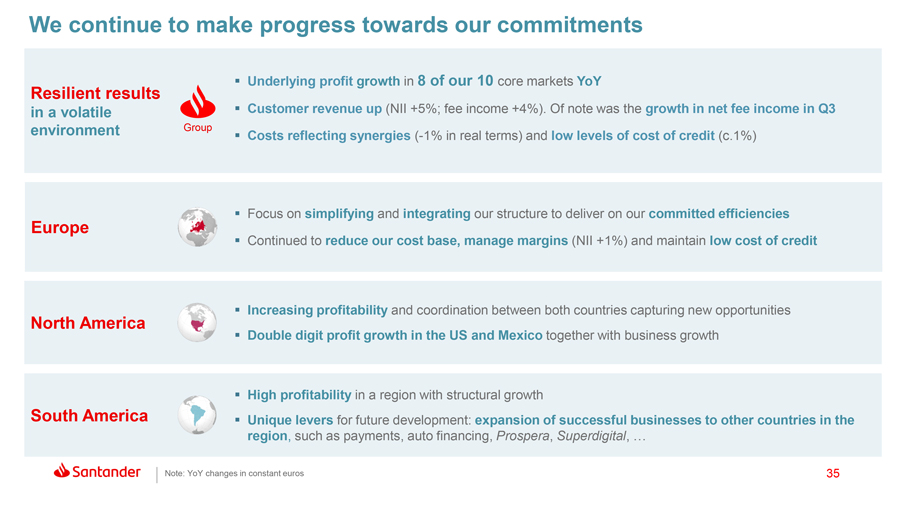
We continue to make progress towards our commitments ï,§ Underlying profit growth in 8 of our 10 core markets YoY Resilient results in a volatile ï,§ Customer revenue up (NII +5%; fee income +4%). Of note was the growth in net fee income in Q3 environment Group ï,§ Costs reflecting synergies(-1% in real terms) and low levels of cost of credit (c.1%) Europeï,§ Focus on simplifying and integrating our structure to deliver on our committed efficiencies ï,§ Continued to reduce our cost base, manage margins (NII +1%) and maintain low cost of credit ï,§ Increasing profitability and coordination between both countries capturing new opportunities North America in ï,§ Double digit profit growth the US and Mexico together with business growth ï,§ High profitability in a region with structural growth South Americaï,§ Unique levers for future development: expansion of successful businesses to other countries in the region, such as payments, auto financing, Prospera, Superdigital, … Note: YoY changes in constant euros 35
Table of Contents
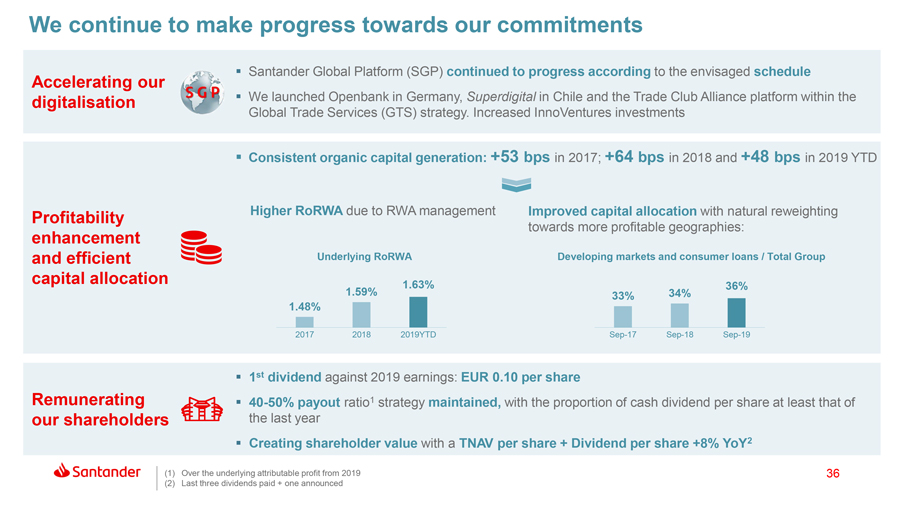
We continue to make progress towards our commitments ï,§ Santander Global Platform (SGP) continued to progress according to the envisaged schedule Accelerating our digitalisationï,§ We launched Openbank in Germany, Superdigital in Chile and the Trade Club Alliance platform within the Global Trade Services (GTS) strategy. Increased InnoVentures investments ï,§ Consistent organic capital generation: +53 bps in 2017; +64 bps in 2018 and +48 bps in 2019 YTD Profitability Higher RoRWA due to RWA management Improved capital allocation with natural reweighting towards more profitable geographies: enhancement and efficient Underlying RoRWA Developing markets and consumer loans / Total Group capital allocation 1.63% 36% 1.59% 33% 34% 1.48% 2017 2018 2019YTDSep-17Sep-18Sep-19 ï,§ 1st dividend against 2019 earnings: EUR 0.10 per share Remunerating ï,§40-50% payout ratio1 strategy maintained, with the proportion of cash dividend per share at least that of our shareholders the last year ï,§ Creating shareholder value with a TNAV per share + Dividend per share +8% YoY2 (1) Over the underlying attributable profit from 2019 36 (2) Last three dividends paid + one announced
Table of Contents
Appendix 04
Table of Contents
Appendix Primary segments Secondary segments Other countries Balance sheet and capital management NPL and coverage ratios and cost of credit Responsible Banking Quarterly income statements
Table of Contents
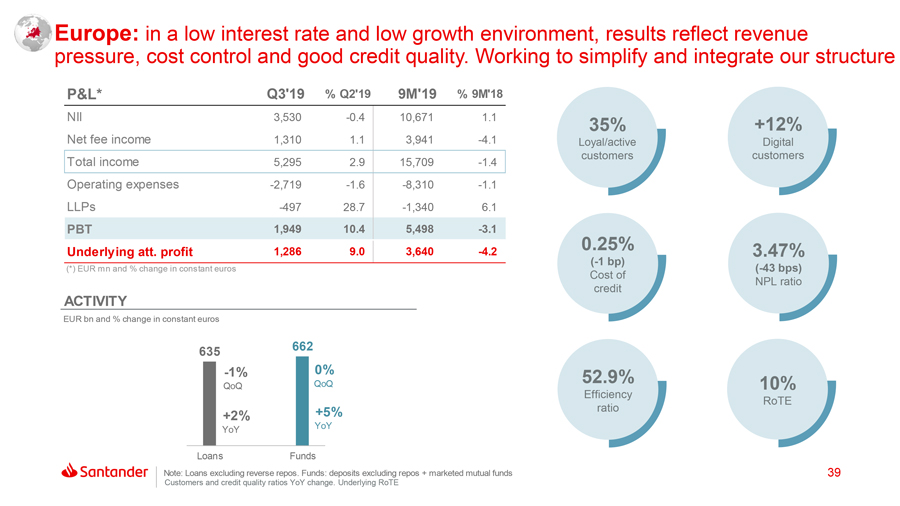
Europe: in a low interest rate and low growth environment, results reflect revenue pressure, cost control and good credit quality. Working to simplify and integrate our structure P&L* Q3’19 % Q2’19 9M’19 % 9M’18 NII 3,530-0.4 10,671 1.1 35% +12% Net fee income 1,310 1.1 3,941-4.1 Loyal/active Digital customers customers Total income 5,295 2.9 15,709-1.4 Operating expenses -2,719-1.6-8,310-1.1 LLPs -497 28.7-1,340 6.1 PBT 1,949 10.4 5,498-3.1 0.25% Underlying att. profit 1,286 9.0 3,640-4.2(-1 bp) 3.47% (*) EUR mn and % change in constant euros(-43 bps) Cost of NPL ratio credit ACTIVITY EUR bn and % change in constant euros 635 662 -1% 0% 52.9% QoQ QoQ 10% Efficiency RoTE +5% ratio +2% YoY YoY Loans Funds Note: Loans excluding reverse repos. Funds: deposits excluding repos + marketed mutual funds 39 Customers and credit quality ratios YoY change. Underlying RoTE
Table of Contents
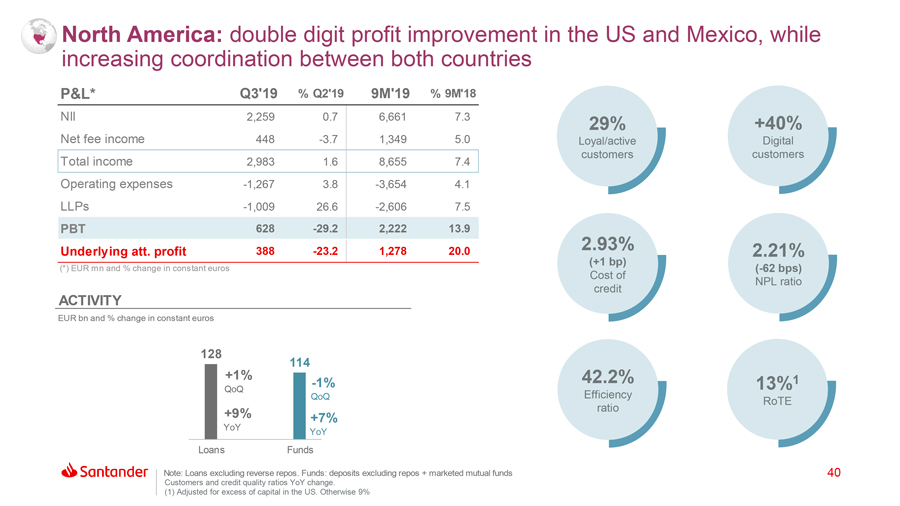
North America: double digit profit improvement in the US and Mexico, while increasing coordination between both countries P&L* Q3’19 % Q2’19 9M’19 % 9M’18 NII 2,259 0.7 6,661 7.3 29% +40% Net fee income 448-3.7 1,349 5.0 Loyal/active Digital customers customers Total income 2,983 1.6 8,655 7.4 Operating expenses -1,267 3.8-3,654 4.1 LLPs -1,009 26.6-2,606 7.5 PBT 628-29.2 2,222 13.9 Underlying att. profit 388-23.2 1,278 20.0 2.93% 2.21% (+1 bp) (*) EUR mn and % change in constant euros(-62 bps) Cost of NPL ratio credit ACTIVITY EUR bn and % change in constant euros 128 114 +1% 42.2% 1 -1% 13% QoQ QoQ Efficiency RoTE +9% ratio YoY +7% YoY Loans Funds Note: Loans excluding reverse repos. Funds: deposits excluding repos + marketed mutual funds 40 Customers and credit quality ratios YoY change. (1) Adjusted for excess of capital in the US. Otherwise 9%
Table of Contents
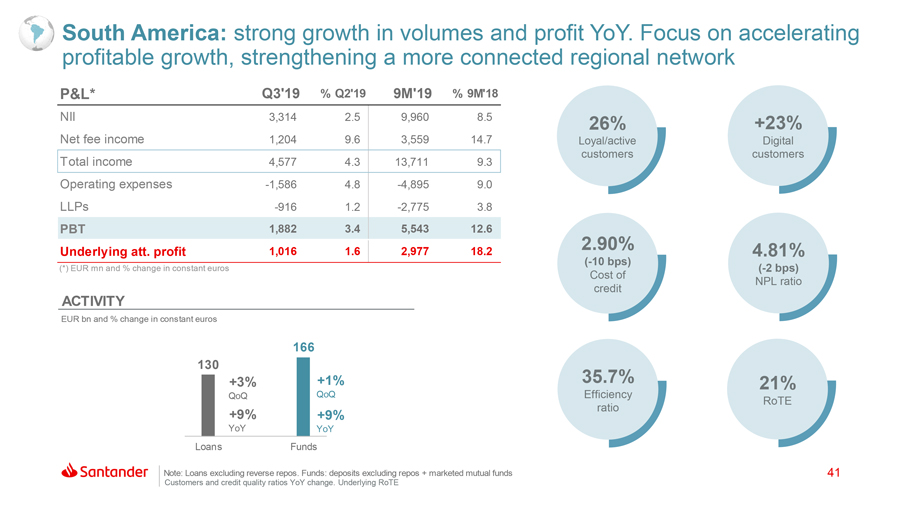
South America: strong growth in volumes and profit YoY. Focus on accelerating profitable growth, strengthening a more connected regional network P&L* Q3’19 % Q2’19 9M’19 % 9M’18 NII 3,314 2.5 9,960 8.5 26% +23% Net fee income 1,204 9.6 3,559 14.7 Loyal/active Digital customers customers Total income 4,577 4.3 13,711 9.3 Operating expenses -1,586 4.8-4,895 9.0 LLPs -916 1.2-2,775 3.8 PBT 1,882 3.4 5,543 12.6 2.90% Underlying att. profit 1,016 1.6 2,977 18.2(-10 bps) 4.81% (*) EUR mn and % change in constant euros(-2 bps) Cost of NPL ratio credit ACTIVITY EUR bn and % change in constant euros 166 130 +3% +1% 35.7% 21% QoQ QoQ Efficiency RoTE ratio +9% +9% YoY YoY Loans Funds Note: Loans excluding reverse repos. Funds: deposits excluding repos + marketed mutual funds 41 Customers and credit quality ratios YoY change. Underlying RoTE
Table of Contents
Appendix Primary segments Secondary segments Other countries Balance sheet and capital management NPL and coverage ratios and cost of credit Responsible Banking Quarterly income statements 42
Table of Contents
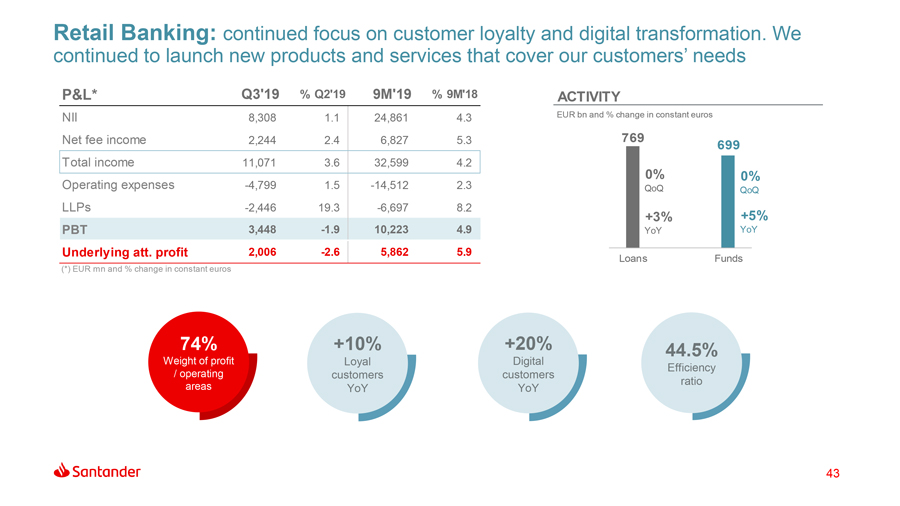
Retail Banking: continued focus on customer loyalty and digital transformation. We continued to launch new products and services that cover our customers’ needs P&L* Q3’19 % Q2’19 9M’19 % 9M’18 ACTIVITY NII 8,308 1.1 24,861 4.3 EUR bn and % change in constant euros Net fee income 2,244 2.4 6,827 5.3 769 699 Total income 11,071 3.6 32,599 4.2 1.5-14,512 2.3 0% 0% Operating expenses -4,799 QoQ QoQ LLPs -2,446 19.3-6,697 8.2 +3% +5% PBT 3,448-1.9 10,223 4.9 YoY YoY Underlying att. profit 2,006-2.6 5,862 5.9 Loans Funds (*) EUR mn and % change in constant euros 74% +10% +20% 44.5% Weight of profit Loyal Digital Efficiency / operating customers customers ratio areas YoY YoY 43
Table of Contents
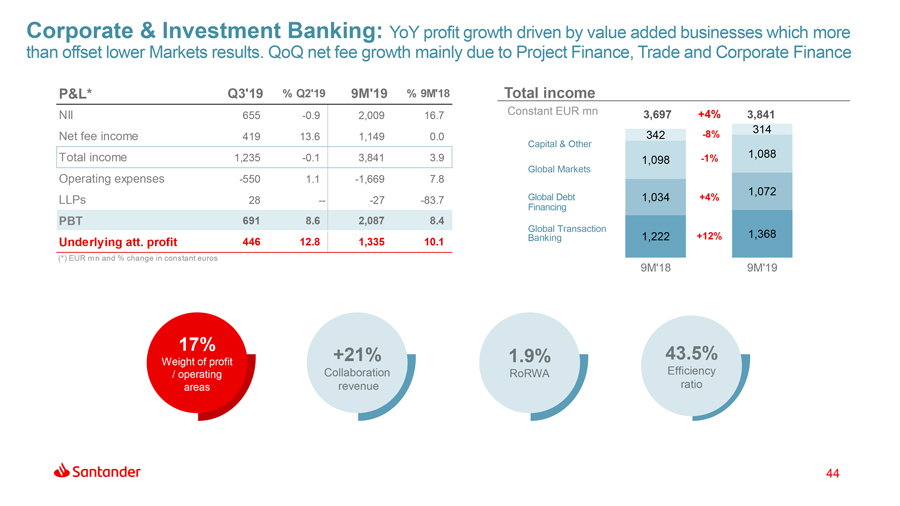
Corporate & Investment Banking: YoY profit growth driven by value added businesses which more than offset lower Markets results. QoQnet fee growth mainly due to Project Finance, Trade and Corporate Finance P&L* Q3’19 % Q2’19 9M’19 % 9M’18 Total income NII 655-0.9 2,009 16.7 Constant EUR mn 3,697 +4% 3,841 -8% 314 Net fee income 419 13.6 1,149 0.0 Capital & Other 342 Total income 1,235-0.1 3,841 3.9 -1% 1,088 Global Markets 1,098 Operating expenses -550 1.1-1,669 7.8 1,072 LLPs 28 —-27-83.7 Global Debt 1,034 +4% Financing PBT 691 8.6 2,087 8.4 Global Transaction Banking 1,222 +12% 1,368 Underlying att. profit 446 12.8 1,335 10.1 (*) EUR mn and % change in constant euros 9M’18 9M’19 17% +21% 1.9% 43.5% Weight of profit Efficiency / operating Collaboration RoRWA areas revenue ratio 44
Table of Contents
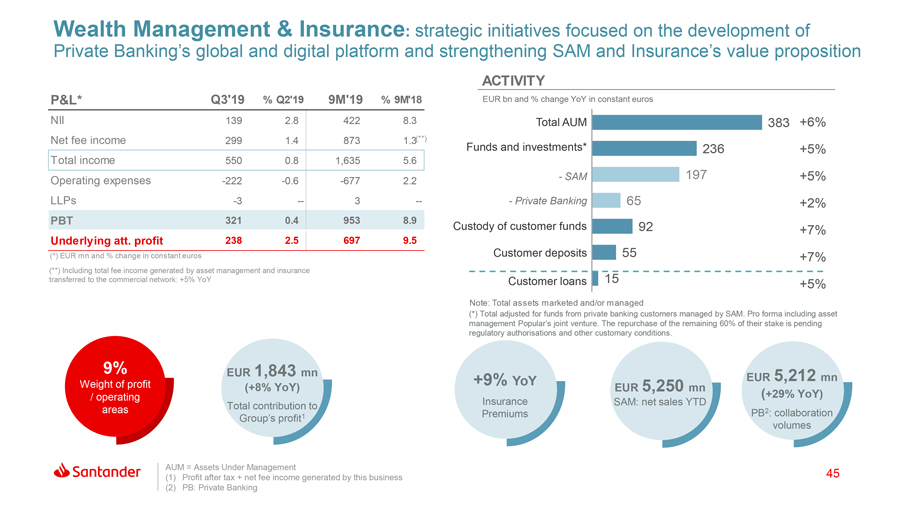
Wealth Management & Insurance: strategic initiatives focused on the development of Private Banking’s global and digital platform and strengthening SAM and Insurance’s value proposition ACTIVITY P&L* Q3’19 % Q2’19 9M’19 % 9M’18 EUR bn and % change YoY in constant euros NII 139 2.8 422 8.3 Total AUM 383 +6% Net fee income 299 1.4 873 1.3 (**) Funds and investments* 236 +5% Total income 550 0.8 1,635 5.6 - SAM 197 +5% Operating expenses -222-0.6-677 2.2 LLPs -3 — 3 — - Private Banking 65 +2% PBT 321 0.4 953 8.9 Custody of customer funds 92 +7% Underlying att. profit 238 2.5 697 9.5 (*) EUR mn and % change in constant euros Customer deposits 55 +7% (**) Including total fee income generated by asset management and insurance transferred to the commercial network: +5% YoY Customer loans 15 +5% (*) Total adjusted for funds from private banking customers managed by SAM Note: Total assets marketed and/or managed in 2019 and 2018 (*) Total adjusted for funds from private banking customers managed by SAM. Pro forma including asset management Popular’s joint venture. The repurchase of the remaining 60% of their stake is pending regulatory authorisations and other customary conditions. 9% EUR 1,843 mn +9% YoY EUR 5,212 mn Weight of profit (+8% YoY) EUR 5,250 mn +29% / operating ( YoY) Insurance SAM: net sales YTD Total contribution to areas Premiums PB2: collaboration Group’s profit1 volumes AUM = Assets Under Management (1) Profit after tax + net fee income generated by this business 45 (2) PB: Private Banking
Table of Contents
Appendix Primary segments Secondary segments Other countries Balance sheet and capital management NPL and coverage ratios and cost of credit Responsible Banking Quarterly income statements 46
Table of Contents
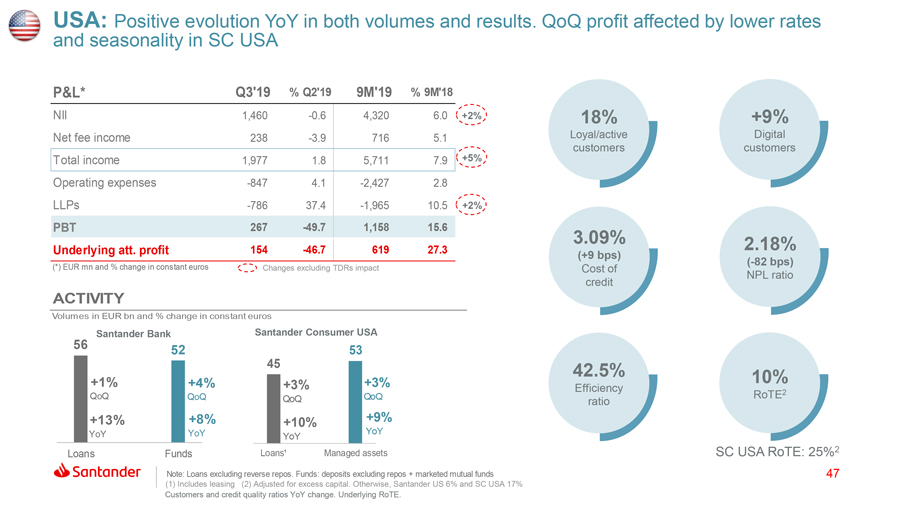
USA: Positive evolution YoY in both volumes and results. QoQ profit affected by lower rates and seasonality in SC USA P&L* Q3’19 % Q2’19 9M’19 % 9M’18 NII 1,460-0.6 4,320 6.0 +2% 18% +9% Net fee income 238-3.9 716 5.1 Loyal/active Digital customers customers Total income 1,977 1.8 5,711 7.9 +5% Operating expenses -847 4.1-2,427 2.8 LLPs -786 37.4-1,965 10.5 +2% PBT 267-49.7 1,158 15.6 Underlying att. profit 154-46.7 619 27.3 3.09% 2.18% (+9 bps)(-82 bps) (*) EUR mn and % change in constant euros Changes excluding TDRs impact Cost of NPL ratio credit ACTIVITY Volumes in EUR bn and % change in constant euros Santander Bank Santander Consumer USA 56 52 53 45 42.5% +1% +4% +3% 10% +3% Efficiency QoQ QoQ RoTE2 QoQ QoQ ratio +13% +8% +10% +9% YoY YoY YoY YoY Loans Funds Loans¹ Managed assets SC USA RoTE: 25%2 Note: Loans excluding reverse repos. Funds: deposits excluding repos + marketed mutual funds 47 (1) Includes leasing(2) Adjusted for excess capital. Otherwise, Santander US 6% and SC USA 17% Customers and credit quality ratios YoY change. Underlying RoTE.
Table of Contents

Mexico: YoY double-digit profit growth due to higher customer revenue and lower cost of credit. Santander’s stake in Santander México increased to 91.65% P&L* Q3’19 % Q2’19 9M’19 % 9M’18 NII 798 3.2 2,341 9.8 32% +51% Net fee income 210-3.4 633 4.8 Loyal/active Digital customers customers Total income 1,007 1.2 2,944 6.6 Operating expenses -420 3.3-1,226 7.0 LLPs -223-0.8-642-0.8 PBT 361 0.7 1,064 12.2 Underlying att. profit 234 7.3 659 13.9 2.55% 2.30%(-17 bps) (*) EUR mn and % change in constant euros Cost of(-11 bps) NPL ratio credit ACTIVITY Volumes in EUR bn and % change in constant euros 41 12.49% 12.66% 12.74% 12.82% 12.67% 34 Yield on loans -4% 41.6% -1% QoQ 8.85% 8.73% 8.54% 20% Efficiency QoQ ratio RoTE +4%-1% Cost of deposits 3.64% 3.66% 3.95% 4.09% 4.13% YoY YoY Loans Funds Q3’18 Q4 Q1’19 Q2 Q3 Note: Loans excluding reverse repos. Funds: deposits excluding repos + marketed mutual funds 48 Customers and credit quality ratios YoY change. Underlying RoTE
Table of Contents
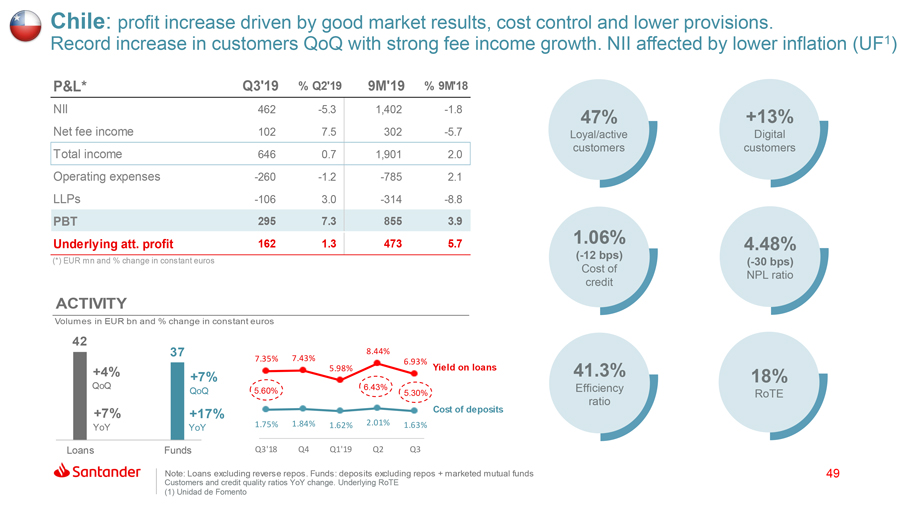
Chile: profit increase driven by good market results, cost control and lower provisions. Record increase in customers QoQ with strong fee income growth. NII affected by lower inflation (UF1) P&L* Q3’19 % Q2’19 9M’19 % 9M’18 NII 462-5.3 1,402-1.8 47% +13% Net fee income 102 7.5 302-5.7 Loyal/active Digital customers customers Total income 646 0.7 1,901 2.0 Operating expenses -260-1.2-785 2.1 LLPs -106 3.0-314-8.8 PBT 295 7.3 855 3.9 Underlying att. profit 162 1.3 473 5.7 1.06% 4.48%(-12 bps) (*) EUR mn and % change in constant euros(-30 bps) Cost of NPL ratio credit ACTIVITY Volumes in EUR bn and % change in constant euros 42 37 7.43% 8.44% 7.35% 6.93% +4% 5.98% Yield on loans 41.3% QoQ +7% 18% QoQ 5.60% 6.43% Efficiency 5.30% RoTE ratio +7% +17% Cost of deposits 1.75% 1.84% 1.62% 2.01% 1.63% YoY YoY Loans Funds Q3’18 Q4 Q1’19 Q2 Q3 Note: Loans excluding reverse repos. Funds: deposits excluding repos + marketed mutual funds 49 Customers and credit quality ratios YoY change. Underlying RoTE (1) Unidad de Fomento
Table of Contents
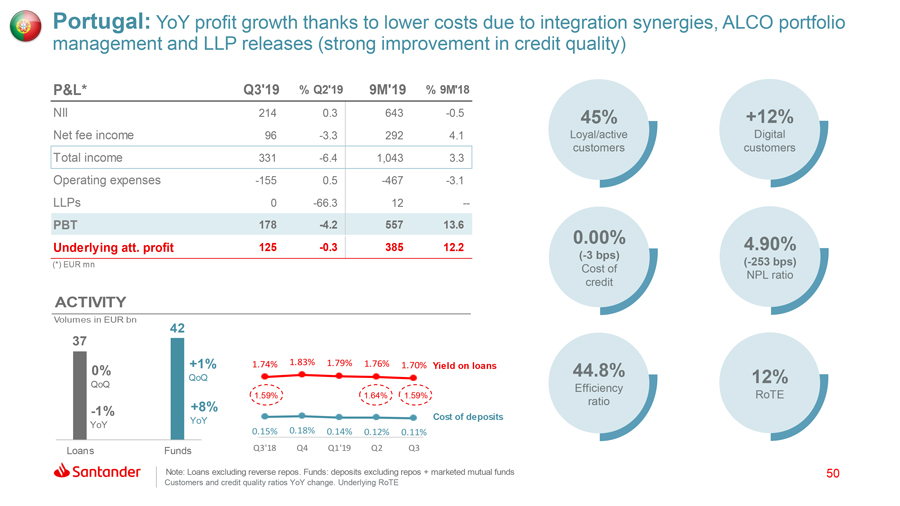
Portugal: YoY profit growth thanks to lower costs due to integration synergies, ALCO portfolio management and LLP releases (strong improvement in credit quality) P&L* Q3’19 % Q2’19 9M’19 % 9M’18 NII 214 0.3 643-0.5 45% +12% Net fee income 96-3.3 292 4.1 Loyal/active Digital customers customers Total income 331-6.4 1,043 3.3 Operating expenses -155 0.5-467-3.1 LLPs 0-66.3 12 — PBT 178-4.2 557 13.6 0.00% 4.90% Underlying att. profit 125-0.3 385 12.2(-3 bps) (*) EUR mn(-253 bps) Cost of NPL ratio credit ACTIVITY Volumes in EUR bn 42 37 +1% 1.74% 1.83% 1.79% 1.76% 1.70% Yield on loans 0% 44.8% QoQ 12% QoQ Efficiency 1.59% 1.64% 1.59% RoTE +8% ratio -1% Cost of deposits YoY YoY 0.15% 0.18% 0.14% 0.12% 0.11% Loans Funds Q3’18 Q4 Q1’19 Q2 Q3 Note: Loans excluding reverse repos. Funds: deposits excluding repos + marketed mutual funds 50 Customers and credit quality ratios YoY change. Underlying RoTE
Table of Contents
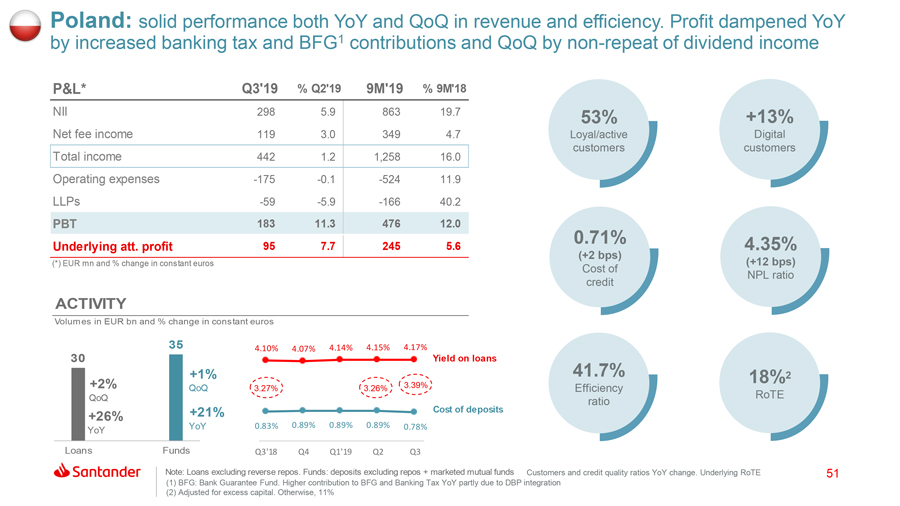
Poland: solid performance both YoY and QoQ in revenue and efficiency. Profit dampened YoY by increased banking tax and BFG1 contributions and QoQ bynon-repeat of dividend income P&L* Q3’19 % Q2’19 9M’19 % 9M’18 NII 298 5.9 863 19.7 53% +13% Net fee income 119 3.0 349 4.7 Loyal/active Digital customers customers Total income 442 1.2 1,258 16.0 Operating expenses -175-0.1-524 11.9 LLPs -59-5.9-166 40.2 PBT 183 11.3 476 12.0 0.71% Underlying att. profit 95 7.7 245 5.6 4.35% (+2 bps) (*) EUR mn and % change in constant euros (+12 bps) Cost of NPL ratio credit ACTIVITY Volumes in EUR bn and % change in constant euros 35 4.10% 4.07% 4.14% 4.15% 4.17% 30 Yield on loans +1% 41.7% 18%2 +2% QoQ 3.27% 3.26% 3.39% Efficiency RoTE QoQ ratio +21% Cost of deposits +26% 0.89% 0.89% 0.89% YoY 0.83% 0.78% YoY Loans Funds Q3’18 Q4 Q1’19 Q2 Q3 Note: Loans excluding reverse repos. Funds: deposits excluding repos + marketed mutual funds Customers and credit quality ratios YoY change. Underlying RoTE 51 (1) BFG: Bank Guarantee Fund. Higher contribution to BFG and Banking Tax YoY partly due to DBP integration (2) Adjusted for excess capital. Otherwise, 11%
Table of Contents
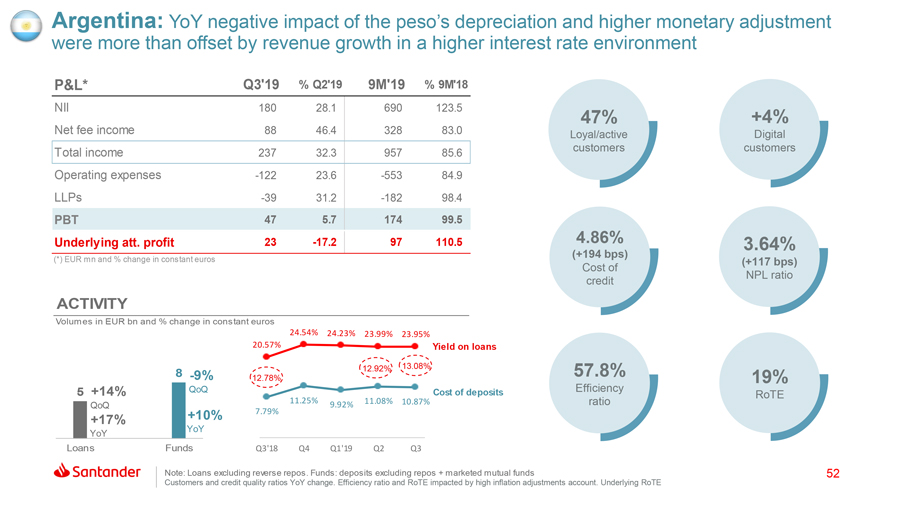
Argentina: YoY negative impact of the peso’s depreciation and higher monetary adjustment were more than offset by revenue growth in a higher interest rate environment P&L* Q3’19 % Q2’19 9M’19 % 9M’18 NII 180 28.1 690 123.5 47% +4% Net fee income 88 46.4 328 83.0 Loyal/active Digital Total income customers customers 237 32.3 957 85.6 Operating expenses -122 23.6-553 84.9 LLPs -39 31.2-182 98.4 PBT 47 5.7 174 99.5 Underlying att. profit 23-17.2 97 110.5 4.86% 3.64% (+194 bps) (*) EUR mn and % change in constant euros (+117 bps) Cost of NPL ratio credit ACTIVITY Volumes in EUR bn and % change in constant euros 24.54% 24.23% 23.99% 23.95% 20.57% Yield on loans 12.92% 13.08% 57.8% 8 -9% 12.78% 19% 5 +14% QoQ Cost of deposits Efficiency RoTE 11.25% 11.08% 10.87% ratio QoQ +10% 7.79% 9.92% +17% YoY YoY Loans Funds Q3’18 Q4 Q1’19 Q2 Q3 Note: Loans excluding reverse repos. Funds: deposits excluding repos + marketed mutual funds 52 Customers and credit quality ratios YoY change. Efficiency ratio and RoTE impacted by high inflation adjustments account. Underlying RoTE
Table of Contents
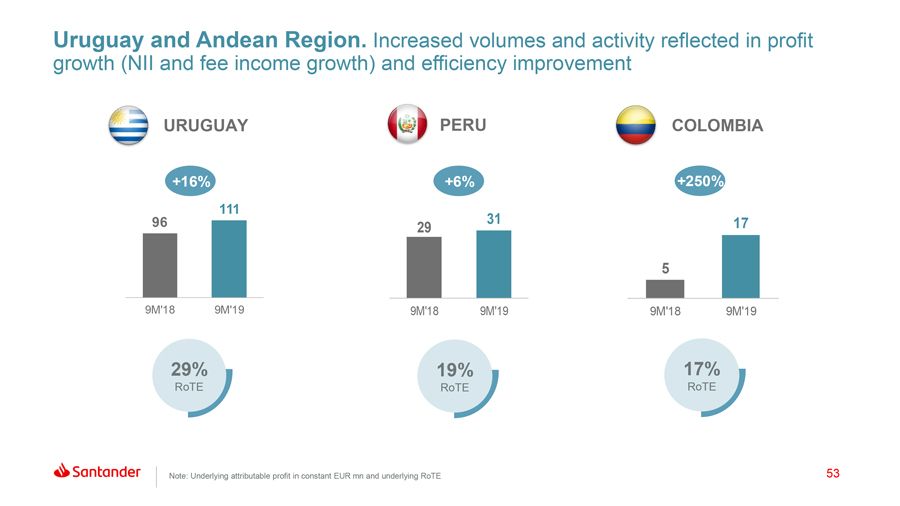
Uruguay and Andean Region. Increased volumes and activity reflected in profit growth (NII and fee income growth) and efficiency improvement URUGUAY PERU COLOMBIA +16% +6% +250% 111 96 31 17 29 5 9M’18 9M’19 9M’18 9M’19 9M’18 9M’19 29% 19% 17% RoTE RoTE RoTE Note: Underlying attributable profit in constant EUR mn and underlying RoTE 53
Table of Contents
Appendix Primary segments Secondary segments Other countries Balance sheet and capital management NPL and coverage ratios and cost of credit Responsible Banking Quarterly income statements 54
Table of Contents
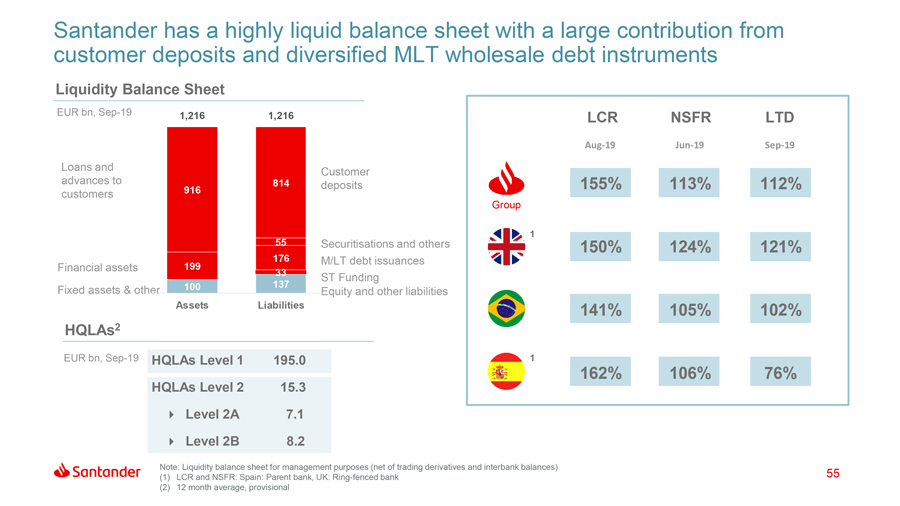
Santander has a highly liquid balance sheet with a large contribution from customer deposits and diversified MLT wholesale debt instruments Liquidity Balance Sheet EUR bn,Sep-19 1,216 1,216 LCR NSFR LTDAug-19Jun-19Sep-19 Loans and Customer advances to 916 814 deposits 155% 113% 112% customers Group 55 1 Securitisations and others 150% 124% 121% 176 M/LT debt issuances Financial assets 199 33 ST Funding 100 137 Fixed assets & other Equity and other liabilities Assets Liabilities 141% 105% 102% HQLAs2 EUR bn,Sep-19 HQLAs Level 1 195.0 1 162% 106% 76% HQLAs Level 2 15.34 Level 2A7.14 Level 2B8.2 Note: Liquidity balance sheet for management purposes (net of trading derivatives and interbank balances) (1) LCR and NSFR: Spain: Parent bank, UK: Ring-fenced bank 55 (2) 12 month average, provisional
Table of Contents
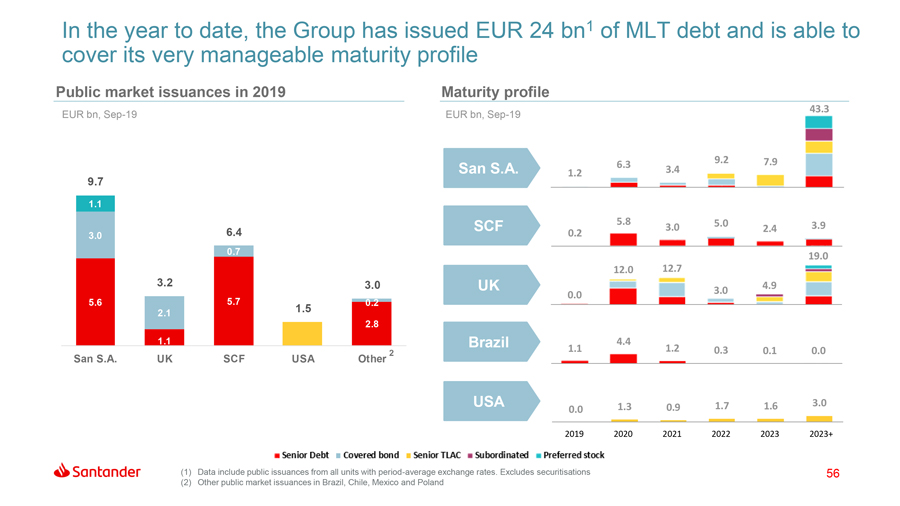
In the year to date, the Group has issued EUR 24 bn1 of MLT debt and is able to cover its very manageable maturity profile Public market issuances in 2019 Maturity profile 43.3 EUR bn,Sep-19 EUR bn,Sep-19 9.2 7.9 6.3 San S.A. 1.2 3.4 9.7 1.1 5.8 5.0 3.9 6.4 SCF 3.0 2.4 3.0 0.2 0.7 19.0 12.0 12.7 3.2 3.0 UK 4.9 3.0 0.0 5.6 5.7 0.2 2.1 1.5 2.8 1.1 Brazil 4.4 1.1 1.2 0.3 0.1 0.0 2 San S.A. UK SCF USA Other USA 1.3 1.7 1.6 3.0 0.0 0.9 2019 2020 2021 2022 2023 2023+ nces from all units with period-average exchange rates. Excludes securitisations 56 ances in Brazil, Chile, Mexico and Poland
Table of Contents
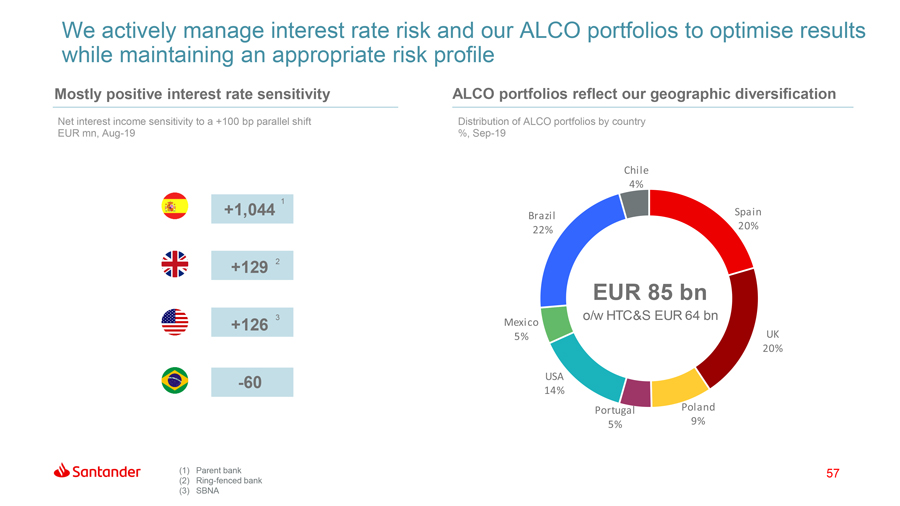
We actively manage interest rate risk and our ALCO portfolios to optimise results while maintaining an appropriate risk profile Mostly positive interest rate sensitivity ALCO portfolios reflect our geographic diversification Net interest income sensitivity to a +100 bp parallel shift Distribution of ALCO portfolios by country EUR mn,Aug-19 %,Sep-19 Chile 4% +1,044 1 Brazil Spain 22% 20% +129 2 EUR 85 bn 3 o/w HTC&S EUR 64 bn +126 Mexico 5% UK 20% -60 USA 14% Portugal Poland 5% 9% (1) Parent bank 57 (2) Ring-fenced bank (3) SBNA
Table of Contents
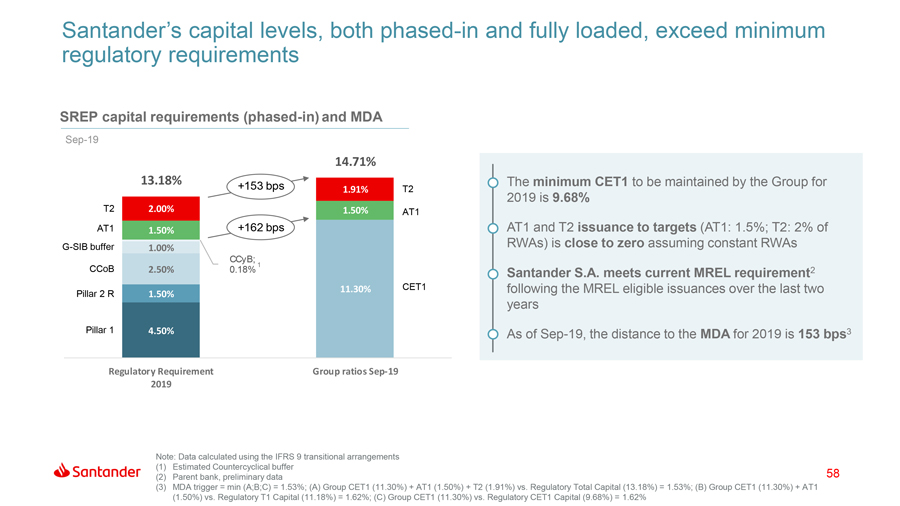
Santander’s capital levels, bothphased-in and fully loaded, exceed minimum regulatory requirements SREP capital requirements(phased-in)and MDASep-19 14.71% 13.18% The minimum CET1 to be maintained by the Group for +153 bps 1.91% T2 2019 is 9.68% T2 2.00% 1.50% AT1 AT1 1.50% +162 bps AT1 and T2 issuance to targets (AT1: 1.5%; T2: 2% ofG-SIB buffer 1.00% RWAs) is close to zero assuming constant RWAs CCyB; CCoB 1 2.50% 0.18% Santander S.A. meets current MREL requirement2 11.30% CET1 following the MREL eligible issuances over the last two Pillar 2 R 1.50% years Pillar 1 4.50% As ofSep-19, the distance to the MDA for 2019 is 153 bps3 Regulatory Requirement Group ratiosSep-19 2019 Note: Data calculated using the IFRS 9 transitional arrangements (1) Estimated Countercyclical buffer (2) Parent bank, preliminary data 58 (3) MDA trigger = min (A;B;C) = 1.53%; (A) Group CET1 (11.30%) + AT1 (1.50%) + T2 (1.91%) vs. Regulatory Total Capital (13.18%) = 1.53%; (B) Group CET1 (11.30%) + AT1 (1.50%) vs. Regulatory T1 Capital (11.18%) = 1.62%; (C) Group CET1 (11.30%) vs. Regulatory CET1 Capital (9.68%) = 1.62%
Table of Contents
Appendix Primary segments Secondary segments Other countries Balance sheet and capital management NPL and coverage ratios and cost of credit Responsible Banking Quarterly income statements 59
Table of Contents
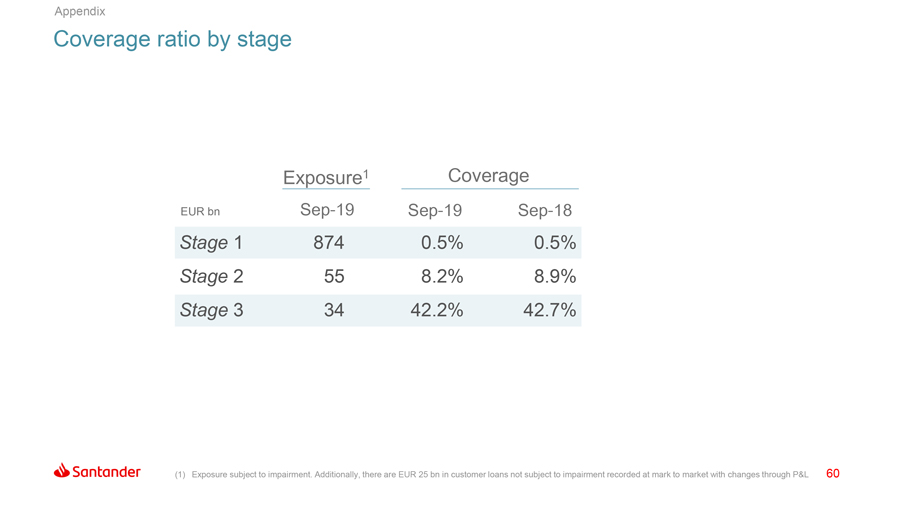
Appendix Coverage ratio by stage Exposure1 Coverage EUR bnSep-19Sep-19Sep-18 Stage 1 874 0.5% 0.5% Stage 2 55 8.2% 8.9% Stage 3 34 42.2% 42.7% (1) Exposure subject to impairment. Additionally, there are EUR 25 bn in customer loans not subject to impairment recorded at mark to market with changes through P&L 60
Table of Contents
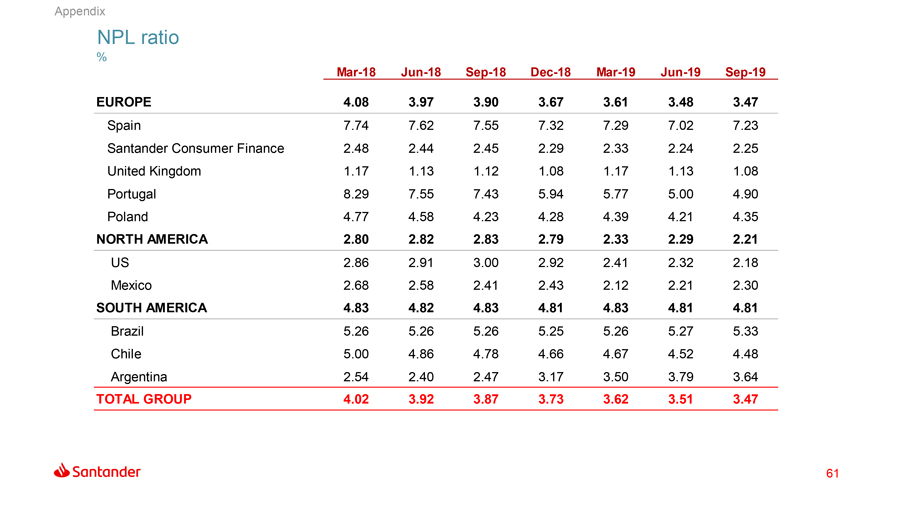
Appendix NPL ratio %Mar-18Jun-18Sep-18Dec-18Mar-19Jun-19Sep-19 EUROPE 4.08 3.97 3.90 3.67 3.61 3.48 3.47 Spain 7.74 7.62 7.55 7.32 7.29 7.02 7.23 Santander Consumer Finance 2.48 2.44 2.45 2.29 2.33 2.24 2.25 United Kingdom 1.17 1.13 1.12 1.08 1.17 1.13 1.08 Portugal 8.29 7.55 7.43 5.94 5.77 5.00 4.90 Poland 4.77 4.58 4.23 4.28 4.39 4.21 4.35 NORTH AMERICA 2.80 2.82 2.83 2.79 2.33 2.29 2.21 US 2.86 2.91 3.00 2.92 2.41 2.32 2.18 Mexico 2.68 2.58 2.41 2.43 2.12 2.21 2.30 SOUTH AMERICA 4.83 4.82 4.83 4.81 4.83 4.81 4.81 Brazil 5.26 5.26 5.26 5.25 5.26 5.27 5.33 Chile 5.00 4.86 4.78 4.66 4.67 4.52 4.48 Argentina 2.54 2.40 2.47 3.17 3.50 3.79 3.64 TOTAL GROUP 4.02 3.92 3.87 3.73 3.62 3.51 3.47 61
Table of Contents
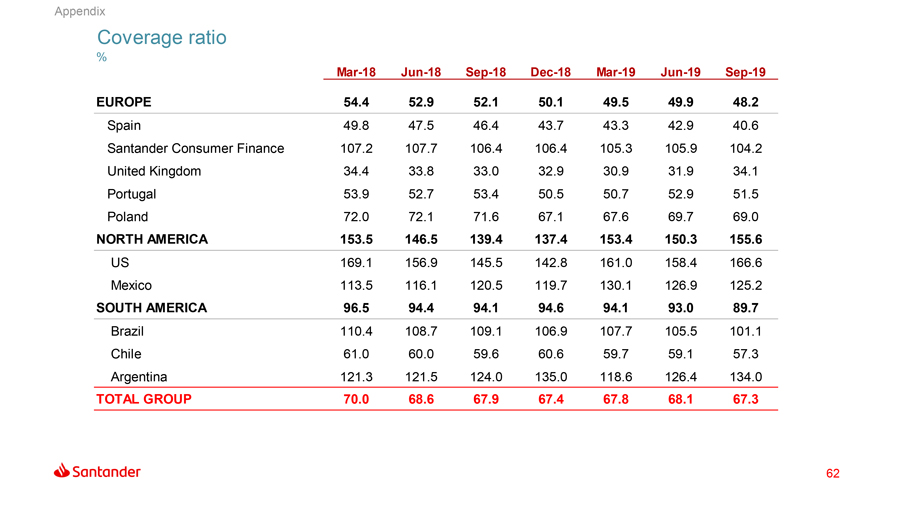
Appendix Coverage ratio %Mar-18Jun-18Sep-18Dec-18Mar-19Jun-19Sep-19 EUROPE 54.4 52.9 52.1 50.1 49.5 49.9 48.2 Spain 49.8 47.5 46.4 43.7 43.3 42.9 40.6 Santander Consumer Finance 107.2 107.7 106.4 106.4 105.3 105.9 104.2 United Kingdom 34.4 33.8 33.0 32.9 30.9 31.9 34.1 Portugal 53.9 52.7 53.4 50.5 50.7 52.9 51.5 Poland 72.0 72.1 71.6 67.1 67.6 69.7 69.0 NORTH AMERICA 153.5 146.5 139.4 137.4 153.4 150.3 155.6 US 169.1 156.9 145.5 142.8 161.0 158.4 166.6 Mexico 113.5 116.1 120.5 119.7 130.1 126.9 125.2 SOUTH AMERICA 96.5 94.4 94.1 94.6 94.1 93.0 89.7 Brazil 110.4 108.7 109.1 106.9 107.7 105.5 101.1 Chile 61.0 60.0 59.6 60.6 59.7 59.1 57.3 Argentina 121.3 121.5 124.0 135.0 118.6 126.4 134.0 TOTAL GROUP 70.0 68.6 67.9 67.4 67.8 68.1 67.3 62
Table of Contents
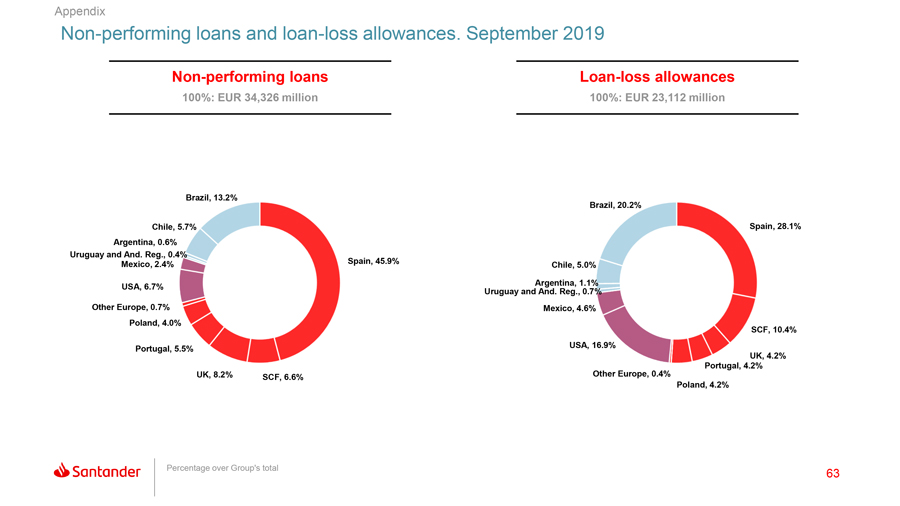
AppendixNon-performing loans and loan-loss allowances. September 2019Non-performing loans Loan-loss allowances 100%: EUR 34,326 million 100%: EUR 23,112 million Brazil, 13.2% Brazil, 20.2% Chile, 5.7% Spain, 28.1% Argentina, 0.6% Uruguay and And. Reg., 0.4% Mexico, 2.4% Spain, 45.9% Chile, 5.0% Argentina, 1.1% USA, 6.7% Uruguay and And. Reg., 0.7% Other Europe, 0.7% Mexico, 4.6% Poland, 4.0% SCF, 10.4% USA, 16.9% Portugal, 5.5% UK, 4.2% Portugal, 4.2% UK, 8.2% SCF, 6.6% Other Europe, 0.4% Poland, 4.2% Percentage over Group’s total 63
Table of Contents
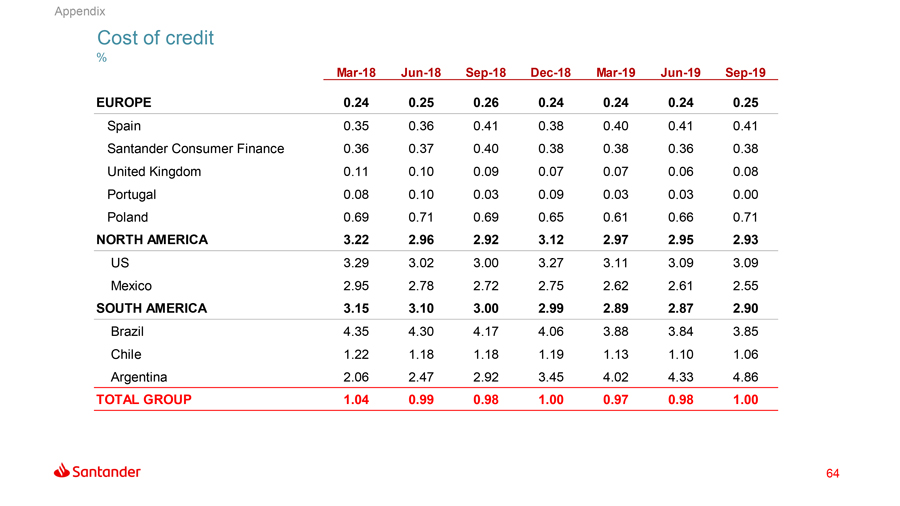
Appendix Cost of credit %Mar-18Jun-18Sep-18Dec-18Mar-19Jun-19Sep-19 EUROPE 0.24 0.25 0.26 0.24 0.24 0.24 0.25 Spain 0.35 0.36 0.41 0.38 0.40 0.41 0.41 Santander Consumer Finance 0.36 0.37 0.40 0.38 0.38 0.36 0.38 United Kingdom 0.11 0.10 0.09 0.07 0.07 0.06 0.08 Portugal 0.08 0.10 0.03 0.09 0.03 0.03 0.00 Poland 0.69 0.71 0.69 0.65 0.61 0.66 0.71 NORTH AMERICA 3.22 2.96 2.92 3.12 2.97 2.95 2.93 US 3.29 3.02 3.00 3.27 3.11 3.09 3.09 Mexico 2.95 2.78 2.72 2.75 2.62 2.61 2.55 SOUTH AMERICA 3.15 3.10 3.00 2.99 2.89 2.87 2.90 Brazil 4.35 4.30 4.17 4.06 3.88 3.84 3.85 Chile 1.22 1.18 1.18 1.19 1.13 1.10 1.06 Argentina 2.06 2.47 2.92 3.45 4.02 4.33 4.86 TOTAL GROUP 1.04 0.99 0.98 1.00 0.97 0.98 1.00 64
Table of Contents
Appendix Primary segments Secondary segments Other countries Balance sheet and capital management NPL and coverage ratios and cost of credit Responsible Banking Quarterly income statements 65
Table of Contents
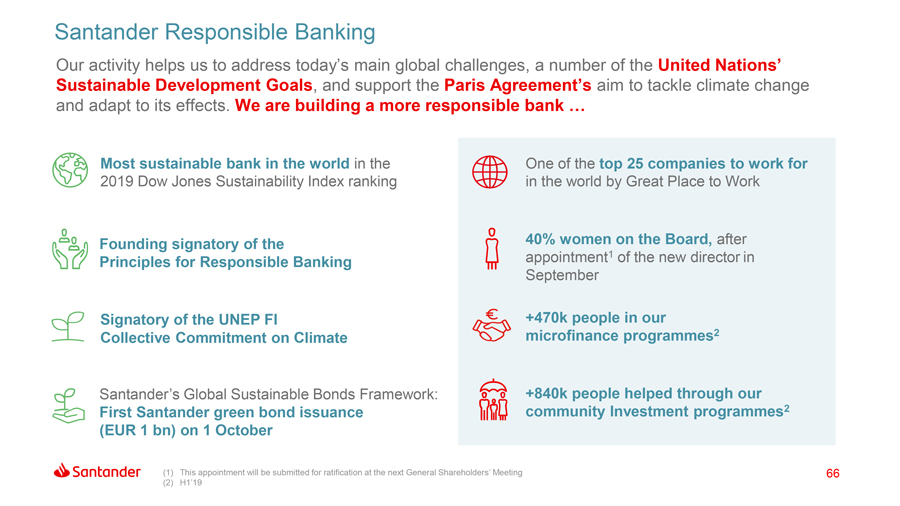
Santander Responsible Banking Our activity helps us to address today’s main global challenges, a number of the United Nations’ Sustainable Development Goals, and support the Paris Agreement’s aim to tackle climate change and adapt to its effects. We are building a more responsible bank … Most sustainable bank in the world in the One of the top 25 companies to work for 2019 Dow Jones Sustainability Index ranking in the world by Great Place to Work Founding signatory of the 40% women on the Board, after appointment1 of the new directorin Principles for Responsible Banking September Signatory of the UNEP FI +470k people in our Collective Commitment on Climate microfinance programmes2 Santander’s Global Sustainable Bonds Framework: +840k people helped through our First Santander green bond issuance community Investment programmes2 (EUR 1 bn) on 1 October (1) This appointment will be submitted for ratification at the next General Shareholders’ Meeting 66 (2) H1’19
Table of Contents
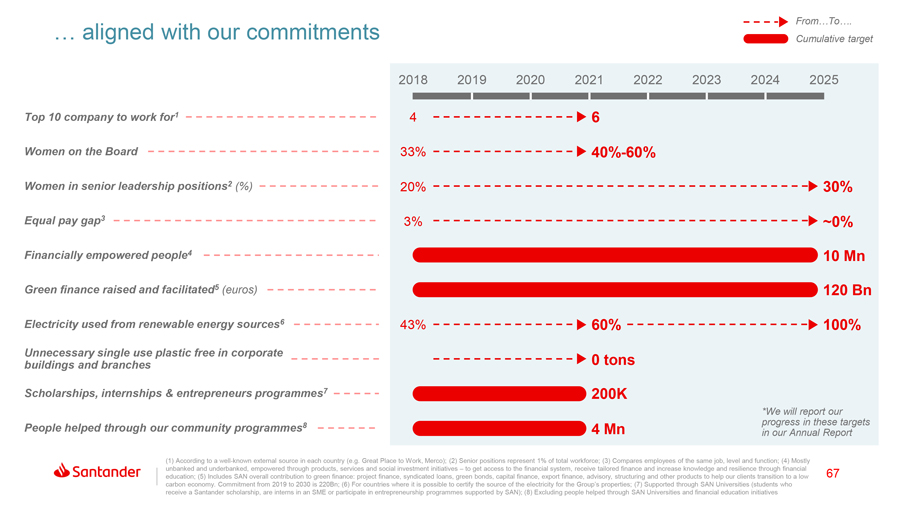
… aligned with our commitments From…To…. Cumulative target 2018 2019 2020 2021 2022 2023 2024 2025 Top 10 company to work for1 4 6 Women on the Board 33%40%-60% Women in senior leadership positions2 (%) 20% 30% Equal pay gap3 3% ~0% Financially empowered people4 10 Mn Green finance raised and facilitated5 (euros) 120 Bn Electricity used from renewable energy sources6 43% 60% 100% Unnecessary single use plastic free in corporate buildings and branches 0 tons Scholarships, internships & entrepreneurs programmes7 200K *We will report our 8 progress in these targets People helped through our community programmes 4 Mn in our Annual Report (1) According to a well-known external source in each country (e.g. Great Place to Work, Merco); (2) Senior positions represent 1% of total workforce; (3) Compares employees of the same job, level and function; (4) Mostly unbanked and underbanked, empowered through products, services and social investment initiatives – to get access to the financial system, receive tailored finance and increase knowledge and resilience through financial 67 education; (5) Includes SAN overall contribution to green finance: project finance, syndicated loans, green bonds, capital finance, export finance, advisory, structuring and other products to help our clients transition to a low carbon economy. Commitment from 2019 to 2030 is 220Bn; (6) For countries where it is possible to certify the source of the electricity for the Group’s properties; (7) Supported through SAN Universities (students who receive a Santander scholarship, are interns in an SME or participate in entrepreneurship programmes supported by SAN); (8) Excluding people helped through SAN Universities and financial education initiatives
Table of Contents
Appendix Primary segments Secondary segments Other countries Balance sheet and capital management NPL and coverage ratios and cost of credit Responsible Banking Quarterly income statements 68
Table of Contents
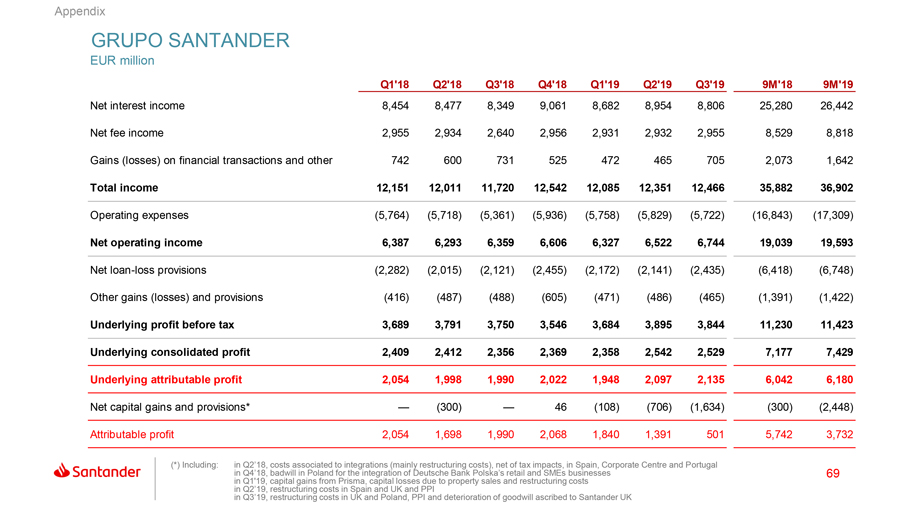
Appendix GRUPO SANTANDER EUR million Q1’18 Q2’18 Q3’18 Q4’18 Q1’19 Q2’19 Q3’19 9M’18 9M’19 Net interest income 8,454 8,477 8,349 9,061 8,682 8,954 8,806 25,280 26,442 Net fee income 2,955 2,934 2,640 2,956 2,931 2,932 2,955 8,529 8,818 Gains (losses) on financial transactions and other 742 600 731 525 472 465 705 2,073 1,642 Total income 12,151 12,011 11,720 12,542 12,085 12,351 12,466 35,882 36,902 Operating expenses (5,764) (5,718) (5,361) (5,936) (5,758) (5,829) (5,722) (16,843) (17,309) Net operating income 6,387 6,293 6,359 6,606 6,327 6,522 6,744 19,039 19,593 Net loan-loss provisions (2,282) (2,015) (2,121) (2,455) (2,172) (2,141) (2,435) (6,418) (6,748) Other gains (losses) and provisions (416) (487) (488) (605) (471) (486) (465) (1,391) (1,422) Underlying profit before tax 3,689 3,791 3,750 3,546 3,684 3,895 3,844 11,230 11,423 Underlying consolidated profit 2,409 2,412 2,356 2,369 2,358 2,542 2,529 7,177 7,429 Underlying attributable profit 2,054 1,998 1,990 2,022 1,948 2,097 2,135 6,042 6,180 Net capital gains and provisions* — (300) — 46 (108) (706) (1,634) (300) (2,448) Attributable profit 2,054 1,698 1,990 2,068 1,840 1,391 501 5,742 3,732 (*) Including: in Q2’18, costs associated to integrations (mainly restructuring costs), net of tax impacts, in Spain, Corporate Centre and Portugal in Q4’18, badwill in Poland for the integration of Deutsche Bank Polska’s retail and SMEs businesses 69 in Q1’19, capital gains from Prisma, capital losses due to property sales and restructuring costs in Q2’19, restructuring costs in Spain and UK and PPI in Q3’19, restructuring costs in UK and Poland, PPI and deterioration of goodwill ascribed to Santander UK
Table of Contents

Appendix GRUPO SANTANDER Constant EUR million Q1’18 Q2’18 Q3’18 Q4’18 Q1’19 Q2’19 Q3’19 9M’18 9M’19 Net interest income 8,232 8,386 8,663 8,926 8,581 8,895 8,966 25,281 26,442 Net fee income 2,821 2,862 2,774 2,852 2,884 2,910 3,024 8,457 8,818 Gains (losses) on financial transactions and other 731 574 786 544 472 473 697 2,091 1,642 Total income 11,784 11,822 12,224 12,322 11,937 12,278 12,687 35,830 36,902 Operating expenses (5,604) (5,632) (5,577) (5,774) (5,684) (5,779) (5,846) (16,813) (17,309) Net operating income 6,180 6,190 6,646 6,548 6,253 6,499 6,841 19,016 19,593 Net loan-loss provisions (2,241) (1,992) (2,223) (2,432) (2,146) (2,131) (2,472) (6,456) (6,748) Other gains (losses) and provisions (395) (464) (517) (601) (463) (488) (471) (1,376) (1,422) Underlying profit before tax 3,544 3,734 3,906 3,515 3,644 3,880 3,898 11,184 11,423 Underlying consolidated profit 2,320 2,377 2,464 2,362 2,336 2,530 2,563 7,161 7,429 Underlying attributable profit 1,968 1,959 2,091 2,013 1,928 2,084 2,167 6,018 6,180 Net capital gains and provisions* — (300) — 46 (144) (703) (1,601) (300) (2,448) Attributable profit 1,968 1,659 2,091 2,059 1,785 1,381 566 5,718 3,732 (*) Including: in Q2’18, costs associated to integrations (mainly restructuring costs), net of tax impacts, in Spain, Corporate Centre and Portugal in Q4’18, badwill in Poland for the integration of Deutsche Bank Polska’s retail and SMEs businesses 70 in Q1’19, capital gains from Prisma, capital losses due to property sales and restructuring costs in Q2’19, restructuring costs in Spain and UK and PPI in Q3’19, restructuring costs in UK and Poland, PPI and deterioration of goodwill ascribed to Santander UK
Table of Contents

Appendix EUROPE EUR million Q1’18 Q2’18 Q3’18 Q4’18 Q1’19 Q2’19 Q3’19 9M’18 9M’19 Net interest income 3,502 3,508 3,562 3,631 3,561 3,580 3,530 10,573 10,671 Net fee income 1,372 1,382 1,354 1,327 1,327 1,304 1,310 4,108 3,941 Gains (losses) on financial transactions and other 477 282 503 355 337 304 455 1,263 1,097 Total income 5,352 5,173 5,419 5,314 5,225 5,188 5,295 15,943 15,709 Operating expenses (2,841) (2,825) (2,735) (2,764) (2,802) (2,789) (2,719) (8,402) (8,310) Net operating income 2,510 2,348 2,684 2,550 2,423 2,399 2,576 7,541 7,398 Net loan-loss provisions (457) (403) (406) (306) (457) (387) (497) (1,266) (1,340) Other gains (losses) and provisions (195) (194) (205) (435) (198) (231) (130) (593) (560) Underlying profit before tax 1,859 1,751 2,072 1,809 1,768 1,781 1,949 5,683 5,498 Underlying consolidated profit 1,359 1,276 1,498 1,339 1,276 1,306 1,418 4,133 4,001 Underlying attributable profit 1,260 1,162 1,384 1,242 1,163 1,191 1,286 3,805 3,640 71
Table of Contents
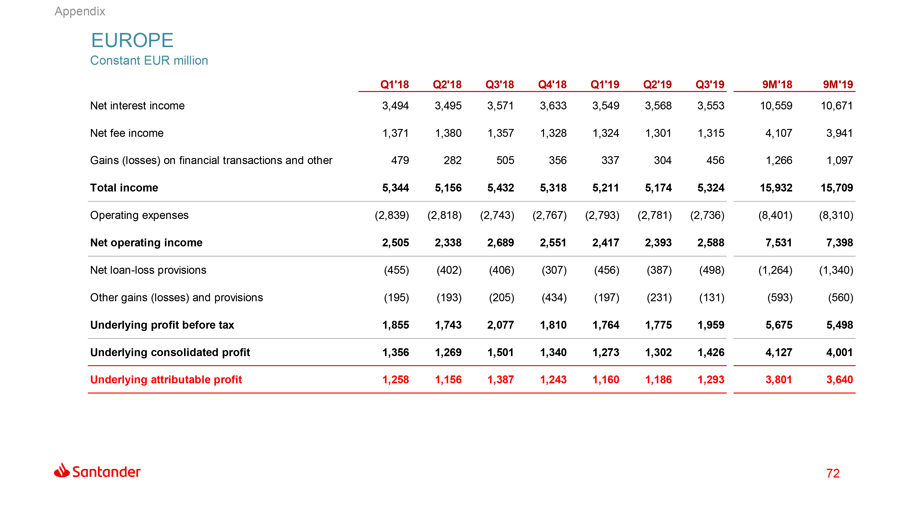
Appendix EUROPE Constant EUR million Q1’18 Q2’18 Q3’18 Q4’18 Q1’19 Q2’19 Q3’19 9M’18 9M’19 Net interest income 3,494 3,495 3,571 3,633 3,549 3,568 3,553 10,559 10,671 Net fee income 1,371 1,380 1,357 1,328 1,324 1,301 1,315 4,107 3,941 Gains (losses) on financial transactions and other 479 282 505 356 337 304 456 1,266 1,097 Total income 5,344 5,156 5,432 5,318 5,211 5,174 5,324 15,932 15,709 Operating expenses (2,839) (2,818) (2,743) (2,767) (2,793) (2,781) (2,736) (8,401) (8,310) Net operating income 2,505 2,338 2,689 2,551 2,417 2,393 2,588 7,531 7,398 Net loan-loss provisions (455) (402) (406) (307) (456) (387) (498) (1,264) (1,340) Other gains (losses) and provisions (195) (193) (205) (434) (197) (231) (131) (593) (560) Underlying profit before tax 1,855 1,743 2,077 1,810 1,764 1,775 1,959 5,675 5,498 Underlying consolidated profit 1,356 1,269 1,501 1,340 1,273 1,302 1,426 4,127 4,001 Underlying attributable profit 1,258 1,156 1,387 1,243 1,160 1,186 1,293 3,801 3,640 72
Table of Contents

Appendix Spain EUR million Q1’18 Q2’18 Q3’18 Q4’18 Q1’19 Q2’19 Q3’19 9M’18 9M’19 Net interest income 969 1,026 1,044 1,054 1,009 1,009 967 3,040 2,985 Net fee income 669 671 651 633 623 624 614 1,991 1,861 Gains (losses) on financial transactions and other 247 163 370 117 224 216 408 781 849 Total income 1,885 1,860 2,065 1,804 1,857 1,849 1,989 5,811 5,695 Operating expenses (1,112) (1,093) (1,065) (1,068) (1,025) (1,020) (999) (3,271) (3,043) Net operating income 773 767 1,000 737 832 829 990 2,540 2,652 Net loan-loss provisions (217) (220) (213) (140) (242) (228) (210) (649) (680) Other gains (losses) and provisions (131) (102) (132) (60) (112) (143) (100) (365) (355) Underlying profit before tax 425 446 655 537 478 458 681 1,526 1,617 Underlying consolidated profit 326 335 486 408 356 338 491 1,147 1,184 Underlying attributable profit 326 335 486 408 356 338 491 1,146 1,185 73
Table of Contents
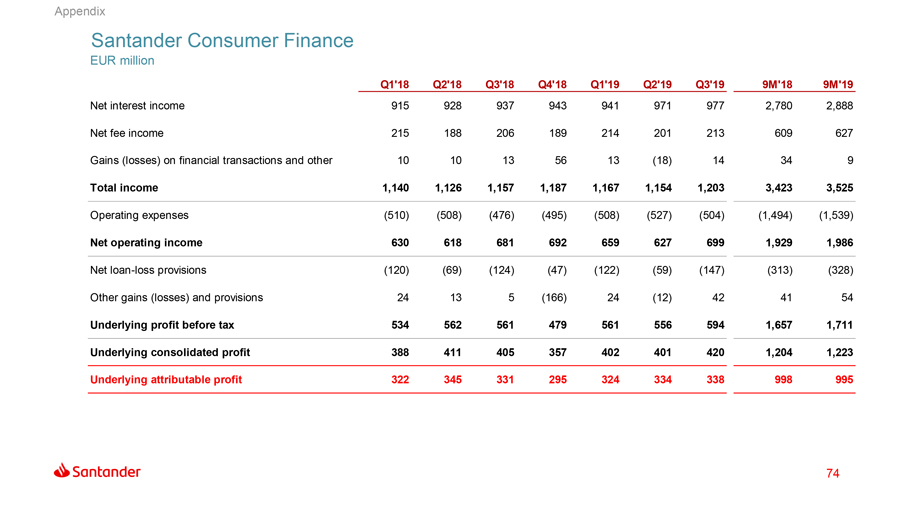
Appendix Santander Consumer Finance EUR million Q1’18 Q2’18 Q3’18 Q4’18 Q1’19 Q2’19 Q3’19 9M’18 9M’19 Net interest income 915 928 937 943 941 971 977 2,780 2,888 Net fee income 215 188 206 189 214 201 213 609 627 Gains (losses) on financial transactions and other 10 10 13 56 13 (18) 14 34 9 Total income 1,140 1,126 1,157 1,187 1,167 1,154 1,203 3,423 3,525 Operating expenses (510) (508) (476) (495) (508) (527) (504) (1,494) (1,539) Net operating income 630 618 681 692 659 627 699 1,929 1,986 Net loan-loss provisions (120) (69) (124) (47) (122) (59) (147) (313) (328) Other gains (losses) and provisions 24 13 5 (166) 24 (12) 42 41 54 Underlying profit before tax 534 562 561 479 561 556 594 1,657 1,711 Underlying consolidated profit 388 411 405 357 402 401 420 1,204 1,223 Underlying attributable profit 322 345 331 295 324 334 338 998 995 74
Table of Contents

Appendix Santander Consumer Finance Constant EUR million Q1’18 Q2’18 Q3’18 Q4’18 Q1’19 Q2’19 Q3’19 9M’18 9M’19 Net interest income 911 924 934 941 941 969 978 2,769 2,888 Net fee income 214 188 206 189 214 201 213 608 627 Gains (losses) on financial transactions and other 10 10 14 56 13 (18) 14 34 9 Total income 1,135 1,122 1,154 1,185 1,167 1,153 1,205 3,411 3,525 Operating expenses (508) (506) (475) (494) (508) (526) (505) (1,489) (1,539) Net operating income 627 616 679 691 659 626 700 1,922 1,986 Net loan-loss provisions (120) (69) (123) (47) (122) (59) (147) (312) (328) Other gains (losses) and provisions 24 13 5 (166) 24 (12) 42 41 54 Underlying profit before tax 532 559 560 478 561 555 595 1,651 1,711 Underlying consolidated profit 386 409 404 356 402 400 421 1,199 1,223 Underlying attributable profit 321 343 330 294 324 333 338 994 995 75
Table of Contents

Appendix United Kingdom EUR million Q1’18 Q2’18 Q3’18 Q4’18 Q1’19 Q2’19 Q3’19 9M’18 9M’19 Net interest income 1,023 1,029 1,016 1,011 975 944 908 3,068 2,827 Net fee income 219 240 230 224 216 207 217 688 640 Gains (losses) on financial transactions and other 29 50 55 8 15 32 (5) 134 41 Total income 1,270 1,319 1,300 1,242 1,206 1,183 1,119 3,890 3,508 Operating expenses (725) (715) (697) (700) (739) (703) (681) (2,137) (2,123) Net operating income 545 605 603 542 467 479 438 1,753 1,384 Net loan-loss provisions (66) (36) (26) (43) (61) (19) (77) (129) (157) Other gains (losses) and provisions (59) (44) (63) (155) (50) (25) (43) (166) (118) Underlying profit before tax 420 524 514 344 357 435 318 1,458 1,110 Underlying consolidated profit 297 382 364 254 260 333 252 1,042 844 Underlying attributable profit 290 375 358 249 254 327 246 1,023 828 76
Table of Contents
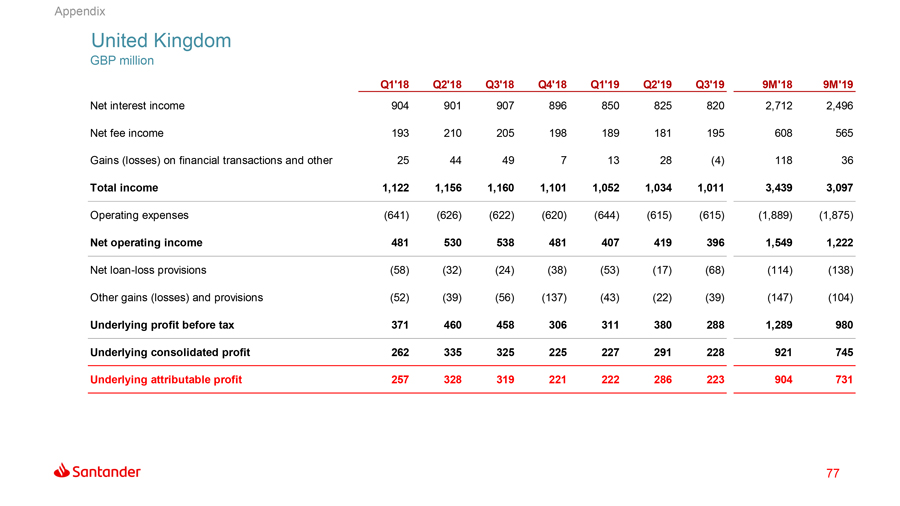
Appendix United Kingdom GBP million Q1’18 Q2’18 Q3’18 Q4’18 Q1’19 Q2’19 Q3’19 9M’18 9M’19 Net interest income 904 901 907 896 850 825 820 2,712 2,496 Net fee income 193 210 205 198 189 181 195 608 565 Gains (losses) on financial transactions and other 25 44 49 7 13 28 (4) 118 36 Total income 1,122 1,156 1,160 1,101 1,052 1,034 1,011 3,439 3,097 Operating expenses (641) (626) (622) (620) (644) (615) (615) (1,889) (1,875) Net operating income 481 530 538 481 407 419 396 1,549 1,222 Net loan-loss provisions (58) (32) (24) (38) (53) (17) (68) (114) (138) Other gains (losses) and provisions (52) (39) (56) (137) (43) (22) (39) (147) (104) Underlying profit before tax 371 460 458 306 311 380 288 1,289 980 Underlying consolidated profit 262 335 325 225 227 291 228 921 745 Underlying attributable profit 257 328 319 221 222 286 223 904 731 77
Table of Contents
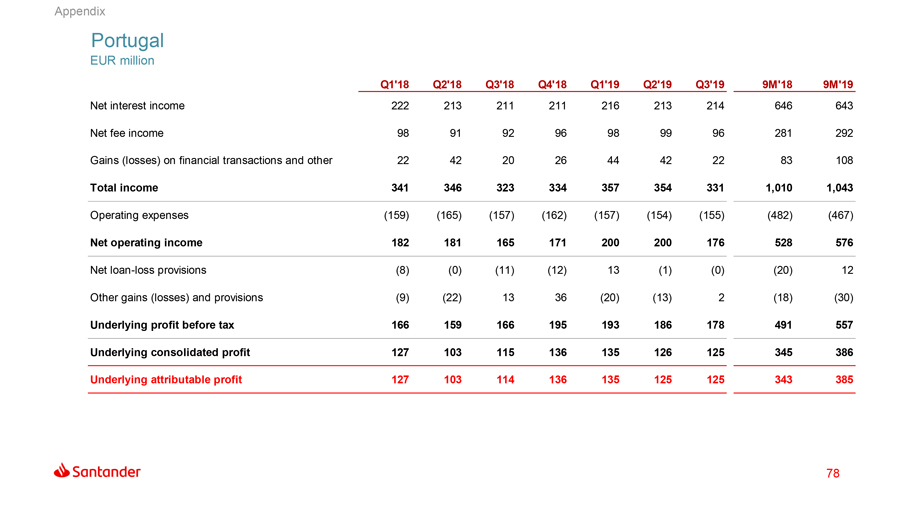
Appendix Portugal EUR million Q1’18 Q2’18 Q3’18 Q4’18 Q1’19 Q2’19 Q3’19 9M’18 9M’19 Net interest income 222 213 211 211 216 213 214 646 643 Net fee income 98 91 92 96 98 99 96 281 292 Gains (losses) on financial transactions and other 22 42 20 26 44 42 22 83 108 Total income 341 346 323 334 357 354 331 1,010 1,043 Operating expenses (159) (165) (157) (162) (157) (154) (155) (482) (467) Net operating income 182 181 165 171 200 200 176 528 576 Net loan-loss provisions (8) (0) (11) (12) 13 (1) (0) (20) 12 Other gains (losses) and provisions (9) (22) 13 36 (20) (13) 2 (18) (30) Underlying profit before tax 166 159 166 195 193 186 178 491 557 Underlying consolidated profit 127 103 115 136 135 126 125 345 386 Underlying attributable profit 127 103 114 136 135 125 125 343 385 78
Table of Contents
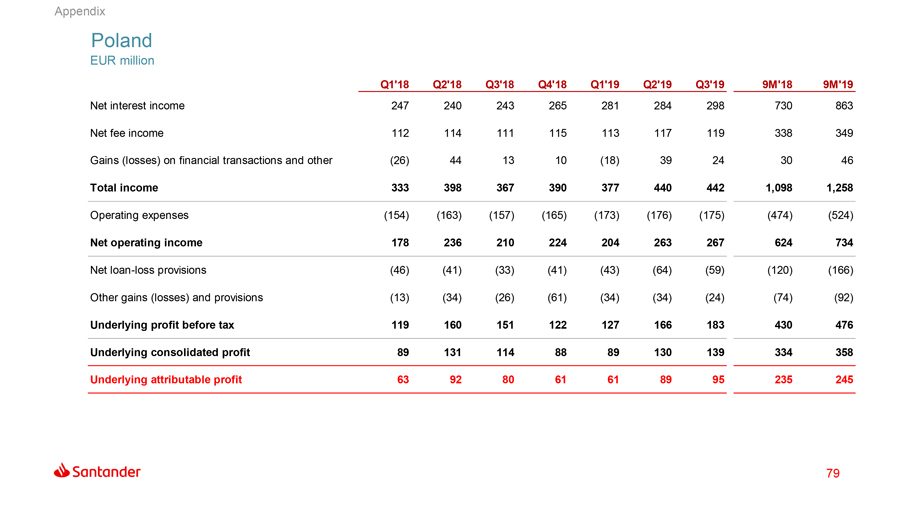
Appendix Poland EUR million Q1’18 Q2’18 Q3’18 Q4’18 Q1’19 Q2’19 Q3’19 9M’18 9M’19 Net interest income 247 240 243 265 281 284 298 730 863 Net fee income 112 114 111 115 113 117 119 338 349 Gains (losses) on financial transactions and other (26) 44 13 10 (18) 39 24 30 46 Total income 333 398 367 390 377 440 442 1,098 1,258 Operating expenses (154) (163) (157) (165) (173) (176) (175) (474) (524) Net operating income 178 236 210 224 204 263 267 624 734 Net loan-loss provisions (46) (41) (33) (41) (43) (64) (59) (120) (166) Other gains (losses) and provisions (13) (34) (26) (61) (34) (34) (24) (74) (92) Underlying profit before tax 119 160 151 122 127 166 183 430 476 Underlying consolidated profit 89 131 114 88 89 130 139 334 358 Underlying attributable profit 63 92 80 61 61 89 95 235 245 79
Table of Contents
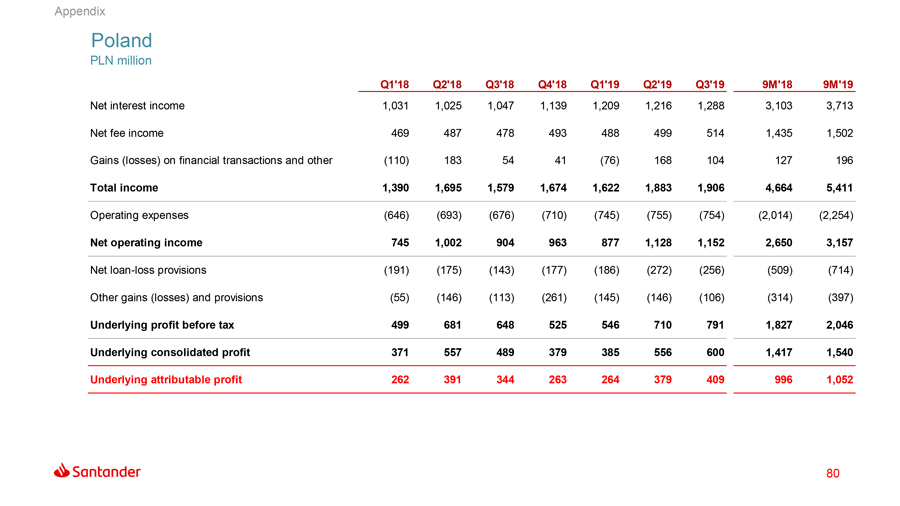
Appendix Poland PLN million Q1’18 Q2’18 Q3’18 Q4’18 Q1’19 Q2’19 Q3’19 9M’18 9M’19 Net interest income 1,031 1,025 1,047 1,139 1,209 1,216 1,288 3,103 3,713 Net fee income 469 487 478 493 488 499 514 1,435 1,502 Gains (losses) on financial transactions and other (110) 183 54 41 (76) 168 104 127 196 Total income 1,390 1,695 1,579 1,674 1,622 1,883 1,906 4,664 5,411 Operating expenses (646) (693) (676) (710) (745) (755) (754) (2,014) (2,254) Net operating income 745 1,002 904 963 877 1,128 1,152 2,650 3,157 Net loan-loss provisions (191) (175) (143) (177) (186) (272) (256) (509) (714) Other gains (losses) and provisions (55) (146) (113) (261) (145) (146) (106) (314) (397) Underlying profit before tax 499 681 648 525 546 710 791 1,827 2,046 Underlying consolidated profit 371 557 489 379 385 556 600 1,417 1,540 Underlying attributable profit 262 391 344 263 264 379 409 996 1,052 80
Table of Contents
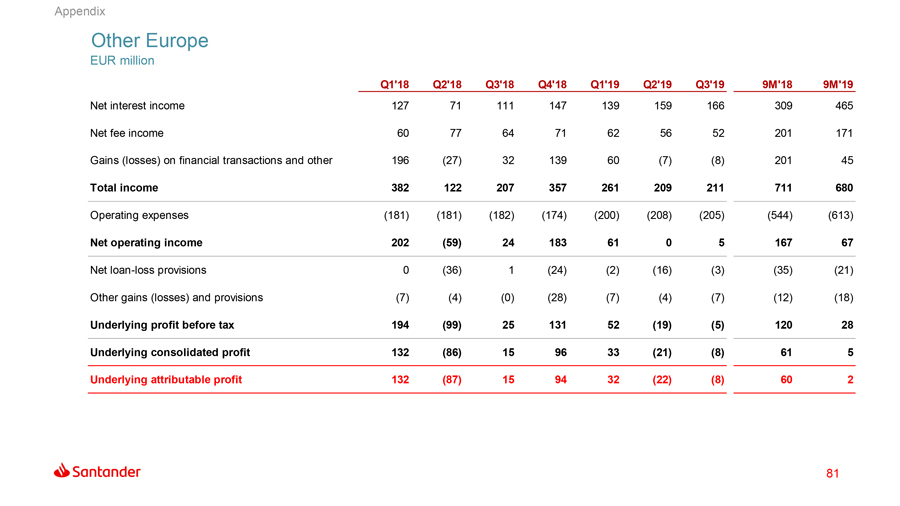
Appendix Other Europe EUR million Q1’18 Q2’18 Q3’18 Q4’18 Q1’19 Q2’19 Q3’19 9M’18 9M’19 Net interest income 127 71 111 147 139 159 166 309 465 Net fee income 60 77 64 71 62 56 52 201 171 Gains (losses) on financial transactions and other 196 (27) 32 139 60 (7) (8) 201 45 Total income 382 122 207 357 261 209 211 711 680 Operating expenses (181) (181) (182) (174) (200) (208) (205) (544) (613) Net operating income 202 (59) 24 183 61 0 5 167 67 Net loan-loss provisions 0 (36) 1 (24) (2) (16) (3) (35) (21) Other gains (losses) and provisions (7) (4) (0) (28) (7) (4) (7) (12) (18) Underlying profit before tax 194 (99) 25 131 52 (19) (5) 120 28 Underlying consolidated profit 132 (86) 15 96 33 (21) (8) 61 5 Underlying attributable profit 132 (87) 15 94 32 (22) (8) 60 2 81
Table of Contents
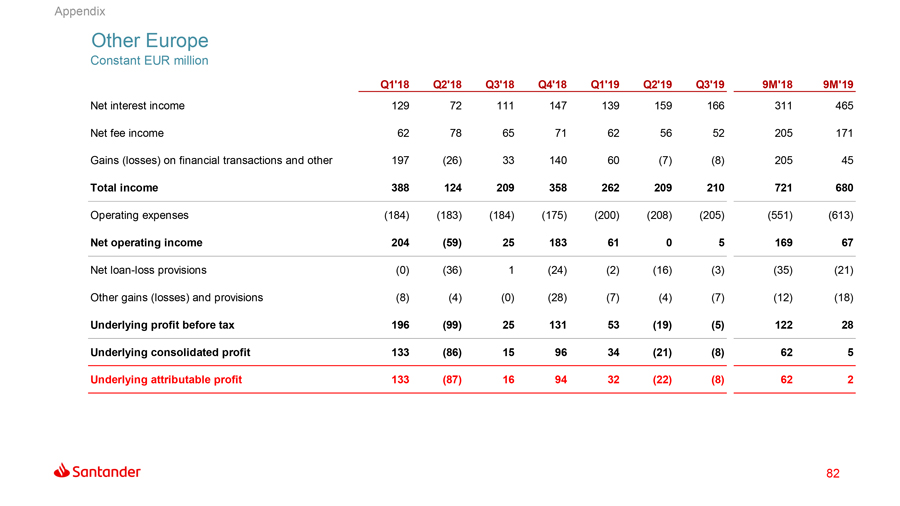
Appendix Other Europe Constant EUR million Q1’18 Q2’18 Q3’18 Q4’18 Q1’19 Q2’19 Q3’19 9M’18 9M’19 Net interest income 129 72 111 147 139 159 166 311 465 Net fee income 62 78 65 71 62 56 52 205 171 Gains (losses) on financial transactions and other 197 (26) 33 140 60 (7) (8) 205 45 Total income 388 124 209 358 262 209 210 721 680 Operating expenses (184) (183) (184) (175) (200) (208) (205) (551) (613) Net operating income 204 (59) 25 183 61 0 5 169 67 Net loan-loss provisions (0) (36) 1 (24) (2) (16) (3) (35) (21) Other gains (losses) and provisions (8) (4) (0) (28) (7) (4) (7) (12) (18) Underlying profit before tax 196 (99) 25 131 53 (19) (5) 122 28 Underlying consolidated profit 133 (86) 15 96 34 (21) (8) 62 5 Underlying attributable profit 133 (87) 16 94 32 (22) (8) 62 2 82
Table of Contents
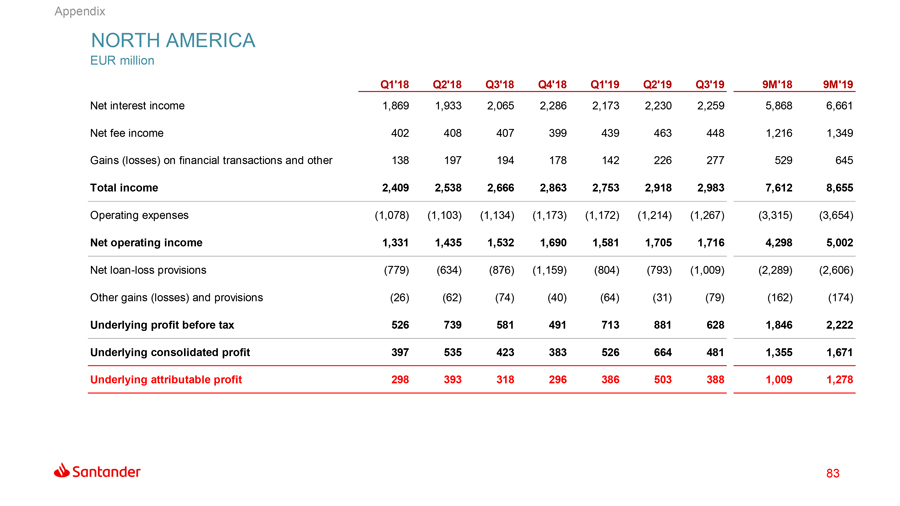
Appendix NORTH AMERICA EUR million Q1’18 Q2’18 Q3’18 Q4’18 Q1’19 Q2’19 Q3’19 9M’18 9M’19 Net interest income 1,869 1,933 2,065 2,286 2,173 2,230 2,259 5,868 6,661 Net fee income 402 408 407 399 439 463 448 1,216 1,349 Gains (losses) on financial transactions and other 138 197 194 178 142 226 277 529 645 Total income 2,409 2,538 2,666 2,863 2,753 2,918 2,983 7,612 8,655 Operating expenses (1,078) (1,103) (1,134) (1,173) (1,172) (1,214) (1,267) (3,315) (3,654) Net operating income 1,331 1,435 1,532 1,690 1,581 1,705 1,716 4,298 5,002 Net loan-loss provisions (779) (634) (876) (1,159) (804) (793) (1,009) (2,289) (2,606) Other gains (losses) and provisions (26) (62) (74) (40) (64) (31) (79) (162) (174) Underlying profit before tax 526 739 581 491 713 881 628 1,846 2,222 Underlying consolidated profit 397 535 423 383 526 664 481 1,355 1,671 Underlying attributable profit 298 393 318 296 386 503 388 1,009 1,278 83
Table of Contents
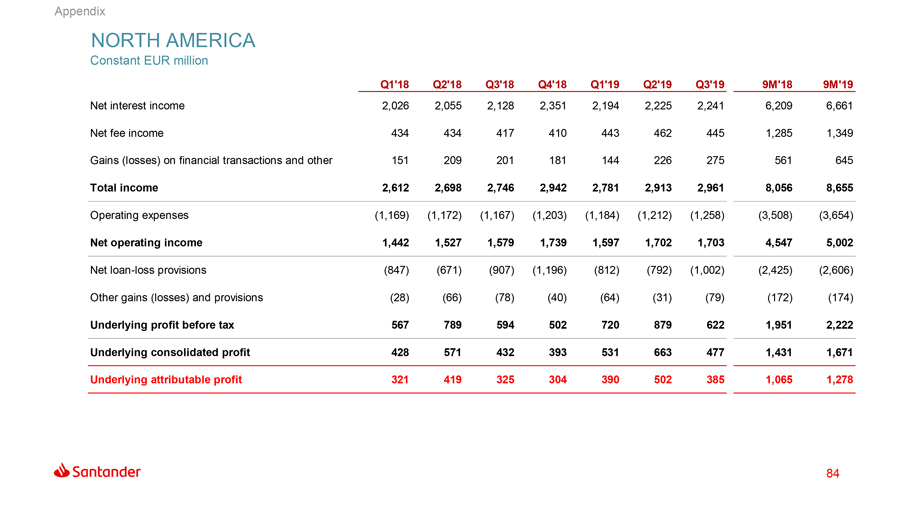
Appendix NORTH AMERICA Constant EUR million Q1’18 Q2’18 Q3’18 Q4’18 Q1’19 Q2’19 Q3’19 9M’18 9M’19 Net interest income 2,026 2,055 2,128 2,351 2,194 2,225 2,241 6,209 6,661 Net fee income 434 434 417 410 443 462 445 1,285 1,349 Gains (losses) on financial transactions and other 151 209 201 181 144 226 275 561 645 Total income 2,612 2,698 2,746 2,942 2,781 2,913 2,961 8,056 8,655 Operating expenses (1,169) (1,172) (1,167) (1,203) (1,184) (1,212) (1,258) (3,508) (3,654) Net operating income 1,442 1,527 1,579 1,739 1,597 1,702 1,703 4,547 5,002 Net loan-loss provisions (847) (671) (907) (1,196) (812) (792) (1,002) (2,425) (2,606) Other gains (losses) and provisions (28) (66) (78) (40) (64) (31) (79) (172) (174) Underlying profit before tax 567 789 594 502 720 879 622 1,951 2,222 Underlying consolidated profit 428 571 432 393 531 663 477 1,431 1,671 Underlying attributable profit 321 419 325 304 390 502 385 1,065 1,278 84
Table of Contents
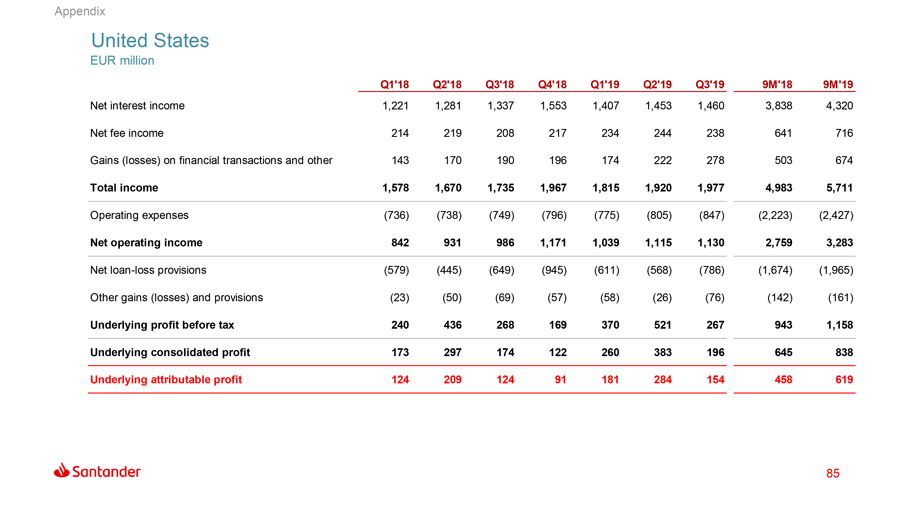
Appendix United States EUR million Q1’18 Q2’18 Q3’18 Q4’18 Q1’19 Q2’19 Q3’19 9M’18 9M’19 Net interest income 1,221 1,281 1,337 1,553 1,407 1,453 1,460 3,838 4,320 Net fee income 214 219 208 217 234 244 238 641 716 Gains (losses) on financial transactions and other 143 170 190 196 174 222 278 503 674 Total income 1,578 1,670 1,735 1,967 1,815 1,920 1,977 4,983 5,711 Operating expenses (736) (738) (749) (796) (775) (805) (847) (2,223) (2,427) Net operating income 842 931 986 1,171 1,039 1,115 1,130 2,759 3,283 Net loan-loss provisions (579) (445) (649) (945) (611) (568) (786) (1,674) (1,965) Other gains (losses) and provisions (23) (50) (69) (57) (58) (26) (76) (142) (161) Underlying profit before tax 240 436 268 169 370 521 267 943 1,158 Underlying consolidated profit 173 297 174 122 260 383 196 645 838 Underlying attributable profit 124 209 124 91 181 284 154 458 619 85
Table of Contents
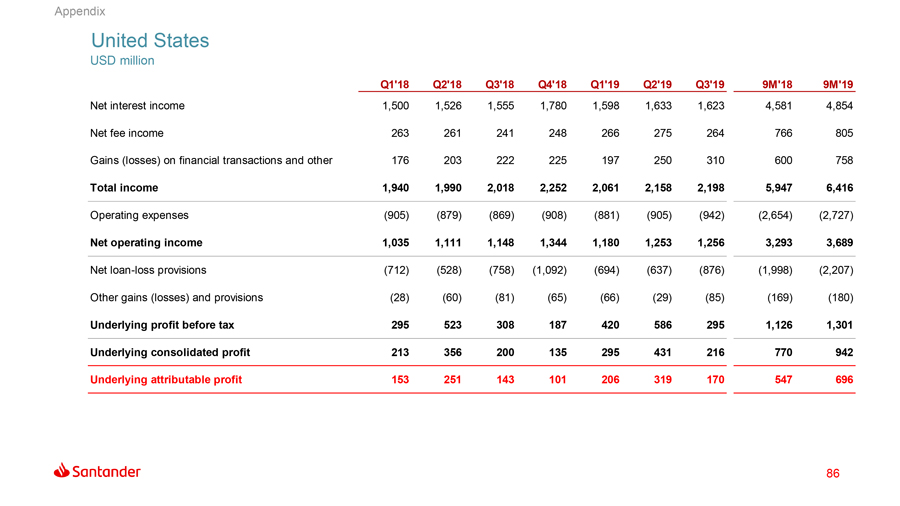
Appendix United States USD million Q1’18 Q2’18 Q3’18 Q4’18 Q1’19 Q2’19 Q3’19 9M’18 9M’19 Net interest income 1,500 1,526 1,555 1,780 1,598 1,633 1,623 4,581 4,854 Net fee income 263 261 241 248 266 275 264 766 805 Gains (losses) on financial transactions and other 176 203 222 225 197 250 310 600 758 Total income 1,940 1,990 2,018 2,252 2,061 2,158 2,198 5,947 6,416 Operating expenses (905) (879) (869) (908) (881) (905) (942) (2,654) (2,727) Net operating income 1,035 1,111 1,148 1,344 1,180 1,253 1,256 3,293 3,689 Net loan-loss provisions (712) (528) (758) (1,092) (694) (637) (876) (1,998) (2,207) Other gains (losses) and provisions (28) (60) (81) (65) (66) (29) (85) (169) (180) Underlying profit before tax 295 523 308 187 420 586 295 1,126 1,301 Underlying consolidated profit 213 356 200 135 295 431 216 770 942 Underlying attributable profit 153 251 143 101 206 319 170 547 696 86
Table of Contents
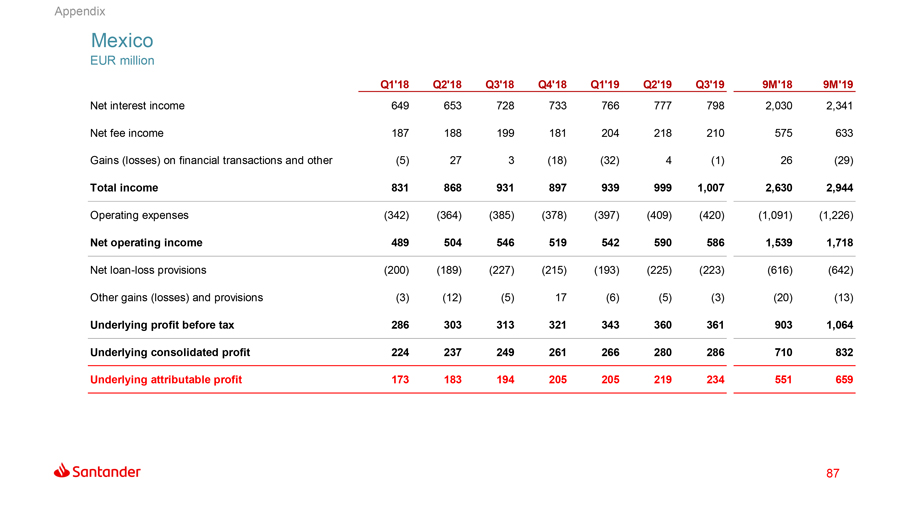
Appendix Mexico EUR million Q1’18 Q2’18 Q3’18 Q4’18 Q1’19 Q2’19 Q3’19 9M’18 9M’19 Net interest income 649 653 728 733 766 777 798 2,030 2,341 Net fee income 187 188 199 181 204 218 210 575 633 Gains (losses) on financial transactions and other (5) 27 3 (18) (32) 4 (1) 26 (29) Total income 831 868 931 897 939 999 1,007 2,630 2,944 Operating expenses (342) (364) (385) (378) (397) (409) (420) (1,091) (1,226) Net operating income 489 504 546 519 542 590 586 1,539 1,718 Net loan-loss provisions (200) (189) (227) (215) (193) (225) (223) (616) (642) Other gains (losses) and provisions (3) (12) (5) 17 (6) (5) (3) (20) (13) Underlying profit before tax 286 303 313 321 343 360 361 903 1,064 Underlying consolidated profit 224 237 249 261 266 280 286 710 832 Underlying attributable profit 173 183 194 205 205 219 234 551 659 87
Table of Contents

Appendix Mexico MXN million Q1’18 Q2’18 Q3’18 Q4’18 Q1’19 Q2’19 Q3’19 9M’18 9M’19 Net interest income 14,945 15,080 16,086 16,573 16,703 16,694 17,231 46,112 50,628 Net fee income 4,312 4,355 4,390 4,098 4,455 4,695 4,535 13,056 13,684 Gains (losses) on financial transactions and other (114) 623 71 (407) (687) 83 (31) 580 (635) Total income 19,143 20,058 20,546 20,264 20,471 21,471 21,735 59,747 63,676 Operating expenses (7,870) (8,418) (8,504) (8,534) (8,655) (8,786) (9,076) (24,792) (26,517) Net operating income 11,273 11,640 12,043 11,730 11,816 12,685 12,659 34,955 37,160 Net loan-loss provisions (4,610) (4,357) (5,020) (4,853) (4,211) (4,850) (4,813) (13,987) (13,874) Other gains (losses) and provisions (72) (272) (115) 383 (120) (105) (59) (459) (284) Underlying profit before tax 6,591 7,011 6,908 7,259 7,485 7,729 7,787 20,509 23,001 Underlying consolidated profit 5,155 5,484 5,491 5,892 5,804 6,028 6,167 16,130 17,999 Underlying attributable profit 3,995 4,233 4,281 4,626 4,472 4,713 5,059 12,509 14,243 88
Table of Contents
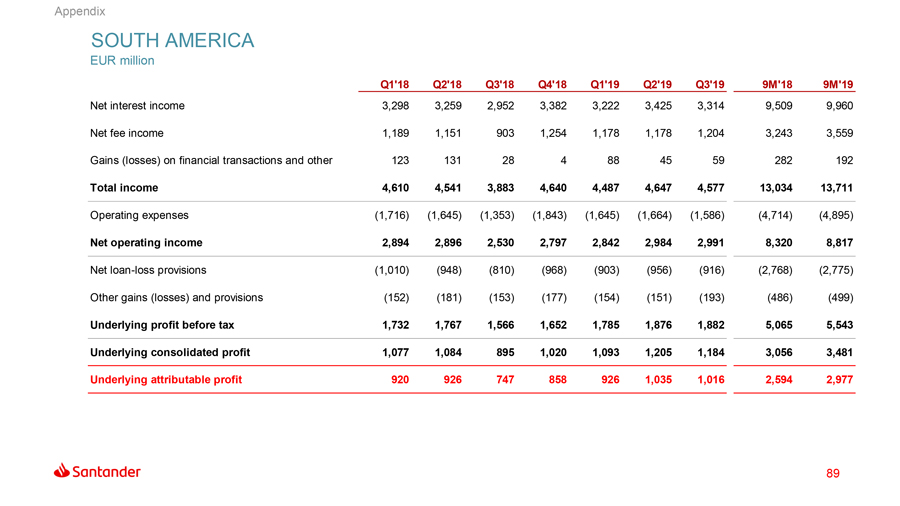
Appendix SOUTH AMERICA EUR million Q1’18 Q2’18 Q3’18 Q4’18 Q1’19 Q2’19 Q3’19 9M’18 9M’19 Net interest income 3,298 3,259 2,952 3,382 3,222 3,425 3,314 9,509 9,960 Net fee income 1,189 1,151 903 1,254 1,178 1,178 1,204 3,243 3,559 Gains (losses) on financial transactions and other 123 131 28 4 88 45 59 282 192 Total income 4,610 4,541 3,883 4,640 4,487 4,647 4,577 13,034 13,711 Operating expenses (1,716) (1,645) (1,353) (1,843) (1,645) (1,664) (1,586) (4,714) (4,895) Net operating income 2,894 2,896 2,530 2,797 2,842 2,984 2,991 8,320 8,817 Net loan-loss provisions (1,010) (948) (810) (968) (903) (956) (916) (2,768) (2,775) Other gains (losses) and provisions (152) (181) (153) (177) (154) (151) (193) (486) (499) Underlying profit before tax 1,732 1,767 1,566 1,652 1,785 1,876 1,882 5,065 5,543 Underlying consolidated profit 1,077 1,084 895 1,020 1,093 1,205 1,184 3,056 3,481 Underlying attributable profit 920 926 747 858 926 1,035 1,016 2,594 2,977 89
Table of Contents
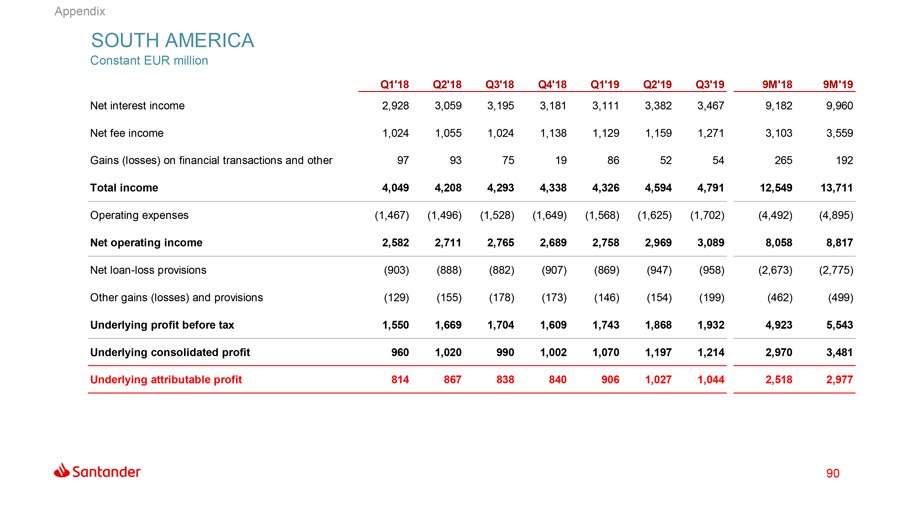
Appendix SOUTH AMERICA Constant EUR million Q1’18 Q2’18 Q3’18 Q4’18 Q1’19 Q2’19 Q3’19 9M’18 9M’19 Net interest income 2,928 3,059 3,195 3,181 3,111 3,382 3,467 9,182 9,960 Net fee income 1,024 1,055 1,024 1,138 1,129 1,159 1,271 3,103 3,559 Gains (losses) on financial transactions and other 97 93 75 19 86 52 54 265 192 Total income 4,049 4,208 4,293 4,338 4,326 4,594 4,791 12,549 13,711 Operating expenses (1,467) (1,496) (1,528) (1,649) (1,568) (1,625) (1,702) (4,492) (4,895) Net operating income 2,582 2,711 2,765 2,689 2,758 2,969 3,089 8,058 8,817 Net loan-loss provisions (903) (888) (882) (907) (869) (947) (958) (2,673) (2,775) Other gains (losses) and provisions (129) (155) (178) (173) (146) (154) (199) (462) (499) Underlying profit before tax 1,550 1,669 1,704 1,609 1,743 1,868 1,932 4,923 5,543 Underlying consolidated profit 960 1,020 990 1,002 1,070 1,197 1,214 2,970 3,481 Underlying attributable profit 814 867 838 840 906 1,027 1,044 2,518 2,977 90
Table of Contents

Appendix Brazil EUR million Q1’18 Q2’18 Q3’18 Q4’18 Q1’19 Q2’19 Q3’19 9M’18 9M’19 Net interest income 2,482 2,424 2,377 2,475 2,459 2,520 2,560 7,283 7,539 Net fee income 920 872 776 929 931 924 970 2,568 2,825 Gains (losses) on financial transactions and other 42 27 27 (8) 21 9 (7) 97 23 Total income 3,445 3,323 3,180 3,396 3,411 3,453 3,522 9,949 10,386 Operating expenses (1,169) (1,100) (1,036) (1,196) (1,125) (1,102) (1,137) (3,304) (3,364) Net operating income 2,276 2,224 2,145 2,201 2,286 2,351 2,385 6,644 7,022 Net loan-loss provisions (822) (750) (665) (726) (710) (761) (753) (2,236) (2,223) Other gains (losses) and provisions (154) (170) (174) (198) (167) (153) (178) (499) (498) Underlying profit before tax 1,300 1,303 1,306 1,276 1,409 1,438 1,454 3,909 4,301 Underlying consolidated profit 758 726 695 749 816 856 862 2,179 2,535 Underlying attributable profit 674 643 615 659 721 762 767 1,933 2,249 91
Table of Contents
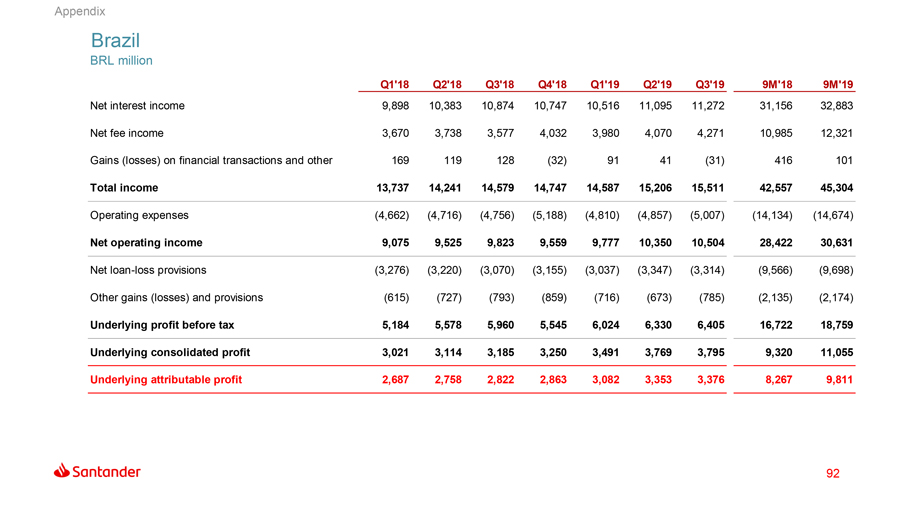
Appendix Brazil BRL million Q1’18 Q2’18 Q3’18 Q4’18 Q1’19 Q2’19 Q3’19 9M’18 9M’19 Net interest income 9,898 10,383 10,874 10,747 10,516 11,095 11,272 31,156 32,883 Net fee income 3,670 3,738 3,577 4,032 3,980 4,070 4,271 10,985 12,321 Gains (losses) on financial transactions and other 169 119 128 (32) 91 41 (31) 416 101 Total income 13,737 14,241 14,579 14,747 14,587 15,206 15,511 42,557 45,304 Operating expenses (4,662) (4,716) (4,756) (5,188) (4,810) (4,857) (5,007) (14,134) (14,674) Net operating income 9,075 9,525 9,823 9,559 9,777 10,350 10,504 28,422 30,631 Net loan-loss provisions (3,276) (3,220) (3,070) (3,155) (3,037) (3,347) (3,314) (9,566) (9,698) Other gains (losses) and provisions (615) (727) (793) (859) (716) (673) (785) (2,135) (2,174) Underlying profit before tax 5,184 5,578 5,960 5,545 6,024 6,330 6,405 16,722 18,759 Underlying consolidated profit 3,021 3,114 3,185 3,250 3,491 3,769 3,795 9,320 11,055 Underlying attributable profit 2,687 2,758 2,822 2,863 3,082 3,353 3,376 8,267 9,811 92
Table of Contents
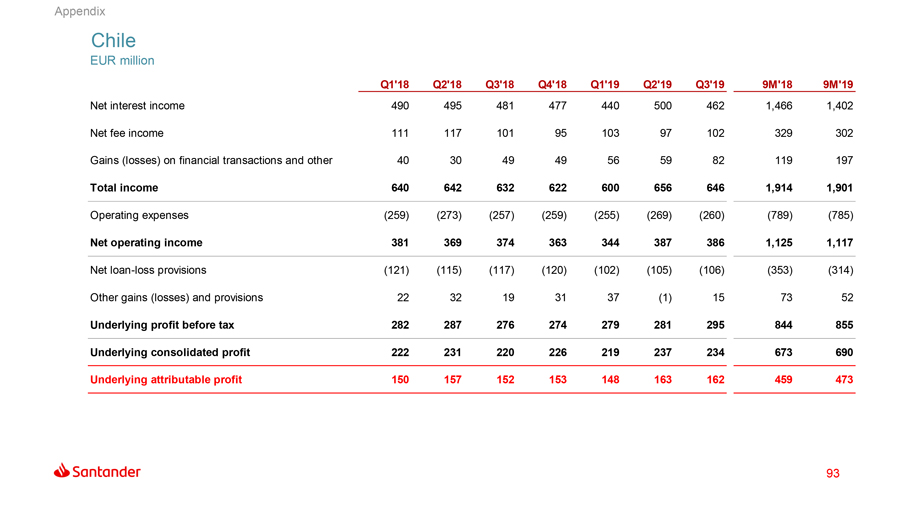
Appendix Chile EUR million Q1’18 Q2’18 Q3’18 Q4’18 Q1’19 Q2’19 Q3’19 9M’18 9M’19 Net interest income 490 495 481 477 440 500 462 1,466 1,402 Net fee income 111 117 101 95 103 97 102 329 302 Gains (losses) on financial transactions and other 40 30 49 49 56 59 82 119 197 Total income 640 642 632 622 600 656 646 1,914 1,901 Operating expenses (259) (273) (257) (259) (255) (269) (260) (789) (785) Net operating income 381 369 374 363 344 387 386 1,125 1,117 Net loan-loss provisions (121) (115) (117) (120) (102) (105) (106) (353) (314) Other gains (losses) and provisions 22 32 19 31 37 (1) 15 73 52 Underlying profit before tax 282 287 276 274 279 281 295 844 855 Underlying consolidated profit 222 231 220 226 219 237 234 673 690 Underlying attributable profit 150 157 152 153 148 163 162 459 473 93
Table of Contents

Appendix Chile CLP million Q1’18 Q2’18 Q3’18 Q4’18 Q1’19 Q2’19 Q3’19 9M’18 9M’19 Net interest income 362,502 366,847 370,827 370,410 333,439 383,545 363,195 1,100,175 1,080,180 Net fee income 81,758 86,556 78,318 73,959 78,010 74,473 80,052 246,633 232,535 Gains (losses) on financial transactions and other 29,304 22,193 37,699 38,131 42,713 45,387 63,719 89,195 151,819 Total income 473,564 475,595 486,844 482,500 454,162 503,405 506,966 1,436,003 1,464,533 Operating expenses (191,398) (202,047) (198,556) (200,524) (193,440) (206,641) (204,239) (592,001) (604,321) Net operating income 282,166 273,549 288,288 281,976 260,722 296,763 302,727 844,002 860,213 Net loan-loss provisions (89,852) (84,920) (90,252) (93,034) (77,584) (80,828) (83,231) (265,024) (241,643) Other gains (losses) and provisions 16,034 23,790 14,617 23,614 28,393 (417) 11,726 54,441 39,702 Underlying profit before tax 208,348 212,419 212,652 212,555 211,531 215,518 231,222 633,419 658,272 Underlying consolidated profit 164,447 171,185 169,725 174,910 165,949 182,169 183,336 505,357 531,454 Underlying attributable profit 111,006 116,570 117,196 118,562 112,355 125,176 126,756 344,772 364,287 94
Table of Contents
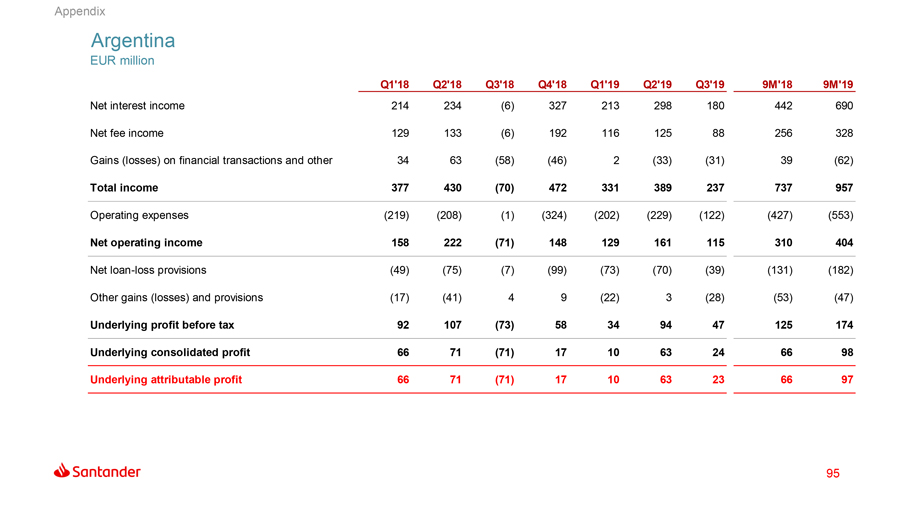
Appendix Argentina EUR million Q1’18 Q2’18 Q3’18 Q4’18 Q1’19 Q2’19 Q3’19 9M’18 9M’19 Net interest income 214 234 (6) 327 213 298 180 442 690 Net fee income 129 133 (6) 192 116 125 88 256 328 Gains (losses) on financial transactions and other 34 63 (58) (46) 2 (33) (31) 39 (62) Total income 377 430 (70) 472 331 389 237 737 957 Operating expenses (219) (208) (1) (324) (202) (229) (122) (427) (553) Net operating income 158 222 (71) 148 129 161 115 310 404 Net loan-loss provisions (49) (75) (7) (99) (73) (70) (39) (131) (182) Other gains (losses) and provisions (17) (41) 4 9 (22) 3 (28) (53) (47) Underlying profit before tax 92 107 (73) 58 34 94 47 125 174 Underlying consolidated profit 66 71 (71) 17 10 63 24 66 98 Underlying attributable profit 66 71 (71) 17 10 63 23 66 97 95
Table of Contents
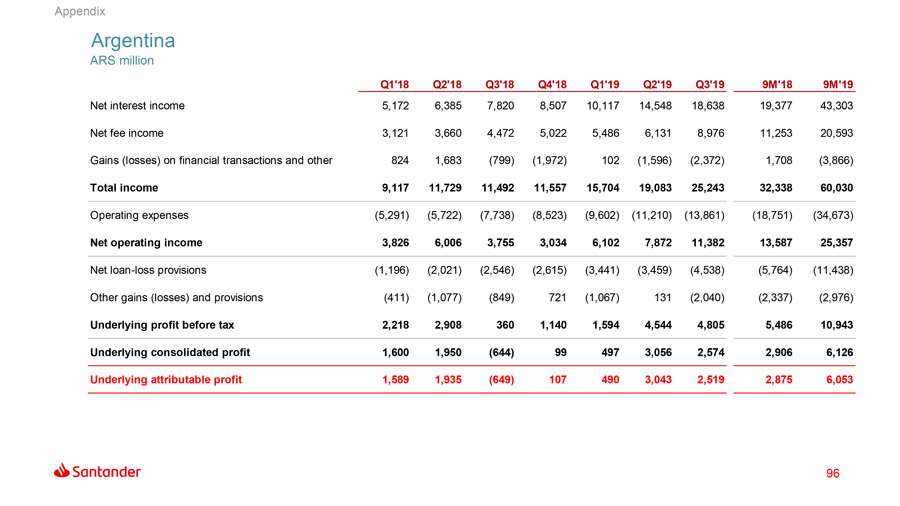
Appendix Argentina ARS million Q1’18 Q2’18 Q3’18 Q4’18 Q1’19 Q2’19 Q3’19 9M’18 9M’19 Net interest income 5,172 6,385 7,820 8,507 10,117 14,548 18,638 19,377 43,303 Net fee income 3,121 3,660 4,472 5,022 5,486 6,131 8,976 11,253 20,593 Gains (losses) on financial transactions and other 824 1,683 (799) (1,972) 102 (1,596) (2,372) 1,708 (3,866) Total income 9,117 11,729 11,492 11,557 15,704 19,083 25,243 32,338 60,030 Operating expenses (5,291) (5,722) (7,738) (8,523) (9,602) (11,210) (13,861) (18,751) (34,673) Net operating income 3,826 6,006 3,755 3,034 6,102 7,872 11,382 13,587 25,357 Net loan-loss provisions (1,196) (2,021) (2,546) (2,615) (3,441) (3,459) (4,538) (5,764) (11,438) Other gains (losses) and provisions (411) (1,077) (849) 721 (1,067) 131 (2,040) (2,337) (2,976) Underlying profit before tax 2,218 2,908 360 1,140 1,594 4,544 4,805 5,486 10,943 Underlying consolidated profit 1,600 1,950 (644) 99 497 3,056 2,574 2,906 6,126 Underlying attributable profit 1,589 1,935 (649) 107 490 3,043 2,519 2,875 6,053 96
Table of Contents
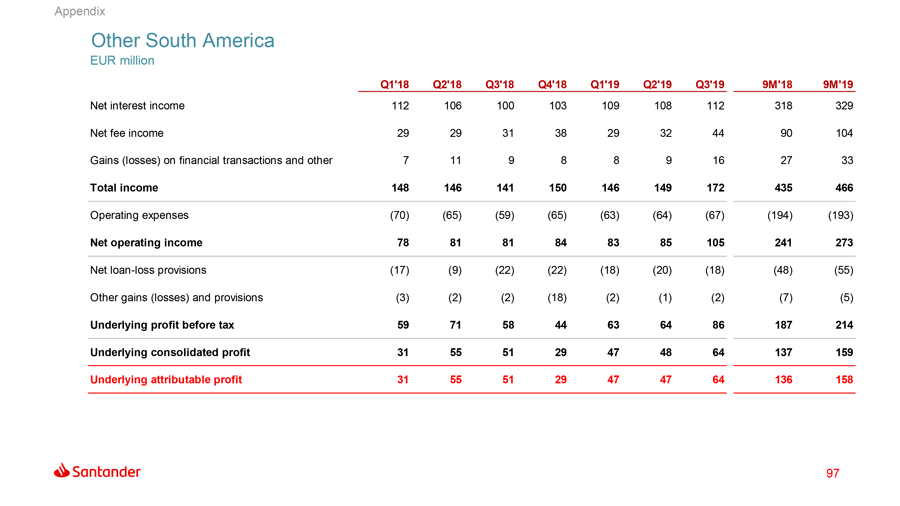
Appendix Other South America EUR million Q1’18 Q2’18 Q3’18 Q4’18 Q1’19 Q2’19 Q3’19 9M’18 9M’19 Net interest income 112 106 100 103 109 108 112 318 329 Net fee income 29 29 31 38 29 32 44 90 104 Gains (losses) on financial transactions and other 7 11 9 8 8 9 16 27 33 Total income 148 146 141 150 146 149 172 435 466 Operating expenses (70) (65) (59) (65) (63) (64) (67) (194) (193) Net operating income 78 81 81 84 83 85 105 241 273 Net loan-loss provisions (17) (9) (22) (22) (18) (20) (18) (48) (55) Other gains (losses) and provisions (3) (2) (2) (18) (2) (1) (2) (7) (5) Underlying profit before tax 59 71 58 44 63 64 86 187 214 Underlying consolidated profit 31 55 51 29 47 48 64 137 159 Underlying attributable profit 31 55 51 29 47 47 64 136 158 97
Table of Contents

Appendix Other South America Constant EUR million Q1’18 Q2’18 Q3’18 Q4’18 Q1’19 Q2’19 Q3’19 9M’18 9M’19 Net interest income 105 100 96 100 106 109 114 302 329 Net fee income 27 28 30 38 28 32 45 85 104 Gains (losses) on financial transactions and other 7 10 9 8 8 9 16 26 33 Total income 139 138 135 146 142 150 175 413 466 Operating expenses (65) (62) (57) (63) (61) (64) (68) (184) (193) Net operating income 74 77 79 83 81 86 107 229 273 Net loan-loss provisions (16) (7) (20) (21) (17) (20) (18) (44) (55) Other gains (losses) and provisions (2) (2) (2) (18) (2) (1) (2) (6) (5) Underlying profit before tax 55 68 56 43 62 65 87 179 214 Underlying consolidated profit 28 53 50 29 46 48 65 131 159 Underlying attributable profit 28 52 49 28 45 48 65 130 158 98
Table of Contents
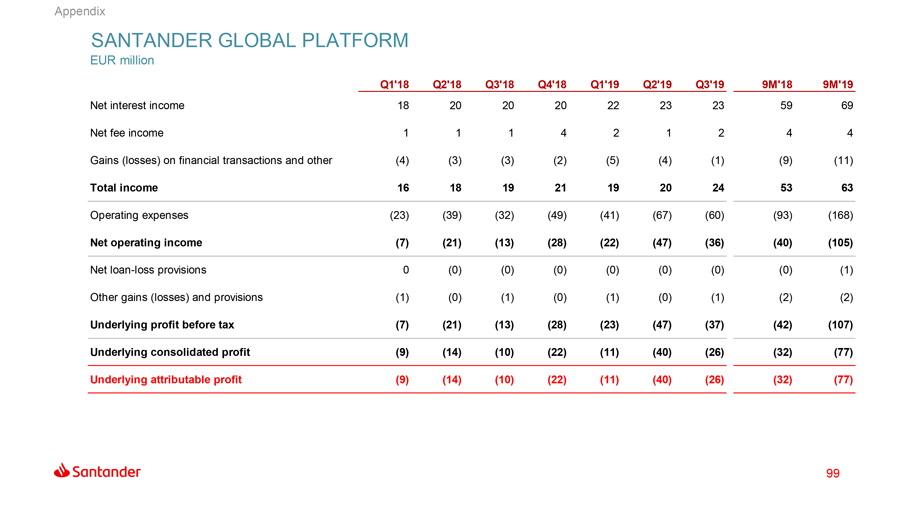
Appendix SANTANDER GLOBAL PLATFORM EUR million Q1’18 Q2’18 Q3’18 Q4’18 Q1’19 Q2’19 Q3’19 9M’18 9M’19 Net interest income 18 20 20 20 22 23 23 59 69 Net fee income 1 1 1 4 2 1 2 4 4 Gains (losses) on financial transactions and other (4) (3) (3) (2) (5) (4) (1) (9) (11) Total income 16 18 19 21 19 20 24 53 63 Operating expenses (23) (39) (32) (49) (41) (67) (60) (93) (168) Net operating income (7) (21) (13) (28) (22) (47) (36) (40) (105) Net loan-loss provisions 0 (0) (0) (0) (0) (0) (0) (0) (1) Other gains (losses) and provisions (1) (0) (1) (0) (1) (0) (1) (2) (2) Underlying profit before tax (7) (21) (13) (28) (23) (47) (37) (42) (107) Underlying consolidated profit (9) (14) (10) (22) (11) (40) (26) (32) (77) Underlying attributable profit (9) (14) (10) (22) (11) (40) (26) (32) (77) 99
Table of Contents
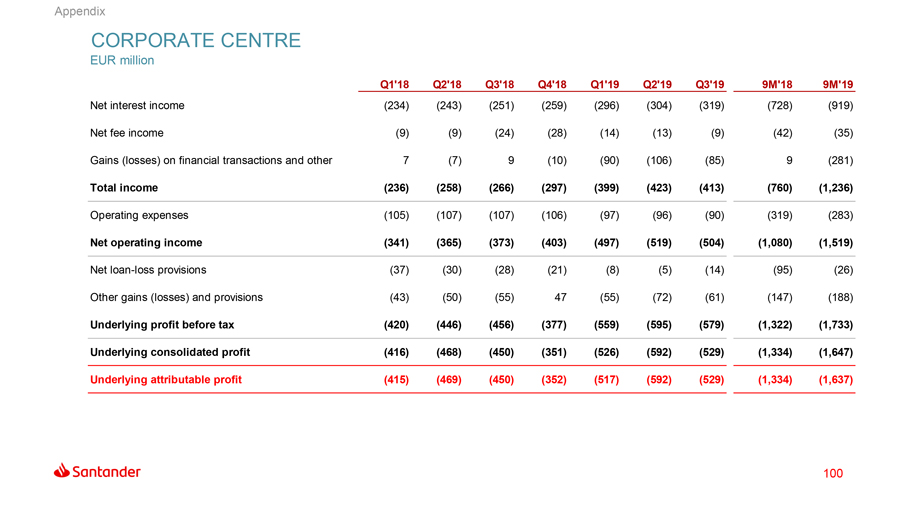
Appendix CORPORATE CENTRE EUR million Q1’18 Q2’18 Q3’18 Q4’18 Q1’19 Q2’19 Q3’19 9M’18 9M’19 Net interest income (234) (243) (251) (259) (296) (304) (319) (728) (919) Net fee income (9) (9) (24) (28) (14) (13) (9) (42) (35) Gains (losses) on financial transactions and other 7 (7) 9 (10) (90) (106) (85) 9 (281) Total income (236) (258) (266) (297) (399) (423) (413) (760) (1,236) Operating expenses (105) (107) (107) (106) (97) (96) (90) (319) (283) Net operating income (341) (365) (373) (403) (497) (519) (504) (1,080) (1,519) Net loan-loss provisions (37) (30) (28) (21) (8) (5) (14) (95) (26) Other gains (losses) and provisions (43) (50) (55) 47 (55) (72) (61) (147) (188) Underlying profit before tax (420) (446) (456) (377) (559) (595) (579) (1,322) (1,733) Underlying consolidated profit (416) (468) (450) (351) (526) (592) (529) (1,334) (1,647) Underlying attributable profit (415) (469) (450) (352) (517) (592) (529) (1,334) (1,637) 100
Table of Contents
Glossary 05
Table of Contents
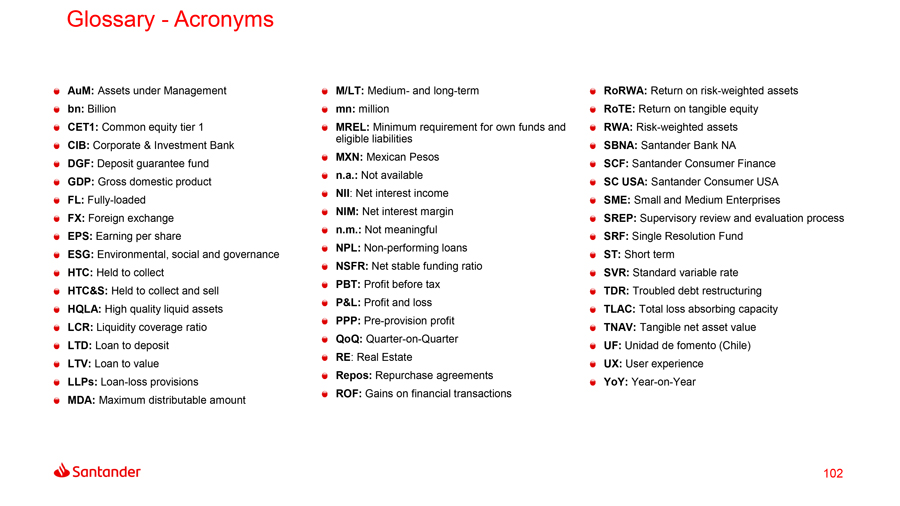
Glossary -Acronyms AuM: Assets under Management M/LT: Medium- and long-term RoRWA: Return on risk-weighted assets bn: Billion mn: million RoTE: Return on tangible equity CET1: Common equity tier 1 MREL: Minimum requirement for own funds and RWA: Risk-weighted assets eligible liabilities CIB: Corporate & Investment Bank SBNA: Santander Bank NA MXN: Mexican Pesos DGF: Deposit guarantee fund SCF: Santander Consumer Finance n.a.: Not available GDP: Gross domestic product SC USA: Santander Consumer USA NII: Net interest income FL: Fully-loaded SME: Small and Medium Enterprises NIM: Net interest margin FX: Foreign exchange SREP: Supervisory review and evaluation process n.m.: Not meaningful EPS: Earning per share SRF: Single Resolution Fund NPL:Non-performing loans ESG: Environmental, social and governance ST: Short term NSFR: Net stable funding ratio HTC: Held to collect SVR: Standard variable rate PBT: Profit before tax HTC&S: Held to collect and sell TDR: Troubled debt restructuring P&L: Profit and loss HQLA: High quality liquid assets TLAC: Total loss absorbing capacity PPP:Pre-provision profit LCR: Liquidity coverage ratio TNAV: Tangible net asset value QoQ:Quarter-on-Quarter LTD: Loan to deposit UF: Unidad de fomento (Chile) RE: Real Estate LTV: Loan to value UX: User experience Repos: Repurchase agreements LLPs: Loan-loss provisions YoY:Year-on-Year ROF: Gains on financial transactions MDA: Maximum distributable amount 102
Table of Contents
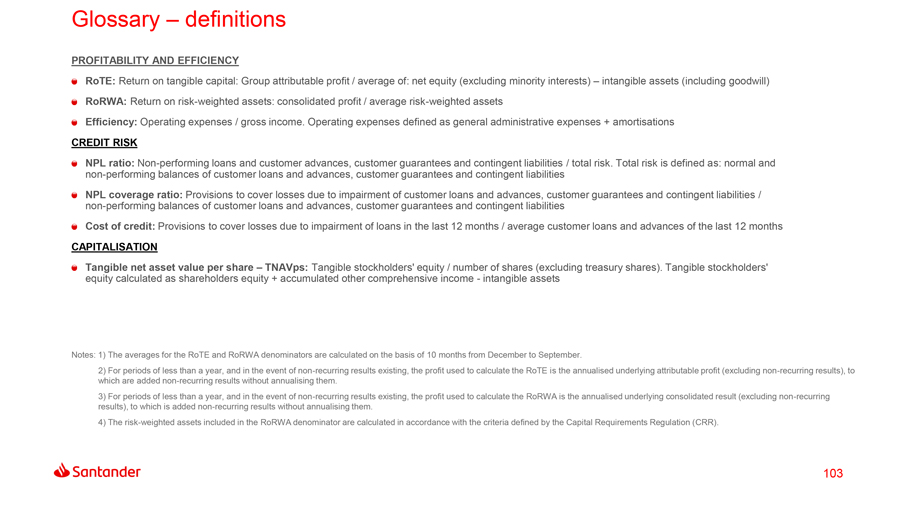
Glossary – definitions PROFITABILITY AND EFFICIENCY RoTE: Return on tangible capital: Group attributable profit / average of: net equity (excluding minority interests) – intangible assets (including goodwill) RoRWA: Return on risk-weighted assets: consolidated profit / average risk-weighted assets Efficiency: Operating expenses / gross income. Operating expenses defined as general administrative expenses + amortisations CREDIT RISK NPL ratio:Non-performing loans and customer advances, customer guarantees and contingent liabilities / total risk. Total risk is defined as: normal andnon-performing balances of customer loans and advances, customer guarantees and contingent liabilities NPL coverage ratio: Provisions to cover losses due to impairment of customer loans and advances, customer guarantees and contingent liabilities /non-performing balances of customer loans and advances, customer guarantees and contingent liabilities Cost of credit: Provisions to cover losses due to impairment of loans in the last 12 months / average customer loans and advances of the last 12 months CAPITALISATION Tangible net asset value per share – TNAVps: Tangible stockholders’ equity / number of shares (excluding treasury shares). Tangible stockholders’ equity calculated as shareholders equity + accumulated other comprehensive income—intangible assets Notes: 1) The averages for the RoTE and RoRWA denominators are calculated on the basis of 10 months from December to September. 2) For periods of less than a year, and in the event ofnon-recurring results existing, the profit used to calculate the RoTE is the annualised underlying attributable profit (excludingnon-recurring results), to which are addednon-recurring results without annualising them. 3) For periods of less than a year, and in the event ofnon-recurring results existing, the profit used to calculate the RoRWA is the annualised underlying consolidated result (excludingnon-recurring results), to which is addednon-recurring results without annualising them. 4) The risk-weighted assets included in the RoRWA denominator are calculated in accordance with the criteria defined by the Capital Requirements Regulation (CRR). 103
Table of Contents

Thank you. Our purpose is to help people and business prosper. Our culture is based on believing that everything we do should be
Table of Contents
SIGNATURE
Pursuant to the requirements of the Securities Exchange Act of 1934, the registrant has duly caused this report to be signed on its behalf by the undersigned, thereunto duly authorized.
| Banco Santander, S.A. | ||||||||
| Date: October 31, 2019 | By: | /s/ José García Cantera | ||||||
| Name: | José García Cantera | |||||||
| Title: | Chief Financial Officer | |||||||