SECURITIES AND EXCHANGE COMMISSION
Washington,
REPORT OF FOREIGN PRI VATE ISSUER PURSUANT TO
RULE 13a-16 OR 15d-16 UNDER
THE SECURITIES EXCHANGE ACT OF 1934
For the six months ended June 30, 2019
Commission File Number: 001 - 12518
BANCO SANTANDER, S.A.
Ciudad Grupo Santander
28660 Boadilla del Monte
Madrid - Spain
(Address of principal executive offices)
Indicate by check mark whether the registrant files or will file annual reports under cover of Form 20-F or Form 40-F:
Form 20-F X | Form 40-F |
Indicate by check mark if the registrant is submitting the Form 6-K in paper as permitted by Regulation S-T Rule 101 (b) (1):
Yes | No X |
Indicate by check mark if the registrant is submitting the Form 6-K in paper as permitted by Regulation S-T Rule 101 (b) (7):
Yes | No X |
Indicate by check mark whether the registrant by furnishing the information contained in this Form is also thereby furnishing the information to the Commission pursuant to Rule 12g3-2(b) under the Securities Exchange Act of 1934:
Yes | No X |
If “Yes” is marked, indicate below the file number assigned to the registrant in connection with Rule 12g3-2(b):
Not applicable
BANCO SANTANDER, S.A.
________________________
TABLE OF CONTENTS
|
|
djajsdijsj |
PAGE
|
| 3 | |
| 89 | |
| 140 |


|
|
|
|
Interim consolidated directors’ report |
|

First half
|
|
|
|
|
|
|
|
|
|
| |||
|
|
|
|
|
|
|
2019

| 3 |
|
|
| |
| 4 |
|
|
| |
| 6 |
|
|
| |
| 6 |
|
|
| |
| 8 |
|
|
| |
| 17 |
|
|
| |
| 18 |
|
|
| |
| 22 |
|
|
| |
| 26 |
|
|
| |
| 42 |
|
|
| |
| 45 |
|
|
| |
| 47 |
|
|
| |
| 48 |
|
|
| |
| 50 |
|
|
| |
| 51 |
|
|
| |
| 72 |
|
|
| |
| 79 |
|
|
| |
| 80 |
|
|
| |
|
|
|
|
|
|
|
|
|
|
|
|
|
|
|
|
|
|
|
|
|
|
|
|
|
|
|
|
|
Santander vision and |
| Group financial |
| Financial information |
| Responsible banking |
| Appendix |
|
|
|
|
|
|
|
|
|
|
|
|
|
|
|
|
|
|
|
|
|
|
|
|
|
|
|
BALANCE SHEET (EUR million) | Jun-19 | Mar-19 | % | Jun-19 | Jun-18 | % | Dec-18 |
Total assets | 1,512,096 | 1,506,151 | 0.4 | 1,512,096 | 1,433,833 | 5.5 | 1,459,271 |
Loans and advances to customers | 908,235 | 910,195 | (0.2) | 908,235 | 862,092 | 5.4 | 882,921 |
Customer deposits | 814,751 | 808,361 | 0.8 | 814,751 | 774,425 | 5.2 | 780,496 |
Total funds | 1,032,769 | 1,019,878 | 1.3 | 1,032,769 | 981,363 | 5.2 | 980,562 |
Total equity | 109,985 | 110,365 | (0.3) | 109,985 | 104,445 | 5.3 | 107,361 |
Note: Total funds includes customer deposits, mutual funds, pension funds and managed portfolios.
INCOME STATEMENT (EUR million) | Q2'19 | Q1'19 | % | H1'19 | H1'18 | % | 2018 |
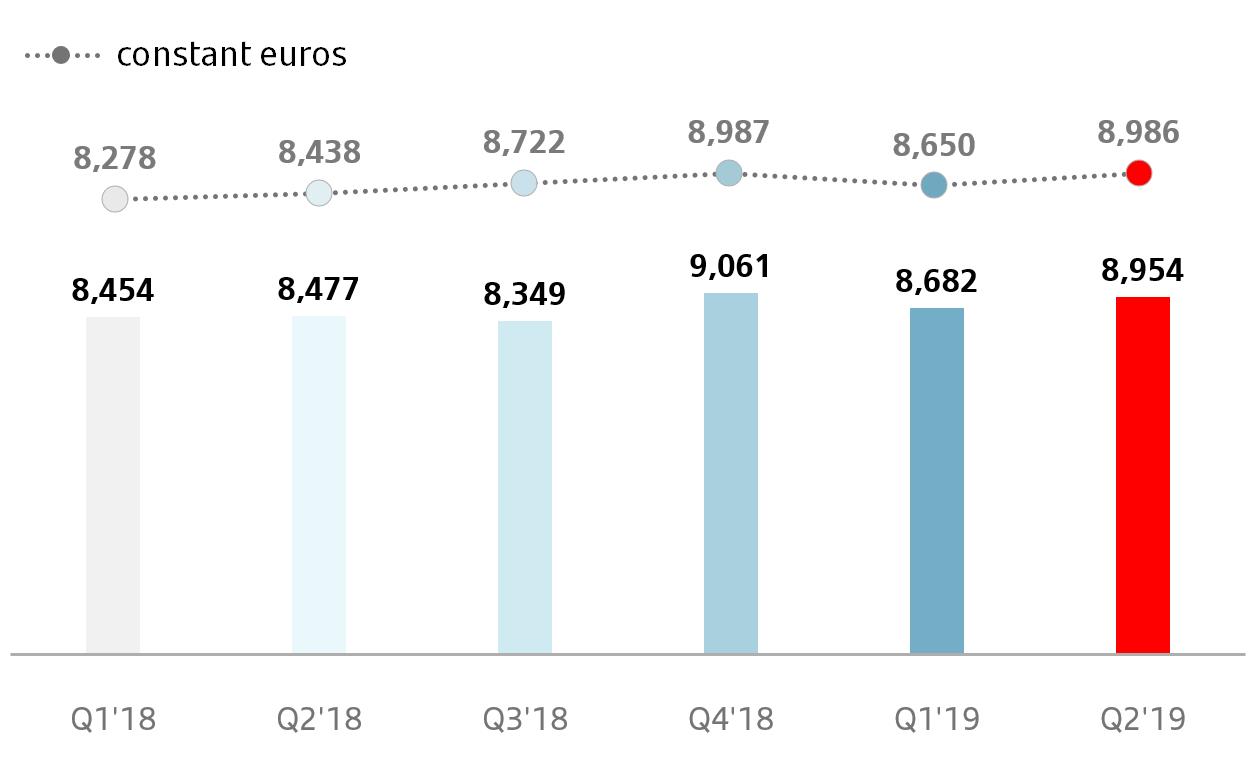
Net interest income | 8,954 | 8,682 | 3.1 | 17,636 | 16,931 | 4.2 | 34,341 |
Total income | 12,351 | 12,085 | 2.2 | 24,436 | 24,162 | 1.1 | 48,424 |
Net operating income | 6,522 | 6,327 | 3.1 | 12,849 | 12,680 | 1.3 | 25,645 |
Profit before tax | 2,929 | 3,602 | (18.7) | 6,531 | 6,899 | (5.3) | 14,201 |
Attributable profit to the parent | 1,391 | 1,840 | (24.4) | 3,231 | 3,752 | (13.9) | 7,810 |
Changes in constant euros: Q2'19 / Q1'19: NII: +3.9%; Total income: +3.0%; Net operating income: +4.0%; Attributable profit: -23.2% H1'19 / H1'18: NII: +5.5%; Total income: +2.8%; Net operating income: +3.2%; Attributable profit: -11.7%
UNDERLYING INCOME STATEMENT (1) (EUR million) | Q2'19 | Q1'19 | % | H1'19 | H1'18 | % | 2018 |
Net interest income | 8,954 | 8,682 | 3.1 | 17,636 | 16,931 | 4.2 | 34,341 |
Total income | 12,351 | 12,085 | 2.2 | 24,436 | 24,162 | 1.1 | 48,424 |
Net operating income | 6,522 | 6,327 | 3.1 | 12,849 | 12,680 | 1.3 | 25,645 |
Profit before tax | 3,895 | 3,684 | 5.7 | 7,579 | 7,480 | 1.3 | 14,776 |
Attributable profit to the parent | 2,097 | 1,948 | 7.6 | 4,045 | 4,052 | (0.2) | 8,064 |
Variations in constant euros: Q2'19 / Q1'19: NII: +3.9%; Total income: +3.0%; Net operating income: +4.0%; Attributable profit: +8.7% H1'19 / H1'18: NII: +5.5%; Total income: +2.8%; Net operating income: +3.2%; Attributable profit: +2.1%
EPS, PROFITABILITY AND EFFICIENCY (%) | Q2'19 | Q1'19 | % | H1'19 | H1'18 | % | 2018 |
EPS (euro) | 0.076 | 0.104 | (26.7) | 0.181 | 0.216 | (16.4) | 0.449 |
Underlying EPS (euros) (1) | 0.120 | 0.111 | 8.1 | 0.231 | 0.235 | (1.6) | 0.465 |
RoE | 7.79 | 7.85 |
| 7.41 | 8.24 |
| 8.21 |
RoTE | 11.02 | 11.15 |
| 10.51 | 11.79 |
| 11.70 |
Underlying RoTE (1) | 12.03 | 11.31 |
| 11.68 | 12.24 |
| 12.08 |
RoA | 0.63 | 0.63 |
| 0.60 | 0.65 |
| 0.64 |
RoRWA | 1.56 | 1.54 |
| 1.48 | 1.55 |
| 1.55 |
Underlying RoRWA (1) | 1.67 | 1.56 |
| 1.62 | 1.60 |
| 1.59 |
Efficiency ratio | 47.2 | 47.6 |
| 47.4 | 47.5 |
| 47.0 |
SOLVENCY AND NPL RATIOS (%) | Jun-19 | Mar-19 |
| Jun-19 | Jun-18 |
| Dec-18 |
CET1 (2) | 11.30 | 11.23 |
| 11.30 | 10.80 |
| 11.30 |
Fully loaded Total ratio (2) | 14.80 | 14.82 |
| 14.80 | 14.24 |
| 14.77 |
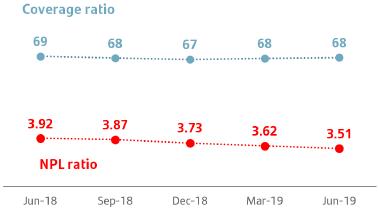
NPL ratio | 3.51 | 3.62 |
| 3.51 | 3.92 |
| 3.73 |
Coverage ratio | 68 | 68 |
| 68 | 69 |
| 67 |
MARKET CAPITALISATION AND SHARES | Jun-19 | Mar-19 | % | Jun-19 | Jun-18 | % | Dec-18 |
Shares (millions) | 16,237 | 16,237 | — | 16,237 | 16,136 | 0.6 | 16,237 |
Share price (euros) | 4.081 | 4.145 | (1.5) | 4.081 | 4.592 | (11.1) | 3.973 |
Market capitalisation (EUR million) | 66,253 | 67,292 | (1.5) | 66,253 | 74,097 | (10.6) | 64,508 |
Tangible book value per share (euros) | 4.30 | 4.30 |
| 4.30 | 4.10 |
| 4.19 |
Price / Tangible book value per share (X) | 0.95 | 0.96 |
| 0.95 | 1.12 |
| 0.95 |
P/E ratio (X) | 11.29 | 9.94 |
| 11.29 | 10.62 |
| 8.84 |
OTHER DATA | Jun-19 | Mar-19 | % | Jun-19 | Jun-18 | % | Dec-18 |
Number of shareholders | 4,054,208 | 4,089,097 | (0.9) | 4,054,208 | 4,152,125 | (2.4) | 4,131,489 |
Number of employees | 201,804 | 202,484 | (0.3) | 201,804 | 200,961 | 0.4 | 202,713 |
Number of branches | 13,081 | 13,277 | (1.5) | 13,081 | 13,482 | (3.0) | 13,217 |
(1) | In addition to financial information prepared in accordance with International Financial Reporting Standards (IFRS) and derived from our consolidated financial statements, this report contains certain financial measures that constitute alternative performance measures (APMs) as defined in the Guidelines on Alternative Performance Measures issued by the European Securities and Markets Authority (ESMA) on October 5, 2015 and other non-IFRS measures, including the figures related to “underlying” results, as they are recorded in the separate line of “net capital gains and provisions”, above the line of attributable profit to the parent. Further details are provided on page 12 of this report. |
For further details of the APMs and non-IFRS measures used, including its definition or a reconciliation between any applicable management indicators and the financial data presented in the consolidated financial statements prepared under IFRS, please see 2018 Annual Financial Report, published in the CNMV on February 28, 2019, our 20-F report for the year ending December 31, 2018 registered with the SEC in the United States as well as the “Alternative performance measures” section of the annex to this report.
(2) | 2019 and 2018 data applying the IFRS 9 transitional arrangements. As indicated by the consolidating supervisor a pay-out of 50%, the maximum within the target range (40%- 50%), was applied for the calculation of the capital ratios in 2019. Previously, the average cash pay-out for the last three years was considered. |
|
|
|
|
| January – June 2019 |
| 3 |

|
|
|
|
|
|
|
|
|
Santander vision and |
| Group financial |
| Financial information |
| Responsible banking |
| Appendix |
|
|
|
|
|
|
|
|
|
|
|
|
|
|
|
|
|
|
|
|
|
|
|
|
|
|
|
SANTANDER VISION AND CORPORATE CULTURE
Our success is based on a clear purpose, aim and approach to business.
We are building a more responsible bank
A digital Santander.
To continue growing in a sustainable and profitable way and to accelerate execution, we will remain focused on our digital transformation.
To help |
|
To be the best open
|
|
Everything |
| Santander expects to accelerate its digital transformation and the launch of global platforms, which will enable the Group to offer new solutions, products and services to our customers, and compete in the open market for new ones. |
|
| |||||||


Strong corporate culture.
The Santander Way is our global culture, fully aligned to our corporate strategy. It includes our purpose, our aim, and how we do business.
|
|
|
|
|
|
|
|
|
|
|
|
|
|
|
|
|
|
|
|
|
|
|
|
|
|
|
|
|
|
|
| Our corporate culture includes eight corporate behaviors... |
|
| |||||
|
|
|
|
|
|
|
|
|
|
|
|
|
|
|
|
|
|
|
|
|
|
|
|
|
|
|
|
|
|
| Show | Truly listen | Talk | Keep | Support | Embrace | Actively | Bring |
|
| respect |
| straight | promises | people | change | collaborate | passion |
|
|
|
|
|
|
|
|
|
|
|
|
|
|
|
|
|
|
|
|
|
|
|
|
|
|
|
|
|
|
|
|
| …and a strong risk culture where everyone is personally responsible for managing their risks in their day to day work |
|
| |||||
|
|
|
|
|
|
|
|
|
|
|
|
|
|
|
|
|
|
|
|
|
|
|
|
|
|
|
|
| |
|
|
|
|
|
|
|
|
|
|
|
|
|
|
|
|
|
|
|
|


|
|
|
|
4 |
| January – June 2019 |
|

|
|
|
|
|
|
|
|
|
Santander vision and |
| Group financial |
| Financial information |
| Responsible banking |
| Appendix |
|
|
|
|
|
|
|
|
|
|
|
|
|
|
|
|
|
|
|
|
|
|
|
|
|
|
|
Generating confidence and operating responsibly, we contribute value to all our stakeholders
|
|
|
| |
|
|
At June 30, 2019 Grupo Santander had 201,804 professionals throughout the world, with an average age of 38, 55% of them women and 45% men. | ||
|
|
|
|
The aim of our human resources strategy is to be a reference employer, working on these strategic drivers: a common culture (the Santander Way), dynamic management of talent (Workday, the new central global platform for employees and their skills) and talent for the future (Strategic Workforce Planning). |
|
|
|
|
|
|
|
|
|
Significant progress is being made in various initiatives within the priorities of culture and commitment (such as Flexiworking, StarMeUp, commitment surveys); attraction and recruitment (such as remuneration plans that involve shares); retaining and developing talent (such as Young Leaders, learning platforms, succession plans, international mobility), as well as diversity and inclusion (gender salary equity, development of diversity and inclusion principles, etc.). |
|
|
|
|
|
|
|
|
| |
|
|
| ||
|
|
We continued to focus on improving customer loyalty and experience. Progress was reflected in the increase of 1.9 million loyal customers, greater penetration over active clients and 6.4 million digital customers in the last 12 months. | ||
|
|
|
|
|
|
|
|
|
With the creation of Santander Global Platform, we are taking a further step forward in our digital transformation, which aligns our reporting structure with our organisation and strategy.. |
|
|
|
|
|
|
|
|
|
We also continued to strengthen our traditional branches and develop new models (SMART, Súper Ágil and Work Café), while investing in new generation ATMs and in contact centres. |
|
|
|
|
|
|
|
|
| |
|
|
| ||
|
|
Extel recognised Banco Santander as one of the three best banks in Europe for investor relations, based on a survey of more than 14,000 investment professionals. IR Magazine awarded the Santander Investor Relations team its Best Crisis Management Prize. | ||
|
|
|
|
|
|
|
|
|
The Bank maintains a constant communication commitment with its investors and shareholders. In line with this strategy, analysts and investors in Spain and the UK took part in a survey to assess the rollout of the Group’s corporate culture. |
|
|
|
|
|
|
|
|
|
The Bank launched the XI edition of the Universia Foundation Scholarships, which help university students with disabilities who are Santander shareholders or relatives of shareholders. |
|
|
|
|
|
|
|
|
| |
|
|
| ||
|
|
The Group announced new responsible banking commitments for 2019-2025. These include, among other things: make available EUR 120,000 million of green financing, eliminate single use unnecessary plastic in all the Group’s buildings, increase the consumption of renewable energy to 100% in those countries where it is possible to certify its origin and raise the number of women in senior management. Further details in page 46. | ||
|
|
|
| |
|
|
|
Grupo Santander is classified as first in the Spanish ranking of sustainable debt issues, after acting as bookrunner in the majority of the green bond issues in Spain, according to Dealogic. | |
|
|
|
| |
|
|
|
Santander is also very actively involved in syndicated loans of sustainable bonds in Spain, and has a range of ESG mutual funds (Santander Sostenible) that make us the leader with a 66% market share. | |


|
|
|
|
| January – June 2019 |
| 5 |
|
|
|
|
|
|
|
|
|
Santander vision and |
| Group financial |
| Financial information |
| Responsible banking |
| Appendix |
|
|
|
|
|
|
|
|
|
|
|
|
|
|
|
|
|
|
|
|
|
|
|
|
|
|
|
|
|
|
|
|
|
|
| |
|
| | ||||||
|
|
|
| |||||
|
|
|
|
| ||||
|
|
| ||||||
| The Group’s strategy is driving growth in loyal and digital customers and is reflected in greater activity in almost all markets | |||||||
|
| |||||||
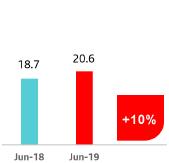
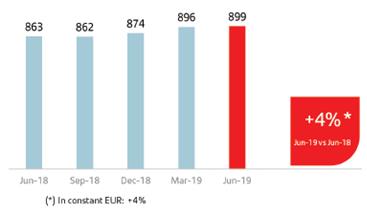
| Further increase in loyal customers to more than 20 million in June 2019, 1.9 million more than at the end of June 2018 (+10%), with individuals up 11% and companies 7%. | |||||||
|
| |||||||
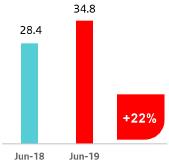
| The faster pace of digitalisation is producing notable growth in digital customers, whose number increased by 6.4 million (+22%) in the 12 months since June 2018 to nearly 35 million. There was also strong growth in the number of online and mobile phone accesses in the first half to 3,725 million (+28% year-on-year) and in monetary and voluntary transactions to 1,062 million (+25%). | |||||||
|
| |||||||
| Loyal customers |
| Digital customers | |||||
| Millions |
| Millions | |||||
|
|
|
| |||||
|
| |||||||
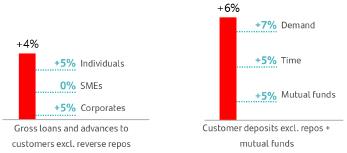
| Volumes (at constant exchange rates) increased in the second quarter both gross loans and advances to customers (excluding reverse repos), as well as customer funds (+2% and +3%, respectively).
Compared to June 2018 (at constant exchange rates), gross loans and advances to customers (excluding reverse repos) grew 4% and increased in seven of the 10 core units. Customer funds (+6% year- on-year) rose in all of them. Growth in demand and time deposits as well as mutual funds.
Solid funding structure and liquidity: net loan-to-deposit ratio of 111% (the same as in June 2018).
| |||||||
| Activity: Jun-19 vs. Jun-18 | |||||||
| % change in constant euros | |||||||
|
| |||||||
 GROWTH
|
|
|
|
6 |
| January – June 2019 |
|
|
|
|
|
|
|
|
|
|
Santander vision and |
| Group financial |
| Financial information |
| Responsible banking |
| Appendix |
|
|
|
|
|
|
|
|
|
|
|
|
|
|
|
|
|
|
|
|
|
|
|
|
|
|
|
GROUP PERFORMANCE
|
| | ||||||
|
|
|
|
| ||||
|
|
|
|
|
|
|
| |
|
|
| ||||||
Solid business model which enables us to generate value based on profitability, efficiency and innovation, and obtain profits on a recurring basis |
| Santander is strengthening its capital ratios and improving credit quality while maintaining a high level of profitability | ||||||
|
|
| ||||||
The positive trends in results were maintained in the current context, with solid customer revenue. Of note, growth in net interest income, costs which reflect the first synergies in some countries and stable provisions. |
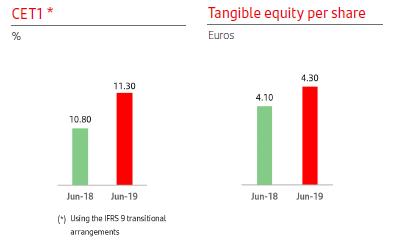
| The CET1 ratio stood at 11.30% after organically generating 11 basis points in the second quarter and absorbing regulatory impacts and restructuring costs (-20 bps). The CET1 ratio was 50 basis points higher year-on-year. | ||||||
|
|
| ||||||
Second quarter attributable profit of EUR 1,391 million, affected by EUR 706 million of net charges, mainly in restructuring costs. Excluding this impact, underlying profit was EUR 2,097 million (+8% quarter-on-quarter). Excluding the contribution to the Single Resolution Fund (SRF) underlying profit would have risen 16% (+17% in constant euros). |
| Tangible equity per share (TNAV) was EUR 4.30 in June 2019, 5% higher than a year earlier. In addition, and in terms of value creation per shareholder, the recording between the two dates of the cash dividend should be taken into account. Including it, the TNAV per share increased 10% in the last 12 months. | ||||||
|
|
| ||||||
|
|
| ||||||
|
|
| ||||||
First half attributable profit of EUR 3,231 million, affected by net charges of EUR 814 million in ‘net capital gains and provisions’ (see page 12). Excluding them, underlying attributable profit (EUR 4,045 million) was stable in euros (+2% in constant euros), after absorbing the markets’ negative performance, higher costs for foreign currency hedging, the impact of implementing IFRS 16 and the high inflation adjustment in Argentina. Profit rose in seven of the 10 core units.
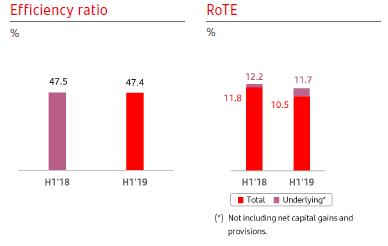
The efficiency ratio remained at around 47%, one of the best among our peers, the RoTE was 10.5% and underlying RoTE 11.7%. Lastly, RoRWA of 1.48% and underlying RoRWA of 1.62%. |
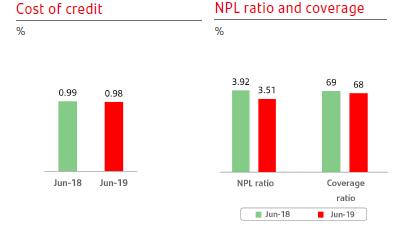
| Credit quality improved in the quarter and in the last 12 months. The cost of credit ended June below 1% (0.98% in June 2019) and the NPL ratio dropped for the eighth consecutive quarter (-11 bps in the second quarter and -41 bps since June 2018). Coverage remained at 68%. | ||||||
|
|
| ||||||
|
|
| ||||||
 PROFITABILITY
 STRENGTH
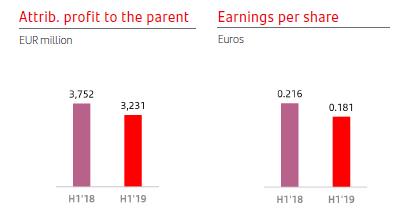
|
|
|
|
| January – June 2019 |
| 7 |
|
|
|
|
|
|
|
|
|
Santander vision and |
| Group financial |
| Financial information |
| Responsible banking |
| Appendix |
|
|
|
|
|
|
|
|
|
|
|
|
|
|
|
|
|
|
|
| Income statement |
|
|
|
|
|
|
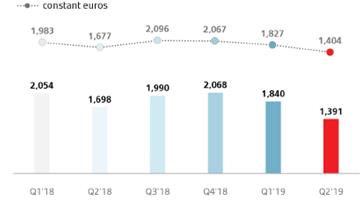
Second quarter attributable profit to the Parent of EUR 1,391 million, affected by EUR -706 million of net charges that are outside the ordinary course performance of our business, mainly restructuring costs. Excluding this charge, underlying profit was 8% higher (+9% excluding exchange rates).
First half attributable profit was 14% lower year-on-year at EUR 3,231 million (-12% in constant euros) after recording net results that are outside the ordinary course performance of our business, amounting to EUR -814 million in 2019 and EUR -300 million in 2018. Excluding these results, the underlying attributable profit was EUR 4,045 million, very similar to that in the same period of 2018 (+2% in constant euros).
At the end of June 2019, the results continued to reflect a solid underlying trend. Customer revenue increased and costs began to show the synergies obtained in various units. The efficiency ratio continued to be one of the best in the sector (47.4%).
The cost of credit remained at very low levels (0.98%) and profitability ratios were high: RoTE of 10.5% (underlying RoTE of 11.7%) and RoRWA of 1.48% (underlying RoRWA of 1.62%).
Grupo Santander. Summarised income statement
EUR million
|
|
|
|
|
|
|
|
|
|
|
| Change |
|
| Change | ||
| Q2'19 | Q1'19 | % | % excl. FX | H1'19 | H1'18 | % | % excl. FX |
Net interest income | 8,954 | 8,682 | 3.1 | 3.9 | 17,636 | 16,931 | 4.2 | 5.5 |
Net fee income (commission income minus commission expense) | 2,932 | 2,931 | 0.0 | 1.0 | 5,863 | 5,889 | (0.4) | 2.3 |
Gains or losses on financial assets and liabilities and exchange differences (net) | 234 | 277 | (15.5) | (14.3) | 511 | 854 | (40.2) | (37.2) |
Dividend income | 295 | 66 | 347.0 | 346.8 | 361 | 264 | 36.7 | 37.2 |
Share of results of entities accounted for using the equity method | 153 | 153 | — | 0.7 | 306 | 354 | (13.6) | (11.2) |
Other operating income / expenses | (217) | (24) | 804.2 | 905.8 | (241) | (130) | 85.4 | 131.7 |
Total income | 12,351 | 12,085 | 2.2 | 3.0 | 24,436 | 24,162 | 1.1 | 2.8 |
Operating expenses | (5,829) | (5,758) | 1.2 | 1.8 | (11,587) | (11,482) | 0.9 | 2.4 |
Administrative expenses | (5,099) | (5,011) | 1.8 | 2.3 | (10,110) | (10,265) | (1.5) | (0.0) |
Staff costs | (3,074) | (3,006) | 2.3 | 2.7 | (6,080) | (5,960) | 2.0 | 3.3 |
Other general administrative expenses | (2,025) | (2,005) | 1.0 | 1.7 | (4,030) | (4,305) | (6.4) | (4.7) |
Depreciation and amortisation | (730) | (747) | (2.3) | (1.7) | (1,477) | (1,217) | 21.4 | 23.0 |
Impairment or reversal of impairment of financial assets not measured at fair value through profit or loss (net) | (2,122) | (2,246) | (5.5) | (4.8) | (4,368) | (4,352) | 0.4 | 1.5 |
o/w: net loan-loss provisions | (2,141) | (2,172) | (1.4) | (0.7) | (4,313) | (4,297) | 0.4 | 1.4 |
Impairment on other assets (net) | (7) | (20) | (65.0) | (69.2) | (27) | (96) | (71.9) | (72.6) |
Provisions or reversal of provisions | (1,451) | (465) | 212.0 | 214.4 | (1,916) | (1,262) | 51.8 | 54.8 |
Gain or losses on non financial assets and investments, net | 31 | 219 | (85.8) | (85.8) | 250 | 23 | 987.0 | 987.0 |
Negative goodwill recognised in results | — | — | — | — | — | — | — | — |
Gains or losses on non-current assets held for sale not classified as discontinued operations | (44) | (213) | (79.3) | (79.3) | (257) | (94) | 173.4 | 173.4 |
Profit or loss before tax from continuing operations | 2,929 | 3,602 | (18.7) | (17.5) | 6,531 | 6,899 | (5.3) | (3.1) |
Tax expense or income from continuing operations | (1,092) | (1,357) | (19.5) | (18.3) | (2,449) | (2,378) | 3.0 | 6.1 |
Profit from the period from continuing operations | 1,837 | 2,245 | (18.2) | (17.1) | 4,082 | 4,521 | (9.7) | (7.9) |
Profit or loss after tax from discontinued operations | — | — | — | — | — | — | — | — |
Profit for the period | 1,837 | 2,245 | (18.2) | (17.1) | 4,082 | 4,521 | (9.7) | (7.9) |
Attributable profit to non-controlling interests | (446) | (405) | 10.1 | 10.7 | (851) | (769) | 10.7 | 10.3 |
Attributable profit to the parent | 1,391 | 1,840 | (24.4) | (23.2) | 3,231 | 3,752 | (13.9) | (11.7) |
EPS (euros) | 0.076 | 0.104 | (26.7) |
| 0.181 | 0.216 | (16.4) |
|
Diluted EPS (euros) | 0.076 | 0.104 | (26.7) |
| 0.180 | 0.216 | (16.4) |
|
Memorandum items: |
|
|
|
|
|
|
|
|
Average total assets | 1,500,703 | 1,488,505 | 0.8 |
| 1,492,954 | 1,438,444 | 3.8 |
|
Average stockholders' equity | 98,659 | 97,886 | 0.8 |
| 98,191 | 94,662 | 3.7 |
|
|
|
|
|
8 |
| January – June 2019 |
|
|
|
|
|
|
|
|
|
|
Santander vision and |
| Group financial |
| Financial information |
| Responsible banking |
| Appendix |
|
|
|
|
|
|
|
|
|
|
|
|
|
|
|
|
|
|
|
| Income statement |
|
|
|
|
|
|
 First half of 2019 results compared to the first half of 2018
The underlying trends of the P&L remained solid compared to the first half of 2018, with customer revenue growing, mainly net interest income, costs beginning to reflect the synergies obtained in various units and a cost of credit still at historically low levels.
This good performance, however, is not fully reflected in the year-on-year comparison for attributable profit because of the recording of a net negative amount of EUR 814 million for charges that are outside the ordinary course performance of our business, mainly restructuring costs for ongoing integrations, as set out on page 12 of this report. In addition, the comparison is also affected by the poorer performance of gains on financial transactions, implementing IFRS 16 and the high inflation adjustment in Argentina.
This performance is explained in detail below:
 Revenue
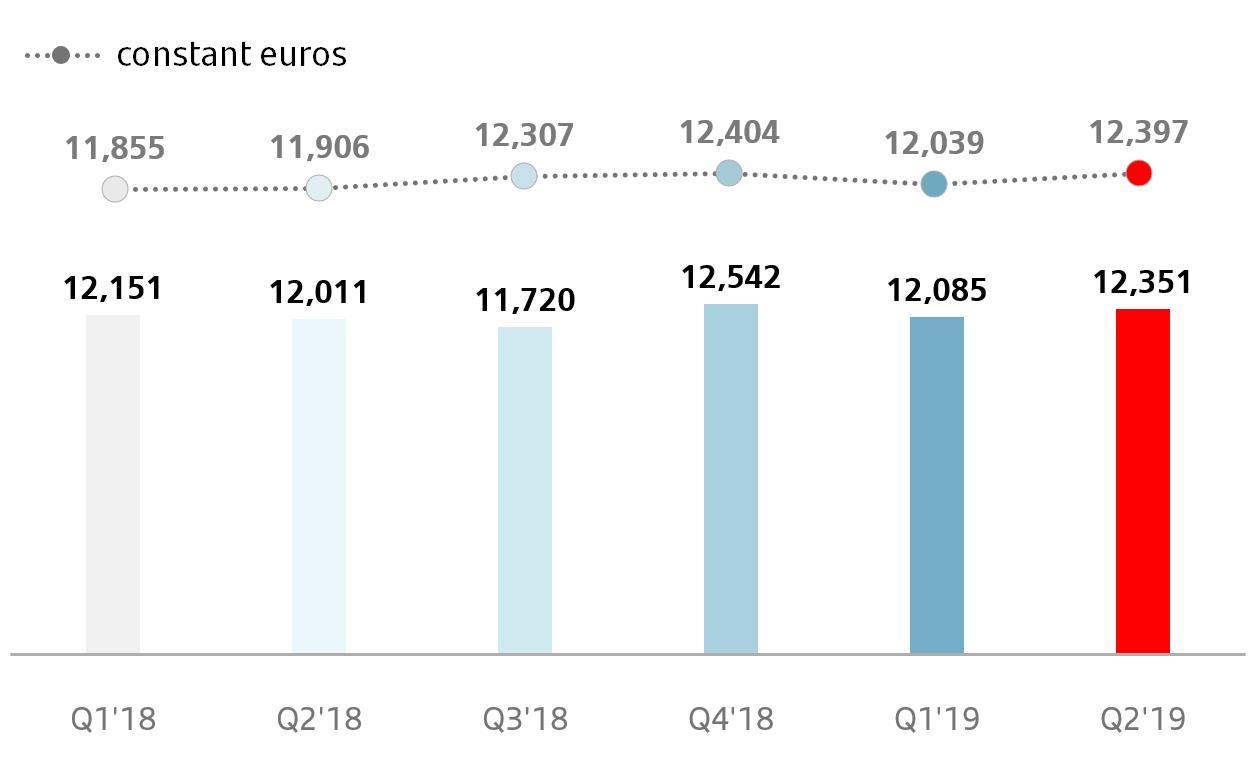
● Our revenue structure, where net interest income and net fee income generate more than 96% of total income in 2019, well above the average of our competitors, enables us to grow consistently and recurrently, limiting the impact that bouts of high volatility could have on our results from financial operations. Total income grew 1% (+3% without the FX impact), as follows:
– Net interest income rose 4%. Excluding the FX impact, growth was 6% and due to greater lending and deposits, mainly in developing countries where, overall, they increased at double-digit rates in constant euros, and management of spreads in a low interest rate environment in mature markets and which fell in some countries in the last 12 months. There was also a negative impact of around EUR 150 million from IFRS 16 application.
All units rose in local currency terms, except the UK which was affected by the pressure of spreads in new mortgage loans and SVR balances (Standard Variable Rate), Portugal, due to low interest rates and the impact of ALCO portfolio sales, and Chile because of lower inflation. Mexico, Uruguay, Argentina and Poland increased at double digit rates and Brazil, and the US at around 7%.
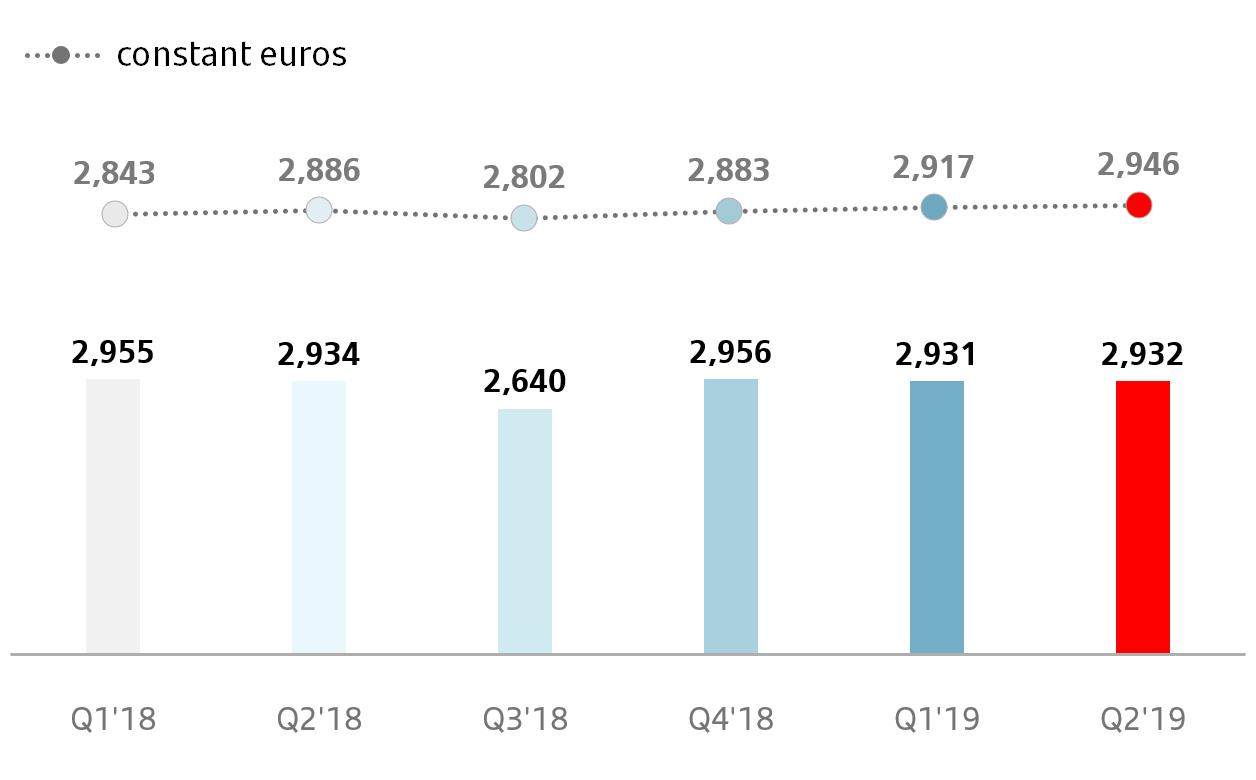
– Net fee income fell 0.4%. The increase without the FX impact was 2%, reflecting the greater customer loyalty combined with the growth strategy in services and higher value-added products. Of note was the growth in the most transactional businesses from cards, insurance, custody, foreign currency and cheques and transfers. On the other hand, decline in net fee income from advising operations and guarantees, affected by reduced activity in the markets.
– Gains on financial transactions and other operating income (dividends, equity method income and others), which accounted for less than 4% of total income, fell 30% in euros and 29% without the FX impact because of lower activity in the first half of 2019, combined with a higher cost of foreign currency hedging compared to a very good first quarter in 2018 in the markets and higher income from the ALCO portfolio sales.
Net interest income |
| Net fee income |
EUR million |
| EUR million |
|
|
|
|
|
|
|
| January – June 2019 |
| 9 |
|
|
|
|
|
|
|
|
|
Santander vision and |
| Group financial |
| Financial information |
| Responsible banking |
| Appendix |
|
|
|
|
|
|
|
|
|
|
|
|
|
|
|
|
|
|
|
| Income statement |
|
|
|
|
|
|
 Costs
Costs
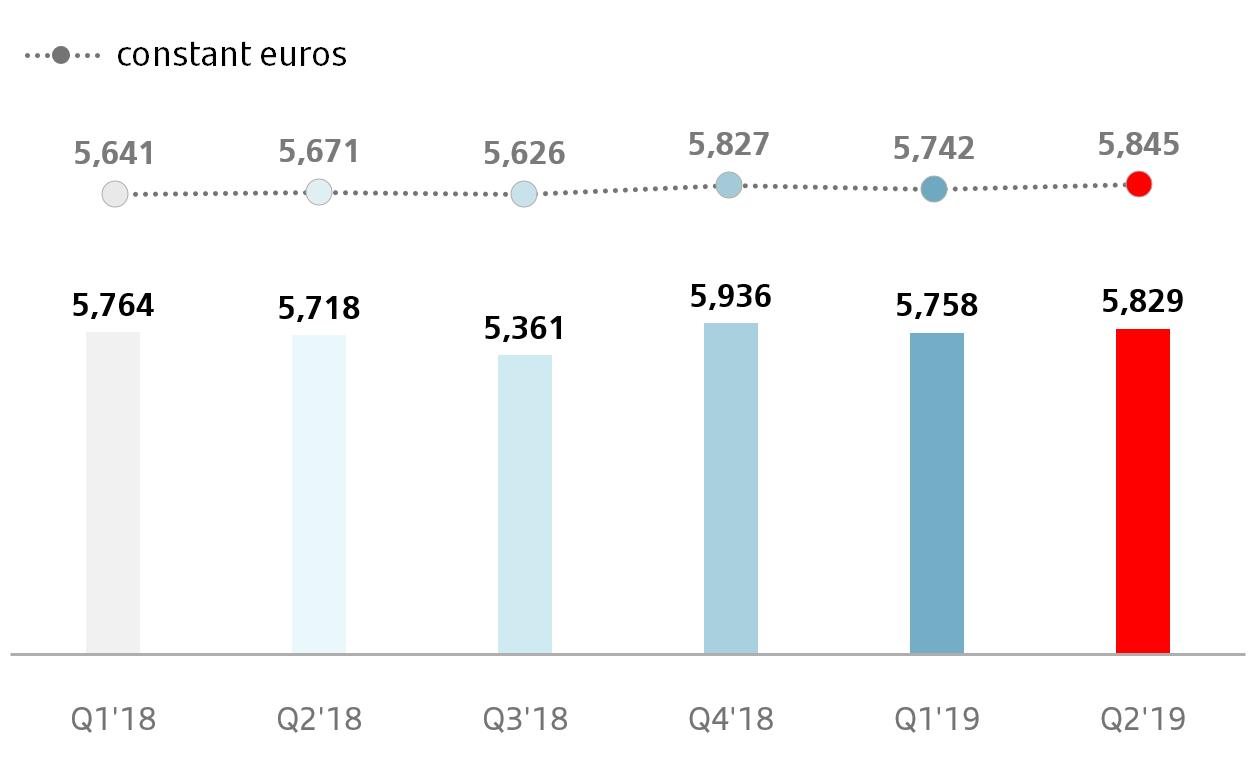
● Costs grew 1% in euros and 2% without the FX impact, as a result of investments in transformation and digitalisation, the improvements made to the distribution networks, the slight perimeter impact from the integration of the retail and SME businesses acquired from Deutsche Bank Polska and the impact on Argentina of high inflation.
● In real terms (excluding inflation), costs were 2% lower (excluding the FX impact). The Group’s aim is to improve our operational capacity and at the same time manage our costs more efficiently adapted to each area, via an exemplary execution of the integrations currently underway and fostering the use of shared services, mainly in Europe, where costs are beginning to reflect the first synergies of integrations, and fell 3% in real terms, underpinned by decreases in Spain (-9%), the UK (-3%) and Portugal (-5%). Of note among other countries was the US, where costs fell 2% in real terms backed by an improvement in operational leveraging, as well as Brazil and Chile whose costs were controlled despite the ongoing investment to improve the distribution capacity.
The efficiency ratio continued to be a reference in the sector at 47.4%, virtually unchanged from 47.5% in the first half of 2018.
Impairment or reversal of impairment of financial assets not measured at fair value through profit or loss (net)
● The impairment or reversal of impairment of financial assets not measured at fair value through profit or loss (net) amounted to EUR 4,368 million, 0.4% more year-on-year (1% without the FX impact).
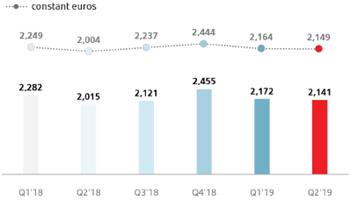
● As part of this item, loan-loss provisions were the same in euros and 1% higher without the FX impact. By units, Brazil, Portugal, SCF, Chile and the UK declined, while those that increased are linked mainly to countries with stronger growth in volumes.
● The cost of credit inched down from 0.99% in June 2018 to 0.98% a year later. In year-on-year terms all units improved or remained stable, except for Argentina.
Impairment on other assets (net)
● The impairment on other assets (net) in the first half of 2019 was EUR 27 million (EUR 96 million in the same period of 2018).
Total income |
| Operating expenses |
EUR million |
| EUR million |
|
|
|
|
|
|
|
10 |
| January – June 2019 |
|
|
|
|
|
|
|
|
|
|
Santander vision and |
| Group financial |
| Financial information |
| Responsible banking |
| Appendix |
|
|
|
|
|
|
|
|
|
|
|
|
|
|
|
|
|
|
|
| Income statement |
|
|
|
|
|
|
Provisions or reversal of provisions
● Provisions (net of reversal of provisions) amounted to EUR 1,916 million in the first half of 2019 (EUR 1,262 million in the same period of 2018). The increase was mainly due to restructuring charges in Spain, the UK and Poland, which are set out on page 12 of this report.
Gains or losses on non-financial assets and investments (net)
● This item reflects a profit of EUR 250 million in 2019 (EUR 23 million in the first half of 2018). The increase was mainly due to the recording of capital gains from the sale of 51% our stake in Prisma Medios de Pago S.A. and the revaluation of the rest of the stake (49%), with a positive net tax impact in the first half of EUR 150 million.
Gains or losses on non-current assets held for sale not classified as discontinued operations
● This item, which mainly includes the sale and deterioration of foreclosed assets recorded during the quarter, amounted to EUR-257 million in the first half (EUR -94 million in the same period of 2018).The difference was mainly due to the recording of capital losses from the sale of a portfolio of real estate to a subsidiary of Cerberus.
Profit before tax
● First half profit before tax was EUR 6,531 million, 5% lower year- on-year. Excluding the FX impact, the fall was 3%, largely due to the non-recurring charges already mentioned.
Income tax
● Income tax was EUR 2,449 million, 3% higher than in the first half of 2018.
Attributable profit to non-controlling interests
● This amounted to EUR 851 million, 11% more year-on-year. Excluding the FX impact, it was 10% higher, mainly due to Brazil, the US, Mexico and Santander Consumer Finance.
Attributable profit to the parent
● Profit attributed to the Parent was EUR 3,231 million, 14% less than in the first half of 2018. Excluding the FX impact it was 12% lower.
● RoE was 7.4%, RoTE 10.5% and RoRWA 1.48% (8.2%, 11.8% and 1.55%, respectively, in the first half of 2018). Earnings per share were EUR 0.181 (EUR 0.216in the first half of 2018).
|
|
|
Net loan-loss provisions |
| Attributable profit to the parent |
EUR million
|
| EUR million |
|
|
|
|
|
|
|
| January – June 2019 |
| 11 |
|
|
|
|
|
|
|
|
|
Santander vision and |
| Group financial |
| Financial information |
| Responsible banking |
| Appendix |
|
|
|
|
|
|
|
|
|
|
|
|
|
|
|
|
|
|
|
| Income statement |
|
|
|
|
|
|
Underlying attributable profit to the parent
● Underlying profit attributed to the parent was affected in 2019 and 2018 by the following net results, which are outside the ordinary course performance of our business and which distort year-on-year comparisons:
First half 2019:
1. | Restructuring costs in Spain as part of the plan to integrate Banco Popular’s commercial networks amounting to EUR 600 million, recorded in the second quarter. |
2. | Charges in the UK of EUR 172 million were recorded in the first half for restructuring costs related to its optimisation plan and PPI provisions (of which EUR 106 million of were charged in the second quarter). |
3. | Net capital losses of EUR 180 million for the sale of real estate assets in the first quarter. |
4. | We also recorded restructuring costs of EUR 12 million in the first quarter for the integration process in Poland in the first quarter. |
5. | Lastly, capital gains from the sale of 51% of our stake in the Argentinian entity Prisma Medios de Pago S.A. and the revaluation of the remaining 49%, generating a capital gain of EUR 150 million in the first quarter. |
First half 2018:
1. | Positive results from the integration in Portugal (EUR 20 million), recorded in the second quarter. |
2. | Charges for restructuring costs: EUR -280 million in Spain and EUR -40 million in the Corporate Centre, both related to Popular’s integration, recorded in the second quarter. |
Excluding these results from the various P&L lines where they are recorded, and incorporating them separately in the line ‘net capital gains and provisions’, adjusted profit or underlying profit attributed to the parent was EUR 4,045 million in the first half of 2019, almost the same as a year earlier and 2% higher without the FX impact.
Seven of the 10 core units increased in their local currencies, and at double digit rates in Brazil, Mexico, the US and Portugal.
Profit decreased in the UK (mainly because of competitive pressure on revenue), in Poland (impacted by the higher contribution to the Bank Guarantee Fund and Banking Tax) and in Santander Consumer Finance, the last two falling 1% each in constant euros.
As a result, the Group’s underlying RoTE was 11.7%, the underlying RoRWA 1.62% and underlying earnings per share EUR 0.231 (EUR 0.235 in the first half of 2018).
Summarised underlying income statement (EUR million)
|
|
|
|
|
|
|
|
|
|
|
| Change |
|
| Change | ||
| Q2'19 | Q1'19 | % | % excl. FX | H1'19 | H1'18 | % | % excl. FX |
Net interest income | 8,954 | 8,682 | 3.1 | 3.9 | 17,636 | 16,931 | 4.2 | 5.5 |
Net fee income | 2,932 | 2,931 | 0.0 | 1.0 | 5,863 | 5,889 | (0.4) | 2.3 |
Gains (losses) on financial transactions (1) | 234 | 277 | (15.5) | (14.3) | 511 | 854 | (40.2) | (37.2) |
Other operating income | 231 | 195 | 18.5 | 16.5 | 426 | 488 | (12.7) | (15.4) |
Total income | 12,351 | 12,085 | 2.2 | 3.0 | 24,436 | 24,162 | 1.1 | 2.8 |
Administrative expenses and amortisations | (5,829) | (5,758) | 1.2 | 1.8 | (11,587) | (11,482) | 0.9 | 2.4 |
Net operating income | 6,522 | 6,327 | 3.1 | 4.0 | 12,849 | 12,680 | 1.3 | 3.2 |
Net loan-loss provisions | (2,141) | (2,172) | (1.4) | (0.7) | (4,313) | (4,297) | 0.4 | 1.4 |
Other gains (losses) and provisions | (486) | (471) | 3.2 | 4.2 | (957) | (903) | 6.0 | 10.2 |
Profit before tax | 3,895 | 3,684 | 5.7 | 6.8 | 7,579 | 7,480 | 1.3 | 3.4 |
Tax on profit | (1,353) | (1,326) | 2.0 | 3.4 | (2,679) | (2,659) | 0.8 | 3.2 |
Profit from continuing operations | 2,542 | 2,358 | 7.8 | 8.8 | 4,900 | 4,821 | 1.6 | 3.6 |
Net profit from discontinued operations | — | — | — | — | — | — | — | — |
Consolidated profit | 2,542 | 2,358 | 7.8 | 8.8 | 4,900 | 4,821 | 1.6 | 3.6 |
Non-controlling interests | (445) | (410) | 8.5 | 9.0 | (855) | (769) | 11.2 | 10.8 |
Underlying attributable profit to the parent | 2,097 | 1,948 | 7.6 | 8.7 | 4,045 | 4,052 | (0.2) | 2.1 |
Net capital gains and provisions | (706) | (108) | 553.7 | 536.6 | (814) | (300) | 171.3 | 171.3 |
Attributable profit to the parent | 1,391 | 1,840 | (24.4) | (23.2) | 3,231 | 3,752 | (13.9) | (11.7) |
(1) Includes exchange differences.
|
|
|
|
12 |
| January – June 2019 |
|
|
|
|
|
|
|
|
|
|
Santander vision and |
| Group financial |
| Financial information |
| Responsible banking |
| Appendix |
|
|
|
|
|
|
|
|
|
|
|
|
|
|
|
|
|
|
|
| Income statement |
|
|
|
|
|
|
 Second quarter results compared to the first quarter of 2019
The second quarter’s attributable profit to the parent was 24% lower than the first quarter’s in euros and 23% lower without the FX impact. This comparison is conditioned by those amounts that are outside the ordinary course performance of our business (EUR-706 million), which are explained in previous pages.
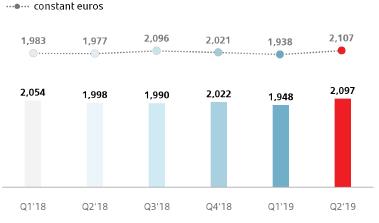
Excluding these results, underlying attributable profit to the parent was 8% higher quarter-on-quarter in euros and 9% higher without the FX impact, as follows:
Total income increased 3% due to growth in customer revenue.
– Net interest income was 4% higher, mainly due to the good performance in Brazil, the recovery of inflation in Chile and rises at Santander Consumer Finance and the US because of larger volumes.
– Net fee income increased 1% after absorbing the decrease derived from wholesale markets. The main increase was in Brazil.
– Gains on financial transactions and other operating income remained virtually flat, after absorbing the contribution to the Single Resolution Fund (SRF) in the second quarter.
Operating expenses rose 2% driven by North America, South America (partly due to high inflation in Argentina) and Santander Global Platform (investments made in the initial phase), while Europe decreases, with falls in the UK, Spain and Portugal.
Loan-loss provisions decreased 1%, due to falls in Europe and the US.
| Underlying attributable profit to the parent* |
|
| EUR million |
|
|
|
|
| (*) Excluding net capital gains and provisions. |
|
|
|
|
|
| January – June 2019 |
| 13 |
|
|
|
|
|
|
|
|
|
Santander vision and |
| Group financial |
| Financial information |
| Responsible banking |
| Appendix |
|
|
|
|
|
|
|
|
|
|
|
|
|
|
|
|
|
|
|
| Balance sheet |
|
|
|
|
|
|
Grupo Santander. Condensed balance sheet
EUR million
Assets | Jun-19 | Jun-18 | Absolute | % | Dec-18 |
Cash, cash balances at central banks and other demand deposits | 104,104 | 107,687 | (3,583) | (3.3) | 113,663 |
Financial assets held for trading | 102,574 | 112,947 | (10,373) | (9.2) | 92,879 |
Debt securities | 33,343 | 27,005 | 6,338 | 23.5 | 27,800 |
Equity instruments | 11,133 | 17,670 | (6,537) | (37.0) | 8,938 |
Loans and advances to customers | 300 | 5,103 | (4,803) | (94.1) | 202 |
Loans and advances to central banks and credit institutions | — | 7,172 | (7,172) | (100.0) | — |
Derivatives | 57,798 | 55,997 | 1,801 | 3.2 | 55,939 |
Financial assets designated at fair value through profit or loss | 78,813 | 53,306 | 25,507 | 47.9 | 68,190 |
Loans and advances to customers | 23,407 | 20,289 | 3,118 | 15.4 | 23,796 |
Loans and advances to central banks and credit institutions | 46,915 | 25,131 | 21,784 | 86.7 | 32,325 |
Other (debt securities an equity instruments) | 8,491 | 7,886 | 605 | 7.7 | 12,069 |
Financial assets at fair value through other comprehensive income | 118,062 | 120,831 | (2,769) | (2.3) | 121,091 |
Debt securities | 111,891 | 116,520 | (4,629) | (4.0) | 116,819 |
Equity instruments | 2,789 | 2,766 | 23 | 0.8 | 2,671 |
Loans and advances to customers | 3,382 | 1,545 | 1,837 | 118.9 | 1,601 |
Loans and advances to central banks and credit institutions | — | — | — | — | — |
Financial assets measured at amortised cost | 981,046 | 922,948 | 58,098 | 6.3 | 946,099 |
Debt securities | 39,382 | 39,524 | (142) | (0.4) | 37,696 |
Loans and advances to customers | 881,146 | 835,155 | 45,991 | 5.5 | 857,322 |
Loans and advances to central banks and credit institutions | 60,518 | 48,269 | 12,249 | 25.4 | 51,081 |
Investments in subsidiaries, joint ventures and associates | 7,788 | 9,262 | (1,474) | (15.9) | 7,588 |
Tangible assets | 33,755 | 23,461 | 10,294 | 43.9 | 26,157 |
Intangible assets | 28,794 | 27,893 | 901 | 3.2 | 28,560 |
Goodwill | 25,613 | 25,035 | 578 | 2.3 | 25,466 |
Other intangible assets | 3,181 | 2,858 | 323 | 11.3 | 3,094 |
Other assets | 57,160 | 55,498 | 1,662 | 3.0 | 55,044 |
Total assets | 1,512,096 | 1,433,833 | 78,263 | 5.5 | 1,459,271 |
Liabilities and shareholders' equity | |||||
Financial liabilities held for trading | 74,187 | 75,350 | (1,163) | (1.5) | 70,343 |
Customer deposits | — | 5,777 | (5,777) | (100.0) | — |
Debt securities issued | — | — | — | — | — |
Deposits by central banks and credit institutions | — | 558 | (558) | (100.0) | — |
Derivatives | 58,341 | 54,892 | 3,449 | 6.3 | 55,341 |
Other | 15,846 | 14,123 | 1,723 | 12.2 | 15,002 |
Financial liabilities designated at fair value through profit or loss | 60,237 | 58,153 | 2,084 | 3.6 | 68,058 |
Customer deposits | 37,849 | 31,881 | 5,968 | 18.7 | 39,597 |
Debt securities issued | 3,117 | 2,309 | 808 | 35.0 | 2,305 |
Deposits by central banks and credit institutions | 19,141 | 23,535 | (4,394) | (18.7) | 25,707 |
Other | 130 | 428 | (298) | (69.6) | 449 |
Financial liabilities measured at amortized cost | 1,224,194 | 1,153,918 | 70,276 | 6.1 | 1,171,630 |
Customer deposits | 776,902 | 736,767 | 40,135 | 5.4 | 740,899 |
Debt securities issued | 251,672 | 224,466 | 27,206 | 12.1 | 244,314 |
Deposits by central banks and credit institutions | 160,808 | 164,164 | (3,356) | (2.0) | 162,202 |
Other | 34,812 | 28,521 | 6,291 | 22.1 | 24,215 |
Liabilities under insurance contracts | 731 | 936 | (205) | (21.9) | 765 |
Provisions | 14,571 | 13,758 | 813 | 5.9 | 13,225 |
Other liabilities | 28,191 | 27,273 | 918 | 3.4 | 27,889 |
Total liabilities | 1,402,111 | 1,329,388 | 72,723 | 5.5 | 1,351,910 |
Shareholders' equity | 120,054 | 117,935 | 2,119 | 1.8 | 118,613 |
Capital stock | 8,118 | 8,068 | 50 | 0.6 | 8,118 |
Reserves | 108,705 | 107,164 | 1,541 | 1.4 | 104,922 |
Attributable profit to the Group | 3,231 | 3,752 | (521) | (13.9) | 7,810 |
Less: dividends | — | (1,049) | 1,049 | (100.0) | (2,237) |
Other comprehensive income | (21,425) | (23,885) | 2,460 | (10.3) | (22,141) |
Minority interests | 11,356 | 10,395 | 961 | 9.2 | 10,889 |
Total equity | 109,985 | 104,445 | 5,540 | 5.3 | 107,361 |
Total liabilities and equity | 1,512,096 | 1,433,833 | 78,263 | 5.5 | 1,459,271 |
|
|
|
|
14 |
| January – June 2019 |
|
|
|
|
|
|
|
|
|
|
Santander vision and |
| Group financial |
| Financial information |
| Responsible banking |
| Appendix |
|
|
|
|
|
|
|
|
|
|
|
|
|
|
|
|
|
|
|
| Balance sheet |
|
|
|
|
|
|
GRUPO SANTANDER BALANCE SHEET
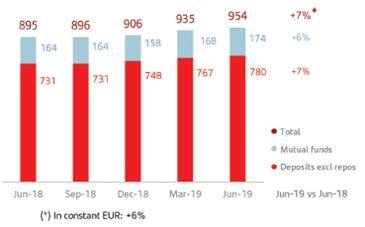
Compared to June 2018, gross loans and advances to customers (excluding reverse repos) as well as customer funds increased.
Gross loans and advances to customers excluding reverse repos rose 4% year-on-year, both in euros and in constant euros, with growth in seven of the 10 core countries, particularly in developing markets (+12%).
Customer funds increased 7% year-on-year in euros. In constant euros up 6%, with rises in the 10 core units. Deposits (excluding repos) grew in all units and mutual funds in most of them, due to the better performance in recent months (+4% in constant euros in the quarter and 9% since December 2018).
 Loans and advances to customers
Gross loans and advances to customers rose to EUR 908,234 million, 5% growth year-on-year.
The Group uses gross loans and advances to customers excluding reverse repos for the purpose of analysing traditional commercial banking loans.
Compared to June 2018, gross loans and advances to customers excluding reverse repos and the exchange rate impact increased 4%, with the following evolution by countries:
− Increase in seven of the 10 core units, particularly all developing countries, which overall grew 12%: Poland (+26%), partly because of the increased perimeter, Argentina (+14%), due to peso balances as well as the impact of the currency’s depreciation on dollar balances, Brazil (+9%), Mexico (+8%) and Chile (+7%).
− As regards mature markets, notable growth in the United States (+10%, with growth in SC USA and SBNA) and Santander Consumer Finance (+7%), with rises in all countries that comprise it. The UK’s balances remained stable, as mortgage and other retail loan growth was partially offset by the reduction of commercial real estate exposure.
− The only declines were in Portugal and Spain, markets that continued to deleverage and where gross loans and advances to customers excluding reverse repos fell by 1% and 4%, respectively. Portugal was affected by the sale of non-productive portfolios, and Spain was affected by lower wholesale balances and with institutions.
Quarter-on-quarter, gross loans and advances to customers excluding reverse repos increased 2%. Growth of 3% in Santander Consumer Finance and in the US, 2% in Poland, Mexico and Chile and around 1% in the UK and Brazil. Spain remained stable in the quarter and Argentina decreased 2%.
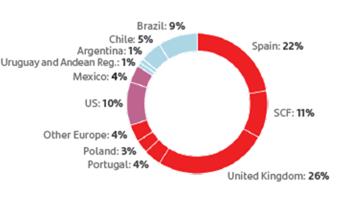
Loans and advances to customers maintained a balanced structure at the end of the semester: individuals (46%), consumer credit (17%), SMEs and companies (25%) and SCIB (12%).
|
|
|
Gross loans and advances to customers (Excl. reverse repos) |
| Gross loans and advances to customers (Excl. reverse repos) |
EUR billion
|
| % operating areas. June 2019 |
|
|
|
|
|
|
|
| January – June 2019 |
| 15 |
|
|
|
|
|
|
|
|
|
Santander vision and |
| Group financial |
| Financial information |
| Responsible banking |
| Appendix |
|
|
|
|
|
|
|
|
|
|
|
|
|
|
|
|
|
|
|
| Balance sheet |
|
|
|
|
|
|
Customer funds
Customer deposits amounted to EUR 814,751 million, 5% growth in the last 12 months.
The Group uses customer funds (customer deposits excluding repos, and including mutual funds) for the purpose of analysing traditional retail banking funds.
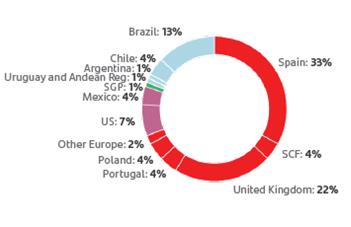
Compared to June 2018, customer funds increased 7%. Excluding the exchange rate impact, growth was 6%, as follows:
– By units, funds rose in all of them, particularly Argentina (+40%), Poland (+22%), Brazil (+11%) and the US (+10%). More moderate growth of between 3% and 5% in Santander Consumer Finance, Spain and Chile. Balances in the UK and Mexico rose 2%.
– Demand deposits increased 7%, with growth in all units except Mexico. Time deposits rose 5% mainly due to the US and South American countries, particularly Brazil, which grew 14% under its strategy of replacing letras financeiras with customer deposits in order to optimise the cost of funds. Mutual funds rose 5%, recovering growth in 2019 in most of the units after the fall in markets in 2018.
In the second quarter, customer funds increased 2% (+3% excluding exchange rate impacts). Deposits grew 3% and mutual funds grew 4%. By countries, and in local currency, there was an increase in the 10 core units, with the following detail by product:
− As regards deposits, without repos, notable growth in Brazil (+8%), Argentina (+6%), and the US (+4%). Rises in all of them in demand as well as time deposits.
− Mutual funds grew strongly in all the units.
Customer funds continued to be well diversified by products: 60% are demand deposits, 22% time deposits and 18% mutual funds.
As well as capturing customer deposits, Grupo Santander, for strategic reasons, maintains a selective policy of issuing securities in the international fixed income markets and strives to adapt the frequency and volume of its market operations to the structural liquidity needs of each unit, as well as to the receptiveness of each market.
In the first half, the Group issued:
− Medium- and long-term senior debt amounting to EUR 12,254 million and covered bonds placed in the market of EUR 4,511 million.
− There were EUR 7,885 million of securitisations placed in the market.
− Issuances to meet the TLAC (Total Loss-Absorbing Capacity) requirement amounting to EUR 1,947 million, in order to strengthen the Group’s situation (senior non-preferred: EUR 885 million, preferred: EUR 1,062 million).
− Maturities of medium- and long-term debt of EUR 13,918 million.
The net loan-to-deposit ratio was 111% (111% in June 2018). The ratio of deposits plus medium- and long-term funding to the Group’s loans was 115%, underscoring the comfortable funding structure.
|
|
|
Customer funds |
| Customer funds |
EUR billion
|
| % operating areas. June 2019 |
|
|
|
|
|
|
|
16 |
| January – June 2019 |
|
|
|
|
|
|
|
|
|
|
Santander vision and |
| Group financial |
| Financial information |
| Responsible banking |
| Appendix |
|
|
|
|
|
|
|
|
|
|
|
|
|
|
|
|
|
|
|
| Solvency ratios |
|
|
|
|
|
|
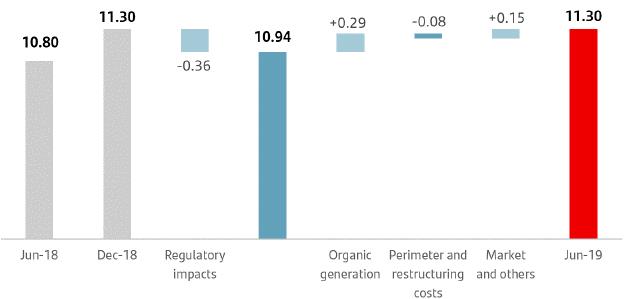
The CET1 ratio reached 11.30% following the organic generation of 11 bps in the quarter and absorbing -20 basis points of regulatory impacts and restructuring costs.
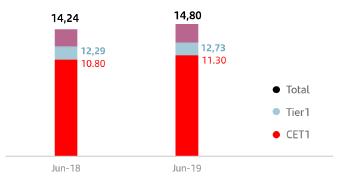
Tangible equity per share was EUR 4.30.
The fully loaded leverage ratio was 5.0%, almost the same quarter-on-quarter.
At the end of June 2019, the total phased-in capital ratio stood at 14.83% and the CET1 ratio (phased-in and fully loaded) at 11.30%, comfortably meeting the minimum levels required by the European Central Bank on a consolidated basis (13.187% for the total capital ratio and 9.687% for the CET1 ratio).
In the quarter, we continued to generate capital organically, +11 basis points, as a result of underlying profits and the active management of risk weighted assets. As such, the organic generation in the first half of the year was 29 basis points.
This, together with favourable market movements benefiting the held to collect and sell portfolio (due to falling interest rates), compensated the negative accounting and regulatory impacts registered in the year to date (-36 basis points, principally due to IFRS 16 application and TRIM), as well as the negative 13 basis point impact from restructuring costs, mainly in Spain.
Had the IFRS 9 transitional arrangement not been applied, the total impact on the CET1 would have been -23 basis points.
In April 2019, the European Central Bank published the aggregate result of its Supervisory Review and Evaluation Process (SREP) carried out in 2018. Santander has lower capital requirements than the average of SSM banks. This positive differential was wider in 2018 than in 2017.
Eligible capital. June 2019* |
| Fully-loaded capital ratio* | ||
EUR million |
| % | ||
| Phased-in | Fully loaded |
|
|
CET1 | 68,406 | 68,406 |
| |
Basic capital | 77,915 | 77,096 |
| |
Eligible capital | 89,782 | 89,640 |
| |
Risk-weighted assets | 605,470 | 605,470 |
| |
CET1 capital ratio | 11.30 | 11.30 |
| |
T1 capital ratio | 12.87 | 12.73 |
| |
Total capital ratio | 14.83 | 14.80 |
| |
|
|
|
| |
|
|
|
| |
CET1*
%
(*) All 2018 and 2019 data was calculated using the IFRS 9 transitional arrangements, unless otherwise indicated. As indicated by the consolidating supervisor a pay-out of 50%, the maximum within the target range (40%-50%), was applied for the calculation of the capital ratios in June 2019. Previously, the average cash pay-out for the last three years was considered.
|
|
|
|
| January – June 2019 |
| 17 |
|
|
|
|
|
|
|
|
|
Santander vision and |
| Group financial |
| Financial information |
| Responsible banking |
| Appendix |
|
|
|
|
|
|
|
|
|
|
|
|
|
|
|
|
|
|
|
| Risk management |
|
|
|
|
|
|
Santander maintained its medium-low risk profile in the second quarter with an enhanced credit quality, low risk market activity focused on our customers and limited exposure to operational risk events.
The Group’s credit quality improved: NPL ratio decreased to 3.51% and cost of credit is still below 1%. Coverage remained stable at 68%.
Market risk exposure remained at low levels despite continued volatility and uncertainty.
The operational risk profile remained stable, with a similar distribution of losses by category in the quarter.
| Credit risk management |

The positive trend in credit quality continued, underpinned by the good year-on-year evolution of the NPL ratios, coverage and cost of credit in the second quarter.
Non-performing loans amounted to EUR 34,421 million at the end of June 2019, 3% lower than in the first quarter. Excluding the exchange-rate impact, the volume of NPLs also decreased by 3%, with reductions in Europe, and similar levels in North and South America. Both net inflows to NPLs and charge-offs were reduced on a year-on-year basis.
The Group’s NPL ratio continued to fall (-11 bps in the quarter to 3.51% and -41 bps since June 2018). Significant reductions have been observed in Spain, Chile, Portugal and Poland, while Argentina showed an increase due to the country’s complex economic situation.
Loan-loss provisions made in the second quarter amounted to EUR 2,141 million, 1% lower than in the first quarter.
Cumulative loan-loss reserves remained stable year-on-year at EUR 4,313 million (+1% in constant euros) with improvements in most of the geographies.
The cost of credit remained below 1% (0.98%), with falls in seven of the 10 core units in the second quarter.
Credit risk
EUR million
| Jun-19 | Jun-18 | Var. % | Dec-18 |
Non-performing loans | 34,421 | 36,654 | (6.1) | 35,692 |
NPL ratio (%) | 3.51 | 3.92 |
| 3.73 |
Loan-loss allowances | 23,432 | 25,148 | (6.8) | 24,061 |
For impaired assets | 14,723 | 15,849 | (7.1) | 15,148 |
For other assets | 8,709 | 9,298 | (6.3) | 8,913 |
Coverage ratio (%) | 68 | 69 |
| 67 |
Cost of credit (%) | 0.98 | 0.99 |
| 1.00 |
Key metrics geographic performance. June 2019
%
|
|
|
|
|
| NPL | Change (bps) | Coverage | |
| ratio | QoQ | YoY | ratio |
Spain | 7.02 | (27) | (60) | 43 |
SCF | 2.24 | (9) | (20) | 106 |
United Kingdom | 1.13 | (4) | — | 32 |
Portugal | 5.00 | (77) | (255) | 53 |
Poland | 4.21 | (18) | (37) | 70 |
USA | 2.32 | (9) | (59) | 158 |
Mexico | 2.21 | 9 | (37) | 127 |
Brazil | 5.27 | 1 | 1 | 106 |
Chile | 4.52 | (15) | (34) | 59 |
Argentina | 3.79 | 29 | 139 | 126 |
NPL and coverage ratios. Total Group |
% |
|
|
|
|
|
18 |
| January – June 2019 |
|
|
|
|
|
|
|
|
|
|
Santander vision and |
| Group financial |
| Financial information |
| Responsible banking |
| Appendix |
|
|
|
|
|
|
|
|
|
|
|
|
|
|
|
|
|
|
|
| Risk management |
|
|
|
|
|
|
Total loan-loss reserves amounted to EUR 23,432 million. Coverage at the end of June 2019 was 68% for the Group. Also taking into account that in Spain and the UK, a large part of their portfolios have real estate collateral, which justifies lower coverage levels.
The Group’s coverage by IFRS 9 stages remained stable on a year-on-year basis, with no significant movements.
|
|
Coverage ratio by stage |
|
EUR billion |
|
|
|
|
|
|
| Exposure* |
| Coverage | |
| Jun-19 |
| Jun-19 | Jun-18 |
Stage 1 | 870 |
| 0.5% | 0.6% |
Stage 2 | 53 |
| 8.5% | 8.5% |
Stage 3 | 34 |
| 42.8% | 43.2% |
(*) Exposure subject to impairment. Additionally, there are EUR 24 billion in loans and advances to customers not subject to impairment recorded at mark to market with changes through P&L.
Non-performing loans by quarter
EUR million
|
|
|
|
|
|
|
| Q1'18 | Q2'18 | Q3'18 | Q4'18 | Q1'19 | Q2'19 |
Balance at beginning of period | 37,596 | 37,407 | 36,654 | 36,332 | 35,692 | 35,590 |
Net additions | 2,340 | 2,906 | 2,528 | 3,136 | 2,147 | 2,511 |
Increase in scope of consolidation | — | — | — | 177 | — | — |
Exchange rate differences and other | 361 | (409) | (140) | (130) | 479 | (162) |
Write-offs | (2,890) | (3,250) | (2,710) | (3,823) | (2,728) | (3,518) |
Balance at period-end | 37,407 | 36,654 | 36,332 | 35,692 | 35,590 | 34,421 |
|
|
| Market risk |
In the second quarter, the global corporate banking trading activity risk, which is mainly interest rate driven and focused on servicing our customer’s needs, measured in daily VaR terms at 99%, fluctuated around an average value of EUR 11.4 million and reached EUR 20.4 million mainly as a result of increased volatility and the exposure to interest rate and FX risk in Brazil, and always within the established limits. These figures are low compared to the size of the Group’s balance sheet and activity. In addition, there are other positions classified for accounting purposes as trading (total VaR of EUR 16.6 million at the end of June 2019).
|
|
Trading portfolios*. VaR performance |
|
EUR million |
|
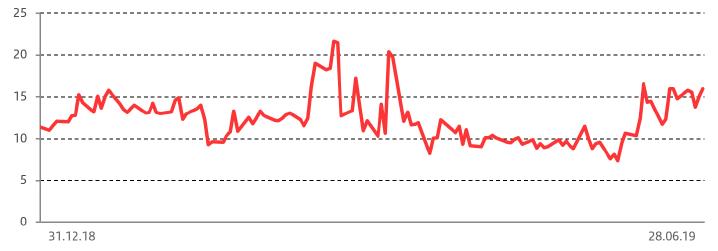
(*) Corporate & Investment Banking performance in financial markets.
|
|
|
|
| January – June 2019 |
| 19 |
|
|
|
|
|
|
|
|
|
Santander vision and |
| Group financial |
| Financial information |
| Responsible banking |
| Appendix |
|
|
|
|
|
|
|
|
|
|
|
|
|
|
|
|
|
|
|
| Risk management |
|
|
|
|
|
|
|
|
Trading portfolio*. VaR by geographic region |
|
EUR million |
|
|
|
|
|
|
| 2019 |
| 2018 | |
Second quarter | Average | Latest |
| Average |
|
|
|
|
|
Total | 11.4 | 16.0 |
| 9.5 |
Europe | 5.8 | 5.9 |
| 5.5 |
North America | 3.6 | 4.9 |
| 3.9 |
South America | 8.6 | 10.8 |
| 6.9 |
(*) Activity performance in Santander Corporate & Investment Banking markets.
|
|
Trading portfolio*. VaR by market factor |
|
EUR million |
|
|
|
|
|
|
Second quarter 2019 | Min. | Avg. | Max. | Last |
Total VaR | 7.3 | 11.4 | 20.4 | 16.0 |
Diversification effect | (0.4) | (6.4) | (12.0) | (11.1) |
Interest rate VaR | 7.0 | 8.9 | 15.5 | 15.5 |
Equity VaR | 1.0 | 1.7 | 3.2 | 3.2 |
FX VaR | 1.8 | 3.4 | 7.2 | 4.8 |
Credit spreads VaR | 2.9 | 3.7 | 4.8 | 3.5 |
Commodities VaR | 0.0 | 0.0 | 0.1 | 0.0 |
(*) Activity performance in Corporate & Investment Banking markets.
NOTE: In the Latin America, United States and Asia portfolios, VaR corresponding to the credit spreads factor other than sovereign risk is not relevant and is included in the interest rate factor.
| Structural and liquidity risk |
With regards to structural exchange rate risk, Santander’s CET1 ratio coverage remained around 100% in order to protect it from foreign currency movements.
In structural interest rate risk, during the second quarter a positive impact was generated in the value of the structural debt portfolio that was close to EUR 800 million, given the downward pressure on interest rates due to trade disputes, greater geopolitical tensions and increased expectations of new stimuli by the ECB and the Fed, as well as implementation of the economic reforms proposed in Brazil.
In liquidity risk during the second quarter, the Group maintained a comfortable position, supported by a robust and diversified liquidity buffer, with ratios well above regulatory limits.
|
|
| Operational risk |
The operational risk profile remained stable in the second quarter, although the volume of losses increased slightly due to the PPI claims in the UK, given that the deadline to present claims is approaching. Nevertheless, accumulated losses in the first half are lower than in the previous half year.
In relative terms, levels of losses by Basel categories were similar, mainly those derived from civil claims with customers and external fraud.
Specific risk-monitoring frameworks continued to improve such as those for suppliers or the most significant change management processes, as well as implementing measures to mitigate fraud in the main units (Mexico, UK and Brazil).
Cybersecurity, a key area for the Group, continues to improve. Progress continued to be made in the first half of 2019 in our cybersecurity transformation programme in order to strengthen the detection, response and protection mechanisms.
|
|
|
|
20 |
| January – June 2019 |
|
|
|
|
|
|
|
|
|
|
Santander vision and |
| Group financial |
| Financial information |
| Responsible banking |
| Appendix |
|
|
|
|
|
|
|
|
|
|
|
|
|
|
|
|
|
|
|
|
|
|
|
|
|
|
|
GENERAL BACKGROUND
Economic activity slowed in the second quarter of 2019, particularly in mature economies, as a result of trade tensions which hit exports and investment and some one-off factors. Growth was noticeably slower in EU countries. The forecast for global growth in 2019 is around 3.25% (3.6% in 2018).
Slower growth together with downside risks and inflation generally below target produced a downward change in markets’ expectations on official interest rates – reinforced by central banks – which now discount cuts in the Fed’s and ECB’s benchmark rates. Latin American central banks thus have greater leeway.
|
|
|
Country | GDP | Economic performance |
| +1.2% | Growth weakened, affected by idiosyncratic factors in some countries combined with a weakening of global trade and greater uncertainties. Inflation fell to 1.2% in June as a result of lower energy prices. The European Central Bank held its very soft monetary policy and is contemplating, if necessary, expansive measures. |
| +2.4% | Economic growth remained stronger than the Eurozone’s, despite weakening a little. Job creation was still notable. The unemployment rate continued to fall. Inflation slipped to 0.4% in June. |
| +4.7% | GDP growth in the first quarter was brisk and based on solid foundations. The jobless rate is close to a historic low (3.9% in the first quarter). Inflation was 2.6% in June, exceeding the 2.5% inflation target for the first time in seven years. The benchmark rate, however, remained at 1.5%. |
| +1.8% | Growth quickened slightly in the first quarter, but was not enough to keep on reducing the unemployment rate which is 6.8%, due to lower employment growth. Inflation was low at 0.4% in June. The fiscal deficit fell to 0.5% in 2018. |
| +1.8% | The economy grew strongly in the first quarter (+0.5% over Q4’18). Inflation was 2.0% in June, in line with the Bank of England’s target and the unemployment rate inched down to 3.8%. The base rate remained at 0.75%, pending the outcome of Brexit. |
| +0.5% | Growth slowed in the first quarter, due to weaker investment. Inflation eased to 3.4% in June, after rising in the first quarter and is expected to be below the 4.25% target. The central bank held its key rate at 6.50% (a historic low) but introduced a downward bias at its June meeting. The pension reform was passed the first vote in Congress. |
| +1.2% | The economy slowed in the first quarter. Inflation was 3.9% in June and the expectations are anchored at around 3.5%. The central bank held its key rate at 8.25%, but at its June meeting a member of the monetary committee voted to cut it by 25 bps. |
| +1.6% | GDP growth decelerated in the first quarter, due to lower growth in investment and a fall in exports. The central bank cut its benchmark rate by 25 bps in June to 2.5% and left the bias neutral, suggesting stability. Inflation remained low (2.3% in June). |
| -5.8% | The economy continued its adjustment process in order to reduce inflation and the fiscal and external imbalances. Activity seems to have reached a cyclical low in the first quarter, as April’s indicators suggest. Inflation shows incipient signs of easing in the second quarter, underpinned by a stable exchange rate. |
| +3.2% | GDP growth gathered pace due to temporary factors in the first quarter. The unemployment rate was 3.7% in June and inflation remained below the Fed’s target (underlying rate of 1.6% in May), which kept interest rates stable at 2.25-2.5%, but gave a downward bias to its messages. |
 Eurozone
 Spain
Spain Poland
 Portugal
 United Kingdom
 Brazil
 Mexico
 Chile
Chile Argentina
 United States
(1) Year-on-year change Q1'19.
|
|
|
|
| January – June 2019 |
| 21 |
|
|
|
|
|
|
|
|
|
Santander vision and |
| Group financial |
| Financial information |
| Responsible banking |
| Appendix |
|
|
|
|
|
|
|
|
|
|
|
|
|
|
|
|
|
|
|
|
|
|
|
|
|
|
|
The segment reporting is based on financial information presented to the chief operating decision maker, which excludes certain items included in the statutory results that distort year-on-year comparisons and are not considered for management reporting purposes. This financial information (underlying basis) is computed by adjusting reported results for the effects of certain gains and losses (e.g.: capital gains, write-downs, impairment of goodwill, etc.). These gains and losses are items that management and investors ordinarily identify and consider separately to better understand the underlying trends in the business.
The Group has aligned the information in this operating segment section in a manner consistent with the underlying information used internally for management reporting purposes and with that presented throughout the Group’s other public documents.
The Group executive committee has been determined to be the chief operating decision maker for the Group. The Group’s operating segments reflect the organisational and management structures. The Group executive committee reviews the internal reporting based on these segments in order to assess performance and allocate resources.
The segments are differentiated by the geographic area where profits are earned, and by type of business. The financial information of each reportable segment is prepared by aggregating the figures for the Group’s various geographic areas and business units. The information relates to both the accounting data of the units integrated in each segment and that provided by management information systems. In all cases, the same general principles as those used in the Group are applied.
The businesses included in each of the business areas in this report and the accounting principles under which their results are presented here may differ from the businesses included and accounting principles applied in the financial information separately prepared and disclosed by our subsidiaries (some of which are publicly listed) which in name or geographical description may seem to correspond to the business areas covered in this report. Accordingly, the results of operations and trends shown for our business areas in this document may differ materially from those of such subsidiaries.
At the beginning of July 2019, we announced that, starting with the financial information for the first half of 2019, we would carry out a change in our reported segments to reflect our current organisational and management structure.
This change in our reported segments aims to align the segment information to how segments and units are managed and has no impact on accounting figures at the Group level. The main changes, which have been applied to segment information for all periods included in the consolidated financial statements, are the following:
Primary segments
1. Creation of the new geographic segment Europe that includes the existing units under the previous Continental Europe segment (Spain, Portugal, Poland and Santander Consumer Finance) plus the UK (that was previously a segment on its own and is now a unit under the segment Europe).
– The UK is aligned with the ring-fencing structure, including products and services distributed to our retail customers and the majority of our business customers. The businesses excluded are now incorporated in the rest of Europe.
– Spain now includes the Real Estate Activity Spain unit, previously included in the rest of Europe, and it excludes some treasury businesses now reported in the rest of Europe and the online bank Openbank is now incorporated in the new digital segment (Santander Global Platform).
– Rest of Europe, included within the Europe segment, comprises mainly (i) CIB businesses such as Banco Santander, S.A. branches outside of Spain (including the businesses excluded from the UK as a result of ring-fencing) as well as Spain’s treasury business and (ii) Private Banking’s Wealth Management & Insurance businesses in Switzerland, mutual funds in Luxemburg and Insurance in Zurich.
2. Creation of the new geographic segment North America that comprises the existing units under the previous US segment plus Mexico.
3. Creation of the new geographic segment South America that comprises the existing units under the previous Latin America segment except for Mexico.
4. Creation of a new reporting unit segment, Santander Global Platform, which includes our global digital services under a single unit:
– Our fully digital native bank Openbank and Open Digital Services.
– Global Payments Services: payments platform to better serve our customers with value propositions developed globally, including Superdigital, Pago FX and our recently launched global businesses (Global Merchant Services and Global Trade Services).
– Digital Assets: common digital assets and Centres of Digital Expertise which help our banks in their digital transformation.
Secondary segments
5. The Real Estate Activity Spain unit, that was previously a segment reported on its own, is now included in Retail Banking.
6. The insurance business, previously included in Retail Banking, is now included in the Wealth Management segment, which was renamed Wealth Management & Insurance.
|
|
|
|
22 |
| January – June 2019 |
|
|
|
|
|
|
|
|
|
|
Santander vision and |
| Group financial |
| Financial information |
| Responsible banking |
| Appendix |
|
|
|
|
|
|
|
|
|
|
|
|
|
|
|
|
|
|
|
|
|
|
|
|
|
|
|
7. The new digital segment (Santander Global Platform) is also incorporated as a secondary segment.
8. Finally, the change in reported segments also includes adjustments of the clients of the Global Customer Relationship Model between Retail Banking and Santander Corporate & Investment Banking and between Retail Banking and Wealth Management & Insurance.
The changes in the secondary segments have no impact on the primary segments.
To allow better quarter-on-quarter and year-on-year comparability, and as was published in the Relevant Fact in July 2019, the Group has provided the quarterly 2018 and first quarter of 2019 data on a new basis, in accordance with the new structure of the Group.
After these changes, the operating business areas are structured in two levels:
Primary segments
This primary level of segmentation, which is based on the Group’s management structure, comprises five reportable segments: four operating areas plus the Corporate Centre. The operating areas are:
Europe: which comprises all the business activities carried out in the region. Detailed financial information is provided on Spain, Portugal, Poland, Santander Consumer Finance (which incorporates all the region’s business, including the three countries mentioned herewith) and the UK.
North America: which comprises all the business activities carried out in Mexico and the US, which includes the holding company (SHUSA) and the businesses of Santander Bank, Santander Consumer USA, Banco Santander Puerto Rico, the specialised unit Banco Santander International and the New York branch.
South America: includes all the financial activities carried out by the Group through its banks and subsidiary banks in the region. Detailed information is provided on Brazil, Chile, Argentina, Uruguay, Peru and Colombia.
Santander Global Platform: includes our fully digital bank Openbank and Open Digital Services, Global Payments Services (Superdigital, Pago FX, Global Merchant Services, Global Trade Services) and Digital Assets (Centres of Digital Expertise, InnoVentures and Digital Assets).
Secondary segments
At this secondary level of segment reporting, the Group is structured into Retail Banking, Santander Corporate & Investment Banking, Wealth Management & Insurance and Santander Global Platform.
Retail Banking: this covers all customer banking businesses, including consumer finance, except those of corporate banking, which are managed through Santander Corporate & Investment Banking, and asset management, private banking and insurance, which are managed by Wealth Management & Insurance. The results of the hedging positions in each country are also included, conducted within the sphere of each one’s assets and liabilities committee.
Santander Corporate & Investment Banking (SCIB): This business reflects revenue from global corporate banking, investment banking and markets worldwide including treasuries managed globally (always after the appropriate distribution with Retail Banking customers), as well as equity business.
Wealth Management & Insurance: Includes the asset management business (Santander Asset Management), the corporate unit of Private Banking and International Private Banking in Miami and Switzerland and the insurance business (Santander Insurance).
Santander Global Platform: includes our fully digital bank Openbank and Open Digital Services, Global Payments Services (Superdigital, Pago FX, Global Merchant Services, Global Trade Services) and Digital Assets (Centres of Digital Expertise, InnoVentures and Digital Assets).
In addition to these operating units, which report by geographic area and businesses, the Group continues to maintain the area of Corporate Centre, that includes the centralised activities relating to equity stakes in financial companies, financial management of the structural exchange rate position, assumed within the sphere of the Group’s assets and liabilities committee, as well as management of liquidity and of shareholders’ equity via issuances.
As the Group’s holding entity, this area manages all capital and reserves and allocations of capital and liquidity with the rest of businesses. It also incorporates amortisation of goodwill but not the costs related to the Group’s central services (charged to the areas), except for corporate and institutional expenses related to the Group’s functioning.
|
As described on the previous page, the results of our business areas presented below are provided on the basis of underlying results only and including the impact of foreign exchange rate fluctuations. However, for a better understanding of the actual changes in the performance of our business areas, we provide and discuss the year-on-year changes to our results excluding such impact. |
|
On the other hand, certain figures contained in this report, including financial information, have been subject to rounding to enhance their presentation. Accordingly, in certain instances, the sum of the numbers in a column or a row in tables contained in this report may not conform exactly to the total figure given for that column or row. |
|
|
|
|
| January – June 2019 |
| 23 |
|
|
|
|
|
|
|
|
|
Santander vision and |
| Group financial |
| Financial information |
| Responsible banking |
| Appendix |
|
|
|
|
|
|
|
|
|
|
|
|
|
|
|
|
|
|
|
|
|
|
|
|
|
|
|
|
|
First half 2019 |
|
Main items of the underlying income statement |
|
EUR million |
|
|
|
|
|
|
|
|
Primary segments | Net interest | Net fee | Total | Net operating | Profit | Underlying |
EUROPE | 7,141 | 2,630 | 10,413 | 4,822 | 3,549 | 2,354 |
Spain | 2,018 | 1,247 | 3,706 | 1,661 | 936 | 694 |
Santander Consumer Finance | 1,911 | 415 | 2,321 | 1,286 | 1,117 | 658 |
United Kingdom | 1,919 | 423 | 2,388 | 946 | 792 | 582 |
Portugal | 429 | 197 | 712 | 400 | 379 | 260 |
Poland | 565 | 230 | 817 | 467 | 293 | 150 |
Other | 299 | 118 | 469 | 62 | 33 | 10 |
NORTH AMERICA | 4,403 | 901 | 5,672 | 3,286 | 1,594 | 889 |
US | 2,860 | 479 | 3,734 | 2,154 | 891 | 465 |
Mexico | 1,543 | 423 | 1,938 | 1,132 | 703 | 424 |
SOUTH AMERICA | 6,647 | 2,355 | 9,134 | 5,825 | 3,661 | 1,961 |
Brazil | 4,979 | 1,855 | 6,864 | 4,637 | 2,846 | 1,482 |
Chile | 940 | 200 | 1,255 | 731 | 560 | 311 |
Argentina | 511 | 241 | 720 | 289 | 127 | 73 |
Other | 217 | 60 | 295 | 168 | 128 | 94 |
SANTANDER GLOBAL PLATFORM | 46 | 2 | 39 | (69) | (70) | (51) |
CORPORATE CENTRE | (600) | (27) | (822) | (1,015) | (1,155) | (1,108) |
TOTAL GROUP | 17,636 | 5,863 | 24,436 | 12,849 | 7,579 | 4,045 |
Secondary segments |
|
|
| |||
RETAIL BANKING | 16,553 | 4,583 | 21,528 | 11,816 | 6,776 | 3,856 |
CORPORATE & INVESTMENT BANKING | 1,354 | 730 | 2,606 | 1,488 | 1,396 | 889 |
WEALTH MANAGEMENT & INSURANCE | 283 | 574 | 1,085 | 630 | 632 | 459 |
SANTANDER GLOBAL PLATFORM | 46 | 2 | 39 | (69) | (70) | (51) |
CORPORATE CENTRE | (600) | (27) | (822) | (1,015) | (1,155) | (1,108) |
TOTAL GROUP | 17,636 | 5,863 | 24,436 | 12,849 | 7,579 | 4,045 |
|
|
|
Underlying attributable profit H1'19. Core markets |
| Underlying attributable profit geographic distribution* |
EUR million. % change YoY in constant euros |
| H1'19 |
|
|
|
|
|
|
|
|
|
|
| (*) Excluding Corporate Centre and Santander Global Platform. |
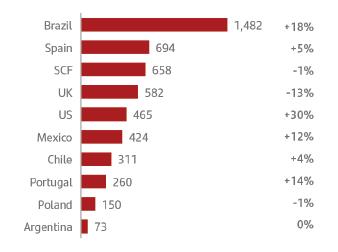
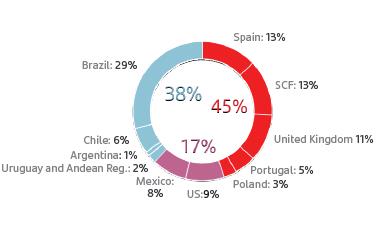
|
|
|
|
24 |
| January – June 2019 |
|
|
|
|
|
|
|
|
|
|
Santander vision and |
| Group financial |
| Financial information |
| Responsible banking |
| Appendix |
|
|
|
|
|
|
|
|
|
|
|
|
|
|
|
|
|
|
|
|
|
|
|
|
|
|
|
|
|
First half 2018 |
|
Main items of the underlying income statement |
|
EUR million |
|
|
|
|
|
|
|
|
Primary segments | Net interest | Net fee | Total | Net operating | Profit | Underlying |
EUROPE | 7,010 | 2,754 | 10,524 | 4,858 | 3,610 | 2,422 |
Spain | 1,995 | 1,340 | 3,746 | 1,540 | 871 | 661 |
Santander Consumer Finance | 1,843 | 403 | 2,266 | 1,248 | 1,096 | 667 |
United Kingdom | 2,052 | 459 | 2,590 | 1,150 | 944 | 665 |
Portugal | 435 | 189 | 688 | 363 | 324 | 229 |
Poland | 487 | 227 | 731 | 414 | 280 | 155 |
Other | 198 | 137 | 504 | 142 | 95 | 45 |
NORTH AMERICA | 3,802 | 809 | 4,947 | 2,766 | 1,265 | 690 |
US | 2,501 | 434 | 3,248 | 1,773 | 676 | 334 |
Mexico | 1,301 | 376 | 1,699 | 993 | 589 | 357 |
SOUTH AMERICA | 6,557 | 2,340 | 9,151 | 5,790 | 3,499 | 1,846 |
Brazil | 4,906 | 1,792 | 6,768 | 4,499 | 2,603 | 1,317 |
Chile | 985 | 227 | 1,282 | 751 | 568 | 307 |
Argentina | 447 | 263 | 807 | 381 | 198 | 136 |
Other | 218 | 58 | 294 | 160 | 129 | 85 |
SANTANDER GLOBAL PLATFORM | 38 | 2 | 34 | (28) | (29) | (23) |
CORPORATE CENTRE | (477) | (17) | (494) | (706) | (866) | (884) |
TOTAL GROUP | 16,931 | 5,889 | 24,162 | 12,680 | 7,480 | 4,052 |
|
|
|
|
|
|
|
Secondary segments |
|
|
| |||
RETAIL BANKING | 15,972 | 4,502 | 21,029 | 11,302 | 6,430 | 3,677 |
CORPORATE & INVESTMENT BANKING | 1,141 | 819 | 2,561 | 1,523 | 1,360 | 858 |
WEALTH MANAGEMENT & INSURANCE | 256 | 583 | 1,032 | 589 | 584 | 424 |
SANTANDER GLOBAL PLATFORM | 38 | 2 | 34 | (28) | (29) | (23) |
CORPORATE CENTRE | (477) | (17) | (494) | (706) | (866) | (884) |
TOTAL GROUP | 16,931 | 5,889 | 24,162 | 12,680 | 7,480 | 4,052 |
|
|
|
|
| January – June 2019 |
| 25 |
|
|
|
|
|
|
|
|
|
Santander vision and |
| Group financial |
| Financial information |
| Responsible banking |
| Appendix |
|
|
|
|
|
|
|
|
|
|
|
|
|
|
|
|
|
|
|
|
|
| Primary segments |
|
|
|
|
|
|
|
Strategy |
| Customers |
|
| June 2019. Thousands |
Santander's subsidiaries in Europe are managed according to their local priorities. At the same time, initiatives are being considered to enable greater integration of businesses, shared services and cost saving measures. For example:
Integration of the different technological platforms and acceleration of the bank's digital transformation, to help improve the customer experience and expand the distribution channels for our products and services.
We also continue to work on obtaining additional synergies from the ongoing integration processes, especially in the case of Popular in Spain and the retail and SME business of Deutsche Bank Polska in Poland.
And finally, simplification of our business model, reducing the number of products to gain efficiency and agility, but maintaining a full value proposition that is capable of meeting the daily needs of our individual customers and offering tailor-made solutions for SMEs and large companies.
All of this, with the medium-term objective to obtain EUR 1 billion of additional savings, based on our global capabilities to strengthen operational efficiency in the region.
|
|
|
Business performance |
| Activity |
|
| June 2019. EUR billion and % change in constant euros |
Gross loans and advances to customers (excluding reverse repos) increased by 2%, driven by strong organic growth in SCF (France, Spain and Nordic countries) and the integration of Deutsche Bank Polska’s retail and SME business in Poland.
Customer funds increased by 5% mainly due to higher retail deposits and seasonal factors in Spain in the quarter, and the inclusion of balances from Deutsche Bank Polska in Poland. |
|
|
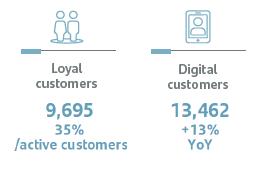
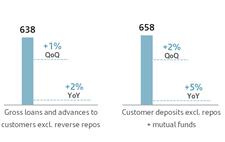
Results |
|
|
| |||||
Underlying profit amounted to EUR 2,354 million, 3% less than in the same period of the previous year. By lines:
Revenue was down 1%. Net interest income increased by 2%, supported by higher volumes in SCF, the increase in Poland and the CIB business. This increase is offset by lower gains on financial transactions (markets) and net fee income (mainly CIB).
Costs decreased 1% (-3% in real terms) reflecting the first savings from our optimisation processes.
Provisions fell and cost of credit stood at 0.24%.
Compared to the previous quarter, underlying profit rose 2% due to lower provisions. |
| Underlying income statement | ||||||
EUR million and % change in constant euros
| ||||||||
|
| Q2'19 | /Q1'19 |
| H1'19 | /H1'18 | ||
|
|
|
|
|
|
| ||
| Revenue | 5,188 | -1% |
| 10,413 | -1% | ||
| Expenses | -2,789 | 0% |
| -5,591 | -1% | ||
| LLPs | -387 | -15% |
| -844 | -2% | ||
| PBT | 1,781 | +1% |
| 3,549 | -2% | ||
| Underlying attrib. profit | 1,191 | +2% |
| 2,354 | -3% | ||
|
Detailed financial information on page 53 | |||||||
|
|
|
|
26 |
| January – June 2019 |
|
|
|
|
|
|
|
|
|
|
Santander vision and |
| Group financial |
| Financial information |
| Responsible banking |
| Appendix |
|
|
|
|
|
|
|
|
|
|
|
|
|
|
|
|
|
|
|
|
|
| Primary segments |
|
|
|
|
|
| Spain | |
| Highlights | ||
| The integration of Banco Popular with the migration of all offices and customers to the Santander platform was successfully completed. The process of optimising the commercial network, which will be gradually carried out over the coming months, begun. | ||
| Positive evolution of the levels of customer satisfaction in the migration, particularly in transparency, accompanying customers and communication. | ||
|
| We completed the reorganisation of the strategic insurance business, with the end of the agreement with Allianz and the creation of new joint ventures with Aegon and Mapfre1. The first half underlying profit was 5% higher year-on-year at EUR 694 million, mainly due to lower costs. (1) Transactions pending regulatory authorisation and other customary conditions. | |
|
|
| |
EUR 694 Mn Underlying | |||

Commercial activity |
| Customers |
|
| June 2019. Thousands |
Sustained commercial dynamism with year-on-year growth in business combined with increased profitability in all segments and products (+15 bps). Of note by products was consumer credit with existing customers (+24% year-on-year), spurred by pre-approval and digital contraction of loans.
The main drivers of loyalty continued to grow at double digit rates in both Santander and Popular (+13% in cards turnover and +7% from point-of-sale terminals).
New insurance premium rose 9%, consolidating itself as a strategic driver, while at the same time we completed the reorganisation of this business.
Mutual funds grew more quickly to almost EUR 5 billion, producing a further gain in market share.
Launch in April 2019 of the Smith Plan in order to be the leader in the non-resident segment, via a differentiated value proposal focused mainly on covering the needs of those who are purchasing a house in Spain.
Our remote management model, Santander Personal, now includes companies, strengthening the digital transformation process. |
|
|
|
| Activity |
Business performance |
| June 2019. EUR billion and % change |
Gross loans and advances to customers (excluding reverse repos) were affected by the deleveraging in wholesale banking due to the market environment and the move toward a capital light model, while new mortgages do not yet offset maturities. The stock, however, rose by EUR 600 million in the first half.
Customer deposits (excluding repos) increased by EUR 13.3 billion in the year, of which EUR 6 billion were retail customer deposits, impacted by seasonality at the end of the quarter. |
|
|
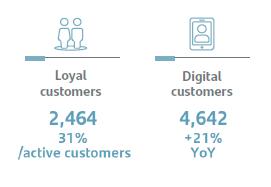
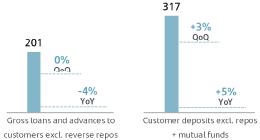
Results |
|
| |||||
First half attributable profit was 5% higher year-on-year at EUR 694 million. By lines:
Net interest income rose 1%, underpinned by retail banking, due to a continued improvement in the customer spread to 1.94% (+23 bps year-on-year), from the fall in the cost of deposits (-15 bps) as well as the rise in the return on loans (+8 bps).
Net fee income fell 7%, due to lower activity at SCIB.
Operating expenses continued to fall (-7%) due to the efficiencies resulting from Popular’s integration and the optimisation efforts.
Further decline in the stock of non-performing loans (-12% year-on-year) and fall in the NPL ratio to 7.02%.
Compared to the first quarter, underlying profit was 5% lower than the first quarter’s because of the SRF contribution. Excluding this impact, it would have been 7% higher. |
| Underlying income statement | |||||
EUR million and % change
| |||||||
|
| Q2'19 | /Q1'19 |
| H1'19 | /H1'18 | |
|
|
|
|
|
|
| |
| Revenue | 1,849 | 0% |
| 3,706 | -1% | |
| Expenses | -1,020 | 0% |
| -2,044 | -7% | |
| LLPs | -228 | -6% |
| -470 | +8% | |
| PBT | 458 | -4% |
| 936 | +7% | |
| Underlying attrib. profit | 338 | -5% |
| 694 | +5% | |
|
Detailed financial information on page 54 | ||||||
|
|
|
|
| January – June 2019 |
| 27 |
|
|
|
|
|
|
|
|
|
Santander vision and |
| Group financial |
| Financial information |
| Responsible banking |
| Appendix |
|
|
|
|
|
|
|
|
|
|
|
|
|
|
|
|
|
|
|
|
|
| Primary segments |
|
|
|
|
|
| Santander Consumer Finance | |
| Highlights (changes in constant euros) | ||
| SCF continues to be the European consumer finance leader, with critical mass and among the Top 3 in its markets in Europe. Gross loans and advances to customers (excluding reverse repos) rose 7% and new lending 4% year-on-year. | ||
| Total income increased 3%, largely due to net interest income and net fee income, which together with cost control pushed up net operating income by 3%. | ||
|
| First half underlying attributable profit was EUR 658 million, virtually unchanged year-on-year due to the good performance of revenue, operating expenses and the cost of credit (still at low levels for this business). Continued high profitability: RoTE of around 15% and RoRWA of more than 2%. | |
|
|
| |
EUR 658 Mn Underlying | |||

|
|
|
Commercial activity |
| Customers loans distribution |
|
| June 2019 |
SCF continued its growth based on its solid business model, enabling it to confront new market trends: diversification by country, scale, leadership in efficiency and risk and recovery systems that allow it to maintain a better performance than its European competitors in the key metrics.
Management continued to focus on boosting auto finance and increasing consumer finance through strengthening digital channels.
The auto business in SCF continued to grow despite the fall in car sales in Europe (‑2% in the first five months), due to the good performance of the brands with which SCF operates, via more than 115 captive agreements.
The agreement with Hyundai Kia to acquire 51% of the financial entity that both companies own in Germany was completed in March 2019, bolstering our leadership in this market.
|
|
|
Business performance |
| Activity |
|
| June 2019. EUR billion and % change in constant euros |
New lending rose 4% year-on-year, underpinned by commercial agreements in several countries. Of note: Italy (+13%), France (+8%) and Spain (+7%).
Customer deposits (excluding repos) amounted to EUR 37,900 million and continued to be a factor that differentiated us from our competitors. They continued to be stable, due to various measures taken to complete the digital transformation plan.
Recourse to wholesale funding amounted to EUR 9,934 million in the first half. Customer deposits (excluding repos), issuances and securitisations covered 73% of net loans. |
|
|
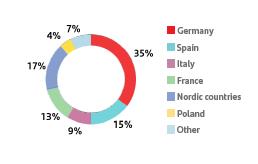
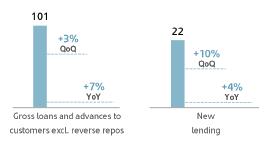
Results |
|
| |||||
First half underlying attributable profit of EUR 658 million, slightly lower than the same period of 2018:
Net interest income rose 4% due to higher volumes.
Costs rose more slowly (+2%), improving the efficiency ratio to 44.6%, 33 bps better year-on-year.
The cost of credit remained at low levels (0.36%), reflecting a conservative risk appetite and a solid credit management policy. The NPL ratio was 2.24%, 20 bps lower than in the first half of 2018.
The largest profits were generated by the Nordic countries (EUR 177 million), Germany (EUR 157 million) and Spain (EUR 116 million).
Compared to the first quarter of 2019, underlying attributable profit was 3% higher due to lower loan-loss provisions. |
| Underlying income statement | |||||
EUR million and % change in constant euros
| |||||||
|
| Q2'19 | /Q1'19 |
| H1'19 | /H1'18 | |
|
|
|
|
|
|
| |
| Revenue | 1,154 | -1% |
| 2,321 | +3% | |
| Expenses | -527 | +4% |
| -1,035 | +2% | |
| LLPs | -59 | -51% |
| -181 | -4% | |
| PBT | 556 | -1% |
| 1,117 | +2% | |
| Underlying attrib. profit | 334 | +3% |
| 658 | -1% | |
|
Detailed financial information on page 55 | ||||||
|
|
|
|
28 |
| January – June 2019 |
|
|
|
|
|
|
|
|
|
|
Santander vision and |
| Group financial |
| Financial information |
| Responsible banking |
| Appendix |
|
|
|
|
|
|
|
|
|
|
|
|
|
|
|
|
|
|
|
|
|
| Primary segments |
|
|
|
|
|
| United Kingdom | |
| Highlights (changes in constant euros) | ||
| Business performance remained solid: switcher’ levels above market average, strong increase in digital customers and amongst the best in customer satisfaction. | ||
| In terms of volumes, growth in mortgages due to the strengthening of our activity in a competitive market. Solid trend in customer funds, especially in savings deposits, underpinned by the success of an ISA campaign. | ||
|
| Underlying attributable profit fell 13%, reflecting the continued competitive pressure on mortgage margins and SVR attrition. On the other hand, the costs and provisions trend improved. | |
|
|
| |
EUR 582 Mn Underlying | |||

|
|
|
Commercial activity |
| Customers |
|
| June 2019. Thousands |
To better meet the needs of our customers and reflect the way customers are banking with us, in 2019 we announced changes to the branch network and the reshaping of the Corporate & Commercial Banking business.
We continued to focus on customer experience; the bank is second in retail satisfaction and top 3 for corporates. Since its launch in October 2018, we have opened 31,000 new 1|2|3 Business accounts with switcher1 levels above market average. The number of loyal customers continued to grow: Individuals +6%, SMEs and corporates +7% and loyal customers as a percentage of total active customers rose 2 percentage points to 31%.
Digital adoption continues to drive change in the organisation. We attracted more than 420,000 digital customers in the last 12 months (+8%), retained 60% of refinanced mortgage loans online (+6 pp year-on-year), and 44% of current accounts (+3 pp) and 66% of credit cards (+9 pp) were opened through digital channels. |
|
|
|
| Activity |
Business performance |
| June 2019. EUR billion and % change in constant euros |
Gross loans and advances to customers (excluding reverse repos) were stable. Mortgages, consumer and non-CRE trading business volumes increased, while the latter continued to fall.
Customer deposits (excluding repos) increased by 2%, boosted by higher corporate and retail savings deposits, partly due to a strong ISA campaign (Individual Savings Account - savings product with tax benefits). |
|
|
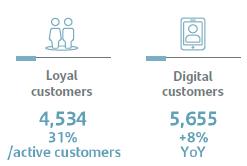
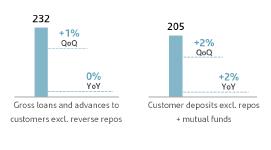
Results |
|
| |||||
Underlying attributable profit in the first half stood at EUR 582 million, down 13% year- on-year.
Total revenue fell 8% due to continued competitive pressure on mortgage margins and SVR (Standard Variable Rate) attrition, net fee income reduction and lower gains on financial transactions (-67%).
Costs fell 1%, though in real terms (w/o inflation) fell 3%.
Loan-loss provisions fell by 22%, with the cost of credit at just 6 basis points. The NPL ratio was stable at 1.13%, supported by prudent approach to risk management and the resilience of the UK economy.
Compared to the first quarter of 2019, underlying attributable profit improved by 29%, due to reductions in costs and provisions that more than offset the aforementioned factors affecting revenue. |
| Underlying income statement | |||||
EUR million and % change in constant euros
| |||||||
|
| Q2'19 | /Q1'19 |
| H1'19 | /H1'18 | |
|
|
|
|
|
|
| |
| Revenue | 1,183 | -2% |
| 2,388 | -8% | |
| Expenses | -703 | -5% |
| -1,442 | -1% | |
| LLPs | -19 | -68% |
| -80 | -22% | |
| PBT | 435 | +22% |
| 792 | -17% | |
| Underlying attrib. profit | 327 | +29% |
| 582 | -13% | |
|
Detailed financial information on page 56 | ||||||
(1) Switcher: clients who change bank as part of the Current Account Switch Service, in which the new bank is in charge of managing the whole process, free of charge, within 7 working days.
|
|
|
|
| January – June 2019 |
| 29 |
|
|
|
|
|
|
|
|
|
Santander vision and |
| Group financial |
| Financial information |
| Responsible banking |
| Appendix |
|
|
|
|
|
|
|
|
|
|
|
|
|
|
|
|
|
|
|
|
|
| Primary segments |
|
|
|
|
|
| Portugal | |
| Highlights | ||
| The Bank continued its commercial and digital transformation, marketing new products for companies and SMEs and making the granting of new mortgages simpler and faster. | ||
| Market shares in new lending to companies and mortgages reached around 20%, in a market that is still deleveraging. | ||
|
| Underlying attributable profit increased 14% year-on-year, reflecting revenue growth, lower costs from optimising the structure and a very low cost of credit. | |
|
|
| |
EUR 260 Mn Underlying | |||

|
|
|
Commercial activity |
| Customers |
|
| June 2019. Thousands |
The Bank continued its strategy to tailor products and services to customers’ needs, focusing on increasing the number of customers and their loyalty:
The commercial transformation continued to renew the offer and benefits in Mundo 1|2|3 and strengthened our presence in the agrifood sector. As a result of this strategy, loyal customers already account for 45% of active customers.
The second Work Café was opened in Coimbra, expanding this new customer relationship model which is a driver for increasing attraction and loyalty.
The Bank continued its policy of local proximity and offering non-financial solutions (Santander Advance Empresas). A Box Santander Advance was held in Funchal (Madeira), with the active participation of local companies and entities in exchange of experiences, opinions and knowledge workshops. |
|
|
|
| Activity |
Business performance |
| June 2019. EUR billion and % change |
Gross loans and advances to customers (excluding reverse repos) were still lower than a year ago, but they rose slightly, aligned with the dynamism of market shares in new mortgages and loans to companies in the first half.
Customer funds increased 7% year-on-year, spurred by the growth in deposits and mutual funds.
|
|
|
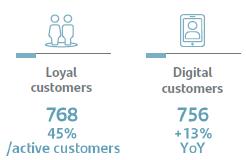
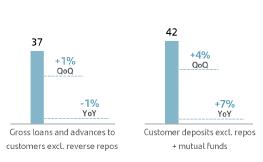
Results |
|
| |||||
The first half underlying attributable profit rose 14% year-on-year to EUR 260 million. By lines:
Total income increased 3%, driven by gains on financial transactions that rose more than 50% because of ALCO portfolio sales, and net fee income which offset the fall in net interest income, which was still in line with the year-on-year dynamic of the stock of credit.
Costs declined further, enabling net operating income to rise 10% and the efficiency ratio to improve 3.3 pp to 43.8%.
Provisions were slightly positive due to greater recoveries, mainly in the first quarter. The NPL ratio fell to 5.00% from 7.55% in June 2018, and the cost of credit was only 0.03%.
Compared to the first quarter of 2019, underlying profit was lower because of reduced revenue, mainly gains on financial transactions, and higher provisions due to greater recoveries in the first quarter. |
| Underlying income statement | |||||
EUR million and % change
| |||||||
|
| Q2'19 | /Q1'19 |
| H1'19 | /H1'18 | |
|
|
|
|
|
|
| |
| Revenue | 354 | -1% |
| 712 | +3% | |
| Expenses | -154 | -2% |
| -312 | -4% | |
| LLPs | -1 | — |
| 12 | — | |
| PBT | 186 | -4% |
| 379 | +17% | |
| Underlying attrib. profit | 125 | -7% |
| 260 | +14% | |
|
|
|
|
|
|
| |
|
Detailed financial information on page 57 | ||||||
|
|
|
|
30 |
| January – June 2019 |
|
|
|
|
|
|
|
|
|
|
Santander vision and |
| Group financial |
| Financial information |
| Responsible banking |
| Appendix |
|
|
|
|
|
|
|
|
|
|
|
|
|
|
|
|
|
|
|
|
|
| Primary segments |
|
|
|
|
|
| Poland | |
| Highlights (changes in constant euros) | ||
| As at end of the first half of 2019, Santander is the second largest bank in Poland in terms of assets following the integration of Deutsche Bank Polska’s retail and SME business in 2018. | ||
| The main management priorities are increasing revenue in a competitive environment and achieving synergies from the integration. | ||
|
| In earnings, net operating income (after provisions) increased 12%, which is not reflected in underlying profit (-1%) due to the higher BFG and Banking Tax contribution, the latter adding to fiscal pressures as it is not tax deductible. | |
|
|
| |
EUR 150 Mn Underlying | |||


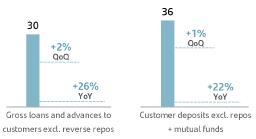
Results |
|
| |||||
Underlying attributable profit in the first half of 2019 of EUR 150 million, down 1% on the same period of 2018.
Positive top line performance, supported by the integration of Deutsche Bank Polska’s retail and SME business. Net operating income was up 15%. Costs, also impacted by acquisition, increased 12%.
Loan-loss provisions were up 25%, driven by the review of consumer finance parameters. The cost of credit improved slightly to 0.66%.
The other results line is affected by the higher Banking Tax contribution, also added to fiscal pressures as it is not tax deductible.
Compared to the previous quarter, underlying profit increased by 44%, due to the annual BFG and Banking Tax contributions in the first quarter of the year and the greater (seasonal) collection of dividends in the second quarter. |
| Underlying income statement | |||||
EUR million and % change in constant euros
| |||||||
|
| Q2'19 | /Q1'19 |
| H1'19 | /H1'18 | |
|
|
|
|
|
|
| |
| Revenue | 440 | +16% |
| 817 | +14% | |
| Expenses | -176 | +1% |
| -349 | +12% | |
| LLPs | -64 | +47% |
| -107 | +25% | |
| PBT | 166 | +30% |
| 293 | +6% | |
| Underlying attrib. profit | 89 | +44% |
| 150 | -1% | |
Detailed financial information on page 58
|
|
|
|
| January – June 2019 |
| 31 |
|
|
|
|
|
|
|
|
|
Santander vision and |
| Group financial |
| Financial information |
| Responsible banking |
| Appendix |
|
|
|
|
|
|
|
|
|
|
|
|
|
|
|
|
|
|
|
|
|
| Primary segments |
|
|
|
|
|
| NORTH AMERICA | |
| Highlights (changes in constant euros) | ||
| In North America, the US and Mexico are managed according to their local strategic priorities, while increasing coordination and cooperation between the two units. | ||
| Volumes grew both in the quarter and over the past twelve months. | ||
|
| Underlying attributable profit increased 21% year-on-year, driven by total revenue and improved efficiency. | |
|
|
| |
EUR 889 Mn Underlying | |||

|
|
|
Strategy |
| Customers |
|
| June 2019. Thousands |
In the United States, SBNA's strategy focuses on improving customer satisfaction through our digital channels and branches, while being the “Lead bank” for our customers. In SC USA, the focus is to drive originations growth and improve profitability via dealers.
In Mexico, the main objectives are to improve the distribution network and develop digital channels to attract new customers and increase their loyalty.
Coordination between the units has increased. We are analysing new joint projects and initiatives, such as:
Approval of financing for SBNA customers granted by Santander México and vice versa.
Further develop the USMX trade corridor, for example, by increasing capabilities for DCM and ECM transactions.
Launch of a same-day remittance service from Santander US branches to any bank in Mexico. |
|
|
|
| Activity |
Business performance |
| June 2019. EUR billion and % change in constant euros |
Gross loans and advances to customers (excluding reverse repos) increased by 10%, with similar growth rates in both units.
Customer funds grew in both countries, driven by time deposits, especially at SBNA and the New York branch. Demand deposits from individuals in Mexico continued their solid performance. Mutual funds increased by 6%.
|
|
|
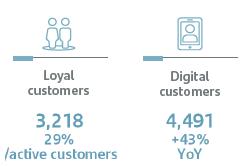
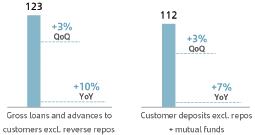
Results |
|
| |||||
In the first half of the year, underlying attributable profit was EUR 889 million (17% of the Group's total operating areas), up 21% year-on-year.
Good performance in total income at both units, with growth driven by both net interest income (+8%) and net fee income (+4%).
Expenses grew less than revenue, resulting in an improved efficiency ratio from 44% in the first half of 2018 to 42% at present. Mexico increased its costs due to the investment plan and while they were stable in the US (-2% in real terms).
Provisions were up 6% on the back of higher volumes. The cost of credit was stable at 2.95%, the NPL ratio fell to 2.29% and coverage remained around 150%.
In the quarter, the underlying attributable profit increased by 29% due to good performance in revenue and lower provisions. |
| Underlying income statement | |||||
EUR million and % change in constant euros
| |||||||
|
| Q2'19 | /Q1'19 |
| H1'19 | /H1'18 | |
|
|
|
|
|
|
| |
| Revenue | 2,918 | +5% |
| 5,672 | +7% | |
| Expenses | -1,214 | +2% |
| -2,386 | +2% | |
| LLPs | -793 | -3% |
| -1,597 | +6% | |
| PBT | 881 | +22% |
| 1,594 | +18% | |
| Underlying attrib. profit | 503 | +29% |
| 889 | +21% | |
Detailed financial information on page 60
|
|
|
|
32 |
| January – June 2019 |
|
|
|
|
|
|
|
|
|
|
Santander vision and |
| Group financial |
| Financial information |
| Responsible banking |
| Appendix |
|
|
|
|
|
|
|
|
|
|
|
|
|
|
|
|
|
|
|
|
|
| Primary segments |
|
|
|
|
|
| United States | |
| Highlights (changes in constant euros) | ||
| The strategy is focused on improving customer satisfaction at SBNA and at SC USA on the relationship with distributors to increase originations. | ||
| Following the strong gains in the quarter, the year-on-year volume trend in both gross loans and advances to customers (excluding reverse repos) and customer deposits (excluding repos) was more pronounced. | ||
|
| Underlying attributable profit increased by 30% in the first half compared to the same period of 2018, due to a strong top line performance, with total revenue up 7% and costs remaining flat. | |
|
|
| |
EUR 465 Mn Underlying | |||

|
|
|
Commercial activity |
| Customers (1) |
|
| June 2019. Thousands |
In 2019, Santander US remains focused on the following strategic priorities:
Santander Bank: Commercial Banking’s “Lead Bank” strategy continues to show gains in primary customers. Better customer satisfaction scores are being achieved as a result of improved product offerings in both digital channels and branches. The joint initiative with SC USA in auto finance continues to generate high volumes, having originated almost USD 3 billion in the first half of the year.
Santander Consumer USA: The key levers to drive profitability remain increase in originations and management of credit risk and prices. In addition, the agreement with Fiat Chrysler was amended strengthening its partnership establishing an operating framework for the remainder of the contract, which ends in 2023. In addition, a plan has been approved to repurchase USD 1.1 billion in common stock and to increase the cash dividend to USD 0.22 from Q3 2019 to Q2 2020. |
|
(1) Santander Bank + Puerto Rico.
|
|
| Activity |
Business performance |
| June 2019. EUR billion and % change in constant euros |
Volumes improved in the quarter due to lending growth in retail banking (auto) and commercial banking. Originations increased 5% year-on-year in SC USA, mainly due to Chrysler loans (+25%).
Customer funds rose 10%, boosted by strong growth in time deposits at SBNA and the New York branch. |
|
|

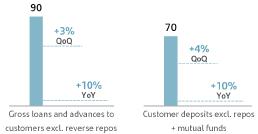
Results |
|
| |||||
Underlying attributable profit in the first half of 465 million euros, 30% more than in the same period of 2018. The year-on-year comparison of net interest income and provisions is affected by methodological changes in the accrual of TDRs made at the end of 2018, though with almost no impact on bottom line results.
Total income was up 7% (+4% ex. TDRs) due to higher loan and leasing volumes.
Costs remained under control, virtually flat compared to the same period of 2018. As a result, efficiency improved by 3 percentage points to 42%.
Loan-loss provisions increased 7%. Excluding the impact of TDRs, they fell 1% partly favoured by a provisions release related to auto finance business in SC USA. The NPL ratio improved and coverage increased to 158%. The cost of credit remained stable at 3.09%.
Compared to the previous quarter, underlying attributable profit rose 55% as a result of higher loan and leasing volumes, higher gains on financial transactions and lower provisions. |
| Underlying income statement | |||||
EUR million and % change in constant euros
| |||||||
|
| Q2'19 | /Q1'19 |
| H1'19 | /H1'18 | |
|
|
|
|
|
|
| |
| Revenue | 1,920 | +5% |
| 3,734 | +7% | |
| Expenses | -805 | +3% |
| -1,581 | +0% | |
| LLPs | -568 | -8% |
| -1,178 | +7% | |
| PBT | 521 | +40% |
| 891 | +23% | |
| Underlying attrib. profit | 284 | +55% |
| 465 | +30% | |
Detailed financial information on page 61
|
|
|
|
| January – June 2019 |
| 33 |
|
|
|
|
|
|
|
|
|
Santander vision and |
| Group financial |
| Financial information |
| Responsible banking |
| Appendix |
|
|
|
|
|
|
|
|
|
|
|
|
|
|
|
|
|
|
|
|
|
| Primary segments |
|
|
|
|
|
| Mexico | |
| Highlights (changes in constant euros) | ||
| The strategy continued to focus on the digital and operational transformation, reflected in greater customer attraction and increased loyalty. Faster growth in gross loans and advances to customers (excluding reverse repos), notably to large companies (+15%) and payroll (+15%). The rise in customer funds continued to be spurred by deposits from individuals and SMEs. | ||
|
| Underlying attributable profit was up 12%, underpinned by the good performance of net interest income, net fee income and loan-loss provisions, which more than offset the rise in costs. | |
|
|
| |
EUR 424 Mn Underlying | |||

Commercial activity |
| Customers |
The commercial strategy remained focused on boosting the use of digital channels, attracting new customers and increasing their loyalty with new products and services:
As regards the distribution model, we transformed 428 branches, and the number of latest generation full function ATMs reached 921.
The Santander Plus programme has captured more than 5.7 million customers since May 2016, 53% of them new ones.
In digital strategy, SúperMóvil has new functionalities, notably Santander Tap, a system for transfers via instant messaging for sending money to customers of other banks, at any time and free of charge.
Launch of the Legacy credit card for private banking customers. Santander is the first and only bank in the country to have an alliance with American Express.
We continued to drive growth in deposits of individuals by launching promotions such as Arma tu Kit in order to reward customer loyalty and the campaign Champions to attract customer funds.
Strong year-on-year growth of digital and mobile banking customers (+68%). Penetration of loyal customers over active ones increased significantly (+5 pp).
|
| June 2019. Thousands |
|
| |
Business performance |
| Activity |
|
| June 2019. EUR billion and % change in constant euros |
Gross loans and advances to customers (excluding reverse repos) increased 8% year-on-year, while maintaining the focus on profitability. Loans to individuals rose 7% with notable growth in payroll loans (+15%) and mortgages (+8%). Total corporate loans increased 9%, driven by large companies (+15%), corporates (+7%) and SMEs (+4%).
Customer funds increased slightly, backed by time deposits (+13%) which offset the fall in demand deposits, affected by the rise in interest rates. Those of individuals were up 11%. |
|
|
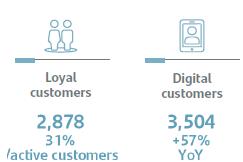
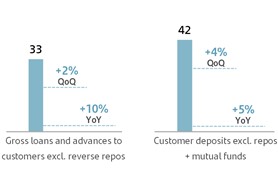
Results |
|
| |||||
First half underlying profit of EUR 424 million was 12% higher than in the same period of 2018, as follows:
Net interest income rose 11%, driven by increased volumes and higher interest rates. Net fee income grew 6%, mainly from cards and insurance, and gains on financial transactions fell because of a weak quarter in the markets.
Operating expenses increased 7%, reflecting the ongoing investment plans.
Loan-loss provisions increased slightly, with good credit quality in all metrics.
Compared to the first quarter of 2019, profit was 5% higher due to higher net fee income and the recovery of gains on financial transactions. |
| Underlying income statement | |||||
EUR million and % change in constant euros
| |||||||
|
| Q2’19 | /Q1’19 |
| H1'19 | /H1’18 | |
|
|
|
|
|
|
| |
| Revenue | 999 | +5% |
| 1,938 | +7% | |
| Expenses | -409 | +2% |
| -806 | +7% | |
| LLPs | -225 | +15% |
| -419 | +1% | |
| PBT | 360 | +3% |
| 703 | +12% | |
| Underlying attrib. profit | 219 | +5% |
| 424 | +12% | |
Detailed financial information on page 62
|
|
|
|
34 |
| January – June 2019 |
|
|
|
|
|
|
|
|
|
|
Santander vision and |
| Group financial |
| Financial information |
| Responsible banking |
| Appendix |
|
|
|
|
|
|
|
|
|
|
|
|
|
|
|
|
|
|
|
|
|
| Primary segments |
|
|
|
|
|
| SOUTH AMERICA | |
| Highlights (changes in constant euros) | ||
| In South America, the focus is to accelerate profitable growth and lead the retail financial industry. To this end, we have a strategy that seeks to strengthen a more connected regional network and facilitate the expansion of successful businesses to other countries in the region. In activity, there was a volume growth in the last 12 months. Increases in all countries, where we are capturing new business opportunities. | ||
|
| Regarding results, underlying attributable profit increased by 15% year-on-year, boosted by revenue and an improvement in the cost of credit. | |
|
|
| |
EUR 1,961 Mn Underlying | |||

Strategy |
| Customers |
The units in the region continued identifying initiatives that allow the businesses to expand, further leveraging positive experiences in other markets, for example:
In auto financing, we will use the Group's experience and the development of this business in Brazil to boost growth in other neighbouring countries. In terms of financing goods and services, we plan to export Uruguay’s successful model to Brazil and to other major regions. We will also accelerate growth in consumer finance in Peru and Colombia.
In payment methods, where Santander is one of the largest credit card issuers and merchant acquirers in the region, we are exploring e-commerce strategies, instant domestic and international transfers in some countries and the roll-out of Getnet, our acquiring business in Brazil, to the rest of Latin America. We are also launching Superdigital in other countries (starting with Chile).
Further develop the retail franchise, in particular the mass market segment, through increased penetration of new channels. Sales through digital channels already account for a high percentage of the total in Brazil and Argentina, with a significant upside in Chile, where the Life model is being developed to provide a 100% digital service to customers. The Work Café experience developed in Chile will be accelerated in countries such as Argentina and Brazil.
|
| June 2019. Thousands |
|
| |
Business performance |
| Activity |
Year-on-year increase in gross loans and advances to customers (excluding reverse repos) in all units. With regard to June 2018, Brazil grew 9%, Chile 7%, Uruguay 20% and Argentina 14%. Colombia and Peru present very high growth rates but from smaller bases.
Customer funds also rose in the last 12 months and in all units. Demand deposits (+16%), time deposits (+11%) and mutual funds (+9%) increased year-on-year. |
| June 2019. EUR billion and % change in constant euros |
|
|
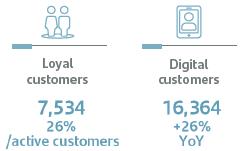
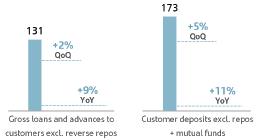
Results |
|
| |||||
Underlying attributable profit in the first half of the year amounted to EUR 1,961 million (38% of the Group's total operating areas), up 15% year-on-year due to:
Total income increased 9%, underpinned by the sound performance by commercial revenue, driven by higher volumes, spread management and increased loyalty. Net interest income rose 9% and net fee income increased by 11%.
Costs reflect commercial transformation plans, greater digitalisation of the retail network, reviews of collective wage agreements and high inflation in Argentina.
Loan-loss provisions increased at a slower pace than credit, enabling the cost of lending to improve by 23 bps in the last twelve months to 2.87%. In credit quality, the NPL ratio was stable (4.81%) and coverage was 93%.
In the quarter, underlying attributable profit rose 15% driven by the good performance of revenue, which grew more than costs. |
| Underlying income statement | |||||
EUR million and % change in constant euros
| |||||||
|
| Q2’19 | /Q1’19 |
| H1'19 | /H1’18 | |
|
|
|
|
|
|
| |
| Revenue | 4,647 | +6% |
| 9,134 | +9% | |
| Expenses | -1,664 | +4% |
| -3,309 | +9% | |
| LLPs | -956 | +9% |
| -1,859 | +2% | |
| PBT | 1,876 | +8% |
| 3,661 | +12% | |
| Underlying attrib. profit | 1,035 | +15% |
| 1,961 | +15% | |
Detailed financial information on page 63
|
|
|
|
| January – June 2019 |
| 35 |
|
|
|
|
|
|
|
|
|
Santander vision and |
| Group financial |
| Financial information |
| Responsible banking |
| Appendix |
|
|
|
|
|
|
|
|
|
|
|
|
|
|
|
|
|
|
|
|
|
| Primary segments |
|
|
|
|
|
| Brazil | |
| Highlights (changes in constant euros) | ||
| Generating results supported by a business model focused on improving customer attention and loyalty leading to profitable market share gains. | ||
| Strong revenue, underpinned by increased volumes, while costs remained under control thereby achieving the best efficiency among our local peers. | ||
|
| Prudent risk management produced growth in gross loans and advances (excluding reverse repos) and a controlled cost of credit. Profit growing sustainably reaching EUR 1,482 million in the first half of the year (+18% year-on-year), with RoTE of 22%. | |
|
|
| |
EUR 1,482 Mn Underlying | |||

|
|
|
Commercial activity |
| Customers |
|
| June 2019. Thousands |
We continued to progress in our strategic actions, including:
The customer base continued to expand to 24.6 million active clients.
We announced Santander Duo, a new product with a differentiated offer for small entrepreneurs, which combines accounts of legal and natural persons.
In cards, turnover continued to increase at double digit rates (+21%) and gained market share year-on-year (+86 bps).
In acquiring, launch of a new offer for SMEs and microbusinesses, where merchants are credited within two working days and charged the same rate for debit and credit cards. As a result we captured 200,000 new customers.
In consumer finance, we remained the leader (market share in vehicles loans for individuals of 25.3% in May 2019).
In our new businesses, Pi, a digital investment platform, already offers close to 180 fixed income products and began to distribute mutual funds. Ben, focused on food benefits, started to operate (77,000 cards issued and 143,000 commercial establishments accredited).
We are committed to using renewable energy in all our offices by 2021 and in administrative buildings and processing centres by 2025. |
|
|
|
| Activity |
Business performance |
| June 2019. EUR billion and % change in constant euros |
Gross loans and advances (excluding reverse repos) grew 9% year-on-year, with profitable gains in market share. This was mainly due to business with individuals and consumer finance which increased at double digit rates.
Customer deposits (excluding repos) rose 13% year-on-year. |
|
|
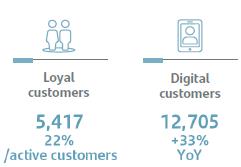
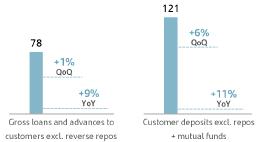
Results |
|
| |||||
First half underlying attributable profit of EUR 1,482 million (+18% YoY). Of note:
Net interest income rose 7%, with better net interest income from credit and liabilities, partly offset by lower market interest income.
Net fee income grew 9% year-on-year, with rises in almost all lines. Of note: cards (+13%), insurance (+17%) and securities (+32%).
Operating expenses increased 3%, which helped improve the efficiency ratio to 32.4% (-108 bps year-on-year).
Our solid risk management is reflected in stable provisions. The cost of credit dropped to 3.84%, the NPL ratio was 5.27% and coverage 106%.
Compared to the first quarter of 2019, underlying attributable profit was 9% higher, underpinned by higher customer revenue. |
| Underlying income statement | |||||
EUR million and % change in constant euros
| |||||||
|
| Q2’19 | /Q1’19 |
| H1'19 | /H1’18 | |
|
|
|
|
|
|
| |
| Revenue | 3,453 | +4% |
| 6,864 | +6% | |
| Expenses | -1,102 | +1% |
| -2,227 | +3% | |
| LLPs | -761 | +10% |
| -1,471 | -2% | |
| PBT | 1,438 | +5% |
| 2,846 | +15% | |
| Underlying attrib. profit | 762 | +9% |
| 1,482 | +18% | |
|
Detailed financial information on page 64 | ||||||
|
|
|
|
36 |
| January – June 2019 |
|
|
|
|
|
|
|
|
|
|
Santander vision and |
| Group financial |
| Financial information |
| Responsible banking |
| Appendix |
|
|
|
|
|
|
|
|
|
|
|
|
|
|
|
|
|
|
|
|
|
| Primary segments |
|
|
|
|
|
| Chile | |
| Highlights (changes in constant euros) | ||
| We continued the commercial and branch network transformation, based on technological developments in order to attract new customers and boost loyalty. Loyal customers already account for 46% of total active clients. | ||
| Growth in business volumes at a faster pace, mainly with individuals, companies and institutions. | ||
|
| Underlying attributable profit increased 4% year-on-year, benefiting from the performance of markets and lower provisions. Higher inflation in the second quarter spurred net interest income. | |
|
|
| |
EUR 311 Mn Underlying | |||

Commercial activity |
| Customers |
Santander is the leading privately-owned bank in Chile in terms of assets and customers. The Group continued its strategy in the first half, focused on offering an attractive profitability in a stable and low risk country where the economy is growing:
We continued to transform the network, opening more Work Café offices in the quarter and continuing with the pilot of Work Café 2.0, with good initial results in efficiency and productivity.
We launched new products under the Santander Life programme, including a digital demand account and a new credit card associated with the Meritolife programme which also allows accumulation of Latam air miles. The Santander Life products are centred on promoting good credit performance and deepening financial education.
Launch of a new Súper Hipoteca, aimed at individuals under the age of 35.
|
| June 2019. Thousands |
|
| |
Business performance |
| Activity |
|
| June 2019. EUR billion and % change in constant euros |
Gross loans and advances to customers (excluding reverse repos) rose 7% year-on-year, underpinned by mortgages (+12%), consumer finance (+12%) and large corporates (+6%). Cards increased 4% and SMEs 6%.
Customer funds rose 5%, with 10% growth in demand deposits and mutual funds. Time deposits remained stable. |
|
|
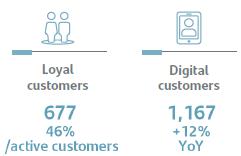
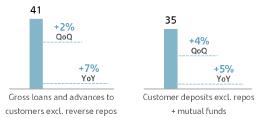
Results |
|
| |||||
First half of 2019 underlying attributable profit of EUR 311 million, 4% higher year-on-year. Of note were:
Net interest income recovered in the second quarter due to larger volumes and higher inflation. Net fee income declined 9% year-on-year partly because of wholesale business. Gains on financial transactions rose due to customer treasury and the sale of ALCO portfolios.
Operating expenses rose slightly because of investments in technology and branches.
Loan-loss provisions were lower and the cost of credit was 1.10% (-8 bps). The NPL ratio decreased to around 4.5% and coverage was 59%.
Compared to the first quarter of 2019, attributable profit was 11% higher due to net interest income, which more than offset the seasonal growth in costs. |
| Underlying income statement | |||||
EUR million and % change in constant euros
| |||||||
|
| Q2’19 | /Q1’19 |
| H1'19 | /H1’18 | |
|
|
|
|
|
|
| |
| Revenue | 656 | +11% |
| 1,255 | +1% | |
| Expenses | -269 | +7% |
| -524 | +2% | |
| LLPs | -105 | +4% |
| -208 | -9% | |
| PBT | 281 | +2% |
| 560 | +1% | |
| Underlying attrib. profit | 163 | +11% |
| 311 | +4% | |
Detailed financial information on page 65
|
|
|
|
| January – June 2019 |
| 37 |
|
|
|
|
|
|
|
|
|
Santander vision and |
| Group financial |
| Financial information |
| Responsible banking |
| Appendix |
|
|
|
|
|
|
|
|
|
|
|
|
|
|
|
|
|
|
|
|
|
| Primary segments |
|
|
|
|
|
| Argentina | |
| Highlights (changes in constant euros) | ||
| The Bank announced the change of its commercial brand from Santander Río to Santander. | ||
| We continued to focus on our four strategic pillars: growth, risk control, efficiency and customer experience. Santander is the largest privately-owned bank in Argentina by volume of business (loans + deposits +mutual funds). | ||
|
| First half underlying profit of EUR 73 million after earning EUR 63 million in the second quarter. The year-on-year comparison is impacted by the adjustment for inflation included starting from the third quarter of 2018. | |
|
|
| |
EUR 73 Mn Underlying | |||

Commercial activity |
| Customers |
The commercial strategy during the first half focused on transactional business and customer service improvements, notably a campaign to increase direct debit sign-ups, which enabled the stock to increase 50% in a month.
We continued advance in the digital transformation of the main processes and products. Loyal customers accounted for 47% of active clients and digital ones 74% (+3% year-on-year). In individuals, new accounts and product package openings are done digitally in more than 60% of our branches.
We launched Women, a comprehensive proposal for financial and non-financial services, which focuses on female entrepreneurs, owners of SMEs and professionals.
|
| June 2019. Thousands |
|
| |
Business performance |
| Activity |
|
| June 2019. EUR billion and % change in constant euros |
Gross loans and advances to customers (excluding reverse repos) was impacted by the economic recession and higher interest rates (+14% year-on-year), below inflation in this period. The peso denominated portfolio increased, driven by inflation-adjusted products (mortgages, auto finance, personal finance) and by cards, while dollar balances declined in the currency of origin.
Customer deposits (excluding repos) rose 45%, in both the portfolio in pesos (+27% in demand deposits and +41% in interest-bearing accounts and time deposits) and in foreign currency deposits (+58%; 8% in dollars). The excess liquidity is placed in Central Bank treasury bonds.
|
|
|
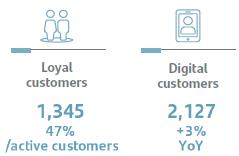
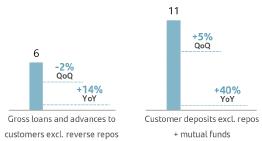
Results |
|
| |||||
First half underlying profit stable at EUR 73 million, including a negative EUR 74 million impact from the high inflation adjustment.
As regards the main income statement lines:
Revenue rose 67%, growing above inflation, driven by customer revenue (+98%). Net interest income rose 113%, underpinned by the larger position in public securities and higher interest rates, while net fee income increased 71% driven by greater foreign currency transactions and income from accounts and cash deposits.
Costs surged 89%, hit by the inflationary environment and the peso’s depreciation.
Loan-loss provisions stood at EUR 143 million, with an NPL ratio of 3.79% and a coverage ratio of 126%. |
| Underlying income statement | |||||
EUR million and % change in constant euros
| |||||||
|
| Q2’19 | /Q1’19 |
| H1'19 | /H1’18 | |
|
|
|
|
|
|
| |
| Revenue | 389 | +22% |
| 720 | +67% | |
| Expenses | -229 | +17% |
| -431 | +89% | |
| LLPs | -70 | +1% |
| -143 | +114% | |
| PBT | 94 | — |
| 127 | +20% | |
| Underlying attrib. profit | 63 | — |
| 73 | 0% | |
Detailed financial information on page 66
|
|
|
|
38 |
| January – June 2019 |
|
|
|
|
|
|
|
|
|
|
Santander vision and |
| Group financial |
| Financial information |
| Responsible banking |
| Appendix |
|
|
|
|
|
|
|
|
|
|
|
|
|
|
|
|
|
|
|
|
|
| Primary segments |
|
|
|
|
Uruguay
|
| Highlights (changes in constant euros) | |
| The Group is the country’s leading privately-owned bank, doing business with all segments and with a strategy focused on retail banking, improving efficiency and enhancing the quality of service. | ||
|
| Underlying attributable profit rose 13%, spurred by the good performance of customer revenue and improved efficiency. | |
|
|
| |
EUR 71 Mn Underlying | |||
Commercial activity and business performance
Santander continued to focus on improving customer satisfaction and increasing loyalty. Loyal customers rose 19% and now account for 24% of active clients.
We continued to advance in our digital transformation strategy and in modernising channels. The number of digital customers increased 9% (digital penetration of 48%, up from 45% in June 2018) while transactions via digital channels rose 36% year-on-year.
The Group’s consumer finance companies now lead the local market, with a market share of more than 22%. Commercial activity continued to grow briskly, with significant growth in the customer base. In line with our strategy of innovation and contributing to people’s progress, we launched Prosperá, which provides microcredits to small businesses.
Gross loans and advances to customer (excluding reverse repos) grew in target segments, products and currencies: +14% in consumer credit and cards and +19% in the national currency portfolio. Customer deposits (excluding repos) in pesos grew 11% and foreign currency deposits increased 4% year-on-year.
Results
First half of 2019 underlying attributable profit of EUR 71 million, 13% higher year-on-year.
Gross income rose 15%, driven by customer revenue, with increases in both net interest income and net fee income.
Operating expenses rose at a slower pace than total income, improving the efficiency ratio to 43% (-63 bps year-on-year).
Loan-loss provisions increased 9%, however the NPL ratio remained at a low level (3.46%), coverage was high (109%) and the cost of credit was 2.60%.
Peru Highlights (changes in constant euros)
The strategy remained focused on the corporate segment, the country’s large companies and the Group’s global customers.
The auto loan financial entity continued to expand its business within the Group’s strategy of increasing its presence in this business.
First half underlying attributable profit of EUR 19 million (+8% year-on-year). Total income rose 23% underpinned by higher net interest income, net fee income and gains on financial transactions. Operating expenses increased 12% and the efficiency ratio was 33.3% (-3.3 pp year-on-year).
The NPL ratio was 0.81%, coverage was very high and the cost of credit only 0.30%.
Colombia Highlights (changes in constant euros)
Activity in Colombia remained focused on SCIB clients, large companies and corporates, contributing solutions in treasury, risk hedging, foreign trade, confirming, custody and development of investment banking products supporting the country’s infrastructure plan.
Auto finance is also increasing. The origination share reached 2.3% (+60 bps in 12 months), in line with the strategy to attain the critical mass needed to consolidate ourselves in this market. We signed an alliance with Chekar.co, a fully digital platform for buying and selling vehicles. We will begin to grant consumer loans in the coming quarters.
Gross loans and advances to customers (excluding reverse repos) more than doubled, with growth in all business segments. Of note was the fivefold rise in auto finance. Customer deposits (excluding repos) rose 75%.
The first half underlying attributable profit was EUR 5 million (EUR 2 million in the same period of 2018). Total income grew 66%, underpinned by net interest income and net fee income, thanks to greater commercial activity.
|
|
|
|
| January – June 2019 |
| 39 |
|
|
|
|
|
|
|
|
|
Santander vision and |
| Group financial |
| Financial information |
| Responsible banking |
| Appendix |
|
|
|
|
|
|
|
|
|
|
|
|
|
|
|
|
|
|
|
|
|
| Primary segments |
|
|
|
|
|
| SANTANDER GLOBAL PLATFORM (SGP) | |
| Highlights | ||
| With the creation of Santander Global Platform, we are taking a further step forward in our digital transformation, which aligns our reporting structure with our organisation and strategy. Our goal is to extend the benefits of the talent and scale of the Group to the payment and digital businesses with higher growth, building platforms only once for all of our banks which allow us to offer the best digital services aimed at retail customers, merchants and SMEs. | ||
|
| In making our Santander Global Platform results public, we are improving the transparency around our digital investments and accelerate the execution of our initiatives. | |
|
|
| |
EUR -51 Mn Underlying | |||

|
|
|
Strategy |
|
|
In 2019, the unit is focused on the following priorities:
Openbank and Open Digital Services (ODS):
– Openbank, our digital bank in Spain, has a large base of 1.2 million customers and is increasing strongly the number of transactions (29%) and volumes. All of this with high levels of transactionality and productivity per customer and employee.
– Open Digital Services (ODS) is creating a new banking platform with a complete range of products for individuals. This platform will be used for Openbank’s international expansion. In a first phase, it will be available in Germany, Portugal, the Netherlands, Argentina and Mexico.
Global Payments Services:
– Superdigital: is aimed at the unbanked population. In a first phase, it is expected to be rolled out in Mexico and Chile, leveraging the experience in Brazil. We currently have more than 500,000 active users.
– Pago FX: aims to create an app for the open market, with low cost, transparent, same day or next day international transfers. The first phase is expected to be launched in three European countries.
– Global Merchant Services is developing a global acquiring solution, a segment that already has more than one million active customers. Taking advantage of Getnet’s capabilities, it will be installed in a first phase in Mexico and followed by the rest of Latin America.
– At Global Trade Services, we want to continue being the partner for our more than 200,000 companies that are growing and doing international business with us. The aim is to develop the platform in 2019 and an initial roll-out in the UK, Spain, Brazil and Chile. In the future, we hope to capture business in the rest of Santander geographies and the open market.
Digital Assets:
– The Centres of Digital Expertise continue leveraging the Group’s scale and ensuring all countries have access to the most innovative technologies.
– InnoVentures, our venture capital investments in the fintech ecosystem, had approximately USD 100 million invested in 24 companies in June.
– Finally, in the rest of Digital Assets, we continued to advance in Globile, our shared mobile phone platform, with more than 20 components implemented in six countries. We also progressed in Open Platform, a new cloud based technological platform used to develop corporate projects. |
|
(1) Loyal.
|
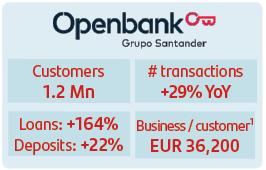


Detailed financial information on page 68
|
|
|
|
40 |
| January – June 2019 |
|
|
|
|
|
|
|
|
|
|
Santander vision and |
| Group financial |
| Financial information |
| Responsible banking |
| Appendix |
|
|
|
|
|
|
|
|
|
|
|
|
|
|
|
|
|
|
|
|
|
| Primary segments |
|
|
|
|
|
| CORPORATE CENTRE | |
| Highlights | ||
| The Corporate Centre’s objective is to aid the operating units by contributing value and carrying out the corporate function of oversight and control. It also carries out functions related to financial and capital management. | ||
|
| ||
| The underlying attributable loss was higher compared to the first half of 2018, mainly due to higher costs related to foreign currency hedging and increased stock of issuances. | ||
|
|
| |
|
|
| |
EUR ‐1,108 Mn Underlying | |||

Strategy and functions
The Corporate Centre contributes value to the Group in various ways:
It makes the Group’s governance more solid, through global control frameworks and supervision.
Fostering the exchange of best practices in management of costs and generating economies of scale. This enables us to be one of the most efficient banks.
The Corporate Centre contributes to the Group’s revenue growth, by sharing the best commercial practices, launching global commercial initiatives and accelerating the digital transformation simultaneously in all countries.
It also coordinates the relationship with European regulators and develops functions related to financial and capital management, as follows:
Financial Management functions
– Structural management of liquidity risk associated with funding the Group’s recurring activity, stakes of a financial nature and management of net liquidity related to the needs of some business units.
– This activity is carried out by the different funding sources (issuances and other), always maintaining an adequate profile in volumes, maturities and costs. The price at which these operations are made with other Group units is the market rate (Euribor or mid-swap) plus the premium, which in liquidity terms, the Group supports by immobilising funds during the term of the operation.
– Interest rate risk is also actively managed in order to soften the impact of interest rate changes on net interest income, conducted via high credit quality, very liquid and low capital consumption derivatives.
– Strategic management of the exposure to exchange rates in equity and dynamic in the countervalue of the units’ annual results in euros. Net investments in equity are currently covered by EUR 24,990 million (mainly Brazil, the UK, Mexico, Chile, the US, Poland and Norway) with different instruments (spot, fx, forwards).
Management of total capital and reserves: capital allocated to each of the units.
|
|
|
|
|
|
|
|
|
Results
First half underlying attributable loss of EUR 1,108 million, 25% higher than in the same period of 2018, largely because of three factors: the higher costs related to foreign currency hedging, the higher stock of issuances and, to a lesser extent, IFRS 16.
Operating expenses were 9% lower driven by ongoing streamlining and simplification measures. |
| Corporate Centre | ||||||
| EUR million
| |||||||
|
| Q2'19 | Q1'19 | Chg. | H1'19 | H1'18 | Chg. | |
| Gross income | -423 | -399 | +6% | -822 | -494 | +66% | |
| Net operating income | -519 | -497 | +4% | -1,015 | -706 | +44% | |
| PBT | -595 | -559 | +6% | -1,155 | -866 | +33% | |
| Underlying attrib. profit | -592 | -517 | +15% | -1,108 | -884 | +25% | |
Detailed financial information on page 69
|
|
|
|
| January – June 2019 |
| 41 |
|
|
|
|
|
|
|
|
|
Santander vision and |
| Group financial |
| Financial information |
| Responsible banking |
| Appendix |
|
|
|
|
|
|
|
|
|
|
|
|
|
|
|
|
|
|
|
|
|
| Secondary segments |
|
|
|
|
|
| ||
| Highlights (changes in constant euros) | ||
| The Group continued to focus on customer loyalty, with new products and services that cover the current needs of our customers. At end of June 2019, the Group had 142 million customers, more than 20 million of whom are loyal. | ||
| Underlying attributable profit of EUR 3,856 million in the first half, 6% higher than in the same period of 2018 due to the positive customer revenue dynamics and controlled costs. | ||
|
| Santander was named the Best Bank in Latin America and the Best SME Bank in Western Europe by Euromoney. | |
|
|
| |
EUR 3,856 Mn Underlying | |||

Commercial activity |
| Customers |
|
| June 2019. Thousands |
The Group had 142 million customers at the end of June 2019 (including 24 million consumer finance customers), almost all of whom are from the retail banking segment. In 2019, the focus remains on customer loyalty, already exceeding 20 million loyal customers, equivalent to 30% of active ones. Santander wants to be the reference bank for customers of all income levels, offering them the services and products that best meet their needs. Furthermore, we are fostering entrepreneurship, helping SMEs and other companies via loans and non-financial support such as training and access to our networks. As a universal bank, we continued to reinforce our business with new products and services. Of note in the second quarter were: – In Spain, launch of Cuenta Mundo for non-residents, via a differential value proposition with a package of innovative products and services. We also extended Santander Personal, the remote management model, for individuals and companies. – In Poland, we launched a new commercial website. Santander’s online service is now also available in more languages. – In Portugal, the commercial transformation continued with the renewal of the offer and benefits in Mundo 1|2|3 and a stronger presence in the agrifood sector. – In Mexico, SuperMóvil incorporates new functionalities, notably Santander Tap, a transfer system by instant message for operations between customers and for sending money to customer of other banks, at any time and with no fees. – In Brazil, Santander Duo was announced for small entrepreneurs, which combines accounts of a legal and natural person and has a single customer service manager. – In Chile, launch of the Súper Hipoteca for those under the age of 35 and new Santander Life products. Branches continued to be opened based on the Work Café model. All of these measures helped to boost the number of loyal customers (+11% individuals and +7% companies year-on-year). |
|
|
| Activity
June 2019. EUR billion and % change in constant euros
|
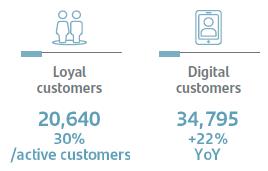
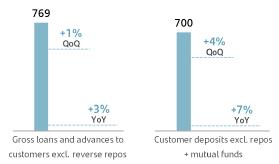
Results |
|
| |||||
The first half underlying attributable profit rose 6%, driven by the good dynamics in customer revenue (+5%) and controlled costs. Of note was the performance of North America and South America. |
| Underlying income statement | |||||
EUR million and % change in constant euros
| |||||||
|
| Q2'19 | /Q1'19 |
| H1'19 | /H1'18 | |
|
|
|
|
|
|
| |
| Revenue | 10,881 | +3% |
| 21,528 | +4% | |
| Expenses | -4,882 | +2% |
| -9,712 | +2% | |
| LLPs | -2,090 | -3% |
| -4,251 | +5% | |
| PBT | 3,512 | +9% |
| 6,776 | +7% | |
| Underlying attrib. profit | 2,053 | +15% |
| 3,856 | +6% | |
Detailed financial information on page 70
|
|
|
|
42 |
| January – June 2019 |
|
|
|
|
|
|
|
|
|
|
Santander vision and |
| Group financial |
| Financial information |
| Responsible banking |
| Appendix |
|
|
|
|
|
|
|
|
|
|
|
|
|
|
|
|
|
|
|
|
|
| Secondary segments |
|
|
|
|
|
| CORPORATE & INVESTMENT BANKING | |
| Highlights (changes in constant euros) | ||
| Santander is among the leaders in Latin America and Europe, particularly in export & agency finance, and structured financing. | ||
| In capital markets, we are one of the main bookrunners of green bonds in Spain and Europe. We continued to advance in our mission to help our global customers in their capital issuances, providing them with financing solutions and transaction services. We also continued to adapt our offer of products to the Bank’s digital transformation. | ||
|
| Underlying attributable profit was 10% higher year-on-year, driven by growth in revenue and lower loan-loss provisions. | |
|
|
| |
EUR 889 Mn Underlying | |||

Commercial activity |
| Activity |
|
| June 2019. EUR billion and % change in constant euros |
Cash management: we consolidated our leadership in our main countries, particularly in Latin America. We also grew strongly in the US, the result of strengthening our product capacities. Trade & Working Capital Solutions: strong growth in all products, particularly in receivables finance, structured trade and trade funding. Of note was the positive evolution in the US where we secured growth with our local clients and in Latin America. Corporate Finance: Notable participation in the re-IPO of CPFL Energía, the largest operation this year in Brazil, where Santander was the main global coordinator, thereby strengthening our position in the Brazilian market. We maintained our leadership in Spain, Portugal, Mexico and Poland. Debt Capital Markets: Santander continued to be the leader in Latin America and was among the Top 5 in European corporate issuances. Also noteworthy was our increased participation in dollar issues and the focus on activities linked to sustainable finance, making us one of the leading bookrunners of green bonds in Spain and Europe. Syndicated Corporate Loans: Santander continued to play a key role in corporate financing, although the volumes of financing acquisitions were very affected by the lack of M&A activity. In line with our responsible banking strategy, Santander is increasing its range of sustainable finance products via green loans and/or linked to sustainable indices such as that of Merlín, Spain’s largest syndicated real estate loan so far, or Goldwind which launched the first syndicated green loan in Asia. Structured Financing: the Group held its global leadership position in Project Bonds, having issued more globally than any other bank. In structured loans, Santander is the leader by volume in Latin America and the third in Europe. The contribution from markets’ activity remained stable: the positive evolution of markets in the Americas offset the reduced activity in Europe. Good sales performance in Brazil, Chile, and Argentina, as well as management of books in the UK, US, Argentina and Chile. |
|
|
| Total income breakdown | |
| Constant EUR million | |
|
|
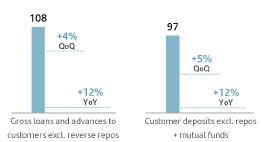
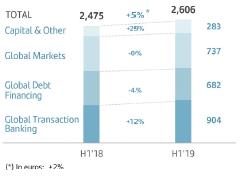
Results |
|
| |||||
The first half underlying attributable profit was 10% higher at EUR 889 million, underpinned by the good results of Global Transaction Banking and maintaining operations in Global Markets, which offset the lower activity in Global Debt Finance. Revenue growth and lower provisions absorbed the higher costs in transformational projects. |
| Underlying income statement | |||||
EUR million and % change in constant euros
| |||||||
|
| Q2'19 | /Q1'19 |
| H1'19 | /H1'18 | |
|
|
|
|
|
|
| |
| Revenue | 1,313 | +2% |
| 2,606 | +5% | |
| Expenses | -559 | 0% |
| -1,119 | +9% | |
| LLPs | -46 | +375% |
| -55 | ‐56% | |
| PBT | 693 | 0% |
| 1,396 | +8% | |
| Underlying attrib. profit | 434 | -3% |
| 889 | +10% | |
Detailed financial information on page 70
|
|
|
|
| January – June 2019 |
| 43 |
|
|
|
|
|
|
|
|
|
Santander vision and |
| Group financial |
| Financial information |
| Responsible banking |
| Appendix |
|
|
|
|
|
|
|
|
|
|
|
|
|
|
|
|
|
|
|
|
|
| Secondary segments |
|
|
|
|
|
| WEALTH MANAGEMENT & INSURANCE | |
| Highlights (changes in constant euros) | ||
| Insurance business was incorporated into this Division during the second quarter, having restated previous periods for comparison purposes. | ||
| The first half underlying attributable profit was 10% higher than in the same period of 2018. | ||
| Total contribution (net profit + fee income) amounted to EUR 1,227 million, 8% more than in the first half of 2018. | ||
|
| Assets under management amounted to EUR 377,000 million, +3% year-on-year. | |
|
|
| |
EUR 459 Mn Underlying | |||

Commercial activity |
| Total profit contribution |
|
| % change in constant euros |
We continued to progress in our strategy to make us the best wealth manager in Europe and Latin America: – Santander Asset Management (SAM): is developing its own rating methodology in order to make the alignment of all our funds with the market’s ESG criteria transparent. In Spain, we are the leaders with 66% share of ESG mutual funds and in Latin America we continue to develop the offering. – In Private Banking: we are developing a global platform. The SPB Desk will provide customer attention and service offering across geographies to our global clients. Our digital tools for clients (Virginia) and bankers (SPiRIT) were recognised for providing the best solutions in Latin America in the Financial Times 2019 Wealth Tech Awards. – In Insurance, we are completing our value proposition with the aim to become the leaders in bancassurance in all our markets. Of note is the creation of a joint company with MAPFRE to provide car insurance and specific products for SMEs in Spain, and the alliance with HDI in car business in Brazil. |
|
Distributed insurance premiums % change in constant euros
|
Business performance |
| Business performance |
Total assets under management at the end of June 2019 amounted to EUR 377 billion (+3% year-on-year), with increases in Private Banking as well as in SAM: – In 2019, SAM increased its market share in almost all countries, notably in Spain and Chile. – Of note in Private Banking grew in Brazil (+13%) and Chile (+10%). Loans and advances to customers grew 9%. In Insurance, in the first half of 2019, premium volumes grew 10% compared to the same period last year. Of note was the growth in Spain, Mexico and Brazil. |
| June 2019. EUR billion and % change in constant euros |
|
(*) Total adjusted for funds from private banking customers managed by SAM Note: Total assets marketed and/or managed in 2019 and 2018 |
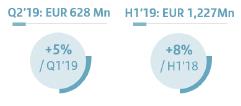

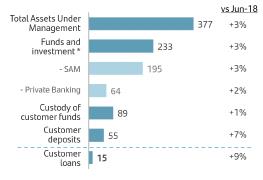
Results |
|
| |||||
The first half underlying attributable profit was EUR 459 million, 10% more year-on-year:
Higher revenue, from growth in net interest income, in line with greater lending, as well as the larger contribution from insurance.
Flat operating expenses, due to optimisation measures which offset investments in platforms.
Recovery of provisions from reduced doubtful loan positions, mainly in Spain.
When the total fee income generated by this business is added to net profit, the total contribution to the Group was EUR 1,227 million, 8% more year-on-year. |
| Underlying income statement | |||||
EUR million and % change in constant euros
| |||||||
|
| Q2'19 | /Q1'19 |
| H1'19 | / H1'18 | |
|
|
|
|
|
|
| |
| Revenue | 560 | +7% |
| 1,085 | +6% | |
| Expenses | ‐226 | ‐2% |
| -455 | +2% | |
| LLPs | 0 | — |
| 7 | — | |
| PBT | 332 | +12% |
| 632 | +10% | |
| Underlying attrib. profit | 241 | 11% |
| 459 | +10% | |
The total fee income generated, including those transferred to the commercial network, represents 30% of the Group's total and rose 4%. |
|
|
|
|
|
|
|
Detailed financial information on page 71
|
|
|
|
44 |
| January – June 2019 |
|
|
|
|
|
|
|
|
|
|
Santander vision and |
| Group financial |
| Financial information |
| Responsible banking |
| Appendix |
|
|
|
|
|
|
|
|
|
|
|
|
|
|
|
|
|
|
|
|
|
|
|
| Responsible banking |
|
|
In 2018, the responsible banking, sustainability & culture committee (RBSCC) was created to ensure that, wherever we operate, our manage teams are aware of the need to be responsible in all that we do and in the management of the challenges we face. We have identified two challenges: adapt to the new business environment and support inclusive and sustainable growth.
Santander is helping to address today’s main global challenges
Our activity and investments help us to address a number of the United Nations’ Sustainable Development Goals, and support the Paris Agreement’s aim to combat climate change and adapt to its effects. We are:

Promoting the UNEP FI Principles for Responsible Banking, embedding sustainability across all its business areas and contributing to develop methods to align with the Paris Agreement.
Incorporating the UN Global Compact principles into our policies and procedures, fulfilling our fundamental responsibilities in the areas of human rights, labour, environment and anticorruption.
Supporting the Task Force for Climate-related Financial Disclosure (TCFD) recommendations, identifying and assessing risk and opportunities developing a forward looking climate strategy and disclosing to stakeholders.
Included in various sustainability indices, providing non-financial information to markets, investors and analysts on ESG:

Two key challenges have been identified and we have recently published our commitments regarding these challenges:
|
|
|
Challenge 1: Adapt to the new business environment: |
| Challenge 2: Support inclusive and sustainable growth: |
|
|
|
Our commitments:
– Be one of the top 10 companies to work for in at least 6 of the core geographies where we operate by 2021.
– Have 40% - 60% of women members on our Group Board by 2021; and have at least 30% of women in senior leadership positions by 2025.
– Achieve gender pay equality by 2025.
|
| Our commitments:
– Financial empowerment of more than 10 million people from 2019 to 2025.
– Mobilisation of EUR 120 billion from 2019 to 2025, and EUR 220 bn from 2019 to 2030 in green finance to help tackle climate change.
– Eliminate unnecessary single use plastic in our branches and corporate buildings by 2021 and by 2025 have 100% of our electricity from renewable sources.
– Fund 200,000 scholarships, internships and entrepreneurs programmes from 2019 to 2021.
– Help 4 million people through our community programmes from 2019 to 2021.
|
|
|
|
|
| January – June 2019 |
| 45 |
|
|
|
|
|
|
|
|
|
Santander vision and |
| Group financial |
| Financial information |
| Responsible banking |
| Appendix |
|
|
|
|
|
|
|
|
|
|
|
|
|
|
|
|
|
|
|
|
|
|
|
|
|
|
|
|
| Santander Responsible banking targets |
|
|
|

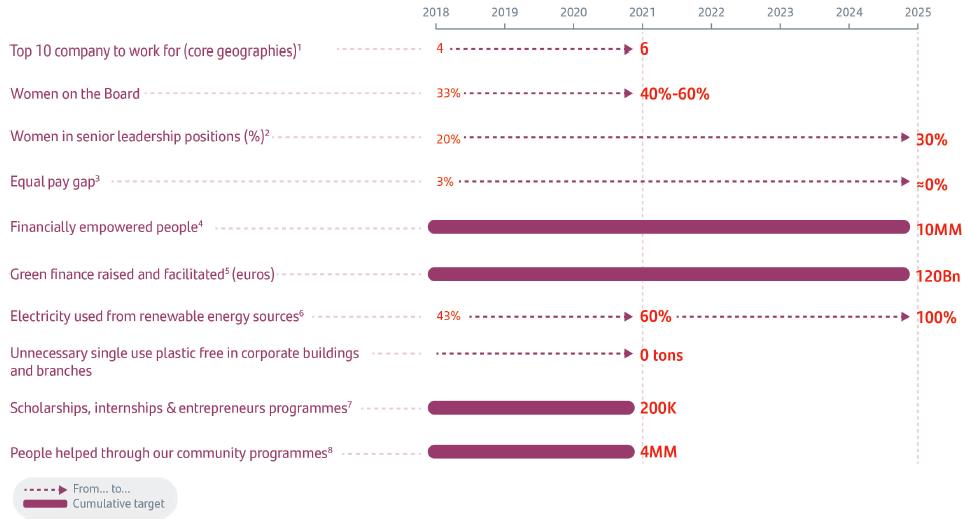
1. According to a well-known external source in each country (Great Place to Work, Top Employer, Merco, etc.).
2. Senior positions represent 1% of total workforce.
3. Calculation of equal pay gap compares employees of the same job, level and function.
4. Financially empowered people (mostly unbanked and underbanked), through products and services and social investment initiatives, to get access to the financial system, receive tailored finance and increase their knowledge and resilience through financial education.
5. Includes Santander overall contribution to green finance: project finance, syndicated loans, green bonds, capital finance, export finance, advisory, structuring and other products to help our clients in the transition to a low carbon economy. Commitment from 2019 to 2030 is EUR 220 billion.
6. In those countries where it is possible to certify renewable sourced electricity for the properties occupied by the Group.
7. People supported through Santander Universities initiative (students who will receive a Santander scholarship, will achieve an internship in an SME or participate in entrepreneurship programmes supported by the bank).
8. People helped through our community investment programmes (excluded Santander Universities and financial education initiatives).
First half 2019 highlights | ||
|
|
|
| SCIB financed Acciona's first ESG loan in the Chilean market in May 2019 for USD 30 million. In Spain, Santander is classified as first in the Spanish ranking of sustainable debt issues according to Dealogic, after participating as a joint bookrunner in Telefónica, Iberdrola, Adif, ICO and the Basque Country government. |
|
|
| Santander Wealth Management & Insurance has a range of ESG mutual funds (Santander Sostenible) that make us the leader with a 66% market share. |


|
|
|
|
46 |
| January – June 2019 |
|
|
|
|
|
|
|
|
|
|
Santander vision and |
| Group financial |
| Financial information |
| Responsible banking |
| Appendix |
|
|
|
|
|
|
|
|
|
|
|
|
|
|
|
|
|
|
|
|
|
|
|
| Corporate governance |
|
|
|
|
A responsible bank has a solid governance model with well-defined functions; it manages risks and opportunities prudently and defines its long-term strategy watching out for the interests of all its stakeholders and society in general |
|

Extraordinary General Meeting of Shareholders
An extraordinary general meeting was called on June 21 for July 23, 2019 (second call) in order to submit for shareholders’ approval the capital increases needed to carry out the offer to acquire all the share capital of Banco Santander México, S.A., Institución de Banca Multiple, Grupo Financiero Santander México, which are not owned by Grupo Santander, as announced on April 12, 2019.
In order to facilitate the informed participation of shareholders at this meeting, all the proposed agreements, relevant administrator reports and the necessary legal documentation were published on the Group’s website (www.santander.com) when the meeting was called. The contents of our website are not incorporated into this report.
Changes in the board in the second quarter
As of May 1, 2019, Mr. Rodrigo Echenique Gordillo no longer exercises his executive functions in the Group and ceases to be a deputy chairman of the board and a member of its executive committee. As such, he becomes a non-executive director (neither proprietary nor independent).
On June 19, 2019, authorisation was received from the European Central Bank to appoint Mr. Henrique de Castro as a director of the
Bank, who will join the Board on July 17, 2019.
Changes to the composition of the board’s committees in the second quarter
As of May 1, 2019, Mr. Rodrigo Echenique Gordillo is a member of the appointments committee.
On July 23, 2019, Mr. Henrique de Castro will join the innovation and technology committee.
Changes to the Group’s senior management in the second quarter
Ms. Mónica López-Monis Gallego was appointed on May 7, 2019 the new head of supervisory and regulatory relations.
SIGNIFICANT EVENTS SINCE QUARTER END
From July 1, 2019 until the approval date of the interim financial statements for the six-month period ended June 30, 2019, no significant events other than those indicated in the interim financial statements have occurred.
|
|
|
|
| January – June 2019 |
| 47 |
|
|
|
|
|
|
|
|
|
Santander vision and |
| Group financial |
| Financial information |
| Responsible banking |
| Appendix |
|
|
|
|
|
|
|
|
|
|
|
|
|
|
|
|
|
|
|
|
|
|
|
| Santander share |
|
|
Shareholder remuneration |
| Dividend |
The fourth dividend of EUR 0.065 per share charged to 2018’s earnings was paid in cash in May 2019.
This brought the total shareholder remuneration for 2018 to EUR 0.23 per share, 4.5% more than in 2017.
This remuneration represents a return on the average share price in 2019 of 5.5%.
In order to align us with the current practices of our peers in Europe, the board's target is to maintain in the medium term a pay-out ratio of 40%-50%, up from the previous 30%-40% target, and, as announced at the 2018 annual general meeting, make two payments charged to 2019’s earnings. The board expects to announce the interim 2019 dividend after its meeting in September 2019.
Share price performance
The Santander share is listed in five markets, in Spain, Mexico and Poland as an ordinary share, in the UK as a CDI and in the US as an ADR.
In Spain, the main market where the Bank is listed, the share price ended June 2019 at EUR 4.081, 2.7% higher than at the end of 2018. This performance was below that of the Ibex 35 benchmark Spanish index, which rose 7.7%, and that of the DJ Stoxx 50 and MSCI World Banks (+15.2% and +9.5%, respectively), but above DJ Stoxx Banks, the main European banking index (+0.9%).
|
| Euro cents / share
|
In terms of total return, the Santander share increased 5.8% in the first half, better than the DJ Stoxx Banks (+5.0%). |
| Dividend 2019 |
|
| |
|
|
|
|
| Share price |
|
|
|
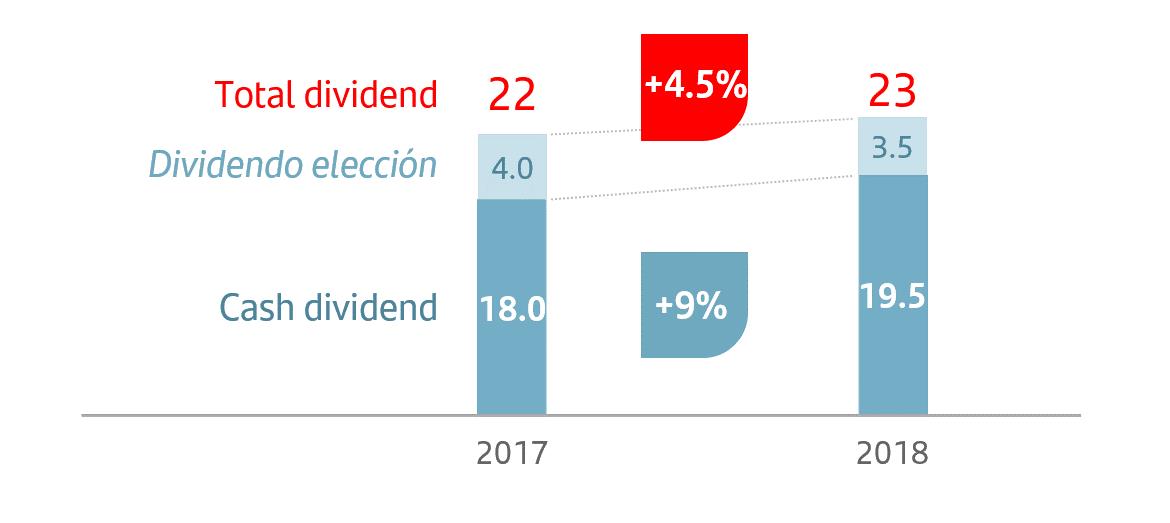
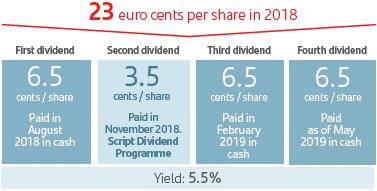

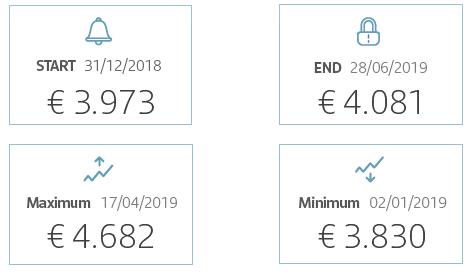
s |
Comparative share performance |
|
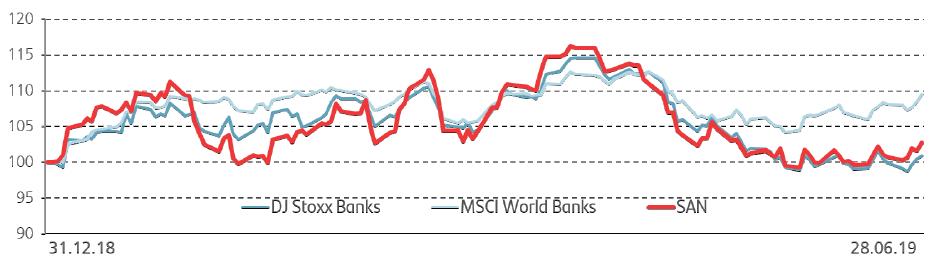
|
|
|
|
48 |
| January – June 2019 |
|
|
|
|
|
|
|
|
|
|
Santander vision and |
| Group financial |
| Financial information |
| Responsible banking |
| Appendix |
|
|
|
|
|
|
|
|
|
|
|
|
|
|
|
|
|
|
|
|
|
|
|
| Santander share |
|
|
SANTANDER SHARE
Market capitalisation and trading |
|
| |
By June 28, 2019, Santander was the largest bank in the Eurozone by market capitalisation and the 19th in the world among financial entities (EUR 66,253 million).
The share’s weighting in the DJ Stoxx 50 at the end of June 2019 was 1.8%, 8.1% in the DJ Stoxx Banks and 13.9% in the Ibex 35.
|
| ||
A total of 10,262 million Santander shares were traded in the first half for an effective value of EUR 43,668 million, the largest figure among the shares that comprise the EuroStoxx (liquidity ratio of 63%). |
| The Santander share | |
| June 2019 |
| |
|
|
| |
|
| Shares and trading data |
|
The daily trading volume was 82 million shares with an effective value of EUR 349 million. |
| Shares (number) | 16,236,573,942 |
| Average daily turnover (number of shares) | 82,094,277 | |
|
| Share liquidity (%) | 63 |
|
| (Number of shares traded during the year / number of shares) |
|
|
|
|
|
|
| Stock market indicators |
|
|
| Price / Tangible book value (X) | 0.95 |
|
| P/E ratio (X) | 11.29 |
|
| Free float (%) | 99.98 |

|
|
|
Shareholder base |
| Share capital distribution by type of shareholder |
The total number of Santander shareholders on June 30, 2019 was 4,054,208 of which 3,809,676 were European (77.1% of the capital stock) and 228,225 from the Americas (21.9%).
Excluding the board, which holds 1.1% of the Bank’s capital stock, retail shareholders account for 39.5% and institutional shareholders 59.4%. |
| June 2019
(*) Shares owned or represented by directors. |
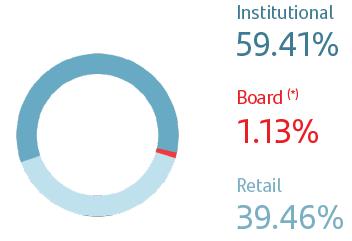
|
|
|
| Share capital distribution by geographic area |
|
| June 2019
|
|
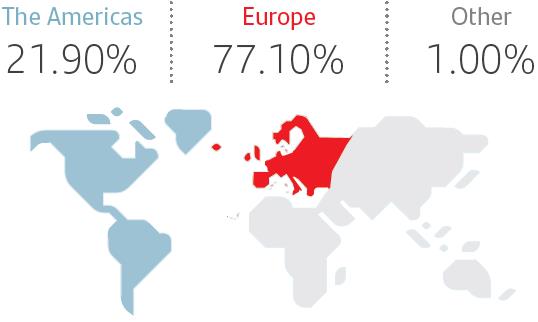
|
|
|
|
| January – June 2019 |
| 49 |
|
|
|
|
|
|
|
|
|
Santander vision and |
| Group financial |
| Financial information |
| Responsible banking |
| Appendix |
|
|
|
|
|
|
|
|
|
|
|
|
|
|
|
|
|
|
|
|
|
|
|
|
|
|
|
|
|
|
|
|
|
|
|
|
|
|
|
|
|
|
|
|
Santander vision and |
| Group financial |
| Financial information |
| Responsible banking |
| Appendix |
|
|
|
|
|
|
|
|
|
|
|
|
|
|
|
|
|
|
|
|
|
|
|
|
|
| Group financial information |
|
|
|
|
|
|
|
|
|
|
|
|
|
|
|
|
|
|
|
| |
EUR million |
|
|
|
|
|
|
| Q2'19 | Q1'19 | Chg. % | H1’19 | H1'18 | Chg. % |
Fees from services | 1,734 | 1,779 | (2.5) | 3,513 | 3,603 | (2.5) |
Wealth management and marketing of customer funds | 962 | 936 | 2.8 | 1,898 | 1,840 | 3.2 |
Securities and custody | 236 | 216 | 9.3 | 452 | 446 | 1.3 |
Net fee income | 2,932 | 2,931 | 0.0 | 5,863 | 5,889 | (0.4) |
|
|
|
|
|
|
|
Operating expenses. Consolidated |
|
|
|
|
|
|
EUR million |
|
|
|
|
|
|
| Q2'19 | Q1'19 | Chg. % | H1'19 | H1'18 | Chg. % |
Staff costs | 3,074 | 3,006 | 2.3 | 6,080 | 5,960 | 2.0 |
Other general administrative expenses | 2,025 | 2,005 | 1.0 | 4,030 | 4,305 | (6.4) |
Information technology | 562 | 551 | 2.0 | 1,113 | 763 | 46.0 |
Communications | 132 | 132 | — | 264 | 262 | 0.9 |
Advertising | 168 | 157 | 7.0 | 325 | 310 | 4.8 |
Buildings and premises | 218 | 211 | 3.3 | 429 | 927 | (53.7) |
Printed and office material | 31 | 32 | (3.1) | 63 | 62 | 2.3 |
Taxes (other than tax on profits) | 138 | 126 | 9.5 | 264 | 287 | (7.9) |
Other expenses | 776 | 796 | (2.5) | 1,572 | 1,695 | (7.3) |
Administrative expenses | 5,099 | 5,011 | 1.8 | 10,110 | 10,265 | (1.5) |
Depreciation and amortisation | 730 | 747 | (2.3) | 1,477 | 1,217 | 21.4 |
Operating expenses | 5,829 | 5,758 | 1.2 | 11,587 | 11,482 | 0.9 |
(1) In H1'19, impact of the IFRS 16 application.
|
|
|
|
|
|
|
|
|
|
|
|
|
|
Operating means. Consolidated |
|
|
|
|
|
|
|
|
|
|
|
|
|
| Employees | Branches | ||||
| Jun‑19 | Jun‑18 | Var. | Jun‑19 | Jun‑18 | Var. |
Europe | 91,488 | 92,521 | (1,033) | 6,427 | 6,912 | (485) |
Spain | 30,682 | 31,393 | (711) | 4,247 | 4,468 | (221) |
Santander Consumer Finance | 14,494 | 15,083 | (589) | 424 | 442 | (18) |
United Kingdom | 25,761 | 25,829 | (68) | 659 | 779 | (120) |
Portugal | 6,736 | 6,940 | (204) | 553 | 672 | (119) |
Poland | 11,488 | 11,494 | (6) | 532 | 540 | (8) |
Other | 2,327 | 1,782 | 545 | 12 | 11 | 1 |
North America | 36,917 | 36,270 | 647 | 2,062 | 2,072 | (10) |
US | 17,381 | 17,191 | 190 | 646 | 670 | (24) |
Mexico | 19,536 | 19,079 | 457 | 1,416 | 1,402 | 14 |
South America | 71,158 | 69,997 | 1,161 | 4,591 | 4,497 | 94 |
Brazil | 48,118 | 46,672 | 1,446 | 3,643 | 3,490 | 153 |
Chile | 11,797 | 12,023 | (226) | 380 | 420 | (40) |
Argentina | 9,183 | 9,222 | (39) | 469 | 482 | (13) |
Other | 2,060 | 2,080 | (20) | 99 | 105 | (6) |
Santander Global Platform | 597 | 427 | 170 | 1 | 1 | — |
Corporate Centre | 1,644 | 1,746 | (102) |
|
|
|
Total Group | 201,804 | 200,961 | 843 | 13,081 | 13,482 | (401) |
|
|
|
|
|
|
|
Impairment or reversal of impairment of financial assets not measured at fair value through profit or loss (net) | ||||||
EUR million | ||||||
|
|
|
|
|
|
|
| Q2'19 | Q1'19 | Chg. % | H1'19 | H1'18 | Chg. % |
Net loan-loss provisions | 2,141 | 2,172 | (1.4) | 4,313 | 4,297 | 0.4 |
Non-performing loans | 2,637 | 2,515 | 4.9 | 5,152 | 5,112 | 0.8 |
Country-risk | (2) | 1 | — | (1) | 9 | — |
Recovery of written-off assets | (494) | (344) | 43.6 | (838) | (823) | 1.8 |
Other impairment | (19) | 74 | (125.7) | 55 | 55 | (134.8) |
Total | 2,122 | 2,246 | (5.5) | 4,368 | 4,352 | (51.2) |
|
|
|
|
| January – June 2019 |
| 51 |
Santander vision and |
| Group financial |
| Financial information |
| Responsible banking |
| Appendix |
|
|
|
|
|
|
|
|
|
|
|
|
|
|
|
|
|
|
|
|
|
|
|
|
|
| Group financial information |
|
|
|
|
|
|
Loans and advances to customers. Consolidated | |||||
EUR million | |||||
|
|
| Change |
| |
| Jun-19 | Jun-18 | Absolute | % | Dec-18 |
Commercial bills | 34,275 | 30,301 | 3,974 | 13.1 | 33,301 |
Secured loans | 495,091 | 475,428 | 19,663 | 4.1 | 478,068 |
Other term loans | 270,244 | 261,538 | 8,706 | 3.3 | 265,696 |
Finance leases | 34,534 | 29,804 | 4,730 | 15.9 | 30,758 |
Receivable on demand | 8,689 | 9,936 | (1,247) | (12.6) | 8,794 |
Credit cards receivable | 23,031 | 20,728 | 2,303 | 11.1 | 23,083 |
Impaired assets | 33,045 | 35,150 | (2,105) | (6.0) | 34,218 |
Gross loans and advances to customers (excl. reverse repos) | 898,909 | 862,885 | 36,024 | 4.2 | 873,918 |
Reverse repos | 32,049 | 23,523 | 8,526 | 36.2 | 32,310 |
Gross loans and advances to customers | 930,958 | 886,408 | 44,550 | 5.0 | 906,228 |
Loan-loss allowances | 22,723 | 24,316 | (1,593) | (6.6) | 23,307 |
Loans and advances to customers | 908,235 | 862,092 | 46,143 | 5.4 | 882,921 |
|
|
|
|
|
|
Total funds. Consolidated | |||||
EUR million | |||||
|
|
| Change |
| |
| Jun-19 | Jun-18 | Absolute | % | Dec-18 |
Demand deposits | 573,079 | 535,084 | 37,995 | 7.1 | 548,711 |
Time deposits | 206,431 | 196,154 | 10,277 | 5.2 | 199,025 |
Mutual funds | 174,294 | 163,790 | 10,504 | 6.4 | 157,888 |
Customer funds | 953,804 | 895,028 | 58,776 | 6.6 | 905,624 |
Pension funds | 15,602 | 15,900 | (298) | (1.9) | 15,393 |
Managed portfolios | 28,122 | 27,248 | 874 | 3.2 | 26,785 |
Repos | 35,241 | 43,187 | (7,946) | (18.4) | 32,760 |
Total funds | 1,032,769 | 981,363 | 51,406 | 5.2 | 980,562 |
|
|
|
|
|
|
Eligible capital (fully loaded) | |||||
EUR million | |||||
|
|
| Change |
| |
| Jun-19* | Jun-18 | Absolute | % | Dec-18 |
Capital stock and reserves | 117,699 | 116,371 | 1,327 | 1.1 | 114,147 |
Attributable profit | 3,231 | 3,752 | (521) | (13.9) | 7,810 |
Dividends | (1,615) | (1,635) | 19 | (1.2) | (3,292) |
Other retained earnings | (22,937) | (25,341) | 2,404 | (9.5) | (23,606) |
Minority interests | 6,893 | 6,567 | 325 | 5.0 | 6,981 |
Goodwill and intangible assets | (28,810) | (28,726) | (84) | 0.3 | (28,644) |
Other deductions | (6,054) | (6,741) | 687 | (10.2) | (6,492) |
Core CET1 | 68,406 | 64,248 | 4,158 | 6.5 | 66,904 |
Preferred shares and other eligible T1 | 8,690 | 8,824 | (134) | (1.5) | 8,934 |
Tier 1 | 77,096 | 73,072 | 4,024 | 5.5 | 75,838 |
Generic funds and eligible T2 instruments | 12,544 | 11,646 | 897 | 7.7 | 11,669 |
Eligible capital | 89,640 | 84,718 | 4,921 | 5.8 | 87,506 |
Risk-weighted assets | 605,470 | 594,754 | 10,716 | 1.8 | 592,319 |
CET1 capital ratio | 11.30 | 10.80 | 0.50 |
| 11.30 |
T1 capital ratio | 12.73 | 12.29 | 0.44 |
| 12.80 |
Total capital ratio | 14.80 | 14.24 | 0.56 |
| 14.77 |
|
|
|
|
|
|
(*) Applying a 50% pay-out in the calculation of the capital ratios. |
|
|
|
|
|
|
|
|
|
52 |
| January – June 2019 |
|
|
|
|
|
|
|
|
|
|
Santander vision and |
| Group financial |
| Financial information |
| Responsible banking |
| Appendix |
|
|
|
|
|
|
|
|
|
|
|
|
|
|
|
|
|
|
|
|
|
|
|
|
|
| Financial information |
|
|
|
|
|
|
|
EUROPE |
|
|
|
|
|
|
EUR million |
|
|
|
|
|
|
|
| / Q1'19 |
| / H1'18 | ||
Underlying income statement | Q2’19 | % | % excl. FX | H1'19 | % | % excl. FX |
Net interest income | 3,580 | 0.5 | 0.5 | 7,141 | 1.9 | 1.8 |
Net fee income | 1,304 | (1.7) | (1.8) | 2,630 | (4.5) | (4.6) |
Gains (losses) on financial transactions (1) | 146 | (21.1) | (21.3) | 332 | (31.1) | (31.3) |
Other operating income | 158 | 4.1 | 4.2 | 310 | 11.5 | 11.3 |
Total income | 5,188 | (0.7) | (0.7) | 10,413 | (1.1) | (1.1) |
Administrative expenses and amortisations | (2,789) | (0.5) | (0.5) | (5,591) | (1.3) | (1.5) |
Net operating income | 2,399 | (1.0) | (1.0) | 4,822 | (0.7) | (0.7) |
Net loan-loss provisions | (387) | (15.3) | (15.4) | (844) | (1.8) | (1.7) |
Other gains (losses) and provisions | (231) | 17.0 | 17.0 | (429) | 10.5 | 10.5 |
Profit before tax | 1,781 | 0.7 | 0.7 | 3,549 | (1.7) | (1.7) |
Tax on profit | (475) | (3.5) | (3.5) | (967) | (0.9) | (0.9) |
Profit from continuing operations | 1,306 | 2.3 | 2.3 | 2,583 | (2.0) | (2.0) |
Net profit from discontinued operations | — | — | — | — | — | — |
Consolidated profit | 1,306 | 2.3 | 2.3 | 2,583 | (2.0) | (2.0) |
Non-controlling interests | (116) | 2.1 | 1.9 | (229) | 7.4 | 8.0 |
Underlying attributable profit to the parent | 1,191 | 2.4 | 2.4 | 2,354 | (2.8) | (2.8) |

Balance sheet | ||||||
Loans and advances to customers | 650,061 | (0.9) | 0.9 | 650,061 | 2.4 | 2.8 |
Cash, central banks and credit institutions | 200,873 | 10.6 | 12.5 | 200,873 | 13.2 | 13.7 |
Debt instruments | 113,844 | (1.8) | (0.4) | 113,844 | (2.7) | (2.5) |
Other financial assets | 51,503 | (5.4) | (2.6) | 51,503 | (11.3) | (10.7) |
Other asset accounts | 42,961 | (4.1) | (3.1) | 42,961 | (8.1) | (8.0) |
Total assets | 1,059,243 | 0.6 | 2.4 | 1,059,243 | 2.4 | 2.8 |
Customer deposits | 589,590 | 0.4 | 2.0 | 589,590 | 3.3 | 3.6 |
Central banks and credit institutions | 204,741 | 1.4 | 3.3 | 204,741 | 0.1 | 0.4 |
Marketable debt securities | 129,654 | 0.4 | 2.7 | 129,654 | 4.9 | 5.6 |
Other financial liabilities | 63,161 | 4.8 | 7.3 | 63,161 | 3.4 | 4.4 |
Other liabilities accounts | 17,466 | (5.2) | (4.2) | 17,466 | (15.1) | (15.0) |
Total liabilities | 1,004,613 | 0.7 | 2.6 | 1,004,613 | 2.4 | 2.9 |
Total equity | 54,629 | (1.8) | (0.5) | 54,629 | 2.1 | 2.2 |
|
|
|
|
|
|
|
Memorandum items: | 638,237 | (0.2) | 1.5 | 638,237 | 2.0 | 2.3 |
Customer funds | 658,498 | 0.9 | 2.3 | 658,498 | 4.7 | 5.0 |
Customer deposits (3) | 573,618 | 0.7 | 2.2 | 573,618 | 5.1 | 5.4 |
Mutual funds | 84,880 | 2.6 | 3.0 | 84,880 | 2.6 | 2.6 |
|
|
|
|
|
|
|
Ratios (%) and operating means |
|
|
|
|
|
|
Underlying RoTE | 9.80 | 0.19 |
| 9.72 | (0.76) |
|
Efficiency ratio | 53.7 | 0.1 |
| 53.7 | (0.2) |
|
NPL ratio | 3.48 | (0.13) |
| 3.48 | (0.49) |
|
NPL coverage | 49.9 | 0.4 |
| 49.9 | (3.0) |
|
Number of employees | 91,488 | (1.7) |
| 91,488 | (1.1) |
|
Number of branches | 6,427 | (4.0) |
| 6,427 | (7.0) |
|
(1) Includes exchange differences.
(2) Excluding reverse repos.
(3) Excluding repos.
|
|
|
|
| January – June 2019 |
| 53 |
|
|
|
|
|
|
|
|
|
Santander vision and |
| Group financial |
| Financial information |
| Responsible banking |
| Appendix |
|
|
|
|
|
|
|
|
|
|
|
|
|
|
|
|
|
|
|
|
|
|
|
|
|
| Financial information |
|
|
|
|
|
|
Spain |
|
|
|
|
|
EUR million |
|
|
|
|
|
|
| / Q1'19 |
|
| s/ H1'18 |
Underlying income statement | Q2'19 | % |
| H1’19 | % |
Net interest income | 1,009 | (0.0) |
| 2,018 | 1.1 |
Net fee income | 624 | 0.1 |
| 1,247 | (6.9) |
Gains (losses) on financial transactions (1) | 214 | 79.1 |
| 333 | 22.8 |
Other operating income | 2 | (97.6) |
| 107 | (23.0) |
Total income | 1,849 | (0.4) |
| 3,706 | (1.1) |
Administrative expenses and amortisations | (1,020) | (0.5) |
| (2,044) | (7.3) |
Net operating income | 829 | (0.3) |
| 1,661 | 7.9 |
Net loan-loss provisions | (228) | (6.0) |
| (470) | 7.7 |
Other gains (losses) and provisions | (143) | 28.1 |
| (255) | 9.7 |
Profit before tax | 458 | (4.1) |
| 936 | 7.4 |
Tax on profit | (120) | (0.9) |
| (242) | 15.4 |
Profit from continuing operations | 338 | (5.2) |
| 694 | 4.9 |
Net profit from discontinued operations | — | — |
| — | — |
Consolidated profit | 338 | (5.2) |
| 694 | 4.9 |
Non-controlling interests | 0 | 110.6 |
| 0 | — |
Underlying attributable profit to the parent | 338 | (5.1) |
| 694 | 5.0 |
|
|
|
|
|
|
|
|
|
|
|
|
Balance sheet |
|
|
|
|
|
Loans and advances to customers | 194,417 | 0.1 |
| 194,417 | (3.9) |
Cash, central banks and credit institutions | 87,193 | 8.3 |
| 87,193 | 14.7 |
Debt instruments | 39,289 | (6.3) |
| 39,289 | (24.2) |
Other financial assets | 1,469 | (23.7) |
| 1,469 | (53.6) |
Other asset accounts | 22,464 | (9.1) |
| 22,464 | (14.8) |
Total assets | 344,831 | 0.4 |
| 344,831 | (4.1) |
Customer deposits | 252,057 | 3.9 |
| 252,057 | 5.8 |
Central banks and credit institutions | 38,002 | (18.6) |
| 38,002 | (41.5) |
Marketable debt securities | 24,841 | 6.2 |
| 24,841 | 2.7 |
Other financial liabilities | 8,842 | 10.2 |
| 8,842 | 19.2 |
Other liabilities accounts | 6,090 | (18.7) |
| 6,090 | (38.7) |
Total liabilities | 329,833 | 0.5 |
| 329,833 | (4.3) |
Total equity | 14,999 | (1.5) |
| 14,999 | 0.3 |
|
|
|
|
|
|
Memorandum items: | 201,058 | (0.1) |
| 201,058 | (4.5) |
Customer funds | 317,169 | 3.4 |
| 317,169 | 4.8 |
Customer deposits (3) | 251,170 | 3.8 |
| 251,170 | 5.7 |
Mutual funds | 65,999 | 1.7 |
| 65,999 | 1.6 |
|
|
|
|
|
|
|
|
|
|
|
|
Ratios (%) and operating means |
|
|
|
|
|
Underlying RoTE | 8.99 | (0.62) |
| 9.31 | 0.66 |
Efficiency ratio | 55.2 | (0.0) |
| 55.2 | (3.7) |
NPL ratio | 7.02 | (0.27) |
| 7.02 | (0.60) |
NPL coverage | 42.9 | (0.4) |
| 42.9 | (4.6) |
Number of employees | 30,682 | (2.1) |
| 30,682 | (2.3) |
Number of branches | 4,247 | (2.7) |
| 4,247 | (4.9) |
(1) Includes exchange differences.
(2) Excluding reverse repos.
(3) Excluding repos.
|
|
|
|
54 |
| January – June 2019 |
|
|
|
|
|
|
|
|
|
|
Santander vision and |
| Group financial |
| Financial information |
| Responsible banking |
| Appendix |
|
|
|
|
|
|
|
|
|
|
|
|
|
|
|
|
|
|
|
|
|
|
|
|
|
| Financial information |
|
|
|
|
|
|
|
Santander Consumer Finance |
|
|
|
|
|
|
EUR million |
|
|
|
|
|
|
|
| / Q1'19 |
| / H1'18 | ||
Underlying income statement | Q2’19 | % | % excl. FX | H1'19 | % | % excl. FX |
Net interest income | 971 | 3.1 | 3.0 | 1,911 | 3.7 | 4.1 |
Net fee income | 201 | (6.1) | (6.1) | 415 | 2.9 | 3.0 |
Gains (losses) on financial transactions (1) | (1) | — | — | 1 | (95.1) | (95.1) |
Other operating income | (17) | — | — | (6) | — | — |
Total income | 1,154 | (1.2) | (1.3) | 2,321 | 2.4 | 2.8 |
Administrative expenses and amortisations | (527) | 3.6 | 3.5 | (1,035) | 1.7 | 2.0 |
Net operating income | 627 | (4.9) | (4.9) | 1,286 | 3.0 | 3.4 |
Net loan-loss provisions | (59) | (51.3) | (51.4) | (181) | (4.3) | (4.3) |
Other gains (losses) and provisions | (12) | — | — | 12 | (68.4) | (68.5) |
Profit before tax | 556 | (1.0) | (1.1) | 1,117 | 1.9 | 2.3 |
Tax on profit | (155) | (2.7) | (2.7) | (314) | 5.5 | 5.9 |
Profit from continuing operations | 401 | (0.3) | (0.4) | 803 | 0.6 | 1.0 |
Net profit from discontinued operations | — | — | — | — | — | — |
Consolidated profit | 401 | (0.3) | (0.4) | 803 | 0.6 | 1.0 |
Non-controlling interests | (67) | (14.0) | (14.0) | (145) | 10.6 | 10.8 |
Underlying attributable profit to the parent | 334 | 3.0 | 2.9 | 658 | (1.4) | (1.0) |
|
|
|
|
|
|
|
|
|
|
|
|
|
|
Balance sheet |
|
|
|
|
|
|
Loans and advances to customers | 98,395 | 2.7 | 2.7 | 98,395 | 7.1 | 7.3 |
Cash, central banks and credit institutions | 6,799 | 7.9 | 8.0 | 6,799 | 30.8 | 31.3 |
Debt instruments | 3,288 | (4.5) | (4.6) | 3,288 | 2.0 | 1.8 |
Other financial assets | 38 | 14.2 | 14.3 | 38 | 78.1 | 78.6 |
Other asset accounts | 4,102 | 10.0 | 10.1 | 4,102 | 14.6 | 14.7 |
Total assets | 112,622 | 3.1 | 3.1 | 112,622 | 8.4 | 8.6 |
Customer deposits | 37,896 | 2.7 | 2.7 | 37,896 | 3.1 | 3.2 |
Central banks and credit institutions | 25,104 | 1.4 | 1.4 | 25,104 | (0.3) | (0.2) |
Marketable debt securities | 33,946 | 5.8 | 5.9 | 33,946 | 24.2 | 24.4 |
Other financial liabilities | 1,395 | 16.8 | 16.8 | 1,395 | 40.3 | 40.0 |
Other liabilities accounts | 3,905 | 4.0 | 4.0 | 3,905 | 5.9 | 6.0 |
Total liabilities | 102,247 | 3.6 | 3.6 | 102,247 | 8.8 | 8.9 |
Total equity | 10,375 | (2.1) | (2.2) | 10,375 | 4.8 | 4.9 |
|
|
|
|
|
|
|
Memorandum items: | 100,752 | 2.7 | 2.7 | 100,752 | 6.8 | 7.0 |
Customer funds | 37,896 | 2.8 | 2.8 | 37,896 | 3.2 | 3.3 |
Customer deposits (3) | 37,896 | 2.8 | 2.8 | 37,896 | 3.2 | 3.3 |
Mutual funds | — | — | — | — | (100.0) | (100.0) |
|
|
|
|
|
|
|
|
|
|
|
|
|
|
Ratios (%) and operating means |
|
|
|
|
|
|
Underlying RoTE | 15.83 | 0.98 |
| 15.36 | (1.64) |
|
Efficiency ratio | 45.6 | 2.1 |
| 44.6 | (0.3) |
|
NPL ratio | 2.24 | (0.09) |
| 2.24 | (0.20) |
|
NPL coverage | 105.9 | 0.6 |
| 105.9 | (1.8) |
|
Number of employees | 14,494 | (2.0) |
| 14,494 | (3.9) |
|
Number of branches | 424 | (2.1) |
| 424 | (4.1) |
|
(1) Includes exchange differences.
(2) Excluding reverse repos.
(3) Excluding repos.
|
|
|
|
| January – June 2019 |
| 55 |
|
|
|
|
|
|
|
|
|
Santander vision and |
| Group financial |
| Financial information |
| Responsible banking |
| Appendix |
|
|
|
|
|
|
|
|
|
|
|
|
|
|
|
|
|
|
|
|
|
|
|
|
|
| Financial information |
|
|
|
|
|
|
|
United Kingdom |
|
|
|
|
|
|
EUR million |
|
|
|
|
|
|
|
| / Q1'19 |
| / H1'18 | ||
Underlying income statement | Q2’19 | % | % excl. FX | H1'19 | % | % excl. FX |
Net interest income | 944 | (3.2) | (2.9) | 1,919 | (6.5) | (7.2) |
Net fee income | 207 | (4.3) | (4.0) | 423 | (7.7) | (8.4) |
Gains (losses) on financial transactions (1) | 20 | — | — | 20 | (66.3) | (66.6) |
Other operating income | 12 | (16.4) | (16.2) | 26 | 36.7 | 35.7 |
Total income | 1,183 | (1.9) | (1.7) | 2,388 | (7.8) | (8.4) |
Administrative expenses and amortisations | (703) | (4.8) | (4.5) | (1,442) | 0.1 | (0.6) |
Net operating income | 479 | 2.6 | 2.8 | 946 | (17.7) | (18.3) |
Net loan-loss provisions | (19) | (67.9) | (67.7) | (80) | (21.7) | (22.3) |
Other gains (losses) and provisions | (25) | (50.2) | (50.0) | (75) | (27.4) | (27.9) |
Profit before tax | 435 | 21.9 | 22.2 | 792 | (16.2) | (16.8) |
Tax on profit | (102) | 5.2 | 5.5 | (199) | (25.2) | (25.8) |
Profit from continuing operations | 333 | 28.2 | 28.4 | 593 | (12.6) | (13.3) |
Net profit from discontinued operations | — | — | — | — | — | — |
Consolidated profit | 333 | 28.2 | 28.4 | 593 | (12.6) | (13.3) |
Non-controlling interests | (5) | 2.5 | 2.7 | (11) | (20.6) | (21.2) |
Underlying attributable profit to the parent | 327 | 28.7 | 29.0 | 582 | (12.5) | (13.1) |
|
|
|
|
|
|
|
|
|
|
|
|
|
|
Balance sheet |
|
|
|
|
|
|
Loans and advances to customers | 251,543 | (4.6) | (0.3) | 251,543 | 1.0 | 2.2 |
Cash, central banks and credit institutions | 40,536 | 7.3 | 12.1 | 40,536 | (23.8) | (22.9) |
Debt instruments | 23,609 | (0.4) | 4.0 | 23,609 | (10.8) | (9.7) |
Other financial assets | 1,092 | 44.9 | 51.3 | 1,092 | (84.7) | (84.6) |
Other asset accounts | 10,328 | 0.7 | 5.1 | 10,328 | 1.7 | 2.9 |
Total assets | 327,109 | (2.7) | 1.7 | 327,109 | (5.5) | (4.3) |
Customer deposits | 211,025 | (2.7) | 1.7 | 211,025 | (3.6) | (2.5) |
Central banks and credit institutions | 24,521 | (2.9) | 1.5 | 24,521 | 2.0 | 3.2 |
Marketable debt securities | 65,236 | (3.4) | 0.9 | 65,236 | (2.0) | (0.8) |
Other financial liabilities | 4,875 | 10.3 | 15.2 | 4,875 | (68.7) | (68.4) |
Other liabilities accounts | 4,470 | (2.2) | 2.1 | 4,470 | 4.4 | 5.7 |
Total liabilities | 310,128 | (2.7) | 1.7 | 310,128 | (5.9) | (4.8) |
Total equity | 16,981 | (2.6) | 1.8 | 16,981 | 2.7 | 4.0 |
|
|
|
|
|
|
|
Memorandum items: | 232,150 | (3.4) | 0.9 | 232,150 | (0.9) | 0.3 |
Customer funds | 205,064 | (2.3) | 2.1 | 205,064 | 0.5 | 1.7 |
Customer deposits (3) | 196,925 | (2.3) | 2.1 | 196,925 | 0.6 | 1.8 |
Mutual funds | 8,139 | (1.7) | 2.7 | 8,139 | (3.0) | (1.9) |
|
|
|
|
|
|
|
|
|
|
|
|
|
|
Ratios (%) and operating means |
|
|
|
|
|
|
Underlying RoTE | 8.68 | 1.76 |
| 7.81 | (2.12) |
|
Efficiency ratio | 59.5 | (1.8) |
| 60.4 | 4.8 |
|
NPL ratio | 1.13 | (0.04) |
| 1.13 | — |
|
NPL coverage | 31.9 | 1.0 |
| 31.9 | (1.9) |
|
Number of employees | 25,761 | 1.1 |
| 25,761 | (0.3) |
|
Number of branches | 659 | (12.6) |
| 659 | (15.4) |
|
(1) Includes exchange differences.
(2) Excluding reverse repos.
(3) Excluding repos.
|
|
|
|
56 |
| January – June 2019 |
|
|
|
|
|
|
|
|
|
|
Santander vision and |
| Group financial |
| Financial information |
| Responsible banking |
| Appendix |
|
|
|
|
|
|
|
|
|
|
|
|
|
|
|
|
|
|
|
|
|
|
|
|
|
| Financial information |
Portugal |
|
|
|
| |
EUR million |
|
|
|
| |
|
| / Q1'19 |
|
| s/ H1'18 |
Underlying income statement | Q2’19 | % |
| H1’19 | % |
Net interest income | 213 | (1.2) |
| 429 | (1.4) |
Net fee income | 99 | 0.8 |
| 197 | 4.1 |
Gains (losses) on financial transactions (1) | 42 | (15.4) |
| 91 | 58.6 |
Other operating income | 0 | — |
| (6) | — |
Total income | 354 | (0.9) |
| 712 | 3.5 |
Administrative expenses and amortisations | (154) | (1.9) |
| (312) | (3.8) |
Net operating income | 200 | (0.1) |
| 400 | 10.0 |
Net loan-loss provisions | (1) | — |
| 12 | — |
Other gains (losses) and provisions | (13) | (34.9) |
| (33) | 6.1 |
Profit before tax | 186 | (3.9) |
| 379 | 16.9 |
Tax on profit | (60) | 3.4 |
| (118) | 25.9 |
Profit from continuing operations | 126 | (7.0) |
| 261 | 13.3 |
Net profit from discontinued operations | — | — |
| — | — |
Consolidated profit | 126 | (7.0) |
| 261 | 13.3 |
Non-controlling interests | (1) | 17.2 |
| (1) | (24.6) |
Underlying attributable profit to the parent | 125 | (7.1) |
| 260 | 13.5 |
Balance sheet |
|
|
|
|
|
Loans and advances to customers | 35,734 | 0.9 |
| 35,734 | 0.5 |
Cash, central banks and credit institutions | 4,025 | (4.0) |
| 4,025 | (7.7) |
Debt instruments | 13,238 | 0.3 |
| 13,238 | 12.2 |
Other financial assets | 1,809 | (1.7) |
| 1,809 | (6.5) |
Other asset accounts | 1,941 | (1.6) |
| 1,941 | (20.9) |
Total assets | 56,747 | 0.2 |
| 56,747 | 1.1 |
Customer deposits | 38,975 | 1.9 |
| 38,975 | 5.1 |
Central banks and credit institutions | 8,064 | (1.1) |
| 8,064 | (10.8) |
Marketable debt securities | 3,426 | (19.0) |
| 3,426 | (20.9) |
Other financial liabilities | 326 | 14.1 |
| 326 | 24.2 |
Other liabilities accounts | 1,701 | 20.0 |
| 1,701 | 14.3 |
Total liabilities | 52,491 | 0.3 |
| 52,491 | 0.6 |
Total equity | 4,256 | (0.7) |
| 4,256 | 8.4 |
|
|
|
|
|
|
Memorandum items: | 36,691 | 0.6 |
| 36,691 | (1.0) |
Customer funds | 41,784 | 3.8 |
| 41,784 | 6.6 |
Customer deposits (3) | 38,975 | 1.9 |
| 38,975 | 5.1 |
Mutual funds | 2,809 | 40.5 |
| 2,809 | 32.0 |
|
|
|
|
|
|
Ratios (%) and operating means |
|
|
|
|
|
Underlying RoTE | 11.96 | (1.09) |
| 12.54 | 0.98 |
Efficiency ratio | 43.6 | (0.4) |
| 43.8 | (3.3) |
NPL ratio | 5.00 | (0.77) |
| 5.00 | (2.55) |
NPL coverage | 52.9 | 2.2 |
| 52.9 | 0.2 |
Number of employees | 6,736 | 0.0 |
| 6,736 | (2.9) |
Number of branches | 553 | (1.4) |
| 553 | (17.7) |
(1) Includes exchange differences.
(2) Excluding reverse repos.
(3) Excluding repos.
|
|
|
|
| January – June 2019 |
| 57 |
|
|
|
|
|
|
|
|
|
Santander vision and |
| Group financial |
| Financial information |
| Responsible banking |
| Appendix |
|
|
|
|
|
|
|
|
|
|
|
|
|
|
|
|
|
|
|
|
|
|
|
|
|
| Financial information |
|
|
|
|
|
Poland |
|
|
|
|
EUR million |
|
|
|
|
|
|
|
|
|
|
|
|
|
|
| / Q1’19 |
|
| / H1'18 | |||
Underlying income statement | Q2’19 |
| % | % excl. FX | H1'19 |
| % | % excl. FX |
Net interest income | 284 |
| 1.0 | 0.6 | 565 |
| 16.0 | 18.0 |
Net fee income | 117 |
| 2.7 | 2.3 | 230 |
| 1.5 | 3.2 |
Gains (losses) on financial transactions (1) | 21 |
| 12.1 | 11.6 | 39 |
| 102.7 | 106.2 |
Other operating income | 18 |
| — | — | (18) |
| 756.6 | 771.2 |
Total income | 440 |
| 16.6 | 16.1 | 817 |
| 11.7 | 13.6 |
Administrative expenses and amortisations | (176) |
| 1.8 | 1.3 | (349) |
| 10.2 | 12.0 |
Net operating income | 263 |
| 29.2 | 28.7 | 467 |
| 12.9 | 14.8 |
Net loan-loss provisions | (64) |
| 47.1 | 46.5 | (107) |
| 23.0 | 25.1 |
Other gains (losses) and provisions | (34) |
| 1.4 | 0.9 | (68) |
| 42.7 | 45.1 |
Profit before tax | 166 |
| 30.6 | 30.0 | 293 |
| 4.7 | 6.5 |
Tax on profit | (36) |
| (3.8) | (4.3) | (73) |
| 23.3 | 25.4 |
Profit from continuing operations | 130 |
| 44.9 | 44.4 | 219 |
| (0.4) | 1.3 |
Net profit from discontinued operations | — |
| — | — | — |
| — | — |
Consolidated profit | 130 |
| 44.9 | 44.4 | 219 |
| (0.4) | 1.3 |
Non-controlling interests | (41) |
| 46.2 | 45.7 | (69) |
| 6.2 | 8.0 |
Underlying attributable profit to the parent | 89 |
| 44.3 | 43.8 | 150 |
| (3.1) | (1.5) |
|
|
|
|
|
|
|
|
|
Balance sheet |
|
|
|
|
|
|
|
|
Loans and advances to customers | 29,345 |
| 3.3 | 2.0 | 29,345 |
| 29.9 | 26.3 |
Cash, central banks and credit institutions | 2,987 |
| 11.8 | 10.5 | 2,987 |
| 84.7 | 79.5 |
Debt instruments | 10,367 |
| (8.0) | (9.0) | 10,367 |
| 23.4 | 19.9 |
Other financial assets | 565 |
| 3.9 | 2.7 | 565 |
| 0.9 | (1.9) |
Other asset accounts | 1,326 |
| 1.3 | 0.1 | 1,326 |
| 29.6 | 26.0 |
Total assets | 44,591 |
| 0.9 | (0.3) | 44,591 |
| 30.4 | 26.7 |
Customer deposits | 32,758 |
| 1.0 | (0.2) | 32,758 |
| 27.6 | 24.0 |
Central banks and credit institutions | 3,243 |
| (3.2) | (4.3) | 3,243 |
| 89.7 | 84.3 |
Marketable debt securities | 2,091 |
| 16.6 | 15.2 | 2,091 |
| 107.0 | 101.2 |
Other financial liabilities | 814 |
| 8.6 | 7.3 | 814 |
| 90.3 | 84.9 |
Other liabilities accounts | 894 |
| 9.1 | 7.8 | 894 |
| 16.6 | 13.3 |
Total liabilities | 39,800 |
| 1.7 | 0.5 | 39,800 |
| 34.5 | 30.7 |
Total equity | 4,791 |
| (5.3) | (6.4) | 4,791 |
| 4.0 | 1.1 |
|
|
|
|
|
|
|
|
|
Memorandum items: | 30,278 |
| 3.3 | 2.0 | 30,278 |
| 29.5 | 25.8 |
Customer funds | 36,060 |
| 2.5 | 1.3 | 36,060 |
| 25.4 | 21.9 |
Customer deposits (3) | 31,867 |
| 2.4 | 1.2 | 31,867 |
| 27.5 | 23.9 |
Mutual funds | 4,193 |
| 3.1 | 1.8 | 4,193 |
| 11.6 | 8.4 |
Ratios (%) and operating means |
|
|
|
|
|
|
|
|
Underlying RoTE | 11.44 |
| 3.68 |
| 9.61 |
| (1.32) |
|
Efficiency ratio | 40.1 |
| (5.8) |
| 42.8 |
| (0.6) |
|
NPL ratio | 4.21 |
| (0.18) |
| 4.21 |
| (0.37) |
|
NPL coverage | 69.7 |
| 2.1 |
| 69.7 |
| (2.4) |
|
Number of employees | 11,488 |
| (8.5) |
| 11,488 |
| (0.1) |
|
Number of branches | 532 |
| (6.8) |
| 532 |
| (1.5) |
|
(1) Includes exchange differences.
(2) Excluding reverse repos.
(3) Excluding repos.
|
|
|
|
58 |
| January – June 2019 |
|
|
|
|
|
|
|
|
|
|
Santander vision and |
| Group financial |
| Financial information |
| Responsible banking |
| Appendix |
|
|
|
|
|
|
|
|
|
|
|
|
|
|
|
|
|
|
|
|
|
|
|
|
|
|
|
Other Europe
EUR million
|
|
|
|
|
|
|
|
|
|
|
| / Q1’19 |
|
| / H1'18 | ||
Underlying income statement | Q2'19 |
| % | % w/o FX | H1'19 |
| % | % w/o FX |
Net interest income | 159 |
| 14.4 | 14.3 | 299 |
| 50.8 | 49.0 |
Net fee income | 56 |
| (8.6) | (8.9) | 118 |
| (13.7) | (15.4) |
Gains (losses) on financial transactions (1) | (149) |
| — | — | (153) |
| — | — |
Other operating income | 142 |
| 122.8 | 122.7 | 205 |
| 79.0 | 78.4 |
Total income | 209 |
| (20.1) | (20.3) | 469 |
| (6.8) | (8.2) |
Administrative expenses and amortisations | (208) |
| 4.2 | 4.0 | (408) |
| 12.8 | 11.1 |
Net operating income | 0 |
| (99.2) | (99.3) | 62 |
| (56.7) | (57.3) |
Net loan-loss provisions | (16) |
| 612.4 | 612.5 | (18) |
| (50.5) | (50.7) |
Other gains (losses) and provisions | (4) |
| (37.5) | (37.5) | (11) |
| (5.1) | (8.3) |
Profit before tax | (19) |
| — | — | 33 |
| (65.1) | (65.6) |
Tax on profit | (2) |
| (91.9) | (91.9) | (20) |
| (58.1) | (58.5) |
Profit from continuing operations | (21) |
| — | — | 13 |
| (72.5) | (73.1) |
Net profit from discontinued operations | — |
| — | — | — |
| — | — |
Consolidated profit | (21) |
| — | — | 13 |
| (72.5) | (73.1) |
Non-controlling interests | (1) |
| 12.7 | 11.9 | (3) |
| 141.0 | 127.1 |
Underlying attributable profit to the parent | (22) |
| — | — | 10 |
| (78.1) | (78.5) |
|
|
|
|
|
|
|
|
|
Balance sheet |
|
|
|
|
|
|
|
|
Loans and advances to customers | 40,627 |
| 5.6 | 7.5 | 40,627 |
| 21.5 | 21.8 |
Cash, central banks and credit institutions | 59,334 |
| 18.2 | 21.9 | 59,334 |
| 60.0 | 60.8 |
Debt instruments | 24,053 |
| 7.3 | 11.1 | 24,053 |
| 57.5 | 59.0 |
Other financial assets | 46,529 |
| (5.7) | (2.7) | 46,529 |
| 2.9 | 3.7 |
Other asset accounts | 2,801 |
| (0.2) | 0.6 | 2,801 |
| (12.1) | (13.0) |
Total assets | 173,344 |
| 6.2 | 9.2 | 173,344 |
| 29.1 | 29.9 |
Customer deposits | 16,880 |
| (17.1) | (15.3) | 16,880 |
| 19.5 | 19.9 |
Central banks and credit institutions | 105,808 |
| 12.8 | 16.3 | 105,808 |
| 33.0 | 33.5 |
Marketable debt securities | 114 |
| 11.0 | 11.9 | 114 |
| (16.2) | (17.9) |
Other financial liabilities | 46,909 |
| 2.9 | 5.8 | 46,909 |
| 29.0 | 30.4 |
Other liabilities accounts | 405 |
| 8.1 | 9.9 | 405 |
| (3.0) | (3.0) |
Total liabilities | 170,116 |
| 6.2 | 9.2 | 170,116 |
| 30.2 | 31.0 |
Total equity | 3,228 |
| 6.5 | 8.1 | 3,228 |
| (10.5) | (11.1) |
|
|
|
|
|
|
|
|
|
Memorandum items: | 37,309 |
| 10.2 | 11.8 | 37,309 |
| 40.3 | 40.3 |
Customer funds | 20,525 |
| (12.7) | (11.2) | 20,525 |
| 18.2 | 18.5 |
Customer deposits (3) | 16,785 |
| (16.3) | (14.5) | 16,785 |
| 20.8 | 21.2 |
Mutual funds | 3,739 |
| 7.8 | 7.8 | 3,739 |
| 7.8 | 7.8 |
Resources |
|
|
|
|
|
|
|
|
Number of employees | 2,327 |
| 7.3 |
| 2,327 |
| 30.6 |
|
(1) Includes exchange differences.
(2) Excluding reverse repos.
(3) Excluding repos.
|
|
|
|
| January – June 2019 |
| 59 |
|
|
|
|
|
|
|
|
|
Santander vision and |
| Group financial |
| Financial information |
| Responsible banking |
| Appendix |
|
|
|
|
|
|
|
|
|
|
|
|
|
|
|
|
|
|
|
|
|
|
|
|
|
| Financial information |
NORTH AMERICA |
|
|
|
|
EUR million |
|
|
|
|
|
|
|
|
|
|
|
|
|
|
|
| / Q1’19 |
|
| / H1'18 | ||
Underlying income statement | Q2’19 |
| % | % excl. FX | H1'19 |
| % | % excl. FX |
Net interest income | 2,230 |
| 2.6 | 1.4 | 4,403 |
| 15.8 | 8.3 |
Net fee income | 463 |
| 5.5 | 4.3 | 901 |
| 11.4 | 4.2 |
Gains (losses) on financial transactions (1) | 50 |
| 312.8 | 310.4 | 62 |
| (44.4) | (47.9) |
Other operating income | 176 |
| 35.5 | 34.4 | 306 |
| 36.9 | 27.7 |
Total income | 2,918 |
| 6.0 | 4.8 | 5,672 |
| 14.7 | 7.2 |
Administrative expenses and amortisations | (1,214) |
| 3.5 | 2.3 | (2,386) |
| 9.4 | 2.3 |
Net operating income | 1,705 |
| 7.8 | 6.6 | 3,286 |
| 18.8 | 11.1 |
Net loan-loss provisions | (793) |
| (1.4) | (2.5) | (1,597) |
| 13.0 | 5.7 |
Other gains (losses) and provisions | (31) |
| (51.5) | (52.3) | (95) |
| 7.8 | 0.8 |
Profit before tax | 881 |
| 23.5 | 22.1 | 1,594 |
| 26.0 | 17.9 |
Tax on profit | (217) |
| 15.7 | 14.4 | (405) |
| 21.4 | 13.5 |
Profit from continuing operations | 664 |
| 26.2 | 24.8 | 1,189 |
| 27.6 | 19.4 |
Net profit from discontinued operations | — |
| — | — | — |
| — | — |
Consolidated profit | 664 |
| 26.2 | 24.8 | 1,189 |
| 27.6 | 19.4 |
Non-controlling interests | (161) |
| 15.4 | 14.0 | (300) |
| 24.1 | 16.1 |
Underlying attributable profit to the parent | 503 |
| 30.1 | 28.7 | 889 |
| 28.8 | 20.6 |
|
|
|
|
|
|
|
|
|
Balance sheet |
|
|
|
|
|
|
|
|
Loans and advances to customers | 126,478 |
| 1.7 | 2.8 | 126,478 |
| 20.9 | 17.3 |
Cash, central banks and credit institutions | 25,352 |
| (22.5) | (21.8) | 25,352 |
| 1.5 | (2.1) |
Debt instruments | 26,739 |
| 8.8 | 9.9 | 26,739 |
| 0.3 | (3.2) |
Other financial assets | 9,483 |
| 12.0 | 13.0 | 9,483 |
| (9.6) | (13.0) |
Other asset accounts | 21,451 |
| 6.1 | 7.4 | 21,451 |
| 33.5 | 29.8 |
Total assets | 209,503 |
| (0.4) | 0.7 | 209,503 |
| 14.6 | 11.0 |
Customer deposits | 98,362 |
| (2.2) | (1.1) | 98,362 |
| 12.7 | 9.0 |
Central banks and credit institutions | 28,072 |
| 20.1 | 21.3 | 28,072 |
| 28.8 | 24.6 |
Marketable debt securities | 41,825 |
| (10.4) | (9.3) | 41,825 |
| 21.4 | 18.0 |
Other financial liabilities | 11,912 |
| 9.2 | 10.1 | 11,912 |
| (0.5) | (4.4) |
Other liabilities accounts | 5,884 |
| 4.5 | 5.6 | 5,884 |
| 1.5 | (1.8) |
Total liabilities | 186,055 |
| (0.6) | 0.5 | 186,055 |
| 15.3 | 11.6 |
Total equity | 23,447 |
| 0.9 | 2.0 | 23,447 |
| 9.1 | 5.9 |
|
|
|
|
|
|
|
|
|
Memorandum items: | 122,869 |
| 1.9 | 3.0 | 122,869 |
| 13.0 | 9.6 |
Customer funds | 111,544 |
| 1.8 | 2.8 | 111,544 |
| 10.2 | 6.6 |
Customer deposits (3) | 90,533 |
| 1.4 | 2.5 | 90,533 |
| 10.1 | 6.6 |
Mutual funds | 21,011 |
| 3.5 | 4.4 | 21,011 |
| 10.4 | 6.4 |
Ratios (%) and operating means |
|
|
|
|
|
|
|
|
Underlying RoTE | 10.56 |
| 2.11 |
| 9.54 |
| 1.28 |
|
Efficiency ratio | 41.6 |
| (1.0) |
| 42.1 |
| (2.0) |
|
NPL ratio | 2.29 |
| (0.04) |
| 2.29 |
| (0.53) |
|
NPL coverage | 150.3 |
| (3.1) |
| 150.3 |
| 3.8 |
|
Number of employees | 36,917 |
| (0.6) |
| 36,917 |
| 1.8 |
|
Number of branches | 2,062 |
| (0.4) |
| 2,062 |
| (0.5) |
|
(1) Includes exchange differences.
(2) Excluding reverse repos.
(3) Excluding repos.
|
|
|
|
60 |
| January – June 2019 |
|
|
|
|
|
|
|
|
|
|
Santander vision and |
| Group financial |
| Financial information |
| Responsible banking |
| Appendix |
|
|
|
|
|
|
|
|
|
|
|
|
|
|
|
|
|
|
|
|
|
|
|
|
|
| Financial information |
|
|
|
|
|
United States |
|
|
|
|
EUR million |
|
|
|
|
|
|
|
|
|
|
|
|
|
| / Q1’19 |
|
| / H1'18 | ||
Underlying income statement | Q2’19 | % | % excl. FX | H1'19 |
| % | % excl. FX |
Net interest income | 1,453 | 3.3 | 2.2 | 2,860 |
| 14.3 | 6.8 |
Net fee income | 244 | 4.4 | 3.3 | 479 |
| 10.4 | 3.1 |
Gains (losses) on financial transactions (1) | 23 | 46.8 | 45.5 | 39 |
| (0.0) | (6.7) |
Other operating income | 199 | 26.3 | 25.1 | 357 |
| 30.3 | 21.7 |
Total income | 1,920 | 5.8 | 4.7 | 3,734 |
| 15.0 | 7.4 |
Administrative expenses and amortisations | (805) | 3.8 | 2.7 | (1,581) |
| 7.2 | 0.1 |
Net operating income | 1,115 | 7.3 | 6.2 | 2,154 |
| 21.5 | 13.4 |
Net loan-loss provisions | (568) | (7.1) | (8.1) | (1,178) |
| 15.0 | 7.4 |
Other gains (losses) and provisions | (26) | (55.3) | (56.1) | (84) |
| 15.7 | 8.0 |
Profit before tax | 521 | 40.8 | 39.6 | 891 |
| 31.9 | 23.1 |
Tax on profit | (138) | 24.9 | 23.7 | (248) |
| 21.1 | 13.1 |
Profit from continuing operations | 383 | 47.7 | 46.3 | 643 |
| 36.5 | 27.5 |
Net profit from discontinued operations | — | — | — | — |
| — | — |
Consolidated profit | 383 | 47.7 | 46.3 | 643 |
| 36.5 | 27.5 |
Non-controlling interests | (99) | 27.2 | 26.0 | (178) |
| 29.6 | 21.0 |
Underlying attributable profit to the parent | 284 | 56.4 | 55.1 | 465 |
| 39.4 | 30.2 |
|
|
|
|
|
|
|
|
Balance sheet |
|
|
|
|
|
|
|
Loans and advances to customers | 93,133 | 2.0 | 3.3 | 93,133 |
| 22.2 | 19.3 |
Cash, central banks and credit institutions | 13,790 | (23.7) | (22.7) | 13,790 |
| 18.3 | 15.4 |
Debt instruments | 13,849 | 3.1 | 4.4 | 13,849 |
| (3.5) | (5.8) |
Other financial assets | 3,913 | 10.3 | 11.8 | 3,913 |
| (9.3) | (11.5) |
Other asset accounts | 17,888 | 5.5 | 6.9 | 17,888 |
| 34.4 | 31.2 |
Total assets | 142,572 | (0.5) | 0.8 | 142,572 |
| 19.0 | 16.2 |
Customer deposits | 64,373 | (0.7) | 0.5 | 64,373 |
| 19.2 | 16.4 |
Central banks and credit institutions | 17,495 | 34.1 | 35.8 | 17,495 |
| 31.0 | 27.9 |
Marketable debt securities | 35,261 | (13.6) | (12.5) | 35,261 |
| 23.6 | 20.7 |
Other financial liabilities | 4,277 | 17.4 | 18.9 | 4,277 |
| 8.1 | 5.5 |
Other liabilities accounts | 3,722 | 0.9 | 2.2 | 3,722 |
| 2.5 | 0.1 |
Total liabilities | 125,129 | (0.7) | 0.5 | 125,129 |
| 20.9 | 18.1 |
Total equity | 17,443 | 1.1 | 2.4 | 17,443 |
| 6.7 | 4.1 |
|
|
|
|
|
|
|
|
Memorandum items: | 89,636 | 2.1 | 3.5 | 89,636 |
| 12.7 | 10.0 |
Customer funds | 69,967 | 2.9 | 4.3 | 69,967 |
| 12.5 | 9.8 |
Customer deposits (3) | 60,470 | 2.7 | 4.0 | 60,470 |
| 12.5 | 9.8 |
Mutual funds | 9,497 | 4.4 | 5.8 | 9,497 |
| 12.6 | 9.9 |
Ratios (%) and operating means |
|
|
|
|
|
|
|
Underlying RoTE | 7.65 | 2.58 |
| 6.38 |
| 1.27 |
|
Efficiency ratio | 41.9 | (0.8) |
| 42.3 |
| (3.1) |
|
NPL ratio | 2.32 | (0.09) |
| 2.32 |
| (0.59) |
|
NPL coverage | 158.4 | (2.6) |
| 158.4 |
| 1.5 |
|
Number of employees | 17,381 | 0.6 |
| 17,381 |
| 1.1 |
|
Number of branches | 646 | (2.0) |
| 646 |
| (3.6) |
|
(1) Includes exchange differences.
(2) Excluding reverse repos.
(3) Excluding repos.
|
|
|
|
| January – June 2019 |
| 61 |
|
|
|
|
|
|
|
|
|
Santander vision and |
| Group financial |
| Financial information |
| Responsible banking |
| Appendix |
|
|
|
|
|
|
|
|
|
|
|
|
|
|
|
|
|
|
|
|
|
|
|
|
|
| Financial information |
Mexico |
|
|
|
|
EUR million |
|
|
|
|
|
|
|
|
|
|
|
|
|
| / Q1’19 |
|
| / H1'18 | ||
Underlying income statement | Q2’19 | % | % excl. FX | H1'19 |
| % | % excl. FX |
Net interest income | 777 | 1.4 | (0.1) | 1,543 |
| 18.6 | 11.2 |
Net fee income | 218 | 6.9 | 5.4 | 423 |
| 12.5 | 5.6 |
Gains (losses) on financial transactions (1) | 27 | — | — | 23 |
| (68.4) | (70.4) |
Other operating income | (23) | (17.2) | (18.5) | (51) |
| 1.1 | (5.1) |
Total income | 999 | 6.4 | 4.9 | 1,938 |
| 14.0 | 7.0 |
Administrative expenses and amortisations | (409) | 3.0 | 1.5 | (806) |
| 14.1 | 7.1 |
Net operating income | 590 | 8.8 | 7.3 | 1,132 |
| 14.0 | 6.9 |
Net loan-loss provisions | (225) | 16.7 | 15.2 | (419) |
| 7.7 | 1.1 |
Other gains (losses) and provisions | (5) | (11.2) | (12.6) | (10) |
| (30.3) | (34.6) |
Profit before tax | 360 | 4.7 | 3.3 | 703 |
| 19.2 | 11.9 |
Tax on profit | (79) | 2.7 | 1.2 | (156) |
| 21.7 | 14.2 |
Profit from continuing operations | 280 | 5.3 | 3.9 | 547 |
| 18.5 | 11.2 |
Net profit from discontinued operations | — | — | — | — |
| — | — |
Consolidated profit | 280 | 5.3 | 3.9 | 547 |
| 18.5 | 11.2 |
Non-controlling interests | (61) | 0.2 | (1.3) | (122) |
| 17.0 | 9.8 |
Underlying attributable profit to the parent | 219 | 6.9 | 5.4 | 424 |
| 19.0 | 11.6 |
|
|
|
|
|
|
|
|
Balance sheet |
|
|
|
|
|
|
|
Loans and advances to customers | 33,345 | 0.9 | 1.5 | 33,345 |
| 17.3 | 11.8 |
Cash, central banks and credit institutions | 11,563 | (21.1) | (20.6) | 11,563 |
| (13.2) | (17.2) |
Debt instruments | 12,890 | 15.7 | 16.4 | 12,890 |
| 4.7 | (0.2) |
Other financial assets | 5,570 | 13.3 | 13.9 | 5,570 |
| (9.8) | (14.0) |
Other asset accounts | 3,563 | 9.1 | 9.7 | 3,563 |
| 29.0 | 23.0 |
Total assets | 66,930 | (0.2) | 0.4 | 66,930 |
| 6.2 | 1.3 |
Customer deposits | 33,989 | (4.8) | (4.2) | 33,989 |
| 2.0 | (2.7) |
Central banks and credit institutions | 10,576 | 2.4 | 3.0 | 10,576 |
| 25.4 | 19.6 |
Marketable debt securities | 6,565 | 12.5 | 13.2 | 6,565 |
| 10.7 | 5.5 |
Other financial liabilities | 7,635 | 5.1 | 5.7 | 7,635 |
| (4.7) | (9.2) |
Other liabilities accounts | 2,161 | 11.3 | 12.0 | 2,161 |
| (0.3) | (4.9) |
Total liabilities | 60,927 | (0.2) | 0.4 | 60,927 |
| 5.3 | 0.4 |
Total equity | 6,004 | 0.4 | 1.0 | 6,004 |
| 16.8 | 11.4 |
|
|
|
|
|
|
|
|
Memorandum items: | 33,234 | 1.1 | 1.7 | 33,234 |
| 13.8 | 8.5 |
Customer funds | 41,577 | (0.1) | 0.5 | 41,577 |
| 6.5 | 1.6 |
Customer deposits (3) | 30,063 | (1.2) | (0.6) | 30,063 |
| 5.7 | 0.8 |
Mutual funds | 11,514 | 2.7 | 3.3 | 11,514 |
| 8.8 | 3.7 |
Ratios (%) and operating means |
|
|
|
|
|
|
|
Underlying RoTE | 20.71 | 0.60 |
| 20.47 |
| 0.60 |
|
Efficiency ratio | 40.9 | (1.3) |
| 41.6 |
| 0.0 |
|
NPL ratio | 2.21 | 0.09 |
| 2.21 |
| (0.37) |
|
NPL coverage | 126.9 | (3.2) |
| 126.9 |
| 10.8 |
|
Number of employees | 19,536 | (1.7) |
| 19,536 |
| 2.4 |
|
Number of branches | 1,416 | 0.3 |
| 1,416 |
| 1.0 |
|
(1) Includes exchange differences.
(2) Excluding reverse repos.
(3) Excluding repos.
|
|
|
|
62 |
| January – June 2019 |
|
|
|
|
|
|
|
|
|
|
Santander vision and |
| Group financial |
| Financial information |
| Responsible banking |
| Appendix |
|
|
|
|
|
|
|
|
|
|
|
|
|
|
|
|
|
|
|
|
|
|
|
|
|
| Financial information |
SOUTH AMERICA
EUR million
|
|
|
|
|
|
|
|
|
| / Q1’19 |
|
| / H1'18 | ||
Underlying income statement | Q2’19 | % | % excl. FX | H1'19 |
| % | % excl. FX |
Net interest income | 3,425 | 6.3 | 9.2 | 6,647 |
| 1.4 | 9.4 |
Net fee income | 1,178 | (0.0) | 2.9 | 2,355 |
| 0.6 | 10.9 |
Gains (losses) on financial transactions (1) | 130 | (18.8) | (16.5) | 289 |
| 13.1 | 40.7 |
Other operating income | (85) | 18.1 | 21.7 | (157) |
| — | — |
Total income | 4,647 | 3.6 | 6.5 | 9,134 |
| (0.2) | 8.7 |
Administrative expenses and amortisations | (1,664) | 1.1 | 4.0 | (3,309) |
| (1.6) | 9.1 |
Net operating income | 2,984 | 5.0 | 7.9 | 5,825 |
| 0.6 | 8.5 |
Net loan-loss provisions | (956) | 5.9 | 8.8 | (1,859) |
| (5.1) | 2.4 |
Other gains (losses) and provisions | (151) | (1.7) | 1.8 | (306) |
| (8.2) | 4.6 |
Profit before tax | 1,876 | 5.1 | 8.0 | 3,661 |
| 4.6 | 12.3 |
Tax on profit | (672) | (2.9) | (0.1) | (1,363) |
| 1.9 | 8.9 |
Profit from continuing operations | 1,205 | 10.2 | 13.0 | 2,297 |
| 6.3 | 14.4 |
Net profit from discontinued operations | — | — | — | — |
| — | — |
Consolidated profit | 1,205 | 10.2 | 13.0 | 2,297 |
| 6.3 | 14.4 |
Non-controlling interests | (169) | 1.3 | 3.7 | (336) |
| 7.0 | 11.5 |
Underlying attributable profit to the parent | 1,035 | 11.8 | 14.7 | 1,961 |
| 6.2 | 14.9 |
|
|
|
|
|
|
|
|
Balance sheet |
|
|
|
|
|
|
|
Loans and advances to customers | 124,950 | 1.3 | 1.4 | 124,950 |
| 8.3 | 9.5 |
Cash, central banks and credit institutions | 49,995 | 12.5 | 12.2 | 49,995 |
| 12.4 | 13.0 |
Debt instruments | 48,204 | 4.8 | 4.2 | 48,204 |
| 9.5 | 7.7 |
Other financial assets | 11,508 | 28.4 | 28.3 | 11,508 |
| 36.2 | 34.6 |
Other asset accounts | 16,456 | 4.5 | 4.1 | 16,456 |
| 16.9 | 15.8 |
Total assets | 251,113 | 5.3 | 5.1 | 251,113 |
| 10.9 | 11.2 |
Customer deposits | 116,739 | 4.7 | 4.7 | 116,739 |
| 7.6 | 9.2 |
Central banks and credit institutions | 37,872 | (2.4) | (2.8) | 37,872 |
| (0.7) | (2.0) |
Marketable debt securities | 31,983 | 3.2 | 3.0 | 31,983 |
| 12.9 | 12.1 |
Other financial liabilities | 31,372 | 21.1 | 20.5 | 31,372 |
| 34.9 | 33.5 |
Other liabilities accounts | 10,320 | 15.8 | 15.3 | 10,320 |
| 34.0 | 32.4 |
Total liabilities | 228,286 | 5.6 | 5.4 | 228,286 |
| 10.8 | 11.2 |
Total equity | 22,827 | 2.3 | 2.1 | 22,827 |
| 11.7 | 11.4 |
|
|
|
|
|
|
|
|
Memorandum items: | 130,953 | 1.5 | 1.5 | 130,953 |
| 8.4 | 9.5 |
Customer funds | 173,298 | 5.7 | 5.4 | 173,298 |
| 10.6 | 11.4 |
Customer deposits (3) | 105,299 | 5.8 | 5.8 | 105,299 |
| 10.5 | 12.9 |
Mutual funds | 67,999 | 5.5 | 4.9 | 67,999 |
| 10.7 | 9.2 |
Ratios (%) and operating means |
|
|
|
|
|
|
|
Underlying RoTE | 21.98 | 2.40 |
| 20.76 |
| 0.95 |
|
Efficiency ratio | 35.8 | (0.9) |
| 36.2 |
| (0.5) |
|
NPL ratio | 4.81 | (0.02) |
| 4.81 |
| (0.01) |
|
NPL coverage | 93.0 | (1.1) |
| 93.0 |
| (1.4) |
|
Number of employees | 71,158 | 1.7 |
| 71,158 |
| 1.7 |
|
Number of branches | 4,591 | 1.8 |
| 4,591 |
| 2.1 |
|
(1) Includes exchange differences.
(2) Excluding reverse repos.
(3) Excluding repos.
|
|
|
|
| January – June 2019 |
| 63 |
|
|
|
|
|
|
|
|
|
Santander vision and |
| Group financial |
| Financial information |
| Responsible banking |
| Appendix |
|
|
|
|
|
|
|
|
|
|
|
|
|
|
|
|
|
|
|
|
|
|
|
|
|
| Financial information |
|
|
|
|
|
Brazil |
|
|
|
|
EUR million |
|
|
|
|
|
|
|
|
|
|
|
|
|
| / Q1’19 |
|
| / H1'18 | ||
Underlying income statement | Q2’19 | % | % excl. FX | H1'19 |
| % | % excl. FX |
Net interest income | 2,520 | 2.5 | 5.5 | 4,979 |
| 1.5 | 6.6 |
Net fee income | 924 | (0.7) | 2.3 | 1,855 |
| 3.5 | 8.7 |
Gains (losses) on financial transactions (1) | 45 | (22.0) | (19.4) | 103 |
| 24.0 | 30.2 |
Other operating income | (36) | (2.0) | 1.0 | (72) |
| 456.3 | 484.2 |
Total income | 3,453 | 1.2 | 4.2 | 6,864 |
| 1.4 | 6.5 |
Administrative expenses and amortisations | (1,102) | (2.0) | 1.0 | (2,227) |
| (1.8) | 3.1 |
Net operating income | 2,351 | 2.8 | 5.9 | 4,637 |
| 3.1 | 8.2 |
Net loan-loss provisions | (761) | 7.1 | 10.2 | (1,471) |
| (6.4) | (1.7) |
Other gains (losses) and provisions | (153) | (8.8) | (6.0) | (320) |
| (1.4) | 3.6 |
Profit before tax | 1,438 | 2.1 | 5.1 | 2,846 |
| 9.3 | 14.8 |
Tax on profit | (581) | (1.9) | 1.1 | (1,173) |
| 4.8 | 10.1 |
Profit from continuing operations | 856 | 4.9 | 8.0 | 1,673 |
| 12.7 | 18.3 |
Net profit from discontinued operations | — | — | — | — |
| — | — |
Consolidated profit | 856 | 4.9 | 8.0 | 1,673 |
| 12.7 | 18.3 |
Non-controlling interests | (94) | (1.4) | 1.6 | (190) |
| 14.0 | 19.7 |
Underlying attributable profit to the parent | 762 | 5.7 | 8.8 | 1,482 |
| 12.6 | 18.2 |
|
|
|
|
|
|
|
|
Balance sheet |
|
|
|
|
|
|
|
Loans and advances to customers | 73,175 | 2.0 | 1.2 | 73,175 |
| 12.1 | 8.7 |
Cash, central banks and credit institutions | 37,661 | 13.0 | 12.1 | 37,661 |
| 8.8 | 5.5 |
Debt instruments | 42,738 | 4.1 | 3.3 | 42,738 |
| 11.9 | 8.5 |
Other financial assets | 6,822 | 20.3 | 19.3 | 6,822 |
| 24.5 | 20.7 |
Other asset accounts | 12,474 | 5.2 | 4.4 | 12,474 |
| 9.1 | 5.8 |
Total assets | 172,869 | 5.6 | 4.8 | 172,869 |
| 11.5 | 8.1 |
Customer deposits | 74,698 | 6.3 | 5.5 | 74,698 |
| 10.7 | 7.3 |
Central banks and credit institutions | 28,908 | (2.6) | (3.4) | 28,908 |
| (5.7) | (8.5) |
Marketable debt securities | 20,584 | 2.9 | 2.1 | 20,584 |
| 15.5 | 12.0 |
Other financial liabilities | 24,148 | 13.5 | 12.6 | 24,148 |
| 30.5 | 26.5 |
Other liabilities accounts | 8,620 | 19.2 | 18.2 | 8,620 |
| 36.3 | 32.2 |
Total liabilities | 156,958 | 5.7 | 4.9 | 156,958 |
| 11.5 | 8.1 |
Total equity | 15,912 | 4.7 | 3.9 | 15,912 |
| 12.2 | 8.8 |
|
|
|
|
|
|
|
|
Memorandum items: | 77,835 | 2.0 | 1.1 | 77,835 |
| 12.0 | 8.6 |
Customer funds | 121,485 | 6.8 | 5.9 | 121,485 |
| 14.5 | 11.0 |
Customer deposits (3) | 63,417 | 8.6 | 7.8 | 63,417 |
| 16.7 | 13.1 |
Mutual funds | 58,069 | 4.8 | 4.0 | 58,069 |
| 12.2 | 8.7 |
Ratios (%) and operating means |
|
|
|
|
|
|
|
Underlying RoTE | 22.40 | 1.42 |
| 21.65 |
| 1.76 |
|
Efficiency ratio | 31.9 | (1.0) |
| 32.4 |
| (1.1) |
|
NPL ratio | 5.27 | 0.01 |
| 5.27 |
| 0.01 |
|
NPL coverage | 105.5 | (2.2) |
| 105.5 |
| (3.2) |
|
Number of employees | 48,118 | 2.8 |
| 48,118 |
| 3.1 |
|
Number of branches | 3,643 | 2.3 |
| 3,643 |
| 4.4 |
|
(1) Includes exchange differences.
(2) Excluding reverse repos.
(3) Excluding repos.
|
|
|
|
64 |
| January – June 2019 |
|
|
|
|
|
|
|
|
|
|
Santander vision and |
| Group financial |
| Financial information |
| Responsible banking |
| Appendix |
|
|
|
|
|
|
|
|
|
|
|
|
|
|
|
|
|
|
|
|
|
|
|
|
|
| Financial information |
Chile
EUR million
|
|
|
|
|
|
|
|
|
| / Q1’19 |
|
| / H1'18 | ||
Underlying income statement | Q2’19 | % | % excl. FX | H1'19 |
| % | % excl. FX |
Net interest income | 500 | 13.5 | 15.0 | 940 |
| (4.6) | (1.7) |
Net fee income | 97 | (5.9) | (4.5) | 200 |
| (12.1) | (9.4) |
Gains (losses) on financial transactions (1) | 59 | 7.9 | 9.4 | 113 |
| 96.0 | 101.9 |
Other operating income | 0 | (82.6) | (81.7) | 2 |
| (80.7) | (80.1) |
Total income | 656 | 9.4 | 10.8 | 1,255 |
| (2.1) | 0.9 |
Administrative expenses and amortisations | (269) | 5.4 | 6.8 | (524) |
| (1.3) | 1.7 |
Net operating income | 387 | 12.3 | 13.8 | 731 |
| (2.6) | 0.3 |
Net loan-loss provisions | (105) | 2.8 | 4.2 | (208) |
| (12.0) | (9.4) |
Other gains (losses) and provisions | (1) | — | — | 37 |
| (31.8) | (29.8) |
Profit before tax | 281 | 0.5 | 1.9 | 560 |
| (1.5) | 1.5 |
Tax on profit | (43) | (28.0) | (26.8) | (103) |
| (10.0) | (7.3) |
Profit from continuing operations | 237 | 8.3 | 9.8 | 456 |
| 0.7 | 3.7 |
Net profit from discontinued operations | — | — | — | — |
| — | — |
Consolidated profit | 237 | 8.3 | 9.8 | 456 |
| 0.7 | 3.7 |
Non-controlling interests | (74) | 4.9 | 6.3 | (145) |
| (0.7) | 2.3 |
Underlying attributable profit to the parent | 163 | 9.9 | 11.4 | 311 |
| 1.3 | 4.4 |
|
|
|
|
|
|
|
|
Balance sheet |
|
|
|
|
|
|
|
Loans and advances to customers | 40,081 | 1.1 | 2.3 | 40,081 |
| 4.8 | 7.0 |
Cash, central banks and credit institutions | 4,742 | 18.4 | 19.8 | 4,742 |
| 21.8 | 24.4 |
Debt instruments | 3,949 | 4.4 | 5.7 | 3,949 |
| (5.8) | (3.8) |
Other financial assets | 4,551 | 43.7 | 45.5 | 4,551 |
| 55.1 | 58.4 |
Other asset accounts | 2,880 | (0.9) | 0.3 | 2,880 |
| 57.4 | 60.8 |
Total assets | 56,203 | 5.0 | 6.3 | 56,203 |
| 10.0 | 12.4 |
Customer deposits | 27,122 | 1.4 | 2.7 | 27,122 |
| 2.2 | 4.4 |
Central banks and credit institutions | 5,586 | (6.6) | (5.5) | 5,586 |
| 6.6 | 8.8 |
Marketable debt securities | 11,076 | 3.5 | 4.8 | 11,076 |
| 11.5 | 13.9 |
Other financial liabilities | 6,417 | 72.0 | 74.2 | 6,417 |
| 64.7 | 68.2 |
Other liabilities accounts | 1,025 | (3.3) | (2.1) | 1,025 |
| 13.7 | 16.1 |
Total liabilities | 51,226 | 6.2 | 7.5 | 51,226 |
| 10.2 | 12.5 |
Total equity | 4,977 | (6.0) | (4.9) | 4,977 |
| 8.6 | 10.9 |
|
|
|
|
|
|
|
|
Memorandum items: | 41,182 | 0.9 | 2.2 | 41,182 |
| 4.5 | 6.8 |
Customer funds | 35,215 | 3.1 | 4.3 | 35,215 |
| 3.2 | 5.4 |
Customer deposits (3) | 26,964 | 1.1 | 2.3 | 26,964 |
| 1.8 | 3.9 |
Mutual funds | 8,251 | 10.3 | 11.6 | 8,251 |
| 8.1 | 10.3 |
Ratios (%) and operating means |
|
|
|
|
|
|
|
Underlying RoTE | 18.75 | 2.41 |
| 17.63 |
| (0.56) |
|
Efficiency ratio | 41.0 | (1.6) |
| 41.8 |
| 0.3 |
|
NPL ratio | 4.52 | (0.15) |
| 4.52 |
| (0.34) |
|
NPL coverage | 59.1 | (0.6) |
| 59.1 |
| (0.9) |
|
Number of employees | 11,797 | (0.8) |
| 11,797 |
| (1.9) |
|
Number of branches | 380 | — |
| 380 |
| (9.5) |
|
(1) Includes exchange differences.
(2) Excluding reverse repos.
(3) Excluding repos.
|
|
|
|
| January – June 2019 |
| 65 |
|
|
|
|
|
|
|
|
|
Santander vision and |
| Group financial |
| Financial information |
| Responsible banking |
| Appendix |
|
|
|
|
|
|
|
|
|
|
|
|
|
|
|
|
|
|
|
|
|
|
|
|
|
| Financial information |
Argentina |
|
|
|
|
EUR million |
|
|
|
|
|
|
|
|
|
|
|
|
|
| / Q1’19 |
|
| / H1'18 | ||
Underlying income statement | Q2’19 | % | % excl. FX | H1'19 |
| % | % excl. FX |
Net interest income | 298 | 39.6 | 43.8 | 511 |
| 14.2 | 113.4 |
Net fee income | 125 | 8.1 | 11.8 | 241 |
| (8.4) | 71.3 |
Gains (losses) on financial transactions (1) | 14 | (61.9) | (59.5) | 52 |
| (44.8) | 3.3 |
Other operating income | (47) | 34.1 | 38.2 | (83) |
| — | — |
Total income | 389 | 17.7 | 21.5 | 720 |
| (10.7) | 66.9 |
Administrative expenses and amortisations | (229) | 13.0 | 16.7 | (431) |
| 1.1 | 89.0 |
Net operating income | 161 | 25.1 | 29.0 | 289 |
| (24.0) | 42.1 |
Net loan-loss provisions | (70) | (2.9) | 0.5 | (143) |
| 14.7 | 114.5 |
Other gains (losses) and provisions | 3 | — | — | (19) |
| (66.4) | (37.1) |
Profit before tax | 94 | 178.5 | 185.1 | 127 |
| (35.9) | 19.7 |
Tax on profit | (30) | 31.7 | 35.7 | (54) |
| (12.3) | 64.0 |
Profit from continuing operations | 63 | 502.8 | 515.0 | 74 |
| (46.5) | 0.1 |
Net profit from discontinued operations | — | — | — | — |
| — | — |
Consolidated profit | 63 | 502.8 | 515.0 | 74 |
| (46.5) | 0.1 |
Non-controlling interests | (0) | 84.1 | 89.1 | (0) |
| (60.1) | (25.4) |
Underlying attributable profit to the parent | 63 | 508.4 | 520.8 | 73 |
| (46.4) | 0.3 |
|
|
|
|
|
|
|
|
Balance sheet |
|
|
|
|
|
|
|
Loans and advances to customers | 5,755 | (5.2) | (6.0) | 5,755 |
| (23.8) | 9.8 |
Cash, central banks and credit institutions | 5,198 | 7.9 | 7.1 | 5,198 |
| 42.5 | 105.3 |
Debt instruments | 917 | 114.3 | 112.7 | 917 |
| (2.6) | 40.4 |
Other financial assets | 125 | 10.2 | 9.4 | 125 |
| 411.2 | 636.6 |
Other asset accounts | 909 | 12.1 | 11.3 | 909 |
| 58.5 | 128.4 |
Total assets | 12,903 | 5.4 | 4.6 | 12,903 |
| 1.3 | 46.0 |
Customer deposits | 9,384 | 6.4 | 5.6 | 9,384 |
| 0.5 | 44.8 |
Central banks and credit institutions | 992 | 2.9 | 2.2 | 992 |
| (0.5) | 43.4 |
Marketable debt securities | 257 | 4.2 | 3.5 | 257 |
| (52.1) | (31.0) |
Other financial liabilities | 762 | (10.6) | (11.3) | 762 |
| (6.9) | 34.1 |
Other liabilities accounts | 415 | 4.9 | 4.1 | 415 |
| 74.5 | 151.5 |
Total liabilities | 11,809 | 4.7 | 4.0 | 11,809 |
| (1.0) | 42.7 |
Total equity | 1,094 | 12.9 | 12.0 | 1,094 |
| 35.4 | 95.1 |
|
|
|
|
|
|
|
|
Memorandum items: | 5,858 | (0.8) | (1.6) | 5,858 |
| (21.0) | 13.8 |
Customer funds | 11,030 | 6.2 | 5.4 | 11,030 |
| (2.6) | 40.3 |
Customer deposits (3) | 9,384 | 6.4 | 5.6 | 9,384 |
| 0.5 | 44.8 |
Mutual funds | 1,646 | 5.0 | 4.2 | 1,646 |
| (17.2) | 19.3 |
Ratios (%) and operating means |
|
|
|
|
|
|
|
Underlying RoTE | 27.09 | 22.01 |
| 16.95 |
| (13.90) |
|
Efficiency ratio | 58.7 | (2.4) |
| 59.8 |
| 7.0 |
|
NPL ratio | 3.79 | 0.29 |
| 3.79 |
| 1.39 |
|
NPL coverage | 126.4 | 7.8 |
| 126.4 |
| 4.9 |
|
Number of employees | 9,183 | (0.9) |
| 9,183 |
| (0.4) |
|
Number of branches | 469 | 0.2 |
| 469 |
| (2.7) |
|
(1) Includes exchange differences.
(2) Excluding reverse repos.
(3) Excluding repos.
|
|
|
|
66 |
| January – June 2019 |
|
|
|
|
|
|
|
|
|
|
Santander vision and |
| Group financial |
| Financial information |
| Responsible banking |
| Appendix |
|
|
|
|
|
|
|
|
|
|
|
|
|
|
|
|
|
|
|
|
|
|
|
|
|
| Financial information |
Other South America
EUR million
|
|
|
|
|
|
|
|
|
| / Q1’19 |
|
| / H1'18 | ||
Underlying income statement | Q2’19 | % | % w/o FX | H1'19 |
| % | % w/o FX |
Net interest income | 108 | (1.3) | 2.4 | 217 |
| (0.4) | 4.5 |
Net fee income | 32 | 10.8 | 14.8 | 60 |
| 3.2 | 9.2 |
Gains (losses) on financial transactions (1) | 12 | 14.3 | 17.2 | 22 |
| 0.9 | 5.6 |
Other operating income | (2) | 4.2 | 8.8 | (5) |
| 22.3 | 32.6 |
Total income | 149 | 2.0 | 5.8 | 295 |
| 0.2 | 5.2 |
Administrative expenses and amortisations | (64) | 1.1 | 5.0 | (127) |
| (6.1) | (1.3) |
Net operating income | 85 | 2.7 | 6.4 | 168 |
| 5.4 | 10.7 |
Net loan-loss provisions | (20) | 9.5 | 13.5 | (38) |
| 45.4 | 59.1 |
Other gains (losses) and provisions | (1) | (31.2) | (27.0) | (3) |
| (40.6) | (37.5) |
Profit before tax | 64 | 1.7 | 5.2 | 128 |
| (1.0) | 3.1 |
Tax on profit | (17) | 1.9 | 5.2 | (33) |
| (23.2) | (21.6) |
Profit from continuing operations | 48 | 1.6 | 5.2 | 95 |
| 10.1 | 15.9 |
Net profit from discontinued operations | — | — | — | — |
| — | — |
Consolidated profit | 48 | 1.6 | 5.2 | 95 |
| 10.1 | 15.9 |
Non-controlling interests | (0) | (2.5) | (3.7) | (1) |
| 30.3 | 24.4 |
Underlying attributable profit to the parent | 47 | 1.6 | 5.3 | 94 |
| 10.0 | 15.8 |
|
|
|
|
|
|
|
|
Balance sheet |
|
|
|
|
|
|
|
Loans and advances to customers | 5,939 | 1.4 | 4.8 | 5,939 |
| 37.2 | 44.6 |
Cash, central banks and credit institutions | 2,395 | 5.4 | 10.7 | 2,395 |
| 2.8 | 9.2 |
Debt instruments | 601 | (18.3) | (14.3) | 601 |
| (12.4) | (4.9) |
Other financial assets | 10 | 9.9 | 12.7 | 10 |
| 5.2 | 12.2 |
Other asset accounts | 193 | 6.9 | 11.7 | 193 |
| (18.9) | (15.2) |
Total assets | 9,137 | 0.9 | 4.9 | 9,137 |
| 20.4 | 27.5 |
Customer deposits | 5,535 | (2.5) | 2.3 | 5,535 |
| 7.5 | 15.1 |
Central banks and credit institutions | 2,386 | 8.8 | 10.3 | 2,386 |
| 90.6 | 94.6 |
Marketable debt securities | 67 | 12.5 | 12.9 | 67 |
| 30.8 | 28.2 |
Other financial liabilities | 46 | (3.9) | 0.7 | 46 |
| 23.8 | 34.5 |
Other liabilities accounts | 260 | 17.0 | 22.6 | 260 |
| 9.1 | 15.9 |
Total liabilities | 8,293 | 1.2 | 5.2 | 8,293 |
| 23.3 | 30.7 |
Total equity | 844 | (1.8) | 2.4 | 844 |
| (2.7) | 2.5 |
|
|
|
|
|
|
|
|
Memorandum items: | 6,079 | 1.3 | 4.8 | 6,079 |
| 36.1 | 43.4 |
Customer funds | 5,567 | (2.4) | 2.4 | 5,567 |
| 7.6 | 15.1 |
Customer deposits (3) | 5,535 | (2.5) | 2.3 | 5,535 |
| 7.5 | 15.1 |
Mutual funds | 32 | (1.5) | 5.0 | 32 |
| 10.4 | 20.9 |
Resources |
|
|
|
|
|
|
|
Number of employees | 2,060 | 1.9 |
| 2,060 |
| (1.0) |
|
(1) Includes exchange differences.
(2) Excluding reverse repos.
(3) Excluding repos.
|
|
|
|
| January – June 2019 |
| 67 |
|
|
|
|
|
|
|
|
|
Santander vision and |
| Group financial |
| Financial information |
| Responsible banking |
| Appendix |
|
|
|
|
|
|
|
|
|
|
|
|
|
|
|
|
|
|
|
|
|
|
|
|
|
| Financial information |
Q2'19 | Q1'19 | % | H1'19 | H1'18 | % | |
Net interest income | 23 | 22 | 5.3 | 46 | 38 | 19.4 |
Net fee income | 1 | 2 | (52.0) | 2 | 2 | (0.4) |
Gains (losses) on financial transactions (1) | (0) | (1) | (67.6) | (2) | 0 | — |
Other operating income | (4) | (4) | (4.4) | (7) | (7) | 6.8 |
Total income | 20 | 19 | 7.6 | 39 | 34 | 14.5 |
Administrative expenses and amortisations | (67) | (41) | 62.4 | (108) | (62) | 75.0 |
Net operating income | (47) | (22) | 108.3 | (69) | (28) | 149.2 |
Net loan-loss provisions | (0) | (0) | 114.6 | (0) | 0 | — |
Other gains (losses) and provisions | (0) | (1) | (56.8) | (1) | (1) | (21.1) |
Profit before tax | (47) | (23) | 103.8 | (70) | (29) | 145.0 |
Tax on profit | 7 | 12 | (41.9) | 19 | 6 | 216.8 |
Profit from continuing operations | (40) | (11) | 266.6 | (51) | (23) | 125.6 |
Net profit from discontinued operations | — | — | — | — | — | — |
Consolidated profit | (40) | (11) | 266.6 | (51) | (23) | 125.6 |
Non-controlling interests | — | — | — | — | — | — |
Underlying attributable profit to the parent | (40) | (11) | 266.6 | (51) | (23) | 125.6 |
|
|
|
|
|
|
|
Balance sheet |
|
|
|
|
|
|
Loans and advances to customers | 515 | 417 | 23.5 | 515 | 193 | 166.8 |
Cash, central banks and credit institutions | 8,938 | 8,673 | 3.1 | 8,938 | 7,567 | 18.1 |
Debt instruments | — | — | — | — | — | — |
Other financial assets | 147 | 152 | (3.0) | 147 | 139 | 5.7 |
Other asset accounts | 132 | 129 | 2.6 | 132 | 91 | 45.7 |
Total assets | 9,732 | 9,370 | 3.9 | 9,732 | 7,990 | 21.8 |
Customer deposits | 9,106 | 8,804 | 3.4 | 9,106 | 7,477 | 21.8 |
Central banks and credit institutions | 130 | 75 | 73.2 | 130 | 83 | 57.6 |
Marketable debt securities | — | — | — | — | — | — |
Other financial liabilities | 67 | 41 | 65.0 | 67 | 45 | 48.0 |
Other liabilities accounts | 81 | 60 | 34.1 | 81 | 131 | (38.0) |
Total liabilities | 9,384 | 8,980 | 4.5 | 9,384 | 7,736 | 21.3 |
Total equity | 348 | 390 | (10.9) | 348 | 254 | 36.8 |
|
|
|
|
|
|
|
Memorandum items: | 518 | 420 | 23.4 | 518 | 196 | 164.4 |
Customer funds | 9,500 | 9,183 | 3.5 | 9,500 | 8,082 | 17.5 |
Customer deposits (3) | 9,106 | 8,804 | 3.4 | 9,106 | 7,477 | 21.8 |
Mutual funds | 394 | 379 | 3.9 | 394 | 605 | (34.9) |
Resources |
|
|
|
|
|
|
Number of employees | 597 | 545 | 9.5 | 597 | 427 | 39.8 |
(1) Includes exchange differences.
(2) Excluding reverse repos.
(3) Excluding repos.
|
|
|
|
68 |
| January – June 2019 |
|
|
|
|
|
|
|
|
|
|
Santander vision and |
| Group financial |
| Financial information |
| Responsible banking |
| Appendix |
|
|
|
|
|
|
|
|
|
|
|
|
|
|
|
|
|
|
|
|
|
|
|
|
|
| Financial information |
|
|
|
|
|
CORPORATE CENTRE |
|
|
|
|
EUR million |
|
|
|
|
Underlying income statement | Q2'19 | Q1'19 | % | H1'19 | H1'18 | % |
Net interest income | (304) | (296) | 2.9 | (600) | (477) | 25.8 |
Net fee income | (13) | (14) | (6.1) | (27) | (17) | 53.8 |
Gains (losses) on financial transactions (1) | (92) | (79) | 15.7 | (171) | 5 | — |
Other operating income | (14) | (11) | 31.8 | (25) | (5) | 422.9 |
Total income | (423) | (399) | 5.9 | (822) | (494) | 66.4 |
Administrative expenses and amortisations | (96) | (97) | (1.5) | (193) | (212) | (9.1) |
Net operating income | (519) | (497) | 4.4 | (1,015) | (706) | 43.7 |
Net loan-loss provisions | (5) | (8) | (38.8) | (13) | (67) | (81.1) |
Other gains (losses) and provisions | (72) | (55) | 31.4 | (127) | (93) | 36.5 |
Profit before tax | (595) | (559) | 6.5 | (1,155) | (866) | 33.3 |
Tax on profit | 3 | 33 | (90.1) | 36 | (18) | — |
Profit from continuing operations | (592) | (526) | 12.5 | (1,118) | (884) | 26.5 |
Net profit from discontinued operations | — | — | — | — | — | — |
Consolidated profit | (592) | (526) | 12.5 | (1,118) | (884) | 26.5 |
Non-controlling interests | 1 | 10 | (94.1) | 10 | 0 | — |
Underlying attributable profit to the parent | (592) | (517) | 14.5 | (1,108) | (884) | 25.4 |
Balance sheet |
|
|
|
|
|
|
Loans and advances to customers | 6,231 | 6,138 | 1.5 | 6,231 | 7,012 | (11.1) |
Cash, central banks and credit institutions | 31,895 | 26,755 | 19.2 | 31,895 | 39,060 | (18.3) |
Debt instruments | 952 | 954 | (0.2) | 952 | 351 | 171.4 |
Other financial assets | 2,446 | 2,207 | 10.9 | 2,446 | 2,240 | 9.2 |
Other asset accounts | 132,086 | 132,551 | (0.4) | 132,086 | 120,821 | 9.3 |
Total assets | 173,610 | 168,605 | 3.0 | 173,610 | 169,484 | 2.4 |
Customer deposits | 953 | 163 | 485.9 | 953 | 231 | 311.9 |
Central banks and credit institutions | 14,650 | 16,920 | (13.4) | 14,650 | 29,012 | (49.5) |
Marketable debt securities | 51,326 | 43,441 | 18.2 | 51,326 | 40,421 | 27.0 |
Other financial liabilities | 2,617 | 2,321 | 12.8 | 2,617 | 1,622 | 61.3 |
Other liabilities accounts | 9,743 | 8,356 | 16.6 | 9,743 | 7,763 | 25.5 |
Total liabilities | 79,290 | 71,201 | 11.4 | 79,290 | 79,050 | 0.3 |
Total equity | 94,320 | 97,404 | (3.2) | 94,320 | 90,433 | 4.3 |
|
|
|
|
|
|
|
Memorandum items: | 6,331 | 6,414 | (1.3) | 6,331 | 7,134 | (11.3) |
Customer funds | 964 | 176 | 449.3 | 964 | 238 | 304.7 |
Customer deposits (3) | 953 | 163 | 485.9 | 953 | 231 | 311.9 |
Mutual funds | 11 | 13 | (15.8) | 11 | 7 | 59.2 |
Resources |
|
|
|
|
|
|
Number of employees | 1,644 | 1,757 | (6.4) | 1,644 | 1,746 | (5.8) |
(1) Includes exchange differences.
(2) Excluding reverse repos.
(3) Excluding repos.
|
|
|
|
| January – June 2019 |
| 69 |
|
|
|
|
|
|
|
|
|
Santander vision and |
| Group financial |
| Financial information |
| Responsible banking |
| Appendix |
|
|
|
|
|
|
|
|
|
|
|
|
|
|
|
|
|
|
|
|
|
|
|
|
|
| Financial information |
RETAIL BANKING |
|
|
|
|
EUR million |
|
|
|
|
|
|
|
|
|
|
|
|
| / Q1’19 |
| / H1'18 | ||
Underlying income statement | Q2'19 | % | % excl. FX | H1'19 | % | % excl. FX |
Net interest income | 8,390 | 2.8 | 3.5 | 16,553 | 3.6 | 4.8 |
Net fee income | 2,269 | (2.0) | (0.9) | 4,583 | 1.8 | 5.2 |
Gains (losses) on financial transactions (1) | 180 | 91.8 | 89.3 | 273 | (9.9) | (8.1) |
Other operating income | 42 | (44.8) | (48.8) | 118 | (53.0) | (56.4) |
Total income | 10,881 | 2.2 | 2.9 | 21,528 | 2.4 | 3.9 |
Administrative expenses and amortisations | (4,882) | 1.1 | 1.7 | (9,712) | (0.2) | 1.5 |
Net operating income | 5,999 | 3.1 | 4.0 | 11,816 | 4.5 | 5.9 |
Net loan-loss provisions | (2,090) | (3.3) | (2.6) | (4,251) | 3.6 | 4.7 |
Other gains (losses) and provisions | (397) | 1.3 | 2.4 | (789) | 2.8 | 7.6 |
Profit before tax | 3,512 | 7.6 | 8.5 | 6,776 | 5.4 | 6.5 |
Tax on profit | (1,073) | (1.9) | (0.6) | (2,166) | 3.6 | 5.4 |
Profit from continuing operations | 2,439 | 12.4 | 13.1 | 4,610 | 6.2 | 7.1 |
Net profit from discontinued operations | — | — | — | — | — | — |
Consolidated profit | 2,439 | 12.4 | 13.1 | 4,610 | 6.2 | 7.1 |
Non-controlling interests | (386) | 5.1 | 5.4 | (754) | 13.6 | 12.7 |
Underlying attributable profit to the parent | 2,053 | 13.9 | 14.7 | 3,856 | 4.9 | 6.0 |
(1) Includes exchange differences.
|
|
|
|
|
CORPORATE & INVESTMENT BANKING |
|
|
|
|
EUR million |
|
|
|
|
|
|
|
|
|
|
|
|
| / Q1’19 |
| / H1'18 | ||
Underlying income statement | Q2'19 | % | % excl. FX | H1'19 | % | % excl. FX |
Net interest income | 701 | 7.3 | 8.0 | 1,354 | 18.6 | 22.5 |
Net fee income | 377 | 6.8 | 7.6 | 730 | (10.9) | (9.3) |
Gains (losses) on financial transactions (1) | 113 | (51.0) | (49.4) | 343 | (31.6) | (26.6) |
Other operating income | 123 | 115.7 | 115.7 | 180 | 80.5 | 83.4 |
Total income | 1,313 | 1.6 | 2.5 | 2,606 | 1.8 | 5.3 |
Administrative expenses and amortisations | (559) | (0.1) | 0.3 | (1,119) | 7.8 | 9.1 |
Net operating income | 754 | 2.9 | 4.2 | 1,488 | (2.3) | 2.6 |
Net loan-loss provisions | (46) | 379.0 | 375.1 | (55) | (56.2) | (55.7) |
Other gains (losses) and provisions | (16) | (25.5) | (25.1) | (36) | (1.8) | (1.8) |
Profit before tax | 693 | (1.4) | (0.1) | 1,396 | 2.6 | 8.4 |
Tax on profit | (212) | 2.0 | 3.5 | (420) | (0.6) | 5.4 |
Profit from continuing operations | 481 | (2.8) | (1.5) | 976 | 4.1 | 9.7 |
Net profit from discontinued operations | — | — | — | — | — | — |
Consolidated profit | 481 | (2.8) | (1.5) | 976 | 4.1 | 9.7 |
Non-controlling interests | (47) | 15.5 | 16.9 | (87) | 9.2 | 11.3 |
Underlying attributable profit to the parent | 434 | (4.4) | (3.2) | 889 | 3.6 | 9.5 |
(1) Includes exchange differences.
|
|
|
|
70 |
| January – June 2019 |
|
|
|
|
|
|
|
|
|
|
Santander vision and |
| Group financial |
| Financial information |
| Responsible banking |
| Appendix |
|
|
|
|
|
|
|
|
|
|
|
|
|
|
|
|
|
|
|
|
|
|
|
|
|
| Financial information |
WEALTH MANAGEMENT & INSURANCE |
|
|
|
|
EUR million |
|
|
|
|
|
|
|
|
|
|
|
|
| / Q1’19 |
| / H1'18 | ||
Underlying income statement | Q2'19 | % | % excl. FX | H1'19 | % | % excl. FX |
Net interest income | 144 | 3.1 | 3.4 | 283 | 10.6 | 10.7 |
Net fee income | 298 | 8.1 | 8.5 | 574 | (1.5) | (0.8) |
Gains (losses) on financial transactions (1) | 34 | (0.0) | 0.5 | 67 | 51.1 | 53.4 |
Other operating income | 84 | 9.8 | 10.7 | 160 | 8.2 | 10.2 |
Total income | 560 | 6.5 | 6.9 | 1,085 | 5.2 | 5.9 |
Administrative expenses and amortisations | (226) | (1.7) | (1.7) | (455) | 2.8 | 2.3 |
Net operating income | 334 | 12.9 | 13.7 | 630 | 6.9 | 8.7 |
Net loan-loss provisions | (0) | — | — | 7 | — | — |
Other gains (losses) and provisions | (1) | (55.6) | (54.7) | (4) | (7.2) | (8.0) |
Profit before tax | 332 | 10.9 | 11.6 | 632 | 8.2 | 10.1 |
Tax on profit | (79) | 11.9 | 12.7 | (149) | 10.7 | 12.6 |
Profit from continuing operations | 254 | 10.5 | 11.3 | 483 | 7.4 | 9.3 |
Net profit from discontinued operations | — | — | — | — | — | — |
Consolidated profit | 254 | 10.5 | 11.3 | 483 | 7.4 | 9.3 |
Non-controlling interests | (13) | 9.5 | 11.6 | (24) | (6.3) | (3.1) |
Underlying attributable profit to the parent | 241 | 10.6 | 11.3 | 459 | 8.3 | 10.1 |
(1) Includes exchange differences.
|
|
|
|
| January – June 2019 |
| 71 |
|
|
|
|
|
|
|
|
|
Santander vision and |
| Group financial |
| Financial information |
| Responsible banking |
| Appendix |
|
|
|
|
|
|
|
|
|
|
|
|
|
|
|
|
|
|
|
|
|
|
|
|
|
| Alternative |
ALTERNATIVE PERFORMANCE MEASURES (APM)
In addition to the financial information prepared under IFRS, this consolidated directors’ report contains financial measures that constitute alternative performance measures (‘APMs’) to comply with the guidelines on alternative performance measures issued by the European Securities and Markets Authority on October 5, 2015 and non-IFRS measures.
The financial measures contained in this consolidated directors’ report that qualify as APMs and non-IFRS measures have been calculated using the financial information from Santander but are not defined or detailed in the applicable financial information framework or under IFRS and have neither been audited nor reviewed by our auditors.
We use these APMs and non-IFRS measures when planning, monitoring and evaluating our performance. We consider these APMs and non-IFRS financial measures to be useful metrics for management and investors to facilitate operating performance comparisons from period to period. While we believe that these APMs and non-IFRS financial measures are useful in evaluating our business, this information should be considered as supplemental in nature and is not meant as a substitute of IFRS measures. In addition, other companies, including companies in our industry, may calculate such measures differently, which reduces their usefulness as comparative measures.
The APMs and non-IFRS measures we use in this document can be categorised as follows:
Underlying results
In addition to IFRS results measures, we present some results measures which are non-IFRS measures and which we refer to as underlying measures. These underlying measures allow in our view a better year-on-year comparability as they exclude items outside the ordinary course performance of our business which are grouped in the non-IFRS line management adjustments and are further detailed on page 12 of this report.
In addition, the results by business areas in the 'Geographic businesses' section are presented only on an underlying basis in accordance with IFRS 8, and reconciled on an aggregate basis to our IFRS consolidated results to the consolidated financial statements.
Reconciliation of underlying results to statutory results
EUR million
|
|
|
|
| First half 2019 | ||
| Underlying | Adjustments | Statutory |
Net interest income | 17,636 | — | 17,636 |
Net fee income | 5,863 | — | 5,863 |
Gains (losses) on financial transactions (1) | 511 | — | 511 |
Other operating income | 426 | — | 426 |
Total income | 24,436 | — | 24,436 |
Administrative expenses and amortisations | (11,587) | — | (11,587) |
Net operating income | 12,849 | — | 12,849 |
Net loan-loss provisions | (4,313) | — | (4,313) |
Other gains (losses) and provisions | (957) | (1,048) | (2,005) |
Profit before tax | 7,579 | (1,048) | 6,531 |
Tax on profit | (2,679) | 230 | (2,449) |
Profit from continuing operations | 4,900 | (818) | 4,082 |
Net profit from discontinued operations | — | — | — |
Consolidated profit | 4,900 | (818) | 4,082 |
Non-controlling interests | (855) | 4 | (851) |
Attributable profit to the parent | 4,045 | (814) | 3,231 |
(1) Includes exchange differences.
Explanation of adjustments:
Net capital gains from the sale of our stake in Prisma of EUR 150 million, net capital losses of EUR 180 million for the sale of real estate assets, restructuring costs in the United Kingdom, Poland and Spain for a net impact of EUR 704 million and PPI provisions for a net amount of EUR 80 million.
|
|
|
|
72 |
| January – June 2019 |
|
|
|
|
|
|
|
|
|
|
Santander vision and |
| Group financial |
| Financial information |
| Responsible banking |
| Appendix |
|
|
|
|
|
|
|
|
|
|
|
|
|
|
|
|
|
|
|
|
|
|
|
|
|
| Glossary |
Reconciliation of underlying results to statutory results
EUR million
|
|
|
|
| First half 2018 | ||
| Underlying | Adjustments | Statutory |
Net interest income | 16,931 | — | 16,931 |
Net fee income | 5,889 | — | 5,889 |
Gains (losses) on financial transactions (1) | 854 | — | 854 |
Other operating income | 488 | — | 488 |
Total income | 24,162 | — | 24,162 |
Administrative expenses and amortisations | (11,482) | — | (11,482) |
Net operating income | 12,680 | — | 12,680 |
Net loan-loss provisions | (4,297) | — | (4,297) |
Other gains (losses) and provisions | (903) | (581) | (1,484) |
Profit before tax | 7,480 | (581) | 6,899 |
Tax on profit | (2,659) | 281 | (2,378) |
Profit from continuing operations | 4,821 | (300) | 4,521 |
Net profit from discontinued operations | — | — | — |
Consolidated profit | 4,821 | (300) | 4,521 |
Non-controlling interests | (769) | — | (769) |
Attributable profit to the parent | 4,052 | (300) | 3,752 |
(1) Includes exchange differences.
Explanation of adjustments:
Restructuring costs: The net impact of EUR -300 million on profit relates to restructuring costs in connection with the integration of Grupo Banco Popular, as follows EUR -280 million in Spain, EUR -40 million in Corporate Centre and EUR 20 million in Portugal.
Profitability and efficiency ratios
The purpose of the profitability and efficiency ratios is to measure the ratio of profit to capital, to tangible capital, to assets and to risk weighted assets, while the efficiency ratio measures how much general administrative expenses (personnel and other) and amortisation costs are needed to generate revenue.
Ratio |
| Formula |
| Relevance of the metric |
|
|
|
|
|
RoE |
| Attributable profit to the parent |
| This ratio measures the return that shareholders obtain on the funds invested in the entity and as such measures the company's ability to pay shareholders. |
(Return on equity) |
| Average stockholders’ equity (1) (excl. minority interests) |
| |
|
|
|
|
|
RoTE |
| Attributable profit to the parent |
| This is a very common indicator, used to evaluate the profitability of the company as a percentage of its tangible equity. It's measured as the return that shareholders receive as a percentage of the funds invested in the entity less intangible assets. |
(Return on tangible equity) |
| Average stockholders' equity (1) (excl. minority interests) - intangible assets |
| |
|
|
|
|
|
Underlying RoTE |
| Attributable profit to the parent |
| This indicator measures the profitability of the tangible equity of a company arising from ordinary activities, i.e. excluding results from non-recurring operations. |
|
| Average stockholders' equity(1) (excl. minority interests) - intangible assets |
| |
|
|
|
|
|
RoA |
| Consolidated profit |
| This metric, commonly used by analysts, measures the profitability of a company as a percentage of its total assets. It is an indicator that reflects the efficiency of the company's total funds in generating profit over a given period. |
(Return on assets) |
| Average total assets |
| |
|
|
|
|
|
RoRWA |
| Consolidated profit |
| The return adjusted for risk is an derivative of the RoA metric. The difference is that RoRWA measures profit in relation to the bank's risk weighted assets. |
(Return on risk weighted assets) |
| Average risk weighted assets |
| |
|
|
|
|
|
Underlying RoRWA |
| Underlying consolidated profit |
| This relates the underlying profit (excluding non-recurring results) to the bank's risk weighted assets. |
|
| Average risk weighted assets |
| |
|
|
|
|
|
Efficiency ratio |
| Operating expenses (2) |
| One of the most commonly used indicators when comparing productivity of different financial entities. It measures the amount of funds used to generate the bank's total income. |
|
| Total income |
|
(1) Stockholders’ equity = Capital and Reserves + Accumulated other comprehensive income + Attributable profit to the parent + Dividends.
(2) Operating expenses = Administrative expenses + amortisations.
|
|
|
|
| January – June 2019 |
| 73 |
|
|
|
|
|
|
|
|
|
Santander vision and |
| Group financial |
| Financial information |
| Responsible banking |
| Appendix |
|
|
|
|
|
|
|
|
|
|
|
|
|
|
|
|
|
|
|
|
|
|
|
|
|
| Alternative |
|
|
|
|
|
Profitability and efficiency (1) (2) (3) (4) | Q2'19 | Q1'19 | H1'19 | H1'18 |
RoE | 7.79% | 7.85% | 7.41% | 8.24% |
Attributable profit to the parent | 7,681 | 7,684 | 7,276 | 7,804 |
Average stockholders' equity (excluding minority interests) | 98,659 | 97,886 | 98,191 | 94,662 |
RoTE | 11.02% | 11.15% | 10.51% | 11.79% |
Attributable profit to the parent | 7,681 | 7,684 | 7,276 | 7,804 |
Average stockholders' equity (excluding minority interests) | 98,659 | 97,886 | 98,191 | 94,662 |
(-) Average intangible assets | 28,965 | 28,978 | 28,952 | 28,472 |
Average stockholders' equity (excl. minority interests) - intangible assets | 69,694 | 68,908 | 69,239 | 66,190 |
Underlying RoTE | 12.03% | 11.31% | 11.68% | 12.24% |
Attributable profit to the parent | 7,681 | 7,684 | 7,276 | 7,804 |
(-) Management adjustments | (706) | (108) | (814) | (300) |
Underlying attributable profit to the parent | 8,388 | 7,792 | 8,090 | 8,104 |
Average stockholders' equity (excl. minority interests) - intangible assets | 69,694 | 68,908 | 69,239 | 66,190 |
RoA | 0.63% | 0.63% | 0.60% | 0.65% |
Consolidated profit | 9,464 | 9,318 | 8,981 | 9,342 |
Average total assets | 1,500,703 | 1,488,505 | 1,492,954 | 1,438,444 |
RoRWA | 1.56% | 1.54% | 1.48% | 1.55% |
Consolidated profit | 9,464 | 9,318 | 8,986 | 9,342 |
Average risk weighted assets | 608,697 | 603,340 | 605,979 | 603,424 |
Underlying RoRWA | 1.67% | 1.56% | 1.62% | 1.60% |
Consolidated profit | 9,464 | 9,318 | 8,986 | 9,342 |
(-) Management adjustments | (701) | (113) | (814) | (300) |
Underlying consolidated profit | 10,169 | 9,431 | 9,800 | 9,642 |
Average risk weighted assets | 608,697 | 603,340 | 605,979 | 603,424 |
Efficiency ratio | 47.2% | 47.6% | 47.4% | 47.5% |
Underlying operating expenses | 5,829 | 5,758 | 11,587 | 11,482 |
Operating expenses | 5,829 | 5,758 | 11,587 | 11,482 |
Management adjustments impact in operating expenses | — | — | — | — |
Underlying total income | 12,351 | 12,085 | 24,436 | 24,162 |
Total income | 12,351 | 12,085 | 24,436 | 24,162 |
Management adjustments impact in total income | — | — | — | — |
(1) | Averages included in the RoE, RoTE, RoA and RoRWA denominators are calculated using 4 months' worth of data in the case of quarterly figures (from March to June in Q2 and December to March in Q1) and 7 months in the case of H1 data (from December to June). |
(2) | For periods less than one year, and if there are results in the net capital gains and provisions line, the profit used to calculate RoE and RoTE is the annualised underlying attributable profit to which said results are added without annualising. |
(3) | For periods less than one year, and if there are results in the net capital gains and provisions line, the profit used to calculate RoA and RoRWA is the annualised underlying consolidated profit, to which said results are added without annualising. |
(4) | The risk weighted assets included in the denominator of the RoRWA metric are calculated in line with the criteria laid out in the CRR (Capital Requirements Regulation). |
Efficiency ratio
|
|
|
|
|
|
|
| H1'19 | H1'18 | ||||
| % | Total | Operating | % | Total | Operating |
Europe | 53.7 | 10,413 | 5,591 | 53.8 | 10,524 | 5,666 |
Spain | 55.2 | 3,706 | 2,044 | 58.9 | 3,746 | 2,205 |
Santander Consumer Finance | 44.6 | 2,321 | 1,035 | 44.9 | 2,266 | 1,018 |
United Kingdom | 60.4 | 2,388 | 1,442 | 55.6 | 2,590 | 1,440 |
Portugal | 43.8 | 712 | 312 | 47.2 | 688 | 324 |
Poland | 42.8 | 817 | 349 | 43.4 | 731 | 317 |
North America | 42.1 | 5,672 | 2,386 | 44.1 | 4,947 | 2,181 |
US | 42.3 | 3,734 | 1,581 | 45.4 | 3,248 | 1,475 |
Mexico | 41.6 | 1,938 | 806 | 41.6 | 1,699 | 706 |
South America | 36.2 | 9,134 | 3,309 | 36.7 | 9,151 | 3,361 |
Brazil | 32.4 | 6,864 | 2,227 | 33.5 | 6,768 | 2,269 |
Chile | 41.8 | 1,255 | 524 | 41.5 | 1,282 | 531 |
Argentina | 59.8 | 720 | 431 | 52.8 | 807 | 426 |
|
|
|
|
74 |
| January – June 2019 |
|
|
|
|
|
|
|
|
|
|
Santander vision and |
| Group financial |
| Financial information |
| Responsible banking |
| Appendix |
|
|
|
|
|
|
|
|
|
|
|
|
|
|
|
|
|
|
|
|
|
|
|
|
|
| Glossary |
Underlying RoTE
|
|
|
|
|
|
|
| H1'19 | H1'18 | ||||
| % | Underlying | Average | % | Underlying | Average |
Europe | 9.72 | 4,707 | 48,442 | 10.48 | 4,844 | 46,225 |
Spain | 9.31 | 1,388 | 14,915 | 8.65 | 1,322 | 15,288 |
Santander Consumer Finance | 15.36 | 1,316 | 8,565 | 17.00 | 1,335 | 7,851 |
United Kingdom | 7.81 | 1,164 | 14,901 | 9.93 | 1,330 | 13,390 |
Portugal | 12.54 | 520 | 4,150 | 11.56 | 459 | 3,967 |
Poland | 9.61 | 300 | 3,119 | 10.93 | 309 | 2,831 |
North America | 9.54 | 1,779 | 18,637 | 8.26 | 1,381 | 16,713 |
US | 6.38 | 930 | 14,578 | 5.11 | 667 | 13,054 |
Mexico | 20.47 | 849 | 4,145 | 19.87 | 713 | 3,589 |
South America | 20.76 | 3,922 | 18,894 | 19.81 | 3,693 | 18,643 |
Brazil | 21.65 | 2,965 | 13,696 | 19.89 | 2,634 | 13,247 |
Chile | 17.63 | 623 | 3,532 | 18.19 | 615 | 3,379 |
Argentina | 16.95 | 146 | 863 | 30.86 | 273 | 884 |
Credit risk indicators
The credit risk indicators measure the quality of the credit portfolio and the percentage of non-performing loans covered by provisions.
| Formula |
| Relevance of the metric | |
|
|
|
|
|
NPL ratio |
| Non-performing loans and advances to customers, customer guarantees and customer commitments granted |
| The NPL ratio is an important variable regarding financial institutions' activity since it gives an indication of the level of risk the entities are exposed to. It calculates risks that are, in accounting terms, declared to be non-performing as a percentage of the total outstanding amount of customer credit and contingent liabilities. |
(Non-performing loans) |
| Total Risk (1) |
| |
|
|
|
|
|
Coverage ratio |
| Provisions to cover impairment losses on loans and advances to customers, customer guarantees and customer commitments granted |
| The coverage ratio is a fundamental metric in the financial sector. It reflects the level of provisions as a percentage of the non-performing assets (credit risk). Therefore it is a good indicator of the entity's solvency against client defaults both present and future. |
|
| Non-performing loans and advances to customers, customer guarantees and customer commitments granted |
| |
|
|
|
|
|
Cost of Credit |
| Allowances for loan-loss provisions over the last 12 months |
| This ratio quantifies loan-loss provisions arising from credit risk over a defined period of time for a given loan portfolio. As such, it acts as an indicator of credit quality. |
|
| Average loans and advances to customers over the last 12 months |
|
(1) Total risk = Total loans and advances and guarantees to customers (performing and non-performing) + non-performing contingent liabilities.
|
|
|
|
|
Credit risk | Jun-19 | Mar-19 | Jun-19 | Jun-18 |
NPL ratio | 3.51% | 3.62% | 3.51% | 3.92% |
Non-performing loans and advances to customers customer guarantees and customer commitments granted | 34,421 | 35,590 | 34,421 | 36,654 |
Total risk | 980,885 | 983,790 | 980,885 | 934,388 |
Coverage ratio | 68% | 68% | 68% | 69% |
Provisions to cover impairment losses on loans and advances to customers, customer guarantees and customer commitments granted | 23,432 | 24,129 | 23,432 | 25,148 |
Non-performing loans and advances to customers customer guarantees and customer commitments granted | 34,421 | 35,590 | 34,421 | 36,654 |
Cost of credit | 0.98% | 0.97% | 0.98% | 0.99% |
Allowances for loan-loss provisions over the last 12 months | 8,889 | 8,762 | 8,889 | 8,729 |
Average loans and advances to customers over the last 12 months | 910,753 | 899,201 | 910,753 | 880,329 |
|
|
|
|
| January – June 2019 |
| 75 |
|
|
|
|
|
|
|
|
|
Santander vision and |
| Group financial |
| Financial information |
| Responsible banking |
| Appendix |
|
|
|
|
|
|
|
|
|
|
|
|
|
|
|
|
|
|
|
|
|
|
|
|
|
| Alternative |
NPL ratio
|
|
|
|
|
|
|
| Jun-19 | Jun-18 | ||||
| % | Non- | Total risk | % | Non- | Total risk |
Europe | 3.48 | 24,156 | 694,083 | 3.97 | 27,042 | 681,565 |
Spain | 7.02 | 15,619 | 222,449 | 7.62 | 17,778 | 233,356 |
Santander Consumer Finance | 2.24 | 2,263 | 100,974 | 2.44 | 2,307 | 94,473 |
United Kingdom | 1.13 | 2,863 | 253,953 | 1.13 | 2,842 | 252,124 |
Portugal | 5.00 | 1,916 | 38,362 | 7.55 | 2,938 | 38,907 |
Poland | 4.21 | 1,353 | 32,129 | 4.58 | 1,129 | 24,631 |
North America | 2.29 | 3,120 | 136,013 | 2.82 | 3,183 | 112,858 |
US | 2.32 | 2,317 | 99,660 | 2.91 | 2,375 | 81,551 |
Mexico | 2.21 | 803 | 36,353 | 2.58 | 808 | 31,307 |
South America | 4.81 | 6,909 | 143,638 | 4.82 | 6,399 | 132,635 |
Brazil | 5.27 | 4,571 | 86,736 | 5.26 | 4,093 | 77,797 |
Chile | 4.52 | 1,969 | 43,537 | 4.86 | 2,024 | 41,659 |
Argentina | 3.79 | 231 | 6,102 | 2.40 | 188 | 7,853 |
Coverage ratio
|
|
|
|
|
|
|
| Jun-19 | Jun-18 | ||||
| % | Provisions | Non- | % | Provisions | Non- |
Europe | 49.9 | 12,047 | 24,156 | 52.9 | 14,318 | 27,042 |
Spain | 42.9 | 6,699 | 15,619 | 47.5 | 8,450 | 17,778 |
Santander Consumer Finance | 105.9 | 2,397 | 2,263 | 107.7 | 2,484 | 2,307 |
United Kingdom | 31.9 | 914 | 2,863 | 33.8 | 962 | 2,842 |
Portugal | 52.9 | 1,015 | 1,916 | 52.7 | 1,550 | 2,938 |
Poland | 69.7 | 942 | 1,353 | 72.1 | 815 | 1,129 |
North America | 150.3 | 4,689 | 3,120 | 146.5 | 4,665 | 3,183 |
US | 158.4 | 3,670 | 2,317 | 156.9 | 3,727 | 2,375 |
Mexico | 126.9 | 1,019 | 803 | 116.1 | 938 | 808 |
South America | 93.0 | 6,429 | 6,909 | 94.4 | 6,039 | 6,399 |
Brazil | 105.5 | 4,821 | 4,571 | 108.7 | 4,449 | 4,093 |
Chile | 59.1 | 1,165 | 1,969 | 60.0 | 1,215 | 2,024 |
Argentina | 126.4 | 292 | 231 | 121.5 | 229 | 188 |
|
|
|
|
76 |
| January – June 2019 |
|
|
|
|
|
|
|
|
|
|
Santander vision and |
| Group financial |
| Financial information |
| Responsible banking |
| Appendix |
|
|
|
|
|
|
|
|
|
|
|
|
|
|
|
|
|
|
|
|
|
|
|
|
|
| Glossary |
Other indicators
The market capitalisation indicator provides information on the volume of tangible equity per share. The loan-to-deposit ratio (LTD) identifies the relationship between net customer loans and advances and customer deposits, assessing the proportion of loans and advances granted by the Group that are funded by customer deposits.
The Group also uses gross customer loan magnitudes excluding reverse repurchase agreements (repos) and customer deposits excluding repos. In order to analyse the evolution of the traditional commercial banking business of granting loans and capturing deposits, repos and reverse repos are excluded, as they are mainly treasury business products and highly volatile.
Ratio |
| Formula |
| Relevance of the metric |
|
|
|
|
|
TNAV per share |
| Tangible book value (1) |
| This is a very commonly used ratio used to measure the company's accounting value per share having deducted the intangible assets. It is useful in evaluating the amount each shareholder would receive if the company were to enter into liquidation and had to sell all the company's tangible assets. |
(Tangible equity net asset value per share) |
| Number of shares excluding treasury stock |
| |
|
|
|
|
|
Price / tangible book |
| Share price |
| Is one of the most commonly used ratios by market participants for the valuation of listed companies both in absolute terms and relative to other entities. This ratio measures the relationship between the price paid for a company and its accounting equity value. |
value per share (X) |
| TNAV per share |
| |
|
|
|
|
|
LTD ratio |
| Net loans and advances to customers |
| This is an indicator of the bank's liquidity. It measures the total (net) loans and advances to customers as a percentage of customer funds. |
(Loan-to-deposit) |
| Customer deposits |
| |
|
|
|
|
|
Loans and advances (excl. reverse repos) |
| Gross loans and advances to customers excluding reverse repos |
| In order to aid analysis of the commercial banking activity, reverse repos are excluded as they are highly volatile treasury products. |
|
|
|
|
|
Deposits (excl. repos) |
| Customer deposits excluding repos |
| In order to aid analysis of the commercial banking activity, repos are excluded as they are highly volatile treasury products. |
|
|
|
|
|
PAT + After tax fees paid to SAN (in Wealth Management & Insurance) |
| Net profit + fees paid from Santander Asset Management to Santander, net of taxes, excluding Private Banking customers |
| Metric to assess Wealth Management & Insurance's total contribution to Grupo Santander profit. |
(1) Tangible book value = Stockholders' equity - intangible assets
|
|
|
|
|
Others | Jun-19 | Mar-19 | Jun-19 | Jun-18 |
TNAV (tangible book value) per share | 4.30 | 4.30 | 4.30 | 4.10 |
Tangible book value | 69,835 | 69,731 | 69,835 | 66,157 |
Number of shares excl. treasury stock (million) | 16,233 | 16,235 | 16,233 | 16,125 |
Price / Tangible book value per share (X) | 0.95 | 0.96 | 0.95 | 1.12 |
Share price (euros) | 4.08 | 4.14 | 4.08 | 4.59 |
TNAV (tangible book value) per share | 4.30 | 4.30 | 4.30 | 4.10 |
Loan-to-deposit ratio | 111% | 113% | 111% | 111% |
Net loans and advances to customers | 908,235 | 910,195 | 908,235 | 862,092 |
Customer deposits | 814,751 | 808,361 | 814,751 | 774,425 |
| Q2'19 | Q1'19 | H1'19 | H1'18 |
PAT + After tax fees paid to SAN (in WM&I) (Constant EUR million) | 628 | 599 | 1,227 | 1,136 |
Profit after tax | 254 | 229 | 483 | 442 |
Net fee income net of tax | 374 | 370 | 744 | 694 |
|
|
|
|
| January – June 2019 |
| 77 |
|
|
|
|
|
|
|
|
|
Santander vision and |
| Group financial |
| Financial information |
| Responsible banking |
| Appendix |
|
|
|
|
|
|
|
|
|
|
|
|
|
|
|
|
|
|
|
|
|
|
|
|
|
| Alternative |
Local currency measures
We make use of certain financial measures in local currency to help in the assessment of our ongoing operating performance. These non-IFRS financial measures include the results of operations of our subsidiary banks located outside the Eurozone, excluding the impact of foreign exchange. Because changes in foreign currency exchange rates do not have an operating impact on the results, we believe that evaluating their performance on a local currency basis provides an additional and meaningful assessment of performance to both management and the company’s investors.
The Group presents, at both the Group level as well as the business unit level, the real changes in the income statement as well as the changes excluding the exchange rate effect, as it considers the latter facilitates analysis, since it enables businesses movements to be identified without taking into account the impact of converting each local currency into euros.
Said variations, excluding the impact of exchange rate movements, are calculated by converting P&L lines for the different business units comprising the Group into our presentation currency, the euro, applying the average exchange rate for the first half of 2019 to all periods contemplated in the analysis.
The Group presents, at both the Group level as well as the business unit level, the changes in euros in the balance sheet as well as the changes excluding the exchange rate effect for loans and advances to customers excluding reverse repos and customer funds (which comprise deposits and mutual funds) excluding repos. As with the income statement, the reason is to facilitate analysis by isolating the changes in the balance sheet that are not caused by converting each local currency into euros.
These changes excluding the impact of exchange rate movements are calculated by converting loans and advances to customers excluding reverse repos and customer funds excluding repos, into our presentation currency, the euro, applying the closing exchange rate on the last working day of the first half of 2019 to all periods contemplated in the analysis.
The average and period-end exchange rates for the main currencies in which the Group operates are set out in the table below.
Exchange rates: 1 euro / currency parity
|
|
|
|
|
|
|
| Average (Income statement) |
| Period-end (balance sheet) | |||
| H1'19 | H1'18 |
| Jun-19 | Mar-19 | Jun-18 |
US dollar | 1.130 | 1.210 |
| 1.138 | 1.124 | 1.166 |
Pound sterling | 0.873 | 0.880 |
| 0.897 | 0.858 | 0.886 |
Brazilian real | 4.341 | 4.134 |
| 4.351 | 4.387 | 4.488 |
Mexican peso | 21.647 | 23.073 |
| 21.820 | 21.691 | 22.882 |
Chilean peso | 762.804 | 740.383 |
| 773.897 | 764.435 | 757.828 |
Argentine peso | 46.643 | 25.832 |
| 48.291 | 48.659 | 33.517 |
Polish zloty | 4.292 | 4.220 |
| 4.250 | 4.301 | 4.373 |
|
|
|
|
78 |
| January – June 2019 |
|
|
|
|
|
|
|
|
|
|
Santander vision and |
| Group financial |
| Financial information |
| Responsible banking |
| Appendix |
|
|
|
|
|
|
|
|
|
|
|
|
|
|
|
|
|
|
|
|
|
|
|
|
|
| Glossary |
Active customer: Those customers who comply with balance, income and/or transactionality demanded minima defined according to the business area ALCO: Assets and Liabilities Committee APM: Alternative Performance Measures Banco Popular/Popular: Banco Popular Español, S.A., a bank whose share capital was acquired by Banco Santander, S.A. on June 7, 2017 and was merged into Santander in September 2018 bps: basis points CAGR: Compound annual growth rate CEO: Chief Executive Officer CET1: Core equity tier 1 CFO: Chief Financial Officer CNMV: Spanish National Securities Market Commission (Comisión Nacional del Mercado de Valores) Digital customers: Every consumer of a commercial bank’s services who has logged on to their personal online banking and/or mobile banking in the last 30 days ECB: European Central Bank EIB: European Investment Bank ESG: Environmental, Social and Governance EPS: Earnings Per Share ESMA: European Securities and Markets Authority Fed: Federal Reserve FX: Foreign Exchange GDP: Gross Domestic Product GRI: Global Reporting Initiative IFRS 9: International Financial Reporting Standard 9, regarding financial instruments IFRS 16: International Financial Reporting Standard 16, regarding leases IT&O: Information technology and operations LCR: Liquidity Coverage Ratio Loyal customers: Active customers who receive most of their financial services from the Group according to the commercial segment that they belong to. Various engaged customer levels have been defined taking profitability into account. |
| NPLs: Non-performing loans P/E ratio: Price / earnings per share ratio pp: percentage points Repos: Repurchase agreements RoA: Return on assets RoE: Return on equity RoRAC: Return on risk adjusted capital RoRWA: Return on risk weighted assets RoTE: Return on tangible equity RWAs: Risk weighted assets SAM: Santander Asset Management SBNA: Santander Bank N.A. SCF: Santander Consumer Finance SCIB: Santander Corporate & Investment Banking SC USA: Santander Consumer USA SEC: Securities and Exchanges Commission SRF: Single Resolution Fund SGP: Santander Global Platform SHUSA: Santander Holdings USA, Inc. SMEs: Small or medium enterprises SPB: Santander Private Banking SPF: Simple, Personal and Fair SSM: Single Supervisory Mechanism, the system of banking supervision in Europe. It comprises the ECB and the national supervisory authorities of the participating countries T1: Tier 1 TLAC: The total loss absorption capacity requirement which is required to be met under the CRD V package TNAV: Tangible net asset value TRIM: Targeted review of internal models UK: United Kingdom US: United States of America VaR: Value at Risk WM&I: Wealth Management & Insurance |
|
|
|
|
| January – June 2019 |
| 79 |

OTHER DISCLOSURES REQUIRED BY THE BANK OF SPAIN
Financing for real estate construction and development
Policies and strategies to manage risks of financing for real estate construction
The policies for managing this portfolio, which are regularly reviewed and approved by the Group's senior management, are currently focused on reducing and consolidating exposure, while also staying attuned to new, viable business opportunities.
In order to manage this credit exposure, the Santander Group creates specialised teams that work not only in the risk areas, but also as a support for the entire life cycle of the operations: commercial management, legal treatment, potential recovery, etc.
Proactive management of these risks has allowed the Group to significantly reduce its exposure, ensuring a granular, regionally-diversified portfolio in which financing for second homes represents a very small portion overall. Mortgage loans for undeveloped land account for only a reduced portion of total land mortgage exposure, as the bulk of these loans relate to developed or developable land.
Exposure to financing of completed residences has been significantly reduced through a number of actions. In tandem with existing specialised sales channels, the Group carried out campaigns supported by specific management teams. In the case of the Santander network, these teams were directly guided by the recovery area. By directly managing loans to property developers and buyers and applying buyer reduction criteria, the Bank was able to subrogate outstanding loans. Subrogating the sale price and adapting financing conditions to borrowers' needs made it possible to diversify risk to a business segment whose NPL ratio is markedly lower.
Loan approval processes are managed by specialised teams working in direct coordination with sales teams, under clearly-defined policies and criteria:
- Property developers must have a strong creditworthiness profile and demonstrable market experience.
- Strict criteria are applied for transaction parameters: financing for the cost of construction only, high percentage of accredited sales, financing for primary residences, etc.
- Support is given for financing state-sponsored housing, with high percentages of accredited sales.
- Land financing is restricted to the level needed to re-establish proper coverage for existing financing or to increase collateral.
In addition to ongoing control by the Group's risk monitoring teams, a technical unit is specialised in monitoring and controlling this portfolio in respect of progress of works, compliance with work schedules and control of sales, as well as validation and control of payments made upon work certified. To that end, Santander uses specific tools created for this purpose. All mortgage distributions, drawdowns for any reason, modification of grace periods, etc., are authorised centrally.
In the event projects in the construction phase present any type of difficulty, the Group guarantees completion of the work in order to ensure that it has finished buildings that can be sold in the market. Individual analyses are carried out for each project and the most efficient measures are adopted for each specific case (supplier payment structures that ensure completion of the works, specific drawdown calendars, etc.).
80
In those cases that could potentially warrant a possible restructuring of the exposure, this restructuring is analysed collaboratively between the risks area and the recovery business area. The analysis is performed before any default occurs, in order to ensure that the payment structure of each project allows for its successful completion. These operations are authorised centrally by expert teams, applying strict criteria in line with the Group's prudent risk management principles. Possible losses are recognised as soon as they are identified, classifying the positions as needed and making any provisions required before any default occurs, in line with Bank of Spain regulations.
On-balance sheet real estate assets are managed through specialised property sales companies (Altamira Santander Real Estate, S.A. and Promodomus Desarrollo de Activos, S.L.), supported by the commercial network structure. Sales are made at low prices, in response to market conditions.
Foreclosed assets (Spain)
The sale and foreclosure of real estate assets is one of the mechanisms adopted in Spain in order to efficiently manage the portfolio.
The Group views acquisitions as a more effective tool for resolving defaulted loans than recurring to legal enforcement proceedings, given the following factors:
- Immediate availability of assets after an acquisition, compared to lengthy legal proceedings
- Cost savings
- Enhanced viability of companies, as acquisition provides them with an injection of liquidity
- Reduction in the possible loss of value of loans to these customers
- Reduction in exposure and expected loss
81
Disclosures required under Bank of Spain Circular 7/2010 on certain aspects of the mortgage market
a) Assets
As required under Bank of Spain Circular 7/2010 and Circular 5/2011 of November 30 on certain aspects of the mortgage market, details are provided below of the nominal value of all mortgage loans and credits and of those that are eligible, pursuant to Royal Decree 716/2009 regulating the Spanish mortgage market, for calculating the limit for issuing mortgage covered bonds, mortgage loans and credits covering the issue of mortgage bonds, loans that have been monetised through mortgage participations or mortgage transfer certificates and uncommitted transactions corresponding to Banco Santander, S.A.
At June 30, 2019, the breakdown of mortgage loans, based on their eligibility in respect of mortgage market calculations, is as follows:
|
|
| Millions of |
| Nominal |
| 30-06-2019 |
|
|
Total mortgage loans and credits (*) | 100,629 |
|
|
Mortgage participations issued | 522 |
Of which: On-balance sheet loans | - |
|
|
Mortgage transfer certificates issued | 14,536 |
Of which: On-balance sheet loans | 14,508 |
|
|
Mortgage loans and credits securing financing received | - |
|
|
Mortgage loans and credits backing the issue of mortgage bonds and mortgage covered bonds (**) | 85,571 |
i) Ineligible mortgage loans and credits (***) | 26,107 |
- That meet the eligibility requirements except for the limit established in article 5.1 of RD 716/2009 | 14,172 |
- Others | 11,935 |
ii) Eligible mortgage loans and credits (****) | 59,464 |
- Amounts not included in calculation (*****) | 13 |
- Amounts included in calculation | 59,451 |
a) Mortgage loans and credits covering issues of mortgage bonds | - |
b) Mortgage loans and credits covering issues of mortgage covered bonds | 59,464 |
(*) Including those acquired through mortgage participations and mortgage transfer certificates, even when derecognised from the balance sheet.
(**) Total loans less mortgage participations issued, mortgage transfer certificates issued and mortgage loans securing financing received.
(***) As the requirements of article 3 of Royal Decree 716/2009 are not meet.
(****) As per article 3 of Royal Decree 716/2009, without deducting the limits for calculation pursuant to article 12 of Royal Decree 716/2009.
(*****) In line with the criteria set out under article 12 of Royal Decree 716/2009.
82
The nominal value of outstanding mortgage loans and credits and the nominal value of eligible loans and credits pursuant to Royal Decree 716/2009, without taking into account the calculation limits established in article 12 thereof and broken down by origin, currency, payment status, average residual maturity, interest rate, holder and type of collateral are as follows:
|
|
|
| Millions of euros | |
| 30-06-2019 | |
| Mortgage loans and | Of which: Eligible |
|
|
|
Origin |
|
|
Originated by the Bank | 83,485 | 57,826 |
Derived from subrogations | 2,086 | 1,638 |
Other | - | - |
| 85,571 | 59,464 |
Currency |
|
|
Euros | 84,466 | 59,399 |
Other currencies | 1,105 | 65 |
| 85,571 | 59,464 |
Payment status |
|
|
Performing | 75,769 | 57,705 |
Other status | 9,802 | 1,759 |
| 85,571 | 59,464 |
Residual maturity |
|
|
Up to 10 years | 28,186 | 16,012 |
10 to 20 years | 31,059 | 25,192 |
20 to 30 years | 22,310 | 17,307 |
Over 30 years | 4,016 | 953 |
| 85,571 | 59,464 |
Interest rate |
|
|
Fixed interest | 10,237 | 6,986 |
Variable interest | 75,334 | 52,478 |
Mixed interest | - | - |
| 85,571 | 59,464 |
Holder |
|
|
Legal entities and individual business owners | 29,706 | 14,762 |
Of which: Real estate developers | 3,560 | 252 |
Other individuals and non-profit institutions serving households | 55,865 | 44,702 |
| 85,571 | 59,464 |
Type of collateral |
|
|
Finished buildings – residential | 62,005 | 48,139 |
Of which: State-sponsored housing | 3,653 | 2,694 |
Finished buildings – commercial | 8,611 | 4,675 |
Finished buildings – other | 9,953 | 4,985 |
Buildings under construction – residential | 1,125 | 78 |
Of which: State-sponsored housing | 40 | - |
Buildings under construction – commercial | 63 | 4 |
Buildings under construction – other | 210 | 3 |
Land – certified for development | 1,882 | 677 |
Land – other | 1,722 | 903 |
| 85,571 | 59,464 |
(*) As per article 3 of Royal Decree 716/2009, without deducting the limits for calculation established in article 12 of Royal Decree 716/2009
83
The nominal value of mortgage loans and credits eligible pursuant to Royal Decree 716/2009, without taking into account the calculation limits established in article 12 thereof and broken down by the percentage loan-to-value (LTV) are as follows:
|
|
|
|
|
|
30-06-2019 | |||||
| LTV (millions of euros) | ||||
| <=40% | >40%, <= | >60%, | >80% | Total |
Mortgage loans and credits eligible for issuing mortgage bonds and mortgage covered bonds (*) | 24,339 | 21,815 | 13,310 | - | 59,464 |
Residential | 18,423 | 16,484 | 13,310 | - | 48,217 |
Other | 5,916 | 5,331 | - | - | 11,247 |
(*) As per article 3 of Royal Decree 716/2009, without deducting the limits for calculation established in article 12 of Royal Decree 716/2009
Changes in the nominal value of mortgage loans and credits, both eligible and ineligible pursuant to Royal Decree 716/2009, are as follows:
|
|
|
| Millions of euros | |
| Eligible | Ineligible |
|
|
|
Balance at December 31, 2018 | 59,057 | 24,648 |
Derecognitions during the period | 5,518 | 3,659 |
Repaid upon maturity | 94 | 493 |
Repaid early | 3,271 | 1,619 |
Subrogated by other entities | - | - |
Other | 2,153 | 1,547 |
Additions during the period | 5,925 | 5,118 |
Originated by the Bank | 4,231 | 3,803 |
Subrogated from other entities | 4 | 1 |
Other | 1,690 | 1,314 |
Balance at June 30, 2019 | 59,464 | 26,107 |
(*) As per article 3 of Royal Decree 716/2009, without deducting the limits for calculation pursuant to article 12 of Royal Decree 716/2009
(**) As the requirements of article 3 of Royal Decree 716/2009 are not meet
84
The breakdown of available balances of mortgage loans and credits backing the issue of mortgage bonds and mortgage covered bonds is as follows:
|
|
| Millions of euros |
| Nominal value (*) |
| 30-06-2019 |
Potentially eligible (**) | 637 |
Ineligible | 2,110 |
(*) Amounts committed less amounts drawn down, including those amounts only delivered to developers upon sale of the property
(**) Pursuant to article 3 of Royal Decree 716/2009
b) Liabilities
The Bank has not issued any mortgage bonds. The aggregate nominal value of outstanding mortgage covered bonds issued by the Bank, pursuant to Royal Decree 716/2009 and broken down by residual maturity, is as follows:
|
|
|
|
|
|
| 30-06-2019 | ||||
Millions of euros | Less |
|
|
|
|
| than 3 | 3 to 5 | 5 to 10 | Over 10 | Total |
| years | years | years | years |
|
Issued through public offerings: | 15,590 | 5,675 | 14,100 | 3,684 | 39,049 |
Marketable mortgage covered bonds (1) | 15,590 | 5,675 | 14,100 | 3,684 | 39,049 |
EIB covered bonds | 100 | - | - | - | 100 |
Multi-seller bonds | - | 300 | - | - | 300 |
Other issue | - | - | - | - | - |
Marketable mortgage covered bonds | - | - | - | - | - |
(-) Issues not recognised under liabilities | - | - | - | - | 17,661 |
Total issued through public offerings and placed in the market | - | - | - | - | 21,388 |
(1)Recognised under "Financial liabilities at amortised cost - Marketable debt securities", for a cash value of EUR 22.156 million, after deducting unrecognised issues
At the subject date, the Bank's overcollateralisation stood at 219% (based on all mortgage covered bonds, EUR 39,049 million), compared to the nominal value of the mortgage loan and credit portfolio pending repayment in accordance with Royal Decree 716/2009 (EUR 85,571 million).
None of the mortgage covered bonds issued by the Bank have replacement assets.
85
The aggregate nominal value of outstanding mortgage transfer certificates issued by the Bank at June 30, 2019, based on residual maturity, is as follows:
|
|
|
|
|
|
| Millions of euros | ||||
30-06-2019 | Less | 3 to 5 | 5 to 10 | Over 10 | Total |
Mortgage transfer certificates | - | - | - | 14,494 | 14,494 |
Issued through public offerings | - | - | - | 14 | 14 |
The members of the Board of Directors hereby state that the Bank has implemented policies and procedures to expressly address all activities carried out in respect of the mortgage market issues it performs and to ensure rigorous compliance with mortgage market regulations applicable to these activities as per Royal Decree 716/2009 of April 24, implementing certain aspects of Mortgage Market Law 2/1981 of March 25, and therefore, of Bank of Spain Circular 7/2010 of November 30, along with other regulations governing the mortgage and financial system. In addition, the financial management area defines the Bank's funding strategy.
The risk policies applied to mortgage market transactions foresee maximum loan-to-value limits. In addition, specific policies are in place for each mortgage product, which at times apply even more restrictive limits. The general policies defined in that respect require that a repayment capacity analysis be carried out for each potential customer. This analysis determines whether the customer's income is sufficient to allow it to settle each repayment required. In addition, the analysis determines whether the customer's income can be considered stable over the entire lifetime of the transaction in question. The indicator used to measure repayment capacity (housing affordability index) of each customer primarily looks at the ratio of the potential debt to the borrowers' income, taking into account both monthly repayments on the requested transaction as well as for other debts held, in comparison with monthly salary income and any other duly-justified income.
In ascertaining the customer's information and creditworthiness, the Bank applies specialised documentary verification tools and procedures (see Note 49 to the Bank's financial statements for the year ended December 31, 2018).
Under the Bank's procedures, an individual appraisal must be carried out by an independent appraisal company for each mortgage loan originated in the mortgage market.
Although under article 5 of Mortgage Market Law 41/2007 any Bank of Spain-certified appraisal company may issue valid valuation reports, under this same article, the Bank of Spain sets out a series of verifications, selecting, among these entities, a smaller group with which it signs collaboration agreements, applying special conditions and automated control mechanisms. The Bank's internal regulations further specify, in detail, each internally-certified appraisal company, along with the pertinent certification requirements and procedures and the specific review controls established. This regulation also governs the functioning of an appraisal committee comprising several Bank areas that engage with these appraisal companies. The purpose of this committee is to regulate and adapt internal rules, as well as these companies' procedures, to the market and business situation.
86
In this way, the appraisal companies that wish to work with the Bank must have a relevant activity in the mortgage market and in the region in question, pass certain filters in respect of independence criteria, technical capacity and creditworthiness (to ensure their business continuity) and, lastly, successfully complete a series of tests prior to definitive certification.
Moreover, in accordance with the Bank's internal regulations, any appraisal submitted by a potential customer is reviewed, regardless of the issuing company, in order to formally verify that all requirements, procedures and methods employed are suitable for the asset valued, based on prevailing regulations, and that the values reported are in line with market conditions.
Disclosures required under Bank of Spain Circular 6/2012 on sector and geographic concentration of risk
Concentration of risk
The breakdown at June 30, 2019 of the concentration of the Group's risk, by activity and geographic location of counterparties, is as follows:
|
|
|
|
|
|
Millions of euros | 30-06-2019 | ||||
| Total | Spain | Rest of | America | Rest of |
Central banks and credit institutions | 263,086 | 42,770 | 123,822 | 81,516 | 14,978 |
Public administrations | 176,355 | 57,428 | 43,382 | 68,897 | 6,648 |
Central government | 155,825 | 45,889 | 39,522 | 63,789 | 6,625 |
Other public administrations | 20,530 | 11,539 | 3,860 | 5,108 | 23 |
Other financial institutions | 102,871 | 15,645 | 53,848 | 29,021 | 4,357 |
Non-financial companies and individual entrepreneurs | 398,225 | 125,572 | 121,208 | 135,218 | 16,227 |
Real estate construction and development (b) | 26,773 | 5,139 | 4,731 | 16,771 | 132 |
Civil engineering | 5,724 | 3,368 | 1,706 | 627 | 23 |
Large companies (c) | 233,234 | 60,281 | 75,982 | 82,385 | 14,586 |
SMEs and individual entrepreneurs (c) | 132,494 | 56,784 | 38,789 | 35,435 | 1,486 |
Other households and non-profit institutions serving households | 503,663 | 90,556 | 280,950 | 123,392 | 8,765 |
Residential (d) | 317,894 | 63,105 | 211,920 | 41,961 | 908 |
Consumer (d) | 164,203 | 20,463 | 66,792 | 71,997 | 4,951 |
Other purposes (d) | 21,566 | 6,988 | 2,238 | 9,434 | 2,906 |
Total | 1,444,200 | 331,971 | 623,210 | 438,044 | 50,975 |
(*) For the purpose of this table, the definition of risk includes the following public balance sheet items: loans and advances to credit institutions, deposits at central banks, loans and advances to customers, debt securities, capital instruments, trading derivatives, hedging derivatives, equity investments and guarantees extended.
87
| Millions of euros (*) | ||||||||
|
|
| Secured loans | ||||||
|
|
| Net exposure | Loan-to-value (a) | |||||
| Total | Unsecured | Of which: | Of which: | Less than | Greater | Greater | Greater | Greater |
Public administrations | 23,580 | 22,481 | 271 | 828 | 111 | 123 | 62 | 682 | 121 |
Other financial institutions | 52,495 | 16,326 | 1,081 | 35,088 | 854 | 600 | 503 | 33,757 | 455 |
Non-financial companies and individual entrepreneurs | 311,933 | 161,745 | 71,909 | 78,279 | 31,010 | 22,504 | 23,075 | 45,587 | 28,012 |
Real estate construction and development | 23,969 | 1,758 | 19,910 | 2,301 | 6,680 | 5,968 | 4,386 | 3,323 | 1,854 |
Civil engineering | 3,220 | 1,791 | 394 | 1,035 | 128 | 309 | 79 | 420 | 493 |
Large companies | 165,612 | 101,685 | 21,368 | 42,559 | 11,742 | 7,415 | 10,459 | 21,046 | 13,265 |
SMEs and individual entrepreneurs | 119,132 | 56,511 | 30,237 | 32,384 | 12,460 | 8,812 | 8,151 | 20,798 | 12,400 |
Other households and non-profit institutions serving households | 498,814 | 112,726 | 327,544 | 58,544 | 86,143 | 104,204 | 105,585 | 55,389 | 34,767 |
Residential | 317,876 | 1,921 | 315,225 | 730 | 77,787 | 98,130 | 99,454 | 34,816 | 5,768 |
Consumer | 163,009 | 107,159 | 4,259 | 51,591 | 4,766 | 4,095 | 3,733 | 15,600 | 27,656 |
Other purposes | 17,929 | 3,646 | 8,060 | 6,223 | 3,590 | 1,979 | 2,398 | 4,973 | 1,343 |
Subtotal | 886,822 | 313,278 | 400,805 | 172,739 | 118,118 | 127,431 | 129,225 | 135,415 | 63,355 |
Memorandum item Refinanced and restructured transactions (**) | 25,287 | 5,310 | 14,285 | 5,692 | 3,162 | 3,004 | 2,855 | 3,157 | 7,799 |
(*) In addition, the Group has granted customer prepayments amounting to EUR 21,413 million; therefore, the total amount of credits and customer prepayments amounts to EUR 908,235 million.
(**) Includes fair value impairment and losses net balance due to credit risk.
88
89
INDEX TO THE INTERIM CONSOLIDATED FINANCIAL STATEMENTS
(a)Index to Unaudited Financial Statements
|
|
|
|
| Page |
Condensed Consolidated Balance Sheets as of June 30, 2019 and December 31, 2018 (unaudited) |
| 91 |
| 93 | |
Notes to the unaudited Condensed Consolidated Financial Statements |
| 98 |
90
SANTANDER GROUP
UNAUDITED CONDENSED CONSOLIDATED BALANCE SHEETS AS AT JUNE 30, 2019 AND DECEMBER 31, 2018
(Millions of euros)
|
|
|
|
|
|
|
|
ASSETS |
|
| Note |
| 06-30-2019 |
| 12-31-2018 |
CASH, CASH BALANCES AT CENTRAL BANKS AND OTHER DEPOSITS ON DEMAND |
|
|
|
| 104,104 |
| 113,663 |
|
|
|
|
|
|
|
|
FINANCIAL ASSETS HELD FOR TRADING |
|
| 5 |
| 102,574 |
| 92,879 |
Memorandum items: lent or delivered as guarantee with disposal or pledge rights |
|
|
|
| 28,424 |
| 23,495 |
|
|
|
|
|
|
|
|
NON-TRADING FINANCIAL ASSETS MANDATORILY AT FAIR VALUE THROUGH PROFIT OR LOSS |
|
| 5 |
| 5,393 |
| 10,730 |
Memorandum items: lent or delivered as guarantee with disposal or pledge rights |
|
|
|
| — |
| — |
|
|
|
|
|
|
|
|
FINANCIAL ASSETS DESIGNATED AT FAIR VALUE THROUGH PROFIT OR LOSS |
|
| 5 |
| 73,420 |
| 57,460 |
Memorandum items: lent or delivered as guarantee with disposal or pledge rights |
|
|
|
| 8,221 |
| 6,477 |
|
|
|
|
|
|
|
|
FINANCIAL ASSETS AT FAIR VALUE THROUGH OTHER COMPREHENSIVE INCOME |
|
| 5 |
| 118,062 |
| 121,091 |
Memorandum items: lent or delivered as guarantee with disposal or pledge rights |
|
|
|
| 26,458 |
| 35,558 |
|
|
|
|
|
|
|
|
FINANCIAL ASSETS AT AMORTISED COST |
|
| 5 |
| 981,046 |
| 946,099 |
Memorandum items: lent or delivered as guarantee with disposal or pledge rights |
|
|
|
| 20,466 |
| 18,271 |
|
|
|
|
|
|
|
|
HEDGING DERIVATIVES |
|
|
|
| 8,451 |
| 8,607 |
|
|
|
|
|
|
|
|
CHANGES IN THE FAIR VALUE OF HEDGED ITEMS IN PORTFOLIO HEDGES OF INTEREST RISK |
|
|
|
| 1,621 |
| 1,088 |
|
|
|
|
|
|
|
|
INVESTMENTS |
|
|
|
| 7,788 |
| 7,588 |
Joint ventures entities |
|
|
|
| 962 |
| 979 |
Associated entities |
|
|
|
| 6,826 |
| 6,609 |
|
|
|
|
|
|
|
|
ASSETS UNDER INSURANCE OR REINSURANCE CONTRACTS |
|
|
|
| 311 |
| 324 |
|
|
|
|
|
|
|
|
TANGIBLE ASSETS |
|
| 7 |
| 33,755 |
| 26,157 |
Property, plant and equipment |
|
|
|
| 32,651 |
| 24,594 |
For own-use |
|
|
|
| 14,522 |
| 8,150 |
Leased out under an operating lease |
|
|
|
| 18,129 |
| 16,444 |
Investment property |
|
|
|
| 1,104 |
| 1,563 |
Of which : Leased out under an operating lease |
|
|
|
| 794 |
| 1,195 |
Memorandum items: acquired in lease |
|
|
|
| 6,608 |
| 98 |
|
|
|
|
|
|
|
|
INTANGIBLE ASSETS |
|
| 8 |
| 28,794 |
| 28,560 |
Goodwill |
|
|
|
| 25,613 |
| 25,466 |
Other intangible assets |
|
|
|
| 3,181 |
| 3,094 |
|
|
|
|
|
|
|
|
TAX ASSETS |
|
|
|
| 30,102 |
| 30,251 |
Current tax assets |
|
|
|
| 6,502 |
| 6,993 |
Deferred tax assets |
|
|
|
| 23,600 |
| 23,258 |
|
|
|
|
|
|
|
|
OTHER ASSETS |
|
|
|
| 12,140 |
| 9,348 |
Insurance contracts linked to pensions |
|
|
|
| 207 |
| 210 |
Inventories |
|
|
|
| 5 |
| 147 |
Other |
|
|
|
| 11,928 |
| 8,991 |
|
|
|
|
|
|
|
|
NON-CURRENT ASSETS HELD FOR SALE |
|
| 6 |
| 4,535 |
| 5,426 |
TOTAL ASSETS |
|
|
|
| 1,512,096 |
| 1,459,271 |
The accompanying explanatory Notes 1 to 17 are an integral part of the condensed consolidated balance sheet as at June 30, 2019.
91
SANTANDER GROUP
UNAUDITED CONDENSED CONSOLIDATED BALANCE SHEETS AS AT JUNE 30, 2019 AND DECEMBER 31, 2018
(Millions of euros)
|
|
|
|
|
|
|
|
LIABILITIES |
|
| Note |
| 06-30-2019 |
| 12-31-2018 |
FINANCIAL LIABILITIES HELD FOR TRADING |
|
| 9 |
| 74,187 |
| 70,343 |
|
|
|
|
|
|
|
|
FINANCIAL LIABILITIES DESIGNATED AT FAIR VALUE THROUGH PROFIT OR LOSS |
|
| 9 |
| 60,237 |
| 68,058 |
Memorandum items: subordinated liabilities |
|
|
|
| — |
| — |
|
|
|
|
|
|
|
|
FINANCIAL LIABILITIES AT AMORTISED COST |
|
| 9 |
| 1,224,194 |
| 1,171,630 |
Memorandum items: subordinated liabilities |
|
|
|
| 21,419 |
| 23,820 |
|
|
|
|
|
|
|
|
HEDGING DERIVATIVES |
|
|
|
| 7,267 |
| 6,363 |
|
|
|
|
|
|
|
|
CHANGES IN THE FAIR VALUE OF HEDGED ITEMS IN PORTFOLIO HEDGES OF INTEREST RATE RISK |
|
|
|
| 296 |
| 303 |
|
|
|
|
|
|
|
|
LIABILITIES UNDER INSURANCE OR REINSURANCE CONTRACTS |
|
|
|
| 731 |
| 765 |
|
|
|
|
|
|
|
|
PROVISIONS |
|
|
|
| 14,571 |
| 13,225 |
Pensions and other post-retirement obligations |
|
| 10 |
| 6,216 |
| 5,558 |
Other long term employee benefits |
|
| 10 |
| 1,708 |
| 1,239 |
Taxes and other legal contingencies |
|
| 10 |
| 3,153 |
| 3,174 |
Contingent liabilities and commitments |
|
| 14 |
| 728 |
| 779 |
Other provisions |
|
| 10 |
| 2,766 |
| 2,475 |
|
|
|
|
|
|
|
|
TAX LIABILITIES |
|
|
|
| 9,838 |
| 8,135 |
Current tax liabilities |
|
|
|
| 3,230 |
| 2,567 |
Deferred tax liabilities |
|
|
|
| 6,608 |
| 5,568 |
|
|
|
|
|
|
|
|
OTHER LIABILITIES |
|
|
|
| 10,790 |
| 13,088 |
|
|
|
|
|
|
|
|
LIABILITIES ASSOCIATED WITH NON-CURRENT ASSETS HELD FOR SALE |
|
|
|
| — |
| — |
TOTAL LIABILITIES |
|
|
|
| 1,402,111 |
| 1,351,910 |
|
|
|
|
|
|
|
|
SHAREHOLDERS´ EQUITY |
|
|
|
| 120,054 |
| 118,613 |
|
|
|
|
|
|
|
|
CAPITAL |
|
| 11 |
| 8,118 |
| 8,118 |
Called up paid capital |
|
|
|
| 8,118 |
| 8,118 |
Unpaid capital which has been called up |
|
|
|
| — |
| — |
Memorandum items: uncalled up capital |
|
|
|
| — |
| — |
SHARE PREMIUM |
|
|
|
| 50,993 |
| 50,993 |
EQUITY INSTRUMENTS ISSUED OTHER THAN CAPITAL |
|
|
|
| 581 |
| 565 |
Equity component of the compound financial instrument |
|
|
|
| — |
| — |
Other equity instruments issued |
|
|
|
| 581 |
| 565 |
OTHER EQUITY |
|
|
|
| 155 |
| 234 |
ACCUMULATED RETAINED EARNINGS |
|
|
|
| 61,049 |
| 56,756 |
REVALUATION RESERVES |
|
|
|
| — |
| — |
OTHER RESERVES |
|
|
|
| (4,061) |
| (3,567) |
(-) OWN SHARES |
|
|
|
| (12) |
| (59) |
PROFIT ATTRIBUTABLE TO SHAREHOLDERS OF THE PARENT |
|
| 3 |
| 3,231 |
| 7,810 |
(-) INTERIM DIVIDENDS |
|
|
|
| — |
| (2,237) |
|
|
|
|
|
|
|
|
OTHER COMPREHENSIVE INCOME (LOSS) |
|
|
|
| (21,425) |
| (22,141) |
|
|
|
|
|
|
|
|
ITEMS NOT RECLASSIFIED TO PROFIT OR LOSS |
|
| 11 |
| (3,625) |
| (2,936) |
|
|
|
|
|
|
|
|
ITEMS THAT MAY BE RECLASSIFIED TO PROFIT OR LOSS |
|
| 11 |
| (17,800) |
| (19,205) |
|
|
|
|
|
|
|
|
NON-CONTROLLING INTEREST |
|
|
|
| 11,356 |
| 10,889 |
Other comprehensive income |
|
|
|
| (1,149) |
| (1,292) |
Other items |
|
|
|
| 12,505 |
| 12,181 |
|
|
|
|
|
|
|
|
EQUITY |
|
|
|
| 109,985 |
| 107,361 |
TOTAL LIABILITIES AND EQUITY |
|
|
|
| 1,512,096 |
| 1,459,271 |
MEMORANDUM ITEMS: OFF BALANCE SHEET AMOUNTS |
|
| 14 |
|
|
|
|
Loan commitments granted |
|
|
|
| 223,954 |
| 218,083 |
Financial guarantees granted |
|
|
|
| 12,077 |
| 11,723 |
Other commitments granted |
|
|
|
| 94,785 |
| 74,389 |
The accompanying explanatory Notes 1 to 17 are an integral part of the condensed consolidated balance sheet as at June 30, 2019.
92
SANTANDER GROUP
UNAUDITED CONDENSED CONSOLIDATED INCOME STATEMENTS FOR THE SIX-MONTH PERIODS
ENDED JUNE 30, 2019 AND 2018
(Millions of euros)
|
|
|
|
|
|
|
|
|
|
|
| Debit/Credit | |||
|
|
|
|
| 01-01-2019 to |
| 01-01-2018 to |
|
|
| Note |
| 06-30-2019 |
| 06-30-2018 |
Interest income |
|
|
|
| 28,669 |
| 26,904 |
Financial assets at fair value with changes in other comprehensive income |
|
|
|
| 2,020 |
| 2,548 |
Financial assets at amortised cost |
|
|
|
| 24,396 |
| 23,011 |
Other interest income |
|
|
|
| 2,253 |
| 1,345 |
Interest expense |
|
|
|
| (11,033) |
| (9,973) |
Interest income/ (charges) |
|
|
|
| 17,636 |
| 16,931 |
Dividend income |
|
|
|
| 361 |
| 264 |
Income from companies accounted for using the equity method |
|
|
|
| 306 |
| 354 |
Commission income |
|
|
|
| 7,502 |
| 7,475 |
Commission expense |
|
|
|
| (1,639) |
| (1,586) |
Gain or losses on financial assets and liabilities not measured at fair value through profit or loss, net |
|
|
|
| 350 |
| 326 |
Financial assets at amortised cost |
|
|
|
| 105 |
| 16 |
Other financial assets and liabilities |
|
|
|
| 245 |
| 310 |
Gain or losses on financial assets and liabilities held for trading, net |
|
|
|
| (12) |
| 1,197 |
Reclassification of financial assets from fair value with changes in other comprehensive income |
|
|
|
| — |
| — |
Reclassification of financial assets from amortised cost |
|
|
|
| — |
| — |
Other gains or (-) losses |
|
|
|
| (12) |
| 1,197 |
Gains or losses on non-trading financial assets and liabilities mandatorily at fair value through profit or loss |
|
|
|
| 215 |
| 56 |
Reclassification of financial assets from fair value with changes in other comprehensive income |
|
|
|
| — |
| — |
Reclassification of financial assets from amortised cost |
|
|
|
| — |
| — |
Other gains or (-) losses |
|
|
|
| 215 |
| 56 |
Gain or losses on financial assets and liabilities measured at fair value through profit or loss, net |
|
|
|
| (207) |
| 132 |
Gain or losses from hedge accounting, net |
|
|
|
| (26) |
| 33 |
Exchange differences, net |
|
|
|
| 191 |
| (890) |
Other operating income |
|
|
|
| 855 |
| 813 |
Other operating expenses |
|
|
|
| (1,136) |
| (979) |
Income from assets under insurance and reinsurance contracts |
|
|
|
| 1,630 |
| 1,756 |
Expenses from liabilities under insurance and reinsurance contracts |
|
|
|
| (1,590) |
| (1,720) |
Total income |
|
|
|
| 24,436 |
| 24,162 |
Administrative expenses |
|
|
|
| (10,110) |
| (10,265) |
Personnel expenses |
|
|
|
| (6,080) |
| (5,960) |
Other general and administrative expenses |
|
|
|
| (4,030) |
| (4,305) |
Depreciation and amortisation |
|
|
|
| (1,477) |
| (1,217) |
Provisions or reversal of provisions, net |
|
|
|
| (1,916) |
| (1,262) |
Impairment or reversal of impairment at financial assets not measured at fair value through profit or loss, net |
|
|
|
| (4,368) |
| (4,352) |
Financial assets at fair value through other comprehensive income |
|
|
|
| (6) |
| (1) |
Financial assets at amortised cost |
|
| 5 |
| (4,362) |
| (4,351) |
Impairment of investments in subsidiaries, joint ventures and associates, net |
|
|
|
| — |
| — |
Impairment on non-financial assets, net |
|
|
|
| (27) |
| (96) |
Tangible assets |
|
|
|
| (19) |
| (33) |
Intangible assets |
|
|
|
| (2) |
| (64) |
Others |
|
|
|
| (6) |
| 1 |
Gain or losses on non financial assets and investments, net |
|
|
|
| 250 |
| 23 |
Gains or losses on non-current assets held for sale not classified as discontinued operations |
|
| 6 |
| (257) |
| (94) |
Operating profit/(loss) before tax |
|
|
|
| 6,531 |
| 6,899 |
Tax expense or income from continuing operations |
|
|
|
| (2,449) |
| (2,378) |
Profit for the period from continuing operations |
|
|
|
| 4,082 |
| 4,521 |
Profit or loss after tax from discontinued operations |
|
|
|
| — |
| — |
Profit for the period |
|
|
|
| 4,082 |
| 4,521 |
Profit attributable to non-controlling interests |
|
|
|
| 851 |
| 769 |
Profit attributable to the parent |
|
|
|
| 3,231 |
| 3,752 |
Earnings per share |
|
| 3 |
|
|
|
|
Basic |
|
|
|
| 0.18 |
| 0.22 |
Diluted |
|
|
|
| 0.18 |
| 0.22 |
The accompanying explanatory Notes 1 to 17 are an integral part of the condensed consolidated income statement for the six-month period ended June 30, 2019.
93
SANTANDER GROUP
UNAUDITED CONDENSED CONSOLIDATED STATEMENTS OF RECOGNISED INCOME AND EXPENSE
FOR THE SIX-MONTH PERIODS ENDED JUNE 30, 2019 AND 2018
(Millions of euros)
|
|
|
|
|
|
|
|
|
|
|
|
| 01-01-2019 to |
| 01-01-2018 to |
|
|
| Note |
| 06-30-2019 |
| 06-30-2018 |
CONSOLIDATED PROFIT FOR THE PERIOD |
|
|
|
| 4,082 |
| 4,521 |
|
|
|
|
|
|
|
|
OTHER RECOGNISED INCOME AND EXPENSE |
|
|
|
| 859 |
| (2,000) |
Items that will not be reclassified to profit or loss |
|
|
|
| (708) |
| 538 |
Actuarial gains and losses on defined benefit pension plans |
|
| 11 |
| (833) |
| 981 |
Non-current assets held for sale |
|
|
|
| — |
| — |
Other recognised income and expense of investments in subsidiaries, joint ventures and associates |
|
|
|
| — |
| — |
Changes in the fair value of equity instruments measured at fair value through other comprehensive income |
|
|
|
| (21) |
| (136) |
Gains or losses resulting from the accounting for hedges of equity instruments measured at fair value through other comprehensive income, net |
|
|
|
| — |
| — |
Changes in the fair value of equity instruments measured at fair value through other comprehensive income (hedged item) |
|
|
|
| — |
| — |
Changes in the fair value of equity instruments measured at fair value through other comprehensive income (hedging instrument) |
|
|
|
| — |
| — |
Changes in the fair value of financial liabilities at fair value through profit or loss attributable to changes in credit risk |
|
|
|
| (120) |
| (33) |
Income tax relating to items that will not be reclassified |
|
|
|
| 266 |
| (274) |
Items that may be reclassified to profit or loss |
|
|
|
| 1,567 |
| (2,538) |
Hedges of net investments in foreign operations (effective portion) |
|
| 11 |
| (762) |
| 293 |
Revaluation gains (losses) |
|
|
|
| (762) |
| 293 |
Amounts transferred to income statement |
|
|
|
| — |
| — |
Other reclassifications |
|
|
|
| — |
| — |
Exchanges differences |
|
| 11 |
| 921 |
| (2,437) |
Revaluation gains (losses) |
|
|
|
| 921 |
| (2,437) |
Amounts transferred to income statement |
|
|
|
| — |
| — |
Other reclassifications |
|
|
|
| — |
| — |
Cash flow hedges (effective portion) |
|
|
|
| 127 |
| (138) |
Revaluation gains (losses) |
|
|
|
| 260 |
| (644) |
Amounts transferred to income statement |
|
|
|
| (133) |
| 506 |
Transferred to initial carrying amount of hedged items |
|
|
|
| — |
| — |
Other reclassifications |
|
|
|
| — |
| — |
Hedging instruments (items not designated) |
|
|
|
| — |
| — |
Revaluation gains (losses) |
|
|
|
| — |
| — |
Amounts transferred to income statement |
|
|
|
| — |
| — |
Other reclassifications |
|
|
|
| — |
| — |
Debt instruments at fair value with changes in other comprehensive income |
|
|
|
| 1,891 |
| (549) |
Revaluation gains (losses) |
|
|
|
| 2,131 |
| (269) |
Amounts transferred to income statement |
|
|
|
| (240) |
| (280) |
Other reclassifications |
|
|
|
| — |
| — |
Non-current assets held for sale |
|
|
|
| — |
| — |
Revaluation gains (losses) |
|
|
|
| — |
| — |
Amounts transferred to income statement |
|
|
|
| — |
| — |
Other reclassifications |
|
|
|
| — |
| — |
Share of other recognised income and expense of investments |
|
|
|
| 26 |
| (85) |
Income tax relating to items that may be reclassified to profit or loss |
|
|
|
| (636) |
| 378 |
Total recognised income and expenses |
|
|
|
| 4,941 |
| 2,521 |
Attributable to non-controlling interests |
|
|
|
| 994 |
| 587 |
Attributable to the parent |
|
|
|
| 3,947 |
| 1,934 |
The accompanying explanatory Notes 1 to 17 are an integral part of the condensed consolidated statement of recognised income and expense for the six-month period ended June 30, 2019.
94
SANTANDER GROUP
UNAUDITED CONDENSED CONSOLIDATED STATEMENTS OF CHANGES IN TOTAL EQUITY
FOR THE SIX-MONTH PERIODS ENDED JUNE 30, 2019 AND 2018
(Millions of euros)
|
|
|
|
|
|
|
|
|
|
|
|
|
|
|
|
|
|
|
|
|
|
|
|
|
|
|
|
|
|
|
|
|
|
|
|
|
|
|
|
|
|
|
|
|
|
|
|
|
|
|
|
|
|
| Non-Controlling interest |
|
| ||
|
|
|
|
|
|
| Equity |
|
|
|
|
|
|
|
|
|
|
| Profit |
|
|
|
|
|
|
|
|
|
|
|
|
|
|
|
|
| instruments |
| Other |
| Accumulated |
|
|
|
|
|
|
| Attributable to |
|
|
| Other |
| Other |
|
|
|
|
|
|
|
|
| Share |
| issued |
| equity |
| retained |
| Revaluation |
| Other |
| (-) Own |
| shareholders |
| (-) Interim |
| comprehensive |
| comprehensive |
| Others |
|
|
|
|
| Capital |
| premium |
| (not capital) |
| instruments |
| earnings |
| reserves |
| reserves |
| shares |
| of the parent |
| dividends |
| income |
| income |
| items |
| Total |
Balance as at 12-31-18 |
|
| 8,118 |
| 50,993 |
| 565 |
| 234 |
| 56,756 |
| — |
| (3,567) |
| (59) |
| 7,810 |
| (2,237) |
| (22,141) |
| (1,292) |
| 12,181 |
| 107,361 |
Adjustments due to errors |
|
| — |
| — |
| — |
| — |
| — |
| — |
| — |
| — |
| — |
| — |
| — |
| — |
| — |
| — |
Adjustments due to changes in accounting policies |
|
| — |
| — |
| — |
| — |
| — |
| — |
| (391) |
| — |
| — |
| — |
| — |
| — |
| — |
| (391) |
Opening balance as at 01-01-19 |
|
| 8,118 |
| 50,993 |
| 565 |
| 234 |
| 56,756 |
| — |
| (3,958) |
| (59) |
| 7,810 |
| (2,237) |
| (22,141) |
| (1,292) |
| 12,181 |
| 106,970 |
Total recognised income and expense |
|
| — |
| — |
| — |
| — |
| — |
| — |
| — |
| — |
| 3,231 |
| — |
| 716 |
| 143 |
| 851 |
| 4,941 |
Other changes in equity |
|
| — |
| — |
| 16 |
| (79) |
| 4,293 |
| — |
| (103) |
| 47 |
| (7,810) |
| 2,237 |
| — |
| — |
| (527) |
| (1,926) |
Issuance of ordinary shares |
|
| — |
| — |
| — |
| — |
| — |
| — |
| — |
| — |
| — |
| — |
| — |
| — |
| — |
| — |
Issuance of preferred shares |
|
| — |
| — |
| — |
| — |
| — |
| — |
| — |
| — |
| — |
| — |
| — |
| — |
| — |
| — |
Issuance of other financial instruments |
|
| — |
| — |
| — |
| — |
| — |
| — |
| — |
| — |
| — |
| — |
| — |
| — |
| — |
| — |
Maturity of other financial instruments |
|
| — |
| — |
| — |
| — |
| — |
| — |
| — |
| — |
| — |
| — |
| — |
| — |
| — |
| — |
Conversion of financial liabilities into equity |
|
| — |
| — |
| — |
| — |
| — |
| — |
| — |
| — |
| — |
| — |
| — |
| — |
| — |
| — |
Capital reduction |
|
| — |
| — |
| — |
| — |
| — |
| — |
| — |
| — |
| — |
| — |
| — |
| — |
| — |
| — |
Dividends |
|
| — |
| — |
| — |
| — |
| (1,055) |
| — |
| — |
| — |
| — |
| — |
| — |
| — |
| (592) |
| (1,647) |
Purchase of equity instruments |
|
| — |
| — |
| — |
| — |
| — |
| — |
| — |
| (522) |
| — |
| — |
| — |
| — |
| — |
| (522) |
Disposal of equity instruments |
|
| — |
| — |
| — |
| — |
| — |
| — |
| (6) |
| 569 |
| — |
| — |
| — |
| — |
| — |
| 563 |
Transfer from equity to liabilities |
|
| — |
| — |
| — |
| — |
| — |
| — |
| — |
| — |
| — |
| — |
| — |
| — |
| — |
| — |
Transfer from liabilities to equity |
|
| — |
| — |
| — |
| — |
| — |
| — |
| — |
| — |
| — |
| — |
| — |
| — |
| — |
| — |
Transfers between equity items |
|
| — |
| — |
| — |
| — |
| 5,348 |
| — |
| 225 |
| — |
| (7,810) |
| 2,237 |
| — |
| — |
| — |
| — |
Increases (decreases) due to business combinations |
|
| — |
| — |
| — |
| — |
| — |
| — |
| — |
| — |
| — |
| — |
| — |
| — |
| 81 |
| 81 |
Share-based payment |
|
| — |
| — |
| — |
| (77) |
| — |
| — |
| — |
| — |
| — |
| — |
| — |
| — |
| — |
| (77) |
Others increases or (-) decreases of the equity |
|
| — |
| — |
| 16 |
| (2) |
| — |
| — |
| (322) |
| — |
| — |
| — |
| — |
| — |
| (16) |
| (324) |
Balance as at 06-30-2019 |
|
| 8,118 |
| 50,993 |
| 581 |
| 155 |
| 61,049 |
| — |
| (4,061) |
| (12) |
| 3,231 |
| — |
| (21,425) |
| (1,149) |
| 12,505 |
| 109,985 |
The accompanying explanatory Notes 1 to 17 are an integral part of the condensed consolidated statement of changes in total equity
for the six-month period ended June 30, 2019.
95
SANTANDER GROUP
UNAUDITED CONDENSED CONSOLIDATED STATEMENTS OF CHANGES IN TOTAL EQUITY
FOR THE SIX-MONTH PERIODS ENDED JUNE 30, 2019 AND 2018
(Millions of euros)
|
|
|
|
|
|
|
|
|
|
|
|
|
|
|
|
|
|
|
|
|
|
|
|
|
|
|
|
|
|
|
|
|
|
|
|
| Other |
|
|
|
|
|
|
|
|
|
|
|
|
|
|
|
|
| Non-Controlling interest |
|
| ||
|
|
|
|
|
|
| equity |
|
|
|
|
|
|
|
|
|
|
| Profit |
|
|
|
|
|
|
|
|
|
|
|
|
|
|
|
|
| instruments |
| Other |
| Accumulated |
|
|
|
|
|
|
| Attributable to |
|
|
| Other |
| Other |
|
|
|
|
|
|
|
|
| Share |
| issued |
| equity |
| retained |
| Revaluation |
| Other |
| (-) Own |
| shareholders |
| (-) Interim |
| comprehensive |
| comprehensive |
| Others |
|
|
(*) |
|
| < |
| premium |
| (not capital) |
| instruments |
| earnings |
| reserves |
| reserves |
| shares |
| of the parent |
| dividends |
| income |
| income |
| items |
| Total |
Balance as at 12-31-17 |
|
| 8,068 |
| 51,053 |
| 525 |
| 216 |
| 53,437 |
| — |
| (1,602) |
| (22) |
| 6,619 |
| (2,029) |
| (21,776) |
| (1,436) |
| 13,780 |
| 106,833 |
Adjustments due to errors |
|
| — |
| — |
| — |
| — |
| — |
| — |
| — |
| — |
| — |
| — |
| — |
| — |
| — |
| — |
Adjustments due to changes in accounting policies |
|
| — |
| — |
| — |
| — |
| — |
| — |
| 112 |
| — |
| — |
| — |
| (291) |
| 241 |
| (1,533) |
| (1,471) |
Opening balance as at 01-01-18 |
|
| 8,068 |
| 51,053 |
| 525 |
| 216 |
| 53,437 |
| — |
| (1,490) |
| (22) |
| 6,619 |
| (2,029) |
| (22,067) |
| (1,195) |
| 12,247 |
| 105,362 |
Total recognised income and expense |
|
| — |
| — |
| — |
| — |
| — |
| — |
| — |
| — |
| 3,752 |
| — |
| (1,818) |
| (182) |
| 769 |
| 2,521 |
Other changes in equity |
|
| — |
| — |
| 17 |
| (1) |
| 3,530 |
| — |
| (62) |
| (39) |
| (6,619) |
| 980 |
| — |
| — |
| (1,244) |
| (3,438) |
Issuance of ordinary shares |
|
| — |
| — |
| — |
| — |
| — |
| — |
| — |
| — |
| — |
| — |
| — |
| — |
| — |
| — |
Issuance of preferred shares |
|
| — |
| — |
| — |
| — |
| — |
| — |
| — |
| — |
| — |
| — |
| — |
| — |
| — |
| — |
Issuance of other financial instruments |
|
| — |
| — |
| — |
| — |
| — |
| — |
| — |
| — |
| — |
| — |
| — |
| — |
| — |
| — |
Maturity of other financial instruments |
|
| — |
| — |
| — |
| — |
| — |
| — |
| — |
| — |
| — |
| — |
| — |
| — |
| — |
| — |
Conversion of financial liabilities into equity |
|
| — |
| — |
| — |
| — |
| — |
| — |
| — |
| — |
| — |
| — |
| — |
| — |
| — |
| — |
Capital reduction |
|
| — |
| — |
| — |
| — |
| — |
| — |
| — |
| — |
| — |
| — |
| — |
| — |
| — |
| — |
Dividends |
|
| — |
| — |
| — |
| — |
| (968) |
| — |
| — |
| — |
| — |
| (1,049) |
| — |
| — |
| (418) |
| (2,435) |
Purchase of equity instruments |
|
| — |
| — |
| — |
| — |
| — |
| — |
| — |
| (624) |
| — |
| — |
| — |
| — |
| — |
| (624) |
Disposal of equity instruments |
|
| — |
| — |
| — |
| — |
| — |
| — |
| 1 |
| 585 |
| — |
| — |
| — |
| — |
| — |
| 586 |
Transfer from equity to liabilities |
|
| — |
| — |
| — |
| — |
| — |
| — |
| — |
| — |
| — |
| — |
| — |
| — |
| — |
| — |
Transfer from liabilities to equity |
|
| — |
| — |
| — |
| — |
| — |
| — |
| — |
| — |
| — |
| — |
| — |
| — |
| — |
| — |
Transfers between equity items |
|
| — |
| — |
| — |
| — |
| 4,498 |
| — |
| 92 |
| — |
| (6,619) |
| 2,029 |
| — |
| — |
| — |
| — |
Increases (decreases) due to business combinations |
|
| — |
| — |
| — |
| — |
| — |
| — |
| — |
| — |
| — |
| — |
| — |
| — |
| (822) |
| (822) |
Share-based payment |
|
| — |
| — |
| — |
| (69) |
| — |
| — |
| — |
| — |
| — |
| — |
| — |
| — |
| 17 |
| (52) |
Others increases or (-) decreases of the equity |
|
| — |
| — |
| 17 |
| 68 |
| — |
| — |
| (155) |
| — |
| — |
| — |
| — |
| — |
| (21) |
| (91) |
Balance as at 06-30-2018 |
|
| 8,068 |
| 51,053 |
| 542 |
| 215 |
| 56,967 |
| — |
| (1,552) |
| (61) |
| 3,752 |
| (1,049) |
| (23,885) |
| (1,377) |
| 11,772 |
| 104,445 |
(*) See reconciliation of IAS39 December 31, 2017 to IFRS9 January 1, 2018 (Note 1.b of the 2018 consolidated annual accounts).
The accompanying explanatory Notes 1 to 17 are an integral part of the condensed consolidated statement of changes in total equity for the six-month period ended June 30, 2019.
96
SANTANDER GROUP
UNAUDITED CONDENSED CONSOLIDATED STATEMENTS OF CASH FLOWS
FOR THE SIX-MONTH PERIODS ENDED JUNE 30, 2019 AND 2018
(Millions of euros)
|
|
|
|
|
|
|
|
|
|
| Note |
| 06-30-2019 |
| 06-30-2018 |
A. CASH FLOWS FROM OPERATING ACTIVITIES |
|
|
|
| (1,700) |
| (7,132) |
Profit for the period |
|
|
|
| 4,082 |
| 4,521 |
Adjustments made to obtain the cash flows from operating activities |
|
|
|
| 12,166 |
| 11,360 |
Depreciation and amortisation cost |
|
|
|
| 1,477 |
| 1,217 |
Other adjustments |
|
|
|
| 10,689 |
| 10,143 |
Net increase/(decrease) in operating assets |
|
|
|
| 51,210 |
| 30,839 |
Financial assets held-for-trading |
|
|
|
| 9,023 |
| (11,425) |
Non-trading financial assets mandatorily at fair value through profit or loss |
|
|
|
| (5,551) |
| 658 |
Financial assets at fair value through profit or loss |
|
|
|
| 15,595 |
| 7,655 |
Financial assets at fair value through other comprehensive income |
|
|
|
| (6,895) |
| (2,306) |
Financial assets at amortised cost |
|
|
|
| 36,158 |
| 33,482 |
Other operating assets |
|
|
|
| 2,880 |
| 2,775 |
Net increase/(decrease) in operating liabilities |
|
|
|
| 34,238 |
| 8,983 |
Financial liabilities held-for-trading |
|
|
|
| 3,370 |
| (31,499) |
Financial liabilities designated at fair value through profit or loss |
|
|
|
| (9,604) |
| (1,621) |
Financial liabilities at amortised cost |
|
|
|
| 44,787 |
| 45,219 |
Other operating liabilities |
|
|
|
| (4,315) |
| (3,116) |
Income tax recovered/(paid) |
|
|
|
| (976) |
| (1,157) |
B. CASH FLOWS FROM INVESTING ACTIVITIES |
|
|
|
| (1,647) |
| 6,490 |
Payments |
|
|
|
| 4,617 |
| 5,550 |
Tangible assets |
|
| 7 |
| 4,053 |
| 4,926 |
Intangible assets |
|
|
|
| 499 |
| 624 |
Investments |
|
|
|
| 7 |
| — |
Subsidiaries and other business units |
|
| 2 |
| 58 |
| — |
Non-current assets held for sale and associated liabilities |
|
|
|
| — |
| — |
Other payments related to investing activities |
|
|
|
| — |
| — |
Proceeds |
|
|
|
| 2,970 |
| 12,040 |
Tangible assets |
|
| 7 |
| 929 |
| 2,459 |
Intangible assets |
|
|
|
| — |
| — |
Investments |
|
|
|
| 363 |
| 548 |
Subsidiaries and other business units |
|
|
|
| 85 |
| 431 |
Non-current assets held for sale and associated liabilities |
|
| 6 |
| 1,593 |
| 8,602 |
Other proceeds related to investing activities |
|
|
|
| — |
| — |
C. CASH FLOW FROM FINANCING ACTIVITIES |
|
|
|
| (6,299) |
| (811) |
Payments |
|
|
|
| 7,915 |
| 4,385 |
Dividends |
|
| 3 |
| 2,110 |
| 1,936 |
Subordinated liabilities |
|
|
|
| 4,137 |
| 1,341 |
Redemption of own equity instruments |
|
|
|
| — |
| — |
Acquisition of own equity instruments |
|
|
|
| 522 |
| 624 |
Other payments related to financing activities |
|
|
|
| 1,146 |
| 484 |
Proceeds |
|
|
|
| 1,616 |
| 3,574 |
Subordinated liabilities |
|
|
|
| 1,056 |
| 2,987 |
Issuance of own equity instruments |
|
| 11 |
| — |
| — |
Disposal of own equity instruments |
|
|
|
| 560 |
| 587 |
Other proceeds related to financing activities |
|
|
|
| — |
| — |
D. EFFECT OF FOREIGN EXCHANGE RATE DIFFERENCES |
|
|
|
| 87 |
| (1,855) |
E. NET INCREASE/(DECREASE) IN CASH AND CASH EQUIVALENTS |
|
|
|
| (9,559) |
| (3,308) |
F. CASH AND CASH EQUIVALENTS AT BEGINNING OF PERIOD |
|
|
|
| 113,663 |
| 110,995 |
G. CASH AND CASH EQUIVALENTS AT END OF PERIOD |
|
|
|
| 104,104 |
| 107,687 |
COMPONENTS OF CASH AND CASH EQUIVALENTS AT END OF PERIOD |
|
|
|
|
|
|
|
Cash |
|
|
|
| 7,606 |
| 6,540 |
Cash equivalents at central banks |
|
|
|
| 80,471 |
| 84,721 |
Other financial assets |
|
|
|
| 16,027 |
| 16,426 |
Less: Bank overdrafts refundable on demand |
|
|
|
| — |
| — |
TOTAL CASH AND CASH EQUIVALENTS AT END OF PERIOD |
|
|
|
| 104,104 |
| 107,687 |
In which: restricted cash |
|
|
|
| — |
| — |
The accompanying explanatory Notes 1 to 17 are an integral part of the condensed consolidated statement of cash flows for the six-month period ended June 30, 2019.
97
Banco Santander, S.A. and Companies composing Santander Group
Explanatory notes to the interim condensed consolidated financial statements for the six-month period ended June 30, 2019
1. Introduction, basis of presentation of the interim condensed consolidated financial statements and other information
a) Introduction
Banco Santander, S.A. (“Bank” or “Banco Santander”) is a private-law entity subject to the rules and regulations applicable to banks operating in Spain. The Bylaws and other public information of the Bank can be consulted at its registered office at Paseo de Pereda 9-12, Santander.
In addition to the operations carried on directly by it, the Bank is the head of a group of subsidiaries that engage in various business activities and which compose, together with it, Santander Group (“Group” or “Santander Group”).
b) Basis of presentation of the interim financial statements
Under Regulation (EC) no. 1606/2002 of the European Parliament and of the Council of July 19, 2002, all companies governed by the law of an EU Member State and whose securities are admitted to trading on a regulated market of any Member State must prepare their consolidated annual accounts for the years beginning on or after January 1, 2005 in accordance with the International Financial Reporting Standards (“IFRSs”) as previously adopted by the European Union (“EU-IFRSs”). In order to adapt the accounting system of Spanish credit institutions to these standards, the Bank of Spain issued Circular 4/2004, of December 22, on Public and Confidential Financial Reporting Rules and Formats, which was repealed on January 1, 2018 by Bank of Spain Circular 4/2017, of November 27, 2017, and subsequent modifications.
The consolidated annual accounts for 2018 were approved at the board of directors meeting on February 26, 2019 in compliance with International Financial Reporting Standards as adopted by the European Union, taking into account Bank of Spain Circular 4/2017, and subsequent modifications, using the basis of consolidation, accounting policies and measurement bases described in Note 2 to the aforementioned consolidated annual accounts and, accordingly, they presented fairly the Group’s consolidated equity and consolidated financial position at December 31, 2018 and the consolidated results of its operations, and the consolidated cash flows in 2018. The aforementioned consolidated annual accounts, which are included in the Group’s Form 20-F filed with the U.S. Securities and Exchange Commission on March 26, 2019, and these interim financial statements are also in compliance with International Financial Reporting Standards as issued by the International Accounting Standards Board (“IFRS-IASB”, and together with EU-IFRS, “IFRS”).
These interim financial statements were prepared and are presented in accordance with International Accounting Standard (“IAS”) 34, Interim Financial Reporting, for the preparation of interim condensed financial statements, in conformity with Article 12 of Royal Decree 1362/2007, and taking into account the requirements of Circular 3/2018, of June 28, of the Spanish National Securities Market Commission (“CNMV”). The aforementioned interim financial statements were included in the half-year financial report for the first semester of 2019 to be presented by the Group in accordance with the Circular 3/2018.
In accordance with IAS34, the interim financial statements are intended only to provide an update on the content of the latest consolidated annual accounts authorised for issue, focusing on new activities, events and circumstances occurring during the six-month period, and does not duplicate information previously reported in the latest consolidated annual accounts. Consequently, these interim financial statements do not include all the information that would be required for a complete set of consolidated annual accounts prepared in accordance with IFRSs and, accordingly, for a proper comprehension of the information included in these interim financial statements, they should be read together with the Group’s consolidated annual accounts for the year ended December 31, 2018.
Santander Group policies include presenting the interim financial statements for its use in the different markets using the Euro as its presentation currency. The amounts held in other currencies and the balances of entities whose functional currency is not the Euro, have been translated to the presentation currency in accordance with the criteria indicated in Note 2.a to the consolidated annual accounts for 2018. As indicated in that Note, for practical reasons, the balance sheet amount has been converted to the closing exchange rate, the equity to the historical type, and the income and expenses have been converted by applying the average exchange rate of the period; the application of such exchange rate or that corresponding to the date of each transaction does not lead to significant differences in the interim financial statements of the Group.
The accounting policies and methods used in preparing these interim financial statements are the same as those applied in the consolidated annual accounts for 2018, taking into account the standards and interpretations which came into effect for the Group in the six-month period ended June 30, 2019, which are detailed below:
98
- | IFRS16 Leases |
On January 1, 2019, IFRS16 Leases came effective. IFRS16 establishes the principles for the recognition, measurement, presentation and breakdown of lease contracts, with the objective of ensuring reporting information that faithfully represents the lease transactions. The Group has adopted the standard, using the modified retrospective approach from January 1, 2019, not restating the comparative financial statements for 2018, as permitted under the specific transitional provisions of the standard.
The adoption of IFRS16 has led to changes in the Group's accounting policies for the recognition, measurement, presentation and breakdown of lease contracts.
The main aspects contained in the new regulations and the breakdowns relating to the impact of the adoption of IFRS16 in the Group are included below:
a) Lease accounting policy
Since January 1, 2019, leases are recognised as right-of-use assets and the corresponding liability on the date on which the leased asset is available for use by the Group. Each lease payment is allocated between the liability and the finance charge. The finance charge is allocated to the income statement during the term of the lease in such a way as to produce a constant periodic interest rate on the remaining balance of the liability for each year. The right-of-use asset is depreciated over the useful life of the asset or the lease term, whichever is shorter, on a straight-line basis.
Assets and liabilities arising from a lease are initially measured at present value. Lease liabilities include the net present value of the following lease payments:
· | Fixed payments (including essentially fixed payments), less any lease incentive receivable, |
· | Variable lease payments that depend on an index or rate, |
· | The amounts expected to be paid by the lessee under residual value guarantees, |
· | The exercise price of a purchase option if the lessee is reasonably certain that it will exercise that option, and |
· | Lease termination penalty payments, if the term of the lease reflects the lessee's exercise of that option. |
Lease payments are discounted using the interest rate implicit in the lease. Given in certain situations this interest rate cannot be obtained, the discount rate used is the lessee's incremental borrowing rate at the related date. For this purpose, the entity has calculated this incremental interest rate taking as reference the listed debt instruments issued by the Group; in this regard, the Group has estimated different interest rate curves depending on the currency and economic environment in which the contracts are located.
In order to construct the incremental interest rate, a methodology has been developed at the corporate level. This methodology is based on the need for each entity to consider its economic and financial situation, for which the following factors must be considered:
· | Economic and political situation (country risk). |
· | Credit risk of the company. |
· | Monetary policy. |
· | Volume and seniority of the company’s debt instrument issues. |
The incremental interest rate is defined as the interest rate that a lessee would have to pay for borrowing, given a similar period to the duration of the lease and with similar security, the funds necessary to obtain an asset of similar value to the asset by right of use in a similar economic environment. The Group Entities have a wide stock and variety of financing instruments issued in different currencies to that of the euro (pound, dollar, etc.) that provide sufficient information to be able to determine an "all in rate" (reference rate plus adjustment for credit spread at different terms and in different currencies). In circumstances, where the leasing company has its own financing, this has been used as the starting point for determining the incremental interest rate. On the other hand, for those Group entities that do not have their own financing, the information from the financing of the consolidated subgroup to which they belong was used as the starting point for estimating the entity's curve, analysing other factors to assess whether it is necessary to make any type of negative or positive adjustment to the initially estimated credit spread.
Right-of-use assets are valued at cost which includes the following:
· | The amount of the initial measurement of the lease liability, |
99
· | Any lease payment made at or before the start date less any lease incentive received, |
· | Any initial direct costs, and |
· | Restoration costs. |
Payments associated with short-term leases and leases of low-value assets are recognised on a straight-line basis as an expense in the income statement. Short-term leases are leases with a lease term less than or equal to 12 months.
b) Recognised effects on the adoption of the standard
With the adoption of IFRS16, the Group recognised lease liabilities in relation to leases previously classified as "operating leases" under the principles of IAS17 Leases in force at December 31, 2018. These liabilities were measured at the present value of the remaining lease payments, discounted using the lessee's incremental borrowing rate at January 1, 2019. At the date of first application, the weighted average discount rate was 4.5%, mainly due to the contribution of rented properties in Spain.
For leases previously classified as finance leases, the Group recognised the carrying amount of the lease asset and lease liability immediately before transition as the carrying amount of the right-of-use asset and lease liability on the initial effective date. The measurement principles in IFRS16 apply only after that date.
The Group has considered the practical expedients defined in paragraph C10 of the standard in the application of the modified retrospective method. Such application shall be made on a contract-by-contract basis and shall not provide for the application of any of the waivers on a generalised basis.
A reconciliation between the operating lease commitments at December 31, 2018 and the lease liability recognised at January 1, 2019 is detailed below:
|
|
|
|
| Millions of |
|
| euros |
|
|
|
Operating lease commitments at December 31, 2018 |
| 8,699 |
Amount of operating lease commitments discounted by the Group rate |
| 6,550 |
(+) Liabilities under financial leases at December 31, 2018 |
| 96 |
(-) Short-term leases recognised as expenses on a straight-line basis |
| (20) |
(-) Low-value leases recognised as expenses on a straight-line basis |
| (2) |
(-) Contracts revalued as service contracts |
| — |
(+)/(-) Adjustments resulting from different treatment of extension and termination options |
| 556 |
(+)/(-) Adjustments related to changes in the index or rate affecting variable payments |
| — |
Lease liability at January 1, 2019 |
| 7,180 |
As a result of the entry into force of IFRS16, the impact of the first application recorded by the Group corresponds, mainly, to the recognition of assets for right of use for an amount of EUR 6,665 million, financial liabilities for an amount of EUR 7,084 million and an negative impact on the Group's equity of EUR 391 million. The impact of the first application of IFRS16 on the ordinary capital ratio (Common Equity Tier 1 - CET 1) was -20 b.p.
- IFRIC23 Uncertainty about the treatment of income tax - applies to the determination of taxable profit or loss, tax bases, unused tax loss carry forwards, unused tax credits and tax rates when there is uncertainty about the treatment of taxes under IAS12.
- Amendment to IFRS9 Financial Instruments - allows entities to measure certain financial assets prepayable with a negative offset at amortised cost. These assets, which include some loans and debt securities, would have had to be measured at fair value through profit or loss.
In order to apply measurement at amortised cost, the negative offset must be 'reasonable compensation for early termination of the contract' and the asset must be maintained within a 'held-to-collect' business model.
- Amendment to IAS28 Investments in associates and joint ventures - the amendments clarify the accounting for long-term interests in an associate or joint venture, which are essentially part of the net investment in the associate or joint venture, but to which equity accounting is not applied. Entities must account for such interest under IFRS9 Financial Instruments before applying the allocation of losses and IAS28 impairment requirements in Investments in associates and joint ventures.
- Amendment to IAS19 Employee Benefits – clarifies the accounting of the amendments, reductions and settlements on defined benefit plans.
100
- Amendment to IFRS 2015-2017 introduces minor amendments to IFRS3, IFRS11, IAS12 and IAS23:
IFRS3, Business Combinations - clarifies that obtaining control of a business that is a joint venture is a business combination achieved in stages.
IFRS11, Joint Arrangements - clarifies that the party that obtains joint control of a business that is a joint venture should not reassess its previous interest in the joint venture.
IAS12, Income Taxes - clarifies that the income tax consequences of dividends on financial instruments classified as equity should be recognised according to where the past transactions or events that generated distributable profits were recognised.
IAS23, Borrowing Costs - clarifies that if a specific loan remains outstanding after the related qualifying asset is ready for sale or intended use, it becomes part of generic loans.
The application of the aforementioned amendments to accounting standards and interpretations did not have any material effects on the Group's interim financial statements.
At the date of preparation of these interim financial statements there are no standards pending adoption by the European Union which came into force on January 1, 2019.
c) Use of critical estimates
The consolidated results and the determination of the consolidated equity are sensitive to the accounting principles and policies, valuation criteria and estimates used by the directors of the Bank in preparing the interim financial statements. The main accounting principles, policies, and valuation criteria are indicated in Note 2 of the consolidated annual accounts of the year 2018, except for those indicated in these interim financial statements due to the rules that have come into effect during the first six months of the year 2019.
The interim financial statements contain estimates made by the senior management of the Bank and of the consolidated entities in order to quantify certain of the assets, liabilities, income, expenses and obligations reported herein. These estimates, which were made on the basis of the best information available, relate mainly to the following:
1. | The income tax expense, which, in accordance with IAS34, is recognised in interim periods based on the best estimate of the weighted average tax rate expected by the Group for the full financial year; |
2. | The impairment losses on certain assets – Financial assets at fair value through other comprehensive income, financial assets at amortised cost, non-current assets held for sale, investments in subsidiaries, joint ventures and associates, tangible assets and intangible assets; |
3. | The assumptions used in the calculation of the post-employment benefit liabilities and commitments and other obligations; |
4. | The useful life of the tangible and intangible assets; |
5. | The measurement of goodwill impairment arising on consolidation; |
6. | The calculation of provisions and the consideration of contingent liabilities; |
7. | The fair value of certain unquoted assets and liabilities; |
8. | The recoverability of deferred tax assets. |
In the six-month period ended June 30, 2019 there were no significant changes in the estimates made at the 2018 year-end other than those indicated in these interim financial statements.
d) Contingent assets and liabilities
Note 2.o to the Group's consolidated annual accounts for the year ended December 31, 2018 includes information on the contingent assets and liabilities at that date. There were no significant changes in the Group’s contingent assets and liabilities from December 31, 2018 to the date of formal preparation of these interim financial statements.
e) Comparative information
The information for the year 2018 contained in these interim financial statements is only presented for comparison purposes with the information relating to the six-month period ended June 30, 2019, except for the effect of hyperinflation in Argentina
101
on the six-month period ended June 30, 2018 balances in accordance with current legislation (see Note 1.h of the 2018 consolidated annual accounts).
In this respect, the segment information corresponding to the first semester of 2018 is recasted for comparative purposes, in accordance with the new organizational structure of the Group, as required by IFRS8 (Note 12).
In order to interpret the changes in the balances with respect to December 31, 2018, it is necessary to take into consideration the exchange rate effect arising from the volume of foreign currency balances held by the Group in view of its geographic diversity (Note 51.b to the consolidated annual accounts for the year ended December 31, 2018) and the impact of the appreciation/depreciation of the various currencies against the euro in the first six months of 2019: Mexican peso (3.08%), US dollar (0.62%), Brazilian real (2.14%), Argentine peso (-10.71%), Pound sterling (-0.23%), Chilean peso (2.68%) and Polish zloty (1.22%); as well as the evolution of the average exchange rates between comparable periods: Mexican peso (6.59%), US dollar (7.10%), Brazilian real (-4.76%), Argentine peso (-44.62%), Pound sterling (0.73%), Chilean peso (-2.94%) and Polish zloty (-1.68%).
f) Seasonality of the Group’s transactions
The business activities carried on by the Group entities, and their transactions are not cyclical or seasonal in nature. Therefore, no specific disclosures are included in these explanatory notes to the interim financial statements for the six-month period ended June 30, 2019.
g) Materiality
In determining the note disclosures to be made on the various items in the interim financial statements or other matters, the Group, in accordance with IAS 34, took into account their materiality in relation to the interim financial statements for the six-month period ended June 30, 2019.
h) Events after the reporting period.
From July 1, 2019 until the approval date of the interim financial statements for the six-month period ended June 30, 2019, no significant events other than those indicated in the interim financial statements have occurred.
i) Other information
Negotiations for the withdrawal of the United Kingdom from the European Union
On June 23, 2016, the UK held a referendum on EU membership in which the majority voted in favour of leaving the EU. There remains a great deal of uncertainty about the UK's exit and its future relationship with the European Union and with regard to the UK's future trading relationship with the rest of the world.
On March 29, 2017, pursuant to Article 50(2) of the Treaty on European Union, the Prime Minister of the United Kingdom notified her intention to leave the European Union. The activation of this Article initiated a two-year negotiation period to determine the terms of the United Kingdom's exit from the European Union and the framework for the United Kingdom's future relationship with the European Union.
The Prime Minister presented to the Parliament of the United Kingdom an exit agreement that established the basic terms for the United Kingdom departure agreed with the European Union. However, the Prime Minister has not achieved a majority for the approval of the exit agreement in the House of Commons which has led her to agree to an extension of Article 50. As a result, the United Kingdom would formally leave the European Union on October 31, 2019.
After the repeated failures of the Prime Minister to approve the exit agreement in the United Kingdom Parliament, on May 24, 2019 she announced that she would resign from her positions both as Prime Minister and as leader of the Conservative party.
There is also the possibility that UK's membership in the EU will end without reaching any agreement on the terms of its future relationship. Moreover, at the date of this document, the exit agreement, which provides for a transitional period while the future relationship is being negotiated, has not been ratified by the UK parliament.
The outcome of Brexit remains uncertain; however, the UK's exit from the European Union without an agreement remains a possibility and the consensus position is that it would have a negative impact on the UK economy and its growth prospects. While it is difficult to predict the long-term effects of the UK's imminent exit from the European Union, in the short term the situation is one of economic and political uncertainty.
102
Santander UK is subject to significant regulation and supervision by the European Union. Although legislation has already been passed transferring EU standards to UK standards, uncertainty persists as to the legal and regulatory environments in which the Group's subsidiaries will operate in the UK when that country is no longer a member of the European Union, and the framework in which cross-border banking business will take place after Brexit.
At the operational level, the Group's UK subsidiaries and other financial institutions may no longer be able to rely on the European cross-border framework for financial services and it is not clear what the alternative regime after Brexit will be. This uncertainty and the measures taken as a result of it, as well as the new or amended rules could have a significant impact on the Group's operations, profitability and business.
The aforementioned UK political developments, together with other changes in the structure and policies of government, could lead to greater market volatility and changes in the tax, monetary and regulatory landscape in which the Group operates and could have material adverse effects on its access to capital and liquidity under acceptable conditions and, more generally, on its business, financial position and operating results. The Group's best estimate at the date of preparation of the interim financial statements has considered these circumstances in its assessment of the various affected items in the consolidated annual accounts, mainly in the recoverability of the cash-generating unit that supports Santander UK's goodwill.
2. Santander Group
Appendices I, II and III to the consolidated annual accounts for the year ended December 31, 2018 provide relevant information on the Group companies at that date and on the companies accounted for under the equity method.
Also, Note 3 to the aforementioned consolidated annual accounts includes a description of the most significant acquisitions and disposals of companies performed by the Group in 2018, 2017 and 2016.
The most significant transactions performed during the first semester of 2019 or pending at June 30, 2019 are as follows:
Reorganization of the banking insurance business, asset management and pension plans in Spain
On June 24, 2019, Banco Santander, S.A. has reached an agreement with the Allianz Group to terminate the agreement that Banco Popular Español, S.A. (“Banco Popular”) held in Spain with the Allianz Group for the exclusive distribution of certain life insurance products, non-life insurance products, collective investment institutions, and pension plans through the Banco Popular network (the “Termination Agreement”).
The Termination Agreement will entail the payment by Santander Group of EUR 936.5 million (including any dividend prior to the closing of the transaction).
It is expected that, upon completion of the Termination Agreement and subject to the satisfaction of certain conditions, 51% of life-risk insurance business and 51% of the future Non-life Insurance Business coming from the Banco Popular network and not transferred to Mapfre (by virtue of the agreement indicated below), will be acquired by Aegon. This acquisition will be executed according to Note 3.b.vi disclosure of the 2018 consolidated annual accounts.
In addition, by virtue of the agreement reached between Banco Santander and Mapfre dated January 21, 2019, 50.01% of the motor insurance, multi-risk business, multi-risk SMEs and civil liability insurance for enterprises businesses in the entire Banco Santander network in Spain will be, subject to the satisfaction of certain conditions and authorizations, acquired by Mapfre.
Offer to acquire shares of Banco Santander Mexico, S.A., Institución de Banca Multiple, Grupo Financiero Santander México
On April 12, 2019, Banco Santander, S.A. announced its intention to make an offer to acquire all the shares of Banco Santander Mexico, S.A., Institución de Banca Multiple, Grupo Financiero Santander México ("Santander México") which are not owned by Grupo Santander, representing approximately 25% of the share capital of Santander México.
The shareholders accepting the offer will receive 0.337 newly issued shares of Banco Santander, S.A. per share of Santander México and 1.685 American Depositary Shares (ADSs) of Banco Santander, S.A. per ADS of Santander México (the "Exchange Ratio").
If all the shares held by minority shareholders accept the offer, Banco Santander, S.A. would issue approximately 571 million shares, representing 3.5% of the share capital at the date of communication of the offer.
On June 17, 2019, the Board of Directors decided to call an Extraordinary Shareholders General Meeting on July 23, 2019 to approve the capital increase for the acquisition of the aforementioned shares; following this approval, the execution and the settlement of the transaction is expected.
103
Agreement with Crédit Agricole S.A. on the depositary and custody business
On April 17, 2019, Banco Santander, S.A. announced that it had signed a memorandum of understanding with Crédit Agricole S.A. with the purpose of combining CACEIS and its subsidiaries (the “CACEIS Group”), which is wholly-owned by Crédit Agricole S.A., with Santander Securities Services, S.A.U. and its subsidiaries (the “S3 Group”), which is wholly-owned by Banco Santander, S.A.
Under the transaction Santander Group will contribute 100% of the S3 Group’s operations in Spain and 49.99% of its operations in Latin America to CACEIS Group, in exchange for 30.5% of the share capital and voting rights of CACEIS Group. The remaining 69.5% would continue to be held by Crédit Agricole S.A. The Latin American operations of the S3 Group would be jointly controlled by CACEIS Group and the Santander Group.
On June 27, 2019 the final agreements were signed following the required prior consultation with the relevant works councils at Credit Agricole, S.A. and the CACEIS Group. The completion of the transaction is expected to take place in throughout the second half of 2019 and is subject to customary closing conditions, including to obtaining the necessary regulatory approvals.
3. Shareholder remuneration system and earnings per share
a) Shareholder remuneration system
The cash remuneration paid by the Bank to its shareholders in the first six months of 2019 and 2018 was as follows:
|
|
|
|
|
|
|
|
|
|
|
|
| 06-30-2019 |
| 06-30-2018 | ||||||||
| % of par | Euros per | Amount | % of par | Euros per | Amount | |||||
Ordinary shares | 26.00 | % | 0.130 |
| 2,110 |
| 24.00 | % | 0.120 |
| 1,936 |
Other shares (without vote, redeemable, etc.) | — |
| — |
| — |
| — |
| — |
| — |
Total remuneration paid | 26.00 | % | 0.130 |
| 2,110 |
| 24.00 | % | 0.120 |
| 1,936 |
Dividend paid out of profit | 13.00 | % | 0.065 |
| 1,055 |
| 12.00 | % | 0.060 |
| 968 |
Dividend paid with a charge to reserves or share premium | 13.00 | % | 0.065 |
| 1,055 |
| 12.00 | % | 0.060 |
| 968 |
Dividend in kind | — |
| — |
| — |
| — |
| — |
| — |
Flexible payment | — |
| — |
| — |
| — |
| — |
| — |
b) Earnings per share from continuing and discontinued operations
i. Basic earnings per share
Basic earnings per share for the period are calculated by dividing the net profit attributable to the Group for the six-month period adjusted by the after-tax amount relating to the remuneration of contingently convertible preference shares recognised in equity by the weighted average number of ordinary shares outstanding during the period, excluding the average number of treasury shares held in the period.
104
Accordingly:
|
|
|
|
|
|
| 06-30-2019 |
| 06-30-2018 |
Profit attributable to the Parent (millions of euros) |
| 3,231 |
| 3,752 |
Remuneration of contingently convertible preference shares (millions of euros) |
| (298) |
| (266) |
|
| 2,933 |
| 3,486 |
Of which: |
|
|
|
|
Profit or Loss from discontinued operations (non controlling interest net) (millions of euros) |
| — |
| — |
Profit or Loss from continuing operations (PPC net) (millions of euros) |
| 2,933 |
| 3,486 |
Weighted average number of shares outstanding |
| 16,231,374,256 |
| 16,129,055,793 |
Basic earnings per share (euros) |
| 0.18 |
| 0.22 |
Of which: from discontinued operations (euros) |
| — |
| — |
from continuing operations (euros) |
| 0.18 |
| 0.22 |
ii. Diluted earnings per share
Diluted earnings per share for the period are calculated by dividing the net profit attributable to the Group for the six-month period adjusted by the after-tax amount relating to the remuneration of contingently convertible preference shares recognised in equity and of perpetual liabilities contingently amortisable in their case by the weighted average number of ordinary shares outstanding during the period, excluding the average number of treasury shares and adjusted for all the dilutive effects inherent to potential ordinary shares (share options, warrants and convertible debt instruments).
Accordingly, diluted earnings per share were determined as follows:
|
|
|
|
|
|
| 06-30-2019 |
| 06-30-2018 |
Profit attributable to the Parent (millions of euros) |
| 3,231 |
| 3,752 |
Remuneration of contingently convertible preference shares (millions of euros) |
| (298) |
| (266) |
Dilutive effect of changes in profit for the period arising from potential conversion of ordinary shares |
| — |
| — |
|
| 2,933 |
| 3,486 |
Of which: |
|
|
|
|
Profit or Loss from discontinued operations (non controlling interest net) (millions of euros) |
| — |
| — |
Profit or Loss from continuing operations (PPC net) (millions of euros) |
| 2,933 |
| 3,486 |
Weighted average number of shares outstanding |
| 16,231,374,256 |
| 16,129,055,793 |
Dilutive effect of options/receipt of shares |
| 41,832,881 |
| 45,858,082 |
Adjusted number of shares |
| 16,273,207,137 |
| 16,174,913,875 |
Diluted earnings per share (euros) |
| 0.18 |
| 0.22 |
Of which: from discontinued operations (euros) |
| — |
| — |
from continuing operations (euros) |
| 0.18 |
| 0.22 |
4. Remuneration and other benefits paid to the Bank’s directors and senior managers
Note 5 to the Group’s consolidated annual accounts for the year ended December 31, 2018 includes the detail of the remuneration and other benefits paid to the Bank’s directors and senior managers in 2018 and 2017.
105
Following is a summary of the most significant data on the remunerations and benefits for the six months ended June 30, 2019 and 2018:
Remuneration of members of the board of directors (1)
|
|
|
|
|
|
| Thousands of euros | ||
|
| 06-30-2019 |
| 06-30-2018 |
|
|
|
|
|
Members of the board of directors (2) (3): |
|
|
|
|
Remuneration concept |
|
|
|
|
Fixed salary remuneration of executive directors |
| 3,459 |
| 3,759 |
Variable salary remuneration of executive directors |
| — |
| — |
Directors fees |
| 579 |
| 488 |
Bylaw-stipulated emoluments (annual emolument) |
| 1,853 |
| 1,785 |
Other (except insurance premiums) (4) |
| 3,354 |
| 691 |
Sub-total |
| 9,245 |
| 6,723 |
|
|
|
|
|
Transactions with shares and/or other financial instruments |
| — |
| — |
|
| 9,245 |
| 6,723 |
(1) | The notes to the consolidated annual accounts for 2019 will contain detailed and complete information on the remuneration paid to all the directors, including executive directors. |
(2) | Mr. Rodrigo Echenique Gordillo ceased his executive duties with effective date May 1, 2019, continuing from that date as a non-executive director. |
(3) | Mr. Juan Miguel Villar Mir ceased as member of the board of director on January 1, 2019. |
(4) | It includes the amount related to the post-contractual non-compete agreement pact received by Mr. Rodrigo Echenique Gordillo as a result of having ceased in his executive functions with effective date May 1, 2019. The comparison of the figures of the two semesters is affected by the timing difference (semi-annual or annual) of the concepts included in the category. |
On June 30, 2019, the remuneration received by the executive directors reflects the transformation into the pension system, which includes the reduction of the amount of the annual contributions to the executive directors' pension system, proportionally increasing the fixed annual salary and without any increase in the total cost to the Bank; and the elimination of the supplementary pension system in the event of death (widowhood and orphanhood) and disability, simultaneously establishing a fixed remuneration complement and improving the life insurance coverage of the executive directors, without any increase in the total cost to the Bank. The section on executive directors' pension funds and plans below reflects this transformation in the provisions and/or contributions to pension funds.
Other benefits of members of the board of directors
|
|
|
|
|
|
| Thousands of euros | ||
|
| 06-30-2019 |
| 06-30-2018 |
|
|
|
|
|
Members of the board of directors: |
|
|
|
|
Other benefits- |
|
|
|
|
Advances |
| — |
| — |
Loans granted |
| 121 |
| 84 |
Pension funds and plans: Endowments and/or contributions (1) |
| 1,001 |
| 1,341 |
Pension funds and plans: Accumulated rights (2) |
| 77,153 |
| 75,804 |
Life insurance premiums |
| 1,069 |
| 862 |
Guarantees provided for directors |
| — |
| — |
|
|
|
|
|
(1) These correspond to the endowments and/or contributions made during the first six months of 2019 and 2018 in respect of retirement pensions and complementary benefits for widowhood, orphanhood and permanent disability.
(2) Corresponds to the rights accrued by the directors in matters of pensions. It also includes for informational purposes the rights accumulated by Mr. Rodrigo Echenique Gordillo, although these rights corresponded to Mr. Echenique before his appointment as executive director. Additionally, former members of the board had at June 30, 2019 and June 30, 2018 rights accrued for this concept for 68,201 thousands of euros and 79,465 thousands of euros, respectively.
106
Remuneration of senior management (1)(2)
The table below includes the corresponding amounts related to remunerations of senior management at June 30, 2019 and 2018, excluding the executive directors:
|
|
|
|
|
|
| Thousands of euros | ||
|
| 06-30-2019 |
| 06-30-2018 |
|
|
|
|
|
Senior management (1): |
|
|
|
|
Total remuneration of senior management (2) |
| 17,690 |
| 16,972 |
|
|
|
|
|
(1) Remunerations regarding to members of senior management who, during the six month period ended June 30, 2019, had ceased their duties amount to EUR 96 thousands (June 30, 2018: EUR 10 thousands).
(2) The number of senior managers of the Bank, excluding executive directors, is 18 as at June 30, 2019. (No changes regarding the figure published at June 30, 2018).
The remuneration received by senior management at June 30, 2019 reflects the improvement in senior management life insurance coverage following the transformation of the pension system at the beginning of 2018. This transformation did not entail any increase in the total cost for the Bank.
The variable annual remuneration (or bonuses) received for fiscal year 2018, both for directors and the rest of senior management, were included in the information on remuneration included in the annual report for that year. Similarly, the variable remuneration attributable to the 2019 results, which will be submitted for approval by the Board of Directors at the appropriate time, will be included in the financial statements for the current year.
Funds and pension plans of senior management
|
|
|
|
|
|
| Thousands of euros | ||
|
| 06-30-2019 |
| 06-30-2018 |
|
|
|
|
|
Senior management: |
|
|
|
|
Pension funds: Endowments and / or contributions (1) |
| 3,190 |
| 2,739 |
Pension funds: Accumulated rights (2) |
| 71,237 |
| 62,872 |
|
|
|
|
|
(1) | Corresponds to the allocations and/or contributions made during the first six months of 2019 and 2018 as retirement pensions. |
(2) | Corresponds to the rights accrued by members of senior management in the area of pensions. In addition, former members of senior management had at June 30, 2019 and June 30, 2018 rights accumulated for this same concept for EUR 166,960 thousands and EUR 173,819 thousands, respectively. |
107
5. Financial assets
a) Breakdown
The detail, by nature and category for measurement purposes, of the Group's financial assets, other than the balances relating to Cash, cash balances at central banks and other deposits on demand and Hedging derivatives, at June 30, 2019 and December 31, 2018 is as follows, presented by the nature and categories for valuation purposes:
|
|
|
|
|
|
|
|
|
|
|
|
| Millions of euros | ||||||||
|
| 06-30-2019 | ||||||||
|
| Financial |
| Non-trading |
| Financial |
| Financial |
| Financial |
|
|
|
|
|
|
|
|
|
|
|
Derivatives |
| 57,798 |
| — |
| — |
| — |
| — |
Equity instruments |
| 11,133 |
| 3,367 |
| — |
| 2,789 |
| — |
Debt instruments |
| 33,343 |
| 1,628 |
| 3,496 |
| 111,891 |
| 39,382 |
Loans and advances |
| 300 |
| 398 |
| 69,924 |
| 3,382 |
| 941,664 |
Central Banks |
| — |
| — |
| 7,105 |
| — |
| 19,450 |
Credit institutions |
| — |
| — |
| 39,810 |
| — |
| 41,068 |
Customers |
| 300 |
| 398 |
| 23,009 |
| 3,382 |
| 881,146 |
Total |
| 102,574 |
| 5,393 |
| 73,420 |
| 118,062 |
| 981,046 |
|
|
|
|
|
|
|
|
|
|
|
|
| Millions of euros | ||||||||
|
| 12-31-2018 | ||||||||
|
| Financial |
| Non-trading |
| Financial |
| Financial |
| Financial |
|
|
|
|
|
|
|
|
|
|
|
Derivatives |
| 55,939 |
| — |
| — |
| — |
| — |
Equity instruments |
| 8,938 |
| 3,260 |
| — |
| 2,671 |
| — |
Debt instruments |
| 27,800 |
| 5,587 |
| 3,222 |
| 116,819 |
| 37,696 |
Loans and advances |
| 202 |
| 1,883 |
| 54,238 |
| 1,601 |
| 908,403 |
Central Banks |
| — |
| — |
| 9,226 |
| — |
| 15,601 |
Credit institutions |
| — |
| 2 |
| 23,097 |
| — |
| 35,480 |
Customers |
| 202 |
| 1,881 |
| 21,915 |
| 1,601 |
| 857,322 |
Total |
| 92,879 |
| 10,730 |
| 57,460 |
| 121,091 |
| 946,099 |
Following is the gross exposure of financial assets subject to impairment stages at June 30, 2019 and December 31, 2018:
|
|
|
|
|
|
|
|
|
|
|
|
|
|
|
|
|
|
| Millions of euros | ||||||||||||||
|
| 06-30-2019 |
| 12-31-2018 | ||||||||||||
|
| Impairment value correction |
| Impairment value correction | ||||||||||||
|
| Stage 1 |
| Stage 2 |
| Stage 3 |
| Total |
| Stage 1 |
| Stage 2 |
| Stage 3 |
| Total |
|
|
|
|
|
|
|
|
|
|
|
|
|
|
|
|
|
Financial assets at fair value through other comprehensive income |
| 115,278 |
| 6 |
| — |
| 115,284 |
| 118,422 |
| 6 |
| — |
| 118,428 |
Debt instruments |
| 111,899 |
| — |
| — |
| 111,899 |
| 116,825 |
| — |
| — |
| 116,825 |
Loans and advances |
| 3,379 |
| 6 |
| — |
| 3,385 |
| 1,597 |
| 6 |
| — |
| 1,603 |
Central Banks |
| — |
| — |
| — |
| — |
| — |
| — |
| — |
| — |
Credit institutions |
| — |
| — |
| — |
| — |
| — |
| — |
| — |
| — |
Customers |
| 3,379 |
| 6 |
| — |
| 3,385 |
| 1,597 |
| 6 |
| — |
| 1,603 |
Financial assets at amortised cost |
| 919,584 |
| 51,025 |
| 33,146 |
| 1,003,755 |
| 882,661 |
| 52,295 |
| 34,333 |
| 969,289 |
Debt instruments |
| 39,129 |
| 114 |
| 736 |
| 39,979 |
| 37,339 |
| 117 |
| 870 |
| 38,326 |
Loans and advances |
| 880,455 |
| 50,911 |
| 32,410 |
| 963,776 |
| 845,322 |
| 52,178 |
| 33,463 |
| 930,963 |
Central Banks |
| 19,450 |
| — |
| — |
| 19,450 |
| 15,601 |
| — |
| — |
| 15,601 |
Credit institutions |
| 41,081 |
| — |
| 1 |
| 41,082 |
| 35,489 |
| 1 |
| 2 |
| 35,492 |
Customers |
| 819,924 |
| 50,911 |
| 32,409 |
| 903,244 |
| 794,232 |
| 52,177 |
| 33,461 |
| 879,870 |
Total |
| 1,034,862 |
| 51,031 |
| 33,146 |
| 1,119,039 |
| 1,001,083 |
| 52,301 |
| 34,333 |
| 1,087,717 |
108
On June 30, 2019, the Group has EUR 623 million (EUR 757 million on December 31, 2018) of exposure in impaired assets purchased with impairment, which mainly correspond to the business combinations carried out by the Group.
b) Valuation adjustments for impairment of financial assets at amortised cost portfolio
The following is the movement that has taken place, during the six-month periods ended June 30, 2019 and 2018, in the balance of provisions that cover losses due to impairment of assets which comprise the heading balance of the financial assets at amortised cost:
|
|
|
|
|
|
| Millions of euros | ||
|
| 06-30-2019 |
| 06-30-2018 (*) |
Balance as at beginning of period |
| 23,945 |
| 26,656 |
Impairment losses charged to income for the period |
| 5,199 |
| 5,174 |
Of which: |
|
|
|
|
Impairment losses charged to income |
| 9,697 |
| 9,042 |
Impairment losses reversed with a credit to income |
| (4,498) |
| (3,868) |
Write-off of impaired balances against recorded impairment allowance |
| (6,246) |
| (6,140) |
Exchange differences and other |
| 434 |
| (749) |
Balance as at end of period |
| 23,332 |
| 24,941 |
Of which, relating to: |
|
|
|
|
Impaired assets |
| 15,110 |
| 16,131 |
Other assets |
| 8,222 |
| 8,810 |
Of which: |
|
|
|
|
Individually calculated |
| 4,983 |
| 6,146 |
Collectively calculated |
| 18,349 |
| 18,795 |
(*) See reconciliation of IAS 39 December 31, 2017 to IFRS 9 January 1, 2018 (Note 1.b of the 2018 Consolidated Annual Accounts).
Following is the movement of the loan loss provision broken down by impairment stage of loans and advances to customers recognised under "Financial assets at amortised cost" as at June 30, 2019:
|
|
|
|
|
|
|
|
|
|
| Millions of euros | ||||||
|
| Stage 1 |
| Stage 2 |
| Stage 3 |
| Total |
Loss allowance as at beginning of period |
| 3,658 |
| 4,743 |
| 14,906 |
| 23,307 |
Transfers between stages |
| (442) |
| (246) |
| 3,160 |
| 2,472 |
Net exposure changes and modifications in the credit risk |
| 673 |
| (336) |
| 2,419 |
| 2,756 |
Write-offs |
| — |
| — |
| (6,246) |
| (6,246) |
Exchange differences and other |
| (54) |
| 198 |
| 290 |
| 434 |
Carrying amount as of June 30, 2019 |
| 3,835 |
| 4,359 |
| 14,529 |
| 22,723 |
Previously written-off assets recovered during the first six months of 2019 and 2018 amount to EUR 837 million and to EUR 823 million, respectively. Considering these amounts, the recorded impairment of financial assets at amortised cost is EUR 4,362 million and EUR 4,351 million, respectively.
c) Impaired assets of financial assets at amortised cost portfolio
The movement produced, during the six-month periods ended June 30, 2019 and 2018, in the balance of financial assets classified at amortised cost and considered doubtful by reason for the credit risk is as follows:
|
|
|
|
|
|
| Millions of euros | ||
|
| 06-30-2019 |
| 06-30-2018 |
|
|
|
|
|
Balance as at beginning of period |
| 35,091 |
| 37,275 |
Net additions |
| 4,581 |
| 5,070 |
Written-off assets |
| (6,246) |
| (6,140) |
Exchange differences and other |
| 343 |
| (267) |
Balance as at end of period |
| 33,769 |
| 35,938 |
This amount, after deducting the related allowances, represents the Group's best estimate of the discounted value of the flows that are expected to be recovered from the impaired assets.
109
d) Guarantees received
Following is the breakdown of the value of the guarantees received to ensure the collection of the financial assets that comprise the heading of financial assets at amortized cost, distinguishing between real guarantees and other guarantees as of June 30, 2019 and December 31, 2018:
|
|
|
|
|
|
|
| Millions of euros |
| ||
|
| 06-30-2019 |
| 12-31-2018 |
|
|
|
|
|
|
|
Real guarantees value |
| 509,859 |
| 460,674 |
|
Of which: non-performing risks |
| 12,080 |
| 13,566 |
|
Other guarantees value |
| 29,298 |
| 36,727 |
|
Of which: non-performing risks |
| 558 |
| 1,131 |
|
Total value of the guarantees received |
| 539,157 |
| 497,401 |
|
e) Fair value of financial assets not measured at fair value
Following is a comparison of the carrying amounts of the Group’s financial assets measured at other than fair value and their respective fair values at June 30, 2019 and December 31, 2018:
|
|
|
|
|
|
|
|
|
|
|
|
| Millions of euros |
|
|
| Millions of euros | ||||
|
| 06-30-2019 |
|
|
| 12-31-2018 | ||||
|
| Carrying amount |
| Fair value |
|
|
| Carrying amount |
| Fair value |
Financial assets at amortised cost |
|
|
|
|
| Financial assets at amortised cost |
|
|
|
|
Loans and advances |
| 941,664 |
| 952,624 |
| Loans and advances |
| 908,403 |
| 914,013 |
Central banks |
| 19,450 |
| 19,450 |
| Central banks |
| 15,601 |
| 15,610 |
Loans and advances to credit institutions |
| 41,068 |
| 41,309 |
| Loans and advances to credit institutions |
| 35,480 |
| 35,833 |
Loans and advances to customers |
| 881,146 |
| 891,865 |
| Loans and advances to customers |
| 857,322 |
| 862,570 |
Debt instruments |
| 39,382 |
| 40,058 |
| Debt instruments |
| 37,696 |
| 38,095 |
ASSETS |
| 981,046 |
| 992,682 |
| ASSETS |
| 946,099 |
| 952,108 |
The main valuation methods and inputs used in the estimation of the fair value of the financial assets of the previous table are detailed in Note 51.c of the consolidated annual accounts for the year 2018.
6. Non-current assets held for sale
The detail, by nature, of the Group’s non-current assets held for sale at June 30, 2019 and December 31, 2018 is as follows presented by nature:
|
|
|
|
|
|
| Millions of euros | ||
|
| 06-30-2019 |
| 06-30-2018 |
|
|
|
|
|
Tangible assets |
| 4,535 |
| 5,424 |
Of which: |
|
|
|
|
Foreclosed assets |
| 4,450 |
| 5,334 |
Of which: Property assets in Spain (*) |
| 3,606 |
| 4,488 |
Other tangible assets held for sale |
| 85 |
| 90 |
Other assets |
| — |
| 2 |
|
| 4,535 |
| 5,426 |
(*) During the first six months of 2019, the sale of foreclosed real estate assets to Cerberus took place, generating EUR 180 million losses.
On June 30, 2019, the allowance that covers the value of the foreclosed assets represents the 49% (December 31, 2018: 49%). The charges recorded in the first six months of 2019 and 2018 amounted to EUR 160 million and EUR 159 million, respectively, and the recoveries undergone during those periods amount to EUR 32 million and EUR 13 million, respectively.
7. Tangible assets
a) Changes in the period
In the first six months of 2019 and 2018, tangible assets were acquired for EUR 4,053 million and EUR 4,926 million, respectively.
110
Also, in the first six months of 2019 and 2018 tangible asset items were disposed of with a carrying amount of EUR 1,004 million and EUR 2,441 million respectively, giving rise to a net gain of EUR 30 million and EUR 18 million, respectively.
b) Property, plant and equipment purchase commitments
At June 30, 2019 and 2018, the Group did not have any significant commitments to purchase property, plant and equipment items.
8. Intangible assets
Goodwill
The detail of Intangible Assets - Goodwill at June 30, 2019 and December 31, 2018, based on the cash-generating units giving rise thereto, is as follows:
|
|
|
|
|
|
| Millions of euros | ||
|
| 06-30-2019 |
| 12-31-2018 |
|
|
|
|
|
Santander UK |
| 8,288 |
| 8,307 |
Banco Santander (Brasil) |
| 4,554 |
| 4,459 |
Santander Bank Polska |
| 2,431 |
| 2,402 |
Santander Consumer USA |
| 2,115 |
| 2,102 |
Santander Bank, National Association |
| 1,804 |
| 1,793 |
Santander Consumer Germany |
| 1,217 |
| 1,217 |
SAM Investment Holdings Limited |
| 1,173 |
| 1,173 |
Santander Portugal |
| 1,040 |
| 1,040 |
Santander España |
| 1,023 |
| 1,023 |
Banco Santander Chile |
| 644 |
| 627 |
Santander Consumer Nordics |
| 494 |
| 502 |
Grupo Financiero Santander (Mexico) |
| 448 |
| 434 |
Other entities |
| 382 |
| 387 |
Total Goodwill |
| 25,613 |
| 25,466 |
In the first six months of 2019, goodwill increased by EUR 147 million mainly due to exchange differences (Note 11), which pursuant to current regulations, were recognised with a debit to Other accumulated results - items that may be reclassified to profit or loss - Exchange differences in equity through the condensed consolidated statement of recognised income and expense.
Note 17 to the consolidated annual accounts for the year ended December 31, 2018 includes detailed information on the procedures followed by the Group to analyse the potential impairment of the goodwill recognised with respect to its recoverable amount and to recognise the related impairment losses, where appropriate.
Accordingly, based on the analysis performed of the available information on the performance of the various cash-generating units which might evidence the existence of indicators of impairment, the Group’s directors concluded that in the first six months of 2019 there were no impairment losses which required recognition.
111
9. Financial liabilities
a) Breakdown
The following is a breakdown of the Group's financial liabilities, other than the balances corresponding to the Derivatives - hedge accounting heading, as of June 30, 2019 and December 31, 2018, presented by nature and categories for valuation purposes:
|
|
|
|
|
|
|
|
|
|
|
|
|
|
| Millions of euros | ||||||||||
|
| 06-30-2019 |
| 12-31-2018 | ||||||||
|
| Financial |
| Financial |
| Financial |
| Financial |
| Financial |
| Financial |
|
|
|
|
|
|
|
|
|
|
|
|
|
Derivatives |
| 58,341 |
| — |
| — |
| 55,341 |
| — |
| — |
Short Positions |
| 15,846 |
| — |
| — |
| 15,002 |
| — |
| — |
Deposits |
| — |
| 56,990 |
| 937,710 |
| — |
| 65,304 |
| 903,101 |
Central banks |
| — |
| 8,836 |
| 71,778 |
| — |
| 14,816 |
| 72,523 |
Credit institutions |
| — |
| 10,305 |
| 89,030 |
| — |
| 10,891 |
| 89,679 |
Customer |
| — |
| 37,849 |
| 776,902 |
| — |
| 39,597 |
| 740,899 |
Debt instruments |
| — |
| 3,117 |
| 251,672 |
| — |
| 2,305 |
| 244,314 |
Other financial liabilities |
| — |
| 130 |
| 34,812 |
| — |
| 449 |
| 24,215 |
Total |
| 74,187 |
| 60,237 |
| 1,224,194 |
| 70,343 |
| 68,058 |
| 1,171,630 |
b) Information on issues, repurchases or redemptions of debt instruments issued
The detail of the balance of debt instruments issued according to their nature is:
|
|
|
|
|
|
| Millions of euros | ||
|
| 06-30-2019 |
| 12-31-2018 |
Bonds and debentures outstanding |
| 202,464 |
| 195,498 |
Subordinated |
| 21,277 |
| 23,676 |
Promissory notes and other securities |
| 31,048 |
| 27,445 |
Total debt instruments issued |
| 254,789 |
| 246,619 |
The detail, at June 30, 2019 and 2018, of the outstanding balance of the debt instruments, excluding promissory notes, which at these dates had been issued by the Bank or any other Group entity is disclosed below. Also included is the detail of the changes in this balance in the first six months of 2019 and 2018:
|
|
|
|
|
|
|
|
|
|
|
|
|
|
| Millions of euros | ||||||||||
|
| 06-30-2019 | ||||||||||
|
| Opening |
| Perimeter |
| Issues |
| Repurchases or |
| Exchange |
| Closing |
|
|
|
|
|
|
|
|
|
|
|
|
|
Bonds and debentures outstanding |
| 195,498 |
| — |
| 32,105 |
| (26,713) |
| 1,574 |
| 202,464 |
Subordinated |
| 23,676 |
| — |
| 1,056 |
| (3,502) |
| 47 |
| 21,277 |
Bonds and debentures outstanding and subordinated liabilities issued |
| 219,174 |
| — |
| 33,161 |
| (30,215) |
| 1,621 |
| 223,741 |
|
|
|
|
|
|
|
|
|
|
|
|
|
|
| Millions of euros | ||||||||||
|
| 06-30-2018 | ||||||||||
|
| Opening |
| Perimeter |
| Issues |
| Repurchases or |
| Exchange |
| Closing |
|
|
|
|
|
|
|
|
|
|
|
|
|
Bonds and debentures outstanding |
| 176,719 |
| — |
| 35,957 |
| (29,081) |
| (765) |
| 182,830 |
Subordinated |
| 21,382 |
| — |
| 2,987 |
| (644) |
| 89 |
| 23,814 |
Bonds and debentures outstanding and subordinated liabilities issued |
| 198,101 |
| — |
| 38,944 |
| (29,725) |
| (676) |
| 206,644 |
112
In April 2019, Banco Santander, S.A. announced its decision to carry out the optional early redemption of all outstanding Series II/2014 Non-Step-Up Non-Cumulative Contingent Convertible Perpetual Preferred Tier 1 Securities, with a nominal total value of USD 1,500 million (EUR 1,345 million) which are traded on the Global Exchange Market of the Irish Stock Exchange.
In February 2019 the Group announced that it had completed the placement of preferred securities contingently convertible into newly issued ordinary shares of the Bank, excluding preemptive subscription rights and for a nominal value of USD 1,200 million (EUR 1,056 million) (the “Issue” and the “CCPS”).
The CCPS were issued at par and its remuneration has been set at 7.50% on an annual basis for the first five years. The payment of the remuneration of the CCPS is subject to certain conditions and to the discretion of the Bank. After that, it will be reviewed every five years by applying a margin of 498.9 basis points on the 5-year Mid-Swap Rate.
In March 2018, Banco Santander, S.A. communicated that the placement of preference shares contingently convertible into newly issued ordinary shares of the Bank was carried out, excluding the right of preferential subscription of its shareholders and for a nominal amount of EUR 1,500 million (the "Issuance" and the CCPSs").
The Issuance was made at par and the remuneration of the CCPSs, whose payment is subject to certain conditions and is also discretionary, was fixed at an annual 4.75% for the first seven years, being revised thereafter every five years applying a margin of 409.7 basis points over the 5-year Euro Mid-Swap Rate.
c) Other issues guaranteed by the Group
At June 30, 2019 and 2018, there were no debt instruments issued by associates or non-Group third parties that had been guaranteed by the Bank or any other Group entity.
d) Fair value of financial liabilities not measured at fair value
Following is a comparison between the value by which the Group’s financial liabilities are recorded that are measured using criteria other than fair value and their corresponding fair value at June 30, 2019 and December 31, 2018:
|
|
|
|
|
|
|
|
|
|
| Millions of euros | ||||||
|
| 06-30-2019 |
| 12-31-2018 | ||||
|
| Carrying amount |
| Fair value |
| Carrying amount |
| Fair value |
Deposits |
| 937,710 |
| 937,371 |
| 903,101 |
| 902,680 |
Central banks |
| 71,778 |
| 71,362 |
| 72,523 |
| 72,039 |
Credit institutions |
| 89,030 |
| 89,078 |
| 89,679 |
| 89,662 |
Customer |
| 776,902 |
| 776,931 |
| 740,899 |
| 740,979 |
Debt instruments |
| 251,672 |
| 259,005 |
| 244,314 |
| 247,029 |
Other financial liabilities |
| 34,812 |
| 34,860 |
| 24,215 |
| 24,197 |
Liabilities |
| 1,224,194 |
| 1,231,236 |
| 1,171,630 |
| 1,173,906 |
The main valuation methods and inputs used in the estimation of the fair value of the financial liabilities in the previous table are detailed in Note 51.c of the consolidated annual accounts for 2018, other than those mentioned in these interim financial statements.
10. Provisions
a) Provisions for Pensions and other post-retirements obligations and Other long term employee benefits
The variation experienced by the balance of the Pensions and other post-retirements obligations and other long term employee benefits from December 31, 2018 to June 30, 2019, is mainly due to higher actuarial losses in the semester as a result of changes in actuarial assumptions (Note 11.c), as well as the provision for pre-retirement (under the restructuring plan of Spain, some of its employees have been offered the possibility of availing themselves of a pre-retirement and incentivised retirement plan, providing a provision for an amount of EUR 615 millions).
113
b) Provisions for taxes and other legal contingencies and Other provisions
Set forth below is the detail, by type of provision, of the balances at June 30, 2019 and at December 31, 2018 of Provisions for taxes and other legal contingencies and Other provisions. The types of provision were determined by grouping together items of a similar nature:
|
|
|
|
|
|
| Millions of euros | ||
|
| 06-30-2019 |
| 12-31-2018 |
|
|
|
|
|
Provisions for taxes |
| 831 |
| 864 |
Provisions for employment-related proceedings (Brazil) |
| 845 |
| 859 |
Provisions for other legal proceedings |
| 1,477 |
| 1,451 |
Provision for customer remediation |
| 689 |
| 652 |
Regulatory framework-related provisions |
| 83 |
| 105 |
Provision for restructuring |
| 689 |
| 492 |
Other |
| 1,305 |
| 1,226 |
|
| 5,919 |
| 5,649 |
Relevant information is set forth below in relation to each type of provision shown in the preceding table.
The provisions for taxes include provisions for tax-related proceedings.
The provisions for employment-related proceedings (Brazil) relate to claims filed by trade unions, associations, the prosecutor's office and ex-employees claiming employment rights to which, in their view, they are entitled, particularly the payment of overtime and other employment rights, including litigation concerning retirement benefits. The number and nature of these proceedings, which are common for banks in Brazil, justify the classification of these provisions in a separate category or as a separate type from the rest. The Group calculates the provisions associated with these claims in accordance with past experience of payments made in relation to claims for similar items. When claims do not fall within these categories, a case-by-case assessment is performed and the amount of the provision is calculated in accordance with the status of each proceeding and the risk assessment carried out by the legal advisers.
The provisions for other legal proceedings include provisions for court, arbitration or administrative proceedings (other than those included in other categories or types of provisions disclosed separately) brought against Santander Group companies.
The provisions for customer remediation include the estimated cost of payments to remedy errors relating to the sale of certain products in the UK, the estimated cost of the floor clauses of Banco Santander, S.A. (from the former Banco Popular, S.A.U.), as well as the estimated cost of the claims related to the bonds and funds sales closed in Puerto Rico. To calculate the provision for customer remediation, the best estimate of the provision made by management is used, which is based on the estimated number of claims to be received and, of these, the number that will be accepted, as well as the estimated average payment per case.
The regulatory framework-related provisions include mainly the provisions for the extraordinary contribution to FSCS (Financial Services Compensation Scheme) and the Bank Levy in the UK, and those relating to Banking Tax in Poland.
The provisions for restructuring include only the direct costs arising from restructuring processes carried out by the various Group companies.
Qualitative information on the main litigation is provided in Note 10.c.
Our general policy is to record provisions for tax and legal proceedings in which we assess the chances of loss to be probable and we do not record provisions when the chances of loss are possible or remote. We determine the amounts to be provided for as our best estimate of the expenditure required to settle the corresponding claim based, among other factors, on a case-by-case analysis of the facts and the legal opinion of internal and external counsel or by considering the historical average amount of the loss incurred in claims of the same nature. The definitive date of the outflow of resources embodying economic benefits for the Group depends on each obligation. In certain cases, the obligations do not have a fixed settlement term and, in others, they depend on legal proceedings in progress.
The changes in provisions arising from civil contingencies and legal nature are disclosed in this note.
Regarding the provisions for labor processes and others of a legal nature, Brazil has charged EUR 85 million and EUR 73 million, respectively, with payments of EUR 134 million and EUR 90 million , respectively.
114
Regarding the provisions arising for customer remediation, EUR 80 million provisions in United Kingdom and EUR 47 million provisions in Puerto Rico for customer compensation have been allocated, partially offset with EUR 78 million provisions in United Kingdom and EUR 21 million provisions in Puerto Rico used, and Banco Popular, S.A.U., which an amount of EUR 40 million has been used in the period from floor clauses.
Regarding in provisions constituted by regulatory framework, EUR 48 million in the six-month period in United Kingdom has been used (Bank Levy and FSCS). In addition, EUR 61 million have been charged and paid in the semester in Poland.
In addition, in the provisions for restructuring, Spain has set aside EUR 242 million, the United Kingdom EUR 124 million and EUR 22 million in Poland. This increase is partially offset by payments of EUR 92 million in Spain, EUR 30 million both in the United Kingdom and Germany and EUR 13 million in Poland.
c) Litigation and other matters
i. Tax-related litigation
At June 30, 2019 the main tax-related proceedings concerning the Group were as follows:
- Legal actions filed by Banco Santander (Brasil) S.A. and certain Group companies in Brazil challenging the increase in the rate of Brazilian social contribution tax on net income from 9% to 15% stipulated by Interim Measure 413/2008, ratified by Law 11.727/2008, a provision having been recognised for the amount of the estimated loss. Due to recent unfavourable decisions of the courts, the Group in Brazil has withdrawn their actions and paid the amount claimed, using the existing provision.
- Legal actions filed by Banco Santander (Brasil) S.A. and other Group entities to avoid the application of Law 9.718/98, which modifies the basis to calculate PIS and COFINS social contribution, extending it to all the entities income, and not only to the income from the provision of services. In relation of Banco Santander (Brasil) S.A. process, in May 2015 the Federal Supreme Court (FSC) admitted the extraordinary appeal filed by the Federal Union regarding PIS, and dismissed the extraordinary appeal lodged by the Brazilian Public Prosecutor's Office regarding COFINS contribution, confirming the decision of Federal Regional Court favourable to Banco Santander (Brasil) S.A. of August 2007. The appeals filed by the other entities before the Federal Supreme Court, both for PIS and COFINS, are still pending. The risk is classified as possible and there is a provision for the amount of the estimated loss.
- Banco Santander (Brasil) S.A. and other Group companies in Brazil have appealed against the assessments issued by the Brazilian tax authorities questioning the deduction of loan losses in their income tax returns (IRPJ and CSLL) in relation to different administrative processes of various years on the ground that the requirements under the applicable legislation were not met. The appeals are pending decision in CARF. No provision was recognised in connection with the amount considered to be a contingent liability.
- Banco Santander (Brasil) S.A. and other Group companies in Brazil are involved in administrative and legal proceedings against several municipalities that demand payment of the Service Tax on certain items of income from transactions not classified as provisions of services. There are several cases in different judicial instances. No provision was recognised in connection with the amount considered to be a contingent liability.
- Banco Santander (Brasil) S.A. and other Group companies in Brazil are involved in administrative and legal proceedings against the tax authorities in connection with the taxation for social security purposes of certain items which are not considered to be employee remuneration. There are several cases in different judicial instances. A provision was recognised in connection with the amount of the estimated loss.
- In May 2003 the Brazilian tax authorities issued separate infringement notices against Santander Distribuidora de Títulos e Valores Mobiliarios Ltda. (DTVM, currently Santander Brasil Tecnologia S.A.) and Banco Santander (Brasil) S.A. in relation to the Provisional Tax on Financial Movements (CPMF) of the years 2000, 2001 and part of 2002. In July 2015, after the unfavourable decision of CARF, both entities appealed at Federal Justice in a single proceeding. In June 2019 this action has been dismissed, and the resolution has been appealed to the higher court. There is a provision recognised for the estimated loss.
- In December 2010 the Brazilian tax authorities issued an infringement notice against Santander Seguros S.A. (Brazil), currently Zurich Santander Brasil Seguros e Previdência S.A., as the successor by merger to ABN AMRO Brasil dois Participações S.A., in relation to income tax (IRPJ and CSLL) for 2005, questioning the tax treatment applied to a sale of shares of Real Seguros, S.A. Actually it is appealed before the CARF. As the former parent of Santander Seguros S.A. (Brasil), Banco Santander (Brasil) S.A. is liable in the event of any adverse outcome of this proceeding. No provision was recognised in connection with this proceeding as it is considered to be a contingent liability.
115
- In November 2014 the Brazilian tax authorities issued an infringement notice against Banco Santander (Brasil) S.A. in relation to corporate income tax (IRPJ and CSLL) for 2009 questioning the tax-deductibility of the amortisation of the goodwill of Banco ABN AMRO Real S.A. performed prior to the absorption of this bank by Banco Santander (Brasil) S.A., but accepting the amortisation performed after the merger. Actually it is appealed before the Higher Chamber of CARF. No provision was recognised in connection with this proceeding as it was considered to be a contingent liability.
- Banco Santander (Brasil) S.A. has also appealed against infringement notices issued by the tax authorities questioning the tax deductibility of the amortisation of the goodwill arising on the acquisition of Banco Comercial e de Investimento Sudameris S.A from years 2007 to 2012. No provision was recognised in connection with this matter as it was considered to be a contingent liability.
- Banco Santander (Brasil) S.A. and other companies of the Group in Brazil are undergoing administrative and judicial procedures against Brazilian tax authorities for not admitting tax compensation with credits derived from other tax concepts, not having registered a provision for such amount since it is considered to be a contingent liability.
- Banco Santander (Brasil) S.A. is involved in appeals in relation to infringement notices initiated by tax authorities regarding the offsetting of tax losses in the CSLL (‘Social Contribution on Net Income’) of year 2009. The appeal is pending decision in CARF. A provision was recognised in connection with the amount of the estimated loss.
- Legal action brought by Sovereign Bancorp, Inc. (currently Santander Holdings USA, Inc.) claiming its right to take a foreign tax credit for taxes paid outside the United States in fiscal years 2003 to 2005 as well as the related issuance and financing costs. On July 17, 2018, the District Court finally ruled against Santander Holdings USA, Inc. Final resolution is anticipated within the coming months, with no effect on income, as it is fully provisioned.
- Banco Santander has appealed before European Courts the Decisions 2011/5/CE of October 28, 2009, and 2011/282/UE of January 12, 2011 of the European Commission, ruling that the deduction regulated pursuant to Article 12.5 of the Corporate Income Tax Law constituted illegal State aid. On November 2018 the General Court confirmed these Decisions but these judgements have been appealed at the Court of justice of the European Union. The Group has not recognised provisions for these suits since they are considered to be a contingent liability.
At the date of approval of these interim financial statements certain other less significant tax-related proceedings were also in progress.
ii. Non-tax-related proceedings
At June 30, 2019, the main non-tax-related proceedings concerning the Group were as follows:
- Payment Protection Insurance (PPI): claims associated with the sale by Santander UK plc of payment protection insurance or PPI to its customers. As of June 30, 2019, the remaining provision for PPI redress and related costs amounted to GBP 247.9 million (EUR 277 million). An additional net provision of GBP 70 million (EUR 80 million) in the first semester of 2019 reflecting an increase in claims volumes and additional industry activities taking into account guidance provided by the FCA (Financial Conduct Authority), in advance of the PPI claims deadline on August 29, 2019. This provision represents management’s best estimate of Santander UK plc future liability in respect of mis-selling of PPI policies and is based on recent claims experience and consideration of the FCA guidance. It has been calculated using key assumptions such as the estimated number of customer complaints received, the number of rejected misselling claims that will be in scope for Plevin and Recurring Non Disclosure of Commission redress, and the determination of liability with respect to a specific portfolio of claims. The provision will be subject to continuous review, taking into account the impact of any further claims received and FCA guidance.
- Delforca: dispute arising from equity swaps entered into by Gaesco (now Delforca 2008, S.A.) on shares of Inmobiliaria Colonial, S.A. Banco Santander, S.A. is claiming to Delforca a total of EUR 66 million from the liquidation of the swaps. Mobiliaria Monesa, S.A. (Delforca’s parent company) has commenced a civil proceeding against the Bank claiming damages which, as of date have not been determined. The proceeding has been stayed because the jurisdiction of the Court has been challenged. Within insolvency proceedings before the Commercial Court, both Delforca and Mobiliaria Monesa have instigated a claim against the Bank seeking the recovery of EUR 56.8 million that the Bank received from the liquidation of the swap. The Bank has filed a claim against Delforca seeking the Bank's recognition of its right to receive the credit. The Bank has not recognised any provisions in this connection.
- Former employees of Banco do Estado de São Paulo S.A., Santander Banespa, Cia. de Arrendamiento Mercantil: a claim was filed in 1998 by the association of retired Banespa employees (AFABESP) requesting the payment of a half-yearly bonus contemplated in the by-laws of Banespa in the event that Banespa obtained a profit and that the distribution of this profit were approved by the Board of Directors. The bonus was not paid in 1994 and 1995 since Banespa had not made a profit during
116
those years. Partial payments were made from 1996 to 2000, as approved by the Board of Directors. The relevant clause was eliminated in 2001. The Regional Labor Court and the High Employment Court ordered Santander Brasil, as successor to Banespa, to pay this half-yearly bonus for the period from 1996 to the present. On March 20, 2019, a decision from the Federal Supreme Court (Supremo Tribunal Federal, or “STF”) rejected the extraordinary appeal filed by Santander Brasil. A rescission action to revert the decision in the main process has been filed by Santander Brasil. The current court decision does not define a specific amount to be paid by the defendants (this would only be determined once a final decision is issued and the enforcement process has begun).
- “Planos Económicos”: like the rest of the banking system in Brasil, Santander Brasil has been the target of customer complaints and collective civil suits stemming from legislative changes and its application to bank deposits, fundamentally ('economic plans'). At the end of 2017, there was an agreement between regulatory entities and the Brazilian Federation of Banks (Febraban), already approved by the Supremo Tribunal Federal, with the purpose of closing the lawsuits. Discussions focused on specifying the amount to be paid to each affected client according to the balance in their notebook at the time of the Plan. Finally, the total value of the payments will depend on the number of endorsements they have made and the number of savers who have demonstrated the existence of the account and its balance on the date the indexes were changed. In November 2018, the STF ordered the suspension of all economic plan processes for two years from February 2018.The provisions recorded for the economic plan processes are considered sufficient.
- CNMC: after an administrative investigation on several financial entities, including Banco Santander, S.A., in relation to possible collusive practices or price-fixing agreements, as well as exchange of commercially sensitive information in relation to financial derivative instruments used as hedge of interest rate risk for syndicated loans, on February 13, 2018, the Competition Directorate of the Spanish “National Commission for Antitrust and Markets” (CNMC) published its decision, by which it fined the Bank and another three financial institutions with EUR 91 million (EUR 23.9 million for the Bank) for offering interest rate derivatives in breach of Articles 1 of the Spanish Act 15/2007 on Defence of Competition and 101 of the Treaty of Functioning of the European Union. According to the CNMC, there would be evidence that there was coordination between the hedging banks/lenders to coordinate the price of the derivatives and offer clients, in each case, a price different from the “market price”. This decision has been appealed before the Spanish National Court by the Bank, that has already paid the fine.
- | Floor clauses (“cláusulas suelo”): As a consequence of the acquisition of Banco Popular, S.A.U, the Group has been exposed to a material number of transactions with floor clauses. The so-called "floor clauses" or minimum clauses are those under which the borrower accepts a minimum interest rate to be paid to the lender, regardless of the applicable reference interest rate. Banco Popular Español, S.A.U. included "floor clauses" in certain asset transactions with customers. In relation to this type of clauses, and after several rulings made by the Court of Justice of the European Union and the Spanish Supreme Court, and the extrajudicial process established by the Spanish Royal Decree-Law 1/2017, of January 2, Banco Popular Español, S.A.U. made extraordinary provisions that were updated in order to cover the effect of the potential return of the excess interest charged for the application of the floor clauses between the contract date of the corresponding mortgage loans and May 2013. The Group considered that the maximum risk associated with the floor clauses applied in its contracts with consumers, in the most severe and not probable scenario, would amount to approximately EUR 900 million, as initially measured and without considering the returns performed. For this matter, after the purchase of Banco Popular Español, S.A.U., EUR 396 million provisions have been used by the Group (EUR 238 million in 2017, EUR 119 million in 2018 and EUR 39 million in the first semester of 2019) mainly for refunds as a result of the extrajudicial process mentioned above. As of June 30, 2019, the amount of the Group's provisions in relation to this matter amounts to EUR 85 million. |
- Banco Popular´s acquisition: considering the declaration setting out the resolution of Banco Popular Español, S.A.U., the redemption and conversion of its capital instruments and the subsequent transfer to Banco Santander, S.A. of the shares resulting from this conversion in exercise of the resolution instrument involving the sale of the institution's business, in the application accordance with the single resolution framework regulation referred to in Note 3 of the 2018 consolidated annual accounts, some investors have filed claims against the EU’s Single Resolution Board decision, the FROB's resolution executed in accordance to the aforementioned decision, and claims have been filed and may be filed in the future against Banco Santander, S.A. or other Santander Group companies deriving from or related to the acquisition of Banco Popular Español, S.A.U.. There are also criminal investigations in progress led by the Spanish National Court in connection with Banco Popular Español, S.A.U., although not with its acquisition. On January 15, 2019, the Spanish National Court, applying article 130.2 of the Spanish Criminal Code, declared the Bank the successor entity to Banco Popular Español, S.A.U. (following the merger of the Bank and Banco Popular Español, S.A.U. on September 28, 2018), and, as a result, determined that the Bank assumed the role of the party being investigated in the criminal proceeding.
The decision was appealed and on April 30, 2019, the Spanish National Court ruled in favor of Banco Santander, S.A. declaring that Banco Santander, S.A. cannot inherit Banco Popular's potential criminal liability. This ruling was appealed by some of the accusing parties, the appeal was non-accepted by the Spanish National Court and those accusing parties have appealed the non-acceptance before the Supreme Court.
117
At this time it is not possible to foresee the total number of lawsuits and additional claims that could be put forth by the former shareholders, nor their economic implications (particularly considering that the resolution decision in application of the new laws is unprecedented in Spain or any other Member State of the European Union and that possible future claims might not specify any specific amount, allege new legal interpretations or involve a large number of parties). The estimated cost of the potential compensation to the shareholders of Banco Popular Español, S.A.U. has been accounted for as disclosed in the aforementioned Note 3.
- German shares investigation: the Cologne Public Prosecution Office is conducting an investigation against the Bank, and other group entities based in UK - Santander UK plc, Abbey National Treasury Services plc and Cater Allen International Limited -, in relation to a particular type of tax dividend linked transactions known as cum-ex transactions. The Group is cooperating with the German authorities. As the investigations are at preliminary stage, the results and the effects for the Group, which may potentially include the imposition of financial penalties, cannot be anticipated. The Bank has not recognised any provisions in this connection in relation to the potential imposition of financial penalties.
- Attorneys General Investigation of auto loan securitisation transactions and fair lending practices: in October 2014, May 2015, July 2015 and February 2017, Santander Consumer USA Inc. (SC) received subpoenas and/or Civil Investigative Demands (CIDs) from the Attorneys General of the U.S. states of California, Illinois, Oregon, New Jersey, Maryland and Washington under the authority of each state's consumer protection statutes. SC was informed that these states serve on behalf of a group of 32 state Attorneys General. The subpoenas contain broad requests for information and the production of documents related to SC’s underwriting, securitization, the recovery efforts servicing and collection of nonprime vehicle loans. SC has responded to these requests within the deadlines specified in the CIDs and has otherwise cooperated with the Attorneys General with respect to this matter. The provisions recorded for this investigation are considered sufficient.
- Financial Industry Regulatory Authority (“FINRA”) Puerto Rico Arbitrations: as of June 30, 2019, Santander Securities LLC (SSLLC) had received 670 FINRA arbitration cases related to Puerto Rico bonds and Puerto Rico closed-end funds (CEFs). The statements of claims allege, among other things, fraud, negligence, breach of fiduciary duty, breach of contract of the acquirers, unsuitability, over-concentration of the investments and defect to supervise. There were 433 arbitration cases that remained pending as of June 30, 2019. The provisions recorded for these matters are considered sufficient.
As a result of various legal, economic and market factors impacting or that could impact of the value Puerto Rico bonds and CEFs, it is possible that additional arbitration claims and/or increased claim amounts may be asserted against SSLLC in future periods.
IRPH Index: a portion of our Spanish mortgage loan portfolio bears interest at a rate indexed to the Índice de Referencia de Préstamos Hipotecarios known as "IRPH," which, at the time the contracts were entered into, served as reference rate for mortgage loan agreements in Spain and was published by the Bank of Spain. Consumers in Spain have brought lawsuits against most of the Spanish banking sector alleging that the use and related disclosures of such rate did not comply with the transparency requirements of European regulation. On December 14, 2017, the Supreme Court of Spain ruled that these clauses were valid, as the IRPH is an official rate and therefore non-subject to transparency requirements. The matter has been referred to the Court of Justice of the European Union through a preliminary ruling procedure. Pending the outcome of this referral, the IRPH remains valid as a result of the decision of the Supreme Court of Spain.
In the event the Court of Justice of the European Union questions these clauses, it would need to be determined the effects of the decision which carries the uncertainty as to the interest rate that would apply to the relevant mortgage loans. Additionally, it is unclear whether such a ruling by the Court of Justice of the European Union would have retroactive effect and to what extent.
The uncertainty regarding the ruling by the Court of Justice of the European Union as well as the effects of such ruling make estimating the potential exposure difficult. Currently, the balance of the relevant mortgage loans held by us equals approximately EUR 4.3 billion. Although it is considered that the decision of the Supreme Court of Spain is well-founded, an unfavorable decision by the Court of Justice of the European Union could result in the charge of a material provision.
Banco Santander has been sued in a legal proceeding in which the plaintiff alleges that a contract was concluded whereby he would be entrusted with the functions of CEO of the Bank. In the complaint, the claimant mainly requests a declaratory ruling that affirms the validity and conclusion of such contract and its enforcement together with the payment of certain amounts. If the main request is not granted, the claimant seeks compensation for a total amount of approximately EUR 112 million or, an alternative relief for other minor amounts. Banco Santander, S.A. will answer to this complaint.
CHF Polish Mortgage Loans: On May 14, 2019, the Advocate General of Court of Justice of the European Union (CJEU) issued a non-binding opinion in relation to a lawsuit against an unrelated bank in Poland regarding unfair contractual clauses in consumer agreements, specifically the consequences of potentially unfair contractual clauses in CHF-indexed loan
118
agreements. The Advocate General concluded that if the FX difference clause is deemed to be unfair, the agreement may be converted to an agreement on a PLN loan with an interest rate based on CHF LIBOR or it may be rendered null and void, as decided by the domestic court. In consultation with the Polish Bank Association (ZBP), the defendant bank filed for rehearing, enclosing a written opinion of the ZBP which pointed to a significant risk of the CJEU ruling based on incorrect legal assumptions presented in the opinion of the Advocate General. The decision by the CJEU is pending.
The uncertainty regarding the ruling by the Court of Justice of the European Union as well as the effects of such ruling make estimating the potential exposure difficult. An unfavorable decision by the Court of Justice of the European Union could result in the charge of a material provision. As at June 30, 2019, the Group has a portfolio of mortgage loans denominated in, or indexed to, CHF of approximately PLN 10,116 million (EUR 2,380 million).
The Bank and the other Group companies are subject to claims and, therefore, are party to certain legal proceedings incidental to the normal course of their business including those in connection with lending activities, relationships with employees and other commercial or tax matters.
With the information available to it, the Group considers that, at June 30, 2019, it had reliably estimated the obligations associated with each proceeding and had recognised, where necessary, sufficient provisions to cover reasonably any liabilities that may arise as a result of these tax and legal risks. Subject to the qualifications made, it also believes that any liability arising from such claims and proceedings will not have, overall, a material adverse effect on the Group’s business, financial position or results of operations.
11. Equity
In the six-month periods ended June 30, 2019 and 2018 there were no quantitative or qualitative changes in the Group's equity other than those indicated in the condensed consolidated statements of changes in total equity.
a) | Capital |
As of June 30, 2019 and December 31, 2018, the Bank's capital stock was represented by 16,236,573,942 shares, with a nominal amount of EUR 8,118 million, in both dates.
119
b) | Breakdown of other comprehensive income - Items not reclassified to profit or loss and Items that may be reclassified to profit or loss |
|
|
|
|
|
|
| Millions of euros | ||
|
| 06-30-2019 |
| 12-31-2018 |
Other comprehensive income accumulated |
| (21,425) |
| (22,141) |
Items not reclassified to profit or loss |
| (3,625) |
| (2,936) |
Actuarial gains or losses on defined benefit pension plans |
| (4,141) |
| (3,609) |
Non-current assets held for sale |
| — |
| — |
Share in other income and expenses recognised in investments, joint ventures and associates |
| 1 |
| 1 |
Other valuation adjustments |
| — |
| — |
Changes in the fair value of equity instruments measured at fair value with changes in other comprehensive income |
| 527 |
| 597 |
Inefficacy of fair value hedges of equity instruments measured at fair value with changes in other comprehensive income |
| — |
| — |
Changes in the fair value of equity instruments measured at fair value with changes in other comprehensive income (hedged item) |
| — |
| — |
Changes in the fair value of equity instruments measured at fair value with changes in other comprehensive income (hedging instrument) |
| — |
| — |
Changes in the fair value of financial liabilities measured at fair value through profit or loss attributable to changes in credit risk |
| (12) |
| 75 |
Items that may be reclassified to profit or loss |
| (17,800) |
| (19,205) |
Hedge of net investments in foreign operations (effective portion) |
| (5,074) |
| (4,312) |
Exchange differences |
| (14,927) |
| (15,730) |
Hedging derivatives. Cash flow hedges (effective portion) |
| 393 |
| 277 |
Changes in the fair value of debt instruments measured at fair value with changes in other comprehensive income |
| 2,051 |
| 828 |
Hedging instruments (items not designated) |
| — |
| — |
Non-current assets held for sale |
| — |
| — |
Share in other income and expenses recognised in investments, joint ventures and associates |
| (243) |
| (268) |
c) Other comprehensive income - Items not reclassified to profit or loss - Actuarial gains or losses on defined benefit pension plans
The changes in the balance of Other comprehensive income - Items not reclassified to profit or loss - Actuarial gains or losses on defined benefit pension plans include the actuarial gains or losses generated in the period and the return on plan assets, excluding amounts included in net interest on the net defined benefit liability (asset), less the administrative expenses and taxes inherent to the plan, and any change in the effect of the asset ceiling. Its variation is shown in the condensed consolidated statement of Recognised income and expense.
During the first six months of 2019 actuarial losses (net of actuarial gains) on defined benefit pension plans amounts to EUR 833 million, which main impact is:
- | Increase of EUR 314 million in the accumulated actuarial losses corresponding to the Group's businesses in the United Kingdom, mainly due to the variation in the discount rate (decrease from 2.90% to 2.35%). |
- | Increase of EUR 304 million in the accumulated actuarial losses corresponding to the Group's businesses in the Brazil, mainly due to the variation in the discount rate (decrease from 9.11% to 7.72%, for pension plans and from 9.26% to 7.86% for medical plans). |
- | Increase of EUR 161 million in the accumulated actuarial losses corresponding to the Group's businesses in the Spain, mainly due to the variation in the discount rate (decrease from 1.55% to 1.10)%. |
Likewise, the differences in the cumulative actuarial gains and losses account for an increase of EUR 54 million, as a consequence of the evolution of exchange rates and other effects.
d) | Other comprehensive income - Items not reclassified to profit or loss – Changes in the fair value of equity instruments measured at fair value with changes in other comprehensive income |
Includes the net amount of unrealised fair value changes in equity instruments at fair value with changes in other comprehensive income.
120
Below is a breakdown of the composition of the balance as of June 30, 2019 under “Other comprehensive income - Items that cannot be reclassified to profit or loss - Changes in the fair value of debt equity measured at fair value with changes in other comprehensive income depending on the geographical origin of the issuer”:
|
|
|
|
|
|
|
|
|
|
|
|
|
|
|
|
|
|
| Millions of euros | ||||||||||||||
|
| 06-30-2019 |
| 12-31-2018 | ||||||||||||
|
|
|
|
|
| Net |
|
|
|
|
|
|
| Net |
|
|
|
| Revaluation |
| Revaluation |
| revaluation |
| Fair |
| Revaluation |
| Revaluation |
| revaluation |
| Fair |
|
| gains |
| losses |
| gains/(losses) |
| value |
| gains |
| losses |
| gains/(losses) |
| value |
Equity instruments |
|
|
|
|
|
|
|
|
|
|
|
|
|
|
|
|
Domestic |
|
|
|
|
|
|
|
|
|
|
|
|
|
|
|
|
Spain |
| 19 |
| (444) |
| (425) |
| 185 |
| 20 |
| (216) |
| (196) |
| 417 |
International |
|
|
|
|
|
|
|
|
|
|
|
|
|
|
|
|
Rest of Europe |
| 60 |
| (78) |
| (18) |
| 319 |
| 160 |
| (76) |
| 84 |
| 652 |
United States |
| 13 |
| — |
| 13 |
| 45 |
| 9 |
| — |
| 9 |
| 42 |
Latin America and rest |
| 960 |
| (3) |
| 957 |
| 2,240 |
| 708 |
| (8) |
| 700 |
| 1,560 |
|
| 1,052 |
| (525) |
| 527 |
| 2,789 |
| 897 |
| (300) |
| 597 |
| 2,671 |
Of which: |
|
|
|
|
|
|
|
|
|
|
|
|
|
|
|
|
Listed |
| 961 |
| (15) |
| 946 |
| 2,289 |
| 818 |
| (18) |
| 800 |
| 1,943 |
Unlisted |
| 91 |
| (510) |
| (419) |
| 500 |
| 79 |
| (282) |
| (203) |
| 728 |
e) | Other comprehensive income - Items that may be reclassified to profit or loss – Hedges of net investments in foreign operations (effective portion) and exchange differences |
Other comprehensive income - Items that may be reclassified to profit or loss - Hedges of net investments in foreign operations (effective portion) includes the net amount of the changes in value of hedging instruments in hedges of net investments in foreign operations, in respect of the portion of these changes considered to be effective hedges.
Other comprehensive income - Items that may be reclassified to profit or loss - Exchange differences includes the net amount of exchange differences arising on non-monetary items whose fair value is adjusted against equity and the differences arising on the translation to euros of the balances of the consolidated entities whose functional currency is not the euro.
The net variation of both headings recognised during the first semester of 2019, recorded in the statement of income and expenses recognised as a consolidated summary, reflects the effect generated by the appreciation of Brazilian real and the depreciation of the Pound sterling and the US Dollar (Note 1.e). From this variation, a gain of EUR 144 million corresponds to the valuation at the closing exchange rate of goodwill of the semester (Note 8).
f) | Other comprehensive income – Items that may be reclassified to profit or loss – Changes in the fair value of debt instruments measured at fair value through other comprehensive income |
Includes the net amount of unrealised fair value changes in debt instruments at fair value through other comprehensive income.
Below is a breakdown of the composition of the balance as of June 30, 2019 and December 31, 2018 under Other comprehensive income - Items that can be reclassified to profit or loss - Changes in the fair value of debt instruments measured at fair value through other comprehensive income depending on the type of instrument and the geographical origin of the issuer:
|
|
|
|
|
|
|
|
|
|
|
|
|
|
|
|
|
|
| Millions of euros | ||||||||||||||
|
| 06-30-2019 |
| 12-31-2018 | ||||||||||||
|
|
|
|
|
| Net |
|
|
|
|
|
|
| Net |
|
|
|
|
|
|
|
| revaluation |
|
|
|
|
|
|
| revaluation |
|
|
|
| Revaluation |
| Revaluation |
| gains/ |
| Fair |
| Revaluation |
| Revaluation |
| gains/ |
| Fair |
|
| gains |
| losses |
| (losses) |
| value |
| gains |
| losses |
| (losses) |
| value |
Debt instruments |
|
|
|
|
|
|
|
|
|
|
|
|
|
|
|
|
Government and central banks debt instruments |
|
|
|
|
|
|
|
|
|
|
|
|
|
|
|
|
Spain |
| 717 |
| (4) |
| 713 |
| 29,002 |
| 323 |
| (3) |
| 320 |
| 38,550 |
Rest of Europe |
| 679 |
| (32) |
| 647 |
| 20,039 |
| 373 |
| (55) |
| 318 |
| 17,494 |
Latin America and rest of the world |
| 715 |
| (42) |
| 673 |
| 44,820 |
| 448 |
| (117) |
| 331 |
| 42,599 |
Private-sector debt instruments |
| 80 |
| (62) |
| 18 |
| 21,412 |
| 37 |
| (178) |
| (141) |
| 19,777 |
|
| 2,191 |
| (140) |
| 2,051 |
| 115,273 |
| 1,181 |
| (353) |
| 828 |
| 118,420 |
12. Segment information
For Group management purposes, the primary level of segmentation, by geographical area, comprised at December 31, 2018, five segments: four operating areas plus Corporate Centre. The operating areas, which include all the business activities carried on therein by the Group, are Continental Europe, the United Kingdom, Latin America and the United States, based on the location of the Group’s assets.
121
As of June 30, 2019 the Group has aligned the information in this note in a manner consistent with the current reporting structure and the way in which Management monitors the Group’s segments and units.
This financial information (“underlying basis”) is computed by adjusting reported results for the effects of certain gains and losses (e.g.: capital gains, write-downs, etc.). These gains and losses are items that management and investors ordinarily identify and consider separately to understand better the underlying trends in the business.
The main changes, which have been applied to all segment information for all periods included in the interim financial statements, are the following:
· | Creation of the new geographic segment Europe that includes the existing units under the previous Continental Europe segment (Spain, Portugal, Poland, Santander Consumer Finance) plus the UK (that was previously a segment on its own and is now a unit under the segment Europe). |
· | Creation of the new geographic segment North America that comprises the existing units under the previous US segment plus Mexico. |
· | Creation of the new geographic segment South America that comprises the existing units under the previous Latin America segment except for Mexico. |
· | Creation of a new reporting segment, Santander Global Platform, which includes the global digital services under a single unit: |
- | The fully digital native bank Openbank and Open Digital Services (ODS). |
- | Global Payments Services: payments platform to better serve the customers with value propositions developed globally, including Superdigital, Pago FX and the recently launched global business (Global Merchant Services and Global Trade Services). |
- | Digital Assets: common digital Assets and Centres of Digital Expertise which help the banks of the Group in their digital transformation. |
Following is the breakdown of revenue that is deemed to be recognised under Dividend income, Commission income, Gain or losses on financial assets and liabilities not measured at fair value through profit or loss, net, Gain or losses on financial assets and liabilities held for trading, net, Gain or losses on non-trading financial assets and liabilities mandatorily at fair value through profit or loss, Gain or losses on financial assets and liabilities measured at fair value through profit or loss, net, Gain or losses from hedge accounting, net, Other operating income and Income from assets under insurance and reinsurance contracts in the accompanying consolidated income statements for the six-month period ended June 30, 2019 and 2018.
Also, it is disclosed the reconciliation between the adjusted profit and the statutory profit corresponding to the six month period ended June 30, 2019 and 2018:
|
|
|
|
|
|
|
|
|
|
|
|
|
|
| Millions of euros | ||||||||||
|
| Revenue from ordinary activities |
| Profit |
| Profit before taxes | ||||||
Segment |
| 06-30-2019 |
| 06-30-2018 |
| 06-30-2019 |
| 06-30-2018 |
| 06-30-2019 |
| 06-30-2018 |
Europe |
| 16,190 |
| 16,406 |
| 2,354 |
| 2,422 |
| 3,549 |
| 3,610 |
South America |
| 14,420 |
| 15,497 |
| 1,961 |
| 690 |
| 3,661 |
| 1,265 |
North America |
| 8,768 |
| 7,179 |
| 889 |
| 1,846 |
| 1,594 |
| 3,499 |
Santander Global Platform |
| 61 |
| 52 |
| (51) |
| (23) |
| (70) |
| (29) |
Corporate Centre |
| (101) |
| (178) |
| (1,108) |
| (883) |
| (1,155) |
| (865) |
Underlying Profit |
| 39,338 |
| 38,956 |
| 4,045 |
| 4,052 |
| 7,579 |
| 7,480 |
Adjustments |
| — |
| — |
| (814) |
| (300) |
| (1,048) |
| (581) |
Statutory Profit |
| 39,338 |
| 38,956 |
| 3,231 |
| 3,752 |
| 6,531 |
| 6,899 |
Explanation of adjustments at June 30, 2019:
· | Gains due to the sale of the equity stake in Prisma, with a net impact of EUR 150 million. |
· | Losses given the sale of properties with a net impact of EUR -180 million. |
· | Restructuring costs in United Kingdom, Poland and Spain with a net impact of EUR-704 million. |
122
· | Provisions for PPI with a net impact of EUR -80 million. |
Explanation of adjustments at June 30, 2018:
· | Restructuring costs: The net impact of EUR -300 million on Profit related to restructuring costs in connection with the integration of Banco Popular Español, S.A.U., as follows EUR -280 million in Spain, EUR -40 million in Corporate Centre and EUR 20 million in Portugal. |
13. Related parties
The parties related to the Group are deemed to include, in addition to its subsidiaries, associates and jointly controlled entities, the Bank’s key management personnel (the members of its board of directors and the executive vice presidents, together with their close family members) and the entities over which the key management personnel may exercise significant influence or control.
Following is a detail of the transactions performed by the Group with its related parties in the first six months of 2019 and 2018, distinguishing between significant shareholders, members of the Bank’s board of directors, the Bank’s executive vice presidents, Group entities and other related parties. Related party transactions were made on terms equivalent to those that prevail in arm’s-length transactions or, when this was not the case, the related compensation in kind was recognised:
|
|
|
|
|
|
|
|
|
|
|
|
| Millions of euros | ||||||||
|
| 06-30-2019 | ||||||||
Expenses and income |
| Significant |
| Directors and |
| Individuals, Group companies |
| Other related |
| Total |
|
|
|
|
|
|
|
|
|
|
|
Expenses: |
|
|
|
|
|
|
|
|
|
|
Finance costs |
| — |
| — |
| 1 |
| — |
| 1 |
Leases |
| — |
| — |
| — |
| — |
| — |
Services received |
| — |
| — |
| — |
| — |
| — |
Purchases of stocks |
| — |
| — |
| — |
| — |
| — |
Other expenses |
| — |
| — |
| 13 |
| — |
| 13 |
|
| — |
| — |
| 14 |
| — |
| 14 |
Income: |
|
|
|
|
|
|
|
|
|
|
Finance income |
| — |
| — |
| 46 |
| — |
| 46 |
Dividends received |
| — |
| — |
| — |
| — |
| — |
Services rendered |
| — |
| — |
| — |
| — |
| — |
Sale of stocks |
| — |
| — |
| — |
| — |
| — |
Other income |
| — |
| — |
| 490 |
| — |
| 490 |
|
| — |
| — |
| 536 |
| — |
| 536 |
|
|
|
|
|
|
|
|
|
|
|
|
| Millions of euros | ||||||||
|
| 06-30-2019 | ||||||||
Other transactions |
| Significant |
| Directors and |
| Individuals, Group companies |
| Other related |
| Total |
|
|
|
|
|
|
|
|
|
|
|
Financing agreements: loans and capital contributions (lender) |
| — |
| — |
| 617 |
| (6) |
| 611 |
Financing agreements: loans and capital contributions (borrower) |
| — |
| — |
| 289 |
| 12 |
| 301 |
Guarantees provided |
| — |
| — |
| (21) |
| — |
| (21) |
Guarantees received |
| — |
| — |
| — |
| — |
| — |
Commitments acquired |
| — |
| — |
| 75 |
| (24) |
| 51 |
Dividends and other distributed profit |
| — |
| 5 |
| — |
| 20 |
| 25 |
Other transactions |
| — |
| — |
| — |
| — |
| — |
123
|
|
|
|
|
|
|
|
|
|
|
|
| Millions of euros | ||||||||
|
| 06-30-2019 | ||||||||
Balance closing period |
| Significant |
| Directors and executives |
| Individuals, Group companies or entities |
| Other related parties |
| Total |
|
|
|
|
|
|
|
|
|
|
|
Debt balances: |
|
|
|
|
|
|
|
|
|
|
Customers and commercial debtors |
| — |
| — |
| — |
| — |
| — |
Loans and credits granted |
| — |
| 24 |
| 7,688 |
| 61 |
| 7,773 |
Other collection rights |
| — |
| — |
| 515 |
| 17 |
| 532 |
|
| — |
| 24 |
| 8,203 |
| 78 |
| 8,305 |
Credit balances: |
|
|
|
|
|
|
|
|
|
|
Suppliers and creditors granted |
| — |
| — |
| — |
| — |
| — |
Loans and credits received |
| — |
| 35 |
| 2,222 |
| 77 |
| 2,334 |
Other payment obligations |
| — |
| — |
| 42 |
| — |
| 42 |
|
| — |
| 35 |
| 2,264 |
| 77 |
| 2,376 |
|
|
|
|
|
|
|
|
|
|
|
|
| Millions of euros | ||||||||
|
| 06-30-2018 | ||||||||
Expenses and income |
| Significant |
| Directors and |
| Individuals, Group companies |
| Other related |
| Total |
|
|
|
|
|
|
|
|
|
|
|
Expenses: |
|
|
|
|
|
|
|
|
|
|
Finance costs |
| — |
| — |
| 1 |
| 1 |
| 2 |
Leases |
| — |
| — |
| — |
| — |
| — |
Services received |
| — |
| — |
| — |
| — |
| — |
Purchases of stocks |
| — |
| — |
| — |
| — |
| — |
Other expenses |
| — |
| — |
| 47 |
| — |
| 47 |
|
| — |
| — |
| 48 |
| 1 |
| 49 |
Income: |
|
|
|
|
|
|
|
|
|
|
Finance income |
| — |
| — |
| 33 |
| 6 |
| 39 |
Dividends received |
| — |
| — |
| — |
| — |
| — |
Services rendered |
| — |
| — |
| — |
| — |
| — |
Sale of stocks |
| — |
| — |
| — |
| — |
| — |
Other income |
| — |
| — |
| 437 |
| 14 |
| 451 |
|
| — |
| — |
| 470 |
| 20 |
| 490 |
|
|
|
|
|
|
|
|
|
|
|
|
| Millions of euros | ||||||||
|
| 06-30-2018 | ||||||||
Other transactions |
| Significant |
| Directors and |
| Individuals, Group companies |
| Other related |
| Total |
|
|
|
|
|
|
|
|
|
|
|
Financing agreements: loans and capital contributions (lender) |
| — |
| 1 |
| 324 |
| (164) |
| 161 |
Financing agreements: loans and capital contributions (borrower) |
| — |
| 2 |
| (251) |
| 335 |
| 86 |
Guarantees provided |
| — |
| — |
| — |
| 31 |
| 31 |
Guarantees received |
| — |
| — |
| — |
| — |
| — |
Commitments acquired |
| — |
| — |
| 75 |
| (2) |
| 73 |
Dividends and other distributed profit |
| — |
| 4 |
| — |
| 18 |
| 22 |
Other transactions |
| — |
| — |
| 9 |
| 220 |
| 229 |
14 Off-balance-sheet exposures
The off-balance-sheet exposures related to balances representing loan commitments, financial guarantees and other commitments granted (recoverables and non recoverables).
Financial guarantees granted include financial guarantees contracts such as financial bank guarantees, credit derivatives, and risks arising from derivatives granted to third parties; non-financial guarantees include other guarantees and irrevocable documentary credits.
124
Loan and other commitments granted include all off-balance-sheet exposures, which are not classified as guarantees provided, including loans commitment granted.
|
|
|
|
|
|
| Millions of euros | ||
|
| 06-30-19 |
| 12-31-18 |
|
|
|
|
|
Loan commitments granted |
| 223,954 |
| 218,083 |
Of which doubtful |
| 339 |
| 298 |
Financial guarantees granted |
| 12,077 |
| 11,723 |
Of which doubtful |
| 161 |
| 181 |
Bank sureties |
| 12,004 |
| 11,558 |
Credit derivatives sold |
| 73 |
| 165 |
Other commitments granted |
| 94,785 |
| 74,389 |
Of which doubtful |
| 889 |
| 983 |
Other granted guarantees |
| 33,447 |
| 35,154 |
Other |
| 61,338 |
| 39,235 |
The breakdown of the off-balance sheet exposure and impairment on June 30, 2019 and December 31, 2018 by impairment stages is EUR 323,500 million and EUR 297,409 million of exposure and EUR 379 million and EUR 382 million of impairment in stage 1, EUR 5,927 million and EUR 5,324 million of exposure and EUR 137 million and EUR 132 million of impairment in stage 2, and EUR 1,389 million and EUR 1,462 million of exposure and EUR 212 million and EUR 265 million of impairment in stage 3, respectively.
15. Average headcount and number of offices
The average number of employees at the Bank and the Group, by gender, in the six month periods ended June 30, 2019 and 2018 is as follows:
|
|
|
|
|
|
|
|
|
|
| Bank |
| Group | ||||
Average headcount |
| 06-30-2019 |
| 06-30-2018 |
| 06-30-2019 |
| 06-30-2018 |
|
|
|
|
|
|
|
|
|
Men |
| 16,240 |
| 11,585 |
| 91,609 |
| 91,051 |
Women |
| 13,739 |
| 9,906 |
| 110,789 |
| 110,833 |
|
| 29,979 |
| 21,491 |
| 202,398 |
| 201,884 |
The increase in the number of employees of the Bank between both periods is due to the merger processes between the Bank and other subsidiaries (mainly Banco Popular).
The number of branches at June 30, 2019 and December 31, 2018 is as follow:
|
|
|
|
|
|
| Group | ||
Number of branches |
| 06-30-2019 |
| 12-31-2018 |
|
|
|
|
|
Spain |
| 4,296 |
| 4,427 |
Foreign |
| 8,785 |
| 8,790 |
|
| 13,081 |
| 13,217 |
125
16. Other disclosures
a)Valuation techniques for financial assets and liabilities
The following table shows a summary of the fair values, at June 30, 2019 and December 31, 2018, of the financial assets and liabilities indicated below, classified on the basis of the various measurement methods used by the Group to determine their fair value:
|
|
|
|
|
|
|
|
|
|
|
|
|
|
| Millions of euros | ||||||||||
|
| 06-30-19 |
| 12-31-18 | ||||||||
|
| Published price |
|
|
|
|
| Published price |
|
|
|
|
|
| quotations in active |
|
|
|
|
| quotations in |
|
|
|
|
|
| markets |
| Internal models |
|
|
| active markets |
| Internal models |
|
|
|
| (Level 1) |
| (Levels 2 and 3) |
| Total |
| (Level 1) |
| (Levels 2 and 3) |
| Total |
|
|
|
|
|
|
|
|
|
|
|
|
|
Financial assets held for trading |
| 44,404 |
| 58,170 |
| 102,574 |
| 37,108 |
| 55,771 |
| 92,879 |
Non-trading financial assets mandatorily at fair value through profit or loss |
| 1,695 |
| 3,698 |
| 5,393 |
| 1,835 |
| 8,895 |
| 10,730 |
Financial assets at fair value through profit and loss |
| 2,739 |
| 70,681 |
| 73,420 |
| 3,102 |
| 54,358 |
| 57,460 |
Financial assets at fair value through other comprehensive income |
| 98,629 |
| 19,433 |
| 118,062 |
| 103,590 |
| 17,501 |
| 121,091 |
Hedging derivatives (assets) |
| — |
| 8,451 |
| 8,451 |
| — |
| 8,607 |
| 8,607 |
Financial liabilities held for trading |
| 16,861 |
| 57,326 |
| 74,187 |
| 16,104 |
| 54,239 |
| 70,343 |
Financial liabilities designated at fair value through profit or loss |
| 1,350 |
| 58,887 |
| 60,237 |
| 987 |
| 67,071 |
| 68,058 |
Hedging derivatives (liabilities) |
| 5 |
| 7,262 |
| 7,267 |
| 5 |
| 6,358 |
| 6,363 |
Liabilities under insurance contracts |
| — |
| 731 |
| 731 |
| — |
| 765 |
| 765 |
Financial instruments at fair value, determined on the basis of published price quotations in active markets (Level 1), include government debt instruments, private-sector debt instruments, derivatives traded in organised markets, securitised assets, shares, short positions and fixed-income securities issued.
In cases where price quotations cannot be observed, management makes its best estimate of the price that the market would set, using its own internal models. In most cases, these internal models use data based on observable market parameters as significant inputs (Level 2) and, in some cases, they use significant inputs not observable in market data (Level 3).
In order to make these estimates, various techniques are employed, including the extrapolation of observable market data. The best evidence of the fair value of a financial instrument on initial recognition is the transaction price, unless the fair value of the instrument can be obtained from other market transactions performed with the same or similar instruments or can be measured by using a valuation technique in which the variables used include only observable market data, mainly interest rates.
During the first semester of 2019, the Group did not make any material transfers of financial instruments between measurement levels other than the transfers included in level 3 table. At this regard, the Group has proceeded to reclassify to level 3 certain government bonds in Brazil that, based on the Group's observability criteria, do not meet the requirements to be considered as observable inputs. Likewise, certain positions (both derivatives and debt instruments) have been reclassified to level 2 with maturities for which there are already observable valuation inputs or for which new sources of recurrent prices have been accessed.
The Group has developed a formal process for the systematic valuation and management of financial instruments, which has been implemented worldwide across all the Group's units. The governance scheme for this process distributes responsibilities between two independent divisions: Treasury (development, marketing and daily management of financial products and market data) and Risk (on a periodic basis, validation of pricing models and market data, computation of risk metrics, new transaction approval policies, management of market risk and implementation of fair value adjustment policies). The approval of new products follows a sequence of steps (request, development, validation, integration in corporate systems and quality assurance) before the product is brought into production. This process ensures that pricing systems have been properly reviewed and are stable before they are used.
The most important products and families of derivatives, and the related valuation techniques and inputs, by asset class, are detailed in the consolidated annual accounts as at December 31, 2018.
126
As of June 30, 2019, the CVA (Credit Valuation Adjustment) accounted for was EUR 302.2 million (-13.9% from December 31, 2018 year end) and adjustments of DVA (Debt Valuation Adjustment) was EUR 192.5 million (-26.2% compared to December 31, 2018). The reductions are mainly due to the decrease of credit spreads by more than 30% in the most liquid periods.
Set forth below are the financial instruments at fair value whose measurement was based on internal models (Levels 2 and 3) at June 30, 2019 and December 31, 2018:
|
|
|
|
|
|
|
|
|
|
|
|
|
|
|
|
| Millions of euros |
| Millions of euros |
|
|
|
| ||||
|
|
| Fair values calculated using |
| Fair values calculated using |
|
|
|
| ||||
|
|
| internal models at |
| internal models at |
|
|
|
| ||||
|
|
| 06-30-19 (*) |
| 12-31-18 (*) |
|
|
|
| ||||
|
|
| Level 2 |
| Level 3 |
| Level 2 |
| Level 3 |
| Valuation techniques |
| Main inputs |
ASSETS |
|
| 153,100 |
| 7,333 |
| 140,659 |
| 4,473 |
|
|
|
|
Financial assets held for trading |
|
| 57,567 |
| 603 |
| 55,033 |
| 738 |
|
|
|
|
Customers (**) |
|
| 300 |
| — |
| 205 |
| — |
| Present value method |
| Yield curves, FX market prices |
Debt instruments and equity instruments |
|
| 990 |
| 74 |
| 314 |
| 153 |
| Present value method |
| Yield curves, HPI, FX market prices |
Derivatives |
|
| 56,277 |
| 529 |
| 54,514 |
| 585 |
|
|
|
|
Swaps |
|
| 47,337 |
| 191 |
| 44,423 |
| 185 |
| Present value method, Gaussian Copula (***) |
| Yield curves, FX market prices, HPI, Basis, Liquidity |
Exchange rate options |
|
| 388 |
| 3 |
| 617 |
| 2 |
| Black-Scholes Model |
| Yield curves, Volatility surfaces, FX market prices, Liquidity |
Interest rate options |
|
| 3,679 |
| 190 |
| 3,778 |
| 149 |
| Black's Model, multifactorial advanced models interest rate |
| Yield curves, Volatility surfaces, FX market prices, Liquidity |
Interest rate futures |
|
| 11 |
| — |
| — |
| — |
| Present value method |
| Yield curves, FX market prices |
Index and securities options |
|
| 1,376 |
| 113 |
| 1,118 |
| 198 |
| Black-Scholes Model |
| Yield curves, Volatility surfaces, FX & EQ market prices, Dividends, Correlation, Liquidity, HPI |
Other |
|
| 3,486 |
| 32 |
| 4,578 |
| 51 |
| Present value method, Advanced stochastic volatility models and other |
| Yield curves, Volatility surfaces, FX and EQ market prices, Dividends, Correlation, Liquidity, Others |
Hedging derivatives |
|
| 8,443 |
| 8 |
| 8,586 |
| 21 |
|
|
|
|
Swaps |
|
| 7,906 |
| — |
| 7,704 |
| 21 |
| Present value method |
| FX market prices, Yield curves, Basis |
Interest rate options |
|
| 17 |
| 8 |
| 20 |
| — |
| Black's Model |
| FX market prices, Yield curves, Volatility surfaces |
Other |
|
| 520 |
| — |
| 862 |
| — |
| Present value method, Advanced stochastic volatility models and other |
| Yield curves, Volatility surfaces, FX market prices, Credit, Liquidity, Others |
Non-trading financial assets mandatorily at fair value through profit or loss |
|
| 1,747 |
| 1,951 |
| 7,492 |
| 1,403 |
|
|
|
|
Equity instruments |
|
| 1,083 |
| 612 |
| 985 |
| 462 |
| Present value method |
| Market price, Interest rates curves, Dividends and Others |
Debt instruments |
|
| 653 |
| 953 |
| 5,085 |
| 481 |
| Present value method |
| Interest rates curves |
Loans and receivables (**) |
|
| 11 |
| 386 |
| 1,422 |
| 460 |
| Present value method, swap asset model & CDS |
| Interest rates curves and Credit curves |
Financial assets designated at fair value through profit or loss |
|
| 69,664 |
| 1,017 |
| 53,482 |
| 876 |
|
|
|
|
Central banks |
|
| 7,105 |
| — |
| 9,226 |
| — |
| Present value method |
| Interest rates curves, FX market prices |
Credit institutions |
|
| 39,760 |
| 50 |
| 22,897 |
| 201 |
| Present value method |
| Interest rates curves, FX market prices |
Customers (****) |
|
| 22,599 |
| 411 |
| 21,355 |
| 560 |
| Present value method |
| Interest rates curves, FX market prices, HPI |
Debt instruments |
|
| 200 |
| 556 |
| 4 |
| 115 |
| Present value method |
| Interest rates curves, FX market prices |
Financial assets at fair value through other comprehensive income |
|
| 15,679 |
| 3,754 |
| 16,066 |
| 1,435 |
|
|
|
|
Equity instruments |
|
| 122 |
| 346 |
| 455 |
| 581 |
| Present value method |
| Market price, Interest rates curves, Dividends and Others |
Debt instruments |
|
| 15,391 |
| 192 |
| 14,699 |
| 165 |
| Present value method |
| Interest rates curves, FX market prices |
Loans and receivables |
|
| 166 |
| 3,216 |
| 912 |
| 689 |
| Present value method |
| Interest rates curves, FX market prices and Credit curves and Liquidity. |
LIABILITIES |
|
| 123,600 |
| 606 |
| 127,991 |
| 442 |
|
|
|
|
Financial liabilities held for trading |
|
| 57,069 |
| 257 |
| 53,950 |
| 289 |
|
|
|
|
Derivatives |
|
| 57,024 |
| 257 |
| 53,950 |
| 289 |
|
|
|
|
Swaps |
|
| 47,255 |
| 110 |
| 43,489 |
| 111 |
| Present value method, Gaussian Copula (***) |
| Yield curves, FX market prices, Basis, Liquidity, HPI |
Exchange rate options |
|
| 464 |
| — |
| 610 |
| 7 |
| Black-Scholes Model |
| Yield curves, Volatility surfaces, FX market prices, Liquidity |
Interest rate options |
|
| 4,709 |
| 32 |
| 4,411 |
| 26 |
| Black's Model, multifactorial advanced models interest rate |
| Yield curves, Volatility surfaces, FX market prices, Liquidity |
Index and securities options |
|
| 1,365 |
| 105 |
| 1,233 |
| 143 |
| Black-Scholes Model |
| Yield curves, FX market prices |
Interest rate and equity futures |
|
| 25 |
| — |
| 7 |
| — |
| Black's Model |
| Yield curves, Volatility surfaces, FX & EQ market prices, Dividends, Correlation, Liquidity, HPI |
Other |
|
| 3,206 |
| 10 |
| 4,200 |
| 2 |
| Present value method, Advanced stochastic volatility models and other |
| Yield curves, Volatility surfaces, FX & EQ market prices, Dividends, Correlation, Liquidity, HPI |
Short positions |
|
| 45 |
| — |
| — |
| — |
| Present value method |
| Yield curves ,FX & EQ market prices, Equity |
Hedging derivatives |
|
| 7,260 |
| 2 |
| 6,352 |
| 6 |
|
|
|
|
Swaps |
|
| 6,513 |
| — |
| 5,868 |
| 6 |
| Present value method |
| Yield curves ,FX & EQ market prices, Basis |
Interest rate options |
|
| 8 |
| 2 |
| 158 |
| — |
| Black's Model |
| Yield curves , Volatility surfaces, FX market prices, Liquidity |
Other |
|
| 739 |
| — |
| 326 |
| — |
| Present value method, Advanced stochastic volatility models and other |
| Yield curves , Volatility surfaces, FX market prices, Liquidity, Other |
Financial liabilities designated at fair value through profit or loss |
|
| 58,540 |
| 347 |
| 66,924 |
| 147 |
| Present value method |
| Yield curves, FX market prices |
Liabilities under insurance contracts |
|
| 731 |
| — |
| 765 |
| — |
|
|
|
|
(*) The internal models of Level 2 implement figures based on the parameters observed in the market, while Level 3 internal models uses significant inputs that are not observable in market data.
(**) Includes mainly short-term loans and reverse repurchase agreements with corporate customers (mainly brokerage and investment companies).
(***) Includes credit risk derivatives with a negative net fair value of EUR 2 million recognised in the interim condensed consolidated balance sheet (December 31, 2018: net fair value of EUR 0 million ). These assets and liabilities are measured using the Standard Gaussian Copula Model.
(****) Includes residential mortgages to financial institutions in the United Kingdom (which are regulated and partly financed by the Government). The fair value of these loans has been obtained using observable market variables, including current market transactions of similar amount and guarantees provided by the UK Housing Association. Given that the Government is involved in these entities, credit risk spreads have remained stable and homogeneous in this sector. The results arising from the valuation model are contrasted against current market transactions.
127
The measurements obtained using the internal models might have been different had other methods or assumptions been used with respect to interest rate risk, to credit risk, market risk and foreign currency risk spreads, or to their related correlations and volatilities. Nevertheless, the Bank’s directors consider that the fair value of the financial assets and liabilities recognised in the consolidated balance sheet and the gains and losses arising from these financial instruments are reasonable.
Level 3 financial instruments
Set forth below are the Group's main financial instruments measured using unobservable market data that constitute significant inputs of the internal models (Level 3):
-Instruments in Santander UK's portfolio (loans, debt instruments and derivatives) linked to the House Price Index (HPI). Even if the valuation techniques used for these instruments may be the same as those used to value similar products (present value in the case of loans and debt instruments, and the Black-Scholes model for derivatives), the main factors used in the valuation of these instruments are the HPI spot rate, the growth rate of that rate, its volatility and mortality rates, which are not always observable in the market and, accordingly, these instruments are considered illiquid
· | The HPI spot rate: for some instruments the NSA HPI spot rate, which is directly observable and published on a monthly basis, is used. For other instruments where regional HPI rates must be used (published quarterly), adjustments are made to reflect the different composition of the rates and adapt them to the regional composition of Santander UK's portfolio. |
· | HPI growth rate: this is not always directly observable in the market, especially for long maturities, and is estimated in accordance with existing quoted prices. To reflect the uncertainty implicit in these estimates, adjustments are made based on an analysis of the historical volatility of the HPI, incorporating reversion to the mean. |
· | HPI volatility: the long-term volatility is not directly observable in the market but is estimated on the basis of more short-term quoted prices and by making an adjustment to reflect the existing uncertainty, based on the standard deviation of historical volatility over various time periods. |
· | Mortality rates: these are based on published official tables and adjusted to reflect the composition of the customer portfolio for this type of product at Santander UK. |
-Callable interest rate trading derivatives (Bermudan style options) where the main unobservable input is mean reversion of interest rates.
-Derivatives of negotiation on interest rates, taking asset securitisations and with the redemption rate (CPR) as the main unobservable input as an underlying asset.
- | Derivatives from trading on inflation in Spain, where volatility is not observable in the market. |
- | Derivatives on long-term interest rate volatility (more than 30 years) where volatility is not observable in the market at the indicated term. |
- | Equity volatility derivatives, specifically indices and equities, where volatility is not observable in the long term. |
- | Syndicated loans with the HTC&S business model (Hold to collect and sale) and classified in the fair value category with changes in other accumulated global result, where the cost of liquidity is not directly observable in the market, as well as the prepayment option in favour of the borrower. |
The net amount recorded in the results of the first six months of 2019 resulting from the aforementioned valuation models which main inputs are unobservable market data (Level 3) amounts to EUR 68 million benefit approximately (EUR 13 million in June 30, 2018).
128
The table below shows the effect, at June 30, 2019, on the fair value of the main financial instruments classified as Level 3 of a reasonable change in the assumptions used in the valuation. This effect was determined by applying the probable valuation ranges of the main unobservable inputs detailed in the following table:
|
|
|
|
|
|
|
|
|
|
|
|
|
|
|
|
|
|
|
|
|
|
| Impacts (in millions of euros) | ||
Portfolio/Instrument |
|
|
|
|
|
|
| Weighted |
| Unfavorable |
| Favorable |
(Level 3) |
| Valuation technique |
| Main unobservable inputs |
| Range |
| average |
| scenario |
| scenario |
Financial assets held for trading |
|
|
|
|
|
|
|
|
|
|
|
|
Trading derivatives |
| Present Value Method |
| Curves on TAB indices (*) |
| (a) |
| (a) |
| (0.3) |
| 0.3 |
|
|
|
| Long-term rates MXN |
| (a) |
| (a) |
| — |
| — |
|
| Present Value Method, Modified Black-Scholes Model |
| HPI forward growth rate |
| 0%-5% |
| 2.53% |
| (4.4) |
| 4.3 |
|
|
|
| HPI spot rate |
| n/a |
| 795.75 (**) |
| (9.8) |
| 9.8 |
|
| Interest curves, Price market FX |
| CPR |
| n/a |
| n/a |
| (163.2) |
| 84.4 |
Quanto options (c) |
| Local term volatility and reference strike under the partial differential equation method |
| Non-existent market volatility, a proxy is used |
| Beta vs Volatility Surface STOXX50E 69%-62% |
| Beta 65% |
| — |
| — |
Financial assets at fair value through other comprehensive income |
|
|
|
|
|
|
|
|
|
|
|
|
Debt instruments and equity holdings |
| Present Value Method, others |
| Contingencies for litigations |
| 0%-100% |
| 22% |
| (27.2) |
| 7.7 |
|
| Present Value Method, others |
| Late payment and prepayment rate capital cost long-term profit growth rate |
| (a) |
| (a) |
| (6.6) |
| 6.6 |
|
| Present Value Method, others |
| Interest curves, price market FX and credit curves |
| (a) |
| (a) |
| 1.8 |
| (1.8) |
|
| Local Volatility |
| Long term volatility |
| n/a |
| 34.0% |
| 244.9 |
| (313.8) |
Non-trading financial assets mandatorily at fair value through profit or loss |
|
|
|
|
|
|
|
|
|
|
|
|
Credit to customers |
| Weighted average by probability (according to forecast mortality rates) of European HPI options, using the Black-Scholes model |
| HPI forward growth rate |
| 0%-5% |
| 2.66% |
| (5.9) |
| 5.2 |
Debt instruments and equity instruments |
|
|
| HPI spot rate |
| n/a |
| 788.41 (**) |
| (10.7) |
| 10.7 |
|
| TD Black |
| Spain Volatility |
| n/a |
| 4.7% |
| 2.2 |
| (11.5) |
|
| Asset Swap Model & CDS |
| Interest and credit curve models |
| n/a |
| 7.7% |
| (19.8) |
| 4.4 |
|
| Cvx. Adj (SLN) |
| Long term volatility |
| n/a |
| 8.0% |
| (121.2) |
| 105.1 |
Financial liabilities held for trading |
|
|
|
|
|
|
|
|
|
|
|
|
Trading derivatives |
| Present Value Method, Modified Black-Scholes Model |
| HPI forward growth rate |
| 0%-5% |
| 2.41% |
| (7.8) |
| 7.3 |
|
|
|
| HPI spot rate |
| n/a |
| 776.48 (**) |
| (4.3) |
| 5.0 |
|
|
|
| Curves on TAB indices (*) |
| (a) |
| (a) |
| — |
| — |
|
| Discounted flows denominated in different currencies |
| Long term rate MXN |
| Bid Offer Spread IRS TIIE 2bp - 6bp X-CCY USD/MXN 3bp - 10bp Swaps UDI/MXN 5bp - 10bp |
| IRS TIIE 3bp X-CCY MXN/USD 4bp Swaps UDI/MXN 10bp |
| (0.481) |
| 0.480 |
Hedging Derivatives (Liabilities) |
| Advances models of local volatility and stochastic |
| Correlation between prices and shares |
| 55%-75% |
| 65% |
| Not applicable |
| Not applicable |
|
| Advanced multi-factor interest rate models |
| Reversion to average interest rate |
| 0.0001-0.03 |
| 0.01 (***) |
| — |
| — |
Financial liabilities designated at fair value through profit or loss |
| — |
| — |
| — |
| — |
| (b) |
| (b) |
(*) TAB: “Tasa Activa Bancaria” (Active Bank Rate). Average deposit interest rates (over 30, 90, 180 and 360 days) published by the Chilean Association of Banks and Financial Institutions (ABIF) in nominal currency (Chilean peso) and in real terms, adjusted for inflation (Unidad de Fomento - UF).
(**) There are national and regional HPI indices. The HPI spot value is the weighted average of the indices that correspond to the positions of each portfolio. The impact reported is a change of 10%.
(***) Theoretical average value of the parameter. The change arising on a favourable scenario is from 0.0001 to 0.03. An unfavourable scenario is not considered as there is insufficient margin for an adverse change from the current parameter level.
(a) The exercise was conducted for the unobservable inputs described in the “main unobservable inputs” column under probable scenarios. The range and weighted average value used are not shown because the aforementioned exercise was conducted jointly for various inputs or variants thereof (e.g. the TAB input comprises vector-time curves, for which there are also nominal yield curves and inflation-indexed yield curves), and it was not possible to break down the results separately by type of input. In the case of the TAB curve the gain or loss is reported for changes of +/-100 b.p. for the total sensitivity to this index in CLP and CLF. The same is applicable to the MXN interest rates.
(b) The Group calculates the potential impact on the measurement of each instrument on a joint basis, regardless of whether the individual value is positive (assets) or negative (liabilities), and discloses the joint effect associated with the related instruments classified on the asset side of the consolidated balance sheet.
(c) No impacts have arisen in Quanto options as the exposure is back to back completely covered.
129
Lastly, the changes in the financial instruments classified as Level 3 in the first six months of 2019 were as follows:
|
|
|
|
|
|
|
|
|
|
|
|
|
|
|
|
|
|
| 01-01-19 |
| Changes |
| 06-30-19 | ||||||||||
|
| Fair value |
|
|
|
|
| Changes in |
| Changes in |
|
|
|
|
| Fair value |
|
| calculated using |
|
|
|
|
| fair value |
| fair value |
|
|
|
|
| calculated using |
|
| internal models |
| Purchases/ |
| Sales/ |
| recognized in |
| recognized |
| Level |
|
|
| internal models |
Millions of euros |
| (Level 3) |
| Issuances |
| Settlements |
| profit or loss |
| in equity |
| reclassifications |
| Other |
| (Level 3) |
|
|
|
|
|
|
|
|
|
|
|
|
|
|
|
|
|
Financial assets held for trading |
| 738 |
| 58 |
| (46) |
| 45 |
| — |
| (200) |
| 8 |
| 603 |
Debt instruments |
| 153 |
| 13 |
| (24) |
| (2) |
| — |
| (69) |
| 3 |
| 74 |
Trading derivatives |
| 585 |
| 45 |
| (22) |
| 47 |
| — |
| (131) |
| 5 |
| 529 |
Swaps |
| 185 |
| 1 |
| (8) |
| 15 |
| — |
| (3) |
| 1 |
| 191 |
Exchange rate options |
| 2 |
| — |
| — |
| 1 |
| — |
| — |
| — |
| 3 |
Interest rate options |
| 149 |
| — |
| — |
| 10 |
| — |
| 31 |
| — |
| 190 |
Index and securities options |
| 198 |
| 33 |
| (11) |
| 21 |
| — |
| (132) |
| 4 |
| 113 |
Other |
| 51 |
| 11 |
| (3) |
| — |
| — |
| (27) |
| — |
| 32 |
Hedging derivatives (Assets) |
| 21 |
| 8 |
| — |
| — |
| — |
| (21) |
| — |
| 8 |
Swaps |
| 21 |
| — |
| — |
| — |
| — |
| (21) |
| — |
| — |
Interest rate options |
| — |
| 8 |
| — |
| — |
| — |
| — |
| — |
| 8 |
Trading financial assets at fair value through profit or loss |
| 876 |
| — |
| (1) |
| 1 |
| — |
| 176 |
| (35) |
| 1,017 |
Credit institutions |
| 201 |
| — |
| — |
| — |
| — |
| (151) |
| - |
| 50 |
Loans and advances to customers |
| 560 |
| — |
| (1) |
| — |
| — |
| (112) |
| (36) |
| 411 |
Debt instruments |
| 115 |
| — |
| — |
| 1 |
| — |
| 439 |
| 1 |
| 556 |
Non-trading financial assets mandatorily at fair value through profit or loss |
| 1,403 |
| 674 |
| (187) |
| 70 |
| — |
| (7) |
| (2) |
| 1,951 |
Loans and advances to customers |
| 460 |
| 67 |
| (176) |
| 19 |
| — |
| — |
| 16 |
| 386 |
Debt instruments |
| 481 |
| 493 |
| (2) |
| 3 |
| — |
| (8) |
| (14) |
| 953 |
Equity instruments |
| 462 |
| 114 |
| (9) |
| 48 |
| — |
| 1 |
| (4) |
| 612 |
Financial assets at fair value through other comprehensive income |
| 1,435 |
| 3,268 |
| (502) |
| — |
| (209) |
| (316) |
| 78 |
| 3,754 |
TOTAL ASSETS |
| 4,473 |
| 4,008 |
| (736) |
| 116 |
| (209) |
| (368) |
| 49 |
| 7,333 |
|
|
|
|
|
|
|
|
|
|
|
|
|
|
|
|
|
Financial liabilities held for trading |
| 289 |
| 42 |
| (2) |
| 42 |
| — |
| (120) |
| 6 |
| 257 |
Trading derivatives |
| 289 |
| 42 |
| (2) |
| 42 |
| — |
| (120) |
| 6 |
| 257 |
Swaps |
| 111 |
| 2 |
| — |
| 4 |
| — |
| (6) |
| (1) |
| 110 |
Exchange rate options |
| 7 |
| — |
| — |
| — |
| — |
| (7) |
| — |
| — |
Interest rate options |
| 26 |
| — |
| — |
| 3 |
| — |
| — |
| 3 |
| 32 |
Index and securities options |
| 143 |
| 40 |
| (2) |
| 34 |
| — |
| (113) |
| 3 |
| 105 |
Others |
| 2 |
| — |
| — |
| 1 |
| — |
| 6 |
| 1 |
| 10 |
Hedging derivatives (Liabilities) |
| 6 |
| 2 |
| — |
| — |
| — |
| (6) |
| — |
| 2 |
Swaps |
| 6 |
| — |
| — |
| — |
| — |
| (6) |
| — |
| — |
Interest rate options |
| — |
| 2 |
| — |
| — |
| — |
| — |
| — |
| 2 |
Financial liabilities designated at fair value through profit or loss |
| 147 |
| 291 |
| (2) |
| 6 |
| — |
| (93) |
| (2) |
| 347 |
TOTAL LIABILITIES |
| 442 |
| 335 |
| (4) |
| 48 |
| — |
| (219) |
| 4 |
| 606 |
b) Sovereign risk with peripheral European countries
The detail at June 30, 2019 and December 31, 2018, by type of financial instrument, of the Group credit institutions’ sovereign risk exposure to Europe’s peripheral countries and of the short positions exposed to them, taking into consideration the scope established by the European Banking Authority (EBA) in the analyses performed on the capital needs of European credit institutions (Note 54 to the consolidated annual accounts for 2018), is as follows:
|
|
|
|
|
|
|
|
|
|
|
|
|
|
|
|
|
|
|
Sovereign risk by country of issuer/borrower at June 30, 2019 (*) | ||||||||||||||||||
|
| Millions of euros | ||||||||||||||||
|
| Debt instruments |
|
|
|
|
| MtM Derivatives (****) | ||||||||||
|
| Financial |
|
|
|
|
|
|
|
|
|
|
|
|
|
|
|
|
|
| assets held for |
|
|
|
|
|
|
|
|
|
|
|
|
|
|
|
|
|
| trading and |
|
|
|
|
| Non-trading |
|
|
|
|
|
|
|
|
|
|
|
| Financial |
|
|
| Financial |
| financial |
|
|
|
|
|
|
|
|
|
|
|
| assets |
|
|
| assets at fair |
| assets |
|
|
|
|
|
|
|
|
|
|
|
| designated at |
|
|
| value through |
| mandatorily |
| Financial |
| Loans and |
|
|
|
|
|
|
|
| fair value |
|
|
| other |
| at fair value |
| assets at |
| advances to |
| Total net |
|
|
|
|
|
| through profit |
| Short |
| comprehensive |
| through |
| amortised |
| customers |
| direct |
| Other than |
|
|
|
| or loss |
| positions |
| income |
| profit or loss |
| cost |
| (**) |
| exposure |
| CDSs |
| CDSs |
Spain |
| 6,084 |
| (1,710) |
| 16,379 |
| — |
| 7,249 |
| 13,932 |
| 41,934 |
| 522 |
| — |
Portugal |
| 365 |
| (759) |
| 5,633 |
| — |
| 564 |
| 3,686 |
| 9,489 |
| — |
| — |
Italy |
| 1,151 |
| (159) |
| 3,188 |
| — |
| 387 |
| 62 |
| 4,629 |
| 3 |
| (3) |
Ireland |
| — |
| — |
| — |
| — |
| — |
| — |
| — |
| (1) |
| — |
(*) Information prepared under EBA standards. Also, there are government debt instruments on insurance companies balance sheets amounting to EUR 15,005 million (of which EUR 13,131 million, EUR 1,406 million, EUR 466 million and EUR 2 million relate to Spain, Portugal, Italy and Ireland, respectively) and off-balance-sheet exposure other than derivatives – contingent liabilities and commitments– amounting to EUR 5,012 million (of which EUR 4,423 million, EUR 297 million and EUR 292 million to Spain, Portugal and Italy, respectively).
(**) Presented without taking into account the valuation adjustments recognised (EUR 22 million).
(***) "Other than CDSs" refers to the exposure to derivatives based on the location of the counterparty, irrespective of the location of the underlying. “CDSs” refers to the exposure to CDSs based on the location of the underlying.
130
|
|
|
|
|
|
|
|
|
|
|
|
|
|
|
|
|
| |
Sovereign risk by country of issuer/borrower at December 31, 2018 (*) | ||||||||||||||||||
|
| Millions of euros | ||||||||||||||||
|
| Debt instruments |
|
|
|
|
| MtM Derivatives (***) | ||||||||||
|
| Financial |
|
|
|
|
|
|
|
|
|
|
|
|
|
|
|
|
|
| assets held for |
|
|
|
|
|
|
|
|
|
|
|
|
|
|
|
|
|
| trading and |
|
|
|
|
| Non-trading |
|
|
|
|
|
|
|
|
|
|
|
| Financial |
|
|
| Financial |
| financial |
|
|
|
|
|
|
|
|
|
|
|
| assets |
|
|
| assets at fair |
| assets |
|
|
|
|
|
|
|
|
|
|
|
| designated at |
|
|
| value through |
| mandatorily |
| Financial |
| Loans and |
|
|
|
|
|
|
|
| fair value |
|
|
| other |
| at fair value |
| assets at |
| advances to |
| Total net |
|
|
|
|
|
| through profit |
| Short |
| comprehensive |
| through |
| amortised |
| customers |
| direct |
| Other than |
|
|
|
| or loss |
| positions |
| income |
| profit or loss |
| cost |
| (**) |
| exposure |
| CDSs |
| CDSs |
Spain |
| 3,601 |
| (2,458) |
| 27,078 |
| — |
| 7,804 |
| 13,615 |
| 49,640 |
| 407 |
| — |
Portugal |
| 72 |
| (115) |
| 4,794 |
| — |
| 277 |
| 3,725 |
| 8,753 |
| — |
| — |
Italy |
| 477 |
| (681) |
| — |
| — |
| 385 |
| 80 |
| 261 |
| 87 |
| — |
Ireland |
| — |
| — |
| — |
| — |
| — |
| — |
| — |
| 2 |
| — |
(*) Information prepared under EBA standards. Also, there are government debt instruments on insurance companies balance sheets amounting to EUR 13,364 million (of which EUR 11,529 million, EUR 1,415 million, EUR 418 million and EUR 2 million relate to Spain, Portugal, Italy and Ireland, respectively) and off-balance-sheet exposure different to derivatives –contingent liabilities and commitments– amounting to EUR 5,622 million (EUR 4,870 million, EUR 366 million and EUR 386 million to Spain, Portugal and Italy, respectively).
(**) Presented without taking into account the valuation adjustments recognised (EUR 34 million)
(***) "Other than CDSs" refers to the exposure to derivatives based on the location of the counterparty, irrespective of the location of the underlying. “CDSs” refers to the exposure to CDSs based on the location of the underlying.
The detail of the Group’s other exposure to other counterparties (private sector, central banks and other public entities that are not considered to be sovereign risks) in the aforementioned countries at June 30, 2019 and December 31, 2018 is as follows:
|
|
|
|
|
|
|
|
|
|
|
|
|
|
|
|
|
|
|
|
|
Exposure to other counterparties by country of issuer/borrower at June 30, 2019 (*) | ||||||||||||||||||||
|
| Millions of euros | ||||||||||||||||||
|
|
|
|
|
| Debt instruments |
|
|
|
|
| Derivatives (***) | ||||||||
|
|
|
|
|
| Financial assets |
| Financial assets at |
|
|
|
|
|
|
|
|
|
|
|
|
|
|
|
|
|
| held for trading and |
| fair value through |
| Non-trading financial |
|
|
| Loans and |
|
|
|
|
|
|
|
| Balances |
| Reverse |
| Financial assets |
| other |
| assets mandatorily at fair |
| Financial assets |
| advances to |
| Total net |
|
|
|
|
|
| with central |
| repurchase |
| designated at |
| comprehensive |
| value through profit or |
| at amortised |
| customers |
| direct |
| Other than |
|
|
|
| banks |
| agreements |
| FVTPL |
| income |
| loss |
| cost |
| (**) |
| exposure |
| CDSs |
| CDSs |
Spain |
| 28,154 |
| 7,433 |
| 614 |
| 1,236 |
| 322 |
| 4,355 |
| 196,633 |
| 238,747 |
| 3,674 |
| 2 |
Portugal |
| 2,179 |
| 205 |
| 31 |
| 38 |
| — |
| 3,561 |
| 33,946 |
| 39,960 |
| 1,084 |
| — |
Italy |
| 361 |
| 3,618 |
| 328 |
| 578 |
| — |
| 148 |
| 11,016 |
| 16,049 |
| 740 |
| — |
Greece |
| — |
| — |
| — |
| — |
| — |
| — |
| 71 |
| 71 |
| 33 |
| — |
Ireland |
| — |
| — |
| 30 |
| 1,398 |
| — |
| 21 |
| 8,564 |
| 10,013 |
| 245 |
| — |
(*) Also, the Group has off-balance-sheet exposure other than derivatives -contingent liabilities and commitments- amounting to EUR 85,514 million, EUR 7,951 million, EUR 3,842 million, EUR 200 million and EUR 801 million to counterparties in Spain, Portugal, Italy, Greece and Ireland, respectively.
(**) Presented without taking into account valuation adjustments or impairment corrections (EUR 8,304 million).
(***) “Other than CDSs” refers to the exposure to derivatives based on the location of the counterparty, irrespective of the location of the underlying. “CDSs” refers to the exposure to CDSs based on the location of the underlying.
|
|
|
|
|
|
|
|
|
|
|
|
|
|
|
|
|
|
|
|
|
Exposure to other counterparties by country of issuer/borrower at December 31, 2018 (*) | ||||||||||||||||||||
|
| Millions of euros |
|
| ||||||||||||||||
|
|
|
|
|
| Debt instruments |
|
|
|
|
| Derivatives (***) | ||||||||
|
|
|
|
|
| Financial assets |
| Financial assets at |
|
|
|
|
|
|
|
|
|
|
|
|
|
|
|
|
|
| held for trading and |
| fair value through |
| Non-trading financial |
|
|
| Loans and |
|
|
|
|
|
|
|
| Balances |
| Reverse |
| Financial assets |
| other |
| assets mandatorily at fair |
| Financial assets |
| advances to |
| Total net |
|
|
|
|
|
| with central |
| repurchase |
| designated at |
| comprehensive |
| value through profit or |
| at amortised |
| customers |
| direct |
| Other than |
|
|
|
| banks |
| agreements |
| FVTPL |
| income |
| loss |
| cost |
| (**) |
| exposure |
| CDSs |
| CDSs |
Spain |
| 42,655 |
| 8,117 |
| 412 |
| 1,760 |
| 320 |
| 2,662 |
| 202,149 |
| 258,075 |
| 3,880 |
| (6) |
Portugal |
| 1,369 |
| — |
| 11 |
| 90 |
| — |
| 3,821 |
| 33,596 |
| 38,887 |
| 1,132 |
| — |
Italy |
| 51 |
| 6,296 |
| 84 |
| 635 |
| — |
| — |
| 10,830 |
| 17,896 |
| 253 |
| — |
Greece |
| — |
| — |
| — |
| — |
| — |
| — |
| 80 |
| 80 |
| 28 |
| — |
Ireland |
| — |
| — |
| 21 |
| 1,093 |
| 16 |
| 25 |
| 10,633 |
| 11,788 |
| 127 |
| — |
(*) Also, the Group has off-balance-sheet exposure other than derivatives -contingent liabilities and commitments- amounting to EUR 76,691 million, EUR 8,158 million, EUR 5,193 million, EUR 200 million and EUR 850 million to counterparties in Spain, Portugal, Italy, Greece and Ireland, respectively.
(**) They are presented without taking into account valuation adjustments or impairment corrections (EUR 9,385 million).
(***) “Other than CDSs” refers to the exposure to derivatives based on the location of the counterparty, irrespective of the location of the underlying. “CDSs” refers to the exposure to CDSs based on the location of the underlying.
131
Following is certain information on the notional amounts of the CDSs detailed in the foregoing tables at June 30, 2019 and December 31, 2018:
|
|
|
|
|
|
|
|
|
|
|
|
|
|
|
06-30-19 | ||||||||||||||
Millions of euros | ||||||||||||||
|
|
|
| Notional amount |
| Fair value | ||||||||
|
|
|
| Bought |
| Sold |
| Net |
| Bought |
| Sold |
| Net |
Spain |
| Sovereign |
| — |
| — |
| — |
| — |
| — |
| — |
|
| Other |
| 216 |
| 380 |
| (164) |
| (2) |
| 4 |
| 2 |
Portugal |
| Sovereign |
| 26 |
| 26 |
| — |
| — |
| — |
| — |
|
| Other |
| — |
| — |
| — |
| — |
| — |
| — |
Italy |
| Sovereign |
| 312 |
| 9 |
| 303 |
| (3) |
| — |
| (3) |
|
| Other |
| 60 |
| 153 |
| (93) |
| (4) |
| 4 |
| — |
|
|
|
|
|
|
|
|
|
|
|
|
|
|
|
12-31-18 | ||||||||||||||
Millions of euros | ||||||||||||||
|
|
|
| Notional amount |
| Fair value | ||||||||
|
|
|
| Bought |
| Sold |
| Net |
| Bought |
| Sold |
| Net |
Spain |
| Sovereign |
| — |
| — |
| — |
| — |
| — |
| — |
|
| Other |
| 151 |
| 382 |
| (231) |
| (2) |
| (4) |
| (6) |
Portugal |
| Sovereign |
| 26 |
| 26 |
| — |
| — |
| — |
| — |
|
| Other |
| — |
| — |
| — |
| — |
| — |
| — |
Italy |
| Sovereign |
| — |
| 265 |
| (265) |
| — |
| — |
| — |
|
| Other |
| 205 |
| 75 |
| 130 |
| (5) |
| 5 |
| — |
c) Refinancing and restructured transactions
The following forms are use with the meanings specified below:
· | Refinancing transaction: transaction that is granted or used, for reasons relating to current or foreseeable financial difficulties of the borrower, to repay one or more of the transactions granted to it, or through which the payments on such transactions are brought fully or partially up to date, in order to enable the borrowers of the cancelled or refinanced transactions to repay their debt (principal and interest) because they are unable, or might foreseeably become unable, to comply with the conditions thereof in due time and form. |
· | Restructured transaction: transaction with respect to which, for economic or legal reasons relating to current or foreseeable financial difficulties of the borrower, the financial terms and conditions are modified in order to facilitate the payment of the debt (principal and interest) because the borrower is unable, or might foreseeably become unable, to comply with the aforementioned terms and conditions in due time and form, even if such modification is envisaged in the agreement. |
For maximum guarantees amount, we will consider as follows:
· | Real guarantees: the appraisal amount or valuation amount of the real guarantees received; for each transaction it cannot be higher than the covered amount of exposure. |
· | Personal guarantees, maximum amount guarantors will have to pay if the guarantee is implemented. |
|
|
|
|
|
|
|
|
|
|
|
|
|
|
|
|
|
|
|
|
|
|
|
|
|
|
|
|
|
|
| 06-30-2019 | ||||||||||||||||||||||||||
|
| Total |
| Of which: Non performing/Doubtful | ||||||||||||||||||||||||
|
| Without collateral |
| With collateral |
|
|
| Without collateral (a) |
| With collateral |
|
| ||||||||||||||||
|
|
|
|
|
|
|
|
|
| Maximum amount of |
| Accumulated |
|
|
|
|
|
|
|
|
| Maximum amount of |
| Accumulated | ||||
|
|
|
|
|
|
|
|
|
| collateral that can be |
| Impairment |
|
|
|
|
|
|
|
|
| collateral that can be |
| Impairment | ||||
Amounts in millions of euros, |
|
|
|
|
|
|
|
|
| considered |
| or losses at |
|
|
|
|
|
|
|
|
| considered |
| or losses at | ||||
except number of transactions |
| Number of |
| Gross |
| Number of |
| Gross |
| Mortgage |
| Other |
| fair value due |
| Number of |
| Gross |
| Number of |
| Gross |
| Mortgage |
| Other |
| fair value due |
in units |
| transactions |
| amount |
| operations |
| amount |
| guarantee |
| guarantees |
| to credit risk |
| transactions |
| amount |
| transactions |
| amount |
| guarantee |
| guarantees |
| to credit risk |
Credit entities |
| — |
| — |
| — |
| — |
| — |
| — |
| — |
| — |
| — |
| — |
| — |
| — |
| — |
| — |
Public sector |
| 36 |
| 34 |
| 16 |
| 10 |
| 8 |
| — |
| 2 |
| 11 |
| 3 |
| 10 |
| 4 |
| 3 |
| — |
| 1 |
Other financial institutions and: individual shareholder) |
| 585 |
| 58 |
| 268 |
| 102 |
| 15 |
| 28 |
| 28 |
| 290 |
| 26 |
| 126 |
| 18 |
| 10 |
| 1 |
| 20 |
Non financial institutions and individual shareholder |
| 145,564 |
| 5,916 |
| 45,194 |
| 12,919 |
| 8,398 |
| 1,272 |
| 5,825 |
| 89,277 |
| 3,927 |
| 30,229 |
| 7,793 |
| 5,143 |
| 622 |
| 5,408 |
Of which: Financing for constructions and property development |
| 5,963 |
| 252 |
| 1,909 |
| 1,653 |
| 1,363 |
| 46 |
| 594 |
| 4,246 |
| 200 |
| 1,400 |
| 1,146 |
| 877 |
| 44 |
| 576 |
Other warehouses |
| 1,640,494 |
| 3,627 |
| 724,916 |
| 12,743 |
| 7,528 |
| 2,382 |
| 4,267 |
| 922,436 |
| 1,792 |
| 145,102 |
| 4,546 |
| 3,310 |
| 367 |
| 2,835 |
Total |
| 1,786,679 |
| 9,635 |
| 770,394 |
| 25,774 |
| 15,949 |
| 3,682 |
| 10,122 |
| 1,012,014 |
| 5,748 |
| 175,467 |
| 12,361 |
| 8,466 |
| 990 |
| 8,264 |
Financing classified as non-current assets |
| — |
| — |
| — |
| — |
| — |
| — |
| — |
| — |
| — |
| — |
| — |
| — |
| — |
| — |
132
The table below shows the changes of these balances during the first semester of 2019:
|
|
|
|
| Millions of euros |
Carrying amount |
| 06-30-2019 |
|
|
|
Beginning balances |
| 30,527 |
Refinancing and restructuring of the period |
| 2,828 |
Memorandum items: impact recorded in the income statement for the period |
| 1,177 |
Debt repayment |
| (3,880) |
Foreclosures |
| (249) |
Derecognised from the consolidated balance sheet |
| (892) |
Other variations |
| (3,047) |
Balances at end of year |
| 25,287 |
d) Real estate business – Spain
i) | Portfolio of home purchase loans to families |
Home purchase loans granted to families in Spain on June 30, 2019 amounted to EUR 63,102 million. Of which mortgage guarantees are 99.41%.
|
|
|
|
|
|
| 06-30-19 | ||
|
| Millions of euros | ||
|
| Gross |
| Of which: |
|
| Amount |
| Non-performing |
|
|
|
|
|
Home purchase loans to families |
|
|
|
|
- Without mortgage guarantee |
| 374 |
| 26 |
- With mortgage guarantee |
| 62,728 |
| 2,477 |
|
| 63,102 |
| 2,503 |
The risk profile of the home purchase mortgage loan portfolio in Spain remained at a medium-low level, with limited prospects of additional impairment:
· | Principal is repaid on all mortgages from the start. |
· | Early repayment is common so the average life of the transaction is well below that of the contract. |
· | High quality of collateral concentrated almost exclusively in financing the first home. |
· | Average affordability rate at the end of June stood at 28.35%. |
· | 84.96% of the portfolio has a LTV below 80%, calculated as total risk/latest available house appraisal. |
|
|
|
|
|
|
|
|
|
|
|
|
|
|
| 06-30-19 | ||||||||||
|
| Gross amount in books on the amount of the last appraisal (loan to value) | ||||||||||
|
|
|
| More than |
| More than |
| More than |
|
|
|
|
|
|
|
| 40% or |
| 60% and |
| 80% and |
|
|
|
|
|
| Less than or |
| less than |
| less than |
| less or |
| More than |
|
|
In millions of euros |
| equal to 40% |
| 60% |
| 80% |
| equal to 100% |
| 100% |
| TOTAL |
Gross amount |
| 16,299 |
| 18,919 |
| 18,078 |
| 5,558 |
| 3,874 |
| 62,728 |
- Of which: watchlist /non performing |
| 220 |
| 306 |
| 454 |
| 433 |
| 1,064 |
| 2,477 |
133
ii)Financing construction and property development
At June 30, 2019 the financing amount related to construction and real estate business in Spain amounted to EUR 3,752 million net of allowances.
|
|
|
|
|
|
|
|
| 06-30-2019 | ||||
|
|
|
| Excess over |
|
|
|
|
|
| collateral |
| Specific |
Millions of euros |
| Gross Amount |
| value |
| allowance |
Financing for construction and property development recognised by the Group's credit institutions (including land) (business in Spain) |
| 4,131 |
| 656 |
| 379 |
Of which: watchlist/ non-performing |
| 955 |
| 288 |
| 354 |
Memorandum items: Written-off assets |
| 2,804 |
| — |
| — |
|
|
|
|
| 06-30-2019 |
Millions of euros |
| Carrying amount |
Memorandum items: |
|
|
Total loans and advances to customers excluding the public sector (business in Spain) (book value) |
| 224,086 |
Total consolidated assets (Total business) (book value) |
| 1,512,096 |
Impairment losses and provision for exposure classified as normal (business in Spain) |
| 1,221 |
At the end June 30, 2019 the concentration of this portfolio was as follows:
|
|
|
|
| Loans: gross amount |
Millions of euros |
| 06-30-2019 |
1. Without mortgage guarantee |
| 288 |
2. With mortgage guarantee |
| 3,843 |
2.1 Completed buildings |
| 2,175 |
2.1.1 Residential |
| 1,073 |
2.1.2 Other |
| 1,102 |
2.2 Buildings and other constructions under construction |
| 1,133 |
2.2.1 Residential |
| 804 |
2.2.2 Other |
| 329 |
2.3 Land |
| 535 |
2.3.1 Developed consolidated land |
| 363 |
2.3.2 Other land |
| 172 |
Total |
| 4,131 |
134
e)Foreclosed real estate assets
The following table shows the breakdown at June 30, 2019 of the foreclosed assets for the Spanish business:
|
|
|
|
|
|
|
|
|
|
| 06-30-2019 | ||||||
|
|
|
|
|
| Of which: |
|
|
|
|
|
|
|
| Impairment |
|
|
|
| Gross |
|
|
| losses |
|
|
|
| carrying |
| Valuation |
| since time of |
| Carrying |
Millions of euros |
| amount |
| Adjustments |
| the foreclosure |
| amount |
Property assets arising from financing provided to construction and property development companies |
| 7,008 |
| 3,726 |
| 2,519 |
| 3,282 |
Of which: |
|
|
|
|
|
|
|
|
Completed Buildings |
| 2,286 |
| 839 |
| 523 |
| 1,447 |
Residential |
| 587 |
| 195 |
| 90 |
| 392 |
Other |
| 1,699 |
| 644 |
| 433 |
| 1,055 |
Buildings under construction |
| 353 |
| 127 |
| 74 |
| 226 |
Residential |
| 341 |
| 123 |
| 74 |
| 218 |
Other |
| 12 |
| 4 |
| - |
| 8 |
Land |
| 4,369 |
| 2,760 |
| 1,922 |
| 1,609 |
Developed Land |
| 1,610 |
| 980 |
| 586 |
| 630 |
Other land |
| 2,759 |
| 1,780 |
| 1,336 |
| 979 |
Property assets from home purchase mortgage loans to households |
| 935 |
| 291 |
| 135 |
| 644 |
Other foreclosed property assets |
| 419 |
| 161 |
| 83 |
| 258 |
Total property assets |
| 8,362 |
| 4,178 |
| 2,737 |
| 4,184 |
In addition, the Group holds an ownership interest in Project Quasar Investments 2017, S.L., for EUR 1,701 million, and EUR 69 million in foreclosed equity instruments or received in payment of debts.
f) Solvency information
The Group commands a solvency position above the levels required by regulators and by the European Central bank. At June 30, 2019, at a consolidated level, the Group must maintain a minimum capital ratio of 9.70% of CET1 fully loaded (4.5% being the requirement for Pillar I, 1.5% being the requirement for Pillar 2R (requirement), 2.5% being the requirement for capital conservation buffer, 1% being the requirement for G-SIB and 0.2% being the requirement for anti-cyclical capital buffer). Santander Group must also maintain a minimum capital ratio of 1.5% of Tier 1 fully loaded and a minimum total ratio of 13.20% fully loaded.
At June 30, 2019, Banco Santander has a capital ratio regulatory CET1 of 11.30% and a total ratio of 14.83%.
Capital ratio
|
|
|
|
|
|
|
| 06-30-2019 |
| 12-31-2018 |
|
Capital coefficients |
|
|
|
|
|
Level 1 ordinary eligible capital (millions of euros) |
| 68,406 |
| 67,962 |
|
Level 1 additional eligible capital (millions of euros) |
| 9,509 |
| 9,754 |
|
Level 2 eligible capital (millions of euros) |
| 11,867 |
| 11,009 |
|
Risk-weighted assets (millions of euros) |
| 605,470 |
| 592,319 |
|
Level 1 ordinary capital coefficient (CET 1) |
| 11.30 | % | 11.47 | % |
Level 1 additional capital coefficient (AT1) |
| 1.57 | % | 1.65 | % |
Level 1 capital coefficient (TIER1) |
| 12.87 | % | 13.12 | % |
Level 2 capital coefficient (TIER 2) |
| 1.96 | % | 1.86 | % |
Total capital coefficient |
| 14.83 | % | 14.98 | % |
Leverage
|
|
|
|
|
|
|
| 06-30-2019 |
| 12-31-2018 |
|
Leverage |
|
|
|
|
|
Tier 1 capital (Millions of euros) |
| 77,915 |
| 77,716 |
|
Exposure (Millions of euros) |
| 1,552,573 |
| 1,489,094 |
|
Leverage ratio |
| 5.02 | % | 5.22 | % |
135
17. Additional disclosure requirements
This Note includes relevant information about additional disclosure requirements.
17.1Parent company financial statements
Following are the summarized balance sheets of Banco Santander, S.A. as of June 30, 2019 and December 31, 2018. In the financial information of the Parent, investments in subsidiaries, jointly controlled entities and associates are recorded at cost.
|
|
|
|
|
|
UNAUDITED CONDENSED BALANCE SHEETS |
| June 30, 2019 |
| December 31, 2018 |
|
(Parent company only) |
| (Millions of Euros) |
| ||
Assets |
|
|
|
|
|
Cash and due from banks |
| 107,566 |
| 105,660 |
|
Of which: |
|
|
|
|
|
To bank subsidiaries |
| 15,732 |
| 16,339 |
|
Trading account assets |
| 81,249 |
| 70,825 |
|
Investment securities |
| 47,575 |
| 61,064 |
|
Of which: |
|
|
|
|
|
To bank subsidiaries |
| 8,744 |
| 11,084 |
|
To non-bank subsidiaries |
| 4,306 |
| 4,581 |
|
Net Loans and leases |
| 276,396 |
| 263,142 |
|
Of which: |
|
|
|
|
|
To non-bank subsidiaries |
| 29,637 |
| 26,505 |
|
Investment in affiliated companies |
| 82,596 |
| 81,734 |
|
Of which: |
|
|
|
|
|
To bank subsidiaries |
| 63,480 |
| 69,118 |
|
To non-bank subsidiaries |
| 19,116 |
| 12,616 |
|
Premises and equipment, net |
| 6,389 |
| 2,410 |
|
Other assets |
| 24,211 |
| 23,541 |
|
Total assets |
| 625,982 |
| 608,376 |
|
|
|
|
|
|
|
Liabilities |
|
|
|
|
|
Deposits |
| 364,457 |
| 350,786 |
|
Of which: |
|
|
|
|
|
To bank subsidiaries |
| 18,668 |
| 18,526 |
|
To non-bank subsidiaries |
| 16,790 |
| 13,655 |
|
Short-term debt |
| 36,163 |
| 30,883 |
|
Long-term debt |
| 68,083 |
| 75,600 |
|
Total debt |
| 104,246 |
| 106,483 |
|
Of which: |
|
|
|
|
|
To bank subsidiaries |
| 501 |
| 2,874 |
|
To non-bank subsidiaries |
| 2,740 |
| 998 |
|
Other liabilities |
| 89,705 |
| 82,340 |
|
Total liabilities |
| 558,408 |
| 539,609 |
|
|
|
|
|
|
|
Stockholders' equity |
|
|
|
|
|
Capital stock |
| 8,118 |
| 8,118 |
|
Retained earnings and other reserves |
| 59,456 |
| 60,649 |
|
Total stockholders' equity |
| 67,574 |
| 68,767 |
|
|
|
|
|
|
|
Total liabilities and Stockholders’ Equity |
| 625,982 |
| 608,376 |
|
136
Following are the summarized unaudited statements of income of Banco Santander, S.A. for the periods ended June 30, 2019 and 2018.
|
|
|
|
|
|
|
|
UNAUDITED CONDENSED STATEMENTS OF INCOME |
|
| Six months ended |
|
| Six months ended |
|
(Parent company only) |
|
| June 30, 2019 |
|
| June 30, 2018 |
|
|
|
| (Millions of Euros) |
| |||
Interest income |
|
|
|
|
|
|
|
Interest from earning assets |
|
| 4,148 |
|
| 2,836 |
|
Dividends from affiliated companies |
|
| 1,735 |
|
| 1,447 |
|
Of which: |
|
|
|
|
|
|
|
From bank subsidiaries |
|
| 1,355 |
|
| 957 |
|
From non-bank subsidiaries |
|
| 381 |
|
| 490 |
|
|
|
| 5,883 |
|
| 4,283 |
|
Interest expense |
|
| (2,113) |
|
| (1,586) |
|
Interest income / (Charges) |
|
| 3,770 |
|
| 2,697 |
|
Provision for credit losses |
|
| (544) |
|
| (209) |
|
Interest income / (Charges) after provision for credit losses |
|
| 3,226 |
|
| 2,488 |
|
Non-interest income: |
|
| 1,805 |
|
| 1,708 |
|
Non-interest expense: |
|
| (4,633) |
|
| (2,937) |
|
Income before income taxes |
|
| 398 |
|
| 1,259 |
|
Income tax expense |
|
| 145 |
|
| 36 |
|
Net income |
|
| 543 |
|
| 1,295 |
|
Following are the summarized unaudited statements of comprehensive income of Banco Santander, S.A. for the periods ended June 30, 2019 and 2018.
|
|
|
|
|
|
|
|
UNAUDITED CONDENSED STATEMENTS OF |
|
| Six months ended |
|
| Six months ended |
|
COMPREHENSIVE INCOME (Parent company only) |
|
| June 30, 2019 |
|
| June 30, 2018 |
|
|
|
| (Millions of Euros) |
| |||
|
|
|
|
|
|
|
|
NET INCOME |
|
| 543 |
|
| 1,295 |
|
OTHER COMPREHENSIVE INCOME |
|
| 15 |
|
| 17 |
|
Items that may be reclassified subsequently to profit or loss |
|
| 179 |
|
| 60 |
|
Available-for-sale financial assets: |
|
| 464 |
|
| 59 |
|
Revaluation gains/(losses) |
|
| 622 |
|
| 188 |
|
Amounts transferred to income statement |
|
| (158) |
|
| (129) |
|
Other reclassifications |
|
| — |
|
| — |
|
Cash flow hedges: |
|
| (207) |
|
| 27 |
|
Revaluation gains/(losses) |
|
| (204) |
|
| 34 |
|
Amounts transferred to income statement |
|
| (3) |
|
| (7) |
|
Amounts transferred to initial carrying amount of hedged items |
|
| — |
|
| — |
|
Other reclassifications |
|
| — |
|
| — |
|
Hedges of net investments in foreign operations: |
|
| — |
|
| — |
|
Revaluation gains/(losses) |
|
| — |
|
| — |
|
Amounts transferred to income statement |
|
| — |
|
| — |
|
Other reclassifications |
|
| — |
|
| — |
|
Exchange differences: |
|
| — |
|
| — |
|
Non-current assets held for sale: |
|
| — |
|
| — |
|
Income tax |
|
| (78) |
|
| (26) |
|
Items that will not be reclassified to profit or loss: |
|
| (164) |
|
| (43) |
|
Actuarial gains/(losses) on pension plans |
|
| (98) |
|
| 81 |
|
Rest of valuation adjustments |
|
| (53) |
|
| (98) |
|
Income tax |
|
| (13) |
|
| (27) |
|
TOTAL COMPREHENSIVE INCOME |
|
| 558 |
|
| 1,312 |
|
137
Following are the summarized unaudited cash flow statements of Banco Santander, S.A. for the periods ended June 30, 2019 and 2018.
|
|
|
|
|
|
|
|
UNAUDITED CONDENSED CASH FLOW STATEMENTS |
|
| Six months ended |
|
| Six months ended |
|
(Parent company only) |
|
| June 30, 2019 |
|
| June 30, 2018 |
|
|
|
| (Millions of Euros) |
| |||
1. Cash flows from operating activities |
|
|
|
|
|
|
|
Consolidated profit |
|
| 543 |
|
| 1,295 |
|
Adjustments to profit |
|
| 1,237 |
|
| 442 |
|
Net increase/decrease in operating assets |
|
| (27,955) |
|
| (12,498) |
|
Net increase/decrease in operating liabilities |
|
| 16,568 |
|
| 17,519 |
|
Reimbursements/payments of income tax |
|
| 882 |
|
| 555 |
|
Total net cash flows from operating activities (1) |
|
| (8,725) |
|
| 7,313 |
|
|
|
|
|
|
|
|
|
2. Cash flows from investing activities |
|
|
|
|
|
|
|
Investments (-) |
|
| (368) |
|
| (336) |
|
Divestments (+) |
|
| 1,042 |
|
| 586 |
|
Total net cash flows from investment activities (2) |
|
| 674 |
|
| 250 |
|
|
|
|
|
|
|
|
|
3. Cash flows from financing activities |
|
|
|
|
|
|
|
Issuance of own equity instruments |
|
| - |
|
| - |
|
Disposal of own equity instruments |
|
| 452 |
|
| 438 |
|
Acquisition of own equity instruments |
|
| (452) |
|
| (438) |
|
Issuance of debt securities |
|
| 1,056 |
|
| 2,750 |
|
Redemption of debt securities |
|
| (3,471) |
|
| (763) |
|
Dividends paid |
|
| (2,111) |
|
| (1,936) |
|
Issuance/Redemption of equity instruments |
|
| - |
|
| - |
|
Other collections/payments related to financing activities |
|
| (219) |
|
| - |
|
Total net cash flows from financing activities (3) |
|
| (4,745) |
|
| 51 |
|
|
|
|
|
|
|
|
|
4. Effect of exchange rate changes on cash and cash equivalents (4) |
|
| 38 |
|
| 148 |
|
|
|
|
|
|
|
|
|
5. Net increase/decrease in cash and cash equivalents (1+2+3+4) |
|
| (12,758) |
|
| 7,762 |
|
Cash and cash equivalents at beginning of period |
|
| 51,931 |
|
| 33,734 |
|
Cash and cash equivalents at end of period |
|
| 39,173 |
|
| 41,496 |
|
17.2Preference Shares and Preferred Securities
The following table shows the balance of the preference shares and preferred securities as of June 30, 2019 and December 31, 2018:
|
|
|
|
|
|
|
|
|
|
| June 30, 2019 |
|
| December 31, 2018 |
|
|
|
| (Millions of Euros) |
| |||
Preference shares |
|
| 308 |
|
| 345 |
|
Preferred securities |
|
| 7,988 |
|
| 9,717 |
|
Total at period-end |
|
| 8,296 |
|
| 10,063 |
|
Both Preference Shares and Preferred Securities are recorded under the “Financial liabilities at amortized cost – Subordinated Liabilities” caption in the consolidated balance sheet as of June 30, 2019 and December 31, 2018.
Preference Shares include the financial instruments issued by the consolidated companies which, although equity for legal purposes, do not meet the requirements for classification as equity in the financial statements. These shares do not carry any voting rights and are non-cumulative.
Preference shares include non-cumulative preferred non-voting shares issued by Santander UK plc and Santander Bank, National Association.
Preferred securities include non-cumulative preferred non-voting securities issued by Banco Santander, S.A., Santander UK Group, Banco Santander, (Brasil), S.A., and Banco Popular.
For the purposes of payment priority, preferred securities are junior to all general creditors and to subordinated deposits. The payment of dividends on these securities, which have no voting rights, is conditional upon the obtainment of sufficient distributable profit and upon the limits imposed by Spanish banking regulations on equity.
Preference shares and preferred securities are perpetual securities and there is no obligation that requires the Group to redeem them. All securities have been fully subscribed by third parties outside the Group. In the consolidated balance sheets, these securities are shown net of any temporary transactions relating to liquidity guarantees.
138
For further information, see Note 23.c. to our consolidated financial statements in our 2018 Form 20-F and Note 9.b. to our consolidated financial statements in Part 2 of this report.
|
|
|
|
|
|
|
|
|
|
|
| Outstanding at June 30, 2019 |
| ||||||
|
|
|
| Amount in |
|
|
|
|
|
Preference Shares |
|
|
| currency |
| Interest rate |
| Redemption |
|
Issuer/Date of issue |
| Currency |
| (million) |
|
|
| Option (A) |
|
|
|
|
|
|
|
|
|
|
|
Santander UK plc, October 1995 |
| Pounds Sterling |
| 80.3 |
| 10.375% |
| No option |
|
Santander UK plc, February 1996 |
| Pounds Sterling |
| 80.3 |
| 10.375% |
| No option |
|
Santander UK plc, May 2006 |
| Pounds Sterling |
| 13.8 |
| 6.222% | (B) | May 24, 2019 |
|
Santander Bank, National Association, August 2000 |
| US Dollar |
| 153.0 |
| 12.00% |
| May 16, 2020 |
|
|
|
|
|
|
|
|
|
|
|
|
|
|
|
|
|
|
|
|
|
|
| Outstanding at June 30, 2019 |
| ||||||
|
|
|
| Amount in |
|
|
|
|
|
Preferred Securities |
|
|
| currency |
| Interest rate |
| Maturity date |
|
Issuer/Date of issue |
| Currency |
| (million) |
|
|
|
|
|
|
|
|
|
|
|
|
|
|
|
Banco Santander, S.A. |
|
|
|
|
|
|
|
|
|
Banco Español de Crédito, October 2004 |
| Euro |
| 36.5 |
| €CMS 10 + 0.125% |
| Perpetuity |
|
Banco Español de Crédito, November 2004 (A) |
| Euro |
| 106.5 |
| 5.50% |
| Perpetuity |
|
Banco Santander, S.A., March 2014 |
| Euro |
| 1,500.0 |
| 6.25% | (C) | Perpetuity |
|
Banco Santander, S.A., September 2014 |
| Euro |
| 1,500.0 |
| 6.25% | (D) | Perpetuity |
|
Banco Santander, S.A., April 2017 |
| Euro |
| 750.0 |
| 6.75% | (E) | Perpetuity |
|
Banco Santander, S.A., September 2017 |
| Euro |
| 1,000.0 |
| 5.25% | (F) | Perpetuity |
|
Banco Santander, S.A., March 2018 |
| Euro |
| 1,500.0 |
| 4.75% | (G) | Perpetuity |
|
Banco Santander, S.A., February 2019 |
| US Dollar |
| 1,200.0 |
| 7.50% | (H) | Perpetuity |
|
Santander Finance Preferred, S.A. (Unipersonal), September 2004 |
| Euro |
| 144.0 |
| €CMS 10 +0.05% subject to a maximum distribution of 8% per annum |
| Perpetuity |
|
Santander Finance Preferred, S.A. (Unipersonal), October 2004 |
| Euro |
| 155.0 |
| 5.75% |
| Perpetuity |
|
Santander Finance Preferred, S.A. (Unipersonal), March 2007 (H) |
| US Dollar |
| 210.4 |
| US3M + 0.52% |
| Perpetuity |
|
Santander Finance Preferred, S.A. (Unipersonal), July 2007 |
| Pounds Sterling |
| 4.9 |
| 7.01% |
| Perpetuity |
|
|
|
|
|
|
|
|
|
|
|
Banco Popular |
|
|
|
|
|
|
|
|
|
Pastor FRN, June 2004 |
| Euro |
| 11.7 |
| 2.07% |
| Perpetuity |
|
A. | From these dates the issuer can redeem the shares, subject to prior authorization by the national supervisor. |
B. | Fixed/Floating Rate Non-Cumulative Callable Preference Shares. Dividends will accrue on a principal amount equal to £1,000 per Preference Share at a rate of 6.222 per cent per annum in respect of the period from (and including) May 24, 2006 (the Issue Date) to (but excluding) May 24, 2019 (the First Call Date) and thereafter at a rate reset quarterly equal to 1.13 per cent per annum above the London interbank offered rate for three-month sterling deposits. From (and including) the Issue Date to (but excluding) the First Call Date, dividends, if declared, will be paid annually in arrears on May 24, in each year. Subject as provided herein, the first such dividend payment date will be May 24, 2007 and the last such dividend payment date will be the First Call Date. From (and including) the First Call Date, dividends, if declared, will be paid quarterly in arrears on May 24, August 24, November 24 and February 24, in each year. Subject as provided herein, the first such dividend payment date will be August 24, 2019. |
C. | Payment is subject to certain conditions and to the discretion of the Bank. The 6.25% interest rate is set for the first five years. After that, it will be reviewed by applying a margin of 541 basis points on the five-year Mid-Swap Rate. |
D. | Payment is subject to certain conditions and to the discretion of the Bank. The 6.25% interest rate is set for the first five years. After that, it will be reviewed by applying a margin of 564 basis points on the five-year Mid-Swap Rate. |
E. | Payment is subject to certain conditions and to the discretion of the Bank. The 6.75% interest rate is set for the first five years. After that, it will be reviewed by applying a margin of 680.3 basis points on the five-year Mid-Swap Rate. |
F. | Payment is subject to certain conditions and to the discretion of the Bank. The 5.25% interest rate is set for the first six years. After that, it will be reviewed by applying a margin of 499.9 basis points on the five-year Mid-Swap Rate. |
G. | Payment is subject to certain conditions and to the discretion of the Bank. The 4.75% interest rate is set for the first seven years. After that, it will be reviewed every 5 years applying a margin of 409.7 basis points on the five-year Mid-Swap Rate. |
H. | Payment is subject to certain conditions and to the discretion of the Bank. The 7.50% interest rate is set for the first five years. After that, it will be reviewed every 5 years by applying a margin of 498.9 basis points on the five-year Mid-Swap Rate. |
I. | Listed in the US. |
Santander Finance Preferred, S.A. (Unipersonal), Santander Finance Capital, S.A. (Unipersonal), Santander International Preferred, S.A. (Unipersonal), Santander Issuances, S.A., and Santander US Debt, S.A. (Sociedad Unipersonal) - issuers of registered securities guaranteed by Banco Santander, S.A. until November 2017, merged in that date with Banco Santander, S.A.
139
140
INDEX TO THE SUPPLEMENTAL INFORMATION FOR US INVESTORS
|
|
| Page |
142 | |
ITEM 2. CAUTIONARY STATEMENT REGARDING FORWARD-LOOKING STATEMENTS | 143 |
145 | |
148 | |
154 | |
154 | |
162 | |
168 | |
186 |
141
ITEM 1. PRESENTATION OF FINANCIAL AND OTHER INFORMATION
Accounting Principles
Under Regulation (EC) No. 1606/2002 of the European Parliament and of the Council of July 19, 2002, all companies governed by the law of an EU Member State (a “Member State”) and whose securities are admitted to trading on a regulated market of any Member State must prepare their consolidated financial statements in conformity with the International Financial Reporting Standards previously adopted by the European Union (“EU-IFRS”). The Bank of Spain Circular 4/2004 of December 22, 2004 on Public and Confidential Financial Reporting Rules and Formats (“Circular 4/2004”) requires Spanish credit institutions to adapt their accounting systems to the principles derived from the adoption by the European Union of International Financial Reporting Standards. This Circular was repealed on January 1, 2018 by Bank of Spain Circular 4/2017, of November 27, 2017 on Public and Confidential Financial Reporting Rules and Formats (“Circular 4/2017”). Therefore, Grupo Santander (“the Group” or “Santander”) is required to prepare its consolidated financial statements for the six-month period ended June 30, 2019 in conformity with EU-IFRS and Bank of Spain’s Circular 4/2017, while previous periods have to be prepared under EU-IFRS and Bank of Spain’s Circular 4/2004. Differences between EU-IFRS, Bank of Spain’s Circulars and International Financial Reporting Standards as issued by the International Accounting Standard Board (“IFRS-IASB”) are not material. Therefore, we assert that the financial information contained in this report on Form 6-K complies with IFRS-IASB.
In July 2014, the IASB published IFRS 9 Financial Instruments – Classification and measurement, hedging and impairment that we adopted with the subsequent amendments on January 1, 2018. As permitted by the regulation, we chose not to re-classify the comparative financial statements. Therefore, previous periods are not comparable. The adoption of Bank of Spain’s Circular 4/2017 modified the breakdown and presentation of certain headings in the financial statements from January 1, 2018, to adapt them to the aforementioned IFRS 9. Previous periods have not been restated under this Circular.
We have presented our financial information according to the classification format for banks used in Spain. We have not reclassified the line items to comply with Article 9 of Regulation S-X. Article 9 is a regulation of the US Securities and Exchange Commission that contains presentation requirements for bank holding company financial statements.
General Information
Our consolidated financial statements are in Euros, which are denoted “euro”, “euros”, “EUR” or “€” throughout this report. Also, throughout this report, when we refer to:
· | “we”, “us”, “our”, the “Group”, “Grupo Santander” or “Santander”, we mean Banco Santander, S.A. and its subsidiaries, unless the context otherwise requires; |
· | “dollars”, “US$” or “$”, we mean United States dollars; and |
· | “pounds”, “GBP sterling” or “£”, we mean United Kingdom pounds. |
When we refer to “net interest income” we mean “interest income/(charges)”.
When we refer to “staff costs” we mean “personnel expenses”.
When we refer to “profit before tax” we mean “operating profit/(loss) before tax”.
When we refer to “average balances” for a particular period, we mean the average of the month-end balances for that period, unless otherwise noted. We do not believe that monthly averages present trends that are materially different from trends that daily averages would show. In calculating our interest income, we include any interest payments we received on non-accruing loans if they were received in the period when due.
When we refer to “loans”, we mean loans, leases, discounted bills and accounts receivable, unless otherwise noted. The loan to value “LTV” ratios disclosed in this report refer to LTV ratios calculated as the ratio of the outstanding amount of the loan to the most recent available appraisal value of the mortgaged asset. Additionally, if a loan is approaching a doubtful status, we update the appraisals which are then used to estimate allowances for loan losses.
When we refer to “non-performing balances”, we mean non-performing loans and contingent liabilities (“NPL”), securities and other assets to collect.
When we refer to “allowances for credit losses” or “allowances for non-performing balances”, we mean the allowances for impaired assets, and unless otherwise noted, the allowance for inherent losses and any allowances for country-risk. See “Item 5. Information on the Company—Bank of Spain ‘s Classification Requirements—Allowances for Credit Losses and Country-Risk Requirements” included
142
in Part 3 of our annual report on Form 20-F for the year ended December 31, 2018 (the “2018 Form 20-F”). From January 1, 2018, after the adoption of IFRS 9, the allowances reflect expected credit losses whereas the previous model (IAS 39) was based on incurred losses.
When we refer to “perimeter effect”, we mean growth or reduction derived from changes in the companies that we consolidate resulting from acquisitions, dispositions or other reasons.
Where a translation of foreign exchange is given for any financial data, we use the exchange rates of the relevant period (as of the end of such period for balance sheet data and the average exchange rate of such period for income statement data) as published by the European Central Bank, unless otherwise noted.
Management makes use of certain financial measures in local currency to help in the assessment of ongoing operating performance. These non-GAAP financial measures include the results of operations of our subsidiary banks located outside the Eurozone, excluding the impact of foreign exchange. We analyze these banks’ performance on a local currency basis to better measure the comparability of results between periods. Because changes in foreign currency exchange rates have a non-operating impact on the results of operations, we believe that evaluating their performance on a local currency basis provides an additional and meaningful assessment of performance to both management and the company’s investors. Variances in financial metrics, excluding the exchange rate impact, are calculated by translating the components of the financial metrics to our Euro presentation currency using the same foreign currency exchange rate for both periods presented. For a discussion of the accounting principles used in translation of foreign currency-denominated assets and liabilities to euros, see Note 2(a) to our consolidated financial statements included in Part 2 of our 2018 Form 20-F.
ITEM 2. CAUTIONARY STATEMENT REGARDING FORWARD-LOOKING STATEMENTS
This report contains statements that constitute “forward-looking statements” within the meaning of the US Private Securities Litigation Reform Act of 1995. Forward-looking statements include, but are not limited to, information regarding:
· | exposure to various types of market risks; |
· | management strategy; |
· | capital expenditures; |
· | earnings and other targets; and |
· | asset portfolios. |
Forward-looking statements may be identified by words such as “expect,” “project,” “anticipate,” “should,” “intend,” “probability,” “risk,” “VaR,” “RORAC,” “target,” “goal,” “objective,” “estimate,” “future” and similar expressions. We include forward-looking statements in the “Operating and Financial Review and Prospects” and “Quantitative Analysis About Market Risk” sections. Forward-looking statements are not guarantees of future performance and involve risks and uncertainties, and actual results may differ materially from those in the forward-looking statements.
You should understand that adverse changes in the following important factors, in addition to those discussed under “Item 4. Risk Factors”, “Item 5. Information on the Company”, “Part 1 Consolidated Directors’ Report —Group Financial Information”, “Part 1 Consolidated Directors’ Report —Financial Information by Segments”, and elsewhere in this current report, could affect our future results and could cause those results or other outcomes to differ materially from those anticipated in any forward-looking statement:
143
Economic and Industry Conditions general economic or industry conditions in Spain, the UK, the US, other European countries, Brazil, other Latin American countries and the other areas in which we have significant business activities or investments; exposure to various types of market risks, principally including interest rate risk, foreign exchange rate risk and equity price risk; a worsening of the economic environment in Spain, the UK, the US, other European countries, Brazil, other Latin American countries, and increase of the volatility in the capital markets; the effects of a decline in real estate prices, particularly in Spain and the UK; the effects of results of the negotiations for the UK’s exit from the European Union; monetary and interest rate policies of the European Central Bank and various central banks; inflation or deflation; the effects of non-linear market behavior that cannot be captured by linear statistical models, such as the VaR model we use; changes in competition and pricing environments; the inability to hedge some risks economically; the adequacy of loss reserves; acquisitions or restructurings of businesses that may not perform in accordance with our expectations; changes in demographics, consumer spending, investment or saving habits; potential losses associated with prepayment of our loan and investment portfolio, declines in the value of collateral securing our loan portfolio, and counterparty risk; and changes in competition and pricing environments as a result of the progressive adoption of the internet for conducting financial services and/or other factors.
|
| Political and Governmental Factors political stability in Spain, the UK, other European countries, Latin America and the US; changes in Spanish, UK, EU, US, Latin American, or other jurisdictions’ laws, regulations or taxes, including changes in regulatory capital and liquidity requirements, including as a result of the UK exiting the European Union; and increased regulation in light of the global financial crisis. Transaction and Commercial Factors damage to our reputation; our ability to integrate successfully our acquisitions and the challenges inherent in diverting management’s focus and resources from other strategic opportunities and from operational matters while we integrate these acquisitions; and the outcome of our negotiations with business partners and governments. Operating Factors potential losses associated with an increase in the level of non‑performance by counterparties to other types of financial instruments; technical difficulties and/or failure to improve or upgrade our information technology; changes in our ability to access liquidity and funding on acceptable terms, including as a result of changes in our credit spreads or a downgrade in our credit ratings or those of our more significant subsidiaries; our exposure to operational losses (e.g., failed internal or external processes, people and systems); changes in our ability to recruit, retain and develop appropriate senior management and skilled personnel; the occurrence of force majeure, such as natural disasters, that impact our operations or impair the asset quality of our loan portfolio; and the impact of changes in the composition of our balance sheet on future interest income / (charges) potential losses associated with cyber-attacks. |
The forward-looking statements contained in this report speak only as of the date of this report. We do not undertake to update any forward-looking statement to reflect events or circumstances after that date or to reflect the occurrence of unanticipated events.
144
ITEM 3. SELECTED FINANCIAL DATA
We have selected the following financial information from our consolidated financial statements. You should read this information in connection with, and it is qualified in its entirety by reference to, our consolidated financial statements included in Part 2 of this report on Form 6-K.
In July 2014, the IASB published IFRS 9 Financial Instruments – Classification and measurement, hedging and impairment that we adopted with the subsequent amendments on January 1, 2018. As permitted by the regulation, we have chosen not to reclassify the comparative financial statements. Therefore, periods previous to January 1, 2018 are not comparable to the June 30, 2019 financial statements.
Similarly, to adapt the accounting system of Spanish credit institutions to the changes related to IFRS 15 and IFRS 9, on December 6, 2017, the Bank of Spain published Circular 4/2017 which repeals Circular 4/2004 for those years beginning on January 1, 2018. The adoption of Circular 4/2017 has modified the breakdown and presentation of certain headings in the financial statements from January 1, 2018, to adapt them to the aforementioned IFRS 9. Previous periods have not been restated under this Circular.
Our unaudited interim condensed consolidated financial statements reflect all adjustments that we believe are necessary to state such information fairly for the six months ended June 30, 2019 and 2018. All those adjustments are of a normal recurring nature. Our results for the six months ended June 30, 2019 are not necessarily indicative of what our results will be for the full year or any other period.
145
|
|
|
|
|
|
|
|
|
|
|
|
|
|
|
|
|
| Year ended 31 December, |
|
|
|
|
| ||||||||
BALANCE SHEET (EUR million) |
| 2018 |
| 2017 |
| 2016 |
| 2015 |
| 2014 |
| As of June 30, 2019 |
| As of June 30, 2018 |
|
Total assets |
| 1,459,271 |
| 1,444,305 |
| 1,339,125 |
| 1,340,260 |
| 1,266,296 |
| 1,512,096 |
| 1,433,833 |
|
Loans and advances to customers |
| 882,921 |
| 848,915 |
| 790,470 |
| 790,848 |
| 734,711 |
| 908,235 |
| 862,092 |
|
Customer deposits |
| 780,496 |
| 777,730 |
| 691,111 |
| 683,142 |
| 647,706 |
| 814,751 |
| 774,425 |
|
Total customer funds (A) |
| 980,562 |
| 985,703 |
| 873,618 |
| 849,402 |
| 809,494 |
| 1,032,769 |
| 981,363 |
|
Total equity |
| 107,361 |
| 106,832 |
| 102,699 |
| 98,753 |
| 89,714 |
| 109,985 |
| 104,445 |
|
|
|
|
|
|
|
|
|
|
|
|
|
|
|
|
|
CAPITALIZATION (EUR million) |
|
|
|
|
|
|
|
|
|
|
|
|
|
|
|
Shareholders' equity |
| 118,613 |
| 116,265 |
| 105,977 |
| 102,402 |
| 91,663 |
| 120,054 |
| 117,935 |
|
Other comprehensive income |
| (22,141) |
| (21,776) |
| (15,039) |
| (14,362) |
| (10,858) |
| (21,425) |
| (23,885) |
|
Stockholders' equity (B) |
| 96,472 |
| 94,489 |
| 90,938 |
| 88,040 |
| 80,805 |
| 98,629 |
| 94,050 |
|
Non-controlling interest (including net income of the period) |
| 10,889 |
| 12,344 |
| 11,761 |
| 10,713 |
| 8,909 |
| 11,356 |
| 10,395 |
|
Total equity |
| 107,361 |
| 106,832 |
| 102,699 |
| 98,753 |
| 89,714 |
| 109,985 |
| 104,445 |
|
Subordinated debt issued by Banco Santander, S.A. or issued by subsidiaries and guaranteed by Banco Santander, S.A., excluding preferred securities and preferred shares (C) |
| 8,368 |
| 7,116 |
| 6,448 |
| 6,091 |
| 3,276 |
| 7,803 |
| 8,423 |
|
Other Subordinated debt (D) |
| 5,390 |
| 5,621 |
| 6,124 |
| 7,864 |
| 6,878 |
| 5,319 |
| 5,482 |
|
Preferred securities (E) |
| 9,717 |
| 8,369 |
| 6,916 |
| 6,749 |
| 6,239 |
| 7,988 |
| 9,628 |
|
Preferred shares (E) |
| 345 |
| 404 |
| 413 |
| 449 |
| 739 |
| 308 |
| 406 |
|
Total subordinated debt |
| 23,820 |
| 21,510 |
| 19,902 |
| 21,153 |
| 17,132 |
| 21,418 |
| 23,939 |
|
Total capitalization |
| 131,181 |
| 128,343 |
| 122,602 |
| 119,906 |
| 106,846 |
| 131,405 |
| 128,384 |
|
|
|
|
|
|
|
|
|
|
|
|
|
|
|
|
|
Stockholders’ Equity per average share (B) |
| 5.97 |
| 6.14 |
| 6.20 |
| 6.14 |
| 6.70 |
| 6.08 |
| 5.83 |
|
Stockholders’ Equity per share at period end (B) |
| 5.95 |
| 5.86 |
| 6.14 |
| 6.02 |
| 6.32 |
| 6.08 |
| 5.83 |
|
|
|
|
|
|
|
|
|
|
|
|
|
|
|
|
|
INCOME STATEMENT (EUR million) |
|
|
|
|
|
|
|
|
|
|
|
|
|
|
|
Interest income / (charges) |
| 34,341 |
| 34,296 |
| 31,089 |
| 32,812 |
| 29,547 |
| 17,636 |
| 16,931 |
|
Total income |
| 48,424 |
| 48,355 |
| 44,232 |
| 45,895 |
| 42,612 |
| 24,436 |
| 24,162 |
|
Net operating income (F) |
| 25,646 |
| 25,362 |
| 23,131 |
| 24,175 |
| 22,426 |
| 12,849 |
| 12,680 |
|
Operating profit/(loss) before tax |
| 14,202 |
| 12,091 |
| 10,768 |
| 9,547 |
| 10,679 |
| 6,531 |
| 6,899 |
|
Profit from continuing operations |
| 9,315 |
| 8,207 |
| 7,486 |
| 7,334 |
| 6,961 |
| 4,082 |
| 4,521 |
|
Profit attributable to the Parent |
| 7,810 |
| 6,619 |
| 6,204 |
| 5,966 |
| 5,816 |
| 3,231 |
| 3,752 |
|
|
|
|
|
|
|
|
|
|
|
|
|
|
|
|
|
PERFORMANCE (%) |
|
|
|
|
|
|
|
|
|
|
|
|
|
|
|
ROE (G) (I) |
| 8.21 |
| 7.14 |
| 6.99 |
| 6.61 |
| 7.75 |
| 6.58 |
| 7.93 |
|
RoTE (H) (I) |
| 11.70 |
| 10.41 |
| 10.38 |
| 9.99 |
| 12.75 |
| 9.33 |
| 11.34 |
|
ROA (I) |
| 0.64 |
| 0.58 |
| 0.56 |
| 0.55 |
| 0.58 |
| 0.55 |
| 0.63 |
|
|
|
|
|
|
|
|
|
|
|
|
|
|
|
|
|
SOLVENCY RATIOS (%) |
|
|
|
|
|
|
|
|
|
|
|
|
|
|
|
Fully loaded CET1 (J) |
| 11.30 |
| 10.84 |
| 10.55 |
| 10.05 |
| 8.27 |
| 11.30 |
| 10.80 |
|
Phased-in CET1 (J) |
| 11.47 |
| 12.26 |
| 12.53 |
| 12.55 |
| 10.97 |
| 11.30 |
| 10.98 |
|
|
|
|
|
|
|
|
|
|
|
|
|
|
|
|
|
CREDIT QUALITY DATA |
|
|
|
|
|
|
|
|
|
|
|
|
|
|
|
Loans and advances to customers |
|
|
|
|
|
|
|
|
|
|
|
|
|
|
|
Allowances for total balances including country risk and excluding contingent liabilities as a percentage of total gross loans |
| 2.57% |
| 2.74% |
| 2.99% |
| 3.24% |
| 3.57% |
| 2.44% |
| 2.74% |
|
Non-performing balances as a percentage of total gross loans (K) |
| 3.78% |
| 4.16% |
| 4.00% |
| 4.42% |
| 5.30% |
| 3.55% |
| 3.97% |
|
Allowances for total balances as a percentage of non-performing balances (K) |
| 68.11% |
| 65.97% |
| 74.89% |
| 73.39% |
| 67.42% |
| 68.77% |
| 69.17% |
|
Net loan charge-offs as a percentage of total gross loans |
| 1.23% |
| 1.36% |
| 1.37% |
| 1.34% |
| 1.38% |
| 1.16% |
| 1.20% |
|
Ratios adding contingent liabilities to loans and advances to customers and excluding country risk (L) |
|
|
|
|
|
|
|
|
|
|
|
|
|
|
|
Allowances for total balances as a percentage of total loans and contingent liabilities |
| 2.51% |
| 2.66% |
| 2.90% |
| 3.19% |
| 3.49% |
| 2.39% |
| 2.69% |
|
Non-performing balances as a percentage of total loans and contingent liabilities (M) (K) |
| 3.73% |
| 4.08% |
| 3.93% |
| 4.36% |
| 5.19% |
| 3.51% |
| 3.92% |
|
Allowances for total balances as a percentage of non-performing balances (M) (K) |
| 67.4% |
| 65.2% |
| 73.8% |
| 73.1% |
| 67.2% |
| 68.1% |
| 68.6% |
|
Net loan and contingent liabilities charge-offs as a percentage of total loans and contingent liabilities |
| 1.16% |
| 1.29% |
| 1.31% |
| 1.29% |
| 1.30% |
| 1.10% |
| 1.14% |
|
|
|
|
|
|
|
|
|
|
|
|
|
|
|
|
|
MARKET CAPITALIZATION AND SHARES |
|
|
|
|
|
|
|
|
|
|
|
|
|
|
|
Number of shareholders |
| 4,131,489 |
| 4,029,630 |
| 3,928,950 |
| 3,573,277 |
| 3,240,395 |
| 4,054,208 |
| 4,152,125 |
|
Shares (millions) |
| 16,237 |
| 16,136 |
| 14,582 |
| 14,434 |
| 12,584 |
| 16,237 |
| 16,136 |
|
Share price (euros) (N) |
| 3.973 |
| 5.479 |
| 4.877 |
| 4.483 |
| 6.881 |
| 4.0805 |
| 4.592 |
|
Market capitalization (EUR million) |
| 64,508 |
| 88,410 |
| 72,314 |
| 65,792 |
| 88,041 |
| 66,253 |
| 74,097 |
|
Payout ratio (O) |
| 42.15% |
| 45.29% |
| 39.79% |
| 38.02% |
| 19.65% |
| - |
| - |
|
|
|
|
|
|
|
|
|
|
|
|
|
|
|
|
|
PER SHARE INFORMATION |
|
|
|
|
|
|
|
|
|
|
|
|
|
|
|
Average number of shares (EUR thousands) (P) |
| 16,150,091 |
| 15,394,459 |
| 14,656,360 |
| 14,349,579 |
| 12,056,951 |
| 16,231,374 |
| 16,129,056 |
|
146
Basic earnings per share (euros) (N) |
| 0.449 |
| 0.404 |
| 0.401 |
| 0.397 |
| 0.472 |
| 0.181 |
| 0.216 |
|
Basic earnings per share continuing operation (euros) (N) |
| 0.449 |
| 0.404 |
| 0.401 |
| 0.397 |
| 0.474 |
| 0.181 |
| 0.216 |
|
Diluted earnings per share (euros) (N) |
| 0.448 |
| 0.403 |
| 0.399 |
| 0.396 |
| 0.470 |
| 0.180 |
| 0.216 |
|
Diluted earnings per share continuing operation (euros) (N) |
| 0.448 |
| 0.403 |
| 0.399 |
| 0.396 |
| 0.472 |
| 0.180 |
| 0.216 |
|
Remuneration (euros) (Q) |
| 0.23 |
| 0.22 |
| 0.21 |
| 0.20 |
| 0.60 |
| 0.13 |
| 0.12 |
|
Remuneration (US$) (Q) |
| 0.26 |
| 0.26 |
| 0.22 |
| 0.22 |
| 0.73 |
| 0.15 |
| 0.13 |
|
|
|
|
|
|
|
|
|
|
|
|
|
|
|
|
|
OPERATING DATA |
|
|
|
|
|
|
|
|
|
|
|
|
|
|
|
Number of employees |
| 202,713 |
| 202,251 |
| 188,492 |
| 193,863 |
| 185,405 |
| 201,804 |
| 200,961 |
|
Number of branches |
| 13,217 |
| 13,697 |
| 12,235 |
| 13,030 |
| 12,951 |
| 13,081 |
| 13,482 |
|
(A) Total customer funds includes customer deposits, mutual funds, pension funds and managed portfolios. See notes 21 and 35 to our consolidated financial statements included in Part 2 of the 2018 Form 20-F.
(B) Equals the sum of the amounts included at the end of each year as “Shareholders’ Equity” and “Other comprehensive income” as stated in our consolidated financial statements included in Part 2 of this report. We have deducted the book value of treasury stock from stockholders’ equity.
(C) In December 2017 the subordinated debt issuer entities merged with Banco Santander, S.A.
(D) Other Subordinated debt amounts are at the subsidiary level.
(E) In our consolidated financial statements included in Part 2 of this report, preferred securities and preferred shares are included under “Subordinated liabilities”.
(F) Net Operating Income is used for the Group’s internal reporting and management reporting purposes but is not a line item in the statutory consolidated income statement. Net operating income equals the sum of "Total income", "Administrative expenses" and "Depreciation and amortization" as stated in our consolidated financial statements included in Part 2 of this report.
(G) The Return on average stockholders’ equity ratio is calculated as profit attributable to the Parent divided by average stockholders’ equity. In 2014, if for comparison purposes we include in the denominator the EUR 7,500 million capital increase made in January 2015, ROE would be 7.05%.
(H) The Return on average tangible equity ratio (ROTE) is calculated as profit attributable to the Parent divided by the monthly average of: capital + reserves + retained earnings + other comprehensive income (excluding non-controlling interests) - goodwill – other intangible assets. We provide this non-GAAP financial measure as an additional measure to return on equity to provide a way to look at our performance which is closely aligned to our capital position. In 2014, if for comparison purposes we include in the denominator the EUR 7,500 million capital increase made in January 2015, ROTE would be 10.95%.
(I) Consolidated profit and profit attributable to the Parent for the six months ended June 30, 2019 and June 30, 2018 have been annualized by doubling all the results (recurring and non-recurring). If we calculate these ratios by assuming that non-recurring results registered during the first half of the year will not be repeated in the second half of the year, that is by doubling only the recurring results, at June 30, 2019 the ROA ratio would have been 0.60%, the ROE ratio would have been 7.41% and the ROTE ratio would have been 10.51% and at June 30, 2018 the ROA ratio would have been 0.65%, the ROE ratio would have been 8.24% and the ROTE ratio would have been 11.79%. In the first half of 2019 and 2018, non-recurring results amounted to -€814 million and -300 million net of tax impacts, respectively, resulting mainly from restructuring costs primarily related to the integration of Banco Popular. We believe that the exclusion of these non-recurring amounts present a more accurate picture of the evolution of our underlying profitability. Consolidated profit and Profit attributable to the Parent for the first half of any year are not necessarily indicative of the results for that full year.
|
|
|
|
|
|
|
|
|
|
|
|
|
|
|
|
|
| (million euros, except percentages) |
| ||||||||||||
|
| 2018 |
| 2017 |
| 2016 |
| 2015 |
| 2014 |
| As of June 30, 2019 |
| As of June 30, 2018 |
|
Profit attributable to the parent |
| 7,810 |
| 6,619 |
| 6,204 |
| 5,966 |
| 5,816 |
| 3,231 |
| 3,752 |
|
|
|
|
|
|
|
|
|
|
|
|
|
|
|
|
|
Average equity |
| 95,071 |
| 92,637 |
| 88,741 |
| 90,220 |
| 75,047 |
| 98,191 |
| 94,662 |
|
Effect of goodwill and other intangible assets |
| (28,331) |
| (29,043) |
| (28,972) |
| (30,486) |
| (29,446) |
| (28,952) |
| (28,472) |
|
Average tangible equity |
| 66,740 |
| 63,594 |
| 59,769 |
| 59,734 |
| 45,601 |
| 69,239 |
| 66,190 |
|
|
|
|
|
|
|
|
|
|
|
|
|
|
|
|
|
Return on equity (ROE) |
| 8.21 |
| 7.14 |
| 6.99 |
| 6.61 |
| 7.75 |
| 6.58 |
| 7.93 |
|
Return on tangible equity (ROTE) |
| 11.70 |
| 10.41 |
| 10.38 |
| 9.99 |
| 12.75 |
| 9.33 |
| 11.34 |
|
(J) 2018 data applying the IFRS9 transitional arrangements. Additionally, if for comparison purposes we had considered in 2014 the EUR 7,500 million capital increase made in January 2015, the CET1 Fully loaded would have been 9.65% and the CET1 Phased-in 12.24%.
(K) Reflect Bank of Spain classifications. These classifications differ from the classifications applied by U.S. banks in reporting loans as non-accrual, past due, restructured and potential problem loans. See “Item 5. Other Industry Guide 3 disclosures - Bank of Spain’s Classification Requirements” in Part 3 of the 2018 Form 20-F.
(L) We disclose these ratios because our credit risk exposure comprises loans and advances to customers as well as contingent liabilities, all of which are subject to impairment and, therefore, allowances are taken in respect thereof.
(M) Includes non-performing loans and contingent liabilities, securities and other assets to collect.
(N) 2016, 2015 and 2014 data adjusted to the capital increase of July 2017.
(O) The pay-out ratio does not include in the numerator the amounts paid under the Santander Dividendo Elección program (scrip dividends) which are not cash dividends paid on account of the net attributable income of the period. Such amounts equivalent to dividends are EUR 432 million, EUR 543 million and EUR 579 million, for 2018, 2017 and 2016, respectively. Dividend information for the six months ended June 30, 2019 and 2018 and for the year-end are not comparable. The interim figures for the six months ended June 30, 2019 and 2018 do not include any dividend (the first interim dividend on account of every year is paid in the second half of that year) and the full-year figure includes all dividends for the year.
(P) Average number of shares has been calculated on a monthly basis as the weighted average number of shares outstanding in the relevant year, net of treasury stock.
(Q) The shareholders at the annual shareholders’ meeting held on June 19, 2009 approved a remuneration scheme (scrip dividend), whereby the Bank offered the shareholders the possibility to opt to receive an amount equivalent to the dividends in cash or new shares. The remuneration per share for 2014 disclosed above, EUR 0.60, is calculated assuming that the four dividends for this year were paid in cash.
On January 8, 2015, an extraordinary meeting of the board of directors took place to reformulate the dividend policy of the Bank to take effect with the first dividend to be paid with respect to our 2015 results, in order to distribute three cash dividends and a scrip dividend relating to such 2015 results. Each of these dividends amounted EUR 0.05 per share. The Bank paid the dividends on account of the earnings for the 2015 financial year in August 2015, November 2015, February 2016 and May 2016 for a gross amount per share of EUR 0.05.
The Bank has paid the four dividends on account of the earnings for the 2016 financial year in August 2016 (cash dividend of EUR 0.055 per share), November 2016 (scrip dividend of EUR 0.045 per share), February 2017 (cash dividend of 0.055 per share) and May 2017 (cash dividend of 0.055 per share).
The Bank has paid the four dividends on account of the earnings for the 2017 financial year in August 2017 (cash dividend of EUR 0.06 per share), November 2017 (scrip dividend of EUR 0.04 per share), February 2018 (cash dividend of 0.06 per share) and May 2018 (cash dividend EUR 0.06 per share).
The Bank has paid the four dividends on account of the earnings for the 2018 financial year in August 2018 (cash dividend of EUR 0.065 per share), November 2018 (scrip dividend of EUR 0.035 per share), February 2019 (cash dividend of 0.065 per share) and May 2019 (cash dividend of EUR 0.065 per share).
The remuneration per share disclosed for each financial year includes the four dividends paid or to be paid on account of that financial year.
The remuneration per share disclosed for the periods ended June 30, 2019 and June 30, 2018 includes the cash dividends paid in those periods; that is, the third and fourth dividends on account of the 2018 financial year paid in February and May 2019 and the third and fourth dividends on account of the 2017 financial year paid in February and May 2018, respectively.
The Group announced at the 2018 annual general shareholders’ meeting that the dividends on account of the earnings of the 2019 financial year will be paid in two payments. The board expects to announce the first interim 2019 dividend after its meeting in September 2019.
147
Set forth below is a table showing our allowances for non-performing balances broken down by various categories as disclosed and discussed throughout this report on Form 6-K:
|
|
|
|
|
|
|
|
|
|
|
|
|
|
|
|
|
| 2018 |
| 2017 |
| 2016 |
| 2015 |
| 2014 |
| As of June 30, 2019 |
| As of June 30, 2018 |
|
Allowances refers to: |
| (in millions of euros) |
|
|
| ||||||||||
Allowances for total balances (A) (excluding country risk) |
| 24,061 |
| 24,529 |
| 24,835 |
| 27,121 |
| 28,046 |
| 23,432 |
| 25,148 |
|
Allowances for contingent liabilities and commitments (excluding country risk) |
| 776 |
| 614 |
| 457 |
| 616 |
| 652 |
| 723 |
| 854 |
|
Allowances for total balances (excluding contingent liabilities and commitments and excluding country risk): |
| 23,285 |
| 23,915 |
| 24,378 |
| 26,505 |
| 27,394 |
| 22,709 |
| 24,294 |
|
Allowances referred to country risk and other |
| 662 |
| 767 |
| 528 |
| 322 |
| 46 |
| 623 |
| 647 |
|
Allowances for total balances (excluding contingent liabilities and commitments) |
| 23,947 |
| 24,682 |
| 24,906 |
| 26,827 |
| 27,440 |
| 23,332 |
| 24,941 |
|
Of which: |
|
|
|
|
|
|
|
|
|
|
|
|
|
|
|
Allowances for customers |
| 23,307 |
| 23,934 |
| 24,393 |
| 26,517 |
| 27,217 |
| 22,720 |
| 24,315 |
|
Allowances for credit institutions and other financial assets |
| 5 |
| 18 |
| 15 |
| 19 |
| 79 |
| 15 |
| 12 |
|
Allowances for Debt instruments |
| 635 |
| 730 |
| 498 |
| 291 |
| 144 |
| 597 |
| 614 |
|
(A) Non-performing loans and contingent liabilities, securities and other assets to collect.
For a description of risks associated with Banco Santander and the Group, see the section entitled “Risk Factors” in Banco Santander’s Annual Report on Form 20-F for the year ended December 31, 2018. Set out below are certain additional risk factors which could have a material adverse effect on Banco Santander’s and the Group’s business, operations, financial condition or prospects and cause future results to be materially different from expected results. Banco Santander’s results could also be affected by competition and other factors. The risks appearing below update and supplement certain risks highlighted in the 2018 Form 20-F. These risks should be read in conjunction with the risks appearing in the 2018 Form 20-F and all of the other information appearing in this report on Form 6-K and should not be regarded as a complete and comprehensive statement of all potential risks and uncertainties that Banco Santander and the Group face. In addition, there may be additional risks that Banco Santander currently considers not to be material or of which they are not currently aware, and any of these risks could have the effects set forth below. All of these factors are contingencies which may or may not occur and Banco Santander is not in a position to express a view on the likelihood of any such contingency occurring.
Risks relating to Banco Santander and the Group
Exposure to UK political developments, including the ongoing negotiations between the UK and the European Union, could have a material adverse effect on us.
On June 23, 2016, the UK held a referendum (the UK EU Referendum) on its membership of the EU, in which a majority voted for the UK to leave the EU. There remains significant uncertainty relating to the timing of the UK’s exit from, and future relationship with, the EU and the basis of the UK’s future trading relationship with the rest of the world.
On March 29, 2017, the UK Prime Minister gave notice under Article 50(2) of the Treaty on European Union of the UK’s intention to withdraw from the EU. The delivery of the Article 50(2) notice triggered a two year period of negotiation to determine the terms on which the UK will exit the EU and the framework for the UK’s future relationship with the EU.
The Prime Minister presented to the UK Parliament the Withdrawal Agreement, which set out the basic terms of the UK’s departure, as agreed with the EU. However, it has thus far proved impossible for the Prime Minister to secure a majority in the House of Commons to ratify the Withdrawal Agreement and as a result, the PM agreed an extension to Article 50, meaning the UK is now scheduled to formally leave the European Union on October 31, 2019.
There is a possibility that the UK’s EU membership ends at such time without reaching any agreement on the terms of its relationship with the EU going forward, and currently the Withdrawal Agreement, which provides for a transitional period whilst the Future Relationship is negotiated, has not been ratified by the UK Parliament.
148
Following her repeated failure to gain the required support for the Withdrawal Agreement, Prime Minister May resigned both as Prime Minister and leader of the Conservative Party. Boris Johnson was appointed as Prime Minister with effect from July 24, 2019. There is still the possibility that Prime Minister Johnson will be unable to secure support for his proposed approach within the Commons, which could lead to a General Election being called in order to secure a mandate from the electorate. This could cause significant market and economic disruption, which could have a material adverse effect on our operations, financial condition and prospects.
The continuing uncertainty surrounding the Brexit outcome has had an effect on the UK economy throughout 2019. The economy started to contract in 2019, with manufacturing in particular struggling. Consumer and Business confidence indicators have continued to fall, for example, the GfK consumer confidence index still remains negative at -13 in June 2019. This has had a significant impact on consumer spending and investment, both of which are vital components of economic growth.
The outcome of Brexit remains unclear; however, a UK exit from the EU with a no-deal continues to remain a possibility and the consensus view is that this would have a negative impact on the UK economy, affecting its growth prospects, based on scenarios put forward by such institutions as the Bank of England, HM Government and other economic forecasters.
While the longer term effects of the UK’s imminent departure from the EU are difficult to predict, there is short term political and economic uncertainty. The Governor of the Bank of England warned that the UK exiting the EU without a deal could lead to considerable financial instability, a very significant fall in property prices, rising unemployment, depressed economic growth, higher inflation and interest rates. The Governor also warned that the Bank would not be able to apply interest rate reductions. This could inevitably affect the UK’s attractiveness as a global investment centre and would likely have a detrimental impact on UK economic growth. The current Brexit Secretary of State also warned that no-deal could lead to a recession.
If a no-deal Brexit did occur it would be likely that the UK’s economic growth would slow significantly, and it would be possible that there would be severely adverse economic effects.
The UK’s imminent departure from the EU has also given rise to further calls for a second referendum on Scottish independence and raised questions over the future status of Northern Ireland. These developments, or the perception that they could occur, could have a material adverse effect on economic conditions and the stability of financial markets in the UK, and could significantly reduce market liquidity and restrict the ability of key market participants to operate in certain financial markets.
Asset valuations, currency exchange rates and credit ratings have been subject to increased market volatility as the negotiation of the UK’s exit from the EU continues as a result of Parliament’s non-ratification of the Withdrawal Agreement. The major credit rating agencies changed their outlook to negative on the UK’s sovereign credit rating following the UK EU Referendum, and that has not changed. In addition, our business in the UK is subject to substantial EU-derived regulation and oversight. Although legislation has now been passed transferring the EU acquis into UK law, there remains significant uncertainty as to the respective legal and regulatory environments in which Santander UK and its subsidiaries will operate when the UK is no longer a member of the EU, and the basis on which cross-border financial business will take place after the UK leaves the EU.
Operationally, Santander UK and other financial institutions may no longer be able to rely on the European passporting framework for financial services, and it is unclear what alternative regime may be in place following the UK’s departure from the EU. This uncertainty, and any actions taken as a result of this uncertainty, as well as new or amended rules, may have a significant impact on our operating results, financial condition and prospects.
Ongoing uncertainty within the UK Government and Parliament, and the rejection of the Withdrawal Agreement by the House of Commons, and the risk that this results in the Government falling could cause significant market and economic disruption, which could have a material adverse effect on our operations, financial condition and prospects.
Continued ambiguity relating to the UK’s withdrawal from the EU, along with any further changes in government structure and policies, may lead to further market volatility and changes to the fiscal, monetary and regulatory landscape in which Santander UK operates and could have a material adverse effect on us, including our ability to access capital and liquidity on financial terms acceptable to us and, more generally, on our operations, financial condition and prospects.
We are subject to substantial regulation and regulatory and governmental oversight which could adversely affect our business, operations and financial condition.
United States significant regulation
The financial services industry continues to experience significant financial regulatory reform in the United States, including from the Dodd-Frank Wall Street Reform and Consumer Protection Act (the “Dodd-Frank Act”) and changes thereto, regulation (including capital, leverage, funding, liquidity and tax requirements), policies (including fiscal and monetary policies established by central banks and financial regulators, and changes to global trade policies), and other legal and regulatory actions. Many of these reforms significantly affected and continue to affect our revenues, costs and organizational structure in the United States and the scope of our permitted activities. We continue to monitor the changing political, tax and regulatory environment in the United States and,
149
while the change in control of the House of Representatives in 2018 makes significant statutory reforms less likely, we still believe that it is likely that there will be further material changes in the way major financial institutions like us are regulated under U.S. law. Although it remains difficult to predict the exact impact these changes will have on our business, financial condition, results of operations and cash flows for a particular future period, further reforms could result in loss of revenue, higher compliance costs, additional limits on our activities, constraints on our ability to enter into new businesses and other adverse effects on our businesses.
The full spectrum of risks that result from pending or future U.S. financial services legislation or regulations cannot be fully known; however, such risks could be material and we could be materially and adversely affected by them. See “Item 10. Supervision and Regulation” for a more detailed discussion of significant U.S. financial regulations applicable to our business.
Enhanced Prudential Standards
As a large foreign banking organization (“FBO”) with significant U.S. operations, we are subject to enhanced prudential standards that required Banco Santander to, among other things, establish or designate a U.S. intermediate holding company (an “IHC”) and to transfer its entire ownership interest in substantially all of its U.S. subsidiaries to such IHC. The Bank designated its wholly-owned subsidiary, Santander Holdings USA, as its U.S. IHC, effective July 1, 2016. As a U.S. IHC, Santander Holdings USA is subject to an enhanced supervision framework that includes, or will include, enhanced risk-based and leverage capital requirements, liquidity requirements, risk management and governance requirements, stress-testing and capital planning requirements, resolution planning requirements and single counterparty credit limits. Collectively, the enhanced prudential standards impose a significant regulatory burden on Santander Holdings USA, in particular with respect to capital and liquidity, which could limit its ability to distribute capital and liquidity to the Bank, thereby negatively affecting the Bank.
In May 2018 the United States Congress passed, and President Donald Trump signed into law, the Economic Growth, Regulatory Relief, and Consumer Protection Act (“EGRRCPA”). Under EGRRCPA, bank holding companies with less than $100 billion in total consolidated assets were immediately exempt from certain enhanced prudential standards, while bank holding companies with between $100 million and $250 million in total consolidated assets will become exempt from certain enhanced prudential standards during November 2019 unless the Board of Governors of the Federal Reserve System (the “Federal Reserve Board”), at any time, determines that particular enhanced prudential standards should apply. EGRRCPA made clear that the Federal Reserve Board retained the right to apply enhanced prudential standards to FBOs with greater than $100 billion in global total consolidated assets, such as Banco Santander.
In April 2019, the Federal Reserve Board and other U.S. banking agencies issued proposed rules to adjust the statutory thresholds at which certain enhanced prudential standards and other capital and liquidity standards apply to FBOs and the U.S. IHCs of FBOs (the “proposed FBO tailoring rules”). The proposed FBO tailoring rules would establish risk-based categories for FBOs and U.S. IHCs of FBOs, based on factors such as the total assets of the FBO’s combined U.S. operations and other risk-based indicators such as cross-jurisdictional activity, reliance on short-term wholesale funding, off-balance sheet exposures, and the amount of the FBO’s nonbank assets. In general, the proposed FBO tailoring rules would apply additional and more stringent enhanced prudential standards and other capital and liquidity requirements to FBOs and the U.S. IHCs of FBOs as the risk-based categories of these organizations increase.
If adopted as proposed, the Federal Reserve Board has indicated that Banco Santander would be a Category IV FBO. As a result, the effects of the proposed FBO tailoring rules on Banco Santander’s U.S. operations could be mixed, providing relief from certain regulatory requirements, such as the stress testing and capital planning requirements for Santander Holdings USA, while potentially subjecting Banco Santander to heightened requirements in some cases, such as more stringent quantitative liquidity requirements applicable to Santander Holdings USA and potentially adverse modifications to the single-counterparty credit limit requirements applicable to Banco Santander’s U.S. operations. It is uncertain, however, and whether the proposed FBO tailoring rules will be adopted as proposed and which risk-based categories would apply to Banco Santander and Santander Holdings USA with respect to certain of the enhanced prudential standard requirements. It is therefore uncertain what effect a final rule ultimately will have on Banco Santander and its U.S. operations. We will continue to monitor the potential impact of these proposed rules.
Resolution Planning
We are required to prepare and submit to the Federal Reserve Board and the Federal Deposit Insurance Corporation (“FDIC”) a plan, commonly called a living will (the “165(d) plan”), for the orderly resolution of our subsidiaries and operations that are domiciled in the United States in the event of future material financial distress or failure. We, on behalf of our insured depository institution (“IDI”) subsidiary, Santander Bank, N.A. (“Santander Bank”), must also submit a separate IDI resolution plan (“IDI plan”) to the FDIC. The 165(d) plan and the IDI plan require substantial effort, time and cost to prepare and are subject to review by the Federal Reserve Board and the FDIC, in the case of the 165(d) plan, and by the FDIC only, in the case of the IDI plan. If, after reviewing our 165(d) plan and any related re-submissions, the Federal Reserve Board and the FDIC jointly determine that we failed to cure identified deficiencies, they are authorized to impose more stringent capital, leverage or liquidity requirements, or restrictions on our growth, activities or operations, or even divestitures, which could have an adverse effect on our business. Banco Santander filed its most recent 165(d) plan on December 19, 2018, and its most recent IDI plan on June 28, 2018.
150
The Federal Reserve Board and the FDIC issued proposed rules in April 2019 to tailor 165(d) plan requirements in a manner consistent with EGRRCPA. If finalized as proposed, the rules would require Banco Santander to submit a full resolution plan on July 1, 2022, followed by reduced 165(d) plan submissions every three years. The confidential portion of reduced 165(d) plan submissions would include only a description of material changes experienced by Banco Santander since its previous 165(d) plan submission, as well as a description of changes to Banco Santander’s strategic analysis resulting from such material changes, changes in law or regulation, or guidance or feedback from the Federal Reserve Board or FDIC. Public section requirements would also be reduced to include only the names of Banco Santander’s material entities, a description of its core business lines, the identities of its principal officers, and a high-level description of the its resolution strategy. FDIC Chairman Jelena McWilliams has indicated that no firm will be required to submit another IDI plan until the FDIC issues a revised IDI plan rule. The timing for the release of a revised IDI plan rule is uncertain.
OTC Derivatives Regulation
Title VII of the Dodd-Frank Act amended the U.S. Commodity Exchange Act and the Securities Exchange Act of 1934 to establish an extensive framework for the regulation of over-the-counter (“OTC”) derivatives, including mandatory clearing of certain standardized OTC derivatives and the trading of such instruments through regulated trading venues, subject to exceptions, and transaction reporting. In addition, Title VII requires the registration of swap dealers and major swap participants with the Commodity Futures Trading Commission (“CFTC”) and of security-based swap dealers and major security-based swap participants with the SEC, and requires the CFTC and SEC to adopt regulations imposing capital, margin, business conduct, record keeping and other requirements on such entities. The CFTC has completed the majority of its regulations in this area, most of which are in effect. The SEC has also finalized many of its Title VII regulations, although a significant number are not yet in effect. Banco Santander is provisionally registered as a swap dealer with the CFTC. Santander is currently considering whether it will be required to register any entity with the SEC as a security-based swap dealer or major security-based swap participant.
While most of the rules applicable to swap dealers have been fully implemented, others are still being phased in. For example, the U.S. prudential regulatory agencies adopted final rules establishing initial and variation margin requirements for uncleared swaps and security-based swaps between prudentially-regulated swap dealers and certain counterparties, and the CFTC adopted a final rule establishing initial and variation margin requirements for uncleared swaps between non-prudentially regulated swap dealers and certain counterparties. All swap dealers must currently comply with the variation margin requirements (to the extent applicable to a particular transaction); however, the initial margin requirements are still being phased in through September 1, 2020, based on the level of specified derivatives activity of the swap dealer and the relevant counterparty (and their affiliates). We are in the process of implementing these rules and believe that these rules and similar rules being considered by regulators in other jurisdictions, and the potential conflicts and inconsistencies between them, will likely increase our costs for engaging in swaps and other derivatives activities and present compliance challenges.
QFC Stay Rules
The U.S. banking agencies have adopted rules (the “QFC stay rules”) that impose contractual requirements on certain qualified financial contracts (“covered QFCs”) to which U.S. G-SIBs and the U.S. operations of foreign G-SIBs (together with U.S. G-SIBs, “covered entities”) are parties. Banco Santander’s U.S. operations, including Santander Bank, are treated as covered entities under the QFC stay rules.
Under the QFC stay rules, covered QFCs generally:
(1) must explicitly recognize the FDIC’s authority to stay the exercise of default rights under and transfer the covered QFC under the Federal Deposit Insurance Act and Title II of the Dodd-Frank Act, and their implementing regulations; and
(2) may not (a) permit the exercise of any cross-default right against a covered entity based on an affiliate’s entry into receivership, insolvency, liquidation, resolution or similar proceedings, subject to certain creditor protections, or (b) prohibit the transfer of any credit enhancement (including a guarantee) provided by an affiliate in the G-SIB group that is a covered entity upon any affiliate in the G-SIB group entering into receivership, insolvency, liquidation, resolution, or similar proceedings.
The QFC stay rules establish a phased-in compliance schedule based on counterparty type. Covered QFCs to which all parties are covered entities were required to be remediated by January 1, 2019; covered QFCs to which all parties are either covered entities or certain other “financial counterparties,” as defined under the rules, were required to be remediated by July 1, 2019; and covered QFCs to which at least one party is neither a covered entity nor a financial counterparty must be remediated by January 1, 2020. The effect of the QFC stay rules is that, to the extent that the U.S. operations of Banco Santander, including Santander Bank, have entered into, or enter into in the future, a new QFC with a counterparty on or after January 1, 2019, all existing QFCs between the U.S. operations of Banco Santander and the counterparty and all of the counterparty’s consolidated affiliates must be remediated to comply with the requirements of the QFC stay rules by the applicable compliance date.
151
The QFC stay rules could lead to increased compliance costs and could affect Banco Santander’s competitive position, as the rules do not apply to all of the firm’s competitors.
United States Capital, Liquidity and Related Requirements and Supervisory Actions
As a U.S. IHC and bank holding company, Santander Holdings USA is subject to the U.S. Basel III capital rules, which implement in the United States the capital components of the Basel Committee’s international capital and liquidity standards known as Basel III. In addition, as a U.S. bank holding company with $50 billion or more of total consolidated assets, Santander Holdings USA is currently subject to a modified version of the quantitative liquidity coverage ratio (“LCR”) requirement. The LCR is one of the liquidity components of the international Basel III framework, and requires firms to meet certain liquidity measures by holding an adequate amount of unencumbered high-quality liquid assets to cover its projected net cash outflows over a 30 day stress scenario window. These capital and liquidity requirements significantly affect the amount of capital and liquidity that Santander Holdings USA maintains to support its operations, and, if Santander Holdings USA fails to meet these quantitative requirements, it could face increasingly stringent regulatory consequences, including but not limited to restrictions on its ability to distribute capital to the Bank. As discussed in the “Enhanced Prudential Standards” section above, the Federal Reserve Board and other U.S. banking agencies have issued the proposed FBO rules to tailor enhanced prudential standards for FBOs, consistent with the requirements of EGRRCPA. Banco Santander continues to monitor how these rules may impact its operations both internationally and in the United States.
Total Loss-Absorbing Capacity and Long-Term Debt Requirements
In addition to the above mentioned capital and liquidity requirements, the Federal Reserve Board adopted a final rule on December 15, 2016 that establishes certain TLAC, long-term debt (“LTD”) and clean holding company requirements in the United States generally consistent with the FSB’s international TLAC standard. Santander Holdings USA is compliant with all applicable requirements under the final rule as of January 1, 2019. Compliance with the final TLAC rule has resulted in increased funding costs for Santander Holdings USA and, indirectly, the Bank.
Stress Testing and Capital Planning
Certain of our U.S. subsidiaries, including Santander Holdings USA, are subject to stress testing and capital planning requirements in the United States, including the Federal Reserve Board’s Comprehensive Capital Analysis and Review (“CCAR”). The Federal Reserve Board expects companies subject to CCAR, such as Santander Holdings USA, to have sufficient capital to withstand a highly adverse operating environment and to be able to continue operations, maintain ready access to funding, meet obligations to creditors and counterparties, and serve as credit intermediaries. In addition, the Federal Reserve Board evaluates the planned capital actions of these bank holding companies, including planned capital distributions such as dividend payments or stock repurchases. In 2017, the Federal Reserve Board finalized a rule that removed the qualitative assessment that was part of CCAR for certain large and noncomplex bank holding companies and U.S. intermediate holding companies of FBOs, including Santander Holdings USA. In 2019, the Federal Reserve Board announced that it would be providing relief to certain less-complex firms, including Santander Holdings USA, by effectively moving these firms to a biennial supervisory stress testing and capital planning cycle. As a result, Santander Holdings USA was not subject to supervisory stress tests or CCAR for the 2019 supervisory cycle and its capital distributions will instead be based on the results of the 2018 supervisory stress tests. As discussed in the “Enhanced Prudential Standards” section above, the Federal Reserve Board and other U.S. banking agencies issued the proposed FBO tailoring rules to tailor enhanced prudential standards for FBOs, consistent with the requirements of EGRRCPA. As proposed, the FBO tailoring rules would potentially provide relief with respect Santander Holdings USA’s U.S. stress testing and capital planning requirements. However, it is unclear if the proposed FBO rules will be adopted as currently written. Banco Santander continues to monitor how these rules may impact its operations both internationally and in the United States.
In April 2018, the Federal Reserve Board proposed a rule that would revise its capital buffer, stress testing and capital planning requirements to restructure how the Federal Reserve Board incorporates the results of supervisory stress testing into firms’ ongoing capital requirements, including by introducing stress buffer requirements that would apply on an ongoing basis and be calibrated to reflect firms’ projected losses under its stress tests. The proposed changes would affect the ongoing capital buffer requirements to which Santander Holdings USA is subject and could raise the regulatory capital ratios that Santander Holdings USA must maintain in order to avoid restrictions on dividends and other capital distributions.
Single Counterparty Credit Limits
In June 2018, the Federal Reserve Board issued a final rule implementing single counterparty credit limits applicable to the U.S. operations of major FBOs, such as the Bank, and to certain large U.S. IHCs of FBOs, such as Santander Holdings USA. The rule will impose percentage limitations on net credit exposures to individual counterparties (aggregated based on affiliation), generally as a percentage of tier 1 capital. This will become effective in January 2020 for the Bank and in July 2020 for Santander Holdings USA, and could adversely affect the financial position of the Bank's U.S. operations or of Santander Holdings USA.
152
As discussed in the “Enhanced Prudential Standards” section above, the Federal Reserve Board and other U.S. banking agencies issued the proposed FBO tailoring rules to tailor enhanced prudential standards for FBOs, consistent with the requirements of EGRRCPA. As proposed, the FBO tailoring rules would modify certain aspects of the single counterparty credit limit requirements applicable to the U.S. operations of FBOs, which could adversely affect how these requirements apply to Banco Santander’s U.S. operations, depending on the risk-based category ultimately applicable to the Bank under the FBO tailoring rules. Banco Santander continues to monitor how these rules may impact its operations both internationally and in the United States.
Other Supervisory Actions and Restrictions on U.S. Activities
In addition to the foregoing, U.S. bank regulatory agencies from time to time take supervisory actions under certain circumstances that restrict or limit a financial institution’s activities. In some instances, we are subject to significant legal restrictions on our ability to publicly disclose these actions or the full details of these actions. Furthermore, as part of the regular examination process, U.S. banking regulators may advise our U.S. banking subsidiaries to operate under various restrictions as a prudential matter. Under the U.S. Bank Holding Company Act of 1956, as amended (the “Bank Holding Company Act”), the Federal Reserve Board has the authority to disallow us and our U.S. banking subsidiaries from engaging in certain categories of new activities in the United States or acquiring shares or control of other companies in the United States. Such actions and restrictions currently applicable to us or our U.S. banking subsidiaries could adversely affect our costs and revenues. Moreover, efforts to comply with non-public supervisory actions or restrictions could require material investments in additional resources and systems, as well as a significant commitment of managerial time and attention. As a result, such supervisory actions or restrictions could have a material adverse effect on our business and results of operations; and we may be subject to significant legal restrictions on our ability to publicly disclose these matters or the full details of these actions.
In addition to such confidential actions and restrictions, we have been, and continue to be, subject to public supervisory actions in the United States. On September 15, 2014, Santander Holdings USA and the Federal Reserve Bank of Boston (“FRB Boston”) had executed a written agreement relating to a subsidiary’s declaration and payment of dividends in the second quarter of 2014 without the Federal Reserve Board’s approval. Under the written agreement, Santander Holdings USA had agreed to certain actions relating to planned capital distributions and to subject future capital distributions to the prior written approval of the Federal Reserve Board. On August 24, 2017, the Federal Reserve announced the termination of this enforcement action. Separately, in July 2015, Santander Holdings USA entered into a written agreement with the FRB Boston and agreed to make enhancements with respect to, among other matters, board oversight of the consolidated organization, risk management, capital planning and liquidity risk management. On August 14, 2018, the Federal Reserve announced the termination of this enforcement action. In addition, in March 2017, Santander Holdings USA and SCUSA entered into a written agreement with the FRB Boston pursuant to which Santander Holdings USA and SCUSA agreed to submit written plans acceptable to the FRB Boston to strengthen board oversight of the management and operations of SCUSA and to strengthen board and senior management oversight of SCUSA’s risk management program, SCUSA agreed to submit a written revised compliance risk management program acceptable to the FRB Boston and Santander Holdings USA agreed to submit written revisions to its firm-wide internal audit program of SCUSA’s compliance risk management program. A response to this written agreement was submitted to the Federal Reserve of Boston in May 2017. The written agreement between Santander Holdings USA and the FRB Boston dated March 21, 2017 has not been terminated and remains in place.
Anti-Money Laundering and Economic Sanctions
A major focus of U.S. governmental policy relating to financial institutions is aimed at preventing money laundering and terrorist financing. The Bank Secrecy Act, as amended by the Uniting and Strengthening America by Providing Appropriate Tools Required to Intercept and Obstruct Terrorism Act of 2001 contains provisions intended to detect, and prevent the use of the U.S. financial system for, money laundering and terrorist financing activities. Under the Bank Secrecy Act, U.S. financial institutions, including U.S. branches and subsidiaries of non-U.S. banks, are required to, among other things, maintain an anti-money laundering (“AML”) program, verify the identity of clients, monitor for and report suspicious transactions, report on cash transactions exceeding specified thresholds, and respond to requests for information by regulatory authorities and law enforcement agencies. The Financial Crimes Enforcement Network of the U.S. Department of the Treasury and U.S. federal and state bank regulatory agencies, as well as the U.S. Department of Justice, have the authority to impose significant civil money penalties for violations of those requirements.
There is also scrutiny of compliance with applicable U.S. economic sanctions administered by the Office of Foreign Assets Control of the U.S. Department of the Treasury against certain foreign countries, governments, individuals and entities to counter threats to the U.S. national security, foreign policy, or economy. In May 2018, the Trump administration announced that the United States would cease its participation in the Joint Comprehensive Plan of Action and re-impose sanctions relating to Iran following wind-down periods, the first which ended on August 6, 2018 and the second of which ended on November 4, 2018. The United States has now completed the process of fully re-imposing sanctions related to Iran that were in force prior to the initial Iran nuclear agreement, and has authorized certain additional secondary sanctions relating to Iran. Accordingly, US secondary sanctions target a wide range of Iran-related activities.
153
Failures to comply with applicable U.S. AML laws or regulations or economic sanctions could have severe legal and reputational consequences, including significant civil and criminal penalties, and certain AML violations could result in a termination of U.S. banking licenses. The lack of certainty on possible requirements arising from any new AML laws or sanctions could pose risks given the possible penalties for financial crime compliance failings. If such penalties are incurred then they could have a material adverse effect on our operations, financial condition and prospects. In addition, U.S. regulators have taken actions against non-U.S. bank holding companies requiring them to improve their oversight of their U.S. subsidiaries’ Bank Secrecy Act programs and compliance. Further, U.S. federal banking agencies are required, when reviewing bank and bank holding company acquisition or merger applications, to take into account the effectiveness of the AML compliance record of the applicant. See also “Item 10. Supervision and Regulation”.
Cybersecurity and Data Privacy
As cybersecurity and data privacy risks for banking organizations and the broader financial system have significantly increased in recent years, cybersecurity and data privacy issues have become the subject of increasing legislative and regulatory focus. The U.S. bank regulatory agencies have proposed enhanced cyber risk management standards, which would apply to a wide range of large financial institutions and their third-party service providers, including Santander Holdings USA and would focus on cyber risk governance and management, management of internal and external dependencies, and incident response, cyber resilience and situational awareness. Several states have also proposed or adopted cybersecurity legislation and regulations, which require, among other things, notification to affected individuals when there has been a security breach of their personal data.
We receive, maintain and store non-public personal information of our customers and counterparties, including, but not limited to, personally identifiable information and personal financial information. The sharing, use, disclosure and protection of this information are governed by U.S. federal and state law. Both personally identifiable information and personal financial information is increasingly subject to legislation and regulation, the intent of which is to protect the privacy of personal information that is collected and handled.
We may become subject to new legislation or regulation concerning cybersecurity or the privacy of personally identifiable information and personal financial information or of any other information we may store or maintain. We could be adversely affected if new legislation or regulations are adopted or if existing legislation or regulations are modified such that we are required to alter our systems or require changes to our business practices or privacy policies. If cybersecurity, data privacy, data protection, data transfer or data retention laws are implemented, interpreted or applied in a manner inconsistent with our current practices, we may be subject to fines, litigation or regulatory enforcement actions or ordered to change our business practices, policies or systems in a manner that adversely impacts our operating results.
If we fall victim to successful cyber-attacks or experience cybersecurity incidents in the future, we may incur substantial costs and suffer other negative consequences, such as remediation costs (liabilities for stolen assets or information, repairs of system damage, among others), increased cybersecurity protection costs, lost revenues arising from the unauthorized use of proprietary information or the failure to retain or attract our customers following an attack, as already mentioned, litigation and legal risks, increased insurance premiums, reputational damage affecting the customers and the investors’ confidence, as well as damages to our competitiveness, stock price and long-term shareholder value.
It is important to highlight that even when a failure of or interruption in our systems or facilities is timely resolved or an attempted cyber incident or other security breach is successfully avoided or thwarted, normally substantial resources are expend in doing so, and we may be required to take actions that could adversely affect customer satisfaction or behavior, as well as represent a threat to our reputation.
ITEM 5. INFORMATION ON THE COMPANY
Average Balance Sheets and Interest Rates
The following tables include, by domicile of the Group entity at which the relevant asset or liability is accounted for, our average balances and interest rates for the six months ended June 30, 2019 and 2018. Domestic balances are those of Group entities domiciled in Spain, which reflect our domestic activities, and international balances are those of Group entities domiciled outside of Spain, which reflect our foreign activities.
To better understand the behaviour of average balance sheets and interest rates, we have split our foreign activities into ‘International – Mature markets’ which include Europe (except for Spain and Poland) and the United States and ‘International – Developing markets’ which include South America, Mexico and Poland.
154
You should read the following tables and the tables included under “—Changes in Net Interest Income—Volume and Rate Analysis” and “—Assets—Earning Assets—Yield Spread” considering the following:
· | We have included interest received on non-accruing assets in interest income only if we received such interest during the period in which it was due; |
· | We have included loan arrangement fees in interest income; |
· | We have not recalculated tax-exempt income on a tax-equivalent basis because the effect of doing so would not be significant; |
· | We have included income and expenses from interest-rate hedging transactions as a separate line item under interest income and expenses if these transactions qualify for hedge accounting under IFRS. If these transactions did not qualify for such treatment, we included income and expenses on these transactions elsewhere in our income statement. See Note 2 to our consolidated financial statements in our 2018 Form 20-F for a discussion of our accounting policies for hedging activities; |
· | We have stated average balances on a net basis, netting our allowances for credit losses; and |
· | All average data have been calculated using month-end balances, which is not significantly different from having used daily averages. |
155
Average Balance Sheet - Assets and Interest Income
|
|
|
|
|
|
|
|
|
| Six months ended 30 June, | |||||||
| 2019 |
| 2018 |
| ||||
ASSETS | Average Balance | Interest | Average Rate |
| Average Balance | Interest | Average Rate |
|
| (in millions of euros, except percentages) | |||||||
Cash and due from central banks and credit entities | 205,013 | 1,700 | 1.66% |
| 189,285 | 1,649 | 1.74% |
|
Domestic | 85,335 | 127 | 0.30% |
| 68,770 | 72 | 0.21% |
|
International - Mature markets | 65,544 | 265 | 0.81% |
| 69,892 | 153 | 0.44% |
|
International - Developing markets | 54,134 | 1,308 | 4.83% |
| 50,623 | 1,424 | 5.63% |
|
|
|
|
|
|
|
|
|
|
Loans and credits | 901,665 | 23,084 | 5.12% |
| 854,390 | 21,434 | 5.02% |
|
Domestic | 238,807 | 2,747 | 2.30% |
| 246,921 | 2,667 | 2.16% |
|
International - Mature markets | 480,816 | 9,158 | 3.81% |
| 439,504 | 8,327 | 3.79% |
|
International - Developing markets | 182,042 | 11,179 | 12.28% |
| 167,965 | 10,440 | 12.43% |
|
|
|
|
|
|
|
|
|
|
Debt securities | 189,193 | 3,393 | 3.59% |
| 194,870 | 3,154 | 3.24% |
|
Domestic | 62,268 | 350 | 1.12% |
| 75,869 | 525 | 1.38% |
|
International - Mature markets | 56,764 | 422 | 1.49% |
| 53,119 | 384 | 1.45% |
|
International - Developing markets | 70,161 | 2,621 | 7.47% |
| 65,882 | 2,245 | 6.82% |
|
|
|
|
|
|
|
|
|
|
Income from hedging operations |
| 106 |
|
|
| 143 |
|
|
Domestic |
| 19 |
|
|
| (24) |
|
|
International - Mature markets |
| 47 |
|
|
| (16) |
|
|
International - Developing markets |
| 40 |
|
|
| 183 |
|
|
|
|
|
|
|
|
|
|
|
Other interest |
| 386 |
|
|
| 524 |
|
|
Domestic |
| 191 |
|
|
| 218 |
|
|
International - Mature markets |
| 209 |
|
|
| 206 |
|
|
International - Developing markets |
| (14) |
|
|
| 100 |
|
|
|
|
|
|
|
|
|
|
|
Total Interest earning assets | 1,295,871 | 28,669 | 4.42% |
| 1,238,545 | 26,904 | 4.34% |
|
Domestic | 386,410 | 3,434 | 1.78% |
| 391,560 | 3,458 | 1.77% |
|
International - Mature markets | 603,124 | 10,101 | 3.35% |
| 562,515 | 9,054 | 3.22% |
|
International - Developing markets | 306,337 | 15,134 | 9.88% |
| 284,470 | 14,392 | 10.12% |
|
Other non-interest earning assets | 197,083 |
|
|
| 199,899 |
|
|
|
Assets from discontinued operations | - |
|
|
| - |
|
|
|
Total Average Assets | 1,492,954 | 28,669 |
|
| 1,438,444 | 26,904 |
|
|
Note: As of June 30, 2019 and June 30, 2018, Total Average Assets attributed to international activities accounted for 68% and 67%, respectively, of the Group's Total Average Assets. (International - Mature markets accounted for 45% and 45% and International - Developing markets accounted for 23% and 22%, respectively).
156
Average Balance Sheet - Liabilities and Interest Expense
|
|
|
|
|
|
|
|
|
| Six months ended 30 June, | |||||||
| 2019 |
| 2018 |
| ||||
LIABILITIES AND STOCKHOLDERS EQUITY | Average Balance | Interest | Average Rate |
| Average Balance | Interest | Average Rate |
|
| (in millions of euros, except percentages) | |||||||
Due to credit entities and central banks | 185,489 | 1,501 | 1.62% |
| 190,990 | 1,438 | 1.51% |
|
Domestic | 91,941 | 177 | 0.39% |
| 102,479 | 147 | 0.29% |
|
International - Mature markets | 58,982 | 438 | 1.49% |
| 57,237 | 306 | 1.07% |
|
International - Developing markets | 34,566 | 886 | 5.13% |
| 31,274 | 985 | 6.30% |
|
|
|
|
|
|
|
|
|
|
Customer Deposits | 802,594 | 5,459 | 1.36% |
| 772,198 | 4,526 | 1.17% |
|
Domestic | 260,685 | 410 | 0.31% |
| 250,895 | 491 | 0.39% |
|
International - Mature markets | 359,823 | 1,319 | 0.73% |
| 352,241 | 996 | 0.57% |
|
International - Developing markets | 182,086 | 3,730 | 4.10% |
| 169,062 | 3,039 | 3.60% |
|
|
|
|
|
|
|
|
|
|
Marketable debt securities (A) | 241,445 | 3,355 | 2.78% |
| 214,454 | 2,918 | 2.72% |
|
Domestic | 81,738 | 785 | 1.92% |
| 75,531 | 756 | 2.00% |
|
International - Mature markets | 123,228 | 1,513 | 2.46% |
| 105,743 | 1,155 | 2.18% |
|
International - Developing markets | 36,479 | 1,057 | 5.80% |
| 33,180 | 1,007 | 6.07% |
|
|
|
|
|
|
|
|
|
|
Other interest bearing liabilities | 7,006 | 76 | 2.17% |
| 7,628 | 95 | 2.49% |
|
Domestic | 5,072 | 41 | 1.62% |
| 5,646 | 42 | 1.49% |
|
International - Mature markets | 885 | 2 | 0.45% |
| 860 | 2 | 0.47% |
|
International - Developing markets | 1,049 | 33 | 6.29% |
| 1,122 | 51 | 9.09% |
|
|
|
|
|
|
|
|
|
|
Expenses from hedging operations |
| (24) |
|
|
| 62 |
|
|
Domestic |
| (6) |
|
|
| (24) |
|
|
International - Mature markets |
| (29) |
|
|
| (8) |
|
|
International - Developing markets |
| 11 |
|
|
| 94 |
|
|
|
|
|
|
|
|
|
|
|
Other interest |
| 666 |
|
|
| 934 |
|
|
Domestic |
| 221 |
|
|
| 225 |
|
|
International - Mature markets |
| 86 |
|
|
| 54 |
|
|
International - Developing markets |
| 359 |
|
|
| 655 |
|
|
|
|
|
|
|
|
|
|
|
Total interest bearing liabilities | 1,236,534 | 11,033 | 1.78% |
| 1,185,270 | 9,973 | 1.68% |
|
Domestic | 439,436 | 1,628 | 0.74% |
| 434,551 | 1,637 | 0.75% |
|
International - Mature markets | 542,918 | 3,329 | 1.23% |
| 516,081 | 2,505 | 0.97% |
|
International - Developing markets | 254,180 | 6,076 | 4.78% |
| 234,638 | 5,831 | 4.97% |
|
Other non-interest bearing liabilities | 146,928 |
|
|
| 147,531 |
|
|
|
Non-Controlling interest | 11,301 |
|
|
| 10,981 |
|
|
|
Stockholders' Equity | 98,191 |
|
|
| 94,662 |
|
|
|
Liabilities from discontinued operations | - |
|
|
| - |
|
|
|
|
|
|
|
|
|
|
|
|
Total average liabilities and Stockholders' Equity | 1,492,954 | 11,033 |
|
| 1,438,444 | 9,973 |
|
|
Note: As of June 30, 2019 and June 30, 2018, Total average liabilities attributed to international activities accounted for 63% and 63%, respectively, of the Group's Total average liabilities. (International - Mature markets accounted for 42% and 42% and International - Developing markets accounted for 22% and 21%, respectively).
(A) Does not include contingently convertible preference shares and perpetual subordinated notes because they do not accrue interests. We include them under “Other non-interest bearing liabilities”. The average balances of these debt securities amounted to €8,823 million and €7,772 million as of June 30, 2019 and June 30, 2018, respectively.
157
Changes in Net Interest Income—Volume and Rate Analysis
The following tables include, by domicile of the Group entity at which the relevant asset or liability is accounted for, changes in our net interest income between changes in average volume and changes in average rate for the first six months of 2019 compared to the same period of 2018. We have calculated volume variances based on movements in average balances over the period and rate variance based on changes in interest rates on average interest-earning assets and average interest-bearing liabilities. We have allocated variances caused by changes in both volume and rate to volume. You should read the following tables and the footnotes thereto in light of our observations noted in the preceding sub-section entitled “—Average Balance Sheets and Interest Rates”.
Volume and Rate Analysis
|
|
|
|
|
|
|
|
| Six months ended 30 June, | ||
| 2019 / 2018 | ||
| Increase (Decrease) due to changes in | ||
INTEREST INCOME | Volume | Rate | Net Change |
| (in millions of euros) | ||
Cash and due from central banks and credit entities | 9 | 42 | 51 |
Domestic | 20 | 35 | 55 |
International - Mature markets | (105) | 217 | 112 |
International - Developing markets | 94 | (210) | (116) |
|
|
|
|
Loans and credits | 1,610 | 40 | 1,650 |
Domestic | (90) | 170 | 80 |
International - Mature markets | 834 | (3) | 831 |
International - Developing markets | 866 | (127) | 739 |
|
|
|
|
Debt securities | 97 | 142 | 239 |
Domestic | (85) | (90) | (175) |
International - Mature markets | 31 | 7 | 38 |
International - Developing markets | 151 | 225 | 376 |
|
|
|
|
Income from hedging operations | (37) | 0 | (37) |
Domestic | 43 | 0 | 43 |
International - Mature markets | 63 | 0 | 63 |
International - Developing markets | (143) | 0 | (143) |
|
|
|
|
Other interest | (138) | 0 | (138) |
Domestic | (27) | 0 | (27) |
International - Mature markets | 3 | 0 | 3 |
International - Developing markets | (114) | 0 | (114) |
|
|
|
|
Total Interest earning assets | 1,541 | 224 | 1,765 |
Domestic | (139) | 115 | (24) |
International - Mature markets | 826 | 221 | 1,047 |
International - Developing markets | 854 | (112) | 742 |
158
|
|
|
|
|
|
|
|
| Six months ended 30 June, | ||
| 2019 / 2018 | ||
| Increase (Decrease) due to changes in | ||
INTEREST CHARGES | Volume | Rate | Net Change |
| (in millions of euros) | ||
Due to credit entities and central banks | 56 | 7 | 63 |
Domestic | (16) | 46 | 30 |
International - Mature markets | (25) | 157 | 132 |
International - Developing markets | 97 | (196) | (99) |
|
|
|
|
Customer Deposits | 184 | 749 | 933 |
Domestic | 19 | (100) | (81) |
International - Mature markets | (81) | 404 | 323 |
International - Developing markets | 246 | 445 | 691 |
|
|
|
|
Marketable debt securities | 392 | 45 | 437 |
Domestic | 60 | (31) | 29 |
International - Mature markets | 235 | 123 | 358 |
International - Developing markets | 97 | (47) | 50 |
|
|
|
|
Other interest bearing liabilities | (5) | (14) | (19) |
Domestic | (4) | 3 | (1) |
International - Mature markets | 2 | (2) | 0 |
International - Developing markets | (3) | (15) | (18) |
|
|
|
|
Expenses from hedging operations | (86) | 0 | (86) |
Domestic | 18 | 0 | 18 |
International - Mature markets | (21) | 0 | (21) |
International - Developing markets | (83) | 0 | (83) |
|
|
|
|
Other interest | (269) | 0 | (269) |
Domestic | (4) | 0 | (4) |
International - Mature markets | 31 | 0 | 31 |
International - Developing markets | (296) | 0 | (296) |
|
|
|
|
Total interest bearing liabilities | 273 | 787 | 1,060 |
Domestic | 73 | (82) | (9) |
International - Mature markets | 141 | 682 | 823 |
International - Developing markets | 59 | 187 | 246 |
159
Assets
Earning Assets—Yield Spread
The following table analyzes our average earning assets, interest income and dividends on equity securities and net interest income by domicile of the Group entity at which they are accounted for. Furthermore, it shows gross yields, net yields and yield spreads for each of the periods indicated. You should read this table and the footnotes thereto in light of our observations noted in the preceding sub-section entitled “—Average Balance Sheets and Interest Rates”, and the footnotes thereto.
|
|
|
|
|
|
| Six months ended 30 June, | |
| 2019 | 2018 |
| (in millions of euros, except percentages) | |
Average interest earning assets | 1,295,871 | 1,238,545 |
Domestic | 386,410 | 391,560 |
International - Mature markets | 603,124 | 562,515 |
International - Developing markets | 306,337 | 284,470 |
|
|
|
Interest and similar income | 28,669 | 26,904 |
Domestic | 3,434 | 3,458 |
International - Mature markets | 10,101 | 9,054 |
International - Developing markets | 15,134 | 14,392 |
|
|
|
Interest income / (charges) (A) | 17,636 | 16,931 |
Domestic | 1,806 | 1,821 |
International - Mature markets | 6,772 | 6,549 |
International - Developing markets | 9,058 | 8,561 |
|
|
|
Gross yield (B) | 4.42% | 4.34% |
Domestic | 1.78% | 1.77% |
International - Mature markets | 3.35% | 3.22% |
International - Developing markets | 9.88% | 10.12% |
|
|
|
Net yield (C) | 2.72% | 2.73% |
Domestic | 0.93% | 0.93% |
International - Mature markets | 2.25% | 2.33% |
International - Developing markets | 5.91% | 6.02% |
|
|
|
Yield spread (D) | 2.64% | 2.66% |
Domestic | 1.04% | 1.01% |
International - Mature markets | 2.12% | 2.25% |
International - Developing markets | 5.10% | 5.15% |
|
|
|
A. | Interest income / (charges) is the net amount of interest and similar income and interest expense and similar charges. — See “Income Statement” on page 101. |
B. | Gross yield is the quotient of interest income divided by average earning assets. |
C. | Net yield is the quotient of net interest income divided by average earning assets. |
D. | Yield spread is the difference between gross yield on earning assets and the average cost of interest-bearing liabilities. For a discussion of the changes in yield spread over the periods presented, see “Part 1. Consolidated Director’s Report — Group Performance — Net Interest Income” |
160
Interest-Earning Assets
The following table shows, by domicile of the Group entity at which the relevant asset is accounted for, the percentage mix of our average interest-earning assets for the periods indicated. You should read this table in light of our observations noted in the preceding sub-section entitled “—Average Balance Sheets and Interest Rates”, and the footnotes thereto.
|
|
|
|
|
|
| Six months ended 30 June, | |
| 2019 | 2018 |
|
|
|
Cash and due from central banks and credit entities | 15.82% | 15.28% |
Domestic | 6.59% | 5.55% |
International - Mature markets | 5.06% | 5.64% |
International - Developing markets | 4.18% | 4.09% |
|
|
|
Loans and credits | 69.58% | 68.98% |
Domestic | 18.43% | 19.94% |
International - Mature markets | 37.10% | 35.49% |
International - Developing markets | 14.05% | 13.56% |
|
|
|
Debt securities | 14.60% | 15.73% |
Domestic | 4.81% | 6.13% |
International - Mature markets | 4.38% | 4.29% |
International - Developing markets | 5.41% | 5.32% |
|
|
|
161
Other Industry Guide 3 Disclosures
Movements in Allowances for Credit Losses
The following table analyzes, for the periods indicated, movements in our allowances for credit losses by domicile of the Group entity at which the relevant allowances are accounted for. See “Item 1—Presentation of Financial and Other Information”. For further discussion of movements in the allowances for credit losses see “Consolidated Directors’ Report —Group financial information —Grupo Santander Results” in Part 1 of this report.
|
|
|
|
|
|
|
|
|
|
|
|
|
| Year ended December 31, |
| Six months ended June 30, |
| ||||||
|
| 2018 |
| 2017 |
| 2016 |
| 2019 |
| 2018 |
|
|
| (in millions of euros, except percentages) |
| ||||||||
Allowance for credit losses at end of 2017 |
|
|
|
|
|
|
|
|
|
|
|
Borrowers in Spain |
| 8,746 |
| n.a. |
| n.a. |
| n.a. |
| 8,746 |
|
Borrowers outside Spain |
| 15,937 |
| n.a. |
| n.a. |
| n.a. |
| 15,937 |
|
Total |
| 24,682 |
| n.a. |
| n.a. |
| n.a. |
| 24,682 |
|
|
|
|
|
|
|
|
|
|
|
|
|
IFRS9 Impact |
|
|
|
|
|
|
|
|
|
|
|
Borrowers in Spain |
| 755 |
| n.a. |
| n.a. |
| n.a. |
| 755 |
|
Borrowers outside Spain |
| 1,219 |
| n.a. |
| n.a. |
| n.a. |
| 1,219 |
|
Total |
| 1,974 |
| n.a. |
| n.a. |
| n.a. |
| 1,974 |
|
|
|
|
|
|
|
|
|
|
|
|
|
Allowance for credit losses at beginning of the period |
|
|
|
|
|
|
|
|
|
|
|
Borrowers in Spain |
| 9,501 |
| 7,215 |
| 9,554 |
| 7,683 |
| 9,501 |
|
Borrowers outside Spain |
| 17,156 |
| 17,686 |
| 17,077 |
| 16,263 |
| 17,156 |
|
Total |
| 26,656 |
| 24,900 |
| 26,631 |
| 23,947 |
| 26,656 |
|
|
|
|
|
|
|
|
|
|
|
|
|
Net provisions for credit losses charged to income statement (B) |
|
|
|
|
|
|
|
|
|
|
|
Borrowers in Spain |
| 1,295 |
| 955 |
| 964 |
| 673 |
| 685 |
|
Borrowers outside Spain |
| 9,206 |
| 9,908 |
| 10,243 |
| 4,526 |
| 4,489 |
|
Total |
| 10,501 |
| 10,863 |
| 11,207 |
| 5,199 |
| 5,174 |
|
|
|
|
|
|
|
|
|
|
|
|
|
Charge offs against credit loss allowance |
|
|
|
|
|
|
|
|
|
|
|
Borrowers in Spain |
| (2,899) |
| (3,160) |
| (2,505) |
| (1,453) |
| (1,372) |
|
Borrowers outside Spain |
| (9,774) |
| (10,362) |
| (10,254) |
| (4,793) |
| (4,768) |
|
Total |
| (12,673) |
| (13,522) |
| (12,758) |
| (6,246) |
| (6,140) |
|
|
|
|
|
|
|
|
|
|
|
|
|
Other movements |
| (538) |
| 2,442 | (A) | (179) |
| 432 |
| (749) |
|
|
|
|
|
|
|
|
|
|
|
|
|
Allowance for credit losses at end of the period (C) (D) |
|
|
|
|
|
|
|
|
|
|
|
Borrowers in Spain |
| 7,683 |
| 8,746 |
| 7,214 |
| 7,076 |
| 8,740 |
|
Borrowers outside Spain |
| 16,263 |
| 15,936 |
| 17,686 |
| 16,256 |
| 16,201 |
|
Total |
| 23,947 |
| 24,682 |
| 24,900 |
| 23,332 |
| 24,941 |
|
|
|
|
|
|
|
|
|
|
|
|
|
Recoveries of loans previously charged off against income statement |
|
|
|
|
|
|
|
|
|
|
|
Borrowers in Spain |
| 255 |
| 247 |
| 283 |
| 120 |
| 164 |
|
Borrowers outside Spain |
| 1,303 |
| 1,374 |
| 1,299 |
| 716 |
| 659 |
|
Total |
| 1,558 |
| 1,621 |
| 1,582 |
| 836 |
| 823 |
|
|
|
|
|
|
|
|
|
|
|
|
|
Average loans outstanding |
|
|
|
|
|
|
|
|
|
|
|
Borrowers in Spain |
| 240,845 |
| 220,067 |
| 175,751 |
| 238,807 |
| 246,921 |
|
Borrowers outside Spain |
| 620,482 |
| 604,159 |
| 605,758 |
| 662,858 |
| 607,469 |
|
Total |
| 861,327 |
| 824,226 |
| 781,509 |
| 901,665 |
| 854,390 |
|
|
|
|
|
|
|
|
|
|
|
|
|
Net charge-offs against loan loss allowance to average loans ratio (E) |
|
|
|
|
|
|
|
|
|
|
|
Borrowers in Spain |
| 1.10% |
| 1.32% |
| 1.26% |
| 1.12% |
| 0.98% |
|
Borrowers outside Spain |
| 1.37% |
| 1.49% |
| 1.48% |
| 1.23% |
| 1.35% |
|
Total |
| 1.29% |
| 1.44% |
| 1.43% |
| 1.20% |
| 1.24% |
|
(A) Under “Other movements” we include mainly the balances of Banco Popular.
(B) We have not included a separate line item for charge-offs of loans not previously provided for (loans charged-off against income) as these are not permitted.
(C) Includes allowances for impairment losses on balances of “Loans and receivables - Loans and advances to customers”, “Loans and receivables - Loans and advances to credit institutions” and “Loans and receivables – Debt securities”. See “Item 2. Selected Consolidated Financial Information”.
(D) The segregation of the allowance for credit losses between Spain and outside Spain was made by geographical location of the Group’s company that accounts for the risk.
(E) For the purpose of calculating the ratio, net charge-offs consist of Charge offs against credit loss allowance less Recoveries of loans previously charged off. Ratios at June 30, 2019 and June 30, 2018 reflect year-to-date net loan charge-offs, annualized. Ratios at year end reflect full year net loan charge-offs.
162
The net charge-offs against loan loss allowance to average loans ratio in Spain increased 14 basis points in June 30, 2019 as compared to June 30, 2018. There was an increase in net charge-offs mainly due to mortgages portfolios and a decrease in average loans due to lower wholesale balances and with institutions. In foreign jurisdictions the ratio decreased 12 basis points at June 30, 2019 as compared to June 30, 2018. Net charge-offs remained stable while there was an increase in average loans, particularly in developing countries.
The table below shows, for the periods indicated, a breakdown of recoveries, net provisions and charge-offs against credit loss allowances by type and by domicile of the Group entity at which these items are accounted for.
|
|
|
|
|
|
|
|
|
|
|
|
|
| Year ended December 31, |
| Six months ended June 30, |
| ||||||
|
| 2018 |
| 2017 |
| 2016 |
| 2019 |
| 2018 |
|
|
| (in millions of euros) |
| ||||||||
Recoveries of loans previously charged-off against income statement |
|
|
|
|
|
|
|
|
|
|
|
Domestic: |
|
|
|
|
|
|
|
|
|
|
|
Commercial, financial, agricultural, industrial |
| 119 |
| 66 |
| 128 |
| 58 |
| 73 |
|
Real estate and construction |
| 58 |
| 87 |
| 72 |
| 26 |
| 41 |
|
Other mortgages |
| 3 |
| 14 |
| 10 |
| 3 |
| 2 |
|
Installment loans to individuals |
| 60 |
| 71 |
| 63 |
| 32 |
| 41 |
|
Lease finance |
| 2 |
| 1 |
| 6 |
| - |
| 1 |
|
Other |
| 13 |
| 8 |
| 4 |
| 1 |
| 6 |
|
Total Borrowers in Spain |
| 255 |
| 247 |
| 283 |
| 120 |
| 164 |
|
Borrowers outside Spain |
|
|
|
|
|
|
|
|
|
|
|
Government and official institutions |
| - |
| - |
| 9 |
| 2 |
| - |
|
Commercial and industrial |
| 1,224 |
| 1,299 |
| 1,146 |
| 654 |
| 617 |
|
Mortgage loans |
| 75 |
| 67 |
| 86 |
| 43 |
| 40 |
|
Other |
| 3 |
| 8 |
| 58 |
| 17 |
| 2 |
|
Total Borrowers outside Spain |
| 1,303 |
| 1,374 |
| 1,299 |
| 716 |
| 659 |
|
Total |
| 1,558 |
| 1,621 |
| 1,582 |
| 836 |
| 823 |
|
Net provisions for credit losses charged to income statement |
|
|
|
|
|
|
|
|
|
|
|
Domestic: |
|
|
|
|
|
|
|
|
|
|
|
Commercial, financial, agricultural, industrial |
| 740 |
| 488 |
| 418 |
| 310 |
| 520 |
|
Real estate and construction |
| 96 |
| 142 |
| (36) |
| 80 |
| (23) |
|
Other mortgages |
| 27 |
| 112 |
| 159 |
| 85 |
| (34) |
|
Installment loans to individuals |
| 434 |
| 217 |
| 484 |
| 195 |
| 191 |
|
Lease finance |
| (51) |
| 22 |
| (22) |
| 4 |
| (6) |
|
Other |
| 49 |
| (25) |
| (39) |
| (1) |
| 37 |
|
Total Borrowers in Spain |
| 1,295 |
| 954 |
| 964 |
| 673 |
| 685 |
|
Borrowers outside Spain |
|
|
|
|
|
|
|
|
|
|
|
Government and official institutions |
| 18 |
| 7 |
| 8 |
| 4 |
| 20 |
|
Commercial and industrial |
| 9,034 |
| 9,688 |
| 8,295 |
| 4,331 |
| 4,344 |
|
Mortgage loans |
| 147 |
| 138 |
| 971 |
| 169 |
| 101 |
|
Other |
| 7 |
| 75 |
| 969 |
| 21 |
| 23 |
|
Total Borrowers outside Spain |
| 9,206 |
| 9,908 |
| 10,243 |
| 4,525 |
| 4,489 |
|
Total |
| 10,501 |
| 10,862 |
| 11,207 |
| 5,199 |
| 5,174 |
|
Charge-offs against credit loss allowance |
|
|
|
|
|
|
|
|
|
|
|
Domestic: |
|
|
|
|
|
|
|
|
|
|
|
Commercial, financial, agricultural, industrial |
| (784) |
| (1,095) |
| (1,264) |
| (468) |
| (375) |
|
Real estate and construction |
| (942) |
| (1,445) |
| (658) |
| (303) |
| (511) |
|
Other mortgages |
| (570) |
| (308) |
| (154) |
| (425) |
| (209) |
|
Installment loans to individuals |
| (565) |
| (243) |
| (408) |
| (242) |
| (249) |
|
Lease finance |
| (1) |
| (20) |
| (7) |
| (6) |
| (1) |
|
Other |
| (37) |
| (49) |
| (14) |
| (9) |
| (27) |
|
Total Borrowers in Spain |
| (2,899) |
| (3,160) |
| (2,505) |
| (1,453) |
| (1,372) |
|
Borrowers outside Spain |
|
|
|
|
|
|
|
|
|
|
|
Government and official institutions |
| - |
| - |
| - |
| (4) |
| (1) |
|
Commercial and industrial |
| (9,528) |
| (9,873) |
| (9,451) |
| (4,610) |
| (4,572) |
|
Mortgage loans |
| (235) |
| (357) |
| (374) |
| (157) |
| (120) |
|
Other |
| (10) |
| (132) |
| (429) |
| (21) |
| (75) |
|
Total Borrowers outside Spain |
| (9,774) |
| (10,362) |
| (10,253) |
| (4,793) |
| (4,768) |
|
Total |
| (12,673) |
| (13,522) |
| (12,758) |
| (6,246) |
| (6,140) |
|
163
The tables below show, for the periods indicated, a breakdown of allowances for credit losses by type and by domicile of the Group entity at which the allowances for credit losses are accounted for.
|
|
|
|
|
|
|
|
|
|
|
|
|
|
|
|
|
|
|
|
|
|
|
| Year Ended December 31, |
| |||||||
|
| 2018 | % |
| 2017 | % |
| 2016 | % |
|
|
| (in millions of euros, except percentages) |
| |||||||
Borrowers in Spain: |
|
|
|
|
|
|
|
|
|
|
Commercial, financial, agricultural, industrial |
| 2,562 | 9.60 |
| 2,011 | 8.15 |
| 1,344 | 5.40 |
|
Real estate and construction (A) |
| 2,450 | 4.07 |
| 2,956 | 11.98 |
| 2,430 | 9.76 |
|
Other mortgages |
| 1,852 | 11.92 |
| 2,460 | 9.97 |
| 2,636 | 10.59 |
|
Installment loans to individuals |
| 611 | 5.67 |
| 1,111 | 4.50 |
| 543 | 2.18 |
|
Lease finance |
| 92 | 0.38 |
| 134 | 0.54 |
| 156 | 0.63 |
|
Other |
| 116 | 0.44 |
| 74 | 0.30 |
| 105 | 0.42 |
|
Total Borrowers in Spain |
| 7,683 | 32.08 |
| 8,746 | 35.43 |
| 7,214 | 28.97 |
|
Borrowers outside Spain: |
|
|
|
|
|
|
|
|
|
|
Government and official institutions |
| 43 | 0.18 |
| 33 | 0.13 |
| 20 | 0.08 |
|
Commercial and industrial |
| 13,912 | 58.09 |
| 13,675 | 55.40 |
| 15,514 | 62.30 |
|
Mortgage loans |
| 2,083 | 8.70 |
| 1,833 | 7.43 |
| 1,970 | 7.91 |
|
Other |
| 226 | 0.94 |
| 395 | 1.60 |
| 182 | 0.73 |
|
Total Borrowers outside Spain |
| 16,264 | 67.92 |
| 15,936 | 64.57 |
| 17,686 | 71.03 |
|
Total |
| 23,947 | 100.00 |
| 24,682 | 100.00 |
| 24,900 | 100.00 |
|
(A) At December 31, 2018, 2017 and 2016 the allowances of the portfolio of loans to construction and property development companies with real estate purposes, defined in accordance with the Bank of Spain’s purpose-based classification guidelines, amounted to €521 million, €1,127 million, and €2,225 million, respectively. In this table and in the previous one, loans to construction and property development companies are defined as loans granted to companies that belong to that sector, irrespective of the purpose of the loan.
|
|
|
|
|
|
|
|
|
|
|
|
|
|
|
|
|
| Six Months Ended June 30, |
| ||||
|
| 2019 | % |
| 2018 | % |
|
|
| (in millions of euros, except percentages) |
| ||||
Borrowers in Spain: |
|
|
|
|
|
|
|
Commercial, financial, agricultural, industrial |
| 2,185 | 9.36 |
| 2,619 | 10.50 |
|
Real estate and construction (A) |
| 784 | 3.36 |
| 1,444 | 5.79 |
|
Other mortgages |
| 2,910 | 12.47 |
| 2,984 | 11.96 |
|
Installment loans to individuals |
| 1,045 | 4.48 |
| 1,467 | 5.88 |
|
Lease finance |
| 87 | 0.37 |
| 122 | 0.49 |
|
Other |
| 65 | 0.28 |
| 103 | 0.41 |
|
Total Borrowers in Spain |
| 7,076 | 30.33 |
| 8,740 | 35.04 |
|
Borrowers outside Spain: |
|
|
|
|
|
|
|
Government and official institutions |
| 44 | 0.19 |
| 54 | 0.22 |
|
Commercial and industrial |
| 13,865 | 59.42 |
| 13,793 | 55.30 |
|
Mortgage loans |
| 2,128 | 9.12 |
| 2,197 | 8.81 |
|
Other |
| 219 | 0.94 |
| 157 | 0.63 |
|
Total Borrowers outside Spain |
| 16,256 | 69.67 |
| 16,201 | 64.96 |
|
Total |
| 23,332 | 100.00 |
| 24,941 | 100.00 |
|
(A) At June 30, 2019 and 2018 the allowances of the portfolio of loans to construction and property development companies with real estate purposes, defined in accordance with the Bank of Spain’s purpose-based classification guidelines, amounted to €379 million and €918 million, respectively. In this table, loans to construction and property development companies are defined as loans granted to companies that belong to that sector, irrespective of the purpose of the loan. Allowances for real estate and construction decreased mainly due to sales of portfolios.
164
Non-performing Balances
The following table shows our non-performing assets (loans and other assets to collect) and contingent liabilities, excluding country-risk.
|
|
|
|
|
|
|
|
|
|
|
|
|
|
|
|
|
|
|
|
|
|
|
|
|
| Year ended December 31, |
| Six Months ended June 30, |
| ||||||
|
| 2018 |
| 2017 |
| 2016 |
| 2019 |
| 2018 |
|
|
| (in millions of euros) |
| ||||||||
Past-due and other non-performing balances (A) (B) (C): |
|
|
|
|
|
|
|
|
|
|
|
Domestic |
| 17,376 |
| 19,138 |
| 14,020 |
| 16,418 |
| 18,441 |
|
International |
| 18,316 |
| 18,459 |
| 19,623 |
| 18,003 |
| 18,212 |
|
Total |
| 35,692 |
| 37,596 |
| 33,643 |
| 34,421 |
| 36,654 |
|
(A) The total amount of our non-performing balances fully provisioned under IFRS was €1,479 million, €4,076 million and €4,514 million, at December 31, 2018, 2017 and 2016, respectively, and €1,340 million and €4,199 million at June 2019 and 2018 respectively. See “Item 5. Information on the Company—Bank of Spain`s Classification Requirements- Charge-off Assets” in part 3 of the 2018 Form 20-F.
(B) Non-performing balances due to country risk were €12 million, €11 million and €8 million, at December 31, 2018, 2017 and 2016, respectively, and €13 million and €11 million at June 2019 and 2018, respectively.
(C) At December 31, 2018, 2017 and 2016 (i) the total amount of our non-performing more than 90 days past-due balances was €21,201 million, €24,652 million and €21,189 million, respectively, and €20,368 million and €21,763 million at June 2019 and 2018, respectively, and (ii) the total amount of our other non-performing balances was €14,491 million, €12,944 million and €12,454 million, respectively, and €14,053 million and €14,891 million at June 2019 and 2018, respectively.
We do not believe that there is a material amount of assets not included in the foregoing table where known information about credit risk at June 30, 2019 (not related to transfer risk inherent in cross-border lending activities) gave rise to serious doubts as to the ability of the borrowers to comply with the loan repayment terms at such date.
Evolution of Non-performing Balances
The following table shows the movement in our non-performing assets and contingent liabilities (excluding country risk):
|
|
|
|
|
|
|
|
|
|
|
|
|
|
|
|
|
|
|
|
|
|
|
|
|
|
|
|
|
|
|
|
|
|
|
|
(in millions of euros) |
| Year ended |
| Year ended |
| Quarter ended |
| ||||||||||
|
| Dec. 31, |
| Dec. 31, |
| Jun. 30, |
| Mar. 31, |
| Dec. 31, |
| Sep. 30, |
| Jun. 30, |
| Mar. 31, |
|
|
| 2018 |
| 2017 |
| 2019 |
| 2019 |
| 2018 |
| 2018 |
| 2018 |
| 2018 |
|
|
|
|
|
|
|
|
|
|
|
|
|
|
|
|
|
|
|
Opening balance |
| 37,596 |
| 33,643 |
| 35,590 |
| 35,692 |
| 36,332 |
| 36,654 |
| 37,407 |
| 37,596 |
|
Entries |
| 10,910 |
| 8,269 |
| 2,511 |
| 2,147 |
| 3,136 |
| 2,528 |
| 2,906 |
| 2,340 |
|
Changes in scope of consolidation |
| 177 |
| 10,032 | (*) | - |
| - |
| 177 |
| - |
| - |
| - |
|
Exchange differences |
| (318) |
| (826) |
| (162) |
| 479 |
| (130) |
| (140) |
| (409) |
| 361 |
|
Write-offs |
| (12,673) |
| (13,522) |
| (3,519) |
| (2,728) |
| (3,823) |
| (2,710) |
| (3,250) |
| (2,890) |
|
Closing balance |
| 35,692 |
| 37,596 |
| 34,421 |
| 35,590 |
| 35,692 |
| 36,332 |
| 36,654 |
| 37,407 |
|
(*) Reflects the acquisition of Banco Popular in June 2017 and the agreement to sell 51% of the real estate business to Blackstone in the third quarter of 2017 (see Note 12 to our consolidated financial statements included in Part 2 of the 2018 Form 20-F).
165
Non-performing Balances Ratios
The following table shows the total amount of our computable credit risk, the amounts of our non-performing assets and contingent liabilities by category, our allowances for credit losses, the ratio of our non-performing balances to total computable credit risk and our coverage ratio at the dates indicated:
|
|
|
|
|
|
|
|
|
|
|
|
|
|
|
|
|
|
|
|
| Year Ended December 31, |
| Six Months Ended June 30, | ||||||
| 2018 |
| 2017 |
| 2016 |
| 2019 |
| 2018 |
| (in millions of euros, except percentages) | ||||||||
Computable credit risk (A) | 958,153 |
| 920,968 |
| 855,510 |
| 980,885 |
| 934,388 |
|
|
|
|
|
|
|
|
|
|
Non-performing balances by category: |
|
|
|
|
|
|
|
|
|
Individuals | 16,511 |
| 16,538 |
| 15,477 |
| 16,504 |
| 15,512 |
Mortgages | 8,371 |
| 9,129 |
| 8,278 |
| 8,314 |
| 8,296 |
Consumer loans | 6,154 |
| 5,307 |
| 5,486 |
| 6,043 |
| 5,542 |
Credit cards and others | 1,986 |
| 2,102 |
| 1,713 |
| 2,148 |
| 1,674 |
Enterprises | 16,137 |
| 18,423 |
| 15,247 |
| 15,447 |
| 17,412 |
Corporate Banking | 2,993 |
| 2,497 |
| 2,817 |
| 2,410 |
| 3,673 |
Public sector | 51 |
| 138 |
| 101 |
| 59 |
| 57 |
Total non-performing balances | 35,692 |
| 37,596 |
| 33,643 |
| 34,421 |
| 36,654 |
|
|
|
|
|
|
|
|
|
|
Allowances for total balances | 24,061 |
| 24,529 |
| 24,835 |
| 23,432 |
| 25,148 |
|
|
|
|
|
|
|
|
|
|
Ratios |
|
|
|
|
|
|
|
|
|
Non-performing balances (B) to computable credit risk | 3.73% |
| 4.08% |
| 3.93% |
| 3.51% |
| 3.92% |
Coverage ratio (C) | 67.41% |
| 65.24% |
| 73.82% |
| 68.07% |
| 68.61% |
Balances charged-off to total loans and contingent liabilities (D) | 1.16% |
| 1.29% |
| 1.31% |
| 1.10% |
| 1.14% |
(A) Computable credit risk is the sum of the face amounts of loans and leases (including non-performing assets but excluding country risk loans), guarantees and documentary credits.
(B) Non-performing loans and contingent liabilities, securities and other assets to collect.
(C) Allowances for total balances as a percentage of non-performing balances.
(D) Ratios at June 30, 2019 and June 30, 2018 reflect year-to-date net loan charge-offs, annualized. Ratios at year end reflect full year net loan charge-offs.
Other non-performing balances
We do not classify our loans and contingent liabilities to borrowers in countries with transitory difficulties (category 3) and countries in serious difficulties (category 4) as impaired balances. Loans and contingent liabilities in these categories do not stop accruing interest. However, we treat category 5 (doubtful countries) country risk outstanding as both a non-accruing and impaired balance.
|
|
|
|
|
|
|
|
|
|
|
|
|
|
|
|
|
|
|
|
|
|
|
|
Summary of non-performing balances |
| Year Ended December 31, |
| Six Months Ended June 30, |
| ||||||
|
| 2018 |
| 2017 |
| 2016 |
| 2019 |
| 2018 |
|
|
| (in millions of euros) |
| ||||||||
Balances classified as non-performing balances |
| 35,692 |
| 37,596 |
| 33,643 |
| 34,421 |
| 36,654 |
|
Non-performing balances due to country risk |
| 12 |
| 11 |
| 8 |
| 13 |
| 11 |
|
Total non-performing balances |
| 35,704 |
| 37,607 |
| 33,651 |
| 34,434 |
| 36,665 |
|
166
Foreclosed Assets
The table below sets forth the movements in our foreclosed assets for the periods shown.
|
|
|
|
|
|
|
|
|
|
|
|
|
|
|
|
|
|
|
|
|
|
|
|
|
|
|
|
|
|
|
|
|
|
|
|
|
| Total Year |
| Quarterly movements |
| Total Year |
| Six Months Ended June 30, |
| ||||||||
|
| Dec. 31, |
| Mar. 31, |
| Jun. 30, |
| Sep. 30, |
| Dec. 31, |
| Dec. 31, |
| Jun. 30, |
| Jun. 30, |
|
|
| (in millions of euros, except percentages) |
| ||||||||||||||
Opening balance |
| 11,685 |
| 27,464 |
| 11,159 |
| 10,860 |
| 10,697 |
| 27,464 |
| 10,468 |
| 27,464 |
|
Foreclosures |
| 1,752 |
| 317 |
| 279 |
| 228 |
| 586 |
| 1,410 |
| 508 |
| 596 |
|
Sales |
| (2,232) |
| (16,672) | (**) | (549) |
| (413) |
| (798) |
| (18,432) |
| (2,729) |
| (17,221) | (**) |
Perimeter |
| 17,529 |
| - |
| - |
| - |
| - |
| - |
| - |
| - |
|
Other movements |
| (1,270) |
| 50 |
| (29) |
| 22 |
| (18) |
| 26 |
| 515 |
| 21 |
|
Gross foreclosed assets and assets acquired in payment of customer debts |
| 27,464 | (*) | 11,159 |
| 10,860 |
| 10,697 |
| 10,468 |
| 10,468 |
| 8,762 |
| 10,860 |
|
Of which: in Spain |
| 26,336 |
| 9,634 |
| 9,401 |
| 9,285 |
| 9,250 |
| 9,250 |
| 7,585 |
| 9,401 |
|
Allowances established |
| 15,898 |
| 5,548 |
| 5,410 |
| 5,344 |
| 5,135 |
| 5,135 |
| 4,313 |
| 5,410 |
|
Of which: in Spain |
| 15,548 |
| 5,035 |
| 4,879 |
| 4,834 |
| 4,758 |
| 4,758 |
| 3,978 |
| 4,879 |
|
Closing balance (net) |
| 11,566 |
| 5,611 |
| 5,450 |
| 5,353 |
| 5,333 |
| 5,333 |
| 4,449 |
| 5,450 |
|
Of which: in Spain |
| 10,787 |
| 4,599 |
| 4,522 |
| 4,451 |
| 4,492 |
| 4,492 |
| 3,606 |
| 4,522 |
|
Allowance as a percentage of foreclosed assets and assets acquired in payment of customer debts |
| 57.9% |
| 49.7% |
| 49.8% |
| 49.9% |
| 49.1% |
| 49.1% |
| 49.2% |
| 49.8% |
|
Of which: in Spain |
| 59.0% |
| 52.3% |
| 51.9% |
| 52.1% |
| 51.4% |
| 51.4% |
| 52.5% |
| 51.9% |
|
|
|
|
|
|
|
|
|
|
|
|
|
|
|
|
|
|
|
(*) Includes the balances of Banco Popular
(**) In the first quarter of 2018 the Group closed the sale of 51% of the real estate business of Banco Popular to Blackstone.
Property financing provided for construction and property development
The table below shows the construction and real estate business in Spain portfolio, defined in accordance with the Bank of Spain’s purpose-based classification guidelines during the first half of 2019:
|
|
|
|
|
|
|
| Millions of euros |
| ||
|
| June 30, |
| June 30, |
|
Balance at the beginning of the year |
| 4,812 |
| 6,472 |
|
Foreclosed assets |
| (21) |
| (64) |
|
Reductions (A) |
| (531) |
| (539) |
|
Written-off assets |
| (129) |
| (117) |
|
Balance at the end of the year |
| 4,131 |
| 5,752 |
|
|
|
|
|
|
|
(A) Includes sales of portfolios, cash recoveries and third parties subrogations.
For more information about property financing provided for construction and property development see Note 16.d.ii to our interim consolidated financial statements in Part 2 of this report.
Research and development, patents and licenses, etc.
During 2018 and the first half of 2019 we spent €1,468 million and €499 million, respectively, in research and development activities in connection with information technology projects.
167
Tabular disclosure of contractual obligations
The following table summarizes our contractual obligations by remaining maturity at June 30, 2019:
|
|
|
|
|
|
|
|
|
|
|
|
Contractual obligations |
|
|
| More than |
| More than |
|
|
|
|
|
|
| Less than |
| 1 year but |
| 3 year but |
| More than |
|
|
|
(in millions of euros) |
| 1 year |
| less than 3 years |
| less than 5 years |
| 5 years |
| Total |
|
|
|
|
|
|
|
|
|
|
|
|
|
Deposits from credit institutions |
| 74,784 |
| 72,563 |
| 8,855 |
| 4,606 |
| 160,808 |
|
Customer deposits |
| 728,255 |
| 35,932 |
| 10,382 |
| 2,333 |
| 776,902 |
|
Marketable debt securities |
| 65,863 |
| 73,968 |
| 39,060 |
| 72,781 |
| 251,672 |
|
Liabilities under insurance contracts (1) |
| 569 |
| 63 |
| 32 |
| 55 |
| 719 |
|
Operating lease obligations |
| 1,213 |
| 1,393 |
| 998 |
| 3,514 |
| 7,118 |
|
Capital lease obligations |
| 44 |
| 46 |
| 30 |
| 56 |
| 176 |
|
Other long-term liabilities (2) |
| 1,624 |
| 3,015 |
| 3,594 |
| 5,728 |
| 13,961 |
|
Contractual interest payment (3) |
| 5,946 |
| 5,564 |
| 5,137 |
| 20,141 |
| 36,788 |
|
Total |
| 878,298 |
| 192,544 |
| 68,088 |
| 109,214 |
| 1,248,144 |
|
(A) Includes life insurance contracts in which the investment risk is borne by the policy holder and insurance savings contracts.
(B) Other long-term liabilities relate to pensions and similar obligations and include the estimated benefit payable for the next ten years.
(C) Calculated for all Deposits from credit institutions, Customer deposits, Marketable debt securities and Subordinated debt assuming a constant interest rate based on data as of December 31, 2018 over time for all maturities, and those obligations with maturities of more than five years have an average life of ten years.
The table above excludes the “fixed payments” of our derivatives since derivative contracts executed by the Group apply close-out netting across all outstanding transactions, that is, these agreements provide for settlements to be made on a maturity or settlement date for the differences that arise, and as such, the obligation to be settled in the future is not fixed at the present date and is not determined by the fixed payments.
Higher-Risk Loans
Grupo Santander does not have any significant exposure to higher-risk loans. Our credit portfolio is focused on retail banking with a medium-low risk profile, and with broad diversification both by geography and segment. 62% of the Group net customer loans are secured, mostly by real estate collateral.
Mortgages to individuals represent approximately 35% of the Group net customer loans, with a low risk profile, low non-performing ratios and an adequate coverage ratio.
Among other factors, this is due to the fact that these loans are mainly first residence mortgages and subject to a rigorous assessment of credit risk and affordability. The admission process assesses both the current and future payment capacity of the customer, evaluating if the client’s disposable income will most likely be enough to meet the loans’ instalments.
Certain mortgage portfolios that may present higher risks than others (interest only, flexible loans, loans with LTV greater than 100%, buy to let), are subject to even more strict lending policies to mitigate their risks. Furthermore, they represent a low percentage of the Group portfolio, and their performance is continuously monitored to ensure an adequate control.
With regards to the real estate unit management in Spain (Actividad Inmobiliaria España), it continued to focus on reducing loans and foreclosed assets. The Group reached an agreement with a subsidiary of Cerberus Capital Management to sell 35,700 properties for EUR 1,535 million, carried out during the 1Q19. The portfolio’s net value as of June was EUR 3.8 billion, equivalent to less than 1% of Spain’s balance-sheet.
In addition, other portfolios also demand specific monitoring due to the inherent nature of their business and particular risk profile, which seeks the optimization of risk adjusted returns. This is the case of the Santander Consumer USA portfolio, mainly focused on auto loans and leases, representing 3.03% of the Group’s total loans with a return on tangible equity, at 2Q19, of 31% .
Changes in Practices
There have not been any significant changes in policies and practices in response to the effects of the current economic environment that might affect the quality of the credit information presented. This is due to the fact that our risk management and control model is based on the principles set down below:
168
1. | An advanced and comprehensive risk management framework, with a forward-looking approach that allows the Group to maintain a medium-low risk profile, through a risk appetite defined by Banco Santander’s board of directors and the identification and assessment of existing and emerging risks. |
2. | Lines of defense that enable risk to be managed and monitored at its source, in addition to an independent assessment. |
3. | A model predicated on autonomous subsidiaries with robust governance based on a clear committee structure that separates the risk management and control functions. |
4. | Information and technological management processes that allow all risks to be identified, developed, managed and reported at appropriate levels. |
5. | A risk culture integrated throughout the organization, composed of a series of attitudes, values, skills and action guidelines to deal with all risks. |
6. | All risks are managed by the units that generate them, using advanced modelling techniques and tools. |
These principles, combined with a series of relevant interrelated tools and processes in the Group strategy planning (risk appetite, risk profile assessment, analysis of scenarios, risk reporting framework, budgetary processes, etc.) are the key components of the risk control framework which are essential for an adequate monitoring and oversight of the risk profile.
Other
We use credit derivatives to cover loans and trading transactions focused on servicing our customers’ needs. This activity is subject to strict internal controls that minimize operational risk. Risk in these activities is controlled via a series of limits such as VaR, nominal by rating, sensitivity to the spread by rating and name, and sensitivity to the rate of recovery and to correlation. Jump-to-default limits are also set by geographic area, sector and liquidity.
Exposures related to complex structured assets
We have a very limited exposure to complex structured assets. See “Quantitative Analysis About Market Risk” below.
Quantitative Analysis About Market Risk
A.Activities subject to market risk and types of market risk
The perimeter of activities subject to market risk involves transactions where patrimonial risk is assumed as a consequence of variations in market factors. Thus they include trading risks and also structural risks, which are also affected by market shifts.
This risk arises from changes in risk factors (interest rates, inflation rates, exchange rates, share prices, the spread on loans, commodity prices and the volatility of each of these elements) as well as from the liquidity risk of the various products and markets in which the Group operates.
· Interest rate risk is the possibility that changes in interest rates could adversely affect the value of a financial instrument, a portfolio or the Group as a whole. It affects loans, deposits, debt securities, most assets and liabilities in the trading books and derivatives, among others. |
· Inflation rate risk is the possibility that changes in inflation rates could adversely affect the value of a financial instrument, a portfolio or the Group as a whole. It affects instruments such as loans, debt securities and derivatives, where the return is linked to inflation or to a change in the actual rate. |
· Exchange rate risk is the sensitivity of the value of a position in a currency other than the base currency to a movement in exchange rates. Hence, a long or open position in a foreign currency will produce a loss if that currency depreciates against the base currency. Among the exposures affected by this risk are the Group’s investments in subsidiaries in non-euro currencies, as well as any foreign currency transactions. |
· Equity risk is the sensitivity of the value of positions in equities to adverse movements in market prices or expectations of future dividends. Among other instruments, this affects positions in shares, stock market indices, convertible bonds and derivatives using shares as the underlying asset (put, call, equity swaps, etc.) |
169
· Credit spread risk is the risk or sensitivity of the value of positions in fixed income securities or in credit derivatives to movements in credit spread curves or in recovery rates associated with issuers and specific types of debt. The spread is the difference between financial instruments listed with a margin over other benchmark instruments, mainly the interest rate risk of Government bonds and interbank interest rates. |
· Commodities price risk is the risk derived from the effect of potential changes in prices. The Group’s exposure to this risk is not significant and is concentrated in derivative transactions on commodities with customers. |
· Volatility risk is the risk or sensitivity of the value of a portfolio to changes in the volatility of risk factors: interest rates, exchange rates, shares, credit spreads and commodities. This risk is incurred by all financial instruments where volatility is a variable in the valuation model. The most significant case is financial options portfolios. |
All these market risks can be partly or fully mitigated by using options, futures, forwards and swaps.
In addition, other types of market risk require more complex hedging. For example:
· Correlation risk is the sensitivity of the portfolio to changes in the relationship between risk factors (correlation), either of the same type (for example, two exchange rates) or different types (for example, an interest rate and the price of a commodity). |
· Market liquidity risk is that of a Group entity or the Group as a whole cannot reverse or close a position in time without having an impact on the market price or the cost of the transaction. Market liquidity risk can be caused by a reduction in the number of market makers or institutional investors, the execution of large volumes of transactions, or market instability. It increases as a result of the concentration of certain products and currencies. |
· Prepayment or cancellation risk. When the contractual relationship in certain transactions explicitly or implicitly allows the possibility of early cancellation without negotiation before maturity, there is a risk that the cash flows may have to be reinvested at a potentially lower interest rate. This mainly affects mortgage loans and mortgage securities. |
· Underwriting risk. This occurs as a result of an entity’s participation in underwriting a placement of securities or another type of debt, assuming the risk of partially owning the issue or the loan due to non-placement of all of it among potential buyers. |
In addition to the above market risks, balance sheet liquidity risk must also be considered. Unlike market liquidity risk, balance sheet liquidity risk is defined as the possibility of not meeting payment obligations on time, or doing so at excessive cost. Among the losses caused by this risk are losses due to forced sales of assets or margin impacts due to the mismatch between expected cash inflows and outflows.
On the other hand, pension and actuarial risks also depend on shifts in market factors, which are described in more detail, in this chapter.
The Group has projects under way for compliance with obligations related to the Basel Committee’s Fundamental Review of the Trading Book, and for compliance with EBA guidelines on balance sheet interest rate risk. The objective of these projects is to have the best tools for control and management of market risks available to both managers and control units, all within a governance framework that is appropriate for the models used and the reporting of risk metrics. These projects allow meeting the requirements related to regulatory demands in these risk factors.
B.Trading market risk management
System for controlling limits
Setting trading market risk limits is a dynamic process, determined by the Group’s predefined risk appetite levels. This process is part of an annual limits plan defined by the Group’s senior management, involving every Group’s entity.
The market risk limits are established based on different metrics and are intended to cover all activities subject to market risk from many perspectives, applying a conservative approach. The main ones are:
• Value at Risk (VaR) and Stressed VaR limits.
• Limits of equivalent and/or nominal positions.
• Interest rate sensitivity limits.
• Vega limits.
• Delivery risk limits for short positions in securities (fixed income and securities).
• Limits to constrain the volume of effective losses, and protect results generated during the period:
• Loss trigger.
• Stop loss.
170
• Credit limits:
• Total exposure limit.
��� Jump to default by issuer limit.
• Others.
• Limits for origination transactions.
These general limits are complemented by other sub-limits to establish a sufficiently granular limits framework for the effective control of the market risk factors to which the Group is exposed in its trading activities. Positions are monitored on a daily basis globally and for each unit at desk level, as well as with an exhaustive control of changes to portfolios and trading desks, so as to identify any incidents that might need immediate correction, and thus comply with the Volcker Rule.
Three categories of limits are established based on the scope of approval and control: global approval and control limits, global approval limits with local control, and local approval and local control limits. The limits are requested by the business executive of each country/entity, considering the particular nature of the business in order to achieve the established budget targets, seeking consistency between the limits and the risk/return ratio. The limits are approved by the corresponding risk bodies.
Business units must comply with the approved limits at all times. In the event of a limit being exceeded, the local business executives have to explain, in writing and on the same day, the reasons for the excess and the action plan to correct the situation, which in general might consist of reducing the position until it reaches the defined limits or setting out the strategy that justifies an increase in the limits.
If the business unit fails to respond to the breach within three days, the global business executives will be asked to set out the actions to be taken in order to make the adjustment to the existing limits. If this situation lasts for ten days as of the first excess, senior risk management will be informed so that a decision can be taken: the risk takers could be required to reduce the levels of risk assumed.
Methodologies
a) Value at Risk (VaR)
The standard methodology Santander applies to trading activities is Value at Risk (VaR), which measures the maximum expected loss with a certain confidence level and time frame. The standard for historic simulation is a confidence level of 99% and a time frame of one day. Statistical adjustments are applied enabling the most recent developments affecting the levels of risk assumed to be incorporated efficiently and on a timely manner. A time frame of two years or at least 520 days from the reference date of the VaR calculation is used. Two figures are calculated every day: one applying an exponential decay factor that allocates less weight to the observations furthest away in time and another with the same weight for all observations. The higher of the two is reported as the VaR.
Simultaneously the Value at Earnings (VaE) is calculated, which measures the maximum potential gain with a certain level of confidence and time frame, applying the same methodology as for VaR.
VaR by historic simulation has many advantages as a risk metric (it sums up in a single number the market risk of a portfolio, it is based on market movements that really occurred without the need to make assumptions of functions forms or correlations between market factors, etc.), but it also has its limitations.
Some limitations are intrinsic to the VaR metrics, regardless of the methodology used in their calculation, including:
• The VaR calculation is calibrated at a certain level of confidence, which does not indicate the levels of possible losses beyond it.
• There are some products in the portfolio with a liquidity horizon greater than that specified in the VaR model.
• VaR is a static analysis of the portfolio risk, and the situation could change significantly during the following day, although the likelihood of this occurring is very low.
Using the historic simulation methodology also has its limitations:
• High sensitivity to the historic window used.
• Inability to capture plausible events that would have significant impact, if these do not occur in the historic window used.
• The existence of valuation parameters with no market input (such as correlations, dividend and recovery rate).
• Slow adjustment to new volatilities and correlations, if the most recent data receives the same weight as the oldest data.
Some of these limitations are overcome by using Stressed VaR and expected shortfall, calculating VaR with exponential decay and applying conservative valuation adjustments. Furthermore, as previously stated, the Group regularly conducts analysis and backtesting of the VaR calculation model accuracy.
171
b) Stressed VaR (sVaR) and expected shortfall (ES)
In addition to standard VaR, Stressed VaR is calculated daily for the main portfolios. The calculation methodology is the same as for VaR, with the two following exceptions:
• The historical observation period for the factors: when calculating stressed VaR a window of 260 observations is used, rather than 520 for VaR. However, this is not the most recent data: rather, the data used is from a continuous period of stress for the portfolio in question. This is determined for each major portfolio by analysing the history of a subset of market risk factors selected based on expert judgement and the most significant positions in the books.
• Unlike VaR, stressed VaR is obtained using the percentile with uniform weighting, not the higher of the percentiles with exponential and uniform weightings.
Moreover, the expected shortfall is also calculated by estimating the expected value of the potential loss when this is higher than the level set by VaR. Unlike VaR, ES has the advantages of capturing the risk of large losses with low probability (tail risk) and being a sub-additive metric. The Basel Committee considers that ES with a 97.5% confidence interval delivers a similar level of risk to VaR at a 99% confidence interval. ES is calculated by applying uniform weights to all observations.
c) Scenario analysis
The Group uses other metrics in addition to VaR, providing it greater control over the risks it faces in the markets where it is active. These measures include scenario analysis, which consists in defining alternative behaviours for various financial variables and obtaining the impact on results of applying these to activities. These scenarios may replicate events that occurred in the past (such as a crisis) or determine plausible alternatives that are unrelated to past events.
The potential impact on earnings of applying different stress scenarios is regularly calculated and analysed, particularly for trading portfolios, considering the same risk factor assumptions. Three scenarios are defined, as a minimum: plausible, severe and extreme. Taken together with VaR, these reveal a much more complete spectrum of the risk profile.
A number of trigger thresholds have also been established for global scenarios, based on their historical results and the capital associated with the portfolio in question. When these triggers are activated, the portfolio managers are notified so they can take appropriate action. The results of the global stress exercises, and any breaches of the trigger thresholds, are reviewed regularly, and reported to senior management, when this is considered appropriate.
d) Analysis of positions, sensitivities and results
Positions are used to quantify the net volume of the market securities for the transactions in the portfolio, grouped by main risk factor, considering the delta value of any futures or options. All risk positions can be expressed in the base currency of the local unit and the currency used for standardizing information. Changes in positions are monitored on a daily basis to detect any incidents, so they can be corrected immediately.
Measurements of market risk sensitivity estimate the variation (sensitivity) of the market value of an instrument or portfolio to any change in a risk factor. The sensitivity of the value of an instrument to changes in market factors can be obtained using analytical approximations through partial derivatives or through a complete revaluation of the portfolio.
Furthermore, the daily formulation of the income statement by the Risk area is an excellent indicator of existing risks, as it allows to identify the impact of changes in financial variables on portfolios.
e) Derivatives activities and credit management
Also noteworthy is the control of derivative activities and credit management which, because of its atypical nature, is conducted daily with specific measures. First, the sensitivities to price movements of the underlying asset (delta and gamma), volatility (vega) and time (theta) are controlled. Second, measures such as the sensitivity to the spread, jump-to-default, concentrations of positions by level of rating, etc., are reviewed systematically.
With regard to the credit risk inherent to trading portfolios, and in line with the recommendations of the Basel Committee and prevailing regulations, a further metric is also calculated: the incremental risk charge (IRC). This seeks to cover the risks of non-
172
compliance and ratings migration that are not adequately captured in VaR, through changes in the corresponding credit spreads. This metric is essentially applied to fixed-income bonds, both public and private, derivatives on bonds (forwards, options, etc.) and credit derivatives (credit default swaps, asset backed securities, etc.). IRC is calculated using direct measurements of loss distribution tails at an appropriate percentile (99.9%), over a one year horizon. The Montecarlo methodology is used, applying one million simulations.
f) Credit Valuation Adjustment (CVA) and Debt Valuation Adjustment (DVA)
The Group incorporates CVA and DVA when calculating the results of trading portfolios. The CVA is a valuation adjustment of over the-counter (OTC) derivatives, as a result of the risk associated with the credit exposure assumed by each counterparty.
It is calculated by taking into account the potential exposures with each counterparty in each future maturity. The CVA for a particular counterparty is the sum of the CVA for all maturities. For its calculation, the following inputs are considered:
• Expected exposure: including, for each operation the current market value (MTM) as well as the potential future risk (add-on) to each maturity. Mitigating factors such as collateral and netting agreements are taken into account, as well as a time decay factor for derivatives with partial interim payments.
• Loss given default: the percentage of final loss assumed in case of default/non-payment of the counterparty.
• Probability of default: for cases in which there is no market information (spread curve traded through CDS, etc.), general proxies generated on the basis of same sector companies with listed CDSs for the same sector and the counterparty’s external rating.
• Discount factor curve.
The Debt Valuation Adjustment (DVA) is a valuation adjustment similar to the CVA, but in this case as a result of the Group’s risk that counterparties assume in OTC derivatives.
C.Key metrics (Trading Market Risk)
Grupo Santander’s trading risk profile remained relatively low in the first half of 2019, in line with previous years, due to the fact that the Group’s activity has traditionally been focused on providing services to its customers, with only limited exposure to complex structured products, and due to the geographic and by risk factor diversification.
Value at Risk (VaR) analysis
During the first half of 2019 year, we maintained our strategy of concentrating our trading activity on customer business, minimizing, where possible, exposures of directional risk opened in net terms.
Evolution of VaR for the first half of 2019.
EUR million. VaR at 99% over a one day horizon.
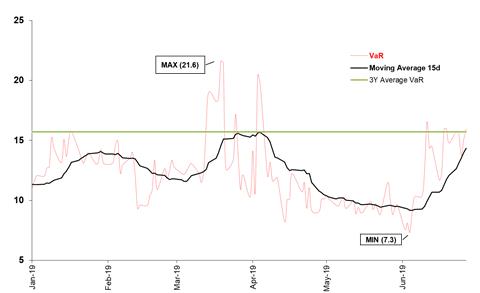
173
VaR during the first half of 2019 fluctuated between EUR 7.3 million and EUR 21.6 million, temporarily above the average of the last three years. The most significant variations were related to changes in exchange rate and interest rate exposure and also market volatility. The average VaR for the period was EUR 12.4 million, ending the VaR in June at EUR 16.0 million.
The following histogram shows the distribution of risk in terms of VaR in the first six months of 2019. The accumulation of days with levels of between EUR 8.5 million and EUR 17.5 million (94%) is shown. Values higher than EUR 17.5 million (6%) largely occur in periods affected by temporary spikes in volatility, mainly in the Brazilian reai against the US dollar and also in Brazilian interest rates.
VaR Histogram
VaR at 99%, over a one day horizon. Number of days (%) in each range for the first half of 2019.
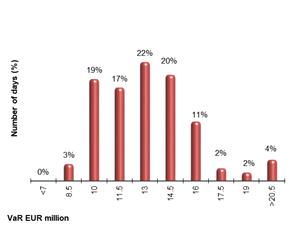
174
Risk by factor
The minimum, average, maximum and final values in VaR terms at 99% for the first six months of 2019 are displayed in the following table:
VaR statistics by risk factor
EUR million. VaR at 99%, with one day time horizon
|
| VaR (99%) | ||||||
|
| Minimum |
| Average |
| Maximum |
| Latest |
Total trading |
|
|
|
|
|
|
|
|
Total |
| 7.3 |
| 12.4 |
| 21.6 |
| 16.0 |
Diversification effect |
| (0.4) |
| (8.1) |
| (21.2) |
| (11.1) |
Interest rate |
| 7.0 |
| 10.8 |
| 17.6 |
| 15.5 |
Equities |
| 1.0 |
| 2.5 |
| 15.3 |
| 3.2 |
Exchange rate |
| 1.8 |
| 3.6 |
| 7.2 |
| 4.8 |
Credit spread |
| 2.3 |
| 3.6 |
| 4.8 |
| 3.5 |
Commodities |
| 0.0 |
| 0.0 |
| 0.1 |
| 0.0 |
|
|
|
|
|
|
|
|
|
Europe |
|
|
|
|
|
|
|
|
Total |
| 4.2 |
| 5.9 |
| 9.5 |
| 5.9 |
Diversification effect |
| (3.6) |
| (6.0) |
| (8.6) |
| (6.4) |
Interest rate |
| 3.6 |
| 5.4 |
| 10.6 |
| 4.4 |
Equities |
| 0.4 |
| 0.9 |
| 2.3 |
| 2.2 |
Exchange rate |
| 1.1 |
| 2.0 |
| 3.5 |
| 2.2 |
Credit spread |
| 2.3 |
| 3.6 |
| 5.1 |
| 3.5 |
Commodities |
| 0.0 |
| 0.0 |
| 0.0 |
| 0.0 |
|
|
|
|
|
|
|
|
|
South America |
|
|
|
|
|
|
|
|
Total |
| 5.8 |
| 10.0 |
| 20.7 |
| 10.8 |
Diversification effect |
| (1.0) |
| (3.7) |
| (7.7) |
| (2.2) |
Interest rate |
| 5.6 |
| 8.4 |
| 16.0 |
| 7.0 |
Equities |
| 0.6 |
| 2.3 |
| 7.0 |
| 2.0 |
Exchange rate |
| 0.6 |
| 2.3 |
| 5.5 |
| 3.8 |
Credit Spread |
| 0.2 |
| 0.2 |
| 1.1 |
| 0.2 |
Commodities |
| 0.0 |
| 0.0 |
| 0.1 |
| 0.0 |
|
|
|
|
|
|
|
|
|
North America |
|
|
|
|
|
|
|
|
Total |
| 1.5 |
| 3.1 |
| 5.0 |
| 4.9 |
Diversification effect |
| (0.4) |
| (1.0) |
| (2.2) |
| (1.9) |
Interest rate |
| 1.5 |
| 2.4 |
| 3.5 |
| 2.6 |
Equities |
| 0.1 |
| 0.2 |
| 0.3 |
| 0.1 |
Exchange rate |
| 0.4 |
| 1.5 |
| 4.0 |
| 4.0 |
Credit Spread |
| 0.0 |
| 0.0 |
| 0.0 |
| 0.0 |
Commodities | �� | 0.0 |
| 0.0 |
| 0.0 |
| 0.0 |
|
|
|
|
|
|
|
|
|
The average VaR in the first half of 2019, EUR 12.4 million, was higher than the average VaR in the first half of 2018, EUR 10.4 million, mainly due to a slight increase in interest rate risk (EUR 10.8 million vs. EUR 10.4 million), in Equities risk (EUR 2.5 million vs. EUR 2.3 million) and lower diversification effect (EUR -8.1 million vs EUR -10.3 million).
175
VaR evolution by risk factor
EUR million. VaR at 99% with one day time horizon (15 day moving average)
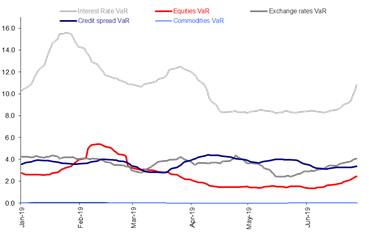
Gauging and contrasting measures
Actual losses can differ from those forecast by the VaR for various reasons related to the limitations of this metric, which are set out in detail later in the section on the methodologies. The Group regularly analyses and contrasts the accuracy of the VaR calculation model in order to confirm its reliability.
The most important test consists of backtesting exercises, analysed at the local and global levels and in all cases with the same methodology. Backtesting consists of comparing the forecast VaR measurements, with a certain level of confidence and time frame, with the real results of losses obtained in a same time frame. This enables anomalies in the VaR model of the portfolio in question to be detected (for example, shortcomings in the parameterization of the valuation models of certain instruments, not very adequate proxies, etc.).
Santander calculates and evaluates three types of backtesting:
· “Clean” backtesting: the daily VaR is compared with the results obtained without taking into account the intraday results or the changes in the portfolio’s positions. This method contrasts the effectiveness of the individual models used to assess and measure the risks of the different positions. |
· Backtesting on complete results: the daily VaR is compared with the day’s net results, including the results of intraday operations and those generated by fees and commissions. |
· Backtesting on complete results without mark-ups or fees: the daily VaR is compared with the day’s net results from intraday transactions but excluding those generated by mark-ups and fees. This method aims to give an idea of the intraday risk assumed by the Group treasuries. |
In the last twelve months, for the first type and for the total portfolio, there were three exceptions to VaR at 99% (days on which the daily loss was higher than VaR) caused by the strong variations in exchange rates and interest rates in Brazil and Mexico motivated by the general elections volatility. There were three exceptions to VaE (days on which the daily profit was higher than VaE) caused by strong shifts in the exchange rates of emerging economies. All exceptions occurred in 2018, with no exceptions recorded in the first half of 2019.
Derivatives risk management
Derivatives activity is mainly focused on commercialisation of investment products and on hedging risks for our customers. Management is focused on ensuring that the net risk opened is the lowest possible.
These transactions include options on equities, fixed income and exchange rates. The units where this activity mainly takes place are: Spain, Brazil, the UK and Mexico.
176
Risk of derivatives (in terms of VaR Vega at 99%, over a one day horizon) moved in the first half of 2019 in a range between EUR 0.8 million and EUR 3.0 million.
The Group continues to have a very limited exposure to instruments or complex structured assets, showing a management culture for which prudence in risk management is one of its hallmarks in risk management. At the end of the first half of 2019, the Group had:
· Hedge funds: the exposure was EUR 18 million, all of it indirect, acting as counterparty in derivatives transactions. The risk with this type of counterparty is analysed case by case, establishing percentages of collateralization on the basis of the features and assets of each fund. |
· Monolines: no exposure at the end of June 2019. |
The Group’s policy for approving new transactions related to these products remains very prudent and conservative. It is subject to strict supervision by the Group’s senior management. Before approving a new transaction, product or underlying asset, the Risk division verifies:
· The existence of an appropriate valuation model to monitor the value of each exposure: Mark-to-Market, Mark-to-Model or Mark-to-Liquidity. |
· The availability in the market of observable data (inputs) needed to be able to apply this valuation model. |
And provided these two conditions are always met:
· The availability of adequate systems, duly adapted to calculate and monitor every day the results, positions and risks of new transactions. |
· The degree of liquidity of the product or underlying asset, in order to make possible their coverage when deemed appropriate. |
Scenario analysis
Various stress scenarios were calculated and analysed regularly in the first half of 2019 (at least monthly) at the local and global levels for all the trading portfolios and using the same risk factor assumptions.
Worst Case scenario
This scenario is given particular attention as it combines historic movements of risk factors with a historic volatility equivalent to ±3 and ± 6 standard deviations. The scenario is defined by taking for each risk factor the movement which represents the largest potential loss in the portfolio.
At the end of June 2019, that scenario implied, for the global portfolio, interest rate rises in South American and European markets and falls in North American markets, stock market falls, depreciation of all currencies against the euro, and increases in credit spreads. The results for this scenario at the end of June 2019 are shown in the following table.
Stress scenario: worst case. EUR million
|
|
|
|
|
|
|
|
|
|
|
|
|
|
|
| Interest rate |
| Equities |
| Exchange rate |
| Credit spread |
| Commodities |
| Total |
|
Total trading |
| (54.9) |
| (23.9) |
| (23.2) |
| (10.1) |
| 0.0 |
| (112.1) |
|
Europe |
| (1.7) |
| (17.3) |
| (3.1) |
| (10.1) |
| 0.0 |
| (32.2) |
|
South America |
| (41.5) |
| (6.2) |
| (13.7) |
| (0.0) |
| 0.0 |
| (61.4) |
|
North America |
| (11.7) |
| (0.4) |
| (6.4) |
| 0.0 |
| 0.0 |
| (18.5) |
|
The stress test shows that the economic loss suffered by the Group in its trading portfolios, in terms of the mark to market (MtM) result would be EUR 112.1 million, if the stress movements defined in the scenario materialized in the market. This loss would be concentrated in South America (in the following order: interest rate, exchange rate and equities).
Other global stress test scenarios
‘Abrupt crisis’: an ad-hoc scenario with sharp market movements. Rise in interest rate curves, sharp falls in stock markets, strong appreciation of the dollar against other currencies, rise in volatility and in credit spreads.
177
‘Subprime crisis’: historic scenario of the US mortgage crisis. The objective of the analysis was to capture the impact on results of the reduction in liquidity in the markets. Two time horizons were used (one day and 10 days), and in both cases there were falls in stock markets and in interest rates in core markets and rises in emerging markets, and appreciation of the US dollar against other currencies.
‘Plausible Forward Looking Scenario’: a hypothetical plausible scenario defined at local level in market risk units, based on the portfolio positions and their expert judgement regarding short-term changes in market variables which can have a negative impact on such positions.
‘EBA adverse scenario’: the scenario proposed by the EBA in April 2014 as part of the EBA 2014 EU-Wide Stress Test and updated in January 2016. It was initially conceived as an adverse scenario proposed by European banks thinking in terms of a 2014-2016 time horizon and subsequently updated to the 2016-2018 time horizon. It reflects the systemic threats which are considered to be the most serious threats to the stability of the banking sector in the European Union.
Analysis of reverse stress tests, which are based on establishing a predefined result (unfeasibility of a business model or possible insolvency) and subsequently the risk factor scenarios and movements which could cause that situation are identified.
On a monthly basis, a stress test assessment report is performed containing explanations of the main results variations for the different scenarios and units. An early warning mechanism has also been established so that when the loss for a scenario is high in historic terms and/or in terms of the capital consumed by the portfolio in question, the relevant business executive is informed.
D.Structural balance sheet risks management
System for controlling limits
As already stated for the market risk in trading, under the annual limits plan framework, limits are set for balance sheet structural risks, responding to the Group’s risk appetite level.
The main limits are:
• Balance sheet structural interest rate risk:
• Limit on the sensitivity of net interest income in 1 year.
• Limit on the sensitivity of equity value.
• Structural exchange rate risk:
• Net position in each currency (for results hedging positions).
In the event one of these limits or their sub limits is exceeded, the risk management executives must explain the reasons and facilitate the actions to correct it.
Methodologies
a) Structural interest rate risk
The Group analyses the sensitivity of its net interest income and equity value to changes in interest rates. This sensitivity arises from differences in maturity dates and interest rate repricing gaps in the various balance sheet items.
Taking into consideration the balance-sheet interest rate position and the market situation and outlook, the necessary financial actions are adopted to align this position with that desired by the Group. These measures can range from opening positions on markets to the definition of the interest rate features of commercialised products.
The metrics used by the Group to control interest rate risk in these activities are the repricing gap, the sensitivity of net interest margin and market value of equity to changes in interest rates, the duration of capital and value at risk (VaR) for economic capital calculation purposes.
b) Interest rate gap on assets and liabilities
This is the basic concept for identifying the Group’s interest rate risk profile and it measures the difference between the volume of sensitive assets and liabilities on and off balance sheet that re-price (i.e. that mature or are subject to rate revisions) at certain times (called, buckets). This provides an immediate approximation of the sensitivity of the entity’s balance sheet and its net interest income and equity value to changes in interest rates.
c) Net interest income (NII) sensitivity
178
This is a key measure of the profitability of balance sheet management. It is calculated as the difference which arises in the net interest income during a certain period of time due to a parallel movement in interest rates. The standard period for measuring net interest income sensitivity is one year.
d) Economic value of equity (EVE) sensitivity
This measures the interest rate risk implicit in equity value (which for the purposes of interest rate risk is defined as the difference between the net current value of assets and the net current value of liabilities outstanding), based on the impact that a change in interest rates would have on those current values.
e) Treatment of liabilities without defined maturity
In the corporate model, the total volume of the balances of accounts without maturity is divided between stable and unstable balances which are obtained from a model that is based on the relationship between balances and their own moving averages.
From this simplified model, the monthly cash flows are obtained and used to calculate NII and EVE sensitivities.
This model requires a variety of inputs:
• Parameters inherent in the product.
• Performance parameters of the client (in this case analysis of historic data is combined with the expert business view).
• Market data.
• Historic data of the portfolio.
f) Pre-payment treatment for certain assets
The pre-payment issue mainly affects fixed-rate mortgages in units where the relevant interest rate curves for the balance sheet are at low levels. This risk is modelled in these units, and this can also be applied, with some modifications, to assets without defined maturity (credit card businesses and similar).
The usual techniques used to value options cannot be applied directly because of the complexity of the factors that determine borrower pre-payments. As a result, the models for assessing options must be combined with empirical statistical models that seek to capture pre-payment performance. Some of the factors conditioning this performance are:
• Interest rate: the differential between fixed rates on the mortgage and the market rate at which it could be refinanced, net of cancellation and opening costs.
• Seasoning: reflects the existing trend of lower prepayments at the beginning of the transaction’s life-cycle, which then increase and stabilises as time goes by.
• Seasonality: redemptions or early cancellations tend to take place at specific dates.
• Burnout: decreasing trend in the speed of pre-payment as the instrument’s maturity approaches, which includes:
a) Age: defines low rates of pre-payment.
b) Cash pooling: defines those loans that have already overcome various waves of interest rate falls as more stable. In other words, when a loan portfolio has passed one or more cycles of downward rates and thus high levels of pre-payment, the ‘surviving’ loans have a significantly lower prepayment probability.
c) Other: geographic mobility, demographic, social and available income factors, etc.
The series of econometric relationships that seek to capture the impact of all these factors is the probability of pre-payment of a loan or pool of loans and is denominated the pre-payment model.
179
g) Value at Risk (VaR)
For balance sheet activity and investment portfolios, this is defined as the 99% percentile of the distribution function of losses in equity value, calculated based on the current market value of positions and returns over the last two years, at a particular level of statistical confidence over a certain time horizon. As with trading portfolios, a time frame of two years or at least 520 days from the reference date of the VaR calculation is used.
The Group is working on implementing the guidelines published by the EBA on management of interest rate risk in the banking book (Irrbb), published in July 2018 and applicable in 2019.
h) Structural foreign exchange rate risk/hedging of results
These activities are monitored via position measurements, VaR and results, on a monthly basis.
i) Structural equity risk
These activities are monitored via position measurements, VaR and results, on a monthly basis.
E. Key metrics (structural balance sheet risks)
The market risk profile inherent in Grupo Santander’s balance sheet, in relation to its asset volumes and shareholders’ funds, as well as the budgeted financial margin, remained moderate in the first half of 2019, in line with previous years.
The interest rate risk originated by commercial banking in each unit is transferred to its management – through an internal risk transfer system – to the local financial division, which is responsible for the subsidiary’s structural risk management generated by interest rate fluctuations. The Group’s usual practice is to measure interest rate risk by using statistical models, relying on mitigation strategies of structural risk using interest rate instruments, such as fixed income bond portfolios and derivative instruments to maintain the risk profile at levels that are appropriate to the risk appetite approved by senior management.
Structural interest rate risk
Europe
The main balance sheets, the Parent and United Kingdom, in mature markets and in a low interest rate setting, usually show positive sensitivities to interest rates in economic value of equity and net interest income.
Exposure levels in all countries are moderate in relation to the annual budget and capital levels.
At June 2019, net interest income risk at one year, measured as sensitivity to parallel changes in the worst-case scenario of ±100 basis points, was concentrated in the British pound yield curve at EUR 186 million, the Euro, at EUR 82 million, the Polish zloty, at EUR 59 million, and the US dollar, at EUR 20 million, all of them related to risks of rate cuts.
Net interest income (NII) sensitivity
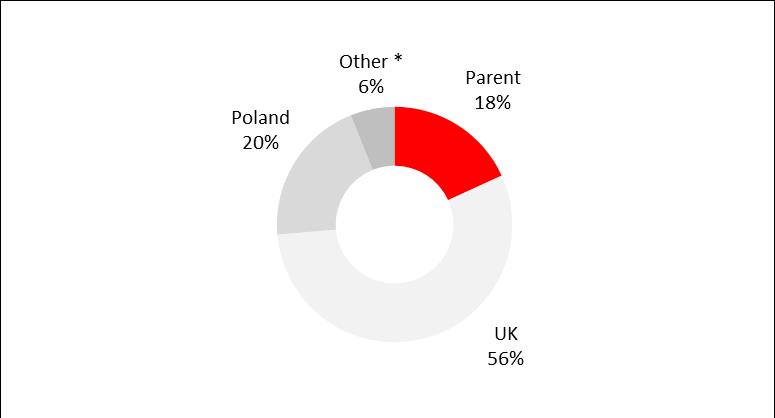 % of the total
Other: Portugal and SCF.
180
At the same date, the most relevant risk in economic value of equity, measured as its sensitivity to parallel changes in the worst-case scenario of ±100 basis points, was in the Euro interest rate curve, at EUR 2,235 million, followed by the British pound at EUR 828 million, the USD dollar at EUR 198 million and the Polish zloty at EUR 2 million, all of them related to risks of rate cuts.
Economic value of equity (EVE) sensitivity
% of the total
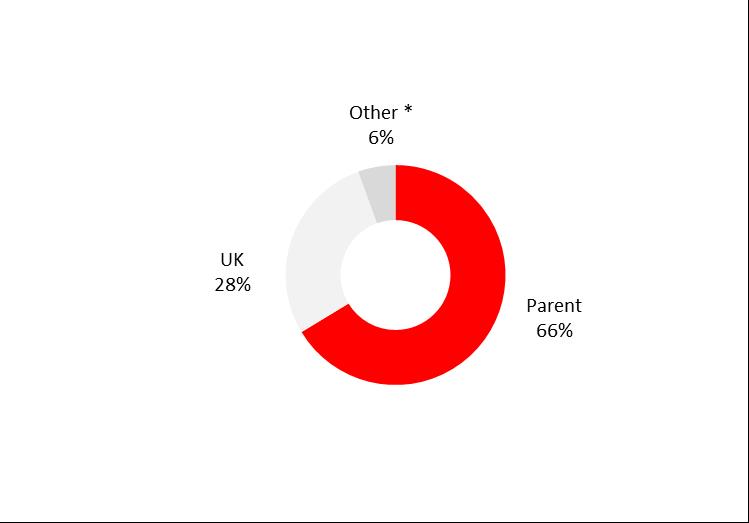
Other: Poland, Portugal and SCF.
South America
South American balance sheets are usually positioned for interest rate cuts for both economic value and net interest income.
In the first half of 2019, exposure levels in all countries were moderate in relation to the annual budget and capital levels.
At the end of June, net interest income risk over one year, measured as sensitivity to parallel changes in the worst case scenario of ±100 basis points, was concentrated in two countries, Chile (EUR 31 million) and Brazil (EUR 11 million) as shown in the chart below.
Net interest income (NII) sensitivity
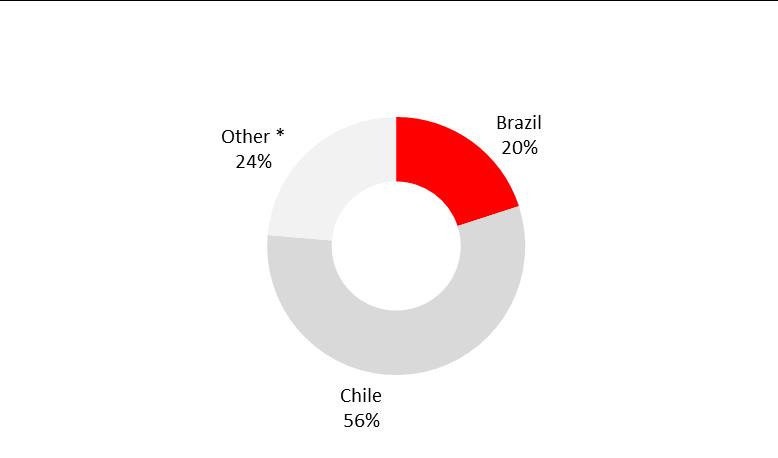
% of the total
Other: Argentina, Peru and Uruguay.
Risk to the economic value of equity over one year, measured as sensitivity to parallel changes in the worst case scenario of ±100 basis points, was also concentrated in Chile (EUR 335 million) and Brazil (EUR 467 million).
181
Economic value of equity (EVE) sensitivity
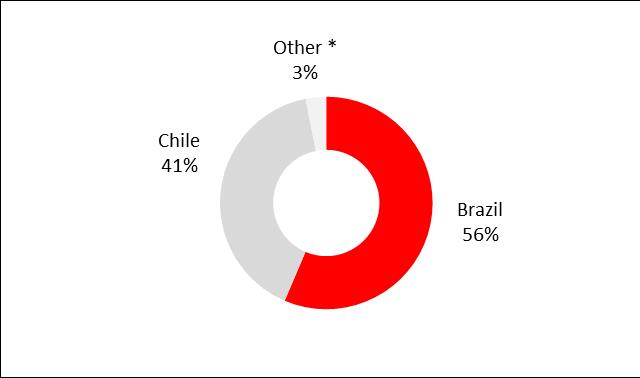 % of the total
Other: Argentina, Peru and Uruguay.
North America
North American balance sheets usually show positive sensitivities to interest rates in economic value of equity and net interest income, except for economic value of equity in Mexico.
In the first half of 2019, exposure levels in all countries were moderate in relation to the annual budget and capital levels.
At the end of June, net interest income risk over one year, measured as sensitivity to parallel changes in the worst case scenario of ±100 basis points, was concentrated in USA (EUR 154 million) as shown in the chart below.
Net interest income (NII) sensitivity
% of the total
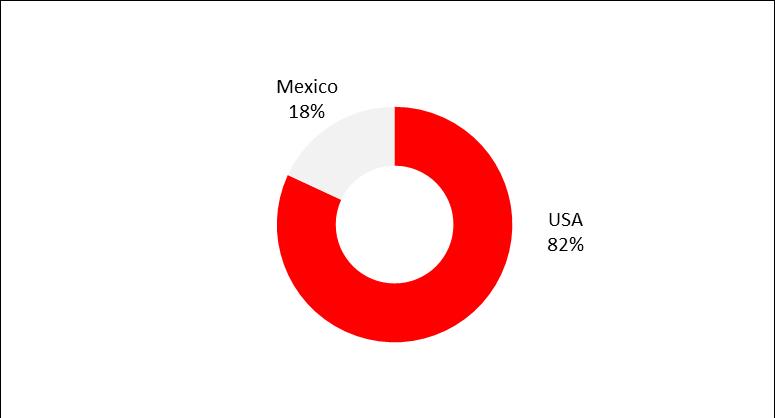
Risk to the economic value of equity over one year, measured as sensitivity to parallel changes in the worst case scenario of ±100 basis points, was also concentrated in USA (EUR 709 million).
182
Economic value of equity (EVE) sensitivity
% of the total
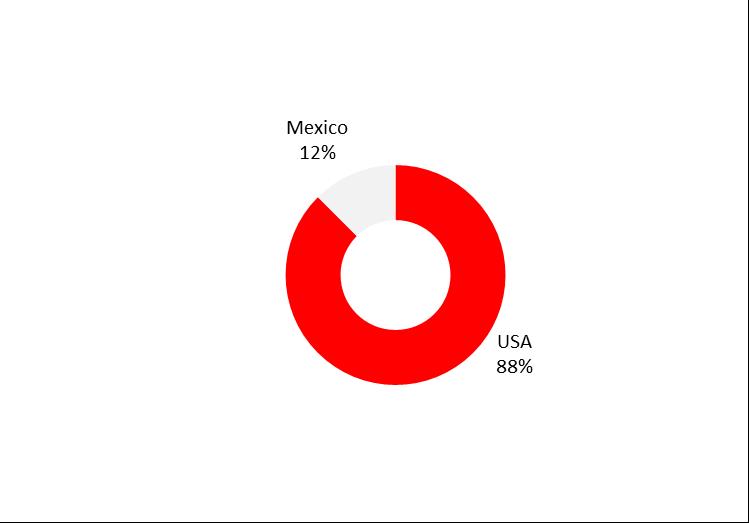
Structural foreign exchange rate risk/hedging of results
Structural exchange rate risk arises from Group transactions in foreign currencies, mainly related to permanent financial investments, results and the hedging of both.
This management is dynamic and seeks to limit the impact on the core capital ratio from foreign exchange rates movements.
At the end of June 2019, the largest exposures of permanent investments (with their potential impact on equity) were, in the following order, in Brazilian reais, US dollars, UK pounds sterling, Chilean pesos, Mexican pesos and Polish zlotys. The Group hedges some of these positions of a permanent nature with foreign exchange-rate derivatives.
In addition, the financial area is responsible for managing foreign exchange rate risk for the Group’s expected results and dividends in units where the base currency is not the euro.
Structural equity risk
The Group maintains equity positions in its banking book in addition to those of the trading portfolio. These positions are maintained as equity instruments or as equity stakes, depending on the percentage or control.
The equity portfolio available for the banking book at the end of June 2019 was diversified in securities in various countries, for example Spain, China, Morocco and Poland among others. Most of the portfolio is invested in financial activities and insurance sectors. Among other sectors, to a lesser extent, are for example real estate activities or public administrations.
Structural equity positions are exposed to market risk. VaR is calculated for these positions using market price data series or proxies. As of the end of June 2019, the VaR at 99% with a one day time frame was EUR 187.4 million (EUR 180.1 and EUR 261.6 million at the end of 2018 and 2017, respectively).
Structural VaR
A standardised metric such as VaR can be used for monitoring total market risk for the banking book, excluding the trading activity of SCIB (the VaR for this activity was described previously), distinguishing between fixed income (considering both interest rates and credit spreads on ALCO portfolios), exchange rate and equities.
183
In general, structural VaR is not high in terms of the Group’s volume of assets or equity.
Structural VaR
EUR million. VaR at 99% with one day time horizon.
|
| 2019 |
| 2018 |
| 2017 |
| ||||||||||
|
| Minimum |
| Average |
| Maximum |
| Latest |
| Average |
| Latest |
| Average |
| Latest |
|
Structural VaR |
| 451.2 |
| 477.9 |
| 503.9 |
| 476.5 |
| 568.5 |
| 556.8 |
| 878.0 |
| 815.7 |
|
Diversification effect |
| (253.3) |
| (288.3) |
| (335.8) |
| (233.1) |
| (325.0) |
| (267.7) |
| (337.3) |
| (376.8) |
|
VaR interest rate* |
| 215.1 |
| 265.8 |
| 324.5 |
| 215.1 |
| 337.1 |
| 319.5 |
| 373.9 |
| 459.6 |
|
VaR exchange rate |
| 307.1 |
| 315.4 |
| 327.8 |
| 307.1 |
| 338.9 |
| 324.9 |
| 546.9 |
| 471.2 |
|
VaR equities |
| 182.3 |
| 185.0 |
| 187.4 |
| 187.4 |
| 217.6 |
| 180.1 |
| 294.5 |
| 261.6 |
|
* Includes credit spread VaR on ALCO portfolios.
F.Pension and actuarial risks
Pension risk
In managing the risk associated with the defined benefit employee pension funds, the Group assumes the financial, market, credit and liquidity risks incurred in connection with the fund’s assets and investments and the actuarial risks arising from the fund’s liabilities, i.e. the pension obligations to its employees.
The aim pursued by the Group in pensions risk control and management is primarily to identify, measure, follow up, control, mitigate and report this risk.
The Group’s priority is to therefore identify and mitigate all clusters of pension’s risk.
This is why the methodology used by the Group estimates every year the combined losses in assets and liabilities under a defined stress scenario from changes in interest rates, inflation, stocks markets and real estate prices, as well as credit and operational risk.
Actuarial risk
Actuarial risk arises due to biometric changes in the life expectancy of those with life insurance, from the unexpected increase in the compensation envisaged in non-life insurance and, in any case, from unexpected changes in the performance of insurance takers in the exercise of the options envisaged in the contracts.
A distinction is made between the following actuarial risks:
Risk of life liability: risk of loss in the value of life assurance liabilities caused by fluctuations in risk factors that affect these liabilities:
· Mortality/longevity risk: risk of loss due to changes in the value of liabilities as a result of changes in the estimate of the probability of death/survival of insureds. |
· Morbidity risk: risk of loss due to changes in the value of liabilities as a result of changes in the estimate of the probability of disability/incapacity of insureds. |
· Redemption/fall risk: risk of loss due to changes in the value of liabilities as a result of the early termination of the contract or changes in the policyholders’ exercise of rights with regard to redemption, extraordinary contributions and/or paid up options. |
· Expense risk: risk of loss due to changes in the value of liabilities arising from adverse variances in expected expenses. |
· Catastrophe risk: losses caused by the occurrence of catastrophic events that increase the entity’s life liabilities. |
Risk of non-life liability: risk of loss from the change in the value of the non-life insurance liability caused by fluctuations in risk factors that affect these liabilities:
· | Premium risk: loss derived from the insufficiency of premiums to cover the disasters that might occur. |
· | Reserve risk: loss derived from the insufficiency of reserves for disasters, already incurred but not settled, including costs for management of these disasters. |
184
· | Catastrophe risk: losses caused by catastrophic events that increase the Group’s non-life liability. |
G.Management of structural liquidity
Structural liquidity management aims to finance the Group’s recurring activity in optimum conditions of maturity and cost and avoid assuming undesired liquidity risks.
Given the retail nature of the Group, commercial branches have continued taking deposits following the selective financing strategy of the Group considering their costs.
Notwithstanding the aforementioned, the different Group companies have maintained frequent issuance activity in the different wholesale funding markets during the year in order to continue strengthening their liquidity position and presence in the markets and take advantage of the better market conditions. The Group issued in the first half of 2019 €18,713 million of medium- and long-term issues, of which €12,255 million was senior debt, €4,511 million was covered bonds and €1,947 million were TLAC (Total Loss Absorbing Capacity) eligible instruments of which €885 million was senior non-preferred and €1,062 million was preference shares . Maturities of medium- and long-term debt amounted to €13,919 million in the first half of 2019, of which €8,201 million was senior debt, €2,096 million was covered bonds, €158 million was senior non-preferred, €648 million was subordinated debt and €2,816 million was preference shares. Additionally, securitizations placed in the market amounted to €7,885 million and maturities followed a similar pattern.
In short, all these actions have contributed to strengthen the Group’s balance sheet and capital base and helped to maintain an appropriate liquidity position.
The main aspects in relation to structural management of liquidity during the first half of 2019 were:
· Adequate position of structural liquidity. We are essentially a retail bank. Therefore, customer deposits are the main source of funds in our financing structure. These deposits, together with capital and similar instruments, enable us to address most of the Group’s liquidity needs. |
Diversification of markets and instruments to obtain liquidity. We have an active presence in several wholesale markets, across the different countries where the Group operates. This strategy limits our dependence on specific markets and allows us to maintain a comfortable capacity of recourse to the markets.
· As of June 30, 2019, the balance sheet of the Group was solid, as befits the Group’s retail nature. Lending, which accounted for around 75% of net assets, was fully financed by customer deposits and medium and long term funding. The Group has an adequate structure of medium and long-term issuances, well diversified by products (including, senior debt, senior non-preferred debt, covered bond, subordinated debt and preferred shares) with a moderately conservative maturity (4.5 years as of June 30, 2019). All of this results in moderate needs of recourse to short term wholesale funding at the Group level. |
Excluding securitizations, most medium- and long-term issuance activity has been concentrated on Eurozone and UK, with a moderate contribution from USA and Latin-American countries.
At June 30, 2019, the Group's structural liquidity surplus stood at €173.6 billion on a consolidated basis. This surplus is based mainly on fixed income securities (€199.4 billion) and equities (€15.5 billion), partially offset by short term funding balance (€32.8 billion) and net borrowed deposits from central banks and credit entities (€8.5 billion).
· High capacity to obtain liquidity on the balance sheet. The reserve includes deposits in central banks and cash, unencumbered sovereign debt, undrawn credit lines granted by central banks, as well as other assets eligible as collateral and other undrawn credit lines in official institutions (FHLB, etc.), all of which reinforce the solid liquidity position of the Group and its subsidiaries. As a proof of this sound and ample liquidity position, the Group as a whole exhibits both Liquidity Coverage Ratio (LCR) well above the 100% regulatory |
185
limit and a Net Stable Funding Ratio (NSFR), also well above 100%. Levels for both ratios have not substantially changed in the first half of 2019. |
· Access to wholesale markets for liquidity on the basis of short and long-term ratings, which remained above the sovereign debt in two of the three main agencies. |
· Independence of the subsidiaries in funding within a coordinated liquidity management. The most important subsidiaries obtain their funding in wholesale markets in accordance with their needs, establishing their own liquidity and contingency plans, without recourse to lines from the parent Bank to finance their activity. |
· Moderate use of assets as security for structural balance-sheet funding sources that has not materially changed since the end of 2018. |
Santander Group performs a continuous internal process to ensure the adequacy of both, its liquidity position and the management, measurement, monitoring and control of its liquidity risk (Group Internal Liquidity Adequacy and Assessment Process). However, in accordance to Santander’s model for liquidity management based on autonomous subsidiaries, this adequacy assessment process in fact encompasses separate adequacy assessment processes at the subsidiary level (each of them an Internal Liquidity Adequacy and Assessment Process), which are complemented and overseen by corporate processes, governance and coordination functions.
All these processes, which are forward looking and integrated into the decision-making and management process, risk management and risk appetite, liquidity planning and overall strategy, have the ultimate objective of ensuring that Group’s entities have and will have adequate liquidity resources to meet their obligations under both normal and stressed conditions and over an appropriate set of time horizons, taking into account all material sources of liquidity risk.
Purchases of Equity Securities by the Issuer and Affiliated Purchasers
The following table shows the repurchases of shares made by the Bank or any of its affiliates during the first six months of 2019:
|
|
|
|
|
|
|
|
|
|
|
|
|
|
|
| (c) Total number of shares (or |
| (d) Maximum number (or |
|
|
| (a) Total number of |
| (b) Average price |
| units) purchased as part of |
| approximate dollar value) of shares |
|
|
| shares -or units |
| paid per share (or |
| publicly announced plans or |
| (or units) that may yet be purchased |
|
2019 |
| purchased |
| unit) in euros |
| programs |
| under the plans or programs |
|
January |
| 45,513,559 |
| 4.33 |
| ― |
| ― |
|
February |
| 13,084,341 |
| 4.09 |
| ― |
| ― |
|
March |
| 16,148,186 |
| 4.09 |
| ― |
| ― |
|
April |
| 10,220,092 |
| 4.40 |
| ― |
| ― |
|
May |
| 22,760,058 |
| 4.20 |
| ― |
| ― |
|
June |
| 15,935,286 |
| 4.07 |
| ― |
| ― |
|
Total |
| 123,661,522 |
|
|
|
|
|
|
|
During the first six months of 2019, all purchases and sales of equity securities were made in open-market transactions.
SIGNATURES
The registrant hereby certifies that it meets all of the requirements for filing on Form 6-K and that it has duly caused and authorized the undersigned to sign this report on its behalf.
|
| BANCO SANTANDER, S.A. | |
|
|
| |
|
| By: | /s/ José G. Cantera |
|
| Name: | José G. Cantera |
|
| Title: | Chief Financial Officer |
Date: August 1, 2019
186