UNITED STATES
SECURITIES AND EXCHANGE COMMISSION
Washington, D.C. 20549
FORM N-CSR
CERTIFIED SHAREHOLDER REPORT OF REGISTERED
MANAGEMENT INVESTMENT COMPANIES
Investment Company Act file number (811-07168)
Hennessy Funds Trust
(Exact name of registrant as specified in charter)
7250 Redwood Blvd., Suite 200
Novato, CA 94945
(Address of principal executive offices) (Zip code)
Neil J. Hennessy
Hennessy Advisors, Inc.
7250 Redwood Blvd., Suite 200
Novato, CA 94945
(Name and address of agent for service)
800-966-4354
Registrant's telephone number, including area code
Date of fiscal year end: October 31, 2006
Date of reporting period: October 31, 2006
Item 1. Report to Stockholders.
HENNESSY FUNDS
ANNUAL REPORT
OCTOBER 31, 2006
Hennessy Cornerstone Growth Fund (HFCGX)
Hennessy Cornerstone Growth Fund, Series II (HENLX)
Hennessy Focus 30 Fund (HFTFX)
Hennessy Cornerstone Value Fund (HFCVX)
Hennessy Total Return Fund (HDOGX)
Hennessy Balanced Fund (HBFBX)
Contents
| Letter to shareholders | 1 |
| Change in value of $10,000 investment | 7 |
| Summaries of investments | |
| Hennessy Cornerstone Growth Fund | 13 |
| Hennessy Cornerstone Growth Fund, Series II | 17 |
| Hennessy Focus 30 Fund | 21 |
| Hennessy Cornerstone Value Fund | 24 |
| Hennessy Total Return Fund | 28 |
| Hennessy Balanced Fund | 31 |
| Financial statements | |
| Statements of assets and liabilities | 34 |
| Statements of operations | 36 |
| Statements of changes in net assets | 40 |
| Financial highlights | |
| Hennessy Cornerstone Growth Fund | 44 |
| Hennessy Cornerstone Growth Fund, Series II | 46 |
| Hennessy Focus 30 Fund | 48 |
| Hennessy Cornerstone Value Fund | 50 |
| Hennessy Total Return Fund | 52 |
| Hennessy Balanced Fund | 54 |
| Statement of cash flows - Hennessy Total Return Fund | 56 |
| Notes to the financial statements | 57 |
| Report of Independent Registered Public Accounting Firm | 66 |
| Directors and Officers of the Funds | 68 |
| Expense example | 74 |
| Proxy voting policy | 76 |
WWW.HENNESSYFUNDS.COM
LETTER TO SHAREHOLDERS
December, 2006
Dear Hennessy Funds Shareholder:
As I look at the last number of letters I’ve written to our shareholders, I realize that the message seems to be exactly the same - that the economy is in good shape and that the market should continue to grow. As I write this letter, I still truly believe that is the case! At Hennessy Funds, we look at current and historical quantitative data, ignoring the sensational media headlines, to make our investing decisions. It is that same data that leads us to our current view of the economy and the stock market. We maintain our optimistic opinion that the market is poised for continued, moderate growth as we move into 2007. Major economic indicators, such as unemployment, inflation and interest rates, remain at favorable levels. We expect corporate profits to continue to increase in the 10-15% range, which alone should be enough to propel the markets higher by that amount in the coming year.
During the past couple of years, we have experienced steady market growth supported by underlying revenue growth. However, we have seen revenue growth outpacing stock price growth, meaning that we believe stock prices are generally undervalued and have room to grow. We also see that the major market indices are currently undervalued versus their historical averages based on price to sales, which is the criteria that we use in our portfolios to determine a stock’s relative value. The Dow is undervalued by approximately 5% and the S&P 500 is undervalued by approximately 9%. Based on these findings, we believe that market has the ability to not only gain the 10-15% that corporate profits growth would suggest, but it could potentially experience an additional gain of between 5 and 9%. Based on our analysis, this excess return would bring the market more in line with its historical averages, putting the Dow Jones Industrial Average above 14,000 by the end of 2007.
Despite good market performance and positive economic indicators, the market is not experiencing the euphoria that we have seen in the past with technology or real estate stocks. Some investors continue to sit on the sidelines waiting for a huge surge in performance before investing more heavily. We believe, however, that smart investors understand we are in a continued bull market, and are investing accordingly.
HENNESSY FUNDS 1-800-966-4354
Returns at a Glance (as of October 31, 2006)
| | | | | | | | |
| | | One Year | Five Year | Since |
| | | Annualized | Annualized | Inception |
| | | Return | Return | (11/1/96) |
Hennessy Cornerstone Growth Fund (HFCGX) | | | 13.59 | % | | 17.43 | % | | 15.93 | % |
| Russell 2000 Index | | | 19.98 | % | | 13.76 | % | | 9.87 | % |
| S&P 500 Index | | | 16.34 | % | | 7.26 | % | | 8.66 | % |
| | | Four-Month | One Year | Five Year | Since |
| | | period | Annualized | Annualized | Inception |
| | | 7/1-10/31/06 | Return | Return | (7/1/05) |
Hennessy Cornerstone Growth | | | | | | | | | |
Fund, Series II (HENLX) | | | -4.47 | % | | 15.97 | % | | n/a | | | 8.33 | % |
| Russell 2000 Index | | | 6.22 | % | | 19.98 | % | | n/a | | | 15.40 | % |
| S&P 500 Index | | | 9.11 | % | | 16.34 | % | | n/a | | | 13.35 | % |
| | | One Year | Five Year | Since |
| | | Annualized | Annualized | Inception |
| | | Return | Return | (9/17/03) |
Hennessy Focus 30 Fund (HFTFX) | | | 16.18 | % | | n/a | | | 19.77 | % |
| S&P 400 Mid-cap Index | | | 13.43 | % | | n/a | | | 15.08 | % |
| S&P 500 Index | | | 16.34 | % | | n/a | | | 11.90 | % |
Performance data quoted represents past performance; past performance does not guarantee future results. The investment return and principal value of an investment will fluctuate so that an investor’s shares, when redeemed, may be worth more or less than their original cost. Current performance of the fund may be lower or higher than the performance quoted. Performance data current to the most recent month end may be obtained by visiting www.hennessyfunds.com. Performance shown does not reflect a 1.5% redemption fee on shares held for less than 90 days. If it did, total returns would be reduced.
For the twelve months ending October 31, 2006, we saw strong performance among large-cap, dividend paying stocks. For the first time in a number of years, the Dow Jones Industrial Average outperformed the S&P 500, with the high dividend-yielding “Dogs of the Dow” leading the pack. Energy, commodities and industrial stocks have been particularly volatile over the past twelve months, but oil prices seem to finally be settling down.
LETTER TO SHAREHOLDERS
| | | | | | | | |
| | | One Year | Five Year | Since |
| | | Annualized | Annualized | Inception |
| | | Return | Return | (11/1/96) |
Hennessy Cornerstone Value Fund (HFCVX) | | | 21.00 | % | | 9.51 | % | | 8.13 | % |
| Russell 1000 Index | | | 16.02 | % | | 7.92 | % | | 8.89 | % |
| S&P 500 Index | | | 16.34 | % | | 7.26 | % | | 8.66 | % |
| | | One Year | Five Year | Since |
| | | Annualized | Annualized | Inception |
| | | Return | Return | (7/29/98) |
Hennessy Total Return Fund (HDOGX) | | | 22.48 | % | | 8.06 | % | | 4.94 | % |
| Dow Jones Industrial Average | | | 18.47 | % | | 8.25 | % | | 5.81 | % |
| S&P 500 Index | | | 16.34 | % | | 7.26 | % | | 4.10 | % |
| | | One Year | Five Year | Ten Year | Since |
| | | Annualized | Annualized | Annualized | Inception |
| | | Return | Return | Return | (3/8/96) |
Hennessy Balanced Fund (HBFBX) | | | 14.92 | % | | 4.58 | % | | 4.89 | % | | 5.23 | % |
| Dow Jones Industrial Average | | | 18.47 | % | | 8.25 | % | | 9.29 | % | | 9.83 | % |
| S&P 500 Index | | | 16.34 | % | | 7.26 | % | | 8.64 | % | | 9.33 | % |
Performance data quoted represents past performance; past performance does not guarantee future results. The investment return and principal value of an investment will fluctuate so that an investor’s shares, when redeemed, may be worth more or less than their original cost. Current performance of the fund may be lower or higher than the performance quoted. Performance data current to the most recent month end may be obtained by visiting www.hennessyfunds.com. Performance shown does not reflect a 1.5% redemption fee on shares held for less than 90 days. If it did, total returns would be reduced.
We are committed to maximizing long-term performance results for our investors by following our disciplined investment formulas, and we refuse to manipulate short-term results in order to try and meet or beat our benchmark indices. We are pleased with the performance of our funds over the past year, as we are with their longer term performance. For the twelve-month period ending October 31, 2006, the Hennessy Cornerstone Growth Fund and Hennessy Cornerstone Growth Fund, Series II underperformed their benchmark indices. The Hennessy Focus 30 Fund outperformed the mid cap index, but lagged the S&P 500 Index slightly. For the period, the Hennessy Cornerstone Growth Fund returned 13.59%, and the Hennessy Cornerstone Growth Fund, Series II
HENNESSY FUNDS 1-800-966-4354
returned 15.97%, versus the S&P 500 at 16.34% and the Russell 2000 at 19.98%. The Hennessy Focus 30 Fund returned 16.18%, versus the S&P 500 at 16.34% and the S&P 400 Midcap Index at 13.43%. There was significant volatility in the energy, industrial and materials stocks in these three portfolios, and performance of those stocks was mixed during the twelve-month period, with some companies delivering well above average returns and some with well below average returns. We believe that choosing individual stocks, not sectors, is the best way to build a portfolio, and performance of these three funds versus their benchmark indices for the twelve-month period ending October 31, 2006 can primarily be attributed to individual stock performance:
Hennessy Cornerstone Growth Fund: A variety of industrial stocks, including General Cable Corp., Manitowoc, Emcor Group and Amerco (parent company of UHaul), were portfolio leaders. Energy stocks Holly Corp. and Frontier Oil did well, however Sunoco and Oil States International showed poor performance during the period. Consumer discretionary stocks Escala Group and Six Flags experienced significant declines, which hurt the overall performance of the Fund.
Hennessy Focus 30 Fund: Materials stock Allegheny Technologies was the top performing stock in the fund, while Quanex was among the bottom performers. Industrial stocks McDermott International and Flowserve Corp. performed well, while Labor Ready did not. Healthcare companies WellCare Health Plans and Humana also performed well, however, consumer discretionary stock Building Materials Holding negatively affected the performance of the Fund.
Hennessy Cornerstone Growth Fund, Series II: Because this Fund rebalances in the summer, both the previous and current portfolios affected performance for the period. In the previous portfolio, purchased in Summer, 2005, Andersons Inc. was a top performing stock. Industrial stocks Badger Meter and Clean Harbors Inc. performed well, as did energy stocks Frontier Oil and Transmontaigne. Poor performance from home builders Standard Pacific, KB Home, Hovnanian and Ryland Group significantly hurt the performance of the previous portfolio. Within the current portfolio, purchased in Summer, 2006, AEP Industries, Casual Male and Meadowbrook Insurance Group are showing strong performance.
LETTER TO SHAREHOLDERS
As a note to our Hennessy Cornerstone Growth Fund, Series II shareholders, we are changing the fiscal year end of this Fund from June 30th to October 31st, to coincide with the fiscal year of our other Funds. Because of this, we also need to report performance of the Fund for that period. For the four-month period ending October 31, 2006, the Hennessy Cornerstone Growth Fund, Series II returned -4.47%, versus the S&P 500 Index at 9.11% and the Russell 200 Index at 6.22%. During the period, the underperformance of transportation stocks Old Dominion Freight, Universal Truckload Services and Arkansas Best Corp hurt the performance of the current Growth II portfolio. In addition, poor short-term returns from energy stocks Alon USA Energy, and FMC Technologies further hampered performance.
Our large-cap funds, which each select high dividend-paying stocks, fared better than our mid and small-cap funds for the twelve-month period ending October 31, 2006. The Hennessy Cornerstone Value Fund and Hennessy Total Return Fund each outperformed their benchmark indices, while the Hennessy Balanced Fund underperformed slightly. The Hennessy Cornerstone Value Fund returned 21.00% for the twelve months ending October 31, 2006, while the S&P 500 returned 16.34% and the Russell 1000 returned 16.02% for the same period. The Cornerstone Value Fund had strong performance from stocks BellSouth, Merck, ING Groep and Reynolds American. Forty six of the 50, or 92% of the stocks in the Cornerstone Value Fund portfolio reported positive returns for the twelve-month period.
The Hennessy Total Return Fund returned 22.48% for the twelve-month period ending October 31, 2006, and the Hennessy Balanced Fund returned 14.92%, versus the S&P 500 Index at 16.34% and the Dow Jones Industrial Average at 18.47%. Each of the “Dogs of the Dow”, the ten highest dividend-yielding stocks in the Dow Jones, which are the stocks included in both the Total Return and Balanced portfolios, had positive returns for the twelve-month period. Performance of both Funds was led by Merck, AT&T, J.P. Morgan Chase and General Motors. Despite strong performance from these stocks, the relatively low returns from short-term U.S. Treasury bills, which make up approximately half of the portfolio of the Hennessy Balanced Fund, caused that Fund to underperform its benchmarks.
We know that investing success comes from time in the market, not timing the market, so at Hennessy Funds we remain committed to our time-tested investment formulas. First and foremost, we remain committed to you, our shareholders, and we will always manage the
HENNESSY FUNDS 1-800-966-4354
portfolios with your best interest in mind. Thank you for your continued confidence and investment in the Funds. Should you have any questions or want to speak with us directly, please don’t hesitate to call us at
(800) 966-4354.
Best regards,
Neil Hennessy
President & Portfolio Manager
Past performance does not guarantee future results.
Small and medium-capitalization companies tend to have limited liquidity and greater price volatility than large-capitalization companies. Investments in foreign securities involve greater volatility and political, economic and currency risk and differences in accounting methods.
The Hennessy Total Return and Balanced Funds are non-diversified, meaning they may concentrate their assets in fewer individual holdings than a diversified fund, making it more exposed to individual stock volatility than a diversified fund.
References to specific securities should not be considered a recommendation to buy or sell any security. Fund holdings are subject to change. Please refer to the Schedule of Investments within this annual report for additional portfolio information, including percentages of holdings.
The S&P 500, Russell 2000, Russell 1000, S&P 400 Midcap and Dow Jones Industrial Average are unmanaged indices commonly used to measure the performance of U.S. stocks. The Dow Jones Industrial Average is an unmanaged index of common stocks comprised of major industrial companies and assumes reinvestment of dividends. The Russell 2000 Index is a recognized small-cap index of 2000 smallest securities of the Russell 3000 Index, which is comprised of the 3,000 largest U.S. securities as determined by total market capitalization. The Russell 1000 is an unmanaged Index that measures the performance of large-cap U.S. stocks. The S&P 400 Midcap Index is an unmanaged Index that measures the performance of mid-cap U.S. stocks. One cannot invest directly in an index.
Opinions expressed are those of Neil Hennessy and are subject to change, are not guaranteed and should not be considered investment advice. 12/06
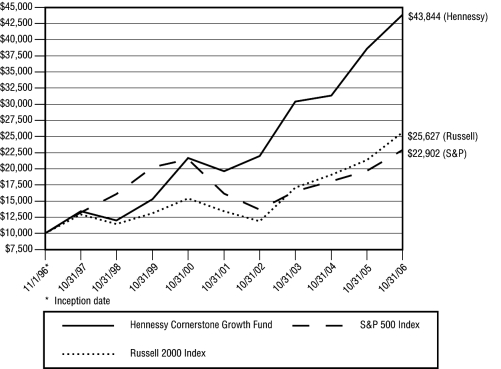
Change in Value of $10,000 Investment
HENNESSY CORNERSTONE GROWTH FUND
This chart assumes an initial gross investment of $10,000 made on November 1, 1996 (inception). Returns shown include the reinvestment of all dividends. Returns shown do not reflect the deduction of taxes that a shareholder would pay on fund distributions or the redemption of fund shares.
Performance data quoted represents past performance; past performance does not guarantee future results. The investment return and principal value of an investment will fluctuate so that an investor’s shares, when redeemed, may be worth more or less than their original cost. Current performance of the fund may be lower or higher than the performance quoted. Performance data current to the most recent month end may be obtained by visiting www.hennessyfunds.com. The funds impose a 1.5% redemption fee on shares held for less than 90 days. Performance data does not reflect redemption fee. Had the fee been included, returns would be lower.
AVERAGE ANNUAL TOTAL RETURN
PERIODS ENDED OCTOBER 31, 2006
| | | | | | | Since Inception |
| | | One Year | Five Years | 11/1/96 |
| Hennessy Cornerstone Growth Fund | | | 13.59 | % | | 17.43 | % | | 15.93 | % |
| Russell 2000 Index | | | 19.98 | % | | 13.76 | % | | 9.87 | % |
| S&P 500 Index | | | 16.34 | % | | 7.26 | % | | 8.66 | % |
RUSSELL 2000 INDEX - An unmanaged index which measures the performance of the 2,000 smallest companies in the Russell 3000 Index. The Russell 3000 Index is an unmanaged index which measures the performance of the 3,000 largest U.S. Companies, based on total market capitalization, which represents approximately 98% of the investable U.S. equity market.
S&P 500 INDEX - An unmanaged capitalization-weighted index of 500 stocks designed to measure performance of the broad domestic economy through changes in the aggregate market value of the 500 stocks which represent all major industries.
HENNESSY FUNDS 1-800-966-4354
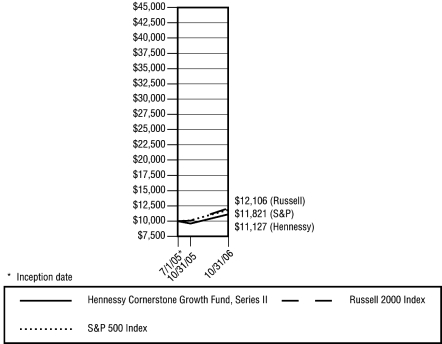
Change in Value of $10,000 Investment
HENNESSY CORNERSTONE GROWTH FUND, SERIES II
This chart assumes an initial gross investment of $10,000 made on July 1, 2005 (inception). Returns shown include the reinvestment of all dividends. Returns shown do not reflect the deduction of taxes that a shareholder would pay on fund distributions or the redemption of fund shares.
Performance data quoted represents past performance; past performance does not guarantee future results. The investment return and principal value of an investment will fluctuate so that an investor’s shares, when redeemed, may be worth more or less than their original cost. Current performance of the fund may be lower or higher than the performance quoted. Performance data current to the most recent month end may be obtained by visiting www.hennessyfunds.com. The funds impose a 1.5% redemption fee on shares held for less than 90 days. Performance data does not reflect redemption fee. Had the fee been included, returns would be lower.
AVERAGE ANNUAL TOTAL RETURN
PERIODS ENDED OCTOBER 31, 2006
| | | Since Inception |
| | One Year | 7/1/05* |
| Hennessy Cornerstone Growth Fund, Series II | 15.97% | 8.33% |
| Russell 2000 Index | 19.98% | 15.40% |
| S&P 500 Index | 16.34% | 13.35% |
| * | On July 1, 2005, Hennessy Advisors, Inc. became the investment advisor to Hennessy Cornerstone Growth Fund, Series II (formerly The Henlopen Fund). Due to the change in investment advisor and investment technique, performance is being quoted for the period after the change of investment advisor. |
RUSSELL 2000 INDEX - An unmanaged index which measures the performance of the 2,000 smallest companies in the Russell 3000 Index. The Russell 3000 Index is an unmanaged index which measures the performance of the 3,000 largest U.S. Companies, based on total market capitalization, which represents approximately 98% of the investable U.S. equity market.
S&P 500 INDEX - An unmanaged capitalization-weighted index of 500 stocks designed to measure performance of the broad domestic economy through changes in the aggregate market value of the 500 stocks which represent all major industries.
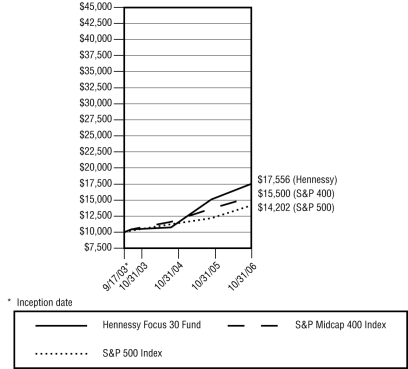
Change in Value of $10,000 Investment
HENNESSY FOCUS 30 FUND
This chart assumes an initial gross investment of $10,000 made on September 17, 2003 (inception). Returns shown include the reinvestment of all dividends. Returns shown do not reflect the deduction of taxes that a shareholder would pay on fund distributions or the redemption of fund shares.
Performance data quoted represents past performance; past performance does not guarantee future results. The investment return and principal value of an investment will fluctuate so that an investor’s shares, when redeemed, may be worth more or less than their original cost. Current performance of the fund may be lower or higher than the performance quoted. Performance data current to the most recent month end may be obtained by visiting www.hennessyfunds.com. The funds impose a 1.5% redemption fee on shares held for less than 90 days. Performance data does not reflect redemption fee. Had the fee been included, returns would be lower.
AVERAGE ANNUAL TOTAL RETURN
PERIODS ENDED OCTOBER 31, 2006
| | | Since Inception |
| | One Year | 9/17/03* |
| Hennessy Focus 30 Fund | 16.18% | 19.77% |
| S&P Midcap 400 Index | 13.43% | 15.08% |
| S&P 500 Index | 16.34% | 11.90% |
| * | On September 17, 2003, the SYM Select Growth Fund merged into the Hennessy Focus 30 Fund. Due to the change in advisor and investment technique, performance is being quoted for the period after the merger. |
S&P MIDCAP 400 INDEX - An unmanaged capitalization-weighted index of 400 stocks designed to measure performance of mid-sized companies through changes in the aggregate market value of the 400 stocks which represent all major industries.
S&P 500 INDEX - An unmanaged capitalization-weighted index of 500 stocks designed to measure performance of the broad domestic economy through changes in the aggregate market value of the 500 stocks which represent all major industries.
HENNESSY FUNDS 1-800-966-4354
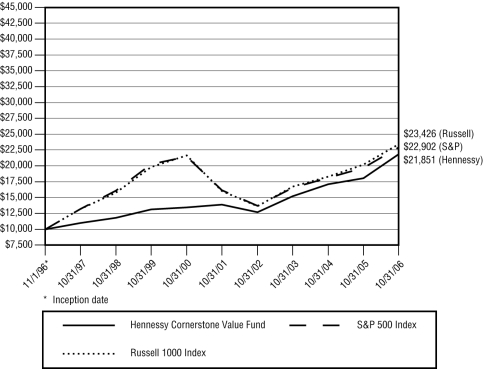
Change in Value of $10,000 Investment
HENNESSY CORNERSTONE VALUE FUND
This chart assumes an initial gross investment of $10,000 made on November 1, 1996 (inception). Returns shown include the reinvestment of all dividends. Returns shown do not reflect the deduction of taxes that a shareholder would pay on fund distributions or the redemption of fund shares.
Performance data quoted represents past performance; past performance does not guarantee future results. The investment return and principal value of an investment will fluctuate so that an investor’s shares, when redeemed, may be worth more or less than their original cost. Current performance of the fund may be lower or higher than the performance quoted. Performance data current to the most recent month end may be obtained by visiting www.hennessyfunds.com. The funds impose a 1.5% redemption fee on shares held for less than 90 days. Performance data does not reflect redemption fee. Had the fee been included, returns would be lower.
AVERAGE ANNUAL TOTAL RETURN
PERIODS ENDED OCTOBER 31, 2006
| | | | Since Inception |
| | One Year | Five Years | 11/1/96 |
| Hennessy Cornerstone Value Fund | 21.00% | 9.51% | 8.13% |
| Russell 1000 Index | 16.02% | 7.92% | 8.89% |
| S&P 500 Index | 16.34% | 7.26% | 8.66% |
RUSSELL 1000 INDEX - An unmanaged index which measures the performance of the 1,000 largest companies in the Russell 3000 Index. The Russell 3000 Index is an unmanaged index which measures the performance of the 3,000 largest U.S. Companies, based on total market capitalization, which represents approximately 98% of the U.S. investable equity market.
S&P 500 INDEX - An unmanaged capitalization-weighted index of 500 stocks designed to measure performance of the broad domestic economy through changes in the aggregate market value of the 500 stocks which represent all major industries.
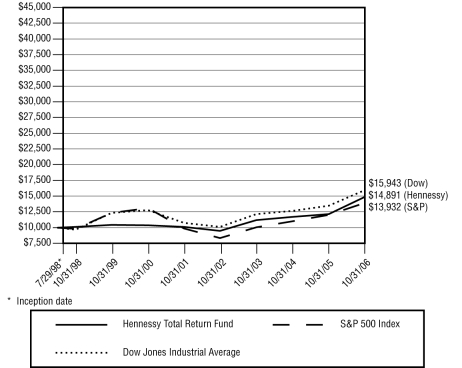
Change in Value of $10,000 Investment
HENNESSY TOTAL RETURN FUND
This chart assumes an initial gross investment of $10,000, made on July 29, 1998 (inception). Performance reflects fee waivers in effect. In the absence of fee waivers, total return would be reduced. Returns shown include the reinvestment of all dividend and other distributions. Returns shown do not reflect the deduction of taxes that a shareholder would pay on fund distributions or the redemption of fund shares.
Performance data quoted represents past performance; past performance does not guarantee future results. The investment return and principal value of an investment will fluctuate so that an investor’s shares, when redeemed, may be worth more or less than their original cost. Current performance of the fund may be lower or higher than the performance quoted. Performance data current to the most recent month end may be obtained by visiting www.hennessyfunds.com. The funds impose a 1.5% redemption fee on shares held for less than 90 days. Performance data does not reflect redemption fee. Had the fee been included, returns would be lower.
AVERAGE ANNUAL TOTAL RETURN
PERIODS ENDED OCTOBER 31, 2006
| | | | Since Inception |
| | One Year | Five Years | 7/29/98 |
| Hennessy Total Return Fund | 22.48% | 8.06% | 4.94% |
| Dow Jones Industrial Average | 18.47% | 8.25% | 5.81% |
| S&P 500 Index | 16.34% | 7.26% | 4.10% |
DOW JONES INDUSTRIAL AVERAGE - The Dow Jones Industrial Average is an unmanaged index of common stocks comprised of major industrial companies.
S&P 500 INDEX - An unmanaged capitalization-weighted index of 500 stocks designed to measure performance of the broad domestic economy through changes in the aggregate market value of the 500 stocks which represent all major industries.
HENNESSY FUNDS 1-800-966-4354
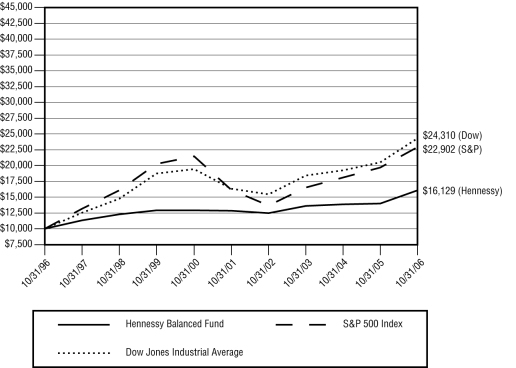
Change in Value of $10,000 Investment
HENNESSY BALANCED FUND
This chart assumes an initial gross investment of $10,000, made on October 31, 1996. Returns shown include the reinvestment of all dividend and other distributions. Returns shown do not reflect the deduction of taxes that a shareholder would pay on fund distributions or the redemption of fund shares.
Performance data quoted represents past performance; past performance does not guarantee future results. The investment return and principal value of an investment will fluctuate so that an investor’s shares, when redeemed, may be worth more or less than their original cost. Current performance of the fund may be lower or higher than the performance quoted. Performance data current to the most recent month end may be obtained by visiting www.hennessyfunds.com. The funds impose a 1.5% redemption fee on shares held for less than 90 days. Performance data does not reflect redemption fee. Had the fee been included, returns would be lower.
AVERAGE ANNUAL TOTAL RETURN
PERIODS ENDED OCTOBER 31, 2006
| | One Year | Five Years | Ten Years |
| Hennessy Balanced Fund | 14.92% | 4.58% | 4.89% |
| Dow Jones Industrial Average | 18.47% | 8.25% | 9.29% |
| S&P 500 Index | 16.34% | 7.26% | 8.64% |
DOW JONES INDUSTRIAL AVERAGE - The Dow Jones Industrial Average is an unmanaged index of common stocks comprised of major industrial companies.
S&P 500 INDEX - An unmanaged capitalization-weighted index of 500 stocks designed to measure performance of the broad domestic economy through changes in the aggregate market value of the 500 stocks which represent all major industries.
Summaries of Investments
The following summaries of investment portfolios are designed to help investors better understand each fund’s principal holdings. Each summary is as of October 31, 2006.
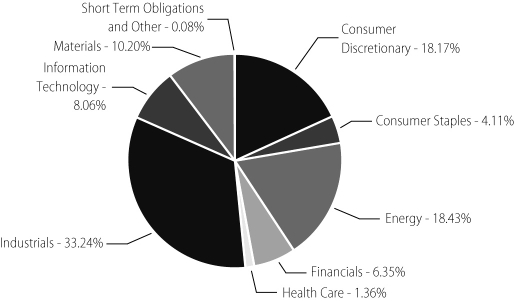
HENNESSY CORNERSTONE GROWTH FUND
(% of Net Assets)
TOP TEN HOLDINGS | % of net assets |
| Allegheny Technologies, Inc. | 3.67% |
| Manitowoc Co. | 3.43% |
| General Cable Corp. | 3.22% |
| EMCOR Group, Inc. | 2.91% |
| Aleris International, Inc. | 2.80% |
| Holly Corp. | 2.78% |
| Giant Industries, Inc. | 2.66% |
| Frontier Oil Corp. | 2.64% |
| Quanta Services, Inc. | 2.60% |
| Amerco, Inc. | 2.47% |
HENNESSY FUNDS 1-800-966-4354
SUMMARY OF INVESTMENTS — CORNERSTONE GROWTH FUND
| COMMON STOCKS - 99.92% | | Number | | | % of Net |
| | | of Shares | Value | Assets |
Consumer Discretionary - 18.17% | | | | | | | |
| Brightpoint, Inc. (a) | | | 1,412,500 | | $ | 17,091,250 | | | 1.36 | % |
| Circuit City Stores, Inc. | | | 971,300 | | | 26,205,674 | | | 2.10 | % |
| Conn’s, Inc. (a) | | | 577,500 | | | 13,871,550 | | | 1.11 | % |
| Dress Barn, Inc. (a) | | | 1,203,700 | | | 26,144,364 | | | 2.09 | % |
| Drew Industries, Inc. (a) | | | 781,800 | | | 21,225,870 | | | 1.70 | % |
| Escala Group, Inc. (a) | | | 1,068,700 | | | 5,332,813 | | | 0.43 | % |
| Nordstrom, Inc. | | | 586,500 | | | 27,770,775 | | | 2.22 | % |
| The Pantry, Inc. (a) | | | 437,500 | | | 23,878,750 | | | 1.91 | % |
| Papa John’s International, Inc. (a) | | | 711,100 | | | 26,097,370 | | | 2.09 | % |
| Payless ShoeSource, Inc. (a) | | | 992,700 | | | 26,554,725 | | | 2.12 | % |
| Six Flags, Inc. (a) | | | 2,292,000 | | | 13,064,400 | | | 1.04 | % |
| | | | | | | 227,237,541 | | | 18.17 | % |
Consumer Staples - 4.11% | | | | | | | | | | |
| Great Atlantic & Pacific Tea Co. | | | 974,500 | | | 26,964,415 | | | 2.15 | % |
| Playtex Products, Inc. (a) | | | 1,756,400 | | | 24,484,216 | | | 1.96 | % |
| | | | | | | 51,448,631 | | | 4.11 | % |
Energy - 18.43% | | | | | | | | | | |
| Frontier Oil Corp. | | | 1,120,300 | | | 32,936,820 | | | 2.64 | % |
| Giant Industries, Inc. (a) | | | 409,700 | | | 33,177,506 | | | 2.66 | % |
| Holly Corp. | | | 731,400 | | | 34,785,384 | | | 2.78 | % |
| Marathon Oil Corp. | | | 328,800 | | | 28,408,320 | | | 2.27 | % |
| Oil States International, Inc. (a) | | | 617,000 | | | 17,917,680 | | | 1.43 | % |
| Petro-Canada (b) | | | 550,400 | | | 23,441,536 | | | 1.87 | % |
| Sunoco, Inc. | | | 265,400 | | | 17,550,902 | | | 1.40 | % |
| Tesoro Petroleum Corp. | | | 331,700 | | | 21,208,898 | | | 1.70 | % |
| Valero Energy Corp. | | | 402,600 | | | 21,068,058 | | | 1.68 | % |
| | | | | | | 230,495,104 | | | 18.43 | % |
Financials - 6.35% | | | | | | | | | | |
| Banco Bradesco SA - ADR (b) | | | 710,500 | | | 25,428,795 | | | 2.03 | % |
| Banco Itau Holding Financiera SA - ADR (b) | | | 859,200 | | | 28,525,440 | | | 2.28 | % |
| WR Berkley Corp. | | | 691,700 | | | 25,496,062 | | | 2.04 | % |
| | | | | | | 79,450,297 | | | 6.35 | % |
The accompanying notes are an integral part of these financial statements.
SUMMARY OF INVESTMENTS — CORNERSTONE GROWTH FUND
| COMMON STOCKS | | Number | | | % of Net |
| | | of Shares | Value | Assets |
Health Care - 1.36% | | | | | | | |
| Express Scripts, Inc. (a) | | | 266,100 | | $ | 16,955,892 | | | 1.36 | % |
Industrials - 33.24% | | | | | | | | | | |
| AAR Corp. (a) | | | 927,500 | | | 24,152,100 | | | 1.93 | % |
| Amerco, Inc. (a) | | | 336,400 | | | 30,854,608 | | | 2.47 | % |
| Astec Industries, Inc. (a) | | | 693,700 | | | 22,122,093 | | | 1.77 | % |
| Beacon Roofing Supply, Inc. (a) | | | 1,134,600 | | | 22,465,080 | | | 1.80 | % |
| EMCOR Group, Inc. (a) | | | 616,000 | | | 36,436,400 | | | 2.91 | % |
| Foster Wheeler Ltd. (a)(b) | | | 559,900 | | | 25,167,505 | | | 2.01 | % |
| General Cable Corp. (a) | | | 1,071,600 | | | 40,292,160 | | | 3.22 | % |
| JLG Industries, Inc. | | | 937,900 | | | 25,932,935 | | | 2.07 | % |
| Manitowoc Co. | | | 781,600 | | | 42,894,208 | | | 3.43 | % |
| Quanta Services, Inc. (a) | | | 1,777,700 | | | 32,531,910 | | | 2.60 | % |
| Reliance Steel & Aluminum Co. | | | 723,700 | | | 24,859,095 | | | 2.00 | % |
| Trinity Industries, Inc. | | | 781,800 | | | 28,191,708 | | | 2.25 | % |
| USG Corp. (a) | | | 321,400 | | | 15,713,246 | | | 1.26 | % |
| Watsco, Inc. | | | 357,000 | | | 17,778,600 | | | 1.42 | % |
| Westinghouse Air Brake Technologies Corp. | | | 838,000 | | | 26,304,820 | | | 2.10 | % |
| | | | | | | 415,696,468 | | | 33.24 | % |
Information Technology - 8.06% | | | | | | | | | | |
| Jabil Circuit, Inc. | | | 618,500 | | | 17,757,135 | | | 1.42 | % |
| ON Semiconductor Corp. (a) | | | 3,378,600 | | | 21,014,892 | | | 1.67 | % |
| Palm, Inc. (a) | | | 1,332,600 | | | 20,455,410 | | | 1.64 | % |
| Plexus Corp. (a) | | | 992,300 | | | 21,751,216 | | | 1.74 | % |
| Western Digital Corp. (a) | | | 1,088,100 | | | 19,890,468 | | | 1.59 | % |
| | | | | | | 100,869,121 | | | 8.06 | % |
Materials - 10.20% | | | | | | | | | | |
| Aleris International, Inc. (a) | | | 679,400 | | | 34,995,894 | | | 2.80 | % |
| Allegheny Technologies, Inc. | | | 583,300 | | | 45,923,209 | | | 3.67 | % |
| Ipsco, Inc. (b) | | | 279,400 | | | 25,548,336 | | | 2.04 | % |
| Ryerson Tull, Inc. | | | 874,900 | | | 21,085,090 | | | 1.69 | % |
| | | | | | | 127,552,529 | | | 10.20 | % |
| | | | | | | | | | | |
Total Common Stocks (Cost $1,167,886,163) | | | | | $ | 1,249,705,583 | | | 99.92 | % |
The accompanying notes are an integral part of these financial statements.
HENNESSY FUNDS 1-800-966-4354
SUMMARY OF INVESTMENTS — CORNERSTONE GROWTH FUND
SHORT-TERM INVESTMENTS - 0.21% | | Principal | | | | % of Net | |
| | | Amount | | Value | | Assets | |
Discount Notes - 0.21% | | | | | | | |
| Federal Home Loan Bank Discount Note, | | | | | | | |
| 5.0600%, due 11/01/2006 | | | | | $ | 2,531,000 | | | 0.21 | % |
| | | | | | | | | | | |
Total Discount Notes (Cost $2,531,000) | | | | | | 2,531,000 | | | 0.21 | % |
Variable Rate Demand Notes# - 0.00% | | | | | | | | | | |
| American Family Financial Services, Inc. | | | | | | | | | | |
| 4.9427% | | | 18,253 | | | 18,253 | | | 0.00 | % |
| | | | | | | | | | | |
Total Variable Rate Demand Notes | | | | | | | | | | |
| | | | | | | | | | % |
| | | | | | | | | | | |
Total Short-Term Investments | | | | | | | | | | |
| (Cost $2,549,253) | | | | | | 2,549,253 | | | 0.21 | % |
| | | | | | | | | | | |
Total Investments - 100.13% | | | | | | | | | | |
| (Cost $1,170,435,416) | | | | | | 1,252,254,836 | | | 100.13 | % |
| | | | | | | | | | | |
| Liabilities in Excess of Other Assets - (0.13)% | | | | | | (1,581,347 | ) | | (0.13 | %) |
TOTAL NET ASSETS - 100.00% | | | | | $ | 1,250,673,489 | | | 100.00 | % |
Percentages are stated as a percent of net assets.
| ADR | American Depository Receipt |
| (b) | Foreign issued security |
| # | Variable rate demand notes are considered short-term obligations and are payable on demand. Interest rates change periodically on specified dates. The rates listed are as of October 31, 2006. |
The accompanying notes are an integral part of these financial statements.
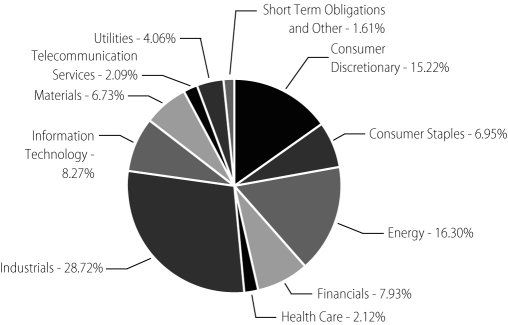
SUMMARY OF INVESTMENTS — CORNERSTONE GROWTH FUND, SERIES II
HENNESSY CORNERSTONE
GROWTH FUND, SERIES II
(% of Net Assets)
TOP TEN HOLDINGS | % of net assets |
| Gymboree Corp. | 2.67% |
| Casual Male Retail Group, Inc. | 2.66% |
| AEP Industries, Inc. | 2.60% |
| Mentor Graphics Corp. | 2.49% |
| Continental Airlines, Inc. | 2.37% |
| Matrix Service Co. | 2.34% |
| Chaparral Steel Co. | 2.34% |
| Belden CDT, Inc. | 2.25% |
| Standard Parking Corp. | 2.25% |
| Clean Harbors, Inc. | 2.17% |
HENNESSY FUNDS 1-800-966-4354
SUMMARY OF INVESTMENTS — CORNERSTONE GROWTH FUND, SERIES II
COMMON STOCKS - 98.39% | | Number | | | % of Net |
| | | of Shares | Value | Assets |
Consumer Discretionary - 15.22% | | | | | | | |
| AnnTaylor Stores Corp. (a) | | | 112,900 | | $ | 4,969,858 | | | 2.04 | % |
| Casual Male Retail Group, Inc. (a) | | | 439,100 | | | 6,503,071 | | | 2.66 | % |
| Dillard’s, Inc. | | | 155,700 | | | 4,697,469 | | | 1.92 | % |
| DSW, Inc. (a) | | | 138,400 | | | 4,788,640 | | | 1.96 | % |
| Gentek, Inc. (a) | | | 161,900 | | | 5,245,560 | | | 2.15 | % |
| Gymboree Corp. (a) | | | 140,400 | | | 6,522,984 | | | 2.67 | % |
| Interstate Hotels & Resorts, Inc. (a) | | | 494,100 | | | 4,432,077 | | | 1.82 | % |
| | | | | | | 37,159,659 | | | 15.22 | % |
Consumer Staples - 6.95% | | | | | | | | | | |
| Archer-Daniels-Midland Co. | | | 109,500 | | | 4,215,750 | | | 1.72 | % |
| National Beverage Corp. | | | 282,500 | | | 3,234,625 | | | 1.32 | % |
| Wild Oats Markets, Inc. (a) | | | 256,100 | | | 4,604,678 | | | 1.89 | % |
| Wimm-Bill-Dann Foods OJSC - ADR (b) | | | 116,800 | | | 4,923,120 | | | 2.02 | % |
| | | | | | | 16,978,173 | | | 6.95 | % |
Energy - 16.30% | | | | | | | | | | |
| Alon USA Energy, Inc. | | | 134,800 | | | 3,783,836 | | | 1.55 | % |
| Crosstex Energy, Inc. | | | 49,700 | | | 4,770,206 | | | 1.95 | % |
| FMC Technologies, Inc. (a) | | | 67,900 | | | 4,104,555 | | | 1.68 | % |
| Frontier Oil Corp. | | | 134,000 | | | 3,939,600 | | | 1.61 | % |
| Holly Corp. | | | 92,800 | | | 4,413,568 | | | 1.81 | % |
| Marathon Oil Corp. | | | 52,200 | | | 4,510,080 | | | 1.85 | % |
| Matrix Service Co. (a) | | | 398,300 | | | 5,723,571 | | | 2.34 | % |
| NATCO Group, Inc. (a) | | | 128,100 | | | 4,245,234 | | | 1.74 | % |
| World Fuel Services Corp. | | | 100,500 | | | 4,323,510 | | | 1.77 | % |
| | | | | | | 39,814,160 | | | 16.30 | % |
Financials - 7.93% | | | | | | | | | | |
| EMC Insurance Group, Inc. | | | 146,700 | | | 4,499,289 | | | 1.84 | % |
| Harleysville Group, Inc. | | | 140,800 | | | 5,080,064 | | | 2.08 | % |
| Meadowbrook Insurance Group, Inc. (a) | | | 439,100 | | | 5,291,155 | | | 2.17 | % |
| Safety Insurance Group, Inc. | | | 90,000 | | | 4,500,900 | | | 1.84 | % |
| | | | | | | 19,371,408 | | | 7.93 | % |
The accompanying notes are an integral part of these financial statements.
SUMMARY OF INVESTMENTS — CORNERSTONE GROWTH FUND, SERIES II
COMMON STOCKS | | Number | | | % of Net |
| | | of Shares | Value | Assets |
Health Care - 2.12% | | | | | | | |
| AMN Healthcare Services, Inc. (a) | | | 204,400 | | $ | 5,169,276 | | | 2.12 | % |
Industrials - 28.72% | | | | | | | | | | |
| Ampco-Pittsburgh Corp. | | | 156,400 | | | 5,192,480 | | | 2.13 | % |
| AMR Corp. (a) | | | 184,600 | | | 5,231,564 | | | 2.14 | % |
| Arkansas Best Corp. | | | 96,200 | | | 3,942,276 | | | 1.61 | % |
| Celadon Group, Inc. (a) | | | 241,100 | | | 4,523,036 | | | 1.85 | % |
| Cenveo, Inc. (a) | | | 254,200 | | | 5,043,328 | | | 2.07 | % |
| Clean Harbors, Inc. (a) | | | 123,800 | | | 5,297,402 | | | 2.17 | % |
| Continental Airlines, Inc. (a) | | | 157,000 | | | 5,790,160 | | | 2.37 | % |
| Cummins, Inc. | | | 39,700 | | | 5,041,106 | | | 2.06 | % |
| Lincoln Electric Holdings, Inc. | | | 77,300 | | | 4,753,177 | | | 1.95 | % |
| Old Dominion Freight Line (a) | | | 131,300 | | | 3,631,758 | | | 1.49 | % |
| PAM Transportation Services (a) | | | 149,000 | | | 3,772,680 | | | 1.54 | % |
| Ryder System, Inc. | | | 83,900 | | | 4,417,335 | | | 1.81 | % |
| Saia, Inc. (a) | | | 167,000 | | | 4,475,600 | | | 1.83 | % |
| Standard Parking Corp. (a) | | | 157,800 | | | 5,486,706 | | | 2.25 | % |
| Universal Truckload Services, Inc. (a) | | | 135,700 | | | 3,530,914 | | | 1.45 | % |
| | | | | | | 70,129,522 | | | 28.72 | % |
Information Technology - 8.27% | | | | | | | | | | |
| Belden CDT, Inc. | | | 151,900 | | | 5,498,780 | | | 2.25 | % |
| Cray, Inc. (a) | | | 407,700 | | | 3,769,187 | | | 1.54 | % |
| Gerber Scientific, Inc. (a) | | | 333,300 | | | 4,869,513 | | | 1.99 | % |
| Mentor Graphics Corp. (a) | | | 359,700 | | | 6,068,139 | | | 2.49 | % |
| | | | | | | 20,205,619 | | | 8.27 | % |
Materials - 6.73% | | | | | | | | | | |
| AEP Industries, Inc. (a) | | | 120,300 | | | 6,337,404 | | | 2.60 | % |
| Arch Chemicals, Inc. | | | 130,900 | | | 4,379,914 | | | 1.79 | % |
| Chaparral Steel Co. | | | 137,400 | | | 5,714,466 | | | 2.34 | % |
| | | | | | | 16,431,784 | | | 6.73 | % |
Telecommunication Services - 2.09% | | | | | | | | | | |
| Qwest Communications International (a) | | | 590,100 | | | 5,092,563 | | | 2.09 | % |
The accompanying notes are an integral part of these financial statements.
HENNESSY FUNDS 1-800-966-4354
SUMMARY OF INVESTMENTS — CORNERSTONE GROWTH FUND, SERIES II
COMMON STOCKS | | Number | | | | % of Net | |
| | | of Shares | | Value | | Assets | |
Utilities - 4.06% | | | | | | | |
| The AES Corp. (a) | | | 230,700 | | $ | 5,073,093 | | | 2.08 | % |
| OGE Energy Corp. | | | 125,200 | | | 4,830,216 | | | 1.98 | % |
| | | | | | | 9,903,309 | | | 4.06 | % |
| | | | | | | | | | | |
Total Common Stocks (Cost $223,766,370) | | | | | | 240,255,473 | | | 98.39 | % |
| | | | | | | | | | | |
Total Investments - 98.39% | | | | | | | | | | |
| (Cost $223,766,370) | | | | | | 240,255,473 | | | 98.39 | % |
| | | | | | | | | | | |
| Other Assets in Excess of Liabilities - 1.61% | | | | | | 3,933,022 | | | 1.61 | % |
TOTAL NET ASSETS - 100.00% | | | | | $ | 244,188,495 | | | 100.00 | % |
Percentages are stated as a percent of net assets.
| ADR | American Depository Receipt |
| (b) | Foreign issued security |
The accompanying notes are an integral part of these financial statements.
SUMMARY OF INVESTMENTS — FOCUS 30 FUND
HENNESSY FOCUS 30 FUND
(% of Net Assets)
TOP TEN HOLDINGS | % of net assets |
| Albemarle Corp. | 3.84% |
| Energizer Holdings, Inc. | 3.54% |
| Emcor Group, Inc. | 3.52% |
| Phillips-Van Heusen | 3.52% |
| Watson Wyatt & Co. Holdings | 3.51% |
| West Pharmaceutical Services, Inc. | 3.50% |
| Pactiv Corp. | 3.47% |
| Anixter International, Inc. | 3.46% |
| Priceline.com, Inc. | 3.44% |
| Acuity Brands, Inc. | 3.44% |
HENNESSY FUNDS 1-800-966-4354
SUMMARY OF INVESTMENTS — FOCUS 30 FUND
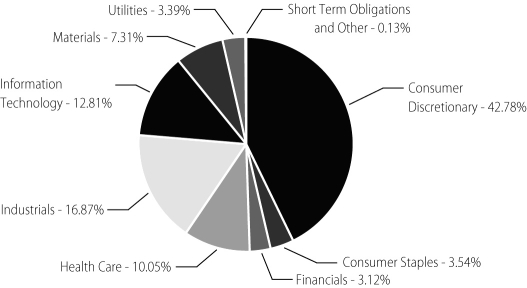
COMMON STOCKS - 99.87% | | Number | | | % of Net |
| | | of Shares | Value | Assets |
Consumer Discretionary - 42.78% | | | | | | | |
| AnnTaylor Stores Corp. (a) | | | 178,400 | | $ | 7,853,168 | | | 3.26 | % |
| Big Lots, Inc. (a) | | | 375,000 | | | 7,905,000 | | | 3.29 | % |
| Carmax, Inc. (a) | | | 184,200 | | | 8,160,060 | | | 3.39 | % |
| Children’s Place (a) | | | 117,000 | | | 8,212,230 | | | 3.41 | % |
| Dick’s Sporting Goods, Inc. (a) | | | 165,000 | | | 8,210,400 | | | 3.41 | % |
| Dillard’s Inc. | | | 232,900 | | | 7,026,593 | | | 2.92 | % |
| Dollar Tree Stores, Inc. (a) | | | 241,100 | | | 7,495,799 | | | 3.12 | % |
| Jack in the Box, Inc. (a) | | | 144,300 | | | 8,096,673 | | | 3.36 | % |
| Men’s Wearhouse, Inc. | | | 201,000 | | | 8,009,850 | | | 3.33 | % |
| Phillips-Van Heusen | | | 185,100 | | | 8,470,176 | | | 3.52 | % |
| Priceline.com, Inc. (a) | | | 205,200 | | | 8,267,508 | | | 3.44 | % |
| United Auto Group, Inc. | | | 323,300 | | | 7,429,434 | | | 3.09 | % |
| VF Corp. | | | 102,600 | | | 7,798,626 | | | 3.24 | % |
| | | | | | | 102,935,517 | | | 42.78 | % |
Consumer Staples - 3.54% | | | | | | | | | | |
| Energizer Holdings, Inc. (a) | | | 109,100 | | | 8,526,165 | | | 3.54 | % |
Financials - 3.12% | | | | | | | | | | |
| Assurant, Inc. | | | 142,500 | | | 7,504,050 | | | 3.12 | % |
Health Care - 10.05% | | | | | | | | | | |
| PSS World Medical, Inc. (a) | | | 396,900 | | | 7,985,628 | | | 3.32 | % |
| WellCare Health Plans, Inc. (a) | | | 132,300 | | | 7,772,625 | | | 3.23 | % |
| West Pharmaceutical Services, Inc. | | | 200,300 | | | 8,420,612 | | | 3.50 | % |
| | | | | | | 24,178,865 | | | 10.05 | % |
Industrials - 16.87% | | | | | | | | | | |
| Acuity Brands, Inc. | | | 166,700 | | | 8,258,318 | | | 3.44 | % |
| Cummins, Inc. | | | 64,100 | | | 8,139,418 | | | 3.38 | % |
| Emcor Group, Inc. (a) | | | 143,400 | | | 8,482,110 | | | 3.52 | % |
| Granite Construction, Inc. | | | 139,500 | | | 7,267,950 | | | 3.02 | % |
| Watson Wyatt & Co. Holdings | | | 187,300 | | | 8,456,595 | | | 3.51 | % |
| | | | | | | 40,604,391 | | | 16.87 | % |
Information Technology - 12.81% | | | | | | | | | | |
| Anixter International, Inc. (a) | | | 139,400 | | | 8,330,544 | | | 3.46 | % |
| Belden CDT, Inc. | | | 206,000 | | | 7,457,200 | | | 3.10 | % |
The accompanying notes are an integral part of these financial statements.
SUMMARY OF INVESTMENTS — FOCUS 30 FUND
COMMON STOCKS | | Number | | | | % of Net | |
| | | of Shares | | Value | | Assets | |
Information Technology (Continued) | | | | | | | |
| Benchmark Electronics, Inc. (a) | | | 278,300 | | $ | 7,388,865 | | | 3.07 | % |
| CommScope, Inc. (a) | | | 240,000 | | | 7,658,400 | | | 3.18 | % |
| | | | | | | 30,835,009 | | | 12.81 | % |
Materials - 7.31% | | | | | | | | | | |
| Albemarle Corp. | | | 142,100 | | | 9,240,763 | | | 3.84 | % |
| Pactiv Corp. (a) | | | 270,600 | | | 8,345,304 | | | 3.47 | % |
| | | | | | | 17,586,067 | | | 7.31 | % |
Utilities - 3.39% | | | | | | | | | | |
| OGE Energy Corp. | | | 211,200 | | | 8,148,096 | | | 3.39 | % |
| | | | | | | | | | | |
Total Common Stocks (Cost $231,442,681) | | | | | | 240,318,160 | | | 99.87 | % |
| | | | | | | | | | | |
Total Investments - 99.87% | | | | | | | | | | |
| (Cost $231,442,681) | | | | | | 240,318,160 | | | 99.87 | % |
| | | | | | | | | | | |
| Other Assets in Excess of Liabilities - 0.13% | | | | | | 312,128 | | | 0.13 | % |
TOTAL NET ASSETS - 100.00% | | | | | $ | 240,630,288 | | | 100.00 | % |
Percentages are stated as a percent of net assets.
The accompanying notes are an integral part of these financial statements.
HENNESSY FUNDS 1-800-966-4354
SUMMARY OF INVESTMENTS — CORNERSTONE VALUE FUND
HENNESSY CORNERSTONE VALUE FUND
(% of Net Assets)
TOP TEN HOLDINGS | % of net assets |
| BellSouth Corp. | 2.70% |
| Merck & Co., Inc. | 2.58% |
| General Motors Corp. | 2.52% |
| AT&T, Inc. | 2.28% |
| Mattel, Inc. | 2.27% |
| Reynolds American, Inc. | 2.26% |
| ING Groep NV - ADR | 2.16% |
| ConAgra Foods, Inc. | 2.15% |
| Pfizer, Inc. | 2.14% |
| Diageo PLC - ADR | 2.07% |
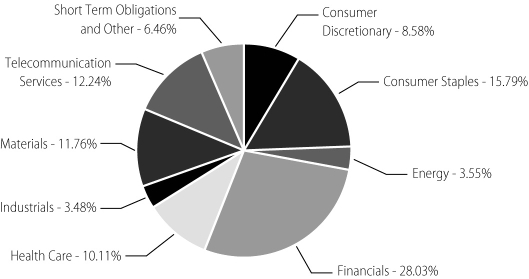
SUMMARY OF INVESTMENTS — CORNERSTONE VALUE FUND
COMMON STOCKS - 93.54% | | Number | | | % of Net |
| | | of Shares | Value | Assets |
Consumer Discretionary - 8.58% | | | | | | | |
| DaimlerChrysler AG (b) | | | 83,000 | | $ | 4,725,190 | | | 1.84 | % |
| Ford Motor Co. | | | 519,600 | | | 4,302,288 | | | 1.68 | % |
| General Motors Corp. | | | 185,500 | | | 6,477,660 | | | 2.52 | % |
| Hanesbrands, Inc. (a) | | | 29,600 | | | 698,560 | | | 0.27 | % |
| Mattel, Inc. | | | 257,600 | | | 5,829,488 | | | 2.27 | % |
| | | | | | | 22,033,186 | | | 8.58 | % |
Consumer Staples - 15.79% | | | | | | | | | | |
| Altria Group, Inc. | | | 58,900 | | | 4,790,337 | | | 1.86 | % |
| ConAgra Foods, Inc. | | | 211,200 | | | 5,522,880 | | | 2.15 | % |
| Diageo PLC - ADR (b) | | | 71,300 | | | 5,309,711 | | | 2.07 | % |
| HJ Heinz Co. | | | 123,600 | | | 5,210,976 | | | 2.03 | % |
| Kimberly-Clark Corp. | | | 73,000 | | | 4,855,960 | | | 1.89 | % |
| Kraft Foods, Inc. | | | 145,500 | | | 5,005,200 | | | 1.95 | % |
| Reynolds American, Inc. | | | 91,900 | | | 5,804,404 | | | 2.26 | % |
| Sara Lee Corp. | | | 236,800 | | | 4,049,280 | | | 1.58 | % |
| | | | | | | 40,548,748 | | | 15.79 | % |
Energy - 3.55% | | | | | | | | | | |
| BP PLC - ADR (b) | | | 63,300 | | | 4,247,430 | | | 1.66 | % |
| ChevronTexaco Corp. | | | 72,300 | | | 4,858,560 | | | 1.89 | % |
| | | | | | | 9,105,990 | | | 3.55 | % |
Financials - 28.03% | | | | | | | | | | |
| Bank of America Corp. | | | 92,600 | | | 4,988,362 | | | 1.93 | % |
| Citigroup, Inc. | | | 86,900 | | | 4,358,904 | | | 1.69 | % |
| Freddie Mac | | | 67,000 | | | 4,622,330 | | | 1.79 | % |
| HSBC Holdings PLC - ADR (b) | | | 52,900 | | | 5,050,363 | | | 1.97 | % |
| ING Groep NV - ADR (b) | | | 125,200 | | | 5,550,116 | | | 2.16 | % |
| J.P. Morgan Chase & Co. | | | 108,700 | | | 5,156,728 | | | 2.01 | % |
| Lincoln National Corp. | | | 82,200 | | | 5,204,082 | | | 2.03 | % |
| National City Corp. | | | 123,800 | | | 4,611,550 | | | 1.80 | % |
| PNC Financial Services Group | | | 66,600 | | | 4,663,998 | | | 1.82 | % |
| Regions Financial Corp. | | | 125,800 | | | 4,774,110 | | | 1.86 | % |
| US Bancorp | | | 141,000 | | | 4,771,440 | | | 1.86 | % |
| Wachovia Corp. | | | 80,500 | | | 4,467,750 | | | 1.74 | % |
The accompanying notes are an integral part of these financial statements.
HENNESSY FUNDS 1-800-966-4354
SUMMARY OF INVESTMENTS — CORNERSTONE VALUE FUND
COMMON STOCKS | | Number | | | % of Net |
| | | of Shares | Value | Assets |
Financials (Continued) | | | | | | | |
| Washington Mutual, Inc. | | | 102,300 | | $ | 4,327,290 | | | 1.69 | % |
| Wells Fargo & Co. | | | 135,800 | | | 4,928,182 | | | 1.92 | % |
| XL Capital Ltd. (b) | | | 63,900 | | | 4,508,145 | | | 1.76 | % |
| | | | | | | 71,983,350 | | | 28.03 | % |
Health Care - 10.11% | | | | | | | | | | |
| Bristol-Myers Squibb Co. | | | 198,400 | | | 4,910,400 | | | 1.91 | % |
| Eli Lilly & Co. | | | 79,600 | | | 4,458,396 | | | 1.74 | % |
| GlaxoSmithKline PLC - ADR (b) | | | 83,900 | | | 4,467,675 | | | 1.74 | % |
| Merck & Co., Inc. | | | 145,900 | | | 6,626,778 | | | 2.58 | % |
| Pfizer, Inc. | | | 206,100 | | | 5,492,565 | | | 2.14 | % |
| | | | | | | 25,955,814 | | | 10.11 | % |
Industrials - 3.48% | | | | | | | | | | |
| Pitney Bowes, Inc. | | | 101,700 | | | 4,750,407 | | | 1.85 | % |
| RR Donnelley & Sons Co. | | | 123,900 | | | 4,195,254 | | | 1.63 | % |
| | | | | | | 8,945,661 | | | 3.48 | % |
Materials - 11.76% | | | | | | | | | | |
| The Dow Chemical Co. | | | 95,200 | | | 3,883,208 | | | 1.52 | % |
| EI Du Pont de Nemours & Co. | | | 99,200 | | | 4,543,360 | | | 1.77 | % |
| International Paper Co. | | | 125,600 | | | 4,188,760 | | | 1.63 | % |
| Lyondell Chemical Co. | | | 170,200 | | | 4,369,034 | | | 1.70 | % |
| MeadWestvaco Corp. | | | 150,700 | | | 4,147,264 | | | 1.61 | % |
| PPG Industries, Inc. | | | 72,900 | | | 4,986,360 | | | 1.94 | % |
| Weyerhaeuser Co. | | | 64,100 | | | 4,076,119 | | | 1.59 | % |
| | | | | | | 30,194,105 | | | 11.76 | % |
Telecommunication Services - 12.24% | | | | | | | | | | |
| AT&T, Inc. | | | 170,700 | | | 5,846,475 | | | 2.28 | % |
| BellSouth Corp. | | | 154,000 | | | 6,945,400 | | | 2.70 | % |
| Chunghwa Telecom Company Ltd. - ADR | | | 245,000 | | | 4,481,050 | | | 1.74 | % |
| Telefonica de Argentina SA (a)(b)Ω | | | 1,200 | | | 12 | | | 0.00 | % |
| Telefonos de Mexico SA de CV - ADR (b) | | | 183,700 | | | 4,847,843 | | | 1.89 | % |
| Verizon Communications, Inc. | | | 136,800 | | | 5,061,600 | | | 1.97 | % |
| Vodafone Group PLC - ADR (b) | | | 164,700 | | | 4,257,495 | | | 1.66 | % |
| | | | | | | 31,439,875 | | | 12.24 | % |
| | | | | | | | | | | |
Total Common Stocks (Cost $216,225,728) | | | | | | 240,206,729 | | | 93.54 | % |
The accompanying notes are an integral part of these financial statements.
SUMMARY OF INVESTMENTS — CORNERSTONE VALUE FUND
SHORT-TERM INVESTMENTS - 5.16% | | Principal | | | % of Net |
| | | Amount | Value | Assets |
Discount Notes - 5.12% | | | | | | | |
| Federal Home Loan Bank Discount Note, | | | | | | | |
| 5.0600%, due 11/01/2006 | | | | | $ | 13,146,000 | | | 5.12 | % |
| | | | | | | | | | | |
Total Discount Notes (Cost $13,146,000) | | | | | | 13,146,000 | | | 5.12 | % |
Variable Rate Demand Notes# - 0.04% | | | | | | | | | | |
| American Family Financial Services, Inc. | | | | | | | | | | |
| 4.9427% | | | 81,384 | | | 81,384 | | | 0.03 | % |
| Wisconsin Corporate Central Credit Union | | | | | | | | | | |
| 4.9900% | | | 25,801 | | | 25,801 | | | 0.01 | % |
| | | | | | | | | | | |
Total Variable Rate Demand Notes | | | | | | | | | | |
| (Cost $107,185) | | | | | | 107,185 | | | 0.04 | % |
| | | | | | | | | | | |
Total Short-Term Investments | | | | | | | | | | |
| (Cost $13,253,185) | | | | | | 13,253,185 | | | 5.16 | % |
| | | | | | | | | | | |
Total Investments - 98.70% | | | | | | | | | | |
| (Cost $229,478,913) | | | | | | 253,459,914 | | | 98.70 | % |
| | | | | | | | | | | |
| Other Assets in Excess of Liabilities - 1.30% | | | | | | 3,342,906 | | | 1.30 | % |
TOTAL NET ASSETS - 100.00% | | | | | $ | 256,802,820 | | | 100.00 | % |
Percentages are stated as a percent of net assets.
| ADR | American Depository Receipt |
| (b) | Foreign issued security |
| # | Variable rate demand notes are considered short-term obligations and are payable on demand. Interest rates change periodically on specified dates. The rates listed are as of October 31, 2006. |
| Ω | Security is fair valued. |
The accompanying notes are an integral part of these financial statements.
HENNESSY FUNDS 1-800-966-4354
SUMMARY OF INVESTMENTS — TOTAL RETURN FUND
HENNESSY TOTAL RETURN FUND
(% of Net Assets)
TOP TEN HOLDINGS | % of net assets |
| General Motors Corp. | 8.86% |
| Merck & Co., Inc. | 8.07% |
| AT&T, Inc. | 7.95% |
| Verizon Communications, Inc. | 7.20% |
| J.P. Morgan Chase & Co. | 7.18% |
| EI Du Pont de Nemours & Co. | 7.13% |
| Altria Group, Inc. | 6.96% |
| Pfizer, Inc. | 6.84% |
| Citigroup, Inc. | 6.76% |
| General Electric Co. | 5.06% |
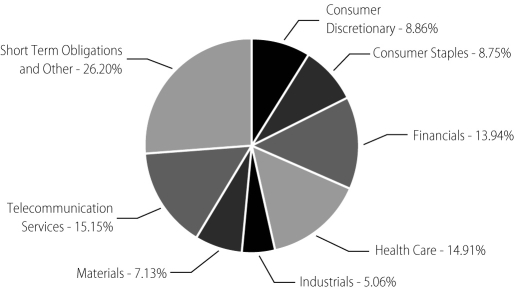
SUMMARY OF INVESTMENTS — TOTAL RETURN FUND
COMMON STOCKS - 73.80% | | Number | | | % of Net |
| | | of Shares | Value | Assets |
Consumer Discretionary - 8.86% | | | | | | | |
| General Motors Corp. | | | 287,400 | | $ | 10,036,008 | | | 8.86 | % |
Consumer Staples - 8.75% | | | | | | | | | | |
| Altria Group, Inc. | | | 96,900 | | | 7,880,877 | | | 6.96 | % |
| The Coca-Cola Co. | | | 43,300 | | | 2,022,976 | | | 1.79 | % |
| | | | | | | 9,903,853 | | | 8.75 | % |
Financials - 13.94% | | | | | | | | | | |
| Citigroup, Inc. | | | 152,600 | | | 7,654,416 | | | 6.76 | % |
| J.P. Morgan Chase & Co. | | | 171,500 | | | 8,135,960 | | | 7.18 | % |
| | | | | | | 15,790,376 | | | 13.94 | % |
Health Care - 14.91% | | | | | | | | | | |
| Merck & Co., Inc. | | | 201,200 | | | 9,138,504 | | | 8.07 | % |
| Pfizer, Inc. | | | 290,900 | | | 7,752,485 | | | 6.84 | % |
| | | | | | | 16,890,989 | | | 14.91 | % |
Industrials - 5.06% | | | | | | | | | | |
| General Electric Co. | | | 163,100 | | | 5,726,441 | | | 5.06 | % |
Materials - 7.13% | | | | | | | | | | |
| EI Du Pont de Nemours & Co. | | | 176,250 | | | 8,072,250 | | | 7.13 | % |
Telecommunication Services - 15.15% | | | | | | | | | | |
| AT&T, Inc. | | | 262,900 | | | 9,004,325 | | | 7.95 | % |
| Verizon Communications, Inc. | | | 220,500 | | | 8,158,500 | | | 7.20 | % |
| | | | | | | 17,162,825 | | | 15.15 | % |
| | | | | | | | | | | |
Total Common Stocks (Cost $76,462,581) | | | | | | 83,582,742 | | | 73.80 | % |
| | | | | | | | | | | |
SHORT-TERM INVESTMENTS - 60.96% | | | Principal | | | | | % of Net |
| | | | Amount | | Value | | Assets |
U.S. Treasury Bill* - 57.91% | | | | | | | | | | |
| 4.838%, 11/16/2006 | | | | | | 20,958,700 | | | 18.51 | % |
| 4.810%, 12/21/2006 | | | 24,000,000 | | | 23,854,000 | | | 21.06 | % |
| 4.820%, 01/18/2007 | | | 21,000,000 | | | 20,776,140 | | | 18.34 | % |
| | | | | | | | | | | |
U.S. Treasury Bills (Cost $65,596,803) | | | | | | 65,588,840 | | | 57.91 | % |
The accompanying notes are an integral part of these financial statements.
HENNESSY FUNDS 1-800-966-4354
SUMMARY OF INVESTMENTS — TOTAL RETURN FUND
SHORT-TERM INVESTMENTS | | Principal | | | % of Net |
| | | Amount | Value | Assets |
Discount Notes - 2.96% | | | | | | | |
| Federal Home Loan Bank Discount Note | | | | | | | |
| 5.0600%, 11/01/2006 | | | | | $ | 3,349,000 | | | 2.96 | % |
| | | | | | | | | | | |
Total Discount Notes (Cost $3,349,000) | | | | | | 3,349,000 | | | 2.96 | % |
Variable Rate Demand Notes# - 0.09% | | | | | | | | | | |
| American Family Financial Services, Inc. | | | | | | | | | | |
| 4.9427% | | | 99,497 | | | 99,497 | | | 0.08 | % |
| Wisconsin Corporate Central Credit Union | | | | | | | | | | |
| 4.9900% | | | 9,428 | | | 9,428 | | | 0.01 | % |
| | | | | | | | | | | |
Total Variable Rate Demand Notes | | | | | | | | | | |
| (Cost $108,925) | | | | | | 108,925 | | | 0.09 | % |
| | | | | | | | | | | |
Total Short-Term Investments | | | | | | | | | | |
| (Cost $69,054,728) | | | | | | 69,046,765 | | | 60.96 | % |
| | | | | | | | | | | |
Total Investments - 134.76% | | | | | | | | | | |
| (Cost $145,517,309) | | | | | | 152,629,507 | | | 134.76 | % |
| | | | | | | | | | | |
| Liabilities in Excess of Other Assets - (34.76)% | | | | | | (39,365,822 | ) | | (34.76 | ) |
TOTAL NET ASSETS - 100.00% | | | | | $ | 113,263,685 | | | 100.00 | % |
Percentages are stated as a percent of net assets.
| * | Collateral or partial collateral for securities sold subject to repurchase. |
| # | Variable rate demand notes are considered short-term obligations and are payable on demand. Interest rates changed periodically on specified dates. The rates listed are as of October 31, 2006. |
The accompanying notes are an integral part of these financial statements.
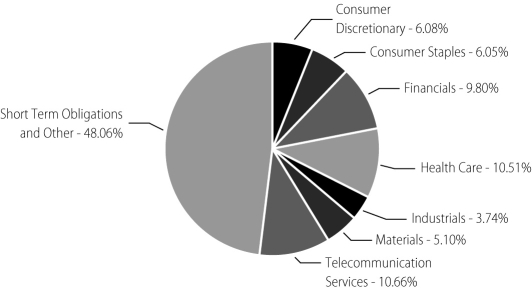
SUMMARY OF INVESTMENTS — BALANCED FUND
HENNESSY BALANCED FUND
(% of Net Assets)
TOP TEN HOLDINGS | % of net assets |
| General Motors Corp. | 6.08% |
| Merck & Co., Inc. | 5.66% |
| AT&T, Inc. | 5.61% |
| EI du Pont de Nemours & Co. | 5.10% |
| Verizon Communications, Inc. | 5.05% |
| J.P. Morgan Chase & Co. | 5.03% |
| Altria Group, Inc. | 4.94% |
| Pfizer, Inc. | 4.85% |
| Citigroup, Inc. | 4.77% |
| General Electric Co. | 3.74% |
HENNESSY FUNDS 1-800-966-4354
SUMMARY OF INVESTMENTS — BALANCED FUND
COMMON STOCKS - 51.94% | | Number | | | % of Net |
| | | of Shares | Value | Assets |
Consumer Discretionary - 6.08% | | | | | | | |
| General Motors Corp. | | | 45,500 | | $ | 1,588,860 | | | 6.08 | % |
Consumer Staples - 6.05% | | | | | | | | | | |
| Altria Group, Inc. | | | 15,875 | | | 1,291,114 | | | 4.94 | % |
| The Coca-Cola Co. | | | 6,225 | | | 290,832 | | | 1.11 | % |
| | | | | | | 1,581,946 | | | 6.05 | % |
Financials - 9.80% | | | | | | | | | | |
| Citigroup, Inc. | | | 24,875 | | | 1,247,730 | | | 4.77 | % |
| J.P. Morgan Chase & Co. | | | 27,700 | | | 1,314,088 | | | 5.03 | % |
| | | | | | | 2,561,818 | | | 9.80 | % |
Health Care - 10.51% | | | | | | | | | | |
| Merck & Co., Inc. | | | 32,575 | | | 1,479,557 | | | 5.66 | % |
| Pfizer, Inc. | | | 47,525 | | | 1,266,541 | | | 4.85 | % |
| | | | | | | 2,746,098 | | | 10.51 | % |
Industrials - 3.74% | | | | | | | | | | |
| General Electric Co. | | | 27,875 | | | 978,691 | | | 3.74 | % |
Materials - 5.10% | | | | | | | | | | |
| EI Du Pont de Nemours & Co. | | | 29,100 | | | 1,332,780 | | | 5.10 | % |
Telecommunication Services - 10.66% | | | | | | | | | | |
| AT&T, Inc. | | | 42,775 | | | 1,465,044 | | | 5.61 | % |
| Verizon Communications, Inc. | | | 35,700 | | | 1,320,900 | | | 5.05 | % |
| | | | | | | 2,785,944 | | | 10.66 | % |
| | | | | | | | | | | |
Total Common Stocks (Cost $11,808,757) | | | | | | 13,576,137 | | | 51.94 | % |
| | | | | | | | | | | |
SHORT-TERM INVESTMENTS - 47.86% | | | Principal | | | | | % of Net |
| | | | Amount | | Value | | Assets |
U.S. Treasury Notes - 47.07% | | | | | | | | | | |
| 2.625%, 11/15/2006 | | $ | 690,000 | | | 689,515 | | | 2.65 | % |
| 2.875%, 11/30/2006 | | | 707,000 | | | 705,868 | | | 2.70 | % |
| 3.000%, 12/31/2006 | | | 400,000 | | | 398,578 | | | 1.53 | % |
| 3.125%, 01/31/2007 | | | 1,300,000 | | | 1,294,160 | | | 4.95 | % |
| 2.250%, 02/15/2007 | | | 1,350,000 | | | 1,339,243 | | | 5.12 | % |
| 3.750%, 03/31/2007 | | | 2,000,000 | | | 1,989,688 | | | 7.61 | % |
The accompanying notes are an integral part of these financial statements.
SUMMARY OF INVESTMENTS — BALANCED FUND
SHORT-TERM INVESTMENTS | | Principal | | | | % of Net | |
| | | Amount | | Value | | Assets | |
U.S. Treasury Notes (Continued) | | | | | | | |
| 3.125%, 05/15/2007 | | | $ 700,000 | | $ | 693,055 | | | 2.65 | % |
| 3.500%, 05/31/2007 | | | | | | 803,135 | | | 3.07 | % |
| 3.625%, 06/30/2007 | | | 1,900,000 | | | 1,883,005 | | | 7.20 | % |
| 2.750%, 08/15/2007 | | | 1,540,000 | | | 1,514,134 | | | 5.79 | % |
| 4.000%, 09/30/2007 | | | 1,000,000 | | | 991,876 | | | 3.80 | % |
| | | | | | | | | | | |
Total U.S. Treasury Notes (Cost $12,306,586) | | | | | | 12,302,257 | | | 47.07 | % |
Discount Notes - 0.52% | | | | | | | | | | |
| Federal Home Loan Bank Discount Note, | | | | | | | | | | |
| 5.0600% | | | 137,000 | | | 137,000 | | | 0.52 | % |
| | | | | | | | | | | |
Total Discount Notes ($137,000) | | | | | | 137,000 | | | 0.52 | % |
Variable Rate Demand Notes# - 0.27% | | | | | | | | | | |
| American Family Financial Services, Inc. | | | | | | | | | | |
| 4.9427% | | | 64,683 | | | 64,683 | | | 0.24 | % |
| Wisconsin Corporate Central Credit Union | | | | | | | | | | |
| 4.9900% | | | 6,645 | | | 6,645 | | | 0.03 | % |
| | | | | | | | | | | |
Total Variable Rate Demand Notes | | | | | | | | | | |
| (Cost $71,328) | | | | | | 71,328 | | | 0.27 | % |
| | | | | | | | | | | |
Total Short-Term Investments | | | | | | | | | | |
| (Cost $12,514,914) | | | | | | 12,510,585 | | | 47.86 | % |
Total Investments - 99.80% | | | | | | | | | | |
| (Cost $24,323,671) | | | | | | 26,086,722 | | | 99.80 | % |
| | | | | | | | | | | |
| Other Assets in Excess of Liabilities - 0.20% | | | | | | 48,716 | | | 0.20 | % |
TOTAL NET ASSETS - 100.00% | | | | | $ | 26,135,438 | | | 100.00 | % |
Percentages are stated as a percent of net assets.
| # | Variable rate demand notes are considered short-term obligations and are payable on demand. Interest rates change periodically on specified dates. The rates listed are as of October 31, 2006. |
The accompanying notes are an integral part of these financial statements.
HENNESSY FUNDS 1-800-966-4354
Financial Statements
Statements of Assets and Liabilities as of October 31, 2006 |
| | | HENNESSY | |
| | | CORNERSTONE | |
| | | GROWTH FUND | |
ASSETS: | | | |
| Investments, at value (cost $1,170,435,416, $223,766,370, | | | |
| $231,442,681, $229,478,913, $145,517,309, $24,323,671, respectively) | | $ | 1,252,254,836 | |
| Cash | | | — | |
| Dividends and interest receivable | | | 518,667 | |
| Receivable for fund shares sold | | | 1,537,875 | |
| Receivable for securities sold | | | — | |
| Prepaid expenses and other assets | | | 67,741 | |
| Total Assets | | | 1,254,379,119 | |
| | | | | |
LIABILITIES: | | | | |
| Loan payable | | | — | |
| Payable for fund shares redeemed | | | 2,100,243 | |
| Payable to Advisor | | | 780,409 | |
| Payable to Administrator | | | 470,340 | |
| Payable to Distributor | | | — | |
| Reverse repurchase agreement | | | — | |
| Accrued sub-transfer agent expenses | | | 181,022 | |
| Accrued interest payable | | | 21,010 | |
| Accrued expenses and other payables | | | 152,606 | |
| Total Liabilities | | | 3,705,630 | |
| | | | | |
NET ASSETS | | $ | 1,250,673,489 | |
| | | | | |
NET ASSETS CONSIST OF: | | | | |
| Capital stock | | $ | 987,196,112 | |
| Accumulated net investment income (loss) | | | — | |
| Accumulated net realized gain (loss) on investments | | | 181,657,957 | |
| Unrealized net appreciation (depreciation) on investments | | | 81,819,420 | |
| Total Net Assets | | $ | 1,250,673,489 | |
| | | | | |
| Shares authorized ($.0001 par value) | | | 25,000,000,000 | |
| Shares issued and outstanding | | | 60,205,024 | |
| Net asset value, offering price and redemption price per share | | $ | 20.77 | |
The accompanying notes are an integral part of these financial statements.
FINANCIAL STATEMENTS — STATEMENTS OF ASSETS AND LIABILITIES
| | | | | | | | | | | | |
| | | HENNESSY | | | | | | | | |
| | | CORNERSTONE | HENNESSY | HENNESSY | HENNESSY | HENNESSY |
| | | GROWTH FUND, | FOCUS 30 | CORNERSTONE | TOTAL RETURN | BALANCED |
| | | SERIES II | FUND | VALUE FUND | FUND | FUND |
| | | | | | | | | | | | |
| | | | | | | | | | | | |
| | | $ | 240,255,473 | | $ | 240,318,160 | | $ | 253,459,914 | | $ | 152,629,507 | | $ | 26,086,722 | |
| | | | 55 | | | 14 | | | — | | | 101,457 | | | — | |
| | | | 81,207 | | | 52,143 | | | 415,533 | | | 171,905 | | | 131,031 | |
| | | | 237,693 | | | 246,442 | | | 3,327,840 | | | 227,369 | | | 10,982 | |
| | | | 4,892,005 | | | 4,888,229 | | | — | | | — | | | — | |
| | | | 63,444 | | | 24,055 | | | 20,508 | | | 15,974 | | | 8,088 | |
| | | | 245,529,877 | | | 245,529,043 | | | 257,223,795 | | | 153,146,212 | | | 26,236,823 | |
| | | | | | | | | | | | | | | | | |
| | | | | | | | | | | | | | | | | |
| | | | 625,400 | | | 3,654,900 | | | — | | | — | | | — | |
| | | | 352,058 | | | 914,188 | | | 131,101 | | | 36,011 | | | 10,828 | |
| | | | 155,071 | | | 157,434 | | | 153,289 | | | 56,563 | | | 13,581 | |
| | | | 94,457 | | | 109,056 | | | 88,798 | | | 41,196 | | | 12,744 | |
| | | | — | | | — | | | — | | | 125,759 | | | 48,041 | |
| | | | — | | | — | | | — | | | 39,400,000 | | | — | |
| | | | 34,150 | | | 17,208 | | | 6,840 | | | — | | | — | |
| | | | 61 | | | 5,589 | | | 667 | | | 187,673 | | | — | |
| | | | 80,185 | | | 40,380 | | | 40,280 | | | 35,325 | | | 16,191 | |
| | | | 1,341,382 | | | 4,898,755 | | | 420,975 | | | 39,882,527 | | | 101,385 | |
| | | | | | | | | | | | | | | | | |
| | | $ | 244,188,495 | | $ | 240,630,288 | | $ | 256,802,820 | | $ | 113,263,685 | | $ | 26,135,438 | |
| | | | | | | | | | | | | | | | | |
| | | | | | | | | | | | | | | | | |
| | | $ | 218,467,562 | | $ | 230,042,627 | | $ | 325,933,936 | | $ | 196,811,829 | | $ | 26,780,938 | |
| | | | — | | | — | | | 4,008,165 | | | 221,710 | | | 70,517 | |
| | | | 9,231,830 | | | 1,712,182 | | | (97,120,282 | ) | | (90,882,052 | ) | | (2,479,068 | ) |
| | | | 16,489,103 | | | 8,875,479 | | | 23,981,001 | | | 7,112,198 | | | 1,763,051 | |
| | | $ | 244,188,495 | | $ | 240,630,288 | | $ | 256,802,820 | | $ | 113,263,685 | | $ | 26,135,438 | |
| | | | | | | | | | | | | | | | | |
| | | | Unlimited | | | 25,000,000,000 | | | 25,000,000,000 | | | 100,000,000 | | | 100,000,000 | |
| | | | 7,940,959 | | | 19,426,478 | | | 16,821,672 | | | 8,980,135 | | | 2,209,497 | |
| | | $ | 30.75 | | $ | 12.39 | | $ | 15.27 | | $ | 12.61 | | $ | 11.83 | |
HENNESSY FUNDS 1-800-966-4354
Financial Statements
| |
INVESTMENT INCOME: |
| Dividend income(1) |
| Interest income |
| Securities lending income |
| |
| Total investment income |
| |
| |
EXPENSES: |
| Investment advisory fees |
| Administration, fund accounting, custody and transfer agent fees (See Note 5) |
| Distribution fees (See Note 5) |
| Service fees (See Note 5) |
| Federal and state registration fees |
| Audit fees |
| Reports to shareholders |
| Directors’ fees and expenses |
| Sub-transfer agent expenses (See Note 5) |
| Interest expense (See Note 3 and 7) |
| Other |
| |
| Total expenses before reimbursement from Advisor |
| Expense reimbursement by Advisor |
| |
| Net expenses |
| |
NET INVESTMENT INCOME (LOSS) |
| |
| |
REALIZED AND UNREALIZED GAINS (LOSSES): |
| Net realized gain on investments |
| Change in unrealized appreciation (depreciation) on investments |
|
| Net gain (loss) on investments |
| |
| |
NET INCREASE (DECREASE) IN NET ASSETS RESULTING FROM OPERATIONS |
| (1) | Net of foreign taxes withheld of $204,835, $5,121, $181 and $0, respectively. |
| * | For the four months ended October 31, 2006. Effective October 31, 2006, the Hennessy Cornerstone Growth Fund, Series II changed its fiscal year end to October 31st from June 30th. |
The accompanying notes are an integral part of these financial statements.
FINANCIAL STATEMENTS — STATEMENTS OF OPERATIONS
| | | | | | | | | | |
| | | HENNESSY | | | | | | | |
| | | CORNERSTONE | | HENNESSY CORNERSTONE | | HENNESSY | |
| | | GROWTH FUND | | GROWTH FUND, SERIES II | | FOCUS 30 FUND | |
| | | Year Ended | | Period Ended | | Year Ended | | Year Ended | |
| | | October 31, 2006 | | October 31, 2006* | | June 30, 2006 | | October 31, 2006 | |
| | | | | | | | | | |
| | | $ | 10,693,209 | | $ | 772,705 | | $ | 2,506,465 | | $ | 853,926 | |
| | | | 2,147,130 | | | 84,964 | | | 310,552 | | | 479,183 | |
| | | | — | | | — | | | — | | | — | |
| | | | 12,840,339 | | | 857,669 | | | 2,817,017 | | | 1,333,109 | |
| | | | | | | | | | | | | | |
| | | | | | | | | | | | | | |
| | | | 9,405,213 | | | 629,088 | | | 2,029,091 | | | 1,761,888 | |
| | | | 2,904,210 | | | 194,582 | | | 634,136 | | | 544,031 | |
| | | | — | | | — | | | — | | | — | |
| | | | 1,270,975 | | | 85,012 | | | 274,201 | | | 238,093 | |
| | | | 64,059 | | | 13,343 | | | 27,788 | | | 34,805 | |
| | | | 18,424 | | | 10,393 | | | 35,000 | | | 15,502 | |
| | | | 147,690 | | | 23,260 | | | 42,275 | | | 27,333 | |
| | | | 12,191 | | | 5,452 | | | 10,374 | | | 12,241 | |
| | | | 1,484,374 | | | 95,515 | | | 340,607 | | | 229,790 | |
| | | | 1,757 | | | 1,061 | | | — | | | 5,589 | |
| | | | 79,051 | | | 7,193 | | | 40,947 | | | 15,963 | |
| | | | 15,387,944 | | | 1,064,899 | | | 3,434,419 | | | 2,885,235 | |
| | | | — | | | — | | | (7,214 | ) | | — | |
| | | | — | | | — | | | 3,427,205 | | | — | |
| | | $ | (2,547,605 | ) | $ | (207,230 | ) | $ | (610,188 | ) | $ | (1,552,126 | ) |
| | | | | | | | | | | | | | |
| | | | | | | | | | | | | | |
| | | $ | 184,186,611 | | $ | 8,338,233 | | $ | 28,215,988 | | $ | 1,712,198 | |
| | | | (52,188,698 | ) | | (21,353,033 | ) | | 9,942,792 | | | 13,224,239 | |
| | | | 131,997,913 | | | (13,014,800 | ) | | 38,158,780 | | | 14,936,437 | |
| | | | | | | | | | | | | | |
| | | $ | 129,450,308 | | $ | (13,222,030 | ) | $ | 37,548,592 | | $ | 13,384,311 | |
HENNESSY FUNDS 1-800-966-4354
Financial Statements
| |
INVESTMENT INCOME: |
| Dividend income(1) |
| Interest income |
| Securities lending income |
| Total investment income |
| |
| |
EXPENSES: |
| Investment advisory fees |
| Administration, fund accounting, custody and transfer agent fees (See Note 5) |
| Distribution fees (See Note 5) |
| Service fees (See Note 5) |
| Federal and state registration fees |
| Audit fees |
| Reports to shareholders |
| Directors’ fees and expenses |
| Sub-transfer agent expenses (See Note 5) |
| Interest expense (See Note 3 and 7) |
| Other |
| Total expenses |
| |
NET INVESTMENT INCOME (LOSS) |
| |
| |
REALIZED AND UNREALIZED GAINS (LOSSES): |
| Net realized gain on investments |
| Change in unrealized appreciation (depreciation) on investments |
| Net gain (loss) on investments |
| |
NET INCREASE (DECREASE) IN NET ASSETS RESULTING FROM OPERATIONS |
| (1) | Net of foreign taxes withheld of $125,762, $0 and $0, respectively. |
The accompanying notes are an integral part of these financial statements.
FINANCIAL STATEMENTS — STATEMENTS OF OPERATIONS
| | | | | | | | |
| | | HENNESSY | | | | | |
| | | CORNERSTONE | | HENNESSY TOTAL | | HENNESSY | |
| | | VALUE FUND | | RETURN FUND | | BALANCED FUND | |
| | | Year Ended | | Year Ended | | Year Ended | |
| | | October 31, 2006 | | October 31, 2006 | | October 31, 2006 | |
| | | | | | | | |
| | | $ | 6,763,163 | | $ | 2,742,391 | | $ | 429,466 | |
| | | | 250,220 | | | 2,260,931 | | | 451,853 | |
| | | | 6,235 | | | — | | | — | |
| | | | 7,019,618 | | | 5,003,322 | | | 881,319 | |
| | | | | | | | | | | |
| | | | | | | | | | | |
| | | | 1,424,068 | | | 536,822 | | | 129,350 | |
| | | | 439,657 | | | 205,097 | | | 49,197 | |
| | | | — | | | 223,676 | | | 53,896 | |
| | | | 192,442 | | | — | | | — | |
| | | | 26,331 | | | 20,203 | | | 19,690 | |
| | | | 18,538 | | | 19,101 | | | 19,532 | |
| | | | 20,075 | | | 10,001 | | | — | |
| | | | 12,116 | | | 7,557 | | | 7,856 | |
| | | | 66,289 | | | — | | | — | |
| | | | 151 | | | 1,465,387 | | | — | |
| | | | 20,692 | | | 14,761 | | | 9,490 | |
| | | | 2,220,359 | | | 2,502,605 | | | 289,011 | |
| | | $ | 4,799,259 | | $ | 2,500,717 | | $ | 592,308 | |
| | | | | | | | | | | |
| | | | | | | | | | | |
| | | $ | 12,643,559 | | $ | 2,471,535 | | $ | 379,500 | |
| | | | 20,367,759 | | | 13,451,078 | | | 2,484,570 | |
| | | | 33,011,318 | | | 15,922,613 | | | 2,864,070 | |
| | | | | | | | | | | |
| | | $ | 37,810,577 | | $ | 18,423,330 | | $ | 3,456,378 | |
HENNESSY FUNDS 1-800-966-4354
Financial Statements
Statements of Changes in Net Assets |
| | | | |
| | | Hennessy Cornerstone Growth Fund | |
| | | Year Ended | | Year Ended | |
| | | October 31, | | October 31, | |
| | | 2006 | | 2005 | |
OPERATIONS: | | | | | |
| Net investment income (loss) | | $ | (2,547,605 | ) | $ | (7,800,866 | ) |
| Net realized gain (loss) on securities | | | 184,186,611 | | | 77,310,944 | |
| Change in unrealized appreciation (depreciation) on securities | | | (52,188,698 | ) | | 124,490,118 | |
| Net increase (decrease) in net assets resulting from operations | | | 129,450,308 | | | 194,000,196 | |
| | | | | | | | |
DISTRIBUTIONS TO SHAREHOLDERS: | | | | | | | |
| From net investment income | | | — | | | — | |
| From net realized gains | | | (68,227,748 | ) | | (173,840,684 | ) |
| Total distributions | | | (68,227,748 | ) | | (173,840,684 | ) |
| | | | | | | | |
CAPITAL SHARE TRANSACTIONS: | | | | | | | |
| Proceeds from shares subscribed | | | 399,293,120 | | | 296,664,690 | |
| Dividends reinvested | | | 66,277,329 | | | 168,579,703 | |
| Redemption fees retained | | | 311,922 | | | 153,093 | |
| Cost of shares redeemed | | | (348,210,594 | ) | | (282,771,265 | ) |
| Net increase (decrease) in net assets derived | | | | | | | |
| from capital share transactions | | | 117,671,777 | | | 182,626,221 | |
| | | | | | | | |
TOTAL INCREASE (DECREASE) IN NET ASSETS | | | 178,894,337 | | | 202,785,733 | |
| | | | | | | | |
| NET ASSETS: | | | | | | | |
| Beginning of period | | | 1,071,779,152 | | | 868,993,419 | |
| End of period | | $ | 1,250,673,489 | | $ | 1,071,779,152 | |
| | | | | | | | |
Accumulated net investment income (loss), end of period | | $ | — | | $ | — | |
| | | | | | | | |
CHANGES IN SHARES OUTSTANDING: | | | | | | | |
| Shares sold | | | 18,991,149 | | | 15,629,397 | |
| Shares issued to holders as reinvestment of dividends | | | 3,544,242 | | | 9,772,736 | |
| Shares redeemed | | | (17,324,674 | ) | | (15,238,651 | ) |
| Net increase (decrease) in shares outstanding | | | 5,210,717 | | | 10,163,482 | |
| * | For the four months ended October 31, 2006. Effective October 31, 2006, the Hennessy Cornerstone Growth Fund, Series II changed its fiscal year end to October 31st from June 30th. |
The accompanying notes are an integral part of these financial statements.
FINANCIAL STATEMENTS — STATEMENTS OF CHANGES IN NET ASSETS
| | | Hennessy Cornerstone | | | |
| | | Growth Fund, Series II | | Hennessy Focus 30 Fund | |
| | | Period Ended | | Year Ended | | Year Ended | | | Year Ended | | Year Ended | | |
| | | October 31, | | June 30, | | June 30, | | | October 31, | | October 31, | | |
| | | 2006* | | 2006 | | 2005 | | | 2006 | | 2005 | | |
| | | | | | | | | | | | | | |
| | | $ | (207,230 | ) | $ | (610,188 | ) | $ | (1,520,993 | ) | | $ | (1,552,126 | ) | $ | (440,682 | ) | |
| | | | 8,338,233 | | | 28,215,988 | | | 16,052,260 | | | | 1,712,198 | | | 25,808,876 | | |
| | | | (21,353,033 | ) | | 9,942,792 | | | 18,659,508 | | | | 13,224,239 | | | (5,110,028 | ) | |
| | | | (13,222,030 | ) | | 37,548,592 | | | 33,190,775 | | | | 13,384,311 | | | 20,258,166 | | |
| | | | | | | | | | | | | | | | | | | |
| | | | | | | | | | | | | | | | | | | |
| | | | — | | | — | | | (108,497 | ) | | | — | | | — | | |
| | | | — | | | (30,993,772 | ) | | — | | | | (17,767,996 | ) | | — | | |
| | | | — | | | (30,993,772 | ) | | (108,497 | ) | | | (17,767,996 | ) | | — | | |
| | | | | | | | | | | | | | | | | | | |
| | | | | | | | | | | | | | | | | | | |
| | | | 13,526,607 | | | 69,453,923 | | | 108,849,934 | | | | 245,270,080 | | | 85,388,827 | | |
| | | | — | | | 30,743,046 | | | 107,365 | | | | 17,531,456 | | | — | | |
| | | | 30,067 | | | 54,048 | | | 23,301 | | | | 292,645 | | | 44,025 | | |
| | | | (35,424,128 | ) | | (126,497,325 | ) | | (190,917,296 | ) | | | (143,395,044 | ) | | (30,735,864 | ) | |
| | | | | | | | | | | | | | | | | | | |
| | | | (21,867,454 | ) | | (26,246,308 | ) | | (81,936,696 | ) | | | 119,699,137 | | | 54,696,988 | | |
| | | | | | | | | | | | | | | | | | | |
| | | | (35,089,484 | ) | | (19,691,488 | ) | | (48,854,418 | ) | | | 115,315,452 | | | 74,955,154 | | |
| | | | | | | | | | | | | | | | | | | |
| | | | 279,277,979 | | | 298,969,467 | | | 347,823,885 | | | | 125,314,836 | | | 50,359,682 | | |
| | | $ | 244,188,495 | | $ | 279,277,979 | | $ | 298,969,467 | | | $ | 240,630,288 | | $ | 125,314,836 | | |
| | | | | | | | | | | | | | | | | | | |
| | | $ | — | | $ | — | | $ | (1,871,871 | ) | | $ | — | | $ | — | | |
| | | | | | | | | | | | | | | | | | | |
| | | | | | | | | | | | | | | | | | | |
| | | | 452,640 | | | 2,162,883 | | | 3,865,585 | | | | 19,254,058 | | | 7,324,736 | | |
| | | | | | | 1,080,457 | | | 3,532 | | | | 1,576,569 | | | — | | |
| | | | (1,187,819 | ) | | (4,122,793 | ) | | (6,875,515 | ) | | | (11,671,094 | ) | | (2,868,066 | ) | |
| | | | (735,179 | ) | | (879,453 | ) | | (3,006,398 | ) | | | 9,159,533 | | | 4,456,670 | | |
HENNESSY FUNDS 1-800-966-4354
Financial Statements
Statements of Changes in Net Assets |
| | | |
| | | Hennessy Cornerstone Value Fund |
| | | Year Ended | | Year Ended | |
| | | October 31, | | October 31, | |
| | | 2006 | | 2005 | |
OPERATIONS: | | | | | |
| Net investment income (loss) | | $ | 4,799,259 | | $ | 4,246,344 | |
| Net realized gain (loss) on securities | | | 12,643,559 | | | 6,603,021 | |
| Change in unrealized appreciation (depreciation) on securities | | | 20,367,759 | | | 146,030 | |
| Net increase (decrease) in net assets resulting from operations | | | 37,810,577 | | | 10,995,395 | |
| | | | | | | | |
DISTRIBUTIONS TO SHAREHOLDERS: | | | | | | | |
| From net investment income | | | (4,751,582 | ) | | (3,734,561 | ) |
| From net realized gains | | | — | | | — | |
| | | | (4,751,582 | ) | | (3,734,561 | ) |
| | | | | | | | |
CAPITAL SHARE TRANSACTIONS: | | | | | | | |
| Proceeds from shares subscribed | | | 70,051,157 | | | 6,508,292 | |
| Dividends reinvested | | | 4,182,613 | | | 3,276,633 | |
| Redemption fees retained | | | 30,899 | | | 5,702 | |
| Cost of shares redeemed | | | (34,281,100 | ) | | (28,936,915 | ) |
| Net increase (decrease) in net assets derived | | | | | | | |
| from capital share transactions | | | 39,983,569 | | | (19,146,288 | ) |
| | | | | | | | |
TOTAL INCREASE (DECREASE) IN NET ASSETS | | | 73,042,564 | | | (11,885,454 | ) |
| | | | | | | | |
| NET ASSETS: | | | | | | | |
| Beginning of period | | | 183,760,256 | | | 195,645,710 | |
| End of period | | $ | 256,802,820 | | $ | 183,760,256 | |
| | | | | | | | |
Accumulated net investment income (loss), end of period | | $ | 4,008,165 | | $ | 3,960,488 | |
| | | | | | | | |
CHANGES IN SHARES OUTSTANDING: | | | | | | | |
| Shares sold | | | 4,814,929 | | | 496,714 | |
| Shares issued to holders as reinvestment of dividends | | | 318,554 | | | 251,468 | |
| Shares redeemed | | | (2,496,829 | ) | | (2,240,984 | ) |
| Net increase (decrease) in shares outstanding | | | 2,636,654 | | | (1,492,802 | ) |
The accompanying notes are an integral part of these financial statements.
FINANCIAL STATEMENTS — STATEMENTS OF CHANGES IN NET ASSETS
| | | | | | |
| | | Hennessy Total Return Fund | | Hennessy Balanced Fund | |
| | | Year Ended | | Year Ended | | | Year Ended | | Year Ended | | |
| | | October 31, | | October 31, | | | October 31, | | October 31, | | |
| | | 2006 | | 2005 | | | 2006 | | 2005 | | |
| | | | | | | | | | | | |
| | | $ | 2,500,717 | | $ | 1,905,070 | | | $ | 592,308 | | $ | 334,050 | | |
| | | | 2,471,535 | | | 3,114,966 | | | | 379,500 | | | 317,416 | | |
| | | | 13,451,078 | | | (1,411,023 | ) | | | 2,484,570 | | | (404,330 | ) | |
| | | | 18,423,330 | | | 3,609,013 | | | | 3,456,378 | | | 247,136 | | |
| | | | | | | | | | | | | | | | |
| | | | | | | | | | | | | | | | |
| | | | (2,378,688 | ) | | (1,946,484 | ) | | | (556,830 | ) | | (324,348 | ) | |
| | | | — | | | — | | | | — | | | — | | |
| | | | (2,378,688 | ) | | (1,946,484 | ) | | | (556,830 | ) | | (324,348 | ) | |
| | | | | | | | | | | | | | | | |
| | | | | | | | | | | | | | | | |
| | | | 24,923,801 | | | 6,370,599 | | | | 19,077,668 | | | 2,758,801 | | |
| | | | 2,237,354 | | | 1,814,414 | | | | 544,793 | | | 313,753 | | |
| | | | 8,471 | | | 2,986 | | | | 4,909 | | | 1,345 | | |
| | | | (16,696,512 | ) | | (15,003,385 | ) | | | (15,658,666 | ) | | (5,494,176 | ) | |
| | | | | | | | | | | | | | | | |
| | | | 10,473,114 | | | (6,815,386 | ) | | | 3,968,704 | | | (2,420,277 | ) | |
| | | | | | | | | | | | | | | | |
| | | | 26,517,756 | | | (5,152,857 | ) | | | 6,868,252 | | | (2,497,489 | ) | |
| | | | | | | | | | | | | | | | |
| | | | | | | | | | | | | | | | |
| | | | 86,745,929 | | | 91,898,786 | | | | 19,267,186 | | | 21,764,675 | | |
| | | $ | 113,263,685 | | $ | 86,745,929 | | | $ | 26,135,438 | | $ | 19,267,186 | | |
| | | | | | | | | | | | | | | | |
| | | $ | 221,710 | | $ | 99,680 | | | $ | 70,517 | | $ | 35,039 | | |
| | | | | | | | | | | | | | | | |
| | | | | | | | | | | | | | | | |
| | | | 2,059,164 | | | 584,878 | | | | 1,713,646 | | | 253,797 | | |
| | | | 196,136 | | | 168,615 | | | | 48,924 | | | 29,331 | | |
| | | | (1,478,816 | ) | | (1,385,192 | ) | | | (1,376,819 | ) | | (509,610 | ) | |
| | | | 776,484 | | | (631,699 | ) | | | 385,751 | | | (226,482 | ) | |
HENNESSY FUNDS 1-800-966-4354
Financial Highlights
Hennessy Cornerstone Growth Fund |
| | | Year Ended | |
| | | October 31, | |
| | | 2006 | |
PER SHARE DATA: | | | |
| Net asset value, beginning of period | | $ | 19.49 | |
| | | | | |
Income from investment operations: | | | | |
| Net investment gain (loss)(3) | | | (0.04 | ) |
| Net realized and unrealized gains (losses) on securities | | | 2.55 | |
| Total from investment operations | | | 2.51 | |
| | | | | |
Less Distributions: | | | | |
| Dividends from net investment income | | | — | |
| Dividends from net realized gains | | | (1.23 | ) |
| Total distributions | | | (1.23 | ) |
| Redemption fees retained(4) | | | — | |
| Net asset value, end of period | | $ | 20.77 | |
| | | | | |
TOTAL RETURN | | | 13.59% | |
| | | | | |
SUPPLEMENTAL DATA AND RATIOS: | | | | |
| Net assets, end of period (millions) | | | | |
| Ratio of expenses to average net assets | | | 1.21% | |
| Ratio of net investment income to average net assets | | | (0.20)% | |
| Portfolio turnover rate | | | 90.44% | |
| (1) | For the one month ended October 31, 2004. Effective October 31, 2004, the Fund changed its fiscal year end to October 31st from September 30th. |
| (2) | All ratios for the period have been annualized, except portfolio turnover and total return. |
| (3) | Net investment loss per share is calculated using ending balances prior to consideration for adjustments for permanent book and tax differences. |
| (4) | Amount is less than $0.01. |
The accompanying notes are an integral part of these financial statements.
FINANCIAL HIGHLIGHTS — HENNESSY CORNERSTONE GROWTH FUND
| | | | | | | | | | | | |
| | | Year Ended | | Period Ended | | | | | | | |
| | | October 31, | | October 31, | | Year Ended September 30, | |
| | | 2005 | | 2004(1)(2) | | 2004 | | 2003 | | 2002 | |
| | | | | | | | | | | | |
| | | $ | 19.38 | | $ | 19.08 | | $ | 17.23 | | $ | 13.55 | | $ | 13.98 | |
| | | | | | | | | | | | | | | | | |
| | | | | | | | | | | | | | | | | |
| | | | (0.14 | ) | | (0.02 | ) | | (0.13 | ) | | (0.07 | ) | | (0.07 | ) |
| | | | 4.13 | | | 0.32 | | | 1.98 | | | 4.23 | | | 0.67 | |
| | | | 3.99 | | | 0.30 | | | 1.85 | | | 4.16 | | | 0.60 | |
| | | | | | | | | | | | | | | | | |
| | | | | | | | | | | | | | | | | |
| | | | — | | | — | | | — | | | — | | | — | |
| | | | (3.88 | ) | | — | | | — | | | (0.48 | ) | | (1.03 | ) |
| | | | (3.88 | ) | | — | | | — | | | (0.48 | ) | | (1.03 | ) |
| | | | — | | | — | | | — | | | — | | | — | |
| | | $ | 19.49 | | $ | 19.38 | | $ | 19.08 | | $ | 17.23 | | $ | 13.55 | |
| | | | | | | | | | | | | | | | | |
| | | | 23.17% | | | 1.57% | | | 10.74% | | | 31.67% | | | 4.47% | |
| | | | | | | | | | | | | | | | | |
| | | | | | | | | | | | | | | | | |
| | | | | | | | | | | | | | | | | |
| | | | 1.23% | | | 1.25% | | | 1.25% | | | 1.27% | | | 1.10% | |
| | | | (0.78)% | | | (1.08)% | | | (0.68)% | | | (0.60)% | | | (0.73)% | |
| | | | 88.98% | | | 0.00% | | | 106.97% | | | 74.80% | | | 70.33% | |
HENNESSY FUNDS 1-800-966-4354
Financial Highlights
Hennessy Cornerstone Growth Fund, Series II |
| | | Four-Months Ended | |
| | | October 31, | |
| | | 2006(1)(2) | |
PER SHARE DATA: | | | |
| Net asset value, beginning of period | | $ | 32.19 | |
| | | | | |
Income from investment operations: | | | | |
| Net investment gain (loss)(3) | | | (0.03 | ) |
| Net realized and unrealized gains (losses) on securities | | | (1.41 | ) |
| Total from investment operations | | | (1.44 | ) |
| | | | | |
Less Distributions: | | | | |
| Dividends from net investment income | | | — | |
| Dividends from net realized gains | | | — | |
| Total distributions | | | — | |
| Redemption fees retained(4) | | | — | |
| Net asset value, end of period | | $ | 30.75 | |
| | | | | |
TOTAL RETURN | | | (4.47)% | |
| | | | | |
SUPPLEMENTAL DATA AND RATIOS: | | | | |
| Net assets, end of period (millions) | | | | |
| Ratio of expenses to average net assets | | | 1.25% | |
| Ratio of net investment income to average net assets | | | (0.24)% | |
| Portfolio turnover rate | | | 92.63% | |
| (1) | For the four months ended October 31, 2006. Effective October 31, 2006, the Fund changed its fiscal year end to October 31st from June 30th. |
| (2) | All ratios for the period have been annualized, except portfolio turnover and total return. |
| (3) | Net investment loss per share is calculated using average shares outstanding. |
| (4) | Amount is less than $0.01. |
| (5) | The financial highlights set forth herein include historical highlights of The Henlopen Fund. On July 1, 2005 Hennessy Advisors, Inc. became the investment advisor to the Fund and the Fund changed its name from “The Henlopen Fund” to Hennessy Cornerstone Growth Fund, Series II. |
The accompanying notes are an integral part of these financial statements.
FINANCIAL HIGHLIGHTS — HENNESSY CORNERSTONE GROWTH FUND, SERIES II
| | | Year Ended June 30, | |
| | | 2006 | | 2005(5) | | 2004(5) | | 2003(5) | | 2002(5) | |
| | | | | | | | | | | | |
| | | $ | 31.29 | | $ | 27.69 | | $ | 18.13 | | $ | 16.79 | | $ | 19.15 | |
| | | | | | | | | | | | | | | | | |
| | | | | | | | | | | | | | | | | |
| | | | (0.07 | ) | | (0.14 | ) | | (0.23 | ) | | (0.16 | ) | | (0.18 | ) |
| | | | 4.65 | | | 3.75 | | | 9.79 | | | 1.50 | | | (2.14 | ) |
| | | | 4.58 | | | 3.61 | | | 9.56 | | | 1.34 | | | (2.32 | ) |
| | | | | | | | | | | | | | | | | |
| | | | | | | | | | | | | | | | | |
| | | | — | | | (0.01 | ) | | — | | | — | | | — | |
| | | | (3.68 | ) | | — | | | — | | | — | | | (0.04 | ) |
| | | | (3.68 | ) | | (0.01 | ) | | — | | | — | | | (0.04 | ) |
| | | | — | | | — | | | — | | | — | | | — | |
| | | $ | 32.19 | | $ | 31.29 | | $ | 27.69 | | $ | 18.13 | | $ | 16.79 | |
| | | | | | | | | | | | | | | | | |
| | | | 16.48% | | | 13.04 | % | | 52.73 | % | | 7.98 | % | | (12.11 | )% |
| | | | | | | | | | | | | | | | | |
| | | | | | | | | | | | | | | | | |
| | | | | | | | | | | | | | | | | |
| | | | 1.25% | | | 1.33% | | | 1.38% | | | 1.58% | | | 1.39% | |
| | | | (0.22)% | | | (0.49)% | | | (0.90)% | | | (1.04)% | | | (0.98)% | |
| | | | 109.02% | | | 192.24% | | | 113.27% | | | 90.06% | | | 132.21% | |
HENNESSY FUNDS 1-800-966-4354
Financial Highlights
| | | Year Ended | |
| | | October 31, | |
| | | 2006 | |
PER SHARE DATA: | | | |
| Net asset value, beginning of period | | $ | 12.21 | |
| | | | | |
Income from investment operations: | | | | |
| Net investment income (loss) | | | (0.08 | ) |
| Net realized and unrealized gains (losses) on investments | | | 1.86 | |
| Total from investment operations | | | 1.78 | |
| | | | | |
Less Distributions: | | | | |
| Dividends from net investment income | | | — | |
| Dividends from net realized gains | | | (1.61 | ) |
| Total distributions | | | (1.61 | ) |
| Redemption fees retained | | | 0.01 | |
| Net asset value, end of period | | $ | 12.39 | |
| | | | | |
TOTAL RETURN | | | 16.18 | % |
| | | | | |
SUPPLEMENTAL DATA AND RATIOS: | | | | |
| Net assets, end of period (millions) | | $ | 240.6 | |
| Ratio of expenses to average net assets: | | | | |
| Before expense reimbursement | | | 1.21 | % |
| After expense reimbursement | | | 1.21 | % |
| Ratio of net investment loss to average net assets: | | | | |
| Before expense reimbursement | | | (0.65 | )% |
| After expense reimbursement | | | (0.65 | )% |
| Portfolio turnover rate | | | 123.71 | % |
| (1) | The financial highlights set forth herein include historical financial highlights of the SYM Select Growth Fund. On September 17, 2003, Hennessy Advisors, Inc. became the investment advisor to the SYMSelect Growth Fund and changed its name to the Hennessy Focus 30 Fund. Effective September 30, 2003, the Fund changed its fiscal year end to September 30th from December 31st. |
| (2) | For the one month ended October 31, 2004. Effective October 31, 2004, the Fund changed its fiscal year end to October 31st from September 30th. |
| (3) | All ratios for the period have been annualized, except portfolio turnover and total return. |
| (4) | Amount is less than $0.01. |
| (5) | From September 17, 2003 to October 31, 2006, the Hennessy Focus 30 Fund imposed an expense cap of 1.45% of the average daily net assets of the Focus 30 Fund. |
The accompanying notes are an integral part of these financial statements.
FINANCIAL HIGHLIGHTS — HENNESSY FOCUS 30 FUND
| | | | | | | | | | | | |
| | | | | | | | | January 1, 2003 | | | |
| | | Year Ended | | Period Ended | | Year Ended | | through | | Year Ended | |
| | | October 31, | | October 31, | | September 30, | | September 30, | | December 31, | |
| | | 2005 | | 2004(2)(3) | | 2004 | | 2003(1) | | 2002(1) | |
| | | | | | | | | | | | |
| | | $ | 8.67 | | $ | 8.78 | | $ | 7.72 | | $ | 6.63 | | $ | 9.27 | |
| | | | | | | | | | | | | | | | | |
| | | | | | | | | | | | | | | | | |
| | | | (0.04 | ) | | (0.01 | ) | | (0.08 | ) | | (0.03 | ) | | (0.02 | ) |
| | | | 3.58 | | | (0.10 | ) | | 1.14 | | | 1.12 | | | (2.62 | ) |
| | | | 3.54 | | | (0.11 | ) | | 1.06 | | | 1.09 | | | (2.64 | ) |
| | | | | | | | | | | | | | | | | |
| | | | | | | | | | | | | | | | | |
| | | | — | | | — | | | — | | | — | | | — | |
| | | | — | | | — | | | — | | | — | | | — | |
| | | | — | | | — | | | — | | | — | | | — | |
| | | | — | | | — | (4) | | — | (4) | | — | (4) | | — | (4) |
| | | $ | 12.21 | | $ | 8.67 | | $ | 8.78 | | $ | 7.72 | | $ | 6.63 | |
| | | | | | | | | | | | | | | | | |
| | | | 40.83% | | | (1.25)% | | | 13.73% | | | 16.44% | | | (28.48)% | |
| | | | | | | | | | | | | | | | | |
| | | | | | | | | | | | | | | | | |
| | | | | | | | | | | | | | | | | |
| | | | | | | | | | | | | | | | | |
| | | | 1.35% | | | 1.45% | | | 1.41% | | | 1.59% | | | 1.54% | |
| | | | 1.35% | | | 1.45% | | | 1.41% | | | 1.49%(5) | | | 1.50% | |
| | | | | | | | | | | | | | | | | |
| | | | (0.60)% | | | (1.33)% | | | (0.92)% | | | (0.67)% | | | (0.24)% | |
| | | | (0.60)% | | | (1.33)% | | | (0.92)% | | | (0.57)% | | | (0.20)% | |
| | | | 155.26% | | | 0.00% | | | 113.13% | | | 356.77% | | | 291.00% | |
HENNESSY FUNDS 1-800-966-4354
Financial Highlights
Hennessy Cornerstone Value Fund |
| | | Year Ended | |
| | | October 31, | |
| | | 2006 | |
PER SHARE DATA: | | | |
| Net asset value, beginning of period | | $ | 12.95 | |
| | | | | |
Income from investment operations: | | | | |
| Net investment income (loss) | | | 0.30 | |
| Net realized and unrealized gains (losses) on investments | | | 2.36 | |
| Total from investment operations | | | 2.66 | |
| | | | | |
Less Distributions: | | | | |
| Dividends from net investment income | | | (0.34 | ) |
| Dividends from net realized gains | | | — | |
| Total distributions | | | (0.34 | ) |
| Redemption fees retained(4) | | | — | |
| Net asset value, end of period | | $ | 15.27 | |
| | | | | |
TOTAL RETURN | | | 21.00% | |
| | | | | |
SUPPLEMENTAL DATA AND RATIOS: | | | | |
| Net assets, end of period (millions) | | | | |
| Ratio of expenses to average net assets | | | 1.15% | |
| Ratio of net investment income to average net assets | | | 2.49% | |
| Portfolio turnover rate | | | 35.40% | |
| (1) | For the one month ended October 31, 2004. Effective October 31, 2004, the Fund changed its fiscal year end to October 31st from September 30th. |
| (2) | All ratios for the period have been annualized, except portfolio turnover and total return. |
| (3) | Calculated using average shares outstanding during period. |
| (4) | Amount is less than $0.01. |
The accompanying notes are an integral part of these financial statements.
FINANCIAL HIGHLIGHTS — HENNESSY CORNERSTONE VALUE FUND
| | | | | | | | | | | | |
| | | Year Ended | | Period Ended | | | | | | | |
| | | October 31, | | October 31, | | Year Ended September 30, | |
| | | 2005 | | 2004(1)(2) | | 2004 | | 2003 | | 2002 | |
| | | | | | | | | | | | |
| | | $ | 12.48 | | $ | 12.37 | | $ | 10.51 | | $ | 8.95 | | $ | 10.91 | |
| | | | | | | | | | | | | | | | | |
| | | | | | | | | | | | | | | | | |
| | | | 0.30 | | | 0.02 | | | 0.31(3 | ) | | 0.21 | | | 0.25 | |
| | | | 0.41 | | | 0.09 | | | 1.76 | | | 1.55 | | | (1.95 | ) |
| | | | 0.71 | | | 0.11 | | | 2.07 | | | 1.76 | | | (1.70 | ) |
| | | | | | | | | | | | | | | | | |
| | | | | | | | | | | | | | | | | |
| | | | (0.24 | ) | | — | | | (0.21 | ) | | (0.20 | ) | | (0.26 | ) |
| | | | — | | | — | | | — | | | — | | | — | |
| | | | (0.24 | ) | | — | | | (0.21 | ) | | (0.20 | ) | | (0.26 | ) |
| | | | — | | | — | | | — | | | — | | | — | |
| | | $ | 12.95 | | $ | 12.48 | | $ | 12.37 | | $ | 10.51 | | $ | 8.95 | |
| | | | | | | | | | | | | | | | | |
| | | | 5.69 | % | | 0.89 | % | | 19.83 | % | | 19.88 | % | | (16.05 | )% |
| | | | | | | | | | | | | | | | | |
| | | | | | | | | | | | | | | | | |
| | | | | | | | | | | | | | | | | |
| | | | 1.20% | | | 1.18% | | | 1.18% | | | 1.51% | | | 1.43% | |
| | | | 2.19% | | | 1.70% | | | 2.56% | | | 2.10% | | | 2.12% | |
| | | | 32.22% | | | 0.00% | | | 8.20% | | | 57.29% | | | 76.93% | |
HENNESSY FUNDS 1-800-966-4354
Financial Highlights
Hennessy Total Return Fund |
| | | Year Ended | |
| | | October 31, | |
| | | 2006 | |
PER SHARE DATA: | | | |
| Net asset value, beginning of period | | $ | 10.57 | |
| | | | | |
Income from investment operations: | | | | |
| Net investment income | | | 0.31 | |
| Net realized and unrealized gains (losses) on securities | | | 2.03 | |
| Total from investment operations | | | 2.34 | |
| | | | | |
Less Distributions: | | | | |
| Dividends from net investment income | | | (0.30 | ) |
| Dividends from realized capital gains | | | — | |
| Return of capital | | | — | |
| Total distributions | | | (0.30 | ) |
| Redemption fees retained(4) | | | — | |
| Net asset value, end of period | | $ | 12.61 | |
| | | | | |
TOTAL RETURN | | | 22.48% | |
| | | | | |
SUPPLEMENTAL DATA AND RATIOS: | | | | |
| Net assets, end of period (millions) | | | | |
| Ratio of expenses, excluding interest | | | | |
| expense, to average net assets: | | | | |
| Before expense reimbursement | | | 1.16% | |
| After expense reimbursement | | | 1.16% | |
| Ratio of expenses, including interest | | | | |
| expense, to average net assets: | | | | |
| Before expense reimbursement | | | 2.80% | |
| After expense reimbursement | | | 2.80% | |
| Ratio of interest expense to average net assets | | | 1.64% | |
| Ratio of net investment income (loss) to average net assets: | | | | |
| Before expense reimbursement | | | 2.79% | |
| After expense reimbursement | | | 2.79% | |
| Portfolio turnover rate | | | 24.16% | |
| (1) | For the four months ended October 31, 2004. Effective October 31, 2004, the Fund changed its fiscal year end to October 31st from June 30th. |
| (2) | All ratios for the period have been annualized, except portfolio turnover and total return. |
| (3) | Calculated using average shares outstanding during period. |
| (4) | Amount is less than $0.01. |
| (5) | From February 27, 2004 to June 30, 2005, the Hennessy Total Return Fund imposed an expense cap, excluding interest expense, of 1.35% of the average daily net assets of the Total Return Fund. This expense cap was in effect through June 30, 2005. |
| (6) | The Hennessy Total Return Fund imposed an expense cap, excluding interest expense, of 1.95%. |
The accompanying notes are an integral part of these financial statements.
FINANCIAL HIGHLIGHTS — HENNESSY TOTAL RETURN FUND
| | | | | | | | | | | | |
| | | Year Ended | | Period Ended | | | | | | | |
| | | October 31, | | October 31, | | Year Ended June 30, | |
| | | 2005 | | 2004(1)(2) | | 2004 | | 2003 | | 2002 | |
| | | | | | | | | | | | |
| | | $ | 10.40 | | $ | 10.62 | | $ | 9.65 | | $ | 9.78 | | $ | 10.49 | |
| | | | | | | | | | | | | | | | | |
| | | | | | | | | | | | | | | | | |
| | | | 0.23 | | | 0.07 | | | 0.17(3 | ) | | 0.12 | | | 0.11 | |
| | | | 0.17 | | | (0.24 | ) | | 0.92 | | | (0.13 | ) | | (0.71 | ) |
| | | | 0.40 | | | (0.17 | ) | | 1.09 | | | (0.01 | ) | | (0.60 | ) |
| | | | | | | | | | | | | | | | | |
| | | | | | | | | | | | | | | | | |
| | | | (0.23 | ) | | (0.05 | ) | | (0.10 | ) | | (0.12 | ) | | (0.11 | ) |
| | | | — | | | — | | | — | | | — | | | — | |
| | | | — | | | — | | | (0.02 | ) | | — | | | — | |
| | | | (0.23 | ) | | (0.05 | ) | | (0.12 | ) | | (0.12 | ) | | (0.11 | ) |
| | | | — | | | — | | | — | | | — | | | — | |
| | | $ | 10.57 | | $ | 10.40 | | $ | 10.62 | | $ | 9.65 | | $ | 9.78 | |
| | | | | | | | | | | | | | | | | |
| | | | 3.83% | | | (1.61)% | | | 11.36% | | | (0.04)% | | | (5.73)% | |
| | | | | | | | | | | | | | | | | |
| | | | | | | | | | | | | | | | | |
| | | | | | | | | | | | | | | | | |
| | | | | | | | | | | | | | | | | |
| | | | | | | | | | | | | | | | | |
| | | | 1.23% | | | 1.20% | | | 1.27% | | | 2.12% | | | 4.35% | |
| | | | 1.23% | | | 1.20% | | | 1.27%(5) | | | 1.95%(6) | | | 1.71%(6) | |
| | | | | | | | | | | | | | | | | |
| | | | | | | | | | | | | | | | | |
| | | | 2.28% | | | 1.78% | | | 1.66% | | | 2.50% | | | 4.97% | |
| | | | 2.28% | | | 1.78% | | | 1.66% | | | 2.33% | | | 2.33% | |
| | | | 1.05% | | | 0.58% | | | 0.39% | | | 0.38% | | | 0.62% | |
| | | | | | | | | | | | | | | | | |
| | | | 2.07% | | | 1.85% | | | 1.55% | | | 1.25% | | | (1.58)% | |
| | | | 2.07% | | | 1.85% | | | 1.55% | | | 1.42% | | | 1.06% | |
| | | | 25.70% | | | 0.30% | | | 8.37% | | | 17.60% | | | 34.76% | |
HENNESSY FUNDS 1-800-966-4354
Financial Highlights
| | | Year Ended | |
| | | October 31, | |
| | | 2006 | |
PER SHARE DATA: | | | |
| Net asset value, beginning of period | | $ | 10.56 | |
| | | | | |
Income from investment operations: | | | | |
| Net investment income | | | 0.30 | |
| Net realized and unrealized gains (losses) on securities | | | 1.25 | |
| Total from investment operations | | | 1.55 | |
| | | | | |
Less Distributions: | | | | |
| Dividends from net investment income | | | (0.28 | ) |
| Dividends from realized capital gains | | | — | |
| Return of capital | | | — | |
| Total distributions | | | (0.28 | ) |
| Redemption fees retained(3) | | | — | |
| Net asset value, end of period | | $ | 11.83 | |
| | | | | |
TOTAL RETURN | | | 14.92% | |
| | | | | |
SUPPLEMENTAL DATA AND RATIOS: | | | | |
| Net assets, end of period (millions) | | | | |
| Ratio of net expenses to average net assets | | | 1.34% | |
| Ratio of net investment income to average net assets | | | 2.75% | |
| Portfolio turnover rate | | | 87.88% | |
| (1) | For the four months ended October 31, 2004. Effective October 31, 2004, the Fund changed its fiscal year end to October 31st from June 30th. |
| (2) | All ratios for the period have been annualized, except portfolio turnover and total return. |
| (3) | Amount is less than $0.01. |
The accompanying notes are an integral part of these financial statements.
FINANCIAL HIGHLIGHTS — HENNESSY BALANCED FUND
| | | | | | | | | | | | |
| | | Year Ended | | Period Ended | | | | | | | |
| | | October 31, | | October 31, | | Year Ended June 30, | |
| | | 2005 | | 2004(1)(2) | | 2004 | | 2003 | | 2002 | |
| | | | | | | | | | | | |
| | | $ | 10.62 | | $ | 10.85 | | $ | 10.44 | | $ | 10.62 | | $ | 11.50 | |
| | | | | | | | | | | | | | | | | |
| | | | | | | | | | | | | | | | | |
| | | | 0.18 | | | 0.04 | | | 0.11 | | | 0.14 | | | 0.15 | |
| | | | (0.07 | ) | | (0.24 | ) | | 0.50 | | | (0.12 | ) | | (0.50 | ) |
| | | | 0.11 | | | (0.20 | ) | | 0.61 | | | 0.02 | | | (0.35 | ) |
| | | | | | | | | | | | | | | | | |
| | | | (0.17 | ) | | (0.03 | ) | | (0.12 | ) | | (0.14 | ) | | (0.15 | ) |
| | | | — | | | — | | | (0.06 | ) | | (0.06 | ) | | (0.38 | ) |
| | | | — | | | — | | | (0.02 | ) | | — | | | — | |
| | | | (0.17 | ) | | (0.03 | ) | | (0.20 | ) | | (0.20 | ) | | (0.53 | ) |
| | | | — | | | — | | | — | | | — | | | — | |
| | | $ | 10.56 | | $ | 10.62 | | $ | 10.85 | | $ | 10.44 | | $ | 10.62 | |
| | | | | | | | | | | | | | | | | |
| | | | 1.13% | | | (1.86)% | | | 5.81% | | | 0.24% | | | (3.12)% | |
| | | | | | | | | | | | | | | | | |
| | | | | | | | | | | | | | | | | |
| | | | | | | | | | | | | | | | | |
| | | | 1.49% | | | 1.41% | | | 1.41% | | | 1.50% | | | 1.84% | |
| | | | 1.58% | | | 1.12% | | | 1.01% | | | 1.40% | | | 1.33% | |
| | | | 21.31% | | | 8.55% | | | 45.17% | | | 21.79% | | | 45.95% | |
| | | | | | | | | | | | | | | | | |
HENNESSY FUNDS 1-800-966-4354
Statement of Cash Flows
Hennessy Total Return Fund For the Year ended October 31, 2006 |
Cash Flows From Operating Activities: | | | |
| | | | |
| Net increase in net assets from operations | | $ | 18,423,330 | |
| Adjustments to reconcile net increase in net assets from | | | | |
| operations to net cash provided by operating activities: | | | | |
| Purchase of investment securities | | | (872,286,684 | ) |
| Proceeds on sale of securities | | | 854,105,438 | |
| Increase in other receivables, net | | | (223,971 | ) |
| Decrease in other assets | | | (1,944 | ) |
| Increase in accrued expenses and other payables | | | 141,470 | |
| Net accretion of discount on securities | | | (2,257,995 | ) |
| Net realized gain on investments | | | (2,471,535 | ) |
| Unrealized appreciation on securities | | | (13,451,078 | ) |
| Net cash used by operating activities | | $ | (18,022,969 | ) |
| | | | | |
Cash Flows From Financing Activities: | | | | |
| | | | | |
| Increase in reverse repurchase agreements | | $ | 10,030,000 | |
| Proceeds on shares sold | | | 24,923,801 | |
| Payment on shares repurchased | | | (16,688,041 | ) |
| Cash dividends paid | | | (141,334 | ) |
| Net cash provided by financing activities | | $ | 18,124,426 | |
| Net increase (decrease) in cash | | | 101,457 | |
| | | | | |
Cash at beginning of period | | | — | |
Cash at end of period | | $ | 101,457 | |
| | | | | |
Cash paid for interest | | $ | 1,411,434 | |
The accompanying notes are an integral part of these financial statements.
Notes to the Financial Statements
October 31, 2006
1). ORGANIZATION
The Hennessy Mutual Funds, Inc. was organized as a Maryland corporation on May 20, 1996 and consists of three separate series: Hennessy Cornerstone Growth Fund (the “Growth Fund”), Hennessy Cornerstone Value Fund (the “Value Fund”) and the Hennessy Focus 30 Fund (the “Focus 30 Fund”), formerly SYM Select Growth Fund. These Funds are open-end, diversified management investment companies registered under the Investment Company Act of 1940, as amended. The Growth Fund and Value Fund commenced operations on November 1, 1996. On September 17, 2003, Hennessy Advisors, Inc. became the investment advisor to the SYMSelect Growth Fund and changed its name to the Hennessy Focus 30 Fund.
The Hennessy Funds, Inc. was organized as a Maryland corporation on January 11, 1996 and consists of two separate series: Hennessy Balanced Fund (the “Balanced Fund”) and Hennessy Total Return Fund (the “Total Return Fund”). The Balanced and Total Return Funds are open-end, non-diversified management investment companies registered under the Investment Company Act of 1940, as amended. The Balanced Fund and Total Return Fund commenced operations on March 8, 1996 and July 29, 1998, respectively.
The Hennessy Funds Trust was organized as a Delaware Statutory Trust on September 17, 1992 and consists of a sole series: Hennessy Cornerstone Growth Fund, Series II (the “Growth II Fund”). Prior to July 1, 2005, both the Trust and Fund were known as The Henlopen Fund. On July 1, 2005, Hennessy Advisors, Inc., became the investment advisor to the fund and the fund changed its name from “The Henlopen Fund” to “Hennessy Cornerstone Growth Fund, Series II”. The Growth II Fund is an open-end, diversified management investment company registered under the Investment Company Act of 1940, as amended.
The Growth Fund, Growth II Fund, Focus 30 Fund, Value Fund, Total Return Fund and Balanced Fund collectively represent the Hennessy Funds (the “Funds”).
2). SIGNIFICANT ACCOUNTING POLICIES
The following is a summary of significant accounting policies consistently followed by the Funds in the preparation of the financial statements. These policies are in conformity with U.S. generally accepted accounting principles (“GAAP”).
| a). | Investment Valuation - Securities which are traded on a national or recognized stock exchange are valued at the last sale price on the securities exchange on which such securities are primarily traded. Exchange-traded securities for which there were no transactions that day and debt securities are valued at the most recent bid prices. Instruments with a remaining maturity of 60 days or less are valued on an amortized cost basis. When a price for an underlying security is not readily available or if a significant |
HENNESSY FUNDS 1-800-966-4354
NOTES TO THE FINANCIAL STATEMENTS
| | event has occurred that indicates the closing price of a security no longer represents the true value of that security, fair value pricing procedures have been adopted by the Board of Directors of the Funds. Fair value pricing determinations are made in good faith in accordance with these procedures. There are numerous criteria that will be given consideration in determining a fair value of a security. Some of these criteria are: trading volume of security and markets, value of other like securities and news events with direct bearing to security or market. Fair value pricing results in an estimated price that reasonably reflects the current market conditions in order to rate the portfolio holdings such that shareholder transactions receive a fair net asset value. |
| b). | Federal Income Taxes - Provision for federal income taxes or excise taxes has not been made since the Funds have elected to be taxed as “regulated investment companies” and intend to distribute substantially all taxable income to shareholders and otherwise comply with the provisions of the Internal Revenue Code applicable to regulated investment companies. Net investment income and realized gains and losses for federal income tax purposes may differ from that reported on the financial statements because of temporary book and tax basis differences. Temporary differences are primarily the result of the treatment of wash sales for tax reporting purposes. Distributions from net realized gains for book purposes may include short-term capital gains, which are included as ordinary income to shareholders for tax purposes. |
| | Due to inherent differences in the recognition of income, expenses, and realized gains/losses under U.S. generally accepted accounting principles and federal income tax purposes, permanent differences between book and tax basis reporting for the 2006 fiscal year have been identified and appropriately reclassified on the Statement of Assets and Liabilities. For the year ended October 31, 2006, the Growth Fund had a $2,547,605 permanent book and tax basis difference relating to the Fund’s net operating loss which resulted in an increase in accumulated net investment income and a decrease in paid-in capital. The Growth II Fund had a $207,230 permanent book and tax basis difference relating to the Growth II Fund’s net operating loss which resulted in an increase in accumulated net investment income and a decrease in paid-in capital. The Focus 30 Fund had a $1,552,126 permanent book and tax basis difference relating to the Fund’s net operating loss which resulted in an increase in accumulated net investment income and decrease in paid in capital. The Value Fund had a $32,310,253 permanent book and tax basis difference relating to the expiration of the Fund’s prior year capital loss carry forward which resulted in an increase in accumulated realized gain and a decrease in accumulated paid-in capital. |
| c). | Income and Expenses - Dividend income is recognized on the ex-dividend date and interest income is recognized on an accrual basis. The Funds are charged for those expenses that are directly attributable to the portfolio, such as advisory, administration and certain shareholder service fees. |
NOTES TO THE FINANCIAL STATEMENTS
| d). | Distributions to Shareholder - Dividends from net investment income for the Growth, Growth II, Focus 30 and Value Funds, if any, are declared and paid out annually, usually in November or December of each year. Dividends from net investment income for the Total Return and Balanced Funds are declared and paid on a calendar quarter basis. Distributions of net realized capital gains, if any, are declared and paid annually, usually in November or December of each year, for all of the Funds. |
| e). | Security Transactions - Investment and shareholder transactions are recorded on the trade date. The Funds determine the gain or loss realized from the investment transactions by comparing the original cost of the security lot sold with the net sale proceeds. Discounts and premiums on securities purchased are accreted/amortized over the life of the respective security. |
| f). | Use of Estimates - The preparation of financial statements in conformity with GAAP requires management to make estimates and assumptions that affect the reported amounts of assets and liabilities and disclosure of contingent assets and liabilities at the date of the financial statements and the reported change in net assets during the reporting period. Actual results could differ from those estimates. |
| g). | Share Valuation - The net asset value (“NAV”) per share of each Fund is calculated by dividing the sum of the value of the securities held by each Fund, plus cash or other assets, minus all liabilities (including estimated accrued expenses) by the total number of shares outstanding for each Fund, rounded to the nearest cent. The Funds’ shares will not be priced on the days on which the NYSE is closed for trading. The offering and redemption price per share for each Fund is equal to each Fund’s net asset value per share. The Funds charge a 1.50% redemption fee on shares held less than 90 days. These fees are deducted from the redemption proceeds otherwise payable to the shareholder. The Funds will retain the fee charged as paid-in capital and such fees become part of that Fund’s daily NAV calculation. |
| h). | Repurchase Agreements - Each Fund may enter into repurchase agreements with member banks or security dealers of the Federal Reserve whom the investment advisor deems creditworthy. The repurchase price generally equals the price paid by the Fund plus interest negotiated on the basis of current short-term rates. |
| | Securities pledged as collateral for repurchase agreements are held by the custodian bank until the respective agreements mature. Provisions of the repurchase agreements ensure that the market value of the collateral, including accrued interest thereon, is sufficient, in the event of default of the counterparty. If the counterparty defaults and the value of the collateral declines or if the counterparty enters an insolvency proceeding, realization of the collateral by the Fund may be delayed or limited. |
| i). | Recently Issued Accounting Pronouncements - On July 13, 2006, the Financial Accounting Standards Board (“FASB”) released FASB Interpretation No. 48 “Accounting for Uncertainty in Income Taxes” (“FIN48”). FIN 48 provides guidance for how uncertain tax positions should be recognized, measured, presented and disclosed in the financial statements. FIN 48 requires the evaluation of tax positions taken or expected to be taken in the |
HENNESSY FUNDS 1-800-966-4354
NOTES TO THE FINANCIAL STATEMENTS
| | course of preparing the Funds tax returns to determine whether the tax positions are “more-likely-than-not” of being sustained by the applicable tax authority. Tax positions not deemed to meet the more-likely-than-not threshold would be recorded as a tax benefit or expense in the current year. Adoption of FIN 48 is required for fiscal years beginning after December 15, 2006 and is to be applied to all open tax years as of the effective date. At this time, management is evaluating the implications of FIN 48 and its impact on each of the Fund’s financial statements has not yet been determined. |
| | In September 2006, FASB issued FASB Statement No. 157, “Fair Value Measurement” (“SFAS 157”), which defines fair value, establishes a framework for measuring fair value, and expands disclosures about fair value measurements. SFAS 157 is effective for fiscal years beginning after November 15, 2007, and interim periods within those fiscal years. The Funds believe the adoption of SFAS 157 will have no material impact on their financial statements. |
3). REVERSE REPURCHASE AGREEMENTS
The Total Return Fund has entered into reverse repurchase agreements with UBS PaineWebber, Inc., under which the Total Return Fund sells securities and agrees to repurchase them later at a mutually agreed upon price. For the year ended October 31, 2006, the average daily balance and average interest rate in effect for reverse repurchase agreements was $29,220,532 and 4.739%, respectively. At October 31, 2006, the interest rate in effect for the outstanding reverse repurchase agreement, scheduled to mature on November 16, 2006 ($12,460,000), December 21, 2006 ($14,368,000) and January 18, 2007 ($12,572,000) were 5.31%, 5.25% and 5.15% and was equal to 34.79% of the Total Return Fund’s total assets.
4). INVESTMENT TRANSACTIONS
Purchases and sales of investment securities (excluding short-term investments) during the following fiscal periods were as follows:
| | | Growth | | Growth II Fund | | Focus 30 | | Value | | Total Return | | Balanced | |
| | | Fund | | Four Months | | Fund | | Fund | | Fund | | Fund | |
| | | Year Ended | | Ended | | Year Ended | | Year Ended | | Year Ended | | Year Ended | |
| | | 10/31/06 | | 10/31/06* | | 10/31/06 | | 10/31/06 | | 10/31/06 | | 10/31/06 | |
| Purchases | | $ | 1,187,394,113 | | $ | 231,756,193 | | $ | 383,789,902 | | $ | 98,286,640 | | $ | 19,508,025 | | $ | 11,031,361 | |
| Sales | | $ | 1,106,427,993 | | $ | 251,262,774 | | $ | 279,473,886 | | $ | 66,957,501 | | $ | 16,301,786 | | $ | 9,385,265 | |
| | | | | | | | | | | | | | | | | | | | |
| | | | Growth II | | | | | | | | | | | | | | | | |
| | | | Fund | | | | | | | | | | | | | | | | |
| | | | Year Ended | | | | | | | | | | | | | | | | |
| | | | 6/30/06 | | | | | | | | | | | | | | | | |
| Purchase | | $ | 291,910,997 | | | | | | | | | | | | | | | | |
| Sales | | $ | 321,219,840 | | | | | | | | | | | | | | | | |
| * | Effective October 31, 2006, the Growth II Fund changed its fiscal year end to October 31st from June 30th. |
5). INVESTMENT MANAGEMENT FEE AND OTHER TRANSACTIONS WITH AFFILIATES
Hennessy Advisors, Inc. (the “Advisor”) is the Advisor of the Funds. The Advisor provides the Funds with investment management services under a Management Agreement. The Advisor furnishes all investment advice, office space, facilities, and provides most of the personnel needed by the Funds. As compensation for
NOTES TO THE FINANCIAL STATEMENTS
its services, the Advisor is entitled to a monthly fee from each Fund. The fee is based upon the average daily net assets of the Funds at the annual rate of:
| Growth Fund | 0.74% |
| Growth II Fund | 0.74% |
| Focus 30 Fund | 0.74% |
| Value Fund | 0.74% |
| Total Return Fund | 0.60% |
| Balanced Fund | 0.60% |
The Board of Directors has approved a Shareholder Servicing Plan which was instituted to compensate the Advisor for the non-investment management services it provides to the Growth, Growth II, Focus 30 and Value Funds. The Plan provides for a monthly fee paid to the Advisor at an annual rate of 0.10% of the average daily net assets of the Growth, Growth II, Focus 30 and Value Funds.
The Growth Fund, Growth II Fund, Focus 30 Fund and Value Fund have entered into agreements with various brokers, dealers and financial intermediaries in connection with the sale of shares of the Funds. The agreements provide for periodic payments by the Funds to the brokers, dealers and financial intermediaries for providing certain shareholder maintenance services (sub-transfer agent expenses). These shareholder services include: the pre-processing and quality control of new accounts, shareholder correspondence, answering customer inquiries regarding account status and facilitating shareholder telephone transactions. Fees paid by the Growth Fund, Focus 30 Fund and Value Fund to various brokers, dealers and financial intermediaries for the year ended October 31, 2006, were $1,484,374, $229,790 and $66,289, respectively. Fees paid by the Growth II Fund to various brokers, dealers and financial intermediaries for the four months ended October 31, 2006 were $95,515 and for the year ended June 30, 2006 were $340,607.
The Total Return and Balanced Funds have adopted a plan pursuant to Rule 12b-1 which authorizes payments in connection with the distribution of the Total Return and Balanced Fund shares at an annual rate not to exceed 0.25% of each Fund’s average daily net assets. Amounts paid under the Plan may be spent on any activities or expenses primarily intended to result in the sale of shares, including but not limited to, advertising, compensation for sales and marketing activities or financial institutions and others such as dealers and distributors, shareholder account servicing, the printing and mailing of prospectuses to other than current shareowners and the printing and mailing of sales literature.
U.S. Bancorp Fund Services, LLC (the “Administrator”) acts as the Funds’ Administrator under an Administration Agreement. The Administrator prepares various federal and state regulatory filings, reports and returns for the Funds; prepares reports and materials to be supplied to the directors; monitors the activities of the Funds’ custodian, transfer agent and accountants; coordinates the preparation and payment of the Funds’ expenses and reviews the Funds’ expense accruals. Fees paid to U.S. Bancorp Fund Services, LLC for the year ended October 31, 2006, were $2,904,210, $544,031, $439,657, $205,097 and $49,197 for Growth, Focus 30, Value, Total Return and Balanced Funds, respectively. Fees paid to U.S. Bancorp Fund Services, LLC for the four months ended October 31, 2006 were $194,582 and for the year ended June 30, 2006, were $634,136 for the Growth II Fund.
HENNESSY FUNDS 1-800-966-4354
NOTES TO THE FINANCIAL STATEMENTS
The SYM Select Growth Fund was the predecessor fund of the Focus 30 Fund. The financial highlights reported for periods before September 17, 2003, represent the activity of the SYM Select Growth Fund.
The Henlopen Fund was the predecessor fund of the Growth II Fund. The financial highlights reported for periods before July 1, 2005, represent the activity of The Henlopen Fund.
Quasar Distributors, LLC (the “Distributor”) acts as the Funds’ principal underwriter in a continuous public offering of the Funds’ shares. The Distributor is an affiliated company of U.S. Bank, N.A.
6). SECURITIES LENDING
The Growth and Value Funds had entered into a securities lending arrangement with the custodian. Under the terms of the agreement, the custodian was authorized to loan securities on behalf of the Funds to approved brokers against the receipt of cash collateral at least 102% of the value of the securities loaned. The cash collateral was invested by the custodian in a money market pooled account approved by the Advisor. Although risk was mitigated by the collateral, the Funds could have experienced a delay in recovering its securities and possible loss of income or value if the borrower failed to return them. The agreement provided that after predetermined rebates to the brokers, the income generated from lending transactions was allocated 60% to the Fund and 40% to the custodian. The Growth Fund discontinued securities lending in February 2005. The Value Fund discontinued securities lending in October 2006.
7). LINE OF CREDIT
The Growth, Growth II, Focus 30, and Value Funds have $20,000,000, $500,000, $500,000 and $500,000 lines of credit, respectively, intended to provide short-term financing, if necessary, subject to certain restrictions, in connection with shareholder redemptions. The credit facility is with its custodian bank, U.S. Bank, N.A. During the year ended October 31, 2006, the Growth Fund had an outstanding average daily balance and a weighed average interest rate of $15,086 and 7.76%, respectively. The maximum amount outstanding for the Growth Fund during the period was $3,597,500. During the period ended October 31, 2006, the Growth II Fund had an outstanding average daily balance and a weighed average interest rate of $66,974 and 8.25%, respectively. The maximum amount outstanding for the Growth II Fund during the period was $1,276,000. During the year ended October 31, 2006, the Focus 30 Fund had an outstanding average daily balance and a weighed average interest rate of $77,273 and 7.76%, respectively. The maximum amount outstanding for the Focus 30 Fund during the period was $4,761,000. During the year ended October 31, 2006, the Value Fund had no line of credit activity.
NOTES TO THE FINANCIAL STATEMENTS
8). FEDERAL TAX INFORMATION
The following balances for the Funds are as of October 31, 2006:
| | | Growth | | Growth II | | Focus 30 | |
| | | Fund | | Fund | | Fund | |
| Cost of Investments for tax purposes | | $ | 1,170,435,416 | | $ | 223,766,370 | | $ | 231,512,070 | |
| Gross tax unrealized appreciation | | | 204,399,099 | | | 25,469,586 | | | 11,780,998 | |
| Gross tax unrealized depreciation | | | (122,579,679 | ) | | (8,980,483 | ) | | (2,974,908 | ) |
| Net tax unrealized appreciation | | | | | | | | | | |
| (depreciation) on investments | | | 81,819,420 | | | 16,489,103 | | | 8,806,090 | |
| Undistributed ordinary income | | $ | — | | $ | 825,569 | | $ | — | |
| Undistributed long-term capital gains | | $ | 183,483,212 | | $ | 8,406,261 | | $ | 1,781,571 | |
| Total Distributable earnings | | $ | 183,483,212 | | $ | 9,231,830 | | $ | 1,781,571 | |
| Other accumulated gains (losses) | | $ | (1,825,255 | ) | $ | — | | $ | — | |
| Total accumulated earnings (losses) | | $ | 263,477,377 | | $ | 25,720,933 | | $ | 10,587,661 | |
| | | Value | | | Total Return | | | Balanced | |
| | | Fund | | | Fund | | | Fund | |
| Cost of Investments for tax purposes | | $ | 229,515,538 | | $ | 145,617,179 | | $ | 24,648,863 | |
| Gross tax unrealized appreciation | | | 29,340,557 | | | 9,505,583 | | | 1,783,471 | |
| Gross tax unrealized depreciation | | | (5,396,181 | ) | | (2,493,255 | ) | | (345,612 | ) |
| Net tax unrealized appreciation | | | | | | | | | | |
| (depreciation) on investments | | | 23,944,376 | | | 7,012,328 | | | 1,437,859 | |
| Undistributed ordinary income | | $ | 4,008,165 | | $ | 221,710 | | $ | 70,517 | |
| Undistributed long-term capital gains | | $ | — | | $ | — | | $ | — | |
| Total Distributable earnings | | $ | 4,008,165 | | $ | 221,710 | | $ | 70,517 | |
| Other accumulated gains (losses) | | $ | (97,083,657 | ) | $ | (90,782,182 | ) | $ | (2,153,876 | ) |
| Total accumulated earnings (losses) | | $ | (69,131,116 | ) | $ | (83,548,144 | ) | $ | (645,500 | ) |
At October 31, 2006, the Growth Fund had tax basis capital losses of $1,825,255, to offset future capital gains, the use of a portion of which is limited by IRS regulations. Of such losses, $752,784 expire October 31, 2008, $889,912 expire October 31, 2009, and $182,559 expire October 31, 2010. Additionally, the Growth Fund had no post-October loss deferrals as of October 31, 2006.
At October 31, 2006, the Growth II Fund had no tax basis capital losses. Additionally, the Growth II Fund had no post-October loss deferrals as of October 31, 2006.
At October 31, 2006, the Focus 30 Fund had no tax basis capital losses which may be carried over to offset future capital gains. Additionally, the Focus 30 Fund had no post-October loss deferrals as of October 31, 2006.
At October 31, 2006, the Value Fund had tax basis capital losses of $97,083,657, to offset future capital gains, the use of a portion of which is limited by IRS regulations. Of such losses, $57,383,495 expire October 31, 2007, $11,505,303 expire October 31, 2008, $27,482,264 expire October 31, 2010 and $712,595 expire October 31, 2011. Additionally, the Value Fund had no post-October loss deferrals as of October 31, 2006.
HENNESSY FUNDS 1-800-966-4354
NOTES TO THE FINANCIAL STATEMENTS
At October 31, 2006, the Total Return Fund had tax basis capital losses of $90,782,182, which may be carried over to offset future capital gains. Of such losses, $56,123,604 expire on October 31, 2008 and $34,658,578 expire October 31, 2009. Additionally, the Total Return Fund had no post-October loss deferrals as of October 31, 2006.
At October 31, 2006, the Balanced Fund had tax basis capital losses of $2,153,876, to offset future capital gains, the use of a portion of which is limited by IRS regulations. Of such losses, $969,136 expire October 31, 2008, $447,964 expire October 31, 2009, $447,964 expire October 31, 2010 and $288,812 expire October 31, 2012. Additionally, the Balanced Fund had no post-October loss deferrals as of October 31, 2006.
The tax character of distributions paid during 2006 and 2005 for the Funds were as follows:
| | | | | Year Ended | | Year Ended | |
Growth Fund | | | | October 31, 2006 | | October 31, 2005 | |
| Distributions paid from: | | | | | | | |
| Ordinary income | | | | | $ | 46,111,012 | | $ | — | |
| Long-term capital gain | | | | | | 22,116,736 | | | 173,840,684 | |
| | | | | | $ | 68,227,748 | | $ | 173,840,684 | |
| | | | | | | | | | | |
| | | Period Ended | | | Year Ended | | | Year Ended | |
Growth II Fund | | | October 31, 2006(1) | | | June 30, 2006 | | | June 30, 2005 | |
| Distributions paid from: | | | | | | | | | | |
| Ordinary income | | $ | — | | $ | 23,569,994 | | $ | 108,497 | |
| Long-term capital gain | | | — | | | 7,423,778 | | | — | |
| | $ | — | | $ | 30,993,772 | | $ | 108,497 | |
| | | | | | | | | | | |
| | | | | | Year Ended | | | Year Ended | |
Focus 30 Fund | | | | | | October 31, 2006 | | | October 31, 2005 | |
| Distributions paid from: | | | | | | | | | | |
| Ordinary income | | | | | $ | — | | $ | — | |
| Long-term capital gain | | | | | | 17,767,996 | | | — | |
| | | | | | $ | 17,767,996 | | $ | — | |
| | | | | | | | | | | |
| | | | | | Year Ended | | | Year Ended | |
Value Fund | | | | | | October 31, 2006 | | | October 31, 2005 | |
| Distributions paid from: | | | | | | | | | | |
| Ordinary income | | | | | $ | 4,751,582 | | $ | 3,734,561 | |
| Long-term capital gain | | | | | | — | | | — | |
| | | | | | $ | 4,751,582 | | $ | 3,734,561 | |
| (1) | For the four months ended October 31, 2006. Effective October 31, 2006, the Fund changed its fiscal year end to October 31st from June 30th. |
NOTES TO THE FINANCIAL STATEMENTS
| | | Year Ended | | Year Ended | |
Total Return Fund | | October 31, 2006 | | October 31, 2005 | |
| Distributions paid from: | | | | | |
| Ordinary income | | $ | 2,378,688 | | $ | 1,946,484 | |
| Long-term capital gain | | | — | | | — | |
| | | $ | 2,378,688 | | $ | 1,946,484 | |
| | | | | | | | |
| | | Year Ended | | | Year Ended | |
Balanced Fund | | | October 31, 2006 | | | October 31, 2005 | |
| Distributions paid from: | | | | | | | |
| Ordinary income | | $ | 556,830 | | $ | 324,348 | |
| Long-term capital gain | | | — | | | — | |
| | | $ | 556,830 | | $ | 324,348 | |
9). FEDERAL TAX DISTRIBUTION INFORMATION
The Growth, Value, Total Return and Balanced Funds designate 9%, 100%, 100%, and 74%, respectively of the dividends declared from net investment income during the year ended October 31, 2006, as qualified dividend income under the Jobs Growth and Tax Reconciliation Act of 2003.
For the year ended October 31, 2006, 8%, 100%, 100% and 74% of the ordinary distributions paid by the Growth, Value, Total Return and Balanced Funds qualify for the dividends received deduction available to corporate shareholders.
Additional Information Applicable to Foreign Shareholders Only. For the year ended October 31, 2006, the funds designate the following percent of ordinary distributions paid as interest-related dividends under the Internal Revenue Code Section 871(k)(1)(c): Growth Fund 1%, Value Fund 1%, Total Return Fund 46%, Balanced Fund 51%. For the fiscal year ended October 31, 2006, the following percentages of its ordinary income distributions paid are designated as short-term capital gain distributions under the Internal Revenue Code Section 871(k)(2)(c): Growth Fund - 100%, Value Fund - 0%, Total Return Fund - 0%, Balanced Fund - 0%.
10). SUBSEQUENT EVENTS
On November 28, 2006, long-term capital gain distributions of $3.11146, $1.09269 and $0.09968 were declared for the Growth Fund, Growth IIFund and Focus 30 Fund, respectively and a short-term capital gain of $0.10732 was declared for the Growth II Fund. The distributions were paid on November 28, 2006 to shareholders of record November 27, 2006.
HENNESSY FUNDS 1-800-966-4354
Report of Independent Registered Public Accounting Firm
The Shareholders and Board of Directors of
The Hennessy Mutual Funds, Inc., The Hennessy Funds, Inc.,
and The Hennessy Funds Trust
We have audited the accompanying statements of assets and liabilities of The Hennessy Mutual Funds, Inc. (comprising, respectively, Hennessy Cornerstone Growth Fund, Hennessy Cornerstone Value Fund, and Hennessy Focus 30 Fund), The Hennessy Funds, Inc. (comprising, respectively, Hennessy Balanced Fund and Hennessy Total Return Fund) and The Hennessy Funds Trust (comprising, Hennessy Cornerstone Growth Fund, Series II), collectively referred to as the Funds, including the schedules of investments, as of October 31, 2006, and the related statements of operations and cash flows for the year then ended, (for the four-month period ended October 31, 2006 and year ended June 30, 2006 for the Hennessy Cornerstone Growth Fund, Series II) and the statements of changes in net assets for each of the two years in the period then ended, (for the four-month period ended October 31, 2006 and year ended June 30, 2006 for the Hennessy Cornerstone Growth Fund, Series II) and the financial highlights for each of the periods presented, (for the period ended October 31, 2006 and year ended June 30, 2006 for the Hennessy Cornerstone Growth Fund, Series II and for each of the periods presented for 2006, 2005, 2004, and 2003 for the Hennessy Focus 30 Fund). These financial statements and financial highlights are the responsibility of the Funds’ management. Our responsibility is to express an opinion on these financial statements and financial highlights based on our audits. The accompanying statement of changes in net assets for the year ended June 30, 2005 and the financial highlights for the years ended June 30, 2005, 2004, 2003, and 2002 of the Hennessy Cornerstone Growth Fund, Series II and financial highlights for the year ended December 31, 2002 of the Hennessy Focus 30 Fund, were audited by other auditors whose reports thereon dated July 28, 2005 and January 25, 2003, respectively, expressed an unqualified opinion on these statements.
We conducted our audits in accordance with the standards of the Public Company Accounting Oversight Board (United States). Those standards require that we plan and perform the audit to obtain reasonable assurance about whether the financial statements and financial highlights are free of material misstatement. An audit includes examining, on a test basis, evidence supporting the amounts and disclosures in the financial statements. Our procedures included confirmation of securities owned as of October 31, 2006, by correspondence with the custodian and brokers. An audit also includes assessing the accounting principles used and significant estimates made by management, as well as evaluating the overall financial statement presentation. We believe that our audits provide a reasonable basis for our opinion.
REPORT OF INDEPENDENT REGISTERED PUBLIC ACCOUNTING FIRM
In our opinion, the financial statements and financial highlights referred to above present fairly, in all material respects, the financial position of the Hennessy Cornerstone Growth Fund, Hennessy Cornerstone Value Fund, Hennessy Focus 30 Fund, Hennessy Balanced Fund, Hennessy Total Return Fund and Hennessy Cornerstone Growth Fund, Series II, as of October 31, 2006, the results of their operations and cash flows for the year then ended (for the four-month period ended October 31, 2006 and year ended June 30, 2006 for the Hennessy Cornerstone Growth Fund, Series II), the changes in their net assets for each of the two years in the period then ended (for the four-month period ended October 31, 2006 and year ended June 30, 2006 for the Hennessy Cornerstone Growth Fund, Series II), and the financial highlights for each of the periods presented (for the period ended October 31, 2006 and year ended June 30, 2006 for the Hennessy Cornerstone Growth Fund, Series II and for each of the periods presented for 2006, 2005, 2004, and 2003 for the Hennessy Focus 30 Fund) in conformity with accounting principles generally accepted in the United States of America.

Chicago, Illinois
December 20, 2006
HENNESSY FUNDS 1-800-966-4354
Directors and Officers of the Funds
| | Position(s) | Term of Office |
| | Held with | and Length of |
Name, Age and Address | the Companies | Time Served |
“Disinterested Persons” | | |
| J. Dennis DeSousa | Independent Director | Indefinite, until |
| Age: 69 | | successor elected |
| Address: | | |
| c/o Hennessy Advisors, Inc. | | Served since January 1996 |
| 7250 Redwood Blvd. | | |
| Suite 200 | | |
| Novato, CA 94945 | | |
| | | |
| Robert T. Doyle | Independent Director | Indefinite, until |
| Age: 58 | | successor elected |
| Address: | | |
| c/o Hennessy Advisors, Inc. | | Served since January 1996 |
| 7250 Redwood Blvd. | | |
| Suite 200 | | |
| Novato, CA 94945 | | |
| | | |
| Gerald P. Richardson | Independent Director | Indefinite, until |
| Age: 59 | | successor elected |
| Address: | | |
| c/o Hennessy Advisors, Inc. | | Served since May 2004 |
| 7250 Redwood Blvd. | | |
| Suite 200 | | |
| Novato, CA 94945 | | |
| | | |
“Interested Persons” | | |
| Neil J. Hennessy(2) | Director | Indefinite, until |
| Age: 50 | and President | successor elected |
| Address: | | |
| c/o Hennessy Advisors, Inc. | | Served since January 1996 |
| 7250 Redwood Blvd. | | |
| Suite 200 | | |
| Novato, CA 94945 | | |
DIRECTORS AND OFFICERS OF THE FUNDS
| | Number of Portfolios | |
Principal Occupation(s) | in the Fund Complex | Other Directorships |
During Past 5 Years | Overseen by Director (1) | Held by Director |
| | | |
| Currently a real estate investor. | 6 | None. |
| | | |
| | | |
| | | |
| | | |
| | | |
| | | |
| | | |
| Currently the Sheriff of Marin County, | 6 | None. |
| California (since 1996) and has been | | |
| employed in the Marin County Sheriff’s | | |
| Office in various capacities since 1969. | | |
| | | |
| | | |
| | | |
| | | |
| Chief Executive Officer and owner of | 6 | None. |
| ORBIS Payment Services since January | | |
| 2001. In 2000, Mr. Richardson | | |
| was an independent consultant. | | |
| | | |
| | | |
| | | |
| | | |
| | | |
| President, Chairman, CEO and | 6 | Director of Hennessy |
| Portfolio Manager of Hennessy | | Advisors, Inc. |
| Advisors, Inc., the Funds’ investment advisor, | | |
| since 1989; President of The Hennessy | | |
| Mutual Funds, Inc., The Hennessy Funds, | | |
| Inc. since 1996 and Hennessy Funds Trust | | |
| since 2005. | | |
HENNESSY FUNDS 1-800-966-4354
DIRECTORS AND OFFICERS OF THE FUNDS
| | Position(s) | Term of Office |
| | Held with | and Length of |
Name, Age and Address | the Companies | Time Served |
| Frank Ingarra, Jr.(2) | Assistant | 1 year term |
| Age: 35 | Portfolio | |
| Address: | Manager and | 3 years |
| c/o Hennessy Advisors, Inc. | Vice President | |
| 7250 Redwood Blvd. | | |
| Suite 200 | | |
| Novato, CA 94945 | | |
| | | |
| | | |
| | | |
| | | |
| | | |
| | | |
| | | |
| | | |
| | | |
| | | |
| Harry F. Thomas(2) | Chief Compliance | 1 year term |
| Age: 59 | Officer | |
| Address: | | 1 year |
| c/o Hennessy Advisors, Inc. | | |
| 7250 Redwood Blvd. | | |
| Suite 200 | | |
| Novato, CA 94945 | | |
| | | |
| | | |
| | | |
| Teresa M. Nilsen(2) | Executive Vice | 1 year term |
| Age: 40 | President and | |
| Address: | Treasurer | 9 years |
| c/o Hennessy Advisors, Inc. | | |
| 7250 Redwood Blvd. | | |
| Suite 200 | | |
| Novato, CA 94945 | | |
| | | |
| | | |
| | | |
| | | |
| Daniel B. Steadman(2) | Executive Vice | 1 year term |
| Age: 50 | President and | |
| Address: | Secretary | 6 years |
| c/o Hennessy Advisors, Inc. | | |
| 7250 Redwood Blvd. | | |
| Suite 200 | | |
| Novato, CA 94945 | | |
DIRECTORS AND OFFICERS OF THE FUNDS
| | Number of Portfolios | |
Principal Occupation(s) | in the Fund Complex | Other Directorships |
During Past 5 Years | Overseen by Director (1) | Held by Director |
| Assistant Portfolio Manager for | Not applicable. | Not applicable. |
| Hennessy Advisors, Inc., the Funds’ | | |
| investment advisor, from March 2002 | | |
| to the present; from August 2000 | | |
| through March 2002, Mr. Ingarra | | |
| was the head trader for Hennessy | | |
| Advisors, Inc.; from August 2002 to | | |
| the present, Mr. Ingarra has been | | |
| a Vice President of The Hennessy | | |
| Mutual Funds, Inc. and The Hennessy | | |
| Funds, Inc. and since July 2005, Mr. Ingarra | | |
| has been Vice President of Hennessy Funds | | |
| Trust; and from July 1999 through | | |
| August 2000, Mr. Ingarra was the Vice | | |
| President and head trader for | | |
| O’Shaughnessy Capital Management. | | |
| | | |
| Chief Compliance Officer for Hennessy | Not applicable. | Not applicable. |
| Advisors, Inc., the Funds’ investment | | |
| advisor, since 2004; retired business | | |
| executive from 2001 through 2004; director | | |
| of The Hennessy Mutual Funds, Inc. and | | |
| The Hennessy Funds, Inc. from 2000 to | | |
| May 2004; and Managing Director of | | |
| Emplifi, Inc., a consulting firm, from 1999 | | |
| through 2001. | | |
| | | |
| Currently Executive Vice President, Chief | Not applicable. | Director of Hennessy |
| Financial Officer and Secretary of Hennessy | | Advisors, Inc. |
| Advisors, Inc., the Funds’ investment advisor; | | |
| Ms. Nilsen has been the corporate secretary | | |
| and a financial officer of Hennessy Advisors, Inc. | | |
| since 1989; Ms. Nilsen has been an officer of | | |
| The Hennessy Mutual Funds, Inc. and The | | |
| Hennessy Funds, Inc. since 1996 and Hennessy | | |
| Funds Trust since 2005, and is currently | | |
| Executive Vice President and Treasurer. | | |
| | | |
| Executive Vice President of Hennessy | Not applicable. | Director of Hennessy |
| Advisors, Inc., the Funds’ investment advisor, | | Advisors, Inc. |
| from 2000 to the present; Vice President of | | |
| Westamerica Bank from 1995 through 2000; | | |
| Mr. Steadman has been Executive Vice | | |
| President and Secretary of The Hennessy | | |
| Mutual Funds, Inc. and The Hennessy | | |
| Funds, Inc. since 2000 and Hennessy | | |
| Funds Trust since 2005. | | |
HENNESSY FUNDS 1-800-966-4354
DIRECTORS AND OFFICERS OF THE FUNDS
| | Position(s) | Term of Office |
| | Held with | and Length of |
Name, Age and Address | the Companies | Time Served |
| Tania A. Kelley | Vice President | 1 year term |
| Age: 41 | of Marketing | |
| Address: | | 3 years |
| c/o Hennessy Advisors, Inc. | | |
| 7250 Redwood Blvd. | | |
| Suite 200 | | |
| Novato, CA 94945 | | |
| | | |
| Ana Miner | Vice President | 1 year term |
| Age: 48 | of Operations | |
| Address: | | 7 years |
| c/o Hennessy Advisors, Inc. | | |
| 7250 Redwood Blvd. | | |
| Suite 200 | | |
| Novato, CA 94945 | | |
| | | |
| Brian Peery | Vice President | 1 year term |
| Age: 37 | of Sales | |
| Address: | | 4 years |
| c/o Hennessy Advisors, Inc. | | |
| 7250 Redwood Blvd. | | |
| Suite 200 | | |
| Novato, CA 94945 | | |
_______________
| (1) | There are six portfolios in the fund complex overseen by the Directors: (a) the Hennessy Cornerstone Growth Fund, Hennessy Focus 30 Fund and Hennessy Cornerstone Value Fund, series of The Hennessy Mutual Funds, Inc.; (b) the Hennessy Total Return Fund and Hennessy Balanced Fund, series of The Hennessy Funds, Inc.; and (c) the Hennessy Cornerstone Growth Fund, Series II, a series of Hennessy Funds Trust (collectively, the “Hennessy Funds”). |
| (2) | All officers of the companies and employees of the Advisor are interested persons (as defined in the 1940 Act) of the Trust. |
DIRECTORS AND OFFICERS OF THE FUNDS
| | Number of Portfolios | |
Principal Occupation(s) | in the Fund Complex | Other Directorships |
During Past 5 Years | Overseen by Director (1) | Held by Director |
| Has been employed by Hennessy | Not applicable. | None. |
| Advisors, Inc., the Funds’ investment | | |
| advisor, since October 2003; Director of | | |
| Sales and Marketing for Comcast from | | |
| 2002 through 2003; from 1999 to 2002, | | |
| Ms. Kelley was Director of Sales and | | |
| Marketing for AT&T. | | |
| | | |
| Has been employed by Hennessy | Not applicable. | None. |
| Advisors, Inc., the Funds’ investment | | |
| advisor, since 1998; from 1990 through | | |
| 1998, Ms. Miner was employed as an | | |
| institutional sales assistant by | | |
| Merrill Lynch Capital Markets. | | |
| | | |
| | | |
| Has been employed by Hennessy | Not applicable. | None. |
| Advisors, Inc., the Funds’ investment | | |
| advisor, since June 2002; Vice President of | | |
| Institutional Sales and Senior Analyst with | | |
| Brad Peery Inc. from June 2000 to June | | |
| 2002; from 1996 to 2002, Mr. Peery worked | | |
| for Haywood Securities where he was a | | |
| Vice President. | | |
HENNESSY FUNDS 1-800-966-4354
Expense Example
October 31, 2006 (Unaudited)
As a shareholder of the Funds, you incur two types of costs: (1) transaction costs, including sales charges (loads) on purchase payments, reinvested dividends, or other distributions; redemption fees; and exchange fees; and (2) ongoing costs, including management fees; service fees; and other Fund expenses. This Example is intended to help you understand your ongoing costs (in dollars) of investing in each of the Funds and to compare these costs with the ongoing costs of investing in other mutual funds. The Example is based on an investment of $1,000 invested at the beginning of the period and held for the entire period from May 1, 2006 to October 31, 2006.
Actual Expenses
The first set of lines of the table below provide information about actual account values and actual expenses. Although the Funds charge no sales loads or transaction fees, you will be assessed fees for outgoing wire transfers, returned checks and stop payment orders at prevailing rates charged by U.S. Bancorp Fund Services, LLC, the Funds’ transfer agent. If you request that a redemption be made by wire transfer, currently a $15.00 fee is charged by the Funds’ transfer agent. You will be charged a redemption fee equal to 1.50% of the net amount of the redemption if you redeem your shares less than 90 calendar days after you purchase them. IRA accounts will be charged a $15.00 annual maintenance fee. The example below includes, but is not limited to, management fees, shareholder servicing fees, fund accounting, custody and transfer agent fees. However, the example below does not include portfolio trading commissions and related expenses, interest expense or dividends on short positions taken by the Fund and other extraordinary expenses as determined under generally accepted accounting principles. You may use the information within these lines, together with the amount you invested, to estimate the expenses that you paid over the six-month period. Simply divide your account value by $1,000 (for example, an $8,600 account value divided by $1,000 = 8.6), then multiply the result by the number in the first line under the heading entitled “Expenses Paid During Period” to estimate the expenses you paid on your account during this period.
Hypothetical Example for Comparison Purposes
The second set of lines within the table below provide information about hypothetical account values and hypothetical expenses based on the Funds’ actual expense ratios and an assumed rate of return of 5% per year before expenses, which is not the Funds’ actual return. The hypothetical account values and expenses may not be used to estimate the actual ending account balance or expenses you paid for the period. You may use this information to compare the ongoing costs of investing in the Funds and other funds. To do so, compare this 5% hypothetical example with the 5% hypothetical examples that appear in the shareholder reports of the other funds. Please note that the expenses shown in the table are meant to highlight your ongoing costs only and do not reflect any transactional costs, such as sales charges (loads), redemption fees, or exchange
EXPENSE EXAMPLE
fees. Therefore, the second line of the table is useful in comparing ongoing costs only, and will not help you determine the relative total costs of owning different funds. In addition, if these transactional costs were included, your costs would have been higher.
| | Beginning | | Ending | | Expenses Paid |
| | Account Value | | Account Value | | During Period(1) |
| | 5/1/06 | | 10/31/06 | | 5/1/06 - 10/31/06 |
Actual | | | | | |
| Growth Fund | $1,000.00 | | $ 896.80 | | $ 5.78 |
| Growth II Fund | $1,000.00 | | $ 876.80 | | $ 5.91 |
| Focus 30 Fund | $1,000.00 | | $ 915.70 | | $ 5.84 |
| Value Fund | $1,000.00 | | $1,091.50 | | $ 6.06 |
| Total Return Fund | $1,000.00 | | $1,125.80 | | $15.00 |
| Balanced Fund | $1,000.00 | | $1,089.00 | | $ 7.06 |
Hypothetical (5% return | | | | | |
before expenses) | | | | | |
| Growth Fund | $1,000.00 | | $1,019.11 | | $ 6.16 |
| Growth II Fund | $1,000.00 | | $1,018.90 | | $ 6.36 |
| Focus 30 Fund | $1,000.00 | | $1,019.11 | | $ 6.16 |
| Value Fund | $1,000.00 | | $1,019.41 | | $ 5.85 |
| Total Return Fund | $1,000.00 | | $1,011.09 | | $14.19 |
| Balanced Fund | $1,000.00 | | $1,018.45 | | $ 6.82 |
| (1) | Expenses are equal to the Growth Fund’s expense ratio of 1.21%, the Growth IIFund’s expense ratio of 1.25%, the Focus 30 Fund’s expense ratio of 1.21%, the Value Fund’s expense ratio of 1.15%, the Total Return Fund’s expense ratio of 2.80%, and the Balanced Fund’s expense ratio of 1.34%, multiplied by the average account value over the period, multiplied by the number of days in the most recent half-year/365 days (to reflect one-half year period). |
HENNESSY FUNDS 1-800-966-4354
How to Obtain a Copy of the Funds’ Proxy Voting Policy and Proxy Voting Records
A description of the policies and procedures that the Funds use to determine how to vote proxies relating to portfolio securities is available without charge: (1) by calling 1-800-966-4354; (2) on the Hennessy Funds website at www.hennessyfunds.com; or (3) on the U.S. Securities and Exchange Commission’s website at www.sec.gov. Hennessy Funds’ proxy voting record is available on the SEC’s website at www.sec.gov no later than August 31 for the prior 12 months ending June 30.
Quarterly Filings on Form N-Q
The Funds file their complete schedule of portfolio holdings with the SEC for the first and third quarters of each fiscal year on Form N-Q. The Funds’ Form N-Q will be available on the SEC’s website at www.sec.gov. The Funds’ Form N-Q may be reviewed and copied at the SEC’s Public Reference Room in Washington, DC and information on the operation of the Public Reference Room may be obtained by calling 1-800-SEC-0330. Information included in the Funds’ N-Q will also be available upon request by calling 1-800-966-4354.
(This Page Intentionally Left Blank.)
HENNESSY FUNDS 1-800-966-4354
For information, questions
or assistance, please call
The Hennessy Funds
1-800-966-4354 or 1-415-899-1555
INVESTMENT ADVISOR | DIRECTORS |
| Hennessy Advisors, Inc. | Neil J. Hennessy |
| 7250 Redwood Blvd., Suite 200 | Robert T. Doyle |
| Novato, California 94945 | J. Dennis DeSousa |
| | Gerald P. Richardson |
| | |
ADMINISTRATOR, TRANSFER | |
Agent, Dividend Paying | Counsel |
Agent & Shareholder | Foley & Lardner LLP |
SERVICING AGENT | 777 East Wisconsin Avenue |
| U.S. Bancorp Fund Services, LLC | Milwaukee, Wisconsin 53202-5306 |
| P.O. Box 701 | |
| Milwaukee, Wisconsin 53201-0701 | INDEPENDENT REGISTERED |
| | PUBLIC ACCOUNTING FIRM |
CUSTODIAN | KPMG LLP |
| U.S. Bank, N.A. | 303 East Wacker Drive |
| Custody Operations | Chicago, Illinois 60601 |
| 1555 North RiverCenter Dr., Suite 302 | |
| Milwaukee, Wisconsin 53212 | DISTRIBUTOR |
| | Quasar Distributors, LLC |
| | 615 East Michigan Street |
| | Milwaukee, Wisconsin 53202 |
| | |

WWW.HENNESSYFUNDS.COM
This report has been prepared for shareholders and may be distributed to others only if preceded or accompanied by a current prospectus.
Item 2. Code of Ethics.
The registrant has adopted a code of ethics that applies to the registrant’s principal executive officer and principal financial officer. The registrant has not made any amendments to its code of ethics during the period covered by this report. The registrant has not granted any waivers from any provisions of the code of ethics during the period covered by this report.
A copy of the registrant’s Code of Ethics is filed herewith.
Item 3. Audit Committee Financial Expert.
The registrant’s board of directors has determined that it does not have an audit committee financial expert serving on its audit committee. At this time, the registrant believes that the experience provided by each member of the audit committee together offers the registrant adequate oversight for the registrant’s level of financial complexity.
Item 4. Principal Accountant Fees and Services.
The registrant has engaged its principal accountant to perform audit services, audit-related services, tax services and other services during the past two fiscal years. “Audit services” refer to performing an audit of the registrant's annual financial statements or services that are normally provided by the accountant in connection with statutory and regulatory filings or engagements for those fiscal years. “Audit-related services” refer to the assurance and related services by the principal accountant that are reasonably related to the performance of the audit. “Tax services” refer to professional services rendered by the principal accountant for tax compliance, tax advice, and tax planning. The following table details the aggregate fees billed or expected to be billed for each of the last two fiscal years for audit fees, audit-related fees, tax fees and other fees by the principal accountant.
| | | |
| | FYE 10/31/06 | FYE 06/30/06 |
| Audit Fees | $16,000 | $16,000 |
| Audit-Related Fees | | �� |
| Tax Fees | 3,600 | 3,600 |
| All Other Fees | | |
The audit committee has adopted pre-approval policies and procedures that require the audit committee to pre-approve all audit and non-audit services of the registrant, including services provided to any entity affiliated with the registrant. All of the principal accountant’s hours spent on auditing the registrant’s financial statements were attributed to work performed by full-time permanent employees of the principal accountant. (If more than 50 percent of the accountant’s hours were spent to audit the registrant's financial statements for the most recent fiscal year, state how many hours were attributed to work performed by persons other than the principal accountant's full-time, permanent employees.)
The following table indicates the non-audit fees billed or expected to be billed by the registrant’s accountant for services to the registrant and to the registrant’s investment adviser (and any other controlling entity, etc.—not sub-adviser) for the last two years. The audit committee of the board of trustees/directors has considered whether the provision of non-audit services that were rendered to the registrant's investment adviser is compatible with maintaining the principal accountant's independence and has concluded that the provision of such non-audit services by the accountant has not compromised the accountant’s independence.
| | | |
| Non-Audit Related Fees | FYE 10/31/06 | FYE 6/30/2006 |
| Registrant | $ - | $ - |
| Registrant’s Investment Adviser | - | - |
Item 5. Audit Committee of Listed Registrants.
Not applicable to registrants who are not listed issuers (as defined in Rule 10A-3 under the Securities Exchange Act of 1934).
Item 6. Schedule of Investments.
Schedule of Investments is included as part of the report to shareholders filed under Item 1 of this Form.
Item 7. Disclosure of Proxy Voting Policies and Procedures for Closed-End Management Investment Companies.
Not applicable to open-end investment companies.
Item 8. Portfolio Managers of Closed-End Management Investment Companies.
Not applicable to open-end investment companies.
Item 9. Purchases of Equity Securities by Closed-End Management Investment Company and Affiliated Purchasers.
Not applicable to open-end investment companies.
Item 10. Submission of Matters to a Vote of Security Holders.
Not Applicable.
Item 11. Controls and Procedures.
| (a) | The Registrant’s President/Chief Executive Officer and Treasurer/Chief Financial Officer have reviewed the Registrant's disclosure controls and procedures (as defined in Rule 30a-3(c) under the Investment Company Act of 1940 (the “Act”)) as of a date within 90 days of the filing of this report, as required by Rule 30a-3(b) under the Act and Rules 13a-15(b) or 15d-15(b) under the Securities Exchange Act of 1934. Based on their review, such officers have concluded that the disclosure controls and procedures are effective in ensuring that information required to be disclosed in this report is appropriately recorded, processed, summarized and reported and made known to them by others within the Registrant and by the Registrant’s service provider. |
| (b) | There were no changes in the Registrant's internal control over financial reporting (as defined in Rule 30a-3(d) under the Act) that occurred during the second fiscal quarter of the period covered by this report that has materially affected, or is reasonably likely to materially affect, the Registrant's internal control over financial reporting. |
Item 12. Exhibits.
| (a) | (1) Any code of ethics or amendment thereto, that is subject of the disclosure required by Item 2, to the extent that the registrant intends to satisfy Item 2 requirements through filing an exhibit. Filed herewith |
| (2) | Certifications pursuant to Section 302 of the Sarbanes-Oxley Act of 2002. Filed herewith. |
| (3) | Any written solicitation to purchase securities under Rule 23c-1 under the Act sent or given during the period covered by the report by or on behalf of the registrant to 10 or more persons. Not applicable to open-end investment companies. |
| (b) | Certification pursuant to Section 906 of the Sarbanes-Oxley Act of 2002. Furnished herewith. |
SIGNATURES
Pursuant to the requirements of the Securities Exchange Act of 1934 and the Investment Company Act of 1940, the registrant has duly caused this report to be signed on its behalf by the undersigned, thereunto duly authorized.
(Registrant) Hennessy Funds Trust
By (Signature and Title)* /s/ Neil J. Hennessy
Neil J. Hennessy, President
Date 1/4/07
Pursuant to the requirements of the Securities Exchange Act of 1934 and the Investment Company Act of 1940, this report has been signed below by the following persons on behalf of the registrant and in the capacities and on the dates indicated.
By (Signature and Title)* /s/ Neil J. Hennessy
Neil J. Hennessy, President
Date 1/4/07
By (Signature and Title)* /s/ Teresa M. Nilsen
Teresa M. Nilsen, Treasurer
Date 1/4/07