UNITED STATES
SECURITIES AND EXCHANGE COMMISSION
Washington, D.C. 20549
FORM N-CSR
CERTIFIED SHAREHOLDER REPORT OF REGISTERED
MANAGEMENT INVESTMENT COMPANIES
Investment Company Act file number (811-07168)
Hennessy Funds Trust
(Exact name of registrant as specified in charter)
7250 Redwood Blvd., Suite 200
Novato, CA 94945
(Address of principal executive offices) (Zip code)
Neil J. Hennessy
Hennessy Advisors, Inc.
7250 Redwood Blvd., Suite 200
Novato, CA 94945
(Name and address of agent for service)
800-966-4354
Registrant's telephone number, including area code
Date of fiscal year end: October 31, 2007
Date of reporting period: April 30, 2007
Item 1. Report to Stockholders.HENNESSY FUNDS
SEMI-ANNUAL REPORT
APRIL 30, 2007
Hennessy Cornerstone Growth Fund (HFCGX)
Hennessy Cornerstone Growth Fund, Series II (HENLX)
Hennessy Focus 30 Fund (HFTFX)
Hennessy Cornerstone Value Fund (HFCVX)
Hennessy Total Return Fund (HDOGX)
Hennessy Balanced Fund (HBFBX)
Contents
| Letter to shareholders | 1 |
| Summaries of investments | |
| Hennessy Cornerstone Growth Fund | 7 |
| Hennessy Cornerstone Growth Fund, Series II | 11 |
| Hennessy Focus 30 Fund | 15 |
| Hennessy Cornerstone Value Fund | 18 |
| Hennessy Total Return Fund | 22 |
| Hennessy Balanced Fund | 25 |
| Financial statements | |
| Statements of assets and liabilities | 28 |
| Statements of operations | 30 |
| Statements of changes in net assets | 32 |
| Financial highlights | |
| Hennessy Cornerstone Growth Fund | 36 |
| Hennessy Cornerstone Growth Fund, Series II | 38 |
| Hennessy Focus 30 Fund | 40 |
| Hennessy Cornerstone Value Fund | 42 |
| Hennessy Total Return Fund | 44 |
| Hennessy Balanced Fund | 46 |
| Statement of cash flows – Hennessy Total Return Fund | 48 |
| Notes to the financial statements | 49 |
| Expense example | 58 |
| Proxy voting policy | 60 |
| Board approval of continuation | |
| of investment advisory agreement | 61 |
LETTER TO SHAREHOLDERS
June, 2007
Dear Hennessy Funds Shareholder:
As we move through 2007, we continue to see significant volatility and lack of investor confidence keeping the markets from reaching the gains that the major economic indicators would suggest. Despite relatively strong gains already year-to-date, investors seem to be waiting for bad news that would cause the market to experience a significant decline or correction before investing. In the first quarter we have already dealt with two potentially devastating issues, the volatile Chinese market and sub-prime mortgages, and thus far we’ve emerged relatively unscathed. In short, the devastation that was predicted by many experts from these events never really materialized.
Despite these two events and the corresponding negative market performance, the major indices, as well as each of our six funds, closed the six-month period ending April 30, 2007 with positive overall performance. We maintain our opinion that the major economic indicators continue to be favorable and that the market remains well positioned for moderate growth as we move through 2007. Every bull market experiences corrections along the way, and the current market is no different, in our opinion. We encourage investors to remain focused on their long-term investing objectives, and not allow short-term market corrections to distract them.
For six-months ending April 30, 2007, we saw the strongest overall performance among mid-cap stocks, followed by large and then small-cap names. The Dow Jones Industrial Average (+9.41%) continued to outpace the S&P 500 (+8.60%) during the period. The Industrials and Materials sectors posted generally positive returns for the six-month period. Consumer Discretionary, Retail and Financials stocks were more of a mixed bag with some stellar performers and some laggards. Again during this period, in our opinion it was more of a “stock-picker’s” market, where individual stocks drove performance more so than did asset classes or specific sectors.
For the six-month period ending April 30, 2007, the Hennessy Cornerstone Growth Fund returned 8.18%, outperforming the Russell 2000 index (+6.86%), but lagging the S&P 500 slightly (+8.60%). Industrials stocks made up over a third of the portfolio as of April 30,
HENNESSY FUNDS 1-800-966-4354
Returns at a Glance (as of April 30, 2007)
| | | Six months | | | One Year | | | Five Year | | | Ten Year | | | Since | |
| | | ending | | | Annualized | | | Annualized | | | Annualized | | | Inception | |
| | | 4/30/07 | | | Return | | | Return | | | Return | | | (11/1/96) | |
Hennessy Cornerstone | | | | | | | | | | | | | | | |
Growth Fund (HFCGX) | | | 8.18 | % | | | -2.98 | % | | | 12.83 | % | | | 17.02 | % | | | 15.89 | % |
| Russell 2000 Index | | | 6.86 | % | | | 7.83 | % | | | 11.14 | % | | | 10.40 | % | | | 10.08 | % |
| S&P 500 Index | | | 8.60 | % | | | 15.24 | % | | | 8.54 | % | | | 8.05 | % | | | 9.09 | % |
| | | Six months | | | One Year | | | Five Year | | | Since | |
| | | ending | | | Annualized | | | Annualized | | | Inception | |
| | | 4/30/07 | | | Return | | | Return | | | (7/1/05) | |
Hennessy Cornerstone | | | | | | | | | | | | |
Growth Fund, Series II (HENLX) | | | 6.12 | % | | | -6.95 | % | | | n/a | | | | 9.51 | % |
| Russell 2000 Index | | | 6.86 | % | | | 7.83 | % | | | n/a | | | | 15.11 | % |
| S&P 500 Index | | | 8.60 | % | | | 15.24 | % | | | n/a | | | | 14.62 | % |
| | | Six months | | | One Year | | | Five Year | | | Since | |
| | | ending | | | Annualized | | | Annualized | | | Inception | |
| | | 4/30/07 | | | Return | | | Return | | | (9/17/03) | |
Hennessy Focus 30 Fund (HFTFX) | | | 15.69 | % | | | 5.94 | % | | | n/a | | | | 21.63 | % |
| S&P 400 Mid-cap Index | | | 11.98 | % | | | 10.19 | % | | | n/a | | | | 16.46 | % |
| S&P 500 Index | | | 8.60 | % | | | 15.24 | % | | | n/a | | | | 12.72 | % |
Performance data quoted represents past performance; past performance does not guarantee future results. The investment return and principal value of an investment will fluctuate so that an investor’s shares, when redeemed, may be worth more or less than their original cost. Current performance of the fund may be lower or higher than the performance quoted. Performance data current to the most recent month end may be obtained by visiting www.hennessyfunds.com. Performance shown does not reflect a 1.5% redemption fee on shares held for less than 90 days. If it did, total returns would be reduced.
The total annual operating expenses of the Funds are as follow: Cornerstone Growth Fund = 1.21%; Cornerstone Growth Fund, Series II = 1.25%; Focus 30 Fund = 1.21% . Performance shown is net of fees and expenses.
2007. Stand outs in this category in the Cornerstone Growth portfolio included M&F Worldwide, LAN Airlines and Volvo, while US Airways and Volt Information Sciences both had poor, negative performance for
LETTER TO SHAREHOLDERS
| | | Six months | | | One Year | | | Five Year | | | Ten Year | | | Since | |
| | | ending | | | Annualized | | | Annualized | | | Annualized | | | Inception | |
| | | 4/30/07 | | | Return | | | Return | | | Return | | | (11/1/96) | |
Hennessy Cornerstone | | | | | | | | | | | | | | | |
Value Fund (HFCVX) | | | 7.90 | % | | | 17.77 | % | | | 9.23 | % | | | 9.12 | % | | | 8.52 | % |
| Russell 1000 Index | | | 9.10 | % | | | 15.16 | % | | | 9.09 | % | | | 8.48 | % | | | 9.32 | % |
| S&P 500 Index | | | 8.60 | % | | | 15.24 | % | | | 8.54 | % | | | 8.05 | % | | | 9.09 | % |
| | | Six months | | | One Year | | | Five Year | | | Since | |
| | | ending | | | Annualized | | | Annualized | | | Inception | |
| | | 4/30/07 | | | Return | | | Return | | | (7/29/98) | |
Hennessy Total Return Fund (HDOGX) | | | 6.29 | % | | | 19.67 | % | | | 7.12 | % | | | 5.39 | % |
| Dow Jones Industrial Average | | | 9.41 | % | | | 17.58 | % | | | 8.02 | % | | | 6.56 | % |
| S&P 500 Index | | | 8.60 | % | | | 15.24 | % | | | 8.54 | % | | | 4.84 | % |
| | | Six months | | | One Year | | | Five Year | | | Ten Year | | | Since | |
| | | ending | | | Annualized | | | Annualized | | | Annualized | | | Inception | |
| | | 4/30/07 | | | Return | | | Return | | | Return | | | (3/8/96) | |
Hennessy Balanced | | | | | | | | | | | | | | | |
Fund (HBFBX) | | | 5.13 | % | | | 14.49 | % | | | 4.24 | % | | | 4.70 | % | | | 5.47 | % |
| Dow Jones Industrial Average | | | 9.41 | % | | | 17.58 | % | | | 8.02 | % | | | 8.53 | % | | | 10.26 | % |
| S&P 500 Index | | | 8.60 | % | | | 15.24 | % | | | 8.54 | % | | | 8.05 | % | | | 9.71 | % |
Performance data quoted represents past performance; past performance does not guarantee future results. The investment return and principal value of an investment will fluctuate so that an investor’s shares, when redeemed, may be worth more or less than their original cost. Current performance of the fund may be lower or higher than the performance quoted. Performance data current to the most recent month end may be obtained by visiting www.hennessyfunds.com. Performance shown does not reflect a 1.5% redemption fee on shares held for less than 90 days. If it did, total returns would be reduced.
The total annual operating expenses of the Funds are as follow: Cornerstone Value = 1.15%; Total Return Fund = 2.80% gross/1.16% net of interest expense; Balanced Fund = 1.34%. Performance shown is net of fees and expenses.
the period. Materials stocks in the Cornerstone Growth portfolio AK Steel, CF Industries, Rock-Tenn Co. and Chaparral Steel each turned in stellar performance for the six month period with returns ranging from 74% to 108% for the period. Within the Consumer Discretionary sector, strong returns from Big Lots, Blockbuster and Lear boosted the performance of the Cornerstone Growth portfolio.
HENNESSY FUNDS 1-800-966-4354
The Hennessy Cornerstone Growth Fund, Series II returned 6.12% for the six-month period ending April 30, 2007, underperforming the Russell 2000 index slightly (+6.86%) as well as the S&P 500 (+8.60%) for the period. Industrial stocks comprised approximately one third of the portfolio as of April 30, 2007. Within that category, Belden CDT, Cummins Inc. and Cenveo were the strongest performers for the six-month period. Conversely, Industrials stocks PAM Transportation Services, Universal Truckload Services and Celadon Group each posted double digit losses for the six-month period ending April 30, 2007. Energy, at almost 20%, made up the second largest sector within the Cornerstone Growth II portfolio as of April 30, 2007. Matrix Services, Holly Corp., Frontier Oil and Marathon Oil each made significant positive contributions to the fund’s performance. Retail stocks within the Cornerstone Growth II portfolio were mixed with winners DSW Inc. and Dillard’s (returning 19% and 16% for the period, respectively) and losers Gymboree and Casual male (returning -15% and -19%, respectively).
For the six-months ending April 30, 2007 the Hennessy Focus 30 Fund outperformed its benchmark indices, returning 15.69% for the six-month period versus the S&P 400 Mid-cap Index at 11.98% the S&P 500 at 8.60%. As of April 30, 2007 the portfolio was heavily weighted in Consumer Discretionary stocks, which include the retail sector. Two of the biggest gainers in this sector during the period were Big Lots and Dollar Tree Stores, however retailer Children’s Place was the worst performer in the portfolio for the six-month period. Industrials made up 21% of the portfolio as of April 30, 2007 and each of these stocks in the Focus 30 portfolio had positive six-month returns, led by Belden CDT (+57%) and Cummins Inc. (+48%). Internet travel site Priceline.com also was a star performer for the six-month period, returning 37%. Additionally, all three Healthcare stocks in the portfolio, WellCare Health Plans, PSS World Medical and West Pharmaceutical Services, each posted strong six-month returns.
The Hennessy Cornerstone Value Fund returned 7.90% during the six-month period ending April 30, 2007, underperforming the Russell 1000 index (+9.10%) and the S&P 500 (+8.60%) for the period. Financials stocks, which made up 29% of the Cornerstone Value Portfolio as of April 30, 2007, were a mixed bag with eight of the 15 stocks with negative performance for the six-month period. However the Financial Stocks that did outperform, outperformed by a good margin. Fidelity National Financial, JP Morgan, Barclays, Citigroup and PNC each posted very healthy six-month returns. Materials, which comprised 18% of the portfolio, was a winning category, with all eight stocks in the Cornerstone Value portfolio showing positive six-month
LETTER TO SHAREHOLDERS
returns. The category was led by Southern Copper, Weyerhauser, Lyondell Chemical and MeadWestvaco. Energy stocks were the third largest sector, making up 13% of the portfolio as of April 30, 2007. Each of the seven energy stocks in the portfolio posted positive six-month returns. In addition to the underperforming Financials stocks in the portfolio, negative performance from GM and Kraft Foods hindered the overall performance of the Cornerstone Value Fund.
The Hennessy Total Return Fund returned 6.29% and the Hennessy Balanced Fund returned 5.13% for the six-month period ending April 30, 2007, both of which underperformed the Dow Jones Industrial Average (+9.41%) and the S&P 500 (+8.60%) for the six-month period ending April 30, 2007. Following very strong performance of the 10 “Dogs of the Dow” stocks last year, in the six-month period ending April 30, the “Dogs” lagged the overall Dow Jones Industrial Average, despite double-digit gains posted by AT&T, Altria, Merck and JP Morgan. GM’s slide of -10% for the six-month period negatively affected both the Total Return and Balanced portfolios. Relatively low returns of approximately 5% from short-term U.S. Treasury bills, which make up approximately 50% of the portfolio of the Balanced Fund and 25% of the Total Return Fund, also played a part in these Funds underperforming their benchmark indices.
At Hennessy Funds, we will maintain our focus on the long-term returns of our Funds for our shareholders. Thank you for your continued confidence and investment in the Funds. Should you have any questions or want to speak with us directly, please don’t hesitate to call us at (800) 966-4354.
Best regards,
Neil Hennessy
President & Portfolio Manager
Past performance does not guarantee future results.
Small and medium-capitalization companies tend to have limited liquidity and greater price volatility than large-capitalization companies. Investments in foreign securities involve greater volatility and political, economic and currency risk and differences in accounting methods.
The Hennessy Total Return and Balanced Funds are non-diversified, meaning they may concentrate their assets in fewer individual holdings than a diversified fund, making it more exposed to individual stock volatility than a diversified fund.
HENNESSY FUNDS 1-800-966-4354
References to specific securities should not be considered a recommendation to buy or sell any security. Fund holdings are subject to change. Please refer to the Schedule of Investments within this semi-annual report for additional portfolio information, including percentages of holdings.
The S&P 500, Russell 2000, Russell 1000, S&P 400 Midcap and Dow Jones Industrial Average are unmanaged indices commonly used to measure the performance of U.S. stocks. The Dow Jones Industrial Average is an unmanaged index of common stocks comprised of major industrial companies and assumes reinvestment of dividends. The Russell 2000 Index is a recognized small-cap index of 2000 smallest securities of the Russell 3000 Index, which is comprised of the 3,000 largest U.S. securities as determined by total market capitalization. The Russell 1000 is an unmanaged index that measures the performance of large-cap U.S. stocks. The S&P 400 Mid-cap index is an unmanaged Index that measures the performance of mid-cap U.S. stocks. One cannot invest directly in an index.
Opinions expressed are those of Neil Hennessy and are subject to change, are not guaranteed and should not be considered investment advice. 6/07
SUMMARY OF INVESTMENTS — CORNERSTONE GROWTH FUND
Summaries of Investments
The following summaries of investment portfolios are designed to help investors better understand each fund’s principal holdings. Each summary is as of April 30, 2007 (Unaudited)
HENNESSY CORNERSTONE GROWTH FUND
(% of Net Assets)
TOP TEN HOLDINGS | % of net assets |
| M&F Worldwide Corp. | 3.76% |
| AK Steel Holding Corp. | 2.76% |
| Chaparral Steel Co. | 2.60% |
| CF Industries Holdings, Inc. | 2.49% |
| Volvo AB | 2.47% |
| Quanta Services, Inc. | 2.37% |
| General Cable Corp. | 2.36% |
| Belden CDT, Inc. | 2.32% |
| The Geo Group, Inc. | 2.30% |
| Markwest Hydrocarbon, Inc. | 2.29% |
HENNESSY FUNDS 1-800-966-4354
SUMMARY OF INVESTMENTS — CORNERSTONE GROWTH FUND
| COMMON STOCKS – 99.35% | | Number | | | | | | % of Net | |
| | | of Shares | | | Value | | | Assets | |
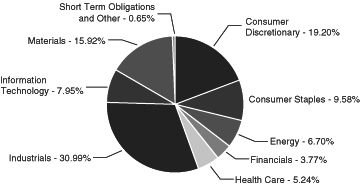
Consumer Discretionary – 19.20% | | | | | | | | | |
| Big Lots, Inc. (a) | | | 800,100 | | | $ | 25,763,220 | | | | 2.26 | % |
| Blockbuster, Inc. (a) | | | 3,262,500 | | | | 20,227,500 | | | | 1.77 | % |
| Brown Shoe Co., Inc. | | | 613,500 | | | | 16,552,230 | | | | 1.45 | % |
| CarMax, Inc. (a) | | | 720,000 | | | | 17,942,400 | | | | 1.57 | % |
| Charlotte Russe Holding, Inc. (a) | | | 712,900 | | | | 19,483,557 | | | | 1.71 | % |
| Jack in the Box, Inc. (a) | | | 337,400 | | | | 22,477,588 | | | | 1.97 | % |
| Lear Corp. (a) | | | 610,600 | | | | 22,421,232 | | | | 1.96 | % |
| Sauer-Danfoss, Inc. | | | 614,300 | | | | 18,318,426 | | | | 1.61 | % |
| The Sherwin-Williams Co. | | | 308,100 | | | | 19,647,537 | | | | 1.72 | % |
| Skechers U.S.A., Inc. (a) | | | 595,600 | | | | 18,701,840 | | | | 1.64 | % |
| Systemax, Inc. | | | 1,031,800 | | | | 17,571,554 | | | | 1.54 | % |
| | | | | | | | 219,107,084 | | | | 19.20 | % |
| | | | | | | | | | | | | |
Consumer Staples – 9.58% | | | | | | | | | | | | |
| Ingles Markets, Inc. | | | 601,700 | | | | 21,637,132 | | | | 1.89 | % |
| M&F Worldwide Corp. (a) | | | 670,600 | | | | 42,884,870 | | | | 3.76 | % |
| Rite Aid Corp. (a) | | | 3,471,900 | | | | 21,317,466 | | | | 1.87 | % |
| Spartan Stores, Inc. | | | 913,100 | | | | 23,521,456 | | | | 2.06 | % |
| | | | | | | | 109,360,924 | | | | 9.58 | % |
| | | | | | | | | | | | | |
Energy – 6.70% | | | | | | | | | | | | |
| Copano Energy LLC | | | 663,000 | | | | 25,896,780 | | | | 2.27 | % |
| Holly Corp. | | | 383,300 | | | | 24,377,880 | | | | 2.14 | % |
| Markwest Hydrocarbon, Inc. | | | 436,400 | | | | 26,114,176 | | | | 2.29 | % |
| | | | | | | | 76,388,836 | | | | 6.70 | % |
| | | | | | | | | | | | | |
Financials – 3.77% | | | | | | | | | | | | |
| The Goldman Sachs Group, Inc. | | | 96,300 | | | | 21,052,143 | | | | 1.84 | % |
| Odyssey Re Holdings Corp. | | | 524,900 | | | | 21,993,310 | | | | 1.93 | % |
| | | | | | | | 43,045,453 | | | | 3.77 | % |
| | | | | | | | | | | | | |
Health Care – 5.24% | | | | | | | | | | | | |
| Amerigroup Corp. (a) | | | 578,800 | | | | 16,281,644 | | | | 1.42 | % |
| Sun Healthcare Group, Inc. (a) | | | 1,718,500 | | | | 21,549,990 | | | | 1.89 | % |
| WellCare Health Plans, Inc. (a) | | | 273,000 | | | | 22,001,070 | | | | 1.93 | % |
| | | | | | | | 59,832,704 | | | | 5.24 | % |
The accompanying notes are an integral part of these financial statements.
SUMMARY OF INVESTMENTS — CORNERSTONE GROWTH FUND
| COMMON STOCKS | | Number | | | | | | % of Net | |
| | | of Shares | | | Value | | | Assets | |
Industrials – 30.99% | | | | | | | | | |
| British Airways PLC - ADR (a)(b) | | | 198,200 | | | $ | 20,053,876 | | | | 1.76 | % |
| Cenveo, Inc. (a) | | | 894,800 | | | | 22,951,620 | | | | 2.01 | % |
| Clean Harbors, Inc. (a) | | | 400,600 | | | | 18,635,912 | | | | 1.63 | % |
| Comsys IT Partners, Inc. (a) | | | 975,000 | | | | 22,191,000 | | | | 1.94 | % |
| Continental Airlines, Inc. (a) | | | 503,900 | | | | 18,422,584 | | | | 1.61 | % |
| FTD Group, Inc. | | | 1,180,600 | | | | 21,073,710 | | | | 1.85 | % |
| General Cable Corp. (a) | | | 468,300 | | | | 26,899,152 | | | | 2.36 | % |
| The Geo Group, Inc. (a) | | | 512,600 | | | | 26,245,120 | | | | 2.30 | % |
| Horizon Lines, Inc. Class A | | | 709,500 | | | | 24,130,095 | | | | 2.11 | % |
| LAN Airlines SA - ADR (b) | | | 343,400 | | | | 25,119,710 | | | | 2.20 | % |
| Manitowoc Co. | | | 352,100 | | | | 24,023,783 | | | | 2.10 | % |
| Quanta Services, Inc. (a) | | | 983,000 | | | | 27,022,670 | | | | 2.37 | % |
| Robbins & Myers, Inc. | | | 495,700 | | | | 19,049,751 | | | | 1.67 | % |
| U S Airways Group, Inc. (a) | | | 394,300 | | | | 14,565,442 | | | | 1.29 | % |
| Volt Information Sciences, Inc. (a) | | | 589,300 | | | | 15,062,508 | | | | 1.32 | % |
| Volvo AB - ADR (b) | | | 290,000 | | | | 28,208,300 | | | | 2.47 | % |
| | | | | | | | 353,655,233 | | | | 30.99 | % |
| | | | | | | | | | | | | |
Information Technology – 7.95% | | | | | | | | | | | | |
| Belden CDT, Inc. | | | 473,600 | | | | 26,464,768 | | | | 2.32 | % |
| Convergys Corp. (a) | | | 807,000 | | | | 20,384,820 | | | | 1.79 | % |
| Infineon Technologies AG - ADR (a)(b) | | | 1,428,300 | | | | 22,181,499 | | | | 1.94 | % |
| Loral Space & Communications Ltd. (a) | | | 452,300 | | | | 21,696,831 | | | | 1.90 | % |
| | | | | | | | 90,727,918 | | | | 7.95 | % |
| | | | | | | | | | | | | |
Materials – 15.92% | | | | | | | | | | | | |
| AK Steel Holding Corp. (a) | | | 1,031,800 | | | | 31,490,536 | | | | 2.76 | % |
| CF Industries Holdings, Inc. | | | 716,200 | | | | 28,425,978 | | | | 2.49 | % |
| Chaparral Steel Co. | | | 421,700 | | | | 29,729,850 | | | | 2.60 | % |
| Greif, Inc. | | | 375,000 | | | | 20,850,000 | | | | 1.83 | % |
| Innospec, Inc. | | | 424,100 | | | | 22,769,929 | | | | 2.00 | % |
| Rock-Tenn Co. | | | 624,500 | | | | 23,893,370 | | | | 2.09 | % |
| Steel Dynamics, Inc. | | | 554,300 | | | | 24,561,033 | | | | 2.15 | % |
| | | | | | | | 181,720,696 | | | | 15.92 | % |
| | | | | | | | | | | | | |
Total Common Stocks (Cost $1,049,893,312) | | | | | | | 1,133,838,848 | | | | 99.35 | % |
The accompanying notes are an integral part of these financial statements.
HENNESSY FUNDS 1-800-966-4354
SUMMARY OF INVESTMENTS — CORNERSTONE GROWTH FUND
| SHORT-TERM INVESTMENTS – 0.81% | | Principal | | | | | | % of Net | |
| | | Amount | | | Value | | | Assets | |
Discount Notes – 0.81% | | | | | | | | | |
| Federal Home Loan Bank Discount Note, | | | | | | | | | |
| 4.9800%, due 05/01/2007 | | $ | 9,226,000 | | | $ | 9,226,000 | | | | 0.81 | % |
| | | | | | | | | | | | | |
Total Discount Notes (Cost $9,226,000) | | | | | | | 9,226,000 | | | | 0.81 | % |
| | | | | | | | | | | | | |
Variable Rate Demand Notes# – 0.00% | | | | | | | | | | | | |
| American Family Financial Services, Inc. | | | | | | | | | | | | |
| 4.9427% | | | 31,928 | | | | 31,928 | | | | 0.00 | % |
| | | | | | | | | | | | | |
Total Variable Rate Demand Notes | | | | | | | | | | | | |
| (Cost $31,928) | | | | | | | 31,928 | | | | 0.00 | % |
| | | | | | | | | | | | | |
Total Short-Term Investments | | | | | | | | | | | | |
| (Cost $9,257,928) | | | | | | | 9,257,928 | | | | 0.81 | % |
| | | | | | | | | | | | | |
Total Investments – 100.16% | | | | | | | | | | | | |
| (Cost $1,059,151,240) | | | | | | | 1,143,096,776 | | | | 100.16 | % |
| | | | | | | | | | | | | |
| Liabilities in Excess of Other Assets – (0.16)% | | | | | | | (1,812,402 | ) | | | (0.16 | )% |
TOTAL NET ASSETS – 100.00% | | | | | | $ | 1,141,284,374 | | | | 100.00 | % |
Percentages are stated as a percent of net assets.
ADR American Depository Receipt
| (b) | Foreign issued security |
| # | Variable rate demand notes are considered short-term obligations and are payable on demand. Interest rates change periodically on specified dates. The rates listed are as of April 30, 2007. |
The accompanying notes are an integral part of these financial statements.
SUMMARY OF INVESTMENTS — CORNERSTONE GROWTH FUND, SERIES II
HENNESSY CORNERSTONE
GROWTH FUND, SERIES II
(% of Net Assets)
TOP TEN HOLDINGS | % of net assets |
| Matrix Service Co. | 3.70% |
| Chaparral Steel Co. | 3.69% |
| Wimm-Bill-Dann Foods - ADR (b) | 3.59% |
| Belden CDT, Inc. | 3.23% |
| Cummins, Inc. | 2.79% |
| Cenveo, Inc. | 2.48% |
| Holly Corp. | 2.24% |
| Mentor Graphics Corp. | 2.22% |
| Clean Harbors, Inc. | 2.19% |
| Continental Airlines, Inc. | 2.18% |
HENNESSY FUNDS 1-800-966-4354
SUMMARY OF INVESTMENTS — CORNERSTONE GROWTH FUND, SERIES II
| COMMON STOCKS – 97.58% | | Number | | | | | | % of Net | |
| | | of Shares | | | Value | | | Assets | |
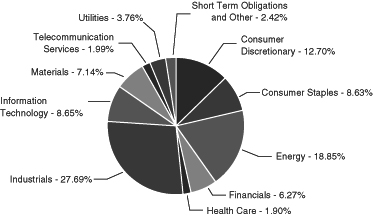
Consumer Discretionary – 12.70% | | | | | | | | | |
| Ann Taylor Stores Corp. (a) | | | 82,900 | | | $ | 3,189,992 | | | | 1.66 | % |
| Casual Male Retail Group, Inc. (a) | | | 322,400 | | | | 3,710,824 | | | | 1.92 | % |
| Dillard's, Inc. | | | 114,300 | | | | 3,958,209 | | | | 2.05 | % |
| DSW, Inc. (a) | | | 101,700 | | | | 3,941,892 | | | | 2.04 | % |
| Gentek, Inc. (a) | | | 118,900 | | | | 3,895,164 | | | | 2.02 | % |
| Gymboree Corp. (a) | | | 103,100 | | | | 3,936,358 | | | | 2.04 | % |
| Interstate Hotels & Resorts, Inc. (a) | | | 362,800 | | | | 1,875,676 | | | | 0.97 | % |
| | | | | | | | 24,508,115 | | | | 12.70 | % |
| | | | | | | | | | | | | |
Consumer Staples – 8.63% | | | | | | | | | | | | |
| Archer-Daniels-Midland Co. | | | 80,400 | | | | 3,111,480 | | | | 1.61 | % |
| National Beverage Corp. (a) | | | 207,400 | | | | 3,227,144 | | | | 1.67 | % |
| Wild Oats Markets, Inc. (a) | | | 188,000 | | | | 3,389,640 | | | | 1.76 | % |
| Wimm-Bill-Dann Foods - ADR (b) | | | 85,800 | | | | 6,915,480 | | | | 3.59 | % |
| | | | | | | | 16,643,744 | | | | 8.63 | % |
| | | | | | | | | | | | | |
Energy – 18.85% | | | | | | | | | | | | |
| Alon USA Energy, Inc. | | | 99,000 | | | | 3,702,600 | | | | 1.92 | % |
| Crosstex Energy, Inc. | | | 109,500 | | | | 3,290,475 | | | | 1.71 | % |
| FMC Technologies, Inc. (a) | | | 49,800 | | | | 3,529,824 | | | | 1.83 | % |
| Frontier Oil Corp. | | | 98,400 | | | | 3,476,472 | | | | 1.80 | % |
| Holly Corp. | | | 68,100 | | | | 4,331,160 | | | | 2.24 | % |
| Marathon Oil Corp. | | | 38,300 | | | | 3,889,365 | | | | 2.02 | % |
| Matrix Service Co. (a) | | | 292,400 | | | | 7,134,560 | | | | 3.70 | % |
| NATCO Group, Inc. (a) | | | 94,100 | | | | 3,594,620 | | | | 1.86 | % |
| World Fuel Services Corp. | | | 73,800 | | | | 3,410,298 | | | | 1.77 | % |
| | | | | | | | 36,359,374 | | | | 18.85 | % |
| | | | | | | | | | | | | |
Financials – 6.27% | | | | | | | | | | | | |
| EMC Insurance Group, Inc. | | | 107,700 | | | | 2,703,270 | | | | 1.40 | % |
| Harleysville Group, Inc. | | | 103,400 | | | | 3,157,836 | | | | 1.64 | % |
| Meadowbrook Insurance Group, Inc. (a) | | | 322,400 | | | | 3,581,864 | | | | 1.86 | % |
| Safety Insurance Group, Inc. | | | 66,100 | | | | 2,647,966 | | | | 1.37 | % |
| | | | | | | | 12,090,936 | | | | 6.27 | % |
| | | | | | | | | | | | | |
Health Care – 1.90% | | | | | | | | | | | | |
| AMN Healthcare Services, Inc. (a) | | | 150,100 | | | | 3,654,935 | | | | 1.90 | % |
The accompanying notes are an integral part of these financial statements.
SUMMARY OF INVESTMENTS — CORNERSTONE GROWTH FUND, SERIES II
| COMMON STOCKS | | Number | | | | | | % of Net | |
| | | of Shares | | | Value | | | Assets | |
Industrials – 27.69% | | | | | | | | | |
| Ampco-Pittsburgh Corp. | | | 114,800 | | | $ | 4,135,096 | | | | 2.14 | % |
| AMR Corp. (a) | | | 135,500 | | | | 3,535,195 | | | | 1.83 | % |
| Arkansas Best Corp. | | | 70,700 | | | | 2,785,580 | | | | 1.45 | % |
| Celadon Group, Inc. (a) | | | 177,000 | | | | 2,913,420 | | | | 1.51 | % |
| Cenveo, Inc. (a) | | | 186,600 | | | | 4,786,290 | | | | 2.48 | % |
| Clean Harbors, Inc. (a) | | | 90,900 | | | | 4,228,668 | | | | 2.19 | % |
| Continental Airlines, Inc. (a) | | | 115,200 | | | | 4,211,712 | | | | 2.18 | % |
| Cummins, Inc. | | | 58,300 | | | | 5,372,928 | | | | 2.79 | % |
| Lincoln Electric Holdings, Inc. | | | 56,700 | | | | 3,613,491 | | | | 1.87 | % |
| Old Dominion Freight Line (a) | | | 96,400 | | | | 2,849,584 | | | | 1.48 | % |
| PAM Transportation Services (a) | | | 109,400 | | | | 2,086,258 | | | | 1.08 | % |
| Ryder System, Inc. | | | 61,600 | | | | 3,242,624 | | | | 1.68 | % |
| Saia, Inc. (a) | | | 122,600 | | | | 3,437,704 | | | | 1.78 | % |
| Standard Parking Corp. (a) | | | 115,800 | | | | 3,905,934 | | | | 2.03 | % |
| Universal Truckload Services, Inc. (a) | | | 99,600 | | | | 2,321,676 | | | | 1.20 | % |
| | | | | | | | 53,426,160 | | | | 27.69 | % |
| | | | | | | | | | | | | |
Information Technology – 8.65% | | | | | | | | | | | | |
| Belden CDT, Inc. | | | 111,500 | | | | 6,230,620 | | | | 3.23 | % |
| Cray, Inc. (a) | | | 299,300 | | | | 3,726,285 | | | | 1.93 | % |
| Gerber Scientific, Inc. (a) | | | 244,700 | | | | 2,449,447 | | | | 1.27 | % |
| Mentor Graphics Corp. (a) | | | 264,100 | | | | 4,273,138 | | | | 2.22 | % |
| | | | | | | | 16,679,490 | | | | 8.65 | % |
| | | | | | | | | | | | | |
Materials – 7.14% | | | | | | | | | | | | |
| AEP Industries, Inc. (a) | | | 88,300 | | | | 3,758,048 | | | | 1.95 | % |
| Arch Chemicals, Inc. | | | 96,100 | | | | 2,904,142 | | | | 1.50 | % |
| Chaparral Steel Co. | | | 100,900 | | | | 7,113,450 | | | | 3.69 | % |
| | | | | | | | 13,775,640 | | | | 7.14 | % |
| | | | | | | | | | | | | |
Telecommunication Services – 1.99% | | | | | | | | | | | | |
| Qwest Communications International (a) | | | 433,300 | | | | 3,847,704 | | | | 1.99 | % |
| | | | | | | | | | | | | |
Utilities – 3.76% | | | | | | | | | | | | |
| The AES Corp. (a) | | | 169,400 | | | | 3,725,106 | | | | 1.93 | % |
| OGE Energy Corp. | | | 91,900 | | | | 3,532,636 | | | | 1.83 | % |
| | | | | | | | 7,257,742 | | | | 3.76 | % |
| | | | | | | | | | | | | |
Total Common Stocks (Cost $162,851,424) | | | | | | | 188,243,840 | | | | 97.58 | % |
The accompanying notes are an integral part of these financial statements.
HENNESSY FUNDS 1-800-966-4354
SUMMARY OF INVESTMENTS — CORNERSTONE GROWTH FUND, SERIES II
| SHORT-TERM INVESTMENTS – 2.74% | | Principal | | | | | | % of Net | |
| | | Amount | | | Value | | | Assets | |
Discount Notes – 2.74% | | | | | | | | | |
| Federal Home Loan Bank Discount Note, | | | | | | | | | |
| 4.9800%, due 05/01/2007 | | $ | 5,286,000 | | | $ | 5,286,000 | | | | 2.74 | % |
| | | | | | | | | | | | | |
Total Discount Notes (Cost $5,286,000) | | | | | | | 5,286,000 | | | | 2.74 | % |
| | | | | | | | | | | | | |
Variable Rate Demand Notes# – 0.00% | | | | | | | | | | | | |
| American Family Financial Services, Inc. | | | | | | | | | | | | |
| 4.9427% | | | 1,904 | | | | 1,904 | | | | 0.00 | % |
| | | | | | | | | | | | | |
Total Variable Rate Demand Notes | | | | | | | | | | | | |
| (Cost $1,904) | | | | | | | 1,904 | | | | 0.00 | % |
| | | | | | | | | | | | | |
Total Short-Term Investments | | | | | | | | | | | | |
| (Cost $5,287,904) | | | | | | | 5,287,904 | | | | 2.74 | % |
| | | | | | | | | | | | | |
Total Investments – 100.32% | | | | | | | | | | | | |
| (Cost $168,139,328) | | | | | | | 193,531,744 | | | | 100.32 | % |
| | | | | | | | | | | | | |
| Liabilities in Excess of Other Assets - (0.32)% | | | | | | | (609,284 | ) | | | (0.32 | )% |
TOTAL NET ASSETS – 100.00% | | | | | | $ | 192,922,460 | | | | 100.00 | % |
Percentages are stated as a percent of net assets.
ADR American Depository Receipt
| (b) | Foreign issued security |
| # | Variable rate demand notes are considered short-term obligations and are payable on demand. Interest rates change periodically on specified dates. The rates listed are as of April 30, 2007. |
The accompanying notes are an integral part of these financial statements.
SUMMARY OF INVESTMENTS — FOCUS 30 FUND
HENNESSY FOCUS 30 FUND
(% of Net Assets)
TOP TEN HOLDINGS | % of net assets |
| Big Lots, Inc. | 4.07% |
| Albemarle Corp. | 4.06% |
| Cummins, Inc. | 3.98% |
| Belden CDT, Inc. | 3.88% |
| Priceline.com, Inc. | 3.84% |
| CommScope, Inc. | 3.77% |
| WellCare Health Plans, Inc. | 3.59% |
| Energizer Holdings, Inc. | 3.57% |
| Phillips-Van Heusen | 3.48% |
| Anixter International, Inc. | 3.36% |
HENNESSY FUNDS 1-800-966-4354
SUMMARY OF INVESTMENTS — FOCUS 30 FUND
| COMMON STOCKS – 94.33% | | Number | | | | | | % of Net | |
| | | of Shares | | | Value | | | Assets | |
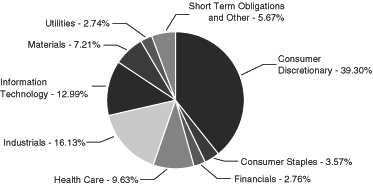
Consumer Discretionary – 39.30% | | | | | | | | | |
| Ann Taylor Stores Corp. (a) | | | 150,600 | | | $ | 5,795,088 | | | | 2.31 | % |
| Big Lots, Inc. (a) | | | 316,600 | | | | 10,194,520 | | | | 4.07 | % |
| CarMax, Inc. (a) | | | 311,100 | | | | 7,752,612 | | | | 3.09 | % |
| Children’s Place (a) | | | 98,800 | | | | 5,223,556 | | | | 2.08 | % |
| Dick’s Sporting Goods, Inc. (a) | | | 139,300 | | | | 7,813,337 | | | | 3.11 | % |
| Dillard’s Inc. | | | 196,700 | | | | 6,811,721 | | | | 2.72 | % |
| Dollar Tree Stores, Inc. (a) | | | 203,500 | | | | 8,001,620 | | | | 3.19 | % |
| Jack in the Box, Inc. (a) | | | 121,800 | | | | 8,114,316 | | | | 3.24 | % |
| Men’s Wearhouse, Inc. | | | 169,700 | | | | 7,342,919 | | | | 2.93 | % |
| Phillips-Van Heusen | | | 156,200 | | | | 8,731,580 | | | | 3.48 | % |
| Priceline.com, Inc. (a) | | | 173,200 | | | | 9,636,848 | | | | 3.84 | % |
| United Auto Group, Inc. | | | 273,000 | | | | 5,536,440 | | | | 2.21 | % |
| VF Corp. | | | 86,600 | | | | 7,604,346 | | | | 3.03 | % |
| | | | | | | | 98,558,903 | | | | 39.30 | % |
| | | | | | | | | | | | | |
Consumer Staples – 3.57% | | | | | | | | | | | | |
| Energizer Holdings, Inc. (a) | | | 92,100 | | | | 8,950,278 | | | | 3.57 | % |
| | | | | | | | | | | | | |
Financials – 2.76% | | | | | | | | | | | | |
| Assurant, Inc. | | | 120,300 | | | | 6,920,859 | | | | 2.76 | % |
| | | | | | | | | | | | | |
Health Care – 9.63% | | | | | | | | | | | | |
| PSS World Medical, Inc. (a) | | | 335,100 | | | | 6,735,510 | | | | 2.68 | % |
| WellCare Health Plans, Inc. (a) | | | 111,700 | | | | 9,001,903 | | | | 3.59 | % |
| West Pharmaceutical Services, Inc. | | | 169,100 | | | | 8,416,107 | | | | 3.36 | % |
| | | | | | | | 24,153,520 | | | | 9.63 | % |
| | | | | | | | | | | | | |
Industrials – 16.13% | | | | | | | | | | | | |
| Acuity Brands, Inc. | | | 140,800 | | | | 8,324,096 | | | | 3.32 | % |
| Cummins, Inc. | | | 108,300 | | | | 9,980,928 | | | | 3.98 | % |
| Emcor Group, Inc. (a) | | | 121,100 | | | | 7,591,759 | | | | 3.03 | % |
| Granite Construction, Inc. | | | 117,800 | | | | 7,096,272 | | | | 2.83 | % |
| Watson Wyatt & Co. Holdings | | | 158,100 | | | | 7,451,253 | | | | 2.97 | % |
| | | | | | | | 40,444,308 | | | | 16.13 | % |
| | | | | | | | | | | | | |
Information Technology – 12.99% | | | | | | | | | | | | |
| Anixter International, Inc. (a) | | | 117,700 | | | | 8,427,320 | | | | 3.36 | % |
| Belden CDT, Inc. | | | 173,900 | | | | 9,717,532 | | | | 3.88 | % |
The accompanying notes are an integral part of these financial statements.
SUMMARY OF INVESTMENTS — FOCUS 30 FUND
| COMMON STOCKS | | Number | | | | | | % of Net | |
| | | of Shares | | | Value | | | Assets | |
Information Technology (Continued) | | | | | | | | | |
| Benchmark Electronics, Inc. (a) | | | 235,000 | | | $ | 4,977,300 | | | | 1.98 | % |
| CommScope, Inc. (a) | | | 202,600 | | | | 9,451,290 | | | | 3.77 | % |
| | | | | | | | 32,573,442 | | | | 12.99 | % |
| | | | | | | | | | | | | |
Materials – 7.21% | | | | | | | | | | | | |
| Albemarle Corp. | | | 239,900 | | | | 10,183,755 | | | | 4.06 | % |
| Pactiv Corp. (a) | | | 228,500 | | | | 7,901,530 | | | | 3.15 | % |
| | | | | | | | 18,085,285 | | | | 7.21 | % |
| | | | | | | | | | | | | |
Utilities – 2.74% | | | | | | | | | | | | |
| OGE Energy Corp. | | | 178,300 | | | | 6,853,852 | | | | 2.74 | % |
| | | | | | | | | | | | | |
Total Common Stocks (Cost $198,355,975) | | | | | | | 236,540,447 | | | | 94.33 | % |
| | | | | | | | | | | | | |
| SHORT-TERM INVESTMENTS – 5.50% | | Principal | | | | | | | % of Net | |
| | | Amount | | | Value | | | Assets | |
Discount Notes – 5.48% | | | | | | | | | | | | |
| Federal Home Loan Bank Discount Note, | | | | | | | | | | | | |
| 4.9800%, due 05/01/2007 | | $ | 13,736,000 | | | | 13,736,000 | | | | 5.48 | % |
| | | | | | | | | | | | | |
Total Discount Notes (Cost $13,736,000) | | | | | | | 13,736,000 | | | | 5.48 | % |
| | | | | | | | | | | | | |
Variable Rate Demand Notes # – 0.02% | | | | | | | | | | | | |
| American Family Financial Services, Inc. | | | | | | | | | | | | |
| 4.9427% | | | 59,050 | | | | 59,050 | | | | 0.02 | % |
| | | | | | | | | | | | | |
Total Variable Rate Demand Notes | | | | | | | | | | | | |
| (Cost $59,050) | | | | | | | 59,050 | | | | 0.02 | % |
| | | | | | | | | | | | | |
Total Short-Term Investments | | | | | | | | | | | | |
| (Cost $13,795,050) | | | | | | | 13,795,050 | | | | 5.50 | % |
| | | | | | | | | | | | | |
Total Investments – 99.83% | | | | | | | | | | | | |
| (Cost $212,151,025) | | | | | | | 250,335,497 | | | | 99.83 | % |
| | | | | | | | | | | | | |
| Other Assets in Excess of Liabilities - 0.17% | | | | | | | 432,051 | | | | 0.17 | % |
TOTAL NET ASSETS – 100.00% | | | | | | $ | 250,767,548 | | | | 100.00 | % |
Percentages are stated as a percent of net assets.
| # | Variable rate demand notes are considered short-term obligations and are payable on demand. Interest rates change periodically on specified dates. The rates listed are as of April 30, 2007. |
The accompanying notes are an integral part of these financial statements.
HENNESSY FUNDS 1-800-966-4354
HENNESSY CORNERSTONE VALUE FUND
(% of Net Assets)
TOP TEN HOLDINGS | % of net assets |
| Southern Copper Corp. | 2.63% |
| DaimlerChrysler AG | 2.49% |
| Mattel, Inc. | 2.33% |
| Lyondell Chemical Co. | 2.25% |
| Kraft Foods, Inc. | 2.24% |
| Weyerhaeuser Co. | 2.14% |
| Bristol-Myers Squibb Co. | 2.08% |
| Merck & Co., Inc. | 2.07% |
| RR Donnelley & Sons Co. | 2.07% |
| Enterprise Products Partners LP | 2.06% |
SUMMARY OF INVESTMENTS — CORNERSTONE VALUE FUND
| COMMON STOCKS – 97.19% | | Number | | | | | | % of Net | |
| | | of Shares | | | Value | | | Assets | |
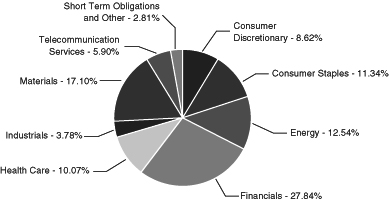
Consumer Discretionary – 8.62% | | | | | | | | | |
| DaimlerChrysler AG (b) | | | 68,800 | | | $ | 5,539,088 | | | | 2.49 | % |
| General Motors Corp. | | | 135,100 | | | | 4,219,173 | | | | 1.89 | % |
| Mattel, Inc. | | | 183,100 | | | | 5,181,730 | | | | 2.33 | % |
| Newell Rubbermaid, Inc. | | | 139,000 | | | | 4,263,130 | | | | 1.91 | % |
| | | | | | | | 19,203,121 | | | | 8.62 | % |
| | | | | | | | | | | | | |
Consumer Staples – 11.34% | | | | | | | | | | | | |
| Altria Group, Inc. | | | 48,500 | | | | 3,342,620 | | | | 1.49 | % |
| Diageo PLC - ADR (b) | | | 52,600 | | | | 4,439,440 | | | | 1.99 | % |
| HJ Heinz Co. | | | 90,300 | | | | 4,254,033 | | | | 1.91 | % |
| Kimberly-Clark Corp. | | | 60,000 | | | | 4,270,200 | | | | 1.92 | % |
| Kraft Foods, Inc. | | | 149,070 | | | | 4,989,373 | | | | 2.24 | % |
| Reynolds American, Inc. | | | 62,100 | | | | 3,990,546 | | | | 1.79 | % |
| | | | | | | | 25,286,212 | | | | 11.34 | % |
| | | | | | | | | | | | | |
Energy – 12.54% | | | | | | | | | | | | |
| BP PLC - ADR (b) | | | 59,300 | | | | 3,992,076 | | | | 1.79 | % |
| ENI SpA - ADR (b) | | | 61,500 | | | | 4,073,760 | | | | 1.83 | % |
| Enterprise Products Partners LP | | | 141,500 | | | | 4,591,675 | | | | 2.06 | % |
| PetroChina Co. Ltd. - ADR (b) | | | 31,300 | | | | 3,509,982 | | | | 1.57 | % |
| Royal Dutch Shell PLC - ADR (b) | | | 56,900 | | | | 3,946,015 | | | | 1.77 | % |
| Sasol Ltd. - ADR (b) | | | 110,900 | | | | 3,789,453 | | | | 1.70 | % |
| Statoil ASA - ADR (b) | | | 144,500 | | | | 4,056,115 | | | | 1.82 | % |
| | | | | | | | 27,959,076 | | | | 12.54 | % |
| | | | | | | | | | | | | |
Financials – 27.84% | | | | | | | | | | | | |
| Bank of America Corp. | | | 77,100 | | | | 3,924,390 | | | | 1.77 | % |
| Barclays PLC - ADR (b) | | | 75,400 | | | | 4,376,216 | | | | 1.96 | % |
| BB&T Corp. | | | 93,400 | | | | 3,887,308 | | | | 1.74 | % |
| Cincinnati Financial Corp. | | | 89,700 | | | | 4,058,028 | | | | 1.82 | % |
| Citigroup, Inc. | | | 80,600 | | | | 4,321,772 | | | | 1.94 | % |
| Fidelity National Title Group, Inc. | | | 175,800 | | | | 4,481,142 | | | | 2.01 | % |
| HSBC Holdings PLC - ADR (b) | | | 44,500 | | | | 4,110,020 | | | | 1.84 | % |
| J.P. Morgan Chase & Co. | | | 86,300 | | | | 4,496,230 | | | | 2.02 | % |
| National City Corp. | | | 113,400 | | | | 4,144,770 | | | | 1.86 | % |
| PNC Financial Services Group | | | 57,000 | | | | 4,223,700 | | | | 1.89 | % |
The accompanying notes are an integral part of these financial statements.
HENNESSY FUNDS 1-800-966-4354
SUMMARY OF INVESTMENTS — CORNERSTONE VALUE FUND
| COMMON STOCKS | | Number | | | | | | % of Net | |
| | | of Shares | | | Value | | | Assets | |
Financials (Continued) | | | | | | | | | |
| Regions Financial Corp. | | | 110,600 | | | $ | 3,880,954 | | | | 1.74 | % |
| US Bancorp | | | 119,800 | | | | 4,115,130 | | | | 1.85 | % |
| Wachovia Corp. | | | 74,000 | | | | 4,109,960 | | | | 1.84 | % |
| Washington Mutual, Inc. | | | 91,100 | | | | 3,824,378 | | | | 1.72 | % |
| Wells Fargo & Co. | | | 114,600 | | | | 4,112,994 | | | | 1.84 | % |
| | | | | | | | 62,066,992 | | | | 27.84 | % |
| | | | | | | | | | | | | |
Health Care – 10.07% | | | | | | | | | | | | |
| Bristol-Myers Squibb Co. | | | 161,000 | | | | 4,646,460 | | | | 2.08 | % |
| Eli Lilly & Co. | | | 74,400 | | | | 4,399,272 | | | | 1.97 | % |
| GlaxoSmithKline PLC - ADR (b) | | | 77,100 | | | | 4,454,838 | | | | 2.00 | % |
| Merck & Co., Inc. | | | 89,700 | | | | 4,614,168 | | | | 2.07 | % |
| Pfizer, Inc. | | | 164,000 | | | | 4,339,440 | | | | 1.95 | % |
| | | | | | | | 22,454,178 | | | | 10.07 | % |
| | | | | | | | | | | | | |
Industrials – 3.78% | | | | | | | | | | | | |
| Masco Corp. | | | 140,200 | | | | 3,814,842 | | | | 1.71 | % |
| RR Donnelley & Sons Co. | | | 114,600 | | | | 4,606,920 | | | | 2.07 | % |
| | | | | | | | 8,421,762 | | | | 3.78 | % |
| | | | | | | | | | | | | |
Materials – 17.10% | | | | | | | | | | | | |
| The Dow Chemical Co. | | | 102,100 | | | | 4,554,681 | | | | 2.04 | % |
| EI Du Pont de Nemours & Co. | | | 86,600 | | | | 4,258,122 | | | | 1.91 | % |
| International Paper Co. | | | 121,500 | | | | 4,582,980 | | | | 2.06 | % |
| Lyondell Chemical Co. | | | 161,500 | | | | 5,025,880 | | | | 2.25 | % |
| MeadWestvaco Corp. | | | 136,400 | | | | 4,550,304 | | | | 2.04 | % |
| PPG Industries, Inc. | | | 61,400 | | | | 4,517,812 | | | | 2.03 | % |
| Southern Copper Corp. | | | 72,900 | | | | 5,853,870 | | | | 2.63 | % |
| Weyerhaeuser Co. | | | 60,200 | | | | 4,769,044 | | | | 2.14 | % |
| | | | | | | | 38,112,693 | | | | 17.10 | % |
| | | | | | | | | | | | | |
Telecommunication Services – 5.90% | | | | | | | | | | | | |
| AT&T, Inc. | | | 117,400 | | | | 4,545,728 | | | | 2.03 | % |
| Chunghwa Telecom Company Ltd. - ADR (b) | | | 207,100 | | | | 4,121,290 | | | | 1.85 | % |
| Telefonica De Argentina (a) | | | 1,200 | | | | 0 | | | | 0.00 | % |
| Verizon Communications, Inc. | | | 117,700 | | | | 4,493,786 | | | | 2.02 | % |
| | | | | | | | 13,160,804 | | | | 5.90 | % |
| | | | | | | | | | | | | |
Total Common Stocks (Cost $186,049,486) | | | | | | | 216,664,838 | | | | 97.19 | % |
The accompanying notes are an integral part of these financial statements.
SUMMARY OF INVESTMENTS — CORNERSTONE VALUE FUND
| SHORT-TERM INVESTMENTS – 2.80% | | Principal | | | | | | % of Net | |
| | | Amount | | | Value | | | Assets | |
Discount Notes – 2.80% | | | | | | | | | |
| Federal Home Loan Bank Discount Note, | | | | | | | | | |
| 5.9800%, due 05/01/2007 | | $ | 6,230,000 | | | $ | 6,230,000 | | | | 2.80 | % |
| | | | | | | | | | | | | |
Total Discount Notes (Cost $6,230,000) | | | | | | | 6,230,000 | | | | 2.80 | % |
| | | | | | | | | | | | | |
Variable Rate Demand Notes# – 0.00% | | | | | | | | | | | | |
| American Family Financial Services, Inc. | | | | | | | | | | | | |
| 4.5950% | | | 8,448 | | | | 8,448 | | | | 0.00 | % |
| | | | | | | | | | | | | |
Total Variable Rate Demand Notes | | | | | | | | | | | | |
| (Cost $8,448) | | | | | | | 8,448 | | | | 0.00 | % |
| | | | | | | | | | | | | |
Total Short-Term Investments | | | | | | | | | | | | |
| (Cost $6,238,448) | | | | | | | 6,238,448 | | | | 2.80 | % |
| | | | | | | | | | | | | |
Total Investments– 99.99% | | | | | | | | | | | | |
| (Cost $192,287,934) | | | | | | | 222,903,286 | | | | 99.99 | % |
| | | | | | | | | | | | | |
| Other Assets in Excess of Liabilities – 0.01% | | | | | | | 26,005 | | | | 0.01 | % |
TOTAL NET ASSETS– 100.00% | | | | | | $ | 222,929,291 | | | | 100.00 | % |
Percentages are stated as a percent of net assets.
ADR American Depository Receipt
| (b) | Foreign issued security |
| # | Variable rate demand notes are considered short-term obligations and are payable on demand. Interest rates change periodically on specified dates. The rates listed are as of April 30, 2007. |
The accompanying notes are an integral part of these financial statements.
HENNESSY FUNDS 1-800-966-4354
HENNESSY TOTAL RETURN FUND
(% of Net Assets)
TOP TEN HOLDINGS | % of net assets |
| Merck & Co., Inc. | 8.60% |
| AT&T, Inc. | 8.28% |
| EI Du Pont de Nemours & Co. | 7.67% |
| Verizon Communications, Inc. | 7.37% |
| Citigroup, Inc. | 7.30% |
| General Motors Corp. | 7.09% |
| Pfizer, Inc. | 6.93% |
| J.P. Morgan Chase & Co. | 6.73% |
| General Electric Co. | 6.23% |
| Altria Group, Inc. | 5.89% |
SUMMARY OF INVESTMENTS — TOTAL RETURN FUND
| COMMON STOCKS – 76.38% | | Number | | | | | | % of Net | |
| | | of Shares | | | Value | | | Assets | |
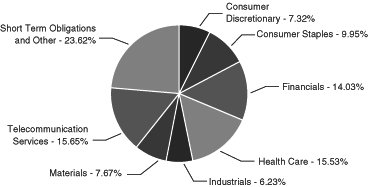
Consumer Discretionary – 7.32% | | | | | | | | | |
| General Motors Corp. | | | 227,200 | | | $ | 7,095,456 | | | | 7.09 | % |
| Idearc, Inc. | | | 6,725 | | | | 233,694 | | | | 0.23 | % |
| | | | | | | | 7,329,150 | | | | 7.32 | % |
| | | | | | | | | | | | | |
Consumer Staples – 9.95% | | | | | | | | | | | | |
| Altria Group, Inc. | | | 85,500 | | | | 5,892,660 | | | | 5.89 | % |
| The Coca-Cola Co. | | | 42,000 | | | | 2,191,980 | | | | 2.19 | % |
| Kraft Foods, Inc. | | | 55,985 | | | | 1,873,818 | | | | 1.87 | % |
| | | | | | | | 9,958,458 | | | | 9.95 | % |
| | | | | | | | | | | | | |
Financials – 14.03% | | | | | | | | | | | | |
| Citigroup, Inc. | | | 136,300 | | | | 7,308,406 | | | | 7.30 | % |
| J.P. Morgan Chase & Co. | | | 129,200 | | | | 6,731,320 | | | | 6.73 | % |
| | | | | | | | 14,039,726 | | | | 14.03 | % |
| | | | | | | | | | | | | |
Health Care – 15.53% | | | | | | | | | | | | |
| Merck & Co., Inc. | | | 167,400 | | | | 8,611,056 | | | | 8.60 | % |
| Pfizer, Inc. | | | 262,000 | | | | 6,932,520 | | | | 6.93 | % |
| | | | | | | | 15,543,576 | | | | 15.53 | % |
| | | | | | | | | | | | | |
Industrials – 6.23% | | | | | | | | | | | | |
| General Electric Co. | | | 169,300 | | | | 6,240,398 | | | | 6.23 | % |
| | | | | | | | | | | | | |
Materials – 7.67% | | | | | | | | | | | | |
| EI Du Pont de Nemours & Co. | | | 156,100 | | | | 7,675,437 | | | | 7.67 | % |
| | | | | | | | | | | | | |
Telecommunication Services – 15.65% | | | | | | | | | | | | |
| AT&T, Inc. | | | 213,900 | | | | 8,282,208 | | | | 8.28 | % |
| Verizon Communications, Inc. | | | 193,300 | | | | 7,380,194 | | | | 7.37 | % |
| | | | | | | | 15,662,402 | | | | 15.65 | % |
| | | | | | | | | | | | | |
Total Common Stocks (Cost $65,388,773) | | | | | | | 76,449,147 | | | | 76.38 | % |
The accompanying notes are an integral part of these financial statements.
HENNESSY FUNDS 1-800-966-4354
SUMMARY OF INVESTMENTS — TOTAL RETURN FUND
| SHORT-TERM INVESTMENTS – 62.19% | | Principal | | | | | | % of Net | |
| | | Amount | | | Value | | | Assets | |
U.S. Treasury Bill* – 60.56% | | | | | | | | | |
| 4.940%, 05/24/2007 | | $ | 22,500,000 | | | $ | 22,431,215 | | | | 22.41 | % |
| 4.885%, 06/21/2007 | | | 22,500,000 | | | | 22,351,144 | | | | 22.33 | % |
| 4.880%, 07/19/2007 | | | 16,000,000 | | | | 15,833,568 | | | | 15.82 | % |
| | | | | | | | | | | | | |
Total U.S. Treasury Bills (Cost $60,619,795) | | | | | | | 60,615,927 | | | | 60.56 | % |
| | | | | | | | | | | | | |
Discount Notes – 1.62% | | | | | | | | | | | | |
| Federal Home Loan Bank Discount Note, | | | | | | | | | | | | |
| 4.9800%, due 05/01/2007 | | | 1,625,000 | | | | 1,625,000 | | | | 1.62 | % |
| | | | | | | | | | | | | |
Total Discount Notes (Cost $1,625,000) | | | | | | | 1,625,000 | | | | 1.62 | % |
| | | | | | | | | | | | | |
Variable Rate Demand Notes# – 0.01% | | | | | | | | | | | | |
| American Family Financial Services, Inc. | | | | | | | | | | | | |
| 4.9427% | | | 7,895 | | | | 7,895 | | | | 0.01 | % |
| | | | | | | | | | | | | |
Total Variable Rate Demand Notes | | | | | | | | | | | | |
| (Cost $7,895) | | | | | | | 7,895 | | | | 0.01 | % |
| | | | | | | | | | | | | |
Total Short-Term Investments | | | | | | | | | | | | |
| (Cost $62,252,690) | | | | | | | 62,248,822 | | | | 62.19 | % |
| | | | | | | | | | | | | |
Total Investments – 138.57% | | | | | | | | | | | | |
| (Cost $127,641,463) | | | | | | | 138,697,969 | | | | 138.57 | % |
| | | | | | | | | | | | | |
| Liabilities in Excess of Other Assets - (38.57)% | | | | | | | (38,605,046 | ) | | | (38.57 | )% |
TOTAL NET ASSETS – 100.00% | | | | | | $ | 100,092,923 | | | | 100.00 | % |
Percentages are stated as a percent of net assets.
| * | Collateral or partial collateral for securities sold subject to repurchase. |
| # | Variable rate demand notes are considered short-term obligations and are payable on demand. Interest rates change periodically on specified dates. The rates listed are as of April 30, 2007. |
The accompanying notes are an integral part of these financial statements.
SUMMARY OF INVESTMENTS — BALANCED FUND
HENNESSY BALANCED FUND
(% of Net Assets)
TOP TEN HOLDINGS | % of net assets |
| Merck & Co., Inc. | 5.81% |
| AT&T, Inc. | 5.64% |
| EI du Pont de Nemours & Co. | 5.25% |
| Citigroup, Inc. | 5.02% |
| Verizon Communications, Inc. | 5.00% |
| General Electric Co. | 4.99% |
| Pfizer, Inc. | 4.72% |
| General Motors Corp. | 4.61% |
| J.P. Morgan Chase & Co. | 4.50% |
| Altria Group, Inc. | 4.15% |
HENNESSY FUNDS 1-800-966-4354
SUMMARY OF INVESTMENTS — BALANCED FUND
| COMMON STOCKS – 51.52% | | Number | | | | | | % of Net | |
| | | of Shares | | | Value | | | Assets | |
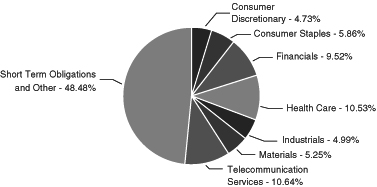
Consumer Discretionary – 4.73% | | | | | | | | | |
| General Motors Corp. | | | 27,275 | | | $ | 851,798 | | | | 4.61 | % |
| Idearc, Inc. | | | 650 | | | | 22,588 | | | | 0.12 | % |
| | | | | | | | 874,386 | | | | 4.73 | % |
| | | | | | | | | | | | | |
Consumer Staples – 5.86% | | | | | | | | | | | | |
| Altria Group, Inc. | | | 11,125 | | | | 766,735 | | | | 4.15 | % |
| The Coca-Cola Co. | | | 2,500 | | | | 130,475 | | | | 0.71 | % |
| Kraft Foods, Inc. | | | 5,501 | | | | 184,118 | | | | 1.00 | % |
| | | | | | | | 1,081,328 | | | | 5.86 | % |
| | | | | | | | | | | | | |
Financials – 9.52% | | | | | | | | | | | | |
| Citigroup, Inc. | | | 17,275 | | | | 926,286 | | | | 5.02 | % |
| J.P. Morgan Chase & Co. | | | 15,950 | | | | 830,995 | | | | 4.50 | % |
| | | | | | | | 1,757,281 | | | | 9.52 | % |
| | | | | | | | | | | | | |
Health Care – 10.53% | | | | | | | | | | | | |
| Merck & Co., Inc. | | | 20,850 | | | | 1,072,524 | | | | 5.81 | % |
| Pfizer, Inc. | | | 32,900 | | | | 870,534 | | | | 4.72 | % |
| | | | | | | | 1,943,058 | | | | 10.53 | % |
| | | | | | | | | | | | | |
Industrials – 4.99% | | | | | | | | | | | | |
| General Electric Co. | | | 25,000 | | | | 921,500 | | | | 4.99 | % |
| | | | | | | | | | | | | |
Materials – 5.25% | | | | | | | | | | | | |
| EI Du Pont de Nemours & Co. | | | 19,700 | | | | 968,649 | | | | 5.25 | % |
| | | | | | | | | | | | | |
Telecommunication Services – 10.64% | | | | | | | | | | | | |
| AT&T, Inc. | | | 26,875 | | | | 1,040,600 | | | | 5.64 | % |
| Verizon Communications, Inc. | | | 24,175 | | | | 923,001 | | | | 5.00 | % |
| | | | | | | | 1,963,601 | | | | 10.64 | % |
| | | | | | | | | | | | | |
Total Common Stocks (Cost $8,147,897) | | | | | | | 9,509,803 | | | | 51.52 | % |
The accompanying notes are an integral part of these financial statements.
SUMMARY OF INVESTMENTS — BALANCED FUND
| SHORT-TERM INVESTMENTS – 48.30% | | Principal | | | | | | % of Net | |
| | | Amount | | | Value | | | Assets | |
U.S. Treasury Notes – 45.15% | | | | | | | | | |
| 3.500%, 05/31/2007 | | $ | 810,000 | | | $ | 809,241 | | | | 4.38 | % |
| 3.625%, 06/30/2007 | | | 1,900,000 | | | | 1,896,440 | | | | 10.28 | % |
| 2.750%, 08/15/2007 | | | 1,540,000 | | | | 1,530,437 | | | | 8.29 | % |
| 4.000%, 09/30/2007 | | | 1,000,000 | | | | 996,251 | | | | 5.40 | % |
| 4.250%, 11/30/2007 | | | 900,000 | | | | 896,414 | | | | 4.86 | % |
| 3.000%, 02/15/2008 | | | 1,225,000 | | | | 1,206,386 | | | | 6.54 | % |
| 4.625%, 03/31/2008 | | | 1,000,000 | | | | 997,227 | | | | 5.40 | % |
| | | | | | | | | | | | | |
Total U.S. Treasury Notes (Cost $8,330,861) | | | | | | | 8,332,396 | | | | 45.15 | % |
| | | | | | | | | | | | | |
Demand Notes – 3.02% | | | | | | | | | | | | |
| Federal Home Loan Bank Discount Note, | | | | | | | | | | | | |
| 4.9800%, due 05/01/2007 | | | 557,000 | | | | 557,000 | | | | 3.02 | % |
| | | | | | | | | | | | | |
Total Demand Notes | | | | | | | | | | | | |
| (Cost $ 557,000) | | | | | | | 557,000 | | | | 3.02 | % |
| | | | | | | | | | | | | |
Variable Rate Demand Notes# – 0.13% | | | | | | | | | | | | |
| American Family Financial Services, Inc. | | | | | | | | | | | | |
| 4.9427% | | | 23,897 | | | | 23,897 | | | | 0.13 | % |
| | | | | | | | | | | | | |
Total Variable Rate Demand Notes | | | | | | | | | | | | |
| (Cost $23,897) | | | | | | | 23,897 | | | | 0.13 | % |
| | | | | | | | | | | | | |
Total Short-Term Investments | | | | | | | | | | | | |
| (Cost $8,911,758) | | | | | | | 8,913,293 | | | | 48.30 | % |
| | | | | | | | | | | | | |
Total Investments– 99.82% | | | | | | | | | | | | |
| (Cost $17,059,655) | | | | | | | 18,423,096 | | | | 99.82 | % |
| | | | | | | | | | | | | |
| Other Assets in Excess of Liabilities – 0.18% | | | | | | | 32,985 | | | | 0.18 | % |
TOTAL NET ASSETS– 100.00% | | | | | | $ | 18,456,081 | | | | 100.00 | % |
Percentages are stated as a percent of net assets.
| # | Variable rate demand notes are considered short-term obligations and are payable on demand. Interest rates change periodically on specified dates. The rates listed are as of April 30, 2007. |
The accompanying notes are an integral part of these financial statements.
HENNESSY FUNDS 1-800-966-4354
FINANCIAL STATEMENTS — STATEMENTS OF ASSETS AND LIABILITIES
Financial Statements
Statements of Assets and Liabilities as of April 30, 2007 (Unaudited) |
| | | HENNESSY | |
| | | CORNERSTONE | |
| | | GROWTH FUND | |
ASSETS: | | | |
| Investments, at value (cost $1,059,151,240, $168,139,328, | | | |
| $212,151,025, $192,287,934, $127,641,463, $17,059,655 respectively) | | $ | 1,143,096,776 | |
| Dividends and interest receivable | | | 1,492,479 | |
| Receivable for fund shares sold | | | 668,130 | |
| Prepaid expenses and other assets | | | 38,654 | |
| Total Assets | | | 1,145,296,039 | |
| | | | | |
LIABILITIES: | | | | |
| Payable for fund shares redeemed | | | 2,358,334 | |
| Payable to Adviser | | | 705,169 | |
| Payable to Administrator | | | 670,325 | |
| Payable to Distributor | | | — | |
| Reverse repurchase agreement | | | — | |
| Accrued interest payable | | | — | |
| Accrued expenses and other payables | | | 277,837 | |
| Total Liabilities | | | 4,011,665 | |
| | | | | |
NET ASSETS | | $ | 1,141,284,374 | |
| | | | | |
NET ASSETS CONSIST OF: | | | | |
| Capital stock | | $ | 968,114,639 | |
| Accumulated net investment income (loss) | | | (559,181 | ) |
| Accumulated net realized gain (loss) on investments | | | 89,783,380 | |
| Unrealized net appreciation (depreciation) on investments | | | 83,945,536 | |
| Total Net Assets | | $ | 1,141,284,374 | |
| | | | | |
| Shares authorized ($.0001 par value) | | | 25,000,000,000 | |
| Shares issued and outstanding | | | 59,597,839 | |
| Net asset value, offering price and redemption price per share | | $ | 19.15 | |
The accompanying notes are an integral part of these financial statements.
FINANCIAL STATEMENTS — STATEMENTS OF ASSETS AND LIABILITIES
| HENNESSY | | | | | | | | | | | | | |
| CORNERSTONE | | | HENNESSY | | | HENNESSY | | | HENNESSY | | | HENNESSY | |
| GROWTH FUND, | | | FOCUS 30 | | | CORNERSTONE | | | TOTAL RETURN | | | BALANCED | |
| SERIES II | | | FUND | | | VALUE FUND | | | FUND | | | FUND | |
| | | | | | | | | | | | | | |
| | | | | | | | | | | | | | |
| $ | 193,531,744 | | | $ | 250,335,497 | | | $ | 222,903,286 | | | $ | 138,697,969 | | | $ | 18,423,096 | |
| | 39,075 | | | | 50,902 | | | | 521,397 | | | | 175,152 | | | | 95,175 | |
| | 173,575 | | | | 991,256 | | | | 13,340 | | | | 13,482 | | | | 16,000 | |
| | 53,199 | | | | 33,303 | | | | 18,617 | | | | 13,830 | | | | 12,748 | |
| | 193,797,593 | | | | 251,410,958 | | | | 223,456,640 | | | | 138,900,433 | | | | 18,547,019 | |
| | | | | | | | | | | | | | | | | | | |
| | | | | | | | | | | | | | | | | | | |
| | 568,635 | | | | 302,108 | | | | 202,744 | | | | 83,612 | | | | 425 | |
| | 120,100 | | | | 148,474 | | | | 136,056 | | | | 50,787 | | | | 9,178 | |
| | 116,404 | | | | 127,470 | | | | 133,429 | | | | 62,681 | | | | 11,066 | |
| | — | | | | — | | | | — | | | | 135,164 | | | | 53,476 | |
| | — | | | | — | | | | — | | | | 38,197,000 | | | | — | |
| | 212 | | | | — | | | | 35 | | | | 242,769 | | | | — | |
| | 69,782 | | | | 65,358 | | | | 55,085 | | | | 35,497 | | | | 16,793 | |
| | 875,133 | | | | 643,410 | | | | 527,349 | | | | 38,807,510 | | | | 90,938 | |
| | | | | | | | | | | | | | | | | | | |
| $ | 192,922,460 | | | $ | 250,767,548 | | | $ | 222,929,291 | | | $ | 100,092,923 | | | $ | 18,456,081 | |
| | | | | | | | | | | | | | | | | | | |
| | | | | | | | | | | | | | | | | | | |
| $ | 163,944,535 | | | $ | 210,601,712 | | | $ | 280,017,950 | | | $ | 178,619,462 | | | $ | 18,452,604 | |
| | (696,311 | ) | | | (682,438 | ) | | | 1,373,166 | | | | 212,167 | | | | 41,900 | |
| | 4,281,820 | | | | 2,663,802 | | | | (89,077,177 | ) | | | (89,795,212 | ) | | | (1,401,864 | ) |
| | 25,392,416 | | | | 38,184,472 | | | | 30,615,352 | | | | 11,056,506 | | | | 1,363,441 | |
| $ | 192,922,460 | | | $ | 250,767,548 | | | $ | 222,929,291 | | | $ | 100,092,923 | | | $ | 18,456,081 | |
| | | | | | | | | | | | | | | | | | | |
| Unlimited | | | | 25,000,000,000 | | | | 25,000,000,000 | | | | 100,000,000 | | | | 100,000,000 | |
| | 6,152,711 | | | | 17,634,238 | | | | 13,835,412 | | | | 7,563,880 | | | | 1,508,718 | |
| $ | 31.36 | | | $ | 14.22 | | | $ | 16.11 | | | $ | 13.23 | | | $ | 12.23 | |
HENNESSY FUNDS 1-800-966-4354
Financial Statements
Statements of Operations Six months ended April 30, 2007 (Unaudited) |
| | | HENNESSY | |
| | | CORNERSTONE | |
| | | GROWTH FUND | |
INVESTMENT INCOME: | | | |
Dividend income(1) | | $ | 5,685,589 | |
| Interest income | | | 832,666 | |
| Securities lending income | | | — | |
| Total investment income | | | 6,518,255 | |
| | | | | |
EXPENSES: | | | | |
| Investment advisory fees | | | 4,378,648 | |
| Administration, fund accounting, custody and transfer agent fees | | | 1,373,389 | |
| Distribution fees (See Note 5) | | | — | |
| Service fees (See Note 5) | | | 591,709 | |
| Federal and state registration fees | | | 30,453 | |
| Audit fees | | | 10,052 | |
| Legal fees | | | 5,207 | |
| Reports to shareholders | | | 53,060 | |
| Directors' fees and expenses | | | 4,958 | |
| Sub-transfer agent expenses (See Note 5) | | | 594,612 | |
| Interest expense (See Note 3 and 7) | | | 2,456 | |
| Other | | | 32,892 | |
| Total expenses | | | 7,077,436 | |
NET INVESTMENT INCOME (LOSS) | | $ | (559,181 | ) |
| | | | | |
REALIZED AND UNREALIZED GAINS: | | | | |
| Net realized gain on investments | | $ | 91,609,007 | |
| Change in unrealized appreciation (depreciation) on investments | | | 2,126,116 | |
| Net gain on investments | | | 93,735,123 | |
| | | | | |
NET INCREASE IN NET ASSETS RESULTING FROM OPERATIONS | | $ | 93,175,942 | |
(1) | Net of foreign taxes withheld of $471,301, $1,232, $0, $36,960, $0 and $0, respectively. |
The accompanying notes are an integral part of these financial statements.
FINANCIAL STATEMENTS — STATEMENTS OF OPERATIONS
| HENNESSY | | | | | | | | | | | | | |
| CORNERSTONE | | | HENNESSY | | | HENNESSY | | | HENNESSY | | | HENNESSY | |
| GROWTH FUND, | | | FOCUS 30 | | | CORNERSTONE | | | TOTAL RETURN | | | BALANCED | |
| SERIES II | | | FUND | | | VALUE FUND | | | FUND | | | FUND | |
| | | | | | | | | | | | | | |
| $ | 583,886 | | | $ | 546,949 | | | $ | 4,335,348 | | | $ | 1,488,212 | | | $ | 187,755 | |
| | 57,102 | | | | 125,262 | | | | 131,299 | | | | 1,570,768 | | | | 240,961 | |
| | — | | | | — | | | | 328 | | | | — | | | | — | |
| | 640,988 | | | | 672,211 | | | | 4,466,975 | | | | 3,058,980 | | | | 428,716 | |
| | | | | | | | | | | | | | | | | | | |
| | | | | | | | | | | | | | | | | | | |
| | 792,711 | | | | 803,397 | | | | 890,161 | | | | 327,355 | | | | 59,718 | |
| | 248,496 | | | | 251,739 | | | | 279,293 | | | | 126,735 | | | | 23,103 | |
| | — | | | | — | | | | — | | | | 136,398 | | | | 24,883 | |
| | 107,123 | | | | 108,567 | | | | 120,292 | | | | — | | | | — | |
| | 17,786 | | | | 27,143 | | | | 13,801 | | | | 11,475 | | | | 9,341 | |
| | 8,925 | | | | 7,687 | | | | 9,474 | | | | 8,927 | | | | 8,679 | |
| | 13,207 | | | | 5,207 | | | | 5,207 | | | | 5,207 | | | | 5,207 | |
| | 14,173 | | | | 15,218 | | | | 10,191 | | | | 4,215 | | | | 1,240 | |
| | 4,711 | | | | 4,740 | | | | 4,711 | | | | 3,224 | | | | 3,224 | |
| | 113,161 | | | | 108,640 | | | | 66,861 | | | | — | | | | — | |
| | 3,972 | | | | 14,448 | | | | 6,391 | | | | 1,012,928 | | | | — | |
| | 13,034 | | | | 7,863 | | | | 4,491 | | | | 2,201 | | | | 695 | |
| | 1,337,299 | | | | 1,354,649 | | | | 1,410,873 | | | | 1,638,665 | | | | 136,090 | |
| $ | (696,311 | ) | | $ | (682,438 | ) | | $ | 3,056,102 | | | $ | 1,420,315 | | | $ | 292,626 | |
| | | | | | | | | | | | | | | | | | | |
| | | | | | | | | | | | | | | | | | | |
| $ | 4,281,935 | | | $ | 2,733,235 | | | $ | 8,043,105 | | | $ | 1,086,840 | | | $ | 1,077,204 | |
| | 8,903,313 | | | | 29,308,993 | | | | 6,634,351 | | | | 3,944,308 | | | | (399,610 | ) |
| | 13,185,248 | | | | 32,042,228 | | | | 14,677,456 | | | | 5,031,148 | | | | 677,594 | |
| | | | | | | | | | | | | | | | | | | |
| $ | 12,488,937 | | | $ | 31,359,790 | | | $ | 17,733,558 | | | $ | 6,451,463 | | | $ | 970,220 | |
HENNESSY FUNDS 1-800-966-4354
FINANCIAL STATEMENTS — STATEMENTS OF CHANGES IN NET ASSETS
Financial Statements
Statements of Changes in Net Assets |
| | | Hennessy Cornerstone Growth Fund | |
| | | Six Months Ended | | | | |
| | | April 30, 2007 | | | Year Ended | |
| | | (Unaudited) | | | October 31, 2006 | |
OPERATIONS: | | | | | | |
| Net investment income (loss) | | $ | (559,181 | ) | | $ | (2,547,605 | ) |
| Net realized gain (loss) on securities | | | 91,609,007 | | | | 184,186,611 | |
| Change in unrealized appreciation (depreciation) on securities | | | 2,126,116 | | | | (52,188,698 | ) |
| Net increase (decrease) in net assets resulting from operations | | | 93,175,942 | | | | 129,450,308 | |
| | | | | | | | | |
DISTRIBUTIONS TO SHAREHOLDERS: | | | | | | | | |
| From net investment income | | | — | | | | — | |
| From net realized gains | | | (183,483,584 | ) | | | (68,227,748 | ) |
| Total distributions | | | (183,483,584 | ) | | | (68,227,748 | ) |
| | | | | | | | | |
CAPITAL SHARE TRANSACTIONS: | | | | | | | | |
| Proceeds from shares subscribed | | | 73,707,969 | | | | 399,293,120 | |
| Dividends reinvested | | | 178,259,103 | | | | 66,277,329 | |
| Redemption fees retained | | | 75,649 | | | | 311,922 | |
| Cost of shares redeemed | | | (271,124,194 | ) | | | (348,210,594 | ) |
| Net increase (decrease) in net assets derived | | | | | | | | |
| from capital share transactions | | | (19,081,473 | ) | | | 117,671,777 | |
| | | | | | | | | |
TOTAL INCREASE (DECREASE) IN NET ASSETS | | | (109,389,115 | ) | | | 178,894,337 | |
| | | | | | | | | |
| NET ASSETS: | | | | | | | | |
| Beginning of period | | | 1,250,673,489 | | | | 1,071,779,152 | |
| End of period | | $ | 1,141,284,374 | | | $ | 1,250,673,489 | |
| | | | | | | | | |
Accumulated net investment income (loss), end of period | | $ | (559,181 | ) | | $ | — | |
| | | | | | | | | |
CHANGES IN SHARES OUTSTANDING: | | | | | | | | |
| Shares sold | | | 3,922,547 | | | | 18,991,149 | |
| Shares issued to holders as reinvestment of dividends | | | 9,930,869 | | | | 3,544,242 | |
| Shares redeemed | | | (14,460,601 | ) | | | (17,324,674 | ) |
| Net increase (decrease) in shares outstanding | | | (607,185 | ) | | | 5,210,717 | |
| * | For the four months ended October 31, 2006. Effective October 31, 2006, the Growth II Fund changed its fiscal year end to October 31st from June 30th. |
The accompanying notes are an integral part of these financial statements.
FINANCIAL STATEMENTS — STATEMENTS OF CHANGES IN NET ASSETS
Hennessy Cornerstone | | | | |
Growth Fund, Series II | | | Hennessy Focus 30 Fund | |
| Six Months Ended | | | Period Ended | | | Year Ended | | | Six Months Ended | | | Year Ended | |
| April 30, 2007 | | | October 31, | | | June 30, | | | April 30, 2007 | | | October 31, | |
| (Unaudited) | | | 2006* | | | 2006 | | | (Unaudited) | | | 2006 | |
| | | | | | | | | | | | | | | |
| $ | (696,311 | ) | | $ | (207,230 | ) | | $ | (610,188 | ) | | $ | (682,438 | ) | | $ | (1,552,126 | ) |
| | 4,281,935 | | | | 8,338,233 | | | | 28,215,988 | | | | 2,733,235 | | | | 1,712,198 | |
| | 8,903,313 | | | | (21,353,033 | ) | | | 9,942,792 | | | | 29,308,993 | | | | 13,224,239 | |
| | 12,488,937 | | | | (13,222,030 | ) | | | 37,548,592 | | | | 31,359,790 | | | | 13,384,311 | |
| | | | | | | | | | | | | | | | | | | |
| | | | | | | | | | | | | | | | | | | |
| | — | | | | — | | | | — | | | | — | | | | — | |
| | (9,231,945 | ) | | | — | | | | (30,993,772 | ) | | | (1,781,615 | ) | | | (17,767,996 | ) |
| | (9,231,945 | ) | | | — | | | | (30,993,772 | ) | | | (1,781,615 | ) | | | (17,767,996 | ) |
| | | | | | | | | | | | | | | | | | | |
| | | | | | | | | | | | | | | | | | | |
| | 7,066,194 | | | | 13,526,607 | | | | 69,453,923 | | | | 57,500,630 | | | | 245,270,080 | |
| | 9,137,765 | | | | — | | | | 30,743,046 | | | | 1,752,078 | | | | 17,531,456 | |
| | 21,271 | | | | 30,067 | | | | 54,048 | | | | 29,109 | | | | 292,645 | |
| | (70,748,257 | ) | | | (35,424,128 | ) | | | (126,497,325 | ) | | | (78,722,732 | ) | | | (143,395,044 | ) |
| | | | | | | | | | | | | | | | | | | |
| | (54,523,027 | ) | | | (21,867,454 | ) | | | (26,246,308 | ) | | | (19,440,915 | ) | | | 119,699,137 | |
| | | | | | | | | | | | | | | | | | | |
| | (51,266,035 | ) | | | (35,089,484 | ) | | | (19,691,488 | ) | | | 10,137,260 | | | | 115,315,452 | |
| | | | | | | | | | | | | | | | | | | |
| | | | | | | | | | | | | | | | | | | |
| | 244,188,495 | | | | 279,277,979 | | | | 298,969,467 | | | | 240,630,288 | | | | 125,314,836 | |
| $ | 192,922,460 | | | $ | 244,188,495 | | | $ | 279,277,979 | | | $ | 250,767,548 | | | $ | 240,630,288 | |
| | | | | | | | | | | | | | | | | | | |
| $ | (696,311 | ) | | $ | — | | | $ | — | | | $ | (682,438 | ) | | $ | — | |
| | | | | | | | | | | | | | | | | | | |
| | | | | | | | | | | | | | | | | | | |
| | 231,326 | | | | 452,640 | | | | 2,162,883 | | | | 4,233,022 | | | | 19,254,058 | |
| | 309,021 | | | | — | | | | 1,080,457 | | | | 141,297 | | | | 1,576,569 | |
| | (2,328,595 | ) | | | (1,187,819 | ) | | | (4,122,793 | ) | | | (6,166,559 | ) | | | (11,671,094 | ) |
| | (1,788,248 | ) | | | (735,179 | ) | | | (879,453 | ) | | | (1,792,240 | ) | | | 9,159,533 | |
HENNESSY FUNDS �� 1-800-966-4354
FINANCIAL STATEMENTS — STATEMENTS OF CHANGES IN NET ASSETS
Financial Statements
Statements of Changes in Net Assets |
| | | Hennessy Cornerstone Value Fund | |
| | | Six Months Ended | | | Year Ended | |
| | | April 30, 2007 | | | October 31, | |
| | | (Unaudited) | | | 2006 | |
OPERATIONS: | | | | | | |
| Net investment income (loss) | | $ | 3,056,102 | | | $ | 4,799,259 | |
| Net realized gain (loss) on securities | | | 8,043,105 | | | | 12,643,559 | |
| Change in unrealized appreciation (depreciation) on securities | | | 6,634,351 | | | | 20,367,759 | |
| Net increase (decrease) in net assets resulting from operations | | | 17,733,558 | | | | 37,810,577 | |
| | | | | | | | | |
DISTRIBUTIONS TO SHAREHOLDERS: | | | | | | | | |
| From net investment income | | | (5,691,101 | ) | | | (4,751,582 | ) |
| From net realized gains | | | — | | | | — | |
| | | | (5,691,101 | ) | | | (4,751,582 | ) |
| | | | | | | | | |
CAPITAL SHARE TRANSACTIONS: | | | | | | | | |
| Proceeds from shares subscribed | | | 22,812,057 | | | | 70,051,157 | |
| Dividends reinvested | | | 5,174,239 | | | | 4,182,613 | |
| Redemption fees retained | | | 110,495 | | | | 30,899 | |
| Cost of shares redeemed | | | (74,012,777 | ) | | | (34,281,100 | ) |
| Net increase (decrease) in net assets derived | | | | | | | | |
| from capital share transactions | | | (45,915,986 | ) | | | 39,983,569 | |
| | | | | | | | | |
TOTAL INCREASE (DECREASE) IN NET ASSETS | | | (33,873,529 | ) | | | 73,042,564 | |
| | | | | | | | | |
| NET ASSETS: | | | | | | | | |
| Beginning of period | | | 256,802,820 | | | | 183,760,256 | |
| End of period | | $ | 222,929,291 | | | $ | 256,802,820 | |
| | | | | | | | | |
Accumulated net investment income (loss), end of period | | $ | 1,373,166 | | | $ | 4,008,165 | |
| | | | | | | | | |
CHANGES IN SHARES OUTSTANDING: | | | | | | | | |
| Shares sold | | | 1,483,300 | | | | 4,814,929 | |
| Shares issued to holders as reinvestment of dividends | | | 337,964 | | | | 318,554 | |
| Shares redeemed | | | (4,807,524 | ) | | | (2,496,829 | ) |
| Net increase (decrease) in shares outstanding | | | (2,986,260 | ) | | | 2,636,654 | |
The accompanying notes are an integral part of these financial statements.
FINANCIAL STATEMENTS — STATEMENTS OF CHANGES IN NET ASSETS
Hennessy Total Return Fund | | | Hennessy Balanced Fund | |
| Six Months Ended | | | Year Ended | | | Six Months Ended | | | Year Ended | |
| April 30, 2007 | | | October 31, | | | April 30, 2007 | | | October 31, | |
| (Unaudited) | | | 2006 | | | (Unaudited) | | | 2006 | |
| | | | | | | | | | | |
| $ | 1,420,315 | | | $ | 2,500,717 | | | $ | 292,626 | | | $ | 592,308 | |
| | 1,086,840 | | | | 2,471,535 | | | | 1,077,204 | | | | 379,500 | |
| | 3,944,308 | | | | 13,451,078 | | | | (399,610 | ) | | | 2,484,570 | |
| | 6,451,463 | | | | 18,423,330 | | | | 970,220 | | | | 3,456,378 | |
| | | | | | | | | | | | | | | |
| | | | | | | | | | | | | | | |
| | (1,429,858 | ) | | | (2,378,688 | ) | | | (321,243 | ) | | | (556,830 | ) |
| | — | | | | — | | | | — | | | | — | |
| | (1,429,858 | ) | | | (2,378,688 | ) | | | (321,243 | ) | | | (556,830 | ) |
| | | | | | | | | | | | | | | |
| | | | | | | | | | | | | | | |
| | 6,467,513 | | | | 24,923,801 | | | | 1,373,104 | | | | 19,077,668 | |
| | 1,356,624 | | | | 2,237,354 | | | | 313,977 | | | | 544,793 | |
| | 30,235 | | | | 8,471 | | | | 8,721 | | | | 4,909 | |
| | (26,046,739 | ) | | | (16,696,512 | ) | | | (10,024,136 | ) | | | (15,658,666 | ) |
| | | | | | | | | | | | | | | |
| | (18,192,367 | ) | | | 10,473,114 | | | | (8,328,334 | ) | | | 3,968,704 | |
| | | | | | | | | | | | | | | |
| | (13,170,762 | ) | | | 26,517,756 | | | | (7,679,357 | ) | | | 6,868,252 | |
| | | | | | | | | | | | | | | |
| | | | | | | | | | | | | | | |
| | 113,263,685 | | | | 86,745,929 | | | | 26,135,438 | | | | 19,267,186 | |
| $ | 100,092,923 | | | $ | 113,263,685 | | | $ | 18,456,081 | | | $ | 26,135,438 | |
| | | | | | | | | | | | | | | |
| $ | 212,167 | | | $ | 221,710 | | | $ | 41,900 | | | $ | 70,517 | |
| | | | | | | | | | | | | | | |
| | | | | | | | | | | | | | | |
| | 503,829 | | | | 2,059,164 | | | | 114,927 | | | | 1,713,646 | |
| | 106,027 | | | | 196,136 | | | | 26,309 | | | | 48,924 | |
| | (2,026,111 | ) | | | (1,478,816 | ) | | | (842,015 | ) | | | (1,376,819 | ) |
| | (1,416,255 | ) | | | 776,484 | | | | (700,779 | ) | | | 385,751 | |
HENNESSY FUNDS 1-800-966-4354
FINANCIAL HIGHLIGHTS — HENNESSY CORNERSTONE GROWTH FUND
Financial Highlights
Hennessy Cornerstone Growth Fund |
| | | Six Months Ended | | | Year Ended | |
| | | April 30, 2007(2) | | | October 31, | |
| | | (Unaudited) | | | 2006 | |
PER SHARE DATA: | | | | | | |
| Net asset value, beginning of period | | $ | 20.77 | | | $ | 19.49 | |
| | | | | | | | | |
Income from investment operations: | | | | | | | | |
| Net investment income (loss) | | | (0.01 | ) | | | (0.04 | ) |
| Net realized and unrealized gains (losses) on securities | | | 1.50 | | | | 2.55 | |
| Total from investment operations | | | 1.49 | | | | 2.51 | |
| | | | | | | | | |
Less Distributions: | | | | | | | | |
| Dividends from net investment income | | | — | | | | — | |
| Dividends from net realized gains | | | (3.11 | ) | | | (1.23 | ) |
| Total distributions | | | (3.11 | ) | | | (1.23 | ) |
Redemption fees retained(3) | | | — | | | | — | |
| Net asset value, end of period | | $ | 19.15 | | | $ | 20.77 | |
| | | | | | | | | |
TOTAL RETURN | | | 8.18 | % | | | 13.59 | % |
| | | | | | | | | |
SUPPLEMENTAL DATA AND RATIOS: | | | | | | | | |
| Net assets, end of period (millions) | | $ | 1,141.3 | | | $ | 1,250.7 | |
| Ratio of expenses to average net assets | | | 1.20 | % | | | 1.21 | % |
| Ratio of net investment income to average net assets | | | (0.09 | )% | | | (0.20 | )% |
| Portfolio turnover rate | | | 92.80 | % | | | 90.44 | % |
(1) | For the one month ended October 31, 2004. Effective October 31, 2004, the Fund changed its fiscal year end to October 31st from September 30th. |
(2) | All ratios for the period have been annualized, except portfolio turnover and total return. |
(3) | Amount is less than $0.01. |
The accompanying notes are an integral part of these financial statements.
FINANCIAL HIGHLIGHTS — HENNESSY CORNERSTONE GROWTH FUND
| Year Ended | | | Year Ended | | | Year Ended September 30, | |
| October 31, | | | October 31, | | | | | | | | | | |
| 2005 | | | 2004(1)(2) | | | 2004 | | | 2003 | | | 2002 | |
| | | | | | | | | | | | | | |
| $ | 19.38 | | | $ | 19.08 | | | $ | 17.23 | | | $ | 13.55 | | | $ | 13.98 | |
| | | | | | | | | | | | | | | | | | | |
| | | | | | | | | | | | | | | | | | | |
| | (0.14 | ) | | | (0.02 | ) | | | (0.13 | ) | | | (0.07 | ) | | | (0.07 | ) |
| | 4.13 | | | | 0.32 | | | | 1.98 | | | | 4.23 | | | | 0.67 | |
| | 3.99 | | | | 0.30 | | | | 1.85 | | | | 4.16 | | | | 0.60 | |
| | | | | | | | | | | | | | | | | | | |
| | | | | | | | | | | | | | | | | | | |
| | — | | | | — | | | | — | | | | — | | | | — | |
| | (3.88 | ) | | | — | | | | — | | | | (0.48 | ) | | | (1.03 | ) |
| | (3.88 | ) | | | — | | | | — | | | | (0.48 | ) | | | (1.03 | ) |
| | — | | | | — | | | | — | | | | — | | | | — | |
| $ | 19.49 | | | $ | 19.38 | | | $ | 19.08 | | | $ | 17.23 | | | $ | 13.55 | |
| | | | | | | | | | | | | | | | | | | |
| | 23.17 | % | | | 1.57 | % | | | 10.74 | % | | | 31.67 | % | | | 4.47 | % |
| | | | | | | | | | | | | | | | | | | |
| | | | | | | | | | | | | | | | | | | |
| $ | 1,071.8 | | | $ | 869.0 | | | $ | 866.0 | | | $ | 752.0 | | | $ | 342.4 | |
| | 1.23 | % | | | 1.25 | % | | | 1.25 | % | | | 1.27 | % | | | 1.10 | % |
| | (0.78 | )% | | | (1.08 | )% | | | (0.68 | )% | | | (0.60 | )% | | | (0.73 | )% |
| | 88.98 | % | | | 0.00 | % | | | 106.97 | % | | | 74.80 | % | | | 70.33 | % |
HENNESSY FUNDS 1-800-966-4354
FINANCIAL HIGHLIGHTS — HENNESSY CORNERSTONE GROWTH FUND, SERIES II
Financial Highlights
Hennessy Cornerstone Growth Fund, Series II |
| | | Six Months Ended | | | Period Ended | |
| | | April 30, 2007(2) | | | October 31, | |
| | | (Unaudited) | | | 2006(1)(2) | |
PER SHARE DATA: | | | | | | |
| Net asset value, beginning of period | | $ | 30.75 | | | $ | 32.19 | |
| | | | | | | | | |
Income from investment operations: | | | | | | | | |
| Net investment income (loss) | | | (0.11 | ) | | | (0.03 | ) |
| Net realized and unrealized gains (losses) on securities | | | 1.92 | | | | (1.41 | ) |
| Total from investment operations | | | 1.81 | | | | (1.44 | ) |
| | | | | | | | | |
Less Distributions: | | | | | | | | |
| Dividends from net investment income | | | — | | | | — | |
| Dividends from net realized gains | | | (1.20 | ) | | | — | |
| Total distributions | | | (1.20 | ) | | | — | |
Redemption fees retained(4) | | | — | | | | — | |
| Net asset value, end of period | | $ | 31.36 | | | $ | 30.75 | |
| | | | | | | | | |
TOTAL RETURN | | | 6.12 | % | | | (4.47 | )% |
| | | | | | | | | |
SUPPLEMENTAL DATA AND RATIOS: | | | | | | | | |
| Net assets, end of period (millions) | | $ | 192.9 | | | $ | 244.2 | |
| Ratio of expenses to average net assets | | | 1.25 | % | | | 1.25 | % |
| Ratio of net investment income to average net assets | | | (0.65 | )% | | | (0.24 | )% |
| Portfolio turnover rate | | | 0.00 | % | | | 92.63 | % |
(1) | For the four months ended October 31, 2006. Effective October 31, 2006 the Fund changed its fiscal year end to October 31st from June 30th. |
(2) | All ratios for the period have been annualized, except portfolio turnover and total return. |
(3) | Net investment income (loss) per share is calculated using the average shares outstanding method. |
(4) | Amount is less than $0.01. |
(5) | The financial highlights set forth herein include the historical highlights of The Henlopen Fund. On July 1, 2005, Hennessy Advisors, Inc. became the investment advisor to the Fund and the Fund changed its name to “Hennessy Cornerstone Growth Fund, Series II”. |
The accompanying notes are an integral part of these financial statements.
FINANCIAL HIGHLIGHTS — HENNESSY CORNERSTONE GROWTH FUND, SERIES II
| Year Ended June 30, | |
| 2006 | | | 2005(5) | | | 2004(5) | | | 2003(5) | | | 2002(5) | |
| | | | | | | | | | | | | | |
| $ | 31.29 | | | $ | 27.69 | | | $ | 18.13 | | | $ | 16.79 | | | $ | 19.15 | |
| | | | | | | | | | | | | | | | | | | |
| | | | | | | | | | | | | | | | | | | |
| | (0.07 | )(3) | | | (0.14 | )(3) | | | (0.23 | )(3) | | | (0.16 | )(3) | | | (0.18 | )(3) |
| | 4.65 | | | | 3.75 | | | | 9.79 | | | | 1.50 | | | | (2.14 | ) |
| | 4.58 | | | | 3.61 | | | | 9.56 | | | | 1.34 | | | | (2.32 | ) |
| | | | | | | | | | | | | | | | | | | |
| | | | | | | | | | | | | | | | | | | |
| | — | | | | (0.01 | ) | | | — | | | | — | | | | — | |
| | (3.68 | ) | | | — | | | | — | | | | — | | | | (0.04 | ) |
| | (3.68 | ) | | | (0.01 | ) | | | — | | | | — | | | | (0.04 | ) |
| | — | | | | — | | | | — | | | | — | | | | — | |
| $ | 32.19 | | | $ | 31.29 | | | $ | 27.69 | | | $ | 18.13 | | | $ | 16.79 | |
| | | | | | | | | | | | | | | | | | | |
| | 16.48 | % | | | 13.04 | % | | | 52.73 | % | | | 7.98 | % | | | (12.11 | )% |
| | | | | | | | | | | | | | | | �� | | | |
| | | | | | | | | | | | | | | | | | | |
| $ | 279.3 | | | $ | 299.0 | | | $ | 347.8 | | | $ | 78.0 | | | $ | 95.3 | |
| | 1.25 | % | | | 1.33 | % | | | 1.38 | % | | | 1.58 | % | | | 1.39 | % |
| | (0.22 | )% | | | (0.49 | )% | | | (0.90 | )% | | | (1.04 | )% | | | (0.98 | )% |
| | 109.02 | % | | | 192.24 | % | | | 113.27 | % | | | 90.06 | % | | | 132.21 | % |
HENNESSY FUNDS 1-800-966-4354
Financial Highlights
| | | Six Months Ended | | | Year Ended | |
| | | April 30, 2007 | | | October 31, | |
| | | (Unaudited)(2) | | | 2006 | |
PER SHARE DATA: | | | | | | |
| Net asset value, beginning of period | | $ | 12.39 | | | $ | 12.21 | |
| | | | | | | | | |
Income from investment operations: | | | | | | | | |
| Net investment income (loss) | | | (0.04 | ) | | | (0.08 | ) |
| Net realized and unrealized gains (losses) on investments | | | 1.97 | | | | 1.86 | |
| Total from investment operations | | | 1.93 | | | | 1.78 | |
| | | | | | | | | |
Less Distributions: | | | | | | | | |
| Dividends from net investment income | | | — | | | | — | |
| Dividends from net realized gains | | | (0.10 | ) | | | (1.61 | ) |
| Total distributions | | | (0.10 | ) | | | (1.61 | ) |
| Redemption fees retained | | | — | (4) | | | 0.01 | |
| Net asset value, end of period | | $ | 14.22 | | | $ | 12.39 | |
| | | | | | | | | |
TOTAL RETURN | | | 15.69 | % | | | 16.18 | % |
| | | | | | | | | |
SUPPLEMENTAL DATA AND RATIOS: | | | | | | | | |
| Net assets, end of period (millions) | | $ | 250.8 | | | $ | 240.6 | |
| Ratio of net expenses to average net assets: | | | | | | | | |
| Before expense reimbursement | | | 1.25 | % | | | 1.21 | % |
| After expense reimbursement | | | 1.25 | % | | | 1.21 | % |
| Ratio of net investment loss to average net assets: | | | | | | | | |
| Before expense reimbursement | | | (0.63 | )% | | | (0.65 | )% |
| After expense reimbursement | | | (0.63 | )% | | | (0.65 | )% |
| Portfolio turnover rate | | | 11.00 | % | | | 123.71 | % |
(1) | The financial highlights set forth herein include the historical financial highlights of the SYM Select Growth Fund, the assets and liabilities of which were acquired by the Hennessy Focus 30 Fund on September 17, 2003. The investment advisor to the SYM Select Growth Fund was SYM Financial Corporation. |
(2) | All ratios for the period have been annualized, except portfolio turnover and total return. |
(3) | For the one month ended October 31, 2004. Effective October 31, 2004, the Fund changed its fiscal year end to October 31st from September 30th. |
(4) | Amount is less than $0.01. |
(5) | From September 17, 2003 to October 31, 2006, the Hennessy Focus 30 Fund imposed an expense cap of 1.45% of the average daily net assets of the Focus 30 Fund. |
The accompanying notes are an integral part of these financial statements.
FINANCIAL HIGHLIGHTS — HENNESSY FOCUS 30 FUND
| | | | | | | | | | January 1, 2003 | | | | |
| Year Ended | | | Period Ended | | | Year Ended | | | through | | | Year Ended | |
| October 31, | | | October 31, | | | September 30, | | | September 30, | | | December 31, | |
| 2005 | | | 2004(2)(3) | | | 2004 | | | 2003(1)(2) | | | 2002 | |
| $ | 8.67 | | | $ | 8.78 | | | $ | 7.72 | | | $ | 6.63 | | | $ | 9.27 | |
| | | | | | | | | | | | | | | | | | | |
| | | | | | | | | | | | | | | | | | | |
| | (0.04 | ) | | | (0.01 | ) | | | (0.08 | ) | | | (0.03 | ) | | | (0.02 | ) |
| | 3.58 | | | | (0.10 | ) | | | 1.14 | | | | 1.12 | | | | (2.62 | ) |
| | 3.54 | | | | (0.11 | ) | | | 1.06 | | | | 1.09 | | | | (2.64 | ) |
| | | | | | | | | | | | | | | | | | | |
| | | | | | | | | | | | | | | | | | | |
| | — | | | | — | | | | — | | | | — | | | | — | |
| | — | | | | — | | | | — | | | | — | | | | — | |
| | — | | | | — | | | | — | | | | — | | | | — | |
| | — | (4) | | | — | (4) | | | — | (4) | | | — | (4) | | | — | (4) |
| $ | 12.21 | | | $ | 8.67 | | | $ | 8.78 | | | $ | 7.72 | | | $ | 6.63 | |
| | | | | | | | | | | | | | | | | | | |
| | 40.83 | % | | | (1.25 | )% | | | 13.73 | % | | | 16.44 | % | | | (28.48 | )% |
| | | | | | | | | | | | | | | | | | | |
| | | | | | | | | | | | | | | | | | | |
| $ | 125.3 | | | $ | 50.4 | | | $ | 51.1 | | | $ | 33.3 | | | $ | 28.5 | |
| | | | | | | | | | | | | | | | | | | |
| | 1.35 | % | | | 1.45 | % | | | 1.41 | % | | | 1.59 | % | | | 1.54 | % |
| | 1.35 | % | | | 1.45 | % | | | 1.41 | % | | | 1.49 | %(5) | | | 1.50 | % |
| | | | | | | | | | | | | | | | | | | |
| | (0.60 | )% | | | (1.33 | )% | | | (0.92 | )% | | | (0.67 | )% | | | (0.24 | )% |
| | (0.60 | )% | | | (1.33 | )% | | | (0.92 | )% | | | (0.57 | )% | | | (0.20 | )% |
| | 155.26 | % | | | 0.00 | % | | | 113.13 | % | | | 356.77 | % | | | 291.00 | % |
HENNESSY FUNDS 1-800-966-4354
FINANCIAL HIGHLIGHTS — HENNESSY CORNERSTONE VALUE FUND
Financial Highlights
Hennessy Cornerstone Value Fund |
| | | Six Months Ended | | | Year Ended | |
| | | April 30, 2007 | | | October 31, | |
| | | (Unaudited)(2) | | | 2006 | |
PER SHARE DATA: | | | | | | |
| Net asset value, beginning of period | | $ | 15.27 | | | $ | 12.95 | |
| | | | | | | | | |
Income from investment operations: | | | | | | | | |
| Net investment income (loss) | | | 0.21 | | | | 0.30 | |
| Net realized and unrealized gains (losses) on investments | | | 0.98 | | | | 2.36 | |
| Total from investment operations | | | 1.19 | | | | 2.66 | |
| | | | | | | | | |
Less Distributions: | | | | | | | | |
| Dividends from net investment income | | | (0.35 | ) | | | (0.34 | ) |
| Dividends from net realized gains | | | — | | | | — | |
| Total distributions | | | (0.35 | ) | | | (0.34 | ) |
Redemption fees retained(4) | | | — | | | | — | |
| Net asset value, end of period | | $ | 16.11 | | | $ | 15.27 | |
| | | | | | | | | |
TOTAL RETURN | | | 7.90 | % | | | 21.00 | % |
| | | | | | | | | |
SUPPLEMENTAL DATA AND RATIOS: | | | | | | | | |
| Net assets, end of period (millions) | | $ | 222.9 | | | $ | 256.8 | |
| Ratio of net expenses to average net assets | | | 1.17 | % | | | 1.15 | % |
| Ratio of net investment income to average net assets | | | 2.54 | % | | | 2.49 | % |
| Portfolio turnover rate | | | 36.91 | % | | | 35.40 | % |
(1) | For the one month ended October 31, 2004. Effective October 31, 2004, the Fund changed its fiscal year end to October 31st from September 30th. |
(2) | All ratios for the period have been annualized, except portfolio turnover and total return. |
(3) | Net investment income (loss) per share is calculated using the average shares outstanding method. |
(4) | Amount is less than $0.01. |
The accompanying notes are an integral part of these financial statements.
FINANCIAL HIGHLIGHTS — HENNESSY CORNERSTONE VALUE FUND
| Year Ended | | | Period Ended | | | Year Ended September 30, | |
| October 31, | | | October 31, | | | | | | | | | | |
| 2005 | | | 2004(1)(2) | | | 2004 | | | 2003 | | | 2002 | |
| | | | | | | | | | | | | | |
| $ | 12.48 | | | $ | 12.37 | | | $ | 10.51 | | | $ | 8.95 | | | $ | 10.91 | |
| | | | | | | | | | | | | | | | | | | |
| | | | | | | | | | | | | | | | | | | |
| | 0.30 | | | | 0.02 | | | | 0.31 | (3) | | | 0.21 | | | | 0.25 | |
| | 0.41 | | | | 0.09 | | | | 1.76 | | | | 1.55 | | | | (1.95 | ) |
| | 0.71 | | | | 0.11 | | | | 2.07 | | | | 1.76 | | | | (1.70 | ) |
| | | | | | | | | | | | | | | | | | | |
| | | | | | | | | | | | | | | | | | | |
| | (0.24 | ) | | | — | | | | (0.21 | ) | | | (0.20 | ) | | | (0.26 | ) |
| | — | | | | — | | | | — | | | | — | | | | — | |
| | (0.24 | ) | | | — | | | | (0.21 | ) | | | (0.20 | ) | | | (0.26 | ) |
| | — | | | | — | | | | — | | | | — | | | | — | |
| $ | 12.95 | | | $ | 12.48 | | | $ | 12.37 | | | $ | 10.51 | | | $ | 8.95 | |
| | | | | | | | | | | | | | | | | | | |
| | 5.69 | % | | | 0.89 | % | | | 19.83 | % | | | 19.88 | % | | | (16.05 | )% |
| | | | | | | | | | | | | | | | | | | |
| | | | | | | | | | | | | | | | | | | |
| $ | 183.8 | | | $ | 195.6 | | | $ | 194.5 | | | $ | 20.3 | | | $ | 15.8 | |
| | 1.20 | % | | | 1.18 | % | | | 1.18 | % | | | 1.51 | % | | | 1.43 | % |
| | 2.19 | % | | | 1.70 | % | | | 2.56 | % | | | 2.10 | % | | | 2.12 | % |
| | 32.22 | % | | | 0.00 | % | | | 8.20 | % | | | 57.29 | % | | | 76.93 | % |
HENNESSY FUNDS 1-800-966-4354
FINANCIAL HIGHLIGHTS — HENNESSY TOTAL RETURN FUND
Financial Highlights
Hennessy Total Return Fund |
| | | Six Months Ended | | | Year Ended | |
| | | April 30, 2007 | | | October 31, | |
| | | (Unaudited)(2) | | | 2006 | |
PER SHARE DATA: | | | | | | |
| Net asset value, beginning of period | | $ | 12.61 | | | $ | 10.57 | |
| | | | | | | | | |
Income from investment operations: | | | | | | | | |
| Net investment income (loss) | | | 0.17 | | | | 0.31 | |
| Net realized and unrealized gains (losses) on securities | | | 0.62 | | | | 2.03 | |
| Total from investment operations | | | 0.79 | | | | 2.34 | |
| | | | | | | | | |
Less Distributions: | | | | | | | | |
| Dividends from net investment income | | | (0.17 | ) | | | (0.30 | ) |
| Dividends from realized capital gains | | | — | | | | — | |
| Return of capital | | | — | | | | — | |
| Total distributions | | | (0.17 | ) | | | (0.30 | ) |
Redemption fees retained(4) | | | — | | | | — | |
| Net asset value, end of period | | $ | 13.23 | | | $ | 12.61 | |
| | | | | | | | | |
TOTAL RETURN | | | 6.29 | % | | | 22.48 | % |
| | | | | | | | | |
SUPPLEMENTAL DATA AND RATIOS: | | | | | | | | |
| Net assets, end of period (millions) | | $ | 100.1 | | | $ | 113.3 | |
| Ratio of net expenses to average net assets, including interest expense: | | | | | | | | |
| Before expense reimbursement | | | 3.00 | % | | | 2.80 | % |
| After expense reimbursement | | | 3.00 | % | | | 2.80 | % |
| Ratio of net expenses to average net assets, excluding interest expense: | | | | | | | | |
| Before expense reimbursement | | | 1.15 | % | | | 1.16 | % |
| After expense reimbursement | | | 1.15 | % | | | 1.16 | % |
| Ratio of interest expense to average net assets | | | 1.85 | % | | | 1.64 | % |
| Ratio of net investment income (loss) to average net assets: | | | | | | | | |
| Before expense reimbursement | | | 2.60 | % | | | 2.79 | % |
| After expense reimbursement | | | 2.60 | % | | | 2.79 | % |
| Portfolio turnover rate | | | 4.51 | % | | | 24.16 | % |
(1) | For the four months ended October 31, 2004. Effective October 31, 2004, the Fund changed its fiscal year end to October 31st from June 30th. |
(2) | All ratios for the period have been annualized, except portfolio turnover and total return. |
(3) | Net investment income (loss) per share is calculated using the average shares outstanding method. |
(4) | Amount is less than $0.01. |
(5) | From February 27, 2004 to June 30, 2005, the Hennessy Total Return Fund imposed an expense cap, excluding interest expense, of 1.35% of the average daily net assets of the Total Return Fund. |
(6) | The Hennessy Total Return Fund imposed an expense cap, excluding interest expense, of 1.95%. |
The accompanying notes are an integral part of these financial statements.
FINANCIAL HIGHLIGHTS — HENNESSY TOTAL RETURN FUND
| Year Ended | | | Period Ended | | | Year Ended June 30, | |
| October 31, | | | October 31, | | | | | | | | | | |
| 2005 | | | 2004(1)(2) | | | 2004 | | | 2003 | | | 2002 | |
| | | | | | | | | | | | | | |
| $ | 10.40 | | | $ | 10.62 | | | $ | 9.65 | | | $ | 9.78 | | | $ | 10.49 | |
| | | | | | | | | | | | | | | | | | | |
| | | | | | | | | | | | | | | | | | | |
| | 0.23 | | | | 0.07 | | | | 0.17 | (3) | | | 0.12 | | | | 0.11 | |
| | 0.17 | | | | (0.24 | ) | | | 0.92 | | | | (0.13 | ) | | | (0.71 | ) |
| | 0.40 | | | | (0.17 | ) | | | 1.09 | | | | (0.01 | ) | | | (0.60 | ) |
| | | | | | | | | | | | | | | | | | | |
| | | | | | | | | | | | | | | | | | | |
| | (0.23 | ) | | | (0.05 | ) | | | (0.10 | ) | | | (0.12 | ) | | | (0.11 | ) |
| | — | | | | — | | | | — | | | | — | | | | — | |
| | — | | | | — | | | | (0.02 | ) | | | — | | | | — | |
| | (0.23 | ) | | | (0.05 | ) | | | (0.12 | ) | | | (0.12 | ) | | | (0.11 | ) |
| | — | | | | — | | | | — | | | | — | | | | — | |
| $ | 10.57 | | | $ | 10.40 | | | $ | 10.62 | | | $ | 9.65 | | | $ | 9.78 | |
| | | | | | | | | | | | | | | | | | | |
| | 3.83 | % | | | (1.61 | )% | | | 11.36 | % | | | (0.04 | )% | | | (5.73 | )% |
| | | | | | | | | | | | | | | | | | | |
| | | | | | | | | | | | | | | | | | | |
| $ | 86.7 | | | $ | 91.9 | | | $ | 97.0 | | | $ | 6.0 | | | $ | 3.5 | |
| | | | | | | | | | | | | | | | | | | |
| | 2.28 | % | | | 1.78 | % | | | 1.66 | % | | | 2.50 | % | | | 4.97 | % |
| | 2.28 | % | | | 1.78 | % | | | 1.66 | %(5) | | | 2.33 | %(6) | | | 2.33 | %(6) |
| | | | | | | | | | | | | | | | | | | |
| | 1.23 | % | | | 1.20 | % | | | 1.27 | % | | | 2.12 | % | | | 4.35 | % |
| | 1.23 | % | | | 1.20 | % | | | 1.27 | %(5) | | | 1.95 | %(6) | | | 1.71 | %(6) |
| | 1.05 | % | | | 0.58 | % | | | 0.39 | % | | | 0.38 | % | | | 0.62 | % |
| | | | | | | | | | | | | | | | | | | |
| | 2.07 | % | | | 1.85 | % | | | 1.55 | % | | | 1.25 | % | | | (1.58 | )% |
| | 2.07 | % | | | 1.85 | % | | | 1.55 | % | | | 1.42 | % | | | 1.06 | % |
| | 25.70 | % | | | 0.30 | % | | | 8.37 | % | | | 17.60 | % | | | 34.76 | % |
HENNESSY FUNDS 1-800-966-4354
Financial Highlights
| | | Six Months Ended | | | Year Ended | |
| | | April 30, 2007 | | | October 31, | |
| | | (Unaudited)(2) | | | 2006 | |
PER SHARE DATA: | | | | | | |
| Net asset value, beginning of period | | $ | 11.83 | | | $ | 10.56 | |
| | | | | | | | | |
Income from investment operations: | | | | | | | | |
| Net investment income (loss) | | | 0.20 | | | | 0.30 | |
| Net realized and unrealized gains (losses) on securities | | | 0.40 | | | | 1.25 | |
| Total from investment operations | | | 0.60 | | | | 1.55 | |
| | | | | | | | | |
Less Distributions: | | | | | | | | |
| Dividends from net investment income | | | (0.20 | ) | | | (0.28 | ) |
| Dividends from realized capital gains | | | — | | | | — | |
| Return of capital | | | — | | | | — | |
| Total distributions | | | (0.20 | ) | | | (0.28 | ) |
Redemption fees retained(3) | | | — | | | | — | |
| Net asset value, end of period | | $ | 12.23 | | | $ | 11.83 | |
| | | | | | | | | |
TOTAL RETURN | | | 5.13 | % | | | 14.92 | % |
| | | | | | | | | |
SUPPLEMENTAL DATA AND RATIOS: | | | | | | | | |
| Net assets, end of period (millions) | | $ | 18.5 | | | $ | 26.1 | |
| Ratio of net expenses to average net assets | | | 1.37 | % | | | 1.34 | % |
| Ratio of net investment income to average net assets | | | 2.94 | % | | | 2.75 | % |
| Portfolio turnover rate | | | 7.85 | % | | | 87.88 | % |
(1) | For the four months ended October 31, 2004. Effective October 31, 2004, the Fund changed its fiscal year end to October 31st from June 30th. |
(2) | All ratios for the period have been annualized, except portfolio turnover and total return. |
(3) | Amount is less than $0.01. |
The accompanying notes are an integral part of these financial statements.
FINANCIAL HIGHLIGHTS — HENNESSY BALANCED FUND
| Year Ended | | | Period Ended | | | Year Ended June 30, | |
| October 31, | | | October 31, | | | | | | | | | | |
| 2005 | | | 2004(1)(2) | | | 2004 | | | 2003 | | | 2002 | |
| | | | | | | | | | | | | | |
| $ | 10.62 | | | $ | 10.85 | | | $ | 10.44 | | | $ | 10.62 | | | $ | 11.50 | |
| | | | | | | | | | | | | | | | | | | |
| | | | | | | | | | | | | | | | | | | |
| | 0.18 | | | | 0.04 | | | | 0.11 | | | | 0.14 | | | | 0.15 | |
| | (0.07 | ) | | | (0.24 | ) | | | 0.50 | | | | (0.12 | ) | | | (0.50 | ) |
| | 0.11 | | | | (0.20 | ) | | | 0.61 | | | | 0.02 | | | | (0.35 | ) |
| | | | | | | | | | | | | | | | | | | |
| | | | | | | | | | | | | | | | | | | |
| | (0.17 | ) | | | (0.03 | ) | | | (0.12 | ) | | | (0.14 | ) | | | (0.15 | ) |
| | — | | | | — | | | | (0.06 | ) | | | (0.06 | ) | | | (0.38 | ) |
| | — | | | | — | | | | (0.02 | ) | | | — | | | | — | |
| | (0.17 | ) | | | (0.03 | ) | | | (0.20 | ) | | | (0.20 | ) | | | (0.53 | ) |
| | — | | | | — | | | | — | | | | — | | | | — | |
| $ | 10.56 | | | $ | 10.62 | | | $ | 10.85 | | | $ | 10.44 | | | $ | 10.62 | |
| | | | | | | | | | | | | | | | | | | |
| | 1.13 | % | | | (1.86 | )% | | | 5.81 | % | | | 0.24 | % | | | (3.12 | )% |
| | | | | | | | | | | | | | | | | | | |
| | | | | | | | | | | | | | | | | | | |
| $ | 19.3 | | | $ | 21.8 | | | $ | 23.4 | | | $ | 16.1 | | | $ | 15.3 | |
| | 1.49 | % | | | 1.41 | % | | | 1.41 | % | | | 1.50 | % | | | 1.84 | % |
| | 1.58 | % | | | 1.12 | % | | | 1.01 | % | | | 1.40 | % | | | 1.33 | % |
| | 21.31 | % | | | 8.55 | % | | | 45.17 | % | | | 21.79 | % | | | 45.95 | % |
HENNESSY FUNDS 1-800-966-4354
Statement of Cash Flows
Hennessy Total Return Fund For the Six Months Ended April 30, 2007 (Unaudited) |
Cash Flows From Operating Activities: | | | |
| | | | |
| Net increase in net assets from operations | | $ | 6,451,463 | |
| Adjustments to reconcile net increase in net assets from | | | | |
| operations to net cash provided by operating activities: | | | | |
| Purchase of investment securities | | | (344,725,482 | ) |
| Proceeds on sale of securities | | | 365,257,897 | |
| Decrease in other receivables, net | | | 210,640 | |
| Decrease in other assets | | | 2,144 | |
| Increase in accrued expenses and other payables | | | 127,983 | |
| Net accretion of discount on securities | | | (1,569,729 | ) |
| Net realized gain on investments | | | (1,086,840 | ) |
| Unrealized appreciation on securities | | | (3,944,308 | ) |
| Net cash used by operating activities | | $ | 20,723,768 | |
| | | | | |
Cash Flows From Financing Activities: | | | | |
| | | | | |
| Decrease in reverse repurchase agreements | | $ | (1,203,000 | ) |
| Proceeds on shares sold | | | 6,467,513 | |
| Payment on shares repurchased | | | (26,016,504 | ) |
| Cash dividends paid | | | (73,234 | ) |
| Net cash provided by financing activities | | $ | (20,825,225 | ) |
| Net increase (decrease) in cash | | | (101,457 | ) |
| | | | | |
Cash at beginning of period | | | 101,457 | |
Cash at end of period | | $ | — | |
| | | | | |
Cash paid for interest | | $ | 957,832 | |
The accompanying notes are an integral part of these financial statements.
Notes to the Financial Statements April 30, 2007 (Unaudited)
1). ORGANIZATION
The Hennessy Mutual Funds, Inc. was organized as a Maryland corporation on May 20, 1996 and consists of three separate series: Hennessy Cornerstone Growth Fund (the “Growth Fund”), Hennessy Cornerstone Value Fund (the “Value Fund”) and the Hennessy Focus 30 Fund (the “Focus 30 Fund”), formerly SYM Select Growth Fund. These Funds are open-end, diversified management investment companies registered under the Investment Company Act of 1940, as amended. The Growth Fund and Value Fund commenced operations on November 1, 1996 and the Focus 30 Fund commenced operations on September 17, 2003 after acquiring the assets and liabilities of the SYMSelect Growth Fund.
The Hennessy Funds, Inc. was organized as a Maryland corporation on January 11, 1996 and consists of two separate series: Hennessy Balanced Fund (the “Balanced Fund”) and Hennessy Total Return Fund (the “Total Return Fund”). The Balanced and Total Return Funds are open-end, non-diversified management investment companies registered under the Investment Company Act of 1940, as amended. The Balanced Fund and Total Return Fund commenced operations on March 8, 1996 and July 29, 1998, respectively.
The Hennessy Funds Trust was organized as a Delaware Statutory Trust on September 17, 1992 and consists of a sole series: Hennessy Cornerstone Growth Fund, Series II (the “Growth II Fund”). Prior to July 1, 2005, both the Trust and Fund were known as The Henlopen Fund. On July 1, 2005, Hennessy Advisors, Inc., became the investment advisor to the fund and the fund changed its name from “The Henlopen Fund” to “Hennessy Cornerstone Growth Fund, Series II”. The Growth II Fund is an open-end, diversified management investment company registered under the Investment Company Act of 1940, as amended.
The Growth Fund, Growth II Fund, Focus 30 Fund, Value Fund, Total Return Fund and Balanced Fund collectively represent the Hennessy Funds (the “Funds”).
2). SIGNIFICANT ACCOUNTING POLICIES
The following is a summary of significant accounting policies consistently followed by the Funds in the preparation of the financial statements. These policies are in conformity with U.S. generally accepted accounting principles (“GAAP”).
| a). | Investment Valuation – Securities that are primarily traded on a national or foreign securities exchange shall be valued at the last sales price on the exchange on which they are primarily traded on the day of valuation or, if there has been no sale on such day, at the mean between the bid and asked prices. Securities primarily traded in the National Association of Securities Dealers Automated Quotation (“NASDAQ”) National Market System for which market quotations are readily available shall be valued using the |
HENNESSY FUNDS 1-800-966-4354
NOTES TO THE FINANCIAL STATEMENTS
| NASDAQ Official Closing Price (“NOCP”). If the NOCP is not available, such securities shall be valued at the last sale price on the day of valuation, or if there has been no sale on such day, at the mean between the bid and asked prices. Instruments with a remaining maturity of 60 days or less are valued on an amortized cost basis. When a price for an underlying security is not readily available or if a significant event has occurred that indicates the closing price of a security no longer represents the true value of that security, fair value pricing procedures have been adopted by the Board of Directors of the Funds. Fair value pricing determinations are made in good faith in accordance with these procedures. There are numerous criteria that will be given consideration in determining a fair value of a security. Some of these criteria are: trading volume of security and markets, value of other like securities and news events with direct bearing to security or market. Fair value pricing results in an estimated price that reasonably reflects the current market conditions in order to rate the portfolio holdings such that shareholder transactions receive a fair net asset value. |
| b). | Federal Income Taxes – Provision for federal income taxes or excise taxes has not been made since the Funds have elected to be taxed as “regulated investment companies” and intend to distribute substantially all taxable income to shareholders and otherwise comply with the provisions of the Internal Revenue Code applicable to regulated investment companies. Net investment income and realized gains and losses for federal income tax purposes may differ from that reported on the financial statements because of temporary book and tax basis differences. Temporary differences are primarily the result of the treatment of wash sales for tax reporting purposes. Distributions from net realized gains for book purposes may include short-term capital gains, which are included as ordinary income to shareholders for tax purposes. |
| Due to inherent differences in the recognition of income, expenses, and realized gains/losses under U.S. generally accepted accounting principles and federal income tax purposes, permanent differences between book and tax basis reporting for the 2006 fiscal year have been identified and appropriately reclassified on the Statement of Assets and Liabilities. For the year ended October 31, 2006, the Growth Fund had a $2,547,605 permanent book and tax basis difference relating to the Fund’s net operating loss which resulted in an increase in accumulated net investment income and a decrease in paid-in capital. The Growth II Fund had a $207,230 permanent book and tax basis difference relating to the Growth II Fund’s net operating loss which resulted in an increase in accumulated net investment income and a decrease in paid-in capital. The Focus 30 Fund had a $1,552,126 permanent book and tax basis difference relating to the Fund’s net operating loss which resulted in an increase in accumulated net investment income and decrease in paid in capital. The Value Fund had a $32,310,253 permanent book and tax basis difference relating to the expiration of the Fund’s prior year capital loss carry forward which resulted in an increase in accumulated realized gain and a decrease in accumulated paid-in capital. |
| c). | Income and Expenses – Dividend income is recognized on the ex-dividend date and interest income is recognized on an accrual basis. The Funds are |
NOTES TO THE FINANCIAL STATEMENTS
| charged for those expenses that are directly attributable to the portfolio, such as advisory, administration and certain shareholder service fees. |
| d). | Distributions to Shareholder – Dividends from net investment income for the Growth, Growth II, Focus 30 and Value Funds, if any, are declared and paid out annually, usually in November or December of each year. Dividends from net investment income for the Total Return and Balanced Funds are declared and paid on a calendar quarter basis. Distributions of net realized capital gains, if any, are declared and paid annually, usually in November or December of each year, for all of the Funds. |
| e). | Security Transactions – Investment and shareholder transactions are recorded on the trade date. The Funds determine the gain or loss realized from the investment transactions by comparing the original cost of the security lot sold with the net sale proceeds. Discounts and premiums on securities purchased are accreted/amortized over the life of the respective security. |
| f). | Use of Estimates – The preparation of financial statements in conformity with GAAP requires management to make estimates and assumptions that affect the reported amounts of assets and liabilities and disclosure of contingent assets and liabilities at the date of the financial statements and the reported change in net assets during the reporting period. Actual results could differ from those estimates. |
| g). | Share Valuation – The net asset value (“NAV”) per share of each Fund is calculated by dividing the sum of the value of the securities held by each Fund, plus cash or other assets, minus all liabilities (including estimated accrued expenses) by the total number of shares outstanding for each Fund, rounded to the nearest cent. The Funds’ shares will not be priced on the days on which the NYSE is closed for trading. The offering and redemption price per share for each Fund is equal to each Fund’s net asset value per share. The Funds charge a 1.50% redemption fee on shares held less than 90 days. These fees are deducted from the redemption proceeds otherwise payable to the shareholder. The Funds will retain the fee charged as paid-in capital and such fees become part of that Fund’s daily NAV calculation. |
| h). | Repurchase Agreements – Each Fund may enter into repurchase agreements with member banks or security dealers of the Federal Reserve whom the investment advisor deems creditworthy. The repurchase price generally equals the price paid by the Fund plus interest negotiated on the basis of current short-term rates. |
| Securities pledged as collateral for repurchase agreements are held by the custodian bank until the respective agreements mature. Provisions of the repurchase agreements ensure that the market value of the collateral, including accrued interest thereon, is sufficient, in the event of default of the counterparty. If the counterparty defaults and the value of the collateral declines or if the counterparty enters an insolvency proceeding, realization of the collateral by the Fund may be delayed or limited. |
| i). | Recently Issued Accounting Pronouncements – On July 13, 2006, the Financial Accounting Standards Board (“FASB”) released FASB Interpretation No. 48 “Accounting for Uncertainty in Income Taxes” (“FIN 48”). FIN 48 provides guidance for how uncertain tax positions should be recognized, |
HENNESSY FUNDS 1-800-966-4354
NOTES TO THE FINANCIAL STATEMENTS
| measured, presented and disclosed in the financial statements. FIN 48 requires the evaluation of tax positions taken or expected to be taken in the course of preparing the Funds tax returns to determine whether the tax positions are “more-likely-than-not” of being sustained by the applicable tax authority. Tax positions not deemed to meet the more-likely-than-not threshold would be recorded as a tax benefit or expense in the current year. Adoption of FIN 48 is required as of the date of the last Net Asset Value (“NAV”) calculation in the first required financial statement reporting period for fiscal years beginning after December 15, 2006 and is to be applied to all open tax years as of the effective date. At this time, management is evaluating the implications of FIN 48 and its impact on each of the Fund’s financial statements has not yet been determined. |
| In September 2006, FASB issued FASB Statement No. 157, “Fair Value Measurement” (“SFAS 157”), which defines fair value, establishes a framework for measuring fair value, and expands disclosures about fair value measurements. SFAS 157 is effective for fiscal years beginning after November 15, 2007, and interim periods within those fiscal years. The Funds believe the adoption of SFAS 157 will have no material impact on their financial statements. |
3). REVERSE REPURCHASE AGREEMENTS
The Total Return Fund has entered into reverse repurchase agreements with UBS PaineWebber, Inc., under which the Total Return Fund sells securities and agrees to repurchase them later at a mutually agreed upon price. For the six months ended April 30, 2007, the average daily balance and average interest rate in effect for reverse repurchase agreements was $38,917,337 and 5.177%, respectively. At April 30, 2007, the interest rate in effect for the outstanding reverse repurchase agreement, scheduled to mature on May 24, 2007 ($13,320,000), June 21, 2007 ($13,320,000), July 19, 2007 ($11,557,000) were 5.15%, 5.10% and 5.00% and was equal to 27.50% of the Total Return Fund’s total assets.
4). INVESTMENT TRANSACTIONS
During the six months ended April 30, 2007, purchases and sales of investment securities (excluding short-term investments) were as follows:
| | | Growth | | | | | | Focus 30 | | | Value | | | Total Return | | | Balanced | |
| | | Fund | | | Growth II Fund | | | Fund | | | Fund | | | Fund | | | Fund | |
| Purchases | | $ | 1,056,326,063 | | | $ | — | | | $ | 23,960,584 | | | $ | 86,566,928 | | | $ | 3,722,503 | | | $ | 805,753 | |
| Sales | | $ | 1,265,888,184 | | | $ | 65,175,808 | | | $ | 59,680,151 | | | $ | 124,150,879 | | | $ | 15,786,170 | | | $ | 5,530,242 | |
NOTES TO THE FINANCIAL STATEMENTS
5). INVESTMENT MANAGEMENT FEE AND OTHER TRANSACTIONS WITH AFFILIATES
Hennessy Advisors, Inc. (the “Advisor”) is the Advisor of the Funds. The Advisor provides the Funds with investment management services under a Management Agreement. The Advisor furnishes all investment advice, office space, facilities, and provides most of the personnel needed by the Funds. As compensation for its services, the Advisor is entitled to a monthly fee from each Fund. The fee is based upon the average daily net assets of the Funds at the annual rate of:
| Growth Fund | 0.74% |
| Growth II Fund | 0.74% |
| Focus 30 Fund | 0.74% |
| Value Fund | 0.74% |
| Total Return Fund | 0.60% |
| Balanced Fund | 0.60% |
The Board of Directors has approved a Shareholder Servicing Plan which was instituted to compensate the Advisor for the non-investment management services it provides the Growth, Growth II, Focus 30 and Value Funds. The Plan provides for a monthly fee paid to the Advisor at an annual rate of 0.10% of the average daily net assets of the Growth, Growth II, Focus 30 and Value Funds. At its meeting on June 5, 2007, the Board of Directors approved a Shareholder Servicing Plan for the Total Return and Balanced Funds. Effective July 1, 2007, the Plan provides for a monthly fee paid to the Advisor at a rate of 0.10% of the average daily net assets of the Total Return and Balanced Funds.
The Growth Fund,Growth II Fund, Focus 30 Fund and Value Fund have entered into agreements with various brokers, dealers and financial intermediaries in connection with the sale of shares of the Funds. The agreements provide for periodic payments by the Funds to the brokers, dealers and financial intermediaries for providing certain shareholder maintenance services (sub-transfer agent expenses). These shareholder services include: the pre-processing and quality control of new accounts, shareholder correspondence, answering customer inquiries regarding account status and facilitating shareholder telephone transactions. Fees paid by the Growth Fund, Growth II Fund, Focus 30 Fund and Value Fund to various brokers, dealers and financial intermediaries for the six months ended April 30, 2007, were $594,612, $113,161, $108,640 and $66,861, respectively.
The Total Return and Balanced Funds have adopted a plan pursuant to Rule 12b-1 which authorizes payments in connection with the distribution of the Total Return and Balanced Fund shares at an annual rate not to exceed 0.25% of each Fund’s average daily net assets. At its meeting on June 5, 2007, the Board of Directors approved a 0.10% reduction of the 12b-1 accrual. Effective July 1, 2007, the Total Return and Balanced Funds Plan will accrue 12b-1 fees at a rate of 0.15% of the average daily net assets of the Total Return and Balanced Funds. Overall, the changes to the fee structures of the Total Return and Balanced Funds will have a zero net effect on the total expense ratios of each respective Fund. Amounts paid under the Plan may be spent on any activities or expenses primarily intended to result in the sale of shares, including but not limited to, advertising, compensation for sales and marketing activities or financial
HENNESSY FUNDS 1-800-966-4354
NOTES TO THE FINANCIAL STATEMENTS
institutions and others such as dealers and distributors, shareholder account servicing, the printing and mailing of prospectuses to other than current shareowners and the printing and mailing of sales literature.
U.S. Bancorp Fund Services, LLC (the “Administrator”) acts as the Funds’ Administrator under an Administration Agreement. The Administrator prepares various federal and state regulatory filings, prepares reports and reports returns for the Funds; prepares reports and materials to be supplied to the directors; monitors the activities of the Funds’ custodian, transfer agent and accountants; coordinates the preparation and payment of the Funds’ expenses and reviews the Funds’ expense accruals. Fees paid to U.S. Bancorp Fund Services, LLC for the six months ended April 30, 2007, were $1,373,389, $248,496, $251,739, $279,293, $126,735 and $23,103 for Growth, Growth II, Focus 30, Value, Total Return and Balanced Funds, respectively.
The SYM Select Growth Fund was the predecessor fund of the Focus 30 Fund. The financial highlights reported for periods before September 17, 2003, represent the activity of the SYM Select Growth Fund.
The Henlopen Fund was the predecessor fund of the Growth II Fund. The financial highlights reported for periods before July 1, 2005, represent the activity of The Henlopen Fund.
Quasar Distributors, LLC (the “Distributor”) acts as the Funds’ principal underwriter in a continuous public offering of the Funds’ shares. The Distributor is an affiliated company of U.S. Bank, N.A.
6). LINE OF CREDIT
The Growth, Growth II, Focus 30, and Value Funds have $20,000,000, $10,000,000, $20,000,000 and $20,000,000 lines of credit, respectively, intended to provide short-term financing, if necessary, subject to certain restrictions, in connection with shareholder redemptions. The credit facility is with its custodian bank, U.S. Bank, N.A. During the six months ended April 30, 2007, the Growth Fund had an outstanding average daily balance and a weighed average interest rate of $535,306 and 8.25%, respectively. The maximum amount outstanding for the Growth Fund during the period was $12,251,000. During the six months ended April 30, 2007, the Growth II Fund had an outstanding average daily balance and a weighed average interest rate of $52,539 and 8.25%, respectively. The maximum amount outstanding for the Growth II Fund during the period was $1,395,000. During the six months ended April 30, 2007, the Focus 30 Fund had an outstanding average daily balance and a weighed average interest rate of $325,741 and 8.25%, respectively. The maximum amount outstanding for the Focus 30 Fund during the period was $5,449,000. During the six months ended April 30, 2007, the Value Fund had an outstanding average balance and a weighted average interest rate of $158,088 and 8.25%. The maximum amount outstanding for the Value Fund during the period was $4,290,000.
NOTES TO THE FINANCIAL STATEMENTS
7). FEDERAL TAX INFORMATION
The following balances for the Funds are as of October 31, 2006, the Funds’ most recent fiscal year end:
| | | Growth | | | Growth II | | | Focus 30 | |
| | | Fund | | | Fund | | | Fund | |
| Cost of Investments for tax purposes | | $ | 1,170,435,416 | | | $ | 223,766,370 | | | $ | 231,512,070 | |
| Gross tax unrealized appreciation | | | 204,399,099 | | | | 25,469,586 | | | | 11,780,998 | |
| Gross tax unrealized depreciation | | | (122,579,679 | ) | | | (8,980,483 | ) | | | (2,974,908 | ) |
| Net tax unrealized appreciation | | | | | | | | | | | | |
| (depreciation) on investments | | | 81,819,420 | | | | 16,489,103 | | | | 8,806,090 | |
| Undistributed ordinary income | | $ | — | | | $ | 825,569 | | | $ | — | |
| Undistributed long-term capital gains | | $ | 183,483,212 | | | $ | 8,406,261 | | | $ | 1,781,571 | |
| Total Distributable earnings | | $ | 183,483,212 | | | $ | 9,231,830 | | | $ | 1,781,571 | |
| Other accumulated gains (losses) | | $ | (1,825,255 | ) | | $ | — | | | $ | — | |
| Total accumulated earnings (losses) | | $ | 263,477,377 | | | $ | 25,720,933 | | | $ | 10,587,661 | |
| | | Value | | | Total Return | | | Balanced | |
| | | Fund | | | Fund | | | Fund | |
| Cost of Investments for tax purposes | | $ | 229,515,538 | | | $ | 145,617,179 | | | $ | 24,648,863 | |
| Gross tax unrealized appreciation | | | 29,340,557 | | | | 9,505,583 | | | | 1,783,471 | |
| Gross tax unrealized depreciation | | | (5,396,181 | ) | | | (2,493,255 | ) | | | (345,612 | ) |
| Net tax unrealized appreciation | | | | | | | | | | | | |
| (depreciation) on investments | | | 23,944,376 | | | | 7,012,328 | | | | 1,437,859 | |
| Undistributed ordinary income | | $ | 4,008,165 | | | $ | 221,710 | | | $ | 70,517 | |
| Undistributed long-term capital gains | | $ | — | | | $ | — | | | $ | — | |
| Total Distributable earnings | | $ | 4,008,165 | | | $ | 221,710 | | | $ | 70,517 | |
| Other accumulated gains (losses) | | $ | (97,083,657 | ) | | $ | (90,782,182 | ) | | $ | (2,153,876 | ) |
| Total accumulated earnings (losses) | | $ | (69,131,116 | ) | | $ | (83,548,144 | ) | | $ | (645,500 | ) |
At October 31, 2006, the Growth Fund had tax basis capital losses of $1,825,255, to offset future capital gains, the use of a portion of which is limited by IRS regulations. Of such losses, $752,784 expire October 31, 2008, $889,912 expire October 31, 2009, and $182,559 expire October 31, 2010. Additionally, the Growth Fund had no post-October loss deferrals as of October 31, 2006.
At October 31, 2006, the Growth II Fund had no tax basis capital losses. Additionally, the Growth II Fund had no post-October loss deferrals as of October 31, 2006.
At October 31, 2006, the Focus 30 Fund had no tax basis capital losses which may be carried over to offset future capital gains. Additionally, the Focus 30 Fund had no post-October loss deferrals as of October 31, 2006.
At October 31, 2006, the Value Fund had tax basis capital losses of $97,083,657, to offset future capital gains, the use of a portion of which is limited by IRS regulations. Of such losses, $57,383,495 expire October 31, 2007, $11,505,303 expire October 31, 2008, $27,482,264 expire October 31, 2010 and $712,595 expire October 31, 2011. Additionally, the Value Fund had no post-October loss deferrals as of October 31, 2006.
HENNESSY FUNDS 1-800-966-4354
NOTES TO THE FINANCIAL STATEMENTS
At October 31, 2006, the Total Return Fund had tax basis capital losses of $90,782,182, which may be carried over to offset future capital gains. Of such losses, $56,123,604 expire on October 31, 2008 and $34,658,578 expire October 31, 2009. Additionally, the Total Return Fund had no post-October loss deferrals as of October 31, 2006.
At October 31, 2006, the Balanced Fund had tax basis capital losses of $2,153,876, to offset future capital gains, the use of a portion of which is limited by IRS regulations. Of such losses, $969,136 expire October 31, 2008, $447,964 expire October 31, 2009, $447,964 expire October 31, 2010 and $288,812 expire October 31, 2012. Additionally, the Balanced Fund had no post-October loss deferrals as of October 31, 2006.
The tax character of distributions paid during 2007 and 2006 for the Funds were as follows:
| | | Six Months Ended | | | | |
| | | April 30, 2007 | | | Year Ended | |
Growth Fund | | (Unaudited) | | | October 31, 2006 | |
| Distributions paid from: | | | | | | |
| Ordinary income | | $ | — | | | $ | 46,111,012 | |
| Long-term capital gain | | | 183,483,584 | | | | 22,116,736 | |
| | | $ | 183,483,584 | | | $ | 68,227,748 | |
| | | Six Months Ended | | | | | | | |
| | | April 30, 2007 | | | Period Ended | | | Year Ended | |
Growth II Fund | | (Unaudited) | | | October 31, 2006(1) | | | June 30, 2006 | |
| Distributions paid from: | | | | | | | | | |
| Ordinary income | | $ | 8,406,308 | | | $ | — | | | $ | 23,569,994 | |
| Long-term capital gain | | | 825,637 | | | | — | | | | 7,423,778 | |
| | | $ | 9,281,945 | | | $ | — | | | $ | 30,993,772 | |
| | | Six Months Ended | | | | |
| | | April 30, 2007 | | | Year Ended | |
Focus 30 Fund | | (Unaudited) | | | October 31, 2006 | |
| Distributions paid from: | | | | | | |
| Ordinary income | | $ | — | | | $ | — | |
| Long-term capital gain | | | 1,781,615 | | | | 17,767,996 | |
| | | $ | 1,781,615 | | | $ | 17,767,996 | |
| | | Six Months Ended | | | | |
| | | April 30, 2007 | | | Year Ended | |
Value Fund | | (Unaudited) | | | October 31, 2006 | |
| Distributions paid from: | | | | | | |
| Ordinary income | | $ | 5,691,101 | | | $ | 4,751,582 | |
| Long-term capital gain | | | — | | | | — | |
| | | $ | 5,691,101 | | | $ | 4,751,582 | |
(1) | For the four months ended October 31, 2006. Effective October 31, 2006, the Fund changed its fiscal year end to October 31st from June 30th. |
NOTES TO THE FINANCIAL STATEMENTS
| | | Six Months Ended | | | | |
| | | April 30, 2007 | | | Year Ended | |
Total Return Fund | | (Unaudited) | | | October 31, 2006 | |
| Distributions paid from: | | | | | | |
| Ordinary income | | $ | 1,429,858 | | | $ | 2,378,688 | |
| Long-term capital gain | | | — | | | | — | |
| | | $ | 1,429,858 | | | $ | 2,378,688 | |
| | | Six Months Ended | | | | |
| | | April 30, 2007 | | | Year Ended | |
Balanced Fund | | (Unaudited) | | | October 31, 2006 | |
| Distributions paid from: | | | | | | |
| Ordinary income | | $ | 321,243 | | | $ | 556,830 | |
| Long-term capital gain | | | — | | | | — | |
| | | $ | 321,243 | | | $ | 556,830 | |
8). FEDERAL TAX DISTRIBUTION INFORMATION
The Growth, Value, Total Return and Balanced Funds designate 9%, 100%, 100%, and 74%, respectively of the dividends declared from net investment income during the year ended October 31, 2006, as qualified dividend income under the Jobs Growth and Tax Reconciliation Act of 2003.
For the year ended October 31, 2006, 8%, 100%, 100% and 74% of the ordinary distributions paid by the Growth, Value, Total Return and Balanced Funds qualify for the dividends received deduction available to corporate shareholders.
Additional Information Applicable to Foreign Shareholders Only. For the year ended October 31, 2006, the funds designate the following percent of ordinary distributions paid as interest-related dividends under the Internal Revenue Code Section 871(k)(1)(c): Growth Fund 1%, Value Fund 1%, Total Return Fund 46%, Balanced Fund 51%. For the fiscal year ended October 31, 2006, the following percentages of its ordinary income distributions paid are designated as short-term capital gain distributions under the Internal Revenue Code Section 871(k)(2)(c): Growth Fund - 100%, Value Fund - 0%, Total Return Fund - 0%, Balanced Fund - 0%.
HENNESSY FUNDS 1-800-966-4354
Expense Example
April 30, 2007 (Unaudited)
As a shareholder of the Funds, you incur two types of costs: (1) transaction costs, including sales charges (loads) on purchase payments, reinvested dividends, or other distributions; redemption fees; and exchange fees; and (2) ongoing costs, including management fees; service fees; and other fund expenses. This Example is intended to help you understand your ongoing costs (in dollars) of investing in each of the Funds and to compare these costs with the ongoing costs of investing in other mutual funds. The Example is based on an investment of $1,000 invested at the beginning of the period and held for the entire period from November 1, 2006 to April 30, 2007.
Actual Expenses
The first set of lines of the table below provide information about actual account values and actual expenses. Although the Funds charge no sales loads or transaction fees, you will be assessed fees for outgoing wire transfers, returned checks and stop payment orders at prevailing rates charged by U.S. Bancorp Fund Services, LLC, the Funds’ transfer agent. If you request that a redemption be made by wire transfer, currently a $15.00 fee is charged by the Funds’ transfer agent. You will be charged a redemption fee equal to 1.50% of the net amount of the redemption if you redeem your shares less than 90 calendar days after you purchase them. IRA accounts will be charged a $15.00 annual maintenance fee. The example below includes, but is not limited to, management fees, shareholder servicing fees, fund accounting, custody and transfer agent fees. However, the example below does not include portfolio trading commissions and related expenses, interest expense or dividends on short positions taken by the Fund and other extraordinary expenses as determined under generally accepted accounting principles. You may use the information within these lines, together with the amount you invested, to estimate the expenses that you paid over the six-month period. Simply divide your account value by $1,000 (for example, an $8,600 account value divided by $1,000 = 8.6), then multiply the result by the number in the first line under the heading entitled “Expenses Paid During Period” to estimate the expenses you paid on your account during this period.
Hypothetical Example for Comparison Purposes
The second set of lines within the table below provide information about hypothetical account values and hypothetical expenses based on the Funds’ actual expense ratios and an assumed rate of return of 5% per year before expenses, which is not the Funds’ actual return. The hypothetical account values and expenses may not be used to estimate the actual ending account balance or expenses you paid for the period. You may use this information to compare the ongoing costs of investing in the Funds and other funds. To do so, compare this 5% hypothetical example with the 5% hypothetical examples that appear in the shareholder reports of the other funds. Please note that the expenses shown in the table are meant to highlight your ongoing costs only and do not reflect any transactional costs, such as sales charges (loads), redemption fees, or exchange
EXPENSE EXAMPLE
fees. Therefore, the second line of the table is useful in comparing ongoing costs only, and will not help you determine the relative total costs of owning different funds. In addition, if these transactional costs were included, your costs would have been higher.
| | | Beginning | | | Ending | | | Expenses Paid | |
| | | Account Value | | | Account Value | | | During Period(1) | |
| | | 11/1/06 | | | 4/30/07 | | | 11/1/06 – 4/30/07 | |
Actual | | | | | | | | | |
| Growth Fund | | $ | 1,000.00 | | | $ | 1,081.80 | | | $ | 6.17 | |
| Growth II Fund | | $ | 1,000.00 | | | $ | 1,061.20 | | | $ | 6.38 | |
| Focus 30 Fund | | $ | 1,000.00 | | | $ | 1,156.90 | | | $ | 6.67 | |
| Value Fund | | $ | 1,000.00 | | | $ | 1,079.00 | | | $ | 6.05 | |
| Total Return Fund | | $ | 1,000.00 | | | $ | 1,062.90 | | | $ | 15.36 | |
| Balanced Fund | | $ | 1,000.00 | | | $ | 1,051.30 | | | $ | 6.95 | |
| | | | | | | | | | | | | |
Hypothetical (5% return | | | | | | | | | | | | |
before expenses) | | | | | | | | | | | | |
| Growth Fund | | $ | 1,000.00 | | | $ | 1,018.86 | | | $ | 5.99 | |
| Growth II Fund | | $ | 1,000.00 | | | $ | 1,018.60 | | | $ | 6.25 | |
| Focus 30 Fund | | $ | 1,000.00 | | | $ | 1,018.61 | | | $ | 6.25 | |
| Value Fund | | $ | 1,000.00 | | | $ | 1,018.78 | | | $ | 5.87 | |
| Total Return Fund | | $ | 1,000.00 | | | $ | 1,009.90 | | | $ | 14.97 | |
| Balanced Fund | | $ | 1,000.00 | | | $ | 1,018.02 | | | $ | 6.84 | |
| (1) | Expenses are equal to the Growth Fund’s expense ratio of 1.20%, the Growth IIFund’s expense ratio of 1.25%, the Focus 30 Fund’s expense ratio of 1.25%, the Value Fund’s expense ratio of 1.17%, the Total Return Fund’s expense ratio of 3.00%, and the Balanced Fund’s expense ratio of 1.37%, multiplied by the average account value over the period, multiplied by the number of days in the most recent half-year/365 days (to reflect one-half year period). |
HENNESSY FUNDS 1-800-966-4354
PROXY VOTING POLICY
How to Obtain a Copy of the Funds’ Proxy Voting Policy and Proxy Voting Records
A description of the policies and procedures that the Funds use to determine how to vote proxies relating to portfolio securities is available without charge: (1) by calling 1-800-966-4354; (2) on the Hennessy Funds website at www.hennessyfunds.com; or (3) on the U.S. Securities and Exchange Commission’s website at www.sec.gov. Hennessy Funds’ proxy voting record is available on the SEC’s website at www.sec.gov no later than August 31 for the prior 12 months ending June 30.
Quarterly Filings on Form N-Q
The Funds file their complete schedule of portfolio holdings with the SEC for the first and third quarters of each fiscal year on Form N-Q. The Funds’ Form N-Q will be available on the SEC’s website at www.sec.gov. The Funds’ Form N-Q may be reviewed and copied at the SEC’s Public Reference Room in Washington, DC and information on the operation of the Public Reference Room may be obtained by calling 1-800-SEC-0330. Information included in the Funds’ N-Q will also be available upon request by calling 1-800-966-4354.
Board Approval of Continuation of Investment Advisory Agreement
At its meeting on March 6, 2007, the Board of Directors (the “Board”) of The Hennessy Funds, Inc. (the “Company”) and its two series, the Hennessy Balanced Fund (the “Balanced Fund”) and the Hennessy Total Return Fund (the “Total Return Fund”) (each a “Fund” or collectively the “Funds”), The Hennessy Mutual Funds, Inc. (the “Company”) and its three series, the Hennessy Cornerstone Growth Fund (the “Growth Fund”), the Hennessy Cornerstone Value Fund (the “Value Fund”), and the Hennessy Focus 30 Fund (the “Focus 30 Fund”) and The Hennessy Funds Trust (the “Company”) which includes the Hennessy Cornerstone Growth Fund, Series II (the “Growth II Fund”) (each a “Fund” or collectively the “Funds”), including the Directors who are not “interested persons” (as defined in the Investment Company Act of 1940) of the Funds’ voted to re-approve the current investment advisory agreement (the “Advisory Agreement”) between the Funds and Hennessy Advisors, Inc. (the “Advisor”). In connection with its re-approval of the Advisory Agreement, the Board considered the following factors:
The Board reviewed and discussed the specific services provided by the Advisor. The Advisor:
| 1) | Provides formula driven investment management for The Funds. Hennessy Advisors, Inc. holds the rights to the formulas used for The Cornerstone Growth, Growth II, Value and Focus 30. In providing investment management, Hennessy Advisors, Inc. directs and oversees the trading of securities within and the rebalancing of the portfolios of The Funds. |
| 2) | Continues to retain the services of The Funds’ Chief Compliance Officer and will make all reasonable efforts to insure that The Funds are in compliance with the securities laws. |
| 3) | Provides responsive customer and shareholder servicing which consists of providing a call center to respond to shareholder inquiries, including specific mutual fund account information. |
| 4) | Oversees distribution of The Funds through third-party broker/dealers and independent financial institutions such as Charles Schwab, Inc., Fidelity, TD Waterhouse and Pershing. Hennessy Advisors participates in “no transaction fee” (“NTF“) programs with these companies, which allows customers to purchase the Hennessy Funds through third party distribution channels without paying a transaction fee. Hennessy Advisors compensates these third party distributors under a pre-determined contractual agreement. |
| 5) | Oversees those third party service providers that support The Funds in providing fund accounting, fund administration, fund distribution, transfer agency and custodial services. |
The Board also: (i) compared the performance of each Fund to benchmark indices over various periods of time and concluded that the performance of each Fund warranted the continuation of the Advisory Agreement; (ii) compared the
HENNESSY FUNDS 1-800-966-4354
BOARD APPROVAL OF CONTINUATION OF INVESTMENT ADVISORY AGREEMENT
expense ratios of funds similar in asset size and investment objective to each of the Funds and concluded the expenses of each Fund were reasonable and warranted continuation of the Advisory Agreement; (iii) considered the fees charged by Hennessy Advisors, Inc. to those of funds similar in asset size and investment objective to each of the Funds and concluded the advisory fees of each Fund were reasonable and warranted continuation of the Advisory Agreement; and (iv) considered the profitability of Hennessy Advisors, Inc. with respect to each Fund, the profits were reasonable and not excessive when compared to profitability guidelines set forth in relevant court cases.
The Board then discussed economies of scale and breakpoints and determined that the Funds managed by Hennessy Advisors, Inc. have not yet grown in size, nor has their marketplace demonstrated significantly rapid potential growth to any extent that would warrant the use of breakpoints by the manager. In reaching this conclusion the Board took into consideration the profitability of Hennessy Advisors, Inc. and the advisory fees of comparable mutual funds.
The Board reviewed the Funds’ expense ratios and comparable expense ratios for funds like the six funds being considered for contract renewal by Hennessy Advisors, Inc. The Board used data from Lipper showing funds similar in nature to the Funds (Mid-Cap Blend, Small Cap Blend, etc.). The Board determined that the expense ratios of the Funds fall within the range of the ratios of other funds in their classification. Based on the factors discussed above, the Board, including all Independent Directors, recommended continuation of the Advisory Agreement.
(This Page Intentionally Left Blank.)
HENNESSY FUNDS 1-800-966-4354
For information, questions
or assistance, please call
The Hennessy Funds
1-800-966-4354 or 1-415-899-1555
INVESTMENT ADVISOR
Hennessy Advisors, Inc.
7250 Redwood Blvd., Suite 200
Novato, California 94945
ADMINISTRATOR, TRANSFER
AGENT, DIVIDEND PAYING
AGENT & SHAREHOLDER
SERVICING AGENT
U.S. Bancorp Fund Services, LLC
P.O. Box 701
Milwaukee, Wisconsin 53201-0701
CUSTODIAN
U.S. Bank, N.A.
Custody Operations
1555 North RiverCenter Dr., Suite 302
Milwaukee, Wisconsin 53212
DIRECTORS
Neil J. Hennessy
Robert T. Doyle
J. Dennis DeSousa
Gerald P. Richardson
COUNSEL
Foley & Lardner LLP
777 East Wisconsin Avenue
Milwaukee, Wisconsin 53202-5306
INDEPENDENT REGISTERED
PUBLIC ACCOUNTING FIRM
KPMG LLP
303 East Wacker Drive
Chicago, Illinois 60601
DISTRIBUTOR
Quasar Distributors, LLC
615 East Michigan Street
Milwaukee, Wisconsin 53202
WWW.HENNESSYFUNDS.COM
This report has been prepared for shareholders and may be distributed
to others only if preceded or accompanied by a current prospectus.
Item 2. Code of Ethics.
Not applicable for semi-annual reports.
Item 3. Audit Committee Financial Expert.
Not applicable for semi-annual reports.
Item 4. Principal Accountant Fees and Services.
Not applicable for semi-annual reports.
Item 5. Audit Committee of Listed Registrants.
Not applicable to registrants who are not listed issuers (as defined in Rule 10A-3 under the Securities Exchange Act of 1934).
Item 6. Schedule of Investments.
Schedule of Investments is included as part of the report to shareholders filed under Item 1 of this Form.
Item 7. Disclosure of Proxy Voting Policies and Procedures for Closed-End Management Investment Companies.
Not applicable to open-end investment companies.
Item 8. Portfolio Managers of Closed-End Management Investment Companies.
Not applicable to open-end investment companies.
Item 9. Purchases of Equity Securities by Closed-End Management Investment Company and Affiliated Purchasers.
Not applicable to open-end investment companies.
Item 10. Submission of Matters to a Vote of Security Holders.
Not Applicable.
Item 11. Controls and Procedures.
| (a) | The Registrant’s President/Chief Executive Officer and Treasurer/Chief Financial Officer have reviewed the Registrant's disclosure controls and procedures (as defined in Rule 30a-3(c) under the Investment Company Act of 1940 (the “Act”)) as of a date within 90 days of the filing of this report, as required by Rule 30a-3(b) under the Act and Rules 13a-15(b) or 15d-15(b) under the Securities Exchange Act of 1934. Based on their review, such officers have concluded that the disclosure controls and procedures are effective in ensuring that information required to be disclosed in this report is appropriately recorded, processed, summarized and reported and made known to them by others within the Registrant and by the Registrant’s service provider. |
| (b) | There were no significant changes in the Registrant's internal controls over financial reporting that occurred during the Registrant's last fiscal half-year that has materially affected, or is reasonably likely to materially affect, the Registrant's internal control over financial reporting. |
Item 12. Exhibits.
(a) | (1) Any code of ethics or amendment thereto, that is subject of the disclosure required by Item 2, to the extent that the registrant intends to satisfy Item 2 requirements through filing an exhibit. Not Applicable. |
(2) Certifications pursuant to Section 302 of the Sarbanes-Oxley Act of 2002. Filed herewith.
(3) Any written solicitation to purchase securities under Rule 23c-1 under the Act sent or given during the period covered by the report by or on behalf of the registrant to 10 or more persons. Not applicable to open-end investment companies.
(b) | Certification pursuant to Section 906 of the Sarbanes-Oxley Act of 2002. Furnished herewith. |
SIGNATURES
Pursuant to the requirements of the Securities Exchange Act of 1934 and the Investment Company Act of 1940, the registrant has duly caused this report to be signed on its behalf by the undersigned, thereunto duly authorized.
(Registrant) Hennessy Funds Trust
By (Signature and Title)* /s/Neil J. Hennessy
Neil J. Hennessy, President
Date July 9, 2007
Pursuant to the requirements of the Securities Exchange Act of 1934 and the Investment Company Act of 1940, this report has been signed below by the following persons on behalf of the registrant and in the capacities and on the dates indicated.
By (Signature and Title)* /s/Neil J. Hennessy
Neil J. Hennessy, President
Date July 9, 2007
By (Signature and Title)* /s/Teresa M. Nilsen
Teresa M. Nilsen, Treasurer
Date July 9, 2007