UNITED STATES
SECURITIES AND EXCHANGE COMMISSION
Washington, D.C. 20549
FORM N-CSR
CERTIFIED SHAREHOLDER REPORT OF REGISTERED
MANAGEMENT INVESTMENT COMPANIES
Investment Company Act file number (811-07168)
Hennessy Funds Trust
(Exact name of registrant as specified in charter)
7250 Redwood Blvd., Suite 200
Novato, CA 94945
(Address of principal executive offices) (Zip code)
Neil J. Hennessy
Hennessy Advisors, Inc.
7250 Redwood Blvd., Suite 200
Novato, CA 94945
(Name and address of agent for service)
800-966-4354
Registrant's telephone number, including area code
Date of fiscal year end: October 31, 2008
Date of reporting period: April 30, 2008
Item 1. Report to Stockholders.
H E N N E S S Y F U N D S
S E M I - A N N U A L R E P O R T
APRIL 30, 2008
Hennessy Cornerstone Growth Fund
Hennessy Cornerstone Growth Fund, Series II
Hennessy Focus 30 Fund
Hennessy Cornerstone Value Fund
Hennessy Total Return Fund
Hennessy Balanced Fund
Contents
| Letter to shareholders | 1 |
| Summaries of investments | |
| Hennessy Cornerstone Growth Fund | 7 |
| Hennessy Cornerstone Growth Fund, Series II | 11 |
| Hennessy Focus 30 Fund | 15 |
| Hennessy Cornerstone Value Fund | 18 |
| Hennessy Total Return Fund | 22 |
| Hennessy Balanced Fund | 25 |
| Financial statements | |
| Statements of assets and liabilities | 28 |
| Statements of operations | 30 |
| Statements of changes in net assets | 32 |
| Financial highlights | |
| Hennessy Cornerstone Growth Fund | 36 |
| Hennessy Cornerstone Growth Fund, Series II | 38 |
| Hennessy Focus 30 Fund | 40 |
| Hennessy Cornerstone Value Fund | 42 |
| Hennessy Total Return Fund | 44 |
| Hennessy Balanced Fund | 46 |
| Statement of cash flows – Hennessy Total Return Fund | 48 |
| Notes to the financial statements | 49 |
| Expense example | 58 |
| Proxy voting policy | 60 |
| Board approval of continuation | |
| of investment advisory agreement | 61 |
June, 2008
Dear Hennessy Funds Shareholder:
As I scanned the headlines from Investors Business Daily top stories a few days ago, I had to shake my head as I read:
#1 – Oil Falls on Weak Demand Fears
#2 – Stocks Rise, But in Tepid Volume
#3 – New Home Sales Rise “A Surprise”
#4 – Home Prices Suffer Record Drop
#5 – Consumer Confidence Tumbles
With these overwhelmingly negative headlines, is it any wonder that investors are panicked and holding their money close to the vest? I believe one of the primary reasons we have low investor confidence is the media has successfully confused investors to such an extent that they are frozen with fear.
As a money manager with nearly 30 years of experience, here is what I believe:
| – | Emerging markets appear to be correcting. The major exchanges in China, India and Southeast Asia have already experienced double digit losses year to date. |
| – | The price of oil is poised to move lower. Once selling pressure in the oil market is ignited by a price decline, margin calls, stop losses and leveraged positions could fuel a real tumble. |
| – | Home prices and sales appear to be stabilizing. |
I remain bullish on the market, as we continue to see low levels of inflation (excluding food and energy), interest rates and unemployment, despite downturns in the Auto, Housing and Financial sectors. We also are seeing reasonable, if not remarkable, corporate profits in a slow economy.
The Dow is trading at 1.11 times sales, versus its 10-year average of 1.32, which suggests to me that we could see the market move to the upside by about 19%, to nearly 15,000, before we reach historical parity. I suspect that the overall economy will start to regain its footing sometime in the 4th quarter of 2008 or the 1st quarter of 2009. We encourage investors to remain focused on their long-term investing objectives, and to stay the course.
HENNESSY FUNDS 1-800-966-4354
Average Annual Total Returns (as of April 30, 2008)
Original Class Shares
| | | | | | | |
| | Six months | One Year | Three Year | Five Year | Ten Year | |
| | ending | Annualized | Annualized | Annualized | Annualized | Since |
| Fund (Inception date) | 4/30/08 | Return | Return | Return | Return | Inception |
| Cornerstone | | | | | | |
| Growth Fund (11/1/96) | -21.48% | -20.41% | 3.67% | 10.82% | 9.12% | 12.16% |
| S&P 500 Index | -9.64% | -4.68% | 8.23% | 10.62% | 3.89% | 7.82% |
| | | | | | | |
| Cornerstone Growth | | | | | | |
| Fund, Series II (7/1/05) | -17.57% | -20.30% | n/a | n/a | n/a | -2.12% |
| S&P 500 Index | -9.64% | -4.68% | n/a | n/a | n/a | 7.39% |
| | | | | | | |
| Focus 30 Fund (9/17/03) | 2.49% | -1.40% | 16.78% | n/a | n/a | 16.22% |
| S&P 500 Index | -9.64% | -4.68% | 8.23% | n/a | n/a | 8.70% |
| | | | | | | |
| Cornerstone | | | | | | |
| Value Fund (11/1/96) | -16.11% | -11.16% | 6.26% | 10.30% | 4.84% | 6.64% |
| S&P 500 Index | -9.64% | -4.68% | 8.23% | 10.62% | 3.89% | 7.82% |
| | | | | | | |
| Total Return Fund (7/29/98) | -11.70% | -7.21% | 6.12% | 7.83% | n/a | 4.02% |
| S&P 500 Index | -9.64% | -4.68% | 8.23% | 10.62% | n/a | 3.83% |
| DJIA Index | -6.79% | 0.47% | 10.49% | 11.12% | n/a | 5.92% |
| | | | | | | |
| Balanced Fund (3/8/96) | -6.96% | -3.40% | 4.94% | 4.94% | 2.87% | 4.71% |
| S&P 500 Index | -9.64% | -4.68% | 8.23% | 10.62% | 3.89% | 8.44% |
| DJIA Index | -6.79% | 0.47% | 10.49% | 11.12% | 5.64% | 9.42% |
| | | | | | | |
Performance data quoted represents past performance; past performance does not guarantee future results. The investment return and principal value of an investment will fluctuate so that an investor’s shares, when redeemed, may be worth more or less than their original cost. Current performance of the fund may be lower or higher than the performance quoted. Performance data current to the most recent month end may be obtained by visiting www.hennessyfunds.com. Performance shown does not reflect a 1.5% redemption fee on shares held for less than 90 days. If it did, total returns would be reduced. All performance shown is net of fees and expenses.
The total annual operating expenses of the Original Class shares of the Funds are as follow: Cornerstone Growth Fund (HFCGX) = 1.20%; Cornerstone Growth Fund, Series II (HENLX) = 1.27%; Focus 30 Fund (HFTFX) = 1.23%; Cornerstone Value Fund (HFCVX) = 1.17%; Total Return Fund (HDOGX) = 3.04% gross/1.16% net of interest expense; and Balanced Fund (HBFBX) = 1.36%.
Despite strong market fundamentals in place, the major indices, as well as five of our funds, posted negative returns for the six-month period ending April 30, 2008. The notable exception was our Hennessy Focus 30, which had positive returns for the period. For the six-months ending April 30, 2008, we saw the strongest overall performance among mid-cap stocks, followed by large and then small-cap names. The Dow Jones Industrial Average (-6.79%) continued to outpace the S&P 500 (-9.64%) during the period. Financials were the big loser during the period, as these companies reeled from the unwinding sub-prime mortgage and credit crunch crises. While some sectors fared better than others, we continue to see better and worse performing stocks in each and maintain our view that it is still primarily a stock picker’s market.
For the six-month period ending April 30, 2008, the Hennessy Cornerstone Growth Fund returned -21.48%, significantly lagging the S&P 500 (-9.64%). Health care stocks have stumbled year to date in 2008 and made up over 18% of the Cornerstone Growth portfolio as of 4/30/08. Only 1 of the 11 stocks held was positive for the three months ending 4/30/08, with most stocks in the sector down over 15%. As of 12/31/07, prior to the 2008 rebalance, 17% of the portfolio was in Consumer Discretionary, which negatively affected performance of the fund, as 9 of the 12 stocks experienced losses during November and December of 2007.
We understand that these short term returns of the Cornerstone Growth Fund have been disappointing, but we always try to keep a long-term view in mind when assessing performance. Since its inception, the Fund has experienced a total of six different corrections, where performance has fallen more than 20%. However, had you purchased the fund on its inception date of 11/01/96 and held it through all the corrections, as of 4/30/08, your average annual return would have been +12.16%, approximately 55% higher than the return for the S&P 500 over the same period, which was 7.82%.
The Hennessy Cornerstone Growth Fund, Series II returned -17.57% for the six-month period ending April 30, 2008, underperforming the S&P 500 for the period. Industrial stocks made up over 36% of the portfolio as of 4/30/08. While a handful of Industrial stocks in the portfolio (Chart Industries, Robbins & Myers, Celanese and General Cable) had positive performance for the six-month period, the majority of these stocks were hard hit, with 14 stocks experiencing losses greater than 15% for the six-month period. Stocks within the other sectors in the portfolio were a mixed bag. Materials stocks AK Steel, Owens Illinois, and Arcelor Mittal were the strongest performers in the portfolio for the period, but overall the losers outnumbered the
HENNESSY FUNDS 1-800-966-4354
For the six-months ending April 30, 2008 the Hennessy Focus 30 Fund returned +2.49%, significantly outperforming the S&P 500 for the same period. During the period, the portfolio held no Financial stocks, which contributed to its outperformance of the S&P 500. Alpha Natural Resources (+ 87%) and Flowserve Corp. (+65%) were the stand-out performers for the six-month period ending April 30, 2008. While Consumer Discretionary stocks generally struggled for the period, two of the three in the portfolio performed very well (Warnaco +22% and Tupperware Brands +13%).
The Hennessy Cornerstone Value Fund returned -16.11% during the six-month period ending April 30, 2008, underperforming the S&P 500. Financial stocks made up over 40% of the portfolio as of 4/30/08, and out of the 21 Financial stocks in the fund, only US Bancorp had positive performance for the period. The overall sector was crushed by the sub-prime fallout, although some of these companies did not have direct exposure to the sub-prime market. 16 of the Financial stocks in the portfolio posted double digit losses, with National City, CIT Group, Countrywide Financial and Washington Mutual producing the worst results, all down over 50%. The top four performers in the portfolio for the period were all ADR’s, including Chunghwa Telecom Co. (+23%), Sasol Ltd. (+16%), ENI Spa (+8%) and Taiwan Semiconductor (+7%).
The Hennessy Total Return Fund returned -11.70%, underperforming the S&P 500 and Dow Jones Industrial Average, while the Hennessy Balanced Fund returned -6.96% for the six-month period ending April 30, 2008, on par with the Dow (-6.79%) and beating the S&P 500 (-9.64%) for the period. While the entire Dow Jones Industrial Average was down less than 7% for the six-month period, the Dogs of the Dow did not fare as well. Only two of the Dogs stocks, JP Morgan and DuPont, had positive performance for the period. The very poor performance of Merck (-34%), Citigroup (-34%) and General Motors (-38%) significantly hampered performance of both funds. During the period, the inclusion of short-term Treasury notes in the portfolios (25% weighting in Total Return and 50% weighting in Balanced) helped to partially offset the equity sell off.
Corrections can be painful, but I believe that historical performance data shows how patience, discipline and a long-term investing view can be rewarded. Savvy investors know that when things look bleakest, it may be a good time to buy rather than sell. We believe that in the future
we’ll look back at the 2007-2008 market with the same type of “20-20 hindsight” with which we view other past corrections and bear markets. At Hennessy Funds, we vigilantly maintain our focus on the long-term, and on building value for our shareholders. Thank you for your continued confidence and investment in the Funds. Should you have any questions or want to speak with us directly, please don’t hesitate to call us at (800) 966-4354.
Best regards,
Neil Hennessy
Chairman & Portfolio Manager
Past performance does not guarantee future results.
Small and medium-capitalization companies tend to have limited liquidity and greater price volatility than large-capitalization companies. Investments in foreign securities involve greater volatility and political, economic and currency risk and differences in accounting methods.
The Hennessy Total Return and Balanced Funds are non-diversified, meaning they may concentrate their assets in fewer individual holdings than a diversified fund, making it more exposed to individual stock volatility than a diversified fund.
References to specific securities should not be considered a recommendation to buy or sell any security. Fund holdings are subject to change. Please refer to the Schedule of Investments within this semi-annual report for additional portfolio information, including percentages of holdings.
The S&P 500 and Dow Jones Industrial Average are unmanaged indices commonly used to measure the performance of U.S. stocks. The Dow Jones Industrial Average (DJIA Index) is an unmanaged index of common stocks comprised of major industrial companies and assumes reinvestment of dividends. One cannot invest directly in an index.
Opinions expressed are those of Neil Hennessy and are subject to change, are not guaranteed and should not be considered investment advice.
Price to Sales (P/S) ratio is a tool for calculating a stock’s valuation relative to other companies, calculated by dividing a stock’s current price by its revenue per share.
HENNESSY FUNDS 1-800-966-4354
(This Page Intentionally Left Blank.)
SUMMARY OF INVESTMENTS — CORNERSTONE GROWTH FUND
Summaries of Investments
The following summaries of investment portfolios are designed to help investors better understand each fund’s principal holdings. Each summary is as of April 30, 2008 (Unaudited).
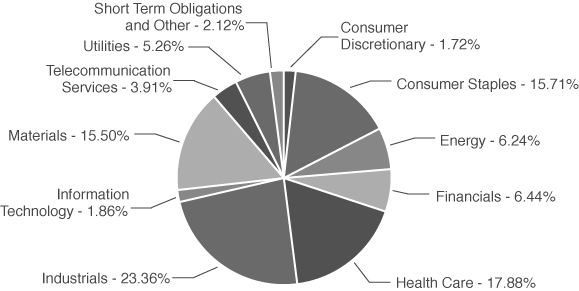
HENNESSY CORNERSTONE GROWTH FUND
(% of Net Assets)
| TOP TEN HOLDINGS | % of net assets |
| Alpha Natural Resources, Inc. | 3.54% |
| Massey Energy Co. | 3.35% |
| Flowserve Corp. | 2.90% |
| Steel Dynamics, Inc. | 2.72% |
| Owens-Illinois, Inc. | 2.55% |
| Teledyne Technologies, Inc. | 2.37% |
| Coca-Cola Femsa S.A. de CV – ADR | 2.32% |
| Fairfax Financial Holdings, Ltd. | 2.27% |
| L-3 Communications Holdings Inc. | 2.21% |
| Enbridge, Inc. | 2.19% |
HENNESSY FUNDS 1-800-966-4354
| | COMMON STOCKS – 97.88% | | Number | | | | | | % of Net | |
| | | | of Shares | | | Value | | | Assets | |
| | Consumer Discretionary – 1.72% | | | | | | | | | |
| | Sony Corp. – ADR (b) | | | 216,600 | | | $ | 9,918,114 | | | | 1.72 | % |
| | | | | | | | | | | | | | |
| | Consumer Staples – 15.71% | | | | | | | | | | | | |
| | Archer-Daniels-Midland Co. | | | 274,200 | | | | 12,081,252 | | | | 2.09 | % |
| | Bunge Ltd. (b) | | | 96,200 | | | | 10,975,458 | | | | 1.90 | % |
| | Coca-Cola Femsa S.A. de CV – ADR (b) | | | 257,100 | | | | 13,405,194 | | | | 2.32 | % |
| | Costco Wholesale Corp. | | | 175,000 | | | | 12,468,750 | | | | 2.16 | % |
| | Fresh Del Monte Produce, Inc. (a)(b) | | | 352,100 | | | | 11,158,049 | | | | 1.93 | % |
| | Pepsi Bottling Group, Inc. | | | 293,700 | | | | 9,900,627 | | | | 1.71 | % |
| | PepsiAmericas, Inc. | | | 367,500 | | | | 9,444,750 | | | | 1.63 | % |
| | Pricesmart, Inc. | | | 398,400 | | | | 11,374,320 | | | | 1.97 | % |
| | | | | | | | | 90,808,400 | | | | 15.71 | % |
| | | | | | | | | | | | | | |
| | Energy – 6.24% | | | | | | | | | | | | |
| | Bristow Group, Inc. (a) | | | 216,500 | | | | 11,420,375 | | | | 1.98 | % |
| | Enbridge, Inc. (b) | | | 307,400 | | | | 12,658,732 | | | | 2.19 | % |
| | Total S.A. – ADR (b) | | | 142,700 | | | | 11,986,800 | | | | 2.07 | % |
| | | | | | | | | 36,065,907 | | | | 6.24 | % |
| | | | | | | | | | | | | | |
| | Financials – 6.44% | | | | | | | | | | | | |
| | AON Corp. | | | 268,600 | | | | 12,191,754 | | | | 2.11 | % |
| | Assurant, Inc. | | | 183,500 | | | | 11,927,500 | | | | 2.06 | % |
| | Fairfax Financial Holdings Ltd. (b) | | | 43,700 | | | | 13,118,303 | | | | 2.27 | % |
| | | | | | | | | 37,237,557 | | | | 6.44 | % |
| | | | | | | | | | | | | | |
| | Health Care – 17.88% | | | | | | | | | | | | |
| | Aetna, Inc. | | | 206,500 | | | | 9,003,400 | | | | 1.55 | % |
| | Alliance Imaging, Inc. (a) | | | 1,253,700 | | | | 10,217,655 | | | | 1.77 | % |
| | Cigna Corp. | | | 217,100 | | | | 9,272,341 | | | | 1.61 | % |
| | Express Scripts, Inc. (a) | | | 166,500 | | | | 11,658,330 | | | | 2.02 | % |
| | Humana, Inc. (a) | | | 143,700 | | | | 6,867,423 | | | | 1.19 | % |
| | McKesson Corp. | | | 181,400 | | | | 9,454,568 | | | | 1.64 | % |
| | Medco Health Solutions, Inc. (a) | | | 232,500 | | | | 11,518,050 | | | | 1.99 | % |
| | Molina Healthcare, Inc. (a) | | | 313,000 | | | | 7,771,790 | | | | 1.35 | % |
| | MWI Veterinary Supply, Inc. (a) | | | 298,100 | | | | 10,275,507 | | | | 1.78 | % |
| | RehabCare Group, Inc. (a) | | | 503,400 | | | | 8,557,800 | | | | 1.48 | % |
The accompanying notes are an integral part of these financial statements.
| | COMMON STOCKS | | Number | | | | | | % of Net | |
| | | | of Shares | | | Value | | | Assets | |
| | Health Care (Continued) | | | | | | | | | |
| | Sun Healthcare Group, Inc. (a) | | | 659,300 | | | $ | 8,669,795 | | | | 1.50 | % |
| | | | | | | | | 103,266,659 | | | | 17.88 | % |
| | | | | | | | | | | | | | |
| | Industrials – 23.36% | | | | | | | | | | | | |
| | AGCO Corp. (a) | | | 188,900 | | | | 11,358,557 | | | | 1.96 | % |
| | Azz, Inc. (a) | | | 352,400 | | | | 9,402,032 | | | | 1.63 | % |
| | CBIZ, Inc. (a) | | | 1,331,500 | | | | 11,810,405 | | | | 2.04 | % |
| | Chicago Bridge & Iron Co. N.V. (b) | | | 228,400 | | | | 9,099,456 | | | | 1.58 | % |
| | Dyncorp International, Inc. (a) | | | 486,400 | | | | 8,730,880 | | | | 1.51 | % |
| | EnerSys (a) | | | 441,000 | | | | 10,319,400 | | | | 1.79 | % |
| | Flowserve Corp. | | | 134,900 | | | | 16,739,741 | | | | 2.90 | % |
| | Jacobs Engineering Group, Inc. (a) | | | 135,000 | | | | 11,654,550 | | | | 2.02 | % |
| | L-3 Communications Holdings, Inc. | | | 114,400 | | | | 12,749,880 | | | | 2.21 | % |
| | Siemens AG – ADR (b) | | | 84,900 | | | | 10,056,405 | | | | 1.74 | % |
| | Stanley, Inc. (a) | | | 368,200 | | | | 9,289,686 | | | | 1.61 | % |
| | Teledyne Technologies, Inc. (a) | | | 233,500 | | | | 13,713,455 | | | | 2.37 | % |
| | | | | | | | | 134,924,447 | | | | 23.36 | % |
| | | | | | | | | | | | | | |
| | Information Technology – 1.86% | | | | | | | | | | | | |
| | LG Display Company Ltd. – ADR (a)(b) | | | 493,300 | | | | 10,739,141 | | | | 1.86 | % |
| | | | | | | | | | | | | | |
| | Materials – 15.50% | | | | | | | | | | | | |
| | Alpha Natural Resources, Inc. (a) | | | 420,900 | | | | 20,476,785 | | | | 3.54 | % |
| | BASF AG – ADR (b) | | | 82,400 | | | | 11,719,200 | | | | 2.03 | % |
| | LSB Industries, Inc. (a) | | | 494,900 | | | | 7,576,919 | | | | 1.31 | % |
| | Massey Energy Co. | | | 369,500 | | | | 19,335,935 | | | | 3.35 | % |
| | Owens-Illinois, Inc. (a) | | | 266,900 | | | | 14,719,535 | | | | 2.55 | % |
| | Steel Dynamics, Inc. | | | 450,300 | | | | 15,692,955 | | | | 2.72 | % |
| | | | | | | | | 89,521,329 | | | | 15.50 | % |
| | | | | | | | | | | | | | |
| | Telecommunication Services – 3.91% | | | | | | | | | | | | |
| | EMS Technologies, Inc. (a) | | | 442,200 | | | | 11,435,292 | | | | 1.98 | % |
| | Tele Norte Leste Participacoes SA (b) | | | 485,400 | | | | 11,120,514 | | | | 1.93 | % |
| | | | | | | | | 22,555,806 | | | | 3.91 | % |
| | | | | | | | | | | | | | |
| | Utilities – 5.26% | | | | | | | | | | | | |
| | Constellation Energy Group, Inc. | | | 115,500 | | | | 9,777,075 | | | | 1.69 | % |
| | Northwest Natural Gas Co. | | | 244,300 | | | | 10,961,741 | | | | 1.90 | % |
The accompanying notes are an integral part of these financial statements.
HENNESSY FUNDS 1-800-966-4354
| | COMMON STOCKS | | Number | | | | | | % of Net | |
| | | | of Shares | | | Value | | | Assets | |
| | Utilities (Continued) | | | | | | | | | |
| | RWE AG – ADR (b) | | | 83,700 | | | $ | 9,662,705 | | | | 1.67 | % |
| | | | | | | | | 30,401,521 | | | | 5.26 | % |
| | | | | | | | | | | | | | |
| | Total Common Stocks (Cost $580,953,218) | | | | | | | 565,438,881 | | | | 97.88 | % |
| | | | | | | | | | | | | | |
| | SHORT-TERM INVESTMENTS – 2.45% | | Principal | | | | | | | | | |
| | | | Amount | | | | | | | | | |
| | Discount Notes – 2.45% | | | | | | | | | | | | |
| | Federal Home Loan Bank Discount Note, | | | | | | | | | | | | |
| | 1.6200%, 05/01/2008 | | $ | 14,166,000 | | | | 14,166,000 | | | | 2.45 | % |
| | | | | | | | | | | | | | |
| | Total Discount Notes (Cost $14,166,000) | | | | | | | 14,166,000 | | | | 2.45 | % |
| | | | | | | | | | | | | | |
| | Variable Rate Demand Notes# – 0.00% | | | | | | | | | | | | |
| | American Family Financial Services, Inc. | | | | | | | | | | | | |
| | 1.7835% | | | 1,331 | | | | 1,331 | | | | 0.00 | % |
| | | | | | | | | | | | | | |
| | Total Variable Rate Demand Notes | | | | | | | | | | | | |
| | (Cost $1,331) | | | | | | | 1,331 | | | | 0.00 | % |
| | | | | | | | | | | | | | |
| | Total Short-Term Investments | | | | | | | | | | | | |
| | (Cost $14,167,331) | | | | | | | 14,167,331 | | | | 2.45 | % |
| | | | | | | | | | | | | | |
| | Total Investments – 100.33% | | | | | | | | | | | | |
| | (Cost $595,120,549) | | | | | | | 579,606,212 | | | | 100.33 | % |
| | | | | | | | | | | | | | |
| | Liabilities in Excess of Other Assets – (0.33)% | | | | | | | (1,896,852 | ) | | | (0.33 | )% |
| | TOTAL NET ASSETS – 100.00% | | | | | | $ | 577,709,360 | | | | 100.00 | % |
Percentages are stated as a percent of net assets.
ADR American Depositary Receipt
| (a) | | Non Income Producing |
| (b) | | Foreign Issued Security |
| # | | Variable rate demand notes are considered short-term obligations and are payable on demand. Interest rates change periodically on specified dates. The rates listed are as of April 30, 2008. |
The accompanying notes are an integral part of these financial statements.
SUMMARY OF INVESTMENTS — CORNERSTONE GROWTH FUND, SERIES II
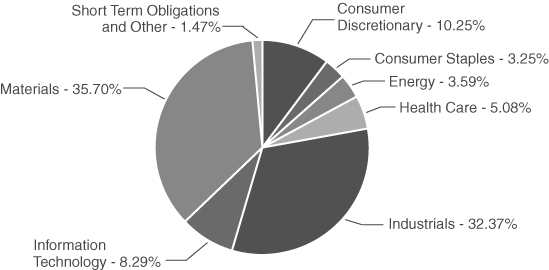
HENNESSY CORNERSTONE
GROWTH FUND, SERIES II
(% of Net Assets)
| TOP TEN HOLDINGS | % of net assets |
| AK Steel Holding Corp. | 4.15% |
| Owens-Illinois, Inc. | 3.80% |
| Cal-Maine Foods, Inc. | 3.71% |
| Chart Industries, Inc. | 3.56% |
| Robbins & Myers, Inc. | 3.47% |
| Arcelor Mittal – ADR | 3.44% |
| Terra Industries, Inc. | 3.38% |
| Gamestop Corp. | 3.33% |
| Celanese Corp. | 3.04% |
| Warnaco Group, Inc. | 2.99% |
HENNESSY FUNDS 1-800-966-4354
| | COMMON STOCKS – 99.71% | | Number | | | | | | % of Net | |
| | | | of Shares | | | Value | | | Assets | |
| | Consumer Discretionary – 11.49% | | | | | | | | | |
| | 1-800Flowers.com, Inc. (a) | | | 213,400 | | | $ | 1,882,188 | | | | 2.26 | % |
| | Fiat SPA – ADR (b) | | | 66,200 | | | | 1,483,138 | | | | 1.78 | % |
| | Gamestop Corp. (a) | | | 50,300 | | | | 2,768,512 | | | | 3.33 | % |
| | Nexstar Broadcasting Group, Inc. (a) | | | 167,100 | | | | 942,444 | | | | 1.13 | % |
| | Warnaco Group, Inc. (a) | | | 53,900 | | | | 2,486,946 | | | | 2.99 | % |
| | | | | | | | | 9,563,228 | | | | 11.49 | % |
| | | | | | | | | | | | | | |
| | Consumer Staples – 6.60% | | | | | | | | | | | | |
| | Cal-Maine Foods, Inc. | | | 104,500 | | | | 3,087,975 | | | | 3.71 | % |
| | Pricesmart, Inc. | | | 84,200 | | | | 2,403,910 | | | | 2.89 | % |
| | | | | | | | | 5,491,885 | | | | 6.60 | % |
| | | | | | | | | | | | | | |
| | Energy – 5.54% | | | | | | | | | | | | |
| | Genesis Energy LP | | | 59,300 | | | | 1,140,932 | | | | 1.37 | % |
| | Ico Inc. (a) | | | 188,300 | | | | 1,399,069 | | | | 1.68 | % |
| | Matrix Service Co. (a) | | | 85,100 | | | | 1,711,361 | | | | 2.05 | % |
| | Western Refining, Inc. | | | 36,300 | | | | 363,363 | | | | 0.44 | % |
| | | | | | | | | 4,614,725 | | | | 5.54 | % |
| | | | | | | | | | | | | | |
| | Health Care – 2.43% | | | | | | | | | | | | |
| | Emergency Medical Services Corp. (a) | | | 49,300 | | | | 1,112,701 | | | | 1.34 | % |
| | WellCare Health Plans, Inc. (a) | | | 20,800 | | | | 910,624 | | | | 1.09 | % |
| | | | | | | | | 2,023,325 | | | | 2.43 | % |
| | | | | | | | | | | | | | |
| | Industrials – 37.39% | | | | | | | | | | | | |
| | Astec Industries, Inc. (a) | | | 44,200 | | | | 1,619,930 | | | | 1.95 | % |
| | Barnes Group, Inc. | | | 64,100 | | | | 1,671,728 | | | | 2.01 | % |
| | Chart Industries, Inc. (a) | | | 72,800 | | | | 2,958,592 | | | | 3.56 | % |
| | CNH Global N.V. (b) | | | 37,000 | | | | 1,596,180 | | | | 1.92 | % |
| | CPI Corp. | | | 33,200 | | | | 626,152 | | | | 0.75 | % |
| | Cummins, Inc. | | | 36,400 | | | | 2,280,460 | | | | 2.74 | % |
| | Dyncorp International, Inc. (a) | | | 97,800 | | | | 1,755,510 | | | | 2.11 | % |
| | General Cable Corp. (a) | | | 25,400 | | | | 1,701,800 | | | | 2.04 | % |
| | Hardinge, Inc. | | | 55,400 | | | | 924,072 | | | | 1.11 | % |
| | Horizon Lines Inc. Class A | | | 59,400 | | | | 626,670 | | | | 0.75 | % |
| | Hudson Highland Group, Inc. (a) | | | 115,400 | | | | 1,023,598 | | | | 1.23 | % |
| | Integrated Electrical Service (a) | | | 64,700 | | | | 1,082,431 | | | | 1.30 | % |
The accompanying notes are an integral part of these financial statements.
| | COMMON STOCKS | | Number | | | | | | % of Net | |
| | | | of Shares | | | Value | | | Assets | |
| | Industrials (Continued) | | | | | | | | | |
| | Kaman Corp. | | | 62,000 | | | $ | 1,680,200 | | | | 2.02 | % |
| | MFRI, Inc. (a) | | | 74,600 | | | | 1,175,696 | | | | 1.41 | % |
| | Perini Corp. (a) | | | 29,400 | | | | 1,063,692 | | | | 1.28 | % |
| | Pinnacle Airlines Corp. (a) | | | 111,100 | | | | 924,352 | | | | 1.11 | % |
| | Robbins & Myers, Inc. | | | 72,500 | | | | 2,889,850 | | | | 3.47 | % |
| | Terex Corp. (a) | | | 23,200 | | | | 1,616,576 | | | | 1.94 | % |
| | Twin Disc, Inc. | | | 55,900 | | | | 1,007,877 | | | | 1.21 | % |
| | Volvo AB – ADR (b) | | | 97,300 | | | | 1,485,343 | | | | 1.78 | % |
| | VSE Corp. | | | 42,400 | | | | 1,417,432 | | | | 1.70 | % |
| | | | | | | | | 31,128,141 | | | | 37.39 | % |
| | | | | | | | | | | | | | |
| | Information Technology – 7.11% | | | | | | | | | | | | |
| | Amkor Technology, Inc. (a) | | | 143,300 | | | | 1,368,515 | | | | 1.64 | % |
| | Avnet, Inc. (a) | | | 48,200 | | | | 1,262,358 | | | | 1.52 | % |
| | Iomega Corp. (a) | | | 391,600 | | | | 1,499,828 | | | | 1.80 | % |
| | Methode Electronics, Inc. | | | 118,200 | | | | 1,281,288 | | | | 1.54 | % |
| | Miva, Inc. (a) | | | 303,650 | | | | 510,132 | | | | 0.61 | % |
| | | | | | | | | 5,922,121 | | | | 7.11 | % |
| | | | | | | | | | | | | | |
| | Oil & Gas – 2.68% | | | | | | | | | | | | |
| | Ultrapar Participacoes SA – ADR (b) | | | 61,100 | | | | 2,224,040 | | | | 2.68 | % |
| | | | | | | | | | | | | | |
| | Materials – 24.28% | | | | | | | | | | | | |
| | AK Steel Holding Corp. | | | 55,000 | | | | 3,452,900 | | | | 4.15 | % |
| | Arcelor Mittal – ADR (b) | | | 32,100 | | | | 2,859,789 | | | | 3.44 | % |
| | Buckeye Technologies, Inc. (a) | | | 137,000 | | | | 1,182,310 | | | | 1.42 | % |
| | Celanese Corp. | | | 56,600 | | | | 2,532,850 | | | | 3.04 | % |
| | Innospec, Inc. | | | 69,600 | | | | 1,419,144 | | | | 1.70 | % |
| | LSB Industries, Inc. (a) | | | 98,400 | | | | 1,506,504 | | | | 1.81 | % |
| | Owens-Illinois, Inc. (a) | | | 57,400 | | | | 3,165,610 | | | | 3.80 | % |
| | Penford Corp. | | | 58,200 | | | | 1,278,072 | | | | 1.54 | % |
| | Terra Industries, Inc. (a) | | | 74,300 | | | | 2,812,998 | | | | 3.38 | % |
| | | | | | | | | 20,210,177 | | | | 24.28 | % |
| | | | | | | | | | | | | | |
| | Utilities – 2.19% | | | | | | | | | | | | |
| | Reliant Energy, Inc. (a) | | | 70,900 | | | | 1,824,966 | | | | 2.19 | % |
| | | | | | | | | | | | | | |
| | Total Common Stocks (Cost $102,234,234) | | | | | | | 83,002,608 | | | | 99.71 | % |
The accompanying notes are an integral part of these financial statements.
HENNESSY FUNDS 1-800-966-4354
| | SHORT-TERM INVESTMENTS – 0.27% | | Principal | | | | | | % of Net | |
| | | | Amount | | | Value | | | Assets | |
| | Discount Notes – 0.26% | | | | | | | | | |
| | Federal Home Loan Bank Discount Note, | | | | | | | | | |
| | 1.6200%, 05/01/2008 | | $ | 220,000 | | | $ | 220,000 | | | | 0.26 | % |
| | | | | | | | | | | | | | |
| | Total Discount Notes (Cost $220,000) | | | | | | | 220,000 | | | | 0.26 | % |
| | | | | | | | | | | | | | |
| | Variable Rate Demand Notes# – 0.01% | | | | | | | | | | | | |
| | American Family Financial Services, Inc. | | | | | | | | | | | | |
| | 1.7835% | | | 5,479 | | | | 5,479 | | | | 0.01 | % |
| | | | | | | | | | | | | | |
| | Total Variable Rate Demand Notes | | | | | | | | | | | | |
| | (Cost $5,479) | | | | | | | 5,479 | | | | 0.01 | % |
| | | | | | | | | | | | | | |
| | Total Short-Term Investments | | | | | | | | | | | | |
| | (Cost $225,479) | | | | | | | 225,479 | | | | 0.27 | % |
| | | | | | | | | | | | | | |
| | Total Investments – 99.98% | | | | | | | | | | | | |
| | (Cost $102,459,713) | | | | | | | 83,228,087 | | | | 99.98 | % |
| | | | | | | | | | | | | | |
| | Other Assets in Excess of Liabilities – 0.02% | | | | | | | 20,547 | | | | 0.02 | % |
| | TOTAL NET ASSETS – 100.00% | | | | | | $ | 83,248,634 | | | | 100.00 | % |
Percentages are stated as a percent of net assets.
ADR American Depositary Receipt
| (a) | | Non Income Producing |
| (b) | | Foreign Issued Security |
| # | | Variable rate demand notes are considered short-term obligations and are payable on demand. Interest rates change periodically on specified dates. The rates listed are as of April 30, 2008. |
The accompanying notes are an integral part of these financial statements.
SUMMARY OF INVESTMENTS — FOCUS 30 FUND
HENNESSY FOCUS 30 FUND
(% of Net Assets)
| TOP TEN HOLDINGS | % of net assets |
| Alpha Natural Resources, Inc. | 6.27% |
| Flowserve Corp. | 5.28% |
| SPX Corp. | 4.38% |
| AK Steel Holding Corp. | 4.27% |
| Owens-Illinois, Inc. | 4.25% |
| Schnitzer Steel Industries, Inc. | 4.17% |
| Hewitt Associates, Inc. | 3.88% |
| Parexel International Corp. | 3.78% |
| Terra Industries, Inc. | 3.76% |
| Tupperware Corp. | 3.73% |
HENNESSY FUNDS 1-800-966-4354
| | COMMON STOCKS – 98.53% | | Number | | | | | | % of Net | |
| | | | of Shares | | | Value | | | Assets | |
| | Consumer Discretionary – 10.25% | | | | | | | | | |
| | Dick’s Sporting Goods, Inc. (a) | | | 201,200 | | | $ | 5,754,320 | | | | 2.84 | % |
| | Tupperware Corp. | | | 192,000 | | | | 7,564,800 | | | | 3.73 | % |
| | Warnaco Group, Inc. (a) | | | 161,900 | | | | 7,470,066 | | | | 3.68 | % |
| | | | | | | | | 20,789,186 | | | | 10.25 | % |
| | | | | | | | | | | | | | |
| | Consumer Staples – 3.25% | | | | | | | | | | | | |
| | Corn Products International, Inc. | | | 142,300 | | | | 6,599,874 | | | | 3.25 | % |
| | | | | | | | | | | | | | |
| | Energy – 3.59% | | | | | | | | | | | | |
| | Oil States International, Inc. (a) | | | 145,400 | | | | 7,278,724 | | | | 3.59 | % |
| | | | | | | | | | | | | | |
| | Health Care – 5.08% | | | | | | | | | | | | |
| | Parexel International Corp. (a) | | | 301,600 | | | | 7,660,640 | | | | 3.78 | % |
| | WellCare Health Plans, Inc. (a) | | | 60,300 | | | | 2,639,934 | | | | 1.30 | % |
| | | | | | | | | 10,300,574 | | | | 5.08 | % |
| | | | | | | | | | | | | | |
| | Industrials – 32.37% | | | | | | | | | | | | |
| | Alliant Techsystems, Inc. (a) | | | 61,400 | | | | 6,752,772 | | | | 3.33 | % |
| | Barnes Group, Inc. | | | 194,700 | | | | 5,077,776 | | | | 2.50 | % |
| | Esterline Technologies Corp. (a) | | | 125,900 | | | | 7,007,594 | | | | 3.45 | % |
| | Flowserve Corp. | | | 86,300 | | | | 10,708,967 | | | | 5.28 | % |
| | Goodrich Corp. | | | 97,800 | | | | 6,665,070 | | | | 3.28 | % |
| | Harsco Corp. | | | 112,700 | | | | 6,686,491 | | | | 3.30 | % |
| | Oshkosh Truck Corp. | | | 110,200 | | | | 4,474,120 | | | | 2.21 | % |
| | SPX Corp. | | | 72,200 | | | | 8,880,600 | | | | 4.38 | % |
| | Triumph Group, Inc. | | | 83,900 | | | | 4,939,193 | | | | 2.43 | % |
| | URS Corp. (a) | | | 111,000 | | | | 4,477,740 | | | | 2.21 | % |
| | | | | | | | | 65,670,323 | | | | 32.37 | % |
| | | | | | | | | | | | | | |
| | Information Technology – 8.29% | | | | | | | | | | | | |
| | Anixter International, Inc. (a) | | | 80,500 | | | | 4,586,085 | | | | 2.26 | % |
| | Arrow Electronics, Inc. (a) | | | 160,800 | | | | 4,375,368 | | | | 2.15 | % |
| | Hewitt Associates, Inc. (a) | | | 191,900 | | | | 7,867,900 | | | | 3.88 | % |
| | | | | | | | | 16,829,353 | | | | 8.29 | % |
| | | | | | | | | | | | | | |
| | Materials – 35.70% | | | | | | | | | | | | |
| | Airgas, Inc. | | | 125,600 | | | | 6,045,128 | | | | 2.98 | % |
| | AK Steel Holding Corp. | | | 138,000 | | | | 8,663,640 | | | | 4.27 | % |
| | Alpha Natural Resources, Inc. (a) | | | 261,600 | | | | 12,726,840 | | | | 6.27 | % |
The accompanying notes are an integral part of these financial statements.
| | COMMON STOCKS | | Number | | | | | | % of Net | |
| | | | of Shares | | | Value | | | Assets | |
| | Materials (Continued) | | | | | | | | | |
| | Brush Engineered Materials, Inc. (a) | | | 122,100 | | | $ | 3,786,321 | | | | 1.87 | % |
| | Lubrizol Corp. | | | 98,300 | | | | 5,732,856 | | | | 2.82 | % |
| | Nalco Holding Co. | | | 223,200 | | | | 5,131,368 | | | | 2.53 | % |
| | Owens-Illinois, Inc. (a) | | | 156,400 | | | | 8,625,460 | | | | 4.25 | % |
| | Schnitzer Steel Industries, Inc. | | | 96,100 | | | | 8,456,800 | | | | 4.17 | % |
| | Terra Industries, Inc. (a) | | | 201,300 | | | | 7,621,218 | | | | 3.75 | % |
| | WR Grace & Co. (a) | | | 223,000 | | | | 5,655,280 | | | | 2.79 | % |
| | | | | | | | | 72,444,911 | | | | 35.70 | % |
| | | | | | | | | | | | | | |
| | Total Common Stocks (Cost $195,831,684) | | | | | | | 199,912,945 | | | | 98.53 | % |
| | | | | | | | | | | | | | |
| | SHORT-TERM INVESTMENTS – 1.46% | | Principal | | | | | | | | | |
| | | | Amount | | | | | | | | | |
| | Discount Notes – 1.04% | | | | | | | | | | | | |
| | Federal Home Loan Bank Discount Note, | | | | | | | | | | | | |
| | 1.6200%, 05/01/2008 | | $ | 2,115,000 | | | | 2,115,000 | | | | 1.04 | % |
| | | | | | | | | | | | | | |
| | Total Discount Notes (Cost $2,115,000) | | | | | | | 2,115,000 | | | | 1.04 | % |
| | | | | | | | | | | | | | |
| | Variable Rate Demand Notes# – 0.42% | | | | | | | | | | | | |
| | American Family Financial Services, Inc. | | | | | | | | | | | | |
| | 1.7835% | | | 858,551 | | | | 858,551 | | | | 0.42 | % |
| | | | | | | | | | | | | | |
| | Total Variable Rate Demand Notes | | | | | | | | | | | | |
| | (Cost $858,551) | | | | | | | 858,551 | | | | 0.42 | % |
| | | | | | | | | | | | | | |
| | Total Short-Term Investments | | | | | | | | | | | | |
| | (Cost $2,973,551) | | | | | | | 2,973,551 | | | | 1.46 | % |
| | | | | | | | | | | | | | |
| | Total Investments – 99.99% | | | | | | | | | | | | |
| | (Cost $198,805,235) | | | | | | | 202,886,496 | | | | 99.99 | % |
| | | | | | | | | | | | | | |
| | Other Assets in Excess of Liabilities – 0.01% | | | | | | | 18,883 | | | | 0.01 | % |
| | TOTAL NET ASSETS – 100.00% | | | | | | $ | 202,905,379 | | | | 100.00 | % |
Percentages are stated as a percent of net assets.
| (a) | | Non Income Producing |
| # | | Variable rate demand notes are considered short-term obligations and are payable on demand. Interest rates change periodically on specified dates. The rate listed are as of April 30, 2008. |
The accompanying notes are an integral part of these financial statements.
HENNESSY FUNDS 1-800-966-4354
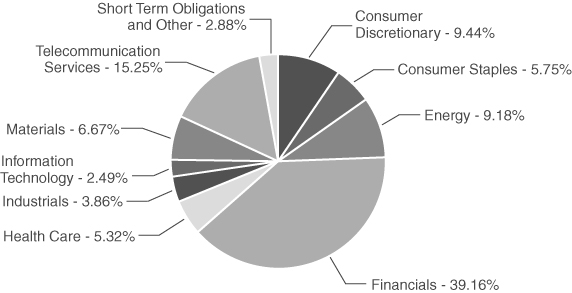
HENNESSY CORNERSTONE VALUE FUND
(% of Net Assets)
| TOP TEN HOLDINGS | % of net assets |
| Chunghwa Telecom Co. Ltd. – ADR | 2.66% |
| Sasol Ltd. – ADR | 2.58% |
| Taiwan Semiconductor Manufacturing Co., Ltd. – ADR | 2.49% |
| EI Du Pont De Nemours & Co. | 2.34% |
| Southern Copper Corp. | 2.34% |
| ENI SpA – ADR | 2.33% |
| PNC Financial Services Group | 2.29% |
| KeyCorp | 2.28% |
| BB&T Corp. | 2.25% |
| US Bancorp | 2.22% |
| | COMMON STOCKS – 97.12% | | Number | | | | | | % of Net | |
| | | | of Shares | | | Value | | | Assets | |
| | Consumer Discretionary – 9.44% | | | | | | | | | |
| | Carnival Corp. (b) | | | 77,000 | | | $ | 3,093,090 | | | | 1.91 | % |
| | CBS Corp. | | | 132,600 | | | | 3,059,082 | | | | 1.89 | % |
| | Gannett Co, Inc. | | | 98,200 | | | | 2,810,484 | | | | 1.74 | % |
| | General Motors Corp. | | | 130,700 | | | | 3,032,240 | | | | 1.87 | % |
| | Mattel, Inc. | | | 175,400 | | | | 3,288,750 | | | | 2.03 | % |
| | | | | | | | | 15,283,646 | | | | 9.44 | % |
| | | | | | | | | | | | | | |
| | Consumer Staples – 5.75% | | | | | | | | | | | | |
| | Altria Group, Inc. | | | 45,100 | | | | 902,000 | | | | 0.56 | % |
| | Diageo PLC – ADR (b) | | | 40,500 | | | | 3,316,950 | | | | 2.05 | % |
| | Philip Morris International, Inc. (a) | | | 45,100 | | | | 2,301,453 | | | | 1.42 | % |
| | Reynolds American, Inc. | | | 51,800 | | | | 2,789,430 | | | | 1.72 | % |
| | | | | | | | | 9,309,833 | | | | 5.75 | % |
| | | | | | | | | | | | | | |
| | Energy – 9.18% | | | | | | | | | | | | |
| | BP PLC – ADR (b) | | | 46,700 | | | | 3,399,293 | | | | 2.10 | % |
| | ENI SpA – ADR (b) | | | 49,100 | | | | 3,781,682 | | | | 2.33 | % |
| | Enterprise Products Partners LP | | | 112,500 | | | | 3,513,375 | | | | 2.17 | % |
| | Sasol Ltd. – ADR (b) | | | 73,700 | | | | 4,175,105 | | | | 2.58 | % |
| | | | | | | | | 14,869,455 | | | | 9.18 | % |
| | | | | | | | | | | | | | |
| | Financials – 39.16% | | | | | | | | | | | | |
| | Aegon NV – ADR (b) | | | 200,300 | | | | 3,192,782 | | | | 1.97 | % |
| | Allied Irish Banks PLC – ADR (b) | | | 77,100 | | | | 3,286,773 | | | | 2.03 | % |
| | Bank of America Corp. | | | 82,200 | | | | 3,085,788 | | | | 1.91 | % |
| | Barclays PLC – ADR (b) | | | 81,400 | | | | 2,962,960 | | | | 1.83 | % |
| | BB&T Corp. | | | 106,100 | | | | 3,638,169 | | | | 2.25 | % |
| | CIT Group, Inc. | | | 140,100 | | | | 1,525,689 | | | | 0.94 | % |
| | Citigroup, Inc. | | | 112,900 | | | | 2,852,983 | | | | 1.76 | % |
| | Countrywide Financial Corp. | | | 353,700 | | | | 2,044,386 | | | | 1.26 | % |
| | HSBC Holdings PLC – ADR (b) | | | 41,100 | | | | 3,567,069 | | | | 2.20 | % |
| | ING Groep NV – ADR (b) | | | 89,900 | | | | 3,415,301 | | | | 2.11 | % |
| | KeyCorp | | | 152,900 | | | | 3,689,477 | | | | 2.28 | % |
| | Kookmin Bank – ADR (a)(b) | | | 48,300 | | | | 3,368,925 | | | | 2.08 | % |
| | Lloyds TSB Group PLC – ADR (b) | | | 90,800 | | | | 3,111,716 | | | | 1.92 | % |
| | Marshall & Ilsley Corp. | | | 122,600 | | | | 3,062,548 | | | | 1.89 | % |
The accompanying notes are an integral part of these financial statements.
HENNESSY FUNDS 1-800-966-4354
| | COMMON STOCKS | | Number | | | | | | % of Net | |
| | | | of Shares | | | Value | | | Assets | |
| | Financials (Continued) | | | | | | | | | |
| | National City Corp. | | | 208,600 | | | $ | 1,314,180 | | | | 0.81 | % |
| | PNC Financial Services Group | | | 53,500 | | | | 3,710,225 | | | | 2.29 | % |
| | Regions Financial Corp. | | | 144,400 | | | | 3,165,248 | | | | 1.95 | % |
| | US Bancorp | | | 106,100 | | | | 3,595,729 | | | | 2.22 | % |
| | Wachovia Corp. | | | 88,800 | | | | 2,588,520 | | | | 1.60 | % |
| | Washington Mutual, Inc. | | | 228,800 | | | | 2,811,952 | | | | 1.74 | % |
| | Wells Fargo & Co. | | | 115,300 | | | | 3,430,175 | | | | 2.12 | % |
| | | | | | | | | 63,420,595 | | | | 39.16 | % |
| | | | | | | | | | | | | | |
| | Health Care – 5.32% | | | | | | | | | | | | |
| | Bristol-Myers Squibb Co. | | | 123,500 | | | | 2,713,295 | | | | 1.68 | % |
| | GlaxoSmithKline PLC – ADR (b) | | | 65,400 | | | | 2,884,794 | | | | 1.78 | % |
| | Pfizer, Inc. | | | 150,100 | | | | 3,018,511 | | | | 1.86 | % |
| | | | | | | | | 8,616,600 | | | | 5.32 | % |
| | | | | | | | | | | | | | |
| | Industrials – 3.86% | | | | | | | | | | | | |
| | Masco Corp. | | | 157,800 | | | | 2,873,538 | | | | 1.78 | % |
| | Pitney Bowes, Inc. | | | 93,300 | | | | 3,369,063 | | | | 2.08 | % |
| | | | | | | | | 6,242,601 | | | | 3.86 | % |
| | | | | | | | | | | | | | |
| | Information Technology – 2.49% | | | | | | | | | | | | |
| | Taiwan Semiconductor | | | | | | | | | | | | |
| | Manufacturing Co., Ltd. – ADR (b) | | | 359,200 | | | | 4,037,408 | | | | 2.49 | % |
| | | | | | | | | | | | | | |
| | Materials – 6.67% | | | | | | | | | | | | |
| | The Dow Chemical Co. | | | 80,400 | | | | 3,228,060 | | | | 1.99 | % |
| | EI Du Pont de Nemours & Co. | | | 77,500 | | | | 3,790,525 | | | | 2.34 | % |
| | Southern Copper Corp. | | | 33,000 | | | | 3,787,080 | | | | 2.34 | % |
| | | | | | | | | 10,805,665 | | | | 6.67 | % |
| | | | | | | | | | | | | | |
| | Telecommunication Services – 15.25% | | | | | | | | | | | | |
| | AT&T, Inc. | | | 84,300 | | | | 3,263,253 | | | | 2.02 | % |
| | BT Group PLC – ADR (b) | | | 60,700 | | | | 2,679,298 | | | | 1.65 | % |
| | Chunghwa Telecom Co. Ltd. – ADR (b) | | | 168,809 | | | | 4,306,318 | | | | 2.66 | % |
| | Deutsche Telekom AG – ADR (b) | | | 160,600 | | | | 2,866,710 | | | | 1.77 | % |
| | Embarq Corp. | | | 70,200 | | | | 2,918,214 | | | | 1.80 | % |
| | Fairpoint Communications, Inc. | | | 1,472 | | | | 13,557 | | | | 0.01 | % |
| | France Telecom – ADR (b) | | | 98,400 | | | | 3,082,872 | | | | 1.90 | % |
The accompanying notes are an integral part of these financial statements.
| | COMMON STOCKS | | Number | | | | | | % of Net | |
| | | | of Shares | | | Value | | | Assets | |
| | Telecommunication Services (Continued) | | | | | | | | | |
| | Qwest Communications International | | | 494,500 | | | $ | 2,551,620 | | | | 1.58 | % |
| | Telefonica De Argentina (a)(b)Ω | | | 1,200 | | | | 0 | | | | 0.00 | % |
| | Verizon Communications, Inc. | | | 78,100 | | | | 3,005,288 | | | | 1.86 | % |
| | | | | | | | | 24,687,130 | | | | 15.25 | % |
| | | | | | | | | | | | | | |
| | Total Common Stocks (Cost $168,381,350) | | | | | | | 157,272,933 | | | | 97.12 | % |
| | | | | | | | | | | | | | |
| | SHORT-TERM INVESTMENTS – 2.57% | | Principal | | | | | | | | | |
| | | | Amount | | | | | | | | | |
| | Discount Notes – 1.50% | | | | | | | | | | | | |
| | Federal Home Loan Bank Discount Note, | | | | | | | | | | | | |
| | 1.6200%, 05/01/2008 | | $ | 2,427,000 | | | | 2,427,000 | | | | 1.50 | % |
| | | | | | | | | | | | | | |
| | Total Discount Notes (Cost $2,427,000) | | | | | | | 2,427,000 | | | | 1.50 | % |
| | | | | | | | | | | | | | |
| | Variable Rate Demand Notes# – 1.07% | | | | | | | | | | | | |
| | American Family Financial Services, Inc. | | | | | | | | | | | | |
| | 1.7835% | | | 1,732,132 | | | | 1,732,132 | | | | 1.07 | % |
| | | | | | | | | | | | | | |
| | Total Variable Rate Demand Notes | | | | | | | | | | | | |
| | (Cost $1,732,132) | | | | | | | 1,732,132 | | | | 1.07 | % |
| | | | | | | | | | | | | | |
| | Total Short-Term Investments | | | | | | | | | | | | |
| | (Cost $4,159,132) | | | | | | | 4,159,132 | | | | 2.57 | % |
| | | | | | | | | | | | | | |
| | Total Investments – 99.69% | | | | | | | | | | | | |
| | (Cost $172,540,482) | | | | | | | 161,432,065 | | | | 99.69 | % |
| | | | | | | | | | | | | | |
| | Other Assets in Excess of Liabilities – 0.31% | | | | | | | 506,038 | | | | 0.31 | % |
| | TOTAL NET ASSETS – 100.00% | | | | | | $ | 161,938,103 | | | | 100.00 | % |
Percentages are stated as a percent of net assets.
ADR American Depositary Receipt
| (a) | | Non Income Producing |
| (b) | | Foreign Issued Security |
| Ω | | Security is fair valued. |
| # | | Variable rate demand notes are considered short-term obligations and are payable on demand. Interest rates change periodically on specified dates. The rates listed are as of April 30, 2008. |
The accompanying notes are an integral part of these financial statements.
HENNESSY FUNDS 1-800-966-4354
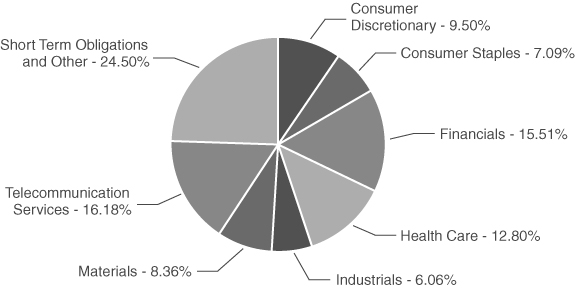
HENNESSY TOTAL RETURN FUND
(% of Net Assets)
| TOP TEN HOLDINGS | % of net assets |
| J.P. Morgan Chase & Co. | 8.48% |
| EI Du Pont de Nemours & Co. | 8.36% |
| AT&T, Inc. | 8.28% |
| Verizon Communications, Inc. | 7.87% |
| Pfizer, Inc | 7.02% |
| General Electric Co. | 6.06% |
| Merck & Co., Inc. | 5.78% |
| General Motors Corp. | 5.73% |
| Citigroup, Inc. | 5.62% |
| Philip Morris International, Inc. | 5.09% |
| | COMMON STOCKS – 75.50% | | Number | | | | | | % of Net | |
| | | | of Shares | | | Value | | | Assets | |
| | Consumer Discretionary – 9.50% | | | | | | | | | |
| | General Motors Corp. | | | 197,600 | | | $ | 4,584,320 | | | | 5.73 | % |
| | Home Depot, Inc. | | | 104,700 | | | | 3,015,360 | | | | 3.77 | % |
| | | | | | | | | 7,599,680 | | | | 9.50 | % |
| | | | | | | | | | | | | | |
| | Consumer Staples – 7.09% | | | | | | | | | | | | |
| | Altria Group, Inc. | | | 79,900 | | | | 1,598,000 | | | | 2.00 | % |
| | Philip Morris International, Inc. (a) | | | 79,900 | | | | 4,077,297 | | | | 5.09 | % |
| | | | | | | | | 5,675,297 | | | | 7.09 | % |
| | | | | | | | | | | | | | |
| | Financials – 15.51% | | | | | | | | | | | | |
| | Bank of America Corp. | | | 30,000 | | | | 1,126,200 | | | | 1.41 | % |
| | Citigroup, Inc. | | | 178,100 | | | | 4,500,587 | | | | 5.62 | % |
| | J.P. Morgan Chase & Co. | | | 142,400 | | | | 6,785,360 | | | | 8.48 | % |
| | | | | | | | | 12,412,147 | | | | 15.51 | % |
| | | | | | | | | | | | | | |
| | Health Care – 12.80% | | | | | | | | | | | | |
| | Merck & Co., Inc. | | | 121,600 | | | | 4,625,664 | | | | 5.78 | % |
| | Pfizer, Inc. | | | 279,100 | | | | 5,612,701 | | | | 7.02 | % |
| | | | | | | | | 10,238,365 | | | | 12.80 | % |
| | | | | | | | | | | | | | |
| | Industrials – 6.06% | | | | | | | | | | | | |
| | General Electric Co. | | | 148,300 | | | | 4,849,410 | | | | 6.06 | % |
| | | | | | | | | | | | | | |
| | Materials – 8.36% | | | | | | | | | | | | |
| | EI Du Pont de Nemours & Co. | | | 136,700 | | | | 6,685,997 | | | | 8.36 | % |
| | | | | | | | | | | | | | |
| | Telecommunication Services – 16.18% | | | | | | | | | | | | |
| | AT&T, Inc. | | | 171,100 | | | | 6,623,281 | | | | 8.28 | % |
| | Fairpoint Communications, Inc. | | | 2,886 | | | | 26,580 | | | | 0.03 | % |
| | Verizon Communications, Inc. | | | 163,500 | | | | 6,291,480 | | | | 7.87 | % |
| | | | | | | | | 12,941,341 | | | | 16.18 | % |
| | | | | | | | | | | | | | |
| | Total Common Stocks (Cost $61,102,067) | | | | | | | 60,402,237 | | | | 75.50 | % |
The accompanying notes are an integral part of these financial statements.
HENNESSY FUNDS 1-800-966-4354
| | SHORT-TERM INVESTMENTS – 72.82% | | Principal | | | | | | % of Net | |
| | | | Amount | | | Value | | | Assets | |
| | Discount Notes – 0.29% | | | | | | | | | |
| | Federal Home Loan Bank Discount Note, | | | | | | | | | |
| | 1.6200%, 05/01/2008 | | $ | 235,000 | | | $ | 235,000 | | | | 0.29 | % |
| | Total Discount Notes (Cost $235,000) | | | | | | | 235,000 | | | | 0.29 | % |
| | | | | | | | | | | | | | |
| | U.S. Treasury Bills* – 69.89% | | | | | | | | | | | | |
| | 2.3000%, 05/22/2008 | | | 19,000,000 | | | | 18,978,166 | | | | 23.72 | % |
| | 1.0000%, 06/19/2008 | | | 20,000,000 | | | | 19,989,111 | | | | 24.99 | % |
| | 1.5000%, 07/24/2008 | | | 17,000,000 | | | | 16,948,031 | | | | 21.18 | % |
| | Total U.S. Treasury Bills (Cost $55,928,007) | | | | | | | 55,915,308 | | | | 69.89 | % |
| | | | | | | | | | | | | | |
| | Variable Rate Demand Notes# – 2.64% | | | | | | | | | | | | |
| | American Family Financial Services, Inc. | | | | | | | | | | | | |
| | 1.7835% | | | 2,108,232 | | | | 2,108,232 | | | | 2.64 | % |
| | | | | | | | | | | | | | |
| | Total Variable Rate Demand Notes | | | | | | | | | | | | |
| | (Cost $2,108,232) | | | | | | | 2,108,232 | | | | 2.64 | % |
| | | | | | | | | | | | | | |
| | Total Short-Term Investments | | | | | | | | | | | | |
| | (Cost $58,271,239) | | | | | | | 58,258,540 | | | | 72.82 | % |
| | | | | | | | | | | | | | |
| | Total Investments – 148.32% | | | | | | | | | | | | |
| | (Cost $119,373,306) | | | | | | | 118,660,777 | | | | 148.32 | % |
| | | | | | | | | | | | | | |
| | Liabilities in Excess of Other Assets – (48.32)% | | | | | | | (38,656,845 | ) | | | (48.32 | )% |
| | TOTAL NET ASSETS – 100.00% | | | | | | $ | 80,003,932 | | | | 100.00 | % |
Percentages are stated as a percent of net assets.
| (a) | | Non Income Producing |
| # | | Variable rate demand notes are considered short-term obligations and are payable on demand. Interest rates change periodically on specified dates. The rates listed are as of April 30, 2008. |
| * | | Collateral or partial collateral for securities sold subject to repurchase. |
The accompanying notes are an integral part of these financial statements.
SUMMARY OF INVESTMENTS — BALANCED FUND
HENNESSY BALANCED FUND
(% of Net Assets)
| TOP TEN HOLDINGS | % of net assets |
| J.P. Morgan Chase & Co. | 5.67% |
| AT&T, Inc. | 5.47% |
| EI Du Pont de Nemours & Co. | 5.43% |
| Verizon Communications, Inc. | 5.14% |
| General Electric Co. | 4.92% |
| Pfizer, Inc. | 4.66% |
| General Motors Corp. | 4.51% |
| Citigroup, Inc. | 4.05% |
| Home Depot, Inc. | 2.94% |
| Philip Morris International, Inc. | 2.60% |
HENNESSY FUNDS 1-800-966-4354
| | COMMON STOCKS – 50.07% | | Number | | | | | | % of Net | |
| | | | of Shares | | | Value | | | Assets | |
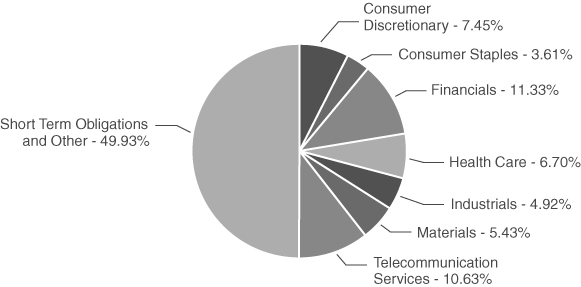
| | Consumer Discretionary – 7.45% | | | | | | | | | |
| | General Motors Corp. | | | 28,515 | | | $ | 661,548 | | | | 4.51 | % |
| | Home Depot, Inc. | | | 15,010 | | | | 432,288 | | | | 2.94 | % |
| | | | | | | | | 1,093,836 | | | | 7.45 | % |
| | | | | | | | | | | | | | |
| | Consumer Staples – 3.61% | | | | | | | | | | | | |
| | Altria Group, Inc. | | | 7,470 | | | | 149,400 | | | | 1.01 | % |
| | Philip Morris International, Inc. (a) | | | 7,470 | | | | 381,194 | | | | 2.60 | % |
| | | | | | | | | 530,594 | | | | 3.61 | % |
| | | | | | | | | | | | | | |
| | Financials – 11.33% | | | | | | | | | | | | |
| | Bank of America Corp. | | | 6,320 | | | | 237,253 | | | | 1.61 | % |
| | Citigroup, Inc. | | | 23,525 | | | | 594,476 | | | | 4.05 | % |
| | J.P. Morgan Chase & Co. | | | 17,475 | | | | 832,684 | | | | 5.67 | % |
| | | | | | | | | 1,664,413 | | | | 11.33 | % |
| | | | | | | | | | | | | | |
| | Health Care – 6.70% | | | | | | | | | | | | |
| | Merck & Co., Inc. | | | 7,860 | | | | 298,994 | | | | 2.04 | % |
| | Pfizer, Inc. | | | 34,050 | | | | 684,746 | | | | 4.66 | % |
| | | | | | | | | 983,740 | | | | 6.70 | % |
| | | | | | | | | | | | | | |
| | Industrials – 4.92% | | | | | | | | | | | | |
| | General Electric Co. | | | 22,080 | | | | 722,016 | | | | 4.92 | % |
| | | | | | | | | | | | | | |
| | Materials – 5.43% | | | | | | | | | | | | |
| | EI Du Pont de Nemours & Co. | | | 16,295 | | | | 796,989 | | | | 5.43 | % |
| | | | | | | | | | | | | | |
| | Telecommunication Services – 10.63% | | | | | | | | | | | | |
| | AT&T, Inc. | | | 20,760 | | | | 803,620 | | | | 5.47 | % |
| | Fairpoint Communications, Inc. | | | 323 | | | | 2,975 | | | | 0.02 | % |
| | Verizon Communications, Inc. | | | 19,630 | | | | 755,362 | | | | 5.14 | % |
| | | | | | | | | 1,561,957 | | | | 10.63 | % |
| | | | | | | | | | | | | | |
| | Total Common Stocks (Cost $8,045,219) | | | | | | | 7,353,545 | | | | 50.07 | % |
The accompanying notes are an integral part of these financial statements.
| | SHORT-TERM INVESTMENTS – 49.84% | | Principal | | | | | | % of Net | |
| | | | Amount | | | Value | | | Assets | |
| | Discount Notes – 1.16% | | | | | | | | | |
| | Federal Home Loan Bank Discount Note, | | | | | | | | | |
| | 1.6200%, 05/01/2008 | | $ | 171,000 | | | $ | 171,000 | | | | 1.16 | % |
| | Total Discount Notes (Cost $171,000) | | | | | | | 171,000 | | | | 1.16 | % |
| | | | | | | | | | | | | | |
| | U.S. Treasury Notes – 47.69% | | | | | | | | | | | | |
| | 4.875%, 05/31/2008 | | | 1,000,000 | | | | 1,003,126 | | | | 6.83 | % |
| | 3.250%, 08/15/2008 | | | 2,600,000 | | | | 2,614,422 | | | | 17.80 | % |
| | 4.625%, 09/30/2008 | | | 850,000 | | | | 860,957 | | | | 5.86 | % |
| | 3.000%, 02/15/2009 | | | 1,600,000 | | | | 1,615,626 | | | | 11.00 | % |
| | 3.125%, 04/15/2009 | | | 900,000 | | | | 910,829 | | | | 6.20 | % |
| | Total U.S. Treasury Notes (Cost $6,975,242) | | | | | | | 7,004,960 | | | | 47.69 | % |
| | | | | | | | | | | | | | |
| | Variable Rate Demand Notes# – 0.99% | | | | | | | | | | | | |
| | American Family Financial Services, Inc. | | | | | | | | | | | | |
| | 1.7835% | | | 144,925 | | | | 144,925 | | | | 0.99 | % |
| | | | | | | | | | | | | | |
| | Total Variable Rate Demand Notes | | | | | | | | | | | | |
| | (Cost $144,925) | | | | | | | 144,925 | | | | 0.99 | % |
| | | | | | | | | | | | | | |
| | Total Short-Term Investments | | | | | | | | | | | | |
| | (Cost $7,291,167) | | | | | | | 7,320,885 | | | | 49.84 | % |
| | | | | | | | | | | | | | |
| | Total Investments – 99.91% | | | | | | | | | | | | |
| | (Cost $15,336,386) | | | | | | | 14,674,430 | | | | 99.91 | % |
| | | | | | | | | | | | | | |
| | Other Assets in Excess of Liabilities – 0.09% | | | | | | | 12,487 | | | | 0.09 | % |
| | TOTAL NET ASSETS – 100.00% | | | | | | $ | 14,686,917 | | | | 100.00 | % |
Percentages are stated as a percent of net assets.
| (a) | | Non Income Producing |
| # | | Variable rate demand notes are considered short-term obligations and are payable on demand. Interest rates change periodically on specified dates. The rates listed are as of April 30, 2008. |
The accompanying notes are an integral part of these financial statements.
HENNESSY FUNDS 1-800-966-4354
Financial Statements
Statements of Assets and Liabilities as of April 30, 2008 (Unaudited) |
| | | HENNESSY | |
| | | CORNERSTONE | |
| | | GROWTH FUND | |
| ASSETS: | | | |
| Investments, at value (cost $595,120,549, $102,459,713, | | | |
| $198,805,235, $172,540,482, $119,373,306 and $15,336,386, respectively) | | $ | 579,606,212 | |
| Cash | | | — | |
| Dividends and interest receivable | | | 539,814 | |
| Receivable for fund shares sold | | | 282,425 | |
| Prepaid expenses and other assets | | | 37,104 | |
| Total Assets | | | 580,465,555 | |
| | | | | |
| LIABILITIES: | | | | |
| Loan payable | | | — | |
| Payable for securities purchased | | | 40,581 | |
| Payable for fund shares redeemed | | | 1,857,152 | |
| Payable to Advisor | | | 357,854 | |
| Payable to Administrator | | | 378,990 | |
| Payable to Auditor | | | 11,939 | |
| Payable to Distributor | | | — | |
| Accrued interest payable | | | — | |
| Accrued service fees | | | 47,545 | |
| Accrued expenses and other payables | | | 62,134 | |
| Total Liabilities | | | 2,756,195 | |
| | | | | |
| NET ASSETS | | $ | 577,709,360 | |
| | | | | |
| NET ASSETS CONSIST OF: | | | | |
| Capital stock | | $ | 696,178,698 | |
| Accumulated net investment income (loss) | | | (1,143,675 | ) |
| Accumulated net realized gain (loss) on investments | | | (101,811,326 | ) |
| Unrealized net appreciation (depreciation) on investments | | | (15,514,337 | ) |
| Total Net Assets | | $ | 577,709,360 | |
| | | | | |
| Shares authorized ($.0001 par value) – Original Class | | | 25,000,000,000 | |
| Net assets applicable to outstanding Original Class shares | | | 565,634,508 | |
| Shares issued and outstanding – Original Class | | | 42,549,012 | |
| Net asset value, offering price and redemption price per share – Original Class | | $ | 13.29 | |
| | | | | |
| Shares authorized ($.0001 par value) – Institutional Class | | | 25,000,000,000 | |
| Net assets applicable to outstanding Institutional Class shares | | | 12,074,852 | |
| Shares issued and outstanding – Institutional Class | | | 907,860 | |
| Net asset value, offering price and redemption price per share – Institutional Class | | $ | 13.30 | |
The accompanying notes are an integral part of these financial statements.
FINANCIAL STATEMENTS — STATEMENTS OF ASSETS AND LIABILITIES
| HENNESSY | | | | | | | | | | | | | |
| CORNERSTONE | | | HENNESSY | | | HENNESSY | | | HENNESSY | | | HENNESSY | |
| GROWTH FUND, | | | FOCUS 30 | | | CORNERSTONE | | | TOTAL RETURN | | | BALANCED | |
| SERIES II | | | FUND | | | VALUE FUND | | | FUND | | | FUND | |
| | | | | | | | | | | | | | |
| | | | | | | | | | | | | | |
| $ | 83,228,087 | | | $ | 202,886,496 | | | $ | 161,432,065 | | | $ | 118,660,777 | | | $ | 14,674,430 | |
| | 29,759 | | | | 11,263 | | | | — | | | | — | | | | — | |
| | 171,585 | | | | 11,204 | | | | 721,130 | | | | 142,408 | | | | 69,775 | |
| | 44,408 | | | | 433,000 | | | | 817 | | | | 137 | | | | — | |
| | 54,584 | | | | 32,115 | | | | 24,746 | | | | 10,838 | | | | 14,030 | |
| | 83,528,423 | | | | 203,374,078 | | | | 162,178,758 | | | | 118,814,160 | | | | 14,758,235 | |
| | | | | | | | | | | | | | | | | | | |
| | — | | | | — | | | | — | | | | 38,565,500 | | | | — | |
| | — | | | | — | | | | — | | | | — | | | | — | |
| | 137,379 | | | | 202,780 | | | | 14,417 | | | | 9,340 | | | | — | |
| | 51,956 | | | | 117,904 | | | | 97,529 | | | | 39,162 | | | | 7,226 | |
| | 52,277 | | | | 112,318 | | | | 98,307 | | | | 48,427 | | | | 8,955 | |
| | 12,320 | | | | 7,272 | | | | 9,804 | | | | 8,671 | | | | 8,994 | |
| | — | | | | — | | | | — | | | | 55,134 | | | | 44,884 | |
| | — | | | | — | | | | — | | | | 56,155 | | | | — | |
| | 7,016 | | | | 12,875 | | | | 13,112 | | | | 6,527 | | | | 1,204 | |
| | 18,841 | | | | 15,550 | | | | 7,486 | | | | 21,312 | | | | 55 | |
| | 279,789 | | | | 468,699 | | | | 240,655 | | | | 38,810,228 | | | | 71,318 | |
| $ | 83,248,634 | | | $ | 202,905,379 | | | $ | 161,938,103 | | | $ | 80,003,932 | | | $ | 14,686,917 | |
| | | | | | | | | | | | | | | | | | | |
| $ | 110,433,179 | | | $ | 203,934,109 | | | $ | 198,110,615 | | | $ | 167,053,174 | | | $ | 16,577,819 | |
| | (122,323 | ) | | | (693,582 | ) | | | 2,217,083 | | | | 116,893 | | | | 24,441 | |
| | (7,830,596 | ) | | | (4,416,409 | ) | | | (27,281,178 | ) | | | (86,453,606 | ) | | | (1,253,387 | ) |
| | (19,231,626 | ) | | | 4,081,261 | | | | (11,108,417 | ) | | | (712,529 | ) | | | (661,956 | ) |
| $ | 83,248,634 | | | $ | 202,905,379 | | | $ | 161,938,103 | | | $ | 80,003,932 | | | $ | 14,686,917 | |
| | | | | | | | | | | | | | | | | | | |
| Unlimited | | | | 25,000,000,000 | | | | 25,000,000,000 | | | | 100,000,000 | | | | 100,000,000 | |
| | 83,153,792 | | | | 162,548,905 | | | | 160,972,636 | | | | 80,003,932 | | | | 14,686,917 | |
| | 4,307,548 | | | | 13,683,726 | | | | 11,554,116 | | | | 6,676,870 | | | | 1,343,739 | |
| $ | 19.30 | | | $ | 11.88 | | | $ | 13.93 | | | $ | 11.98 | | | $ | 10.93 | |
| | | | | | | | | | | | | | | | | | |
| Unlimited | | | | 25,000,000,000 | | | | 25,000,000,000 | | | | | | | | | |
| | 94,842 | | | | 40,356,474 | | | | 965,467 | | | | | | | | | |
| | 4,907 | | | | 3,395,412 | | | | 69,312 | | | | | | | | | |
| $ | 19.33 | | | $ | 11.89 | | | $ | 13.93 | | | | | | | | | |
HENNESSY FUNDS 1-800-966-4354
Financial Statements
Statements of Operations Six months ended April 30, 2008 (Unaudited) |
| | | HENNESSY | |
| | | CORNERSTONE | |
| | | GROWTH FUND | |
| INVESTMENT INCOME: | | | |
Dividend income(1) | | $ | 3,150,006 | |
| Interest income | | | 107,352 | |
| Total investment income | | | 3,257,358 | |
| | | | | |
| EXPENSES: | | | | |
| Investment advisory fees (See Note 5) | | | 2,636,830 | |
| Administration, fund accounting, custody and transfer agent fees (See Note 5) | | | 870,918 | |
| Distribution fees (See Note 5) | | | — | |
| Service fees (See Note 5) | | | 355,060 | |
| Federal and state registration fees | | | 14,783 | |
| Audit fees | | | 11,468 | |
| Legal fees | | | 10,236 | |
| Reports to shareholders | | | 68,250 | |
| Directors’ fees and expenses | | | 5,552 | |
| Sub-transfer agent expenses (See Note 5) | | | 376,363 | |
| Interest expense (See Note 3 and 7) | | | 23,152 | |
| Other | | | 30,318 | |
| Total expenses before reimbursement from advisor | | | 4,402,930 | |
| Expense reimbursement from advisor (See Note 5) | | | (1,897 | ) |
| Net expenses | | | 4,401,033 | |
| NET INVESTMENT INCOME (LOSS) | | $ | (1,143,675 | ) |
| | | | | |
| REALIZED AND UNREALIZED GAINS (LOSSES): | | | | |
| Net realized gain(loss) on investments | | $ | (100,316,708 | ) |
| Change in unrealized appreciation (depreciation) on investments | | | (96,457,256 | ) |
| Net gain (loss) on investments | | | (196,773,964 | ) |
| | | | | |
| | | | | |
| NET INCREASE (DECREASE) IN NET ASSETS | | | | |
| RESULTING FROM OPERATIONS | | $ | (197,917,639 | ) |
(1) Net of foreign taxes withheld of $409,879, $32,166, $0, $55,048, $0, & $0, respectively.
The accompanying notes are an integral part of these financial statements.
FINANCIAL STATEMENTS — STATEMENTS OF OPERATIONS
| HENNESSY | | | | | | | | | | | | | |
| CORNERSTONE | | | HENNESSY | | | HENNESSY | | | HENNESSY | | | HENNESSY | |
| GROWTH FUND, | | | FOCUS 30 | | | CORNERSTONE | | | TOTAL RETURN | | | BALANCED | |
| SERIES II | | | FUND | | | VALUE FUND | | | FUND | | | FUND | |
| | | | | | | | | | | | | | |
| $ | 490,630 | | | $ | 491,175 | | | $ | 3,779,015 | | | $ | 1,268,421 | | | $ | 148,320 | |
| | 17,971 | | | | 42,402 | | | | 65,999 | | | | 770,191 | | | | 152,438 | |
| | 508,601 | | | | 533,577 | | | | 3,845,014 | | | | 2,038,612 | | | | 300,758 | |
| | | | | | | | | | | | | | | | | | | |
| | 363,478 | | | | 719,215 | | | | 634,950 | | | | 251,431 | | | | 45,851 | |
| | 118,767 | | �� | | 235,460 | | | | 207,908 | | | | 101,559 | | | | 18,488 | |
| | — | | | | — | | | | — | | | | 62,858 | | | | 11,463 | |
| | 49,104 | | | | 93,180 | | | | 85,689 | | | | 41,905 | | | | 7,642 | |
| | 13,047 | | | | 16,778 | | | | 11,656 | | | | 10,938 | | | | 9,610 | |
| | 5,020 | | | | 8,821 | | | | 9,582 | | | | 8,976 | | | | 8,727 | |
| | 12,236 | | | | 10,236 | | | | 10,236 | | | | 6,032 | | | | 5,236 | |
| | 14,959 | | | | 14,959 | | | | 13,161 | | | | 4,239 | | | | 975 | |
| | 5,553 | | | | 5,552 | | | | 5,524 | | | | 3,745 | | | | 3,745 | |
| | 56,497 | | | | 111,706 | | | | 30,991 | | | | — | | | | — | |
| | 3,700 | | | | 8,039 | | | | 375 | | | | 593,399 | | | | — | |
| | 10,003 | | | | 7,756 | | | | 6,211 | | | | 3,281 | | | | 1,348 | |
| | 652,364 | | | | 1,231,702 | | | | 1,016,283 | | | | 1,088,363 | | | | 113,085 | |
| | (27 | ) | | | (4,543 | ) | | | (146 | ) | | | — | | | | — | |
| | 652,337 | | | | 1,227,159 | | | | 1,016,137 | | | | 1,088,363 | | | | 113,085 | |
| $ | (143,736 | ) | | $ | (693,582 | ) | | $ | 2,828,877 | | | $ | 950,249 | | | $ | 187,673 | |
| | | | | | | | | | | | | | | | | | | |
| $ | (6,657,810 | ) | | $ | (3,969,362 | ) | | $ | 12,717,021 | | | $ | 1,214,166 | | | $ | 217,435 | |
| | (16,092,232 | ) | | | 6,552,117 | | | | (48,154,613 | ) | | | (13,251,088 | ) | | | (1,564,559 | ) |
| | (22,750,042 | ) | | | 2,582,755 | | | | (35,437,592 | ) | | | (12,036,922 | ) | | | (1,347,124 | ) |
| | | | | | | | | | | | | | | | | | | |
| $ | (22,893,778 | ) | | $ | 1,889,173 | | | $ | (32,608,715 | ) | | $ | (11,086,673 | ) | | $ | (1,159,451 | ) |
HENNESSY FUNDS 1-800-966-4354
| Statements of Changes in Net Assets |
| | | Hennessy Cornerstone Growth Fund | |
| | | Six Months Ended | | | | |
| | | April 30, 2008 | | | Year Ended | |
| | | (Unaudited) | | | October 31, 2007 | |
| OPERATIONS: | | | | | | |
| Net investment income (loss) | | $ | (1,143,675 | ) | | $ | (3,634,032 | ) |
| Net realized gain (loss) on securities | | | (100,316,708 | ) | | | 111,245,274 | |
| Change in unrealized appreciation (depreciation) on securities | | | (96,457,256 | ) | | | (876,501 | ) |
| Net increase (decrease) in net assets resulting from operations | | | (197,917,639 | ) | | | 106,734,741 | |
| | | | | | | | | |
| DISTRIBUTIONS TO SHAREHOLDERS FROM: | | | | | | | | |
| Net investment income – Original Class | | | — | | | | — | |
| Net investment income – Institutional Class | | | — | | | | — | |
| Net realized gains – Original Class | | | (110,914,265 | ) | | | (183,483,584 | ) |
| Net realized gains – Institutional Class | | | — | | | | — | |
| Total distributions | | | (110,914,265 | ) | | | (183,483,584 | ) |
| | | | | | | | | |
| CAPITAL SHARE TRANSACTIONS: | | | | | | | | |
| Proceeds from shares subscribed – Original Class | | | 24,673,684 | | | | 113,042,125 | |
| Proceeds from shares subscribed – Institutional Class | | | 12,208,657 | | | | — | |
| Dividends reinvested – Original Class | | | 107,702,229 | | | | 178,259,103 | |
| Dividends reinvested – Institutional Class | | | — | | | | — | |
| Redemption fees retained – Original Class | | | 19,442 | | | | 88,873 | |
| Redemption fees retained – Institutional Class | | | — | | | | — | |
| Cost of shares redeemed – Original Class | | | (247,857,153 | ) | | | (474,889,281 | ) |
| Cost of shares redeemed – Institutional Class | | | (631,061 | ) | | | — | |
| Net increase (decrease) in net assets derived | | | | | | | | |
| from capital share transactions | | | (103,884,202 | ) | | | (183,499,180 | ) |
| | | | | | | | | |
| TOTAL INCREASE (DECREASE) IN NET ASSETS | | | (412,716,106 | ) | | | (260,248,023 | ) |
| | | | | | | | | |
| NET ASSETS: | | | | | | | | |
| Beginning of period | | | 990,425,466 | | | | 1,250,673,489 | |
| End of period | | $ | 577,709,360 | | | $ | 990,425,466 | |
| | | | | | | | | |
| Accumulated net investment income (loss), end of period | | $ | (1,143,675 | ) | | $ | — | |
| | | | | | | | | |
| CHANGES IN SHARES OUTSTANDING: | | | | | | | | |
| Shares sold – Original Class | | | 40,945,549 | | | | 5,966,383 | |
| Shares sold – Institutional Class | | | 956,321 | | | | — | |
| Shares reinvested – Original Class | | | 7,062,441 | | | | 9,930,869 | |
| Shares reinvested – Institutional Class | | | — | | | | — | |
| Shares redeemed – Original Class | | | (56,485,778 | ) | | | (25,075,476 | ) |
| Shares redeemed – Institutional Class | | | (48,461 | ) | | | | |
| Net increase (decrease) in shares outstanding | | | (7,569,928 | ) | | | (9,178,224 | ) |
The accompanying notes are an integral part of these financial statements.
FINANCIAL STATEMENTS — STATEMENTS OF CHANGES IN NET ASSETS
| Hennessy Cornerstone | | | | | | | |
| Growth Fund, Series II | | | Hennessy Focus 30 Fund | |
| Six Month Ended | | | | | | Six Month Ended | | | | |
| April 30, 2008 | | | Year Ended | | | April 30, 2008 | | | Year Ended | |
| (Unaudited) | | | October 31, 2007 | | | (Unaudited) | | | October 31, 2007 | |
| | | | | | | | | | | |
| $ | (143,736 | ) | | $ | (1,128,653 | ) | | $ | (693,582 | ) | | $ | (1,462,891 | ) |
| | (6,657,810 | ) | | | 27,032,411 | | | | (3,969,362 | ) | | | 34,333,802 | |
| | (16,092,232 | ) | | | (19,628,497 | ) | | | 6,552,117 | | | | (11,346,335 | ) |
| | (22,893,778 | ) | | | 6,275,261 | | | | 1,889,173 | | | | 21,524,576 | |
| | | | | | | | | | | | | | | |
| | | | | | | | | | | | | | | |
| | — | | | | — | | | | — | | | | — | |
| | — | | | | — | | | | — | | | | — | |
| | (27,055,016 | ) | | | (9,231,945 | ) | | | (33,248,525 | ) | | | (1,781,615 | ) |
| | — | | | | — | | | | — | | | | — | |
| | (27,055,016 | ) | | | (9,231,945 | ) | | | (33,248,525 | ) | | | (1,781,615 | ) |
| | | | | | | | | | | | | | | |
| | | | | | | | | | | | | | | |
| | 3,013,847 | | | | 12,110,526 | | | | 30,074,213 | | | | 119,498,304 | |
| | 94,046 | | | | — | | | | 36,734,583 | | | | — | |
| | 26,856,690 | | | | 9,137,765 | | | | 32,845,640 | | | | 1,752,077 | |
| | — | | | | — | | | | — | | | | — | |
| | 6,129 | | | | 24,177 | | | | 42,208 | | | | 124,025 | |
| | — | | | | — | | | | — | | | | — | |
| | (35,351,860 | ) | | | (123,925,703 | ) | | | (98,385,058 | ) | | | (148,376,546 | ) |
| | — | | | | — | | | | (417,964 | ) | | | — | |
| | | | | | | | | | | | | | | |
| | (5,381,148 | ) | | | (102,653,235 | ) | | | 893,622 | | | | (27,002,140 | ) |
| | | | | | | | | | | | | | | |
| | (55,329,942 | ) | | | (105,609,919 | ) | | | (30,465,730 | ) | | | (7,259,179 | ) |
| | | | | | | | | | | | | | | |
| | | | | | | | | | | | | | | |
| | 138,578,576 | | | | 244,188,495 | | | | 233,371,109 | | | | 240,630,288 | |
| $ | 83,248,634 | | | $ | 138,578,576 | | | $ | 202,905,379 | | | $ | 233,371,109 | |
| | | | | | | | | | | | | | | |
| $ | (143,736 | ) | | $ | 21,413 | | | $ | (693,582 | ) | | $ | — | |
| | | | | | | | | | | | | | | |
| | | | | | | | | | | | | | | |
| | 3,337,897 | | | | 396,382 | | | | 14,879,796 | | | | 8,519,202 | |
| | 4,908 | | | | — | | | | 3,431,686 | | | | — | |
| | 1,292,430 | | | | 309,021 | | | | 2,935,267 | | | | 141,297 | |
| | — | | | | — | | | | — | | | | — | |
| | (4,893,200 | ) | | | (4,075,942 | ) | | | (21,198,714 | ) | | | (11,019,600 | ) |
| | — | | | | — | | | | (36,274 | ) | | | — | |
| | (257,965 | ) | | | (3,370,539 | ) | | | 11,761 | | | | (2,359,101 | ) |
HENNESSY FUNDS 1-800-966-4354
| Statements of Changes in Net Assets |
| | | Hennessy Cornerstone Value Fund | |
| | | Six Month Ended | | | | |
| | | April 30, 2008 | | | Year Ended | |
| | | (Unaudited) | | | October 31, 2007 | |
| OPERATIONS: | | | | | | |
| Net investment income (loss) | | $ | 2,828,877 | | | $ | 5,930,170 | |
| Net realized gain (loss) on securities | | | 12,717,021 | | | | 10,584,083 | |
| Change in unrealized appreciation (depreciation) on securities | | | (48,154,613 | ) | | | 13,065,195 | |
| Net increase (decrease) in net assets resulting from operations | | | (32,608,715 | ) | | | 29,579,448 | |
| | | | | | | | | |
| DISTRIBUTIONS TO SHAREHOLDERS FROM: | | | | | | | | |
| Net investment income – Original Class | | | (4,859,028 | ) | | | (5,691,101 | ) |
| Net investment income – Institutional Class | | | — | | | | — | |
| Net realized gains – Original Class | | | — | | | | — | |
| Net realized gains – Institutional Class | | | — | | | | — | |
| Total distributions | | | (4,859,028 | ) | | | (5,691,101 | ) |
| | | | | | | | | |
| CAPITAL SHARE TRANSACTIONS: | | | | | | | | |
| Proceeds from shares subscribed – Original Class | | | 2,082,120 | | | | 25,534,075 | |
| Proceeds from shares subscribed – Institutional Class | | | 945,342 | | | | — | |
| Dividends reinvested – Original Class | | | 4,316,070 | | | | 5,174,239 | |
| Dividends reinvested – Institutional Class | | | — | | | | — | |
| Redemption fees retained – Original Class | | | 127 | | | | 128,422 | |
| Redemption fees retained – Institutional Class | | | — | | | | — | |
| Cost of shares redeemed – Original Class | | | (12,442,020 | ) | | | (107,023,696 | ) |
| Cost of shares redeemed – Institutional Class | | | — | | | | — | |
| Net increase (decrease) in net assets derived | | | | | | | | |
| from capital share transactions | | | (5,098,361 | ) | | | (76,186,960 | ) |
| | | | | | | | | |
| TOTAL INCREASE (DECREASE) IN NET ASSETS | | | (42,566,104 | ) | | | (52,298,613 | ) |
| | | | | | | | | |
| NET ASSETS: | | | | | | | | |
| Beginning of period | | | 204,504,207 | | | | 256,802,820 | |
| End of period | | $ | 161,938,103 | | | $ | 204,504,207 | |
| | | | | | | | | |
| Accumulated net investment income (loss), end of period | | $ | 2,214,938 | | | $ | 4,247,234 | |
| | | | | | | | | |
| CHANGES IN SHARES OUTSTANDING: | | | | | | | | |
| Shares sold – Original Class | | | 11,599,934 | | | | 1,648,918 | |
| Shares sold – Institutional Class | | | 69,312 | | | | — | |
| Shares reinvested – Original Class | | | 288,122 | | | | 337,964 | |
| Shares reinvested – Institutional Class | | | — | | | | — | |
| Shares redeemed – Original Class | | | (12,322,959 | ) | | | (6,819,535 | ) |
| Shares redeemed – Institutional Class | | | — | | | | — | |
| Net increase (decrease) in shares outstanding | | | (365,591 | ) | | | (4,832,653 | ) |
The accompanying notes are an integral part of these financial statements.
FINANCIAL STATEMENTS — STATEMENTS OF CHANGES IN NET ASSETS
| Hennessy Total Return Fund | | | Hennessy Balanced Fund | |
| Six Months Ended | | | | | | Six Months Ended | | | | |
| April 30, 2008 | | | Year Ended | | | April 30, 2008 | | | Year Ended | |
| (Unaudited) | | | October 31, 2007 | | | (Unaudited) | | | October 31, 2007 | |
| | | | | | | | | | | |
| $ | 950,249 | | | $ | 2,576,108 | | | $ | 187,673 | | | $ | 574,530 | |
| | 1,214,166 | | | | 3,214,280 | | | | 217,435 | | | | 1,794,111 | |
| | (13,251,088 | ) | | | 5,426,361 | | | | (1,564,559 | ) | | | (860,448 | ) |
| | (11,086,673 | ) | | | 11,216,749 | | | | (1,159,451 | ) | | | 1,508,193 | |
| | | | | | | | | | | | | | | |
| | (977,500 | ) | | | (2,653,674 | ) | | | (199,941 | ) | | | (608,338 | ) |
| | — | | | | — | | | | — | | | | — | |
| | — | | | | — | | | | (785,865 | ) | | | — | |
| | — | | | | — | | | | — | | | | — | |
| | (977,500 | ) | | | (2,653,674 | ) | | | (985,806 | ) | | | (608,338 | ) |
| | | | | | | | | | | | | | | |
| | 1,476,442 | | | | 7,605,881 | | | | 467,404 | | | | 6,969,033 | |
| | — | | | | — | | | | — | | | | — | |
| | 916,175 | | | | 2,513,974 | | | | 963,226 | | | | 594,977 | |
| | — | | | | — | | | | — | | | | — | |
| | 678 | | | | 31,831 | | | | 595 | | | | 10,406 | |
| | — | | | | — | | | | — | | | | — | |
| | (6,634,109 | ) | | | (35,669,527 | ) | | | (1,419,934 | ) | | | (17,788,826 | ) |
| | — | | | | — | | | | — | | | | — | |
| | | | | | | | | | | | | | | |
| | (4,240,814 | ) | | | (25,517,841 | ) | | | 11,291 | | | | (10,214,410 | ) |
| | (16,304,987 | ) | | | (16,954,766 | ) | | | (2,133,966 | ) | | | (9,314,555 | ) |
| | | | | | | | | | | | | | | |
| | | | | | | | | | | | | | | |
| | 96,308,919 | | | | 113,263,685 | | | | 16,820,883 | | | | 26,135,438 | |
| $ | 80,003,932 | | | $ | 96,308,919 | | | $ | 14,686,917 | | | $ | 16,820,883 | |
| $ | 116,893 | | | $ | 144,144 | | | $ | 24,441 | | | $ | 36,709 | |
| | | | | | | | | | | | | | | |
| | 119,173 | | | | 629,320 | | | | 41,705 | | | | 576,031 | |
| | — | | | | — | | | | — | | | | — | |
| | 75,742 | | | | 151,028 | | | | 84,410 | | | | 37,600 | |
| | — | | | | — | | | | — | | | | — | |
| | (534,983 | ) | | | (2,743,545 | ) | | | (127,308 | ) | | | (1,478,196 | ) |
| | — | | | | — | | | | — | | | | — | |
| | (340,068 | ) | | | (1,963,197 | ) | | | (1,193 | ) | | | (864,565 | ) |
HENNESSY FUNDS 1-800-966-4354
| Hennessy Cornerstone Growth Fund |
| | | Six Months Ended | |
| | | April 30, 2008 | |
| | | (Unaudited)(2) | |
| | | | | | Institutional | |
| | | Original Class | | | Class(5) | |
| PER SHARE DATA: | | | | | | |
| Net asset value, beginning of period | | $ | 19.41 | | | $ | 13.29 | |
| | | | | | | | | |
| Income from investment operations: | | | | | | | | |
Net investment gain (loss)(3) | | | (0.03 | ) | | | — | |
| Net realized and unrealized gains (losses) on securities | | | (3.85 | ) | | | 0.01 | |
| Total from investment operations | | | (3.88 | ) | | | 0.01 | |
| | | | | | | | | |
| Less Distributions: | | | | | | | | |
| Dividends from net investment income | | | — | | | | — | |
| Dividends from net realized gains | | | (2.24 | ) | | | — | |
| Total distributions | | | (2.24 | ) | | | — | |
Redemption fees retained(4) | | | — | | | | — | |
| Net asset value, end of period | | $ | 13.29 | | | $ | 13.30 | |
| | | | | | | | | |
| TOTAL RETURN | | | (21.48 | )% | | | (0.67 | )% |
| | | | | | | | | |
| SUPPLEMENTAL DATA AND RATIOS: | | | | | | | | |
| Net assets, end of period (millions) | | $ | 565.6 | | | $ | 12.1 | |
| Ratio of expenses to average net assets: | | | | | | | | |
| Before expense reimbursement | | | 1.23 | % | | | 1.12 | % |
| After expense reimbursement | | | 1.23 | % | | | 0.98 | %(6) |
| Ratio of net investment income to average net assets | | | | | | | | |
| Before expense reimbursement | | | (0.12 | )% | | | 0.38 | % |
| After expense reimbursement | | | (0.12 | )% | | | 0.52 | % |
| Portfolio turnover rate | | | 87.37 | % | | | 87.37 | % |
(1) For the one month ended October 31, 2004. Effective October 31, 2004, the Fund changed its fiscal year end to October 31st from September 30th.
(2) All ratios for the period have been annualized, except portfolio turnover and total return.
(3) Net investment loss per share is calculated using ending balances prior to consideration for adjustments for permanent book and tax differences.
(4) Amount is less than $0.01.
(5) Institutional Class shares commenced operations on March 3, 2008.
(6) The Advisor has agreed to cap the Institutional Class Share expenses at 0.98%.
The accompanying notes are an integral part of these financial statements.
FINANCIAL HIGHLIGHTS — HENNESSY CORNERSTONE GROWTH FUND
| | | | | | | | | | | | | | | | | |
| Year Ended October 31, | | | Period Ended | | | Year Ended September 30, |
| 2007 | | | 2006 | | | 2005 | | | October 31, 2004(1)(2) | | | 2004 | | | 2003 | |
| Original Class |
| | | | | | | | | | | | | | | | | |
| $ | 20.77 | | | $ | 19.49 | | | $ | 19.38 | | | $ | 19.08 | | | $ | 17.23 | | | $ | 13.55 | |
| | | | | | | | | | | | | | | | | | | | | | | |
| | | | | | | | | | | | | | | | | | | | | | | |
| | (0.07 | ) | | | (0.04 | ) | | | (0.14 | ) | | | (0.02 | ) | | | (0.13 | ) | | | (0.07 | ) |
| | 1.82 | | | | 2.55 | | | | 4.13 | | | | 0.32 | | | | 1.98 | | | | 4.23 | |
| | 1.75 | | | | 2.51 | | | | 3.99 | | | | 0.30 | | | | 1.85 | | | | 4.16 | |
| | | | | | | | | | | | | | | | | | | | | | | |
| | | | | | | | | | | | | | | | | | | | | | | |
| | — | | | | — | | | | — | | | | — | | | | — | | | | — | |
| | (3.11 | ) | | | (1.23 | ) | | | (3.88 | ) | | | — | | | | — | | | | (0.48 | ) |
| | (3.11 | ) | | | (1.23 | ) | | | (3.88 | ) | | | — | | | | — | | | | (0.48 | ) |
| | — | | | | — | | | | — | | | | — | | | | — | | | | — | |
| $ | 19.41 | | | $ | 20.77 | | | $ | 19.49 | | | $ | 19.38 | | | $ | 19.08 | | | $ | 17.23 | |
| | | | | | | | | | | | | | | | | | | | | | | |
| | 9.65 | % | | | 13.59 | % | | | 23.17 | % | | | 1.57 | % | | | 10.74 | % | | | 31.67 | % |
| | | | | | | | | | | | | | | | | | | | | | | |
| | | | | | | | | | | | | | | | | | | | | | | |
| $ | 990.4 | | | $ | 1,250.7 | | | $ | 1,071.8 | | | $ | 869.0 | | | $ | 866.0 | | | $ | 752.0 | |
| | | | | | | | | | | | | | | | | | | | | | | |
| | 1.20 | % | | | 1.21 | % | | | 1.23 | % | | | 1.25 | % | | | 1.25 | % | | | 1.27 | % |
| | 1.20 | % | | | 1.21 | % | | | 1.23 | % | | | 1.25 | % | | | 1.25 | % | | | 1.27 | % |
| | | | | | | | | | | | | | | | | | | | | | | |
| | (0.32 | )% | | | (0.20 | )% | | | (0.78 | )% | | | (1.08 | )% | | | (0.68 | )% | | | (0.60 | )% |
| | (0.32 | )% | | | (0.20 | )% | | | (0.78 | )% | | | (1.08 | )% | | | (0.68 | )% | | | (0.60 | )% |
| | 96.56 | % | | | 90.44 | % | | | 88.98 | % | | | 0.00 | % | | | 106.97 | % | | | 74.80 | % |
HENNESSY FUNDS 1-800-966-4354
| Hennessy Cornerstone Growth Fund, Series II |
| | | Six Months Ended | |
| | | April 30, 2008 | |
| | | (Unaudited)(2) | |
| | | | | | Institutional | |
| | | Original Class | | | Class (6) | |
| PER SHARE DATA: | | | | | | |
| Net asset value, beginning of period | | $ | 30.32 | | | $ | 19.17 | |
| | | | | | | | | |
| Income from investment operations: | | | | | | | | |
| Net investment gain (loss) | | | (0.03 | ) | | | 0.02 | |
| Net realized and unrealized gains (losses) on securities | | | (4.86 | ) | | | 0.14 | |
| Total from investment operations | | | (4.89 | ) | | | 0.16 | |
| | | | | | | | | |
| Less Distributions: | | | | | | | | |
| Dividends from net investment income | | | — | | | | — | |
| Dividends from net realized gains | | | (6.13 | ) | | | — | |
| Total distributions | | | (6.13 | ) | | | — | |
Redemption fees retained(4) | | | — | | | | — | |
| Net asset value, end of period | | $ | 19.30 | | | $ | 19.33 | |
| | | | | | | | | |
| TOTAL RETURN | | | (17.57 | )% | | | 0.83 | % |
| | | | | | | | | |
| SUPPLEMENTAL DATA AND RATIOS: | | | | | | | | |
| Net assets, end of period (millions) | | $ | 83.2 | | | $ | 0.1 | |
| Ratio of expenses to average net assets | | | | | | | | |
| Before expense reimbursement | | | 1.32 | % | | | 1.16 | % |
| After expense reimbursement | | | 1.32 | % | | | 0.98 | %(7) |
| Ratio of net investment income to average net assets | | | | | | | | |
| Before expense reimbursement | | | (0.09 | )% | | | 0.82 | % |
| After expense reimbursement | | | (0.09 | )% | | | 1.00 | % |
| Portfolio turnover rate | | | 0 | % | | | 0 | % |
(1) For the four months ended October 31, 2006. Effective October 31, 2006 the Fund changed its fiscal year end to October 31st from June 30th.
(2) All ratios for the period have been annualized, except portfolio turnover and total return.
(3) Net investment loss per share is calculated using average shares outstanding.
(4) Amount is less than $0.01.
(5) The financial highlights set forth herein include the historical highlights of The Henlopen Fund. On July 1, 2005 Hennessy Advisors, Inc. became the
investment advisor to the Fund and the Fund changed its name from “The Henlopen Fund” to Hennessy Cornerstone Growth Fund, Series II.
(6) Institutional Class shares commenced operations on March 3, 2008.
(7) The Advisor has agreed to cap the Institutional Class Share expenses at 0.98%.
The accompanying notes are an integral part of these financial statements.
FINANCIAL HIGHLIGHTS — HENNESSY CORNERSTONE GROWTH FUND, SERIES II
| Year Ended | | | Period Ended | | | | | | | | | | | | | |
| October 31, | | | October 31, | | | Year Ended June 30, | |
| 2007 | | | 2006(1)(2) | | | 2006 | | | 2005(5) | | | 2004(5) | | | 2003(5) | |
| Original Class | |
| | | | | | | | | | | | | | | | | |
| $ | 30.75 | | | $ | 32.19 | | | $ | 31.29 | | | $ | 27.69 | | | $ | 18.13 | | | $ | 16.79 | |
| | | | | | | | | | | | | | | | | | | | | | | |
| | | | | | | | | | | | | | | | | | | | | | | |
| | (0.25 | ) | | | (0.03 | ) | | | (0.07 | )(3) | | | (0.14 | )(3) | | | (0.23 | )(3) | | | (0.16 | )(3) |
| | 1.02 | | | | (1.41 | ) | | | 4.65 | | | | 3.75 | | | | 9.79 | | | | 1.50 | |
| | 0.77 | | | | (1.44 | ) | | | 4.58 | | | | 3.61 | | | | 9.56 | | | | 1.34 | |
| | | | | | | | | | | | | | | | | | | | | | | |
| | | | | | | | | | | | | | | | | | | | | | | |
| | — | | | | — | | | | — | | | | (0.01 | ) | | | — | | | | — | |
| | (1.20 | ) | | | — | | | | (3.68 | ) | | | — | | | | — | | | | — | |
| | (1.20 | ) | | | — | | | | (3.68 | ) | | | (0.01 | ) | | | — | | | | — | |
| | — | | | | — | | | | — | | | | — | | | | — | | | | — | |
| $ | 30.32 | | | $ | 30.75 | | | $ | 32.19 | | | $ | 31.29 | | | $ | 27.69 | | | $ | 18.13 | |
| | | | | | | | | | | | | | | | | | | | | | | |
| | 2.60 | % | | | (4.47 | )% | | | 16.48 | % | | | 13.04 | % | | | 52.73 | % | | | 7.98 | % |
| | | | | | | | | | | | | | | | | | | | | | | |
| | | | | | | | | | | | | | | | | | | | | | | |
| $ | 138.6 | | | $ | 244.2 | | | $ | 279.3 | | | $ | 299.0 | | | $ | 347.8 | | | $ | 78.0 | |
| | | | | | | | | | | | | | | | | | | | | | | |
| | 1.27 | % | | | 1.25 | % | | | 1.25 | % | | | 1.33 | % | | | 1.38 | % | | | 1.58 | % |
| | 1.27 | % | | | 1.25 | % | | | 1.25 | % | | | 1.33 | % | | | 1.38 | % | | | 1.58 | % |
| | | | | | | | | | | | | | | | | | | | | | | |
| | (0.59 | )% | | | (0.24 | )% | | | (0.22 | )% | | | (0.49 | )% | | | (0.90 | )% | | | (1.04 | )% |
| | (0.59 | )% | | | (0.24 | )% | | | (0.22 | )% | | | (0.49 | )% | | | (0.90 | )% | | | (1.04 | )% |
| | 85.61 | % | | | 92.63 | % | | | 109.02 | % | | | 192.24 | % | | | 113.27 | % | | | 90.06 | % |
HENNESSY FUNDS 1-800-966-4354
| | | Six Months Ended | �� | | Year Ended | |
| | | April 30, 2008 | | | October 31, | |
| | | (Unaudited)(2) | | | 2007 | |
| | | | | | Institutional | | | | |
| | | Original Class | | | Class(6) | | | Original Class | |
| PER SHARE DATA: | | | | | | | | | |
| Net asset value, beginning of period | | $ | 13.67 | | | $ | 11.15 | | | $ | 12.39 | |
| | | | | | | | | | | | | |
| Income from investment operations: | | | | | | | | | | | | |
| Net investment income (loss) | | | (0.05 | ) | | | (0.01 | ) | | | (0.09 | ) |
| Net realized and unrealized | | | | | | | | | | | | |
| gains (losses) on investments | | | 0.28 | | | | 0.75 | | | | 1.47 | |
| Total from investment operations | | | 0.23 | | | | 0.74 | | | | 1.38 | |
| | | | | | | | | | | | | |
| Less Distributions: | | | | | | | | | | | | |
| Dividends from net investment income | | | — | | | | — | | | | — | |
| Dividends from net realized gains | | | (2.02 | ) | | | — | | | | (0.10 | ) |
| Total distributions | | | (2.02 | ) | | | — | | | | (0.10 | ) |
| Redemption fees retained | | | — | (4) | | | — | (4) | | | — | (4) |
| Net asset value, end of period | | $ | 11.88 | | | $ | 11.89 | | | $ | 13.67 | |
| | | | | | | | | | | | | |
| TOTAL RETURN | | | 2.49 | % | | | 6.64 | % | | | 11.30 | % |
| | | | | | | | | | | | | |
| SUPPLEMENTAL DATA AND RATIOS: | | | | | | | | | | | | |
| Net assets, end of period (millions) | | $ | 162.5 | | | $ | 40.4 | | | $ | 233.4 | |
| Ratio of net expenses to average net assets: | | | | | | | | | | | | |
| Before expense reimbursement | | | 1.27 | % | | | 1.09 | % | | | 1.23 | % |
| After expense reimbursement | | | 1.27 | % | | | 0.98 | %(7) | | | 1.23 | % |
| Ratio of net investment loss to average net assets: | | | | | | | | | | | | |
| Before expense reimbursement | | | (0.51 | )% | | | (0.44 | )% | | | (0.61 | )% |
| After expense reimbursement | | | (0.51 | )% | | | (0.33 | )% | | | (0.61 | )% |
| Portfolio turnover rate | | | 3.68 | % | | | 3.68 | % | | | 111.84 | % |
(1) The financial highlights set forth herein include the historical financial highlights of the SYM Select Growth Fund. On September 17, 2003, Hennessy
Advisors, Inc. became the investment advisor to the SYM Select Growth Fund and changed its name to the Hennessy Focus 30 Fund. Effective September
30, 2003 the Fund changed its fiscal year end to September 30th from December 31st.
(2) For the one month ended October 31, 2004. Effective October 31, 2004, the Fund changed its fiscal year end to October 31st from September 30th.
(3) All ratios for the period have been annualized, except portfolio turnover and total return.
(4) Amount is less than $0.01.
(5) From September 17, 2003 to October 31, 2006, the Hennessy Focus 30 Fund imposed an expense cap of 1.45% of the average daily net assets of the Focus
30 Fund.
(6) Institutional Class shares commenced operations on March 3, 2008.
(7) The Advisor has agreed to cap the Institutional Class Share expenses at 0.98%.
The accompanying notes are an integral part of these financial statements.
FINANCIAL HIGHLIGHTS — HENNESSY FOCUS 30 FUND
| | | | | | | | | | | | | January 1, 2003 | | | | |
| | | | | | Period Ended | | | Year Ended | | | through | | | Year Ended | |
| Year Ended October 31, | | | October 31, | | | September 30, | | | September 30, | | | December 31, | |
| 2006 | | | 2005 | | | 2004(2)(3) | | | 2004 | | | 2003(1)(3) | | | 2002(1) | |
| Original Class | |
| | | | | | | | | | | | | | | | | |
| $ | 12.21 | | | $ | 8.67 | | | $ | 8.78 | | | $ | 7.72 | | | $ | 6.63 | | | $ | 9.27 | |
| | | | | | | | | | | | | | | | | | | | | | | |
| | | | | | | | | | | | | | | | | | | | | | | |
| | (0.08 | ) | | | (0.04 | ) | | | (0.01 | ) | | | (0.08 | ) | | | (0.03 | ) | | | (0.02 | ) |
| | | | | | | | | | | | | | | | | | | | | | | |
| | 1.86 | | | | 3.58 | | | | (0.10 | ) | | | 1.14 | | | | 1.12 | | | | (2.62 | ) |
| | 1.78 | | | | 3.54 | | | | (0.11 | ) | | | 1.06 | | | | 1.09 | | | | (2.64 | ) |
| | | | | | | | | | | | | | | | | | | | | | | |
| | | | | | | | | | | | | | | | | | | | | | | |
| | — | | | | — | | | | — | | | | — | | | | — | | | | — | |
| | (1.61 | ) | | | — | | | | — | | | | — | | | | — | | | | — | |
| | (1.61 | ) | | | — | | | | — | | | | — | | | | — | | | | — | |
| | 0.01 | | | | — | (4) | | | — | (4) | | | — | (4) | | | — | (4) | | | — | (4) |
| $ | 12.39 | | | $ | 12.21 | | | $ | 8.67 | | | $ | 8.78 | | | $ | 7.72 | | | $ | 6.63 | |
| | | | | | | | | | | | | | | | | | | | | | | |
| | 16.18 | % | | | 40.83 | % | | | (1.25 | )% | | | 13.73 | % | | | 16.44 | % | | | (28.48 | )% |
| | | | | | | | | | | | | | | | | | | | | | | |
| | | | | | | | | | | | | | | | | | | | | | | |
| $ | 240.6 | | | $ | 125.3 | | | $ | 50.4 | | | $ | 51.1 | | | $ | 33.3 | | | $ | 28.5 | |
| | | | | | | | | | | | | | | | | | | | | | | |
| | 1.21 | % | | | 1.35 | % | | | 1.45 | % | | | 1.41 | % | | | 1.59 | % | | | 1.54 | % |
| | 1.21 | % | | | 1.35 | % | | | 1.45 | % | | | 1.41 | % | | | 1.49 | %(5) | | | 1.50 | % |
| | | | | | | | | | | | | | | | | | | | | | | |
| | (0.65 | )% | | | (0.60 | )% | | | (1.33 | )% | | | (0.92 | )% | | | (0.67 | )% | | | (0.24 | )% |
| | (0.65 | )% | | | (0.60 | )% | | | (1.33 | )% | | | (0.92 | )% | | | (0.57 | )% | | | (0.20 | )% |
| | 123.71 | % | | | 155.26 | % | | | 0.00 | % | | | 113.13 | % | | | 356.77 | % | | | 291.00 | % |
HENNESSY FUNDS 1-800-966-4354
| Hennessy Cornerstone Value Fund |
| | | Six Months Ended | |
| | | April 30, 2008 | |
| | | (Unaudited)(2) | |
| | | | | | Institutional | |
| | | Original Class | | | Class(5) | |
| PER SHARE DATA: | | | | | | |
| Net asset value, beginning of period | | $ | 17.06 | | | $ | 13.79 | |
| | | | | | | | | |
| Income from investment operations: | | | | | | | | |
| Net investment income (loss) | | | 0.25 | | | | 0.08 | |
| Net realized and unrealized gains (losses) on investments | | | (2.97 | ) | | | 0.06 | |
| Total from investment operations | | | (2.72 | ) | | | 0.14 | |
| | | | | | | | | |
| Less Distributions: | | | | | | | | |
| Dividends from net investment income | | | (0.41 | ) | | | — | |
| Dividends from net realized gains | | | — | | | | — | |
| Total distributions | | | (0.41 | ) | | | — | |
Redemption fees retained(4) | | | — | | | | — | |
| Net asset value, end of period | | $ | 13.93 | | | $ | 13.93 | |
| | | | | | | | | |
| TOTAL RETURN | | | (16.11 | )% | | | 1.02 | % |
| | | | | | | | | |
| SUPPLEMENTAL DATA AND RATIOS: | | | | | | | | |
| Net assets, end of period (millions) | | $ | 161.0 | | | $ | 1.0 | |
| Ratio of net expenses to average net assets | | | | | | | | |
| Before expense reimbursement | | | 1.18 | % | | | 1.11 | % |
| After expense reimbursement | | | 1.18 | % | | | 0.98 | %(6) |
| Ratio of net investment income to average net assets | | | | | | | | |
| Before expense reimbursement | | | (3.42 | )% | | | 4.75 | % |
| After expense reimbursement | | | (3.42 | )% | | | 4.88 | % |
| Portfolio turnover rate | | | 46.21 | % | | | 46.21 | % |
(1) For the one month ended October 31, 2004. Effective October 31, 2004, the Fund changed its fiscal year end to October 31st from September 30th.
(2) All ratios for the period have been annualized, except portfolio turnover and total return.
(3) Calculated using average shares outstanding during period.
(4) Amount is less than $0.01.
(5) Institutional Class shares commenced operations on March 3, 2008.
(6) The Advisor has agreed to cap the Institutional Class Share expenses at 0.98%.
The accompanying notes are an integral part of these financial statements.
FINANCIAL HIGHLIGHTS — HENNESSY CORNERSTONE VALUE FUND
| | | | | | | | | | Period Ended | | | | | | | |
| Year Ended October 31, | | | October 31, | | | Year Ended September 30, | |
| 2007 | | | 2006 | | | 2005 | | | 2004(1)(2) | | | 2004 | | | 2003 | |
| Original Class | |
| | | | | | | | | | | | | | | | | |
| $ | 15.27 | | | $ | 12.95 | | | $ | 12.48 | | | $ | 12.37 | | | $ | 10.51 | | | $ | 8.95 | |
| | | | | | | | | | | | | | | | | | | | | | | |
| | | | | | | | | | | | | | | | | | | | | | | |
| | 0.46 | | | | 0.30 | | | | 0.30 | | | | 0.02 | | | | 0.31 | (3) | | | 0.21 | |
| | 1.68 | | | | 2.36 | | | | 0.41 | | | | 0.09 | | | | 1.76 | | | | 1.55 | |
| | 2.14 | | | | 2.66 | | | | 0.71 | | | | 0.11 | | | | 2.07 | | | | 1.76 | |
| | | | | | | | | | | | | | | | | | | | | | | |
| | | | | | | | | | | | | | | | | | | | | | | |
| | (0.35 | ) | | | (0.34 | ) | | | (0.24 | ) | | | — | | | | (0.21 | ) | | | (0.20 | ) |
| | — | | | | — | | | | — | | | | — | | | | — | | | | — | |
| | (0.35 | ) | | | (0.34 | ) | | | (0.24 | ) | | | — | | | | (0.21 | ) | | | (0.20 | ) |
| | — | | | | — | | | | — | | | | — | | | | — | | | | — | |
| $ | 17.06 | | | $ | 15.27 | | | $ | 12.95 | | | $ | 12.48 | | | $ | 12.37 | | | $ | 10.51 | |
| | | | | | | | | | | | | | | | | | | | | | | |
| | 14.26 | % | | | 21.00 | % | | | 5.69 | % | | | 0.89 | % | | | 19.83 | % | | | 19.88 | % |
| | | | | | | | | | | | | | | | | | | | | | | |
| | | | | | | | | | | | | | | | | | | | | | | |
| $ | 204.5 | | | $ | 256.8 | | | $ | 183.8 | | | $ | 195.6 | | | $ | 194.5 | | | $ | 20.3 | |
| | | | | | | | | | | | | | | | | | | | | | | |
| | 1.17 | % | | | 1.15 | % | | | 1.20 | % | | | 1.18 | % | | | 1.18 | % | | | 1.51 | % |
| | 1.17 | % | | | 1.15 | % | | | 1.20 | % | | | 1.18 | % | | | 1.18 | % | | | 1.51 | % |
| | | | | | | | | | | | | | | | | | | | | | | |
| | 2.64 | % | | | 2.49 | % | | | 2.19 | % | | | 1.70 | % | | | 2.56 | % | | | 2.10 | % |
| | 2.64 | % | | | 2.49 | % | | | 2.19 | % | | | 1.70 | % | | | 2.56 | % | | | 2.10 | % |
| | 39.55 | % | | | 35.40 | % | | | 32.22 | % | | | 0.00 | % | | | 8.20 | % | | | 57.29 | % |
HENNESSY FUNDS 1-800-966-4354
| Hennessy Total Return Fund |
| | | Six Months Ended | | | Year Ended | |
| | | April 30, 2008 | | | October 31, | |
| | | (Unaudited)(2) | | | 2007 | |
| | | Original Class | |
| PER SHARE DATA: | | | | | | |
| Net asset value, beginning of period | | $ | 13.73 | | | $ | 12.61 | |
| | | | | | | | | |
| Income from investment operations: | | | | | | | | |
| Net investment income | | | 0.14 | | | | 0.33 | |
| Net realized and unrealized gains (losses) on securities | | | (1.75 | ) | | | 1.13 | |
| Total from investment operations | | | (1.61 | ) | | | 1.46 | |
| | | | | | | | | |
| Less Distributions: | | | | | | | | |
| Dividends from net investment income | | | (0.14 | ) | | | (0.34 | ) |
| Dividends from realized capital gains | | | — | | | | — | |
| Return of capital | | | — | | | | — | |
| Total distributions | | | (0.14 | ) | | | (0.34 | ) |
Redemption fees retained(4) | | | — | | | | — | |
| Net asset value, end of period | | $ | 11.98 | | | $ | 13.73 | |
| | | | | | | | | |
| TOTAL RETURN | | | (11.70 | )% | | | 11.70 | % |
| | | | | | | | | |
| SUPPLEMENTAL DATA AND RATIOS: | | | | | | | | |
| Net assets, end of period (millions) | | $ | 80.0 | | | $ | 96.3 | |
| Gross ratio of expenses, including | | | | | | | | |
| interest expense,to average net asset: | | | | | | | | |
| Before expense reimbursement | | | 2.59 | % | | | 3.04 | % |
| After expense reimbursement | | | 2.59 | % | | | 3.04 | % |
| Ratio of interest expense to average net assets | | | 1.41 | % | | | 1.88 | % |
| Net ratio of expenses, excluding | | | | | | | | |
| interest expense, to average net assets: | | | | | | | | |
| Before expense reimbursement | | | 1.18 | % | | | 1.16 | % |
| After expense reimbursement | | | 1.18 | % | | | 1.16 | % |
| Ratio of net investment income (loss) to average net assets: | | | | | | | | |
| Before expense reimbursement | | | 2.26 | % | | | 2.48 | % |
| After expense reimbursement | | | 2.26 | % | | | 2.48 | % |
| Portfolio turnover rate | | | 5.22 | % | | | 11.92 | % |
| (1) For the four months ended October 31, 2004. Effective October 31, 2004, the Fund changed its fiscal year end to October 31st from June 30th. |
| (2) All ratios for the period have been annualized, except portfolio turnover and total return. |
| (3) Calculated using average shares outstanding during period. |
| (4) Amount is less than $0.01. |
(5) On February 27, 2004, the Hennessy Total Return Fund instituted an expense cap, excluding interest expense, of 1.35% of the average daily net assets of the Total Return Fund. This expense cap was in effect through June 30, 2005. |
| (6) The Hennessy Total Return Fund imposed an expense cap, excluding interest expense, of 1.95%. |
The accompanying notes are an integral part of these financial statements.
FINANCIAL HIGHLIGHTS — HENNESSY TOTAL RETURN FUND
| | | | | | Period Ended | | | | | | | |
| Year Ended October 31, | | | October 31, | | | Year Ended June 30, | |
| 2006 | | | 2005 | | | 2004(1)(2) | | | 2004 | | | 2003 | |
| Original Class | |
| | | | | | | | | | | | | | |
| $ | 10.57 | | | $ | 10.40 | | | $ | 10.62 | | | $ | 9.65 | | | $ | 9.78 | |
| | | | | | | | | | | | | | | | | | | |
| | 0.31 | | | | 0.23 | | | | 0.07 | | | | 0.17 | (3) | | | 0.12 | |
| | 2.03 | | | | 0.17 | | | | (0.24 | ) | | | 0.92 | | | | (0.13 | ) |
| | 2.34 | | | | 0.40 | | | | (0.17 | ) | | | 1.09 | | | | (0.01 | ) |
| | | | | | | | | | | | | | | | | | | |
| | (0.30 | ) | | | (0.23 | ) | | | (0.05 | ) | | | (0.10 | ) | | | (0.12 | ) |
| | — | | | | — | | | | — | | | | — | | | | — | |
| | — | | | | — | | | | — | | | | (0.02 | ) | | | — | |
| | (0.30 | ) | | | (0.23 | ) | | | (0.05 | ) | | | (0.12 | ) | | | (0.12 | ) |
| | — | | | | — | | | | — | | | | — | | | | — | |
| $ | 12.61 | | | $ | 10.57 | | | $ | 10.40 | | | $ | 10.62 | | | $ | 9.65 | |
| | | | | | | | | | | | | | | | | | | |
| | 22.48 | % | | | 3.83 | % | | | (1.61 | )% | | | 11.36 | % | | | (0.04 | )% |
| | | | | | | | | | | | | | | | | | | |
| $ | 113.3 | | | $ | 86.7 | | | $ | 91.9 | | | $ | 97.0 | | | $ | 6.0 | |
| | | | | | | | | | | | | | | | | | | |
| | | | | | | | | | | | | | | | | | | |
| | 2.80 | % | | | 2.28 | % | | | 1.78 | % | | | 1.66 | % | | | 2.50 | % |
| | 2.80 | % | | | 2.28 | % | | | 1.78 | % | | | 1.66 | % | | | 2.33 | % |
| | 1.64 | % | | | 1.05 | % | | | 0.58 | % | | | 0.39 | % | | | 0.38 | % |
| | | | | | | | | | | | | | | | | | | |
| | | | | | | | | | | | | | | | | | | |
| | 1.16 | % | | | 1.23 | % | | | 1.20 | % | | | 1.27 | % | | | 2.12 | % |
| | 1.16 | % | | | 1.23 | % | | | 1.20 | % | | | 1.27 | %(5) | | | 1.95 | %(6) |
| | | | | | | | | | | | | | | | | | | |
| | 2.79 | % | | | 2.07 | % | | | 1.85 | % | | | 1.55 | % | | | 1.25 | % |
| | 2.79 | % | | | 2.07 | % | | | 1.85 | % | | | 1.55 | % | | | 1.42 | % |
| | 24.16 | % | | | 25.70 | % | | | 0.30 | % | | | 8.37 | % | | | 17.60 | % |
HENNESSY FUNDS 1-800-966-4354
| | | Six Months Ended | | | Year Ended | |
| | | April 30, 2008 | | | October 31, | |
| | | (Unaudited)(2) | | | 2007 | |
| | | Original Class | |
| PER SHARE DATA: | | | | | | |
| Net asset value, beginning of period | | $ | 12.51 | | | $ | 11.83 | |
| | | | | | | | | |
| Income from investment operations: | | | | | | | | |
| Net investment income | | | 0.14 | | | | 0.38 | |
| Net realized and unrealized gains (losses) on securities | | | (0.98 | ) | | | 0.69 | |
| Total from investment operations | | | (0.84 | ) | | | 1.07 | |
| | | | | | | | | |
| Less Distributions: | | | | | | | | |
| Dividends from net investment income | | | (0.15 | ) | | | (0.39 | ) |
| Dividends from realized capital gains | | | (0.59 | ) | | | — | |
| Return of capital | | | — | | | | — | |
| Total distributions | | | (0.74 | ) | | | (0.39 | ) |
Redemption fees retained(3) | | | — | | | | — | |
| Net asset value, end of period | | $ | 10.93 | | | $ | 12.51 | |
| | | | | | | | | |
| TOTAL RETURN | | | (6.96 | )% | | | 9.16 | % |
| | | | | | | | | |
| SUPPLEMENTAL DATA AND RATIOS: | | | | | | | | |
| Net assets, end of period (millions) | | $ | 14.7 | | | $ | 16.8 | |
| Ratio of net expenses to average net assets | | | 1.48 | % | | | 1.36 | % |
| Ratio of net investment income to average net assets | | | 2.45 | % | | | 2.86 | % |
| Portfolio turnover rate | | | 7.39 | % | | | 34.65 | % |
| (1) For the four months ended October 31, 2004. Effective October 31, 2004, the Fund changed its fiscal year end to October 31st from June 30th. |
| (2) All ratios for the period have been annualized, except portfolio turnover and total return. |
| (3) Amount is less than $0.01. |
The accompanying notes are an integral part of these financial statements.
FINANCIAL HIGHLIGHTS — HENNESSY BALANCED FUND
| | | | | | Period Ended | | | | | | | |
| Year Ended October 31, | | | October 31, | | | Year Ended June 30, | |
| 2006 | | | 2005 | | | 2004(1)(2) | | | 2004 | | | 2003 | |
| Original Class | |
| | | | | | | | | | | | | | |
| $ | 10.56 | | | $ | 10.62 | | | $ | 10.85 | | | $ | 10.44 | | | $ | 10.62 | |
| | | | | | | | | | | | | | | | | | | |
| | | | | | | | | | | | | | | | | | | |
| | 0.30 | | | | 0.18 | | | | 0.04 | | | | 0.11 | | | | 0.14 | |
| | 1.25 | | | | (0.07 | ) | | | (0.24 | ) | | | 0.50 | | | | (0.12 | ) |
| | 1.55 | | | | 0.11 | | | | (0.20 | ) | | | 0.61 | | | | 0.02 | |
| | | | | | | | | | | | | | | | | | | |
| | | | | | | | | | | | | | | | | | | |
| | (0.28 | ) | | | (0.17 | ) | | | (0.03 | ) | | | (0.12 | ) | | | (0.14 | ) |
| | — | | | | — | | | | — | | | | (0.06 | ) | | | (0.06 | ) |
| | — | | | | — | | | | — | | | | (0.02 | ) | | | — | |
| | (0.28 | ) | | | (0.17 | ) | | | (0.03 | ) | | | (0.20 | ) | | | (0.20 | ) |
| | — | | | | — | | | | — | | | | — | | | | — | |
| $ | 11.83 | | | $ | 10.56 | | | $ | 10.62 | | | $ | 10.85 | | | $ | 10.44 | |
| | | | | | | | | | | | | | | | | | | |
| | 14.92 | % | | | 1.13 | % | | | (1.86 | )% | | | 5.81 | % | | | 0.24 | % |
| | | | | | | | | | | | | | | | | | | |
| | | | | | | | | | | | | | | | | | | |
| $ | 26.1 | | | $ | 19.3 | | | $ | 21.8 | | | $ | 23.4 | | | $ | 16.1 | |
| | 1.34 | % | | | 1.49 | % | | | 1.41 | % | | | 1.41 | % | | | 1.50 | % |
| | 2.75 | % | | | 1.58 | % | | | 1.12 | % | | | 1.01 | % | | | 1.40 | % |
| | 87.88 | % | | | 21.31 | % | | | 8.55 | % | | | 45.17 | % | | | 21.79 | % |
HENNESSY FUNDS 1-800-966-4354
Hennessy Total Return Fund For the Six Months Ended April 30, 2008 (Unaudited) |
| Cash Flows From Operating Activities: | | | |
| | | | |
| Net decrease in net assets from operations | | $ | (11,086,673 | ) |
| Adjustments to reconcile net decrease in net assets from | | | | |
| operations to net cash provided by operating activities: | | | | |
| Purchase of investment securities | | | (225,412,521 | ) |
| Proceeds on sale of securities | | | 231,324,536 | |
| Decrease in other receivables, net | | | 9,754 | |
| Decrease in other assets | | | 3,279 | |
| Decrease in accrued expenses and other payables | | | (246,617 | ) |
| Net accretion of discount on securities | | | (734,866 | ) |
| Net realized gain on investments | | | (1,214,166 | ) |
| Unrealized depreciation on securities | | | 13,251,088 | |
| Net cash provided by operating activities | | $ | 5,893,814 | |
| | | | | |
| Cash Flows From Financing Activities: | | | | |
| | | | | |
| Decrease in reverse repurchase agreements | | $ | (675,500 | ) |
| Proceeds on shares sold | | | 1,476,442 | |
| Payment on shares repurchased | | | (6,633,431 | ) |
| Cash dividends paid | | | (61,325 | ) |
| Net cash used by financing activities | | $ | (5,893,814 | ) |
| Net increase (decrease) in cash | | | 0 | |
| | | | | |
| Cash at beginning of period | | | — | |
| Cash at end of period | | $ | — | |
| | | | | |
| Cash paid for interest | | $ | 714,968 | |
The accompanying notes are an integral part of these financial statements.
Notes to the Financial Statements April 30, 2008 (Unaudited)
1). ORGANIZATION
The Hennessy Mutual Funds, Inc. was organized as a Maryland corporation on May 20, 1996 and consists of three separate series: Hennessy Cornerstone Growth Fund (the “Growth Fund”), Hennessy Cornerstone Value Fund (the “Value Fund”) and the Hennessy Focus 30 Fund (the “Focus 30 Fund”), formerly SYM Select Growth Fund. These Funds are open-end, diversified management investment companies registered under the Investment Company Act of 1940, as amended. The Growth Fund and Value Fund commenced operations on November 1, 1996. On September 17, 2003, Hennessy Advisors, Inc. became the investment advisor to the SYM Select Growth Fund and the fund changed its name to the Hennessy Focus 30 Fund.
The Hennessy Funds, Inc. was organized as a Maryland corporation on January 11, 1996 and consists of two separate series: Hennessy Balanced Fund (the “Balanced Fund”) and Hennessy Total Return Fund (the “Total Return Fund”). The Balanced and Total Return Funds are open-end, non-diversified management investment companies registered under the Investment Company Act of 1940, as amended. The Balanced Fund and Total Return Fund commenced operations on March 8, 1996 and July 29, 1998, respectively.
The Hennessy Funds Trust was organized as a Delaware Statutory Trust on September 17, 1992 and consists of two series: Hennessy Cornerstone Growth Fund, Series II (the “Growth II Fund”) and Hennessy Large Cap Growth Fund (the “Large Cap Fund”). Prior to July 1, 2005, both the Trust and the Growth II Fund were known as The Henlopen Fund. On July 1, 2005, Hennessy Advisors, Inc., became the investment advisor to the fund and the fund changed its name from “The Henlopen Fund” to “Hennessy Cornerstone Growth Fund, Series II”. The Growth II Fund is an open-end, diversified management investment company registered under the Investment Company Act of 1940, as amended. The Large Cap Fund has not yet commenced operations.
The Growth Fund, Growth II Fund, Focus 30 Fund, Value Fund, Total Return Fund and Balanced Fund collectively represent the Hennessy Funds (the “Funds”).
2). SIGNIFICANT ACCOUNTING POLICIES
The following is a summary of significant accounting policies consistently followed by the Funds in the preparation of the financial statements. These policies are in conformity with U.S. generally accepted accounting principles (“GAAP”).
| a). | Investment Valuation – Securities which are traded on a national or recognized stock exchange are valued at the last sale price on the securities exchange on which such securities are primarily traded. Exchange-traded securities for which there were no transactions that day and debt securities are valued at the most recent bid prices. Instruments with a remaining maturity of 60 days or less are valued on an amortized cost basis. When a price for an |
HENNESSY FUNDS 1-800-966-4354
| | underlying security is not readily available or if a significant event has occurred that indicates the closing price of a security no longer represents the true value of that security, fair value pricing procedures have been adopted by the Board of Directors of the Funds. Fair value pricing determinations are made in good faith in accordance with these procedures. There are numerous criteria that will be given consideration in determining a fair value of a security. Some of these criteria are: trading volume of security and markets, value of other like securities and news events with direct bearing to security or market. Fair value pricing results in an estimated price that reasonably reflects the current market conditions in order to rate the portfolio holdings such that shareholder transactions receive a fair net asset value. |
| b). | Federal Income Taxes – Provision for federal income taxes or excise taxes has not been made since the Funds have elected to be taxed as “regulated investment companies” and intend to distribute substantially all taxable income to shareholders and otherwise comply with the provisions of the Internal Revenue Code applicable to regulated investment companies. Net investment income and realized gains and losses for federal income tax purposes may differ from that reported on the financial statements because of temporary book and tax basis differences. Temporary differences are primarily the result of the treatment of wash sales for tax reporting purposes. Distributions from net realized gains for book purposes may include short-term capital gains, which are included as ordinary income to shareholders for tax purposes. |
Due to inherent differences in the recognition of income, expenses, and realized gains/losses under U.S. generally accepted accounting principles and federal income tax purposes, permanent differences between book and tax basis reporting for the 2007 fiscal year have been identified and appropriately reclassified on the Statement of Assets and Liabilities. For the year ended October 31, 2007, the Growth Fund had a $3,634,032 permanent book and tax basis difference relating to the Fund’s net operating loss which resulted in an increase in accumulated net investment income and a decrease in paid-in capital. The Growth II Fund had a $1,150,066 permanent book and tax basis difference relating to the Growth II Fund’s net operating loss which resulted in an increase in accumulated net investment income and a decrease to accumulated gains. The Focus 30 Fund had a $1,462,892 permanent book and tax basis difference relating to the Fund’s net operating loss which resulted in an increase in accumulated net investment income and decrease to accumulated gains. The Value Fund had a $46,538,000 permanent book and tax basis difference relating to the expiration of the Funds prior year capital loss carryforward which resulted in an increase in accumulated realized gain and a decrease in accumulated paid-in capital.
| c). | Income and Expenses – Dividend income is recognized on the ex-dividend date and interest income is recognized on an accrual basis. The Funds are charged for those expenses that are directly attributable to the portfolio, such as advisory, administration and certain shareholder service fees. |
| d). | Distributions to Shareholders – Dividends from net investment income for the Growth, Growth II, Focus 30 and Value Funds, if any, are declared and paid out annually, usually in November or December of each year. Dividends |
from net investment income for the Total Return and Balanced Funds are declared and paid on a calendar quarter basis. Distributions of net realized capital gains, if any, are declared and paid annually, usually in November or December of each year, for all of the Funds.
| e). | Security Transactions – Investment and shareholder transactions are recorded on the trade date. The Funds determine the gain or loss realized from the investment transactions by comparing the original cost of the security lot sold with the net sale proceeds. Discounts and premiums on securities purchased are accreted/amortized over the life of the respective security. |
| f). | Use of Estimates – The preparation of financial statements in conformity with GAAP requires management to make estimates and assumptions that affect the reported amounts of assets and liabilities and disclosure of contingent assets and liabilities at the date of the financial statements and the reported change in net assets during the reporting period. Actual results could differ from those estimates. |
| g). | Share Valuation – The net asset value (“NAV”) per share of each Fund is calculated by dividing the sum of the value of the securities held by each Fund, plus cash or other assets, minus all liabilities (including estimated accrued expenses) by the total number of shares outstanding for each Fund, rounded to the nearest cent. The Funds’ shares will not be priced on the days on which the NYSE is closed for trading. The offering and redemption price per share for each Fund is equal to each Fund’s net asset value per share. The Funds charge a 1.50% redemption fee on shares held less than 90 days. These fees are deducted from the redemption proceeds otherwise payable to the shareholder. The Funds will retain the fee charged as paid-in capital and such fees become part of that Fund’s daily NAV calculation. |
| h). | Repurchase Agreements – Each Fund may enter into repurchase agreements with member banks or security dealers of the Federal Reserve whom the investment advisor deems creditworthy. The repurchase price generally equals the price paid by the Fund plus interest negotiated on the basis of current short-term rates. |
Securities pledged as collateral for repurchase agreements are held by the custodian bank until the respective agreements mature. Provisions of the repurchase agreements ensure that the market value of the collateral, including accrued interest thereon, is sufficient, in the event of default of the counterparty. If the counterparty defaults and the value of the collateral declines or if the counterparty enters an insolvency proceeding, realization of the collateral by the Fund may be delayed or limited.
| i). | Accounting for Uncertainty in Income Taxes – Effective April 30, 2008, the Funds adopted Financial Accounting Standards Board (FASB) Interpretation No. 48 (FIN 48), “Accounting for Uncertainty in Income Taxes”. FIN 48 requires the evaluation of tax positions taken on previously filed tax returns or expected to be taken on future returns. These positions must meet a “more likely than not” standard that, based on the technical merits, have a more than fifty percent likelihood of being sustained upon examination. In evaluating whether a tax position has met the recognition threshold, the Funds must presume that the position will be examined by the appropriate taxing authority that has full knowledge of all relevant information. Tax |
HENNESSY FUNDS 1-800-966-4354
positions not deemed to meet the “more-likely-than-not” threshold are recorded as a tax expense in the current year.
FIN 48 requires the Funds to analyze all open tax years, as defined by the Statute of Limitations, for all major jurisdictions. Open tax years are those that are open for exam by taxing authorities. Major jurisdictions for the Funds include Federal and the state of Maryland for the Growth, Focus 30, Value, Total Return and Balanced Fund and the state of Delaware for the Growth II Fund. As of April 29, 2008, open Federal, state of Maryland and state of Delaware tax years include the tax years ended December 31, 2004 through 2006. The Fund has no examination in progress.
The Funds have reviewed all open tax years and major jurisdictions and concluded that the adoption of FIN 48 resulted in no effect to the Fund’s financial position or results of operations. There is no tax liability resulting from unrecognized tax benefits relating to uncertain income tax positions taken or expected to be taken on the tax return for the fiscal year-end October 31, 2007. The Funds are also not aware of any tax positions for which it is reasonably possible that the total amounts of unrecognized tax benefits will significantly change in the next twelve months.
| j). | Recently Issued Accounting Pronouncements – In September 2006, the Financial Accounting Standards Board (“FASB”) issued Statement on Financial Accounting Standards (SFAS) No. 157, “Fair Value Measurements.” This standard establishes a single authoritative definition of fair value, sets out a framework for measuring fair value and requires additional disclosures about fair value measurements. SFAS No. 157 applies to fair value measurements already required or permitted by existing standards. SFAS No. 157 is effective for financial statements issued for fiscal years beginning after November 15, 2007 and interim periods within those fiscal years. The changes to current generally accepted accounting principles from the application of this statement relate to the definition of fair value, the methods used to measure fair value, and the expanded disclosures about fair value measurements. As of December 31, 2007, the Funds do not believe the adoption of SFAS No. 157 will impact the financial statement amounts; however additional disclosures may be required about the inputs used to develop the measurements and the effect of certain measurements included within the Statement of Operations for the period. |
In March 2008, Statement of Financial Accounting Standards No. 161, “Disclosures about Derivative Instruments and Hedging Activities” (“SFAS 161”) was issued and is effective for fiscal years beginning after November 15, 2008. SFAS 161 is intended to improve financial reporting for derivative instruments by requiring enhanced disclosure that enables investors to understand how and why an entity uses derivatives, how derivatives are accounted for, and how derivative instruments affect an entity’s results of operations and financial position. Management is currently evaluating the implications of SFAS 161. The impact on the Fund’s financial statement disclosures, if any, is currently being assessed.
3). REVERSE REPURCHASE AGREEMENTS
The Total Return Fund has entered into reverse repurchase agreements with UBS PaineWebber, Inc., under which the Total Return Fund sells securities and agrees
to repurchase them later at a mutually agreed upon price. For the six months ended April 30, 2008, the average daily balance and average interest rate in effect for reverse repurchase agreements was $37,606,267 and 3.195%, respectively. At April 30, 2008, the interest rate in effect for the outstanding reverse repurchase agreements, scheduled to mature on May 22, 2008 ($12,523,000), June 19, 2008 ($13,477,500), July 24, 2008 ($12,565,000) were 2.30%, 1.00% and 1.50%, respectively, and were equal to 32.46% of the Total Return Fund’s total assets.
4). INVESTMENT TRANSACTIONS
Purchases and sales of investment securities (excluding government and short-term investments) during the following fiscal periods were as follows:
| | | Growth | | | Growth II | | | Focus 30 | | | Value | | | Total Return | | | Balanced | |
| | | Fund | | | Fund | | | Fund | | | Fund | | | Fund | | | Fund | |
| | | Period Ended | | | Period Ended | | | Period Ended | | | Period Ended | | | Period Ended | | | Period Ended | |
| | | 4/30/08 | | | 4/30/08 | | | 4/30/08 | | | 4/30/08 | | | 4/30/08 | | | 4/30/08 | |
| Purchases | | $ | 636,457,244 | | | $ | — | | | $ | 7,385,152 | | | $ | 81,618,419 | | | $ | 4,755,678 | | | $ | 1,475,812 | |
| Sales | | $ | 857,913,183 | | | $ | 30,912,970 | | | $ | 37,787,152 | | | $ | 90,089,359 | | | $ | 5,321,701 | | | $ | 1,052,211 | |
5). INVESTMENT MANAGEMENT FEE AND OTHER TRANSACTIONS WITH AFFILIATES
Hennessy Advisors, Inc. (the “Advisor”) is the Advisor of the Funds. The Advisor provides the Funds with investment management services under a Management Agreement. The Advisor furnishes all investment advice, office space, facilities, and provides most of the personnel needed by the Funds. As compensation for its services, the Advisor is entitled to a monthly fee from each Fund. The fee is based upon the average daily net assets of the Funds at the annual rate of:
| Growth Fund | 0.74% |
| Growth II Fund | 0.74% |
| Focus 30 Fund | 0.74% |
| Value Fund | 0.74% |
| Total Return Fund | 0.60% |
| Balanced Fund | 0.60% |
The Advisor has agreed to waive its fees and absorb expenses to the extent that the Funds’ total annual operating expenses (excluding all federal, state and local taxes, interest, brokerage commissions, acquired fund fees and expenses and other costs incurred in connection with the purchase and sale of securities and extraordinary items) do not exceed 0.98% of the Funds’ net assets for the Institutional Class shares in the Growth, Growth II, Focus 30 and Value Funds. For a period of three years after the year in which the Advisor waives or reimburses expenses, the Advisor may seek reimbursement from the Fund to the extent that total annual Fund operating expenses are less than the expense limitation in effect at the time of the waiver or reimbursement. The Advisor waived or reimbursed expenses of $1,897, $27, $4,543 and $146 for the Growth, Growth II, Focus 30 and Value Funds, respectively for the six months ended April 30, 2008. These reimbursed / absorbed expenses are subject to potential recovery by year of expiration October 31, 2011.
The Board of Directors has approved a Shareholder Servicing Plan which was instituted to compensate the Advisor for the non-investment management services it provides to the Funds. The Plan provides for a monthly fee paid to the Advisor at an annual rate of 0.10% of the average daily net assets of the Funds.
The Growth Fund, Growth II Fund, Focus 30 Fund and Value Fund have entered into agreements with various brokers, dealers and financial
HENNESSY FUNDS 1-800-966-4354
The Total Return and Balanced Funds have adopted a plan pursuant to Rule 12b-1 which authorizes payments in connection with the distribution of the Total Return and Balanced Fund shares at an annual rate not to exceed 0.15% of each Fund’s average daily net assets. Amounts paid under the Plan may be spent on any activities or expenses primarily intended to result in the sale of shares, including but not limited to, advertising, compensation for sales and marketing activities or financial institutions and others such as dealers and distributors, shareholder account servicing, the printing and mailing of prospectuses to other than current shareowners and the printing and mailing of sales literature.
U.S. Bancorp Fund Services, LLC (the “Administrator”) acts as the Funds’ Administrator under an Administration Agreement. The Administrator prepares various federal and state regulatory filings, reports and returns for the Funds; prepares reports and materials to be supplied to the directors; monitors the activities of the Funds’ custodian, transfer agent and accountants; coordinates the preparation and payment of the Funds’ expenses and reviews the Funds’ expense accruals. Fees paid to U.S. Bancorp Fund Services, LLC for the six months ended April 30, 2008, were $870,918, $118,767, $235,460, $207,908, $101,559 and $18,488 for Growth, Growth II, Focus 30, Value, Total Return and Balanced Funds, respectively.
The SYM Select Growth Fund was the predecessor fund of the Focus 30 Fund. The financial highlights reported for periods before September 17, 2003, represent the activity of the SYM Select Growth Fund.
The Henlopen Fund was the predecessor fund of the Growth II Fund. The financial highlights reported for periods before July 1, 2005, represent the activity of The Henlopen Fund.
Quasar Distributors, LLC (the “Distributor”) acts as the Funds’ principal underwriter in a continuous public offering of the Funds’ shares. The Distributor is an affiliated company of U.S. Bank, N.A.
6). SECURITIES LENDING
The Growth and Value Funds had entered into a securities lending arrangement with the custodian. Under the terms of the agreement, the custodian was authorized to loan securities on behalf of the Funds to approved brokers against the receipt of cash collateral at least 102% of the value of the securities loaned. The cash collateral was invested by the custodian in a money market pooled account approved by the Advisor. Although risk was mitigated by the collateral, the Funds could have experienced a delay in recovering its securities and possible loss of income or value if the borrower failed to return them. The agreement provided that after predetermined rebates to the brokers, the income
generated from lending transactions was allocated 60% to the Fund and 40% to the custodian. The Growth Fund discontinued securities lending in February 2005. The Value Fund discontinued securities lending in October 2006.
7). LINE OF CREDIT
The Growth, Growth II, Focus 30, and Value Funds have $20,000,000, $10,000,000, $20,000,000 and $20,000,000 lines of credit, respectively, intended to provide short-term financing, if necessary, subject to certain restrictions, in connection with shareholder redemptions. The credit facility is with its custodian bank, U.S. Bank, N.A. During the six months ended April 30, 2008, the Growth Fund had an outstanding average daily balance and a weighted average interest rate of $644,505 and 6.47%, respectively. The maximum amount outstanding for the Growth Fund during the period was $9,170,000. During the six months ended April 30, 2008, the Growth II Fund had an outstanding average daily balance and a weighted average interest rate of $90,769 and 6.47%, respectively. The maximum amount outstanding for the Growth II Fund during the period was $2,558,000. During the six months ended April 30, 2008, the Focus 30 Fund had an outstanding average daily balance and a weighted average interest rate of $111,115 and 6.47%, respectively. The maximum amount outstanding for the Focus 30 Fund during the period was $3,670,000. During the six months ended April 30, 2008, the Value Fund had no line of credit activity.
8). FEDERAL TAX INFORMATION
The following balances for the Funds are as of October 31, 2007:
| | | Growth | | | Growth II | | | Focus 30 | |
| | | Fund | | | Fund | | | Fund | |
| Cost of Investments for tax purposes | | $ | 903,107,962 | | | $ | 143,074,458 | | | $ | 230,677,691 | |
| Gross tax unrealized appreciation | | | 205,872,689 | | | | 15,476,859 | | | | 6,685,103 | |
| Gross tax unrealized depreciation | | | (125,302,193 | ) | | | (19,592,919 | ) | | | (9,413,579 | ) |
| Net tax unrealized appreciation | | | | | | | | | | | | |
| (depreciation) on investments | | | 80,570,496 | | | | (4,116,060 | ) | | | (2,728,476 | ) |
| Undistributed ordinary income | | $ | — | | | $ | 7,021,406 | | | $ | 1,697,121 | |
| Undistributed long-term capital gains | | $ | 110,914,201 | | | $ | 19,858,903 | | | $ | 31,369,777 | |
| Total Distributable earnings | | $ | 110,914,201 | | | $ | 26,880,309 | | | $ | 33,066,898 | |
| Other accumulated gains (losses) | | $ | (1,122,131 | ) | | $ | — | | | $ | (7,800 | ) |
| Total accumulated earnings (losses) | | $ | 190,362,566 | | | $ | 22,764,249 | | | $ | 30,330,622 | |
| | | | | | | | | | |
| | | Value | | | Total Return | | | Balanced | |
| | | Fund | | | Fund | | | Fund | |
| Cost of Investments for tax purposes | | $ | 167,431,032 | | | $ | 123,450,651 | | | $ | 16,050,470 | |
| Gross tax unrealized appreciation | | | 44,131,530 | | | | 14,602,502 | | | | 1,125,590 | |
| Gross tax unrealized depreciation | | | (7,123,953 | ) | | | (2,178,305 | ) | | | (349,902 | ) |
| Net tax unrealized appreciation | | | | | | | | | | | | |
| (depreciation) on investments | | | 37,007,577 | | | | 12,424,197 | | | | 775,688 | |
| Undistributed ordinary income | | $ | 3,980,567 | | | $ | 144,144 | | | $ | 45,041 | |
| Undistributed long-term capital gains | | $ | — | | | $ | — | | | $ | 777,518 | |
| Total Distributable earnings | | $ | 3,980,567 | | | $ | 144,144 | | | $ | 822,559 | |
| Other accumulated gains (losses) | | $ | (39,692,913 | ) | | $ | (87,553,410 | ) | | $ | (1,343,892 | ) |
| Total accumulated earnings (losses) | | $ | 1,295,231 | | | $ | 74,985,069 | | | $ | 254,355 | |
HENNESSY FUNDS 1-800-966-4354
At October 31, 2007, the Growth Fund had tax basis capital losses of $1,122,131, to offset future capital gains, the use of a portion of which is limited by IRS regulations. Of such losses, $376,392 expire October 31, 2008, $563,180 expire October 31, 2009, and $182,559 expire October 31, 2010. Additionally, the Growth Fund had no post-October loss deferrals as of October 31, 2007.
At October 31, 2007, the Growth II Fund had no tax basis capital losses. Additionally, the Growth II Fund had no post-October loss deferrals as of October 31, 2007.
At October 31, 2007, the Focus 30 Fund had no tax basis capital losses which may be carried over to offset future capital gains. Additionally, the Focus 30 Fund had no post-October loss deferrals as of October 31, 2007.
At October 31, 2007, the Value Fund had tax basis capital losses of $39,700,162, to offset future capital gains, the use of a portion of which is limited by IRS regulations. Of such losses, $11,505,303 expire October 31, 2008, $27,482,264 expire October 31, 2010 and $712,595 expire October 31, 2011. Additionally, the Value Fund had no post-October loss deferrals as of October 31, 2007.
At October 31, 2007, the Total Return Fund had tax basis capital losses of $87,555,329, which may be carried over to offset future capital gains. Of such losses, $52,894,232 expire on October 31, 2008 and $34,658,578 expire October 31, 2009. Additionally, the Total Return Fund had no post-October loss deferrals as of October 31, 2007.
At October 31, 2007, the Balanced Fund had tax basis capital losses of $1,343,892, to offset future capital gains, the use of a portion of which is limited by IRS regulations. Of such losses, $447,964 expire October 31, 2008, $447,964 expire October 31, 2009 and $447,964 expire October 31, 2010. Additionally, the Balanced Fund had no post-October loss deferrals as of October 31, 2007.
The tax character of distributions paid during 2008 and 2007 for the Funds were as follows:
| | | Six Months Ended | | | | |
| | | April 30, 2008 | | | Year Ended | |
| Growth Fund | | (Unaudited) | | | October 31, 2007 | |
| Distributions paid from: | | | | | | |
| Ordinary income | | | — | | | | — | |
| Long-term capital gain | | $ | 110,914,265 | | | $ | 183,483,584 | |
| | | $ | 110,914,265 | | | $ | 183,483,584 | |
| | | | | | | | |
| | | Six Months Ended | | | | | |
| | | April 30, 2008 | | | Year Ended | |
| Growth II Fund | | (Unaudited) | | | October 31, 2007 | |
| Distributions paid from: | | | | | | | | |
| Ordinary income | | $ | 7,021,436 | | | $ | 825,637 | |
| Long-term capital gain | | | 20,033,580 | | | | 8,406,308 | |
| | | $ | 27,055,016 | | | $ | 9,231,945 | |
| | | Six Months Ended | | | | |
| | | April 30, 2008 | | | Year Ended | |
| Focus 30 Fund | | (Unaudited) | | | October 31, 2007 | |
| Distributions paid from: | | | | | | |
| Ordinary income | | $ | 1,689,401 | | | $ | — | |
| Long-term capital gain | | | 31,559,124 | | | | 1,781,615 | |
| | | $ | 33,248,525 | | | $ | 1,781,615 | |
| | | | | | | | |
| | | Six Months Ended | | | | | |
| | | April 30, 2008 | | | Year Ended | |
| Value Fund | | (Unaudited) | | | October 31, 2007 | |
| Distributions paid from: | | | | | | | | |
| Ordinary income | | $ | 4,859,028 | | | $ | 5,691,101 | |
| Long-term capital gain | | | — | | | | — | |
| | | $ | 4,859,028 | | | $ | 5,691,101 | |
| | | | | | | | |
| | | Six Months Ended | | | | | |
| | | April 30, 2008 | | | Year Ended | |
| Total Return Fund | | (Unaudited) | | | October 31, 2007 | |
| Distributions paid from: | | | | | | | | |
| Ordinary income | | $ | 977,500 | | | $ | 2,653,674 | |
| Long-term capital gain | | | — | | | | — | |
| | | $ | 977,500 | | | $ | 2,653,674 | |
| | | | | | | | |
| | | Six Months Ended | | | | | |
| | | April 30, 2008 | | | Year Ended | |
| Balanced Fund | | (Unaudited) | | | October 31, 2007 | |
| Distributions paid from: | | | | | | | | |
| Ordinary income | | $ | 208,276 | | | $ | 608,338 | |
| Long-term capital gain | | | 777,530 | | | | — | |
| | | $ | 985,806 | | | $ | 608,338 | |
9). FEDERAL TAX DISTRIBUTION INFORMATION
The Growth II, Value, Total Return and Balanced Funds designate 14%, 100%, 100%, and 64%, respectively of the dividends declared from net investment income during the year ended October 31, 2007, as qualified dividend income under the Jobs Growth and Tax Reconciliation Act of 2003.
For the year ended October 31, 2007, 14%, 100%, 100% and 64% of the ordinary distributions paid by the Growth II, Value, Total Return and Balanced Funds qualify for the dividends received deduction available to corporate shareholders.
Additional Information Applicable to Foreign Shareholders Only. For the fiscal year ended October 31, 2007, the following percentages of its ordinary income distributions paid are designated as short-term capital gain distributions under the Internal Revenue Code Section 871(k)(2)(c): Growth II Fund - 100% and Focus 30 Fund - 100%.
HENNESSY FUNDS 1-800-966-4354
Expense Example
April 30, 2008 (Unaudited)
As a shareholder of the Funds, you incur two types of costs: (1) transaction costs, including sales charges (loads) on purchase payments, reinvested dividends, or other distributions; redemption fees; and exchange fees; and (2) ongoing costs, including management fees; service fees; and other Fund expenses. This Example is intended to help you understand your ongoing costs (in dollars) of investing in each of the Funds and to compare these costs with the ongoing costs of investing in other mutual funds. The Example for Original Class Shares is based on an investment of $1,000 invested at the beginning of the period and held for the entire period from November 1, 2007 to April 30, 2008. The Example for Institutional Class Shares is based on an investment of $1,000 invested on March 3, 2008 and held for the entire period through April 30, 2008.
Actual Expenses
The first set of lines of the table below provide information about actual account values and actual expenses. Although the Funds charge no sales loads or transaction fees, you will be assessed fees for outgoing wire transfers, returned checks and stop payment orders at prevailing rates charged by U.S. Bancorp Fund Services, LLC, the Funds’ transfer agent. If you request that a redemption be made by wire transfer, currently a $15.00 fee is charged by the Funds’ transfer agent. You will be charged a redemption fee equal to 1.50% of the net amount of the redemption if you redeem your shares less than 90 calendar days after you purchase them. IRA accounts will be charged a $15.00 annual maintenance fee. The example below includes, but is not limited to, management fees, shareholder servicing fees, fund accounting, custody and transfer agent fees. However, the example below does not include portfolio trading commissions and related expenses, interest expense or dividends on short positions taken by the Fund and other extraordinary expenses as determined under generally accepted accounting principles. You may use the information within these lines, together with the amount you invested, to estimate the expenses that you paid over the six-month period. Simply divide your account value by $1,000 (for example, an $8,600 account value divided by $1,000 = 8.6), then multiply the result by the number in the first line under the heading entitled “Expenses Paid During Period” to estimate the expenses you paid on your account during this period.
Hypothetical Example for Comparison Purposes
The second set of lines within the table below provide information about hypothetical account values and hypothetical expenses based on the Funds’ actual expense ratios and an assumed rate of return of 5% per year before expenses, which is not the Funds’ actual return. The hypothetical account values and expenses may not be used to estimate the actual ending account balance or expenses you paid for the period. You may use this information to compare the ongoing costs of investing in the Funds and other funds. To do so, compare this 5% hypothetical example with the 5% hypothetical examples that appear in the shareholder reports of the other funds. Please note that the expenses shown in the table are meant to highlight your ongoing costs only and do not reflect any
transactional costs, such as sales charges (loads), redemption fees, or exchange fees. Therefore, the second line of the table is useful in comparing ongoing costs only, and will not help you determine the relative total costs of owning different funds. In addition, if these transactional costs were included, your costs would have been higher.
| | | Beginning | | | Ending | | | Expenses Paid | |
| | | Account Value | | | Account Value | | | During Period(1) | |
| | | 11/1/07 | | | 4/30/08 | | | 11/1/07 – 4/30/08 | |
| Actual | | | | | | | | | |
| Growth Fund – Original Class | | $ | 1,000.00 | | | $ | 785.20 | | | $ | 5.56 | |
| Growth II Fund – Original Class | | $ | 1,000.00 | | | $ | 824.30 | | | $ | 6.11 | |
| Focus 30 Fund – Original Class | | $ | 1,000.00 | | | $ | 1,024.90 | | | $ | 6.51 | |
| Value Fund – Original Class | | $ | 1,000.00 | | | $ | 838.90 | | | $ | 5.49 | |
| Total Return Fund – Original Class | | $ | 1,000.00 | | | $ | 883.00 | | | $ | 12.33 | |
| Balanced Fund – Original Class | | $ | 1,000.00 | | | $ | 930.40 | | | $ | 7.20 | |
| | | | | | | | | | | | | |
| Hypothetical (5% return | | | | | | | | | | | | |
| before expenses) | | | | | | | | | | | | |
| Growth Fund – Original Class | | $ | 1,000.00 | | | $ | 1,018.97 | | | $ | 6.29 | |
| Growth II Fund – Original Class | | $ | 1,000.00 | | | $ | 1,018.51 | | | $ | 6.76 | |
| Focus 30 Fund – Original Class | | $ | 1,000.00 | | | $ | 1,018.78 | | | $ | 6.49 | |
| Value Fund – Original Class | | $ | 1,000.00 | | | $ | 1,019.24 | | | $ | 6.03 | |
| Total Return Fund – Original Class | | $ | 1,000.00 | | | $ | 1,012.11 | | | $ | 13.17 | |
| Balanced Fund – Original Class | | $ | 1,000.00 | | | $ | 1,017.74 | | | $ | 7.53 | |
| (1) | Expenses are equal to the Growth Fund’s expense ratio of 1.23%, the Growth II Fund’s expense ratio of 1.32%, the Focus 30 Fund’s expense ratio of 1.27%, the Value Fund’s expense ratio of 1.18%, the Total Return Fund’s expense ratio of 2.59%, and the Balanced Fund’s expense ratio of 1.48%, multiplied by the average account value over the period, multiplied by the number of days in the most recent half-year/366 days (to reflect one-half year period). |
| | | Beginning | | | Ending | | | Expenses Paid | |
| | | Account Value | | | Account Value | | | During Period(1) | |
| | | 3/3/08(2) | | | 4/30/08 | | | 3/3/08(2) – 4/30/08 | |
| Actual | | | | | | | | | |
| Growth Fund – Institutional Class | | $ | 1,000.00 | | | $ | 998.96 | | | $ | 4.87 | |
| Growth II Fund – Institutional Class | | $ | 1,000.00 | | | $ | 1,001.29 | | | $ | 4.88 | |
| Focus 30 Fund – Institutional Class | | $ | 1,000.00 | | | $ | 1,010.34 | | | $ | 4.90 | |
| Value Fund – Institutional Class | | $ | 1,000.00 | | | $ | 1,001.59 | | | $ | 4.88 | |
| | | | | | | | | | | | | |
| Hypothetical (5% return | | | | | | | | | | | | |
| before expenses) | | | | | | | | | | | | |
| Growth Fund – Institutional Class | | $ | 1,000.00 | | | $ | 1,003.11 | | | $ | 4.88 | |
| Growth II Fund – Institutional Class | | $ | 1,000.00 | | | $ | 1,003.11 | | | $ | 4.88 | |
| Focus 30 Fund – Institutional Class | | $ | 1,000.00 | | | $ | 1,003.11 | | | $ | 4.88 | |
| Value Fund – Institutional Class | | $ | 1,000.00 | | | $ | 1,003.11 | | | $ | 4.88 | |
| (1) | Expenses are equal to the Growth, Growth II, Focus 30 and Value Fund’s expense ratio of 0.98%, multiplied by the average account value over the period, multiplied by the number of days in the period/366 days (to reflect the period). |
| (2) | Commencement of operations for Institutional Class Shares. |
HENNESSY FUNDS 1-800-966-4354
PROXY VOTING POLICY
How to Obtain a Copy of the Funds’ Proxy Voting Policy and Proxy Voting Records
A description of the policies and procedures that the Funds use to determine how to vote proxies relating to portfolio securities is available without charge: (1) by calling 1-800-966-4354; (2) on the Hennessy Funds website at www.hennessyfunds.com; or (3) on the U.S. Securities and Exchange Commission’s website at www.sec.gov. Hennessy Funds’ proxy voting record is available on the SEC’s website at www.sec.gov no later than August 31 for the prior 12 months ending June 30.
Quarterly Filings on Form N-Q
The Funds file their complete schedule of portfolio holdings with the SEC for the first and third quarters of each fiscal year on Form N-Q. The Funds’ Form N-Q will be available on the SEC’s website at www.sec.gov. The Funds’ Form N-Q may be reviewed and copied at the SEC’s Public Reference Room in Washington, DC and information on the operation of the Public Reference Room may be obtained by calling 1-800-SEC-0330. Information included in the Funds’ N-Q will also be available upon request by calling 1-800-966-4354.
Board Approval of Continuation of Investment Advisory Agreement
At its meeting on March 4, 2008, the Board of Directors (the “Board”) of The Hennessy Funds, Inc. (the “Company”) and its two series, the Hennessy Balanced Fund (the “Balanced Fund”) and the Hennessy Total Return Fund (the “Total Return Fund”) (each a “Fund” or collectively the “Funds”), The Hennessy Mutual Funds, Inc. (the “Company”) and its three series, the Hennessy Cornerstone Growth Fund (the “Growth Fund”), the Hennessy Cornerstone Value Fund (the “Value Fund”), and the Hennessy Focus 30 Fund (the “Focus 30 Fund”) and The Hennessy Funds Trust (the “Company”) which includes the Hennessy Cornerstone Growth Fund, Series II (the “Growth II Fund”) (each a “Fund” or collectively the “Funds”), including the Directors who are not “interested persons” (as defined in the Investment Company Act of 1940) of the Funds’ voted to re-approve the current investment advisory agreement (the “Advisory Agreement”) between the Funds and Hennessy Advisors, Inc. (the “Advisor”). In connection with its re-approval of the Advisory Agreement, the Board considered the following factors:
The Board reviewed and discussed the specific services provided by the Advisor. The Advisor:
| 1) | Provides formula driven investment management for the Funds. Hennessy Advisors, Inc. holds the rights to the formulas used for The Cornerstone Growth, Growth II, Value and Focus 30 funds. In providing investment management, Hennessy Advisors, Inc. directs and oversees the trading of securities within and the rebalancing of the portfolios of the Funds. |
| | |
| 2) | Continues to retain the services of The Funds’ Chief Compliance Officer and will make all reasonable efforts to insure that the Funds are in compliance with the securities laws. |
| | |
| 3) | Provides responsive customer and shareholder servicing which consists of providing a call center to respond to shareholder inquiries, including specific mutual fund account information. |
| | |
| 4) | Oversees distribution of the Funds through third-party broker/dealers and independent financial institutions such as Charles Schwab, Inc., Fidelity, TD Waterhouse and Pershing. Hennessy Advisors participates in “no transaction fee” (“NTF”) programs with these companies, which allows customers to purchase the Hennessy Funds through third party distribution channels without paying a transaction fee. Hennessy Advisors compensates these third party distributors under a pre-determined contractual agreement. |
| | |
| 5) | Oversees those third party service providers that support the Funds in providing fund accounting, fund administration, fund distribution, transfer agency and custodial services. |
The Board also: (i) compared the performance of each Fund to benchmark indices over various periods of time and concluded that the performance of each Fund warranted the continuation of the Advisory Agreement; (ii) compared the expense ratios of funds similar in asset size and investment objective to each of
HENNESSY FUNDS 1-800-966-4354
the Funds and concluded the expenses of each Fund were reasonable and warranted continuation of the Advisory Agreement; (iii) considered the fees charged by Hennessy Advisors, Inc. to those of funds similar in asset size and investment objective to each of the Funds and concluded the advisory fees of each Fund were reasonable and warranted continuation of the Advisory Agreement; (iv) considered the profitability of Hennessy Advisors, Inc. with respect to each Fund, the profits were reasonable and not excessive when compared to profitability guidelines set forth in relevant court cases; (v) considered the high level of professionalism and knowledge, along with the extremely low level of turnover, of the employees of the Advisor; and (vi) considered that Neil Hennessy was named one of the top 100 portfolio managers in the nation during each of the previous five years by Barron’s.
The Board then discussed economies of scale and breakpoints and determined that the Funds managed by Hennessy Advisors, Inc. have not yet grown in size, nor has their marketplace demonstrated significantly rapid potential growth to any extent that would warrant the use of breakpoints by the Advisor. The Funds have, in fact, had their assets under management greatly diminished during 2007. In reaching this conclusion the Board took into consideration the profitability of Hennessy Advisors, Inc. and the advisory fees of comparable mutual funds.
The Board reviewed the Funds’ expense ratios and comparable expense ratios for funds like the six funds being considered for contract renewal by Hennessy Advisors, Inc. The Board used data from Lipper showing funds similar in nature to the Funds (Mid-Cap Blend, Small Cap Blend, etc.). The Board determined that the expense ratios of the Funds fall within the range of the ratios of other funds in their classification. Based on the factors discussed above, the Board, including all Independent Directors, recommended continuation of the Advisory Agreement.
(This Page Intentionally Left Blank.)
HENNESSY FUNDS 1-800-966-4354
For information, questions
or assistance, please call
The Hennessy Funds
1-800-966-4354 or 1-415-899-1555
INVESTMENT ADVISOR
Hennessy Advisors, Inc.
7250 Redwood Blvd., Suite 200
Novato, California 94945
ADMINISTRATOR, TRANSFER
AGENT, DIVIDEND PAYING
AGENT & SHAREHOLDER
SERVICING AGENT
U.S. Bancorp Fund Services, LLC
P.O. Box 701
Milwaukee, Wisconsin 53201-0701
CUSTODIAN
U.S. Bank N.A.
Custody Operations
1555 North River Center Dr., Suite 302
Milwaukee, Wisconsin 53212
DIRECTORS
Neil J. Hennessy
Robert T. Doyle
J. Dennis DeSousa
Gerald P. Richardson
COUNSEL
Foley & Lardner LLP
777 East Wisconsin Avenue
Milwaukee, Wisconsin 53202-5306
INDEPENDENT REGISTERED
PUBLIC ACCOUNTING FIRM
KPMG LLP
303 East Wacker Drive
Chicago, Illinois 60601
DISTRIBUTOR
Quasar Distributors, LLC
615 East Michigan Street
Milwaukee, Wisconsin 53202
WWW.HENNESSYFUNDS.COM
This report has been prepared for shareholders and may be distributed to others only if preceded or accompanied by a current prospectus.
Item 2. Code of Ethics.
Not applicable for semi-annual reports.
Item 3. Audit Committee Financial Expert.
Not applicable for semi-annual reports.
Item 4. Principal Accountant Fees and Services.
Not applicable for semi-annual reports.
Item 5. Audit Committee of Listed Registrants.
Not applicable to registrants who are not listed issuers (as defined in Rule 10A-3 under the Securities Exchange Act of 1934).
Item 6. Schedule of Investments.
Schedule of Investments is included as part of the report to shareholders filed under Item 1 of this Form.
Item 7. Disclosure of Proxy Voting Policies and Procedures for Closed-End Management Investment Companies.
Not applicable to open-end investment companies.
Item 8. Portfolio Managers of Closed-End Management Investment Companies.
Not applicable to open-end investment companies.
Item 9. Purchases of Equity Securities by Closed-End Management Investment Company and Affiliated Purchasers.
Not applicable to open-end investment companies.
Item 10. Submission of Matters to a Vote of Security Holders.
Not Applicable
Item 11. Controls and Procedures.
| (a) | The Registrant’s Chief Executive Officer and Chief Financial Officer have reviewed the Registrant's disclosure controls and procedures (as defined in Rule 30a-3(c) under the Investment Company Act of 1940 (the “Act”)) as of a date within 90 days of the filing of this report, as required by Rule 30a-3(b) under the Act and Rules 13a-15(b) or 15d-15(b) under the Securities Exchange Act of 1934. Based on their review, such officers have concluded that the disclosure controls and procedures are effective in ensuring that information required to be disclosed in this report is appropriately recorded, processed, summarized and reported and made known to them by others within the Registrant and by the Registrant’s service provider. |
| (b) | There were no changes in the Registrant's internal control over financial reporting (as defined in Rule 30a-3(d) under the Act) that occurred during the second fiscal quarter of the period covered by this report that has materially affected, or is reasonably likely to materially affect, the Registrant's internal control over financial reporting. |
Item 12. Exhibits.
| (a) | (1) Any code of ethics or amendment thereto, that is subject of the disclosure required by Item 2, to the extent that the registrant intends to satisfy Item 2 requirements through filing an exhibit. Not Applicable |
(2) Certifications pursuant to Section 302 of the Sarbanes-Oxley Act of 2002. Filed herewith.
(3) Any written solicitation to purchase securities under Rule 23c-1 under the Act sent or given during the period covered by the report by or on behalf of the registrant to 10 or more persons. Not applicable to open-end investment companies.
| (b) | Certification pursuant to Section 906 of the Sarbanes-Oxley Act of 2002. Furnished herewith. |
SIGNATURES
Pursuant to the requirements of the Securities Exchange Act of 1934 and the Investment Company Act of 1940, the registrant has duly caused this report to be signed on its behalf by the undersigned, thereunto duly authorized.
(Registrant) Hennessy Funds Trust
By (Signature and Title)* /s/ Neil J. Hennessy
Neil J. Hennessy, Chief Executive Officer
Date July 8, 2008
Pursuant to the requirements of the Securities Exchange Act of 1934 and the Investment Company Act of 1940, this report has been signed below by the following persons on behalf of the registrant and in the capacities and on the dates indicated.
By (Signature and Title)* /s/ Neil J. Hennessy
Neil J. Hennessy, Chief Executive Officer
Date July 8, 2008
By (Signature and Title) )* /s/Teresa M. Nilsen
Teresa M. Nilsen, Chief Financial Officer
Date July 8, 2008