UNITED STATES
SECURITIES AND EXCHANGE COMMISSION
Washington, D.C. 20549
FORM N-CSR
CERTIFIED SHAREHOLDER REPORT OF REGISTERED
MANAGEMENT INVESTMENT COMPANIES
Investment Company Act file number (811-07168)
Hennessy Funds Trust
(Exact name of registrant as specified in charter)
7250 Redwood Blvd., Suite 200
Novato, CA 94945
(Address of principal executive offices) (Zip code)
Neil J. Hennessy
Hennessy Advisors, Inc.
7250 Redwood, Blvd., Suite 200
Novato, CA 94945
(Name and address of agent for service)
800-966-4354
Registrant's telephone number, including area code
Date of fiscal year end: October 31, 2008
Date of reporting period: October 31, 2008
Item 1. Reports to Stockholders.
HENNESSY FUNDS
ANNUAL REPORT
October 31, 2008

Hennessy Cornerstone Growth Fund
Hennessy Cornerstone Growth Fund, Series II
Hennessy Focus 30 Fund
Hennessy Cornerstone Value Fund
Hennessy Total Return Fund
Hennessy Balanced Fund
Contents
| Letter to shareholders | 1 |
| Performance overview | |
| Hennessy Cornerstone Growth Fund | 4 |
| Hennessy Cornerstone Growth Fund, Series II | 6 |
| Hennessy Focus 30 Fund | 8 |
| Hennessy Cornerstone Value Fund | 10 |
| Hennessy Total Return Fund | 12 |
| Hennessy Balanced Fund | 13 |
| Summaries of investments | |
| Hennessy Cornerstone Growth Fund | 15 |
| Hennessy Cornerstone Growth Fund, Series II | 19 |
| Hennessy Focus 30 Fund | 23 |
| Hennessy Cornerstone Value Fund | 26 |
| Hennessy Total Return Fund | 30 |
| Hennessy Balanced Fund | 33 |
| Financial statements | |
| Statements of assets and liabilities | 36 |
| Statements of operations | 38 |
| Statements of changes in net assets | 40 |
| Financial highlights | |
| Hennessy Cornerstone Growth Fund | 44 |
| Hennessy Cornerstone Growth Fund, Series II | 46 |
| Hennessy Focus 30 Fund | 48 |
| Hennessy Cornerstone Value Fund | 50 |
| Hennessy Total Return Fund | 52 |
| Hennessy Balanced Fund | 54 |
| Statement of cash flows – Hennessy Total Return Fund | 56 |
| Notes to the financial statements | 57 |
| Report of Independent Registered Public Accounting Firm | 66 |
| Directors and Officers of the Funds | 68 |
| Expense example | 74 |
| Proxy voting policy | 76 |
WWW.HENNESSYFUNDS.COM
LETTER TO SHAREHOLDERS
December, 2008
Dear Hennessy Funds Shareholder:
The end of the world only comes once, and this isn’t it. However, listening to the non-stop coverage of every gyration of the financial markets, it is hard to feel like the end isn’t at hand. Financial news is now available 24 hours a day, and every news outlet, including local TV and radio stations as well as neighborhood newspapers, seem to now be focused on reporting on the financial crisis, further eroding already low consumer confidence and leaving many people feeling confused and fearful. The average investor is simply not emotionally and psychologically prepared for this kind of negative media onslaught day after day, and it is this emotion that is fanning the flames of this current “crisis.”
We have seen extreme volatility in the financial markets over the past months as subprime mortgages and other questionable products have unraveled, leaving behind a credit and financial mess. We have seen major institutions, such as Freddie Mac, Fannie Mae, Bear Stearns, Lehman Brothers and Merrill Lynch fail and/or be acquired, we have seen banks, such as Wachovia, Washington Mutual and Indy Mac, be acquired or go out of business, and we have seen the U.S. Government come to the aid of failing companies, such as AIG, with their “TARP,” or Troubled Asset Relief Plan.
Many in the industry have called these events unprecedented. However, as we look throughout history, it is littered with “unprecedented” events. Who could forget “Black Monday” (Oct. 19, 1987) when stock markets around the world crashed; the Dow Jones Industrial Average dropped 23% and the S&P 500 Index dropped 20% in just one day. In the early 1990’s, we were plagued by a slumping real estate market, the Savings and Loan crisis, historically low consumer confidence, volatile oil prices and a war in Iraq. Sound familiar? Then we had the tech bubble/bear market of 2000-2002. Investors poignantly remember these periods of crisis, but how many people realize that if they had invested in the S&P 500 Index just prior to Black Monday and held through all these unprecedented events, that by the end of October, 2008 their average annual return would have been approximately 8.5%?
I believe we will look back on today’s market with the same kind of “20-20 hindsight” with which we view past corrections and bear
HENNESSY FUNDS 1-800-966-4354
1
markets. No one knows exactly what will happen in the short term; however, historically the stock market has been resilient and has rebounded. I believe the market will continue to be one of the best long term investments, as it has been in the past.
For the twelve months ending October 31, 2008, we saw significant losses for all the major indices, such as the S&P 500 and Dow Jones Industrial Average, and in each asset class (small, medium and large cap). Stocks in the Financial sector took the hardest hit during the twelve months, as many reeled from the subprime fallout and credit crisis. International funds also experienced significant corrections and outflows, and hedge funds have struggled. Even money market funds were put to the test this past fall, as some of these “broke the buck”, demonstrating that this market left investors no place to hide.
We understand that the current market is difficult and causing people to feel very uneasy. However, we urge investors to stay the course, to maintain their long term view and to have the courage to believe that this bear market too will pass. At Hennessy Funds we remain firmly committed to our time-tested, quantitative formulas and to our disciplined management approach. Thank you for your continued confidence and investment in the Hennessy Funds. Should you have any questions or want to speak with us directly, please don’t hesitate to call us at (800) 966-4354. A discussion on each Fund’s performance follows this letter.
Best regards,

Neil Hennessy
Chief Investment Officer & Portfolio Manager
Past performance does not guarantee future results. Mutual fund investing involves risk. Principal loss is possible.
The S&P 500 Index is a broad based, unmanaged index of 500 stocks, which is widely recognized as representative of the equity market in general. The Dow Jones Industrial Average is an unmanaged index of common stocks comprised of major industrial companies and assumes reinvestment of dividends. You cannot invest directly in an index.
Fund holdings and sector allocations are subject to change. Please refer to the included Schedule of Investments. Current and future portfolio holdings are subject to risk.
Opinions expressed are those of Neil Hennessy and are subject to change, are not guaranteed and should not be considered investment advice.
12/08
WWW.HENESSYFUNDS.COM
2
(This Page Intentionally Left Blank.)
HENNESSY FUNDS 1-800-966-4354
3
HENNESSY CORNERSTONE GROWTH FUND
Hennessy Cornerstone Growth Fund
Original Class Shares
AVERAGE ANNUAL TOTAL RETURN PERIODS ENDED OCTOBER 31, 2008
| Since Inception | ||||||||||||||||
| One Year | Five Years | Ten Years | (11/1/96) | |||||||||||||
| Hennessy Cornerstone | ||||||||||||||||
| Growth Fund – Original Class | (48.00 | )% | (3.84 | )% | 7.50 | % | 7.85 | % | ||||||||
| S&P 400 Midcap Index | (36.46 | )% | 1.96 | % | 6.71 | % | 8.66 | % | ||||||||
| S&P 500 Index | (36.10 | )% | 0.26 | % | 0.40 | % | 4.42 | % | ||||||||
Performance data quoted represents past performance; past performance does not guarantee future results. The investment return and principal value of an investment will fluctuate so that an investor’s shares, when redeemed, may be worth more or less than their original cost. Current performance of the fund may be lower or higher than the performance quoted. Performance data current to the most recent month end may be obtained by visiting www.hennessyfunds.com.
PERFORMANCE NARRATIVE
The Hennessy Cornerstone Growth Fund returned -48.00% for the twelve-month period ending October 31, 2008, underperforming the S&P 400 Midcap and S&P 500 indices. The performance of the Fund was negatively impacted by stock selection, particularly in the Consumer Discretionary sector, by stocks such as Systemax (-54%), Sony (-50%) and Blockbuster (-41% for the twelve-month period), and in the Information Technology sector, by stocks such as LG (-57%) and EMS Technologies, Inc. (-23%). The strongest performers in the portfolio for the twelve month period were Alpha Natural Resources (+39%), Stanley Inc. (+10%) and Northwest Natural Gas (+8%), while the portfolio laggards were Chicago Bridge and Iron (-76%) and Constellation Energy (-74%).
Change in Value of $10,000 Investment
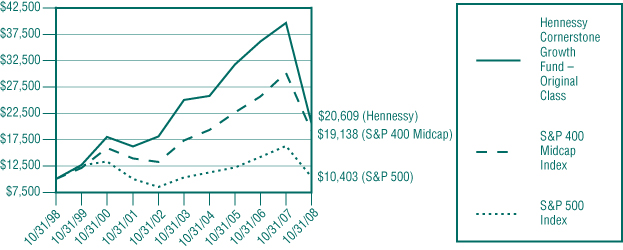
This chart assumes an initial gross investment of $10,000 made on October 31, 1998. Returns shown include the reinvestment of all dividends. Returns shown do not reflect the deduction of taxes that a shareholder would pay on fund distributions or the redemption of fund shares.
The S&P 500 Index and S&P 400 Midcap Index are unmanaged indices commonly used to measure the performance of U.S. Stocks. You cannot invest directly in an index. Small and medium-capitalization companies tend to have limited liquidity and greater price volatility than large-capitalization companies. Investments in foreign securities involve greater volatility and political, economic and currency risk and differences in accounting methods. References to specific securities should not be considered a recommendation to buy or sell any security. Fund holdings and sector allocations are subject to change. Please refer to the included Schedule of Investments.
WWW.HENNESSYFUNDS.COM
4
Hennessy Cornerstone Growth Fund
Institutional Class Shares
CUMULATIVE TOTAL RETURN PERIOD ENDED OCTOBER 31, 2008
| Since Inception | ||||
| 3/3/08 | ||||
| Hennessy Cornerstone Growth Fund – Institutional Class | (34.13 | )% | ||
| S&P 400 Midcap Index | (27.34 | )% | ||
| S&P 500 Index | (26.20 | )% | ||
Performance data quoted represents past performance; past performance does not guarantee future results. The investment return and principal value of an investment will fluctuate so that an investor’s shares, when redeemed, may be worth more or less than their original cost. Current performance of the fund may be lower or higher than the performance quoted. Performance data current to the most recent month end may be obtained by visiting www.hennessyfunds.com.
Change in Value of $250,000 Investment
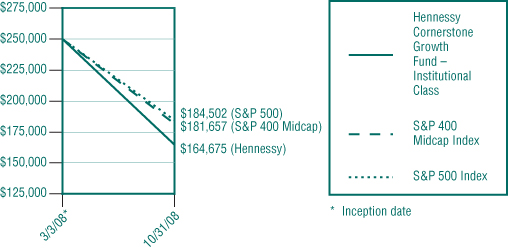
This chart assumes an initial gross investment of $250,000 (minimum investment) made on March 3, 2008 (inception date of share class). Returns shown include the reinvestment of all dividends. Returns shown do not reflect the deduction of taxes that a shareholder would pay on fund distributions or the redemption of fund shares.
The S&P 500 Index and S&P 400 Midcap Index are unmanaged indices commonly used to measure the performance of U.S. Stocks. You cannot invest directly in an index. Small and medium-capitalization companies tend to have limited liquidity and greater price volatility than large-capitalization companies. Investments in foreign securities involve greater volatility and political, economic and currency risk and differences in accounting methods.
HENNESSY FUNDS 1-800-966-4354
5
HENNESSY CORNERSTONE GROWTH FUND, SERIES II
Hennessy Cornerstone Growth Fund, Series II
Original Class Shares
AVERAGE ANNUAL TOTAL RETURN PERIODS ENDED OCTOBER 31, 2008
| Since Inception | ||||||||||||
| One Year | Three Year | 7/1/05 | ||||||||||
| Hennessy Cornerstone Growth | ||||||||||||
| Fund, Series II – Original Class | (55.79 | )% | (19.28 | )% | (18.54 | )% | ||||||
| Russell 2000 Growth Index | (37.87 | )% | (5.31 | )% | (4.24 | )% | ||||||
| S&P 500 Index | (36.10 | )% | (5.21 | )% | (4.25 | )% | ||||||
Performance data quoted represents past performance; past performance does not guarantee future results. The investment return and principal value of an investment will fluctuate so that an investor’s shares, when redeemed, may be worth more or less than their original cost. Current performance of the fund may be lower or higher than the performance quoted. Performance data current to the most recent month end may be obtained by visiting www.hennessyfunds.com.
PERFORMANCE NARRATIVE
The Hennessy Cornerstone Growth Fund, Series II returned -55.79% for the twelve-month period ending October 31, 2008, underperforming the Russell 2000 Growth and S&P 500 indices. Because this Fund rebalances in the summer, both the previous and current portfolios significantly affected performance for the twelve-month period ending October 31, 2008, although the current portfolio, affected by the steep corrections in the market, had a relatively larger effect on overall performance for the twelve-month period ending October 31, 2008. The relative performance of the Fund versus its benchmark indices can be explained in part by the portfolio’s underweighting in Energy stocks prior to the rebalance, with commodities prices soaring during the first half of the year, and its overweighting in Energy stocks after the rebalance, when these stocks were underperforming, as commodity prices cratered. In the previous portfolio, purchased in summer, 2007, the top performing stocks were Chart Industries and AK Steel. Some of the poorer performers included Pinnacle Airlines Corp and Nexstar Broadcasting Corp. A stand out performer in the current portfolio, purchased in the summer of 2008, is Laclede Group, while AK Steel, a stock that remained in the portfolio year to year, has had poor performance since the rebalance.
Change in Value of $10,000 Investment
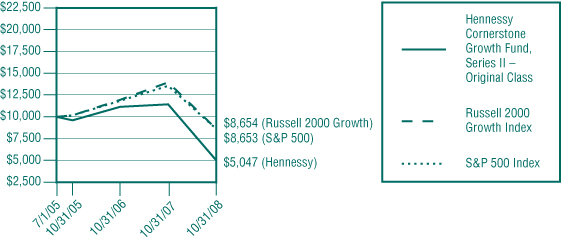
This chart assumes an initial gross investment of $10,000 made on July 1, 2005 (inception). Returns shown include the reinvestment of all dividends. Returns shown do not reflect the deduction of taxes that a shareholder would pay on fund distributions or the redemption of fund shares. The Russell 2000 Growth Index and S&P 500 Index are unmanaged indices commonly used to measure the performance of U.S. Stocks. You cannot invest directly in an index. Small and medium-capitalization companies tend to have limited liquidity and greater price volatility than large-capitalization companies. Investments in foreign securities involve greater volatility and political, economic and currency risk and differences in accounting methods. References to specific securities should not be considered a recommendation to buy or sell any security. Fund holdings and sector allocations are subject to change. Please refer to the included Schedule of Investments.
WWW.HENNESSYFUNDS.COM
6
Hennessy Cornerstone Growth Fund, Series II
Institutional Class Shares
CUMULATIVE TOTAL RETURN PERIOD ENDED OCTOBER 31, 2008
| Since Inception | ||||
| 3/3/08 | ||||
| Hennessy Cornerstone Growth Fund, Series II – Institutional Class | (45.80 | )% | ||
| Russell 2000 Growth Index | (24.16 | )% | ||
| S&P 500 Index | (26.20 | )% | ||
Performance data quoted represents past performance; past performance does not guarantee future results. The investment return and principal value of an investment will fluctuate so that an investor’s shares, when redeemed, may be worth more or less than their original cost. Current performance of the fund may be lower or higher than the performance quoted. Performance data current to the most recent month end may be obtained by visiting www.hennessyfunds.com.
Change in Value of $250,000 Investment
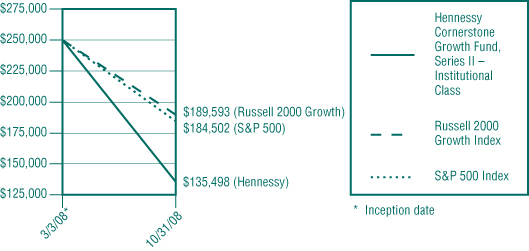
This chart assumes an initial gross investment of $250,000 (minimum investment) made on March 3, 2008 (date of share class inception). Returns shown include the reinvestment of all dividends. Returns shown do not reflect the deduction of taxes that a shareholder would pay on fund distributions or the redemption of fund shares.
The Russell 2000 Growth Index and S&P 500 Index are unmanaged indices commonly used to measure the performance of U.S. Stocks. You cannot invest directly in an index. Small and medium-capitalization companies tend to have limited liquidity and greater price volatility than large-capitalization companies. Investments in foreign securities involve greater volatility and political, economic and currency risk and differences in accounting methods.
HENNESSY FUNDS 1-800-966-4354
7
HENNESSY FOCUS 30 FUND
Hennessy Focus 30 Fund
Original Class Shares
AVERAGE ANNUAL TOTAL RETURN PERIODS ENDED OCTOBER 31, 2008
| Since Inception | ||||||||||||||||
| One Year | Three Years | Five Years | (9/17/03) | |||||||||||||
| Hennessy Focus 30 | ||||||||||||||||
| Fund – Original Class | (30.81 | )% | (3.64 | )% | 5.30 | % | 6.07 | % | ||||||||
| S&P Midcap 400 Index | (36.46 | )% | (5.52 | )% | 1.96 | % | 2.81 | % | ||||||||
| S&P 500 Index | (36.10 | )% | (5.21 | )% | 0.26 | % | 0.76 | % | ||||||||
Performance data quoted represents past performance; past performance does not guarantee future results. The investment return and principal value of an investment will fluctuate so that an investor’s shares, when redeemed, may .be worth more or less than their original cost. Current performance of the fund may be lower or higher than the performance quoted. Performance data current to the most recent month end may be obtained by visiting www.hennessyfunds.com.
PERFORMANCE NARRATIVE
The Hennessy Focus 30 Fund returned -30.81% for the twelve-month period ending October 31, 2008, beating both the S&P 400 Midcap and S&P 500 by over 500 basis points. This Fund rebalances in the fall, therefore, the stocks purchased in fall, 2007, rather than the current portfolio, are primarily responsible for the performance of the Fund for the twelve-month period ending October 31, 2008. The strong relative performance of the Fund versus its benchmark indices is attributable almost entirely to stock selection, notably in the Energy sector, with stocks such as Alpha Natural Resources (+138% while in the portfolio) and in the Healthcare sector, with stocks such as Parexel (+31%). Other top performing stocks selected in the fall of 2007 were Terra Industries, Flowserve Corp., and Warnaco Group. Within the current portfolio, we are seeing strong performance thus far from Tetra Tech and Autozone.
Change in Value of $10,000 Investment
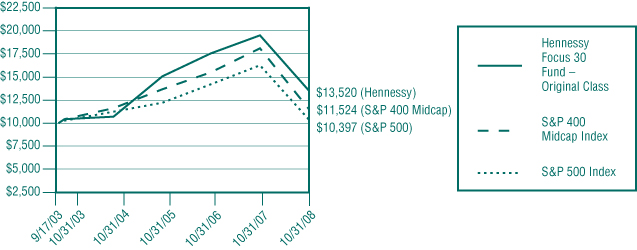
This chart assumes an initial gross investment of $10,000 made on September 17, 2003 (inception). Returns shown include the reinvestment of all dividends. Returns shown do not reflect the deduction of taxes that a shareholder would pay on fund distributions or the redemption of fund shares.
The S&P 500 Index and S&P 400 Midcap Index are unmanaged indices commonly used to measure the performance of U.S. Stocks. You cannot invest directly in an index. Small and medium-capitalization companies tend to have limited liquidity and greater price volatility than large-capitalization companies. References to specific securities should not be considered a recommendation to buy or sell any security. Fund holdings and sector allocations are subject to change. Please refer to the included Schedule of Investments. Basis point is a unit that is equal to 1/100th of 1%, and is used to denote the change in a financial instrument.
WWW.HENNESSYFUNDS.COM
8
Hennessy Focus 30 Fund
Institutional Class Shares
CUMULATIVE TOTAL RETURN PERIOD ENDED OCTOBER 31, 2008
| Since Inception | ||||
| 3/3/08 | ||||
| Hennessy Focus 30 Fund – Institutional Class | (27.89 | )% | ||
| S&P Midcap 400 Index | (27.34 | )% | ||
| S&P 500 Index | (26.20 | )% | ||
Performance data quoted represents past performance; past performance does not guarantee future results. The investment return and principal value of an investment will fluctuate so that an investor’s shares, when redeemed, may be worth more or less than their original cost. Current performance of the fund may be lower or higher than the performance quoted. Performance data current to the most recent month end may be obtained by visiting www.hennessyfunds.com.
Change in Value of $250,000 Investment
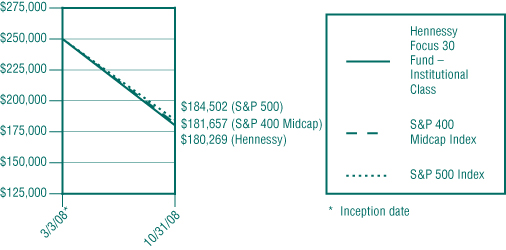
This chart assumes an initial gross investment of $250,000 (minimum investment) made on March 3, 2008 (inception date of share class). Returns shown include the reinvestment of all dividends. Returns shown do not reflect the deduction of taxes that a shareholder would pay on fund distributions or the redemption of fund shares.
The S&P 500 Index and S&P 400 Midcap Index are unmanaged indices commonly used to measure the performance of U.S. Stocks. You cannot invest directly in an index. Small and medium-capitalization companies tend to have limited liquidity and greater price volatility than large-capitalization companies.
HENNESSY FUNDS 1-800-966-4354
9
HENNESSY CORNERSTONE VALUE FUND
Hennessy Cornerstone Value Fund
Original Class Shares
AVERAGE ANNUAL TOTAL RETURN PERIODS ENDED OCTOBER 31, 2008
| Since Inception | ||||||||||||||||
| One Year | Five Years | Ten Years | (11/1/96) | |||||||||||||
| Hennessy Cornerstone | ||||||||||||||||
| Value Fund – Original Class | (45.50 | )% | (2.17 | )% | 1.40 | % | 2.60 | % | ||||||||
| Russell 1000 Value Index | (36.80 | )% | 1.90 | % | 2.79 | % | 6.01 | % | ||||||||
| S&P 500 Index | (36.10 | )% | 0.26 | % | 0.40 | % | 4.42 | % | ||||||||
Performance data quoted represents past performance; past performance does not guarantee future results. The investment return and principal value of an investment will fluctuate so that an investor’s shares, when redeemed, may be worth more or less than their original cost. Current performance of the fund may be lower or higher than the performance quoted. Performance data current to the most recent month end may be obtained by visiting www.hennessyfunds.com.
PERFORMANCE NARRATIVE
The Hennessy Cornerstone Value Fund returned -45.50% for the twelve-month period ending October 31, 2008, underperforming the Russell 1000 Value and S&P 500 indices. Financial stocks have always made up a large percentage of the Fund’s portfolio, as these stocks tend to meet the criteria of the Cornerstone Value Formula, specifically, large, widely-held companies with high dividend yield. As of 10/31/08, Financial stocks accounted for 35% of the portfolio, which represents an overweighting in that sector versus the benchmark indices. Financial stocks had a terrible year in general, and specific poor performers in the portfolio were Wachovia (-85% for the twelve-month period through 10/31/08), National City Corp (-88%), Washington Mutual (-99%), and CIT Group (-87%). Some positive performing stocks in the portfolio were Wells Fargo (+5.4%) and BB&T Corp (+4.2%).
Change in Value of $10,000 Investment
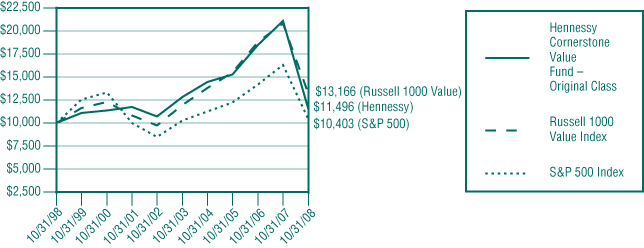
This chart assumes an initial gross investment of $10,000 made on October 31, 1998. Returns shown include the reinvestment of all dividends. Returns shown do not reflect the deduction of taxes that a shareholder would pay on fund distributions or the redemption of fund shares.
The Russell 1000 Value Index and S&P 500 Index are unmanaged indices commonly used to measure the performance of U.S. Stocks. You cannot invest directly in an index. The Fund may invest in medium-capitalization companies which tend to have limited liquidity and greater price volatility than large-capitalization companies. Investments in foreign securities involve greater volatility and political, economic and currency risk and differences in accounting methods. References to specific securities should not be considered a recommendation to buy or sell any security. Fund holdings and sector allocations are subject to change. Please refer to the included Schedule of Investments. Current or future portfolio holdings are subject to risk.
WWW.HENNESSYFUNDS.COM
10
Hennessy Cornerstone Value Fund
Institutional Class Shares
CUMULATIVE TOTAL RETURN PERIOD ENDED OCTOBER 31, 2008
| Since Inception | ||||
| 3/3/08 | ||||
| Hennessy Cornerstone Value Fund – Institutional Class | (34.30 | )% | ||
| Russell 1000 Value Index | (27.13 | )% | ||
| S&P 500 Index | (26.20 | )% | ||
Performance data quoted represents past performance; past performance does not guarantee future results. The investment return and principal value of an investment will fluctuate so that an investor’s shares, when redeemed, may be worth more or less than their original cost. Current performance of the fund may be lower or higher than the performance quoted. Performance data current to the most recent month end may be obtained by visiting www.hennessyfunds.com.
Change in Value of $250,000 Investment
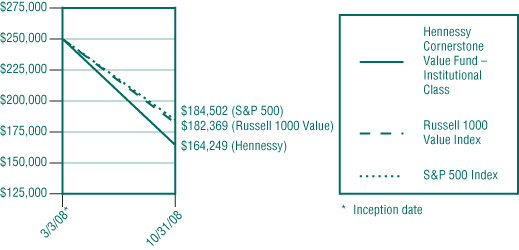
This chart assumes an initial gross investment of $250,000 (minimum investment) made on March 3, 2008 (inception date of share class). Returns shown include the reinvestment of all dividends. Returns shown do not reflect the deduction of taxes that a shareholder would pay on fund distributions or the redemption of fund shares.
The Russell 1000 Value Index and S&P 500 Index are unmanaged indices commonly used to measure the performance of U.S. Stocks. You cannot invest directly in an index. The Fund may invest in medium-capitalization companies which tend to have limited liquidity and greater price volatility than large-capitalization companies. Investments in foreign securities involve greater volatility and political, economic and currency risk and differences in accounting methods.
HENNESSY FUNDS 1-800-966-4354
11
HENNESSY TOTAL RETURN FUND
Hennessy Total Return Fund
Original Class Shares
AVERAGE ANNUAL TOTAL RETURN PERIODS ENDED OCTOBER 31, 2008
| Since Inception | ||||
| One Year | Five Years | Ten Years | (7/29/98) | |
| Hennessy Total Return Fund | (30.97)% | 0.54% | 1.26% | 1.36% |
| Dow Jones Industrial Average | (31.24)% | 1.33% | 2.93% | 2.54% |
| S&P 500 Index | (36.10)% | 0.26% | 0.40% | 0.19% |
Performance data quoted represents past performance; past performance does not guarantee future results. The investment return and principal value of an investment will fluctuate so that an investor’s shares, when redeemed, may be worth more or less than their original cost. Current performance of the fund may be lower or higher than the performance quoted. Performance data current to the most recent month end may be obtained by visiting www.hennessyfunds.com.
PERFORMANCE NARRATIVE
The Hennessy Total Return Fund returned - -30.97% for the twelve-month period ending October 31, 2008, outperforming both the Dow Jones Industrial Average and the S&P 500 Index. While the Dow Jones overall beat the S&P 500, the Dogs of the Dow stocks underperformed both the Dow and S&P 500 for the period. None of the Dogs stocks had positive returns for the twelve-month period, and the portfolio held shares in AIG and also General Motors, currently on the verge of bankruptcy/bailout. The overperformance versus the benchmark indices is due primarily to the Fund’s 25% stake in short-term U.S. Treasury bills.
Change in Value of $10,000 Investment
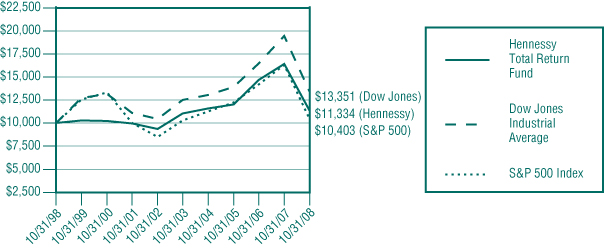
This chart assumes an initial gross investment of $10,000 made on October 31, 1998. Performance reflects fee waivers in effect. In the absence of fee waivers, total return would be reduced. Returns shown include the reinvestment of all dividend and other distributions. Returns shown do not reflect the deduction of taxes that a shareholder would pay on fund distributions or the redemption of fund shares.
The Dow Jones Industrial Average and S&P 500 Index are unmanaged indices commonly used to measure the performance of U.S. Stocks. You cannot invest directly in an index. The Hennessy Total Return Fund is non-diversified, meaning it may concentrate its assets in fewer individual holdings than a diversified fund, making it more exposed to individual stock volatility than a diversified fund. References to specific securities should not be considered a recommendation to buy or sell any security. Fund holdings are subject to change. Please refer to the included Schedule of Investments. Current or future portfolio holdings are subject to risk.
WWW.HENNESSYFUNDS.COM
12
HENNESSY BALANCED FUND
Hennessy Balanced Fund
Original Class Shares
AVERAGE ANNUAL TOTAL RETURN PERIODS ENDED OCTOBER 31, 2008
| Since Inception | ||||||||||||||||
| One Year | Five Years | Ten Years | (3/8/96) | |||||||||||||
| Hennessy Balanced Fund | (21.55 | )% | 0.27 | % | 1.15 | % | 3.12 | % | ||||||||
| Dow Jones Industrial Average | (31.24 | )% | 1.33 | % | 2.93 | % | 6.44 | % | ||||||||
| S&P 500 Index | (36.10 | )% | 0.26 | % | 0.40 | % | 5.17 | % | ||||||||
Performance data quoted represents past performance; past performance does not guarantee future results. The investment return and principal value of an investment will fluctuate so that an investor’s shares, when redeemed, may be worth more or less than their original cost. Current performance of the fund may be lower or higher than the performance quoted. Performance data current to the most recent month end may be obtained by visiting www.hennessyfunds.com.
PERFORMANCE NARRATIVE
The Hennessy Balanced Fund returned -21.55% for the twelve-month period ending October 31, 2008, significantly beating both the Dow Jones Industrial Average and the S&P 500 Index. While the Dow Jones overall beat the S&P 500, the Dogs of the Dow stocks underperformed both the Dow and S&P 500 for the period. None of the Dogs stocks had positive returns for the twelve-month period, and the portfolio held shares in AIG and also General Motors, currently in the news for being on the verge of bankruptcy/bailout. The overperformance versus the benchmark indices is due to the Fund’s 50% stake in short-term U.S. Treasury bills.
Change in Value of $10,000 Investment
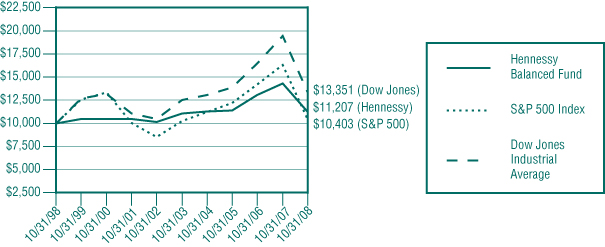
This chart assumes an initial gross investment of $10,000, made on October 31, 1998. Returns shown include the reinvestment of all dividend and other distributions. Returns shown do not reflect the deduction of taxes that a shareholder would pay on fund distributions or the redemption of fund shares.
The Dow Jones Industrial Average and S&P 500 Index are unmanaged indices commonly used to measure the performance of U.S. Stocks. You cannot invest directly in an index. The Hennessy Balanced Fund is non-diversified, meaning it may concentrate its assets in fewer individual holdings than a diversified fund, making it more exposed to individual stock volatility than a diversified fund. References to specific securities should not be considered a recommendation to buy or sell any security. Fund holdings are subject to change. Please refer to the included Schedule of Investments. Current or future portfolio holdings are subject to risk.
HENNESSY FUNDS 1-800-966-4354
13
(This Page Intentionally Left Blank.)
WWW.HENNESSYFUNDS.COM
14
SUMMARY OF INVESTMENTS — HENNESSY CORNERSTONE GROWTH FUND
Summaries of Investments
The following summaries of investment portfolios are designed to help investors better understand each fund’s principal holdings. Each summary is as of October 31, 2008.
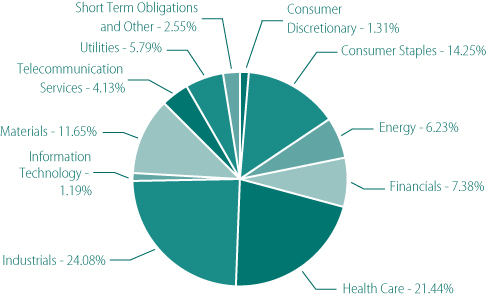
HENNESSY CORNERSTONE GROWTH FUND
(% of Net Assets)
| TOP TEN HOLDINGS | % of net assets |
| Alpha Natural Resources, Inc. | 3.94% |
| Stanley, Inc. | 3.29% |
| Northwest National Gas Co. | 3.24% |
| Fairfax Financial Holdings, Ltd. | 3.20% |
| Aon Corp. | 2.96% |
| CBIZ, Inc. | 2.81% |
| Enbridge, Inc. | 2.77% |
| Teledyne Technologies, Inc. | 2.78% |
| MWI Veterinary Supply, Inc. | 2.69% |
| AZZ, Inc. | 2.68% |
HENNESSY FUNDS 1-800-966-4354
15
| COMMON STOCKS – 97.45% | Number | % of Net | ||||||||||
| of Shares | Value | Assets | ||||||||||
| Consumer Discretionary – 1.31% | ||||||||||||
| Sony Corp. – ADR (b) | 179,400 | $ | 4,169,256 | 1.31 | % | |||||||
| Consumer Staples – 14.25% | ||||||||||||
| Archer-Daniels-Midland Co. | 227,100 | 4,707,783 | 1.48 | % | ||||||||
| Bunge Ltd. (b) | 79,600 | 3,057,436 | 0.96 | % | ||||||||
| Coca-Cola Femsa SA de CV – ADR (b) | 212,900 | 6,778,736 | 2.13 | % | ||||||||
| Costco Wholesale Corp. | 144,900 | 8,260,749 | 2.60 | % | ||||||||
| Fresh Del Monte Produce, Inc. (a)(b) | 291,500 | 6,153,565 | 1.95 | % | ||||||||
| Pepsi Bottling Group, Inc. | 243,200 | 5,622,784 | 1.77 | % | ||||||||
| PepsiAmericas, Inc. | 304,300 | 5,760,399 | 1.81 | % | ||||||||
| Pricesmart, Inc. | 329,900 | 4,915,510 | 1.55 | % | ||||||||
| 45,256,962 | 14.25 | % | ||||||||||
| Energy – 6.23% | ||||||||||||
| Bristow Group, Inc. (a) | 179,300 | 4,441,261 | 1.40 | % | ||||||||
| Enbridge, Inc. (b) | 254,600 | 8,809,160 | 2.77 | % | ||||||||
| Total S.A. – ADR (b) | 118,200 | 6,553,008 | 2.06 | % | ||||||||
| 19,803,429 | 6.23 | % | ||||||||||
| Financials – 7.38% | ||||||||||||
| Aon Corp. | 222,400 | 9,407,520 | 2.96 | % | ||||||||
| Assurant, Inc. | 151,900 | 3,870,412 | 1.22 | % | ||||||||
| Fairfax Financial Holdings, Ltd. (b) | 36,200 | 10,154,462 | 3.20 | % | ||||||||
| 23,432,394 | 7.38 | % | ||||||||||
| Health Care – 21.44% | ||||||||||||
| Aetna, Inc. | 171,000 | 4,252,770 | 1.34 | % | ||||||||
| Alliance Imaging, Inc. (a) | 1,038,200 | 8,461,330 | 2.66 | % | ||||||||
| Cigna Corp. | 179,800 | 2,930,740 | 0.92 | % | ||||||||
| Express Scripts, Inc. (a) | 137,900 | 8,358,119 | 2.63 | % | ||||||||
| Humana, Inc. (a) | 119,000 | 3,521,210 | 1.11 | % | ||||||||
| McKesson Corp. | 150,200 | 5,525,858 | 1.74 | % | ||||||||
| Medco Health Solutions, Inc. (a) | 192,500 | 7,305,375 | 2.30 | % | ||||||||
| Molina Healthcare, Inc. (a) | 259,200 | 5,772,384 | 1.83 | % | ||||||||
| MWI Veterinary Supply, Inc. (a) | 246,900 | 8,550,147 | 2.69 | % | ||||||||
| RehabCare Group, Inc. (a) | 416,900 | 7,141,497 | 2.25 | % | ||||||||
The accompanying notes are an integral part of these financial statements.
WWW.HENNESSYFUNDS.COM
16
| COMMON STOCKS | Number | % of Net | ||||||||||
| of Shares | Value | Assets | ||||||||||
| Health Care (Continued) | ||||||||||||
| Sun Healthcare Group, Inc. (a) | 546,000 | $ | 6,268,080 | 1.97 | % | |||||||
| 68,087,510 | 21.44 | % | ||||||||||
| Industrials – 24.08% | ||||||||||||
| AGCO Corp. (a) | 156,400 | 4,929,728 | 1.55 | % | ||||||||
| AZZ, Inc. (a) | 291,800 | 8,514,724 | 2.68 | % | ||||||||
| CBIZ, Inc. (a) | 1,102,600 | 8,931,060 | 2.81 | % | ||||||||
| Chicago Bridge & Iron Co. N.V. (b) | 189,200 | 2,344,188 | 0.74 | % | ||||||||
| Dyncorp International, Inc. (a) | 402,800 | 5,325,016 | 1.68 | % | ||||||||
| EnerSys (a) | 365,200 | 4,827,944 | 1.52 | % | ||||||||
| Flowserve Corp. | 111,700 | 6,357,964 | 2.00 | % | ||||||||
| Jacobs Engineering Group, Inc. (a) | 111,800 | 4,072,874 | 1.28 | % | ||||||||
| L-3 Communications Holdings, Inc. | 94,800 | 7,694,916 | 2.42 | % | ||||||||
| Siemens AG – ADR (b) | 70,300 | 4,228,545 | 1.33 | % | ||||||||
| Stanley, Inc. (a) | 304,900 | 10,445,874 | 3.29 | % | ||||||||
| Teledyne Technologies, Inc. (a) | 193,300 | 8,808,681 | 2.78 | % | ||||||||
| 76,481,514 | 24.08 | % | ||||||||||
| Information Technology – 1.19% | ||||||||||||
| LG Display Company Ltd. – ADR (a)(b) | 408,500 | 3,766,370 | 1.19 | % | ||||||||
| Materials – 11.65% | ||||||||||||
| Alpha Natural Resources, Inc. (a) | 348,600 | 12,469,422 | 3.94 | % | ||||||||
| BASF AG – ADR (b) | 136,500 | 4,588,598 | 1.44 | % | ||||||||
| LSB Industries, Inc. (a) | 409,800 | 3,368,556 | 1.06 | % | ||||||||
| Massey Energy Co. | 306,000 | 7,065,540 | 2.22 | % | ||||||||
| Owens-Illinois, Inc. (a) | 221,000 | 5,056,480 | 1.59 | % | ||||||||
| Steel Dynamics, Inc. | 372,900 | 4,444,968 | 1.40 | % | ||||||||
| 36,993,564 | 11.65 | % | ||||||||||
| Telecommunication Services – 4.13% | ||||||||||||
| EMS Technologies, Inc. (a) | 366,200 | 7,653,580 | 2.41 | % | ||||||||
| Tele Norte Leste Participacoes SA – ADR (b) | 402,000 | 5,459,160 | 1.72 | % | ||||||||
| 13,112,740 | 4.13 | % | ||||||||||
| Utilities – 5.79% | ||||||||||||
| Constellation Energy Group, Inc. | 95,600 | 2,314,476 | 0.73 | % | ||||||||
| Northwest Natural Gas Co. | 202,300 | 10,293,024 | 3.24 | % | ||||||||
The accompanying notes are an integral part of these financial statements.
HENNESSY FUNDS 1-800-966-4354
17
| COMMON STOCKS | Number | % of Net | ||||||||||
| of Shares | Value | Assets | ||||||||||
| Utilities (Continued) | ||||||||||||
| RWE AG – ADR (b) | 69,300 | $ | 5,775,219 | 1.82 | % | |||||||
| 18,382,719 | 5.79 | % | ||||||||||
Total Common Stocks (Cost $476,559,626) | 309,486,458 | 97.45 | % | |||||||||
| SHORT-TERM INVESTMENTS – 2.73% | Principal | |||||||||||
| Amount | ||||||||||||
| Discount Notes – 2.43% | ||||||||||||
| Federal Home Loan Bank Discount Note, | ||||||||||||
| 0.378% , 12/01/2008 | $ | 7,740,000 | 7,738,701 | 2.43 | % | |||||||
Total Discount Notes (Cost $7,738,701) | 7,738,701 | 2.43 | % | |||||||||
| Variable Rate Demand Notes# – 0.30% | ||||||||||||
| American Family Financial Services, Inc. | ||||||||||||
| 1.412%, 12/31/2031 | 946,602 | 946,602 | 0.30 | % | ||||||||
Total Variable Demand Notes | ||||||||||||
| (Cost $946,602) | 946,602 | 0.30 | % | |||||||||
| Total Short-Term Investments | ||||||||||||
| (Cost $8,685,303) | 8,685,303 | 2.73 | % | |||||||||
Total Investments – 100.18% | ||||||||||||
| (Cost $485,244,929) | 318,171,761 | 100.18 | % | |||||||||
| Liabilities in Excess of Other Assets – (0.18)% | (582,442 | ) | (0.18 | )% | ||||||||
TOTAL NET ASSETS – 100.00% | $ | 317,589,319 | 100.00 | % | ||||||||
Percentages are stated as a percent of net assets.
ADR American Depositary Receipt
| (a) | Non Income Producing |
| (b) | Foreign Issued Security |
| # | Variable rate demand notes are considered short-term obligations and are payable on demand. Interest rates change periodically on specified dates. The rates listed are as of October 31, 2008. |
The accompanying notes are an integral part of these financial statements.
WWW.HENNESSYFUNDS.COM
18
SUMMARY OF INVESTMENTS — HENNESSY CORNERSTONE GROWTH FUND, SERIES II
HENNESSY CORNERSTONE
GROWTH FUND, SERIES II
(% of Net Assets)
| TOP TEN HOLDINGS | % of net assets |
| The Laclede Group, Inc. | 4.55% |
| ManTech International, Corp. – Class A | 3.93% |
| Flowers Foods, Inc. | 3.68% |
| NCI, Inc. | 3.66% |
| Stanley, Inc. | 3.59% |
| Hanger Orthopedic Group, Inc. | 3.55% |
| Clean Harbors, Inc. | 3.25% |
| Cal-Maine Foods, Inc. | 3.21% |
| America’s Car Mart, Inc. | 3.21% |
| Innophos Holdings, Inc. | 2.95% |
HENNESSY FUNDS 1-800-966-4354
19
| COMMON STOCKS – 98.84% | Number | % of Net | ||||||||||
| of Shares | Value | Assets | ||||||||||
| Consumer Discretionary – 9.92% | ||||||||||||
| America’s Car Mart, Inc. (a) | 71,300 | $ | 1,164,329 | 3.21 | % | |||||||
| Exide Technologies (a) | 76,200 | 361,950 | 1.00 | % | ||||||||
| Hasbro, Inc. | 35,800 | 1,040,706 | 2.86 | % | ||||||||
| Overstock.com, Inc. (a) | 49,200 | 610,572 | 1.68 | % | ||||||||
| Stoneridge, Inc. (a) | 74,900 | 426,181 | 1.17 | % | ||||||||
| 3,603,738 | 9.92 | % | ||||||||||
| Consumer Staples – 6.89% | ||||||||||||
| Cal-Maine Foods, Inc. | 39,700 | 1,166,783 | 3.21 | % | ||||||||
| Flowers Foods, Inc. | 45,100 | 1,337,215 | 3.68 | % | ||||||||
| 2,503,998 | 6.89 | % | ||||||||||
| Energy – 15.70% | ||||||||||||
| Enbridge, Inc. (b) | 29,600 | 1,024,160 | 2.82 | % | ||||||||
| Gulf Island Fabrication, Inc. | 26,100 | 514,431 | 1.42 | % | ||||||||
| Hess Corp. | 10,100 | 608,121 | 1.67 | % | ||||||||
| Interoil Corp. (a)(b) | 43,400 | 626,696 | 1.72 | % | ||||||||
| Murphy Oil Corp. | 13,000 | 658,320 | 1.81 | % | ||||||||
| Oil States International, Inc. (a) | 20,100 | 464,913 | 1.28 | % | ||||||||
| PHI, Inc. (a) | 31,800 | 667,164 | 1.84 | % | ||||||||
| Statoil ASA – ADR (b) | 34,200 | 687,420 | 1.89 | % | ||||||||
| Willbros Group, Inc. (a)(b) | 29,200 | 452,308 | 1.25 | % | ||||||||
| 5,703,533 | 15.70 | % | ||||||||||
| Health Care – 3.55% | ||||||||||||
| Hanger Orthopedic Group, Inc. (a) | 77,400 | 1,289,484 | 3.55 | % | ||||||||
| Industrials – 17.53% | ||||||||||||
| Aecom Technology Corp Delaware (a) | 39,300 | 692,859 | 1.91 | % | ||||||||
| Clean Harbors, Inc. (a) | 18,000 | 1,180,260 | 3.25 | % | ||||||||
| EnerSys (a) | 37,300 | 493,106 | 1.36 | % | ||||||||
| ENGlobal Corp. (a) | 89,700 | 393,783 | 1.08 | % | ||||||||
| Fluor Corp. | 13,700 | 547,041 | 1.51 | % | ||||||||
| Metalico, Inc. (a) | 72,900 | 233,280 | 0.64 | % | ||||||||
| Reliance Steel & Aluminum Co. | 16,600 | 415,664 | 1.14 | % | ||||||||
| Ryder System, Inc. | 18,500 | 732,970 | 2.02 | % | ||||||||
| SPX Corp. | 9,700 | 375,778 | 1.03 | % | ||||||||
The accompanying notes are an integral part of these financial statements.
WWW.HENNESSYFUNDS.COM
20
| COMMON STOCKS | Number | % of Net | ||||||||||
| of Shares | Value | Assets | ||||||||||
| Industrials (Continued) | ||||||||||||
| Stanley, Inc. (a) | 38,100 | $ | 1,305,306 | 3.59 | % | |||||||
| 6,370,047 | 17.53 | % | ||||||||||
| Information Technology – 16.19% | ||||||||||||
| Celestica, Inc. (a)(b) | 151,500 | 755,985 | 2.08 | % | ||||||||
| Hackett Group, Inc. (a) | 222,500 | 663,050 | 1.82 | % | ||||||||
| ManTech International Corp. – Class A (a) | 26,500 | 1,429,410 | 3.93 | % | ||||||||
| Multi-Fineline Electronix, Inc. (a) | 46,200 | 539,616 | 1.49 | % | ||||||||
| NCI, Inc. (a) | 55,800 | 1,328,040 | 3.66 | % | ||||||||
| UTStarcom, Inc. (a) | 233,500 | 555,730 | 1.53 | % | ||||||||
| Western Digital Corp. (a) | 37,000 | 610,500 | 1.68 | % | ||||||||
| 5,882,331 | 16.19 | % | ||||||||||
| Materials – 15.82% | ||||||||||||
| Airgas, Inc. | 21,900 | 840,084 | 2.31 | % | ||||||||
| AK Steel Holding Corp. | 19,000 | 264,480 | 0.73 | % | ||||||||
| Arcelor Mittal – ADR (b) | 13,200 | 346,500 | 0.96 | % | ||||||||
| Celanese Corp. | 28,600 | 396,396 | 1.09 | % | ||||||||
| General Steel Holdings, Inc. (a) | 81,300 | 385,362 | 1.06 | % | ||||||||
| Gerdau Ameristeel Corp. (b) | 66,200 | 366,748 | 1.01 | % | ||||||||
| Innophos Holdings, Inc. | 40,000 | 1,070,000 | 2.95 | % | ||||||||
| Olympic Steel, Inc. | 16,800 | 384,048 | 1.06 | % | ||||||||
| Schnitzer Steel Industries, Inc. | 11,100 | 298,923 | 0.82 | % | ||||||||
| Steel Dynamics, Inc. | 32,700 | 389,784 | 1.07 | % | ||||||||
| Stepan Co. | 28,000 | 1,003,240 | 2.76 | % | ||||||||
| 5,745,565 | 15.82 | % | ||||||||||
| Utilities – 13.24% | ||||||||||||
| The Laclede Group, Inc. | 31,600 | 1,653,312 | 4.55 | % | ||||||||
| MDU Resources Group, Inc. | 36,600 | 666,486 | 1.83 | % | ||||||||
| Otter Tail Corp. | 32,900 | 772,492 | 2.13 | % | ||||||||
| TECO Energy, Inc. | 59,400 | 685,476 | 1.89 | % | ||||||||
| Vectren Corp. | 40,900 | 1,030,680 | 2.84 | % | ||||||||
| 4,808,446 | 13.24 | % | ||||||||||
Total Common Stocks (Cost $60,050,716) | 35,907,142 | 98.84 | % | |||||||||
The accompanying notes are an integral part of these financial statements.
HENNESSY FUNDS 1-800-966-4354
21
| SHORT-TERM INVESTMENTS – 1.39% | Principal | % in | ||||||||||
| Amount | Value | Net Assets | ||||||||||
| Discount Notes – 1.31% | ||||||||||||
| Federal Home Loan Bank Discount Note, | ||||||||||||
| 1.1380%, 11/17/2008 | $ | 475,000 | $ | 474,782 | 1.31 | % | ||||||
Total Discount Notes (Cost $474,782) | 474,782 | 1.31 | % | |||||||||
| Variable Rate Demand Notes# – 0.08% | ||||||||||||
| American Family Financial Services, Inc. | ||||||||||||
| 1.4124%, 12/31/2031 | 28,896 | 28,896 | 0.08 | % | ||||||||
| Total Variable Rate Demand Notes | ||||||||||||
| (Cost $28,896) | 28,896 | 0.08 | % | |||||||||
| Total Short-Term Investments | ||||||||||||
| (Cost $503,678) | 503,678 | 1.39 | % | |||||||||
Total Investments – 100.23% | ||||||||||||
| (Cost $60,554,394) | 36,410,820 | 100.23 | % | |||||||||
| Liabilities in Excess of Other Assets – (0.23)% | (83,504 | ) | (0.23 | )% | ||||||||
TOTAL NET ASSETS – 100.00% | $ | 36,327,316 | 100.00 | % | ||||||||
Percentages are stated as a percent of net assets.
ADR American Depositary Receipt
| (a) | Non Income Producing |
| (b) | Foreign Issued Security |
| # | Variable rate demand notes are considered short-term obligations and are payable on demand. Interest rates change periodically on specified dates. The rates listed are as of October 31, 2008. |
The accompanying notes are an integral part of these financial statements.
WWW.HENNESSYFUNDS.COM
22
SUMMARY OF INVESTMENTS — HENNESSY FOCUS 30 FUND
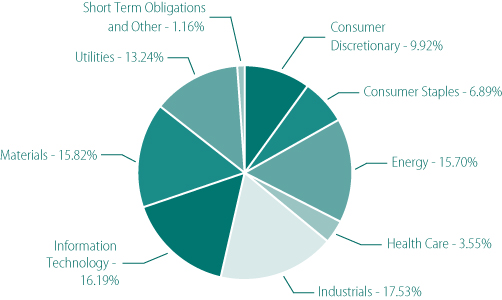
HENNESSY FOCUS 30 FUND
(% of Net Assets)
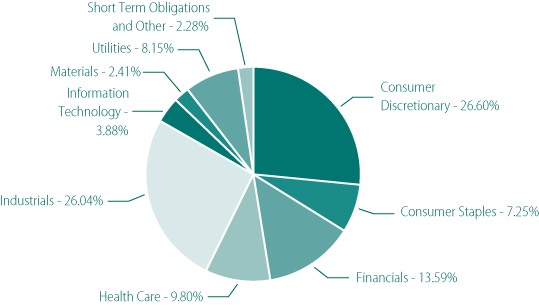
| TOP TEN HOLDINGS | % of net assets |
| Ralcorp Holdings, Inc. | 4.26% |
| Piedmont Natural Gas Co. | 4.19% |
| Odyssey Re Holdings Corp. | 4.15% |
| AutoZone, Inc. | 4.11% |
| Hawaiian Electric Industries | 3.96% |
| ManTech International Corp. – Class A | 3.88% |
| Owens & Minor, Inc. | 3.80% |
| Ross Stores, Inc. | 3.69% |
| Stifel Financial Corp. | 3.62% |
| Corinthian Colleges, Inc. | 3.60% |
HENNESSY FUNDS 1-800-966-4354
23
| COMMON STOCKS – 97.72% | Number | % of Net | ||||||||||
| of Shares | Value | Assets | ||||||||||
| Consumer Discretionary – 26.60% | ||||||||||||
| Aeropostale, Inc. (a) | 247,400 | $ | 5,989,554 | 3.09 | % | |||||||
| ArvinMeritor, Inc. | 522,900 | 3,095,568 | 1.60 | % | ||||||||
| AutoZone, Inc. (a) | 62,700 | 7,981,083 | 4.11 | % | ||||||||
| Hasbro, Inc. | 224,500 | 6,526,215 | 3.36 | % | ||||||||
| Panera Bread Co. (a) | 145,000 | 6,542,400 | 3.37 | % | ||||||||
| Rent-A-Center, Inc. (a) | 340,900 | 4,977,140 | 2.56 | % | ||||||||
| Ross Stores, Inc. | 219,100 | 7,162,379 | 3.69 | % | ||||||||
| Sally Beauty Holdings, Inc. (a) | 822,100 | 4,176,268 | 2.15 | % | ||||||||
| Snap-On, Inc. | 140,400 | 5,187,780 | 2.67 | % | ||||||||
| 51,638,387 | 26.60 | % | ||||||||||
| Consumer Staples – 7.25% | ||||||||||||
| The Estee Lauder Cos., Inc. | 161,000 | 5,802,440 | 2.99 | % | ||||||||
| Ralcorp Holdings, Inc. (a) | 122,200 | 8,270,496 | 4.26 | % | ||||||||
| 14,072,936 | 7.25 | % | ||||||||||
| Financials – 13.59% | ||||||||||||
| Hanover Insurance Group, Inc. | 160,900 | 6,315,325 | 3.25 | % | ||||||||
| Odyssey Re Holdings Corp. | 204,000 | 8,045,760 | 4.15 | % | ||||||||
| Raymond James Financial, Inc. | 214,500 | 4,995,705 | 2.57 | % | ||||||||
| Stifel Financial Corp. (a) | 160,900 | 7,023,285 | 3.62 | % | ||||||||
| 26,380,075 | 13.59 | % | ||||||||||
| Health Care – 9.80% | ||||||||||||
| LifePoint Hospitals, Inc. (a) | 246,500 | 5,908,605 | 3.04 | % | ||||||||
| Owens & Minor, Inc. | 170,500 | 7,377,535 | 3.80 | % | ||||||||
| Tenet Healthcare Corp. (a) | 1,310,700 | 5,740,866 | 2.96 | % | ||||||||
| 19,027,006 | 9.80 | % | ||||||||||
| Industrials – 26.04% | ||||||||||||
| AO Smith Corp. | 184,000 | 5,805,200 | 2.99 | % | ||||||||
| Brady Corp. | 217,700 | 6,748,700 | 3.48 | % | ||||||||
| Corinthian Colleges, Inc. (a) | 489,300 | 6,987,204 | 3.60 | % | ||||||||
| HUB Group, Inc. (a) | 196,500 | 6,179,925 | 3.18 | % | ||||||||
| Lennox International, Inc. | 215,300 | 6,420,246 | 3.31 | % | ||||||||
| Pentair, Inc. | 207,900 | 5,746,356 | 2.96 | % | ||||||||
| Teledyne Technologies, Inc. (a) | 138,200 | 6,297,774 | 3.24 | % | ||||||||
The accompanying notes are an integral part of these financial statements.
WWW.HENNESSYFUNDS.COM
24
| COMMON STOCKS | Number | % of Net | ||||||||||
| of Shares | Value | Assets | ||||||||||
| Industrials (Continued) | ||||||||||||
| Tetra Tech, Inc. (a) | 289,600 | $ | 6,368,304 | 3.28 | % | |||||||
| 50,553,709 | 26.04 | % | ||||||||||
| Information Technology – 3.88% | ||||||||||||
| ManTech International Corp. – Class A (a) | 139,400 | 7,519,236 | 3.88 | % | ||||||||
| Materials – 2.41% | ||||||||||||
| Greif, Inc. | 115,500 | 4,686,990 | 2.41 | % | ||||||||
| Utilities – 8.15% | ||||||||||||
| Hawaiian Electric Industries | 288,900 | 7,690,518 | 3.96 | % | ||||||||
| Piedmont Natural Gas Co. | 246,800 | 8,124,656 | 4.19 | % | ||||||||
| 15,815,174 | 8.15 | % | ||||||||||
Total Common Stocks (Cost $241,439,256) | 189,693,513 | 97.72 | % | |||||||||
| WARRANTS – 0.00% | ||||||||||||
| Lantronix Inc. Warrant | ||||||||||||
| Expiration: February, 2011, Exercise Price: $0.850 | 158 | 0 | 0.00 | % | ||||||||
Total Warrants (Cost $0) | 0 | 0.00 | % | |||||||||
| SHORT-TERM INVESTMENTS – 1.63% | Principal | |||||||||||
| Amount | ||||||||||||
| Variable Rate Demand Notes# – 1.63% | ||||||||||||
| American Family Financial Services, Inc., | ||||||||||||
| 1.4124%, 12/31/2031 | $ | 2,641,527 | 2,641,527 | 1.36 | % | |||||||
| Wisconsin Corporate Central Credit Union, | ||||||||||||
| 1.8475%, 12/31/2031 | 519,027 | 519,027 | 0.27 | % | ||||||||
| Total Variable Rate Demand Notes | ||||||||||||
| (Cost $3,160,554) | 3,160,554 | 1.63 | % | |||||||||
| Total Short-Term Investments | ||||||||||||
| (Cost $3,160,554) | 3,160,554 | 1.63 | % | |||||||||
Total Investments – 99.35% | ||||||||||||
| (Cost $244,599,810) | 192,854,067 | 99.35 | % | |||||||||
| Other Assets in Excess of Liabilities – 0.65% | 1,252,853 | 0.65 | % | |||||||||
TOTAL NET ASSETS – 100.00% | $ | 194,106,920 | 100.00 | % | ||||||||
Percentages are stated as a percent of net assets.
| (a) | Non Income Producing |
| # | Variable rate demand notes are considered short-term obligations and are payable on demand. Interest rates change periodically on specified dates. The rates listed are as of October 31, 2008. |
The accompanying notes are an integral part of these financial statements.
HENNESSY FUNDS 1-800-966-4354
25
SUMMARY OF INVESTMENTS — HENNESSY CORNERSTONE VALUE FUND
HENNESSY CORNERSTONE VALUE FUND
(% of Net Assets)
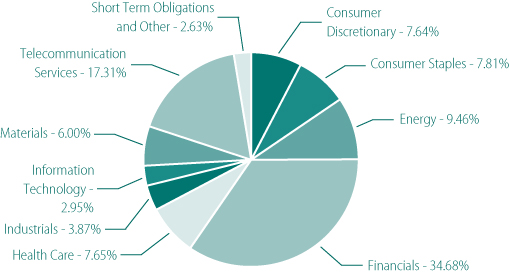
| TOP TEN HOLDINGS | % of net assets |
| Wells Fargo & Co. | 3.89% |
| BB&T Corp. | 3.77% |
| PNC Financial Services Group | 3.53% |
| Bank of America Corp. | 3.51% |
| Chunghwa Telecom Co. Ltd. – ADR | 3.33% |
| US Bancorp | 3.13% |
| Taiwan Semiconductor Manufacturing Co., Ltd. – ADR | 2.95% |
| Enterprise Products Partners LP | 2.72% |
| Pfizer, Inc. | 2.63% |
| Mattel, Inc. | 2.61% |
WWW.HENNESSYFUNDS.COM
26
| COMMON STOCKS – 97.37% | Number | % of Net | ||||||||||
| of Shares | Value | Assets | ||||||||||
| Consumer Discretionary – 7.64% | ||||||||||||
| Carnival Corp. (b) | 74,700 | $ | 1,897,380 | 1.94 | % | |||||||
| CBS Corp. | 128,600 | 1,248,706 | 1.27 | % | ||||||||
| Gannett Co, Inc. | 95,200 | 1,047,200 | 1.07 | % | ||||||||
| General Motors Corp. | 126,800 | 732,904 | 0.75 | % | ||||||||
| Mattel, Inc. | 170,100 | 2,554,902 | 2.61 | % | ||||||||
| 7,481,092 | 7.64 | % | ||||||||||
| Consumer Staples – 7.81% | ||||||||||||
| Altria Group, Inc. | 43,800 | 840,522 | 0.86 | % | ||||||||
| Diageo PLC – ADR (b) | 39,300 | 2,444,067 | 2.50 | % | ||||||||
| Philip Morris International, Inc. | 43,800 | 1,903,986 | 1.94 | % | ||||||||
| Reynolds American, Inc. | 50,200 | 2,457,792 | 2.51 | % | ||||||||
| 7,646,367 | 7.81 | % | ||||||||||
| Energy – 9.46% | ||||||||||||
| BP PLC – ADR (b) | 45,300 | 2,251,410 | 2.30 | % | ||||||||
| Enterprise Products Partners LP | 109,100 | 2,662,040 | 2.72 | % | ||||||||
| ENI SpA – ADR (b) | 47,600 | 2,287,180 | 2.33 | % | ||||||||
| Sasol Ltd. – ADR (b) | 71,500 | 2,068,495 | 2.11 | % | ||||||||
| 9,269,125 | 9.46 | % | ||||||||||
| Financials – 34.68% | ||||||||||||
| Aegon NV – ADR (b) | 194,200 | 798,162 | 0.81 | % | ||||||||
| Allied Irish Banks PLC – ADR (b) | 74,800 | 774,180 | 0.79 | % | ||||||||
| Bank of America Corp. | 142,200 | 3,436,974 | 3.51 | % | ||||||||
| Barclays PLC – ADR (b) | 79,000 | 850,830 | 0.87 | % | ||||||||
| BB&T Corp. | 102,900 | 3,688,965 | 3.77 | % | ||||||||
| CIT Group, Inc. | 135,800 | 562,212 | 0.57 | % | ||||||||
| Citigroup, Inc. | 109,500 | 1,494,675 | 1.52 | % | ||||||||
| HSBC Holdings PLC – ADR (b) | 39,900 | 2,354,100 | 2.40 | % | ||||||||
| ING Groep NV – ADR (b) | 87,200 | 811,832 | 0.83 | % | ||||||||
| KB Financial Group, Inc. – ADR (a)(b) | 46,800 | 1,151,748 | 1.17 | % | ||||||||
| KeyCorp | 148,300 | 1,813,709 | 1.85 | % | ||||||||
| Lloyds TSB Group PLC – ADR (b) | 88,100 | 1,113,584 | 1.14 | % | ||||||||
| Marshall & Ilsley Corp. | 118,900 | 2,143,767 | 2.19 | % | ||||||||
| National City Corp. | 202,300 | 546,210 | 0.56 | % | ||||||||
The accompanying notes are an integral part of these financial statements.
HENNESSY FUNDS 1-800-966-4354
27
| COMMON STOCKS | Number | % of Net | ||||||||||
| of Shares | Value | Assets | ||||||||||
| Financials (Continued) | ||||||||||||
| PNC Financial Services Group | 51,900 | $ | 3,460,173 | 3.53 | % | |||||||
| Regions Financial Corp. | 140,100 | 1,553,709 | 1.59 | % | ||||||||
| US Bancorp | 102,900 | 3,067,449 | 3.13 | % | ||||||||
| Wachovia Corp. | 86,100 | 551,901 | 0.56 | % | ||||||||
| Wells Fargo & Co. | 111,800 | 3,806,790 | 3.89 | % | ||||||||
| 33,980,970 | 34.68 | % | ||||||||||
| Health Care – 7.65% | ||||||||||||
| Bristol-Myers Squibb Co. | 119,700 | 2,459,835 | 2.51 | % | ||||||||
| GlaxoSmithKline PLC – ADR (b) | 63,400 | 2,453,580 | 2.51 | % | ||||||||
| Pfizer, Inc. | 145,500 | 2,576,805 | 2.63 | % | ||||||||
| 7,490,220 | 7.65 | % | ||||||||||
| Industrials – 3.87% | ||||||||||||
| Masco Corp. | 153,000 | 1,552,950 | 1.58 | % | ||||||||
| Pitney Bowes, Inc. | 90,500 | 2,242,590 | 2.29 | % | ||||||||
| 3,795,540 | 3.87 | % | ||||||||||
| Information Technology – 2.95% | ||||||||||||
| Taiwan Semiconductor | ||||||||||||
| Manufacturing Co., Ltd. – ADR (b) | 350,100 | 2,891,826 | 2.95 | % | ||||||||
| Materials – 6.00% | ||||||||||||
| The Dow Chemical Co. | 78,000 | 2,080,260 | 2.12 | % | ||||||||
| EI Du Pont de Nemours & Co. | 75,200 | 2,406,400 | 2.46 | % | ||||||||
| Southern Copper Corp. | 95,900 | 1,396,304 | 1.42 | % | ||||||||
| 5,882,964 | 6.00 | % | ||||||||||
| Telecommunication Services – 17.31% | ||||||||||||
| AT&T, Inc. | 81,700 | 2,187,109 | 2.23 | % | ||||||||
| BT Group PLC – ADR (b) | 58,900 | 1,113,210 | 1.14 | % | ||||||||
| Chunghwa Telecom Co. Ltd. – ADR (b) | 198,077 | 3,260,347 | 3.33 | % | ||||||||
| Deutsche Telekom AG – ADR (b) | 155,800 | 2,313,630 | 2.36 | % | ||||||||
| Embarq Corp. | 68,100 | 2,043,000 | 2.09 | % | ||||||||
| Fairpoint Communications, Inc. | 1,400 | 5,572 | 0.01 | % | ||||||||
| France Telecom – ADR (b) | 95,400 | 2,415,528 | 2.46 | % | ||||||||
| Qwest Communications International | 479,600 | 1,371,656 | 1.40 | % | ||||||||
| Telefonica De Argentina (a)(b)Ω | 1,200 | 0 | 0.00 | % | ||||||||
The accompanying notes are an integral part of these financial statements.
WWW.HENNESSYFUNDS.COM
28
| COMMON STOCKS | Number | % of Net | ||||||||||
| of Shares | Value | Assets | ||||||||||
| Telecommunication Services (Continued) | ||||||||||||
| Verizon Communications, Inc. | 75,800 | $ | 2,248,986 | 2.29 | % | |||||||
| 16,959,038 | 17.31 | % | ||||||||||
Total Common Stocks (Cost $157,654,734) | 95,397,142 | 97.37 | % | |||||||||
| SHORT-TERM INVESTMENTS – 2.33% | Principal | |||||||||||
| Amount | ||||||||||||
| Variable Rate Demand Notes# – 2.33% | ||||||||||||
| American Family Financial Services, Inc. | ||||||||||||
| 1.4124%, 12/31/2031 | $ | 2,202,137 | 2,202,137 | 2.25 | % | |||||||
| Wisconsin Corporate Central Credit Union | ||||||||||||
| 1.8475%, 12/31/2031 | 82,334 | 82,334 | 0.08 | % | ||||||||
| Total Variable Rate Demand Notes | ||||||||||||
| (Cost $ 2,284,471) | 2,284,471 | 2.33 | % | |||||||||
| Total Short-Term Investments | ||||||||||||
| (Cost $2,284,471) | 2,284,471 | 2.33 | % | |||||||||
Total Investments – 99.70% | ||||||||||||
| (Cost $159,939,205) | 97,681,613 | 99.70 | % | |||||||||
| Other Assets in Excess of Liabilities – 0.30% | 298,365 | 0.30 | % | |||||||||
TOTAL NET ASSETS – 100.00% | $ | 97,979,978 | 100.00 | % | ||||||||
Percentages are stated as a percent of net assets.
ADR American Depositary Receipt
| (a) | Non Income Producing |
| (b) | Foreign Issued Security |
| Ω | Security is fair valued. |
| # | Variable rate demand notes are considered short-term obligations and are payable on demand. Interest rates change periodically on specified dates. The rates listed are as of October 31, 2008. |
The accompanying notes are an integral part of these financial statements.
HENNESSY FUNDS 1-800-966-4354
29
SUMMARY OF INVESTMENTS — HENNESSY TOTAL RETURN FUND
HENNESSY TOTAL RETURN FUND
(% of Net Assets)
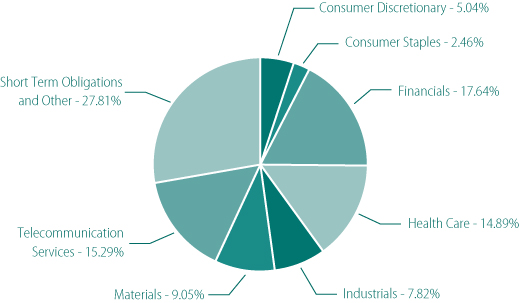
| TOP TEN HOLDINGS | % of net assets |
| Pfizer, Inc | 8.18% |
| Verizon Communications, Inc. | 7.85% |
| AT&T, Inc. | 7.43% |
| EI Du Pont de Nemours & Co. | 6.88% |
| Merck & Co., Inc. | 6.71% |
| General Electric Co. | 6.57% |
| J.P. Morgan Chase & Co. | 6.23% |
| Bank of America Corp. | 6.01% |
| Citigroup, Inc. | 5.32% |
| Home Depot, Inc. | 3.42% |
WWW.HENNESSYFUNDS.COM
30
| COMMON STOCKS – 72.19% | Number | % of Net | ||||||||||
| of Shares | Value | Assets | ||||||||||
| Consumer Discretionary – 5.04% | ||||||||||||
| General Motors Corp. | 162,900 | $ | 941,562 | 1.62 | % | |||||||
| Home Depot, Inc. | 84,400 | 1,990,996 | 3.42 | % | ||||||||
| 2,932,558 | 5.04 | % | ||||||||||
| Consumer Staples – 2.46% | ||||||||||||
| Altria Group, Inc. | 10,800 | 207,252 | 0.36 | % | ||||||||
| Kraft Foods, Inc. – Class A | 26,000 | 757,640 | 1.30 | % | ||||||||
| Philip Morris International, Inc. | 10,800 | 469,476 | 0.80 | % | ||||||||
| 1,434,368 | 2.46 | % | ||||||||||
| Financials – 17.64% | ||||||||||||
| American International Group, Inc. | 22,900 | 43,739 | 0.08 | % | ||||||||
| Bank of America Corp. | 144,700 | 3,497,399 | 6.01 | % | ||||||||
| Citigroup, Inc. | 227,000 | 3,098,550 | 5.32 | % | ||||||||
| J.P. Morgan Chase & Co. | 87,900 | 3,625,875 | 6.23 | % | ||||||||
| 10,265,563 | 17.64 | % | ||||||||||
| Health Care – 14.89% | ||||||||||||
| Merck & Co., Inc. | 126,200 | 3,905,890 | 6.71 | % | ||||||||
| Pfizer, Inc. | 269,100 | 4,765,761 | 8.18 | % | ||||||||
| 8,671,651 | 14.89 | % | ||||||||||
| Industrials – 7.82% | ||||||||||||
| Caterpillar, Inc. | 19,000 | 725,230 | 1.25 | % | ||||||||
| General Electric Co. | 196,100 | 3,825,911 | 6.57 | % | ||||||||
| 4,551,141 | 7.82 | % | ||||||||||
| Materials – 9.05% | ||||||||||||
| Alcoa, Inc. | 109,900 | 1,264,949 | 2.17 | % | ||||||||
| EI Du Pont de Nemours & Co. | 125,100 | 4,003,200 | 6.88 | % | ||||||||
| 5,268,149 | 9.05 | % | ||||||||||
| Telecommunication Services – 15.29% | ||||||||||||
| AT&T, Inc. | 161,600 | 4,326,032 | 7.43 | % | ||||||||
| Fairpoint Communications, Inc. | 806 | 3,208 | 0.01 | % | ||||||||
| Verizon Communications, Inc. | 154,200 | 4,575,114 | 7.85 | % | ||||||||
| 8,904,354 | 15.29 | % | ||||||||||
Total Common Stocks (Cost $58,882,459) | 42,027,784 | 72.19 | % | |||||||||
The accompanying notes are an integral part of these financial statements.
HENNESSY FUNDS 1-800-966-4354
31
| SHORT-TERM INVESTMENTS – 66.41% | Principal | % of Net | ||||||||||
| Amount | Value | Assets | ||||||||||
| Discount Notes – 0.66% | ||||||||||||
| Federal Home Loan Bank Discount Note, | ||||||||||||
| 1.1380%, 11/17/2008 | $ | 385,000 | $ | 384,823 | 0.66 | % | ||||||
Total Discount Notes (Cost $384,823) | 384,823 | 0.66 | % | |||||||||
| U.S. Treasury Bills* – 61.78% | ||||||||||||
| 1.465%, 11/20/2008 | 4,000,000 | 3,996,960 | 6.87 | % | ||||||||
| 0.152%, 12/04/2008 | 5,000,000 | 4,999,313 | 8.59 | % | ||||||||
| 1.435%, 12/11/2008 | 9,000,000 | 8,985,900 | 15.43 | % | ||||||||
| 0.630%, 01/15/2009 | 18,000,000 | 17,987,040 | 30.89 | % | ||||||||
Total U.S. Treasury Bills (Cost $35,958,923) | 35,969,213 | 61.78 | % | |||||||||
| Variable Rate Demand Notes# – 3.97% | ||||||||||||
| American Family Financial Services, Inc. | ||||||||||||
| 1.4124%, 12/31/2031 | 2,212,325 | 2,212,325 | 3.80 | % | ||||||||
| Wisconsin Corporate Central Credit Union | ||||||||||||
| 1.8475%, 12/31/2031 | 100,491 | 100,491 | 0.17 | % | ||||||||
| Total Variable Rate Demand Notes | ||||||||||||
| (Cost $2,312,816) | 2,312,816 | 3.97 | % | |||||||||
| Total Short-Term Investments | ||||||||||||
| (Cost $38,656,562) | 38,666,852 | 66.41 | % | |||||||||
Total Investments – 138.60% | ||||||||||||
| (Cost $97,539,021) | 80,694,636 | 138.60 | % | |||||||||
| Liabilities in Excess of Other Assets – (38.60)% | (22,471,985 | ) | (38.60 | )% | ||||||||
TOTAL NET ASSETS – 100.00% | $ | 58,222,651 | 100.00 | % | ||||||||
Percentages are stated as a percent of net assets.
| # | Variable rate demand notes are considered short-term obligations and are payable on demand. Interest rates change periodically on specified dates. The rates listed are as of October 31, 2008. |
| * | Collateral or partial collateral for securities sold subject to repurchase. |
The accompanying notes are an integral part of these financial statements.
WWW.HENNESSYFUNDS.COM
32
SUMMARY OF INVESTMENTS — HENNESSY BALANCED FUND
HENNESSY BALANCED FUND
(% of Net Assets)
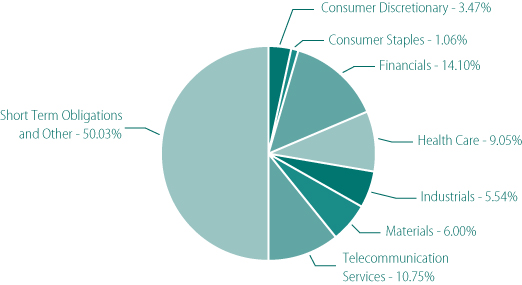
| TOP TEN HOLDINGS | % of net assets |
| J.P. Morgan Chase & Co. | 5.52% |
| Pfizer, Inc. | 5.50% |
| Verizon Communications, Inc. | 5.48% |
| AT&T, Inc. | 5.26% |
| EI Du Pont de Nemours & Co. | 4.84% |
| General Electric Co. | 4.44% |
| Citigroup, Inc. | 4.32% |
| Bank of America Corp. | 4.14% |
| Merck & Co., Inc. | 3.55% |
| Home Depot, Inc. | 2.37% |
HENNESSY FUNDS 1-800-966-4354
33
| COMMON STOCKS – 49.97% | Number | % of Net | ||||||||||
| of Shares | Value | Assets | ||||||||||
| Consumer Discretionary – 3.47% | ||||||||||||
| General Motors Corp. | 21,955 | $ | 126,900 | 1.10 | % | |||||||
| Home Depot, Inc. | 11,500 | 271,285 | 2.37 | % | ||||||||
| 398,185 | 3.47 | % | ||||||||||
| Consumer Staples – 1.06% | ||||||||||||
| Altria Group, Inc. | 1,940 | 37,229 | 0.32 | % | ||||||||
| Philip Morris International, Inc. | 1,940 | 84,332 | 0.74 | % | ||||||||
| 121,561 | 1.06 | % | ||||||||||
| Financials – 14.10% | ||||||||||||
| American International Group, Inc. | 7,210 | 13,771 | 0.12 | % | ||||||||
| Bank of America Corp. | 19,620 | 474,215 | 4.14 | % | ||||||||
| Citigroup, Inc. | 36,275 | 495,154 | 4.32 | % | ||||||||
| J.P. Morgan Chase & Co. | 15,325 | 632,156 | 5.52 | % | ||||||||
| 1,615,296 | 14.10 | % | ||||||||||
| Health Care – 9.05% | ||||||||||||
| Merck & Co., Inc. | 13,130 | 406,373 | 3.55 | % | ||||||||
| Pfizer, Inc. | 35,590 | 630,299 | 5.50 | % | ||||||||
| 1,036,672 | 9.05 | % | ||||||||||
| Industrials – 5.54% | ||||||||||||
| Caterpillar, Inc. | 3,310 | 126,343 | 1.10 | % | ||||||||
| General Electric Co. | 26,070 | 508,626 | 4.44 | % | ||||||||
| 634,969 | 5.54 | % | ||||||||||
| Materials – 6.00% | ||||||||||||
| Alcoa, Inc. | 11,590 | 133,401 | 1.16 | % | ||||||||
| EI Du Pont de Nemours & Co. | 17,335 | 554,720 | 4.84 | % | ||||||||
| 688,121 | 6.00 | % | ||||||||||
| Telecommunication Services – 10.75% | ||||||||||||
| AT&T, Inc. | 22,520 | 602,860 | 5.26 | % | ||||||||
| Fairpoint Communications, Inc. | 152 | 605 | 0.01 | % | ||||||||
| Verizon Communications, Inc. | 21,160 | 627,817 | 5.48 | % | ||||||||
| 1,231,282 | 10.75 | % | ||||||||||
Total Common Stocks (Cost $8,504,600) | 5,726,086 | 49.97 | % | |||||||||
The accompanying notes are an integral part of these financial statements.
WWW.HENNESSYFUNDS.COM
34
| SHORT-TERM INVESTMENTS – 50.28% | Principal | % of Net | ||||||||||
| Amount | Value | Assets | ||||||||||
| Discount Notes – 6.11% | ||||||||||||
| Federal Home Loan Bank Discount Note, | ||||||||||||
| 1.138%, 11/5/2008 | $ | 700,000 | $ | 699,956 | 6.11 | % | ||||||
Total Discount Notes (Cost $699,956) | 699,956 | 6.11 | % | |||||||||
| U.S. Treasury Bills – 43.76% | ||||||||||||
| 3.000%, 02/15/2009 | 1,600,000 | 1,610,376 | 14.05 | % | ||||||||
| 3.125%, 04/15/2009 | 900,000 | 908,719 | 7.93 | % | ||||||||
| 4.875%, 05/31/2009 | 600,000 | 612,656 | 5.35 | % | ||||||||
| 3.500%, 08/15/2009 | 1,450,000 | 1,474,697 | 12.87 | % | ||||||||
| 3.375%, 10/15/2009 | 400,000 | 407,469 | 3.56 | % | ||||||||
Total U.S. Treasury Bills (Cost $4,989,041) | 5,013,917 | 43.76 | % | |||||||||
| Variable Rate Demand Notes# – 0.41% | ||||||||||||
| American Family Financial Services, Inc. | ||||||||||||
| 1.4124%, 12/31/2031 | 47,038 | 47,038 | 0.41 | % | ||||||||
| Total Variable Rate Demand Notes | ||||||||||||
| (Cost $47,038) | 47,038 | 0.41 | % | |||||||||
| Total Short-Term Investments | ||||||||||||
| (Cost $5,736,035) | 5,760,911 | 50.28 | % | |||||||||
Total Investments – 100.25% | ||||||||||||
| (Cost $14,240,635) | 11,486,997 | 100.25 | % | |||||||||
| Liabilities in Excess of Other Assets – (0.25)% | (28,453 | ) | (0.25 | )% | ||||||||
TOTAL NET ASSETS – 100.00% | $ | 11,458,544 | 100.00 | % | ||||||||
Percentages are stated as a percent of net assets.
| # | Variable rate demand notes are considered short-term obligations and are payable on demand. Interest rates change periodically on specified dates. The rates listed are as of October 31, 2008. |
The accompanying notes are an integral part of these financial statements.
HENNESSY FUNDS 1-800-966-4354
35
Financial Statements
Statements of Assets and Liabilities as of October 31, 2008 |
| HENNESSY | ||||
| CORNERSTONE | ||||
| GROWTH FUND | ||||
| ASSETS: | ||||
| Investments, at value (cost $485,244,929, $60,554,394, | ||||
| $244,599,810, $159,939,205, $97,539,021 and $14,240,635, respectively) | $ | 318,171,761 | ||
| Cash | 164,378 | |||
| Dividends and interest receivable | 165,501 | |||
| Receivable for fund shares sold | 172,779 | |||
| Prepaid expenses and other assets | 55,199 | |||
| Total Assets | 318,729,618 | |||
| LIABILITIES: | ||||
| Payable for fund shares redeemed | 534,213 | |||
| Payable to Advisor | 211,122 | |||
| Payable to Administrator | 280,674 | |||
| Payable to Auditor | 23,533 | |||
| Payable to Distributor | — | |||
| Reverse repurchase agreement | — | |||
| Accrued interest payable | 1,378 | |||
| Accrued service fees | 27,633 | |||
| Accrued expenses and other payables | 61,746 | |||
| Total Liabilities | 1,140,299 | |||
| NET ASSETS | $ | 317,589,319 | ||
| NET ASSETS CONSIST OF: | ||||
| Capital stock | $ | 601,916,306 | ||
| Accumulated net investment income (loss) | — | |||
| Accumulated net realized gain (loss) on investments | (117,253,819 | ) | ||
| Unrealized net appreciation (depreciation) on investments | (167,073,168 | ) | ||
| Total Net Assets | $ | 317,589,319 | ||
| NET ASSETS | ||||
| Original Class: | ||||
| Shares authorized ($.0001 par value) | 25,000,000,000 | |||
| Net assets applicable to outstanding Original Class shares | 312,500,489 | |||
| Shares issued and outstanding | 35,493,845 | |||
| Net asset value, offering price and redemption price per share | $ | 8.80 | ||
| Institutional Class: | ||||
| Shares authorized ($.0001 par value) | 25,000,000,000 | |||
| Net assets applicable to outstanding Institutional Class shares | 5,088,830 | |||
| Shares issued and outstanding | 576,966 | |||
| Net asset value, offering price and redemption price per share | $ | 8.82 | ||
The accompanying notes are an integral part of these financial statements.
WWW.HENNESSYFUNDS.COM
36
FINANCIAL STATEMENTS — STATEMENTS OF ASSETS AND LIABILITIES
| HENNESSY | ||||||||||||||||||
| CORNERSTONE | HENNESSY | HENNESSY | HENNESSY | HENNESSY | ||||||||||||||
| GROWTH FUND, | FOCUS 30 | CORNERSTONE | TOTAL RETURN | BALANCED | ||||||||||||||
| SERIES II | FUND | VALUE FUND | FUND | FUND | ||||||||||||||
| $ | 36,410,820 | $ | 192,854,067 | $ | 97,681,613 | $ | 80,694,636 | $ | 11,486,997 | |||||||||
| — | — | — | — | — | ||||||||||||||
| 14,731 | 123,023 | 470,632 | 177,111 | 59,759 | ||||||||||||||
| 14,515 | 1,999,473 | 16,899 | 37 | — | ||||||||||||||
| 37,740 | 31,421 | 28,530 | 13,150 | 9,337 | ||||||||||||||
| 36,477,806 | 195,007,984 | 98,197,674 | 80,884,934 | 11,556,093 | ||||||||||||||
| 44,299 | 561,103 | 33,878 | 59,172 | 10,858 | ||||||||||||||
| 24,986 | 125,024 | 64,209 | 29,750 | 5,819 | ||||||||||||||
| 33,688 | 157,340 | 76,846 | 41,376 | 7,835 | ||||||||||||||
| 20,385 | 17,599 | 19,492 | 18,101 | 17,817 | ||||||||||||||
| — | — | — | 24,231 | 44,989 | ||||||||||||||
| — | — | — | 22,427,000 | — | ||||||||||||||
| 163 | — | — | 32,392 | — | ||||||||||||||
| 3,168 | 14,187 | 8,437 | 4,958 | 970 | ||||||||||||||
| �� | 23,801 | 25,811 | 14,834 | 24,803 | 9,261 | |||||||||||||
| 150,490 | 901,064 | 217,696 | 22,662,283 | 97,549 | ||||||||||||||
| $ | 36,327,316 | $ | 194,106,920 | $ | 97,979,978 | $ | 58,222,651 | $ | 11,458,544 | |||||||||
| $ | 96,867,785 | $ | 293,832,228 | $ | 183,838,489 | $ | 111,221,027 | $ | 15,252,604 | |||||||||
| — | — | 5,319,895 | — | 17,790 | ||||||||||||||
| (36,396,895 | ) | (47,979,565 | ) | (28,920,814 | ) | (36,153,991 | ) | (1,058,212 | ) | |||||||||
| (24,143,574 | ) | (51,745,743 | ) | (62,257,592 | ) | (16,844,385 | ) | (2,753,638 | ) | |||||||||
| $ | 36,327,316 | $ | 194,106,920 | $ | 97,979,978 | $ | 58,222,651 | $ | 11,458,544 | |||||||||
| Unlimited | 25,000,000,000 | 25,000,000,000 | 100,000,000 | 100,000,000 | ||||||||||||||
| 36,265,049 | 167,322,974 | 97,106,055 | 58,222,651 | 11,458,544 | ||||||||||||||
| 3,502,781 | 20,853,707 | 10,728,272 | 6,314,022 | 1,257,997 | ||||||||||||||
| $ | 10.35 | $ | 8.02 | $ | 9.05 | $ | 9.22 | $ | 9.11 | |||||||||
| Unlimited | 25,000,000,000 | 25,000,000,000 | — | — | ||||||||||||||
| 62,267 | 26,783,946 | 873,923 | — | — | ||||||||||||||
| 5,992 | 3,332,771 | 96,448 | — | — | ||||||||||||||
| $ | 10.39 | $ | 8.04 | $ | 9.06 | — | — | |||||||||||
HENNESSY FUNDS 1-800-966-4354
37
Financial Statements
Statements of Operations Year ended October 31, 2008 |
| HENNESSY | ||||
| CORNERSTONE | ||||
| GROWTH FUND | ||||
| INVESTMENT INCOME: | ||||
Dividend income(1) | $ | 5,725,237 | ||
| Interest income | 162,533 | |||
| Total investment income | 5,887,770 | |||
| EXPENSES: | ||||
| Investment advisory fees | 4,507,375 | |||
| Administration, fund accounting, custody and transfer agent fees | 1,508,661 | |||
| Distribution fees – Original Class (See Note 5) | — | |||
| Service fees – Original Class (See Note 5) | 603,479 | |||
| Federal and state registration fees | 37,531 | |||
| Audit fees | 23,062 | |||
| Legal fees | 15,530 | |||
| Reports to shareholders | 162,250 | |||
| Directors’ fees and expenses | 12,966 | |||
| Sub-transfer agent expenses – Original Class (See Note 5) | 645,029 | |||
| Sub-transfer agent expenses – Institutional Class (See Note 5) | 2,132 | |||
| Interest expense (See Note 3 and 7) | 27,237 | |||
| Other | 68,197 | |||
| Total expenses before reimbursement from advisor | 7,613,449 | |||
| Expense reimbursement from advisor – Institutional Class | (7,464 | ) | ||
| Net expenses | 7,605,985 | |||
| NET INVESTMENT INCOME (LOSS) | $ | (1,718,215 | ) | |
| REALIZED AND UNREALIZED GAINS (LOSSES): | ||||
| Net realized gain(loss) on investments | $ | (116,321,526 | ) | |
| Change in unrealized appreciation (depreciation) on investments | (248,016,087 | ) | ||
| Net gain (loss) on investments | (364,337,613 | ) | ||
| NET INCREASE (DECREASE) IN NET ASSETS | ||||
| RESULTING FROM OPERATIONS | $ | (366,055,828 | ) | |
| (1) | Net of foreign taxes withheld of $536,430, $37,424, $0, $332,882, $0 & $0, respectively. |
The accompanying notes are an integral part of these financial statements.
WWW.HENNESSYFUNDS.COM
38
FINANCIAL STATEMENTS — STATEMENTS OF OPERATIONS
| HENNESSY | ||||||||||||||||||
| CORNERSTONE | HENNESSY | HENNESSY | HENNESSY | HENNESSY | ||||||||||||||
| GROWTH FUND, | FOCUS 30 | CORNERSTONE | TOTAL RETURN | BALANCED | ||||||||||||||
| SERIES II | FUND | VALUE FUND | FUND | FUND | ||||||||||||||
| $ | 768,871 | $ | 1,300,228 | $ | 7,745,756 | $ | 2,568,776 | $ | 309,111 | |||||||||
| 29,228 | 138,167 | 88,229 | 1,106,668 | 237,467 | ||||||||||||||
| 798,099 | 1,438,395 | 7,833,985 | 3,675,444 | 546,578 | ||||||||||||||
| 607,588 | 1,621,538 | 1,128,306 | 459,664 | 84,820 | ||||||||||||||
| 203,228 | 545,602 | 378,545 | 190,310 | 35,095 | ||||||||||||||
| — | — | — | 114,916 | 21,205 | ||||||||||||||
| 82,050 | 195,316 | 151,814 | 76,611 | 14,137 | ||||||||||||||
| 36,430 | 40,938 | 29,528 | 21,921 | 20,809 | ||||||||||||||
| 13,084 | 19,149 | 19,270 | 18,406 | 17,550 | ||||||||||||||
| 21,030 | 15,530 | 15,530 | 12,090 | 12,294 | ||||||||||||||
| 27,082 | 40,081 | 29,734 | 10,024 | 2,236 | ||||||||||||||
| 12,967 | 12,966 | 12,938 | 9,210 | 9,210 | ||||||||||||||
| 94,733 | 210,690 | 53,047 | — | — | ||||||||||||||
| — | 12,213 | 205 | — | — | ||||||||||||||
| 4,069 | 8,039 | 375 | 890,947 | — | ||||||||||||||
| 26,849 | 26,210 | 21,663 | 6,625 | 2,706 | ||||||||||||||
| 1,219,110 | 2,748,272 | 1,840,955 | 1,810,724 | 220,062 | ||||||||||||||
| (137 | ) | (35,499 | ) | (1,056 | ) | — | — | |||||||||||
| 1,128,973 | 2,712,773 | 1,839,899 | 1,810,724 | 220,062 | ||||||||||||||
| $ | (330,874 | ) | $ | (1,274,378 | ) | $ | 5,994,086 | $ | 1,864,720 | $ | 326,516 | |||||||
| $ | (35,487,492 | ) | $ | (47,714,145 | ) | $ | 5,901,494 | $ | (447,136 | ) | $ | (35,369 | ) | |||||
| (21,004,180 | ) | (49,274,887 | ) | (99,303,788 | ) | (29,382,944 | ) | (3,656,241 | ) | |||||||||
| (56,491,672 | ) | (96,989,032 | ) | (93,402,294 | ) | (29,830,080 | ) | (3,691,610 | ) | |||||||||
| $ | (56,822,546 | ) | $ | (98,263,410 | ) | $ | (87,408,208 | ) | $ | (27,965,360 | ) | $ | (3,365,094 | ) | ||||
HENNESSY FUNDS 1-800-966-4354
39
Financial Statements
| Statements of Changes in Net Assets |
Hennessy Cornerstone Growth Fund | ||||||||
| Year Ended | Year Ended | |||||||
| October 31, 2008 | October 31, 2007 | |||||||
| OPERATIONS: | ||||||||
| Net investment income (loss) | $ | (1,718,215 | ) | $ | (3,634,032 | ) | ||
| Net realized gain (loss) on securities | (116,321,526 | ) | 111,245,274 | |||||
| Change in unrealized appreciation (depreciation) on securities | (248,016,087 | ) | (876,501 | ) | ||||
| Net increase (decrease) in net assets resulting from operations | (366,055,828 | ) | 106,734,741 | |||||
| DISTRIBUTIONS TO SHAREHOLDERS FROM: | ||||||||
| Net investment income – Original Class | — | — | ||||||
| Net investment income – Institutional Class | — | — | ||||||
| Net realized gains – Original Class | (110,914,265 | ) | (183,483,584 | ) | ||||
| Net realized gains – Institutional Class | — | — | ||||||
| Total distributions | (110,914,265 | ) | (183,483,584 | ) | ||||
| CAPITAL SHARE TRANSACTIONS: | ||||||||
| Proceeds from shares subscribed – Original Class | 39,355,042 | 113,042,125 | ||||||
| Proceeds from shares subscribed – Institutional Class | 14,450,082 | — | ||||||
| Dividends reinvested – Original Class | 107,702,229 | 178,259,103 | ||||||
| Dividends reinvested – Institutional Class | — | — | ||||||
| Redemption fees retained – Original Class | 23,170 | 88,873 | ||||||
| Redemption fees retained – Institutional Class | 205 | — | ||||||
| Cost of shares redeemed – Original Class | (350,084,701 | ) | (474,889,281 | ) | ||||
| Cost of shares redeemed – Institutional Class | (7,312,081 | ) | — | |||||
| Net increase (decrease) in net assets derived | ||||||||
| from capital share transactions | (195,866,054 | ) | (183,499,180 | ) | ||||
| TOTAL INCREASE (DECREASE) IN NET ASSETS | (672,836,147 | ) | (260,248,023 | ) | ||||
| NET ASSETS: | ||||||||
| Beginning of period | 990,425,466 | 1,250,673,489 | ||||||
| End of period | $ | 317,589,319 | $ | 990,425,466 | ||||
| Accumulated net investment income (loss), end of period | $ | — | $ | — | ||||
| CHANGES IN SHARES OUTSTANDING: | ||||||||
| Shares sold – Original Class | 42,121,972 | 5,966,383 | ||||||
| Shares sold – Institutional Class | 1,117,876 | — | ||||||
| Shares issued to holders as reinvestment of dividends | ||||||||
| Original Class | 7,062,441 | 9,930,869 | ||||||
| Institutional Class | — | — | ||||||
| Shares redeemed – Original Class | (64,717,368 | ) | (25,075,476 | ) | ||||
| Shares redeemed – Institutional Class | (540,910 | ) | — | |||||
| Net increase (decrease) in shares outstanding | (14,955,989 | ) | (9,178,224 | ) | ||||
The accompanying notes are an integral part of these financial statements.
WWW.HENNESSYFUNDS.COM
40
FINANCIAL STATEMENTS — STATEMENTS OF CHANGES IN NET ASSETS
Hennessy Cornerstone Growth Fund, Series II | Hennessy Focus 30 Fund | |||||||||||||
| Year Ended | Year Ended | Year Ended | Year Ended | |||||||||||
| October 31, 2008 | October 31, 2007 | October 31, 2008 | October 31, 2007 | |||||||||||
| $ | (330,874 | ) | $ | (1,128,653 | ) | $ | (1,274,378 | ) | $ | (1,462,891 | ) | |||
| (35,487,492 | ) | 27,032,411 | (47,714,145 | ) | 34,333,802 | |||||||||
| (21,004,180 | ) | (19,628,497 | ) | (49,274,887 | ) | (11,346,335 | ) | |||||||
| (56,822,546 | ) | 6,275,261 | (98,263,410 | ) | 21,524,576 | |||||||||
| — | — | — | — | |||||||||||
| — | — | — | — | |||||||||||
| (27,055,016 | ) | (9,231,945 | ) | (33,250,015 | ) | (1,781,615 | ) | |||||||
| — | — | — | — | |||||||||||
| (27,055,016 | ) | (9,231,945 | ) | (33,250,015 | ) | (1,781,615 | ) | |||||||
| 3,777,707 | 12,110,526 | 169,225,771 | 119,498,304 | |||||||||||
| 108,132 | — | 40,370,645 | — | |||||||||||
| 26,856,690 | 9,137,765 | 32,845,640 | 1,752,077 | |||||||||||
| — | — | — | — | |||||||||||
| 6,554 | 24,177 | 118,011 | 124,025 | |||||||||||
| — | — | 2,592 | — | |||||||||||
| (49,122,781 | ) | (123,925,703 | ) | (146,107,945 | ) | (148,376,546 | ) | |||||||
| — | — | (4,205,478 | ) | — | ||||||||||
| (18,373,698 | ) | (102,653,235 | ) | 92,249,236 | (27,002,140 | ) | ||||||||
| (102,251,260 | ) | (105,609,919 | ) | (39,264,189 | ) | (7,259,179 | ) | |||||||
| 138,578,576 | 244,188,495 | 233,371,109 | 240,630,288 | |||||||||||
| $ | 36,327,316 | $ | 138,578,576 | $ | 194,106,920 | $ | 233,371,109 | |||||||
| $ | — | $ | 21,413 | $ | — | $ | — | |||||||
| 3,389,025 | 396,382 | 26,879,882 | 8,519,202 | |||||||||||
| 5,992 | — | 3,743,355 | — | |||||||||||
| 1,292,430 | 309,021 | 2,935,134 | 141,297 | |||||||||||
| — | — | — | — | |||||||||||
| (5,749,094 | ) | (4,075,942 | ) | (26,028,686 | ) | (11,019,600 | ) | |||||||
| — | — | (410,584 | ) | — | ||||||||||
| (1,061,647 | ) | (3,370,539 | ) | 7,119,101 | (2,359,101 | ) | ||||||||
HENNESSY FUNDS 1-800-966-4354
41
Financial Statements
| Statements of Changes in Net Assets |
Hennessy Cornerstone Value Fund | ||||||||
| Year Ended | Year Ended | |||||||
| October 31, 2008 | October 31, 2007 | |||||||
| OPERATIONS: | ||||||||
| Net investment income (loss) | $ | 5,994,086 | $ | 5,930,170 | ||||
| Net realized gain (loss) on securities | 5,901,494 | 10,584,083 | ||||||
| Change in unrealized appreciation (depreciation) on securities | (99,303,788 | ) | 13,065,195 | |||||
| Net increase (decrease) in net assets resulting from operations | (87,408,208 | ) | 29,579,448 | |||||
| DISTRIBUTIONS TO SHAREHOLDERS FROM: | ||||||||
| Net investment income – Original Class | (4,859,028 | ) | (5,691,101 | ) | ||||
| Net investment income – Institutional Class | — | — | ||||||
| Net realized gains – Original Class | — | — | ||||||
| Net realized gains – Institutional Class | — | — | ||||||
| Total distributions | (4,859,028 | ) | (5,691,101 | ) | ||||
| CAPITAL SHARE TRANSACTIONS: | ||||||||
| Proceeds from shares subscribed – Original Class | 2,874,361 | 25,534,075 | ||||||
| Proceeds from shares subscribed – Institutional Class | 1,312,785 | — | ||||||
| Dividends reinvested – Original Class | 4,316,071 | 5,174,239 | ||||||
| Dividends reinvested – Institutional Class | — | — | ||||||
| Redemption fees retained – Original Class | 664 | 128,422 | ||||||
| Redemption fees retained – Institutional Class | — | — | ||||||
| Cost of shares redeemed – Original Class | (22,760,874 | ) | (107,023,696 | ) | ||||
| Cost of shares redeemed – Institutional Class | — | — | ||||||
| Net increase (decrease) in net assets derived | ||||||||
| from capital share transactions | (14,256,993 | ) | (76,186,960 | ) | ||||
| TOTAL INCREASE (DECREASE) IN NET ASSETS | (106,524,229 | ) | (52,298,613 | ) | ||||
| NET ASSETS: | ||||||||
| Beginning of period | 204,504,207 | 256,802,820 | ||||||
| End of period | $ | 97,979,978 | $ | 204,504,207 | ||||
| Accumulated net investment income (loss), end of period | $ | 5,319,895 | $ | 4,247,234 | ||||
| CHANGES IN SHARES OUTSTANDING: | ||||||||
| Shares sold – Original Class | 11,669,368 | 1,648,918 | ||||||
| Shares sold – Institutional Class | 96,448 | — | ||||||
| Shares issued to holders as reinvestment of dividends | ||||||||
| Original Class | 288,122 | 337,964 | ||||||
| Institutional Class | — | — | ||||||
| Shares redeemed – Original Class | (13,218,237 | ) | (6,819,535 | ) | ||||
| Shares redeemed – Institutional Class | — | — | ||||||
| Net increase (decrease) in shares outstanding | (1,164,299 | ) | (4,832,653 | ) | ||||
The accompanying notes are an integral part of these financial statements.
WWW.HENNESSYFUNDS.COM
42
FINANCIAL STATEMENTS — STATEMENTS OF CHANGES IN NET ASSETS
Hennessy Total Return Fund | Hennessy Balanced Fund | |||||||||||||
| Year Ended | Year Ended | Year Ended | Year Ended | |||||||||||
| October 31, 2008 | October 31, 2007 | October 31, 2008 | October 31, 2007 | |||||||||||
| $ | 1,864,720 | $ | 2,576,108 | $ | 326,516 | $ | 574,530 | |||||||
| (447,136 | ) | 3,214,280 | (35,369 | ) | 1,794,111 | |||||||||
| (29,382,944 | ) | 5,426,361 | (3,656,241 | ) | (860,448 | ) | ||||||||
| (27,965,360 | ) | 11,216,749 | (3,365,094 | ) | 1,508,193 | |||||||||
| (2,023,302 | ) | (2,653,674 | ) | (345,420 | ) | (608,338 | ) | |||||||
| N/A | N/A | N/A | N/A | |||||||||||
| — | — | (785,865 | ) | — | ||||||||||
| N/A | N/A | N/A | N/A | |||||||||||
| (2,023,302 | ) | (2,653,674 | ) | (1,131,285 | ) | (608,338 | ) | |||||||
| 1,911,184 | 7,605,881 | 656,445 | 6,969,033 | |||||||||||
| N/A | N/A | N/A | N/A | |||||||||||
| 1,889,484 | 2,513,974 | 1,104,807 | 594,977 | |||||||||||
| N/A | N/A | N/A | N/A | |||||||||||
| 855 | 31,831 | 610 | 10,406 | |||||||||||
| N/A | N/A | N/A | N/A | |||||||||||
| (11,899,129 | ) | (35,669,527 | ) | (2,627,822 | ) | (17,788,826 | ) | |||||||
| N/A | N/A | N/A | N/A | |||||||||||
| (8,097,606 | ) | (25,517,841 | ) | (865,960 | ) | (10,214,410 | ) | |||||||
| (38,086,268 | ) | (16,954,766 | ) | (5,362,339 | ) | (9,314,555 | ) | |||||||
| 96,308,919 | 113,263,685 | 16,820,883 | 26,135,438 | |||||||||||
| $ | 58,222,651 | $ | 96,308,919 | $ | 11,458,544 | $ | 16,820,883 | |||||||
| $ | — | $ | 144,144 | $ | 17,790 | $ | 36,709 | |||||||
| 161,806 | 629,320 | 61,447 | 576,031 | |||||||||||
| N/A | N/A | N/A | N/A | |||||||||||
| 169,813 | 151,028 | 98,884 | 37,600 | |||||||||||
| N/A | N/A | N/A | N/A | |||||||||||
| (1,034,535 | ) | (2,743,545 | ) | (247,266 | ) | (1,478,196 | ) | |||||||
| N/A | N/A | N/A | N/A | |||||||||||
| (702,916 | ) | (1,963,197 | ) | (86,935 | ) | (864,565 | ) | |||||||
HENNESSY FUNDS 1-800-966-4354
43
Financial Highlights
| Hennessy Cornerstone Growth Fund |
| Year Ended | ||||||||
| October 31, 2008 | ||||||||
| Institutional | ||||||||
| Original Class | Class(1)(3) | |||||||
| PER SHARE DATA: | ||||||||
| Net asset value, beginning of period | $ | 19.41 | $ | 13.29 | ||||
| Income from investment operations: | ||||||||
Net investment gain (loss)(4) | (0.05 | ) | 0.01 | |||||
| Net realized and unrealized gains (losses) on securities | (8.32 | ) | (4.48 | ) | ||||
| Total from investment operations | (8.37 | ) | (4.47 | ) | ||||
| Less Distributions: | ||||||||
| Dividends from net investment income | — | — | ||||||
| Dividends from net realized gains | (2.24 | ) | — | |||||
| Total distributions | (2.24 | ) | — | |||||
Redemption fees retained(5) | — | — | ||||||
| Net asset value, end of period | $ | 8.80 | $ | 8.82 | ||||
| TOTAL RETURN | (48.00 | )% | (34.13 | )% | ||||
| SUPPLEMENTAL DATA AND RATIOS: | ||||||||
| Net assets, end of period (millions) | $ | 312.50 | $ | 5.09 | ||||
| Ratio of expenses to average net assets: | ||||||||
| Before expense reimbursement | 1.25 | % | 1.12 | % | ||||
| After expense reimbursement | 1.25 | % | 0.98 | %(6) | ||||
| Ratio of net investment income to average net assets | ||||||||
| Before expense reimbursement | (0.29 | )% | 0.15 | % | ||||
| After expense reimbursement | (0.29 | )% | 0.29 | % | ||||
Portfolio turnover rate(7) | 103 | % | 103 | % | ||||
| (1) | Institutional Class shares commenced operations on March 3, 2008. |
| (2) | For the one month ended October 31, 2004. Effective October 31, 2004, the Fund changed its fiscal year end to October 31st from September 30th. |
| (3) | All ratios for the period have been annualized, except portfolio turnover and total return. |
| (4) | Net investment loss per share is calculated using ending balances prior to consideration for adjustments for permanent book and tax differences. |
| (5) | Amount is less than $0.01. |
| (6) | The Advisor has agreed to cap the Institutional Class Share expenses at 0.98%. |
| (7) | Portfolio turnover is calculated on the basis of the Fund as a whole without distinguishing between the classes of shares issued. |
The accompanying notes are an integral part of these financial statements.
WWW.HENNESSYFUNDS.COM
44
FINANCIAL HIGHLIGHTS — HENNESSY CORNERSTONE GROWTH FUND
| Year Ended | ||||||||||||||||||
| Year Ended October 31, | Period Ended | September 30, | ||||||||||||||||
| 2007 | 2006 | 2005 | October 31, 2004(2)(3) | 2004 | ||||||||||||||
| Original Class | ||||||||||||||||||
| $ | 20.77 | $ | 19.49 | $ | 19.38 | $ | 19.08 | $ | 17.23 | |||||||||
| (0.07 | ) | (0.04 | ) | (0.14 | ) | (0.02 | ) | (0.13 | ) | |||||||||
| 1.82 | 2.55 | 4.13 | 0.32 | 1.98 | ||||||||||||||
| 1.75 | 2.51 | 3.99 | 0.30 | 1.85 | ||||||||||||||
| — | — | — | — | — | ||||||||||||||
| (3.11 | ) | (1.23 | ) | (3.88 | ) | — | — | |||||||||||
| (3.11 | ) | (1.23 | ) | (3.88 | ) | — | — | |||||||||||
| — | — | — | — | — | ||||||||||||||
| $ | 19.41 | $ | 20.77 | $ | 19.49 | $ | 19.38 | $ | 19.08 | |||||||||
| 9.65 | % | 13.59 | % | 23.17 | % | 1.57 | % | 10.74 | % | |||||||||
| $ | 990.4 | $ | 1,250.7 | $ | 1,071.8 | $ | 869.0 | $ | 866.0 | |||||||||
| 1.20 | % | 1.21 | % | 1.23 | % | 1.25 | % | 1.25 | % | |||||||||
| 1.20 | % | 1.21 | % | 1.23 | % | 1.25 | % | 1.25 | % | |||||||||
| (0.32 | )% | (0.20 | )% | (0.78 | )% | (1.08 | )% | (0.68 | )% | |||||||||
| (0.32 | )% | (0.20 | )% | (0.78 | )% | (1.08 | )% | (0.68 | )% | |||||||||
| 97 | % | 90 | % | 89 | % | 0 | % | 107 | % | |||||||||
HENNESSY FUNDS 1-800-966-4354
45
Financial Highlights
| Hennessy Cornerstone Growth Fund, Series II |
| Year Ended | ||||||||
| October 31, 2008 | ||||||||
| Institutional | ||||||||
| Original Class | Class(1)(3) | |||||||
| PER SHARE DATA: | ||||||||
| Net asset value, beginning of period | $ | 30.32 | $ | 19.17 | ||||
| Income from investment operations: | ||||||||
| Net investment gain (loss) | (0.09 | ) | 0.02 | |||||
| Net realized and unrealized gains (losses) on securities | (13.75 | ) | (8.80 | ) | ||||
| Total from investment operations | (13.84 | ) | (8.78 | ) | ||||
| Less Distributions: | ||||||||
| Dividends from net investment income | — | — | ||||||
| Dividends from net realized gains | (6.13 | ) | — | |||||
| Total distributions | (6.13 | ) | — | |||||
Redemption fees retained(5) | — | — | ||||||
| Net asset value, end of period | $ | 10.35 | $ | 10.39 | ||||
| TOTAL RETURN | (55.79 | )% | (45.80 | )% | ||||
| SUPPLEMENTAL DATA AND RATIOS: | ||||||||
| Net assets, end of period (millions) | $ | 36.27 | $ | 0.06 | ||||
| Ratio of expenses to average net assets | ||||||||
| Before expense reimbursement | 1.37 | % | 1.22 | % | ||||
| After expense reimbursement | 1.37 | % | 0.98 | %(7) | ||||
| Ratio of net investment income to average net assets | ||||||||
| Before expense reimbursement | (0.40 | )% | 0.17 | % | ||||
| After expense reimbursement | (0.40 | )% | 0.41 | % | ||||
Portfolio turnover rate(8) | 75 | % | 75 | % | ||||
| (1) | Institutional Class shares commenced operations on March 3, 2008. |
| (2) | For the four months ended October 31, 2006. Effective October 31, 2006 the Fund changed its fiscal year end to October 31st from June 30th. |
| (3) | All ratios for the period have been annualized, except portfolio turnover and total return. |
| (4) | Net investment loss per share is calculated using average shares outstanding. |
| (5) | Amount is less than $0.01. |
| (6) | The financial highlights set forth herein include the historical highlights of The Henlopen Fund. On July 1, 2005 Hennessy Advisors, Inc. became the investment advisor to the Fund and the Fund changed its name from "The Henlopen Fund" to Hennessy Cornerstone Growth Fund, Series II. |
| (7) | The Advisor has agreed to cap the Institutional Class Share expenses at 0.98%. |
| (8) | Portfolio turnover is calculated on the basis of the Fund as a whole without distinguishing between the classes of shares issued. |
The accompanying notes are an integral part of these financial statements.
WWW.HENNESSYFUNDS.COM
46
FINANCIAL HIGHLIGHTS — HENNESSY CORNERSTONE GROWTH FUND, SERIES II
| Year Ended | Period Ended | |||||||||||||||||
| October 31, | October 31, | Year Ended June 30, | ||||||||||||||||
| 2007 | 2006(2)(3) | 2006 | 2005(6) | 2004(6) | ||||||||||||||
| Original Class | ||||||||||||||||||
| $ | 30.75 | $ | 32.19 | $ | 31.29 | $ | 27.69 | $ | 18.13 | |||||||||
| (0.25 | ) | (0.03 | ) | (0.07 | )(4) | (0.14 | )(4) | (0.23 | )(4) | |||||||||
| 1.02 | (1.41 | ) | 4.65 | 3.75 | 9.79 | |||||||||||||
| 0.77 | (1.44 | ) | 4.58 | 3.61 | 9.56 | |||||||||||||
| — | — | — | (0.01 | ) | — | |||||||||||||
| (1.20 | ) | — | (3.68 | ) | — | — | ||||||||||||
| (1.20 | ) | — | (3.68 | ) | (0.01 | ) | — | |||||||||||
| — | — | — | — | — | ||||||||||||||
| $ | 30.32 | $ | 30.75 | $ | 32.19 | $ | 31.29 | $ | 27.69 | |||||||||
| 2.60 | % | (4.47 | )% | 16.48 | % | 13.04 | % | 52.73 | % | |||||||||
| $ | 138.6 | $ | 244.2 | $ | 279.3 | $ | 299.0 | $ | 347.8 | |||||||||
| 1.27 | % | 1.25 | % | 1.25 | % | 1.33 | % | 1.38 | % | |||||||||
| 1.27 | % | 1.25 | % | 1.25 | % | 1.33 | % | 1.38 | % | |||||||||
| (0.59 | )% | (0.24 | )% | (0.22 | )% | (0.49 | )% | (0.90 | )% | |||||||||
| (0.59 | )% | (0.24 | )% | (0.22 | )% | (0.49 | )% | (0.90 | )% | |||||||||
| 86 | % | 93 | % | 109 | % | 192 | % | 113 | % | |||||||||
HENNESSY FUNDS 1-800-966-4354
47
Financial Highlights
| Hennessy Focus 30 Fund |
| Year Ended | ||||||||
| October 31, 2008 | ||||||||
| Institutional | ||||||||
| Original Class | Class(1)(3) | |||||||
| PER SHARE DATA: | ||||||||
| Net asset value, beginning of period | $ | 13.67 | $ | 11.15 | ||||
| Income from investment operations: | ||||||||
| Net investment income (loss) | (0.06 | ) | (0.02 | ) | ||||
| Net realized and unrealized | ||||||||
| gains (losses) on investments | (3.57 | ) | (3.09 | ) | ||||
| Total from investment operations | (3.63 | ) | (3.11 | ) | ||||
| Less Distributions: | ||||||||
| Dividends from net investment income | — | — | ||||||
| Dividends from net realized gains | (2.02 | ) | — | |||||
| Total distributions | (2.02 | ) | — | |||||
| Redemption fees retained | — | (4) | — | (4) | ||||
| Net asset value, end of period | $ | 8.02 | $ | 8.04 | ||||
| TOTAL RETURN | (30.81 | )% | (27.89 | )% | ||||
| SUPPLEMENTAL DATA AND RATIOS: | ||||||||
| Net assets, end of period (millions) | $ | 167.32 | $ | 26.78 | ||||
| Ratio of net expenses to average net assets: | ||||||||
| Before expense reimbursement | 1.27 | % | 1.13 | % | ||||
| After expense reimbursement | 1.27 | % | 0.98 | %(5) | ||||
| Ratio of net investment loss to average net assets: | ||||||||
| Before expense reimbursement | (0.62 | )% | (0.28 | )% | ||||
| After expense reimbursement | (0.62 | )% | (0.13 | )% | ||||
Portfolio turnover rate(6) | 123 | % | 123 | % | ||||
| (1) | Institutional Class shares commenced operations on March 3, 2008. |
| (2) | For the one month ended October 31, 2004. Effective October 31, 2004, the Fund changed its fiscal year end to October 31st from September 30th. |
| (3) | All ratios for the period have been annualized, except portfolio turnover and total return. |
| (4) | Amount is less than $0.01. |
| (5) | The Advisor has agreed to cap the Institutional Class Share expenses at 0.98%. |
| (6) | Portfolio turnover is calculated on the basis of the Fund as a whole without distinguishing between the classes of shares issued. |
The accompanying notes are an integral part of these financial statements.
WWW.HENNESSYFUNDS.COM
48
FINANCIAL HIGHLIGHTS — HENNESSY FOCUS 30 FUND
| Period Ended | Year Ended | |||||||||||||||||
| Year Ended October 31, | October 31, | September 30, | ||||||||||||||||
| 2007 | 2006 | 2005 | 2004(2)(3) | 2004 | ||||||||||||||
| Original Class | ||||||||||||||||||
| $ | 12.39 | $ | 12.21 | $ | 8.67 | $ | 8.78 | $ | 7.72 | |||||||||
| (0.09 | ) | (0.08 | ) | (0.04 | ) | (0.01 | ) | (0.08 | ) | |||||||||
| 1.47 | 1.86 | 3.58 | (0.10 | ) | 1.14 | |||||||||||||
| 1.38 | 1.78 | 3.54 | (0.11 | ) | 1.06 | |||||||||||||
| — | — | — | — | — | ||||||||||||||
| (0.10 | ) | (1.61 | ) | — | — | — | ||||||||||||
| (0.10 | ) | (1.61 | ) | — | — | — | ||||||||||||
| — | (4) | 0.01 | — | (4) | — | (4) | — | (4) | ||||||||||
| $ | 13.67 | $ | 12.39 | $ | 12.21 | $ | 8.67 | $ | 8.78 | |||||||||
| 11.30 | % | 16.18 | % | 40.83 | % | (1.25 | )% | 13.73 | % | |||||||||
| $ | 233.4 | $ | 240.6 | $ | 125.3 | $ | 50.4 | $ | 51.1 | |||||||||
| 1.23 | % | 1.21 | % | 1.35 | % | 1.45 | % | 1.41 | % | |||||||||
| 1.23 | % | 1.21 | % | 1.35 | % | 1.45 | % | 1.41 | % | |||||||||
| (0.61 | )% | (0.65 | )% | (0.60 | )% | (1.33 | )% | (0.92 | )% | |||||||||
| (0.61 | )% | (0.65 | )% | (0.60 | )% | (1.33 | )% | (0.92 | )% | |||||||||
| 112 | % | 124 | % | 155 | % | 0 | % | 113 | % | |||||||||
HENNESSY FUNDS 1-800-966-4354
49
Financial Highlights
| Hennessy Cornerstone Value Fund |
| Year Ended | ||||||||
| October 31, 2008 | ||||||||
| Institutional | ||||||||
| Original Class | Class(1)(3) | |||||||
| PER SHARE DATA: | ||||||||
| Net asset value, beginning of period | $ | 17.06 | $ | 13.79 | ||||
| Income from investment operations: | ||||||||
| Net investment income (loss) | 0.55 | 0.34 | ||||||
| Net realized and unrealized gains (losses) on investments | (8.15 | ) | (5.07 | ) | ||||
| Total from investment operations | (7.60 | ) | (4.73 | ) | ||||
| Less Distributions: | ||||||||
| Dividends from net investment income | (0.41 | ) | — | |||||
| Dividends from net realized gains | — | — | ||||||
| Total distributions | (0.41 | ) | — | |||||
Redemption fees retained(5) | — | — | ||||||
| Net asset value, end of period | $ | 9.05 | $ | 9.06 | ||||
| TOTAL RETURN | (45.50 | )% | (34.30 | )% | ||||
| SUPPLEMENTAL DATA AND RATIOS: | ||||||||
| Net assets, end of period (millions) | $ | 97.10 | $ | 0.87 | ||||
| Ratio of net expenses to average net assets | ||||||||
| Before expense reimbursement | 1.20 | % | 1.14 | % | ||||
| After expense reimbursement | 1.20 | % | 0.98 | %(6) | ||||
| Ratio of net investment income to average net assets | ||||||||
| Before expense reimbursement | 3.92 | % | 4.94 | % | ||||
| After expense reimbursement | 3.92 | % | 5.10 | % | ||||
Portfolio turnover rate(7) | 53 | % | 53 | % | ||||
| (1) | Institutional Class shares commenced operations on March 3, 2008. |
| (2) | For the one month ended October 31, 2004. Effective October 31, 2004, the Fund changed its fiscal year end to October 31st from September 30th. |
| (3) | All ratios for the period have been annualized, except portfolio turnover and total return. |
| (4) | Calculated using average shares outstanding during period. |
| (5) | Amount is less than $0.01. |
| (6) | The Advisor has agreed to cap the Institutional Class Share expenses at 0.98%. |
| (7) | Portfolio turnover is calculated on the basis of the Fund as a whole without distinguishing between the classes of shares issued. |
The accompanying notes are an integral part of these financial statements.
WWW.HENNESSYFUNDS.COM
50
FINANCIAL HIGHLIGHTS — HENNESSY CORNERSTONE VALUE FUND
| Period Ended | Year Ended | |||||||||||||||||
| Year Ended October 31, | October 31, | September 30, | ||||||||||||||||
| 2007 | 2006 | 2005 | 2004(2)(3) | 2004 | ||||||||||||||
| Original Class | ||||||||||||||||||
| $ | 15.27 | $ | 12.95 | $ | 12.48 | $ | 12.37 | $ | 10.51 | |||||||||
| 0.46 | 0.30 | 0.30 | 0.02 | 0.31 | (4) | |||||||||||||
| 1.68 | 2.36 | 0.41 | 0.09 | 1.76 | ||||||||||||||
| 2.14 | 2.66 | 0.71 | 0.11 | 2.07 | ||||||||||||||
| (0.35 | ) | (0.34 | ) | (0.24 | ) | — | (0.21 | ) | ||||||||||
| — | — | — | — | — | ||||||||||||||
| (0.35 | ) | (0.34 | ) | (0.24 | ) | — | (0.21 | ) | ||||||||||
| — | — | — | — | — | ||||||||||||||
| $ | 17.06 | $ | 15.27 | $ | 12.95 | $ | 12.48 | $ | 12.37 | |||||||||
| 14.26 | % | 21.00 | % | 5.69 | % | 0.89 | % | 19.83 | % | |||||||||
| $ | 204.5 | $ | 256.8 | $ | 183.8 | $ | 195.6 | $ | 194.5 | |||||||||
| 1.17 | % | 1.15 | % | 1.20 | % | 1.18 | % | 1.18 | % | |||||||||
| 1.17 | % | 1.15 | % | 1.20 | % | 1.18 | % | 1.18 | % | |||||||||
| 2.64 | % | 2.49 | % | 2.19 | % | 1.70 | % | 2.56 | % | |||||||||
| 2.64 | % | 2.49 | % | 2.19 | % | 1.70 | % | 2.56 | % | |||||||||
| 40 | % | 35 | % | 32 | % | 0 | % | 8 | % | |||||||||
HENNESSY FUNDS 1-800-966-4354
51
Financial Highlights
| Hennessy Total Return Fund |
| Year Ended | Year Ended | |||||||
| October 31, 2008 | October 31, 2007 | |||||||
| Original Class | ||||||||
| PER SHARE DATA: | ||||||||
| Net asset value, beginning of period | $ | 13.73 | $ | 12.61 | ||||
| Income from investment operations: | ||||||||
| Net investment income | 0.28 | 0.33 | ||||||
| Net realized and unrealized gains (losses) on securities | (4.49 | ) | 1.13 | |||||
| Total from investment operations | (4.21 | ) | 1.46 | |||||
| Less Distributions: | ||||||||
| Dividends from net investment income | (0.30 | ) | (0.34 | ) | ||||
| Dividends from realized capital gains | — | — | ||||||
| Return of capital | — | — | ||||||
| Total distributions | (0.30 | ) | (0.34 | ) | ||||
Redemption fees retained(4) | — | — | ||||||
| Net asset value, end of period | $ | 9.22 | $ | 13.73 | ||||
| TOTAL RETURN | (30.97 | )% | 11.70 | % | ||||
| SUPPLEMENTAL DATA AND RATIOS: | ||||||||
| Net assets, end of period (millions) | $ | 58.2 | $ | 96.3 | ||||
| Gross ratio of expenses, including | ||||||||
| interest expense, to average net asset: | ||||||||
| Before expense reimbursement | 2.36 | % | 3.04 | % | ||||
| After expense reimbursement | 2.36 | % | 3.04 | % | ||||
| Ratio of interest expense to average net assets | 1.16 | % | 1.88 | % | ||||
| Net ratio of expenses, excluding | ||||||||
| interest expense, to average net assets: | ||||||||
| Before expense reimbursement | 1.20 | % | 1.16 | % | ||||
| After expense reimbursement | 1.20 | % | 1.16 | % | ||||
| Ratio of net investment income (loss) to average net assets: | ||||||||
| Before expense reimbursement | 2.43 | % | 2.48 | % | ||||
| After expense reimbursement | 2.43 | % | 2.48 | % | ||||
| Portfolio turnover rate | 16 | % | 12 | % | ||||
| (1) | For the four months ended October 31, 2004. Effective October 31, 2004, the Fund changed its fiscal year end to October 31st from June 30th. |
| (2) | All ratios for the period have been annualized, except portfolio turnover and total return. |
| (3) | Calculated using average shares outstanding during period. |
| (4) | Amount is less than $0.01. |
The accompanying notes are an integral part of these financial statements.
WWW.HENNESSYFUNDS.COM
52
FINANCIAL HIGHLIGHTS — HENNESSY TOTAL RETURN FUND
| Year Ended | ||||||||||||||
| Year Ended October 31, | October 31, | June 30, | ||||||||||||
| 2006 | 2005 | 2004(1)(2) | 2004 | |||||||||||
| Original Class | ||||||||||||||
| $ | 10.57 | $ | 10.40 | $ | 10.62 | $ | 9.65 | |||||||
| 0.31 | 0.23 | 0.07 | 0.17 | (3) | ||||||||||
| 2.03 | 0.17 | (0.24 | ) | 0.92 | ||||||||||
| 2.34 | 0.40 | (0.17 | ) | 1.09 | ||||||||||
| (0.30 | ) | (0.23 | ) | (0.05 | ) | (0.10 | ) | |||||||
| — | — | — | — | |||||||||||
| — | — | — | (0.02 | ) | ||||||||||
| (0.30 | ) | (0.23 | ) | (0.05 | ) | (0.12 | ) | |||||||
| — | — | — | — | |||||||||||
| $ | 12.61 | $ | 10.57 | $ | 10.40 | $ | 10.62 | |||||||
| 22.48 | % | 3.83 | % | (1.61 | )% | 11.36 | % | |||||||
| $ | 113.3 | $ | 86.7 | $ | 91.9 | $ | 97.0 | |||||||
| 2.80 | % | 2.28 | % | 1.78 | % | 1.66 | % | |||||||
| 2.80 | % | 2.28 | % | 1.78 | % | 1.66 | % | |||||||
| 1.64 | % | 1.05 | % | 0.58 | % | 0.39 | % | |||||||
| 1.16 | % | 1.23 | % | 1.20 | % | 1.27 | % | |||||||
| 1.16 | % | 1.23 | % | 1.20 | % | 1.27 | % | |||||||
| 2.79 | % | 2.07 | % | 1.85 | % | 1.55 | % | |||||||
| 2.79 | % | 2.07 | % | 1.85 | % | 1.55 | % | |||||||
| 24 | % | 26 | % | 0 | % | 8 | % | |||||||
HENNESSY FUNDS 1-800-966-4354
53
Financial Highlights
| Hennessy Balanced Fund |
| Year Ended | Year Ended | |||||||
| October 31, 2008 | October 31, 2007 | |||||||
| Original Class | ||||||||
| PER SHARE DATA: | ||||||||
| Net asset value, beginning of period | $ | 12.51 | $ | 11.83 | ||||
| Income from investment operations: | ||||||||
| Net investment income | 0.25 | 0.38 | ||||||
| Net realized and unrealized gains (losses) on securities | (2.80 | ) | 0.69 | |||||
| Total from investment operations | (2.55 | ) | 1.07 | |||||
| Less Distributions: | ||||||||
| Dividends from net investment income | (0.26 | ) | (0.39 | ) | ||||
| Dividends from realized capital gains | (0.59 | ) | — | |||||
| Return of capital | — | — | ||||||
| Total distributions | (0.85 | ) | (0.39 | ) | ||||
Redemption fees retained(3) | — | — | ||||||
| Net asset value, end of period | $ | 9.11 | $ | 12.51 | ||||
| TOTAL RETURN | (21.55 | )% | 9.16 | % | ||||
| SUPPLEMENTAL DATA AND RATIOS: | ||||||||
| Net assets, end of period (millions) | $ | 11.5 | $ | 16.8 | ||||
| Ratio of net expenses to average net assets | 1.56 | % | 1.36 | % | ||||
| Ratio of net investment income to average net assets | 2.31 | % | 2.86 | % | ||||
| Portfolio turnover rate | 13 | % | 35 | % | ||||
| (1) | For the four months ended October 31, 2004. Effective October 31, 2004, the Fund changed its fiscal year end to October 31st from June 30th. |
| (2) | All ratios for the period have been annualized, except portfolio turnover and total return. |
| (3) | Amount is less than $0.01. |
The accompanying notes are an integral part of these financial statements.
WWW.HENNESSYFUNDS.COM
54
FINANCIAL HIGHLIGHTS — HENNESSY BALANCED FUND
| Year Ended | ||||||||||||||
| Year Ended October 31, | October 31, | June 30, | ||||||||||||
| 2006 | 2005 | 2004(1)(2) | 2004 | |||||||||||
| Original Class | ||||||||||||||
| $ | 10.56 | $ | 10.62 | $ | 10.85 | $ | 10.44 | |||||||
| 0.30 | 0.18 | 0.04 | 0.11 | |||||||||||
| 1.25 | (0.07 | ) | (0.24 | ) | 0.50 | |||||||||
| 1.55 | 0.11 | (0.20 | ) | 0.61 | ||||||||||
| (0.28 | ) | (0.17 | ) | (0.03 | ) | (0.12 | ) | |||||||
| — | — | — | (0.06 | ) | ||||||||||
| — | — | — | (0.02 | ) | ||||||||||
| (0.28 | ) | (0.17 | ) | (0.03 | ) | (0.20 | ) | |||||||
| — | — | — | — | |||||||||||
| $ | 11.83 | $ | 10.56 | $ | 10.62 | $ | 10.85 | |||||||
| 14.92 | % | 1.13 | % | (1.86 | )% | 5.81 | % | |||||||
| $ | 26.1 | $ | 19.3 | $ | 21.8 | $ | 23.4 | |||||||
| 1.34 | % | 1.49 | % | 1.41 | % | 1.41 | % | |||||||
| 2.75 | % | 1.58 | % | 1.12 | % | 1.01 | % | |||||||
| 88 | % | 21 | % | 9 | % | 45 | % | |||||||
HENNESSY FUNDS 1-800-966-4354
55
Statement of Cash Flows
Hennessy Total Return Fund For the Year Ended October 31, 2008 |
| Cash Flows From Operating Activities: | ||||
| Net decrease in net assets from operations | $ | (27,965,360 | ) | |
| Adjustments to reconcile net decrease in net assets from | ||||
| operations to net cash provided by operating activities: | ||||
| Purchase of investment securities | (425,136,558 | ) | ||
| Proceeds on sale of securities | 451,544,624 | |||
| Increase in other receivables, net | (24,849 | ) | ||
| Decrease in other assets | 967 | |||
| Decrease in accrued expenses and other payables | (256,562 | ) | ||
| Net accretion of discount on securities | (1,057,934 | ) | ||
| Net realized loss on investments | 447,136 | |||
| Unrealized depreciation on securities | 29,382,944 | |||
| Net cash provided by operating activities | $ | 26,934,408 | ||
| Cash Flows From Financing Activities: | ||||
| Decrease in reverse repurchase agreements | $ | (16,813,500 | ) | |
| Proceeds on shares sold | 1,911,184 | |||
| Payment on shares repurchased | (11,898,274 | ) | ||
| Cash dividends paid | (133,818 | ) | ||
| Net cash used by financing activities | $ | (26,934,408 | ) | |
| Net increase (decrease) in cash | — | |||
| Cash at beginning of period | — | |||
| Cash at end of period | $ | — | ||
| Cash paid for interest | $ | 1,036,279 | ||
The accompanying notes are an integral part of these financial statements.
WWW.HENNESSYFUNDS.COM
56
NOTES TO THE FINANCIAL STATEMENTS
Notes to the Financial Statements
October 31, 2008
| 1). | ORGANIZATION |
The Hennessy Mutual Funds, Inc. was organized as a Maryland corporation on May 20, 1996 and consists of three separate series: Hennessy Cornerstone Growth Fund (the “Growth Fund”), Hennessy Cornerstone Value Fund (the “Value Fund”) and the Hennessy Focus 30 Fund (the “Focus 30 Fund”), formerly SYM Select Growth Fund. These Funds are open-end, diversified management investment companies registered under the Investment Company Act of 1940, as amended. The Growth Fund and Value Fund commenced operations on November 1, 1996. On September 17, 2003, Hennessy Advisors, Inc. became the investment advisor to the SYM Select Growth Fund and the fund changed its name to the Hennessy Focus 30 Fund.
The Hennessy Funds, Inc. was organized as a Maryland corporation on January 11, 1996 and consists of two separate series: Hennessy Balanced Fund (the “Balanced Fund”) and Hennessy Total Return Fund (the “Total Return Fund”). The Balanced and Total Return Funds are open-end, non-diversified management investment companies registered under the Investment Company Act of 1940, as amended. The Balanced Fund and Total Return Fund commenced operations on March 8, 1996 and July 29, 1998, respectively.
The Hennessy Funds Trust was organized as a Delaware Statutory Trust on September 17, 1992 and consists of two series: Hennessy Cornerstone Growth Fund, Series II (the “Growth II Fund”) and Hennessy Large Cap Growth Fund (the “Large Cap Fund”). Prior to July 1, 2005, both the Trust and the Growth II Fund were known as The Henlopen Fund. On July 1, 2005, Hennessy Advisors, Inc., became the investment advisor to the fund and the fund changed its name from “The Henlopen Fund” to “Hennessy Cornerstone Growth Fund, Series II”. The Growth II Fund is an open-end, diversified management investment company registered under the Investment Company Act of 1940, as amended. The Large Cap Fund has not yet commenced operations.
The Growth Fund, Growth II Fund, Focus 30 Fund, Value Fund, Total Return Fund and Balanced Fund collectively represent the Hennessy Funds (the “Funds”).
The Growth, Growth II, Focus 30 and Value Fund’s offer Original and Institutional Class shares. Each class of shares differs principally in its respective administration and transfer agent expenses and sales charges, if any. Each class has identical rights to earnings, assets and voting privileges, except for class-specific expenses and exclusive rights to vote on matters affecting only individual classes.
| 2). | SIGNIFICANT ACCOUNTING POLICIES |
The following is a summary of significant accounting policies consistently followed by the Funds in the preparation of the financial statements. These policies are in conformity with U.S. generally accepted accounting principles (“GAAP”).
HENNESSY FUNDS 1-800-966-4354
57
| a). | Investment Valuation – Securities which are traded on a national or recognized stock exchange are valued at the last sale price on the securities exchange on which such securities are primarily traded. Exchange-traded securities for which there were no transactions that day and debt securities are valued at the most recent bid prices. Instruments with a remaining maturity of 60 days or less are valued on an amortized cost basis. When a price for an underlying security is not readily available or if a significant event has occurred that indicates the closing price of a security no longer represents the true value of that security, fair value pricing procedures have been adopted by the Board of Directors of the Funds. Fair value pricing determinations are made in good faith in accordance with these procedures. There are numerous criteria that will be given consideration in determining a fair value of a security. Some of these criteria are: trading volume of security and markets, value of other like securities and news events with direct bearing to security or market. Fair value pricing results in an estimated price that reasonably reflects the current market conditions in order to rate the portfolio holdings such that shareholder transactions receive a fair net asset value. |
| b). | Federal Income Taxes – Provision for federal income taxes or excise taxes has not been made since the Funds have elected to be taxed as “regulated investment companies” and intend to distribute substantially all taxable income to shareholders and otherwise comply with the provisions of the Internal Revenue Code applicable to regulated investment companies. Net investment income and realized gains and losses for federal income tax purposes may differ from that reported on the financial statements because of temporary book and tax basis differences. Temporary differences are primarily the result of the treatment of wash sales for tax reporting purposes. Distributions from net realized gains for book purposes may include short-term capital gains, which are included as ordinary income to shareholders for tax purposes. |
| Due to inherent differences in the recognition of income, expenses, and realized gains/losses under U.S. generally accepted accounting principles and federal income tax purposes, permanent differences between book and tax basis reporting for the 2008 fiscal year have been identified and appropriately reclassified on the Statement of Assets and Liabilities. |
| | Undistributed Net | Accumulated Net | Paid In | |||||||||
| Investment Income/(Loss) | Realized Gain/(Loss) | Capital | ||||||||||
| Growth Fund | 1,718,215 | 562,325 | (2,280,540 | ) | ||||||||
| Growth II Fund | 309,461 | 263,383 | (572,844 | ) | ||||||||
| Focus 30 Fund | 1,274,378 | 183,117 | (1,457,495 | ) | ||||||||
| Value Fund | (62,397 | ) | 5,175,891 | (5,113,494 | ) | |||||||
| Total Return Fund | 14,438 | 51,960,917 | (51,975,355 | ) | ||||||||
| Balanced Fund | (15 | ) | 447,979 | (447,964 | ) | |||||||
| The permanent differences primarily relate to Net Operating Losses and Capital Loss Carryover lost due to expiration. |
| c). | Income and Expenses – Dividend income is recognized on the ex-dividend date or as soon as information is available to the Funds and interest income is recognized on an accrual basis. Income expenses (other than expenses |
WWW.HENNESSYFUNDS.COM
58
| attributable to a specific class), and realized and unrealized gains or losses on investments are allocated to each class of shares based on its respective net assets. |
| d). | Distributions to Shareholders – Dividends from net investment income for the Growth, Growth II, Focus 30 and Value Funds, if any, are declared and paid out annually, usually in November or December of each year. Dividends from net investment income for the Total Return and Balanced Funds are declared and paid on a calendar quarter basis. Distributions of net realized capital gains, if any, are declared and paid annually, usually in November or December of each year, for all of the Funds. |
| e). | Security Transactions – Investment and shareholder transactions are recorded on the trade date. The Funds determine the gain or loss realized from the investment transactions by comparing the original cost of the security lot sold with the net sale proceeds. Discounts and premiums on securities purchased are accreted/amortized over the life of the respective security. |
| f). | Use of Estimates – The preparation of financial statements in conformity with GAAP requires management to make estimates and assumptions that affect the reported amounts of assets and liabilities and disclosure of contingent assets and liabilities at the date of the financial statements and the reported change in net assets during the reporting period. Actual results could differ from those estimates. |
| g). | Share Valuation – The net asset value (“NAV”) per share of each Fund is calculated by dividing the sum of the value of the securities held by each Fund, plus cash or other assets, minus all liabilities (including estimated accrued expenses) by the total number of shares outstanding for each Fund, rounded to the nearest cent. The Funds’ shares will not be priced on the days on which the NYSE is closed for trading. The offering and redemption price per share for each Fund is equal to each Fund’s net asset value per share. During the period November 1, 2007 through August 29, 2008 the Funds charged a 1.50% redemption fee on shares held less than 90 days. These fees were deducted from the redemption proceeds otherwise payable to the shareholder. The Funds retained the fee charged as paid-in capital and such fees became part of that Fund’s daily NAV calculation. |
| h). | Repurchase Agreements – Each Fund may enter into repurchase agreements with member banks or security dealers of the Federal Reserve whom the investment advisor deems creditworthy. The repurchase price generally equals the price paid by the Fund plus interest negotiated on the basis of current short-term rates. |
| Securities pledged as collateral for repurchase agreements are held by the custodian bank until the respective agreements mature. Provisions of the repurchase agreements ensure that the market value of the collateral, including accrued interest thereon, is sufficient, in the event of default of the counterparty. If the counterparty defaults and the value of the collateral declines or if the counterparty enters an insolvency proceeding, realization of the collateral by the Fund may be delayed or limited. |
| i). | Accounting for Uncertainty in Income Taxes – In June 2006, the Financial Accounting Standards Board (“FASB”) issued FASB Interpretation 48 (“FIN |
HENNESSY FUNDS 1-800-966-4354
59
| 48”), “Accounting for Uncertainty in Income Taxes.” This standard defines the threshold for recognizing the benefits of tax-return positions in the financial statements as “more-likely-than-not” to be sustained by the taxing authority and requires measurement of a tax position meeting the more-likely-than-not criterion, based on the largest benefit that is more than 50 percent likely to be realized. FIN 48 is effective as of the beginning of the first fiscal year beginning after December 15, 2006, and is to be applied to all open tax years as of the effective date. The tax periods open to examination by the Internal Revenue Service include the fiscal years ended October 31, 2008, 2007, 2006 and 2005. As a result, the Funds have evaluated the implications of FIN 48 and determined that there is no material impact on the financial statements. |
| j). | Recently Issued Accounting Pronouncements – In September 2006, the Financial Accounting Standards Board (“FASB”) issued Statement on Financial Accounting Standards (SFAS) No. 157, “Fair Value Measurements.” This standard establishes a single authoritative definition of fair value, sets out a framework for measuring fair value and requires additional disclosures about fair value measurements. SFAS No. 157 applies to fair value measurements already required or permitted by existing standards. SFAS No. 157 is effective for financial statements issued for fiscal years beginning after November 15, 2007 and interim periods within those fiscal years. The changes to current generally accepted accounting principles from the application of this statement relate to the definition of fair value, the methods used to measure fair value, and the expanded disclosures about fair value measurements. As of October 31, 2008, the Funds do not believe the adoption of SFAS No. 157 will impact the financial statement amounts; however additional disclosures may be required about the inputs used to develop the measurements and the effect of certain measurements included within the Statement of Operations for the period. |
| In March 2008, Statement of Financial Accounting Standards No. 161, “Disclosures about Derivative Instruments and Hedging Activities” (“SFAS 161”) was issued and is effective for fiscal years beginning after November 15, 2008. SFAS 161 is intended to improve financial reporting for derivative instruments by requiring enhanced disclosure that enables investors to understand how and why an entity uses derivatives, how derivatives are accounted for, and how derivative instruments affect an entity’s results of operations and financial position. Management is currently evaluating the implications of SFAS 161. The impact on the Fund’s financial statement disclosures, if any, is currently being assessed. |
| 3). | REVERSE REPURCHASE AGREEMENTS |
The Total Return Fund has entered into reverse repurchase agreements with UBS PaineWebber, Inc., under which the Total Return Fund sells securities and agrees to repurchase them later at a mutually agreed upon price. For the year ended October 31, 2008, the average daily balance and average interest rate in effect for reverse repurchase agreements was $35,424,379 and 2.485%, respectively. At October 31, 2008, the interest rate in effect for the outstanding reverse repurchase agreements, scheduled to mature on December 11, 2008 ($8,059,500), and January 15, 2009 ($14,368,000) were 2.05% and 1.25%, respectively, and were equal to 27.23% of the Total Return Fund’s total assets.
WWW.HENNESSYFUNDS.COM
60
| 4). | INVESTMENT TRANSACTIONS |
Purchases and sales of investment securities (excluding government and short-term investments) during the following fiscal periods were as follows:
| Growth | Growth II | Focus 30 | Value | Total Return | Balanced | |
| Fund | Fund | Fund | Fund | Fund | Fund | |
| Year Ended | Year Ended | Year Ended | Year Ended | Year Ended | Year Ended | |
| 10/31/08 | 10/31/08 | 10/31/08 | 10/31/08 | 10/31/08 | 10/31/08 | |
| Purchases | $636,457,245 | $ 62,641,351 | $335,910,195 | $81,618,419 | $15,047,294 | $2,835,754 |
| Sales | $945,745,614 | $105,154,660 | $276,917,838 | $93,965,671 | $15,999,706 | $1,697,468 |
| 5). | INVESTMENT MANAGEMENT FEE AND OTHER TRANSACTIONS WITH AFFILIATES |
Hennessy Advisors, Inc. (the “Advisor”) is the Advisor of the Funds. The Advisor provides the Funds with investment management services under a Management Agreement. The Advisor furnishes all investment advice, office space, facilities, and provides most of the personnel needed by the Funds. As compensation for its services, the Advisor is entitled to a monthly fee from each Fund. The fee is based upon the average daily net assets of the Funds at the annual rate of:
| Growth Fund | 0.74% |
| Growth II Fund | 0.74% |
| Focus 30 Fund | 0.74% |
| Value Fund | 0.74% |
| Total Return Fund | 0.60% |
| Balanced Fund | 0.60% |
The Advisor has agreed to waive its fees and absorb expenses to the extent that the total annual operating expenses (excluding all federal, state and local taxes, interest, brokerage commissions, acquired fund fees and expenses and other costs incurred in connection with the purchase and sale of securities and extraordinary items) do not exceed 0.98% of the Funds’ net assets for the Institutional Class shares in the Growth, Growth II, Focus 30 and Value Funds. For a period of three years after the year in which the Advisor waives or reimburses expenses, the Advisor may seek reimbursement from the Fund to the extent that total annual Fund operating expenses are less than the expense limitation in effect at the time of the waiver or reimbursement. The Advisor waived or reimbursed expenses of $7,464, $137, $35,499 and $1,056 for the Growth, Growth II, Focus 30 and Value Funds, respectively for the year ended October 31, 2008. These reimbursed / absorbed expenses are subject to potential recovery by year of expiration October 31, 2011.
The Board of Directors has approved a Shareholder Servicing Plan for the Original Class shares of the Growth, Growth II, Focus 30, Value, Total Return and Balanced Funds which was instituted to compensate the Advisor for the non-investment management services it provides to the Funds. The Plan provides for a monthly fee paid to the Advisor at an annual rate of 0.10% of the average daily net assets of the Funds.
The Growth Fund, Growth II Fund, Focus 30 Fund and Value Fund have entered into agreements with various brokers, dealers and financial intermediaries in connection with the sale of shares of the Funds. The agreements provide for periodic payments by the Funds to the brokers, dealers and financial intermediaries for providing certain shareholder maintenance services (sub-transfer agent expenses). These shareholder services include: the
HENNESSY FUNDS 1-800-966-4354
61
pre-processing and quality control of new accounts, shareholder correspondence, answering customer inquiries regarding account status and facilitating shareholder telephone transactions. Fees paid by the Growth Fund, Growth II Fund, Focus 30 Fund and Value Fund to various brokers, dealers and financial intermediaries for the year ended October 31, 2008, were $647,161, $94,733, $222,903 and $53,252, respectively.
The Total Return and Balanced Funds have adopted a plan pursuant to Rule 12b-1 which authorizes payments in connection with the distribution of the Total Return and Balanced Fund shares at an annual rate not to exceed 0.15% of each Fund’s average daily net assets. Amounts paid under the Plan may be spent on any activities or expenses primarily intended to result in the sale of shares, including but not limited to, advertising, compensation for sales and marketing activities or financial institutions and others such as dealers and distributors, shareholder account servicing, the printing and mailing of prospectuses to other than current shareowners and the printing and mailing of sales literature.
U.S. Bancorp Fund Services, LLC (the “Administrator”) acts as the Funds’ Administrator under an Administration Agreement. The Administrator prepares various federal and state regulatory filings, reports and returns for the Funds; prepares reports and materials to be supplied to the directors; monitors the activities of the Funds’ custodian, transfer agent and accountants; coordinates the preparation and payment of the Funds’ expenses and reviews the Funds’ expense accruals. Fees paid to U.S. Bancorp Fund Services, LLC for the year ended October 31, 2008, were $1,508,661, $203,228, $545,602, $378,545, $190,310 and $35,095 for Growth, Growth II, Focus 30, Value, Total Return and Balanced Funds, respectively.
The Henlopen Fund was the predecessor fund of the Growth II Fund. The financial highlights reported for periods before July 1, 2005, represent the activity of The Henlopen Fund.
Quasar Distributors, LLC (the “Distributor”) acts as the Funds’ principal underwriter in a continuous public offering of the Funds’ shares. The Distributor is an affiliated company of U.S. Bank, N.A.
| 6). | LINE OF CREDIT |
The Growth, Growth II, Focus 30, and Value Funds have $20,000,000, $10,000,000, $20,000,000 and $20,000,000 lines of credit, respectively, intended to provide short-term financing, if necessary, subject to certain restrictions, in connection with shareholder redemptions. The credit facility is with its custodian bank, U.S. Bank, N.A. During the year ended October 31, 2008, the Growth Fund had an outstanding average daily balance and a weighted average interest rate of $398,708 and 5.70%, respectively. The maximum amount outstanding for the Growth Fund during the period was $9,170,000. During the year ended October 31, 2008, the Growth II Fund had an outstanding average daily balance and a weighted average interest rate of $51,571 and 5.70%, respectively. The maximum amount outstanding for the Growth II Fund during the period was $2,558,000. During the year ended October 31, 2008, the Focus 30 Fund had an outstanding average daily balance and a weighted average interest rate of $104,227 and 5.70%, respectively. The maximum amount outstanding for the Focus 30 Fund during the period was $3,670,000. During the year ended October 31, 2008, the Value Fund had no line of credit activity.
WWW.HENNESSYFUNDS.COM
62
| 7). | FEDERAL TAX INFORMATION |
The following balances for the Funds are as of October 31, 2008:
| Growth | Growth II | Focus 30 | ||||||||||
| Fund | Fund | Fund | ||||||||||
| Cost of Investments for tax purposes | $ | 486,769,385 | $ | 60,665,177 | $ | 244,599,810 | ||||||
| Gross tax unrealized appreciation | 4,923,772 | 1,164,960 | 279,299 | |||||||||
| Gross tax unrealized depreciation | (173,521,396 | ) | (25,419,306 | ) | (52,025,042 | ) | ||||||
| Net tax unrealized appreciation | ||||||||||||
| (depreciation) on investments | (168,597,624 | ) | (24,254,346 | ) | (51,745,743 | ) | ||||||
| Undistributed ordinary income | $ | — | $ | — | $ | — | ||||||
| Undistributed long-term capital gains | $ | — | $ | — | $ | — | ||||||
| Total Distributable earnings | $ | — | $ | — | $ | — | ||||||
| Other accumulated gains (losses) | $ | (115,729,363 | ) | $ | (36,286,123 | ) | $ | (47,979,565 | ) | |||
| Total accumulated earnings (losses) | $ | (284,326,987 | ) | $ | 60,540,469 | $ | (99,725,308 | ) | ||||
| Value | Total Return | Balanced | ||||||||||
| Fund | Fund | Fund | ||||||||||
| Cost of Investments for tax purposes | $ | 160,236,141 | $ | 99,034,433 | $ | 14,283,892 | ||||||
| Gross tax unrealized appreciation | 3,608,046 | 911,006 | 128,916 | |||||||||
| Gross tax unrealized depreciation | (66,162,574 | ) | (19,250,803 | ) | (2,925,811 | ) | ||||||
| Net tax unrealized appreciation | ||||||||||||
| (depreciation) on investments | (62,554,528 | ) | (18,339,797 | ) | (2,796,895 | ) | ||||||
| Undistributed ordinary income | $ | 4,891,467 | $ | — | $ | 17,790 | ||||||
| Undistributed long-term capital gains | $ | — | $ | — | $ | — | ||||||
| Total Distributable earnings | $ | 4,891,467 | $ | — | $ | 17,790 | ||||||
| Other accumulated gains (losses) | $ | (28,195,450 | ) | $ | (34,658,579 | ) | $ | (1,014,955 | ) | |||
| Total accumulated earnings (losses) | $ | (85,858,611 | ) | $ | (52,998,376 | ) | $ | (3,794,060 | ) | |||
At October 31, 2008, the Growth Fund had tax basis capital losses of $115,729,363, to offset future capital gains, the use of a portion of which is limited by IRS regulations. Of such losses, $376,392 expire October 31, 2008, $182,559 expire October 31, 2009, and $115,170,412 expire October 31, 2016. Additionally, the Growth Fund had no post-October loss deferrals as of October 31, 2008.
At October 31, 2008, the Growth II Fund had tax basis capital losses of $36,286,123, to offset future capital gains, the use of a portion of which is limited by IRS regulations. Of such losses, $36,286,123 expire October 31, 2016. Additionally, the Growth II Fund had no post-October loss deferrals as of October 31, 2008.
At October 31, 2008, the Focus 30 Fund had tax basis capital losses of $47,979,565, to offset future capital gains, the use of a portion of which is limited by IRS regulations. Of such losses, $47,979,565 expire October 31, 2016. Additionally, the Focus 30 Fund had no post-October loss deferrals as of October 31, 2008.
HENNESSY FUNDS 1-800-966-4354
63
At October 31, 2008, the Value Fund had tax basis capital losses of $28,194,859, to offset future capital gains, the use of a portion of which is limited by IRS regulations. Of such losses, $27,482,264 expire October 31, 2010 and $712,595 expire October 31, 2011. Additionally, the Value Fund had no post-October loss deferrals as of October 31, 2008.
At October 31, 2008, the Total Return Fund had tax basis capital losses of $34,658,578, which may be carried over to offset future capital gains. Of such $34,658,578 expire October 31, 2009. Additionally, the Total Return Fund had no post-October loss deferrals as of October 31, 2008.
At October 31, 2008, the Balanced Fund had tax basis capital losses of $1,014,955, to offset future capital gains, the use of a portion of which is limited by IRS regulations. Of such losses, $447,964 expire October 31, 2009, $447,964 expire October 31, 2010 and $119,027 expire October 31, 2016. Additionally, the Balanced Fund had no post-October loss deferrals as of October 31, 2008.
The tax character of distributions paid during 2008 and 2007 for the Funds were as follows:
| Year Ended | Year Ended | |||||||
| Growth Fund | October 31, 2008 | October 31, 2007 | ||||||
| Distributions paid from: | ||||||||
| Ordinary income | $ | — | $ | — | ||||
| Long-term capital gain | 110,914,201 | 183,483,584 | ||||||
| Return of capital | 64 | — | ||||||
| $ | 110,914,265 | $ | 183,483,584 | |||||
| Year Ended | Year Ended | |||||||
| Growth II Fund | October 31, 2008 | October 31, 2007 | ||||||
| Distributions paid from: | ||||||||
| Ordinary income | $ | 7,021,405 | $ | 825,637 | ||||
| Long-term capital gain | 19,858,903 | 8,406,308 | ||||||
| Return of capital | 174,708 | — | ||||||
| $ | 27,055,016 | $ | 9,231,945 | |||||
| Year Ended | Year Ended | |||||||
| Focus 30 Fund | October 31, 2008 | October 31, 2007 | ||||||
| Distributions paid from: | ||||||||
| Ordinary income | $ | 1,697,121 | $ | — | ||||
| Long-term capital gain | 31,369,777 | 1,781,615 | ||||||
| Return of capital | 183,117 | — | ||||||
| $ | 33,250,015 | $ | 1,781,615 | |||||
| Year Ended | Years Ended | |||||||
| Value Fund | October 31, 2008 | October 31, 2007 | ||||||
| Distributions paid from: | ||||||||
| Ordinary income | $ | 4,859,028 | $ | 5,691,101 | ||||
| Long-term capital gain | — | — | ||||||
| $ | 4,859,028 | $ | 5,691,101 | |||||
WWW.HENNESSYFUNDS.COM
64
| Year Ended | Year Ended | |||||||
| Total Return Fund | October 31, 2008 | October 31, 2007 | ||||||
| Distributions paid from: | ||||||||
| Ordinary income | $ | 2,008,865 | $ | 2,653,674 | ||||
| Long-term capital gain | — | — | ||||||
| Return of capital | 14,437 | — | ||||||
| $ | 2,023,302 | $ | 2,653,674 | |||||
| Year Ended | Year Ended | |||||||
| Balanced Fund | October 31, 2008 | October 31, 2007 | ||||||
| Distributions paid from: | ||||||||
| Ordinary income | $ | 353,767 | $ | 608,338 | ||||
| Long-term capital gain | 777,518 | — | ||||||
| $ | 1,131,285 | $ | 608,338 | |||||
| 8). | SUBSEQUENT EVENT |
Hennessy Advisors, Inc. on December 9, 2008 signed an agreement with RBC’s Voyageur Asset Management to purchase the assets related to the management of the Tamarack Large Cap Growth Fund and the Tamarack Value Fund. These two funds have combined assets of just under $200 million as of that date.
Upon completion of the transaction, which is subject to regulatory approvals and the approval of Tamarack Funds’ shareholders and Trustees, Hennessy Advisors will become the manager of the Tamarack Value Fund and Voyageur Asset Management will act as the Fund’s sub-advisor. The assets related to the Tamarack Large Cap Growth Fund will be invested in the Hennessy Large Cap Growth Fund, with Hennessy Advisors as the manager of the Fund. The transaction will be tax-free for Tamarack Fund shareholders. This transaction is expected to be completed by the end of March, 2009.
| 9). | FEDERAL TAX DISTRIBUTION INFORMATION (Unaudited) |
The Growth, Focus 30, Value, Total Return and Balanced Funds designate 16%, 67%, 100%, 100% and 91%, respectively of the dividends declared from net investment income during the year ended October 31, 2008, as qualified dividend income under the Jobs Growth and Tax Reconciliation Act of 2003.
For the year ended October 31, 2008, 16%, 67%, 97%, 100% and 91% of the ordinary distributions paid by the Growth, Focus 30, Value, Total Return and Balanced Funds qualify for the dividends received deduction available to corporate shareholders.
Additional Information Applicable to Foreign Shareholders Only. For the fiscal year ended October 31, 2008, the following percentages of its ordinary income distributions paid are designated as short-term capital gain distributions under the Internal Revenue Code Section 871(k)(2)(c): Growth II Fund - 100% and Focus 30 Fund - 100%.
HENNESSY FUNDS 1-800-966-4354
65
Report of Independent Registered Public Accounting Firm
The Shareholders and Board of Directors of
The Hennessy Mutual Funds, Inc., The Hennessy Funds, Inc.,
and The Hennessy Funds Trust:
We have audited the statements of assets and liabilities of The Hennessy Mutual Funds, Inc. (comprising, respectively, Hennessy Cornerstone Growth Fund, Hennessy Cornerstone Value Fund, and Hennessy Focus 30 Fund), The Hennessy Funds, Inc. (comprising, respectively, Hennessy Balanced Fund and Hennessy Total Return Fund) and the Hennessy Funds Trust (comprising, Hennessy Cornerstone Growth Fund, Series II), collectively referred to as the Funds, including the schedules of investments, as of October 31, 2008, and the related statements of operations and cash flows for the year then ended, and the statements of changes in net assets for each of the two years in the period then ended, and the financial highlights for each of the periods presented, (for the years ended October 31, 2008 and 2007, the period ended October 31, 2006 and year ended June 30, 2006 for the Hennessy Cornerstone Growth Fund, Series II and for each of the periods presented for 2007, 2006, 2005, and 2004 for the Hennessy Focus 30 Fund). These financial statements and financial highlights are the responsibility of the Funds’ management. Our responsibility is to express an opinion on these financial statements and financial highlights based on our audits. The accompanying financial highlights for the years ended June 30, 2005 and 2004 of the Hennessy Cornerstone Growth Fund, Series II were audited by other auditors whose reports thereon dated July 28, 2005 expressed an unqualified opinion on these statements.
We conducted our audits in accordance with generally accepted auditing standards as established by the Auditing Standards Board (United States) and in accordance with the auditing standards of the Public Company Accounting Oversight Board (United States). Those standards require that we plan and perform the audit to obtain reasonable assurance about whether the financial statements are free of material misstatement. The Company is not required to have, nor were we engaged to perform, an audit of its internal control over financial reporting. Our audit included consideration of internal control over financial reporting as a basis for designing audit procedures that are appropriate in the circumstances, but not for the purpose of expressing an opinion on the effectiveness of the Company’s internal control over financial reporting. Accordingly, we express no such opinion. An audit also includes examining, on a test basis, evidence supporting the amounts and disclosures in the financial statements. Our procedures included confirmation of securities owned as of October 31, 2008, by correspondence with the custodian and brokers. An audit also includes assessing the accounting principles used and significant estimates made by management, as well as evaluating the overall financial statement presentation. We believe that our audits provide a reasonable basis for our opinion.
WWW.HENNESSYFUNDS.COM
66
In our opinion, the financial statements and financial highlights referred to above present fairly, in all material respects, the financial position of the Hennessy Cornerstone Growth Fund, Hennessy Cornerstone Value Fund, Hennessy Focus 30 Fund, Hennessy Balanced Fund, Hennessy Total Return Fund and Hennessy Cornerstone Growth Fund, Series II, as of October 31, 2008, the results of their operations and cash flows for the year then ended, the changes in their net assets for each of the two years in the period then ended, and the financial highlights for each of the period presented (for the years ended October 31, 2008 and 2007, the period ended October 31, 2006 and the year ended June 30, 2006 for the Hennessy Cornerstone Growth Fund, Series II and for each of the period presented for 2006, 2005, and 2004 for the Hennessy Focus 30 Fund) in conformity with U.S. generally accepted accounting principles.

December 29, 2008
HENNESSY FUNDS 1-800-966-4354
67
Directors and Officers of the Funds
| Position(s) | Term of Office | |
| Held with | and Length of | |
| Name, Age and Address | the Companies | Time Served |
| “Disinterested Persons” | ||
| J. Dennis DeSousa | Independent Director | Indefinite, until |
| Age: 71 | successor elected | |
| Address: | ||
| c/o Hennessy Advisors, Inc. | Served since January 1996 | |
| 7250 Redwood Blvd. | ||
| Suite 200 | ||
| Novato, CA 94945 | ||
| Robert T. Doyle | Independent Director | Indefinite, until |
| Age: 60 | successor elected | |
| Address: | ||
| c/o Hennessy Advisors, Inc. | Served since January 1996 | |
| 7250 Redwood Blvd. | ||
| Suite 200 | ||
| Novato, CA 94945 | ||
| Gerald P. Richardson | Independent Director | Indefinite, until |
| Age: 61 | successor elected | |
| Address: | ||
| c/o Hennessy Advisors, Inc. | Served since May 2004 | |
| 7250 Redwood Blvd. | ||
| Suite 200 | ||
| Novato, CA 94945 | ||
| “Interested Persons” | ||
Neil J. Hennessy(2) | Director, | Indefinite, until |
| Age: 52 | Chief Investment Officer | successor elected |
| Address: | and Portfolio Manager | |
| c/o Hennessy Advisors, Inc. | Served since January 1996 | |
| 7250 Redwood Blvd. | ||
| Suite 200 | ||
| Novato, CA 94945 | ||
| Kevin A. Rowell | President | 1 year term |
| Age: 48 | ||
| Address: | Since June 2008 | |
| c/o Hennessy Advisors, Inc. | HMFI, HFI and HFT | |
| 7250 Redwood Blvd. | ||
| Suite 200 | ||
| Novato, CA 94945 |
WWW.HENNESSYFUNDS.COM
68
| Number of Portfolios | ||
| Principal Occupation(s) | in the Fund Complex | Other Directorships |
| During Past 5 Years | Overseen by Director (1) | Held by Director |
| Currently a real estate investor. | 7 | None. |
| Currently the Sheriff of Marin County, | 7 | None. |
| California (since 1996) and has been | ||
| employed in the Marin County Sheriff’s | ||
| Office in various capacities since 1969. | ||
| Chief Executive Officer and owner of | 7 | None. |
| ORBIS Payment Services since January | ||
| 2001. In 2000, Mr. Richardson | ||
| was an independent consultant. | ||
| Chairman of the Board, CIO and | 7 | Director of Hennessy |
| Portfolio Manager of Hennessy | Advisors, Inc. | |
| Advisors, Inc., the Funds’ investment advisor, | ||
| since 1989; President of The Hennessy | ||
| Mutual Funds, Inc., The Hennessy Funds, | ||
| Inc. since 1996 and Hennessy Funds Trust | ||
| since 2005. | ||
| President of Pioneer Funds Distributor from | ||
| January 2006 to July 2007; Executive Vice | ||
| President at Charles Schwab & Co., Inc. from | ||
| April 2004 through November 2005; and | ||
| President of SAFECO Mutual Funds from | ||
| September 2002 through April 2004. |
HENNESSY FUNDS 1-800-966-4354
69
| Position(s) | Term of Office | |
| Held with | and Length of | |
| Name, Age and Address | the Companies | Time Served |
Frank Ingarra, Jr.(2) | Vice President, | 1 year term |
| Age: 37 | Co-Portfolio | |
| Address: | Manager | 6 years |
| c/o Hennessy Advisors, Inc. | ||
| 7250 Redwood Blvd. | ||
| Suite 200 | ||
| Novato, CA 94945 | ||
Harry F. Thomas(2) | Chief Compliance | 1 year term |
| Age: 61 | Officer | |
| Address: | 3 years | |
| c/o Hennessy Advisors, Inc. | ||
| 7250 Redwood Blvd. | ||
| Suite 200 | ||
| Novato, CA 94945 | ||
Teresa M. Nilsen(2) | Executive Vice | 1 year term |
| Age: 42 | President and | |
| Address: | Treasurer | 11 years |
| c/o Hennessy Advisors, Inc. | ||
| 7250 Redwood Blvd. | ||
| Suite 200 | ||
| Novato, CA 94945 | ||
Daniel B. Steadman(2) | Executive Vice | 1 year term |
| Age: 52 | President and | |
| Address: | Secretary | 8 years |
| c/o Hennessy Advisors, Inc. | ||
| 7250 Redwood Blvd. | ||
| Suite 200 | ||
| Novato, CA 94945 |
WWW.HENNESSYFUNDS.COM
70
| Number of Portfolios | ||
| Principal Occupation(s) | in the Fund Complex | Other Directorships |
| During Past 5 Years | Overseen by Director (1) | Held by Director |
| Co-Portfolio Manager for | Not applicable. | Not applicable. |
| Hennessy Advisors, Inc., the Funds’ | ||
| investment advisor, from March 2002 | ||
| to the present; from August 2000 | ||
| through March 2002, Mr. Ingarra | ||
| was the head trader for Hennessy | ||
| Advisors, Inc.; from August 2002 to | ||
| the present, Mr. Ingarra has been | ||
| a Vice President of The Hennessy | ||
| Mutual Funds, Inc. and The Hennessy | ||
| Funds, Inc. and since July 2005, Mr. Ingarra | ||
| has been Vice President of Hennessy Funds | ||
| Trust; and from July 1999 through | ||
| August 2000, Mr. Ingarra was the Vice | ||
| President and head trader for | ||
| O’Shaughnessy Capital Management. | ||
| Chief Compliance Officer for Hennessy | Not applicable. | Not applicable. |
| Advisors, Inc., the Funds’ investment | ||
| advisor, since 2004; retired business | ||
| executive from 2001 through 2004; director | ||
| of The Hennessy Mutual Funds, Inc. and | ||
| The Hennessy Funds, Inc. from 2000 to | ||
| May 2004; and Managing Director of | ||
| Emplifi, Inc., a consulting firm, from 1999 | ||
| through 2001. | ||
| Currently Executive Vice President, Chief | Not applicable. | Director of Hennessy |
| Financial Officer and Secretary of Hennessy | Advisors, Inc. | |
| Advisors, Inc., the Funds’ investment advisor; | ||
| Ms. Nilsen has been the corporate secretary | ||
| and a financial officer of Hennessy Advisors, Inc. | ||
| since 1989; Ms. Nilsen has been an officer of | ||
| The Hennessy Mutual Funds, Inc. and The | ||
| Hennessy Funds, Inc. since 1996 and Hennessy | ||
| Funds Trust since 2005, and is currently | ||
| Executive Vice President and Treasurer. | ||
| Executive Vice President of Hennessy | Not applicable. | Director of Hennessy |
| Advisors, Inc., the Funds’ investment advisor, | Advisors, Inc. | |
| from 2000 to the present; Vice President of | ||
| Westamerica Bank from 1995 through 2000; | ||
| Mr. Steadman has been Executive Vice | ||
| President and Secretary of The Hennessy | ||
| Mutual Funds, Inc. and The Hennessy | ||
| Funds, Inc. since 2000 and Hennessy | ||
| Funds Trust since 2005. |
HENNESSY FUNDS 1-800-966-4354
71
| Position(s) | Term of Office | |
| Held with | and Length of | |
| Name, Age and Address | the Companies | Time Served |
| Tania A. Kelley | Vice President | 1 year term |
| Age: 43 | of Marketing | |
| Address: | 5 years | |
| c/o Hennessy Advisors, Inc. | ||
| 7250 Redwood Blvd. | ||
| Suite 200 | ||
| Novato, CA 94945 | ||
| Ana Miner | Vice President | 1 year term |
| Age: 50 | of Operations | |
| Address: | 9 years | |
| c/o Hennessy Advisors, Inc. | ||
| 7250 Redwood Blvd. | ||
| Suite 200 | ||
| Novato, CA 94945 | ||
| Brian Peery | VP, Director | 1 year term |
| Age: 39 | of Research | |
| Address: | 5 years | |
| c/o Hennessy Advisors, Inc. | ||
| 7250 Redwood Blvd. | ||
| Suite 200 | ||
| Novato, CA 94945 |
__________
| (1) | There are seven portfolios in the fund complex overseen by the Directors: (a) the Hennessy Cornerstone Growth Fund, Hennessy Focus 30 Fund and Hennessy Cornerstone Value Fund, series of The Hennessy Mutual Funds, Inc.; (b) the Hennessy Total Return Fund and Hennessy Balanced Fund, series of The Hennessy Funds, Inc.; and (c) the Hennessy Cornerstone Growth Fund, Series II, a series of Hennessy Funds Trust (collectively, the “Hennessy Funds”). |
| (2) | All officers of the companies and employees of the Advisor are interested persons (as defined in the 1940 Act) of the Trust. |
WWW.HENNESSYFUNDS.COM
72
| Number of Portfolios | ||
| Principal Occupation(s) | in the Fund Complex | Other Directorships |
| During Past 5 Years | Overseen by Director (1) | Held by Director |
| Has been employed by Hennessy | Not applicable. | None. |
| Advisors, Inc., the Funds’ investment | ||
| advisor, since October 2003; Director of | ||
| Sales and Marketing for Comcast from | ||
| 2002 through 2003; from 1999 to 2002, | ||
| Ms. Kelley was Director of Sales and | ||
| Marketing for AT&T. | ||
| Has been employed by Hennessy | Not applicable. | None. |
| Advisors, Inc., the Funds’ investment | ||
| advisor, since 1998; from 1990 through | ||
| 1998, Ms. Miner was employed as an | ||
| institutional sales assistant by | ||
| Merrill Lynch Capital Markets. | ||
| Has been employed by Hennessy | Not applicable. | None. |
| Advisors, Inc., the Funds’ investment | ||
| advisor, since June 2002; Vice President of | ||
| Institutional Sales and Senior Analyst with | ||
| Brad Peery Inc. from June 2000 to June | ||
| 2002; from 1996 to 2002, Mr. Peery worked | ||
| for Haywood Securities where he was a | ||
| Vice President. |
HENNESSY FUNDS 1-800-966-4354
73
Expense Example
October 31, 2008
As a shareholder of the Funds, you incur two types of costs: (1) transaction costs, including sales charges (loads) on purchase payments, reinvested dividends, or other distributions; redemption fees; and exchange fees; and (2) ongoing costs, including management fees; service fees; and other Fund expenses. This Example is intended to help you understand your ongoing costs (in dollars) of investing in each of the Funds and to compare these costs with the ongoing costs of investing in other mutual funds. The Example is based on an investment of $1,000 invested at the beginning of the period and held for the entire period from May 1, 2008 through October 31, 2008.
Actual Expenses
The first set of lines of the table below provide information about actual account values and actual expenses. Although the Funds charge no sales loads or transaction fees, you will be assessed fees for outgoing wire transfers, returned checks and stop payment orders at prevailing rates charged by U.S. Bancorp Fund Services, LLC, the Funds’ transfer agent. If you request that a redemption be made by wire transfer, currently a $15.00 fee is charged by the Funds’ transfer agent. IRA accounts will be charged a $15.00 annual maintenance fee. The example below includes, but is not limited to, management fees, shareholder servicing fees, fund accounting, custody and transfer agent fees. However, the example below does not include portfolio trading commissions and related expenses, interest expense or dividends on short positions taken by the Fund and other extraordinary expenses as determined under generally accepted accounting principles. You may use the information within these lines, together with the amount you invested, to estimate the expenses that you paid over the six-month period. Simply divide your account value by $1,000 (for example, an $8,600 account value divided by $1,000 = 8.6), then multiply the result by the number in the first line under the heading entitled “Expenses Paid During Period” to estimate the expenses you paid on your account during this period.
Hypothetical Example for Comparison Purposes
The second set of lines within the table below provide information about hypothetical account values and hypothetical expenses based on the Funds’ actual expense ratios and an assumed rate of return of 5% per year before expenses, which is not the Funds’ actual return. The hypothetical account values and expenses may not be used to estimate the actual ending account balance or expenses you paid for the period. You may use this information to compare the ongoing costs of investing in the Funds and other funds. To do so, compare this 5% hypothetical example with the 5% hypothetical examples that appear in the shareholder reports of the other funds. Please note that the expenses shown in the table are meant to highlight your ongoing costs only and do not reflect any transactional costs, such as sales charges (loads), or exchange fees. Therefore, the second line of the table is useful in comparing ongoing costs only, and will not help you determine the relative total costs of owning different funds. In addition, if these transactional costs were included, your costs would have been higher.
WWW.HENNESSYFUNDS.COM
74
| Beginning | Ending | Expenses Paid | ||||||||||
| Account Value | Account Value | During Period(1) | ||||||||||
| Original Class | 5/1/08 | 10/31/08 | 5/1/08 – 10/31/08 | |||||||||
| Actual | ||||||||||||
| Growth Fund – Original Class | $ | 1,000.00 | $ | 662.20 | $ | 5.31 | ||||||
| Growth II Fund – Original Class | $ | 1,000.00 | $ | 536.30 | $ | 5.60 | ||||||
| Focus 30 Fund – Original Class | $ | 1,000.00 | $ | 675.10 | $ | 5.31 | ||||||
| Value Fund – Original Class | $ | 1,000.00 | $ | 649.70 | $ | 5.14 | ||||||
| Total Return Fund – Original Class | $ | 1,000.00 | $ | 781.70 | $ | 9.32 | ||||||
| Balanced Fund – Original Class | $ | 1,000.00 | $ | 843.20 | $ | 7.64 | ||||||
| Hypothetical (5% return | ||||||||||||
| before expenses) | ||||||||||||
| Growth Fund – Original Class | $ | 1,000.00 | $ | 1,018.75 | $ | 6.44 | ||||||
| Growth II Fund – Original Class | $ | 1,000.00 | $ | 1,017.85 | $ | 7.35 | ||||||
| Focus 30 Fund – Original Class | $ | 1,000.00 | $ | 1,018.80 | $ | 6.39 | ||||||
| Value Fund – Original Class | $ | 1,000.00 | $ | 1,018.90 | $ | 6.29 | ||||||
| Total Return Fund – Original Class | $ | 1,000.00 | $ | 1,014.68 | $ | 10.53 | ||||||
| Balanced Fund – Original Class | $ | 1,000.00 | $ | 1,016.84 | $ | 8.36 | ||||||
| (1) | Expenses are equal to the Growth Fund’s expense ratio of 1.27%, the Growth II Fund’s expense ratio of 1.45%, the Focus 30 Fund’s expense ratio of 1.26%, the Value Fund’s expense ratio of 1.24%, the Total Return Fund’s expense ratio of 2.08%, and the Balanced Fund’s expense ratio of 1.65%, multiplied by the average account value over the period, multiplied by 184/366 days (to reflect one-half year period). |
| Beginning | Ending | Expenses Paid | ||||||||||
| Account Value | Account Value | During Period(2) | ||||||||||
| Institutional Class | 5/1/08 | 10/31/08 | 5/1/08 – 10/31/08 | |||||||||
| Actual | ||||||||||||
| Growth Fund – Institutional Class | $ | 1,000.00 | $ | 998.96 | $ | 4.80 | ||||||
| Growth II Fund – Institutional Class | $ | 1,000.00 | $ | 1,001.29 | $ | 4.75 | ||||||
| Focus 30 Fund – Institutional Class | $ | 1,000.00 | $ | 1,010.34 | $ | 4.80 | ||||||
| Value Fund – Institutional Class | $ | 1,000.00 | $ | 1,001.59 | $ | 4.79 | ||||||
| Hypothetical (5% return | ||||||||||||
| before expenses) | ||||||||||||
| Growth Fund – Institutional Class | $ | 1,000.00 | $ | 1,003.15 | $ | 4.93 | ||||||
| Growth II Fund – Institutional Class | $ | 1,000.00 | $ | 1,003.15 | $ | 4.93 | ||||||
| Focus 30 Fund – Institutional Class | $ | 1,000.00 | $ | 1,003.15 | $ | 4.93 | ||||||
| Value Fund – Institutional Class | $ | 1,000.00 | $ | 1,003.15 | $ | 4.93 | ||||||
| (2) | Expenses are equal to the Growth, Growth II, Focus 30 and Value Fund’s expense ratio of 0.98%, multiplied by the average account value over the period, multiplied by 184/366 days (to reflect the period). |
HENNESSY FUNDS 1-800-966-4354
75
PROXY VOTING POLICY
How to Obtain a Copy of the Funds’ Proxy Voting Policy and Proxy Voting Records
A description of the policies and procedures that the Funds use to determine how to vote proxies relating to portfolio securities is available without charge: (1) by calling 1-800-966-4354; (2) on the Hennessy Funds website at www.hennessyfunds.com; or (3) on the U.S. Securities and Exchange Commission’s website at www.sec.gov. Hennessy Funds’ proxy voting record is available on the SEC’s website at www.sec.gov no later than August 31 for the prior 12 months ending June 30.
Quarterly Filings on Form N-Q
The Funds file their complete schedule of portfolio holdings with the SEC for the first and third quarters of each fiscal year on Form N-Q. The Funds’ Form N-Q will be available on the SEC’s website at www.sec.gov. The Funds’ Form N-Q may be reviewed and copied at the SEC’s Public Reference Room in Washington, DC and information on the operation of the Public Reference Room may be obtained by calling 1-800-SEC-0330. Information included in the Funds’ N-Q will also be available upon request by calling 1-800-966-4354.
WWW.HENNESSYFUNDS.COM
76
(This Page Intentionally Left Blank.)
HENNESSY FUNDS 1-800-966-4354
77
For information, questions
or assistance, please call
The Hennessy Funds
1-800-966-4354 or 1-415-899-1555
investment advisor
Hennessy Advisors, Inc.
7250 Redwood Blvd., Suite 200
Novato, California 94945
administrator, transfer
agent, dividend paying
agent & shareholder
servicing agent
U.S. Bancorp Fund Services, LLC
P.O. Box 701
Milwaukee, Wisconsin 53201-0701
custodian
U.S. Bank N.A.
Custody Operations
1555 North River Center Dr., Suite 302
Milwaukee, Wisconsin 53212
directors
Neil J. Hennessy
Robert T. Doyle
J. Dennis DeSousa
Gerald P. Richardson
counsel
Foley & Lardner LLP
777 East Wisconsin Avenue
Milwaukee, Wisconsin 53202-5306
independent registered
public accounting firm
KPMG LLP
303 East Wacker Drive
Chicago, Illinois 60601
distributor
Quasar Distributors, LLC
615 East Michigan Street
Milwaukee, Wisconsin 53202
WWW.HENNESSYFUNDS.COM
This report has been prepared for shareholders and may be distributed to others only if preceded or accompanied by a current prospectus.
Item 2. Code of Ethics.
A copy of the registrant’s Code of Ethics is filed herewith.
Item 3. Audit Committee Financial Expert.
The registrant’s board of directors has determined that it does not have an audit committee financial expert serving on its audit committee. At this time, the registrant believes that the experience provided by each member of the audit committee together offers the registrant adequate oversight for the registrant’s level of financial complexity.
Item 4. Principal Accountant Fees and Services.
The registrant has engaged its principal accountant to perform audit services, audit-related services, tax services and other services during the past two fiscal years. “Audit services” refer to performing an audit of the registrant's annual financial statements or services that are normally provided by the accountant in connection with statutory and regulatory filings or engagements for those fiscal years. “Audit-related services” refer to the assurance and related services by the principal accountant that are reasonably related to the performance of the audit. “Tax services” refer to professional services rendered by the principal accountant for tax compliance, tax advice, and tax planning. The following table details the aggregate fees billed or expected to be billed for each of the last two fiscal years for audit fees, audit-related fees, tax fees and other fees by the principal accountant.
| FYE 10/31/2008 | FYE 10/31/2007 | |
| Audit Fees | $16,500 | $16,000 |
| Audit-Related Fees | - | - |
| Tax Fees | 3,250 | 3,200 |
| All Other Fees | - | - |
The audit committee has adopted pre-approval policies and procedures that require the audit committee to pre-approve all audit and non-audit services of the registrant, including services provided to any entity affiliated with the registrant.
The percentage of fees billed by KPMG, LLP applicable to non-audit services pursuant to waiver of pre-approval requirement were as follows:
| FYE 10/31/2008 | FYE 10/31/2007 | |
| Audit-Related Fees | 0% | 0% |
| Tax Fees | 0% | 0% |
| All Other Fees | 0% | 0% |
All of the principal accountant’s hours spent on auditing the registrant’s financial statements were attributed to work performed by full-time permanent employees of the principal accountant. (If more than 50 percent of the accountant’s hours were spent to audit the registrant's financial statements for the most recent fiscal year, state how many hours were attributed to work performed by persons other than the principal accountant's full-time, permanent employees.)
The following table indicates the non-audit fees billed or expected to be billed by the registrant’s accountant for services to the registrant and to the registrant’s investment adviser (and any other controlling entity, etc.—not sub-adviser) for the last two years. The audit committee of the board of trustees/directors has considered whether the provision of non-audit services that were rendered to the registrant's investment adviser is compatible with maintaining the principal accountant's independence and has concluded that the provision of such non-audit services by the accountant has not compromised the accountant’s independence.
| Non-Audit Related Fees | FYE 10/31/2008 | FYE 10/31/2007 |
| Registrant | $- | $- |
| Registrant’s Investment Adviser | - | - |
Item 5. Audit Committee of Listed Registrants.
Not applicable to registrants who are not listed issuers (as defined in Rule 10A-3 under the Securities Exchange Act of 1934).
Item 6. Investments.
Schedule of Investments is included as part of the report to shareholders filed under Item 1 of this Form.
Item 7. Disclosure of Proxy Voting Policies and Procedures for Closed-End Management Investment Companies.
Not applicable to open-end investment companies.
Item 8. Portfolio Managers of Closed-End Management Investment Companies.
Not applicable to open-end investment companies.
Item 9. Purchases of Equity Securities by Closed-End Management Investment Company and Affiliated Purchasers.
Not applicable to open-end investment companies.
Item 10. Submission of Matters to a Vote of Security Holders.
Not Applicable.
Item 11. Controls and Procedures.
| (a) | The Registrant’s Chief Executive Officer and Treasurer have reviewed the Registrant's disclosure controls and procedures (as defined in Rule 30a-3(c) under the Investment Company Act of 1940 (the “Act”)) as of a date within 90 days of the filing of this report, as required by Rule 30a-3(b) under the Act and Rules 13a-15(b) or 15d-15(b) under the Securities Exchange Act of 1934. Based on their review, such officers have concluded that the disclosure controls and procedures are effective in ensuring that information required to be disclosed in this report is appropriately recorded, processed, summarized and reported and made known to them by others within the Registrant and by the Registrant’s service provider. |
| (b) | There were no changes in the Registrant's internal control over financial reporting (as defined in Rule 30a-3(d) under the Act) that occurred during the second fiscal quarter of the period covered by this report that has materially affected, or is reasonably likely to materially affect, the Registrant's internal control over financial reporting. |
Item 12. Exhibits.
| (a) | (1) Any code of ethics or amendment thereto, that is the subject of the disclosure required by Item 2, to the extent that the registrant intends to satisfy Item 2 requirements through filing an exhibit. Filed herewith |
(2) A separate certification for each principal executive and principal financial officer pursuant to Section 302 of the Sarbanes-Oxley Act of 2002. Filed herewith
(3) Any written solicitation to purchase securities under Rule 23c-1 under the Act sent or given during the period covered by the report by or on behalf of the registrant to 10 or more persons. Not applicable to open-end investment companies.
| (b) | Certifications pursuant to Section 906 of the Sarbanes-Oxley Act of 2002. Furnished herewith. |
SIGNATURES
Pursuant to the requirements of the Securities Exchange Act of 1934 and the Investment Company Act of 1940, the registrant has duly caused this report to be signed on its behalf by the undersigned, thereunto duly authorized.
(Registrant) Hennessy Funds Trust.
By (Signature and Title)* /s/Neil J. Hennessy
Neil J. Hennessy, Principal Executive Officer
Date January 9, 2009
Pursuant to the requirements of the Securities Exchange Act of 1934 and the Investment Company Act of 1940, this report has been signed below by the following persons on behalf of the registrant and in the capacities and on the dates indicated.
By (Signature and Title) /s/Neil J. Hennessy
Neil J. Hennessy, Principal Executive Officer
Date January 9, 2009
By (Signature and Title) /s/Teresa M. Nilsen
Teresa M. Nilsen, Treasurer
Date January 9, 2009