UNITED STATES
SECURITIES AND EXCHANGE COMMISSION
Washington, D.C. 20549
FORM N-CSR
CERTIFIED SHAREHOLDER REPORT OF REGISTERED
MANAGEMENT INVESTMENT COMPANIES
Investment Company Act file number (811-07168)
Hennessy Funds Trust
(Exact name of registrant as specified in charter)
7250 Redwood Blvd., Suite 200
Novato, CA 94945
(Address of principal executive offices) (Zip code)
Neil J. Hennessy
Hennessy Advisors, Inc.
7250 Redwood Blvd., Suite 200
Novato, CA 94945
(Name and address of agent for service)
800-966-4354
Registrant's telephone number, including area code
Date of fiscal year end: September 30, 2009
Date of reporting period: March 31, 2009
Item 1. Reports to Stockholders.
HENNESSY FUNDS
SEMI-ANNUAL REPORT
MARCH 31, 2009
Hennessy Cornerstone Large Growth Fund
Contents
| Letter to shareholders | 1 |
| Summary of investments | 3 |
| Financial statements | |
| Statements of assets and liabilities | 7 |
| Statement of operations | 8 |
| Statements of changes in net assets | 9 |
| Financial highlights | 10 |
| Notes to the financial statements | 12 |
| Expense example | 19 |
| Proxy voting policy | 21 |
| Board approval of investment advisory agreement | 22 |
May, 2009
Dear Hennessy Funds Shareholder:
First, I would like to thank the shareholders of the Tamarack Large Cap Growth Fund for voting in favor of having Hennessy Funds manage your mutual fund investment. The name of the Fund is now the Hennessy Cornerstone Large Growth Fund. We appreciate the vote of confidence and want to assure you that we will manage the Fund with your best interest in mind. We welcome you to the Hennessy family of shareholders, and we look forward to the opportunity to help you meet your investment goals.
When Hennessy assumed management of the Fund on March 23, 2009, the portfolio began utilizing a purely quantitative formula, which differs from the investment strategy employed by the Tamarack Large Cap Growth Fund. This semi-annual report covers the period from October 1, 2008 through March 31, 2009, and given the short period of time that we have managed the fund (March 23rd to March 31st), we do not think that delving into the Fund’s performance for that time frame would be useful. Rather, I would like to provide a general overview of the markets for the six-month period and our thoughts going forward.
During the period October 1, 2008 through March 31, 2009, the financial markets experienced their darkest days in recent history, with the major indices losing approximately 30% of their value in just six months. During my 30 years in the financial industry, I have never seen the kind of crisis of confidence that we experienced at the end of February and the beginning of March. As retirement account balances and home values plummeted, even the most disciplined, long-term investors had simply had enough and began moving their money to the sidelines. For me, that signaled a turning point and suggested that the markets and consumer confidence had hit bottom.
I believe that the recovery actually began in November with the first injection of government TARP (Troubled Asset Relief Program) spending and that the lows the market hit in March are behind us. As in any type of recovery, it will take time. I use the analogy of putting a cast on a broken bone; the fix is in place but it will be a slow and painful process to heal the break.
I foresee steady economic growth in the coming months. It seems that many people have the perception that the majority of companies are
HENNESSY FUNDS 1-800-966-4354
losing money, but our analysis shows that is simply not the case. I believe that companies are taking the opportunity, while their stock prices have been driven down, to become as lean as possible so that any increase in revenue will fall to the bottom line and increase profitability. A full recovery may take longer than some would hope, but I believe that the growth we will experience will be based on solid, tangible business results and, most importantly, it will be sustainable. It is my opinion that investors learned an important lesson about leverage and will resume investing in high quality stocks and mutual funds as confidence in the markets is restored.
Corrections are always painful, and I understand that the magnitude of the most recent market downturn has left investors feeling overwhelmed and distraught. I do, however, believe that historical performance data has shown how discipline and a long-term investing view can be rewarded, particularly now. Some of the savviest investors know that when things look bleakest, it may be a good time to buy rather than sell. I believe it is a phenomenal time to consider putting long-term money to work in the market.
We vigilantly maintain our focus on building long-term value for our shareholders. At Hennessy Funds, we believe in servicing our shareholders directly, so that we can provide instant answers to shareholder questions and concerns. Please don’t hesitate to contact us at 800-966-4354 if we can answer any questions or can be of service.
Best regards,
Neil Hennessy
Portfolio Manager & Chief Investment Officer
Past performance does not guarantee future results.
Mutual fund investing involves risk. Principal loss is possible. Small and medium-capitalization companies tend to have limited liquidity and greater price volatility than large-capitalization companies. Growth stocks typically are more volatile than value stocks; however value stocks have a lower expected growth rate in earnings and sales.
Opinions expressed are those of Neil Hennessy and are subject to change, are not guaranteed and should not be considered investment advice.
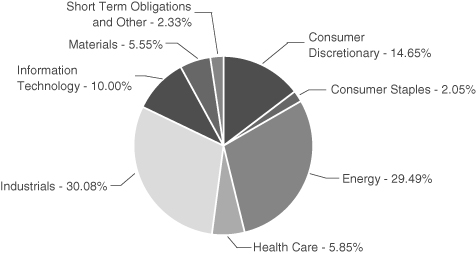
The following summary of investment portfolios is designed to help investors better understand the fund’s principal holdings. The summary is as of March 31, 2009.
HENNESSY CORNERSTONE
LARGE GROWTH FUND
(% of Net Assets)
| TOP TEN HOLDINGS | % of net assets |
| The McGraw-Hill Companies, Inc. | 2.31% |
| Best Buy Co., Inc. | 2.24% |
| Coach, Inc. | 2.12% |
| General Dynamics Corp. | 2.11% |
| Boeing Co. | 2.09% |
| Cooper Industries Ltd. | 2.08% |
| The Gap, Inc. | 2.07% |
| Cummins, Inc. | 2.07% |
| Marathon Oil Corp. | 2.07% |
| 3M Co. | 2.06% |
HENNESSY FUNDS 1-800-966-4354
| COMMON STOCKS – 97.67% | | Number | | | | | | % of Net | |
| | | of Shares | | | Value | | | Assets | |
| Consumer Discretionary – 14.65% | | | | | | | | | |
| Best Buy Co., Inc. | | | 31,000 | | | $ | 1,176,760 | | | | 2.24 | % |
| Coach, Inc. (a) | | | 66,700 | | | | 1,113,890 | | | | 2.12 | % |
| Dish Network Corp. (a) | | | 96,900 | | | | 1,076,559 | | | | 2.05 | % |
| The Gap, Inc. | | | 83,700 | | | | 1,087,263 | | | | 2.07 | % |
| The McGraw-Hill Companies, Inc. | | | 53,000 | | | | 1,212,110 | | | | 2.31 | % |
| Omnicom Group | | | 42,100 | | | | 985,140 | | | | 1.88 | % |
| TJX Cos., Inc. | | | 40,600 | | | | 1,040,984 | | | | 1.98 | % |
| | | | | | | | 7,692,706 | | | | 14.65 | % |
| | | | | | | | | | | | | |
| Consumer Staples – 2.05% | | | | | | | | | | | | |
| Avon Products, Inc. | | | 56,100 | | | | 1,078,803 | | | | 2.05 | % |
| | | | | | | | | | | | | |
| Energy – 29.49% | | | | | | | | | | | | |
| Baker Hughes, Inc. | | | 32,300 | | | | 922,165 | | | | 1.76 | % |
| Cameron International Corp. (a) | | | 44,400 | | | | 973,692 | | | | 1.85 | % |
| ChevronTexaco Corp. | | | 15,500 | | | | 1,042,220 | | | | 1.98 | % |
| ConocoPhillips | | | 26,500 | | | | 1,037,740 | | | | 1.98 | % |
| Denbury Resources, Inc. (a) | | | 63,900 | | | | 949,554 | | | | 1.81 | % |
| Diamond Offshore Drilling | | | 15,200 | | | | 955,472 | | | | 1.82 | % |
| ENSCO International, Inc. | | | 35,700 | | | | 942,480 | | | | 1.79 | % |
| EOG Resources, Inc. | | | 16,200 | | | | 887,112 | | | | 1.69 | % |
| Exxon Mobil Corp. | | | 15,200 | | | | 1,035,120 | | | | 1.97 | % |
| Halliburton Co. | | | 59,500 | | | | 920,465 | | | | 1.75 | % |
| Hess Corp. | | | 16,200 | | | | 878,040 | | | | 1.67 | % |
| Marathon Oil Corp. | | | 41,300 | | | | 1,085,777 | | | | 2.07 | % |
| Murphy Oil Corp. | | | 21,000 | | | | 940,170 | | | | 1.79 | % |
| Noble Corporation Baar | | | 39,800 | | | | 958,782 | | | | 1.83 | % |
| Occidental Petroleum Corp. | | | 17,700 | | | | 985,005 | | | | 1.87 | % |
| Schlumberger Ltd. | | | 24,100 | | | | 978,942 | | | | 1.86 | % |
| | | | | | | | 15,492,736 | | | | 29.49 | % |
| | | | | | | | | | | | | |
| Health Care – 5.85% | | | | | | | | | | | | |
| Eli Lilly & Co. | | | 30,800 | | | | 1,029,028 | | | | 1.96 | % |
| Forest Laboratories, Inc. (a) | | | 47,500 | | | | 1,043,100 | | | | 1.98 | % |
| Merck & Co., Inc. | | | 37,500 | | | | 1,003,125 | | | | 1.91 | % |
| | | | | | | | 3,075,253 | | | | 5.85 | % |
The accompanying notes are an integral part of these financial statements.
| COMMON STOCKS | | Number | | | | | | % of Net | |
| | | of Shares | | | Value | | | Assets | |
| Industrials – 30.08% | | | | | | | | | |
| 3M Co. | | | 21,800 | | | $ | 1,083,896 | | | | 2.06 | % |
| Boeing Co. | | | 30,800 | | | | 1,095,864 | | | | 2.09 | % |
| Cooper Industries Ltd. | | | 42,300 | | | | 1,093,878 | | | | 2.08 | % |
| Cummins, Inc. | | | 42,700 | | | | 1,086,715 | | | | 2.07 | % |
| Emerson Electric Co. | | | 37,400 | | | | 1,068,892 | | | | 2.04 | % |
| Fluor Corp. | | | 27,400 | | | | 946,670 | | | | 1.80 | % |
| General Dynamics Corp. | | | 26,600 | | | | 1,106,294 | | | | 2.11 | % |
| Goodrich Corp. | | | 26,900 | | | | 1,019,241 | | | | 1.94 | % |
| Honeywell International, Inc. | | | 37,200 | | | | 1,036,392 | | | | 1.97 | % |
| ITT Industries, Inc. | | | 26,600 | | | | 1,023,302 | | | | 1.95 | % |
| Lockheed Martin Corp. | | | 14,800 | | | | 1,021,644 | | | | 1.95 | % |
| Pitney Bowes, Inc. | | | 45,900 | | | | 1,071,765 | | | | 2.04 | % |
| Precision Castparts Corp. | | | 17,400 | | | | 1,042,260 | | | | 1.98 | % |
| Rockwell Collins, Inc. | | | 31,900 | | | | 1,041,216 | | | | 1.98 | % |
| United Technologies Corp. | | | 24,700 | | | | 1,061,606 | | | | 2.02 | % |
| | | | | | | | 15,799,635 | | | | 30.08 | % |
| | | | | | | | | | | | | |
| Information Technology – 10.00% | | | | | | | | | | | | |
| Dell, Inc. (a) | | | 101,500 | | | | 962,220 | | | | 1.83 | % |
| International Business Machines Corp. | | | 10,800 | | | | 1,046,412 | | | | 1.99 | % |
| Mastercard, Inc. | | | 6,400 | | | | 1,071,872 | | | | 2.04 | % |
| Texas Instruments, Inc. | | | 63,500 | | | | 1,048,385 | | | | 2.00 | % |
| Western Digital Corp. (a) | | | 58,000 | | | | 1,121,720 | | | | 2.14 | % |
| | | | | | | | 5,250,609 | | | | 10.00 | % |
| | | | | | | | | | | | | |
| Materials – 5.55% | | | | | | | | | | | | |
| Consol Energy, Inc. | | | 34,900 | | | | 880,876 | | | | 1.68 | % |
| Mosaic Co. | | | 24,100 | | | | 1,011,718 | | | | 1.92 | % |
| Nucor Corp. | | | 26,800 | | | | 1,022,956 | | | | 1.95 | % |
| | | | | | | | 2,915,550 | | | | 5.55 | % |
| | | | | | | | | | | | | |
Total Common Stocks (Cost $54,901,916) | | | | | | | 51,305,292 | | | | 97.67 | % |
The accompanying notes are an integral part of these financial statements.
HENNESSY FUNDS 1-800-966-4354
| SHORT-TERM INVESTMENTS – 2.32% | | Principal | | | | | | % of Net | |
| | | Amount | | | Value | | | Value | |
| Variable Rate Demand Notes# – 2.32% | | | | | | | | | |
| American Family Financial Services | | | | | | | | | |
| 0.100% (b) | | $ | 1,220,000 | | | $ | 1,220,000 | | | | 2.32 | % |
| | | | | | | | | | | | | |
| Total Short-Term Investments | | | | | | | | | | | | |
| (Cost $1,220,000) | | | | | | | 1,220,000 | | | | 2.32 | % |
| | | | | | | | | | | | | |
Total Investments – 99.99% | | | | | | | | | | | | |
| (Cost $56,121,916) | | | | | | | 52,525,292 | | | | 99.99 | % |
| | | | | | | | | | | | | |
| Other Assets in Excess of Liabilities – 0.01% | | | | | | | 4,494 | | | | 0.01 | % |
TOTAL NET ASSETS – 100.00% | | | | | | $ | 52,529,786 | | | | 100.00 | % |
Percentages are stated as a percent of net assets.
| # | Variable rate demand notes are considered shor-term obligations and are payable on demand. Interest rates change periodically on specified dates. The rates listed are as of March 31, 2009. |
FAS 157 – Summary of Fair Value Exposure at March 31, 2009 (Unaudited)
Various inputs are used in determining the value of the Fund’s investments, which are summarized as follows:
| Level 1 – | Quoted prices in active markets for identical securities |
| Level 2 – | Other significant observable inputs (including quoted prices for similar securities, interest rates, prepayment speeds, credit risk, etc.) |
| Level 3 – | Significant unobservable inputs (including the Fund’s own assumptions in determining the fair value of investments) |
The inputs or methodology used for valuing securities are not an indication of the risk associated with investing in those securities.
The following is a summary of the inputs used to value the Fund’s net assets as of March 31, 2009:
| Description | | Investments in Securities | |
| Level 1 – Quoted prices in active markets for identical securities | | $ | 51,305,292 | |
| Level 2 – Other significant observable inputs | | | 1,220,000 | |
| Level 3 – Significant unobservable inputs | | | — | |
| Total | | $ | 52,525,292 | |
The accompanying notes are an integral part of these financial statements.
Financial Statements
Statement of Assets and Liabilities as of March 31, 2009 (Unaudited) |
| ASSETS: | | | |
| Investments, at value (cost $56,121,916) | | $ | 52,525,292 | |
| Cash | | | 76,748 | |
| Dividends and interest receivable | | | 38,818 | |
| Receivable for fund shares sold | | | 171 | |
| Receivable for securities sold | | | — | |
| Prepaid expenses and other assets | | | 54,267 | |
| Total Assets | | | 52,695,296 | |
| | | | | |
| LIABILITIES: | | | | |
| Payable for fund shares redeemed | | | 93,383 | |
| Payable to Advisor | | | 14,131 | |
| Payable to Distributor | | | 332 | |
| Accrued administration fees | | | 5,625 | |
| Accrued fund accounting fees | | | 2,030 | |
| Accrued custody fees | | | 138 | |
| Accrued transfer agent fees | | | 35,506 | |
| Accrued audit fees | | | 5,043 | |
| Accrued legal fees | | | 616 | |
| Accrued service fees | | | 1,340 | |
| Accrued printing and mailing expense | | | 6,727 | |
| Accrued expenses and other payables | | | 639 | |
| Total Liabilities | | | 165,510 | |
| | | | | |
| NET ASSETS | | $ | 52,529,786 | |
| | | | | |
| NET ASSETS CONSIST OF: | | | | |
| Capital stock | | $ | 90,981,991 | |
| Accumulated net investment income | | | 92,012 | |
| Accumulated net realized loss on investments | | | (34,947,593 | ) |
| Unrealized net depreciation on investments | | | (3,596,624 | ) |
| Total Net Assets | | $ | 52,529,786 | |
| | | | | |
| NET ASSETS | | | | |
| | | | | |
| Original Class: | | | | |
| Shares authorized (no par value) | | Unlimited | |
| Net assets applicable to outstanding Original Class shares | | | 52,518,505 | |
| Shares issued and outstanding | | | 7,699,758 | |
| Net asset value, offering price and redemption price per share | | $ | 6.82 | |
| | | | | |
| Institutional Class: | | | | |
| Shares authorized (no par value) | | Unlimited | |
| Net assets applicable to outstanding Institutional Class shares | | | 11,281 | |
| Shares issued and outstanding | | | 1,654 | |
| Net asset value, offering price and redemption price per share | | $ | 6.82 | |
The accompanying notes are an integral part of these financial statements.
HENNESSY FUNDS 1-800-966-4354
Financial Statements
Statement of Operations Six months ended March 31, 2009 (Unaudited) |
| INVESTMENT INCOME: | | | |
Dividend income(1) | | $ | 393,344 | |
| Interest income | | | 4,281 | |
| Total investment income | | | 397,625 | |
| | | | | |
| EXPENSES: | | | | |
Investment advisory fees(2) | | | 205,329 | |
| Transfer agent fees | | | 95,371 | |
| Administration fees | | | 24,798 | |
| Federal and state registration fees | | | 22,326 | |
| Fund accounting fees | | | 15,540 | |
| Printing and mailing expense | | | 14,429 | |
Sub-transfer agent expenses(2) | | | 9,620 | |
| Legal fees | | | 7,836 | |
Distribution fees(2) | | | | |
| Original Class | | | — | |
| Institutional Class | | | — | |
| Class A | | | 5,320 | |
| Class C | | | 435 | |
| Class R | | | 15 | |
| Audit fees | | | 3,411 | |
| Custody fees | | | 1,666 | |
Service fees(2) | | | | |
| Original Class | | | 1,340 | |
| Institutional Class | | | — | |
| Class A | | | — | |
| Class C | | | — | |
| Class R | | | — | |
| Directors’ fees and expenses | | | 1,163 | |
| Other | | | 6,248 | |
| Total expenses before waiver/reimbursement | | | 414,847 | |
| Expense waiver/reimbursement by: | | | | |
| Advisor | | | (106,574 | ) |
| Distributor | | | (2,660 | ) |
| Net expenses | | | 305,613 | |
| NET INVESTMENT INCOME | | $ | 92,012 | |
| | | | | |
| REALIZED AND UNREALIZED LOSSES: | | | | |
| Net realized loss on investments | | $ | (21,492,365 | ) |
| Change in unrealized appreciation (depreciation) on investments | | | (5,817,490 | ) |
| Net loss on investments | | | (27,309,855 | ) |
| | | | | |
| NET DECREASE IN NET ASSETS | | | | |
| RESULTING FROM OPERATIONS | | $ | (27,217,843 | ) |
(1) | Net of foreign taxes withheld of $924. |
(2) | Please see Note 4 in Notes to Financial Statements. |
The accompanying notes are an integral part of these financial statements.
Financial Statements
| Statement of Changes in Net Assets |
| | | Six Months Ended | | | Year Ended | |
| | | March 31, 2009 | | | September 30, | |
| | | (Unaudited) | | | 2008 | |
| OPERATIONS: | | | | | | |
| Net investment income (loss) | | $ | 92,012 | | | $ | (22,418 | ) |
| Net realized gain (loss) on securities | | | (21,492,365 | ) | | | (866,288 | ) |
| Change in unrealized appreciation (depreciation) on securities | | | (5,817,490 | ) | | | (21,199,636 | ) |
| Net increase (decrease) in net assets resulting from operations | | | (27,217,843 | ) | | | (22,088,342 | ) |
| | | | | | | | | |
| CAPITAL SHARE TRANSACTIONS: | | | | | | | | |
| Proceeds from shares subscribed – Original Class | | | 51,967,592 | | | | — | |
| Proceeds from shares subscribed – Institutional Class | | | 11,138 | | | | — | |
| Proceeds from shares subscribed – Class A | | | 354,913 | | | | 637,476 | |
| Proceeds from shares subscribed – Class I | | | 1,450 | | | | 43,830 | |
| Proceeds from shares subscribed – Class C | | | — | | | | 114,000 | |
| Proceeds from shares subscribed – Class R | | | — | | | | — | |
| Proceeds from shares subscribed – Class S | | | 226,710 | | | | 1,012,835 | |
| Cost of shares redeemed – Original Class | | | (152,821 | ) | | | — | |
| Cost of shares redeemed – Institutional Class | | | — | | | | — | |
| Cost of shares redeemed – Class A | | | (2,440,221 | ) | | | (1,104,104 | ) |
| Cost of shares redeemed – Class I | | | (397,219 | ) | | | (316,089 | ) |
| Cost of shares redeemed – Class C | | | (83,679 | ) | | | (4,572 | ) |
| Cost of shares redeemed – Class R | | | (5,615 | ) | | | (514 | ) |
| Cost of shares redeemed – Class S | | | (54,491,897 | ) | | | (12,226,101 | ) |
| Net increase (decrease) in net assets | | | | | | | | |
| derived from capital share transactions | | | (5,009,649 | ) | | | (11,843,239 | ) |
| | | | | | | | | |
| TOTAL INCREASE (DECREASE) IN NET ASSETS | | | (32,227,492 | ) | | | (33,931,581 | ) |
| | | | | | | | | |
| NET ASSETS: | | | | | | | | |
| Beginning of period | | | 84,757,278 | | | | 118,688,859 | |
| End of period | | $ | 52,529,786 | | | $ | 84,757,278 | |
| | | | | | | | | |
| Accumulated net investment income (loss), end of period | | $ | 92,012 | | | $ | — | |
| | | | | | | | | |
| CHANGES IN SHARES OUTSTANDING: | | | | | | | | |
| Shares sold – Original Class | | | 7,720,902 | | | | — | |
| Shares sold – Institutional Class | | | 1,654 | | | | — | |
| Shares sold – Class A | | | 49,665 | | | | 55,203 | |
| Shares sold – Class I | | | 198 | | | | 4,066 | |
| Shares sold – Class C | | | — | | | | 10,374 | |
| Shares sold – Class R | | | — | | | | — | |
| Shares sold – Class S | | | 30,610 | | | | 87,136 | |
| Shares redeemed – Original Class | | | (21,144 | ) | | | — | |
| Shares redeemed – Institutional Class | | | — | | | | — | |
| Shares redeemed – Class A | | | (364,776 | ) | | | (98,867 | ) |
| Shares redeemed – Class I | | | (58,158 | ) | | | (28,065 | ) |
| Shares redeemed – Class C | | | (13,146 | ) | | | (418 | ) |
| Shares redeemed – Class R | | | (876 | ) | | | (46 | ) |
| Shares redeemed – Class S | | | (8,047,615 | ) | | | (1,041,694 | ) |
| Net increase (decrease) in shares outstanding | | | (702,686 | ) | | | (1,012,311 | ) |
The accompanying notes are an integral part of these financial statements.
HENNESSY FUNDS 1-800-966-4354
| Hennessy Cornerstone Large Growth Fund |
| | | March 23, 2009 | |
| | | through | |
| | | March 31, 2009 | |
| | | (Unaudited) | |
| | | Original | | | Institutional | |
| | | Class(3) | | | Class(3) | |
| PER SHARE DATA: | | | | | | |
| Net asset value, beginning of period | | $ | 6.73 | | | $ | 6.73 | |
| Income from investment operations: | | | | | | | | |
| Net investment income | | | — | | | | — | (5) |
| Net realized and unrealized gains (losses) on securities | | | 0.09 | | | | 0.09 | |
| Total from investment operations | | | 0.09 | | | | 0.09 | |
| Less Distributions: | | | | | | | | |
| Dividends from net investment income | | | — | | | | — | |
| Dividends from net realized gains | | | — | | | | — | |
| Total distributions | | | — | | | | — | |
Redemption fees retained(5) | | | — | | | | — | |
| Net asset value, end of period | | $ | 6.82 | | | $ | 6.82 | |
| TOTAL RETURN | | | 1.34 | %(7) | | | 1.34 | %(7) |
| SUPPLEMENTAL DATA AND RATIOS: | | | | | | | | |
| Net assets, end of period (millions) | | $ | 52.5 | | | $ | 0.1 | |
| Ratio of expenses to average net assets: | | | | | | | | |
| Before expense reimbursement | | | 1.38 | %(8) | | | 1.35 | %(8) |
After expense reimbursement(10) | | | 1.30 | %(8) | | | 0.98 | %(8) |
| Ratio of net investment income to average net assets | | | | | | | | |
| Before expense reimbursement | | | (0.68 | )%(8) | | | (0.58 | )%(8) |
| After expense reimbursement | | | (0.60 | )%(8) | | | (0.21 | )%(8) |
| Portfolio turnover rate | | | 95 | %(7) | | | 95 | %(7) |
(1) | For the period from May 1, 2004 to September 30, 2004. |
(2) | Class S shares commenced operations on April 19, 2004. |
(3) | Original Class and Institutional Class shares commenced operations on March 23, 2009. |
(4) | The financial highlights set forth for periods prior to March 23, 2009 represent the historical financial highlights of the Tamarack Large Cap Growth Fund, Class S shares. The assets of the Tamarack Large Cap Growth Fund were acquired by the Hennessy Cornerstone Large Growth Fund on March 23, 2009. |
(5) | Amount is less than $0.01 or ($0.01) per share. |
(6) | Per share net investment income (loss) has been calculated using the average daily shares method. |
(9) | There were no fee waivers or reimbursements during the period. |
(10) | See Note 4 in Notes to Financial Statements. |
The accompanying notes are an integral part of these financial statements.
| October 1, 2008 | | | | | | | | | | | | | | | | | | | |
| through | | | | | | | | | | | | | | | Period Ended | | | Period Ended | |
| March 22, 2009 | | | Year Ended September 30, | | | September 30, | | | April 30, | |
| (Unaudited) | | | 2008 | | | 2007 | | | 2006 | | | 2005 | | | 2004(1) | | | 2004(2) | |
| | | | | | | | | | | | | | | | | | | | |
Tamarack Large Cap Growth Fund, Class S(4) | |
| | | | | | | | | | | | | | | | | | | | |
| $ | 10.09 | | | $ | 12.61 | | | $ | 10.98 | | | $ | 10.75 | | | $ | 9.97 | | | $ | 10.11 | | | $ | 10.37 | |
| | | | | | | | | | | | | | | | | | | | | | | | | | | |
| | 0.01 | | | | — | (5)(6) | | | — | (5) | | | — | (5) | | | 0.02 | | | | — | | | | 0.00 | |
| | (3.37 | ) | | | (2.52 | ) | | | 1.63 | | | | 0.23 | | | | 0.78 | | | | (0.14 | ) | | | (0.26 | ) |
| | (3.36 | ) | | | (2.52 | ) | | | 1.63 | | | | 0.23 | | | | 0.80 | | | | (0.14 | ) | | | (0.26 | ) |
| | | | | | | | | | | | | | | | | | | | | | | | | | | |
| | — | | | | — | | | | — | | | | — | (5) | | | (0.02 | ) | | | — | | | | — | |
| | — | | | | — | | | | — | | | | — | | | | — | | | | — | | | | — | |
| | — | | | | — | | | | — | | | | — | | | | (0.02 | ) | | | — | | | | — | |
| | — | | | | — | | | | — | | | | — | | | | — | | | | — | | | | — | |
| $ | 6.73 | | | $ | 10.09 | | | $ | 12.61 | | | $ | 10.98 | | | $ | 10.75 | | | $ | 9.97 | | | $ | 10.11 | |
| | (33.30 | )%(7) | | | (19.98 | )% | | | 14.85 | % | | | 2.18 | % | | | 8.04 | % | | | (1.38 | )%(7) | | | (2.51 | )%(7) |
| | | | | | | | | | | | | | | | | | | | | | | | | | | |
| $ | 52.0 | | | $ | 80.9 | | | $ | 113.1 | | | $ | 125.2 | | | $ | 145.6 | | | $ | 168.8 | | | $ | 190.7 | |
| | | | | | | | | | | | | | | | | | | | | | | | | | | |
| | 1.36 | %(8) | | | 1.16 | % | | | 1.18 | % | | | 1.18 | % | | | 1.25 | % | | | 1.13 | %(8) | | | 0.85 | %(8)(9) |
| | 1.00 | %(8) | | | 0.98 | % | | | 1.00 | % | | | 1.00 | % | | | 0.91 | % | | | 0.85 | %(8) | | | 0.85 | %(8)(9) |
| | | | | | | | | | | | | | | | | | | | | | | | | | | |
| | 0.00 | %(8) | | | (0.19 | )% | | | (0.19 | )% | | | (0.20 | )% | | | (0.10 | )% | | | (0.30 | )%(8) | | | (0.27 | )%(8) |
| | 0.36 | %(8) | | | (0.01 | )% | | | (0.01 | )% | | | (0.02 | )% | | | 0.24 | % | | | (0.02 | )%(8) | | | (0.27 | )%(8) |
| | 42 | %(7) | | | 38 | % | | | 25 | % | | | 35 | % | | | 28 | % | | | 16 | %(7) | | | 264 | %(7) |
HENNESSY FUNDS 1-800-966-4354
March 31, 2009 (Unaudited)
1). ORGANIZATION
The Hennessy Cornerstone Large Growth Fund (the “Fund”, formerly known as the Tamarack Large Cap Growth Fund) is organized as a separate investment portfolio or series of Hennessy Funds Trust (the “Trust”), a Delaware statutory trust that was organized on September 17, 1992. Prior to July 1, 2005, the Trust was known as “The Henlopen Fund”. The Trust is an open-end, management investment company registered under the Investment Company Act of 1940, as amended. The Fund is a diversified portfolio.
The Fund is the successor to the Tamarack Large Cap Growth Fund (the “Predecessor Fund”) pursuant to a reorganization that took place on March 23, 2009. As a result of the reorganization, holders of the Class A, Class C, Class I, Class R and Class S shares of the Tamarack Large Cap Growth Fund received Original Class shares of the Hennessy Cornerstone Large Growth Fund.
The Fund offers Original and Institutional Class shares. Each class of shares differs principally in its respective administration and transfer agent expenses and sales charges, if any. Each class has identical rights to earnings, assets and voting privileges, except for class-specific expenses and exclusive rights to vote on matters affecting only individual classes.
2). SIGNIFICANT ACCOUNTING POLICIES
The following is a summary of significant accounting policies consistently followed by the Fund in the preparation of the financial statements. These policies are in conformity with U.S. generally accepted accounting principles (“GAAP”).
| a). | Investment Valuation – Securities which are traded on a national or recognized stock exchange are valued at the last sale price on the securities exchange on which such securities are primarily traded. Exchange-traded securities for which there were no transactions that day and debt securities are valued at the most recent bid prices. Instruments with a remaining maturity of 60 days or less are valued on an amortized cost basis. When a price for an underlying security is not readily available or if a significant event has occurred that indicates the closing price of a security no longer represents the true value of that security, fair value pricing procedures have been adopted by the Board of Trustees of the Fund. Fair value pricing determinations are made in good faith in accordance with these procedures. There are numerous criteria that will be given consideration in determining a fair value of a security. Some of these criteria are: trading volume of security and markets, value of other like securities and news events with direct bearing to security or market. Fair value pricing results in an estimated price that reasonably reflects the current market conditions in order to rate the portfolio holdings such that shareholder transactions receive a fair net asset value. |
| b). | Federal Income Taxes – Provision for federal income taxes or excise taxes has not been made since the Fund has elected to be taxed as a “regulated investment company” and intends to distribute substantially all taxable income to shareholders and otherwise comply with the provisions of the Internal Revenue Code applicable to regulated investment companies. Net investment income and realized gains and losses for federal income tax purposes may differ from that reported on the financial statements because of temporary book and tax basis differences. Temporary differences are primarily the result of the treatment of wash sales for tax reporting purposes. Distributions from net realized gains for book purposes may include short-term capital gains, which are included as ordinary income to shareholders for tax purposes. |
Due to inherent differences in the recognition of income, expenses, and realized gains/losses under U.S. generally accepted accounting principles and federal income tax purposes, permanent differences between book and tax basis reporting for the 2008 fiscal year have been identified and appropriately reclassified on the Statement of Assets and Liabilities.
| Undistributed Net | Accumulated Net | Paid In |
| Investment Income/(Loss) | Realized Gain/(Loss) | Capital |
| 22,418 | 14,484,486 | (14,506,904) |
The permanent differences primarily relate to Net Operating Losses and Capital Loss Carryover lost due to expiration.
| c). | Income and Expenses – Dividend income is recognized on the ex-dividend date or as soon as information is available to the Fund and interest income is recognized on an accrual basis. Income expenses (other than expenses attributable to a specific class), and realized and unrealized gains or losses on investments are allocated to each class of shares based on its respective net assets. |
| d). | Distributions to Shareholders – Dividends from net investment income and distributions of net realized capital gains for the Fund, if any, are declared and paid out annually, usually in November or December of each year. |
| e). | Security Transactions – Investment and shareholder transactions are recorded on the trade date. The Fund determines the gain or loss realized from the investment transactions by comparing the original cost of the security lot sold with the net sale proceeds. Discounts and premiums on securities purchased are accreted/amortized over the life of the respective security. |
| f). | Use of Estimates – The preparation of financial statements in conformity with GAAP requires management to make estimates and assumptions that affect the reported amounts of assets and liabilities and disclosure of contingent assets and liabilities at the date of the financial statements and the reported change in net assets during the reporting period. Actual results could differ from those estimates. |
| g). | Share Valuation – The net asset value (“NAV”) per share of the Fund is calculated by dividing the sum of the value of the securities held, plus cash or other assets, minus all liabilities (including estimated accrued expenses) by the total number of shares outstanding, rounded to the nearest cent. The Fund’s shares will not be priced on the days on which the NYSE is closed for |
HENNESSY FUNDS 1-800-966-4354
trading. The offering and redemption price per share for each Fund is equal to each Fund’s net asset value per share.
| h). | Repurchase Agreements – The Fund may enter into repurchase agreements with member banks or security dealers of the Federal Reserve whom the investment advisor deems creditworthy. The repurchase price generally equals the price paid by the Fund plus interest negotiated on the basis of current short-term rates. |
Securities pledged as collateral for repurchase agreements are held by the custodian bank until the respective agreements mature. Provisions of the repurchase agreements ensure that the market value of the collateral, including accrued interest thereon, is sufficient, in the event of default of the counterparty. If the counterparty defaults and the value of the collateral declines or if the counterparty enters an insolvency proceeding, realization of the collateral by the Fund may be delayed or limited.
| i). | Accounting for Uncertainty in Income Taxes – In June 2006, the Financial Accounting Standards Board (“FASB”) issued FASB Interpretation 48 (“FIN 48”), “Accounting for Uncertainty in Income Taxes.” This standard defines the threshold for recognizing the benefits of tax-return positions in the financial statements as “more-likely-than-not” to be sustained by the taxing authority and requires measurement of a tax position meeting the more-likely-than-not criterion, based on the largest benefit that is more than 50 percent likely to be realized. FIN 48 is effective as of the beginning of the first fiscal year beginning after December 15, 2006, and is to be applied to all open tax years as of the effective date. The tax periods open to examination by the Internal Revenue Service include the fiscal years ended September 30, 2008, 2007, 2006 and 2005. As a result, the Fund has evaluated the implications of FIN 48 and determined that there is no material impact on the financial statements. |
| j.) | Fair Value Measurements – In September 2006, FASB issued Statement on Financial Accounting Standards (SFAS) No. 157, “Fair Value Measurements.” This standard establishes a single authoritative definition of fair value, sets out a framework for measuring fair value and requires additional disclosures about fair value measurements. SFAS No. 157 applies to fair value measurements already required or permitted by existing standards. SFAS No. 157 is effective for financial statements issued for fiscal years beginning after November 15, 2007 and interim periods within those fiscal years. The Fund adopted the provisions of Statement of Financial Accounting Standards No. 157, “Fair Value Measurements” (SFAS 157, effective with the beginning of the Fund’s fiscal year. SFAS 157 establishes a hierarchy that prioritizes the inputs to valuation techniques giving the highest priority to readily available unadjusted quoted prices in active markets for identical assets (level 1 measurements) and the lowest priority to unobservable inputs (level 3 measurements) when market prices are not readily available or reliable. |
| k). | Recently Issued Accounting Pronouncements – In March 2008, Statement of Financial Accounting Standards No. 161, “Disclosures about Derivative Instruments and Hedging Activities” (“SFAS 161”) was issued and is effective for fiscal years beginning after November 15, 2008. SFAS 161 is intended to improve financial reporting for derivative instruments by requiring enhanced |
disclosure that enables investors to understand how and why an entity uses derivatives, how derivatives are accounted for, and how derivative instruments affect an entity’s results of operations and financial position. Management is currently evaluating the implications of SFAS 161. The impact on the Fund’s financial statement disclosures, if any, is currently being assessed.
3). INVESTMENT TRANSACTIONS
Purchases and sales of investment securities (excluding government and short-term investments) during the six months ended March 31, 2009 were $74,544,445 and $79,987,863, respectively.
4). INVESTMENT MANAGEMENT FEE AND OTHER TRANSACTIONS WITH AFFILIATES
Hennessy Advisors, Inc. (the “Advisor”) is the Advisor of the Fund. The Advisor provides the Fund with investment management services under an Investment Advisory Agreement. The Advisor furnishes all investment advice, office space, facilities, and provides most of the personnel needed by the Fund. As compensation for its services, the Advisor is entitled to a monthly fee from the Fund. The fee is based upon the average daily net assets of the Fund at the annual rate of 0.74%.
The Advisor has agreed to waive its fees and absorb expenses to the extent that the total annual operating expenses (excluding all federal, state and local taxes, interest, brokerage commissions, acquired fund fees and expenses and other costs incurred in connection with the purchase and sale of securities and extraordinary items) do not exceed 1.30% and 0.98% of the Fund’s net assets for the Original Class and Institutional Class shares, respectively. The expense limitation agreement for the Original Class shares is in place until March 31, 2010. The expense limitation agreement for the Institutional Class shares is in place until October 31, 2009 and is renewed annually. Voyageur had contractually agreed to waive fees/or make payments in order to keep total operating expenses of the Large Cap Growth Fund, Class S at 1.00%. This limitation was in place February 1, 2008 until January 31, 2009. For a period of three years after the year in which the Advisor waives or reimburses expenses, the Advisor may seek reimbursement from the Fund to the extent that total annual Fund operating expenses are less than the expense limitation in effect at the time of the waiver or reimbursement. The Advisor waived or reimbursed expenses of $1,061 for the Fund for the period March 23, 2009 through March 31, 2009. These reimbursed / absorbed expenses are subject to potential recovery by year of expiration September 30, 2012.
Prior to March 23, 2009, Voyageur Asset Management Inc. (“Voyageur”) acted as the investment advisor for the Predecessor Fund. The Predecessor Fund entered an agreement with Voyageur whereas they furnished related office facilities, equipment, research and personnel. The agreement required the Predecessor Fund to pay Voyageur a monthly fee of 0.70% based upon average daily net assets.
The Board of Trustees has approved a Shareholder Servicing Plan for the Original Class shares of the Fund which was instituted to compensate the Advisor for the non-investment management services it provides to the Funds. The Plan provides for a monthly fee paid to the Advisor at an annual rate of 0.10% of the average daily net assets of the Fund.
HENNESSY FUNDS 1-800-966-4354
The Fund and Predecessor Fund have entered into agreements with various brokers, dealers and financial intermediaries in connection with the sale of shares of the Fund. The agreements provide for periodic payments by the Fund to the brokers, dealers and financial intermediaries for providing certain shareholder maintenance services (sub-transfer agent expenses). These shareholder services include: the pre-processing and quality control of new accounts, shareholder correspondence, answering customer inquiries regarding account status and facilitating shareholder telephone transactions. Fees paid by the Fund and Predecessor Fund to various brokers, dealers and financial intermediaries for the six months ended March 31, 2009, were $9,620.
The Predecessor Fund had adopted a Master Distribution 12b-1 Plan (the “Plan”) in which Tamarack Distributors Inc. (the “Distributor”) acted as the Predecessor Fund’s distributor. The Distributor is an affiliate of Voyageur. The Plan permitted the Predecessor Fund to make payments for or reimburse the Distributor monthly for distribution-related costs and expenses of marketing shares of each share class covered under the Plan; and/or for providing shareholder services. The following chart shows the most recent Plan fee rate for each class of the Predecessor Fund.
| | Class A | Class C | Class R |
| 12b-1 Plan Fee | 0.25%* | 1.00% | 0.50% |
| * | The maximum Plan fee rate for Class A shares is 0.50%. The Distributor has contractually waived 0.25% of the total 0.50% Plan fee for Class A. |
Plan fees are based on average daily net assets of the applicable class. Up to 0.25% of each Plan fee may be designated as a Service Fee, as defined by the applicable rules of the Financial Industry Regulatory Authority. The Distributor, subject to applicable legal requirements, may waive a Plan fee voluntarily, in whole or in part. Neither the Original nor the Institutional Class shares of the Cornerstone Large Growth Fund have a 12b-1 Plan.
For the period ended March 23, 2009, the Distributor received commissions of $436 from front-end sales charges of Class A shares of the Predecessor Fund, all of which was paid to affiliated broker-dealers. The Distributor received no CDSC fees from Class A shares or Class C shares of the Predecessor Fund during the period ended March 23, 2009. Class A and Class C shares were no longer offered for sale after March 23, 2009.
Effective March 23, 2009 U.S. Bancorp Fund Services, LLC (the “Administrator”) acts as the Fund’s Administrator under an Administration Agreement. The Administrator prepares various federal and state regulatory filings, reports and returns for the Fund; prepares reports and materials to be supplied to the directors; monitors the activities of the Fund’s custodian, transfer agent and accountants; coordinates the preparation and payment of the Fund’s expenses and reviews the Fund’s expense accruals. Fees paid to U.S. Bancorp Fund Services, LLC for the period March 23, 2009 through March 31, 2009, were $3,417.
Prior to March 23, 2009 Voyageur and PNC Global Investment Servicing (U.S.) Inc. (“PNC”) served as co-administrators of the Predecessor Fund. Services provided under the administrative services contract included providing day-to-day administration of matters related to the Predecessor Fund,
maintenance of its records and the preparation of reports. Under the terms of the administrative services contract, Voyageur received a fee, payable monthly, at the annual rate of 0.075% of the Predecessor Fund’s average daily net assets. PNC received a fee for its services payable by the Predecessor Fund based on the Predecessor Fund’s average net assets. Voyageur’s fee is included in “Administration fees” in the Statement of Operations. PNC’s fee is included with “Fund Accounting fees” in the Statement of Operations.
The Tamarack Large Cap Growth Fund was the predecessor fund of the Fund. The financial highlights reported for periods prior March 23, 2009, represents the activity of The Tamarack Large Cap Growth Fund.
Quasar Distributors, LLC (“Quasar”) acts as the Fund’s principal underwriter in a continuous public offering of the Fund’s shares. Quasar is an affiliated company of U.S. Bank, N.A.
5). FEDERAL TAX INFORMATION
The following balances for the Fund are as of September 30, 2008, the Fund’s most recent fiscal year end:
| Cost of Investments for tax purposes | | $ | 82,623,453 | |
| Gross tax unrealized appreciation | | | 9,196,370 | |
| Gross tax unrealized depreciation | | | (7,061,023 | ) |
| Net tax unrealized appreciation (depreciation) on investments | | | 2,135,347 | |
| Undistributed ordinary income | | $ | — | |
| Undistributed long-term capital gains | | $ | — | |
| Total Distributable earnings | | $ | — | |
| Other accumulated gains (losses) | | $ | (13,369,709 | ) |
| Total accumulated earnings (losses) | | $ | (11,234,362 | ) |
At September 30, 2008, the Fund had tax basis capital losses of $13,369,709, to offset future capital gains, the use of a portion of which is limited by IRS regulations. Of such losses, $9,673,722 expire September 30, 2009, $2,915,217 expire September 30, 2010, and $612,261 expire September 30, 2016. Additionally, the Fund had no post-September loss deferrals as of September 30, 2008.
6). FUND MERGER
On March 20, 2009 the shareholders of the Tamarack Large Cap Growth Fund approved the agreement and plan of reorganization providing for the transfer of assets of the Tamarack Large Cap Growth Fund to the Hennessy Cornerstone Large Growth Fund and the assumption of the liabilities of the Tamarack Large Cap Growth Fund by the Hennessy Cornerstone Large Growth Fund. The following table illustrates the specifics of the merger:
| | Shares issued to | | | |
| Acquired Fund | Shareholders of | Acquiring Fund | Combined | Tax Status |
| Net Assets | Acquired Fund | Net Assets | Net Assets | of Transfer |
$49,555,615(1) | 7,722,854 | — | $49,555,615 | Non-taxable |
(1) | Includes capital loss carryovers and unrealized depreciation in the amount of $13,369,709 and ($16,139,531) respectively. |
HENNESSY FUNDS 1-800-966-4354
A special meeting of shareholders of the Tamarack Large Cap Growth Fund was held on March 20, 2009 and the following matters were approved by such Fund’s voting shares:
| 1). | Approve an Agreement and Plan of Reorganization pursuant to which all of the assets of the Tamarack Large Cap Growth Fund will be transferred to a newly formed series of Hennessy Funds Trust named the Hennessy Cornerstone Large Growth Fund, in exchange for Original Class shares of the Hennessy Cornerstone Large Growth Fund, which will be distributed pro rata by the Tamarack Large Cap Growth Fund to its Class A, Class C, Class I, Class R and Class S shareholders, and the Hennessy Cornerstone Large Growth Fund’s assumption of the Tamarack Large Cap Growth Fund’s stated liabilities: |
| For | 4,050,694 |
| Against | 374,649 |
| Abstain | 159,262 |
| Broker non-vote | — |
| 2). | Adjourn the special meeting to permit further solicitation of proxies in the event there are not sufficient votes at the time of the special meeting to approve the Agreement and Plan of Reorganization: |
| For | 4,039,639 |
| Against | 375,203 |
| Abstain | 169,762 |
| Broker non-vote | 1 |
March 31, 2009 (Unaudited)
As a shareholder of the Fund, you incur two types of costs: (1) transaction costs, including sales charges (loads) on purchase payments, reinvested dividends, or other distributions; redemption fees; and exchange fees; and (2) ongoing costs, including management fees; service fees; and other Fund expenses. This Example is intended to help you understand your ongoing costs (in dollars) of investing in the Fund and to compare these costs with the ongoing costs of investing in other mutual funds. The Example is based on an investment of $1,000 invested at the beginning of the period and held for the entire period from March 23, 2009 through March 31, 2009.
Actual Expenses
The first set of lines of the table below provide information about actual account values and actual expenses. Although the Fund charges no sales loads or transaction fees, you will be assessed fees for outgoing wire transfers, returned checks and stop payment orders at prevailing rates charged by U.S. Bancorp Fund Services, LLC, the Fund’s transfer agent. If you request that a redemption be made by wire transfer, currently a $15.00 fee is charged by the Fund’s transfer agent. IRA accounts will be charged a $15.00 annual maintenance fee. The example below includes, but is not limited to, management fees, shareholder servicing fees, fund accounting, custody and transfer agent fees. However, the example below does not include portfolio trading commissions and related expenses, interest expense or dividends on short positions taken by the Fund and other extraordinary expenses as determined under generally accepted accounting principles. You may use the information within these lines, together with the amount you invested, to estimate the expenses that you paid over the six-month period. Simply divide your account value by $1,000 (for example, an $8,600 account value divided by $1,000 = 8.6), then multiply the result by the number in the first line under the heading entitled “Expenses Paid During Period” to estimate the expenses you paid on your account during this period.
Hypothetical Example for Comparison Purposes
The second set of lines within the table below provide information about hypothetical account values and hypothetical expenses based on the Fund’s actual expense ratios and an assumed rate of return of 5% per year before expenses, which is not the Fund’s actual return. The hypothetical account values and expenses may not be used to estimate the actual ending account balance or expenses you paid for the period. You may use this information to compare the ongoing costs of investing in the Fund and other funds. To do so, compare this 5% hypothetical example with the 5% hypothetical examples that appear in the shareholder reports of the other funds. Please note that the expenses shown in the table are meant to highlight your ongoing costs only and do not reflect any transactional costs, such as sales charges (loads), or exchange fees. Therefore, the second line of the table is useful in comparing ongoing costs only, and will not help you determine the relative total costs of owning different funds. In addition, if these transactional costs were included, your costs would have been higher.
HENNESSY FUNDS 1-800-966-4354
| | Beginning | Ending | Expenses Paid |
| | Account Value | Account Value | During Period(1) |
| Original Class | 3/23/09 | 3/31/09 | 3/23/09 – 3/31/09 |
| | | | |
| Actual | $1,000.00 | $1,013.40 | $0.32 |
| Hypothetical (5% return | | | |
| before expenses) | $1,000.00 | $1,000.91 | $0.32 |
(1) | Expenses are equal to the Large Growth Fund’s expense ratio of 1.30%, multiplied by the average account value over the period, multiplied by 9/365 days (to reflect the period ended March 31, 2009). |
| | Beginning | Ending | Expenses Paid |
| | Account Value | Account Value | During Period(2) |
| Institutional Class | 3/23/09 | 3/31/09 | 3/23/09 – 3/31/09 |
| | | | |
| Actual | $1,000.00 | $1,038.60 | $0.25 |
| Hypothetical (5% return | | | |
| before expenses) | $1,000.00 | $1,009.99 | $0.24 |
(2) | Expenses are equal to the Large Growth Fund’s expense ratio of 0.98%, multiplied by the average account value over the period, multiplied by 9/365 days (to reflect the period ended March 31, 2009). |
How to Obtain a Copy of the Funds’ Proxy Voting Policy and Proxy Voting Records
A description of the policies and procedures that the Fund uses to determine how to vote proxies relating to portfolio securities is available without charge: (1) by calling 1-800-966-4354; (2) on the Hennessy Funds website at www.hennessyfunds.com; or (3) on the U.S. Securities and Exchange Commission’s website at www.sec.gov. Hennessy Funds’ proxy voting record is available on the SEC’s website at www.sec.gov no later than August 31 for the prior 12 months ending June 30.
Quarterly Filings on Form N-Q
The Fund files its complete schedule of portfolio holdings with the SEC for the first and third quarters of each fiscal year on Form N-Q. The Fund’s Form N-Q will be available on the SEC’s website at www.sec.gov. The Fund’s Form N-Q may be reviewed and copied at the SEC’s Public Reference Room in Washington, DC and information on the operation of the Public Reference Room may be obtained by calling 1-800-SEC-0330. Information included in the Fund’s N-Q will also be available upon request by calling 1-800-966-4354.
HENNESSY FUNDS 1-800-966-4354
Advisory Agreements
At its meeting on March 2, 2009, the Board of Directors (the “Board”) of The Hennessy Funds, Inc. (the “Company”) and its two series, the Hennessy Balanced Fund (the “Balanced Fund”) and the Hennessy Total Return Fund (the “Total Return Fund”) (each a “Fund” or collectively the “Funds”), The Hennessy Mutual Funds, Inc. (the “Company”) and its three series, the Hennessy Cornerstone Growth Fund (the “Growth Fund”), the Hennessy Cornerstone Value Fund (the “Value Fund”), and the Hennessy Focus 30 Fund (the “Focus 30 Fund”) and The Hennessy Funds Trust (the “Company”) which includes the Hennessy Cornerstone Growth Fund, Series II (the “Growth II Fund”), Hennessy Cornerstone Large Growth Fund (the “Large Growth” Fund), and the Hennessy Select Large Value Fund (the “Select Value” Fund), (each a “Fund” or collectively the “Funds”), including the Directors who are not “interested persons” (as defined in the Investment Company Act of 1940) of the Funds’ voted to re-approve (approve with respect to the investment advisory agreements for the Large Growth Fund and the Select Value Fund) the current investment advisory agreement (the “Advisory Agreement”) between the Funds and Hennessy Advisors, Inc. (the “Advisor”) and approve the sub-advisory agreement with Voyageur Asset Management, Inc. (the “Sub-Advisor”). In connection with its re-approval or approval of the Advisory Agreement, the Board considered the following factors:
| 1) | The Advisor provides formula driven investment management for the Funds (except for the Select Value Fund). Hennessy Advisors, Inc. holds the patent rights to the formulas used for The Cornerstone Growth, Growth II, Value, Large Growth and Focus 30 funds. In providing investment management, Hennessy Advisors, Inc. will direct and oversee the trading of securities within and the rebalancing of the portfolios of the Funds (except for the Select Value Fund). |
| 2) | The Advisor oversees the performance of the Sub-Advisor and pays the sub-advisory fee. |
| 3) | The Advisor pays for the services to retain the Funds’ Chief Compliance Officer and will make all reasonable efforts to insure that the Funds are in compliance with the securities laws. |
| 4) | The Advisor provides responsive customer and shareholder servicing which consists of providing a call center to respond to shareholder inquiries, including specific mutual fund account information. Shareholders can contact Hennessy Advisors, Inc., directly during office hours. The firm endeavors to answer all calls in-person within two rings of the telephone. |
| 5) | The Advisor oversees distribution of the Funds through third-party broker/dealers and independent financial institutions such as Charles Schwab, Inc., Fidelity, TD Ameritrade and Pershing. Hennessy Advisors participates in “no transaction fee” (“NTF”) programs with these companies, which allows customers to purchase the Hennessy Funds |
| | through third party distribution channels without paying a transaction fee. Hennessy Advisors compensates these third party distributors under a pre-determined contractual agreement. |
| 6) | The Advisor oversees those third party service providers that support the Funds in providing fund accounting, fund administration, fund distribution, transfer agency and custodial services. |
| 7) | The Sub-Advisor provides investment services to the Select Value Fund and oversees the trading of securities for the Select Value Fund. |
The Board also: (i) compared the performance of each Fund (other than the Large Growth Fund where the performance of the investment formula was reviewed) to benchmark indices over various periods of time and concluded that the performance of each Fund warranted the continuation or approval of the Advisory Agreement; (ii) compared the expense ratios of funds similar in asset size and investment objective to each of the Funds and concluded the actual or projected expenses of each Fund were reasonable and warranted continuation of the Advisory Agreement; (iii) considered the fees charged by Hennessy Advisors, Inc. to those of funds similar in asset size and investment objective to each of the Funds and concluded the advisory fees of each Fund were reasonable and warranted continuation or approval of the Advisory Agreement; (iv) considered the profitability or projected profitability of Hennessy Advisors, Inc. with respect to each Fund and the projected profitability of the Sub-Advisor with respect to the Select Value Fund and concluded the profits were reasonable and not excessive when compared to profitability guidelines set forth in relevant court cases; (v) considered the high level of professionalism and knowledge, along with an extremely low level of turnover, of the employees of the Advisor; and (vi) considered that Neil Hennessy was named one of the top 100 portfolio managers in the nation during each of the previous six years by Barron’s.
The Board then discussed economies of scale and breakpoints and determined that the Funds managed by Hennessy Advisors, Inc. have not yet grown in size, nor has their marketplace demonstrated significantly rapid potential growth to any extent that would warrant the use of breakpoints. The Funds have, in fact, had their assets under management greatly diminish during 2008. In reaching this conclusion the Board took into consideration the profitability of Hennessy Advisors, Inc. and the advisory fees of comparable mutual funds.
The Board reviewed the Funds’ expense ratios and comparable expense ratios for funds like the eight funds being considered for contract approval/renewal by Hennessy Advisors, Inc. The Board used data from Lipper as presented in the charts in the Board Materials showing funds similar in nature to the Hennessy Funds (Mid-Cap Blend, Small Cap Blend, etc.). The Board determined that the expense ratios of The Funds fall within the range of the ratios of other funds in their classification. (Please see Lipper charts provided in the Board Materials). The Board also referenced the Advisor’s Form ADV and copies of the current Investment Advisory Agreements. All of the factors above were considered separately by the non-interested Directors in an executive session during which management of the Advisor was not present. The factors were viewed in their totality by the Board, with no single factor being the principal or determinative factor in the Board’s determination of whether to
HENNESSY FUNDS 1-800-966-4354
approve the continuation or approval of the Advisory Agreements. The Board was also assisted in its review, consideration and discussion of the Advisory Agreements by legal counsel, who had prepared a summary of the Board’s legal obligations. Based on the factors discussed above, the Board, including all Independent Directors, recommended continuation or approval of the Advisory Agreements.
(This Page Intentionally Left Blank.)
HENNESSY FUNDS 1-800-966-4354
For information, questions
or assistance, please call
The Hennessy Funds
1-800-966-4354 or 1-415-899-1555
INVESTMENT ADVISOR
Hennessy Advisors, Inc.
7250 Redwood Blvd., Suite 200
Novato, California 94945
ADMINISTRATOR, TRANSFER
AGENT, DIVIDEND PAYING
AGENT & SHAREHOLDER
SERVICING AGENT
U.S. Bancorp Fund Services, LLC
P.O. Box 701
Milwaukee, Wisconsin 53201-0701
CUSTODIAN
U.S. Bank N.A.
Custody Operations
1555 North River Center Dr., Suite 302
Milwaukee, Wisconsin 53212
TRUSTEES
Neil J. Hennessy
Robert T. Doyle
J. Dennis DeSousa
Gerald P. Richardson
COUNSEL
Foley & Lardner LLP
777 East Wisconsin Avenue
Milwaukee, Wisconsin 53202-5306
INDEPENDENT REGISTERED
PUBLIC ACCOUNTING FIRM
KPMG LLP
303 East Wacker Drive
Chicago, Illinois 60601
DISTRIBUTOR
Quasar Distributors, LLC
615 East Michigan Street
Milwaukee, Wisconsin 53202
WWW.HENNESSYFUNDS.COM
This report has been prepared for shareholders and may be distributed
to others only if preceded or accompanied by a current prospectus.
HENNESSY FUNDS
SEMI-ANNUAL REPORT
MARCH 31, 2009
Hennessy Select Large Value Fund
Contents
| Letter to shareholders | 1 |
| Summary of investments | 5 |
| Financial statements | |
| Statements of assets and liabilities | 10 |
| Statement of operations | 11 |
| Statements of changes in net assets | 12 |
| Financial highlights | 14 |
| Notes to the financial statements | 16 |
| Expense example | 23 |
| Proxy voting policy | 25 |
| Board approval of investment advisory agreement | 26 |
May, 2009
Dear Hennessy Select Large Value Fund Shareholder:
First, I would like to thank the shareholders of the Tamarack Value Fund for voting in favor of having Hennessy Funds manage your mutual fund investment. The name of the Fund is now the Hennessy Select Large Value Fund. We appreciate the vote of confidence and want to assure you that we will manage the Fund with your best interest in mind. We welcome you to the Hennessy family of shareholders, and we look forward to the opportunity to help you meet your investment goals.
While Hennessy became the new investment manager of the Fund on March 23, 2009, we retained the seasoned portfolio managers that managed the Tamarack Value Fund to act as sub-advisor. That means that the same team of investment professionals that have been successfully selecting stocks for the portfolio will continue to do so. As such, I would like to provide a general overview of the markets for the six-month period ending March 31st and our thoughts about the future, followed by specific fund performance information provided by the Fund’s sub-advisor, Voyageur Asset Management.
Market Overview and Outlook
During the period October 1, 2008 through March 31, 2009, the financial markets experienced their darkest days in recent history, with the major indices losing approximately 30% of their value in just six months. During my 30 years in the financial industry, I have never seen the kind of crisis of confidence that we experienced at the end of February and the beginning of March. As retirement account balances and home values plummeted, even the most disciplined, long-term investors had simply had enough and began moving their money to the sidelines. For me, that signaled a turning point and suggested that the markets and consumer confidence had hit bottom.
I believe that the recovery actually began in November with the first injection of government TARP (Troubled Asset Relief Program) spending and that the lows the market hit in March are behind us. As in any type of recovery, it will take time. I use the analogy of putting a cast on a broken bone; the fix is in place but it will be a slow and painful process to heal the break.
HENNESSY FUNDS 1-800-966-4354
I foresee steady economic growth in the coming months. It seems that many people have the perception that the majority of companies are losing money, but our analysis shows that is simply not the case. I believe that companies are taking the opportunity, while their stock prices have been driven down, to become as lean as possible so that any increase in revenue will fall to the bottom line and increase profitability. A full recovery may take longer than some would hope, but I believe that the growth we will experience will be based on solid, tangible business results and, most importantly, it will be sustainable. It is my opinion that investors learned an important lesson about leverage and will resume investing in high quality stocks and mutual funds as confidence in the markets is restored.
Corrections are always painful, and I understand that the magnitude of the most recent market downturn has left investors feeling overwhelmed and distraught. I do, however, believe that historical performance data has shown how discipline and a long-term investing view can be rewarded, particularly now. Some of the savviest investors know that when things look bleakest, it may be a good time to buy rather than sell. I believe it is a phenomenal time to consider putting long-term money to work in the market.
We vigilantly maintain our focus on building long-term value for our shareholders. At Hennessy Funds, we believe in servicing our shareholders directly, so that we can provide instant answers to shareholder questions and concerns. Please don’t hesitate to contact us at 800-966-4354 if we can answer any questions or can be of service.
Best regards,
Neil J. Hennessy
Portfolio Manager & Chief Investment Officer
Hennessy Funds
Portfolio Manager’s Fund Performance Review and Outlook
For the six-month period ending March 31, 2009, the Hennessy Select Large Value Fund, formerly known as the Tamarack Value Fund, returned -30.5%. While the Fund suffered a large loss, it significantly outperformed its benchmark index, the Russell 1000 Value Index, which lost 35.2% in the same period. Because the Hennessy Select Large Value portfolio is managed to be sector neutral to the benchmark, all of the Fund’s excess performance was attributable to stock selection.
No sector gained ground over the last six months; however, the best sectors within the Russell 1000 Value Index were defensive ones. Telecomm Services performed most strongly among the sectors, losing 8.9%. For the six-month period the Utilities and Health Care sectors each lost 20% and Consumer Staples lost 22%. The Financial sector had abysmal performance for the period, losing 54%, followed by Industrials, down 48%, and Materials, down 45%.
The Hennessy Select Large Value Fund performed better than the market in most sectors. The best relative returns were posted by Financial stocks in the portfolio, with a broad base of companies outperforming the sector overall. Our strategy of owning quality regional banks and former brokerage companies, rather than the large national banks, served the portfolio well. Notable was the return in Morgan Stanley, which gained 37% while in the portfolio during the six-month period.
Our holdings in Consumer Discretionary, Energy, and Materials also aided the relative performance of the portfolio during the six-month period. Consumer Discretionary stock Home Depot lost just 7% while in the portfolio, outperforming the market handily. Within the Materials sector, two fertilizer companies, FMC and CF Industries contributed the most to the portfolio’s performance. FMC was down much less than the sector, at -15%, and CF Industries was one of the few companies to post positive returns, gaining 46%. In the Energy sector, Noble Energy performed better than the market, returning -2% while in the portfolio during the period.
Among the sectors in the Select Large Value portfolio that did not outperform the benchmark, Information Technology saw a very minor underperformance and is a very small part of the Value Universe, so therefore, did not appreciably affect relative returns. The only substantial underperformance was in the Consumer Staples sector, where our position in Tyson Foods lost 58% while in the portfolio during the period. While we had correctly anticipated that one of Tyson’s main competitors, Pilgrims Pride, would file for bankruptcy, we did not anticipate the precipitous drop in international demand for Tyson products. The position in Tyson has since been eliminated.
HENNESSY FUNDS 1-800-966-4354
Within the Large-cap Value universe, the disparity in valuation between companies perceived to have lower earnings variability and stronger balance sheets (deemed higher quality companies) and those which do not (deemed lower quality companies) is wider than anything we have seen in decades. We believe that the next significant move upward in the Large-cap Value universe is likely to be found in the narrowing of the valuation spread among higher and lower quality companies in a rising market. We do not know exactly when this will happen, but we are slowly moving our portfolio holdings in the direction of lower quality and early cyclical companies to capture potential opportunities. The Select Large Value portfolio is still generally more defensive than aggressive. However, valuation differences in the face of significant government attempts to bring the economy out of recession are impressive enough to begin to take the risk that we will see broader economic recovery by the end of the year, which should lift all companies, regardless of quality. As always, given our focus on stock selection, we will continue to evaluate the potential risks and rewards on a company by company basis.
Sincerely, 
Michael M. Spencer, CFA
Senior Portfolio Manager
Voyageur Asset Management
Sub Advisor to Hennessy Select Large Value Fund
Past performance does not guarantee future results.
Mutual fund investing involves risk. Principal loss is possible. Small and medium-capitalization companies tend to have limited liquidity and greater price volatility than large-capitalization companies. Growth stocks typically are more volatile than value stocks; however, value stocks have a lower expected growth rate in earnings and sales.
References to specific securities should not be considered a recommendation to buy or sell any security. Fund holdings are subject to change. Please refer to the Schedule of Investments within this semi-annual report for additional portfolio information, including percentages of holdings.
The Russell 1000 Value Index is commonly used to measure the performance of large-cap value stocks. One cannot invest directly in an index.
Opinions expressed are those of Neil Hennessy and Michael Spencer and are subject to change, are not guaranteed and should not be considered investment advice.
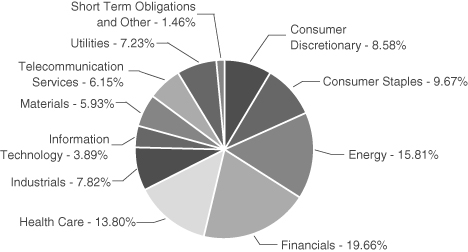
The following summary of investment portfolios is designed to help investors better understand the fund’s principal holdings. The summary is as of March 31, 2009.
HENNESSY SELECT
LARGE VALUE FUND
(% of Net Assets)
| TOP TEN HOLDINGS | % of net assets |
| Exxon Mobil Corp. | 5.84% |
| ChevronTexaco Corp. | 5.13% |
| AT&T, Inc. | 4.44% |
| J.P. Morgan Chase & Co. | 3.01% |
| FPL Group, Inc. | 2.90% |
| Home Depot, Inc. | 2.52% |
| Travelers Companies, Inc. | 2.35% |
| General Electric Co. | 2.30% |
| Noble Energy, Inc. | 2.14% |
| Peabody Energy Corp. | 2.01% |
HENNESSY FUNDS 1-800-966-4354
| COMMON STOCKS – 98.54% | | Number | | | | | | % of Net | |
| | | of Shares | | | Value | | | Assets | |
| Consumer Discretionary – 8.58% | | | | | | | | | |
| Abercrombie & Fitch Co. – Class A | | | 40,560 | | | $ | 965,328 | | | | 0.88 | % |
| Comcast Corp. | | | 123,920 | | | | 1,690,269 | | | | 1.53 | % |
| Darden Restaurants, Inc. | | | 27,415 | | | | 939,238 | | | | 0.85 | % |
| Home Depot, Inc. | | | 117,815 | | | | 2,775,721 | | | | 2.52 | % |
| JC Penney Co., Inc. Holding Co. | | | 58,415 | | | | 1,172,389 | | | | 1.06 | % |
| MDC Holdings Co., Inc. | | | 13,760 | | | | 428,486 | | | | 0.39 | % |
| Nordstrom, Inc. | | | 54,830 | | | | 918,403 | | | | 0.83 | % |
| Starbucks Corp. (a) | | | 51,805 | | | | 575,554 | | | | 0.52 | % |
| | | | | | | | 9,465,388 | | | | 8.58 | % |
| | | | | | | | | | | | | |
| Consumer Staples – 9.67% | | | | | | | | | | | | |
| Campbell Soup Co. | | | 22,300 | | | | 610,128 | | | | 0.55 | % |
| Clorox Co. | | | 32,595 | | | | 1,677,990 | | | | 1.52 | % |
| The Coca-Cola Co. | | | 43,105 | | | | 1,894,465 | | | | 1.72 | % |
| Kraft Foods, Inc. – Class A | | | 44,406 | | | | 989,810 | | | | 0.90 | % |
| Lorillard, Inc. | | | 11,810 | | | | 729,149 | | | | 0.66 | % |
| Procter & Gamble Co. | | | 45,810 | | | | 2,157,193 | | | | 1.95 | % |
| Safeway, Inc. | | | 41,610 | | | | 840,106 | | | | 0.76 | % |
| Wal-Mart Stores, Inc. | | | 34,130 | | | | 1,778,173 | | | | 1.61 | % |
| | | | | | | | 10,677,014 | | | | 9.67 | % |
| | | | | | | | | | | | | |
| Energy – 15.81% | | | | | | | | | | | | |
| Anadarko Petroleum Corp. | | | 30,170 | | | | 1,173,311 | | | | 1.06 | % |
| Apache Corp. | | | 28,210 | | | | 1,807,979 | | | | 1.64 | % |
| ChevronTexaco Corp. | | | 84,215 | | | | 5,662,617 | | | | 5.13 | % |
| Exxon Mobil Corp. | | | 94,685 | | | | 6,448,048 | | | | 5.84 | % |
| Noble Energy, Inc. | | | 43,740 | | | | 2,356,711 | | | | 2.14 | % |
| | | | | | | | 17,448,666 | | | | 15.81 | % |
| | | | | | | | | | | | | |
| Financials – 19.66% | | | | | | | | | | | | |
| Bank of America Corp. | | | 191,480 | | | | 1,305,894 | | | | 1.18 | % |
| BB&T Corp. | | | 34,345 | | | | 581,118 | | | | 0.53 | % |
| Capital One Financial Corp. | | | 25,175 | | | | 308,142 | | | | 0.28 | % |
| Digital Realty Trust, Inc. | | | 41,640 | | | | 1,381,615 | | | | 1.25 | % |
| The Goldman Sachs Group, Inc. | | | 17,410 | | | | 1,845,808 | | | | 1.67 | % |
| J.P. Morgan Chase & Co. | | | 125,115 | | | | 3,325,557 | | | | 3.01 | % |
The accompanying notes are an integral part of these financial statements.
| COMMON STOCKS | | Number | | | | | | % of Net | |
| | | of Shares | | | Value | | | Assets | |
| Financials (Continued) | | | | | | | | | |
| KeyCorp | | | 71,105 | | | $ | 559,596 | | | | 0.51 | % |
| Marsh & McLennan Companies, Inc. | | | 27,225 | | | | 551,306 | | | | 0.50 | % |
| MetLife, Inc. | | | 38,525 | | | | 877,214 | | | | 0.80 | % |
| Morgan Stanley | | | 42,195 | | | | 960,780 | | | | 0.87 | % |
| PartnerRe Ltd. | | | 18,190 | | | | 1,129,053 | | | | 1.02 | % |
| Prudential Financial, Inc. | | | 28,970 | | | | 551,009 | | | | 0.50 | % |
| Simon Property Group, Inc. | | | 26,518 | | | | 918,588 | | | | 0.83 | % |
| State Street Corp. | | | 54,525 | | | | 1,678,280 | | | | 1.52 | % |
| Travelers Companies, Inc. | | | 63,675 | | | | 2,587,752 | | | | 2.35 | % |
| US Bancorp | | | 144,625 | | | | 2,112,971 | | | | 1.91 | % |
| Wells Fargo & Co. | | | 71,690 | | | | 1,020,866 | | | | 0.93 | % |
| | | | | | | | 21,695,549 | | | | 19.66 | % |
| | | | | | | | | | | | | |
| Health Care – 13.80% | | | | | | | | | | | | |
| Abbott Laboratories | | | 21,045 | | | | 1,003,846 | | | | 0.91 | % |
| Aetna, Inc. | | | 77,275 | | | | 1,880,101 | | | | 1.70 | % |
| Amgen, Inc. (a) | | | 35,235 | | | | 1,744,837 | | | | 1.58 | % |
| Cephalon, Inc. (a) | | | 27,170 | | | | 1,850,277 | | | | 1.68 | % |
| Johnson & Johnson | | | 36,870 | | | | 1,939,362 | | | | 1.76 | % |
| Pfizer, Inc. | | | 109,560 | | | | 1,492,207 | | | | 1.35 | % |
| Quest Diagnostics | | | 38,570 | | | | 1,831,304 | | | | 1.66 | % |
| Schering Plough Corporation | | | 33,080 | | | | 779,034 | | | | 0.71 | % |
| Thermo Electron Corp. (a) | | | 26,100 | | | | 930,987 | | | | 0.84 | % |
| Wyeth | | | 41,180 | | | | 1,772,387 | | | | 1.61 | % |
| | | | | | | | 15,224,342 | | | | 13.80 | % |
| | | | | | | | | | | | | |
| Industrials – 7.82% | | | | | | | | | | | | |
| CSX Corp. | | | 20,740 | | | | 536,129 | | | | 0.49 | % |
| General Electric Co. | | | 250,925 | | | | 2,536,852 | | | | 2.30 | % |
| Lockheed Martin Corp. | | | 16,775 | | | | 1,157,978 | | | | 1.05 | % |
| SPX Corp. | | | 21,970 | | | | 1,032,810 | | | | 0.94 | % |
| Tyco International Ltd. | | | 63,395 | | | | 1,240,006 | | | | 1.12 | % |
| United Technologies Corp. | | | 26,640 | | | | 1,144,987 | | | | 1.04 | % |
| Waste Management, Inc. | | | 37,990 | | | | 972,544 | | | | 0.88 | % |
| | | | | | | | 8,621,306 | | | | 7.82 | % |
The accompanying notes are an integral part of these financial statements.
HENNESSY FUNDS 1-800-966-4354
| COMMON STOCKS | | Number | | | | | | % of Net | |
| | | of Shares | | | Value | | | Assets | |
| Information Technology – 3.89% | | | | | | | | | |
| Applied Materials, Inc. | | | 136,220 | | | $ | 1,464,365 | | | | 1.33 | % |
| Hewlett-Packard Co. | | | 43,695 | | | | 1,400,862 | | | | 1.27 | % |
| Western Union Co. | | | 73,180 | | | | 919,873 | | | | 0.83 | % |
| Yahoo!, Inc. (a) | | | 39,925 | | | | 511,439 | | | | 0.46 | % |
| | | | | | | | 4,296,539 | | | | 3.89 | % |
| | | | | | | | | | | | | |
| Materials – 5.93% | | | | | | | | | | | | |
| FMC Corp. | | | 47,375 | | | | 2,043,757 | | | | 1.85 | % |
| Freeport-McMoRan Copper & Gold, Inc. | | | 26,585 | | | | 1,013,154 | | | | 0.92 | % |
| International Paper Co. | | | 61,690 | | | | 434,298 | | | | 0.39 | % |
| Packaging Corp. of America | | | 64,730 | | | | 842,785 | | | | 0.76 | % |
| Peabody Energy Corp. | | | 88,645 | | | | 2,219,671 | | | | 2.01 | % |
| | | | | | | | 6,553,665 | | | | 5.93 | % |
| | | | | | | | | | | | | |
| Telecommunication Services – 6.15% | | | | | | | | | | | | |
| AT&T, Inc. | | | 194,550 | | | | 4,902,660 | | | | 4.44 | % |
| Verizon Communications, Inc. | | | 62,535 | | | | 1,888,557 | | | | 1.71 | % |
| | | | | | | | 6,791,217 | | | | 6.15 | % |
| | | | | | | | | | | | | |
| Utilities – 7.23% | | | | | | | | | | | | |
| Duke Energy Corp. | | | 148,110 | | | | 2,120,935 | | | | 1.92 | % |
| Edison International | | | 25,645 | | | | 738,833 | | | | 0.67 | % |
| FirstEnergy Corp. | | | 18,520 | | | | 714,872 | | | | 0.65 | % |
| FPL Group, Inc. | | | 63,105 | | | | 3,201,317 | | | | 2.90 | % |
| The Southern Co. | | | 39,365 | | | | 1,205,356 | | | | 1.09 | % |
| | | | | | | | 7,981,313 | | | | 7.23 | % |
| | | | | | | | | | | | | |
Total Common Stocks (Cost $125,064,574) | | | | | | | 108,754,999 | | | | 98.54 | % |
The accompanying notes are an integral part of these financial statements.
| SHORT-TERM INVESTMENTS – 0.28% | | Principal | | | | | | % of | |
| | | Amount | | | Value | | | Net Assets | |
| Variable Rate Demand Notes# – 0.28% | | | | | | | | | |
| American Family Financial Services | | | | | | | | | |
| 0.100% (b) | | $ | 310,000 | | | $ | 310,000 | | | | 0.28 | % |
| | | | | | | | | | | | | |
| Total Short-Term Investments | | | | | | | | | | | | |
| (Cost $310,000) | | | | | | | 310,000 | | | | 0.28 | % |
| | | | | | | | | | | | | |
Total Investments – 98.82% | | | | | | | | | | | | |
| (Cost $125,374,574) | | | | | | | 109,064,999 | | | | 98.82 | % |
| | | | | | | | | | | | | |
| Other Assets in Excess of Liabilities – 1.18% | | | | | | | 1,306,146 | | | | 1.18 | % |
TOTAL NET ASSETS – 100.00% | | | | | | $ | 110,371,145 | | | | 100.00 | % |
Percentages are stated as a percent of net assets.
| # | Variable rate demand notes are considered shor-term obligations and are payable on demand. Interest rates change periodically on specified dates. The rates listed are as of March 31, 2009. |
FAS 157 – Summary of Fair Value Exposure at March 31, 2009 (Unaudited)
Various inputs are used in determining the value of the Fund’s investments, which are summarized as follows:
| Level 1 – | Quoted prices in active markets for identical securities |
| Level 2 – | Other significant observable inputs (including quoted prices for similar securities, interest rates, prepayment speeds, credit risk, etc.) |
| Level 3 – | Significant unobservable inputs (including the Fund’s own assumptions in determining the fair value of investments) |
The inputs or methodology used for valuing securities are not an indication of the risk associated with investing in those securities.
The following is a summary of the inputs used to value the Fund’s net assets as of March 31, 2009:
| Description | | Investments in Securities | |
| Level 1 – Quoted prices in active markets for identical securities | | $ | 108,754,999 | |
| Level 2 – Other significant observable inputs | | | 310,000 | |
| Level 3 – Significant unobservable inputs | | | — | |
| Total | | $ | 109,064,999 | |
The accompanying notes are an integral part of these financial statements.
HENNESSY FUNDS 1-800-966-4354
Financial Statements
Statement of Assets and Liabilities as of March 31, 2009 (Unaudited) |
| ASSETS: | | | |
| Investments, at value (cost $125,374,574) | | $ | 109,064,999 | |
| Cash | | | 1,030,444 | |
| Dividends and interest receivable | | | 170,608 | |
| Receivable for fund shares sold | | | 25,077 | |
| Receivable for securities sold | | | 194,167 | |
| Prepaid expenses and other assets | | | 52,087 | |
| Total Assets | | | 110,537,382 | |
| | | | | |
| LIABILITIES: | | | | |
| Payable for fund shares redeemed | | | 17,530 | |
| Payable to Advisor | | | 40,715 | |
| Payable to Distributor | | | 27 | |
| Accrued administration fees | | | 11,455 | |
| Accrued fund accounting fees | | | 2,404 | |
| Accrued custody fees | | | 689 | |
| Accrued transfer agent fees | | | 62,337 | |
| Accrued audit fees | | | 5,883 | |
| Accrued legal fees | | | 3,369 | |
| Accrued service fees | | | 2,767 | |
| Accrued printing and mailing expense | | | 16,619 | |
| Accrued expenses and other payables | | | 2,442 | |
| Total Liabilities | | | 166,237 | |
| | | | | |
| NET ASSETS | | $ | 110,371,145 | |
| | | | | |
| NET ASSETS CONSIST OF: | | | | |
| Capital stock | | $ | 185,843,218 | |
| Accumulated net investment income | | | 718,045 | |
| Accumulated net realized loss on investments | | | (59,880,543 | ) |
| Unrealized net depreciation on investments | | | (16,309,575 | ) |
| Total Net Assets | | $ | 110,371,145 | |
| | | | | |
| NET ASSETS | | | | |
| Original Class: | | | | |
| Shares authorized (no par value) | | Unlimited | |
| Net assets applicable to outstanding Original Class shares | | | 110,365,378 | |
| Shares issued and outstanding | | | 7,457,114 | |
| Net asset value, offering price and redemption price per share | | $ | 14.80 | |
| | | | | |
| Institutional Class: | | | | |
| Shares authorized (no par value) | | Unlimited | |
| Net assets applicable to outstanding Institutional Class shares | | | 5,767 | |
| Shares issued and outstanding | | | 390 | |
| Net asset value, offering price and redemption price per share | | $ | 14.80 | |
The accompanying notes are an integral part of these financial statements.
Statement of Operations Six months ended March 31, 2009 (Unaudited) |
| INVESTMENT INCOME: | | | |
| Dividend income | | $ | 2,211,029 | |
| Interest income | | | 7,521 | |
| Total investment income | | | 2,218,550 | |
| | | | | |
| EXPENSES: | | | | |
Investment advisory fees(1) | | | 521,705 | |
| Transfer agent fees | | | 152,202 | |
| Administration fees | | | 51,633 | |
Sub-transfer agent expenses(1) | | | 30,608 | |
| Printing and mailing expense | | | 30,301 | |
| Legal fees | | | 28,512 | |
| Federal and state registration fees | | | 18,993 | |
| Fund accounting fees | | | 17,825 | |
| Custody fees | | | 6,234 | |
| Audit fees | | | 4,266 | |
| Directors’ fees and expenses | | | 2,134 | |
Service fees(1) | | | | |
| Original Class | | | 2,767 | |
| Institutional Class | | | — | |
| Class A | | | — | |
| Class C | | | — | |
| Class R | | | — | |
Distribution fees(1) | | | | |
| Original Class | | | — | |
| Institutional Class | | | — | |
| Class A | | | 576 | |
| Class C | | | 86 | |
| Class R | | | 6 | |
| Other | | | 7,721 | |
| Total expenses before waiver/reimbursement | | | 875,569 | |
| Expense waiver/reimbursement by: | | | | |
| Advisor | | | (226,920 | ) |
| Distributor | | | (288 | ) |
| Net expenses | | | 648,361 | |
| NET INVESTMENT INCOME | | $ | 1,570,189 | |
| | | | | |
| REALIZED AND UNREALIZED LOSSES: | | | | |
| Net realized loss on investments | | $ | (32,575,403 | ) |
| Change in unrealized appreciation (depreciation) on investments | | | (21,205,154 | ) |
| Net loss on investments | | | (53,780,557 | ) |
| | | | | |
| NET DECREASE IN NET ASSETS | | | | |
| RESULTING FROM OPERATIONS | | $ | (52,210,368 | ) |
(1) | See Note 4 in Notes to the Financial Statements. |
The accompanying notes are an integral part of these financial statements.
HENNESSY FUNDS 1-800-966-4354
| Statement of Changes in Net Assets |
| | | Six Months Ended | | | Year Ended | |
| | | March 31, 2009 | | | September 30, | |
| | | (Unaudited) | | | 2008 | |
| OPERATIONS: | | | | | | |
| Net investment income (loss) | | $ | 1,570,189 | | | $ | 3,227,881 | |
| Net realized gain (loss) on securities | | | (32,575,403 | ) | | | (23,643,916 | ) |
| Change in unrealized appreciation (depreciation) on securities | | | (21,205,154 | ) | | | (34,396,957 | ) |
| Net increase (decrease) in net assets resulting from operations | | | (52,210,368 | ) | | | (54,812,992 | ) |
| | | | | | | | | |
| DISTRIBUTIONS TO SHAREHOLDERS FROM: | | | | | | | | |
| Net investment income – Original Class | | | — | | | | — | |
| Net investment income – Institutional Class | | | — | | | | — | |
| Net investment income – Class A | | | (2,447 | ) | | | (7,765 | ) |
| Net investment income – Class C | | | (250 | ) | | | (142 | ) |
| Net investment income – Class R | | | (47 | ) | | | (61 | ) |
| Net investment income – Class S | | | (3,119,888 | ) | | | (4,736,449 | ) |
| Net realized gains – Original Class | | | — | | | | — | |
| Net realized gains – Institutional Class | | | — | | | | — | |
| Net realized gains – Class A | | | — | | | | (157,564 | ) |
| Net realized gains – Class C | | | — | | | | (6,277 | ) |
| Net realized gains – Class R | | | — | | | | (1,434 | ) |
| Net realized gains – Class S | | | — | | | | (81,783,401 | ) |
| Total distributions | | | (3,122,632 | ) | | | (86,693,093 | ) |
| | | | | | | | | |
| CAPITAL SHARE TRANSACTIONS: | | | | | | | | |
| Proceeds from shares subscribed – Original Class | | | 106,401,526 | | | | — | |
| Proceeds from shares subscribed – Institutional Class | | | 5,559 | | | | — | |
| Proceeds from shares subscribed – Class A | | | 4,294 | | | | 371,029 | |
| Proceeds from shares subscribed – Class C | | | 300 | | | | 11,100 | |
| Proceeds from shares subscribed – Class R | | | — | | | | 1,487 | |
| Proceeds from shares subscribed – Class S | | | 1,105,178 | | | | 3,663,742 | |
| Dividends reinvested – Original Class | | | — | | | | — | |
| Dividends reinvested – Institutional Class | | | — | | | | — | |
| Dividends reinvested – Class A | | | 2,160 | | | | 108,540 | |
| Dividends reinvested – Class C | | | 250 | | | | 6,411 | |
| Dividends reinvested – Class R | | | 47 | | | | — | |
| Dividends reinvested – Class S | | | 2,990,948 | | | | 82,713,848 | |
| Cost of shares redeemed – Original Class | | | (169,582 | ) | | | — | |
| Cost of shares redeemed – Institutional Class | | | — | | | | — | |
| Cost of shares redeemed – Class A | | | (336,825 | ) | | | (205,995 | ) |
| Cost of shares redeemed – Class C | | | (16,427 | ) | | | (263 | ) |
| Cost of shares redeemed – Class R | | | (2,172 | ) | | | (13 | ) |
| Cost of shares redeemed – Class S | | | (119,004,816 | ) | | | (40,339,761 | ) |
| Net increase (decrease) in net assets | | | | | | | | |
| derived from capital share transactions | | | (9,019,560 | ) | | | 46,330,125 | |
| | | | | | | | | |
| TOTAL INCREASE (DECREASE) IN NET ASSETS | | | (64,352,560 | ) | | | (95,175,960 | ) |
| | | | | | | | | |
| NET ASSETS: | | | | | | | | |
| Beginning of period | | | 174,723,705 | | | | 269,899,665 | |
| End of period | | $ | 110,371,145 | | | $ | 174,723,705 | |
| | | | | | | | | |
| Accumulated net investment income (loss), end of period | | $ | 718,045 | | | $ | 2,270,488 | |
The accompanying notes are an integral part of these financial statements.
| Statement of Changes in Net Assets (Continued) |
| | | Six Months Ended | | | Year Ended | |
| | | March 31, 2009 | | | September 30, | |
| | | (Unaudited) | | | 2008 | |
| CHANGES IN SHARES OUTSTANDING: | | | | | | |
| Shares sold | | | | | | |
| Original Class | | | 7,468,470 | | | | — | |
| Institutional Class | | | 390 | | | | — | |
| Class A | | | 272 | | | | 14,127 | |
| Class C | | | 20 | | | | 436 | |
| Class R | | | — | | | | — | |
| Class S | | | 68,408 | | | | 133,042 | |
| Shares issued to holders as reinvestment of dividends | | | | | | | | |
| Original Class | | | — | | | | — | |
| Institutional Class | | | — | | | | — | |
| Class A | | | 134 | | | | 4,035 | |
| Class C | | | 16 | | | | 241 | |
| Class R | | | 3 | | | | 56 | |
| Class S | | | 187,051 | | | | 3,074,865 | |
| Shares redeemed | | | | | | | | |
| Original Class | | | (11,356 | ) | | | — | |
| Institutional Class | | | — | | | | — | |
| Class A | | | (21,715 | ) | | | (8,629 | ) |
| Class C | | | (1,176 | ) | | | (7 | ) |
| Class R | | | (164 | ) | | | (1 | ) |
| Class S | | | (8,248,800 | ) | | | (1,460,879 | ) |
| Net increase (decrease) in shares outstanding | | | (558,447 | ) | | | 1,757,286 | |
HENNESSY FUNDS 1-800-966-4354
| Hennessy Select Large Value Fund |
| | | March 23, 2009 | |
| | | through | |
| | | March 31, 2009 | |
| | | (Unaudited) | |
| | | Original | | | Institutional | |
| | | Class(3) | | | Class(3) | |
| PER SHARE DATA: | | | | | | |
| Net asset value, beginning of period | | $ | 14.25 | | | $ | 14.25 | |
| | | | | | | | | |
| Income from investment operations: | | | | | | | | |
| Net investment income | | | — | | | | — | |
| Net realized and unrealized gains (losses) on securities | | | 0.55 | | | | 0.55 | |
| Total from investment operations | | | 0.55 | | | | 0.55 | |
| | | | | | | | | |
| Less Distributions: | | | | | | | | |
| Dividends from net investment income | | | — | | | | — | |
| Dividends from net realized gains | | | — | | | | — | |
| Total distributions | | | — | | | | — | |
Redemption fees retained(6) | | | — | | | | — | |
| Net asset value, end of period | | $ | 14.80 | | | $ | 14.80 | |
| | | | | | | | | |
| TOTAL RETURN | | | 3.86 | %(7) | | | 3.86 | %(7) |
| | | | | | | | | |
| SUPPLEMENTAL DATA AND RATIOS: | | | | | | | | |
| Net assets, end of period (millions) | | $ | 110.4 | | | $ | 0.1 | |
| Ratio of expenses to average net assets: | | | | | | | | |
| Before expense reimbursement | | | 1.41 | %(8) | | | 0.98 | %(8) |
After expense reimbursement(9) | | | 1.30 | %(8) | | | 0.98 | %(8) |
| Ratio of net investment income to average net assets | | | | | | | | |
| Before expense reimbursement | | | (0.04 | )%(8) | | | 0.06 | %(8) |
| After expense reimbursement | | | 0.07 | %(8) | | | 0.06 | %(8) |
| Portfolio turnover rate | | | 2 | %(7) | | | 2 | %(7) |
(1) | For the period from July 1, 2004 to September 30, 2004. |
(2) | The existing class of shares was designated Class S shares as of April 19, 2004. |
(3) | Original Class and Institutional Class shares commenced operations on March 23, 2009. |
(4) | The financial highlights set forth for periods prior to March 23, 2009 represent the historical financial highlights of the Tamarack Value Fund, Class S shares. The assets of the Tamarack Value Fund were acquired by the Hennessy Select Value Fund on March 23, 2009. |
(5) | Per share net investment income (loss) has been calculated using the average daily shares method. |
(6) | Amount is less than $0.01 or ($0.01) per share. |
(9) | See Note 4 in Notes to the Financial Statements. |
The accompanying notes are an integral part of these financial statements.
| October 1, 2008 | | | | | | | | | | | | | | | | | | | |
| through | | | | | | | | | | | | | | | Period Ended | | | Year Ended | |
| March 22, 2009 | | | Year Ended September 30, | | | September 30, | | | June 30, | |
| (Unaudited) | | | 2008 | | | 2007 | | | 2006 | | | 2005 | | | 2004(1) | | | 2004(2) | |
| | | | | | | | | | | | | | | | | | | | |
Tamarack Value Fund, Class S(4) | |
| | | | | | | | | | | | | | | | | | | | |
| $ | 21.80 | | | $ | 43.12 | | | $ | 41.74 | | | $ | 45.78 | | | $ | 45.05 | | | $ | 44.20 | | | $ | 37.98 | |
| | | | | | | | | | | | | | | | | | | | | | | | | | | |
| | | | | | | | | | | | | | | | | | | | | | | | | | | |
| | 0.22 | | | | 0.42 | (5) | | | 0.58 | (5) | | | 0.55 | (5) | | | 0.74 | | | | 0.14 | | | | 0.56 | |
| | (7.36 | ) | | | (7.43 | ) | | | 5.04 | | | | 3.07 | | | | 4.35 | | | | 0.71 | | | | 6.47 | |
| | (7.14 | ) | | | (7.01 | ) | | | 5.62 | | | | 3.62 | | | | 5.09 | | | | 0.85 | | | | 7.03 | |
| | | | | | | | | | | | | | | | | | | | | | | | | | | |
| | | | | | | | | | | | | | | | | | | | | | | | | | | |
| | (0.41 | ) | | | (0.78 | ) | | | (0.63 | ) | | | (0.61 | ) | | | (0.46 | ) | | | — | | | | (0.41 | ) |
| | — | | | | (13.53 | ) | | | (3.61 | ) | | | (7.05 | ) | | | (3.90 | ) | | | — | | | | (0.40 | ) |
| | (0.41 | ) | | | (14.31 | ) | | | (4.24 | ) | | | (7.66 | ) | | | (4.36 | ) | | | — | | | | (0.81 | ) |
| | — | | | | — | | | | — | | | | — | | | | — | | | | — | | | | — | |
| $ | 14.25 | | | $ | 21.80 | | | $ | 43.12 | | | $ | 41.74 | | | $ | 45.78 | | | $ | 45.05 | | | $ | 44.20 | |
| | | | | | | | | | | | | | | | | | | | | | | | | | | |
| | (32.99 | )%(7) | | | (22.42 | )% | | | 14.19 | % | | | 9.10 | % | | | 11.42 | % | | | 1.92 | %(7) | | | 18.60 | % |
| | | | | | | | | | | | | | | | | | | | | | | | | | | |
| | | | | | | | | | | | | | | | | | | | | | | | | | | |
| $ | 106.2 | | | $ | 174.2 | | | $ | 269.4 | | | $ | 291.6 | | | $ | 366.9 | | | $ | 379.0 | | | $ | 386.9 | |
| | | | | | | | | | | | | | | | | | | | | | | | | | | |
| | 1.39 | %(8) | | | 1.22 | % | | | 1.26 | % | | | 1.22 | % | | | 1.25 | % | | | 1.15 | %(8) | | | 1.14 | % |
| | 1.02 | %(8) | | | 1.02 | % | | | 1.03 | % | | | 1.05 | % | | | 1.01 | % | | | 0.96 | %(8) | | | 0.96 | % |
| | | | | | | | | | | | | | | | | | | | | | | | | | | |
| | 2.25 | %(8) | | | 1.32 | % | | | 1.13 | % | | | 1.60 | % | | | 1.28 | % | | | 1.03 | %(8) | | | 1.12 | % |
| | 2.62 | %(8) | | | 1.52 | % | | | 1.36 | % | | | 1.33 | % | | | 1.52 | % | | | 1.22 | %(8) | | | 1.30 | % |
| | 59 | %(7) | | | 162 | % | | | 136 | % | | | 38 | % | | | 35 | % | | | 5 | %(7) | | | 14 | % |
HENNESSY FUNDS 1-800-966-4354
Notes to the Financial Statements
March 31, 2009 (Unaudited)
1). ORGANIZATION
The Hennessy Select Large Value Fund (the “Fund”, formerly known as the Tamarack Value Fund) is organized as a separate investment portfolio or series of Hennessy Funds Trust (the “Trust”), a Delaware statutory trust that was organized on September 17, 1992. Prior to July 1, 2005, the Trust was known as “The Henlopen Fund”. The Trust is an open-end, management investment company registered under the Investment Company Act of 1940, as amended. The Fund is a diversified portfolio.
The Fund is the successor to the Tamarack Value Fund (the “Predecessor Fund”) pursuant to a reorganization that took place on March 23, 2009. As a result of the reorganization, holders of the Class A, Class C, Class R and Class S shares of the Tamarack Value Fund received Original Class shares of the Hennessy Select Large Value Fund.
The Fund offers Original and Institutional Class shares. Each class of shares differs principally in its respective administration and transfer agent expenses and sales charges, if any. Each class has identical rights to earnings, assets and voting privileges, except for class-specific expenses and exclusive rights to vote on matters affecting only individual classes.
2). SIGNIFICANT ACCOUNTING POLICIES
The following is a summary of significant accounting policies consistently followed by the Fund in the preparation of the financial statements. These policies are in conformity with U.S. generally accepted accounting principles (“GAAP”).
| a). | Investment Valuation – Securities which are traded on a national or recognized stock exchange are valued at the last sale price on the securities exchange on which such securities are primarily traded. Exchange-traded securities for which there were no transactions that day and debt securities are valued at the most recent bid prices. Instruments with a remaining maturity of 60 days or less are valued on an amortized cost basis. When a price for an underlying security is not readily available or if a significant event has occurred that indicates the closing price of a security no longer represents the true value of that security, fair value pricing procedures have been adopted by the Board of Trustees of the Fund. Fair value pricing determinations are made in good faith in accordance with these procedures. There are numerous criteria that will be given consideration in determining a fair value of a security. Some of these criteria are: trading volume of security and markets, value of other like securities and news events with direct bearing to security or market. Fair value pricing results in an estimated price that reasonably reflects the current market conditions in order to rate the portfolio holdings such that shareholder transactions receive a fair net asset value. |
| b). | Federal Income Taxes – Provision for federal income taxes or excise taxes has not been made since the Fund has elected to be taxed as a “regulated investment company” and intends to distribute substantially all taxable income to shareholders and otherwise comply with the provisions of the Internal Revenue Code applicable to regulated investment companies. Net investment income and realized gains and losses for federal income tax purposes may differ from that reported on the financial statements because of temporary book and tax basis differences. Temporary differences are primarily the result of the treatment of wash sales for tax reporting purposes. Distributions from net realized gains for book purposes may include short-term capital gains, which are included as ordinary income to shareholders for tax purposes. |
Due to inherent differences in the recognition of income, expenses, and realized gains/losses under U.S. generally accepted accounting principles and federal income tax purposes, permanent differences between book and tax basis reporting for the 2008 fiscal year have been identified and appropriately reclassified on the Statement of Assets and Liabilities.
| Undistributed Net | Accumulated Net | Paid In |
| Investment Income/(Loss) | Realized Gain/(Loss) | Capital |
| (88) | 87 | 1 |
The permanent differences primarily relate to Net Operating Losses and Capital Loss Carryover lost due to expiration.
| c). | Income and Expenses – Dividend income is recognized on the ex-dividend date or as soon as information is available to the Fund and interest income is recognized on an accrual basis. Income expenses (other than expenses attributable to a specific class), and realized and unrealized gains or losses on investments are allocated to each class of shares based on its respective net assets. |
| d). | Distributions to Shareholders – Dividends from net investment income and distributions of net realized capital gains for the Fund, if any, are declared and paid out annually, usually in November or December of each year. |
| e). | Security Transactions – Investment and shareholder transactions are recorded on the trade date. The Fund determines the gain or loss realized from the investment transactions by comparing the original cost of the security lot sold with the net sale proceeds. Discounts and premiums on securities purchased are accreted/amortized over the life of the respective security. |
| f). | Use of Estimates – The preparation of financial statements in conformity with GAAP requires management to make estimates and assumptions that affect the reported amounts of assets and liabilities and disclosure of contingent assets and liabilities at the date of the financial statements and the reported change in net assets during the reporting period. Actual results could differ from those estimates. |
| g). | Share Valuation – The net asset value (“NAV”) per share of the Fund is calculated by dividing the sum of the value of the securities held, plus cash or other assets, minus all liabilities (including estimated accrued expenses) by the total number of shares outstanding, rounded to the nearest cent. The Fund’s shares will not be priced on the days on which the NYSE is closed for |
HENNESSY FUNDS 1-800-966-4354
trading. The offering and redemption price per share for each Fund is equal to each Fund’s net asset value per share.
| h). | Repurchase Agreements – The Fund may enter into repurchase agreements with member banks or security dealers of the Federal Reserve whom the investment advisor deems creditworthy. The repurchase price generally equals the price paid by the Fund plus interest negotiated on the basis of current short-term rates. |
Securities pledged as collateral for repurchase agreements are held by the custodian bank until the respective agreements mature. Provisions of the repurchase agreements ensure that the market value of the collateral, including accrued interest thereon, is sufficient, in the event of default of the counterparty. If the counterparty defaults and the value of the collateral declines or if the counterparty enters an insolvency proceeding, realization of the collateral by the Fund may be delayed or limited.
| i). | Accounting for Uncertainty in Income Taxes – In June 2006, the Financial Accounting Standards Board (“FASB”) issued FASB Interpretation 48 (“FIN 48”), “Accounting for Uncertainty in Income Taxes.” This standard defines the threshold for recognizing the benefits of tax-return positions in the financial statements as “more-likely-than-not” to be sustained by the taxing authority and requires measurement of a tax position meeting the more-likely-than-not criterion, based on the largest benefit that is more than 50 percent likely to be realized. FIN 48 is effective as of the beginning of the first fiscal year beginning after December 15, 2006, and is to be applied to all open tax years as of the effective date. The tax periods open to examination by the Internal Revenue Service include the fiscal years ended September 30, 2008, 2007, 2006 and 2005. As a result, the Fund has evaluated the implications of FIN 48 and determined that there is no material impact on the financial statements. |
| j.) | Fair Value Measurements – In September 2006, FASB issued Statement on Financial Accounting Standards (SFAS) No. 157, “Fair Value Measurements.” This standard establishes a single authoritative definition of fair value, sets out a framework for measuring fair value and requires additional disclosures about fair value measurements. SFAS No. 157 applies to fair value measurements already required or permitted by existing standards. SFAS No. 157 is effective for financial statements issued for fiscal years beginning after November 15, 2007 and interim periods within those fiscal years. The Fund adopted the provisions of Statement of Financial Accounting Standards No. 157, “Fair Value Measurements” (SFAS 157, effective with the beginning of the Fund’s fiscal year. SFAS 157 establishes a hierarchy that prioritizes the inputs to valuation techniques giving the highest priority to readily available unadjusted quoted prices in active markets for identical assets (level 1 measurements) and the lowest priority to unobservable inputs (level 3 measurements) when market prices are not readily available or reliable. |
| k). | Recently Issued Accounting Pronouncements – In March 2008, Statement of Financial Accounting Standards No. 161, “Disclosures about Derivative Instruments and Hedging Activities” (“SFAS 161”) was issued and is effective for fiscal years beginning after November 15, 2008. SFAS 161 is intended to improve financial reporting for derivative instruments by requiring enhanced |
disclosure that enables investors to understand how and why an entity uses derivatives, how derivatives are accounted for, and how derivative instruments affect an entity’s results of operations and financial position. Management is currently evaluating the implications of SFAS 161. The impact on the Fund’s financial statement disclosures, if any, is currently being assessed.
3). INVESTMENT TRANSACTIONS
Purchases and sales of investment securities (excluding government and short-term investments) during the six months ended March 31, 2009 were $78,045,288 and $86,265,232, respectively.
4). INVESTMENT MANAGEMENT FEE AND OTHER TRANSACTIONS WITH AFFILIATES
Hennessy Advisors, Inc. (the “Advisor”) is the Advisor of the Fund. The Advisor provides the Fund with investment management services under an Investment Advisory Agreement. The Advisor furnishes all investment advice, office space, facilities, and provides most of the personnel needed by the Fund. As compensation for its services, the Advisor is entitled to a monthly fee from the Fund. The fee is based upon the average daily net assets of the Fund at the annual rate of 0.85%. The Advisor has delegated the day to day management of the Funds to a Sub-Advisor, Voyageur Asset Management, Inc. (the “Sub-Advisor”). The Advisor pays Sub-Advisor fees from its own assets and these fees are not an additional expense of the Fund.
The Advisor has agreed to waive its fees and absorb expenses to the extent that the total annual operating expenses (excluding all federal, state and local taxes, interest, brokerage commissions, acquired fund fees and expenses and other costs incurred in connection with the purchase and sale of securities and extraordinary items) do not exceed 1.30% and 0.98% of the Fund’s net assets for the Original Class and Institutional Class shares, respectively. The expense limitation agreement for the Original Class shares is in place until March 31, 2010. The expense limitation agreement for the Institutional Class shares is in place until October 31, 2009 and is renewed annually. Voyageur had contractually agreed to waive fees/or make payments in order to keep total operating expenses of the Value Fund, Class S at 1.03%. This limitation was in place February 1, 2008 until January 31, 2009. For a period of three years after the year in which the Advisor waives or reimburses expenses, the Advisor may seek reimbursement from the Fund to the extent that total annual Fund operating expenses are less than the expense limitation in effect at the time of the waiver or reimbursement. The Advisor waived or reimbursed expenses of $3,044 for the Fund for the period March 23, 2009 through March 31, 2009. These reimbursed / absorbed expenses are subject to potential recovery by year of expiration September 30, 2012.
Prior to March 23, 2009, Voyageur Asset Management, Inc. (“Voyageur”) acted as the investment advisor for the Predecessor Fund. The Predecessor Fund entered an agreement with Voyageur whereas they furnished related office facilities, equipment, research and personnel. The agreement required the Predecessor Fund to pay Voyageur a monthly fee of 0.85% based upon average daily net assets.
The Board of Trustees has approved a Shareholder Servicing Plan for the Original Class shares of the Fund which was instituted to compensate the
HENNESSY FUNDS 1-800-966-4354
The Fund and Predecessor Fund have entered into agreements with various brokers, dealers and financial intermediaries in connection with the sale of shares of the Fund. The agreements provide for periodic payments by the Fund to the brokers, dealers and financial intermediaries for providing certain shareholder maintenance services (sub-transfer agent expenses). These shareholder services include: the pre-processing and quality control of new accounts, shareholder correspondence, answering customer inquiries regarding account status and facilitating shareholder telephone transactions. Fees paid by the Fund and Predecessor Fund to various brokers, dealers and financial intermediaries for the six months ended March 31, 2009, were $30,608.
The Predecessor Fund had adopted a Master Distribution 12b-1 Plan (the “Plan”) in which Tamarack Distributors Inc. (the “Distributor”) acted as the Fund’s distributor. The Distributor is an affiliate of Voyageur. The Plan permitted the Predecessor Fund to make payments for or reimburse the Distributor monthly for distribution-related costs and expenses of marketing shares of each share class covered under the Plan; and/or for providing shareholder services. The following chart shows the most recent Plan fee rate for each class of the Predecessor Fund.
| | Class A | Class C | Class R |
| 12b-1 Plan Fee | 0.25%* | 1.00% | 0.50% |
| * | The maximum Plan fee rate for Class A shares is 0.50%. The Distributor has contractually waived 0.25% of the total 0.50% Plan fee for Class A. |
Plan fees are based on average daily net assets of the applicable class. Up to 0.25% of each Plan fee may be designated as a Service Fee, as defined by the applicable rules of the Financial Industry Regulatory Authority. The Distributor, subject to applicable legal requirements, may waive a Plan fee voluntarily, in whole or in part. Neither the Original nor the Institutional Class shares of the Select Large Value Fund have a 12b-1 Plan.
For the period ended March 23, 2009, the Distributor received commissions of $27 from front-end sales charges of Class A shares of the Predecessor Fund, all of which was paid to affiliated broker-dealers. The Distributor also received $3 from CDSC fees from Class C shares of the Predecessor Fund. The Distributor received no CDSC fees from Class A shares of the Predecessor Fund during the period ended March 23, 2009. Class A and Class C shares were no longer offered for sale after March 23, 2009.
Effective March 23, 2009 U.S. Bancorp Fund Services, LLC (the “Administrator”) acts as the Fund’s Administrator under an Administration Agreement. The Administrator prepares various federal and state regulatory filings, reports and returns for the Fund; prepares reports and materials to be supplied to the directors; monitors the activities of the Fund’s custodian, transfer agent and accountants; coordinates the preparation and payment of the Fund’s expenses and reviews the Fund’s expense accruals. Fees paid to U.S. Bancorp Fund Services, LLC for the period March 23, 2009 through March 31, 2009, were $7,057.
Prior to March 23, 2009 Voyageur and PNC Global Investment Servicing (U.S.) Inc. (“PNC”) served as co-administrators of the Predecessor Fund. Services provided under the administrative services contract included providing day-to-day administration of matters related to the Predecessor Fund, maintenance of its records and the preparation of reports. Under the terms of the administrative services contract, Voyageur received a fee, payable monthly, at the annual rate of 0.075% of the Predecessor Fund’s average daily net assets. PNC received a fee for its services payable by the Predecessor Fund based on the Predecessor Fund’s average net assets. Voyageur’s fee is included in “Administration fees” in the Statement of Operations. PNC’s fee is included with “Fund Accounting fees” in the Statement of Operations.
The Tamarack Value Fund was the predecessor fund of the Fund. The financial highlights reported for periods prior to March 23, 2009, represents the activity of The Tamarack Value Fund.
Quasar Distributors, LLC (“Quasar”) acts as the Fund’s principal underwriter in a continuous public offering of the Fund’s shares. Quasar is an affiliated company of U.S. Bank, N.A.
5). FEDERAL TAX INFORMATION
The following balances for the Fund are as of September 30, 2008, the Fund’s most recent fiscal year end:
| Cost of Investments for tax purposes | | $ | 173,654,479 | |
| Gross tax unrealized appreciation | | | 11,813,495 | |
| Gross tax unrealized depreciation | | | (11,954,460 | ) |
| Net tax unrealized appreciation (depreciation) on investments | | | (140,965 | ) |
| Undistributed ordinary income | | $ | 2,270,488 | |
| Undistributed long-term capital gains | | $ | — | |
| Total Distributable earnings | | $ | — | |
| Other accumulated gains (losses) | | $ | (22,268,596 | ) |
| Total accumulated earnings (losses) | | $ | (20,139,073 | ) |
At September 30, 2008, the Fund had tax basis capital losses of $22,268,596, to offset future capital gains, the use of a portion of which is limited by IRS regulations. Of such losses, $22,268,596 expire September 30, 2016. Additionally, the Fund had no post-October loss deferrals as of September 30, 2008.
The tax character of distributions paid during 2009 and 2008 for the Fund was as follows:
| | | Six Months Ended | | | | |
| | | March 31, 2009 | | | Year Ended | |
| | | (Unaudited) | | | September 30, 2008 | |
| Distributions paid from: | | | | | | |
| Ordinary income | | $ | 3,122,632 | | | $ | 11,195,735 | |
| Long-term capital gain | | | — | | | | 75,497,358 | |
| | | $ | 3,122,632 | | | $ | 86,693,093 | |
HENNESSY FUNDS 1-800-966-4354
On March 20, 2009 the shareholders of the Tamarack Value Fund approved the agreement and plan of reorganization providing for the transfer of assets of the Tamarack Value Fund to the Hennessy Select Value Fund and the assumption of the liabilities of the Tamarack Value Fund by the Hennessy Select Value Fund. The following table illustrates the specifics of the merger:
| Acquired | Shares issued to | Acquiring | | |
| Fund | Shareholders of | Fund | Combined | Tax Status |
| Net Assets | Acquired Fund | Net Assets | Net Assets | of Transfer |
$106,344,111(1) | 7,462,745 | — | $106,344,111 | Non-taxable |
(1) | Includes capital loss carryovers and unrealized depreciation in the amount of $22,268,596 and ($20,869,681) respectively. |
7). MATTERS SUBMITTED TO A SHAREHOLDER VOTE
A special meeting of shareholders of the Tamarack Value Fund was held on March 20, 2009 and the following matters were approved by such Fund’s voting shares:
| 1). | Approve an Agreement and Plan of Reorganization pursuant to which all of the assets of the Tamarack Value Fund will be transferred to a newly formed series of Hennessy Funds Trust named the Hennessy Select Large Value Fund, in exchange for Original Class shares of the Hennessy Select Large Value Fund, which will be distributed pro rata by the Tamarack Value Fund to its Class A, Class C, Class R and Class S shareholders, and the Hennessy Select Large Value Fund’s assumption of the Tamarack Value Fund’s stated liabilities: |
| For | 3,310,941 |
| Against | 410,811 |
| Abstain | 266,743 |
| Broker non-vote | — |
| 2). | Adjourn the special meeting to permit further solicitation of proxies in the event there are not sufficient votes at the time of the special meeting to approve the Agreement and Plan of Reorganization: |
| For | 3,273,443 |
| Against | 404,912 |
| Abstain | 310,139 |
| Broker non-vote | 1 |
March 31, 2009 (Unaudited)
As a shareholder of the Fund, you incur two types of costs: (1) transaction costs, including sales charges (loads) on purchase payments, reinvested dividends, or other distributions; redemption fees; and exchange fees; and (2) ongoing costs, including management fees; service fees; and other Fund expenses. This Example is intended to help you understand your ongoing costs (in dollars) of investing in the Fund and to compare these costs with the ongoing costs of investing in other mutual funds. The Original Class shares Example is based on an investment of $1,000 invested in Original Class shares at the beginning of the period and held for the entire period from October 1, 2008 through March 31, 2009. The Institutional Class shares Example is based on an investment of $1,000 invested in Institutional Class shares held for the entire period from March 23, 2009 through March 31, 2009.
Actual Expenses
The first set of lines of the table below provide information about actual account values and actual expenses. Although the Fund charges no sales loads or transaction fees, you will be assessed fees for outgoing wire transfers, returned checks and stop payment orders at prevailing rates charged by U.S. Bancorp Fund Services, LLC, the Fund’s transfer agent. If you request that a redemption be made by wire transfer, currently a $15.00 fee is charged by the Fund’s transfer agent. IRA accounts will be charged a $15.00 annual maintenance fee. The example below includes, but is not limited to, management fees, shareholder servicing fees, fund accounting, custody and transfer agent fees. However, the example below does not include portfolio trading commissions and related expenses, interest expense or dividends on short positions taken by the Fund and other extraordinary expenses as determined under generally accepted accounting principles. You may use the information within these lines, together with the amount you invested, to estimate the expenses that you paid over the six-month period. Simply divide your account value by $1,000 (for example, an $8,600 account value divided by $1,000 = 8.6), then multiply the result by the number in the first line under the heading entitled “Expenses Paid During Period” to estimate the expenses you paid on your account during this period.
Hypothetical Example for Comparison Purposes
The second set of lines within the table below provide information about hypothetical account values and hypothetical expenses based on the Fund’s actual expense ratios and an assumed rate of return of 5% per year before expenses, which is not the Fund’s actual return. The hypothetical account values and expenses may not be used to estimate the actual ending account balance or expenses you paid for the period. You may use this information to compare the ongoing costs of investing in the Fund and other funds. To do so, compare this 5% hypothetical example with the 5% hypothetical examples that appear in the shareholder reports of the other funds. Please note that the expenses shown in the table are meant to highlight your ongoing costs only and do not reflect any
HENNESSY FUNDS 1-800-966-4354
| | Beginning | Ending | Expenses Paid |
| | Account Value | Account Value | During Period(1) |
| Original Class | 10/1/08 | 3/31/09 | 10/1/08 – 3/31/09 |
| | | | |
| Actual | $1,000.00 | $ 695.00 | $4.69 |
| Hypothetical (5% return | | | |
| before expenses) | $1,000.00 | $1,019.40 | $5.59 |
(1) | Expenses are equal to the Select Value Fund’s expense ratio of 1.11%, multiplied by the average account value over the period, multiplied by 182/365 days (to reflect one-half year period ended March 31, 2009). For the current fiscal one-half year, the Select Value Fund’s expense ratio is anticipated to be 1.30%, resulting in expenses paid during the period of $5.49 (actual) and $6.54 (hypothetical). |
| | Beginning | Ending | Expenses Paid |
| | Account Value | Account Value | During Period(2) |
| Institutional Class | 3/23/09 | 3/31/09 | 3/23/09 – 3/31/09 |
| | | | |
| Actual | $1,000.00 | $1,038.60 | $0.25 |
| Hypothetical (5% return | | | |
| before expenses) | $1,000.00 | $1,000.99 | $0.24 |
(2) | Expenses are equal to the Select Value Fund’s expense ratio of 0.98%, multiplied by the average account value over the period, multiplied by 9/365 days (to reflect the period ended March 31, 2009). |
How to Obtain a Copy of the Funds’ Proxy Voting Policy and Proxy Voting Records
A description of the policies and procedures that the Funds use to determine how to vote proxies relating to portfolio securities is available without charge: (1) by calling 1-800-966-4354; (2) on the Hennessy Funds website at www.hennessyfunds.com; or (3) on the U.S. Securities and Exchange Commission’s website at www.sec.gov. Hennessy Funds’ proxy voting record is available on the SEC’s website at www.sec.gov no later than August 31 for the prior 12 months ending June 30.
Quarterly Filings on Form N-Q
The Funds file their complete schedule of portfolio holdings with the SEC for the first and third quarters of each fiscal year on Form N-Q. The Funds’ Form N-Q will be available on the SEC’s website at www.sec.gov. The Funds’ Form N-Q may be reviewed and copied at the SEC’s Public Reference Room in Washington, DC and information on the operation of the Public Reference Room may be obtained by calling 1-800-SEC-0330. Information included in the Funds’ N-Q will also be available upon request by calling 1-800-966-4354.
HENNESSY FUNDS 1-800-966-4354
Board Approval of Investment
Advisory Agreements
At its meeting on March 2, 2009, the Board of Directors (the “Board”) of The Hennessy Funds, Inc. (the “Company”) and its two series, the Hennessy Balanced Fund (the “Balanced Fund”) and the Hennessy Total Return Fund (the “Total Return Fund”) (each a “Fund” or collectively the “Funds”), The Hennessy Mutual Funds, Inc. (the “Company”) and its three series, the Hennessy Cornerstone Growth Fund (the “Growth Fund”), the Hennessy Cornerstone Value Fund (the “Value Fund”), and the Hennessy Focus 30 Fund (the “Focus 30 Fund”) and The Hennessy Funds Trust (the “Company”) which includes the Hennessy Cornerstone Growth Fund, Series II (the “Growth II Fund”), Hennessy Cornerstone Large Growth Fund (the “Large Growth” Fund), and the Hennessy Select Large Value Fund (the “Select Value” Fund), (each a “Fund” or collectively the “Funds”), including the Directors who are not “interested persons” (as defined in the Investment Company Act of 1940) of the Funds’ voted to re-approve (approve with respect to the investment advisory agreements for the Large Growth Fund and the Select Value Fund) the current investment advisory agreement (the “Advisory Agreement”) between the Funds and Hennessy Advisors, Inc. (the “Advisor”) and approve the sub-advisory agreement with Voyageur Asset Management, Inc. (the “Sub-Advisor”). In connection with its re-approval or approval of the Advisory Agreement, the Board considered the following factors:
| 1) | The Advisor provides formula driven investment management for the Funds (except for the Select Value Fund). Hennessy Advisors, Inc. holds the patent rights to the formulas used for The Cornerstone Growth, Growth II, Value, Large Growth and Focus 30 funds. In providing investment management, Hennessy Advisors, Inc. will direct and oversee the trading of securities within and the rebalancing of the portfolios of the Funds (except for the Select Value Fund). |
| 2) | The Advisor oversees the performance of the Sub-Advisor and pays the sub-advisory fee. |
| 3) | The Advisor pays for the services to retain the Funds’ Chief Compliance Officer and will make all reasonable efforts to insure that the Funds are in compliance with the securities laws. |
| 4) | The Advisor provides responsive customer and shareholder servicing which consists of providing a call center to respond to shareholder inquiries, including specific mutual fund account information. Shareholders can contact Hennessy Advisors, Inc., directly during office hours. The firm endeavors to answer all calls in-person within two rings of the telephone. |
| 5) | The Advisor oversees distribution of the Funds through third-party broker/dealers and independent financial institutions such as Charles Schwab, Inc., Fidelity, TD Ameritrade and Pershing. Hennessy Advisors participates in “no transaction fee” (“NTF”) programs with these companies, which allows customers to purchase the Hennessy Funds |
| | through third party distribution channels without paying a transaction fee. Hennessy Advisors compensates these third party distributors under a pre-determined contractual agreement. |
| 6) | The Advisor oversees those third party service providers that support the Funds in providing fund accounting, fund administration, fund distribution, transfer agency and custodial services. |
| 7) | The Sub-Advisor provides investment services to the Select Value Fund and oversees the trading of securities for the Select Value Fund. |
The Board also: (i) compared the performance of each Fund (other than the Large Growth Fund where the performance of the investment formula was reviewed) to benchmark indices over various periods of time and concluded that the performance of each Fund warranted the continuation or approval of the Advisory Agreement; (ii) compared the expense ratios of funds similar in asset size and investment objective to each of the Funds and concluded the actual or projected expenses of each Fund were reasonable and warranted continuation of the Advisory Agreement; (iii) considered the fees charged by Hennessy Advisors, Inc. to those of funds similar in asset size and investment objective to each of the Funds and concluded the advisory fees of each Fund were reasonable and warranted continuation or approval of the Advisory Agreement; (iv) considered the profitability or projected profitability of Hennessy Advisors, Inc. with respect to each Fund and the projected profitability of the Sub-Advisor with respect to the Select Value Fund and concluded the profits were reasonable and not excessive when compared to profitability guidelines set forth in relevant court cases; (v) considered the high level of professionalism and knowledge, along with an extremely low level of turnover, of the employees of the Advisor; and (vi) considered that Neil Hennessy was named one of the top 100 portfolio managers in the nation during each of the previous six years by Barron’s.
The Board then discussed economies of scale and breakpoints and determined that the Funds managed by Hennessy Advisors, Inc. have not yet grown in size, nor has their marketplace demonstrated significantly rapid potential growth to any extent that would warrant the use of breakpoints. The Funds have, in fact, had their assets under management greatly diminish during 2008. In reaching this conclusion the Board took into consideration the profitability of Hennessy Advisors, Inc. and the advisory fees of comparable mutual funds.
The Board reviewed the Funds’ expense ratios and comparable expense ratios for funds like the eight funds being considered for contract approval/renewal by Hennessy Advisors, Inc. The Board used data from Lipper as presented in the charts in the Board Materials showing funds similar in nature to the Hennessy Funds (Mid-Cap Blend, Small Cap Blend, etc.). The Board determined that the expense ratios of The Funds fall within the range of the ratios of other funds in their classification. (Please see Lipper charts provided in the Board Materials). The Board also referenced the Advisor’s Form ADV and copies of the current Investment Advisory Agreements. All of the factors above were considered separately by the non-interested Directors in an executive session during which management of the Advisor was not present. The factors were viewed in their totality by the Board, with no single factor being the principal or determinative factor in the Board’s determination of whether to
HENNESSY FUNDS 1-800-966-4354
(This Page Intentionally Left Blank.)
HENNESSY FUNDS 1-800-966-4354
For information, questions
or assistance, please call
The Hennessy Funds
1-800-966-4354 or 1-415-899-1555
INVESTMENT ADVISOR
Hennessy Advisors, Inc.
7250 Redwood Blvd., Suite 200
Novato, California 94945
ADMINISTRATOR, TRANSFER
AGENT, DIVIDEND PAYING
AGENT & SHAREHOLDER
SERVICING AGENT
U.S. Bancorp Fund Services, LLC
P.O. Box 701
Milwaukee, Wisconsin 53201-0701
CUSTODIAN
U.S. Bank N.A.
Custody Operations
1555 North River Center Dr., Suite 302
Milwaukee, Wisconsin 53212
TRUSTEES
Neil J. Hennessy
Robert T. Doyle
J. Dennis DeSousa
Gerald P. Richardson
COUNSEL
Foley & Lardner LLP
777 East Wisconsin Avenue
Milwaukee, Wisconsin 53202-5306
INDEPENDENT REGISTERED
PUBLIC ACCOUNTING FIRM
KPMG LLP
303 East Wacker Drive
Chicago, Illinois 60601
DISTRIBUTOR
Quasar Distributors, LLC
615 East Michigan Street
Milwaukee, Wisconsin 53202
WWW.HENNESSYFUNDS.COM
This report has been prepared for shareholders and may be distributed
to others only if preceded or accompanied by a current prospectus.
Item 2. Code of Ethics.
Not applicable for semi-annual reports.
Item 3. Audit Committee Financial Expert.
Not applicable for semi-annual reports.
Item 4. Principal Accountant Fees and Services.
Not applicable for semi-annual reports.
Item 5. Audit Committee of Listed Registrants.
Not applicable to registrants who are not listed issuers (as defined in Rule 10A-3 under the Securities Exchange Act of 1934).
Item 6. Investments.
Schedule of Investments is included as part of the report to shareholders filed under Item 1 of this Form.
Item 7. Disclosure of Proxy Voting Policies and Procedures for Closed-End Management Investment Companies.
Not applicable to open-end investment companies.
Item 8. Portfolio Managers of Closed-End Management Investment Companies.
Not applicable to open-end investment companies.
Item 9. Purchases of Equity Securities by Closed-End Management Investment Company and Affiliated Purchasers.
Not applicable to open-end investment companies.
Item 10. Submission of Matters to a Vote of Security Holders.
Not Applicable.
Item 11. Controls and Procedures.
| (a) | The Registrant’s Chief Executive Officer and Treasurer have reviewed the Registrant's disclosure controls and procedures (as defined in Rule 30a-3(c) under the Investment Company Act of 1940 (the “Act”)) as of a date within 90 days of the filing of this report, as required by Rule 30a-3(b) under the Act and Rules 13a-15(b) or 15d-15(b) under the Securities Exchange Act of 1934. Based on their review, such officers have concluded that the disclosure controls and procedures are effective in ensuring that information required to be disclosed in this report is appropriately recorded, processed, summarized and reported and made known to them by others within the Registrant and by the Registrant’s service provider. |
| (b) | There were no changes in the Registrant's internal control over financial reporting (as defined in Rule 30a-3(d) under the Act) that occurred during the second fiscal quarter of the period covered by this report that has materially affected, or is reasonably likely to materially affect, the Registrant's internal control over financial reporting. |
Item 12. Exhibits.
| (a) | (1) Any code of ethics or amendment thereto, that is the subject of the disclosure required by Item 2, to the extent that the registrant intends to satisfy Item 2 requirements through filing an exhibit. Not applicable. |
(2) A separate certification for each principal executive and principal financial officer pursuant to Section 302 of the Sarbanes-Oxley Act of 2002. Filed herewith
(3) Any written solicitation to purchase securities under Rule 23c-1 under the Act sent or given during the period covered by the report by or on behalf of the registrant to 10 or more persons. Not applicable to open-end investment companies.
| (b) | Certifications pursuant to Section 906 of the Sarbanes-Oxley Act of 2002. Furnished herewith. |
SIGNATURES
Pursuant to the requirements of the Securities Exchange Act of 1934 and the Investment Company Act of 1940, the registrant has duly caused this report to be signed on its behalf by the undersigned, thereunto duly authorized.
(Registrant) Hennessy Funds Trust
By (Signature and Title) /s/Neil J. Hennessy
Neil J. Hennessy, Principal Executive Officer
Date June 5, 2009
Pursuant to the requirements of the Securities Exchange Act of 1934 and the Investment Company Act of 1940, this report has been signed below by the following persons on behalf of the registrant and in the capacities and on the dates indicated.
By (Signature and Title)* /s/Neil J. Hennessy
Neil J. Hennessy, Principal Executive Officer
Date June 5, 2009
By (Signature and Title)* /s/Teresa M. Nilsen
Teresa M. Nilsen, Treasurer
Date June 5, 2009