UNITED STATES
SECURITIES AND EXCHANGE COMMISSION
Washington, D.C. 20549
FORM N-CSR
CERTIFIED SHAREHOLDER REPORT OF REGISTERED
MANAGEMENT INVESTMENT COMPANIES
Investment Company Act file number (811-07168)
Hennessy Funds Trust
(Exact name of registrant as specified in charter)
7250 Redwood Blvd., Suite 200
Novato, CA 94945
(Address of principal executive offices) (Zip code)
Neil J. Hennessy
Hennessy Advisors, Inc.
7250 Redwood Blvd., Suite 200
Novato, CA 94945
(Name and address of agent for service)
800-966-4354
Registrant's telephone number, including area code
Date of fiscal year end: October 31, 2009
Date of reporting period: April 30, 2009
Item 1. Reports to Stockholders.
HENNESSY FUNDS
SEMI-ANNUAL REPORT
APRIL 30, 2009
Hennessy Cornerstone Growth Fund
Hennessy Cornerstone Growth Fund, Series II
Hennessy Focus 30 Fund
Hennessy Cornerstone Value Fund
Hennessy Total Return Fund
Hennessy Balanced Fund
Contents
| Letter to shareholders | 1 |
| Summaries of investments | |
| Hennessy Cornerstone Growth Fund | 7 |
| Hennessy Cornerstone Growth Fund, Series II | 12 |
| Hennessy Focus 30 Fund | 17 |
| Hennessy Cornerstone Value Fund | 21 |
| Hennessy Total Return Fund | 25 |
| Hennessy Balanced Fund | 28 |
| Financial statements | |
| Statements of assets and liabilities | 32 |
| Statements of operations | 34 |
| Statements of changes in net assets | 36 |
| Financial highlights | |
| Hennessy Cornerstone Growth Fund | 40 |
| Hennessy Cornerstone Growth Fund, Series II | 42 |
| Hennessy Focus 30 Fund | 44 |
| Hennessy Cornerstone Value Fund | 46 |
| Hennessy Total Return Fund | 48 |
| Hennessy Balanced Fund | 50 |
| Statement of cash flows – Hennessy Total Return Fund | 52 |
| Notes to the financial statements | 53 |
| Expense example | 62 |
| Proxy voting policy | 64 |
| Board approval of continuation | |
| of investment advisory agreement | 65 |
LETTER TO SHAREHOLDERS
June, 2009
Dear Hennessy Funds Shareholder:
During the six-month period ending April 30, 2009, the financial markets experienced some of their darkest days in recent history, but also saw the beginning of a significant rebound. During my 30 years in the financial industry, I have never seen the kind of crisis of confidence that we experienced at the end of February/beginning of March. As retirement account balances and home values plummeted, even the most disciplined, long-term investors had simply had enough and began moving their money to the sidelines. For me, that signaled a turning point and suggested that the markets and consumer confidence had hit bottom. The markets hit their lows on March 9th, and we have seen steady improvement since.
I believe that the recovery actually began in November with the first injection of government TARP (Troubled Asset Relief Program) spending and that the lows the market hit in March are behind us. As in any type of recovery, it will take time. I use the analogy of putting a cast on a broken bone; the fix is in place but it will be a slow and painful healing process.
I foresee steady economic growth in the coming months. It seems that many people have the perception that the majority of companies are losing money, but our analysis shows that is simply not the case. I believe that companies are taking the opportunity, while their stock prices have been driven down, to become as lean as possible so that any increase in revenue will fall to the bottom line and increase profitability. A full recovery may take longer than some would hope, but I believe that the growth we will experience will be based on solid, tangible business results and, most importantly, it will be sustainable. It is my opinion that investors learned an important lesson about leverage and will resume investing in high quality stocks and mutual funds as confidence in the markets is restored.
Funds Performance Review
The Hennessy Cornerstone Growth Fund returned -8.86% for the six-month period ending 4/31/09, slightly underperforming its benchmark index, the Russell 2000, which returned -8.40%. The fund’s relative performance was helped by positive sector allocation decisions, including overweighting Consumer Discretionary stocks and
HENNESSY FUNDS 1-800-966-4354
Average Annual Total Return (as of April 30, 2009)
| Original Class Shares | | | | | | |
| | Six months | One Year | Three Year | Five Year | Ten Year | |
| | ending | Annualized | Annualized | Annualized | Annualized | Since |
| Fund (Inception date) | 4/30/09 | Return | Return | Return | Return | Inception |
| Cornerstone Growth | | | | | | |
| Fund (11/1/96) | -8.86% | -39.65% | -22.47% | -4.70% | 5.31% | 6.73% |
| Russell 2000 Index | -8.40% | -30.74% | -12.72% | -1.45% | 2.53% | 4.28% |
| | | | | | | |
| | | | | | | |
| Cornerstone Growth | | | | | | |
| Fund, Series II (7/1/05) | -5.02% | -49.07% | -27.71% | n/a | n/a | -17.47% |
| Russell 2000 Growth Index | -3.77% | -30.36% | -12.10% | n/a | n/a | -4.66% |
| | | | | | | |
| | | | | | | |
| Focus 30 Fund (9/17/03) | -5.99% | -36.53% | -12.80% | 3.76% | n/a | 4.36% |
| S&P 400 Mid-cap Index | -0.18% | -31.84% | -9.95% | 0.56% | n/a | 2.52% |
| | | | | | | |
| | | | | | | |
| Cornerstone Value | | | | | | |
| Fund (11/1/96) | -3.78% | -37.48% | -13.20% | -4.39% | -0.83% | 2.18% |
| Russell 1000 Value Index | -13.27% | -39.21% | -13.21% | -2.50% | -0.50% | 4.57% |
| | | | | | | |
| | | | | | | |
| Total Return | | | | | | |
| Fund (7/29/98) | -13.69% | -32.53% | -9.18% | -3.69% | -1.22% | -0.08% |
| Dow Jones | | | | | | |
| Industrial Average | -10.78% | -34.19% | -8.05% | -2.00% | -0.61% | 1.34% |
| | | | | | | |
| | | | | | | |
| Balanced Fund (3/8/96) | -7.63% | -22.11% | -4.85% | -2.08% | -0.55% | 2.38% |
| Dow Jones | | | | | | |
| Industrial Average | -10.78% | -34.19% | -8.05% | -2.00% | -0.61% | 5.27% |
| S&P 500 Index | -8.53% | -35.31% | -10.76% | -2.70% | -2.48% | |
| | | | | | | |
Performance data quoted represents past performance; past performance does not guarantee future results. The investment return and principal value of an investment will fluctuate so that an investor’s shares, when redeemed, may be worth more or less than their original cost. Current performance of the fund may be lower or higher than the performance quoted. Performance data current to the most recent month end may be obtained by visiting www.hennessyfunds.com.
The total annual operating expenses of the Original Class shares of the Funds are as follow: Cornerstone Growth Fund = 1.25%; Cornerstone Growth Fund, Series II = 1.37%; Focus 30 Fund = 1.27%; Cornerstone Value = 1.20%; Total Return Fund = 2.36% gross/1.20% net of interest expense; and Balanced Fund = 1.56%.
All performance shown is net of fees and expenses.
LETTER TO SHAREHOLDERS
underweighting Financials. Performance was hampered by weaker security selection in the Information Technology sector. One of the best performers prior to the rebalance (which took place in the winter) was Consumer Discretionary stock, Sony Corp. After the rebalance some of the better performers included Consumer Discretionary stocks Aaron’s Inc. and Hot Topic. Some of the weaker performers included Information Technology stocks NCI Inc. and ManTech International.
The Hennessy Cornerstone Growth Fund, Series II returned -5.02% for the six-month period ending 4/31/09, underperforming its benchmark index, the Russell 2000 Growth, which returned -3.77%, but outperforming the S&P 500 Index. The relative performance of the fund is attributable in part to avoiding Financial stocks completely; the fund was able to avoid the carnage in the Financial sector in the last two months of the year and early in 2009. In addition, a major positive contributor to the fund’s performance was superior security selection in the Energy sector. Among the best performing Energy stocks in the portfolio were Interoil Corp. (+123% for the period) and Englobal (+31%). These positive contributors offset weaker security selection in Information Technology, where poor performers, such as UT Starcom (-51%), The Hackett Group (-25%), and Mantech International (-33%) offset good performers in the sector, such as Multi-Fineline Electronix (+72%) and Western Digital (+43%).
The Hennessy Focus 30 Fund returned -5.99% for the six-month period ending 4/31/09, underperforming its benchmark index, the S&P 400 Mid-cap, which returned -0.18%, but outperforming the S&P 500. The fund’s relative performance was affected by a number of factors, however, there were some common themes in the performance trends vs. both of the indices. The fund benefited from overweighting Consumer Discretionary stocks relative to both benchmarks, with the fund having a 34.06% weighting vs. 8.42% and 14.56% weightings in the S&P 500 and the S&P 400 index, respectively. Some of the best performers in the portfolio from that sector were AutoZone (+31% for the six-month period), Panera Bread (+24), Rent-a-center (+32%), Aeropostale (+40%) and Sally Beauty Holdings (+46%). Security selection in the Information Technology sector hampered performance of the fund, particularly Mantech, which returned -33% for the period.
The Hennessy Cornerstone Value Fund returned -3.78% for six-month period ending 4/30/09, significantly outperforming its benchmark index, the Russell 1000 Value, which returned -13.27%, as well as the S&P 500. The fund’s relative performance was almost entirely due to superior security selection, specifically in the Consumer Staples and Information Technology sectors, which helped to offset an underweight position in Information Technology, which outperformed the broader
HENNESSY FUNDS 1-800-966-4354
benchmarks. Two strong Information Technology stocks in the portfolio were Taiwan Semiconductor and AU Optronics, which returned +28% and +57%, respectively for the period. Within the Consumer Staples sector, Supervalu (+15%) offset the weaker performing stocks in that sector in the portfolio.
The Hennessy Total Return Fund returned -13.69% for the six-month period ending 4/30/09, underperforming its benchmark index, the Dow Jones Industrial Average, which returned -10.78% for the period. The portfolio contained stocks that performed well during the period, including Home Depot (+12%) and IBM (+11%), however performance of the fund was negatively impacted by Citigroup (-78%), Bank of America (-63%), and General Motors (-67%).
The Hennessy Balanced Fund returned -7.63% for the six-month period ending 4/30/09, outperforming both the Dow Jones Industrial Average and the S&P 500 for the period. As with the Total Return Fund, the performance of the Balanced Fund was helped by holding strong Dogs of the Dow stocks Home Depot and IBM, but hurt by Citigroup, Bank of America and General Motors. The outperformance versus the indices can primarily be attributed to the fund’s 50% allocation to U.S. Treasury Bills, which performed especially well in the latter part of 2008, as risk aversion peaked amongst investors.
Corrections are always painful, and I understand that the magnitude of the most recent market downturn has left investors feeling overwhelmed and distraught. I do, however, believe that historical performance data has shown how patience, discipline and a long-term investing view can be rewarded, particularly now. Some of the savviest investors know that when things look bleakest, it may be a good time to buy rather than sell. I believe it is an opportune time to consider putting long-term money to work in the market.
We vigilantly maintain our focus on the long-term, and on building value for our shareholders. At Hennessy Funds, we believe in servicing our shareholders directly, so that we can provide instant answers to shareholder questions and concerns. Please don’t hesitate to contact us at 800-966-4354 if we can answer any questions or can be of service.
Best regards,
Neil J. Hennessy
Portfolio Manager & Chief Investment Officer
Hennessy Funds
LETTER TO SHAREHOLDERS
Past performance does not guarantee future results.
Mutual fund investing involves risk. Principal loss is possible. Small and medium-capitalization companies tend to have limited liquidity and greater price volatility than large-capitalization companies. Investments in foreign securities involve greater volatility and political, economic and currency risk and differences in accounting methods.
The Hennessy Total Return and Balanced Funds are non-diversified, meaning they may concentrate their assets in fewer individual holdings than a diversified fund, making it more exposed to individual stock volatility than a diversified fund.
References to specific securities should not be considered a recommendation to buy or sell any security. Fund holdings are subject to change. Please refer to the Schedule of Investments within this semi-annual report for additional portfolio information, including percentages of holdings.
The S&P 500 and Dow Jones Industrial Average are unmanaged indices commonly used to measure the performance of U.S. stocks. The Russell 2000 and Russell 2000 Growth Indices are unmanaged indices commonly used to measure the performance of small cap stocks, while the Russell 1000 Value index measures performance of large cap stocks. The S&P 400 Mid-cap Index is an unmanaged index commonly used to measure the performance of mid-cap stocks. One cannot invest directly in an index.
Opinions expressed are those of Neil Hennessy and are subject to change, are not guaranteed and should not be considered investment advice.
Current and future holdings are subject to risk.
HENNESSY FUNDS 1-800-966-4354
(This Page Intentionally Left Blank.)
SUMMARY OF INVESTMENTS — HENNESSY CORNERSTONE GROWTH FUND
Summaries of Investments
The following summaries of investment portfolios are designed to help investors better understand each fund’s principal holdings. Each summary is as of April 30, 2009 (Unaudited).
HENNESSY CORNERSTONE GROWTH FUND
(% of Net Assets)
| TOP TEN EQUITY HOLDINGS | % of net assets |
| Netflix, Inc. | 3.26% |
| American Italian Pasta Co. | 3.03% |
| HOT Topic, Inc. | 2.85% |
| Family Dollar Stores, Inc. | 2.75% |
| Aaron’s, Inc. | 2.72% |
| AutoZone, Inc. | 2.58% |
| Beacon Roofing Supply, Inc. | 2.47% |
| Carter’s, Inc. | 2.39% |
| Applied Signal Technology, Inc. | 2.38% |
| Stifel Financial Corp. | 2.32% |
HENNESSY FUNDS 1-800-966-4354
| COMMON STOCKS – 98.33% | | Number | | | | | | % of Net | |
| | | of Shares | | | Value | | | Assets | |
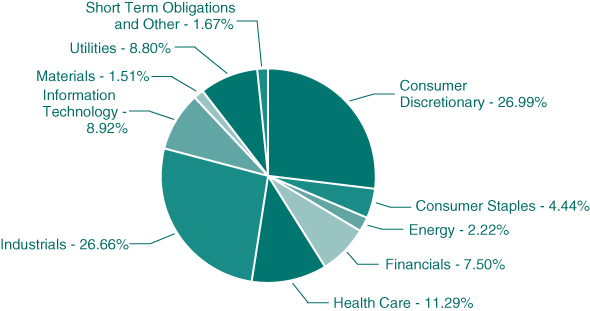
| Consumer Discretionary – 26.99% | | | | | | | | | |
| Aaron’s, Inc. | | | 197,300 | | | $ | 6,621,388 | | | | 2.72 | % |
| AutoZone, Inc. (a) | | | 37,700 | | | | 6,272,903 | | | | 2.58 | % |
| Carter’s, Inc. (a) | | | 272,700 | | | | 5,830,326 | | | | 2.39 | % |
| Dollar Tree, Inc. (a) | | | 126,000 | | | | 5,334,840 | | | | 2.19 | % |
| Family Dollar Stores, Inc. | | | 201,500 | | | | 6,687,785 | | | | 2.75 | % |
| FGX International Holdings Ltd. (a)(b) | | | 386,100 | | | | 4,447,872 | | | | 1.83 | % |
| HOT Topic, Inc. (a) | | | 566,700 | | | | 6,936,408 | | | | 2.85 | % |
| Monro Muffler, Inc. | | | 206,000 | | | | 5,143,820 | | | | 2.11 | % |
| National Presto Industries, Inc. | | | 68,200 | | | | 4,859,932 | | | | 2.00 | % |
| Netflix, Inc. (a) | | | 175,700 | | | | 7,960,967 | | | | 3.26 | % |
| Panera Bread Co. (a) | | | 100,600 | | | | 5,634,606 | | | | 2.31 | % |
| | | | | | | | 65,730,847 | | | | 26.99 | % |
| | | | | | | | | | | | | |
| Consumer Staples – 4.44% | | | | | | | | | | | | |
| American Italian Pasta Co. (a) | | | 235,100 | | | | 7,391,544 | | | | 3.03 | % |
| Nash Finch Co. | | | 117,000 | | | | 3,426,930 | | | | 1.41 | % |
| | | | | | | | 10,818,474 | | | | 4.44 | % |
| | | | | | | | | | | | | |
| Energy – 2.22% | | | | | | | | | | | | |
| World Fuel Services Corp. | | | 142,000 | | | | 5,414,460 | | | | 2.22 | % |
| | | | | | | | | | | | | |
| Financials – 7.50% | | | | | | | | | | | | |
| Amerisafe, Inc. (a) | | | 255,900 | | | | 3,930,624 | | | | 1.61 | % |
| First Bancorp Puerto Rico (b) | | | 471,500 | | | | 2,597,965 | | | | 1.07 | % |
| Nelnet, Inc. (a) | | | 366,600 | | | | 2,210,598 | | | | 0.91 | % |
| Odyssey Re Holdings Corp. | | | 101,400 | | | | 3,882,606 | | | | 1.59 | % |
| Stifel Financial Corp. (a) | | | 114,600 | | | | 5,641,758 | | | | 2.32 | % |
| | | | | | | | 18,263,551 | | | | 7.50 | % |
| | | | | | | | | | | | | |
| Health Care – 11.29% | | | | | | | | | | | | |
| Cantel Medical Corp. (a) | | | 360,230 | | | | 5,090,050 | | | | 2.09 | % |
| Emergency Medical Services Corp. (a) | | | 143,500 | | | | 4,999,540 | | | | 2.05 | % |
| Ensign Group, Inc. | | | 313,800 | | | | 4,863,900 | | | | 2.00 | % |
| Gentiva Health Services, Inc. (a) | | | 179,500 | | | | 2,859,435 | | | | 1.17 | % |
| PSS World Medical, Inc. (a) | | | 279,100 | | | | 4,052,532 | | | | 1.66 | % |
| SXC Health Solutions Corp. (a)(b) | | | 281,400 | | | | 5,636,442 | | | | 2.32 | % |
| | | | | | | | 27,501,899 | | | | 11.29 | % |
The accompanying notes are an integral part of these financial statements.
SUMMARY OF INVESTMENTS — HENNESSY CORNERSTONE GROWTH FUND
| COMMON STOCKS | | Number | | | | | | % of Net | |
| | | of Shares | | | Value | | | Assets | |
| Industrials – 26.66% | | | | | | | | | |
| Aaon, Inc. | | | 251,600 | | | $ | 4,901,168 | | | | 2.01 | % |
| Aceto Corp. | | | 527,100 | | | | 3,768,765 | | | | 1.55 | % |
| Aecom Technology Corp. Delaware (a) | | | 170,900 | | | | 4,397,257 | | | | 1.81 | % |
| Applied Signal Technology, Inc. | | | 292,800 | | | | 5,785,728 | | | | 2.38 | % |
| Beacon Roofing Supply, Inc. (a) | | | 378,500 | | | | 6,018,150 | | | | 2.47 | % |
| Corinthian Colleges, Inc. (a) | | | 320,900 | | | | 4,941,860 | | | | 2.03 | % |
| Granite Construction, Inc. | | | 119,600 | | | | 4,718,220 | | | | 1.94 | % |
| Insituform Technologies, Inc. (a) | | | 266,800 | | | | 4,090,044 | | | | 1.68 | % |
| Michael Baker Corp. (a) | | | 142,700 | | | | 4,794,720 | | | | 1.97 | % |
| SAIC, Inc. (a) | | | 269,700 | | | | 4,881,570 | | | | 2.00 | % |
| Stanley, Inc. (a) | | | 145,000 | | | | 3,738,100 | | | | 1.54 | % |
| Tetra Tech, Inc. (a) | | | 217,500 | | | | 5,341,800 | | | | 2.19 | % |
| Trex Co., Inc. (a) | | | 319,100 | | | | 3,494,145 | | | | 1.43 | % |
| VSE Corp. | | | 135,500 | | | | 4,050,095 | | | | 1.66 | % |
| | | | | | | | 64,921,622 | | | | 26.66 | % |
| | | | | | | | | | | | | |
| Information Technology – 8.92% | | | | | | | | | | | | |
| CACI International, Inc. – Class A (a) | | | 116,500 | | | | 4,607,575 | | | | 1.89 | % |
| CSG Systems International (a) | | | 300,700 | | | | 4,360,150 | | | | 1.79 | % |
| ManTech International Corp. – Class A (a) | | | 96,900 | | | | 3,506,811 | | | | 1.44 | % |
| NCI, Inc. (a) | | | 174,300 | | | | 4,245,948 | | | | 1.74 | % |
| Viasat, Inc. (a) | | | 218,100 | | | | 5,014,119 | | | | 2.06 | % |
| | | | | | | | 21,734,603 | | | | 8.92 | % |
| | | | | | | | | | | | | |
| Materials – 1.51% | | | | | | | | | | | | |
| Zep, Inc. | | | 272,000 | | | | 3,680,160 | | | | 1.51 | % |
| | | | | | | | | | | | | |
| Utilities – 8.80% | | | | | | | | | | | | |
| The Laclede Group, Inc. | | | 112,100 | | | | 3,887,628 | | | | 1.60 | % |
| New Jersey Resources Corp. | | | 133,500 | | | | 4,394,820 | | | | 1.80 | % |
| NSTAR | | | 144,000 | | | | 4,523,040 | | | | 1.86 | % |
| Piedmont Natural Gas Co. | | | 165,900 | | | | 4,051,278 | | | | 1.66 | % |
| South Jersey Industries, Inc. | | | 131,800 | | | | 4,574,778 | | | | 1.88 | % |
| | | | | | | | 21,431,544 | | | | 8.80 | % |
| | | | | | | | | | | | | |
Total Common Stocks (Cost $260,284,119) | | | | | | $ | 239,497,160 | | | | 98.33 | % |
The accompanying notes are an integral part of these financial statements.
HENNESSY FUNDS 1-800-966-4354
| SHORT-TERM INVESTMENTS – 1.68% | | Principal | | | | | | % of | |
| | | Amount | | | Value | | | Net Assets | |
| Commercial Paper – 0.10% | | | | | | | | | |
| Intesa Funding, 05/01/2009 | | $ | 250,000 | | | $ | 250,000 | | | | 0.10 | % |
| | | | | | | | | | | | | |
Total Commercial Paper (Cost $250,000) | | | | | | | 250,000 | | | | 0.10 | % |
| | | | | | | | | | | | | |
| Variable Rate Demand Notes# – 0.52% | | | | | | | | | | | | |
American Family Financial Services 0.1001% | | | 1,274,379 | | | | 1,274,379 | | | | 0.52 | % |
Total Variable Rate Demand Notes | | | | | | | | | | | | |
| (Cost $1,274,379) | | | | | | | 1,274,379 | | | | 0.52 | % |
| | | | | | | | | | | | | |
| Money Market Funds – 1.06% | | | | | | | | | | | | |
Fidelity Government Portfolio 0.3877% | | | 2,569,287 | | | | 2,569,287 | | | | 1.06 | % |
| | | | | | | | | | | | | |
| Total Money Market Funds | | | | | | | | | | | | |
| (Cost $2,569,287) | | | | | | | 2,569,287 | | | | 1.06 | % |
| | | | | | | | | | | | | |
| Total Short-Term Investments | | | | | | | | | | | | |
| (Cost $4,093,666) | | | | | | | 4,093,666 | | | | 1.68 | % |
| | | | | | | | | | | | | |
Total Investments – 100.01% | | | | | | | | | | | | |
| (Cost $264,377,785) | | | | | | | 243,590,826 | | | | 100.01 | % |
| | | | | | | | | | | | | |
| Liabilities in Excess of Other Assets – (0.01)% | | | | | | | (24,385 | ) | | | (0.01 | )% |
TOTAL NET ASSETS – 100.00% | | | | | | $ | 243,566,441 | | | | 100.00 | % |
Percentages are stated as a percent of net assets.
| (b) | Foreign Issued Security |
| # | Variable rate demand notes are considered short-term obligations and are payable on demand. Interest rates change periodically on specified dates. The rates listed are as of April 30, 2009. |
FAS 157 – Summary of Fair Value Exposure at April 30, 2009 (Unaudited)
Various inputs are used in determining the value of the Fund’s investments, which are summarized as follows:
Level 1 – Quoted prices in active markets for identical securities
Level 2 – Other significant observable inputs (including quoted prices for similar securities, interest rates, prepayment speeds, credit risk, etc.)
Level 3 – Significant unobservable inputs (including the Fund’s own assumptions in determining the fair value of investments)
The inputs or methodology used for valuing securities are not an indication of the risk associated with investing in those securities.
The accompanying notes are an integral part of these financial statements.
SUMMARY OF INVESTMENTS — HENNESSY CORNERSTONE GROWTH FUND
The following is a summary of the inputs used to value the Fund’s net assets as of April 30, 2009:
| Description | | Investments in Securities | |
| Level 1 – Quoted prices in active markets for identical securities | | $ | 242,066,447 | |
| Level 2 – Other significant observable inputs | | | 1,524,379 | |
| Level 3 – Significant unobservable inputs | | | — | |
| Total | | $ | 243,590,826 | |
HENNESSY FUNDS 1-800-966-4354
HENNESSY CORNERSTONE
GROWTH FUND, SERIES II
(% of Net Assets)
| TOP TEN EQUITY HOLDINGS | % of net assets |
| Interoil Corp. | 4.09% |
| NCI, Inc. | 3.96% |
| America’s Car Mart, Inc. | 3.37% |
| Stepan Co. | 3.23% |
| The Laclede Group, Inc. | 3.20% |
| Hanger Orthopedic Group, Inc. | 3.14% |
| Cal-Maine Foods, Inc. | 3.06% |
| Flowers Foods, Inc. | 3.03% |
| Aecom Technology Corp. Delaware | 2.95% |
| Stanley, Inc. | 2.86% |
SUMMARY OF INVESTMENTS — HENNESSY CORNERSTONE GROWTH FUND, SERIES II
| COMMON STOCKS – 99.16% | | Number | | | | | | % of Net | |
| | | of Shares | | | Value | | | Assets | |
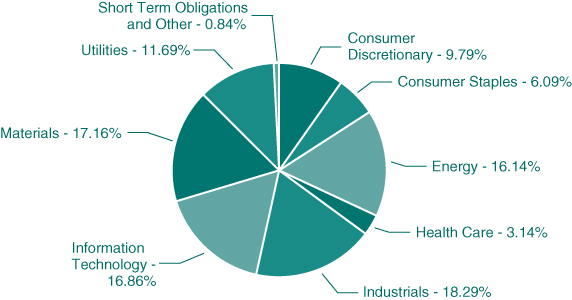
| Consumer Discretionary – 9.79% | | | | | | | | | |
| America’s Car Mart, Inc. (a) | | | 60,800 | | | $ | 986,176 | | | | 3.37 | % |
| Exide Technologies (a) | | | 65,000 | | | | 352,950 | | | | 1.21 | % |
| Hasbro, Inc. | | | 30,500 | | | | 813,130 | | | | 2.78 | % |
| Overstock.com, Inc. (a) | | | 42,000 | | | | 566,160 | | | | 1.93 | % |
| Stoneridge, Inc. (a) | | | 63,900 | | | | 147,609 | | | | 0.50 | % |
| | | | | | | | 2,866,025 | | | | 9.79 | % |
| | | | | | | | | | | | | |
| Consumer Staples – 6.09% | | | | | | | | | | | | |
| Cal-Maine Foods, Inc. | | | 33,800 | | | | 894,686 | | | | 3.06 | % |
| Flowers Foods, Inc. | | | 38,400 | | | | 887,040 | | | | 3.03 | % |
| | | | | | | | 1,781,726 | | | | 6.09 | % |
| | | | | | | | | | | | | |
| Energy – 16.14% | | | | | | | | | | | | |
| Enbridge, Inc. (b) | | | 25,200 | | | | 777,420 | | | | 2.65 | % |
| Gulf Island Fabrication, Inc. | | | 22,300 | | | | 288,562 | | | | 0.99 | % |
| Hess Corp. | | | 8,600 | | | | 471,194 | | | | 1.61 | % |
| Interoil Corp. (a)(b) | | | 37,100 | | | | 1,197,959 | | | | 4.09 | % |
| Murphy Oil Corp. | | | 11,100 | | | | 529,581 | | | | 1.81 | % |
| Oil States International, Inc. (a) | | | 17,200 | | | | 325,080 | | | | 1.11 | % |
| PHI, Inc. (a) | | | 27,100 | | | | 306,772 | | | | 1.05 | % |
| Statoil ASA – ADR (b) | | | 29,200 | | | | 543,120 | | | | 1.86 | % |
| Willbros Group, Inc. (a) | | | 24,900 | | | | 285,354 | | | | 0.97 | % |
| | | | | | | | 4,725,042 | | | | 16.14 | % |
| | | | | | | | | | | | | |
| Health Care – 3.14% | | | | | | | | | | | | |
| Hanger Orthopedic Group, Inc. (a) | | | 66,100 | | | | 919,451 | | | | 3.14 | % |
| | | | | | | | | | | | | |
| Industrials – 18.29% | | | | | | | | | | | | |
| Aecom Technology Corp. Delaware (a) | | | 33,500 | | | | 861,955 | | | | 2.95 | % |
| Clean Harbors, Inc. (a) | | | 15,300 | | | | 766,530 | | | | 2.62 | % |
| EnerSys (a) | | | 31,800 | | | | 542,190 | | | | 1.85 | % |
| ENGlobal Corp. (a) | | | 76,500 | | | | 441,405 | | | | 1.51 | % |
| Fluor Corp. | | | 11,700 | | | | 443,079 | | | | 1.51 | % |
| Metalico, Inc. (a) | | | 62,200 | | | | 143,060 | | | | 0.49 | % |
| Reliance Steel & Aluminum Co. | | | 14,100 | | | | 496,743 | | | | 1.70 | % |
| Ryder System, Inc. | | | 15,800 | | | | 437,502 | | | | 1.49 | % |
| SPX Corp. | | | 8,300 | | | | 383,211 | | | | 1.31 | % |
The accompanying notes are an integral part of these financial statements.
HENNESSY FUNDS 1-800-966-4354
| COMMON STOCKS | | Number | | | | | | % of Net | |
| | | of Shares | | | Value | | | Assets | |
| Industrials (Continued) | | | | | | | | | |
| Stanley, Inc. (a) | | | 32,500 | | | $ | 837,850 | | | | 2.86 | % |
| | | | | | | | 5,353,525 | | | | 18.29 | % |
| | | | | | | | | | | | | |
| Information Technology – 16.86% | | | | | | | | | | | | |
| Celestica, Inc. (a)(b) | | | 129,300 | | | | 764,163 | | | | 2.61 | % |
| Hackett Group, Inc. (a) | | | 189,800 | | | | 427,050 | | | | 1.46 | % |
| ManTech International Corp. – Class A (a) | | | 22,600 | | | | 817,894 | | | | 2.79 | % |
| Multi-Fineline Electronix, Inc. (a) | | | 39,400 | | | | 790,758 | | | | 2.70 | % |
| NCI, Inc. (a) | | | 47,600 | | | | 1,159,536 | | | | 3.96 | % |
| UTStarcom, Inc. (a) | | | 199,200 | | | | 233,064 | | | | 0.80 | % |
| Western Digital Corp. (a) | | | 31,600 | | | | 743,232 | | | | 2.54 | % |
| | | | | | | | 4,935,697 | | | | 16.86 | % |
| | | | | | | | | | | | | |
| Materials – 17.16% | | | | | | | | | | | | |
| Airgas, Inc. | | | 18,700 | | | | 806,344 | | | | 2.75 | % |
| AK Steel Holding Corp. | | | 16,100 | | | | 209,461 | | | | 0.72 | % |
| Arcelor Mittal – ADR (b) | | | 11,200 | | | | 264,096 | | | | 0.90 | % |
| Celanese Corp. | | | 24,400 | | | | 508,496 | | | | 1.74 | % |
| General Steel Holdings, Inc. (a) | | | 69,400 | | | | 403,908 | | | | 1.38 | % |
| Gerdau Ameristeel Corp. (b) | | | 56,500 | | | | 295,495 | | | | 1.01 | % |
| Innophos Holdings, Inc. | | | 34,100 | | | | 505,703 | | | | 1.73 | % |
| Olympic Steel, Inc. | | | 14,400 | | | | 264,096 | | | | 0.90 | % |
| Schnitzer Steel Industries, Inc. | | | 9,500 | | | | 470,820 | | | | 1.61 | % |
| Steel Dynamics, Inc. | | | 27,900 | | | | 347,355 | | | | 1.19 | % |
| Stepan Co. | | | 23,900 | | | | 945,723 | | | | 3.23 | % |
| | | | | | | | 5,021,497 | | | | 17.16 | % |
| | | | | | | | | | | | | |
| Utilities – 11.69% | | | | | | | | | | | | |
| The Laclede Group, Inc. | | | 27,000 | | | | 936,360 | | | | 3.20 | % |
| MDU Resources Group, Inc. | | | 31,300 | | | | 549,941 | | | | 1.88 | % |
| Otter Tail Corp. | | | 28,100 | | | | 623,258 | | | | 2.13 | % |
| TECO Energy, Inc. | | | 50,700 | | | | 536,913 | | | | 1.84 | % |
| Vectren Corp. | | | 34,900 | | | | 773,733 | | | | 2.64 | % |
| | | | | | | | 3,420,205 | | | | 11.69 | % |
| | | | | | | | | | | | | |
Total Common Stocks (Cost $50,900,868) | | | | | | | 29,023,168 | | | | 99.16 | % |
The accompanying notes are an integral part of these financial statements.
SUMMARY OF INVESTMENTS — HENNESSY CORNERSTONE GROWTH FUND, SERIES II
| WARRANTS – 0.00% | | Number | | | | | | % of Net | |
| | | of Shares | | | Value | | | Assets | |
| Krispy Kreme Doughnuts, Inc. | | | | | | | | | |
| Expiration: March, 2012, | | | | | | | | | |
| Exercise Price: $0.110 (a) | | | 984 | | | $ | 10 | | | | 0.00 | % |
| | | | | | | | | | | | | |
Total Warrants (Cost $0) | | | | | | | 10 | | | | 0.00 | % |
| | | | | | | | | | | | | |
| SHORT-TERM INVESTMENTS – 0.84% | | Principal | | | | | | | | | |
| | | Amount | | | | | | | | | |
| Commercial Paper – 0.47% | | | | | | | | | | | | |
| Intesa Funding, 05/01/2009 | | $ | 138,000 | | | | 138,000 | | | | 0.47 | % |
| | | | | | | | | | | | | |
Total Commercial Paper (Cost $138,000) | | | | | | | 138,000 | | | | 0.47 | % |
| | | | | | | | | | | | | |
| Variable Rate Demand Notes# – 0.37% | | | | | | | | | | | | |
American Family Financial Services 0.1001% | | | 108,618 | | | | 108,618 | | | | 0.37 | % |
| | | | | | | | | | | | | |
| Total Variable Rate Demand Notes | | | | | | | | | | | | |
| (Cost $108,618) | | | | | | | 108,618 | | | | 0.37 | % |
| | | | | | | | | | | | | |
| Total Short-Term Investments | | | | | | | | | | | | |
| (Cost $246,618) | | | | | | | 246,618 | | | | 0.84 | % |
| | | | | | | | | | | | | |
Total Investments – 100.00% | | | | | | | | | | | | |
| (Cost $51,147,486) | | | | | | | 29,269,796 | | | | 100.00 | % |
| | | | | | | | | | | | | |
| Liabilities in Excess of Other Assets – 0.00% | | | | | | | (800 | ) | | | 0.00 | % |
TOTAL NET ASSETS – 100.00% | | | | | | $ | 29,268,996 | | | | 100.00 | % |
Percentages are stated as a percent of net assets.
ADR American Depositary Receipt
| (b) | Foreign Issued Security |
| # | Variable rate demand notes are considered short-term obligations and are payable on demand. Interest rates change periodically on specified dates. The rates listed are as of April 30, 2009. |
FAS 157 – Summary of Fair Value Exposure at April 30, 2009 (Unaudited)
Various inputs are used in determining the value of the Fund’s investments, which are summarized as follows:
Level 1 – Quoted prices in active markets for identical securities
Level 2 – Other significant observable inputs (including quoted prices for similar securities, interest rates, prepayment speeds, credit risk, etc.)
Level 3 – Significant unobservable inputs (including the Fund’s own assumptions in determining the fair value of investments)
HENNESSY FUNDS 1-800-966-4354
The inputs or methodology used for valuing securities are not an indication of the risk associated with investing in those securities.
The following is a summary of the inputs used to value the Fund’s net assets as of April 30, 2009:
| Description | | Investments in Securities | |
| Level 1 – Quoted prices in active markets for identical securities | | $ | 29,023,178 | |
| Level 2 – Other significant observable inputs | | | 246,618 | |
| Level 3 – Significant unobservable inputs | | | — | |
| Total | | $ | 29,269,796 | |
SUMMARY OF INVESTMENTS — HENNESSY FOCUS 30 FUND
HENNESSY FOCUS 30 FUND
(% of Net Assets)
| TOP TEN EQUITY HOLDINGS | % of net assets |
| AutoZone, Inc. | 5.86% |
| Aeropostale, Inc. | 4.72% |
| Ross Stores, Inc. | 4.67% |
| Panera Bread Co. | 4.56% |
| Stifel Financial Corp. | 4.44% |
| Odyssey Re Holding, Corp. | 4.39% |
| Corinthian Colleges, Inc. | 4.23% |
| Tetra Tech, Inc. | 3.99% |
| Ralcorp Holdings, Inc. | 3.92% |
| Lennox International, Inc. | 3.86% |
HENNESSY FUNDS 1-800-966-4354
| COMMON STOCKS – 99.57% | | Number | | | | | | % of Net | |
| | | of Shares | | | Value | | | Assets | |
| Consumer Discretionary – 33.31% | | | | | | | | | |
| Aeropostale, Inc. (a) | | | 231,100 | | | $ | 7,850,467 | | | | 4.72 | % |
| ArvinMeritor, Inc. | | | 488,400 | | | | 605,616 | | | | 0.37 | % |
| AutoZone, Inc. (a) | | | 58,600 | | | | 9,750,454 | | | | 5.86 | % |
| Hasbro, Inc. | | | 209,600 | | | | 5,587,936 | | | | 3.36 | % |
| Panera Bread Co. (a) | | | 135,400 | | | | 7,583,754 | | | | 4.56 | % |
| Rent-A-Center, Inc. (a) | | | 318,300 | | | | 6,127,275 | | | | 3.68 | % |
| Ross Stores, Inc. | | | 204,700 | | | | 7,766,318 | | | | 4.67 | % |
| Sally Beauty Holdings, Inc. (a) | | | 767,800 | | | | 5,681,720 | | | | 3.42 | % |
| Snap-On, Inc. | | | 131,100 | | | | 4,446,912 | | | | 2.67 | % |
| | | | | | | | 55,400,452 | | | | 33.31 | % |
| | | | | | | | | | | | | |
| Consumer Staples – 6.62% | | | | | | | | | | | | |
| The Estee Lauder Cos., Inc. | | | 150,400 | | | | 4,496,960 | | | | 2.70 | % |
| Ralcorp Holdings, Inc. (a) | | | 114,100 | | | | 6,521,956 | | | | 3.92 | % |
| | | | | | | | 11,018,916 | | | | 6.62 | % |
| | | | | | | | | | | | | |
| Financials – 13.43% | | | | | | | | | | | | |
| Hanover Insurance Group, Inc. | | | 150,200 | | | | 4,502,996 | | | | 2.71 | % |
| Odyssey Re Holdings Corp. | | | 190,700 | | | | 7,301,903 | | | | 4.39 | % |
| Raymond James Financial, Inc. | | | 200,300 | | | | 3,142,707 | | | | 1.89 | % |
| Stifel Financial Corp. (a) | | | 150,200 | | | | 7,394,346 | | | | 4.44 | % |
| | | | | | | | 22,341,952 | | | | 13.43 | % |
| | | | | | | | | | | | | |
| Health Care – 8.55% | | | | | | | | | | | | |
| LifePoint Hospitals, Inc. (a) | | | 230,200 | | | | 5,950,670 | | | | 3.58 | % |
| Owens & Minor, Inc. | | | 159,200 | | | | 5,521,056 | | | | 3.32 | % |
| Tenet Healthcare Corp. (a) | | | 1,224,100 | | | | 2,754,225 | | | | 1.65 | % |
| | | | | | | | 14,225,951 | | | | 8.55 | % |
| | | | | | | | | | | | | |
| Industrials – 25.99% | | | | | | | | | | | | |
| AO Smith Corp. | | | 171,800 | | | | 5,341,262 | | | | 3.21 | % |
| Brady Corp. | | | 203,300 | | | | 4,283,531 | | | | 2.57 | % |
| Corinthian Colleges, Inc. (a) | | | 456,900 | | | | 7,036,260 | | | | 4.23 | % |
| HUB Group, Inc. (a) | | | 183,500 | | | | 4,220,500 | | | | 2.54 | % |
| Lennox International, Inc. | | | 201,100 | | | | 6,413,079 | | | | 3.86 | % |
| Pentair, Inc. | | | 194,100 | | | | 5,170,824 | | | | 3.11 | % |
| Teledyne Technologies, Inc. (a) | | | 129,000 | | | | 4,118,970 | | | | 2.48 | % |
The accompanying notes are an integral part of these financial statements.
SUMMARY OF INVESTMENTS — HENNESSY FOCUS 30 FUND
| COMMON STOCKS | | Number | | | | | | % of Net | |
| | | of Shares | | | Value | | | Assets | |
| Industrials (Continued) | | | | | | | | | |
| Tetra Tech, Inc. (a) | | | 270,500 | | | $ | 6,643,480 | | | | 3.99 | % |
| | | | | | | | 43,227,906 | | | | 25.99 | % |
| | | | | | | | | | | | | |
| Materials – 2.94% | | | | | | | | | | | | |
| Greif, Inc. | | | 107,900 | | | | 4,884,633 | | | | 2.94 | % |
| | | | | | | | | | | | | |
| Technology – 2.83% | | | | | | | | | | | | |
| ManTech International Corp. – Class A (a) | | | 130,200 | | | | 4,711,938 | | | | 2.83 | % |
| | | | | | | | | | | | | |
| Utilities – 5.90% | | | | | | | | | | | | |
| Hawaiian Electric Industries | | | 269,800 | | | | 4,192,692 | | | | 2.52 | % |
| Piedmont Natural Gas Co. | | | 230,500 | | | | 5,628,810 | | | | 3.38 | % |
| | | | | | | | 9,821,502 | | | | 5.90 | % |
| | | | | | | | | | | | | |
Total Common Stocks (Cost $225,209,722) | | | | | | | 165,633,250 | | | | 99.57 | % |
| | | | | | | | | | | | | |
| WARRANTS – 0.00% | | | | | | | | | | | | |
| Lantronix Inc. Warrant Ω | | | | | | | | | | | | |
| Expiration: February, 2011, | | | | | | | | | | | | |
| Exercise Price: $0.850 | | | 158 | | | | 0 | | | | 0.00 | % |
| | | | | | | | | | | | | |
Total Warrants (Cost $0) | | | | | | | 0 | | | | 0.00 | % |
The accompanying notes are an integral part of these financial statements.
HENNESSY FUNDS 1-800-966-4354
| SHORT-TERM INVESTMENTS – 0.50% | | Principal | | | | | | % of Net | |
| | | Amount | | | Value | | | Assets | |
| Commercial Paper – 0.48% | | | | | | | | | |
| Intesa Funding, 05/01/2009 | | $ | 800,000 | | | $ | 800,000 | | | | 0.48 | % |
| | | | | | | | | | | | | |
Total Commercial Paper (Cost $800,000) | | | | | | | 800,000 | | | | 0.48 | % |
| | | | | | | | | | | | | |
| Variable Rate Demand Notes# – 0.01% | | | | | | | | | | | | |
| American Family Financial Services, Inc., 0.1001% | | | 17,600 | | | | 17,600 | | | | 0.01 | % |
| | | | | | | | | | | | | |
| Total Variable Rate Demand Notes | | | | | | | | | | | | |
| (Cost $17,600) | | | | | | | 17,600 | | | | 0.01 | % |
| | | | | | | | | | | | | |
| Money Market Funds – 0.01% | | | | | | | | | | | | |
| Fidelity Government Portfolio, 0.3877% | | | 20,289 | | | | 20,289 | | | | 0.01 | % |
| | | | | | | | | | | | | |
| Total Money Market Funds | | | | | | | | | | | | |
| (Cost $20,289) | | | | | | | 20,289 | | | | 0.01 | % |
| | | | | | | | | | | | | |
| Total Short-Term Investments | | | | | | | | | | | | |
| (Cost $837,889) | | | | | | | 837,889 | | | | 0.50 | % |
| | | | | | | | | | | | | |
Total Investments – 100.07% | | | | | | | | | | | | |
| (Cost $226,047,611) | | | | | | | 166,471,139 | | | | 100.07 | % |
| | | | | | | | | | | | | |
| Liabilities in Excess of Other Assets – (0.07)% | | | | | | | (128,278 | ) | | | (0.07 | )% |
TOTAL NET ASSETS – 100.00% | | | | | | $ | 166,342,861 | | | | 100.00 | % |
Percentages are stated as a percent of net assets.
| # | Variable rate demand notes are considered short-term obligations and are payable on demand. Interest rates change periodically on specified dates. The rates listed are as of April 30, 2009. |
| Ω | Security is fair valued. |
FAS 157 – Summary of Fair Value Exposure at April 30, 2009 (Unaudited)
Various inputs are used in determining the value of the Fund’s investments, which are summarized as follows:
Level 1 – Quoted prices in active markets for identical securities
Level 2 – Other significant observable inputs (including quoted prices for similar securities, interest rates, prepayment speeds, credit risk, etc.)
Level 3 – Significant unobservable inputs (including the Fund’s own assumptions in determining the fair value of investments)
The inputs or methodology used for valuing securities are not an indication of the risk associated with investing in those securities.
The following is a summary of the inputs used to value the Fund’s net assets as of April 30, 2009:
| Description | | Investments in Securities | |
| Level 1 – Quoted prices in active markets for identical securities | | $ | 165,653,539 | |
| Level 2 – Other significant observable inputs | | | 817,600 | |
| Level 3 – Significant unobservable inputs | | | — | |
| Total | | $ | 166,471,139 | |
SUMMARY OF INVESTMENTS — HENNESSY CORNERSTONE VALUE FUND
HENNESSY CORNERSTONE VALUE FUND
(% of Net Assets)
| TOP TEN EQUITY HOLDINGS | % of net assets |
| Rio Tinto PLC | 4.44% |
| AU Optronics Corp. | 3.28% |
| Macy’s, Inc. | 2.81% |
| Taiwan Semiconductor Manufacturing Co., Ltd. – ADR | 2.78% |
| Credit Suisse Group | 2.73% |
| Southern Copper Corp. | 2.67% |
| Morgan Stanley | 2.66% |
| Supervalu, Inc. | 2.56% |
| CNOOC, Ltd. | 2.56% |
| Harley-Davidson, Inc. | 2.36% |
HENNESSY FUNDS 1-800-966-4354
| COMMON STOCKS – 97.44% | | Number | | | | | | % of Net | |
| | | of Shares | | | Value | | | Assets | |
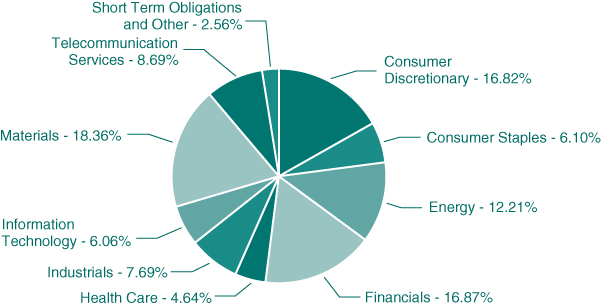
| Consumer Discretionary – 16.82% | | | | | | | | | |
| CBS Corp. – Class B | | | 205,200 | | | $ | 1,444,608 | | | | 1.68 | % |
| DaimlerChrysler AG (b) | | | 51,000 | | | | 1,820,700 | | | | 2.12 | % |
| Harley-Davidson, Inc. | | | 91,400 | | | | 2,025,424 | | | | 2.36 | % |
| Koninklijke Philips Electronics NV – ADR (b) | | | 94,000 | | | | 1,690,120 | | | | 1.97 | % |
| Limited Brands | | | 162,400 | | | | 1,854,608 | | | | 2.16 | % |
| Macy’s, Inc. | | | 176,100 | | | | 2,409,048 | | | | 2.81 | % |
| Newell Rubbermaid, Inc. | | | 116,400 | | | | 1,216,380 | | | | 1.42 | % |
| Starwood Hotels & Resorts Worldwide | | | 94,500 | | | | 1,971,270 | | | | 2.30 | % |
| | | | | | | | 14,432,158 | | | | 16.82 | % |
| | | | | | | | | | | | | |
| Consumer Staples – 6.10% | | | | | | | | | | | | |
| Altria Group, Inc. | | | 101,100 | | | | 1,650,963 | | | | 1.92 | % |
| Reynolds American, Inc. | | | 36,500 | | | | 1,386,270 | | | | 1.62 | % |
| Supervalu, Inc. | | | 134,200 | | | | 2,194,170 | | | | 2.56 | % |
| | | | | | | | 5,231,403 | | | | 6.10 | % |
| | | | | | | | | | | | | |
| Energy – 12.21% | | | | | | | | | | | | |
| BP PLC – ADR (b) | | | 34,800 | | | | 1,477,608 | | | | 1.72 | % |
| CNOOC Ltd. – ADR (b) | | | 19,700 | | | | 2,193,595 | | | | 2.55 | % |
| Enterprise Products Partners LP | | | 76,500 | | | | 1,804,635 | | | | 2.10 | % |
| ENI SpA – ADR (b) | | | 36,700 | | | | 1,566,723 | | | | 1.83 | % |
| Sasol Ltd. – ADR (b) | | | 61,500 | | | | 1,851,765 | | | | 2.16 | % |
| Total SA – ADR (b) | | | 32,000 | | | | 1,591,040 | | | | 1.85 | % |
| | | | | | | | 10,485,366 | | | | 12.21 | % |
| | | | | | | | | | | | | |
| Financials – 16.87% | | | | | | | | | | | | |
| Allianz AG – ADR (b) | | | 173,700 | | | | 1,573,722 | | | | 1.83 | % |
| The Allstate Corp. | | | 56,100 | | | | 1,308,813 | | | | 1.53 | % |
| Bank of America Corp. | | | 99,500 | | | | 888,535 | | | | 1.04 | % |
| BB&T Corp. | | | 52,000 | | | | 1,213,680 | | | | 1.41 | % |
| Credit Suisse Group – ADR (b) | | | 61,200 | | | | 2,342,736 | | | | 2.73 | % |
| Hartford Financial Services Group, Inc. | | | 104,000 | | | | 1,192,880 | | | | 1.39 | % |
| HSBC Holdings PLC – ADR (b) | | | 28,500 | | | | 1,014,600 | | | | 1.18 | % |
| Morgan Stanley | | | 96,500 | | | | 2,281,260 | | | | 2.66 | % |
| Sun Life Financial, Inc. (b) | | | 73,500 | | | | 1,706,670 | | | | 1.99 | % |
| US Bancorp | | | 52,500 | | | | 956,550 | | | | 1.11 | % |
| | | | | | | | 14,479,446 | | | | 16.87 | % |
The accompanying notes are an integral part of these financial statements.
SUMMARY OF INVESTMENTS — HENNESSY CORNERSTONE VALUE FUND
| COMMON STOCKS | | Number | | | | | | % of Net | |
| | | of Shares | | | Value | | | Assets | |
| Health Care – 4.64% | | | | | | | | | |
| Bristol-Myers Squibb Co. | | | 71,400 | | | $ | 1,370,880 | | | | 1.60 | % |
| Merck & Co., Inc. | | | 57,300 | | | | 1,388,952 | | | | 1.62 | % |
| Pfizer, Inc. | | | 91,600 | | | | 1,223,776 | | | | 1.42 | % |
| | | | | | | | 3,983,608 | | | | 4.64 | % |
| | | | | | | | | | | | | |
| Industrials – 7.69% | | | | | | | | | | | | |
| General Electric Co. | | | 85,000 | | | | 1,075,250 | | | | 1.25 | % |
| Masco Corp. | | | 149,000 | | | | 1,320,140 | | | | 1.54 | % |
| Pitney Bowes, Inc. | | | 64,500 | | | | 1,582,830 | | | | 1.84 | % |
| RR Donnelley & Sons Co. | | | 126,300 | | | | 1,471,395 | | | | 1.72 | % |
| Textron, Inc. | | | 107,400 | | | | 1,152,402 | | | | 1.34 | % |
| | | | | | | | 6,602,017 | | | | 7.69 | % |
| | | | | | | | | | | | | |
| Information Technology – 6.06% | | | | | | | | | | | | |
| AU Optronics Corp. – ADR (b) | | | 259,300 | | | | 2,813,405 | | | | 3.28 | % |
| Taiwan Semiconductor | | | | | | | | | | | | |
| Manufacturing Co., Ltd. – ADR (b) | | | 225,700 | | | | 2,385,649 | | | | 2.78 | % |
| | | | | | | | 5,199,054 | | | | 6.06 | % |
| | | | | | | | | | | | | |
| Materials – 18.36% | | | | | | | | | | | | |
| Alcoa, Inc. | | | 186,100 | | | | 1,687,927 | | | | 1.97 | % |
| Arcelor Mittal – ADR (b) | | | 71,400 | | | | 1,683,612 | | | | 1.96 | % |
| The Dow Chemical Co. | | | 79,800 | | | | 1,276,800 | | | | 1.49 | % |
| EI Du Pont de Nemours & Co. | | | 62,900 | | | | 1,754,910 | | | | 2.05 | % |
| International Paper Co. | | | 137,100 | | | | 1,735,686 | | | | 2.02 | % |
| Rio Tinto PLC – ADR (b) | | | 23,400 | | | | 3,813,030 | | | | 4.44 | % |
| Southern Copper Corp. | | | 123,600 | | | | 2,295,252 | | | | 2.67 | % |
| Weyerhaeuser Co. | | | 42,900 | | | | 1,512,654 | | | | 1.76 | % |
| | | | | | | | 15,759,871 | | | | 18.36 | % |
| | | | | | | | | | | | | |
| Telecommunication Services – 8.69% | | | | | | | | | | | | |
| AT&T, Inc. | | | 53,900 | | | | 1,380,918 | | | | 1.61 | % |
| Deutsche Telekom AG – ADR (b) | | | 103,500 | | | | 1,126,080 | | | | 1.31 | % |
| Mobile Telesystems – ADR (a)(b) | | | 56,100 | | | | 1,859,154 | | | | 2.17 | % |
| Verizon Communications, Inc. | | | 45,700 | | | | 1,386,538 | | | | 1.62 | % |
| Vimpel-Communications – ADR (b) | | | 180,600 | | | | 1,701,252 | | | | 1.98 | % |
| | | | | | | | 7,453,942 | | | | 8.69 | % |
| | | | | | | | | | | | | |
Total Common Stocks (Cost $95,867,773) | | | | | | | 83,626,865 | | | | 97.44 | % |
The accompanying notes are an integral part of these financial statements.
HENNESSY FUNDS 1-800-966-4354
| SHORT-TERM INVESTMENTS – 2.25% | | Principal | | | | | | % of Net | |
| | | Amount | | | Value | | | Assets | |
| Commercial Paper – 1.75% | | | | | | | | | |
| Intesa Funding, 05/01/2009 | | $ | 1,500,000 | | | $ | 1,500,000 | | | | 1.75 | % |
| | | | | | | | | | | | | |
Total Commercial Paper (Cost $1,500,000) | | | | | | | 1,500,000 | | | | 1.75 | % |
| | | | | | | | | | | | | |
| Variable Rate Demand Notes# – 0.50% | | | | | | | | | | | | |
American Family Financial Services 0.1001% | | | 433,486 | | | | 433,486 | | | | 0.50 | % |
| | | | | | | | | | | | | |
| Total Variable Rate Demand Notes | | | | | | | | | | | | |
| (Cost $433,486) | | | | | | | 433,486 | | | | 0.50 | % |
| | | | | | | | | | | | | |
| Total Short-Term Investments | | | | | | | | | | | | |
| (Cost $1,933,486) | | | | | | | 1,933,486 | | | | 2.25 | % |
| | | | | | | | | | | | | |
Total Investments – 99.69% | | | | | | | | | | | | |
| (Cost $97,801,259) | | | | | | | 85,560,351 | | | | 99.69 | % |
| | | | | | | | | | | | | |
| Other Assets in Excess of Liabilities – 0.31% | | | | | | | 263,575 | | | | 0.31 | % |
TOTAL NET ASSETS – 100.00% | | | | | | $ | 85,823,926 | | | | 100.00 | % |
Percentages are stated as a percent of net assets.
ADR American Depositary Receipt
| (b) | Foreign Issued Security |
| # | Variable rate demand notes are considered short-term obligations and are payable on demand. Interest rates change periodically on specified dates. The rates listed are as of April 30, 2009. |
FAS 157 – Summary of Fair Value Exposure at April 30, 2009 (Unaudited)
Various inputs are used in determining the value of the Fund’s investments, which are summarized as follows:
Level 1 – Quoted prices in active markets for identical securities
Level 2 – Other significant observable inputs (including quoted prices for similar securities, interest rates, prepayment speeds, credit risk, etc.)
Level 3 – Significant unobservable inputs (including the Fund’s own assumptions in determining the fair value of investments)
The inputs or methodology used for valuing securities are not an indication of the risk associated with investing in those securities.
The following is a summary of the inputs used to value the Fund’s net assets as of April 30, 2009:
| Description | | Investments in Securities | |
| Level 1 – Quoted prices in active markets for identical securities | | $ | 83,626,865 | |
| Level 2 – Other significant observable inputs | | | 1,933,486 | |
| Level 3 – Significant unobservable inputs | | | — | |
| Total | | $ | 85,560,351 | |
SUMMARY OF INVESTMENTS — HENNESSY TOTAL RETURN FUND
HENNESSY TOTAL RETURN FUND
(% of Net Assets)
| TOP TEN EQUITY HOLDINGS | % of net assets |
| Verizon Communications, Inc. | 9.05% |
| AT&T, Inc. | 8.47% |
| EI Du Pont de Nemours & Co. | 7.81% |
| Pfizer, Inc. | 7.24% |
| Merck & Co., Inc. | 6.23% |
| General Electric Co. | 5.53% |
| J.P. Morgan Chase & Co. | 4.91% |
| Alcoa, Inc. | 4.28% |
| Caterpillar, Inc. | 3.71% |
| American Express Co. | 3.27% |
HENNESSY FUNDS 1-800-966-4354
| COMMON STOCKS – 71.91% | | Number | | | | | | % of Net | |
| | | of Shares | | | Value | | | Assets | |
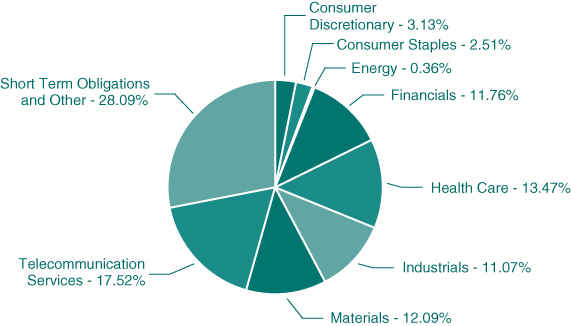
| Consumer Discretionary – 3.13% | | | | | | | | | |
| General Motors Corp. | | | 71,000 | | | $ | 136,320 | | | | 0.29 | % |
| Home Depot, Inc. | | | 51,000 | | | | 1,342,320 | | | | 2.84 | % |
| | | | | | | | 1,478,640 | | | | 3.13 | % |
| | | | | | | | | | | | | |
| Consumer Staples – 2.51% | | | | | | | | | | | | |
| Kraft Foods, Inc. – Class A | | | 50,600 | | | | 1,184,040 | | | | 2.51 | % |
| | | | | | | | | | | | | |
| Energy – 0.36% | | | | | | | | | | | | |
| Chevron Corp. | | | 2,600 | | | | 171,860 | | | | 0.36 | % |
| | | | | | | | | | | | | |
| Financials – 11.76% | | | | | | | | | | | | |
| American Express Co. | | | 61,300 | | | | 1,545,986 | | | | 3.27 | % |
| American International Group, Inc. | | | 22,900 | | | | 31,602 | | | | 0.07 | % |
| Bank of America Corp. | | | 135,900 | | | | 1,213,587 | | | | 2.57 | % |
| Citigroup, Inc. | | | 145,900 | | | | 444,995 | | | | 0.94 | % |
| J.P. Morgan Chase & Co. | | | 70,200 | | | | 2,316,600 | | | | 4.91 | % |
| | | | | | | | 5,552,770 | | | | 11.76 | % |
| | | | | | | | | | | | | |
| Health Care – 13.47% | | | | | | | | | | | | |
| Merck & Co., Inc. | | | 121,400 | | | | 2,942,736 | | | | 6.23 | % |
| Pfizer, Inc. | | | 255,700 | | | | 3,416,152 | | | | 7.24 | % |
| | | | | | | | 6,358,888 | | | | 13.47 | % |
| | | | | | | | | | | | | |
| Industrials – 11.07% | | | | | | | | | | | | |
| 3M Co. | | | 2,400 | | | | 138,240 | | | | 0.29 | % |
| Boeing Co. | | | 18,100 | | | | 724,905 | | | | 1.54 | % |
| Caterpillar, Inc. | | | 49,200 | | | | 1,750,536 | | | | 3.71 | % |
| General Electric Co. | | | 206,400 | | | | 2,610,960 | | | | 5.53 | % |
| | | | | | | | 5,224,641 | | | | 11.07 | % |
| | | | | | | | | | | | | |
| Materials – 12.09% | | | | | | | | | | | | |
| Alcoa, Inc. | | | 222,700 | | | | 2,019,889 | | | | 4.28 | % |
| EI Du Pont de Nemours & Co. | | | 132,100 | | | | 3,685,590 | | | | 7.81 | % |
| | | | | | | | 5,705,479 | | | | 12.09 | % |
| | | | | | | | | | | | | |
| Telecommunication Services – 17.52% | | | | | | | | | | | | |
| AT&T, Inc. | | | 156,000 | | | | 3,996,720 | | | | 8.47 | % |
| Verizon Communications, Inc. | | | 140,900 | | | | 4,274,906 | | | | 9.05 | % |
| | | | | | | | 8,271,626 | | | | 17.52 | % |
| | | | | | | | | | | | | |
Total Common Stocks (Cost $51,863,516) | | | | | | | 33,947,944 | | | | 71.91 | % |
The accompanying notes are an integral part of these financial statements.
SUMMARY OF INVESTMENTS — HENNESSY TOTAL RETURN FUND
| SHORT-TERM INVESTMENTS – 56.52% | | Principal | | | | | | % of Net | |
| | | Amount | | | Value | | | Assets | |
| U.S. Treasury Bills – 55.06% | | | | | | | | | |
| 0.001%, 06/04/2009 | | $ | 8,000,000 | | | $ | 7,998,942 | | | | 16.94 | % |
| 0.000%, 06/25/2009 | | | 18,000,000 | | | | 17,996,682 | | | | 38.12 | % |
| | | | | | | | | | | | | |
Total U.S. Treasury Bills (Cost $25,995,624) | | | | | | | 25,995,624 | | | | 55.06 | % |
| | | | | | | | | | | | | |
| Variable Rate Demand Notes# – 1.46% | | | | | | | | | | | | |
American Family Financial Services 0.1001% | | | 690,154 | | | | 690,154 | | | | 1.46 | % |
| | | | | | | | | | | | | |
| Total Variable Rate Demand Notes | | | | | | | | | | | | |
| (Cost $690,154) | | | | | | | 690,154 | | | | 1.46 | % |
| | | | | | | | | | | | | |
| Total Short-Term Investments | | | | | | | | | | | | |
| (Cost $26,685,778) | | | | | | | 26,685,778 | | | | 56.52 | % |
| | | | | | | | | | | | | |
Total Investments – 128.43% | | | | | | | | | | | | |
| (Cost $78,549,294) | | | | | | | 60,633,722 | | | | 128.43 | % |
| | | | | | | | | | | | | |
| Liabilities in Excess of Other Assets – (28.43)% | | | | | | | (13,423,385 | ) | | | (28.43 | )% |
TOTAL NET ASSETS – 100.00% | | | | | | $ | 47,210,337 | | | | 100.00 | % |
Percentages are stated as a percent of net assets.
| # | Variable rate demand notes are considered short-term obligations and are payable on demand. Interest rates change periodically on specified dates. The rates listed are as of April 30, 2009. |
FAS 157 – Summary of Fair Value Exposure at April 30, 2009 (Unaudited)
Various inputs are used in determining the value of the Fund’s investments, which are summarized as follows:
Level 1 – Quoted prices in active markets for identical securities
Level 2 – Other significant observable inputs (including quoted prices for similar securities, interest rates, prepayment speeds, credit risk, etc.)
Level 3 – Significant unobservable inputs (including the Fund’s own assumptions in determining the fair value of investments)
The inputs or methodology used for valuing securities are not an indication of the risk associated with investing in those securities.
The following is a summary of the inputs used to value the Fund’s net assets as of April 30, 2009:
| Description | | Investments in Securities | |
| Level 1 – Quoted prices in active markets for identical securities | | $ | 33,947,944 | |
| Level 2 – Other significant observable inputs | | | 26,685,778 | |
| Level 3 – Significant unobservable inputs | | | — | |
| Total | | $ | 60,633,722 | |
HENNESSY FUNDS 1-800-966-4354
HENNESSY BALANCED FUND
(% of Net Assets)
| TOP TEN EQUITY HOLDINGS | % of net assets |
| J.P. Morgan Chase & Co. | 6.09% |
| General Electric Co. | 5.73% |
| Alcoa, Inc. | 5.63% |
| Verizon Communications, Inc. | 5.61% |
| EI Du Pont de Nemours & Co. | 5.46% |
| AT&T, Inc. | 5.13% |
| American Express Co. | 4.98% |
| Caterpillar, Inc. | 4.75% |
| Pfizer, Inc. | 4.23% |
| Merck & Co, Inc. | 3.68% |
SUMMARY OF INVESTMENTS — HENNESSY BALANCED FUND
| COMMON STOCKS – 55.88% | | Number | | | | | | % of Net | |
| | | of Shares | | | Value | | | Assets | |
| Consumer Discretionary – 0.11% | | | | | | | | | |
| General Motors Corp. | | | 5,910 | | | $ | 11,347 | | | | 0.11 | % |
| | | | | | | | | | | | | |
| Consumer Staples – 1.07% | | | | | | | | | | | | |
| Kraft Foods, Inc. – Class A | | | 4,650 | | | | 108,810 | | | | 1.07 | % |
| | | | | | | | | | | | | |
| Energy – 0.19% | | | | | | | | | | | | |
| Chevron Corp. | | | 300 | | | | 19,830 | | | | 0.19 | % |
| | | | | | | | | | | | | |
| Financials – 13.88% | | | | | | | | | | | | |
| American Express Co. | | | 20,140 | | | | 507,931 | | | | 4.98 | % |
| American International Group, Inc. | | | 7,210 | | | | 9,950 | | | | 0.10 | % |
| Bank of America Corp. | | | 19,290 | | | | 172,259 | | | | 1.69 | % |
| Citigroup, Inc. | | | 33,935 | | | | 103,502 | | | | 1.02 | % |
| J.P. Morgan Chase & Co. | | | 18,825 | | | | 621,225 | | | | 6.09 | % |
| | | | | | | | 1,414,867 | | | | 13.88 | % |
| | | | | | | | | | | | | |
| Health Care – 8.12% | | | | | | | | | | | | |
| Johnson & Johnson | | | 400 | | | | 20,944 | | | | 0.21 | % |
| Merck & Co., Inc. | | | 15,490 | | | | 375,477 | | | | 3.68 | % |
| Pfizer, Inc. | | | 32,310 | | | | 431,662 | | | | 4.23 | % |
| | | | | | | | 828,083 | | | | 8.12 | % |
| | | | | | | | | | | | | |
| Industrials – 10.68% | | | | | | | | | | | | |
| Boeing Co. | | | 500 | | | | 20,025 | | | | 0.20 | % |
| Caterpillar, Inc. | | | 13,630 | | | | 484,956 | | | | 4.75 | % |
| General Electric Co. | | | 46,160 | | | | 583,924 | | | | 5.73 | % |
| | | | | | | | 1,088,905 | | | | 10.68 | % |
| | | | | | | | | | | | | |
| Materials – 11.09% | | | | | | | | | | | | |
| Alcoa, Inc. | | | 63,260 | | | | 573,768 | | | | 5.63 | % |
| EI Du Pont de Nemours & Co. | | | 19,975 | | | | 557,303 | | | | 5.46 | % |
| | | | | | | | 1,131,071 | | | | 11.09 | % |
| | | | | | | | | | | | | |
| Telecommunication Services – 10.74% | | | | | | | | | | | | |
| AT&T, Inc. | | | 20,430 | | | | 523,417 | | | | 5.13 | % |
| Verizon Communications, Inc. | | | 18,840 | | | | 571,605 | | | | 5.61 | % |
| | | | | | | | 1,095,022 | | | | 10.74 | % |
| | | | | | | | | | | | | |
Total Common Stocks (Cost $8,091,692) | | | | | | | 5,697,935 | | | | 55.88 | % |
The accompanying notes are an integral part of these financial statements.
HENNESSY FUNDS 1-800-966-4354
| SHORT-TERM INVESTMENTS – 43.70% | | Principal | | | | | | % of Net | |
| | | Amount | | | Value | | | Assets | |
| U.S. Treasury Bills – 39.84% | | | | | | | | | |
| 4.875%, 05/31/2009 | | $ | 600,000 | | | $ | 602,532 | | | | 5.91 | % |
| 3.500%, 08/15/2009 | | | 900,000 | | | | 909,001 | | | | 8.92 | % |
| 3.375%, 10/15/2009 | | | 400,000 | | | | 405,734 | | | | 3.98 | % |
| 3.125%, 11/30/2009 | | | 800,000 | | | | 813,094 | | | | 7.97 | % |
| 3.500%, 02/15/2010 | | | 1,300,000 | | | | 1,331,637 | | | | 13.06 | % |
| | | | | | | | | | | | | |
Total U.S. Treasury Bills (Cost $4,051,302) | | | | | | | 4,061,998 | | | | 39.84 | % |
| | | | | | | | | | | | | |
| Variable Rate Demand Notes# – 3.86% | | | | | | | | | | | | |
American Family Financial Services 0.1001% | | | 393,782 | | | | 393,782 | | | | 3.86 | % |
| | | | | | | | | | | | | |
| Total Variable Rate Demand Notes | | | | | | | | | | | | |
| (Cost $393,782) | | | | | | | 393,782 | | | | 3.86 | % |
| | | | | | | | | | | | | |
| Total Short-Term Investments | | | | | | | | | | | | |
| (Cost $4,445,084) | | | | | | | 4,455,780 | | | | 43.70 | % |
| | | | | | | | | | | | | |
Total Investments – 99.58% | | | | | | | | | | | | |
| (Cost $12,536,776) | | | | | | | 10,153,715 | | | | 99.58 | % |
| | | | | | | | | | | | | |
| Other Assets in Excess of Liabilities – 0.42% | | | | | | | 43,057 | | | | 0.42 | % |
TOTAL NET ASSETS – 100.00% | | | | | | $ | 10,196,772 | | | | 100.00 | % |
Percentages are stated as a percent of net assets.
| # | Variable rate demand notes are considered short-term obligations and are payable on demand. Interest rates change periodically on specified dates. The rates listed are as of April 30, 2009. |
FAS 157 – Summary of Fair Value Exposure at April 30, 2009 (Unaudited)
Various inputs are used in determining the value of the Fund’s investments, which are summarized as follows:
Level 1 – Quoted prices in active markets for identical securities
Level 2 – Other significant observable inputs (including quoted prices for similar securities, interest rates, prepayment speeds, credit risk, etc.)
Level 3 – Significant unobservable inputs (including the Fund’s own assumptions in determining the fair value of investments)
The inputs or methodology used for valuing securities are not an indication of the risk associated with investing in those securities.
SUMMARY OF INVESTMENTS — HENNESSY BALANCED FUND
The following is a summary of the inputs used to value the Fund’s net assets as of April 30, 2009:
| Description | | Investments in Securities | |
| Level 1 – Quoted prices in active markets for identical securities | | $ | 5,697,935 | |
| Level 2 – Other significant observable inputs | | | 4,455,780 | |
| Level 3 – Significant unobservable inputs | | | — | |
| Total | | $ | 10,153,715 | |
HENNESSY FUNDS 1-800-966-4354
Financial Statements
Statements of Assets and Liabilities as of April 30, 2009 (Unaudited) |
| | | HENNESSY | |
| | | CORNERSTONE | |
| | | GROWTH FUND | |
| ASSETS: | | | |
| Investments, at value (cost $264,377,785, $51,147,486, $226,047,611, | | | |
| $97,801,259, $78,549,294 and $12,536,776, respectively) | | $ | 243,590,826 | |
| Cash | | | 20 | |
| Dividends and interest receivable | | | 289,185 | |
| Receivable for fund shares sold | | | 184,579 | |
| Prepaid expenses and other assets | | | 29,176 | |
| Total Assets | | | 244,093,786 | |
| | | | | |
| LIABILITIES: | | | | |
| Payable for fund shares redeemed | | | 188,456 | |
| Payable to Advisor | | | 149,604 | |
| Payable to Administrator | | | 93,745 | |
| Payable to Auditor | | | 11,654 | |
| Payable to Distributor | | | — | |
| Reverse repurchase agreement | | | — | |
| Accrued interest payable | | | 287 | |
| Accrued service fees | | | 19,942 | |
| Accrued expenses and other payables | | | 63,657 | |
| Total Liabilities | | | 527,345 | |
| | | | | |
| NET ASSETS | | $ | 243,566,441 | |
| | | | | |
| NET ASSETS CONSIST OF: | | | | |
| Capital stock | | $ | 556,423,639 | |
| Accumulated net investment income (loss) | | | (232,391 | ) |
| Accumulated net realized gain (loss) on investments | | | (291,837,848 | ) |
| Unrealized net appreciation (depreciation) on investments | | | (20,786,959 | ) |
| Total Net Assets | | $ | 243,566,441 | |
| | | | | |
| NET ASSETS | | | | |
| Original Class: | | | | |
| Shares authorized ($.0001 par value) | | | 25,000,000,000 | |
| Net assets applicable to outstanding Original Class shares | | | 239,281,993 | |
| Shares issued and outstanding | | | 29,818,545 | |
| Net asset value, offering price and redemption price per share | | $ | 8.02 | |
| | | | | |
| Institutional Class: | | | | |
| Shares authorized ($.0001 par value) | | | 25,000,000,000 | |
| Net assets applicable to outstanding Institutional Class shares | | | 4,284,448 | |
| Shares issued and outstanding | | | 532,130 | |
| Net asset value, offering price and redemption price per share | | $ | 8.05 | |
The accompanying notes are an integral part of these financial statements.
FINANCIAL STATEMENTS — STATEMENTS OF ASSETS AND LIABILITIES
| HENNESSY | | | | | | | | | | | | | |
| CORNERSTONE | | | HENNESSY | | | HENNESSY | | | HENNESSY | | | HENNESSY | |
| GROWTH FUND, | | | FOCUS 30 | | | CORNERSTONE | | | TOTAL RETURN | | | BALANCED | |
| SERIES II | | | FUND | | | VALUE FUND | | | FUND | | | FUND | |
| | | | | | | | | | | | | | |
| | | | | | | | | | | | | | |
| $ | 29,269,796 | | | $ | 166,471,139 | | | $ | 85,560,351 | | | $ | 60,633,722 | | | $ | 10,153,715 | |
| | — | | | | — | | | | 20 | | | | 10 | | | | — | |
| | 21,646 | | | | 109,685 | | | | 369,829 | | | | 162,962 | | | | 66,986 | |
| | 11,496 | | | | 329,070 | | | | 250 | | | | 418 | | | | — | |
| | 36,807 | | | | 30,400 | | | | 20,964 | | | | 10,796 | | | | 13,681 | |
| | 29,339,745 | | | | 166,940,294 | | | | 85,951,414 | | | | 60,807,908 | | | | 10,234,382 | |
| | | | | | | | | | | | | | | | | | | |
| | 17,346 | | | | 397,151 | | | | 21,252 | | | | 22,488 | | | | — | |
| | 17,159 | | | | 95,498 | | | | 48,941 | | | | 22,915 | | | | 4,975 | |
| | 5,341 | | | | 58,173 | | | | 25,186 | | | | 12,699 | | | | — | |
| | 9,997 | | | | 8,400 | | | | 9,238 | | | | 8,487 | | | | 8,212 | |
| | — | | | | — | | | | — | | | | 5,598 | | | | 17,128 | |
| | — | | | | — | | | | — | | | | 13,492,500 | | | | — | |
| | — | | | | — | | | | — | | | | 4,722 | | | | — | |
| | 2,317 | | | | 11,353 | | | | 6,572 | | | | 3,819 | | | | 829 | |
| | 18,589 | | | | 26,858 | | | | 16,299 | | | | 24,343 | | | | 6,466 | |
| | 70,749 | | | | 597,433 | | | | 127,488 | | | | 13,597,571 | | | | 37,610 | |
| | | | | | | | | | | | | | | | | | | |
| $ | 29,268,996 | | | $ | 166,342,861 | | | $ | 85,823,926 | | | $ | 47,210,337 | | | $ | 10,196,772 | |
| | | | | | | | | | | | | | | | | | | |
| $ | 92,060,274 | | | $ | 279,825,451 | | | $ | 182,346,137 | | | $ | 108,799,019 | | | $ | 15,019,531 | |
| | (2,874 | ) | | | 151,357 | | | | 1,317,595 | | | | 114,347 | | | | 11,597 | |
| | (40,910,714 | ) | | | (54,057,475 | ) | | | (85,598,898 | ) | | | (43,787,457 | ) | | | (2,451,295 | ) |
| | (21,877,690 | ) | | | (59,576,472 | ) | | | (12,240,908 | ) | | | (17,915,572 | ) | | | (2,383,061 | ) |
| $ | 29,268,996 | | | $ | 166,342,861 | | | $ | 85,823,926 | | | $ | 47,210,337 | | | $ | 10,196,772 | |
| | | | | | | | | | | | | | | | | | | |
| | | | | | | | | | | | | | | | | | | |
| Unlimited | | | | 25,000,000,000 | | | | 25,000,000,000 | | | | 100,000,000 | | | | 100,000,000 | |
| | 29,186,907 | | | | 141,923,952 | | | | 84,983,961 | | | | 47,210,337 | | | | 10,196,772 | |
| | 2,969,774 | | | | 18,812,383 | | | | 10,433,773 | | | | 5,999,166 | | | | 1,224,524 | |
| $ | 9.83 | | | $ | 7.54 | | | $ | 8.15 | | | $ | 7.87 | | | $ | 8.33 | |
| | | | | | | | | | | | | | | | | | | |
| Unlimited | | | | 25,000,000,000 | | | | 25,000,000,000 | | | | | | | | | |
| | 82,089 | | | | 24,418,909 | | | | 839,965 | | | | | | | | | |
| | 8,292 | | | | 3,225,113 | | | | 103,267 | | | | | | | | | |
| $ | 9.90 | | | $ | 7.57 | | | $ | 8.13 | | | | | | | | | |
HENNESSY FUNDS 1-800-966-4354
Financial Statements
Statements of Operations Six Months ended April 30, 2009 (Unaudited) |
| | | HENNESSY | |
| | | CORNERSTONE | |
| | | GROWTH FUND | |
| INVESTMENT INCOME: | | | |
Dividend income(1) | | $ | 1,524,660 | |
| Interest income | | | 275 | |
| Total investment income | | | 1,524,935 | |
| | | | | |
| EXPENSES: | | | | |
| Investment advisory fees | | | 972,227 | |
| Administration, fund accounting, custody and transfer agent fees | | | 334,989 | |
| Distribution fees – Original Class (See Note 5) | | | — | |
| Service fees – Original Class (See Note 5) | | | 129,159 | |
| Federal and state registration fees | | | 22,830 | |
| Audit fees | | | 11,405 | |
| Legal fees | | | 13,843 | |
| Reports to shareholders | | | 44,888 | |
| Directors’ fees and expenses | | | 6,838 | |
| Sub-transfer agent expenses – Original Class (See Note 5) | | | 196,464 | |
| Sub-transfer agent expenses – Institutional Class (See Note 5) | | | 1,058 | |
| Interest expense (See Note 3 and 7) | | | 798 | |
| Other | | | 26,394 | |
| Total expenses before reimbursement from advisor | | | 1,760,893 | |
| Expense reimbursement from advisor – Institutional Class | | | (3,567 | ) |
| Net expenses | | | 1,757,326 | |
| NET INVESTMENT INCOME (LOSS) | | $ | (232,391 | ) |
| | | | | |
| REALIZED AND UNREALIZED GAINS (LOSSES): | | | | |
| Net realized gain (loss) on investments | | $ | (174,584,029 | ) |
| Change in unrealized appreciation (depreciation) on investments | | | 146,286,209 | |
| Net gain (loss) on investments | | | (28,297,820 | ) |
| | | | | |
| NET INCREASE (DECREASE) IN NET ASSETS | | | | |
| RESULTING FROM OPERATIONS | | $ | (28,530,211 | ) |
(1) | Net of foreign taxes withheld of $78,584, $3,810, $0, $332,882, $0, & $0, respectively. |
The accompanying notes are an integral part of these financial statements.
FINANCIAL STATEMENTS — STATEMENTS OF OPERATIONS
| HENNESSY | | | | | | | | | | | | | |
| CORNERSTONE | | | HENNESSY | | | HENNESSY | | | HENNESSY | | | HENNESSY | |
| GROWTH FUND, | | | FOCUS 30 | | | CORNERSTONE | | | TOTAL RETURN | | | BALANCED | |
| SERIES II | | | FUND | | | VALUE FUND | | | FUND | | | FUND | |
| | | | | | | | | | | | | | |
| $ | 247,282 | | | $ | 1,207,936 | | | $ | 2,160,385 | | | $ | 993,332 | | | $ | 140,566 | |
| | 480 | | | | 1,917 | | | | 1,395 | | | | 50,010 | | | | 44,346 | |
| | 247,762 | | | | 1,209,853 | | | | 2,161,780 | | | | 1,043,342 | | | | 184,912 | |
| | | | | | | | | | | | | | | | | | | |
| | 107,883 | | | | 597,625 | | | | 294,166 | | | | 142,526 | | | | 30,364 | |
| | 37,172 | | | | 205,917 | | | | 101,357 | | | | 60,567 | | | | 12,904 | |
| | — | | | | — | | | | — | | | | 35,631 | | | | 7,591 | |
| | 14,550 | | | | 69,182 | | | | 39,383 | | | | 23,754 | | | | 5,061 | |
| | 22,666 | | | | 25,471 | | | | 19,995 | | | | 10,504 | | | | 11,472 | |
| | 9,895 | | | | 9,084 | | | | 9,530 | | | | 9,170 | | | | 8,679 | |
| | 9,914 | | | | 7,414 | | | | 7,414 | | | | 5,962 | | | | 4,981 | |
| | 10,953 | | | | 18,658 | | | | 8,925 | | | | 4,216 | | | | 1,240 | |
| | 5,521 | | | | 5,520 | | | | 5,521 | | | | 4,168 | | | | 4,167 | |
| | 23,064 | | | | 120,182 | | | | 19,202 | | | | — | | | | — | |
| | 30 | | | | 6,439 | | | | 401 | | | | — | | | | — | |
| | 85 | | | | — | | | | 14 | | | | 118,306 | | | | — | |
| | 9,077 | | | | 12,464 | | | | 6,721 | | | | 3,883 | | | | 1,104 | |
| | 250,810 | | | | 1,077,956 | | | | 512,629 | | | | 418,687 | | | | 87,563 | |
| | (174 | ) | | | (19,460 | ) | | | (1,001 | ) | | | — | | | | — | |
| | 250,636 | | | | 1,058,496 | | | | 511,628 | | | | 418,687 | | | | 87,563 | |
| $ | (2,874 | ) | | $ | 151,357 | | | $ | 1,650,152 | | | $ | 624,655 | | | $ | 97,349 | |
| | | | | | | | | | | | | | | | | | | |
| $ | (4,513,819 | ) | | $ | (6,077,910 | ) | | $ | (56,678,085 | ) | | $ | (7,633,466 | ) | | $ | (1,393,083 | ) |
| | 2,265,884 | | | | (7,830,729 | ) | | | 50,016,684 | | | | (1,071,187 | ) | | | 370,577 | |
| | (2,247,935 | ) | | | (13,908,639 | ) | | | (6,661,401 | ) | | | (8,704,653 | ) | | | (1,022,506 | ) |
| | | | | | | | | | | | | | | | | | | |
| $ | (2,250,809 | ) | | $ | (13,757,282 | ) | | $ | (5,011,249 | ) | | $ | (8,079,998 | ) | | $ | (925,157 | ) |
HENNESSY FUNDS 1-800-966-4354
Financial Statements
| Statements of Changes in Net Assets |
| | | Hennessy Cornerstone Growth Fund | |
| | | Six Months Ended | | | | |
| | | April 30, 2009 | | | Year Ended | |
| | | (Unaudited) | | | October 31, 2008 | |
| OPERATIONS: | | | | | | |
| Net investment income (loss) | | $ | (232,391 | ) | | $ | (1,718,215 | ) |
| Net realized gain (loss) on securities | | | (174,584,029 | ) | | | (116,321,526 | ) |
| Change in unrealized appreciation (depreciation) on securities | | | 146,286,209 | | | | (248,016,087 | ) |
| Net increase (decrease) in net assets resulting from operations | | | (28,530,211 | ) | | | (366,055,828 | ) |
| | | | | | | | | |
| DISTRIBUTIONS TO SHAREHOLDERS FROM: | | | | | | | | |
| Net investment income – Original Class | | | — | | | | — | |
| Net investment income – Institutional Class | | | — | | | | — | |
| Net realized gains – Original Class | | | — | | | | (110,914,265 | ) |
| Net realized gains – Institutional Class | | | — | | | | — | |
| Total distributions | | | — | | | | (110,914,265 | ) |
| | | | | | | | | |
| CAPITAL SHARE TRANSACTIONS: | | | | | | | | |
| Proceeds from shares subscribed – Original Class | | | 7,703,678 | | | | 39,355,042 | |
| Proceeds from shares subscribed – Institutional Class | | | 61,013 | | | | 14,450,082 | |
| Dividends reinvested – Original Class | | | — | | | | 107,702,229 | |
| Dividends reinvested – Institutional Class | | | — | | | | — | |
| Redemption fees retained – Original Class | | | — | | | | 23,170 | |
| Redemption fees retained – Institutional Class | | | — | | | | 205 | |
| Cost of shares redeemed – Original Class | | | (52,866,973 | ) | | | (350,084,701 | ) |
| Cost of shares redeemed – Institutional Class | | | (390,385 | ) | | | (7,312,081 | ) |
| Net increase (decrease) in net assets derived | | | | | | | | |
| from capital share transactions | | | (45,492,667 | ) | | | (195,866,054 | ) |
| TOTAL INCREASE (DECREASE) IN NET ASSETS | | | (74,022,878 | ) | | | (672,836,147 | ) |
| | | | | | | | | |
| NET ASSETS: | | | | | | | | |
| Beginning of period | | | 317,589,319 | | | | 990,425,466 | |
| End of period | | $ | 243,566,441 | | | $ | 317,589,319 | |
| Accumulated net investment income (loss), end of period | | $ | (232,391 | ) | | $ | — | |
| | | | | | | | | |
| CHANGES IN SHARES OUTSTANDING: | | | | | | | | |
| Shares sold – Original Class | | | 959,937 | | | | 42,121,972 | |
| Shares sold – Institutional Class | | | 7,623 | | | | 1,117,876 | |
| Shares issued to holders as reinvestment of dividends | | | | | | | | |
| Original Class | | | — | | | | 7,062,441 | |
| Institutional Class | | | — | | | | — | |
| Shares redeemed – Original Class | | | (6,635,237 | ) | | | (64,717,368 | ) |
| Shares redeemed – Institutional Class | | | (52,459 | ) | | | (540,910 | ) |
| Net increase (decrease) in shares outstanding | | | (5,720,136 | ) | | | (14,955,989 | ) |
The accompanying notes are an integral part of these financial statements.
FINANCIAL STATEMENTS — STATEMENTS OF CHANGES IN NET ASSETS
| Hennessy Cornerstone | | | | | | | |
| Growth Fund, Series II | | | Hennessy Focus 30 Fund | |
| Six Months Ended | | | | | | Six Months Ended | | | | |
| April 30, 2009 | | | Year Ended | | | April 30, 2009 | | | Year Ended | |
| (Unaudited) | | | October 31, 2008 | | | (Unaudited) | | | October 31, 2008 | |
| | | | | | | | | | | |
| $ | (2,874 | ) | | $ | (330,874 | ) | | $ | 151,357 | | | $ | (1,274,378 | ) |
| | (4,513,819 | ) | | | (35,487,492 | ) | | | (6,077,910 | ) | | | (47,714,145 | ) |
| | 2,265,884 | | | | (21,004,180 | ) | | | (7,830,729 | ) | | | (49,274,887 | ) |
| | (2,250,809 | ) | | | (56,822,546 | ) | | | (13,757,282 | ) | | | (98,263,410 | ) |
| | | | | | | | | | | | | | | |
| | | | | | | | | | | | | | | |
| | — | | | | — | | | | — | | | | — | |
| | — | | | | — | | | | — | | | | — | |
| | — | | | | (27,055,016 | ) | | | — | | | | (33,250,015 | ) |
| | — | | | | — | | | | — | | | | — | |
| | — | | | | (27,055,016 | ) | | | — | | | | (33,250,015 | ) |
| | | | | | | | | | | | | | | |
| | | | | | | | | | | | | | | |
| | 539,751 | | | | 3,777,707 | | | | 21,247,920 | | | | 169,225,771 | |
| | 35,121 | | | | 108,132 | | | | 1,721,741 | | | | 40,370,645 | |
| | — | | | | 26,856,690 | | | | — | | | | 32,845,640 | |
| | — | | | | — | | | | — | | | | — | |
| | — | | | | 6,554 | | | | — | | | | 118,011 | |
| | — | | | | — | | | | — | | | | 2,592 | |
| | (5,371,027 | ) | | | (49,122,781 | ) | | | (34,600,660 | ) | | | (146,107,945 | ) |
| | (11,356 | ) | | | — | | | | (2,375,778 | ) | | | (4,205,478 | ) |
| | | | | | | | | | | | | | | |
| | (4,807,511 | ) | | | (18,373,698 | ) | | | (14,006,777 | ) | | | 92,249,236 | |
| | (7,058,320 | ) | | | (102,251,260 | ) | | | (27,764,059 | ) | | | (39,264,189 | ) |
| | | | | | | | | | | | | | | |
| | | | | | | | | | | | | | | |
| | 36,327,316 | | | | 138,578,576 | | | | 194,106,920 | | | | 233,371,109 | |
| $ | 29,268,996 | | | $ | 36,327,316 | | | $ | 166,342,861 | | | $ | 194,106,920 | |
| $ | (2,874 | ) | | $ | — | | | $ | 151,357 | | | $ | — | |
| | | | | | | | | | | | | | | |
| | | | | | | | | | | | | | | |
| | 59,168 | | | | 3,389,025 | | | | 2,976,185 | | | | 26,879,882 | |
| | 3,660 | | | | 5,992 | | | | 239,725 | | | | 3,743,355 | |
| | | | | | | | | | | | | | | |
| | — | | | | 1,292,430 | | | | — | | | | 2,935,134 | |
| | — | | | | — | | | | — | | | | — | |
| | (592,175 | ) | | | (5,749,094 | ) | | | (5,017,510 | ) | | | (26,028,686 | ) |
| | (1,360 | ) | | | — | | | | (347,382 | ) | | | (410,584 | ) |
| | (530,707 | ) | | | (1,061,647 | ) | | | (2,148,982 | ) | | | 7,119,101 | |
HENNESSY FUNDS 1-800-966-4354
Financial Statements
| Statements of Changes in Net Assets |
| | | Hennessy Cornerstone Value Fund | |
| | | Six Months Ended | | | | |
| | | April 30, 2009 | | | Year Ended | |
| | | (Unaudited) | | | October 31, 2008 | |
| OPERATIONS: | | | | | | |
| Net investment income (loss) | | $ | 1,650,152 | | | $ | 5,994,086 | |
| Net realized gain (loss) on securities | | | (56,678,085 | ) | | | 5,901,494 | |
| Change in unrealized appreciation (depreciation) on securities | | | 50,016,684 | | | | (99,303,788 | ) |
| Net increase (decrease) in net assets resulting from operations | | | (5,011,249 | ) | | | (87,408,208 | ) |
| | | | | | | | | |
| DISTRIBUTIONS TO SHAREHOLDERS FROM: | | | | | | | | |
| Net investment income – Original Class | | | (5,597,237 | ) | | | (4,859,028 | ) |
| Net investment income – Institutional Class | | | (55,214 | ) | | | — | |
| Net realized gains – Original Class | | | — | | | | — | |
| Net realized gains – Institutional Class | | | — | | | | — | |
| Total distributions | | | (5,652,451 | ) | | | (4,859,028 | ) |
| | | | | | | | | |
| CAPITAL SHARE TRANSACTIONS: | | | | | | | | |
| Proceeds from shares subscribed – Original Class | | | 638,448 | | | | 2,874,361 | |
| Proceeds from shares subscribed – Institutional Class | | | 23,743 | | | | 1,312,785 | |
| Dividends reinvested – Original Class | | | 4,981,771 | | | | 4,316,071 | |
| Dividends reinvested – Institutional Class | | | 33,372 | | | | — | |
| Redemption fees retained – Original Class | | | — | | | | 664 | |
| Redemption fees retained – Institutional Class | | | — | | | | — | |
| Cost of shares redeemed – Original Class | | | (7,165,686 | ) | | | (22,760,874 | ) |
| Cost of shares redeemed – Institutional Class | | | (4,000 | ) | | | — | |
| Net increase (decrease) in net assets derived | | | | | | | | |
| from capital share transactions | | | (1,492,352 | ) | | | (14,256,993 | ) |
| TOTAL INCREASE (DECREASE) IN NET ASSETS | | | (12,156,052 | ) | | | (106,524,229 | ) |
| | | | | | | | | |
| NET ASSETS: | | | | | | | | |
| Beginning of period | | | 97,979,978 | | | | 204,504,207 | |
| End of period | | $ | 85,823,926 | | | $ | 97,979,978 | |
| Accumulated net investment income (loss), end of period | | $ | 1,317,595 | | | $ | 5,319,895 | |
| | | | | | | | | |
| CHANGES IN SHARES OUTSTANDING: | | | | | | | | |
| Shares sold – Original Class | | | 84,575 | | | | 11,669,368 | |
| Shares sold – Institutional Class | | | 3,150 | | | | 96,448 | |
| Shares issued to holders as reinvestment of dividends | | | | | | | | |
| Original Class | | | 638,689 | | | | 288,122 | |
| Institutional Class | | | 4,289 | | | | — | |
| Shares redeemed – Original Class | | | (1,017,763 | ) | | | (13,218,237 | ) |
| Shares redeemed – Institutional Class | | | (620 | ) | | | — | |
| Net increase (decrease) in shares outstanding | | | (287,680 | ) | | | (1,164,299 | ) |
The accompanying notes are an integral part of these financial statements.
FINANCIAL STATEMENTS — STATEMENTS OF CHANGES IN NET ASSETS
| Hennessy Total Return Fund | | | Hennessy Balanced Fund | |
| Six Months Ended | | | | | | Six Months Ended | | | | |
| April 30, 2009 | | | Year Ended | | | April 30, 2009 | | | Year Ended | |
| (Unaudited) | | | October 31, 2008 | | | (Unaudited) | | | October 31, 2008 | |
| | | | | | | | | | | |
| $ | 624,655 | | | $ | 1,864,720 | | | $ | 97,349 | | | $ | 326,516 | |
| | (7,633,466 | ) | | | (447,136 | ) | | | (1,393,083 | ) | | | (35,369 | ) |
| | (1,071,187 | ) | | | (29,382,944 | ) | | | 370,577 | | | | (3,656,241 | ) |
| | (8,079,998 | ) | | | (27,965,360 | ) | | | (925,157 | ) | | | (3,365,094 | ) |
| | | | | | | | | | | | | | | |
| | (510,308 | ) | | | (2,023,302 | ) | | | (103,542 | ) | | | (345,420 | ) |
| | N/A | | | | N/A | | | | N/A | | | | N/A | |
| | — | | | | — | | | | — | | | | (785,865 | ) |
| | N/A | | | | N/A | | | | N/A | | | | N/A | |
| | (510,308 | ) | | | (2,023,302 | ) | | | (103,542 | ) | | | (1,131,285 | ) |
| | | | | | | | | | | | | | | |
| | 436,291 | | | | 1,911,184 | | | | 545,816 | | | | 656,445 | |
| | N/A | | | | N/A | | | | N/A | | | | N/A | |
| | 472,480 | | | | 1,889,484 | | | | 100,865 | | | | 1,104,807 | |
| | N/A | | | | N/A | | | | N/A | | | | N/A | |
| | — | | | | 855 | | | | — | | | | 610 | |
| | N/A | | | | N/A | | | | N/A | | | | N/A | |
| | (3,330,779 | ) | | | (11,899,129 | ) | | | (879,754 | ) | | | (2,627,822 | ) |
| | N/A | | | | N/A | | | | N/A | | | | N/A | |
| | | | | | | | | | | | | | | |
| | (2,422,008 | ) | | | (8,097,606 | ) | | | (233,073 | ) | | | (865,960 | ) |
| | (11,012,314 | ) | | | (38,086,268 | ) | | | (1,261,772 | ) | | | (5,362,339 | ) |
| | | | | | | | | | | | | | | |
| | | | | | | | | | | | | | | |
| | 58,222,651 | | | | 96,308,919 | | | | 11,458,544 | | | | 16,820,883 | |
| $ | 47,210,337 | | | $ | 58,222,651 | | | $ | 10,196,772 | | | $ | 11,458,544 | |
| $ | 114,347 | | | $ | — | | | $ | 11,597 | | | $ | 17,790 | |
| | | | | | | | | | | | | | | |
| | 54,618 | | | | 161,806 | | | | 65,185 | | | | 61,447 | |
| | N/A | | | | N/A | | | | N/A | | | | N/A | |
| | | | | | | | | | | | | | | |
| | 62,161 | | | | 169,813 | | | | 12,531 | | | | 98,884 | |
| | N/A | | | | N/A | | | | N/A | | | | N/A | |
| | (431,635 | ) | | | (1,034,535 | ) | | | (111,189 | ) | | | (247,266 | ) |
| | N/A | | | | N/A | | | | N/A | | | | N/A | |
| | (314,856 | ) | | | (702,916 | ) | | | (33,473 | ) | | | (86,935 | ) |
HENNESSY FUNDS 1-800-966-4354
Financial Highlights
| Hennessy Cornerstone Growth Fund |
| | | Six Months Ended | |
| | | April 30, 2009(3) | |
| | | (Unaudited) | |
| | | | | | Institutional | |
| | | Original Class | | | Class | |
| PER SHARE DATA: | | | | | | |
| Net asset value, beginning of period | | $ | 8.80 | | | $ | 8.82 | |
| | | | | | | | | |
| Income from investment operations: | | | | | | | | |
Net investment gain (loss)(4) | | | (0.01 | ) | | | 0.01 | |
| Net realized and unrealized gains (losses) on securities | | | (0.77 | ) | | | (0.78 | ) |
| Total from investment operations | | | (0.78 | ) | | | (0.77 | ) |
| | | | | | | | | |
| Less Distributions: | | | | | | | | |
| Dividends from net investment income | | | — | | | | — | |
| Dividends from net realized gains | | | — | | | | — | |
| Total distributions | | | — | | | | — | |
Redemption fees retained(5) | | | — | | | | — | |
| Net asset value, end of period | | $ | 8.02 | | | $ | 8.05 | |
| | | | | | | | | |
| TOTAL RETURN | | | (8.86 | )% | | | (8.73 | )% |
| | | | | | | | | |
| SUPPLEMENTAL DATA AND RATIOS: | | | | | | | | |
| Net assets, end of period (millions) | | $ | 239.28 | | | $ | 4.28 | |
| Ratio of expenses to average net assets: | | | | | | | | |
| Before expense reimbursement | | | 1.34 | % | | | 1.14 | % |
| After expense reimbursement | | | 1.34 | % | | | 0.98 | %(6) |
| Ratio of net investment income to average net assets: | | | | | | | | |
| Before expense reimbursement | | | (0.18 | )% | | | 0.09 | % |
| After expense reimbursement | | | (0.18 | )% | | | 0.25 | % |
| Portfolio turnover rate | | | 103 | % | | | 103 | % |
(1) | Institutional Class shares commenced operations on March 3, 2008. |
(2) | For the one month ended October 31, 2004. Effective October 31, 2004, the Fund changed its fiscal year end to October 31st from September 30th. |
(3) | All ratios for the period have been annualized, except portfolio turnover and total return. |
(4) | Net investment loss per share is calculated using ending balances prior to consideration for adjustments for permanent book and tax differences. |
(5) | Amount is less than $0.01. |
(6) | The Advisor has agreed to cap the Institutional Class Share expenses at 0.98%. |
The accompanying notes are an integral part of these financial statements.
FINANCIAL HIGHLIGHTS — HENNESSY CORNERSTONE GROWTH FUND
| | | | | | | | | | | | | | | | Period Ended | | | Year Ended | |
| Year Ended October 31, | | | Year Ended October 31, | | | October 31, | | | September 30, | |
| 2008 | | | 2007 | | | 2006 | | | 2005 | | | 2004(2)(3) | | | 2004 | |
| | | | Institutional | | | | | | | | | | | | | | | | |
| Original Class | | | Class(1)(3) | | | Original Class | |
| | | | | | | | | | | | | | | | | | | | |
| $ | 19.41 | | | $ | 13.29 | | | $ | 20.77 | | | $ | 19.49 | | | $ | 19.38 | | | $ | 19.08 | | | $ | 17.23 | |
| | | | | | | | | | | | | | | | | | | | | | | | | | | |
| | | | | | | | | | | | | | | | | | | | | | | | | | | |
| | (0.05 | ) | | | 0.01 | | | | (0.07 | ) | | | (0.04 | ) | | | (0.14 | ) | | | (0.02 | ) | | | (0.13 | ) |
| | (8.32 | ) | | | (4.48 | ) | | | 1.82 | | | | 2.55 | | | | 4.13 | | | | 0.32 | | | | 1.98 | |
| | (8.37 | ) | | | (4.47 | ) | | | 1.75 | | | | 2.51 | | | | 3.99 | | | | 0.30 | | | | 1.85 | |
| | | | | | | | | | | | | | | | | | | | | | | | | | | |
| | | | | | | | | | | | | | | | | | | | | | | | | | | |
| | — | | | | — | | | | — | | | | — | | | | — | | | | — | | | | — | |
| | (2.24 | ) | | | — | | | | (3.11 | ) | | | (1.23 | ) | | | (3.88 | ) | | | — | | | | — | |
| | (2.24 | ) | | | — | | | | (3.11 | ) | | | (1.23 | ) | | | (3.88 | ) | | | — | | | | — | |
| | — | | | | — | | | | — | | | | — | | | | — | | | | — | | | | — | |
| $ | 8.80 | | | $ | 8.82 | | | $ | 19.41 | | | $ | 20.77 | | | $ | 19.49 | | | $ | 19.38 | | | $ | 19.08 | |
| | | | | | | | | | | | | | | | | | | | | | | | | | | |
| | (48.00 | )% | | | (34.13 | )% | | | 9.65 | % | | | 13.59 | % | | | 23.17 | % | | | 1.57 | % | | | 10.74 | % |
| | | | | | | | | | | | | | | | | | | | | | | | | | | |
| | | | | | | | | | | | | | | | | | | | | | | | | | | |
| $ | 317.50 | | | $ | 5.09 | | | $ | 990.4 | | | $ | 1,250.7 | | | $ | 1,071.8 | | | $ | 869.0 | | | $ | 866.0 | |
| | | | | | | | | | | | | | | | | | | | | | | | | | | |
| | 1.25 | % | | | 1.12 | % | | | 1.20 | % | | | 1.21 | % | | | 1.23 | % | | | 1.25 | % | | | 1.25 | % |
| | 1.25 | % | | | 0.98 | %(6) | | | 1.20 | % | | | 1.21 | % | | | 1.23 | % | | | 1.25 | % | | | 1.25 | % |
| | | | | | | | | | | | | | | | | | | | | | | | | | | |
| | (0.29 | )% | | | 0.15 | % | | | (0.32 | )% | | | (0.20 | )% | | | (0.78 | )% | | | (1.08 | )% | | | (0.68 | )% |
| | (0.29 | )% | | | 0.29 | % | | | (0.32 | )% | | | (0.20 | )% | | | (0.78 | )% | | | (1.08 | )% | | | (0.68 | )% |
| | 103 | % | | | 103 | % | | | 97 | % | | | 90 | % | | | 89 | % | | | 0 | % | | | 107 | % |
HENNESSY FUNDS 1-800-966-4354
Financial Highlights
| Hennessy Cornerstone Growth Fund, Series II |
| | | Six Months Ended | |
| | | April 30, 2009(3) | |
| | | (Unaudited) | |
| | | | | | Institutional | |
| | | Original Class | | | Class | |
| PER SHARE DATA: | | | | | | |
| Net asset value, beginning of period | | $ | 10.35 | | | $ | 10.39 | |
| | | | | | | | | |
| Income from investment operations: | | | | | | | | |
| Net investment gain (loss) | | | — | | | | 0.03 | |
| Net realized and unrealized gains (losses) on securities | | | (0.52 | ) | | | (0.52 | ) |
| Total from investment operations | | | (0.52 | ) | | | (0.49 | ) |
| | | | | | | | | |
| Less Distributions: | | | | | | | | |
| Dividends from net investment income | | | — | | | | — | |
| Dividends from net realized gains | | | — | | | | — | |
| Total distributions | | | — | | | | — | |
Redemption fees retained(5) | | | — | | | | — | |
| Net asset value, end of period | | $ | 9.83 | | | $ | 9.90 | |
| | | | | | | | | |
| TOTAL RETURN | | | (5.02 | )% | | | (4.72 | )% |
| | | | | | | | | |
| SUPPLEMENTAL DATA AND RATIOS: | | | | | | | | |
| Net assets, end of period (millions) | | $ | 29.19 | | | $ | 0.08 | |
| Ratio of expenses to average net assets: | | | | | | | | |
| Before expense reimbursement | | | 1.72 | % | | | 1.58 | % |
| After expense reimbursement | | | 1.72 | % | | | 0.98 | %(7) |
| Ratio of net investment income to average net assets: | | | | | | | | |
| Before expense reimbursement | | | (0.02 | )% | | | 0.72 | % |
| After expense reimbursement | | | (0.02 | )% | | | 1.32 | % |
| Portfolio turnover rate | | | 0 | % | | | 0 | % |
(1) | Institutional Class shares commenced operations on March 3, 2008. |
(2) | For the four months ended October 31, 2006. Effective October 31, 2006 the Fund changed its fiscal year end to October 31st from June 30th. |
(3) | All ratios for the period have been annualized, except portfolio turnover and total return. |
(4) | Net investment loss per share is calculated using average shares outstanding. |
(5) | Amount is less than $0.01. |
(6) | The financial highlights set forth herein include the historical highlights of The Henlopen Fund. On July 1, 2005 Hennessy Advisors, Inc. became the investment advisor to the Fund and the Fund changed its name from “The Henlopen Fund” to Hennessy Cornerstone Growth Fund, Series II. |
(7) | The Advisor has agreed to cap the Institutional Class Share expenses at 0.98%. |
The accompanying notes are an integral part of these financial statements.
FINANCIAL HIGHLIGHTS — HENNESSY CORNERSTONE GROWTH FUND, SERIES II
| Year Ended | | | Year Ended | | | Period Ended | | | | | | | | | | |
| October 31, | | | October 31, | | | October 31, | | | Year Ended June 30, | |
| 2008 | | | 2007 | | | 2006(2)(3) | | | 2006 | | | 2005(6) | | | 2004(6) | |
| | | | Institutional | | | | | | | | | | | | | | | | |
| Original Class | | | Class(1)(3) | | | Original Class | |
| | | | | | | | | | | | | | | | | | | | |
| $ | 30.32 | | | $ | 19.17 | | | $ | 30.75 | | | $ | 32.19 | | | $ | 31.29 | | | $ | 27.69 | | | $ | 18.13 | |
| | | | | | | | | | | | | | | | | | | | | | | | | | | |
| | | | | | | | | | | | | | | | | | | | | | | | | | | |
| | (0.09 | ) | | | 0.02 | | | | (0.25 | ) | | | (0.03 | ) | | | (0.07 | )(4) | | | (0.14 | )(4) | | | (0.23 | )(4) |
| | (13.75 | ) | | | (8.80 | ) | | | 1.02 | | | | (1.41 | ) | | | 4.65 | | | | 3.75 | | | | 9.79 | |
| | (13.84 | ) | | | (8.78 | ) | | | 0.77 | | | | (1.44 | ) | | | 4.58 | | | | 3.61 | | | | 9.56 | |
| | | | | | | | | | | | | | | | | | | | | | | | | | | |
| | | | | | | | | | | | | | | | | | | | | | | | | | | |
| | — | | | | — | | | | — | | | | — | | | | — | | | | (0.01 | ) | | | — | |
| | (6.13 | ) | | | — | | | | (1.20 | ) | | | — | | | | (3.68 | ) | | | — | | | | — | |
| | (6.13 | ) | | | — | | | | (1.20 | ) | | | — | | | | (3.68 | ) | | | (0.01 | ) | | | — | |
| | — | | | | — | | | | — | | | | — | | | | — | | | | — | | | | — | |
| $ | 10.35 | | | $ | 10.39 | | | $ | 30.32 | | | $ | 30.75 | | | $ | 32.19 | | | $ | 31.29 | | | $ | 27.69 | |
| | | | | | | | | | | | | | | | | | | | | | | | | | | |
| | (55.79 | )% | | | (45.80 | )% | | | 2.60 | % | | | (4.47 | )% | | | 16.48 | % | | | 13.04 | % | | | 52.73 | % |
| | | | | | | | | | | | | | | | | | | | | | | | | | | |
| | | | | | | | | | | | | | | | | | | | | | | | | | | |
| $ | 36.27 | | | $ | 0.06 | | | $ | 138.6 | | | $ | 244.2 | | | $ | 279.3 | | | $ | 299.0 | | | $ | 347.8 | |
| | | | | | | | | | | | | | | | | | | | | | | | | | | |
| | 1.37 | % | | | 1.22 | % | | | 1.27 | % | | | 1.25 | % | | | 1.25 | % | | | 1.33 | % | | | 1.38 | % |
| | 1.37 | % | | | 0.98 | %(7) | | | 1.27 | % | | | 1.25 | % | | | 1.25 | % | | | 1.33 | % | | | 1.38 | % |
| | | | | | | | | | | | | | | | | | | | | | | | | | | |
| | (0.40 | )% | | | 0.17 | % | | | (0.59 | )% | | | (0.24 | )% | | | (0.22 | )% | | | (0.49 | )% | | | (0.90 | )% |
| | (0.40 | )% | | | 0.41 | % | | | (0.59 | )% | | | (0.24 | )% | | | (0.22 | )% | | | (0.49 | )% | | | (0.90 | )% |
| | 75 | % | | | 75 | % | | | 86 | % | | | 93 | % | | | 109 | % | | | 192 | % | | | 113 | % |
HENNESSY FUNDS 1-800-966-4354
Financial Highlights
| | | Six Months Ended | |
| | | April 30, 2009(3) | |
| | | (Unaudited) | |
| | | | | | Institutional | |
| | | Original Class | | | Class | |
| PER SHARE DATA: | | | | | | |
| Net asset value, beginning of period | | $ | 8.02 | | | $ | 8.04 | |
| | | | | | | | | |
| Income from investment operations: | | | | | | | | |
| Net investment income (loss) | | | — | | | | 0.02 | |
| Net realized and unrealized gains (losses) on investments | | | (0.48 | ) | | | (0.49 | ) |
| Total from investment operations | | | (0.48 | ) | | | (0.47 | ) |
| | | | | | | | | |
| Less Distributions: | | | | | | | | |
| Dividends from net investment income | | | — | | | | — | |
| Dividends from net realized gains | | | — | | | | — | |
| Total distributions | | | — | | | | — | |
| Redemption fees retained | | | — | (4) | | | — | (4) |
| Net asset value, end of period | | $ | 7.54 | | | $ | 7.57 | |
| | | | | | | | | |
| TOTAL RETURN | | | (5.99 | )% | | | (5.85 | )% |
| | | | | | | | | |
| SUPPLEMENTAL DATA AND RATIOS: | | | | | | | | |
| Net assets, end of period (millions) | | $ | 141.92 | | | $ | 24.42 | |
| Ratio of net expenses to average net assets: | | | | | | | | |
| Before expense reimbursement | | | 1.37 | % | | | 1.15 | % |
| After expense reimbursement | | | 1.37 | % | | | 0.98 | %(5) |
| Ratio of net investment loss to average net assets: | | | | | | | | |
| Before expense reimbursement | | | 0.13 | % | | | 0.52 | % |
| After expense reimbursement | | | 0.13 | % | | | 0.69 | % |
| Portfolio turnover rate | | | 0 | % | | | 0 | % |
(1) | Institutional Class shares commenced operations on March 3, 2008. |
(2) | For the one month ended October 31, 2004. Effective October 31, 2004, the Fund changed its fiscal year end to October 31st from September 30th. |
(3) | All ratios for the period have been annualized, except portfolio turnover and total return. |
(4) | Amount is less than $0.01. |
(5) | The Advisor has agreed to cap the Institutional Class Share expenses at 0.98%. |
The accompanying notes are an integral part of these financial statements.
HENNESSY FUNDS 1-800-966-4354 WWW.HENNESSYFUNDS.COM
FINANCIAL HIGHLIGHTS — HENNESSY FOCUS 30 FUND
| | | | | | | | | | | | | | | | Period Ended | | | Year Ended | |
| Year Ended October 31, | | | Year Ended October 31, | | | October 31, | | | September 30, | |
| 2008 | | | | | | 2006 | | | 2005 | | | 2004(2)(3) | | | 2004 | |
| | | | Institutional | | | | | | | | | | | | | | | | |
| Original Class | | | Class(1)(3) | | | Original Class | |
| | | | | | | | | | | | | | | | | | | | |
| $ | 13.67 | | | $ | 11.15 | | | $ | 12.39 | | | $ | 12.21 | | | $ | 8.67 | | | $ | 8.78 | | | $ | 7.72 | |
| | | | | | | | | | | | | | | | | | | | | | | | | | | |
| | | | | | | | | | | | | | | | | | | | | | | | | | | |
| | (0.06 | ) | | | (0.02 | ) | | | (0.09 | ) | | | (0.08 | ) | | | (0.04 | ) | | | (0.01 | ) | | | (0.08 | ) |
| | (3.57 | ) | | | (3.09 | ) | | | 1.47 | | | | 1.86 | | | | 3.58 | | | | (0.10 | ) | | | 1.14 | |
| | (3.63 | ) | | | (3.11 | ) | | | 1.38 | | | | 1.78 | | | | 3.54 | | | | (0.11 | ) | | | 1.06 | |
| | | | | | | | | | | | | | | | | | | | | | | | | | | |
| | | | | | | | | | | | | | | | | | | | | | | | | | | |
| | — | | | | — | | | | — | | | | — | | | | — | | | | — | | | | — | |
| | (2.02 | ) | | | — | | | | (0.10 | ) | | | (1.61 | ) | | | — | | | | — | | | | — | |
| | (2.02 | ) | | | — | | | | (0.10 | ) | | | (1.61 | ) | | | — | | | | — | | | | — | |
| | — | (4) | | | — | (4) | | | — | (4) | | | 0.01 | | | | — | (4) | | | — | (4) | | | — | (4) |
| $ | 8.02 | | | $ | 8.04 | | | $ | 13.67 | | | $ | 12.39 | | | $ | 12.21 | | | $ | 8.67 | | | $ | 8.78 | |
| | | | | | | | | | | | | | | | | | | | | | | | | | | |
| | (30.81 | )% | | | (27.89 | )% | | | 11.30 | % | | | 16.18 | % | | | 40.83 | % | | | (1.25 | )% | | | 13.73 | % |
| | | | | | | | | | | | | | | | | | | | | | | | | | | |
| | | | | | | | | | | | | | | | | | | | | | | | | | | |
| $ | 167.32 | | | $ | 26.78 | | | $ | 233.4 | | | $ | 240.6 | | | $ | 125.3 | | | $ | 50.4 | | | $ | 51.1 | |
| | | | | | | | | | | | | | | | | | | | | | | | | | | |
| | 1.27 | % | | | 1.13 | % | | | 1.23 | % | | | 1.21 | % | | | 1.35 | % | | | 1.45 | % | | | 1.41 | % |
| | 1.27 | % | | | 0.98 | %(5) | | | 1.23 | % | | | 1.21 | % | | | 1.35 | % | | | 1.45 | % | | | 1.41 | % |
| | | | | | | | | | | | | | | | | | | | | | | | | | | |
| | (0.62 | )% | | | (0.28 | )% | | | (0.61 | )% | | | (0.65 | )% | | | (0.60 | )% | | | (1.33 | )% | | | (0.92 | )% |
| | (0.62 | )% | | | (0.13 | )% | | | (0.61 | )% | | | (0.65 | )% | | | (0.60 | )% | | | (1.33 | )% | | | (0.92 | )% |
| | 123 | % | | | 123 | % | | | 112 | % | | | 124 | % | | | 155 | % | | | 0 | % | | | 113 | % |
HENNESSY FUNDS 1-800-966-4354
Financial Highlights
| Hennessy Cornerstone Value Fund |
| | | Six Months Ended | |
| | | April 30, 2009(3) | |
| | | (Unaudited) | |
| | | | | | Institutional | |
| | | Original Class | | | Class | |
| PER SHARE DATA: | | | | | | |
| Net asset value, beginning of period | | $ | 9.05 | | | $ | 9.06 | |
| | | | | | | | | |
| Income from investment operations: | | | | | | | | |
| Net investment income (loss) | | | 0.17 | | | | 0.17 | |
| Net realized and unrealized gains (losses) on investments | | | (0.53 | ) | | | (0.53 | ) |
| Total from investment operations | | | (0.36 | ) | | | (0.36 | ) |
| | | | | | | | | |
| Less Distributions: | | | | | | | | |
| Dividends from net investment income | | | (0.54 | ) | | | (0.57 | ) |
| Dividends from net realized gains | | | — | | | | — | |
| Total distributions | | | (0.54 | ) | | | (0.57 | ) |
Redemption fees retained(5) | | | — | | | | — | |
| Net asset value, end of period | | $ | 8.15 | | | $ | 8.13 | |
| | | | | | | | | |
| TOTAL RETURN | | | (3.78 | )% | | | (3.73 | )% |
| | | | | | | | | |
| SUPPLEMENTAL DATA AND RATIOS: | | | | | | | | |
| Net assets, end of period (millions) | | $ | 84.98 | | | $ | 0.84 | |
| Ratio of net expenses to average net assets: | | | | | | | | |
| Before expense reimbursement | | | 1.29 | % | | | 1.25 | % |
| After expense reimbursement | | | 1.29 | % | | | 0.98 | %(6) |
| Ratio of net investment income to average net assets: | | | | | | | | |
| Before expense reimbursement | | | 4.15 | % | | | 4.46 | % |
| After expense reimbursement | | | 4.15 | % | | | 4.73 | % |
| Portfolio turnover rate | | | 64 | % | | | 64 | % |
(1) | Institutional Class shares commenced operations on March 3, 2008. |
(2) | For the one month ended October 31, 2004. Effective October 31, 2004, the Fund changed its fiscal year end to October 31st from September 30th. |
(3) | All ratios for the period have been annualized, except portfolio turnover and total return. |
(4) | Calculated using average shares outstanding during period. |
(5) | Amount is less than $0.01. |
(6) | The Advisor has agreed to cap the Institutional Class Share expenses at 0.98%. |
The accompanying notes are an integral part of these financial statements.
FINANCIAL HIGHLIGHTS — HENNESSY CORNERSTONE VALUE FUND
| | | | | | | | | | | | | | | | Period Ended | | | Year Ended | |
| Year Ended October 31, | | | Year Ended October 31, | | | October 31, | | | September 30, | |
| 2008 | | | 2007 | | | 2006 | | | 2005 | | | 2004(2)(3) | | | 2004 | |
| | | | Institutional | | | | | | | | | | | | | | | | |
| Original Class | | | Class(1)(3) | | | Original Class | |
| | | | | | | | | | | | | | | | | | | | |
| $ | 17.06 | | | $ | 13.79 | | | $ | 15.27 | | | $ | 12.95 | | | $ | 12.48 | | | $ | 12.37 | | | $ | 10.51 | |
| | | | | | | | | | | | | | | | | | | | | | | | | | | |
| | | | | | | | | | | | | | | | | | | | | | | | | | | |
| | 0.55 | | | | 0.34 | | | | 0.46 | | | | 0.30 | | | | 0.30 | | | | 0.02 | | | | 0.31 | (4) |
| | (8.15 | ) | | | (5.07 | ) | | | 1.68 | | | | 2.36 | | | | 0.41 | | | | 0.09 | | | | 1.76 | |
| | (7.60 | ) | | | (4.73 | ) | | | 2.14 | | | | 2.66 | | | | 0.71 | | | | 0.11 | | | | 2.07 | |
| | | | | | | | | | | | | | | | | | | | | | | | | | | |
| | | | | | | | | | | | | | | | | | | | | | | | | | | |
| | (0.41 | ) | | | — | | | | (0.35 | ) | | | (0.34 | ) | | | (0.24 | ) | | | — | | | | (0.21 | ) |
| | — | | | | — | | | | — | | | | — | | | | — | | | | — | | | | — | |
| | (0.41 | ) | | | — | | | | (0.35 | ) | | | (0.34 | ) | | | (0.24 | ) | | | — | | | | (0.21 | ) |
| | — | | | | — | | | | — | | | | — | | | | — | | | | — | | | | — | |
| $ | 9.05 | | | $ | 9.06 | | | | 17.06 | | | $ | 15.27 | | | $ | 12.95 | | | $ | 12.48 | | | $ | 12.37 | |
| | | | | | | | | | | | | | | | | | | | | | | | | | | |
| | (45.50 | )% | | | (34.30 | )% | | | 14.26 | % | | | 21.00 | % | | | 5.69 | % | | | 0.89 | % | | | 19.83 | % |
| | | | | | | | | | | | | | | | | | | | | | | | | | | |
| | | | | | | | | | | | | | | | | | | | | | | | | | | |
| $ | 97.10 | | | $ | 0.87 | | | $ | 204.5 | | | $ | 256.8 | | | $ | 183.8 | | | $ | 195.6 | | | $ | 194.5 | |
| | | | | | | | | | | | | | | | | | | | | | | | | | | |
| | 1.20 | % | | | 1.14 | % | | | 1.17 | % | | | 1.15 | % | | | 1.20 | % | | | 1.18 | % | | | 1.18 | % |
| | 1.20 | % | | | 0.98 | %(6) | | | 1.17 | % | | | 1.15 | % | | | 1.20 | % | | | 1.18 | % | | | 1.18 | % |
| | | | | | | | | | | | | | | | | | | | | | | | | | | |
| | 3.92 | % | | | 4.94 | % | | | 2.64 | % | | | 2.49 | % | | | 2.19 | % | | | 1.70 | % | | | 2.56 | % |
| | 3.92 | % | | | 5.10 | % | | | 2.64 | % | | | 2.49 | % | | | 2.19 | % | | | 1.70 | % | | | 2.56 | % |
| | 53 | % | | | 53 | % | | | 40 | % | | | 35 | % | | | 32 | % | | | 0 | % | | | 8 | % |
HENNESSY FUNDS 1-800-966-4354
Financial Highlights
| Hennessy Total Return Fund |
| | | Six Months Ended | | | | |
| | | April 30, 2009(2) | | | Year Ended | |
| | | (Unaudited) | | | October 31, 2008 | |
| | | Original Class | |
| PER SHARE DATA: | | | | | | |
| Net asset value, beginning of period | | $ | 9.22 | | | $ | 13.73 | |
| Income from investment operations: | | | | | | | | |
| Net investment income | | | 0.10 | | | | 0.28 | |
| Net realized and unrealized gains (losses) on securities | | | (1.37 | ) | | | (4.49 | ) |
| Total from investment operations | | | (1.27 | ) | | | (4.21 | ) |
| Less Distributions: | | | | | | | | |
| Dividends from net investment income | | | (0.08 | ) | | | (0.30 | ) |
| Dividends from realized capital gains | | | | | | | | |
| Return of capital | | | — | | | | — | |
| Total distributions | | | (0.08 | ) | | | (0.30 | ) |
Redemption fees retained(4) | | | — | | | | — | |
| Net asset value, end of period | | $ | 7.87 | | | $ | 9.22 | |
| | | | | | | | | |
| TOTAL RETURN | | | (13.69 | )% | | | (30.97 | )% |
| SUPPLEMENTAL DATA AND RATIOS: | | | | | | | | |
| Net assets, end of period (millions) | | $ | 47.2 | | | $ | 58.2 | |
| Gross ratio of expenses, including | | | | | | | | |
| interest expense, to average net asset: | | | | | | | | |
| Before expense reimbursement | | | 1.76 | % | | | 2.36 | % |
| After expense reimbursement | | | 1.76 | % | | | 2.36 | % |
| Ratio of interest expense to average net assets | | | 0.49 | % | | | 1.16 | % |
| Net ratio of expenses, excluding | | | | | | | | |
| interest expense, to average net assets: | | | | | | | | |
| Before expense reimbursement | | | 1.27 | % | | | 1.20 | % |
| After expense reimbursement | | | 1.27 | % | | | 1.20 | % |
| Ratio of net investment income (loss) to average net assets: | | | | | | | | |
| Before expense reimbursement | | | 2.63 | % | | | 2.43 | % |
| After expense reimbursement | | | 2.63 | % | | | 2.43 | % |
| Portfolio turnover rate | | | 14 | % | | | 16 | % |
(1) | For the four months ended October 31, 2004. Effective October 31, 2004, the Fund changed its fiscal year end to October 31st from June 30th. |
(2) | All ratios for the period have been annualized, except portfolio turnover and total return. |
(3) | Calculated using average shares outstanding during period. |
(4) | Amount is less than $0.01. |
The accompanying notes are an integral part of these financial statements.
FINANCIAL HIGHLIGHTS — HENNESSY TOTAL RETURN FUND
| | | | | | | | | Period Ended | | | Year Ended | |
| Year Ended October 31, | | | October 31, | | | June 30, | |
| 2007 | | | 2006 | | | 2005 | | | 2004(1)(2) | | | 2004 | |
| Original Class | |
| | | | | | | | | | | | | | |
| $ | 12.61 | | | $ | 10.57 | | | $ | 10.40 | | | $ | 10.62 | | | $ | 9.65 | |
| | | | | | | | | | | | | | | | | | | |
| | 0.33 | | | | 0.31 | | | | 0.23 | | | | 0.07 | | | | 0.17 | (3) |
| | 1.13 | | | | 2.03 | | | | 0.17 | | | | (0.24 | ) | | | 0.92 | |
| | 1.46 | | | | 2.34 | | | | 0.40 | | | | (0.17 | ) | | | 1.09 | |
| | | | | | | | | | | | | | | | | | | |
| | (0.34 | ) | | | (0.30 | ) | | | (0.23 | ) | | | (0.05 | ) | | | (0.10 | ) |
| | — | | | | — | | | | — | | | | — | | | | — | |
| | — | | | | — | | | | — | | | | — | | | | (0.02 | ) |
| | (0.34 | ) | | | (0.30 | ) | | | (0.23 | ) | | | (0.05 | ) | | | (0.12 | ) |
| | — | | | | — | | | | — | | | | — | | | | — | |
| $ | 13.73 | | | $ | 12.61 | | | $ | 10.57 | | | $ | 10.40 | | | $ | 10.62 | |
| | | | | | | | | | | | | | | | | | | |
| | 11.70 | % | | | 22.48 | % | | | 3.83 | % | | | (1.61 | )% | | | 11.36 | % |
| | | | | | | | | | | | | | | | | | | |
| $ | 96.3 | | | $ | 113.3 | | | $ | 86.7 | | | $ | 91.9 | | | $ | 97.0 | |
| | | | | | | | | | | | | | | | | | | |
| | | | | | | | | | | | | | | | | | | |
| | 3.04 | % | | | 2.80 | % | | | 2.28 | % | | | 1.78 | % | | | 1.66 | % |
| | 3.04 | % | | | 2.80 | % | | | 2.28 | % | | | 1.78 | % | | | 1.66 | % |
| | 1.88 | % | | | 1.64 | % | | | 1.05 | % | | | 0.58 | % | | | 0.39 | % |
| | | | | | | | | | | | | | | | | | | |
| | | | | | | | | | | | | | | | | | | |
| | 1.16 | % | | | 1.16 | % | | | 1.23 | % | | | 1.20 | % | | | 1.27 | % |
| | 1.16 | % | | | 1.16 | % | | | 1.23 | % | | | 1.20 | % | | | 1.27 | % |
| | | | | | | | | | | | | | | | | | | |
| | 2.48 | % | | | 2.79 | % | | | 2.07 | % | | | 1.85 | % | | | 1.55 | % |
| | 2.48 | % | | | 2.79 | % | | | 2.07 | % | | | 1.85 | % | | | 1.55 | % |
| | 12 | % | | | 24 | % | | | 26 | % | | | 0 | % | | | 8 | % |
| | | | | | | | | | | | | | | | | | | |
HENNESSY FUNDS 1-800-966-4354
Financial Highlights
| | | Six Months Ended | | | | |
| | | April 30, 2009(2) | | | Year Ended | |
| | | (Unaudited) | | | October 31, 2008 | |
| | | Original Class | |
| PER SHARE DATA: | | | | | | |
| Net asset value, beginning of period | | $ | 9.11 | | | $ | 12.51 | |
| | | | | | | | | |
| Income from investment operations: | | | | | | | | |
| Net investment income | | | 0.08 | | | | 0.25 | |
| Net realized and unrealized gains (losses) on securities | | | (0.78 | ) | | | (2.80 | ) |
| Total from investment operations | | | (0.70 | ) | | | (2.55 | ) |
| | | | | | | | | |
| Less Distributions: | | | | | | | | |
| Dividends from net investment income | | | (0.08 | ) | | | (0.26 | ) |
| Dividends from realized capital gains | | | 0.00 | | | | (0.59 | ) |
| Return of capital | | | — | | | | — | |
| Total distributions | | | (0.08 | ) | | | (0.85 | ) |
Redemption fees retained(3) | | | — | | | | — | |
| Net asset value, end of period | | $ | 8.33 | | | $ | 9.11 | |
| | | | | | | | | |
| TOTAL RETURN | | | (7.63 | )% | | | (21.55 | )% |
| | | | | | | | | |
| SUPPLEMENTAL DATA AND RATIOS: | | | | | | | | |
| Net assets, end of period (millions) | | $ | 10.2 | | | $ | 11.5 | |
| Ratio of net expenses to average net assets | | | 1.73 | % | | | 1.56 | % |
| Ratio of net investment income to average net assets | | | 1.92 | % | | | 2.31 | % |
| Portfolio turnover rate | | | 67 | % | | | 13 | % |
(1) | For the four months ended October 31, 2004. Effective October 31, 2004, the Fund changed its fiscal year end to October 31st from June 30th. |
(2) | All ratios for the period have been annualized, except portfolio turnover and total return. |
(3) | Amount is less than $0.01. |
The accompanying notes are an integral part of these financial statements.
FINANCIAL HIGHLIGHTS — HENNESSY BALANCED FUND
| | | | | | | | | | Period Ended | | | Year Ended | |
| | | October 31, | | | June 30, | |
| 2007 | | | 2006 | | | 2005 | | | 2004(1)(2) | | | 2004 | |
| Original Class | |
| | | | | | | | | | | | | | |
| $ | 11.83 | | | $ | 10.56 | | | $ | 10.62 | | | $ | 10.85 | | | $ | 10.44 | |
| | | | | | | | | | | | | | | | | | | |
| | | | | | | | | | | | | | | | | | | |
| | 0.38 | | | | 0.30 | | | | 0.18 | | | | 0.04 | | | | 0.11 | |
| | 0.69 | | | | 1.25 | | | | (0.07 | ) | | | (0.24 | ) | | | 0.50 | |
| | 1.07 | | | | 1.55 | | | | 0.11 | | | | (0.20 | ) | | | 0.61 | |
| | | | | | | | | | | | | | | | | | | |
| | | | | | | | | | | | | | | | | | | |
| | (0.39 | ) | | | (0.28 | ) | | | (0.17 | ) | | | (0.03 | ) | | | (0.12 | ) |
| | — | | | | — | | | | — | | | | — | | | | (0.06 | ) |
| | — | | | | — | | | | — | | | | — | | | | (0.02 | ) |
| | (0.39 | ) | | | (0.28 | ) | | | (0.17 | ) | | | (0.03 | ) | | | (0.20 | ) |
| | — | | | | — | | | | — | | | | — | | | | — | |
| $ | 12.51 | | | $ | 11.83 | | | $ | 10.56 | | | $ | 10.62 | | | $ | 10.85 | |
| | | | | | | | | | | | | | | | | | | |
| | 9.16 | % | | | 14.92 | % | | | 1.13 | % | | | (1.86 | )% | | | 5.81 | % |
| | | | | | | | | | | | | | | | | | | |
| | | | | | | | | | | | | | | | | | | |
| $ | 16.8 | | | $ | 26.1 | | | $ | 19.3 | | | $ | 21.8 | | | $ | 23.4 | |
| | 1.36 | % | | | 1.34 | % | | | 1.49 | % | | | 1.41 | % | | | 1.41 | % |
| | 2.86 | % | | | 2.75 | % | | | 1.58 | % | | | 1.12 | % | | | 1.01 | % |
| | 35 | % | | | 88 | % | | | 21 | % | | | 9 | % | | | 45 | % |
HENNESSY FUNDS 1-800-966-4354
Statement of Cash Flows
Hennessy Total Return Fund For the Six Months Ended April 30, 2009 (Unaudited) |
| Cash Flows From Operating Activities: | | | |
| | | | |
| Net decrease in net assets from operations | | $ | (8,079,998 | ) |
| Adjustments to reconcile net decrease in net assets from | | | | |
| operations to net cash provided by operating activities: | | | | |
| Purchase of investment securities | | | (60,015,555 | ) |
| Proceeds on sale of securities | | | 71,419,533 | |
| Decrease in other receivables, net | | | 13,768 | |
| Decrease in other assets | | | 2,354 | |
| Decrease in accrued expenses and other payables | | | (129,712 | ) |
| Net accretion of discount on securities | | | (47,717 | ) |
| Net realized loss on investments | | | 7,633,466 | |
| Unrealized depreciation on securities | | | 1,071,187 | |
| Net cash provided by operating activities | | $ | 11,867,326 | |
| | | | | |
| Cash Flows From Financing Activities: | | | | |
| | | | | |
| Decrease in reverse repurchase agreements | | $ | (8,935,000 | ) |
| Proceeds on shares sold | | | 436,291 | |
| Payment on shares repurchased | | | (3,330,779 | ) |
| Cash dividends paid | | | (37,828 | ) |
| Net cash used by financing activities | | $ | (11,867,316 | ) |
| Net increase (decrease) in cash | | | 10 | |
| | | | | |
| Cash at beginning of period | | | — | |
| Cash at end of period | | $ | 10 | |
| | | | | |
| Cash paid for interest | | $ | 145,976 | |
The accompanying notes are an integral part of these financial statements.
NOTES TO THE FINANCIAL STATEMENTS
Notes to the Financial Statements
April 30, 2009 (Unaudited)
The Hennessy Mutual Funds, Inc. was organized as a Maryland corporation on May 20, 1996 and consists of three separate series: Hennessy Cornerstone Growth Fund (the “Growth Fund”), Hennessy Cornerstone Value Fund (the “Value Fund”) and the Hennessy Focus 30 Fund (the “Focus 30 Fund”), formerly SYM Select Growth Fund. These Funds are open-end, diversified management investment companies registered under the Investment Company Act of 1940, as amended. The Growth Fund and Value Fund commenced operations on November 1, 1996. On September 17, 2003, Hennessy Advisors, Inc. became the investment advisor to the SYM Select Growth Fund and the fund changed its name to the Hennessy Focus 30 Fund.
The Hennessy Funds, Inc. was organized as a Maryland corporation on January 11, 1996 and consists of two separate series: Hennessy Balanced Fund (the “Balanced Fund”) and Hennessy Total Return Fund (the “Total Return Fund”). The Balanced and Total Return Funds are open-end, non-diversified management investment companies registered under the Investment Company Act of 1940, as amended. The Balanced Fund and Total Return Fund commenced operations on March 8, 1996 and July 29, 1998, respectively.
The Hennessy Funds Trust was organized as a Delaware Statutory Trust on September 17, 1992 and consists of three series: Hennessy Cornerstone Growth Fund, Series II (the “Growth II Fund”), Hennessy Cornerstone Large Growth Fund (the “Large Growth Fund”) and Hennessy Select Large Value Fund (the “Large Value Fund”). Financial information for the Large Growth and Large Value Fund are not included in this report. Prior to July 1, 2005, both the Trust and the Growth II Fund were known as The Henlopen Fund. On July 1, 2005, Hennessy Advisors, Inc., became the investment advisor to the Growth II Fund and the Growth II Fund changed its name from “The Henlopen Fund” to “Hennessy Cornerstone Growth Fund, Series II”. The Growth II Fund is an open-end, diversified management investment company registered under the Investment Company Act of 1940, as amended.
The Growth Fund, Growth II Fund, Focus 30 Fund, Value Fund, Total Return Fund and Balanced Fund collectively represent the Hennessy Funds (the “Funds”) with respect to these financial statements.
The Growth, Growth II, Focus 30 and Value Fund’s offer Original and Institutional Class shares. Each class of shares differs principally in its respective administration and transfer agent expenses and sales charges, if any. Each class has identical rights to earnings, assets and voting privileges, except for class-specific expenses and exclusive rights to vote on matters affecting only individual classes.
| 2). | SIGNIFICANT ACCOUNTING POLICIES |
The following is a summary of significant accounting policies consistently followed by the Funds in the preparation of the financial statements. These
HENNESSY FUNDS 1-800-966-4354
policies are in conformity with U.S. generally accepted accounting principles (“GAAP”).
| a). | Investment Valuation – Securities which are traded on a national or recognized stock exchange are valued at the last sale price on the securities exchange on which such securities are primarily traded. Exchange-traded securities for which there were no transactions that day and debt securities are valued at the most recent bid prices. Instruments with a remaining maturity of 60 days or less are valued on an amortized cost basis. When a price for an underlying security is not readily available or if a significant event has occurred that indicates the closing price of a security no longer represents the true value of that security, fair value pricing procedures have been adopted by the Board of Directors of the Funds. Fair value pricing determinations are made in good faith in accordance with these procedures. There are numerous criteria that will be given consideration in determining a fair value of a security. Some of these criteria are: trading volume of security and markets, value of other like securities and news events with direct bearing to security or market. Fair value pricing results in an estimated price that reasonably reflects the current market conditions in order to rate the portfolio holdings such that shareholder transactions receive a fair net asset value. |
| b). | Federal Income Taxes – Provision for federal income taxes or excise taxes has not been made since the Funds have elected to be taxed as “regulated investment companies” and intend to distribute substantially all taxable income to shareholders and otherwise comply with the provisions of the Internal Revenue Code applicable to regulated investment companies. Net investment income and realized gains and losses for federal income tax purposes may differ from that reported on the financial statements because of temporary book and tax basis differences. Temporary differences are primarily the result of the treatment of wash sales for tax reporting purposes. Distributions from net realized gains for book purposes may include short-term capital gains, which are included as ordinary income to shareholders for tax purposes. |
| | Due to inherent differences in the recognition of income, expenses, and realized gains/losses under U.S. generally accepted accounting principles and federal income tax purposes, permanent differences between book and tax basis reporting for the 2008 fiscal year have been identified and appropriately reclassified on the Statement of Assets and Liabilities. |
| | | Undistributed Net | | Accumulated Net | | Paid In |
| | | Investment Income/(Loss) | | Realized Gain/(Loss) | | Capital |
| Growth Fund | | | 1,718,215 | | | | 562,325 | | | | (2,280,540 | ) |
| Growth II Fund | | | 309,461 | | | | 263,383 | | | | (572,844 | ) |
| Focus 30 Fund | | | 1,274,378 | | | | 183,117 | | | | (1,457,495 | ) |
| Value Fund | | | (62,397 | ) | | | 5,175,891 | | | | (5,113,494 | ) |
| Total Return Fund | | | 14,438 | | | | 51,960,917 | | | | (51,975,355 | ) |
| Balanced Fund | | | (15 | ) | | | 447,979 | | | | (447,964 | ) |
| The permanent differences primarily relate to Net Operating Losses and Capital Loss Carryover lost due to expiration. |
| c). | Income and Expenses – Dividend income is recognized on the ex-dividend date or as soon as information is available to the Funds and interest income is recognized on an accrual basis. Income expenses (other than expenses |
NOTES TO THE FINANCIAL STATEMENTS
| | attributable to a specific class), and realized and unrealized gains or losses on investments are allocated to each class of shares based on its respective net assets. |
| d). | Distributions to Shareholders – Dividends from net investment income for the Growth, Growth II, Focus 30 and Value Funds, if any, are declared and paid out annually, usually in November or December of each year. Dividends from net investment income for the Total Return and Balanced Funds are declared and paid on a calendar quarter basis. Distributions of net realized capital gains, if any, are declared and paid annually, usually in November or December of each year, for all of the Funds. |
| e). | Security Transactions – Investment and shareholder transactions are recorded on the trade date. The Funds determine the gain or loss realized from the investment transactions by comparing the original cost of the security lot sold with the net sale proceeds. Discounts and premiums on securities purchased are accreted/amortized over the life of the respective security. |
| f). | Use of Estimates – The preparation of financial statements in conformity with GAAP requires management to make estimates and assumptions that affect the reported amounts of assets and liabilities and disclosure of contingent assets and liabilities at the date of the financial statements and the reported change in net assets during the reporting period. Actual results could differ from those estimates. |
| g). | Share Valuation – The net asset value (“NAV”) per share of each Fund is calculated by dividing the sum of the value of the securities held by each Fund, plus cash or other assets, minus all liabilities (including estimated accrued expenses) by the total number of shares outstanding for each Fund, rounded to the nearest cent. The Funds’ shares will not be priced on the days on which the NYSE is closed for trading. The offering and redemption price per share for each Fund is equal to each Fund’s net asset value per share. During the period November 1, 2007 through August 29, 2008 the Funds charged a 1.50% redemption fee on shares held less than 90 days. These fees were deducted from the redemption proceeds otherwise payable to the shareholder. The Funds retained the fee charged as paid-in capital and such fees became part of that Fund’s daily NAV calculation. |
| h). | Repurchase Agreements – Each Fund may enter into repurchase agreements with member banks or security dealers of the Federal Reserve whom the investment advisor deems creditworthy. The repurchase price generally equals the price paid by the Fund plus interest negotiated on the basis of current short-term rates. |
| | Securities pledged as collateral for repurchase agreements are held by the custodian bank until the respective agreements mature. Provisions of the repurchase agreements ensure that the market value of the collateral, including accrued interest thereon, is sufficient, in the event of default of the counterparty. If the counterparty defaults and the value of the collateral declines or if the counterparty enters an insolvency proceeding, realization of the collateral by the Fund may be delayed or limited. |
| i). | Accounting for Uncertainty in Income Taxes – In June 2006, the Financial Accounting Standards Board (“FASB”) issued FASB Interpretation 48 (“FIN |
HENNESSY FUNDS 1-800-966-4354
| | 48”), “Accounting for Uncertainty in Income Taxes.” This standard defines the threshold for recognizing the benefits of tax-return positions in the financial statements as “more-likely-than-not” to be sustained by the taxing authority and requires measurement of a tax position meeting the more-likely-than-not criterion, based on the largest benefit that is more than 50 percent likely to be realized. FIN 48 is effective as of the beginning of the first fiscal year beginning after December 15, 2006, and is to be applied to all open tax years as of the effective date. The tax periods open to examination by the Internal Revenue Service include the fiscal years ended October 31, 2008, 2007, 2006 and 2005. As a result, the Funds have evaluated the implications of FIN 48 and determined that there is no material impact on the financial statements. |
| j). | Fair Value Measurements – In September 2006, FASB issued Statement on Financial Accounting Standards (SFAS) No. 157, “Fair Value Measurements.” This standard establishes a single authoritative definition of fair value, sets out a framework for measuring fair value and requires additional disclosures about fair value measurements. SFAS No. 157 applies to fair value measurements already required or permitted by existing standards. SFAS No. 157 is effective for financial statements issued for fiscal years beginning after November 15, 2007 and interim periods within those fiscal years. The Fund adopted the provisions of Statement of Financial Accounting Standards No. 157, “Fair Value Measurements” (SFAS 157, effective with the beginning of the Fund’s fiscal year. SFAS 157 establishes a hierarchy that prioritizes the inputs to valuation techniques giving the highest priority to readily available unadjusted quoted prices in active markets for identical assets (level 1 measurements) and the lowest priority to unobservable inputs (level 3 measurements) when market prices are not readily available or reliable. |
| k). | Recently Issued Accounting Pronouncements – In March 2008, Statement of Financial Accounting Standards No. 161, “Disclosures about Derivative Instruments and Hedging Activities” (“SFAS 161”) was issued and is effective for fiscal years beginning after November 15, 2008. SFAS 161 is intended to improve financial reporting for derivative instruments by requiring enhanced disclosure that enables investors to understand how and why an entity uses derivatives, how derivatives are accounted for, and how derivative instruments affect an entity’s results of operations and financial position. Management is currently evaluating the implications of SFAS 161. The impact on the Fund’s financial statement disclosures, if any, is currently being assessed. |
| 3). | REVERSE REPURCHASE AGREEMENTS |
The Total Return Fund has entered into reverse repurchase agreements with UBS PaineWebber, Inc., under which the Total Return Fund sells securities and agrees to repurchase them later at a mutually agreed upon price. For the six months ended April 30, 2009, the average daily balance and average interest rate in effect for reverse repurchase agreements was $15,497,232 and 0.741%, respectively. At April 30, 2009, the interest rate in effect for the outstanding reverse repurchase agreement, scheduled to mature on June 25, 2009 ($13,492,500) was 0.35% and was equal to 22.19% of the Total Return Fund’s total assets.
NOTES TO THE FINANCIAL STATEMENTS
| 4). | INVESTMENT TRANSACTIONS |
Purchases and sales of investment securities (excluding government and short-term investments) during the following fiscal periods were as follows:
| | Growth | Growth II | Focus 30 | Value | Total Return | Balanced |
| | Fund | Fund | Fund | Fund | Fund | Fund |
| | Period Ended | Period Ended | Period Ended | Period Ended | Period Ended | Period Ended |
| | 4/30/09 | 4/30/09 | 4/30/09 | 4/30/09 | 4/30/09 | 4/30/09 |
| Purchases | $273,736,263 | $ — | $ — | $51,084,200 | $5,189,894 | $4,381,488 |
| Sales | $315,368,623 | $4,443,915 | $10,081,704 | $56,100,939 | $3,892,687 | $3,396,611 |
Purchases and sales of long-term U.S. Government Securities for the Total Return Fund were $48,964,161 and $59,360,000, respectively. Purchases and sales of long-term U.S. Government Securities for the Balanced Fund were $4,110,350 and $5,706,143, respectively.
There were no purchases or sales of long-term U.S. Government Securities for the Growth, Growth II, Focus 30 or Value Funds.
| 5). | INVESTMENT MANAGEMENT FEE AND OTHER TRANSACTIONS WITH AFFILIATES |
Hennessy Advisors, Inc. (the “Advisor”) is the Advisor of the Funds. The Advisor provides the Funds with investment management services under a Management Agreement. The Advisor furnishes all investment advice, office space, facilities, and provides most of the personnel needed by the Funds. As compensation for its services, the Advisor is entitled to a monthly fee from each Fund. The fee is based upon the average daily net assets of the Funds at the annual rate of:
| Growth Fund | 0.74% |
| Growth II Fund | 0.74% |
| Focus 30 Fund | 0.74% |
| Value Fund | 0.74% |
| Total Return Fund | 0.60% |
| Balanced Fund | 0.60% |
The Advisor has agreed to waive its fees and absorb expenses to the extent that the total annual operating expenses (excluding all federal, state and local taxes, interest, brokerage commissions, acquired fund fees and expenses and other costs incurred in connection with the purchase and sale of securities and extraordinary items) do not exceed 0.98% of the Funds’ net assets for the Institutional Class shares in the Growth, Growth II, Focus 30 and Value Funds. For a period of three years after the year in which the Advisor waives or reimburses expenses, the Advisor may seek reimbursement from the Fund to the extent that total annual Fund operating expenses are less than the expense limitation in effect at the time of the waiver or reimbursement. The Advisor waived or reimbursed expenses of $3,567, $174, $19,460 and $1,001 for the Growth, Growth II, Focus 30 and Value Funds, respectively for the six months ended April 30, 2009. These reimbursed / absorbed expenses are subject to potential recovery by year of expiration as follows:
| Year of Expiration | Growth | Growth II | Focus 30 | Value |
| October 31, 2011 | $ 7,464 | $137 | $35,499 | $1,056 |
| October 31, 2012 | 3,567 | 174 | 19,460 | 1,001 |
| | $11,031 | $311 | $54,959 | $2,057 |
The Board of Directors has approved a Shareholder Servicing Plan for the Original Class shares of the Growth, Growth II, Focus 30, Value, Total Return
HENNESSY FUNDS 1-800-966-4354
and Balanced Funds which was instituted to compensate the Advisor for the non-investment management services it provides to the Funds. The Plan provides for a monthly fee paid to the Advisor at an annual rate of 0.10% of the average daily net assets of the Funds.
The Growth Fund, Growth II Fund, Focus 30 Fund and Value Fund have entered into agreements with various brokers, dealers and financial intermediaries in connection with the sale of shares of the Funds. The agreements provide for periodic payments by the Funds to the brokers, dealers and financial intermediaries for providing certain shareholder maintenance services (sub-transfer agent expenses). These shareholder services include: the pre-processing and quality control of new accounts, shareholder correspondence, answering customer inquiries regarding account status and facilitating shareholder telephone transactions. Fees paid by the Growth Fund, Growth II Fund, Focus 30 Fund and Value Fund to various brokers, dealers and financial intermediaries for the six months ended April 30, 2009, were $197,522, $23,094, $126,621 and $19,603, respectively.
The Total Return and Balanced Funds have adopted a plan pursuant to Rule 12b-1 which authorizes payments in connection with the distribution of the Total Return and Balanced Fund shares at an annual rate not to exceed 0.15% of each Fund’s average daily net assets. Amounts paid under the Plan may be spent on any activities or expenses primarily intended to result in the sale of shares, including but not limited to, advertising, compensation for sales and marketing activities or financial institutions and others such as dealers and distributors, shareholder account servicing, the printing and mailing of prospectuses to other than current shareowners and the printing and mailing of sales literature.
U.S. Bancorp Fund Services, LLC (the “Administrator”) acts as the Funds’ Administrator under an Administration Agreement. The Administrator prepares various federal and state regulatory filings, reports and returns for the Funds; prepares reports and materials to be supplied to the directors; monitors the activities of the Funds’ custodian, transfer agent and accountants; coordinates the preparation and payment of the Funds’ expenses and reviews the Funds’ expense accruals. Fees paid to U.S. Bancorp Fund Services, LLC for the six months ended April 30, 2009, were $334,989, $37,172, $205,917, $101,357, $60,567 and $12,904 for Growth, Growth II, Focus 30, Value, Total Return and Balanced Funds, respectively.
The Henlopen Fund was the predecessor fund of the Growth II Fund. The financial highlights reported for periods before July 1, 2005, represent the activity of The Henlopen Fund.
Quasar Distributors, LLC (the “Distributor”) acts as the Funds’ principal underwriter in a continuous public offering of the Funds’ shares. The Distributor is an affiliated company of U.S. Bank, N.A.
The Growth, Growth II, Focus 30, and Value Funds have $20,000,000, $10,000,000, $20,000,000 and $20,000,000 lines of credit, respectively, intended to provide short-term financing, if necessary, subject to certain restrictions, in connection with shareholder redemptions. The credit facility is with its custodian bank, U.S. Bank, N.A. During the six months ended April 30, 2009, the Growth
NOTES TO THE FINANCIAL STATEMENTS
Fund had an outstanding average daily balance and a weighted average interest rate of $68,552 and 3.44%, respectively. The maximum amount outstanding for the Growth Fund during the period was $1,511,000. During the six months ended April 30, 2009, the Growth II Fund had an outstanding average daily balance and a weighted average interest rate of $8,094 and 3.44%, respectively. The maximum amount outstanding for the Growth II Fund during the period was $303,000. During the six months ended April 30, 2009, the Focus 30 Fund had no line of credit activity. During the six months ended April 30, 2009, the Value Fund had an outstanding average daily balance and a weighted average interest rate of $834 and 3.44%. The maximum amount outstanding for the Value Fund during the period was $108,000.
| 7). | FEDERAL TAX INFORMATION |
The following balances for the Funds are as of October 31, 2008:
| | | Growth | | | Growth II | | | Focus 30 | |
| | | Fund | | | Fund | | | Fund | |
| Cost of Investments for tax purposes | | $ | 486,769,385 | | | $ | 60,665,177 | | | $ | 244,599,810 | |
| Gross tax unrealized appreciation | | | 4,923,772 | | | | 1,164,960 | | | | 279,299 | |
| Gross tax unrealized depreciation | | | (173,521,396 | ) | | | (25,419,306 | ) | | | (52,025,042 | ) |
| Net tax unrealized appreciation | | | | | | | | | | | | |
| (depreciation) on investments | | | (168,597,624 | ) | | | (24,254,346 | ) | | | (51,745,743 | ) |
| Undistributed ordinary income | | $ | — | | | $ | — | | | $ | — | |
| Undistributed long-term capital gains | | $ | — | | | $ | — | | | $ | — | |
| Total Distributable earnings | | $ | — | | | $ | — | | | $ | — | |
| Other accumulated gains (losses) | | $ | (115,729,363 | ) | | $ | (36,286,123 | ) | | $ | (47,979,565 | ) |
| Total accumulated earnings (losses) | | $ | (284,326,987 | ) | | $ | 60,540,469 | | | $ | (99,725,308 | ) |
| | | | | | | | | | |
| | | Value | | | Total Return | | | Balanced | |
| | | Fund | | | Fund | | | Fund | |
| Cost of Investments for tax purposes | | $ | 160,236,141 | | | $ | 99,034,433 | | | $ | 14,283,892 | |
| Gross tax unrealized appreciation | | | 3,608,046 | | | | 911,006 | | | | 128,916 | |
| Gross tax unrealized depreciation | | | (66,162,574 | ) | | | (19,250,803 | ) | | | (2,925,811 | ) |
| Net tax unrealized appreciation | | | | | | | | | | | | |
| (depreciation) on investments | | | (62,554,528 | ) | | | (18,339,797 | ) | | | (2,796,895 | ) |
| Undistributed ordinary income | | $ | 4,891,467 | | | $ | — | | | $ | 17,790 | |
| Undistributed long-term capital gains | | $ | — | | | $ | — | | | $ | — | |
| Total Distributable earnings | | $ | 4,891,467 | | | $ | — | | | $ | 17,790 | |
| Other accumulated gains (losses) | | $ | (28,195,450 | ) | | $ | (34,658,579 | ) | | $ | (1,014,955 | ) |
| Total accumulated earnings (losses) | | $ | (85,858,611 | ) | | $ | (52,998,376 | ) | | $ | (3,794,060 | ) |
At October 31, 2008, the Growth Fund had tax basis capital losses of $115,729,363, to offset future capital gains, the use of a portion of which is limited by IRS regulations. Of such losses, $376,392 expire October 31, 2008, $182,559 expire October 31, 2009, and $115,170,412 expire October 31, 2016. Additionally, the Growth Fund had no post-October loss deferrals as of October 31, 2008.
At October 31, 2008, the Growth II Fund had tax basis capital losses of $36,286,123, to offset future capital gains, the use of a portion of which is limited by IRS regulations. Of such losses, $36,286,123 expire October 31, 2016.
HENNESSY FUNDS 1-800-966-4354
Additionally, the Growth II Fund had no post-October loss deferrals as of October 31, 2008.
At October 31, 2008, the Focus 30 Fund had tax basis capital losses of $47,979,565, to offset future capital gains, the use of a portion of which is limited by IRS regulations. Of such losses, $47,979,565 expire October 31, 2016. Additionally, the Focus 30 Fund had no post-October loss deferrals as of October 31, 2008.
At October 31, 2008, the Value Fund had tax basis capital losses of $28,194,859, to offset future capital gains, the use of a portion of which is limited by IRS regulations. Of such losses, $27,482,264 expire October 31, 2010 and $712,595 expire October 31, 2011. Additionally, the Value Fund had no post-October loss deferrals as of October 31, 2008.
At October 31, 2008, the Total Return Fund had tax basis capital losses of $34,658,578, which may be carried over to offset future capital gains. Of such $34,658,578 expire October 31, 2009. Additionally, the Total Return Fund had no post-October loss deferrals as of October 31, 2008.
At October 31, 2008, the Balanced Fund had tax basis capital losses of $1,014,955, to offset future capital gains, the use of a portion of which is limited by IRS regulations. Of such losses, $447,964 expire October 31, 2009, $447,964 expire October 31, 2010 and $119,027 expire October 31, 2016. Additionally, the Balanced Fund had no post-October loss deferrals as of October 31, 2008.
The tax character of distributions paid during 2009 and 2008 for the Funds were as follows:
| | | Six Months Ended | | | | |
| | | April 30, 2009 | | | Year Ended | |
| Growth Fund | | (Unaudited) | | | October 31, 2008 | |
| Distributions paid from: | | | | | | |
| Ordinary income | | $ | — | | | $ | — | |
| Long-term capital gain | | | — | | | | 110,914,201 | |
| Return of capital | | | — | | | | 64 | |
| | | $ | — | | | $ | 110,914,265 | |
| | | | | | | | |
| | | Six Months Ended | | | | | |
| | | April 30, 2009 | | | Year Ended | |
| Growth II Fund | | (Unaudited) | | | October 31, 2008 | |
| Distributions paid from: | | | | | | | | |
| Ordinary income | | $ | — | | | $ | 7,021,405 | |
| Long-term capital gain | | | — | | | | 19,858,903 | |
| Return of capital | | | — | | | | 174,708 | |
| | | $ | — | | | $ | 27,055,016 | |
| | | | | | | | |
| | | Six Months Ended | | | | | |
| | | April 30, 2009 | | | Year Ended | |
| Focus 30 Fund | | (Unaudited) | | | October 31, 2008 | |
| Distributions paid from: | | | | | | | | |
| Ordinary income | | $ | — | | | $ | 1,697,121 | |
| Long-term capital gain | | | — | | | | 31,369,777 | |
| Return of capital | | | — | | | | 183,117 | |
| | | $ | — | | | $ | 33,250,015 | |
NOTES TO THE FINANCIAL STATEMENTS
| | | Six Months Ended | | | | |
| | | April 30, 2009 | | | Year Ended | |
| Value Fund | | (Unaudited) | | | October 31, 2008 | |
| Distributions paid from: | | | | | | |
| Ordinary income | | $ | 5,652,451 | | | $ | 4,859,028 | |
| Long-term capital gain | | | — | | | | — | |
| | | $ | 5,652,451 | | | $ | 4,859,028 | |
| | | | | | | | |
| | | Six Months Ended | | | | | |
| | | April 30, 2009 | | | Year Ended | |
| Total Return Fund | | (Unaudited) | | | October 31, 2008 | |
| Distributions paid from: | | | | | | | | |
| Ordinary income | | $ | 510,308 | | | $ | 2,008,865 | |
| Long-term capital gain | | | — | | | | — | |
| Return of capital | | | — | | | | 14,437 | |
| | | $ | 510,308 | | | $ | 2,023,302 | |
| | | | | | | | |
| | | Six Months Ended | | | | | |
| | | April 30, 2009 | | | Year Ended | |
| Balanced Fund | | (Unaudited) | | | October 31, 2008 | |
| Distributions paid from: | | | | | | | | |
| Ordinary income | | $ | 103,542 | | | $ | 353,767 | |
| Long-term capital gain | | | — | | | | 777,518 | |
| | | $ | 103,542 | | | $ | 1,131,285 | |
| 8). | FEDERAL TAX DISTRIBUTION INFORMATION (Unaudited) |
The Growth, Focus 30, Value, Total Return and Balanced Funds designate 16%, 67%, 100%, 100% and 91%, respectively of the dividends declared from net investment income during the year ended October 31, 2008, as qualified dividend income under the Jobs Growth and Tax Reconciliation Act of 2003.
For the year ended October 31, 2008, 16%, 67%, 97%, 100% and 91% of the ordinary distributions paid by the Growth, Focus 30, Value, Total Return and Balanced Funds qualify for the dividends received deduction available to corporate shareholders.
Additional Information Applicable to Foreign Shareholders Only. For the fiscal year ended October 31, 2008, the following percentages of its ordinary income distributions paid are designated as short-term capital gain distributions under the Internal Revenue Code Section 871(k)(2)(c): Growth II Fund - 100% and Focus 30 Fund - 100%.
HENNESSY FUNDS 1-800-966-4354
Expense Example
April 30, 2009 (Unaudited)
As a shareholder of the Funds, you incur two types of costs: (1) transaction costs, including sales charges (loads) on purchase payments, reinvested dividends, or other distributions; redemption fees; and exchange fees; and (2) ongoing costs, including management fees; service fees; and other Fund expenses. This Example is intended to help you understand your ongoing costs (in dollars) of investing in each of the Funds and to compare these costs with the ongoing costs of investing in other mutual funds. The Example is based on an investment of $1,000 invested at the beginning of the period and held for the entire period from November 1, 2008 through April 30, 2009.
Actual Expenses
The first set of lines of the table below provide information about actual account values and actual expenses. Although the Funds charge no sales loads or transaction fees, you will be assessed fees for outgoing wire transfers, returned checks and stop payment orders at prevailing rates charged by U.S. Bancorp Fund Services, LLC, the Funds’ transfer agent. If you request that a redemption be made by wire transfer, currently a $15.00 fee is charged by the Funds’ transfer agent. IRA accounts will be charged a $15.00 annual maintenance fee. The example below includes, but is not limited to, management fees, shareholder servicing fees, fund accounting, custody and transfer agent fees. However, the example below does not include portfolio trading commissions and related expenses, interest expense or dividends on short positions taken by the Fund and other extraordinary expenses as determined under generally accepted accounting principles. You may use the information within these lines, together with the amount you invested, to estimate the expenses that you paid over the six-month period. Simply divide your account value by $1,000 (for example, an $8,600 account value divided by $1,000 = 8.6), then multiply the result by the number in the first line under the heading entitled “Expenses Paid During Period” to estimate the expenses you paid on your account during this period.
Hypothetical Example for Comparison Purposes
The second set of lines within the table below provide information about hypothetical account values and hypothetical expenses based on the Funds’ actual expense ratios and an assumed rate of return of 5% per year before expenses, which is not the Funds’ actual return. The hypothetical account values and expenses may not be used to estimate the actual ending account balance or expenses you paid for the period. You may use this information to compare the ongoing costs of investing in the Funds and other funds. To do so, compare this 5% hypothetical example with the 5% hypothetical examples that appear in the shareholder reports of the other funds. Please note that the expenses shown in the table are meant to highlight your ongoing costs only and do not reflect any transactional costs, such as sales charges (loads), or exchange fees. Therefore, the second line of the table is useful in comparing ongoing costs only, and will not help you determine the relative total costs of owning different funds. In addition, if these transactional costs were included, your costs would have been higher.
EXPENSE EXAMPLE
| | Beginning | Ending | Expenses Paid |
| | Account Value | Account Value | During Period(1) |
| Original Class | 11/1/08 | 4/30/09 | 11/1/08 – 4/30/09 |
| | | | |
| Actual | | | |
| Growth Fund – Original Class | $1,000.00 | $ 911.40 | $ 6.35 |
| Growth II Fund – Original Class | $1,000.00 | $ 949.80 | $ 8.82 |
| Focus 30 Fund – Original Class | $1,000.00 | $ 940.10 | $ 6.59 |
| Value Fund – Original Class | $1,000.00 | $ 962.20 | $ 6.28 |
| Total Return Fund – Original Class | $1,000.00 | $ 863.10 | $ 8.13 |
| Balanced Fund – Original Class | $1,000.00 | $ 923.70 | $ 8.25 |
| | | | |
| Hypothetical (5% return | | | |
| before expenses) | | | |
| Growth Fund – Original Class | $1,000.00 | $1,018.15 | $ 6.71 |
| Growth II Fund – Original Class | $1,000.00 | $1,016.27 | $ 8.60 |
| Focus 30 Fund – Original Class | $1,000.00 | $1,018.00 | $ 6.85 |
| Value Fund – Original Class | $1,000.00 | $1,018.40 | $ 6.46 |
| Total Return Fund – Original Class | $1,000.00 | $1,016.07 | $ 8.80 |
| Balanced Fund – Original Class | $1,000.00 | $1,016.22 | $ 8.65 |
(1) | Expenses are equal to the Growth Fund’s expense ratio of 1.34%, the Growth II Fund’s expense ratio of 1.72%, the Focus 30 Fund’s expense ratio of 1.37%, the Value Fund’s expense ratio of 1.29%, the Total Return Fund’s expense ratio of 1.76%, and the Balanced Fund’s expense ratio of 1.73%, multiplied by the average account value over the period, multiplied by 181/365 days (to reflect one-half year period). |
| | Beginning | Ending | Expenses Paid |
| | Account Value | Account Value | During Period(2) |
| Institutional Class | 11/1/08 | 4/30/09 | 11/1/08 – 4/30/09 |
| | | | |
| Actual | | | |
| Growth Fund – Institutional Class | $1,000.00 | $ 986.40 | $ 4.83 |
| Growth II Fund – Institutional Class | $1,000.00 | $ 992.65 | $ 4.84 |
| Focus 30 Fund – Institutional Class | $1,000.00 | $ 990.89 | $ 4.84 |
| Value Fund – Institutional Class | $1,000.00 | $ 994.19 | $ 4.85 |
| | | | |
| Hypothetical (5% return | | | |
| before expenses) | | | |
| Growth Fund – Institutional Class | $1,000.00 | $1,003.10 | $ 4.87 |
| Growth II Fund – Institutional Class | $1,000.00 | $1,003.10 | $ 4.87 |
| Focus 30 Fund – Institutional Class | $1,000.00 | $1,003.10 | $ 4.87 |
| Value Fund – Institutional Class | $1,000.00 | $1,003.10 | $ 4.87 |
(2) | Expenses are equal to the Growth, Growth II, Focus 30 and Value Fund’s expense ratio of 0.98%, multiplied by the average account value over the period, multiplied by 181/365 days (to reflect the period). |
HENNESSY FUNDS 1-800-966-4354
How to Obtain a Copy of the Funds’ Proxy Voting Policy and Proxy Voting Records
A description of the policies and procedures that the Funds use to determine how to vote proxies relating to portfolio securities is available without charge: (1) by calling 1-800-966-4354; (2) on the Hennessy Funds website at www.hennessyfunds.com; or (3) on the U.S. Securities and Exchange Commission’s website at www.sec.gov. Hennessy Funds’ proxy voting record is available on the SEC’s website at www.sec.gov no later than August 31 for the prior 12 months ending June 30.
Quarterly Filings on Form N-Q
The Funds file their complete schedule of portfolio holdings with the SEC for the first and third quarters of each fiscal year on Form N-Q. The Funds’ Form N-Q will be available on the SEC’s website at www.sec.gov. The Funds’ Form N-Q may be reviewed and copied at the SEC’s Public Reference Room in Washington, DC and information on the operation of the Public Reference Room may be obtained by calling 1-800-SEC-0330. Information included in the Funds’ N-Q will also be available upon request by calling 1-800-966-4354.
PROXY VOTING POLICY AND BOARD APPROVAL OF CONTINUATION OF INVESTMENT ADVISORY AGREEMENT
Board Approval of Investment
Advisory Agreements
At its meeting on March 2, 2009, the Board of Directors (the “Board”) of The Hennessy Funds, Inc. (the “Company”) and its two series, the Hennessy Balanced Fund (the “Balanced Fund”) and the Hennessy Total Return Fund (the “Total Return Fund”) (each a “Fund” or collectively the “Funds”), The Hennessy Mutual Funds, Inc. (the “Company”) and its three series, the Hennessy Cornerstone Growth Fund (the “Growth Fund”), the Hennessy Cornerstone Value Fund (the “Value Fund”), and the Hennessy Focus 30 Fund (the “Focus 30 Fund”) and The Hennessy Funds Trust (the “Company”) which includes the Hennessy Cornerstone Growth Fund, Series II (the “Growth II Fund”), Hennessy Cornerstone Large Growth Fund (the “Large Growth” Fund), and the Hennessy Select Large Value Fund (the “Select Value” Fund), (each a “Fund” or collectively the “Funds”), including the Directors who are not “interested persons” (as defined in the Investment Company Act of 1940) of the Funds’ voted to re-approve (approve with respect to the investment advisory agreements for the Large Growth Fund and the Select Value Fund) the current investment advisory agreement (the “Advisory Agreement”) between the Funds and Hennessy Advisors, Inc. (the “Advisor”) and approve the sub-advisory agreement with Voyageur Asset Management, Inc. (the “Sub-Advisor”). In connection with its re-approval or approval of the Advisory Agreement, the Board considered the following factors:
| 1) | The Advisor provides formula driven investment management for the Funds (except for the Select Value Fund). Hennessy Advisors, Inc. holds the patent rights to the formulas used for The Cornerstone Growth, Growth II, Value, Large Growth and Focus 30 funds. In providing investment management, Hennessy Advisors, Inc. will direct and oversee the trading of securities within and the rebalancing of the portfolios of the Funds (except for the Select Value Fund). |
| 2) | The Advisor oversees the performance of the Sub-Advisor and pays the sub-advisory fee. |
| 3) | The Advisor pays for the services to retain the Funds’ Chief Compliance Officer and will make all reasonable efforts to insure that the Funds are in compliance with the securities laws. |
| 4) | The Advisor provides responsive customer and shareholder servicing which consists of providing a call center to respond to shareholder inquiries, including specific mutual fund account information. Shareholders can contact Hennessy Advisors, Inc., directly during office hours. The firm endeavors to answer all calls in-person within two rings of the telephone. |
| 5) | The Advisor oversees distribution of the Funds through third-party broker/dealers and independent financial institutions such as Charles Schwab, Inc., Fidelity, TD Ameritrade and Pershing. Hennessy Advisors participates in “no transaction fee” (“NTF”) programs with these companies, which allows customers to purchase the Hennessy Funds |
HENNESSY FUNDS 1-800-966-4354
| | through third party distribution channels without paying a transaction fee. Hennessy Advisors compensates these third party distributors under a pre-determined contractual agreement. |
| 6) | The Advisor oversees those third party service providers that support the Funds in providing fund accounting, fund administration, fund distribution, transfer agency and custodial services. |
| 7) | The Sub-Advisor provides investment services to the Select Value Fund and oversees the trading of securities for the Select Value Fund. |
The Board also: (i) compared the performance of each Fund (other than the Large Growth Fund where the performance of the investment formula was reviewed) to benchmark indices over various periods of time and concluded that the performance of each Fund warranted the continuation or approval of the Advisory Agreement; (ii) compared the expense ratios of funds similar in asset size and investment objective to each of the Funds and concluded the actual or projected expenses of each Fund were reasonable and warranted continuation of the Advisory Agreement; (iii) considered the fees charged by Hennessy Advisors, Inc. to those of funds similar in asset size and investment objective to each of the Funds and concluded the advisory fees of each Fund were reasonable and warranted continuation or approval of the Advisory Agreement; (iv) considered the profitability or projected profitability of Hennessy Advisors, Inc. with respect to each Fund and the projected profitability of the Sub-Advisor with respect to the Select Value Fund and concluded the profits were reasonable and not excessive when compared to profitability guidelines set forth in relevant court cases; (v) considered the high level of professionalism and knowledge, along with an extremely low level of turnover, of the employees of the Advisor; and (vi) considered that Neil Hennessy was named one of the top 100 portfolio managers in the nation during each of the previous six years by Barron’s.
The Board then discussed economies of scale and breakpoints and determined that the Funds managed by Hennessy Advisors, Inc. have not yet grown in size, nor has their marketplace demonstrated significantly rapid potential growth to any extent that would warrant the use of breakpoints. The Funds have, in fact, had their assets under management greatly diminish during 2008. In reaching this conclusion the Board took into consideration the profitability of Hennessy Advisors, Inc. and the advisory fees of comparable mutual funds.
The Board reviewed the Funds’ expense ratios and comparable expense ratios for funds like the eight funds being considered for contract approval/renewal by Hennessy Advisors, Inc. The Board used data from Lipper as presented in the charts in the Board Materials showing funds similar in nature to the Hennessy Funds (Mid-Cap Blend, Small Cap Blend, etc.). The Board determined that the expense ratios of The Funds fall within the range of the ratios of other funds in their classification. (Please see Lipper charts provided in the Board Materials). The Board also referenced the Advisor’s Form ADV and copies of the current Investment Advisory Agreements. All of the factors above were considered separately by the non-interested Directors in an executive session during which management of the Advisor was not present. The factors were viewed in their totality by the Board, with no single factor being the principal or determinative factor in the Board’s determination of whether to
BOARD APPROVAL OF CONTINUATION OF INVESTMENT ADVISORY AGREEMENT
approve the continuation or approval of the Advisory Agreements. The Board was also assisted in its review, consideration and discussion of the Advisory Agreements by legal counsel, who had prepared a summary of the Board’s legal obligations. Based on the factors discussed above, the Board, including all Independent Directors, recommended continuation or approval of the Advisory Agreements.
HENNESSY FUNDS 1-800-966-4354
(This Page Intentionally Left Blank.)
(This Page Intentionally Left Blank.)
HENNESSY FUNDS 1-800-966-4354
For information, questions
or assistance, please call
The Hennessy Funds
1-800-966-4354 or 1-415-899-1555
| INVESTMENT ADVISOR | TRUSTEES |
| Hennessy Advisors, Inc. | Neil J. Hennessy |
| 7250 Redwood Blvd., Suite 200 | Robert T. Doyle |
| Novato, California 94945 | J. Dennis DeSousa |
| | Gerald P. Richardson |
| ADMINISTRATOR, TRANSFER | |
| AGENT, DIVIDEND PAYING | COUNSEL |
| AGENT & SHAREHOLDER | Foley & Lardner LLP |
| SERVICING AGENT | 777 East Wisconsin Avenue |
| U.S. Bancorp Fund Services, LLC | Milwaukee, Wisconsin 53202-5306 |
| P.O. Box 701 | |
| Milwaukee, Wisconsin 53201-0701 | INDEPENDENT REGISTERED |
| | PUBLIC ACCOUNTING FIRM |
| CUSTODIAN | KPMG LLP |
| U.S. Bank N.A. | 303 East Wacker Drive |
| Custody Operations | Chicago, Illinois 60601 |
| 1555 North River Center Dr., Suite 302 | |
| Milwaukee, Wisconsin 53212 | DISTRIBUTOR |
| | Quasar Distributors, LLC |
| | 615 East Michigan Street |
| | Milwaukee, Wisconsin 53202 |
WWW.HENNESSYFUNDS.COM
This report has been prepared for shareholders and may be distributed to others only if preceded or accompanied by a current prospectus.
Item 2. Code of Ethics.
Not applicable for semi-annual reports.
Item 3. Audit Committee Financial Expert.
Not applicable for semi-annual reports.
Item 4. Principal Accountant Fees and Services.
Not applicable for semi-annual reports.
Item 5. Audit Committee of Listed Registrants.
Not applicable to registrants who are not listed issuers (as defined in Rule 10A-3 under the Securities Exchange Act of 1934).
Item 6. Investments.
Schedule of Investments is included as part of the report to shareholders filed under Item 1 of this Form.
Item 7. Disclosure of Proxy Voting Policies and Procedures for Closed-End Management Investment Companies.
Not applicable to open-end investment companies.
Item 8. Portfolio Managers of Closed-End Management Investment Companies.
Not applicable to open-end investment companies.
Item 9. Purchases of Equity Securities by Closed-End Management Investment Company and Affiliated Purchasers.
Not applicable to open-end investment companies.
Item 10. Submission of Matters to a Vote of Security Holders.
Not Applicable.
Item 11. Controls and Procedures.
| (a) | The Registrant’s Chief Executive Officer]and Treasurer have reviewed the Registrant's disclosure controls and procedures (as defined in Rule 30a-3(c) under the Investment Company Act of 1940 (the “Act”)) as of a date within 90 days of the filing of this report, as required by Rule 30a-3(b) under the Act and Rules 13a-15(b) or 15d-15(b) under the Securities Exchange Act of 1934. Based on their review, such officers have concluded that the disclosure controls and procedures are effective in ensuring that information required to be disclosed in this report is appropriately recorded, processed, summarized and reported and made known to them by others within the Registrant and by the Registrant’s service provider. |
| (b) | There were no changes in the Registrant's internal control over financial reporting (as defined in Rule 30a-3(d) under the Act) that occurred during the second fiscal quarter of the period covered by this report that has materially affected, or is reasonably likely to materially affect, the Registrant's internal control over financial reporting. |
Item 12. Exhibits.
| (a) | (1) Any code of ethics or amendment thereto, that is the subject of the disclosure required by Item 2, to the extent that the registrant intends to satisfy Item 2 requirements through filing an exhibit. Not Applicable |
| | (2) A separate certification for each principal executive and principal financial officer pursuant to Section 302 of the Sarbanes-Oxley Act of 2002. Filed herewith. |
| | (3) Any written solicitation to purchase securities under Rule 23c-1 under the Act sent or given during the period covered by the report by or on behalf of the registrant to 10 or more persons. Not applicable to open-end investment companies. |
| (b) | Certifications pursuant to Section 906 of the Sarbanes-Oxley Act of 2002. Furnished herewith. |
SIGNATURES
Pursuant to the requirements of the Securities Exchange Act of 1934 and the Investment Company Act of 1940, the registrant has duly caused this report to be signed on its behalf by the undersigned, thereunto duly authorized.
(Registrant) Hennessy Funds Trust
By (Signature and Title)* /s/Neil J. Hennessy
Neil J. Hennessy, Principal Executive Officer
Date July 9, 2009
Pursuant to the requirements of the Securities Exchange Act of 1934 and the Investment Company Act of 1940, this report has been signed below by the following persons on behalf of the registrant and in the capacities and on the dates indicated.
By (Signature and Title)* /s/Neil J. Hennessy
Neil J. Hennessy, Principal Executive Officer
Date July 9, 2009
By (Signature and Title)* /s/Teresa M. Nilsen
Teresa M. Nilsen, Treasurer
Date July 9, 2009