The Securities and Exchange Commission has adopted new regulations that will impact the design and delivery of future Semi-Annual and Annual Reports. Beginning with the 2024 Annual Reports, paper copies will be mailed to you unless you have opted for electronic delivery of the report. See Go Paperless with eDelivery for instructions about how to sign up for electronic delivery.
Past performance does not guarantee future results.
Investing involves risk. Principal loss is possible.
Opinions expressed are those of Ryan C. Kelley and are subject to change, are not guaranteed, and should not be considered investment advice.
Performance data quoted represents past performance; past performance does not guarantee future results. The investment return and principal value of an investment will fluctuate so that an investor’s shares, when redeemed, may be worth more or less than their original cost. The performance table does not reflect the deduction of taxes that a shareholder would pay on Fund distributions or the redemption of Fund shares. Current performance of the Fund may be lower or higher than the performance quoted. Performance data current to the most recent month end may be obtained by visiting www.hennessyfunds.com.
Frank Russell Company (“Russell”) is the source and owner of the trademarks, service marks, and copyrights related to the Russell Indexes. Russell® is a trademark of Frank Russell Company. Neither Russell nor its licensors accept any liability for any errors or omissions in the Russell Indexes or Russell ratings or underlying data and no party may rely on any Russell Indexes or Russell ratings or underlying data contained in this communication. No further distribution of Russell data is permitted without Russell’s express written consent. Russell does not promote, sponsor, or endorse the content of this communication.
The expense ratios presented are from the most recent prospectus. The expense ratios for the current reporting period are available in the Financial Highlights section of this report.
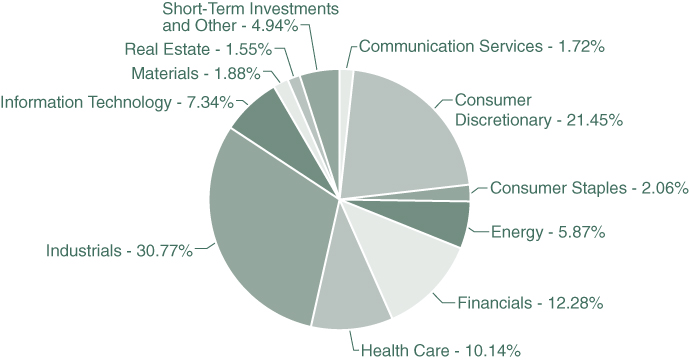
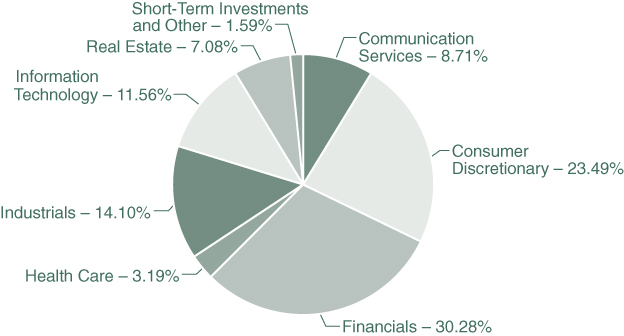
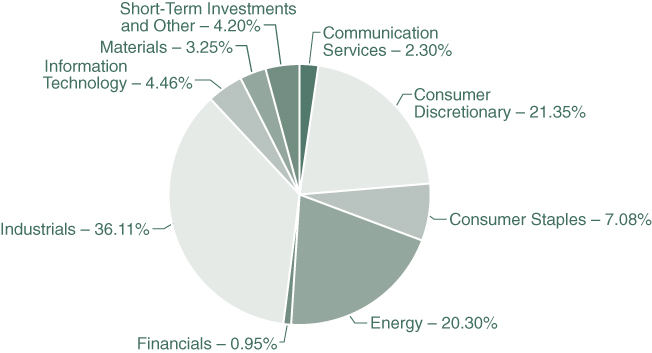
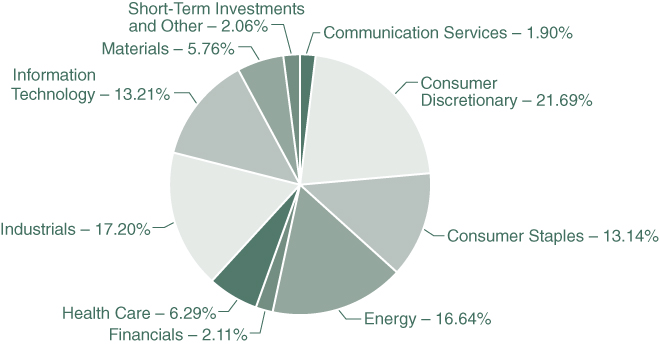
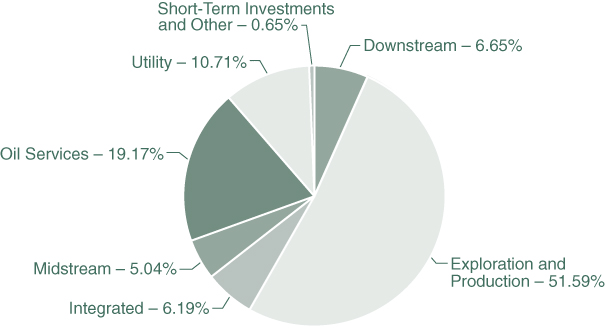
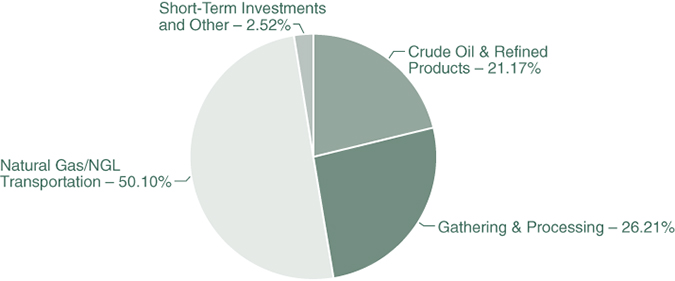
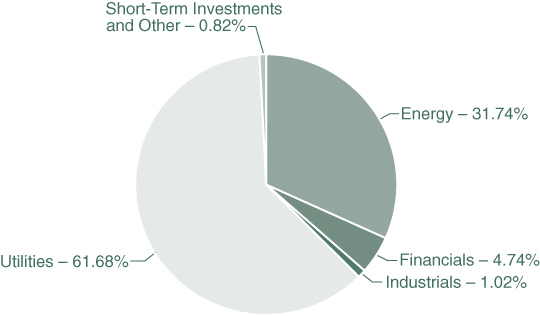
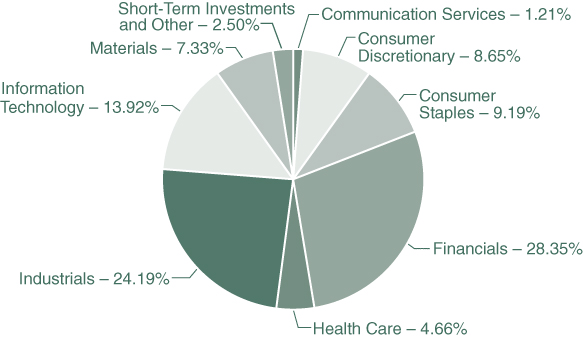
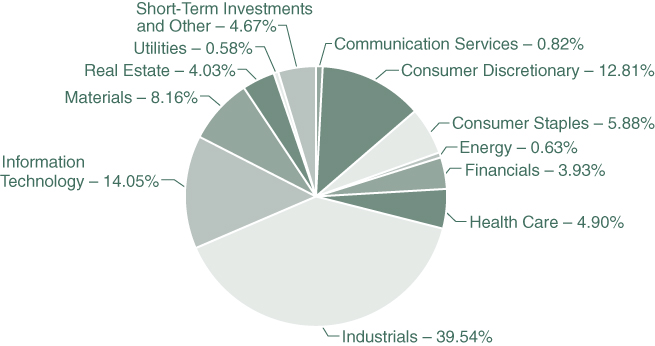
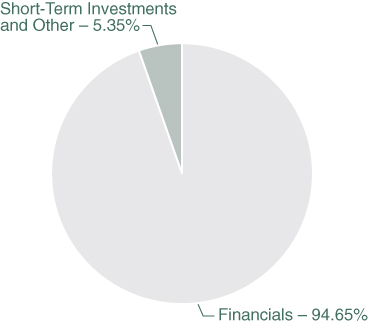
Note: For presentation purposes, the Fund has grouped some of the industry categories. For purposes of categorizing securities for compliance with Section 8(b)(1) of the Investment Company Act of 1940, as amended, the Fund uses more specific industry classifications.
The accompanying notes are an integral part of these financial statements.
Percentages are stated as a percent of net assets.
The following is a summary of the inputs used to value the Fund’s net assets as of April 30, 2024 (see Note 3 in the accompanying Notes to the Financial Statements):
The accompanying notes are an integral part of these financial statements.
The accompanying notes are an integral part of these financial statements.
The accompanying notes are an integral part of these financial statements.
The accompanying notes are an integral part of these financial statements.
The accompanying notes are an integral part of these financial statements.
The accompanying notes are an integral part of these financial statements.
The accompanying notes are an integral part of these financial statements.
The accompanying notes are an integral part of these financial statements.
The Hennessy Large Cap Financial Fund (the “Fund”) is a series of Hennessy Funds Trust (the “Trust”), which was organized as a Delaware statutory trust on September 17, 1992. The Fund is an open-end management investment company registered under the Investment Company Act of 1940, as amended. The investment objective of the Fund is capital appreciation. The Fund is a non-diversified fund.
The Fund offers Investor Class and Institutional Class shares. Each class of shares differs principally in its respective 12b-1 distribution and service, shareholder servicing, and sub-transfer agent expenses. There are no sales charges. Each class has identical rights to earnings, assets, and voting privileges, except for class-specific expenses and exclusive rights to vote on matters affecting only one class.
As an investment company, the Fund follows the investment company accounting and reporting guidance of the Financial Accounting Standards Board (the “FASB”) Accounting Standard Codification Topic 946 “Financial Services—Investment Companies.”
The following is a summary of significant accounting policies consistently followed by the Fund in the preparation of the financial statements. These policies conform to U.S. generally accepted accounting principles (“GAAP”).
The Fund follows its valuation policies and procedures in determining its NAV and, in preparing these financial statements, the fair value accounting standards that establish an authoritative definition of fair value and set out a hierarchy for measuring fair value. These standards require additional disclosures about the various inputs and valuation techniques used to develop the measurements of fair value and a discussion of changes in valuation techniques and related inputs during the period. These inputs are summarized in the three broad levels listed below:
The following is a description of the valuation techniques applied to the Fund’s major categories of assets and liabilities on a recurring basis:
If market quotations are not readily available or if a significant event has occurred that indicates the closing price of a security no longer represents the true value of that security, such security will be valued at its fair value under the Fund’s established fair valuation procedures as implemented by Hennessy Advisors, Inc. (the “Advisor”), the Fund’s valuation designee. The Advisor, as the valuation designee, is subject to the oversight of the Board of Trustees of the Fund (the “Board”). There are numerous criteria considered in determining a fair value of a security, such as the trading volume of a security and markets, the values of other similar securities, and news events with direct bearing on a security or markets. Fair value pricing results in an estimated price for a security that reflects the amount the Fund might reasonably expect to receive in a current sale. Depending on the relative significance of the valuation inputs, these securities may be classified in either Level 2 or Level 3 of the fair value hierarchy. The Advisor will regularly evaluate whether the Fund’s fair value pricing procedures continue to be appropriate in light of the specific circumstances of the Fund and the quality of prices obtained through their application of such procedures.
The fair value of foreign securities may be determined with the assistance of a pricing service using correlations between the movement of prices of such securities and indices of domestic securities and other appropriate indicators, such as closing market prices of
relevant American Depositary Receipts or futures contracts. Using fair value pricing means that the Fund’s NAV reflects the affected portfolio securities’ values as determined by the Advisor, instead of being determined by the market. Using a fair value pricing methodology to price a foreign security may result in a value that is different from such foreign security’s most recent closing price and from the value used by other investment companies to calculate their NAVs. Such securities are generally classified in Level 2 of the fair value hierarchy. Because the Fund may invest in foreign securities, the value of the Fund’s portfolio securities may change on days when a shareholder is unable to purchase or redeem Fund shares.
The Fund has performed an analysis of all existing investments to determine the significance and character of all inputs to their fair value determinations. Various inputs are used to determine the value of the Fund’s investments. The inputs or methodology used for valuing securities are not necessarily an indication of the risk associated with investing in those securities. Details related to the fair value hierarchy of the Fund’s securities as of April 30, 2024, are included in the Schedule of Investments.
Purchases and sales of investment securities (excluding government and short-term investments) for the Fund during the six months ended April 30, 2024, were $7,774,047 and $15,644,908, respectively.
There were no purchases or sales/maturities of long-term U.S. government securities for the Fund during the six months ended April 30, 2024.
The Advisor provides the Fund with investment advisory services under an Investment Advisory Agreement. The Advisor furnishes all investment advice, office space, and facilities and most of the personnel needed by the Fund. As compensation for its services, the Advisor is entitled to a monthly fee from the Fund. The fee is based on the average daily net assets of the Fund at an annual rate of 0.90%. The net investment advisory fees expensed by the Fund during the six months ended April 30, 2024, are included in the Statement of Operations.
The Board has approved a Shareholder Servicing Agreement for Investor Class shares of the Fund, which compensates the Advisor for the non-investment advisory services it provides to the Fund. The Shareholder Servicing Agreement provides for a monthly fee paid to the Advisor at an annual rate of 0.10% of the average daily net assets of the Fund attributable to Investor Class shares. The shareholder service fees expensed by the Fund during the six months ended April 30, 2024, are included in the Statement of Operations.
The Fund has adopted a plan pursuant to Rule 12b-1 under the Investment Company Act of 1940, as amended, that authorizes payments in connection with the distribution of Fund shares at an annual rate of up to 0.25% of the Fund’s average daily net assets attributable to Investor Class shares. Even though the authorized rate is up to 0.25%, the Fund is currently only using up to 0.15% of its average daily net assets attributable to Investor Class shares for such purpose. Amounts paid under the plan may be spent on any activities or expenses primarily intended to result in the sale of shares, including, but not limited to, advertising, shareholder account servicing, printing and mailing of prospectuses to other than current shareholders, printing and mailing of sales literature, and compensation for sales and marketing activities or to financial institutions and others, such as dealers and distributors. The distribution fees expensed by the Fund during the six months ended April 30, 2024, are included in the Statement of Operations.
The Fund has entered into agreements with various brokers, dealers, and financial intermediaries in connection with the sale of Fund shares. The agreements provide for periodic payments of sub-transfer agent expenses by the Fund to the brokers, dealers, and financial intermediaries for providing certain shareholder maintenance services. These shareholder services include the pre-processing and quality control of new accounts, shareholder correspondence, answering customer inquiries regarding account status, and facilitating shareholder telephone transactions. The sub-transfer agent fees expensed by the Fund during the six months ended April 30, 2024, are included in the Statement of Operations.
U.S. Bancorp Fund Services, LLC, d/b/a U.S. Bank Global Fund Services (“Fund Services”) provides the Fund with administrative, accounting, and transfer agent services. As administrator, Fund Services is responsible for activities such as (i) preparing various federal and state regulatory filings, reports, and returns for the Fund, (ii) preparing reports and materials to be supplied to the Board, (iii) monitoring the activities of the Fund’s custodian, transfer agent, and accountants, and (iv) coordinating the preparation and payment of the Fund’s expenses and reviewing the Fund’s expense accruals. U.S. Bank N.A., an affiliate of Fund Services, serves as the Fund’s custodian. The servicing agreements between the Trust, Fund Services, and U.S. Bank N.A. contain a fee schedule that is inclusive of administrative, accounting, custody, and transfer agent fees. The administrative, accounting, custody, and transfer agent fees expensed by the Fund during the six months ended April 30, 2024, are included in the Statement of Operations.
Quasar Distributors, LLC, a wholly owned broker-dealer subsidiary of Foreside Financial Group, LLC, acts as the Fund’s principal underwriter in a continuous public offering of Fund shares.
The officers of the Fund are affiliated with the Advisor. With the exception of the Chief Compliance Officer, such officers receive no compensation from the Fund for serving in their respective roles. The Fund, along with the other funds in the Hennessy Funds family (collectively, the “Hennessy Funds”), makes reimbursement payments on an equal basis to the Advisor for a portion of the salary and benefits associated with the office of the Chief Compliance Officer. The compliance fees expensed by the Fund during the six months ended April 30, 2024, for reimbursement payments to the Advisor are included in the Statement of Operations.
Under the Hennessy Funds’ organizational documents, their officers and trustees are indemnified by the Hennessy Funds against certain liabilities arising out of the performance of their duties to the Hennessy Funds. Additionally, in the normal course of business, the Hennessy Funds enter into contracts with service providers that contain general indemnification clauses. The Fund’s maximum exposure under these arrangements is unknown as this would involve future claims that may be made against the Fund that have not yet occurred. Currently, the Fund expects the risk of loss to be remote.
The Fund has an uncommitted line of credit with the other Hennessy Funds in the amount of the lesser of (i) $100,000,000 or (ii) 33.33% of each Hennessy Fund’s net assets, or 30% for the Hennessy Gas Utility Fund, the Hennessy Japan Fund, and the Hennessy Japan Small Cap Fund and 10% for the Hennessy Balanced Fund. The line of credit is intended to provide any necessary short-term financing in connection with shareholder redemptions, subject to certain restrictions. The credit facility is with the Hennessy Funds’ custodian
bank, U.S. Bank N.A. Borrowings under this arrangement bear interest at the bank’s prime rate and are secured by all of the Fund’s assets (as to its own borrowings only). During the six months ended April 30, 2024, the Fund had an outstanding average daily balance and a weighted average interest rate of $66,951 and 8.50%, respectively. The interest expensed by the Fund during the six months ended April 30, 2024, is included in the Statement of Operations. The maximum amount outstanding for the Fund during the six months ended April 30, 2024, was $2,244,000. As of April 30,2024, the Fund did not have any borrowings outstanding under the line of credit.
As of October 31, 2023, the Fund’s most recent fiscal year end, the components of accumulated earnings (losses) for income tax purposes were as follows:
The difference between book-basis unrealized appreciation/depreciation and tax-basis unrealized appreciation/depreciation (as shown above) is attributable primarily to wash sales.
As of October 31, 2023, the Fund had $2,567,969 in unlimited short-term capital loss carryforwards.
Capital losses sustained in or after fiscal year 2012 can be carried forward indefinitely, but any such loss retains the character of the original loss and must be utilized prior to any loss incurred before fiscal year 2012. As a result of this ordering rule, capital loss carryforwards incurred prior to fiscal year 2012 may be more likely to expire unused. Capital losses sustained prior to fiscal year 2012 can be carried forward for eight years and can be carried forward as short-term capital losses regardless of the character of the original loss.
As of October 31, 2023, the Fund did not defer, on a tax basis, any late-year ordinary losses. Late-year ordinary losses are net ordinary losses incurred after December 31, 2022, but within the taxable year, that are deemed to arise on the first day of the Fund’s next taxable year.
During fiscal year 2024 (year to date) and fiscal year 2023, the tax character of distributions paid by the Fund was as follows:
A rise in protectionist trade policies, the possibility of a national or global recession, risks associated with pandemic and epidemic diseases, trade tensions, the possibility of changes to some international trade agreements, political events, and continuing political tension and armed conflicts may adversely impact financial markets and the broader economy. For example, ongoing armed conflicts between Ukraine and Russia in Europe and among Israel, Hamas, and other militant groups in the Middle East have caused and could continue to cause significant market disruptions and volatility with the markets in Europe and the Middle East, and have had negative impacts on markets in the United States. These events could also have negative effects on the Fund’s investments that cannot be foreseen at the present time. As global systems, economies and financial markets are increasingly interconnected, events that once had only local impact are now more likely to have regional or even global effects. Events that occur in one country, region or financial market will, more frequently, adversely impact issuers in other countries, regions, or markets. These impacts can be exacerbated by failures of governments and societies to adequately respond to an emerging event or threat. Your investment would be negatively impacted if the value of your portfolio holdings decreases as a result of such events, if these events adversely impact the operations and effectiveness of the Advisor or other key service providers or if these events disrupt systems and processes necessary or beneficial to the management of accounts. These events may negatively impact broad segments of businesses and populations and could have a significant and rapid negative impact on the performance of the Fund’s investments, increase the Fund’s volatility, or exacerbate pre-existing risks to the Fund.
Management has evaluated the Fund’s related events and transactions that occurred subsequent to April 30, 2024, through the date of issuance of the Fund’s financial statements. Management has determined that there were no subsequent events requiring recognition or disclosure in the financial statements.
As a shareholder of the Fund, you incur ongoing costs, including management fees, service fees, and other Fund expenses. This Example is intended to help you understand your ongoing costs (in dollars) of investing in the Fund and to compare these costs with the ongoing costs of investing in other investment funds. The Example is based on an investment of $1,000 invested at the beginning of the period and held for the entire period from November 1, 2023, through April 30, 2024.
In the table below, the first line under each of the “Investor Class” and “Institutional Class” headings provides information about actual account values and actual expenses for each share class. You may use this information, together with the amount you invested, to estimate the expenses that you paid over the period. Simply divide your account value by $1,000 (for example, an $8,600 account value divided by $1,000 = 8.6), then multiply the result by the number in the first line under the heading “Expenses Paid During Period” to estimate the expenses you paid on your account during this period. Although the Fund charges no sales loads or transaction fees, you will be assessed fees for outgoing wire transfers, returned checks, and stop payment orders at prevailing rates charged by U.S. Bank Global Fund Services, the Fund’s transfer agent. If you request that a redemption be made by wire transfer, the Fund’s transfer agent charges a $15 fee. IRAs are charged a $15 annual maintenance fee (up to $30 maximum per shareholder for shareholders with multiple IRAs). The examples below include, but are not limited to, management, shareholder servicing, accounting, custody, and transfer agent fees. However, the examples below do not include portfolio trading commissions and related expenses.
In the table below, the second line under each of the “Investor Class” and “Institutional Class” headings provides information about hypothetical account values and hypothetical expenses based on the Fund’s actual expense ratio for each share class and an assumed rate of return of 5% per year before expenses, which is not the Fund’s actual return for such share class. The hypothetical account values and expenses may not be used to estimate the actual ending account balance or expenses you paid for the period. You may use this information to compare the ongoing costs of investing in the Fund and other funds. To do so, compare these 5% hypothetical examples with the 5% hypothetical examples that appear in the shareholder reports of the other funds. Please note that the expenses shown in the table are meant to highlight your ongoing costs only. Therefore, the second lines under “Investor Class” and “Institutional Class” are useful in comparing ongoing costs only and will not help you determine the relative total costs of owning different funds.
A description of the policies and procedures the Fund uses to determine how to vote proxies relating to portfolio securities is available without charge (1) by calling 800-966-4354, (2) on the Hennessy Funds’ website at www.hennessyfunds.com/proxy-voting/voting-policy, or (3) on the U.S. Securities and Exchange Commission’s (the “SEC”) website at www.sec.gov. The Fund’s proxy voting record is available without charge on both the Hennessy Funds’ website at www.hennessyfunds.com/proxy-voting/voting-record and the SEC’s website at www.sec.gov no later than August 31 for the prior 12 months ending June 30.
The Fund files a complete schedule of portfolio holdings with the SEC for the first and third quarters of each fiscal year as an exhibit to its reports on Form N-PORT. The Fund’s Form N-PORT reports are available on the SEC’s website at www.sec.gov or on request by calling 800-966-4354.
For fiscal year 2023, certain dividends paid by the Fund may be subject to a maximum tax rate of 23.8%, as provided for by the Jobs and Growth Tax Relief Reconciliation Act of 2003. The percentage of dividends declared from ordinary income designated as qualified dividend income was 100.00%.
For corporate shareholders, the percent of ordinary income distributions that qualified for the corporate dividends received deduction for fiscal year 2023 was 100.00%.
The percentage of taxable ordinary income distributions that were designated as short-term capital gain distributions under Section 871(k)(2)(C) of the Internal Revenue Code of 1986, as amended, for the Fund was 0.00%.
To help keep the Fund’s costs as low as possible, we generally deliver a single copy of shareholder reports, proxy statements, and prospectuses to shareholders who share an address and have the same last name. This process does not apply to account statements. You may request an individual copy of a shareholder document at any time. If you would like to receive separate mailings of shareholder documents, please call U.S. Bank Global Fund Services at 800-261-6950 or 414-765-4124, and individual delivery will begin within 30 days of your request. If your account is held through a financial institution or other intermediary, please contact such intermediary directly to request individual delivery.
The SEC has adopted new regulations that will impact the design and delivery of future Semi-Annual and Annual Reports. Beginning with the 2024 Annual Reports, paper copies will be mailed to you unless you have opted for electronic delivery of the reports. We encourage all direct shareholders to sign up to receive all notices, account statements, prospectuses, tax forms, and shareholder reports electronically to help reduce expenses and the volume of paper U.S. mail received. To sign up for eDelivery or to change your delivery preference, please visit www.hennessyfunds.com/account.
If you hold your Fund shares through a financial intermediary, please contact your financial intermediary regarding electronic delivery options.
Subscribe to receive our team’s unique market and sector insights delivered to your inbox
At its meeting on March 6, 2024, the Board of Trustees of the Fund (the “Board,” and the members thereof, the “Trustees”) unanimously approved the continuation of the investment advisory agreement of the Fund with Hennessy Advisors, Inc. (the “Advisor”). As part of the process, the Trustees reviewed their fiduciary duties and the relevant factors for them to consider with respect to approving the advisory agreement. In addition, the Trustees who are not deemed interested persons (as defined by the Investment Company Act of 1940, as amended) of the Fund (the “Independent Trustees”) met in executive session to discuss the approval of the advisory agreement. As part of their discussion, the Independent Trustees confirmed their understanding of the need to have asked about, and received answers to, any matters that they believed are relevant to determining whether to approve the continuation of the advisory and sub-advisory agreements.
In advance of the meeting, the Advisor sent detailed information to the Trustees to assist them in their evaluation of the advisory agreement. This information included, but was not limited to, the following:
All of the factors discussed were considered as a whole by the Trustees, as well as by the Independent Trustees meeting in executive session. The Trustees viewed the relevant factors in their totality, with no single factor being the principal or determinative factor in the Trustees’ determination of whether to approve the continuation of the advisory agreement. The Trustees recognized that the management and fee arrangements for the Fund are the result of years of review and discussion between the Independent Trustees and the Advisor, that certain aspects of such arrangements may receive greater scrutiny in some years than in others, and that the Trustees’ conclusions may be based, in part, on their consideration of these same arrangements and information received during the course of the year and in prior years.
Prior to approving the continuation of the advisory agreement, the Trustees, including the Independent Trustees in executive session, considered, among other items:
The material considerations and determinations of the Trustees, including the Independent Trustees, were as follows:
After reviewing the materials and information provided at the meeting, as well as other information regularly provided at the Board’s quarterly meetings throughout the year regarding the quality of services provided by the Advisor, the performance of the Fund, expense information, brokerage commissions information, the adequacy and efficacy of the Advisor’s written policies and procedures, other regulatory compliance issues, trading information and related matters, and other factors that the Trustees deemed relevant, the Trustees, including the Independent Trustees, approved the continuation of the advisory agreement.
Hennessy Advisors, Inc.
U.S. Bancorp Fund Services, LLC
d/b/a U.S. Bank Global Fund Services
P.O. Box 701
U.S. Bank N.A.
Neil J. Hennessy
Robert T. Doyle
J. Dennis DeSousa
Gerald P. Richardson
others only if preceded or accompanied by a current prospectus.
SEMI-ANNUAL REPORT
APRIL 30, 2024
HENNESSY SMALL CAP FINANCIAL FUND
Investor Class HSFNX
Institutional Class HISFX
www.hennessyfunds.com | 1-800-966-4354
(This Page Intentionally Left Blank.)
Contents
| Letter to Shareholders | | 2 |
| Performance Overview | | 4 |
| Financial Statements | | |
| Schedule of Investments | | 5 |
| Statement of Assets and Liabilities | | 9 |
| Statement of Operations | | 10 |
| Statements of Changes in Net Assets | | 11 |
| Financial Highlights | | 12 |
| Notes to the Financial Statements | | 16 |
| Expense Example | | 24 |
| Proxy Voting Policy and Proxy Voting Records | | 26 |
| Availability of Quarterly Portfolio Schedule | | 26 |
| Federal Tax Distribution Information | | 26 |
| Important Notice Regarding Delivery of Shareholder Documents | | 26 |
| Go Paperless with eDelivery | | 26 |
| Board Approval of Investment Advisory Agreement | | 27 |
The Securities and Exchange Commission has adopted new regulations that will impact the design and delivery of future Semi-Annual and Annual Reports. Beginning with the 2024 Annual Reports, paper copies will be mailed to you unless you have opted for electronic delivery of the report. See Go Paperless with eDelivery for instructions about how to sign up for electronic delivery.
| HENNESSY FUNDS | 1-800-966-4354 | |
May 2024
Dear Hennessy Funds Shareholder:
Market Highs, Uncertainties & Opportunities
As I write this semi-annual letter, the three major market indexes have hit all-time highs. We are enjoying robust returns in the U.S. across all sectors and several asset classes. We also understand that markets are driven by optimism. As markets hover at or near record highs, often uncertainty, risk, and volatility creep in. Have we gone too far, too fast? Is the market overvalued? What if the unexpected happens and sentiment turns in the other direction? There will always be uncertainties and unknowns, and that is why we remain steadfast in sticking to a consistent and focused investment style through every part of a market cycle, which we believe will perform well over the long term.
Given the unpredictable nature of the stock market, we encourage a sensible approach to investing. We can consider certain well-known adages and try to prove them, in exact terms, but we may find that there is no silver bullet in investing. “Sell in May and stay away.” “The trend is your friend.” “Expect increased volatility before a presidential election, followed by an up market through year end.” These tips for investing can be based on statistical correlations, some stronger and some weaker, but none are correct all the time. In investing, we want to avoid following pseudo-rules that are not always true; “60% of the time, it works every time” is not strong enough. All this to say, investing is full of risks, the market is full of uncertainties, and investors should be wary of investing silver bullets.
At Hennessy, we understand the uncertainty inherent in all investing, but we also understand that without uncertainty, there would not be opportunity. Our portfolio managers (PMs) have many years of experience (over 26 years average for all our PMs combined), and each of them apply their experience to investing for the long term to attempt to mitigate risk. Investors can mitigate risk in their own portfolios as well, by staying diversified, avoiding highly speculative investments, not chasing performance, not trying to time the market, and staying invested over longer periods. Most important of all, though, is having realistic expectations for your own level of risk tolerance.
While uncertainty and opportunities persist in any market, the past six-month period has been an overall positive period for many investors and for the stock market overall. For the six months ended April 30, 2024, all three broad-based indexes were positive with the Dow Jones Industrial Average up 15.58%, the S&P 500® Index up 20.98%, and the Nasdaq Composite Index up 22.31%. Robust performance was broad based. In fact, the dispersion of returns was relatively low across all market cap sizes and all GICS sectors, with the highest being Financials (+25.92% for the S&P 500® Financials Sector Index) and the lowest being Real Estate (+11.24% for the S&P 500® Real Estate Sector Index).
Several factors contributed to the strong, broad-based returns in the market. We believe the two most important of those factors were continued signs of a strong economy and solid corporate earnings. Although the market does not expect more than one or two rate decreases in 2024, fear of a recession due to the Federal Reserve’s rate hiking cycle seems to have abated slightly. Consumer demand and spending remain resilient, wages continue to increase, and unemployment numbers remain historically low. For most of the period, inflation expectations remained relatively low, although data in the later part of the period was somewhat higher than anticipated.
Like the overall market, our funds experienced strong results. All 17 of our funds posted positive returns during the six months ended April 30, 2024. Given that growth outperformed value and that many of our funds are value oriented, only seven Hennessy Funds outperformed their primary benchmarks. However, we continue to focus on providing attractive returns for our shareholders over a complete market cycle, and we are pleased that all but five of our funds have posted positive returns over one-, three-, five-, and ten-year periods ended April 30, 2024, with the remaining five funds posting positive returns over the one-, five-, and ten-year (but not three-year) periods ended April 30, 2024.
We believe that the outlook for U.S. stocks remains positive, primarily because we believe that the Federal Reserve will eventually begin to lower interest rates. Despite the recent up-tick, inflation has shown signs of easing, creating a better environment for consumers as well as businesses. The unemployment rate is still near record lows, there are elevated levels of cash on the balance sheets of U.S. companies and in the pockets of many consumers and investors, and there is the prospect of a more dovish Federal Reserve heading into the second half of 2024. However, we are cautiously watching certain parts of the economy for any hints of weakness, including consumer spending and credit issues. While volatility and uncertainty may affect the markets, we encourage investors to keep a long-term perspective and maintain a diversified portfolio.
We thank you for your continued interest in the Hennessy Funds and are grateful that you have chosen to invest with us. If you have any questions or would like to speak with us directly, please call us at (800) 966-4354.
Best regards,

| |
| |
| |
 |
| Ryan C. Kelley, CFA |
| Chief Investment Officer, |
| Senior Vice President, and Portfolio Manager |
Past performance does not guarantee future results.
Investing involves risk. Principal loss is possible.
Opinions expressed are those of Ryan C. Kelley and are subject to change, are not guaranteed, and should not be considered investment advice.
The Dow Jones Industrial Average and S&P 500® Index are commonly used to measure the performance of U.S. stocks. The Nasdaq Composite Index comprises all common stocks listed on The Nasdaq Stock Market and is commonly used to measure the performance of technology-related stocks. The Nasdaq-100 Index includes 100 of the largest domestic and international non-financial companies listed on The NASDAQ Stock Market based on market capitalization. The indices are used herein for comparative purposes in accordance with SEC regulations. One cannot invest directly in an index. All returns are shown on a total return basis.
| HENNESSY FUNDS | 1-800-966-4354 | |
Performance Overview (Unaudited)
AVERAGE ANNUAL TOTAL RETURN FOR PERIODS ENDED APRIL 30, 2024
| | | Six | One | Five | Ten |
| | | Months(1) | Year
| Years
| Years
|
| | Hennessy Small Cap Financial Fund – | | | | |
| | Investor Class (HSFNX) | 13.23% | 13.34% | 4.40% | 6.08% |
| | Hennessy Small Cap Financial Fund – | | | | |
| | Institutional Class (HISFX) | 13.45% | 13.73% | 4.75% | 6.47% |
| | Russell 2000® Index Financials | 17.48% | 16.73% | 3.44% | 6.68% |
| | Russell 2000® Index | 19.66% | 13.32% | 5.83% | 7.22% |
Expense ratios: 1.63% (Investor Class); 1.30% (Institutional Class)
(1) | Periods of less than one year are not annualized. |
_______________
Performance data quoted represents past performance; past performance does not guarantee future results. The investment return and principal value of an investment will fluctuate so that an investor’s shares, when redeemed, may be worth more or less than their original cost. The performance table does not reflect the deduction of taxes that a shareholder would pay on Fund distributions or the redemption of Fund shares. Current performance of the Fund may be lower or higher than the performance quoted. Performance data current to the most recent month end may be obtained by visiting www.hennessyfunds.com.
The Russell 2000® Index Financials is a subset of the Russell 2000® Index that measures the performance of securities classified in the Financials sector of the small-cap U.S. equity market. The Russell 2000® Index is a subset of the Russell 3000® Index that measures the performance of the small-cap segment of the U.S. equity market. The Russell 2000® Index comprises the smallest 2,000 companies in the Russell 3000® Index based on market capitalization and current index membership, representing approximately 7% of the total market capitalization of the Russell 3000® Index. One cannot invest directly in an index. These indices are used for comparative purposes in accordance with Securities and Exchange Commission regulations.
Frank Russell Company (“Russell”) is the source and owner of the trademarks, service marks, and copyrights related to the Russell Indexes. Russell® is a trademark of Frank Russell Company. Neither Russell nor its licensors accept any liability for any errors or omissions in the Russell Indexes or Russell ratings or underlying data and no party may rely on any Russell Indexes or Russell ratings or underlying data contained in this communication. No further distribution of Russell data is permitted without Russell’s express written consent. Russell does not promote, sponsor, or endorse the content of this communication.
The expense ratios presented are from the most recent prospectus. The expense ratios for the current reporting period are available in the Financial Highlights section of this report.
| PERFORMANCE OVERVIEW/SCHEDULE OF INVESTMENTS |
Financial Statements
Schedule of Investments as of April 30, 2024 (Unaudited) |
HENNESSY SMALL CAP FINANCIAL FUND
(% of Net Assets)
| TOP TEN HOLDINGS (EXCLUDING MONEY MARKET FUNDS) | % NET ASSETS |
| OceanFirst Financial Corp. | 4.95% |
| Banc of California, Inc. | 4.91% |
| BankUnited, Inc. | 4.90% |
| Associated Banc-Corp. | 4.71% |
| WaFd, Inc. | 4.54% |
| HomeTrust Bancshares, Inc. | 4.51% |
| Brookline Bancorp, Inc. | 4.24% |
| Eastern Bankshares, Inc. | 4.21% |
| Banner Corp. | 4.18% |
| Pacific Premier Bancorp, Inc. | 4.12% |
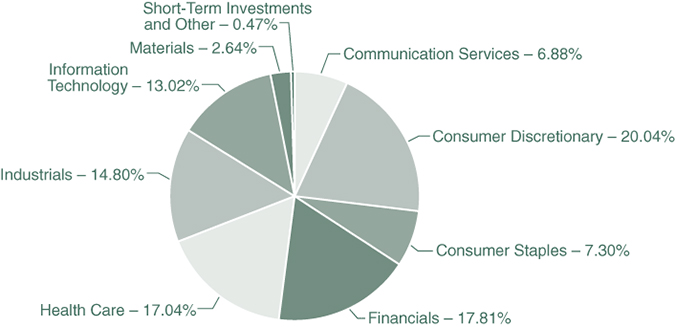
Note: For presentation purposes, the Fund has grouped some of the industry categories. For purposes of categorizing securities for compliance with Section 8(b)(1) of the Investment Company Act of 1940, as amended, the Fund uses more specific industry classifications.
The Global Industry Classification Standard (GICS®) was developed by and is the exclusive property and a service mark of MSCI, Inc. and Standard & Poor’s Financial Services LLC. It has been licensed for use by the Hennessy Funds.
| HENNESSY FUNDS | 1-800-966-4354 | |
| COMMON STOCKS – 94.65% | | Number | | | | | | % of | |
| | | of Shares | | | Value | | | Net Assets | |
| Financials – 94.65% | | | | | | | | | |
| Associated Banc-Corp. | | | 140,000 | | | $ | 2,949,800 | | | | 4.71 | % |
| Banc of California, Inc. | | | 225,000 | | | | 3,080,250 | | | | 4.91 | % |
| BankUnited, Inc. | | | 115,000 | | | | 3,073,950 | | | | 4.90 | % |
| Banner Corp. | | | 60,000 | | | | 2,617,800 | | | | 4.18 | % |
| Brookline Bancorp, Inc. | | | 320,000 | | | | 2,656,000 | | | | 4.24 | % |
| Columbia Banking System, Inc. | | | 55,000 | | | | 1,034,550 | | | | 1.65 | % |
| ConnectOne Bancorp, Inc. | | | 58,000 | | | | 1,038,780 | | | | 1.66 | % |
| Dime Community Bancshares, Inc. | | | 50,000 | | | | 910,000 | | | | 1.45 | % |
| Eastern Bankshares, Inc. | | | 210,000 | | | | 2,637,600 | | | | 4.21 | % |
| First BanCorp. | | | 80,000 | | | | 1,380,000 | | | | 2.20 | % |
| Flushing Financial Corp. | | | 110,000 | | | | 1,212,200 | | | | 1.93 | % |
| Hancock Whitney Corp. | | | 50,000 | | | | 2,269,500 | | | | 3.62 | % |
| HomeStreet, Inc. | | | 165,000 | | | | 2,021,250 | | | | 3.23 | % |
| HomeTrust Bancshares, Inc. | | | 110,000 | | | | 2,827,000 | | | | 4.51 | % |
| Independent Bank Corp. | | | 36,000 | | | | 1,808,640 | | | | 2.89 | % |
| Lakeland Bancorp, Inc. | | | 175,000 | | | | 2,133,250 | | | | 3.40 | % |
| Midland States Bancorp, Inc. | | | 87,500 | | | | 1,916,250 | | | | 3.06 | % |
| NB Bancorp, Inc. (a) | | | 160,000 | | | | 2,339,200 | | | | 3.73 | % |
| Northeast Community Bancorp, Inc. | | | 65,000 | | | | 1,025,700 | | | | 1.64 | % |
| OceanFirst Financial Corp. | | | 210,000 | | | | 3,099,600 | | | | 4.95 | % |
| Old National Bancorp | | | 115,000 | | | | 1,902,100 | | | | 3.03 | % |
| Orange County Bancorp, Inc. | | | 30,809 | | | | 1,331,257 | | | | 2.12 | % |
| Pacific Premier Bancorp, Inc. | | | 120,000 | | | | 2,580,000 | | | | 4.12 | % |
| Southern California Bancorp (a) | | | 119,000 | | | | 1,664,810 | | | | 2.66 | % |
| Texas Capital Bancshares, Inc. (a) | | | 25,000 | | | | 1,435,000 | | | | 2.29 | % |
| The Hingham Institution for Savings | | | 5,500 | | | | 928,950 | | | | 1.48 | % |
| UMB Financial Corp. | | | 8,000 | | | | 637,280 | | | | 1.02 | % |
| WaFd, Inc. | | | 105,000 | | | | 2,844,450 | | | | 4.54 | % |
| Western New England Bancorp, Inc. | | | 416,000 | | | | 2,512,640 | | | | 4.01 | % |
| Wintrust Financial Corp. | | | 15,000 | | | | 1,449,600 | | | | 2.31 | % |
| | | | | | | | 59,317,407 | | | | 94.65 | % |
| Total Common Stocks | | | | | | | | | | | | |
| (Cost $54,334,063) | | | | | | | 59,317,407 | | | | 94.65 | % |
The accompanying notes are an integral part of these financial statements.
| SHORT-TERM INVESTMENTS – 5.52% | | Number | | | | | | % of | |
| | | of Shares | | | Value | | | Net Assets | |
| Money Market Funds – 5.52% | | | | | | | | | |
| First American Government Obligations Fund – Class X, 5.227% (b) | | | 3,192,170 | | | $ | 3,192,170 | | | | 5.09 | % |
| First American Treasury Obligations Fund – Class X, 5.213% (b) | | | 267,623 | | | | 267,623 | | | | 0.43 | % |
| | | | | | | | 3,459,793 | | | | 5.52 | % |
| Total Short-Term Investments | | | | | | | | | | | | |
| (Cost $3,459,793) | | | | | | | 3,459,793 | | | | 5.52 | % |
| | | | | | | | | | | | | |
| Total Investments | | | | | | | | | | | | |
| (Cost $57,793,856) – 100.17% | | | | | | | 62,777,200 | | | | 100.17 | % |
| Liabilities in Excess of Other Assets – (0.17)% | | | | | | | (109,196 | ) | | | (0.17 | )% |
| | | | | | | | | | | | | |
TOTAL NET ASSETS – 100.00% | | | | | | $ | 62,668,004 | | | | 100.00 | % |
Percentages are stated as a percent of net assets.
| (a) | Non-income producing security. |
| (b) | The rate listed is the fund’s seven-day yield as of April 30, 2024. |
Summary of Fair Value Exposure as of April 30, 2024
The following is a summary of the inputs used to value the Fund’s net assets as of April 30, 2024 (see Note 3 in the accompanying Notes to the Financial Statements):
| Common Stocks | | Level 1 | | | Level 2 | | | Level 3 | | | Total | |
| Financials | | $ | 59,317,407 | | | $ | — | | | $ | — | | | $ | 59,317,407 | |
| Total Common Stocks | | $ | 59,317,407 | | | $ | — | | | $ | — | | | $ | 59,317,407 | |
| Short-Term Investments | | | | | | | | | | | | | | | | |
| Money Market Funds | | $ | 3,459,793 | | | $ | — | | | $ | — | | | $ | 3,459,793 | |
| Total Short-Term Investments | | $ | 3,459,793 | | | $ | — | | | $ | — | | | $ | 3,459,793 | |
| Total Investments | | $ | 62,777,200 | | | $ | — | | | $ | — | | | $ | 62,777,200 | |
The accompanying notes are an integral part of these financial statements.
| HENNESSY FUNDS | 1-800-966-4354 | |
(This Page Intentionally Left Blank.)
| STATEMENT OF ASSETS AND LIABILITIES |
Financial Statements
Statement of Assets and Liabilities as of April 30, 2024 (Unaudited) |
| ASSETS: | | | |
| Investments in securities, at value (cost $57,793,856) | | $ | 62,777,200 | |
| Dividends and interest receivable | | | 74,406 | |
| Receivable for fund shares sold | | | 2,051 | |
| Receivable for securities sold | | | 900,508 | |
| Prepaid expenses and other assets | | | 21,447 | |
| Total assets | | | 63,775,612 | |
| | | | | |
| LIABILITIES: | | | | |
| Payable for securities purchased | | | 918,623 | |
| Payable for fund shares redeemed | | | 82,829 | |
| Payable to advisor | | | 47,544 | |
| Payable to administrator | | | 11,446 | |
| Payable to auditor | | | 11,288 | |
| Accrued distribution fees | | | 9,622 | |
| Accrued service fees | | | 4,748 | |
| Accrued trustees fees | | | 5,610 | |
| Accrued expenses and other payables | | | 15,898 | |
| Total liabilities | | | 1,107,608 | |
| NET ASSETS | | $ | 62,668,004 | |
| | | | | |
| NET ASSETS CONSISTS OF: | | | | |
| Capital stock | | $ | 57,788,473 | |
| Total distributable earnings | | | 4,879,531 | |
| Total net assets | | $ | 62,668,004 | |
| | | | | |
| NET ASSETS: | | | | |
| Investor Class | | | | |
| Shares authorized (no par value) | | Unlimited | |
| Net assets applicable to outstanding shares | | $ | 56,412,556 | |
| Shares issued and outstanding | | | 2,558,023 | |
| Net asset value, offering price, and redemption price per share | | $ | 22.05 | |
| | | | | |
| Institutional Class | | | | |
| Shares authorized (no par value) | | Unlimited | |
| Net assets applicable to outstanding shares | | $ | 6,255,448 | |
| Shares issued and outstanding | | | 498,379 | |
| Net asset value, offering price, and redemption price per share | | $ | 12.55 | |
The accompanying notes are an integral part of these financial statements.
| HENNESSY FUNDS | 1-800-966-4354 | |
Financial Statements
Statement of Operations for the six months ended April 30, 2024 (Unaudited) |
| INVESTMENT INCOME: | | | |
Dividend income(1) | | $ | 1,221,411 | |
| Interest income | | | 82,362 | |
| Total investment income | | | 1,303,773 | |
| | | | | |
| EXPENSES: | | | | |
| Investment advisory fees (See Note 5) | | | 313,496 | |
| Sub-transfer agent expenses – Investor Class (See Note 5) | | | 60,094 | |
| Sub-transfer agent expenses – Institutional Class (See Note 5) | | | 4,042 | |
| Distribution fees – Investor Class (See Note 5) | | | 46,816 | |
| Administration, accounting, custody, and transfer agent fees (See Note 5) | | | 37,074 | |
| Service fees – Investor Class (See Note 5) | | | 31,211 | |
| Federal and state registration fees | | | 16,882 | |
| Audit fees | | | 11,284 | |
| Trustees’ fees and expenses | | | 11,274 | |
| Compliance expense (See Note 5) | | | 9,574 | |
| Reports to shareholders | | | 6,620 | |
| Legal fees | | | 1,004 | |
| Other expenses | | | 8,820 | |
| Total expenses | | | 558,191 | |
| NET INVESTMENT INCOME | | $ | 745,582 | |
| | | | | |
| REALIZED AND UNREALIZED GAINS (LOSSES): | | | | |
| Net realized gain on investments | | $ | 2,235,040 | |
| Net change in unrealized appreciation/depreciation on investments | | | 5,588,494 | |
| Net gain on investments | | | 7,823,534 | |
| NET INCREASE IN NET ASSETS RESULTING FROM OPERATIONS | | $ | 8,569,116 | |
(1) | Net of foreign taxes withheld of $4,308. |
The accompanying notes are an integral part of these financial statements.
| STATEMENT OF OPERATIONS/STATEMENTS OF CHANGES IN NET ASSETS |
Financial Statements
| Statements of Changes in Net Assets |
| | | Six Months Ended | | | | |
| | | April 30, 2024 | | | Year Ended | |
| | | (Unaudited) | | | October 31, 2023 | |
| OPERATIONS: | | | | | | |
| Net investment income | | $ | 745,582 | | | $ | 1,551,087 | |
| Net realized gain on investments | | | 2,235,040 | | | | 2,691,655 | |
| Net change in unrealized | | | | | | | | |
| appreciation/depreciation on investments | | | 5,588,494 | | | | (28,455,053 | ) |
| Net increase (decrease) in net assets | | | | | | | | |
| resulting from operations | | | 8,569,116 | | | | (24,212,311 | ) |
| | | | | | | | | |
| DISTRIBUTIONS TO SHAREHOLDERS: | | | | | | | | |
| Distributable earnings – Investor Class | | | (3,164,215 | ) | | | (7,452,661 | ) |
| Distributable earnings – Institutional Class | | | (528,957 | ) | | | (1,876,496 | ) |
| Total distributions | | | (3,693,172 | ) | | | (9,329,157 | ) |
| | | | | | | | | |
| CAPITAL SHARE TRANSACTIONS: | | | | | | | | |
| Proceeds from shares subscribed – Investor Class | | | 2,903,768 | | | | 2,129,827 | |
| Proceeds from shares subscribed – Institutional Class | | | 234,886 | | | | 2,747,009 | |
| Dividends reinvested – Investor Class | | | 3,082,419 | | | | 7,283,862 | |
| Dividends reinvested – Institutional Class | | | 492,770 | | | | 1,825,197 | |
| Cost of shares redeemed – Investor Class | | | (8,514,051 | ) | | | (20,718,495 | ) |
| Cost of shares redeemed – Institutional Class | | | (1,883,517 | ) | | | (11,825,149 | ) |
| Net decrease in net assets | | | | | | | | |
| derived from capital share transactions | | | (3,683,725 | ) | | | (18,557,749 | ) |
| TOTAL INCREASE (DECREASE) IN NET ASSETS | | | 1,192,219 | | | | (52,099,217 | ) |
| | | | | | | | | |
| NET ASSETS: | | | | | | | | |
| Beginning of period | | | 61,475,785 | | | | 113,575,002 | |
| End of period | | $ | 62,668,004 | | | $ | 61,475,785 | |
| | | | | | | | | |
| CHANGES IN SHARES OUTSTANDING: | | | | | | | | |
| Shares sold – Investor Class | | | 118,000 | | | | 86,638 | |
| Shares sold – Institutional Class | | | 16,840 | | | | 172,929 | |
| Shares issued to holders as reinvestment | | | | | | | | |
| of dividends – Investor Class | | | 124,439 | | | | 274,193 | |
| Shares issued to holders as reinvestment | | | | | | | | |
| of dividends – Institutional Class | | | 34,257 | | | | 118,272 | |
| Shares redeemed – Investor Class | | | (358,818 | ) | | | (855,557 | ) |
| Shares redeemed – Institutional Class | | | (134,087 | ) | | | (879,954 | ) |
| Net decrease in shares outstanding | | | (199,369 | ) | | | (1,083,479 | ) |
The accompanying notes are an integral part of these financial statements.
| HENNESSY FUNDS | 1-800-966-4354 | |
Financial Statements
For an Investor Class share outstanding throughout each period
| | | Six Months Ended | |
| | | April 30, 2024 | |
| | | (Unaudited) | |
| PER SHARE DATA: | | | |
| Net asset value, beginning of period | | $ | 20.42 | |
| | | | | |
| Income from investment operations: | | | | |
Net investment income(1) | | | 0.25 | |
| Net realized and unrealized gains (losses) on investments | | | 2.57 | |
| Total from investment operations | | | 2.82 | |
| | | | | |
| Less distributions: | | | | |
| Dividends from net investment income | | | (0.48 | ) |
| Dividends from net realized gains | | | (0.71 | ) |
| Total distributions | | | (1.19 | ) |
| Net asset value, end of period | | $ | 22.05 | |
| | | | | |
| TOTAL RETURN | | | 13.23 | %(2) |
| | | | | |
| SUPPLEMENTAL DATA AND RATIOS: | | | | |
| Net assets, end of period (millions) | | $ | 56.41 | |
| Ratio of expenses to average net assets | | | 1.64 | %(3) |
| Ratio of net investment income to average net assets | | | 2.10 | %(3) |
Portfolio turnover rate(4) | | | 32 | %(2) |
(1) | Calculated using the average shares outstanding method. |
(2) | Not annualized. |
(3) | Annualized. |
(4) | Calculated on the basis of the Fund as a whole. |
The accompanying notes are an integral part of these financial statements.
| FINANCIAL HIGHLIGHTS — INVESTOR CLASS |
| Year Ended October 31, | |
| 2023 | | | 2022 | | | 2021 | | | 2020 | | | 2019 | |
| | | | | | | | | | | | | | |
| $ | 29.47 | | | $ | 31.52 | | | $ | 17.46 | | | $ | 21.60 | | | $ | 21.96 | |
| | | | | | | | | | | | | | | | | | | |
| | | | | | | | | | | | | | | | | | | |
| | 0.43 | | | | 0.22 | | | | 0.25 | | | | 0.16 | | | | 0.10 | |
| | (7.13 | ) | | | (1.96 | ) | | | 14.01 | | | | (3.55 | ) | | | 0.93 | |
| | (6.70 | ) | | | (1.74 | ) | | | 14.26 | | | | (3.39 | ) | | | 1.03 | |
| | | | | | | | | | | | | | | | | | | |
| | | | | | | | | | | | | | | | | | | |
| | (0.19 | ) | | | (0.22 | ) | | | (0.20 | ) | | | (0.09 | ) | | | (0.07 | ) |
| | (2.16 | ) | | | (0.09 | ) | | | — | | | | (0.66 | ) | | | (1.32 | ) |
| | (2.35 | ) | | | (0.31 | ) | | | (0.20 | ) | | | (0.75 | ) | | | (1.39 | ) |
| $ | 20.42 | | | $ | 29.47 | | | $ | 31.52 | | | $ | 17.46 | | | $ | 21.60 | |
| | | | | | | | | | | | | | | | | | | |
| | -24.53 | % | | | -5.60 | % | | | 82.20 | % | | | -16.37 | % | | | 5.27 | % |
| | | | | | | | | | | | | | | | | | | |
| | | | | | | | | | | | | | | | | | | |
| $ | 54.60 | | | $ | 93.40 | | | $ | 140.03 | | | $ | 54.96 | | | $ | 89.36 | |
| | 1.62 | % | | | 1.59 | % | | | 1.58 | % | | | 1.65 | % | | | 1.58 | % |
| | 1.83 | % | | | 0.72 | % | | | 0.90 | % | | | 0.96 | % | | | 0.47 | % |
| | 72 | % | | | 27 | % | | | 28 | % | | | 75 | % | | | 46 | % |
The accompanying notes are an integral part of these financial statements.
| HENNESSY FUNDS | 1-800-966-4354 | |
Financial Statements
For an Institutional Class share outstanding throughout each period
| | | Six Months Ended | |
| | | April 30, 2024 | |
| | | (Unaudited) | |
| PER SHARE DATA: | | | |
| Net asset value, beginning of period | | $ | 11.82 | |
| | | | | |
| Income from investment operations: | | | | |
Net investment income(1) | | | 0.17 | |
| Net realized and unrealized gains (losses) on investments | | | 1.53 | |
| Total from investment operations | | | 1.70 | |
| | | | | |
| Less distributions: | | | | |
| Dividends from net investment income | | | (0.56 | ) |
| Dividends from net realized gains | | | (0.41 | ) |
| Total distributions | | | (0.97 | ) |
| Net asset value, end of period | | $ | 12.55 | |
| | | | | |
| TOTAL RETURN | | | 13.45 | %(2) |
| | | | | |
| SUPPLEMENTAL DATA AND RATIOS: | | | | |
| Net assets, end of period (millions) | | $ | 6.26 | |
| Ratio of expenses to average net assets | | | 1.31 | %(3) |
| Ratio of net investment income to average net assets | | | 2.50 | %(3) |
Portfolio turnover rate(4) | | | 32 | %(2) |
(1) | Calculated using the average shares outstanding method. |
(2) | Not annualized. |
(3) | Annualized. |
(4) | Calculated on the basis of the Fund as a whole. |
The accompanying notes are an integral part of these financial statements.
| FINANCIAL HIGHLIGHTS — INSTITUTIONAL CLASS |
| Year Ended October 31, | |
| 2023 | | | 2022 | | | 2021 | | | 2020 | | | 2019 | |
| | | | | | | | | | | | | | |
| $ | 17.24 | | | $ | 18.57 | | | $ | 10.37 | | | $ | 12.92 | | | $ | 13.28 | |
| | | | | | | | | | | | | | | | | | | |
| | | | | | | | | | | | | | | | | | | |
| | 0.30 | | | | 0.20 | | | | 0.21 | | | | 0.13 | | | | 0.10 | |
| | (4.14 | ) | | | (1.14 | ) | | | 8.26 | | | | (2.10 | ) | | | 0.54 | |
| | (3.84 | ) | | | (0.94 | ) | | | 8.47 | | | | (1.97 | ) | | | 0.64 | |
| | | | | | | | | | | | | | | | | | | |
| | | | | | | | | | | | | | | | | | | |
| | (0.31 | ) | | | (0.34 | ) | | | (0.27 | ) | | | (0.19 | ) | | | (0.18 | ) |
| | (1.27 | ) | | | (0.05 | ) | | | — | | | | (0.39 | ) | | | (0.82 | ) |
| | (1.58 | ) | | | (0.39 | ) | | | (0.27 | ) | | | (0.58 | ) | | | (1.00 | ) |
| $ | 11.82 | | | $ | 17.24 | | | $ | 18.57 | | | $ | 10.37 | | | $ | 12.92 | |
| | | | | | | | | | | | | | | | | | | |
| | -24.32 | % | | | -5.21 | % | | | 82.88 | % | | | -16.05 | % | | | 5.57 | % |
| | | | | | | | | | | | | | | | | | | |
| | | | | | | | | | | | | | | | | | | |
| $ | 6.87 | | | $ | 20.17 | | | $ | 32.08 | | | $ | 10.61 | | | $ | 20.74 | |
| | 1.29 | % | | | 1.22 | % | | | 1.20 | % | | | 1.29 | % | | | 1.23 | % |
| | 2.13 | % | | | 1.13 | % | | | 1.31 | % | | | 1.27 | % | | | 0.84 | % |
| | 72 | % | | | 27 | % | | | 28 | % | | | 75 | % | | | 46 | % |
The accompanying notes are an integral part of these financial statements.
| HENNESSY FUNDS | 1-800-966-4354 | |
Financial Statements
Notes to the Financial Statements April 30, 2024 (Unaudited) |
1). ORGANIZATION
The Hennessy Small Cap Financial Fund (the “Fund”) is a series of Hennessy Funds Trust (the “Trust”), which was organized as a Delaware statutory trust on September 17, 1992. The Fund is an open-end management investment company registered under the Investment Company Act of 1940, as amended. The investment objective of the Fund is capital appreciation. The Fund is a non-diversified fund.
The Fund offers Investor Class and Institutional Class shares. Each class of shares differs principally in its respective 12b-1 distribution and service, shareholder servicing, and sub-transfer agent expenses. There are no sales charges. Each class has identical rights to earnings, assets, and voting privileges, except for class-specific expenses and exclusive rights to vote on matters affecting only one class.
As an investment company, the Fund follows the investment company accounting and reporting guidance of the Financial Accounting Standards Board (the “FASB”) Accounting Standard Codification Topic 946 “Financial Services—Investment Companies.”
2). SIGNIFICANT ACCOUNTING POLICIES
The following is a summary of significant accounting policies consistently followed by the Fund in the preparation of the financial statements. These policies conform to U.S. generally accepted accounting principles (“GAAP”).
| a). | Securities Valuation – All investments in securities are valued in accordance with the Fund’s valuation policies and procedures, as described in Note 3. |
| | |
| b). | Federal Income Taxes – The Fund has elected to be taxed as a regulated investment company and intends to distribute substantially all of its taxable income to its shareholders and otherwise comply with the provisions of the Internal Revenue Code of 1986, as amended, applicable to regulated investment companies. As a result, the Fund has made no provision for federal income taxes or excise taxes. Net investment income/loss and realized gains/losses for federal income tax purposes may differ from those reported in the financial statements because of temporary book-basis and tax-basis differences. Temporary differences are primarily the result of the treatment of wash sales for tax reporting purposes. The Fund recognizes interest and penalties related to income tax benefits, if any, in the Statement of Operations as an income tax expense. Distributions from net realized gains for book purposes may include short-term capital gains, which are included as ordinary income to shareholders for tax purposes. The Fund may utilize equalization accounting for tax purposes and designate earnings and profits, including net realized gains distributed to shareholders on redemption of shares, as part of the dividends paid deduction for income tax purposes. |
| | |
| c). | Accounting for Uncertainty in Income Taxes – The Fund has accounting policies regarding recognition and measurement of tax positions taken or expected to be taken on a tax return. The tax returns of the Fund for the prior three fiscal years are open for examination. The Fund has reviewed all open tax years in major tax jurisdictions and concluded that there is no impact on the Fund’s net assets and no tax liability resulting from unrecognized tax benefits relating to uncertain income tax positions taken or expected to be taken on a tax return. The Fund’s major tax jurisdictions are U.S. federal and Delaware. |
| NOTES TO THE FINANCIAL STATEMENTS |
| d). | Income and Expenses – Dividend income is recognized on the ex-dividend date or as soon as information is available to the Fund. Interest income, which includes the amortization of premium and accretion of discount, is recognized on an accrual basis. Market discounts, original issue discounts, and market premiums on debt securities are accreted or amortized to interest income over the life of a security with a corresponding increase or decrease, as applicable, in the cost basis of such security using the yield-to-maturity method or, where applicable, the first call date of the security. Other non-cash dividends are recognized as investment income at the fair value of the property received. The Fund is charged for those expenses that are directly attributable to its portfolio, such as advisory, administration, and certain shareholder service fees. Income, expenses (other than expenses attributable to a specific class), and realized and unrealized gains/losses on investments are allocated to each class of shares based on such class’s net assets. |
| | |
| e). | Distributions to Shareholders – Dividends from net investment income for the Fund, if any, are declared and paid annually, usually in December. Distributions of net realized capital gains, if any, are declared and paid annually, usually in December. |
| | |
| f). | Security Transactions – Investment and shareholder transactions are recorded on the trade date. The Fund determines the realized gain/loss from an investment transaction by comparing the original cost of the security lot sold with the net sale proceeds. Discounts and premiums on securities purchased are accreted or amortized, respectively, over the life of each such security. |
| | |
| g). | Use of Estimates – Preparing financial statements in accordance with GAAP requires management to make estimates and assumptions that affect the reported amounts of assets and liabilities and disclosure of contingent assets and liabilities at the date of the financial statements, as well as the reported change in net assets during the reporting period. Actual results could differ from those estimates. |
| | |
| h). | Share Valuation – The net asset value (“NAV”) per share of the Fund is calculated by dividing (i) the total value of the securities held by the Fund, plus cash and other assets, minus all liabilities (including estimated accrued expenses) by (ii) the total number of Fund shares outstanding, rounded to the nearest $0.01. Fund shares are not priced on days the New York Stock Exchange is closed for trading. The offering and redemption price per share for the Fund is equal to the Fund’s NAV per share. |
| | |
| i). | Illiquid Securities – Pursuant to Rule 22e-4 under the 1940 Act, the Fund has adopted a Liquidity Risk Management Program (the “Liquidity Program”). The Liquidity Program requires, among other things, that the Fund limit its illiquid investments to no more than 15% of its net assets. An illiquid investment is any investment that the Fund reasonably expects cannot be sold or disposed of by the Fund in current market conditions in seven calendar days or less without the sale or disposition significantly changing the market value of the investment. |
| | |
| j). | Recent Accounting Pronouncements and Regulatory Updates – In October 2022, the Securities and Exchange Commission (“SEC”) adopted a final rule relating to Tailored Shareholder Reports for Mutual Funds and Exchange-Traded Funds (ETFs); Fee Information in Investment Company Advertisements. The rule and form amendments will require mutual funds and ETFs to transmit concise and visually engaging shareholder reports that highlight key information. The amendments also will require that funds tag information in a structured data format. In addition, the rule amendments will require that certain more in-depth information be made available online and available for delivery free of charge to investors on request. The amendments became effective January 24, 2023. There is an 18-month transition period after the effective date of the amendment. |
| HENNESSY FUNDS | 1-800-966-4354 | |
| In June 2022, the FASB issued Accounting Standards Update (“ASU”) 2022-03, Fair Value Measurement (Topic 820): Fair Value Measurement of Equity Securities Subject to Contractual Sale Restrictions. The ASU clarifies that a contractual restriction on the sale of an equity security is not considered part of the unit of account of the equity security and, therefore, is not considered in measuring the fair value. The amendments also require additional disclosures related to equity securities subject to contractual sale restrictions. The ASU is effective for fiscal years beginning after December 15, 2023, and interim periods within those fiscal years. |
3). SECURITIES VALUATION
The Fund follows its valuation policies and procedures in determining its NAV and, in preparing these financial statements, the fair value accounting standards that establish an authoritative definition of fair value and set out a hierarchy for measuring fair value. These standards require additional disclosures about the various inputs and valuation techniques used to develop the measurements of fair value and a discussion of changes in valuation techniques and related inputs during the period. These inputs are summarized in the three broad levels listed below:
| | Level 1 – | Unadjusted, quoted prices in active markets for identical instruments that the Fund has the ability to access at the date of measurement. |
| | | |
| | Level 2 – | Other significant observable inputs other than quoted prices included in Level 1 (including, but not limited to, quoted prices in active markets for similar instruments, quoted prices in markets that are not active for identical or similar instruments, and model-derived valuations in which all significant inputs and significant value drivers are observable in active markets, such as interest rates, prepayment speeds, credit risk curves, default rates, and similar data). |
| | | |
| | Level 3 – | Significant unobservable inputs (including the Fund’s own assumptions about what market participants would use to price the asset or liability based on the best available information) when observable inputs are unavailable. |
The following is a description of the valuation techniques applied to the Fund’s major categories of assets and liabilities on a recurring basis:
| | Equity Securities – Equity securities, including common stocks, preferred stocks, foreign-issued common stocks, exchange-traded funds, closed-end mutual funds, partnerships, rights, and real estate investment trusts, that are traded on a securities exchange for which a last-quoted sales price is readily available generally are valued at the last sales price as reported by the primary exchange on which the securities are listed. Securities listed on The Nasdaq Stock Market (“Nasdaq”) generally are valued at the Nasdaq Official Closing Price, which may differ from the last sales price reported. Securities traded on a securities exchange for which a last-quoted sales price is not readily available generally are valued at the mean between the bid and ask prices. To the extent these securities are actively traded and valuation adjustments are not applied, they are classified in Level 1 of the fair value hierarchy. Securities traded on foreign exchanges generally are not valued at the same time the Fund calculates its NAV because most foreign markets close well before such time. The earlier close of most foreign markets gives rise to the possibility that significant events, including broad market moves, may have occurred in the interim. In certain circumstances, it may be determined that a foreign security needs to be fair valued because it appears that the value of the security might have been materially affected |
| NOTES TO THE FINANCIAL STATEMENTS |
| | by events occurring after the close of the market in which the security is principally traded, but before the time the Fund calculates its NAV, such as by a development that affects an entire market or region (e.g., a weather-related event) or a potentially global development (e.g., a terrorist attack that may be expected to have an effect on investor expectations worldwide). |
| | |
| | Registered Investment Companies – Investments in open-end registered investment companies, commonly referred to as mutual funds, generally are priced at the ending NAV provided by the applicable mutual fund’s service agent and are classified in Level 1 of the fair value hierarchy. |
| | |
| | Debt Securities – Debt securities, including corporate bonds, asset-backed securities, mortgage-backed securities, municipal bonds, U.S. Treasuries, and U.S. government agency issues, are generally valued at market on the basis of valuations furnished by an independent pricing service that utilizes both dealer-supplied valuations and formula-based techniques. The pricing service may consider recently executed transactions in securities of the issuer or comparable issuers, market price quotations (where observable), bond spreads, and fundamental data relating to the issuer. In addition, the model may incorporate observable market data, such as reported sales of similar securities, broker quotes, yields, bids, offers, and reference data. Certain securities are valued primarily using dealer quotations. These securities are generally classified in Level 2 of the fair value hierarchy. |
| | |
| | Short-Term Securities – Short-term equity investments, including money market funds, are valued in the manner specified above for equity securities. Short-term debt investments with an original term to maturity of 60 days or less are valued at amortized cost, which approximates fair market value. If the original term to maturity of a short-term debt investment exceeds 60 days, then the values as of the 61st day prior to maturity are amortized. Amortized cost is not used if its use would be inappropriate due to credit or other impairments of the issuer, in which case the security’s fair value would be determined as described below. Short-term securities are generally classified in Level 1 or Level 2 of the fair value hierarchy depending on the inputs used and market activity levels for specific securities. |
If market quotations are not readily available or if a significant event has occurred that indicates the closing price of a security no longer represents the true value of that security, such security will be valued at its fair value under the Fund’s established fair valuation procedures as implemented by Hennessy Advisors, Inc. (the “Advisor”), the Fund’s valuation designee. The Advisor, as the valuation designee, is subject to the oversight of the Board of Trustees of the Fund (the “Board”). There are numerous criteria considered in determining a fair value of a security, such as the trading volume of a security and markets, the values of other similar securities, and news events with direct bearing on a security or markets. Fair value pricing results in an estimated price for a security that reflects the amount the Fund might reasonably expect to receive in a current sale. Depending on the relative significance of the valuation inputs, these securities may be classified in either Level 2 or Level 3 of the fair value hierarchy. The Advisor will regularly evaluate whether the Fund’s fair value pricing procedures continue to be appropriate in light of the specific circumstances of the Fund and the quality of prices obtained through their application of such procedures.
The fair value of foreign securities may be determined with the assistance of a pricing service using correlations between the movement of prices of such securities and indices of domestic securities and other appropriate indicators, such as closing market prices of
| HENNESSY FUNDS | 1-800-966-4354 | |
relevant American Depositary Receipts or futures contracts. Using fair value pricing means that the Fund’s NAV reflects the affected portfolio securities’ values as determined by the Advisor, instead of being determined by the market. Using a fair value pricing methodology to price a foreign security may result in a value that is different from such foreign security’s most recent closing price and from the value used by other investment companies to calculate their NAVs. Such securities are generally classified in Level 2 of the fair value hierarchy. Because the Fund may invest in foreign securities, the value of the Fund’s portfolio securities may change on days when a shareholder is unable to purchase or redeem Fund shares.
The Fund has performed an analysis of all existing investments to determine the significance and character of all inputs to their fair value determinations. Various inputs are used to determine the value of the Fund’s investments. The inputs or methodology used for valuing securities are not necessarily an indication of the risk associated with investing in those securities. Details related to the fair value hierarchy of the Fund’s securities as of April 30, 2024, are included in the Schedule of Investments.
4). INVESTMENT TRANSACTIONS
Purchases and sales of investment securities (excluding government and short-term investments) for the Fund during the six months ended April 30, 2024, were $21,130,283 and $23,776,869, respectively.
There were no purchases or sales/maturities of long-term U.S. government securities for the Fund during the six months ended April 30, 2024.
5). INVESTMENT ADVISORY FEE AND OTHER TRANSACTIONS WITH AFFILIATES
The Advisor provides the Fund with investment advisory services under an Investment Advisory Agreement. The Advisor furnishes all investment advice, office space, and facilities and most of the personnel needed by the Fund. As compensation for its services, the Advisor is entitled to a monthly fee from the Fund. The fee is based on the average daily net assets of the Fund at an annual rate of 0.90%. The net investment advisory fees expensed by the Fund during the six months ended April 30, 2024, are included in the Statement of Operations.
The Board has approved a Shareholder Servicing Agreement for Investor Class shares of the Fund, which compensates the Advisor for the non-investment advisory services it provides to the Fund. The Shareholder Servicing Agreement provides for a monthly fee paid to the Advisor at an annual rate of 0.10% of the average daily net assets of the Fund attributable to Investor Class shares. The shareholder service fees expensed by the Fund during the six months ended April 30, 2024, are included in the Statement of Operations.
The Fund has adopted a plan pursuant to Rule 12b-1 under the Investment Company Act of 1940, as amended, that authorizes payments in connection with the distribution of Fund shares at an annual rate of up to 0.25% of the Fund’s average daily net assets attributable to Investor Class shares. Even though the authorized rate is up to 0.25%, the Fund is currently only using up to 0.15% of its average daily net assets attributable to Investor Class shares for such purpose. Amounts paid under the plan may be spent on any activities or expenses primarily intended to result in the sale of shares, including, but not limited to, advertising, shareholder account servicing, printing and mailing of prospectuses to other than current shareholders, printing and mailing of sales literature, and compensation for sales and marketing activities or to financial institutions and others, such as dealers and distributors. The distribution fees expensed by the Fund during the six months ended April 30, 2024, are included in the Statement of Operations.
| NOTES TO THE FINANCIAL STATEMENTS |
The Fund has entered into agreements with various brokers, dealers, and financial intermediaries in connection with the sale of Fund shares. The agreements provide for periodic payments of sub-transfer agent expenses by the Fund to the brokers, dealers, and financial intermediaries for providing certain shareholder maintenance services. These shareholder services include the pre-processing and quality control of new accounts, shareholder correspondence, answering customer inquiries regarding account status, and facilitating shareholder telephone transactions. The sub-transfer agent fees expensed by the Fund during the six months ended April 30, 2024, are included in the Statement of Operations.
U.S. Bancorp Fund Services, LLC, d/b/a U.S. Bank Global Fund Services (“Fund Services”) provides the Fund with administrative, accounting, and transfer agent services. As administrator, Fund Services is responsible for activities such as (i) preparing various federal and state regulatory filings, reports, and returns for the Fund, (ii) preparing reports and materials to be supplied to the Board, (iii) monitoring the activities of the Fund’s custodian, transfer agent, and accountants, and (iv) coordinating the preparation and payment of the Fund’s expenses and reviewing the Fund’s expense accruals. U.S. Bank N.A., an affiliate of Fund Services, serves as the Fund’s custodian. The servicing agreements between the Trust, Fund Services, and U.S. Bank N.A. contain a fee schedule that is inclusive of administrative, accounting, custody, and transfer agent fees. The administrative, accounting, custody, and transfer agent fees expensed by the Fund during the six months ended April 30, 2024, are included in the Statement of Operations.
Quasar Distributors, LLC, a wholly owned broker-dealer subsidiary of Foreside Financial Group, LLC, acts as the Fund’s principal underwriter in a continuous public offering of Fund shares.
The officers of the Fund are affiliated with the Advisor. With the exception of the Chief Compliance Officer, such officers receive no compensation from the Fund for serving in their respective roles. The Fund, along with the other funds in the Hennessy Funds family (collectively, the “Hennessy Funds”), makes reimbursement payments on an equal basis to the Advisor for a portion of the salary and benefits associated with the office of the Chief Compliance Officer. The compliance fees expensed by the Fund during the six months ended April 30, 2024, for reimbursement payments to the Advisor are included in the Statement of Operations.
6). GUARANTEES AND INDEMNIFICATIONS
Under the Hennessy Funds’ organizational documents, their officers and trustees are indemnified by the Hennessy Funds against certain liabilities arising out of the performance of their duties to the Hennessy Funds. Additionally, in the normal course of business, the Hennessy Funds enter into contracts with service providers that contain general indemnification clauses. The Fund’s maximum exposure under these arrangements is unknown as this would involve future claims that may be made against the Fund that have not yet occurred. Currently, the Fund expects the risk of loss to be remote.
7). LINE OF CREDIT
The Fund has an uncommitted line of credit with the other Hennessy Funds in the amount of the lesser of (i) $100,000,000 or (ii) 33.33% of each Hennessy Fund’s net assets, or 30% for the Hennessy Gas Utility Fund, the Hennessy Japan Fund, and the Hennessy Japan Small Cap Fund and 10% for the Hennessy Balanced Fund. The line of credit is intended to provide any necessary short-term financing in connection with shareholder redemptions, subject to certain restrictions. The credit facility is with the Hennessy Funds’ custodian bank, U.S. Bank N.A. Borrowings under this arrangement bear
| HENNESSY FUNDS | 1-800-966-4354 | |
interest at the bank’s prime rate and are secured by all of the Fund’s assets (as to its own borrowings only). During the six months ended April 30, 2024, the Fund did not have any borrowings outstanding under the line of credit.
8). FEDERAL TAX INFORMATION
As of October 31, 2023, the Fund’s most recent fiscal year end, the components of accumulated earnings (losses) for income tax purposes were as follows:
| | | | Investments | |
| | Cost of investments for tax purposes | | $ | 64,777,154 | |
| | Gross tax unrealized appreciation | | $ | 7,591,484 | |
| | Gross tax unrealized depreciation | | | (10,505,804 | ) |
| | Net tax unrealized appreciation/(depreciation) | | $ | (2,914,320 | ) |
| | Undistributed ordinary income | | $ | 807,532 | |
| | Undistributed long-term capital gains | | | 2,110,375 | |
| | Total distributable earnings | | $ | 2,917,907 | |
| | Other accumulated gain/(loss) | | $ | — | |
| | Total accumulated gain/(loss) | | $ | 3,587 | |
The difference between book-basis unrealized appreciation/depreciation and tax-basis unrealized appreciation/depreciation (as shown above) is attributable primarily to wash sales.
As of October 31, 2023, the Fund had no tax-basis capital losses to offset future capital gains.
As of October 31, 2023, the Fund did not defer, on a tax basis, any late-year ordinary losses. Late-year ordinary losses are net ordinary losses incurred after December 31, 2022, but within the taxable year, that are deemed to arise on the first day of the Fund’s next taxable year.
During fiscal year 2024 (year to date) and fiscal year 2023, the tax character of distributions paid by the Fund was as follows:
| | | | Six Months Ended | | | Year Ended | |
| | | | April 30, 2024 | | | October 31, 2023 | |
| | Ordinary income(1) | | $ | 1,582,796 | | | $ | 995,722 | |
| | Long-term capital gains | | | 2,110,376 | | | | 8,333,435 | |
| | Total distributions | | $ | 3,693,172 | | | $ | 9,329,157 | |
| | | | | | | | | | |
| | (1) Ordinary income includes short-term capital gains. | | | | | | | | |
9). GLOBAL EVENTS
A rise in protectionist trade policies, the possibility of a national or global recession, risks associated with pandemic and epidemic diseases, trade tensions, the possibility of changes to some international trade agreements, political events, and continuing political tension and armed conflicts may adversely impact financial markets and the broader economy. For example, ongoing armed conflicts between Ukraine and Russia in Europe and among Israel, Hamas, and other militant groups in the Middle East have caused and could continue to cause significant market disruptions and volatility with the markets in Europe and the Middle East, and have had negative impacts on markets in the United States. These events could also have negative effects on the Fund’s investments that cannot be foreseen at the present time. As global systems, economies and financial markets are
| NOTES TO THE FINANCIAL STATEMENTS |
increasingly interconnected, events that once had only local impact are now more likely to have regional or even global effects. Events that occur in one country, region or financial market will, more frequently, adversely impact issuers in other countries, regions, or markets. These impacts can be exacerbated by failures of governments and societies to adequately respond to an emerging event or threat. Your investment would be negatively impacted if the value of your portfolio holdings decreases as a result of such events, if these events adversely impact the operations and effectiveness of the Advisor or other key service providers or if these events disrupt systems and processes necessary or beneficial to the management of accounts. These events may negatively impact broad segments of businesses and populations and could have a significant and rapid negative impact on the performance of the Fund’s investments, increase the Fund’s volatility, or exacerbate pre-existing risks to the Fund.
10). EVENTS SUBSEQUENT TO PERIOD END
Management has evaluated the Fund’s related events and transactions that occurred subsequent to April 30, 2024, through the date of issuance of the Fund’s financial statements. Management has determined that there were no subsequent events requiring recognition or disclosure in the financial statements.
| HENNESSY FUNDS | 1-800-966-4354 | |
Expense Example (Unaudited)
April 30, 2024
As a shareholder of the Fund, you incur ongoing costs, including management fees, service fees, and other Fund expenses. This Example is intended to help you understand your ongoing costs (in dollars) of investing in the Fund and to compare these costs with the ongoing costs of investing in other investment funds. The Example is based on an investment of $1,000 invested at the beginning of the period and held for the entire period from November 1, 2023, through April 30, 2024.
Actual Expenses
In the table below, the first line under each of the “Investor Class” and “Institutional Class” headings provides information about actual account values and actual expenses for each share class. You may use this information, together with the amount you invested, to estimate the expenses that you paid over the period. Simply divide your account value by $1,000 (for example, an $8,600 account value divided by $1,000 = 8.6), then multiply the result by the number in the first line under the heading “Expenses Paid During Period” to estimate the expenses you paid on your account during this period. Although the Fund charges no sales loads or transaction fees, you will be assessed fees for outgoing wire transfers, returned checks, and stop payment orders at prevailing rates charged by U.S. Bank Global Fund Services, the Fund’s transfer agent. If you request that a redemption be made by wire transfer, the Fund’s transfer agent charges a $15 fee. IRAs are charged a $15 annual maintenance fee (up to $30 maximum per shareholder for shareholders with multiple IRAs). The examples below include, but are not limited to, management, shareholder servicing, accounting, custody, and transfer agent fees. However, the examples below do not include portfolio trading commissions and related expenses.
Hypothetical Example for Comparison Purposes
In the table below, the second line under each of the “Investor Class” and “Institutional Class” headings provides information about hypothetical account values and hypothetical expenses based on the Fund’s actual expense ratio for each share class and an assumed rate of return of 5% per year before expenses, which is not the Fund’s actual return for such share class. The hypothetical account values and expenses may not be used to estimate the actual ending account balance or expenses you paid for the period. You may use this information to compare the ongoing costs of investing in the Fund and other funds. To do so, compare these 5% hypothetical examples with the 5% hypothetical examples that appear in the shareholder reports of the other funds. Please note that the expenses shown in the table are meant to highlight your ongoing costs only. Therefore, the second lines under “Investor Class” and “Institutional Class” are useful in comparing ongoing costs only and will not help you determine the relative total costs of owning different funds.
| | Beginning | Ending | |
| | Account Value | Account Value | Expenses Paid |
| | November 1, 2023 | April 30, 2024
| During Period(1) |
| Investor Class | | | |
| Actual | $1,000.00 | $1,132.30 | $8.69 |
| Hypothetical (5% return before expenses) | $1,000.00 | $1,016.71 | $8.22 |
| | | | |
| Institutional Class | | | |
| Actual | $1,000.00 | $1,134.50 | $6.95 |
| Hypothetical (5% return before expenses) | $1,000.00 | $1,018.35 | $6.57 |
(1) | Expenses are equal to the Fund’s annualized expense ratio of 1.64% for Investor Class shares or 1.31% for Institutional Class shares, as applicable, multiplied by the average account value over the period, multiplied by 182/366 days (to reflect the half-year period). |
| HENNESSY FUNDS | 1-800-966-4354 | |
How to Obtain a Copy of the Fund’s Proxy
Voting Policy and Proxy Voting Records
A description of the policies and procedures the Fund uses to determine how to vote proxies relating to portfolio securities is available without charge (1) by calling 800-966-4354, (2) on the Hennessy Funds’ website at www.hennessyfunds.com/proxy-voting/voting-policy, or (3) on the U.S. Securities and Exchange Commission’s (the “SEC”) website at www.sec.gov. The Fund’s proxy voting record is available without charge on both the Hennessy Funds’ website at www.hennessyfunds.com/proxy-voting/voting-record and the SEC’s website at www.sec.gov no later than August 31 for the prior 12 months ending June 30.
Availability of Quarterly Portfolio Schedule
The Fund files a complete schedule of portfolio holdings with the SEC for the first and third quarters of each fiscal year as an exhibit to its reports on Form N-PORT. The Fund’s Form N-PORT reports are available on the SEC’s website at www.sec.gov or on request by calling 800-966-4354.
Federal Tax Distribution Information (Unaudited)
For fiscal year 2023, certain dividends paid by the Fund may be subject to a maximum tax rate of 23.8%, as provided for by the Jobs and Growth Tax Relief Reconciliation Act of 2003. The percentage of dividends declared from ordinary income designated as qualified dividend income was 100.00%.
For corporate shareholders, the percent of ordinary income distributions that qualified for the corporate dividends received deduction for fiscal year 2023 was 100.00%.
The percentage of taxable ordinary income distributions that were designated as short-term capital gain distributions under Section 871(k)(2)(C) of the Internal Revenue Code of 1986, as amended, for the Fund was 0.00%.
Important Notice Regarding Delivery
of Shareholder Documents
To help keep the Fund’s costs as low as possible, we generally deliver a single copy of shareholder reports, proxy statements, and prospectuses to shareholders who share an address and have the same last name. This process does not apply to account statements. You may request an individual copy of a shareholder document at any time. If you would like to receive separate mailings of shareholder documents, please call U.S. Bank Global Fund Services at 800-261-6950 or 414-765-4124, and individual delivery will begin within 30 days of your request. If your account is held through a financial institution or other intermediary, please contact such intermediary directly to request individual delivery.
Go Paperless with eDelivery
The SEC has adopted new regulations that will impact the design and delivery of future Semi-Annual and Annual Reports. Beginning with the 2024 Annual Reports, paper copies will be mailed to you unless you have opted for electronic delivery of the reports. We encourage all direct shareholders to sign up to receive all notices, account statements, prospectuses, tax forms, and shareholder reports electronically to help reduce expenses and the volume of paper U.S. mail received. To sign up for eDelivery or to change your delivery preference, please visit www.hennessyfunds.com/account.
If you hold your Fund shares through a financial intermediary, please contact your financial intermediary regarding electronic delivery options.
Subscribe to receive our team’s unique market and sector insights delivered to your inbox
www.hennessyfunds.com/subscribe
Follow us on social media
| PROXY VOTING — BOARD APPROVAL OF INVESTMENT ADVISORY AGREEMENT |
Board Approval of Investment Advisory
Agreement
At its meeting on March 6, 2024, the Board of Trustees of the Fund (the “Board,” and the members thereof, the “Trustees”) unanimously approved the continuation of the investment advisory agreement of the Fund with Hennessy Advisors, Inc. (the “Advisor”). As part of the process, the Trustees reviewed their fiduciary duties and the relevant factors for them to consider with respect to approving the advisory agreement. In addition, the Trustees who are not deemed interested persons (as defined by the Investment Company Act of 1940, as amended) of the Fund (the “Independent Trustees”) met in executive session to discuss the approval of the advisory agreement. As part of their discussion, the Independent Trustees confirmed their understanding of the need to have asked about, and received answers to, any matters that they believed are relevant to determining whether to approve the continuation of the advisory and sub-advisory agreements.
In advance of the meeting, the Advisor sent detailed information to the Trustees to assist them in their evaluation of the advisory agreement. This information included, but was not limited to, the following:
| | (1) | A memorandum from outside legal counsel that described the fiduciary duties of the Board with respect to approving the continuation of the advisory agreement and the relevant factors for consideration; |
| | | |
| | (2) | A memorandum from the Advisor that listed the factors relevant to the Board’s approval of the continuation of the advisory agreement and also referenced the documents that had been provided to help the Board assess each such factor; |
| | | |
| | (3) | A summary of the advisory agreement; |
| | | |
| | (4) | The Advisor’s financial statements from its most recent Form 10-K and Form 10-Q, which included information about the Advisor’s profitability; |
| | | |
| | (5) | A recent Fund fact sheet, which included, among other things, Fund performance over various periods; |
| | | |
| | (6) | A description of the range of services provided by the Advisor and the distinction between the Advisor-provided services and the Sub-Advisor-provided services; |
| | | |
| | (7) | A peer expense comparison of the net expense ratio and investment advisory fee of the Fund; and |
| | | |
| | (8) | A memorandum from the Advisor regarding economies of scale. |
All of the factors discussed were considered as a whole by the Trustees, as well as by the Independent Trustees meeting in executive session. The Trustees viewed the relevant factors in their totality, with no single factor being the principal or determinative factor in the Trustees’ determination of whether to approve the continuation of the advisory agreement. The Trustees recognized that the management and fee arrangements for the Fund are the result of years of review and discussion between the Independent Trustees and the Advisor, that certain aspects of such arrangements may receive greater scrutiny in some years than in others, and that the Trustees’ conclusions may be based, in part, on their consideration of these same arrangements and information received during the course of the year and in prior years.
| HENNESSY FUNDS | 1-800-966-4354 | |
Prior to approving the continuation of the advisory agreement, the Trustees, including the Independent Trustees in executive session, considered, among other items:
| | (1) | The nature and quality of the advisory services provided by the Advisor; |
| | | |
| | (2) | A comparison of the fees and expenses of the Fund to other similar funds; |
| | | |
| | (3) | Whether economies of scale are recognized by the Fund; |
| | | |
| | (4) | The costs and profitability of the Fund to the Advisor; |
| | | |
| | (5) | The performance of the Fund; and |
| | | |
| | (6) | Any benefits to the Advisor from serving as an investment advisor to the Fund (other than the advisory fee). |
The material considerations and determinations of the Trustees, including the Independent Trustees, were as follows:
| | (1) | The Trustees considered the services identified below that are provided by the Advisor. Based on this review and an assessment of the Advisor’s performance, the Trustees concluded that the Advisor provides high-quality services to the Fund, and they noted that their overall confidence in the Advisor was high. The Trustees also concluded that they were satisfied with the nature, extent, and quality of the advisory services provided to the Fund by the Advisor and that the nature and extent of the services provided by the Advisor were appropriate to assure that the Fund’s operations are conducted in compliance with applicable laws, rules, and regulations. |
| | | (a) | The Advisor acts as the portfolio manager for the Fund. In this capacity, the Advisor does the following: |
| | | | (i) | manages the composition of the Fund’s portfolio, including the purchase, retention, and disposition of portfolio securities in accordance with the Fund’s investment objectives, policies, and restrictions; |
| | | | | |
| | | | (ii) | seeks best execution for the Fund’s portfolio; |
| | | | | |
| | | | (iii) | manages the use of soft dollars for the Fund; and |
| | | | | |
| | | | (iv) | manages proxy voting for the Fund. |
| | | (b) | The Advisor performs a daily reconciliation of portfolio positions and cash for the Fund. |
| | | | |
| | | (c) | The Advisor monitors the liquidity of the Fund. |
| | | | |
| | | (d) | The Advisor monitors the Fund’s compliance with its investment objectives and restrictions and federal securities laws. |
| | | | |
| | | (e) | The Advisor maintains a compliance program (including a code of ethics), conducts ongoing reviews of the compliance programs of the Fund’s service providers (including their codes of ethics, as appropriate), conducts on-site visits to the Fund’s service providers, as feasible, monitors incidents of abusive trading practices, reviews Fund expense accruals, payments, and fixed expense ratios, evaluates insurance providers for fidelity bond, D&O/E&O insurance, and cybersecurity insurance coverage, manages regulatory examination compliance and responses, conducts employee compliance training, reviews reports provided by service providers, and maintains books and records. |
| BOARD APPROVAL OF INVESTMENT ADVISORY AGREEMENT |
| | | (f) | The Advisor oversees service providers that provide accounting, administration, distribution, transfer agency, custodial, sales, marketing, public relations, audit, information technology, and legal services to the Fund. |
| | | | |
| | | (g) | The Advisor maintains in-house marketing and distribution departments on behalf of the Fund. |
| | | | |
| | | (h) | The Advisor prepares or directs the preparation of all regulatory filings for the Fund, including writing and annually updating the Fund’s prospectus and related documents. |
| | | | |
| | | (i) | For each annual report of the Fund, the Advisor prepares a written summary of the Fund’s performance during the most recent 12-month period. |
| | | | |
| | | (j) | The Advisor oversees distribution of the Fund through third-party broker/dealers and independent financial institutions such as Charles Schwab, Inc., Fidelity, TD Ameritrade, and Pershing. The Advisor participates in no-transaction fee (“NTF”) programs with these companies on behalf of the Fund, which allow customers to purchase the Fund through third-party distribution channels without paying a transaction fee. The Advisor compensates, in part, a number of these third-party providers of NTF programs out of its own revenues. |
| | | | |
| | | (k) | The Advisor pays the incentive compensation of the Fund’s compliance officer and employs other staff, such as legal, marketing, national accounts, distribution, sales, administrative, and trading oversight personnel, as well as management executives. |
| | | | |
| | | (l) | The Advisor provides a quarterly compliance certification to the Board. |
| | | | |
| | | (m) | The Advisor prepares or reviews all Board materials, presents to and leads discussions with the Board, prepares or reviews all meeting minutes, and arranges for Board training and education. |
| | (2) | The Trustees compared the performance of the Fund to benchmark indices over various periods and noted that the Trustees review and discuss reports comparing the investment performance of the Fund to various indices at each quarterly Board meeting. Based on such information, the Trustees determined that the Advisor manages the Fund in a manner materially consistent with its stated investment objective and style. The Trustees concluded that the performance of the Fund over various periods warranted the continuation of the advisory agreement. |
| | | |
| | (3) | The Trustees reviewed the advisory fees and overall expense ratios of the Fund compared to other funds similar in asset size and investment objective to the Fund using data from Morningstar. As part of the discussion with management, the Trustees ensured that they understood and were comfortable with the criteria used to determine the funds included in the Morningstar categories for purposes of the materials considered at the meeting. The Trustees determined that the advisory fee and overall expense ratio of the Fund falls within a reasonable range of the advisory fees and overall expense ratios of other comparable funds and concluded that they are reasonable and warranted continuation of the advisory agreement. |
| HENNESSY FUNDS | 1-800-966-4354 | |
| | (4) | The Trustees also considered whether the Advisor was realizing economies of scale that should be shared with the Fund’s shareholders. The Trustees noted that many of the expenses incurred to manage the Fund are variable asset-based fees, so the Advisor does not realize material economies of scale relating to these expenses as the assets of the Fund increase. For example, third-party platform fees increase as a fund’s assets grow. |
| | | |
| | (5) | The Trustees considered the profitability of the Advisor, including the impact of platform fees on the Advisor’s profitability, and also considered the resources and revenues that the Advisor has put into managing and distributing the Fund. The Trustees then concluded that the profits of the Advisor are reasonable and not excessive when compared to profitability guidelines set forth in relevant court cases. |
| | | |
| | (6) | The Trustees considered the high level of professionalism and knowledge of the Advisor’s employees and concluded that this was beneficial to the Fund and its shareholders. |
| | | |
| | (7) | The Trustees considered any benefits to the Advisor from serving as an advisor to the Fund (other than the advisory fee). The Trustees noted that the Advisor may derive ancillary benefits from, by way of example, its association with the Fund in the form of proprietary and third-party research products and services received from broker-dealers that execute portfolio trades for the Fund. The Trustees determined that any such products and services have been used for legitimate purposes relating to the Fund by providing assistance in the investment decision-making process. The Trustees concluded that any additional benefits realized by the Advisor from its relationship with the Fund were reasonable, which was based on, among other things, the Trustees’ finding that the research, analytical, statistical, and other information and services provided by brokers are merely supplemental to the Advisor’s own efforts in the performance of its duties under the advisory agreement. |
After reviewing the materials and information provided at the meeting, as well as other information regularly provided at the Board’s quarterly meetings throughout the year regarding the quality of services provided by the Advisor, the performance of the Fund, expense information, brokerage commissions information, the adequacy and efficacy of the Advisor’s written policies and procedures, other regulatory compliance issues, trading information and related matters, and other factors that the Trustees deemed relevant, the Trustees, including the Independent Trustees, approved the continuation of the advisory agreement.
| BOARD APPROVAL OF INVESTMENT ADVISORY AGREEMENT |
(This Page Intentionally Left Blank.)
For information, questions, or assistance, please call
The Hennessy Funds
800-966-4354 or 415-899-1555
INVESTMENT ADVISOR
Hennessy Advisors, Inc.
7250 Redwood Boulevard, Suite 200
Novato, California 94945
ADMINISTRATOR,
TRANSFER AGENT,
DIVIDEND PAYING AGENT, &
SHAREHOLDER SERVICING AGENT
U.S. Bancorp Fund Services, LLC
d/b/a U.S. Bank Global Fund Services
P.O. Box 701
Milwaukee, Wisconsin 53201-0701
CUSTODIAN
U.S. Bank N.A.
Custody Operations
1555 North River Center Drive, Suite 302
Milwaukee, Wisconsin 53212
TRUSTEES
Neil J. Hennessy
Robert T. Doyle
J. Dennis DeSousa
Doug Franklin
Claire Garvie
Gerald P. Richardson
COUNSEL
Foley & Lardner LLP
777 East Wisconsin Avenue
Milwaukee, Wisconsin 53202-5306
INDEPENDENT REGISTERED
PUBLIC ACCOUNTING FIRM
Tait, Weller & Baker LLP
Two Liberty Place
50 South 16th Street, Suite 2900
Philadelphia, Pennsylvania 19102-2529
DISTRIBUTOR
Quasar Distributors, LLC
Three Canal Plaza, Suite 100
Portland, Maine 04101
www.hennessyfunds.com | 800-966-4354
This report has been prepared for shareholders and may be distributed to
others only if preceded or accompanied by a current prospectus.

SEMI-ANNUAL REPORT
APRIL 30, 2024
HENNESSY TECHNOLOGY FUND
Investor Class HTECX
Institutional Class HTCIX
www.hennessyfunds.com | 1-800-966-4354
(This Page Intentionally Left Blank.)
Contents
| Letter to Shareholders | | 2 |
| Performance Overview | | 4 |
| Financial Statements | | |
| Schedule of Investments | | 5 |
| Statement of Assets and Liabilities | | 9 |
| Statement of Operations | | 10 |
| Statements of Changes in Net Assets | | 11 |
| Financial Highlights | | 12 |
| Notes to the Financial Statements | | 16 |
| Expense Example | | 26 |
| Proxy Voting Policy and Proxy Voting Records | | 28 |
| Availability of Quarterly Portfolio Schedule | | 28 |
| Federal Tax Distribution Information | | 28 |
| Important Notice Regarding Delivery of Shareholder Documents | | 28 |
| Go Paperless with eDelivery | | 28 |
| Board Approval of Investment Advisory Agreement | | 29 |
The Securities and Exchange Commission has adopted new regulations that will impact the design and delivery of future Semi-Annual and Annual Reports. Beginning with the 2024 Annual Reports, paper copies will be mailed to you unless you have opted for electronic delivery of the report. See Go Paperless with eDelivery for instructions about how to sign up for electronic delivery.
| HENNESSY FUNDS | 1-800-966-4354 | |
May 2024
Dear Hennessy Funds Shareholder:
Market Highs, Uncertainties & Opportunities
As I write this semi-annual letter, the three major market indexes have hit all-time highs. We are enjoying robust returns in the U.S. across all sectors and several asset classes. We also understand that markets are driven by optimism. As markets hover at or near record highs, often uncertainty, risk, and volatility creep in. Have we gone too far, too fast? Is the market overvalued? What if the unexpected happens and sentiment turns in the other direction? There will always be uncertainties and unknowns, and that is why we remain steadfast in sticking to a consistent and focused investment style through every part of a market cycle, which we believe will perform well over the long term.
Given the unpredictable nature of the stock market, we encourage a sensible approach to investing. We can consider certain well-known adages and try to prove them, in exact terms, but we may find that there is no silver bullet in investing. “Sell in May and stay away.” “The trend is your friend.” “Expect increased volatility before a presidential election, followed by an up market through year end.” These tips for investing can be based on statistical correlations, some stronger and some weaker, but none are correct all the time. In investing, we want to avoid following pseudo-rules that are not always true; “60% of the time, it works every time” is not strong enough. All this to say, investing is full of risks, the market is full of uncertainties, and investors should be wary of investing silver bullets.
At Hennessy, we understand the uncertainty inherent in all investing, but we also understand that without uncertainty, there would not be opportunity. Our portfolio managers (PMs) have many years of experience (over 26 years average for all our PMs combined), and each of them apply their experience to investing for the long term to attempt to mitigate risk. Investors can mitigate risk in their own portfolios as well, by staying diversified, avoiding highly speculative investments, not chasing performance, not trying to time the market, and staying invested over longer periods. Most important of all, though, is having realistic expectations for your own level of risk tolerance.
While uncertainty and opportunities persist in any market, the past six-month period has been an overall positive period for many investors and for the stock market overall. For the six months ended April 30, 2024, all three broad-based indexes were positive with the Dow Jones Industrial Average up 15.58%, the S&P 500® Index up 20.98%, and the Nasdaq Composite Index up 22.31%. Robust performance was broad based. In fact, the dispersion of returns was relatively low across all market cap sizes and all GICS sectors, with the highest being Financials (+25.92% for the S&P 500® Financials Sector Index) and the lowest being Real Estate (+11.24% for the S&P 500® Real Estate Sector Index).
Several factors contributed to the strong, broad-based returns in the market. We believe the two most important of those factors were continued signs of a strong economy and solid corporate earnings. Although the market does not expect more than one or two rate decreases in 2024, fear of a recession due to the Federal Reserve’s rate hiking cycle seems to have abated slightly. Consumer demand and spending remain resilient, wages continue to increase, and unemployment numbers remain historically low. For most of the period, inflation expectations remained relatively low, although data in the later part of the period was somewhat higher than anticipated.
Like the overall market, our funds experienced strong results. All 17 of our funds posted positive returns during the six months ended April 30, 2024. Given that growth outperformed value and that many of our funds are value oriented, only seven Hennessy Funds outperformed their primary benchmarks. However, we continue to focus on providing attractive returns for our shareholders over a complete market cycle, and we are pleased that all but five of our funds have posted positive returns over one-, three-, five-, and ten-year periods ended April 30, 2024, with the remaining five funds posting positive returns over the one-, five-, and ten-year (but not three-year) periods ended April 30, 2024.
We believe that the outlook for U.S. stocks remains positive, primarily because we believe that the Federal Reserve will eventually begin to lower interest rates. Despite the recent up-tick, inflation has shown signs of easing, creating a better environment for consumers as well as businesses. The unemployment rate is still near record lows, there are elevated levels of cash on the balance sheets of U.S. companies and in the pockets of many consumers and investors, and there is the prospect of a more dovish Federal Reserve heading into the second half of 2024. However, we are cautiously watching certain parts of the economy for any hints of weakness, including consumer spending and credit issues. While volatility and uncertainty may affect the markets, we encourage investors to keep a long-term perspective and maintain a diversified portfolio.
We thank you for your continued interest in the Hennessy Funds and are grateful that you have chosen to invest with us. If you have any questions or would like to speak with us directly, please call us at (800) 966-4354.
Best regards,
| |
| |
| |
|
| Ryan C. Kelley, CFA |
| Chief Investment Officer, |
| Senior Vice President, and Portfolio Manager |
Past performance does not guarantee future results.
Investing involves risk. Principal loss is possible.
Opinions expressed are those of Ryan C. Kelley and are subject to change, are not guaranteed, and should not be considered investment advice.
The Dow Jones Industrial Average and S&P 500® Index are commonly used to measure the performance of U.S. stocks. The Nasdaq Composite Index comprises all common stocks listed on The Nasdaq Stock Market and is commonly used to measure the performance of technology-related stocks. The Nasdaq-100 Index includes 100 of the largest domestic and international non-financial companies listed on The NASDAQ Stock Market based on market capitalization. The indices are used herein for comparative purposes in accordance with SEC regulations. One cannot invest directly in an index. All returns are shown on a total return basis.
| HENNESSY FUNDS | 1-800-966-4354 | |
Performance Overview (Unaudited)
AVERAGE ANNUAL TOTAL RETURN FOR PERIODS ENDED APRIL 30, 2024
| | | Six | One | Five | Ten |
| | | Months(1) | Year
| Years
| Years
|
| | Hennessy Technology Fund – | | | | |
| | Investor Class (HTECX) | 20.37% | 28.64% | 10.53% | 11.25% |
| | Hennessy Technology Fund – | | | | |
| | Institutional Class (HTCIX) | 20.54% | 28.97% | 10.82% | 11.56% |
| | Nasdaq Composite Index | 22.31% | 29.08% | 15.07% | 15.44% |
| | S&P 500® Index | 20.98% | 22.66% | 13.19% | 12.41% |
| Expense ratios: | Gross 3.17%, Net 1.23%(2)(3) (Investor Class); |
| | Gross 2.85%, Net 0.98%(2)(3) (Institutional Class) |
(1) | Periods of less than one year are not annualized. |
(2) | The Fund’s investment advisor has contractually agreed to limit expenses until February 28, 2025. |
(3) | Certain service provider expenses will be voluntarily waived through July 31, 2025, at which time the arrangement will automatically terminate. In addition, the arrangement will not apply at any time the Fund’s net assets exceed $125 million. |
_______________
Performance data quoted represents past performance; past performance does not guarantee future results. The investment return and principal value of an investment will fluctuate so that an investor’s shares, when redeemed, may be worth more or less than their original cost. The performance table does not reflect the deduction of taxes that a shareholder would pay on Fund distributions or the redemption of Fund shares. Current performance of the Fund may be lower or higher than the performance quoted. Performance data current to the most recent month end may be obtained by visiting www.hennessyfunds.com.
The Nasdaq Composite Index is a broad-based capitalization-weighted index of all common stocks listed on The Nasdaq Stock Market LLC. The S&P 500® Index is a capitalization-weighted index that is designed to represent the broad domestic economy through changes in the aggregate market value of 500 stocks across all major industries. One cannot invest directly in an index. These indices are used for comparative purposes in accordance with Securities and Exchange Commission regulations.
Standard & Poor’s Financial Services is the source and owner of the S&P® and S&P 500® trademarks.
The expense ratios presented are from the most recent prospectus. The expense ratios for the current reporting period are available in the Financial Highlights section of this report.
| PERFORMANCE OVERVIEW/SCHEDULE OF INVESTMENTS |
Financial Statements
Schedule of Investments as of April 30, 2024 (Unaudited) |
HENNESSY TECHNOLOGY FUND
(% of Net Assets)
| TOP TEN HOLDINGS (EXCLUDING MONEY MARKET FUNDS) | % NET ASSETS |
| Palo Alto Networks, Inc. | 1.78% |
| Bentley Systems, Inc., Class B | 1.73% |
| NXP Semiconductors NV | 1.72% |
| Texas Instruments, Inc. | 1.71% |
| Vishay Intertechnology, Inc. | 1.70% |
| Arlo Technologies, Inc. | 1.69% |
| Methode Electronics, Inc. | 1.68% |
| CommVault Systems, Inc. | 1.68% |
| Microchip Technology, Inc. | 1.67% |
| Apple, Inc. | 1.66% |
Note: For presentation purposes, the Fund has grouped some of the industry categories. For purposes of categorizing securities for compliance with Section 8(b)(1) of the Investment Company Act of 1940, as amended, the Fund uses more specific industry classifications.
The Global Industry Classification Standard (GICS®) was developed by and is the exclusive property and a service mark of MSCI, Inc. and Standard & Poor’s Financial Services LLC. It has been licensed for use by the Hennessy Funds.
| HENNESSY FUNDS | 1-800-966-4354 | |
| COMMON STOCKS – 93.60% | | Number | | | | | | % of | |
| | | of Shares | | | Value | | | Net Assets | |
| Communication Services – 3.00% | | | | | | | | | |
| Meta Platforms, Inc., Class A | | | 238 | | | $ | 102,380 | | | | 1.38 | % |
| Shutterstock, Inc. | | | 2,831 | | | | 120,912 | | | | 1.62 | % |
| | | | | | | | 223,292 | | | | 3.00 | % |
| | | | | | | | | | | | | |
| Information Technology – 90.60% | | | | | | | | | | | | |
| Adobe, Inc. (a) | | | 247 | | | | 114,319 | | | | 1.53 | % |
| Apple, Inc. | | | 725 | | | | 123,489 | | | | 1.66 | % |
| Applied Materials, Inc. | | | 591 | | | | 117,402 | | | | 1.57 | % |
| Arlo Technologies, Inc. (a) | | | 10,197 | | | | 126,239 | | | | 1.69 | % |
| Arrow Electronics, Inc. (a) | | | 965 | | | | 123,202 | | | | 1.65 | % |
| ASE Technology Holding Co. Ltd. – ADR | | | 11,062 | | | | 111,062 | | | | 1.49 | % |
| ASML Holding NV | | | 126 | | | | 109,931 | | | | 1.47 | % |
| Atlassian Corp., Class A (a) | | | 629 | | | | 108,377 | | | | 1.45 | % |
| Autodesk, Inc. (a) | | | 496 | | | | 105,574 | | | | 1.42 | % |
| Avnet, Inc. | | | 2,496 | | | | 121,980 | | | | 1.64 | % |
| Axcelis Technologies, Inc. (a) | | | 1,151 | | | | 119,152 | | | | 1.60 | % |
| Bentley Systems, Inc., Class B | | | 2,459 | | | | 129,171 | | | | 1.73 | % |
| Broadcom, Inc. | | | 89 | | | | 115,724 | | | | 1.55 | % |
| Cadence Design Systems, Inc. (a) | | | 392 | | | | 108,047 | | | | 1.45 | % |
| CDW Corp. | | | 475 | | | | 114,884 | | | | 1.54 | % |
| Cellebrite DI Ltd. (a) | | | 11,062 | | | | 119,580 | | | | 1.60 | % |
| Check Point Software Technologies Ltd. (a) | | | 741 | | | | 110,720 | | | | 1.49 | % |
| Clear Secure, Inc., Class A | | | 6,340 | | | | 110,760 | | | | 1.49 | % |
| CommVault Systems, Inc. (a) | | | 1,223 | | | | 125,321 | | | | 1.68 | % |
| Crowdstrike Holdings, Inc., Class A (a) | | | 385 | | | | 112,628 | | | | 1.51 | % |
| DXC Technology Co. (a) | | | 5,845 | | | | 113,919 | | | | 1.53 | % |
| Enphase Energy, Inc. (a) | | | 978 | | | | 106,367 | | | | 1.43 | % |
| ePlus, Inc. (a) | | | 1,606 | | | | 123,469 | | | | 1.66 | % |
| Extreme Networks, Inc. (a) | | | 10,630 | | | | 119,056 | | | | 1.60 | % |
| Flex Ltd. (a) | | | 4,192 | | | | 120,101 | | | | 1.61 | % |
| Fortinet, Inc. (a) | | | 1,712 | | | | 108,164 | | | | 1.45 | % |
| Gartner, Inc. (a) | | | 263 | | | | 108,511 | | | | 1.46 | % |
| Hackett Group, Inc. | | | 5,059 | | | | 109,730 | | | | 1.47 | % |
| Hewlett Packard Enterprise Co. | | | 6,579 | | | | 111,843 | | | | 1.50 | % |
| Infosys Ltd. – ADR | | | 6,911 | | | | 115,483 | | | | 1.55 | % |
The accompanying notes are an integral part of these financial statements.
| COMMON STOCKS | | Number | | | | | | % of | |
| | | of Shares | | | Value | | | Net Assets | |
| Information Technology (Continued) | | | | | | | | | |
| International Business Machines Corp. | | | 644 | | | $ | 107,033 | | | | 1.44 | % |
| Jabil, Inc. | | | 906 | | | | 106,328 | | | | 1.43 | % |
| KLA Corp. | | | 177 | | | | 122,004 | | | | 1.64 | % |
| Lam Research Corp. | | | 125 | | | | 111,801 | | | | 1.50 | % |
| Logitech International SA | | | 1,385 | | | | 108,570 | | | | 1.46 | % |
| Methode Electronics, Inc. | | | 10,303 | | | | 125,594 | | | | 1.68 | % |
| Microchip Technology, Inc. | | | 1,354 | | | | 124,541 | | | | 1.67 | % |
| Microsoft Corp. | | | 291 | | | | 113,295 | | | | 1.52 | % |
| Motorola Solutions, Inc. | | | 361 | | | | 122,433 | | | | 1.64 | % |
| NetApp, Inc. | | | 1,150 | | | | 117,542 | | | | 1.58 | % |
| NVIDIA Corp. | | | 138 | | | | 119,235 | | | | 1.60 | % |
| NXP Semiconductors NV | | | 502 | | | | 128,607 | | | | 1.72 | % |
| Oracle Corp. | | | 974 | | | | 110,792 | | | | 1.49 | % |
| Palo Alto Networks, Inc. (a) | | | 457 | | | | 132,937 | | | | 1.78 | % |
| Pure Storage, Inc., Class A (a) | | | 2,295 | | | | 115,668 | | | | 1.55 | % |
| QUALCOMM, Inc. | | | 707 | | | | 117,256 | | | | 1.57 | % |
| Qualys, Inc. (a) | | | 741 | | | | 121,457 | | | | 1.63 | % |
| Sanmina Corp. (a) | | | 2,017 | | | | 122,371 | | | | 1.64 | % |
| ServiceNow, Inc. (a) | | | 160 | | | | 110,933 | | | | 1.49 | % |
| STMicroelectronics NV | | | 2,873 | | | | 113,656 | | | | 1.52 | % |
| Super Micro Computer, Inc. (a) | | | 120 | | | | 103,056 | | | | 1.38 | % |
| Telefonaktiebolaget LM Ericsson – ADR | | | 23,103 | | | | 115,977 | | | | 1.55 | % |
| Teradata Corp. (a) | | | 3,187 | | | | 118,238 | | | | 1.59 | % |
| Texas Instruments, Inc. | | | 721 | | | | 127,199 | | | | 1.71 | % |
| United Microelectronics Corp. – ADR | | | 15,070 | | | | 116,039 | | | | 1.56 | % |
| Vishay Intertechnology, Inc. | | | 5,480 | | | | 126,807 | | | | 1.70 | % |
| Vontier Corp. | | | 2,852 | | | | 115,877 | | | | 1.55 | % |
| Zscaler, Inc. (a) | | | 665 | | | | 115,005 | | | | 1.54 | % |
| | | | | | | | 6,754,456 | | | | 90.60 | % |
| Total Common Stocks | | | | | | | | | | | | |
| (Cost $5,629,989) | | | | | | | 6,977,748 | | | | 93.60 | % |
The accompanying notes are an integral part of these financial statements.
| HENNESSY FUNDS | 1-800-966-4354 | |
| SHORT-TERM INVESTMENTS – 6.37% | | Number | | | | | | % of | |
| | | of Shares | | | Value | | | Net Assets | |
| Money Market Funds – 6.37% | | | | | | | | | |
| First American Government Obligations Fund – Class X, 5.227% (b) | | | 379,958 | | | $ | 379,958 | | | | 5.10 | % |
| First American Treasury Obligations Fund – Class X, 5.213% (b) | | | 94,554 | | | | 94,554 | | | | 1.27 | % |
| | | | | | | | | | | | | |
| Total Short-Term Investments | | | | | | | | | | | | |
| (Cost $474,512) | | | | | | | 474,512 | | | | 6.37 | % |
| | | | | | | | | | | | | |
| Total Investments | | | | | | | | | | | | |
| (Cost $6,104,501) – 99.97% | | | | | | | 7,452,260 | | | | 99.97 | % |
| Other Assets in Excess of Liabilities – 0.03% | | | | | | | 2,623 | | | | 0.03 | % |
| | | | | | | | | | | | | |
TOTAL NET ASSETS – 100.00% | | | | | | $ | 7,454,883 | | | | 100.00 | % |
Percentages are stated as a percent of net assets.
ADR – American Depositary Receipt
| (a) | Non-income producing security. |
| (b) | The rate listed is the fund’s seven-day yield as of April 30, 2024. |
Summary of Fair Value Exposure as of April 30, 2024
The following is a summary of the inputs used to value the Fund’s net assets as of April 30, 2024 (see Note 3 in the accompanying Notes to the Financial Statements):
| Common Stocks | | Level 1 | | | Level 2 | | | Level 3 | | | Total | |
| Communication Services | | $ | 223,292 | | | $ | — | | | $ | — | | | $ | 223,292 | |
| Information Technology | | | 6,754,456 | | | | — | | | | — | | | | 6,754,456 | |
| Total Common Stocks | | $ | 6,977,748 | | | $ | — | | | $ | — | | | $ | 6,977,748 | |
| Short-Term Investments | | | | | | | | | | | | | | | | |
| Money Market Funds | | $ | 474,512 | | | $ | — | | | $ | — | | | $ | 474,512 | |
| Total Short-Term Investments | | $ | 474,512 | | | $ | — | | | $ | — | | | $ | 474,512 | |
| Total Investments | | $ | 7,452,260 | | | $ | — | | | $ | — | | | $ | 7,452,260 | |
The accompanying notes are an integral part of these financial statements.
| SCHEDULE OF INVESTMENTS/STATEMENT OF ASSETS AND LIABILITIES |
Financial Statements
Statement of Assets and Liabilities as of April 30, 2024 (Unaudited) |
| ASSETS: | | | |
| Investments in securities, at value (cost $6,104,501) | | $ | 7,452,260 | |
| Dividends and interest receivable | | | 1,604 | |
| Receivable for securities sold | | | 525 | |
| Prepaid expenses and other assets | | | 19,410 | |
| Due from advisor | | | 3,007 | |
| Total assets | | | 7,476,806 | |
| | | | | |
| LIABILITIES: | | | | |
| Payable to auditor | | | 11,290 | |
| Accrued distribution fees | | | 916 | |
| Accrued service fees | | | 410 | |
| Accrued trustees fees | | | 5,191 | |
| Accrued expenses and other payables | | | 4,116 | |
| Total liabilities | | | 21,923 | |
| NET ASSETS | | $ | 7,454,883 | |
| | | | | |
| NET ASSETS CONSISTS OF: | | | | |
| Capital stock | | $ | 6,397,420 | |
| Total distributable earnings | | | 1,057,463 | |
| Total net assets | | $ | 7,454,883 | |
| | | | | |
| NET ASSETS: | | | | |
| Investor Class | | | | |
| Shares authorized (no par value) | | Unlimited | |
| Net assets applicable to outstanding shares | | $ | 4,950,535 | |
| Shares issued and outstanding | | | 242,792 | |
| Net asset value, offering price, and redemption price per share | | $ | 20.39 | |
| | | | | |
| Institutional Class | | | | |
| Shares authorized (no par value) | | Unlimited | |
| Net assets applicable to outstanding shares | | $ | 2,504,348 | |
| Shares issued and outstanding | | | 119,223 | |
| Net asset value, offering price, and redemption price per share | | $ | 21.01 | |
The accompanying notes are an integral part of these financial statements.
| HENNESSY FUNDS | 1-800-966-4354 | |
Financial Statements
Statement of Operations for the six months ended April 30, 2024 (Unaudited) |
| INVESTMENT INCOME: | | | |
Dividend income(1) | | $ | 29,227 | |
| Interest income | | | 4,802 | |
| Total investment income | | | 34,029 | |
| | | | | |
| EXPENSES: | | | | |
| Investment advisory fees (See Note 5) | | | 27,350 | |
| Federal and state registration fees | | | 14,500 | |
| Audit fees | | | 11,284 | |
| Trustees’ fees and expenses | | | 10,562 | |
| Compliance expense (See Note 5) | | | 9,574 | |
| Administration, accounting, custody, and transfer agent fees (See Note 5) | | | 9,528 | |
| Distribution fees – Investor Class (See Note 5) | | | 3,746 | |
| Sub-transfer agent expenses – Investor Class (See Note 5) | | | 2,637 | |
| Sub-transfer agent expenses – Institutional Class (See Note 5) | | | 663 | |
| Reports to shareholders | | | 3,270 | |
| Service fees – Investor Class (See Note 5) | | | 2,497 | |
| Interest expense (See Note 7) | | | 307 | |
| Legal fees | | | 274 | |
| Other expenses | | | 2,372 | |
| Total expenses before waivers and reimbursements | | | 98,564 | |
| Service provider expense waiver (See Note 5) | | | (9,528 | ) |
| Expense reimbursement from advisor – Investor Class | | | (31,658 | ) |
| Expense reimbursement from advisor – Institutional Class | | | (14,608 | ) |
| Net expenses | | | 42,770 | |
| NET INVESTMENT LOSS | | $ | (8,741 | ) |
| | | | | |
| REALIZED AND UNREALIZED GAINS (LOSSES): | | | | |
| Net realized gain on investments | | $ | 579,908 | |
| Net change in unrealized appreciation/depreciation on investments | | | 741,604 | |
| Net gain on investments | | | 1,321,512 | |
| NET INCREASE IN NET ASSETS RESULTING FROM OPERATIONS | | $ | 1,312,771 | |
(1) | Net of foreign taxes withheld and issuance fees of $1,535. |
The accompanying notes are an integral part of these financial statements.
| STATEMENT OF OPERATIONS/STATEMENTS OF CHANGES IN NET ASSETS |
Financial Statements
| Statements of Changes in Net Assets |
| | | Six Months Ended | | | | |
| | | April 30, 2024 | | | Year Ended | |
| | | (Unaudited) | | | October 31, 2023 | |
| OPERATIONS: | | | | | | |
| Net investment loss | | $ | (8,741 | ) | | $ | (737 | ) |
| Net realized gain on investments | | | 579,908 | | | | 42,670 | |
| Net change in unrealized | | | | | | | | |
| appreciation/depreciation on investments | | | 741,604 | | | | 724,024 | |
| Net increase in net assets resulting from operations | | | 1,312,771 | | | | 765,957 | |
| | | | | | | | | |
| DISTRIBUTIONS TO SHAREHOLDERS: | | | | | | | | |
| Distributable earnings – Investor Class | | | — | | | | (2,801 | ) |
| Distributable earnings – Institutional Class | | | — | | | | (6,430 | ) |
| Total distributions | | | — | | | | (9,231 | ) |
| | | | | | | | | |
| CAPITAL SHARE TRANSACTIONS: | | | | | | | | |
| Proceeds from shares subscribed – Investor Class | | | 234,720 | | | | 371,996 | |
| Proceeds from shares subscribed – Institutional Class | | | 551,357 | | | | 522,804 | |
| Dividends reinvested – Investor Class | | | — | | | | 2,743 | |
| Dividends reinvested – Institutional Class | | | — | | | | 6,429 | |
| Cost of shares redeemed – Investor Class | | | (528,070 | ) | | | (569,642 | ) |
| Cost of shares redeemed – Institutional Class | | | (461,688 | ) | | | (121,520 | ) |
| Net increase (decrease) in net assets derived | | | | | | | | |
| from capital share transactions | | | (203,681 | ) | | | 212,810 | |
| TOTAL INCREASE IN NET ASSETS | | | 1,109,090 | | | | 969,536 | |
| | | | | | | | | |
| NET ASSETS: | | | | | | | | |
| Beginning of period | | | 6,345,793 | | | | 5,376,257 | |
| End of period | | $ | 7,454,883 | | | $ | 6,345,793 | |
| | | | | | | | | |
| CHANGES IN SHARES OUTSTANDING: | | | | | | | | |
| Shares sold – Investor Class | | | 12,063 | | | | 21,312 | |
| Shares sold – Institutional Class | | | 27,312 | | | | 29,720 | |
| Shares issued to holders as reinvestment | | | | | | | | |
| of dividends – Investor Class | | | — | | | | 189 | |
| Shares issued to holders as reinvestment | | | | | | | | |
| of dividends – Institutional Class | | | — | | | | 433 | |
| Shares redeemed – Investor Class | | | (26,249 | ) | | | (33,810 | ) |
| Shares redeemed – Institutional Class | | | (22,355 | ) | | | (6,780 | ) |
| Net increase (decrease) in shares outstanding | | | (9,229 | ) | | | 11,064 | |
The accompanying notes are an integral part of these financial statements.
| HENNESSY FUNDS | 1-800-966-4354 | |
Financial Statements
For an Investor Class share outstanding throughout each period
| | | Six Months Ended | |
| | | April 30, 2024 | |
| | | (Unaudited) | |
| PER SHARE DATA: | | | |
| Net asset value, beginning of period | | $ | 16.94 | |
| | | | | |
| Income from investment operations: | | | | |
Net investment income (loss)(1) | | | (0.03 | ) |
| Net realized and unrealized gains (losses) on investments | | | 3.48 | |
| Total from investment operations | | | 3.45 | |
| | | | | |
| Less distributions: | | | | |
| Dividends from net investment income | | | — | |
| Dividends from net realized gains | | | — | |
| Total distributions | | | — | |
| Net asset value, end of period | | $ | 20.39 | |
| | | | | |
| TOTAL RETURN | | | 20.37 | %(3) |
| | | | | |
| SUPPLEMENTAL DATA AND RATIOS: | | | | |
| Net assets, end of period (millions) | | $ | 4.95 | |
| Ratio of expenses to average net assets: | | | | |
| Before expense reimbursement | | | 2.76 | %(4) |
| After expense reimbursement | | | 1.24 | %(4)(5) |
| Ratio of net investment income (loss) to average net assets: | | | | |
| Before expense reimbursement | | | (1.84 | )%(4) |
| After expense reimbursement | | | (0.32 | )%(4) |
Portfolio turnover rate(6) | | | 40 | %(3) |
(1) | Calculated using the average shares outstanding method. |
(2) | Amount is between $(0.005) and $0.005. |
(3) | Not annualized. |
(4) | Annualized. |
(5) | Certain service provider expenses were voluntarily waived during the fiscal period. |
(6) | Calculated on the basis of the Fund as a whole. |
The accompanying notes are an integral part of these financial statements.
| FINANCIAL HIGHLIGHTS — INVESTOR CLASS |
| Year Ended October 31, | |
| 2023 | | | 2022 | | | 2021 | | | 2020 | | | 2019 | |
| | | | | | | | | | | | | | |
| $ | 14.81 | | | $ | 26.89 | | | $ | 20.50 | | | $ | 18.90 | | | $ | 18.04 | |
| | | | | | | | | | | | | | | | | | | |
| | | | | | | | | | | | | | | | | | | |
| | (0.01 | ) | | | 0.00 | (2) | | | (0.02 | ) | | | 0.02 | | | | (0.03 | ) |
| | 2.15 | | | | (5.38 | ) | | | 8.82 | | | | 2.10 | | | | 3.15 | |
| | 2.14 | | | | (5.38 | ) | | | 8.80 | | | | 2.12 | | | | 3.12 | |
| | | | | | | | | | | | | | | | | | | |
| | | | | | | | | | | | | | | | | | | |
| | (0.01 | ) | | | — | | | | (0.04 | ) | | | — | | | | — | |
| | — | | | | (6.70 | ) | | | (2.37 | ) | | | (0.52 | ) | | | (2.26 | ) |
| | (0.01 | ) | | | (6.70 | ) | | | (2.41 | ) | | | (0.52 | ) | | | (2.26 | ) |
| $ | 16.94 | | | $ | 14.81 | | | $ | 26.89 | | | $ | 20.50 | | | $ | 18.90 | |
| | | | | | | | | | | | | | | | | | | |
| | 14.47 | % | | | -26.44 | % | | | 45.11 | % | | | 11.42 | % | | | 20.47 | % |
| | | | | | | | | | | | | | | | | | | |
| | | | | | | | | | | | | | | | | | | |
| $ | 4.35 | | | $ | 3.99 | | | $ | 6.06 | | | $ | 4.26 | | | $ | 3.89 | |
| | | | | | | | | | | | | | | | | | | |
| | 3.17 | % | | | 3.06 | % | | | 2.79 | % | | | 3.45 | % | | | 3.84 | % |
| | 1.23 | %(5) | | | 1.23 | %(5) | | | 1.23 | %(5) | | | 1.23 | %(5) | | | 1.23 | % |
| | | | | | | | | | | | | | | | | | | |
| | (2.02 | )% | | | (1.81 | )% | | | (1.64 | )% | | | (2.12 | )% | | | (2.80 | )% |
| | (0.08 | )% | | | 0.02 | % | | | (0.08 | )% | | | 0.10 | % | | | (0.19 | )% |
| | 101 | % | | | 151 | % | | | 200 | % | | | 192 | % | | | 185 | % |
The accompanying notes are an integral part of these financial statements.
| HENNESSY FUNDS | 1-800-966-4354 | |
Financial Statements
For an Institutional Class share outstanding throughout each period
| | | Six Months Ended | |
| | | April 30, 2024 | |
| | | (Unaudited) | |
| PER SHARE DATA: | | | |
| Net asset value, beginning of period | | $ | 17.43 | |
| | | | | |
| Income from investment operations: | | | | |
Net investment income (loss)(1) | | | (0.01 | ) |
| Net realized and unrealized gains (losses) on investments | | | 3.59 | |
| Total from investment operations | | | 3.58 | |
| | | | | |
| Less distributions: | | | | |
| Dividends from net investment income | | | — | |
| Dividends from net realized gains | | | — | |
| Total distributions | | | — | |
| Net asset value, end of period | | $ | 21.01 | |
| | | | | |
| TOTAL RETURN | | | 20.54 | %(2) |
| | | | | |
| SUPPLEMENTAL DATA AND RATIOS: | | | | |
| Net assets, end of period (millions) | | $ | 2.50 | |
| Ratio of expenses to average net assets: | | | | |
| Before expense reimbursement | | | 2.46 | %(3) |
| After expense reimbursement | | | 0.99 | %(3)(4) |
| Ratio of net investment income (loss) to average net assets: | | | | |
| Before expense reimbursement | | | (1.54 | )%(3) |
| After expense reimbursement | | | (0.07 | )%(3) |
Portfolio turnover rate(5) | | | 40 | %(2) |
(1) | Calculated using the average shares outstanding method. |
(2) | Not annualized. |
(3) | Annualized. |
(4) | Certain service provider expenses were voluntarily waived during the fiscal period. |
(5) | Calculated on the basis of the Fund as a whole. |
The accompanying notes are an integral part of these financial statements.
| FINANCIAL HIGHLIGHTS — INSTITUTIONAL CLASS |
| Year Ended October 31, | |
| 2023 | | | 2022 | | | 2021 | | | 2020 | | | 2019 | |
| | | | | | | | | | | | | | |
| $ | 15.26 | | | $ | 27.65 | | | $ | 21.08 | | | $ | 19.40 | | | $ | 18.47 | |
| | | | | | | | | | | | | | | | | | | |
| | | | | | | | | | | | | | | | | | | |
| | 0.03 | | | | 0.05 | | | | 0.05 | | | | 0.07 | | | | 0.01 | |
| | 2.21 | | | | (5.55 | ) | | | 9.06 | | | | 2.15 | | | | 3.23 | |
| | 2.24 | | | | (5.50 | ) | | | 9.11 | | | | 2.22 | | | | 3.24 | |
| | | | | | | | | | | | | | | | | | | |
| | | | | | | | | | | | | | | | | | | |
| | (0.07 | ) | | | — | | | | (0.11 | ) | | | (0.01 | ) | | | — | |
| | — | | | | (6.89 | ) | | | (2.43 | ) | | | (0.53 | ) | | | (2.31 | ) |
| | (0.07 | ) | | | (6.89 | ) | | | (2.54 | ) | | | (0.54 | ) | | | (2.31 | ) |
| $ | 17.43 | | | $ | 15.26 | | | $ | 27.65 | | | $ | 21.08 | | | $ | 19.40 | |
| | | | | | | | | | | | | | | | | | | |
| | 14.77 | % | | | -26.28 | % | | | 45.49 | % | | | 11.67 | % | | | 20.77 | % |
| | | | | | | | | | | | | | | | | | | |
| | | | | | | | | | | | | | | | | | | |
| $ | 1.99 | | | $ | 1.39 | | | $ | 2.06 | | | $ | 1.47 | | | $ | 1.34 | |
| | | | | | | | | | | | | | | | | | | |
| | 2.85 | % | | | 2.73 | % | | | 2.44 | % | | | 3.08 | % | | | 3.47 | % |
| | 0.98 | %(4) | | | 0.98 | %(4) | | | 0.98 | %(4) | | | 0.98 | %(4) | | | 0.98 | % |
| | | | | | | | | | | | | | | | | | | |
| | (1.70 | )% | | | (1.48 | )% | | | (1.29 | )% | | | (1.74 | )% | | | (2.43 | )% |
| | 0.17 | % | | | 0.27 | % | | | 0.17 | % | | | 0.36 | % | | | 0.06 | % |
| | 101 | % | | | 151 | % | | | 200 | % | | | 192 | % | | | 185 | % |
The accompanying notes are an integral part of these financial statements.
| HENNESSY FUNDS | 1-800-966-4354 | |
Financial Statements
Notes to the Financial Statements April 30, 2024 (Unaudited) |
1). ORGANIZATION
The Hennessy Technology Fund (the “Fund”) is a series of Hennessy Funds Trust (the “Trust”), which was organized as a Delaware statutory trust on September 17, 1992. The Fund is an open-end management investment company registered under the Investment Company Act of 1940, as amended. The investment objective of the Fund is long-term capital appreciation. The Fund is a diversified fund.
The Fund offers Investor Class and Institutional Class shares. Each class of shares differs principally in its respective 12b-1 distribution and service, shareholder servicing, and sub-transfer agent expenses. There are no sales charges. Each class has identical rights to earnings, assets, and voting privileges, except for class-specific expenses and exclusive rights to vote on matters affecting only one class.
As an investment company, the Fund follows the investment company accounting and reporting guidance of the Financial Accounting Standards Board (the “FASB”) Accounting Standard Codification Topic 946 “Financial Services—Investment Companies.”
2). SIGNIFICANT ACCOUNTING POLICIES
The following is a summary of significant accounting policies consistently followed by the Fund in the preparation of the financial statements. These policies conform to U.S. generally accepted accounting principles (“GAAP”).
| a). | Securities Valuation – All investments in securities are valued in accordance with the Fund’s valuation policies and procedures, as described in Note 3. |
| | |
| b). | Federal Income Taxes – The Fund has elected to be taxed as a regulated investment company and intends to distribute substantially all of its taxable income to its shareholders and otherwise comply with the provisions of the Internal Revenue Code of 1986, as amended, applicable to regulated investment companies. As a result, the Fund has made no provision for federal income taxes or excise taxes. Net investment income/loss and realized gains/losses for federal income tax purposes may differ from those reported in the financial statements because of temporary book-basis and tax-basis differences. Temporary differences are primarily the result of the treatment of wash sales for tax reporting purposes. The Fund recognizes interest and penalties related to income tax benefits, if any, in the Statement of Operations as an income tax expense. Distributions from net realized gains for book purposes may include short-term capital gains, which are included as ordinary income to shareholders for tax purposes. The Fund may utilize equalization accounting for tax purposes and designate earnings and profits, including net realized gains distributed to shareholders on redemption of shares, as part of the dividends paid deduction for income tax purposes. |
| | |
| c). | Accounting for Uncertainty in Income Taxes – The Fund has accounting policies regarding recognition and measurement of tax positions taken or expected to be taken on a tax return. The tax returns of the Fund for the prior three fiscal years are open for examination. The Fund has reviewed all open tax years in major tax jurisdictions and concluded that there is no impact on the Fund’s net assets and no tax liability resulting from unrecognized tax benefits relating to uncertain income tax positions taken or expected to be taken on a tax return. The Fund’s major tax jurisdictions are U.S. federal and Delaware. |
| NOTES TO THE FINANCIAL STATEMENTS |
| d). | Income and Expenses – Dividend income is recognized on the ex-dividend date or as soon as information is available to the Fund. Interest income, which includes the amortization of premium and accretion of discount, is recognized on an accrual basis. Market discounts, original issue discounts, and market premiums on debt securities are accreted or amortized to interest income over the life of a security with a corresponding increase or decrease, as applicable, in the cost basis of such security using the yield-to-maturity method or, where applicable, the first call date of the security. Other non-cash dividends are recognized as investment income at the fair value of the property received. The Fund is charged for those expenses that are directly attributable to its portfolio, such as advisory, administration, and certain shareholder service fees. Income, expenses (other than expenses attributable to a specific class), and realized and unrealized gains/losses on investments are allocated to each class of shares based on such class’s net assets. |
| | |
| e). | Distributions to Shareholders – Dividends from net investment income for the Fund, if any, are declared and paid annually, usually in December. Distributions of net realized capital gains, if any, are declared and paid annually, usually in December. |
| | |
| f). | Security Transactions – Investment and shareholder transactions are recorded on the trade date. The Fund determines the realized gain/loss from an investment transaction by comparing the original cost of the security lot sold with the net sale proceeds. Discounts and premiums on securities purchased are accreted or amortized, respectively, over the life of each such security. |
| | |
| g). | Use of Estimates – Preparing financial statements in accordance with GAAP requires management to make estimates and assumptions that affect the reported amounts of assets and liabilities and disclosure of contingent assets and liabilities at the date of the financial statements, as well as the reported change in net assets during the reporting period. Actual results could differ from those estimates. |
| | |
| h). | Share Valuation – The net asset value (“NAV”) per share of the Fund is calculated by dividing (i) the total value of the securities held by the Fund, plus cash and other assets, minus all liabilities (including estimated accrued expenses) by (ii) the total number of Fund shares outstanding, rounded to the nearest $0.01. Fund shares are not priced on days the New York Stock Exchange is closed for trading. The offering and redemption price per share for the Fund is equal to the Fund’s NAV per share. |
| | |
| i). | Illiquid Securities – Pursuant to Rule 22e-4 under the 1940 Act, the Fund has adopted a Liquidity Risk Management Program (the “Liquidity Program”). The Liquidity Program requires, among other things, that the Fund limit its illiquid investments to no more than 15% of its net assets. An illiquid investment is any investment that the Fund reasonably expects cannot be sold or disposed of by the Fund in current market conditions in seven calendar days or less without the sale or disposition significantly changing the market value of the investment. |
| | |
| j). | Recent Accounting Pronouncements and Regulatory Updates – In October 2022, the Securities and Exchange Commission (“SEC”) adopted a final rule relating to Tailored Shareholder Reports for Mutual Funds and Exchange-Traded Funds (ETFs); Fee Information in Investment Company Advertisements. The rule and form amendments will require mutual funds and ETFs to transmit concise and visually engaging shareholder reports that highlight key information. The amendments also will require that funds tag information in a structured data format. In addition, the rule amendments will require that certain more in-depth information be made available online and available for delivery free of charge to investors on request. The amendments became effective January 24, 2023. There is an 18-month transition period after the effective date of the amendment. |
| HENNESSY FUNDS | 1-800-966-4354 | |
| | In June 2022, the FASB issued Accounting Standards Update (“ASU”) 2022-03, Fair Value Measurement (Topic 820): Fair Value Measurement of Equity Securities Subject to Contractual Sale Restrictions. The ASU clarifies that a contractual restriction on the sale of an equity security is not considered part of the unit of account of the equity security and, therefore, is not considered in measuring the fair value. The amendments also require additional disclosures related to equity securities subject to contractual sale restrictions. The ASU is effective for fiscal years beginning after December 15, 2023, and interim periods within those fiscal years. |
3). SECURITIES VALUATION
The Fund follows its valuation policies and procedures in determining its NAV and, in preparing these financial statements, the fair value accounting standards that establish an authoritative definition of fair value and set out a hierarchy for measuring fair value. These standards require additional disclosures about the various inputs and valuation techniques used to develop the measurements of fair value and a discussion of changes in valuation techniques and related inputs during the period. These inputs are summarized in the three broad levels listed below:
| | Level 1 – | Unadjusted, quoted prices in active markets for identical instruments that the Fund has the ability to access at the date of measurement. |
| | | |
| | Level 2 – | Other significant observable inputs other than quoted prices included in Level 1 (including, but not limited to, quoted prices in active markets for similar instruments, quoted prices in markets that are not active for identical or similar instruments, and model-derived valuations in which all significant inputs and significant value drivers are observable in active markets, such as interest rates, prepayment speeds, credit risk curves, default rates, and similar data). |
| | | |
| | Level 3 – | Significant unobservable inputs (including the Fund’s own assumptions about what market participants would use to price the asset or liability based on the best available information) when observable inputs are unavailable. |
The following is a description of the valuation techniques applied to the Fund’s major categories of assets and liabilities on a recurring basis:
| | Equity Securities – Equity securities, including common stocks, preferred stocks, foreign-issued common stocks, exchange-traded funds, closed-end mutual funds, partnerships, rights, and real estate investment trusts, that are traded on a securities exchange for which a last-quoted sales price is readily available generally are valued at the last sales price as reported by the primary exchange on which the securities are listed. Securities listed on The Nasdaq Stock Market (“Nasdaq”) generally are valued at the Nasdaq Official Closing Price, which may differ from the last sales price reported. Securities traded on a securities exchange for which a last-quoted sales price is not readily available generally are valued at the mean between the bid and ask prices. To the extent these securities are actively traded and valuation adjustments are not applied, they are classified in Level 1 of the fair value hierarchy. Securities traded on foreign exchanges generally are not valued at the same time the Fund calculates its NAV because most foreign markets close well before such time. The earlier close of most foreign markets gives rise to the possibility that significant events, including broad market moves, may have occurred in the interim. In certain circumstances, it may be determined that a foreign security needs to be fair valued because it appears that the value of the security might have been materially affected |
| NOTES TO THE FINANCIAL STATEMENTS |
| | by events occurring after the close of the market in which the security is principally traded, but before the time the Fund calculates its NAV, such as by a development that affects an entire market or region (e.g., a weather-related event) or a potentially global development (e.g., a terrorist attack that may be expected to have an effect on investor expectations worldwide). |
| | |
| | Registered Investment Companies – Investments in open-end registered investment companies, commonly referred to as mutual funds, generally are priced at the ending NAV provided by the applicable mutual fund’s service agent and are classified in Level 1 of the fair value hierarchy. |
| | |
| | Debt Securities – Debt securities, including corporate bonds, asset-backed securities, mortgage-backed securities, municipal bonds, U.S. Treasuries, and U.S. government agency issues, are generally valued at market on the basis of valuations furnished by an independent pricing service that utilizes both dealer-supplied valuations and formula-based techniques. The pricing service may consider recently executed transactions in securities of the issuer or comparable issuers, market price quotations (where observable), bond spreads, and fundamental data relating to the issuer. In addition, the model may incorporate observable market data, such as reported sales of similar securities, broker quotes, yields, bids, offers, and reference data. Certain securities are valued primarily using dealer quotations. These securities are generally classified in Level 2 of the fair value hierarchy. |
| | |
| | Short-Term Securities – Short-term equity investments, including money market funds, are valued in the manner specified above for equity securities. Short-term debt investments with an original term to maturity of 60 days or less are valued at amortized cost, which approximates fair market value. If the original term to maturity of a short-term debt investment exceeds 60 days, then the values as of the 61st day prior to maturity are amortized. Amortized cost is not used if its use would be inappropriate due to credit or other impairments of the issuer, in which case the security’s fair value would be determined as described below. Short-term securities are generally classified in Level 1 or Level 2 of the fair value hierarchy depending on the inputs used and market activity levels for specific securities. |
If market quotations are not readily available or if a significant event has occurred that indicates the closing price of a security no longer represents the true value of that security, such security will be valued at its fair value under the Fund’s established fair valuation procedures as implemented by Hennessy Advisors, Inc. (the “Advisor”), the Fund’s valuation designee. The Advisor, as the valuation designee, is subject to the oversight of the Board of Trustees of the Fund (the “Board”). There are numerous criteria considered in determining a fair value of a security, such as the trading volume of a security and markets, the values of other similar securities, and news events with direct bearing on a security or markets. Fair value pricing results in an estimated price for a security that reflects the amount the Fund might reasonably expect to receive in a current sale. Depending on the relative significance of the valuation inputs, these securities may be classified in either Level 2 or Level 3 of the fair value hierarchy. The Advisor will regularly evaluate whether the Fund’s fair value pricing procedures continue to be appropriate in light of the specific circumstances of the Fund and the quality of prices obtained through their application of such procedures.
The fair value of foreign securities may be determined with the assistance of a pricing service using correlations between the movement of prices of such securities and indices of domestic securities and other appropriate indicators, such as closing market prices of
| HENNESSY FUNDS | 1-800-966-4354 | |
relevant American Depositary Receipts or futures contracts. Using fair value pricing means that the Fund’s NAV reflects the affected portfolio securities’ values as determined by the Advisor, instead of being determined by the market. Using a fair value pricing methodology to price a foreign security may result in a value that is different from such foreign security’s most recent closing price and from the value used by other investment companies to calculate their NAVs. Such securities are generally classified in Level 2 of the fair value hierarchy. Because the Fund may invest in foreign securities, the value of the Fund’s portfolio securities may change on days when a shareholder is unable to purchase or redeem Fund shares.
The Fund has performed an analysis of all existing investments to determine the significance and character of all inputs to their fair value determinations. Various inputs are used to determine the value of the Fund’s investments. The inputs or methodology used for valuing securities are not necessarily an indication of the risk associated with investing in those securities. Details related to the fair value hierarchy of the Fund’s securities as of April 30, 2024, are included in the Schedule of Investments.
4). INVESTMENT TRANSACTIONS
Purchases and sales of investment securities (excluding government and short-term investments) for the Fund during the six months ended April 30, 2024, were $2,880,464 and $3,381,492, respectively.
There were no purchases or sales/maturities of long-term U.S. government securities for the Fund during the six months ended April 30, 2024.
5). INVESTMENT ADVISORY FEE AND OTHER TRANSACTIONS WITH AFFILIATES
The Advisor provides the Fund with investment advisory services under an Investment Advisory Agreement. The Advisor furnishes all investment advice, office space, and facilities and most of the personnel needed by the Fund. As compensation for its services, the Advisor is entitled to a monthly fee from the Fund. The fee is based on the average daily net assets of the Fund at an annual rate of 0.74%. The net investment advisory fees expensed by the Fund during the six months ended April 30, 2024, are included in the Statement of Operations.
The Advisor has contractually agreed to limit total annual operating expenses to 0.98% of the Fund’s net assets for both Investor Class shares and Institutional Class shares (excluding all federal, state and local taxes, interest, brokerage commissions, 12b-1 fees, shareholder servicing fees payable to the Advisor, extraordinary items, and acquired fund fees and expenses and other costs incurred in connection with the purchase and sale of securities) through February 28, 2025.
For three years following the date on which expenses were waived or incurred, the Advisor may recoup waived or reimbursed expenses from the Fund if total operating expenses, including such recoupment, does not exceed the expense limitation in effect (i) at the time the Advisor waived or reimbursed such expenses and (ii) at the time the Advisor recoups such expenses. As of April 30, 2024, expenses subject to potential recovery for Investor Class and Institutional Class shares and the fiscal years in which they expire were as follows:
| | | | Fiscal Year | | | Fiscal Year | | | Fiscal Year | | | Fiscal Year | | | | |
| | | | 2024 | | | 2025 | | | 2026 | | | 2027 | | | Total | |
| | Investor Class | | $ | 38,479 | | | $ | 73,628 | | | $ | 72,197 | | | $ | 31,658 | | | $ | 215,962 | |
| | Institutional Class | | $ | 11,944 | | | $ | 23,122 | | | $ | 25,964 | | | $ | 14,608 | | | $ | 75,638 | |
| NOTES TO THE FINANCIAL STATEMENTS |
The Advisor did not recoup expenses from the Fund during the six months ended April 30, 2024.
The Board has approved a Shareholder Servicing Agreement for Investor Class shares of the Fund, which compensates the Advisor for the non-investment advisory services it provides to the Fund. The Shareholder Servicing Agreement provides for a monthly fee paid to the Advisor at an annual rate of 0.10% of the average daily net assets of the Fund attributable to Investor Class shares. The shareholder service fees expensed by the Fund during the six months ended April 30, 2024, are included in the Statement of Operations.
The Fund has adopted a plan pursuant to Rule 12b-1 under the Investment Company Act of 1940, as amended, that authorizes payments in connection with the distribution of Fund shares at an annual rate of up to 0.25% of the Fund’s average daily net assets attributable to Investor Class shares. Even though the authorized rate is up to 0.25%, the Fund is currently only using up to 0.15% of its average daily net assets attributable to Investor Class shares for such purpose. Amounts paid under the plan may be spent on any activities or expenses primarily intended to result in the sale of shares, including, but not limited to, advertising, shareholder account servicing, printing and mailing of prospectuses to other than current shareholders, printing and mailing of sales literature, and compensation for sales and marketing activities or to financial institutions and others, such as dealers and distributors. The distribution fees expensed by the Fund during the six months ended April 30, 2024, are included in the Statement of Operations.
The Fund has entered into agreements with various brokers, dealers, and financial intermediaries in connection with the sale of Fund shares. The agreements provide for periodic payments of sub-transfer agent expenses by the Fund to the brokers, dealers, and financial intermediaries for providing certain shareholder maintenance services. These shareholder services include the pre-processing and quality control of new accounts, shareholder correspondence, answering customer inquiries regarding account status, and facilitating shareholder telephone transactions. The sub-transfer agent fees expensed by the Fund during the six months ended April 30, 2024, are included in the Statement of Operations.
U.S. Bancorp Fund Services, LLC, d/b/a U.S. Bank Global Fund Services (“Fund Services”) provides the Fund with administrative, accounting, and transfer agent services. As administrator, Fund Services is responsible for activities such as (i) preparing various federal and state regulatory filings, reports, and returns for the Fund, (ii) preparing reports and materials to be supplied to the Board, (iii) monitoring the activities of the Fund’s custodian, transfer agent, and accountants, and (iv) coordinating the preparation and payment of the Fund’s expenses and reviewing the Fund’s expense accruals. U.S. Bank N.A., an affiliate of Fund Services, serves as the Fund’s custodian. The servicing agreements between the Trust, Fund Services, and U.S. Bank N.A. contain a fee schedule that is inclusive of administrative, accounting, custody, and transfer agent fees. The administrative, accounting, custody, and transfer agent fees expensed by the Fund during the six months ended April 30, 2024, are included in the Statement of Operations. Fund Services has voluntarily waived all or a portion of its fees for the Fund. The fees voluntarily waived by Fund Services during the six months ended April 30, 2024, are included in the Statement of Operations.
Quasar Distributors, LLC, a wholly owned broker-dealer subsidiary of Foreside Financial Group, LLC, acts as the Fund’s principal underwriter in a continuous public offering of Fund shares.
The officers of the Fund are affiliated with the Advisor. With the exception of the Chief Compliance Officer, such officers receive no compensation from the Fund for
| HENNESSY FUNDS | 1-800-966-4354 | |
serving in their respective roles. The Fund, along with the other funds in the Hennessy Funds family (collectively, the “Hennessy Funds”), makes reimbursement payments on an equal basis to the Advisor for a portion of the salary and benefits associated with the office of the Chief Compliance Officer. The compliance fees expensed by the Fund during the six months ended April 30, 2024, for reimbursement payments to the Advisor are included in the Statement of Operations.
6). GUARANTEES AND INDEMNIFICATIONS
Under the Hennessy Funds’ organizational documents, their officers and trustees are indemnified by the Hennessy Funds against certain liabilities arising out of the performance of their duties to the Hennessy Funds. Additionally, in the normal course of business, the Hennessy Funds enter into contracts with service providers that contain general indemnification clauses. The Fund’s maximum exposure under these arrangements is unknown as this would involve future claims that may be made against the Fund that have not yet occurred. Currently, the Fund expects the risk of loss to be remote.
7). LINE OF CREDIT
The Fund has an uncommitted line of credit with the other Hennessy Funds in the amount of the lesser of (i) $100,000,000 or (ii) 33.33% of each Hennessy Fund’s net assets, or 30% for the Hennessy Gas Utility Fund, the Hennessy Japan Fund, and the Hennessy Japan Small Cap Fund and 10% for the Hennessy Balanced Fund. The line of credit is intended to provide any necessary short-term financing in connection with shareholder redemptions, subject to certain restrictions. The credit facility is with the Hennessy Funds’ custodian bank, U.S. Bank N.A. Borrowings under this arrangement bear interest at the bank’s prime rate and are secured by all of the Fund’s assets (as to its own borrowings only). During the six months ended April 30, 2024, the Fund had an outstanding average daily balance and a weighted average interest rate of $7,137 and 8.50%, respectively. The interest expensed by the Fund during the six months ended April 30, 2024, is included in the Statement of Operations. The maximum amount outstanding for the Fund during the six months ended April 30, 2024, was $231,000. As of April 30, 2024, the Fund did not have any borrowings outstanding under the line of credit.
8). FEDERAL TAX INFORMATION
As of October 31, 2023, the Fund’s most recent fiscal year end, the components of accumulated earnings (losses) for income tax purposes were as follows:
| | | | Investments | |
| | Cost of investments for tax purposes | | $ | 5,762,718 | |
| | Gross tax unrealized appreciation | | $ | 961,825 | |
| | Gross tax unrealized depreciation | | | (369,255 | ) |
| | Net tax unrealized appreciation/(depreciation) | | $ | 592,570 | |
| | Undistributed ordinary income | | $ | — | |
| | Undistributed long-term capital gains | | | — | |
| | Total distributable earnings | | $ | — | |
| | Other accumulated gain/(loss) | | $ | (847,878 | ) |
| | Total accumulated gain/(loss) | | $ | (255,308 | ) |
The difference between book-basis unrealized appreciation/depreciation and tax-basis unrealized appreciation/depreciation (as shown above) is attributable primarily to wash sales.
| NOTES TO THE FINANCIAL STATEMENTS |
As of October 31, 2023, the Fund had $106,038 in unlimited long-term and $741,103 in unlimited short-term capital loss carryforwards. During fiscal year 2023, the capital losses utilized by the Fund were $5,730.
Capital losses sustained in or after fiscal year 2012 can be carried forward indefinitely, but any such loss retains the character of the original loss and must be utilized prior to any loss incurred before fiscal year 2012. As a result of this ordering rule, capital loss carryforwards incurred prior to fiscal year 2012 may be more likely to expire unused. Capital losses sustained prior to fiscal year 2012 can be carried forward for eight years and can be carried forward as short-term capital losses regardless of the character of the original loss.
As of October 31, 2023, the Fund deferred, on a tax basis, a late-year ordinary loss of $737. Late-year ordinary losses are net ordinary losses incurred after December 31, 2022, but within the taxable year, that are deemed to arise on the first day of the Fund’s next taxable year.
During fiscal year 2024 (year to date) and fiscal year 2023, the tax character of distributions paid by the Fund was as follows:
| | | | Six Months Ended | | | Year Ended | |
| | | | April 30, 2024 | | | October 31, 2023 | |
| | Ordinary income(1) | | $ | — | | | $ | 9,231 | |
| | Long-term capital gains | | | — | | | | — | |
| | Total distributions | | $ | — | | | $ | 9,231 | |
| | | | | | | | | | |
| | (1) Ordinary income includes short-term capital gains. | | | | | | | | |
9). GLOBAL EVENTS
A rise in protectionist trade policies, the possibility of a national or global recession, risks associated with pandemic and epidemic diseases, trade tensions, the possibility of changes to some international trade agreements, political events, and continuing political tension and armed conflicts may adversely impact financial markets and the broader economy. For example, ongoing armed conflicts between Ukraine and Russia in Europe and among Israel, Hamas, and other militant groups in the Middle East have caused and could continue to cause significant market disruptions and volatility with the markets in Europe and the Middle East, and have had negative impacts on markets in the United States. These events could also have negative effects on the Fund’s investments that cannot be foreseen at the present time. As global systems, economies and financial markets are increasingly interconnected, events that once had only local impact are now more likely to have regional or even global effects. Events that occur in one country, region or financial market will, more frequently, adversely impact issuers in other countries, regions, or markets. These impacts can be exacerbated by failures of governments and societies to adequately respond to an emerging event or threat. Your investment would be negatively impacted if the value of your portfolio holdings decreases as a result of such events, if these events adversely impact the operations and effectiveness of the Advisor or other key service providers or if these events disrupt systems and processes necessary or beneficial to the management of accounts. These events may negatively impact broad segments of businesses and populations and could have a significant and rapid negative impact on the performance of the Fund’s investments, increase the Fund’s volatility, or exacerbate pre-existing risks to the Fund.
| HENNESSY FUNDS | 1-800-966-4354 | |
10). EVENTS SUBSEQUENT TO PERIOD END
Management has evaluated the Fund’s related events and transactions that occurred subsequent to April 30, 2024, through the date of issuance of the Fund’s financial statements. Management has determined that there were no subsequent events requiring recognition or disclosure in the financial statements.
| NOTES TO THE FINANCIAL STATEMENTS |
(This Page Intentionally Left Blank.)
| HENNESSY FUNDS | 1-800-966-4354 | |
Expense Example (Unaudited)
April 30, 2024
As a shareholder of the Fund, you incur ongoing costs, including management fees, service fees, and other Fund expenses. This Example is intended to help you understand your ongoing costs (in dollars) of investing in the Fund and to compare these costs with the ongoing costs of investing in other investment funds. The Example is based on an investment of $1,000 invested at the beginning of the period and held for the entire period from November 1, 2023, through April 30, 2024.
Actual Expenses
In the table below, the first line under each of the “Investor Class” and “Institutional Class” headings provides information about actual account values and actual expenses for each share class. You may use this information, together with the amount you invested, to estimate the expenses that you paid over the period. Simply divide your account value by $1,000 (for example, an $8,600 account value divided by $1,000 = 8.6), then multiply the result by the number in the first line under the heading “Expenses Paid During Period” to estimate the expenses you paid on your account during this period. Although the Fund charges no sales loads or transaction fees, you will be assessed fees for outgoing wire transfers, returned checks, and stop payment orders at prevailing rates charged by U.S. Bank Global Fund Services, the Fund’s transfer agent. If you request that a redemption be made by wire transfer, the Fund’s transfer agent charges a $15 fee. IRAs are charged a $15 annual maintenance fee (up to $30 maximum per shareholder for shareholders with multiple IRAs). The examples below include, but are not limited to, management, shareholder servicing, accounting, custody, and transfer agent fees. However, the examples below do not include portfolio trading commissions and related expenses.
Hypothetical Example for Comparison Purposes
In the table below, the second line under each of the “Investor Class” and “Institutional Class” headings provides information about hypothetical account values and hypothetical expenses based on the Fund’s actual expense ratio for each share class and an assumed rate of return of 5% per year before expenses, which is not the Fund’s actual return for such share class. The hypothetical account values and expenses may not be used to estimate the actual ending account balance or expenses you paid for the period. You may use this information to compare the ongoing costs of investing in the Fund and other funds. To do so, compare these 5% hypothetical examples with the 5% hypothetical examples that appear in the shareholder reports of the other funds. Please note that the expenses shown in the table are meant to highlight your ongoing costs only. Therefore, the second lines under “Investor Class” and “Institutional Class” are useful in comparing ongoing costs only and will not help you determine the relative total costs of owning different funds.
| | Beginning | Ending | |
| | Account Value | Account Value | Expenses Paid |
| | November 1, 2023 | April 30, 2024
| During Period(1) |
| Investor Class | | | |
| Actual | $1,000.00 | $1,203.70 | $6.79 |
| Hypothetical (5% return before expenses) | $1,000.00 | $1,018.70 | $6.22 |
| | | | |
| Institutional Class | | | |
| Actual | $1,000.00 | $1,205.40 | $5.43 |
| Hypothetical (5% return before expenses) | $1,000.00 | $1,019.94 | $4.97 |
(1) | Expenses are equal to the Fund’s annualized expense ratio of 1.24% for Investor Class shares or 0.99% for Institutional Class shares, as applicable, multiplied by the average account value over the period, multiplied by 182/366 days (to reflect the half-year period). |
| HENNESSY FUNDS | 1-800-966-4354 | |
How to Obtain a Copy of the Fund’s Proxy
Voting Policy and Proxy Voting Records
A description of the policies and procedures the Fund uses to determine how to vote proxies relating to portfolio securities is available without charge (1) by calling 800-966-4354, (2) on the Hennessy Funds’ website at www.hennessyfunds.com/proxy-voting/voting-policy, or (3) on the U.S. Securities and Exchange Commission’s (the “SEC”) website at www.sec.gov. The Fund’s proxy voting record is available without charge on both the Hennessy Funds’ website at www.hennessyfunds.com/proxy-voting/voting-record and the SEC’s website at www.sec.gov no later than August 31 for the prior 12 months ending June 30.
Availability of Quarterly Portfolio Schedule
The Fund files a complete schedule of portfolio holdings with the SEC for the first and third quarters of each fiscal year as an exhibit to its reports on Form N-PORT. The Fund’s Form N-PORT reports are available on the SEC’s website at www.sec.gov or on request by calling 800-966-4354.
Federal Tax Distribution Information (Unaudited)
For fiscal year 2023, certain dividends paid by the Fund may be subject to a maximum tax rate of 23.8%, as provided for by the Jobs and Growth Tax Relief Reconciliation Act of 2003. The percentage of dividends declared from ordinary income designated as qualified dividend income was 7.34%.
For corporate shareholders, the percent of ordinary income distributions that qualified for the corporate dividends received deduction for fiscal year 2023 was 5.48%.
The percentage of taxable ordinary income distributions that were designated as short-term capital gain distributions under Section 871(k)(2)(C) of the Internal Revenue Code of 1986, as amended, for the Fund was 0.00%.
Important Notice Regarding Delivery
of Shareholder Documents
To help keep the Fund’s costs as low as possible, we generally deliver a single copy of shareholder reports, proxy statements, and prospectuses to shareholders who share an address and have the same last name. This process does not apply to account statements. You may request an individual copy of a shareholder document at any time. If you would like to receive separate mailings of shareholder documents, please call U.S. Bank Global Fund Services at 800-261-6950 or 414-765-4124, and individual delivery will begin within 30 days of your request. If your account is held through a financial institution or other intermediary, please contact such intermediary directly to request individual delivery.
Go Paperless with eDelivery
The SEC has adopted new regulations that will impact the design and delivery of future Semi-Annual and Annual Reports. Beginning with the 2024 Annual Reports, paper copies will be mailed to you unless you have opted for electronic delivery of the reports. We encourage all direct shareholders to sign up to receive all notices, account statements, prospectuses, tax forms, and shareholder reports electronically to help reduce expenses and the volume of paper U.S. mail received. To sign up for eDelivery or to change your delivery preference, please visit www.hennessyfunds.com/account.
If you hold your Fund shares through a financial intermediary, please contact your financial intermediary regarding electronic delivery options.
Subscribe to receive our team’s unique market and sector insights delivered to your inbox
www.hennessyfunds.com/subscribe
Follow us on social media
| PROXY VOTING — BOARD APPROVAL OF INVESTMENT ADVISORY AGREEMENT |
Board Approval of Investment Advisory
Agreement
At its meeting on March 6, 2024, the Board of Trustees of the Fund (the “Board,” and the members thereof, the “Trustees”) unanimously approved the continuation of the investment advisory agreement of the Fund with Hennessy Advisors, Inc. (the “Advisor”). As part of the process, the Trustees reviewed their fiduciary duties and the relevant factors for them to consider with respect to approving the advisory agreement. In addition, the Trustees who are not deemed interested persons (as defined by the Investment Company Act of 1940, as amended) of the Fund (the “Independent Trustees”) met in executive session to discuss the approval of the advisory agreement. As part of their discussion, the Independent Trustees confirmed their understanding of the need to have asked about, and received answers to, any matters that they believed are relevant to determining whether to approve the continuation of the advisory and sub-advisory agreements.
In advance of the meeting, the Advisor sent detailed information to the Trustees to assist them in their evaluation of the advisory agreement. This information included, but was not limited to, the following:
| | (1) | A memorandum from outside legal counsel that described the fiduciary duties of the Board with respect to approving the continuation of the advisory agreement and the relevant factors for consideration; |
| | | |
| | (2) | A memorandum from the Advisor that listed the factors relevant to the Board’s approval of the continuation of the advisory agreement and also referenced the documents that had been provided to help the Board assess each such factor; |
| | | |
| | (3) | A summary of the advisory agreement; |
| | | |
| | (4) | The Advisor’s financial statements from its most recent Form 10-K and Form 10-Q, which included information about the Advisor’s profitability; |
| | | |
| | (5) | A recent Fund fact sheet, which included, among other things, Fund performance over various periods; |
| | | |
| | (6) | A description of the range of services provided by the Advisor and the distinction between the Advisor-provided services and the Sub-Advisor-provided services; |
| | | |
| | (7) | A peer expense comparison of the net expense ratio and investment advisory fee of the Fund; and |
| | | |
| | (8) | A memorandum from the Advisor regarding economies of scale. |
All of the factors discussed were considered as a whole by the Trustees, as well as by the Independent Trustees meeting in executive session. The Trustees viewed the relevant factors in their totality, with no single factor being the principal or determinative factor in the Trustees’ determination of whether to approve the continuation of the advisory agreement. The Trustees recognized that the management and fee arrangements for the Fund are the result of years of review and discussion between the Independent Trustees and the Advisor, that certain aspects of such arrangements may receive greater scrutiny in some years than in others, and that the Trustees’ conclusions may be based, in part, on their consideration of these same arrangements and information received during the course of the year and in prior years.
| HENNESSY FUNDS | 1-800-966-4354 | |
Prior to approving the continuation of the advisory agreement, the Trustees, including the Independent Trustees in executive session, considered, among other items:
| | (1) | The nature and quality of the advisory services provided by the Advisor; |
| | | |
| | (2) | A comparison of the fees and expenses of the Fund to other similar funds; |
| | | |
| | (3) | Whether economies of scale are recognized by the Fund; |
| | | |
| | (4) | The costs and profitability of the Fund to the Advisor; |
| | | |
| | (5) | The performance of the Fund; and |
| | | |
| | (6) | Any benefits to the Advisor from serving as an investment advisor to the Fund (other than the advisory fee). |
The material considerations and determinations of the Trustees, including the Independent Trustees, were as follows:
| | (1) | The Trustees considered the services identified below that are provided by the Advisor. Based on this review and an assessment of the Advisor’s performance, the Trustees concluded that the Advisor provides high-quality services to the Fund, and they noted that their overall confidence in the Advisor was high. The Trustees also concluded that they were satisfied with the nature, extent, and quality of the advisory services provided to the Fund by the Advisor and that the nature and extent of the services provided by the Advisor were appropriate to assure that the Fund’s operations are conducted in compliance with applicable laws, rules, and regulations. |
| | | (a) | The Advisor acts as the portfolio manager for the Fund. In this capacity, the Advisor does the following: |
| | | | (i) | manages the composition of the Fund’s portfolio, including the purchase, retention, and disposition of portfolio securities in accordance with the Fund’s investment objectives, policies, and restrictions; |
| | | | | |
| | | | (ii) | seeks best execution for the Fund’s portfolio; |
| | | | | |
| | | | (iii) | manages the use of soft dollars for the Fund; and |
| | | | | |
| | | | (iv) | manages proxy voting for the Fund. |
| | | (b) | The Advisor performs a daily reconciliation of portfolio positions and cash for the Fund. |
| | | | |
| | | (c) | The Advisor monitors the liquidity of the Fund. |
| | | | |
| | | (d) | The Advisor monitors the Fund’s compliance with its investment objectives and restrictions and federal securities laws. |
| | | | |
| | | (e) | The Advisor maintains a compliance program (including a code of ethics), conducts ongoing reviews of the compliance programs of the Fund’s service providers (including their codes of ethics, as appropriate), conducts on-site visits to the Fund’s service providers, as feasible, monitors incidents of abusive trading practices, reviews Fund expense accruals, payments, and fixed expense ratios, evaluates insurance providers for fidelity bond, D&O/E&O insurance, and cybersecurity insurance coverage, manages regulatory examination compliance and responses, conducts employee compliance training, reviews reports provided by service providers, and maintains books and records. |
| BOARD APPROVAL OF INVESTMENT ADVISORY AGREEMENT |
| | | (f) | The Advisor oversees service providers that provide accounting, administration, distribution, transfer agency, custodial, sales, marketing, public relations, audit, information technology, and legal services to the Fund. |
| | | | |
| | | (g) | The Advisor maintains in-house marketing and distribution departments on behalf of the Fund. |
| | | | |
| | | (h) | The Advisor prepares or directs the preparation of all regulatory filings for the Fund, including writing and annually updating the Fund’s prospectus and related documents. |
| | | | |
| | | (i) | For each annual report of the Fund, the Advisor prepares a written summary of the Fund’s performance during the most recent 12-month period. |
| | | | |
| | | (j) | The Advisor oversees distribution of the Fund through third-party broker/dealers and independent financial institutions such as Charles Schwab, Inc., Fidelity, TD Ameritrade, and Pershing. The Advisor participates in no-transaction fee (“NTF”) programs with these companies on behalf of the Fund, which allow customers to purchase the Fund through third-party distribution channels without paying a transaction fee. The Advisor compensates, in part, a number of these third-party providers of NTF programs out of its own revenues. |
| | | | |
| | | (k) | The Advisor pays the incentive compensation of the Fund’s compliance officer and employs other staff, such as legal, marketing, national accounts, distribution, sales, administrative, and trading oversight personnel, as well as management executives. |
| | | | |
| | | (l) | The Advisor provides a quarterly compliance certification to the Board. |
| | | | |
| | | (m) | The Advisor prepares or reviews all Board materials, presents to and leads discussions with the Board, prepares or reviews all meeting minutes, and arranges for Board training and education. |
| | (2) | The Trustees compared the performance of the Fund to benchmark indices over various periods and noted that the Trustees review and discuss reports comparing the investment performance of the Fund to various indices at each quarterly Board meeting. Based on such information, the Trustees determined that the Advisor manages the Fund in a manner materially consistent with its stated investment objective and style. The Trustees concluded that the performance of the Fund over various periods warranted the continuation of the advisory agreement. |
| | | |
| | (3) | The Trustees reviewed the advisory fees and overall expense ratios of the Fund compared to other funds similar in asset size and investment objective to the Fund using data from Morningstar. As part of the discussion with management, the Trustees ensured that they understood and were comfortable with the criteria used to determine the funds included in the Morningstar categories for purposes of the materials considered at the meeting. The Trustees determined that the advisory fee and overall expense ratio of the Fund falls within a reasonable range of the advisory fees and overall expense ratios of other comparable funds and concluded that they are reasonable and warranted continuation of the advisory agreement. |
| HENNESSY FUNDS | 1-800-966-4354 | |
| | (4) | The Trustees also considered whether the Advisor was realizing economies of scale that should be shared with the Fund’s shareholders. The Trustees noted that many of the expenses incurred to manage the Fund are variable asset-based fees, so the Advisor does not realize material economies of scale relating to these expenses as the assets of the Fund increase. For example, third-party platform fees increase as a fund’s assets grow. |
| | | |
| | (5) | The Trustees considered the profitability of the Advisor, including the impact of platform fees on the Advisor’s profitability, and also considered the resources and revenues that the Advisor has put into managing and distributing the Fund. The Trustees then concluded that the profits of the Advisor are reasonable and not excessive when compared to profitability guidelines set forth in relevant court cases. |
| | | |
| | (6) | The Trustees considered the high level of professionalism and knowledge of the Advisor’s employees and concluded that this was beneficial to the Fund and its shareholders. |
| | | |
| | (7) | The Trustees considered any benefits to the Advisor from serving as an advisor to the Fund (other than the advisory fee). The Trustees noted that the Advisor may derive ancillary benefits from, by way of example, its association with the Fund in the form of proprietary and third-party research products and services received from broker-dealers that execute portfolio trades for the Fund. The Trustees determined that any such products and services have been used for legitimate purposes relating to the Fund by providing assistance in the investment decision-making process. The Trustees concluded that any additional benefits realized by the Advisor from its relationship with the Fund were reasonable, which was based on, among other things, the Trustees’ finding that the research, analytical, statistical, and other information and services provided by brokers are merely supplemental to the Advisor’s own efforts in the performance of its duties under the advisory agreement. |
After reviewing the materials and information provided at the meeting, as well as other information regularly provided at the Board’s quarterly meetings throughout the year regarding the quality of services provided by the Advisor, the performance of the Fund, expense information, brokerage commissions information, the adequacy and efficacy of the Advisor’s written policies and procedures, other regulatory compliance issues, trading information and related matters, and other factors that the Trustees deemed relevant, the Trustees, including the Independent Trustees, approved the continuation of the advisory agreement.
| BOARD APPROVAL OF INVESTMENT ADVISORY AGREEMENT |
(This Page Intentionally Left Blank.)
For information, questions, or assistance, please call
The Hennessy Funds
800-966-4354 or 415-899-1555
INVESTMENT ADVISOR
Hennessy Advisors, Inc.
7250 Redwood Boulevard, Suite 200
Novato, California 94945
ADMINISTRATOR,
TRANSFER AGENT,
DIVIDEND PAYING AGENT, &
SHAREHOLDER SERVICING AGENT
U.S. Bancorp Fund Services, LLC
d/b/a U.S. Bank Global Fund Services
P.O. Box 701
Milwaukee, Wisconsin 53201-0701
CUSTODIAN
U.S. Bank N.A.
Custody Operations
1555 North River Center Drive, Suite 302
Milwaukee, Wisconsin 53212
TRUSTEES
Neil J. Hennessy
Robert T. Doyle
J. Dennis DeSousa
Doug Franklin
Claire Garvie
Gerald P. Richardson
COUNSEL
Foley & Lardner LLP
777 East Wisconsin Avenue
Milwaukee, Wisconsin 53202-5306
INDEPENDENT REGISTERED
PUBLIC ACCOUNTING FIRM
Tait, Weller & Baker LLP
Two Liberty Place
50 South 16th Street, Suite 2900
Philadelphia, Pennsylvania 19102-2529
DISTRIBUTOR
Quasar Distributors, LLC
Three Canal Plaza, Suite 100
Portland, Maine 04101
www.hennessyfunds.com | 800-966-4354
This report has been prepared for shareholders and may be distributed to
others only if preceded or accompanied by a current prospectus.
SEMI-ANNUAL REPORT
APRIL 30, 2024
HENNESSY STANCE ESG ETF
Ticker STNC
This ETF is different from traditional ETFs.
Traditional ETFs tell the public what assets they hold each day. This ETF will not. This may create additional risks for your investment. For example:
• You may have to pay more money to trade the ETF’s shares. This ETF will provide less information to traders, who tend to charge more for trades when they have less information.
• The price you pay to buy ETF shares on an exchange may not match the value of the ETF’s portfolio. The same is true when you sell shares. These price differences may be greater for this ETF compared to other ETFs because it provides less information to traders.
• These additional risks may be even greater in bad or uncertain market conditions.
• The ETF will publish on its website each day a “Portfolio Reference Basket” designed to help trading in shares of the ETF. While the Portfolio Reference Basket includes all the names of the ETF’s holdings, it is not the ETF’s actual portfolio.
The differences between this ETF and other ETFs may also have advantages. By keeping certain information about the ETF portfolio secret, this ETF may face less risk that other traders can predict or copy its investment strategy. This may improve the ETF’s performance. If other traders are able to copy or predict the ETF’s investment strategy, however, this may hurt the ETF’s performance.
www.hennessyetfs.com | 1-800-966-4354
(This Page Intentionally Left Blank.)
Contents
| Letter to Shareholders | | 2 |
| Performance Overview | | 4 |
| Financial Statements | | |
| Schedule of Investments | | 5 |
| Statement of Assets and Liabilities | | 9 |
| Statement of Operations | | 10 |
| Statements of Changes in Net Assets | | 11 |
| Financial Highlights | | 12 |
| Notes to the Financial Statements | | 14 |
| Expense Example | | 24 |
| Proxy Voting Policy and Proxy Voting Records | | 25 |
| Availability of Quarterly Portfolio Schedule | | 25 |
| Federal Tax Distribution Information | | 25 |
| Premium/Discount Information | | 25 |
| Important Notice Regarding Delivery of Shareholder Documents | | 26 |
| Board Approval of Investment Advisory Agreements | | 27 |
The Securities and Exchange Commission has adopted new regulations that will impact the design and delivery of future Semi-Annual and Annual Reports. Beginning with the 2024 Annual Reports, paper copies will be mailed to you unless you have opted for electronic delivery of the report. See Go Paperless with eDelivery for instructions about how to sign up for electronic delivery.
| HENNESSY FUNDS | 1-800-966-4354 | |
May 2024
Dear Hennessy Funds Shareholder:
Market Highs, Uncertainties & Opportunities
As I write this semi-annual letter, the three major market indexes have hit all-time highs. We are enjoying robust returns in the U.S. across all sectors and several asset classes. We also understand that markets are driven by optimism. As markets hover at or near record highs, often uncertainty, risk, and volatility creep in. Have we gone too far, too fast? Is the market overvalued? What if the unexpected happens and sentiment turns in the other direction? There will always be uncertainties and unknowns, and that is why we remain steadfast in sticking to a consistent and focused investment style through every part of a market cycle, which we believe will perform well over the long term.
Given the unpredictable nature of the stock market, we encourage a sensible approach to investing. We can consider certain well-known adages and try to prove them, in exact terms, but we may find that there is no silver bullet in investing. “Sell in May and stay away.” “The trend is your friend.” “Expect increased volatility before a presidential election, followed by an up market through year end.” These tips for investing can be based on statistical correlations, some stronger and some weaker, but none are correct all the time. In investing, we want to avoid following pseudo-rules that are not always true; “60% of the time, it works every time” is not strong enough. All this to say, investing is full of risks, the market is full of uncertainties, and investors should be wary of investing silver bullets.
At Hennessy, we understand the uncertainty inherent in all investing, but we also understand that without uncertainty, there would not be opportunity. Our portfolio managers (PMs) have many years of experience (over 26 years average for all our PMs combined), and each of them apply their experience to investing for the long term to attempt to mitigate risk. Investors can mitigate risk in their own portfolios as well, by staying diversified, avoiding highly speculative investments, not chasing performance, not trying to time the market, and staying invested over longer periods. Most important of all, though, is having realistic expectations for your own level of risk tolerance.
While uncertainty and opportunities persist in any market, the past six-month period has been an overall positive period for many investors and for the stock market overall. For the six months ended April 30, 2024, all three broad-based indexes were positive with the Dow Jones Industrial Average up 15.58%, the S&P 500® Index up 20.98%, and the Nasdaq Composite Index up 22.31%. Robust performance was broad based. In fact, the dispersion of returns was relatively low across all market cap sizes and all GICS sectors, with the highest being Financials (+25.92% for the S&P 500® Financials Sector Index) and the lowest being Real Estate (+11.24% for the S&P 500® Real Estate Sector Index).
Several factors contributed to the strong, broad-based returns in the market. We believe the two most important of those factors were continued signs of a strong economy and solid corporate earnings. Although the market does not expect more than one or two rate decreases in 2024, fear of a recession due to the Federal Reserve’s rate hiking cycle seems to have abated slightly. Consumer demand and spending remain resilient, wages continue to increase, and unemployment numbers remain historically low. For most of the period, inflation expectations remained relatively low, although data in the later part of the period was somewhat higher than anticipated.
Like the overall market, the Hennessy Stance ESG ETF (ticker: STNC) experienced strong results. We continue to focus on providing attractive returns for our shareholders over a complete market cycle, and we are pleased that the Fund posted positive returns over the six-month, one year, and since inception periods ended April 30, 2024.
We believe that the outlook for U.S. stocks remains positive, primarily because we believe that the Federal Reserve will eventually begin to lower interest rates. Despite the recent up-tick, inflation has shown signs of easing, creating a better environment for consumers as well as businesses. The unemployment rate is still near record lows, there are elevated levels of cash on the balance sheets of U.S. companies and in the pockets of many consumers and investors, and there is the prospect of a more dovish Federal Reserve heading into the second half of 2024. However, we are cautiously watching certain parts of the economy for any hints of weakness, including consumer spending and credit issues. While volatility and uncertainty may affect the markets, we encourage investors to keep a long-term perspective and maintain a diversified portfolio.
We thank you for your continued interest in the Hennessy Funds and are grateful that you have chosen to invest with us. If you have any questions or would like to speak with us directly, please call us at (800) 966-4354.
Best regards,
| |
| |
| |
|
| Ryan C. Kelley, CFA |
| Chief Investment Officer, |
| Senior Vice President, and Portfolio Manager |
Past performance does not guarantee future results.
Investing involves risk. Principal loss is possible.
Opinions expressed are those of Ryan C. Kelley and are subject to change, are not guaranteed, and should not be considered investment advice.
The Dow Jones Industrial Average and S&P 500® Index are commonly used to measure the performance of U.S. stocks. The Nasdaq Composite Index comprises all common stocks listed on The Nasdaq Stock Market and is commonly used to measure the performance of technology-related stocks. The Nasdaq-100 Index includes 100 of the largest domestic and international non-financial companies listed on The NASDAQ Stock Market based on market capitalization. The indices are used herein for comparative purposes in accordance with SEC regulations. One cannot invest directly in an index. All returns are shown on a total return basis.
| HENNESSY FUNDS | 1-800-966-4354 | |
Performance Overview (Unaudited)
AVERAGE ANNUAL TOTAL RETURN FOR PERIODS ENDED APRIL 30, 2024
| | | | | Since |
| | | Six | One | Inception |
| | | Months(1) | Year
| (3/15/21)
|
| | Hennessy Stance ESG ETF – | | | |
| | (STNC) – NAV(2) | 20.81% | 8.29% | 5.13% |
| | Hennessy Stance ESG ETF – | | | |
| | (STNC) – Market Price(2) | 20.85% | 8.39% | 5.15% |
| | S&P 500® Index | 20.98% | 22.66% | 9.59% |
Expense ratio: Gross 0.95%, Net 0.85%(3)
(1) | Periods of less than one year are not annualized. |
(2) | Fund performance is shown based on both a net asset value (“NAV”) and market price basis. The Fund’s per share NAV is the value of one share of the Fund. NAV is calculated by taking the Fund’s total assets (including the fair value of securities owned), subtracting liabilities, and dividing by the number of shares outstanding. The NAV return is based on the NAV of the Fund, and the market price return is based on the market price per share of the Fund. The price used to calculate market price return is determined using the official closing price of the primary stock exchange (generally, 4:00 p.m. Eastern time) and may not represent the returns you would receive if shares were traded at other times. NAV and market price returns assume that dividends and capital gain distributions have been reinvested in the Fund at NAV and market price, respectively. |
(3) | The Fund’s investment advisor has contractually agreed to limit expenses until February 28, 2025. |
_______________
Performance data quoted represents past performance; past performance does not guarantee future results. The investment return and principal value of an investment will fluctuate so that an investor’s shares, when redeemed, may be worth more or less than their original cost. Shares are bought and sold at market price (closing price), not NAV, and are not individually redeemed from the Fund. Brokerage commissions will reduce returns. The performance table does not reflect the deduction of taxes that a shareholder would pay on Fund distributions or the redemption of Fund shares. Current performance of the Fund may be lower or higher than the performance quoted. Performance data current to the most recent month end may be obtained by visiting www.hennessyetfs.com. Performance for periods including or prior to December 22, 2022, is that of the Stance Equity ESG Large Cap Core ETF.
The S&P 500® Index is a capitalization-weighted index that is designed to represent the broad domestic economy through changes in the aggregate market value of 500 stocks across all major industries. One cannot invest directly in an index. This index is used for comparative purposes in accordance with Securities and Exchange Commission regulations.
Standard & Poor’s Financial Services is the source and owner of the S&P® and S&P 500® trademarks.
The expense ratio presented is from the most recent prospectus. The expense ratio for the current reporting period is available in the Financial Highlights section of this report.
| PERFORMANCE OVERVIEW/SCHEDULE OF INVESTMENTS |
Financial Statements
Schedule of Investments as of April 30, 2024 (Unaudited) |
HENNESSY STANCE ESG ETF
(% of Net Assets)
| TOP TEN HOLDINGS (EXCLUDING MONEY MARKET FUNDS) | % NET ASSETS |
| Chipotle Mexican Grill, Inc. | 3.96% |
| Tyson Foods, Inc., Class A | 3.76% |
| McDonald’s Corp. | 3.75% |
| Apple, Inc. | 3.69% |
| Capital One Financial Corp. | 3.65% |
| The Cigna Group | 3.60% |
| Cencora, Inc. | 3.58% |
| AT&T, Inc. | 3.57% |
| Sysco Corp. | 3.54% |
| The TJX Companies, Inc. | 3.53% |
Note: For presentation purposes, the Fund has grouped some of the industry categories. For purposes of categorizing securities for compliance with Section 8(b)(1) of the Investment Company Act of 1940, as amended, the Fund uses more specific industry classifications.
The Global Industry Classification Standard (GICS®) was developed by and is the exclusive property and a service mark of MSCI, Inc. and Standard & Poor’s Financial Services LLC. It has been licensed for use by the Hennessy Funds.
| HENNESSY FUNDS | 1-800-966-4354 | |
| COMMON STOCKS – 99.53% | | Number | | | | | | % of | |
| | | of Shares | | | Value | | | Net Assets | |
| Communication Services – 6.88% | | | | | | | | | |
| AT&T, Inc. | | | 236,795 | | | $ | 3,999,468 | | | | 3.57 | % |
| The Walt Disney Co. | | | 33,408 | | | | 3,711,629 | | | | 3.31 | % |
| | | | | | | | 7,711,097 | | | | 6.88 | % |
| | | | | | | | | | | | | |
| Consumer Discretionary – 20.04% | | | | | | | | | | | | |
| Chipotle Mexican Grill, Inc. (a) | | | 1,407 | | | | 4,445,557 | | | | 3.96 | % |
| Hilton Worldwide Holdings, Inc. | | | 15,146 | | | | 2,988,003 | | | | 2.66 | % |
| McDonald’s Corp. | | | 15,420 | | | | 4,210,277 | | | | 3.75 | % |
| NIKE, Inc., Class B | | | 23,816 | | | | 2,197,264 | | | | 1.96 | % |
| Starbucks Corp. | | | 39,818 | | | | 3,523,495 | | | | 3.14 | % |
| The Home Depot, Inc. | | | 3,483 | | | | 1,164,088 | | | | 1.04 | % |
| The TJX Companies, Inc. | | | 42,104 | | | | 3,961,565 | | | | 3.53 | % |
| | | | | | | | 22,490,249 | | | | 20.04 | % |
| | | | | | | | | | | | | |
| Consumer Staples – 7.30% | | | | | | | | | | | | |
| Sysco Corp. | | | 53,337 | | | | 3,964,006 | | | | 3.54 | % |
| Tyson Foods, Inc., Class A | | | 69,603 | | | | 4,221,422 | | | | 3.76 | % |
| | | | | | | | 8,185,428 | | | | 7.30 | % |
| | | | | | | | | | | | | |
| Financials – 17.81% | | | | | | | | | | | | |
| Capital One Financial Corp. | | | 28,559 | | | | 4,096,217 | | | | 3.65 | % |
| Citigroup, Inc. | | | 5,685 | | | | 348,661 | | | | 0.31 | % |
| Mastercard, Inc., Class A | | | 8,574 | | | | 3,868,589 | | | | 3.45 | % |
| Nasdaq, Inc. | | | 66,144 | | | | 3,958,719 | | | | 3.53 | % |
| The Bank of New York Mellon Corp. | | | 5,988 | | | | 338,262 | | | | 0.30 | % |
| The Travelers Companies, Inc. | | | 17,615 | | | | 3,737,198 | | | | 3.33 | % |
| W.R. Berkley Corp. | | | 47,207 | | | | 3,633,523 | | | | 3.24 | % |
| | | | | | | | 19,981,169 | | | | 17.81 | % |
| | | | | | | | | | | | | |
| Health Care – 17.04% | | | | | | | | | | | | |
| AbbVie, Inc. | | | 24,160 | | | | 3,929,382 | | | | 3.50 | % |
| Cencora, Inc. | | | 16,806 | | | | 4,017,474 | | | | 3.58 | % |
| Laboratory Corp. of America Holdings | | | 16,154 | | | | 3,252,931 | | | | 2.90 | % |
| Regeneron Pharmaceuticals, Inc. (a) | | | 4,362 | | | | 3,885,059 | | | | 3.46 | % |
| The Cigna Group | | | 11,286 | | | | 4,029,553 | | | | 3.60 | % |
| | | | | | | | 19,114,399 | | | | 17.04 | % |
The accompanying notes are an integral part of these financial statements.
| COMMON STOCKS | | Number | | | | | | % of | |
| | | of Shares | | | Value | | | Net Assets | |
| Industrials – 14.80% | | | | | | | | | |
| A O Smith Corp. | | | 46,809 | | | $ | 3,877,658 | | | | 3.46 | % |
| Cintas Corp. | | | 1,854 | | | | 1,220,562 | | | | 1.09 | % |
| CSX Corp. | | | 113,607 | | | | 3,774,025 | | | | 3.36 | % |
| Emerson Electric Co. | | | 35,421 | | | | 3,817,675 | | | | 3.40 | % |
| Paychex, Inc. | | | 32,982 | | | | 3,918,591 | | | | 3.49 | % |
| | | | | | | | 16,608,511 | | | | 14.80 | % |
| | | | | | | | | | | | | |
| Information Technology – 13.02% | | | | | | | | | | | | |
| Accenture PLC, Class A | | | 9,203 | | | | 2,769,275 | | | | 2.47 | % |
| Advanced Micro Devices, Inc. (a) | | | 2,034 | | | | 322,145 | | | | 0.29 | % |
| Apple, Inc. | | | 24,301 | | | | 4,139,190 | | | | 3.69 | % |
| Cognizant Technology Solutions Corp., Class A | | | 55,219 | | | | 3,626,784 | | | | 3.23 | % |
| Microsoft Corp. | | | 9,627 | | | | 3,748,080 | | | | 3.34 | % |
| | | | | | | | 14,605,474 | | | | 13.02 | % |
| | | | | | | | | | | | | |
| Materials – 2.64% | | | | | | | | | | | | |
| Newmont Corp. | | | 30,902 | | | | 1,255,857 | | | | 1.12 | % |
| The Sherwin-Williams Co. | | | 5,672 | | | | 1,699,388 | | | | 1.52 | % |
| | | | | | | | 2,955,245 | | | | 2.64 | % |
| Total Common Stocks | | | | | | | | | | | | |
| (Cost $114,270,021) | | | | | | | 111,651,572 | | | | 99.53 | % |
| | | | | | | | | | | | | |
| SHORT-TERM INVESTMENTS – 0.44% | | | | | | | | | | | | |
| | | | | | | | | | | | | |
| Money Market Funds – 0.44% | | | | | | | | | | | | |
| First American Government Obligations Fund – Class X, 5.227% (b) | | | 491,228 | | | | 491,228 | | | | 0.44 | % |
| | | | | | | | | | | | | |
| Total Short-Term Investments | | | | | | | | | | | | |
| (Cost $491,228) | | | | | | | 491,228 | | | | 0.44 | % |
| | | | | | | | | | | | | |
| Total Investments | | | | | | | | | | | | |
| (Cost $114,761,249) – 99.97% | | | | | | | 112,142,800 | | | | 99.97 | % |
| Other Assets in Excess of Liabilities – 0.03% | | | | | | | 27,542 | | | | 0.03 | % |
| | | | | | | | | | | | | |
TOTAL NET ASSETS – 100.00% | | | | | | $ | 112,170,342 | | | | 100.00 | % |
Percentages are stated as a percent of net assets.
PLC – Public Limited Company
| (a) | Non-income producing security. |
| (b) | The rate listed is the fund’s seven-day yield as of April 30, 2024. |
The accompanying notes are an integral part of these financial statements.
| HENNESSY FUNDS | 1-800-966-4354 | |
Summary of Fair Value Exposure as of April 30, 2024
The following is a summary of the inputs used to value the Fund’s net assets as of April 30, 2024 (see Note 3 in the accompanying Notes to the Financial Statements):
| Common Stocks | | Level 1 | | | Level 2 | | | Level 3 | | | Total | |
| Communication Services | | $ | 7,711,097 | | | $ | — | | | $ | — | | | $ | 7,711,097 | |
| Consumer Discretionary | | | 22,490,249 | | | | — | | | | — | | | | 22,490,249 | |
| Consumer Staples | | | 8,185,428 | | | | — | | | | — | | | | 8,185,428 | |
| Financials | | | 19,981,169 | | | | — | | | | — | | | | 19,981,169 | |
| Health Care | | | 19,114,399 | | | | — | | | | — | | | | 19,114,399 | |
| Industrials | | | 16,608,511 | | | | — | | | | — | | | | 16,608,511 | |
| Information Technology | | | 14,605,474 | | | | — | | | | — | | | | 14,605,474 | |
| Materials | | | 2,955,245 | | | | — | | | | — | | | | 2,955,245 | |
| Total Common Stocks | | $ | 111,651,572 | | | $ | — | | | $ | — | | | $ | 111,651,572 | |
| Short-Term Investments | | | | | | | | | | | | | | | | |
| Money Market Funds | | $ | 491,228 | | | $ | — | | | $ | — | | | $ | 491,228 | |
| Total Short-Term Investments | | $ | 491,228 | | | $ | — | | | $ | — | | | $ | 491,228 | |
| Total Investments | | $ | 112,142,800 | | | $ | — | | | $ | — | | | $ | 112,142,800 | |
The accompanying notes are an integral part of these financial statements.
| SCHEDULE OF INVESTMENTS/STATEMENT OF ASSETS AND LIABILITIES |
Financial Statements
Statement of Assets and Liabilities as of April 30, 2024 (Unaudited) |
| ASSETS: | | | |
| Investments in securities, at value (cost $114,761,249) | | $ | 112,142,800 | |
| Dividends and interest receivable | | | 157,364 | |
| Receivable for securities sold | | | 867,122 | |
| Total assets | | | 113,167,286 | |
| | | | | |
| LIABILITIES: | | | | |
| Payable for fund shares redeemed | | | 868,158 | |
| Payable to advisor | | | 81,379 | |
| Accrued expenses and other payables | | | 47,407 | |
| Total liabilities | | | 996,944 | |
| NET ASSETS | | $ | 112,170,342 | |
| | | | | |
| NET ASSETS CONSIST OF: | | | | |
| Par Value | | $ | 3,876 | |
| Capital stock | | | 94,418,136 | |
| Total distributable earnings | | | 17,748,330 | |
| Total net assets | | $ | 112,170,342 | |
| | | | | |
| NET ASSETS: | | | | |
| Shares authorized ($0.001 par value) | | | 100,000,000 | |
| Net assets applicable to outstanding shares | | $ | 112,170,342 | |
| Shares issued and outstanding | | | 3,876,142 | |
| Net asset value, offering price, and redemption price per share | | $ | 28.94 | |
The accompanying notes are an integral part of these financial statements.
| HENNESSY FUNDS | 1-800-966-4354 | |
Financial Statements
Statement of Operations for the six months ended April 30, 2024 (Unaudited) |
| INVESTMENT INCOME: | | | |
Dividend income(1) | | $ | 516,963 | |
| Total investment income | | | 516,963 | |
| | | | | |
| EXPENSES: | | | | |
| Investment advisory fees (See Note 5) | | | 384,220 | |
| Total expenses before waivers | | | 384,220 | |
| Expense reimbursement from advisor | | | (40,444 | ) |
| Net expenses | | | 343,776 | |
| NET INVESTMENT INCOME | | $ | 173,187 | |
| | | | | |
| REALIZED AND UNREALIZED GAINS (LOSSES): | | | | |
| Net realized loss on investments | | $ | (171,587 | ) |
| Net realized gain from redemption in-kind | | | 28,465,788 | |
| Net change in unrealized appreciation/depreciation on investments | | | (18,921,211 | ) |
| Net gain on investments | | | 9,372,990 | |
| NET INCREASE IN NET ASSETS RESULTING FROM OPERATIONS | | $ | 9,546,177 | |
(1) | Net of foreign taxes and issuance fees withheld of $825. |
The accompanying notes are an integral part of these financial statements.
| STATEMENT OF OPERATIONS/STATEMENTS OF CHANGES IN NET ASSETS |
Financial Statements
| Statements of Changes in Net Assets |
| | | Six Months Ended | | | Two-Month | | | | |
| | | April 30, 2024 | | | Period Ended | | | Year Ended | |
| | | (Unaudited) | | | October 31, 2023(1) | | | August 31, 2023 | |
| OPERATIONS: | | | | | | | | | |
| Net investment income (loss) | | $ | 173,187 | | | $ | (404 | ) | | $ | 118,013 | |
| Net realized gain (loss) on investments | | | 28,294,201 | | | | (2,637,379 | ) | | | 2,948,962 | |
| Net change in unrealized | | | | | | | | | | | | |
| appreciation/depreciation on investments | | | (18,921,211 | ) | | | (1,930,821 | ) | | | 454,119 | |
| Net increase (decrease) in net assets | | | | | | | | | | | | |
| resulting from operations | | | 9,546,177 | | | | (4,568,604 | ) | | | 3,521,094 | |
| | | | | | | | | | | | | |
| DISTRIBUTIONS TO SHAREHOLDERS: | | | | | | | | | | | | |
| Distributable earnings | | | (50,006 | ) | | | — | | | | (247,449 | ) |
| Total distributions | | | (50,006 | ) | | | — | | | | (247,449 | ) |
| | | | | | | | | | | | | |
| CAPITAL SHARE TRANSACTIONS: | | | | | | | | | | | | |
| Proceeds from shares issued | | | | | | | | | | | | |
| in the Reorganization (See Note 10) | | | 71,656,846 | | | | — | | | | — | |
| Proceeds from shares subscribed | | | 143,715,569 | | | | 596,298 | | | | 4,008,931 | |
| Cost of shares redeemed | | | (153,093,397 | ) | | | (938,382 | ) | | | (4,506,305 | ) |
| Net increase (decrease) in net assets | | | | | | | | | | | | |
| derived from capital share transactions | | | 62,279,018 | | | | (342,084 | ) | | | (497,374 | ) |
| TOTAL INCREASE | | | | | | | | | | | | |
| (DECREASE) IN NET ASSETS | | | 71,775,189 | | | | (4,910,688 | ) | | | 2,776,271 | |
| | | | | | | | | | | | | |
| NET ASSETS: | | | | | | | | | | | | |
| Beginning of period | | | 40,395,153 | | | | 45,305,841 | | | | 42,529,570 | |
| End of period | | $ | 112,170,342 | | | $ | 40,395,153 | | | $ | 45,305,841 | |
| | | | | | | | | | | | | |
| CHANGES IN SHARES OUTSTANDING: | | | | | | | | | | | | |
| Shares issued in the Reorganization | | | 2,506,142 | | | | — | | | | — | |
| Shares sold | | | 4,960,000 | | | | 25,000 | | | | 155,000 | |
| Shares redeemed | | | (5,275,000 | ) | | | (35,000 | ) | | | (175,000 | ) |
| Net increase (decrease) | | | | | | | | | | | | |
| in shares outstanding | | | 2,191,142 | | | | (10,000 | ) | | | (20,000 | ) |
(1) | The period ended October 31, 2023, consists of 2 months due to the Fund’s fiscal year end change from August 31 to October 31, effective October 8, 2023. |
The accompanying notes are an integral part of these financial statements.
| HENNESSY FUNDS | 1-800-966-4354 | |
Financial Statements
For a share outstanding throughout each period
| | | Six Months Ended | |
| | | April 30, 2024 | |
| | | (Unaudited) | |
| PER SHARE DATA: | | | |
| Net asset value, beginning of period | | $ | 23.97 | |
| | | | | |
| Income from investment operations: | | | | |
Net investment income (loss)(2) | | | 0.06 | |
| Net realized and unrealized gains (losses) on investments | | | 4.93 | |
| Total from investment operations | | | 4.99 | |
| | | | | |
| Less distributions: | | | | |
| Dividends from net investment income | | | (0.02 | ) |
| Dividends from net realized gains | | | — | |
| Total distributions | | | (0.02 | ) |
| Net asset value, end of period | | $ | 28.94 | |
| Market value, end of period | | $ | 28.95 | |
| | | | | |
TOTAL RETURN ON NET ASSET VALUE(4) | | | 20.81 | %(6) |
TOTAL RETURN ON MARKET PRICE(5) | | | 20.85 | %(6) |
| | | | | |
| SUPPLEMENTAL DATA AND RATIOS: | | | | |
| Net assets, end of period (millions) | | $ | 112.17 | |
| Ratio of expenses to average net assets: | | | | |
| Before expense reimbursement | | | 0.95 | %(7) |
| After expense reimbursement | | | 0.85 | %(7) |
| Ratio of net investment income (loss) to average net assets: | | | | |
| Before expense reimbursement | | | 0.33 | %(7) |
| After expense reimbursement | | | 0.43 | %(7) |
Portfolio turnover rate(8) | | | 145 | %(6)(9) |
(1) | Inception date of the Fund was March 15, 2021. |
(2) | Calculated using the average shares outstanding method. |
(3) | Amount is between $(0.005) and $0.005. |
(4) | Total investment return/(loss) on net asset value is calculated assuming a purchase of shares on the first day and a sale of shares on the last day of each period reported and includes reinvestments of dividends and distributions, if any. |
(5) | Total investment return/(loss) on market price is calculated assuming an initial investment made at the market price on the first day of the period, reinvestment of dividends and distributions at market price during the period, and redemption at market price on the last day of the period. |
(6) | Not annualized. |
(7) | Annualized. |
The accompanying notes are an integral part of these financial statements.
| Two-Month | | | | | | | | | | | |
| Period Ended | | | | | | | | | Period Ended | | |
| October 31, | | | Year Ended August 31, | | | August 31, | | |
| 2023 | | | 2023 | | | 2022 | | | 2021(1) | | |
| | | | | | | | | | | | |
| $ | 26.73 | | | $ | 24.80 | | | $ | 27.82 | | | $ | 25.00 | | |
| | | | | | | | | | | | | | | | |
| | | | | | | | | | | | | | | | |
| | (0.00 | )(3) | | | 0.07 | | | | 0.20 | | | | 0.02 | | |
| | (2.76 | ) | | | 2.01 | | | | (3.10 | ) | | | 2.80 | | |
| | (2.76 | ) | | | 2.08 | | | | (2.90 | ) | | | 2.82 | | |
| | | | | | | | | | | | | | | | |
| | | | | | | | | | | | | | | | |
| | — | | | | (0.15 | ) | | | (0.10 | ) | | | — | | |
| | — | | | | — | | | | (0.02 | ) | | | — | | |
| | — | | | | (0.15 | ) | | | (0.12 | ) | | | — | | |
| $ | 23.97 | | | $ | 26.73 | | | $ | 24.80 | | | $ | 27.82 | | |
| $ | 23.98 | | | $ | 26.74 | | | $ | 24.83 | | | $ | 27.91 | | |
| | | | | | | | | | | | | | | | |
| | -10.31 | %(6) | | | 8.39 | % | | | -10.50 | % | | | 11.23 | %(6) | |
| | -10.34 | %(6) | | | 8.32 | % | | | -10.63 | % | | | 11.56 | %(6) | |
| | | | | | | | | | | | | | | | |
| | | | | | | | | | | | | | | | |
| $ | 40.40 | | | $ | 45.31 | | | $ | 42.53 | | | $ | 37.29 | | |
| | | | | | | | | | | | | | | | |
| | 0.95 | %(7) | | | 0.95 | % | | | 0.95 | % | | | 0.95 | %(7) | |
| | 0.85 | %(7) | | | 0.85 | % | | | 0.85 | % | | | 0.85 | %(7) | |
| | | | | | | | | | | | | | | | |
| | (0.11 | )%(7) | | | 0.17 | % | | | 0.64 | % | | | 0.09 | %(7) | |
| | (0.01 | )%(7) | | | 0.27 | % | | | 0.74 | % | | | 0.19 | %(7) | |
| | 62 | %(6) | | | 274 | % | | | 290 | % | | | 180 | %(6) | |
(8) | Excludes effect of in-kind transfers. |
(9) | The cost of purchases and proceeds from sales of securities that were incurred to realign the CCM Small/Mid-Cap Impact Value Fund and CCM Core Impact Equity Fund portfolios subsequent to November 10, 2023 and February 23, 2024, the reorganization dates, respectively, are excluded from the portfolio turnover rate calculation. See Note 10 of the Notes to Financial Statements for further information regarding this reorganization. If such amounts had not been excluded, the portfolio turnover rate would have been 173% for the period ended April 30, 2024. |
The accompanying notes are an integral part of these financial statements.
| HENNESSY FUNDS | 1-800-966-4354 | |
Financial Statements
Notes to the Financial Statements April 30, 2024 (Unaudited) |
1). ORGANIZATION
The Hennessy Stance ESG ETF (the “Fund”) is a series of Hennessy Funds Trust (the “Trust”), which was organized as a Delaware statutory trust on September 17, 1992. The Fund is an actively managed exchange-traded fund that operates pursuant to an exemptive order from the Securities and Exchange Commission (the “SEC”). The Fund is a successor to the Stance Equity ESG Large Cap Core ETF (the “Predecessor Fund”) pursuant to a reorganization that took place after the close of business on December 22, 2022. Prior to December 22, 2022, the Fund had no investment operations. The Fund is the accounting and performance information successor of the Predecessor Fund. The investment objective of the Fund is long-term capital appreciation. The Fund is a diversified fund and offers one class of shares. Effective October 8, 2023, the Fund changed its fiscal year end for financial reporting purposes from August 31 to October 31.
As an investment company, the Fund follows the investment company accounting and reporting guidance of the Financial Accounting Standards Board (the “FASB”) Accounting Standard Codification Topic 946 “Financial Services—Investment Companies.”
2). SIGNIFICANT ACCOUNTING POLICIES
The following is a summary of significant accounting policies consistently followed by the Fund in the preparation of the financial statements. These policies conform to U.S. generally accepted accounting principles (“GAAP”).
| a). | Securities Valuation – All investments in securities are valued in accordance with the Fund’s valuation policies and procedures, as described in Note 3. |
| | |
| b). | Federal Income Taxes – The Fund has elected to be taxed as a regulated investment company and intends to distribute substantially all of its taxable income to its shareholders and otherwise comply with the provisions of the Internal Revenue Code of 1986, as amended, applicable to regulated investment companies. As a result, the Fund has made no provision for federal income taxes or excise taxes. Net investment income/loss and realized gains/losses for federal income tax purposes may differ from those reported in the financial statements because of temporary book-basis and tax-basis differences. Temporary differences are primarily the result of the treatment of partnership income and wash sales for tax reporting purposes. The Fund recognizes interest and penalties related to income tax benefits, if any, in the Statement of Operations as an income tax expense. Distributions from net realized gains for book purposes may include short-term capital gains, which are included as ordinary income to shareholders for tax purposes. The Fund may utilize equalization accounting for tax purposes and designate earnings and profits, including net realized gains distributed to shareholders on redemption of shares, as part of the dividends paid deduction for income tax purposes. |
| | |
| c). | Accounting for Uncertainty in Income Taxes – The Fund has accounting policies regarding recognition and measurement of tax positions taken or expected to be taken on a tax return. The tax returns of the Fund for the prior three fiscal years are open for examination. The Fund has reviewed all open tax years in major tax |
| NOTES TO THE FINANCIAL STATEMENTS |
| | jurisdictions and concluded that there is no impact on the Fund’s net assets and no tax liability resulting from unrecognized tax benefits relating to uncertain income tax positions taken or expected to be taken on a tax return. The Fund’s major tax jurisdictions are U.S. federal and Delaware. |
| | |
| d). | Income and Expenses – Dividend income is recognized on the ex-dividend date or as soon as information is available to the Fund. Interest income, which includes the amortization of premium and accretion of discount, is recognized on an accrual basis. Market discounts, original issue discounts, and market premiums on debt securities are accreted or amortized to interest income over the life of a security with a corresponding increase or decrease, as applicable, in the cost basis of such security using the yield-to-maturity method or, where applicable, the first call date of the security. Other non-cash dividends are recognized as investment income at the fair value of the property received. Expenses and fees, including investment advisory fees, are accrued daily and taken into account for the purpose of determining the net asset value (“NAV”) of the Fund. As discussed further in Note 5, most expenses of the Fund are paid by Hennessy Advisors, Inc. (the “Advisor”) under a unitary fee arrangement. |
| | |
| e). | Distributions to Shareholders – Dividends from net investment income for the Fund, if any, are declared and paid annually, usually in December. Distributions of net realized capital gains, if any, are declared and paid annually, usually in December. |
| | |
| f). | Security Transactions – Investment transactions are recorded on the trade date. The Fund determines the realized gain/loss from an investment transaction by comparing the original cost of the security lot sold with the net sale proceeds. Discounts and premiums on securities purchased are accreted or amortized, respectively, over the life of each such security. |
| | |
| g). | Use of Estimates – Preparing financial statements in accordance with GAAP requires management to make estimates and assumptions that affect the reported amounts of assets and liabilities and disclosure of contingent assets and liabilities at the date of the financial statements, as well as the reported change in net assets during the reporting period. Actual results could differ from those estimates. |
| | |
| h). | Share Valuation – The NAV per share of the Fund is calculated by dividing (i) the total value of the securities held by the Fund, plus cash and other assets, minus all liabilities (including estimated accrued expenses) by (ii) the total number of Fund shares outstanding, rounded to the nearest $0.01. Fund shares are not priced on days the New York Stock Exchange is closed for trading. |
| | |
| i). | Illiquid Securities – Pursuant to Rule 22e-4 under the 1940 Act, the Fund has adopted a Liquidity Risk Management Program (the “Liquidity Program”). The Liquidity Program requires, among other things, that the Fund limit its illiquid investments to no more than 15% of its net assets. An illiquid investment is any investment that the Fund reasonably expects cannot be sold or disposed of by the Fund in current market conditions in seven calendar days or less without the sale or disposition significantly changing the market value of the investment. |
| | |
| j). | Recent Accounting Pronouncements and Regulatory Updates – In October 2022, the Securities and Exchange Commission (“SEC”) adopted a final rule relating to Tailored Shareholder Reports for Mutual Funds and Exchange-Traded Funds (ETFs); Fee Information in Investment Company Advertisements. The rule and form amendments will require mutual funds and ETFs to transmit concise and visually engaging shareholder reports that highlight key information. The amendments also will require that funds tag information in a structured data format. In addition, the |
| HENNESSY FUNDS | 1-800-966-4354 | |
| | rule amendments will require that certain more in-depth information be made available online and available for delivery free of charge to investors on request. The amendments became effective January 24, 2023. There is an 18-month transition period after the effective date of the amendment. |
| | |
| | In June 2022, the FASB issued Accounting Standards Update (“ASU”) 2022-03, Fair Value Measurement (Topic 820): Fair Value Measurement of Equity Securities Subject to Contractual Sale Restrictions. The ASU clarifies that a contractual restriction on the sale of an equity security is not considered part of the unit of account of the equity security and, therefore, is not considered in measuring the fair value. The amendments also require additional disclosures related to equity securities subject to contractual sale restrictions. The ASU is effective for fiscal years beginning after December 15, 2023, and interim periods within those fiscal years. |
3). SECURITIES VALUATION
The Fund follows its valuation policies and procedures in determining its NAV and, in preparing these financial statements, the fair value accounting standards that establish an authoritative definition of fair value and set out a hierarchy for measuring fair value. These standards require additional disclosures about the various inputs and valuation techniques used to develop the measurements of fair value and a discussion of changes in valuation techniques and related inputs during the period. These inputs are summarized in the three broad levels listed below:
| | Level 1 – | Unadjusted, quoted prices in active markets for identical instruments that the Fund has the ability to access at the date of measurement. |
| | | |
| | Level 2 – | Other significant observable inputs other than quoted prices included in Level 1 (including, but not limited to, quoted prices in active markets for similar instruments, quoted prices in markets that are not active for identical or similar instruments, and model-derived valuations in which all significant inputs and significant value drivers are observable in active markets, such as interest rates, prepayment speeds, credit risk curves, default rates, and similar data). |
| | | |
| | Level 3 – | Significant unobservable inputs (including the Fund’s own assumptions about what market participants would use to price the asset or liability based on the best available information) when observable inputs are unavailable. |
The following is a description of the valuation techniques applied to the Fund’s major categories of assets and liabilities on a recurring basis:
| | Equity Securities – Equity securities, including common stocks, preferred stocks, foreign-issued common stocks, exchange- traded funds, and real estate investment trusts, that are traded on a securities exchange for which a last-quoted sales price is readily available generally are valued at the last sales price as reported by the primary exchange on which the securities are listed. Securities listed on The Nasdaq Stock Market (“Nasdaq”) generally are valued at the Nasdaq Official Closing Price, which may differ from the last sales price reported. Securities traded on a securities exchange for which a last-quoted sales price is not readily available generally are valued at the mean between the bid and ask prices. To the extent these securities are actively traded and valuation adjustments are not applied, they are classified in Level 1 of the fair value hierarchy. Securities traded on foreign exchanges generally are not valued at the same time the Fund calculates its NAV because most foreign markets close well before such time. The earlier close of most foreign markets gives rise to the |
| NOTES TO THE FINANCIAL STATEMENTS |
| | possibility that significant events, including broad market moves, may have occurred in the interim. In certain circumstances, it may be determined that a foreign security needs to be fair valued because it appears that the value of the security might have been materially affected by events occurring after the close of the market in which the security is principally traded, but before the time the Fund calculates its NAV, such as by a development that affects an entire market or region (e.g., a weather-related event) or a potentially global development (e.g., a terrorist attack that may be expected to have an effect on investor expectations worldwide). |
| | |
| | Registered Investment Companies – Investments in open-end registered investment companies, commonly referred to as mutual funds, generally are priced at the ending NAV provided by the applicable mutual fund’s service agent and are classified in Level 1 of the fair value hierarchy. |
| | |
| | Debt Securities – Debt securities, including corporate bonds, asset-backed securities, mortgage-backed securities, municipal bonds, U.S. Treasuries, and U.S. government agency issues, are generally valued at market on the basis of valuations furnished by an independent pricing service that utilizes both dealer-supplied valuations and formula-based techniques. The pricing service may consider recently executed transactions in securities of the issuer or comparable issuers, market price quotations (where observable), bond spreads, and fundamental data relating to the issuer. In addition, the model may incorporate observable market data, such as reported sales of similar securities, broker quotes, yields, bids, offers, and reference data. Certain securities are valued primarily using dealer quotations. These securities are generally classified in Level 2 of the fair value hierarchy. |
| | |
| | Short-Term Securities – Short-term equity investments, including money market funds, are valued in the manner specified above for equity securities. Short-term debt investments with an original term to maturity of 60 days or less are valued at amortized cost, which approximates fair market value. If the original term to maturity of a short-term debt investment exceeds 60 days, then the values as of the 61st day prior to maturity are amortized. Amortized cost is not used if its use would be inappropriate due to credit or other impairments of the issuer, in which case the security’s fair value would be determined as described below. Short-term securities are generally classified in Level 1 or Level 2 of the fair value hierarchy depending on the inputs used and market activity levels for specific securities. |
If market quotations are not readily available or if a significant event has occurred that indicates the closing price of a security no longer represents the true value of that security, such security will be valued at its fair value under the Fund’s established fair valuation procedures as implemented by the Advisor, the Fund’s valuation designee. The Advisor, as the valuation designee, is subject to the oversight of the Board of Trustees of the Fund (the “Board”). There are numerous criteria considered in determining a fair value of a security, such as the trading volume of a security and markets, the values of other similar securities, and news events with direct bearing on a security or markets. Fair value pricing results in an estimated price for a security that reflects the amount the Fund might reasonably expect to receive in a current sale. Depending on the relative significance of the valuation inputs, these securities may be classified in either Level 2 or Level 3 of the fair value hierarchy. The Advisor will regularly evaluate whether the Fund’s fair value pricing procedures continue to be appropriate in light of the specific circumstances of the Fund and the quality of prices obtained through their application of such procedures.
| HENNESSY FUNDS | 1-800-966-4354 | |
The fair value of foreign securities may be determined with the assistance of a pricing service using correlations between the movement of prices of such securities and indices of domestic securities and other appropriate indicators, such as closing market prices of relevant American Depositary Receipts or futures contracts. Using fair value pricing means that the Fund’s NAV reflects the affected portfolio securities’ values as determined by the Advisor, instead of being determined by the market. Using a fair value pricing methodology to price a foreign security may result in a value that is different from such foreign security’s most recent closing price and from the value used by other investment companies to calculate their NAVs. Such securities are generally classified in Level 2 of the fair value hierarchy. Because the Fund may invest in foreign securities, the value of the Fund’s portfolio securities may change on days when a shareholder is unable to purchase or redeem Fund shares.
The Fund has performed an analysis of all existing investments to determine the significance and character of all inputs to their fair value determinations. Various inputs are used to determine the value of the Fund’s investments. The inputs or methodology used for valuing securities are not necessarily an indication of the risk associated with investing in those securities. Details related to the fair value hierarchy of the Fund’s securities as of April 30, 2024, are included in the Schedule of Investments.
4). INVESTMENT TRANSACTIONS
Purchases and sales of investment securities (excluding government and short-term investments) for the Fund during the six months ended April 30, 2024, were $120,963,532 and $118,648,307, respectively. Purchases of $23,627,016 and sales of $23,253,088 were made to realign the Fund’s portfolio subsequent to the reorganization detailed in Note 10. During the two-month period ended October 31, 2023, purchases and sales of investment securities (excluding government and short-term investments) for the Fund were $26,345,300 and $26,601,479, respectively. For the fiscal year ended August 31, 2023, the purchases and sales of investment securities (excluding government and short-term investments) for the Fund were $120,620,332 and $120,596,628, respectively.
There were no purchases or sales/maturities of long-term U.S. government securities for the Fund during the six months ended April 30, 2024, the two-month period ended October 31, 2023, or the fiscal year ended August 31, 2023.
Purchases and sales of in-kind transactions for the Fund during the six months ended April 30, 2024, were $140,370,426 and $150,947,076, respectively. During the two-month period ended October 31, 2023, purchases and sales of in-kind transactions for the Fund were $593,476 and $904,720, respectively. For the fiscal year ended August 31, 2023, purchases and sales of in-kind transactions for the Fund were $3,928,126 and $4,415,168, respectively.
5). INVESTMENT ADVISORY FEE AND OTHER TRANSACTIONS WITH AFFILIATES
The Advisor provides the Fund with investment advisory services under an Investment Advisory Agreement (the “Investment Advisory Agreement”). The Advisor furnishes all investment advice, office space, and facilities and most of the personnel needed by the Fund. As compensation for its services, the Advisor is entitled to a unitary management fee from the Fund. The fee is based on the average daily net assets of the Fund at an annual rate of 0.95%. From the unitary management fee, the Advisor pays most of the expenses of the Fund, including the cost of sub-advisory, transfer agency, custody, fund administration, legal, audit, and other services. The net investment advisory fees expensed by the Fund during the six months ended April 30, 2024, are included in the Statement of Operations.
| NOTES TO THE FINANCIAL STATEMENTS |
The Advisor has delegated the day-to-day management of the portfolio composition of the Fund to a sub-advisor, Stance Capital, LLC (“Stance Capital”), and has delegated the responsibility for selecting broker-dealers to execute purchase and sale transactions for the Fund to Vident Advisory, LLC (“Vident”), as instructed by Stance Capital and subject to the supervision of the Advisor and the Board. The Advisor pays the sub-advisory fees from its own assets, and these fees are not an additional expense of the Fund. During the six months ended April 30, 2024, the Advisor (not the Fund) paid a sub-advisory fee to Stance Capital at the average rate of 0.40% of the daily net assets of the Fund. Pursuant to the sub-advisory agreement with Stance Capital, the Advisor pays sub-advisory fees to Stance Capital at an annual rate of 0.40% of the average daily net assets up to $125 million, 0.37% of average daily net assets for assets over $125 million and up to $250 million, and 0.35% for average daily net assets over $250 million. During the six months ended April 30, 2024, the Advisor (not the Fund) paid a sub-advisory fee to Vident at the average rate of 0.05% of the daily net assets of the Fund. Pursuant to the sub-advisory agreement with Vident, the Advisor pays sub-advisory fees to Vident of at an annual rate of 0.05% of the Fund’s average daily net assets up to $250 million, 0.045% of average daily net assets for assets over $250 million and up to $500 million, and 0.04% for average daily net assets in excess of $500 million, subject to a minimum sub-advisory fee to of $18,750 on an annual basis.
The Advisor has contractually agreed to waive a portion of its unitary management fee to the extent necessary to limit the Fund’s annual operating expenses (excluding all federal, state, and local taxes, interest, brokerage commissions, dividend and interest expenses on short sales, extraordinary items, and acquired fund fees and expenses and other costs incurred in connection with the purchase and sale of securities) to 0.85% of the Fund’s net assets through February 28, 2025.
For three years following the date on which expenses were waived or incurred, the Advisor may recoup waived or reimbursed expenses from the Fund if total operating expenses, including such recoupment, does not exceed the expense limitation in effect (i) at the time the Advisor waived or reimbursed such expenses and (ii) at the time the Advisor recoups such expenses. As of April 30, 2024, expenses subject to potential recovery and the periods in which they expire were as follows:
| | August 31, | October 31, | Fiscal Year | | |
| | 2026
| 2026
| 2027
| Total
| |
| | $30,660 | $7,067 | $40,444 | $78,171 | |
U.S. Bancorp Fund Services, LLC, d/b/a U.S. Bank Global Fund Services (“Fund Services”) provides the Fund with administrative, accounting, and transfer agent services. As administrator, Fund Services is responsible for activities such as (i) preparing various federal and state regulatory filings, reports, and returns for the Fund, (ii) preparing reports and materials to be supplied to the Board, (iii) monitoring the activities of the Fund’s custodian, transfer agent, and accountants, and (iv) coordinating the preparation and payment of the Fund’s expenses and reviewing the Fund’s expense accruals. U.S. Bank N.A., an affiliate of Fund Services, serves as the Fund’s custodian. The servicing agreements between the Trust, Fund Services, and U.S. Bank N.A. contain a fee schedule that is inclusive of administrative, accounting, custody, and transfer agent fees. Under the terms of the Investment Advisory Agreement, the Advisor pays the Fund’s administrative, accounting, custody, and transfer agency fees.
| HENNESSY FUNDS | 1-800-966-4354 | |
Quasar Distributors, LLC, a wholly owned broker-dealer subsidiary of Foreside Financial Group, LLC, acts as the Fund’s principal underwriter in a continuous public offering of Fund shares.
The officers of the Fund are affiliated with the Advisor. Under the terms of the Investment Advisory Agreement, the Advisor pays the Fund’s Chief Compliance Officer fees.
6). GUARANTEES AND INDEMNIFICATIONS
Under the Hennessy Funds’ organizational documents, their officers and trustees are indemnified by the Hennessy Funds against certain liabilities arising out of the performance of their duties to the Hennessy Funds. Additionally, in the normal course of business, the Hennessy Funds enter into contracts with service providers that contain general indemnification clauses. The Fund’s maximum exposure under these arrangements is unknown as this would involve future claims that may be made against the Fund that have not yet occurred. Currently, the Fund expects the risk of loss to be remote.
7). FEDERAL TAX INFORMATION
As of October 31, 2023, the Fund’s most recent fiscal period end, the components of accumulated earnings (losses) for income tax purposes were as follows:
| | | | Investments | |
| | Cost of investments for tax purposes | | $ | 42,691,300 | |
| | Gross tax unrealized appreciation | | $ | 542,957 | |
| | Gross tax unrealized depreciation | | | (2,835,290 | ) |
| | Net tax unrealized appreciation/(depreciation) | | $ | (2,292,333 | ) |
| | Undistributed ordinary income | | $ | 50,006 | |
| | Undistributed long-term capital gains | | | — | |
| | Total distributable earnings | | $ | 50,006 | |
| | Other accumulated gain/(loss) | | $ | (4,188,055 | ) |
| | Total accumulated gain/(loss) | | $ | (6,430,382 | ) |
As of October 31, 2023, the Fund had $4,188,055 in unlimited short-term capital loss carryforwards.
As of October 31, 2023, the Fund did not defer, on a tax basis, any late-year ordinary losses. Late-year ordinary losses are net ordinary losses incurred after December 31, 2022, but within the taxable year, that are deemed to arise on the first day of the Fund’s next taxable year.
During fiscal year 2024 (year to date), the two-month period ended October 31, 2023, and the fiscal year ended August 31, 2023, the tax character of distributions paid by the Fund was as follows:
| | | | Six Months Ended | | Two-Month Period Ended | | Year Ended | |
| | | | April 30, 2024 | | | October 31, 2023 | | | August 31, 2023 | |
| | Ordinary income(1) | | $ | 50,006 | | | $ | — | | | $ | 247,449 | |
| | Long-term capital gains | | | — | | | | — | | | | — | |
| | Total distributions | | $ | 50,006 | | | $ | — | | | $ | 247,449 | |
| | | | | | | | | | | | | | |
| | (1) Ordinary income includes short-term capital gains. | | | | | | | | | | | | |
| NOTES TO THE FINANCIAL STATEMENTS |
8). SHARE TRANSACTIONS
Shares of the Fund are listed and traded on the NYSE Arca, Inc. (the “Exchange”). Market prices for the shares may be different from their NAV. The Fund issues and redeems shares on a continuous basis at NAV only in blocks of 5,000 shares, called “Creation Units.” Creation Units are issued and redeemed principally in-kind for securities included in a specified universe. Once created, shares generally trade in the secondary market at market prices that change throughout the day. Except when aggregated in Creation Units, shares are not redeemable securities of the Fund. Creation Units may only be purchased or redeemed by certain financial institutions (“Authorized Participants”). An Authorized Participant is either (i) a broker-dealer or other participant in the clearing process through the Continuous Net Settlement System of the National Securities Clearing Corporation or (ii) a Depository Trust Company participant and, in each case, must have executed a Participant Agreement with the Distributor. Most retail investors do not qualify as Authorized Participants and do not have the resources to buy and sell whole Creation Units. Therefore, they are unable to purchase or redeem shares directly from the Fund. Rather, most retail investors may purchase shares in the secondary market with the assistance of a broker and are subject to customary brokerage commissions or fees.
The Fund currently offers one class of shares, which has no front-end sales load, no deferred sales charge, and no redemption fee. A fixed transaction fee is imposed for the transfer and other transaction costs associated with the purchase or sale of Creation Units. The standard fixed transaction fee for the Fund is $300, payable to the custodian. In addition, a variable fee may be charged on all cash transactions or substitutes for Creation Units of up to a maximum of 2% as a percentage of the value of the Creation Units subject to the transaction. Variable fees are imposed to compensate the Fund for the transaction costs associated with the cash transactions. Variable fees received by the Fund, if any, are displayed in the capital shares transactions section of the Statement of Changes in Net Assets. Shares of the Fund have equal rights and privileges.
From time to time, settlement of securities related to in-kind redemptions may be delayed. In such cases, securities related to in-kind transactions are reflected as a receivable or a payable in the Statements of Assets and Liabilities.
9). GLOBAL EVENTS
A rise in protectionist trade policies, the possibility of a national or global recession, risks associated with pandemic and epidemic diseases, trade tensions, the possibility of changes to some international trade agreements, political events, and continuing political tension and armed conflicts may adversely impact financial markets and the broader economy. For example, ongoing armed conflicts between Ukraine and Russia in Europe and among Israel, Hamas, and other militant groups in the Middle East have caused and could continue to cause significant market disruptions and volatility with the markets in Europe and the Middle East, and have had negative impacts on markets in the United States. These events could also have negative effects on the Fund’s investments that cannot be foreseen at the present time. As global systems, economies and financial markets are increasingly interconnected, events that once had only local impact are now more likely to have regional or even global effects. Events that occur in one country, region or financial market will, more frequently, adversely impact issuers in other countries, regions, or markets. These impacts can be exacerbated by failures of governments and societies to adequately respond to an emerging event or threat. Your investment would be negatively impacted if the value of your portfolio holdings decreases as a result of such events, if
| HENNESSY FUNDS | 1-800-966-4354 | |
these events adversely impact the operations and effectiveness of the Advisor or other key service providers or if these events disrupt systems and processes necessary or beneficial to the management of accounts. These events may negatively impact broad segments of businesses and populations and could have a significant and rapid negative impact on the performance of the Fund’s investments, increase the Fund’s volatility, or exacerbate pre-existing risks to the Fund.
10). AGREEMENT AND PLAN OF REORGANIZATION
On December 6, 2022, shareholders of the Predecessor Fund approved an Agreement and Plan of Reorganization between the Trust, on behalf of the Fund, and The RBB Fund, Inc., a Maryland corporation, on behalf of the Predecessor Fund. The Agreement and Plan of Reorganization provided for the transfer of all of the assets of the Predecessor Fund to the Fund and the assumption of the liabilities (other than any excluded liabilities) of the Predecessor Fund by the Fund. The Fund was created to carry out the reorganization and has a substantially similar investment objective and substantially similar principal investment strategies as the Predecessor Fund. The following table illustrates the specifics of the reorganization of the Predecessor Fund into the Fund as of December 22, 2022:
| | | Shares Issued to | | | | |
| | Predecessor | Shareholders of | Fund | Combined | Tax Status | |
| | Fund Net Assets | Predecessor Fund | Net Assets | Net Assets
| of Transfer
| |
| | $42,147,609(1) | 1,670,000 | $0 | $42,147,609 | Non-taxable | |
| | (1) | Includes accumulated net investment income, accumulated realized gains, and unrealized appreciation in the amounts of $14,189, $5,465,299, and $2,059,710, respectively. |
On October 24, 2023, and January 31, 2024, shareholders of each of the CCM Small/Mid-Cap Impact Value Fund and the CCM Core Impact Equity Fund, respectively, approved an Agreement and Plan of Reorganization between the Trust, on behalf of the Fund, and Quaker Investment Trust, a Massachusetts business trust, on behalf of the CCM Small/Mid-Cap Impact Value Fund and the CCM Core Impact Equity Fund, respectively. The Agreements and Plans of Reorganization provided for the transfer of all of the assets of the CCM Small/Mid-Cap Impact Value Fund and the CCM Core Impact Equity Fund to the Fund and the assumption of the liabilities (other than any excluded liabilities) of the CCM Small/Mid-Cap Impact Value Fund and the CCM Core Impact Equity Fund by the Fund. The CCM Small/Mid-Cap Impact Value Fund, the CCM Core Impact Equity Fund, and the Fund have substantially similar investment objectives. The following tables illustrate the specifics of the reorganization of the CCM Small/Mid-Cap Impact Value Fund and the CCM Core Impact Equity Fund into the Fund:
| | Shares Issued | | Shares | | | | |
| CCM Small/ | to Shareholders | | Issued to | | | | |
| Mid-Cap | of CCM Small/ | CCM Core | Shareholders | | | | |
| Impact | Mid-Cap | Impact | of CCM Core | | | | |
| Value Fund | Impact | Equity Fund | Impact | Fund | Combined | Tax Status | |
Net Assets
| Value Fund
| Net Assets
| Equity Fund
| Net Assets
| Net Assets
| of Transfer
| |
$12,436,393(1) | 490,155 | $59,220,453(2) | 2,015,987 | $113,981,010 | $173,221,575 | Non-taxable | |
(1) | Includes accumulated net investment loss, accumulated realized losses, and unrealized appreciation in the amounts of $(129,972), $(3,067,772), and $1,219,276, respectively. |
(2) | Includes accumulated net investment loss, accumulated realized losses, and unrealized appreciation in the amounts of $(454,376), $(242,945), and $17,358,330, respectively. |
| NOTES TO THE FINANCIAL STATEMENTS |
For financial reporting purposes, the Fund is deemed to be the accounting survivor and as a result, the Statement of Operations and Financial Highlights reflect the operations of the Fund only. The assets received and shares issued by the Fund were recorded at fair value; however, the cost basis of the investments received from the CCM Small/Mid-Cap Impact Value Fund and CCM Core Impact Equity Fund were carried forward to align ongoing reporting of the Fund’s realized and unrealized gains and losses with amounts distributable to shareholders for tax purposes.
Assuming the reorganizations had been completed on November 1, 2023, the beginning of the reporting period, the unaudited pro forma results of operations as of April 30, 2024, would have been as follows:
| | | | (Unaudited) | |
| | Net investment loss | | $ | (411,161 | ) |
| | Net realized gain on investments | | | 34,986,877 | |
| | Net change in unrealized | | | | |
| | appreciation/depreciation on investments | | | (343,605 | ) |
| | Net increase in net assets resulting from operations | | $ | 34,232,111 | |
Because the Fund has been managed as a single integrated portfolio since the reorganization was completed, it is not practicable to separate the amounts of revenue and earnings of the CCM Small/Mid-Cap Impact Value Fund and CCM Core Impact Equity Fund that have been included in the Fund’s Statement of Operations since November 10, 2023 and February 23, 2024, the dates the reorganizations were completed, respectively.
11). EVENTS SUBSEQUENT TO PERIOD END
Management has evaluated the Fund’s related events and transactions that occurred subsequent to April 30, 2024, through the date of issuance of the Fund’s financial statements. Management has determined that there were no subsequent events requiring recognition or disclosure in the financial statements.
| HENNESSY FUNDS | 1-800-966-4354 | |
Expense Example (Unaudited)
April 30, 2024
As a shareholder of the Fund, you incur ongoing costs, including management fees, service fees, and other Fund expenses. This Example is intended to help you understand your ongoing costs (in dollars) of investing in the Fund and to compare these costs with the ongoing costs of investing in other investment funds. The Example is based on an investment of $1,000 invested at the beginning of the period and held for the entire period from November 1, 2023, through April 30, 2024.
Actual Expenses
The first line of the table below provides information about actual account values and actual expenses. You may use this information, together with the amount you invested, to estimate the expenses that you paid over the period. Simply divide your account value by $1,000 (for example, an $8,600 account value divided by $1,000 = 8.6), then multiply the result by the number in the first line under the heading “Expenses Paid During Period” to estimate the expenses you paid on your account during this period. You may pay brokerage commissions on your purchases and sales of Fund shares, which are not reflected in the example.
Hypothetical Example for Comparison Purposes
The second line of the table below provides information about hypothetical account values and hypothetical expenses based on the Fund’s actual expense ratio and an assumed rate of return of 5% per year before expenses, which is not the Fund’s actual return. The hypothetical account values and expenses may not be used to estimate the actual ending account balance or expenses you paid for the period. You may use this information to compare the ongoing costs of investing in the Fund and other funds. To do so, compare this 5% hypothetical example with the 5% hypothetical examples that appear in the shareholder reports of the other funds. Please note that the expenses shown in the table are meant to highlight your ongoing costs only. Therefore, the second line is useful in comparing ongoing costs only and will not help you determine the relative total costs of owning different funds.
| | Beginning | Ending | |
| | Account Value | Account Value | Expenses Paid |
| | November 1, 2023 | April 30, 2024
| During Period(1) |
| Actual | $1,000.00 | $1,208.10 | $4.67 |
| Hypothetical (5% return before expenses) | $1,000.00 | $1,020.64 | $4.27 |
(1) | Expenses are equal to the Fund’s annualized expense ratio of 0.85%, multiplied by the average account value over the period, multiplied by 182/366 days (to reflect the half-year period). |
| EXPENSE EXAMPLE — PREMIUM/DISCOUNT INFORMATION |
How to Obtain a Copy of the Fund’s Proxy
Voting Policy and Proxy Voting Records
A description of the policies and procedures the Fund uses to determine how to vote proxies relating to portfolio securities is available without charge (1) by calling 800-966-4354, (2) on the Fund’s website at www.hennessyetfs.com/proxy-voting/voting-policy, or (3) on the U.S. Securities and Exchange Commission’s (the “SEC”) website at www.sec.gov. The Fund’s proxy voting record is available without charge on both the Fund’s website at www.hennessyetfs.com/proxy-voting/voting-record and the SEC’s website at www.sec.gov no later than August 31 for the prior 12 months ending June 30.
Availability of Quarterly Portfolio Schedule
The Fund files a complete schedule of portfolio holdings with the SEC for the first and third quarters of each fiscal year as an exhibit to its reports on Form N-PORT. The Fund’s Form N-PORT reports are available on the SEC’s website at www.sec.gov or on request by calling 800-966-4354.
Federal Tax Distribution Information (Unaudited)
For tax year 2023, certain dividends paid by the Fund may be subject to a maximum tax rate of 23.8%, as provided for by the Jobs and Growth Tax Relief Reconciliation Act of 2003. The percentage of dividends declared from ordinary income designated as qualified dividend income was 100.00%.
For corporate shareholders, the percent of ordinary income distributions that qualified for the corporate dividends received deduction for tax year 2023 was 100.00%.
The percentage of taxable ordinary income distributions that were designated as short-term capital gain distributions under Section 871(k)(2)(C) of the Internal Revenue Code of 1986, as amended, for the Fund was 0.00%.
Frequency Distributions of Premiums
and Discounts
Information regarding how often the shares of the Fund trade on an exchange at a price above (i.e., at a premium) or below (i.e., at a discount) the net asset value of the Fund is available, without charge, on the Fund’s website at www.hennessyetfs.com.
| HENNESSY FUNDS | 1-800-966-4354 | |
Important Notice Regarding Delivery
of Shareholder Documents
All of our shareholders other than banks, broker-dealers and other financial intermediaries acting as authorized participants of the Fund are beneficial owners, as shown on the records of The Depository Trust Company (“DTC”) or its participants. The DTC participants are the banks, broker-dealers and other financial intermediaries acting as authorized participants of the Fund, and these financial intermediaries are responsible to pass along communications to you, including notices, account statements, prospectuses, tax forms, and shareholder reports.
The SEC has adopted new regulations that will impact the design and delivery of future Semi-Annual and Annual Reports. Beginning with the 2024 Annual Reports, paper copies will be mailed to you unless you have opted for electronic delivery of the reports. We encourage all shareholders to sign up to receive all notices, account statements, prospectuses, tax forms, and shareholder reports electronically to help reduce expenses and the volume of paper U.S. mail received. To sign up for eDelivery or to change your delivery preference, please contact your financial intermediary.
Householding is a method of delivery, based on the preference of the individual beneficial owner, in which a single copy of certain shareholder documents can be delivered to beneficial owners who share the same address, even if their accounts are registered under different names. Householding for the Fund may be available through the banks, broker-dealers and other financial intermediaries acting as authorized participants of the Fund. If you are interested in enrolling in householding and receiving a single copy of the prospectus and other shareholder documents, please contact your financial intermediary. If you currently are enrolled in householding and wish to change your householding status, please contact your financial intermediary.
Subscribe to receive our team’s unique market and sector insights delivered to your inbox
www.hennessyetfs.com/subscribe
Follow us on social media
| IMPORTANT NOTICE/BOARD APPROVAL OF INVESTMENT ADVISORY AGREEMENTS |
Board Approval of Investment Advisory
Agreements
At its meeting on March 6, 2024, the Board of Trustees of the Fund (the “Board,” and the members thereof, the “Trustees”) unanimously approved the continuation of the investment advisory agreement of the Fund with Hennessy Advisors, Inc. (the “Advisor”) and the sub-advisory agreement for portfolio management services for the Fund between the Advisor and Stance Capital, LLC (the “Sub-Advisor”). As part of the process, the Trustees reviewed their fiduciary duties and the relevant factors for them to consider with respect to approving the advisory and sub-advisory agreements. In addition, the Trustees who are not deemed interested persons (as defined by the Investment Company Act of 1940, as amended) of the Fund (the “Independent Trustees”) met in executive session to discuss the approval of the advisory and sub-advisory agreements. As part of their discussion, the Independent Trustees confirmed their understanding of the need to have asked about, and received answers to, any matters that they believed are relevant to determining whether to approve the continuation of the advisory and sub-advisory agreements.
In advance of the meeting, the Advisor sent detailed information to the Trustees to assist them in their evaluation of the advisory and sub-advisory agreements. This information included, but was not limited to, the following:
| | (1) | A memorandum from outside legal counsel that described the fiduciary duties of the Board with respect to approving the continuation of the advisory and sub-advisory agreements and the relevant factors for consideration; |
| | | |
| | (2) | A memorandum from outside legal counsel regarding the Board’s oversight responsibilities with respect to the Fund as an exchange-traded fund; |
| | | |
| | (3) | A memorandum from the Advisor that listed the factors relevant to the Board’s approval of the continuation of the advisory and sub-advisory agreements and also referenced the documents that had been provided to help the Board assess each such factor; |
| | | |
| | (4) | Summaries of the advisory and sub-advisory agreements; |
| | | |
| | (5) | The Advisor’s financial statements from its most recent Form 10-K and Form 10-Q, which included information about the Advisor’s profitability; |
| | | |
| | (6) | A recent Fund fact sheet, which included, among other things, Fund performance over various periods; |
| | | |
| | (7) | A description of the range of services provided by the Advisor and the sub-advisors to the Fund and the distinction between the Advisor-provided services and the sub-advisor-provided services; |
| | | |
| | (8) | A peer expense comparison of the net expense ratio and investment advisory fee of the Fund; |
| | | |
| | (9) | A memorandum from the Advisor regarding economies of scale; |
| | | |
| | (10) | A completed questionnaire from the Sub-Advisor; |
| | | |
| | (11) | A summary of the Sub-Advisor’s responses to the questionnaire, as well as relevant information from the Sub-Advisor’s Form ADV and the certifications submitted by the Sub-Advisor each quarter; |
| | | |
| | (12) | Financial information of the Sub-Advisor; and |
| | | |
| | (13) | The Sub-Advisor’s Code of Ethics. |
| HENNESSY FUNDS | 1-800-966-4354 | |
The Trustees reviewed and discussed all of the information provided by the Advisor and the Sub-Advisor. Following this review, and further discussion with the Advisor, the Trustees concluded that the information provided before and at the meeting addressed all of the relevant matters that they wanted to consider in assessing the performance of the Fund and the performance of the Advisor and the Sub-Advisor, and that said information provided them with a fulsome understanding of the advisory and sub-advisory agreements and the services provided by the Advisor and the Sub-Advisor.
All of the factors discussed were considered as a whole by the Trustees, as well as by the Independent Trustees meeting in executive session. The Trustees viewed the relevant factors in their totality, with no single factor being the principal or determinative factor in the Trustees’ determination of whether to approve the continuation of the advisory and sub-advisory agreements. The Trustees recognized that the management and fee arrangements for the Fund are the result of ongoing review and discussion between the Independent Trustees and the Advisor, that certain aspects of such arrangements may receive greater scrutiny at some meetings than in others, and that the Trustees’ conclusions may be based, in part, on their consideration of these same arrangements and information received during the course of the year and in prior years.
Prior to approving the continuation of the advisory and sub-advisory agreements, the Trustees, including the Independent Trustees in executive session, considered, among other items:
| | (1) | The nature and quality of the advisory services provided by the Advisor and the Sub-Advisor; |
| | | |
| | (2) | A comparison of the fees and expenses of the Fund to other similar funds; |
| | | |
| | (3) | Whether economies of scale are recognized by the Fund; |
| | | |
| | (4) | The costs and profitability of the Fund to the Advisor and the Sub-Advisor; |
| | | |
| | (5) | The performance of the Fund; and |
| | | |
| | (6) | Any benefits to the Advisor and the Sub-Advisor from serving as an investment advisor to the Fund (other than the advisory and sub-advisory fees). |
The material considerations and determinations of the Trustees, including the Independent Trustees, were as follows:
| | (1) | The Trustees considered the services identified below that are provided by the Advisor. Based on this review and an assessment of the Advisor’s performance, the Trustees concluded that the Advisor provides high-quality services to the Fund, and they noted that their overall confidence in the Advisor was high. The Trustees also concluded that they were satisfied with the nature, extent, and quality of the advisory services provided to the Fund by the Advisor and that the nature and extent of the services provided by the Advisor were appropriate to assure that the Fund’s operations are conducted in compliance with applicable laws, rules, and regulations. |
| | | (a) | The Advisor oversees the Sub-Advisor for the Fund, and the Sub-Advisor acts as the portfolio manager for the Fund by providing portfolio management services. |
| | | | |
| | | (b) | The Advisor performs a daily reconciliation of portfolio positions and cash for the Fund. |
| | | | |
| | | (c) | The Advisor monitors the liquidity of the Fund. |
| BOARD APPROVAL OF INVESTMENT ADVISORY AGREEMENTS |
| | | (d) | The Advisor monitors the Fund’s compliance with its investment objectives and restrictions and federal securities laws. |
| | | | |
| | | (e) | The Advisor maintains a compliance program (including a code of ethics), conducts ongoing reviews of the compliance programs of the Sub-Advisor and the Fund’s other service providers, conducts on-site visits to the Sub-Advisor and the Fund’s other service providers as feasible, monitors incidents of abusive trading practices, reviews Fund expense accruals, payments, and fixed expense ratios, evaluates insurance providers for fidelity bond, D&O/E&O insurance, and cybersecurity insurance coverage, manages regulatory examination compliance and responses, conducts employee compliance training, reviews reports provided by service providers, and maintains books and records. |
| | | | |
| | | (f) | The Advisor oversees the selection and continued employment of the Sub-Advisor, reviews the Fund’s investment performance, and monitors the Sub-Advisor’s adherence to the Fund’s investment objectives, policies, and restrictions. |
| | | | |
| | | (g) | The Advisor oversees service providers that provide accounting, administration, distribution, transfer agency, custodial, sales, marketing, public relations, audit, information technology, and legal services to the Fund. |
| | | | |
| | | (h) | The Advisor maintains in-house marketing and distribution departments on behalf of the Fund. |
| | | | |
| | | (i) | The Advisor prepares or directs the preparation of all regulatory filings for the Fund, including writing and annually updating the Fund’s prospectus and related documents. |
| | | | |
| | | (j) | For each annual report of the Fund, the Advisor reviews the written summary prepared by the Sub-Advisor of the Fund’s performance during the most recent 12-month period. |
| | | | |
| | | (k) | The Advisor oversees distribution of the Fund through third-party broker/dealers and independent financial institutions such as Charles Schwab, Inc., Fidelity, TD Ameritrade, and Pershing. The Advisor participates in no-transaction fee (“NTF”) programs with these companies on behalf of the Fund, which allow customers to purchase the Fund through third-party distribution channels without paying a transaction fee. The Advisor compensates, in part, a number of these third-party providers of NTF programs out of its own revenues. |
| | | | |
| | | (l) | The Advisor pays the incentive compensation of the Fund’s compliance officer and employs other staff such as legal, marketing, national accounts, distribution, sales, administrative, and trading oversight personnel, as well as management executives. |
| | | | |
| | | (m) | The Advisor provides a quarterly compliance certification to the Board. |
| | | | |
| | | (n) | The Advisor prepares or reviews all Board materials, presents to and leads discussions with the Board, prepares or reviews all meeting minutes, and arranges for Board training and education. |
| HENNESSY FUNDS | 1-800-966-4354 | |
| | (2) | The Trustees considered the services identified below that are provided by the Sub-Advisor. Based on this review and an assessment of the Sub-Advisor’s performance, the Trustees concluded that the Sub-Advisor provides high-quality services to the Fund. The Trustees also concluded that they were satisfied with the nature, extent, and quality of the advisory services provided to the Fund by the Sub-Advisor and that the nature and extent of the services provided by the Sub-Advisor were appropriate to assure that the Fund’s portfolio aligns properly with its investment objective and principal investment strategies. |
| | | (a) | The Sub-Advisor acts as the portfolio manager for the Fund. In this capacity, the Sub-Advisor does the following: |
| | | | (i) | manages the composition of the Fund’s portfolio, including the purchase, retention, and disposition of portfolio securities in accordance with the Fund’s investment objectives, policies, and restrictions; and |
| | | | | |
| | | | (ii) | manages proxy voting for the Fund. |
| | | (b) | The Sub-Advisor ensures that its compliance program includes policies and procedures relevant to the Fund and the Sub-Advisor’s duties as a portfolio manager to the Fund. |
| | | | |
| | | (c) | For each annual report of the Fund, the Sub-Advisor prepares a written summary of the Fund’s performance during the most recent 12-month period. |
| | | | |
| | | (d) | The Sub-Advisor provides a quarterly compliance certification to the Board regarding trading and allocation practices, supervisory matters, the Sub-Advisor’s compliance program (including its code of ethics), compliance with the Fund’s policies, and general firm updates. |
| | (3) | The Trustees considered the distinction between the services performed by the Advisor and the Sub-Advisor. The Trustees noted that the management of the Fund, including the oversight of the Sub-Advisor, involves more comprehensive and substantive duties than the duties of the Sub-Advisor. Specifically, the Trustees considered the lists of Advisor services previously identified and concluded that the services performed by the Advisor for the Fund require a higher level of service and oversight than the services performed by the Sub-Advisor. Based on this determination, the Trustees concluded that the differential in advisory fees between the Advisor and the Sub-Advisor is reasonable. |
| | | |
| | (4) | The Trustees compared the performance of the Fund to benchmark indices over various periods and noted that the Trustees review and discuss reports comparing the investment performance of the Fund to various indices at each quarterly Board meeting. Based on such information, the Trustees determined that the Advisor and the Sub-Advisor manage the Fund in a manner materially consistent with its stated investment objective and style. The Trustees concluded that the performance of the Fund over various periods warranted the continuation of the advisory and sub-advisory agreements. |
| | | |
| | (5) | The Trustees reviewed the unitary fee for the Fund compared to other funds similar in asset size and investment objective to the Fund using data from Morningstar. As part of the discussion with management, the Trustees ensured that they understood and were comfortable with the criteria used to determine |
| BOARD APPROVAL OF INVESTMENT ADVISORY AGREEMENTS |
| | | the funds included in the Morningstar categories for purposes of the materials considered at the meeting. The Trustees determined that the unitary fee of the Fund falls within a reasonable range of fees of other comparable funds and concluded that they are reasonable and warranted continuation of the advisory and sub-advisory agreements. |
| | | |
| | (6) | The Trustees also considered whether the Advisor was realizing economies of scale that should be shared with the Fund’s shareholders. The Trustees noted that many of the expenses incurred to manage the Fund are variable asset-based fees, so the Advisor does not realize material economies of scale relating to these expenses as the assets of the Fund increase. For example, third-party platform fees and sub-advisory fees increase as a fund’s assets grow. |
| | | |
| | (7) | The Trustees considered the profitability of the Advisor and the Sub-Advisor, including the impact of platform fees on the Advisor’s profitability, and also considered the resources and revenues that the Advisor has put into managing and distributing the Fund. The Trustees then concluded that the profits of the Advisor and the Sub-Advisor are reasonable and not excessive when compared to profitability guidelines set forth in relevant court cases. |
| | | |
| | (8) | The Trustees considered the high level of professionalism and knowledge of the Advisor’s employees and concluded that this was beneficial to the Fund and its shareholders. |
| | | |
| | (9) | The Trustees considered any benefits to the Advisor and the Sub-Advisor from serving as an advisor to the Fund (other than the advisory and sub-advisory fees). They concluded that any such benefits were expected to be minimal. |
After reviewing the materials and information provided at the meeting, as well as other information regularly provided at the Board’s quarterly meetings throughout the year regarding the quality of services provided by the Advisor and the Sub Advisor, the performance of the Fund, expense information, the adequacy and efficacy of the Advisor’s and the Sub Advisor’s written policies and procedures, other regulatory compliance issues, trading information and related matters, and other factors that the Trustees deemed relevant, the Trustees, including the Independent Trustees, approved the continuation of the advisory and sub-advisory agreements.
| HENNESSY FUNDS | 1-800-966-4354 | |
(This Page Intentionally Left Blank.)
For information, questions, or assistance, please call
The Hennessy Funds
800-966-4354 or 415-899-1555
INVESTMENT ADVISOR
Hennessy Advisors, Inc.
7250 Redwood Boulevard, Suite 200
Novato, California 94945
ADMINISTRATOR,
TRANSFER AGENT,
DIVIDEND PAYING AGENT, &
SHAREHOLDER SERVICING AGENT
U.S. Bancorp Fund Services, LLC
d/b/a U.S. Bank Global Fund Services
P.O. Box 701
Milwaukee, Wisconsin 53201-0701
CUSTODIAN
U.S. Bank N.A.
Custody Operations
1555 North River Center Drive, Suite 302
Milwaukee, Wisconsin 53212
TRUSTEES
Neil J. Hennessy
Robert T. Doyle
J. Dennis DeSousa
Doug Franklin
Claire Garvie
Gerald P. Richardson
COUNSEL
Foley & Lardner LLP
777 East Wisconsin Avenue
Milwaukee, Wisconsin 53202-5306
INDEPENDENT REGISTERED
PUBLIC ACCOUNTING FIRM
Tait, Weller & Baker LLP
Two Liberty Place
50 South 16th Street, Suite 2900
Philadelphia, Pennsylvania 19102-2529
DISTRIBUTOR
Quasar Distributors, LLC
Three Canal Plaza, Suite 100
Portland, Maine 04101
www.hennessyetfs.com | 800-966-4354
This report has been prepared for shareholders and may be distributed to
others only if preceded or accompanied by a current prospectus.