0000891944 hennessy:SAndP500IndexOneMember 2014-10-31 2019-12-31 0000891944 hennessy:C000118916Member 2014-10-31 2024-02-29 0000891944 hennessy:Russell1000IndexOneMember 2014-10-31 2020-03-31 0000891944 hennessy:BlendedDJIATreasuryIndexMember 2014-10-31 2022-07-31 0000891944 hennessy:C000205117Member 2014-10-31 2017-12-31 0000891944 hennessy:RussellNomuraTotalMarketTMIndexMember 2014-10-31 2019-12-31 0000891944 hennessy:TokyoStockPriceIndexTOPIXOneMember 2014-10-31 2017-01-31 0000891944 hennessy:Russell2000IndexFinancialsMember 2014-10-31 2018-12-31 0000891944 hennessy:C000239897Member 2021-03-15 2022-04-30
As filed with the Securities and Exchange Commission on January 8, 2025
UNITED STATES
SECURITIES AND EXCHANGE COMMISSION
Washington, D.C. 20549
FORM N-CSR
CERTIFIED SHAREHOLDER REPORT OF REGISTERED
MANAGEMENT INVESTMENT COMPANIES
Investment Company Act file number (811-07168)
Hennessy Funds Trust
(Exact name of registrant as specified in charter)
| 7250 Redwood Boulevard, Suite 200 | |
| Novato, California | 94945 |
| (Address of principal executive offices) | (Zip code) |
| Teresa M. Nilsen |
| 7250 Redwood Boulevard, Suite 200 |
| Novato, California |
| (Name and address of agent for service) |
Registrant’s telephone number, including area code: 800-966-4354
Date of fiscal year end: October 31, 2024
Date of reporting period: October 31, 2024
Item 1. | Reports to Stockholders. |
Annual Shareholder Report Hennessy Cornerstone Growth Fund Investor Class HFCGX | |
This annual shareholder report contains important information about the Hennessy Cornerstone Growth Fund – Investor Class (the “Fund”) for the period of November 1, 2023, to October 31, 2024. You can find additional information about the Fund at https://www.hennessyfunds.com/funds/regulatory-documents . You can also request this information by contacting us at 1-800-966-4354 or fundsinfo@hennessyfunds.com .
What were the Fund costs for the last year?
(based on a hypothetical $10,000 investment)
Class Name | Costs of a $10,000 investment | Costs paid as a percentage of a $10,000 investment |
|---|
Investor Class | $161 | 1.29% |
How did the Fund perform last year and what affected its performance?
For the one-year period ended October 31, 2024, the Fund outperformed both the Russell 2000® Index (the Fund’s primary benchmark) and the S&P 500® Index.
Factors Influencing Performance
● Holdings in the Industrials, Information Technology, and Energy sectors contributed the most to performance.● Holdings in the Financials, Health Care, and Real Estate sectors detracted the most from performance.● Stocks that contributed most to performance included Super Micro Computer, Inc., Modine Manufacturing Co., and Sprouts Farmers Market, Inc.● Stocks that detracted most from performance included Koppers Holdings Inc., Stellantis N.V., and Dave & Buster’s Entertainment, Inc.
Positioning
● At the end of the period, compared to its primary benchmark, the Fund was most overweight Industrials and Consumer Discretionary companies and was most underweight Health Care and Financials companies.
Performance
● The majority of outperformance was due to stock selection rather than sector allocation.
● The Fund outperformed the broader market, as represented by the S&P 500® Index, despite small- and mid-cap stocks significantly underperforming such broader market during the period.
How did the Fund perform over the last 10 years?
Change in Value of $10,000 Investment
Date | Hennessy Cornerstone Growth Fund | Russell 2000® Index | S&P 500® Index |
10/31/2014 | 10000 | 10000 | 10000 |
11/30/2014 | 10203 | 10009 | 10269 |
12/31/2014 | 10359 | 10294 | 10243 |
1/31/2015 | 10075 | 9963 | 9936 |
2/28/2015 | 10755 | 10555 | 10507 |
3/31/2015 | 10857 | 10738 | 10340 |
4/30/2015 | 10364 | 10465 | 10440 |
5/31/2015 | 10658 | 10703 | 10574 |
6/30/2015 | 10771 | 10784 | 10369 |
7/31/2015 | 10964 | 10658 | 10586 |
8/31/2015 | 10401 | 9989 | 9948 |
9/30/2015 | 10203 | 9498 | 9702 |
10/31/2015 | 10707 | 10034 | 10520 |
11/30/2015 | 10605 | 10360 | 10551 |
12/31/2015 | 10246 | 9840 | 10385 |
1/31/2016 | 9517 | 8975 | 9869 |
2/29/2016 | 9775 | 8974 | 9856 |
3/31/2016 | 10219 | 9690 | 10525 |
4/30/2016 | 9951 | 9842 | 10566 |
5/31/2016 | 10096 | 10064 | 10755 |
6/30/2016 | 10262 | 10058 | 10783 |
7/31/2016 | 10739 | 10658 | 11181 |
8/31/2016 | 10589 | 10847 | 11196 |
9/30/2016 | 10605 | 10968 | 11199 |
10/31/2016 | 10171 | 10446 | 10994 |
11/30/2016 | 11071 | 11611 | 11401 |
12/31/2016 | 11104 | 11936 | 11627 |
1/31/2017 | 11023 | 11984 | 11847 |
2/28/2017 | 10996 | 12215 | 12318 |
3/31/2017 | 11055 | 12231 | 12332 |
4/30/2017 | 11066 | 12365 | 12459 |
5/31/2017 | 10782 | 12113 | 12634 |
6/30/2017 | 11066 | 12532 | 12713 |
7/31/2017 | 11479 | 12625 | 12974 |
8/31/2017 | 11618 | 12465 | 13014 |
9/30/2017 | 12492 | 13243 | 13283 |
10/31/2017 | 12942 | 13355 | 13593 |
11/30/2017 | 12883 | 13740 | 14009 |
12/31/2017 | 12947 | 13685 | 14165 |
1/31/2018 | 13322 | 14042 | 14976 |
2/28/2018 | 12395 | 13499 | 14424 |
3/31/2018 | 12481 | 13673 | 14058 |
4/30/2018 | 12593 | 13792 | 14112 |
5/31/2018 | 12952 | 14629 | 14451 |
6/30/2018 | 12797 | 14734 | 14540 |
7/31/2018 | 12738 | 14990 | 15081 |
8/31/2018 | 13440 | 15637 | 15573 |
9/30/2018 | 13263 | 15260 | 15662 |
10/31/2018 | 11881 | 13603 | 14591 |
11/30/2018 | 11409 | 13819 | 14888 |
12/31/2018 | 10200 | 12178 | 13544 |
1/31/2019 | 11335 | 13548 | 14629 |
2/28/2019 | 11494 | 14252 | 15099 |
3/31/2019 | 11064 | 13954 | 15393 |
4/30/2019 | 11229 | 14428 | 16016 |
5/31/2019 | 10582 | 13306 | 14998 |
6/30/2019 | 11482 | 14246 | 16055 |
7/31/2019 | 11611 | 14328 | 16286 |
8/31/2019 | 11159 | 13621 | 16028 |
9/30/2019 | 11117 | 13904 | 16328 |
10/31/2019 | 11264 | 14270 | 16681 |
11/30/2019 | 11835 | 14858 | 17287 |
12/31/2019 | 12311 | 15286 | 17809 |
1/31/2020 | 11717 | 14796 | 17802 |
2/29/2020 | 10535 | 13550 | 16336 |
3/31/2020 | 7476 | 10606 | 14319 |
4/30/2020 | 8753 | 12063 | 16154 |
5/31/2020 | 9653 | 12848 | 16923 |
6/30/2020 | 10176 | 13302 | 17260 |
7/31/2020 | 10888 | 13670 | 18233 |
8/31/2020 | 11641 | 14441 | 19544 |
9/30/2020 | 11747 | 13958 | 18801 |
10/31/2020 | 11711 | 14251 | 18301 |
11/30/2020 | 13788 | 16877 | 20305 |
12/31/2020 | 14494 | 18337 | 21085 |
1/31/2021 | 14794 | 19260 | 20872 |
2/28/2021 | 15794 | 20460 | 21448 |
3/31/2021 | 17029 | 20666 | 22387 |
4/30/2021 | 17452 | 21100 | 23582 |
5/31/2021 | 18194 | 21143 | 23747 |
6/30/2021 | 18252 | 21553 | 24301 |
7/31/2021 | 17258 | 20775 | 24878 |
8/31/2021 | 17670 | 21239 | 25635 |
9/30/2021 | 16882 | 20613 | 24443 |
10/31/2021 | 17547 | 21490 | 26155 |
11/30/2021 | 18070 | 20594 | 25974 |
12/31/2021 | 18681 | 21055 | 27138 |
1/31/2022 | 16723 | 19028 | 25734 |
2/28/2022 | 16776 | 19231 | 24963 |
3/31/2022 | 17695 | 19470 | 25890 |
4/30/2022 | 17209 | 17540 | 23632 |
5/31/2022 | 18300 | 17567 | 23676 |
6/30/2022 | 15946 | 16122 | 21721 |
7/31/2022 | 17545 | 17805 | 23724 |
8/31/2022 | 17336 | 17441 | 22757 |
9/30/2022 | 15468 | 15769 | 20661 |
10/31/2022 | 17986 | 17506 | 22334 |
11/30/2022 | 18808 | 17914 | 23582 |
12/31/2022 | 17761 | 16752 | 22223 |
1/31/2023 | 18876 | 18384 | 23619 |
2/28/2023 | 18357 | 18074 | 23043 |
3/31/2023 | 17467 | 17210 | 23889 |
4/30/2023 | 16607 | 16901 | 24262 |
5/31/2023 | 16391 | 16745 | 24367 |
6/30/2023 | 18822 | 18106 | 25977 |
7/31/2023 | 20053 | 19213 | 26812 |
8/31/2023 | 19937 | 18252 | 26385 |
9/30/2023 | 19712 | 17178 | 25127 |
10/31/2023 | 18442 | 16006 | 24599 |
11/30/2023 | 19495 | 17455 | 26845 |
12/31/2023 | 21239 | 19588 | 28065 |
1/31/2024 | 22078 | 18826 | 28536 |
2/29/2024 | 24775 | 19890 | 30060 |
3/31/2024 | 26617 | 20602 | 31027 |
4/30/2024 | 25334 | 19152 | 29760 |
5/31/2024 | 27246 | 20113 | 31236 |
6/30/2024 | 25707 | 19927 | 32356 |
7/31/2024 | 27798 | 21952 | 32750 |
8/31/2024 | 27953 | 21624 | 33545 |
9/30/2024 | 28023 | 21775 | 34261 |
10/31/2024 | 27510 | 21460 | 33950 |

Average Annual Total Returns
for Periods Ended October 31, 2024
| 1 Year | 5 Year | 10 Year |
|---|
Hennessy Cornerstone Growth Fund | 49.17% | 19.55% | 10.65% |
Russell 2000® Index | 34.07% | 8.50% | 7.94% |
S&P 500® Index | 38.02% | 15.27% | 13.00% |
Past performance does not guarantee future results. The graph above illustrates the performance of an initial investment of $10,000 in the Fund 10 years ago compared with the performance of the indices shown. Fund performance in the graph and table assumes the reinvestment of dividends and capital gains and does not reflect the deduction of taxes that a shareholder would pay on Fund distributions or the redemption of Fund shares. Unlike the Fund, indices are not subject to fees and other expenses. Investors cannot invest directly in any index. These indices are used for comparative purposes in accordance with Securities and Exchange Commission regulations. Performance data current to the most recent month end may be obtained by visiting https://www.hennessyfunds.com/.Frank Russell Company (“Russell”) is the source and owner of the trademarks, service marks, and copyrights related to the Russell Indexes. Russell® is a trademark of Frank Russell Company. Neither Russell nor its licensors accept any liability for any errors or omissions in the Russell Indexes or Russell ratings or underlying data and no party may rely on any Russell Indexes or Russell ratings or underlying data contained in this communication. No further distribution of Russell data is permitted without Russell’s express written consent. Russell does not promote, sponsor, or endorse the content of this communication. Standard & Poor’s Financial Services is the source and owner of the S&P® and S&P 500® trademarks.
Key Fund Statistics
(as of October 31, 2024)
| |
|---|
Fund Size | $511,430,886 |
Number of Holdings | 50 |
Annual Portfolio Turnover | 94% |
Total Advisory Fee | $2,550,903 |
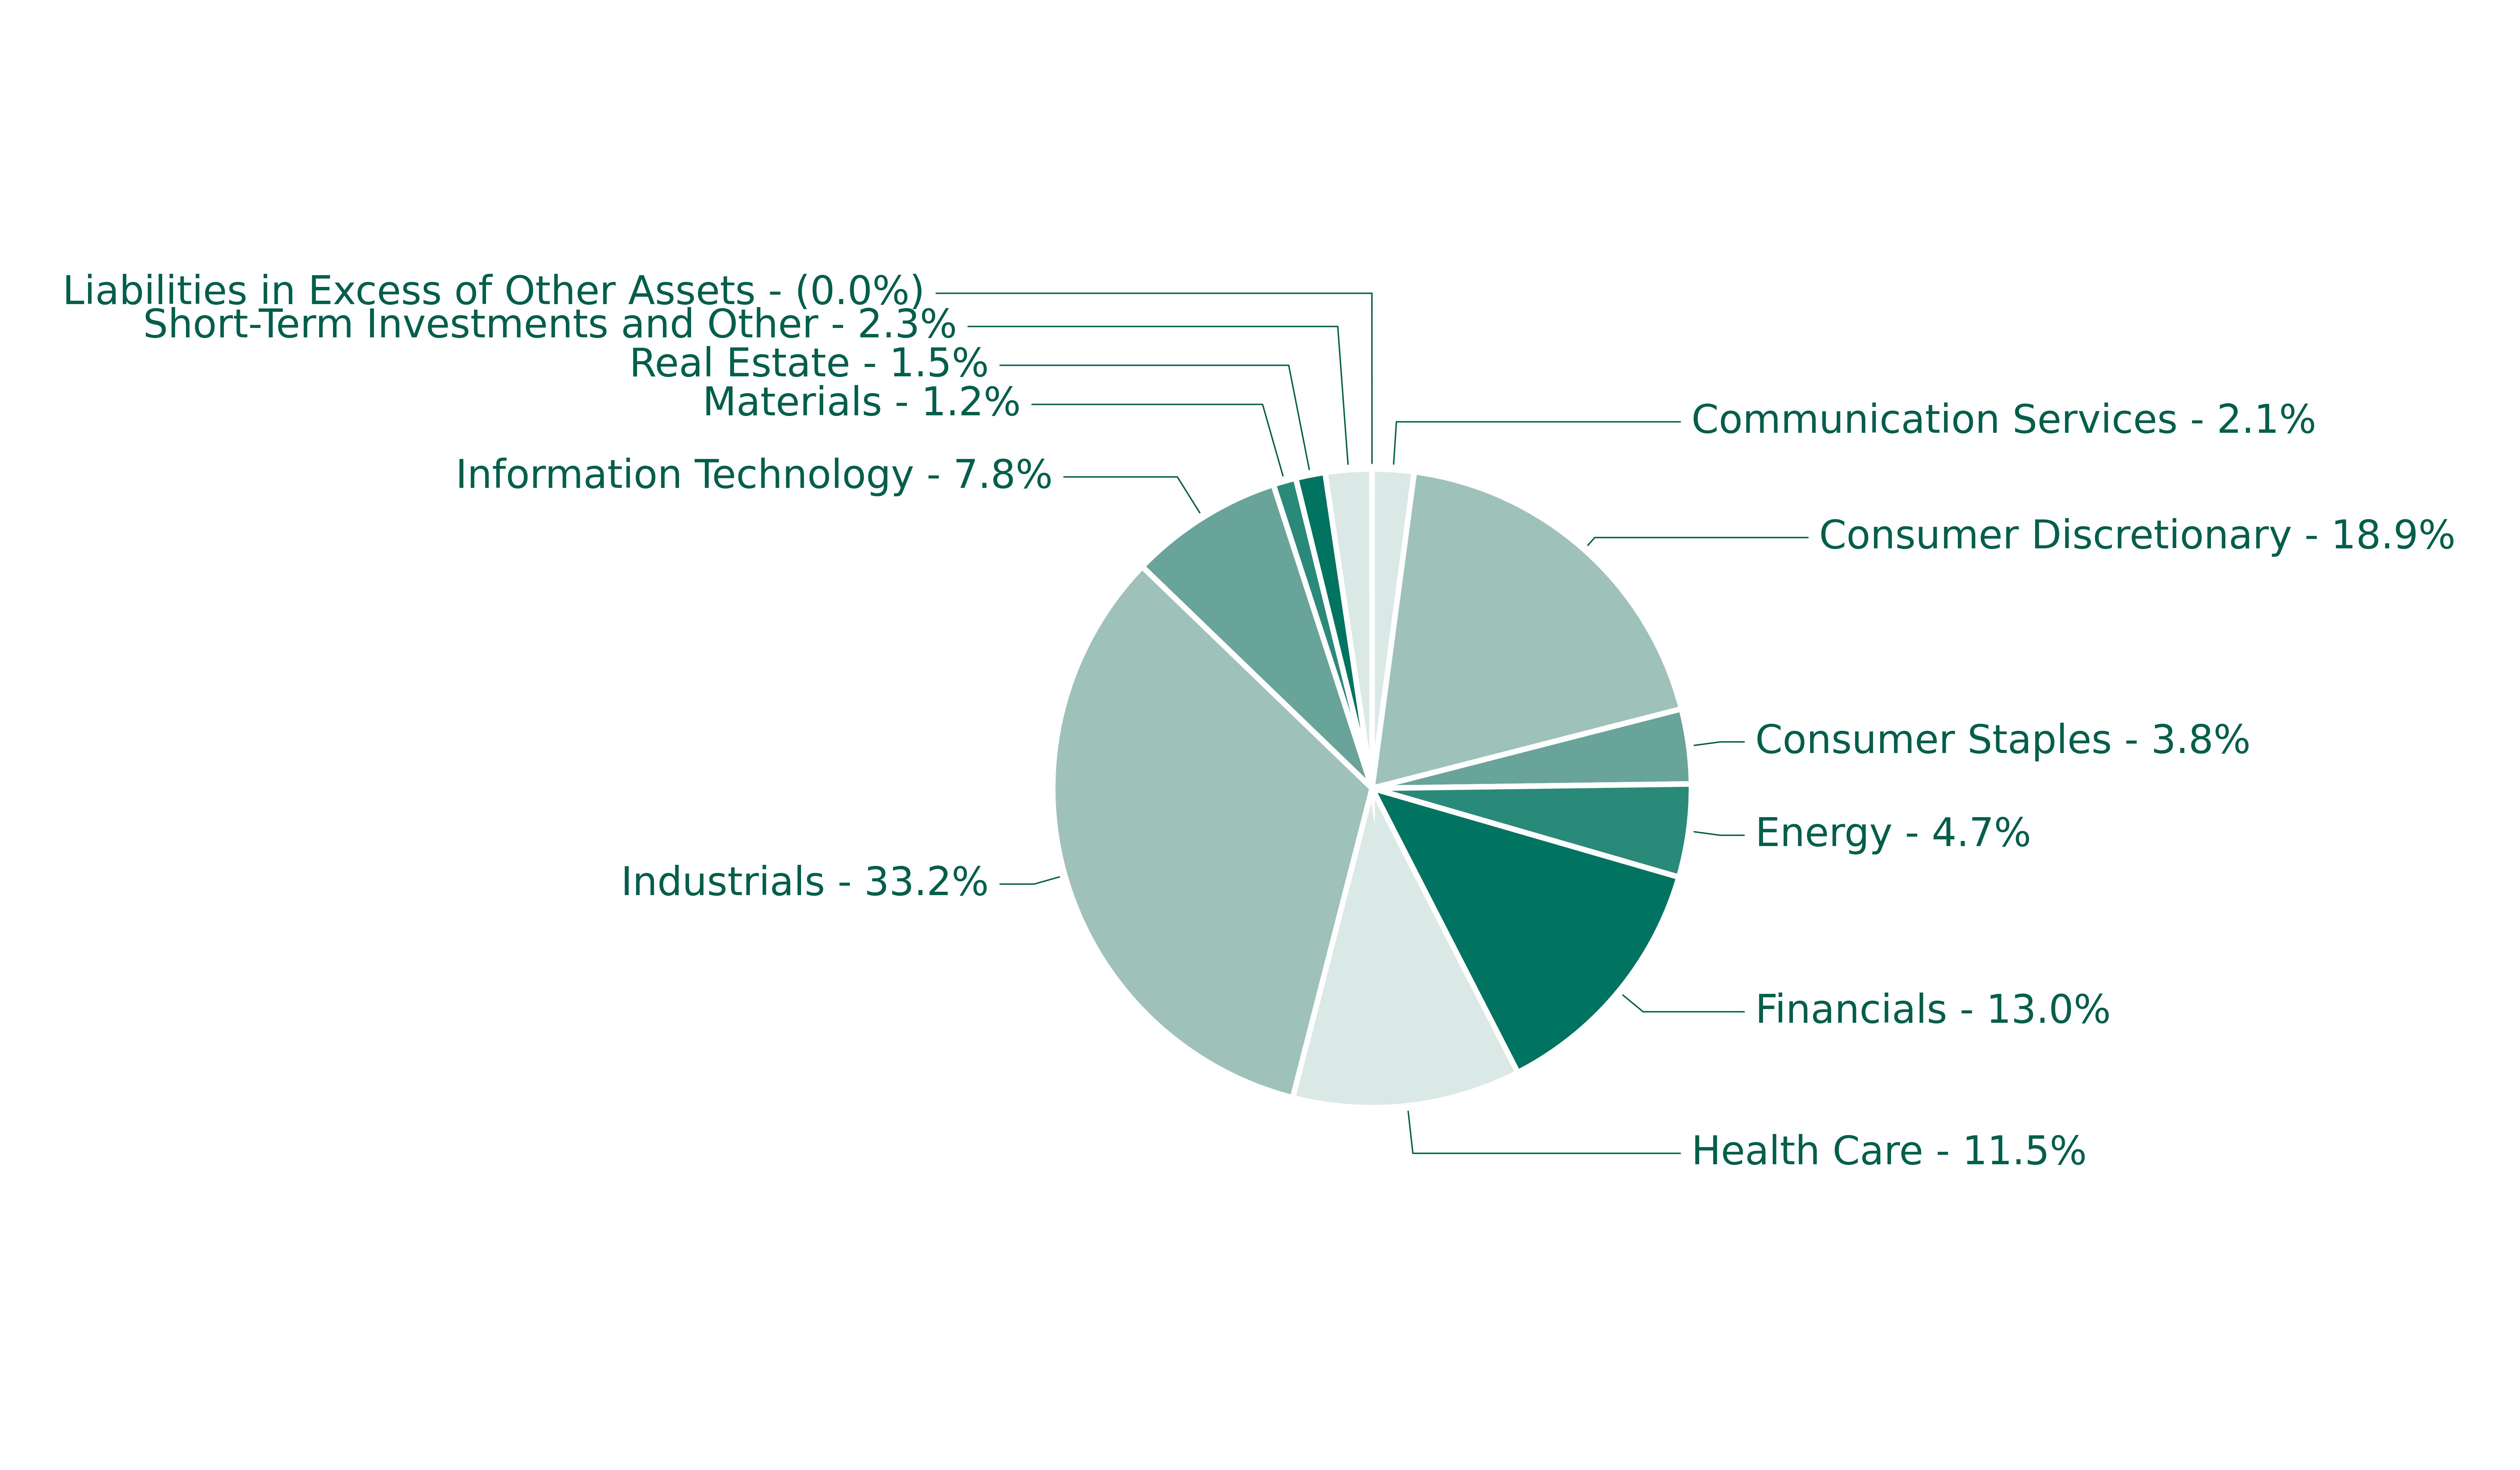
Sector Breakdown (% of net assets)
sector breakdown | (%) |
Communication Services | 2.11% |
Consumer Discretionary | 18.88% |
Consumer Staples | 3.78% |
Energy | 4.70% |
Financials | 12.97% |
Health Care | 11.53% |
Industrials | 33.20% |
Information Technology | 7.78% |
Materials | 1.16% |
Real Estate | 1.49% |
Short-Term Investments and Other | 2.34% |
Liabilities in Excess of Other Assets | -0.01% |
Sector sub-classifications may differ from those utilized for compliance purposes.
For additional information about the Fund, including its prospectus, financial information, holdings, and proxy information, visit https://www.hennessyfunds.com/funds/regulatory-documents.
Householding
To help keep the Fund’s costs as low as possible, we generally deliver a single copy of shareholder reports, proxy statements, and prospectuses to shareholders who share an address and have the same last name. This process does not apply to account statements. you may request an individual copy of a shareholder document at any time. If you would like to receive separate mailings of shareholder documents, please call U.S. Bank Global Fund services at 800-261-6950 or 414-765-4124, and individual delivery will begin within 30 days of your request. If your account is held through a financial institution or other intermediary, please contact such intermediary directly to request individual delivery.
Annual Shareholder Report Hennessy Cornerstone Growth Fund Institutional Class HICGX | |
This annual shareholder report contains important information about the Hennessy Cornerstone Growth Fund – Institutional Class (the “Fund”) for the period of November 1, 2023, to October 31, 2024. You can find additional information about the Fund at https://www.hennessyfunds.com/funds/regulatory-documents. You can also request this information by contacting us at1-800-966-4354 or fundsinfo@hennessyfunds.com.
What were the Fund costs for the last year?
(based on a hypothetical $10,000 investment)
Class Name | Costs of a $10,000 investment | Costs paid as a percentage of a $10,000 investment |
|---|
Institutional Class | $121 | 0.97% |
How did the Fund perform last year and what affected its performance?
For the one-year period ended October 31, 2024, the Fund outperformed both the Russell 2000® Index (the Fund’s primary benchmark) and the S&P 500® Index.
Factors Influencing Performance
● Holdings in the Industrials, Information Technology, and Energy sectors contributed the most to performance.● Holdings in the Financials, Health Care, and Real Estate sectors detracted the most from performance.● Stocks that contributed most to performance included Super Micro Computer, Inc., Modine Manufacturing Co., and Sprouts Farmers Market, Inc.● Stocks that detracted most from performance included Koppers Holdings Inc., Stellantis N.V., and Dave & Buster’s Entertainment, Inc.
Positioning
● At the end of the period, compared to its primary benchmark, the Fund was most overweight Industrials and Consumer Discretionary companies and was most underweight Health Care and Financials companies.
Performance
● The majority of outperformance was due to stock selection rather than sector allocation.
● The Fund outperformed the broader market, as represented by the S&P 500® Index, despite small- and mid-cap stocks significantly underperforming such broader market during the period.
How did the Fund perform over the last 10 years?
Change in Value of $250,000 Investment
Date | Hennessy Cornerstone Growth Fund | Russell 2000® Index | S&P 500® Index |
10/31/2014 | 250000 | 250000 | 250000 |
11/30/2014 | 255110 | 250224 | 256724 |
12/31/2014 | 259041 | 257355 | 256077 |
01/31/2015 | 251965 | 249077 | 248390 |
02/28/2015 | 268999 | 263864 | 262665 |
03/31/2015 | 271619 | 268461 | 258511 |
04/30/2015 | 259434 | 261614 | 260991 |
05/31/2015 | 266771 | 267587 | 264347 |
06/30/2015 | 269654 | 269591 | 259230 |
07/31/2015 | 274502 | 266458 | 264661 |
08/31/2015 | 260482 | 249713 | 248693 |
09/30/2015 | 255634 | 237462 | 242540 |
10/31/2015 | 268213 | 250840 | 262999 |
11/30/2015 | 265723 | 259000 | 263781 |
12/31/2015 | 256815 | 245996 | 259621 |
01/31/2016 | 238555 | 224364 | 246737 |
02/29/2016 | 245123 | 224354 | 246404 |
03/31/2016 | 256289 | 242260 | 263120 |
04/30/2016 | 249590 | 246062 | 264140 |
05/31/2016 | 253268 | 251605 | 268883 |
06/30/2016 | 257603 | 251446 | 269580 |
07/31/2016 | 269688 | 266459 | 279519 |
08/31/2016 | 266010 | 271171 | 279912 |
09/30/2016 | 266404 | 274192 | 279965 |
10/31/2016 | 255632 | 261157 | 274858 |
11/30/2016 | 278358 | 290279 | 285037 |
12/31/2016 | 279146 | 298412 | 290671 |
01/31/2017 | 277307 | 299589 | 296184 |
02/28/2017 | 276782 | 305371 | 307944 |
03/31/2017 | 278227 | 305771 | 308304 |
04/30/2017 | 278621 | 309124 | 311470 |
05/31/2017 | 271527 | 302835 | 315853 |
06/30/2017 | 278621 | 313304 | 317824 |
07/31/2017 | 289130 | 315631 | 324360 |
08/31/2017 | 292677 | 311616 | 325353 |
09/30/2017 | 314746 | 331063 | 332064 |
10/31/2017 | 326306 | 333885 | 339813 |
11/30/2017 | 324992 | 343508 | 350235 |
12/31/2017 | 326568 | 342121 | 354129 |
01/31/2018 | 336158 | 351062 | 374404 |
02/28/2018 | 312775 | 337469 | 360605 |
03/31/2018 | 315140 | 341833 | 351441 |
04/30/2018 | 318030 | 344789 | 352789 |
05/31/2018 | 327225 | 365718 | 361285 |
06/30/2018 | 323284 | 368338 | 363509 |
07/31/2018 | 321971 | 374758 | 377036 |
08/31/2018 | 339705 | 390914 | 389322 |
09/30/2018 | 335370 | 381511 | 391538 |
10/31/2018 | 300558 | 340073 | 364776 |
11/30/2018 | 288736 | 345478 | 372210 |
12/31/2018 | 258268 | 304440 | 338603 |
01/31/2019 | 286965 | 338689 | 365737 |
02/28/2019 | 291002 | 356297 | 377480 |
03/31/2019 | 280331 | 348840 | 384815 |
04/30/2019 | 284513 | 360690 | 400396 |
05/31/2019 | 268362 | 332639 | 374952 |
06/30/2019 | 291146 | 356149 | 401377 |
07/31/2019 | 294463 | 358199 | 407146 |
08/31/2019 | 283071 | 340513 | 400696 |
09/30/2019 | 282206 | 347598 | 408194 |
10/31/2019 | 285955 | 356753 | 417035 |
11/30/2019 | 300520 | 371438 | 432173 |
12/31/2019 | 312633 | 382148 | 445217 |
01/31/2020 | 297636 | 369892 | 445042 |
02/29/2020 | 267641 | 338754 | 408407 |
03/31/2020 | 190060 | 265155 | 357963 |
04/30/2020 | 222506 | 301575 | 403852 |
05/31/2020 | 245434 | 321200 | 423087 |
06/30/2020 | 258701 | 332553 | 431501 |
07/31/2020 | 277014 | 341758 | 455831 |
08/31/2020 | 296194 | 361014 | 488596 |
09/30/2020 | 298933 | 348955 | 470031 |
10/31/2020 | 298212 | 356263 | 457531 |
11/30/2020 | 351135 | 421931 | 507614 |
12/31/2020 | 369160 | 458428 | 527131 |
01/31/2021 | 376947 | 481498 | 521809 |
02/28/2021 | 402616 | 511507 | 536198 |
03/31/2021 | 434196 | 516644 | 559681 |
04/30/2021 | 445156 | 527493 | 589551 |
05/31/2021 | 464190 | 528581 | 593669 |
06/30/2021 | 465777 | 538822 | 607528 |
07/31/2021 | 440541 | 519366 | 621959 |
08/31/2021 | 451212 | 530983 | 640871 |
09/30/2021 | 431168 | 515327 | 611064 |
10/31/2021 | 448328 | 537249 | 653876 |
11/30/2021 | 461739 | 514862 | 649345 |
12/31/2021 | 477542 | 526363 | 678446 |
01/31/2022 | 427535 | 475688 | 643339 |
02/28/2022 | 429000 | 480766 | 624076 |
03/31/2022 | 452630 | 486750 | 647248 |
04/30/2022 | 440357 | 438508 | 590807 |
05/31/2022 | 468383 | 439171 | 591891 |
06/30/2022 | 408301 | 403052 | 543034 |
07/31/2022 | 449333 | 445132 | 593104 |
08/31/2022 | 444204 | 436023 | 568916 |
09/30/2022 | 396212 | 394237 | 516520 |
10/31/2022 | 461056 | 437638 | 558338 |
11/30/2022 | 482122 | 447860 | 589540 |
12/31/2022 | 455328 | 418793 | 555574 |
01/31/2023 | 484072 | 459611 | 590483 |
02/28/2023 | 471128 | 451848 | 576076 |
03/31/2023 | 448285 | 430259 | 597226 |
04/30/2023 | 426204 | 422523 | 606548 |
05/31/2023 | 420874 | 418620 | 609184 |
06/30/2023 | 483501 | 452655 | 649436 |
07/31/2023 | 515100 | 480336 | 670299 |
08/31/2023 | 512244 | 456306 | 659627 |
09/30/2023 | 506724 | 429442 | 628177 |
10/31/2023 | 474173 | 400155 | 614969 |
11/30/2023 | 501394 | 436372 | 671131 |
12/31/2023 | 546337 | 489690 | 701621 |
01/31/2024 | 567984 | 470644 | 713411 |
02/29/2024 | 637521 | 497255 | 751504 |
03/31/2024 | 685220 | 515056 | 775684 |
04/30/2024 | 652272 | 478805 | 744001 |
05/31/2024 | 701886 | 502826 | 780892 |
06/30/2024 | 662233 | 498174 | 808912 |
07/31/2024 | 716445 | 548789 | 818759 |
08/31/2024 | 720660 | 540591 | 838619 |
09/30/2024 | 722575 | 544369 | 856530 |
10/31/2024 | 709549 | 536506 | 848762 |

Average Annual Total Returns
for Periods Ended October 31, 2024
| 1 Year | 5 Year | 10 Year |
|---|
Hennessy Cornerstone Growth Fund | 49.64% | 19.93% | 11.00% |
Russell 2000® Index | 34.07% | 8.50% | 7.94% |
S&P 500® Index | 38.02% | 15.27% | 13.00% |
Past performance does not guarantee future results. The graph above illustrates the performance of an initial investment of $250,000 in the Fund 10 years ago compared with the performance of the indices shown. Fund performance in the graph and table assumes the reinvestment of dividends and capital gains and does not reflect the deduction of taxes that a shareholder would pay on Fund distributions or the redemption of Fund shares. Unlike the Fund, indices are not subject to fees and other expenses. Investors cannot invest directly in any index. These indices are used for comparative purposes in accordance with Securities and Exchange Commission regulations. Performance data current to the most recent month end may be obtained by visiting https://www.hennessyfunds.com/.Frank Russell Company (“Russell”) is the source and owner of the trademarks, service marks, and copyrights related to the Russell Indexes. Russell® is a trademark of Frank Russell Company. Neither Russell nor its licensors accept any liability for any errors or omissions in the Russell Indexes or Russell ratings or underlying data and no party may rely on any Russell Indexes or Russell ratings or underlying data contained in this communication. No further distribution of Russell data is permitted without Russell’s express written consent. Russell does not promote, sponsor, or endorse the content of this communication.Standard & Poor’s Financial Services is the source and owner of the S&P® and S&P 500® trademarks.
Key Fund Statistics
(as of October 31, 2024)
| |
|---|
Fund Size | $511,430,886 |
Number of Holdings | 50 |
Annual Portfolio Turnover | 94% |
Total Advisory Fee | $2,550,903 |
Sector Breakdown (% of net assets)
sector breakdown | (%) |
Communication Services | 2.11% |
Consumer Discretionary | 18.88% |
Consumer Staples | 3.78% |
Energy | 4.70% |
Financials | 12.97% |
Health Care | 11.53% |
Industrials | 33.20% |
Information Technology | 7.78% |
Materials | 1.16% |
Real Estate | 1.49% |
Short-Term Investments and Other | 2.34% |
Liabilities in Excess of Other Assets | -0.01% |
Sector sub-classifications may differ from those utilized for compliance purposes.
For additional information about the Fund, including its prospectus, financial information, holdings, and proxy information, visit https://www.hennessyfunds.com/funds/regulatory-documents.
Householding
To help keep the Fund’s costs as low as possible, we generally deliver a single copy of shareholder reports, proxy statements, and prospectuses to shareholders who share an address and have the same last name. This process does not apply to account statements. you may request an individual copy of a shareholder document at any time. If you would like to receive separate mailings of shareholder documents, please call U.S. Bank Global Fund services at 800-261-6950 or 414-765-4124, and individual delivery will begin within 30 days of your request. If your account is held through a financial institution or other intermediary, please contact such intermediary directly to request individual delivery.
Annual Shareholder Report Hennessy Focus Fund Investor Class HFCSX | |
This annual shareholder report contains important information about the Hennessy Focus Fund – Investor Class (the “Fund”) for the period of November 1, 2023, to October 31, 2024.You can find additional information about the Fund at https://www.hennessyfunds.com/funds/regulatory-documents. You can also request this information by contacting us at 1-800-966-4354 orfundsinfo@hennessyfunds.com.
What were the Fund costs for the last year?
(based on a hypothetical $10,000 investment)
Class Name | Costs of a $10,000 investment | Costs paid as a percentage of a $10,000 investment |
|---|
Investor Class | $177 | 1.49% |
How did the Fund perform last year and what affected its performance?
For the one-year period ended October 31, 2024, the Fund slightly outperformed the Russell 3000® Index (the Fund’s primary benchmark) and slightly underperformed the Russell Midcap® Growth Index.
Investment Strategy
We implement the Fund’s strategy through a concentrated portfolio of approximately 25 companies that we believe are high-quality businesses with large growth opportunities, excellent management, low tail risk, and discount valuations. We invest with a long-term time horizon and encourage shareholders to do the same. Periods can be influenced by many transitory issues unrelated to the growth in the intrinsic value of the Fund’s holdings.
Factors Influencing Performance
The biggest contributors to the Fund’s performance relative to the Russell 3000® Index were stock selection in the Communication Services sector, the Fund’s overweighting to the Financials sector, and the Fund’s underweighting to the Health Care sector. The biggest contributors to the Fund’s performance relative to the Russell Midcap® Growth Index were the Fund’s overweighting to the Communication Services sector and the Fund’s underweighting to the Consumer Staples and Health Care sectors.On an individual stock basis, the leading contributors to the Fund’s performance were AST SpaceMobile, Inc. (up 619%), Brookfield Corp. (up 83%), and Applied Materials, Inc. (up 38%).The biggest detractors from the Fund’s performance relative to the Russell 3000® Index were stock selection in the Information Technology and Financials sectors and the Fund’s underweighting to the Informational Technology sector. The biggest detractors from the Fund’s performance relative to the Russell Midcap® Growth Index were stock selection in the Information Technology, Real Estate, and Financials sectors.On an individual stock basis, the leading detractors from the Fund’s performance were Shenandoah Telecommunications Co. (down 41%), Floor & Decor Holdings, Inc. (down 5% since the Fund’s purchase), and CDW Corp. (down 5%).
How did the Fund perform over the last 10 years?
Change in Value of $10,000 Investment
Date | Hennessy Focus Fund | Russell 3000® Index | Russell Midcap® Growth Index |
10/31/2014 | 10000 | 10000 | 10000 |
11/30/2014 | 10292 | 10242 | 10329 |
12/31/2014 | 10470 | 10242 | 10299 |
01/31/2015 | 10153 | 9957 | 10126 |
02/28/2015 | 10871 | 10534 | 10823 |
03/31/2015 | 11020 | 10427 | 10853 |
04/30/2015 | 10900 | 10474 | 10777 |
05/31/2015 | 10953 | 10619 | 10905 |
06/30/2015 | 10988 | 10441 | 10729 |
07/31/2015 | 11284 | 10616 | 10903 |
08/31/2015 | 10669 | 9975 | 10269 |
09/30/2015 | 10415 | 9684 | 9872 |
10/31/2015 | 11183 | 10449 | 10494 |
11/30/2015 | 11135 | 10507 | 10516 |
12/31/2015 | 10771 | 10291 | 10279 |
01/31/2016 | 10156 | 9711 | 9501 |
02/29/2016 | 10271 | 9707 | 9650 |
03/31/2016 | 10984 | 10391 | 10338 |
04/30/2016 | 11000 | 10455 | 10332 |
05/31/2016 | 11192 | 10642 | 10501 |
06/30/2016 | 10925 | 10664 | 10500 |
07/31/2016 | 11389 | 11087 | 11020 |
08/31/2016 | 11319 | 11116 | 10988 |
09/30/2016 | 11249 | 11133 | 10982 |
10/31/2016 | 11002 | 10892 | 10536 |
11/30/2016 | 11352 | 11380 | 10994 |
12/31/2016 | 11542 | 11602 | 11032 |
01/31/2017 | 11662 | 11820 | 11400 |
02/28/2017 | 12005 | 12260 | 11728 |
03/31/2017 | 12062 | 12268 | 11793 |
04/30/2017 | 12050 | 12398 | 11968 |
05/31/2017 | 12276 | 12525 | 12253 |
06/30/2017 | 12438 | 12638 | 12290 |
07/31/2017 | 12576 | 12876 | 12495 |
08/31/2017 | 12587 | 12901 | 12583 |
09/30/2017 | 13022 | 13216 | 12939 |
10/31/2017 | 13227 | 13504 | 13301 |
11/30/2017 | 13512 | 13914 | 13746 |
12/31/2017 | 13766 | 14053 | 13820 |
01/31/2018 | 14292 | 14794 | 14602 |
02/28/2018 | 13568 | 14249 | 14143 |
03/31/2018 | 13438 | 13963 | 14120 |
04/30/2018 | 13414 | 14016 | 13987 |
05/31/2018 | 13775 | 14412 | 14510 |
06/30/2018 | 13847 | 14506 | 14566 |
07/31/2018 | 14144 | 14987 | 14879 |
08/31/2018 | 14384 | 15514 | 15736 |
09/30/2018 | 14186 | 15539 | 15669 |
10/31/2018 | 12960 | 14395 | 14118 |
11/30/2018 | 13473 | 14683 | 14477 |
12/31/2018 | 12325 | 13317 | 13163 |
01/31/2019 | 13316 | 14460 | 14676 |
02/28/2019 | 13941 | 14968 | 15536 |
03/31/2019 | 14044 | 15187 | 15746 |
04/30/2019 | 14783 | 15793 | 16454 |
05/31/2019 | 14469 | 14771 | 15507 |
06/30/2019 | 15197 | 15809 | 16596 |
07/31/2019 | 15401 | 16044 | 16984 |
08/31/2019 | 15473 | 15717 | 16675 |
09/30/2019 | 15792 | 15993 | 16485 |
10/31/2019 | 16091 | 16337 | 16790 |
11/30/2019 | 16738 | 16958 | 17626 |
12/31/2019 | 16622 | 17447 | 17832 |
01/31/2020 | 16835 | 17428 | 17999 |
02/29/2020 | 15710 | 16002 | 16758 |
03/31/2020 | 11596 | 13801 | 14259 |
04/30/2020 | 13270 | 15629 | 16491 |
05/31/2020 | 14402 | 16465 | 18148 |
06/30/2020 | 15036 | 16841 | 18573 |
07/31/2020 | 15806 | 17797 | 20057 |
08/31/2020 | 16747 | 19087 | 20603 |
09/30/2020 | 15841 | 18392 | 20314 |
10/31/2020 | 14998 | 17995 | 20339 |
11/30/2020 | 16858 | 20184 | 23071 |
12/31/2020 | 17535 | 21092 | 24178 |
01/31/2021 | 17094 | 20998 | 24097 |
02/28/2021 | 18259 | 21654 | 24509 |
03/31/2021 | 19880 | 22431 | 24041 |
04/30/2021 | 20877 | 23587 | 25392 |
05/31/2021 | 20960 | 23695 | 25004 |
06/30/2021 | 21313 | 24279 | 26703 |
07/31/2021 | 21737 | 24689 | 26978 |
08/31/2021 | 22230 | 25393 | 27849 |
09/30/2021 | 21475 | 24254 | 26500 |
10/31/2021 | 22928 | 25894 | 28358 |
11/30/2021 | 22205 | 25500 | 27160 |
12/31/2021 | 23067 | 26504 | 27255 |
01/31/2022 | 21151 | 24945 | 23738 |
02/28/2022 | 20656 | 24317 | 23450 |
03/31/2022 | 20934 | 25105 | 23826 |
04/30/2022 | 19020 | 22852 | 21144 |
05/31/2022 | 19581 | 22822 | 20325 |
06/30/2022 | 17912 | 20912 | 18806 |
07/31/2022 | 19925 | 22874 | 21107 |
08/31/2022 | 18453 | 22021 | 20416 |
09/30/2022 | 16105 | 19979 | 18683 |
10/31/2022 | 17070 | 21617 | 20151 |
11/30/2022 | 18476 | 22745 | 21248 |
12/31/2022 | 17303 | 21414 | 19972 |
01/31/2023 | 19195 | 22888 | 21715 |
02/28/2023 | 18517 | 22353 | 21501 |
03/31/2023 | 18065 | 22951 | 21797 |
04/30/2023 | 18379 | 23196 | 21481 |
05/31/2023 | 17812 | 23286 | 21495 |
06/30/2023 | 19803 | 24876 | 23156 |
07/31/2023 | 20102 | 25768 | 23857 |
08/31/2023 | 20083 | 25270 | 23070 |
09/30/2023 | 18612 | 24067 | 21946 |
10/31/2023 | 17670 | 23429 | 20826 |
11/30/2023 | 19298 | 25613 | 23367 |
12/31/2023 | 20910 | 26972 | 25139 |
01/31/2024 | 20374 | 27271 | 25003 |
02/29/2024 | 21509 | 28747 | 26883 |
03/31/2024 | 21837 | 29674 | 27526 |
04/30/2024 | 19867 | 28369 | 25927 |
05/31/2024 | 21219 | 29709 | 26204 |
06/30/2024 | 21306 | 30629 | 26641 |
07/31/2024 | 24262 | 31198 | 26803 |
08/31/2024 | 24948 | 31877 | 27469 |
09/30/2024 | 25320 | 32537 | 28384 |
10/31/2024 | 24373 | 32298 | 28880 |

Average Annual Total Returns
for Periods Ended October 31, 2024
| 1 Year | 5 Year | 10 Year |
|---|
Hennessy Focus Fund | 37.93% | 8.66% | 9.32% |
Russell 3000® Index | 37.86% | 14.60% | 12.44% |
Russell Midcap® Growth Index | 38.67% | 11.46% | 11.19% |
Past performance does not guarantee future results. The graph above illustrates the performance of an initial investment of $10,000 in the Fund 10 years ago compared with the performance of the indices shown. Fund performance in the graph and table assumes the reinvestment of dividends and capital gains and does not reflect the deduction of taxes that a shareholder would pay on Fund distributions or the redemption of Fund shares. Unlike the Fund, indices are not subject to fees and other expenses. Investors cannot invest directly in any index. These indices are used for comparative purposes in accordance with Securities and Exchange Commission regulations. Performance data current to the most recent month end may be obtained by visiting https://www.hennessyfunds.com/.Frank Russell Company (“Russell”) is the source and owner of the trademarks, service marks, and copyrights related to the Russell Indexes. Russell® is a trademark of Frank Russell Company. Neither Russell nor its licensors accept any liability for any errors or omissions in the Russell Indexes or Russell ratings or underlying data and no party may rely on any Russell Indexes or Russell ratings or underlying data contained in this communication. No further distribution of Russell data is permitted without Russell’s express written consent. Russell does not promote, sponsor, or endorse the content of this communication.
Key Fund Statistics
(as of October 31, 2024)
| |
|---|
Fund Size | $674,729,060 |
Number of Holdings | 23 |
Annual Portfolio Turnover | 10% |
Total Advisory Fee | $5,881,996 |
Sector Breakdown (% of net assets)
sector breakdown | (%) |
Communication Services | 18.53% |
Consumer Discretionary | 23.52% |
Financials | 29.77% |
Health Care | 2.58% |
Industrials | 9.48% |
Information Technology | 8.03% |
Real Estate | 7.17% |
Short-Term Investments and Other | 1.08% |
Liabilities in Excess of Other Assets | -0.16% |

Sector sub-classifications may differ from those utilized for compliance purposes.
For additional information about the Fund, including its prospectus, financial information, holdings, and proxy information, visit https://www.hennessyfunds.com/funds/regulatory-documents.
Householding
To help keep the Fund’s costs as low as possible, we generally deliver a single copy of shareholder reports, proxy statements, and prospectuses to shareholders who share an address and have the same last name. This process does not apply to account statements. you may request an individual copy of a shareholder document at any time. If you would like to receive separate mailings of shareholder documents, please call U.S. Bank Global Fund services at 800-261-6950 or 414-765-4124, and individual delivery will begin within 30 days of your request. If your account is held through a financial institution or other intermediary, please contact such intermediary directly to request individual delivery.
Annual Shareholder Report Hennessy Focus Fund Institutional Class HFCIX | |
This annual shareholder report contains important information about the Hennessy Focus Fund – Institutional Class (the “Fund”) for the period of November 1, 2023, to October 31, 2024.You can find additional information about the Fund at https://www.hennessyfunds.com/funds/regulatory-documents. You can also request this information by contacting us at 1-800-966-4354 orfundsinfo@hennessyfunds.com.
What were the Fund costs for the last year?
(based on a hypothetical $10,000 investment)
Class Name | Costs of a $10,000 investment | Costs paid as a percentage of a $10,000 investment |
|---|
Institutional Class | $132 | 1.11% |
How did the Fund perform last year and what affected its performance?
For the one-year period ended October 31, 2024, the Fund slightly outperformed the Russell 3000® Index (the Fund’s primary benchmark) and slightly underperformed the Russell Midcap® Growth Index.
Investment Strategy
We implement the Fund’s strategy through a concentrated portfolio of approximately 25 companies that we believe are high-quality businesses with large growth opportunities, excellent management, low tail risk, and discount valuations. We invest with a long-term time horizon and encourage shareholders to do the same. Periods can be influenced by many transitory issues unrelated to the growth in the intrinsic value of the Fund’s holdings.
Factors Influencing Performance
The biggest contributors to the Fund’s performance relative to the Russell 3000® Index were stock selection in the Communication Services sector, the Fund’s overweighting to the Financials sector, and the Fund’s underweighting to the Health Care sector. The biggest contributors to the Fund’s performance relative to the Russell Midcap® Growth Index were the Fund’s overweighting to the Communication Services sector and the Fund’s underweighting to the Consumer Staples and Health Care sectors.On an individual stock basis, the leading contributors to the Fund’s performance were AST SpaceMobile, Inc. (up 619%), Brookfield Corp. (up 83%), and Applied Materials, Inc. (up 38%).The biggest detractors from the Fund’s performance relative to the Russell 3000® Index were stock selection in the Information Technology and Financials sectors and the Fund’s underweighting to the Informational Technology sector. The biggest detractors from the Fund’s performance relative to the Russell Midcap® Growth Index were stock selection in the Information Technology, Real Estate, and Financials sectors.On an individual stock basis, the leading detractors from the Fund’s performance were Shenandoah Telecommunications Co. (down 41%), Floor & Decor Holdings, Inc. (down 5% since the Fund’s purchase), and CDW Corp. (down 5%).
How did the Fund perform over the last 10 years?
Change in Value of $250,000 Investment
Date | Hennessy Focus Fund | Russell 3000® Index | Russell Midcap® Growth Index |
10/31/2014 | 250000 | 250000 | 250000 |
11/30/2014 | 257376 | 256058 | 258217 |
12/31/2014 | 261880 | 256056 | 257485 |
01/31/2015 | 253988 | 248929 | 253147 |
02/28/2015 | 272031 | 263342 | 270570 |
03/31/2015 | 275862 | 260665 | 271333 |
04/30/2015 | 272951 | 261844 | 269428 |
05/31/2015 | 274330 | 265466 | 272628 |
06/30/2015 | 275249 | 261025 | 268237 |
07/31/2015 | 282834 | 265390 | 272584 |
08/31/2015 | 267473 | 249369 | 256724 |
09/30/2015 | 261228 | 242102 | 246806 |
10/31/2015 | 280574 | 261225 | 262340 |
11/30/2015 | 279425 | 262673 | 262912 |
12/31/2015 | 270382 | 257281 | 256970 |
01/31/2016 | 255028 | 242764 | 237517 |
02/29/2016 | 257984 | 242686 | 241240 |
03/31/2016 | 275987 | 259773 | 258458 |
04/30/2016 | 276486 | 261383 | 258301 |
05/31/2016 | 281169 | 266059 | 262537 |
06/30/2016 | 274758 | 266606 | 262497 |
07/31/2016 | 286504 | 277187 | 275497 |
08/31/2016 | 284815 | 277894 | 274688 |
09/30/2016 | 283165 | 278331 | 274551 |
10/31/2016 | 277023 | 272309 | 263396 |
11/30/2016 | 285928 | 284495 | 274847 |
12/31/2016 | 290803 | 290047 | 275802 |
01/31/2017 | 293951 | 295506 | 284997 |
02/28/2017 | 302664 | 306496 | 293192 |
03/31/2017 | 304199 | 306705 | 294817 |
04/30/2017 | 304007 | 309956 | 299191 |
05/31/2017 | 309804 | 313128 | 306335 |
06/30/2017 | 313987 | 315954 | 307243 |
07/31/2017 | 317596 | 321911 | 312376 |
08/31/2017 | 317941 | 322531 | 314580 |
09/30/2017 | 329034 | 330397 | 323475 |
10/31/2017 | 334331 | 337607 | 332527 |
11/30/2017 | 341663 | 347858 | 343641 |
12/31/2017 | 348133 | 351335 | 345492 |
01/31/2018 | 361568 | 369854 | 365039 |
02/28/2018 | 343334 | 356222 | 353581 |
03/31/2018 | 340187 | 349071 | 353004 |
04/30/2018 | 339649 | 350397 | 349670 |
05/31/2018 | 348939 | 360289 | 362748 |
06/30/2018 | 350858 | 362645 | 364150 |
07/31/2018 | 358536 | 374680 | 371967 |
08/31/2018 | 364716 | 387838 | 393406 |
09/30/2018 | 359764 | 388480 | 391733 |
10/31/2018 | 328824 | 359875 | 352942 |
11/30/2018 | 341914 | 367083 | 361919 |
12/31/2018 | 312904 | 332919 | 329079 |
01/31/2019 | 338139 | 361495 | 366893 |
02/28/2019 | 354186 | 374208 | 388407 |
03/31/2019 | 356845 | 379672 | 393647 |
04/30/2019 | 375736 | 394833 | 411349 |
05/31/2019 | 367853 | 369283 | 387685 |
06/30/2019 | 386465 | 395220 | 414911 |
07/31/2019 | 391783 | 401095 | 424598 |
08/31/2019 | 393742 | 392919 | 416864 |
09/30/2019 | 401952 | 399815 | 412117 |
10/31/2019 | 409695 | 408421 | 419757 |
11/30/2019 | 426301 | 423946 | 440640 |
12/31/2019 | 423474 | 436187 | 445802 |
01/31/2020 | 428998 | 435711 | 449973 |
02/29/2020 | 400450 | 400038 | 418945 |
03/31/2020 | 295652 | 345025 | 356463 |
04/30/2020 | 338397 | 390721 | 412282 |
05/31/2020 | 367359 | 411616 | 453698 |
06/30/2020 | 383723 | 421026 | 464332 |
07/31/2020 | 403496 | 444933 | 501428 |
08/31/2020 | 427656 | 477166 | 515069 |
09/30/2020 | 404683 | 459792 | 507857 |
10/31/2020 | 383259 | 449868 | 508479 |
11/30/2020 | 430960 | 504596 | 576778 |
12/31/2020 | 448383 | 527297 | 604447 |
01/31/2021 | 437206 | 524952 | 602429 |
02/28/2021 | 467150 | 541360 | 612717 |
03/31/2021 | 508832 | 560764 | 601030 |
04/30/2021 | 534488 | 589671 | 634800 |
05/31/2021 | 536808 | 592363 | 625099 |
06/30/2021 | 545946 | 606970 | 667577 |
07/31/2021 | 557051 | 617234 | 674453 |
08/31/2021 | 569844 | 634836 | 696223 |
09/30/2021 | 550655 | 606352 | 662504 |
10/31/2021 | 588050 | 647357 | 708955 |
11/30/2021 | 569633 | 637503 | 679001 |
12/31/2021 | 591953 | 662607 | 681382 |
01/31/2022 | 543015 | 623622 | 593454 |
02/28/2022 | 530492 | 607913 | 586250 |
03/31/2022 | 537825 | 627632 | 595662 |
04/30/2022 | 488804 | 571307 | 528591 |
05/31/2022 | 503387 | 570541 | 508130 |
06/30/2022 | 460628 | 522810 | 470146 |
07/31/2022 | 512532 | 571859 | 527680 |
08/31/2022 | 474799 | 550518 | 510396 |
09/30/2022 | 414491 | 499469 | 467076 |
10/31/2022 | 439454 | 540428 | 503784 |
11/30/2022 | 475787 | 568636 | 531192 |
12/31/2022 | 445709 | 535341 | 499310 |
01/31/2023 | 494655 | 572211 | 542882 |
02/28/2023 | 477269 | 558837 | 537522 |
03/31/2023 | 465835 | 573780 | 544927 |
04/30/2023 | 473961 | 579893 | 537034 |
05/31/2023 | 459504 | 582149 | 537365 |
06/30/2023 | 511001 | 621902 | 578899 |
07/31/2023 | 518939 | 644195 | 596416 |
08/31/2023 | 518561 | 631759 | 576753 |
09/30/2023 | 480765 | 601666 | 548658 |
10/31/2023 | 456575 | 585717 | 520661 |
11/30/2023 | 498812 | 640334 | 584180 |
12/31/2023 | 540690 | 674298 | 628466 |
01/31/2024 | 526865 | 681771 | 625080 |
02/29/2024 | 556420 | 718676 | 672078 |
03/31/2024 | 565120 | 741858 | 688149 |
04/30/2024 | 514352 | 709215 | 648184 |
05/31/2024 | 549508 | 742724 | 655094 |
06/30/2024 | 551892 | 765717 | 666036 |
07/31/2024 | 628759 | 779950 | 670073 |
08/31/2024 | 646754 | 796929 | 686721 |
09/30/2024 | 656526 | 813414 | 709604 |
10/31/2024 | 632096 | 807441 | 722000 |

Average Annual Total Returns
for Periods Ended October 31, 2024
| 1 Year | 5 Year | 10 Year |
|---|
Hennessy Focus Fund | 38.44% | 9.06% | 9.72% |
Russell 3000® Index | 37.86% | 14.60% | 12.44% |
Russell Midcap® Growth Index | 38.67% | 11.46% | 11.19% |
Past performance does not guarantee future results. The graph above illustrates the performance of an initial investment of $250,000 in the Fund 10 years ago compared with the performance of the indices shown. Fund performance in the graph and table assumes the reinvestment of dividends and capital gains and does not reflect the deduction of taxes that a shareholder would pay on Fund distributions or the redemption of Fund shares. Unlike the Fund, indices are not subject to fees and other expenses. Investors cannot invest directly in any index. These indices are used for comparative purposes in accordance with Securities and Exchange Commission regulations. Performance data current to the most recent month end may be obtained by visiting https://www.hennessyfunds.com/.Frank Russell Company (“Russell”) is the source and owner of the trademarks, service marks, and copyrights related to the Russell Indexes. Russell® is a trademark of Frank Russell Company. Neither Russell nor its licensors accept any liability for any errors or omissions in the Russell Indexes or Russell ratings or underlying data and no party may rely on any Russell Indexes or Russell ratings or underlying data contained in this communication. No further distribution of Russell data is permitted without Russell’s express written consent. Russell does not promote, sponsor, or endorse the content of this communication.
Key Fund Statistics
(as of October 31, 2024)
| |
|---|
Fund Size | $674,729,060 |
Number of Holdings | 23 |
Annual Portfolio Turnover | 10% |
Total Advisory Fee | $5,881,996 |
Sector Breakdown (% of net assets)
sector breakdown | (%) |
Communication Services | 18.53% |
Consumer Discretionary | 23.52% |
Financials | 29.77% |
Health Care | 2.58% |
Industrials | 9.48% |
Information Technology | 8.03% |
Real Estate | 7.17% |
Short-Term Investments and Other | 1.08% |
Liabilities in Excess of Other Assets | -0.16% |
Sector sub-classifications may differ from those utilized for compliance purposes.
For additional information about the Fund, including its prospectus, financial information, holdings, and proxy information, visit https://www.hennessyfunds.com/funds/regulatory-documents.
Householding
To help keep the Fund’s costs as low as possible, we generally deliver a single copy of shareholder reports, proxy statements, and prospectuses to shareholders who share an address and have the same last name. This process does not apply to account statements. you may request an individual copy of a shareholder document at any time. If you would like to receive separate mailings of shareholder documents, please call U.S. Bank Global Fund services at 800-261-6950 or 414-765-4124, and individual delivery will begin within 30 days of your request. If your account is held through a financial institution or other intermediary, please contact such intermediary directly to request individual delivery.
Annual Shareholder Report Hennessy Cornerstone Mid Cap 30 Fund Investor Class HFMDX | |
This annual shareholder report contains important information about the Hennessy Cornerstone Mid Cap 30 Fund – Investor Class (the “Fund”) for the period of November 1, 2023, to October 31, 2024. You can find additional information about the Fund at https://www.hennessyfunds.com/funds/regulatory-documents. You can also request this information by contacting us at1-800-966-4354 or fundsinfo@hennessyfunds.com.
What were the Fund costs for the last year?
(based on a hypothetical $10,000 investment)
Class Name | Costs of a $10,000 investment | Costs paid as a percentage of a $10,000 investment |
|---|
Investor Class | $169 | 1.33% |
How did the Fund perform last year and what affected its performance?
For the one-year period ended October 31, 2024, the Fund outperformed both the Russell Midcap® Index (the Fund’s primary benchmark) and the S&P 500® Index.
Factors Influencing Performance
● Holdings in the Consumer Discretionary, Industrials, and Consumer Staples sectors contributed the most to performance.● Holdings in the Financials, Information Technology, and Real Estate sectors detracted the most from performance.● Stocks that contributed most to performance included Modine Manufacturing Co., Sprouts Farmers Market, Inc., and Abercrombie & Fitch Co.● Stocks that detracted most from performance included Par Pacific Holdings, Inc., PBF Energy, Inc., and Insight Enterprises, Inc.
Positioning
● At the end of the period, compared to its primary benchmark, the Fund was most overweight Consumer Discretionary and Energy companies and was most underweight Information Technology and Health Care companies.
Performance
● The majority of outperformance was due to stock selection rather than sector allocation.
● The Fund outperformed the broader market, as represented by the S&P 500® Index, despite small- and mid-cap stocks significantly underperforming such broader market during the period.
How did the Fund perform over the last 10 years?
Change in Value of $10,000 Investment
Date | Hennessy Cornerstone Mid Cap 30 Fund | Russell Midcap® Index | S&P 500® Index |
10/31/2014 | 10000 | 10000 | 10000 |
11/30/2014 | 10411 | 10256 | 10269 |
12/31/2014 | 10442 | 10278 | 10243 |
01/31/2015 | 10191 | 10117 | 9936 |
02/28/2015 | 10833 | 10677 | 10507 |
03/31/2015 | 10995 | 10684 | 10340 |
04/30/2015 | 10967 | 10587 | 10440 |
05/31/2015 | 11425 | 10742 | 10574 |
06/30/2015 | 11610 | 10520 | 10369 |
07/31/2015 | 11961 | 10598 | 10586 |
08/31/2015 | 11431 | 10038 | 9948 |
09/30/2015 | 11012 | 9677 | 9702 |
10/31/2015 | 11235 | 10277 | 10520 |
11/30/2015 | 10939 | 10303 | 10551 |
12/31/2015 | 10444 | 10027 | 10385 |
01/31/2016 | 9892 | 9370 | 9869 |
02/29/2016 | 10202 | 9476 | 9856 |
03/31/2016 | 10839 | 10252 | 10525 |
04/30/2016 | 10349 | 10360 | 10566 |
05/31/2016 | 10489 | 10530 | 10755 |
06/30/2016 | 10371 | 10578 | 10783 |
07/31/2016 | 10867 | 11061 | 11181 |
08/31/2016 | 10658 | 11034 | 11196 |
09/30/2016 | 10794 | 11056 | 11199 |
10/31/2016 | 10349 | 10705 | 10994 |
11/30/2016 | 11115 | 11282 | 11401 |
12/31/2016 | 11053 | 11411 | 11627 |
01/31/2017 | 11194 | 11686 | 11847 |
02/28/2017 | 11608 | 12017 | 12318 |
03/31/2017 | 11495 | 11998 | 12332 |
04/30/2017 | 11608 | 12090 | 12459 |
05/31/2017 | 11478 | 12201 | 12634 |
06/30/2017 | 11704 | 12322 | 12713 |
07/31/2017 | 11835 | 12503 | 12974 |
08/31/2017 | 11778 | 12406 | 13014 |
09/30/2017 | 12368 | 12750 | 13283 |
10/31/2017 | 12730 | 12963 | 13593 |
11/30/2017 | 13082 | 13399 | 14009 |
12/31/2017 | 13319 | 13524 | 14165 |
01/31/2018 | 13353 | 14033 | 14976 |
02/28/2018 | 12266 | 13453 | 14424 |
03/31/2018 | 12395 | 13461 | 14058 |
04/30/2018 | 12719 | 13441 | 14112 |
05/31/2018 | 13279 | 13746 | 14451 |
06/30/2018 | 13070 | 13841 | 14540 |
07/31/2018 | 13130 | 14186 | 15081 |
08/31/2018 | 13124 | 14626 | 15573 |
09/30/2018 | 12590 | 14533 | 15662 |
10/31/2018 | 11389 | 13325 | 14591 |
11/30/2018 | 11362 | 13653 | 14888 |
12/31/2018 | 10285 | 12299 | 13544 |
01/31/2019 | 11400 | 13625 | 14629 |
02/28/2019 | 11765 | 14210 | 15099 |
03/31/2019 | 11522 | 14332 | 15393 |
04/30/2019 | 11728 | 14878 | 16016 |
05/31/2019 | 10641 | 13965 | 14998 |
06/30/2019 | 11456 | 14924 | 16055 |
07/31/2019 | 11428 | 15137 | 16286 |
08/31/2019 | 10876 | 14706 | 16028 |
09/30/2019 | 11213 | 14995 | 16328 |
10/31/2019 | 11250 | 15153 | 16681 |
11/30/2019 | 11775 | 15695 | 17287 |
12/31/2019 | 11906 | 16055 | 17809 |
01/31/2020 | 11887 | 15926 | 17802 |
02/29/2020 | 10623 | 14543 | 16336 |
03/31/2020 | 7466 | 11709 | 14319 |
04/30/2020 | 8936 | 13390 | 16154 |
05/31/2020 | 9995 | 14331 | 16923 |
06/30/2020 | 10257 | 14590 | 17260 |
07/31/2020 | 11353 | 15446 | 18233 |
08/31/2020 | 12159 | 15989 | 19544 |
09/30/2020 | 12524 | 15678 | 18801 |
10/31/2020 | 12430 | 15778 | 18301 |
11/30/2020 | 13995 | 17959 | 20305 |
12/31/2020 | 14688 | 18800 | 21085 |
01/31/2021 | 16028 | 18751 | 20872 |
02/28/2021 | 17339 | 19795 | 21448 |
03/31/2021 | 18351 | 20330 | 22387 |
04/30/2021 | 18585 | 21367 | 23582 |
05/31/2021 | 19053 | 21538 | 23747 |
06/30/2021 | 18875 | 21855 | 24301 |
07/31/2021 | 18688 | 22023 | 24878 |
08/31/2021 | 18679 | 22583 | 25635 |
09/30/2021 | 17451 | 21653 | 24443 |
10/31/2021 | 18529 | 22941 | 26155 |
11/30/2021 | 18070 | 22142 | 25974 |
12/31/2021 | 18686 | 23046 | 27138 |
01/31/2022 | 17790 | 21348 | 25734 |
02/28/2022 | 18657 | 21195 | 24963 |
03/31/2022 | 19343 | 21737 | 25890 |
04/30/2022 | 18838 | 20063 | 23632 |
05/31/2022 | 19439 | 20079 | 23676 |
06/30/2022 | 16828 | 18075 | 21721 |
07/31/2022 | 18638 | 19859 | 23724 |
08/31/2022 | 19077 | 19236 | 22757 |
09/30/2022 | 17323 | 17453 | 20661 |
10/31/2022 | 19849 | 19002 | 22334 |
11/30/2022 | 20601 | 20144 | 23582 |
12/31/2022 | 19207 | 19056 | 22223 |
01/31/2023 | 20720 | 20638 | 23619 |
02/28/2023 | 21170 | 20138 | 23043 |
03/31/2023 | 20962 | 19828 | 23889 |
04/30/2023 | 20189 | 19724 | 24262 |
05/31/2023 | 20316 | 19173 | 24367 |
06/30/2023 | 22740 | 20773 | 25977 |
07/31/2023 | 24367 | 21597 | 26812 |
08/31/2023 | 23271 | 20847 | 26385 |
09/30/2023 | 23063 | 19800 | 25127 |
10/31/2023 | 21839 | 18811 | 24599 |
11/30/2023 | 23698 | 20736 | 26845 |
12/31/2023 | 25120 | 22338 | 28065 |
01/31/2024 | 24942 | 22020 | 28536 |
02/29/2024 | 27842 | 23251 | 30060 |
03/31/2024 | 29534 | 24259 | 31027 |
04/30/2024 | 28300 | 22949 | 29760 |
05/31/2024 | 31187 | 23603 | 31236 |
06/30/2024 | 30691 | 23447 | 32356 |
07/31/2024 | 32841 | 24552 | 32750 |
08/31/2024 | 32701 | 25050 | 33545 |
09/30/2024 | 33184 | 25607 | 34261 |
10/31/2024 | 33680 | 25469 | 33950 |
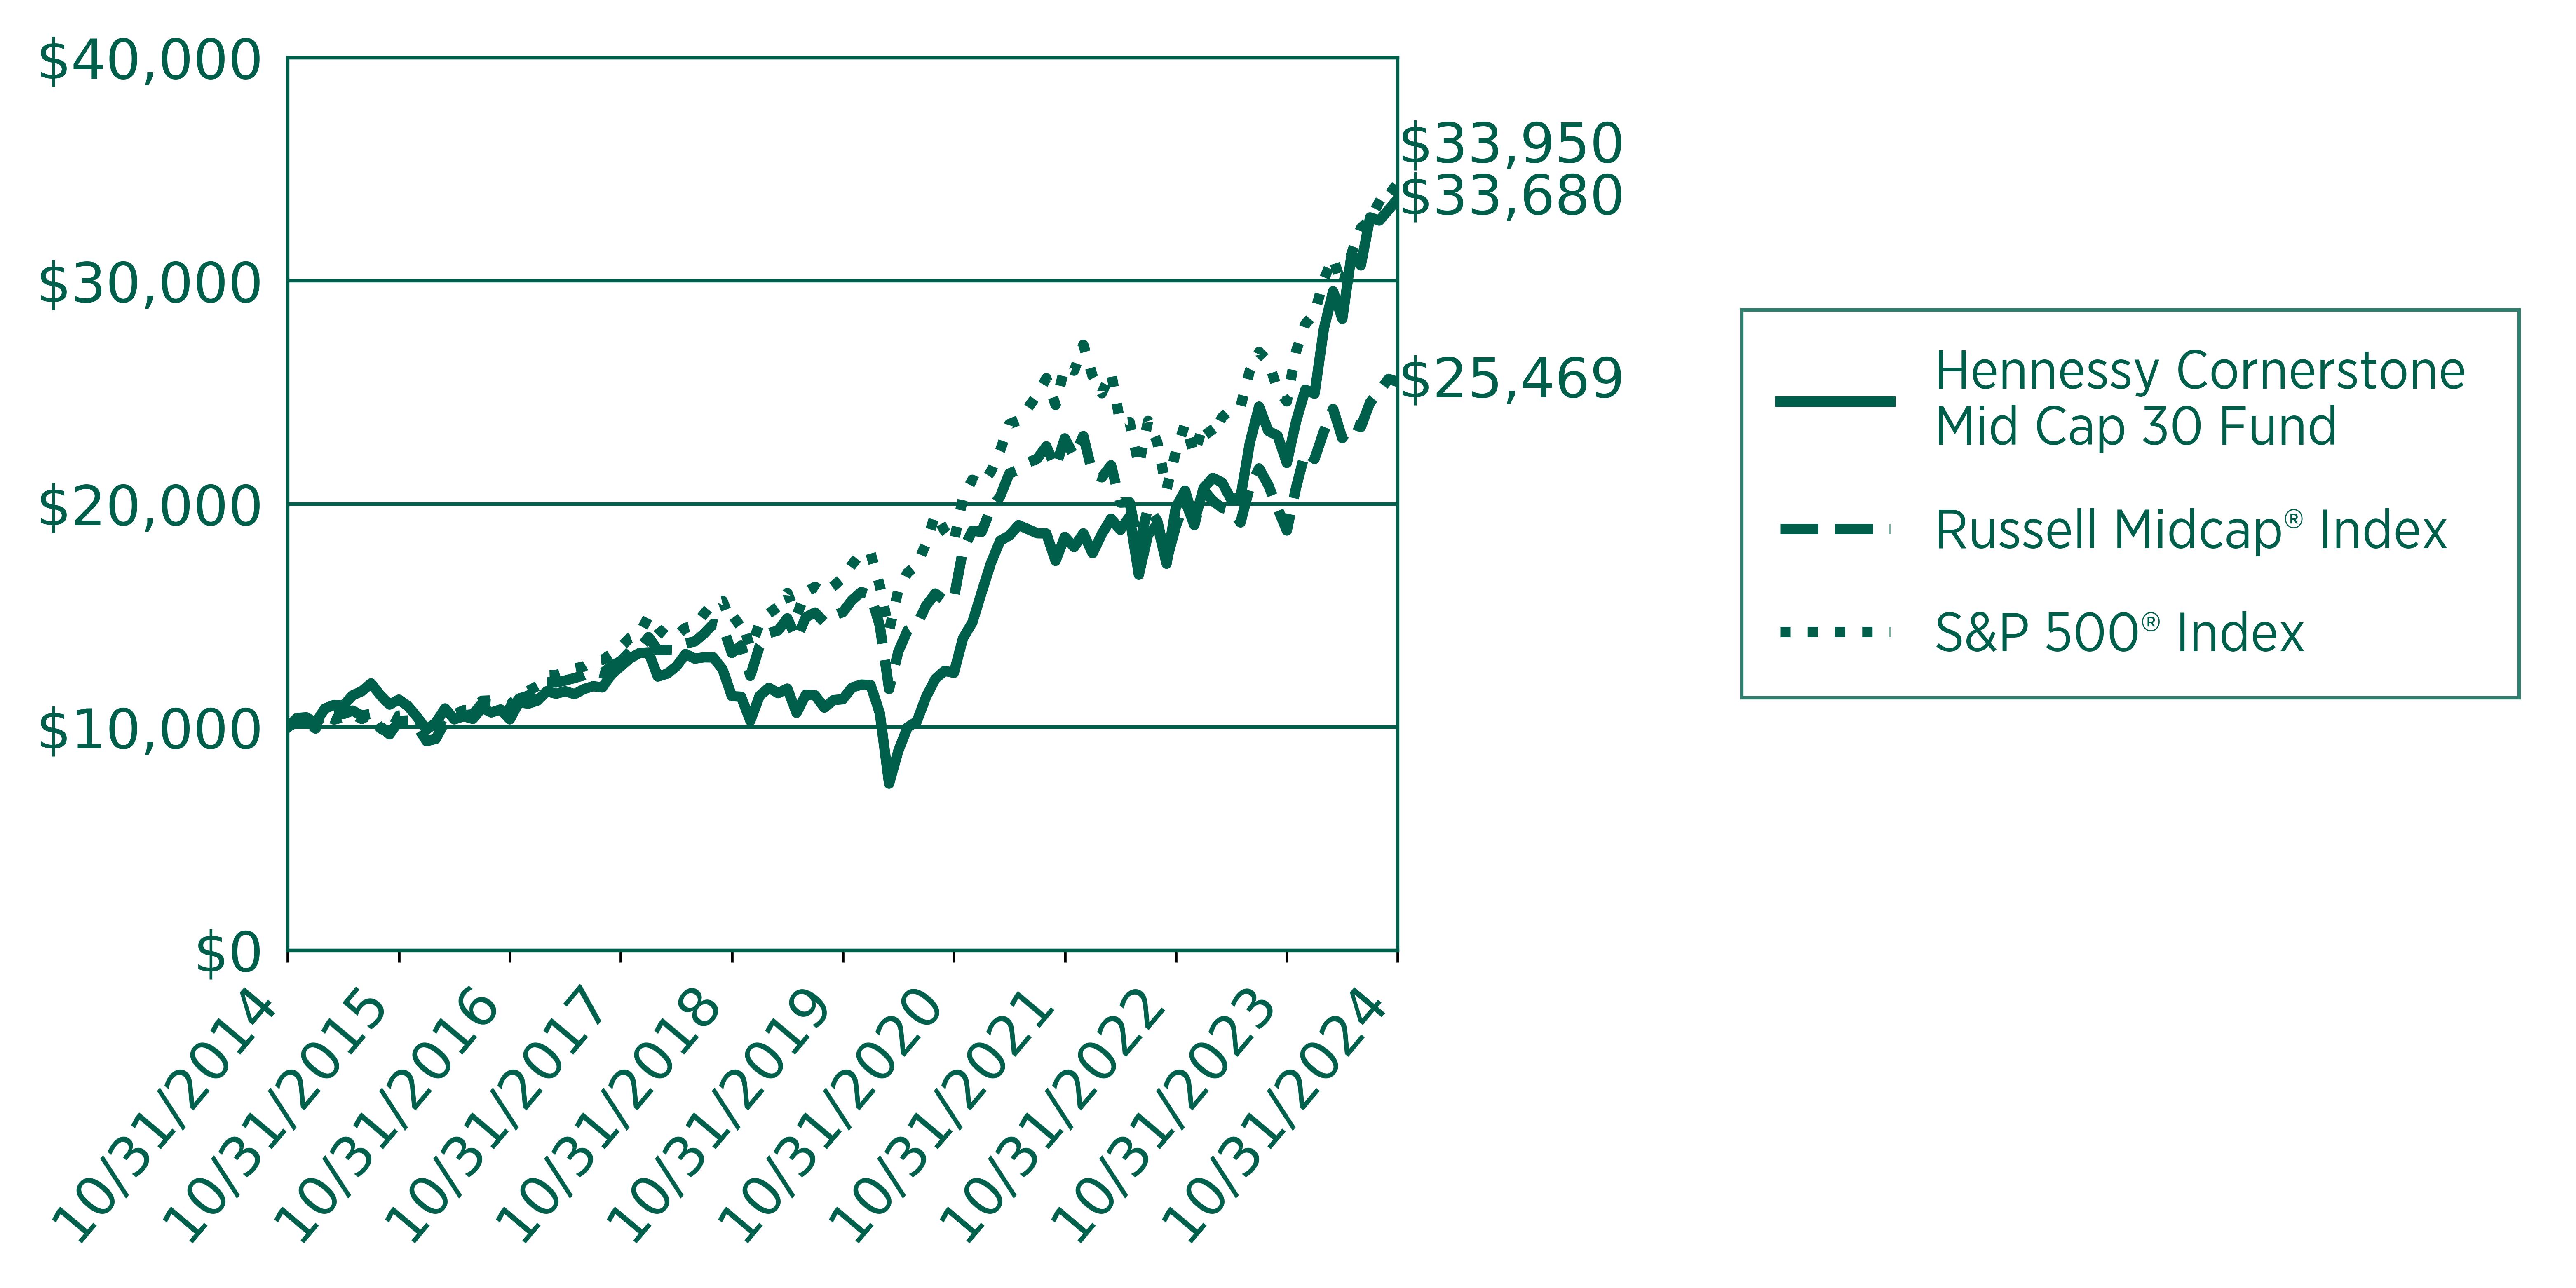
Average Annual Total Returns
for Periods Ended October 31, 2024
| 1 Year | 5 Year | 10 Year |
|---|
Hennessy Cornerstone Mid Cap 30 Fund | 54.22% | 24.52% | 12.91% |
Russell Midcap® Index | 35.39% | 10.94% | 9.80% |
S&P 500® Index | 38.02% | 15.27% | 13.00% |
Past performance does not guarantee future results. The graph above illustrates the performance of an initial investment of $10,000 in the Fund 10 years ago compared with the performance of the indices shown. Fund performance in the graph and table assumes the reinvestment of dividends and capital gains and does not reflect the deduction of taxes that a shareholder would pay on Fund distributions or the redemption of Fund shares. Unlike the Fund, indices are not subject to fees and other expenses. Investors cannot invest directly in any index. These indices are used for comparative purposes in accordance with Securities and Exchange Commission regulations. Performance data current to the most recent month end may be obtained by visiting https://www.hennessyfunds.com/.Frank Russell Company (“Russell”) is the source and owner of the trademarks, service marks, and copyrights related to the Russell Indexes. Russell® is a trademark of Frank Russell Company. Neither Russell nor its licensors accept any liability for any errors or omissions in the Russell Indexes or Russell ratings or underlying data and no party may rely on any Russell Indexes or Russell ratings or underlying data contained in this communication. No further distribution of Russell data is permitted without Russell’s express written consent. Russell does not promote, sponsor, or endorse the content of this communication.Standard & Poor’s Financial Services is the source and owner of the S&P® and S&P 500® trademarks.
Key Fund Statistics
(as of October 31, 2024)
| |
|---|
Fund Size | $1,597,111,530 |
Number of Holdings | 59¹ |
Annual Portfolio Turnover | 94% |
Total Advisory Fee | $7,873,052 |
| ¹ | | Due to the timing of the Fund's annual rebalance, the Fund held more than 30 securities at year end. |
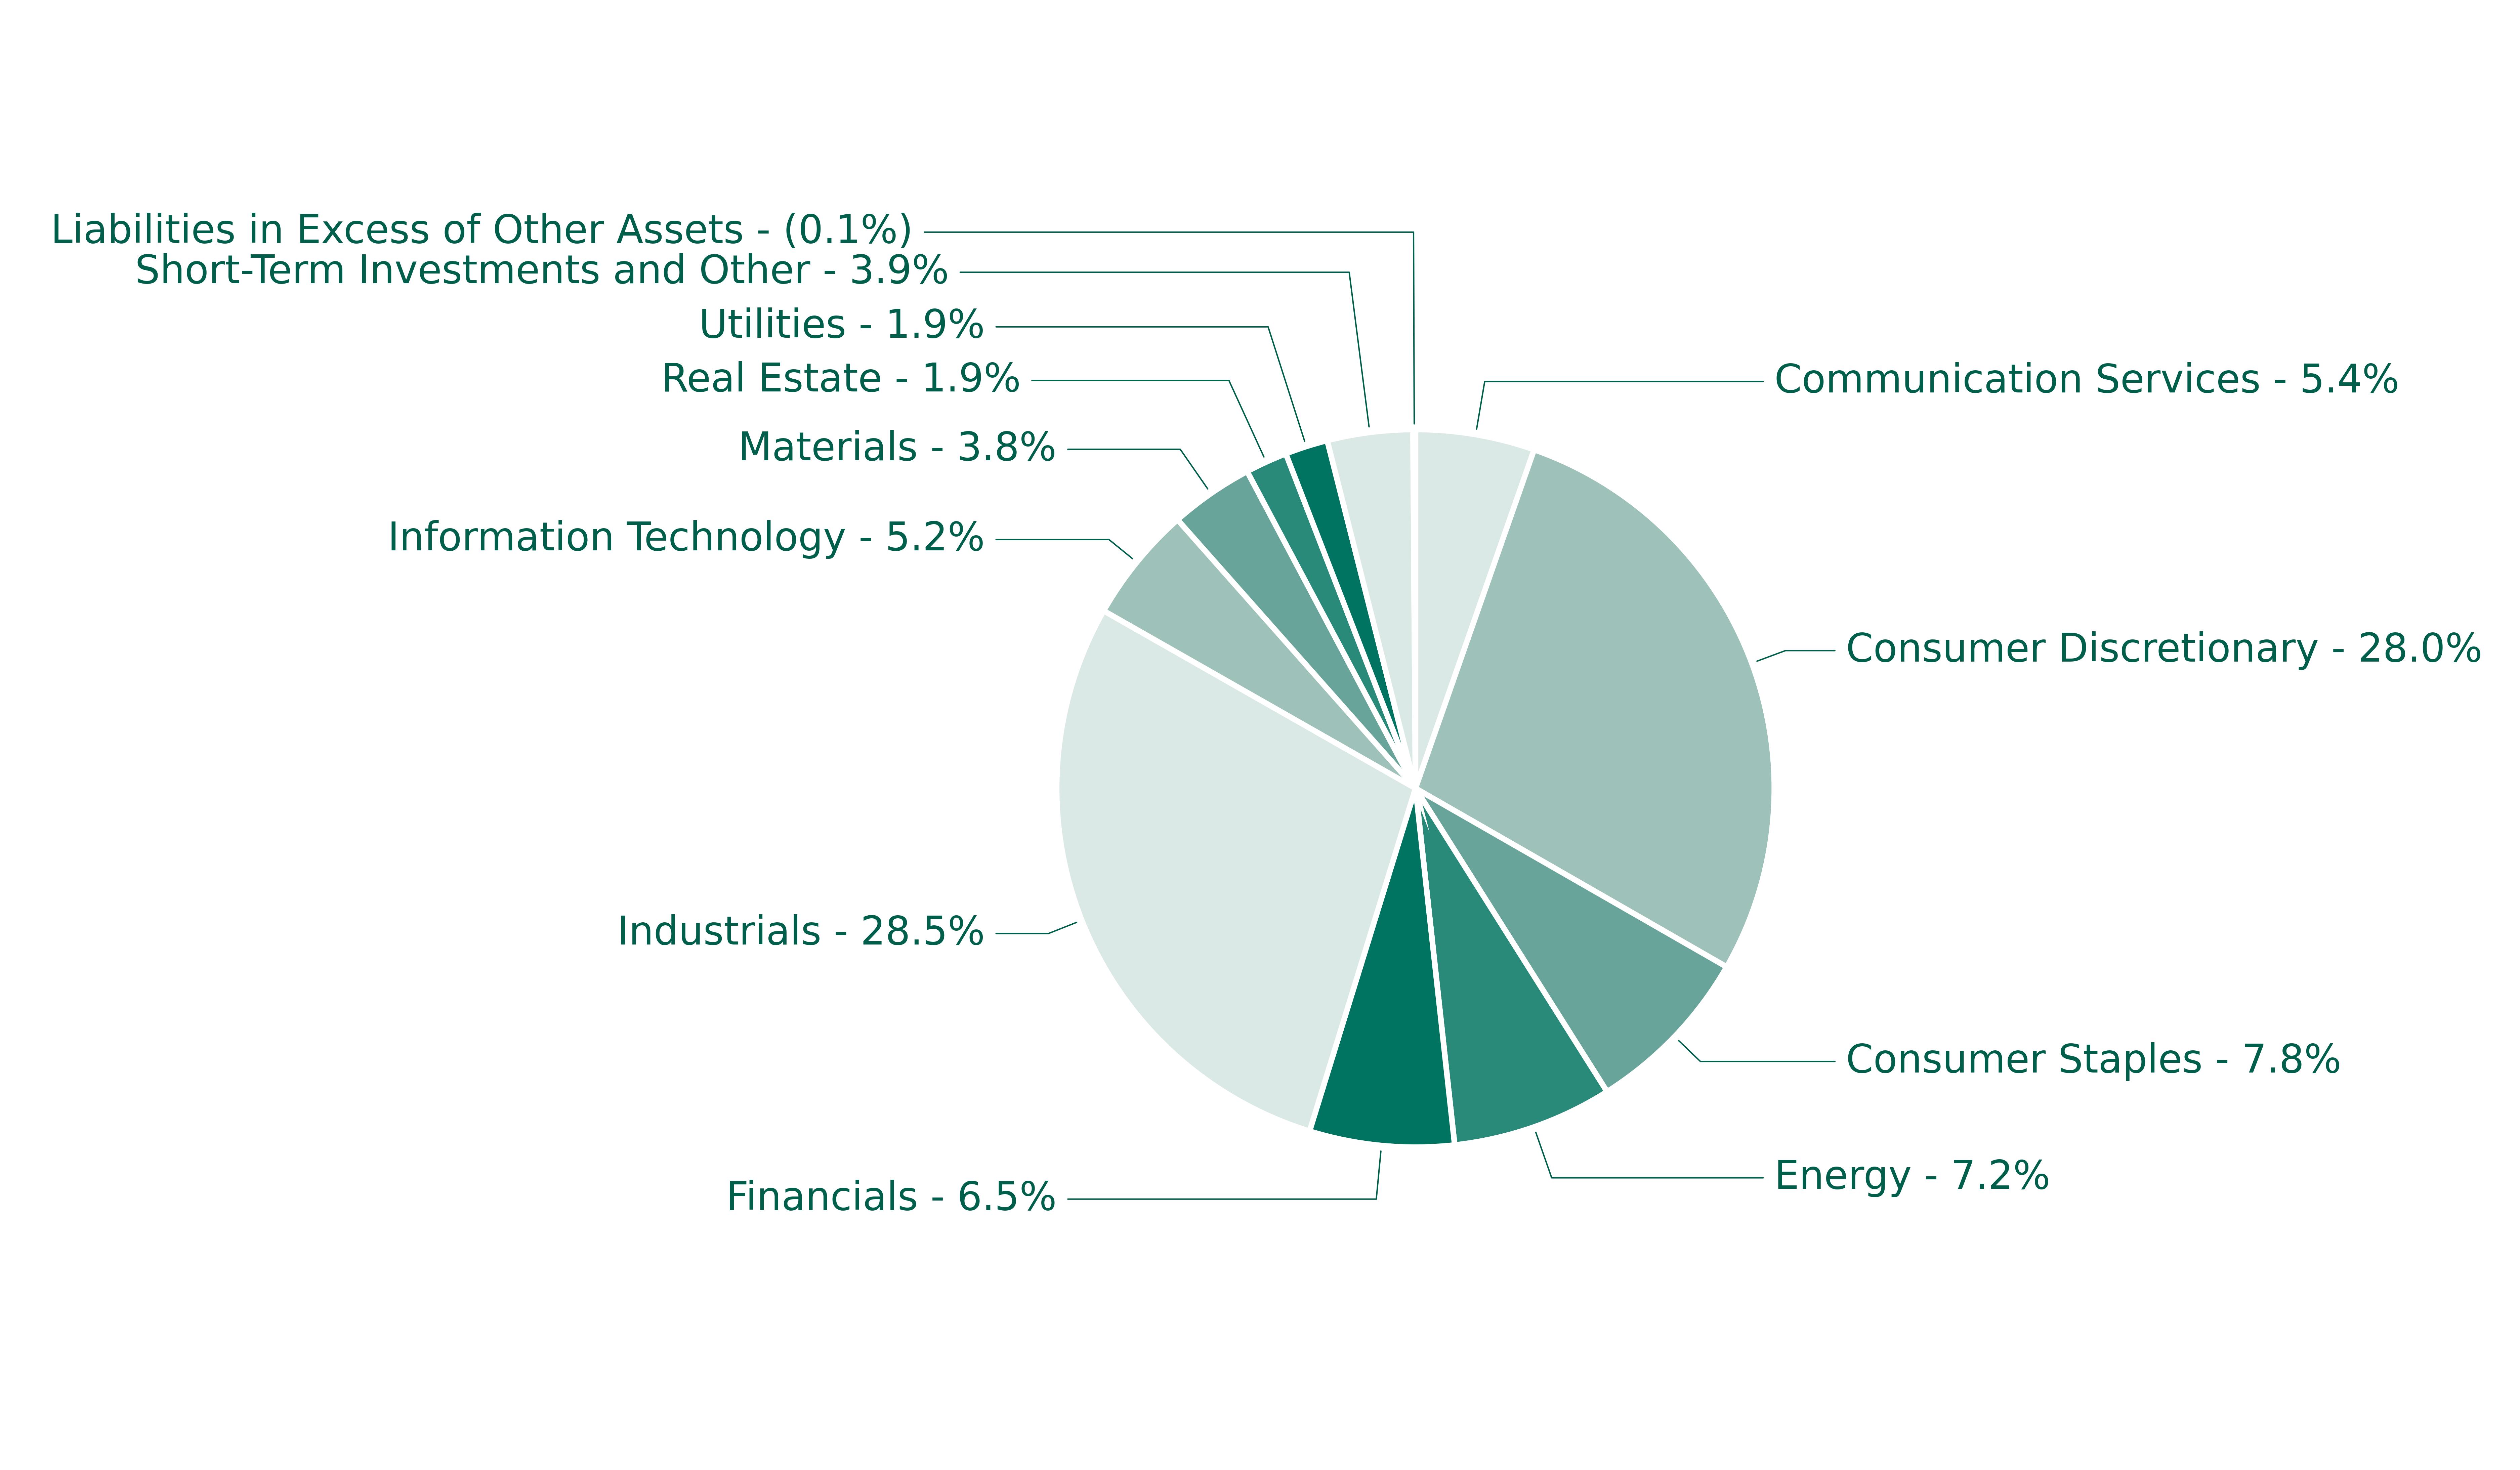
Sector Breakdown (% of net assets)
sector breakdown | (%) |
Communication Services | 5.37% |
Consumer Discretionary | 27.96% |
Consumer Staples | 7.75% |
Energy | 7.23% |
Financials | 6.52% |
Industrials | 28.50% |
Information Technology | 5.23% |
Materials | 3.77% |
Real Estate | 1.89% |
Utilities | 1.93% |
Short-Term Investments and Other | 3.85% |
Liabilities in Excess of Other Assets | -0.11% |
Sector sub-classifications may differ from those utilized for compliance purposes.
For additional information about the Fund, including its prospectus, financial information, holdings, and proxy information, visit https://www.hennessyfunds.com/funds/regulatory-documents.
Householding
To help keep the Fund’s costs as low as possible, we generally deliver a single copy of shareholder reports, proxy statements, and prospectuses to shareholders who share an address and have the same last name. This process does not apply to account statements. you may request an individual copy of a shareholder document at any time. If you would like to receive separate mailings of shareholder documents, please call U.S. Bank Global Fund services at 800-261-6950 or 414-765-4124, and individual delivery will begin within 30 days of your request. If your account is held through a financial institution or other intermediary, please contact such intermediary directly to request individual delivery.
Annual Shareholder Report Hennessy Cornerstone Mid Cap 30 Fund Institutional Class HIMDX | |
This annual shareholder report contains important information about the Hennessy Cornerstone Mid Cap 30 Fund – Institutional Class (the “Fund”) for the period of November 1, 2023, to October 31, 2024. You can find additional information about the Fund at https://www.hennessyfunds.com/funds/regulatory-documents. You can also request this information by contacting us at1-800-966-4354 or fundsinfo@hennessyfunds.com.
What were the Fund costs for the last year?
(based on a hypothetical $10,000 investment)
Class Name | Costs of a $10,000 investment | Costs paid as a percentage of a $10,000 investment |
|---|
Institutional Class | $121 | 0.95% |
How did the Fund perform last year and what affected its performance?
For the one-year period ended October 31, 2024, the Fund outperformed both the Russell Midcap® Index (the Fund’s primary benchmark) and the S&P 500® Index.
Factors Influencing Performance
● Holdings in the Consumer Discretionary, Industrials, and Consumer Staples sectors contributed the most to performance.● Holdings in the Financials, Information Technology, and Real Estate sectors detracted the most from performance.● Stocks that contributed most to performance included Modine Manufacturing Co., Sprouts Farmers Market, Inc., and Abercrombie & Fitch Co.● Stocks that detracted most from performance included Par Pacific Holdings, Inc., PBF Energy, Inc., and Insight Enterprises, Inc.
Positioning
● At the end of the period, compared to its primary benchmark, the Fund was most overweight Consumer Discretionary and Energy companies and was most underweight Information Technology and Health Care companies.
Performance
● The majority of outperformance was due to stock selection rather than sector allocation.
● The Fund outperformed the broader market, as represented by the S&P 500® Index, despite small- and mid-cap stocks significantly underperforming such broader market during the period.
How did the Fund perform over the last 10 years?
Change in Value of $250,000 Investment
Date | Hennessy Cornerstone Mid Cap 30 Fund | Russell Midcap® Index | S&P 500® Index |
10/31/2014 | 250000 | 250000 | 250000 |
11/30/2014 | 260331 | 256397 | 256724 |
12/31/2014 | 261280 | 256940 | 256077 |
01/31/2015 | 254977 | 252931 | 248390 |
02/28/2015 | 271144 | 266935 | 262665 |
03/31/2015 | 275118 | 267095 | 258511 |
04/30/2015 | 274570 | 264667 | 260991 |
05/31/2015 | 286079 | 268544 | 264347 |
06/30/2015 | 290737 | 262990 | 259230 |
07/31/2015 | 299643 | 264941 | 264661 |
08/31/2015 | 286353 | 250960 | 248693 |
09/30/2015 | 275940 | 241925 | 242540 |
10/31/2015 | 281557 | 256923 | 262999 |
11/30/2015 | 274296 | 257578 | 263781 |
12/31/2015 | 261873 | 250674 | 259621 |
01/31/2016 | 248024 | 234250 | 246737 |
02/29/2016 | 255918 | 236898 | 246404 |
03/31/2016 | 271982 | 256301 | 263120 |
04/30/2016 | 259795 | 259011 | 264140 |
05/31/2016 | 263396 | 263258 | 268883 |
06/30/2016 | 260488 | 264457 | 269580 |
07/31/2016 | 273090 | 276531 | 279519 |
08/31/2016 | 267966 | 275840 | 279912 |
09/30/2016 | 271428 | 276398 | 279965 |
10/31/2016 | 260349 | 267627 | 274858 |
11/30/2016 | 279737 | 282060 | 285037 |
12/31/2016 | 278113 | 285263 | 290671 |
01/31/2017 | 281875 | 292147 | 296184 |
02/28/2017 | 292325 | 300414 | 307944 |
03/31/2017 | 289538 | 299945 | 308304 |
04/30/2017 | 292464 | 302255 | 311470 |
05/31/2017 | 289399 | 305016 | 315853 |
06/30/2017 | 295112 | 308050 | 317824 |
07/31/2017 | 298456 | 312586 | 324360 |
08/31/2017 | 297062 | 310156 | 325353 |
09/30/2017 | 312111 | 318750 | 332064 |
10/31/2017 | 321446 | 324069 | 339813 |
11/30/2017 | 330363 | 334973 | 350235 |
12/31/2017 | 336416 | 338088 | 354129 |
01/31/2018 | 337413 | 350815 | 374404 |
02/28/2018 | 310015 | 336324 | 360605 |
03/31/2018 | 313502 | 336533 | 351441 |
04/30/2018 | 321638 | 336021 | 352789 |
05/31/2018 | 335918 | 343648 | 361285 |
06/30/2018 | 330605 | 346020 | 363509 |
07/31/2018 | 332431 | 354640 | 377036 |
08/31/2018 | 332265 | 365656 | 389322 |
09/30/2018 | 318981 | 363313 | 391538 |
10/31/2018 | 288594 | 333127 | 364776 |
11/30/2018 | 287930 | 341315 | 372210 |
12/31/2018 | 260913 | 307463 | 338603 |
01/31/2019 | 289163 | 340630 | 365737 |
02/28/2019 | 298350 | 355261 | 377480 |
03/31/2019 | 292378 | 358307 | 384815 |
04/30/2019 | 297661 | 371941 | 400396 |
05/31/2019 | 270100 | 349117 | 374952 |
06/30/2019 | 291000 | 373097 | 401377 |
07/31/2019 | 290311 | 378424 | 407146 |
08/31/2019 | 276531 | 367645 | 400696 |
09/30/2019 | 284799 | 374886 | 408194 |
10/31/2019 | 286177 | 378828 | 417035 |
11/30/2019 | 299498 | 392366 | 432173 |
12/31/2019 | 302714 | 401369 | 445217 |
01/31/2020 | 302484 | 398151 | 445042 |
02/29/2020 | 270329 | 363567 | 408407 |
03/31/2020 | 190172 | 292713 | 357963 |
04/30/2020 | 227609 | 334752 | 403852 |
05/31/2020 | 254711 | 358285 | 423087 |
06/30/2020 | 261372 | 364740 | 431501 |
07/31/2020 | 289392 | 386157 | 455831 |
08/31/2020 | 309834 | 399734 | 488596 |
09/30/2020 | 319480 | 391952 | 470031 |
10/31/2020 | 317183 | 394451 | 457531 |
11/30/2020 | 357147 | 448972 | 507614 |
12/31/2020 | 374832 | 470006 | 527131 |
01/31/2021 | 409284 | 468763 | 521809 |
02/28/2021 | 442816 | 494869 | 536198 |
03/31/2021 | 468999 | 508260 | 559681 |
04/30/2021 | 475201 | 534163 | 589551 |
05/31/2021 | 487144 | 538450 | 593669 |
06/30/2021 | 482780 | 546375 | 607528 |
07/31/2021 | 478186 | 550579 | 621959 |
08/31/2021 | 477957 | 564576 | 640871 |
09/30/2021 | 446721 | 541316 | 611064 |
10/31/2021 | 474512 | 573513 | 653876 |
11/30/2021 | 463028 | 553543 | 649345 |
12/31/2021 | 478871 | 576152 | 678446 |
01/31/2022 | 455978 | 533707 | 643339 |
02/28/2022 | 478170 | 529868 | 624076 |
03/31/2022 | 496157 | 543437 | 647248 |
04/30/2022 | 483309 | 501574 | 590807 |
05/31/2022 | 498960 | 501974 | 591891 |
06/30/2022 | 431918 | 451873 | 543034 |
07/31/2022 | 478404 | 496479 | 593104 |
08/31/2022 | 490083 | 480903 | 568916 |
09/30/2022 | 444999 | 436333 | 516520 |
10/31/2022 | 510173 | 475059 | 558338 |
11/30/2022 | 529561 | 503609 | 589540 |
12/31/2022 | 494071 | 476391 | 555574 |
01/31/2023 | 533122 | 515952 | 590483 |
02/28/2023 | 544724 | 503438 | 576076 |
03/31/2023 | 539630 | 495712 | 597226 |
04/30/2023 | 519822 | 493094 | 606548 |
05/31/2023 | 523218 | 479317 | 609184 |
06/30/2023 | 585755 | 519313 | 649436 |
07/31/2023 | 627918 | 539913 | 670299 |
08/31/2023 | 599903 | 521187 | 659627 |
09/30/2023 | 594527 | 495003 | 628177 |
10/31/2023 | 563400 | 470277 | 614969 |
11/30/2023 | 611505 | 518391 | 671131 |
12/31/2023 | 648559 | 558460 | 701621 |
01/31/2024 | 643882 | 550508 | 713411 |
02/29/2024 | 719340 | 581264 | 751504 |
03/31/2024 | 762993 | 606483 | 775684 |
04/30/2024 | 731188 | 573722 | 744001 |
05/31/2024 | 806022 | 590085 | 780892 |
06/30/2024 | 793550 | 586177 | 808912 |
07/31/2024 | 849363 | 613803 | 818759 |
08/31/2024 | 846245 | 626240 | 838619 |
09/30/2024 | 858718 | 640178 | 856530 |
10/31/2024 | 872125 | 636730 | 848762 |

Average Annual Total Returns
for Periods Ended October 31, 2024
| 1 Year | 5 Year | 10 Year |
|---|
Hennessy Cornerstone Mid Cap 30 Fund | 54.74% | 24.97% | 13.31% |
Russell Midcap® Index | 35.39% | 10.94% | 9.80% |
S&P 500® Index | 38.02% | 15.27% | 13.00% |
Past performance does not guarantee future results. The graph above illustrates the performance of an initial investment of $250,000 in the Fund 10 years ago compared with the performance of the indices shown. Fund performance in the graph and table assumes the reinvestment of dividends and capital gains and does not reflect the deduction of taxes that a shareholder would pay on Fund distributions or the redemption of Fund shares. Unlike the Fund, indices are not subject to fees and other expenses. Investors cannot invest directly in any index. These indices are used for comparative purposes in accordance with Securities and Exchange Commission regulations. Performance data current to the most recent month end may be obtained by visiting https://www.hennessyfunds.com/.Frank Russell Company (“Russell”) is the source and owner of the trademarks, service marks, and copyrights related to the Russell Indexes. Russell® is a trademark of Frank Russell Company. Neither Russell nor its licensors accept any liability for any errors or omissions in the Russell Indexes or Russell ratings or underlying data and no party may rely on any Russell Indexes or Russell ratings or underlying data contained in this communication. No further distribution of Russell data is permitted without Russell’s express written consent. Russell does not promote, sponsor, or endorse the content of this communication.Standard & Poor’s Financial Services is the source and owner of the S&P® and S&P 500® trademarks.
Key Fund Statistics
(as of October 31, 2024)
| |
|---|
Fund Size | $1,597,111,530 |
Number of Holdings | 59¹ |
Annual Portfolio Turnover | 94% |
Total Advisory Fee | $7,873,052 |
| ¹ | | Due to the timing of the Fund's annual rebalance, the Fund held more than 30 securities at year end. |
Sector Breakdown (% of net assets)
sector breakdown | (%) |
Communication Services | 5.37% |
Consumer Discretionary | 27.96% |
Consumer Staples | 7.75% |
Energy | 7.23% |
Financials | 6.52% |
Industrials | 28.50% |
Information Technology | 5.23% |
Materials | 3.77% |
Real Estate | 1.89% |
Utilities | 1.93% |
Short-Term Investments and Other | 3.85% |
Liabilities in Excess of Other Assets | -0.11% |
Sector sub-classifications may differ from those utilized for compliance purposes.
For additional information about the Fund, including its prospectus, financial information, holdings, and proxy information, visit https://www.hennessyfunds.com/funds/regulatory-documents.
Householding
To help keep the Fund’s costs as low as possible, we generally deliver a single copy of shareholder reports, proxy statements, and prospectuses to shareholders who share an address and have the same last name. This process does not apply to account statements. you may request an individual copy of a shareholder document at any time. If you would like to receive separate mailings of shareholder documents, please call U.S. Bank Global Fund services at 800-261-6950 or 414-765-4124, and individual delivery will begin within 30 days of your request. If your account is held through a financial institution or other intermediary, please contact such intermediary directly to request individual delivery.
Annual Shareholder Report Hennessy Cornerstone Large Growth Fund Investor Class HFLGX | |
This annual shareholder report contains important information about the Hennessy Cornerstone Large Growth Fund – Investor Class (the “Fund”) for the period of November 1, 2023, to October 31, 2024. You can find additional information about the Fund at https://www.hennessyfunds.com/funds/regulatory-documents. You can also request this information by contacting us at1-800-966-4354 or fundsinfo@hennessyfunds.com.
What were the Fund costs for the last year?
(based on a hypothetical $10,000 investment)
Class Name | Costs of a $10,000 investment | Costs paid as a percentage of a $10,000 investment |
|---|
Investor Class | $142 | 1.27% |
How did the Fund perform last year and what affected its performance?
For the one-year period ended October 31, 2024, the Fund underperformed both the Russell 1000® Index (the Fund’s primary benchmark) and the S&P 500® Index.
Factors Influencing Performance
● Holdings in the Consumer Discretionary, Industrials, and Materials sectors contributed the most to performance.● Holdings in the Information Technology, Financials, and Communications Services sectors detracted the most from performance.● Stocks that contributed most to performance included Dell Technologies Inc., Pulte Group, Inc., and Builders FirstSource, Inc.● Stocks that detracted most from performance included Dollar General Corp., Lamb Weston Holdings, Inc., and APA Corp.
Positioning
● At the end of the period, compared to its primary benchmark, the Fund was most overweight Energy and Consumer Discretionary companies and was most underweight Information Technology and Financials companies.
Performance
● The Fund’s underperformance was due to both sector allocation and stock selection.
How did the Fund perform over the last 10 years?
Change in Value of $10,000 Investment
Date | Hennessy Cornerstone Large Growth Fund | Russell 1000® Index | S&P 500® Index |
10/31/2014 | 10000 | 10000 | 10000 |
11/30/2014 | 10323 | 10262 | 10269 |
12/31/2014 | 10407 | 10238 | 10243 |
01/31/2015 | 10181 | 9957 | 9936 |
02/28/2015 | 10757 | 10532 | 10507 |
03/31/2015 | 10648 | 10401 | 10340 |
04/30/2015 | 10640 | 10475 | 10440 |
05/31/2015 | 10648 | 10612 | 10574 |
06/30/2015 | 10368 | 10413 | 10369 |
07/31/2015 | 10368 | 10613 | 10586 |
08/31/2015 | 9761 | 9975 | 9948 |
09/30/2015 | 9395 | 9702 | 9702 |
10/31/2015 | 10111 | 10486 | 10520 |
11/30/2015 | 10080 | 10521 | 10551 |
12/31/2015 | 9720 | 10332 | 10385 |
01/31/2016 | 9397 | 9776 | 9869 |
02/29/2016 | 9690 | 9772 | 9856 |
03/31/2016 | 10306 | 10453 | 10525 |
04/30/2016 | 9942 | 10510 | 10566 |
05/31/2016 | 9690 | 10694 | 10755 |
06/30/2016 | 9518 | 10718 | 10783 |
07/31/2016 | 10134 | 11127 | 11181 |
08/31/2016 | 10276 | 11141 | 11196 |
09/30/2016 | 10387 | 11150 | 11199 |
10/31/2016 | 10377 | 10933 | 10994 |
11/30/2016 | 11205 | 11364 | 11401 |
12/31/2016 | 11148 | 11577 | 11627 |
01/31/2017 | 11209 | 11810 | 11847 |
02/28/2017 | 11567 | 12267 | 12318 |
03/31/2017 | 11556 | 12275 | 12332 |
04/30/2017 | 11597 | 12405 | 12459 |
05/31/2017 | 11740 | 12563 | 12634 |
06/30/2017 | 11843 | 12651 | 12713 |
07/31/2017 | 11873 | 12901 | 12974 |
08/31/2017 | 11638 | 12942 | 13014 |
09/30/2017 | 12057 | 13217 | 13283 |
10/31/2017 | 12006 | 13520 | 13593 |
11/30/2017 | 12742 | 13933 | 14009 |
12/31/2017 | 13052 | 14088 | 14165 |
01/31/2018 | 13765 | 14861 | 14976 |
02/28/2018 | 13296 | 14316 | 14424 |
03/31/2018 | 12977 | 13991 | 14058 |
04/30/2018 | 12711 | 14038 | 14112 |
05/31/2018 | 12892 | 14397 | 14451 |
06/30/2018 | 12945 | 14490 | 14540 |
07/31/2018 | 13392 | 14990 | 15081 |
08/31/2018 | 13754 | 15506 | 15573 |
09/30/2018 | 13701 | 15565 | 15662 |
10/31/2018 | 13030 | 14464 | 14591 |
11/30/2018 | 13339 | 14758 | 14888 |
12/31/2018 | 11879 | 13414 | 13544 |
01/31/2019 | 12879 | 14538 | 14629 |
02/28/2019 | 13173 | 15030 | 15099 |
03/31/2019 | 13199 | 15292 | 15393 |
04/30/2019 | 13719 | 15910 | 16016 |
05/31/2019 | 12306 | 14896 | 14998 |
06/30/2019 | 13399 | 15942 | 16055 |
07/31/2019 | 13813 | 16189 | 16286 |
08/31/2019 | 13253 | 15893 | 16028 |
09/30/2019 | 13746 | 16168 | 16328 |
10/31/2019 | 14053 | 16511 | 16681 |
11/30/2019 | 14732 | 17135 | 17287 |
12/31/2019 | 15149 | 17629 | 17809 |
01/31/2020 | 14562 | 17649 | 17802 |
02/29/2020 | 13100 | 16206 | 16336 |
03/31/2020 | 10778 | 14065 | 14319 |
04/30/2020 | 12226 | 15923 | 16154 |
05/31/2020 | 12895 | 16763 | 16923 |
06/30/2020 | 13196 | 17134 | 17260 |
07/31/2020 | 13934 | 18137 | 18233 |
08/31/2020 | 14767 | 19469 | 19544 |
09/30/2020 | 14494 | 18757 | 18801 |
10/31/2020 | 13947 | 18305 | 18301 |
11/30/2020 | 15559 | 20460 | 20305 |
12/31/2020 | 15981 | 21325 | 21085 |
01/31/2021 | 16096 | 21150 | 20872 |
02/28/2021 | 17290 | 21763 | 21448 |
03/31/2021 | 19088 | 22586 | 22387 |
04/30/2021 | 19620 | 23802 | 23582 |
05/31/2021 | 19793 | 23915 | 23747 |
06/30/2021 | 19936 | 24514 | 24301 |
07/31/2021 | 20310 | 25023 | 24878 |
08/31/2021 | 20670 | 25748 | 25635 |
09/30/2021 | 19577 | 24565 | 24443 |
10/31/2021 | 20641 | 26269 | 26155 |
11/30/2021 | 20282 | 25917 | 25974 |
12/31/2021 | 21519 | 26967 | 27138 |
01/31/2022 | 20447 | 25446 | 25734 |
02/28/2022 | 20217 | 24748 | 24963 |
03/31/2022 | 20728 | 25583 | 25890 |
04/30/2022 | 19359 | 23303 | 23632 |
05/31/2022 | 19326 | 23267 | 23676 |
06/30/2022 | 16754 | 21319 | 21721 |
07/31/2022 | 18370 | 23304 | 23724 |
08/31/2022 | 17793 | 22409 | 22757 |
09/30/2022 | 16061 | 20336 | 20661 |
10/31/2022 | 18007 | 21967 | 22334 |
11/30/2022 | 19557 | 23155 | 23582 |
12/31/2022 | 18655 | 21809 | 22223 |
01/31/2023 | 20379 | 23271 | 23619 |
02/28/2023 | 19713 | 22717 | 23043 |
03/31/2023 | 19458 | 23436 | 23889 |
04/30/2023 | 19223 | 23726 | 24262 |
05/31/2023 | 18773 | 23837 | 24367 |
06/30/2023 | 20811 | 25447 | 25977 |
07/31/2023 | 22124 | 26322 | 26812 |
08/31/2023 | 21516 | 25861 | 26385 |
09/30/2023 | 20713 | 24646 | 25127 |
10/31/2023 | 19713 | 24050 | 24599 |
11/30/2023 | 21183 | 26296 | 26845 |
12/31/2023 | 22705 | 27595 | 28065 |
01/31/2024 | 22339 | 27979 | 28536 |
02/29/2024 | 23500 | 29490 | 30060 |
03/31/2024 | 25169 | 30436 | 31027 |
04/30/2024 | 23846 | 29141 | 29760 |
05/31/2024 | 24111 | 30513 | 31236 |
06/30/2024 | 23581 | 31523 | 32356 |
07/31/2024 | 24559 | 31981 | 32750 |
08/31/2024 | 24599 | 32740 | 33545 |
09/30/2024 | 25027 | 33440 | 34261 |
10/31/2024 | 24314 | 33206 | 33950 |
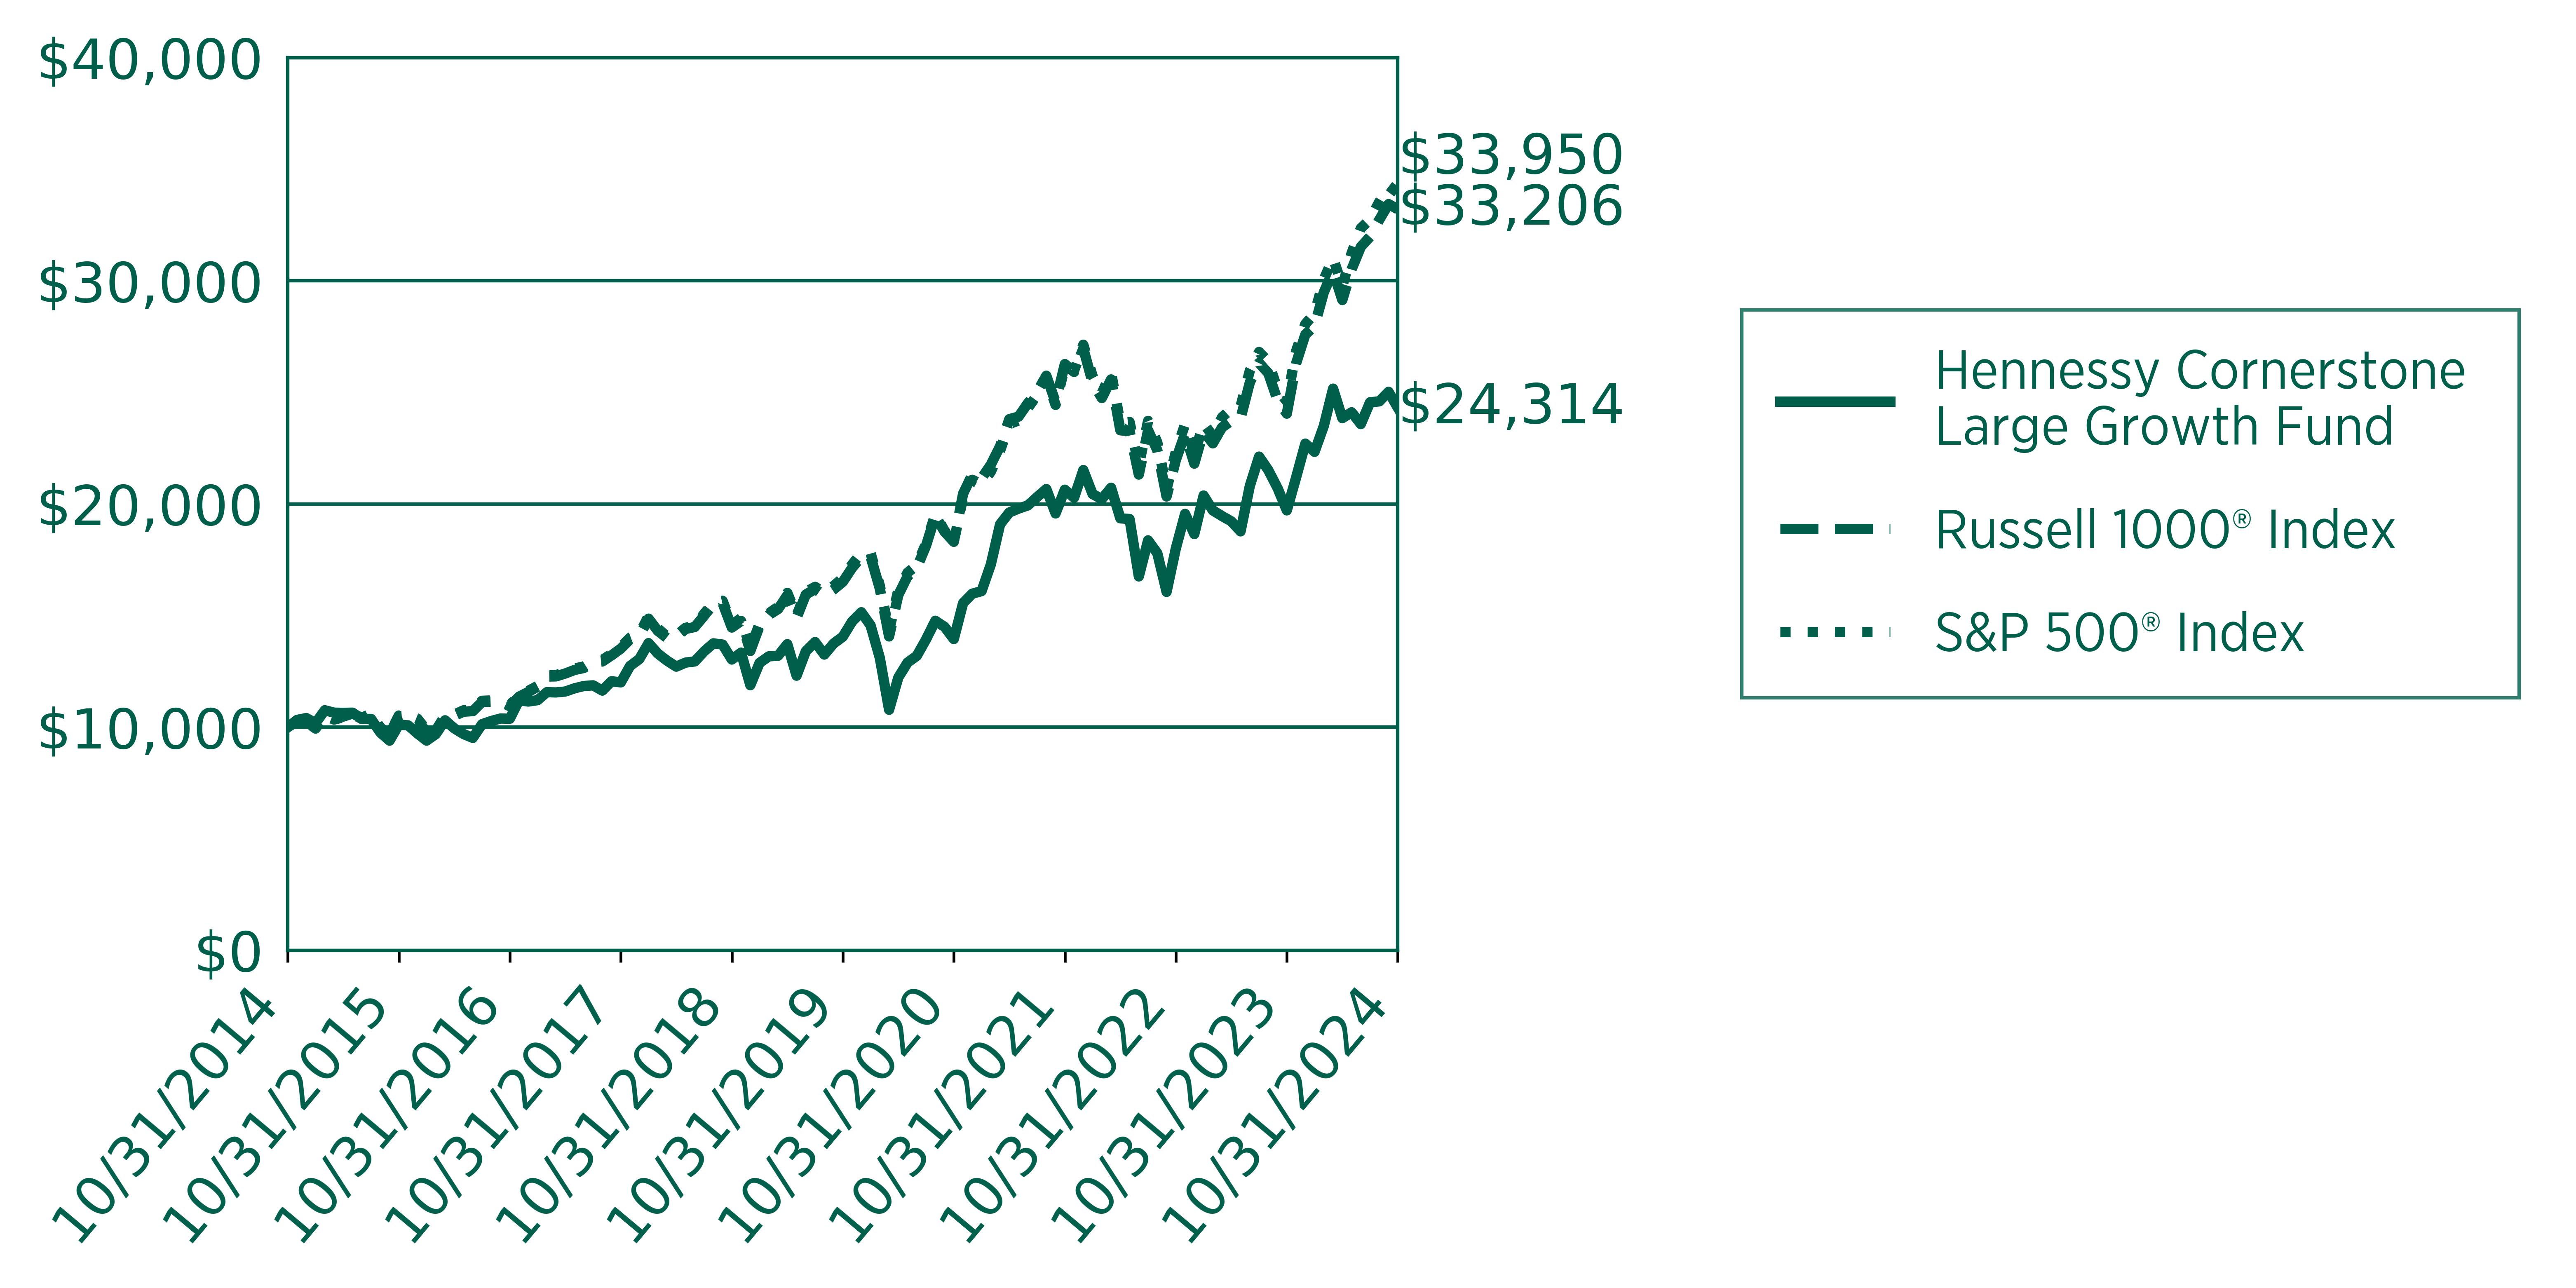
Average Annual Total Returns
for Periods Ended October 31, 2024
| 1 Year | 5 Year | 10 Year |
|---|
Hennessy Cornerstone Large Growth Fund | 23.34% | 11.59% | 9.29% |
Russell 1000® Index | 38.07% | 15.00% | 12.75% |
S&P 500® Index | 38.02% | 15.27% | 13.00% |
Past performance does not guarantee future results. The graph above illustrates the performance of an initial investment of $10,000 in the Fund 10 years ago compared with the performance of the indices shown. Fund performance in the graph and table assumes the reinvestment of dividends and capital gains and does not reflect the deduction of taxes that a shareholder would pay on Fund distributions or the redemption of Fund shares. Unlike the Fund, indices are not subject to fees and other expenses. Investors cannot invest directly in any index. These indices are used for comparative purposes in accordance with Securities and Exchange Commission regulations. Performance data current to the most recent month end may be obtained by visiting https://www.hennessyfunds.com/.Frank Russell Company (“Russell”) is the source and owner of the trademarks, service marks, and copyrights related to the Russell Indexes. Russell® is a trademark of Frank Russell Company. Neither Russell nor its licensors accept any liability for any errors or omissions in the Russell Indexes or Russell ratings or underlying data and no party may rely on any Russell Indexes or Russell ratings or underlying data contained in this communication. No further distribution of Russell data is permitted without Russell’s express written consent. Russell does not promote, sponsor, or endorse the content of this communication.Standard & Poor’s Financial Services is the source and owner of the S&P® and S&P 500® trademarks.
Key Fund Statistics
(as of October 31, 2024)
| |
|---|
Fund Size | $145,162,717 |
Number of Holdings | 51 |
Annual Portfolio Turnover | 54% |
Total Advisory Fee | $1,084,833 |
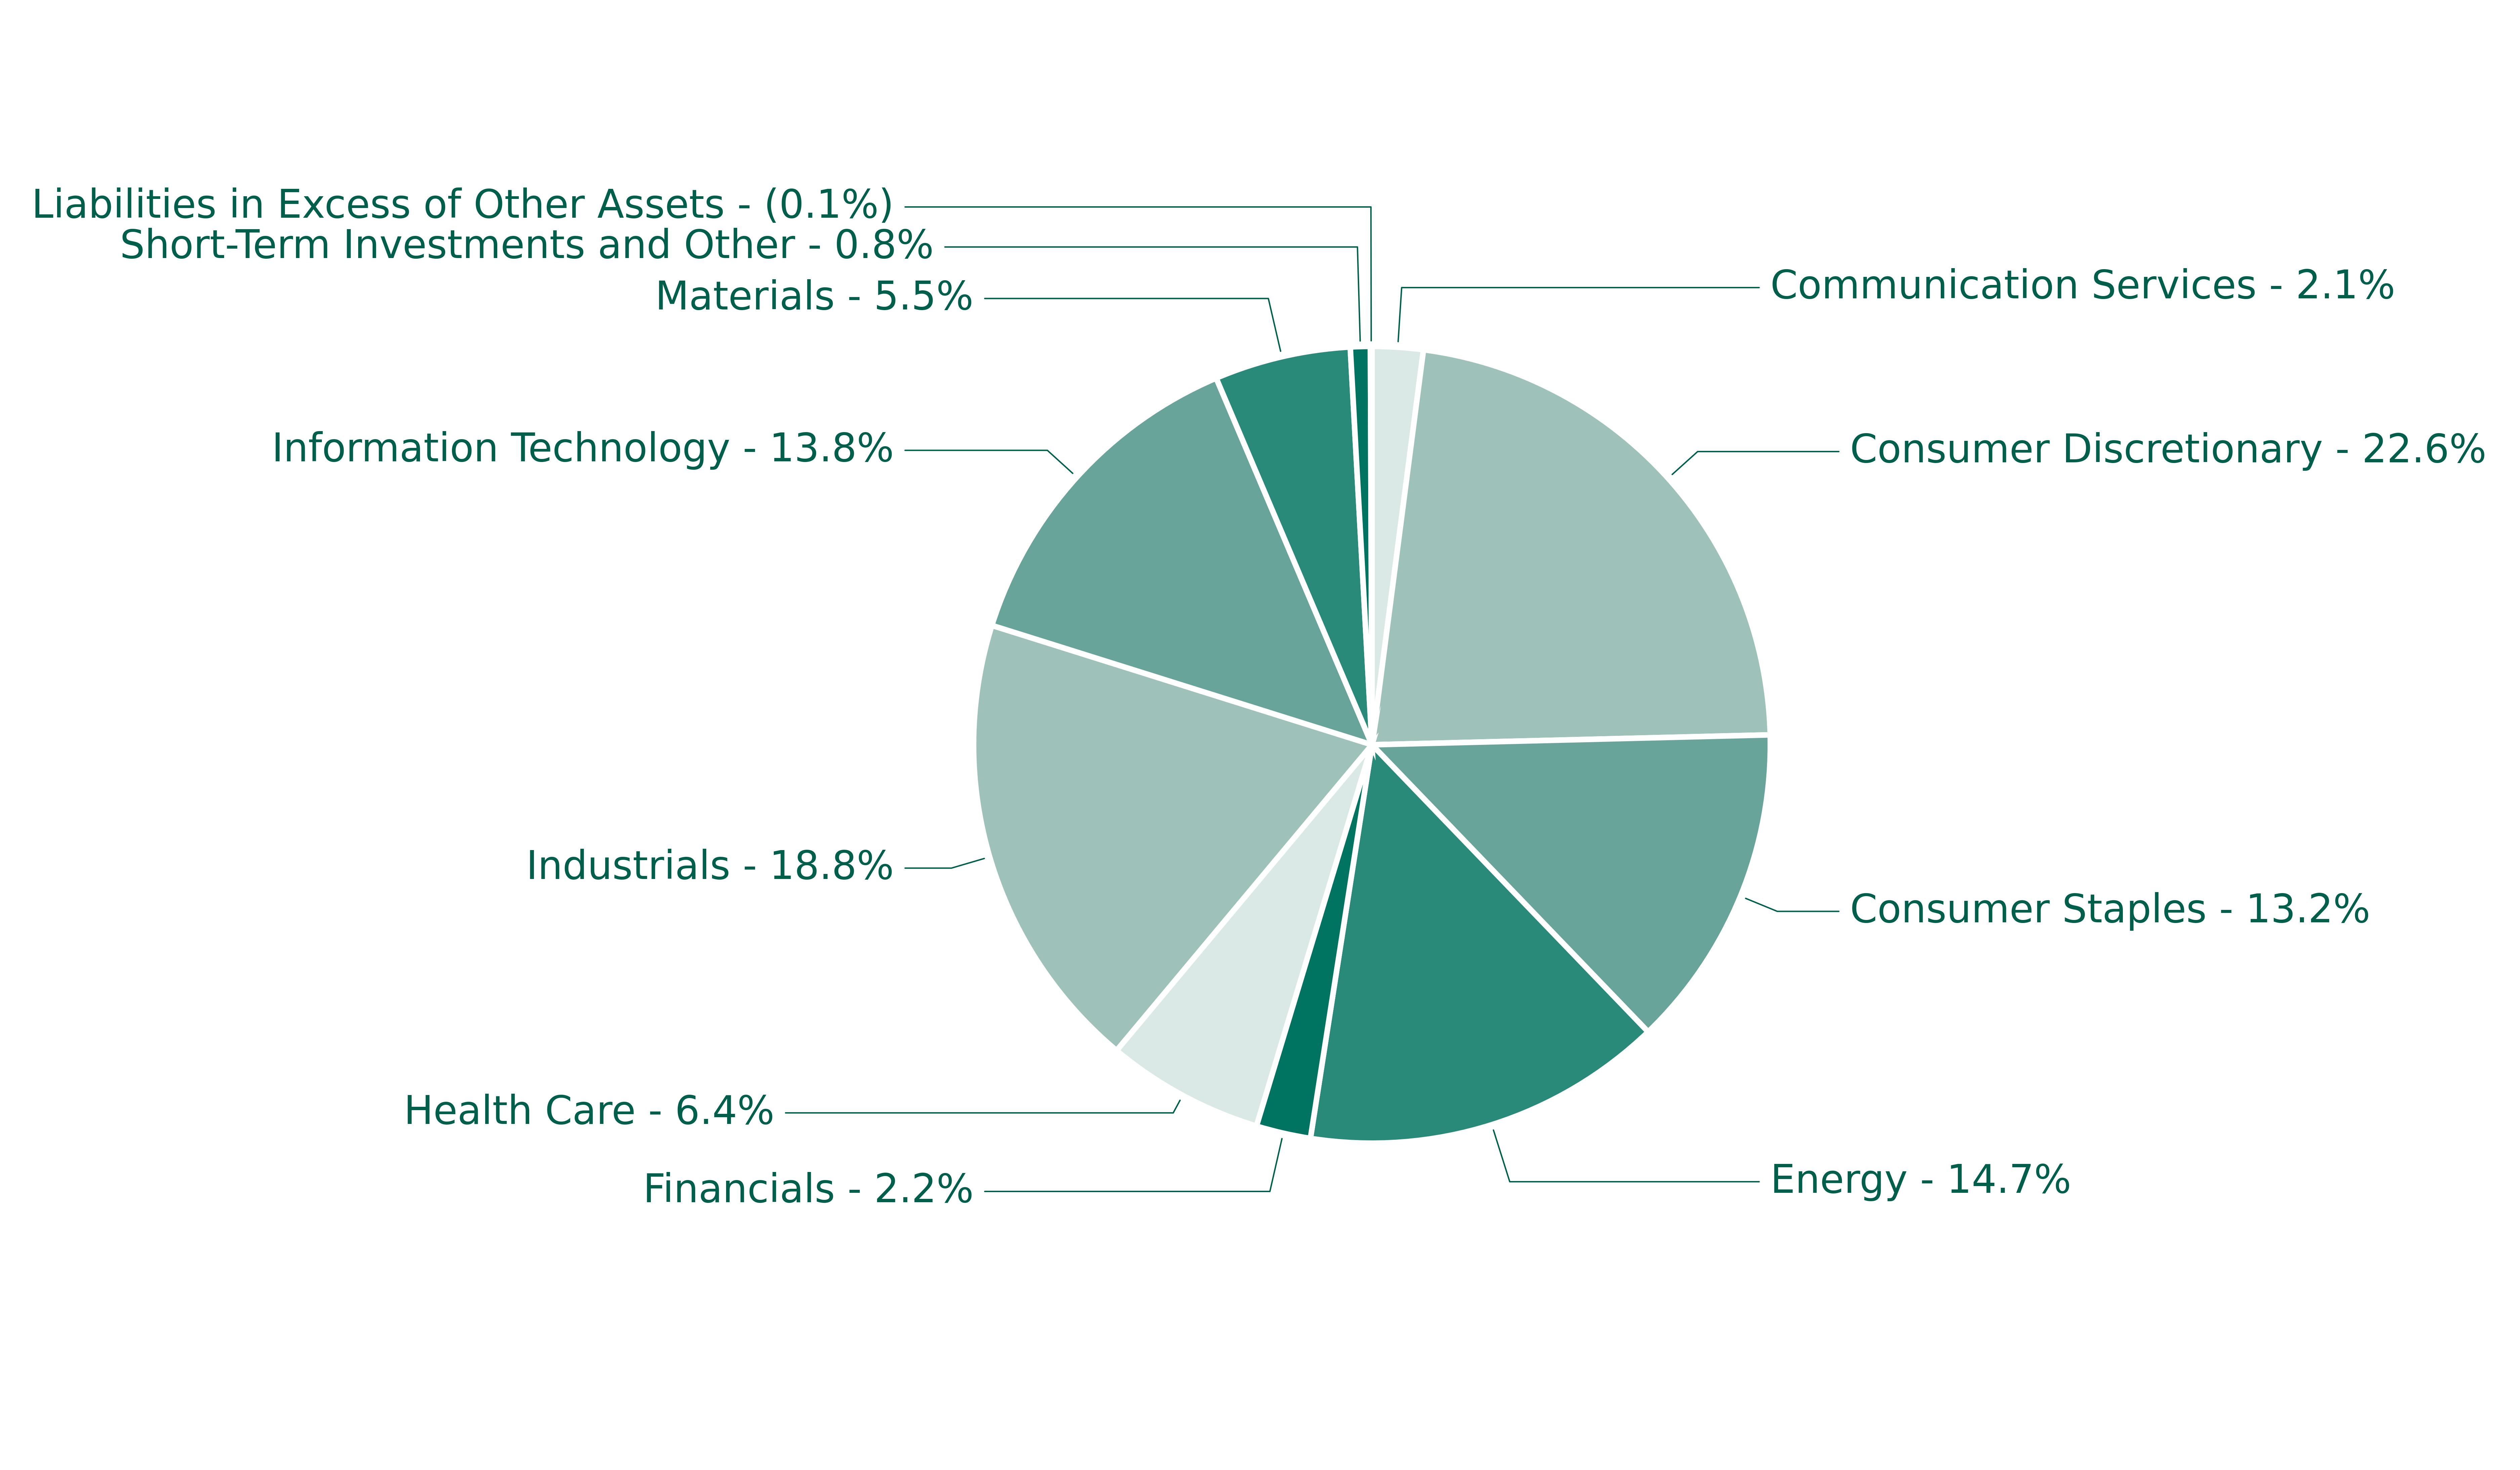
Sector Breakdown (% of net assets)
sector breakdown | (%) |
Communication Services | 2.07% |
Consumer Discretionary | 22.60% |
Consumer Staples | 13.24% |
Energy | 14.70% |
Financials | 2.22% |
Health Care | 6.41% |
Industrials | 18.82% |
Information Technology | 13.80% |
Materials | 5.54% |
Short-Term Investments and Other | 0.81% |
Liabilities in Excess of Other Assets | -0.06% |
Sector sub-classifications may differ from those utilized for compliance purposes.
For additional information about the Fund, including its prospectus, financial information, holdings, and proxy information, visit https://www.hennessyfunds.com/funds/regulatory-documents.
Householding
To help keep the Fund’s costs as low as possible, we generally deliver a single copy of shareholder reports, proxy statements, and prospectuses to shareholders who share an address and have the same last name. This process does not apply to account statements. you may request an individual copy of a shareholder document at any time. If you would like to receive separate mailings of shareholder documents, please call U.S. Bank Global Fund services at 800-261-6950 or 414-765-4124, and individual delivery will begin within 30 days of your request. If your account is held through a financial institution or other intermediary, please contact such intermediary directly to request individual delivery.
Annual Shareholder Report Hennessy Cornerstone Large Growth Fund Institutional Class HILGX | |
This annual shareholder report contains important information about the Hennessy Cornerstone Large Growth Fund – Institutional Class (the “Fund”) for the period of November 1, 2023, to October 31, 2024. You can find additional information about the Fund at https://www.hennessyfunds.com/funds/regulatory-documents. You can also request this information by contacting us at1-800-966-4354 or fundsinfo@hennessyfunds.com.
What were the Fund costs for the last year?
(based on a hypothetical $10,000 investment)
Class Name | Costs of a $10,000 investment | Costs paid as a percentage of a $10,000 investment |
|---|
Institutional Class | $112 | 1.00% |
How did the Fund perform last year and what affected its performance?
For the one-year period ended October 31, 2024, the Fund underperformed both the Russell 1000® Index (the Fund’s primary benchmark) and the S&P 500® Index.
Factors Influencing Performance
● Holdings in the Consumer Discretionary, Industrials, and Materials sectors contributed the most to performance.● Holdings in the Information Technology, Financials, and Communications Services sectors detracted the most from performance.● Stocks that contributed most to performance included Dell Technologies Inc., Pulte Group, Inc., and Builders FirstSource, Inc.● Stocks that detracted most from performance included Dollar General Corp., Lamb Weston Holdings, Inc., and APA Corp.
Positioning
● At the end of the period, compared to its primary benchmark, the Fund was most overweight Energy and Consumer Discretionary companies and was most underweight Information Technology and Financials companies.
Performance
● The Fund’s underperformance was due to both sector allocation and stock selection.
How did the Fund perform over the last 10 years?
Change in Value of $250,000 Investment
Date | Hennessy Cornerstone Large Growth Fund | Russell 1000® Index | S&P 500® Index |
10/31/2014 | 250000 | 250000 | 250000 |
11/30/2014 | 258007 | 256545 | 256724 |
12/31/2014 | 260129 | 255948 | 256077 |
01/31/2015 | 254721 | 248917 | 248390 |
02/28/2015 | 269012 | 263300 | 262665 |
03/31/2015 | 266308 | 260021 | 258511 |
04/30/2015 | 266115 | 261867 | 260991 |
05/31/2015 | 266308 | 265293 | 264347 |
06/30/2015 | 259356 | 260316 | 259230 |
07/31/2015 | 259356 | 265334 | 264661 |
08/31/2015 | 244293 | 249373 | 248693 |
09/30/2015 | 235023 | 242538 | 242540 |
10/31/2015 | 252983 | 262162 | 262999 |
11/30/2015 | 252211 | 263028 | 263781 |
12/31/2015 | 243300 | 258296 | 259621 |
01/31/2016 | 235265 | 244393 | 246737 |
02/29/2016 | 242547 | 244309 | 246404 |
03/31/2016 | 258114 | 261328 | 263120 |
04/30/2016 | 249075 | 262749 | 264140 |
05/31/2016 | 243049 | 267351 | 268883 |
06/30/2016 | 238530 | 267956 | 269580 |
07/31/2016 | 254097 | 278164 | 279519 |
08/31/2016 | 257612 | 278533 | 279912 |
09/30/2016 | 260374 | 278754 | 279965 |
10/31/2016 | 260374 | 273318 | 274858 |
11/30/2016 | 280963 | 284093 | 285037 |
12/31/2016 | 279907 | 289430 | 290671 |
01/31/2017 | 281433 | 295250 | 296184 |
02/28/2017 | 290594 | 306679 | 307944 |
03/31/2017 | 290085 | 306873 | 308304 |
04/30/2017 | 291357 | 310117 | 311470 |
05/31/2017 | 295174 | 314075 | 315853 |
06/30/2017 | 297719 | 316268 | 317824 |
07/31/2017 | 298482 | 322531 | 324360 |
08/31/2017 | 292630 | 323540 | 325353 |
09/30/2017 | 303062 | 330430 | 332064 |
10/31/2017 | 302045 | 338008 | 339813 |
11/30/2017 | 320620 | 348316 | 350235 |
12/31/2017 | 328421 | 352199 | 354129 |
01/31/2018 | 346210 | 371533 | 374404 |
02/28/2018 | 334528 | 357893 | 360605 |
03/31/2018 | 326829 | 349769 | 351441 |
04/30/2018 | 319926 | 350958 | 352789 |
05/31/2018 | 324970 | 359917 | 361285 |
06/30/2018 | 326032 | 362244 | 363509 |
07/31/2018 | 337448 | 374746 | 377036 |
08/31/2018 | 346741 | 387658 | 389322 |
09/30/2018 | 345413 | 389130 | 391538 |
10/31/2018 | 328687 | 361594 | 364776 |
11/30/2018 | 336386 | 368953 | 372210 |
12/31/2018 | 299994 | 335350 | 338603 |
01/31/2019 | 325021 | 363453 | 365737 |
02/28/2019 | 332696 | 375759 | 377480 |
03/31/2019 | 333364 | 382301 | 384815 |
04/30/2019 | 346712 | 397740 | 400396 |
05/31/2019 | 311006 | 372394 | 374952 |
06/30/2019 | 338703 | 398538 | 401377 |
07/31/2019 | 349047 | 404727 | 407146 |
08/31/2019 | 335032 | 397314 | 400696 |
09/30/2019 | 347713 | 404201 | 408194 |
10/31/2019 | 355388 | 412767 | 417035 |
11/30/2019 | 372740 | 428367 | 432173 |
12/31/2019 | 383440 | 440737 | 445217 |
01/31/2020 | 368363 | 441213 | 445042 |
02/29/2020 | 331698 | 405158 | 408407 |
03/31/2020 | 273102 | 351617 | 357963 |
04/30/2020 | 309767 | 398080 | 403852 |
05/31/2020 | 326901 | 419084 | 423087 |
06/30/2020 | 334439 | 428351 | 431501 |
07/31/2020 | 353286 | 453434 | 455831 |
08/31/2020 | 374531 | 486715 | 488596 |
09/30/2020 | 367677 | 468926 | 470031 |
10/31/2020 | 353971 | 457618 | 457531 |
11/30/2020 | 394748 | 511506 | 507614 |
12/31/2020 | 405551 | 533130 | 527131 |
01/31/2021 | 408807 | 528739 | 521809 |
02/28/2021 | 438834 | 544063 | 536198 |
03/31/2021 | 484780 | 564652 | 559681 |
04/30/2021 | 498527 | 595047 | 589551 |
05/31/2021 | 503230 | 597872 | 593669 |
06/30/2021 | 506848 | 612853 | 607528 |
07/31/2021 | 516254 | 625584 | 621959 |
08/31/2021 | 525661 | 643690 | 640871 |
09/30/2021 | 497804 | 614123 | 611064 |
10/31/2021 | 524937 | 656735 | 653876 |
11/30/2021 | 515893 | 647925 | 649345 |
12/31/2021 | 547750 | 674170 | 678446 |
01/31/2022 | 520736 | 636160 | 643339 |
02/28/2022 | 514503 | 618703 | 624076 |
03/31/2022 | 527802 | 639581 | 647248 |
04/30/2022 | 493307 | 582568 | 590807 |
05/31/2022 | 492476 | 581683 | 591891 |
06/30/2022 | 426813 | 532967 | 543034 |
07/31/2022 | 468372 | 582607 | 593104 |
08/31/2022 | 453826 | 560237 | 568916 |
09/30/2022 | 409773 | 508400 | 516520 |
10/31/2022 | 459229 | 549174 | 558338 |
11/30/2022 | 499126 | 578883 | 589540 |
12/31/2022 | 476222 | 545222 | 555574 |
01/31/2023 | 520326 | 581776 | 590483 |
02/28/2023 | 503478 | 567932 | 576076 |
03/31/2023 | 497035 | 585898 | 597226 |
04/30/2023 | 491089 | 593158 | 606548 |
05/31/2023 | 479691 | 595921 | 609184 |
06/30/2023 | 531724 | 636168 | 649436 |
07/31/2023 | 565421 | 658044 | 670299 |
08/31/2023 | 550555 | 646533 | 659627 |
09/30/2023 | 529742 | 616149 | 628177 |
10/31/2023 | 504469 | 601257 | 614969 |
11/30/2023 | 542130 | 657411 | 671131 |
12/31/2023 | 581295 | 689865 | 701621 |
01/31/2024 | 572002 | 699486 | 713411 |
02/29/2024 | 601945 | 737259 | 751504 |
03/31/2024 | 644277 | 760894 | 775684 |
04/30/2024 | 610721 | 728516 | 744001 |
05/31/2024 | 617948 | 762821 | 780892 |
06/30/2024 | 604526 | 788068 | 808912 |
07/31/2024 | 629306 | 799537 | 818759 |
08/31/2024 | 630338 | 818489 | 838619 |
09/30/2024 | 641696 | 835989 | 856530 |
10/31/2024 | 623627 | 830148 | 848762 |

Average Annual Total Returns
for Periods Ended October 31, 2024
| 1 Year | 5 Year | 10 Year |
|---|
Hennessy Cornerstone Large Growth Fund | 23.62% | 11.90% | 9.57% |
Russell 1000® Index | 38.07% | 15.00% | 12.75% |
S&P 500® Index | 38.02% | 15.27% | 13.00% |
Past performance does not guarantee future results. The graph above illustrates the performance of an initial investment of $250,000 in the Fund 10 years ago compared with the performance of the indices shown. Fund performance in the graph and table assumes the reinvestment of dividends and capital gains and does not reflect the deduction of taxes that a shareholder would pay on Fund distributions or the redemption of Fund shares. Unlike the Fund, indices are not subject to fees and other expenses. Investors cannot invest directly in any index. These indices are used for comparative purposes in accordance with Securities and Exchange Commission regulations. Performance data current to the most recent month end may be obtained by visiting https://www.hennessyfunds.com/.Frank Russell Company (“Russell”) is the source and owner of the trademarks, service marks, and copyrights related to the Russell Indexes. Russell® is a trademark of Frank Russell Company. Neither Russell nor its licensors accept any liability for any errors or omissions in the Russell Indexes or Russell ratings or underlying data and no party may rely on any Russell Indexes or Russell ratings or underlying data contained in this communication. No further distribution of Russell data is permitted without Russell’s express written consent. Russell does not promote, sponsor, or endorse the content of this communication.Standard & Poor’s Financial Services is the source and owner of the S&P® and S&P 500® trademarks.
Key Fund Statistics
(as of October 31, 2024)
| |
|---|
Fund Size | $145,162,717 |
Number of Holdings | 51 |
Annual Portfolio Turnover | 54% |
Total Advisory Fee | $1,084,833 |
Sector Breakdown (% of net assets)
sector breakdown | (%) |
Communication Services | 2.07% |
Consumer Discretionary | 22.60% |
Consumer Staples | 13.24% |
Energy | 14.70% |
Financials | 2.22% |
Health Care | 6.41% |
Industrials | 18.82% |
Information Technology | 13.80% |
Materials | 5.54% |
Short-Term Investments and Other | 0.81% |
Liabilities in Excess of Other Assets | -0.06% |
Sector sub-classifications may differ from those utilized for compliance purposes.
For additional information about the Fund, including its prospectus, financial information, holdings, and proxy information, visit https://www.hennessyfunds.com/funds/regulatory-documents.
Householding
To help keep the Fund’s costs as low as possible, we generally deliver a single copy of shareholder reports, proxy statements, and prospectuses to shareholders who share an address and have the same last name. This process does not apply to account statements. you may request an individual copy of a shareholder document at any time. If you would like to receive separate mailings of shareholder documents, please call U.S. Bank Global Fund services at 800-261-6950 or 414-765-4124, and individual delivery will begin within 30 days of your request. If your account is held through a financial institution or other intermediary, please contact such intermediary directly to request individual delivery.
Annual Shareholder Report Hennessy Cornerstone Value Fund Investor Class HFCVX | |
This annual shareholder report contains important information about the Hennessy Cornerstone Value Fund – Investor Class (the “Fund”) for the period of November 1, 2023, to October 31, 2024.You can find additional information about the Fund at https://www.hennessyfunds.com/funds/regulatory-documents. You can also request this information by contacting us at 1-800-966-4354 orfundsinfo@hennessyfunds.com.
What were the Fund costs for the last year?
(based on a hypothetical $10,000 investment)
Class Name | Costs of a $10,000 investment | Costs paid as a percentage of a $10,000 investment |
|---|
Investor Class | $136 | 1.22% |
How did the Fund perform last year and what affected its performance?
For the one-year period ended October 31, 2024, the Fund underperformed both the Russell 1000® Value Index (the Fund’s primary benchmark) and the S&P 500® Index.
Factors Influencing Performance
● Holdings in the Consumer Staples, Energy, and Communication Services sectors contributed the most to performance.● Holdings in Industrials, Utilities, and Real Estate sectors detracted the most from performance.● Stocks that contributed most to performance included Manulife Financial Corp., Wells Fargo & Co., and JPMorgan Chase & Co.● Stocks that detracted most from performance included Equinor ASA, BP PLC, and CVS Health Corp.
Positioning
● At the end of the period, compared to its primary benchmark, the Fund was most overweight Energy and Consumer Staples companies and was most underweight Industrials and Utilities companies.
Performance
● While security selection contributed positively to the Fund’s performance, sector allocation contributed strongly to the Fund’sunderperformance.
How did the Fund perform over the last 10 years?
Change in Value of $10,000 Investment
Date | Hennessy Cornerstone Value Fund | Russell 1000® Value Index | S&P 500® Index |
10/31/2014 | 10000 | 10000 | 10000 |
11/30/2014 | 10255 | 10205 | 10269 |
12/31/2014 | 10112 | 10267 | 10243 |
01/31/2015 | 9790 | 9857 | 9936 |
02/28/2015 | 10195 | 10334 | 10507 |
03/31/2015 | 9956 | 10193 | 10340 |
04/30/2015 | 10367 | 10289 | 10440 |
05/31/2015 | 10178 | 10412 | 10574 |
06/30/2015 | 9945 | 10204 | 10369 |
07/31/2015 | 9795 | 10249 | 10586 |
08/31/2015 | 9307 | 9639 | 9948 |
09/30/2015 | 8990 | 9348 | 9702 |
10/31/2015 | 9823 | 10053 | 10520 |
11/30/2015 | 9768 | 10091 | 10551 |
12/31/2015 | 9468 | 9874 | 10385 |
01/31/2016 | 9092 | 9364 | 9869 |
02/29/2016 | 9240 | 9362 | 9856 |
03/31/2016 | 9992 | 10036 | 10525 |
04/30/2016 | 10117 | 10247 | 10566 |
05/31/2016 | 10054 | 10406 | 10755 |
06/30/2016 | 10088 | 10496 | 10783 |
07/31/2016 | 10493 | 10801 | 11181 |
08/31/2016 | 10527 | 10884 | 11196 |
09/30/2016 | 10538 | 10861 | 11199 |
10/31/2016 | 10453 | 10693 | 10994 |
11/30/2016 | 10937 | 11304 | 11401 |
12/31/2016 | 11102 | 11587 | 11627 |
01/31/2017 | 11323 | 11669 | 11847 |
02/28/2017 | 11579 | 12089 | 12318 |
03/31/2017 | 11556 | 11965 | 12332 |
04/30/2017 | 11492 | 11943 | 12459 |
05/31/2017 | 11567 | 11931 | 12634 |
06/30/2017 | 11777 | 12126 | 12713 |
07/31/2017 | 12033 | 12287 | 12974 |
08/31/2017 | 11864 | 12144 | 13014 |
09/30/2017 | 12411 | 12504 | 13283 |
10/31/2017 | 12505 | 12595 | 13593 |
11/30/2017 | 12825 | 12980 | 14009 |
12/31/2017 | 13229 | 13170 | 14165 |
01/31/2018 | 13820 | 13679 | 14976 |
02/28/2018 | 12940 | 13026 | 14424 |
03/31/2018 | 12846 | 12797 | 14058 |
04/30/2018 | 13061 | 12839 | 14112 |
05/31/2018 | 13202 | 12915 | 14451 |
06/30/2018 | 13188 | 12947 | 14540 |
07/31/2018 | 13638 | 13460 | 15081 |
08/31/2018 | 13665 | 13659 | 15573 |
09/30/2018 | 13732 | 13686 | 15662 |
10/31/2018 | 12960 | 12977 | 14591 |
11/30/2018 | 13128 | 13364 | 14888 |
12/31/2018 | 11993 | 12081 | 13544 |
01/31/2019 | 12854 | 13021 | 14629 |
02/28/2019 | 13088 | 13437 | 15099 |
03/31/2019 | 13190 | 13523 | 15393 |
04/30/2019 | 13566 | 14003 | 16016 |
05/31/2019 | 12478 | 13102 | 14998 |
06/30/2019 | 13268 | 14043 | 16055 |
07/31/2019 | 13307 | 14159 | 16286 |
08/31/2019 | 12963 | 13743 | 16028 |
09/30/2019 | 13472 | 14233 | 16328 |
10/31/2019 | 13636 | 14432 | 16681 |
11/30/2019 | 14066 | 14878 | 17287 |
12/31/2019 | 14487 | 15288 | 17809 |
01/31/2020 | 13719 | 14959 | 17802 |
02/29/2020 | 12409 | 13510 | 16336 |
03/31/2020 | 10373 | 11201 | 14319 |
04/30/2020 | 11332 | 12460 | 16154 |
05/31/2020 | 11549 | 12887 | 16923 |
06/30/2020 | 11649 | 12802 | 17260 |
07/31/2020 | 11833 | 13308 | 18233 |
08/31/2020 | 12317 | 13858 | 19544 |
09/30/2020 | 11700 | 13518 | 18801 |
10/31/2020 | 11424 | 13340 | 18301 |
11/30/2020 | 13268 | 15135 | 20305 |
12/31/2020 | 13562 | 15715 | 21085 |
01/31/2021 | 13605 | 15571 | 20872 |
02/28/2021 | 14453 | 16512 | 21448 |
03/31/2021 | 15574 | 17484 | 22387 |
04/30/2021 | 15874 | 18183 | 23582 |
05/31/2021 | 16508 | 18607 | 23747 |
06/30/2021 | 16456 | 18394 | 24301 |
07/31/2021 | 16242 | 18541 | 24878 |
08/31/2021 | 16430 | 18909 | 25635 |
09/30/2021 | 16148 | 18251 | 24443 |
10/31/2021 | 16773 | 19178 | 26155 |
11/30/2021 | 16388 | 18502 | 25974 |
12/31/2021 | 17618 | 19669 | 27138 |
01/31/2022 | 18283 | 19211 | 25734 |
02/28/2022 | 18184 | 18988 | 24963 |
03/31/2022 | 18651 | 19524 | 25890 |
04/30/2022 | 18094 | 18423 | 23632 |
05/31/2022 | 19190 | 18781 | 23676 |
06/30/2022 | 17466 | 17140 | 21721 |
07/31/2022 | 17861 | 18276 | 23724 |
08/31/2022 | 17466 | 17732 | 22757 |
09/30/2022 | 16083 | 16177 | 20661 |
10/31/2022 | 18229 | 17836 | 22334 |
11/30/2022 | 19351 | 18950 | 23582 |
12/31/2022 | 18698 | 18186 | 22223 |
01/31/2023 | 19232 | 19129 | 23619 |
02/28/2023 | 18618 | 18454 | 23043 |
03/31/2023 | 18539 | 18369 | 23889 |
04/30/2023 | 18985 | 18646 | 24262 |
05/31/2023 | 17816 | 17927 | 24367 |
06/30/2023 | 18886 | 19118 | 25977 |
07/31/2023 | 19559 | 19790 | 26812 |
08/31/2023 | 19015 | 19256 | 26385 |
09/30/2023 | 18708 | 18513 | 25127 |
10/31/2023 | 17965 | 17860 | 24599 |
11/30/2023 | 18945 | 19207 | 26845 |
12/31/2023 | 19785 | 20271 | 28065 |
01/31/2024 | 19836 | 20292 | 28536 |
02/29/2024 | 19928 | 21041 | 30060 |
03/31/2024 | 20954 | 22092 | 31027 |
04/30/2024 | 20513 | 21149 | 29760 |
05/31/2024 | 21159 | 21819 | 31236 |
06/30/2024 | 20851 | 21614 | 32356 |
07/31/2024 | 21682 | 22719 | 32750 |
08/31/2024 | 22359 | 23328 | 33545 |
09/30/2024 | 22308 | 23652 | 34261 |
10/31/2024 | 22164 | 23392 | 33950 |

Average Annual Total Returns
for Periods Ended October 31, 2024
| 1 Year | 5 Year | 10 Year |
|---|
Hennessy Cornerstone Value Fund | 23.38% | 10.20% | 8.28% |
Russell 1000® Value Index | 30.98% | 10.14% | 8.87% |
S&P 500® Index | 38.02% | 15.27% | 13.00% |
Past performance does not guarantee future results. The graph above illustrates the performance of an initial investment of $10,000 in the Fund 10 years ago compared with the performance of the indices shown. Fund performance in the graph and table assumes the reinvestment of dividends and capital gains and does not reflect the deduction of taxes that a shareholder would pay on Fund distributions or the redemption of Fund shares. Unlike the Fund, indices are not subject to fees and other expenses. Investors cannot invest directly in any index. These indices are used for comparative purposes in accordance with Securities and Exchange Commission regulations. Performance data current to the most recent month end may be obtained by visiting https://www.hennessyfunds.com/.Frank Russell Company (“Russell”) is the source and owner of the trademarks, service marks, and copyrights related to the Russell Indexes. Russell® is a trademark of Frank Russell Company. Neither Russell nor its licensors accept any liability for any errors or omissions in the Russell Indexes or Russell ratings or underlying data and no party may rely on any Russell Indexes or Russell ratings or underlying data contained in this communication. No further distribution of Russell data is permitted without Russell’s express written consent. Russell does not promote, sponsor, or endorse the content of this communication.Standard & Poor’s Financial Services is the source and owner of the S&P® and S&P 500® trademarks.
Key Fund Statistics
(as of October 31, 2024)
| |
|---|
Fund Size | $281,962,897 |
Number of Holdings | 50 |
Annual Portfolio Turnover | 22% |
Total Advisory Fee | $2,022,870 |
Sector Breakdown (% of net assets)
sector breakdown | (%) |
Communication Services | 7.68% |
Consumer Discretionary | 3.44% |
Consumer Staples | 20.10% |
Energy | 19.86% |
Financials | 19.76% |
Health Care | 15.91% |
Industrials | 2.53% |
Information Technology | 8.52% |
Short-Term Investments and Other | 2.06% |
Other Assets in Excess of Liabilities | 0.14% |
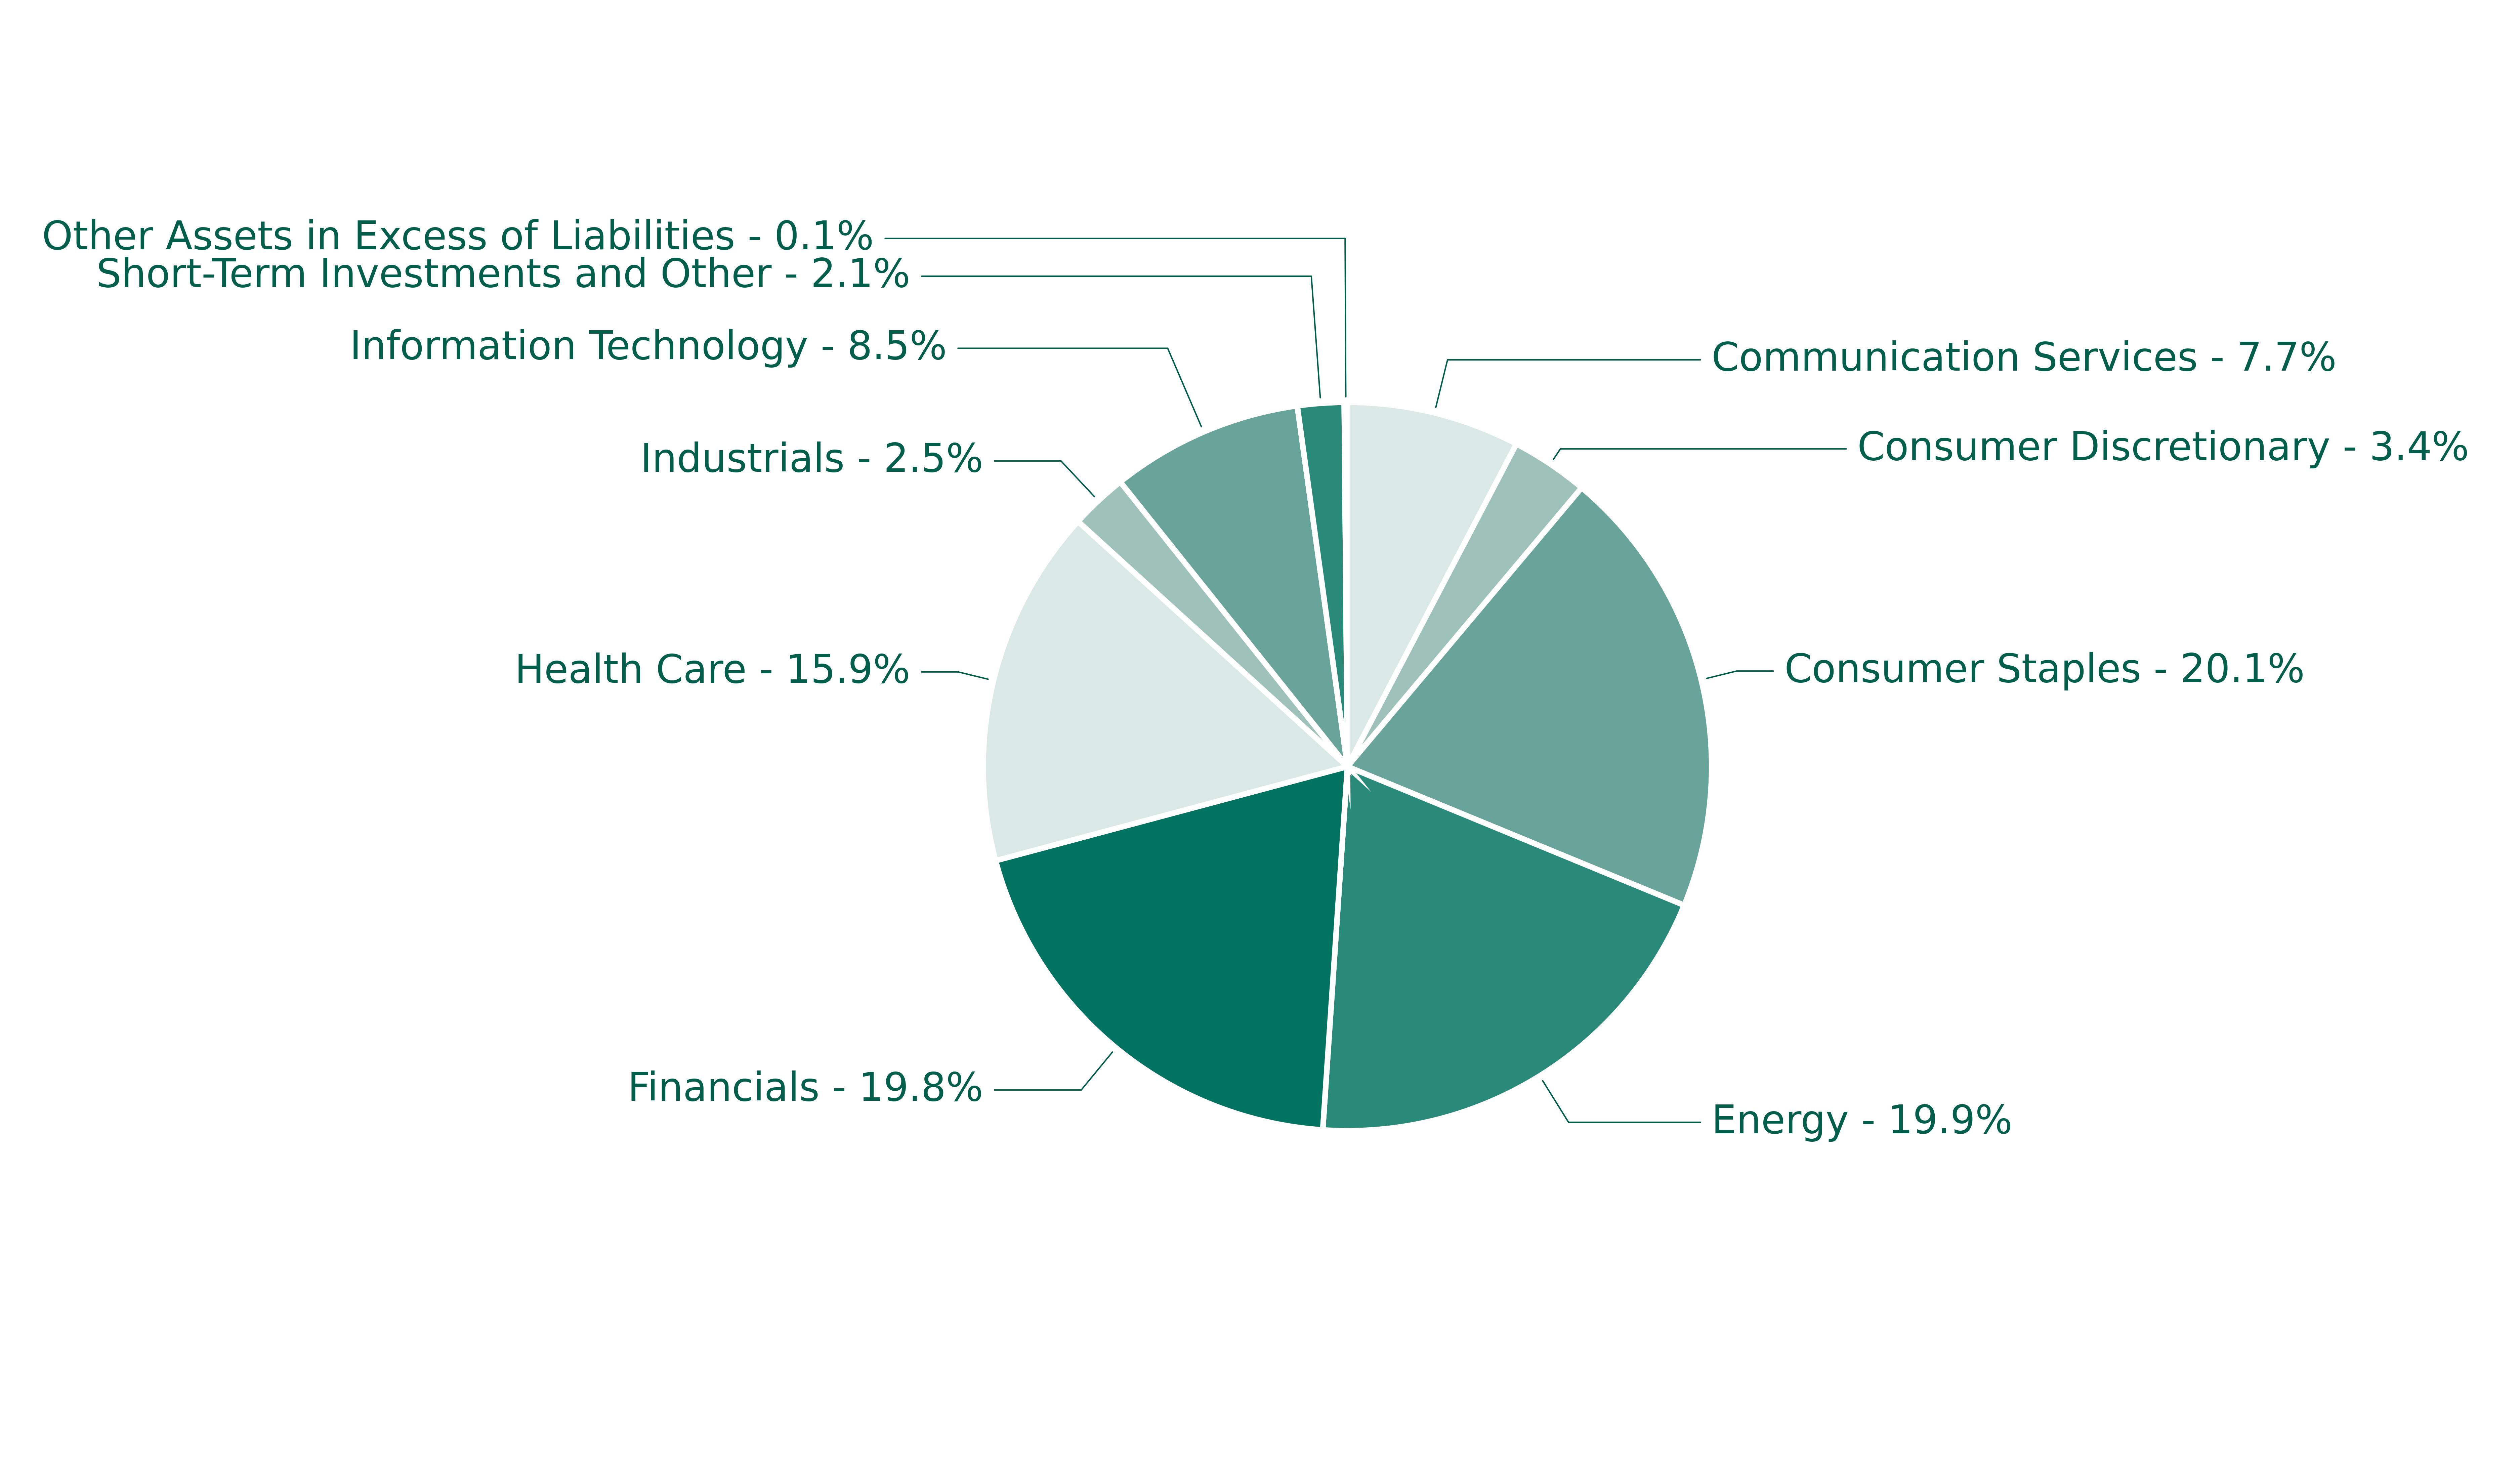
Sector sub-classifications may differ from those utilized for compliance purposes.
For additional information about the Fund, including its prospectus, financial information, holdings, and proxy information, visit https://www.hennessyfunds.com/funds/regulatory-documents.
Householding
To help keep the Fund’s costs as low as possible, we generally deliver a single copy of shareholder reports, proxy statements, and prospectuses to shareholders who share an address and have the same last name. This process does not apply to account statements. you may request an individual copy of a shareholder document at any time. If you would like to receive separate mailings of shareholder documents, please call U.S. Bank Global Fund services at 800-261-6950 or 414-765-4124, and individual delivery will begin within 30 days of your request. If your account is held through a financial institution or other intermediary, please contact such intermediary directly to request individual delivery.
Annual Shareholder Report Hennessy Cornerstone Value Fund Institutional Class HICVX | |
This annual shareholder report contains important information about the Hennessy Cornerstone Value Fund – Institutional Class (the “Fund”) for the period of November 1, 2023, to October 31, 2024. You can find additional information about the Fund at https://www.hennessyfunds.com/funds/regulatory-documents. You can also request this information by contacting us at1-800-966-4354 or fundsinfo@hennessyfunds.com.
What were the Fund costs for the last year?
(based on a hypothetical $10,000 investment)
Class Name | Costs of a $10,000 investment | Costs paid as a percentage of a $10,000 investment |
|---|
Institutional Class | $110 | 0.98% |
How did the Fund perform last year and what affected its performance?
For the one-year period ended October 31, 2024, the Fund underperformed both the Russell 1000® Value Index (the Fund’s primary benchmark) and the S&P 500® Index.
Factors Influencing Performance
● Holdings in the Consumer Staples, Energy, and Communication Services sectors contributed the most to performance.● Holdings in Industrials, Utilities, and Real Estate sectors detracted the most from performance.● Stocks that contributed most to performance included Manulife Financial Corp., Wells Fargo & Co., and JPMorgan Chase & Co.● Stocks that detracted most from performance included Equinor ASA, BP PLC, and CVS Health Corp.
Positioning
● At the end of the period, compared to its primary benchmark, the Fund was most overweight Energy and Consumer Staples companies and was most underweight Information Industrials and Utilities companies.
Performance
● While security selection contributed positively to the Fund’s performance, sector allocation contributed strongly to the Fund’sunderperformance.
How did the Fund perform over the last 10 years?
Change in Value of $250,000 Investment
Date | Hennessy Cornerstone Value Fund | Russell 1000® Value Index | S&P 500® Index |
10/31/2014 | 250000 | 250000 | 250000 |
11/30/2014 | 256382 | 255119 | 256724 |
12/31/2014 | 252943 | 256684 | 256077 |
01/31/2015 | 244878 | 246423 | 248390 |
02/28/2015 | 255168 | 258348 | 262665 |
03/31/2015 | 249050 | 254831 | 258511 |
04/30/2015 | 259340 | 257213 | 260991 |
05/31/2015 | 254612 | 260304 | 264347 |
06/30/2015 | 248772 | 255107 | 259230 |
07/31/2015 | 245017 | 256225 | 264661 |
08/31/2015 | 232780 | 240965 | 248693 |
09/30/2015 | 224854 | 233691 | 242540 |
10/31/2015 | 245712 | 251323 | 262999 |
11/30/2015 | 244461 | 252285 | 263781 |
12/31/2015 | 236853 | 246860 | 259621 |
01/31/2016 | 227590 | 234104 | 246737 |
02/29/2016 | 231295 | 234045 | 246404 |
03/31/2016 | 250249 | 250904 | 263120 |
04/30/2016 | 253384 | 256175 | 264140 |
05/31/2016 | 251959 | 260154 | 268883 |
06/30/2016 | 252956 | 262403 | 269580 |
07/31/2016 | 263075 | 270022 | 279519 |
08/31/2016 | 264072 | 272104 | 279912 |
09/30/2016 | 264357 | 271537 | 279965 |
10/31/2016 | 262220 | 267335 | 274858 |
11/30/2016 | 274476 | 282603 | 285037 |
12/31/2016 | 278566 | 289666 | 290671 |
01/31/2017 | 284266 | 291730 | 296184 |
02/28/2017 | 290697 | 302213 | 307944 |
03/31/2017 | 290259 | 299134 | 308304 |
04/30/2017 | 288651 | 298573 | 311470 |
05/31/2017 | 290697 | 298280 | 315853 |
06/30/2017 | 296105 | 303156 | 317824 |
07/31/2017 | 302535 | 307185 | 324360 |
08/31/2017 | 298297 | 303607 | 325353 |
09/30/2017 | 312182 | 312599 | 332064 |
10/31/2017 | 314520 | 314869 | 339813 |
11/30/2017 | 322558 | 324511 | 350235 |
12/31/2017 | 332823 | 329248 | 354129 |
01/31/2018 | 347697 | 341977 | 374404 |
02/28/2018 | 325723 | 325647 | 360605 |
03/31/2018 | 323357 | 319919 | 351441 |
04/30/2018 | 328766 | 320975 | 352789 |
05/31/2018 | 332485 | 322880 | 361285 |
06/30/2018 | 332316 | 323680 | 363509 |
07/31/2018 | 343641 | 336491 | 377036 |
08/31/2018 | 344317 | 341464 | 389322 |
09/30/2018 | 346176 | 342142 | 391538 |
10/31/2018 | 326738 | 324425 | 364776 |
11/30/2018 | 330963 | 334111 | 372210 |
12/31/2018 | 302468 | 302028 | 338603 |
01/31/2019 | 324172 | 325536 | 365737 |
02/28/2019 | 330091 | 335937 | 377480 |
03/31/2019 | 332853 | 338073 | 384815 |
04/30/2019 | 342521 | 350065 | 400396 |
05/31/2019 | 314898 | 327557 | 374952 |
06/30/2019 | 334826 | 351070 | 401377 |
07/31/2019 | 336010 | 353980 | 407146 |
08/31/2019 | 327526 | 343572 | 400696 |
09/30/2019 | 340153 | 355829 | 408194 |
10/31/2019 | 344297 | 360803 | 417035 |
11/30/2019 | 355148 | 371958 | 432173 |
12/31/2019 | 365926 | 382190 | 445217 |
01/31/2020 | 346533 | 373968 | 445042 |
02/29/2020 | 313651 | 337751 | 408407 |
03/31/2020 | 262219 | 280031 | 357963 |
04/30/2020 | 286459 | 311512 | 403852 |
05/31/2020 | 291940 | 322187 | 423087 |
06/30/2020 | 294680 | 320049 | 431501 |
07/31/2020 | 299317 | 332702 | 455831 |
08/31/2020 | 311543 | 346459 | 488596 |
09/30/2020 | 295945 | 337949 | 470031 |
10/31/2020 | 288989 | 333507 | 457531 |
11/30/2020 | 335783 | 378368 | 507614 |
12/31/2020 | 343246 | 392875 | 527131 |
01/31/2021 | 344329 | 389277 | 521809 |
02/28/2021 | 365999 | 412802 | 536198 |
03/31/2021 | 394603 | 437093 | 559681 |
04/30/2021 | 402187 | 454573 | 589551 |
05/31/2021 | 418223 | 465185 | 593669 |
06/30/2021 | 416923 | 459857 | 607528 |
07/31/2021 | 411505 | 463533 | 621959 |
08/31/2021 | 416706 | 472725 | 640871 |
09/30/2021 | 409338 | 456271 | 611064 |
10/31/2021 | 425374 | 479439 | 653876 |
11/30/2021 | 415622 | 462544 | 649345 |
12/31/2021 | 446917 | 491724 | 678446 |
01/31/2022 | 464001 | 480270 | 643339 |
02/28/2022 | 461495 | 474696 | 624076 |
03/31/2022 | 473568 | 488097 | 647248 |
04/30/2022 | 459445 | 460566 | 590807 |
05/31/2022 | 487235 | 469519 | 591891 |
06/30/2022 | 443728 | 428496 | 543034 |
07/31/2022 | 453750 | 456911 | 593104 |
08/31/2022 | 443956 | 443297 | 568916 |
09/30/2022 | 408649 | 404426 | 516520 |
10/31/2022 | 463317 | 445892 | 558338 |
11/30/2022 | 492019 | 473756 | 589540 |
12/31/2022 | 475365 | 454658 | 555574 |
01/31/2023 | 488961 | 478219 | 590483 |
02/28/2023 | 473351 | 461357 | 576076 |
03/31/2023 | 471588 | 459233 | 597226 |
04/30/2023 | 482919 | 466152 | 606548 |
05/31/2023 | 453208 | 448173 | 609184 |
06/30/2023 | 480653 | 477944 | 649436 |
07/31/2023 | 497774 | 494751 | 670299 |
08/31/2023 | 484177 | 481395 | 659627 |
09/30/2023 | 476372 | 462818 | 628177 |
10/31/2023 | 457489 | 446489 | 614969 |
11/30/2023 | 482415 | 480176 | 671131 |
12/31/2023 | 503882 | 506774 | 701621 |
01/31/2024 | 505448 | 507299 | 713411 |
02/29/2024 | 507796 | 526013 | 751504 |
03/31/2024 | 534152 | 552311 | 775684 |
04/30/2024 | 522931 | 528719 | 744001 |
05/31/2024 | 539370 | 545479 | 780892 |
06/30/2024 | 531803 | 540348 | 808912 |
07/31/2024 | 552939 | 567972 | 818759 |
08/31/2024 | 570423 | 583208 | 838619 |
09/30/2024 | 569379 | 591302 | 856530 |
10/31/2024 | 565726 | 584795 | 848762 |

Average Annual Total Returns
for Periods Ended October 31, 2024
| 1 Year | 5 Year | 10 Year |
|---|
Hennessy Cornerstone Value Fund | 23.66% | 10.44% | 8.51% |
Russell 1000® Value | 30.98% | 10.14% | 8.87% |
S&P 500® Index | 38.02% | 15.27% | 13.00% |
Past performance does not guarantee future results. The graph above illustrates the performance of an initial investment of $250,000 in the Fund 10 years ago compared with the performance of the indices shown. Fund performance in the graph and table assumes the reinvestment of dividends and capital gains and does not reflect the deduction of taxes that a shareholder would pay on Fund distributions or the redemption of Fund shares. Unlike the Fund, indices are not subject to fees and other expenses. Investors cannot invest directly in any index. These indices are used for comparative purposes in accordance with Securities and Exchange Commission regulations. Performance data current to the most recent month end may be obtained by visiting https://www.hennessyfunds.com/.Frank Russell Company (“Russell”) is the source and owner of the trademarks, service marks, and copyrights related to the Russell Indexes. Russell® is a trademark of Frank Russell Company. Neither Russell nor its licensors accept any liability for any errors or omissions in the Russell Indexes or Russell ratings or underlying data and no party may rely on any Russell Indexes or Russell ratings or underlying data contained in this communication. No further distribution of Russell data is permitted without Russell’s express written consent. Russell does not promote, sponsor, or endorse the content of this communication.Standard & Poor’s Financial Services is the source and owner of the S&P® and S&P 500® trademarks.
Key Fund Statistics
(as of October 31, 2024)
| |
|---|
Fund Size | $281,962,897 |
Number of Holdings | 50 |
Annual Portfolio Turnover | 22% |
Total Advisory Fee | $2,022,870 |
Sector Breakdown (% of net assets)
sector breakdown | (%) |
Communication Services | 7.68% |
Consumer Discretionary | 3.44% |
Consumer Staples | 20.10% |
Energy | 19.86% |
Financials | 19.76% |
Health Care | 15.91% |
Industrials | 2.53% |
Information Technology | 8.52% |
Short-Term Investments and Other | 2.06% |
Other Assets in Excess of Liabilities | 0.14% |
Sector sub-classifications may differ from those utilized for compliance purposes.
For additional information about the Fund, including its prospectus, financial information, holdings, and proxy information, visit https://www.hennessyfunds.com/funds/regulatory-documents.
Householding
To help keep the Fund’s costs as low as possible, we generally deliver a single copy of shareholder reports, proxy statements, and prospectuses to shareholders who share an address and have the same last name. This process does not apply to account statements. you may request an individual copy of a shareholder document at any time. If you would like to receive separate mailings of shareholder documents, please call U.S. Bank Global Fund services at 800-261-6950 or 414-765-4124, and individual delivery will begin within 30 days of your request. If your account is held through a financial institution or other intermediary, please contact such intermediary directly to request individual delivery.
Annual Shareholder Report Hennessy Total Return Fund Investor Class HDOGX | |
This annual shareholder report contains important information about the Hennessy Total Return Fund – Investor Class (the “Fund”) for the period of November 1, 2023, to October 31, 2024.You can find additional information about the Fund at https://www.hennessyfunds.com/funds/regulatory-documents. You can also request this information by contacting us at 1-800-966-4354 orfundsinfo@hennessyfunds.com.
What were the Fund costs for the last year?
(based on a hypothetical $10,000 investment)
Class Name | Costs of a $10,000 investment | Costs paid as a percentage of a $10,000 investment |
|---|
Investor Class | $390 | 3.62% |
How did the Fund perform last year and what affected its performance?
For the one-year period ended October 31, 2024, the Fund underperformed both the 75/25 Blended DJIA/Treasury Index (the Fund’s primary benchmark) and the Dow Jones Industrial Average.
Factors Influencing Performance
● Holdings in the Information Technology, Industrials, and Financials sectors contributed the most to performance.● Holdings in the Consumer Staples sector detracted from performance.● Stocks that contributed most to performance included 3M Company, International Business Machines Corporation, and The Goldman Sachs Group, Inc.● Stocks that detracted most from performance included Walgreens Boots Alliance, Inc., Solventum Corporation, and Merck & Co., Inc.
Positioning
● At the end of the period, compared to its primary benchmark, the Fund was most overweight Communication Services and Materials companies and was most underweight Financials and Consumer Discretionary companies.
How did the Fund perform over the last 10 years?
Change in Value of $10,000 Investment
Date | Hennessy Total Return Fund | Dow Jones Industrial Average | 75/25 Blended DJIA/Treasury Index |
10/31/2014 | 10000 | 10000 | 10000 |
11/30/2014 | 10216 | 10286 | 10215 |
12/31/2014 | 10027 | 10298 | 10224 |
01/31/2015 | 9815 | 9929 | 9949 |
02/28/2015 | 10238 | 10526 | 10398 |
03/31/2015 | 10010 | 10332 | 10253 |
04/30/2015 | 10222 | 10378 | 10288 |
05/31/2015 | 10201 | 10518 | 10392 |
06/30/2015 | 9970 | 10301 | 10232 |
07/31/2015 | 10034 | 10355 | 10272 |
08/31/2015 | 9572 | 9714 | 9795 |
09/30/2015 | 9452 | 9582 | 9695 |
10/31/2015 | 10122 | 10406 | 10320 |
11/30/2015 | 10101 | 10479 | 10375 |
12/31/2015 | 10126 | 10320 | 10258 |
01/31/2016 | 9993 | 9764 | 9843 |
02/29/2016 | 10072 | 9837 | 9899 |
03/31/2016 | 10597 | 10547 | 10436 |
04/30/2016 | 10683 | 10612 | 10485 |
05/31/2016 | 10778 | 10664 | 10524 |
06/30/2016 | 11030 | 10765 | 10599 |
07/31/2016 | 11172 | 11081 | 10834 |
08/31/2016 | 11125 | 11110 | 10855 |
09/30/2016 | 11198 | 11064 | 10823 |
10/31/2016 | 10953 | 10977 | 10760 |
11/30/2016 | 11269 | 11622 | 11234 |
12/31/2016 | 11434 | 12022 | 11526 |
01/31/2017 | 11393 | 12097 | 11581 |
02/28/2017 | 11708 | 12722 | 12031 |
03/31/2017 | 11584 | 12646 | 11978 |
04/30/2017 | 11626 | 12829 | 12110 |
05/31/2017 | 11601 | 12921 | 12176 |
06/30/2017 | 11643 | 13146 | 12338 |
07/31/2017 | 11928 | 13498 | 12588 |
08/31/2017 | 11962 | 13586 | 12653 |
09/30/2017 | 12261 | 13880 | 12861 |
10/31/2017 | 12320 | 14497 | 13292 |
11/30/2017 | 12556 | 15111 | 13717 |
12/31/2017 | 12711 | 15402 | 13919 |
01/31/2018 | 12936 | 16307 | 14537 |
02/28/2018 | 12383 | 15661 | 14108 |
03/31/2018 | 12316 | 15099 | 13733 |
04/30/2018 | 12486 | 15151 | 13773 |
05/31/2018 | 12486 | 15364 | 13924 |
06/30/2018 | 12592 | 15290 | 13879 |
07/31/2018 | 12849 | 16029 | 14388 |
08/31/2018 | 13029 | 16439 | 14670 |
09/30/2018 | 13211 | 16762 | 14893 |
10/31/2018 | 12935 | 15927 | 14342 |
11/30/2018 | 13411 | 16262 | 14576 |
12/31/2018 | 12725 | 14866 | 13644 |
01/31/2019 | 13119 | 15950 | 14397 |
02/28/2019 | 13513 | 16593 | 14839 |
03/31/2019 | 13741 | 16622 | 14866 |
04/30/2019 | 13800 | 17064 | 15170 |
05/31/2019 | 13345 | 15986 | 14460 |
06/30/2019 | 13895 | 17155 | 15261 |
07/31/2019 | 13965 | 17346 | 15395 |
08/31/2019 | 13676 | 17116 | 15251 |
09/30/2019 | 13921 | 17468 | 15492 |
10/31/2019 | 13961 | 17570 | 15568 |
11/30/2019 | 14041 | 18292 | 16052 |
12/31/2019 | 14323 | 18633 | 16282 |
01/31/2020 | 13712 | 18468 | 16179 |
02/29/2020 | 12740 | 16667 | 15002 |
03/31/2020 | 11763 | 14397 | 13481 |
04/30/2020 | 12754 | 16012 | 14615 |
05/31/2020 | 12986 | 16758 | 15126 |
06/30/2020 | 12696 | 17062 | 15332 |
07/31/2020 | 12818 | 17490 | 15621 |
08/31/2020 | 12930 | 18875 | 16549 |
09/30/2020 | 12593 | 18464 | 16280 |
10/31/2020 | 12235 | 17630 | 15729 |
11/30/2020 | 13400 | 19771 | 17161 |
12/31/2020 | 13632 | 20445 | 17601 |
01/31/2021 | 13632 | 20046 | 17343 |
02/28/2021 | 13969 | 20734 | 17790 |
03/31/2021 | 14881 | 22140 | 18695 |
04/30/2021 | 14859 | 22756 | 19086 |
05/31/2021 | 15154 | 23259 | 19402 |
06/30/2021 | 15071 | 23263 | 19405 |
07/31/2021 | 14928 | 23575 | 19600 |
08/31/2021 | 15049 | 23928 | 19820 |
09/30/2021 | 14606 | 22924 | 19196 |
10/31/2021 | 14892 | 24282 | 20049 |
11/30/2021 | 14441 | 23432 | 19523 |
12/31/2021 | 15241 | 24727 | 20333 |
01/31/2022 | 15362 | 23926 | 19839 |
02/28/2022 | 15175 | 23138 | 19349 |
03/31/2022 | 15553 | 23713 | 19711 |
04/30/2022 | 15364 | 22569 | 18999 |
05/31/2022 | 16018 | 22643 | 19049 |
06/30/2022 | 14966 | 21157 | 18112 |
07/31/2022 | 15122 | 22600 | 19041 |
08/31/2022 | 14577 | 21759 | 18517 |
09/30/2022 | 13717 | 19852 | 17312 |
10/31/2022 | 15059 | 22645 | 19145 |
11/30/2022 | 15864 | 24013 | 20029 |
12/31/2022 | 15454 | 23031 | 19432 |
01/31/2023 | 15642 | 23705 | 19874 |
02/28/2023 | 15206 | 22770 | 19303 |
03/31/2023 | 15477 | 23245 | 19625 |
04/30/2023 | 15453 | 23843 | 20020 |
05/31/2023 | 14906 | 23088 | 19564 |
06/30/2023 | 15360 | 24167 | 20273 |
07/31/2023 | 15887 | 24999 | 20817 |
08/31/2023 | 15791 | 24497 | 20526 |
09/30/2023 | 15344 | 23660 | 20024 |
10/31/2023 | 15138 | 23362 | 19857 |
11/30/2023 | 15887 | 25501 | 21243 |
12/31/2023 | 16693 | 26757 | 22053 |
01/31/2024 | 16718 | 27108 | 22294 |
02/29/2024 | 16604 | 27786 | 22735 |
03/31/2024 | 17097 | 28399 | 23137 |
04/30/2024 | 16649 | 27003 | 22308 |
05/31/2024 | 16982 | 27699 | 22767 |
06/30/2024 | 16715 | 28039 | 23000 |
07/31/2024 | 17541 | 29305 | 23804 |
08/31/2024 | 17735 | 29900 | 24196 |
09/30/2024 | 17916 | 30485 | 24577 |
10/31/2024 | 17487 | 30102 | 24369 |
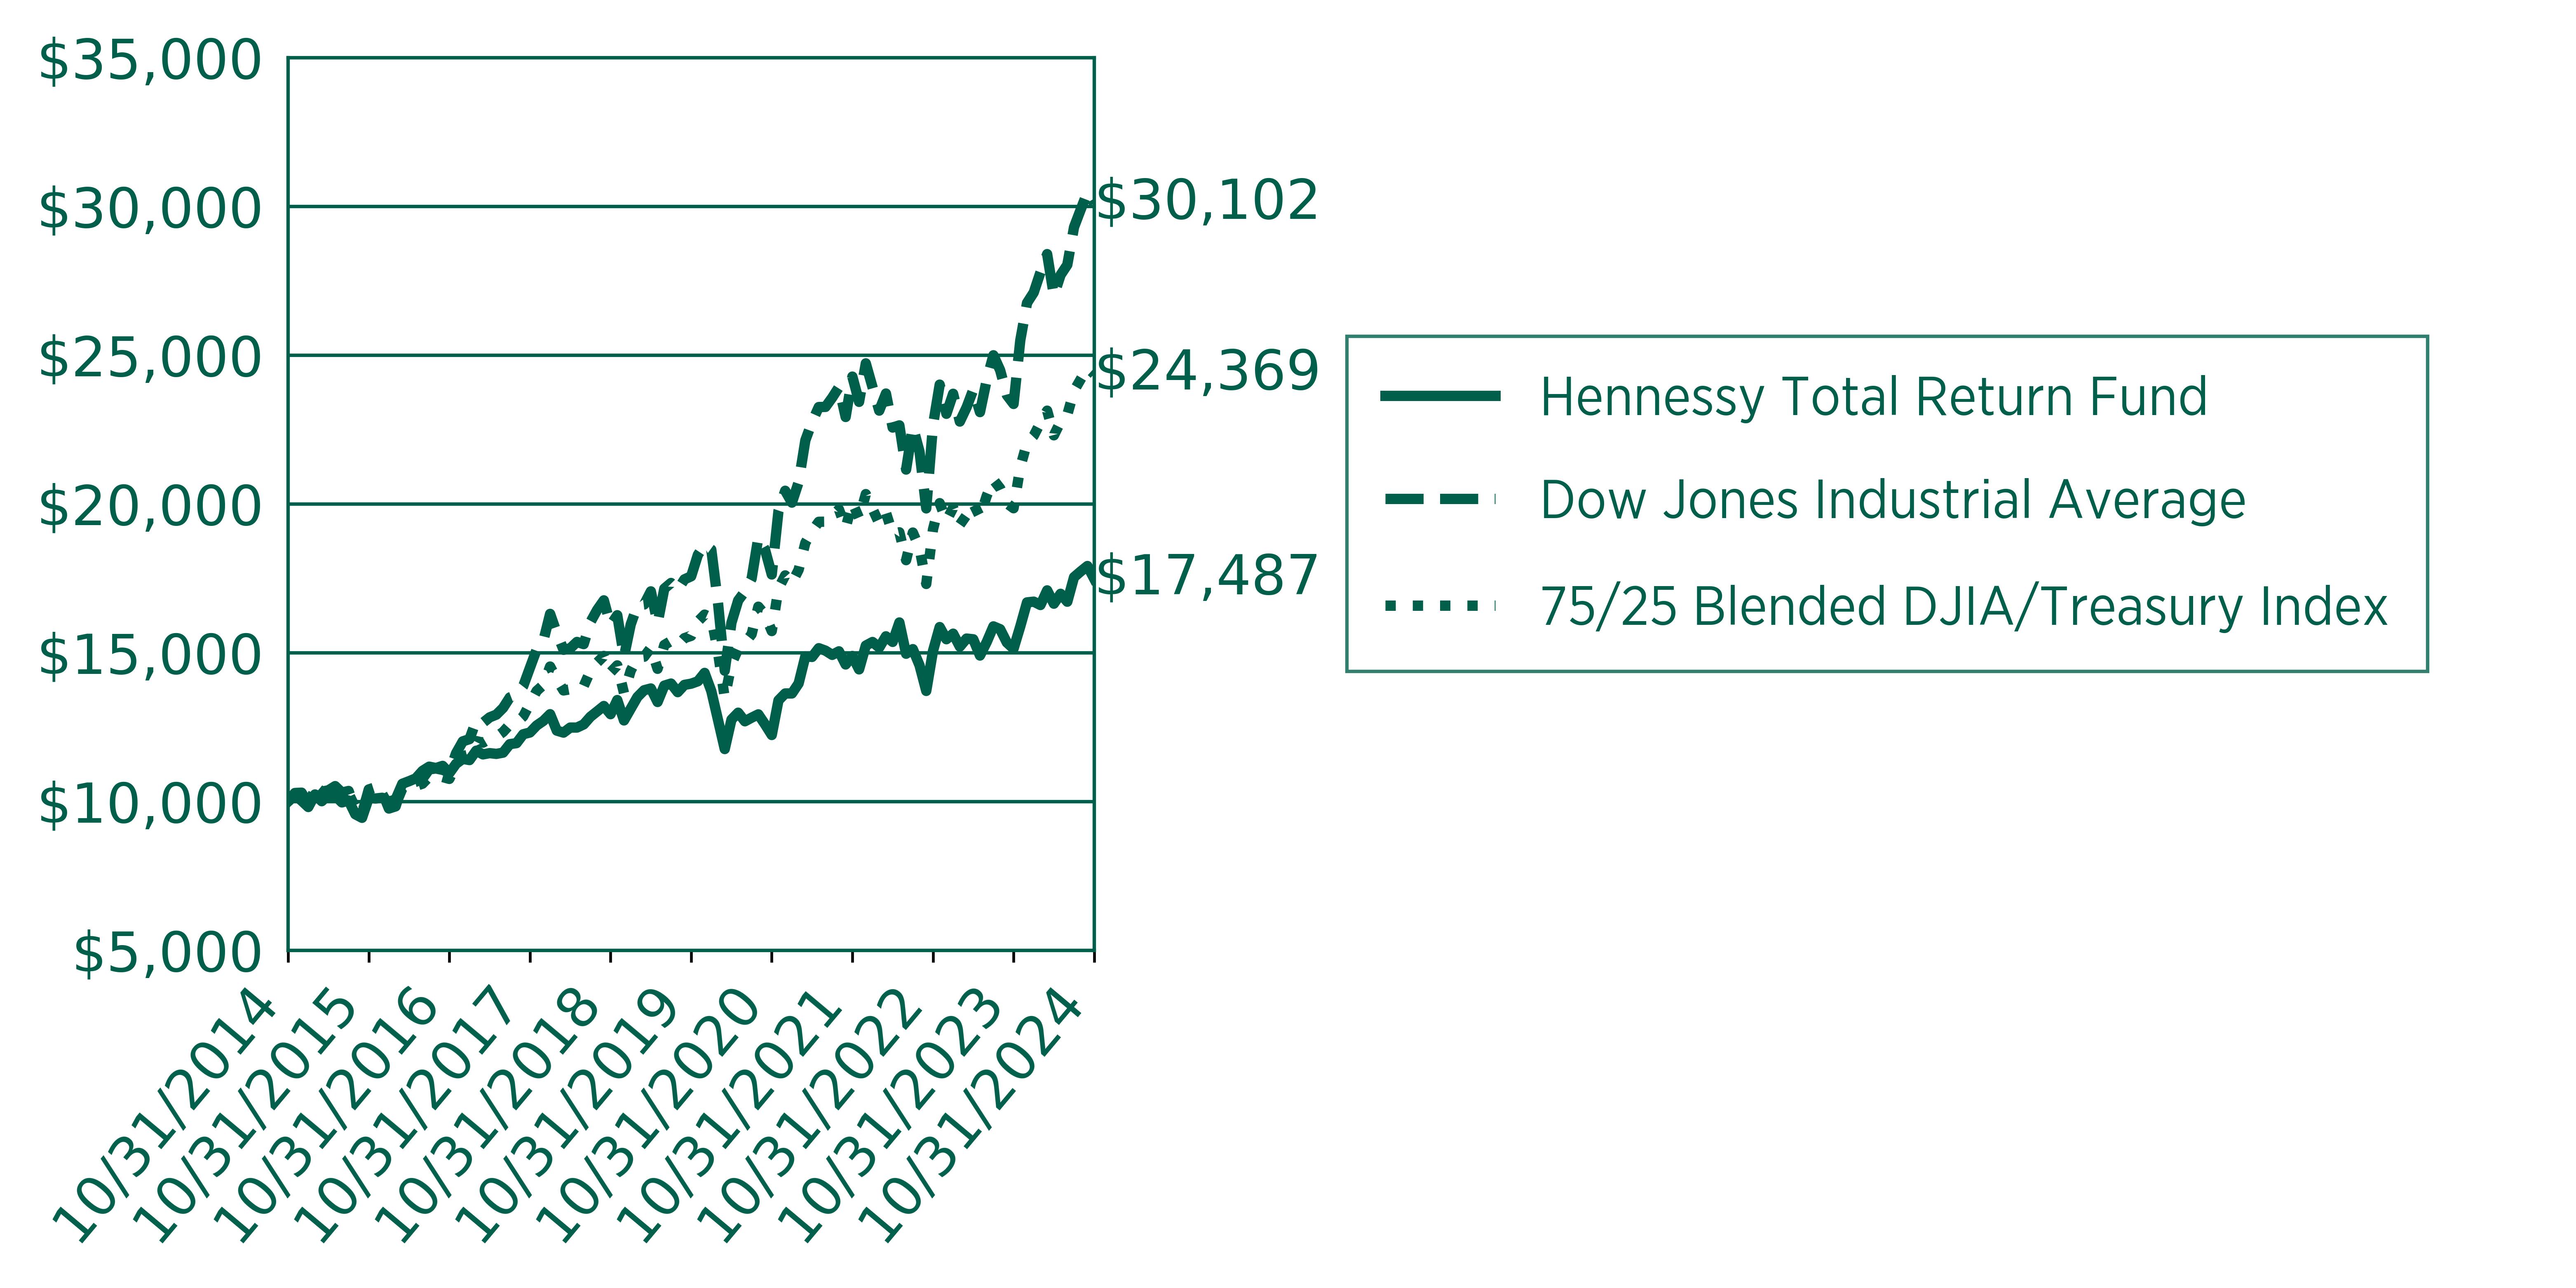
Average Annual Total Returns
for Periods Ended October 31, 2024
| 1 Year | 5 Year | 10 Year |
|---|
Hennessy Total Return Fund | 15.52% | 4.61% | 5.75% |
75/25 Blended DJIA/Treasury Index | 22.72% | 9.38% | 9.32% |
Dow Jones Industrial Average | 28.85% | 11.37% | 11.65% |
Past performance does not guarantee future results. The graph above illustrates the performance of an initial investment of $10,000 in the Fund 10 years ago compared with the performance of the indices shown. Fund performance in the graph and table assumes the reinvestment of dividends and capital gains and does not reflect the deduction of taxes that a shareholder would pay on Fund distributions or the redemption of Fund shares. Unlike the Fund, indices are not subject to fees and other expenses. Investors cannot invest directly in any index. These indices are used for comparative purposes in accordance with Securities and Exchange Commission regulations. Performance data current to the most recent month end may be obtained by visiting https://www.hennessyfunds.com/.
Key Fund Statistics
(as of October 31, 2024)
| |
|---|
Fund Size | $49,044,336 |
Number of Holdings | 15 |
Annual Portfolio Turnover | 32% |
Total Advisory Fee | $299,567 |
Sector Breakdown (% of net assets)
sector breakdown | (%) |
Communication Services | 7.44% |
Consumer Staples | 8.92% |
Energy | 6.92% |
Financials | 4.75% |
Health Care | 13.97% |
Industrials | 8.17% |
Information Technology | 12.35% |
Materials | 6.36% |
Money Market Funds | 2.47% |
U.S. Treasury Bills | 72.90% |
Liabilities in Excess of Other Assets | -44.32% |

Sector sub-classifications may differ from those utilized for compliance purposes.
For additional information about the Fund, including its prospectus, financial information, holdings, and proxy information, visit https://www.hennessyfunds.com/funds/regulatory-documents.
Householding
To help keep the Fund’s costs as low as possible, we generally deliver a single copy of shareholder reports, proxy statements, and prospectuses to shareholders who share an address and have the same last name. This process does not apply to account statements. you may request an individual copy of a shareholder document at any time. If you would like to receive separate mailings of shareholder documents, please call U.S. Bank Global Fund services at 800-261-6950 or 414-765-4124, and individual delivery will begin within 30 days of your request. If your account is held through a financial institution or other intermediary, please contact such intermediary directly to request individual delivery.
Annual Shareholder Report Hennessy Equity and Income Fund Investor Class HEIFX | |
This annual shareholder report contains important information about the Hennessy Equity and Income Fund – Investor Class (the “Fund”) for the period of November 1, 2023, to October 31, 2024.You can find additional information about the Fund at https://www.hennessyfunds.com/funds/regulatory-documents. You can also request this information by contacting us at 1-800-966-4354 orfundsinfo@hennessyfunds.com.
What were the Fund costs for the last year?
(based on a hypothetical $10,000 investment)
Class Name | Costs of a $10,000 investment | Costs paid as a percentage of a $10,000 investment |
|---|
Investor Class | $171 | 1.55% |
How did the Fund perform last year and what affected its performance?
For the one-year period ended October 31, 2024, the Fund underperformed the S&P 500® Index.
Factors Influencing Performance
Equities: The positive returns of the Fund’s equity allocation reflected solid overall economic growth, decelerating inflation, and a strong labor market. Headwinds to the Fund’s relative performance included less exposure to growth, momentum, and volatility factors and greater relative exposure to quality and shareholder yield factors. The concentration of the S&P 500® Index in a few holdings made relative performance challenging. The absolute return of the Fund’s equity allocation lagged the strong return of the broader market. The Fund’s focus on downside protection typically results in lower upside participation in rising markets and greater downside protection in declining markets.Fixed Income: The majority of the performance of the Fund’s fixed income allocation was attributed to two primary factors. The largest contributor to performance was sector allocation. The Fund held an overweight position in investment-grade corporate bonds, a sector that tightened generally by 45 basis points over the period. The second driver of performance was the result of active duration management decisions made throughout the year. Specifically, the Fund’s duration was extended as interest rates approached the highs of the year in April 2024. This strategy enabled the Fund to capitalize on several months of subsequent rate decreases before the portfolio was repositioned to a neutral duration in mid-August 2024. The strategic timing of this adjustment added value for shareholders.
Positioning
The Fund seeks a balanced portfolio with the goal of maintaining broad market exposure with low volatility. The Fund’s equity allocation is designed to invest in companies with sustainably high returns on capital and balance sheet flexibility at reasonable valuations. The Fund’s fixed income allocation focuses on high-quality domestic corporate, agency, and government bonds.
How did the Fund perform over the last 10 years?
Change in Value of $10,000 Investment
Date | Hennessy Equity and Income Fund | S&P 500® Index |
10/31/2014 | 10000 | 10000 |
11/30/2014 | 10240 | 10269 |
12/31/2014 | 10288 | 10243 |
1/31/2015 | 10176 | 9936 |
2/28/2015 | 10475 | 10507 |
3/31/2015 | 10328 | 10340 |
4/30/2015 | 10328 | 10440 |
5/31/2015 | 10415 | 10574 |
6/30/2015 | 10242 | 10369 |
7/31/2015 | 10267 | 10586 |
8/31/2015 | 9872 | 9948 |
9/30/2015 | 9716 | 9702 |
10/31/2015 | 10143 | 10520 |
11/30/2015 | 10174 | 10551 |
12/31/2015 | 10019 | 10385 |
1/31/2016 | 9709 | 9869 |
2/29/2016 | 9696 | 9856 |
3/31/2016 | 10078 | 10525 |
4/30/2016 | 10175 | 10566 |
5/31/2016 | 10227 | 10755 |
6/30/2016 | 10268 | 10783 |
7/31/2016 | 10489 | 11181 |
8/31/2016 | 10437 | 11196 |
9/30/2016 | 10299 | 11199 |
10/31/2016 | 10131 | 10994 |
11/30/2016 | 10449 | 11401 |
12/31/2016 | 10592 | 11627 |
1/31/2017 | 10734 | 11847 |
2/28/2017 | 11010 | 12318 |
3/31/2017 | 10943 | 12332 |
4/30/2017 | 11028 | 12459 |
5/31/2017 | 11141 | 12634 |
6/30/2017 | 11154 | 12713 |
7/31/2017 | 11246 | 12974 |
8/31/2017 | 11275 | 13014 |
9/30/2017 | 11486 | 13283 |
10/31/2017 | 11565 | 13593 |
11/30/2017 | 11821 | 14009 |
12/31/2017 | 12023 | 14165 |
1/31/2018 | 12346 | 14976 |
2/28/2018 | 12023 | 14424 |
3/31/2018 | 11853 | 14058 |
4/30/2018 | 11710 | 14112 |
5/31/2018 | 11861 | 14451 |
6/30/2018 | 11863 | 14540 |
7/31/2018 | 12187 | 15081 |
8/31/2018 | 12421 | 15573 |
9/30/2018 | 12492 | 15662 |
10/31/2018 | 11963 | 14591 |
11/30/2018 | 12076 | 14888 |
12/31/2018 | 11503 | 13544 |
1/31/2019 | 11928 | 14629 |
2/28/2019 | 12198 | 15099 |
3/31/2019 | 12389 | 15393 |
4/30/2019 | 12709 | 16016 |
5/31/2019 | 12233 | 14998 |
6/30/2019 | 12638 | 16055 |
7/31/2019 | 12762 | 16286 |
8/31/2019 | 12663 | 16028 |
9/30/2019 | 12827 | 16328 |
10/31/2019 | 12967 | 16681 |
11/30/2019 | 13198 | 17287 |
12/31/2019 | 13342 | 17809 |
1/31/2020 | 13386 | 17802 |
2/29/2020 | 12583 | 16336 |
3/31/2020 | 11368 | 14319 |
4/30/2020 | 12227 | 16154 |
5/31/2020 | 12670 | 16923 |
6/30/2020 | 12803 | 17260 |
7/31/2020 | 13327 | 18233 |
8/31/2020 | 13931 | 19544 |
9/30/2020 | 13674 | 18801 |
10/31/2020 | 13452 | 18301 |
11/30/2020 | 14270 | 20305 |
12/31/2020 | 14538 | 21085 |
1/31/2021 | 14397 | 20872 |
2/28/2021 | 14623 | 21448 |
3/31/2021 | 15369 | 22387 |
4/30/2021 | 15822 | 23582 |
5/31/2021 | 15907 | 23747 |
6/30/2021 | 15962 | 24301 |
7/31/2021 | 16142 | 24878 |
8/31/2021 | 16312 | 25635 |
9/30/2021 | 15723 | 24443 |
10/31/2021 | 16309 | 26155 |
11/30/2021 | 16224 | 25974 |
12/31/2021 | 16968 | 27138 |
1/31/2022 | 16383 | 25734 |
2/28/2022 | 15747 | 24963 |
3/31/2022 | 15952 | 25890 |
4/30/2022 | 14972 | 23632 |
5/31/2022 | 15053 | 23676 |
6/30/2022 | 14250 | 21721 |
7/31/2022 | 15070 | 23724 |
8/31/2022 | 14574 | 22757 |
9/30/2022 | 13656 | 20661 |
10/31/2022 | 14254 | 22334 |
11/30/2022 | 15035 | 23582 |
12/31/2022 | 14618 | 22223 |
1/31/2023 | 15108 | 23619 |
2/28/2023 | 14763 | 23043 |
3/31/2023 | 14942 | 23889 |
4/30/2023 | 15214 | 24262 |
5/31/2023 | 14963 | 24367 |
6/30/2023 | 15667 | 25977 |
7/31/2023 | 15960 | 26812 |
8/31/2023 | 15772 | 26385 |
9/30/2023 | 15155 | 25127 |
10/31/2023 | 14777 | 24599 |
11/30/2023 | 15668 | 26845 |
12/31/2023 | 16142 | 28065 |
1/31/2024 | 16119 | 28536 |
2/29/2024 | 16553 | 30060 |
3/31/2024 | 16984 | 31027 |
4/30/2024 | 16355 | 29760 |
5/31/2024 | 16641 | 31236 |
6/30/2024 | 16731 | 32356 |
7/31/2024 | 17315 | 32750 |
8/31/2024 | 17761 | 33545 |
9/30/2024 | 17831 | 34261 |
10/31/2024 | 17796 | 33950 |

Average Annual Total Returns
for Periods Ended October 31, 2024
| 1 Year | 5 Year | 10 Year |
|---|
Hennessy Equity and Income Fund | 20.43% | 6.54% | 5.93% |
S&P 500® Index | 38.02% | 15.27% | 13.00% |
Past performance does not guarantee future results. The graph above illustrates the performance of an initial investment of $10,000 in the Fund 10 years ago compared with the performance of the indices shown. Fund performance in the graph and table assumes the reinvestment of dividends and capital gains and does not reflect the deduction of taxes that a shareholder would pay on Fund distributions or the redemption of Fund shares. Unlike the Fund, indices are not subject to fees and other expenses. Investors cannot invest directly in any index. These indices are used for comparative purposes in accordance with Securities and Exchange Commission regulations. Performance data current to the most recent month end may be obtained by visiting https://www.hennessyfunds.com/.Standard & Poor’s Financial Services is the source and owner of the S&P® and S&P 500® trademarks.
Key Fund Statistics
(as of October 31, 2024)
| |
|---|
Fund Size | $59,525,606 |
Number of Holdings | 85 |
Annual Portfolio Turnover | 15% |
Total Advisory Fee | $521,187 |
Sector Breakdown (% of net assets)
sector breakdown | (%) |
Communication Services | 6.06% |
Consumer Discretionary | 8.78% |
Consumer Staples | 5.26% |
Energy | 2.36% |
Financials | 28.10% |
Health Care | 3.94% |
Industrials | 9.91% |
Information Technology | 10.30% |
Materials | 7.80% |
Mortgage-Backed Securities | 3.03% |
U.S. Treasury Obligations | 12.67% |
Short-Term Investments and Other | 2.53% |
Liabilities in Excess of Other Assets | -0.80% |

Sector sub-classifications may differ from those utilized for compliance purposes.
For additional information about the Fund, including its prospectus, financial information, holdings, and proxy information, visit https://www.hennessyfunds.com/funds/regulatory-documents.
Householding
To help keep the Fund’s costs as low as possible, we generally deliver a single copy of shareholder reports, proxy statements, and prospectuses to shareholders who share an address and have the same last name. This process does not apply to account statements. you may request an individual copy of a shareholder document at any time. If you would like to receive separate mailings of shareholder documents, please call U.S. Bank Global Fund services at 800-261-6950 or 414-765-4124, and individual delivery will begin within 30 days of your request. If your account is held through a financial institution or other intermediary, please contact such intermediary directly to request individual delivery.
Annual Shareholder Report Hennessy Equity and Income Fund Institutional Class HEIIX | |
This annual shareholder report contains important information about the Hennessy Equity and Income Fund – Institutional Class (the “Fund”) for the period of November 1, 2023, to October 31, 2024. You can find additional information about the Fund at https://www.hennessyfunds.com/funds/regulatory-documents. You can also request this information by contacting us at1-800-966-4354 or fundsinfo@hennessyfunds.com.
What were the Fund costs for the last year?
(based on a hypothetical $10,000 investment)
Class Name | Costs of a $10,000 investment | Costs paid as a percentage of a $10,000 investment |
|---|
Institutional Class | $130 | 1.18% |
How did the Fund perform last year and what affected its performance?
For the one-year period ended October 31, 2024, the Fund underperformed the S&P 500® Index.
Factors Influencing Performance
Equities: The positive returns of the Fund’s equity allocation reflected solid overall economic growth, decelerating inflation, and a strong labor market. Headwinds to the Fund’s relative performance included less exposure to growth, momentum, and volatility factors and greater relative exposure to quality and shareholder yield factors. The concentration of the S&P 500® Index in a few holdings made relative performance challenging. The absolute return of the Fund’s equity allocation lagged the strong return of the broader market. The Fund’s focus on downside protection typically results in lower upside participation in rising markets and greater downside protection in declining markets.Fixed Income: The majority of the performance of the Fund’s fixed income allocation was attributed to two primary factors. The largest contributor to performance was sector allocation. The Fund held an overweight position in investment-grade corporate bonds, a sector that tightened generally by 45 basis points over the period. The second driver of performance was the result of active duration management decisions made throughout the year. Specifically, the Fund’s duration was extended as interest rates approached the highs of the year in April 2024. This strategy enabled the Fund to capitalize on several months of subsequent rate decreases before the portfolio was repositioned to a neutral duration in mid-August 2024. The strategic timing of this adjustment added value for shareholders.
Positioning
The Fund seeks a balanced portfolio with the goal of maintaining broad market exposure with low volatility. The Fund’s equity allocation is designed to invest in companies with sustainably high returns on capital and balance sheet flexibility at reasonable valuations. The Fund’s fixed income allocation focuses on high-quality domestic corporate, agency, and government bonds.
How did the Fund perform over the last 10 years?
Change in Value of $250,000 Investment
Date | Hennessy Equity and Income Fund | S&P 500® Index |
10/31/2014 | 250000 | 250000 |
11/30/2014 | 256013 | 256724 |
12/31/2014 | 257273 | 256077 |
1/31/2015 | 254469 | 248390 |
2/28/2015 | 262056 | 262665 |
3/31/2015 | 258542 | 258511 |
4/30/2015 | 258542 | 260991 |
5/31/2015 | 260858 | 264347 |
6/30/2015 | 256523 | 259230 |
7/31/2015 | 257352 | 264661 |
8/31/2015 | 247397 | 248693 |
9/30/2015 | 243729 | 242540 |
10/31/2015 | 254384 | 262999 |
11/30/2015 | 255216 | 263781 |
12/31/2015 | 251488 | 259621 |
1/31/2016 | 243784 | 246737 |
2/29/2016 | 243442 | 246404 |
3/31/2016 | 253348 | 263120 |
4/30/2016 | 255581 | 264140 |
5/31/2016 | 257127 | 268883 |
6/30/2016 | 258181 | 269580 |
7/31/2016 | 263869 | 279519 |
8/31/2016 | 262662 | 279912 |
9/30/2016 | 259294 | 279965 |
10/31/2016 | 255145 | 274858 |
11/30/2016 | 263270 | 285037 |
12/31/2016 | 267050 | 290671 |
1/31/2017 | 270639 | 296184 |
2/28/2017 | 277627 | 307944 |
3/31/2017 | 275935 | 308304 |
4/30/2017 | 278210 | 311470 |
5/31/2017 | 281242 | 315853 |
6/30/2017 | 281675 | 317824 |
7/31/2017 | 283955 | 324360 |
8/31/2017 | 284906 | 325353 |
9/30/2017 | 290305 | 332064 |
10/31/2017 | 292402 | 339813 |
11/30/2017 | 298883 | 350235 |
12/31/2017 | 304113 | 354129 |
1/31/2018 | 312365 | 374404 |
2/28/2018 | 304314 | 360605 |
3/31/2018 | 300101 | 351441 |
4/30/2018 | 296666 | 352789 |
5/31/2018 | 300506 | 361285 |
6/30/2018 | 300690 | 363509 |
7/31/2018 | 309003 | 377036 |
8/31/2018 | 315086 | 389322 |
9/30/2018 | 316907 | 391538 |
10/31/2018 | 303686 | 364776 |
11/30/2018 | 306737 | 372210 |
12/31/2018 | 292005 | 338603 |
1/31/2019 | 303024 | 365737 |
2/28/2019 | 310077 | 377480 |
3/31/2019 | 315131 | 384815 |
4/30/2019 | 323325 | 400396 |
5/31/2019 | 311145 | 374952 |
6/30/2019 | 321514 | 401377 |
7/31/2019 | 324849 | 407146 |
8/31/2019 | 322625 | 400696 |
9/30/2019 | 326710 | 408194 |
10/31/2019 | 330280 | 417035 |
11/30/2019 | 336306 | 432173 |
12/31/2019 | 340180 | 445217 |
1/31/2020 | 341135 | 445042 |
2/29/2020 | 320830 | 408407 |
3/31/2020 | 290187 | 357963 |
4/30/2020 | 312047 | 403852 |
5/31/2020 | 323577 | 423087 |
6/30/2020 | 327005 | 431501 |
7/31/2020 | 340269 | 455831 |
8/31/2020 | 355944 | 488596 |
9/30/2020 | 349591 | 470031 |
10/31/2020 | 344027 | 457531 |
11/30/2020 | 365075 | 507614 |
12/31/2020 | 371983 | 527131 |
1/31/2021 | 368653 | 521809 |
2/28/2021 | 374289 | 536198 |
3/31/2021 | 393490 | 559681 |
4/30/2021 | 405312 | 589551 |
5/31/2021 | 407625 | 593669 |
6/30/2021 | 409275 | 607528 |
7/31/2021 | 413911 | 621959 |
8/31/2021 | 418547 | 640871 |
9/30/2021 | 403397 | 611064 |
10/31/2021 | 418624 | 653876 |
11/30/2021 | 416302 | 649345 |
12/31/2021 | 435704 | 678446 |
1/31/2022 | 421079 | 643339 |
2/28/2022 | 404799 | 624076 |
3/31/2022 | 410003 | 647248 |
4/30/2022 | 385121 | 590807 |
5/31/2022 | 387056 | 591891 |
6/30/2022 | 366583 | 543034 |
7/31/2022 | 387657 | 593104 |
8/31/2022 | 375179 | 568916 |
9/30/2022 | 351502 | 516520 |
10/31/2022 | 367352 | 558338 |
11/30/2022 | 387097 | 589540 |
12/31/2022 | 376473 | 555574 |
1/31/2023 | 389642 | 590483 |
2/28/2023 | 380767 | 576076 |
3/31/2023 | 385194 | 597226 |
4/30/2023 | 392370 | 606548 |
5/31/2023 | 386055 | 609184 |
6/30/2023 | 404355 | 649436 |
7/31/2023 | 412131 | 670299 |
8/31/2023 | 407523 | 659627 |
9/30/2023 | 391832 | 628177 |
10/31/2023 | 382014 | 614969 |
11/30/2023 | 405114 | 671131 |
12/31/2023 | 417503 | 701621 |
1/31/2024 | 417188 | 713411 |
2/29/2024 | 428523 | 751504 |
3/31/2024 | 439558 | 775684 |
4/30/2024 | 423465 | 744001 |
5/31/2024 | 431038 | 780892 |
6/30/2024 | 433637 | 808912 |
7/31/2024 | 448830 | 818759 |
8/31/2024 | 460542 | 838619 |
9/30/2024 | 462296 | 856530 |
10/31/2024 | 461661 | 848762 |
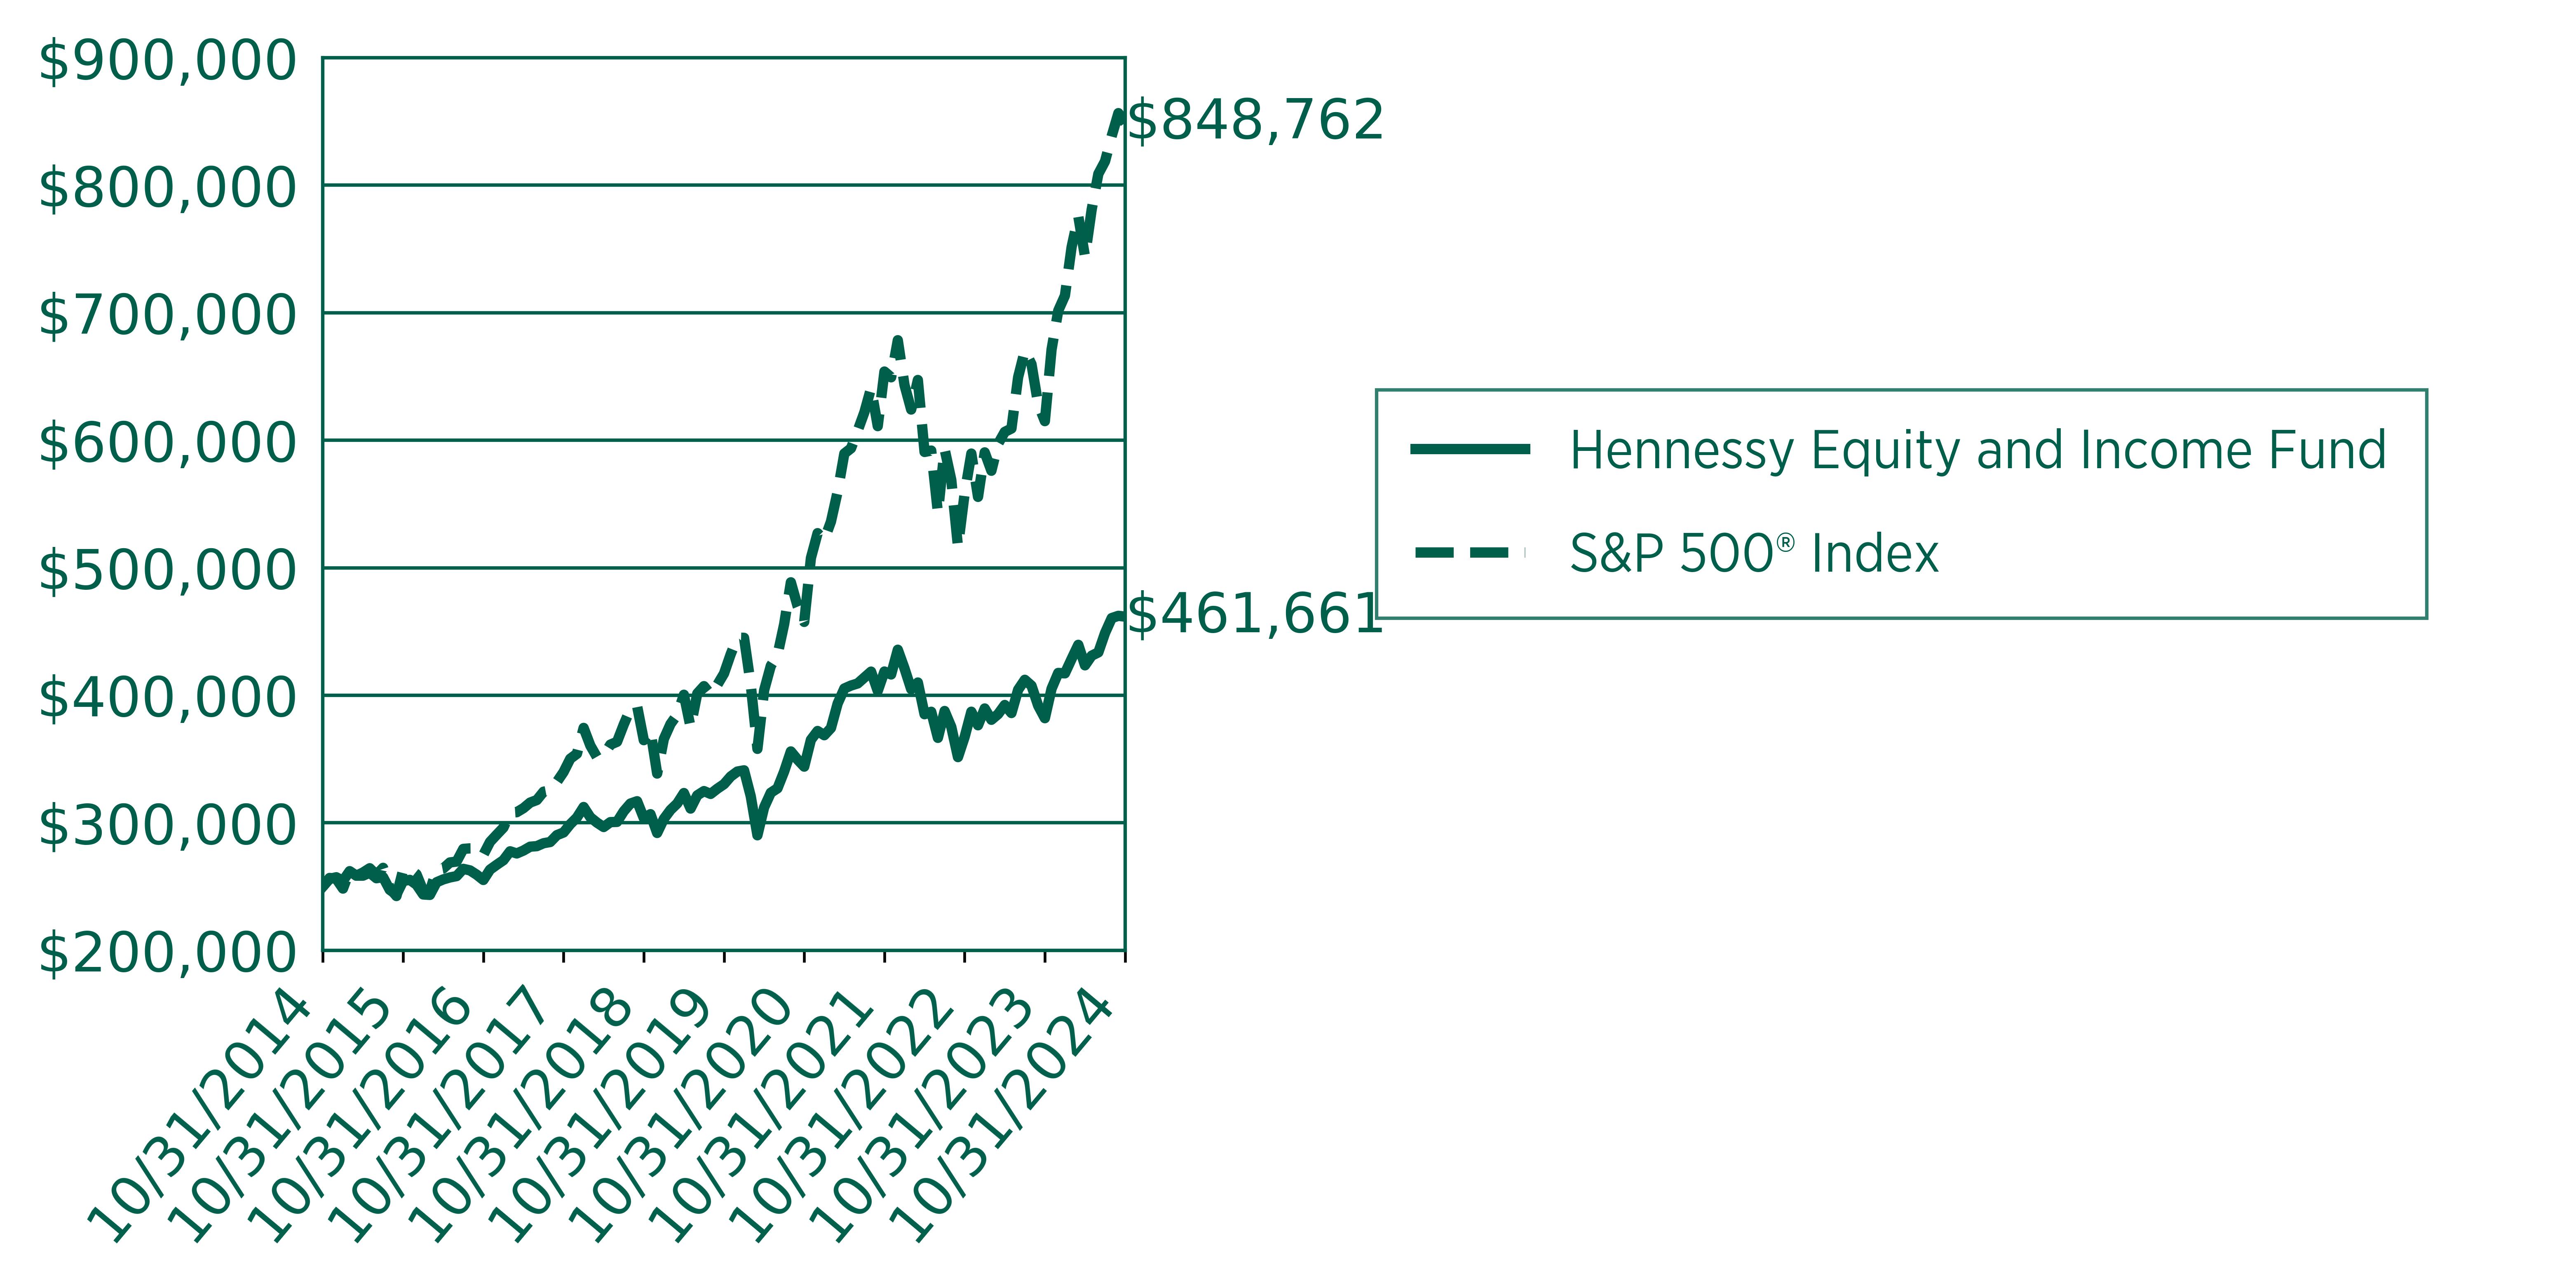
Average Annual Total Returns
for Periods Ended October 31, 2024
| 1 Year | 5 Year | 10 Year |
|---|
Hennessy Equity and Income Fund | 20.85% | 6.93% | s6.33% |
S&P 500® Index | 38.02% | 15.27% | 13.00% |
Past performance does not guarantee future results. The graph above illustrates the performance of an initial investment of $250,000 in the Fund 10 years ago compared with the performance of the indices shown. Fund performance in the graph and table assumes the reinvestment of dividends and capital gains and does not reflect the deduction of taxes that a shareholder would pay on Fund distributions or the redemption of Fund shares. Unlike the Fund, indices are not subject to fees and other expenses. Investors cannot invest directly in any index. These indices are used for comparative purposes in accordance with Securities and Exchange Commission regulations. Performance data current to the most recent month end may be obtained by visiting https://www.hennessyfunds.com/.Standard & Poor’s Financial Services is the source and owner of the S&P® and S&P 500® trademarks.
Key Fund Statistics
(as of October 31, 2024)
| |
|---|
Fund Size | $59,525,606 |
Number of Holdings | 85 |
Annual Portfolio Turnover | 15% |
Total Advisory Fee | $521,187 |
Sector Breakdown (% of net assets)
sector breakdown | (%) |
Communication Services | 6.06% |
Consumer Discretionary | 8.78% |
Consumer Staples | 5.26% |
Energy | 2.36% |
Financials | 28.10% |
Health Care | 3.94% |
Industrials | 9.91% |
Information Technology | 10.30% |
Materials | 7.80% |
Mortgage-Backed Securities | 3.03% |
U.S. Treasury Obligations | 12.67% |
Short-Term Investments and Other | 2.53% |
Liabilities in Excess of Other Assets | -0.80% |
Sector sub-classifications may differ from those utilized for compliance purposes.
For additional information about the Fund, including its prospectus, financial information, holdings, and proxy information, visit https://www.hennessyfunds.com/funds/regulatory-documents.
Householding
To help keep the Fund’s costs as low as possible, we generally deliver a single copy of shareholder reports, proxy statements, and prospectuses to shareholders who share an address and have the same last name. This process does not apply to account statements. you may request an individual copy of a shareholder document at any time. If you would like to receive separate mailings of shareholder documents, please call U.S. Bank Global Fund services at 800-261-6950 or 414-765-4124, and individual delivery will begin within 30 days of your request. If your account is held through a financial institution or other intermediary, please contact such intermediary directly to request individual delivery.
Annual Shareholder Report Hennessy Balanced Fund Investor Class HBFBX | |
This annual shareholder report contains important information about the Hennessy Balanced Fund – Investor Class (the “Fund”) for the period of November 1, 2023, to October 31, 2024.You can find additional information about the Fund at https://www.hennessyfunds.com/funds/regulatory-documents. You can also request this information by contacting us at 1-800-966-4354 orfundsinfo@hennessyfunds.com.
What were the Fund costs for the last year?
(based on a hypothetical $10,000 investment)
Class Name | Costs of a $10,000 investment | Costs paid as a percentage of a $10,000 investment |
|---|
Investor Class | $192 | 1.82% |
How did the Fund perform last year and what affected its performance?
For the one-year period ended October 31, 2024, the Fund underperformed both the 50/50 Blended DJIA/Treasury Index (the Fund’s primary benchmark) and the Dow Jones Industrial Average.
Factors Influencing Performance
● Holdings in the Industrials, Information Technology, and Financials sectors contributed the most to performance.● Holdings in the Consumer Staples sector detracted from performance.● Stocks that contributed most to performance included 3M Company, The Goldman Sachs Group, Inc., and International Business Machines Corporation.● Stocks that detracted most from performance included Walgreens Boots Alliance, Inc., Merck & Co., Inc., and Solventum Corporation.
Positioning
● At the end of the period, compared to its primary benchmark, the Fund was most overweight Materials and Communication Services companies and was most underweight Financials and Consumer Discretionary companies.
Performance
● The majority of underperformance was due to sector allocation rather than stock selection.
● The Fund underperformed the broader market due to both its allocation to U.S. Treasury securities, which underperformed equities, as well as the individual stocks it owned.
How did the Fund perform over the last 10 years?
Change in Value of $10,000 Investment
Date | Hennessy Balanced Fund | Dow Jones Industrial Average | 50/50 Blended DJIA/Treasury Index |
10/31/2014 | 10000 | 10000 | 10000 |
11/30/2014 | 10162 | 10286 | 10144 |
12/31/2014 | 10017 | 10298 | 10145 |
1/31/2015 | 9863 | 9929 | 9969 |
2/28/2015 | 10154 | 10526 | 10267 |
3/31/2015 | 9973 | 10332 | 10173 |
4/30/2015 | 10110 | 10378 | 10199 |
5/31/2015 | 10102 | 10518 | 10270 |
6/30/2015 | 9925 | 10301 | 10164 |
7/31/2015 | 9965 | 10355 | 10192 |
8/31/2015 | 9641 | 9714 | 9876 |
9/30/2015 | 9534 | 9582 | 9814 |
10/31/2015 | 10011 | 10406 | 10235 |
11/30/2015 | 9987 | 10479 | 10263 |
12/31/2015 | 9991 | 10320 | 10185 |
1/31/2016 | 9891 | 9764 | 9921 |
2/29/2016 | 9908 | 9837 | 9959 |
3/31/2016 | 10275 | 10547 | 10325 |
4/30/2016 | 10341 | 10612 | 10362 |
5/31/2016 | 10366 | 10664 | 10386 |
6/30/2016 | 10557 | 10765 | 10447 |
7/31/2016 | 10689 | 11081 | 10600 |
8/31/2016 | 10656 | 11110 | 10613 |
9/30/2016 | 10706 | 11064 | 10595 |
10/31/2016 | 10532 | 10977 | 10556 |
11/30/2016 | 10789 | 11622 | 10863 |
12/31/2016 | 10905 | 12022 | 11053 |
1/31/2017 | 10887 | 12097 | 11096 |
2/28/2017 | 11119 | 12722 | 11385 |
3/31/2017 | 11022 | 12646 | 11349 |
4/30/2017 | 11066 | 12829 | 11436 |
5/31/2017 | 11048 | 12921 | 11478 |
6/30/2017 | 11085 | 13146 | 11580 |
7/31/2017 | 11317 | 13498 | 11743 |
8/31/2017 | 11317 | 13586 | 11787 |
9/30/2017 | 11520 | 13880 | 11916 |
10/31/2017 | 11538 | 14497 | 12182 |
11/30/2017 | 11690 | 15111 | 12437 |
12/31/2017 | 11815 | 15402 | 12559 |
1/31/2018 | 12056 | 16307 | 12932 |
2/28/2018 | 11729 | 15661 | 12677 |
3/31/2018 | 11638 | 15099 | 12460 |
4/30/2018 | 11725 | 15151 | 12485 |
5/31/2018 | 11735 | 15364 | 12587 |
6/30/2018 | 11785 | 15290 | 12564 |
7/31/2018 | 11920 | 16029 | 12876 |
8/31/2018 | 12017 | 16439 | 13055 |
9/30/2018 | 12112 | 16762 | 13187 |
10/31/2018 | 11937 | 15927 | 12872 |
11/30/2018 | 12257 | 16262 | 13022 |
12/31/2018 | 11827 | 14866 | 12486 |
1/31/2019 | 12122 | 15950 | 12958 |
2/28/2019 | 12395 | 16593 | 13232 |
3/31/2019 | 12533 | 16622 | 13267 |
4/30/2019 | 12573 | 17064 | 13458 |
5/31/2019 | 12258 | 15986 | 13054 |
6/30/2019 | 12651 | 17155 | 13557 |
7/31/2019 | 12692 | 17346 | 13637 |
8/31/2019 | 12467 | 17116 | 13572 |
9/30/2019 | 12618 | 17468 | 13720 |
10/31/2019 | 12659 | 17570 | 13783 |
11/30/2019 | 12823 | 18292 | 14070 |
12/31/2019 | 12973 | 18633 | 14215 |
1/31/2020 | 12578 | 18468 | 14169 |
2/29/2020 | 12002 | 16667 | 13512 |
3/31/2020 | 11392 | 14397 | 12658 |
4/30/2020 | 11895 | 16012 | 13366 |
5/31/2020 | 11981 | 16758 | 13675 |
6/30/2020 | 11818 | 17062 | 13802 |
7/31/2020 | 11904 | 17490 | 13979 |
8/31/2020 | 12043 | 18875 | 14532 |
9/30/2020 | 11839 | 18464 | 14376 |
10/31/2020 | 11667 | 17630 | 14052 |
11/30/2020 | 12420 | 19771 | 14908 |
12/31/2020 | 12587 | 20445 | 15163 |
1/31/2021 | 12554 | 20046 | 15016 |
2/28/2021 | 12878 | 20734 | 15276 |
3/31/2021 | 13413 | 22140 | 15795 |
4/30/2021 | 13435 | 22756 | 16018 |
5/31/2021 | 13640 | 23259 | 16195 |
6/30/2021 | 13534 | 23263 | 16196 |
7/31/2021 | 13437 | 23575 | 16307 |
8/31/2021 | 13523 | 23928 | 16429 |
9/30/2021 | 13221 | 22924 | 16083 |
10/31/2021 | 13372 | 24282 | 16557 |
11/30/2021 | 13059 | 23432 | 16263 |
12/31/2021 | 13592 | 24727 | 16704 |
1/31/2022 | 13626 | 23926 | 16411 |
2/28/2022 | 13514 | 23138 | 16128 |
3/31/2022 | 13719 | 23713 | 16298 |
4/30/2022 | 13562 | 22569 | 15890 |
5/31/2022 | 13909 | 22643 | 15933 |
6/30/2022 | 13237 | 21157 | 15370 |
7/31/2022 | 13372 | 22600 | 15907 |
8/31/2022 | 13058 | 21759 | 15594 |
9/30/2022 | 12515 | 19852 | 14877 |
10/31/2022 | 13279 | 22645 | 15929 |
11/30/2022 | 13762 | 24013 | 16435 |
12/31/2022 | 13429 | 23031 | 16132 |
1/31/2023 | 13558 | 23705 | 16397 |
2/28/2023 | 13266 | 22770 | 16077 |
3/31/2023 | 13465 | 23245 | 16315 |
4/30/2023 | 13406 | 23843 | 16540 |
5/31/2023 | 13077 | 23088 | 16280 |
6/30/2023 | 13324 | 24167 | 16680 |
7/31/2023 | 13643 | 24999 | 17006 |
8/31/2023 | 13643 | 24497 | 16870 |
9/30/2023 | 13380 | 23660 | 16611 |
10/31/2023 | 13249 | 23362 | 16545 |
11/30/2023 | 13654 | 25501 | 17355 |
12/31/2023 | 14133 | 26757 | 17844 |
1/31/2024 | 14169 | 27108 | 17997 |
2/29/2024 | 14073 | 27786 | 18227 |
3/31/2024 | 14388 | 28399 | 18464 |
4/30/2024 | 14134 | 27003 | 18031 |
5/31/2024 | 14340 | 27699 | 18306 |
6/30/2024 | 14217 | 28039 | 18459 |
7/31/2024 | 14728 | 29305 | 18943 |
8/31/2024 | 14874 | 29900 | 19197 |
9/30/2024 | 15014 | 30485 | 19450 |
10/31/2024 | 14769 | 30102 | 19327 |
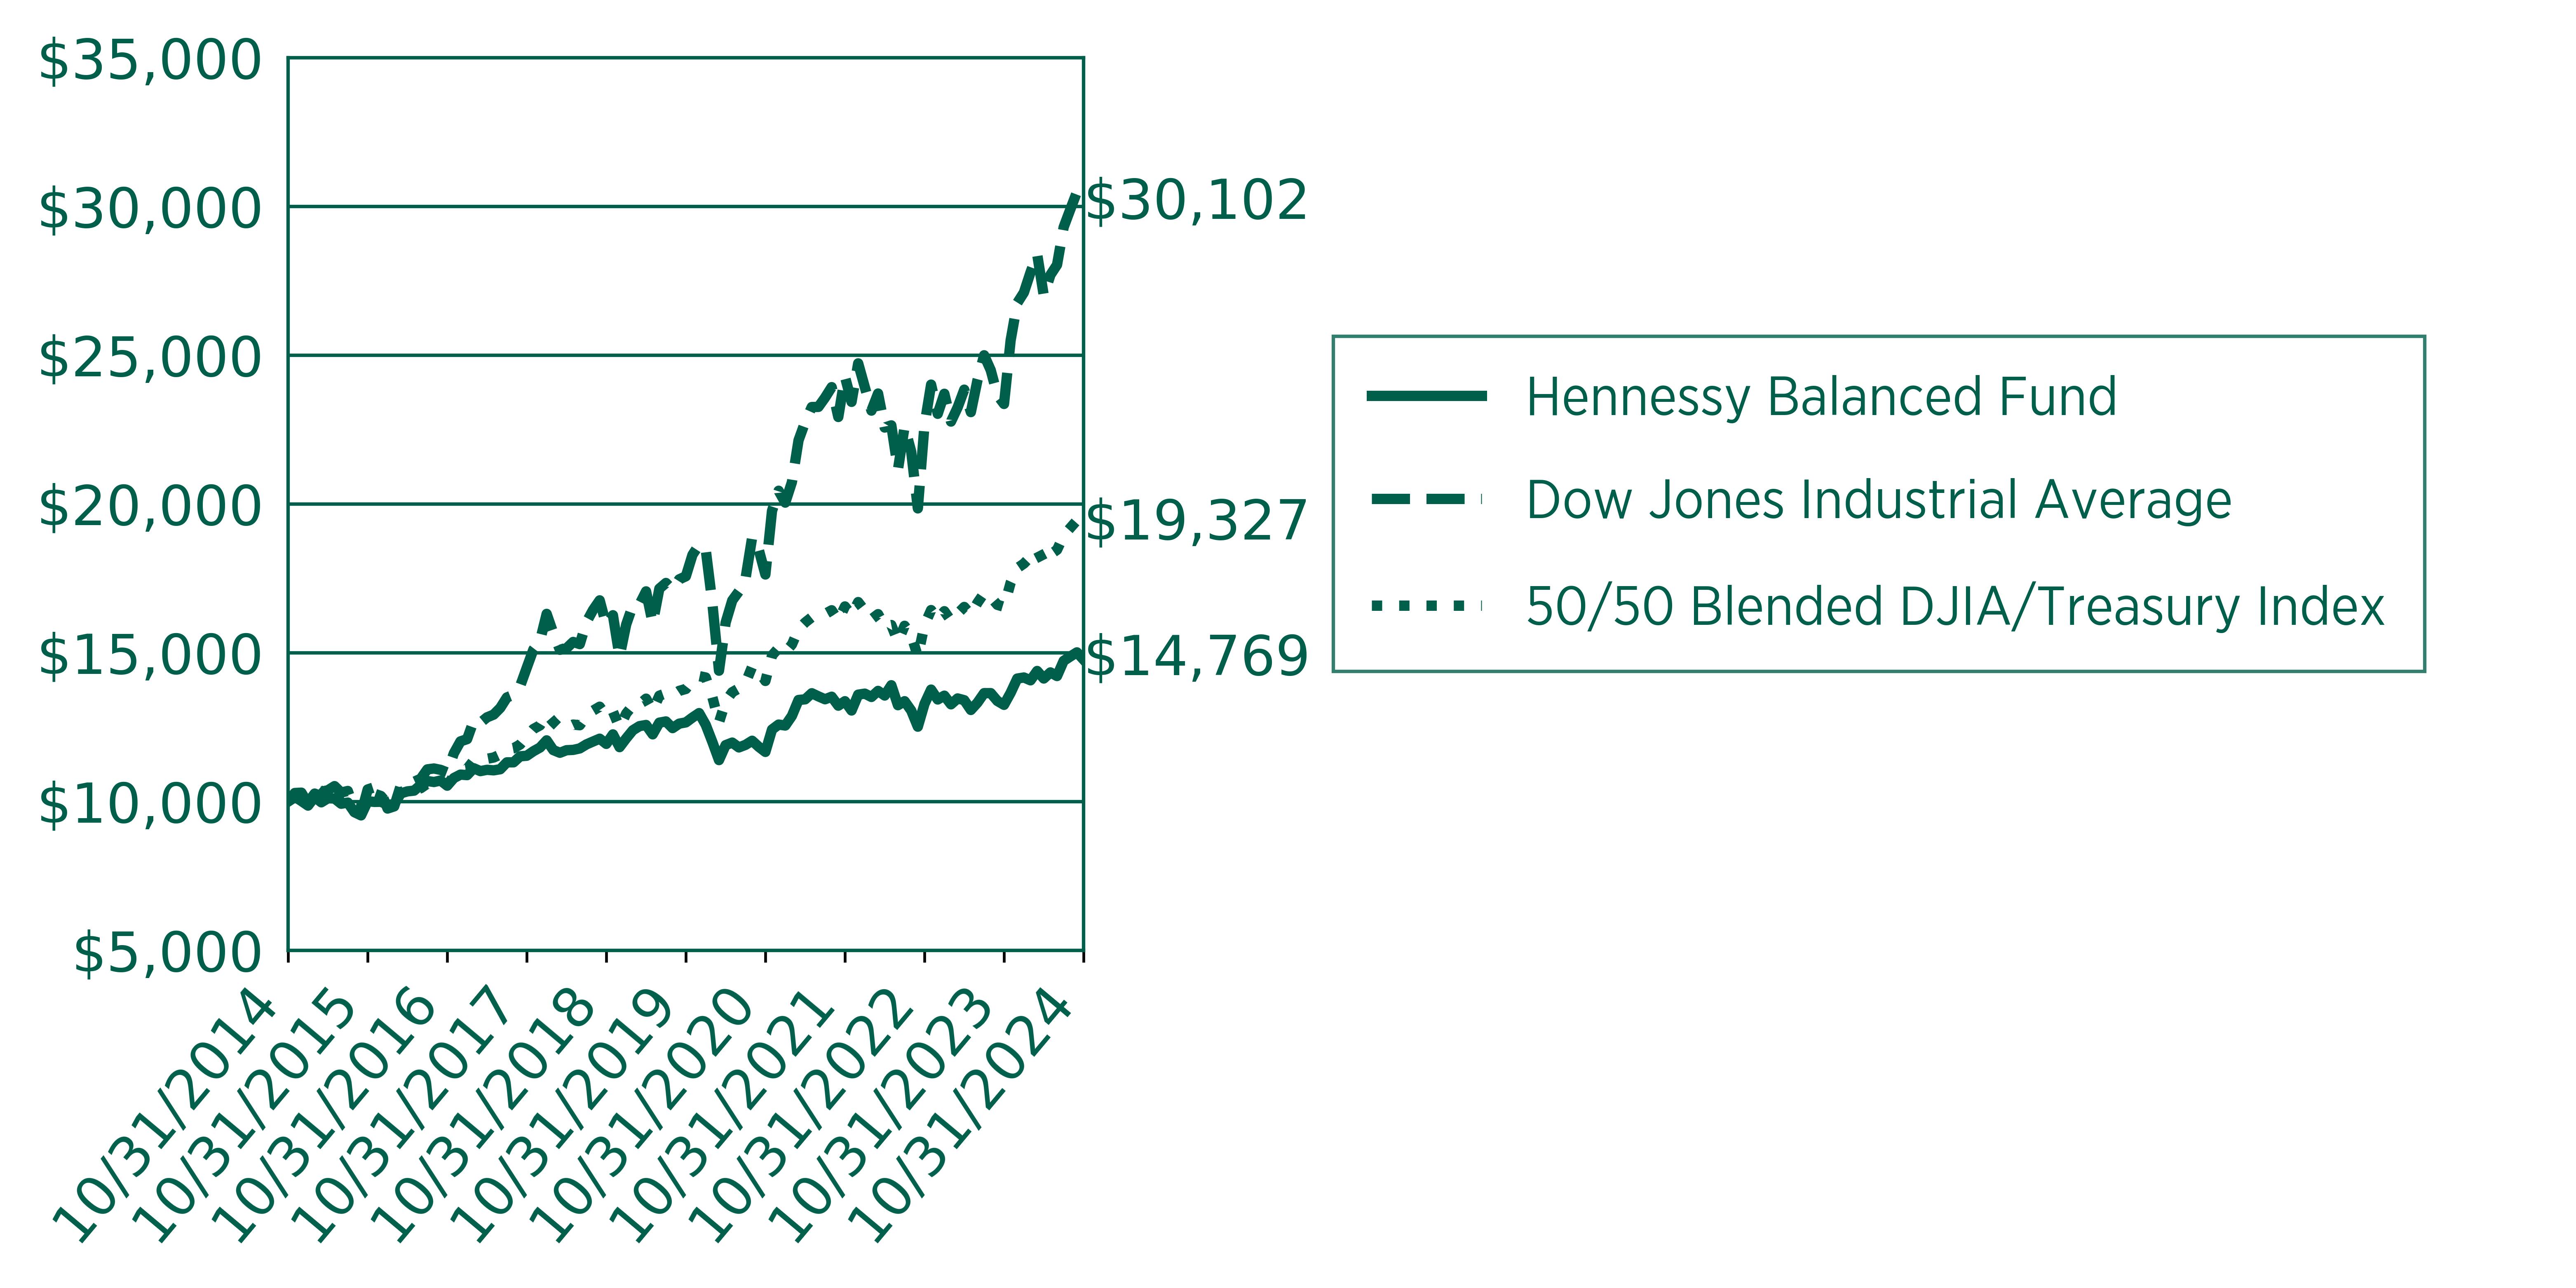
Average Annual Total Returns
for Periods Ended October 31, 2024
| 1 Year | 5 Year | 10 Year |
|---|
Hennessy Balanced Fund | 11.47% | 3.13% | 3.98% |
50/50 Blended DJIA/Treasury Index | 16.82% | 7.00% | 6.81% |
Dow Jones Industrial Average | 28.85% | 11.37% | 11.65% |
Past performance does not guarantee future results. The graph above illustrates the performance of an initial investment of $10,000 in the Fund 10 years ago compared with the performance of the indices shown. Fund performance in the graph and table assumes the reinvestment of dividends and capital gains and does not reflect the deduction of taxes that a shareholder would pay on Fund distributions or the redemption of Fund shares. Unlike the Fund, indices are not subject to fees and other expenses. Investors cannot invest directly in any index. These indices are used for comparative purposes in accordance with Securities and Exchange Commission regulations. Performance data current to the most recent month end may be obtained by visiting https://www.hennessyfunds.com/.
Key Fund Statistics
(as of October 31, 2024)
| |
|---|
Fund Size | $12,711,042 |
Number of Holdings | 16 |
Annual Portfolio Turnover | 57% |
Total Advisory Fee | $79,916 |
Sector Breakdown (% of net assets)
sector breakdown | (%) |
Communication Services | 5.04% |
Consumer Discretionary | 0.77% |
Consumer Staples | 6.39% |
Energy | 4.97% |
Financials | 3.26% |
Health Care | 10.05% |
Industrials | 4.09% |
Information Technology | 9.25% |
Materials | 4.51% |
Short-Term Investments and Other | 51.4% |
Other Assets in Excess of Liabilities | 0.19% |

Sector sub-classifications may differ from those utilized for compliance purposes.
For additional information about the Fund, including its prospectus, financial information, holdings, and proxy information, visit https://www.hennessyfunds.com/funds/regulatory-documents.
Householding
To help keep the Fund’s costs as low as possible, we generally deliver a single copy of shareholder reports, proxy statements, and prospectuses to shareholders who share an address and have the same last name. This process does not apply to account statements. you may request an individual copy of a shareholder document at any time. If you would like to receive separate mailings of shareholder documents, please call U.S. Bank Global Fund services at 800-261-6950 or 414-765-4124, and individual delivery will begin within 30 days of your request. If your account is held through a financial institution or other intermediary, please contact such intermediary directly to request individual delivery.
Annual Shareholder Report Hennessy Energy Transition Fund Investor Class HNRGX | |
This annual shareholder report contains important information about the Hennessy Energy Transition Fund – Investor Class (the “Fund”) for the period of November 1, 2023, to October 31, 2024.You can find additional information about the Fund at https://www.hennessyfunds.com/funds/regulatory-documents. You can also request this information by contacting us at 1-800-966-4354 orfundsinfo@hennessyfunds.com.
What were the Fund costs for the last year?
(based on a hypothetical $10,000 investment)
Class Name | Costs of a $10,000 investment | Costs paid as a percentage of a $10,000 investment |
|---|
Investor Class | $252 | 2.44% |
How did the Fund perform last year and what affected its performance?
For the one-year period ended October 31, 2024, the Fund underperformed both the S&P 500® Energy Index (the Fund’s primary benchmark) and the S&P 500® Index.
Factors Influencing Performance
● Holdings in Utilities, Materials, and small-capitalization Oilfield Services companies contributed the most to performance.● Holdings in large-capitalization Oilfield Services companies detracted the most from performance.● Stocks that contributed most to performance included Solaris Energy Infrastructure, Inc., NextEra Energy, Inc. and Freeport-McMoRan, Inc.● Stocks that detracted most from performance included Haliburton Co., Schlumberger N.V., and NOV, Inc.
Positioning
● At the end of the period, compared to its primary benchmark, the Fund was most overweight Exploration & Production, Materials, and Utilities companies and was most underweight Integrated Oil companies.
Performance
● The majority of underperformance was due to sub-industry allocation to large-capitalization Oilfield Services companies.
● The Fund underperformed the broader market, as represented by the S&P 500® Index, due to the Fund’s significant weighting toward hydrocarbon-oriented Energy stocks, which underperformed such broader market during the period.
How did the Fund perform over the last 10 years?
Change in Value of $10,000 Investment
Date | Hennessy Energy Transition Fund | S&P 500® Index | S&P 500® Energy Index |
10/31/2014 | 10000 | 10000 | 10000 |
11/30/2014 | 9368 | 10269 | 9151 |
12/31/2014 | 9001 | 10243 | 9197 |
1/31/2015 | 8870 | 9936 | 8754 |
2/28/2015 | 9434 | 10507 | 9109 |
3/31/2015 | 9462 | 10340 | 8934 |
4/30/2015 | 10394 | 10440 | 9529 |
5/31/2015 | 9745 | 10574 | 9075 |
6/30/2015 | 9312 | 10369 | 8766 |
7/31/2015 | 8328 | 10586 | 8096 |
8/31/2015 | 7872 | 9948 | 7757 |
9/30/2015 | 6931 | 9702 | 7240 |
10/31/2015 | 7665 | 10520 | 8068 |
11/30/2015 | 7721 | 10551 | 8049 |
12/31/2015 | 6780 | 10385 | 7255 |
1/31/2016 | 6418 | 9869 | 7036 |
2/29/2016 | 6225 | 9856 | 6904 |
3/31/2016 | 7166 | 10525 | 7546 |
4/30/2016 | 8117 | 10566 | 8203 |
5/31/2016 | 8065 | 10755 | 8155 |
6/30/2016 | 8173 | 10783 | 8423 |
7/31/2016 | 8343 | 11181 | 8260 |
8/31/2016 | 8724 | 11196 | 8355 |
9/30/2016 | 9133 | 11199 | 8613 |
10/31/2016 | 8583 | 10994 | 8362 |
11/30/2016 | 9665 | 11401 | 9065 |
12/31/2016 | 9693 | 11627 | 9239 |
1/31/2017 | 9815 | 11847 | 8907 |
2/28/2017 | 9585 | 12318 | 8712 |
3/31/2017 | 9505 | 12332 | 8622 |
4/30/2017 | 9095 | 12459 | 8373 |
5/31/2017 | 8663 | 12634 | 8088 |
6/30/2017 | 8587 | 12713 | 8074 |
7/31/2017 | 8686 | 12974 | 8276 |
8/31/2017 | 8211 | 13014 | 7847 |
9/30/2017 | 9015 | 13283 | 8627 |
10/31/2017 | 8940 | 13593 | 8569 |
11/30/2017 | 9161 | 14009 | 8720 |
12/31/2017 | 9877 | 14165 | 9146 |
1/31/2018 | 10008 | 14976 | 9495 |
2/28/2018 | 9039 | 14424 | 8468 |
3/31/2018 | 9152 | 14058 | 8608 |
4/30/2018 | 10036 | 14112 | 9414 |
5/31/2018 | 10319 | 14451 | 9700 |
6/30/2018 | 10098 | 14540 | 9769 |
7/31/2018 | 10375 | 15081 | 9908 |
8/31/2018 | 10135 | 15573 | 9581 |
9/30/2018 | 10084 | 15662 | 9829 |
10/31/2018 | 8620 | 14591 | 8722 |
11/30/2018 | 8145 | 14888 | 8578 |
12/31/2018 | 6799 | 13544 | 7491 |
1/31/2019 | 7806 | 14629 | 8323 |
2/28/2019 | 7877 | 15099 | 8541 |
3/31/2019 | 7961 | 15393 | 8722 |
4/30/2019 | 8131 | 16016 | 8728 |
5/31/2019 | 6926 | 14998 | 7755 |
6/30/2019 | 7609 | 16055 | 8474 |
7/31/2019 | 7420 | 16286 | 8323 |
8/31/2019 | 6583 | 16028 | 7652 |
9/30/2019 | 6813 | 16328 | 7940 |
10/31/2019 | 6625 | 16681 | 7759 |
11/30/2019 | 6578 | 17287 | 7900 |
12/31/2019 | 7190 | 17809 | 8376 |
1/31/2020 | 6348 | 17802 | 7449 |
2/29/2020 | 5402 | 16336 | 6365 |
3/31/2020 | 2884 | 14319 | 4150 |
4/30/2020 | 4192 | 16154 | 5386 |
5/31/2020 | 4371 | 16923 | 5487 |
6/30/2020 | 4320 | 17260 | 5416 |
7/31/2020 | 4451 | 18233 | 5139 |
8/31/2020 | 4578 | 19544 | 5086 |
9/30/2020 | 3915 | 18801 | 4348 |
10/31/2020 | 4112 | 18301 | 4156 |
11/30/2020 | 5054 | 20305 | 5321 |
12/31/2020 | 5341 | 21085 | 5555 |
1/31/2021 | 5741 | 20872 | 5765 |
2/28/2021 | 6809 | 21448 | 7072 |
3/31/2021 | 6945 | 22387 | 7269 |
4/30/2021 | 7011 | 23582 | 7312 |
5/31/2021 | 7514 | 23747 | 7734 |
6/30/2021 | 7886 | 24301 | 8091 |
7/31/2021 | 7147 | 24878 | 7422 |
8/31/2021 | 7006 | 25635 | 7270 |
9/30/2021 | 7980 | 24443 | 7956 |
10/31/2021 | 8615 | 26155 | 8781 |
11/30/2021 | 8065 | 25974 | 8334 |
12/31/2021 | 8300 | 27138 | 8591 |
1/31/2022 | 9344 | 25734 | 10232 |
2/28/2022 | 10180 | 24963 | 10961 |
3/31/2022 | 11228 | 25890 | 11943 |
4/30/2022 | 11095 | 23632 | 11759 |
5/31/2022 | 12703 | 23676 | 13614 |
6/30/2022 | 10318 | 21721 | 11326 |
7/31/2022 | 11319 | 23724 | 12427 |
8/31/2022 | 11559 | 22757 | 12778 |
9/30/2022 | 10414 | 20661 | 11592 |
10/31/2022 | 12858 | 22334 | 14485 |
11/30/2022 | 13001 | 23582 | 14668 |
12/31/2022 | 12245 | 22223 | 14236 |
1/31/2023 | 12721 | 23619 | 14636 |
2/28/2023 | 12020 | 23043 | 13595 |
3/31/2023 | 11603 | 23889 | 13571 |
4/30/2023 | 11742 | 24262 | 14019 |
5/31/2023 | 10789 | 24367 | 12613 |
6/30/2023 | 11844 | 25977 | 13451 |
7/31/2023 | 13064 | 26812 | 14446 |
8/31/2023 | 13149 | 26385 | 14708 |
9/30/2023 | 13144 | 25127 | 15094 |
10/31/2023 | 12962 | 24599 | 14193 |
11/30/2023 | 12786 | 26845 | 14050 |
12/31/2023 | 12700 | 28065 | 14047 |
1/31/2024 | 12341 | 28536 | 13994 |
2/29/2024 | 12796 | 30060 | 14439 |
3/31/2024 | 14215 | 31027 | 15970 |
4/30/2024 | 14284 | 29760 | 15848 |
5/31/2024 | 14643 | 31236 | 15786 |
6/30/2024 | 14113 | 32356 | 15583 |
7/31/2024 | 14514 | 32750 | 15912 |
8/31/2024 | 14252 | 33545 | 15641 |
9/30/2024 | 13968 | 34261 | 15222 |
10/31/2024 | 13851 | 33950 | 15342 |
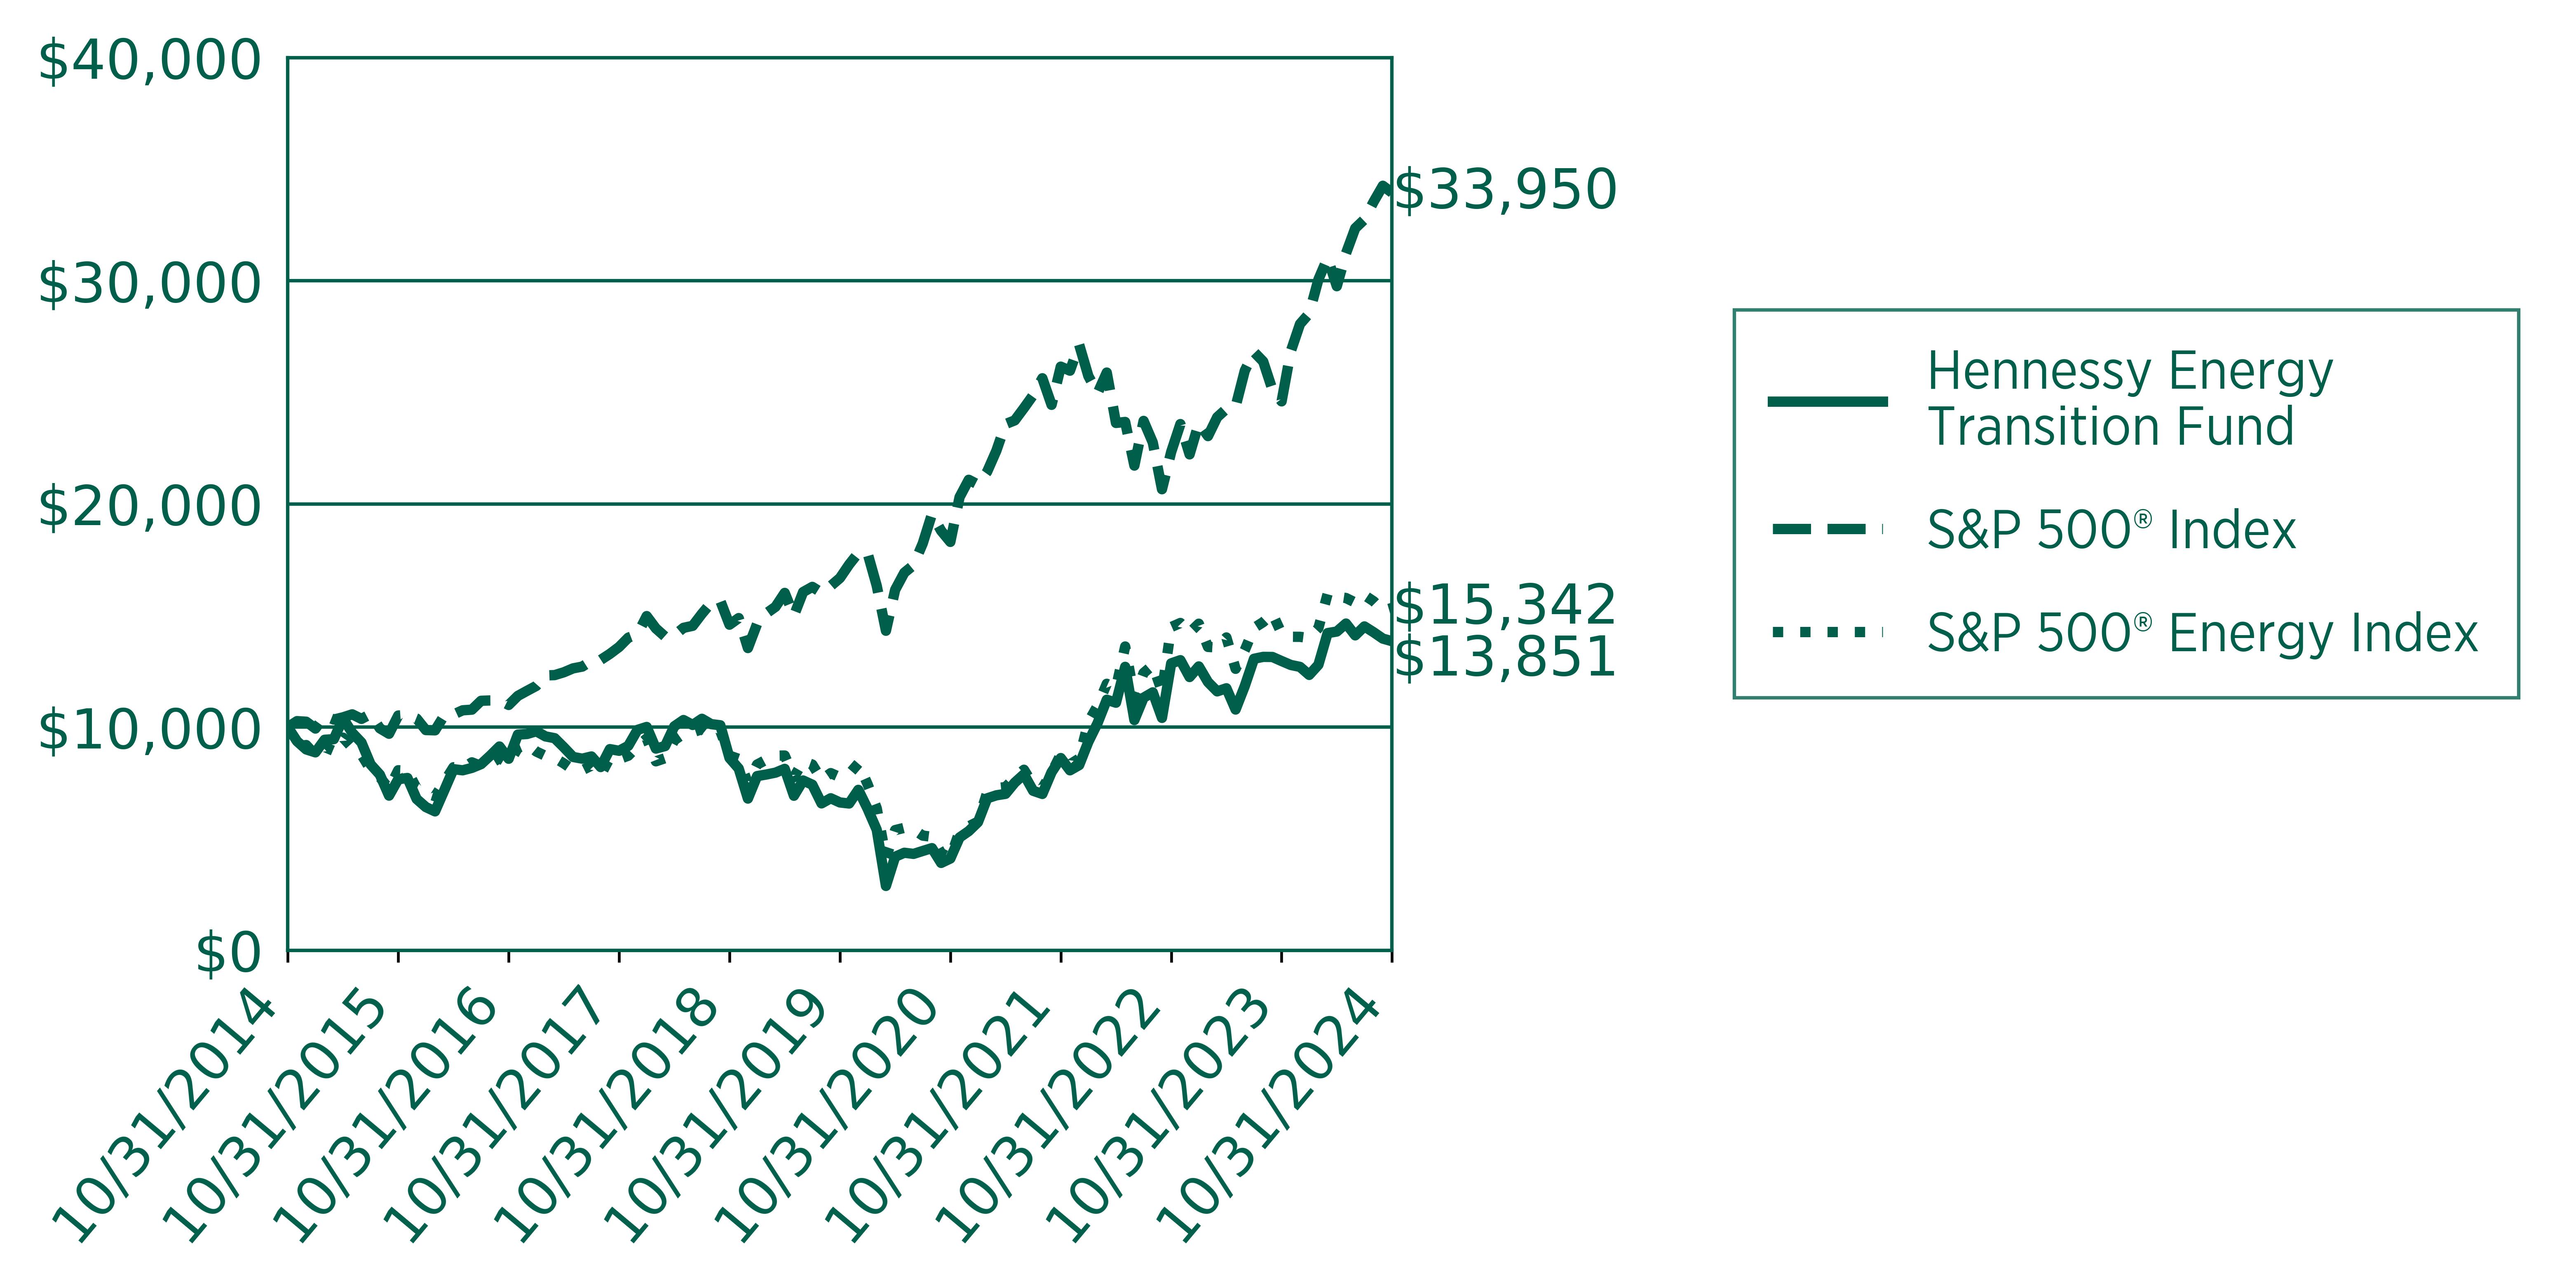
Average Annual Total Returns
for Periods Ended October 31, 2024
| 1 Year | 5 Year | 10 Year |
|---|
Hennessy Energy Transition Fund | 6.85% | 15.89% | 3.31% |
S&P 500® Energy Index | 8.09% | 14.61% | 4.37% |
S&P 500® Index | 38.02% | 15.27% | 13.00% |
Past performance does not guarantee future results. The graph above illustrates the performance of an initial investment of $10,000 in the Fund 10 years ago compared with the performance of the indices shown. Fund performance in the graph and table assumes the reinvestment of dividends and capital gains and does not reflect the deduction of taxes that a shareholder would pay on Fund distributions or the redemption of Fund shares. Unlike the Fund, indices are not subject to fees and other expenses. Investors cannot invest directly in any index. These indices are used for comparative purposes in accordance with Securities and Exchange Commission regulations. Performance data current to the most recent month end may be obtained by visiting https://www.hennessyfunds.com/. Performance for periods including or prior to October 26, 2018, is that of the BP Capital TwinLine Energy Fund.Standard & Poor’s Financial Services is the source and owner of the S&P® and S&P 500® trademarks.
Key Fund Statistics
(as of October 31, 2024)
| |
|---|
Fund Size | $14,612,549 |
Number of Holdings | 24 |
Annual Portfolio Turnover | 14% |
Total Advisory Fee | $193,777 |
Sector Breakdown (% of net assets)
sector breakdown | (%) |
Downstream | 5.81% |
Exploration and Production | 41.80% |
Integrated | 11.80% |
Materials | 4.44% |
Midstream | 6.42% |
Oil Services | 19.67% |
Utilities | 9.75% |
Short-Term Investments and Other | 1.37% |
Liabilities in Excess of Other Assets | -1.12% |

Sector sub-classifications may differ from those utilized for compliance purposes.
For additional information about the Fund, including its prospectus, financial information, holdings, and proxy information, visit https://www.hennessyfunds.com/funds/regulatory-documents.
Householding
To help keep the Fund’s costs as low as possible, we generally deliver a single copy of shareholder reports, proxy statements, and prospectuses to shareholders who share an address and have the same last name. This process does not apply to account statements. you may request an individual copy of a shareholder document at any time. If you would like to receive separate mailings of shareholder documents, please call U.S. Bank Global Fund services at 800-261-6950 or 414-765-4124, and individual delivery will begin within 30 days of your request. If your account is held through a financial institution or other intermediary, please contact such intermediary directly to request individual delivery.
Annual Shareholder Report Hennessy Energy Transition Fund Institutional Class HNRIX | |
This annual shareholder report contains important information about the Hennessy Energy Transition Fund – Institutional Class (the “Fund”) for the period of November 1, 2023, to October 31, 2024. You can find additional information about the Fund at https://www.hennessyfunds.com/funds/regulatory-documents. You can also request this information by contacting us at1-800-966-4354 or fundsinfo@hennessyfunds.com.
What were the Fund costs for the last year?
(based on a hypothetical $10,000 investment)
Class Name | Costs of a $10,000 investment | Costs paid as a percentage of a $10,000 investment |
|---|
Institutional Class | $219 | 2.11% |
How did the Fund perform last year and what affected its performance?
For the one-year period ended October 31, 2024, the Fund underperformed both the S&P 500® Energy Index (the Fund’s primary benchmark) and the S&P 500® Index.
Factors Influencing Performance
● Holdings in Utilities, Materials, and small-capitalization Oilfield Services companies contributed the most to performance.● Holdings in large-capitalization Oilfield Services companies detracted the most from performance.● Stocks that contributed most to performance included Solaris Energy Infrastructure, Inc., NextEra Energy, Inc. and Freeport-McMoRan, Inc.● Stocks that detracted most from performance included Haliburton Co., Schlumberger N.V., and NOV, Inc.
Positioning
● At the end of the period, compared to its primary benchmark, the Fund was most overweight Exploration & Production, Materials, and Utilities companies and was most underweight Integrated Oil companies.
Performance
● The majority of underperformance was due to sub-industry allocation to large-capitalization Oilfield Services companies.
● The Fund underperformed the broader market, as represented by the S&P 500® Index, due to the Fund’s significant weighting toward hydrocarbon-oriented Energy stocks, which underperformed such broader market during the period.
How did the Fund perform over the last 10 years?
Change in Value of $250,000 Investment
Date | Hennessy Energy Transition Fund | S&P 500® Index | S&P 500® Energy Index |
10/31/2014 | 250000 | 250000 | 250000 |
11/30/2014 | 234089 | 256724 | 228787 |
12/31/2014 | 224930 | 256077 | 229924 |
1/31/2015 | 221755 | 248390 | 218865 |
2/28/2015 | 235865 | 262665 | 227736 |
3/31/2015 | 236688 | 258511 | 223364 |
4/30/2015 | 259969 | 260991 | 238218 |
5/31/2015 | 243860 | 264347 | 226872 |
6/30/2015 | 233043 | 259230 | 219161 |
7/31/2015 | 208469 | 264661 | 202394 |
8/31/2015 | 197064 | 248693 | 193941 |
9/30/2015 | 173548 | 242540 | 181002 |
10/31/2015 | 192008 | 262999 | 201715 |
11/30/2015 | 193536 | 263781 | 201226 |
12/31/2015 | 170020 | 259621 | 181370 |
1/31/2016 | 160967 | 246737 | 175891 |
2/29/2016 | 156146 | 246404 | 172591 |
3/31/2016 | 179779 | 263120 | 188657 |
4/30/2016 | 203648 | 264140 | 205072 |
5/31/2016 | 202472 | 268883 | 203883 |
6/30/2016 | 205294 | 269580 | 210573 |
7/31/2016 | 209527 | 279519 | 206509 |
8/31/2016 | 219169 | 279912 | 208889 |
9/30/2016 | 229516 | 279965 | 215325 |
10/31/2016 | 215641 | 274858 | 209061 |
11/30/2016 | 243104 | 285037 | 226631 |
12/31/2016 | 243693 | 290671 | 230991 |
1/31/2017 | 246873 | 296184 | 222681 |
2/28/2017 | 241220 | 307944 | 217795 |
3/31/2017 | 239217 | 308304 | 215557 |
4/30/2017 | 228970 | 311470 | 209329 |
5/31/2017 | 218016 | 315853 | 202210 |
6/30/2017 | 216250 | 317824 | 201852 |
7/31/2017 | 218723 | 324360 | 206901 |
8/31/2017 | 206827 | 325353 | 196174 |
9/30/2017 | 227086 | 332064 | 215667 |
10/31/2017 | 225319 | 339813 | 214241 |
11/30/2017 | 230973 | 350235 | 218016 |
12/31/2017 | 248993 | 354129 | 228660 |
1/31/2018 | 252291 | 374404 | 237380 |
2/28/2018 | 228028 | 360605 | 211694 |
3/31/2018 | 230855 | 351441 | 215213 |
4/30/2018 | 253234 | 352789 | 235348 |
5/31/2018 | 260418 | 361285 | 242503 |
6/30/2018 | 254882 | 363509 | 244224 |
7/31/2018 | 262067 | 377036 | 247693 |
8/31/2018 | 255943 | 389322 | 239526 |
9/30/2018 | 254647 | 391538 | 245723 |
10/31/2018 | 217899 | 364776 | 218043 |
11/30/2018 | 205767 | 372210 | 214455 |
12/31/2018 | 171963 | 338603 | 187282 |
1/31/2019 | 197404 | 365737 | 208091 |
2/28/2019 | 199289 | 377480 | 213542 |
3/31/2019 | 201409 | 384815 | 218048 |
4/30/2019 | 205767 | 400396 | 218199 |
5/31/2019 | 175379 | 374952 | 193891 |
6/30/2019 | 192693 | 401377 | 211866 |
7/31/2019 | 187982 | 407146 | 208089 |
8/31/2019 | 166899 | 400696 | 191302 |
9/30/2019 | 172670 | 408194 | 198516 |
10/31/2019 | 167959 | 417035 | 193976 |
11/30/2019 | 166781 | 432173 | 197503 |
12/31/2019 | 182370 | 445217 | 209406 |
1/31/2020 | 161005 | 445042 | 186229 |
2/29/2020 | 137043 | 408407 | 159121 |
3/31/2020 | 73184 | 357963 | 103754 |
4/30/2020 | 106353 | 403852 | 134651 |
5/31/2020 | 110838 | 423087 | 137187 |
6/30/2020 | 109658 | 431501 | 135408 |
7/31/2020 | 112963 | 455831 | 128465 |
8/31/2020 | 116150 | 488596 | 127154 |
9/30/2020 | 99388 | 470031 | 108700 |
10/31/2020 | 104464 | 457531 | 103902 |
11/30/2020 | 128426 | 507614 | 133030 |
12/31/2020 | 135626 | 527131 | 138881 |
1/31/2021 | 145896 | 521809 | 144138 |
2/28/2021 | 173045 | 536198 | 176796 |
3/31/2021 | 176586 | 559681 | 181732 |
4/30/2021 | 178238 | 589551 | 182805 |
5/31/2021 | 191222 | 593669 | 193347 |
6/30/2021 | 200784 | 607528 | 202269 |
7/31/2021 | 182015 | 621959 | 185546 |
8/31/2021 | 178474 | 640871 | 181752 |
9/30/2021 | 203380 | 611064 | 198911 |
10/31/2021 | 219552 | 653876 | 219526 |
11/30/2021 | 205505 | 649345 | 208357 |
12/31/2021 | 211602 | 678446 | 214770 |
1/31/2022 | 238202 | 643339 | 255800 |
2/28/2022 | 259723 | 624076 | 274031 |
3/31/2022 | 286458 | 647248 | 298587 |
4/30/2022 | 283116 | 590807 | 293990 |
5/31/2022 | 324287 | 591891 | 340348 |
6/30/2022 | 263600 | 543034 | 283155 |
7/31/2022 | 288997 | 593104 | 310676 |
8/31/2022 | 295280 | 568916 | 319465 |
9/30/2022 | 266273 | 516520 | 289808 |
10/31/2022 | 328698 | 558338 | 362142 |
11/30/2022 | 332440 | 589540 | 366696 |
12/31/2022 | 313192 | 555574 | 355909 |
1/31/2023 | 325451 | 590483 | 365911 |
2/28/2023 | 307669 | 576076 | 339871 |
3/31/2023 | 297162 | 597226 | 339291 |
4/30/2023 | 300665 | 606548 | 350491 |
5/31/2023 | 276417 | 609184 | 315320 |
6/30/2023 | 303493 | 649436 | 336274 |
7/31/2023 | 334880 | 670299 | 361147 |
8/31/2023 | 337170 | 659627 | 367698 |
9/30/2023 | 337170 | 628177 | 377366 |
10/31/2023 | 332455 | 614969 | 354826 |
11/30/2023 | 328145 | 671131 | 351263 |
12/31/2023 | 325989 | 701621 | 351187 |
1/31/2024 | 316829 | 713411 | 349865 |
2/29/2024 | 328684 | 751504 | 360978 |
3/31/2024 | 365189 | 775684 | 399250 |
4/30/2024 | 367075 | 744001 | 396200 |
5/31/2024 | 376370 | 780892 | 394666 |
6/30/2024 | 362899 | 808912 | 389578 |
7/31/2024 | 373271 | 818759 | 397804 |
8/31/2024 | 366671 | 838619 | 391045 |
9/30/2024 | 359531 | 856530 | 380555 |
10/31/2024 | 356433 | 848762 | 383554 |

Average Annual Total Returns
for Periods Ended October 31, 2024
| 1 Year | 5 Year | 10 Year |
|---|
Hennessy Energy Transition Fund | 7.21% | 16.24% | 3.61% |
S&P 500® Energy Index | 8.09% | 14.61% | 4.37% |
S&P 500® Index | 38.02% | 15.27% | 13.00% |
Past performance does not guarantee future results. The graph above illustrates the performance of an initial investment of $250,000 in the Fund 10 years ago compared with the performance of the indices shown. Fund performance in the graph and table assumes the reinvestment of dividends and capital gains and does not reflect the deduction of taxes that a shareholder would pay on Fund distributions or the redemption of Fund shares. Unlike the Fund, indices are not subject to fees and other expenses. Investors cannot invest directly in any index. These indices are used for comparative purposes in accordance with Securities and Exchange Commission regulations. Performance data current to the most recent month end may be obtained by visiting https://www.hennessyfunds.com/. Performance for periods including or prior to October 26, 2018, is that of the BP Capital TwinLine Energy Fund.Standard & Poor’s Financial Services is the source and owner of the S&P® and S&P 500® trademarks.
Key Fund Statistics
(as of October 31, 2024)
| |
|---|
Fund Size | $14,612,549 |
Number of Holdings | 24 |
Annual Portfolio Turnover | 14% |
Total Advisory Fee | $193,777 |
Sector Breakdown (% of net assets)
sector breakdown | (%) |
Downstream | 5.81% |
Exploration and Production | 41.80% |
Integrated | 11.80% |
Materials | 4.44% |
Midstream | 6.42% |
Oil Services | 19.67% |
Utilities | 9.75% |
Short-Term Investments and Other | 1.37% |
Liabilities in Excess of Other Assets | -1.12% |
Sector sub-classifications may differ from those utilized for compliance purposes.
For additional information about the Fund, including its prospectus, financial information, holdings, and proxy information, visit https://www.hennessyfunds.com/funds/regulatory-documents.
Householding
To help keep the Fund’s costs as low as possible, we generally deliver a single copy of shareholder reports, proxy statements, and prospectuses to shareholders who share an address and have the same last name. This process does not apply to account statements. you may request an individual copy of a shareholder document at any time. If you would like to receive separate mailings of shareholder documents, please call U.S. Bank Global Fund services at 800-261-6950 or 414-765-4124, and individual delivery will begin within 30 days of your request. If your account is held through a financial institution or other intermediary, please contact such intermediary directly to request individual delivery.
Annual Shareholder Report Hennessy Midstream Fund Investor Class HMSFX | |
This annual shareholder report contains important information about the Hennessy Midstream Fund – Investor Class (the “Fund”) for the period of November 1, 2023, to October 31, 2024.You can find additional information about the Fund at https://www.hennessyfunds.com/funds/regulatory-documents. You can also request this information by contacting us at 1-800-966-4354 orfundsinfo@hennessyfunds.com.
What were the Fund costs for the last year?
(based on a hypothetical $10,000 investment)
Class Name | Costs of a $10,000 investment | Costs paid as a percentage of a $10,000 investment |
|---|
Investor Class | $201 | 1.75% |
How did the Fund perform last year and what affected its performance?
For the one-year period ended October 31, 2024, the Fund underperformed both the Alerian US Midstream Energy Index (the Fund’s primary benchmark) and the S&P 500® Index.
Factors Influencing Performance
● Holdings in large-capitalization hydrocarbon processing and transportation companies structured as master limited partnerships and C-corp. companies contributed the most to performance.● Holdings in the natural gas transportation-oriented master limited partnerships and natural gas liquid processing C-corp. structured companies detracted the most from performance.● Stocks that contributed most to performance included Energy Transfer, LP, ONEOK, Inc., and MPLX, LP.● Stocks that detracted most from performance included Cheniere Energy Partners, LP and EnLink Midstream, LLC.
Positioning
● At the end of the period, compared to its primary benchmark, the Fund was most overweight natural gas and natural gas liquids transportation master limited partnerships and C corp. structured companies and was most underweight gathering and processing service-oriented companies.
Performance
● The majority of the Fund’s underperformance was due to stock selection, rather than sub-industry allocation.
● The Fund underperformed the broader market, as represented by the S&P 500® Index, due to the Fund’s significant weighting toward hydrocarbon-oriented transportation master limited partnerships and C-corp. structured companies, which underperformed such broader market during the period.
How did the Fund perform over the last 10 years?
Change in Value of $10,000 Investment
Date | Hennessy Midstream Fund | S&P 500® Index | Alerian US Midstream Energy Index |
10/31/14 | 10000 | 10000 | 10000 |
10/31/15 | 7665 | 10520 | 7280 |
10/31/16 | 7994 | 10994 | 7351 |
10/31/17 | 7798 | 13593 | 7175 |
10/31/18 | 7238 | 14591 | 7420 |
10/31/19 | 6784 | 16681 | 7354 |
10/31/20 | 3926 | 18301 | 4626 |
10/31/21 | 7004 | 26155 | 8788 |
10/31/22 | 8687 | 22334 | 11093 |
10/31/23 | 10110 | 24599 | 12337 |
10/31/24 | 12618 | 33950 | 17806 |

Average Annual Total Returns
for Periods Ended October 31, 2024
| 1 Year | 5 Year | 10 Year |
|---|
Hennessy Midstream Fund | 24.81% | 13.22% | 2.35% |
Alerian US Midstream Energy Index | 44.33% | 19.35% | 5.94% |
S&P 500® Index | 38.02% | 15.27% | 13.00% |
Past performance does not guarantee future results. The graph above illustrates the performance of an initial investment of $10,000 in the Fund 10 years ago compared with the performance of the indices shown. Fund performance in the graph and table assumes the reinvestment of dividends and capital gains and does not reflect the deduction of taxes that a shareholder would pay on Fund distributions or the redemption of Fund shares. Unlike the Fund, indices are not subject to fees and other expenses. Investors cannot invest directly in any index. These indices are used for comparative purposes in accordance with Securities and Exchange Commission regulations. Performance data current to the most recent month end may be obtained by visiting https://www.hennessyfunds.com/. Performance for periods including or prior to October 26, 2018, is that of the BP Capital TwinLine MLP Fund.Standard & Poor’s Financial Services is the source and owner of the S&P® and S&P 500® trademarks.The Alerian US Midstream Energy Index is a servicemark of GKD Index Partners, LLC d/b/a Alerian (“Alerian”), and its use is granted under a license from Alerian. Alerian makes no express or implied warranties, representations, or promises regarding the originality, merchantability, suitability, or fitness for a particular purpose or use with respect to the Alerian indices. No party may rely on, and Alerian does not accept any liability for any errors, omissions, interruptions, or defects in, the Alerian indices or underlying data. In no event shall Alerian have any liability for any direct, indirect, special, incidental, punitive, consequential, or other damages (including lost profits), even if notified of the possibility of such damages.
Key Fund Statistics
(as of October 31, 2024)
| |
|---|
Fund Size | $67,303,172 |
Number of Holdings | 17 |
Annual Portfolio Turnover | 6% |
Total Advisory Fee | $686,633 |
Sector Breakdown (% of net assets)
sector breakdown | (%) |
Crude Oil and Refined Products | 21.00% |
Geathering and Processing | 24.40% |
Natural Gas/NGL Transportation | 56.70% |
Short-Term Investments and Other | 5.80% |
Liabilities in Excess of Other Assets | -7.90% |
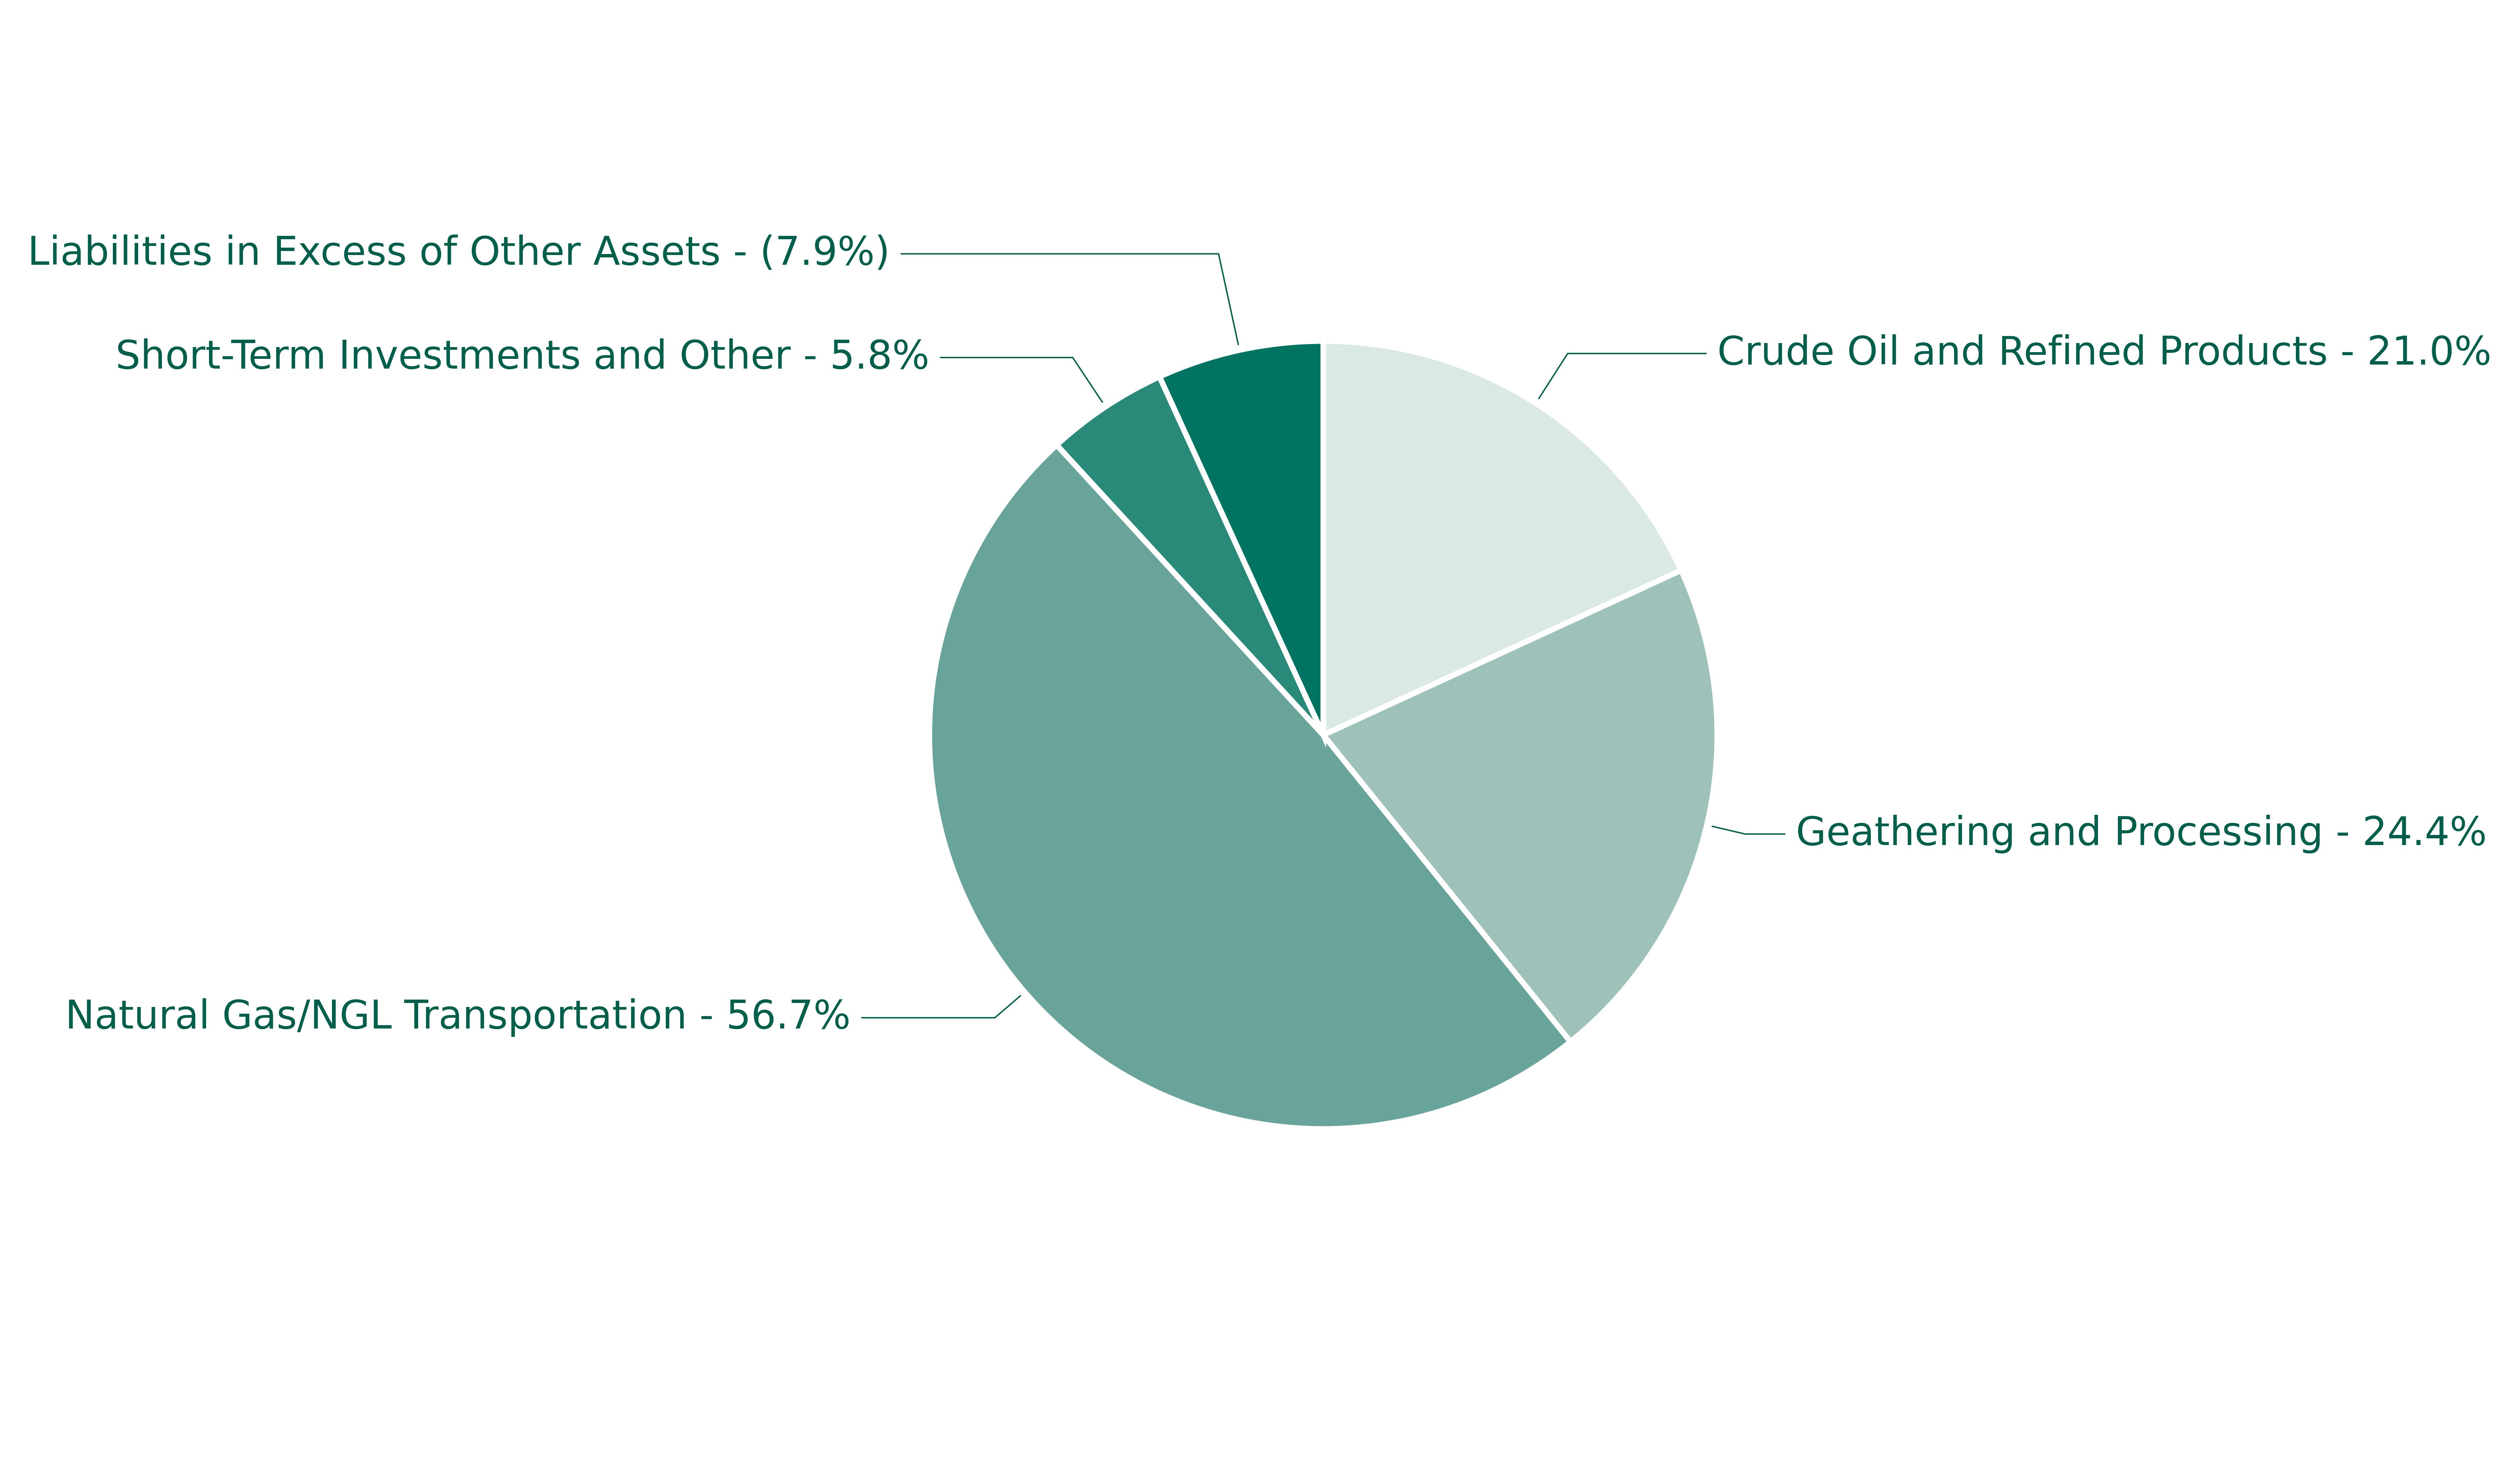
Sector sub-classifications may differ from those utilized for compliance purposes.
Specified Level of Distributions Disclosure
The Fund’s dividend distribution policy is intended to provide consistent distributions to its shareholders at a rate that over time is similar to the distribution rate the Fund receives from the companies in which it invests, without offset for the expenses of the Fund. Under the distribution policy, to the extent that sufficient investment income is not available on a quarterly basis, the Fund’s distributions could consist of return of capital in order to maintain the distribution rate. A return of capital occurs when some or all of the money that a shareholder invested in the Fund is paid back to the shareholder. During fiscal year 2024, the Fund maintained consistent distributions of $0.2575 per share per quarter. On a tax basis, the estimated component of the cumulative distribution for fiscal year 2024 includes an estimated return of capital of $0.7774 (75.48%) per share. This amount is an estimate, and the actual amounts and sources for tax reporting purposes may change upon final determination of tax characteristics and based on tax regulations.
For additional information about the Fund, including its prospectus, financial information, holdings, and proxy information, visit https://www.hennessyfunds.com/funds/regulatory-documents.
Householding
To help keep the Fund’s costs as low as possible, we generally deliver a single copy of shareholder reports, proxy statements, and prospectuses to shareholders who share an address and have the same last name. This process does not apply to account statements. you may request an individual copy of a shareholder document at any time. If you would like to receive separate mailings of shareholder documents, please call U.S. Bank Global Fund services at 800-261-6950 or 414-765-4124, and individual delivery will begin within 30 days of your request. If your account is held through a financial institution or other intermediary, please contact such intermediary directly to request individual delivery.
Annual Shareholder Report Hennessy Midstream Fund Institutional Class HMSIX | |
This annual shareholder report contains important information about the Hennessy Midstream Fund – Institutional Class (the “Fund”) for the period of November 1, 2023, to October 31, 2024.You can find additional information about the Fund at https://www.hennessyfunds.com/funds/regulatory-documents. You can also request this information by contacting us at 1-800-966-4354 orfundsinfo@hennessyfunds.com.
What were the Fund costs for the last year?
(based on a hypothetical $10,000 investment)
Class Name | Costs of a $10,000 investment | Costs paid as a percentage of a $10,000 investment |
|---|
Institutional Class | $169 | 1.50% |
How did the Fund perform last year and what affected its performance?
For the one-year period ended October 31, 2024, the Fund underperformed both the Alerian US Midstream Energy Index (the Fund’s primary benchmark) and the S&P 500® Index.
Factors Influencing Performance
● Holdings in large-capitalization hydrocarbon processing and transportation companies structured as master limited partnerships and C-corp. companies contributed the most to performance.● Holdings in the natural gas transportation-oriented master limited partnerships and natural gas liquid processing C-corp. structured companies detracted the most from performance.● Stocks that contributed most to performance included Energy Transfer, LP, ONEOK, Inc., and MPLX, LP.● Stocks that detracted most from performance included Cheniere Energy Partners, LP and EnLink Midstream, LLC.
Positioning
● At the end of the period, compared to its primary benchmark, the Fund was most overweight natural gas and natural gas liquids transportation master limited partnerships and C corp. structured companies and was most underweight gathering and processing service-oriented companies.
Performance
● The majority of the Fund’s underperformance was due to stock selection, rather than sub-industry allocation.
● The Fund underperformed the broader market, as represented by the S&P 500® Index, due to the Fund’s significant weighting toward hydrocarbon-oriented transportation master limited partnerships and C-corp. structured companies, which underperformed such broader market during the period.
How did the Fund perform over the last 10 years?
Change in Value of $250,000 Investment
Date | Hennessy Midstream Fund | S&P 500® Index | Alerian US Midstream Energy Index |
10/31/14 | 250000 | 250000 | 250000 |
10/31/15 | 192167 | 262999 | 181997 |
10/31/16 | 200963 | 274858 | 183773 |
10/31/17 | 196466 | 339813 | 179363 |
10/31/18 | 182934 | 364776 | 185512 |
10/31/19 | 171768 | 417035 | 183844 |
10/31/20 | 99740 | 457531 | 115648 |
10/31/21 | 178106 | 653876 | 219710 |
10/31/22 | 221591 | 558338 | 277314 |
10/31/23 | 258528 | 614969 | 308432 |
10/31/24 | 323938 | 848762 | 445154 |

Average Annual Total Returns
for Periods Ended October 31, 2024
| 1 Year | 5 Year | 10 Year |
|---|
Hennessy Midstream Fund | 25.30% | 13.53% | 2.62% |
Alerian US Midstream Energy Index | 44.33% | 19.35% | 5.94% |
S&P 500® Index | 38.02% | 15.27% | 13.00% |
Past performance does not guarantee future results. The graph above illustrates the performance of an initial investment of $250,000 in the Fund 10 years ago compared with the performance of the indices shown. Fund performance in the graph and table assumes the reinvestment of dividends and capital gains and does not reflect the deduction of taxes that a shareholder would pay on Fund distributions or the redemption of Fund shares. Unlike the Fund, indices are not subject to fees and other expenses. Investors cannot invest directly in any index. These indices are used for comparative purposes in accordance with Securities and Exchange Commission regulations. Performance data current to the most recent month end may be obtained by visiting https://www.hennessyfunds.com/. Performance for periods including or prior to October 26, 2018, is that of the BP Capital TwinLine MLP Fund.Standard & Poor’s Financial Services is the source and owner of the S&P® and S&P 500® trademarks.The Alerian US Midstream Energy Index is a servicemark of GKD Index Partners, LLC d/b/a Alerian (“Alerian”), and its use is granted under a license from Alerian. Alerian makes no express or implied warranties, representations, or promises regarding the originality, merchantability, suitability, or fitness for a particular purpose or use with respect to the Alerian indices. No party may rely on, and Alerian does not accept any liability for any errors, omissions, interruptions, or defects in, the Alerian indices or underlying data. In no event shall Alerian have any liability for any direct, indirect, special, incidental, punitive, consequential, or other damages (including lost profits), even if notified of the possibility of such damages.
Key Fund Statistics
(as of October 31, 2024)
| |
|---|
Fund Size | $67,303,172 |
Number of Holdings | 17 |
Annual Portfolio Turnover | 6% |
Total Advisory Fee | $686,633 |
Sector Breakdown (% of net assets)
sector breakdown | (%) |
Crude Oil and Refined Products | 21.00% |
Geathering and Processing | 24.40% |
Natural Gas/NGL Transportation | 56.70% |
Short-Term Investments and Other | 5.80% |
Liabilities in Excess of Other Assets | -7.90% |
Sector sub-classifications may differ from those utilized for compliance purposes.
Specified Level of Distributions Disclosure
The Fund’s dividend distribution policy is intended to provide consistent distributions to its shareholders at a rate that over time is similar to the distribution rate the Fund receives from the companies in which it invests, without offset for the expenses of the Fund. Under the distribution policy, to the extent that sufficient investment income is not available on a quarterly basis, the Fund’s distributions could consist of return of capital in order to maintain the distribution rate. A return of capital occurs when some or all of the money that a shareholder invested in the Fund is paid back to the shareholder. During fiscal year 2024, the Fund maintained consistent distributions of $0.2575 per share per quarter. On a tax basis, the estimated component of the cumulative distribution for fiscal year 2024 includes an estimated return of capital of $0.7774 (75.48%) per share. This amount is an estimate, and the actual amounts and sources for tax reporting purposes may change upon final determination of tax characteristics and based on tax regulations.
For additional information about the Fund, including its prospectus, financial information, holdings, and proxy information, visit https://www.hennessyfunds.com/funds/regulatory-documents.
Householding
To help keep the Fund’s costs as low as possible, we generally deliver a single copy of shareholder reports, proxy statements, and prospectuses to shareholders who share an address and have the same last name. This process does not apply to account statements. you may request an individual copy of a shareholder document at any time. If you would like to receive separate mailings of shareholder documents, please call U.S. Bank Global Fund services at 800-261-6950 or 414-765-4124, and individual delivery will begin within 30 days of your request. If your account is held through a financial institution or other intermediary, please contact such intermediary directly to request individual delivery.
Annual Shareholder Report Hennessy Gas Utility Fund Investor Class GASFX | |
This annual shareholder report contains important information about the Hennessy Gas Utility Fund – Investor Class (the “Fund”) for the period of November 1, 2023, to October 31, 2024.You can find additional information about the Fund at https://www.hennessyfunds.com/funds/regulatory-documents. You can also request this information by contacting us at 1-800-966-4354 orfundsinfo@hennessyfunds.com.
What were the Fund costs for the last year?
(based on a hypothetical $10,000 investment)
Class Name | Costs of a $10,000 investment | Costs paid as a percentage of a $10,000 investment |
|---|
Investor Class | $114 | 0.99% |
How did the Fund perform last year and what affected its performance?
For the one-year period ended October 31, 2024, the Fund slightly underperformed the AGA Stock Index (the Fund’s primary benchmark) and significantly underperformed the S&P 500® Index.
Factors Influencing Performance
● Holdings in the Oil & Gas Storage & Transportation industry and Multi-Utilities contributed the most to performance.● Exposure to Oil & Gas Exploration & Production sectors detracted from performance.● Stocks that contributed the most to performance included Kinder Morgan Inc., TC Energy Corp., and ONEOK, Inc.● Only EQT Corp. detracted from performance.
Positioning
● At the end of the period, the Fund was most exposed to Multi-Utilities, Oil & Gas Storage & Transportation, and Electric Utilities companies.
Performance
● The Fund’s slight underperformance to its primary benchmark was due to the Fund’s fees and expenses.
● The Fund’s strong absolute performance was largely due to the prospect of lower interest rates, which makes dividend-paying utilities more attractive, as well as strong demand for electricity due to the buildout of data centers related to Artificial Intelligence.
How did the Fund perform over the last 10 years?
Change in Value of $10,000 Investment
Date | Hennessy Gas Utility Fund | S&P 500® Index | AGA Stock Index |
10/31/2014 | 10000 | 10000 | 10000 |
11/30/2014 | 9901 | 10269 | 9897 |
12/31/2014 | 10098 | 10243 | 10080 |
1/31/2015 | 10059 | 9936 | 10065 |
2/28/2015 | 9880 | 10507 | 9872 |
3/31/2015 | 9913 | 10340 | 9917 |
4/30/2015 | 10023 | 10440 | 10038 |
5/31/2015 | 9983 | 10574 | 9999 |
6/30/2015 | 9489 | 10369 | 9508 |
7/31/2015 | 9616 | 10586 | 9665 |
8/31/2015 | 9211 | 9948 | 9256 |
9/30/2015 | 8889 | 9702 | 8956 |
10/31/2015 | 9341 | 10520 | 9416 |
11/30/2015 | 8879 | 10551 | 8953 |
12/31/2015 | 8482 | 10385 | 8581 |
1/31/2016 | 8684 | 9869 | 8793 |
2/29/2016 | 8869 | 9856 | 8991 |
3/31/2016 | 9518 | 10525 | 9663 |
4/30/2016 | 9613 | 10566 | 9768 |
5/31/2016 | 9711 | 10755 | 9884 |
6/30/2016 | 10426 | 10783 | 10635 |
7/31/2016 | 10429 | 11181 | 10640 |
8/31/2016 | 10065 | 11196 | 10277 |
9/30/2016 | 10340 | 11199 | 10570 |
10/31/2016 | 10137 | 10994 | 10362 |
11/30/2016 | 9981 | 11401 | 10216 |
12/31/2016 | 10238 | 11627 | 10492 |
1/31/2017 | 10476 | 11847 | 10743 |
2/28/2017 | 10751 | 12318 | 11030 |
3/31/2017 | 10806 | 12332 | 11101 |
4/30/2017 | 10824 | 12459 | 11127 |
5/31/2017 | 11046 | 12634 | 11369 |
6/30/2017 | 10856 | 12713 | 11183 |
7/31/2017 | 11128 | 12974 | 11480 |
8/31/2017 | 11275 | 13014 | 11642 |
9/30/2017 | 11080 | 13283 | 11461 |
10/31/2017 | 11190 | 13593 | 11586 |
11/30/2017 | 11389 | 14009 | 11805 |
12/31/2017 | 10958 | 14165 | 11371 |
1/31/2018 | 10619 | 14976 | 11025 |
2/28/2018 | 10013 | 14424 | 10403 |
3/31/2018 | 10235 | 14058 | 10652 |
4/30/2018 | 10538 | 14112 | 10979 |
5/31/2018 | 10662 | 14451 | 11122 |
6/30/2018 | 10972 | 14540 | 11458 |
7/31/2018 | 11100 | 15081 | 11607 |
8/31/2018 | 11149 | 15573 | 11677 |
9/30/2018 | 11048 | 15662 | 11585 |
10/31/2018 | 10870 | 14591 | 11403 |
11/30/2018 | 11215 | 14888 | 11750 |
12/31/2018 | 10573 | 13544 | 11076 |
1/31/2019 | 11350 | 14629 | 11917 |
2/28/2019 | 11679 | 15099 | 12272 |
3/31/2019 | 12061 | 15393 | 12690 |
4/30/2019 | 12103 | 16016 | 12750 |
5/31/2019 | 11944 | 14998 | 12596 |
6/30/2019 | 12386 | 16055 | 13088 |
7/31/2019 | 12142 | 16286 | 12841 |
8/31/2019 | 12281 | 16028 | 13011 |
9/30/2019 | 12704 | 16328 | 13475 |
10/31/2019 | 12531 | 16681 | 13306 |
11/30/2019 | 12201 | 17287 | 12955 |
12/31/2019 | 12771 | 17809 | 13586 |
1/31/2020 | 13105 | 17802 | 13962 |
2/29/2020 | 11757 | 16336 | 12551 |
3/31/2020 | 10332 | 14319 | 10976 |
4/30/2020 | 10957 | 16154 | 11673 |
5/31/2020 | 11133 | 16923 | 11875 |
6/30/2020 | 10729 | 17260 | 11467 |
7/31/2020 | 11181 | 18233 | 11954 |
8/31/2020 | 11027 | 19544 | 11803 |
9/30/2020 | 10779 | 18801 | 11553 |
10/31/2020 | 10966 | 18301 | 11768 |
11/30/2020 | 11649 | 20305 | 12530 |
12/31/2020 | 11581 | 21085 | 12465 |
1/31/2021 | 11472 | 20872 | 12346 |
2/28/2021 | 11244 | 21448 | 12124 |
3/31/2021 | 12463 | 22387 | 13456 |
4/30/2021 | 13041 | 23582 | 14096 |
5/31/2021 | 13121 | 23747 | 14200 |
6/30/2021 | 12825 | 24301 | 13892 |
7/31/2021 | 12981 | 24878 | 14032 |
8/31/2021 | 13116 | 25635 | 14201 |
9/30/2021 | 12610 | 24443 | 13655 |
10/31/2021 | 13149 | 26155 | 14255 |
11/30/2021 | 12791 | 25974 | 13888 |
12/31/2021 | 13841 | 27138 | 15048 |
1/31/2022 | 14138 | 25734 | 15384 |
2/28/2022 | 14314 | 24963 | 15525 |
3/31/2022 | 15675 | 25890 | 17080 |
4/30/2022 | 15332 | 23632 | 16713 |
5/31/2022 | 16024 | 23676 | 17497 |
6/30/2022 | 14661 | 21721 | 16004 |
7/31/2022 | 15706 | 23724 | 17168 |
8/31/2022 | 15484 | 22757 | 16941 |
9/30/2022 | 13789 | 20661 | 15103 |
10/31/2022 | 14482 | 22334 | 15868 |
11/30/2022 | 15332 | 23582 | 16814 |
12/31/2022 | 14693 | 22223 | 16126 |
1/31/2023 | 14938 | 23619 | 16409 |
2/28/2023 | 14262 | 23043 | 15679 |
3/31/2023 | 14564 | 23889 | 16023 |
4/30/2023 | 14919 | 24262 | 16435 |
5/31/2023 | 14059 | 24367 | 15506 |
6/30/2023 | 14575 | 25977 | 16040 |
7/31/2023 | 14926 | 26812 | 16449 |
8/31/2023 | 14309 | 26385 | 15776 |
9/30/2023 | 13732 | 25127 | 15140 |
10/31/2023 | 13756 | 24599 | 15183 |
11/30/2023 | 14500 | 26845 | 16030 |
12/31/2023 | 14732 | 28065 | 16303 |
1/31/2024 | 14311 | 28536 | 15851 |
2/29/2024 | 14502 | 30060 | 16076 |
3/31/2024 | 15176 | 31027 | 16832 |
4/30/2024 | 15163 | 29760 | 16831 |
5/31/2024 | 15740 | 31236 | 17497 |
6/30/2024 | 15529 | 32356 | 17231 |
7/31/2024 | 16505 | 32750 | 18344 |
8/31/2024 | 17191 | 33545 | 19111 |
9/30/2024 | 17702 | 34261 | 19706 |
10/31/2024 | 17929 | 33950 | 19872 |

Average Annual Total Returns
for Periods Ended October 31, 2024
| 1 Year | 5 Year | 10 Year |
|---|
Hennessy Gas Utility Fund | 30.34% | 7.43% | 6.01% |
AGA Stock Index | 30.88% | 8.35% | 7.11% |
S&P 500® Index | 38.02% | 15.27% | 13.00% |
Past performance does not guarantee future results. The graph above illustrates the performance of an initial investment of $10,000 in the Fund 10 years ago compared with the performance of the indices shown. Fund performance in the graph and table assumes the reinvestment of dividends and capital gains and does not reflect the deduction of taxes that a shareholder would pay on Fund distributions or the redemption of Fund shares. Unlike the Fund, indices are not subject to fees and other expenses. Investors cannot invest directly in any index. These indices are used for comparative purposes in accordance with Securities and Exchange Commission regulations. Performance data current to the most recent month end may be obtained by visiting https://www.hennessyfunds.com/.Standard & Poor’s Financial Services is the source and owner of the S&P® and S&P 500® trademarks.
Key Fund Statistics
(as of October 31, 2024)
| |
|---|
Fund Size | $477,829,775 |
Number of Holdings | 49 |
Annual Portfolio Turnover | 13% |
Total Advisory Fee | $1,785,847 |
Sector Breakdown (% of net assets)
sector breakdown | (%) |
Energy | 34.01% |
Financials | 4.82% |
Industrials | 1.06% |
Utilities | 59.79% |
Short-Term Investments and Other | 0.33% |
Liabilities in Excess of Other Assets | -0.01% |

Sector sub-classifications may differ from those utilized for compliance purposes.
For additional information about the Fund, including its prospectus, financial information, holdings, and proxy information, visit https://www.hennessyfunds.com/funds/regulatory-documents.
Householding
To help keep the Fund’s costs as low as possible, we generally deliver a single copy of shareholder reports, proxy statements, and prospectuses to shareholders who share an address and have the same last name. This process does not apply to account statements. you may request an individual copy of a shareholder document at any time. If you would like to receive separate mailings of shareholder documents, please call U.S. Bank Global Fund services at 800-261-6950 or 414-765-4124, and individual delivery will begin within 30 days of your request. If your account is held through a financial institution or other intermediary, please contact such intermediary directly to request individual delivery.
Annual Shareholder Report Hennessy Gas Utility Fund Institutional Class HGASX | |
This annual shareholder report contains important information about the Hennessy Gas Utility Fund – Institutional Class (the “Fund”) for the period of November 1, 2023, to October 31, 2024.You can find additional information about the Fund at https://www.hennessyfunds.com/funds/regulatory-documents. You can also request this information by contacting us at 1-800-966-4354 orfundsinfo@hennessyfunds.com.
What were the Fund costs for the last year?
(based on a hypothetical $10,000 investment)
Class Name | Costs of a $10,000 investment | Costs paid as a percentage of a $10,000 investment |
|---|
Institutional Class | $80 | 0.69% |
How did the Fund perform last year and what affected its performance?
For the one-year period ended October 31, 2024, the Fund slightly underperformed the AGA Stock Index (the Fund’s primary benchmark) and significantly underperformed the S&P 500® Index.
Factors Influencing Performance
● Holdings in the Oil & Gas Storage & Transportation industry and Multi-Utilities contributed the most to performance.● Exposure to Oil & Gas Exploration & Production sectors detracted from performance.● Stocks that contributed the most to performance included Kinder Morgan Inc., TC Energy Corp., and ONEOK, Inc.● Only EQT Corp. detracted from performance.
Positioning
● At the end of the period, the Fund was most exposed to Multi-Utilities, Oil & Gas Storage & Transportation, and Electric Utilities companies.
Performance
● The Fund’s slight underperformance to its primary benchmark was due to the Fund’s fees and expenses.
● The Fund’s strong absolute performance was largely due to the prospect of lower interest rates, which makes dividend-paying utilities more attractive, as well as strong demand for electricity due to the buildout of data centers related to Artificial Intelligence.
How did the Fund perform over the last 10 years?
Change in Value of $250,000 Investment
Date | Hennessy Gas Utility Fund | S&P 500® Index | AGA Stock Index |
10/31/2014 | 250000 | 250000 | 250000 |
11/30/2014 | 247524 | 256724 | 247414 |
12/31/2014 | 252459 | 256077 | 252009 |
1/31/2015 | 251466 | 248390 | 251623 |
2/28/2015 | 246997 | 262665 | 246810 |
3/31/2015 | 247821 | 258511 | 247926 |
4/30/2015 | 250569 | 260991 | 250962 |
5/31/2015 | 249570 | 264347 | 249977 |
6/30/2015 | 237221 | 259230 | 237696 |
7/31/2015 | 240406 | 264661 | 241625 |
8/31/2015 | 230263 | 248693 | 231397 |
9/30/2015 | 222226 | 242540 | 223911 |
10/31/2015 | 233527 | 262999 | 235398 |
11/30/2015 | 221973 | 263781 | 223825 |
12/31/2015 | 212047 | 259621 | 214518 |
1/31/2016 | 217107 | 246737 | 219828 |
2/29/2016 | 221730 | 246404 | 224777 |
3/31/2016 | 237954 | 263120 | 241574 |
4/30/2016 | 240325 | 264140 | 244205 |
5/31/2016 | 242783 | 268883 | 247102 |
6/30/2016 | 260638 | 269580 | 265877 |
7/31/2016 | 260726 | 279519 | 265999 |
8/31/2016 | 251632 | 279912 | 256914 |
9/30/2016 | 258490 | 279965 | 264251 |
10/31/2016 | 253433 | 274858 | 259041 |
11/30/2016 | 249530 | 285037 | 255397 |
12/31/2016 | 255947 | 290671 | 262294 |
1/31/2017 | 261910 | 296184 | 268565 |
2/28/2017 | 268776 | 307944 | 275749 |
3/31/2017 | 270264 | 308304 | 277514 |
4/30/2017 | 270719 | 311470 | 278174 |
5/31/2017 | 276357 | 315853 | 284230 |
6/30/2017 | 271721 | 317824 | 279571 |
7/31/2017 | 278615 | 324360 | 286989 |
8/31/2017 | 282383 | 325353 | 291046 |
9/30/2017 | 277513 | 332064 | 286528 |
10/31/2017 | 280380 | 339813 | 289657 |
11/30/2017 | 285466 | 350235 | 295120 |
12/31/2017 | 274723 | 354129 | 284264 |
1/31/2018 | 266319 | 374404 | 275620 |
2/28/2018 | 251191 | 360605 | 260078 |
3/31/2018 | 256848 | 351441 | 266300 |
4/30/2018 | 264565 | 352789 | 274484 |
5/31/2018 | 267671 | 361285 | 278046 |
6/30/2018 | 275558 | 363509 | 286456 |
7/31/2018 | 278875 | 377036 | 290164 |
8/31/2018 | 280202 | 389322 | 291921 |
9/30/2018 | 277827 | 391538 | 289620 |
10/31/2018 | 273343 | 364776 | 285069 |
11/30/2018 | 282120 | 372210 | 293760 |
12/31/2018 | 266056 | 338603 | 276909 |
1/31/2019 | 285667 | 365737 | 297914 |
2/28/2019 | 294057 | 377480 | 306793 |
3/31/2019 | 303765 | 384815 | 317255 |
4/30/2019 | 304928 | 400396 | 318747 |
5/31/2019 | 301017 | 374952 | 314912 |
6/30/2019 | 312169 | 401377 | 327212 |
7/31/2019 | 306100 | 407146 | 321017 |
8/31/2019 | 309720 | 400696 | 325276 |
9/30/2019 | 320460 | 408194 | 336869 |
10/31/2019 | 316076 | 417035 | 332657 |
11/30/2019 | 307949 | 432173 | 323877 |
12/31/2019 | 322413 | 445217 | 339643 |
1/31/2020 | 330886 | 445042 | 349058 |
2/29/2020 | 296995 | 408407 | 313782 |
3/31/2020 | 260964 | 357963 | 274400 |
4/30/2020 | 276804 | 403852 | 291837 |
5/31/2020 | 281362 | 423087 | 296885 |
6/30/2020 | 271329 | 431501 | 286668 |
7/31/2020 | 282678 | 455831 | 298861 |
8/31/2020 | 278895 | 488596 | 295078 |
9/30/2020 | 272727 | 470031 | 288832 |
10/31/2020 | 277465 | 457531 | 294201 |
11/30/2020 | 294915 | 507614 | 313239 |
12/31/2020 | 293255 | 527131 | 311632 |
1/31/2021 | 290612 | 521809 | 308658 |
2/28/2021 | 284822 | 536198 | 303092 |
3/31/2021 | 315914 | 559681 | 336405 |
4/30/2021 | 330607 | 589551 | 352399 |
5/31/2021 | 332634 | 593669 | 355005 |
6/30/2021 | 325239 | 607528 | 347310 |
7/31/2021 | 329320 | 621959 | 350796 |
8/31/2021 | 332892 | 640871 | 355025 |
9/30/2021 | 320023 | 611064 | 341386 |
10/31/2021 | 333753 | 653876 | 356364 |
11/30/2021 | 324771 | 649345 | 347202 |
12/31/2021 | 351629 | 678446 | 376194 |
1/31/2022 | 359340 | 643339 | 384604 |
2/28/2022 | 363827 | 624076 | 388135 |
3/31/2022 | 398509 | 647248 | 427005 |
4/30/2022 | 389763 | 590807 | 417834 |
5/31/2022 | 407678 | 591891 | 437427 |
6/30/2022 | 372961 | 543034 | 400089 |
7/31/2022 | 399783 | 593104 | 429195 |
8/31/2022 | 394106 | 568916 | 423529 |
9/30/2022 | 351052 | 516520 | 377566 |
10/31/2022 | 368898 | 558338 | 396688 |
11/30/2022 | 390598 | 589540 | 420338 |
12/31/2022 | 374405 | 555574 | 403152 |
1/31/2023 | 380826 | 590483 | 410216 |
2/28/2023 | 363704 | 576076 | 391964 |
3/31/2023 | 371370 | 597226 | 400570 |
4/30/2023 | 380596 | 606548 | 410866 |
5/31/2023 | 358760 | 609184 | 387651 |
6/30/2023 | 371893 | 649436 | 400989 |
7/31/2023 | 381032 | 670299 | 411229 |
8/31/2023 | 365233 | 659627 | 394400 |
9/30/2023 | 350617 | 628177 | 378512 |
10/31/2023 | 351398 | 614969 | 379577 |
11/30/2023 | 370443 | 671131 | 400743 |
12/31/2023 | 376490 | 701621 | 407569 |
1/31/2024 | 365850 | 713411 | 396281 |
2/29/2024 | 370924 | 751504 | 401908 |
3/31/2024 | 388122 | 775684 | 420791 |
4/30/2024 | 387793 | 744001 | 420783 |
5/31/2024 | 402771 | 780892 | 437433 |
6/30/2024 | 397479 | 808912 | 430771 |
7/31/2024 | 422539 | 818759 | 458590 |
8/31/2024 | 440131 | 838619 | 477781 |
9/30/2024 | 453413 | 856530 | 492654 |
10/31/2024 | 459427 | 848762 | 496789 |

Average Annual Total Returns
for Periods Ended October 31, 2024
| 1 Year | 5 Year | 10 Year |
|---|
Hennessy Gas Utility Fund | 30.74% | 7.77% | 6.27% |
AGA Stock Index | 30.88% | 8.35% | 7.11% |
S&P 500® Index | 38.02% | 15.27% | 13.00% |
Past performance does not guarantee future results. The graph above illustrates the performance of an initial investment of $250,000 in the Fund 10 years ago compared with the performance of the indices shown. Fund performance in the graph and table assumes the reinvestment of dividends and capital gains and does not reflect the deduction of taxes that a shareholder would pay on Fund distributions or the redemption of Fund shares. Unlike the Fund, indices are not subject to fees and other expenses. Investors cannot invest directly in any index. These indices are used for comparative purposes in accordance with Securities and Exchange Commission regulations. Performance data current to the most recent month end may be obtained by visiting https://www.hennessyfunds.com/.Standard & Poor’s Financial Services is the source and owner of the S&P® and S&P 500® trademarks.The inception date of Institutional Class shares is March 1, 2017. Performance shown prior to the inception of Institutional Class shares reflects the performance of Investor Class shares and includes expenses that are not applicable to, and are higher than, those of Institutional Class shares.
Key Fund Statistics
(as of October 31, 2024)
| |
|---|
Fund Size | $477,829,775 |
Number of Holdings | 49 |
Annual Portfolio Turnover | 13% |
Total Advisory Fee | $1,785,847 |
Sector Breakdown (% of net assets)
sector breakdown | (%) |
Energy | 34.01% |
Financials | 4.82% |
Industrials | 1.06% |
Utilities | 59.79% |
Short-Term Investments and Other | 0.33% |
Liabilities in Excess of Other Assets | -0.01% |
Sector sub-classifications may differ from those utilized for compliance purposes.
For additional information about the Fund, including its prospectus, financial information, holdings, and proxy information, visit https://www.hennessyfunds.com/funds/regulatory-documents.
Householding
To help keep the Fund’s costs as low as possible, we generally deliver a single copy of shareholder reports, proxy statements, and prospectuses to shareholders who share an address and have the same last name. This process does not apply to account statements. you may request an individual copy of a shareholder document at any time. If you would like to receive separate mailings of shareholder documents, please call U.S. Bank Global Fund services at 800-261-6950 or 414-765-4124, and individual delivery will begin within 30 days of your request. If your account is held through a financial institution or other intermediary, please contact such intermediary directly to request individual delivery.
Annual Shareholder Report Hennessy Japan Fund Investor Class HJPNX | |
This annual shareholder report contains important information about the Hennessy Japan Fund – Investor Class (the “Fund”) for the period of November 1, 2023, to October 31, 2024.You can find additional information about the Fund at https://www.hennessyfunds.com/funds/regulatory-documents. You can also request this information by contacting us at 1-800-966-4354 orfundsinfo@hennessyfunds.com.
What were the Fund costs for the last year?
(based on a hypothetical $10,000 investment)
Class Name | Costs of a $10,000 investment | Costs paid as a percentage of a $10,000 investment |
|---|
Investor Class | $164 | 1.42% |
How did the Fund perform last year and what affected its performance?
For the one year period ended October 31, 2024, the Fund outperformed both the Russell/Nomura Total Market™ Index (the Fund’s primary benchmark) and the Tokyo Stock Price Index (TOPIX).
Factors Influencing Performance
Exposure to Financial and Industrial sectors contributed positively, while exposure to the Communication Service sector detracted from the Fund’s performance. Positive contributions were led by Insurance companies such as MS&AD Insurance Group Holdings, Inc., Tokio Marine Holdings, Inc., and Sompo Holdings, Inc. With pressure from the Japanese Financial Services Agency, these insurers have adopted plans for divesting certain strategic equity holdings, which has been positively received by the market. We believe that corporate governance reforms remain the biggest driver of the Japanese stock market.
Positioning
As of October 31, 2024, our sector allocation to Financials is approximately 27% versus a 13% weighting in the Fund’s primary benchmark. We believe in our investment approach to concentrate on a limited number of high-conviction stocks with a long-term investment horizon.
How did the Fund perform over the last 10 years?
Change in Value of $10,000 Investment
Date | Hennessy Japan Fund | Russell/Nomura Total Market™ Index | Tokyo Stock Price Index (TOPIX) |
10/31/2014 | 10000 | 10000 | 10000 |
11/30/2014 | 9729 | 9950 | 9994 |
12/31/2014 | 9646 | 9801 | 9926 |
01/31/2015 | 10005 | 10015 | 10142 |
02/28/2015 | 10519 | 10658 | 10732 |
03/31/2015 | 10721 | 10804 | 10923 |
04/30/2015 | 10813 | 11282 | 11298 |
05/31/2015 | 10831 | 11401 | 11446 |
06/30/2015 | 11052 | 11256 | 11329 |
07/31/2015 | 11346 | 11273 | 11391 |
08/31/2015 | 10744 | 10704 | 10788 |
09/30/2015 | 9867 | 9997 | 10092 |
10/31/2015 | 11056 | 10979 | 11065 |
11/30/2015 | 11116 | 10944 | 10985 |
12/31/2015 | 10896 | 10949 | 11015 |
01/31/2016 | 10464 | 10122 | 10154 |
02/29/2016 | 10570 | 9811 | 9871 |
03/31/2016 | 10974 | 10334 | 10394 |
04/30/2016 | 11208 | 10669 | 10708 |
05/31/2016 | 11709 | 10712 | 10788 |
06/30/2016 | 11851 | 10489 | 10542 |
07/31/2016 | 12081 | 11033 | 11206 |
08/31/2016 | 12145 | 11129 | 11163 |
09/30/2016 | 12687 | 11423 | 11446 |
10/31/2016 | 12774 | 11571 | 11612 |
11/30/2016 | 12186 | 11349 | 11298 |
12/31/2016 | 12122 | 11312 | 11422 |
01/31/2017 | 12811 | 11698 | 11858 |
02/28/2017 | 12761 | 11934 | 12043 |
03/31/2017 | 12802 | 11927 | 12025 |
04/30/2017 | 13050 | 12132 | 12172 |
05/31/2017 | 13730 | 12475 | 12560 |
06/30/2017 | 13817 | 12705 | 12726 |
07/31/2017 | 14038 | 12923 | 12997 |
08/31/2017 | 14166 | 12936 | 13046 |
09/30/2017 | 14355 | 13255 | 13305 |
10/31/2017 | 15044 | 13906 | 13902 |
11/30/2017 | 15765 | 14223 | 14326 |
12/31/2017 | 16006 | 14384 | 14455 |
01/31/2018 | 16581 | 15080 | 15077 |
02/28/2018 | 16213 | 14746 | 14849 |
03/31/2018 | 16227 | 14559 | 14597 |
04/30/2018 | 16195 | 14619 | 14689 |
05/31/2018 | 16420 | 14469 | 14548 |
06/30/2018 | 16365 | 14105 | 14160 |
07/31/2018 | 16153 | 14193 | 14197 |
08/31/2018 | 16585 | 14135 | 14185 |
09/30/2018 | 17366 | 14562 | 14615 |
10/31/2018 | 15446 | 13228 | 13329 |
11/30/2018 | 16016 | 13365 | 13415 |
12/31/2018 | 14955 | 12310 | 12388 |
01/31/2019 | 15447 | 13145 | 13188 |
02/28/2019 | 15700 | 13238 | 13231 |
03/31/2019 | 16044 | 13243 | 13317 |
04/30/2019 | 16545 | 13386 | 13434 |
05/31/2019 | 15778 | 12845 | 12898 |
06/30/2019 | 16343 | 13339 | 13360 |
07/31/2019 | 16081 | 13363 | 13378 |
08/31/2019 | 15792 | 13154 | 13225 |
09/30/2019 | 16394 | 13764 | 13772 |
10/31/2019 | 17083 | 14357 | 14455 |
11/30/2019 | 17322 | 14516 | 14548 |
12/31/2019 | 17653 | 14780 | 14825 |
01/31/2020 | 16976 | 14477 | 14591 |
02/29/2020 | 15716 | 13028 | 13157 |
03/31/2020 | 14795 | 12264 | 12357 |
04/30/2020 | 15720 | 13046 | 13015 |
05/31/2020 | 17506 | 13869 | 13800 |
06/30/2020 | 17860 | 13806 | 13755 |
07/31/2020 | 18412 | 13703 | 13471 |
08/31/2020 | 19346 | 14584 | 14528 |
09/30/2020 | 19673 | 14777 | 14789 |
10/31/2020 | 19692 | 14555 | 14506 |
11/30/2020 | 21611 | 16263 | 16163 |
12/31/2020 | 22158 | 16855 | 16808 |
01/31/2021 | 21753 | 16741 | 16614 |
02/28/2021 | 21629 | 17012 | 16835 |
03/31/2021 | 21086 | 17192 | 17158 |
04/30/2021 | 20718 | 17030 | 16867 |
05/31/2021 | 20856 | 17093 | 17072 |
06/30/2021 | 20718 | 17167 | 17026 |
07/31/2021 | 20943 | 16920 | 16843 |
08/31/2021 | 21928 | 17419 | 17360 |
09/30/2021 | 22559 | 17841 | 17837 |
10/31/2021 | 21988 | 17345 | 17207 |
11/30/2021 | 21592 | 16812 | 16656 |
12/31/2021 | 21478 | 17082 | 16990 |
01/31/2022 | 19096 | 16140 | 16159 |
02/28/2022 | 18149 | 16059 | 16096 |
03/31/2022 | 17517 | 15928 | 15931 |
04/30/2022 | 15270 | 14464 | 14404 |
05/31/2022 | 15642 | 14928 | 14785 |
06/30/2022 | 14384 | 13682 | 13713 |
07/31/2022 | 15549 | 14564 | 14458 |
08/31/2022 | 14931 | 14128 | 14108 |
09/30/2022 | 13422 | 12812 | 12769 |
10/31/2022 | 13664 | 13135 | 13068 |
11/30/2022 | 15400 | 14452 | 14331 |
12/31/2022 | 14894 | 14447 | 14464 |
01/31/2023 | 15814 | 15331 | 15325 |
02/28/2023 | 15168 | 14726 | 14769 |
03/31/2023 | 15957 | 15381 | 15373 |
04/30/2023 | 15995 | 15490 | 15431 |
05/31/2023 | 16496 | 15628 | 15583 |
06/30/2023 | 17336 | 16202 | 16200 |
07/31/2023 | 17555 | 16751 | 16726 |
08/31/2023 | 17248 | 16371 | 16394 |
09/30/2023 | 16649 | 16113 | 16076 |
10/31/2023 | 16241 | 15470 | 15366 |
11/30/2023 | 17401 | 16679 | 16595 |
12/31/2023 | 18297 | 17335 | 17363 |
01/31/2024 | 18746 | 17878 | 18054 |
02/29/2024 | 20298 | 18502 | 18501 |
03/31/2024 | 21126 | 19097 | 19107 |
04/30/2024 | 20042 | 18245 | 18209 |
05/31/2024 | 20875 | 18445 | 18445 |
06/30/2024 | 21353 | 18313 | 18281 |
07/31/2024 | 22053 | 19439 | 19439 |
08/31/2024 | 22718 | 19663 | 19505 |
09/30/2024 | 22787 | 19723 | 19551 |
10/31/2024 | 21294 | 18799 | 18704 |

Average Annual Total Returns
for Periods Ended October 31, 2024
| 1 Year | 5 Year | 10 Year |
|---|
Hennessy Japan Fund | 31.08% | 4.50% | 7.85% |
Russell/Nomura Total Market™ Index | 21.52% | 5.54% | 6.52% |
TOPIX | 21.72% | 5.29% | 6.46% |
Past performance does not guarantee future results. The graph above illustrates the performance of an initial investment of $10,000 in the Fund 10 years ago compared with the performance of the indices shown. Fund performance in the graph and table assumes the reinvestment of dividends and capital gains and does not reflect the deduction of taxes that a shareholder would pay on Fund distributions or the redemption of Fund shares. Unlike the Fund, indices are not subject to fees and other expenses. Investors cannot invest directly in any index. These indices are used for comparative purposes in accordance with Securities and Exchange Commission regulations. Performance data current to the most recent month end may be obtained by visiting https://www.hennessyfunds.com/.Frank Russell Company (“Russell”) is the source and owner of the trademarks, service marks, and copyrights related to the Russell Indexes. Russell® is a trademark of Frank Russell Company. Neither Russell nor its licensors accept any liability for any errors or omissions in the Russell Indexes or Russell ratings or underlying data and no party may rely on any Russell Indexes or Russell ratings or underlying data contained in this communication. No further distribution of Russell data is permitted without Russell’s express written consent. Russell does not promote, sponsor, or endorse the content of this communication.
Key Fund Statistics
(as of October 31, 2024)
| |
|---|
Fund Size | $413,607,966 |
Number of Holdings | 27 |
Annual Portfolio Turnover | 17% |
Total Advisory Fee | $3,059,845 |
Sector Breakdown (% of net assets)
sector breakdown | (%) |
Communication Services | 2.59% |
Consumer Discretionary | 9.10% |
Consumer Staples | 10.40% |
Financials | 26.10% |
Health Care | 3.84% |
Industrials | 23.90% |
Information Technology | 10.99% |
Materials | 6.72% |
Short-Term Investments and Other | 5.74% |
Other Assets in Excess of Liabilities | 0.71% |
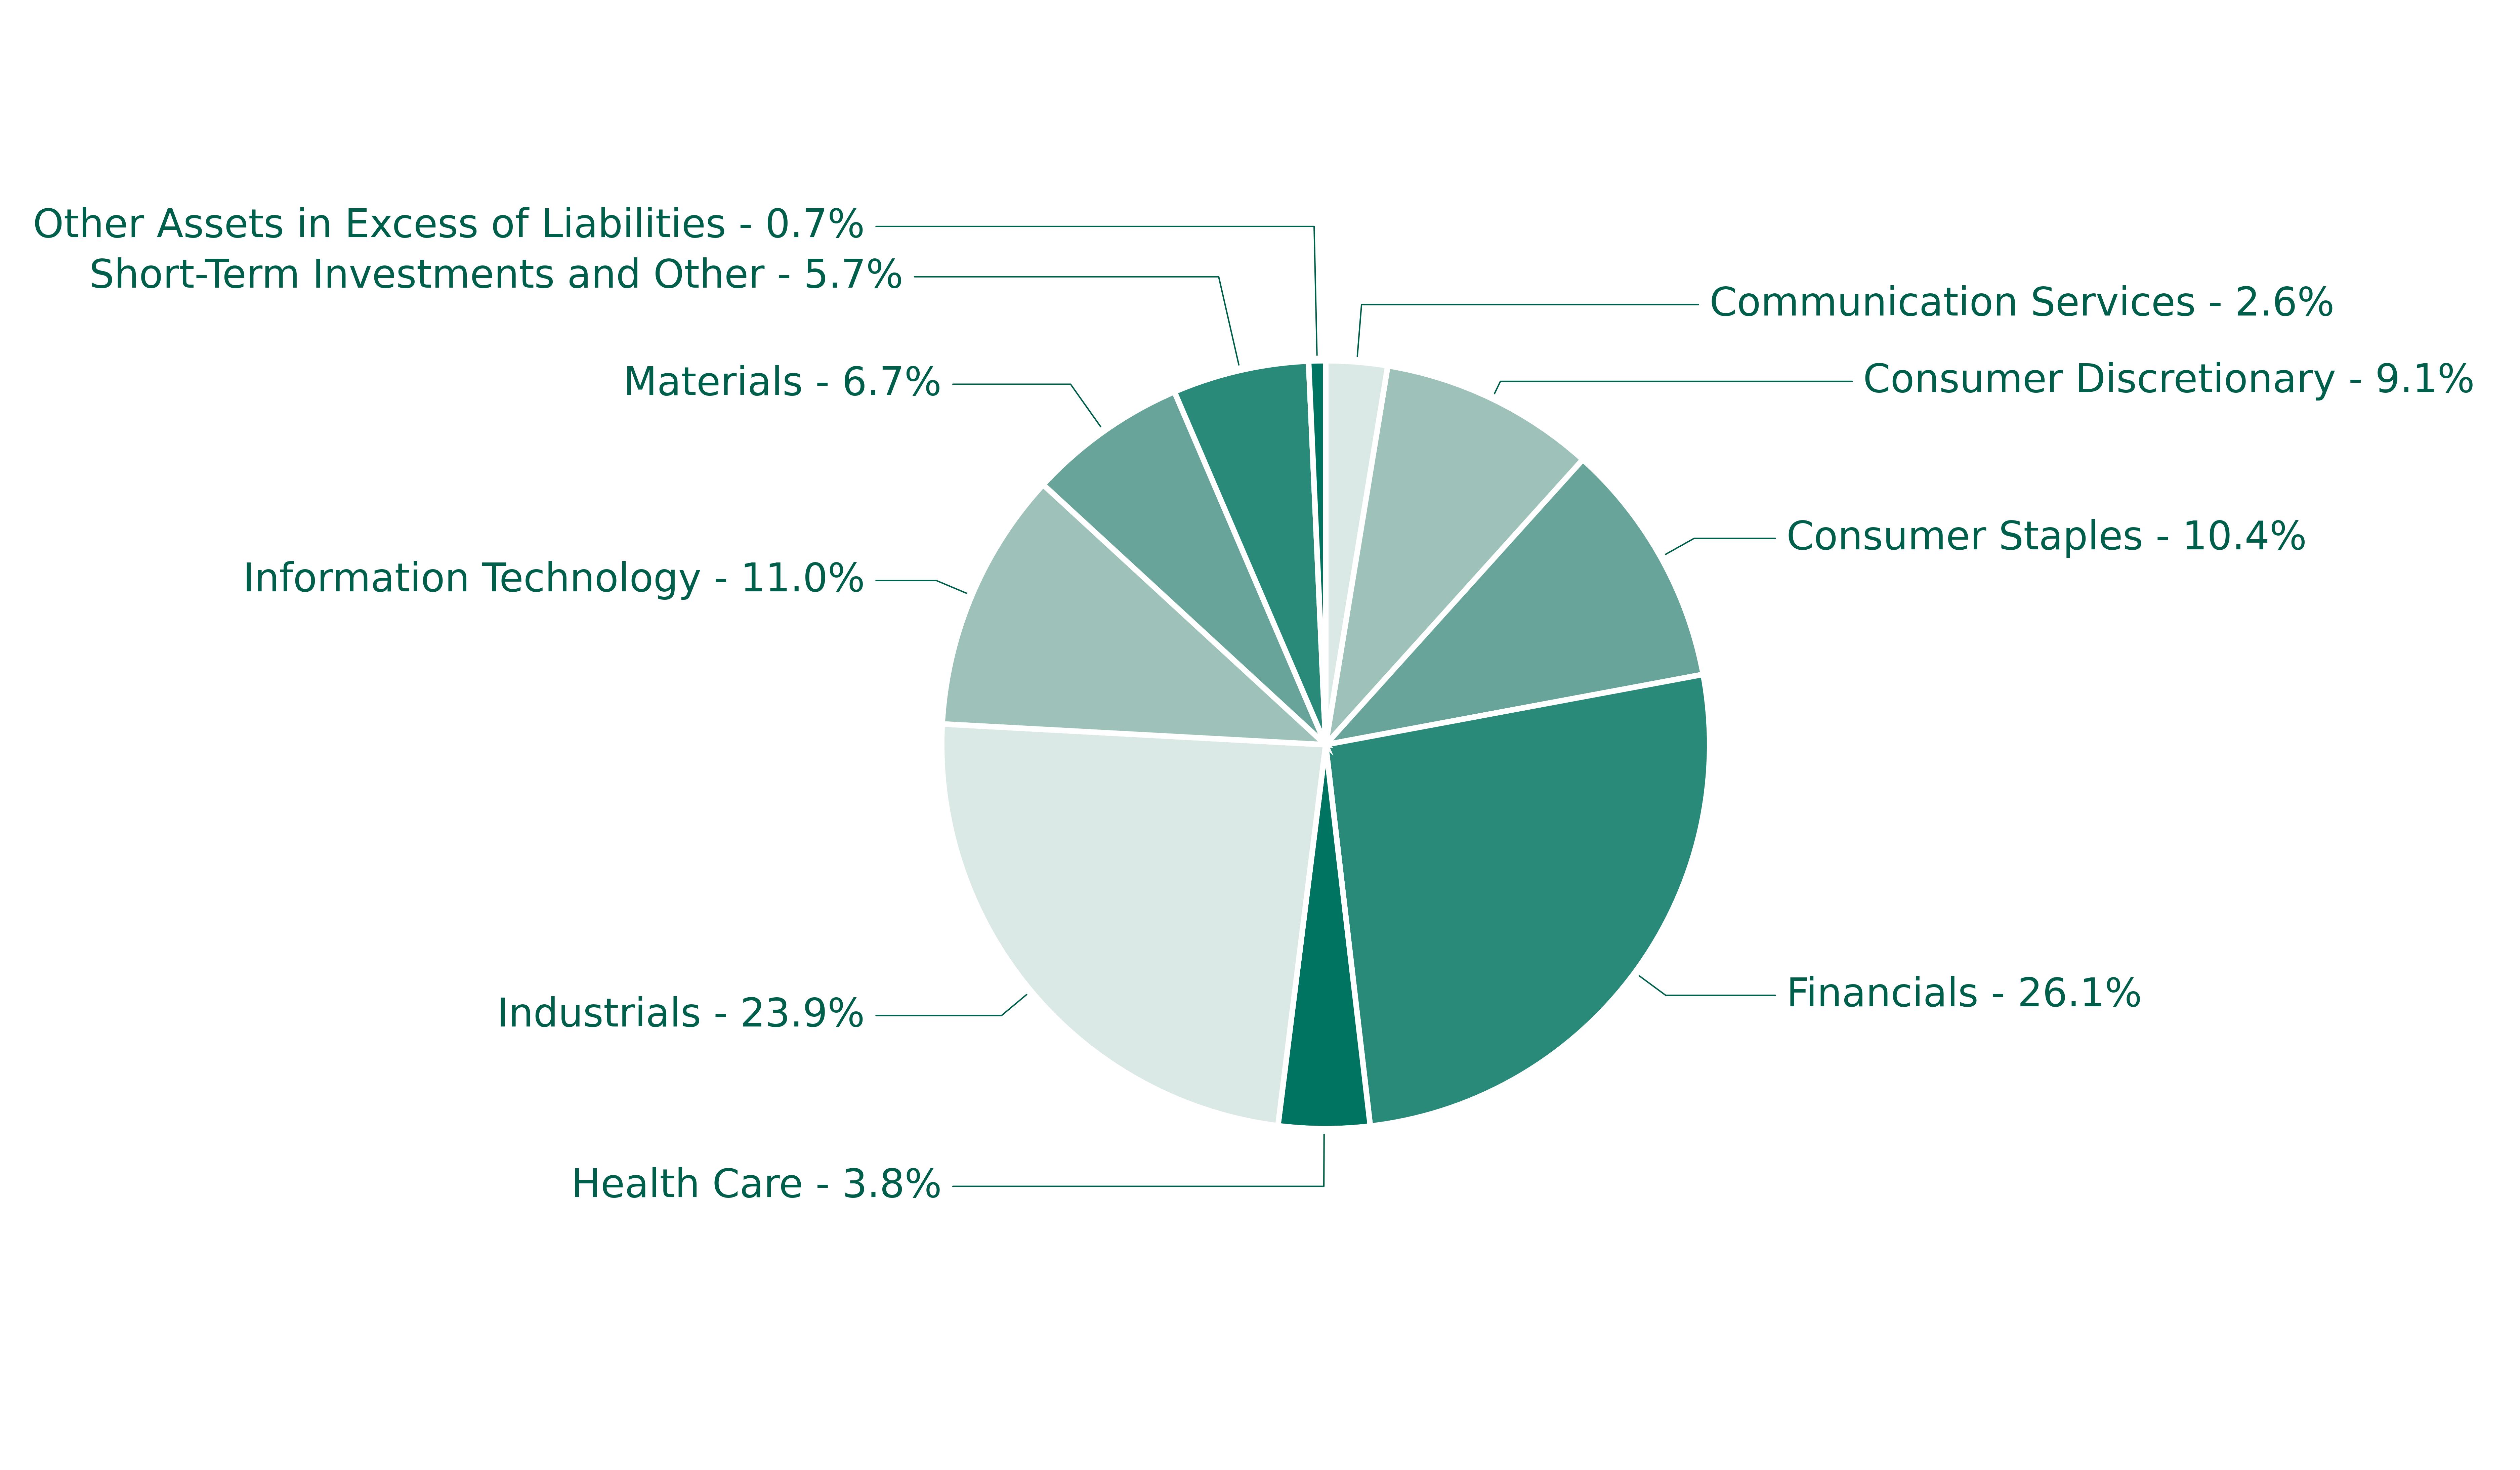
Sector sub-classifications may differ from those utilized for compliance purposes.
For additional information about the Fund, including its prospectus, financial information, holdings, and proxy information, visit https://www.hennessyfunds.com/funds/regulatory-documents.
Householding
To help keep the Fund’s costs as low as possible, we generally deliver a single copy of shareholder reports, proxy statements, and prospectuses to shareholders who share an address and have the same last name. This process does not apply to account statements. you may request an individual copy of a shareholder document at any time. If you would like to receive separate mailings of shareholder documents, please call U.S. Bank Global Fund services at 800-261-6950 or 414-765-4124, and individual delivery will begin within 30 days of your request. If your account is held through a financial institution or other intermediary, please contact such intermediary directly to request individual delivery.
Annual Shareholder Report Hennessy Japan Fund Institutional Class HJPIX | |
This annual shareholder report contains important information about the Hennessy Japan Fund – Institutional Class (the “Fund”) for the period of November 1, 2023, to October 31, 2024.You can find additional information about the Fund at https://www.hennessyfunds.com/funds/regulatory-documents. You can also request this information by contacting us at 1-800-966-4354 orfundsinfo@hennessyfunds.com.
What were the Fund costs for the last year?
(based on a hypothetical $10,000 investment)
Class Name | Costs of a $10,000 investment | Costs paid as a percentage of a $10,000 investment |
|---|
Institutional Class | $118 | 1.02% |
How did the Fund perform last year and what affected its performance?
For the one year period ended October 31, 2024, the Fund outperformed both the Russell/Nomura Total Market™ Index (the Fund’s primary benchmark) and the Tokyo Stock Price Index (TOPIX).
Factors Influencing Performance
Exposure to Financial and Industrial sectors contributed positively, while exposure to the Communication Service sector detracted from the Fund’s performance. Positive contributions were led by Insurance companies such as MS&AD Insurance Group Holdings, Inc., Tokio Marine Holdings, Inc., and Sompo Holdings, Inc. With pressure from the Japanese Financial Services Agency, these insurers have adopted plans for divesting certain strategic equity holdings, which has been positively received by the market. We believe that corporate governance reforms remain the biggest driver of the Japanese stock market.
Positioning
As of October 31, 2024, our sector allocation to Financials is approximately 27% versus a 13% weighting in the Fund’s primary benchmark. We believe in our investment approach to concentrate on a limited number of high-conviction stocks with a long-term investment horizon.
How did the Fund perform over the last 10 years?
Change in Value of $250,000 Investment
Date | Hennessy Japan Fund | Russell/Nomura Total Market™ Index | Tokyo Stock Price Index (TOPIX) |
10/31/2014 | 250000 | 250000 | 250000 |
11/30/2014 | 243228 | 248754 | 249846 |
12/31/2014 | 241196 | 245017 | 248154 |
01/31/2015 | 250226 | 250385 | 253538 |
02/28/2015 | 263093 | 266438 | 268308 |
03/31/2015 | 268172 | 270096 | 273077 |
04/30/2015 | 270542 | 282054 | 282462 |
05/31/2015 | 270993 | 285013 | 286154 |
06/30/2015 | 276637 | 281389 | 283231 |
07/31/2015 | 284086 | 281821 | 284769 |
08/31/2015 | 269074 | 267589 | 269692 |
09/30/2015 | 247178 | 249924 | 252308 |
10/31/2015 | 277088 | 274485 | 276615 |
11/30/2015 | 278668 | 273609 | 274615 |
12/31/2015 | 273138 | 273737 | 275385 |
01/31/2016 | 262415 | 253039 | 253846 |
02/29/2016 | 265011 | 245278 | 246769 |
03/31/2016 | 275282 | 258340 | 259846 |
04/30/2016 | 281264 | 266727 | 267692 |
05/31/2016 | 293905 | 267797 | 269692 |
06/30/2016 | 297630 | 262219 | 263538 |
07/31/2016 | 303386 | 275816 | 280154 |
08/31/2016 | 305192 | 278224 | 279077 |
09/30/2016 | 318849 | 285579 | 286154 |
10/31/2016 | 321106 | 289266 | 290308 |
11/30/2016 | 306546 | 283714 | 282462 |
12/31/2016 | 304966 | 282788 | 285538 |
01/31/2017 | 322460 | 292453 | 296462 |
02/28/2017 | 321219 | 298339 | 301077 |
03/31/2017 | 322348 | 298178 | 300615 |
04/30/2017 | 328781 | 303310 | 304308 |
05/31/2017 | 346050 | 311882 | 314000 |
06/30/2017 | 348307 | 317620 | 318154 |
07/31/2017 | 353950 | 323082 | 324923 |
08/31/2017 | 357336 | 323393 | 326154 |
09/30/2017 | 362190 | 331379 | 332615 |
10/31/2017 | 379684 | 347651 | 347538 |
11/30/2017 | 398081 | 355573 | 358154 |
12/31/2017 | 404387 | 359612 | 361385 |
01/31/2018 | 418958 | 376997 | 376923 |
02/28/2018 | 409809 | 368648 | 371231 |
03/31/2018 | 410260 | 363981 | 364923 |
04/30/2018 | 409696 | 365474 | 367231 |
05/31/2018 | 415456 | 361722 | 363692 |
06/30/2018 | 414214 | 352627 | 354000 |
07/31/2018 | 409131 | 354819 | 354923 |
08/31/2018 | 420201 | 353383 | 354615 |
09/30/2018 | 440081 | 364041 | 365385 |
10/31/2018 | 391622 | 330699 | 333231 |
11/30/2018 | 406194 | 334130 | 335385 |
12/31/2018 | 379373 | 307741 | 309692 |
01/31/2019 | 391951 | 328628 | 329692 |
02/28/2019 | 398523 | 330960 | 330769 |
03/31/2019 | 407475 | 331080 | 332923 |
04/30/2019 | 420392 | 334639 | 335846 |
05/31/2019 | 400903 | 321125 | 322462 |
06/30/2019 | 415407 | 333476 | 334000 |
07/31/2019 | 408948 | 334083 | 334462 |
08/31/2019 | 401696 | 328855 | 330615 |
09/30/2019 | 417106 | 344094 | 344308 |
10/31/2019 | 434783 | 358929 | 361385 |
11/30/2019 | 441015 | 362910 | 363692 |
12/31/2019 | 449601 | 369505 | 370615 |
01/31/2020 | 432523 | 361933 | 364769 |
02/29/2020 | 400531 | 325700 | 328923 |
03/31/2020 | 377191 | 306590 | 308923 |
04/30/2020 | 400872 | 326156 | 325385 |
05/31/2020 | 446527 | 346714 | 345012 |
06/30/2020 | 455749 | 345145 | 343877 |
07/31/2020 | 470094 | 342567 | 336763 |
08/31/2020 | 494003 | 364608 | 363211 |
09/30/2020 | 502656 | 369419 | 369729 |
10/31/2020 | 503111 | 363886 | 362645 |
11/30/2020 | 552409 | 406572 | 404068 |
12/31/2020 | 566679 | 421384 | 420200 |
01/31/2021 | 556431 | 418518 | 415346 |
02/28/2021 | 553471 | 425301 | 420872 |
03/31/2021 | 539808 | 429805 | 428942 |
04/30/2021 | 530358 | 425739 | 421675 |
05/31/2021 | 534115 | 427315 | 426789 |
06/30/2021 | 530699 | 429178 | 425652 |
07/31/2021 | 536734 | 422995 | 421085 |
08/31/2021 | 562124 | 435474 | 433991 |
09/30/2021 | 578634 | 446018 | 445934 |
10/31/2021 | 564060 | 433616 | 430172 |
11/30/2021 | 554154 | 420294 | 416406 |
12/31/2021 | 551379 | 427062 | 424749 |
01/31/2022 | 490449 | 403507 | 403985 |
02/28/2022 | 466285 | 401469 | 402408 |
03/31/2022 | 450214 | 398203 | 398265 |
04/30/2022 | 392637 | 361609 | 360109 |
05/31/2022 | 402233 | 373209 | 369620 |
06/30/2022 | 369976 | 342046 | 342825 |
07/31/2022 | 400152 | 364112 | 361457 |
08/31/2022 | 384312 | 353188 | 352692 |
09/30/2022 | 345580 | 320290 | 319223 |
10/31/2022 | 351824 | 328382 | 326711 |
11/30/2022 | 396683 | 361298 | 358277 |
12/31/2022 | 383734 | 361177 | 361602 |
01/31/2023 | 407667 | 383275 | 383120 |
02/28/2023 | 391018 | 368154 | 369226 |
03/31/2023 | 411482 | 384531 | 384325 |
04/30/2023 | 412639 | 387252 | 385782 |
05/31/2023 | 425703 | 390705 | 389577 |
06/30/2023 | 447439 | 405040 | 405012 |
07/31/2023 | 453336 | 418784 | 418162 |
08/31/2023 | 445590 | 409267 | 409860 |
09/30/2023 | 430212 | 402828 | 401898 |
10/31/2023 | 419922 | 386750 | 384160 |
11/30/2023 | 449983 | 416965 | 414875 |
12/31/2023 | 473318 | 433363 | 434063 |
01/31/2024 | 485099 | 446956 | 451342 |
02/29/2024 | 525473 | 462546 | 462515 |
03/31/2024 | 547071 | 477435 | 477686 |
04/30/2024 | 519092 | 456135 | 455215 |
05/31/2024 | 540935 | 461130 | 461128 |
06/30/2024 | 553575 | 457814 | 457020 |
07/31/2024 | 571860 | 485984 | 485968 |
08/31/2024 | 589286 | 491582 | 487626 |
09/30/2024 | 591249 | 493067 | 488769 |
10/31/2024 | 552593 | 469986 | 467606 |

Average Annual Total Returns
for Periods Ended October 31, 2024
| 1 Year | 5 Year | 10 Year |
|---|
Hennessy Japan Fund | 31.59% | 4.91% | 8.25% |
Russell/Nomura Total Market™ Index | 21.52% | 5.54% | 6.52% |
TOPIX | 21.72% | 5.29% | 6.46% |
Past performance does not guarantee future results. The graph above illustrates the performance of an initial investment of $250,000 in the Fund 10 years ago compared with the performance of the indices shown. Fund performance in the graph and table assumes the reinvestment of dividends and capital gains and does not reflect the deduction of taxes that a shareholder would pay on Fund distributions or the redemption of Fund shares. Unlike the Fund, indices are not subject to fees and other expenses. Investors cannot invest directly in any index. These indices are used for comparative purposes in accordance with Securities and Exchange Commission regulations. Performance data current to the most recent month end may be obtained by visiting https://www.hennessyfunds.com/.Frank Russell Company (“Russell”) is the source and owner of the trademarks, service marks, and copyrights related to the Russell Indexes. Russell® is a trademark of Frank Russell Company. Neither Russell nor its licensors accept any liability for any errors or omissions in the Russell Indexes or Russell ratings or underlying data and no party may rely on any Russell Indexes or Russell ratings or underlying data contained in this communication. No further distribution of Russell data is permitted without Russell’s express written consent. Russell does not promote, sponsor, or endorse the content of this communication.
Key Fund Statistics
(as of October 31, 2024)
| |
|---|
Fund Size | $413,607,966 |
Number of Holdings | 27 |
Annual Portfolio Turnover | 17% |
Total Advisory Fee | $3,059,845 |
Sector Breakdown (% of net assets)
sector breakdown | (%) |
Communication Services | 2.59% |
Consumer Discretionary | 9.10% |
Consumer Staples | 10.40% |
Financials | 26.10% |
Health Care | 3.84% |
Industrials | 23.90% |
Information Technology | 10.99% |
Materials | 6.72% |
Short-Term Investments and Other | 5.74% |
Other Assets in Excess of Liabilities | 0.71% |
Sector sub-classifications may differ from those utilized for compliance purposes.
For additional information about the Fund, including its prospectus, financial information, holdings, and proxy information, visit https://www.hennessyfunds.com/funds/regulatory-documents.
Householding
To help keep the Fund’s costs as low as possible, we generally deliver a single copy of shareholder reports, proxy statements, and prospectuses to shareholders who share an address and have the same last name. This process does not apply to account statements. you may request an individual copy of a shareholder document at any time. If you would like to receive separate mailings of shareholder documents, please call U.S. Bank Global Fund services at 800-261-6950 or 414-765-4124, and individual delivery will begin within 30 days of your request. If your account is held through a financial institution or other intermediary, please contact such intermediary directly to request individual delivery.
Annual Shareholder Report Hennessy Japan Small Cap Fund Investor Class HJPSX | |
This annual shareholder report contains important information about the Hennessy Japan Small Cap Fund – Investor Class (the “Fund”) for the period of November 1, 2023, to October 31, 2024.You can find additional information about the Fund at https://www.hennessyfunds.com/funds/regulatory-documents. You can also request this information by contacting us at 1-800-966-4354 orfundsinfo@hennessyfunds.com.
What were the Fund costs for the last year?
(based on a hypothetical $10,000 investment)
Class Name | Costs of a $10,000 investment | Costs paid as a percentage of a $10,000 investment |
|---|
Investor Class | $162 | 1.52% |
How did the Fund perform last year and what affected its performance?
For the one year period ended October 31, 2024, the Fund underperformed both the Russell/Nomura Small Cap™ Index (the Fund’s primary benchmark) and the Tokyo Stock Price Index (TOPIX).
Factors Influencing Performance
In January through March 2024, the Fund faced performance pressures from the strong broader market rally, which was driven primarily by large-cap companies, whereas the Fund had lower exposure due to its outsized allocation toward small-cap companies relative to the broader market. From March through September 2024, substantial shifts in the external environment, such as fluctuations in the yen and diminished expectations for rising interest rates, further weighed on the Fund’s performance, creating additional headwinds.
Positioning
Our portfolio is strategically positioned to capture the recovery in domestic consumption. We believe the Japanese economy is at a pivotal turning point and has moved away from a prolonged deflationary period toward a virtuous cycle of inflation, wage growth, and earnings expansion. We believe the market will benefit from rising consumer spending and improved corporate profitability as real wage growth becomes more sustainable.
How did the Fund perform over the last 10 years?
Change in Value of $10,000 Investment
Date | Hennessy Japan Small Cap Fund | Russell/Nomura Small Cap™ Index | Tokyo Stock Price Index (TOPIX) |
10/31/2014 | 10000 | 10000 | 10000 |
11/30/2014 | 9696 | 9816 | 9994 |
12/31/2014 | 9862 | 9866 | 9926 |
01/31/2015 | 10039 | 10101 | 10142 |
02/28/2015 | 10195 | 10526 | 10732 |
03/31/2015 | 10362 | 10656 | 10923 |
04/30/2015 | 10654 | 10992 | 11298 |
05/31/2015 | 11050 | 11070 | 11446 |
06/30/2015 | 11404 | 11228 | 11329 |
07/31/2015 | 11175 | 11205 | 11391 |
08/31/2015 | 10716 | 10882 | 10788 |
09/30/2015 | 10477 | 10452 | 10092 |
10/31/2015 | 10727 | 11139 | 11065 |
11/30/2015 | 10956 | 11345 | 10985 |
12/31/2015 | 11004 | 11395 | 11015 |
01/31/2016 | 10595 | 10622 | 10154 |
02/29/2016 | 10239 | 10417 | 9871 |
03/31/2016 | 11069 | 11188 | 10394 |
04/30/2016 | 11026 | 11490 | 10708 |
05/31/2016 | 11338 | 11649 | 10788 |
06/30/2016 | 11457 | 11539 | 10542 |
07/31/2016 | 11845 | 12100 | 11206 |
08/31/2016 | 11522 | 11752 | 11163 |
09/30/2016 | 12211 | 12442 | 11446 |
10/31/2016 | 12168 | 12671 | 11612 |
11/30/2016 | 11910 | 12245 | 11298 |
12/31/2016 | 11941 | 12277 | 11422 |
01/31/2017 | 12601 | 12704 | 11858 |
02/28/2017 | 13349 | 13181 | 12043 |
03/31/2017 | 13712 | 13167 | 12025 |
04/30/2017 | 13778 | 13456 | 12172 |
05/31/2017 | 14382 | 13867 | 12560 |
06/30/2017 | 14778 | 14236 | 12726 |
07/31/2017 | 15240 | 14588 | 12997 |
08/31/2017 | 15504 | 14833 | 13046 |
09/30/2017 | 15999 | 15216 | 13305 |
10/31/2017 | 16406 | 15790 | 13902 |
11/30/2017 | 17263 | 16215 | 14326 |
12/31/2017 | 17862 | 16615 | 14455 |
01/31/2018 | 18659 | 17375 | 15077 |
02/28/2018 | 18367 | 17066 | 14849 |
03/31/2018 | 18401 | 16967 | 14597 |
04/30/2018 | 18412 | 16979 | 14689 |
05/31/2018 | 18626 | 16893 | 14548 |
06/30/2018 | 18143 | 16460 | 14160 |
07/31/2018 | 18154 | 16378 | 14197 |
08/31/2018 | 18019 | 16154 | 14185 |
09/30/2018 | 18401 | 16432 | 14615 |
10/31/2018 | 16839 | 14745 | 13329 |
11/30/2018 | 17311 | 15145 | 13415 |
12/31/2018 | 15627 | 13604 | 12388 |
01/31/2019 | 16276 | 14353 | 13188 |
02/28/2019 | 16798 | 14625 | 13231 |
03/31/2019 | 16427 | 14508 | 13317 |
04/30/2019 | 16821 | 14625 | 13434 |
05/31/2019 | 16508 | 14015 | 12898 |
06/30/2019 | 17019 | 14427 | 13360 |
07/31/2019 | 17169 | 14521 | 13378 |
08/31/2019 | 16589 | 14139 | 13225 |
09/30/2019 | 17100 | 14745 | 13772 |
10/31/2019 | 17900 | 15535 | 14455 |
11/30/2019 | 18086 | 15806 | 14548 |
12/31/2019 | 18744 | 16099 | 14825 |
01/31/2020 | 17781 | 15392 | 14591 |
02/29/2020 | 15571 | 13355 | 13157 |
03/31/2020 | 14396 | 12801 | 12357 |
04/30/2020 | 15513 | 13650 | 13015 |
05/31/2020 | 17358 | 14753 | 13800 |
06/30/2020 | 17181 | 14485 | 13755 |
07/31/2020 | 16923 | 14190 | 13471 |
08/31/2020 | 17640 | 15176 | 14528 |
09/30/2020 | 18545 | 15850 | 14789 |
10/31/2020 | 18486 | 15434 | 14506 |
11/30/2020 | 20378 | 16339 | 16163 |
12/31/2020 | 21262 | 16898 | 16808 |
01/31/2021 | 20708 | 16759 | 16614 |
02/28/2021 | 20414 | 16889 | 16835 |
03/31/2021 | 21368 | 17409 | 17158 |
04/30/2021 | 20849 | 17177 | 16867 |
05/31/2021 | 20755 | 16962 | 17072 |
06/30/2021 | 20861 | 17279 | 17026 |
07/31/2021 | 21321 | 17145 | 16843 |
08/31/2021 | 21179 | 17557 | 17360 |
09/30/2021 | 21627 | 17816 | 17837 |
10/31/2021 | 21344 | 17255 | 17207 |
11/30/2021 | 19966 | 16229 | 16656 |
12/31/2021 | 20273 | 16423 | 16990 |
01/31/2022 | 18972 | 15482 | 16159 |
02/28/2022 | 19114 | 15748 | 16096 |
03/31/2022 | 17801 | 15116 | 15931 |
04/30/2022 | 16441 | 13891 | 14404 |
05/31/2022 | 16926 | 14215 | 14785 |
06/30/2022 | 16051 | 13443 | 13713 |
07/31/2022 | 16997 | 14275 | 14458 |
08/31/2022 | 16678 | 13966 | 14108 |
09/30/2022 | 15637 | 13018 | 12769 |
10/31/2022 | 15507 | 13039 | 13068 |
11/30/2022 | 17068 | 14238 | 14331 |
12/31/2022 | 16960 | 14489 | 14464 |
01/31/2023 | 18055 | 15152 | 15325 |
02/28/2023 | 17519 | 14627 | 14769 |
03/31/2023 | 18340 | 15189 | 15373 |
04/30/2023 | 18186 | 15288 | 15431 |
05/31/2023 | 17650 | 14868 | 15583 |
06/30/2023 | 18174 | 15221 | 16200 |
07/31/2023 | 18483 | 15919 | 16726 |
08/31/2023 | 18328 | 15777 | 16394 |
09/30/2023 | 18007 | 15472 | 16076 |
10/31/2023 | 17543 | 14908 | 15366 |
11/30/2023 | 18638 | 15922 | 16595 |
12/31/2023 | 19722 | 16719 | 17363 |
01/31/2024 | 19422 | 16678 | 18054 |
02/29/2024 | 19854 | 16991 | 18501 |
03/31/2024 | 20490 | 17475 | 19107 |
04/30/2024 | 19830 | 16664 | 18209 |
05/31/2024 | 19938 | 16643 | 18445 |
06/30/2024 | 20034 | 16536 | 18281 |
07/31/2024 | 21439 | 17790 | 19439 |
08/31/2024 | 21078 | 18060 | 19505 |
09/30/2024 | 21475 | 18487 | 19551 |
10/31/2024 | 19962 | 17412 | 18704 |

Average Annual Total Returns
for Periods Ended October 31, 2024
| 1 Year | 5 Year | 10 Year |
|---|
Hennessy Japan Small Cap Fund | 13.79% | 2.20% | 7.16% |
Russell/Nomura Small Cap™ Index | 16.80% | 2.31% | 5.70% |
TOPIX | 21.72% | 5.29% | 6.46% |
Past performance does not guarantee future results. The graph above illustrates the performance of an initial investment of $10,000 in the Fund 10 years ago compared with the performance of the indices shown. Fund performance in the graph and table assumes the reinvestment of dividends and capital gains and does not reflect the deduction of taxes that a shareholder would pay on Fund distributions or the redemption of Fund shares. Unlike the Fund, indices are not subject to fees and other expenses. Investors cannot invest directly in any index. These indices are used for comparative purposes in accordance with Securities and Exchange Commission regulations. Performance data current to the most recent month end may be obtained by visiting https://www.hennessyfunds.com/.Frank Russell Company (“Russell”) is the source and owner of the trademarks, service marks, and copyrights related to the Russell Indexes. Russell® is a trademark of Frank Russell Company. Neither Russell nor its licensors accept any liability for any errors or omissions in the Russell Indexes or Russell ratings or underlying data and no party may rely on any Russell Indexes or Russell ratings or underlying data contained in this communication. No further distribution of Russell data is permitted without Russell’s express written consent. Russell does not promote, sponsor, or endorse the content of this communication.
Key Fund Statistics
(as of October 31, 2024)
| |
|---|
Fund Size | $109,181,957 |
Number of Holdings | 66 |
Annual Portfolio Turnover | 28% |
Total Advisory Fee | $902,610 |
Sector Breakdown (% of net assets)
sector breakdown | (%) |
Communication Services | 0.97% |
Consumer Discretionary | 14.87% |
Consumer Staples | 5.92% |
Energy | 0.61% |
Financials | 3.81% |
Health Care | 5.39% |
Industrials | 39.21% |
Information Technology | 11.14% |
Materials | 8.80% |
Real Estate | 5.48% |
Utilities | 0.52% |
Short-Term Investments and Other | 2.60% |
Other Assets in Excess of Liabilities | 0.68% |

Sector sub-classifications may differ from those utilized for compliance purposes.
For additional information about the Fund, including its prospectus, financial information, holdings, and proxy information, visit https://www.hennessyfunds.com/funds/regulatory-documents.
Householding
To help keep the Fund’s costs as low as possible, we generally deliver a single copy of shareholder reports, proxy statements, and prospectuses to shareholders who share an address and have the same last name. This process does not apply to account statements. you may request an individual copy of a shareholder document at any time. If you would like to receive separate mailings of shareholder documents, please call U.S. Bank Global Fund services at 800-261-6950 or 414-765-4124, and individual delivery will begin within 30 days of your request. If your account is held through a financial institution or other intermediary, please contact such intermediary directly to request individual delivery.
Annual Shareholder Report Hennessy Japan Small Cap Fund Institutional Class HJSIX | |
This annual shareholder report contains important information about the Hennessy Japan Small Cap Fund – Institutional Class (the “Fund”) for the period of November 1, 2023, to October 31, 2024. You can find additional information about the Fund at https://www.hennessyfunds.com/funds/regulatory-documents. You can also request this information by contacting us at1-800-966-4354 or fundsinfo@hennessyfunds.com.
What were the Fund costs for the last year?
(based on a hypothetical $10,000 investment)
Class Name | Costs of a $10,000 investment | Costs paid as a percentage of a $10,000 investment |
|---|
Institutional Class | $120 | 1.12% |
How did the Fund perform last year and what affected its performance?
For the one year period ended October 31, 2024, the Fund underperformed both the Russell/Nomura Small Cap™ Index (the Fund’s primary benchmark) and the Tokyo Stock Price Index (TOPIX).
Factors Influencing Performance
In January through March 2024, the Fund faced performance pressures from the strong broader market rally, which was driven primarily by large-cap companies, whereas the Fund had lower exposure due to its outsized allocation toward small-cap companies relative to the broader market. From March through September 2024, substantial shifts in the external environment, such as fluctuations in the yen and diminished expectations for rising interest rates, further weighed on the Fund’s performance, creating additional headwinds.
Positioning
Our portfolio is strategically positioned to capture the recovery in domestic consumption. We believe the Japanese economy is at a pivotal turning point and has moved away from a prolonged deflationary period toward a virtuous cycle of inflation, wage growth, and earnings expansion. We believe the market will benefit from rising consumer spending and improved corporate profitability as real wage growth becomes more sustainable.
How did the Fund perform over the last 10 years?
Change in Value of $250,000 Investment
Date | Hennessy Japan Small Cap Fund | Russell/Nomura Small Cap™ Index | Tokyo Stock Price Index (TOPIX) |
10/31/2014 | 250000 | 250000 | 250000 |
11/30/2014 | 242395 | 245405 | 249846 |
12/31/2014 | 246538 | 246662 | 248154 |
01/31/2015 | 250968 | 252516 | 253538 |
02/28/2015 | 254877 | 263143 | 268308 |
03/31/2015 | 259047 | 266407 | 273077 |
04/30/2015 | 266344 | 274802 | 282462 |
05/31/2015 | 276248 | 276746 | 286154 |
06/30/2015 | 285108 | 280708 | 283231 |
07/31/2015 | 279636 | 280137 | 284769 |
08/31/2015 | 268169 | 272049 | 269692 |
09/30/2015 | 262435 | 261312 | 252308 |
10/31/2015 | 268429 | 278464 | 276615 |
11/30/2015 | 274423 | 283617 | 274615 |
12/31/2015 | 275652 | 284873 | 275385 |
01/31/2016 | 265143 | 265552 | 253846 |
02/29/2016 | 256520 | 260426 | 246769 |
03/31/2016 | 277268 | 279706 | 259846 |
04/30/2016 | 276190 | 287240 | 267692 |
05/31/2016 | 284005 | 291228 | 269692 |
06/30/2016 | 286969 | 288470 | 263538 |
07/31/2016 | 296938 | 302490 | 280154 |
08/31/2016 | 289124 | 293796 | 279077 |
09/30/2016 | 306369 | 311060 | 286154 |
10/31/2016 | 305291 | 316786 | 290308 |
11/30/2016 | 298825 | 306131 | 282462 |
12/31/2016 | 299405 | 306914 | 285538 |
01/31/2017 | 316226 | 317595 | 296462 |
02/28/2017 | 335009 | 329529 | 301077 |
03/31/2017 | 344540 | 329167 | 300615 |
04/30/2017 | 345942 | 336404 | 304308 |
05/31/2017 | 361361 | 346685 | 314000 |
06/30/2017 | 371453 | 355897 | 318154 |
07/31/2017 | 382947 | 364700 | 324923 |
08/31/2017 | 389956 | 370827 | 326154 |
09/30/2017 | 402291 | 380398 | 332615 |
10/31/2017 | 412663 | 394751 | 347538 |
11/30/2017 | 434530 | 405375 | 358154 |
12/31/2017 | 449909 | 415364 | 361385 |
01/31/2018 | 470281 | 434387 | 376923 |
02/28/2018 | 462821 | 426650 | 371231 |
03/31/2018 | 463682 | 424167 | 364923 |
04/30/2018 | 464543 | 424465 | 367231 |
05/31/2018 | 469995 | 422333 | 363692 |
06/30/2018 | 457656 | 411500 | 354000 |
07/31/2018 | 458230 | 409447 | 354923 |
08/31/2018 | 455074 | 403861 | 354615 |
09/30/2018 | 464830 | 410795 | 365385 |
10/31/2018 | 425520 | 368629 | 333231 |
11/30/2018 | 437571 | 378614 | 335385 |
12/31/2018 | 395321 | 340099 | 309692 |
01/31/2019 | 411966 | 358830 | 329692 |
02/28/2019 | 425342 | 365613 | 330769 |
03/31/2019 | 416127 | 362694 | 332923 |
04/30/2019 | 426233 | 365625 | 335846 |
05/31/2019 | 418208 | 350374 | 322462 |
06/30/2019 | 431583 | 360684 | 334000 |
07/31/2019 | 435150 | 363019 | 334462 |
08/31/2019 | 420883 | 353481 | 330615 |
09/30/2019 | 433664 | 368623 | 344308 |
10/31/2019 | 454173 | 388387 | 361385 |
11/30/2019 | 458929 | 395153 | 363692 |
12/31/2019 | 476051 | 402467 | 370615 |
01/31/2020 | 451568 | 384792 | 364769 |
02/29/2020 | 395651 | 333884 | 328923 |
03/31/2020 | 366030 | 320037 | 308923 |
04/30/2020 | 394442 | 341254 | 325385 |
05/31/2020 | 441594 | 368821 | 345012 |
06/30/2020 | 437362 | 362113 | 343877 |
07/31/2020 | 430713 | 354760 | 336763 |
08/31/2020 | 449150 | 379402 | 363211 |
09/30/2020 | 472122 | 396244 | 369729 |
10/31/2020 | 470913 | 385855 | 362645 |
11/30/2020 | 519273 | 408486 | 404068 |
12/31/2020 | 542139 | 422462 | 420200 |
01/31/2021 | 528145 | 418982 | 415346 |
02/28/2021 | 520843 | 422224 | 420872 |
03/31/2021 | 545486 | 435237 | 428942 |
04/30/2021 | 532100 | 429432 | 421675 |
05/31/2021 | 529970 | 424045 | 426789 |
06/30/2021 | 533012 | 431979 | 425652 |
07/31/2021 | 544877 | 428614 | 421085 |
08/31/2021 | 541227 | 438916 | 433991 |
09/30/2021 | 553092 | 445404 | 445934 |
10/31/2021 | 545790 | 431379 | 430172 |
11/30/2021 | 510803 | 405724 | 416406 |
12/31/2021 | 518815 | 410575 | 424749 |
01/31/2022 | 485660 | 387061 | 403985 |
02/28/2022 | 489650 | 393688 | 402408 |
03/31/2022 | 455881 | 377901 | 398265 |
04/30/2022 | 421191 | 347287 | 360109 |
05/31/2022 | 433778 | 355382 | 369620 |
06/30/2022 | 411675 | 336076 | 342825 |
07/31/2022 | 435927 | 356871 | 361457 |
08/31/2022 | 427945 | 349141 | 352692 |
09/30/2022 | 401544 | 325439 | 319223 |
10/31/2022 | 398167 | 325968 | 326711 |
11/30/2022 | 438383 | 355954 | 358277 |
12/31/2022 | 435849 | 362215 | 361602 |
01/31/2023 | 464118 | 378789 | 383120 |
02/28/2023 | 450449 | 365686 | 369226 |
03/31/2023 | 471885 | 379719 | 384325 |
04/30/2023 | 467846 | 382190 | 385782 |
05/31/2023 | 454488 | 371688 | 389577 |
06/30/2023 | 467846 | 380532 | 405012 |
07/31/2023 | 476234 | 397966 | 418162 |
08/31/2023 | 472195 | 394435 | 409860 |
09/30/2023 | 463808 | 386806 | 401898 |
10/31/2023 | 452313 | 372691 | 384160 |
11/30/2023 | 480894 | 398060 | 414875 |
12/31/2023 | 508813 | 417978 | 434063 |
01/31/2024 | 501266 | 416952 | 451342 |
02/29/2024 | 512587 | 424778 | 462515 |
03/31/2024 | 528940 | 436887 | 477686 |
04/30/2024 | 512273 | 416597 | 455215 |
05/31/2024 | 515103 | 416067 | 461128 |
06/30/2024 | 517933 | 413394 | 457020 |
07/31/2024 | 554412 | 444748 | 485968 |
08/31/2024 | 545292 | 451490 | 487626 |
09/30/2024 | 555670 | 462165 | 488769 |
10/31/2024 | 516675 | 435298 | 467606 |

Average Annual Total Returns
for Periods Ended October 31, 2024
| 1 Year | 5 Year | 10 Year |
|---|
Hennessy Japan Small Cap Fund | 14.23% | 2.61% | 7.53% |
Russell/Nomura Small Cap™ Index | 16.80% | 2.31% | 5.70% |
TOPIX | 21.72% | 5.29% | 6.46% |
Past performance does not guarantee future results. The graph above illustrates the performance of an initial investment of $250,000 in the Fund 10 years ago compared with the performance of the indices shown. Fund performance in the graph and table assumes the reinvestment of dividends and capital gains and does not reflect the deduction of taxes that a shareholder would pay on Fund distributions or the redemption of Fund shares. Unlike the Fund, indices are not subject to fees and other expenses. Investors cannot invest directly in any index. These indices are used for comparative purposes in accordance with Securities and Exchange Commission regulations. Performance data current to the most recent month end may be obtained by visiting https://www.hennessyfunds.com/.Frank Russell Company (“Russell”) is the source and owner of the trademarks, service marks, and copyrights related to the Russell Indexes. Russell® is a trademark of Frank Russell Company. Neither Russell nor its licensors accept any liability for any errors or omissions in the Russell Indexes or Russell ratings or underlying data and no party may rely on any Russell Indexes or Russell ratings or underlying data contained in this communication. No further distribution of Russell data is permitted without Russell’s express written consent. Russell does not promote, sponsor, or endorse the content of this communication.The inception date of Institutional Class shares is June 15, 2015. Performance shown prior to the inception of Institutional Class shares reflects the performance of Investor Class shares and includes expenses that are not applicable to, and are higher than, those of Institutional Class shares.
Key Fund Statistics
(as of October 31, 2024)
| |
|---|
Fund Size | $109,181,957 |
Number of Holdings | 66 |
Annual Portfolio Turnover | 28% |
Total Advisory Fee | $902,610 |
Sector Breakdown (% of net assets)
sector breakdown | (%) |
Communication Services | 0.97% |
Consumer Discretionary | 14.87% |
Consumer Staples | 5.92% |
Energy | 0.61% |
Financials | 3.81% |
Health Care | 5.39% |
Industrials | 39.21% |
Information Technology | 11.14% |
Materials | 8.80% |
Real Estate | 5.48% |
Utilities | 0.52% |
Short-Term Investments and Other | 2.60% |
Other Assets in Excess of Liabilities | 0.68% |
Sector sub-classifications may differ from those utilized for compliance purposes.
For additional information about the Fund, including its prospectus, financial information, holdings, and proxy information, visit https://www.hennessyfunds.com/funds/regulatory-documents.
Householding
To help keep the Fund’s costs as low as possible, we generally deliver a single copy of shareholder reports, proxy statements, and prospectuses to shareholders who share an address and have the same last name. This process does not apply to account statements. you may request an individual copy of a shareholder document at any time. If you would like to receive separate mailings of shareholder documents, please call U.S. Bank Global Fund services at 800-261-6950 or 414-765-4124, and individual delivery will begin within 30 days of your request. If your account is held through a financial institution or other intermediary, please contact such intermediary directly to request individual delivery.
Annual Shareholder Report Hennessy Large Cap Financial Fund Investor Class HLFNX | |
This annual shareholder report contains important information about the Hennessy Large Cap Financial Fund – Investor Class (the “Fund”) for the period of November 1, 2023, to October 31, 2024. You can find additional information about the Fund at https://www.hennessyfunds.com/funds/regulatory-documents. You can also request this information by contacting us at1-800-966-4354 or fundsinfo@hennessyfunds.com.
What were the Fund costs for the last year?
(based on a hypothetical $10,000 investment)
Class Name | Costs of a $10,000 investment | Costs paid as a percentage of a $10,000 investment |
|---|
Investor Class | $236 | 1.89% |
How did the Fund perform last year and what affected its performance?
For the one-year period ended October 31, 2024, the Fund slightly outperformed the Russell 1000® Index Financials (the Fund’s primary benchmark) and significantly outperformed the Russell 1000® Index.
Factors Influencing Performance
● Holdings in the Diversified Banks and Regional Banks sub-industries contributed the most to performance.● Holdings in the Financial Exchanges & Data sub-industry detracted from performance.● Stocks that contributed the most to performance included Wells Fargo & Company, M&T Bank Corporation, and KeyCorp.● Stocks that detracted the most from performance included Flagstar Financial, Inc. and Coinbase Global, Inc.
Positioning
● At the end of the period, compared to its primary benchmark, the Fund was most overweight Transaction & Payment Processing Services companies and Diversified Banks and was most underweight Property & Casualty Insurance companies andAsset Management & Custody Banks.
Performance
● The majority of outperformance was due to sub-industry allocation rather than stock selection.
● As investors seem to have been anticipating lower interest rates and a strong economy, financial companies have outperformed the broader stock market, as represented by the Russell 1000® Index, this year by a significant amount.
● The outperformance of financial stocks has been fueled by solid earnings results and attractive valuations compared to such broader market.
How did the Fund perform over the last 10 years?
Change in Value of $10,000 Investment
Date | Hennessy Large Cap Financial Fund | Russell 1000® Index | Russell 1000® Index Financials |
10/31/2014 | 10000 | 10000 | 10000 |
11/30/2014 | 10216 | 10262 | 10249 |
12/31/2014 | 10428 | 10238 | 10405 |
01/31/2015 | 9621 | 9957 | 9845 |
02/28/2015 | 10104 | 10532 | 10384 |
03/31/2015 | 10019 | 10401 | 10348 |
04/30/2015 | 10067 | 10475 | 10348 |
05/31/2015 | 10295 | 10612 | 10541 |
06/30/2015 | 10301 | 10413 | 10488 |
07/31/2015 | 10455 | 10613 | 10855 |
08/31/2015 | 9786 | 9975 | 10155 |
09/30/2015 | 9330 | 9702 | 9900 |
10/31/2015 | 9743 | 10486 | 10541 |
11/30/2015 | 10088 | 10521 | 10711 |
12/31/2015 | 9791 | 10332 | 10478 |
01/31/2016 | 8762 | 9776 | 9624 |
02/29/2016 | 8393 | 9772 | 9397 |
03/31/2016 | 8762 | 10453 | 10090 |
04/30/2016 | 9136 | 10510 | 10373 |
05/31/2016 | 9136 | 10694 | 10608 |
06/30/2016 | 8580 | 10718 | 10307 |
07/31/2016 | 8926 | 11127 | 10704 |
08/31/2016 | 9335 | 11141 | 11030 |
09/30/2016 | 9206 | 11150 | 10844 |
10/31/2016 | 9493 | 10933 | 10878 |
11/30/2016 | 10809 | 11364 | 11780 |
12/31/2016 | 11256 | 11577 | 12211 |
01/31/2017 | 11256 | 11810 | 12298 |
02/28/2017 | 11820 | 12267 | 12912 |
03/31/2017 | 11338 | 12275 | 12635 |
04/30/2017 | 11279 | 12405 | 12628 |
05/31/2017 | 11250 | 12563 | 12584 |
06/30/2017 | 11755 | 12651 | 13162 |
07/31/2017 | 12091 | 12901 | 13441 |
08/31/2017 | 11973 | 12942 | 13344 |
09/30/2017 | 12443 | 13217 | 13816 |
10/31/2017 | 12949 | 13520 | 14187 |
11/30/2017 | 13308 | 13933 | 14648 |
12/31/2017 | 13437 | 14088 | 14844 |
01/31/2018 | 14544 | 14861 | 15603 |
02/28/2018 | 14304 | 14316 | 15122 |
03/31/2018 | 13744 | 13991 | 14782 |
04/30/2018 | 13658 | 14038 | 14778 |
05/31/2018 | 13830 | 14397 | 14881 |
06/30/2018 | 13615 | 14490 | 14838 |
07/31/2018 | 14033 | 14990 | 15389 |
08/31/2018 | 14464 | 15506 | 15811 |
09/30/2018 | 14132 | 15565 | 15532 |
10/31/2018 | 13184 | 14464 | 14715 |
11/30/2018 | 13301 | 14758 | 15140 |
12/31/2018 | 11861 | 13414 | 13640 |
01/31/2019 | 12976 | 14538 | 14903 |
02/28/2019 | 13546 | 15030 | 15381 |
03/31/2019 | 13217 | 15292 | 15356 |
04/30/2019 | 14389 | 15910 | 16365 |
05/31/2019 | 13540 | 14896 | 15604 |
06/30/2019 | 14459 | 15942 | 16475 |
07/31/2019 | 15022 | 16189 | 16898 |
08/31/2019 | 14300 | 15893 | 16526 |
09/30/2019 | 14066 | 16168 | 16931 |
10/31/2019 | 14338 | 16511 | 17234 |
11/30/2019 | 15155 | 17135 | 17888 |
12/31/2019 | 15390 | 17629 | 18245 |
01/31/2020 | 15694 | 17649 | 18193 |
02/29/2020 | 14465 | 16206 | 16454 |
03/31/2020 | 11449 | 14065 | 13124 |
04/30/2020 | 12938 | 15923 | 14518 |
05/31/2020 | 13724 | 16763 | 15158 |
06/30/2020 | 13926 | 17134 | 15263 |
07/31/2020 | 14440 | 18137 | 15887 |
08/31/2020 | 15371 | 19469 | 16583 |
09/30/2020 | 15060 | 18757 | 15834 |
10/31/2020 | 14148 | 18305 | 15849 |
11/30/2020 | 16746 | 20460 | 18408 |
12/31/2020 | 17937 | 21325 | 19563 |
01/31/2021 | 17329 | 21150 | 19255 |
02/28/2021 | 19014 | 21763 | 21420 |
03/31/2021 | 19324 | 22586 | 22650 |
04/30/2021 | 20775 | 23802 | 24091 |
05/31/2021 | 20959 | 23915 | 25119 |
06/30/2021 | 20946 | 24514 | 24347 |
07/31/2021 | 21232 | 25023 | 24278 |
08/31/2021 | 22100 | 25748 | 25575 |
09/30/2021 | 21213 | 24565 | 25069 |
10/31/2021 | 22378 | 26269 | 27081 |
11/30/2021 | 21111 | 25917 | 25662 |
12/31/2021 | 21310 | 26967 | 26418 |
01/31/2022 | 20584 | 25446 | 26337 |
02/28/2022 | 19779 | 24748 | 25906 |
03/31/2022 | 18900 | 25583 | 25945 |
04/30/2022 | 16889 | 23303 | 23293 |
05/31/2022 | 17482 | 23267 | 24085 |
06/30/2022 | 15285 | 21319 | 21499 |
07/31/2022 | 16610 | 23304 | 23073 |
08/31/2022 | 16303 | 22409 | 22623 |
09/30/2022 | 14859 | 20336 | 20867 |
10/31/2022 | 16510 | 21967 | 23366 |
11/30/2022 | 17295 | 23155 | 24916 |
12/31/2022 | 16008 | 21809 | 23538 |
01/31/2023 | 17594 | 23271 | 25257 |
02/28/2023 | 17008 | 22717 | 24697 |
03/31/2023 | 13599 | 23436 | 22321 |
04/30/2023 | 13957 | 23726 | 22952 |
05/31/2023 | 13363 | 23837 | 22056 |
06/30/2023 | 14035 | 25447 | 23531 |
07/31/2023 | 15900 | 26322 | 25037 |
08/31/2023 | 14700 | 25861 | 24253 |
09/30/2023 | 14085 | 24646 | 23702 |
10/31/2023 | 13271 | 24050 | 23032 |
11/30/2023 | 15014 | 26296 | 25599 |
12/31/2023 | 16740 | 27595 | 27177 |
01/31/2024 | 16529 | 27979 | 27766 |
02/29/2024 | 16892 | 29490 | 29058 |
03/31/2024 | 18186 | 30436 | 30663 |
04/30/2024 | 17430 | 29141 | 29226 |
05/31/2024 | 17837 | 30513 | 30545 |
06/30/2024 | 17656 | 31523 | 30438 |
07/31/2024 | 19015 | 31981 | 32550 |
08/31/2024 | 19160 | 32740 | 33814 |
09/30/2024 | 18913 | 33440 | 33520 |
10/31/2024 | 19894 | 33206 | 34454 |

Average Annual Total Returns
for Periods Ended October 31, 2024
| 1 Year | 5 Year | 10 Year |
|---|
Hennessy Large Cap Financial Fund | 49.91% | 6.77% | 7.12% |
Russell 1000® Index Financials | 49.59% | 14.86% | 13.17% |
Russell 1000® Index | 38.07% | 15.00% | 12.75% |
Past performance does not guarantee future results. The graph above illustrates the performance of an initial investment of $10,000 in the Fund 10 years ago compared with the performance of the indices shown. Fund performance in the graph and table assumes the reinvestment of dividends and capital gains and does not reflect the deduction of taxes that a shareholder would pay on Fund distributions or the redemption of Fund shares. Unlike the Fund, indices are not subject to fees and other expenses. Investors cannot invest directly in any index. These indices are used for comparative purposes in accordance with Securities and Exchange Commission regulations. Performance data current to the most recent month end may be obtained by visiting https://www.hennessyfunds.com/.Frank Russell Company (“Russell”) is the source and owner of the trademarks, service marks, and copyrights related to the Russell Indexes. Russell® is a trademark of Frank Russell Company. Neither Russell nor its licensors accept any liability for any errors or omissions in the Russell Indexes or Russell ratings or underlying data and no party may rely on any Russell Indexes or Russell ratings or underlying data contained in this communication. No further distribution of Russell data is permitted without Russell’s express written consent. Russell does not promote, sponsor, or endorse the content of this communication.
Key Fund Statistics
(as of October 31, 2024)
| |
|---|
Fund Size | $28,795,722 |
Number of Holdings | 24 |
Annual Portfolio Turnover | 37% |
Total Advisory Fee | $256,284 |
Sector Breakdown (% of net assets)
sector breakdown | (%) |
Financials | 99.16% |
Short-Term Investments and Other | 0.94% |
Liabilities in Excess of Other Assets | -0.10% |

Sector sub-classifications may differ from those utilized for compliance purposes.
For additional information about the Fund, including its prospectus, financial information, holdings, and proxy information, visit https://www.hennessyfunds.com/funds/regulatory-documents.
Householding
To help keep the Fund’s costs as low as possible, we generally deliver a single copy of shareholder reports, proxy statements, and prospectuses to shareholders who share an address and have the same last name. This process does not apply to account statements. you may request an individual copy of a shareholder document at any time. If you would like to receive separate mailings of shareholder documents, please call U.S. Bank Global Fund services at 800-261-6950 or 414-765-4124, and individual delivery will begin within 30 days of your request. If your account is held through a financial institution or other intermediary, please contact such intermediary directly to request individual delivery.
Annual Shareholder Report Hennessy Large Cap Financial Fund Institutional Class HILFX | |
This annual shareholder report contains important information about the Hennessy Large Cap Financial Fund – Institutional Class (the “Fund”) for the period of November 1, 2023, to October 31, 2024. You can find additional information about the Fund at https://www.hennessyfunds.com/funds/regulatory-documents. You can also request this information by contacting us at1-800-966-4354 or fundsinfo@hennessyfunds.com.
What were the Fund costs for the last year?
(based on a hypothetical $10,000 investment)
Class Name | Costs of a $10,000 investment | Costs paid as a percentage of a $10,000 investment |
|---|
Institutional Class | $197 | 1.57% |
How did the Fund perform last year and what affected its performance?
For the one-year period ended October 31, 2024, the Fund slightly outperformed the Russell 1000® Index Financials (the Fund’s primary benchmark) and significantly outperformed the Russell 1000® Index.
Factors Influencing Performance
● Holdings in the Diversified Banks and Regional Banks sub-industries contributed the most to performance.● Holdings in the Financial Exchanges & Data sub-industry detracted from performance.● Stocks that contributed the most to performance included Wells Fargo & Company, M&T Bank Corporation, and KeyCorp.● Stocks that detracted the most from performance included Flagstar Financial, Inc. and Coinbase Global, Inc.
Positioning
● At the end of the period, compared to its primary benchmark, the Fund was most overweight Transaction & Payment Processing Services companies and Diversified Banks and was most underweight Property & Casualty Insurance companies andAsset Management & Custody Banks.
Performance
● The majority of outperformance was due to sub-industry allocation rather than stock selection.
● As investors seem to have been anticipating lower interest rates and a strong economy, financial companies have outperformed the broader stock market, as represented by the Russell 1000® Index, this year by a significant amount.
● The outperformance of financial stocks has been fueled by solid earnings results and attractive valuations compared to such broader market.
How did the Fund perform over the last 10 years?
Change in Value of $250,000 Investment
Date | Hennessy Large Cap Financial Fund | Russell 1000® Index | Russell 1000® Index Financials |
10/31/2014 | 250000 | 250000 | 250000 |
11/30/2014 | 255391 | 256545 | 256223 |
12/31/2014 | 260701 | 255948 | 260127 |
01/31/2015 | 240535 | 248917 | 246132 |
02/28/2015 | 252608 | 263300 | 259588 |
03/31/2015 | 250485 | 260021 | 258707 |
04/30/2015 | 251679 | 261867 | 258701 |
05/31/2015 | 257384 | 265293 | 263515 |
06/30/2015 | 257517 | 260316 | 262205 |
07/31/2015 | 261497 | 265334 | 271370 |
08/31/2015 | 244913 | 249373 | 253887 |
09/30/2015 | 233503 | 242538 | 247500 |
10/31/2015 | 243984 | 262162 | 263515 |
11/30/2015 | 252741 | 263028 | 267776 |
12/31/2015 | 245359 | 258296 | 261947 |
01/31/2016 | 219663 | 244393 | 240597 |
02/29/2016 | 210559 | 244309 | 234936 |
03/31/2016 | 219957 | 261328 | 252238 |
04/30/2016 | 229354 | 262749 | 259321 |
05/31/2016 | 229354 | 267351 | 265203 |
06/30/2016 | 215698 | 267956 | 257684 |
07/31/2016 | 224362 | 278164 | 267588 |
08/31/2016 | 234640 | 278533 | 275754 |
09/30/2016 | 231556 | 278754 | 271108 |
10/31/2016 | 238751 | 273318 | 271952 |
11/30/2016 | 271936 | 284093 | 294498 |
12/31/2016 | 283473 | 289430 | 305263 |
01/31/2017 | 283473 | 295250 | 307446 |
02/28/2017 | 297796 | 306679 | 322804 |
03/31/2017 | 285711 | 306873 | 315872 |
04/30/2017 | 284368 | 310117 | 315704 |
05/31/2017 | 283771 | 314075 | 314610 |
06/30/2017 | 296602 | 316268 | 329045 |
07/31/2017 | 305256 | 322531 | 336037 |
08/31/2017 | 302272 | 323540 | 333599 |
09/30/2017 | 314357 | 330430 | 345407 |
10/31/2017 | 326889 | 338008 | 354670 |
11/30/2017 | 336139 | 348316 | 366206 |
12/31/2017 | 339404 | 352199 | 371096 |
01/31/2018 | 367506 | 371533 | 390069 |
02/28/2018 | 361573 | 357893 | 378051 |
03/31/2018 | 347522 | 349769 | 369554 |
04/30/2018 | 345337 | 350958 | 369461 |
05/31/2018 | 349864 | 359917 | 372023 |
06/30/2018 | 344400 | 362244 | 370938 |
07/31/2018 | 355172 | 374746 | 384723 |
08/31/2018 | 366101 | 387658 | 395278 |
09/30/2018 | 357982 | 389130 | 388299 |
10/31/2018 | 334096 | 361594 | 367868 |
11/30/2018 | 337218 | 368953 | 378503 |
12/31/2018 | 300712 | 335350 | 341008 |
01/31/2019 | 329175 | 363453 | 372576 |
02/28/2019 | 343648 | 375759 | 384516 |
03/31/2019 | 335447 | 382301 | 383899 |
04/30/2019 | 365197 | 397740 | 409114 |
05/31/2019 | 343809 | 372394 | 390090 |
06/30/2019 | 367287 | 398538 | 411884 |
07/31/2019 | 381760 | 404727 | 422461 |
08/31/2019 | 363428 | 397314 | 413138 |
09/30/2019 | 357639 | 404201 | 423285 |
10/31/2019 | 364714 | 412767 | 430858 |
11/30/2019 | 385458 | 428367 | 447203 |
12/31/2019 | 391569 | 440737 | 456123 |
01/31/2020 | 399449 | 441213 | 454822 |
02/29/2020 | 368252 | 405158 | 411356 |
03/31/2020 | 291546 | 351617 | 328096 |
04/30/2020 | 329497 | 398080 | 362948 |
05/31/2020 | 349598 | 419084 | 378955 |
06/30/2020 | 354905 | 428351 | 381584 |
07/31/2020 | 367930 | 453434 | 397166 |
08/31/2020 | 391891 | 486715 | 414587 |
09/30/2020 | 384011 | 468926 | 395853 |
10/31/2020 | 360855 | 457618 | 396221 |
11/30/2020 | 427269 | 511506 | 460202 |
12/31/2020 | 457822 | 533130 | 489084 |
01/31/2021 | 442385 | 528739 | 481381 |
02/28/2021 | 485642 | 544063 | 535505 |
03/31/2021 | 493843 | 564652 | 566240 |
04/30/2021 | 530990 | 595047 | 602267 |
05/31/2021 | 535975 | 597872 | 627986 |
06/30/2021 | 535815 | 612853 | 608681 |
07/31/2021 | 543212 | 625584 | 606953 |
08/31/2021 | 565564 | 643690 | 639387 |
09/30/2021 | 543051 | 614123 | 626724 |
10/31/2021 | 572961 | 656735 | 677037 |
11/30/2021 | 540639 | 647925 | 641551 |
12/31/2021 | 545919 | 674170 | 660458 |
01/31/2022 | 527502 | 636160 | 658436 |
02/28/2022 | 507057 | 618703 | 647648 |
03/31/2022 | 484754 | 639581 | 648621 |
04/30/2022 | 433220 | 582568 | 582324 |
05/31/2022 | 448427 | 581683 | 602136 |
06/30/2022 | 392162 | 532967 | 537479 |
07/31/2022 | 426462 | 582607 | 576816 |
08/31/2022 | 418690 | 560237 | 565582 |
09/30/2022 | 381687 | 508400 | 521665 |
10/31/2022 | 424265 | 549174 | 584146 |
11/30/2022 | 444541 | 578883 | 622897 |
12/31/2022 | 411541 | 545222 | 588462 |
01/31/2023 | 452185 | 581776 | 631414 |
02/28/2023 | 437239 | 567932 | 617429 |
03/31/2023 | 349755 | 585898 | 558026 |
04/30/2023 | 359050 | 593158 | 573804 |
05/31/2023 | 343923 | 595921 | 551408 |
06/30/2023 | 361237 | 636168 | 588264 |
07/31/2023 | 409354 | 658044 | 625927 |
08/31/2023 | 378734 | 646533 | 606318 |
09/30/2023 | 362878 | 616149 | 592561 |
10/31/2023 | 341918 | 601257 | 575808 |
11/30/2023 | 387118 | 657411 | 639987 |
12/31/2023 | 431560 | 689865 | 679432 |
01/31/2024 | 426358 | 699486 | 694153 |
02/29/2024 | 435833 | 737259 | 726453 |
03/31/2024 | 469459 | 760894 | 766580 |
04/30/2024 | 449952 | 728516 | 730658 |
05/31/2024 | 460541 | 762821 | 763622 |
06/30/2024 | 455897 | 788068 | 760941 |
07/31/2024 | 491195 | 799537 | 813749 |
08/31/2024 | 495096 | 818489 | 845348 |
09/30/2024 | 488779 | 835989 | 838007 |
10/31/2024 | 514417 | 830148 | 861347 |

Average Annual Total Returns
for Periods Ended October 31, 2024
| 1 Year | 5 Year | 10 Year |
|---|
Hennessy Large Cap Financial Fund | 50.45% | 7.12% | 7.48% |
Russell 1000® Index Financials | 49.59% | 14.86% | 13.17% |
Russell 1000® Index | 38.07% | 15.00% | 12.75% |
Past performance does not guarantee future results. The graph above illustrates the performance of an initial investment of $250,000 in the Fund 10 years ago compared with the performance of the indices shown. Fund performance in the graph and table assumes the reinvestment of dividends and capital gains and does not reflect the deduction of taxes that a shareholder would pay on Fund distributions or the redemption of Fund shares. Unlike the Fund, indices are not subject to fees and other expenses. Investors cannot invest directly in any index. These indices are used for comparative purposes in accordance with Securities and Exchange Commission regulations. Performance data current to the most recent month end may be obtained by visiting https://www.hennessyfunds.com/.Frank Russell Company (“Russell”) is the source and owner of the trademarks, service marks, and copyrights related to the Russell Indexes. Russell® is a trademark of Frank Russell Company. Neither Russell nor its licensors accept any liability for any errors or omissions in the Russell Indexes or Russell ratings or underlying data and no party may rely on any Russell Indexes or Russell ratings or underlying data contained in this communication. No further distribution of Russell data is permitted without Russell’s express written consent. Russell does not promote, sponsor, or endorse the content of this communication.The inception date of Institutional Class shares is June 15, 2015. Performance shown prior to the inception of Institutional Class shares reflects the performance of Investor Class shares and includes expenses that are not applicable to, and are higher than, those of Institutional Class shares.
Key Fund Statistics
(as of October 31, 2024)
| |
|---|
Fund Size | $28,795,722 |
Number of Holdings | 24 |
Annual Portfolio Turnover | 37% |
Total Advisory Fee | $256,284 |
Sector Breakdown (% of net assets)
sector breakdown | (%) |
Financials | 99.16% |
Short-Term Investments and Other | 0.94% |
Liabilities in Excess of Other Assets | -0.10% |
Sector sub-classifications may differ from those utilized for compliance purposes.
For additional information about the Fund, including its prospectus, financial information, holdings, and proxy information, visit https://www.hennessyfunds.com/funds/regulatory-documents.
Householding
To help keep the Fund’s costs as low as possible, we generally deliver a single copy of shareholder reports, proxy statements, and prospectuses to shareholders who share an address and have the same last name. This process does not apply to account statements. you may request an individual copy of a shareholder document at any time. If you would like to receive separate mailings of shareholder documents, please call U.S. Bank Global Fund services at 800-261-6950 or 414-765-4124, and individual delivery will begin within 30 days of your request. If your account is held through a financial institution or other intermediary, please contact such intermediary directly to request individual delivery.
Annual Shareholder Report Hennessy Small Cap Financial Fund Investor Class HSFNX | |
This annual shareholder report contains important information about the Hennessy Small Cap Financial Fund – Investor Class (the “Fund”) for the period of November 1, 2023, to October 31, 2024. You can find additional information about the Fund at https://www.hennessyfunds.com/funds/regulatory-documents. You can also request this information by contacting us at1-800-966-4354 or fundsinfo@hennessyfunds.com.
What were the Fund costs for the last year?
(based on a hypothetical $10,000 investment)
Class Name | Costs of a $10,000 investment | Costs paid as a percentage of a $10,000 investment |
|---|
Investor Class | $197 | 1.62% |
How did the Fund perform last year and what affected its performance?
For the one-year period ended October 31, 2024, the Fund underperformed the Russell 2000® Index Financials (the Fund’s primary benchmark) and outperformed the Russell 2000® Index.
Factors Influencing Performance
● Holdings in the Regional Banks sub-industry contributed the most to performance.● Stocks that contributed the most to performance included BankUnited, Inc., HomeTrust Bancshares, Inc., and Associated Banc-Corp.● Stocks that detracted the most from performance included California BanCorp and Flagstar Financial, Inc.
Positioning
● At the end of the period, compared to its primary benchmark, the Fund was most overweight Regional Banks and was most underweight Property & Casualty Insurance companies and Commercial and Residential Mortgage Finance companies.
Performance
● While security selection contributed positively to the Fund’s performance, sub-industry allocation contributed strongly to the Fund’s underperformance.
● As investors seem to have been anticipating lower interest rates and a strong economy, small-cap financial companies have outperformed small caps in the aggregate this year by a significant amount.
● The outperformance of small-cap financial stocks has been fueled by solid earnings results and attractive valuations compared to the broader market, as represented by the Russell 2000® Index.
How did the Fund perform over the last 10 years?
Change in Value of $10,000 Investment
Date | Hennessy Small Cap Financial Fund | Russell 2000® Index | Russell 2000® Index Financials |
10/31/2014 | 10000 | 10000 | 10000 |
11/30/2014 | 9896 | 10009 | 9950 |
12/31/2014 | 10200 | 10294 | 10206 |
01/31/2015 | 9532 | 9963 | 9796 |
02/28/2015 | 10210 | 10555 | 10163 |
03/31/2015 | 10450 | 10738 | 10387 |
04/30/2015 | 10426 | 10465 | 10184 |
05/31/2015 | 10609 | 10703 | 10247 |
06/30/2015 | 11109 | 10784 | 10452 |
07/31/2015 | 11191 | 10658 | 10585 |
08/31/2015 | 10854 | 9989 | 9927 |
09/30/2015 | 11013 | 9498 | 9933 |
10/31/2015 | 11451 | 10034 | 10431 |
11/30/2015 | 12100 | 10360 | 10792 |
12/31/2015 | 11398 | 9840 | 10267 |
01/31/2016 | 10711 | 8975 | 9576 |
02/29/2016 | 10407 | 8974 | 9533 |
03/31/2016 | 10949 | 9690 | 10298 |
04/30/2016 | 11377 | 9842 | 10463 |
05/31/2016 | 11681 | 10064 | 10768 |
06/30/2016 | 11098 | 10058 | 10713 |
07/31/2016 | 11501 | 10658 | 11282 |
08/31/2016 | 12089 | 10847 | 11671 |
09/30/2016 | 12125 | 10968 | 11513 |
10/31/2016 | 12115 | 10446 | 11293 |
11/30/2016 | 14086 | 11611 | 12682 |
12/31/2016 | 15206 | 11936 | 13464 |
01/31/2017 | 14705 | 11984 | 13269 |
02/28/2017 | 14863 | 12215 | 13618 |
03/31/2017 | 14443 | 12231 | 13340 |
04/30/2017 | 14327 | 12365 | 13385 |
05/31/2017 | 13855 | 12113 | 12933 |
06/30/2017 | 14455 | 12532 | 13539 |
07/31/2017 | 14507 | 12625 | 13654 |
08/31/2017 | 13949 | 12465 | 13288 |
09/30/2017 | 15095 | 13243 | 14101 |
10/31/2017 | 15148 | 13355 | 14183 |
11/30/2017 | 15666 | 13740 | 14588 |
12/31/2017 | 15175 | 13685 | 14242 |
01/31/2018 | 15591 | 14042 | 14442 |
02/28/2018 | 15238 | 13499 | 13736 |
03/31/2018 | 15232 | 13673 | 14046 |
04/30/2018 | 15333 | 13792 | 14202 |
05/31/2018 | 16025 | 14629 | 14946 |
06/30/2018 | 15830 | 14734 | 14972 |
07/31/2018 | 15710 | 14990 | 15247 |
08/31/2018 | 15874 | 15637 | 15601 |
09/30/2018 | 15169 | 15260 | 15058 |
10/31/2018 | 13816 | 13603 | 13900 |
11/30/2018 | 14257 | 13819 | 14347 |
12/31/2018 | 12768 | 12178 | 12700 |
01/31/2019 | 13771 | 13548 | 14035 |
02/28/2019 | 14754 | 14252 | 14644 |
03/31/2019 | 13535 | 13954 | 14115 |
04/30/2019 | 14417 | 14428 | 14800 |
05/31/2019 | 13508 | 13306 | 13975 |
06/30/2019 | 14330 | 14246 | 14671 |
07/31/2019 | 14511 | 14328 | 14850 |
08/31/2019 | 13387 | 13621 | 14258 |
09/30/2019 | 13939 | 13904 | 14855 |
10/31/2019 | 14545 | 14270 | 15239 |
11/30/2019 | 14848 | 14858 | 15528 |
12/31/2019 | 15306 | 15286 | 15775 |
01/31/2020 | 14373 | 14796 | 15294 |
02/29/2020 | 13174 | 13550 | 13873 |
03/31/2020 | 9482 | 10606 | 10374 |
04/30/2020 | 10590 | 12063 | 11221 |
05/31/2020 | 10325 | 12848 | 11249 |
06/30/2020 | 10666 | 13302 | 11705 |
07/31/2020 | 10325 | 13670 | 11616 |
08/31/2020 | 10659 | 14441 | 12115 |
09/30/2020 | 9984 | 13958 | 11431 |
10/31/2020 | 12164 | 14251 | 12515 |
11/30/2020 | 14317 | 16877 | 14279 |
12/31/2020 | 15701 | 18337 | 15467 |
01/31/2021 | 16270 | 19260 | 15458 |
02/28/2021 | 19090 | 20460 | 17295 |
03/31/2021 | 20461 | 20666 | 18451 |
04/30/2021 | 21340 | 21100 | 18897 |
05/31/2021 | 22050 | 21143 | 19318 |
06/30/2021 | 20602 | 21553 | 18682 |
07/31/2021 | 19835 | 20775 | 18276 |
08/31/2021 | 21080 | 21239 | 19029 |
09/30/2021 | 21473 | 20613 | 18958 |
10/31/2021 | 22163 | 21490 | 20061 |
11/30/2021 | 21860 | 20594 | 19464 |
12/31/2021 | 22413 | 21055 | 20099 |
01/31/2022 | 22498 | 19028 | 19418 |
02/28/2022 | 22740 | 19231 | 19485 |
03/31/2022 | 21370 | 19470 | 18819 |
04/30/2022 | 19453 | 17540 | 17020 |
05/31/2022 | 20219 | 17567 | 17608 |
06/30/2022 | 18579 | 16122 | 16335 |
07/31/2022 | 20305 | 17805 | 17900 |
08/31/2022 | 19943 | 17441 | 17352 |
09/30/2022 | 19076 | 15769 | 16070 |
10/31/2022 | 20922 | 17506 | 18092 |
11/30/2022 | 21391 | 17914 | 18399 |
12/31/2022 | 19911 | 16752 | 16989 |
01/31/2023 | 20685 | 18384 | 17942 |
02/28/2023 | 20785 | 18074 | 17977 |
03/31/2023 | 16749 | 17210 | 15508 |
04/30/2023 | 15774 | 16901 | 15014 |
05/31/2023 | 14692 | 16745 | 14214 |
06/30/2023 | 15836 | 18106 | 15302 |
07/31/2023 | 18914 | 19213 | 17420 |
08/31/2023 | 17468 | 18252 | 16228 |
09/30/2023 | 16625 | 17178 | 15444 |
10/31/2023 | 15790 | 16006 | 14917 |
11/30/2023 | 17568 | 17455 | 16463 |
12/31/2023 | 20823 | 19588 | 19069 |
01/31/2024 | 19858 | 18826 | 18102 |
02/29/2024 | 18658 | 19890 | 18016 |
03/31/2024 | 19282 | 20602 | 18717 |
04/30/2024 | 17879 | 19152 | 17525 |
05/31/2024 | 18504 | 20113 | 18332 |
06/30/2024 | 18869 | 19927 | 18491 |
07/31/2024 | 22380 | 21952 | 21564 |
08/31/2024 | 22469 | 21624 | 21631 |
09/30/2024 | 22185 | 21775 | 21412 |
10/31/2024 | 22607 | 21460 | 21687 |
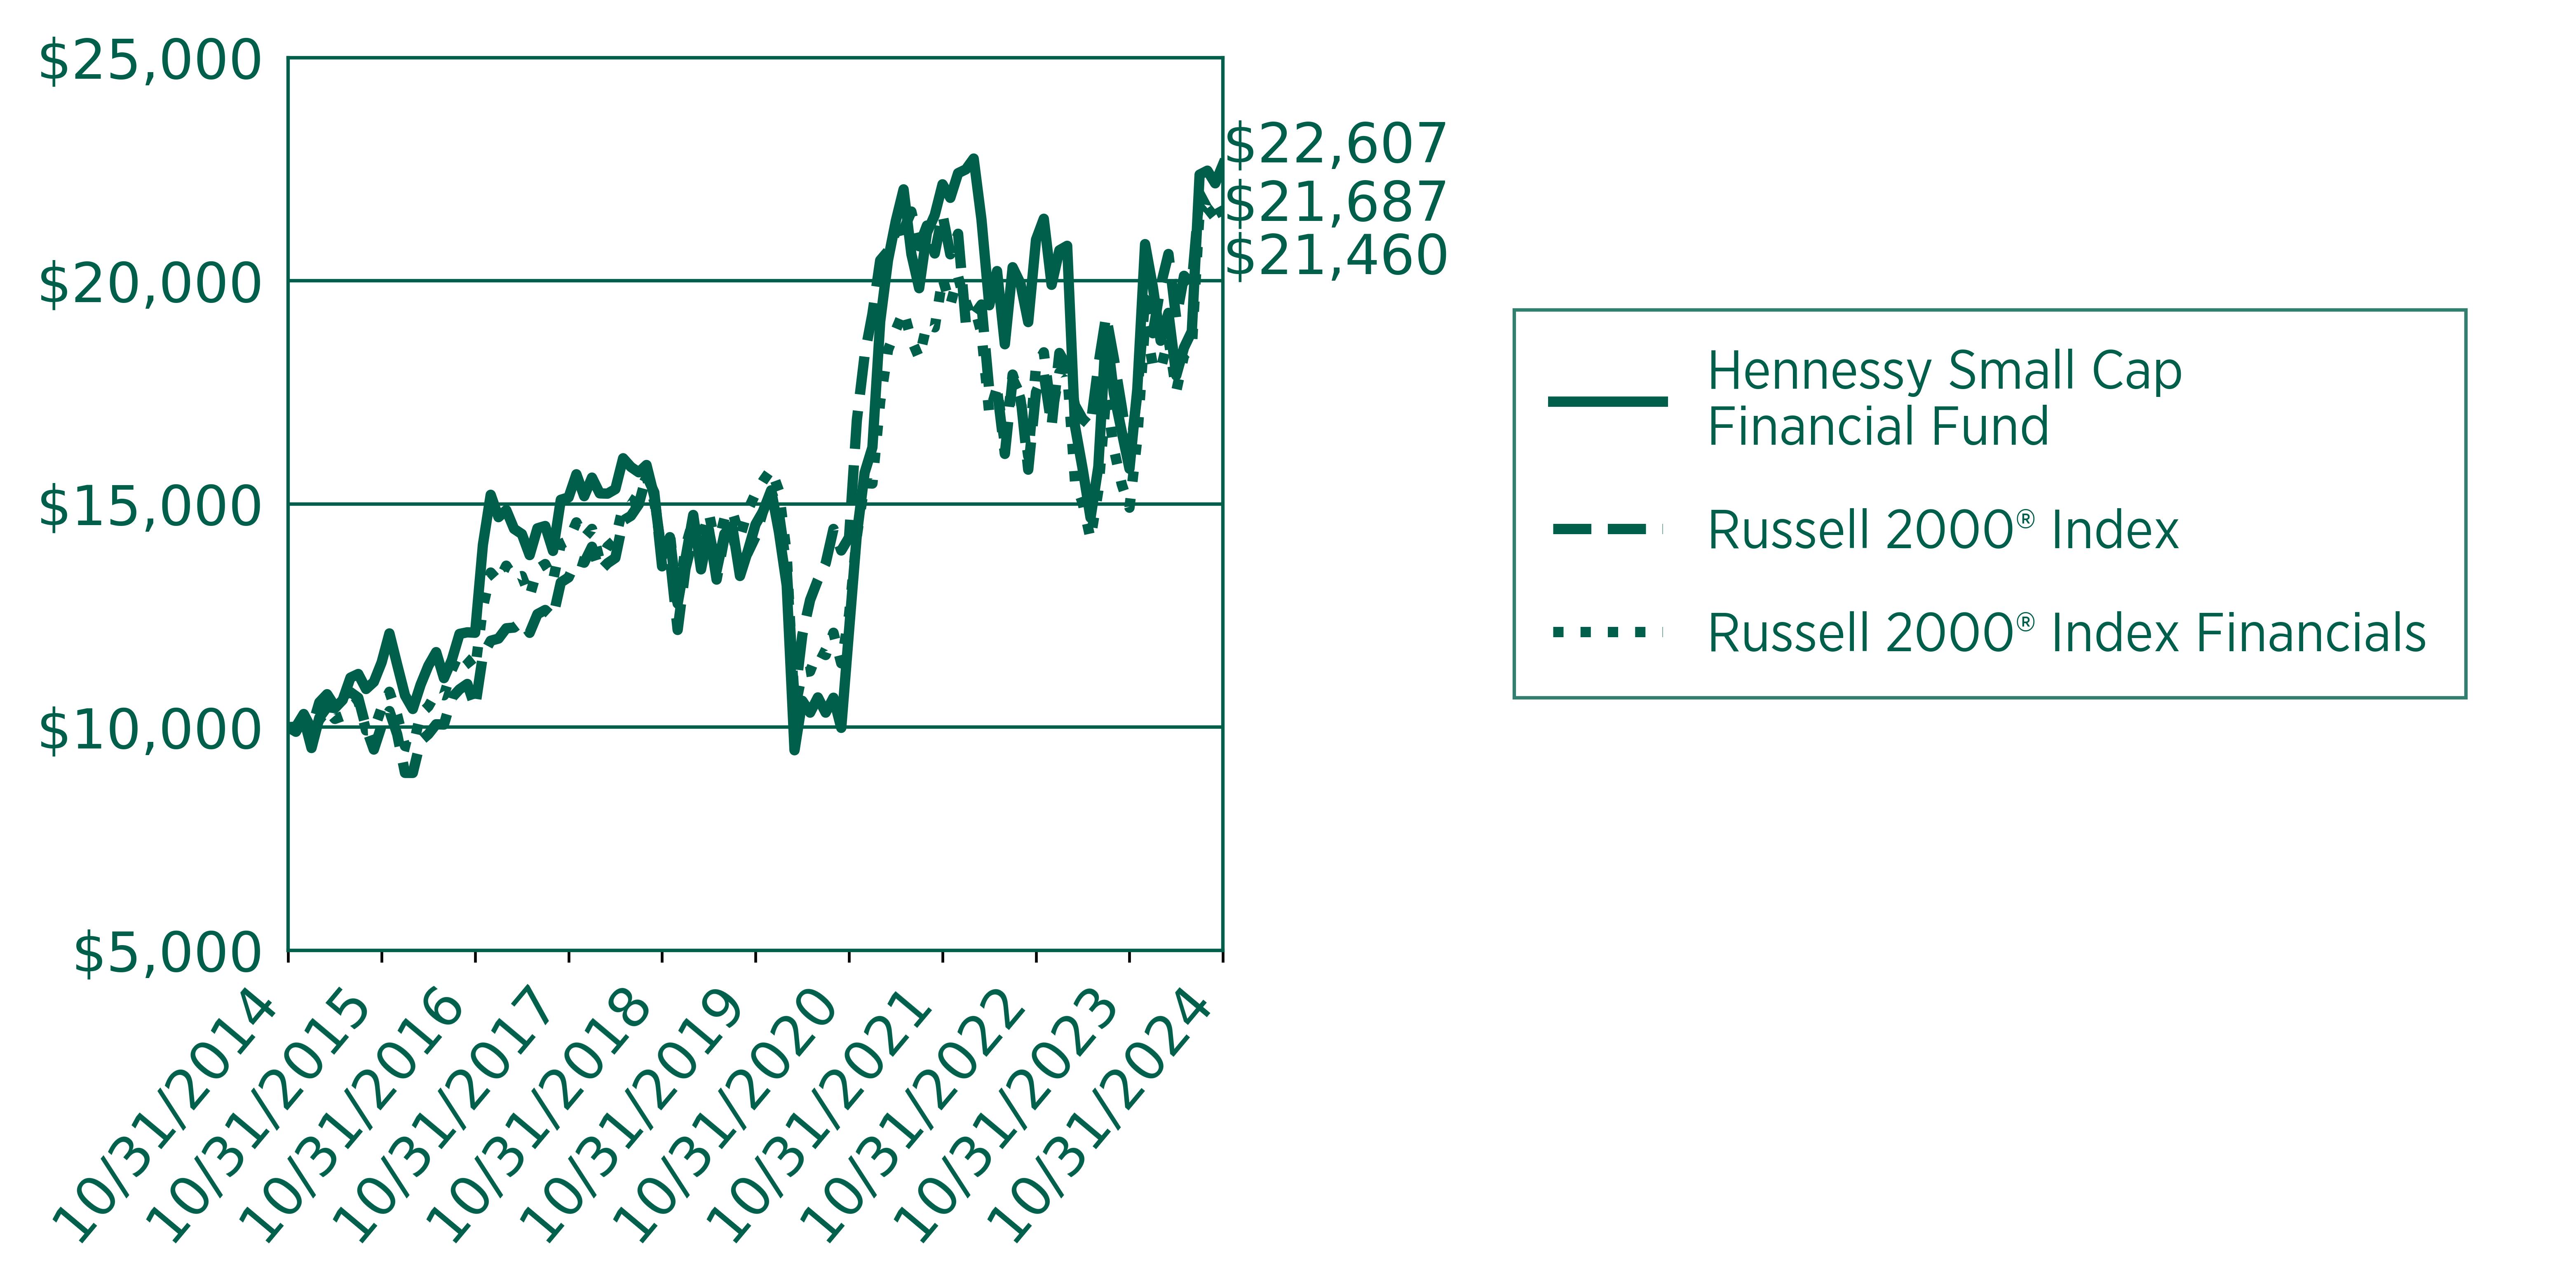
Average Annual Total Returns
for Periods Ended October 31, 2024
| 1 Year | 5 Year | 10 Year |
|---|
Hennessy Small Cap Financial Fund | 43.17% | 9.22% | 8.50% |
Russell 2000® Index Financials | 45.38% | 7.31% | 8.05% |
Russell 2000® Index | 34.07% | 8.50% | 7.94% |
Past performance does not guarantee future results. The graph above illustrates the performance of an initial investment of $10,000 in the Fund 10 years ago compared with the performance of the indices shown. Fund performance in the graph and table assumes the reinvestment of dividends and capital gains and does not reflect the deduction of taxes that a shareholder would pay on Fund distributions or the redemption of Fund shares. Unlike the Fund, indices are not subject to fees and other expenses. Investors cannot invest directly in any index. These indices are used for comparative purposes in accordance with Securities and Exchange Commission regulations. Performance data current to the most recent month end may be obtained by visiting https://www.hennessyfunds.com/.Frank Russell Company (“Russell”) is the source and owner of the trademarks, service marks, and copyrights related to the Russell Indexes. Russell® is a trademark of Frank Russell Company. Neither Russell nor its licensors accept any liability for any errors or omissions in the Russell Indexes or Russell ratings or underlying data and no party may rely on any Russell Indexes or Russell ratings or underlying data contained in this communication. No further distribution of Russell data is permitted without Russell’s express written consent. Russell does not promote, sponsor, or endorse the content of this communication.
Key Fund Statistics
(as of October 31, 2024)
| |
|---|
Fund Size | $87,201,263 |
Number of Holdings | 34 |
Annual Portfolio Turnover | 54% |
Total Advisory Fee | $658,265 |
Sector Breakdown (% of net assets)
sector breakdown | (%) |
Financials | 97.87% |
Short-Term Investments and Other | 2.25% |
Liabilities in Excess of Other Assets | -0.12% |
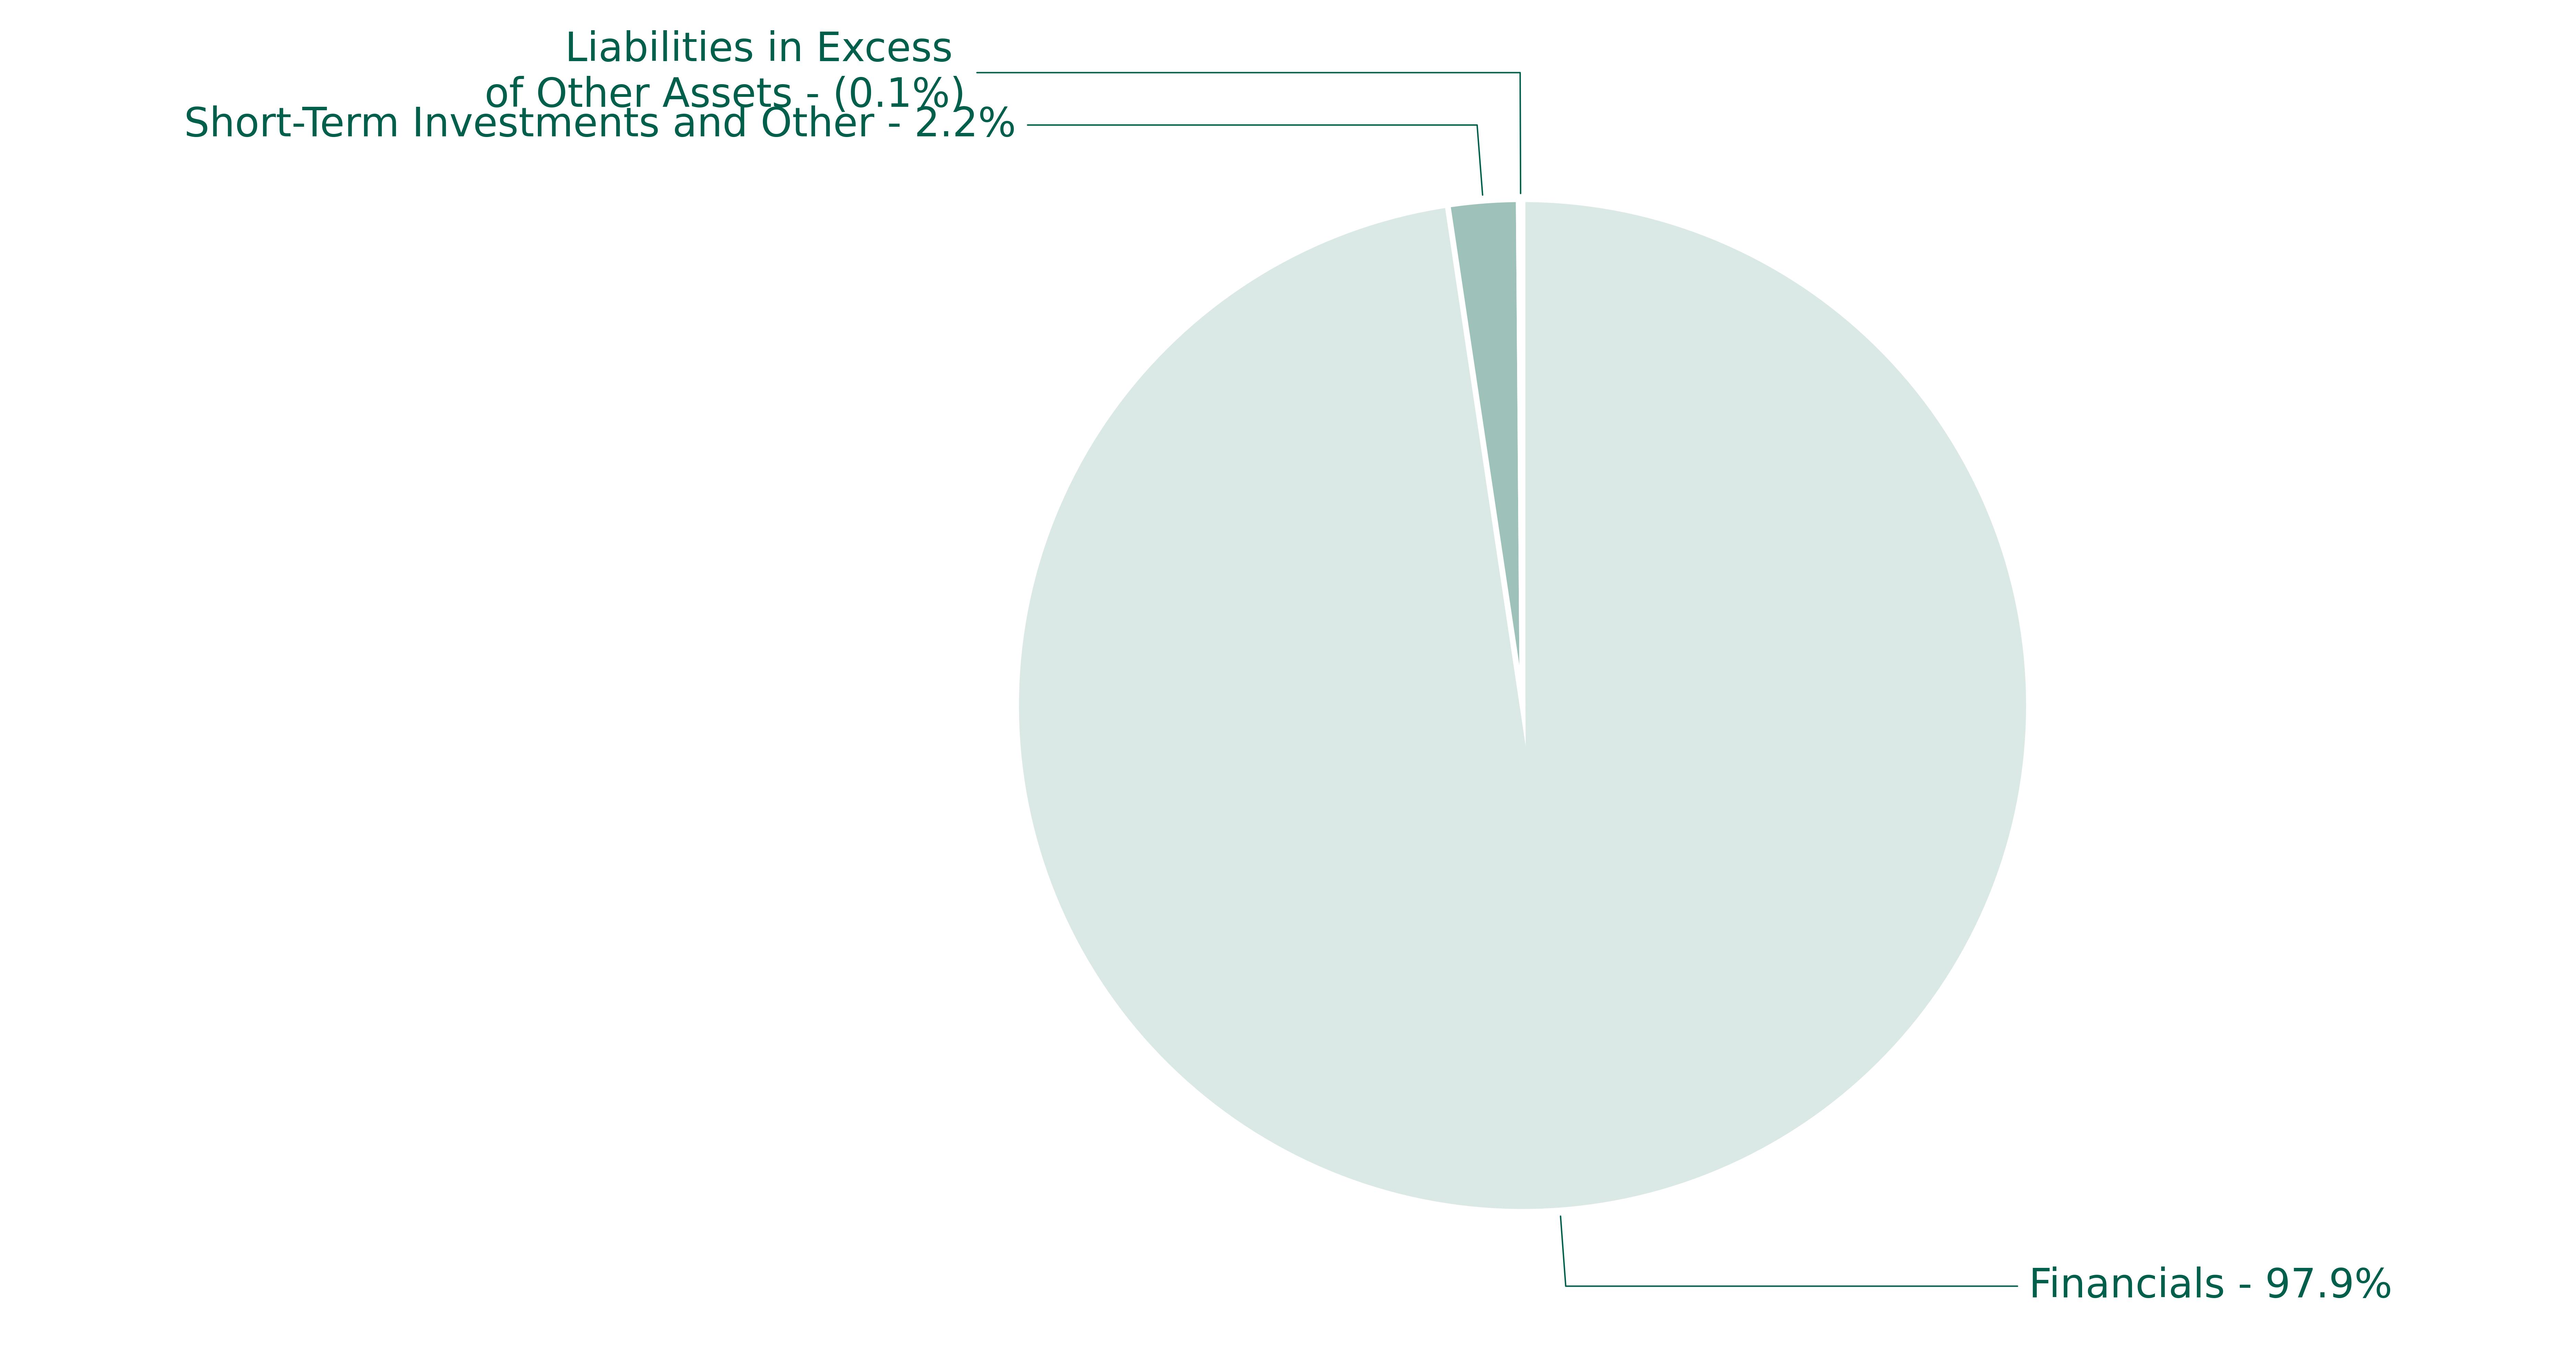
Sector sub-classifications may differ from those utilized for compliance purposes.
For additional information about the Fund, including its prospectus, financial information, holdings, and proxy information, visit https://www.hennessyfunds.com/funds/regulatory-documents.
Householding
To help keep the Fund’s costs as low as possible, we generally deliver a single copy of shareholder reports, proxy statements, and prospectuses to shareholders who share an address and have the same last name. This process does not apply to account statements. you may request an individual copy of a shareholder document at any time. If you would like to receive separate mailings of shareholder documents, please call U.S. Bank Global Fund services at 800-261-6950 or 414-765-4124, and individual delivery will begin within 30 days of your request. If your account is held through a financial institution or other intermediary, please contact such intermediary directly to request individual delivery.
Annual Shareholder Report Hennessy Small Cap Financial Fund Institutional Class HISFX | |
This annual shareholder report contains important information about the Hennessy Small Cap Financial Fund – Institutional Class (the “Fund”) for the period of November 1, 2023, to October 31, 2024. You can find additional information about the Fund at https://www.hennessyfunds.com/funds/regulatory-documents. You can also request this information by contacting us at1-800-966-4354 or fundsinfo@hennessyfunds.com.
What were the Fund costs for the last year?
(based on a hypothetical $10,000 investment)
Class Name | Costs of a $10,000 investment | Costs paid as a percentage of a $10,000 investment |
|---|
Institutional Class | $156 | 1.28% |
How did the Fund perform last year and what affected its performance?
For the one-year period ended October 31, 2024, the Fund underperformed the Russell 2000® Index Financials (the Fund’s primary benchmark) and outperformed the Russell 2000® Index.
Factors Influencing Performance
● Holdings in the Regional Banks sub-industry contributed the most to performance.● Stocks that contributed the most to performance included BankUnited, Inc., HomeTrust Bancshares, Inc., and Associated Banc-Corp.● Stocks that detracted the most from performance included California BanCorp and Flagstar Financial, Inc.
Positioning
● At the end of the period, compared to its primary benchmark, the Fund was most overweight Regional Banks and was most underweight Property & Casualty Insurance companies and Commercial and Residential Mortgage Finance companies.
Performance
● While security selection contributed positively to the Fund’s performance, sub-industry allocation contributed strongly to the Fund’s underperformance.
● As investors seem to have been anticipating lower interest rates and a strong economy, small-cap financial companies have outperformed small caps in the aggregate this year by a significant amount.
● The outperformance of small-cap financial stocks has been fueled by solid earnings results and attractive valuations compared to the broader market, as represented by the Russell 2000® Index.
How did the Fund perform over the last 10 years?
Change in Value of $250,000 Investment
Date | Hennessy Small Cap Financial Fund | Russell 2000® Index | Russell 2000® Index Financials |
10/31/2014 | 250000 | 250000 | 250000 |
11/30/2014 | 247591 | 250224 | 248750 |
12/31/2014 | 255130 | 257355 | 255148 |
01/31/2015 | 238560 | 249077 | 244890 |
02/28/2015 | 255529 | 263864 | 254067 |
03/31/2015 | 261718 | 268461 | 259663 |
04/30/2015 | 261119 | 261614 | 254600 |
05/31/2015 | 265910 | 267587 | 256177 |
06/30/2015 | 278487 | 269591 | 261288 |
07/31/2015 | 280483 | 266458 | 264615 |
08/31/2015 | 272099 | 249713 | 248169 |
09/30/2015 | 276291 | 237462 | 248324 |
10/31/2015 | 287470 | 250840 | 260770 |
11/30/2015 | 303641 | 259000 | 269809 |
12/31/2015 | 286257 | 245996 | 256676 |
01/31/2016 | 269103 | 224364 | 239391 |
02/29/2016 | 261384 | 224354 | 238323 |
03/31/2016 | 275107 | 242260 | 257444 |
04/30/2016 | 286043 | 246062 | 261563 |
05/31/2016 | 293762 | 251605 | 269200 |
06/30/2016 | 279181 | 251446 | 267822 |
07/31/2016 | 289474 | 266459 | 282050 |
08/31/2016 | 304269 | 271171 | 291781 |
09/30/2016 | 305341 | 274192 | 287826 |
10/31/2016 | 305127 | 261157 | 282315 |
11/30/2016 | 354873 | 290279 | 317057 |
12/31/2016 | 383356 | 298412 | 336609 |
01/31/2017 | 370903 | 299589 | 331728 |
02/28/2017 | 375054 | 305371 | 340450 |
03/31/2017 | 364311 | 305771 | 333506 |
04/30/2017 | 361625 | 309124 | 334627 |
05/31/2017 | 349904 | 302835 | 323318 |
06/30/2017 | 365043 | 313304 | 338482 |
07/31/2017 | 366508 | 315631 | 341356 |
08/31/2017 | 352590 | 311616 | 332192 |
09/30/2017 | 381647 | 331063 | 352529 |
10/31/2017 | 383112 | 333885 | 354568 |
11/30/2017 | 396298 | 343508 | 364705 |
12/31/2017 | 383872 | 342121 | 356062 |
01/31/2018 | 394703 | 351062 | 361041 |
02/28/2018 | 385985 | 337469 | 343391 |
03/31/2018 | 385985 | 341833 | 351157 |
04/30/2018 | 388627 | 344789 | 355047 |
05/31/2018 | 406328 | 365718 | 373655 |
06/30/2018 | 401308 | 368338 | 374291 |
07/31/2018 | 398402 | 374758 | 381180 |
08/31/2018 | 402629 | 390914 | 390034 |
09/30/2018 | 385193 | 381511 | 376456 |
10/31/2018 | 350848 | 340073 | 347510 |
11/30/2018 | 362208 | 345478 | 358686 |
12/31/2018 | 324527 | 304440 | 317494 |
01/31/2019 | 350042 | 338689 | 350878 |
02/28/2019 | 374983 | 356297 | 366106 |
03/31/2019 | 344308 | 348840 | 352880 |
04/30/2019 | 366956 | 360690 | 370005 |
05/31/2019 | 343734 | 332639 | 349372 |
06/30/2019 | 364662 | 356149 | 366768 |
07/31/2019 | 369536 | 358199 | 371249 |
08/31/2019 | 340868 | 340513 | 356446 |
09/30/2019 | 355202 | 347598 | 371369 |
10/31/2019 | 370396 | 356753 | 380969 |
11/30/2019 | 378423 | 371438 | 388205 |
12/31/2019 | 390099 | 382148 | 394366 |
01/31/2020 | 366412 | 369892 | 382352 |
02/29/2020 | 336127 | 338754 | 346834 |
03/31/2020 | 241976 | 265155 | 259339 |
04/30/2020 | 270161 | 301575 | 280527 |
05/31/2020 | 263564 | 321200 | 281223 |
06/30/2020 | 272260 | 332553 | 292634 |
07/31/2020 | 263564 | 341758 | 290402 |
08/31/2020 | 272260 | 361014 | 302873 |
09/30/2020 | 254869 | 348955 | 285783 |
10/31/2020 | 310940 | 356263 | 312881 |
11/30/2020 | 366112 | 421931 | 356984 |
12/31/2020 | 401446 | 458428 | 386663 |
01/31/2021 | 416144 | 481498 | 386459 |
02/28/2021 | 488717 | 511507 | 432376 |
03/31/2021 | 523932 | 516644 | 461265 |
04/30/2021 | 546591 | 527493 | 472432 |
05/31/2021 | 564964 | 528581 | 482961 |
06/30/2021 | 527912 | 538822 | 467041 |
07/31/2021 | 508621 | 519366 | 456892 |
08/31/2021 | 540467 | 530983 | 475732 |
09/30/2021 | 550878 | 515327 | 473938 |
10/31/2021 | 568639 | 537249 | 501522 |
11/30/2021 | 561290 | 514862 | 486594 |
12/31/2021 | 575573 | 526363 | 502480 |
01/31/2022 | 577762 | 475688 | 485449 |
02/28/2022 | 584327 | 480766 | 487128 |
03/31/2022 | 549311 | 486750 | 470465 |
04/30/2022 | 499914 | 438508 | 425497 |
05/31/2022 | 519923 | 439171 | 440188 |
06/30/2022 | 478029 | 403052 | 408387 |
07/31/2022 | 522424 | 445132 | 447496 |
08/31/2022 | 513357 | 436023 | 433795 |
09/30/2022 | 491160 | 394237 | 401750 |
10/31/2022 | 538994 | 437638 | 452298 |
11/30/2022 | 551187 | 447860 | 459986 |
12/31/2022 | 513160 | 418793 | 424729 |
01/31/2023 | 533175 | 459611 | 448551 |
02/28/2023 | 535936 | 451848 | 449421 |
03/31/2023 | 432062 | 430259 | 387690 |
04/30/2023 | 406870 | 422523 | 375354 |
05/31/2023 | 379262 | 418620 | 355354 |
06/30/2023 | 408940 | 452655 | 382546 |
07/31/2023 | 488313 | 480336 | 435501 |
08/31/2023 | 451042 | 456306 | 405703 |
09/30/2023 | 429646 | 429442 | 386107 |
10/31/2023 | 407905 | 400155 | 372932 |
11/30/2023 | 454148 | 436372 | 411579 |
12/31/2023 | 538338 | 489690 | 476736 |
01/31/2024 | 513633 | 470644 | 452547 |
02/29/2024 | 482660 | 497255 | 450391 |
03/31/2024 | 498884 | 515056 | 467920 |
04/30/2024 | 462749 | 478805 | 438137 |
05/31/2024 | 478973 | 502826 | 458289 |
06/30/2024 | 488560 | 498174 | 462273 |
07/31/2024 | 579635 | 548789 | 539090 |
08/31/2024 | 582216 | 540591 | 540778 |
09/30/2024 | 574842 | 544369 | 535292 |
10/31/2024 | 585903 | 536506 | 542171 |

Average Annual Total Returns
for Periods Ended October 31, 2024
| 1 Year | 5 Year | 10 Year |
|---|
Hennessy Small Cap Financial Fund | 43.64% | 9.61% | 8.89% |
Russell 2000® Index Financials | 45.38% | 7.31% | 8.05% |
Russell 2000® Index | 34.07% | 8.50% | 7.94% |
Past performance does not guarantee future results. The graph above illustrates the performance of an initial investment of $250,000 in the Fund 10 years ago compared with the performance of the indices shown. Fund performance in the graph and table assumes the reinvestment of dividends and capital gains and does not reflect the deduction of taxes that a shareholder would pay on Fund distributions or the redemption of Fund shares. Unlike the Fund, indices are not subject to fees and other expenses. Investors cannot invest directly in any index. These indices are used for comparative purposes in accordance with Securities and Exchange Commission regulations. Performance data current to the most recent month end may be obtained by visiting https://www.hennessyfunds.com/.Frank Russell Company (“Russell”) is the source and owner of the trademarks, service marks, and copyrights related to the Russell Indexes. Russell® is a trademark of Frank Russell Company. Neither Russell nor its licensors accept any liability for any errors or omissions in the Russell Indexes or Russell ratings or underlying data and no party may rely on any Russell Indexes or Russell ratings or underlying data contained in this communication. No further distribution of Russell data is permitted without Russell’s express written consent. Russell does not promote, sponsor, or endorse the content of this communication.
Key Fund Statistics
(as of October 31, 2024)
| |
|---|
Fund Size | $87,201,263 |
Number of Holdings | 34 |
Annual Portfolio Turnover | 54% |
Total Advisory Fee | $658,265 |
Sector Breakdown (% of net assets)
sector breakdown | (%) |
Financials | 97.87% |
Short-Term Investments and Other | 2.25% |
Liabilities in Excess of Other Assets | -0.12% |
Sector sub-classifications may differ from those utilized for compliance purposes.
For additional information about the Fund, including its prospectus, financial information, holdings, and proxy information, visit https://www.hennessyfunds.com/funds/regulatory-documents.
Householding
To help keep the Fund’s costs as low as possible, we generally deliver a single copy of shareholder reports, proxy statements, and prospectuses to shareholders who share an address and have the same last name. This process does not apply to account statements. you may request an individual copy of a shareholder document at any time. If you would like to receive separate mailings of shareholder documents, please call U.S. Bank Global Fund services at 800-261-6950 or 414-765-4124, and individual delivery will begin within 30 days of your request. If your account is held through a financial institution or other intermediary, please contact such intermediary directly to request individual delivery.
Annual Shareholder Report Hennessy Technology Fund Investor Class HTECX | |
This annual shareholder report contains important information about the Hennessy Technology Fund – Investor Class (the “Fund”) for the period of November 1, 2023, to October 31, 2024.You can find additional information about the Fund at https://www.hennessyfunds.com/funds/regulatory-documents. You can also request this information by contacting us at 1-800-966-4354 orfundsinfo@hennessyfunds.com.
What were the Fund costs for the last year?
(based on a hypothetical $10,000 investment)
Class Name | Costs of a $10,000 investment | Costs paid as a percentage of a $10,000 investment |
|---|
Investor Class | $142 | 1.23% |
How did the Fund perform last year and what affected its performance?
For the one-year period ended October 31, 2024, the Fund underperformed both the Nasdaq Composite Index (the Fund’s primary benchmark) and the S&P 500® Index.
Factors Influencing Performance
● Holdings in the Semiconductors, Systems Software, and Application Software industries contributed the most to performance.● Holdings in the Electronic Components industry detracted the most from performance.● Stocks that contributed the most to performance included NVIDIA Corp., Cellebrite DI Ltd., and Commvault Systems, Inc.● Stocks that detracted the most from performance included Super Micro Computer, Inc., Qualys, Inc., and Viasat, Inc.
Positioning
● At the end of the period, the Fund was most exposed to companies in the Systems Software, Semiconductors, and Application Software industries.
Performance
● While the Fund’s absolute performance was strong, it was underexposed to the large “Magnificent Seven”companies that accounted for a large share of the primary benchmarks’ performance.
● The Fund’s exposure to companies such as NVIDIA Corp. and Broadcom Inc., that are helping to power the next generation of artificial intelligence computing, contributed strongly to performance.
How did the Fund perform over the last 10 years?
Change in Value of $10,000 Investment
Date | Hennessy Technology Fund | S&P 500® Index | Nasdaq Composite Index |
10/31/2014 | 10000 | 10000 | 10000 |
11/30/2014 | 10155 | 10269 | 10366 |
12/31/2014 | 9913 | 10243 | 10252 |
01/31/2015 | 9731 | 9936 | 10039 |
02/28/2015 | 10336 | 10507 | 10767 |
03/31/2015 | 10175 | 10340 | 10641 |
04/30/2015 | 10283 | 10440 | 10732 |
05/31/2015 | 10525 | 10574 | 11029 |
06/30/2015 | 10276 | 10369 | 10857 |
07/31/2015 | 10518 | 10586 | 11170 |
08/31/2015 | 9697 | 9948 | 10422 |
09/30/2015 | 9361 | 9702 | 10087 |
10/31/2015 | 10336 | 10520 | 11039 |
11/30/2015 | 10417 | 10551 | 11180 |
12/31/2015 | 10256 | 10385 | 10966 |
01/31/2016 | 9280 | 9869 | 10109 |
02/29/2016 | 9206 | 9856 | 10006 |
03/31/2016 | 9758 | 10525 | 10700 |
04/30/2016 | 9798 | 10566 | 10498 |
05/31/2016 | 10114 | 10755 | 10899 |
06/30/2016 | 9899 | 10783 | 10675 |
07/31/2016 | 10518 | 11181 | 11385 |
08/31/2016 | 10707 | 11196 | 11519 |
09/30/2016 | 10962 | 11199 | 11744 |
10/31/2016 | 10646 | 10994 | 11478 |
11/30/2016 | 10485 | 11401 | 11799 |
12/31/2016 | 10464 | 11627 | 11939 |
01/31/2017 | 10962 | 11847 | 12458 |
02/28/2017 | 11319 | 12318 | 12945 |
03/31/2017 | 11218 | 12332 | 13148 |
04/30/2017 | 11265 | 12459 | 13456 |
05/31/2017 | 11642 | 12634 | 13815 |
06/30/2017 | 11649 | 12713 | 13695 |
07/31/2017 | 12059 | 12974 | 14164 |
08/31/2017 | 11891 | 13014 | 14367 |
09/30/2017 | 12147 | 13283 | 14526 |
10/31/2017 | 12423 | 13593 | 15051 |
11/30/2017 | 12544 | 14009 | 15403 |
12/31/2017 | 12578 | 14165 | 15477 |
01/31/2018 | 13420 | 14976 | 16623 |
02/28/2018 | 13516 | 14424 | 16334 |
03/31/2018 | 13412 | 14058 | 15878 |
04/30/2018 | 13420 | 14112 | 15890 |
05/31/2018 | 14003 | 14451 | 16764 |
06/30/2018 | 13626 | 14540 | 16927 |
07/31/2018 | 13929 | 15081 | 17298 |
08/31/2018 | 15229 | 15573 | 18311 |
09/30/2018 | 14867 | 15662 | 18182 |
10/31/2018 | 13324 | 14591 | 16516 |
11/30/2018 | 13457 | 14888 | 16597 |
12/31/2018 | 12348 | 13544 | 15038 |
01/31/2019 | 14021 | 14629 | 16509 |
02/28/2019 | 15006 | 15099 | 17103 |
03/31/2019 | 14947 | 15393 | 17565 |
04/30/2019 | 15941 | 16016 | 18403 |
05/31/2019 | 14038 | 14998 | 16970 |
06/30/2019 | 15227 | 16055 | 18245 |
07/31/2019 | 15737 | 16286 | 18638 |
08/31/2019 | 15219 | 16028 | 18180 |
09/30/2019 | 15567 | 16328 | 18277 |
10/31/2019 | 16051 | 16681 | 18956 |
11/30/2019 | 16892 | 17287 | 19836 |
12/31/2019 | 17177 | 17809 | 20556 |
01/31/2020 | 17072 | 17802 | 20972 |
02/29/2020 | 15519 | 16336 | 19658 |
03/31/2020 | 13347 | 14319 | 17687 |
04/30/2020 | 15223 | 16154 | 20426 |
05/31/2020 | 16086 | 16923 | 21835 |
06/30/2020 | 16819 | 17260 | 23160 |
07/31/2020 | 17351 | 18233 | 24748 |
08/31/2020 | 18468 | 19544 | 27148 |
09/30/2020 | 18145 | 18801 | 25763 |
10/31/2020 | 17883 | 18301 | 25181 |
11/30/2020 | 21207 | 20305 | 28179 |
12/31/2020 | 22842 | 21085 | 29789 |
01/31/2021 | 22833 | 20872 | 30218 |
02/28/2021 | 24107 | 21448 | 30523 |
03/31/2021 | 24879 | 22387 | 30669 |
04/30/2021 | 25390 | 23582 | 32335 |
05/31/2021 | 25313 | 23747 | 31869 |
06/30/2021 | 26336 | 24301 | 33636 |
07/31/2021 | 26268 | 24878 | 34036 |
08/31/2021 | 26693 | 25635 | 35426 |
09/30/2021 | 25168 | 24443 | 33560 |
10/31/2021 | 25950 | 26155 | 36007 |
11/30/2021 | 25187 | 25974 | 36127 |
12/31/2021 | 25895 | 27138 | 36395 |
01/31/2022 | 23846 | 25734 | 33134 |
02/28/2022 | 23060 | 24963 | 32024 |
03/31/2022 | 23111 | 25890 | 33139 |
04/30/2022 | 20624 | 23632 | 28752 |
05/31/2022 | 20701 | 23676 | 28196 |
06/30/2022 | 18484 | 21721 | 25756 |
07/31/2022 | 20469 | 23724 | 28946 |
08/31/2022 | 19683 | 22757 | 27635 |
09/30/2022 | 17543 | 20661 | 24749 |
10/31/2022 | 19090 | 22334 | 25723 |
11/30/2022 | 20482 | 23582 | 26883 |
12/31/2022 | 19091 | 22223 | 24554 |
01/31/2023 | 21116 | 23619 | 27187 |
02/28/2023 | 20974 | 23043 | 26914 |
03/31/2023 | 22032 | 23889 | 28739 |
04/30/2023 | 20445 | 24262 | 28758 |
05/31/2023 | 22393 | 24367 | 30462 |
06/30/2023 | 24005 | 25977 | 32490 |
07/31/2023 | 24470 | 26812 | 33814 |
08/31/2023 | 23851 | 26385 | 33119 |
09/30/2023 | 22754 | 25127 | 31210 |
10/31/2023 | 21851 | 24599 | 30350 |
11/30/2023 | 24238 | 26845 | 33638 |
12/31/2023 | 25953 | 28065 | 35514 |
01/31/2024 | 26082 | 28536 | 35885 |
02/29/2024 | 27346 | 30060 | 38117 |
03/31/2024 | 27772 | 31027 | 38822 |
04/30/2024 | 26301 | 29760 | 37121 |
05/31/2024 | 27488 | 31236 | 39713 |
06/30/2024 | 28894 | 32356 | 42108 |
07/31/2024 | 29449 | 32750 | 41802 |
08/31/2024 | 29436 | 33545 | 42109 |
09/30/2024 | 29449 | 34261 | 43270 |
10/31/2024 | 28739 | 33950 | 43056 |
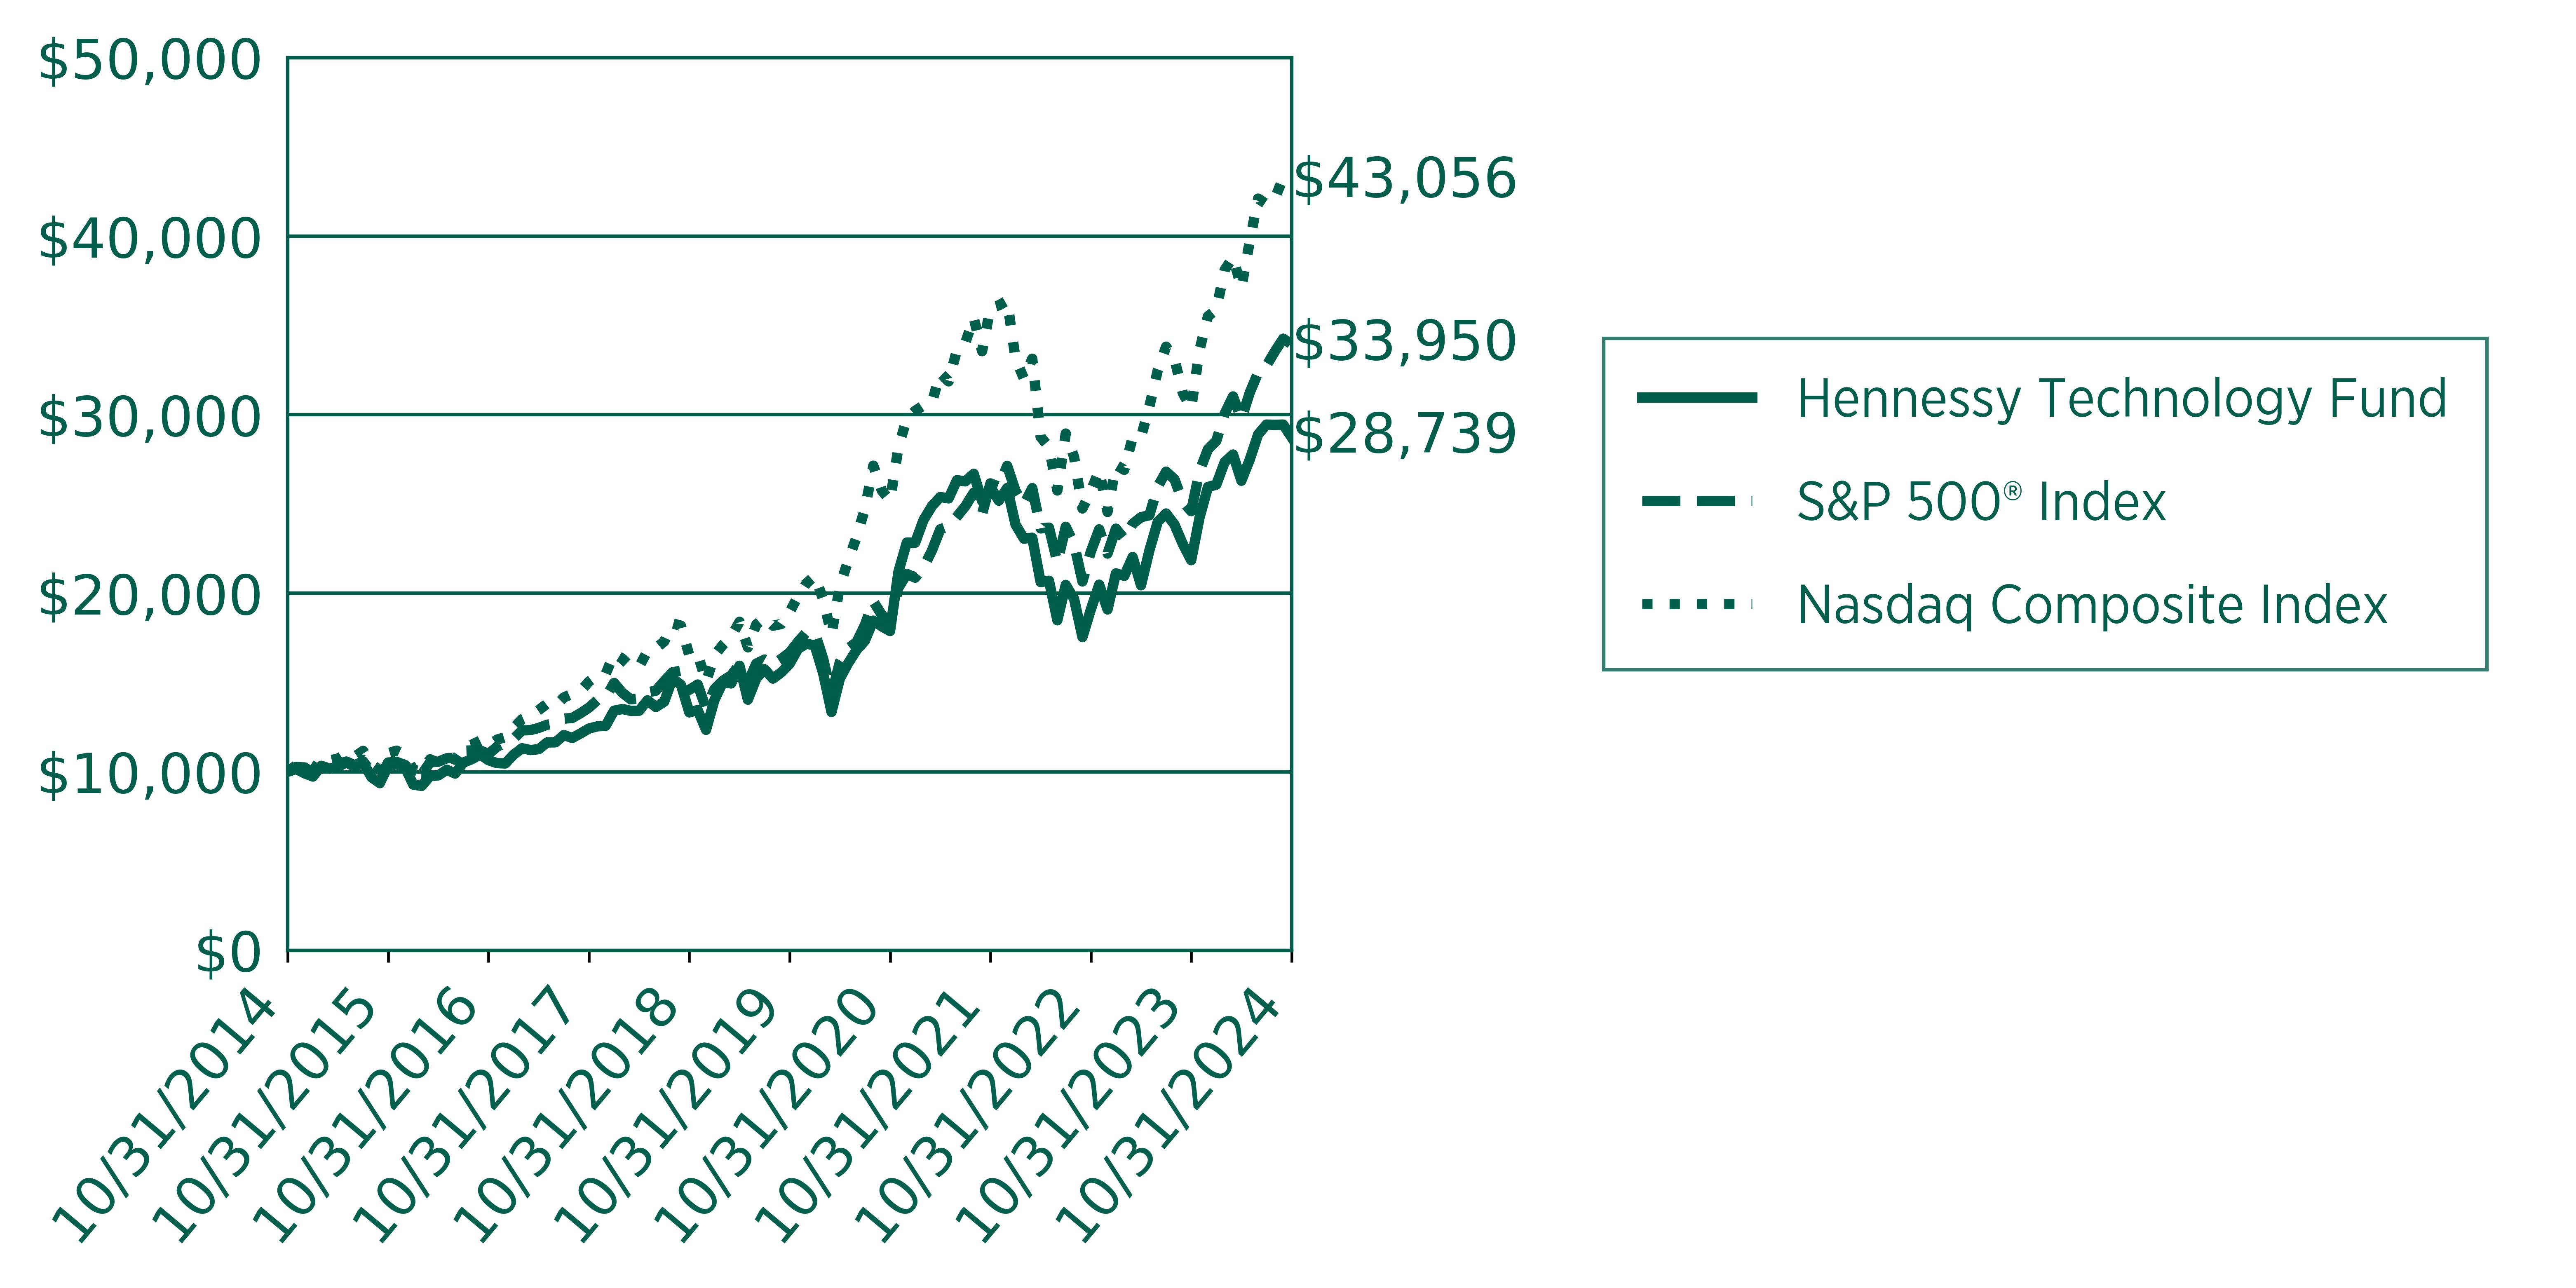
Average Annual Total Returns
for Periods Ended October 31, 2024
| 1 Year | 5 Year | 10 Year |
|---|
Hennessy Technology Fund | 31.52% | 12.36% | 11.13% |
Nasdaq Composite Index | 41.87% | 17.83% | 15.72% |
S&P 500® Index | 38.02% | 15.27% | 13.00% |
Past performance does not guarantee future results. The graph above illustrates the performance of an initial investment of $10,000 in the Fund 10 years ago compared with the performance of the indices shown. Fund performance in the graph and table assumes the reinvestment of dividends and capital gains and does not reflect the deduction of taxes that a shareholder would pay on Fund distributions or the redemption of Fund shares. Unlike the Fund, indices are not subject to fees and other expenses. Investors cannot invest directly in any index. These indices are used for comparative purposes in accordance with Securities and Exchange Commission regulations. Performance data current to the most recent month end may be obtained by visiting https://www.hennessyfunds.com/.Standard & Poor’s Financial Services is the source and owner of the S&P® and S&P 500® trademarks.
Key Fund Statistics
(as of October 31, 2024)
| |
|---|
Fund Size | $7,893,487 |
Number of Holdings | 60 |
Annual Portfolio Turnover | 84% |
Total Advisory Fee | $57,066 |
Sector Breakdown (% of net assets)
sector breakdown | (%) |
Communication Services | 8.28% |
Information Technology | 88.96% |
Short-Term Investments and Other | 2.92% |
Liabilities in Excess of Other Assets | -0.16% |
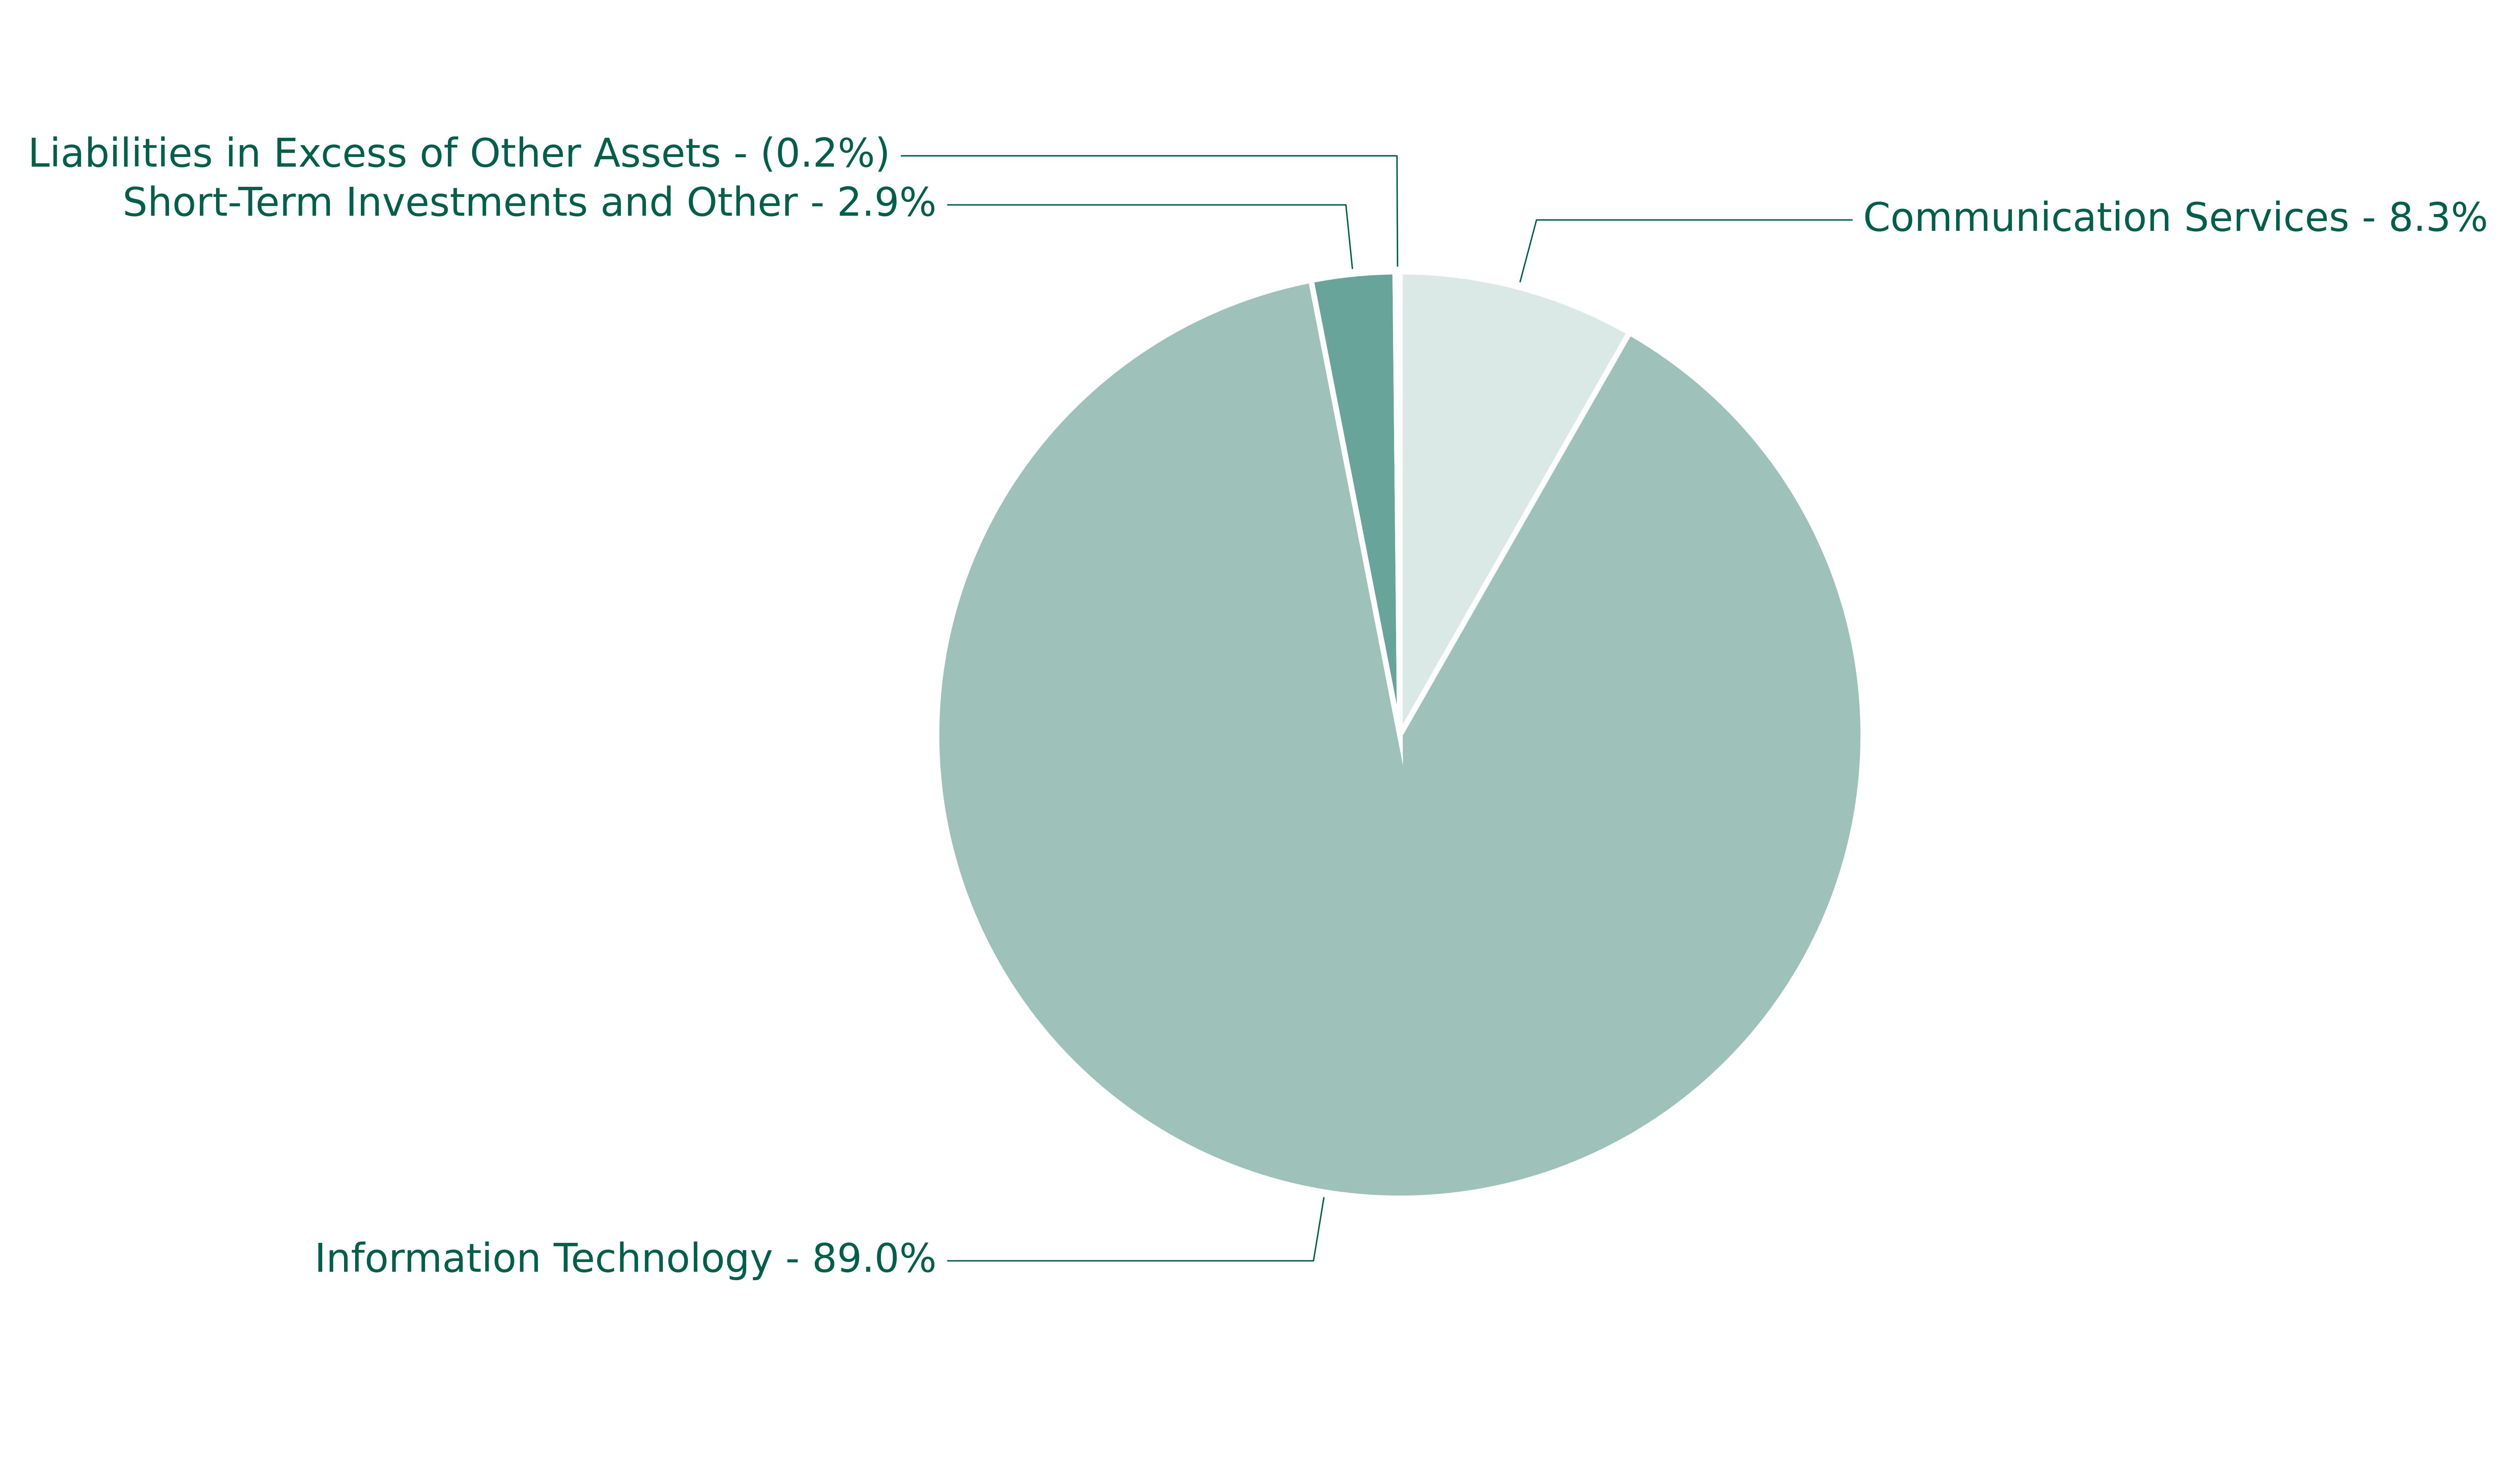
Sector sub-classifications may differ from those utilized for compliance purposes.
For additional information about the Fund, including its prospectus, financial information, holdings, and proxy information, visit https://www.hennessyfunds.com/funds/regulatory-documents.
Householding
To help keep the Fund’s costs as low as possible, we generally deliver a single copy of shareholder reports, proxy statements, and prospectuses to shareholders who share an address and have the same last name. This process does not apply to account statements. you may request an individual copy of a shareholder document at any time. If you would like to receive separate mailings of shareholder documents, please call U.S. Bank Global Fund services at 800-261-6950 or 414-765-4124, and individual delivery will begin within 30 days of your request. If your account is held through a financial institution or other intermediary, please contact such intermediary directly to request individual delivery.
Annual Shareholder Report Hennessy Technology Fund Institutional Class HTCIX | |
This annual shareholder report contains important information about the Hennessy Technology Fund – Institutional Class (the “Fund”) for the period of November1, 2023, to October 31, 2024.You can find additional information about the Fund at https://www.hennessyfunds.com/funds/regulatory-documents. You can also request this information by contacting us at 1-800-966-4354 orfundsinfo@hennessyfunds.com.
What were the Fund costs for the last year?
(based on a hypothetical $10,000 investment)
Class Name | Costs of a $10,000 investment | Costs paid as a percentage of a $10,000 investment |
|---|
Institutional Class | $114 | 0.98% |
How did the Fund perform last year and what affected its performance?
For the one-year period ended October 31, 2024, the Fund underperformed both the Nasdaq Composite Index (the Fund’s primary benchmark) and the S&P 500® Index.
Factors Influencing Performance
● Holdings in the Semiconductors, Systems Software, and Application Software industries contributed the most to performance.● Holdings in the Electronic Components industry detracted the most from performance.● Stocks that contributed the most to performance included NVIDIA Corp., Cellebrite DI Ltd., and Commvault Systems, Inc.● Stocks that detracted the most from performance included Super Micro Computer, Inc., Qualys, Inc., and Viasat, Inc.
Positioning
● At the end of the period, the Fund was most exposed to companies in the Systems Software, Semiconductors, and Application Software industries.
Performance
● While the Fund’s absolute performance was strong, it was underexposed to the large “Magnificent Seven”companies that accounted for a large share of the primary benchmarks’ performance.
● The Fund’s exposure to companies such as NVIDIA Corp. and Broadcom Inc., that are helping to power the next generation of artificial intelligence computing, contributed strongly to performance.
How did the Fund perform over the last 10 years?
Change in Value of $250,000 Investment
Date | Hennessy Technology Fund | S&P 500® Index | Nasdaq Composite Index |
10/31/2014 | 250000 | 250000 | 250000 |
11/30/2014 | 253828 | 256724 | 259145 |
12/31/2014 | 247836 | 256077 | 256312 |
01/31/2015 | 243509 | 248390 | 250968 |
02/28/2015 | 258655 | 262665 | 269167 |
03/31/2015 | 254660 | 258511 | 266024 |
04/30/2015 | 257490 | 260991 | 268311 |
05/31/2015 | 263648 | 264347 | 275725 |
06/30/2015 | 257490 | 259230 | 271430 |
07/31/2015 | 263648 | 264661 | 279252 |
08/31/2015 | 243176 | 248693 | 260538 |
09/30/2015 | 234687 | 242540 | 252187 |
10/31/2015 | 259321 | 262999 | 275986 |
11/30/2015 | 261485 | 263781 | 279507 |
12/31/2015 | 257490 | 259621 | 274159 |
01/31/2016 | 233189 | 246737 | 252731 |
02/29/2016 | 231358 | 246404 | 250140 |
03/31/2016 | 245173 | 263120 | 267497 |
04/30/2016 | 246338 | 264140 | 262442 |
05/31/2016 | 254328 | 268883 | 272483 |
06/30/2016 | 248835 | 269580 | 266872 |
07/31/2016 | 264647 | 279519 | 284619 |
08/31/2016 | 269308 | 279912 | 287964 |
09/30/2016 | 275965 | 279965 | 293608 |
10/31/2016 | 268142 | 274858 | 286938 |
11/30/2016 | 264148 | 285037 | 294972 |
12/31/2016 | 263648 | 290671 | 298469 |
01/31/2017 | 276298 | 296184 | 311438 |
02/28/2017 | 285453 | 307944 | 323615 |
03/31/2017 | 282956 | 308304 | 328695 |
04/30/2017 | 284121 | 311470 | 336406 |
05/31/2017 | 293775 | 315853 | 345378 |
06/30/2017 | 293941 | 317824 | 342384 |
07/31/2017 | 304427 | 324360 | 354098 |
08/31/2017 | 300100 | 325353 | 359178 |
09/30/2017 | 306758 | 332064 | 363147 |
10/31/2017 | 313748 | 339813 | 376268 |
11/30/2017 | 316744 | 350235 | 385085 |
12/31/2017 | 317866 | 354129 | 386928 |
01/31/2018 | 339240 | 374404 | 415566 |
02/28/2018 | 341614 | 360605 | 408348 |
03/31/2018 | 339057 | 351441 | 396938 |
04/30/2018 | 339240 | 352789 | 397248 |
05/31/2018 | 354037 | 361285 | 419090 |
06/30/2018 | 344720 | 363509 | 423185 |
07/31/2018 | 352393 | 377036 | 432462 |
08/31/2018 | 385458 | 389322 | 457774 |
09/30/2018 | 376324 | 391538 | 454551 |
10/31/2018 | 337413 | 364776 | 412903 |
11/30/2018 | 340884 | 372210 | 414936 |
12/31/2018 | 312772 | 338603 | 375939 |
01/31/2019 | 355203 | 365737 | 412726 |
02/28/2019 | 380200 | 377480 | 427574 |
03/31/2019 | 378940 | 384815 | 439123 |
04/30/2019 | 403936 | 400396 | 460085 |
05/31/2019 | 355834 | 374952 | 424262 |
06/30/2019 | 386292 | 401377 | 456115 |
07/31/2019 | 399315 | 407146 | 465943 |
08/31/2019 | 386081 | 400696 | 454489 |
09/30/2019 | 394904 | 408194 | 456928 |
10/31/2019 | 407507 | 417035 | 473890 |
11/30/2019 | 428723 | 432173 | 495902 |
12/31/2019 | 436269 | 445217 | 513888 |
01/31/2020 | 433678 | 445042 | 524306 |
02/29/2020 | 394175 | 408407 | 491449 |
03/31/2020 | 339128 | 357963 | 442176 |
04/30/2020 | 386835 | 403852 | 510659 |
05/31/2020 | 409070 | 423087 | 545866 |
06/30/2020 | 427418 | 431501 | 579010 |
07/31/2020 | 441234 | 455831 | 618697 |
08/31/2020 | 469513 | 488596 | 678704 |
09/30/2020 | 461525 | 470031 | 644077 |
10/31/2020 | 455049 | 457531 | 629537 |
11/30/2020 | 539670 | 507614 | 704486 |
12/31/2020 | 581379 | 527131 | 744717 |
01/31/2021 | 581379 | 521809 | 755453 |
02/28/2021 | 613944 | 536198 | 763087 |
03/31/2021 | 633578 | 559681 | 766714 |
04/30/2021 | 646748 | 589551 | 808373 |
05/31/2021 | 644832 | 593669 | 796718 |
06/30/2021 | 671172 | 607528 | 840904 |
07/31/2021 | 669735 | 621959 | 850903 |
08/31/2021 | 680510 | 640871 | 885641 |
09/30/2021 | 641959 | 611064 | 838989 |
10/31/2021 | 662073 | 653876 | 900181 |
11/30/2021 | 642677 | 649345 | 903186 |
12/31/2021 | 660799 | 678446 | 909874 |
01/31/2022 | 608665 | 643339 | 828358 |
02/28/2022 | 588834 | 624076 | 800611 |
03/31/2022 | 590114 | 647248 | 828482 |
04/30/2022 | 526784 | 590807 | 718791 |
05/31/2022 | 529023 | 591891 | 704890 |
06/30/2022 | 472411 | 543034 | 643908 |
07/31/2022 | 523266 | 593104 | 723659 |
08/31/2022 | 503116 | 568916 | 690869 |
09/30/2022 | 448422 | 516520 | 618713 |
10/31/2022 | 488083 | 558338 | 643081 |
11/30/2022 | 523906 | 589540 | 672080 |
12/31/2022 | 488517 | 555574 | 613843 |
01/31/2023 | 540261 | 590483 | 679673 |
02/28/2023 | 536725 | 576076 | 672841 |
03/31/2023 | 564044 | 597226 | 718476 |
04/30/2023 | 523548 | 606548 | 718950 |
05/31/2023 | 573364 | 609184 | 761559 |
06/30/2023 | 614824 | 649436 | 812238 |
07/31/2023 | 626715 | 670299 | 845346 |
08/31/2023 | 610967 | 659627 | 827980 |
09/30/2023 | 583006 | 628177 | 780245 |
10/31/2023 | 560187 | 614969 | 758746 |
11/30/2023 | 621252 | 671131 | 840942 |
12/31/2023 | 665604 | 701621 | 887855 |
01/31/2024 | 669139 | 713411 | 897122 |
02/29/2024 | 701600 | 751504 | 952928 |
03/31/2024 | 712527 | 775684 | 970539 |
04/30/2024 | 675246 | 744001 | 928022 |
05/31/2024 | 705778 | 780892 | 992825 |
06/30/2024 | 742095 | 808912 | 1052711 |
07/31/2024 | 756558 | 818759 | 1045052 |
08/31/2024 | 756236 | 838619 | 1052737 |
09/30/2024 | 756879 | 856530 | 1081751 |
10/31/2024 | 738560 | 848762 | 1076404 |

Average Annual Total Returns
for Periods Ended October 31, 2024
| 1 Year | 5 Year | 10 Year |
|---|
Hennessy Technology Fund | 31.84% | 12.63% | 11.44% |
Nasdaq Composite Index | 41.87% | 17.83% | 15.72% |
S&P 500® Index | 38.02% | 15.27% | 13.00% |
Past performance does not guarantee future results. The graph above illustrates the performance of an initial investment of $250,000 in the Fund 10 years ago compared with the performance of the indices shown. Fund performance in the graph and table assumes the reinvestment of dividends and capital gains and does not reflect the deduction of taxes that a shareholder would pay on Fund distributions or the redemption of Fund shares. Unlike the Fund, indices are not subject to fees and other expenses. Investors cannot invest directly in any index. These indices are used for comparative purposes in accordance with Securities and Exchange Commission regulations. Performance data current to the most recent month end may be obtained by visiting https://www.hennessyfunds.com/.Standard & Poor’s Financial Services is the source and owner of the S&P® and S&P 500® trademarks.
Key Fund Statistics
(as of October 31, 2024)
| |
|---|
Fund Size | $7,893,487 |
Number of Holdings | 60 |
Annual Portfolio Turnover | 84% |
Total Advisory Fee | $57,066 |
Sector Breakdown (% of net assets)
sector breakdown | (%) |
Communication Services | 8.28% |
Information Technology | 88.96% |
Short-Term Investments and Other | 2.92% |
Liabilities in Excess of Other Assets | -0.16% |
Sector sub-classifications may differ from those utilized for compliance purposes.
For additional information about the Fund, including its prospectus, financial information, holdings, and proxy information, visit https://www.hennessyfunds.com/funds/regulatory-documents.
Householding
To help keep the Fund’s costs as low as possible, we generally deliver a single copy of shareholder reports, proxy statements, and prospectuses to shareholders who share an address and have the same last name. This process does not apply to account statements. you may request an individual copy of a shareholder document at any time. If you would like to receive separate mailings of shareholder documents, please call U.S. Bank Global Fund services at 800-261-6950 or 414-765-4124, and individual delivery will begin within 30 days of your request. If your account is held through a financial institution or other intermediary, please contact such intermediary directly to request individual delivery.
Annual Shareholder Report Hennessy Stance ESG ETF Hennessy Stance ESG ETF STNC | |
This annual shareholder report contains important information about the Hennessy Stance ESG ETF (the “Fund”) for the period of November 1, 2023, to October31,2024.You can find additional information about the Fund at https://www.hennessyetfs.com/etfs/regulatory-documents. You can also request this information by contacting us at 1-800-966-4354 orfundsinfo@hennessyfunds.com. This report describes changes to the Fund that occurred during the reporting period.
What were the Fund costs for the last year?
(based on a hypothetical $10,000 investment)
Class Name | Costs of a $10,000 investment | Costs paid as a percentage of a $10,000 investment |
|---|
Hennessy Stance ESG ETF | $97 | 0.85% |
How did the Fund perform last year and what affected its performance?
For the one-year period ended October 31, 2024, the Fund underperformed the S&P 500® Index.
Factors Influencing Performance
The largest driver of the Fund’s underperformance relative to the S&P 500® Index was the Fund having less exposure to mega-cap names that have been large contributors to benchmark performance. The Fund has a targeted maximum position size in a single security of 3.5%, whereas the “Magnificent Seven”stocks (Microsoft, Tesla, Facebook (Meta), Apple, Amazon, NVIDIA, and Google (Alphabet)) comprised more than 31% of the S&P 500® Index by weight as of October 31, 2024.
Positioning
The Fund invests in companies that have two key properties: (1) they are in the top half of their sector peers based on up to 25 sustainability-related key performance indicators and (2) they are identified by our machine-learning model as most likely to outperform both in absolute returns and in risk adjusted returns over the next quarter. Investments are then allocated with the goal of having the least amount of risk. We generally expect the Fund to outperform in a down market and underperform in a rising market environment after a large downturn.
How did the Fund perform over the last 10 years?
Change in Value of $10,000 Investment
Date | Hennessy Stance ESG ETF | S&P 500® Index |
03/15/2021 | 10000 | 10000 |
04/30/2021 | 10043 | 10549 |
07/31/2021 | 10802 | 11129 |
10/31/2021 | 11116 | 11700 |
01/31/2022 | 10899 | 11512 |
04/30/2022 | 10304 | 10572 |
07/31/2022 | 10351 | 10613 |
10/31/2022 | 10294 | 9991 |
01/31/2023 | 10684 | 10566 |
04/30/2023 | 10796 | 10853 |
07/31/2023 | 10942 | 11994 |
10/31/2023 | 9677 | 11004 |
01/31/2024 | 11374 | 12766 |
04/30/2024 | 11691 | 13313 |
07/31/2024 | 12136 | 14651 |
10/31/2024 | 12405 | 15188 |

Average Annual Total Returns
for Periods Ended October 31, 2024
| 1 Year | SinceInception (3/15/21) |
|---|
Hennessy Stance ESG ETF - NAV | 28.18% | 6.17% |
S&P 500® Index | 38.02% | 12.20% |
Past performance does not guarantee future results. The graph above illustrates the performance of an initial investment of $10,000 in the Fund made on its inception date compared with the performance of the indices shown. Fund performance in the graph and table assumes the reinvestment of dividends and capital gains and does not reflect the deduction of taxes that a shareholder would pay on Fund distributions or the redemption of Fund shares. Unlike the Fund, indices are not subject to fees and other expenses. Investors cannot invest directly in any index. These indices are used for comparative purposes in accordance with Securities and Exchange Commission regulations. Performance data current to the most recent month end may be obtained by visiting https://www.hennessyetfs.com/. Performance for periods including or prior to December 22, 2022, is that of the Stance Equity ESG Large Cap Core ETF.
Key Fund Statistics
(as of October31,2024)
| |
|---|
Fund Size | $99,824,552 |
Number of Holdings | 36 |
Annual Portfolio Turnover | 291% |
Total Advisory Fee | $905,589 |
Sector Breakdown (% of net assets)
sector breakdown | (%) |
Communication Services | 6.50% |
Consumer Discretionary | 20.05% |
Consumer Staples | 3.31% |
Financials | 19.98% |
Health Care | 21.89% |
Industrials | 11.98% |
Information Technology | 9.43% |
Materials | 1.54% |
Utilities | 4.95% |
Short-Term Investments and Other | 0.35% |
Other Assets in Excess of Liabilities | 0.02% |

Sector sub-classifications may differ from those utilized for compliance purposes.
Material Fund Changes
This is a summary of certain changes to the Fund since November 1, 2023. For more complete information, you may review the Fund’s next prospectus, which we expect to be available by February 28, 2025, at https://www.hennessyetfs.com/etfs/regulatory-documents or upon request at fundsinfo@hennessyfunds.com or by calling 1-800-966-4354.
On October 24, 2023, and January 31, 2024, respectively, the Fund acquired the net assets of CCM Small/Mid-Cap Impact Value Fund and CCM Core Impact Equity Fund (together, the “CCM Funds”) in the amounts of $12,436,393 and $49,220,453 and issued 490,155 and 2,015,987 shares of the Fund to prior shareholders of the CCM Funds in a non-taxable reorganization. The CCM Funds and the Fund have substantially similar investment objectives.
Effective as of April 22, 2024, Austin Wen, CFA, replaced Ryan Dofflemeyer as a Portfolio Manager of the Fund.
Effective as of December 18, 2024, the exchange on which shares of the Fund trade changed from NYSE Arca, Inc. to The Nasdaq Stock Market LLC.
For additional information about the Fund, including its prospectus, financial information, holdings, and proxy information, visit https://www.hennessyetfs.com/etfs/regulatory-documents.
Householding
Householding is a method of delivery, based on the preference of the individual beneficial owner, in which a single copy of certain shareholder documents can be delivered to beneficial owners who share the same address, even if their accounts are registered under different names. Householding for the Fund may be available through the banks, broker-dealers and other financial intermediaries acting as authorized participants of the Fund. If you are interested in enrolling in householding and receiving a single copy of the prospectus and other shareholder documents, please contact your financial intermediary. If you currently are enrolled in householding and wish to change your householding status, please contact your financial intermediary.
The registrant has adopted a code of ethics that applies to the registrant’s principal executive officer and principal financial officer. The registrant has not made any amendments to its code of ethics or granted any waivers from any provisions thereunder during the period covered by this report. A copy of the registrant’s code of ethics is filed herewith.
Item 3. | Audit Committee Financial Expert. |
The registrant’s board of trustees has determined that it does not have an audit committee financial expert serving on its audit committee. At this time, the registrant believes that the financial and business experience provided by each member of the audit committee together offers the registrant adequate oversight for the registrant’s level of financial complexity.
Item 4. | Principal Accountant Fees and Services. |
| (a)–(d) | The registrant has engaged its principal accountant, Tait, Weller & Baker LLP, to perform audit services, audit-related services, tax services, and other services during the past two fiscal years. “Audit services” refer to performing an audit of the registrant’s annual financial statements or services that are normally provided by the accountant in connection with statutory and regulatory filings or engagements for those fiscal years. “Audit‑related services” refer to the assurance and related services by the principal accountant that are reasonably related to the performance of the audit. “Tax services” refer to professional services rendered by the principal accountant for tax compliance, tax advice, tax planning, and review of federal and state tax returns. The following table details the aggregate fees billed or expected to be billed for each of the last two fiscal years by the registrant’s principal accountant: |
| | FYE 10/31/2024 | FYE 10/31/2023 |
(a) Audit Fees | $331,300 | $328,300 |
(b) Audit-Related Fees | - | - |
(c) Tax Fees | $70,550 | $69,900 |
(d) All Other Fees | - | - |
| (e)(1) | The audit committee has adopted pre-approval procedures for audit and non-audit services provided to the registrant. Under the procedures, at any regularly scheduled audit committee meeting, the audit committee may pre-approve any audit, audit-related, tax, and other non-audit services to be rendered or that may be rendered by a principal accountant to the registrant and certain non-audit services to be rendered by a principal accountant to the investment advisor to the registrant’s series or such advisor’s affiliates that provide ongoing services to the registrant. The audit committee either specifically pre-approves the services or pre-approves a type of a service. No pre-approval is required for non-audit services that meet the following criteria: (1) the aggregate amount of fees to be paid for all such non-audit services is not more than 5% of the total revenues paid by the registrant to the principal accountant in the fiscal year in which the non-audit services are provided; (2) such services were not recognized by the registrant at the time of the engagement to be non-audit services; and (3) such services are promptly brought to the attention of the audit committee and approved prior to the completion of the audit.
The audit committee must pre-approve a principal accountant’s engagements for non-audit services with the investment advisor to the registrant’s series and such advisor’s affiliates that provide ongoing services to the registrant, if the engagement relates directly to the operations and financial reporting of the registrant, unless the aggregate amount of fees to be paid for all such services provided constitutes no more than 5% of the aggregate revenues paid to the principal accountant by the registrant, the investment advisor and such advisor’s affiliates that provide ongoing services to the registrant, during the fiscal year in which the services are to be provided.
If a service has not been pre-approved at a regularly scheduled audit committee meeting, and if, in the opinion of the Chief Compliance Officer of the registrant, a proposed engagement must commence before the next regularly scheduled audit committee meeting, any member of the audit committee is authorized under the procedures to pre-approve the engagement. The Chief Compliance Officer of the registrant will arrange for this interim review, coordinate with the designated member of the audit committee and provide, with the assistance of the principal accountant, information about the service to be pre-approved for the interim period. Any interim pre-approval decisions are reported (for informational purposes) to the audit committee at its next regularly scheduled meeting.
All of the tax services referenced above were pre-approved in accordance with the pre-approval procedures for audit and non-audit services. |
| (e)(2) | None of the fees billed by Tait, Weller & Baker LLP applicable to non-audit services in each of Items 4(b) through (d) of this Form were pursuant to a waiver of a pre‑approval requirement. |
| (f) | Not applicable. All of the principal accountant’s hours spent on auditing the registrant’s financial statements were attributed to work performed by full‑time permanent employees of the principal accountant. |
| (g) | The principal accountant has not provided any non-audit services in the last two fiscal years to the registrant, to the investment advisor to the registrant’s series, Hennessy Advisors, Inc., or to any entity controlling, controlled by, or under common control with Hennessy Advisors, Inc. |
| (h) | In assessing the independence of the registrant’s principal accountant, the registrant’s board of trustees noted that the principal accountant has not provided any non‑audit services to the investment advisor to the registrant’s series, Hennessy Advisors, Inc., or to any entity controlling, controlled by, or under common control with Hennessy Advisors, Inc. |
Item 5. | Audit Committee of Listed Registrants. |
(a) | The registrant is an issuer as defined in Rule 10A-3 under the Exchange Act and has a separately-designated standing audit committee established in accordance with Section 3(a)(58)(A) of the Exchange Act. The independent members of the committee are as follows: Robert Doyle, J. Dennis DeSousa, Doug Franklin, Claire Garvie, and Gerald Richardson. |
(a) | The Schedules of Investments are included within the financial statements filed under Item 7(a) of this Form. |
Financial Statements and Other Information
Name of registrant: Hennessy Funds Trust
Date of fiscal year end: October 31, 2024
Date of reporting period: November 1, 2023 – October 31, 2024
Item 7. | Financial Statements and Financial Highlights for Open-End Management Investment Companies. |
ANNUAL FINANCIAL STATEMENTS
AND OTHER INFORMATION
OCTOBER 31, 2024
| | | |
| DOMESTIC EQUITY | Investor | Institutional |
| Hennessy Cornerstone Growth Fund | HFCGX | HICGX |
| Hennessy Focus Fund | HFCSX | HFCIX |
| Hennessy Cornerstone Mid Cap 30 Fund | HFMDX | HIMDX |
| Hennessy Cornerstone Large Growth Fund | HFLGX | HILGX |
| Hennessy Cornerstone Value Fund | HFCVX | HICVX |
| | | |
| MULTI-ASSET | | |
| Hennessy Total Return Fund | HDOGX | — |
| Hennessy Equity and Income Fund | HEIFX | HEIIX |
| Hennessy Balanced Fund | HBFBX | — |
| | | |
| SECTOR & SPECIALTY | | |
| Hennessy Energy Transition Fund | HNRGX | HNRIX |
| Hennessy Midstream Fund | HMSFX | HMSIX |
| Hennessy Gas Utility Fund | GASFX | HGASX |
| Hennessy Japan Fund | HJPNX | HJPIX |
| Hennessy Japan Small Cap Fund | HJPSX | HJSIX |
| Hennessy Large Cap Financial Fund | HLFNX | HILFX |
| Hennessy Small Cap Financial Fund | HSFNX | HISFX |
| Hennessy Technology Fund | HTECX | HTCIX |
| | | |
www.hennessyfunds.com | 1-800-966-4354
(This Page Intentionally Left Blank.)
Contents
Financial Statements | |
| Schedules of Investments | |
| Hennessy Cornerstone Growth Fund | 2 |
| Hennessy Focus Fund | 4 |
| Hennessy Cornerstone Mid Cap 30 Fund | 6 |
| Hennessy Cornerstone Large Growth Fund | 8 |
| Hennessy Cornerstone Value Fund | 10 |
| Hennessy Total Return Fund | 12 |
| Hennessy Equity and Income Fund | 14 |
| Hennessy Balanced Fund | 17 |
| Hennessy Energy Transition Fund | 18 |
| Hennessy Midstream Fund | 20 |
| Hennessy Gas Utility Fund | 21 |
| Hennessy Japan Fund | 23 |
| Hennessy Japan Small Cap Fund | 24 |
| Hennessy Large Cap Financial Fund | 26 |
| Hennessy Small Cap Financial Fund | 27 |
| Hennessy Technology Fund | 28 |
| Statements of Assets and Liabilities | 30 |
| Statements of Operations | 34 |
| Statements of Changes in Net Assets | 38 |
| Statement of Cash Flows – Hennessy Total Return Fund | 46 |
| Financial Highlights | |
| Hennessy Cornerstone Growth Fund | 47 |
| Hennessy Focus Fund | 49 |
| Hennessy Cornerstone Mid Cap 30 Fund | 51 |
| Hennessy Cornerstone Large Growth Fund | 53 |
| Hennessy Cornerstone Value Fund | 55 |
| Hennessy Total Return Fund | 57 |
| Hennessy Equity and Income Fund | 58 |
| Hennessy Balanced Fund | 60 |
| Hennessy Energy Transition Fund | 61 |
| Hennessy Midstream Fund | 63 |
| Hennessy Gas Utility Fund | 65 |
| Hennessy Japan Fund | 67 |
| Hennessy Japan Small Cap Fund | 69 |
| Hennessy Large Cap Financial Fund | 71 |
| Hennessy Small Cap Financial Fund | 73 |
| Hennessy Technology Fund | 75 |
| Notes to the Financial Statements | 77 |
Report of Independent Registered Public Accounting Firm | 88 |
Federal Tax Distribution Information | 89 |
HENNESSY FUNDS | 1-800-966-4354 |
Financial Statements — Schedule of Investments
| Hennessy Cornerstone Growth Fund |
COMMON STOCKS – 97.67% | | Number of | | | | | | % of | |
| | | Shares | | | Value | | | Net Assets | |
| Communication Services – 2.11% | | | | | | | | | |
Live Nation Entertainment, Inc. (a) | | | 91,900 | | | $ | 10,765,166 | | | | 2.11 | % |
| | | | | | | | | | | | | |
| Consumer Discretionary – 18.88% | | | | | | | | | | | | |
American Eagle Outfitters, Inc. | | | 365,700 | | | | 7,164,063 | | | | 1.40 | % |
Dave & Buster’s Entertainment, Inc. (a) | | | 148,700 | | | | 5,491,491 | | | | 1.07 | % |
Dream Finders Homes, Inc., Class A (a) | | | 223,400 | | | | 6,668,490 | | | | 1.30 | % |
Gap, Inc. | | | 380,300 | | | | 7,898,831 | | | | 1.55 | % |
Groupon, Inc. (a) | | | 811,200 | | | | 8,322,912 | | | | 1.63 | % |
Guess?, Inc. | | | 306,000 | | | | 5,198,940 | | | | 1.02 | % |
PVH Corp. | | | 76,180 | | | | 7,500,683 | | | | 1.47 | % |
Stellantis NV | | | 339,200 | | | | 4,619,904 | | | | 0.90 | % |
Stride, Inc. (a) | | | 152,100 | | | | 14,187,888 | | | | 2.77 | % |
Toll Brothers, Inc. | | | 74,800 | | | | 10,953,712 | | | | 2.14 | % |
Universal Technical Institute, Inc. (a) | | | 654,800 | | | | 10,895,872 | | | | 2.13 | % |
Urban Outfitters, Inc. (a) | | | 213,500 | | | | 7,675,325 | | | | 1.50 | % |
| | | | | | | | 96,578,111 | | | | 18.88 | % |
| | | | | | | | | | | | | |
| Consumer Staples – 3.78% | | | | | | | | | | | | |
Sprouts Farmers Market, Inc. (a) | | | 150,600 | | | | 19,341,558 | | | | 3.78 | % |
| | | | | | | | | | | | | |
| Energy – 4.70% | | | | | | | | | | | | |
Liberty Energy, Inc. | | | 456,900 | | | | 7,799,283 | | | | 1.52 | % |
TechnipFMC PLC | | | 375,800 | | | | 10,030,102 | | | | 1.96 | % |
Ultrapar Participacoes SA – ADR | | | 1,716,900 | | | | 6,215,178 | | | | 1.22 | % |
| | | | | | | | 24,044,563 | | | | 4.70 | % |
| | | | | | | | | | | | | |
| Financials – 12.97% | | | | | | | | | | | | |
Allstate Corp. | | | 55,500 | | | | 10,351,860 | | | | 2.03 | % |
Assurant, Inc. | | | 51,200 | | | | 9,815,040 | | | | 1.92 | % |
LendingTree, Inc. (a) | | | 229,800 | | | | 13,105,494 | | | | 2.56 | % |
Mercury General Corp. | | | 182,200 | | | | 12,322,186 | | | | 2.41 | % |
Oscar Health, Inc., Class A (a) | | | 652,200 | | | | 10,956,960 | | | | 2.14 | % |
SiriusPoint Ltd. (a) | | | 743,205 | | | | 9,765,714 | | | | 1.91 | % |
| | | | | | | | 66,317,254 | | | | 12.97 | % |
| | | | | | | | | | | | | |
| Health Care – 11.53% | | | | | | | | | | | | |
Amneal Pharmaceuticals, Inc. (a) | | | 1,583,500 | | | | 13,412,245 | | | | 2.62 | % |
Brookdale Senior Living, Inc. (a) | | | 1,421,400 | | | | 8,912,178 | | | | 1.74 | % |
DaVita, Inc. (a) | | | 69,500 | | | | 9,716,795 | | | | 1.90 | % |
Tenet Healthcare Corp. (a) | | | 91,800 | | | | 14,230,836 | | | | 2.78 | % |
Teva Pharmaceutical
| | | | | | | | | | | | |
Industries Ltd. – ADR (a) | | | 688,700 | | | | 12,699,628 | | | | 2.49 | % |
| | | | | | | | 58,971,682 | | | | 11.53 | % |
| | | | | | | | | | | | | |
| Industrials – 33.27% | | | | | | | | | | | | |
American Woodmark Corp. (a) | | | 95,800 | | | | 8,690,018 | | | | 1.70 | % |
AZZ, Inc. | | | 124,600 | | | | 9,492,028 | | | | 1.86 | % |
Blue Bird Corp. (a) | | | 249,600 | | | | 10,510,656 | | | | 2.06 | % |
Cimpress PLC (a) | | | 104,600 | | | | 7,218,446 | | | | 1.41 | % |
EMCOR Group, Inc. | | | 27,000 | | | | 12,043,890 | | | | 2.35 | % |
Greenbrier Companies, Inc. | | | 187,000 | | | | 11,083,490 | | | | 2.17 | % |
Griffon Corp. | | | 132,700 | | | | 8,344,176 | | | | 1.63 | % |
IES Holdings, Inc. (a) | | | 78,300 | | | | 17,121,469 | | | | 3.35 | % |
Interface, Inc. | | | 577,100 | | | | 10,081,937 | | | | 1.97 | % |
JELD-WEN Holding, Inc. (a) | | | 452,300 | | | | 6,404,568 | | | | 1.25 | % |
Masterbrand, Inc. (a) | | | 521,200 | | | | 9,360,752 | | | | 1.83 | % |
Moog, Inc., Class A | | | 61,000 | | | | 11,504,600 | | | | 2.25 | % |
Quanex Building Products Corp. | | | 258,418 | | | | 7,509,627 | | | | 1.47 | % |
REV Group, Inc. | | | 436,900 | | | | 11,577,850 | | | | 2.26 | % |
Tutor Perini Corp. (a) | | | 647,281 | | | | 16,777,524 | | | | 3.28 | % |
VSE Corp. | | | 121,246 | | | | 12,442,264 | | | | 2.43 | % |
| | | | | | | | 170,163,295 | | | | 33.27 | % |
| | | | | | | | | | | | | |
| Information Technology – 7.78% | | | | | | | | | | | | |
Celestica, Inc. (a) | | | 208,700 | | | | 14,275,080 | | | | 2.79 | % |
Dell Technologies, Inc., Class C | | | 80,100 | | | | 9,902,763 | | | | 1.94 | % |
Penguin Solutions, Inc. (a) | | | 459,000 | | | | 6,907,950 | | | | 1.35 | % |
Turtle Beach Corp. (a) | | | 543,600 | | | | 8,681,292 | | | | 1.70 | % |
| | | | | | | | 39,767,085 | | | | 7.78 | % |
| | | | | | | | | | | | | |
| Materials – 1.16% | | | | | | | | | | | | |
Koppers Holdings, Inc. | | | 174,900 | | | | 5,948,349 | | | | 1.16 | % |
| | | | | | | | | | | | | |
| Real Estate – 1.49% | | | | | | | | | | | | |
Forestar Group, Inc. (a) | | | 240,700 | | | | 7,598,899 | | | | 1.49 | % |
| | | | | | | | | | | | | |
| Total Common Stocks | | | | | | | | | | | | |
(Cost $475,041,097) | | | | | | | 499,495,962 | | | | 97.67 | % |
The accompanying notes are an integral part of these financial statements.
WWW.HENNESSYFUNDS.COM
Financial Statements — Schedule of Investments
| Hennessy Cornerstone Growth Fund |
SHORT-TERM INVESTMENTS – 2.34% | | Number of | | | | | | % of | |
| | | Shares | | | Value | | | Net Assets | |
| Money Market Funds – 2.34% | | | | | | | | | |
First American Government | | | | | | | | | |
Obligations Fund – Class X, 4.781% (b) | | | 11,977,133 | | | $ | 11,977,133 | | | | 2.34 | % |
| | | | | | | | | | | | | |
| Total Short-Term Investments | | | | | | | | | | | | |
(Cost $11,977,133) | | | | | | | 11,977,133 | | | | 2.34 | % |
| | | | | | | | | | | | | |
| Total Investments | | | | | | | | | | | | |
(Cost $487,018,230) – 100.01% | | | | | | | 511,473,095 | | | | 100.01 | % |
Liabilities in Excess of | | | | | | | | | | | | |
Other Assets – (0.01)% | | | | | | | (42,209 | ) | | | (0.01 | )% |
| | | | | | | | | | | | | |
TOTAL NET ASSETS – 100.00% | | | | | | $ | 511,430,886 | | | | 100.00 | % |
Percentages are stated as a percent of net assets.
ADR – American Depositary Receipt
PLC – Public Limited Company
(a) | Non-income producing security. |
(b) | The rate listed is the fund’s seven-day yield as of October 31, 2024. |
Note: For presentation purposes, the Fund has grouped some of the industry categories. For purposes of categorizing securities for compliance with Section 8(b)(1) of the Investment Company Act of 1940, as amended, the Fund uses more specific industry classifications.
The Global Industry Classification Standard (GICS®) was developed by and is the exclusive property and a service mark of MSCI, Inc. and Standard & Poor’s Financial Services LLC. It has been licensed for use by the Hennessy Funds.
Summary of Fair Value Exposure as of October 31, 2024
The following is a summary of the inputs used to value the Fund’s net assets as of October 31, 2024 (see Note 3 in the accompanying Notes to the Financial Statements):
| Common Stocks | | Level 1 | | | Level 2 | | | Level 3 | | | Total | |
Communication Services | | $ | 10,765,166 | | | $ | — | | | $ | — | | | $ | 10,765,166 | |
Consumer Discretionary | | | 96,578,111 | | | | — | | | | — | | | | 96,578,111 | |
Consumer Staples | | | 19,341,558 | | | | — | | | | — | | | | 19,341,558 | |
Energy | | | 24,044,563 | | | | — | | | | — | | | | 24,044,563 | |
Financials | | | 66,317,254 | | | | — | | | | — | | | | 66,317,254 | |
Health Care | | | 58,971,682 | | | | — | | | | — | | | | 58,971,682 | |
Industrials | | | 170,163,295 | | | | — | | | | — | | | | 170,163,295 | |
Information Technology | | | 39,767,085 | | | | — | | | | — | | | | 39,767,085 | |
Materials | | | 5,948,349 | | | | — | | | | — | | | | 5,948,349 | |
Real Estate | | | 7,598,899 | | | | — | | | | — | | | | 7,598,899 | |
| Total Common Stocks | | $ | 499,495,962 | | | $ | — | | | $ | — | | | $ | 499,495,962 | |
| Short-Term Investments | | | | | | | | | | | | | | | | |
Money Market Funds | | $ | 11,977,133 | | | $ | — | | | $ | — | | | $ | 11,977,133 | |
| Total Short-Term Investments | | $ | 11,977,133 | | | $ | — | | | $ | — | | | $ | 11,977,133 | |
| Total Investments | | $ | 511,473,095 | | | $ | — | | | $ | — | | | $ | 511,473,095 | |
The accompanying notes are an integral part of these financial statements.
HENNESSY FUNDS | 1-800-966-4354 |
Financial Statements — Schedule of Investments
COMMON STOCKS – 92.98% | | Number of | | | | | | % of | |
| | | Shares | | | Value | | | Net Assets | |
| Communication Services – 18.53% | | | | | | | | | |
AST SpaceMobile, Inc. (a) | | | 2,982,567 | | | $ | 71,014,920 | | | | 10.53 | % |
Cogent Communications Holdings, Inc. | | | 492,488 | | | | 39,532,012 | | | | 5.86 | % |
Shenandoah Telecommunications Co. | | | 796,737 | | | | 11,026,840 | | | | 1.63 | % |
Warner Music Group Corp., Class A | | | 107,601 | | | | 3,438,928 | | | | 0.51 | % |
| | | | | | | | 125,012,700 | | | | 18.53 | % |
| | | | | | | | | | | | | |
| Consumer Discretionary – 23.52% | | | | | | | | | | | | |
CarMax, Inc. (a) | | | 551,679 | | | | 39,930,526 | | | | 5.92 | % |
Floor & Decor Holdings, Inc., Class A (a) | | | 62,000 | | | | 6,389,100 | | | | 0.95 | % |
Hilton Worldwide Holdings, Inc. | | | 84,181 | | | | 19,769,908 | | | | 2.93 | % |
NVR, Inc. (a) | | | 2,348 | | | | 21,490,798 | | | | 3.18 | % |
O’Reilly Automotive, Inc. (a) | | | 39,839 | | | | 45,939,944 | | | | 6.81 | % |
Restoration Hardware Holdings, Inc. (a) | | | 79,151 | | | | 25,173,975 | | | | 3.73 | % |
| | | | | | | | 158,694,251 | | | | 23.52 | % |
| | | | | | | | | | | | | |
| Financials – 29.77% | | | | | | | | | | | | |
Aon PLC, Class A | | | 126,627 | | | | 46,455,648 | | | | 6.89 | % |
Brookfield Asset Management Ltd. | | | 455,853 | | | | 24,178,443 | | | | 3.58 | % |
Brookfield Corp. | | | 916,868 | | | | 48,594,004 | | | | 7.20 | % |
Brookfield Wealth Solutions Ltd. | | | 15,721 | | | | 834,313 | | | | 0.12 | % |
Encore Capital Group, Inc. (a) | | | 926,569 | | | | 42,325,672 | | | | 6.27 | % |
Markel Group, Inc. (a) | | | 24,959 | | | | 38,487,027 | | | | 5.71 | % |
| | | | | | | | 200,875,107 | | | | 29.77 | % |
| | | | | | | | | | | | | |
| Health Care – 2.58% | | | | | | | | | | | | |
Danaher Corp. | | | 70,807 | | | | 17,394,448 | | | | 2.58 | % |
| | | | | | | | | | | | | |
| Industrials – 9.48% | | | | | | | | | | | | |
Ashtead Group PLC | | | 616,544 | | | | 46,015,018 | | | | 6.82 | % |
TransDigm Group, Inc. | | | 13,794 | | | | 17,963,926 | | | | 2.66 | % |
| | | | | | | | 63,978,944 | | | | 9.48 | % |
| | | | | | | | | | | | | |
| Information Technology – 8.03% | | | | | | | | | | | | |
Applied Materials, Inc. | | | 149,465 | | | | 27,139,855 | | | | 4.02 | % |
CDW Corp. | | | 143,625 | | | | 27,034,534 | | | | 4.01 | % |
| | | | | | | | 54,174,389 | | | | 8.03 | % |
| | | | | | | | | | | | | |
| Real Estate – 1.07% | | | | | | | | | | | | |
Altus Group Ltd. | | | 191,795 | | | | 7,256,624 | | | | 1.07 | % |
| | | | | | | | | | | | | |
| Total Common Stocks | | | | | | | | | | | | |
(Cost $258,696,352) | | | | | | | 627,386,463 | | | | 92.98 | % |
| | | | | | | | | | | | | |
REITS – 6.10% | | | | | | | | | | | | |
| Real Estate – 6.10% | | | | | | | | | | | | |
American Tower Corp., Class A | | | 192,727 | | | | 41,154,924 | | | | 6.10 | % |
| | | | | | | | | | | | | |
| Total REITS | | | | | | | | | | | | |
(Cost $148,400) | | | | | | | 41,154,924 | | | | 6.10 | % |
| | | | | | | | | | | | | |
| | | | | | | | | | | | | |
SHORT-TERM INVESTMENTS – 1.08% | | | | | | | | | | | | |
| Money Market Funds – 1.08% | | | | | | | | | | | | |
First American Government | | | | | | | | | | | | |
Obligations Fund – Class X, 4.821% (b) | | | 7,285,087 | | | | 7,285,087 | | | | 1.08 | % |
| | | | | | | | | | | | | |
| Total Short-Term Investments | | | | | | | | | | | | |
(Cost $7,285,087) | | | | | | | 7,285,087 | | | | 1.08 | % |
| | | | | | | | | | | | | |
| Total Investments | | | | | | | | | | | | |
(Cost $266,129,839) – 100.16% | | | | | | | 675,826,474 | | | | 100.16 | % |
Liabilities in Excess of | | | | | | | | | | | | |
Other Assets – (0.16)% | | | | | | | (1,097,414 | ) | | | (0.16 | )% |
| | | | | | | | | | | | | |
TOTAL NET ASSETS – 100.00% | | | | | | $ | 674,729,060 | | | | 100.00 | % |
Percentages are stated as a percent of net assets.
PLC – Public Limited Company
REIT – Real Estate Investment Trust
(a) | Non-income producing security. |
(b) | The rate listed is the fund’s seven-day yield as of October 31, 2024. |
Note: For presentation purposes, the Fund has grouped some of the industry categories. For purposes of categorizing securities for compliance with Section 8(b)(1) of the Investment Company Act of 1940, as amended, the Fund uses more specific industry classifications.
The Global Industry Classification Standard (GICS®) was developed by and is the exclusive property and a service mark of MSCI, Inc. and Standard & Poor’s Financial Services LLC. It has been licensed for use by the Hennessy Funds.
The accompanying notes are an integral part of these financial statements.
WWW.HENNESSYFUNDS.COM
Financial Statements — Schedule of Investments
Summary of Fair Value Exposure as of October 31, 2024
The following is a summary of the inputs used to value the Fund’s net assets as of October 31, 2024 (see Note 3 in the accompanying Notes to the Financial Statements):
| Common Stocks | | Level 1 | | | Level 2 | | | Level 3 | | | Total | |
Communication Services | | $ | 125,012,700 | | | $ | — | | | $ | — | | | $ | 125,012,700 | |
Consumer Discretionary | | | 158,694,251 | | | | — | | | | — | | | | 158,694,251 | |
Financials | | | 200,875,107 | | | | — | | | | — | | | | 200,875,107 | |
Health Care | | | 17,394,448 | | | | — | | | | — | | | | 17,394,448 | |
Industrials | | | 63,978,944 | | | | — | | | | — | | | | 63,978,944 | |
Information Technology | | | 54,174,389 | | | | — | | | | — | | | | 54,174,389 | |
Real Estate | | | 7,256,624 | | | | — | | | | — | | | | 7,256,624 | |
| Total Common Stocks | | $ | 627,386,463 | | | $ | — | | | $ | — | | | $ | 627,386,463 | |
| REITS | | | | | | | | | | | | | | | | |
Real Estate | | $ | 41,154,924 | | | $ | — | | | $ | — | | | $ | 41,154,924 | |
| Total REITS | | $ | 41,154,924 | | | $ | — | | | $ | — | | | $ | 41,154,924 | |
| Short-Term Investments | | | | | | | | | | | | | | | | |
Money Market Funds | | $ | 7,285,087 | | | $ | — | | | $ | — | | | $ | 7,285,087 | |
| Total Short-Term Investments | | $ | 7,285,087 | | | $ | — | | | $ | — | | | $ | 7,285,087 | |
| Total Investments | | $ | 675,826,474 | | | $ | — | | | $ | — | | | $ | 675,826,474 | |
The accompanying notes are an integral part of these financial statements.
HENNESSY FUNDS | 1-800-966-4354 |
Financial Statements — Schedule of Investments
| Hennessy Cornerstone Mid Cap 30 Fund |
COMMON STOCKS – 96.26% | | Number of | | | | | | % of | |
| | | Shares | | | Value | | | Net Assets | |
| Communication Services – 5.37% | | | | | | | | | |
Cinemark Holdings, Inc. (a) | | | 1,833,000 | | | $ | 54,531,750 | | | | 3.42 | % |
Lumen Technologies, Inc. (a) | | | 4,882,700 | | | | 31,200,453 | | | | 1.95 | % |
| | | | | | | | 85,732,203 | | | | 5.37 | % |
| | | | | | | | | | | | | |
| Consumer Discretionary – 27.96% | | | | | | | | | | | | |
Abercrombie & Fitch Co., Class A (a) | | | 37,500 | | | | 4,942,125 | | | | 0.31 | % |
Brinker International, Inc. (a) | | | 369,200 | | | | 37,920,532 | | | | 2.37 | % |
Cheesecake Factory, Inc. | | | 1,054,400 | | | | 48,734,368 | | | | 3.05 | % |
Gap, Inc. | | | 1,228,700 | | | | 25,520,099 | | | | 1.60 | % |
Group 1 Automotive, Inc. | | | 36,000 | | | | 13,115,520 | | | | 0.82 | % |
Guess?, Inc. | | | 405,300 | | | | 6,886,047 | | | | 0.43 | % |
Hanesbrands, Inc. (a) | | | 4,363,800 | | | | 30,328,410 | | | | 1.90 | % |
KB Home | | | 383,400 | | | | 30,096,900 | | | | 1.89 | % |
M/I Homes, Inc. (a) | | | 187,500 | | | | 28,423,125 | | | | 1.78 | % |
Mattel, Inc. (a) | | | 1,717,400 | | | | 35,000,612 | | | | 2.19 | % |
Meritage Homes Corp. | | | 205,800 | | | | 37,290,960 | | | | 2.34 | % |
Modine Manufacturing Co. (a) | | | 284,700 | | | | 33,529,119 | | | | 2.10 | % |
Newell Rubbermaid, Inc. | | | 4,154,800 | | | | 36,562,240 | | | | 2.29 | % |
Nordstrom, Inc. | | | 1,324,000 | | | | 29,935,640 | | | | 1.87 | % |
Peloton Interactive, Inc., Class A (a) | | | 5,681,100 | | | | 48,289,350 | | | | 3.02 | % |
| | | | | | | | 446,575,047 | | | | 27.96 | % |
| | | | | | | | | | | | | |
| Consumer Staples – 7.75% | | | | | | | | | | | | |
Coca-Cola Consolidated, Inc. | | | 19,256 | | | | 21,648,750 | | | | 1.35 | % |
Ingredion, Inc. | | | 243,200 | | | | 32,287,232 | | | | 2.02 | % |
Post Holdings, Inc. (a) | | | 283,400 | | | | 30,950,114 | | | | 1.94 | % |
Sprouts Farmers Market, Inc. (a) | | | 303,300 | | | | 38,952,819 | | | | 2.44 | % |
| | | | | | | | 123,838,915 | | | | 7.75 | % |
| | | | | | | | | | | | | |
| Energy – 7.23% | | | | | | | | | | | | |
California Resources Corp. | | | 229,500 | | | | 11,927,115 | | | | 0.75 | % |
CONSOL Energy, Inc. | | | 125,700 | | | | 13,942,644 | | | | 0.87 | % |
EnLink Midstream LLC | | | 802,500 | | | | 11,909,100 | | | | 0.74 | % |
Liberty Energy, Inc. | | | 693,900 | | | | 11,844,873 | | | | 0.74 | % |
Oceaneering International, Inc. (a) | | | 403,400 | | | | 9,842,960 | | | | 0.62 | % |
Par Pacific Holdings, Inc. (a) | | | 369,300 | | | | 5,705,685 | | | | 0.36 | % |
PBF Energy, Inc., Class A | | | 224,234 | | | | 6,395,154 | | | | 0.40 | % |
Plains GP Holdings LP. | | | 614,100 | | | | 10,562,520 | | | | 0.66 | % |
World Kinect Corp. | | | 1,276,434 | | | | 33,378,749 | | | | 2.09 | % |
| | | | | | | | 115,508,800 | | | | 7.23 | % |
| | | | | | | | | | | | | |
| Financials – 6.52% | | | | | | | | | | | | |
Lincoln National Corp. | | | 975,100 | | | | 33,884,725 | | | | 2.12 | % |
NCR Atleos Corp. (a) | | | 205,050 | | | | 5,368,209 | | | | 0.34 | % |
Oscar Health, Inc., Class A (a) | | | 1,993,200 | | | | 33,485,760 | | | | 2.10 | % |
Voya Financial, Inc. | | | 390,900 | | | | 31,389,270 | | | | 1.96 | % |
| | | | | | | | 104,127,964 | | | | 6.52 | % |
| | | | | | | | | | | | | |
| Industrials – 28.61% | | | | | | | | | | | | |
Alaska Air Group, Inc. (a) | | | 726,400 | | | | 34,801,824 | | | | 2.18 | % |
Applied Industrial Technologies, Inc. | | | 78,900 | | | | 18,272,451 | | | | 1.14 | % |
Comfort Systems USA, Inc. | | | 70,700 | | | | 27,646,528 | | | | 1.73 | % |
Dycom Industries, Inc. (a) | | | 164,700 | | | | 28,712,151 | | | | 1.80 | % |
EMCOR Group, Inc. | | | 59,700 | | | | 26,630,379 | | | | 1.67 | % |
Flowserve Corp. | | | 312,500 | | | | 16,450,000 | | | | 1.03 | % |
Fluor Corp. (a) | | | 963,500 | | | | 50,371,780 | | | | 3.15 | % |
Granite Construction, Inc. | | | 397,200 | | | | 33,384,660 | | | | 2.09 | % |
Herc Holdings, Inc. | | | 238,459 | | | | 49,871,315 | | | | 3.12 | % |
KBR, Inc. | | | 472,700 | | | | 31,675,627 | | | | 1.98 | % |
MDU Resources Group, Inc. | | | 1,699,100 | | | | 49,019,035 | | | | 3.07 | % |
MillerKnoll, Inc. | | | 425,100 | | | | 9,505,236 | | | | 0.60 | % |
MSC Industrial Direct Co., Inc., Class A | | | 115,800 | | | | 9,156,306 | | | | 0.57 | % |
Oshkosh Corp. | | | 129,400 | | | | 13,229,856 | | | | 0.83 | % |
Parsons Corp. (a) | | | 233,300 | | | | 25,233,728 | | | | 1.58 | % |
Sterling Infrastructure, Inc. (a) | | | 116,275 | | | | 17,958,674 | | | | 1.13 | % |
XPO, Inc. (a) | | | 114,800 | | | | 14,984,844 | | | | 0.94 | % |
| | | | | | | | 456,904,394 | | | | 28.61 | % |
| | | | | | | | | | | | | |
| Information Technology – 5.23% | | | | | | | | | | | | |
Insight Enterprises, Inc. (a) | | | 147,400 | | | | 25,783,208 | | | | 1.61 | % |
Kyndryl Holdings, Inc. (a) | | | 721,100 | | | | 16,505,979 | | | | 1.03 | % |
NCR Voyix Corp. (a) | | | 507,300 | | | | 6,498,513 | | | | 0.41 | % |
RingCentral, Inc., Class A (a) | | | 964,300 | | | | 34,724,443 | | | | 2.18 | % |
| | | | | | | | 83,512,143 | | | | 5.23 | % |
| | | | | | | | | | | | | |
| Materials – 3.77% | | | | | | | | | | | | |
Carpenter Technology Corp. | | | 195,200 | | | | 29,182,400 | | | | 1.83 | % |
Graphic Packaging Holding Co. | | | 1,093,500 | | | | 30,902,310 | | | | 1.94 | % |
| | | | | | | | 60,084,710 | | | | 3.77 | % |
| | | | | | | | | | | | | |
| Real Estate – 1.89% | | | | | | | | | | | | |
Redfin Corp. (a) | | | 2,912,600 | | | | 30,203,662 | | | | 1.89 | % |
| | | | | | | | | | | | | |
| Utilities – 1.93% | | | | | | | | | | | | |
UGI Corp. | | | 1,291,300 | | | | 30,874,983 | | | | 1.93 | % |
| | | | | | | | | | | | | |
| Total Common Stocks | | | | | | | | | | | | |
(Cost $1,408,729,332) | | | | | | | 1,537,362,821 | | | | 96.26 | % |
The accompanying notes are an integral part of these financial statements.
WWW.HENNESSYFUNDS.COM
Financial Statements — Schedule of Investments
| Hennessy Cornerstone Mid Cap 30 Fund |
SHORT-TERM INVESTMENTS – 3.85% | | Number of | | | | | | % of | |
| | | Shares | | | Value | | | Net Assets | |
| Money Market Funds – 3.85% | | | | | | | | | |
First American Government | | | | | | | | | |
Obligations Fund – Class X, 4.821% (b) | | | 61,456,754 | | | $ | 61,456,754 | | | | 3.85 | % |
| | | | | | | | | | | | | |
| Total Short-Term Investments | | | | | | | | | | | | |
(Cost $61,456,754) | | | | | | | 61,456,754 | | | | 3.85 | % |
| | | | | | | | | | | | | |
| Total Investments | | | | | | | | | | | | |
(Cost $1,470,186,086) – 100.11% | | | | | | | 1,598,819,575 | | | | 100.11 | % |
Liabilities in Excess of | | | | | | | | | | | | |
Other Assets – (0.11)% | | | | | | | (1,708,045 | ) | | | (0.11 | )% |
| | | | | | | | | | | | | |
TOTAL NET ASSETS – 100.00% | | | | | | $ | 1,597,111,530 | | | | 100.00 | % |
Percentages are stated as a percent of net assets.
(a) | Non-income producing security. |
(b) | The rate listed is the fund’s seven-day yield as of October 31, 2024. |
Note: For presentation purposes, the Fund has grouped some of the industry categories. For purposes of categorizing securities for compliance with Section 8(b)(1) of the Investment Company Act of 1940, as amended, the Fund uses more specific industry classifications.
The Global Industry Classification Standard (GICS®) was developed by and is the exclusive property and a service mark of MSCI, Inc. and Standard & Poor’s Financial Services LLC. It has been licensed for use by the Hennessy Funds.
Summary of Fair Value Exposure as of October 31, 2024
The following is a summary of the inputs used to value the Fund’s net assets as of October 31, 2024 (see Note 3 in the accompanying Notes to the Financial Statements):
| Common Stocks | | Level 1 | | | Level 2 | | | Level 3 | | | Total | |
Communication Services | | $ | 85,732,203 | | | $ | — | | | $ | — | | | $ | 85,732,203 | |
Consumer Discretionary | | | 446,575,047 | | | | — | | | | — | | | | 446,575,047 | |
Consumer Staples | | | 123,838,915 | | | | — | | | | — | | | | 123,838,915 | |
Energy | | | 115,508,800 | | | | — | | | | — | | | | 115,508,800 | |
Financials | | | 104,127,964 | | | | — | | | | — | | | | 104,127,964 | |
Industrials | | | 456,904,394 | | | | — | | | | — | | | | 456,904,394 | |
Information Technology | | | 83,512,143 | | | | — | | | | — | | | | 83,512,143 | |
Materials | | | 60,084,710 | | | | — | | | | — | | | | 60,084,710 | |
Real Estate | | | 30,203,662 | | | | — | | | | — | | | | 30,203,662 | |
Utilities | | | 30,874,983 | | | | — | | | | — | | | | 30,874,983 | |
| Total Common Stocks | | $ | 1,537,362,821 | | | $ | — | | | $ | — | | | $ | 1,537,362,821 | |
| Short-Term Investments | | | | | | | | | | | | | | | | |
Money Market Funds | | $ | 61,456,754 | | | $ | — | | | $ | — | | | $ | 61,456,754 | |
| Total Short-Term Investments | | $ | 61,456,754 | | | $ | — | | | $ | — | | | $ | 61,456,754 | |
| Total Investments | | $ | 1,598,819,575 | | | $ | — | | | $ | — | | | $ | 1,598,819,575 | |
The accompanying notes are an integral part of these financial statements.
HENNESSY FUNDS | 1-800-966-4354 |
Financial Statements — Schedule of Investments
| Hennessy Cornerstone Large Growth Fund |
COMMON STOCKS – 99.25% | | Number of | | | | | | % of | |
| | | Shares | | | Value | | | Net Assets | |
| Communication Services – 2.07% | | | | | | | | | |
Omnicom Group, Inc. | | | 29,700 | | | $ | 2,999,700 | | | | 2.07 | % |
| | | | | | | | | | | | | |
| Consumer Discretionary – 22.50% | | | | | | | | | | | | |
AutoZone, Inc. (a) | | | 1,000 | | | | 3,009,000 | | | | 2.07 | % |
Best Buy Co., Inc. | | | 35,400 | | | | 3,201,222 | | | | 2.21 | % |
Darden Restaurants, Inc. | | | 16,500 | | | | 2,640,330 | | | | 1.82 | % |
DR Horton, Inc. | | | 17,100 | | | | 2,889,900 | | | | 1.99 | % |
Genuine Parts Co. | | | 19,100 | | | | 2,190,770 | | | | 1.51 | % |
Lowe’s Companies, Inc. | | | 12,000 | | | | 3,141,960 | | | | 2.16 | % |
NVR, Inc. (a) | | | 400 | | | | 3,661,124 | | | | 2.52 | % |
PulteGroup, Inc. | | | 25,000 | | | | 3,238,250 | | | | 2.23 | % |
Tractor Supply Co. | | | 11,900 | | | | 3,159,569 | | | | 2.18 | % |
Ulta Beauty, Inc. (a) | | | 5,500 | | | | 2,029,390 | | | | 1.40 | % |
Williams-Sonoma, Inc. | | | 26,100 | | | | 3,500,793 | | | | 2.41 | % |
| | | | | | | | 32,662,308 | | | | 22.50 | % |
| | | | | | | | | | | | | |
| Consumer Staples – 13.24% | | | | | | | | | | | | |
Altria Group, Inc. | | | 63,600 | | | | 3,463,656 | | | | 2.39 | % |
Dollar General Corp. | | | 19,800 | | | | 1,584,792 | | | | 1.09 | % |
Kimberly-Clark Corp. | | | 21,400 | | | | 2,871,452 | | | | 1.98 | % |
Lamb Weston Holdings, Inc. | | | 24,700 | | | | 1,918,943 | | | | 1.32 | % |
Philip Morris International, Inc. | | | 27,800 | | | | 3,689,060 | | | | 2.54 | % |
The Hershey Co. | | | 13,900 | | | | 2,468,362 | | | | 1.70 | % |
The Kroger Co. | | | 57,700 | | | | 3,217,929 | | | | 2.22 | % |
| | | | | | | | 19,214,194 | | | | 13.24 | % |
| | | | | | | | | | | | | |
| Energy – 14.65% | | | | | | | | | | | | |
Cheniere Energy, Inc. | | | 16,100 | | | | 3,081,218 | | | | 2.12 | % |
ConocoPhillips | | | 23,800 | | | | 2,607,052 | | | | 1.79 | % |
Devon Energy Corp. | | | 60,700 | | | | 2,347,876 | | | | 1.62 | % |
EOG Resources, Inc. | | | 23,000 | | | | 2,805,080 | | | | 1.93 | % |
Exxon Mobil Corp. | | | 26,800 | | | | 3,129,704 | | | | 2.16 | % |
Halliburton Co. | | | 77,300 | | | | 2,144,302 | | | | 1.48 | % |
Marathon Petroleum Corp. | | | 17,000 | | | | 2,472,990 | | | | 1.70 | % |
Valero Energy Corp. | | | 20,700 | | | | 2,686,032 | | | | 1.85 | % |
| | | | | | | | 21,274,254 | | | | 14.65 | % |
| | | | | | | | | | | | | |
| Financials – 2.22% | | | | | | | | | | | | |
LPL Financial Holdings, Inc. | | | 11,400 | | | | 3,216,852 | | | | 2.22 | % |
| | | | | | | | | | | | | |
| Health Care – 6.41% | | | | | | | | | | | | |
Cencora, Inc. | | | 12,100 | | | | 2,759,768 | | | | 1.90 | % |
HCA Healthcare, Inc. | | | 9,400 | | | | 3,372,156 | | | | 2.32 | % |
McKesson Corp. | | | 5,400 | | | | 2,703,186 | | | | 1.86 | % |
Solventum Corp. (a) | | | 6,625 | | | | 480,843 | | | | 0.33 | % |
| | | | | | | | 9,315,953 | | | | 6.41 | % |
| | | | | | | | | | | | | |
| Industrials – 18.82% | | | | | | | | | | | | |
3M Co. | | | 24,300 | | | | 3,121,821 | | | | 2.15 | % |
Builders FirstSource, Inc. (a) | | | 15,800 | | | | 2,708,120 | | | | 1.86 | % |
Caterpillar, Inc. | | | 9,100 | | | | 3,423,420 | | | | 2.36 | % |
Deere & Co. | | | 6,800 | | | | 2,751,892 | | | | 1.90 | % |
Lockheed Martin Corp. | | | 5,800 | | | | 3,167,090 | | | | 2.18 | % |
Masco Corp. | | | 38,800 | | | | 3,100,508 | | | | 2.14 | % |
PACCAR, Inc. | | | 28,000 | | | | 2,919,840 | | | | 2.01 | % |
United Parcel Service, Inc., Class B | | | 16,600 | | | | 2,225,396 | | | | 1.53 | % |
United Rentals, Inc. | | | 4,800 | | | | 3,901,440 | | | | 2.69 | % |
| | | | | | | | 27,319,527 | | | | 18.82 | % |
| | | | | | | | | | | | | |
| Information Technology – 13.80% | | | | | | | | | | | | |
Cisco Systems, Inc. | | | 52,400 | | | | 2,869,948 | | | | 1.98 | % |
Cognizant Technology | | | | | | | | | | | | |
Solutions Corp., Class A | | | 35,300 | | | | 2,633,027 | | | | 1.81 | % |
Dell Technologies, Inc., Class C | | | 33,200 | | | | 4,104,516 | | | | 2.83 | % |
HP, Inc. | | | 88,100 | | | | 3,129,312 | | | | 2.16 | % |
Jabil, Inc. | | | 20,500 | | | | 2,523,345 | | | | 1.74 | % |
Microchip Technology, Inc. | | | 30,900 | | | | 2,267,133 | | | | 1.56 | % |
ON Semiconductor Corp. (a) | | | 35,500 | | | | 2,502,395 | | | | 1.72 | % |
| | | | | | | | 20,029,676 | | | | 13.80 | % |
| | | | | | | | | | | | | |
| Materials – 5.54% | | | | | | | | | | | | |
CF Industries Holdings, Inc. | | | 33,600 | | | | 2,762,928 | | | | 1.90 | % |
Nucor Corp. | | | 15,700 | | | | 2,226,888 | | | | 1.54 | % |
Steel Dynamics, Inc. | | | 23,400 | | | | 3,053,700 | | | | 2.10 | % |
| | | | | | | | 8,043,516 | | | | 5.54 | % |
| | | | | | | | | | | | | |
| Total Common Stocks | | | | | | | | | | | | |
(Cost $122,820,882) | | | | | | | 144,075,980 | | | | 99.25 | % |
| | | | | | | | | | | | | |
The accompanying notes are an integral part of these financial statements.
WWW.HENNESSYFUNDS.COM
Financial Statements — Schedule of Investments
| Hennessy Cornerstone Large Growth Fund |
SHORT-TERM INVESTMENTS – 0.81% | | Number of | | | | | | % of | |
| | | Shares | | | Value | | | Net Assets | |
| Money Market Funds – 0.81% | | | | | | | | | |
First American Government | | | | | | | | | |
Obligations Fund – Class X, 4.781% (b) | | | 1,182,168 | | | $ | 1,182,168 | | | | 0.81 | % |
| | | | | | | | | | | | | |
| Total Short-Term Investments | | | | | | | | | | | | |
(Cost $1,182,168) | | | | | | | 1,182,168 | | | | 0.81 | % |
| | | | | | | | | | | | | |
| Total Investments | | | | | | | | | | | | |
(Cost $124,003,050) – 100.06% | | | | | | | 145,258,148 | | | | 100.06 | % |
Liabilities in Excess of | | | | | | | | | | | | |
Other Assets – (0.06)% | | | | | | | (95,431 | ) | | | (0.06 | )% |
| | | | | | | | | | | | | |
TOTAL NET ASSETS – 100.00% | | | | | | $ | 145,162,717 | | | | 100.00 | % |
Percentages are stated as a percent of net assets.
(a) | Non-income producing security. |
(b) | The rate listed is the fund’s seven-day yield as of October 31, 2024. |
Note: For presentation purposes, the Fund has grouped some of the industry categories. For purposes of categorizing securities for compliance with Section 8(b)(1) of the Investment Company Act of 1940, as amended, the Fund uses more specific industry classifications.
The Global Industry Classification Standard (GICS®) was developed by and is the exclusive property and a service mark of MSCI, Inc. and Standard & Poor’s Financial Services LLC. It has been licensed for use by the Hennessy Funds
Summary of Fair Value Exposure as of October 31, 2024
The following is a summary of the inputs used to value the Fund’s net assets as of October 31, 2024 (see Note 3 in the accompanying Notes to the Financial Statements):
| Common Stocks | | Level 1 | | | Level 2 | | | Level 3 | | | Total | |
Communication Services | | $ | 2,999,700 | | | $ | — | | | $ | — | | | $ | 2,999,700 | |
Consumer Discretionary | | | 32,662,308 | | | | — | | | | — | | | | 32,662,308 | |
Consumer Staples | | | 19,214,194 | | | | — | | | | — | | | | 19,214,194 | |
Energy | | | 21,274,254 | | | | — | | | | — | | | | 21,274,254 | |
Financials | | | 3,216,852 | | | | — | | | | — | | | | 3,216,852 | |
Health Care | | | 9,315,953 | | | | — | | | | — | | | | 9,315,953 | |
Industrials | | | 27,319,527 | | | | — | | | | — | | | | 27,319,527 | |
Information Technology | | | 20,029,676 | | | | — | | | | — | | | | 20,029,676 | |
Materials | | | 8,043,516 | | | | — | | | | — | | | | 8,043,516 | |
| Total Common Stocks | | $ | 144,075,980 | | | $ | — | | | $ | — | | | $ | 144,075,980 | |
| Short-Term Investments | | | | | | | | | | | | | | | | |
Money Market Funds | | $ | 1,182,168 | | | $ | — | | | $ | — | | | $ | 1,182,168 | |
| Total Short-Term Investments | | $ | 1,182,168 | | | $ | — | | | $ | — | | | $ | 1,182,168 | |
| Total Investments | | $ | 145,258,148 | | | $ | — | | | $ | — | | | $ | 145,258,148 | |
The accompanying notes are an integral part of these financial statements.
HENNESSY FUNDS | 1-800-966-4354 |
Financial Statements — Schedule of Investments
| Hennessy Cornerstone Value Fund |
COMMON STOCKS – 97.80% | | Number of | | | | | | % of | |
| | | Shares | | | Value | | | Net Assets | |
| Communication Services – 7.68% | | | | | | | | | |
AT&T, Inc. | | | 310,060 | | | $ | 6,988,752 | | | | 2.48 | % |
BCE, Inc. | | | 123,700 | | | | 3,990,562 | | | | 1.42 | % |
Comcast Corp., Class A | | | 116,300 | | | | 5,078,821 | | | | 1.80 | % |
Verizon Communications, Inc. | | | 132,800 | | | | 5,594,864 | | | | 1.98 | % |
| | | | | | | | 21,652,999 | | | | 7.68 | % |
| | | | | | | | | | | | | |
| Consumer Discretionary – 3.44% | | | | | | | | | | | | |
Ford Motor Co. | | | 429,800 | | | | 4,422,642 | | | | 1.57 | % |
Starbucks Corp. | | | 54,100 | | | | 5,285,570 | | | | 1.87 | % |
| | | | | | | | 9,708,212 | | | | 3.44 | % |
| | | | | | | | | | | | | |
| Consumer Staples – 20.10% | | | | | | | | | | | | |
Altria Group, Inc. | | | 121,000 | | | | 6,589,660 | | | | 2.34 | % |
British American Tobacco PLC ADR | | | 166,100 | | | | 5,810,178 | | | | 2.06 | % |
Kenvue, Inc. | | | 229,500 | | | | 5,262,435 | | | | 1.87 | % |
Keurig Dr Pepper, Inc. | | | 157,500 | | | | 5,189,625 | | | | 1.84 | % |
Kraft Heinz Co. | | | 133,900 | | | | 4,480,294 | | | | 1.59 | % |
PepsiCo, Inc. | | | 30,300 | | | | 5,032,224 | | | | 1.78 | % |
Philip Morris International, Inc. | | | 52,900 | | | | 7,019,830 | | | | 2.49 | % |
The Coca-Cola Co. | | | 84,100 | | | | 5,492,571 | | | | 1.95 | % |
The Procter & Gamble Co. | | | 33,400 | | | | 5,517,012 | | | | 1.95 | % |
Unilever PLC ADR | | | 103,100 | | | | 6,279,821 | | | | 2.23 | % |
| | | | | | | | 56,673,650 | | | | 20.10 | % |
| | | | | | | | | | | | | |
| Energy – 19.86% | | | | | | | | | | | | |
Baker Hughes Co. | | | 161,500 | | | | 6,149,920 | | | | 2.18 | % |
BP PLC ADR | | | 145,400 | | | | 4,268,944 | | | | 1.51 | % |
Canadian Natural Resources Ltd. | | | 154,800 | | | | 5,266,296 | | | | 1.87 | % |
Cenovus Energy, Inc. | | | 316,700 | | | | 5,089,369 | | | | 1.80 | % |
Chevron Corp. | | | 34,675 | | | | 5,160,333 | | | | 1.83 | % |
Equinor ASA ADR | | | 167,600 | | | | 3,935,248 | | | | 1.40 | % |
Exxon Mobil Corp. | | | 51,010 | | | | 5,956,948 | | | | 2.11 | % |
Petroleo Brasileiro SA ADR | | | 309,700 | | | | 4,165,465 | | | | 1.48 | % |
Shell PLC ADR | | | 79,600 | | | | 5,376,980 | | | | 1.91 | % |
Suncor Energy, Inc. | | | 154,000 | | | | 5,816,580 | | | | 2.06 | % |
TotalEnergies SE ADR | | | 77,000 | | | | 4,817,120 | | | | 1.71 | % |
| | | | | | | | 56,003,203 | | | | 19.86 | % |
| | | | | | | | | | | | | |
| Financials – 19.76% | | | | | | | | | | | | |
Bank of America Corp. | | | 151,800 | | | | 6,348,276 | | | | 2.25 | % |
Citigroup, Inc. | | | 96,600 | | | | 6,198,822 | | | | 2.20 | % |
HSBC Holdings PLC ADR | | | 127,700 | | | | 5,890,801 | | | | 2.09 | % |
JPMorgan Chase & Co. | | | 29,600 | | | | 6,568,832 | | | | 2.33 | % |
Manulife Financial Corp. | | | 234,300 | | | | 6,843,903 | | | | 2.43 | % |
Morgan Stanley | | | 55,600 | | | | 6,463,500 | | | | 2.29 | % |
Royal Bank of Canada | | | 50,600 | | | | 6,117,034 | | | | 2.17 | % |
Toronto-Dominion Bank | | | 83,500 | | | | 4,615,045 | | | | 1.64 | % |
Wells Fargo & Co. | | | 102,600 | | | | 6,660,792 | | | | 2.36 | % |
| | | | | | | | 55,707,005 | | | | 19.76 | % |
| | | | | | | | | | | | | |
| Health Care – 15.91% | | | | | | | | | | | | |
AbbVie, Inc. | | | 30,700 | | | | 6,258,809 | | | | 2.22 | % |
Bristol-Myers Squibb Co. | | | 100,200 | | | | 5,588,154 | | | | 1.98 | % |
CVS Health Corp. | | | 63,800 | | | | 3,602,148 | | | | 1.28 | % |
Gilead Sciences, Inc. | | | 58,900 | | | | 5,231,498 | | | | 1.86 | % |
GSK PLC ADR | | | 126,960 | | | | 4,667,050 | | | | 1.65 | % |
Johnson & Johnson | | | 31,200 | | | | 4,987,632 | | | | 1.77 | % |
Medtronic PLC | | | 57,800 | | | | 5,158,650 | | | | 1.83 | % |
Merck & Co., Inc. | | | 42,500 | | | | 4,348,600 | | | | 1.54 | % |
Pfizer, Inc. | | | 177,200 | | | | 5,014,760 | | | | 1.78 | % |
| | | | | | | | 44,857,301 | | | | 15.91 | % |
| | | | | | | | | | | | | |
| Industrials – 2.53% | | | | | | | | | | | | |
RTX Corp. | | | 59,000 | | | | 7,138,410 | | | | 2.53 | % |
| | | | | | | | | | | | | |
| Information Technology – 8.52% | | | | | | | | | | | | |
Cisco Systems, Inc. | | | 99,800 | | | | 5,466,046 | | | | 1.94 | % |
HP, Inc. | | | 167,800 | | | | 5,960,256 | | | | 2.12 | % |
International Business Machines Corp. | | | 31,000 | | | | 6,408,320 | | | | 2.27 | % |
Texas Instruments, Inc. | | | 30,400 | | | | 6,176,064 | | | | 2.19 | % |
| | | | | | | | 24,010,686 | | | | 8.52 | % |
| | | | | | | | | | | | | |
| Total Common Stocks | | | | | | | | | | | | |
(Cost $218,419,477) | | | | | | | 275,751,466 | | | | 97.80 | % |
| | | | | | | | | | | | | |
The accompanying notes are an integral part of these financial statements.
WWW.HENNESSYFUNDS.COM
Financial Statements — Schedule of Investments
| Hennessy Cornerstone Value Fund |
SHORT-TERM INVESTMENTS – 2.06% | | Number of | | | | | | % of | |
| | | Shares | | | Value | | | Net Assets | |
| Money Market Funds – 2.06% | | | | | | | | | |
First American Government | | | | | | | | | |
Obligations Fund – Class X, 4.821% (a) | | | 5,813,779 | | | $ | 5,813,779 | | | | 2.06 | % |
| | | | | | | | | | | | | |
| Total Short-Term Investments | | | | | | | | | | | | |
(Cost $5,813,779) | | | | | | | 5,813,779 | | | | 2.06 | % |
| | | | | | | | | | | | | |
| Total Investments | | | | | | | | | | | | |
(Cost $224,233,256) – 99.86% | | | | | | | 281,565,245 | | | | 99.86 | % |
Other Assets in Excess of | | | | | | | | | | | | |
Liabilities – 0.14% | | | | | | | 397,652 | | | | 0.14 | % |
| | | | | | | | | | | | | |
TOTAL NET ASSETS – 100.00% | | | | | | $ | 281,962,897 | | | | 100.00 | % |
Percentages are stated as a percent of net assets.
ADR – American Depositary Receipt
PLC – Public Limited Company
(a) The rate listed is the fund’s seven-day yield as of October 31, 2024.
Note: For presentation purposes, the Fund has grouped some of the industry categories. For purposes of categorizing securities for compliance with Section 8(b)(1) of the Investment Company Act of 1940, as amended, the Fund uses more specific industry classifications.
The Global Industry Classification Standard (GICS®) was developed by and is the exclusive property and a service mark of MSCI, Inc. and Standard & Poor’s Financial Services LLC. It has been licensed for use by the Hennessy Funds.
Summary of Fair Value Exposure as of October 31, 2024
The following is a summary of the inputs used to value the Fund’s net assets as of October 31, 2024 (see Note 3 in the accompanying Notes to the Financial Statements):
| Common Stocks | | Level 1 | | | Level 2 | | | Level 3 | | | Total | |
Communication Services | | $ | 21,652,999 | | | $ | — | | | $ | — | | | $ | 21,652,999 | |
Consumer Discretionary | | | 9,708,212 | | | | — | | | | — | | | | 9,708,212 | |
Consumer Staples | | | 56,673,650 | | | | — | | | | — | | | | 56,673,650 | |
Energy | | | 56,003,203 | | | | — | | | | — | | | | 56,003,203 | |
Financials | | | 55,707,005 | | | | — | | | | — | | | | 55,707,005 | |
Health Care | | | 44,857,301 | | | | — | | | | — | | | | 44,857,301 | |
Industrials | | | 7,138,410 | | | | — | | | | — | | | | 7,138,410 | |
Information Technology | | | 24,010,686 | | | | — | | | | — | | | | 24,010,686 | |
| Total Common Stocks | | $ | 275,751,466 | | | $ | — | | | $ | — | | | $ | 275,751,466 | |
| Short-Term Investments | | | | | | | | | | | | | | | | |
Money Market Funds | | $ | 5,813,779 | | | $ | — | | | $ | — | | | $ | 5,813,779 | |
| Total Short-Term Investments | | $ | 5,813,779 | | | $ | — | | | $ | — | | | $ | 5,813,779 | |
| Total Investments | | $ | 281,565,245 | | | $ | — | | | $ | — | | | $ | 281,565,245 | |
The accompanying notes are an integral part of these financial statements.
HENNESSY FUNDS | 1-800-966-4354 |
Financial Statements — Schedule of Investments
| Hennessy Total Return Fund |
COMMON STOCKS – 68.88% | | Number of Shares/ | | | | | | % of | |
| | | Par Amount | | | Value | | | Net Assets | |
| Communication Services – 7.44% | | | | | | | | | |
Verizon Communications, Inc. | | | 86,600 | | | $ | 3,648,458 | | | | 7.44 | % |
| | | | | | | | | | | | | |
| Consumer Staples – 8.92% | | | | | | | | | | | | |
The Coca-Cola Co. | | | 55,000 | | | | 3,592,050 | | | | 7.32 | % |
Walgreens Boots Alliance, Inc. | | | 82,900 | | | | 784,234 | | | | 1.60 | % |
| | | | | | | | 4,376,284 | | | | 8.92 | % |
| | | | | | | | | | | | | |
| Energy – 6.92% | | | | | | | | | | | | |
Chevron Corp. | | | 22,800 | | | | 3,393,096 | | | | 6.92 | % |
| | | | | | | | | | | | | |
| Financials – 4.75% | | | | | | | | | | | | |
The Goldman Sachs Group, Inc. | | | 4,500 | | | | 2,330,055 | | | | 4.75 | % |
| | | | | | | | | | | | | |
| Health Care – 13.97% | | | | | | | | | | | | |
Amgen, Inc. | | | 11,100 | | | | 3,553,776 | | | | 7.25 | % |
Johnson & Johnson | | | 19,400 | | | | 3,101,284 | | | | 6.32 | % |
Merck & Co., Inc. | | | 1,900 | | | | 194,408 | | | | 0.40 | % |
| | | | | | | | 6,849,468 | | | | 13.97 | % |
| | | | | | | | | | | | | |
| Industrials – 8.17% | | | | | | | | | | | | |
3M Co. | | | 31,200 | | | | 4,008,264 | | | | 8.17 | % |
| | | | | | | | | | | | | |
| Information Technology – 12.35% | | | | | | | | | | | | |
Cisco Systems, Inc. | | | 42,600 | | | | 2,333,202 | | | | 4.76 | % |
International Business Machines Corp. | | | 18,000 | | | | 3,720,960 | | | | 7.59 | % |
| | | | | | | | 6,054,162 | | | | 12.35 | % |
| | | | | | | | | | | | | |
| Materials – 6.36% | | | | | | | | | | | | |
Dow, Inc. | | | 63,200 | | | | 3,120,816 | | | | 6.36 | % |
| | | | | | | | | | | | | |
| Total Common Stocks | | | | | | | | | | | | |
(Cost $30,273,013) | | | | | | | 33,780,603 | | | | 68.88 | % |
| | | | | | | | | | | | | |
SHORT-TERM | | | | | | | | | | | | |
INVESTMENTS – 75.44% | | | | | | | | | | | | |
| U.S. Treasury Bills – 72.97% | | | | | | | | | | | | |
4.620%, 11/07/2024 (a)(b) | | $ | 9,000,000 | | | | 8,992,388 | | | | 18.33 | % |
4.630%, 12/12/2024 (a)(b) | | | 9,000,000 | | | | 8,950,493 | | | | 18.25 | % |
4.550%, 01/09/2025 (a)(b) | | | 18,000,000 | | | | 17,846,086 | | | | 36.39 | % |
| | | | | | | | 35,788,967 | | | | 72.97 | % |
| | | | | | | | | | | | | |
| Money Market Funds – 2.47% | | | | | | | | | | | | |
First American Government | | | | | | | | | | | | |
Obligations Fund – Class X, 4.821% (c) | | | 1,210,603 | | | | 1,210,603 | | | | 2.47 | % |
| | | | | | | | | | | | | |
| Total Short-Term Investments | | | | | | | | | | | | |
(Cost $36,997,888) | | | | | | | 36,999,570 | | | | 75.44 | % |
| | | | | | | | | | | | | |
| Total Investments | | | | | | | | | | | | |
(Cost $67,270,901) – 144.32% | | | | | | | 70,780,173 | | | | 144.32 | % |
Liabilities in Excess of | | | | | | | | | | | | |
Other Assets – (44.32)% | | | | | | | (21,735,837 | ) | | | (44.32 | )% |
| | | | | | | | | | | | | |
TOTAL NET ASSETS – 100.00% | | | | | | $ | 49,044,336 | | | | 100.00 | % |
Percentages are stated as a percent of net assets.
(a) | The rate listed is the discount rate at issue. |
(b) | All or a portion of this security is pledged as collateral for securities sold subject to repurchase. The aggregate fair value of the collateral is $23,859,306. |
(c) | The rate listed is the fund’s seven-day yield as of October 31, 2024. |
Note: For presentation purposes, the Fund has grouped some of the industry categories. For purposes of categorizing securities for compliance with Section 8(b)(1) of the Investment Company Act of 1940, as amended, the Fund uses more specific industry classifications.
The Global Industry Classification Standard (GICS®) was developed by and is the exclusive property and a service mark of MSCI, Inc. and Standard & Poor’s Financial Services LLC. It has been licensed for use by the Hennessy Funds.
The accompanying notes are an integral part of these financial statements.
WWW.HENNESSYFUNDS.COM
Financial Statements — Schedule of Investments
| Hennessy Total Return Fund |
Summary of Fair Value Exposure as of October 31, 2024
The following is a summary of the inputs used to value the Fund’s net assets as of October 31, 2024 (see Note 3 in the accompanying Notes to the Financial Statements):
| Common Stocks | | Level 1 | | | Level 2 | | | Level 3 | | | Total | |
Communication Services | | $ | 3,648,458 | | | $ | — | | | $ | — | | | $ | 3,648,458 | |
Consumer Staples | | | 4,376,284 | | | | — | | | | — | | | | 4,376,284 | |
Energy | | | 3,393,096 | | | | — | | | | — | | | | 3,393,096 | |
Financials | | | 2,330,055 | | | | — | | | | — | | | | 2,330,055 | |
Health Care | | | 6,849,468 | | | | — | | | | — | | | | 6,849,468 | |
Industrials | | | 4,008,264 | | | | — | | | | — | | | | 4,008,264 | |
Information Technology | | | 6,054,162 | | | | — | | | | — | | | | 6,054,162 | |
Materials | | | 3,120,816 | | | | — | | | | — | | | | 3,120,816 | |
| Total Common Stocks | | $ | 33,780,603 | | | $ | — | | | $ | — | | | $ | 33,780,603 | |
| Short-Term Investments | | | | | | | | | | | | | | | | |
U.S. Treasury Bills | | $ | — | | | $ | 35,788,967 | | | $ | — | | | $ | 35,788,967 | |
Money Market Funds | | | 1,210,603 | | | | — | | | | — | | | | 1,210,603 | |
| Total Short-Term Investments | | $ | 1,210,603 | | | $ | 35,788,967 | | | $ | — | | | $ | 36,999,570 | |
| Total Investments | | $ | 34,991,206 | | | $ | 35,788,967 | | | $ | — | | | $ | 70,780,173 | |
Schedule of Reverse Repurchase Agreements
| Face Value | | Counterparty | | Rate | | Principal Trade Date | Maturity Date | | Maturity Amount | |
$ | 5,397,000 | | Jefferies LLC | | | 5.45% |
| 8/9/2024 | 11/7/2024 | | $ | 5,470,534 | |
| | 5,397,000 | | Jefferies LLC | | | 5.35% |
| 9/12/2024 | 12/12/2024 | | | 5,469,185 | |
| | 10,794,000 | | Jefferies LLC | | | 5.00% |
| 10/10/2024 | 1/9/2025 | | | 10,928,925 | |
$ | 21,588,000 | | | | | | | | | | $ | 21,868,644 | |
As of October 31, 2024, the fair value of securities held as collateral for reverse repurchase agreements was $23,859,306 as noted on the Schedule of Investments.
Reverse repurchase agreements are carried at face value; hence, they are not included in the fair valuation hierarchy. The face value of the reverse repurchase agreements at October 31, 2024, was $21,588,000. Due to the short-term nature of the reverse repurchase agreements, face value approximates fair value. The face value plus interest due at maturity is equal to $21,868,644.
The accompanying notes are an integral part of these financial statements.
HENNESSY FUNDS | 1-800-966-4354 |
Financial Statements — Schedule of Investments
| Hennessy Equity and Income Fund |
COMMON STOCKS – 68.85% | | Number of Shares/ | | | | | | % of | |
| | | Par Amount | | | Value | | | Net Assets | |
| Communication Services – 4.49% | | | | | | | | | |
Alphabet, Inc., Class C | | | 15,481 | | | $ | 2,673,414 | | | | 4.49 | % |
| | | | | | | | | | | | | |
| Consumer Discretionary – 8.30% | | | | | | | | | | | | |
CarMax, Inc. (a) | | | 8,016 | | | | 580,198 | | | | 0.98 | % |
Lowe’s Companies, Inc. | | | 3,270 | | | | 856,184 | | | | 1.44 | % |
O’Reilly Automotive, Inc. (a) | | | 738 | | | | 851,017 | | | | 1.43 | % |
Starbucks Corp. | | | 11,780 | | | | 1,150,906 | | | | 1.93 | % |
The Home Depot, Inc. | | | 3,816 | | | | 1,502,550 | | | | 2.52 | % |
| | | | | | | | 4,940,855 | | | | 8.30 | % |
| | | | | | | | | | | | | |
| Consumer Staples – 5.26% | | | | | | | | | | | | |
Altria Group, Inc. | | | 20,066 | | | | 1,092,794 | | | | 1.84 | % |
Church & Dwight Co., Inc. | | | 10,646 | | | | 1,063,642 | | | | 1.79 | % |
Nestlé S.A. – ADR | | | 10,289 | | | | 972,516 | | | | 1.63 | % |
| | | | | | | | 3,128,952 | | | | 5.26 | % |
| | | | | | | | | | | | | |
| Energy – 1.67% | | | | | | | | | | | | |
Chevron Corp. | | | 6,664 | | | | 991,737 | | | | 1.67 | % |
| | | | | | | | | | | | | |
| Financials – 21.82% | | | | | | | | | | | | |
Berkshire Hathaway, Inc., Class B (a) | | | 6,046 | | | | 2,726,262 | | | | 4.58 | % |
Blackrock, Inc. | | | 2,116 | | | | 2,075,860 | | | | 3.49 | % |
Chubb, Ltd. | | | 4,527 | | | | 1,278,606 | | | | 2.15 | % |
Fiserv, Inc. (a) | | | 9,272 | | | | 1,834,929 | | | | 3.08 | % |
The Charles Schwab Corp. | | | 18,768 | | | | 1,329,337 | | | | 2.23 | % |
The Progressive Corp. | | | 8,668 | | | | 2,104,851 | | | | 3.54 | % |
Visa, Inc., Class A | | | 5,662 | | | | 1,641,131 | | | | 2.75 | % |
| | | | | | | | 12,990,976 | | | | 21.82 | % |
| | | | | | | | | | | | | |
| Health Care – 2.19% | | | | | | | | | | | | |
Johnson & Johnson | | | 5,284 | | | | 844,700 | | | | 1.42 | % |
Pfizer, Inc. | | | 16,232 | | | | 459,366 | | | | 0.77 | % |
| | | | | | | | 1,304,066 | | | | 2.19 | % |
| | | | | | | | | | | | | |
| Industrials – 8.75% | | | | | | | | | | | | |
FedEx Corp. | | | 4,534 | | | | 1,241,636 | | | | 2.09 | % |
Norfolk Southern Corp. | | | 6,897 | | | | 1,727,216 | | | | 2.90 | % |
Old Dominion Freight Line, Inc. | | | 4,495 | | | | 904,933 | | | | 1.52 | % |
Republic Services, Inc. | | | 6,724 | | | | 1,331,352 | | | | 2.24 | % |
| | | | | | | | 5,205,137 | | | | 8.75 | % |
| | | | | | | | | | | | | |
| Information Technology – 8.57% | | | | | | | | | | | | |
Apple, Inc. | | | 11,319 | | | | 2,557,075 | | | | 4.29 | % |
TE Connectivity PLC | | | 7,781 | | | | 1,147,075 | | | | 1.93 | % |
Texas Instruments, Inc. | | | 6,877 | | | | 1,397,131 | | | | 2.35 | % |
| | | | | | | | 5,101,281 | | | | 8.57 | % |
| | | | | | | | | | | | | |
| Materials – 7.80% | | | | | | | | | | | | |
Air Products and Chemicals, Inc. | | | 6,521 | | | | 2,024,966 | | | | 3.40 | % |
Martin Marietta Materials, Inc. | | | 2,380 | | | | 1,409,769 | | | | 2.37 | % |
NewMarket Corp. | | | 2,303 | | | | 1,209,006 | | | | 2.03 | % |
| | | | | | | | 4,643,741 | | | | 7.80 | % |
| | | | | | | | | | | | | |
| Total Common Stocks | | | | | | | | | | | | |
(Cost $21,273,643) | | | | | | | 40,980,159 | | | | 68.85 | % |
| | | | | | | | | | | | | |
| | | | | | | | | | | | | |
CORPORATE BONDS – 13.72% | | | | | | | | | | | | |
| Communication Services – 1.57% | | | | | | | | | | | | |
AT&T, Inc., 4.250%, 3/1/2027 | | $ | 550,000 | | | | 546,056 | | | | 0.92 | % |
Comcast Corp., 4.650%, 2/15/2033 | | | 250,000 | | | | 246,221 | | | | 0.41 | % |
T-Mobile USA, Inc., 3.875%, 4/15/2030 | | | 150,000 | | | | 142,509 | | | | 0.24 | % |
| | | | | | | | 934,786 | | | | 1.57 | % |
| | | | | | | | | | | | | |
| Consumer Discretionary – 0.48% | | | | | | | | | | | | |
Lowe’s Companies, Inc., 2.625%, 4/1/2031 | | | 325,000 | | | | 285,336 | | | | 0.48 | % |
| | | | | | | | | | | | | |
| Energy – 0.69% | | | | | | | | | | | | |
The Williams Companies, Inc., | | | | | | | | | | | | |
2.600%, 3/15/2031 | | | 475,000 | | | | 411,551 | | | | 0.69 | % |
| | | | | | | | | | | | | |
| Financials – 6.34% | | | | | | | | | | | | |
Aflac, Inc., 3.600%, 4/1/2030 | | | 300,000 | | | | 283,762 | | | | 0.48 | % |
Bank of America Corp., | | | | | | | | | | | | |
2.299% to 7/21/2031 then SOFR + | | | | | | | | | | | | |
1.220%, 07/21/2032 (b) | | | 575,000 | | | | 483,428 | | | | 0.81 | % |
Huntington Bancshares, Inc. | | | | | | | | | | | | |
2.550%, 2/4/2030 | | | 525,000 | | | | 463,053 | | | | 0.78 | % |
4.000%, 5/15/2025 | | | 365,000 | | | | 363,014 | | | | 0.61 | % |
JPMorgan Chase & Co., | | | | | | | | | | | | |
2.069% to 6/1/2028 then SOFR + | | | | | | | | | | | | |
1.015%, 06/01/2029 (b) | | | 325,000 | | | | 295,448 | | | | 0.50 | % |
Morgan Stanley, | | | | | | | | | | | | |
2.239% to 7/21/2031 then SOFR + | | | | | | | | | | | | |
1.178%, 07/21/2032 (b) | | | 680,000 | | | | 569,693 | | | | 0.96 | % |
Prudential Financial, Inc., | | | | | | | | | | | | |
3.878%, 3/27/2028 | | | 260,000 | | | | 253,984 | | | | 0.43 | % |
Regions Financial Corp., | | | | | | | | | | | | |
1.800%, 8/12/2028 | | | 325,000 | | | | 289,459 | | | | 0.48 | % |
State Street Corp., | | | | | | | | | | | | |
4.821% to 1/26/2033 then SOFR + | | | | | | | | | | | | |
1.567%, 01/26/2034 (b) | | | 175,000 | | | | 172,617 | | | | 0.29 | % |
The Goldman Sachs Group, Inc., | | | | | | | | | | | | |
4.223% to 5/1/2028 then 3 mo. Term | | | | | | | | | | | | |
SOFR + 1.563%, 05/01/2029 (b) | | | 300,000 | | | | 293,219 | | | | 0.49 | % |
Wells Fargo & Co., | | | | | | | | | | | | |
5.499% to 1/23/2034 then SOFR + | | | | | | | | | | | | |
1.780%, 01/23/2035 (b) | | | 300,000 | | | | 303,948 | | | | 0.51 | % |
| | | | | | | | 3,771,625 | | | | 6.34 | % |
The accompanying notes are an integral part of these financial statements.
WWW.HENNESSYFUNDS.COM
Financial Statements — Schedule of Investments
| Hennessy Equity and Income Fund |
| | | Number of Shares/ | | | | | | % of | |
| | | Par Amount | | | Value | | | Net Assets | |
| Health Care – 1.75% | | | | | | | | | |
Edwards Lifesciences Corp., | | | | | | | | | |
4.300%, 6/15/2028 | | $ | 700,000 | | | $ | 687,944 | | | | 1.15 | % |
Regeneron Pharmaceuticals, Inc., | | | | | | | | | | | | |
1.750%, 9/15/2030 | | | 425,000 | | | | 356,877 | | | | 0.60 | % |
| | | | | | | | 1,044,821 | | | | 1.75 | % |
| | | | | | | | | | | | | |
| Industrials – 1.16% | | | | | | | | | | | | |
General Electric Co., 3.625%, 5/1/2030 | | | 380,000 | | | | 357,046 | | | | 0.60 | % |
The Boeing Co., 2.196%, 2/4/2026 | | | 225,000 | | | | 216,744 | | | | 0.37 | % |
Timken Co., 6.875%, 5/8/2028 | | | 110,000 | | | | 114,550 | | | | 0.19 | % |
| | | | | | | | 688,340 | | | | 1.16 | % |
| | | | | | | | | | | | | |
| Information Technology – 1.73% | | | | | | | | | | | | |
Autodesk, Inc., 2.850%, 1/15/2030 | | | 675,000 | | | | 615,173 | | | | 1.03 | % |
Broadcom, Inc., 4.110%, 9/15/2028 | | | 425,000 | | | | 415,336 | | | | 0.70 | % |
| | | | | | | | 1,030,509 | | | | 1.73 | % |
| | | | | | | | | | | | | |
| Total Corporate Bonds | | | | | | | | | | | | |
(Cost $8,807,967) | | | | | | | 8,166,968 | | | | 13.72 | % |
| | | | | | | | | | | | | |
| | | | | | | | | | | | | |
MORTGAGE-BACKED SECURITIES – 3.03% | | | | | | | | | | | | |
| Federal Agency Mortgage-Backed Obligations – 3.03% | | | | | | | | | | | | |
Fannie Mae Pool | | | | | | | | | | | | |
3.000%, AU4405, 10/1/2043 | | | 740,628 | | | | 660,713 | | | | 1.11 | % |
3.500%, AB4300, 1/1/2042 | | | 128,205 | | | | 118,188 | | | | 0.20 | % |
6.000%, 928831, 10/1/2037 | | | 70,061 | | | | 71,334 | | | | 0.12 | % |
Fannie Mae REMICS | | | | | | | | | | | | |
Series 2013-52, 1.250%, 6/25/2043 | | | 34,343 | | | | 28,204 | | | | 0.05 | % |
Series 2012-16, 2.000%, 11/25/2041 | | | 30,165 | | | | 27,092 | | | | 0.04 | % |
Freddie Mac Gold Pool | | | | | | | | | | | | |
5.500%, G02922, 4/1/2037 | | | 23,744 | | | | 24,131 | | | | 0.04 | % |
3.000%, Q08238, 5/1/2042 | | | 393,891 | | | | 352,250 | | | | 0.59 | % |
3.000%, Q11129, 9/1/2042 | | | 448,177 | | | | 401,550 | | | | 0.67 | % |
Freddie Mac REMICS | | | | | | | | | | | | |
Series 4146, 1.500%, 10/15/2042 | | | 4,659 | | | | 4,560 | | | | 0.01 | % |
Series 4309, 2.000%, 10/15/2043 | | | 24,483 | | | | 22,543 | | | | 0.04 | % |
Series 3870, 2.750%, 1/15/2041 | | | 6,058 | | | | 5,912 | | | | 0.01 | % |
Series 4322, 3.000%, 5/15/2043 | | | 29,428 | | | | 28,697 | | | | 0.05 | % |
Government National Mortgage | | | | | | | | | | | | |
Association, Series 2013-24, | | | | | | | | | | | | |
1.750%, 2/16/2043 | | | 68,575 | | | | 60,306 | | | | 0.10 | % |
| | | | | | | | 1,805,480 | | | | 3.03 | % |
| | | | | | | | | | | | | |
| Total Mortgage-Backed Securities | | | | | | | | | | | | |
(Cost $2,005,060) | | | | | | | 1,805,480 | | | | 3.03 | % |
| | | | | | | | | | | | | |
| | | | | | | | | | | | | |
U.S. TREASURY | | | | | | | | | | | | |
OBLIGATIONS – 12.67% | | | | | | | | | | | | |
| U.S. Treasury Notes – 12.67% | | | | | | | | | | | | |
0.625%, 03/31/2027 | | | 450,000 | | | | 414,123 | | | | 0.70 | % |
0.750%, 04/30/2026 | | | 1,000,000 | | | | 950,117 | | | | 1.60 | % |
1.250%, 12/31/2026 | | | 625,000 | | | | 588,110 | | | | 0.99 | % |
1.875%, 07/31/2026 | | | 1,000,000 | | | | 961,328 | | | | 1.61 | % |
2.750%, 08/15/2032 | | | 150,000 | | | | 135,205 | | | | 0.23 | % |
3.375%, 05/15/2033 | | | 200,000 | | | | 187,383 | | | | 0.31 | % |
3.500%, 02/15/2033 | | | 225,000 | | | | 213,161 | | | | 0.36 | % |
3.625%, 05/15/2026 | | | 350,000 | | | | 346,931 | | | | 0.58 | % |
3.875%, 08/15/2034 | | | 150,000 | | | | 145,137 | | | | 0.24 | % |
3.875%, 10/15/2027 | | | 600,000 | | | | 595,758 | | | | 1.00 | % |
4.000%, 02/15/2034 | | | 350,000 | | | | 342,535 | | | | 0.58 | % |
4.000%, 02/28/2030 | | | 200,000 | | | | 198,336 | | | | 0.33 | % |
4.125%, 10/31/2027 | | | 400,000 | | | | 399,930 | | | | 0.67 | % |
4.125%, 09/30/2027 | | | 275,000 | | | | 275,011 | | | | 0.46 | % |
4.125%, 11/15/2032 | | | 50,000 | | | | 49,630 | | | | 0.08 | % |
4.375%, 08/31/2028 | | | 300,000 | | | | 302,185 | | | | 0.51 | % |
4.375%, 11/30/2028 | | | 450,000 | | | | 453,507 | | | | 0.76 | % |
4.500%, 11/15/2033 | | | 275,000 | | | | 279,641 | | | | 0.47 | % |
4.625%, 11/15/2026 | | | 500,000 | | | | 504,512 | | | | 0.85 | % |
4.875%, 05/31/2026 | | | 200,000 | | | | 201,984 | | | | 0.34 | % |
| Total U.S. Treasury Obligations | | | | | | | | | | | | |
(Cost $7,725,167) | | | | | | | 7,544,524 | | | | 12.67 | % |
| | | | | | | | | | | | | |
| | | | | | | | | | | | | |
SHORT-TERM INVESTMENTS – 2.53% | | | | | | | | | | | | |
| Money Market Funds – 2.53% | | | | | | | | | | | | |
First American Government | | | | | | | | | | | | |
Obligations Fund – Class X, 4.781% (c) | | | 1,285,417 | | | | 1,285,417 | | | | 2.16 | % |
First American Treasury | | | | | | | | | | | | |
Obligations Fund Class X – 4.74% (c) | | | 222,801 | | | | 222,801 | | | | 0.37 | % |
| | | | | | | | 1,508,218 | | | | 2.53 | % |
| | | | | | | | | | | | | |
| Total Short-Term Investments | | | | | | | | | | | | |
(Cost $1,508,218) | | | | | | | 1,508,218 | | | | 2.53 | % |
| | | | | | | | | | | | | |
| Total Investments | | | | | | | | | | | | |
(Cost $41,320,055) – 100.80% | | | | | | | 60,005,349 | | | | 100.80 | % |
Liabilities in Excess of | | | | | | | | | | | | |
Other Assets – (0.80)% | | | | | | | (479,743 | ) | | | (0.80 | )% |
| | | | | | | | | | | | | |
TOTAL NET ASSETS – 100.00% | | | | | | $ | 59,525,606 | | | | 100.00 | % |
| | | | | | | | | | | | | |
Percentages are stated as a percent of net assets.
ADR – American Depositary Receipt
PLC – Public Limited Company
SOFR – Secured Overnight Financing Rate
(a) | Non-income producing security. |
(b) | Variable rate security; rate disclosed is the rate as of October 31, 2024 |
(c) | The rate listed is the fund’s seven-day yield as of October 31, 2024. |
Note: For presentation purposes, the Fund has grouped some of the industry categories. For purposes of categorizing securities for compliance with Section 8(b)(1) of the Investment Company Act of 1940, as amended, the Fund uses more specific industry classifications.
The Global Industry Classification Standard (GICS®) was developed by and is the exclusive property and a service mark of MSCI, Inc. and Standard & Poor’s Financial Services LLC. It has been licensed for use by the Hennessy Funds.
The accompanying notes are an integral part of these financial statements.
HENNESSY FUNDS | 1-800-966-4354 |
Financial Statements — Schedule of Investments
| Hennessy Equity and Income Fund |
Summary of Fair Value Exposure as of October 31, 2024
The following is a summary of the inputs used to value the Fund’s net assets as of October 31, 2024 (see Note 3 in the accompanying Notes to the Financial Statements):
| Common Stocks | | Level 1 | | | Level 2 | | | Level 3 | | | Total | |
Communication Services | | $ | 2,673,414 | | | $ | — | | | $ | — | | | $ | 2,673,414 | |
Consumer Discretionary | | | 4,940,855 | | | | — | | | | — | | | | 4,940,855 | |
Consumer Staples | | | 3,128,952 | | | | — | | | | — | | | | 3,128,952 | |
Energy | | | 991,737 | | | | — | | | | — | | | | 991,737 | |
Financials | | | 12,990,976 | | | | — | | | | — | | | | 12,990,976 | |
Health Care | | | 1,304,066 | | | | — | | | | — | | | | 1,304,066 | |
Industrials | | | 5,205,137 | | | | — | | | | — | | | | 5,205,137 | |
Information Technology | | | 5,101,281 | | | | — | | | | — | | | | 5,101,281 | |
Materials | | | 4,643,741 | | | | — | | | | — | | | | 4,643,741 | |
| Total Common Stocks | | $ | 40,980,159 | | | $ | — | | | $ | — | | | $ | 40,980,159 | |
| Corporate Bonds | | | | | | | | | | | | | | | | |
Communication Services | | $ | — | | | $ | 934,786 | | | $ | — | | | $ | 934,786 | |
Consumer Discretionary | | | — | | | | 285,336 | | | | — | | | | 285,336 | |
Energy | | | — | | | | 411,551 | | | | — | | | | 411,551 | |
Financials | | | — | | | | 3,771,625 | | | | — | | | | 3,771,625 | |
Health Care | | | — | | | | 1,044,821 | | | | — | | | | 1,044,821 | |
Industrials | | | — | | | | 688,340 | | | | — | | | | 688,340 | |
Information Technology | | | — | | | | 1,030,509 | | | | — | | | | 1,030,509 | |
| Total Corporate Bonds | | $ | — | | | $ | 8,166,968 | | | $ | — | | | $ | 8,166,968 | |
| Mortgage-Backed Securities | | | | | | | | | | | | | | | | |
Federal Agency Mortgage-Backed Obligations | | $ | — | | | $ | 1,805,480 | | | $ | — | | | $ | 1,805,480 | |
| Total Mortgage-Backed Securities | | $ | — | | | $ | 1,805,480 | | | $ | — | | | $ | 1,805,480 | |
| U.S. Treasury Obligations | | | | | | | | | | | | | | | | |
U.S. Treasury Notes | | $ | — | | | $ | 7,544,524 | | | $ | — | | | $ | 7,544,524 | |
| Total U.S. Treasury Obligations | | $ | — | | | $ | 7,544,524 | | | $ | — | | | $ | 7,544,524 | |
| Short-Term Investments | | | | | | | | | | | | | | | | |
Money Market Funds | | $ | 1,508,218 | | | $ | — | | | $ | — | | | $ | 1,508,218 | |
| Total Short-Term Investments | | $ | 1,508,218 | | | $ | — | | | $ | — | | | $ | 1,508,218 | |
| Total Investments | | $ | 42,488,377 | | | $ | 17,516,972 | | | $ | — | | | $ | 60,005,349 | |
The accompanying notes are an integral part of these financial statements.
WWW.HENNESSYFUNDS.COM
Financial Statements — Schedule of Investments
COMMON STOCKS – 48.33% | | Number of Shares/ | | | | | | % of | |
| | | Par Amount | | | Value | | | Net Assets | |
| Communication Services – 5.04% | | | | | | | | | |
Verizon Communications, Inc. | | | 15,200 | | | $ | 640,376 | | | | 5.04 | % |
| | | | | | | | | | | | | |
| Consumer Discretionary – 0.77% | | | | | | | | | | | | |
The Home Depot, Inc. | | | 250 | | | | 98,438 | | | | 0.77 | % |
| | | | | | | | | | | | | |
| Consumer Staples – 6.39% | | | | | | | | | | | | |
The Coca-Cola Co. | | | 9,750 | | | | 636,772 | | | | 5.01 | % |
Walgreens Boots Alliance, Inc. | | | 18,550 | | | | 175,483 | | | | 1.38 | % |
| | | | | | | | 812,255 | | | | 6.39 | % |
| | | | | | | | | | | | | |
| Energy – 4.97% | | | | | | | | | | | | |
Chevron Corp. | | | 4,250 | | | | 632,485 | | | | 4.97 | % |
| | | | | | | | | | | | | |
| Financials – 3.26% | | | | | | | | | | | | |
The Goldman Sachs Group, Inc. | | | 800 | | | | 414,232 | | | | 3.26 | % |
| | | | | | | | | | | | | |
| Health Care – 10.05% | | | | | | | | | | | | |
Amgen, Inc. | | | 2,000 | | | | 640,320 | | | | 5.04 | % |
Johnson & Johnson | | | 2,800 | | | | 447,608 | | | | 3.52 | % |
Merck & Co., Inc. | | | 1,850 | | | | 189,292 | | | | 1.49 | % |
| | | | | | | | 1,277,220 | | | | 10.05 | % |
| | | | | | | | | | | | | |
| Industrials – 4.09% | | | | | | | | | | | | |
3M Co. | | | 4,050 | | | | 520,304 | | | | 4.09 | % |
| | | | | | | | | | | | | |
| Information Technology – 9.25% | | | | | | | | | | | | |
Cisco Systems, Inc. | | | 9,000 | | | | 492,930 | | | | 3.88 | % |
International Business Machines Corp. | | | 3,300 | | | | 682,176 | | | | 5.37 | % |
| | | | | | | | 1,175,106 | | | | 9.25 | % |
| | | | | | | | | | | | | |
| Materials – 4.51% | | | | | | | | | | | | |
Dow, Inc. | | | 11,600 | | | | 572,808 | | | | 4.51 | % |
| | | | | | | | | | | | | |
| Total Common Stocks | | | | | | | | | | | | |
(Cost $5,585,753) | | | | | | | 6,143,224 | | | | 48.33 | % |
| | | | | | | | | | | | | |
| | | | | | | | | | | | | |
SHORT-TERM | | | | | | | | | | | | |
INVESTMENTS – 51.48% | | | | | | | | | | | | |
| Money Market Funds – 3.16% | | | | | | | | | | | | |
First American Government | | | | | | | | | | | | |
Obligations Fund – Class X, 4.781% (a) | | | 401,928 | | | | 401,928 | | | | 3.16 | % |
| | | | | | | | | | | | | |
| U.S. Treasury Bills – 48.32% | | | | | | | | | | | | |
4.685%, 11/29/2024 (b) | | $ | 3,800,000 | | | | 3,786,142 | | | | 29.79 | % |
4.510%, 01/23/2025 (b) | | | 1,100,000 | | | | 1,088,752 | | | | 8.57 | % |
4.915%, 06/12/2025 (b) | | | 1,300,000 | | | | 1,266,537 | | | | 9.96 | % |
| | | | | | | | 6,141,431 | | | | 48.32 | % |
| | | | | | | | | | | | | |
| Total Short-Term Investments | | | | | | | | | | | | |
(Cost $6,537,928) | | | | | | | 6,543,359 | | | | 51.48 | % |
| | | | | | | | | | | | | |
| Total Investments | | | | | | | | | | | | |
(Cost $12,123,681) – 99.81% | | | | | | | 12,686,583 | | | | 99.81 | % |
Other Assets in Excess of | | | | | | | | | | | | |
Liabilities – 0.19% | | | | | | | 24,459 | | | | 0.19 | % |
| | | | | | | | | | | | | |
TOTAL NET ASSETS – 100.00% | | | | | | $ | 12,711,042 | | | | 100.00 | % |
Percentages are stated as a percent of net assets.
(a) | The rate listed is the fund’s seven-day yield as of October 31, 2024. |
(b) | The rate listed is the discount rate at issue. |
Note: For presentation purposes, the Fund has grouped some of the industry categories. For purposes of categorizing securities for compliance with Section 8(b)(1) of the Investment Company Act of 1940, as amended, the Fund uses more specific industry classifications.
The Global Industry Classification Standard (GICS®) was developed by and is the exclusive property and a service mark of MSCI, Inc. and Standard & Poor’s Financial Services LLC. It has been licensed for use by the Hennessy Funds.
Summary of Fair Value Exposure as of October 31, 2024
The following is a summary of the inputs used to value the Fund’s net assets as of October 31, 2024 (see Note 3 in the accompanying Notes to the Financial Statements):
| Common Stocks | | Level 1 | | | Level 2 | | | Level 3 | | | Total | |
Communication Services | | $ | 640,376 | | | $ | — | | | $ | — | | | $ | 640,376 | |
Consumer Discretionary | | | 98,438 | | | | — | | | | — | | | | 98,438 | |
Consumer Staples | | | 812,255 | | | | — | | | | — | | | | 812,255 | |
Energy | | | 632,485 | | | | — | | | | — | | | | 632,485 | |
Financials | | | 414,232 | | | | — | | | | — | | | | 414,232 | |
Health Care | | | 1,277,220 | | | | — | | | | — | | | | 1,277,220 | |
Industrials | | | 520,304 | | | | — | | | | — | | | | 520,304 | |
Information Technology | | | 1,175,106 | | | | — | | | | — | | | | 1,175,106 | |
Materials | | | 572,808 | | | | — | | | | — | | | | 572,808 | |
| Total Common Stocks | | $ | 6,143,224 | | | $ | — | | | $ | — | | | $ | 6,143,224 | |
| Short-Term Investments | | | | | | | | | | | | | | | | |
Money Market Funds | | $ | 401,928 | | | $ | — | | | $ | — | | | $ | 401,928 | |
U.S. Treasury Bills | | | — | | | | 6,141,431 | | | | — | | | | 6,141,431 | |
| Total Short-Term Investments | | $ | 401,928 | | | $ | 6,141,431 | | | $ | — | | | $ | 6,543,359 | |
| Total Investments | | $ | 6,545,152 | | | $ | 6,141,431 | | | $ | — | | | $ | 12,686,583 | |
The accompanying notes are an integral part of these financial statements.
HENNESSY FUNDS | 1-800-966-4354 |
Financial Statements — Schedule of Investments
| Hennessy Energy Transition Fund |
COMMON STOCKS – 99.75% | | Number of | | | | | | % of | |
| | | Shares | | | Value | | | Net Assets | |
| Downstream – 5.81% | | | | | | | | | |
Phillips 66 | | | 3,500 | | | $ | 426,370 | | | | 2.92 | % |
Valero Energy Corp. | | | 3,250 | | | | 421,720 | | | | 2.89 | % |
| | | | | | | | 848,090 | | | | 5.81 | % |
| | | | | | | | | | | | | |
| Exploration and Production – 41.86% | | | | | | | | | | | | |
Antero Resources Corp. (a) | | | 27,200 | | | | 703,936 | | | | 4.82 | % |
Canadian Natural Resources Ltd. | | | 19,600 | | | | 666,792 | | | | 4.56 | % |
Comstock Resources, Inc. | | | 30,000 | | | | 346,800 | | | | 2.37 | % |
ConocoPhillips | | | 7,245 | | | | 793,617 | | | | 5.43 | % |
Diamondback Energy, Inc. | | | 4,120 | | | | 728,292 | | | | 4.98 | % |
EOG Resources, Inc. | | | 5,530 | | | | 674,439 | | | | 4.62 | % |
EQT Corp. | | | 22,600 | | | | 825,804 | | | | 5.65 | % |
Marathon Oil Corp. | | | 25,800 | | | | 714,660 | | | | 4.89 | % |
Suncor Energy, Inc. | | | 17,560 | | | | 663,241 | | | | 4.54 | % |
| | | | | | | | 6,117,581 | | | | 41.86 | % |
| | | | | | | | | | | | | |
| Integrated – 11.80% | | | | | | | | | | | | |
Chevron Corp. | | | 5,157 | | | | 767,465 | | | | 5.25 | % |
Exxon Mobil Corp. | | | 8,202 | | | | 957,830 | | | | 6.55 | % |
| | | | | | | | 1,725,295 | | | | 11.80 | % |
| | | | | | | | | | | | | |
| Materials – 4.44% | | | | | | | | | | | | |
Freeport-McMoRan, Inc. | | | 14,420 | | | | 649,188 | | | | 4.44 | % |
| | | | | | | | | | | | | |
| Midstream – 6.42% | | | | | | | | | | | | |
Cheniere Energy, Inc. | | | 4,900 | | | | 937,762 | | | | 6.42 | % |
| | | | | | | | | | | | | |
| Oil Services – 19.67% | | | | | | | | | | | | |
Halliburton Co. | | | 19,980 | | | | 554,245 | | | | 3.79 | % |
NOV, Inc. | | | 23,400 | | | | 362,934 | | | | 2.48 | % |
ProFrac Holding Corp., Class A (a) | | | 40,000 | | | | 238,200 | | | | 1.63 | % |
Schlumberger NV | | | 14,810 | | | | 593,437 | | | | 4.06 | % |
Solaris Energy Infrastructure, Inc., Class A | | | 38,920 | | | | 511,409 | | | | 3.50 | % |
TechnipFMC PLC | | | 8,240 | | | | 219,925 | | | | 1.51 | % |
Tenaris SA – ADR | | | 12,000 | | | | 394,560 | | | | 2.70 | % |
| | | | | | | | 2,874,710 | | | | 19.67 | % |
| | | | | | | | | | | | | |
| Utilities – 9.75% | | | | | | | | | | | | |
National Fuel Gas Co. | | | 12,300 | | | | 744,519 | | | | 5.10 | % |
NextEra Energy, Inc. | | | 8,570 | | | | 679,173 | | | | 4.65 | % |
| | | | | | | | 1,423,692 | | | | 9.75 | % |
| | | | | | | | | | | | | |
| Total Common Stocks | | | | | | | | | | | | |
(Cost $10,042,385) | | | | | | | 14,576,318 | | | | 99.75 | % |
| | | | | | | | | | | | | |
SHORT-TERM INVESTMENTS – 1.37% | | | | | | | | | | | | |
| Money Market Funds – 1.37% | | | | | | | | | | | | |
First American Government | | | | | | | | | | | | |
Obligations Fund – Class X, 4.781% (b) | | | 199,810 | | | | 199,810 | | | | 1.37 | % |
| | | | | | | | | | | | | |
| Total Short-Term Investments | | | | | | | | | | | | |
(Cost $199,810) | | | | | | | 199,810 | | | | 1.37 | % |
| | | | | | | | | | | | | |
| Total Investments | | | | | | | | | | | | |
(Cost $10,242,195) – 101.12% | | | | | | | 14,776,128 | | | | 101.12 | % |
Liabilities in Excess of | | | | | | | | | | | | |
Other Assets – (1.12)% | | | | | | | (163,579 | ) | | | (1.12 | )% |
| | | | | | | | | | | | | |
TOTAL NET ASSETS – 100.00% | | | | | | $ | 14,612,549 | | | | 100.00 | % |
Percentages are stated as a percent of net assets.
ADR – American Depositary Receipt
PLC – Public Limited Company
(a) | Non-income producing security. |
(b) | The rate listed is the fund’s seven-day yield as of October 31, 2024. |
Note: The Fund concentrates its investments in the Energy industry. For presentation purposes, the Fund uses custom categories.
The accompanying notes are an integral part of these financial statements.
WWW.HENNESSYFUNDS.COM
Financial Statements — Schedule of Investments
| Hennessy Energy Transition Fund |
Summary of Fair Value Exposure as of October 31, 2024
The following is a summary of the inputs used to value the Fund’s net assets as of October 31, 2024 (see Note 3 in the accompanying Notes to the Financial Statements):
| Common Stocks | | Level 1 | | | Level 2 | | | Level 3 | | | Total | |
Downstream | | $ | 848,090 | | | $ | — | | | $ | — | | | $ | 848,090 | |
Exploration and Production | | | 6,117,581 | | | | — | | | | — | | | | 6,117,581 | |
Integrated | | | 1,725,295 | | | | — | | | | — | | | | 1,725,295 | |
Materials | | | 649,188 | | | | — | | | | — | | | | 649,188 | |
Midstream | | | 937,762 | | | | — | | | | — | | | | 937,762 | |
Oil Services | | | 2,874,710 | | | | — | | | | — | | | | 2,874,710 | |
Utilities | | | 1,423,692 | | | | — | | | | — | | | | 1,423,692 | |
| Total Common Stocks | | $ | 14,576,318 | | | $ | — | | | $ | — | | | $ | 14,576,318 | |
| Short-Term Investments | | | | | | | | | | | | | | | | |
Money Market Funds | | $ | 199,810 | | | $ | — | | | $ | — | | | $ | 199,810 | |
| Total Short-Term Investments | | $ | 199,810 | | | $ | — | | | $ | — | | | $ | 199,810 | |
| Total Investments | | $ | 14,776,128 | | | $ | — | | | $ | — | | | $ | 14,776,128 | |
The accompanying notes are an integral part of these financial statements.
HENNESSY FUNDS | 1-800-966-4354 |
Financial Statements — Schedule of Investments
COMMON STOCKS – 49.12% | | Number of | | | | | | % of | |
| | | Shares | | | Value | | | Net Assets | |
| Crude Oil and Refined Products – 0.43% | | | | | | | | | |
South Bow Corp. (a) | | | 11,700 | | | $ | 292,032 | | | | 0.43 | % |
| | | | | | | | | | | | | |
| Gathering and Processing – 17.82% | | | | | | | | | | | | |
Antero Midstream Corp. | | | 337,900 | | | | 4,855,623 | | | | 7.21 | % |
EnLink Midstream LLC | | | 106,300 | | | | 1,577,492 | | | | 2.34 | % |
EQT Corp. | | | 81,468 | | | | 2,976,841 | | | | 4.42 | % |
Targa Resources Corp. | | | 15,500 | | | | 2,587,880 | | | | 3.85 | % |
| | | | | | | | 11,997,836 | | | | 17.82 | % |
| | | | | | | | | | | | | |
| Natural Gas/NGL Transportation – 30.87% | | | | | | | | | | | | |
Cheniere Energy, Inc. | | | 15,100 | | | | 2,889,838 | | | | 4.29 | % |
DT Midstream, Inc. | | | 19,300 | | | | 1,739,895 | | | | 2.59 | % |
Kinder Morgan, Inc. | | | 123,490 | | | | 3,026,740 | | | | 4.50 | % |
ONEOK, Inc. | | | 58,845 | | | | 5,700,903 | | | | 8.47 | % |
TC Energy Corp. | | | 58,500 | | | | 2,720,835 | | | | 4.04 | % |
The Williams Companies, Inc. | | | 89,652 | | | | 4,695,075 | | | | 6.98 | % |
| | | | | | | | 20,773,286 | | | | 30.87 | % |
| | | | | | | | | | | | | |
| Total Common Stocks | | | | | | | | | | | | |
(Cost $16,362,271) | | | | | | | 33,063,154 | | | | 49.12 | % |
| | | | | | | | | | | | | |
| | | | | | | | | | | | | |
PARTNERSHIPS AND TRUSTS – 52.94% | | | | | | | | | | | | |
| Crude Oil and Refined Products – 20.50% | | | | | | | | | | | | |
MPLX LP | | | 156,449 | | | | 6,949,465 | | | | 10.33 | % |
Plains All American Pipeline LP | | | 420,626 | | | | 6,843,585 | | | | 10.17 | % |
| | | | | | | | 13,793,050 | | | | 20.50 | % |
| | | | | | | | | | | | | |
| Gathering and Processing – 6.60% | | | | | | | | | | | | |
Western Midstream Partners LP | | | 117,700 | | | | 4,440,821 | | | | 6.60 | % |
| | | | | | | | | | | | | |
| Natural Gas/NGL Transportation – 25.84% | | | | | | | | | | | | |
Cheniere Energy Partners LP | | | 10,600 | | | | 535,830 | | | | 0.80 | % |
Energy Transfer LP | | | 570,900 | | | | 9,408,432 | | | | 13.98 | % |
Enterprise Products Partners LP | | | 259,700 | | | | 7,443,002 | | | | 11.06 | % |
| | | | | | | | 17,387,264 | | | | 25.84 | % |
| | | | | | | | | | | | | |
| Total Partnerships and Trusts | | | | | | | | | | | | |
(Cost $15,137,172) | | | | | | | 35,621,135 | | | | 52.94 | % |
| | | | | | | | | | | | | |
| | | | | | | | | | | | | |
SHORT-TERM INVESTMENTS – 5.79% | | | | | | | | | | | | |
| Money Market Funds – 5.79% | | | | | | | | | | | | |
First American Government | | | | | | | | | | | | |
Obligations Fund – Class X, 4.781% (b) | | | 3,667,850 | | | | 3,667,850 | | | | 5.45 | % |
First American Treasury | | | | | | | | | | | | |
Obligations Fund – Class X, 4.793% (b) | | | 226,791 | | | | 226,791 | | | | 0.34 | % |
| | | | | | | | 3,894,641 | | | | 5.79 | % |
| | | | | | | | | | | | | |
| Total Short-Term Investments | | | | | | | | | | | | |
(Cost $3,894,641) | | | | | | | 3,894,641 | | | | 5.79 | % |
| | | | | | | | | | | | | |
| Total Investments | | | | | | | | | | | | |
(Cost $35,394,084) – 107.85% | | | | | | | 72,578,930 | | | | 107.85 | % |
Liabilities in Excess of | | | | | | | | | | | | |
Other Assets – (7.85)% | | | | | | | (5,275,758 | ) | | | (7.85 | )% |
| | | | | | | | | | | | | |
TOTAL NET ASSETS – 100.00% | | | | | | $ | 67,303,172 | | | | 100.00 | % |
Percentages are stated as a percent of net assets.
(a) | Non-income producing security. |
(b) | The rate listed is the fund’s seven-day yield as of October 31, 2024. |
Note: The Fund concentrates its investments in the Energy industry. For presentation purposes, the Fund uses custom categories.
Summary of Fair Value Exposure as of October 31, 2024
The following is a summary of the inputs used to value the Fund’s net assets as of October 31, 2024 (see Note 3 in the accompanying Notes to the Financial Statements):
| Common Stocks | | Level 1 | | | Level 2 | | | Level 3 | | | Total | |
Crude Oil and Refined Products | | $ | 292,032 | | | $ | — | | | $ | — | | | $ | 292,032 | |
Gathering and Processing | | | 11,997,836 | | | | — | | | | — | | | | 11,997,836 | |
Natural Gas/NGL Transportation | | | 20,773,286 | | | | — | | | | — | | | | 20,773,286 | |
| Total Common Stocks | | $ | 33,063,154 | | | $ | — | | | $ | — | | | $ | 33,063,154 | |
| Partnerships and Trusts | | | | | | | | | | | | | | | | |
Crude Oil and Refined Products | | $ | 13,793,050 | | | $ | — | | | $ | — | | | $ | 13,793,050 | |
Gathering and Processing | | | 4,440,821 | | | | — | | | | — | | | | 4,440,821 | |
Natural Gas/NGL Transportation | | | 17,387,264 | | | | — | | | | — | | | | 17,387,264 | |
| Total Partnerships and Trusts | | $ | 35,621,135 | | | $ | — | | | $ | — | | | $ | 35,621,135 | |
| Short-Term Investments | | | | | | | | | | | | | | | | |
Money Market Funds | | $ | 3,894,641 | | | $ | — | | | $ | — | | | $ | 3,894,641 | |
| Total Short-Term Investments | | $ | 3,894,641 | | | $ | — | | | $ | — | | | $ | 3,894,641 | |
| Total Investments | | $ | 72,578,930 | | | $ | — | | | $ | — | | | $ | 72,578,930 | |
The accompanying notes are an integral part of these financial statements.
WWW.HENNESSYFUNDS.COM
Financial Statements — Schedule of Investments
| Hennessy Gas Utility Fund |
COMMON STOCKS – 99.68% | | Number of | | | | | | % of | |
| | | Shares | | | Value | | | Net Assets | |
| Energy – 34.01% | | | | | | | | | |
Cheniere Energy, Inc. | | | 129,847 | | | $ | 24,850,119 | | | | 5.20 | % |
DT Midstream, Inc. | | | 143,200 | | | | 12,909,480 | | | | 2.70 | % |
Enbridge, Inc. | | | 574,365 | | | | 23,204,346 | | | | 4.86 | % |
EQT Corp. | | | 649,700 | | | | 23,740,038 | | | | 4.97 | % |
Kinder Morgan, Inc. | | | 1,047,601 | | | | 25,676,701 | | | | 5.37 | % |
ONEOK, Inc. | | | 254,900 | | | | 24,694,712 | | | | 5.17 | % |
South Bow Corp. (a) | | | 97,580 | | | | 2,435,597 | | | | 0.51 | % |
TC Energy Corp. | | | 537,900 | | | | 25,017,729 | | | | 5.23 | % |
| | | | | | | | 162,528,722 | | | | 34.01 | % |
| | | | | | | | | | | | | |
| Financials – 4.82% | | | | | | | | | | | | |
Berkshire Hathaway, Inc., Class A (a) | | | 34 | | | | 23,016,623 | | | | 4.82 | % |
| | | | | | | | | | | | | |
| Industrials – 1.06% | | | | | | | | | | | | |
MDU Resources Group, Inc. | | | 175,707 | | | | 5,069,147 | | | | 1.06 | % |
| | | | | | | | | | | | | |
| Utilities – 59.79% | | | | | | | | | | | | |
Algonquin Power & Utilities Corp. | | | 113,564 | | | | 549,650 | | | | 0.11 | % |
ALLETE, Inc. | | | 375 | | | | 23,966 | | | | – | % |
Alliant Energy Corp. | | | 30,050 | | | | 1,803,000 | | | | 0.38 | % |
Ameren Corp. | | | 41,580 | | | | 3,622,034 | | | | 0.76 | % |
Atmos Energy Corp. | | | 169,186 | | | | 23,479,633 | | | | 4.91 | % |
Avangrid, Inc. | | | 81,100 | | | | 2,896,081 | | | | 0.61 | % |
Avista Corp. | | | 24,572 | | | | 920,959 | | | | 0.19 | % |
Black Hills Corp. | | | 44,647 | | | | 2,642,656 | | | | 0.55 | % |
CenterPoint Energy, Inc. | | | 421,728 | | | | 12,453,628 | | | | 2.61 | % |
Chesapeake Utilities Corp. | | | 28,158 | | | | 3,373,047 | | | | 0.71 | % |
CMS Energy Corp. | | | 162,398 | | | | 11,304,525 | | | | 2.36 | % |
Consolidated Edison, Inc. | | | 136,136 | | | | 13,842,308 | | | | 2.90 | % |
Dominion Energy, Inc. | | | 63,077 | | | | 3,754,974 | | | | 0.79 | % |
DTE Energy Co. | | | 50,804 | | | | 6,310,873 | | | | 1.32 | % |
Duke Energy Corp. | | | 111,687 | | | | 12,874,160 | | | | 2.69 | % |
Entergy Corp. | | | 3,360 | | | | 520,061 | | | | 0.11 | % |
Essential Utilities, Inc. | | | 166,900 | | | | 6,442,340 | | | | 1.35 | % |
Exelon Corp. | | | 143,231 | | | | 5,628,978 | | | | 1.18 | % |
Fortis, Inc. | | | 115,376 | | | | 4,987,704 | | | | 1.04 | % |
MGE Energy, Inc. | | | 9,379 | | | | 848,706 | | | | 0.18 | % |
National Fuel Gas Co. | | | 75,024 | | | | 4,541,203 | | | | 0.95 | % |
National Grid PLC-ADR | | | 198,844 | | | | 12,644,490 | | | | 2.65 | % |
New Jersey Resources Corp. | | | 123,834 | | | | 5,682,742 | | | | 1.19 | % |
NiSource, Inc. | | | 385,581 | | | | 13,557,028 | | | | 2.84 | % |
Northwest Natural Holding Co. | | | 52,903 | | | | 2,057,398 | | | | 0.43 | % |
Northwestern Energy Group, Inc. | | | 18,398 | | | | 983,557 | | | | 0.20 | % |
ONE Gas, Inc. | | | 83,575 | | | | 5,956,390 | | | | 1.25 | % |
PG&E Corp. | | | 814,949 | | | | 16,478,269 | | | | 3.45 | % |
PPL Corp. | | | 181,119 | | | | 5,897,235 | | | | 1.23 | % |
Public Service Enterprise Group, Inc. | | | 174,490 | | | | 15,601,151 | | | | 3.26 | % |
RGC Resources, Inc. | | | 15,654 | | | | 320,437 | | | | 0.07 | % |
Sempra | | | 280,380 | | | | 23,375,281 | | | | 4.89 | % |
Southwest Gas Holdings, Inc. | | | 82,617 | | | | 6,051,695 | | | | 1.27 | % |
Spire, Inc. | | | 60,641 | | | | 3,872,534 | | | | 0.81 | % |
The Southern Co. | | | 258,000 | | | | 23,485,740 | | | | 4.92 | % |
UGI Corp. | | | 108,052 | | | | 2,583,523 | | | | 0.54 | % |
Unitil Corp. | | | 14,998 | | | | 868,234 | | | | 0.18 | % |
WEC Energy Group, Inc. | | | 170,640 | | | | 16,301,239 | | | | 3.41 | % |
Xcel Energy, Inc. | | | 107,099 | | | | 7,155,284 | | | | 1.50 | % |
| | | | | | | | 285,692,713 | | | | 59.79 | % |
| | | | | | | | | | | | | |
| Total Common Stocks | | | | | | | | | | | | |
(Cost $215,627,159) | | | | | | | 476,307,205 | | | | 99.68 | % |
| | | | | | | | | | | | | |
| | | | | | | | | | | | | |
SHORT-TERM INVESTMENTS – 0.33% | | | | | | | | | | | | |
| Money Market Funds – 0.33% | | | | | | | | | | | | |
First American Government | | | | | | | | | | | | |
Obligations Fund – Class X, 4.821% (b) | | | 1,581,567 | | | | 1,581,567 | | | | 0.33 | % |
| | | | | | | | | | | | | |
| Total Short-Term Investments | | | | | | | | | | | | |
(Cost $1,581,567) | | | | | | | 1,581,567 | | | | 0.33 | % |
| | | | | | | | | | | | | |
| Total Investments | | | | | | | | | | | | |
(Cost $217,208,726) – 100.01% | | | | | | | 477,888,772 | | | | 100.01 | % |
Liabilities in Excess of | | | | | | | | | | | | |
Other Assets – (0.01)% | | | | | | | (58,997 | ) | | | (0.01 | )% |
| | | | | | | | | | | | | |
TOTAL NET ASSETS – 100.00% | | | | | | $ | 477,829,775 | | | | 100.00 | % |
Percentages are stated as a percent of net assets.
ADR – American Depositary Receipt
PLC – Public Limited Company
(a) | Non-income producing security. |
(b) | The rate listed is the fund’s seven-day yield as of October 31, 2024. |
Note: For presentation purposes, the Fund has grouped some of the industry categories. For purposes of categorizing securities for compliance with Section 8(b)(1) of the Investment Company Act of 1940, as amended, the Fund uses more specific industry classifications.
The Global Industry Classification Standard (GICS®) was developed by and is the exclusive property and a service mark of MSCI, Inc. and Standard & Poor’s Financial Services LLC. It has been licensed for use by the Hennessy Funds.
The accompanying notes are an integral part of these financial statements.
HENNESSY FUNDS | 1-800-966-4354 |
Financial Statements — Schedule of Investments
| Hennessy Gas Utility Fund |
Summary of Fair Value Exposure as of October 31, 2024
The following is a summary of the inputs used to value the Fund’s net assets as of October 31, 2024 (see Note 3 in the accompanying Notes to the Financial Statements):
| Common Stocks | | Level 1 | | | Level 2 | | | Level 3 | | | Total | |
Energy | | $ | 162,528,722 | | | $ | — | | | $ | — | | | $ | 162,528,722 | |
Financials | | | 23,016,623 | | | | — | | | | — | | | | 23,016,623 | |
Industrials | | | 5,069,147 | | | | — | | | | — | | | | 5,069,147 | |
Utilities | | | 285,692,713 | | | | — | | | | — | | | | 285,692,713 | |
| Total Common Stocks | | $ | 476,307,205 | | | $ | — | | | $ | — | | | $ | 476,307,205 | |
| Short-Term Investments | | | | | | | | | | | | | | | | |
Money Market Funds | | $ | 1,581,567 | | | $ | — | | | $ | — | | | $ | 1,581,567 | |
| Total Short-Term Investments | | $ | 1,581,567 | | | $ | — | | | $ | — | | | $ | 1,581,567 | |
| Total Investments | | $ | 477,888,772 | | | $ | — | | | $ | — | | | $ | 477,888,772 | |
The accompanying notes are an integral part of these financial statements.
WWW.HENNESSYFUNDS.COM
Financial Statements — Schedule of Investments
COMMON STOCKS – 93.55% | | Number of | | | | | | % of | |
| | | Shares | | | Value | | | Net Assets | |
| Communication Services – 2.59% | | | | | | | | | |
Nippon Telegraph & Telephone Corp. | | | 4,299,700 | | | $ | 4,148,503 | | | | 1.00 | % |
SoftBank Group Corp. | | | 109,900 | | | | 6,552,072 | | | | 1.59 | % |
| | | | | | | | 10,700,575 | | | | 2.59 | % |
| | | | | | | | | | | | | |
| Consumer Discretionary – 9.10% | | | | | | | | | | | | |
Asics Corp. | | | 265,800 | | | | 4,642,701 | | | | 1.13 | % |
Fast Retailing Co. Ltd. | | | 39,000 | | | | 12,469,139 | | | | 3.01 | % |
Sony Group Corp. | | | 1,166,800 | | | | 20,532,783 | | | | 4.96 | % |
| | | | | | | | 37,644,623 | | | | 9.10 | % |
| | | | | | | | | | | | | |
| Consumer Staples – 10.40% | | | | | | | | | | | | |
Rohto Pharmaceutical Co. Ltd. | | | 517,800 | | | | 11,643,958 | | | | 2.81 | % |
Seven & i Holdings Co. Ltd. | | | 1,868,900 | | | | 26,912,054 | | | | 6.51 | % |
Unicharm Corp. | | | 138,700 | | | | 4,472,378 | | | | 1.08 | % |
| | | | | | | | 43,028,390 | | | | 10.40 | % |
| | | | | | | | | | | | | |
| Financials – 26.01% | | | | | | | | | | | | |
Japan Exchange Group, Inc. | | | 842,200 | | | | 9,871,481 | | | | 2.39 | % |
Mitsubishi UFJ Financial Group, Inc. | | | 1,815,300 | | | | 19,133,705 | | | | 4.63 | % |
Mizuho Financial Group | | | 234,700 | | | | 4,874,955 | | | | 1.18 | % |
MS&AD Insurance Group Holdings, Inc. | | | 746,100 | | | | 16,503,235 | | | | 3.99 | % |
ORIX Corp. | | | 973,900 | | | | 20,519,958 | | | | 4.96 | % |
Sompo Holdings, Inc. | | | 802,900 | | | | 17,213,441 | | | | 4.16 | % |
Tokio Marine Holdings, Inc. | | | 540,200 | | | | 19,455,932 | | | | 4.70 | % |
| | | | | | | | 107,572,707 | | | | 26.01 | % |
| | | | | | | | | | | | | |
| Health Care – 3.84% | | | | | | | | | | | | |
Olympus Corp. | | | 504,700 | | | | 8,883,877 | | | | 2.15 | % |
Santen Pharmaceutical Co. Ltd. | | | 586,600 | | | | 7,015,066 | | | | 1.69 | % |
| | | | | | | | 15,898,943 | | | | 3.84 | % |
| | | | | | | | | | | | | |
| Industrials – 23.90% | | | | | | | | | | | | |
Daikin Industries, Ltd. | | | 122,000 | | | | 14,646,921 | | | | 3.54 | % |
Hitachi Ltd. | | | 1,356,900 | | | | 34,091,923 | | | | 8.24 | % |
Mitsubishi Corp. | | | 1,170,900 | | | | 21,420,535 | | | | 5.18 | % |
Recruit Holdings Co. Ltd. | | | 470,000 | | | | 28,699,389 | | | | 6.94 | % |
| | | | | | | | 98,858,768 | | | | 23.90 | % |
| | | | | | | | | | | | | |
| Information Technology – 10.99% | | | | | | | | | | | | |
Keyence Corp. | | | 21,300 | | | | 9,615,111 | | | | 2.32 | % |
Renesas Electronics Corp. | | | 1,194,000 | | | | 15,997,595 | | | | 3.87 | % |
Socionext, Inc. | | | 292,200 | | | | 5,439,928 | | | | 1.32 | % |
Tokyo Electron Ltd. | | | 97,800 | | | | 14,391,569 | | | | 3.48 | % |
| | | | | | | | 45,444,203 | | | | 10.99 | % |
| | | | | | | | | | | | | |
| Materials – 6.72% | | | | | | | | | | | | |
Nissan Chemical Corp. | | | 260,900 | | | | 8,811,953 | | | | 2.13 | % |
Shin-Etsu Chemical Co. Ltd. | | | 518,000 | | | | 18,981,573 | | | | 4.59 | % |
| | | | | | | | 27,793,526 | | | | 6.72 | % |
| | | | | | | | | | | | | |
| Total Common Stocks | | | | | | | | | | | | |
(Cost $268,641,274) | | | | | | | 386,941,735 | | | | 93.55 | % |
| | | | | | | | | | | | | |
| | | | | | | | | | | | | |
SHORT-TERM INVESTMENTS – 5.74% | | | | | | | | | | | | |
| Money Market Funds – 5.74% | | | | | | | | | | | | |
First American Government | | | | | | | | | | | | |
Obligations Fund – Class X, 4.781% (a) | | | 21,004,470 | | | | 21,004,470 | | | | 5.08 | % |
First American Treasury | | | | | | | | | | | | |
Obligations Fund – Class X, 4.735% (a) | | | 2,741,643 | | | | 2,741,643 | | | | 0.66 | % |
| | | | | | | | 23,746,113 | | | | 5.74 | % |
| | | | | | | | | | | | | |
| Total Short-Term Investments | | | | | | | | | | | | |
(Cost $23,746,113) | | | | | | | 23,746,113 | | | | 5.74 | % |
| | | | | | | | | | | | | |
| Total Investments | | | | | | | | | | | | |
(Cost $292,387,387) – 99.29% | | | | | | | 410,687,848 | | | | 99.29 | % |
Other Assets in Excess of | | | | | | | | | | | | |
Liabilities – 0.71% | | | | | | | 2,920,118 | | | | 0.71 | % |
| | | | | | | | | | | | | |
TOTAL NET ASSETS – 100.00% | | | | | | $ | 413,607,966 | | | | 100.00 | % |
| | | | | | | | | | | | | |
Percentages are stated as a percent of net assets.
(a) | The rate listed is the fund’s seven-day yield as of October 31, 2024. |
Note: For presentation purposes, the Fund has grouped some of the industry categories. For purposes of categorizing securities for compliance with Section 8(b)(1) of the Investment Company Act of 1940, as amended, the Fund uses more specific industry classifications.
The Global Industry Classification Standard (GICS®) was developed by and is the exclusive property and a service mark of MSCI, Inc. and Standard & Poor’s Financial Services LLC. It has been licensed for use by the Hennessy Funds.
Summary of Fair Value Exposure as of October 31, 2024
The following is a summary of the inputs used to value the Fund’s net assets as of October 31, 2024 (see Note 3 in the accompanying Notes to the Financial Statements):
| Common Stocks | | Level 1 | | | Level 2 | | | Level 3 | | | Total | |
Communication Services | | $ | — | | | $ | 10,700,575 | | | $ | — | | | $ | 10,700,575 | |
Consumer Discretionary | | | — | | | | 37,644,623 | | | | — | | | | 37,644,623 | |
Consumer Staples | | | — | | | | 43,028,390 | | | | — | | | | 43,028,390 | |
Financials | | | — | | | | 107,572,707 | | | | — | | | | 107,572,707 | |
Health Care | | | — | | | | 15,898,943 | | | | — | | | | 15,898,943 | |
Industrials | | | — | | | | 98,858,768 | | | | — | | | | 98,858,768 | |
Information Technology | | | — | | | | 45,444,203 | | | | — | | | | 45,444,203 | |
Materials | | | — | | | | 27,793,526 | | | | — | | | | 27,793,526 | |
| Total Common Stocks | | $ | — | | | $ | 386,941,735 | | | $ | — | | | $ | 386,941,735 | |
| Short-Term Investments | | | | | | | | | | | | | | | | |
Money Market Funds | | $ | 23,746,113 | | | $ | — | | | $ | — | | | $ | 23,746,113 | |
| Total Short-Term Investments | | $ | 23,746,113 | | | $ | — | | | $ | — | | | $ | 23,746,113 | |
| Total Investments | | $ | 23,746,113 | | | $ | 386,941,735 | | | $ | — | | | $ | 410,687,848 | |
The accompanying notes are an integral part of these financial statements.
HENNESSY FUNDS | 1-800-966-4354 |
Financial Statements — Schedule of Investments
| Hennessy Japan Small Cap Fund |
COMMON STOCKS – 96.72% | | Number of | | | | | | % of | |
| | | Shares | | | Value | | | Net Assets | |
| Communication Services – 0.97% | | | | | | | | | |
Macromill, Inc. | | | 200,000 | | | $ | 1,056,942 | | | | 0.97 | % |
| | | | | | | | | | | | | |
| Consumer Discretionary – 14.87% | | | | | | | | | | | | |
Aeon Fantasy Co. Ltd. | | | 90,400 | | | | 1,578,537 | | | | 1.45 | % |
J Front Retailing Co. Ltd. | | | 206,800 | | | | 2,196,148 | | | | 2.01 | % |
Koshidaka Holdings Co. Ltd. | | | 291,900 | | | | 2,289,705 | | | | 2.10 | % |
LITALICO, Inc. | | | 210,700 | | | | 1,504,852 | | | | 1.38 | % |
Musashi Seimitsu Industry Co. Ltd. | | | 175,400 | | | | 2,275,232 | | | | 2.08 | % |
Nojima Corp. | | | 38,100 | | | | 534,346 | | | | 0.49 | % |
Onward Holdings Co. Ltd. | | | 383,400 | | | | 1,309,181 | | | | 1.20 | % |
Saizeriya Co. Ltd. | | | 43,900 | | | | 1,620,457 | | | | 1.48 | % |
Topre Corp. | | | 110,900 | | | | 1,277,475 | | | | 1.17 | % |
Treasure Factory Co. Ltd. | | | 188,000 | | | | 1,647,762 | | | | 1.51 | % |
| | | | | | | | 16,233,695 | | | | 14.87 | % |
| | | | | | | | | | | | | |
| Consumer Staples – 5.92% | | | | | | | | | | | | |
Ariake Japan Co. Ltd. | | | 54,000 | | | | 1,885,302 | | | | 1.73 | % |
Cosmos Pharmaceutical Corp. | | | 43,600 | | | | 2,095,549 | | | | 1.92 | % |
Nishimoto Co. Ltd. | | | 147,000 | | | | 1,266,758 | | | | 1.16 | % |
Warabeya Nichiyo Holdings Co. Ltd. | | | 90,000 | | | | 1,212,292 | | | | 1.11 | % |
| | | | | | | | 6,459,901 | | | | 5.92 | % |
| | | | | | | | | | | | | |
| Energy – 0.61% | | | | | | | | | | | | |
Iwatani Corp. | | | 50,800 | | | | 662,229 | | | | 0.61 | % |
| | | | | | | | | | | | | |
| Financials – 3.81% | | | | | | | | | | | | |
Musashino Bank Ltd. | | | 125,600 | | | | 2,190,742 | | | | 2.01 | % |
Nishi-Nippon Financial Holdings, Inc. | | | 182,500 | | | | 1,965,452 | | | | 1.80 | % |
| | | | | | | | 4,156,194 | | | | 3.81 | % |
| | | | | | | | | | | | | |
| Health Care – 5.39% | | | | | | | | | | | | |
Nihon Kohden Corp. | | | 162,600 | | | | 2,423,767 | | | | 2.22 | % |
Paramount Bed Holdings Co. Ltd. | | | 69,800 | | | | 1,206,223 | | | | 1.10 | % |
PeptiDream, Inc. (a) | | | 123,100 | | | | 2,259,660 | | | | 2.07 | % |
| | | | | | | | 5,889,650 | | | | 5.39 | % |
| | | | | | | | | | | | | |
| Industrials – 39.21% | | | | | | | | | | | | |
Amada Co. Ltd. | | | 218,300 | | | | 2,151,326 | | | | 1.97 | % |
Creek & River Co. Ltd. | | | 96,300 | | | | 1,010,385 | | | | 0.93 | % |
Daihen Corp. | | | 62,200 | | | | 2,580,210 | | | | 2.36 | % |
Furukawa Co. Ltd. | | | 89,500 | | | | 971,983 | | | | 0.89 | % |
Gakujo Co. Ltd. | | | 112,500 | | | | 1,224,309 | | | | 1.12 | % |
Hanwa Co. Ltd. | | | 34,500 | | | | 1,143,103 | | | | 1.05 | % |
Integrated Design & Engineering | | | | | | | | | | | | |
Holdings Co. Ltd. | | | 80,100 | | | | 2,279,001 | | | | 2.09 | % |
Kanamoto Co. Ltd. | | | 93,300 | | | | 1,686,233 | | | | 1.54 | % |
Keihan Holdings Co. Ltd. | | | 78,400 | | | | 1,463,511 | | | | 1.34 | % |
Kyudenko Corp. | | | 53,100 | | | | 1,906,311 | | | | 1.75 | % |
Mitsubishi Logisnext Co. Ltd. | | | 183,000 | | | | 1,360,876 | | | | 1.25 | % |
Nabtesco Corp. | | | 101,800 | | | | 1,650,149 | | | | 1.51 | % |
Nichiha Corp. | | | 71,700 | | | | 1,619,245 | | | | 1.48 | % |
Nissei ASB Machine Co. Ltd. | | | 54,700 | | | | 1,660,073 | | | | 1.52 | % |
Nittoku Co. Ltd. | | | 80,200 | | | | 885,506 | | | | 0.81 | % |
Penta-Ocean Construction Co. Ltd. | | | 606,900 | | | | 2,520,915 | | | | 2.31 | % |
Raksul, Inc. | | | 147,200 | | | | 1,240,212 | | | | 1.14 | % |
SBS Holdings, Inc. | | | 96,200 | | | | 1,580,369 | | | | 1.45 | % |
Tadano Ltd. | | | 314,400 | | | | 2,001,406 | | | | 1.83 | % |
Takasago Thermal Engineering Co. Ltd. | | | 61,100 | | | | 1,959,432 | | | | 1.79 | % |
Tanseisha Co. Ltd. | | | 299,900 | | | | 1,583,357 | | | | 1.45 | % |
Tocalo Co. Ltd. | | | 137,900 | | | | 1,604,124 | | | | 1.47 | % |
TRE Holdings Corp. | | | 240,700 | | | | 2,823,012 | | | | 2.59 | % |
Trusco Nakayama Corp. | | | 111,900 | | | | 1,652,943 | | | | 1.51 | % |
Tsukishima Holdings Co. Ltd. | | | 251,200 | | | | 2,254,335 | | | | 2.06 | % |
| | | | | | | | 42,812,326 | | | | 39.21 | % |
| | | | | | | | | | | | | |
| Information Technology – 11.14% | | | | | | | | | | | | |
Canon Marketing Japan, Inc. | | | 42,800 | | | | 1,285,672 | | | | 1.18 | % |
Computer Engineering & Consulting Ltd. | | | 55,100 | | | | 649,031 | | | | 0.60 | % |
Future Corp. | | | 161,900 | | | | 2,073,013 | | | | 1.90 | % |
Macnica Holdings, Inc. | | | 75,900 | | | | 865,741 | | | | 0.79 | % |
Mimaki Engineering Co., Ltd. | | | 165,700 | | | | 1,459,988 | | | | 1.34 | % |
NEC Networks & System Integration Corp. | | | 126,600 | | | | 2,674,581 | | | | 2.45 | % |
Nippon Signal Co. Ltd. | | | 207,400 | | | | 1,266,570 | | | | 1.16 | % |
Optex Group Co. Ltd. | | | 15,600 | | | | 165,924 | | | | 0.15 | % |
SIIX Corp. | | | 186,400 | | | | 1,364,624 | | | | 1.25 | % |
Towa Corp. | | | 27,600 | | | | 353,384 | | | | 0.32 | % |
| | | | | | | | 12,158,528 | | | | 11.14 | % |
| | | | | | | | | | | | | |
| Materials – 8.80% | | | | | | | | | | | | |
Asia Pile Holdings Corp. | | | 307,800 | | | | 1,612,902 | | | | 1.48 | % |
Daicel Corp. | | | 119,400 | | | | 1,053,833 | | | | 0.96 | % |
Maeda Kosen Co. Ltd. | | | 185,400 | | | | 2,145,965 | | | | 1.96 | % |
Nissan Chemical Corp. | | | 54,800 | | | | 1,850,882 | | | | 1.70 | % |
Tokyo Ohka Kogyo Co. Ltd. | | | 78,700 | | | | 1,811,260 | | | | 1.66 | % |
Toyobo Co. Ltd. | | | 178,200 | | | | 1,136,049 | | | | 1.04 | % |
| | | | | | | | 9,610,891 | | | | 8.80 | % |
| | | | | | | | | | | | | |
| Real Estate – 5.48% | | | | | | | | | | | | |
Relo Group, Inc. | | | 236,800 | | | | 2,880,524 | | | | 2.64 | % |
Star Mica Holdings Co. Ltd. | | | 214,200 | | | | 896,867 | | | | 0.82 | % |
Tosei Corp. | | | 141,900 | | | | 2,206,966 | | | | 2.02 | % |
| | | | | | | | 5,984,357 | | | | 5.48 | % |
| | | | | | | | | | | | | |
| Utilities – 0.52% | | | | | | | | | | | | |
EF-ON INC | | | 244,900 | | | | 568,853 | | | | 0.52 | % |
| | | | | | | | | | | | | |
| Total Common Stocks | | | | | | | | | | | | |
(Cost $99,504,131) | | | | | | | 105,593,566 | | | | 96.72 | % |
| | | | | | | | | | | | | |
The accompanying notes are an integral part of these financial statements.
WWW.HENNESSYFUNDS.COM
Financial Statements — Schedule of Investments
| Hennessy Japan Small Cap Fund |
SHORT-TERM INVESTMENTS – 2.60% | | Number of | | | | | | % of | |
| | | Shares | | | Value | | | Net Assets | |
| Money Market Funds – 2.60% | | | | | | | | | |
First American Government | | | | | | | | | |
Obligations Fund – Class X, 4.781% (b) | | | 2,841,090 | | | $ | 2,841,090 | | | | 2.60 | % |
| | | | | | | | | | | | | |
| Total Short-Term Investments | | | | | | | | | | | | |
(Cost $2,841,090) | | | | | | | 2,841,090 | | | | 2.60 | % |
| | | | | | | | | | | | | |
| Total Investments | | | | | | | | | | | | |
(Cost $102,345,221) – 99.32% | | | | | | | 108,434,656 | | | | 99.32 | % |
Other Assets in Excess of | | | | | | | | | | | | |
Liabilities – 0.68% | | | | | | | 747,301 | | | | 0.68 | % |
| | | | | | | | | | | | | |
TOTAL NET ASSETS – 100.00% | | | | | | $ | 109,181,957 | | | | 100.00 | % |
Percentages are stated as a percent of net assets.
REIT – Real Estate Investment Trust
(a) | Non-income producing security. |
(b) | The rate listed is the fund’s seven-day yield as of October 31, 2024. |
Note: For presentation purposes, the Fund has grouped some of the industry categories. For purposes of categorizing securities for compliance with Section 8(b)(1) of the Investment Company Act of 1940, as amended, the Fund uses more specific industry classifications.
The Global Industry Classification Standard (GICS®) was developed by and is the exclusive property and a service mark of MSCI, Inc. and Standard & Poor’s Financial Services LLC. It has been licensed for use by the Hennessy Funds.
Summary of Fair Value Exposure as of October 31, 2024
The following is a summary of the inputs used to value the Fund’s net assets as of October 31, 2024 (see Note 3 in the accompanying Notes to the Financial Statements):
| Common Stocks | | Level 1 | | | Level 2 | | | Level 3 | | | Total | |
Communication Services | | $ | — | | | $ | 1,056,942 | | | $ | — | | | $ | 1,056,942 | |
Consumer Discretionary | | | — | | | | 16,233,695 | | | | — | | | | 16,233,695 | |
Consumer Staples | | | — | | | | 6,459,901 | | | | — | | | | 6,459,901 | |
Energy | | | — | | | | 662,229 | | | | — | | | | 662,229 | |
Financials | | | — | | | | 4,156,194 | | | | — | | | | 4,156,194 | |
Health Care | | | — | | | | 5,889,650 | | | | — | | | | 5,889,650 | |
Industrials | | | — | | | | 42,812,326 | | | | — | | | | 42,812,326 | |
Information Technology | | | — | | | | 12,158,528 | | | | — | | | | 12,158,528 | |
Materials | | | — | | | | 9,610,891 | | | | — | | | | 9,610,891 | |
Real Estate | | | — | | | | 5,984,357 | | | | — | | | | 5,984,357 | |
Utilities | | | — | | | | 568,853 | | | | — | | | | 568,853 | |
| Total Common Stocks | | $ | — | | | $ | 105,593,566 | | | $ | — | | | $ | 105,593,566 | |
| Short-Term Investments | | | | | | | | | | | | | | | | |
Money Market Funds | | $ | 2,841,090 | | | $ | — | | | $ | — | | | $ | 2,841,090 | |
| Total Short-Term Investments | | $ | 2,841,090 | | | $ | — | | | $ | — | | | $ | 2,841,090 | |
| Total Investments | | $ | 2,841,090 | | | $ | 105,593,566 | | | $ | — | | | $ | 108,434,656 | |
The accompanying notes are an integral part of these financial statements.
HENNESSY FUNDS | 1-800-966-4354 |
Financial Statements — Schedule of Investments
| Hennessy Large Cap Financial Fund |
COMMON STOCKS – 99.16% | | Number of | | | | | | % of | |
| | | Shares | | | Value | | | Net Assets | |
| Financials – 99.16% | | | | | | | | | |
Bank of America Corp. | | | 39,000 | | | $ | 1,630,980 | | | | 5.66 | % |
Berkshire Hathaway, Inc., Class B (a) | | | 3,000 | | | | 1,352,760 | | | | 4.70 | % |
Capital One Financial Corp. | | | 7,500 | | | | 1,220,925 | | | | 4.24 | % |
Citigroup, Inc. | | | 24,000 | | | | 1,540,080 | | | | 5.35 | % |
Citizens Financial Group, Inc. | | | 15,000 | | | | 631,800 | | | | 2.19 | % |
Coinbase Global, Inc., Class A (a) | | | 6,000 | | | | 1,075,500 | | | | 3.74 | % |
Equitable Holdings, Inc. | | | 19,000 | | | | 861,460 | | | | 2.99 | % |
Fifth Third Bancorp | | | 13,500 | | | | 589,680 | | | | 2.05 | % |
First Citizens BancShares, Inc., Class A | | | 500 | | | | 968,675 | | | | 3.36 | % |
JPMorgan Chase & Co. | | | 7,000 | | | | 1,553,440 | | | | 5.39 | % |
KeyCorp | | | 56,500 | | | | 974,625 | | | | 3.38 | % |
M&T Bank Corp. | | | 7,500 | | | | 1,460,100 | | | | 5.07 | % |
Mastercard, Inc., Class A | | | 3,000 | | | | 1,498,770 | | | | 5.21 | % |
Morgan Stanley | | | 12,500 | | | | 1,453,125 | | | | 5.05 | % |
PayPal Holdings, Inc. (a) | | | 19,000 | | | | 1,506,700 | | | | 5.23 | % |
Synchrony Financial | | | 16,000 | | | | 882,240 | | | | 3.06 | % |
The Charles Schwab Corp. | | | 15,900 | | | | 1,126,197 | | | | 3.91 | % |
The Goldman Sachs Group, Inc. | | | 2,400 | | | | 1,242,696 | | | | 4.32 | % |
The PNC Financial Services Group, Inc. | | | 8,000 | | | | 1,506,160 | | | | 5.23 | % |
Truist Financial Corp. | | | 25,000 | | | | 1,076,250 | | | | 3.74 | % |
U.S. Bancorp | | | 10,500 | | | | 507,255 | | | | 1.76 | % |
Visa, Inc., Class A | | | 4,800 | | | | 1,391,280 | | | | 4.83 | % |
Webster Financial Corp. | | | 17,000 | | | | 880,600 | | | | 3.06 | % |
Wells Fargo & Co. | | | 25,000 | | | | 1,623,000 | | | | 5.64 | % |
| | | | | | | | 28,554,298 | | | | 99.16 | % |
| Total Common Stocks | | | | | | | | | | | | |
(Cost $17,234,932) | | | | | | | 28,554,298 | | | | 99.16 | % |
| | | | | | | | | | | | | |
| | | | | | | | | | | | | |
SHORT-TERM INVESTMENTS – 0.94% | | | | | | | | | | | | |
| Money Market Funds – 0.94% | | | | | | | | | | | | |
First American Government | | | | | | | | | | | | |
Obligations Fund – Class X, 4.781% (b) | | | 270,332 | | | | 270,332 | | | | 0.94 | % |
| | | | | | | | | | | | | |
| Total Short-Term Investments | | | | | | | | | | | | |
(Cost $270,332) | | | | | | | 270,332 | | | | 0.94 | % |
| | | | | | | | | | | | | |
| Total Investments | | | | | | | | | | | | |
(Cost $17,505,264) – 100.10% | | | | | | | 28,824,630 | | | | 100.10 | % |
Liabilities in Excess of | | | | | | | | | | | | |
Other Assets – (0.10)% | | | | | | | (28,908 | ) | | | (0.10 | )% |
| | | | | | | | | | | | | |
TOTAL NET ASSETS – 100.00% | | | | | | $ | 28,795,722 | | | | 100.00 | % |
Percentages are stated as a percent of net assets.
(a) | Non-income producing security. |
(b) | The rate listed is the fund’s seven-day yield as of October 31, 2024. |
Summary of Fair Value Exposure as of October 31, 2024
The following is a summary of the inputs used to value the Fund’s net assets as of October 31, 2024 (see Note 3 in the accompanying Notes to the Financial Statements):
| Common Stocks | | Level 1 | | | Level 2 | | | Level 3 | | | Total | |
Financials | | $ | 28,554,298 | | | $ | — | | | $ | — | | | $ | 28,554,298 | |
| Total Common Stocks | | $ | 28,554,298 | | | $ | — | | | $ | — | | | $ | 28,554,298 | |
| Short-Term Investments | | | | | | | | | | | | | | | | |
Money Market Funds | | $ | 270,332 | | | $ | — | | | $ | — | | | $ | 270,332 | |
| Total Short-Term Investments | | $ | 270,332 | | | $ | — | | | $ | — | | | $ | 270,332 | |
| Total Investments | | $ | 28,824,630 | | | $ | — | | | $ | — | | | $ | 28,824,630 | |
The accompanying notes are an integral part of these financial statements.
WWW.HENNESSYFUNDS.COM
Financial Statements — Schedule of Investments
| Hennessy Small Cap Financial Fund |
COMMON STOCKS – 97.87% | | Number of | | | | | | % of | |
| | | Shares | | | Value | | | Net Assets | |
| Financials – 97.87% | | | | | | | | | |
Associated Banc-Corp. | | | 155,000 | | | $ | 3,679,700 | | | | 4.22 | % |
Banc of California, Inc. | | | 270,000 | | | | 4,147,200 | | | | 4.76 | % |
BankUnited, Inc. | | | 97,000 | | | | 3,427,980 | | | | 3.93 | % |
Banner Corp. | | | 45,000 | | | | 2,881,800 | | | | 3.30 | % |
Brookline Bancorp, Inc. | | | 324,000 | | | | 3,645,000 | | | | 4.18 | % |
Columbia Banking System, Inc. | | | 58,000 | | | | 1,653,580 | | | | 1.90 | % |
ConnectOne Bancorp, Inc. | | | 104,000 | | | | 2,520,960 | | | | 2.89 | % |
Dime Community Bancshares, Inc. | | | 65,000 | | | | 1,954,550 | | | | 2.24 | % |
Eagle Bancorp, Inc. | | | 138,000 | | | | 3,616,980 | | | | 4.15 | % |
Eastern Bankshares, Inc. | | | 225,000 | | | | 3,674,250 | | | | 4.21 | % |
First BanCorp. | | | 40,000 | | | | 771,200 | | | | 0.88 | % |
Flagstar Financial, Inc. | | | 130,000 | | | | 1,315,600 | | | | 1.51 | % |
Flushing Financial Corp. | | | 170,000 | | | | 2,664,750 | | | | 3.06 | % |
Hancock Whitney Corp. | | | 35,000 | | | | 1,822,800 | | | | 2.09 | % |
HomeStreet, Inc. | | | 80,000 | | | | 724,400 | | | | 0.83 | % |
HomeTrust Bancshares, Inc. | | | 90,000 | | | | 2,983,500 | | | | 3.42 | % |
Independent Bank Corp. | | | 59,000 | | | | 3,711,100 | | | | 4.26 | % |
Independent Bank Group, Inc. | | | 45,000 | | | | 2,626,200 | | | | 3.01 | % |
Midland States Bancorp, Inc. | | | 95,000 | | | | 2,356,950 | | | | 2.70 | % |
NB Bancorp, Inc. (a) | | | 155,000 | | | | 2,927,950 | | | | 3.36 | % |
Northeast Community Bancorp, Inc. | | | 49,000 | | | | 1,272,040 | | | | 1.46 | % |
OceanFirst Financial Corp. | | | 215,000 | | | | 3,913,000 | | | | 4.49 | % |
Old National Bancorp | | | 115,000 | | | | 2,214,900 | | | | 2.54 | % |
Orange County Bancorp, Inc. | | | 30,000 | | | | 1,587,600 | | | | 1.82 | % |
Pacific Premier Bancorp, Inc. | | | 115,000 | | | | 2,933,650 | | | | 3.36 | % |
Provident Financial Services, Inc. | | | 170,000 | | | | 3,175,600 | | | | 3.64 | % |
Southern California Bancorp (a) | | | 190,000 | | | | 2,770,200 | | | | 3.18 | % |
Texas Capital Bancshares, Inc. (a) | | | 13,000 | | | | 1,000,350 | | | | 1.15 | % |
The Hingham Institution for Savings | | | 5,000 | | | | 1,267,600 | | | | 1.45 | % |
UMB Financial Corp. | | | 13,000 | | | | 1,426,490 | | | | 1.64 | % |
WaFd, Inc. | | | 97,000 | | | | 3,296,060 | | | | 3.78 | % |
Washington Trust Bancorp, Inc. | | | 70,000 | | | | 2,389,100 | | | | 2.74 | % |
Western New England Bancorp, Inc. | | | 440,000 | | | | 3,832,400 | | | | 4.39 | % |
Wintrust Financial Corp. | | | 10,000 | | | | 1,158,900 | | | | 1.33 | % |
| | | | | | | | 85,344,340 | | | | 97.87 | % |
| | | | | | | | | | | | | |
| Total Common Stocks | | | | | | | | | | | | |
(Cost $66,751,543) | | | | | | | 85,344,340 | | | | 97.87 | % |
| | | | | | | | | | | | | |
| | | | | | | | | | | | | |
SHORT-TERM INVESTMENTS – 2.25% | | | | | | | | | | | | |
| Money Market Funds – 2.25% | | | | | | | | | | | | |
First American Government | | | | | | | | | | | | |
Obligations Fund – Class X, 4.781% (b) | | | 1,959,809 | | | | 1,959,809 | | | | 2.25 | % |
| | | | | | | | | | | | | |
| Total Short-Term Investments | | | | | | | | | | | | |
(Cost $1,959,809) | | | | | | | 1,959,809 | | | | 2.25 | % |
| | | | | | | | | | | | | |
| Total Investments | | | | | | | | | | | | |
(Cost $68,711,352) – 100.12% | | | | | | | 87,304,149 | | | | 100.12 | % |
Liabilities in Excess of | | | | | | | | | | | | |
Other Assets – (0.12)% | | | | | | | (102,886 | ) | | | (0.12 | )% |
| | | | | | | | | | | | | |
TOTAL NET ASSETS – 100.00% | | | | | | $ | 87,201,263 | | | | 100.00 | % |
Percentages are stated as a percent of net assets.
(a) | Non-income producing security. |
(b) | The rate listed is the fund’s seven-day yield as of October 31, 2024. |
Note: For presentation purposes, the Fund has grouped some of the industry categories. For purposes of categorizing securities for compliance with Section 8(b)(1) of the Investment Company Act of 1940, as amended, the Fund uses more specific industry classifications.
The Global Industry Classification Standard (GICS®) was developed by and is the exclusive property and a service mark of MSCI, Inc. and Standard & Poor’s Financial Services LLC. It has been licensed for use by the Hennessy Funds
Summary of Fair Value Exposure as of October 31, 2024
The following is a summary of the inputs used to value the Fund’s net assets as of October 31, 2024 (see Note 3 in the accompanying Notes to the Financial Statements):
| Common Stocks | | Level 1 | | | Level 2 | | | Level 3 | | | Total | |
Financials | | $ | 85,344,340 | | | $ | — | | | $ | — | | | $ | 85,344,340 | |
| Total Common Stocks | | $ | 85,344,340 | | | $ | — | | | $ | — | | | $ | 85,344,340 | |
| Short-Term Investments | | | | | | | | | | | | | | | | |
Money Market Funds | | $ | 1,959,809 | | | $ | — | | | $ | — | | | $ | 1,959,809 | |
| Total Short-Term Investments | | $ | 1,959,809 | | | $ | — | | | $ | — | | | $ | 1,959,809 | |
| Total Investments | | $ | 87,304,149 | | | $ | — | | | $ | — | | | $ | 87,304,149 | |
The accompanying notes are an integral part of these financial statements.
HENNESSY FUNDS | 1-800-966-4354 |
Financial Statements — Schedule of Investments
COMMON STOCKS – 97.24% | | Number of | | | | | | % of | |
| | | Shares | | | Value | | | Net Assets | |
| Communication Services – 8.28% | | | | | | | | | |
Meta Platforms, Inc., Class A | | | 230 | | | $ | 130,543 | | | | 1.65 | % |
ROBLOX Corp., Class A (a) | | | 2,959 | | | | 153,040 | | | | 1.94 | % |
Shutterstock, Inc. | | | 3,680 | | | | 118,091 | | | | 1.50 | % |
Yelp, Inc. (a) | | | 3,745 | | | | 127,854 | | | | 1.62 | % |
Ziff Davis, Inc. (a) | | | 2,677 | | | | 123,865 | | | | 1.57 | % |
| | | | | | | | 653,393 | | | | 8.28 | % |
| | | | | | | | | | | | | |
| Information Technology – 88.96% | | | | | | | | | | | | |
Adobe, Inc. (a) | | | 254 | | | | 121,432 | | | | 1.54 | % |
Aehr Test Systems (a) | | | 9,883 | | | | 139,153 | | | | 1.76 | % |
Apple, Inc. | | | 574 | | | | 129,672 | | | | 1.64 | % |
Applied Materials, Inc. | | | 638 | | | | 115,848 | | | | 1.47 | % |
Arlo Technologies, Inc. (a) | | | 11,052 | | | | 112,288 | | | | 1.42 | % |
Arrow Electronics, Inc. (a) | | | 976 | | | | 115,822 | | | | 1.47 | % |
ASE Technology Holding Co. Ltd. – ADR | | | 12,837 | | | | 122,722 | | | | 1.55 | % |
ASML Holding NV | | | 155 | | | | 104,245 | | | | 1.32 | % |
Atlassian Corp., Class A (a) | | | 811 | | | | 152,906 | | | | 1.94 | % |
Autodesk, Inc. (a) | | | 481 | | | | 136,508 | | | | 1.73 | % |
Avnet, Inc. | | | 2,406 | | | | 130,429 | | | | 1.65 | % |
Bentley Systems, Inc., Class B | | | 2,572 | | | | 124,125 | | | | 1.57 | % |
BlackLine, Inc. (a) | | | 2,474 | | | | 136,985 | | | | 1.73 | % |
CDW Corp. | | | 577 | | | | 108,609 | | | | 1.37 | % |
Cellebrite DI Ltd. (a) | | | 7,759 | | | | 140,826 | | | | 1.78 | % |
Clear Secure, Inc., Class A | | | 4,006 | | | | 147,341 | | | | 1.87 | % |
CommVault Systems, Inc. (a) | | | 861 | | | | 134,480 | | | | 1.70 | % |
Crowdstrike Holdings, Inc., Class A (a) | | | 457 | | | | 135,670 | | | | 1.72 | % |
Daktronics, Inc. (a) | | | 10,096 | | | | 131,551 | | | | 1.67 | % |
DocuSign, Inc. (a) | | | 2,120 | | | | 147,086 | | | | 1.86 | % |
DXC Technology Co. (a) | | | 6,310 | | | | 125,317 | | | | 1.59 | % |
ePlus, Inc. (a) | | | 1,323 | | | | 117,681 | | | | 1.49 | % |
Fortinet, Inc. (a) | | | 1,688 | | | | 132,778 | | | | 1.68 | % |
Gartner, Inc. (a) | | | 257 | | | | 129,142 | | | | 1.64 | % |
Hackett Group, Inc. | | | 5,035 | | | | 122,451 | | | | 1.55 | % |
Hewlett Packard Enterprise Co. | | | 6,492 | | | | 126,529 | | | | 1.60 | % |
Immersion Corp. | | | 14,609 | | | | 123,154 | | | | 1.56 | % |
InterDigital, Inc. | | | 927 | | | | 139,458 | | | | 1.77 | % |
International Business Machines Corp. | | | 592 | | | | 122,378 | | | | 1.55 | % |
Jabil, Inc. | | | 1,069 | | | | 131,583 | | | | 1.67 | % |
KLA-Tencor Corp. | | | 167 | | | | 111,260 | | | | 1.41 | % |
Lam Research Corp. | | | 1,580 | | | | 117,473 | | | | 1.49 | % |
Logitech International SA | | | 1,468 | | | | 119,936 | | | | 1.52 | % |
Microsoft Corp. | | | 305 | | | | 123,937 | | | | 1.57 | % |
Motorola Solutions, Inc. | | | 293 | | | | 131,660 | | | | 1.67 | % |
NetApp, Inc. | | | 1,078 | | | | 124,304 | | | | 1.57 | % |
NVIDIA Corp. | | | 1,068 | | | | 141,788 | | | | 1.80 | % |
Oracle Corp. | | | 775 | | | | 130,076 | | | | 1.65 | % |
Palo Alto Networks, Inc. (a) | | | 386 | | | | 139,087 | | | | 1.76 | % |
Pure Storage, Inc., Class A (a) | | | 2,645 | | | | 132,382 | | | | 1.68 | % |
QUALCOMM, Inc. | | | 769 | | | | 125,170 | | | | 1.59 | % |
Qualys, Inc. (a) | | | 1,006 | | | | 119,955 | | | | 1.52 | % |
Sanmina Corp. (a) | | | 1,900 | | | | 133,190 | | | | 1.69 | % |
Semtech Corp. (a) | | | 2,821 | | | | 124,660 | | | | 1.58 | % |
ServiceNow, Inc. (a) | | | 148 | | | | 138,082 | | | | 1.75 | % |
STMicroelectronics NV | | | 4,308 | | | | 116,919 | | | | 1.48 | % |
TD SYNNEX Corp. | | | 1,093 | | | | 126,078 | | | | 1.60 | % |
Teradata Corp. (a) | | | 4,308 | | | | 138,847 | | | | 1.76 | % |
United Microelectronics Corp. – ADR | | | 14,994 | | | | 102,559 | | | | 1.30 | % |
Vertex, Inc., Class A (a) | | | 3,560 | | | | 147,776 | | | | 1.87 | % |
Viasat, Inc. (a) | | | 10,739 | | | | 103,094 | | | | 1.31 | % |
Vishay Intertechnology, Inc. | | | 6,856 | | | | 116,278 | | | | 1.47 | % |
Vishay Precision Group, Inc. (a) | | | 5,129 | | | | 119,044 | | | | 1.51 | % |
Vontier Corp. | | | 3,859 | | | | 143,092 | | | | 1.81 | % |
Zscaler, Inc. (a) | | | 761 | | | | 137,581 | | | | 1.74 | % |
| | | | | | | | 7,022,397 | | | | 88.96 | % |
| | | | | | | | | | | | | |
| Total Common Stocks | | | | | | | | | | | | |
(Cost $6,243,051) | | | | | | | 7,675,790 | | | | 97.24 | % |
| | | | | | | | | | | | | |
| | | | | | | | | | | | | |
SHORT-TERM INVESTMENTS – 2.92% | | | | | | | | | | | | |
| Money Market Funds – 2.92% | | | | | | | | | | | | |
First American Government | | | | | | | | | | | | |
Obligations Fund – Class X, 4.781% (b) | | | 230,446 | | | | 230,446 | | | | 2.92 | % |
| | | | | | | | | | | | | |
| Total Short-Term Investments | | | | | | | | | | | | |
(Cost $230,446) | | | | | | | 230,446 | | | | 2.92 | % |
| | | | | | | | | | | | | |
| Total Investments | | | | | | | | | | | | |
(Cost $6,473,497) – 100.16% | | | | | | | 7,906,236 | | | | 100.16 | % |
Liabilities in Excess of | | | | | | | | | | | | |
Other Assets – (0.16)% | | | | | | | (12,749 | ) | | | (0.16 | )% |
| | | | | | | | | | | | | |
TOTAL NET ASSETS – 100.00% | | | | | | $ | 7,893,487 | | | | 100.00 | % |
Percentages are stated as a percent of net assets.
ADR – American Depositary Receipt
(a) | Non-income producing security. |
(b) | The rate listed is the fund’s seven-day yield as of October 31, 2024. |
Note: For presentation purposes, the Fund has grouped some of the industry categories. For purposes of categorizing securities for compliance with Section 8(b)(1) of the Investment Company Act of 1940, as amended, the Fund uses more specific industry classifications.
The Global Industry Classification Standard (GICS®) was developed by and is the exclusive property and a service mark of MSCI, Inc. and Standard & Poor’s Financial Services LLC. It has been licensed for use by the Hennessy Funds.
The accompanying notes are an integral part of these financial statements.
WWW.HENNESSYFUNDS.COM
Financial Statements — Schedule of Investments
Summary of Fair Value Exposure as of October 31, 2024
The following is a summary of the inputs used to value the Fund’s net assets as of October 31, 2024 (see Note 3 in the accompanying Notes to the Financial Statements):
| Common Stocks | | Level 1 | | | Level 2 | | | Level 3 | | | Total | |
Communication Services | | $ | 653,393 | | | $ | — | | | $ | — | | | $ | 653,393 | |
Information Technology | | | 7,022,397 | | | | — | | | | — | | | | 7,022,397 | |
| Total Common Stocks | | $ | 7,675,790 | | | $ | — | | | $ | — | | | $ | 7,675,790 | |
| Short-Term Investments | | | | | | | | | | | | | | | | |
Money Market Funds | | $ | 230,446 | | | $ | — | | | $ | — | | | $ | 230,446 | |
| Total Short-Term Investments | | $ | 230,446 | | | $ | — | | | $ | — | | | $ | 230,446 | |
| Total Investments | | $ | 7,906,236 | | | $ | — | | | $ | — | | | $ | 7,906,236 | |
The accompanying notes are an integral part of these financial statements.
HENNESSY FUNDS | 1-800-966-4354 |
Financial Statements — Statements of Assets and Liabilities
| | | HENNESSY | | | | |
| | | CORNERSTONE | | | | |
| | | GROWTH | | | HENNESSY | |
| | | FUND | | | FOCUS FUND | |
| ASSETS: | | | | | | |
Investments in securities, at value (cost $487,018,230, $266,129,839, $1,470,186,086, $124,003,050, | | | | | | |
$224,233,256, $67,270,901, $41,320,055, and $12,123,681) | | $ | 511,473,095 | | | $ | 675,826,474 | |
Dividends and interest receivable | | | 101,473 | | | | 33,483 | |
Receivable for fund shares sold | | | 488,183 | | | | 104,444 | |
Receivable for securities sold | | | — | | | | — | |
Return of capital receivable | | | — | | | | — | |
Dividend tax reclaim receivable | | | 8,270 | | | | — | |
Prepaid expenses and other assets | | | 56,285 | | | | 52,385 | |
| Total assets | | | 512,127,306 | | | | 676,016,786 | |
| | | | | | | | | |
| LIABILITIES: | | | | | | | | |
Payable for fund securities purchased | | | — | | | | — | |
Payable for fund shares redeemed | | | 159,405 | | | | 366,931 | |
Payable to advisor | | | 319,962 | | | | 533,498 | |
Payable to administrator | | | 72,376 | | | | 116,062 | |
Payable to auditor | | | 22,753 | | | | 22,756 | |
Accrued distribution fees | | | 49,028 | | | | 68,608 | |
Accrued service fees | | | 28,685 | | | | 34,739 | |
Accrued trustees’ fees | | | 5,308 | | | | 5,319 | |
Reverse repurchase agreement | | | — | | | | — | |
Accrued interest payable | | | — | | | | — | |
Deferred income tax | | | — | | | | — | |
Accrued expenses and other payables | | | 38,903 | | | | 139,813 | |
| Total liabilities | | | 696,420 | | | | 1,287,726 | |
| NET ASSETS | | $ | 511,430,886 | | | $ | 674,729,060 | |
| | | | | | | | | |
| NET ASSETS CONSIST OF: | | | | | | | | |
Capital stock | | $ | 419,027,879 | | | $ | 178,645,675 | |
Total distributable earnings (accumulated deficit) | | | 92,403,007 | | | | 496,083,385 | |
| Total net assets | | $ | 511,430,886 | | | $ | 674,729,060 | |
| | | | | | | | | |
| NET ASSETS | | | | | | | | |
| Investor Class: | | | | | | | | |
Shares authorized (no par value) | | Unlimited | | | Unlimited | |
Net assets applicable to outstanding shares | | $ | 337,857,628 | | | $ | 394,899,994 | |
Shares issued and outstanding | | | 9,543,549 | | | | 7,826,492 | |
Net asset value, offering price, and redemption price per share | | $ | 35.40 | | | $ | 50.46 | |
| | | | | | | | | |
| Institutional Class: | | | | | | | | |
Shares authorized (no par value) | | Unlimited | | | Unlimited | |
Net assets applicable to outstanding shares | | $ | 173,573,258 | | | $ | 279,829,066 | |
Shares issued and outstanding | | | 4,685,791 | | | | 5,275,329 | |
Net asset value, offering price, and redemption price per share | | $ | 37.04 | | | $ | 53.04 | |
The accompanying notes are an integral part of these financial statements.
WWW.HENNESSYFUNDS.COM
Financial Statements — Statements of Assets and Liabilities
| HENNESSY | | | HENNESSY | | | | | | | | | | | | | |
| CORNERSTONE | | | CORNERSTONE | | | HENNESSY | | | HENNESSY | | | HENNESSY | | | HENNESSY | |
| MID CAP 30 | | | LARGE | | | CORNERSTONE | | | TOTAL RETURN | | | EQUITY AND | | | BALANCED | |
| FUND | | | GROWTH FUND | | | VALUE FUND | | | FUND | | | INCOME FUND | | | FUND | |
| | | | | | | | | | | | | | | | | |
| | | | | | | | | | | | | | | | | |
$ | 1,598,819,575 | | | $ | 145,258,148 | | | $ | 281,565,245 | | | $ | 70,780,173 | | | $ | 60,005,349 | | | $ | 12,686,583 | |
| | 415,629 | | | | 104,659 | | | | 754,536 | | | | 64,542 | | | | 167,432 | | | | 12,232 | |
| | 3,489,169 | | | | 843 | | | | 20,225 | | | | 201 | | | | 23 | | | | 50,000 | |
| | 87,878,269 | | | | — | | | | — | | | | — | | | | — | | | | — | |
| | 227,457 | | | | — | | | | — | | | | — | | | | — | | | | — | |
| | — | | | | 534 | | | | 18,063 | | | | — | | | | 20,539 | | | | — | |
| | 87,320 | | | | 21,798 | | | | 29,588 | | | | 11,639 | | | | 20,574 | | | | 9,364 | |
| | 1,690,917,419 | | | | 145,385,982 | | | | 282,387,657 | | | | 70,856,555 | | | | 60,213,917 | | | | 12,758,179 | |
| | | | | | | | | | | | | | | | | | | | | | | |
| | | | | | | | | | | | | | | | | | | | | | | |
| | 91,346,901 | | | | — | | | | — | | | | — | | | | 577,046 | | | | — | |
| | 994,193 | | | | 28,726 | | | | 64,830 | | | | — | | | | 5,430 | | | | 100 | |
| | 986,775 | | | | 93,922 | | | | 179,338 | | | | 25,651 | | | | 40,793 | | | | 6,571 | |
| | 218,800 | | | | 23,311 | | | | 43,180 | | | | 9,101 | | | | 10,708 | | | | 3,855 | |
| | 22,753 | | | | 22,753 | | | | 22,753 | | | | 22,753 | | | | 22,745 | | | | 22,753 | |
| | 88,698 | | | | 24,734 | | | | 60,240 | | | | 8,723 | | | | 6,121 | | | | 1,703 | |
| | 52,465 | | | | 11,170 | | | | 23,543 | | | | 4,275 | | | | 2,722 | | | | 1,095 | |
| | 5,314 | | | | 5,316 | | | | 5,309 | | | | 5,317 | | | | 5,307 | | | | 5,312 | |
| | — | | | | — | | | | — | | | | 21,588,000 | | | | — | | | | — | |
| | — | | | | — | | | | — | | | | 139,415 | | | | — | | | | — | |
| | — | | | | — | | | | — | | | | — | | | | — | | | | — | |
| | 89,990 | | | | 13,333 | | | | 25,567 | | | | 8,984 | | | | 17,439 | | | | 5,748 | |
| | 93,805,889 | | | | 223,265 | | | | 424,760 | | | | 21,812,219 | | | | 688,311 | | | | 47,137 | |
$ | 1,597,111,530 | | | $ | 145,162,717 | | | $ | 281,962,897 | | | $ | 49,044,336 | | | $ | 59,525,606 | | | $ | 12,711,042 | |
| | | | | | | | | | | | | | | | | | | | | | | |
| | | | | | | | | | | | | | | | | | | | | | | |
$ | 1,191,231,514 | | | $ | 117,979,093 | | | $ | 215,369,065 | | | $ | 45,014,682 | | | $ | 34,754,830 | | | $ | 12,016,562 | |
| | 405,880,016 | | | | 27,183,624 | | | | 66,593,832 | | | | 4,029,654 | | | | 24,770,776 | | | | 694,480 | |
$ | 1,597,111,530 | | | $ | 145,162,717 | | | $ | 281,962,897 | | | $ | 49,044,336 | | | $ | 59,525,606 | | | $ | 12,711,042 | |
| | | | | | | | | | | | | | | | | | | | | | | |
| | | | | | | | | | | | | | | | | | | | | | | |
| | | | | | | | | | | | | | | | | | | | | | | |
| Unlimited | | | Unlimited | | | Unlimited | | | Unlimited | | | Unlimited | | | Unlimited | |
$ | 627,170,809 | | | $ | 127,753,243 | | | $ | 273,891,323 | | | $ | 49,044,336 | | | $ | 31,748,803 | | | $ | 12,711,042 | |
| | 23,687,184 | | | | 10,703,744 | | | | 12,672,109 | | | | 3,646,749 | | | | 2,046,283 | | | | 1,054,307 | |
$ | 26.48 | | | $ | 11.94 | | | $ | 21.61 | | | $ | 13.45 | | | $ | 15.52 | | | $ | 12.06 | |
| | | | | | | | | | | | | | | | | | | | | | | |
| | | | | | | | | | | | | | | | | | | | | | | |
| Unlimited | | | Unlimited | | | Unlimited | | | | N/A | | | Unlimited | | | | N/A | |
$ | 969,940,721 | | | $ | 17,409,474 | | | $ | 8,071,574 | | | | N/A | | | $ | 27,776,803 | | | | N/A | |
| | 34,685,222 | | | | 1,441,404 | | | | 372,255 | | | | N/A | | | | 1,909,192 | | | | N/A | |
$ | 27.96 | | | $ | 12.08 | | | $ | 21.68 | | | | N/A | | | $ | 14.55 | | | | N/A | |
| | | | | | | | | | | | | | | | | | | | | | | |
The accompanying notes are an integral part of these financial statements.
HENNESSY FUNDS | 1-800-966-4354 |
Financial Statements — Statements of Assets and Liabilities
| | | HENNESSY | | | | |
| | | ENERGY | | | HENNESSY | |
| | | TRANSITION | | | MIDSTREAM | |
| | | FUND | | | FUND | |
| ASSETS: | | | | | | |
Investments in securities, at value (cost $10,242,195, $35,394,084, $217,208,726, $292,387,387, | | | | | | |
$102,345,221, $17,505,264, $68,711,352, and $6,473,497) | | $ | 14,776,128 | | | $ | 72,578,930 | |
Dividends and interest receivable | | | 3,344 | | | | 83,436 | |
Receivable for fund shares sold | | | 68 | | | | 2,534 | |
Receivable for securities sold | | | — | | | | — | |
Return of capital receivable | | | — | | | | 323,871 | |
Dividend tax reclaim receivable | | | — | | | | — | |
Due from Advisor | | | — | | | | — | |
Prepaid expenses and other assets | | | 9,077 | | | | 12,314 | |
| Total assets | | | 14,788,617 | | | | 73,001,085 | |
| | | | | | | | | |
| LIABILITIES: | | | | | | | | |
Payable for fund securities purchased | | | — | | | | — | |
Payable for fund shares redeemed | | | 120,520 | | | | 49,343 | |
Payable to advisor | | | 16,190 | | | | 65,990 | |
Payable to administrator | | | — | | | | — | |
Payable to auditor | | | 23,397 | | | | 41,305 | |
Accrued distribution fees | | | 1,831 | | | | 3,033 | |
Accrued service fees | | | 583 | | | | 1,822 | |
Accrued trustees’ fees | | | 5,313 | | | | 5,306 | |
Reverse repurchase agreement | | | — | | | | — | |
Accrued interest payable | | | — | | | | — | |
Deferred income tax | | | — | | | | 5,518,263 | |
Accrued expenses and other payables | | | 8,234 | | | | 12,851 | |
| Total liabilities | | | 176,068 | | | | 5,697,913 | |
| NET ASSETS | | $ | 14,612,549 | | | $ | 67,303,172 | |
| | | | | | | | | |
| NET ASSETS CONSIST OF: | | | | | | | | |
Capital stock | | $ | 46,681,439 | | | $ | 58,796,387 | |
Total distributable earnings (accumulated deficit) | | | (32,068,890 | ) | | | 8,506,785 | |
| Total net assets | | $ | 14,612,549 | | | $ | 67,303,172 | |
| | | | | | | | | |
| NET ASSETS | | | | | | | | |
| Investor Class: | | | | | | | | |
Shares authorized (no par value) | | Unlimited | | | Unlimited | |
Net assets applicable to outstanding shares | | $ | 6,474,025 | | | $ | 20,531,472 | |
Shares issued and outstanding | | | 250,194 | | | | 1,801,844 | |
Net asset value, offering price, and redemption price per share | | $ | 25.88 | | | $ | 11.39 | |
| | | | | | | | | |
| Institutional Class: | | | | | | | | |
Shares authorized (no par value) | | Unlimited | | | Unlimited | |
Net assets applicable to outstanding shares | | $ | 8,138,524 | | | $ | 46,771,700 | |
Shares issued and outstanding | | | 307,571 | | | | 3,914,872 | |
Net asset value, offering price, and redemption price per share | | $ | 26.46 | | | $ | 11.95 | |
The accompanying notes are an integral part of these financial statements.
WWW.HENNESSYFUNDS.COM
Financial Statements — Statements of Assets and Liabilities
| | | | | | | | | | HENNESSY | | | HENNESSY | | | | |
| HENNESSY | | | | | | HENNESSY | | | LARGE CAP | | | SMALL CAP | | | HENNESSY | |
| GAS UTILITY | | | HENNESSY | | | JAPAN SMALL | | | FINANCIAL | | | FINANCIAL | | | TECHNOLOGY | |
| FUND | | | JAPAN FUND | | | CAP FUND | | | FUND | | | FUND | | | FUND | |
| | | | | | | | | | | | | | | | | |
| | | | | | | | | | | | | | | | | |
$ | 477,888,772 | | | $ | 410,687,848 | | | $ | 108,434,656 | | | $ | 28,824,630 | | | $ | 87,304,149 | | | $ | 7,906,236 | |
| | 458,903 | | | | 3,144,622 | | | | 803,948 | | | | 33,714 | | | | 40,232 | | | | 1,156 | |
| | 8,545 | | | | 727,167 | | | | 45,702 | | | | 18,000 | | | | 545 | | | | 962 | |
| | — | | | | 234,142 | | | | — | | | | — | | | | — | | | | — | |
| | — | | | | — | | | | — | | | | — | | | | — | | | | — | |
| | — | | | | 221,356 | | | | 51,356 | | | | — | | | | — | | | | 615 | |
| | — | | | | — | | | | — | | | | — | | | | — | | | | 3,623 | |
| | 31,770 | | | | 48,567 | | | | 21,169 | | | | 17,546 | | | | 22,604 | | | | 16,386 | |
| | 478,387,990 | | | | 415,063,702 | | | | 109,356,831 | | | | 28,893,890 | | | | 87,367,530 | | | | 7,928,978 | |
| | | | | | | | | | | | | | | | | | | | | | | |
| | | | | | | | | | | | | | | | | | | | | | | |
| | — | | | | — | | | | 4,235 | | | | — | | | | — | | | | — | |
| | 92,781 | | | | 1,039,256 | | | | 20,531 | | | | 26,101 | | | | 22,311 | | | | — | |
| | 162,956 | | | | 292,462 | | | | 76,799 | | | | 21,903 | | | | 66,006 | | | | — | |
| | 76,376 | | | | 64,645 | | | | 18,391 | | | | 6,288 | | | | 14,557 | | | | — | |
| | 22,753 | | | | 22,757 | | | | 22,753 | | | | 22,753 | | | | 22,747 | | | | 22,749 | |
| | 64,804 | | | | 8,706 | | | | 5,002 | | | | 3,277 | | | | 11,943 | | | | 887 | |
| | 36,403 | | | | 4,658 | | | | 2,625 | | | | 1,785 | | | | 6,762 | | | | 452 | |
| | 5,310 | | | | 5,316 | | | | 5,311 | | | | 5,307 | | | | 5,311 | | | | 5,315 | |
| | — | | | | — | | | | — | | | | — | | | | — | | | | — | |
| | — | | | | — | | | | — | | | | — | | | | 718 | | | | — | |
| | — | | | | — | | | | — | | | | — | | | | — | | | | — | |
| | 96,832 | | | | 17,936 | | | | 19,227 | | | | 10,754 | | | | 15,912 | | | | 6,088 | |
| | 558,215 | | | | 1,455,736 | | | | 174,874 | | | | 98,168 | | | | 166,267 | | | | 35,491 | |
$ | 477,829,775 | | | $ | 413,607,966 | | | $ | 109,181,957 | | | $ | 28,795,722 | | | $ | 87,201,263 | | | $ | 7,893,487 | |
| | | | | | | | | | | | | | | | | | | | | | | |
| | | | | | | | | | | | | | | | | | | | | | | |
$ | 212,150,968 | | | $ | 274,998,535 | | | $ | 99,296,481 | | | $ | 20,965,065 | | | $ | 66,250,395 | | | $ | 6,143,073 | |
| | 265,678,807 | | | | 138,609,431 | | | | 9,885,476 | | | | 7,830,657 | | | | 20,950,868 | | | | 1,750,414 | |
$ | 477,829,775 | | | $ | 413,607,966 | | | $ | 109,181,957 | | | $ | 28,795,722 | | | $ | 87,201,263 | | | $ | 7,893,487 | |
| | | | | | | | | | | | | | | | | | | | | | | |
| | | | | | | | | | | | | | | | | | | | | | | |
| Unlimited | | | Unlimited | | | Unlimited | | | Unlimited | | | Unlimited | | | Unlimited | |
$ | 426,631,173 | | | $ | 52,493,765 | | | $ | 30,023,751 | | | $ | 21,294,756 | | | $ | 80,803,625 | | | $ | 5,209,648 | |
| | 15,473,975 | | | | 1,214,968 | | | | 1,805,303 | | | | 777,965 | | | | 2,898,516 | | | | 233,845 | |
$ | 27.57 | | | $ | 43.21 | | | $ | 16.63 | | | $ | 27.37 | | | $ | 27.88 | | | $ | 22.28 | |
| | | | | | | | | | | | | | | | | | | | | | | |
| | | | | | | | | | | | | | | | | | | | | | | |
| Unlimited | | | Unlimited | | | Unlimited | | | Unlimited | | | Unlimited | | | Unlimited | |
$ | 51,198,602 | | | $ | 361,114,201 | | | $ | 79,158,206 | | | $ | 7,500,966 | | | $ | 6,397,638 | | | $ | 2,683,839 | |
| | 1,861,993 | | | | 8,019,116 | | | | 4,817,668 | | | | 270,899 | | | | 402,582 | | | | 116,792 | |
$ | 27.50 | | | $ | 45.03 | | | $ | 16.43 | | | $ | 27.69 | | | $ | 15.89 | | | $ | 22.98 | |
| | | | | | | | | | | | | | | | | | | | | | | |
The accompanying notes are an integral part of these financial statements.
HENNESSY FUNDS | 1-800-966-4354 |
Financial Statements — Statements of Operations
| for the year ended October 31, 2024 |
| | | HENNESSY | | | | |
| | | CORNERSTONE | | | | |
| | | GROWTH | | | HENNESSY | |
| | | FUND | | | FOCUS FUND | |
| INVESTMENT INCOME: | | | | | | |
Distributions received from master limited partnerships | | $ | — | | | $ | — | |
Return of capital on distributions received | | | — | | | | — | |
Dividend income(1) | | | 3,217,852 | | | | 6,053,689 | |
Interest income | | | 560,896 | | | | 537,935 | |
| Total investment income | | | 3,778,748 | | | | 6,591,624 | |
| | | | | | | | | |
| EXPENSES: | | | | | | | | |
Investment advisory fees (See Note 5) | | | 2,550,903 | | | | 5,881,996 | |
Sub-transfer agent expenses – Investor Class (See Note 5) | | | 399,756 | | | | 759,447 | |
Sub-transfer agent expenses – Institutional Class (See Note 5) | | | 83,202 | | | | 205,702 | |
Distribution fees – Investor Class (See Note 5) | | | 379,960 | | | | 561,798 | |
Administration, accounting, custody, and transfer agent fees (See Note 5) | | | 306,606 | | | | 573,772 | |
Service fees – Investor Class (See Note 5) | | | 253,306 | | | | 374,532 | |
Federal and state registration fees | | | 47,104 | | | | 56,136 | |
Trustees’ fees and expenses | | | 22,909 | | | | 25,902 | |
Audit fees | | | 22,757 | | | | 22,757 | |
Compliance expense (See Note 5) | | | 22,715 | | | | 22,869 | |
Reports to shareholders | | | 22,308 | | | | 42,028 | |
Legal fees | | | 5,006 | | | | 13,525 | |
Interest expense (See Notes 7 and 9) | | | — | | | | 4,175 | |
Income tax expense | | | — | | | | — | |
Other expenses | | | 42,047 | | | | 112,356 | |
| Total expenses before waivers and reimbursements | | | 4,158,579 | | | | 8,656,995 | |
Service provider expense waiver (See Note 5) | | | — | | | | — | |
Expense reimbursement by advisor – Investor Class (See Note 5) | | | — | | | | — | |
Expense reimbursement by advisor – Institutional Class (See Note 5) | | | — | | | | — | |
| Net expenses | | | 4,158,579 | | | | 8,656,995 | |
| NET INVESTMENT INCOME (LOSS) | | $ | (379,831 | ) | | $ | (2,065,371 | ) |
| | | | | | | | | |
| REALIZED AND UNREALIZED GAINS: | | | | | | | | |
| Net realized gain on investments | | $ | 87,209,748 | | | $ | 108,696,237 | |
| Net change in unrealized appreciation/depreciation on investments | | | 6,152,759 | | | | 98,523,270 | |
| Deferred income tax | | | — | | | | — | |
| Net gain on investments | | | 93,362,507 | | | | 207,219,507 | |
| NET INCREASE IN NET ASSETS RESULTING FROM OPERATIONS | | $ | 92,982,676 | | | $ | 205,154,136 | |
(1) | Net of foreign taxes withheld and issuance fees of $68,533, $160,956, $0, $0, $554,723, $0, $5,704, and $0. |
The accompanying notes are an integral part of these financial statements.
WWW.HENNESSYFUNDS.COM
Financial Statements — Statements of Operations
| for the year ended October 31, 2024 |
| HENNESSY | | | HENNESSY | | | | | | | | | | | | | |
| CORNERSTONE | | | CORNERSTONE | | | HENNESSY | | | HENNESSY | | | HENNESSY | | | HENNESSY | |
| MID CAP 30 | | | LARGE | | | CORNERSTONE | | | TOTAL RETURN | | | EQUITY AND | | | BALANCED | |
| FUND | | | GROWTH FUND | | | VALUE FUND | | | FUND | | | INCOME FUND | | | FUND | |
| | | | | | | | | | | | | | | | | |
$ | — | | | $ | — | | | $ | — | | | $ | — | | | $ | — | | | $ | — | |
| | — | | | | — | | | | — | | | | — | | | | — | | | | — | |
| | 11,429,078 | | | | 3,056,413 | | | | 11,930,640 | | | | 1,449,561 | | | | 743,516 | | | | 269,695 | |
| | 1,810,397 | | | | 112,775 | | | | 166,870 | | | | 1,921,602 | | | | 655,086 | | | | 333,100 | |
| | 13,239,475 | | | | 3,169,188 | | | | 12,097,510 | | | | 3,371,163 | | | | 1,398,602 | | | | 602,795 | |
| | | | | | | | | | | | | | | | | | | | | | | |
| | | | | | | | | | | | | | | | | | | | | | | |
| | 7,873,052 | | | | 1,084,833 | | | | 2,022,870 | | | | 299,567 | | | | 521,187 | | | | 79,916 | |
| | 983,949 | | | | 109,313 | | | | 185,887 | | | | 34,949 | | | | 70,087 | | | | 6,237 | |
| | 536,534 | | | | 11,301 | | | | 6,475 | | | | — | | | | 27,314 | | | | — | |
| | 689,543 | | | | 192,733 | | | | 398,330 | | | | 74,892 | | | | 51,059 | | | | 19,979 | |
| | 923,783 | | | | 139,013 | | | | 248,565 | | | | 55,255 | | | | 70,064 | | | | 23,590 | |
| | 459,695 | | | | 128,489 | | | | 265,553 | | | | 49,928 | | | | 34,040 | | | | 13,319 | |
| | 91,134 | | | | 33,732 | | | | 35,247 | | | | 20,246 | | | | 31,756 | | | | 20,016 | |
| | 29,403 | | | | 22,400 | | | | 23,071 | | | | 21,587 | | | | 21,674 | | | | 21,362 | |
| | 22,757 | | | | 22,757 | | | | 22,757 | | | | 22,757 | | | | 22,743 | | | | 22,757 | |
| | 23,331 | | | | 22,491 | | | | 22,575 | | | | 22,435 | | | | 22,435 | | | | 22,407 | |
| | 67,046 | | | | 11,491 | | | | 17,208 | | | | 9,144 | | | | 10,541 | | | | 5,920 | |
| | 18,240 | | | | 3,092 | | | | 5,480 | | | | 1,161 | | | | 1,544 | | | | 462 | |
| | — | | | | 258 | | | | 4,425 | | | | 1,184,387 | | | | 126 | | | | 1,767 | |
| | — | | | | — | | | | — | | | | — | | | | — | | | | — | |
| | 121,411 | | | | 27,224 | | | | 49,876 | | | | 8,753 | | | | 12,451 | | | | 5,017 | |
| | 11,839,878 | | | | 1,809,127 | | | | 3,308,319 | | | | 1,805,061 | | | | 897,021 | | | | 242,749 | |
| | — | | | | — | | | | — | | | | — | | | | — | | | | — | |
| | — | | | | — | | | | — | | | | — | | | | — | | | | — | |
| | — | | | | — | | | | — | | | | — | | | | — | | | | — | |
| | 11,839,878 | | | | 1,809,127 | | | | 3,308,319 | | | | 1,805,061 | | | | 897,021 | | | | 242,749 | |
$ | 1,399,597 | | | $ | 1,360,061 | | | $ | 8,789,191 | | | $ | 1,566,102 | | | $ | 501,581 | | | $ | 360,046 | |
| | | | | | | | | | | | | | | | | | | | | | | |
| | | | | | | | | | | | | | | | | | | | | | | |
$ | 278,822,792 | | | $ | 5,023,205 | | | $ | 7,254,630 | | | $ | 720,394 | | | $ | 7,451,969 | | | $ | 207,706 | |
| | 126,453,711 | | | | 23,155,669 | | | | 40,523,513 | | | | 4,854,980 | | | | 4,549,342 | | | | 863,545 | |
| | — | | | | — | | | | — | | | | — | | | | — | | | | — | |
| | 405,276,503 | | | | 28,178,874 | | | | 47,778,143 | | | | 5,575,374 | | | | 12,001,311 | | | | 1,071,251 | |
$ | 406,676,100 | | | $ | 29,538,935 | | | $ | 56,567,334 | | | $ | 7,141,476 | | | $ | 12,502,892 | | | $ | 1,431,297 | |
The accompanying notes are an integral part of these financial statements.
HENNESSY FUNDS | 1-800-966-4354 |
Financial Statements — Statements of Operations
| for the year ended October 31, 2024 |
| | | HENNESSY | | | | |
| | | ENERGY | | | HENNESSY | |
| | | TRANSITION | | | MIDSTREAM | |
| | | FUND | | | FUND | |
| INVESTMENT INCOME: | | | | | | |
Distributions received from master limited partnerships | | $ | — | | | $ | 2,480,229 | |
Return of capital on distributions received | | | — | | | | (2,480,229 | ) |
Dividend income(1) | | | 454,072 | | | | 974,080 | |
Interest income | | | 12,279 | | | | 91,385 | |
| Total investment income | | | 466,351 | | | | 1,065,465 | |
| | | | | | | | | |
| EXPENSES: | | | | | | | | |
Investment advisory fees (See Note 5) | | | 193,777 | | | | 686,633 | |
Sub-transfer agent expenses – Investor Class (See Note 5) | | | 14,372 | | | | 47,023 | |
Sub-transfer agent expenses – Institutional Class (See Note 5) | | | 9,194 | | | | 40,679 | |
Distribution fees – Investor Class (See Note 5) | | | 11,270 | | | | 29,164 | |
Administration, accounting, custody, and transfer agent fees (See Note 5) | | | 25,618 | | | | 65,858 | |
Service fees – Investor Class (See Note 5) | | | 7,513 | | | | 19,443 | |
Federal and state registration fees | | | 30,546 | | | | 32,439 | |
Trustees’ fees and expenses | | | 21,366 | | | | 21,783 | |
Audit fees | | | 23,396 | | | | 41,307 | |
Compliance expense (See Note 5) | | | 22,407 | | | | 22,449 | |
Reports to shareholders | | | 8,079 | | | | 14,286 | |
Legal fees | | | 541 | | | | 1,403 | |
Interest expense (See Notes 7 and 9) | | | 3,420 | | | | — | |
Income tax expense | | | — | | | | — | |
Other expenses | | | 6,253 | | | | 16,177 | |
| Total expenses before waivers and reimbursements | | | 377,752 | | | | 1,038,644 | |
Service provider expense waiver (See Note 5) | | | (25,618 | ) | | | (65,858 | ) |
Expense reimbursement by advisor – Investor Class (See Note 5) | | | — | | | | (15,904 | ) |
Expense reimbursement by advisor – Institutional Class (See Note 5) | | | — | | | | 28,041 | |
| Net expenses | | | 352,134 | | | | 984,923 | |
| NET INVESTMENT INCOME (LOSS) | | $ | 114,217 | | | $ | 80,542 | |
| | | | | | | | | |
| REALIZED AND UNREALIZED GAINS (LOSSES): | | | | | | | | |
| Net realized gain (loss) on investments | | $ | 2,446,699 | | | $ | 822,198 | |
| Net change in unrealized appreciation/depreciation on investments | | | (1,819,834 | ) | | | 17,964,696 | |
| Net change in unrealized appreciation/depreciation on foreign currency | | | — | | | | — | |
| Deferred income tax | | | — | | | | (5,518,263 | ) |
| Net gain (loss) on investments | | | 626,865 | | | | 13,268,631 | |
| NET INCREASE (DECREASE) IN NET ASSETS RESULTING FROM OPERATIONS | | $ | 741,082 | | | $ | 13,349,173 | |
(1) | Net of foreign taxes withheld and issuance fees of $11,111, $24,695, $512,278, $755,488, $285,630, $0, $7,668, and $5,324. |
The accompanying notes are an integral part of these financial statements.
WWW.HENNESSYFUNDS.COM
Financial Statements — Statements of Operations
| for the year ended October 31, 2024 |
| | | | | | | | | | HENNESSY | | | HENNESSY | | | | |
| HENNESSY | | | | | | HENNESSY | | | LARGE CAP | | | SMALL CAP | | | HENNESSY | |
| GAS UTILITY | | | HENNESSY | | | JAPAN SMALL | | | FINANCIAL | | | FINANCIAL | | | TECHNOLOGY | |
| FUND | | | JAPAN FUND | | | CAP FUND | | | FUND | | | FUND | | | FUND | |
| | | | | | | | | | | | | | | | | |
$ | — | | | $ | — | | | $ | — | | | $ | — | | | $ | — | | | $ | — | |
| | — | | | | — | | | | — | | | | — | | | | — | | | | — | |
| | 15,260,438 | | | | 6,799,399 | | | | 2,573,743 | | | | 777,291 | | | | 2,371,023 | | | | 67,795 | |
| | 116,685 | | | | 595,024 | | | | 276,898 | | | | 15,687 | | | | 164,954 | | | | 10,000 | |
| | 15,377,123 | | | | 7,394,423 | | | | 2,850,641 | | | | 792,978 | | | | 2,535,977 | | | | 77,795 | |
| | | | | | | | | | | | | | | | | | | | | | | |
| | | | | | | | | | | | | | | | | | | | | | | |
| | 1,785,847 | | | | 3,059,845 | | | | 902,610 | | | | 256,284 | | | | 658,265 | | | | 57,066 | |
| | 624,099 | | | | 117,093 | | | | 77,203 | | | | 36,511 | | | | 122,176 | | | | 5,584 | |
| | 54,684 | | | | 254,490 | | | | 73,896 | | | | 10,424 | | | | 7,951 | | | | 1,668 | |
| | 595,075 | | | | 79,545 | | | | 49,163 | | | | 29,890 | | | | 98,010 | | | | 7,741 | |
| | 394,071 | | | | 340,053 | | | | 109,766 | | | | 37,063 | | | | 75,471 | | | | 18,881 | |
| | 396,717 | | | | 53,030 | | | | 32,776 | | | | 19,926 | | | | 65,340 | | | | 5,161 | |
| | 36,825 | | | | 56,983 | | | | 41,029 | | | | 31,981 | | | | 34,946 | | | | 31,107 | |
| | 24,064 | | | | 24,667 | | | | 22,114 | | | | 21,393 | | | | 21,600 | | | | 21,311 | |
| | 22,757 | | | | 22,757 | | | | 22,757 | | | | 22,757 | | | | 22,743 | | | | 22,743 | |
| | 22,701 | | | | 22,673 | | | | 22,477 | | | | 22,421 | | | | 22,449 | | | | 22,407 | |
| | 36,795 | | | | 31,253 | | | | 16,622 | | | | 8,555 | | | | 11,349 | | | | 6,612 | |
| | 8,603 | | | | 7,597 | | | | 2,600 | | | | 633 | | | | 1,447 | | | | 365 | |
| | 22,305 | | | | 2 | | | | — | | | | 2,881 | | | | 718 | | | | 307 | |
| | — | | | | — | | | | — | | | | — | | | | — | | | | — | |
| | 235,027 | | | | 56,102 | | | | 22,366 | | | | 9,173 | | | | 15,605 | | | | 4,920 | |
| | 4,259,570 | | | | 4,126,090 | | | | 1,395,379 | | | | 509,892 | | | | 1,158,070 | | | | 205,873 | |
| | — | | | | — | | | | — | | | | — | | | | — | | | | (18,881 | ) |
| | — | | | | — | | | | — | | | | — | | | | — | | | | (66,424 | ) |
| | — | | | | — | | | | — | | | | — | | | | — | | | | (31,785 | ) |
| | 4,259,570 | | | | 4,126,090 | | | | 1,395,379 | | | | 509,892 | | | | 1,158,070 | | | | 88,783 | |
$ | 11,117,553 | | | $ | 3,268,333 | | | $ | 1,455,262 | | | $ | 283,086 | | | $ | 1,377,907 | | | $ | (10,988 | ) |
| | | | | | | | | | | | | | | | | | | | | | | |
| | | | | | | | | | | | | | | | | | | | | | | |
$ | 31,301,117 | | | $ | 21,733,323 | | | $ | 4,432,544 | | | $ | 1,119,131 | | | $ | 4,939,106 | | | $ | 1,187,606 | |
| | 76,748,141 | | | | 68,355,005 | | | | 8,128,236 | | | | 10,431,649 | | | | 19,197,947 | | | | 826,584 | |
| | — | | | | (108,741 | ) | | | (4,453 | ) | | | — | | | | — | | | | — | |
| | — | | | | — | | | | — | | | | — | | | | — | | | | — | |
| | 108,049,258 | | | | 89,979,587 | | | | 12,556,327 | | | | 11,550,780 | | | | 24,137,053 | | | | 2,014,190 | |
$ | 119,166,811 | | | $ | 93,247,920 | | | $ | 14,011,589 | | | $ | 11,833,866 | | | $ | 25,514,960 | | | $ | 2,003,202 | |
The accompanying notes are an integral part of these financial statements.
HENNESSY FUNDS | 1-800-966-4354 |
Financial Statements — Statements of Changes in Net Assets
| | | Hennessy Cornerstone
Growth Fund | |
| | | | | | | |
| | | Year Ended | | | Year Ended | |
| | | October 31, 2024 | | | October 31, 2023 | |
| OPERATIONS: | | | | | | |
Net investment income (loss) | | $ | (379,831 | ) | | $ | 1,626,833 | |
Net realized gain (loss) on investments | | | 87,209,748 | | | | (4,138,289 | ) |
Net change in unrealized appreciation/depreciation on investments | | | 6,152,759 | | | | 5,434,239 | |
Net increase (decrease) in net assets resulting from operations | | | 92,982,676 | | | | 2,922,783 | |
| | | | | | | | | |
| DISTRIBUTIONS TO SHAREHOLDERS: | | | | | | | | |
Distributable earnings – Investor Class | | | (606,782 | ) | | | (5,391,788 | ) |
Distributable earnings – Institutional Class | | | (167,282 | ) | | | (694,551 | ) |
Total distributions | | | (774,064 | ) | | | (6,086,339 | ) |
| | | | | | | | | |
| CAPITAL SHARE TRANSACTIONS: | | | | | | | | |
Proceeds from shares subscribed – Investor Class | | | 187,004,052 | | | | 11,362,449 | |
Proceeds from shares subscribed – Institutional Class | | | 176,079,733 | | | | 9,926,784 | |
Dividends reinvested – Investor Class | | | 578,789 | | | | 5,220,465 | |
Dividends reinvested – Institutional Class | | | 152,443 | | | | 627,346 | |
Cost of shares redeemed – Investor Class | | | (66,009,736 | ) | | | (26,505,700 | ) |
Cost of shares redeemed – Institutional Class | | | (42,258,515 | ) | | | (6,562,918 | ) |
Net increase (decrease) in net assets derived from capital share transactions | | | 255,546,766 | | | | (5,931,574 | ) |
| TOTAL INCREASE (DECREASE) IN NET ASSETS | | | 347,755,378 | | | | (9,095,130 | ) |
| | | | | | | | | |
| NET ASSETS: | | | | | | | | |
Beginning of year | | | 163,675,508 | | | | 172,770,638 | |
End of year | | $ | 511,430,886 | | | $ | 163,675,508 | |
| | | | | | | | | |
| CHANGES IN SHARES OUTSTANDING: | | | | | | | | |
Shares sold – Investor Class | | | 5,583,614 | | | | 465,038 | |
Shares sold – Institutional Class | | | 5,015,256 | | | | 400,968 | |
Shares issued to holders as reinvestment of dividends – Investor Class | | | 20,835 | | | | 227,645 | |
Shares issued to holders as reinvestment of dividends – Institutional Class | | | 5,260 | | | | 26,210 | |
Shares redeemed – Investor Class | | | (1,996,103 | ) | | | (1,164,869 | ) |
Shares redeemed – Institutional Class | | | (1,230,851 | ) | | | (266,969 | ) |
Net increase (decrease) in shares outstanding | | | 7,398,011 | | | | (311,977 | ) |
The accompanying notes are an integral part of these financial statements.
WWW.HENNESSYFUNDS.COM
Financial Statements — Statements of Changes in Net Assets
| Hennessy Focus Fund | | | Hennessy Cornerstone Mid Cap 30 Fund | | | Hennessy Cornerstone Large Growth Fund | |
| Year Ended | | | Year Ended | | | Year Ended | | | Year Ended | | | Year Ended | | | Year Ended | |
| October 31, 2024 | | | October 31, 2023 | | | October 31, 2024 | | | October 31, 2023 | | | October 31, 2024 | | | October 31, 2023 | |
| | | | | | | | | | | | | | | | | |
$ | (2,065,371 | ) | | $ | (2,967,717 | ) | | $ | 1,399,597 | | | $ | 1,162,868 | | | $ | 1,360,061 | | | $ | 1,525,599 | |
| | 108,696,237 | | | | 155,366,048 | | | | 278,822,792 | | | | 63,162,651 | | | | 5,023,205 | | | | 4,429,506 | |
| | 98,523,270 | | | | (118,570,475 | ) | | | 126,453,711 | | | | (36,349,926 | ) | | | 23,155,669 | | | | 6,248,824 | |
| | 205,154,136 | | | | 33,827,856 | | | | 406,676,100 | | | | 27,975,593 | | | | 29,538,935 | | | | 12,203,929 | |
| | | | | | | | | | | | | | | | | | | | | | | |
| | | | | | | | | | | | | | | | | | | | | | | |
| | (79,757,816 | ) | | | (55,979,529 | ) | | | (30,621,646 | ) | | | (37,371,548 | ) | | | (4,666,709 | ) | | | (19,315,909 | ) |
| | (49,294,820 | ) | | | (38,238,761 | ) | | | (30,645,521 | ) | | | (30,112,291 | ) | | | (700,235 | ) | | | (2,556,836 | ) |
| | (129,052,636 | ) | | | (94,218,290 | ) | | | (61,267,167 | ) | | | (67,483,839 | ) | | | (5,366,944 | ) | | | (21,872,745 | ) |
| | | | | | | | | | | | | | | | | | | | | | | |
| | | | | | | | | | | | | | | | | | | | | | | |
| | 29,277,840 | | | | 5,238,833 | | | | 282,252,860 | | | | 118,407,401 | | | | 730,180 | | | | 1,360,431 | |
| | 123,166,611 | | | | 33,286,516 | | | | 597,592,597 | | | | 149,518,551 | | | | 1,517,612 | | | | 1,393,373 | |
| | 77,544,027 | | | | 54,418,112 | | | | 29,980,981 | | | | 36,888,250 | | | | 4,502,505 | | | | 18,623,426 | |
| | 44,780,385 | | | | 35,095,377 | | | | 29,053,170 | | | | 29,290,877 | | | | 687,942 | | | | 2,501,083 | |
| | (109,103,205 | ) | | | (97,262,475 | ) | | | (131,986,048 | ) | | | (52,168,702 | ) | | | (11,559,927 | ) | | | (13,722,728 | ) |
| | (138,696,803 | ) | | | (139,348,625 | ) | | | (146,433,185 | ) | | | (40,806,405 | ) | | | (3,548,864 | ) | | | (1,777,358 | ) |
| | 26,968,855 | | | | (108,572,262 | ) | | | 660,460,375 | | | | 241,129,972 | | | | (7,670,552 | ) | | | 8,378,227 | |
| | 103,070,355 | | | | (168,962,696 | ) | | | 1,005,869,308 | | | | 201,621,726 | | | | 16,501,439 | | | | (1,290,589 | ) |
| | | | | | | | | | | | | | | | | | | | | | | |
| | | | | | | | | | | | | | | | | | | | | | | |
| | 571,658,705 | | | | 740,621,401 | | | | 591,242,222 | | | | 389,620,496 | | | | 128,661,278 | | | | 129,951,867 | |
$ | 674,729,060 | | | $ | 571,658,705 | | | $ | 1,597,111,530 | | | $ | 591,242,222 | | | $ | 145,162,717 | | | $ | 128,661,278 | |
| | | | | | | | | | | | | | | | | | | | | | | |
| | | | | | | | | | | | | | | | | | | | | | | |
| | 600,016 | | | | 107,578 | | | | 12,231,650 | | | | 6,016,089 | | | | 64,598 | | | | 131,258 | |
| | 2,677,784 | | | | 655,626 | | | | 24,551,093 | | | | 7,194,865 | | | | 130,300 | | | | 131,707 | |
| | 1,909,481 | | | | 1,168,021 | | | | 1,609,285 | | | | 2,163,534 | | | | 419,889 | | | | 1,887,812 | |
| | 1,052,418 | | | | 721,682 | | | | 1,481,549 | | | | 1,638,192 | | | | 63,274 | | | | 250,554 | |
| | (2,423,040 | ) | | | (1,980,392 | ) | | | (5,870,859 | ) | | | (2,782,892 | ) | | | (1,002,293 | ) | | | (1,344,112 | ) |
| | (2,894,254 | ) | | | (2,730,525 | ) | | | (6,109,706 | ) | | | (2,066,940 | ) | | | (301,654 | ) | | | (171,833 | ) |
| | 922,405 | | | | (2,058,010 | ) | | | 27,893,012 | | | | 12,162,848 | | | | (625,886 | ) | | | 885,386 | |
The accompanying notes are an integral part of these financial statements.
HENNESSY FUNDS | 1-800-966-4354 |
Financial Statements — Statements of Changes in Net Assets
| | | Hennessy Cornerstone
Value Fund | |
| | | Year Ended | | | Year Ended | |
| | | October 31, 2024 | | | October 31, 2023 | |
| OPERATIONS: | | | | | | |
Net investment income (loss) | | $ | 8,789,191 | | | $ | 9,448,170 | |
Net realized gain (loss) on investments | | | 7,254,630 | | | | (3,834,975 | ) |
Net change in unrealized appreciation/depreciation on investments | | | 40,523,513 | | | | (8,473,514 | ) |
Net increase (decrease) in net assets resulting from operations | | | 56,567,334 | | | | (2,860,319 | ) |
| | | | | | | | | |
| DISTRIBUTIONS TO SHAREHOLDERS: | | | | | | | | |
Distributable earnings – Investor Class | | | (9,186,043 | ) | | | (26,252,846 | ) |
Distributable earnings – Institutional Class | | | (284,175 | ) | | | (2,313,856 | ) |
Total distributions | | | (9,470,218 | ) | | | (28,566,702 | ) |
| | | | | | | | | |
| CAPITAL SHARE TRANSACTIONS: | | | | | | | | |
Proceeds from shares subscribed – Investor Class | | | 1,844,518 | | | | 11,286,745 | |
Proceeds from shares subscribed – Institutional Class | | | 1,069,369 | | | | 6,698,572 | |
Dividends reinvested – Investor Class | | | 8,633,177 | | | | 24,939,854 | |
Dividends reinvested – Institutional Class | | | 258,511 | | | | 2,247,245 | |
Cost of shares redeemed – Investor Class | | | (28,713,534 | ) | | | (29,291,239 | ) |
Cost of shares redeemed – Institutional Class | | | (2,125,183 | ) | | | (23,714,925 | ) |
Net increase (decrease) in net assets derived from capital share transactions | | | (19,033,142 | ) | | | (7,833,748 | ) |
| TOTAL INCREASE (DECREASE) IN NET ASSETS | | | 28,063,974 | | | | (39,260,769 | ) |
| | | | | | | | | |
| NET ASSETS: | | | | | | | | |
Beginning of year | | | 253,898,923 | | | | 293,159,692 | |
End of year | | $ | 281,962,897 | | | $ | 253,898,923 | |
| | | | | | | | | |
| CHANGES IN SHARES OUTSTANDING: | | | | | | | | |
Shares sold – Investor Class | | | 91,909 | | | | 577,984 | |
Shares sold – Institutional Class | | | 53,722 | | | | 332,692 | |
Shares issued to holders as reinvestment of dividends – Investor Class | | | 446,390 | | | | 1,290,673 | |
Shares issued to holders as reinvestment of dividends – Institutional Class | | | 13,353 | | | | 116,262 | |
Shares redeemed – Investor Class | | | (1,445,888 | ) | | | (1,532,736 | ) |
Shares redeemed – Institutional Class | | | (107,627 | ) | | | (1,233,563 | ) |
Net increase (decrease) in shares outstanding | | | (948,141 | ) | | | (448,688 | ) |
The accompanying notes are an integral part of these financial statements.
WWW.HENNESSYFUNDS.COM
Financial Statements — Statements of Changes in Net Assets
| Hennessy Total Return Fund | | | Hennessy Equity and Income Fund | | | Hennessy Balanced Fund | |
| Year Ended | | | Year Ended | | | Year Ended | | | Year Ended | | | Year Ended | | | Year Ended | |
| October 31, 2024 | | | October 31, 2023 | | | October 31, 2024 | | | October 31, 2023 | | | October 31, 2024 | | | October 31, 2023 | |
| | | | | | | | | | | | | | | | | |
$ | 1,566,102 | | | $ | 1,594,586 | | | $ | 501,581 | | | $ | 740,773 | | | $ | 360,046 | | | $ | 281,960 | |
| | 720,394 | | | | 2,437,331 | | | | 7,451,969 | | | | 6,577,550 | | | | 207,706 | | | | 24,850 | |
| | 4,854,980 | | | | (3,681,426 | ) | | | 4,549,342 | | | | (3,501,366 | ) | | | 863,545 | | | | (338,727 | ) |
| | 7,141,476 | | | | 350,491 | | | | 12,502,892 | | | | 3,816,957 | | | | 1,431,297 | | | | (31,917 | ) |
| | | | | | | | | | | | | | | | | | | | | | | |
| | | | | | | | | | | | | | | | | | | | | | | |
| | (3,616,720 | ) | | | (4,133,781 | ) | | | (3,105,856 | ) | | | (1,298,637 | ) | | | (376,967 | ) | | | (743,448 | ) |
| | N/A | | | | N/A | | | | (3,077,045 | ) | | | (1,743,953 | ) | | | N/A | | | | N/A | |
| | (3,616,720 | ) | | | (4,133,781 | ) | | | (6,182,901 | ) | | | (3,042,590 | ) | | | (376,967 | ) | | | (743,448 | ) |
| | | | | | | | | | | | | | | | | | | | | | | |
| | | | | | | | | | | | | | | | | | | | | | | |
| | 419,282 | | | | 4,112,285 | | | | 361,950 | | | | 316,740 | | | | 4,638,036 | | | | 1,168,635 | |
| | N/A | | | | N/A | | | | 2,227,852 | | | | 1,100,458 | | | | N/A | | | | N/A | |
| | 3,438,144 | | | | 3,946,628 | | | | 3,000,628 | | | | 1,260,827 | | | | 365,342 | | | | 729,717 | |
| | N/A | | | | N/A | | | | 2,617,818 | | | | 1,285,409 | | | | N/A | | | | N/A | |
| | (5,881,147 | ) | | | (10,088,636 | ) | | | (9,212,958 | ) | | | (6,701,151 | ) | | | (5,638,415 | ) | | | (1,723,755 | ) |
| | N/A | | | | N/A | | | | (14,790,153 | ) | | | (15,950,410 | ) | | | N/A | | | | N/A | |
| | (2,023,721 | ) | | | (2,029,723 | ) | | | (15,794,863 | ) | | | (18,688,127 | ) | | | (635,037 | ) | | | 174,597 | |
| | 1,501,035 | | | | (5,813,013 | ) | | | (9,474,872 | ) | | | (17,913,760 | ) | | | 419,293 | | | | (600,768 | ) |
| | | | | | | | | | | | | | | | | | | | | | | |
| | | | | | | | | | | | | | | | | | | | | | | |
| | 47,543,301 | | | | 53,356,314 | | | | 69,000,478 | | | | 86,914,238 | | | | 12,291,749 | | | | 12,892,517 | |
$ | 49,044,336 | | | $ | 47,543,301 | | | $ | 59,525,606 | | | $ | 69,000,478 | | | $ | 12,711,042 | | | $ | 12,291,749 | |
| | | | | | | | | | | | | | | | | | | | | | | |
| | | | | | | | | | | | | | | | | | | | | | | |
| | 31,697 | | | | 308,055 | | | | 24,874 | | | | 22,144 | | | | 394,942 | | | | 102,839 | |
| | N/A | | | | N/A | | | | 162,896 | | | | 81,665 | | | | N/A | | | | N/A | |
| | 265,100 | | | | 299,644 | | | | 216,412 | | | | 88,230 | | | | 30,750 | | | | 63,200 | |
| | N/A | | | | N/A | | | | 200,484 | | | | 95,776 | | | | N/A | | | | N/A | |
| | (443,078 | ) | | | (774,401 | ) | | | (627,737 | ) | | | (462,960 | ) | | | (477,224 | ) | | | (150,502 | ) |
| | N/A | | | | N/A | | | | (1,078,531 | ) | | | (1,168,441 | ) | | | N/A | | | | N/A | |
| | (146,281 | ) | | | (166,702 | ) | | | (1,101,602 | ) | | | (1,343,586 | ) | | | (51,532 | ) | | | 15,537 | |
The accompanying notes are an integral part of these financial statements.
HENNESSY FUNDS | 1-800-966-4354 |
Financial Statements — Statements of Changes in Net Assets
| | | Hennessy Energy
Transition Fund | |
| | | Year Ended | | | Year Ended | |
| | | October 31, 2024 | | | October 31, 2023 | |
| OPERATIONS: | | | | | | |
Net investment income (loss) | | $ | 114,217 | | | $ | 190,297 | |
Net realized gain (loss) on investments | | | 2,446,699 | | | | 1,977,506 | |
Net change in unrealized appreciation/depreciation on investments and foreign currency | | | (1,819,834 | ) | | | (2,314,370 | ) |
Net increase (decrease) in net assets resulting from operations | | | 741,082 | | | | (146,567 | ) |
| | | | | | | | | |
| DISTRIBUTIONS TO SHAREHOLDERS: | | | | | | | | |
Distributable earnings – Investor Class | | | — | | | | (51,574 | ) |
Return of capital – Investor Class | | | — | | | | — | |
Distributable earnings – Institutional Class | | | — | | | | (87,195 | ) |
Return of capital – Institutional Class | | | — | | | | — | |
Total distributions | | | — | | | | (138,769 | ) |
| | | | | | | | | |
| CAPITAL SHARE TRANSACTIONS: | | | | | | | | |
Proceeds from shares subscribed – Investor Class | | | 826,073 | | | | 3,946,163 | |
Proceeds from shares subscribed – Institutional Class | | | 1,770,310 | | | | 2,359,407 | |
Dividends reinvested – Investor Class | | | — | | | | 47,756 | |
Dividends reinvested – Institutional Class | | | — | | | | 86,765 | |
Cost of shares redeemed – Investor Class | | | (3,752,323 | ) | | | (5,037,219 | ) |
Cost of shares redeemed – Institutional Class | | | (5,369,899 | ) | | | (4,259,986 | ) |
Net increase (decrease) in net assets derived from capital share transactions | | | (6,525,839 | ) | | | (2,857,114 | ) |
| TOTAL INCREASE (DECREASE) IN NET ASSETS | | | (5,784,757 | ) | | | (3,142,450 | ) |
| | | | | | | | | |
| NET ASSETS: | | | | | | | | |
Beginning of year | | | 20,397,306 | | | | 23,539,756 | |
End of year | | $ | 14,612,549 | | | $ | 20,397,306 | |
| | | | | | | | | |
| CHANGES IN SHARES OUTSTANDING: | | | | | | | | |
Shares sold – Investor Class | | | 32,213 | | | | 166,878 | |
Shares sold – Institutional Class | | | 69,692 | | | | 100,869 | |
Shares issued to holders as reinvestment of dividends – Investor Class | | | — | | | | 2,122 | |
Shares issued to holders as reinvestment of dividends – Institutional Class | | | — | | | | 3,794 | |
Shares redeemed – Investor Class | | | (152,192 | ) | | | (221,723 | ) |
Shares redeemed – Institutional Class | | | (225,321 | ) | | | (183,343 | ) |
Net increase (decrease) in shares outstanding | | | (275,608 | ) | | | (131,403 | ) |
The accompanying notes are an integral part of these financial statements.
WWW.HENNESSYFUNDS.COM
Financial Statements — Statements of Changes in Net Assets
| Hennessy Midstream Fund | | | Hennessy Gas Utility Fund | | | Hennessy Japan Fund | |
| Year Ended | | | Year Ended | | | Year Ended | | | Year Ended | | | Year Ended | | | Year Ended | |
| October 31, 2024 | | | October 31, 2023 | | | October 31, 2024 | | | October 31, 2023 | | | October 31, 2024 | | | October 31, 2023 | |
| | | | | | | | | | | | | | | | | |
$ | 80,542 | | | $ | (36,118 | ) | | $ | 11,117,553 | | | $ | 11,286,812 | | | $ | 3,268,333 | | | $ | 2,318,825 | |
| | 822,198 | | | | 4,940,132 | | | | 31,301,117 | | | | 20,986,535 | | | | 21,733,323 | | | | 42,400,692 | |
| | 12,446,433 | | | | 2,693,911 | | | | 76,748,141 | | | | (54,552,818 | ) | | | 68,246,264 | | | | 6,442,668 | |
| | 13,349,173 | | | | 7,597,925 | | | | 119,166,811 | | | | (22,279,471 | ) | | | 93,247,920 | | | | 51,162,185 | |
| | | | | | | | | | | | | | | | | | | | | | | |
| | | | | | | | | | | | | | | | | | | | | | | |
| | (310,240 | ) | | | (1,196,626 | ) | | | (25,604,263 | ) | | | (38,297,319 | ) | | | (2,789,944 | ) | | | — | |
| | (1,489,856 | ) | | | (266,609 | ) | | | — | | | | — | | | | — | | | | — | |
| | (651,672 | ) | | | (2,875,616 | ) | | | (3,717,985 | ) | | | (6,775,915 | ) | | | (14,520,668 | ) | | | — | |
| | (3,129,507 | ) | | | (640,689 | ) | | | — | | | | — | | | | — | | | | — | |
| | (5,581,275 | ) | | | (4,979,540 | ) | | | (29,322,248 | ) | | | (45,073,234 | ) | | | (17,310,612 | ) | | | — | |
| | | | | | | | | | | | | | | | | | | | | | | |
| | | | | | | | | | | | | | | | | | | | | | | |
| | 6,761,271 | | | | 6,315,025 | | | | 5,548,732 | | | | 8,286,887 | | | | 21,905,975 | | | | 20,718,473 | |
| | 7,301,317 | | | | 6,346,640 | | | | 7,890,354 | | | | 13,926,472 | | | | 134,234,776 | | | | 125,835,127 | |
| | 1,299,243 | | | | 1,090,514 | | | | 24,042,649 | | | | 36,097,085 | | | | 2,698,448 | | | | — | |
| | 3,572,791 | | | | 3,298,865 | | | | 3,561,181 | | | | 6,392,644 | | | | 14,281,682 | | | | — | |
| | (6,649,066 | ) | | | (2,904,969 | ) | | | (67,542,228 | ) | | | (61,097,011 | ) | | | (28,127,178 | ) | | | (21,606,576 | ) |
| | (6,998,085 | ) | | | (7,050,850 | ) | | | (26,637,584 | ) | | | (48,130,570 | ) | | | (86,372,015 | ) | | | (211,849,600 | ) |
| | 5,287,471 | | | | 7,095,225 | | | | (53,136,896 | ) | | | (44,524,493 | ) | | | 58,621,688 | | | | (86,902,576 | ) |
| | 13,055,369 | | | | 9,713,610 | | | | 36,707,667 | | | | (111,877,198 | ) | | | 134,558,996 | | | | (35,740,391 | ) |
| | | | | | | | | | | | | | | | | | | | | | | |
| | | | | | | | | | | | | | | | | | | | | | | |
| | 54,247,803 | | | | 44,534,193 | | | | 441,122,108 | | | | 552,999,306 | | | | 279,048,970 | | | | 314,789,361 | |
$ | 67,303,172 | | | $ | 54,247,803 | | | $ | 477,829,775 | | | $ | 441,122,108 | | | $ | 413,607,966 | | | $ | 279,048,970 | |
| | | | | | | | | | | | | | | | | | | | | | | |
| | | | | | | | | | | | | | | | | | | | | | | |
| | 606,486 | | | | 662,994 | | | | 230,697 | | | | 335,314 | | | | 522,382 | | | | 585,760 | |
| | 616,439 | | | | 637,501 | | | | 326,870 | | | | 578,892 | | | | 3,221,145 | | | | 3,442,909 | |
| | 119,217 | | | | 114,390 | | | | 1,023,187 | | | | 1,467,946 | | | | 76,013 | | | | — | |
| | 313,677 | | | | 334,274 | | | | 152,311 | | | | 260,586 | | | | 387,352 | | | | — | |
| | (599,504 | ) | | | (299,262 | ) | | | (2,813,424 | ) | | | (2,499,516 | ) | | | (686,959 | ) | | | (626,166 | ) |
| | (608,303 | ) | | | (716,204 | ) | | | (1,138,705 | ) | | | (1,939,801 | ) | | | (2,016,273 | ) | | | (6,060,158 | ) |
| | 448,012 | | | | 733,693 | | | | (2,219,064 | ) | | | (1,796,579 | ) | | | 1,503,660 | | | | (2,657,655 | ) |
| | | | | | | | | | | | | | | | | | | | | | | |
The accompanying notes are an integral part of these financial statements.
HENNESSY FUNDS | 1-800-966-4354 |
Financial Statements — Statements of Changes in Net Assets
| | | Hennessy Japan
Small Cap Fund | |
| | | Year Ended | | | Year Ended | |
| | | October 31, 2024 | | | October 31, 2023 | |
| OPERATIONS: | | | | | | |
Net investment income (loss) | | $ | 1,455,262 | | | $ | 1,329,033 | |
Net realized gain (loss) on investments | | | 4,432,544 | | | | 207,238 | |
Net change in unrealized appreciation/depreciation on investments and foreign currency | | | 8,123,783 | | | | 9,306,806 | |
Net increase (decrease) in net assets resulting from operations | | | 14,011,589 | | | | 10,843,077 | |
| | | | | | | | | |
| DISTRIBUTIONS TO SHAREHOLDERS: | | | | | | | | |
Distributable earnings – Investor Class | | | (297,604 | ) | | | (198,569 | ) |
Distributable earnings – Institutional Class | | | (914,493 | ) | | | (658,423 | ) |
Total distributions | | | (1,212,097 | ) | | | (856,992 | ) |
| | | | | | | | | |
| CAPITAL SHARE TRANSACTIONS: | | | | | | | | |
Proceeds from shares subscribed – Investor Class | | | 6,202,819 | | | | 5,265,277 | |
Proceeds from shares subscribed – Institutional Class | | | 18,992,960 | | | | 44,132,157 | |
Dividends reinvested – Investor Class | | | 288,648 | | | | 191,702 | |
Dividends reinvested – Institutional Class | | | 907,721 | | | | 641,326 | |
Cost of shares redeemed – Investor Class | | | (12,937,514 | ) | | | (7,954,407 | ) |
Cost of shares redeemed – Institutional Class | | | (20,616,892 | ) | | | (27,597,536 | ) |
Net increase (decrease) in net assets derived from capital share transactions | | | (7,162,258 | ) | | | 14,678,519 | |
| TOTAL INCREASE (DECREASE) IN NET ASSETS | | | 5,637,234 | | | | 24,664,604 | |
| | | | | | | | | |
| NET ASSETS: | | | | | | | | |
Beginning of year | | | 103,544,723 | | | | 78,880,119 | |
End of year | | $ | 109,181,957 | | | $ | 103,544,723 | |
| | | | | | | | | |
| CHANGES IN SHARES OUTSTANDING: | | | | | | | | |
Shares sold – Investor Class | | | 365,195 | | | | 350,407 | |
Shares sold – Institutional Class | | | 1,165,653 | | | | 3,029,428 | |
Shares issued to holders as reinvestment of dividends – Investor Class | | | 17,774 | | | | 13,791 | |
Shares issued to holders as reinvestment of dividends – Institutional Class | | | 56,732 | | | | 46,881 | |
Shares redeemed – Investor Class | | | (785,981 | ) | | | (538,838 | ) |
Shares redeemed – Institutional Class | | | (1,279,525 | ) | | | (1,876,510 | ) |
Net increase (decrease) in shares outstanding | | | (460,152 | ) | | | 1,025,159 | |
The accompanying notes are an integral part of these financial statements.
WWW.HENNESSYFUNDS.COM
Financial Statements — Statements of Changes in Net Assets
| Hennessy Large Cap Financial Fund | | | Hennessy Small Cap Financial Fund | | | Hennessy Technology Fund | |
| Year Ended | | | Year Ended | | | Year Ended | | | Year Ended | | | Year Ended | | | Year Ended | |
| October 31, 2024 | | | October 31, 2023 | | | October 31, 2024 | | | October 31, 2023 | | | October 31, 2024 | | | October 31, 2023 | |
| | | | | | | | | | | | | | | | | |
$ | 283,086 | | | $ | 673,763 | | | $ | 1,377,907 | | | $ | 1,551,087 | | | $ | (10,988 | ) | | $ | (737 | ) |
| | 1,119,131 | | | | (3,665,381 | ) | | | 4,939,106 | | | | 2,691,655 | | | | 1,187,606 | | | | 42,670 | |
| | 10,431,649 | | | | (4,861,309 | ) | | | 19,197,947 | | | | (28,455,053 | ) | | | 826,584 | | | | 724,024 | |
| | 11,833,866 | | | | (7,852,927 | ) | | | 25,514,960 | | | | (24,212,311 | ) | | | 2,003,202 | | | | 765,957 | |
| | | | | | | | | | | | | | | | | | | | | | | |
| | | | | | | | | | | | | | | | | | | | | | | |
| | (343,966 | ) | | | (1,558,247 | ) | | | (3,164,215 | ) | | | (7,452,661 | ) | | | — | | | | (2,801 | ) |
| | (181,936 | ) | | | (1,514,267 | ) | | | (528,957 | ) | | | (1,876,496 | ) | | | — | | | | (6,430 | ) |
| | (525,902 | ) | | | (3,072,514 | ) | | | (3,693,172 | ) | | | (9,329,157 | ) | | | — | | | | (9,231 | ) |
| | | | | | | | | | | | | | | | | | | | | | | |
| | | | | | | | | | | | | | | | | | | | | | | |
| | 1,178,009 | | | | 760,547 | | | | 19,347,685 | | | | 2,129,827 | | | | 304,942 | | | | 371,996 | |
| | 371,407 | | | | 1,148,806 | | | | 7,371,175 | | | | 2,747,009 | | | | 568,046 | | | | 522,804 | |
| | 334,786 | | | | 1,514,582 | | | | 3,082,419 | | | | 7,283,862 | | | | — | | | | 2,743 | |
| | 176,363 | | | | 1,483,154 | | | | 492,770 | | | | 1,825,197 | | | | — | | | | 6,429 | |
| | (4,548,139 | ) | | | (3,144,689 | ) | | | (16,067,224 | ) | | | (20,718,495 | ) | | | (796,185 | ) | | | (569,642 | ) |
| | (9,480,261 | ) | | | (7,157,957 | ) | | | (10,323,135 | ) | | | (11,825,149 | ) | | | (532,311 | ) | | | (121,520 | ) |
| | (11,967,835 | ) | | | (5,395,557 | ) | | | 3,903,690 | | | | (18,557,749 | ) | | | (455,508 | ) | | | 212,810 | |
| | (659,871 | ) | | | (16,320,998 | ) | | | 25,725,478 | | | | (52,099,217 | ) | | | 1,547,694 | | | | 969,536 | |
| | | | | | | | | | | | | | | | | | | | | | | |
| | | | | | | | | | | | | | | | | | | | | | | |
| | 29,455,593 | | | | 45,776,591 | | | | 61,475,785 | | | | 113,575,002 | | | | 6,345,793 | | | | 5,376,257 | |
$ | 28,795,722 | | | $ | 29,455,593 | | | $ | 87,201,263 | | | $ | 61,475,785 | | | $ | 7,893,487 | | | $ | 6,345,793 | |
| | | | | | | | | | | | | | | | | | | | | | | |
| | | | | | | | | | | | | | | | | | | | | | | |
| | 48,787 | | | | 38,167 | | | | 752,848 | | | | 86,638 | | | | 15,198 | | | | 21,312 | |
| | 15,487 | | | | 54,558 | | | | 490,962 | | | | 172,929 | | | | 28,028 | | | | 29,720 | |
| | 14,468 | | | | 66,892 | | | | 124,439 | | | | 274,193 | | | | — | | | | 189 | |
| | 7,556 | | | | 64,811 | | | | 34,257 | | | | 118,272 | | | | — | | | | 433 | |
| | (194,450 | ) | | | (148,352 | ) | | | (653,173 | ) | | | (855,557 | ) | | | (38,331 | ) | | | (33,810 | ) |
| | (422,417 | ) | | | (331,352 | ) | | | (704,006 | ) | | | (879,954 | ) | | | (25,502 | ) | | | (6,780 | ) |
| | (530,569 | ) | | | (255,276 | ) | | | 45,327 | | | | (1,083,479 | ) | | | (20,607 | ) | | | 11,064 | |
The accompanying notes are an integral part of these financial statements.
HENNESSY FUNDS | 1-800-966-4354 |
Financial Statements — Statement of Cash Flows
Hennessy Total Return Fund for the year ended October 31, 2024 |
| Cash flows from operating activities: | | | |
| Net increase in net assets from operations | | $ | 7,141,476 | |
| Adjustments to reconcile net increase in net assets resulting from operations to net cash provided by operating activities: | | | | |
| Payments to purchase securities | | | (11,128,617 | ) |
| Proceeds from sale of securities | | | 15,566,418 | |
| Proceeds from securities litigation | | | — | |
| Net sale of short term investments | | | (338,357 | ) |
| Realized gain on investments in securities | | | (720,394 | ) |
| Net accretion of discount on securities | | | (1,839,273 | ) |
| Change in unrealized appreciation/depreciation on investments in securities | | | (4,854,980 | ) |
| Decreases in operating assets: | | | | |
| Decrease in dividends and interest receivable | | | 7,105 | |
| Decrease in prepaid expenses and other assets | | | 699 | |
| Increases (decreases) in operating liabilities: | | | | |
| Increase in payable to advisor | | | 1,278 | |
| Decrease in payable to administrator | | | (376 | ) |
| Increase in payable for distribution fees | | | 917 | |
| Increase in payable for service fees | | | 213 | |
| Increase in accrued interest payable | | | 3,703 | |
| Increase in accrued audit fees | | | 7 | |
| Decrease in accrued trustee fees | | | (496 | ) |
| Increase in other accrued expenses and payables | | | 2,288 | |
| Net cash provided by operating securities | | | 3,841,611 | |
| | | | | |
| Cash flows from financing activities: | | | | |
| Increase in reverse repurchase agreements | | | 1,799,000 | |
| Proceeds on shares sold | | | 419,112 | |
| Payment on shares redeemed | | | (5,881,147 | ) |
| Distributions paid in cash, net of reinvestments | | | (178,576 | ) |
Net cash used for financing activities | | | (3,841,611 | ) |
| Net increase in cash | | | — | |
| | | | | |
| Cash: | | | | |
Beginning balance | | | — | |
Ending balance | | | — | |
| | | | | |
| Supplemental information: | | | | |
Non-cash financing activities not included herein, consisting of dividend reinvestment of dividends and distributions | | | 3,438,144 | |
| | | | | |
| Cash paid for interest | | | 1,180,684 | |
The accompanying notes are an integral part of these financial statements.
WWW.HENNESSYFUNDS.COM
Financial Statements — Financial Highlights
| Hennessy Cornerstone Growth Fund |
For an Investor Class share outstanding throughout each year
| | | Year Ended October 31 | |
| | | 2024 | | | 2023 | | | 2022 | | | 2021 | | | 2020 | |
| PER SHARE DATA: | | | | | | | | | | | | | | | |
Net asset value, beginning of year | | $ | 23.82 | | | $ | 24.07 | | | $ | 29.83 | | | $ | 19.91 | | | $ | 19.15 | |
| | | | | | | | | | | | | | | | | | | | | |
| Income from investment operations: | | | | | | | | | | | | | | | | | | | | |
Net investment income (loss)(1) | | | (0.05 | ) | | | 0.22 | | | | 0.26 | | | | (0.14 | ) | | | (0.08 | ) |
Net realized and unrealized gains on investments | | | 11.73 | | | | 0.35 | | | | 0.62 | | | | 10.06 | | | | 0.84 | |
| Total from investment operations | | | 11.68 | | | | 0.57 | | | | 0.88 | | | | 9.92 | | | | 0.76 | |
| | | | | | | | | | | | | | | | | | | | | |
| Less distributions: | | | | | | | | | | | | | | | | | | | | |
Dividends from net investment income | | | (0.10 | ) | | | (0.27 | ) | | | — | | | | — | | | | — | |
Dividends from net realized gains | | | — | | | | (0.55 | ) | | | (6.64 | ) | | | — | | | | — | |
| Total distributions | | | (0.10 | ) | | | (0.82 | ) | | | (6.64 | ) | | | — | | | | — | |
Net asset value, end of year | | $ | 35.40 | | | $ | 23.82 | | | $ | 24.07 | | | $ | 29.83 | | | $ | 19.91 | |
| | | | | | | | | | | | | | | | | | | | | |
| TOTAL RETURN | | | 49.17 | % | | | 2.54 | % | | | 2.51 | % | | | 49.82 | % | | | 3.97 | % |
| | | | | | | | | | | | | | | | | | | | | |
| SUPPLEMENTAL DATA AND RATIOS: | | | | | | | | | | | | | | | | | | | | |
Net assets, end of year (millions) | | $ | 337.86 | | | $ | 141.36 | | | $ | 154.25 | | | $ | 151.96 | | | $ | 110.96 | |
Ratio of expenses to average net assets | | | 1.29 | % | | | 1.33 | % | | | 1.33 | % | | | 1.34 | % | | | 1.36 | % |
Ratio of net investment income (loss) to average net assets | | | (0.16 | )% | | | 0.95 | % | | | 1.10 | % | | | (0.51 | )% | | | (0.45 | )% |
Portfolio turnover rate(2) | | | 94 | % | | | 90 | % | | | 102 | % | | | 98 | % | | | 98 | % |
(1) | Calculated using the average shares outstanding method. |
(2) | Calculated on the basis of the Fund as a whole. |
The accompanying notes are an integral part of these financial statements.
HENNESSY FUNDS | 1-800-966-4354 |
Financial Statements — Financial Highlights
| Hennessy Cornerstone Growth Fund |
For an Institutional Class share outstanding throughout each year
| | | Year Ended October 31 | |
| | | 2024 | | | 2023 | | | 2022 | | | 2021 | | | 2020 | |
| PER SHARE DATA: | | | | | | | | | | | | | | | |
Net asset value, beginning of year | | $ | 24.91 | | | $ | 25.17 | | | $ | 31.09 | | | $ | 20.68 | | | $ | 19.83 | |
| | | | | | | | | | | | | | | | | | | | | |
| Income from investment operations: | | | | | | | | | | | | | | | | | | | | |
Net investment income (loss)(1) | | | 0.01 | | | | 0.29 | | | | 0.34 | | | | (0.05 | ) | | | (0.03 | ) |
Net realized and unrealized gains on investments | | | 12.30 | | | | 0.38 | | | | 0.67 | | | | 10.46 | | | | 0.88 | |
| Total from investment operations | | | 12.31 | | | | 0.67 | | | | 1.01 | | | | 10.41 | | | | 0.85 | |
| | | | | | | | | | | | | | | | | | | | | |
| Less distributions: | | | | | | | | | | | | | | | | | | | | |
Dividends from net investment income | | | (0.18 | ) | | | (0.35 | ) | | | — | | | | — | | | | — | |
Dividends from net realized gains | | | — | | | | (0.58 | ) | | | (6.93 | ) | | | — | | | | — | |
| Total distributions | | | (0.18 | ) | | | (0.93 | ) | | | (6.93 | ) | | | — | | | | — | |
Net asset value, end of year | | $ | 37.04 | | | $ | 24.91 | | | $ | 25.17 | | | $ | 31.09 | | | $ | 20.68 | |
| | | | | | | | | | | | | | | | | | | | | |
| TOTAL RETURN | | | 49.64 | % | | | 2.85 | % | | | 2.84 | % | | | 50.34 | % | | | 4.29 | % |
| | | | | | | | | | | | | | | | | | | | | |
| SUPPLEMENTAL DATA AND RATIOS: | | | | | | | | | | | | | | | | | | | | |
Net assets, end of year (millions) | | $ | 173.57 | | | $ | 22.32 | | | $ | 18.52 | | | $ | 15.78 | | | $ | 11.65 | |
Ratio of expenses to average net assets | | | 0.97 | % | | | 1.02 | % | | | 1.01 | % | | | 1.01 | % | | | 1.05 | % |
Ratio of net investment income (loss) to average net assets | | | 0.02 | % | | | 1.18 | % | | | 1.38 | % | | | (0.17 | )% | | | (0.14 | )% |
Portfolio turnover rate(2) | | | 94 | % | | | 90 | % | | | 102 | % | | | 98 | % | | | 98 | % |
(1) | Calculated using the average shares outstanding method. |
(2) | Calculated on the basis of the Fund as a whole. |
The accompanying notes are an integral part of these financial statements.
WWW.HENNESSYFUNDS.COM
Financial Statements — Financial Highlights
For an Investor Class share outstanding throughout each year
| | | Year Ended October 31 | |
| | | 2024 | | | 2023 | | | 2022 | | | 2021 | | | 2020 | |
| PER SHARE DATA: | | | | | | | | | | | | | | | |
Net asset value, beginning of year | | $ | 46.14 | | | $ | 51.12 | | | $ | 80.48 | | | $ | 71.68 | | | $ | 85.11 | |
| | | | | | | | | | | | | | | | | | | | | |
| Income from investment operations: | | | | | | | | | | | | | | | | | | | | |
Net investment loss(1) | | | (0.21 | ) | | | (0.29 | ) | | | (0.56 | ) | | | (0.63 | ) | | | (0.66 | ) |
Net realized and unrealized gains (losses) on investments | | | 15.14 | | | | 2.15 | | | | (16.93 | ) | | | 31.46 | | | | (4.21 | ) |
| Total from investment operations | | | 14.93 | | | | 1.86 | | | | (17.49 | ) | | | 30.83 | | | | (4.87 | ) |
| | | | | | | | | | | | | | | | | | | | | |
| Less distributions: | | | | | | | | | | | | | | | | | | | | |
Dividends from net realized gains | | | (10.61 | ) | | | (6.84 | ) | | | (11.87 | ) | | | (22.03 | ) | | | (8.56 | ) |
| Total distributions | | | (10.61 | ) | | | (6.84 | ) | | | (11.87 | ) | | | (22.03 | ) | | | (8.56 | ) |
Net asset value, end of year | | $ | 50.46 | | | $ | 46.14 | | | $ | 51.12 | | | $ | 80.48 | | | $ | 71.68 | |
| | | | | | | | | | | | | | | | | | | | | |
| TOTAL RETURN | | | 37.93 | % | | | 3.52 | % | | | -25.55 | % | | | 52.87 | % | | | -6.79 | % |
| | | | | | | | | | | | | | | | | | | | | |
| SUPPLEMENTAL DATA AND RATIOS: | | | | | | | | | | | | | | | | | | | | |
Net assets, end of year (millions) | | $ | 394.90 | | | $ | 357.13 | | | $ | 431.67 | | | $ | 709.40 | | | $ | 678.72 | |
Ratio of expenses to average net assets | | | 1.49 | % | | | 1.50 | % | | | 1.52 | % | | | 1.49 | % | | | 1.51 | % |
Ratio of net investment loss to average net assets | | | (0.46 | )% | | | (0.58 | )% | | | (0.92 | )% | | | (0.88 | )% | | | (0.88 | )% |
Portfolio turnover rate(2) | | | 10 | % | | | 12 | % | | | 5 | % | | | 4 | % | | | 5 | % |
(1) | Calculated using the average shares outstanding method. |
(2) | Calculated on the basis of the Fund as a whole. |
The accompanying notes are an integral part of these financial statements.
HENNESSY FUNDS | 1-800-966-4354 |
Financial Statements — Financial Highlights
For an Institutional Class share outstanding throughout each year
| | | Year Ended October 31 | |
| | | 2024 | | | 2023 | | | 2022 | | | 2021 | | | 2020 | |
| PER SHARE DATA: | | | | | | | | | | | | | | | |
Net asset value, beginning of year | | $ | 48.32 | | | $ | 53.34 | | | $ | 83.66 | | | $ | 74.24 | | | $ | 87.83 | |
| | | | | | | | | | | | | | | | | | | | | |
| Income from investment operations: | | | | | | | | | | | | | | | | | | | | |
Net investment loss(1) | | | (0.06 | ) | | | (0.11 | ) | | | (0.34 | ) | | | (0.37 | ) | | | (0.39 | ) |
Net realized and unrealized gains (losses) on investments | | | 15.89 | | | | 2.23 | | | | (17.63 | ) | | | 32.62 | | | | (4.36 | ) |
| Total from investment operations | | | 15.83 | | | | 2.12 | | | | (17.97 | ) | | | 32.25 | | | | (4.75 | ) |
| | | | | | | | | | | | | | | | | | | | | |
| Less distributions: | | | | | | | | | | | | | | | | | | | | |
Dividends from net realized gains | | | (11.11 | ) | | | (7.14 | ) | | | (12.35 | ) | | | (22.83 | ) | | | (8.84 | ) |
| Total distributions | | | (11.11 | ) | | | (7.14 | ) | | | (12.35 | ) | | | (22.83 | ) | | | (8.84 | ) |
Net asset value, end of year | | $ | 53.04 | | | $ | 48.32 | | | $ | 53.34 | | | $ | 83.66 | | | $ | 74.24 | |
| | | | | | | | | | | | | | | | | | | | | |
| TOTAL RETURN | | | 38.44 | % | | | 3.90 | % | | | -25.27 | % | | | 53.43 | % | | | -6.45 | % |
| | | | | | | | | | | | | | | | | | | | | |
| SUPPLEMENTAL DATA AND RATIOS: | | | | | | | | | | | | | | | | | | | | |
Net assets, end of year (millions) | | $ | 279.83 | | | $ | 214.53 | | | $ | 308.95 | | | $ | 498.51 | | | $ | 387.55 | |
Ratio of expenses to average net assets | | | 1.11 | % | | | 1.13 | % | | | 1.13 | % | | | 1.12 | % | | | 1.14 | % |
Ratio of net investment loss to average net assets | | | (0.12 | )% | | | (0.22 | )% | | | (0.53 | )% | | | (0.50 | )% | | | (0.51 | )% |
Portfolio turnover rate(2) | | | 10 | % | | | 12 | % | | | 5 | % | | | 4 | % | | | 5 | % |
(1) | Calculated using the average shares outstanding method. |
(2) | Calculated on the basis of the Fund as a whole. |
The accompanying notes are an integral part of these financial statements.
WWW.HENNESSYFUNDS.COM
Financial Statements — Financial Highlights
| Hennessy Cornerstone Mid Cap 30 Fund |
For an Investor Class share outstanding throughout each year
| | | Year Ended October 31 | |
| | | 2024 | | | 2023 | | | 2022 | | | 2021 | | | 2020 | |
| PER SHARE DATA: | | | | | | | | | | | | | | | |
Net asset value, beginning of year | | $ | 18.92 | | | $ | 20.83 | | | $ | 19.78 | | | $ | 13.27 | | | $ | 12.01 | |
| | | | | | | | | | | | | | | | | | | | | |
| Income from investment operations: | | | | | | | | | | | | | | | | | | | | |
Net investment income (loss)(1) | | | (0.01 | ) | | | 0.01 | | | | 0.17 | | | | (0.14 | ) | | | (0.03 | ) |
Net realized and unrealized gains on investments | | | 9.47 | | | | 1.68 | | | | 1.22 | | | | 6.65 | | | | 1.29 | |
| Total from investment operations | | | 9.46 | | | | 1.69 | | | | 1.39 | | | | 6.51 | | | | 1.26 | |
| | | | | | | | | | | | | | | | | | | | | |
| Less distributions: | | | | | | | | | | | | | | | | | | | | |
Dividends from net investment income | | | — | | | | — | | | | (0.34 | ) | | | — | | | | — | |
Dividends from net realized gains | | | (1.90 | ) | | | (3.60 | ) | | | — | | | | — | | | | — | |
| Total distributions | | | (1.90 | ) | | | (3.60 | ) | | | (0.34 | ) | | | — | | | | — | |
Net asset value, end of year | | $ | 26.48 | | | $ | 18.92 | | | $ | 20.83 | | | $ | 19.78 | | | $ | 13.27 | |
| | | | | | | | | | | | | | | | | | | | | |
| TOTAL RETURN | | | 54.22 | % | | | 10.03 | % | | | 7.12 | % | | | 49.06 | % | | | 10.49 | % |
| | | | | | | | | | | | | | | | | | | | | |
| SUPPLEMENTAL DATA AND RATIOS: | | | | | | | | | | | | | | | | | | | | |
Net assets, end of year (millions) | | $ | 627.17 | | | $ | 297.37 | | | $ | 215.00 | | | $ | 219.58 | | | $ | 188.71 | |
Ratio of expenses to average net assets | | | 1.33 | % | | | 1.34 | % | | | 1.35 | % | | | 1.36 | % | | | 1.37 | % |
Ratio of net investment income (loss) to average net assets | | | (0.06 | )% | | | 0.09 | % | | | 0.84 | % | | | (0.74 | )% | | | (0.27 | )% |
Portfolio turnover rate(2) | | | 94 | % | | | 120 | % | | | 176 | % | | | 0 | % | | | 94 | % |
(1) | Calculated using the average shares outstanding method. |
(2) | Calculated on the basis of the Fund as a whole. |
The accompanying notes are an integral part of these financial statements.
HENNESSY FUNDS | 1-800-966-4354 |
Financial Statements — Financial Highlights
| Hennessy Cornerstone Mid Cap 30 Fund |
For an Institutional Class share outstanding throughout each year
| | | Year Ended October 31 | |
| | | 2024 | | | 2023 | | | 2022 | | | 2021 | | | 2020 | |
| PER SHARE DATA: | | | | | | | | | | | | | | | |
Net asset value, beginning of year | | $ | 19.91 | | | $ | 21.84 | | | $ | 20.66 | | | $ | 13.81 | | | $ | 12.46 | |
| | | | | | | | | | | | | | | | | | | | | |
| Income from investment operations: | | | | | | | | | | | | | | | | | | | | |
Net investment income (loss)(1) | | | 0.07 | | | | 0.09 | | | | 0.24 | | | | (0.07 | ) | | | 0.01 | |
Net realized and unrealized gains on investments | | | 9.98 | | | | 1.76 | | | | 1.29 | | | | 6.92 | | | | 1.34 | |
| Total from investment operations | | | 10.05 | | | | 1.85 | | | | 1.53 | | | | 6.85 | | | | 1.35 | |
| | | | | | | | | | | | | | | | | | | | | |
| Less distributions: | | | | | | | | | | | | | | | | | | | | |
Dividends from net investment income | | | — | | | | — | | | | (0.35 | ) | | | — | | | | — | |
Dividends from net realized gains | | | (2.00 | ) | | | (3.78 | ) | | | — | | | | — | | | | — | |
| Total distributions | | | (2.00 | ) | | | (3.78 | ) | | | (0.35 | ) | | | — | | | | — | |
Net asset value, end of year | | $ | 27.96 | | | $ | 19.91 | | | $ | 21.84 | | | $ | 20.66 | | | $ | 13.81 | |
| | | | | | | | | | | | | | | | | | | | | |
| TOTAL RETURN | | | 54.74 | % | | | 10.43 | % | | | 7.52 | % | | | 49.60 | % | | | 10.83 | % |
| | | | | | | | | | | | | | | | | | | | | |
| SUPPLEMENTAL DATA AND RATIOS: | | | | | | | | | | | | | | | | | | | | |
Net assets, end of year (millions) | | $ | 969.94 | | | $ | 293.88 | | | $ | 174.62 | | | $ | 169.19 | | | $ | 136.09 | |
Ratio of expenses to average net assets | | | 0.95 | % | | | 0.97 | % | | | 1.00 | % | | | 0.99 | % | | | 1.01 | % |
Ratio of net investment income (loss) to average net assets | | | 0.27 | % | | | 0.44 | % | | | 1.18 | % | | | (0.38 | )% | | | 0.09 | % |
Portfolio turnover rate(2) | | | 94 | % | | | 120 | % | | | 176 | % | | | 0 | % | | | 94 | % |
(1) | Calculated using the average shares outstanding method. |
(2) | Calculated on the basis of the Fund as a whole. |
The accompanying notes are an integral part of these financial statements.
WWW.HENNESSYFUNDS.COM
Financial Statements — Financial Highlights
| Hennessy Cornerstone Large Growth Fund |
For an Investor Class share outstanding throughout each year
| | | Year Ended October 31 | |
| | | 2024 | | | 2023 | | | 2022 | | | 2021 | | | 2020 | |
| PER SHARE DATA: | | | | | | | | | | | | | | | |
Net asset value, beginning of year | | $ | 10.06 | | | $ | 10.92 | | | $ | 14.35 | | | $ | 10.21 | | | $ | 10.54 | |
| | | | | | | | | | | | | | | | | | | | | |
| Income from investment operations: | | | | | | | | | | | | | | | | | | | | |
Net investment income(1) | | | 0.10 | | | | 0.11 | | | | 0.09 | | | | 0.09 | | | | 0.09 | |
Net realized and unrealized gains (losses) on investments | | | 2.19 | | | | 0.87 | | | | (1.66 | ) | | | 4.64 | | | | (0.15 | ) |
| Total from investment operations | | | 2.29 | | | | 0.98 | | | | (1.57 | ) | | | 4.73 | | | | (0.06 | ) |
| | | | | | | | | | | | | | | | | | | | | |
| Less distributions: | | | | | | | | | | | | | | | | | | | | |
Dividends from net investment income | | | (0.11 | ) | | | (0.08 | ) | | | (0.08 | ) | | | (0.10 | ) | | | (0.14 | ) |
Dividends from net realized loss | | | (0.30 | ) | | | (1.76 | ) | | | (1.78 | ) | | | (0.49 | ) | | | (0.13 | ) |
| Total distributions | | | (0.41 | ) | | | (1.84 | ) | | | (1.86 | ) | | | (0.59 | ) | | | (0.27 | ) |
Net asset value, end of year | | $ | 11.94 | | | $ | 10.06 | | | $ | 10.92 | | | $ | 14.35 | | | $ | 10.21 | |
| | | | | | | | | | | | | | | | | | | | | |
| TOTAL RETURN | | | 23.34 | % | | | 9.48 | % | | | -12.76 | % | | | 48.00 | % | | | -0.75 | % |
| | | | | | | | | | | | | | | | | | | | | |
| SUPPLEMENTAL DATA AND RATIOS: | | | | | | | | | | | | | | | | | | | | |
Net assets, end of year (millions) | | $ | 127.75 | | | $ | 112.89 | | | $ | 115.15 | | | $ | 143.11 | | | $ | 103.11 | |
Ratio of expenses to average net assets: | | | | | | | | | | | | | | | | | | | | |
| Before expense reimbursement/recoupment | | | 1.27 | % | | | 1.28 | % | | | 1.30 | % | | | 1.29 | % | | | 1.31 | % |
| After expense reimbursement/recoupment | | | 1.27 | % | | | 1.28 | % | | | 1.30 | % | | | 1.29 | % | | | 1.31 | %(2) |
Ratio of net investment income to average net assets: | | | | | | | | | | | | | | | | | | | | |
| Before expense reimbursement/recoupment | | | 0.89 | % | | | 1.10 | % | | | 0.76 | % | | | 0.69 | % | | | 0.93 | % |
| After expense reimbursement/recoupment | | | 0.89 | % | | | 1.10 | % | | | 0.76 | % | | | 0.69 | % | | | 0.93 | % |
Portfolio turnover rate(3) | | | 54 | % | | | 53 | % | | | 76 | % | | | 68 | % | | | 62 | % |
(1) | Calculated using the average shares outstanding method. |
(2) | The Fund had an expense limitation agreement in place through November 30, 2019. |
(3) | Calculated on the basis of the Fund as a whole. |
The accompanying notes are an integral part of these financial statements.
HENNESSY FUNDS | 1-800-966-4354 |
Financial Statements — Financial Highlights
| Hennessy Cornerstone Large Growth Fund |
For an Institutional Class share outstanding throughout each year
| | | Year Ended October 31 | |
| | | 2024 | | | 2023 | | | 2022 | | | 2021 | | | 2020 | |
| PER SHARE DATA: | | | | | | | | | | | | | | | |
Net asset value, beginning of year | | $ | 10.18 | | | $ | 11.05 | | | $ | 14.51 | | | $ | 10.33 | | | $ | 10.65 | |
| | | | | | | | | | | | | | | | | | | | | |
| Income from investment operations: | | | | | | | | | | | | | | | | | | | | |
Net investment income(1) | | | 0.14 | | | | 0.14 | | | | 0.13 | | | | 0.12 | | | | 0.13 | |
Net realized and unrealized gains (losses) on investments | | | 2.21 | | | | 0.89 | | | | (1.68 | ) | | | 4.68 | | | | (0.15 | ) |
| Total from investment operations | | | 2.35 | | | | 1.03 | | | | (1.55 | ) | | | 4.80 | | | | (0.02 | ) |
| | | | | | | | | | | | | | | | | | | | | |
| Less distributions: | | | | | | | | | | | | | | | | | | | | |
Dividends from net investment income | | | (0.14 | ) | | | (0.12 | ) | | | (0.11 | ) | | | (0.13 | ) | | | (0.17 | ) |
Dividends from net realized loss | | | (0.31 | ) | | | (1.78 | ) | | | (1.80 | ) | | | (0.49 | ) | | | (0.13 | ) |
| Total distributions | | | (0.45 | ) | | | (1.90 | ) | | | (1.91 | ) | | | (0.62 | ) | | | (0.30 | ) |
Net asset value, end of year | | $ | 12.08 | | | $ | 10.18 | | | $ | 11.05 | | | $ | 14.51 | | | $ | 10.33 | |
| | | | | | | | | | | | | | | | | | | | | |
| TOTAL RETURN | | | 23.62 | % | | | 9.85 | % | | | -12.52 | % | | | 48.30 | % | | | -0.40 | % |
| | | | | | | | | | | | | | | | | | | | | |
| SUPPLEMENTAL DATA AND RATIOS: | | | | | | | | | | | | | | | | | | | | |
Net assets, end of year (millions) | | $ | 17.41 | | | $ | 15.77 | | | $ | 14.80 | | | $ | 18.39 | | | $ | 12.60 | |
Ratio of expenses to average net assets: | | | | | | | | | | | | | | | | | | | | |
| Before expense reimbursement/recoupment | | | 1.00 | % | | | 1.00 | % | | | 0.99 | % | | | 1.04 | % | | | 1.01 | % |
| After expense reimbursement/recoupment | | | 1.00 | % | | | 1.00 | % | | | 0.99 | % | | | 1.04 | % | | | 1.01 | %(2) |
Ratio of net investment income to average net assets: | | | | | | | | | | | | | | | | | | | | |
| Before expense reimbursement/recoupment | | | 1.17 | % | | | 1.37 | % | | | 1.08 | % | | | 0.91 | % | | | 1.23 | % |
| After expense reimbursement/recoupment | | | 1.17 | % | | | 1.37 | % | | | 1.08 | % | | | 0.91 | % | | | 1.23 | % |
Portfolio turnover rate(3) | | | 54 | % | | | 53 | % | | | 76 | % | | | 68 | % | | | 62 | % |
(1) | Calculated using the average shares outstanding method. |
(2) | The Fund had an expense limitation agreement in place through November 30, 2019. |
(3) | Calculated on the basis of the Fund as a whole. |
The accompanying notes are an integral part of these financial statements.
WWW.HENNESSYFUNDS.COM
Financial Statements — Financial Highlights
| Hennessy Cornerstone Value Fund |
For an Investor Class share outstanding throughout each year
| | | Year Ended October 31 | |
| | | 2024 | | | 2023 | | | 2022 | | | 2021 | | | 2020 | |
| PER SHARE DATA: | | | | | | | | | | | | | | | |
Net asset value, beginning of year | | $ | 18.14 | | | $ | 20.30 | | | $ | 19.59 | | | $ | 13.69 | | | $ | 17.43 | |
| | | | | | | | | | | | | | | | | | | | | |
| Income from investment operations: | | | | | | | | | | | | | | | | | | | | |
Net investment income(1) | | | 0.65 | | | | 0.63 | | | | 0.55 | | | | 0.44 | | | | 0.41 | |
Net realized and unrealized gains (losses) on investments | | | 3.51 | | | | (0.84 | ) | | | 1.10 | | | | 5.87 | | | | (3.01 | ) |
| Total from investment operations | | | 4.16 | | | | (0.21 | ) | | | 1.65 | | | | 6.31 | | | | (2.60 | ) |
| | | | | | | | | | | | | | | | | | | | | |
| Less distributions: | | | | | | | | | | | | | | | | | | | | |
Dividends from net investment income | | | (0.69 | ) | | | (0.50 | ) | | | (0.51 | ) | | | (0.41 | ) | | | (0.47 | ) |
Dividends from net realized gains | | | — | | | | (1.45 | ) | | | (0.43 | ) | | | — | | | | (0.67 | ) |
| Total distributions | | | (0.69 | ) | | | (1.95 | ) | | | (0.94 | ) | | | (0.41 | ) | | | (1.14 | ) |
Net asset value, end of year | | $ | 21.61 | | | $ | 18.14 | | | $ | 20.30 | | | $ | 19.59 | | | $ | 13.69 | |
| | | | | | | | | | | | | | | | | | | | | |
| TOTAL RETURN | | | 23.38 | % | | | -1.45 | % | | | 8.68 | % | | | 46.82 | % | | | -16.22 | % |
| | | | | | | | | | | | | | | | | | | | | |
| SUPPLEMENTAL DATA AND RATIOS: | | | | | | | | | | | | | | | | | | | | |
Net assets, end of year (millions) | | $ | 273.89 | | | $ | 246.40 | | | $ | 268.81 | | | $ | 254.23 | | | $ | 189.60 | |
Ratio of expenses to average net assets | | | 1.22 | % | | | 1.23 | % | | | 1.23 | % | | | 1.23 | % | | | 1.30 | % |
Ratio of net investment income to average net assets | | | 3.21 | % | | | 3.31 | % | | | 2.74 | % | | | 2.43 | % | | | 2.71 | % |
Portfolio turnover rate(2) | | | 22 | % | | | 31 | % | | | 36 | % | | | 41 | % | | | 32 | % |
(1) | Calculated using the average shares outstanding method. |
(2) | Calculated on the basis of the Fund as a whole. |
The accompanying notes are an integral part of these financial statements.
HENNESSY FUNDS | 1-800-966-4354 |
Financial Statements — Financial Highlights
| Hennessy Cornerstone Value Fund |
For an Institutional Class share outstanding throughout each year
| | | Year Ended October 31 | |
| | | 2024 | | | 2023 | | | 2022 | | | 2021 | | | 2020 | |
| PER SHARE DATA: | | | | | | | | | | | | | | | |
Net asset value, beginning of year | | $ | 18.17 | | | $ | 20.34 | | | $ | 19.63 | | | $ | 13.71 | | | $ | 17.45 | |
| | | | | | | | | | | | | | | | | | | | | |
| Income from investment operations: | | | | | | | | | | | | | | | | | | | | |
Net investment income(1) | | | 0.69 | | | | 0.67 | | | | 0.58 | | | | 0.48 | | | | 0.44 | |
Net realized and unrealized gains (losses) on investments | | | 3.52 | | | | (0.84 | ) | | | 1.12 | | | | 5.88 | | | | (3.01 | ) |
| Total from investment operations | | | 4.21 | | | | (0.17 | ) | | | 1.70 | | | | 6.36 | | | | (2.57 | ) |
| | | | | | | | | | | | | | | | | | | | | |
| Less distributions: | | | | | | | | | | | | | | | | | | | | |
Dividends from net investment income | | | (0.70 | ) | | | (0.55 | ) | | | (0.56 | ) | | | (0.44 | ) | | | (0.49 | ) |
Dividends from net realized gains | | | — | | | | (1.45 | ) | | | (0.43 | ) | | | — | | | | (0.68 | ) |
| Total distributions | | | (0.70 | ) | | | (2.00 | ) | | | (0.99 | ) | | | (0.44 | ) | | | (1.17 | ) |
Net asset value, end of year | | $ | 21.68 | | | $ | 18.17 | | | $ | 20.34 | | | $ | 19.63 | | | $ | 13.71 | |
| | | | | | | | | | | | | | | | | | | | | |
| TOTAL RETURN | | | 23.66 | % | | | -1.26 | % | | | 8.92 | % | | | 47.19 | % | | | -16.06 | % |
| | | | | | | | | | | | | | | | | | | | | |
| SUPPLEMENTAL DATA AND RATIOS: | | | | | | | | | | | | | | | | | | | | |
Net assets, end of year (millions) | | $ | 8.07 | | | $ | 7.50 | | | $ | 24.35 | | | $ | 5.50 | | | $ | 4.29 | |
Ratio of expenses to average net assets: | | | 0.98 | % | | | 1.06 | % | | | 1.00 | % | | | 0.99 | % | | | 1.08 | % |
Ratio of net investment income to average net assets: | | | 3.44 | % | | | 3.48 | % | | | 2.92 | % | | | 2.67 | % | | | 2.94 | % |
Portfolio turnover rate(2) | | | 22 | % | | | 31 | % | | | 36 | % | | | 41 | % | | | 32 | % |
(1) | Calculated using the average shares outstanding method. |
(2) | Calculated on the basis of the Fund as a whole. |
The accompanying notes are an integral part of these financial statements.
WWW.HENNESSYFUNDS.COM
Financial Statements — Financial Highlights
| Hennessy Total Return Fund |
For an Investor Class share outstanding throughout each year
| | | Year Ended October 31 | |
| | | 2024 | | | 2023 | | | 2022 | | | 2021 | | | 2020 | |
| PER SHARE DATA: | | | | | | | | | | | | | | | |
Net asset value, beginning of year | | $ | 12.53 | | | $ | 13.47 | | | $ | 13.54 | | | $ | 11.97 | | | $ | 13.98 | |
| | | | | | | | | | | | | | | | | | | | | |
| Income from investment operations: | | | | | | | | | | | | | | | | | | | | |
Net investment income(1) | | | 0.42 | | | | 0.40 | | | | 0.22 | | | | 0.20 | | | | 0.27 | |
Net realized and unrealized gains (losses) on investments | | | 1.47 | | | | (0.30 | ) | | | (0.07 | ) | | | 2.33 | | | | (1.99 | ) |
| Total from investment operations | | | 1.89 | | | | 0.10 | | | | 0.15 | | | | 2.53 | | | | (1.72 | ) |
| | | | | | | | | | | | | | | | | | | | | |
| Less distributions: | | | | | | | | | | | | | | | | | | | | |
Dividends from net investment income | | | (0.43 | ) | | | (0.38 | ) | | | (0.22 | ) | | | (0.20 | ) | | | (0.29 | ) |
Dividends from net realized gains | | | (0.54 | ) | | | (0.66 | ) | | | — | | | | (0.76 | ) | | | — | |
| Total distributions | | | (0.97 | ) | | | (1.04 | ) | | | (0.22 | ) | | | (0.96 | ) | | | (0.29 | ) |
Net asset value, end of year | | $ | 13.45 | | | $ | 12.53 | | | $ | 13.47 | | | $ | 13.54 | | | $ | 11.97 | |
| | | | | | | | | | | | | | | | | | | | | |
| TOTAL RETURN | | | 15.52 | % | | | 0.53 | % | | | 1.12 | % | | | 21.72 | % | | | -12.36 | % |
| | | | | | | | | | | | | | | | | | | | | |
| SUPPLEMENTAL DATA AND RATIOS: | | | | | | | | | | | | | | | | | | | | |
Net assets, end of year (millions) | | $ | 49.04 | | | $ | 47.54 | | | $ | 53.36 | | | $ | 54.45 | | | $ | 50.67 | |
Ratio of expenses to average net assets | | | 3.62 | % | | | 3.37 | % | | | 1.77 | % | | | 1.35 | % | | | 1.73 | % |
Ratio of net investment income to average net assets | | | 3.14 | % | | | 3.05 | % | | | 1.62 | % | | | 1.52 | % | | | 2.05 | % |
Portfolio turnover rate | | | 32 | % | | | 36 | % | | | 24 | % | | | 19 | % | | | 39 | % |
(1) | Calculated using the average shares outstanding method. |
The accompanying notes are an integral part of these financial statements.
HENNESSY FUNDS | 1-800-966-4354 |
Financial Statements — Financial Highlights
| Hennessy Equity and Income Fund |
For an Investor Class share outstanding throughout each year
| | | Year Ended October 31 | |
| | | 2024 | | | 2023 | | | 2022 | | | 2021 | | | 2020 | |
| PER SHARE DATA: | | | | | | | | | | | | | | | |
Net asset value, beginning of year | | $ | 14.10 | | | $ | 14.06 | | | $ | 17.26 | | | $ | 15.12 | | | $ | 15.72 | |
| | | | | | | | | | | | | | | | | | | | | |
| Income from investment operations: | | | | | | | | | | | | | | | | | | | | |
Net investment income(1) | | | 0.09 | | | | 0.10 | | | | 0.08 | | | | 0.09 | | | | 0.16 | |
Net realized and unrealized gains (losses) on investments | | | 2.63 | | | | 0.42 | | | | (2.09 | ) | | | 3.01 | | | | 0.40 | |
| Total from investment operations | | | 2.72 | | | | 0.52 | | | | (2.01 | ) | | | 3.10 | | | | 0.56 | |
| | | | | | | | | | | | | | | | | | | | | |
| Less distributions: | | | | | | | | | | | | | | | | | | | | |
Dividends from net investment income | | | (0.09 | ) | | | (0.10 | ) | | | (0.08 | ) | | | (0.10 | ) | | | (0.16 | ) |
Dividends from net realized gains | | | (1.21 | ) | | | (0.38 | ) | | | (1.11 | ) | | | (0.86 | ) | | | (1.00 | ) |
| Total distributions | | | (1.30 | ) | | | (0.48 | ) | | | (1.19 | ) | | | (0.96 | ) | | | (1.16 | ) |
Net asset value, end of year | | $ | 15.52 | | | $ | 14.10 | | | $ | 14.06 | | | $ | 17.26 | | | $ | 15.12 | |
| | | | | | | | | | | | | | | | | | | | | |
| TOTAL RETURN | | | 20.43 | % | | | 3.67 | % | | | -12.60 | % | | | 21.24 | % | | | 3.74 | % |
| | | | | | | | | | | | | | | | | | | | | |
| SUPPLEMENTAL DATA AND RATIOS: | | | | | | | | | | | | | | | | | | | | |
Net assets, end of year (millions) | | $ | 31.75 | | | $ | 34.29 | | | $ | 39.17 | | | $ | 53.97 | | | $ | 51.29 | |
Ratio of expenses to average net assets | | | 1.55 | % | | | 1.52 | % | | | 1.51 | % | | | 1.49 | % | | | 1.49 | % |
Ratio of net investment income to average net assets | | | 0.59 | % | | | 0.71 | % | | | 0.53 | % | | | 0.54 | % | | | 1.08 | % |
Portfolio turnover rate(2) | | | 16 | % | | | 11 | % | | | 15 | % | | | 26 | % | | | 22 | % |
(1) | Calculated using the average shares outstanding method. |
(2) | Calculated on the basis of the Fund as a whole. |
The accompanying notes are an integral part of these financial statements.
WWW.HENNESSYFUNDS.COM
Financial Statements — Financial Highlights
| Hennessy Equity and Income Fund |
For an Institutional Class share outstanding throughout each year
| | | Year Ended October 31 | |
| | | 2024 | | | 2023 | | | 2022 | | | 2021 | | | 2020 | |
| PER SHARE DATA: | | | | | | | | | | | | | | | |
Net asset value, beginning of year | | $ | 13.23 | | | $ | 13.21 | | | $ | 16.22 | | | $ | 14.22 | | | $ | 14.80 | |
| | | | | | | | | | | | | | | | | | | | | |
| Income from investment operations: | | | | | | | | | | | | | | | | | | | | |
Net investment income(1) | | | 0.13 | | | | 0.15 | | | | 0.13 | | | | 0.14 | | | | 0.20 | |
Net realized and unrealized gains (losses) on investments | | | 2.47 | | | | 0.38 | | | | (1.97 | ) | | | 2.83 | | | | 0.38 | |
| Total from investment operations | | | 2.60 | | | | 0.53 | | | | (1.84 | ) | | | 2.97 | | | | 0.58 | |
| | | | | | | | | | | | | | | | | | | | | |
| Less distributions: | | | | | | | | | | | | | | | | | | | | |
Dividends from net investment income | | | (0.14 | ) | | | (0.15 | ) | | | (0.13 | ) | | | (0.16 | ) | | | (0.22 | ) |
Dividends from net realized gains | | | (1.14 | ) | | | (0.36 | ) | | | (1.04 | ) | | | (0.81 | ) | | | (0.94 | ) |
| Total distributions | | | (1.28 | ) | | | (0.51 | ) | | | (1.17 | ) | | | (0.97 | ) | | | (1.16 | ) |
Net asset value, end of year | | $ | 14.55 | | | $ | 13.23 | | | $ | 13.21 | | | $ | 16.22 | | | $ | 14.22 | |
| | | | | | | | | | | | | | | | | | | | | |
| TOTAL RETURN | | | 20.85 | % | | | 3.99 | % | | | -12.25 | % | | | 21.68 | % | | | 4.16 | % |
| | | | | | | | | | | | | | | | | | | | | |
| SUPPLEMENTAL DATA AND RATIOS: | | | | | | | | | | | | | | | | | | | | |
Net assets, end of year (millions) | | $ | 27.78 | | | $ | 34.71 | | | $ | 47.74 | | | $ | 66.06 | | | $ | 61.75 | |
Ratio of expenses to average net assets | | | 1.18 | % | | | 1.15 | % | | | 1.13 | % | | | 1.12 | % | | | 1.12 | % |
Ratio of net investment income to average net assets | | | 0.97 | % | | | 1.08 | % | | | 0.90 | % | | | 0.91 | % | | | 1.44 | % |
Portfolio turnover rate(2) | | | 16 | % | | | 11 | % | | | 15 | % | | | 26 | % | | | 22 | % |
(1) | Calculated using the average shares outstanding method. |
(2) | Calculated on the basis of the Fund as a whole. |
The accompanying notes are an integral part of these financial statements.
HENNESSY FUNDS | 1-800-966-4354 |
Financial Statements — Financial Highlights
For an Investor Class share outstanding throughout each year
| | | Year Ended October 31 | |
| | | 2024 | | | 2023 | | | 2022 | | | 2021 | | | 2020 | |
| PER SHARE DATA: | | | | | | | | | | | | | | | |
Net asset value, beginning of year | | $ | 11.12 | | | $ | 11.82 | | | $ | 12.39 | | | $ | 10.84 | | | $ | 12.38 | |
| | | | | | | | | | | | | | | | | | | | | |
| Income from investment operations: | | | | | | | | | | | | | | | | | | | | |
Net investment income(1) | | | 0.32 | | | | 0.26 | | | | 0.06 | | | | 0.02 | | | | 0.12 | |
Net realized and unrealized gains (losses) on investments | | | 0.95 | | | | (0.27 | ) | | | (0.15 | ) | | | 1.56 | | | | (1.04 | ) |
| Total from investment operations | | | 1.27 | | | | (0.01 | ) | | | (0.09 | ) | | | 1.58 | | | | (0.92 | ) |
| | | | | | | | | | | | | | | | | | | | | |
| Less distributions: | | | | | | | | | | | | | | | | | | | | |
Dividends from net investment income | | | (0.32 | ) | | | (0.25 | ) | | | (0.05 | ) | | | (0.03 | ) | | | (0.12 | ) |
Dividends from net realized gains | | | (0.01 | ) | | | (0.44 | ) | | | (0.43 | ) | | | — | | | | (0.50 | ) |
| Total distributions | | | (0.33 | ) | | | (0.69 | ) | | | (0.48 | ) | | | (0.03 | ) | | | (0.62 | ) |
Net asset value, end of year | | $ | 12.06 | | | $ | 11.12 | | | $ | 11.82 | | | $ | 12.39 | | | $ | 10.84 | |
| | | | | | | | | | | | | | | | | | | | | |
| TOTAL RETURN | | | 11.47 | % | | | -0.22 | % | | | -0.70 | % | | | 14.62 | % | | | -7.84 | % |
| | | | | | | | | | | | | | | | | | | | | |
| SUPPLEMENTAL DATA AND RATIOS: | | | | | | | | | | | | | | | | | | | | |
Net assets, end of year (millions) | | $ | 12.71 | | | $ | 12.29 | | | $ | 12.89 | | | $ | 13.53 | | | $ | 11.99 | |
Ratio of expenses to average net assets | | | 1.82 | % | | | 1.84 | % | | | 1.80 | % | | | 1.85 | % | | | 1.89 | % |
Ratio of net investment income to average net assets | | | 2.70 | % | | | 2.26 | % | | | 0.49 | % | | | 0.17 | % | | | 1.05 | % |
Portfolio turnover rate | | | 57 | % | | | 22 | % | | | 29 | % | | | 31 | % | | | 42 | % |
(1) | Calculated using the average shares outstanding method. |
The accompanying notes are an integral part of these financial statements.
WWW.HENNESSYFUNDS.COM
Financial Statements — Financial Highlights
| Hennessy Energy Transition Fund |
For an Investor Class share outstanding throughout each year
| | | Year Ended October 31 | |
| | | 2024 | | | 2023 | | | 2022 | | | 2021 | | | 2020 | |
| PER SHARE DATA: | | | | | | | | | | | | | | | |
Net asset value, beginning of year | | $ | 24.22 | | | $ | 24.15 | | | $ | 18.31 | | | $ | 8.74 | | | $ | 14.08 | |
| | | | | | | | | | | | | | | | | | | | | |
| Income from investment operations: | | | | | | | | | | | | | | | | | | | | |
Net investment income(1) | | | 0.13 | | | | 0.17 | | | | 0.16 | | | | 0.06 | | | | 0.04 | |
Net realized and unrealized gains (losses) on investments | | | 1.53 | | | | 0.02 | | | | 7.74 | | | | 9.51 | | | | (5.38 | ) |
| Total from investment operations | | | 1.66 | | | | 0.19 | | | | 7.90 | | | | 9.57 | | | | (5.34 | ) |
| | | | | | | | | | | | | | | | | | | | | |
| Less distributions: | | | | | | | | | | | | | | | | | | | | |
Dividends from net investment income | | | — | | | | (0.12 | ) | | | (2.06 | ) | | | — | | | | — | |
| Total distributions | | | — | | | | (0.12 | ) | | | (2.06 | ) | | | — | | | | — | |
Net asset value, end of year | | $ | 25.88 | | | $ | 24.22 | | | $ | 24.15 | | | $ | 18.31 | | | $ | 8.74 | |
| | | | | | | | | | | | | | | | | | | | | |
| TOTAL RETURN | | | 6.85 | % | | | 0.81 | % | | | 49.24 | % | | | 109.50 | % | | | -37.93 | % |
| | | | | | | | | | | | | | | | | | | | | |
| SUPPLEMENTAL DATA AND RATIOS: | | | | | | | | | | | | | | | | | | | | |
Net assets, end of year (millions) | | $ | 6.47 | | | $ | 8.96 | | | $ | 10.21 | | | $ | 6.80 | | | $ | 2.50 | |
Ratio of expenses to average net assets: | | | | | | | | | | | | | | | | | | | | |
| Before expense reimbursement | | | 2.61 | % | | | 2.42 | % | | | 2.42 | % | | | 2.96 | % | | | 2.59 | % |
After expense reimbursement(2) | | | 2.44 | % | | | 2.27 | % | | | 2.25 | % | | | 2.74 | % | | | 2.03 | %(3) |
Ratio of net investment income (loss) to average net assets: | | | | | | | | | | | | | | | | | | | | |
| Before expense reimbursement | | | 0.36 | % | | | 0.59 | % | | | 0.64 | % | | | 0.16 | % | | | (0.18 | )% |
| After expense reimbursement | | | 0.53 | % | | | 0.74 | % | | | 0.81 | % | | | 0.38 | % | | | 0.38 | % |
Portfolio turnover rate(4) | | | 14 | % | | | 28 | % | | | 31 | % | | | 74 | % | | | 73 | % |
(1) | Calculated using the average shares outstanding method. |
(2) | Certain service provider expenses were voluntarily waived during the fiscal year. |
(3) | The Fund had an expense limitation agreement in place through October 25, 2020. |
(4) | Calculated on the basis of the Fund as a whole. |
The accompanying notes are an integral part of these financial statements.
HENNESSY FUNDS | 1-800-966-4354 |
Financial Statements — Financial Highlights
| Hennessy Energy Transition Fund |
For an Institutional Class share outstanding throughout each year
| | | Year Ended October 31 | |
| | | 2024 | | | 2023 | | | 2022 | | | 2021 | | | 2020 | |
| PER SHARE DATA: | | | | | | | | | | | | | | | |
Net asset value, beginning of year | | $ | 24.68 | | | $ | 24.59 | | | $ | 18.60 | | | $ | 8.85 | | | $ | 14.26 | |
| | | | | | | | | | | | | | | | | | | | | |
| Income from investment operations: | | | | | | | | | | | | | | | | | | | | |
Net investment income(1) | | | 0.24 | | | | 0.25 | | | | 0.23 | | | | 0.07 | | | | 0.12 | |
Net realized and unrealized gains (losses) on investments | | | 1.54 | | | | 0.02 | | | | 7.87 | | | | 9.68 | | | | (5.50 | ) |
| Total from investment operations | | | 1.78 | | | | 0.27 | | | | 8.10 | | | | 9.75 | | | | (5.38 | ) |
| | | | | | | | | | | | | | | | | | | | | |
| Less distributions: | | | | | | | | | | | | | | | | | | | | |
Dividends from net investment income | | | — | | | | (0.18 | ) | | | (2.11 | ) | | | — | | | | (0.03 | ) |
| Total distributions | | | — | | | | (0.18 | ) | | | (2.11 | ) | | | — | | | | (0.03 | ) |
Net asset value, end of year | | $ | 26.46 | | | $ | 24.68 | | | $ | 24.59 | | | $ | 18.60 | | | $ | 8.85 | |
| | | | | | | | | | | | | | | | | | | | | |
| TOTAL RETURN | | | 7.21 | % | | | 1.14 | % | | | 49.71 | % | | | 110.17 | % | | | -37.80 | % |
| | | | | | | | | | | | | | | | | | | | | |
| SUPPLEMENTAL DATA AND RATIOS: | | | | | | | | | | | | | | | | | | | | |
Net assets, end of year (millions) | | $ | 8.14 | | | $ | 11.43 | | | $ | 13.33 | | | $ | 9.45 | | | $ | 3.82 | |
Ratio of expenses to average net assets: | | | | | | | | | | | | | | | | | | | | |
| Before expense reimbursement | | | 2.28 | % | | | 2.08 | % | | | 2.09 | % | | | 2.61 | % | | | 2.01 | % |
After expense reimbursement(2) | | | 2.11 | % | | | 1.93 | % | | | 1.92 | % | | | 2.39 | % | | | 1.77 | %(3) |
Ratio of net investment income to average net assets: | | | | | | | | | | | | | | | | | | | | |
| Before expense reimbursement | | | 0.77 | % | | | 0.92 | % | | | 0.96 | % | | | 0.22 | % | | | 0.79 | % |
| After expense reimbursement | | | 0.94 | % | | | 1.07 | % | | | 1.13 | % | | | 0.44 | % | | | 1.03 | % |
Portfolio turnover rate(4) | | | 14 | % | | | 28 | % | | | 31 | % | | | 74 | % | | | 73 | % |
(1) | Calculated using the average shares outstanding method. |
(2) | Certain service provider expenses were voluntarily waived during the fiscal year. |
(3) | The Fund had an expense limitation agreement in place through October 25, 2020. |
(4) | Calculated on the basis of the Fund as a whole. |
The accompanying notes are an integral part of these financial statements.
WWW.HENNESSYFUNDS.COM
Financial Statements — Financial Highlights
For an Investor Class share outstanding throughout each year
| | | Year Ended October 31 | |
| | | 2024 | | | 2023 | | | 2022 | | | 2021 | | | 2020 | |
| PER SHARE DATA: | | | | | | | | | | | | | | | |
Net asset value, beginning of year | | $ | 10.02 | | | $ | 9.58 | | | $ | 8.66 | | | $ | 5.55 | | | $ | 10.90 | |
| | | | | | | | | | | | | | | | | | | | | |
| Income from investment operations: | | | | | | | | | | | | | | | | | | | | |
Net investment loss(1)(2) | | | (0.00 | )(3) | | | (0.02 | ) | | | (0.07 | ) | | | (0.07 | ) | | | (0.10 | ) |
Net realized and unrealized gains (losses) on investments | | | 2.40 | | | | 1.49 | | | | 2.02 | | | | 4.21 | | | | (4.22 | ) |
| Total from investment operations | | | 2.40 | | | | 1.47 | | | | 1.95 | | | | 4.14 | | | | (4.32 | ) |
| | | | | | | | | | | | | | | | | | | | | |
| Less distributions: | | | | | | | | | | | | | | | | | | | | |
Dividends from net investment income | | | (0.18 | ) | | | (0.84 | ) | | | (0.06 | ) | | | — | | | | — | |
Dividends from return of capital | | | (0.85 | ) | | | (0.19 | ) | | | (0.97 | ) | | | (1.03 | ) | | | (1.03 | ) |
| Total distributions | | | (1.03 | ) | | | (1.03 | ) | | | (1.03 | ) | | | (1.03 | ) | | | (1.03 | ) |
Net asset value, end of year | | $ | 11.39 | | | $ | 10.02 | | | $ | 9.58 | | | $ | 8.66 | | | $ | 5.55 | |
| | | | | | | | | | | | | | | | | | | | | |
| TOTAL RETURN | | | 24.81 | % | | | 16.39 | % | | | 24.03 | % | | | 78.41 | % | | | -42.13 | % |
| | | | | | | | | | | | | | | | | | | | | |
| SUPPLEMENTAL DATA AND RATIOS: | | | | | | | | | | | | | | | | | | | | |
Net assets, end of year (millions) | | $ | 20.53 | | | $ | 16.79 | | | $ | 11.47 | | | $ | 6.72 | | | $ | 3.81 | |
Ratio of expenses to average net assets: | | | | | | | | | | | | | | | | | | | | |
| Before expense reimbursement | | | 1.94 | % | | | 2.03 | % | | | 2.05 | % | | | 2.11 | % | | | 2.12 | % |
After expense reimbursement(4) | | | 1.75 | % | | | 1.78 | % | | | 1.76 | % | | | 1.76 | % | | | 1.76 | % |
Ratio of net investment loss to average net assets: | | | | | | | | | | | | | | | | | | | | |
Before expense reimbursement(2) | | | (0.23 | )% | | | (0.50 | )% | | | (1.08 | )% | | | (1.26 | )% | | | (1.63 | )% |
After expense reimbursement(2) | | | (0.04 | )% | | | (0.25 | )% | | | (0.79 | )% | | | (0.91 | )% | | | (1.27 | )% |
Portfolio turnover rate(5) | | | 6 | % | | | 16 | % | | | 33 | % | | | 40 | % | | | 53 | % |
(1) | Calculated using the average shares outstanding method. |
(2) | Includes current and deferred tax benefit/expense from net investment income/loss only. |
(3) | Amount is between $(0.005) and $0.005. |
(4) | Certain service provider expenses were voluntarily waived during the fiscal year. |
(5) | Calculated on the basis of the Fund as a whole. |
The accompanying notes are an integral part of these financial statements.
HENNESSY FUNDS | 1-800-966-4354 |
Financial Statements — Financial Highlights
For an Institutional Class share outstanding throughout each year
| | | Year Ended October 31 | |
| | | 2024 | | | 2023 | | | 2022 | | | 2021 | | | 2020 | |
| PER SHARE DATA: | | | | | | | | | | | | | | | |
Net asset value, beginning of year | | $ | 10.43 | | | $ | 9.91 | | | $ | 8.90 | | | $ | 5.68 | | | $ | 11.09 | |
| | | | | | | | | | | | | | | | | | | | | |
| Income from investment operations: | | | | | | | | | | | | | | | | | | | | |
Net investment income (loss)(1)(2) | | | 0.02 | | | | (0.00 | )(3) | | | (0.05 | ) | | | (0.05 | ) | | | (0.10 | ) |
Net realized and unrealized gains (losses) on investments | | | 2.53 | | | | 1.55 | | | | 2.09 | | | | 4.30 | | | | (4.28 | ) |
| Total from investment operations | | | 2.55 | | | | 1.55 | | | | 2.04 | | | | 4.25 | | | | (4.38 | ) |
| | | | | | | | | | | | | | | | | | | | | |
| Less distributions: | | | | | | | | | | | | | | | | | | | | |
Dividends from net investment income | | | (0.18 | ) | | | (0.84 | ) | | | (0.06 | ) | | | — | | | | — | |
Dividends from return of capital | | | (0.85 | ) | | | (0.19 | ) | | | (0.97 | ) | | | (1.03 | ) | | | (1.03 | ) |
| Total distributions | | | (1.03 | ) | | | (1.03 | ) | | | (1.03 | ) | | | (1.03 | ) | | | (1.03 | ) |
Net asset value, end of year | | $ | 11.95 | | | $ | 10.43 | | | $ | 9.91 | | | $ | 8.90 | | | $ | 5.68 | |
| | | | | | | | | | | | | | | | | | | | | |
| TOTAL RETURN | | | 25.30 | % | | | 16.67 | % | | | 24.41 | % | | | 78.57 | % | | | -41.93 | % |
| | | | | | | | | | | | | | | | | | | | | |
| SUPPLEMENTAL DATA AND RATIOS: | | | | | | | | | | | | | | | | | | | | |
Net assets, end of year (millions) | | $ | 46.77 | | | $ | 37.46 | | | $ | 33.06 | | | $ | 30.45 | | | $ | 18.33 | |
Ratio of expenses to average net assets: | | | | | | | | | | | | | | | | | | | | |
| Before expense reimbursement | | | 1.54 | % | | | 1.65 | % | | | 1.69 | % | | | 1.74 | % | | | 1.79 | % |
After expense reimbursement(4) | | | 1.50 | % | | | 1.53 | % | | | 1.51 | % | | | 1.51 | % | | | 1.51 | % |
Ratio of net investment income (loss) to average net assets: | | | | | | | | | | | | | | | | | | | | |
Before expense reimbursement(2) | | | 0.17 | % | | | (0.12 | )% | | | (0.71 | )% | | | (0.89 | )% | | | (1.55 | )% |
After expense reimbursement(2) | | | 0.21 | % | | | (0.00 | )%(3) | | | (0.53 | )% | | | (0.66 | )% | | | (1.27 | )% |
Portfolio turnover rate(5) | | | 6 | % | | | 16 | % | | | 33 | % | | | 40 | % | | | 53 | % |
(1) | Calculated using the average shares outstanding method. |
(2) | Includes current and deferred tax benefit/expense from net investment income/loss only. |
(3) | Amount is between $(0.005) and $0.005. |
(4) | Certain service provider expenses were voluntarily waived during the fiscal year. |
(5) | Calculated on the basis of the Fund as a whole. |
The accompanying notes are an integral part of these financial statements.
WWW.HENNESSYFUNDS.COM
Financial Statements — Financial Highlights
| Hennessy Gas Utility Fund |
For an Investor Class share outstanding throughout each year
| | | Year Ended October 31 | |
| | | 2024 | | | 2023 | | | 2022 | | | 2021 | | | 2020 | |
| PER SHARE DATA: | | | | | | | | | | | | | | | |
Net asset value, beginning of year | | $ | 22.57 | | | $ | 25.91 | | | $ | 26.09 | | | $ | 24.08 | | | $ | 29.64 | |
| | | | | | | | | | | | | | | | | | | | | |
| Income from investment operations: | | | | | | | | | | | | | | | | | | | | |
Net investment income(1) | | | 0.60 | | | | 0.54 | | | | 0.50 | | | | 0.52 | | | | 0.58 | |
Net realized and unrealized gains (losses) on investments | | | 5.95 | | | | (1.70 | ) | | | 1.98 | | | | 4.00 | | | | (4.14 | ) |
| Total from investment operations | | | 6.55 | | | | (1.16 | ) | | | 2.48 | | | | 4.52 | | | | (3.56 | ) |
| | | | | | | | | | | | | | | | | | | | | |
| Less distributions: | | | | | | | | | | | | | | | | | | | | |
Dividends from net investment income | | | (0.61 | ) | | | (0.53 | ) | | | (0.50 | ) | | | (0.57 | ) | | | (0.56 | ) |
Dividends from net realized gains | | | (0.94 | ) | | | (1.65 | ) | | | (2.16 | ) | | | (1.94 | ) | | | (1.44 | ) |
| Total distributions | | | (1.55 | ) | | | (2.18 | ) | | | (2.66 | ) | | | (2.51 | ) | | | (2.00 | ) |
Net asset value, end of year | | $ | 27.57 | | | $ | 22.57 | | | $ | 25.91 | | | $ | 26.09 | | | $ | 24.08 | |
| | | | | | | | | | | | | | | | | | | | | |
| TOTAL RETURN | | | 30.34 | % | | | -5.01 | % | | | 10.14 | % | | | 19.91 | % | | | -12.49 | % |
| | | | | | | | | | | | | | | | | | | | | |
| SUPPLEMENTAL DATA AND RATIOS: | | | | | | | | | | | | | | | | | | | | |
Net assets, end of year (millions) | | $ | 426.63 | | | $ | 384.37 | | | $ | 459.41 | | | $ | 457.31 | | | $ | 483.56 | |
Ratio of expenses to average net assets | | | 0.99 | % | | | 1.00 | % | | | 1.00 | % | | | 1.00 | % | | | 1.02 | % |
Ratio of net investment income to average net assets | | | 2.46 | % | | | 2.21 | % | | | 1.88 | % | | | 2.06 | % | | | 2.24 | % |
Portfolio turnover rate(2) | | | 13 | % | | | 12 | % | | | 31 | % | | | 15 | % | | | 16 | % |
(1) | Calculated using the average shares outstanding method. |
(2) | Calculated on the basis of the Fund as a whole. |
The accompanying notes are an integral part of these financial statements.
HENNESSY FUNDS | 1-800-966-4354 |
Financial Statements — Financial Highlights
| Hennessy Gas Utility Fund |
For an Institutional Class share outstanding throughout each year
| | | Year Ended October 31 | |
| | | 2024 | | | 2023 | | | 2022 | | | 2021 | | | 2020 | |
| PER SHARE DATA: | | | | | | | | | | | | | | | |
Net asset value, beginning of year | | $ | 22.51 | | | $ | 25.84 | | | $ | 26.01 | | | $ | 24.01 | | | $ | 29.56 | |
| | | | | | | | | | | | | | | | | | | | | |
| Income from investment operations: | | | | | | | | | | | | | | | | | | | | |
Net investment income(1) | | | 0.67 | | | | 0.62 | | | | 0.57 | | | | 0.59 | | | | 0.66 | |
Net realized and unrealized gains (losses) on investments | | | 5.94 | | | | (1.70 | ) | | | 1.99 | | | | 3.99 | | | | (4.13 | ) |
| Total from investment operations | | | 6.61 | | | | (1.08 | ) | | | 2.56 | | | | 4.58 | | | | (3.47 | ) |
| | | | | | | | | | | | | | | | | | | | | |
| Less distributions: | | | | | | | | | | | | | | | | | | | | |
Dividends from net investment income | | | (0.68 | ) | | | (0.60 | ) | | | (0.58 | ) | | | (0.65 | ) | | | (0.64 | ) |
Dividends from net realized gains | | | (0.94 | ) | | | (1.65 | ) | | | (2.15 | ) | | | (1.93 | ) | | | (1.44 | ) |
| Total distributions | | | (1.62 | ) | | | (2.25 | ) | | | (2.73 | ) | | | (2.58 | ) | | | (2.08 | ) |
Net asset value, end of year | | $ | 27.50 | | | $ | 22.51 | | | $ | 25.84 | | | $ | 26.01 | | | $ | 24.01 | |
| | | | | | | | | | | | | | | | | | | | | |
| TOTAL RETURN | | | 30.74 | % | | | -4.74 | % | | | 10.53 | % | | | 20.29 | % | | | -12.22 | % |
| | | | | | | | | | | | | | | | | | | | | |
| SUPPLEMENTAL DATA AND RATIOS: | | | | | | | | | | | | | | | | | | | | |
Net assets, end of year (millions) | | $ | 51.20 | | | $ | 56.75 | | | $ | 93.58 | | | $ | 63.06 | | | $ | 66.46 | |
Ratio of expenses to average net assets | | | 0.69 | % | | | 0.71 | % | | | 0.68 | % | | | 0.69 | % | | | 0.70 | % |
Ratio of net investment income to average net assets | | | 2.76 | % | | | 2.52 | % | | | 2.13 | % | | | 2.35 | % | | | 2.57 | % |
Portfolio turnover rate(2) | | | 13 | % | | | 12 | % | | | 31 | % | | | 15 | % | | | 16 | % |
(1) | Calculated using the average shares outstanding method. |
(2) | Calculated on the basis of the Fund as a whole. |
The accompanying notes are an integral part of these financial statements.
WWW.HENNESSYFUNDS.COM
Financial Statements — Financial Highlights
For an Investor Class share outstanding throughout each year
| | | Year Ended October 31 | |
| | | 2024 | | | 2023 | | | 2022 | | | 2021 | | | 2020 | |
| PER SHARE DATA: | | | | | | | | | | | | | | | |
Net asset value, beginning of year | | $ | 34.99 | | | $ | 29.43 | | | $ | 47.78 | | | $ | 42.79 | | | $ | 37.17 | |
| | | | | | | | | | | | | | | | | | | | | |
| Income from investment operations: | | | | | | | | | | | | | | | | | | | | |
Net investment income (loss)(1) | | | 0.19 | | | | 0.23 | | | | (0.11 | ) | | | (0.23 | ) | | | (0.14 | ) |
Net realized and unrealized gains (losses) on investments | | | 10.21 | | | | 5.33 | | | | (17.83 | ) | | | 5.22 | | | | 5.81 | |
| Total from investment operations | | | 10.40 | | | | 5.56 | | | | (17.94 | ) | | | 4.99 | | | | 5.67 | |
| | | | | | | | | | | | | | | | | | | | | |
| Less distributions: | | | | | | | | | | | | | | | | | | | | |
Dividends from net investment income | | | — | | | | — | | | | (0.41 | ) | | | — | | | | (0.02 | ) |
Dividends from net realized gains | | | (2.18 | ) | | | — | | | | — | | | | — | | | | (0.03 | ) |
| Total distributions | | | (2.18 | ) | | | — | | | | (0.41 | ) | | | — | | | | (0.05 | ) |
Net asset value, end of year | | $ | 43.21 | | | $ | 34.99 | | | $ | 29.43 | | | $ | 47.78 | | | $ | 42.79 | |
| | | | | | | | | | | | | | | | | | | | | |
| TOTAL RETURN | | | 31.08 | % | | | 18.89 | % | | | -37.86 | % | | | 11.66 | % | | | 15.27 | % |
| | | | | | | | | | | | | | | | | | | | | |
| SUPPLEMENTAL DATA AND RATIOS: | | | | | | | | | | | | | | | | | | | | |
Net assets, end of year (millions) | | $ | 52.49 | | | $ | 45.61 | | | $ | 39.55 | | | $ | 86.11 | | | $ | 142.30 | |
Ratio of expenses to average net assets | | | 1.42 | % | | | 1.44 | % | | | 1.44 | % | | | 1.43 | % | | | 1.43 | % |
Ratio of net investment income (loss) to average net assets | | | 0.47 | % | | | 0.65 | % | | | (0.30 | )% | | | (0.49 | )% | | | (0.37 | )% |
Portfolio turnover rate(2) | | | 17 | % | | | 57 | % | | | 21 | % | | | 16 | % | | | 23 | % |
(1) | Calculated using the average shares outstanding method. |
(2) | Calculated on the basis of the Fund as a whole. |
The accompanying notes are an integral part of these financial statements.
HENNESSY FUNDS | 1-800-966-4354 |
Financial Statements — Financial Highlights
For an Institutional Class share outstanding throughout each year
| | | Year Ended October 31 | |
| | | 2024 | | | 2023 | | | 2022 | | | 2021 | | | 2020 | |
| PER SHARE DATA: | | | | | | | | | | | | | | | |
Net asset value, beginning of year | | $ | 36.32 | | | $ | 30.43 | | | $ | 49.54 | | | $ | 44.19 | | | $ | 38.37 | |
| | | | | | | | | | | | | | | | | | | | | |
| Income from investment operations: | | | | | | | | | | | | | | | | | | | | |
Net investment income (loss)(1) | | | 0.39 | | | | 0.30 | | | | 0.02 | | | | (0.03 | ) | | | 0.02 | |
Net realized and unrealized gains (losses) on investments | | | 10.58 | | | | 5.59 | | | | (18.39 | ) | | | 5.38 | | | | 5.99 | |
| Total from investment operations | | | 10.97 | | | | 5.89 | | | | (18.37 | ) | | | 5.35 | | | | 6.01 | |
| | | | | | | | | | | | | | | | | | | | | |
| Less distributions: | | | | | | | | | | | | | | | | | | | | |
Dividends from net investment income | | | — | | | | — | | | | (0.74 | ) | | | (0.00 | )(2) | | | (0.16 | ) |
Dividends from net realized gains | | | (2.26 | ) | | | — | | | | — | | | | — | | | | (0.03 | ) |
| Total distributions | | | (2.26 | ) | | | — | | | | (0.74 | ) | | | (0.00 | )(2) | | | (0.19 | ) |
Net asset value, end of year | | $ | 45.03 | | | $ | 36.32 | | | $ | 30.43 | | | $ | 49.54 | | | $ | 44.19 | |
| | | | | | | | | | | | | | | | | | | | | |
| TOTAL RETURN | | | 31.59 | % | | | 19.36 | % | | | -37.63 | % | | | 12.11 | % | | | 15.72 | % |
| | | | | | | | | | | | | | | | | | | | | |
| SUPPLEMENTAL DATA AND RATIOS: | | | | | | | | | | | | | | | | | | | | |
Net assets, end of year (millions) | | $ | 361.11 | | | $ | 233.44 | | | $ | 275.24 | | | $ | 727.47 | | | $ | 608.11 | |
Ratio of expenses to average net assets | | | 1.02 | % | | | 1.04 | % | | | 1.05 | % | | | 1.04 | % | | | 1.04 | % |
Ratio of net investment income (loss) to average net assets | | | 0.92 | % | | | 0.84 | % | | | 0.04 | % | | | (0.07 | )% | | | 0.04 | % |
Portfolio turnover rate(3) | | | 17 | % | | | 57 | % | | | 21 | % | | | 16 | % | | | 23 | % |
(1) | Calculated using the average shares outstanding method. |
(2) | Amount is between $(0.005) and $0.005. |
(3) | Calculated on the basis of the Fund as a whole. |
The accompanying notes are an integral part of these financial statements.
WWW.HENNESSYFUNDS.COM
Financial Statements — Financial Highlights
| Hennessy Japan Small Cap Fund |
For an Investor Class share outstanding throughout each year
| | | Year Ended October 31 | |
| | | 2024 | | | 2023 | | | 2022 | | | 2021 | | | 2020 | |
| PER SHARE DATA: | | | | | | | | | | | | | | | |
Net asset value, beginning of year | | $ | 14.74 | | | $ | 13.10 | | | $ | 18.12 | | | $ | 15.73 | | | $ | 15.43 | |
| | | | | | | | | | | | | | | | | | | | | |
| Income from investment operations: | | | | | | | | | | | | | | | | | | | | |
Net investment income(1) | | | 0.16 | | | | 0.14 | | | | 0.12 | | | | 0.03 | | | | 0.01 | |
Net realized and unrealized gains (losses) on investments | | | 1.87 | | | | 1.58 | | | | (5.07 | ) | | | 2.40 | | | | 0.50 | |
| Total from investment operations | | | 2.03 | | | | 1.72 | | | | (4.95 | ) | | | 2.43 | | | | 0.51 | |
| | | | | | | | | | | | | | | | | | | | | |
| Less distributions: | | | | | | | | | | | | | | | | | | | | |
Dividends from net investment income | | | (0.14 | ) | | | (0.08 | ) | | | (0.00 | )(2) | | | (0.04 | ) | | | (0.21 | ) |
Dividends from net realized gains | | | — | | | | — | | | | (0.07 | ) | | | — | | | | — | |
| Total distributions | | | (0.14 | ) | | | (0.08 | ) | | | (0.07 | ) | | | (0.04 | ) | | | (0.21 | ) |
Net asset value, end of year | | $ | 16.63 | | | $ | 14.74 | | | $ | 13.10 | | | $ | 18.12 | | | $ | 15.73 | |
| | | | | | | | | | | | | | | | | | | | | |
| TOTAL RETURN | | | 13.79 | % | | | 13.22 | % | | | -27.41 | % | | | 15.46 | % | | | 3.27 | % |
| | | | | | | | | | | | | | | | | | | | | |
| SUPPLEMENTAL DATA AND RATIOS: | | | | | | | | | | | | | | | | | | | | |
Net assets, end of year (millions) | | $ | 30.02 | | | $ | 32.56 | | | $ | 31.23 | | | $ | 46.15 | | | $ | 46.41 | |
Ratio of expenses to average net assets | | | 1.52 | % | | | 1.51 | % | | | 1.57 | % | | | 1.53 | % | | | 1.55 | % |
Ratio of net investment income to average net assets | | | 0.96 | % | | | 0.97 | % | | | 0.83 | % | | | 0.16 | % | | | 0.09 | % |
Portfolio turnover rate(3) | | | 28 | % | | | 32 | % | | | 45 | % | | | 24 | % | | | 17 | % |
(1) | Calculated using the average shares outstanding method. |
(2) | Amount is between $(0.005) and $0.005 |
(3) | Calculated on the basis of the Fund as a whole. |
The accompanying notes are an integral part of these financial statements.
HENNESSY FUNDS | 1-800-966-4354 |
Financial Statements — Financial Highlights
| Hennessy Japan Small Cap Fund |
For an Institutional Class share outstanding throughout each year
| | | Year Ended October 31 | |
| | | 2024 | | | 2023 | | | 2022 | | | 2021 | | | 2020 | |
| PER SHARE DATA: | | | | | | | | | | | | | | | |
Net asset value, beginning of year | | $ | 14.56 | | | $ | 12.97 | | | $ | 17.94 | | | $ | 15.58 | | | $ | 15.28 | |
| | | | | | | | | | | | | | | | | | | | | |
| Income from investment operations: | | | | | | | | | | | | | | | | | | | | |
Net investment income(1) | | | 0.23 | | | | 0.21 | | | | 0.18 | | | | 0.11 | | | | 0.07 | |
Net realized and unrealized gains (losses) on investments | | | 1.83 | | | | 1.54 | | | | (4.99 | ) | | | 2.37 | | | | 0.50 | |
| Total from investment operations | | | 2.06 | | | | 1.75 | | | | (4.81 | ) | | | 2.48 | | | | 0.57 | |
| | | | | | | | | | | | | | | | | | | | | |
| Less distributions: | | | | | | | | | | | | | | | | | | | | |
Dividends from net investment income | | | (0.19 | ) | | | (0.16 | ) | | | (0.09 | ) | | | (0.12 | ) | | | (0.27 | ) |
Dividends from net realized gains | | | — | | | | — | | | | (0.07 | ) | | | — | | | | — | |
| Total distributions | | | (0.19 | ) | | | (0.16 | ) | | | (0.16 | ) | | | (0.12 | ) | | | (0.27 | ) |
Net asset value, end of year | | $ | 16.43 | | | $ | 14.56 | | | $ | 12.97 | | | $ | 17.94 | | | $ | 15.58 | |
| | | | | | | | | | | | | | | | | | | | | |
| TOTAL RETURN | | | 14.23 | % | | | 13.60 | % | | | -27.05 | % | | | 15.90 | % | | | 3.69 | % |
| | | | | | | | | | | | | | | | | | | | | |
| SUPPLEMENTAL DATA AND RATIOS: | | | | | | | | | | | | | | | | | | | | |
Net assets, end of year (millions) | | $ | 79.16 | | | $ | 70.99 | | | $ | 47.65 | | | $ | 66.58 | | | $ | 34.58 | |
Ratio of expenses to average net assets | | | 1.12 | % | | | 1.11 | % | | | 1.17 | % | | | 1.13 | % | | | 1.13 | % |
Ratio of net investment income to average net assets | | | 1.42 | % | | | 1.44 | % | | | 1.22 | % | | | 0.63 | % | | | 0.45 | % |
Portfolio turnover rate(2) | | | 28 | % | | | 32 | % | | | 45 | % | | | 24 | % | | | 17 | % |
(1) | Calculated using the average shares outstanding method. |
(2) | Calculated on the basis of the Fund as a whole. |
The accompanying notes are an integral part of these financial statements.
WWW.HENNESSYFUNDS.COM
Financial Statements — Financial Highlights
| Hennessy Large Cap Financial Fund |
For an Investor Class share outstanding throughout each year
| | | Year Ended October 31 | |
| | | 2024 | | | 2023 | | | 2022 | | | 2021 | | | 2020 | |
| PER SHARE DATA: | | | | | | | | | | | | | | | |
Net asset value, beginning of year | | $ | 18.57 | | | $ | 24.80 | | | $ | 35.32 | | | $ | 22.33 | | | $ | 22.63 | |
| | | | | | | | | | | | | | | | | | | | | |
| Income from investment operations: | | | | | | | | | | | | | | | | | | | | |
Net investment income (loss)(1) | | | 0.20 | | | | 0.35 | | | | 0.15 | | | | (0.15 | ) | | | (0.05 | ) |
Net realized and unrealized gains (losses) on investments | | | 9.00 | | | | (4.92 | ) | | | (9.02 | ) | | | 13.14 | | | | (0.25 | ) |
| Total from investment operations | | | 9.20 | | | | (4.57 | ) | | | (8.87 | ) | | | 12.99 | | | | (0.30 | ) |
| | | | | | | | | | | | | | | | | | | | | |
| Less distributions: | | | | | | | | | | | | | | | | | | | | |
Dividends from net investment income | | | (0.40 | ) | | | (0.13 | ) | | | — | | | | — | | | | — | |
Dividends from net realized gains | | | — | | | | (1.53 | ) | | | (1.65 | ) | | | — | | | | — | |
| Total distributions | | | (0.40 | ) | | | (1.66 | ) | | | (1.65 | ) | | | — | | | | — | |
Net asset value, end of year | | $ | 27.37 | | | $ | 18.57 | | | $ | 24.80 | | | $ | 35.32 | | | $ | 22.33 | |
| | | | | | | | | | | | | | | | | | | | | |
| TOTAL RETURN | | | 49.91 | % | | | -19.62 | % | | | -26.22 | % | | | 58.17 | % | | | -1.33 | % |
| | | | | | | | | | | | | | | | | | | | | |
| SUPPLEMENTAL DATA AND RATIOS: | | | | | | | | | | | | | | | | | | | | |
Net assets, end of year (millions) | | $ | 21.29 | | | $ | 16.88 | | | $ | 23.63 | | | $ | 36.42 | | | $ | 22.51 | |
Ratio of expenses to average net assets | | | 1.89 | % | | | 1.79 | % | | | 1.69 | % | | | 1.68 | % | | | 1.75 | % |
Ratio of net investment income (loss) to average net assets | | | 0.84 | % | | | 1.64 | % | | | 0.55 | % | | | (0.47 | )% | | | (0.21 | )% |
Portfolio turnover rate(2) | | | 37 | % | | | 114 | % | | | 78 | % | | | 62 | % | | | 88 | % |
(1) | Calculated using the average shares outstanding method. |
(2) | Calculated on the basis of the Fund as a whole. |
The accompanying notes are an integral part of these financial statements.
HENNESSY FUNDS | 1-800-966-4354 |
Financial Statements — Financial Highlights
| Hennessy Large Cap Financial Fund |
For an Institutional Class share outstanding throughout each year
| | | Year Ended October 31 | |
| | | 2024 | | | 2023 | | | 2022 | | | 2021 | | | 2020 | |
| PER SHARE DATA: | | | | | | | | | | | | | | | |
Net asset value, beginning of year | | $ | 18.76 | | | $ | 25.11 | | | $ | 35.63 | | | $ | 22.44 | | | $ | 22.68 | |
| | | | | | | | | | | | | | | | | | | | | |
| Income from investment operations: | | | | | | | | | | | | | | | | | | | | |
Net investment income (loss)(1) | | | 0.32 | | | | 0.43 | | | | 0.25 | | | | (0.03 | ) | | | 0.02 | |
Net realized and unrealized gains (losses) on investments | | | 9.06 | | | | (4.99 | ) | | | (9.10 | ) | | | 13.22 | | | | (0.26 | ) |
| Total from investment operations | | | 9.38 | | | | (4.56 | ) | | | (8.85 | ) | | | 13.19 | | | | (0.24 | ) |
| | | | | | | | | | | | | | | | | | | | | |
| Less distributions: | | | | | | | | | | | | | | | | | | | | |
Dividends from net investment income | | | (0.45 | ) | | | (0.24 | ) | | | — | | | | — | | | | — | |
Dividends from net realized gains | | | — | | | | (1.55 | ) | | | (1.67 | ) | | | — | | | | — | |
| Total distributions | | | (0.45 | ) | | | (1.79 | ) | | | (1.67 | ) | | | — | | | | — | |
Net asset value, end of year | | $ | 27.69 | | | $ | 18.76 | | | $ | 25.11 | | | $ | 35.63 | | | $ | 22.44 | |
| | | | | | | | | | | | | | | | | | | | | |
| TOTAL RETURN | | | 50.45 | % | | | -19.41 | % | | | -25.95 | % | | | 58.78 | % | | | -1.06 | % |
| | | | | | | | | | | | | | | | | | | | | |
| SUPPLEMENTAL DATA AND RATIOS: | | | | | | | | | | | | | | | | | | | | |
Net assets, end of year (millions) | | $ | 7.50 | | | $ | 12.58 | | | $ | 22.15 | | | $ | 35.06 | | | $ | 21.15 | |
Ratio of expenses to average net assets | | | 1.57 | % | | | 1.46 | % | | | 1.33 | % | | | 1.32 | % | | | 1.45 | % |
Ratio of net investment income (loss) to average net assets | | | 1.35 | % | | | 1.99 | % | | | 0.89 | % | | | (0.11 | )% | | | 0.08 | % |
Portfolio turnover rate(2) | | | 37 | % | | | 114 | % | | | 78 | % | | | 62 | % | | | 88 | % |
(1) | Calculated using the average shares outstanding method. |
(2) | Calculated on the basis of the Fund as a whole. |
The accompanying notes are an integral part of these financial statements.
WWW.HENNESSYFUNDS.COM
Financial Statements — Financial Highlights
| Hennessy Small Cap Financial Fund |
For an Investor Class share outstanding throughout each year
| | | Year Ended October 31 | |
| | | 2024 | | | 2023 | | | 2022 | | | 2021 | | | 2020 | |
| PER SHARE DATA: | | | | | | | | | | | | | | | |
Net asset value, beginning of year | | $ | 20.42 | | | $ | 29.47 | | | $ | 31.52 | | | $ | 17.46 | | | $ | 21.60 | |
| | | | | | | | | | | | | | | | | | | | | |
| Income from investment operations: | | | | | | | | | | | | | | | | | | | | |
Net investment income(1) | | | 0.45 | | | | 0.43 | | | | 0.22 | | | | 0.25 | | | | 0.16 | |
Net realized and unrealized gains (losses) on investments | | | 8.20 | | | | (7.13 | ) | | | (1.96 | ) | | | 14.01 | | | | (3.55 | ) |
| Total from investment operations | | | 8.65 | | | | (6.70 | ) | | | (1.74 | ) | | | 14.26 | | | | (3.39 | ) |
| | | | | | | | | | | | | | | | | | | | | |
| Less distributions: | | | | | | | | | | | | | | | | | | | | |
Dividends from net investment income | | | (0.48 | ) | | | (0.19 | ) | | | (0.22 | ) | | | (0.20 | ) | | | (0.09 | ) |
Dividends from net realized gains | | | (0.71 | ) | | | (2.16 | ) | | | (0.09 | ) | | | — | | | | (0.66 | ) |
| Total distributions | | | (1.19 | ) | | | (2.35 | ) | | | (0.31 | ) | | | (0.20 | ) | | | (0.75 | ) |
Net asset value, end of year | | $ | 27.88 | | | $ | 20.42 | | | $ | 29.47 | | | $ | 31.52 | | | $ | 17.46 | |
| | | | | | | | | | | | | | | | | | | | | |
| TOTAL RETURN | | | 43.17 | % | | | -24.53 | % | | | -5.60 | % | | | 82.20 | % | | | -16.37 | % |
| | | | | | | | | | | | | | | | | | | | | |
| SUPPLEMENTAL DATA AND RATIOS: | | | | | | | | | | | | | | | | | | | | |
Net assets, end of year (millions) | | $ | 80.80 | | | $ | 54.60 | | | $ | 93.40 | | | $ | 140.03 | | | $ | 54.96 | |
Ratio of expenses to average net assets | | | 1.62 | % | | | 1.62 | % | | | 1.59 | % | | | 1.58 | % | | | 1.65 | % |
Ratio of net investment income to average net assets | | | 1.83 | % | | | 1.83 | % | | | 0.72 | % | | | 0.90 | % | | | 0.96 | % |
Portfolio turnover rate(2) | | | 54 | % | | | 72 | % | | | 27 | % | | | 28 | % | | | 75 | % |
(1) | Calculated using the average shares outstanding method. |
(2) | Calculated on the basis of the Fund as a whole. |
The accompanying notes are an integral part of these financial statements.
HENNESSY FUNDS | 1-800-966-4354 |
Financial Statements — Financial Highlights
| Hennessy Small Cap Financial Fund |
For an Institutional Class share outstanding throughout each year
| | | Year Ended October 31 | |
| | | 2024 | | | 2023 | | | 2022 | | | 2021 | | | 2020 | |
| PER SHARE DATA: | | | | | | | | | | | | | | | |
Net asset value, beginning of year | | $ | 11.82 | | | $ | 17.24 | | | $ | 18.57 | | | $ | 10.37 | | | $ | 12.92 | |
| | | | | | | | | | | | | | | | | | | | | |
| Income from investment operations: | | | | | | | | | | | | | | | | | | | | |
Net investment income(1) | | | 0.33 | | | | 0.30 | | | | 0.20 | | | | 0.21 | | | | 0.13 | |
Net realized and unrealized gains (losses) on investments | | | 4.71 | | | | (4.14 | ) | | | (1.14 | ) | | | 8.26 | | | | (2.10 | ) |
| Total from investment operations | | | 5.04 | | | | (3.84 | ) | | | (0.94 | ) | | | 8.47 | | | | (1.97 | ) |
| | | | | | | | | | | | | | | | | | | | | |
| Less distributions: | | | | | | | | | | | | | | | | | | | | |
Dividends from net investment income | | | (0.56 | ) | | | (0.31 | ) | | | (0.34 | ) | | | (0.27 | ) | | | (0.19 | ) |
Dividends from net realized gains | | | (0.41 | ) | | | (1.27 | ) | | | (0.05 | ) | | | — | | | | (0.39 | ) |
| Total distributions | | | (0.97 | ) | | | (1.58 | ) | | | (0.39 | ) | | | (0.27 | ) | | | (0.58 | ) |
Net asset value, end of year | | $ | 15.89 | | | $ | 11.82 | | | $ | 17.24 | | | $ | 18.57 | | | $ | 10.37 | |
| | | | | | | | | | | | | | | | | | | | | |
| TOTAL RETURN | | | 43.64 | % | | | -24.32 | % | | | -5.21 | % | | | 82.88 | % | | | -16.05 | % |
| | | | | | | | | | | | | | | | | | | | | |
| SUPPLEMENTAL DATA AND RATIOS: | | | | | | | | | | | | | | | | | | | | |
Net assets, end of year (millions) | | $ | 6.40 | | | $ | 6.87 | | | $ | 20.17 | | | $ | 32.08 | | | $ | 10.61 | |
Ratio of expenses to average net assets | | | 1.28 | % | | | 1.29 | % | | | 1.22 | % | | | 1.20 | % | | | 1.29 | % |
Ratio of net investment income to average net assets | | | 2.35 | % | | | 2.13 | % | | | 1.13 | % | | | 1.31 | % | | | 1.27 | % |
Portfolio turnover rate(2) | | | 54 | % | | | 72 | % | | | 27 | % | | | 28 | % | | | 75 | % |
(1) | Calculated using the average shares outstanding method. |
(2) | Calculated on the basis of the Fund as a whole. |
The accompanying notes are an integral part of these financial statements.
WWW.HENNESSYFUNDS.COM
Financial Statements — Financial Highlights
For an Investor Class share outstanding throughout each year
| | | Year Ended October 31 | |
| | | 2024 | | | 2023 | | | 2022 | | | 2021 | | | 2020 | |
| PER SHARE DATA: | | | | | | | | | | | | | | | |
Net asset value, beginning of year | | $ | 16.94 | | | $ | 14.81 | | | $ | 26.89 | | | $ | 20.50 | | | $ | 18.90 | |
| | | | | | | | | | | | | | | | | | | | | |
| Income from investment operations: | | | | | | | | | | | | | | | | | | | | |
Net investment income (loss)(1) | | | (0.05 | ) | | | (0.01 | ) | | | 0.00 | (2) | | | (0.02 | ) | | | 0.02 | |
Net realized and unrealized gains (losses) on investments | | | 5.39 | | | | 2.15 | | | | (5.38 | ) | | | 8.82 | | | | 2.10 | |
| Total from investment operations | | | 5.34 | | | | 2.14 | | | | (5.38 | ) | | | 8.80 | | | | 2.12 | |
| | | | | | | | | | | | | | | | | | | | | |
| Less distributions: | | | | | | | | | | | | | | | | | | | | |
Dividends from net investment income | | | — | | | | (0.01 | ) | | | — | | | | (0.04 | ) | | | — | |
Dividends from net realized gains | | | — | | | | — | | | | (6.70 | ) | | | (2.37 | ) | | | (0.52 | ) |
| Total distributions | | | — | | | | (0.01 | ) | | | (6.70 | ) | | | (2.41 | ) | | | (0.52 | ) |
Net asset value, end of year | | $ | 22.28 | | | $ | 16.94 | | | $ | 14.81 | | | $ | 26.89 | | | $ | 20.50 | |
| | | | | | | | | | | | | | | | | | | | | |
| TOTAL RETURN | | | 31.52 | % | | | 14.47 | % | | | -26.44 | % | | | 45.11 | % | | | 11.42 | % |
| | | | | | | | | | | | | | | | | | | | | |
| SUPPLEMENTAL DATA AND RATIOS: | | | | | | | | | | | | | | | | | | | | |
Net assets, end of year (millions) | | $ | 5.21 | | | $ | 4.35 | | | $ | 3.99 | | | $ | 6.06 | | | $ | 4.26 | |
Ratio of expenses to average net assets: | | | | | | | | | | | | | | | | | | | | |
| Before expense reimbursement | | | 2.77 | % | | | 3.17 | % | | | 3.06 | % | | | 2.79 | % | | | 3.45 | % |
After expense reimbursement(3) | | | 1.23 | % | | | 1.23 | % | | | 1.23 | % | | | 1.23 | % | | | 1.23 | % |
Ratio of net investment income (loss) to average net assets: | | | | | | | | | | | | | | | | | | | | |
| Before expense reimbursement | | | (1.76 | )% | | | (2.02 | )% | | | (1.81 | )% | | | (1.64 | )% | | | (2.12 | )% |
| After expense reimbursement | | | (0.22 | )% | | | (0.08 | )% | | | 0.02 | % | | | (0.08 | )% | | | 0.10 | % |
Portfolio turnover rate(4) | | | 84 | % | | | 101 | % | | | 151 | % | | | 200 | % | | | 192 | % |
(1) | Calculated using the average shares outstanding method. |
(2) | Amount is between $(0.005) and $0.005. |
(3) | Certain service provider expenses were voluntarily waived during the fiscal year. |
(4) | Calculated on the basis of the Fund as a whole. |
The accompanying notes are an integral part of these financial statements.
HENNESSY FUNDS | 1-800-966-4354 |
Financial Statements — Financial Highlights
For an Institutional Class share outstanding throughout each year
| | | Year Ended October 31 | |
| | | 2024 | | | 2023 | | | 2022 | | | 2021 | | | 2020 | |
| PER SHARE DATA: | | | | | | | | | | | | | | | |
Net asset value, beginning of year | | $ | 17.43 | | | $ | 15.26 | | | $ | 27.65 | | | $ | 21.08 | | | $ | 19.40 | |
| | | | | | | | | | | | | | | | | | | | | |
| Income from investment operations: | | | | | | | | | | | | | | | | | | | | |
Net investment income(1) | | | 0.01 | | | | 0.03 | | | | 0.05 | | | | 0.05 | | | | 0.07 | |
Net realized and unrealized gains (losses) on investments | | | 5.54 | | | | 2.21 | | | | (5.55 | ) | | | 9.06 | | | | 2.15 | |
| Total from investment operations | | | 5.55 | | | | 2.24 | | | | (5.50 | ) | | | 9.11 | | | | 2.22 | |
| | | | | | | | | | | | | | | | | | | | | |
| Less distributions: | | | | | | | | | | | | | | | | | | | | |
Dividends from net investment income | | | — | | | | (0.07 | ) | | | — | | | | (0.11 | ) | | | (0.01 | ) |
Dividends from net realized gains | | | — | | | | — | | | | (6.89 | ) | | | (2.43 | ) | | | (0.53 | ) |
| Total distributions | | | — | | | | (0.07 | ) | | | (6.89 | ) | | | (2.54 | ) | | | (0.54 | ) |
Net asset value, end of year | | $ | 22.98 | | | $ | 17.43 | | | $ | 15.26 | | | $ | 27.65 | | | $ | 21.08 | |
| | | | | | | | | | | | | | | | | | | | | |
| TOTAL RETURN | | | 31.84 | % | | | 14.77 | % | | | -26.28 | % | | | 45.49 | % | | | 11.67 | % |
| | | | | | | | | | | | | | | | | | | | | |
| SUPPLEMENTAL DATA AND RATIOS: | | | | | | | | | | | | | | | | | | | | |
Net assets, end of year (millions) | | $ | 2.68 | | | $ | 1.99 | | | $ | 1.39 | | | $ | 2.06 | | | $ | 1.47 | |
Ratio of expenses to average net assets: | | | | | | | | | | | | | | | | | | | | |
| Before expense reimbursement | | | 2.47 | % | | | 2.85 | % | | | 2.73 | % | | | 2.44 | % | | | 3.08 | % |
After expense reimbursement(2) | | | 0.98 | % | | | 0.98 | % | | | 0.98 | % | | | 0.98 | % | | | 0.98 | % |
Ratio of net investment income (loss) to average net assets: | | | | | | | | | | | | | | | | | | | | |
| Before expense reimbursement | | | (1.46 | )% | | | (1.70 | )% | | | (1.48 | )% | | | (1.29 | )% | | | (1.74 | )% |
| After expense reimbursement | | | 0.03 | % | | | 0.17 | % | | | 0.27 | % | | | 0.17 | % | | | 0.36 | % |
Portfolio turnover rate(3) | | | 84 | % | | | 101 | % | | | 151 | % | | | 200 | % | | | 192 | % |
(1) | Calculated using the average shares outstanding method. |
(2) | Certain service provider expenses were voluntarily waived during the fiscal year. |
(3) | Calculated on the basis of the Fund as a whole. |
The accompanying notes are an integral part of these financial statements.
WWW.HENNESSYFUNDS.COM
Notes to the Financial Statements
1). ORGANIZATION
The Hennessy Cornerstone Growth Fund (the “Growth Fund”), the Hennessy Focus Fund (the “Focus Fund”), the Hennessy Cornerstone Mid Cap 30 Fund (the “Mid Cap 30 Fund”), the Hennessy Cornerstone Large Growth Fund (the “Large Growth Fund”), the Hennessy Value Fund (the “Value Fund”), the Hennessy Total Return Fund (the “Total Return Fund”), the Hennessy Equity and Income Fund (the “Equity and Income Fund”), the Hennessy Balanced Fund (the “Balanced Fund”), the Hennessy Energy Transition Fund (the “Energy Transition Fund”), the Hennessy Midstream Fund (the “Midstream Fund”), the Hennessy Gas Utility Fund (the “Gas Utility Fund”), the Hennessy Japan Fund (the “Japan Fund”), the Hennessy Japan Small Cap Fund (the “Japan Small Cap Fund”), the Hennessy Large Cap Financial Fund (the “Large Cap Financial Fund”), the Hennessy Small Cap Financial Fund (the “Small Cap Financial Fund”), and the Hennessy Technology Fund (the “Technology Fund”) (each, a “Fund,” and collectively, the “Funds”) are each a series of Hennessy Funds Trust (the “Trust”), which was organized as a Delaware statutory trust on September 17, 1992. The Funds are open-end management investment companies registered under the Investment Company Act of 1940, as amended.
The investment objective of the Growth Fund, the Mid Cap 30 Fund, and the Large Growth Fund is long-term growth of capital. The investment objective of the Focus Fund, the Large Cap Financial Fund, and the Small Cap Financial Fund is capital appreciation. The investment objective of the Value Fund and the Total Return Fund is total return, consisting of capital appreciation and current income. The investment objective of the Equity and the Income Fund is long-term capital growth and current income. The investment objective of the Balanced Fund is a combination of capital appreciation and current income. The investment objective of the Energy Transition Fund is to seek total return. The investment objective of the Midstream Fund is to seek capital appreciation through distribution growth along with current income. The investment objective of the Gas Utility Fund is income and capital appreciation. The investment objective of the Japan Fund, the Japan Small Cap Fund, and the Technology Fund, is long-term capital appreciation.
The Midstream Fund is treated as a regular corporation, or “C” corporation, for U.S. federal income tax purposes. Because the Midstream Fund is treated as a “C” corporation, it is not taxed as a regulated investment company under Subchapter M of the Code and is not required to comply with the diversification requirements applicable to regulated investment companies. The Growth Fund, the Mid Cap 30 Fund, the Large Growth Fund, the Value Fund, the Equity and Income Fund, the Energy Transition Fund, the Gas Utility Fund, the Japan Fund, the Japan Small Cap Fund, and the Technology Fund are diversified funds, but the Japan Fund employs a relatively concentrated investment strategy and may hold securities of fewer issuers than other diversified funds. The Focus Fund, the Total Return Fund, the Balanced Fund, the Midstream Fund, the Large Cap Financial Fund, and the Small Cap Financial Fund are non-diversified funds.
Each Fund other than the Total Return Fund and the Balanced Fund offers Investor Class and Institutional Class shares. Each class of shares differs principally in its respective 12b-1 distribution and service, shareholder servicing, and sub-transfer agent expenses. There are no sales charges. Each class has identical rights to earnings, assets, and voting privileges, except for class-specific expenses and exclusive rights to vote on matters affecting only one class. The Total Return Fund and the Balanced Fund offer only Investor Class shares.
As investment companies, the Funds follow the investment company accounting and reporting guidance of the Financial Accounting Standards Board (the “FASB”) Accounting Standard Codification Topic 946 “Financial Services—Investment Companies.”
2). SIGNIFICANT ACCOUNTING POLICIES
The following is a summary of significant accounting policies consistently followed by the Funds in the preparation of the financial statements. These policies conform to U.S. generally accepted accounting principles (“GAAP”).
a). | Securities Valuation – All investments in securities are valued in accordance with the Funds’ valuation policies and procedures, as described in Note 3.
|
b). | Federal Income Taxes – This paragraph applies to all Funds other than the Midstream Fund. Each Fund has elected to be taxed as a regulated investment company and intends to distribute substantially all of its taxable income to its shareholders and otherwise comply with the provisions of the Internal Revenue Code of 1986, as amended, applicable to regulated investment companies. As a result, no Fund has made provision for federal income taxes or excise taxes. Net investment income/loss and realized gains/losses for federal income tax purposes may differ from those reported in the financial statements because of temporary book-basis and tax-basis differences. Temporary differences are primarily the result of the treatment of wash sales for tax reporting purposes. Each Fund recognizes interest and penalties related to income tax benefits, if any, in the Statement of Operations as an income tax expense. Distributions from net realized gains for book purposes may include short-term capital gains, which are included as ordinary income to shareholders for tax purposes. Each Fund may utilize equalization accounting for tax purposes and designate earnings and profits, including net realized gains distributed to shareholders on redemption of shares, as part of the dividends paid deduction for income tax purposes. Due to inherent differences in the recognition of income, expenses, and realized gains/losses under GAAP and federal income tax regulations, permanent differences between |
HENNESSY FUNDS | 1-800-966-4354 |
| | book and tax basis for reporting are identified and appropriately reclassified in the Statement of Assets and Liabilities, as needed. The adjustments for fiscal year 2024 are as follows: |
| | | | Total | | | | |
| | | | Distributable | | | Capital | |
| | | | Earnings | | | Stock | |
| | Growth Fund | | $ | (13,169,378 | ) | | $ | 13,169,378 | |
| | Focus Fund | | | (17,841,547 | ) | | | 17,841,547 | |
| | Mid Cap 30 Fund | | | (2,925,061 | ) | | | 2,925,061 | |
| | Large Growth Fund | | | (443,371 | ) | | | 443,371 | |
| | Value Fund | | | — | | | | — | |
| | Total Return Fund | | | (216,685 | ) | | | 216,685 | |
| | Equity and Income Fund | | | (1,157,523 | ) | | | 1,157,523 | |
| | Balanced Fund | | | (73,532 | ) | | | 73,532 | |
| | Energy Transition Fund | | | 9,305 | | | | (9,305 | ) |
| | Gas Utility Fund | | | (2,365,086 | ) | | | 2,365,086 | |
| | Japan Fund | | | (2,875,390 | ) | | | 2,875,390 | |
| | Japan Small Cap Fund | | | (275,298 | ) | | | 275,298 | |
| | Large Cap Financial Fund | | | (32,176 | ) | | | 32,176 | |
| | Small Cap Financial Fund | | | (874,507 | ) | | | 874,507 | |
| | Technology Fund | | | 2,520 | | | | (2,520 | ) |
| | This paragraph applies to the Midstream Fund. The Midstream Fund is taxed as a corporation and is obligated to pay U.S. federal and state income tax on its taxable income. Currently, the maximum marginal regular federal income tax rate for a corporation is 21%. The Midstream Fund invests a substantial portion of its assets in master limited partnerships (ÒMLPsÓ), which are treated as partnerships for federal income tax purposes. As a limited partner in MLPs, the Midstream Fund reports its allocable share of each MLP’s taxable income in computing its own taxable income. The Midstream Fund includes any tax expense or benefit in its Statement of Operations based on the component of income or gains/losses to which such expense or benefit relates. Deferred income taxes reflect the net tax effects of temporary differences between the carrying amount of assets and liabilities for financial reporting purposes and the carrying amount of assets and liabilities for income tax purposes. The Midstream Fund recognizes a valuation allowance if, based on the weight of available evidence, it is more likely than not that the Fund will not realize some portion or all of the deferred income tax assets. As of October 31, 2024, the Midstream Fund did not have a valuation allowance.
|
c). | Accounting for Uncertainty in Income Taxes – The Funds have accounting policies regarding recognition and measurement of tax positions taken or expected to be taken on a tax return. The tax returns of the Funds for the prior three fiscal years are open for examination. The Funds have reviewed all open tax years in major tax jurisdictions and concluded that there is no material impact on the net assets of any Fund and no tax liability resulting from unrecognized tax benefits relating to uncertain income tax positions taken or expected to be taken on a tax return. With the exception of the Midstream Fund, the major tax jurisdictions of the Funds are U.S. federal and Delaware. The Midstream Fund files U.S. federal income tax returns and various state income tax returns.
|
d). | Income and Expenses – Dividend income is recognized on the ex-dividend date or as soon as information is available to the Funds. Interest income, which includes the amortization of premium and accretion of discount, is recognized on an accrual basis. Market discounts, original issue discounts, and market premiums on debt securities are accreted or amortized to interest income over the life of a security with a corresponding increase or decrease, as applicable, in the cost basis of such security using the yield-to-maturity method or, where applicable, the first call date of the security. Other non-cash dividends are recognized as investment income at the fair value of the property received. Each Fund is charged for those expenses that are directly attributable to its portfolio, such as advisory, administration, and certain shareholder service fees.
|
| | For those Funds with multiple classes of shares, income, expenses (other than expenses attributable to a specific class), and realized and unrealized gains/losses on investments are allocated to each class of shares based on such class’s net assets.
|
| | Distributions received from investments in MLPs, if applicable, generally consist of ordinary income, capital gains, and return of capital. The Funds record investment income on the ex-date of the distributions. For financial statement purposes, the Funds use return of capital and income estimates to allocate the dividend income received. Such estimates are based on historical information available from the MLPs and other industry sources. These estimates may subsequently be revised based on information received from the MLPs after their tax reporting periods are concluded, as the actual character of these distributions is not known until after the fiscal year end of the applicable Fund.
|
e). | Distributions to Shareholders – This paragraph applies to all Funds other than the Midstream Fund. Dividends from net investment income, if any, are declared and paid at the end of each calendar quarter for the following Funds: the Total Return Fund, the Equity and Income Fund, the Balanced Fund, and the Gas Utility Fund. Dividends from net investment income, if any, are declared and paid annually, usually in December, for all other Funds. Distributions of net realized capital gains for the Funds, if any, are declared and paid annually, usually in December. The rest of this subsection applies to the Midstream Fund. The Midstream Fund typically makes cash distributions to its shareholders quarterly at the beginning of the months of March, June, September, and December. Due to the tax treatment of the Midstream Fund’s allocations and distributions from MLPs, a significant portion of the Midstream Fund’s distributions to shareholders typically is treated as return of capital to shareholders for U.S. federal income tax purposes (i.e., as distributions in excess of the Midstream Fund’s current and accumulated earnings and profits as described below). However, no assurance can be given in this regard; just as the Midstream Fund’s corporate income tax liability can fluctuate materially from year to year, the extent to which the Midstream Fund is able to make return-of-capital distributions also can vary materially from year to year depending on a number of different factors, including the composition of the
|
WWW.HENNESSYFUNDS.COM
| | Midstream Fund’s portfolio, the level of allocations of net income and other tax items for the Midstream Fund from its underlying MLP investments, the length of time the Midstream Fund has owned the MLP equity securities in its portfolio, and the extent to which the Midstream Fund disposes of MLP equity securities during a particular year, including to meet Midstream Fund shareholder redemption requests as necessary.
|
| | In general, a distribution constitutes a return of capital to a shareholder rather than a dividend to the extent such distribution exceeds the Midstream Fund’s current and accumulated earnings and profits. The portion of any distribution treated as a return of capital constitutes a tax-free return of capital to the extent of a shareholder’s cost basis in shares of the Midstream Fund and thereafter generally is taxable to the shareholder as a capital gain. A return-of-capital distribution also reduces the shareholder’s cost basis in shares of the Midstream Fund (but not below zero). A lower cost basis means that a shareholder recognizes more gain or less loss when the shareholder eventually sells shares of the Midstream Fund, which increases the shareholder’s tax liability.
|
| | The Midstream Fund attempts to maintain a stable distribution rate and therefore may distribute more or less than the actual amount of cash it receives from its investments in a particular period. Any undistributed cash would be available to supplement future distributions, and until distributed would increase the Midstream Fund’s net asset value (“NAV”). Correspondingly, such amounts, once distributed, decrease the Midstream Fund’s NAV. In addition, the Midstream Fund may opt not to make distributions in quarters in which the Midstream Fund believes that a distribution could cause adverse tax consequences to shareholders, including when the Midstream Fund believes that a distribution may not constitute a tax-free return of capital, as described above.
|
f). | Security Transactions – Investment and shareholder transactions are recorded on the trade date. The Fund determines the realized gain/loss from an investment transaction using the specific identification method for the best tax relief order by comparing the original cost of the security lot sold with the net sale proceeds. Discounts and premiums on securities purchased are accreted or amortized, respectively, over the life of each such security.
|
g). | Use of Estimates – Preparing financial statements in accordance with GAAP requires management to make estimates and assumptions that affect the reported amounts of assets and liabilities and disclosure of contingent assets and liabilities at the date of the financial statements, as well as the reported change in net assets during the reporting period. Actual results could differ from those estimates.
|
h). | Share Valuation – The NAV per share of each Fund is calculated by dividing (i) the total value of the securities held by the Fund, plus cash and other assets, minus all liabilities (including estimated accrued expenses) by (ii) the total number of Fund shares outstanding, rounded to the nearest $0.01. Fund shares are not priced on days the New York Stock Exchange is closed for trading. The offering and redemption price per share for each Fund is equal to the Fund’s NAV per share.
|
i). | Foreign Currency – Values of investments denominated in foreign currencies, if any, are converted into U.S. dollars using the spot market exchange rate at the time of valuation. Purchases and sales of investments and income are translated into U.S. dollars using the spot market exchange rate prevailing on the respective dates of such transactions. The Funds do not isolate the portion of the results of operations resulting from fluctuations in foreign exchange rates on investments from fluctuations resulting from changes in the market prices of securities held. Such fluctuations are included in net realized and unrealized gain/loss on investments. Foreign investments present additional risks due to currency fluctuations, economic and political factors, lower liquidity, government regulations, differences in accounting standards, and other factors.
|
j. | Reverse Repurchase Agreements – Transactions involving reverse repurchase agreements by the Total Return Fund are treated as collateralized financing transactions and are recorded at their contracted resell or repurchase amounts, which approximates fair value. Upon entering into a reverse repurchase agreement transaction, the Total Return Fund establishes a segregated account in which it maintains liquid assets in an amount at least equal to the repurchase price marked to market daily (including accrued interest), and the Total Return Fund subsequently monitors the account to ensure that it maintains such equivalent value. Interest on reverse repurchase agreements is included in interest payable.
|
| | As of October 31, 2024, securities with a fair value of $23,859,306 were pledged by the Total Return Fund to collateralize reverse repurchase agreements, which securities are included in investments in securities in its Statement of Assets and Liabilities.
|
k.) | REIT Equity Securities – Distributions received from real estate investment trusts (“REITs”) may be classified as dividends, capital gains, or return of capital. Investments in REITs may require a Fund to accrue and distribute income not yet received. To generate sufficient cash to make any required distributions, a Fund may be required to sell securities in its portfolio (including when it is not advantageous to do so) that it otherwise would have continued to hold. At other times, investments in a REIT may result in a Fund’s receipt of cash in excess of the REIT’s earnings. If a Fund distributes these amounts, these distributions could constitute a return of capital to Fund shareholders for U.S. federal income tax purposes. Dividends received by a Fund from a REIT generally do not constitute qualified dividend income and do not qualify for the dividends-received deduction.
|
l). | Partnership Accounting Policy – To the extent a Fund receives distributions from underlying partnerships in which it invests, the Fund records its pro rata share of income/loss and capital gains/losses and accordingly adjusts the cost basis of the underlying partnerships for return of capital.
|
m). | Offsetting Assets and Liabilities – The Total Return Fund follows the financial reporting rules regarding offsetting assets and liabilities and related netting arrangements to enable users of its financial statements to understand the effect of those arrangements on its financial position. Reverse repurchase transactions are entered into by the Total Return Fund under Master Repurchase Agreements (“MRAs”) that permit the Total Return Fund, under certain circumstances, including an event of default (such as bankruptcy or insolvency), to offset payables under the MRA with collateral held with the counterparty and create one single net payment from the Fund. Upon a bankruptcy or insolvency of the MRA counterparty, the Total Return Fund is considered an unsecured creditor with respect to excess collateral and, as such, the return of excess collateral may be delayed. In the event the buyer of securities under an MRA files for bankruptcy or becomes insolvent, the Total Return Fund’s use of the proceeds of the MRA may be restricted while the other party, or its trustee or receiver, determines whether or not to enforce the Total Return Fund’s obligation to repurchase the securities. For additional information regarding the offsetting of assets and liabilities as of October 31, 2024, please refer to the table in Note 9. |
HENNESSY FUNDS | 1-800-966-4354 |
n). | Illiquid Securities – Pursuant to Rule 22e-4 under the 1940 Act, the Funds have adopted a Liquidity Risk Management Program (the “Liquidity Program”). The Liquidity Program requires, among other things, that the Fund limit its illiquid investments to no more than 15% of its net assets. An illiquid investment is any investment that the Fund reasonably expects cannot be sold or disposed of by the Fund in current market conditions in seven calendar days or less without the sale or disposition significantly changing the market value of the investment. |
3). SECURITIES VALUATION
The Funds follow their valuation policies and procedures in determining their respective NAVs and, in preparing these financial statements, the fair value accounting standards that establish an authoritative definition of fair value and set out a hierarchy for measuring fair value. These standards require additional disclosures about the various inputs and valuation techniques used to develop the measurements of fair value and a discussion of changes in valuation techniques and related inputs during the period. These inputs are summarized in the three broad levels listed below:
| Level 1 – | Unadjusted, quoted prices in active markets for identical instruments that a Fund has the ability to access at the date of measurement. |
| Level 2 – | Other significant observable inputs other than quoted prices included in Level 1 (including, but not limited to, quoted prices in active markets for similar instruments, quoted prices in markets that are not active for identical or similar instruments, and model-derived valuations in which all significant inputs and significant value drivers are observable in active markets, such as interest rates, prepayment speeds, credit risk curves, default rates, and similar data). |
| Level 3 – | Significant unobservable inputs (including a Fund’s own assumptions about what market participants would use to price the asset or liability based on the best available information) when observable inputs are unavailable.
|
The following is a description of the valuation techniques applied to the Funds’ major categories of assets and liabilities on a recurring basis, as applicable:
| | Equity Securities – Equity securities, including common stocks, preferred stocks, foreign-issued common stocks, exchange-traded funds, closed-end mutual funds, partnerships, rights, MLPs, and real estate investment trusts, that are traded on a securities exchange for which a last-quoted sales price is readily available generally are valued at the last sales price as reported by the primary exchange on which the securities are listed. Securities listed on The Nasdaq Stock Market (“Nasdaq”) generally are valued at the Nasdaq Official Closing Price, which may differ from the last sales price reported. Securities traded on a securities exchange for which a last-quoted sales price is not readily available generally are valued at the mean between the bid and ask prices. To the extent these securities are actively traded and valuation adjustments are not applied, they are classified in Level 1 of the fair value hierarchy. Securities traded on foreign exchanges generally are not valued at the same time the Funds calculate their NAVs because most foreign markets close well before such time. The earlier close of most foreign markets gives rise to the possibility that significant events, including broad market moves, may have occurred in the interim. In certain circumstances, it may be determined that a foreign security needs to be fair valued because it appears that the value of the security might have been materially affected by events occurring after the close of the market in which the security is principally traded, but before the time a Fund calculates its NAV, such as by a development that affects an entire market or region (e.g., a weather-related event) or a potentially global development (e.g., a terrorist attack that may be expected to have an effect on investor expectations worldwide).
|
| | Registered Investment Companies – Investments in open-end registered investment companies, commonly referred to as mutual funds, generally are priced at the ending NAV provided by the applicable mutual fund’s service agent and are classified in Level 1 of the fair value hierarchy.
|
| | Debt Securities – Debt securities, including corporate bonds, asset-backed securities, mortgage-backed securities, municipal bonds, U.S. Treasuries, and U.S. government agency issues, are generally valued at market on the basis of valuations furnished by an independent pricing service that utilizes both dealer-supplied valuations and formula-based techniques. The pricing service may consider recently executed transactions in securities of the issuer or comparable issuers, market price quotations (where observable), bond spreads, and fundamental data relating to the issuer. In addition, the model may incorporate observable market data, such as reported sales of similar securities, broker quotes, yields, bids, offers, and reference data. Certain securities are valued primarily using dealer quotations. These securities are generally classified in Level 2 of the fair value hierarchy.
|
| | Short-Term Securities – Short-term equity investments, including money market funds, are valued in the manner specified above for equity securities. Short-term debt investments with an original term to maturity of 60 days or less are valued at amortized cost, which approximates fair market value. If the original term to maturity of a short-term debt investment exceeds 60 days, then the values as of the 61st day prior to maturity are amortized. Amortized cost is not used if its use would be inappropriate due to credit or other impairments of the issuer, in which case the security’s fair value would be determined as described below. Short-term securities are generally classified in Level 1 or Level 2 of the fair value hierarchy depending on the inputs used and market activity levels for specific securities.
|
If market quotations are not readily available or if a significant event has occurred that indicates the closing price of a security no longer represents the true value of that security, such security will be valued at its fair value under the Fund’s established fair valuation procedures as implemented by Hennessy Advisors, Inc. (the “Advisor”), the Funds’ valuation designee. The Advisor, as the valuation designee, is subject to the oversight of the Board of Trustees of the Trust (the “Board”). There are numerous criteria considered in determining a fair value of a security, such as the trading volume of a security and markets, the values of other similar securities, and news events with direct bearing on a security or markets. Fair value pricing results in an estimated price for a security that reflects the amount the Fund might reasonably expect to receive in a current sale. Depending on the relative significance of the valuation inputs, these securities may be classified in either Level 2 or Level 3 of the fair value hierarchy. The Advisor will regularly evaluate whether the Funds’ fair value pricing procedures continue to be appropriate in light of the specific circumstances of each Fund and the quality of prices obtained through the application of such procedures.
WWW.HENNESSYFUNDS.COM
The fair value of any foreign securities may be determined with the assistance of a pricing service using correlations between the movement of prices of such securities and indices of domestic securities and other appropriate indicators, such as closing market prices of relevant American Depositary Receipts or futures contracts. Using fair value pricing means that a Fund’s NAV reflects the affected portfolio securities’ values as determined by the Advisor, the Board’s valuation designee, pursuant to the Fund’s fair value pricing procedures, instead of being determined by the market. Using a fair value pricing methodology to price a foreign security may result in a value that is different from such foreign security’s most recent closing price and from the value used by other investment companies to calculate their NAVs. Such securities are generally classified in Level 2 of the fair value hierarchy. Because the Japan Fund and the Japan Small Cap Fund do invest, and the other Funds except the Mid Cap 30 Fund, the Large Growth Fund, the Total Return Fund, and the Balanced Fund may invest, in foreign securities, for example, the value of a Fund’s portfolio securities may change on days when shareholders are unable to purchase or redeem Fund shares.
The Funds have performed an analysis of all existing investments to determine the significance and character of all inputs to their fair value determinations. Various inputs are used to determine the value of each Fund’s investments. The inputs or methodology used for valuing securities are not necessarily an indication of the risk associated with investing in those securities. Details related to the fair value hierarchy of each Fund’s securities as of October 31, 2024, are included in its Schedule of Investments.
4). INVESTMENT TRANSACTIONS
Purchases and sales of investment securities (excluding government and short-term investments) during fiscal year 2024 were as follows:
| | | | Purchases | | | Sales | |
| | Growth Fund | | $ | 563,181,972 | | | $ | 316,102,074 | |
| | Focus Fund | | | 63,364,077 | | | | 163,128,415 | |
| | Mid Cap 30 Fund | | | 1,538,656,874 | | | | 977,301,399 | |
| | Large Growth Fund | | | 78,142,854 | | | | 87,553,580 | |
| | Value Fund | | | 58,026,721 | | | | 80,704,661 | |
| | Total Return Fund | | | 11,128,617 | | | | 15,566,418 | |
| | Equity and Income Fund | | | 5,020,123 | | | | 24,807,078 | |
| | Balanced Fund | | | 3,769,305 | | | | 4,419,291 | |
| | Energy Transition Fund | | | 2,137,995 | | | | 7,983,092 | |
| | Midstream Fund | | | 4,312,095 | | | | 3,800,217 | |
| | Gas Utility Fund | | | 56,150,634 | | | | 125,499,094 | |
| | Japan Fund | | | 83,759,073 | | | | 62,341,053 | |
| | Japan Small Cap Fund | | | 30,152,286 | | | | 35,996,436 | |
| | Large Cap Financial Fund | | | 10,392,720 | | | | 20,406,981 | |
| | Small Cap Financial Fund | | | 45,264,799 | | | | 38,197,971 | |
| | Technology Fund | | | 6,286,803 | | | | 6,761,265 | |
Purchases and sales/maturities of long-term U.S. government securities for the Equity and Income Fund during fiscal year 2024 were $5,344,603 and $6,750,886, respectively. There were no purchases or sales/maturities of long-term U.S. government securities by any other Funds during fiscal year 2024.
5). INVESTMENT ADVISORY FEE AND OTHER TRANSACTIONS WITH AFFILIATES
The Advisor provides the Funds with investment advisory services under Investment Advisory Agreements between the Advisor and the Trust. The Advisor provides or oversees the provision of all investment advice and furnishes office spaces, facilities, and most of the personnel needed by the Funds. As compensation for its services, the Advisor is entitled to a monthly fee from each Fund. The net investment advisory fees expensed by each Fund during fiscal year 2024 are included in its Statement of Operations. The fee for each Fund is based on the average daily net assets of the Fund at an annual rate of:
| | Growth Fund | 0.74% | Energy Transition Fund | 1.25% |
| | Focus Fund | 0.90% | Midstream Fund | 1.10% |
| | Mid Cap 30 Fund | 0.74% | Gas Utility Fund | 0.40% |
| | Large Growth Fund | 0.74% | Japan Fund | 0.80% |
| | Value Fund | 0.74% | Japan Small Cap Fund | 0.80% |
| | Total Return Fund | 0.60% | Large Cap Financial Fund | 0.90% |
| | Equity and Income Fund | 0.80% | Small Cap Financial Fund | 0.90% |
| | Balanced Fund | 0.60% | Technology Fund | 0.74% |
The Advisor has delegated the day-to-day management of some of the Funds to a sub-advisor. The Advisor pays all sub-advisory fees from its own assets, and these fees are not an additional expense of the Funds. The following table lists each sub-advised Fund, the sub-advisor for such Fund, and the annual rate used to calculate the sub-advisory fee payable by the Advisor to such Fund’s sub-advisor:
| | Fund | Sub-Advisor | Annual Rate |
| | Hennessy Focus Fund | Broad Run Investment Management, LLC | 0.29% |
| | Hennessy Equity and Income Fund | FCI Advisors (fixed income allocation) | 0.27% |
| | | The London Company of Virginia, LLC (equity allocation) | 0.33% |
| | Hennessy Japan Fund | SPARX Asset Management Co., Ltd. | $0-$500 million: 0.35% |
| | | | Above $500 million-$1 billion: 0.40% |
| | | | Above $1 billion: 0.42% |
| | Hennessy Japan Small Cap Fund | SPARX Asset Management Co., Ltd. | $0-$500 million: 0.35% |
| | | | Above $500 million-$1 billion: 0.40% |
| | | | Above $1 billion: 0.42% |
HENNESSY FUNDS | 1-800-966-4354 |
During fiscal year 2024, the Advisor paid a sub-advisory fee at the average rate of 0.35% of the daily net assets of each of the Japan Fund and the Japan Small Cap Fund.
The Advisor has contractually agreed to (i) limit total annual operating expenses of the Midstream Fund to 1.75% of its net assets for Investor Class shares and 1.50% of its net assets for Institutional Class shares (excluding all federal, state, and local taxes, interest, brokerage commissions, dividend and interest expenses on short sales, extraordinary items, and acquired fund fees and expenses and other costs incurred in connection with the purchase and sale of securities) and (ii) limit total annual operating expenses of the Technology Fund to 0.98% of its net assets for both Investor Class shares and Institutional Class shares (excluding all federal, state, and local taxes, interest, brokerage commissions, 12b-1 fees, shareholder servicing fees payable to the Advisor, extraordinary items, and acquired fund fees and expenses and other costs incurred in connection with the purchase and sale of securities), in each case, through February 28, 2025.
For three years following the date on which expenses were waived or incurred, the Advisor may recoup waived or reimbursed expenses from a Fund if total operating expenses, including such recoupment, does not exceed the expense limitation in effect (i) at the time the Advisor waived or reimbursed such expenses and (ii) at the time the Advisor recoups such expenses. As of October 31, 2024, expenses subject to potential recovery and the fiscal years in which they expire were as follows:
| | | Fiscal Year 2025 | | | Fiscal Year 2026 | | | Fiscal Year 2027 | | | Total | |
| Midstream Fund – Investor Class | | $ | 13,391 | | | $ | 19,218 | | | $ | 15,904 | | | $ | 48,513 | |
| Midstream Fund – Institutional Class | | | 3,407 | | | | 2,585 | | | | — | | | | 5,992 | |
| Technology Fund – Investor Class | | | 73,628 | | | | 72,197 | | | | 66,424 | | | | 212,249 | |
| Technology Fund – Institutional Class | | | 23,122 | | | | 25,964 | | | | 31,785 | | | | 80,871 | |
The Advisor recouped $28,041 of previously waived expenses from Institutional Class shares of the Midstream Fund during fiscal year 2024. The Advisor did not recoup expenses from the Technology Fund during fiscal year 2024.
The Board has approved a Shareholder Servicing Agreement for Investor Class shares of each Fund, which compensates the Advisor for the non-investment advisory services it provides to each Fund. The Shareholder Servicing Agreement provides for a monthly fee paid to the Advisor at an annual rate of 0.10% of the average daily net assets of the Funds attributable to Investor Class shares. The shareholder service fees expensed by each Fund during fiscal year 2024 are included in its Statement of Operations.
Each Fund has adopted a plan pursuant to Rule 12b-1 under the Investment Company Act of 1940, as amended, that authorizes payments in connection with the distribution of Fund shares at an annual rate of up to 0.25% of the Fund’s average daily net assets attributable to Investor Class shares. Even though the authorized rate is up to 0.25%, each Fund is currently only using up to 0.15% of its average daily net assets attributable to Investor Class shares for such purpose. Amounts paid under the plans may be spent on any activities or expenses primarily intended to result in the sale of shares, including, but not limited to, advertising, shareholder account servicing, printing and mailing of prospectuses to other than current shareholders, printing and mailing of sales literature, and compensation for sales and marketing activities or to financial institutions and others, such as dealers and distributors. The distribution fees expensed by each Fund during fiscal year 2024 are included in its Statement of Operations.
The Funds have entered into agreements with various brokers, dealers, and financial intermediaries in connection with the sale of Fund shares. The agreements provide for periodic payments of sub-transfer agent expenses by the Funds to brokers, dealers, and financial intermediaries for providing certain shareholder maintenance services. These shareholder services include the pre-processing and quality control of new accounts, shareholder correspondence, answering customer inquiries regarding account status, and facilitating shareholder telephone transactions. The sub-transfer agent fees expensed by each Fund during fiscal year 2024 are included in its Statement of Operations.
The Gas Utility Fund has entered into an Administrative Services Agreement among the Gas Utility Fund, the Advisor, and the American Gas Association (“AGA”), pursuant to which the AGA provides administrative services to the Gas Utility Fund, including overseeing the calculation of the AGA Stock Index. ScottMadden, Inc. performs the actual computations required to produce the AGA Stock Index and receives a fee for such calculations pursuant to a contractual arrangement with AGA. AGA does not furnish other securities advice to the Gas Utility Fund or the Advisor or make recommendations regarding the purchase or sale of securities by the Gas Utility Fund. Under the terms of the Administrative Services Agreement, which has been approved by the Board, AGA provides the Gas Utility Fund with current information regarding the common stock composition of the AGA Stock Index at least monthly. In addition, on request, AGA provides the Gas Utility Fund and the Advisor with information on the natural gas industry. The Gas Utility Fund pays AGA a fee at an annual rate of 0.04% of the average daily net assets of the Gas Utility Fund.
U.S. Bancorp Fund Services, LLC, d/b/a U.S. Bank Global Fund Services (“Fund Services”) provides the Funds with administrative, accounting, and transfer agent services. As administrator, Fund Services is responsible for activities such as (i) preparing various federal and state regulatory filings, reports, and returns for the Funds, (ii) preparing reports and materials to be supplied to the Board, (iii) monitoring the activities of the Funds’ custodian, transfer agent, and accountants, and (iv) coordinating the preparation and payment of the Funds’ expenses and reviewing the Funds’ expense accruals. U.S. Bank N.A., an affiliate of Fund Services, serves as the Funds’ custodian. The servicing agreements between the Trust, Fund Services, and U.S. Bank N.A. contain a fee schedule that is inclusive of administrative, accounting, custody, and transfer agent fees. The administrative, accounting, custody, and transfer agent fees expensed by each Fund during fiscal year 2024 are included in its Statement of Operations. Fund Services has voluntarily waived all or a portion of its fees for the Energy Transition Fund, the Midstream Fund, and the Technology Fund. The fees voluntarily waived by Fund Services during fiscal year 2024 are included in the Statement of Operations for the Energy Transition Fund, the Midstream Fund, and the Technology Fund.
Quasar Distributors, LLC, a wholly owned broker-dealer subsidiary of Foreside Financial Group, LLC, acts as the Funds’ principal underwriter in a continuous public offering of Fund shares.
The officers of the Funds are affiliated with the Advisor. With the exception of the Chief Compliance Officer and Senior Compliance Officer, such officers receive no compensation from the Funds for serving in their respective roles. The Funds make reimbursement payments on an equal basis to the Advisor for a portion of the salary and benefits associated with the office of the Chief Compliance Officer and Senior Compliance Officer. The compliance fees expensed by each Fund during fiscal year 2024 for reimbursement payments to the Advisor are included in its Statement of Operations.
WWW.HENNESSYFUNDS.COM
6). GUARANTEES AND INDEMNIFICATIONS
Under the Hennessy Funds’ organizational documents, their officers and trustees are indemnified by the Hennessy Funds against certain liabilities arising out of the performance of their duties to the Hennessy Funds. Additionally, in the normal course of business, the Hennessy Funds enter into contracts with service providers that contain general indemnification clauses. Each Fund’s maximum exposure under these arrangements is unknown as this would involve future claims that may be made against the Fund that have not yet occurred. Currently, each Fund expects the risk of loss to be remote.
7). LINE OF CREDIT
Each Fund has an uncommitted line of credit with the other Funds in the amount of the lesser of (i) $100,000,000 or (ii) 33.33% of each Fund’s net assets, or 30% for the Gas Utility Fund, the Japan Fund, and the Japan Small Cap Fund, and 10% for the Balanced Fund. The line of credit is intended to provide any necessary short-term financing in connection with shareholder redemptions, subject to certain restrictions. The credit facility is with the Funds’ custodian bank, U.S. Bank N.A. Borrowings under this arrangement bear interest at the bank’s prime rate and are secured by each Funds’ assets (as to its own borrowings only). The following table shows the outstanding average daily balance, weighted average interest rate, and maximum amount outstanding during fiscal year 2024 for each Fund that utilized the line of credit, as well as the amount of borrowings outstanding under the line of credit as of October 31, 2024:
| | | | | | | | | | | | | | |
| | | | Outstanding Daily | | | Weighted | | | Maximum | | | Amount | |
| | | | Average
Balance | | | Average Interest Rate | | | Amount Outstanding | | | Outstanding at October 31, 2024 | |
| | Focus Fund | | $ | 48,317 | | | | 8.50 | % | | $ | 4,932,000 | | | $ | — | |
| | Large Growth Fund | | | 2,989 | | | | 8.50 | % | | | 453,000 | | | | — | |
| | Value Fund | | | 51,202 | | | | 8.50 | % | | | 1,233,000 | | | | — | |
| | Equity and Income Fund | | | 1,454 | | | | 8.50 | % | | | 308,000 | | | | — | |
| | Balanced Fund | | | 20,443 | | | | 8.50 | % | | | 1,616,000 | | | | — | |
| | Energy Transition Fund | | | 39,579 | | | | 8.50 | % | | | 2,496,000 | | | | — | |
| | Gas Utility Fund | | | 258,126 | | | | 8.50 | % | | | 7,362,000 | | | | — | |
| | Japan Fund | | | 19 | | | | 8.50 | % | | | 7,000 | | | | — | |
| | Large Cap Financial Fund | | | 33,342 | | | | 8.50 | % | | | 2,244,000 | | | | — | |
| | Small Cap Financial Fund | | | 8,828 | | | | 8.00 | % | | | 3,231,000 | | | | — | |
| | Technology Fund | | | 3,549 | | | | 8.50 | % | | | 231,000 | | | | — | |
The interest expensed by each Fund under the line of credit during fiscal year 2024 is included in its Statement of Operations.
8). FEDERAL TAX INFORMATION
a). | All Funds other than the Midstream Fund –As of October 31, 2024, the components of accumulated earnings (losses) for income tax purposes were as follows: |
| | | Growth | | | Focus | | | Mid Cap 30 | | | Large Growth | |
| | | Fund | | | Fund | | | Fund | | | Fund | |
| Cost of investments for tax purposes | | $ | 487,023,994 | | | $ | 266,171,819 | | | $ | 1,471,694,139 | | | $ | 124,007,371 | |
| Gross tax unrealized appreciation | | $ | 67,309,332 | | | $ | 414,785,154 | | | $ | 167,421,162 | | | $ | 28,828,988 | |
| Gross tax unrealized depreciation | | | (42,860,231 | ) | | | (5,130,499 | ) | | | (40,295,726 | ) | | | (7,578,211 | ) |
| Net tax unrealized appreciation | | $ | 24,449,101 | | | $ | 409,654,655 | | | $ | 127,125,436 | | | $ | 21,250,777 | |
| Undistributed ordinary income | | $ | 1,089,939 | | | $ | — | | | $ | 6,062,965 | | | $ | 2,770,315 | |
| Undistributed long-term capital gains | | | 66,863,967 | | | | 88,765,061 | | | | 272,691,615 | | | | 3,162,532 | |
| Total distributable earnings | | $ | 67,953,906 | | | $ | 88,765,061 | | | $ | 278,754,580 | | | $ | 5,932,847 | |
| Other accumulated gain/(loss) | | $ | — | | | $ | (2,336,331 | ) | | $ | — | | | $ | — | |
| Total accumulated gain/(loss) | | $ | 92,403,007 | | | $ | 496,083,385 | | | $ | 405,880,016 | | | $ | 27,183,624 | |
| | | | | | | | | | | | | | | | | |
| | |
| | | | | | | Equity and | | | | | |
| | | Value | | | Total Return | | | Income | | | Balanced | |
| | | Fund | | | Fund | | | Fund | | | Fund | |
| Cost of investments for tax purposes | | $ | 225,381,435 | | | $ | 67,316,092 | | | $ | 41,535,116 | | | $ | 12,155,298 | |
| Gross tax unrealized appreciation | | $ | 63,541,881 | | | $ | 7,127,206 | | | $ | 20,126,503 | | | $ | 1,198,897 | |
| Gross tax unrealized depreciation | | | (7,358,071 | ) | | | | ) | | | (1,656,304 | ) | | | (667,612 | |
| Net tax unrealized appreciation | | $ | 56,183,810 | | | $ | 3,464,081 | | | $ | 18,470,199 | | | $ | 531,285 | |
| Undistributed ordinary income | | $ | 10,410,022 | | | $ | 80,158 | | | $ | 6,435 | | | $ | 20,636 | |
| Undistributed long-term capital gains | | | — | | | | 485,415 | | | | 6,294,142 | | | | 142,559 | |
| Total distributable earnings | | $ | 10,410,022 | | | $ | 565,573 | | | $ | 6,300,577 | | | $ | 163,195 | |
| Other accumulated gain/(loss) | | $ | — | | | $ | — | | | $ | — | | | $ | — | |
| Total accumulated gain/(loss) | | $ | 66,593,832 | | | $ | 4,029,654 | | | $ | 24,770,776 | | | $ | 694,480 | |
HENNESSY FUNDS | 1-800-966-4354 |
| | | Energy Transition | | | Gas Utility | | | Japan | | | Japan Small | |
| | | Fund | | | Fund | | | Fund | | | Cap Fund | |
| Cost of investments for tax purposes | | $ | 10,255,203 | | | $ | 237,433,280 | | | $ | 296,504,179 | | | $ | 102,866,966 | |
| Gross tax unrealized appreciation | | $ | 4,729,509 | | | $ | 264,873,594 | | | $ | 129,942,682 | | | $ | 16,113,580 | |
| Gross tax unrealized depreciation | | | (208,584 | ) | | | (24,418,102 | ) | | | (15,925,820 | ) | | | | |
| Net tax unrealized appreciation | | $ | 4,520,925 | | | $ | 240,455,492 | | | $ | 114,016,862 | | | $ | 5,526,567 | |
| Undistributed ordinary income | | $ | — | | | $ | 89,922 | | | $ | 5,417,582 | | | $ | 1,307,095 | |
| Undistributed long-term capital gains | | | — | | | | 25,133,393 | | | | 19,174,987 | | | | | |
| Total distributable earnings | | $ | — | | | $ | 25,223,315 | | | $ | 24,592,569 | | | $ | 4,358,909 | |
| Other accumulated gain/(loss) | | $ | (36,589,815 | ) | | $ | — | | | $ | — | | | $ | — | |
| Total accumulated gain/(loss) | | $ | (32,068,890 | ) | | $ | 265,678,807 | | | $ | 138,609,431 | | | $ | 9,885,476 | |
| | | | | | | | | | | | | | | | | |
| | | Large Cap | | | Small Cap | | | | | | | | | |
| | | Financial | | | Financial | | | Technology | | | | | |
| | | Fund | | | Fund | | | Fund | | | | | |
| Cost of investments for tax purposes | | $ | 18,512,683 | | | $ | 70,911,146 | | | $ | 6,486,263 | | | | | |
| Gross tax unrealized appreciation | | $ | 11,413,952 | | | $ | 19,454,266 | | | $ | 1,814,272 | | | | | |
| Gross tax unrealized depreciation | | | (1,102,005 | ) | | | | | | | (394,299 | ) | | | | |
| Net tax unrealized appreciation | | $ | 10,311,947 | | | $ | 16,393,003 | | | $ | 1,419,973 | | | | | |
| Undistributed ordinary income | | $ | 187,318 | | | $ | 1,680,961 | | | $ | — | | | | | |
| Undistributed long-term capital gains | | | — | | | | 2,876,904 | | | | 339,646 | | | | | |
| Total distributable earnings | | $ | 187,318 | | | $ | 4,557,865 | | | $ | 339,646 | | | | | |
| Other accumulated gain/(loss) | | $ | (2,668,608 | ) | | $ | — | | | $ | (9,205 | ) | | | | |
| Total accumulated gain/(loss) | | $ | 7,830,657 | | | $ | 20,950,868 | | | $ | 1,750,414 | | | | | |
Any differences between book-basis unrealized appreciation/depreciation and tax-basis unrealized appreciation/depreciation (as shown above) may be attributable to capital loss carryforwards, wash sales, partnership adjustments, late-year ordinary losses, and investments in passive foreign investment companies.
Capital loss carryforwards available as of October 31, 2024, to offset future gains, as well as capital loss carryforwards utilized during fiscal year 2024, are as follows:
| | | | | | | | | Capital Loss | | | | |
| | | Non-Expiring | | | Non-Expiring | | | Carryforwards | | | | |
| | | Short Term | | | Long Term | | | Utilized | | | Total | |
Growth Fund | | $ | — | | | $ | — | | | $ | 4,508,485 | | | $ | — | |
Focus Fund | | | — | | | | — | | | | — | | | | — | |
Mid Cap 30 Fund | | | — | | | | — | | | | — | | | | — | |
Large Growth Fund | | | — | | | | — | | | | — | | | | — | |
Value Fund | | | — | | | | — | | | | 4,306,123 | | | | — | |
Total Return Fund | | | — | | | | — | | | | — | | | | — | |
Equity and Income Fund | | | — | | | | — | | | | — | | | | — | |
Balanced Fund | | | — | | | | — | | | | — | | | | — | |
Energy Transition Fund | | | 18,432,357 | | | | 18,157,458 | | | | 1,830,571 | | | | 36,589,815 | |
Gas Utility Fund | | | — | | | | — | | | | — | | | | — | |
Japan Fund | | | — | | | | — | | | | — | | | | — | |
Japan Small Cap Fund | | | — | | | | — | | | | 1,191,834 | | | | — | |
Large Cap Financial Fund | | | 2,668,608 | | | | — | | | | — | | | | 2,668,608 | |
Small Cap Financial Fund | | | — | | | | — | | | | — | | | | — | |
Technology Fund | | | — | | | | — | | | | 847,141 | | | | — | |
As of October 31, 2024, the following Funds deferred, on a tax basis, a late-year ordinary loss as follows:
Growth Fund | | $ | — | | Energy Transition Fund | | $ | — | |
Focus Fund | | | 2,336,331 | | Gas Utility Fund | | | — | |
Mid Cap 30 Fund | | | — | | Japan Fund | | | — | |
Large Growth Fund | | | — | | Japan Small Cap Fund | | | — | |
Value Fund | | | — | | Large Cap Financial Fund | | | — | |
Total Return Fund | | | — | | Small Cap Financial Fund | | | — | |
Equity and Income Fund | | | — | | Technology Fund | | | 9,205 | |
Balanced Fund | | | — | | | | | | |
Late-year ordinary losses are net ordinary losses incurred after December 31, 2023, but within the taxable year, that are deemed to arise on the first day of the Fund’s next taxable year.
WWW.HENNESSYFUNDS.COM
b). | Midstream Fund – As of October 31, 2024, the components of accumulated earnings (losses) for income tax purposes for the Midstream Fund were as follows: |
| | | | Investments | |
| | Cost of investments for tax purposes | | $ | 31,095,709 | |
| | Gross tax unrealized appreciation | | $ | 42,946,663 | |
| | Gross tax unrealized depreciation | | | (1,463,443 | ) |
| | Net tax unrealized appreciation/(depreciation) | | $ | 41,483,220 | |
| | As of October 31, 2024, deferred tax assets (liabilities) for the Midstream Fund consisted of the following: |
| | Deferred tax assets (liabilities): | | | |
| | Net operating losses | | $ | 584,967 | |
| | Capital loss | | | 1,535,592 | |
| | Unrealized (gain) loss on investments | | | (7,638,822 | ) |
| | Total deferred tax assets, net | | | (5,518,263 | ) |
| | Valuation allowance | | | — | |
| | Net | | $ | (5,518,263 | ) |
| | For fiscal year 2024, the Midstream Fund had an effective tax rate of 0% and a federal statutory rate of 21%, with the difference resulting from a change in the valuation allowance of the deferred tax assets.
|
| | Deferred income tax assets and liabilities are recorded for differences between the financial statement and tax basis of the assets and liabilities that will result in taxable or deductible amounts in the future based on enacted laws and rates applicable to the periods in which the differences are expected to affect taxable income. Valuation allowances are established when necessary to reduce deferred tax assets to the amount expected to be realized.
|
| | The Midstream Fund may carry forward any net capital loss five years to offset any future realized capital gains. The Midstream Fund may carry forward indefinitely any net operating loss arising in a tax year ending after December 31, 2019. As of October 31, 2024, the Midstream Fund had $7,178,863 in capital loss carryforwards that will expire as of October 31, 2025.
|
| | As of October 31, 2024, the Midstream Fund had $2,641,562 in net operating loss carryforwards that the Fund may carry forward indefinitely.
|
| | Total income taxes of the Midstream Fund have been computed by applying the federal statutory income tax rate of 21% plus a blended state income tax rate. The Midstream Fund applied this effective rate to net investment income and realized and unrealized gains on investments before taxes in computing its total income taxes. |
| | Tax expense (benefit) at statutory rates | | $ | 3,962,162 | |
| | State income tax expense, net of federal benefit | | | 193,785 | |
| | Tax expense (benefit) on permanent items(1) | | | (48,774 | ) |
| | Tax expense (benefit) on expired carryforwards | | | 1,779,299 | |
| | Tax expense (benefit) due to change in effective state rates | | | — | |
| | Total current tax expense (benefit) | | | — | |
| | Change in valuation allowance | | | (368,210 | ) |
| | Total tax expense | | $ | 5,518,262 | |
| | (1) Permanent items consist of dividends-received deductions. |
| | The Midstream Fund recognizes the tax benefits of uncertain tax positions only where the position is “more likely than not” to be sustained assuming examination by tax authorities. Management has analyzed the Midstream Fund’s tax positions in all open tax years and has concluded that no liability for unrecognized tax benefits should be recorded related to uncertain tax positions taken on U.S. federal tax returns and state tax returns filed or expected to be filed. No income tax returns are currently under examination. Generally, the tax returns of the Midstream Fund for the prior three fiscal years are open for examination. Due to the nature of the Midstream Fund’s investments, the Midstream Fund may be required to file income tax returns in several states. The Midstream Fund is not aware of any tax positions for which it is reasonably possible that the total amounts of unrecognized tax benefits will change materially.
|
| | During fiscal years 2024 and 2023, the tax character of distributions paid by the Funds were as follows (estimated in the case of the Midstream Fund): |
| | | | Fiscal Year 2024 | | | Fiscal Year 2023 | | | | Fiscal Year 2024 | | | Fiscal Year 2023 | |
| | Growth Fund | | | | | | | Energy Transition Fund | | | | | | |
| | Ordinary income(1) | | $ | 774,064 | | | $ | 2,073,376 | | Ordinary income(1) | | $ | — | | | $ | 138,769 | |
| | Long-term capital gains | | | — | | | | 4,012,963 | | Long-term capital gains | | | — | | | | — | |
| | Total distributions | | $ | 774,064 | | | $ | 6,086,339 | | Total distributions | | $ | — | | | $ | 138,769 | |
| | | | | | | | | | | | | | | | | | | |
| | Focus Fund | | | | | | | | | Midstream Fund | | | | | | | | |
| | Ordinary income(1) | | $ | — | | | $ | — | | Ordinary income(1) | | $ | 961,912 | | | $ | 4,072,242 | |
| | Long-term capital gains | | | 129,052,636 | | | | 94,218,290 | | Return of capital | | | 4,619,363 | | | | 907,298 | |
| | Total distributions | | $ | 129,052,636 | | | $ | 94,218,290 | | Total distributions | | $ | 5,581,275 | | | $ | 4,979,540 | |
HENNESSY FUNDS | 1-800-966-4354 |
| | | | Fiscal Year 2024 | | | Fiscal Year 2023 | | | | Fiscal Year 2024 | | | Fiscal Year 2023 | |
| | Mid Cap 30 Fund | | | | | | | Gas Utility Fund | | | | | | |
| | Ordinary income(1) | | $ | — | | | $ | — | | Ordinary income(1) | | $ | 11,304,235 | | | $ | 13,981,342 | |
| | Long-term capital gains | | | 61,267,167 | | | | 67,483,839 | | Long-term capital gains | | | 18,018,013 | | | | 31,091,892 | |
| | Total distributions | | $ | 61,267,167 | | | $ | 67,483,839 | | Total distributions | | $ | 29,322,248 | | | $ | 45,073,234 | |
| | | | | | | | | | | | | | | | | | | |
| | Large Growth Fund | | | | | | | | | Japan Fund | | | | | | | | |
| | Ordinary income(1) | | $ | 1,525,599 | | | $ | 1,161,564 | | Ordinary income(1) | | $ | — | | | $ | — | |
| | Long-term capital gains | | | 3,841,345 | | | | 20,711,181 | | Long-term capital gains | | | 17,310,612 | | | | — | |
| | Total distributions | | $ | 5,366,944 | | | $ | 21,872,745 | | Total distributions | | $ | 17,310,612 | | | $ | — | |
| | | | | | | | | | | | | | | | | | | |
| | Value Fund | | | | | | | | | Japan Small Cap Fund | | | | | | | | |
| | Ordinary income(1) | | $ | 9,470,218 | | | $ | 7,801,294 | | Ordinary income(1) | | $ | 1,212,097 | | | $ | 856,992 | |
| | Long-term capital gains | | | — | | | | 20,765,408 | | Long-term capital gains | | | — | | | | — | |
| | Total distributions | | $ | 9,470,218 | | | $ | 28,566,702 | | Total distributions | | $ | 1,212,097 | | | $ | 856,992 | |
| | | | | | | | | | | | | | | | | | | |
| | Total Return Fund | | | | | | | | | Large Cap Financial Fund | | | | | | | | |
| | Ordinary income(1) | | $ | 1,610,256 | | | $ | 1,508,864 | | Ordinary income(1) | | $ | 525,902 | | | $ | 338,619 | |
| | Long-term capital gains | | | 2,006,464 | | | | 2,624,917 | | Long-term capital gains | | | — | | | | 2,733,895 | |
| | Total distributions | | $ | 3,616,720 | | | $ | 4,133,781 | | Total distributions | | $ | 525,902 | | | $ | 3,072,514 | |
| | | | | | | | | | | | | | | | | | | |
| | Equity and Income Fund | | | | | | | | | Small Cap Financial Fund | | | | | | | | |
| | Ordinary income(1) | | $ | 510,738 | | | $ | 743,879 | | Ordinary income(1) | | $ | 1,582,796 | | | $ | 995,722 | |
| | Long-term capital gains | | | 5,672,163 | | | | 2,298,711 | | Long-term capital gains | | | 2,110,376 | | | | 8,333,435 | |
| | Total distributions | | $ | 6,182,901 | | | $ | 3,042,590 | | Total distributions | | $ | 3,693,172 | | | $ | 9,329,157 | |
| | | | | | | | | | | | | | | | | | | |
| | Balanced Fund | | | | | | | | | Technology Fund | | | | | | | | |
| | Ordinary income(1) | | $ | 363,643 | | | $ | 265,250 | | Ordinary income(1) | | $ | — | | | $ | 9,231 | |
| | Long-term capital gains | | | 13,324 | | | | 478,198 | | Long-term capital gains | | | — | | | | — | |
| | Total distributions | | $ | 376,967 | | | $ | 743,448 | | Total distributions | | $ | — | | | $ | 9,231 | |
(1) Ordinary income includes short-term capital gains. |
9). REVERSE REPURCHASE AGREEMENTS
Under a reverse repurchase agreement, the Total Return Fund sells securities and agrees to repurchase them at a mutually agreed date and price. Reverse repurchase agreements are regarded as a form of secured borrowing by the Total Return Fund. Securities sold under reverse repurchase agreements are reflected as a liability in the Statement of Assets and Liabilities. Interest payments made under reverse repurchase agreements during fiscal year 2024, totaled $1,184,387 and are recorded as interest expense in the Statement of Operations.
During fiscal year 2024, the average daily balance and average interest rate in effect for reverse repurchase agreements held by the Total Return Fund were $20,944,096 and 5.56%, respectively. Below is information about the scheduled maturity date, amount, and interest rate for outstanding reverse repurchase agreements held by the Total Return Fund as of October 31, 2024:
| Maturity Date | | Amount | | | Interest Rate |
| November 7, 2024 | | $ | 5,397,000 | | | 5.45% |
| December 12, 2024 | | $ | 5,397,000 | | | 5.35% |
| January 9, 2025 | | $ | 10,794,000 | | | 5.00% |
Outstanding reverse repurchase agreements as of October 31, 2024, comprised 44.02% of the Total Return Fund’s net assets.
Below is information about reverse repurchase agreements held by the Total Return Fund that are eligible for offset in the Statement of Assets and Liabilities, on both a gross and net basis:
| | | | | | | | | | | Gross Amounts Not Offset in the | | | | |
| | | | | | | | | | | Statement of Assets and Liabilities | | | | |
| | | | | Gross Amounts | | | Net Amounts | | | | | | | | | | |
| | | | | Offset in the | | | Presented in the | | | | | | | | | | |
| | Gross Amounts | | | Statement of | | | Statement of | | | | | | Collateral | | | | |
| | of Recognized | | | Assets and | | | Assets and | | | Financial | | | Pledged | | | | |
| | Liabilities | | | Liabilities | | | Liabilities | | | Instruments | | | (Received) | | | Net Amount | |
| | | | | | | | | | | | | | | | | | |
| | $ | 21,588,000 | | | $ | — | | | $ | 21,588,000 | | | $ | 21,588,000 | | | $ | — | | | $ | — | |
| | $ | 21,588,000 | | | $ | — | | | $ | 21,588,000 | | | $ | 21,588,000 | | | $ | — | | | $ | — | |
For additional information, please refer to the “Offsetting Assets and Liabilities” section in Note 2.
10). GLOBAL EVENTS
A rise in protectionist trade policies, the possibility of a national or global recession, risks associated with pandemic and epidemic diseases, trade tensions, the possibility of changes to some international trade agreements, political events, and continuing political tension and armed conflicts may adversely impact financial markets and the broader economy. For example, ongoing armed conflicts between Ukraine and Russia in Europe
WWW.HENNESSYFUNDS.COM
and among Israel, Hamas, and other militant groups in the Middle East have caused and could continue to cause significant market disruptions and volatility with the markets in Europe and the Middle East, and have had negative impacts on markets in the United States. These events could also have negative effects on the Funds’ investments that cannot be foreseen at the present time. As global systems, economies and financial markets are increasingly interconnected, events that once had only local impact are now more likely to have regional or even global effects. Events that occur in one country, region or financial market will, more frequently, adversely impact issuers in other countries, regions, or markets. These impacts can be exacerbated by failures of governments and societies to adequately respond to an emerging event or threat. Your investment would be negatively impacted if the value of your portfolio holdings decreases as a result of such events, if these events adversely impact the operations and effectiveness of the Advisor or other key service providers or if these events disrupt systems and processes necessary or beneficial to the management of accounts. These events may negatively impact broad segments of businesses and populations and could have a significant and rapid negative impact on the performance of the Funds’ investments, increase the Funds’ volatility, or exacerbate pre-existing risks to the applicable Fund.
11). EVENTS SUBSEQUENT TO YEAR END
Management has evaluated the Funds’ related events and transactions that occurred subsequent to October 31, 2024, through the date of issuance of the Funds’ financial statements. Other than as disclosed below, management has determined that there were no subsequent events requiring recognition or disclosure in the financial statements.
On December 5, 2024, capital gains were declared and paid to shareholders of record on December 4, 2024, as follows:
| | | | Short-term | | | Long-term | |
| | | | Investor Class | | | Institutional Class | | | Investor Class | | | Institutional Class | |
| | Growth Fund | | | N/A | | | | N/A | | | $ | 4.45193 | | | $ | 4.65975 | |
| | Focus Fund | | | N/A | | | | N/A | | | $ | 6.88263 | | | $ | 7.23822 | |
| | Mid Cap 30 Fund | | | N/A | | | | N/A | | | $ | 4.21283 | | | $ | 4.45095 | |
| | Large Growth Fund | | $ | 0.11932 | | | $ | 0.12077 | | | $ | 0.26756 | | | $ | 0.27083 | |
| | Value Fund | | $ | 0.25690 | | | $ | 0.25777 | | | | N/A | | | | N/A | |
| | Total Return Fund | | | N/A | | | | N/A | | | $ | 0.13442 | | | | N/A | |
| | Equity and Income Fund | | | N/A | | | | N/A | | | $ | 1.66289 | | | $ | 1.55969 | |
| | Balanced Fund | | | N/A | | | | N/A | | | $ | 0.13645 | | | | N/A | |
| | Gas Utility Fund | | | N/A | | | | N/A | | | $ | 1.42703 | | | $ | 1.42361 | |
| | Japan Fund | | | N/A | | | | N/A | | | $ | 2.00636 | | | $ | 2.09189 | |
| | Japan Small Cap Fund | | | N/A | | | | N/A | | | $ | 0.47313 | | | $ | 0.46762 | |
| | Small Cap Financial Fund | | $ | 0.34238 | | | $ | 0.19522 | | | $ | 0.91344 | | | $ | 0.52084 | |
| | Technology Fund | | | N/A | | | | N/A | | | $ | 0.96992 | | | $ | 1.00068 | |
On December 2, 2024, distributions were declared and paid to shareholders of record on November 29, 2024, as follows:
| | | Return of Capital | |
| | | Investor Class | | | Institutional Class | |
| Midstream Fund | | $0.2575 | | | $0.2575 | |
HENNESSY FUNDS | 1-800-966-4354 |
Report of Independent Registered Public Accounting Firm
To the Board of Trustees and the
Shareholders of the Hennessy Funds Trust
Novato, CA
Opinion on the Financial Statements
We have audited the accompanying statements of assets and liabilities of the Hennessy Cornerstone Growth Fund, Hennessy Focus Fund, Hennessy Cornerstone Mid Cap 30 Fund, Hennessy Cornerstone Large Growth Fund, Hennessy Cornerstone Value Fund, Hennessy Total Return Fund, Hennessy Equity and Income Fund, Hennessy Balanced Fund, Hennessy Energy Transition Fund, Hennessy Midstream Fund, Hennessy Gas Utility Fund, Hennessy Japan Fund, Hennessy Japan Small Cap Fund, Hennessy Large Cap Financial Fund, Hennessy Small Cap Financial Fund, and Hennessy Technology Fund (the “Funds”), each a series of Hennessy Funds Trust, including the schedules of investments, as of October 31, 2024, the related statements of operations for the year then ended, the statement of cash flows of the Hennessy Total Return Fund for the year then ended, the statements of changes in net assets for each of the two years in the period then ended, the financial highlights for each of the five years in the period then ended, and the related notes (collectively referred to as the “financial statements”). In our opinion, the financial statements present fairly, in all material respects, the financial position of the Funds as of October 31, 2024, the results of their operations for the year then ended, the results of cash flows of the Hennessy Total Return Fund for the year then ended, the changes in their net assets for each of the two years in the period then ended, and the financial highlights for each of the five years in the period then ended in conformity with accounting principles generally accepted in the United States of America.
Basis for Opinion
These financial statements are the responsibility of the Funds’ management. Our responsibility is to express an opinion on the Funds’ financial statements based on our audits. We are a public accounting firm registered with the Public Company Accounting Oversight Board (United States) (“PCAOB”) and are required to be independent with respect to the Fund in accordance with the U.S. federal securities laws and the applicable rules and regulations of the Securities and Exchange Commission and the PCAOB. We have served as the auditor of one or more of the funds in the Trust since 2002.
We conducted our audits in accordance with the standards of the PCAOB. Those standards require that we plan and perform the audit to obtain reasonable assurance about whether the financial statements are free of material misstatement, whether due to error or fraud. The Fund is not required to have, nor were we engaged to perform, an audit of its internal control over financial reporting. As part of our audits we are required to obtain an understanding of internal control over financial reporting, but not for the purpose of expressing an opinion on the effectiveness of the Funds’ internal control over financial reporting. Accordingly, we express no such opinion.
Our audits included performing procedures to assess the risks of material misstatement of the financial statements, whether due to error or fraud, and performing procedures that respond to those risks. Such procedures included examining, on a test basis, evidence regarding the amounts and disclosures in the financial statements. Our audits also included evaluating the accounting principles used and significant estimates made by management, as well as evaluating the overall presentation of the financial statements. Our procedures included confirmation of securities owned as of October 31, 2024 by correspondence with the custodian and brokers; when replies were not received from brokers, we performed other auditing procedures. We believe that our audits provide a reasonable basis for our opinion.
| |  |
| | TAIT, WELLER & BAKER LLP |
Philadelphia, Pennsylvania
December 24, 2024
WWW.HENNESSYFUNDS.COM
Federal Tax Distribution Information (Unaudited)
For fiscal year 2024, certain dividends paid by the Funds may be subject to a maximum tax rate of 23.8%, as provided for the Jobs and Growth Tax Relief Reconciliation Act of 2003. The percentage of dividends declared from ordinary income designated as qualified dividend income were as follows:
| | Growth Fund | 100.00% | | Energy Transition Fund | 0.00% |
| | Focus Fund | 0.00% | | Gas Utility Fund | 100.00% |
| | Mid Cap 30 Fund | 0.00% | | Japan Fund | 0.00% |
| | Large Growth Fund | 100.00% | | Japan Small Cap Fund | 100.00% |
| | Value Fund | 100.00% | | Large Cap Financial Fund | 100.00% |
| | Total Return Fund | 93.13% | | Small Cap Financial Fund | 97.39% |
| | Equity and Income Fund | 100.00% | | Technology Fund | 0.00% |
| | Balanced Fund | 75.85% | | | |
For corporate shareholder, the percent of ordinary income distributions that qualified for the corporate dividends received deduction for fiscal year 2024 were as follows:
| | Growth Fund | 100.00% | | Energy Transition Fund | 0.00% |
| | Focus Fund | 0.00% | | Gas Utility Fund | 100.00% |
| | Mid Cap 30 Fund | 0.00% | | Japan Fund | 0.00% |
| | Large Growth Fund | 100.00% | | Japan Small Cap Fund | 0.00% |
| | Value Fund | 79.15% | | Large Cap Financial Fund | 100.00% |
| | Total Return Fund | 93.13% | | Small Cap Financial Fund | 97.43% |
| | Equity and Income Fund | 100.00% | | Technology Fund | 0.00% |
| | Balanced Fund | 76.22% | | | |
The percentage of taxable ordinary income distributions that were designated as short-term capital gain distributions under Section 871(k)(2)(C) of the Internal Revenue Code of 1986, as amended, for the Funds were as follows:
| | Growth Fund | 0.00% | | Energy Transition Fund | 0.00% |
| | Focus Fund | 0.00% | | Gas Utility Fund | 0.00% |
| | Mid Cap 30 Fund | 0.00% | | Japan Fund | 0.00% |
| | Large Growth Fund | 0.00% | | Japan Small Cap Fund | 0.00% |
| | Value Fund | 0.00% | | Large Cap Financial Fund | 0.00% |
| | Total Return Fund | 0.00% | | Small Cap Financial Fund | 0.00% |
| | Equity and Income Fund | 0.00% | | Technology Fund | 0.00% |
| | Balanced Fund | 0.00% | | | |
For fiscal year 2024, the Japan Fund and Japan Small Cap Fund earned foreign-source income and paid foreign taxes as noted below, which it intends to pass through to its shareholders pursuant to Section 853 of the Internal Revenue Code.
| | Fund Name | Country | | Gross Foreign Income | Foreign Tax Paid |
| | Japan Fund | Japan | | $7,554,877 | $755,488 |
| | Japan Small Cap Fund | Japan | | $2,859,373 | $285,630 |
HENNESSY FUNDS | 1-800-966-4354 |
For information, questions, or assistance, please call
The Hennessy Funds
800-966-4354 or 415-899-1555
INVESTMENT ADVISOR
Hennessy Advisors, Inc.
7250 Redwood Boulevard, Suite 200
Novato, California 94945
ADMINISTRATOR,
TRANSFER AGENT,
DIVIDEND PAYING AGENT, &
SHAREHOLDER SERVICING AGENT
U.S. Bancorp Fund Services, LLC
d/b/a U.S. Bank Global Fund Services
P.O. Box 701
Milwaukee, Wisconsin 53201-0701
CUSTODIAN
U.S. Bank N.A.
Custody Operations
1555 North River Center Drive, Suite 302
Milwaukee, Wisconsin 53212
TRUSTEES
Neil J. Hennessy
Robert T. Doyle
J. Dennis DeSousa
Doug Franklin
Claire Garvie
Gerald P. Richardson
COUNSEL
Foley & Lardner LLP
777 East Wisconsin Avenue
Milwaukee, Wisconsin 53202-5306
INDEPENDENT REGISTERED
PUBLIC ACCOUNTING FIRM
Tait, Weller & Baker LLP
Two Liberty Place
50 South 16th Street, Suite 2900
Philadelphia, Pennsylvania 19102-2529
DISTRIBUTOR
Quasar Distributors, LLC
Three Canal Plaza, Suite 100
Portland, Maine 04101
www.hennessyfunds.com | 800-966-4354
This report has been prepared for shareholders and may be distributed to
others only if preceded or accompanied by a current prospectus.
ANNUAL FINANCIAL STATEMENTS
AND OTHER INFORMATION
OCTOBER 31, 2024
HENNESSY STANCE ESG ETF
Ticker STNC
www.hennessyetfs.com | 1-877-671-3199
(This Page Intentionally Left Blank.)
Contents
Financial Statements | |
| Schedule of Investments | 2 |
| Statement of Assets and Liabilities | 4 |
| Statement of Operations | 5 |
| Statements of Changes in Net Assets | 6 |
| Financial Highlights | 7 |
| Notes to the Financial Statements | 8 |
Report of Independent Registered Public Accounting Firm | 13 |
Federal Tax Distribution Information | 14 |
HENNESSY FUNDS | 1-877-671-3199 |
Financial Statements — Schedule of Investments
COMMON STOCKS – 99.63% | | Number of | | | | | | % of | |
| | | Shares | | | Value | | | Net Assets | |
| Communication Services – 6.50% | | | | | | | | | |
AT&T, Inc. | | | 150,842 | | | $ | 3,399,979 | | | | 3.41 | % |
Verizon Communications, Inc. | | | 73,275 | | | | 3,087,076 | | | | 3.09 | % |
| | | | | | | | 6,487,055 | | | | 6.50 | % |
| | | | | | | | | | | | | |
| Consumer Discretionary – 20.05% | | | | | | | | | | | | |
AutoZone, Inc.(a) | | | 1,036 | | | | 3,117,324 | | | | 3.12 | % |
Best Buy Co., Inc. | | | 32,768 | | | | 2,963,210 | | | | 2.97 | % |
Deckers Outdoor Corp.(a) | | | 20,119 | | | | 3,236,946 | | | | 3.25 | % |
Hilton Worldwide Holdings, Inc. | | | 13,777 | | | | 3,235,528 | | | | 3.24 | % |
Lennar Corp., Class A | | | 8,213 | | | | 1,398,674 | | | | 1.40 | % |
O’Reilly Automotive, Inc.(a) | | | 2,574 | | | | 2,968,182 | | | | 2.97 | % |
TJX Companies, Inc. | | | 27,367 | | | | 3,093,292 | | | | 3.10 | % |
| | | | | | | | 20,013,156 | | | | 20.05 | % |
| | | | | | | | | | | | | |
| Consumer Staples – 3.31% | | | | | | | | | | | | |
Tyson Foods, Inc., Class A | | | 56,317 | | | | 3,299,613 | | | | 3.31 | % |
| | | | | | | | | | | | | |
| Financials – 19.98% | | | | | | | | | | | | |
Aon PLC, Class A | | | 9,425 | | | | 3,457,750 | | | | 3.46 | % |
Everest Group Ltd. | | | 8,101 | | | | 2,880,796 | | | | 2.89 | % |
Hartford Financial Services Group, Inc. | | | 28,105 | | | | 3,103,916 | | | | 3.11 | % |
Mastercard, Inc., Class A | | | 6,294 | | | | 3,144,420 | | | | 3.15 | % |
MSCI, Inc. | | | 862 | | | | 492,375 | | | | 0.49 | % |
The Bank of New York Mellon Corp. | | | 46,212 | | | | 3,482,536 | | | | 3.49 | % |
Wells Fargo & Co. | | | 52,076 | | | | 3,380,774 | | | | 3.39 | % |
| | | | | | | | 19,942,567 | | | | 19.98 | % |
| | | | | | | | | | | | | |
| Health Care – 21.89% | | | | | | | | | | | | |
AbbVie, Inc. | | | 6,935 | | | | 1,413,839 | | | | 1.42 | % |
Amgen, Inc. | | | 10,021 | | | | 3,208,323 | | | | 3.21 | % |
Boston Scientific Corp.(a) | | | 37,665 | | | | 3,164,613 | | | | 3.17 | % |
Catalent, Inc.(a) | | | 52,013 | | | | 3,047,962 | | | | 3.05 | % |
Edwards Lifesciences Corp.(a) | | | 18,304 | | | | 1,226,551 | | | | 1.23 | % |
Johnson & Johnson | | | 19,780 | | | | 3,162,031 | | | | 3.17 | % |
Regeneron Pharmaceuticals, Inc.(a) | | | 3,122 | | | | 2,616,860 | | | | 2.62 | % |
The Cigna Group | | | 9,349 | | | | 2,943,159 | | | | 2.95 | % |
Viatris, Inc. | | | 92,384 | | | | 1,071,654 | | | | 1.07 | % |
| | | | | | | | 21,854,992 | | | | 21.89 | % |
| | | | | | | | | | | | | |
| Industrials – 11.98% | | | | | | | | | | | | |
3M Co. | | | 24,379 | | | | 3,131,970 | | | | 3.14 | % |
Deere & Co. | | | 5,414 | | | | 2,190,992 | | | | 2.19 | % |
PACCAR, Inc. | | | 31,177 | | | | 3,251,138 | | | | 3.26 | % |
Waste Management, Inc. | | | 15,671 | | | | 3,382,585 | | | | 3.39 | % |
| | | | | | | | 11,956,685 | | | | 11.98 | % |
| | | | | | | | | | | | | |
| Information Technology – 9.43% | | | | | | | | | | | | |
Apple, Inc. | | | 14,467 | | | | 3,268,240 | | | | 3.27 | % |
Cognizant Technology | | | | | | | | | | | | |
Solutions Corp., Class A | | | 38,201 | | | | 2,849,413 | | | | 2.86 | % |
HP, Inc. | | | 92,835 | | | | 3,297,499 | | | | 3.30 | % |
| | | | | | | | 9,415,152 | | | | 9.43 | % |
| | | | | | | | | | | | | |
| Materials – 1.54% | | | | | | | | | | | | |
DuPont de Nemours, Inc. | | | 18,574 | | | | 1,541,456 | | | | 1.54 | % |
| | | | | | | | | | | | | |
| Utilities – 4.95% | | | | | | | | | | | | |
Consolidated Edison, Inc. | | | 31,544 | | | | 3,207,394 | | | | 3.21 | % |
Eversource Energy | | | 26,421 | | | | 1,739,823 | | | | 1.74 | % |
| | | | | | | | 4,947,217 | | | | 4.95 | % |
| | | | | | | | | | | | | |
| Total Common Stocks | | | | | | | | | | | | |
(Cost $96,577,870) | | | | | | | 99,457,893 | | | | 99.63 | % |
| | | | | | | | | | | | | |
| | | | | | | | | | | | | |
SHORT-TERM INVESTMENTS – 0.35% | | | | | | | | | | | | |
| Money Market Funds – 0.35% | | | | | | | | | | | | |
First American Government | | | | | | | | | | | | |
Obligations Fund - Class X, 4.821%(b) | | | 347,540 | | | | 347,540 | | | | 0.35 | % |
| | | | | | | | | | | | | |
| Total Short-Term Investments | | | | | | | | | | | | |
(Cost $347,540) | | | | | | | 347,540 | | | | 0.35 | % |
| | | | | | | | | | | | | |
| Total Investments | | | | | | | | | | | | |
(Cost $96,925,410) – 99.98% | | | | | | | 99,805,433 | | | | 99.98 | % |
Other Assets in | | | | | | | | | | | | |
Excess of Liabilities - 0.02% | | | | | | | 19,119 | | | | 0.02 | % |
| | | | | | | | | | | | | |
TOTAL NET ASSETS – 100.00% | | | | | | $ | 99,824,552 | | | | 100.00 | % |
Percentages are stated as a percent of net assets.
PLC – Public Limited Company
(a) | Non-income producing security. |
(b) | The rate listed is the fund’s seven-day yield as of October 31, 2024. |
Note: For presentation purposes, the Fund has grouped some of the industry categories. For purposes of categorizing securities for compliance with Section 8(b)(1) of the Investment Company Act of 1940, as amended, the Fund uses more specific industry classifications.
The Global Industry Classification Standard (GICS®) was developed by and is the exclusive property and a service mark of MSCI, Inc. and Standard & Poor’s Financial Services LLC. It has been licensed for use by the Hennessy Funds.
The accompanying notes are an integral part of these financial statements.
WWW.HENNESSYETFS.COM
Financial Statements — Schedule of Investments
Summary of Fair Value Exposure as of October 31, 2024
The following is a summary of the inputs used to value the Fund’s net assets as of October 31, 2024 (see Note 3 in the accompanying Notes to the Financial Statements):
| Common Stocks | | Level 1 | | | Level 2 | | | Level 3 | | | Total | |
Communication Services | | $ | 6,487,055 | | | $ | — | | | $ | — | | | $ | 6,487,055 | |
Consumer Discretionary | | | 20,013,156 | | | | — | | | | — | | | | 20,013,156 | |
Consumer Staples | | | 3,299,613 | | | | — | | | | — | | | | 3,299,613 | |
Financials | | | 19,942,567 | | | | — | | | | — | | | | 19,942,567 | |
Health Care | | | 21,854,992 | | | | — | | | | — | | | | 21,854,992 | |
Industrials | | | 11,956,685 | | | | — | | | | — | | | | 11,956,685 | |
Information Technology | | | 9,415,152 | | | | — | | | | — | | | | 9,415,152 | |
Materials | | | 1,541,456 | | | | — | | | | — | | | | 1,541,456 | |
Utilities | | | 4,947,217 | | | | — | | | | — | | | | 4,947,217 | |
| Total Common Stocks | | $ | 99,457,893 | | | $ | — | | | $ | — | | | $ | 99,457,893 | |
| Short-Term Investments | | | | | | | | | | | | | | | | |
Money Market Funds | | $ | 347,540 | | | $ | — | | | $ | — | | | $ | 347,540 | |
| Total Short-Term Investments | | $ | 347,540 | | | $ | — | | | $ | — | | | $ | 347,540 | |
| Total Investments | | $ | 99,805,433 | | | $ | — | | | $ | — | | | $ | 99,805,433 | |
The accompanying notes are an integral part of these financial statements.
HENNESSY FUNDS | 1-877-671-3199 |
Financial Statements — Statement of Assets and Liabilities
| as of October 31, 2024 | |
| | | | |
| ASSETS: | | | |
Investments in securities, at value (cost $96,925,410) | | $ | 99,805,433 | |
Dividends and interest receivable | | | 134,782 | |
| Total assets | | | 99,940,215 | |
| | | | | |
| LIABILITIES: | | | | |
Payable to advisor | | | 73,744 | |
Accrued expenses and other payables | | | 41,919 | |
| Total liabilities | | | 115,663 | |
| NET ASSETS | | $ | 99,824,552 | |
| | | | | |
| NET ASSETS CONSIST OF: | | | | |
Par value | | $ | 3,251 | |
Capital stock | | | 109,957,794 | |
Accumulated deficit | | | (10,136,493 | ) |
| Total net assets | | $ | 99,824,552 | |
| | | | | |
| NET ASSETS: | | | | |
Shares authorized ($0.001 par value) | | | 100,000,000 | |
Net assets applicable to outstanding shares | | $ | 99,824,552 | |
Shares issued and outstanding | | | 3,251,142 | |
Net asset value, offering price, and redemption price per share | | $ | 30.70 | |
The accompanying notes are an integral part of these financial statements.
WWW.HENNESSYETFS.COM
Financial Statements — Statement of Operations
| INVESTMENT INCOME: | | | |
Dividend income | | $ | 1,462,525 | (1) |
| Total investment income | | | 1,462,525 | |
| | | | | |
| EXPENSES: | | | | |
Investment advisory fees (See Note 5) | | | 905,589 | |
| Total expenses before waivers | | | 905,589 | |
Expense reimbursement from advisor | | | (95,325 | ) |
| Net expenses | | | 810,264 | |
| NET INVESTMENT INCOME | | $ | 652,261 | |
| | | | | |
| REALIZED AND UNREALIZED GAINS (LOSSES): | | | | |
| Net realized loss on investments | | $ | (2,847,935 | ) |
| Net realized gain from redemption in-kind | | | 31,301,143 | |
| Net change in unrealized appreciation/depreciation on investments | | | (13,422,739 | ) |
| Net gain on investments | | | 15,030,469 | |
| NET INCREASE IN NET ASSETS RESULTING FROM OPERATIONS | | $ | 15,682,730 | |
(1) | Net of foreign taxes and issuance fees withheld of $1,163. |
The accompanying notes are an integral part of these financial statements.
HENNESSY FUNDS | 1-877-671-3199 |
Financial Statements — Statements of Changes in Net Assets
| | | | | | Two-Month | | | | |
| | | Year Ended | | | Period Ended | | | Year Ended | |
| | | October 31, 2024 | | | October 31, 2023(1) | | | August 31, 2023 | |
| OPERATIONS: | | | | | | | | | |
Net investment income (loss) | | $ | 652,261 | | | $ | (404 | ) | | $ | 118,013 | |
Net realized gain (loss) on investments | | | 28,453,208 | | | | (2,637,379 | ) | | | 2,948,962 | |
Net change in unrealized appreciation/depreciation on investments | | | (13,422,739 | ) | | | (1,930,821 | ) | | | 454,119 | |
Net increase (decrease) in net assets resulting from operations | | | 15,682,730 | | | | (4,568,604 | ) | | | 3,521,094 | |
| | | | | | | | | | | | | |
| DISTRIBUTIONS TO SHAREHOLDERS: | | | | | | | | | | | | |
Distributable earnings | | | (50,006 | ) | | | — | | | | (247,449 | ) |
Total distributions | | | (50,006 | ) | | | — | | | | (247,449 | ) |
| | | | | | | | | | | | | |
| CAPITAL SHARE TRANSACTIONS: | | | | | | | | | | | | |
Proceeds from shares issued in the Reorganization (See Note 9) | | | 71,656,846 | | | | — | | | | — | |
Proceeds from shares subscribed | | | 158,492,724 | | | | 596,298 | | | | 4,008,931 | |
Cost of shares redeemed | | | (186,352,895 | ) | | | (938,382 | ) | | | (4,506,305 | ) |
Net increase (decrease) in net assets derived from capital share transactions | | | 43,796,675 | | | | (342,084 | ) | | | (497,374 | ) |
| TOTAL INCREASE (DECREASE) IN NET ASSETS | | | 59,429,399 | | | | (4,910,688 | ) | | | 2,776,271 | |
| | | | | | | | | | | | | |
| NET ASSETS: | | | | | | | | | | | | |
Beginning of period | | | 40,395,153 | | | | 45,305,841 | | | | 42,529,570 | |
End of period | | $ | 99,824,552 | | | $ | 40,395,153 | | | $ | 45,305,841 | |
| | | | | | | | | | | | | |
| CHANGES IN SHARES OUTSTANDING: | | | | | | | | | | | | |
Shares issued in the Reorganization (See Note 9) | | | 2,506,142 | | | | — | | | | — | |
Shares sold | | | 5,435,000 | | | | 25,000 | | | | 155,000 | |
Shares redeemed | | | (6,375,000 | ) | | | (35,000 | ) | | | (175,000 | ) |
Net increase (decrease) in shares outstanding | | | 1,566,142 | | | | (10,000 | ) | | | (20,000 | ) |
(1) | The period ended October 31, 2023, consists of 2 months due to the Fund’s fiscal year end change from August 31 to October 31, effective October 8, 2023. |
The accompanying notes are an integral part of these financial statements.
WWW.HENNESSYETFS.COM
Financial Statements — Financial Highlights
For a share outstanding throughout each period
| | | | | | Two-Month | | | | | | | | | | |
| | | Year Ended | | | Period Ended | | | Year Ended | | | Year Ended | | | Period Ended | |
| | | October 31, | | | October 31, | | | August 31, | | | August 31, | | | August 31, | |
| | | 2024 | | | 2023 | | | 2023 | | | 2022 | | | 2021(1) | |
| PER SHARE DATA: | | | | | | | | | | | | | | | |
Net asset value, beginning of period | | $ | 23.97 | | | $ | 26.73 | | | $ | 24.80 | | | $ | 27.82 | | | $ | 25.00 | |
| | | | | | | | | | | | | | | | | | | | | |
| Income from investment operations: | | | | | | | | | | | | | | | | | | | | |
Net investment income (loss)(2) | | | 0.20 | | | | (0.00 | )(3) | | | 0.07 | | | | 0.20 | | | | 0.02 | |
Net realized and unrealized gains (losses) on investments | | | 6.55 | | | | (2.76 | ) | | | 2.01 | | | | (3.10 | ) | | | 2.80 | |
| Total from investment operations | | | 6.75 | | | | (2.76 | ) | | | 2.08 | | | | (2.90 | ) | | | 2.82 | |
| | | | | | | | | | | | | | | | | | | | | |
| Less distributions: | | | | | | | | | | | | | | | | | | | | |
Dividends from net investment income | | | (0.02 | ) | | | — | | | | (0.15 | ) | | | (0.10 | ) | | | — | |
Dividends from net realized gains | | | — | | | | — | | | | — | | | | (0.02 | ) | | | — | |
| Total distributions | | | (0.02 | ) | | | — | | | | (0.15 | ) | | | (0.12 | ) | | | — | |
Net asset value, end of period | | $ | 30.70 | | | $ | 23.97 | | | $ | 26.73 | | | $ | 24.80 | | | $ | 27.82 | |
Market value, end of period | | $ | 30.75 | | | $ | 23.98 | | | $ | 26.74 | | | $ | 24.83 | | | $ | 27.91 | |
| | | | | | | | | | | | | | | | | | | | | |
TOTAL RETURN ON NET ASSET VALUE(4) | | | 28.18 | % | | | -10.31 | %(6) | | | 8.39 | % | | | -10.50 | % | | | 11.23 | %(6) |
TOTAL RETURN ON MARKET PRICE(5) | | | 28.36 | % | | | -10.34 | %(6) | | | 8.32 | % | | | -10.63 | % | | | 11.56 | %(6) |
| | | | | | | | | | | | | | | | | | | | | |
| SUPPLEMENTAL DATA AND RATIOS: | | | | | | | | | | | | | | | | | | | | |
Net assets, end of period (millions) | | $ | 99.82 | | | $ | 40.40 | | | $ | 45.31 | | | $ | 42.53 | | | $ | 37.29 | |
Ratio of expenses to average net assets: | | | | | | | | | | | | | | | | | | | | |
| Before expense reimbursement | | | 0.95 | % | | | 0.95 | %(7) | | | 0.95 | % | | | 0.95 | % | | | 0.95 | %(7) |
| After expense reimbursement | | | 0.85 | % | | | 0.85 | %(7) | | | 0.85 | % | | | 0.85 | % | | | 0.85 | %(7) |
Ratio of net investment loss to average net assets: | | | | | | | | | | | | | | | | | | | | |
| Before expense reimbursement | | | 0.58 | % | | | (0.11 | )%(7) | | | 0.17 | % | | | 0.64 | % | | | 0.09 | %(7) |
| After expense reimbursement | | | 0.68 | % | | | (0.01 | )%(7) | | | 0.27 | % | | | 0.74 | % | | | 0.19 | %(7) |
Portfolio turnover rate(8) | | | 291 | %(9) | | | 62 | %(6) | | | 274 | % | | | 290 | % | | | 180 | %(6) |
(1) | Inception date of the Fund was March 15, 2021. |
(2) | Calculated using the average shares outstanding method. |
(3) | Amount is between $(0.005) and $0.005. |
(4) | Total investment return/(loss) on net asset value is calculated assuming a purchase of shares on the first day and a sale of shares on the last day of each period reported and includes reinvestments of dividends and distributions, if any. |
(5) | Total investment return/(loss) on market price is calculated assuming an initial investment made at the market price on the first day of the period, reinvestment of dividends and distributions at market price during the period, and redemption at market price on the last day of the period. |
(6) | Not annualized. |
(7) | Annualized. |
(8) | Excludes effect of in-kind transfers. |
(9) | The cost of purchases and proceeds from sales of securities that were incurred to realign the CCM Small/Mid-Cap Impact Value Fund and CCM Core Impact Equity Fund portfolios subsequent to November 10, 2023 and February 23, 2024, the reorganization dates, respectively, are excluded from the portfolio turnover rate calculation. See Note 9 of the Notes to Financial Statements for further information regarding this reorganization. If such amounts had not been excluded, the portfolio turnover rate would have been 316% for the year ended October 31, 2024. |
The accompanying notes are an integral part of these financial statements.
HENNESSY FUNDS | 1-877-671-3199 |
Notes to the Financial Statements
1). ORGANIZATION
The Hennessy Stance ESG ETF (the “Fund”) is a series of Hennessy Funds Trust (the “Trust”), which was organized as a Delaware statutory trust on September 17, 1992. The Fund is an actively managed exchange-traded fund that operates pursuant to an exemptive order from the Securities and Exchange Commission (the “SEC”). The Fund is a successor to the Stance Equity ESG Large Cap Core ETF (the “Predecessor Fund”) pursuant to a reorganization that took place after the close of business on December 22, 2022. Prior to December 22, 2022, the Fund had no investment operations. The Fund is the accounting and performance information successor of the Predecessor Fund. The investment objective of the Fund is long-term capital appreciation. The Fund is a diversified fund and offers one class of shares. Effective October 8, 2023, the Fund changed its fiscal year end for financial reporting purposes from August 31 to October 31.
As an investment company, the Fund follows the investment company accounting and reporting guidance of the Financial Accounting Standards Board (the “FASB”) Accounting Standard Codification Topic 946 “Financial Services—Investment Companies.”
2). SIGNIFICANT ACCOUNTING POLICIES
The following is a summary of significant accounting policies consistently followed by the Fund in the preparation of the financial statements. These policies conform to U.S. generally accepted accounting principles (“GAAP”).
a). | Securities Valuation – All investments in securities are valued in accordance with the Fund’s valuation policies and procedures, as described in Note 3.
|
b). | Federal Income Taxes – The Fund has elected to be taxed as a regulated investment company and intends to distribute substantially all of its taxable income to its shareholders and otherwise comply with the provisions of the Internal Revenue Code of 1986, as amended, applicable to regulated investment companies. As a result, the Fund has made no provision for federal income taxes or excise taxes. Net investment income/loss and realized gains/losses for federal income tax purposes may differ from those reported in the financial statements because of temporary book-basis and tax-basis differences. Temporary differences are primarily the result of the treatment of partnership income and wash sales for tax reporting purposes. The Fund recognizes interest and penalties related to income tax benefits, if any, in the Statement of Operations as an income tax expense. Distributions from net realized gains for book purposes may include short-term capital gains, which are included as ordinary income to shareholders for tax purposes. The Fund may utilize equalization accounting for tax purposes and designate earnings and profits, including net realized gains distributed to shareholders on redemption of shares, as part of the dividends paid deduction for income tax purposes.
|
| | Due to inherent differences in the recognition of income, expenses, and realized gains/losses under GAAP and federal income tax regulations, permanent differences between book and tax basis for reporting are identified and appropriately reclassified in the Statement of Assets and Liabilities, as needed. The adjustments for fiscal year 2024 are as follows: |
| | Total | | |
| | Distributable | Capital | |
| | Earnings | Stock | |
| | $(34,021,376) | $34,021,376 | |
c). | Accounting for Uncertainty in Income Taxes – The Fund has accounting policies regarding recognition and measurement of tax positions taken or expected to be taken on a tax return. The tax returns of the Fund for the prior three fiscal years are open for examination. The Fund has reviewed all open tax years in major tax jurisdictions and concluded that there is no material impact on the Fund’s net assets and no tax liability resulting from unrecognized tax benefits relating to uncertain income tax positions taken or expected to be taken on a tax return. The Fund’s major tax jurisdictions are U.S. federal and Delaware.
|
d). | Income and Expenses – Dividend income is recognized on the ex-dividend date or as soon as information is available to the Fund. Interest income, which includes the amortization of premium and accretion of discount, is recognized on an accrual basis. Market discounts, original issue discounts, and market premiums on debt securities are accreted or amortized to interest income over the life of a security with a corresponding increase or decrease, as applicable, in the cost basis of such security using the yield-to-maturity method or, where applicable, the first call date of the security. Other non-cash dividends are recognized as investment income at the fair value of the property received. Expenses and fees, including investment advisory fees, are accrued daily and taken into account for the purpose of determining the net asset value (“NAV”) of the Fund. As discussed further in Note 5, most expenses of the Fund are paid by Hennessy Advisors, Inc. (the “Advisor”) under a unitary fee arrangement.
|
e). | Distributions to Shareholders – Dividends from net investment income for the Fund, if any, are declared and paid annually, usually in December. Distributions of net realized capital gains, if any, are declared and paid annually, usually in December.
|
f). | Security Transactions – Investment transactions are recorded on the trade date. The Fund determines the realized gain/loss from an investment transaction by comparing the original cost of the security lot sold with the net sale proceeds. Discounts and premiums on securities purchased are accreted or amortized, respectively, over the life of each such security.
|
g). | Use of Estimates – Preparing financial statements in accordance with GAAP requires management to make estimates and assumptions that affect the reported amounts of assets and liabilities and disclosure of contingent assets and liabilities at the date of the financial statements, as well as the reported change in net assets during the reporting period. Actual results could differ from those estimates.
|
h). | Share Valuation –The NAV per share of the Fund is calculated by dividing (i) the total value of the securities held by the Fund, plus cash and other assets, minus all liabilities (including estimated accrued expenses) by (ii) the total number of Fund shares outstanding, rounded to the nearest $0.01. Fund shares are not priced on days the New York Stock Exchange is closed for trading. |
WWW.HENNESSYETFS.COM
i). | Illiquid Securities – Pursuant to Rule 22e-4 under the 1940 Act, the Fund has adopted a Liquidity Risk Management Program (the “Liquidity Program”). The Liquidity Program requires, among other things, that the Fund limit its illiquid investments to no more than 15% of its net assets. An illiquid investment is any investment that the Fund reasonably expects cannot be sold or disposed of by the Fund in current market conditions in seven calendar days or less without the sale or disposition significantly changing the market value of the investment. |
3). SECURITIES VALUATION
The Fund follows its valuation policies and procedures in determining its NAV and, in preparing these financial statements, the fair value accounting standards that establish an authoritative definition of fair value and set out a hierarchy for measuring fair value. These standards require additional disclosures about the various inputs and valuation techniques used to develop the measurements of fair value and a discussion of changes in valuation techniques and related inputs during the period. These inputs are summarized in the three broad levels listed below:
| Level 1 – | Unadjusted, quoted prices in active markets for identical instruments that the Fund has the ability to access at the date of measurement.
|
| Level 2 – | Other significant observable inputs other than quoted prices included in Level 1 (including, but not limited to, quoted prices in active markets for similar instruments, quoted prices in markets that are not active for identical or similar instruments, and model-derived valuations in which all significant inputs and significant value drivers are observable in active markets, such as interest rates, prepayment speeds, credit risk curves, default rates, and similar data).
|
| Level 3 – | Significant unobservable inputs (including the Fund’s own assumptions about what market participants would use to price the asset or liability based on the best available information) when observable inputs are unavailable.
|
The following is a description of the valuation techniques applied to the Fund’s major categories of assets and liabilities on a recurring basis:
| | Equity Securities – Equity securities, including common stocks, preferred stocks, foreign-issued common stocks, exchange-traded funds, closed-end mutual funds, partnerships, rights, and real estate investment trusts, that are traded on a securities exchange for which a last-quoted sales price is readily available generally are valued at the last sales price as reported by the primary exchange on which the securities are listed. Securities listed on The Nasdaq Stock Market (“Nasdaq”) generally are valued at the Nasdaq Official Closing Price, which may differ from the last sales price reported. Securities traded on a securities exchange for which a last-quoted sales price is not readily available generally are valued at the mean between the bid and ask prices. To the extent these securities are actively traded and valuation adjustments are not applied, they are classified in Level 1 of the fair value hierarchy. Securities traded on foreign exchanges generally are not valued at the same time the Fund calculates its NAV because most foreign markets close well before such time. The earlier close of most foreign markets gives rise to the possibility that significant events, including broad market moves, may have occurred in the interim. In certain circumstances, it may be determined that a foreign security needs to be fair valued because it appears that the value of the security might have been materially affected by events occurring after the close of the market in which the security is principally traded, but before the time the Fund calculates its NAV, such as by a development that affects an entire market or region (e.g., a weather-related event) or a potentially global development (e.g., a terrorist attack that may be expected to have an effect on investor expectations worldwide).
|
| | Registered Investment Companies – Investments in open-end registered investment companies, commonly referred to as mutual funds, generally are priced at the ending NAV provided by the applicable mutual fund’s service agent and are classified in Level 1 of the fair value hierarchy.
|
| | Debt Securities – Debt securities, including corporate bonds, asset-backed securities, mortgage-backed securities, municipal bonds, U.S. Treasuries, and U.S. government agency issues, are generally valued at market on the basis of valuations furnished by an independent pricing service that utilizes both dealer-supplied valuations and formula-based techniques. The pricing service may consider recently executed transactions in securities of the issuer or comparable issuers, market price quotations (where observable), bond spreads, and fundamental data relating to the issuer. In addition, the model may incorporate observable market data, such as reported sales of similar securities, broker quotes, yields, bids, offers, and reference data. Certain securities are valued primarily using dealer quotations. These securities are generally classified in Level 2 of the fair value hierarchy.
|
| | Short-Term Securities – Short-term equity investments, including money market funds, are valued in the manner specified above for equity securities. Short-term debt investments with an original term to maturity of 60 days or less are valued at amortized cost, which approximates fair market value. If the original term to maturity of a short-term debt investment exceeds 60 days, then the values as of the 61st day prior to maturity are amortized. Amortized cost is not used if its use would be inappropriate due to credit or other impairments of the issuer, in which case the security’s fair value would be determined as described below. Short-term securities are generally classified in Level 1 or Level 2 of the fair value hierarchy depending on the inputs used and market activity levels for specific securities.
|
If market quotations are not readily available or if a significant event has occurred that indicates the closing price of a security no longer represents the true value of that security, such security will be valued at its fair value under the Fund’s established fair valuation procedures as implemented by the Advisor, the Fund’s valuation designee. The Advisor, as the valuation designee, is subject to the oversight of the Board of Trustees of the Trust (the “Board”). There are numerous criteria considered in determining a fair value of a security, such as the trading volume of a security and markets, the values of other similar securities, and news events with direct bearing on a security or markets. Fair value pricing results in an estimated price for a security that reflects the amount the Fund might reasonably expect to receive in a current sale. Depending on the relative significance of the valuation inputs, these securities may be classified in either Level 2 or Level 3 of the fair value hierarchy. The Advisor will regularly evaluate whether the Fund’s fair value pricing procedures continue to be appropriate in light of the specific circumstances of the Fund and the quality of prices obtained through the application of such procedures.
The fair value of any foreign securities may be determined with the assistance of a pricing service using correlations between the movement of prices of such securities and indices of domestic securities and other appropriate indicators, such as closing market prices of relevant American Depositary Receipts or futures contracts. Using fair value pricing means that the Fund’s NAV reflects the affected portfolio securities’ values as determined by the Advisor, the Board’s valuation designee, pursuant to the Fund’s fair value pricing procedures, instead of being determined by the market. Using a fair value pricing methodology to price a foreign security may result in a value that is different from such
HENNESSY FUNDS | 1-877-671-3199 |
foreign security’s most recent closing price and from the value used by other investment companies to calculate their NAVs. Such securities are generally classified in Level 2 of the fair value hierarchy. Because the Fund may invest in foreign securities, the value of the Fund’s portfolio securities may change on days when shareholders are unable to purchase or redeem Fund shares.
The Fund has performed an analysis of all existing investments to determine the significance and character of all inputs to their fair value determinations. Various inputs are used to determine the value of the Fund’s investments. The inputs or methodology used for valuing securities are not necessarily an indication of the risk associated with investing in those securities. Details related to the fair value hierarchy of the Fund’s securities as of October 31, 2024, are included in the Schedule of Investments.
4). INVESTMENT TRANSACTIONS
Purchases and sales of investment securities (excluding government and short-term investments) for the Fund during fiscal year 2024 were $276,667,929 and $273,749,815, respectively. There were no purchases or sales/maturities of long-term U.S. government securities for the Fund during fiscal year 2024.
Purchases and sales of in-kind transactions for the Fund during fiscal year 2024 were $155,109,701 and $184,135,999, respectively.
5). INVESTMENT ADVISORY FEE AND OTHER TRANSACTIONS WITH AFFILIATES
The Advisor provides the Fund with investment advisory services under an Investment Advisory Agreement (the “Investment Advisory Agreement”). The Advisor furnishes all investment advice, office space, and facilities and most of the personnel needed by the Fund. As compensation for its services, the Advisor is entitled to a unitary management fee from the Fund. The fee is based on the average daily net assets of the Fund at an annual rate of 0.95%. From the unitary management fee, the Advisor pays most of the expenses of the Fund, including the cost of sub-advisory, transfer agency, custody, fund administration, legal, audit, and other services. The net investment advisory fees expensed by the Fund during fiscal year 2024 are included in the Statement of Operations.
The Advisor has delegated the day-to-day management of the portfolio composition of the Fund to a sub-advisor, Stance Capital, LLC (“Stance Capital”), and has delegated the responsibility for selecting broker-dealers to execute purchase and sale transactions for the Fund to Vident Advisory, LLC (“Vident”), as instructed by Stance Capital and subject to the supervision of the Advisor and the Board. The Advisor pays the sub-advisory fees from its own assets, and these fees are not an additional expense of the Fund. During fiscal year 2024, the Advisor (not the Fund) paid a sub-advisory fee to Stance Capital at the average rate of 0.40% of the daily net assets of the Fund. Pursuant to the sub-advisory agreement with Stance Capital, the Advisor pays sub-advisory fees to Stance Capital at an annual rate of 0.40% of the average daily net assets up to $125 million, 0.37% of average daily net assets for assets over $125 million and up to $250 million, and 0.35% for average daily net assets over $250 million. During fiscal year 2024, the Advisor (not the Fund) paid a sub-advisory fee to Vident at the average rate of 0.05% of the daily net assets of the Fund. Pursuant to the sub-advisory agreement with Vident, the Advisor pays sub-advisory fees to Vident of at an annual rate of 0.05% of the Fund’s average daily net assets up to $250 million, 0.045% of average daily net assets for assets over $250 million and up to $500 million, and 0.04% for average daily net assets in excess of $500 million, subject to a minimum sub-advisory fee to of $18,750 on an annual basis.
The Advisor has contractually agreed to waive a portion of its unitary management fee to the extent necessary to limit the Fund’s annual operating expenses (excluding all federal, state, and local taxes, interest, brokerage commissions, dividend and interest expenses on short sales, extraordinary items, and acquired fund fees and expenses and other costs incurred in connection with the purchase and sale of securities) to 0.85% of the Fund’s net assets through February 28, 2025.
During fiscal year 2024, the Advisor waived the following amount:
$95,325
U.S. Bancorp Fund Services, LLC, d/b/a U.S. Bank Global Fund Services (“Fund Services”) provides the Fund with administrative, accounting, and transfer agent services. As administrator, Fund Services is responsible for activities such as (i) preparing various federal and state regulatory filings, reports, and returns for the Fund, (ii) preparing reports and materials to be supplied to the Board, (iii) monitoring the activities of the Fund’s custodian, transfer agent, and accountants, and (iv) coordinating the preparation and payment of the Fund’s expenses and reviewing the Fund’s expense accruals. U.S. Bank N.A., an affiliate of Fund Services, serves as the Fund’s custodian. The servicing agreements between the Trust, Fund Services, and U.S. Bank N.A. contain a fee schedule that is inclusive of administrative, accounting, custody, and transfer agent fees. Under the terms of the Investment Advisory Agreement, the Advisor pays the Fund’s administrative, accounting, custody, and transfer agency fees.
Quasar Distributors, LLC, a wholly owned broker-dealer subsidiary of Foreside Financial Group, LLC, acts as the Fund’s principal underwriter in a continuous public offering of Fund shares.
The officers of the Fund are affiliated with the Advisor. Under the terms of the Investment Advisory Agreement, the Advisor pays the Fund’s Chief Compliance Officer and Senior Compliance Officer fees.
6). GUARANTEES AND INDEMNIFICATIONS
Under the Hennessy Funds’ organizational documents, their officers and trustees are indemnified by the Hennessy Funds against certain liabilities arising out of the performance of their duties to the Hennessy Funds. Additionally, in the normal course of business, the Hennessy Funds enter into contracts with service providers that contain general indemnification clauses. The Fund’s maximum exposure under these arrangements is unknown as this would involve future claims that may be made against the Fund that have not yet occurred. Currently, the Fund expects the risk of loss to be remote.
WWW.HENNESSYETFS.COM
7). FEDERAL TAX INFORMATION
As of October 31, 2024, the components of accumulated earnings (losses) for income tax purposes were as follows:
| | | Investments | |
| Cost of investments for tax purposes | | $ | 97,125,650 | |
| Gross tax unrealized appreciation | | $ | 4,933,399 | |
| Gross tax unrealized depreciation | | | (2,253,616 | ) |
| Net tax unrealized appreciation/(depreciation) | | $ | 2,679,783 | |
| Undistributed ordinary income | | $ | 652,261 | |
| Undistributed long-term capital gains | | | — | |
| Total distributable earnings | | $ | 652,261 | |
| Other accumulated gain/(loss) | | $ | (9,573,472 | ) |
| Total accumulated gain/(loss) | | $ | (6,241,428 | ) |
As of October 31, 2024, the Fund had $6,959,747 in unlimited short-term capital loss carryforwards, $1,958,193 in limited short-term capital loss carryforwards, and $655,532 in limited long-term capital loss carryforwards. As of October 31, 2024, the Fund did not defer, on a tax basis, any late-year ordinary losses. Late-year ordinary losses are net ordinary losses incurred after December 31, 2023, but within the taxable year, that are deemed to arise on the first day of the Fund’s next taxable year.
During fiscal year 2024, the two-month period ended October 31, 2023, and the fiscal year ended August 31, 2023, the tax character of distributions paid by the Fund were as follows:
| | | | | | Two-Month | | | | |
| | | Year Ended | | | Period Ended | | | Year Ended | |
| | | October 31, 2024 | | | October 31, 2023 | | | August 31, 2023 | |
Ordinary income(1) | | $ | 50,006 | | | $ | — | | | $ | 247,449 | |
| Long-term capital gains | | | — | | | | — | | | | — | |
| Total distributions | | $ | 50,006 | | | $ | — | | | $ | 247,449 | |
(1) Ordinary income includes short-term capital gains. |
8). SHARE TRANSACTIONS
Shares of the Fund were listed and traded on the NYSE Arca, Inc. (the “Exchange”) during fiscal year 2024. Market prices for the shares may be different from their NAV. The Fund issues and redeems shares on a continuous basis at NAV only in blocks of 5,000 shares, called “Creation Units.” Creation Units are issued and redeemed principally in-kind for securities included in a specified universe. Once created, shares generally trade in the secondary market at market prices that change throughout the day. Except when aggregated in Creation Units, shares are not redeemable securities of the Fund. Creation Units may only be purchased or redeemed by certain financial institutions (“Authorized Participants”). An Authorized Participant is either (i) a broker-dealer or other participant in the clearing process through the Continuous Net Settlement System of the National Securities Clearing Corporation or (ii) a Depository Trust Company participant and, in each case, must have executed a Participant Agreement with the Distributor. Most retail investors do not qualify as Authorized Participants and do not have the resources to buy and sell whole Creation Units. Therefore, they are unable to purchase or redeem shares directly from the Fund. Rather, most retail investors may purchase shares in the secondary market with the assistance of a broker and are subject to customary brokerage commissions or fees.
The Fund currently offers one class of shares, which has no front-end sales load, no deferred sales charge, and no redemption fee. A fixed transaction fee is imposed for the transfer and other transaction costs associated with the purchase or sale of Creation Units. The standard fixed transaction fee for the Fund is $300, payable to the custodian. In addition, a variable fee may be charged on all cash transactions or substitutes for Creation Units of up to a maximum of 2% as a percentage of the value of the Creation Units subject to the transaction. Variable fees are imposed to compensate the Fund for the transaction costs associated with the cash transactions. Variable fees received by the Fund, if any, are displayed in the capital shares transactions section of the Statement of Changes in Net Assets. Shares of the Fund have equal rights and privileges.
From time to time, settlement of securities related to in-kind redemptions may be delayed. In such cases, securities related to in-kind transactions are reflected as a receivable or a payable in the Statements of Assets and Liabilities.
9). AGREEMENT AND PLAN OF REORGANIZATION
On December 6, 2022, shareholders of the Predecessor Fund approved an Agreement and Plan of Reorganization between the Trust, on behalf of the Fund, and The RBB Fund, Inc., a Maryland corporation, on behalf of the Predecessor Fund. The Agreement and Plan of Reorganization provided for the transfer of all of the assets of the Predecessor Fund to the Fund and the assumption of the liabilities (other than any excluded liabilities) of the Predecessor Fund by the Fund. The Fund was created to carry out the reorganization and has a substantially similar investment objective and substantially similar principal investment strategies as the Predecessor Fund. The following table illustrates the specifics of the reorganization of the Predecessor Fund into the Fund as of December 22, 2022:
| Predecessor | Shares Issued to | | | |
| Fund Net | Shareholders of | Fund Net | | Tax Status |
| Assets | Predecessor Fund | Assets | Combined Net Assets | of Transfer |
$42,147,609(1) | 1,670,000 | $0 | $42,147,609 | Non-taxable |
| | (1) | Includes accumulated net investment income, accumulated realized gains, and unrealized appreciation in the amounts of $14,189, $5,465,299, and $2,059,710, respectively. |
HENNESSY FUNDS | 1-877-671-3199 |
On October 24, 2023, and January 31, 2024, shareholders of each of the CCM Small/Mid-Cap Impact Value Fund and the CCM Core Impact Equity Fund, respectively, approved an Agreement and Plan of Reorganization between the Trust, on behalf of the Fund, and Quaker Investment Trust, a Massachusetts business trust, on behalf of the CCM Small/Mid-Cap Impact Value Fund and the CCM Core Impact Equity Fund, respectively. The Agreements and Plans of Reorganization provided for the transfer of all of the assets of the CCM Small /Mid-Cap Impact Value Fund and the CCM Core Impact Equity Fund to the Fund and the assumption of the liabilities (other than any excluded liabilities) of the CCM Small/Mid-Cap Impact Value Fund and the CCM Core Impact Equity Fund by the Fund. The CCM Small/Mid-Cap Impact Value Fund, the CCM Core Impact Equity Fund, and the Fund have substantially similar investment objectives. The following tables illustrate the specifics of the reorganization of the CCM Small/Mid-Cap Impact Value Fund and the CCM Core Impact Equity Fund into the Fund:
| CCM Small/Mid-Cap | | | | |
| Impact Value Fund | Shares Issued to Shareholder of | | Combined | Tax Status |
| Net Assets | CCM Small/Mid-Cap Impact Value Fund | Fund Net Assets | Net Assets | of Transfer |
$12,436,393(1) | 490,155 | $42,752,473 | $55,188,866 | Non-taxable |
| | | | | |
| CCM Core Impact | | | | |
| Equity Fund | Shares Issued to Shareholders of | | Combined | Tax Status |
| Net Assets | CCM Core Impact Equity Fund | Fund Net Assets | Net Assets | of Transfer |
$59,220,453(2) | 2,015,987 | $113,981,011 | $173,201,464 | Non-taxable |
| | (1) | Includes accumulated net investment loss, accumulated realized losses, and unrealized appreciation in the amounts of $(129,972), $(3,067,772), and $1,219,276, respectively. |
| | (2) | Includes accumulated net investment loss, accumulated realized losses, and unrealized appreciation in the amounts of $(454,376), $(242,945), and $17,358,330, respectively.
|
For financial reporting purposes, the Fund is deemed to be the accounting survivor and as a result, the statement of Operations and Financial Highlights reflect the operations of the Fund only. The assets received and shares issued by the Fund were recorded at fair value; however, the cost basis of the investments received from the CCM Small/Mid-Cap Impact Value Fund and CCM Core Impact Equity Fund were carried forward to align ongoing reporting of the Fund’s realized and unrealized gains and losses with amounts distributable to shareholders for tax purposes. Assuming the reorganizations had been completed on November 1, 2023, the beginning of the reporting period, the unaudited pro forma results of operations as of October 31, 2024, would have been as follows:
| | | (Unaudited) | |
| Net investment loss | | $ | 576,555 | |
| Net realized gain on investments | | | 33,918,701 | |
| Net change in unrealized appreciation/depreciation on investments | | | (4,886,454 | ) |
| Net increase in net assets resulting from operations | | $ | 29,608,802 | |
Because the Fund has been managed as a single integrated portfolio since the reorganization was completed, it is not practicable to separate the amounts of revenue and earnings of the CCM Small/Mid-Cap Impact Value Fund and CCM Core Impact Equity Fund that have been included in the Fund’s Statement of Operations since November 10, 2023, and February 23, 2024, the dates the reorganizations were completed, respectively.
10). GLOBAL EVENTS
A rise in protectionist trade policies, the possibility of a national or global recession, risks associated with pandemic and epidemic diseases, trade tensions, the possibility of changes to some international trade agreements, political events, and continuing political tension and armed conflicts may adversely impact financial markets and the broader economy. For example, ongoing armed conflicts between Ukraine and Russia in Europe and among Israel, Hamas, and other militant groups in the Middle East have caused and could continue to cause significant market disruptions and volatility with the markets in Europe and the Middle East, and have had negative impacts on markets in the United States. These events could also have negative effects on the Fund’s investments that cannot be foreseen at the present time. As global systems, economies and financial markets are increasingly interconnected, events that once had only local impact are now more likely to have regional or even global effects. Events that occur in one country, region or financial market will, more frequently, adversely impact issuers in other countries, regions, or markets. These impacts can be exacerbated by failures of governments and societies to adequately respond to an emerging event or threat. Your investment would be negatively impacted if the value of your portfolio holdings decreases as a result of such events, if these events adversely impact the operations and effectiveness of the Advisor or other key service providers or if these events disrupt systems and processes necessary or beneficial to the management of accounts. These events may negatively impact broad segments of businesses and populations and could have a significant and rapid negative impact on the performance of the Fund’s investments, increase the Fund’s volatility, or exacerbate pre-existing risks to the Fund.
11). EVENTS SUBSEQUENT TO YEAR END
Management has evaluated the Fund’s related events and transactions that occurred subsequent to October 31, 2024, through the date of issuance of the Fund’s financial statements. Other than as disclosed below, management has determined that there were no subsequent events requiring recognition or disclosure in the financial statements.
The Fund paid a distribution to shareholders as follows:
| Record Date | Ex-Date | Payable Date | Ordinary Income Rate |
| 12/13/2024 | 12/13/2024 | 12/16/2024 | $0.29199371 per share |
Effective as of December 18, 2024, the exchange on which the shares of the Fund are listed and traded changed from NYSE Arca, Inc. to The Nasdaq Stock Market LLC.
WWW.HENNESSYETFS.COM
Report of Independent Registered Public Accounting Firm
To the Board of Trustees of Hennessy Funds Trust
and the Shareholders of the Hennessy Stance ESG ETF
Novato, CA
Opinion on the Financial Statements
We have audited the accompanying statement of assets and liabilities of the Hennessy Stance ESG ETF (the “Fund”), a series of Hennessy Funds Trust, including the schedule of investments, as of October 31, 2024, the related statement of operations for the year then ended, the statements of changes in net assets and financial highlights for the year ended October 31, 2024, two-month period ended October 31, 2023, and for the year ended August 31, 2023, and the related notes (collectively referred to as the “financial statements”). In our opinion, the financial statements present fairly, in all material respects, the financial position of the Fund as of October 31, 2024, the results of its operations for the year then ended, the changes in its net assets and the financial highlights for the year ended October 31, 2024, two-month period ended October 31, 2023 and for the year ended August 31, 2023, in conformity with accounting principles generally accepted in the United States of America.
The financial highlights for the year ended August 31, 2022, and for the period March 15, 2021 (commencement of operations) through August 31, 2021, were audited by other auditors, whose report dated October 28, 2022, expressed an unqualified opinion on those financial statements and financial highlights.
Basis for Opinion
These financial statements are the responsibility of the Fund’s management. Our responsibility is to express an opinion on the Fund’s financial statements based on our audits. We are a public accounting firm registered with the Public Company Accounting Oversight Board (United States) (“PCAOB”) and are required to be independent with respect to the Fund in accordance with the U.S. federal securities laws and the applicable rules and regulations of the Securities and Exchange Commission and the PCAOB. We have served as the auditor of one or more of the funds in the Trust since 2002.
We conducted our audits in accordance with the standards of the PCAOB. Those standards require that we plan and perform the audit to obtain reasonable assurance about whether the financial statements are free of material misstatement, whether due to error or fraud. The Fund is not required to have, nor were we engaged to perform, an audit of its internal control over financial reporting. As part of our audits we are required to obtain an understanding of internal control over financial reporting, but not for the purpose of expressing an opinion on the effectiveness of the Fund’s internal control over financial reporting. Accordingly, we express no such opinion.
Our audits included performing procedures to assess the risks of material misstatement of the financial statements, whether due to error or fraud, and performing procedures that respond to those risks. Such procedures included examining, on a test basis, evidence regarding the amounts and disclosures in the financial statements. Our audit also included evaluating the accounting principles used and significant estimates made by management, as well as evaluating the overall presentation of the financial statements. Our procedures included confirmation of securities owned as of October 31, 2024, by correspondence with the custodian and brokers; when replies were not received from brokers, we performed other auditing procedures. We believe that our audits provide a reasonable basis for our opinion.
| | |
| | TAIT, WELLER & BAKER LLP |
Philadelphia, Pennsylvania
December 24, 2024
HENNESSY FUNDS | 1-877-671-3199 |
Federal Tax Distribution Information (Unaudited)
For fiscal year 2024, certain dividends paid by the Funds may be subject to a maximum tax rate of 23.8%, as provided for the Jobs and Growth Tax Relief Reconciliation Act of 2003. The percentage of dividends declared from ordinary income designated as qualified dividend income were as follows:
100.00%
For corporate shareholder, the percent of ordinary income distributions that qualified for the corporate dividends received deduction for fiscal year 2024 were as follows:
100.00%
The percentage of taxable ordinary income distributions that were designated as short-term capital gain distributions under Section 871(k)(2)(C) of the Internal Revenue Code of 1986, as amended, for the Funds were as follows:
0.00%
WWW.HENNESSYETFS.COM
For information, questions, or assistance, please call
The Hennessy Funds
877-671-3199 or 415-899-1555
INVESTMENT ADVISOR
Hennessy Advisors, Inc.
7250 Redwood Boulevard, Suite 200
Novato, California 94945
ADMINISTRATOR,
TRANSFER AGENT,
DIVIDEND PAYING AGENT, &
SHAREHOLDER SERVICING AGENT
U.S. Bancorp Fund Services, LLC
d/b/a U.S. Bank Global Fund Services
P.O. Box 701
Milwaukee, Wisconsin 53201-0701
CUSTODIAN
U.S. Bank N.A.
Custody Operations
1555 North River Center Drive, Suite 302
Milwaukee, Wisconsin 53212
TRUSTEES
Neil J. Hennessy
Robert T. Doyle
J. Dennis DeSousa
Doug Franklin
Claire Garvie
Gerald P. Richardson
COUNSEL
Foley & Lardner LLP
777 East Wisconsin Avenue
Milwaukee, Wisconsin 53202-5306
INDEPENDENT REGISTERED
PUBLIC ACCOUNTING FIRM
Tait, Weller & Baker LLP
Two Liberty Place
50 South 16th Street, Suite 2900
Philadelphia, Pennsylvania 19102-2529
DISTRIBUTOR
Quasar Distributors, LLC
Three Canal Plaza, Suite 100
Portland, Maine 04101
www.hennessyetfs.com | 1-877-671-3199
This report has been prepared for shareholders and may be distributed to
others only if preceded or accompanied by a current prospectus.
| (b) | Financial Highlights are included within the financial statements filed under Item 7(a) of this Form.
|
| Item 8. | Changes in and Disagreements with Accountants for Open-End Management Investment Companies. |
Not applicable. There were no changes in or disagreements with accountants during the period covered by this report.
| Item 9. | Proxy Disclosures for Open-End Management Investment Companies. |
Not applicable. There were no matters submitted to a vote of shareholders during the period covered by this report.
| Item 10. | Remuneration Paid to Directors, Officers, and Others of Open-End Management Investment Companies. |
Not applicable. The trustee fees and compliance expenses for the Hennessy mutual funds are included in the financial statements and related footnotes filed under Item 7 of this Form. For the Hennessy Stance ESG ETF, all fund expenses, including trustee fee and compliance expenses, are paid by the Investment Adviser pursuant to the Investment Advisory Agreement. Additional information related to those fees is available in the Statement of Additional Information for the Hennessy Stance ESG ETF.
| Item 11. | Statement Regarding Basis for Approval of Investment Advisory Contract. |
Not applicable. The registrant’s board of trustees did not approve any investment advisory contracts during the most recent fiscal half year.
| Item 12. | Disclosure of Proxy Voting Policies and Procedures for Closed-End Management Investment Companies. |
Not applicable to open-end investment companies.
| Item 13. | Portfolio Managers of Closed-End Management Investment Companies. |
Not applicable to open-end investment companies.
| Item 14. | Purchases of Equity Securities by Closed‑End Management Investment Company and Affiliated Purchasers. |
Not applicable to open-end investment companies.
| Item 15. | Submission of Matters to a Vote of Security Holders. |
Not applicable. There have not been any material changes to the procedures by which shareholders may recommend nominees to the registrant’s board of trustees during the period.
| Item 16. | Controls and Procedures. |
(a) | The registrant’s principal executive officer and principal financial officer have reviewed the registrant’s disclosure controls and procedures (as defined in Rule 30a-3(c) under the Investment Company Act of 1940 (the “Act”)) as of a date within 90 days of the filing date of this report, as required by Rule 30a‑3(b) under the Act and Rules 13a-15(b) or 15d‑15(b) under the Exchange Act. Based on their review, such officers have concluded that the disclosure controls and procedures are effective in ensuring that information required to be disclosed in this report is appropriately recorded, processed, summarized, and reported and made known to them by others within the registrant and by the registrant’s service providers.
|
(b) | There were no changes in the registrant’s internal control over financial reporting (as defined in Rule 30a-3(d) under the Act) that occurred during the period covered by this report that has materially affected, or is reasonably likely to materially affect, the registrant’s internal control over financial reporting.
|
| Item 17. | Disclosure of Securities Lending Activities for Closed-End Management Investment Companies. |
Not applicable to open-end investment companies.
| Item 18. | Recovery of Erroneously Awarded Compensation. |
Not applicable to this report.
(2) Any policy required by the listing standards adopted pursuant to Rule 10D-1 under the Exchange Act (17 CFR 240.10D-1) by the registered national securities exchange or registered national securities association upon which the registrant’s securities are listed. Not applicable.
(4) Any written solicitation to purchase securities under Rule 23c‑1 under the Act (17 CFR 270.23c-1) sent or given during the period covered by the report by or on behalf of the registrant to 10 or more persons. Not applicable to open-end investment companies.
(5) Change in the registrant’s independent public accountant. Provide the information called for by Item 4 of Form 8-K under the Exchange Act (17 CFR 249.308). Unless otherwise specified by such Item 4, or related to and necessary for a complete understanding of information not previously disclosed, the information should relate to events occurring during the reporting period. Not applicable. There was no change in the registrant’s independent public accountant for the period covered by this report.
SIGNATURES
Pursuant to the requirements of the Securities Exchange Act of 1934 and the Investment Company Act of 1940, the registrant has duly caused this report to be signed on its behalf by the undersigned, thereunto duly authorized.
| | | HENNESSY FUNDS TRUST (Registrant) |
| | | |
| | By: | /s/ Neil J. Hennessy Neil J. Hennessy President
|
| | Date: | January 8, 2025
|
| | | |
Pursuant to the requirements of the Securities Exchange Act of 1934 and the Investment Company Act of 1940, this report has been signed below by the following persons on behalf of the registrant and in the capacities and on the dates indicated.
By: | /s/ Neil J. Hennessy Neil J. Hennessy, President and Principal Executive Officer | Date: January 8, 2025 |
| | | |
By: | /s/ Teresa M. Nilsen Teresa M. Nilsen, Treasurer and
Principal Financial Officer | Date: January 8, 2025 |