SECURITIES AND EXCHANGE COMMISSION
Washington, D.C. 20549
Form 6-K
REPORT OF FOREIGN PRIVATE ISSUER
PURSUANT TO RULE 13a-16 OR 15d-16 OF
THE SECURITIES EXCHANGE ACT OF 1934
For the month of November 2013
Commission File Number 1-14926
KT Corporation
(Translation of registrant’s name into English)
1692-1 Seocho-dong
Seocho-gu, Seoul
137-882
Korea
(Address of principal executive offices)
Indicate by check mark whether the registrant files or will file annual reports under cover of Form 20-F orForm 40-F:
Form 20-F þ Form 40-F ¨
Indicate by check mark if the registrant is submitting the Form 6-K in paper as permitted by Regulation S-T Rule 101(b)(1): ¨
Indicate by check mark if the registrant is submitting the Form 6-K in paper as permitted by Regulation S-T Rule 101(b)(7): ¨
Indicate by check mark whether by furnishing the information contained in this Form, the registrant is also thereby furnishing the information to the Commission pursuant to Rule 12g3-2(b) under the Securities Exchange Act of 1934.
Yes ¨ No þ
If “Yes” is marked, indicate below the file number assigned to the registrant in connection with Rule12g3-2(b): 82-
SIGNATURES
Pursuant to the requirements of the Securities Exchange Act of 1934, the registrant has duly caused this report to be signed on its behalf by the undersigned, thereunto duly authorized.
Dated: November 1, 2013 KT Corporation | ||
| By: | /s/ Youngwoo Kim | |
| Name: | Youngwoo Kim | |
| Title: | Vice President | |
| By: | /s/ Tony Yongrae Jung | |
| Name: | Tony Yongrae Jung | |
| Title: | Team Leader | |
kt 3Q13
Earnings Release
Investor Relations | 2013. 11. 1
Disclaimer
This presentation has been prepared by KT Corp(“the Company”). This presentation contains forward-looking statements, (“the which are subject to risks, uncertainties, and assumptions. This presentation is being presented solely for your information and is subject to change without notice. No representation or warranty, expressed or implied, is made and no reliance should be placed on the accuracy, actuality, fairness, or completeness of the information presented.
Please be informed that items included in our operating income have been prepared in accordance with K-IFRS 1001 released on October 17, 2012, which was revised to coincide with the Korean Accounting Standards for Non-Public Entities(“KAS-NPEs”). As such, our disposal gains from real estates and others have been excluded from our operating income.
The Company, its affiliates or representatives accept no liability whatsoever for any losses arising from any information contained in the presentation. This presentation does not constitute an offer or invitation to purchase or subscribe for any shares of the Company, and no part of this presentation shall form the Basis of or be relied upon in connection with any contract or commitment.
Any decision to purchase shares of the Company should be made solely on the Basis of information, which has been publicly filed with the Securities and Exchange Commission or the Korea Stock Exchange and distributed to all investors.
The contents of this presentation may not be reproduced, redistributed or passed on, directly or indirectly, to any other person or published, in whole or in part, for any purpose.
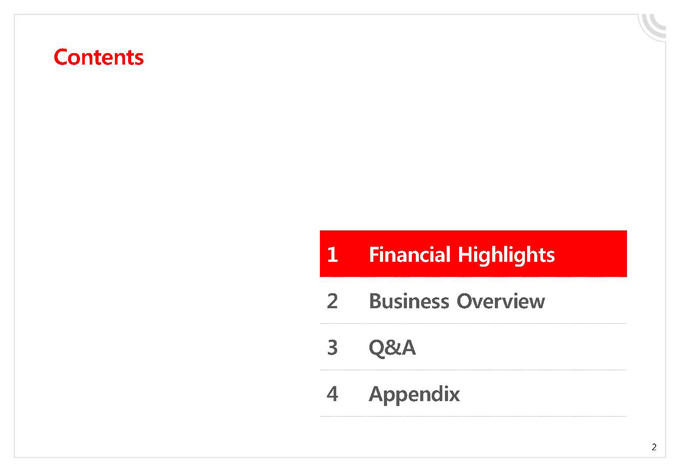
Contents
1 Financial Highlights
2 Business Overview
3 Q&A
4 Appendix
IFRS / Consolida
K-IFRS / Consolidated
1-1 Financial Highlights
Income Statement
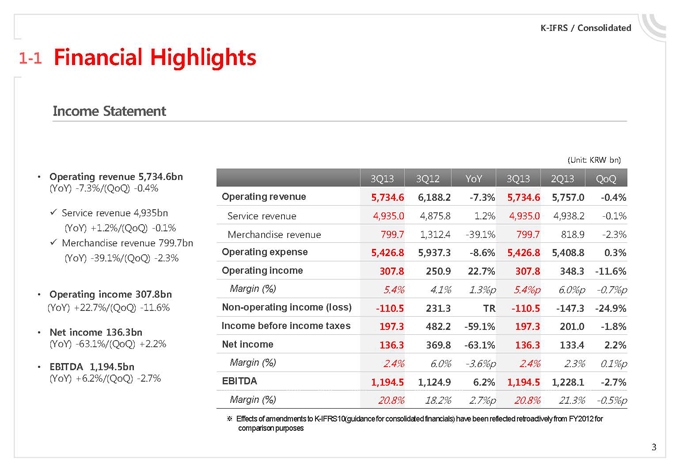
Operating revenue 5,734.6bn
(YoY) -7.3%/(QoQ) -0.4%
??Service revenue 4,935bn (YoY) +1.2%/(QoQ) -0.1% ??Merchandise revenue 799.7bn (YoY) -39.1%/(QoQ) -2.3%
Operating income 307.8bn
(YoY) +22.7%/(QoQ) -11.6%
Net income 136.3bn
(YoY) -63.1%/(QoQ) +2.2%
EBITDA 1,194.5bn
(YoY) +6.2%/(QoQ) -2.7%
(Unit: KRW bn)
3Q13 3Q12 YoY 3Q13 2Q13 QoQ
Operating revenue 5,734.6 6,188.2 -7.3% 5,734.6 5,757.0 -0.4%
Service revenue 4,935.0 4,875.8 1.2% 4,935.0 4,938.2 -0.1% Merchandise revenue 799.7 1,312.4 -39.1% 799.7 818.9 -2.3%
Operating expense 5,426.8 5,937.3 -8.6% 5,426.8 5,408.8 0.3% Operating income 307.8 250.9 22.7% 307.8 348.3 -11.6%
Margin (%) 5.4% 4.1% 1.3%p 5.4%p 6.0%p -0.7%p
Non-operating income (loss) -110.5 231.3 TR -110.5 -147.3 -24.9% Income before income taxes 197.3 482.2 -59.1% 197.3 201.0 -1.8% Net income 136.3 369.8 -63.1% 136.3 133.4 2.2%
Margin (%) 2.4% 6.0% -3.6%p 2.4% 2.3% 0.1%p
EBITDA 1,194.5 1,124.9 6.2% 1,194.5 1,228.1 -2.7%
Margin (%) 20.8% 18.2% 2.7%p 20.8% 21.3% -0.5%p
? Effects of amendments to K-IFRS10(guidance for consolidated financials) have been reflected retroactively from FY2012 for comparison purposes
K-IFRS / Consolidated
K-IFRS / Consolidated
1-2 Financial Highlights
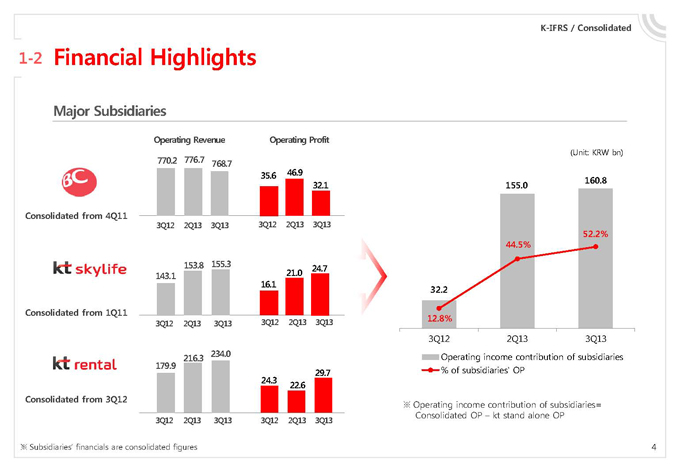
Major Subsidiaries
Operating Revenue Operating Profit 770.2 776.7 768.7
35.6 46.9
32.1
Consolidated from 4Q11 3Q12 2Q13 3Q13 3Q12 2Q13 3Q13
153.8 155.3 24.7 143.1 21.0
16.1
Consolidated from 1Q11
3Q12 2Q13 3Q13 3Q12 2Q13 3Q13
216.3 234.0 179.9
29.7
24.3
22.6 Consolidated from 3Q12
3Q12 2Q13 3Q13 3Q12 2Q13 3Q13
? Subsidiaries’ financials are consolidated
(Unit: KRW bn)
155.0 160.8
52.2%
44.5%
32.2
12.8%
3Q12 2Q13 3Q13 Operating income contribution of subsidiaries % of subsidiaries’ OP
? Operating income contribution of subsidiaries= Consolidated OP – kt stand alone OP
K-IFRS / Consolidated
1-3 Financial Highlights
Operating Revenue
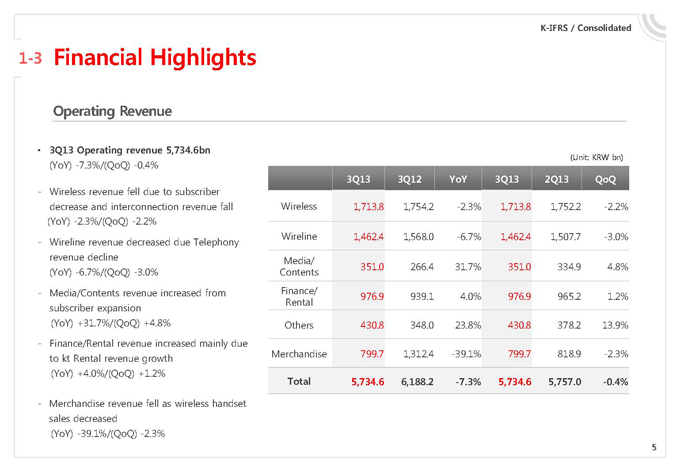
3Q13 Operating revenue 5,734.6bn
(YoY) -7.3%/(QoQ) -0.4%
- Wireless revenue fell due to subscriber decrease and interconnection revenue fall (YoY) -2.3%/(QoQ) -2.2%
- Wireline revenue decreased due Telephony revenue decline (YoY) -6.7%/(QoQ) -3.0%
- Media/Contents revenue increased from subscriber expansion (YoY) +31.7%/(QoQ) +4.8%
- Finance/Rental revenue increased mainly due to kt Rental revenue growth (YoY) +4.0%/(QoQ) +1.2%
- Merchandise revenue fell as wireless handset sales decreased (YoY) -39.1%/(QoQ) -2.3%
(Unit: KRW bn)
3Q13 3Q12 YoY 3Q13 2Q13 QoQ
Wireless 1,713.8 1,754.2 -2.3% 1,713.8 1,752.2 -2.2%
Wireline 1,462.4 1,568.0 -6.7% 1,462.4 1,507.7 -3.0% Media/ 351.0 266.4 31.7% 351.0 334.9 4.8% Contents Finance/ 976.9 939.1 4.0% 976.9 965.2 1.2% Rental Others 430.8 348.0 23.8% 430.8 378.2 13.9%
Merchandise 799.7 1,312.4 -39.1% 799.7 818.9 -2.3%
Total 5,734.6 6,188.2 -7.3% 5,734.6 5,757.0 -0.4%
K-IFRS / Consolidated
1-4 Financial Highlights
Operating Expenses
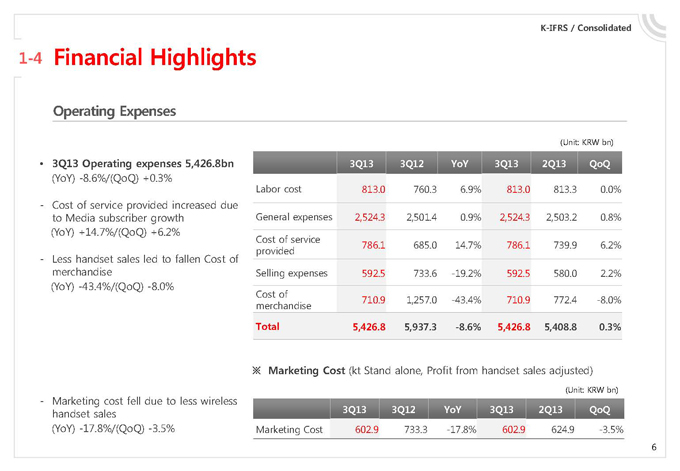
3Q13 Operating expenses 5,426.8bn
(YoY) -8.6%/(QoQ) +0.3%
- Cost of service provided increased due to Media subscriber growth (YoY) +14.7%/(QoQ) +6.2%
- Less handset sales led to fallen Cost of merchandise (YoY) -43.4%/(QoQ) -8.0%
- Marketing cost fell due to less wireless handset sales (YoY) -17.8%/(QoQ) -3.5%
(Unit: KRW bn)
3Q13 3Q12 YoY 3Q13 2Q13 QoQ
Labor cost 813.0 760.3 6.9% 813.0 813.3 0.0%
General expenses 2,524.3 2,501.4 0.9% 2,524.3 2,503.2 0.8% Cost of service 786.1 685.0 14.7% 786.1 739.9 6.2% provided Selling expenses 592.5 733.6 -19.2% 592.5 580.0 2.2% Cost of 710.9 1,257.0 -43.4% 710.9 772.4 -8.0% merchandise
Total 5,426.8 5,937.3 -8.6% 5,426.8 5,408.8 0.3%
? Marketing Cost (kt Stand alone, Profit from handset sales adjusted)
(Unit: KRW bn)
3Q13 3Q12 YoY 3Q13 2Q13 QoQ
Marketing Cost 602.9 733.3 -17.8% 602.9 624.9 -3.5%
K-IFRS / Consolidated
1-5 Financial Highlights
Financial Position
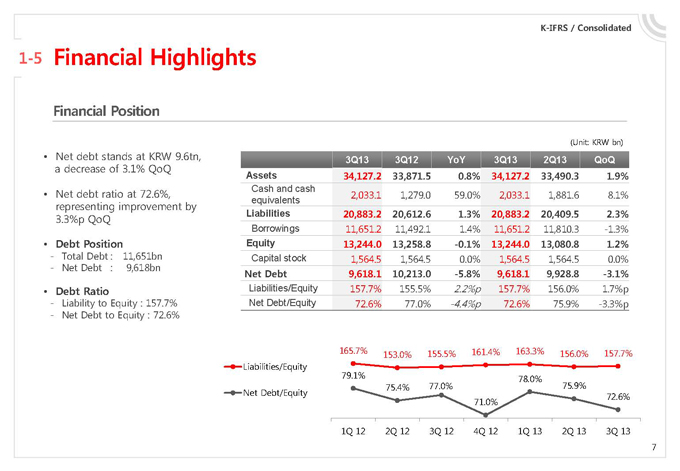
Net debt stands at KRW 9.6tn, a
decrease of 3.1% QoQ
Net debt ratio at 72.6%, representing improvement by
3.3%p QoQ
Debt Position
- Total Debt : 11,651bn
- Net Debt : 9,618bn
Debt Ratio
- Liability to Equity : 157.7%
- Net Debt to Equity : 72.6%
(Unit: KRW bn)
3Q13 3Q12 YoY 3Q13 2Q13 QoQ Assets 34,127.2 33,871.5 0.8% 34,127.2 33,490.3 1.9%
Cash and cash
2,033.1 1,279.0 59.0% 2,033.1 1,881.6 8.1% equivalents
Liabilities 20,883.2 20,612.6 1.3% 20,883.2 20,409.5 2.3%
Borrowings 11,651.2 11,492.1 1.4% 11,651.2 11,810.3 -1.3%
Equity 13,244.0 13,258.8 -0.1% 13,244.0 13,080.8 1.2%
Capital stock 1,564.5 1,564.5 0.0% 1,564.5 1,564.5 0.0%
Net Debt 9,618.1 10,213.0 -5.8% 9,618.1 9,928.8 -3.1%
Liabilities/Equity 157.7% 155.5% 2.2%p 157.7% 156.0% 1.7%p Net Debt/Equity 72.6% 77.0% -4.4%p 72.6% 75.9% -3.3%p
165.7% 153.0% 155.5% 161.4% 163.3% 156.0% 157.7% Liabilities/Equity
79.1% 78.0%
75.4% 77.0% 75.9%
Net Debt/Equity 71.0% 72.6%
1Q 12 2Q 12 3Q 12 4Q 12 1Q 13 2Q 13 3Q 13
K-IFRS / kt St
K-IFRS / kt Stand Alone
1-6 Financial Highlights
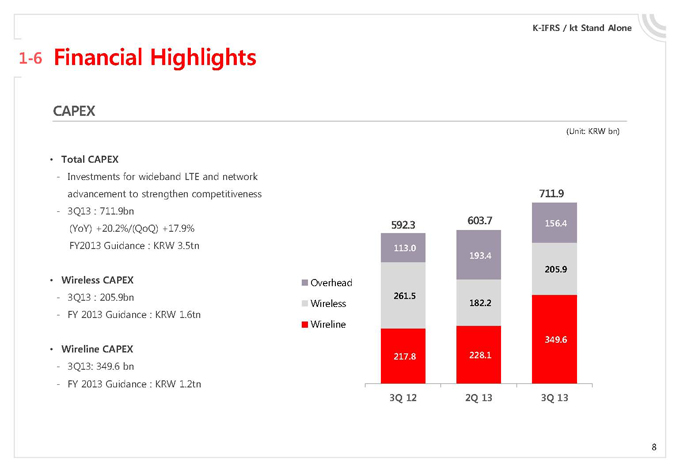
CAPEX
Total CAPEX
- Investments for wideband LTE and network advancement to strengthen competitiveness
- 3Q13 : 711.9bn
(YoY) +20.2%/(QoQ) +17.9% FY2013 Guidance : KRW 3.5tn
Wireless CAPEX
- 3Q13 : 205.9bn
- FY 2013 Guidance : KRW 1.6tn
Wireline CAPEX
- 3Q13: 349.6 bn
- FY 2013 Guidance : KRW 1.2tn
(Unit: KRW bn)
711.9
592.3 603.7 156.4
113.0
193.4
205.9
Overhead
261.5
Wireless 182.2 Wireline
349.6 217.8
228.1
3Q 12 2Q 13 3Q 13
1 Financial Highlights
2 Business Overview
3 Q&A
4 Appendix
K-IFRS / Consolidated
2-1 Business Overview
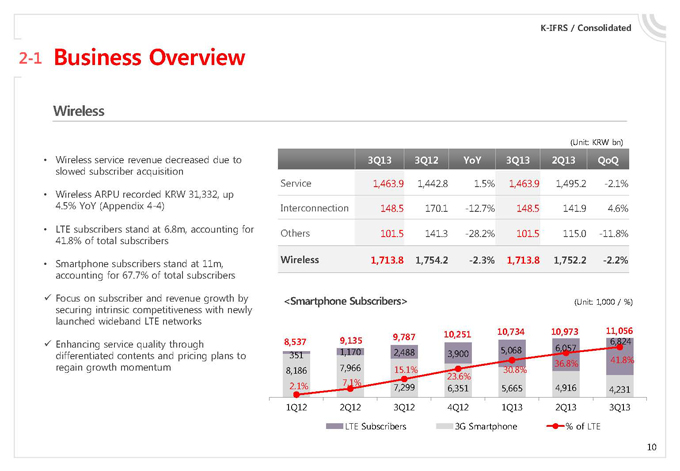
Wireless
Wireless service revenue decreased due to slowed subscriber acquisition
Wireless ARPU recorded KRW 31,332, up
4.5% YoY (Appendix 4-4)
LTE subscribers stand at 6.8m, accounting for
41.8% of total subscribers
Smartphone subscribers stand at 11m, accounting for 67.7% of total subscribers ??Focus on subscriber and revenue growth by securing intrinsic competitiveness with newly launched wideband LTE networks ??Enhancing service quality through differentiated contents and pricing plans to regain growth momentum
(Unit: KRW bn)
3Q13 3Q12 YoY 3Q13 2Q13 QoQ
Service 1,463.9 1,442.8 1.5% 1,463.9 1,495.2 -2.1% Interconnection 148.5 170.1 -12.7% 148.5 141.9 4.6% Others 101.5 141.3 -28.2% 101.5 115.0 -11.8%
Wireless 1,713.8 1,754.2 -2.3% 1,713.8 1,752.2 -2.2%
<Smartphone Subscribers> (Unit: 1,000 / %)
10,251 10,734 10,973 11,056 9,135 9,787 6,824 8,537
1,170 2,488 5,068 6,057 351 3,900
36.8% 41.8% 8,186 7,966 15.1% 30.8%
23.6%
2.1% 7.1% 7,299
6,351 5,665 4,916 4,231 1Q12 2Q12 3Q12 4Q12 1Q13 2Q13 3Q13 LTE Subscribers 3G Smartphone % of LTE
K-IFRS / Consolidated
2-2 Business Overview
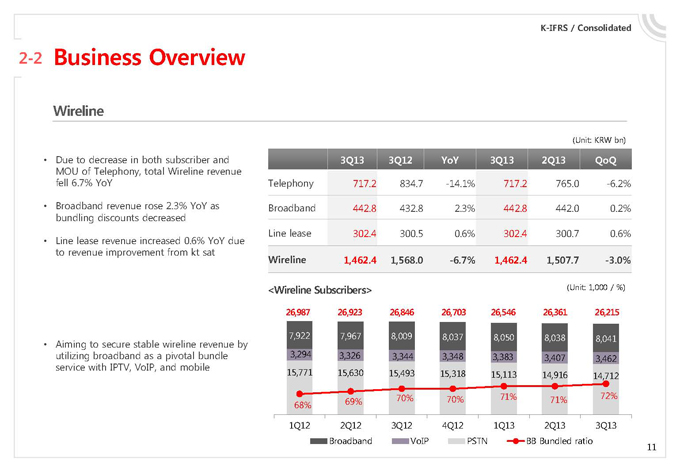
Wireline
Due to decrease in both subscriber and MOU of Telephony, total Wireline revenue fell 6.7% YoY
Broadband revenue rose 2.3% YoY as bundling discounts decreased
Line lease revenue increased 0.6% YoY due to revenue improvement from kt sat
Aiming to secure stable wireline revenue by utilizing broadband as a pivotal bundle service with IPTV, VoIP, and mobile
(Unit: KRW bn)
3Q13 3Q12 YoY 3Q13 2Q13 QoQ
Telephony 717.2 834.7 -14.1% 717.2 765.0 -6.2% Broadband 442.8 432.8 2.3% 442.8 442.0 0.2% Line lease 302.4 300.5 0.6% 302.4 300.7 0.6%
Wireline 1,462.4 1,568.0 -6.7% 1,462.4 1,507.7 -3.0%
<Wireline Subscribers> (Unit: 1,000 / %)
26,987 26,923 26,846 26,703 26,546 26,361 26,215
7,922 7,967 8,009 8,037 8,050 8,038 8,041 3,294 3,326 3,344 3,348 3,383 3,407 3,462 15,771 15,630 15,493 15,318 15,113 14,916 14,712 70% 70% 71% 71% 72% 68% 69% 1Q12 2Q12 3Q12 4Q12 1Q13 2Q13 3Q13 Broadband VoIP PSTN BB Bundled ratio
K-IFRS
K-IFRS / Consolidated
2-3 Business Overview
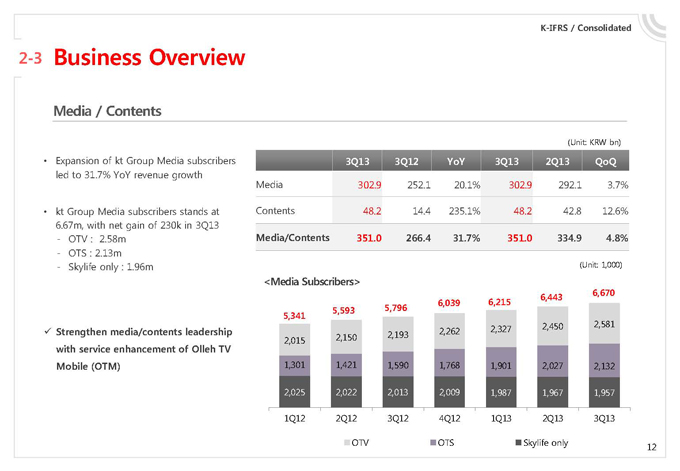
Media / Contents
Expansion of kt Group Media subscribers led to 31.7% YoY revenue growth
kt Group Media subscribers stands at
6.67m, with net gain of 230k in 3Q13
- OTV : 2.58m
- OTS : 2.13m
- Skylife only : 1.96m
??Strengthen media/contents leadership with service enhancement of Olleh TV
Mobile (OTM)
(Unit: KRW bn)
3Q13 3Q12 YoY 3Q13 2Q13 QoQ
Media 302.9 252.1 20.1% 302.9 292.1 3.7%
Contents 48.2 14.4 235.1% 48.2 42.8 12.6%
Media/Contents 351.0 266.4 31.7% 351.0 334.9 4.8%
(Unit: 1,000)
<Media Subscribers>
6,215 6,443 6,670 5,796 6,039 5,593 5,341
2,450 2,581 2,262 2,327 2,150 2,193 2,015
1,301 1,421 1,590 1,768 1,901 2,027 2,132 2,025 2,022 2,013 2,009 1,987 1,967 1,957 1Q12 2Q12 3Q12 4Q12 1Q13 2Q13 3Q13 OTV OTS Skylife only
K-IFRS / Consolidated
2-4 Business Overview
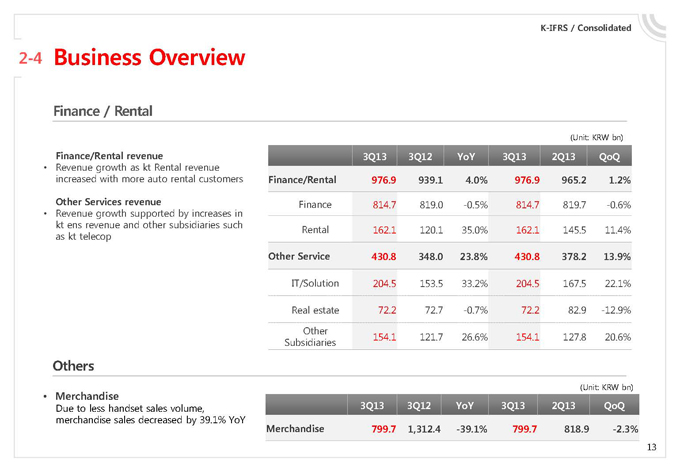
Finance / Rental
Finance/Rental revenue
Revenue growth as kt Rental revenue increased with more auto rental customers
Other Services revenue
Revenue growth supported by increases in kt ens revenue and other subsidiaries such as kt telecop
Others
Merchandise
Due to less handset sales volume, merchandise sales decreased by 39.1% YoY
(Unit: KRW bn)
3Q13 3Q12 YoY 3Q13 2Q13 QoQ
Finance/Rental 976.9 939.1 4.0% 976.9 965.2 1.2%
Finance 814.7 819.0 -0.5% 814.7 819.7 -0.6%
Rental 162.1 120.1 35.0% 162.1 145.5 11.4%
Other Service 430.8 348.0 23.8% 430.8 378.2 13.9%
IT/Solution 204.5 153.5 33.2% 204.5 167.5 22.1%
Real estate 72.2 72.7 -0.7% 72.2 82.9 -12.9%
Other
Subsidiaries 154.1 121.7 26.6% 154.1 127.8 20.6%
(Unit: KRW bn)
3Q13 3Q12 YoY 3Q13 2Q13 QoQ
Merchandise 799.7 1,312.4 -39.1% 799.7 818.9 -2.3%
1 Financial Highlights
2 Business Overview
3 Q&A
4 Appendix
1 Financial Highlights
2 Business Overview
3 Q&A
4 Appendix
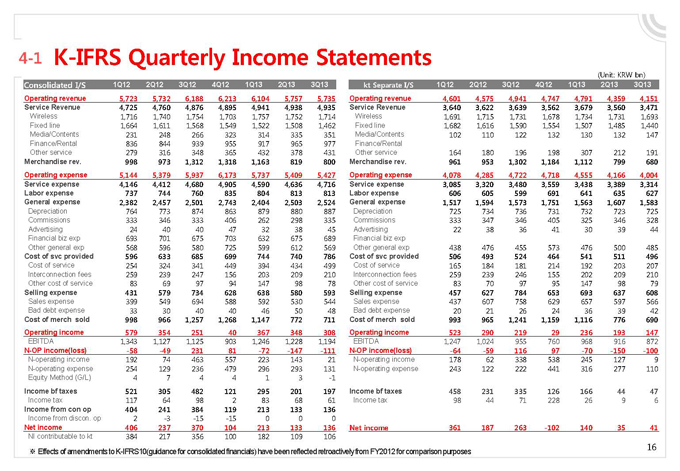
4-1 K-IFRS Quarterly Income Statements
(Unit: KRW bn)
Consolidated I/S 1Q12 2Q12 3Q12 4Q12 1Q13 2Q13 3Q13 Operating revenue 5,723 5,732 6,188 6,213 6,104 5,757 5,735 Service Revenue 4,725 4,760 4,876 4,895 4,941 4,938 4,935
Wireless 1,716 1,740 1,754 1,703 1,757 1,752 1,714 Fixed line 1,664 1,611 1,568 1,549 1,522 1,508 1,462 Media/Contents 231 248 266 323 314 335 351 Finance/Rental 836 844 939 955 917 965 977 Other service 279 316 348 365 432 378 431
Merchandise rev. 998 973 1,312 1,318 1,163 819 800 Operating expense 5,144 5,379 5,937 6,173 5,737 5,409 5,427 Service expense 4,146 4,412 4,680 4,905 4,590 4,636 4,716 Labor expense 737 744 760 835 804 813 813 General expense 2,382 2,457 2,501 2,743 2,404 2,503 2,524
Depreciation 764 773 874 863 879 880 887 Commissions 333 346 333 406 262 298 335 Advertising 24 40 40 47 32 38 45 Financial biz exp 693 701 675 703 632 675 689 Other general exp 568 596 580 725 599 612 569
Cost of svc provided 596 633 685 699 744 740 786
Cost of service 254 324 341 449 394 434 499 Interconnection fees 259 239 247 156 203 209 210
Other cost of service 83 69 97 94 147 98 78
Selling expense 431 579 734 628 638 580 593
Sales expense 399 549 694 588 592 530 544 Bad debt expense 33 30 40 40 46 50 48
Cost of merch sold 998 966 1,257 1,268 1,147 772 711 Operating income 579 354 251 40 367 348 308
EBITDA 1,343 1,127 1,125 903 1,246 1,228 1,194
N-OP income(loss) -58 -49 231 81 -72 -147 -111
N-operating income 192 74 463 557 223 143 21 N-operating expense 254 129 236 479 296 293 131
Equity Method (G/L) 4 7 4 4 1 3 -1
Income bf taxes 521 305 482 121 295 201 197
Income tax 117 64 98 2 83 68 61
Income from con op 404 241 384 119 213 133 136
Income from discon. op 2 -3 -15 -15 0 0 0
Net income 406 237 370 104 213 133 136
NI contributable to kt 384 217 356 100 182 109 106
kt Separate I/S 1Q12 2Q12 3Q12 4Q12 1Q13 2Q13 3Q13 Operating revenue 4,601 4,575 4,941 4,747 4,791 4,359 4,151 Service Revenue 3,640 3,622 3,639 3,562 3,679 3,560 3,471
Wireless 1,691 1,715 1,731 1,678 1,734 1,731 1,693 Fixed line 1,682 1,616 1,590 1,554 1,507 1,485 1,440 Media/Contents 102 110 122 132 130 132 147
Finance/Rental
Other service 164 180 196 198 307 212 191
Merchandise rev. 961 953 1,302 1,184 1,112 799 680 Operating expense 4,078 4,285 4,722 4,718 4,555 4,166 4,004 Service expense 3,085 3,320 3,480 3,559 3,438 3,389 3,314 Labor expense 606 605 599 691 641 635 627 General expense 1,517 1,594 1,573 1,751 1,563 1,607 1,583
Depreciation 725 734 736 731 732 723 725 Commissions 333 347 346 405 325 346 328 Advertising 22 38 36 41 30 39 44
Financial biz exp
Other general exp 438 476 455 573 476 500 485
Cost of svc provided 506 493 524 464 541 511 496
Cost of service 165 184 181 214 192 203 207 Interconnection fees 259 239 246 155 202 209 210
Other cost of service 83 70 97 95 147 98 79
Selling expense 457 627 784 653 693 637 608
Sales expense 437 607 758 629 657 597 566 Bad debt expense 20 21 26 24 36 39 42
Cost of merch sold 993 965 1,241 1,159 1,116 776 690 Operating income 523 290 219 29 236 193 147
EBITDA 1,247 1,024 955 760 968 916 872
N-OP income(loss) -64 -59 116 97 -70 -150 -100
N-operating income 178 62 338 538 245 127 9 N-operating expense 243 122 222 441 316 277 110
Income bf taxes 458 231 335 126 166 44 47
Income tax 98 44 71 228 26 9 6
Net income 361 187 263 -102 140 35 41
? Effects of amendments to K-IFRS10(guidance for consolidated financials) have been reflected retroactively from FY2012 for comparison purposes

4-2 K-IFRS Statement of Financial Position (Unit: KRW bn) Consolidated 1Q12 2Q12 3Q12 4Q12 1Q13 2Q13 3Q13
Asset 33,209 32,253 33,871 34,558 34,075 33,490 34,127 Current assets 10,967 9,872 10,582 10,517 10,546 10,108 10,057
Cash &cash equivalents 1,590 1,411 1,279 2,058 1,493 1,882 2,033 Trade & other rec 5,228 4,947 4,817 4,564 4,214 4,080 3,660 Inventories 897 944 802 935 1,215 866 776 Other current assets 3,253 2,569 3,685 2,961 3,625 3,280 3,588 Non-current assets 22,242 22,382 23,289 24,040 23,529 23,382 24,070 Trade & other rec 1,514 1,212 929 1,073 751 805 648 P.P.E 14,265 14,562 15,431 15,806 15,739 15,714 15,816 Other non-cur assets 6,462 6,607 6,929 7,161 7,039 6,864 7,606 Liabilities 20,710 19,506 20,613 21,340 21,135 20,409 20,883
Current liabilities 10,602 9,609 10,318 11,267 11,184 10,640 9,829
Trade & other payables 6,616 5,914 6,450 7,221 6,964 6,046 6,084 Short-term borrowings 3,086 2,844 3,043 3,197 3,356 3,798 2,982
Other current liabilities 901 851 826 848 864 796 764
Non-current liabilities 10,108 9,897 10,294 10,073 9,951 9,770 11,054
Trade & other payables 658 585 738 701 605 603 1,136 Long-term borrowings 8,386 8,172 8,449 8,239 8,231 8,012 8,669 Other non-cur liabilities 1,064 1,140 1,107 1,133 1,115 1,154 1,248
Equity 12,498 12,747 13,259 13,218 12,939 13,081 13,244
Net debt 9,882 9,605 10,213 9,379 10,095 9,929 9,618
kt Separate 1Q12 2Q12 3Q12 4Q12 1Q13 2Q13 3Q13
Asset 27,126 26,412 25,978 26,509 25,766 24,876 25,318
Current assets 7,072 6,310 6,093 6,090 5,899 5,107 4,992
Cash &cash equivalents 809 791 501 1,173 531 794 901 Trade & other rec 4,740 4,500 4,264 3,951 3,608 3,352 2,910 Inventories 723 764 613 809 1,082 713 634 Other current assets 800 254 715 156 677 249 549
Non-current assets 20,054 20,103 19,885 20,419 19,867 19,768 20,326
Trade & other rec 1,396 1,099 788 926 600 648 485 P.P.E 13,464 13,744 13,604 13,009 12,854 12,723 12,713 Other non-cur assets 5,194 5,260 5,493 6,484 6,412 6,398 7,128
Liabilities 15,503 14,592 13,884 14,638 14,241 13,331 13,716
Current liabilities 7,347 6,582 6,181 7,338 7,294 6,752 5,995
Trade & other payables 4,824 4,322 4,059 4,966 4,542 3,701 3,683 Short-term borrowings 1,877 1,657 1,568 1,781 2,183 2,539 1,897
Other current liabilities 646 603 554 591 569 512 415
Non-current liabilities 8,155 8,010 7,703 7,300 6,947 6,579 7,721
Trade & other payables 611 543 697 676 577 568 1,081 Long-term borrowings 6,811 6,658 6,168 5,785 5,568 5,176 5,758
Other non-cur liabilities 734 809 838 838 802 835 881
Equity 11,623 11,821 12,094 11,871 11,525 11,545 11,603
Net debt 8,291 7,871 7,745 6,851 7,586 7,279 7,644
? Effects of amendments to K-IFRS10(guidance for consolidated financials) have been reflected retroactively from FY2012 for comparison purposes
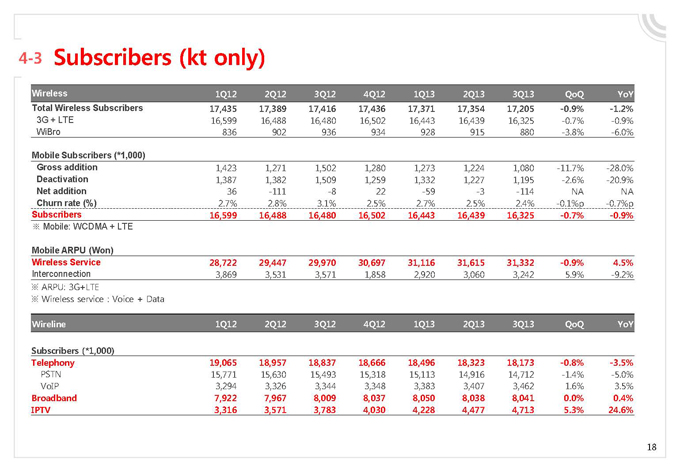
4-3 Subscribers (kt only)
Wireless 1Q12 2Q12 3Q12 4Q12 1Q13 2Q13 3Q13 QoQ YoY Total Wireless Subscribers 17,435 17,389 17,416 17,436 17,371 17,354 17,205 -0.9% -1.2%
3G + LTE 16,599 16,488 16,480 16,502 16,443 16,439 16,325 -0.7% -0.9% WiBro 836 902 936 934 928 915 880 -3.8% -6.0%
Mobile Subscribers (*1,000)
Gross addition 1,423 1,271 1,502 1,280 1,273 1,224
1,080 -11.7% -28.0% Deactivation 1,387 1,382 1,509 1,259 1,332 1,227 1,195 -2.6% -20.9% Net addition 36 -111 -8 22 -59 -3 -114 NA NA Churn rate (%) 2.7% 2.8% 3.1% 2.5% 2.7% 2.5% 2.4% -0.1%p -0.7%p
Subscribers 16,599 16,488 16,480 16,502 16,443 16,439 16,325 -0.7% -0.9%
? Mobile: WCDMA + LTE
Mobile ARPU (Won)
Wireless Service 28,722 29,447 29,970 30,697 31,116 31,615 31,332 -0.9% 4.5%
Interconnection 3,869 3,531 3,571 1,858 2,920 3,060 3,242 5.9% -9.2%
? ARPU: 3G+LTE
? Wireless service : Voice + Data
Wireline 1Q12 2Q12 3Q12 4Q12 1Q13 2Q13 3Q13 QoQ YoY
Subscribers (*1,000)
Telephony 19,065 18,957 18,837 18,666 18,496 18,323 18,173 -0.8% -3.5%
PSTN 15,771 15,630 15,493 15,318 15,113 14,916 14,712 -1.4% -5.0% VoIP 3,294 3,326 3,344 3,348 3,383 3,407 3,462 1.6% 3.5%
Broadband 7,922 7,967 8,009 8,037 8,050 8,038 8,041 0.0% 0.4% IPTV 3,316 3,571 3,783 4,030 4,228 4,477 4,713 5.3% 24.6%

Thank you kt