SECURITIES AND EXCHANGE COMMISSION
Washington, D.C. 20549
Form 6-K
REPORT OF FOREIGN PRIVATE ISSUER
PURSUANT TO RULE 13a-16 OR 15d-16
OF THE SECURITIES EXCHANGE ACT OF 1934
For the month of April 2015
Commission File Number 1-14926
KT Corporation
(Translation of registrant’s name into English)
Kwang Suk Shin
KT Gwanghwamun Building East
33, Jong-ro 3-Gil, Jongno-gu
463-711 Seoul, Korea
(Address of principal executive offices)
Indicate by check mark whether the registrant files or will file annual reports under cover of Form 20-F or Form 40-F:
Form 20-F x Form 40-F ¨
Indicate by check mark if the registrant is submitting the Form 6-K in paper as permitted by Regulation S-T Rule 101(b)(1): ¨
Indicate by check mark if the registrant is submitting the Form 6-K in paper as permitted by Regulation S-T Rule 101(b)(7): ¨
Indicate by check mark whether by furnishing the information contained in this Form, the registrant is also thereby furnishing the information to the Commission pursuant to Rule 12g3-2(b) under the Securities Exchange Act of 1934.
Yes ¨ No x
If “Yes” is marked, indicate below the file number assigned to the registrant in connection with Rule 12g3-2(b): 82-
SIGNATURES
Pursuant to the requirements of the Securities Exchange Act of 1934, the registrant has duly caused this report to be signed on its behalf by the undersigned, thereunto duly authorized.
| Dated: April 30, 2015 | ||
| KT Corporation | ||
| By: | /s/ Youngwoo Kim | |
| Name: | Youngwoo Kim | |
| Title: | Vice President | |
| By: | /s/ Jungsup Jung | |
| Name: | Jungsup Jung | |
| Title: | Director | |
KT 1Q15
Earnings Release
Investor Relations 2015. 4. 30
Disclaimer
This presentation has been prepared by KT Corp. (“the Company”). This presentation contains forward-looking statements, which are subject to risks, uncertainties, and assumptions. This presentation is being presented solely for your information and is subject to change without notice. No representation or warranty, expressed or implied, is made and no reliance should be placed on the accuracy, actuality, fairness, or completeness of the information presented.
Please be informed that items included in our operating income have been prepared in accordance with K-IFRS 1001 released on October 17, 2012, which was revised to coincide with the Korean Accounting Standards for Non-Public Entities (“KAS-NPEs”). As such, our disposal gains from real estates and others have been excluded from our operating income.
The Company, its affiliates or representatives accept no liability whatsoever for any losses arising from any information contained in the presentation. This presentation does not constitute an offer or invitation to purchase or subscribe for any shares of the Company, and no part of this presentation shall form the Basis of or be relied upon in connection with any contract or commitment.
Any decision to purchase shares of the Company should be made solely on the Basis of information, which has been publicly filed with the Securities and Exchange Commission or the Korea Stock Exchange and distributed to all investors.
The contents of this presentation may not be reproduced, redistributed or passed on, directly or indirectly, to any other person or published, in whole or in part, for any purpose.
If you have any related questions to this material, please contact IR department. Tel : 82-2-3495-3557, 3558, 3564, 5529, 5343, 5344 Fax : 82-2-3495-5917
1

Contents
1 Financial Highlights
2 Business Overview
3 Q&A
4 Appendix
2
K-IFRS / Consolidated
1-1 Financial Highlights
Income Statement
(Unit: KRW bn)
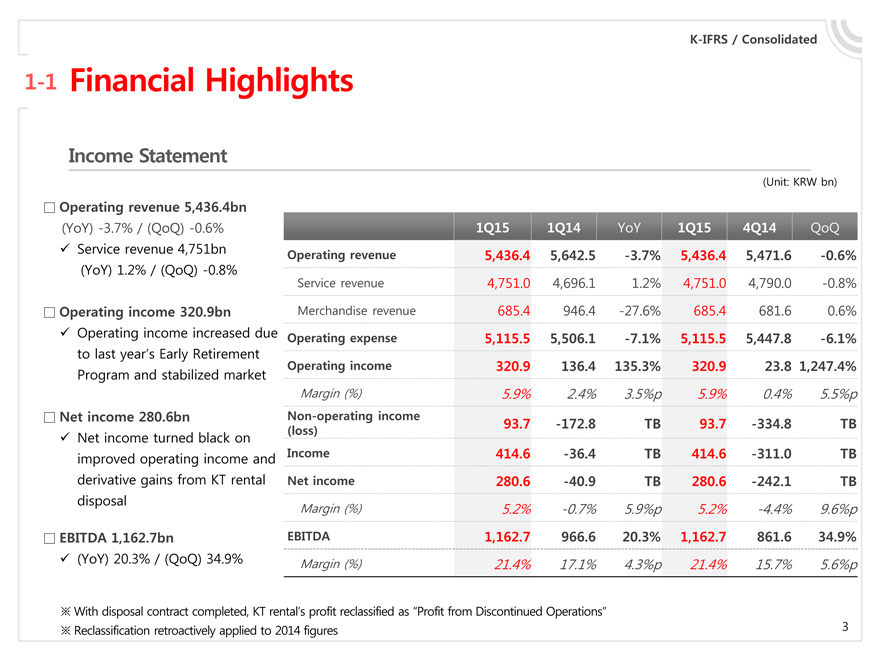
Operating revenue 5,436.4bn
(YoY) -3.7% / (QoQ) -0.6% 1Q15 1Q14 YoY 1Q15 4Q14 QoQ
Service revenue 4,751bn Operating revenue 5,436.4 5,642.5 -3.7% 5,436.4 5,471.6 -0.6%
(YoY) 1.2% / (QoQ) -0.8%
Service revenue 4,751.0 4,696.1 1.2% 4,751.0 4,790.0 -0.8%
Operating income 320.9bn Merchandise revenue 685.4 946.4 -27.6% 685.4 681.6 0.6%
Operating income increased due Operating expense 5,115.5 5,506.1 -7.1% 5,115.5 5,447.8 -6.1% to last year’s Early Retirement
Operating income 320.9 136.4 135.3% 320.9 23.8 1,247.4%
Program and stabilized market
Margin (%) 5.9% 2.4% 3.5%p 5.9% 0.4% 5.5%p
Net income 280.6bn Non-operating income
(loss) 93.7 -172.8 TB 93.7 -334.8 TB
Net income turned black on improved operating income and Income 414.6 -36.4 TB 414.6 -311.0 TB derivative gains from KT rental Net income 280.6 -40.9 TB 280.6 -242.1 TB disposal
Margin (%) 5.2% -0.7% 5.9%p 5.2% -4.4% 9.6%p
EBITDA 1,162.7bn EBITDA 1,162.7 966.6 20.3% 1,162.7 861.6 34.9%
(YoY) 20.3% / (QoQ) 34.9% Margin (%) 21.4% 17.1% 4.3%p 21.4% 15.7% 5.6%p
With disposal contract completed, KT rental’s profit reclassified as “Profit from Discontinued Operations”
Reclassification retroactively applied to 2014 figures
3
K-IFRS / Consolidated
1-2 Financial Highlights
Financial Position
(Unit: KRW bn)
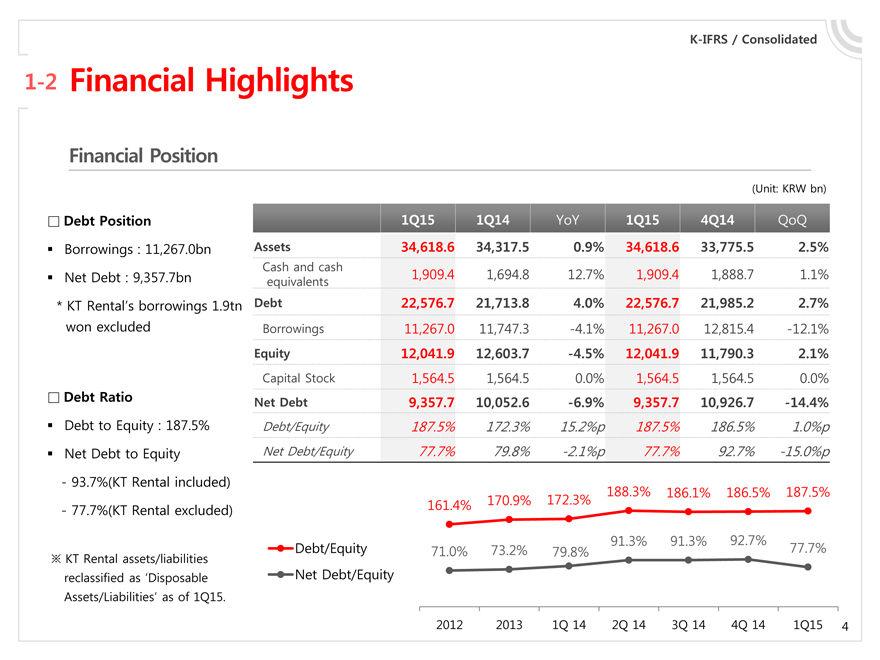
Debt Position 1Q15 1Q14 YoY 1Q15 4Q14 QoQ
Borrowings : 11,267.0bn Assets 34,618.6 34,317.5 0.9% 34,618.6 33,775.5 2.5%
Cash and cash 1,909.4 1,694.8 12.7% 1,909.4 1,888.7 1.1% Net Debt : 9,357.7bn equivalents
* KT Rental’s borrowings 1.9tn Debt 22,576.7 21,713.8 4.0% 22,576.7 21,985.2 2.7% won excluded Borrowings 11,267.0 11,747.3 -4.1% 11,267.0 12,815.4 -12.1%
Equity 12,041.9 12,603.7 -4.5% 12,041.9 11,790.3 2.1%
Capital Stock 1,564.5 1,564.5 0.0% 1,564.5 1,564.5 0.0%
Debt Ratio Net Debt 9,357.7 10,052.6 -6.9% 9,357.7 10,926.7 -14.4%
Debt to Equity : 187.5% Debt/Equity 187.5% 172.3% 15.2%p 187.5% 186.5% 1.0%p Net Debt to Equity Net Debt/Equity 77.7% 79.8% -2.1%p 77.7% 92.7% -15.0%p
—93.7%(KT Rental included)
188.3% 186.1% 186.5% 187.5% 161.4% 170.9% 172.3%
—77.7%(KT Rental excluded)
91.3% 91.3% 92.7%
Debt/Equity 71.0% 73.2% 79.8% 77.7%
KT Rental assets/liabilities reclassified as ‘Disposable Net Debt/Equity
Assets/Liabilities’ as of 1Q15.
2012 2013 1Q 14 2Q 14 3Q 14 4Q 14 1Q15
4
K-IFRS / KT Separate
1-3 Financial Highlights
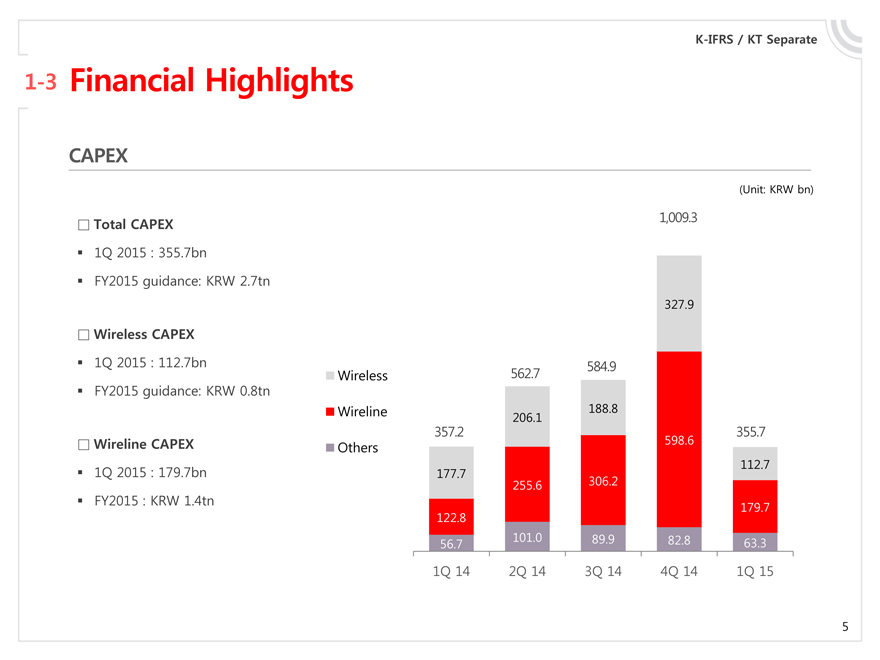
CAPEX
(Unit: KRW bn)
Total CAPEX 1,009.3
1Q 2015 : 355.7bn
FY2015 guidance: KRW 2.7tn
327.9
Wireless CAPEX
1Q 2015 : 112.7bn 584.9 Wireless 562.7 ? FY2015 guidance: KRW 0.8tn Wireline 188.8
206.1
357.2 355.7
Wireline CAPEX Others 598.6
112.7
1Q 2015 : 179.7bn 177.7
255.6 306.2
FY2015 : KRW 1.4tn 179.7
122.8
101.0 89.9 82.8
56.7 63.3
1Q 14 2Q 14 3Q 14 4Q 14 1Q 15
5
1 Financial Highlights
2 Business Overview
3 Q&A
4 Appendix
6
K-IFRS / Consolidated
2-1 Business Overview
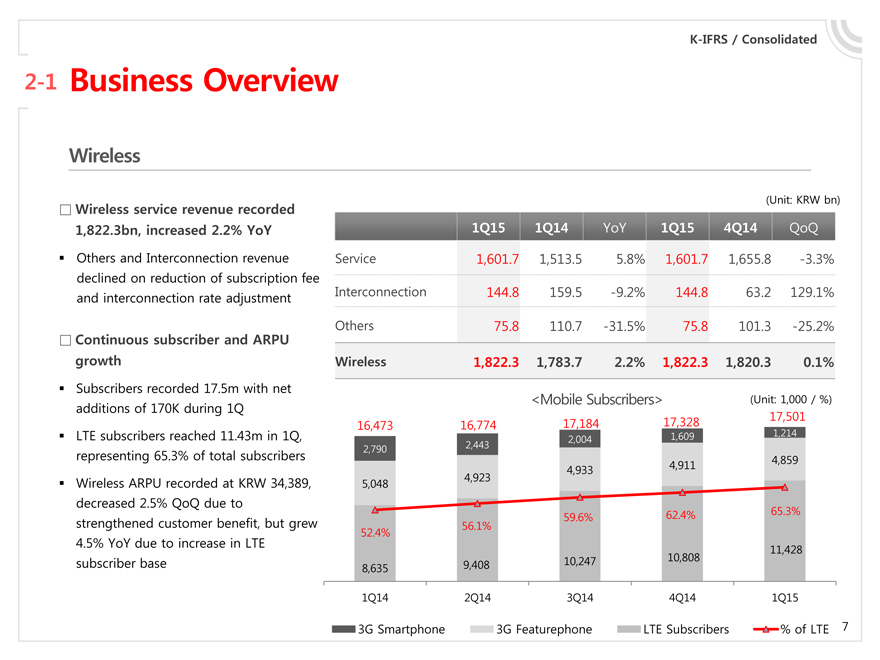
Wireless
(Unit: KRW bn)
Wireless service revenue recorded
1,822.3bn, increased 2.2% YoY 1Q15 1Q14 YoY 1Q15 4Q14 QoQ
Others and Interconnection revenue Service 1,601.7 1,513.5 5.8% 1,601.7 1,655.8 -3.3% declined on reduction of subscription fee Interconnection 144.8 159.5 -9.2% 144.8 63.2 129.1% and interconnection rate adjustment Others
75.8 110.7 -31.5% 75.8 101.3 -25.2%
Continuous subscriber and ARPU growth Wireless 1,822.3 1,783.7 2.2% 1,822.3 1,820.3 0.1%
Subscribers recorded 17.5m with net
<Mobile Subscribers> (Unit: 1,000 / %) additions of 170K during 1Q
17,328 17,501 16,473 16,774 17,184
LTE subscribers reached 11.43m in 1Q, 1,609 1,214
2,004 2,790 2,443
representing 65.3% of total subscribers 4,859
4,923 4,933 4,911
Wireless ARPU recorded at KRW 34,389, 5,048 decreased 2.5% QoQ due to
62.4% 65.3% strengthened customer benefit, but grew 59.6%
56.1% 52.4%
4.5% YoY due to increase in LTE 11,428 subscriber base 10,247 10,808
8,635 9,408
1Q14 2Q14 3Q14 4Q14 1Q15
3G Smartphone 3G Featurephone LTE Subscribers % of LTE
7
K-IFRS / Consolidated
2-2 Business Overview
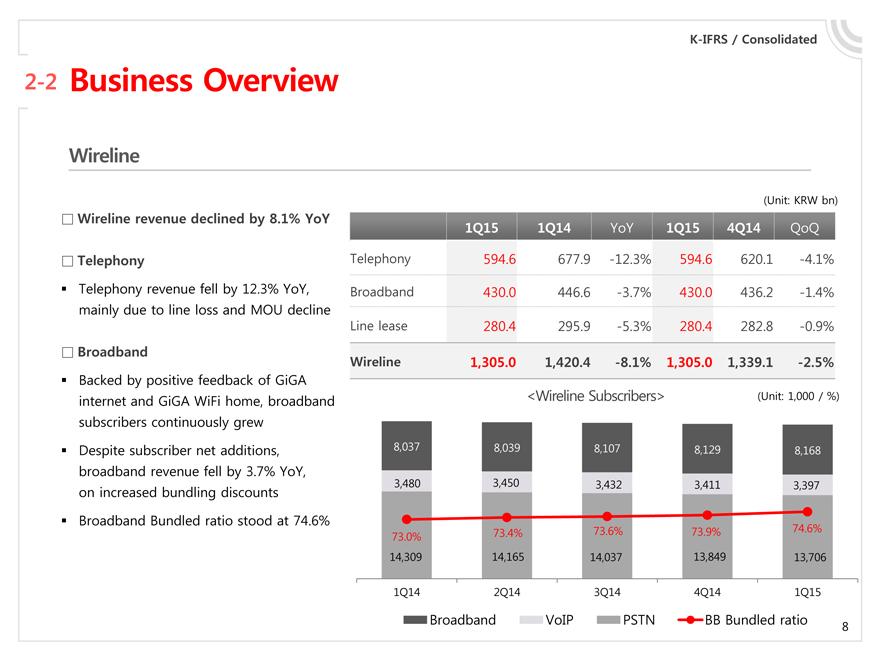
Wireline
(Unit: KRW bn)
Wireline revenue declined by 8.1% YoY
1Q15 1Q14 YoY 1Q15 4Q14 QoQ
Telephony Telephony 594.6 677.9 -12.3% 594.6 620.1 -4.1%? Telephony revenue fell by 12.3% YoY, Broadband 430.0 446.6 -3.7% 430.0 436.2 -1.4% mainly due to line loss and MOU decline Line lease 280.4 295.9 -5.3% 280.4 282.8 -0.9%
Broadband
Wireline 1,305.0 1,420.4 -8.1% 1,305.0 1,339.1 -2.5%
Backed by positive feedback of GiGA internet and GiGA WiFi home, broadband <Wireline Subscribers> (Unit: 1,000 / %) subscribers continuously grew ? Despite subscriber net additions, 8,037 8,039 8,107 8,129 8,168 broadband revenue fell by 3.7% YoY,
3,480 3,450 3,432 3,411 3,397
on increased bundling discounts
Broadband Bundled ratio stood at 74.6%
73.4% 73.6% 73.9% 74.6%
73.0%
14,309 14,165 14,037 13,849 13,706
1Q14 2Q14 3Q14 4Q14 1Q15
Broadband VoIP PSTN BB Bundled ratio
8
K-IFRS / Consolidated
2-3 Business Overview
Media / Contents
(Unit: KRW bn)
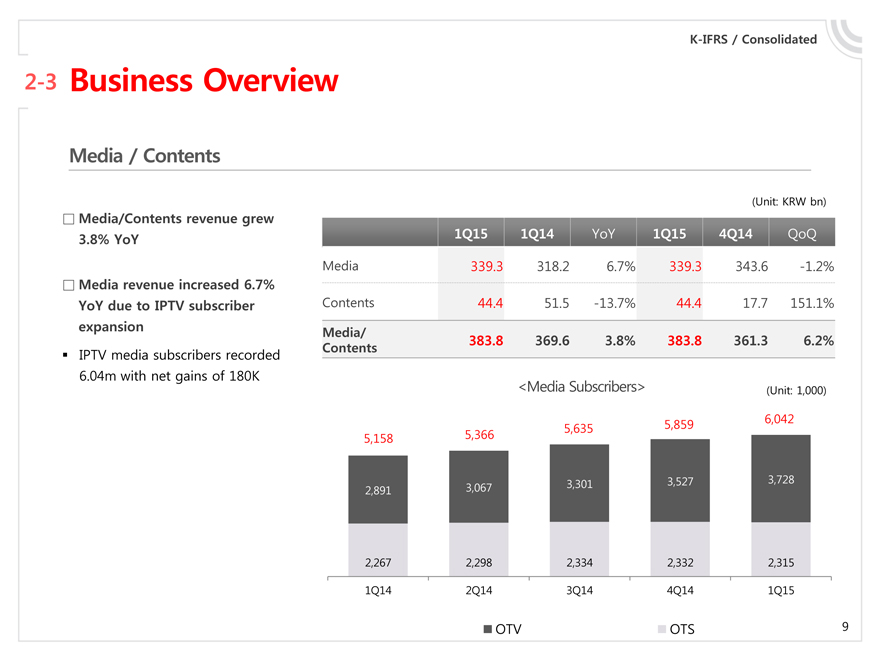
Media/Contents revenue grew 1Q15 1Q14 YoY 1Q15 4Q14 QoQ
3.8% YoY
Media 339.3 318.2 6.7% 339.3 343.6 -1.2%
Media revenue increased 6.7%
YoY due to IPTV subscriber Contents 44.4 51.5 -13.7% 44.4 17.7 151.1% expansion Media/ 383.8 369.6 3.8% 383.8 361.3 6.2%
Contents
IPTV media subscribers recorded
6.04m with net gains of 180K
<Media Subscribers> (Unit: 1,000)
5,859 6,042 5,366 5,635 5,158
3,301 3,527 3,728 2,891 3,067
2,267 2,298 2,334 2,332 2,315
1Q14 2Q14 3Q14 4Q14 1Q15
OTV OTS
9
K-IFRS / Consolidated
2-4 Business Overview
Finance
(Unit: KRW bn)
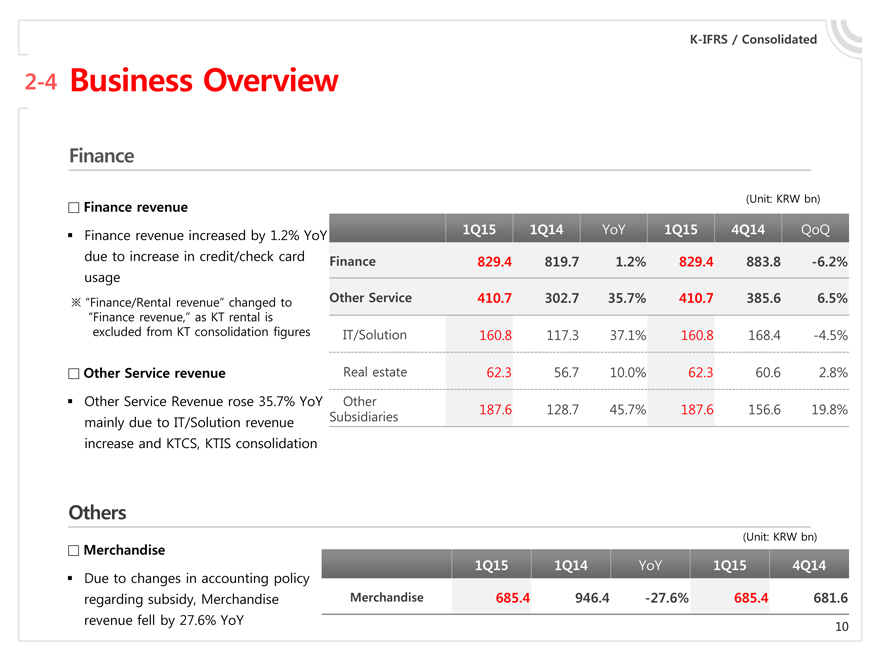
Finance revenue
Finance revenue increased by 1.2% YoY 1Q15 1Q14 YoY 1Q15 4Q14 QoQ due to increase in credit/check card Finance 829.4 819.7 1.2% 829.4 883.8 -6.2% usage
“Finance/Rental revenue” changed to Other Service 410.7 302.7 35.7% 410.7 385.6 6.5%
“Finance revenue,” as KT rental is excluded from KT consolidation figures IT/Solution 160.8 117.3 37.1% 160.8 168.4 -4.5%
Other Service revenue Real estate 62.3 56.7 10.0% 62.3 60.6 2.8%? Other Service Revenue rose 35.7% YoY Other 187.6 128.7 45.7% 187.6 156.6 19.8% mainly due to IT/Solution revenue Subsidiaries increase and KTCS, KTIS consolidation
Others
(Unit: KRW bn)
Merchandise
1Q15 1Q14 YoY 1Q15 4Q14
Due to changes in accounting policy regarding subsidy, Merchandise Merchandise 685.4 946.4 -27.6% 685.4 681.6 revenue fell by 27.6% YoY
10
K-IFRS / Consolidated
2-5 Business Overview
Operating Expenses
(Unit: KRW bn)
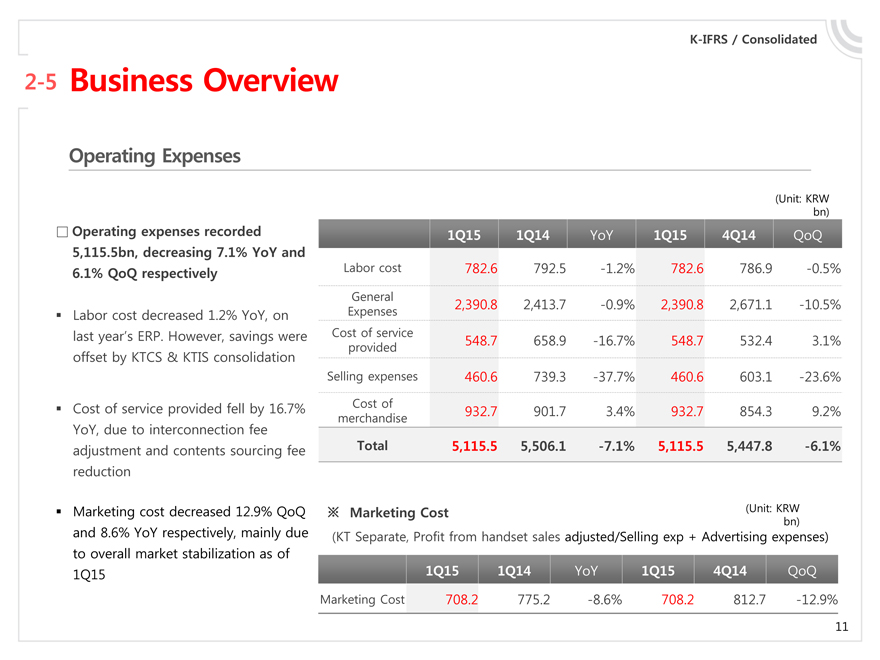
Operating expenses recorded 1Q15 1Q14 YoY 1Q15 4Q14 QoQ 5,115.5bn, decreasing 7.1% YoY and
6.1% QoQ respectively Labor cost 782.6 792.5 -1.2% 782.6 786.9 -0.5%
General
Expenses 2,390.8 2,413.7 -0.9% 2,390.8 2,671.1 -10.5% Labor cost decreased 1.2% YoY, on last year’s ERP. However, savings were Cost of service provided 548.7 658.9 -16.7% 548.7 532.4 3.1% offset by KTCS & KTIS consolidation Selling expenses 460.6 739.3 -37.7% 460.6 603.1 -23.6% Cost of service provided fell by 16.7% Cost of merchandise 932.7 901.7 3.4% 932.7 854.3 9.2% YoY, due to interconnection fee adjustment and contents sourcing fee Total 5,115.5 5,506.1 -7.1% 5,115.5 5,447.8 -6.1% reduction
Marketing cost decreased 12.9% QoQ Marketing Cost (Unit: KRW
bn) and 8.6% YoY respectively, mainly due (KT Separate, Profit from handset sales adjusted/Selling exp + Advertising expenses) to overall market stabilization as of
1Q15 1Q15 1Q14 YoY 1Q15 4Q14 QoQ Marketing Cost 708.2 775.2 -8.6% 708.2 812.7 -12.9%
11
1 Financial Highlights
2 Business Overview
3 Q&A
4 Appendix
12
1 Financial Highlights
2 Business Overview
3 Q&A
4 Appendix
13
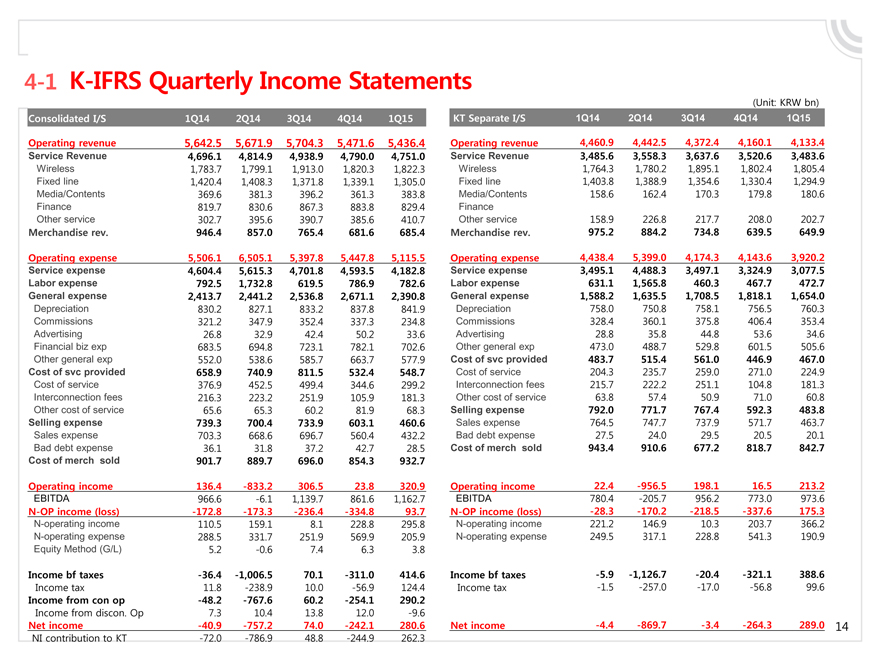
4-1 K-IFRS Quarterly Income Statements
(Unit: KRW bn)
Consolidated I/S 1Q14 2Q14 3Q14 4Q14 1Q15 KT Separate I/S 1Q14 2Q14 3Q14 4Q14 1Q15 Operating revenue 5,642.5 5,671.9 5,704.3 5,471.6 5,436.4 Operating revenue 4,460.9 4,442.5 4,372.4 4,160.1 4,133.4 Service Revenue 4,696.1 4,814.9 4,938.9 4,790.0 4,751.0 Service Revenue 3,485.6 3,558.3 3,637.6 3,520.6 3,483.6
Wireless 1,783.7 1,799.1 1,913.0 1,820.3 1,822.3 Wireless 1,764.3 1,780.2 1,895.1 1,802.4 1,805.4 Fixed line 1,420.4 1,408.3 1,371.8 1,339.1 1,305.0 Fixed line 1,403.8 1,388.9 1,354.6 1,330.4 1,294.9 Media/Contents 369.6 381.3 396.2 361.3 383.8 Media/Contents 158.6 162.4 170.3 179.8 180.6 Finance 819.7 830.6 867.3 883.8 829.4 Finance Other service 302.7 395.6 390.7 385.6 410.7 Other service 158.9 226.8 217.7 208.0 202.7
Merchandise rev. 946.4 857.0 765.4 681.6 685.4 Merchandise rev. 975.2 884.2 734.8 639.5 649.9
Operating expense 5,506.1 6,505.1 5,397.8 5,447.8 5,115.5 Operating expense 4,438.4 5,399.0 4,174.3 4,143.6 3,920.2 Service expense 4,604.4 5,615.3 4,701.8 4,593.5 4,182.8 Service expense 3,495.1 4,488.3 3,497.1 3,324.9 3,077.5 Labor expense 792.5 1,732.8 619.5 786.9 782.6 Labor expense 631.1 1,565.8 460.3 467.7 472.7 General expense 2,413.7 2,441.2 2,536.8 2,671.1 2,390.8 General expense 1,588.2 1,635.5 1,708.5 1,818.1 1,654.0
Depreciation 830.2 827.1 833.2 837.8 841.9 Depreciation 758.0 750.8 758.1 756.5 760.3 Commissions 321.2 347.9 352.4 337.3 234.8 Commissions 328.4 360.1 375.8 406.4 353.4 Advertising 26.8 32.9 42.4 50.2 33.6 Advertising 28.8 35.8 44.8 53.6 34.6
Financial biz exp 683.5 694.8 723.1 782.1 702.6 Other general exp 473.0 488.7 529.8 601.5 505.6
Other general exp 552.0 538.6 585.7 663.7 577.9 Cost of svc provided 483.7 515.4 561.0 446.9 467.0
Cost of svc provided 658.9 740.9 811.5 532.4 548.7 Cost of service 204.3 235.7 259.0 271.0 224.9
Cost of service 376.9 452.5 499.4 344.6 299.2 Interconnection fees 215.7 222.2 251.1 104.8 181.3 Interconnection fees 216.3 223.2 251.9 105.9 181.3 Other cost of service 63.8 57.4 50.9 71.0 60.8
Other cost of service 65.6 65.3 60.2 81.9 68.3 Selling expense 792.0 771.7 767.4 592.3 483.8 Selling expense 739.3 700.4 733.9 603.1 460.6 Sales expense 764.5 747.7 737.9 571.7 463.7
Sales expense 703.3 668.6 696.7 560.4 432.2 Bad debt expense 27.5 24.0 29.5 20.5 20.1
Bad debt expense 36.1 31.8 37.2 42.7 28.5 Cost of merch sold 943.4 910.6 677.2 818.7 842.7 Cost of merch sold 901.7 889.7 696.0 854.3 932.7
Operating income 136.4 -833.2 306.5 23.8 320.9 Operating income 22.4 -956.5 198.1 16.5 213.2
EBITDA 966.6 -6.1 1,139.7 861.6 1,162.7 EBITDA 780.4 -205.7 956.2 773.0 973.6
N-OP income (loss) -172.8 -173.3 -236.4 -334.8 93.7 N-OP income (loss) -28.3 -170.2 -218.5 -337.6 175.3
N-operating income 110.5 159.1 8.1 228.8 295.8 N-operating income 221.2 146.9 10.3 203.7 366.2 N-operating expense 288.5 331.7 251.9 569.9 205.9 N-operating expense 249.5 317.1 228.8 541.3 190.9 Equity Method (G/L) 5.2 -0.6 7.4 6.3 3.8
Income bf taxes -36.4 -1,006.5 70.1 -311.0 414.6 Income bf taxes -5.9 -1,126.7 -20.4 -321.1 388.6
Income tax 11.8 -238.9 10.0 -56.9 124.4 Income tax -1.5 -257.0 -17.0 -56.8 99.6
Income from con op -48.2 -767.6 60.2 -254.1 290.2
Income from discon. Op 7.3 10.4 13.8 12.0 -9.6
Net income -40.9 -757.2 74.0 -242.1 280.6 Net income -4.4 -869.7 -3.4 -264.3 289.0
NI contribution to KT -72.0 -786.9 48.8 -244.9 262.3
14
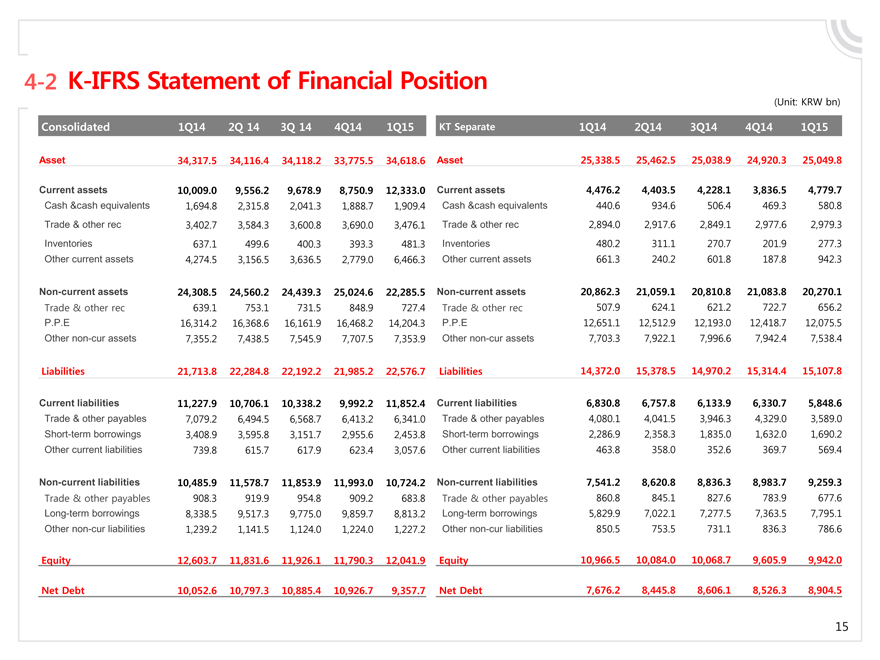
4-2 K-IFRS Statement of Financial Position
(Unit: KRW bn)
Consolidated 1Q14 2Q 14 3Q 14 4Q14 1Q15 KT Separate 1Q14 2Q14 3Q14 4Q14 1Q15
Asset 34,317.5 34,116.4 34,118.2 33,775.5 34,618.6 Asset 25,338.5 25,462.5 25,038.9 24,920.3 25,049.8
Current assets 10,009.0 9,556.2 9,678.9 8,750.9 12,333.0 Current assets 4,476.2 4,403.5 4,228.1 3,836.5 4,779.7
Cash &cash equivalents 1,694.8 2,315.8 2,041.3 1,888.7 1,909.4 Cash &cash equivalents 440.6 934.6 506.4 469.3 580.8
Trade & other rec 3,402.7 3,584.3 3,600.8 3,690.0 3,476.1 Trade & other rec 2,894.0 2,917.6 2,849.1 2,977.6 2,979.3 Inventories 637.1 499.6 400.3 393.3 481.3 Inventories 480.2 311.1 270.7 201.9 277.3 Other current assets 4,274.5 3,156.5 3,636.5 2,779.0 6,466.3 Other current assets 661.3 240.2 601.8 187.8 942.3
Non-current assets 24,308.5 24,560.2 24,439.3 25,024.6 22,285.5 Non-current assets 20,862.3 21,059.1 20,810.8 21,083.8 20,270.1
Trade & other rec 639.1 753.1 731.5 848.9 727.4 Trade & other rec 507.9 624.1 621.2 722.7 656.2 P.P.E 16,314.2 16,368.6 16,161.9 16,468.2 14,204.3 P.P.E 12,651.1 12,512.9 12,193.0 12,418.7 12,075.5 Other non-cur assets 7,355.2 7,438.5 7,545.9 7,707.5 7,353.9 Other non-cur assets 7,703.3 7,922.1 7,996.6 7,942.4 7,538.4
Liabilities 21,713.8 22,284.8 22,192.2 21,985.2 22,576.7 Liabilities 14,372.0 15,378.5 14,970.2 15,314.4 15,107.8
Current liabilities 11,227.9 10,706.1 10,338.2 9,992.2 11,852.4 Current liabilities 6,830.8 6,757.8 6,133.9 6,330.7 5,848.6
Trade & other payables 7,079.2 6,494.5 6,568.7 6,413.2 6,341.0 Trade & other payables 4,080.1 4,041.5 3,946.3 4,329.0 3,589.0 Short-term borrowings 3,408.9 3,595.8 3,151.7 2,955.6 2,453.8 Short-term borrowings 2,286.9 2,358.3 1,835.0 1,632.0 1,690.2 Other current liabilities 739.8 615.7 617.9 623.4 3,057.6 Other current liabilities 463.8 358.0 352.6 369.7 569.4
Non-current liabilities 10,485.9 11,578.7 11,853.9 11,993.0 10,724.2 Non-current liabilities 7,541.2 8,620.8 8,836.3 8,983.7 9,259.3
Trade & other payables 908.3 919.9 954.8 909.2 683.8 Trade & other payables 860.8 845.1 827.6 783.9 677.6
Long-term borrowings 8,338.5 9,517.3 9,775.0 9,859.7 8,813.2 Long-term borrowings 5,829.9 7,022.1 7,277.5 7,363.5 7,795.1
Other non-cur liabilities 1,239.2 1,141.5 1,124.0 1,224.0 1,227.2 Other non-cur liabilities 850.5 753.5 731.1 836.3 786.6
Equity 12,603.7 11,831.6 11,926.1 11,790.3 12,041.9 Equity 10,966.5 10,084.0 10,068.7 9,605.9 9,942.0
Net Debt 10,052.6 10,797.3 10,885.4 10,926.7 9,357.7 Net Debt 7,676.2 8,445.8 8,606.1 8,526.3 8,904.5
15
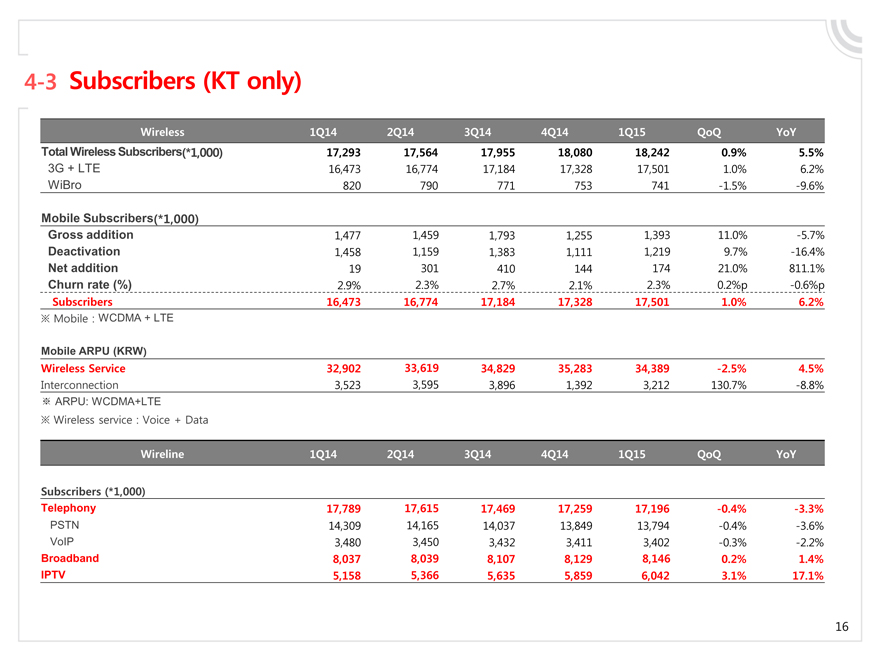
4-3 Subscribers (KT only)
Wireless 1Q14 2Q14 3Q14 4Q14 1Q15 QoQ YoY Total Wireless Subscribers(*1,000) 17,293 17,564 17,955 18,080 18,242 0.9% 5.5%
3G + LTE 16,473 16,774 17,184 17,328 17,501 1.0% 6.2% WiBro 820 790 771 753 741 -1.5% -9.6%
Mobile Subscribers(*1,000)
Gross addition 1,477 1,459 1,793 1,255 1,393 11.0% -5.7% Deactivation 1,458 1,159 1,383 1,111 1,219 9.7% -16.4% Net addition 19 301 410 144 174 21.0% 811.1% Churn rate (%) 2.9% 2.3% 2.7% 2.1% 2.3% 0.2%p -0.6%p
Subscribers 16,473 16,774 17,184 17,328 17,501 1.0% 6.2%
Mobile : WCDMA + LTE
Mobile ARPU (KRW)
Wireless Service 32,902 33,619 34,829 35,283 34,389 -2.5% 4.5%
Interconnection 3,523 3,595 3,896 1,392 3,212 130.7% -8.8%
ARPU: WCDMA+LTE
Wireless service : Voice + Data
Wireline 1Q14 2Q14 3Q14 4Q14 1Q15 QoQ YoY
Subscribers (*1,000)
Telephony 17,789 17,615 17,469 17,259 17,196 -0.4% -3.3%
PSTN 14,309 14,165 14,037 13,849 13,794 -0.4% -3.6% VoIP 3,480 3,450 3,432 3,411 3,402 -0.3% -2.2%
Broadband 8,037 8,039 8,107 8,129 8,146 0.2% 1.4% IPTV 5,158 5,366 5,635 5,859 6,042 3.1% 17.1%
16

Thanks you