SECURITIES AND EXCHANGE COMMISSION
Washington, D.C. 20549
Form 6-K
REPORT OF FOREIGN PRIVATE ISSUER
PURSUANT TO RULE 13a-16 OR 15d-16 OF
THE SECURITIES EXCHANGE ACT OF 1934
For the month of July 2015
Commission File Number 1-14926
KT Corporation
(Translation of registrant’s name into English)
KT Gwanghwamun Building East
33, Jongno 3-gil, Jongno-gu
110-130 Seoul, Korea
(Address of principal executive offices)
Indicate by check mark whether the registrant files or will file annual reports under cover of Form 20-F orForm 40-F:
Form 20-F x Form 40-F ¨
Indicate by check mark if the registrant is submitting the Form 6-K in paper as permitted by Regulation S-T Rule 101(b)(1): ¨
Indicate by check mark if the registrant is submitting the Form 6-K in paper as permitted by Regulation S-T Rule 101(b)(7): ¨
Indicate by check mark whether by furnishing the information contained in this Form, the registrant is also thereby furnishing the information to the Commission pursuant to Rule 12g3-2(b) under the Securities Exchange Act of 1934.
Yes ¨ No x
If “Yes” is marked, indicate below the file number assigned to the registrant in connection with Rule 12g3-2(b): 82-
SIGNATURES
Pursuant to the requirements of the Securities Exchange Act of 1934, the registrant has duly caused this report to be signed on its behalf by the undersigned, thereunto duly authorized.
| Dated: July 31, 2015 | ||
| KT Corporation | ||
| By: | /s/ Youngwoo Kim | |
| Name: Youngwoo Kim | ||
| Title: Vice President | ||
| By: | /s/ Jungsup Jung | |
| Name: Jungsup Jung | ||
| Title: Director | ||
2015 2Q Preliminary Earnings Release
We hereby announce our 2015 2Q preliminary earnings.
Attachment: 2015 2Q Earnings Release

KT 2Q15
Earnings Release
Investor Relations 2015.7.31
Disclaimer
This presentation has been prepared by KT Corp. (“the Company”). This presentation contains forward-looking statements, which are subject to risks, uncertainties, and assumptions. This presentation is being presented solely for your information and is subject to change without notice. No representation or warranty, expressed or implied, is made and no reliance should be placed on the accuracy, actuality, fairness, or completeness of the information presented.
Please be informed that items included in our operating income have been prepared in accordance with K-IFRS 1001 released on October 17, 2012, which was revised to coincide with the Korean Accounting Standards for Non-Public Entities (“KAS-NPEs”). As such, our disposal gains from real estates and others have been excluded from our operating income.
The Company, its affiliates or representatives accept no liability whatsoever for any losses arising from any information contained in the presentation. This presentation does not constitute an offer or invitation to purchase or subscribe for any shares of the Company, and no part of this presentation shall form the Basis of or be relied upon in connection with any contract or commitment.
Any decision to purchase shares of the Company should be made solely on the Basis of information, which has been publicly filed with the Securities and Exchange Commission or the Korea Stock Exchange and distributed to all investors.
The contents of this presentation may not be reproduced, redistributed or passed on, directly or indirectly, to any other person or published, in whole or in part, for any purpose.
If you have any related questions to this material, please contact IR department. Tel : 82-2-3495-3557, 3558, 3564, 5529, 5343, 5344 Fax : 82-2-3495-5917
1
Contents
1 Financial Highlights
2 Business Overview
3 Q&A
4 Appendix
2

K-IFRS / Consolidated | ||||||||||||||||
1-1 Financial Highlights | ||||||||||||||||
Income Statement | ||||||||||||||||
(Unit: KRW bn) | ||||||||||||||||
2Q15 | 2Q14 | YoY | 2Q15 | 1Q15 | QoQ | |||||||||||
? Operating revenue 5,431.3bn | ||||||||||||||||
(YoY) -3.6% / (QoQ) 0.6% | Operating | 5,431.3 | 5,633.6 | -3.6% | 5,431.3 | 5,398.7 | 0.6% | |||||||||
ü Service revenue 4,826.5bn | Service | 4,826.5 | 4,776.6 | 1.0% | 4,826.5 | 4,713.3 | 2.4% | |||||||||
(YoY) 1.0% / (QoQ) 2.4% | Merchandise | 604.9 | 857.0 | -29.4% | 604.9 | 685.4 | -11.7% | |||||||||
? Operating income 368.8bn | Operating | 5,062.5 | 6,471.5 | -21.8% | 5,062.5 | 5,085.1 | -0.4% | |||||||||
ü (YoY)TB / (QoQ) 17.6% | Operating | 368.8 | -837.9 | TB | 368.8 | 313.6 | 17.6% | |||||||||
Margin (%) | 6.8% | -14.9% | 21.7%p | 6.8% | 5.8% | 1.0%p | ||||||||||
? Net income 321.8bn | Non-operating | |||||||||||||||
ü (YoY)TB / (QoQ) 14.7% | (loss) | -171.1 | -174.6 | -2.0% | -171.1 | 93.2 | -283.6% | |||||||||
Income | 197.7 | -1,012.5 | TB | 197.7 | 406.7 | -51.4% | ||||||||||
? EBITDA 1,205.6bn | ||||||||||||||||
ü (YoY)TB / (QoQ) 4.4% | Net income | 321.8 | -757.2 | TB | 321.8 | 280.6 | 14.7% | |||||||||
Margin (%) | 5.9% | -13.4% | 19.3%p | 5.9% | 5.2% | 0.7%p | ||||||||||
EBITDA | 1,205.6 | -11.2 | TB | 1,205.6 | 1,154.9 | 4.4% | ||||||||||
Margin (%) | 22.2% | -0.2% | 22.4%p | 22.2% | 21.4% | 0.8%p | ||||||||||
? With disposal contract completed, profit of KT rental and KT Capital reclassified as “Profit from Discontinued Operations” | ||||||||||||||||
? Reclassification retroactively applied to 2014 figures | 3 | |||||||||||||||
K-IFRS / Consolidated | ||||||||||||||||||
1-2 | Financial Highlights | |||||||||||||||||
Financial Position | ||||||||||||||||||
(Unit: KRW bn) | ||||||||||||||||||
2Q15 | 2Q14 | YoY | 2Q15 | 1Q15 | QoQ | |||||||||||||
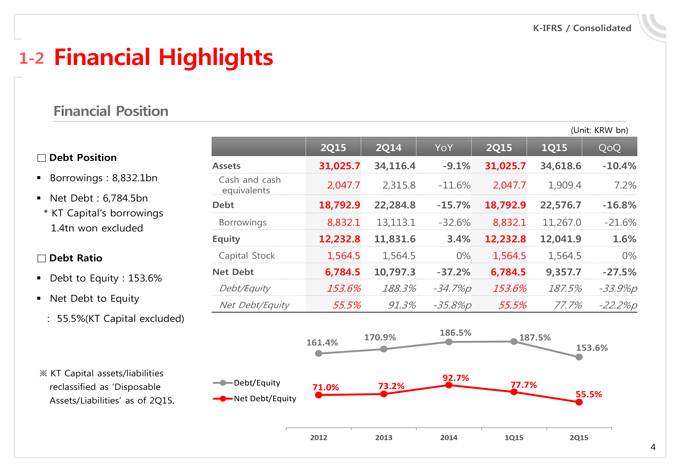
? Debt Position | ||||||||||||||||||
Assets | 31,025.7 | 34,116.4 | -9.1% | 31,025.7 | 34,618.6 | -10.4% | ||||||||||||
¡ | Borrowings | Cash and | 2,047.7 | 2,315.8 | -11.6% | 2,047.7 | 1,909.4 | 7.2% | ||||||||||
equivalents | ||||||||||||||||||
¡ | Net Debt : | Debt | 18,792.9 | 22,284.8 | -15.7% | 18,792.9 | 22,576.7 | -16.8% | ||||||||||
* KT Capital’s borrowings | ||||||||||||||||||
1.4tn won | Borrowings | 8,832.1 | 13,113.1 | -32.6% | 8,832.1 | 11,267.0 | -21.6% | |||||||||||
Equity | 12,232.8 | 11,831.6 | 3.4% | 12,232.8 | 12,041.9 | 1.6% | ||||||||||||
? Debt Ratio | Capital | 1,564.5 | 1,564.5 | 0% | 1,564.5 | 1,564.5 | 0% | |||||||||||
¡ | Debt to | Net Debt | 6,784.5 | 10,797.3 | -37.2% | 6,784.5 | 9,357.7 | -27.5% | ||||||||||
Debt/Equity | 153.6% | 188.3% | -34.7%p | 153.6% | 187.5% | -33.9%p | ||||||||||||
¡ | Net Debt to | Net Debt/ | 55.5% | 91.3% | -35.8%p | 55.5% | 77.7% | -22.2%p | ||||||||||
: | 55.5%(KT | |||||||||||||||||
186.5% | ||||||||||||||||||
161.4% | 170.9% | 187.5% | ||||||||||||||||
153.6% | ||||||||||||||||||
? KT Capital assets/liabilities | 92.7% | |||||||||||||||||
reclassified | Debt/ | 71.0% | 73.2% | 77.7% | ||||||||||||||
Assets/ | Net Debt/ | 55.5% | ||||||||||||||||
2012 | 2013 | 2014 | 1Q15 | 2Q15 | ||||||||||||||
4 | ||||||||||||||||||
K-IFRS | ||||||||||||||||||
1-3 | Financial Highlights | |||||||||||||||||
CAPEX | ||||||||||||||||||
(Unit: | ||||||||||||||||||
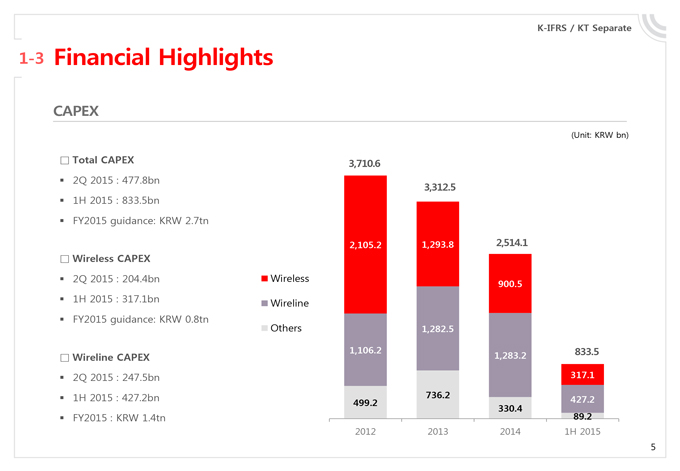
? Total CAPEX | 3,710.6 | |||||||||||||||||
¡ | 2Q 2015 | 3,312.5 | ||||||||||||||||
¡ | 1H 2015 | |||||||||||||||||
¡ | FY2015 | 2.7tn | ||||||||||||||||
2,105.2 | 1,293.8 | 2,514.1 | ||||||||||||||||
? Wireless CAPEX | ||||||||||||||||||
¡ | 2Q 2015 | Wireless | 900.5 | |||||||||||||||
¡ | 1H 2015 | Wireline | ||||||||||||||||
¡ | FY2015 | 0.8tn | ||||||||||||||||
Others | 1,282.5 | |||||||||||||||||
? Wireline CAPEX | 1,106.2 | 1,283.2 | 833.5 | |||||||||||||||
¡ | 2Q 2015 | 317.1 | ||||||||||||||||
¡ | 1H 2015 | 499.2 | 736.2 | 427.2 | ||||||||||||||
330.4 | ||||||||||||||||||
¡ | FY2015 : | 89.2 | ||||||||||||||||
2012 | 2013 | 2014 | 1H | |||||||||||||||
5 | ||||||||||||||||||
1 Financial Highlights
2 Business Overview
3 Q&A
4 Appendix
6
K-IFRS / Consolidated | ||||||||||||||||||||
2-1 | Business Overview | |||||||||||||||||||
Wireless | ||||||||||||||||||||
(Unit: KRW bn) | ||||||||||||||||||||
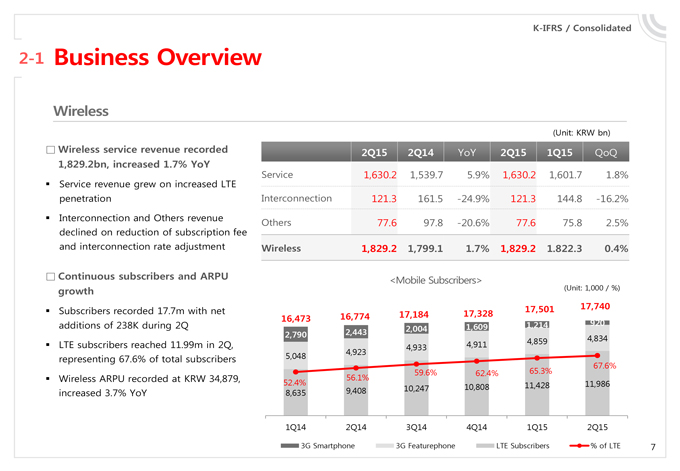
? Wireless service revenue recorded | 2Q15 | 2Q14 | YoY | 2Q15 | 1Q15 | QoQ | ||||||||||||||
1,829.2bn, increased 1.7% YoY | ||||||||||||||||||||
Service | 1,630.2 | 1,539.7 | 5.9% | 1,630.2 | 1,601.7 | 1.8% | ||||||||||||||
¡ | Service | |||||||||||||||||||
penetration | Interconnection | 121.3 | 161.5 | -24.9% | 121.3 | 144.8 | -16.2% | |||||||||||||
¡ | Interconnection | Others | 77.6 | 97.8 | -20.6% | 77.6 | 75.8 | 2.5% | ||||||||||||
declined on reduction of subscription feeand interconnection rate adjustment | Wireless | 1,829.2 | 1,799.1 | 1.7% | 1,829.2 | 1.822.3 | 0.4% | |||||||||||||
? Continuous subscribers and ARPU | <Mobile Subscribers> | |||||||||||||||||||
growth | (Unit: 1,000 / %) | |||||||||||||||||||
¡ | Subscribers | 16,473 | 16,774 | 17,184 | 17,328 | 17,501 | 17,740 | |||||||||||||
additions of 238K during 2Q | 2,004 | 1,609 | 1,214 | 920 | ||||||||||||||||
2,790 | 2,443 | |||||||||||||||||||
¡ | LTE | 4,933 | 4,911 | 4,859 | 4,834 | |||||||||||||||
representing 67.6% of total subscribers | 5,048 | 4,923 | ||||||||||||||||||
67.6% | ||||||||||||||||||||
¡ | Wireless | 52.4% | 56.1% | 59.6% | 62.4% | 65.3% | ||||||||||||||
increased 3.7% YoY | 8,635 | 9,408 | 10,247 | 10,808 | 11,428 | 11,986 | ||||||||||||||
1Q14 | 2Q14 | 3Q14 | 4Q14 | 1Q15 | 2Q15 | |||||||||||||||
3G Smartphone | 3G Featurephone | LTE Subscribers | % of | 7 | ||||||||||||||||
K-IFRS / Consolidated | ||||||||||||||||||
2-2 | Business | |||||||||||||||||
Wireline | ||||||||||||||||||
(Unit: KRW bn) | ||||||||||||||||||
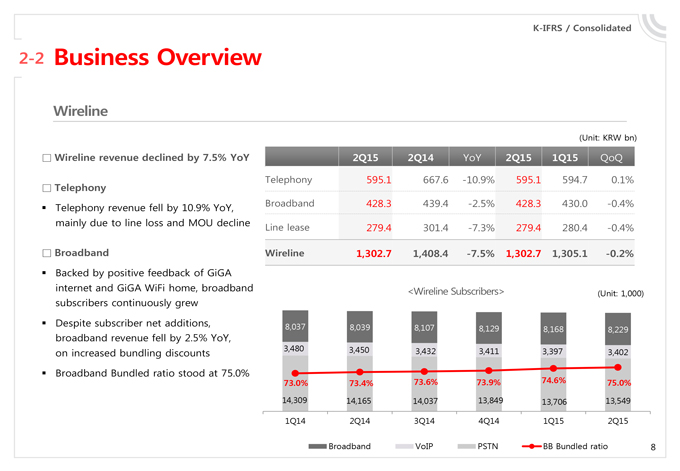
? Wireline revenue declined by 7.5% YoY | 2Q15 | 2Q14 | YoY | 2Q15 | 1Q15 | QoQ | ||||||||||||
? Telephony | Telephony | 595.1 | 667.6 | -10.9% | 595.1 | 594.7 | 0.1% | |||||||||||
¡ | Telephony | Broadband | 428.3 | 439.4 | -2.5% | 428.3 | 430.0 | -0.4% | ||||||||||
mainly due to line loss and MOU decline | Line lease | 279.4 | 301.4 | -7.3% | 279.4 | 280.4 | -0.4% | |||||||||||
? Broadband | Wireline | 1,302.7 | 1,408.4 | -7.5% | 1,302.7 | 1,305.1 | -0.2% | |||||||||||
¡ | Backed by | |||||||||||||||||
internet and GiGA WiFi home, broadband | <Wireline Subscribers> | (Unit: | ||||||||||||||||
subscribers continuously grew | ||||||||||||||||||
¡ | Despite | 8,037 | 8,039 | 8,107 | 8,129 | 8,168 | 8,229 | |||||||||||
broadband revenue fell by 2.5% YoY,on increased bundling discounts | 3,480 | 3,450 | 3,432 | 3,411 | 3,397 | 3,402 | ||||||||||||
¡ | Broadband | |||||||||||||||||
73.0% | 73.4% | 73.6% | 73.9% | 74.6% | 75.0% | |||||||||||||
14,309 | 14,165 | 14,037 | 13,849 | 13,706 | 13,549 | |||||||||||||
1Q14 | 2Q14 | 3Q14 | 4Q14 | 1Q15 | 2Q15 | |||||||||||||
Broadband | VoIP | PSTN | BB Bundled ratio | 8 | ||||||||||||||
K-IFRS / Consolidated | ||||||||||||||||
2-3 | Business | |||||||||||||||
Media / Contents | ||||||||||||||||
(Unit: KRW bn) | ||||||||||||||||
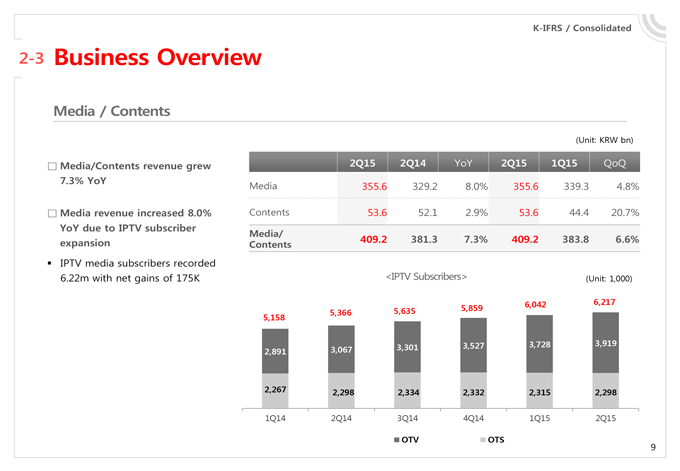
? Media/Contents revenue grew | 2Q15 | 2Q14 | YoY | 2Q15 | 1Q15 | QoQ | ||||||||||
7.3% YoY | Media | 355.6 | 329.2 | 8.0% | 355.6 | 339.3 | 4.8% | |||||||||
? Media revenue increased 8.0% | Contents | 53.6 | 52.1 | 2.9% | 53.6 | 44.4 | 20.7% | |||||||||
YoY due to IPTV subscriber | Media/ | |||||||||||||||
expansion | Contents | 409.2 | 381.3 | 7.3% | 409.2 | 383.8 | 6.6% | |||||||||
¡ IPTV media subscribers recorded | ||||||||||||||||
6.22m with net gains of 175K | <IPTV Subscribers> | (Unit:1,000) | ||||||||||||||
5,366 | 5,635 | 5,859 | 6,042 | 6,217 | ||||||||||||
5,158 | ||||||||||||||||
2,891 | 3,067 | 3,301 | 3,527 | 3,728 | 3,919 | |||||||||||
2,267 | 2,298 | 2,334 | 2,332 | 2,315 | 2,298 | |||||||||||
1Q14 | 2Q14 | 3Q14 | 4Q14 | 1Q15 | 2Q15 | |||||||||||
OTV | OTS | |||||||||||||||
9 | ||||||||||||||||
K-IFRS / Consolidated | ||||||||||||||||
2-4 Business Overview | ||||||||||||||||
Finance | ||||||||||||||||
(Unit: KRW bn) | ||||||||||||||||
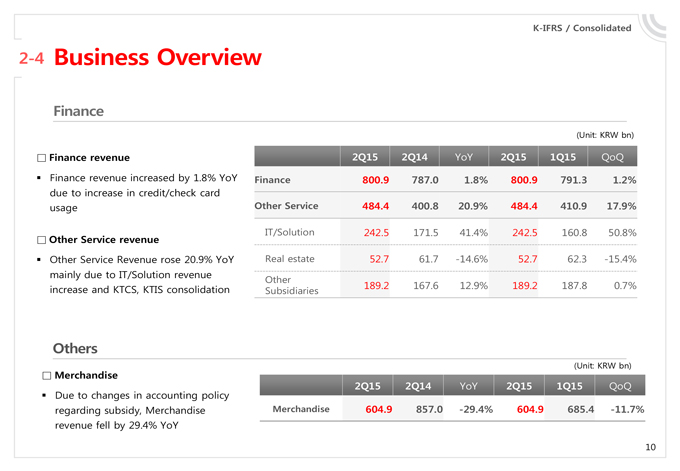
? Finance revenue | 2Q15 | 2Q14 | YoY | 2Q15 | 1Q15 | QoQ | ||||||||||
¡ Finance revenue increased by 1.8% YoY | Finance | 800.9 | 787.0 | 1.8% | 800.9 | 791.3 | 1.2% | |||||||||
due to increase in credit/check cardusage | Other | 484.4 | 400.8 | 20.9% | 484.4 | 410.9 | 17.9% | |||||||||
? Other Service revenue | IT/Solution | 242.5 | 171.5 | 41.4% | 242.5 | 160.8 | 50.8% | |||||||||
¡ Other Service Revenue rose 20.9% YoY | Real estate | 52.7 | 61.7 | -14.6% | 52.7 | 62.3 | -15.4% | |||||||||
mainly due to IT/Solution revenue | Other | |||||||||||||||
increase and KTCS, KTIS consolidation | Subsidiaries | 189.2 | 167.6 | 12.9% | 189.2 | 187.8 | 0.7% | |||||||||
Others | ||||||||||||||||
(Unit: KRW bn) | ||||||||||||||||
? Merchandise | ||||||||||||||||
2Q15 | 2Q14 | YoY | 2Q15 | 1Q15 | QoQ | |||||||||||
¡ Due to changes in accounting policyregarding subsidy, Merchandise | Merchandise | 604.9 | 857.0 | -29.4% | 604.9 | 685.4 | -11.7% | |||||||||
revenue fell by 29.4% YoY | ||||||||||||||||
10 | ||||||||||||||||
K-IFRS / Consolidated | ||||||||||||||||
2-5 | Business Overview | |||||||||||||||
Operating Expenses | ||||||||||||||||
(Unit: KRW bn) | ||||||||||||||||
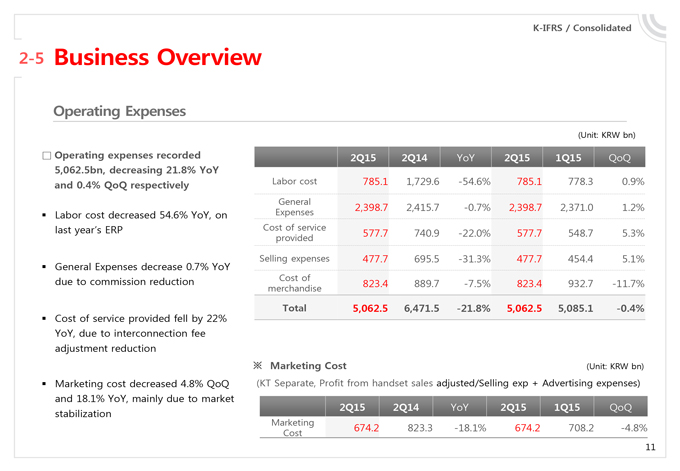
? Operating expenses recorded | 2Q15 | 2Q14 | YoY | 2Q15 | 1Q15 | QoQ | ||||||||||
5,062.5bn, decreasing 21.8% YoY | ||||||||||||||||
and 0.4% | Labor cost | 785.1 | 1,729.6 | -54.6% | 785.1 | 778.3 | 0.9% | |||||||||
General | ||||||||||||||||
¡ | Labor cost | Expenses | 2,398.7 | 2,415.7 | -0.7% | 2,398.7 | 2,371.0 | 1.2% | ||||||||
last year’s | Cost | 577.7 | 740.9 | -22.0% | 577.7 | 548.7 | 5.3% | |||||||||
¡ | General | Selling | 477.7 | 695.5 | -31.3% | 477.7 | 454.4 | 5.1% | ||||||||
due to | merchandise | 823.4 | 889.7 | -7.5% | 823.4 | 932.7 | -11.7% | |||||||||
Total | 5,062.5 | 6,471.5 | -21.8% | 5,062.5 | 5,085.1 | -0.4% | ||||||||||
¡ | Cost of | |||||||||||||||
YoY, due to interconnection feeadjustment reduction | ||||||||||||||||
? Marketing Cost | (Unit:KRWbn) | |||||||||||||||
¡ | Marketing | (KT Separate, Profit from handset sales adjusted/Selling exp + Advertising expenses) | ||||||||||||||
and 18.1% YoY, mainly due to marketstabilization | 2Q15 | 2Q14 | YoY | 2Q15 | 1Q15 | QoQ | ||||||||||
Marketing | 674.2 | 823.3 | -18.1% | 674.2 | 708.2 | -4.8% | ||||||||||
Cost | ||||||||||||||||
11 | ||||||||||||||||
1 Financial Highlights
2 Business Overview
3 Q&A
4 Appendix
12
1 Financial Highlights
2 Business Overview
3 Q&A
4 Appendix
13
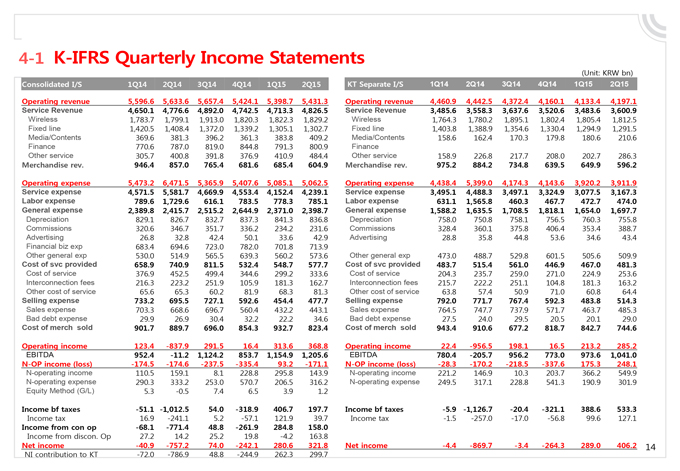
4-1 K-IFRS Quarterly Income Statements | ||||||||||||||||||||||||||||
(Unit: KRW bn) | ||||||||||||||||||||||||||||
Consolidated I/S | 1Q14 | 2Q14 | 3Q14 | 4Q14 | 1Q15 | 2Q15 | KT Separate I/ | 1Q14 | 2Q14 | 3Q14 | 4Q14 | 1Q15 | 2Q15 | |||||||||||||||
Operating revenue | 5,596.6 | 5,633.6 | 5,657.4 | 5,424.1 | 5,398.7 | 5,431.3 | Operating | 4,460.9 | 4,442.5 | 4,372.4 | 4,160.1 | 4,133.4 | 4,197.1 | |||||||||||||||
Service Revenue | 4,650.1 | 4,776.6 | 4,892.0 | 4,742.5 | 4,713.3 | 4,826.5 | Service | 3,485.6 | 3,558.3 | 3,637.6 | 3,520.6 | 3,483.6 | 3,600.9 | |||||||||||||||
Wireless | 1,783.7 | 1,799.1 | 1,913.0 | 1,820.3 | 1,822.3 | 1,829.2 | Wireless | 1,764.3 | 1,780.2 | 1,895.1 | 1,802.4 | 1,805.4 | 1,812.5 | |||||||||||||||
Fixed line | 1,420.5 | 1,408.4 | 1,372.0 | 1,339.2 | 1,305.1 | 1,302.7 | Fixed line | 1,403.8 | 1,388.9 | 1,354.6 | 1,330.4 | 1,294.9 | 1,291.5 | |||||||||||||||
Media/Contents | 369.6 | 381.3 | 396.2 | 361.3 | 383.8 | 409.2 | Media/ | 158.6 | 162.4 | 170.3 | 179.8 | 180.6 | 210.6 | |||||||||||||||
Finance | 770.6 | 787.0 | 819.0 | 844.8 | 791.3 | 800.9 | Finance | |||||||||||||||||||||
Other service | 305.7 | 400.8 | 391.8 | 376.9 | 410.9 | 484.4 | Other service | 158.9 | 226.8 | 217.7 | 208.0 | 202.7 | 286.3 | |||||||||||||||
Merchandise rev. | 946.4 | 857.0 | 765.4 | 681.6 | 685.4 | 604.9 | Merchandise | 975.2 | 884.2 | 734.8 | 639.5 | 649.9 | 596.2 | |||||||||||||||
Operating expense | 5,473.2 | 6,471.5 | 5,365.9 | 5,407.6 | 5,085.1 | 5,062.5 | Operating | 4,438.4 | 5,399.0 | 4,174.3 | 4,143.6 | 3,920.2 | 3,911.9 | |||||||||||||||
Service expense | 4,571.5 | 5,581.7 | 4,669.9 | 4,553.4 | 4,152.4 | 4,239.1 | Service | 3,495.1 | 4,488.3 | 3,497.1 | 3,324.9 | 3,077.5 | 3,167.3 | |||||||||||||||
Labor expense | 789.6 | 1,729.6 | 616.1 | 783.5 | 778.3 | 785.1 | Labor expense | 631.1 | 1,565.8 | 460.3 | 467.7 | 472.7 | 474.0 | |||||||||||||||
General expense | 2,389.8 | 2,415.7 | 2,515.2 | 2,644.9 | 2,371.0 | 2,398.7 | General | 1,588.2 | 1,635.5 | 1,708.5 | 1,818.1 | 1,654.0 | 1,697.7 | |||||||||||||||
Depreciation | 829.1 | 826.7 | 832.7 | 837.3 | 841.3 | 836.8 | Depreciation | 758.0 | 750.8 | 758.1 | 756.5 | 760.3 | 755.8 | |||||||||||||||
Commissions | 320.6 | 346.7 | 351.7 | 336.2 | 234.2 | 231.6 | Commissions | 328.4 | 360.1 | 375.8 | 406.4 | 353.4 | 388.7 | |||||||||||||||
Advertising | 26.8 | 32.8 | 42.4 | 50.1 | 33.6 | 42.9 | Advertising | 28.8 | 35.8 | 44.8 | 53.6 | 34.6 | 43.4 | |||||||||||||||
Financial biz exp | 683.4 | 694.6 | 723.0 | 782.0 | 701.8 | 713.9 | ||||||||||||||||||||||
Other general exp | 530.0 | 514.9 | 565.5 | 639.3 | 560.2 | 573.6 | Other general | 473.0 | 488.7 | 529.8 | 601.5 | 505.6 | 509.9 | |||||||||||||||
Cost of svc provided | 658.9 | 740.9 | 811.5 | 532.4 | 548.7 | 577.7 | Cost of svc | 483.7 | 515.4 | 561.0 | 446.9 | 467.0 | 481.3 | |||||||||||||||
Cost of service | 376.9 | 452.5 | 499.4 | 344.6 | 299.2 | 333.6 | Cost of service | 204.3 | 235.7 | 259.0 | 271.0 | 224.9 | 253.6 | |||||||||||||||
Interconnection fees | 216.3 | 223.2 | 251.9 | 105.9 | 181.3 | 162.7 | Interconnection | 215.7 | 222.2 | 251.1 | 104.8 | 181.3 | 163.2 | |||||||||||||||
Other cost of service | 65.6 | 65.3 | 60.2 | 81.9 | 68.3 | 81.3 | Other cost of | 63.8 | 57.4 | 50.9 | 71.0 | 60.8 | 64.4 | |||||||||||||||
Selling expense | 733.2 | 695.5 | 727.1 | 592.6 | 454.4 | 477.7 | Selling | 792.0 | 771.7 | 767.4 | 592.3 | 483.8 | 514.3 | |||||||||||||||
Sales expense | 703.3 | 668.6 | 696.7 | 560.4 | 432.2 | 443.1 | Sales expense | 764.5 | 747.7 | 737.9 | 571.7 | 463.7 | 485.3 | |||||||||||||||
Bad debt expense | 29.9 | 26.9 | 30.4 | 32.2 | 22.2 | 34.6 | Bad debt | 27.5 | 24.0 | 29.5 | 20.5 | 20.1 | 29.0 | |||||||||||||||
Cost of merch sold | 901.7 | 889.7 | 696.0 | 854.3 | 932.7 | 823.4 | Cost of merch | 943.4 | 910.6 | 677.2 | 818.7 | 842.7 | 744.6 | |||||||||||||||
Operating income | 123.4 | -837.9 | 291.5 | 16.4 | 313.6 | 368.8 | Operating | 22.4 | -956.5 | 198.1 | 16.5 | 213.2 | 285.2 | |||||||||||||||
EBITDA | 952.4 | -11.2 | 1,124.2 | 853.7 | 1,154.9 | 1,205.6 | EBITDA | 780.4 | -205.7 | 956.2 | 773.0 | 973.6 | 1,041.0 | |||||||||||||||
N-OP income (loss) | -174.5 | -174.6 | -237.5 | -335.4 | 93.2 | -171.1 | N-OP income | -28.3 | -170.2 | -218.5 | -337.6 | 175.3 | 248.1 | |||||||||||||||
N-operating income | 110.5 | 159.1 | 8.1 | 228.8 | 295.8 | 143.9 | N-operating | 221.2 | 146.9 | 10.3 | 203.7 | 366.2 | 549.9 | |||||||||||||||
N-operating expense | 290.3 | 333.2 | 253.0 | 570.7 | 206.5 | 316.2 | N-operating | 249.5 | 317.1 | 228.8 | 541.3 | 190.9 | 301.9 | |||||||||||||||
Equity Method (G/L) | 5.3 | -0.5 | 7.4 | 6.5 | 3.9 | 1.2 | ||||||||||||||||||||||
Income bf taxes | -51.1 | -1,012.5 | 54.0 | -318.9 | 406.7 | 197.7 | Income bf | -5.9 | -1,126.7 | -20.4 | -321.1 | 388.6 | 533.3 | |||||||||||||||
Income tax | 16.9 | -241.1 | 5.2 | -57.1 | 121.9 | 39.7 | Income tax | -1.5 | -257.0 | -17.0 | -56.8 | 99.6 | 127.1 | |||||||||||||||
Income from con op | -68.1 | -771.4 | 48.8 | -261.9 | 284.8 | 158.0 | ||||||||||||||||||||||
Income from discon. Op | 27.2 | 14.2 | 25.2 | 19.8 | -4.2 | 163.8 | ||||||||||||||||||||||
Net income | -40.9 | -757.2 | 74.0 | -242.1 | 280.6 | 321.8 | Net income | -4.4 | -869.7 | -3.4 | -264.3 | 289.0 | 406.2 | 14 | ||||||||||||||
NI contribution to KT | -72.0 | -786.9 | 48.8 | -244.9 | 262.3 | 299.7 | ||||||||||||||||||||||
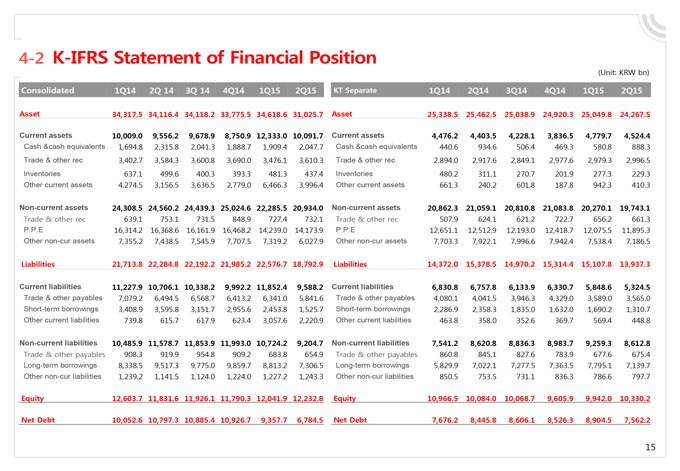
4-2 K-IFRS Statement of Financial Position | ||||||||||||||||||||||||||
(Unit: KRW bn) | ||||||||||||||||||||||||||
Consolidated | 1Q14 | 2Q 14 | 3Q 14 | 4Q14 | 1Q15 | 2Q15 | KT | 1Q14 | 2Q14 | 3Q14 | 4Q14 | 1Q15 | 2Q15 | |||||||||||||
Asset | 34,317.5 | 34,116.4 | 34,118.2 | 33,775.5 | 34,618.6 | 31,025.7 | Asset | 25,338.5 | 25,462.5 | 25,038.9 | 24,920.3 | 25,049.8 | 24,267.5 | |||||||||||||
Current assets | 10,009.0 | 9,556.2 | 9,678.9 | 8,750.9 | 12,333.0 | 10,091.7 | Current | 4,476.2 | 4,403.5 | 4,228.1 | 3,836.5 | 4,779.7 | 4,524.4 | |||||||||||||
Cash &cash equivalents | 1,694.8 | 2,315.8 | 2,041.3 | 1,888.7 | 1,909.4 | 2,047.7 | Cash &cash | 440.6 | 934.6 | 506.4 | 469.3 | 580.8 | 888.3 | |||||||||||||
Trade & other rec | 3,402.7 | 3,584.3 | 3,600.8 | 3,690.0 | 3,476.1 | 3,610.3 | Trade & | 2,894.0 | 2,917.6 | 2,849.1 | 2,977.6 | 2,979.3 | 2,996.5 | |||||||||||||
Inventories | 637.1 | 499.6 | 400.3 | 393.3 | 481.3 | 437.4 | Inventories | 480.2 | 311.1 | 270.7 | 201.9 | 277.3 | 229.3 | |||||||||||||
Other current assets | 4,274.5 | 3,156.5 | 3,636.5 | 2,779.0 | 6,466.3 | 3,996.4 | Other | 661.3 | 240.2 | 601.8 | 187.8 | 942.3 | 410.3 | |||||||||||||
Non-current assets | 24,308.5 | 24,560.2 | 24,439.3 | 25,024.6 | 22,285.5 | 20,934.0 | Non-current | 20,862.3 | 21,059.1 | 20,810.8 | 21,083.8 | 20,270.1 | 19,743.1 | |||||||||||||
Trade & other rec | 639.1 | 753.1 | 731.5 | 848.9 | 727.4 | 732.1 | Trade & | 507.9 | 624.1 | 621.2 | 722.7 | 656.2 | 661.3 | |||||||||||||
P.P.E | 16,314.2 | 16,368.6 | 16,161.9 | 16,468.2 | 14,239.0 | 14,173.9 | P.P.E | 12,651.1 | 12,512.9 | 12,193.0 | 12,418.7 | 12,075.5 | 11,895.3 | |||||||||||||
Other non-cur assets | 7,355.2 | 7,438.5 | 7,545.9 | 7,707.5 | 7,319.2 | 6,027.9 | Other non- | 7,703.3 | 7,922.1 | 7,996.6 | 7,942.4 | 7,538.4 | 7,186.5 | |||||||||||||
Liabilities | 21,713.8 | 22,284.8 | 22,192.2 | 21,985.2 | 22,576.7 | 18,792.9 | Liabilities | 14,372.0 | 15,378.5 | 14,970.2 | 15,314.4 | 15,107.8 | 13,937.3 | |||||||||||||
Current liabilities | 11,227.9 | 10,706.1 | 10,338.2 | 9,992.2 | 11,852.4 | 9,588.2 | Current | 6,830.8 | 6,757.8 | 6,133.9 | 6,330.7 | 5,848.6 | 5,324.5 | |||||||||||||
Trade & other payables | 7,079.2 | 6,494.5 | 6,568.7 | 6,413.2 | 6,341.0 | 5,841.6 | Trade & | 4,080.1 | 4,041.5 | 3,946.3 | 4,329.0 | 3,589.0 | 3,565.0 | |||||||||||||
Short-term borrowings | 3,408.9 | 3,595.8 | 3,151.7 | 2,955.6 | 2,453.8 | 1,525.7 | Short-term | 2,286.9 | 2,358.3 | 1,835.0 | 1,632.0 | 1,690.2 | 1,310.7 | |||||||||||||
Other current liabilities | 739.8 | 615.7 | 617.9 | 623.4 | 3,057.6 | 2,220.9 | Other | 463.8 | 358.0 | 352.6 | 369.7 | 569.4 | 448.8 | |||||||||||||
Non-current liabilities | 10,485.9 | 11,578.7 | 11,853.9 | 11,993.0 | 10,724.2 | 9,204.7 | Non-current | 7,541.2 | 8,620.8 | 8,836.3 | 8,983.7 | 9,259.3 | 8,612.8 | |||||||||||||
Trade & other payables | 908.3 | 919.9 | 954.8 | 909.2 | 683.8 | 654.9 | Trade & | 860.8 | 845.1 | 827.6 | 783.9 | 677.6 | 675.4 | |||||||||||||
Long-term borrowings | 8,338.5 | 9,517.3 | 9,775.0 | 9,859.7 | 8,813.2 | 7,306.5 | Long-term | 5,829.9 | 7,022.1 | 7,277.5 | 7,363.5 | 7,795.1 | 7,139.7 | |||||||||||||
Other non-cur liabilities | 1,239.2 | 1,141.5 | 1,124.0 | 1,224.0 | 1,227.2 | 1,243.3 | Other non- | 850.5 | 753.5 | 731.1 | 836.3 | 786.6 | 797.7 | |||||||||||||
Equity | 12,603.7 | 11,831.6 | 11,926.1 | 11,790.3 | 12,041.9 | 12,232.8 | Equity | 10,966.5 | 10,084.0 | 10,068.7 | 9,605.9 | 9,942.0 | 10,330.2 | |||||||||||||
Net Debt | 10,052.6 | 10,797.3 | 10,885.4 | 10,926.7 | 9,357.7 | 6,784.5 | Net Debt | 7,676.2 | 8,445.8 | 8,606.1 | 8,526.3 | 8,904.5 | 7,562.2 | |||||||||||||
15 | ||||||||||||||||||||||||||
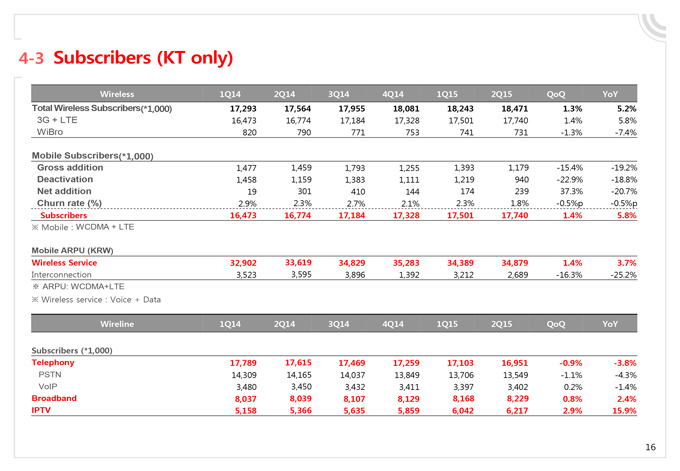
4-3 Subscribers (KT only) | ||||||||||||||||||
Wireless | 1Q14 | 2Q14 | 3Q14 | 4Q14 | 1Q15 | 2Q15 | QoQ | YoY | ||||||||||
Total Wireless Subscribers(*1,000) | 17,293 | 17,564 | 17,955 | 18,081 | 18,243 | 18,471 | 1.3% | 5.2% | ||||||||||
3G + LTE | 16,473 | 16,774 | 17,184 | 17,328 | 17,501 | 17,740 | 1.4% | 5.8% | ||||||||||
WiBro | 820 | 790 | 771 | 753 | 741 | 731 | -1.3% | -7.4% | ||||||||||
Mobile Subscribers(*1,000) | ||||||||||||||||||
Gross addition | 1,477 | 1,459 | 1,793 | 1,255 | 1,393 | 1,179 | -15.4% | -19.2% | ||||||||||
Deactivation | 1,458 | 1,159 | 1,383 | 1,111 | 1,219 | 940 | -22.9% | -18.8% | ||||||||||
Net addition | 19 | 301 | 410 | 144 | 174 | 239 | 37.3% | -20.7% | ||||||||||
Churn rate (%) | 2.9% | 2.3% | 2.7% | 2.1% | 2.3% | 1.8% | -0.5%p | -0.5%p | ||||||||||
Subscribers | 16,473 | 16,774 | 17,184 | 17,328 | 17,501 | 17,740 | 1.4% | 5.8% | ||||||||||
? Mobile : WCDMA + LTE | ||||||||||||||||||
Mobile ARPU (KRW) | ||||||||||||||||||
Wireless Service | 32,902 | 33,619 | 34,829 | 35,283 | 34,389 | 34,879 | 1.4% | 3.7% | ||||||||||
Interconnection | 3,523 | 3,595 | 3,896 | 1,392 | 3,212 | 2,689 | -16.3% | -25.2% | ||||||||||
? ARPU: WCDMA+LTE | ||||||||||||||||||
? Wireless service : Voice + Data | ||||||||||||||||||
Wireline | 1Q14 | 2Q14 | 3Q14 | 4Q14 | 1Q15 | 2Q15 | QoQ | YoY | ||||||||||
Subscribers (*1,000) | ||||||||||||||||||
Telephony | 17,789 | 17,615 | 17,469 | 17,259 | 17,103 | 16,951 | -0.9% | -3.8% | ||||||||||
PSTN | 14,309 | 14,165 | 14,037 | 13,849 | 13,706 | 13,549 | -1.1% | -4.3% | ||||||||||
VoIP | 3,480 | 3,450 | 3,432 | 3,411 | 3,397 | 3,402 | 0.2% | -1.4% | ||||||||||
Broadband | 8,037 | 8,039 | 8,107 | 8,129 | 8,168 | 8,229 | 0.8% | 2.4% | ||||||||||
IPTV | 5,158 | 5,366 | 5,635 | 5,859 | 6,042 | 6,217 | 2.9% | 15.9% | ||||||||||
16 | ||||||||||||||||||

Thank you
kt