SECURITIES AND EXCHANGE COMMISSION
Washington, D.C. 20549
Form 6-K
REPORT OF FOREIGN PRIVATE ISSUER
PURSUANT TO RULE 13a-16 OR 15d-16
OF THE SECURITIES EXCHANGE ACT OF 1934
For the month of October 2015
Commission File Number 1-14926
KT Corporation
(Translation of registrant’s name into English)
KT Gwanghwamun Building East
33, Jongno 3-gil, Jongno-gu
110-130 Seoul, Korea
(Address of principal executive offices)
Indicate by check mark whether the registrant files or will file annual reports under cover of Form 20-F or Form 40-F:
Form 20-F x Form 40-F ¨
Indicate by check mark if the registrant is submitting the Form 6-K in paper as permitted by Regulation S-T Rule 101(b)(1): ¨
Indicate by check mark if the registrant is submitting the Form 6-K in paper as permitted by Regulation S-T Rule 101(b)(7): ¨
Indicate by check mark whether by furnishing the information contained in this Form, the registrant is also thereby furnishing the information to the Commission pursuant to Rule 12g3-2(b) under the Securities Exchange Act of 1934.
Yes ¨ No x
If “Yes” is marked, indicate below the file number assigned to the registrant in connection with Rule 12g3-2(b): 82-
SIGNATURES
Pursuant to the requirements of the Securities Exchange Act of 1934, the registrant has duly caused this report to be signed on its behalf by the undersigned, thereunto duly authorized.
| Dated: | October 30, 2015 | |
| KT Corporation |
| By: | /s/ Youngwoo Kim | |
| Name: | Youngwoo Kim | |
| Title: | Vice President | |
| By: | /s/ Jungsup Jung | |
| Name: | Jungsup Jung | |
| Title: | Director | |
KT 3Q15
Earnings Release
Investor Relations 2015.10.30
Disclaimer
This presentation has been prepared by KT Corp. (“the Company”). This presentation contains forward-looking statements, which are subject to risks, uncertainties, and assumptions. This presentation is being presented solely for your information and is subject to change without notice. No representation or warranty, expressed or implied, is made and no reliance should be placed on the accuracy, actuality, fairness, or completeness of the information presented.
Please be informed that items included in our operating income have been prepared in accordance with K-IFRS 1001 released on October 17, 2012, which was revised to coincide with the Korean Accounting Standards for Non-Public Entities (“KAS-NPEs”). As such, our disposal gains from real estates and others have been excluded from our operating income.
The Company, its affiliates or representatives accept no liability whatsoever for any losses arising from any information contained in the presentation. This presentation does not constitute an offer or invitation to purchase or subscribe for any shares of the Company, and no part of this presentation shall form the Basis of or be relied upon in connection with any contract or commitment.
Any decision to purchase shares of the Company should be made solely on the Basis of information, which has been publicly filed with the Securities and Exchange Commission or the Korea Stock Exchange and distributed to all investors.
The contents of this presentation may not be reproduced, redistributed or passed on, directly or indirectly, to any other person or published, in whole or in part, for any purpose.
If you have any related questions to this material, please contact IR department. Tel : 82-2-3495-3557, 3558, 3564, 5529, 5343, 5344 Fax : 82-2-3495-5917

Contents
Financial Highlights
Business Overview
Q&A
Appendix
K-IFRS / Consolidated
1-1 Financial Highlights
Income Statement
(Unit: KRW bn)
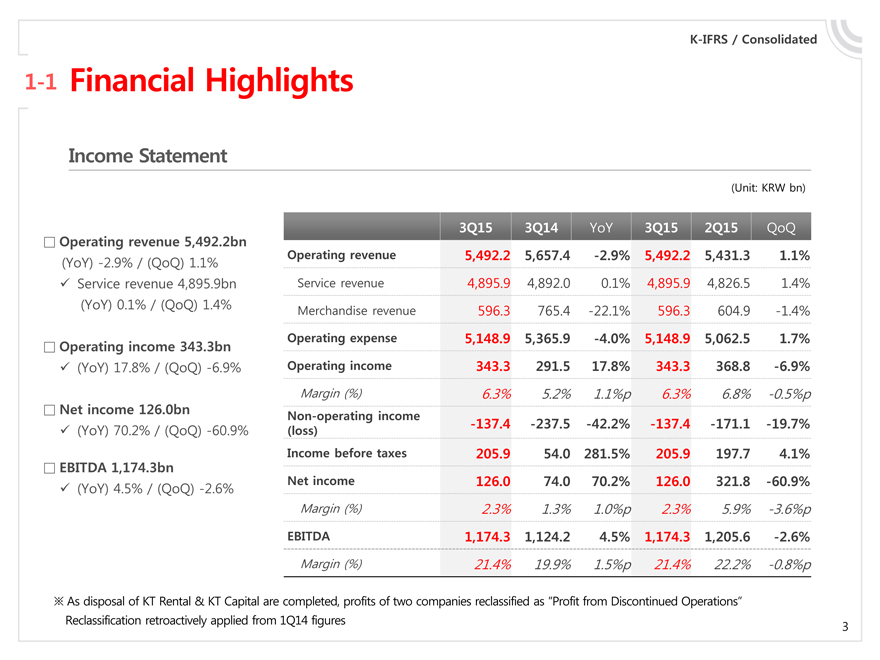
Operating revenue 5,492.2bn
(YoY) -2.9% / (QoQ) 1.1%
Service revenue 4,895.9bn (YoY) 0.1% / (QoQ) 1.4%
Operating income 343.3bn
(YoY) 17.8% / (QoQ) -6.9%
Net income 126.0bn
(YoY) 70.2% / (QoQ) -60.9%
EBITDA 1,174.3bn
(YoY) 4.5% / (QoQ) -2.6%
3Q15 3Q14 YoY 3Q15 2Q15 QoQ
Operating revenue 5,492.2 5,657.4 -2.9% 5,492.2 5,431.3 1.1%
Service revenue 4,895.9 4,892.0 0.1% 4,895.9 4,826.5 1.4%
Merchandise revenue 596.3 765.4 -22.1% 596.3 604.9 -1.4%
Operating expense 5,148.9 5,365.9 -4.0% 5,148.9 5,062.5 1.7%
Operating income 343.3 291.5 17.8% 343.3 368.8 -6.9%
Margin (%) 6.3% 5.2% 1.1%p 6.3% 6.8% -0.5%p
Non-operating income
(loss) -137.4 -237.5 -42.2% -137.4 -171.1 -19.7%
Income before taxes 205.9 54.0 281.5% 205.9 197.7 4.1%
Net income 126.0 74.0 70.2% 126.0 321.8 -60.9%
Margin (%) 2.3% 1.3% 1.0%p 2.3% 5.9% -3.6%p
EBITDA 1,174.3 1,124.2 4.5% 1,174.3 1,205.6 -2.6%
Margin (%) 21.4% 19.9% 1.5%p 21.4% 22.2% -0.8%p
As disposal of KT Rental & KT Capital are completed, profits of two companies reclassified as “Profit from Discontinued Operations”
Reclassification retroactively applied from 1Q14 figures
K-IFRS / Consolidated
1-2 Financial Highlights
Financial Position
(Unit: KRW bn)
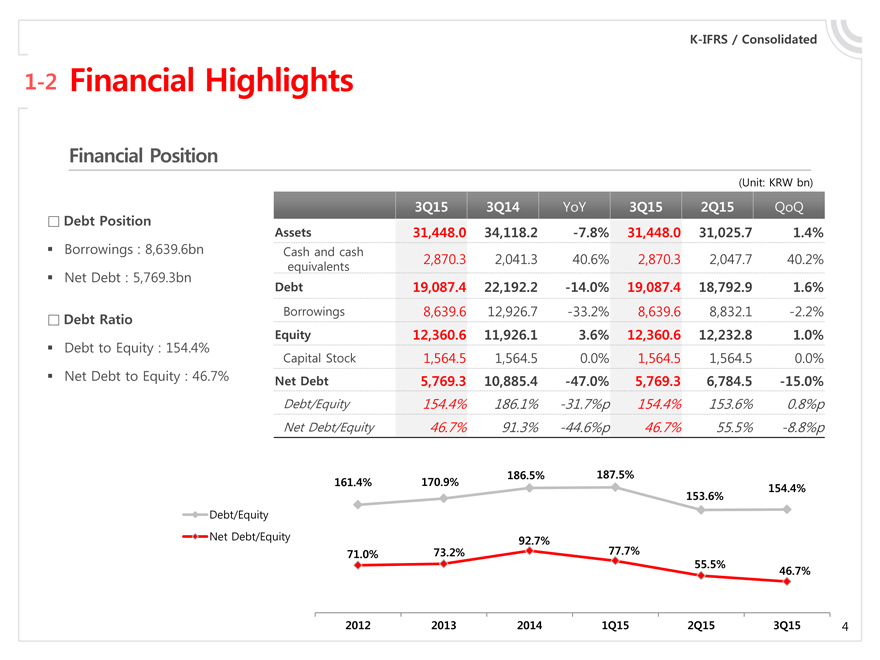
Debt Position
Borrowings : 8,639.6bn Net Debt : 5,769.3bn
Debt Ratio
Debt to Equity : 154.4% Net Debt to Equity : 46.7%
3Q15 3Q14 YoY 3Q15 2Q15 QoQ
Assets 31,448.0 34,118.2 -7.8% 31,448.0 31,025.7 1.4%
Cash and cash 2,870.3 2,041.3 40.6% 2,870.3 2,047.7 40.2%
equivalents
Debt 19,087.4 22,192.2 -14.0% 19,087.4 18,792.9 1.6%
Borrowings 8,639.6 12,926.7 -33.2% 8,639.6 8,832.1 -2.2%
Equity 12,360.6 11,926.1 3.6% 12,360.6 12,232.8 1.0%
Capital Stock 1,564.5 1,564.5 0.0% 1,564.5 1,564.5 0.0%
Net Debt 5,769.3 10,885.4 -47.0% 5,769.3 6,784.5 -15.0%
Debt/Equity 154.4% 186.1% -31.7%p 154.4% 153.6% 0.8%p
Net Debt/Equity 46.7% 91.3% -44.6%p 46.7% 55.5% -8.8%p
Debt/Equity Net Debt/Equity
186.5% 187.5%
161.4% 170.9% 154.4%
153.6%
92.7%
71.0% 73.2% 77.7%
55.5% 46.7%
2012 2013 2014 1Q15 2Q15 3Q15 4
| 4 |
K-IFRS / KT Separate
1-3 Financial Highlights
CAPEX
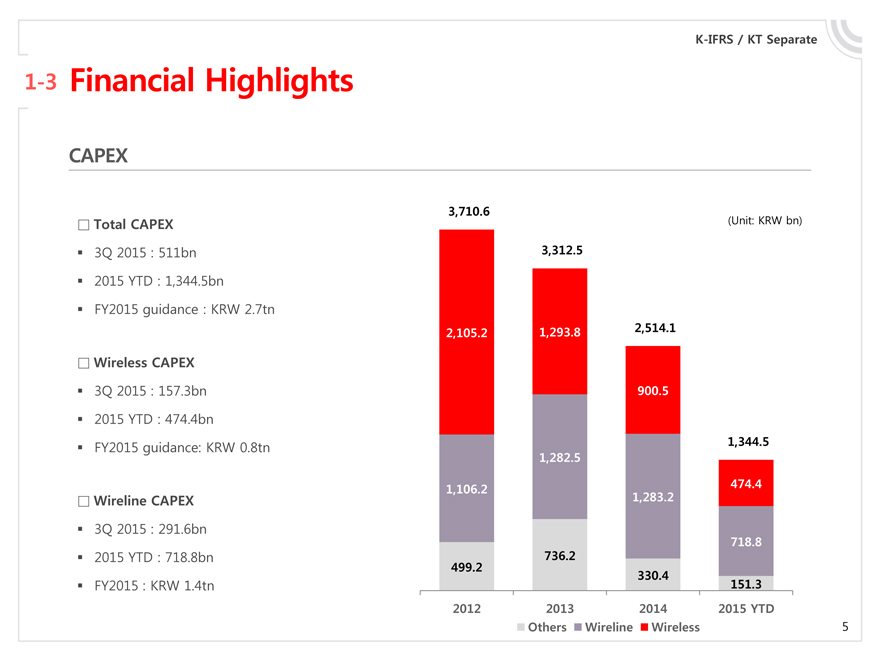
Total CAPEX
3Q 2015 : 511bn 2015 YTD : 1,344.5bn
FY2015 guidance : KRW 2.7tn
Wireless CAPEX
3Q 2015 : 157.3bn 2015 YTD : 474.4bn
FY2015 guidance: KRW 0.8tn
Wireline CAPEX
3Q 2015 : 291.6bn 2015 YTD : 718.8bn FY2015 : KRW 1.4tn
3,710.6 (Unit: KRW bn)
3,312.5
2,105.2 1,293.8 2,514.1
900.5
1,344.5
1,282.5
1,106.2 474.4
1,283.2
718.8
736.2
499.2 330.4
151.3
2012 2013 2014 2015 YTD
Others Wireline Wireless
5
| 1 | Financial Highlights |
| 2 | Business Overview |
| 3 | Q&A |
| 4 | Appendix |
| 6 |
K-IFRS / Consolidated
2-1 Business Overview
Wireless
(Unit: KRW bn)
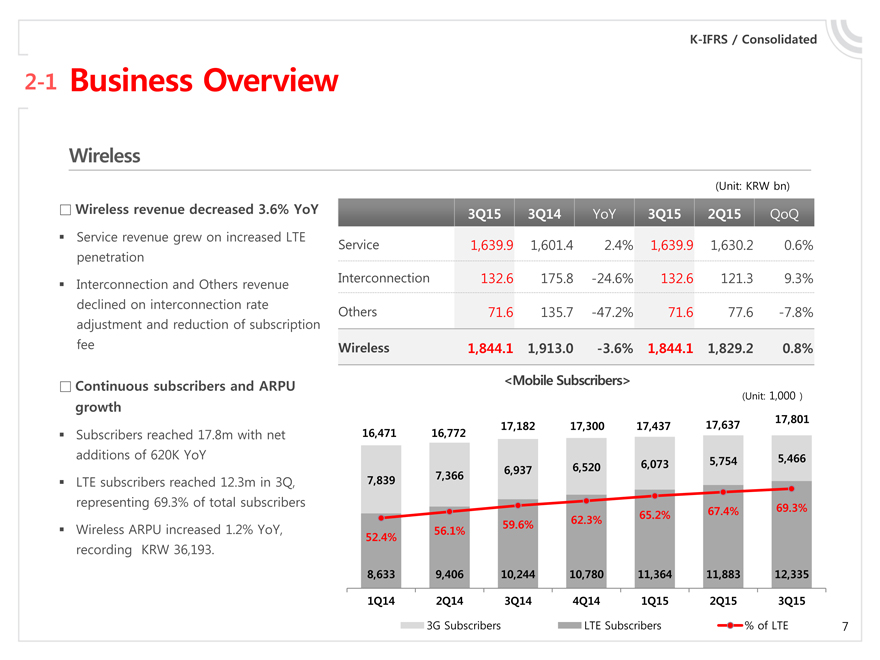
Wireless revenue decreased 3.6% YoY
Service revenue grew on increased LTE penetration Interconnection and Others revenue declined on interconnection rate adjustment and reduction of subscription fee
Continuous subscribers and ARPU growth
Subscribers reached 17.8m with net additions of 620K YoY
LTE subscribers reached 12.3m in 3Q, representing 69.3% of total subscribers Wireless ARPU increased 1.2% YoY, recording KRW 36,193.
3Q15 3Q14 YoY 3Q15 2Q15 QoQ
Service 1,639.9 1,601.4 2.4% 1,639.9 1,630.2 0.6% Interconnection 132.6 175.8 -24.6% 132.6 121.3 9.3% Others 71.6 135.7 -47.2% 71.6 77.6 -7.8%
Wireless 1,844.1 1,913.0 -3.6% 1,844.1 1,829.2 0.8% <Mobile Subscribers>
17,637 17,801
17,182 17,300 17,437 16,471 16,772
6,073 5,754 5,466 6,937 6,520 7,839 7,366 67.4% 69.3% 62.3% 65.2% 59.6%
56.1%
52.4%
8,633 9,406 10,244 10,780 11,364 11,883 12,335 1Q14 2Q14 3Q14 4Q14 1Q15 2Q15 3Q15
(Unit: 1,000 )
3G Subscribers LTE Subscribers % of LTE
7
K-IFRS / Consolidated
2-2 Business Overview
Wireline
(Unit: KRW bn)
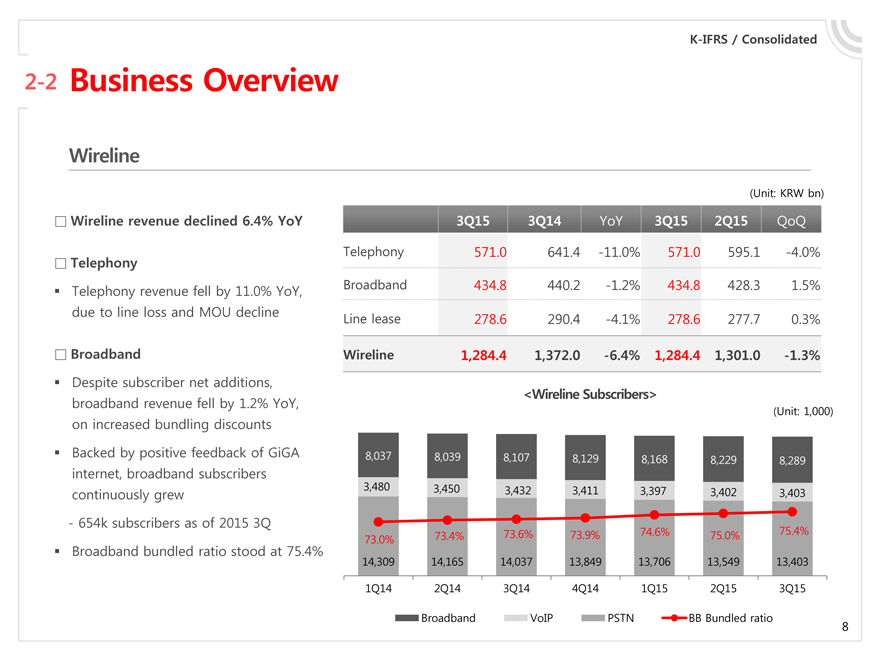
Wireline revenue declined 6.4% YoY
Telephony
Telephony revenue fell by 11.0% YoY, due to line loss and MOU decline
Broadband
Despite subscriber net additions, broadband revenue fell by 1.2% YoY, on increased bundling discounts Backed by positive feedback of GiGA internet, broadband subscribers continuously grew
- 654k subscribers as of 2015 3Q
Broadband bundled ratio stood at 75.4%
3Q15 3Q14 YoY 3Q15 2Q15 QoQ
Telephony 571.0 641.4 -11.0% 571.0 595.1 -4.0% Broadband 434.8 440.2 -1.2% 434.8 428.3 1.5% Line lease 278.6 290.4 -4.1% 278.6 277.7 0.3%
Wireline 1,284.4 1,372.0 -6.4% 1,284.4 1,301.0 -1.3%
<Wireline Subscribers>
(Unit: 1,000)
8,037 8,039 8,107 8,129 8,168 8,229 8,289 3,480 3,450 3,432 3,411 3,397 3,402 3,403
73.4% 73.6% 73.9% 74.6% 75.0% 75.4% 73.0% 14,309 14,165 14,037 13,849 13,706 13,549 13,403 1Q14 2Q14 3Q14 4Q14 1Q15 2Q15 3Q15
| 8 |
Broadband VoIP PSTN BB Bundled ratio
K-IFRS / Consolidated
2-3 Business Overview
Media / Contents
(Unit: KRW bn)
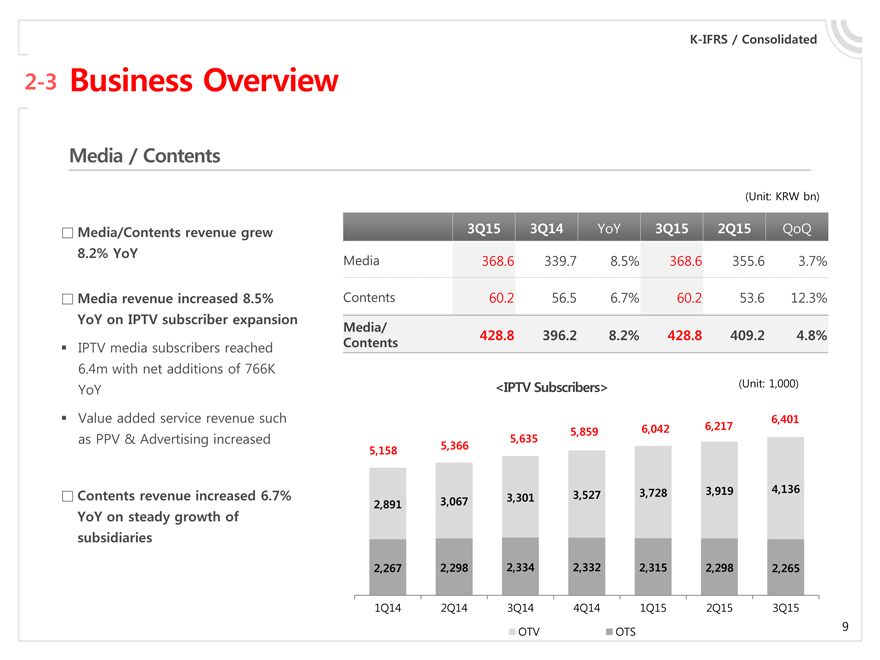
Media/Contents revenue grew 8.2% YoY
Media revenue increased 8.5% YoY on IPTV subscriber expansion
IPTV media subscribers reached 6.4m with net additions of 766K YoY
Value added service revenue such as PPV & Advertising increased
Contents revenue increased 6.7% YoY on steady growth of subsidiaries
3Q15 3Q14 YoY 3Q15 2Q15 QoQ
Media 368.6 339.7 8.5% 368.6 355.6 3.7%
Contents 60.2 56.5 6.7% 60.2 53.6 12.3%
Media/
Contents 428.8 396.2 8.2% 428.8 409.2 4.8%
<IPTV Subscribers> (Unit: 1,000)
6,401 5,635 5,859 6,042 6,217 5,158 5,366
3,527 3,728 3,919 4,136 3,067 3,301 2,891
2,267 2,298 2,334 2,332 2,315 2,298 2,265
1Q14 2Q14 3Q14 4Q14 1Q15 2Q15 3Q15
OTV OTS
K-IFRS / Consolidated
2-4 Business Overview
Finance
(Unit: KRW bn)
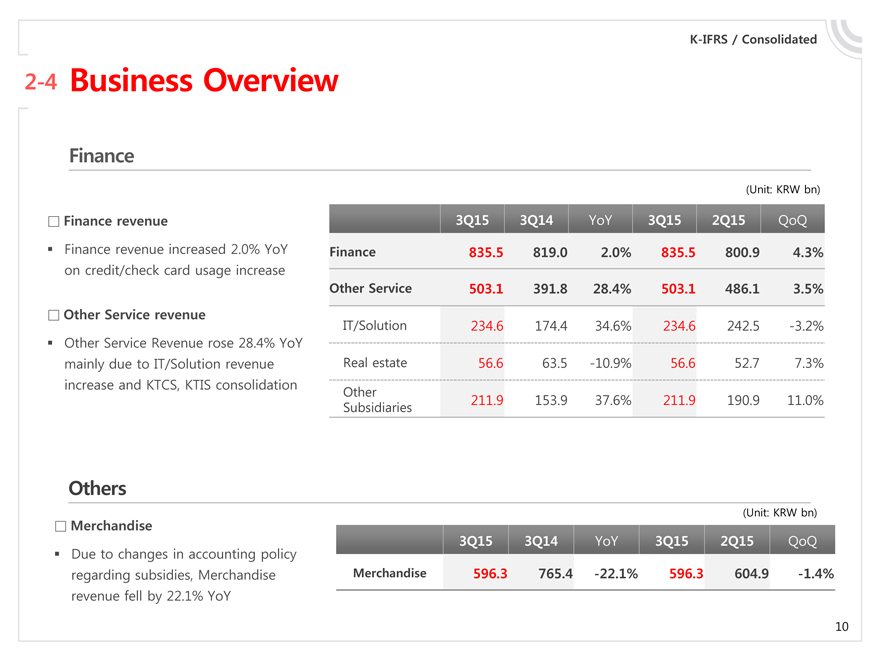
Finance revenue
Finance revenue increased 2.0% YoY on credit/check card usage increase
Other Service revenue
Other Service Revenue rose 28.4% YoY mainly due to IT/Solution revenue increase and KTCS, KTIS consolidation
3Q15 3Q14 YoY 3Q15 2Q15 QoQ Finance 835.5 819.0 2.0% 835.5 800.9 4.3%
Other Service 503.1 391.8 28.4% 503.1 486.1 3.5%
IT/Solution 234.6 174.4 34.6% 234.6 242.5 -3.2%
Real estate 56.6 63.5 -10.9% 56.6 52.7 7.3%
Other
211.9 153.9 37.6% 211.9 190.9 11.0%
Subsidiaries
Others
(Unit: KRW bn)
Merchandise
Due to changes in accounting policy regarding subsidies, Merchandise revenue fell by 22.1% YoY
3Q15 3Q14 YoY 3Q15 2Q15 QoQ Merchandise 596.3 765.4 -22.1% 596.3 604.9 -1.4%
K-IFRS / Consolidated
2-5 Business Overview
Operating Expenses
(Unit: KRW bn)
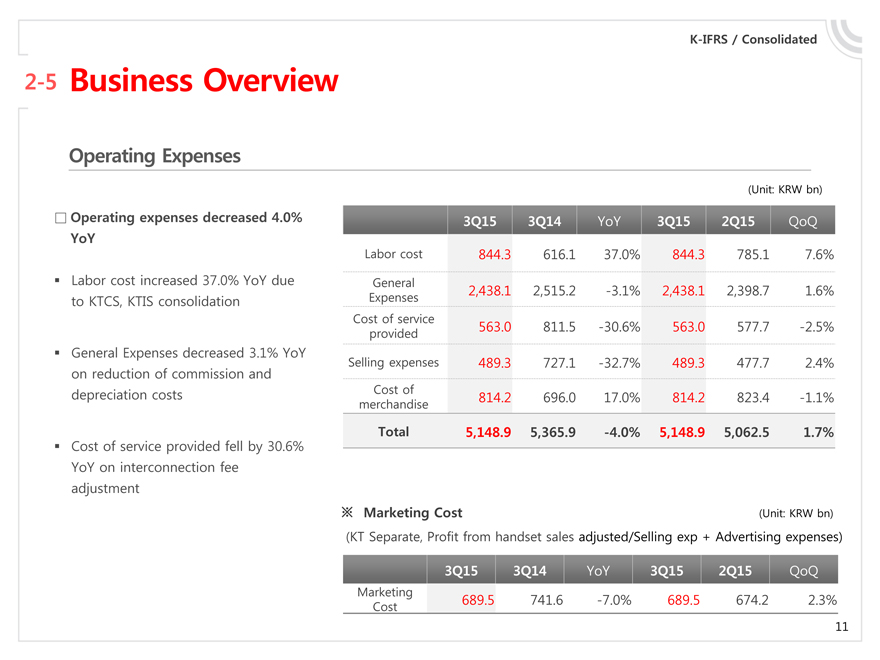
Operating expenses decreased 4.0% YoY
Labor cost increased 37.0% YoY due to KTCS, KTIS consolidation
General Expenses decreased 3.1% YoY on reduction of commission and depreciation costs
Cost of service provided fell by 30.6% YoY on interconnection fee adjustment
3Q15 3Q14 YoY 3Q15 2Q15 QoQ
Labor cost 844.3 616.1 37.0% 844.3 785.1 7.6%
General
Expenses 2,438.1 2,515.2 -3.1% 2,438.1 2,398.7 1.6%
Cost of service provided 563.0 811.5 -30.6% 563.0 577.7 -2.5% Selling expenses 489.3 727.1 -32.7% 489.3 477.7 2.4%
Cost of merchandise 814.2 696.0 17.0% 814.2 823.4 -1.1%
Total 5,148.9 5,365.9 -4.0% 5,148.9 5,062.5 1.7%
Marketing Cost (Unit: KRW bn)
(KT Separate, Profit from handset sales adjusted/Selling exp + Advertising expenses)
3Q15 3Q14 YoY 3Q15 2Q15 QoQ
Marketing
Cost 689.5 741.6 -7.0% 689.5 674.2 2.3%
11
Financial Highlights
Business Overview
Q&A
Appendix
12
Financial Highlights
Business Overview
Q&A
Appendix
13
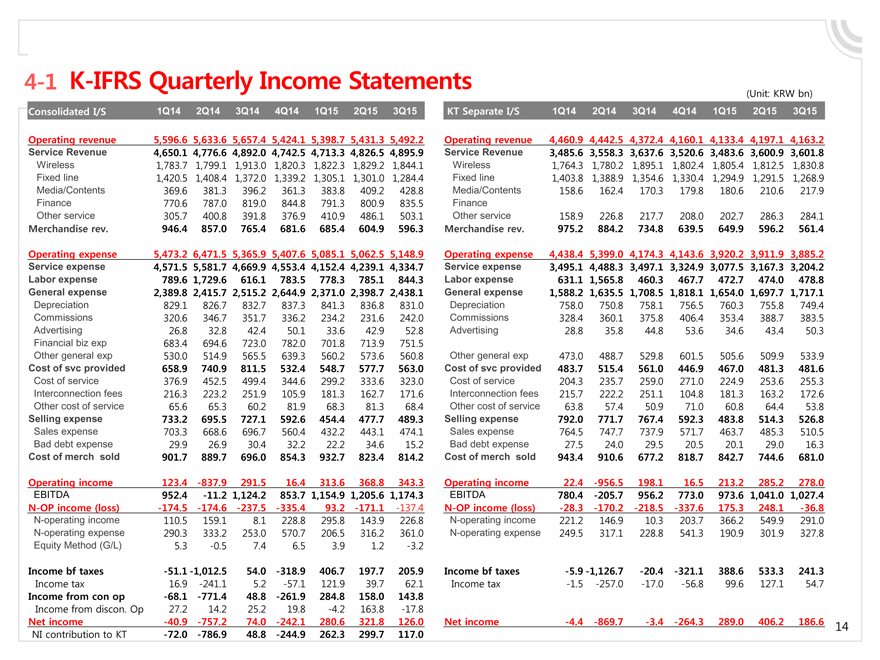
4-1 K-IFRS Quarterly Income Statements
(Unit: KRW bn)
Consolidated I/S 1Q14 2Q14 3Q14 4Q14 1Q15 2Q15 3Q15
Operating revenue 5,596.6 5,633.6 5,657.4 5,424.1 5,398.7 5,431.3 5,492.2
Service Revenue 4,650.1 4,776.6 4,892.0 4,742.5 4,713.3 4,826.5 4,895.9
Wireless 1,783.7 1,799.1 1,913.0 1,820.3 1,822.3 1,829.2 1,844.1
Fixed line 1,420.5 1,408.4 1,372.0 1,339.2 1,305.1 1,301.0 1,284.4
Media/Contents 369.6 381.3 396.2 361.3 383.8 409.2 428.8
Finance 770.6 787.0 819.0 844.8 791.3 800.9 835.5
Other service 305.7 400.8 391.8 376.9 410.9 486.1 503.1
Merchandise rev. 946.4 857.0 765.4 681.6 685.4 604.9 596.3
Operating expense 5,473.2 6,471.5 5,365.9 5,407.6 5,085.1 5,062.5 5,148.9
Service expense 4,571.5 5,581.7 4,669.9 4,553.4 4,152.4 4,239.1 4,334.7
Labor expense 789.6 1,729.6 616.1 783.5 778.3 785.1 844.3
General expense 2,389.8 2,415.7 2,515.2 2,644.9 2,371.0 2,398.7 2,438.1
Depreciation 829.1 826.7 832.7 837.3 841.3 836.8 831.0
Commissions 320.6 346.7 351.7 336.2 234.2 231.6 242.0
Advertising 26.8 32.8 42.4 50.1 33.6 42.9 52.8
Financial biz exp 683.4 694.6 723.0 782.0 701.8 713.9 751.5
Other general exp 530.0 514.9 565.5 639.3 560.2 573.6 560.8
Cost of svc provided 658.9 740.9 811.5 532.4 548.7 577.7 563.0
Cost of service 376.9 452.5 499.4 344.6 299.2 333.6 323.0
Interconnection fees 216.3 223.2 251.9 105.9 181.3 162.7 171.6
Other cost of service 65.6 65.3 60.2 81.9 68.3 81.3 68.4
Selling expense 733.2 695.5 727.1 592.6 454.4 477.7 489.3
Sales expense 703.3 668.6 696.7 560.4 432.2 443.1 474.1
Bad debt expense 29.9 26.9 30.4 32.2 22.2 34.6 15.2
Cost of merch sold 901.7 889.7 696.0 854.3 932.7 823.4 814.2
Operating income 123.4 -837.9 291.5 16.4 313.6 368.8 343.3
EBITDA 952.4 -11.2 1,124.2 853.7 1,154.9 1,205.6 1,174.3
N-OP income (loss) -174.5 -174.6 -237.5 -335.4 93.2 -171.1 -137.4
N-operating income 110.5 159.1 8.1 228.8 295.8 143.9 226.8
N-operating expense 290.3 333.2 253.0 570.7 206.5 316.2 361.0
Equity Method (G/L) 5.3 -0.5 7.4 6.5 3.9 1.2 -3.2
Income bf taxes -51.1 -1,012.5 54.0 -318.9 406.7 197.7 205.9
Income tax 16.9 -241.1 5.2 -57.1 121.9 39.7 62.1
Income from con op -68.1 -771.4 48.8 -261.9 284.8 158.0 143.8
Income from discon. Op 27.2 14.2 25.2 19.8 -4.2 163.8 -17.8
Net income -40.9 -757.2 74.0 -242.1 280.6 321.8 126.0
NI contribution to KT -72.0 -786.9 48.8 -244.9 262.3 299.7 117.0
KT Separate I/S 1Q14 2Q14 3Q14 4Q14 1Q15 2Q15 3Q15
Operating revenue 4,460.9 4,442.5 4,372.4 4,160.1 4,133.4 4,197.1 4,163.2
Service Revenue 3,485.6 3,558.3 3,637.6 3,520.6 3,483.6 3,600.9 3,601.8
Wireless 1,764.3 1,780.2 1,895.1 1,802.4 1,805.4 1,812.5 1,830.8
Fixed line 1,403.8 1,388.9 1,354.6 1,330.4 1,294.9 1,291.5 1,268.9
Media/Contents 158.6 162.4 170.3 179.8 180.6 210.6 217.9
Finance
Other service 158.9 226.8 217.7 208.0 202.7 286.3 284.1
Merchandise rev. 975.2 884.2 734.8 639.5 649.9 596.2 561.4
Operating expense 4,438.4 5,399.0 4,174.3 4,143.6 3,920.2 3,911.9 3,885.2
Service expense 3,495.1 4,488.3 3,497.1 3,324.9 3,077.5 3,167.3 3,204.2
Labor expense 631.1 1,565.8 460.3 467.7 472.7 474.0 478.8
General expense 1,588.2 1,635.5 1,708.5 1,818.1 1,654.0 1,697.7 1,717.1
Depreciation 758.0 750.8 758.1 756.5 760.3 755.8 749.4
Commissions 328.4 360.1 375.8 406.4 353.4 388.7 383.5
Advertising 28.8 35.8 44.8 53.6 34.6 43.4 50.3
Other general exp 473.0 488.7 529.8 601.5 505.6 509.9 533.9
Cost of svc provided 483.7 515.4 561.0 446.9 467.0 481.3 481.6
Cost of service 204.3 235.7 259.0 271.0 224.9 253.6 255.3
Interconnection fees 215.7 222.2 251.1 104.8 181.3 163.2 172.6
Other cost of service 63.8 57.4 50.9 71.0 60.8 64.4 53.8
Selling expense 792.0 771.7 767.4 592.3 483.8 514.3 526.8
Sales expense 764.5 747.7 737.9 571.7 463.7 485.3 510.5
Bad debt expense 27.5 24.0 29.5 20.5 20.1 29.0 16.3
Cost of merch sold 943.4 910.6 677.2 818.7 842.7 744.6 681.0
Operating income 22.4 -956.5 198.1 16.5 213.2 285.2 278.0
EBITDA 780.4 -205.7 956.2 773.0 973.6 1,041.0 1,027.4
N-OP income (loss) -28.3 -170.2 -218.5 -337.6 175.3 248.1 -36.8
N-operating income 221.2 146.9 10.3 203.7 366.2 549.9 291.0
N-operating expense 249.5 317.1 228.8 541.3 190.9 301.9 327.8
Income bf taxes -5.9 -1,126.7 -20.4 -321.1 388.6 533.3 241.3
Income tax -1.5 -257.0 -17.0 -56.8 99.6 127.1 54.7
Net income -4.4 -869.7 -3.4 -264.3 289.0 406.2 186.6
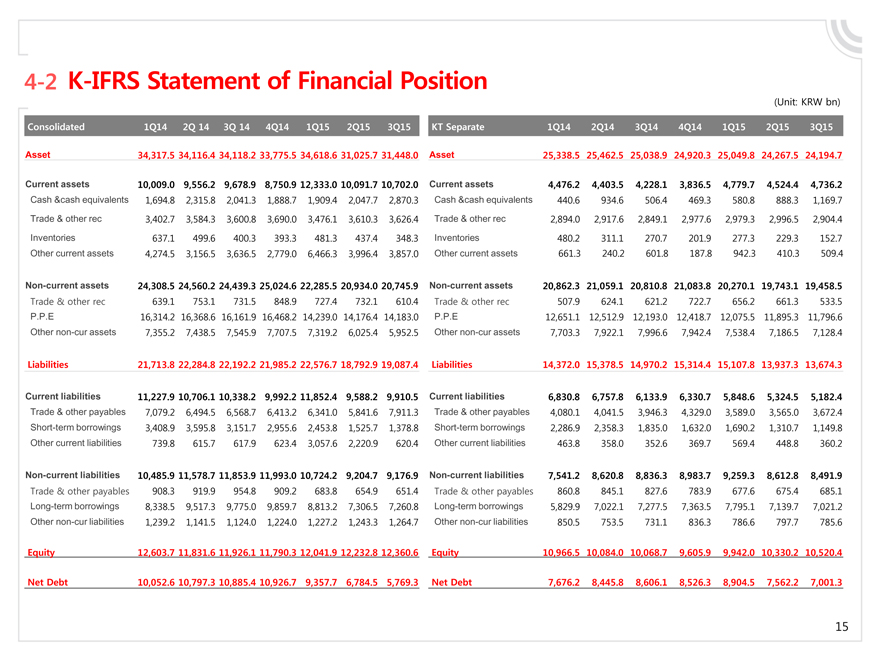
4-2 K-IFRS Statement of Financial Position
(Unit: KRW bn)
Consolidated 1Q14 2Q 14 3Q 14 4Q14 1Q15 2Q15 3Q15
Asset 34,317.5 34,116.4 34,118.2 33,775.5 34,618.6 31,025.7 31,448.0
Current assets 10,009.0 9,556.2 9,678.9 8,750.9 12,333.0 10,091.7 10,702.0
Cash &cash equivalents 1,694.8 2,315.8 2,041.3 1,888.7 1,909.4 2,047.7 2,870.3
Trade & other rec 3,402.7 3,584.3 3,600.8 3,690.0 3,476.1 3,610.3 3,626.4
Inventories 637.1 499.6 400.3 393.3 481.3 437.4 348.3
Other current assets 4,274.5 3,156.5 3,636.5 2,779.0 6,466.3 3,996.4 3,857.0
Non-current assets 24,308.5 24,560.2 24,439.3 25,024.6 22,285.5 20,934.0 20,745.9
Trade & other rec 639.1 753.1 731.5 848.9 727.4 732.1 610.4
P.P.E 16,314.2 16,368.6 16,161.9 16,468.2 14,239.0 14,176.4 14,183.0
Other non-cur assets 7,355.2 7,438.5 7,545.9 7,707.5 7,319.2 6,025.4 5,952.5
Liabilities 21,713.8 22,284.8 22,192.2 21,985.2 22,576.7 18,792.9 19,087.4
Current liabilities 11,227.9 10,706.1 10,338.2 9,992.2 11,852.4 9,588.2 9,910.5
Trade & other payables 7,079.2 6,494.5 6,568.7 6,413.2 6,341.0 5,841.6 7,911.3
Short-term borrowings 3,408.9 3,595.8 3,151.7 2,955.6 2,453.8 1,525.7 1,378.8
Other current liabilities 739.8 615.7 617.9 623.4 3,057.6 2,220.9 620.4
Non-current liabilities 10,485.9 11,578.7 11,853.9 11,993.0 10,724.2 9,204.7 9,176.9
Trade & other payables 908.3 919.9 954.8 909.2 683.8 654.9 651.4
Long-term borrowings 8,338.5 9,517.3 9,775.0 9,859.7 8,813.2 7,306.5 7,260.8
Other non-cur liabilities 1,239.2 1,141.5 1,124.0 1,224.0 1,227.2 1,243.3 1,264.7
Equity 12,603.7 11,831.6 11,926.1 11,790.3 12,041.9 12,232.8 12,360.6
Net Debt 10,052.6 10,797.3 10,885.4 10,926.7 9,357.7 6,784.5 5,769.3
KT Separate 1Q14 2Q14 3Q14 4Q14 1Q15 2Q15 3Q15
Asset 25,338.5 25,462.5 25,038.9 24,920.3 25,049.8 24,267.5 24,194.7
Current assets 4,476.2 4,403.5 4,228.1 3,836.5 4,779.7 4,524.4 4,736.2
Cash &cash equivalents 440.6 934.6 506.4 469.3 580.8 888.3 1,169.7
Trade & other rec 2,894.0 2,917.6 2,849.1 2,977.6 2,979.3 2,996.5 2,904.4
Inventories 480.2 311.1 270.7 201.9 277.3 229.3 152.7
Other current assets 661.3 240.2 601.8 187.8 942.3 410.3 509.4
Non-current assets 20,862.3 21,059.1 20,810.8 21,083.8 20,270.1 19,743.1 19,458.5
Trade & other rec 507.9 624.1 621.2 722.7 656.2 661.3 533.5
P.P.E 12,651.1 12,512.9 12,193.0 12,418.7 12,075.5 11,895.3 11,796.6
Other non-cur assets 7,703.3 7,922.1 7,996.6 7,942.4 7,538.4 7,186.5 7,128.4
Liabilities 14,372.0 15,378.5 14,970.2 15,314.4 15,107.8 13,937.3 13,674.3
Current liabilities 6,830.8 6,757.8 6,133.9 6,330.7 5,848.6 5,324.5 5,182.4
Trade & other payables 4,080.1 4,041.5 3,946.3 4,329.0 3,589.0 3,565.0 3,672.4
Short-term borrowings 2,286.9 2,358.3 1,835.0 1,632.0 1,690.2 1,310.7 1,149.8
Other current liabilities 463.8 358.0 352.6 369.7 569.4 448.8 360.2
Non-current liabilities 7,541.2 8,620.8 8,836.3 8,983.7 9,259.3 8,612.8 8,491.9
Trade & other payables 860.8 845.1 827.6 783.9 677.6 675.4 685.1
Long-term borrowings 5,829.9 7,022.1 7,277.5 7,363.5 7,795.1 7,139.7 7,021.2
Other non-cur liabilities 850.5 753.5 731.1 836.3 786.6 797.7 785.6
Equity 10,966.5 10,084.0 10,068.7 9,605.9 9,942.0 10,330.2 10,520.4
Net Debt 7,676.2 8,445.8 8,606.1 8,526.3 8,904.5 7,562.2 7,001.3
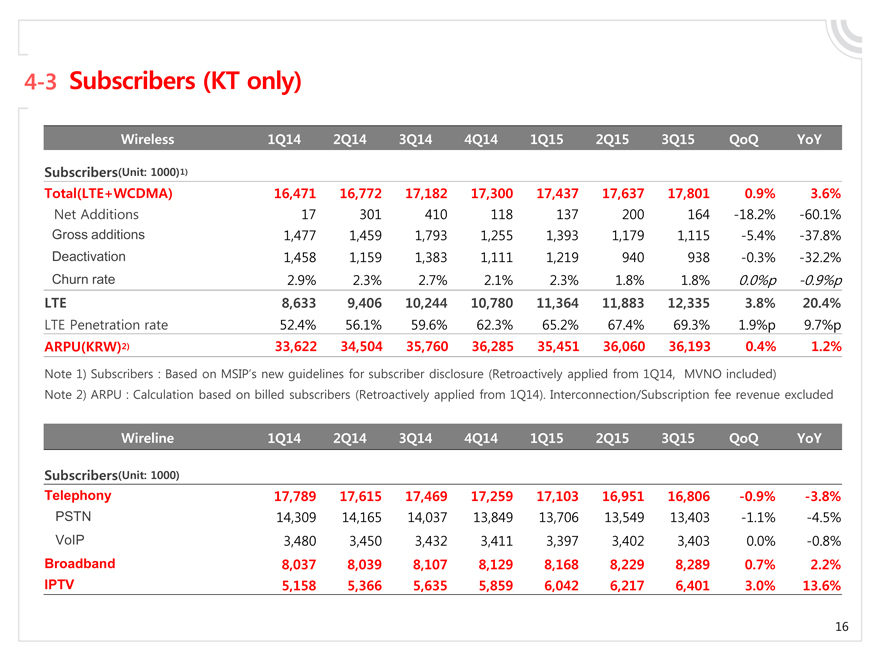
4-3 Subscribers (KT only)
Wireless 1Q14 2Q14 3Q14 4Q14 1Q15 2Q15 3Q15 QoQ YoY Subscribers(Unit: 1000)1) Total(LTE+WCDMA) 16,471 16,772 17,182 17,300 17,437 17,637 17,801 0.9% 3.6%
Net Additions 17 301 410 118 137 200 164 -18.2% -60.1% Gross additions 1,477 1,459 1,793 1,255 1,393 1,179 1,115 -5.4% -37.8% Deactivation 1,458 1,159 1,383 1,111 1,219 940 938 -0.3% -32.2% Churn rate 2.9% 2.3% 2.7% 2.1% 2.3% 1.8% 1.8% 0.0%p -0.9%p
LTE 8,633 9,406 10,244 10,780 11,364 11,883 12,335 3.8% 20.4%
LTE Penetration rate 52.4% 56.1% 59.6% 62.3% 65.2% 67.4% 69.3% 1.9%p 9.7%p
ARPU(KRW)2) 33,622 34,504 35,760 36,285 35,451 36,060 36,193 0.4% 1.2%
Note 1) Subscribers : Based on MSIP’s new guidelines for subscriber disclosure (Retroactively applied from 1Q14, MVNO included)
Note 2) ARPU : Calculation based on billed subscribers (Retroactively applied from 1Q14). Interconnection/Subscription fee revenue excluded
Wireline 1Q14 2Q14 3Q14 4Q14 1Q15 2Q15 3Q15 QoQ YoY
Subscribers(Unit: 1000)
Telephony 17,789 17,615 17,469 17,259 17,103 16,951 16,806 -0.9% -3.8%
PSTN 14,309 14,165 14,037 13,849 13,706 13,549 13,403 -1.1% -4.5% VoIP 3,480 3,450 3,432 3,411 3,397 3,402 3,403 0.0% -0.8%
Broadband 8,037 8,039 8,107 8,129 8,168 8,229 8,289 0.7% 2.2% IPTV 5,158 5,366 5,635 5,859 6,042 6,217 6,401 3.0% 13.6%
16

Thank You KT