SECURITIES AND EXCHANGE COMMISSION
Washington, D.C. 20549
Form6-K
REPORT OF FOREIGN PRIVATE ISSUER
PURSUANT TO RULE13a-16 OR15d-16
OF THE SECURITIES EXCHANGE ACT OF 1934
For the month of May 2018
Commission File Number1-14926
KT Corporation
(Translation of registrant’s name into English)
90,Buljeong-ro,
Bundang-gu,Seongnam-si,
Gyeonggi-do,
Korea
(Address of principal executive offices)
Indicate by check mark whether the registrant files or will file annual reports under cover of Form20-F or Form40-F:
Form20-F ☒ Form40-F ☐
Indicate by check mark if the registrant is submitting the Form6-K in paper as permitted by RegulationS-T Rule 101(b)(1): ☐
Indicate by check mark if the registrant is submitting the Form6-K in paper as permitted by RegulationS-T Rule 101(b)(7): ☐
Indicate by check mark whether by furnishing the information contained in this Form, the registrant is also thereby furnishing the information to the Commission pursuant to Rule12g3-2(b) under the Securities Exchange Act of 1934.
Yes ☐ No ☒
If “Yes” is marked, indicate below the file number assigned to the registrant in connection with Rule12g3-2(b):82-
SIGNATURES
Pursuant to the requirements of the Securities Exchange Act of 1934, the registrant has duly caused this report to be signed on its behalf by the undersigned, thereunto duly authorized.
| Dated: May 3, 2018 | ||
| KT Corporation | ||
| By: | /s/ Seunghoon Chi | |
| Name: | Seunghoon Chi | |
| Title: | Vice President | |
| By: | /s/ Youngkyoon Yun | |
| Name: | Youngkyoon Yun | |
| Title: | Director | |
KT ‘18 1Q Earnings Release
Disclaimer
This presentation has been prepared by KT Corp.(the Company”). This presentation contains forward-looking statements, which are subject to risks, uncertainties, and assumptions. This presentation is being presented solely for your information and is subject to change without notice. No presentation or warranty, expressed or implied, is made and no reliance should be placed on the accuracy, actuality, fairness, or completeness of the information presented.
KT Corp has applied new accounting standard of‘K-IFRS 1115’ as of Jan 1st, 2018. Accordingly, we have elected the modified retrospective approach which will recognize the cumulative impact of the new standard as an adjustment to retained earnings as at January 1 2018, the period of initial application. That said, there are no obligation to apply the new standard to previous financial statements.
In this material, despite the new accounting standard, we have included the restated figures for 1Q18 prepared under IFRS 1018(old standard) for investors’ understandings. The restated figures are followed by ‘*’ marking. However, please be noted that these restated figures have not been audited or reviewed by external auditors.
If you have any related questions to this material, please contact IR department.
Tel :82-2-3495-3512, 3254, 3564, 3976, 5343
Fax :82-2-3495-5917
Contents
1 181Q Highlight
2 Financial Highlights
3 Business Overviews
4 Q&A
5 Appendix
Contents
1 181Q Highlight
2 Financial Highlights
3 Business Overviews
4 Q&A
5 Appendix
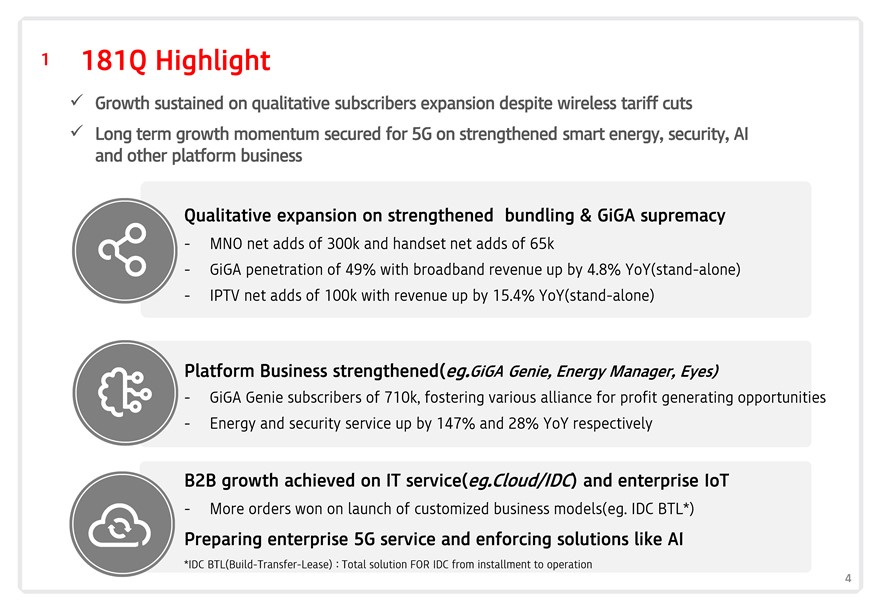
1 181Q Highlight
Growth sustained on qualitative subscribers expansion despite wireless tariff cuts Long term growth momentum secured for 5G on strengthened smart energy, security, AI and other platform business
Qualitative expansion on strengthened bundling & GiGA supremacy
- MNO net adds of 300k and handset net adds of 65k
- GiGA penetration of 49% with broadband revenue up by 4.8% YoY(stand-alone)
- IPTV net adds of 100k with revenue up by 15.4% YoY(stand-alone)
Platform Business strengthened(eg.GiGA Genie, Energy Manager, Eyes)
- GiGA Genie subscribers of 710k, fostering various alliance for profit generating opportunities
- Energy and security service up by 147% and 28% YoY respectively
B2B growth achieved on IT service(eg.Cloud/IDC) and enterprise IoT
- More orders won on launch of customized business models(eg. IDC BTL*)
Preparing enterprise 5G service and enforcing solutions like AI
*IDC BTL(Build-Transfer-Lease) : Total solution FOR IDC from installment to operation
4
Contents
1 181Q Highlight
2 Financial Highlights
3 Business Overviews
4 Q&A
5 Appendix
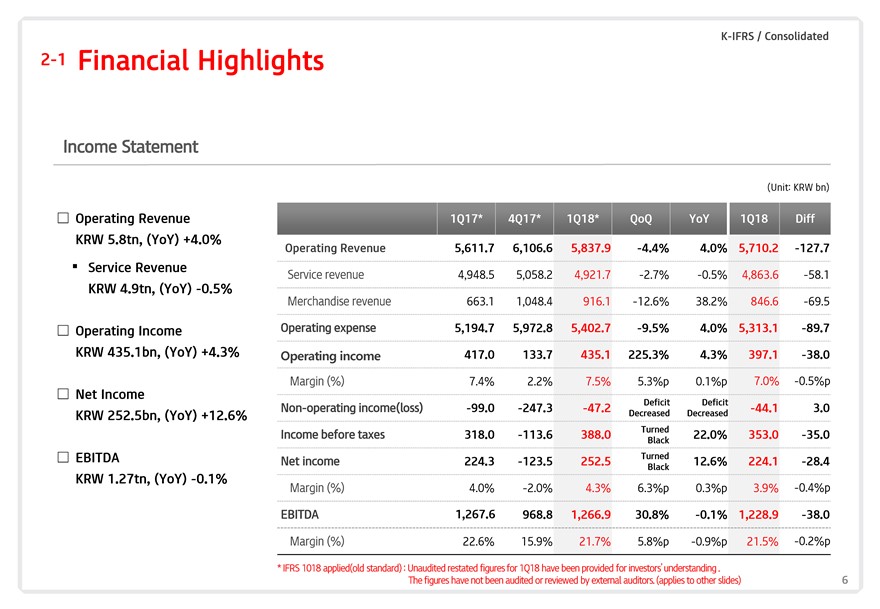
2-1 Financial Highlights
Income Statement
(Unit: KRW bn)
â–¡ Operating Revenue 1Q17* 4Q17* 1Q18* QoQ YoY 1Q18 Diff
KRW 5.8tn, (YoY) +4.0%
Operating Revenue 5,611.7 6,106.6 5,837.9-4.4% 4.0% 5,710.2-127.7
Service Revenue
Servicerevenue 4,948.5 5,058.2 4,921.7-2.7%-0.5% 4,863.6-58.1
KRW 4.9tn, (YoY)-0.5%
Merchandiserevenue 663.1 1,048.4 916.1-12.6% 38.2% 846.6-69.5
â–¡ Operating Income Operating expense 5,194.7 5,972.8 5,402.7-9.5% 4.0% 5,313.1-89.7 KRW 435.1bn, (YoY) +4.3% Operating income 417.0 133.7 435.1 225.3% 4.3% 397.1-38.0
Margin (%) 7.4% 2.2% 7.5% 5.3%p 0.1%p 7.0%-0.5%p
â–¡ Net Income Deficit Deficit
Non-operatingincome(loss)-99.0-247.3-47.2-44.1 3.0
KRW 252.5bn, (YoY) +12.6% Decreased Decreased
Turned
Incomebefore taxes 318.0-113.6 388.0 22.0% 353.0-35.0
Black
â–¡ EBITDA Turned
Netincome 224.3-123.5 252.5 12.6% 224.1-28.4
Black
KRW 1.27tn, (YoY)-0.1%-0.4%p
Margin (%) 4.0%-2.0% 4.3% 6.3%p 0.3%p 3.9%
EBITDA 1,267.6 968.8 1,266.9 30.8%-0.1% 1,228.9-38.0
Margin (%) 22.6% 15.9% 21.7% 5.8%p-0.9%p 21.5%-0.2%p
* IFRS 1018 applied(old standard) : Unaudited restated figures for 1Q18 have been provided for investors’ understanding .
The figures have not been audited or reviewed by external auditors.(applies to other slides) 6
K-IFRS / Consolidated
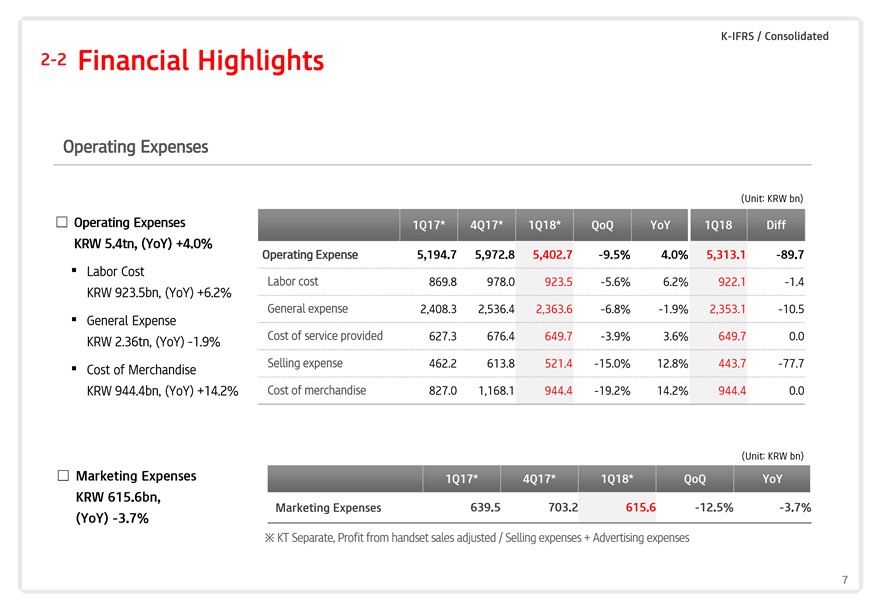
2-2 Financial Highlights
Operating Expenses
(Unit: KRW bn)
â–¡ Operating Expenses 1Q17* 4Q17* 1Q18* QoQ YoY 1Q18 Diff
KRW 5.4tn, (YoY) +4.0%
Operating Expense 5,194.7 5,972.8 5,402.7-9.5% 4.0% 5,313.1-89.7
Labor Cost Laborcost
869.8 978.0 923.5-5.6% 6.2% 922.1-1.4
KRW 923.5bn, (YoY) +6.2%
Generalexpense 2,408.3 2,536.4 2,363.6-6.8%-1.9% 2,353.1-10.5
General Expense
Costof service provided 627.3 676.4 649.7-3.9% 3.6% 649.7 0.0
KRW 2.36tn, (YoY)-1.9%
Sellingexpense 462.2 613.8 521.4-15.0% 12.8% 443.7-77.7
Cost of Merchandise
KRW 944.4bn, (YoY) +14.2% Costof merchandise 827.0 1,168.1 944.4-19.2% 14.2% 944.4 0.0
(Unit: KRW bn)
â–¡ Marketing Expenses 1Q17* 4Q17* 1Q18* QoQ YoY
KRW 615.6bn,
Marketing Expenses 639.5 703.2 615.6-12.5%-3.7%
(YoY)-3.7%
KT Separate, Profit from handset sales adjusted / Selling expenses + Advertising expenses
7
2-3 Financial Highlights
Financial Position
(Unit: KRW bn)
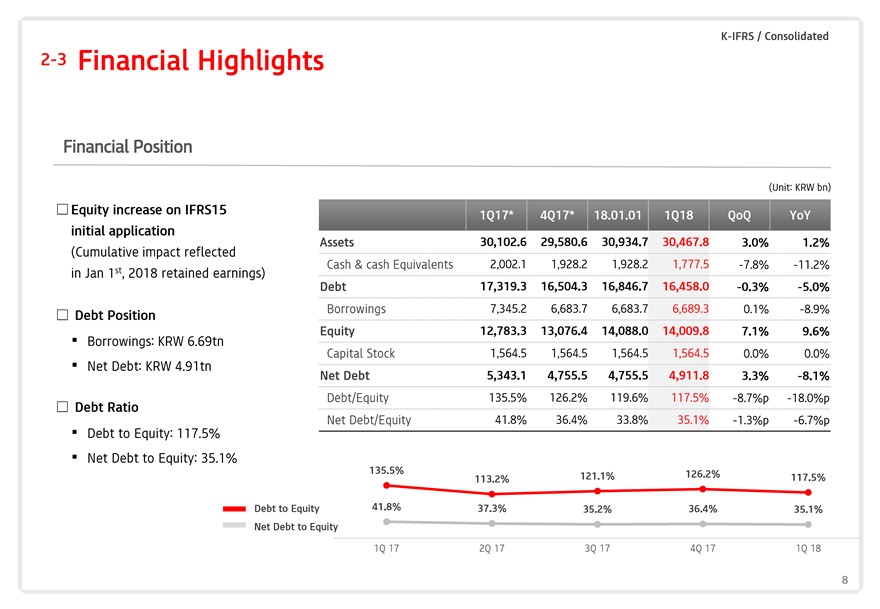
Equity increase on IFRS15
1Q17* 4Q17* 18.01.01 1Q18 QoQ YoY
initial application
(Cumulative impact reflected Assets 30,102.6 29,580.6 30,934.7 30,467.8 3.0% 1.2%
Cash & cash Equivalents 2,002.1 1,928.2 1,928.2 1,777.5-7.8%-11.2%
in Jan 1st, 2018 retained earnings)
Debt 17,319.3 16,504.3 16,846.7 16,458.0-0.3%-5.0%
Borrowings 7,345.2 6,683.7 6,683.7 6,689.3 0.1%-8.9%
Debt Position
Equity 12,783.3 13,076.4 14,088.0 14,009.8 7.1% 9.6%
Borrowings: KRW 6.69tn
Capital Stock 1,564.5 1,564.5 1,564.5 1,564.5 0.0% 0.0%
Net Debt: KRW 4.91tn Net Debt 5,343.1 4,755.5 4,755.5 4,911.8 3.3%-8.1%
Debt Ratio Debt/Equity 135.5% 126.2% 119.6% 117.5%-8.7%p-18.0%p
Net Debt/Equity 41.8% 36.4% 33.8% 35.1%-1.3%p-6.7%p
Debt to Equity: 117.5%
Net Debt to Equity: 35.1%
135.5% 126.2%
113.2% 121.1% 117.5%
Debt to Equity 41.8% 37.3% 35.2% 36.4% 35.1%
Net Debt to Equity
1Q 17 2Q 17 3Q 17 4Q 17 1Q 18
8
2-4 Financial Highlights
CAPEX
(Unit: KRW bn)
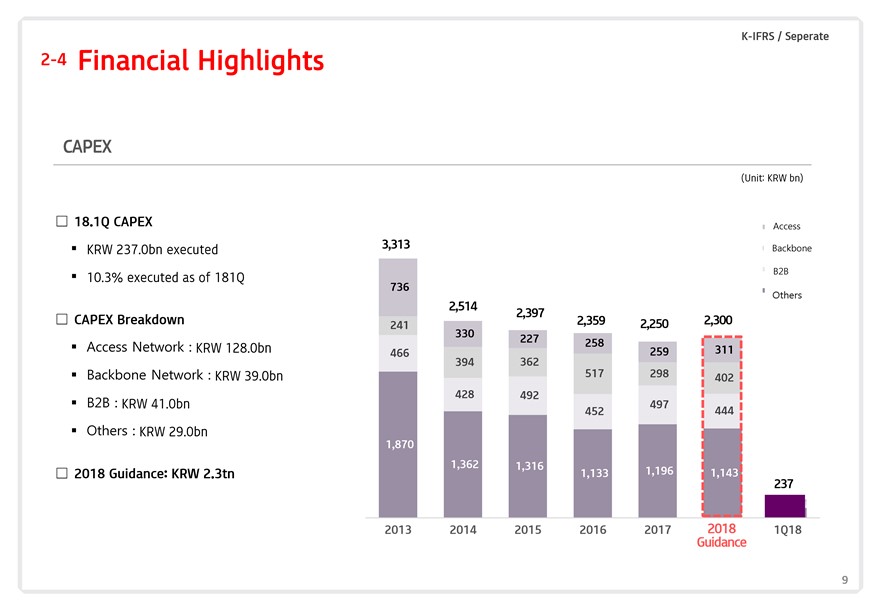
18.1Q CAPEX Access
3,313 Backbone
KRW 237.0bn executed
B2B
10.3% executed as of 181Q 736
2,514 2,397
CAPEX Breakdown 2,359 2,250 2,300
241 330
Access Network : KRW 128.0bn 227 258
259 311 466 362 394
Backbone Network : KRW 39.0bn 517 298
402
KRW 41. 428 492
B2B : 0bn 497
452 444
Others : KRW 29.0bn
1,870
1,362 1,316
2018 Guidance: KRW 2.3tn 1,133 1,196 1,143
237
2013 2014 2015 2016 2017 2018 1Q18
Guidance
Contents
1 181Q Highlight
2 Financial Highlights
3 Business Overviews
4 Q&A
5 Appendix
3-1 Business Overview
Wireless
(Unit: KRW bn)
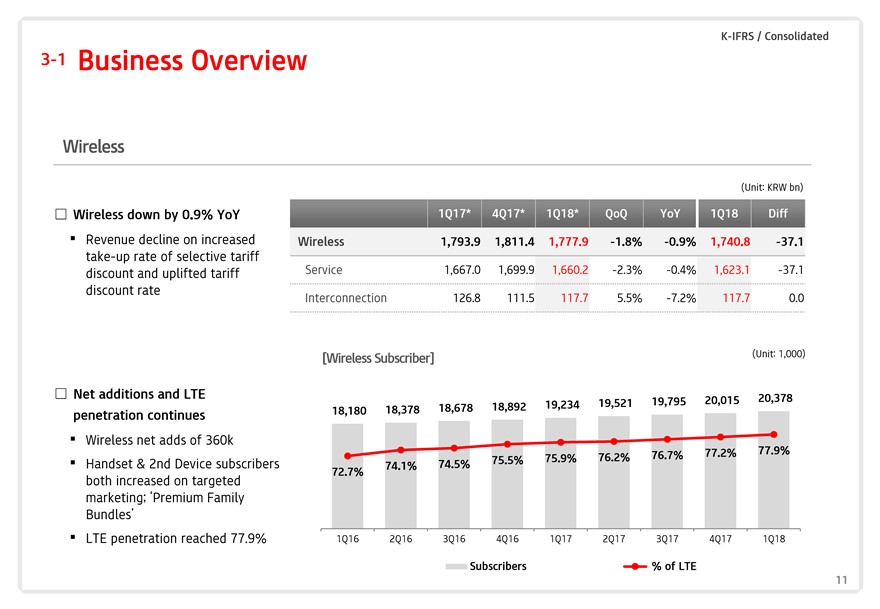
Wireless down by 0.9% YoY 1Q17* 4Q17* 1Q18* QoQ YoY 1Q18 Diff Revenue decline on increased Wireless 1,793.9 1,811.4 1,777.9-1.8%-0.9% 1,740.8-37.1take-up rate of selective tariff discount and uplifted tariff Service 1,667.0 1,699.9 1,660.2-2.3%-0.4% 1,623.1-37.1 discount rate
Interconnection 126.8 111.5 117.7 5.5%-7.2% 117.7 0.0
[Wireless Subscriber] (Unit: 1,000)
Net additions and LTE 20,378
19,521 19,795 20,015 18,678 18,892 19,234 18,180 18,378
penetration continues
Wireless net adds of 360k
77.2% 77.9% 75.9% 76.2% 76.7%
Handset & 2nd Device subscribers 74.5% 75.5%
74.1% 72.7%
both increased on targeted marketing; ‘Premium Family
Bundles’
LTE penetration reached 77.9% 1Q16 2Q16 3Q16 4Q16 1Q17 2Q17 3Q17 4Q17 1Q18
Subscribers % of LTE
11
3-2 Business Overview
Wireline
(Unit: KRW bn)
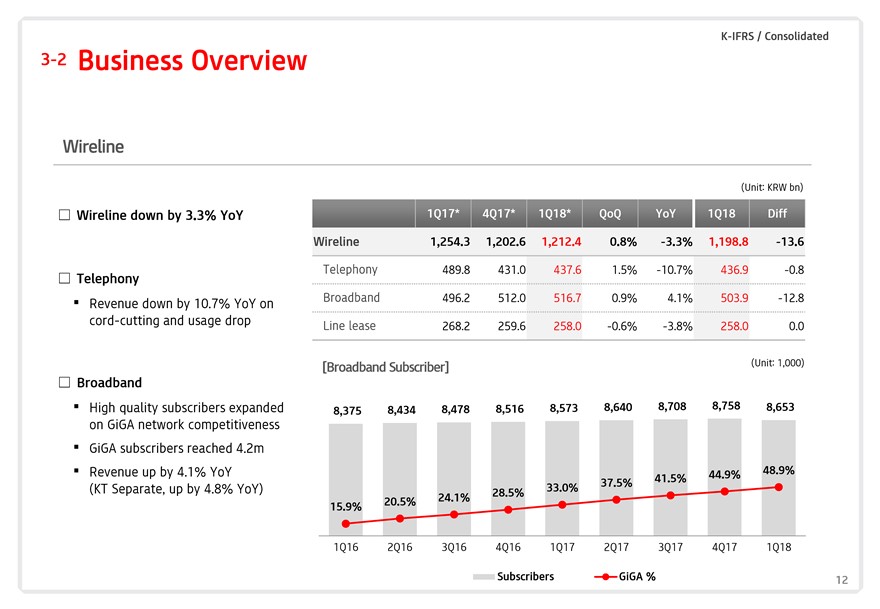
Wireline down by 3.3% YoY 1Q17*4Q17*1Q18*QoQ YoY 1Q18Diff
Wireline 1,254.31,202.61,212.40.8%-3.3%1,198.8-13.6
Telephony Telephony 489.8431.0437.61.5%-10.7%436.9-0.8
Revenue down by 10.7% YoY on Broadband496.2512.0516.70.9%4.1%503.9-12.8
cord-cutting and usage drop Line lease 268.2259.6258.0-0.6%-3.8%258.00.0
[Broadband Subscriber] (Unit: 1,000)
Broadband
High quality subscribers expanded 8,375 8,4348,4788,5168,5738,6408,7088,7588,653
on GiGA network competitiveness
GiGA subscribers reached 4.2m
Revenue up by 4.1% YoY 41.5%44.9%48.9%
(KT Separate, up by 4.8% YoY) 33.0%37.5%
28.5%
15.9% 20.5% 24.1%
1Q16 2Q163Q164Q161Q172Q173Q174Q171Q18
SubscribersGiGA % 12
3-3 Business Overview
Media / Contents
(Unit: KRW bn)
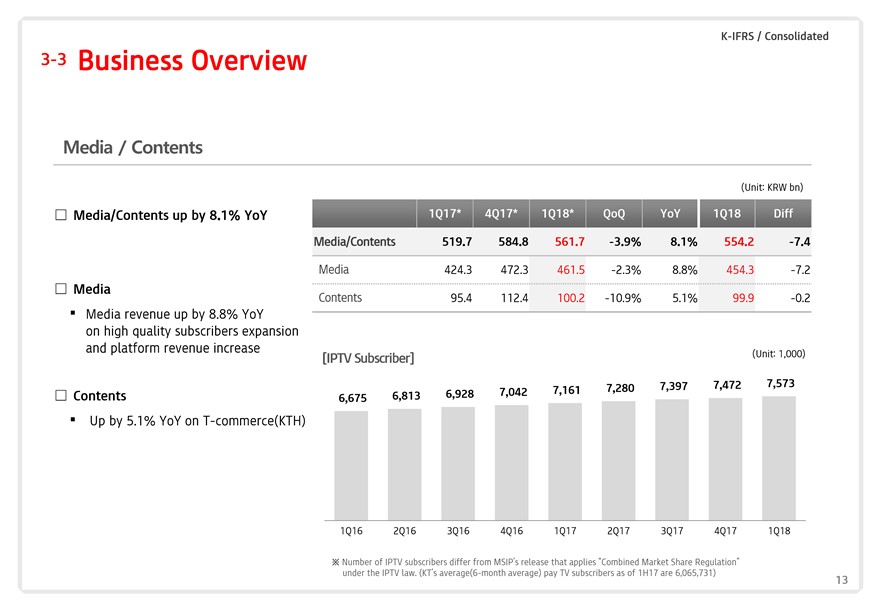
Media/Contents up by 8.1% YoY 1Q17*4Q17*1Q18*QoQ YoY 1Q18Diff
Media/Contents 519.7 584.8561.7-3.9%8.1%554.2-7.4
Media 424.3472.3461.5-2.3%8.8%454.3-7.2
Media
Contents 95.4112.4100.2-10.9%5.1%99.9-0.2
Media revenue up by 8.8% YoY
on high quality subscribers expansion
and platform revenue increase
[IPTV Subscriber] (Unit: 1,000)
Contents 6,675 6,8136,9287,0427,1617,2807,3977,4727,573
Up by 5.1% YoY on T-commerce(KTH)
1Q16 2Q16 3Q164Q161Q172Q173Q174Q171Q18
Number of IPTV subscribers differ from MSIP’s release that applies “Combined Market Share Regulation”
under the IPTV law. (KT’saverage(6-month average) pay TV subscribers as of 1H17 are 6,065,731)
3-4 Business Overview
Finance and others
(Unit: KRW bn)
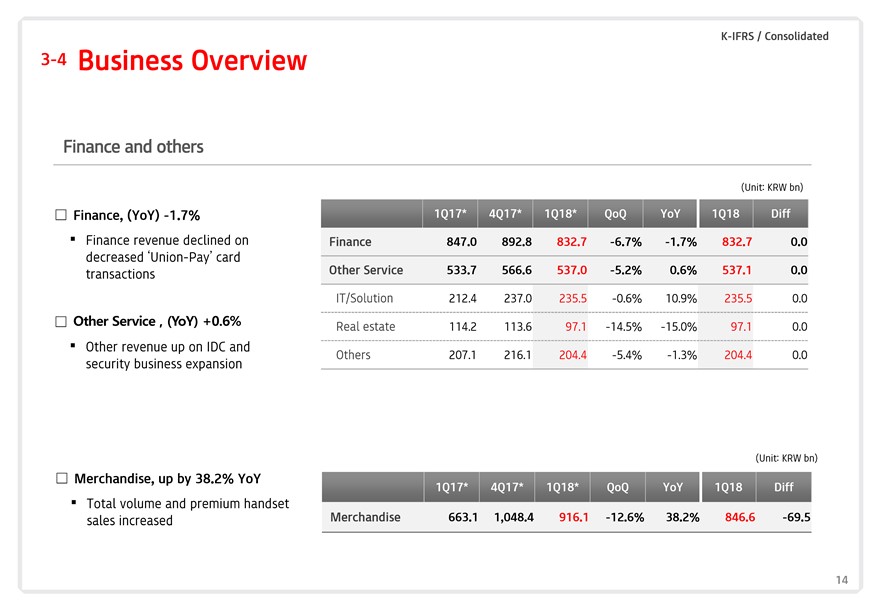
Finance, (YoY)-1.7% 1Q17*4Q17*1Q18*QoQ YoY 1Q18Diff
Finance revenue declined on Finance 847.0892.8832.7-6.7%-1.7%832.70.0
decreased‘Union-Pay’ card
transactions Other Service 533.7566.6537.0-5.2%0.6%537.10.0
IT/Solution 212.4 237.0235.5-0.6%10.9%235.50.0
Other Service , (YoY) +0.6% Real estate 114.2113.697.1-14.5%-15.0%97.10.0
Other revenue up on IDC and
Others 207.1 216.1204.4-5.4%-1.3%204.40.0
security business expansion
(Unit: KRW bn)
Merchandise, up by 38.2% YoY
1Q17* 4Q17*1Q18*QoQ YoY 1Q18Diff
Total volume and premium handset
sales increased Merchandise 663.11,048.4916.1-12.6%38.2%846.6-69.5
14
Contents
1 181Q Highlight
2 Financial Highlights
3 Business Overviews
4 Q&A
5 Appendix
Contents
1 181Q Highlight
2 Financial Highlights
3 Business Overviews
4 Q&A
5 Appendix
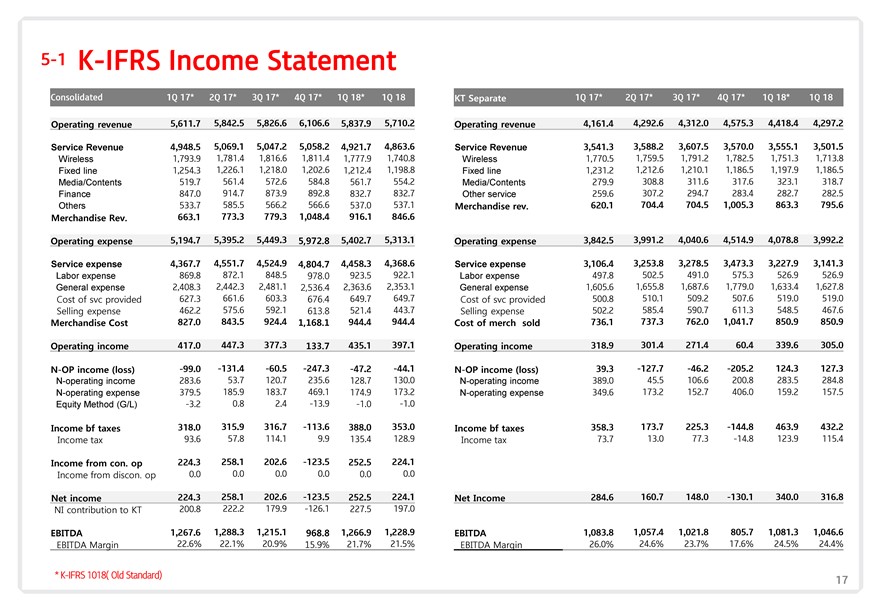
5-1K-IFRS Income Statement
Consolidated 1Q 17* 2Q 17*3Q 17*4Q 17*1Q 18*1Q 18
Operating revenue 5,611.7 5,842.55,826.66,106.65,837.95,710.2
Service Revenue 4,948.5 5,069.15,047.25,058.24,921.74,863.6
Wireless 1,793.9 1,781.41,816.61,811.41,777.91,740.8
Fixed line 1,254.3 1,226.11,218.01,202.61,212.41,198.8
Media/Contents 519.7 561.4572.6584.8561.7554.2
Finance 847.0 914.7873.9892.8832.7832.7
Others 533.7 585.5566.2566.6537.0537.1
Merchandise Rev. 663.1 773.3779.31,048.4916.1846.6
Operating expense 5,194.7 5,395.25,449.35,972.85,402.75,313.1
Service expense 4,367.7 4,551.74,524.94,804.74,458.34,368.6
Labor expense 869.8 872.1848.5978.0923.5922.1
General expense 2,408.3 2,442.32,481.12,536.42,363.62,353.1
Cost of svc provided 627.3 661.6603.3676.4649.7649.7
Selling expense 462.2 575.6592.1613.8521.4443.7
Merchandise Cost 827.0 843.5924.41,168.1944.4944.4
Operating income 417.0 447.3377.3133.7435.1397.1
N-OP income (loss) -99.0 -131.4-60.5-247.3-47.2-44.1
N-operating income 283.6 53.7120.7235.6128.7130.0
N-operating expense 379.5 185.9183.7469.1174.9173.2
Equity Method (G/L) -3.2 0.82.4-13.9-1.0-1.0
Income bf taxes 318.0 315.9316.7-113.6388.0353.0
Income tax 93.6 57.8114.19.9135.4128.9
Income from con. op 224.3 258.1202.6-123.5252.5224.1
Income from discon. op 0.0 0.00.00.00.00.0
Net income 224.3 258.1202.6-123.5252.5224.1
NI contribution to KT 200.8 222.2179.9-126.1227.5197.0
EBITDA 1,267.6 1,288.31,215.1968.81,266.91,228.9
EBITDA Margin 22.6% 22.1%20.9%15.9%21.7%21.5%
KT Separate 1Q 17* 2Q 17*3Q 17*4Q 17*1Q 18*1Q 18
Operating revenue 4,161.4 4,292.64,312.04,575.34,418.44,297.2
Service Revenue 3,541.3 3,588.23,607.53,570.03,555.13,501.5
Wireless 1,770.5 1,759.51,791.21,782.51,751.31,713.8
Fixed line 1,231.2 1,212.61,210.11,186.51,197.91,186.5
Media/Contents 279.9 308.8311.6317.6323.1318.7
Other service 259.6 307.2294.7283.4282.7282.5
Merchandise rev. 620.1 704.4704.51,005.3863.3795.6
Operating expense 3,842.5 3,991.24,040.64,514.94,078.83,992.2
Service expense 3,106.4 3,253.83,278.53,473.33,227.93,141.3
Labor expense 497.8 502.5491.0575.3526.9526.9
General expense 1,605.6 1,655.81,687.61,779.01,633.41,627.8
Cost of svc provided 500.8 510.1509.2507.6519.0519.0
Selling expense 502.2 585.4590.7611.3548.5467.6
Cost of merch sold 736.1 737.3762.01,041.7850.9850.9
Operating income 318.9 301.4271.460.4339.6305.0
N-OP income (loss) 39.3 -127.7-46.2-205.2124.3127.3
N-operating income 389.0 45.5106.6200.8283.5284.8
N-operating expense 349.6 173.2152.7406.0159.2157.5
Income bf taxes 358.3 173.7225.3-144.8463.9432.2
Income tax 73.7 13.077.3-14.8123.9115.4
Net Income 284.6 160.7148.0-130.1340.0316.8
EBITDA 1,083.8 1,057.41,021.8805.71,081.31,046.6
EBITDA Margin 26.0% 24.6%23.7%17.6%24.5%24.4%
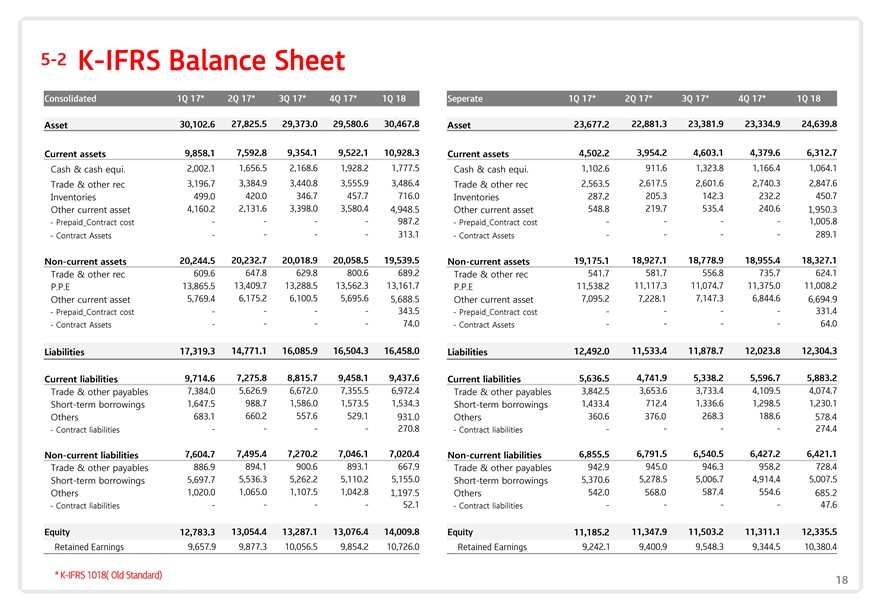
Consolidated 1Q 17* 2Q 17*3Q 17*4Q 17*1Q 18
Asset 30,102.6 27,825.529,373.029,580.630,467.8
Current assets 9,858.1 7,592.89,354.19,522.110,928.3
Cash��& cash equi. 2,002.1 1,656.52,168.61,928.21,777.5
Trade & other rec 3,196.7 3,384.93,440.83,555.93,486.4
Inventories 499.0 420.0346.7457.7716.0
Other current asset 4,160.2 2,131.63,398.03,580.44,948.5
- Prepaid_Contract cost - ---987.2
- Contract Assets - ---313.1
Non-current assets 20,244.5 20,232.720,018.920,058.519,539.5
Trade & other rec 609.6 647.8629.8800.6689.2
P.P.E 13,865.5 13,409.713,288.513,562.313,161.7
Other current asset 5,769.4 6,175.26,100.55,695.65,688.5
- Prepaid_Contract cost - ---343.5
- Contract Assets - ---74.0
Liabilities 17,319.3 14,771.116,085.916,504.316,458.0
Current liabilities 9,714.6 7,275.88,815.79,458.19,437.6
Trade & other payables 7,384.0 5,626.96,672.07,355.56,972.4
Short-term borrowings 1,647.5 988.71,586.01,573.51,534.3
Others 683.1 660.2557.6529.1931.0
- Contract liabilities - ---270.8
Non-current liabilities 7,604.7 7,495.47,270.27,046.17,020.4
Trade & other payables 886.9 894.1900.6893.1667.9
Short-term borrowings 5,697.7 5,536.35,262.25,110.25,155.0
Others 1,020.0 1,065.01,107.51,042.81,197.5
- Contract liabilities - ---52.1
Equity 12,783.3 13,054.413,287.113,076.414,009.8
Retained Earnings 9,657.9 9,877.310,056.59,854.210,726.0
Seperate 1Q 17* 2Q 17*3Q 17*4Q 17*1Q 18
Asset 23,677.2 22,881.323,381.923,334.924,639.8
Current assets 4,502.2 3,954.24,603.14,379.66,312.7
Cash & cash equi. 1,102.6 911.61,323.81,166.41,064.1
Trade & other rec 2,563.5 2,617.52,601.62,740.32,847.6
Inventories 287.2 205.3142.3232.2450.7
Other current asset 548.8 219.7535.4240.61,950.3
- Prepaid_Contract cost - ---1,005.8
- Contract Assets - ---289.1
Non-current assets 19,175.1 18,927.118,778.918,955.418,327.1
Trade & other rec 541.7 581.7556.8735.7624.1
P.P.E 11,538.2 11,117.311,074.711,375.011,008.2
Other current asset 7,095.2 7,228.17,147.36,844.66,694.9
- Prepaid_Contract cost - ---331.4
- Contract Assets - ---64.0
Liabilities 12,492.0 11,533.411,878.712,023.812,304.3
Current liabilities 5,636.5 4,741.95,338.25,596.75,883.2
Trade & other payables 3,842.5 3,653.63,733.44,109.54,074.7
Short-term borrowings 1,433.4 712.41,336.61,298.51,230.1
Others 360.6 376.0268.3188.6578.4
- Contract liabilities - ---274.4
Non-current liabilities 6,855.5 6,791.56,540.56,427.26,421.1
Trade & other payables 942.9 945.0946.3958.2728.4
Short-term borrowings 5,370.6 5,278.55,006.74,914.45,007.5
Others 542.0 568.0587.4554.6685.2
- Contract liabilities - ---47.6
Equity 11,185.2 11,347.911,503.211,311.112,335.5
Retained Earnings 9,242.1 9,400.99,548.39,344.510,380.4
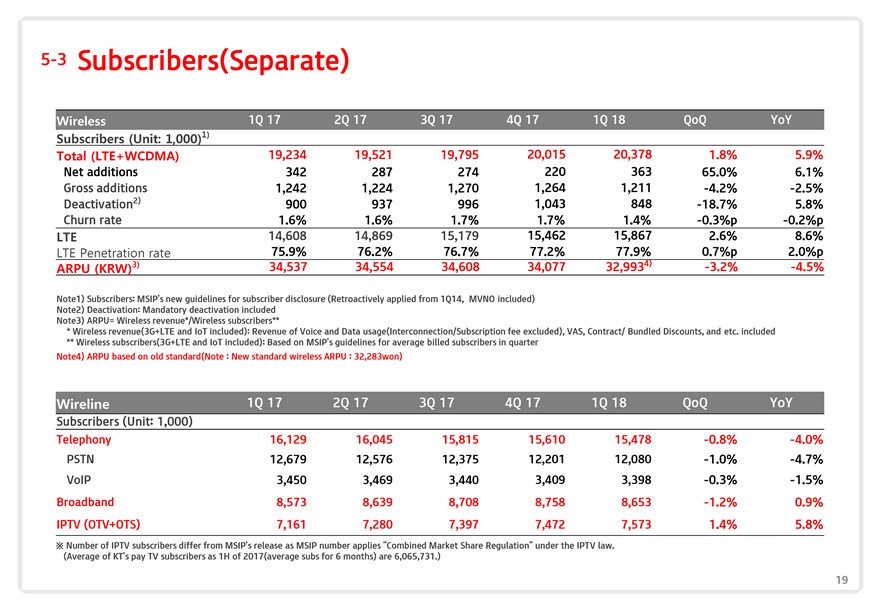
5-3 Subscribers(Separate)
Wireless 1Q 17 2Q 173Q 174Q 171Q 18QoQ YoY
Subscribers (Unit: 1,000)1)
Total (LTE+WCDMA) 19,234 19,52119,79520,01520,3781.8%5.9%
Net additions 342 28727422036365.0%6.1%
Gross additions 1,242 1,2241,2701,2641,211-4.2%-2.5%
Deactivation2) 900 9379961,043848-18.7%5.8%
Churn rate 1.6% 1.6%1.7%1.7%1.4%-0.3%p-0.2%p
LTE 14,608 14,86915,17915,46215,8672.6%8.6%
LTE Penetration rate 75.9% 76.2%76.7%77.2%77.9%0.7%p2.0%p
ARPU (KRW)3) 34,537 34,55434,60834,07732,9934)-3.2%-4.5%
Note1) Subscribers: MSIP’s new guidelines for subscriber disclosure (Retroactively applied from 1Q14, MVNO included)
Note2) Deactivation: Mandatory deactivation included
Note3) ARPU= Wireless revenue*/Wireless subscribers**
* Wireless revenue(3G+LTE and IoT included): Revenue of Voice and Data usage(Interconnection/Subscription fee excluded), VAS, Contract/ Bundled Discounts, and etc. included
** Wireless subscribers(3G+LTE and IoT included): Based on MSIP’s guidelines for average billed subscribers in quarter
Note4) ARPU based on old standard(Note : New standard wireless ARPU : 32,283won)
Wireline 1Q 17 2Q 173Q 174Q 171Q 18QoQ YoY
Subscribers (Unit: 1,000)
Telephony 16,129 16,04515,81515,61015,478-0.8%-4.0%
PSTN 12,679 12,57612,37512,20112,080-1.0%-4.7%
VoIP 3,450 3,4693,4403,4093,398-0.3%-1.5%
Broadband 8,573 8,6398,7088,7588,653-1.2%0.9%
IPTV (OTV+OTS) 7,161 7,2807,3977,4727,5731.4%5.8%
Number of IPTV subscribers differ from MSIP’s release as MSIP number applies “Combined Market Share Regulation” under the IPTV law.
(Average of KT’s pay TV subscribers as 1H of 2017(average subs for 6 months) are 6,065,731.)
19
PEOPLE TECHNOLOGY