SECURITIES AND EXCHANGE COMMISSION
Washington, D.C. 20549
Form6-K
REPORT OF FOREIGN PRIVATE ISSUER
PURSUANT TO RULE13a-16 OR15d-16
OF THE SECURITIES EXCHANGE ACT OF 1934
For the month of February 2019
Commission File Number1-14926
KT Corporation
(Translation of registrant’s name into English)
90,Buljeong-ro,
Bundang-gu,Seongnam-si,
Gyeonggi-do,
Korea
(Address of principal executive offices)
Indicate by check mark whether the registrant files or will file annual reports under cover of Form20-F or Form40-F:
Form20-F ☒ Form40-F ☐
Indicate by check mark if the registrant is submitting the Form6-K in paper as permitted by RegulationS-T Rule 101(b)(1): ☐
Indicate by check mark if the registrant is submitting the Form6-K in paper as permitted by RegulationS-T Rule 101(b)(7): ☐
Indicate by check mark whether by furnishing the information contained in this Form, the registrant is also thereby furnishing the information to the Commission pursuant to Rule12g3-2(b) under the Securities Exchange Act of 1934.
Yes ☐ No ☒
If “Yes” is marked, indicate below the file number assigned to the registrant in connection with Rule12g3-2(b):82-
SIGNATURES
Pursuant to the requirements of the Securities Exchange Act of 1934, the registrant has duly caused this report to be signed on its behalf by the undersigned, thereunto duly authorized.
| Dated: February 12, 2019 | ||
| KT Corporation | ||
| By: | /s/ Seunghoon Chi | |
| Name: Seunghoon Chi | ||
| Title: Vice President | ||
| By: | /s/ Youngkyoon Yun | |
| Name: Youngkyoon Yun | ||
| Title: Director | ||

KT 2018 Earnings Release
Disclaimer This presentation has been prepared by KT Corp.(the “Company”). This presentation contains forward-looking statements, which are subject to risks, uncertainties, and assumptions. This presentation is being presented solely for your information and is subject to change without notice. No presentation or warranty, expressed or implied, is made and no reliance should be placed on the accuracy, actuality, fairness, or completeness of the information presented. KT Corp has applied new accounting standard of ‘K-IFRS 1115’ as of Jan 1st, 2018. Accordingly, we have elected the modified retrospective approach which will recognize the cumulative impact of the new standard as an adjustment to retained earnings as at January 1 2018, the period of initial application. That said, there are no obligation to apply the new standard to previous financial statements. In this material, despite the new accounting standard, we have included the restated figures for 2018 prepared under IFRS 1018 (old-standard) for investors’ understandings. The restated figures are followed by ‘*’ marking. However, please be noted that these restated figures have not been audited or reviewed by external auditors. If you have any related questions to this material, please contact IR department. Tel : +82-2-3495-3512, 3254, 3564, 3976, 5343 Fax : +82-2-3495-5917
Contents 1 Financial Highlights 2 Business Overviews 3 Q&A 4 Appendix
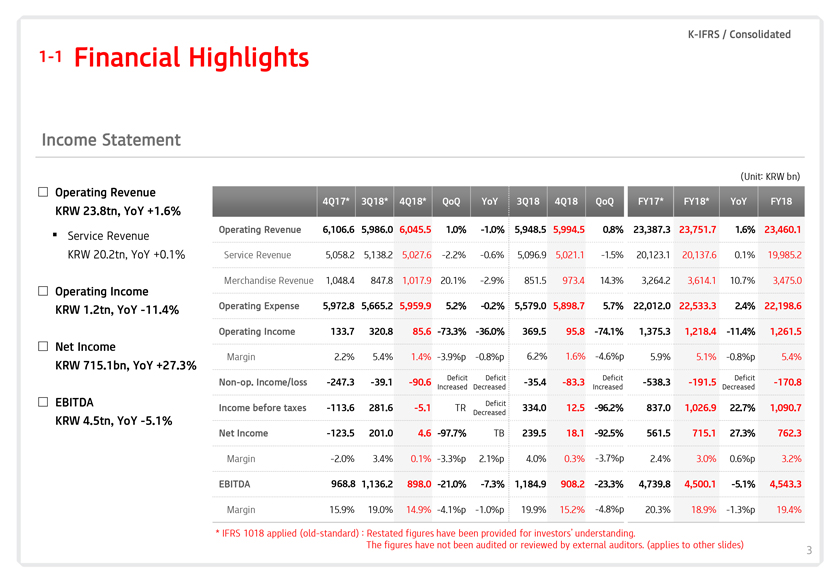
K-IFRS / Consolidated 1-1 Financial Highlights Income Statement (Unit: KRW bn) Operating Revenue 4Q17* 3Q18* 4Q18* QoQ YoY 3Q18 4Q18 QoQ FY17* FY18* YoY FY18 KRW 23.8tn, YoY +1.6% Operating Revenue 6,106.6 5,986.0 6,045.5 1.0% -1.0% 5,948.5 5,994.5 0.8% 23,387.3 23,751.7 1.6% 23,460.1 Service Revenue KRW 20.2tn, YoY +0.1% Service Revenue 5,058.2 5,138.2 5,027.6 -2.2% -0.6% 5,096.9 5,021.1 -1.5% 20,123.1 20,137.6 0.1% 19,985.2 Merchandise Revenue 1,048.4 847.8 1,017.9 20.1% -2.9% 851.5 973.4 14.3% 3,264.2 3,614.1 10.7% 3,475.0 Operating Income KRW 1.2tn, YoY -11.4% Operating Expense 5,972.8 5,665.2 5,959.9 5.2% -0.2% 5,579.0 5,898.7 5.7% 22,012.0 22,533.3 2.4% 22,198.6 Operating Income 133.7 320.8 85.6 -73.3% -36.0% 369.5 95.8 -74.1% 1,375.3 1,218.4 -11.4% 1,261.5 Net Income KRW 715.1bn, YoY +27.3% Margin 2.2% 5.4% 1.4% -3.9%p -0.8%p 6.2% 1.6% -4.6%p 5.9% 5.1% -0.8%p 5.4% Deficit Deficit Deficit Deficit Non-op. Income/loss -247.3 -39.1 -90.6 -35.4 -83.3 -538.3 -191.5 -170.8 Increased Decreased Increased Decreased EBITDA Deficit Income before taxes -113.6 281.6 -5.1 TR 334.0 12.5 -96.2% 837.0 1,026.9 22.7% 1,090.7 KRW 4.5tn, YoY -5.1% Decreased Net Income -123.5 201.0 4.6 -97.7% TB 239.5 18.1 -92.5% 561.5 715.1 27.3% 762.3 Margin -2.0% 3.4% 0.1% -3.3%p 2.1%p 4.0% 0.3% -3.7%p 2.4% 3.0% 0.6%p 3.2% EBITDA 968.8 1,136.2 898.0 -21.0% -7.3% 1,184.9 908.2 -23.3% 4,739.8 4,500.1 -5.1% 4,543.3 Margin 15.9% 19.0% 14.9% -4.1%p -1.0%p 19.9% 15.2% -4.8%p 20.3% 18.9% -1.3%p 19.4% * IFRS 1018 applied (old-standard) : Restated figures have been provided for investors’ understanding. The figures have not been audited or reviewed by external auditors. (applies to other slides) 3
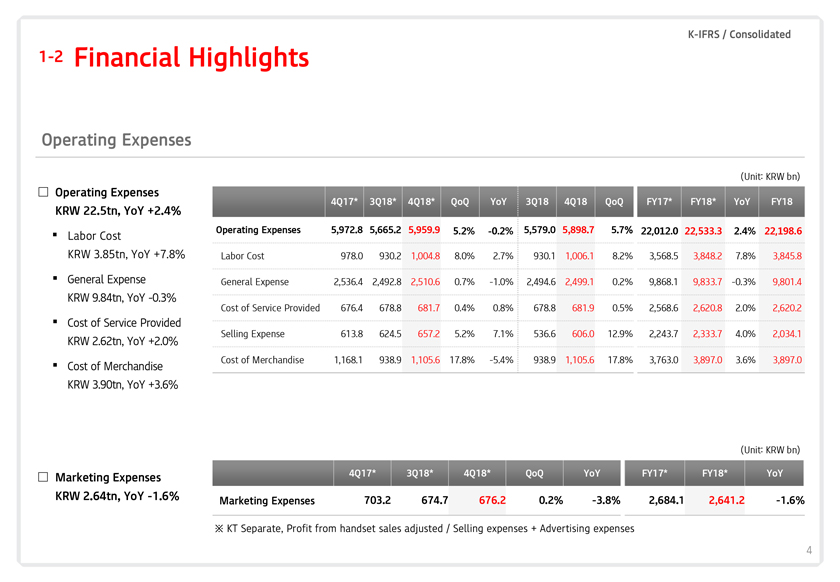
K-IFRS / Consolidated 1-2 Financial Highlights Operating Expenses (Unit: KRW bn) Operating Expenses 4Q17* 3Q18* 4Q18* QoQ YoY 3Q18 4Q18 QoQ FY17* FY18* YoY FY18 KRW 22.5tn, YoY +2.4% Operating Expenses 5,972.8 5,665.2 5,959.9 5.2% -0.2% 5,579.0 5,898.7 5.7% 22,012.0 22,533.3 2.4% 22,198.6 Labor Cost KRW 3.85tn, YoY +7.8% Labor Cost 978.0 930.2 1,004.8 8.0% 2.7% 930.1 1,006.1 8.2% 3,568.5 3,848.2 7.8% 3,845.8 General Expense General Expense 2,536.4 2,492.8 2,510.6 0.7% -1.0% 2,494.6 2,499.1 0.2% 9,868.1 9,833.7 -0.3% 9,801.4 KRW 9.84tn, YoY -0.3% Cost of Service Provided 676.4 678.8 681.7 0.4% 0.8% 678.8 681.9 0.5% 2,568.6 2,620.8 2.0% 2,620.2 Cost of Service Provided Selling Expense 613.8 624.5 657.2 5.2% 7.1% 536.6 606.0 12.9% 2,243.7 2,333.7 4.0% 2,034.1 KRW 2.62tn, YoY +2.0% Cost of Merchandise 1,168.1 938.9 1,105.6 17.8% -5.4% 938.9 1,105.6 17.8% 3,763.0 3,897.0 3.6% 3,897.0 Cost of Merchandise KRW 3.90tn, YoY +3.6% (Unit: KRW bn) Marketing Expenses 4Q17* 3Q18* 4Q18* QoQ YoY FY17* FY18* YoY KRW 2.64tn, YoY -1.6% Marketing Expenses 703.2 674.7 676.2 0.2% -3.8% 2,684.1 2,641.2 -1.6% KT Separate, Profit from handset sales adjusted / Selling expenses + Advertising expenses 4
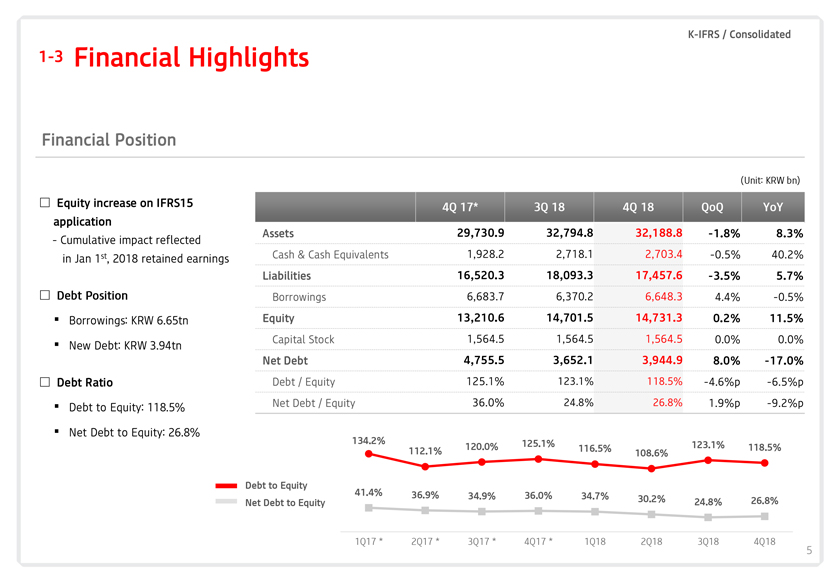
K-IFRS / Consolidated 1-3 Financial Highlights Financial Position (Unit: KRW bn) Equity increase on IFRS15 4Q 17* 3Q 18 4Q 18 QoQ YoY application Assets 29,730.9 32,794.8 32,188.8 -1.8% 8.3% - Cumulative impact reflected in Jan 1st, 2018 retained earnings Cash & Cash Equivalents 1,928.2 2,718.1 2,703.4 -0.5% 40.2% Liabilities 16,520.3 18,093.3 17,457.6 -3.5% 5.7% Debt Position Borrowings 6,683.7 6,370.2 6,648.3 4.4% -0.5% Borrowings: KRW 6.65tn Equity 13,210.6 14,701.5 14,731.3 0.2% 11.5% Capital Stock 1,564.5 1,564.5 1,564.5 0.0% 0.0% New Debt: KRW 3.94tn Net Debt 4,755.5 3,652.1 3,944.9 8.0% -17.0% Debt Ratio Debt / Equity 125.1% 123.1% 118.5% -4.6%p -6.5%p Net Debt / Equity 36.0% 24.8% 26.8% 1.9%p -9.2%p Debt to Equity: 118.5% Net Debt to Equity: 26.8% 134.2% 125.1% 120.0% 123.1% 118.5% 112.1% 116.5% 108.6% Debt to Equity 41.4% 36.9% 34.9% 36.0% 34.7% 30.2% 24.8% 26.8% Net Debt to Equity 1Q17 * 2Q17 * 3Q17 * 4Q17 * 1Q18 2Q18 3Q18 4Q18 5
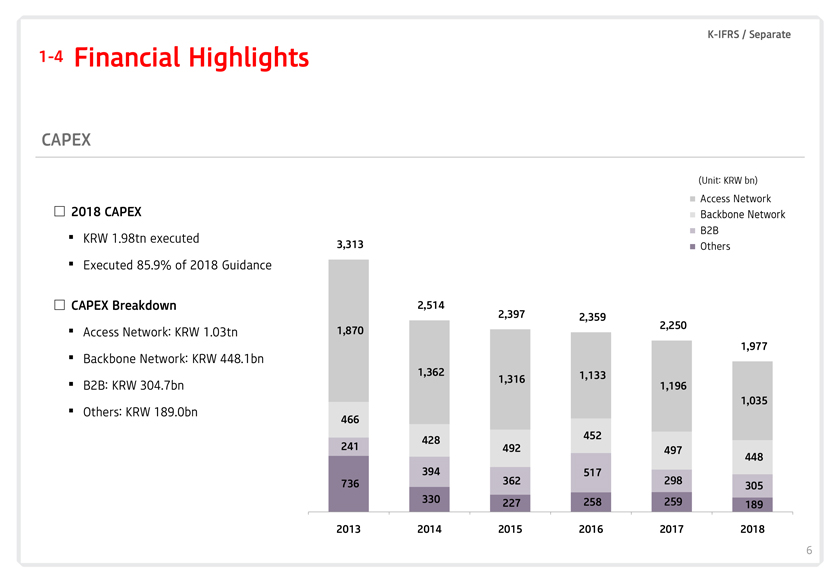
END K-IFRS / Separate 1-4 Financial Highlights CAPEX (Unit: KRW bn) Access Network 2018 CAPEX Backbone Network B2B KRW 1.98tn executed 3,313 Others Executed 85.9% of 2018 Guidance CAPEX Breakdown 2,514 2,397 2,359 2,250 Access Network: KRW 1.03tn 1,870 1,977 Backbone Network: KRW 448.1bn 1,362 1,133 1,316 B2B: KRW 304.7bn 1,196 1,035 Others: KRW 189.0bn 466 452 428 241 492 497 448 394 517 736 362 298 305 330 227 258 259 189 2013 2014 2015 2016 2017 2018 6
Contents 1 Financial Highlights 2 Business Overviews 3 Q&A 4 Appendix
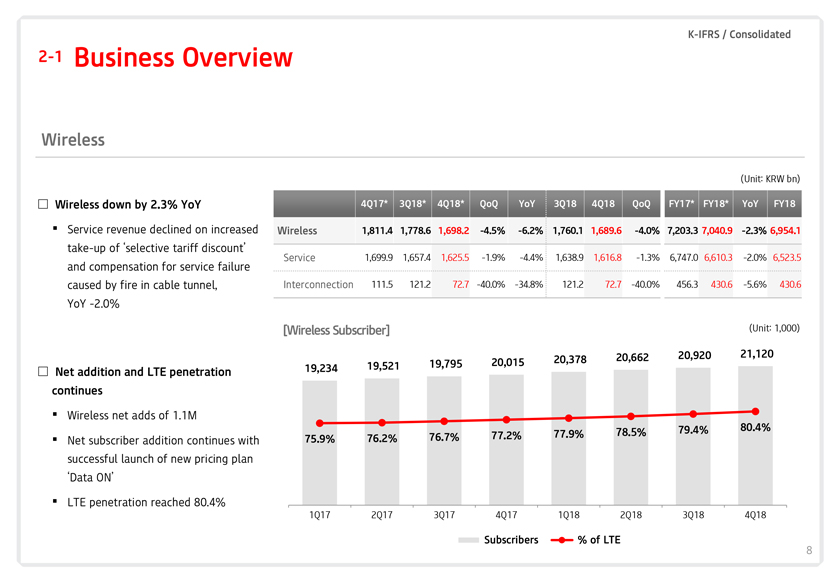
K-IFRS / Consolidated 2-1 Business Overview Wireless (Unit: KRW bn) Wireless down by 2.3% YoY 4Q17* 3Q18* 4Q18* QoQ YoY 3Q18 4Q18 QoQ FY17* FY18* YoY FY18 Service revenue declined on increased Wireless 1,811.4 1,778.6 1,698.2 -4.5% -6.2% 1,760.1 1,689.6 -4.0% 7,203.3 7,040.9 -2.3% 6,954.1 take-up of ‘selective tariff discount’ Service 1,699.9 1,657.4 1,625.5 -1.9% -4.4% 1,638.9 1,616.8 -1.3% 6,747.0 6,610.3 -2.0% 6,523.5 and compensation for service failure caused by fire in cable tunnel, Interconnection 111.5 121.2 72.7 -40.0% -34.8% 121.2 72.7 -40.0% 456.3 430.6 -5.6% 430.6 YoY -2.0% [Wireless Subscriber] (Unit: 1,000) 20,662 20,920 21,120 20,015 20,378 19,521 19,795 Net addition and LTE penetration 19,234 continues Wireless net adds of 1.1M 79.4% 80.4% 77.2% 77.9% 78.5% Net subscriber addition continues with 75.9% 76.2% 76.7% successful launch of new pricing plan ‘Data ON’ LTE penetration reached 80.4% 1Q17 2Q17 3Q17 4Q17 1Q18 2Q18 3Q18 4Q18 Subscribers % of LTE 8
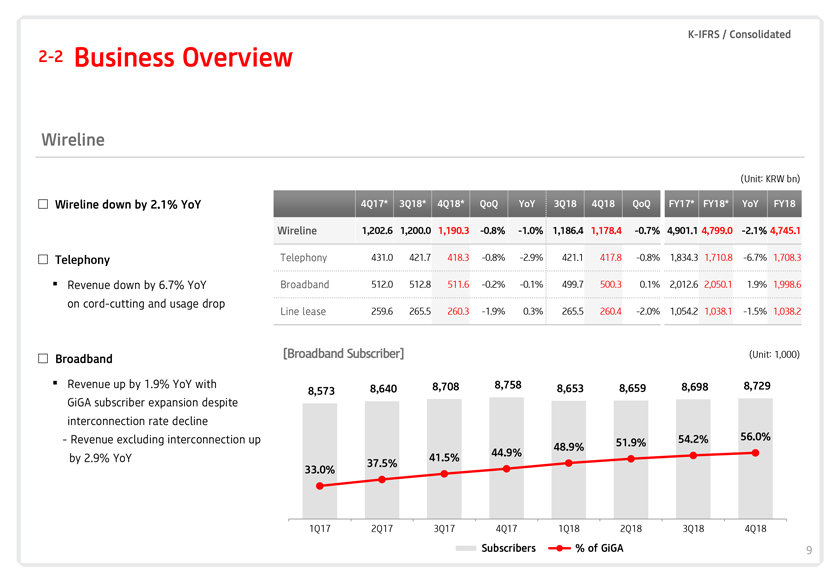
K-IFRS / Consolidated 2-2 Business Overview Wireline (Unit: KRW bn) Wireline down by 2.1% YoY 4Q17* 3Q18* 4Q18* QoQ YoY 3Q18 4Q18 QoQ FY17* FY18* YoY FY18 Wireline 1,202.6 1,200.0 1,190.3 -0.8% -1.0% 1,186.4 1,178.4 -0.7% 4,901.1 4,799.0 -2.1% 4,745.1 Telephony Telephony 431.0 421.7 418.3 -0.8% -2.9% 421.1 417.8 -0.8% 1,834.3 1,710.8 -6.7% 1,708.3 Revenue down by 6.7% YoY Broadband 512.0 512.8 511.6 -0.2% -0.1% 499.7 500.3 0.1% 2,012.6 2,050.1 1.9% 1,998.6 on cord-cutting and usage drop Line lease 259.6 265.5 260.3 -1.9% 0.3% 265.5 260.4 -2.0% 1,054.2 1,038.1 -1.5% 1,038.2 [Broadband Subscriber] (Unit: 1,000) Broadband Revenue up by 1.9% YoY with 8,708 8,758 8,659 8,698 8,729 8,573 8,640 8,653 GiGA subscriber expansion despite interconnection rate decline - Revenue excluding interconnection up 54.2% 56.0% 51.9% 48.9% 44.9% by 2.9% YoY 41.5% 37.5% 33.0% 1Q17 2Q17 3Q17 4Q17 1Q18 2Q18 3Q18 4Q18 Subscribers % of GiGA 9
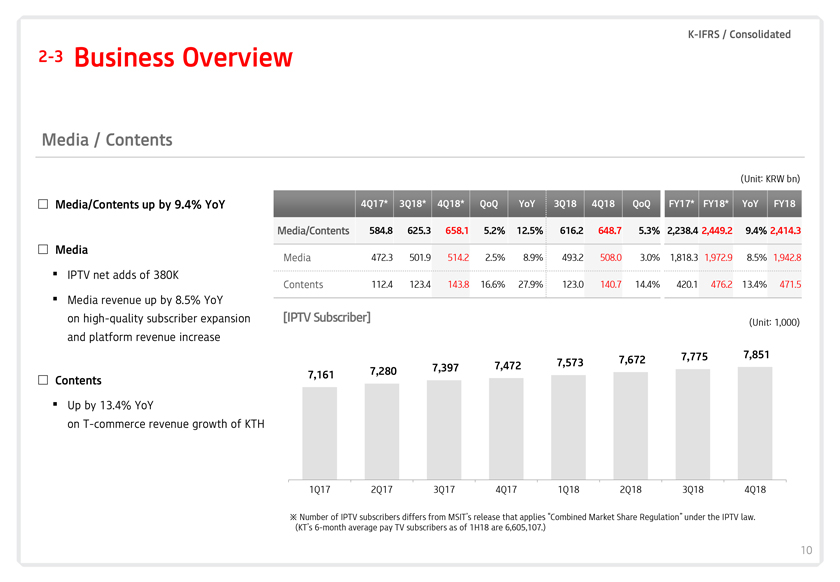
K-IFRS / Consolidated 2-3 Business Overview Media / Contents (Unit: KRW bn) Media/Contents up by 9.4% YoY 4Q17* 3Q18* 4Q18* QoQ YoY 3Q18 4Q18 QoQ FY17* FY18* YoY FY18 Media/Contents 584.8 625.3 658.1 5.2% 12.5% 616.2 648.7 5.3% 2,238.4 2,449.2 9.4% 2,414.3 Media 472.3 501.9 514.2 2.5% 8.9% 493.2 508.0 3.0% 1,818.3 1,972.9 8.5% 1,942.8 Media IPTV net adds of 380K Contents 112.4 123.4 143.8 16.6% 27.9% 123.0 140.7 14.4% 420.1 476.2 13.4% 471.5 Media revenue up by 8.5% YoY on high-quality subscriber expansion [IPTV Subscriber] (Unit: 1,000) and platform revenue increase 7,775 7,851 7,573 7,672 7,397 7,472 7,161 7,280 Contents Up by 13.4% YoY on T-commerce revenue growth of KTH 1Q17 2Q17 3Q17 4Q17 1Q18 2Q18 3Q18 4Q18 Number of IPTV subscribers differs from MSIT’s release that applies “Combined Market Share Regulation” under the IPTV law. (KT’s 6-month average pay TV subscribers as of 1H18 are 6,605,107.) 10
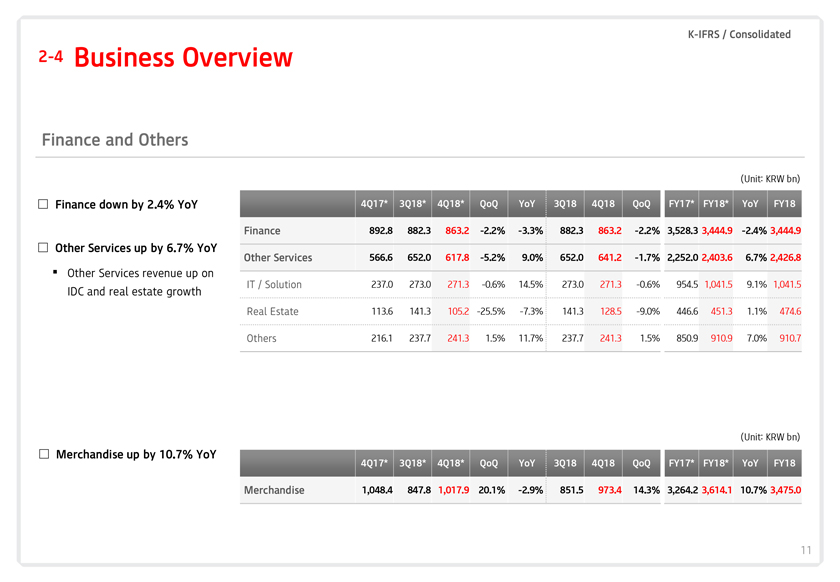
K-IFRS / Consolidated 2-4 Business Overview Finance and Others (Unit: KRW bn) Finance down by 2.4% YoY 4Q17* 3Q18* 4Q18* QoQ YoY 3Q18 4Q18 QoQ FY17* FY18* YoY FY18 Finance 892.8 882.3 863.2 -2.2% -3.3% 882.3 863.2 -2.2% 3,528.3 3,444.9 -2.4% 3,444.9 Other Services up by 6.7% YoY Other Services 566.6 652.0 617.8 -5.2% 9.0% 652.0 641.2 -1.7% 2,252.0 2,403.6 6.7% 2,426.8 Other Services revenue up on IT / Solution 237.0 273.0 271.3 -0.6% 14.5% 273.0 271.3 -0.6% 954.5 1,041.5 9.1% 1,041.5 IDC and real estate growth Real Estate 113.6 141.3 105.2 -25.5% -7.3% 141.3 128.5 -9.0% 446.6 451.3 1.1% 474.6 Others 216.1 237.7 241.3 1.5% 11.7% 237.7 241.3 1.5% 850.9 910.9 7.0% 910.7 (Unit: KRW bn) Merchandise up by 10.7% YoY 4Q17* 3Q18* 4Q18* QoQ YoY 3Q18 4Q18 QoQ FY17* FY18* YoY FY18 Merchandise 1,048.4 847.8 1,017.9 20.1% -2.9% 851.5 973.4 14.3% 3,264.2 3,614.1 10.7% 3,475.0 11

Contents 1 Financial Highlights 2 Business Overviews 3 Q&A 4 Appendix

Contents 1 Financial Highlights 2 Business Overviews 3 Q&A 4 Appendix
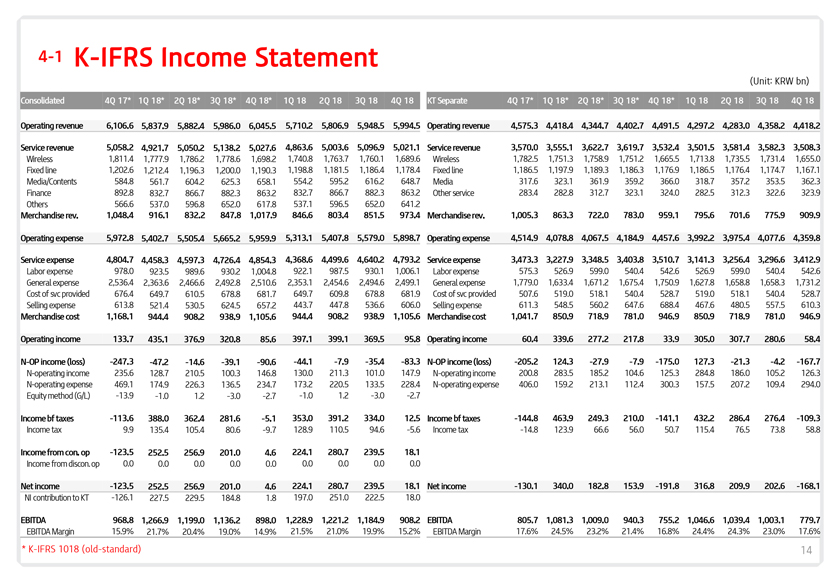
4-1 K-IFRS Income Statement (Unit: KRW bn) Consolidated 4Q 17* 1Q 18* 2Q 18* 3Q 18* 4Q 18* 1Q 18 2Q 18 3Q 18 4Q 18 KT Separate 4Q 17* 1Q 18* 2Q 18* 3Q 18* 4Q 18* 1Q 18 2Q 18 3Q 18 4Q 18 Operating revenue 6,106.6 5,837.9 5,882.4 5,986.0 6,045.5 5,710.2 5,806.9 5,948.5 5,994.5 Operating revenue 4,575.3 4,418.4 4,344.7 4,402.7 4,491.5 4,297.2 4,283.0 4,358.2 4,418.2 Service revenue 5,058.2 4,921.7 5,050.2 5,138.2 5,027.6 4,863.6 5,003.6 5,096.9 5,021.1 Service revenue 3,570.0 3,555.1 3,622.7 3,619.7 3,532.4 3,501.5 3,581.4 3,582.3 3,508.3 Wireless 1,811.4 1,777.9 1,786.2 1,778.6 1,698.2 1,740.8 1,763.7 1,760.1 1,689.6 Wireless 1,782.5 1,751.3 1,758.9 1,751.2 1,665.5 1,713.8 1,735.5 1,731.4 1,655.0 Fixed line 1,202.6 1,212.4 1,196.3 1,200.0 1,190.3 1,198.8 1,181.5 1,186.4 1,178.4 Fixed line 1,186.5 1,197.9 1,189.3 1,186.3 1,176.9 1,186.5 1,176.4 1,174.7 1,167.1 Media/Contents 584.8 561.7 604.2 625.3 658.1 554.2 595.2 616.2 648.7 Media 317.6 323.1 361.9 359.2 366.0 318.7 357.2 353.5 362.3 Finance 892.8 832.7 866.7 882.3 863.2 832.7 866.7 882.3 863.2 Other service 283.4 282.8 312.7 323.1 324.0 282.5 312.3 322.6 323.9 Others 566.6 537.0 596.8 652.0 617.8 537.1 596.5 652.0 641.2 Merchandise rev. 1,048.4 916.1 832.2 847.8 1,017.9 846.6 803.4 851.5 973.4 Merchandise rev. 1,005.3 863.3 722.0 783.0 959.1 795.6 701.6 775.9 909.9 Operating expense 5,972.8 5,402.7 5,505.4 5,665.2 5,959.9 5,313.1 5,407.8 5,579.0 5,898.7 Operating expense 4,514.9 4,078.8 4,067.5 4,184.9 4,457.6 3,992.2 3,975.4 4,077.6 4,359.8 Service expense 4,804.7 4,458.3 4,597.3 4,726.4 4,854.3 4,368.6 4,499.6 4,640.2 4,793.2 Service expense 3,473.3 3,227.9 3,348.5 3,403.8 3,510.7 3,141.3 3,256.4 3,296.6 3,412.9 Labor expense 978.0 923.5 989.6 930.2 1,004.8 922.1 987.5 930.1 1,006.1 Labor expense 575.3 526.9 599.0 540.4 542.6 526.9 599.0 540.4 542.6 General expense 2,536.4 2,363.6 2,466.6 2,492.8 2,510.6 2,353.1 2,454.6 2,494.6 2,499.1 General expense 1,779.0 1,633.4 1,671.2 1,675.4 1,750.9 1,627.8 1,658.8 1,658.3 1,731.2 Cost of svc provided 676.4 649.7 610.5 678.8 681.7 649.7 609.8 678.8 681.9 Cost of svc provided 507.6 519.0 518.1 540.4 528.7 519.0 518.1 540.4 528.7 Selling expense 613.8 521.4 530.5 624.5 657.2 443.7 447.8 536.6 606.0 Selling expense 611.3 548.5 560.2 647.6 688.4 467.6 480.5 557.5 610.3 Merchandise cost 1,168.1 944.4 908.2 938.9 1,105.6 944.4 908.2 938.9 1,105.6 Merchandise cost 1,041.7 850.9 718.9 781.0 946.9 850.9 718.9 781.0 946.9 Operating income 133.7 435.1 376.9 320.8 85.6 397.1 399.1 369.5 95.8 Operating income 60.4 339.6 277.2 217.8 33.9 305.0 307.7 280.6 58.4 N-OP income (loss) -247.3 -47.2 -14.6 -39.1 -90.6 -44.1 -7.9 -35.4 -83.3 N-OP income (loss) -205.2 124.3 -27.9 -7.9 -175.0 127.3 -21.3 -4.2 -167.7 N-operating income 235.6 128.7 210.5 100.3 146.8 130.0 211.3 101.0 147.9 N-operating income 200.8 283.5 185.2 104.6 125.3 284.8 186.0 105.2 126.3 N-operating expense 469.1 174.9 226.3 136.5 234.7 173.2 220.5 133.5 228.4 N-operating expense 406.0 159.2 213.1 112.4 300.3 157.5 207.2 109.4 294.0 Equity method (G/L) -13.9 -1.0 1.2 -3.0 -2.7 -1.0 1.2 -3.0 -2.7 Income bf taxes -113.6 388.0 362.4 281.6 -5.1 353.0 391.2 334.0 12.5 Income bf taxes -144.8 463.9 249.3 210.0 -141.1 432.2 286.4 276.4 -109.3 Income tax 9.9 135.4 105.4 80.6 -9.7 128.9 110.5 94.6 -5.6 Income tax -14.8 123.9 66.6 56.0 50.7 115.4 76.5 73.8 58.8 Income from con. op -123.5 252.5 256.9 201.0 4.6 224.1 280.7 239.5 18.1 Income from discon. op 0.0 0.0 0.0 0.0 0.0 0.0 0.0 0.0 0.0 Net income -123.5 252.5 256.9 201.0 4.6 224.1 280.7 239.5 18.1 Net income -130.1 340.0 182.8 153.9 -191.8 316.8 209.9 202.6 -168.1 NI contribution to KT -126.1 227.5 229.5 184.8 1.8 197.0 251.0 222.5 18.0 EBITDA 968.8 1,266.9 1,199.0 1,136.2 898.0 1,228.9 1,221.2 1,184.9 908.2 EBITDA 805.7 1,081.3 1,009.0 940.3 755.2 1,046.6 1,039.4 1,003.1 779.7 EBITDA Margin 15.9% 21.7% 20.4% 19.0% 14.9% 21.5% 21.0% 19.9% 15.2% EBITDA Margin 17.6% 24.5% 23.2% 21.4% 16.8% 24.4% 24.3% 23.0% 17.6% * K-IFRS 1018 (old-standard) 14
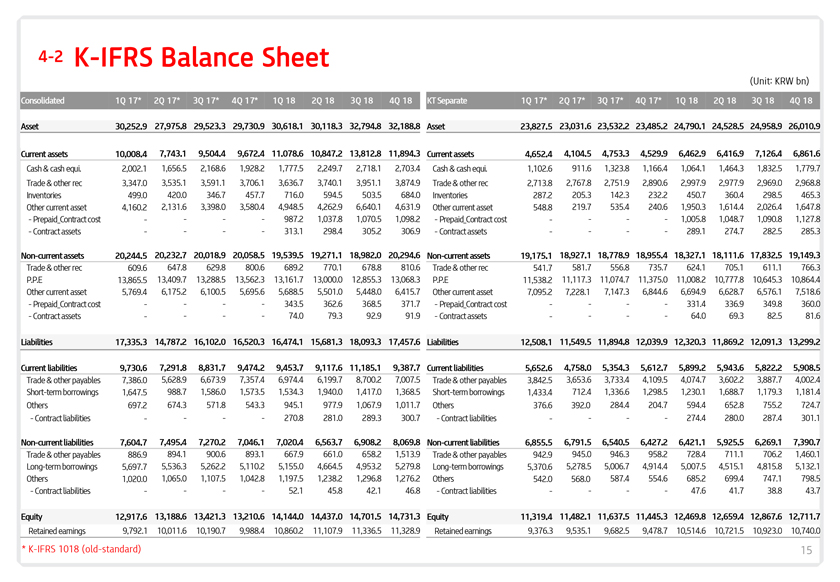
4-2 K-IFRS Balance Sheet (Unit: KRW bn) Consolidated 1Q 17* 2Q 17* 3Q 17* 4Q 17* 1Q 18 2Q 18 3Q 18 4Q 18 KT Separate 1Q 17* 2Q 17* 3Q 17* 4Q 17* 1Q 18 2Q 18 3Q 18 4Q 18 Asset 30,252.9 27,975.8 29,523.3 29,730.9 30,618.1 30,118.3 32,794.8 32,188.8 Asset 23,827.5 23,031.6 23,532.2 23,485.2 24,790.1 24,528.5 24,958.9 26,010.9 Current assets 10,008.4 7,743.1 9,504.4 9,672.4 11.078.6 10,847.2 13,812.8 11,894.3 Current assets 4,652.4 4,104.5 4,753.3 4,529.9 6,462.9 6,416.9 7,126.4 6,861.6 Cash & cash equi. 2,002.1 1,656.5 2,168.6 1,928.2 1,777.5 2,249.7 2,718.1 2,703.4 Cash & cash equi. 1,102.6 911.6 1,323.8 1,166.4 1,064.1 1,464.3 1,832.5 1,779.7 Trade & other rec 3,347.0 3,535.1 3,591.1 3,706.1 3,636.7 3,740.1 3,951.1 3,874.9 Trade & other rec 2,713.8 2,767.8 2,751.9 2,890.6 2,997.9 2,977.9 2,969.0 2,968.8 Inventories 499.0 420.0 346.7 457.7 716.0 594.5 503.5 684.0 Inventories 287.2 205.3 142.3 232.2 450.7 360.4 298.5 465.3 Other current asset 4,160.2 2,131.6 3,398.0 3,580.4 4,948.5 4,262.9 6,640.1 4,631.9 Other current asset 548.8 219.7 535.4 240.6 1,950.3 1,614.4 2,026.4 1,647.8 -Prepaid_Contractcost - - - - 987.2 1,037.8 1,070.5 1,098.2 -Prepaid_Contractcost - - - - 1,005.8 1,048.7 1,090.8 1,127.8 -Contract assets - - - - 313.1 298.4 305.2 306.9 -Contract assets - - - - 289.1 274.7 282.5 285.3 Non-current assets 20,244.5 20,232.7 20,018.9 20,058.5 19,539.5 19,271.1 18,982.0 20,294.6 Non-current assets 19,175.1 18,927.1 18,778.9 18,955.4 18,327.1 18,111.6 17,832.5 19,149.3 Trade & other rec 609.6 647.8 629.8 800.6 689.2 770.1 678.8 810.6 Trade & other rec 541.7 581.7 556.8 735.7 624.1 705.1 611.1 766.3 P.P.E 13,865.5 13,409.7 13,288.5 13,562.3 13,161.7 13,000.0 12,855.3 13,068.3 P.P.E 11,538.2 11,117.3 11,074.7 11,375.0 11,008.2 10,777.8 10,645.3 10,864.4 Other current asset 5,769.4 6,175.2 6,100.5 5,695.6 5,688.5 5,501.0 5,448.0 6,415.7 Other current asset 7,095.2 7,228.1 7,147.3 6,844.6 6,694.9 6,628.7 6,576.1 7,518.6 -Prepaid_Contractcost - - - - 343.5 362.6 368.5 371.7 -Prepaid_Contractcost - - - - 331.4 336.9 349.8 360.0 -Contract assets - - - - 74.0 79.3 92.9 91.9 -Contract assets - - - - 64.0 69.3 82.5 81.6 Liabilities 17,335.3 14,787.2 16,102.0 16,520.3 16,474.1 15,681.3 18,093.3 17,457.6 Liabilities 12,508.1 11,549.5 11,894.8 12,039.9 12,320.3 11,869.2 12,091.3 13,299.2 Current liabilities 9,730.6 7,291.8 8,831.7 9,474.2 9,453.7 9,117.6 11,185.1 9,387.7 Current liabilities 5,652.6 4,758.0 5,354.3 5,612.7 5,899.2 5,943.6 5,822.2 5,908.5 Trade & other payables 7,386.0 5,628.9 6,673.9 7,357.4 6,974.4 6,199.7 8,700.2 7,007.5 Trade & other payables 3,842.5 3,653.6 3,733.4 4,109.5 4,074.7 3,602.2 3,887.7 4,002.4 Short-term borrowings 1,647.5 988.7 1,586.0 1,573.5 1,534.3 1,940.0 1,417.0 1,368.5 Short-term borrowings 1,433.4 712.4 1,336.6 1,298.5 1,230.1 1,688.7 1,179.3 1,181.4 Others 697.2 674.3 571.8 543.3 945.1 977.9 1,067.9 1,011.7 Others 376.6 392.0 284.4 204.7 594.4 652.8 755.2 724.7 -Contract liabilities - - - - 270.8 281.0 289.3 300.7 -Contract liabilities - - - - 274.4 280.0 287.4 301.1 Non-current liabilities 7,604.7 7,495.4 7,270.2 7,046.1 7,020.4 6,563.7 6,908.2 8,069.8 Non-current liabilities 6,855.5 6,791.5 6,540.5 6,427.2 6,421.1 5,925.5 6,269.1 7,390.7 Trade & other payables 886.9 894.1 900.6 893.1 667.9 661.0 658.2 1,513.9 Trade & other payables 942.9 945.0 946.3 958.2 728.4 711.1 706.2 1,460.1 Long-term borrowings 5,697.7 5,536.3 5,262.2 5,110.2 5,155.0 4,664.5 4,953.2 5,279.8 Long-term borrowings 5,370.6 5,278.5 5,006.7 4,914.4 5,007.5 4,515.1 4,815.8 5,132.1 Others 1,020.0 1,065.0 1,107.5 1,042.8 1,197.5 1,238.2 1,296.8 1,276.2 Others 542.0 568.0 587.4 554.6 685.2 699.4 747.1 798.5 -Contract liabilities - - - - 52.1 45.8 42.1 46.8 -Contract liabilities - - - - 47.6 41.7 38.8 43.7 Equity 12,917.6 13,188.6 13,421.3 13,210.6 14,144.0 14,437.0 14,701.5 14,731.3 Equity 11,319.4 11,482.1 11,637.5 11,445.3 12,469.8 12,659.4 12,867.6 12,711.7 Retained earnings 9,792.1 10,011.6 10,190.7 9,988.4 10,860.2 11,107.9 11,336.5 11,328.9 Retained earnings 9,376.3 9,535.1 9,682.5 9,478.7 10,514.6 10,721.5 10,923.0 10,740.0 * K-IFRS 1018 (old-standard) 15
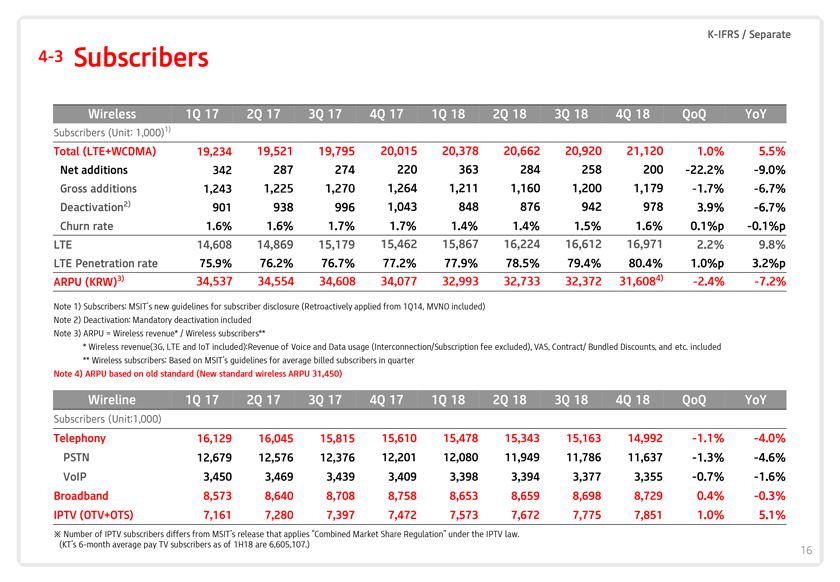
END K-IFRS / Separate 4-3 Subscribers Wireless 1Q 17 2Q 17 3Q 17 4Q 17 1Q 18 2Q 18 3Q 18 4Q 18 QoQ YoY Subscribers (Unit: 1,000)1) Total (LTE+WCDMA) 19,234 19,521 19,795 20,015 20,378 20,662 20,920 21,120 1.0% 5.5% Net additions 342 287 274 220 363 284 258 200 -22.2% -9.0% Gross additions 1,243 1,225 1,270 1,264 1,211 1,160 1,200 1,179 -1.7% -6.7% Deactivation2) 901 938 996 1,043 848 876 942 978 3.9% -6.7% Churn rate 1.6% 1.6% 1.7% 1.7% 1.4% 1.4% 1.5% 1.6% 0.1%p -0.1%p LTE 14,608 14,869 15,179 15,462 15,867 16,224 16,612 16,971 2.2% 9.8% LTE Penetration rate 75.9% 76.2% 76.7% 77.2% 77.9% 78.5% 79.4% 80.4% 1.0%p 3.2%p ARPU (KRW)3) 34,537 34,554 34,608 34,077 32,993 32,733 32,372 31,6084) -2.4% -7.2% Note 1) Subscribers: MSIT’s new guidelines for subscriber disclosure (Retroactively applied from 1Q14, MVNO included) Note 2) Deactivation: Mandatory deactivation included Note 3) ARPU = Wireless revenue* / Wireless subscribers** * Wireless revenue(3G, LTE and IoT included):Revenue of Voice and Data usage (Interconnection/Subscription fee excluded), VAS, Contract/ Bundled Discounts, and etc. included ** Wireless subscribers: Based on MSIT’s guidelines for average billed subscribers in quarter Note 4) ARPU based on old standard (New standard wireless ARPU 31,450) Wireline 1Q 17 2Q 17 3Q 17 4Q 17 1Q 18 2Q 18 3Q 18 4Q 18 QoQ YoY Subscribers (Unit:1,000) Telephony 16,129 16,045 15,815 15,610 15,478 15,343 15,163 14,992 -1.1% -4.0% PSTN 12,679 12,576 12,376 12,201 12,080 11,949 11,786 11,637 -1.3% -4.6% VoIP 3,450 3,469 3,439 3,409 3,398 3,394 3,377 3,355 -0.7% -1.6% Broadband 8,573 8,640 8,708 8,758 8,653 8,659 8,698 8,729 0.4% -0.3% IPTV (OTV+OTS) 7,161 7,280 7,397 7,472 7,573 7,672 7,775 7,851 1.0% 5.1% Number of IPTV subscribers differs from MSIT’s release that applies “Combined Market Share Regulation” under the IPTV law. (KT’s 6-month average pay TV subscribers as of 1H18 are 6,605,107.) 16

HI FIVE ! 5G PEOPLE. TECHNOLOGY. KT