SECURITIES AND EXCHANGE COMMISSION
Washington, D.C. 20549
Form6-K
REPORT OF FOREIGN PRIVATE ISSUER
PURSUANT TO RULE13a-16 OR15d-16
OF THE SECURITIES EXCHANGE ACT OF 1934
For the month of May 2019
Commission File Number1-14926
KT Corporation
(Translation of registrant’s name into English)
90,Buljeong-ro,
Bundang-gu,Seongnam-si,
Gyeonggi-do,
Korea
(Address of principal executive offices)
Indicate by check mark whether the registrant files or will file annual reports under cover of Form20-F or Form40-F:
Form20-F ☒ Form40-F ☐
Indicate by check mark if the registrant is submitting the Form6-K in paper as permitted by RegulationS-T Rule 101(b)(1): ☐
Indicate by check mark if the registrant is submitting the Form6-K in paper as permitted by RegulationS-T Rule 101(b)(7): ☐
Indicate by check mark whether by furnishing the information contained in this Form, the registrant is also thereby furnishing the information to the Commission pursuant to Rule12g3-2(b) under the Securities Exchange Act of 1934.
Yes ☐ No ☒
If “Yes” is marked, indicate below the file number assigned to the registrant in connection with Rule12g3-2(b):82-
SIGNATURES
Pursuant to the requirements of the Securities Exchange Act of 1934, the registrant has duly caused this report to be signed on its behalf by the undersigned, thereunto duly authorized.
| Dated: May 3, 2019 | ||
| KT Corporation | ||
| By: | /s/ Seunghoon Chi | |
| Name: | Seunghoon Chi | |
| Title: | Vice President | |
| By: | /s/ Youngkyoon Yun | |
| Name: | Youngkyoon Yun | |
| Title: | Director | |
KT 1Q19 Earnings Release 2019. 5. 3 | Investor Relations
Disclaimer This presentation has been prepared by KT Corp.(the “Company”) in accordance with K-IFRS. This presentation contains forward-looking statements, which are subject to risks, uncertainties, and assumptions. This presentation is being presented solely for your information and is subject to change without notice. No presentation or warranty, expressed or implied, is made and no reliance should be placed on the accuracy, actuality, fairness, or completeness of the information presented. The Company has applied new accounting standard of K-IFRS 1115 as of Jan 1st, 2018 and K-IFRS 1116 ‘Leases’ as of Jan 1st, 2019. There are no obligation to apply the new standard to previous financial statements. The Company, its affiliates or representatives accept no liability whatsoever for any losses arising from any information contained in the presentation. This presentation does not constitute an offer or invitation to purchase or subscribe for any shares of the Company, and no part of this presentation shall form the Basis of or be relied upon in connection with any contract or commitment. Any decision to purchase shares of the Company could be made solely on the Basis of information, which has been publicly filed with the Securities and Exchange Commission or the Korea Stock Exchange and distributed to all investors. The contents of this presentation may not be reproduced, redistributed or passed on, directly or indirectly, to any other person or published, in whole or in part, for any purpose. If you have any related questions to this material, please contact IR department. Tel : +82-2-3495-3557, 3254, 3564, 3976, 5343 Fax : +82-2-3495-5917 1
Contents 1 Financial Highlights 2 Business Overviews 3 Q&A 4 Appendix 2
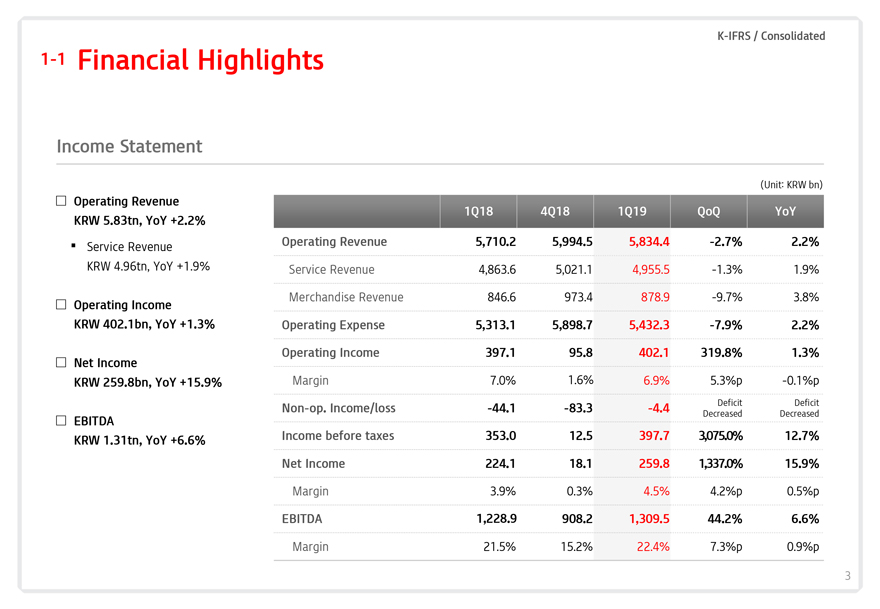
1-1 Financial Highlights K-IFRS / Consolidated Income Statement ? Operating Revenue KRW 5.83tn, YoY +2.2% ? Service Revenue KRW 4.96tn, YoY +1.9% ? Operating Income KRW 402.1bn, YoY +1.3% ? Net Income KRW 259.8bn, YoY +15.9% ? EBITDA KRW 1.31tn, YoY +6.6% (Unit: KRW bn) 1Q18 4Q18 1Q19 QoQ YoY Operating Revenue 5,710.2 5,994.5 5,834.4 -2.7% 2.2% Service Revenue 4,863.6 5,021.1 4,955.5 -1.3% 1.9% Merchandise Revenue 846.6 973.4 878.9 -9.7% 3.8% Operating Expense 5,313.1 5,898.7 5,432.3 -7.9% 2.2% Operating Income 397.1 95.8 402.1 319.8% 1.3% Margin 7.0% 1.6% 6.9% 5.3%p -0.1%p Deficit Deficit Non-op. Income/loss -44.1 -83.3 -4.4 Decreased Decreased Income before taxes 353.0 12.5 397.7 3,075.0% 12.7% Net Income 224.1 18.1 259.8 1,337.0% 15.9% Margin 3.9% 0.3% 4.5% 4.2%p 0.5%p EBITDA 1,228.9 908.2 1,309.5 44.2% 6.6% Margin 21.5% 15.2% 22.4% 7.3%p 0.9%p 3
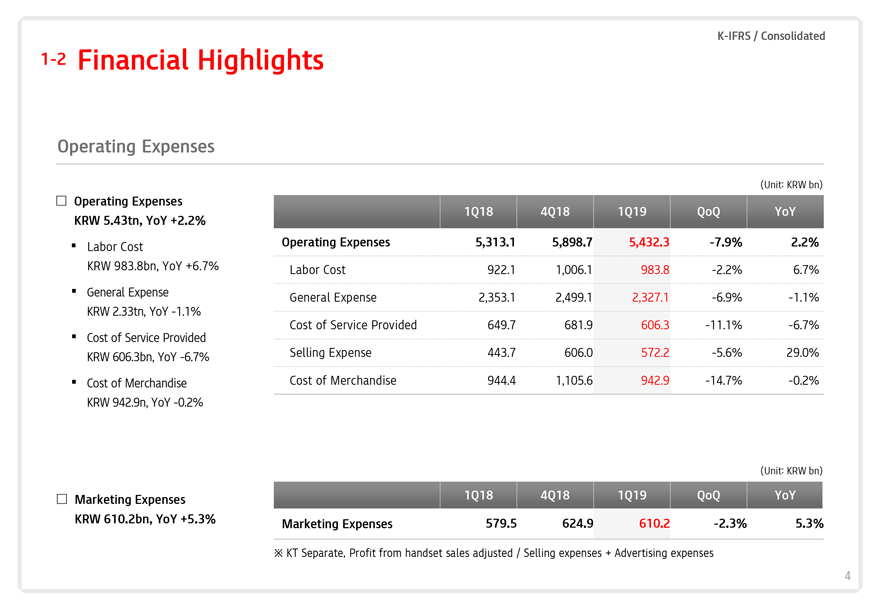
1-2 Financial Highlights K-IFRS / Consolidated Operating Expenses ? Operating Expenses KRW 5.43tn, YoY +2.2% ? Labor Cost KRW 983.8bn, YoY +6.7% ? General Expense KRW 2.33tn, YoY -1.1% ? Cost of Service Provided KRW 606.3bn, YoY -6.7% ? Cost of Merchandise KRW 942.9n, YoY -0.2% ? Marketing Expenses KRW 610.2bn, YoY +5.3% (Unit: KRW bn) 1Q18 4Q18 1Q19 QoQ YoY Operating Expenses 5,313.1 5,898.7 5,432.3 -7.9% 2.2% Labor Cost 922.1 1,006.1 983.8 -2.2% 6.7% General Expense 2,353.1 2,499.1 2,327.1 -6.9% -1.1% Cost of Service Provided 649.7 681.9 606.3 -11.1% -6.7% Selling Expense 443.7 606.0 572.2 -5.6% 29.0% Cost of Merchandise 944.4 1,105.6 942.9 -14.7% -0.2% (Unit: KRW bn) 1Q18 4Q18 1Q19 QoQ YoY Marketing Expenses 579.5 624.9 610.2 -2.3% 5.3% ? KT Separate, Profit from handset sales adjusted / Selling expenses + Advertising expenses 4
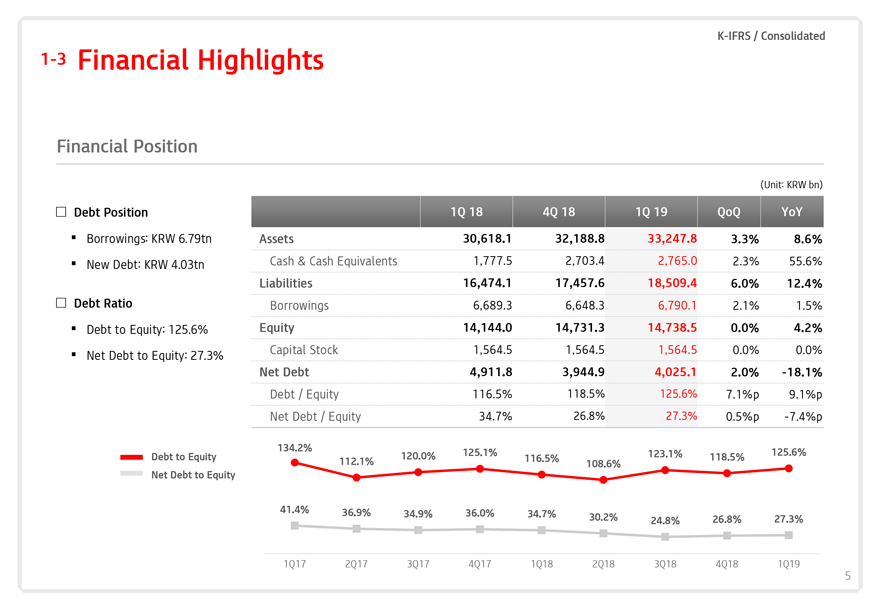
1-3 Financial Highlights K-IFRS / Consolidated Financial Position ? Debt Position ? Borrowings: KRW 6.79tn ? New Debt: KRW 4.03tn ? Debt Ratio ? Debt to Equity: 125.6% ? Net Debt to Equity: 27.3% Debt to Equity Net Debt to Equity (Unit: KRW bn) 1Q 18 4Q 18 1Q 19 QoQ YoY Assets 30,618.1 32,188.8 33,247.8 3.3% 8.6% Cash & Cash Equivalents 1,777.5 2,703.4 2,765.0 2.3% 55.6% Liabilities 16,474.1 17,457.6 18,509.4 6.0% 12.4% Borrowings 6,689.3 6,648.3 6,790.1 2.1% 1.5% Equity 14,144.0 14,731.3 14,738.5 0.0% 4.2% Capital Stock 1,564.5 1,564.5 1,564.5 0.0% 0.0% Net Debt 4,911.8 3,944.9 4,025.1 2.0% -18.1% Debt / Equity 116.5% 118.5% 125.6% 7.1%p 9.1%p Net Debt / Equity 34.7% 26.8% 27.3% 0.5%p -7.4%p 134.2% 125.1% 123.1% 125.6% 120.0% 116.5% 118.5% 112.1% 108.6% 41.4% 36.9% 36.0% 34.9% 34.7% 30.2% 24.8% 26.8% 27.3% 1Q17 2Q17 3Q17 4Q17 1Q18 2Q18 3Q18 4Q18 1Q19 5
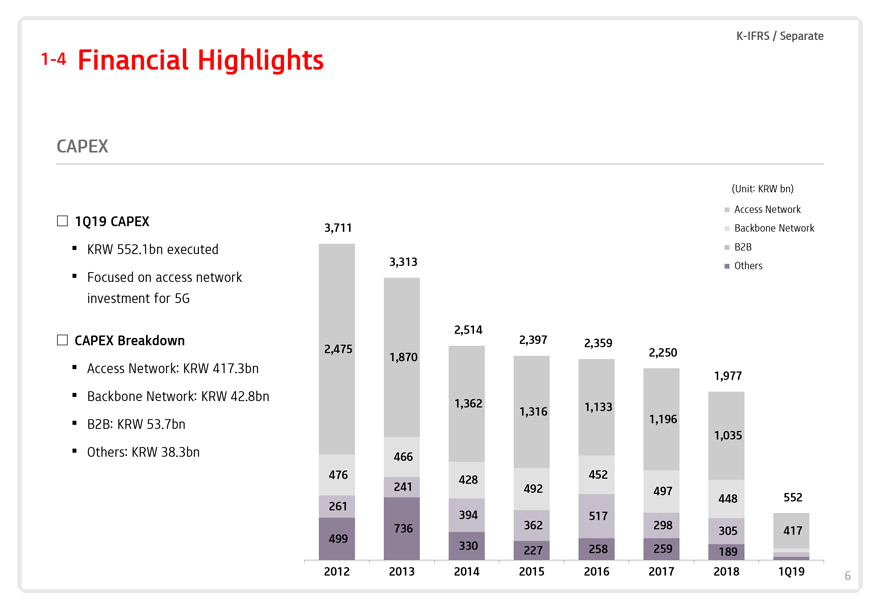
1-4 Financial Highlights K-IFRS / Separate CAPEX ? 1Q19 CAPEX ? KRW 552.1bn executed ? Focused on access network investment for 5G ? CAPEX Breakdown ? Access Network: KRW 417.3bn? Backbone Network: KRW 42.8bn? B2B: KRW 53.7bn? Others: KRW 38.3bn (Unit: KRW bn) Access Network 3,711 Backbone Network B2B 3,313 Others 2,514 2,397 2,359 2,475 1,870 2,250 1,977 1,362 1,316 1,133 1,196 1,035 466 476 452 428 241 492 497 261 448 552 394 517 736 362 298 499 305 417 330 258 259 227 189 2012 2013 2014 2015 2016 2017 2018 1Q19 6
Contents 1 Financial Highlights 2 Business Overviews 3 Q&A 4 Appendix
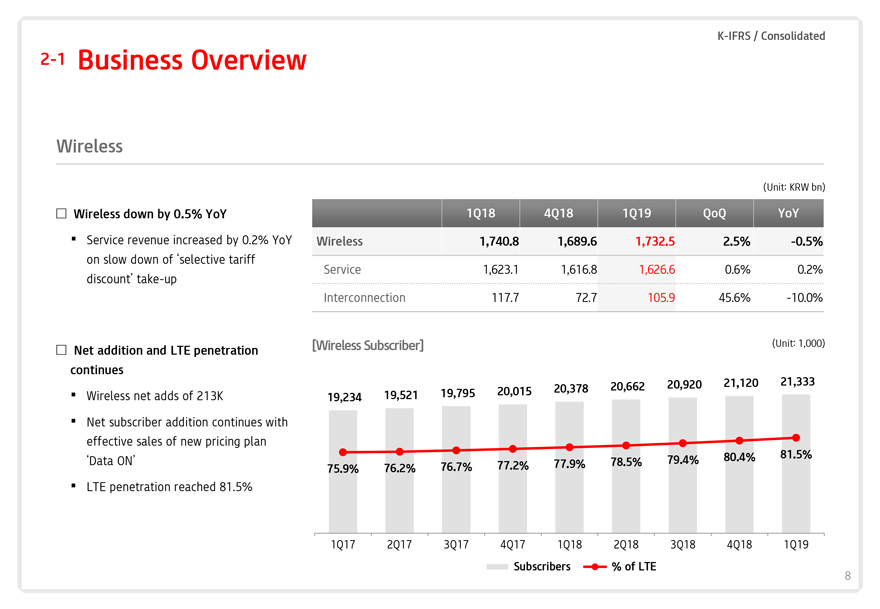
K-IFRS / Consolidated 2-1 Business Overview Wireless ? Wireless down by 0.5% YoY ? Service revenue increased by 0.2% YoY on slow down of ‘selective tariff discount’ take-up ? Net addition and LTE penetration continues ? Wireless net adds of 213K ? Net subscriber addition continues with effective sales of new pricing plan ‘Data ON’ ? LTE penetration reached 81.5% (Unit: KRW bn) 1Q18 4Q18 1Q19 QoQ YoY Wireless 1,740.8 1,689.6 1,732.5 2.5% -0.5% Service 1,623.1 1,616.8 1,626.6 0.6% 0.2% Interconnection 117.7 72.7 105.9 45.6% -10.0% [Wireless Subscriber] (Unit: 1,000) 20,920 21,120 21,333 20,378 20,662 19,521 19,795 20,015 19,234 80.4% 81.5% 77.9% 78.5% 79.4% 75.9% 76.2% 76.7% 77.2% 1Q17 2Q17 3Q17 4Q17 1Q18 2Q18 3Q18 4Q18 1Q19 Subscribers % of LTE 8
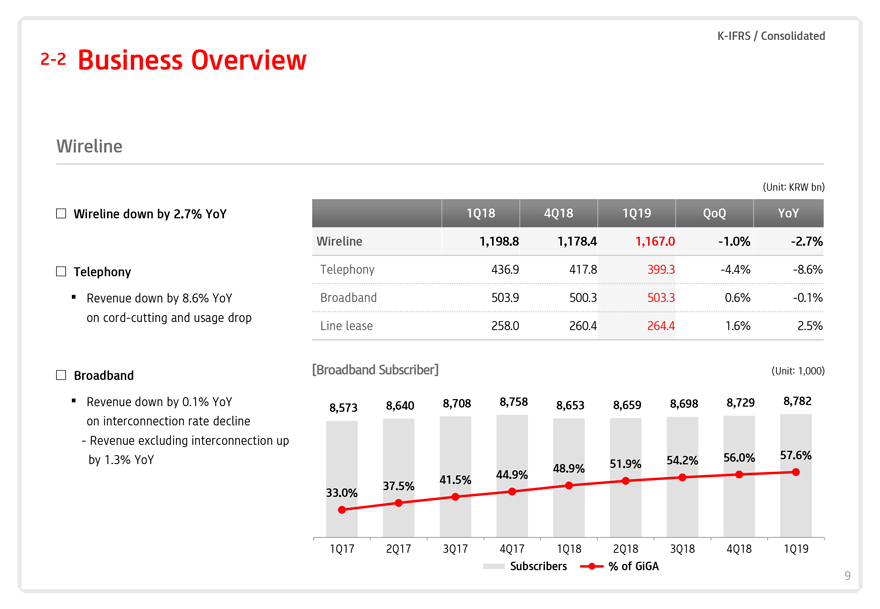
K-IFRS / Consolidated 2-2 Business Overview Wireline ? Wireline down by 2.7% YoY ? Telephony ? Revenue down by 8.6% YoY on cord-cutting and usage drop ? Broadband ? Revenue down by 0.1% YoY on interconnection rate decline - Revenue excluding interconnection up by 1.3% YoY (Unit: KRW bn) 1Q18 4Q18 1Q19 QoQ YoY Wireline 1,198.8 1,178.4 1,167.0 -1.0% -2.7% Telephony 436.9 417.8 399.3 -4.4% -8.6% Broadband 503.9 500.3 503.3 0.6% -0.1% Line lease 258.0 260.4 264.4 1.6% 2.5% [Broadband Subscriber] (Unit: 1,000) 8,708 8,758 8,653 8,659 8,698 8,729 8,782 8,573 8,640 56.0% 57.6% 48.9% 51.9% 54.2% 44.9% 41.5% 37.5% 33.0% 1Q17 2Q17 3Q17 4Q17 1Q18 2Q18 3Q18 4Q18 1Q19 Subscribers % of GiGA 9
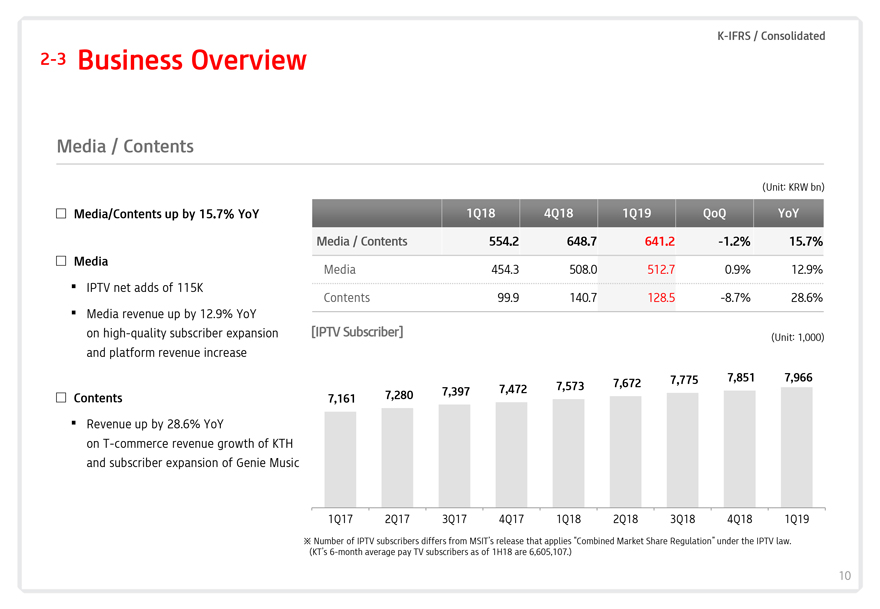
K-IFRS / Consolidated 2-3 Business Overview Media / Contents ? Media/Contents up by 15.7% YoY ? Media ? IPTV net adds of 115K ? Media revenue up by 12.9% YoY on high-quality subscriber expansion and platform revenue increase ? Contents ? Revenue up by 28.6% YoY on T-commerce revenue growth of KTH and subscriber expansion of Genie Music (Unit: KRW bn) 1Q18 4Q18 1Q19 QoQ YoY Media / Contents 554.2 648.7 641.2 -1.2% 15.7% Media 454.3 508.0 512.7 0.9% 12.9% Contents 99.9 140.7 128.5 -8.7% 28.6% [IPTV Subscriber] (Unit: 1,000) 7,775 7,851 7,966 7,573 7,672 7,397 7,472 7,161 7,280 1Q17 2Q17 3Q17 4Q17 1Q18 2Q18 3Q18 4Q18 1Q19 Number of IPTV subscribers differs from MSIT’s release that applies “Combined Market Share Regulation” under the IPTV law. (KT’s 6-month average pay TV subscribers as of 1H18 are 6,605,107.) 10
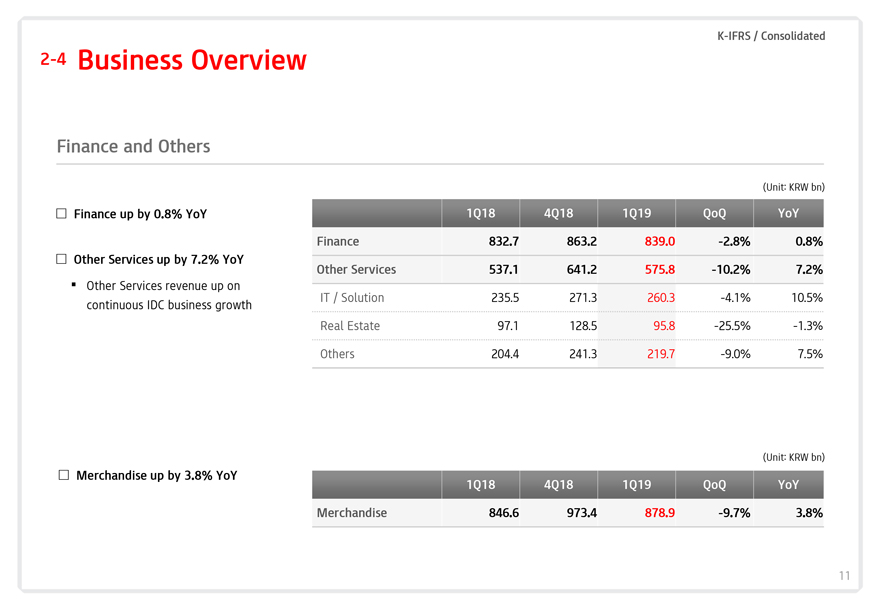
K-IFRS / Consolidated 2-4 Business Overview Finance and Others ? Finance up by 0.8% YoY ? Other Services up by 7.2% YoY ? Other Services revenue up on continuous IDC business growth ? Merchandise up by 3.8% YoY (Unit: KRW bn) 1Q18 4Q18 1Q19 QoQ YoY Finance 832.7 863.2 839.0 -2.8% 0.8% Other Services 537.1 641.2 575.8 -10.2% 7.2% IT / Solution 235.5 271.3 260.3 -4.1% 10.5% Real Estate 97.1 128.5 95.8 -25.5% -1.3% Others 204.4 241.3 219.7 -9.0% 7.5% (Unit: KRW bn) 1Q18 4Q18 1Q19 QoQ YoY Merchandise 846.6 973.4 878.9 -9.7% 3.8% 11

Contents 1 Financial Highlights 2 Business Overviews 3 Q&A 4 Appendix

Contents 1 Financial Highlights 2 Business Overviews 3 Q&A 4 Appendix
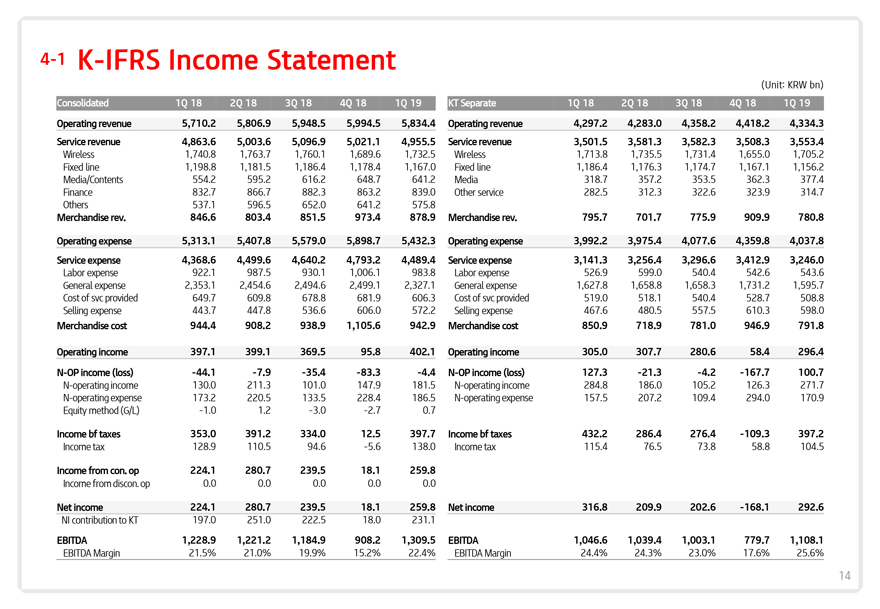
4-1 K-IFRS Income Statement Consolidated 1Q 18 2Q 18 3Q 18 4Q 18 1Q 19 Operating revenue 5,710.2 5,806.9 5,948.5 5,994.5 5,834.4 Service revenue 4,863.6 5,003.6 5,096.9 5,021.1 4,955.5 Wireless 1,740.8 1,763.7 1,760.1 1,689.6 1,732.5 Fixed line 1,198.8 1,181.5 1,186.4 1,178.4 1,167.0 Media/Contents 554.2 595.2 616.2 648.7 641.2 Finance 832.7 866.7 882.3 863.2 839.0 Others 537.1 596.5 652.0 641.2 575.8 Merchandise rev. 846.6 803.4 851.5 973.4 878.9 Operating expense 5,313.1 5,407.8 5,579.0 5,898.7 5,432.3 Service expense 4,368.6 4,499.6 4,640.2 4,793.2 4,489.4 Labor expense 922.1 987.5 930.1 1,006.1 983.8 General expense 2,353.1 2,454.6 2,494.6 2,499.1 2,327.1 Cost of svc provided 649.7 609.8 678.8 681.9 606.3 Selling expense 443.7 447.8 536.6 606.0 572.2 Merchandise cost 944.4 908.2 938.9 1,105.6 942.9 Operating income 397.1 399.1 369.5 95.8 402.1 N-OP income (loss) -44.1 -7.9 -35.4 -83.3 -4.4 N-operating income 130.0 211.3 101.0 147.9 181.5 N-operating expense 173.2 220.5 133.5 228.4 186.5 Equity method (G/L) -1.0 1.2 -3.0 -2.7 0.7 Income bf taxes 353.0 391.2 334.0 12.5 397.7 Income tax 128.9 110.5 94.6 -5.6 138.0 Income from con. op 224.1 280.7 239.5 18.1 259.8 Income from discon. op 0.0 0.0 0.0 0.0 0.0 Net income 224.1 280.7 239.5 18.1 259.8 NI contribution to KT 197.0 251.0 222.5 18.0 231.1 EBITDA 1,228.9 1,221.2 1,184.9 908.2 1,309.5 EBITDA Margin 21.5% 21.0% 19.9% 15.2% 22.4% (Unit: KRW bn) KT Separate 1Q 18 2Q 18 3Q 18 4Q 18 1Q 19 Operating revenue 4,297.2 4,283.0 4,358.2 4,418.2 4,334.3 Service revenue 3,501.5 3,581.3 3,582.3 3,508.3 3,553.4 Wireless 1,713.8 1,735.5 1,731.4 1,655.0 1,705.2 Fixed line 1,186.4 1,176.3 1,174.7 1,167.1 1,156.2 Media 318.7 357.2 353.5 362.3 377.4 Other service 282.5 312.3 322.6 323.9 314.7 Merchandise rev. 795.7 701.7 775.9 909.9 780.8 Operating expense 3,992.2 3,975.4 4,077.6 4,359.8 4,037.8 Service expense 3,141.3 3,256.4 3,296.6 3,412.9 3,246.0 Labor expense 526.9 599.0 540.4 542.6 543.6 General expense 1,627.8 1,658.8 1,658.3 1,731.2 1,595.7 Cost of svc provided 519.0 518.1 540.4 528.7 508.8 Selling expense 467.6 480.5 557.5 610.3 598.0 Merchandise cost 850.9 718.9 781.0 946.9 791.8 Operating income 305.0 307.7 280.6 58.4 296.4 N-OP income (loss) 127.3 -21.3 -4.2 -167.7 100.7 N-operating income 284.8 186.0 105.2 126.3 271.7 N-operating expense 157.5 207.2 109.4 294.0 170.9 Income bf taxes 432.2 286.4 276.4 -109.3 397.2 Income tax 115.4 76.5 73.8 58.8 104.5 Net income 316.8 209.9 202.6 -168.1 292.6 EBITDA 1,046.6 1,039.4 1,003.1 779.7 1,108.1 EBITDA Margin 24.4% 24.3% 23.0% 17.6% 25.6% 14
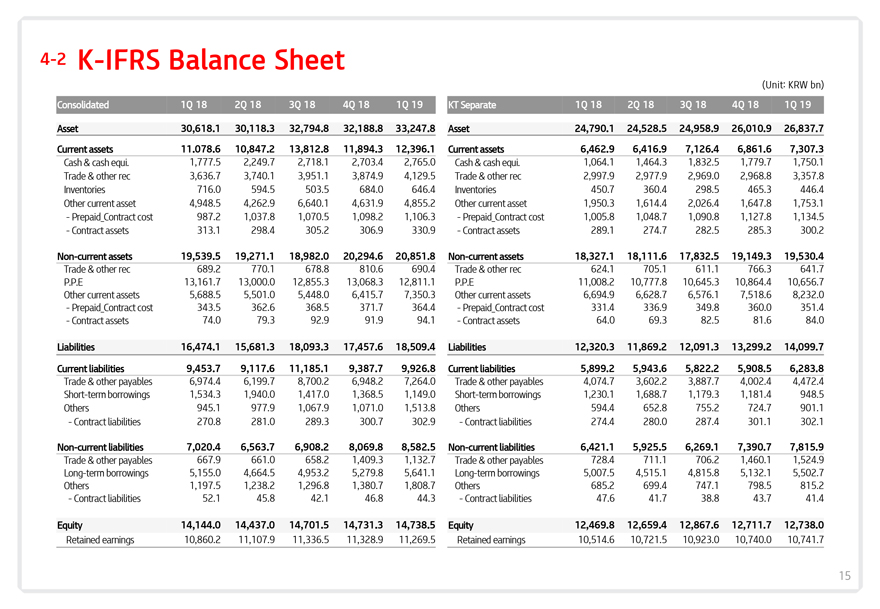
4-2 K-IFRS Balance Sheet Consolidated 1Q 18 2Q 18 3Q 18 4Q 18 1Q 19 Asset 30,618.1 30,118.3 32,794.8 32,188.8 33,247.8 Current assets 11.078.6 10,847.2 13,812.8 11,894.3 12,396.1 Cash & cash equi. 1,777.5 2,249.7 2,718.1 2,703.4 2,765.0 Trade & other rec 3,636.7 3,740.1 3,951.1 3,874.9 4,129.5 Inventories 716.0 594.5 503.5 684.0 646.4 Other current asset 4,948.5 4,262.9 6,640.1 4,631.9 4,855.2 -Prepaid_Contractcost 987.2 1,037.8 1,070.5 1,098.2 1,106.3 -Contract assets 313.1 298.4 305.2 306.9 330.9 Non-current assets 19,539.5 19,271.1 18,982.0 20,294.6 20,851.8 Trade & other rec 689.2 770.1 678.8 810.6 690.4 P.P.E 13,161.7 13,000.0 12,855.3 13,068.3 12,811.1 Other current assets 5,688.5 5,501.0 5,448.0 6,415.7 7,350.3 -Prepaid_Contractcost 343.5 362.6 368.5 371.7 364.4 -Contract assets 74.0 79.3 92.9 91.9 94.1 Liabilities 16,474.1 15,681.3 18,093.3 17,457.6 18,509.4 Current liabilities 9,453.7 9,117.6 11,185.1 9,387.7 9,926.8 Trade & other payables 6,974.4 6,199.7 8,700.2 6,948.2 7,264.0 Short-term borrowings 1,534.3 1,940.0 1,417.0 1,368.5 1,149.0 Others 945.1 977.9 1,067.9 1,071.0 1,513.8 -Contract liabilities 270.8 281.0 289.3 300.7 302.9 Non-current liabilities 7,020.4 6,563.7 6,908.2 8,069.8 8,582.5 Trade & other payables 667.9 661.0 658.2 1,409.3 1,132.7 Long-term borrowings 5,155.0 4,664.5 4,953.2 5,279.8 5,641.1 Others 1,197.5 1,238.2 1,296.8 1,380.7 1,808.7 -Contract liabilities 52.1 45.8 42.1 46.8 44.3 Equity 14,144.0 14,437.0 14,701.5 14,731.3 14,738.5 Retained earnings 10,860.2 11,107.9 11,336.5 11,328.9 11,269.5 (Unit: KRW bn) KT Separate 1Q 18 2Q 18 3Q 18 4Q 18 1Q 19 Asset 24,790.1 24,528.5 24,958.9 26,010.9 26,837.7 Current assets 6,462.9 6,416.9 7,126.4 6,861.6 7,307.3 Cash & cash equi. 1,064.1 1,464.3 1,832.5 1,779.7 1,750.1 Trade & other rec 2,997.9 2,977.9 2,969.0 2,968.8 3,357.8 Inventories 450.7 360.4 298.5 465.3 446.4 Other current asset 1,950.3 1,614.4 2,026.4 1,647.8 1,753.1 -Prepaid_Contractcost 1,005.8 1,048.7 1,090.8 1,127.8 1,134.5 -Contract assets 289.1 274.7 282.5 285.3 300.2 Non-current assets 18,327.1 18,111.6 17,832.5 19,149.3 19,530.4 Trade & other rec 624.1 705.1 611.1 766.3 641.7 P.P.E 11,008.2 10,777.8 10,645.3 10,864.4 10,656.7 Other current assets 6,694.9 6,628.7 6,576.1 7,518.6 8,232.0 -Prepaid_Contractcost 331.4 336.9 349.8 360.0 351.4 -Contract assets 64.0 69.3 82.5 81.6 84.0 Liabilities 12,320.3 11,869.2 12,091.3 13,299.2 14,099.7 Current liabilities 5,899.2 5,943.6 5,822.2 5,908.5 6,283.8 Trade & other payables 4,074.7 3,602.2 3,887.7 4,002.4 4,472.4 Short-term borrowings 1,230.1 1,688.7 1,179.3 1,181.4 948.5 Others 594.4 652.8 755.2 724.7 901.1 -Contract liabilities 274.4 280.0 287.4 301.1 302.1 Non-current liabilities 6,421.1 5,925.5 6,269.1 7,390.7 7,815.9 Trade & other payables 728.4 711.1 706.2 1,460.1 1,524.9 Long-term borrowings 5,007.5 4,515.1 4,815.8 5,132.1 5,502.7 Others 685.2 699.4 747.1 798.5 815.2 -Contract liabilities 47.6 41.7 38.8 43.7 41.4 Equity 12,469.8 12,659.4 12,867.6 12,711.7 12,738.0 Retained earnings 10,514.6 10,721.5 10,923.0 10,740.0 10,741.7 15
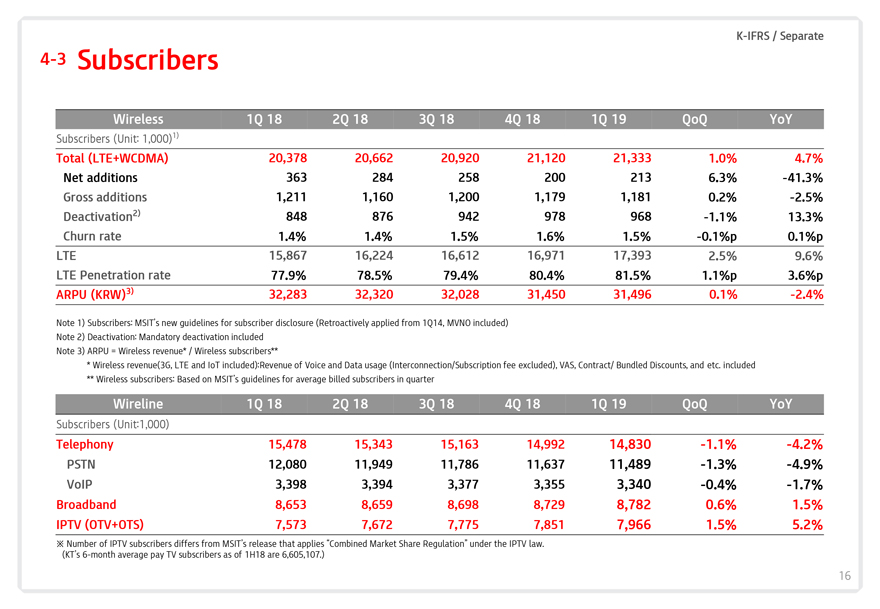
K-IFRS / Separate 4-3 Subscribers Wireless 1Q 18 2Q 18 3Q 18 4Q 18 1Q 19 QoQ YoY Subscribers (Unit: 1,000)1) Total (LTE+WCDMA) 20,378 20,662 20,920 21,120 21,333 1.0% 4.7% Net additions 363 284 258 200 213 6.3% -41.3% Gross additions 1,211 1,160 1,200 1,179 1,181 0.2% -2.5% Deactivation2) 848 876 942 978 968 -1.1% 13.3% Churn rate 1.4% 1.4% 1.5% 1.6% 1.5% -0.1%p 0.1%p LTE 15,867 16,224 16,612 16,971 17,393 2.5% 9.6% LTE Penetration rate 77.9% 78.5% 79.4% 80.4% 81.5% 1.1%p 3.6%p ARPU (KRW)3) 32,283 32,320 32,028 31,450 31,496 0.1% -2.4% Note 1) Subscribers: MSIT’s new guidelines for subscriber disclosure (Retroactively applied from 1Q14, MVNO included) Note 2) Deactivation: Mandatory deactivation included Note 3) ARPU = Wireless revenue* / Wireless subscribers** * Wireless revenue(3G, LTE and IoT included):Revenue of Voice and Data usage (Interconnection/Subscription fee excluded), VAS, Contract/ Bundled Discounts, and etc. included ** Wireless subscribers: Based on MSIT’s guidelines for average billed subscribers in quarter Wireline 1Q 18 2Q 18 3Q 18 4Q 18 1Q 19 QoQ YoY Subscribers (Unit:1,000) Telephony 15,478 15,343 15,163 14,992 14,830 -1.1% -4.2% PSTN 12,080 11,949 11,786 11,637 11,489 -1.3% -4.9% VoIP 3,398 3,394 3,377 3,355 3,340 -0.4% -1.7% Broadband 8,653 8,659 8,698 8,729 8,782 0.6% 1.5% IPTV (OTV+OTS) 7,573 7,672 7,775 7,851 7,966 1.5% 5.2% ? Number of IPTV subscribers differs from MSIT’s release that applies “Combined Market Share Regulation” under the IPTV law. (KT’s 6-month average pay TV subscribers as of 1H18 are 6,605,107.) 16

Hi Five PEOPLE TECHNOLOGY