SECURITIES AND EXCHANGE COMMISSION
Washington, D.C. 20549
Form6-K
REPORT OF FOREIGN PRIVATE ISSUER
PURSUANT TO RULE13a-16 OR15d-16 OF
THE SECURITIES EXCHANGE ACT OF 1934
For the month of November 2019
Commission File Number1-14926
KT Corporation
(Translation of registrant’s name into English)
90,Buljeong-ro,
Bundang-gu,Seongnam-si,
Gyeonggi-do,
Korea
(Address of principal executive offices)
Indicate by check mark whether the registrant files or will file annual reports under cover of Form20-F or Form40-F:
Form 20-F ☒ Form 40-F ☐
Indicate by check mark if the registrant is submitting the Form6-K in paper as permitted by RegulationS-T Rule 101(b)(1): ☐
Indicate by check mark if the registrant is submitting the Form6-K in paper as permitted by RegulationS-T Rule 101(b)(7): ☐
Indicate by check mark whether by furnishing the information contained in this Form, the registrant is also thereby furnishing the information to the Commission pursuant to Rule12g3-2(b) under the Securities Exchange Act of 1934.
Yes ☐ No ☒
If “Yes” is marked, indicate below the file number assigned to the registrant in connection with Rule12g3-2(b):82-
SIGNATURES
Pursuant to the requirements of the Securities Exchange Act of 1934, the registrant has duly caused this report to be signed on its behalf by the undersigned, thereunto duly authorized.
| Dated: November 8, 2019 | ||
| KT Corporation | ||
| By: | /s/ Seunghoon Chi | |
| Name: Seunghoon Chi | ||
| Title: | Senior Vice President | |
| Investor Relations Officer | ||
| By: | /s/ Youngkyoon Yun | |
| Name: Youngkyoon Yun | ||
| Title: | General Manager | |
| IR Team Head | ||
 |
PEOPLE. TECHNOLOGY. Global No. 1 KT KT 3Q19 Earnings Release 2019. 11. 8 Investor Relations
 |
Disclaimer This presentation has been prepared by KT Corp.(the “Company”) in accordance withK-IFRS. This presentation contains forward-looking statements, which are subject to risks, uncertainties, and assumptions. This presentation is being presented solely for your information and is subject to change without notice. No presentation or warranty, expressed or implied, is made and no reliance should be placed on the accuracy, actuality, fairness, or completeness of the information presented. The Company has applied new accounting standard ofK-IFRS 1115 as of Jan 1st, 2018 andK-IFRS 1116 ‘Leases’ as of Jan 1st, 2019. There are no obligation to apply the new standard to previous financial statements. The Company, its affiliates or representatives accept no liability whatsoever for any losses arising from any information contained in the presentation. This presentation does not constitute an offer or invitation to purchase or subscribe for any shares of the Company, and no part of this presentation shall form the Basis of or be relied upon in connection with any contract or commitment. Any decision to purchase shares of the Company could be made solely on the Basis of information, which has been publicly filed with the Securities and Exchange Commission or the Korea Stock Exchange and distributed to all investors. The contents of this presentation may not be reproduced, redistributed or passed on, directly or indirectly, to any other person or published, in whole or in part, for any purpose. If you have any related questions to this material, please contact IR department. Tel :+82-2-3495-3557, 3254, 3564, 3976, 5343 Fax :+82-2-3495-5917 1
 |
Contents 1 2 3 4 Financial Highlights Business Overviews Q&A Appendix
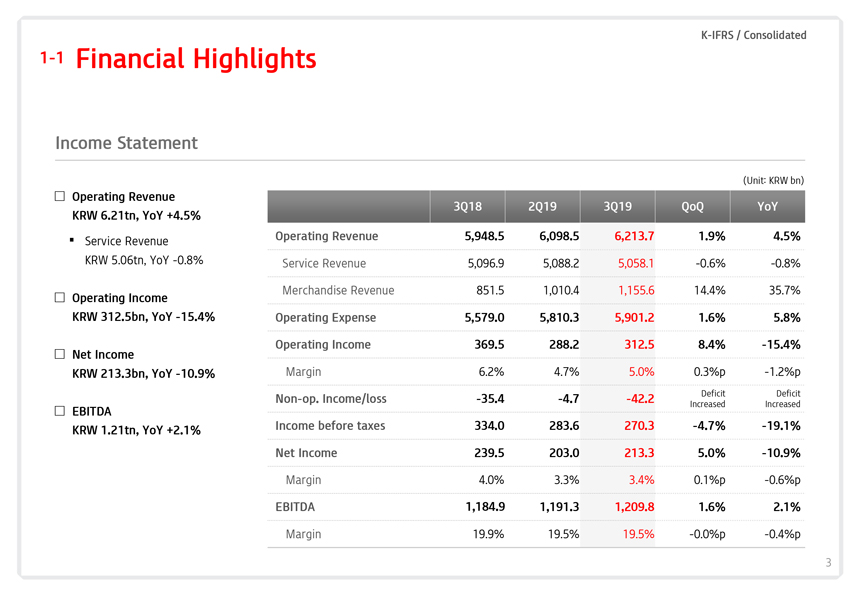 |
K-IFRS / Consolidated1-1 Financial Highlights Income Statement (Unit: KRW bn) Operating Revenue KRW 6.21tn, YoY +4.5% 3Q18 2Q19 3Q19 QoQ YoY◾ Operating Revenue 5,948.5 6,098.5 6,213.7 1.9% 4.5% Service Revenue KRW 5.06tn, YoY-0.8% Service Revenue 5,096.9 5,088.2 5,058.1 -0.6%-0.8% Merchandise Revenue 851.5 1,010.4 1,155.6 14.4% 35.7% Operating Income KRW 312.5bn, YoY-15.4% Operating Expense 5,579.0 5,810.3 5,901.2 1.6% 5.8% Operating Income 369.5 288.2 312.5 8.4%-15.4% Net Income KRW 213.3bn, YoY-10.9% Margin 6.2% 4.7% 5.0% 0.3%p-1.2%p Deficit DeficitNon-op. Income/loss -35.4-4.7 -42.2 Increased Increased EBITDA KRW 1.21tn, YoY +2.1% Income before taxes 334.0 283.6 270.3 -4.7%-19.1% Net Income 239.5 203.0 213.3 5.0%-10.9% Margin 4.0% 3.3% 3.4% 0.1%p-0.6%p EBITDA 1,184.9 1,191.3 1,209.8 1.6% 2.1% Margin 19.9% 19.5% 19.5% -0.0%p-0.4%p 3
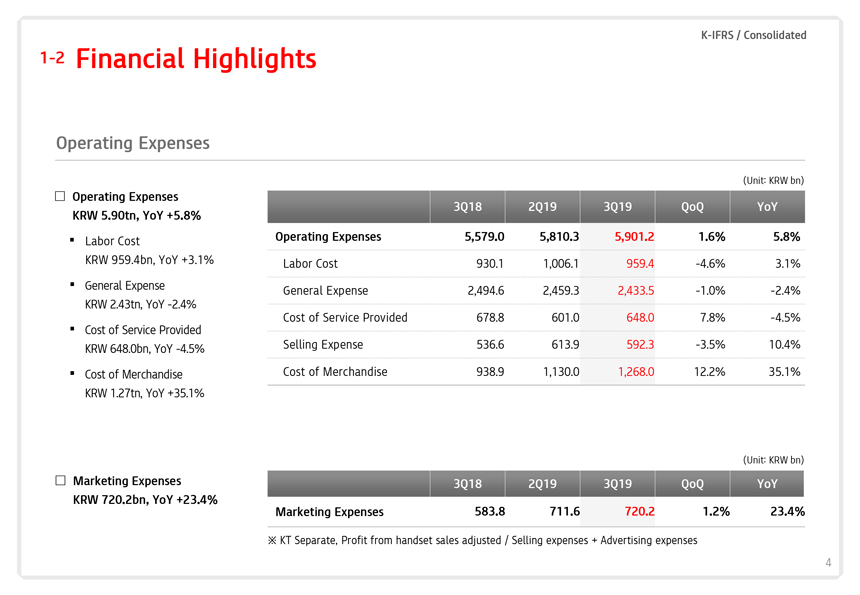 |
K-IFRS / Consolidated1-2 Financial Highlights Operating Expenses (Unit: KRW bn) Operating Expenses KRW 5.90tn, YoY +5.8% 3Q18 2Q19 3Q19 QoQ YoY◾ Labor Cost Operating Expenses 5,579.0 5,810.3 5,901.2 1.6% 5.8% KRW 959.4bn, YoY +3.1% Labor Cost 930.1 1,006.1 959.4 -4.6% 3.1%◾ General Expense General Expense 2,494.6 2,459.3 2,433.5 -1.0%-2.4% KRW 2.43tn, YoY-2.4% Cost of Service Provided 678.8 601.0 648.0 7.8%-4.5%◾ Cost of Service Provided KRW 648.0bn, YoY-4.5% Selling Expense 536.6 613.9 592.3 -3.5% 10.4%◾ Cost of Merchandise Cost of Merchandise 938.9 1,130.0 1,268.0 12.2% 35.1% KRW 1.27tn, YoY +35.1% (Unit: KRW bn) Marketing Expenses 3Q18 2Q19 3Q19 QoQ YoY KRW 720.2bn, YoY +23.4% Marketing Expenses 583.8 711.6 720.2 1.2% 23.4% KT Separate, Profit from handset sales adjusted / Selling expenses + Advertising expenses 4
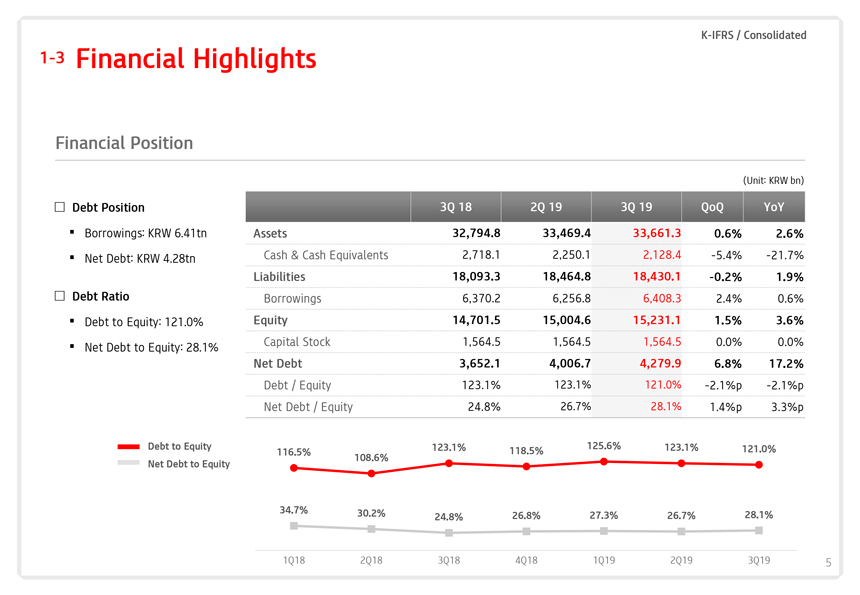 |
K-IFRS / Consolidated1-3 Financial Highlights Financial Position (Unit: KRW bn) Debt Position 3Q 18 2Q 19 3Q 19 QoQ YoY ◾ Borrowings: KRW 6.41tn Assets 32,794.8 33,469.4 33,661.3 0.6% 2.6% ◾ Net Debt: KRW 4.28tn Cash & Cash Equivalents 2,718.1 2,250.1 2,128.4 -5.4%-21.7% Liabilities 18,093.3 18,464.8 18,430.1 -0.2% 1.9% Debt Ratio Borrowings 6,370.2 6,256.8 6,408.3 2.4% 0.6% ◾ Debt to Equity: 121.0% Equity 14,701.5 15,004.6 15,231.1 1.5% 3.6% Capital Stock 1,564.5 1,564.5 1,564.5 0.0% 0.0% ◾ Net Debt to Equity: 28.1% Net Debt 3,652.1 4,006.7 4,279.9 6.8% 17.2% Debt / Equity 123.1% 123.1% 121.0% -2.1%p-2.1%p Net Debt / Equity 24.8% 26.7% 28.1% 1.4%p 3.3%p Debt to Equity 123.1% 125.6% 123.1% 121.0% 116.5% 108.6% 118.5% Net Debt to Equity 34.7% 30.2% 24.8% 26.8% 27.3% 26.7% 28.1% 1Q18 2Q18 3Q18 4Q18 1Q19 2Q19 3Q19 5
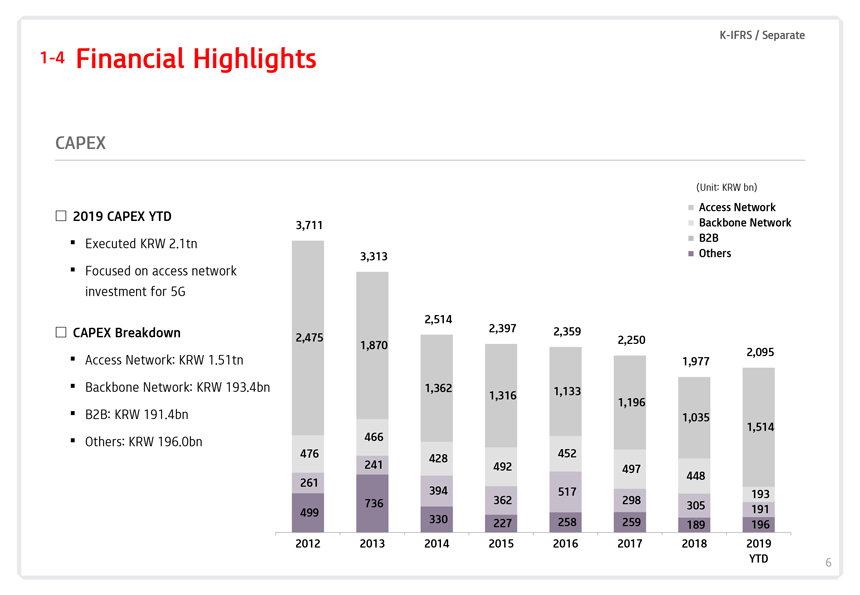 |
K-IFRS / Separate1-4 Financial Highlights CAPEX (Unit: KRW bn) Access Network Backbone Network B2B Others 2019 CAPEX YTD ◾ Executed KRW 2.1tn ◾ Focused on access network investment for 5G CAPEX Breakdown ◾ Access Network: KRW 1.51tn◾ Backbone Network: KRW 193.4bn◾ B2B: KRW 191.4bn◾ Others: KRW 196.0bn 3,711 3,313 2,514 2,397 2,359 2,475 2,250 1,870 1,362 1,133 1,316 1,196 466 476 452 428 241 492 497 261 394 362 517 298 736 499 330 227 258 259 2012 2013 2014 2015 2016 2017 2,095 1,977 1,035 1,514 448 193 305 191 189 196 2018 2019 YTD 6
 |
Contents Financial Highlights Business Overviews Q&A Appendix 1 2 3 4
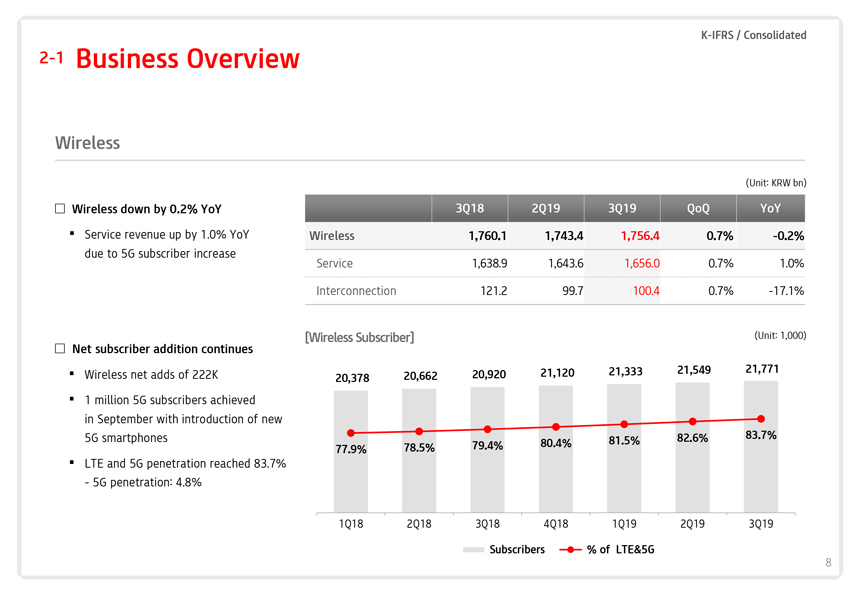 |
K-IFRS / Consolidated2-1 Business Overview Wireless (Unit: KRW bn) Wireless down by 0.2% YoY 3Q18 2Q19 3Q19 QoQ YoY◾ Service revenue up by 1.0% YoY Wireless 1,760.1 1,743.4 1,756.4 0.7%-0.2% due to 5G subscriber increase Service 1,638.9 1,643.6 1,656.0 0.7% 1.0% Interconnection 121.2 99.7 100.4 0.7%-17.1% [Wireless Subscriber] (Unit: 1,000) Net subscriber addition continues 21,333 21,549 21,771 ◾ Wireless net adds of 222K 20,662 20,920 21,120 20,378 ◾ 1 million 5G subscribers achieved in September with introduction of new 5G smartphones 82.6% 83.7% 80.4% 81.5% 77.9% 78.5% 79.4% ◾ LTE and 5G penetration reached 83.7%—5G penetration: 4.8% 1Q18 2Q18 3Q18 4Q18 1Q19 2Q19 3Q19 Subscribers % of LTE&5G 8
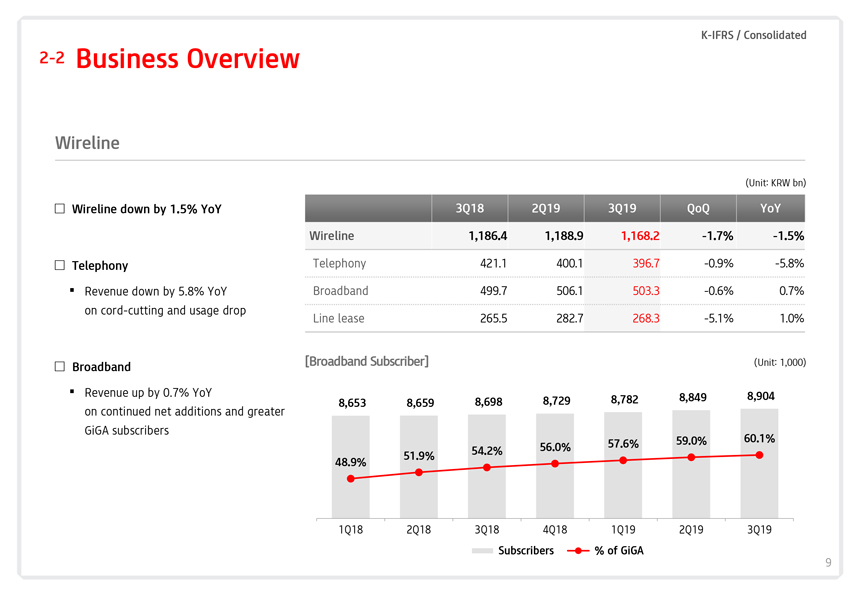 |
K-IFRS / Consolidated2-2 Business Overview Wireline (Unit: KRW bn) Wireline down by 1.5% YoY 3Q18 2Q19 3Q19 QoQ YoY Wireline 1,186.4 1,188.9 1,168.2 -1.7%-1.5% Telephony Telephony 421.1 400.1 396.7 -0.9%-5.8%◾ Revenue down by 5.8% YoY Broadband 499.7 506.1 503.3 -0.6% 0.7% on cord-cutting and usage drop Line lease 265.5 282.7 268.3 -5.1% 1.0% [Broadband Subscriber] (Unit: 1,000) Broadband ◾ Revenue up by 0.7% YoY 8,904 8,729 8,782 8,849 8,653 8,659 8,698 on continued net additions and greater GiGA subscribers 60.1% 57.6% 59.0% 51.9% 54.2% 56.0% 48.9% 1Q18 2Q18 3Q18 4Q18 1Q19 2Q19 3Q19 Subscribers % of GiGA 9
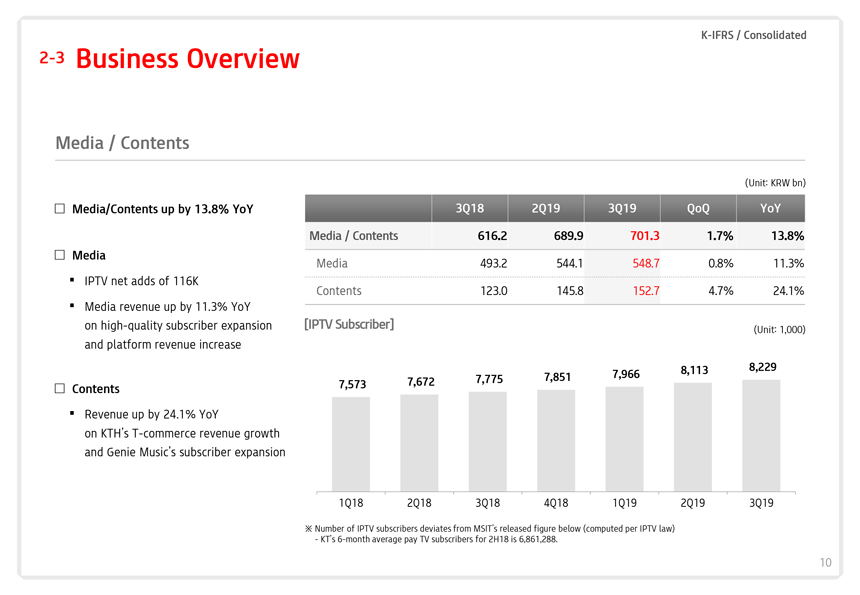 |
K-IFRS / Consolidated2-3 Business Overview Media / Contents (Unit: KRW bn) Media/Contents up by 13.8% YoY 3Q18 2Q19 3Q19 QoQ YoY Media / Contents 616.2 689.9 701.3 1.7% 13.8% Media Media 493.2 544.1 548.7 0.8% 11.3%◾ IPTV net adds of 116K Contents 123.0 145.8 152.7 4.7% 24.1%◾ Media revenue up by 11.3% YoY on high-quality subscriber expansion [IPTV Subscriber] (Unit: 1,000) and platform revenue increase 8,113 8,229 7,851 7,966 7,672 7,775 Contents 7,573 ◾ Revenue up by 24.1% YoY on KTH’sT-commerce revenue growth and Genie Music’s subscriber expansion 1Q18 2Q18 3Q18 4Q18 1Q19 2Q19 3Q19 Number of IPTV subscribers deviates from MSIT’s released figure below (computed per IPTV law) - KT’s6-month average pay TV subscribers for 2H18 is 6,861,288. 10
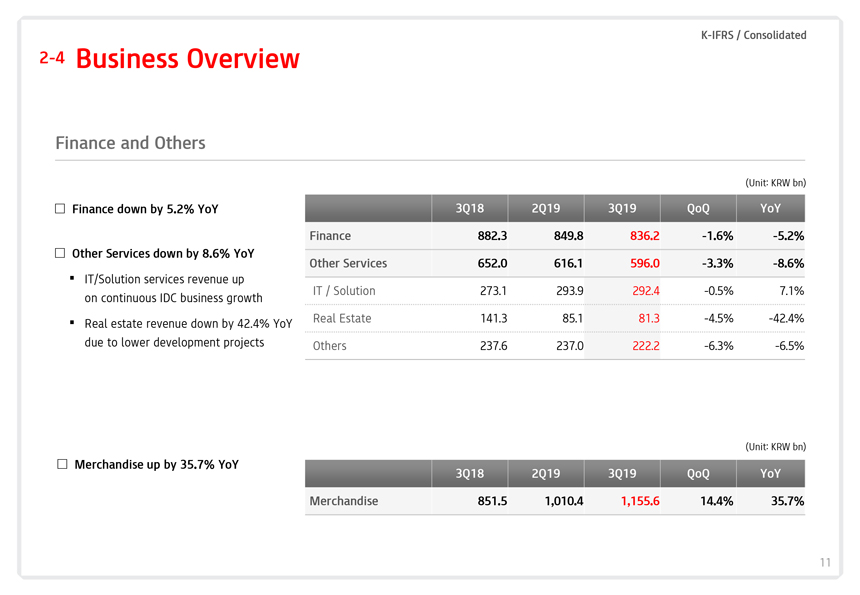 |
K-IFRS / Consolidated2-4 Business Overview Finance and Others (Unit: KRW bn) Finance down by 5.2% YoY 3Q18 2Q19 3Q19 QoQ YoY Finance 882.3 849.8 836.2 -1.6%-5.2% Other Services down by 8.6% YoY Other Services 652.0 616.1 596.0 -3.3%-8.6% ◾ IT/Solution services revenue up IT / Solution 273.1 293.9 292.4 -0.5% 7.1% on continuous IDC business growth Real Estate 141.3 85.1 81.3 -4.5%-42.4%◾ Real estate revenue down by 42.4% YoY due to lower development projects Others 237.6 237.0 222.2 -6.3%-6.5% (Unit: KRW bn) Merchandise up by 35.7% YoY 3Q18 2Q19 3Q19 QoQ YoY Merchandise 851.5 1,010.4 1,155.6 14.4% 35.7% 11
 |
Contents Financial Highlights Business Overviews Q&A Appendix 1 2 3 4
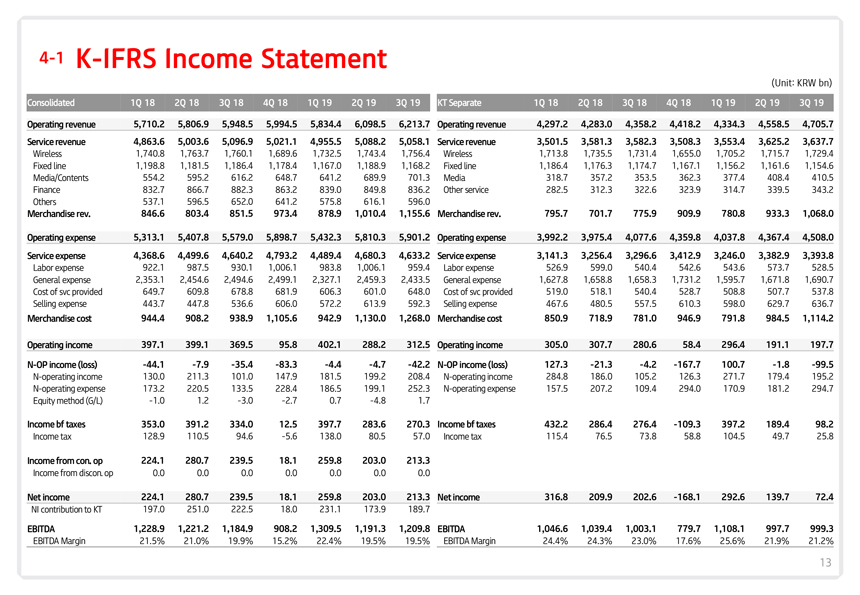 |
4-1 K-IFRS Income Statement (Unit: KRW bn) Consolidated 1Q 18 2Q 18 3Q 18 4Q 18 1Q 19 2Q 19 3Q 19 KT Separate 1Q 18 2Q 18 3Q 18 4Q 18 1Q 19 2Q 19 3Q 19 Operating revenue 5,710.2 5,806.9 5,948.5 5,994.5 5,834.4 6,098.5 6,213.7 Operating revenue 4,297.2 4,283.0 4,358.2 4,418.2 4,334.3 4,558.5 4,705.7 Service revenue 4,863.6 5,003.6 5,096.9 5,021.1 4,955.5 5,088.2 5,058.1 Service revenue 3,501.5 3,581.3 3,582.3 3,508.3 3,553.4 3,625.2 3,637.7 Wireless 1,740.8 1,763.7 1,760.1 1,689.6 1,732.5 1,743.4 1,756.4 Wireless 1,713.8 1,735.5 1,731.4 1,655.0 1,705.2 1,715.7 1,729.4 Fixed line 1,198.8 1,181.5 1,186.4 1,178.4 1,167.0 1,188.9 1,168.2 Fixed line 1,186.4 1,176.3 1,174.7 1,167.1 1,156.2 1,161.6 1,154.6 Media/Contents 554.2 595.2 616.2 648.7 641.2 689.9 701.3 Media 318.7 357.2 353.5 362.3 377.4 408.4 410.5 Finance 832.7 866.7 882.3 863.2 839.0 849.8 836.2 Other service 282.5 312.3 322.6 323.9 314.7 339.5 343.2 Others 537.1 596.5 652.0 641.2 575.8 616.1 596.0 Merchandise rev. 846.6 803.4 851.5 973.4 878.9 1,010.4 1,155.6 Merchandise rev. 795.7 701.7 775.9 909.9 780.8 933.3 1,068.0 Operating expense 5,313.1 5,407.8 5,579.0 5,898.7 5,432.3 5,810.3 5,901.2 Operating expense 3,992.2 3,975.4 4,077.6 4,359.8 4,037.8 4,367.4 4,508.0 Service expense 4,368.6 4,499.6 4,640.2 4,793.2 4,489.4 4,680.3 4,633.2 Service expense 3,141.3 3,256.4 3,296.6 3,412.9 3,246.0 3,382.9 3,393.8 Labor expense 922.1 987.5 930.1 1,006.1 983.8 1,006.1 959.4 Labor expense 526.9 599.0 540.4 542.6 543.6 573.7 528.5 General expense 2,353.1 2,454.6 2,494.6 2,499.1 2,327.1 2,459.3 2,433.5 General expense 1,627.8 1,658.8 1,658.3 1,731.2 1,595.7 1,671.8 1,690.7 Cost of svc provided 649.7 609.8 678.8 681.9 606.3 601.0 648.0 Cost of svc provided 519.0 518.1 540.4 528.7 508.8 507.7 537.8 Selling expense 443.7 447.8 536.6 606.0 572.2 613.9 592.3 Selling expense 467.6 480.5 557.5 610.3 598.0 629.7 636.7 Merchandise cost 944.4 908.2 938.9 1,105.6 942.9 1,130.0 1,268.0 Merchandise cost 850.9 718.9 781.0 946.9 791.8 984.5 1,114.2 Operating income 397.1 399.1 369.5 95.8 402.1 288.2 312.5 Operating income 305.0 307.7 280.6 58.4 296.4 191.1 197.7N-OP income (loss) -44.1 -7.9 -35.4 -83.3 -4.4 -4.7 -42.2N-OP income (loss) 127.3 -21.3 -4.2 -167.7 100.7 -1.8 -99.5N-operating income 130.0 211.3 101.0 147.9 181.5 199.2 208.4N-operating income 284.8 186.0 105.2 126.3 271.7 179.4 195.2N-operating expense 173.2 220.5 133.5 228.4 186.5 199.1 252.3N-operating expense 157.5 207.2 109.4 294.0 170.9 181.2 294.7 Equity method (G/L) -1.0 1.2 -3.0 -2.7 0.7 -4.8 1.7 Income bf taxes 353.0 391.2 334.0 12.5 397.7 283.6 270.3 Income bf taxes 432.2 286.4 276.4 -109.3 397.2 189.4 98.2 Income tax 128.9 110.5 94.6 -5.6 138.0 80.5 57.0 Income tax 115.4 76.5 73.8 58.8 104.5 49.7 25.8 Income from con. op 224.1 280.7 239.5 18.1 259.8 203.0 213.3 Income from discon. op 0.0 0.0 0.0 0.0 0.0 0.0 0.0 Net income 224.1 280.7 239.5 18.1 259.8 203.0 213.3 Net income 316.8 209.9 202.6 -168.1 292.6 139.7 72.4 NI contribution to KT 197.0 251.0 222.5 18.0 231.1 173.9 189.7 EBITDA 1,228.9 1,221.2 1,184.9 908.2 1,309.5 1,191.3 1,209.8 EBITDA 1,046.6 1,039.4 1,003.1 779.7 1,108.1 997.7 999.3 EBITDA Margin 21.5% 21.0% 19.9% 15.2% 22.4% 19.5% 19.5% EBITDA Margin 24.4% 24.3% 23.0% 17.6% 25.6% 21.9% 21.2% 13
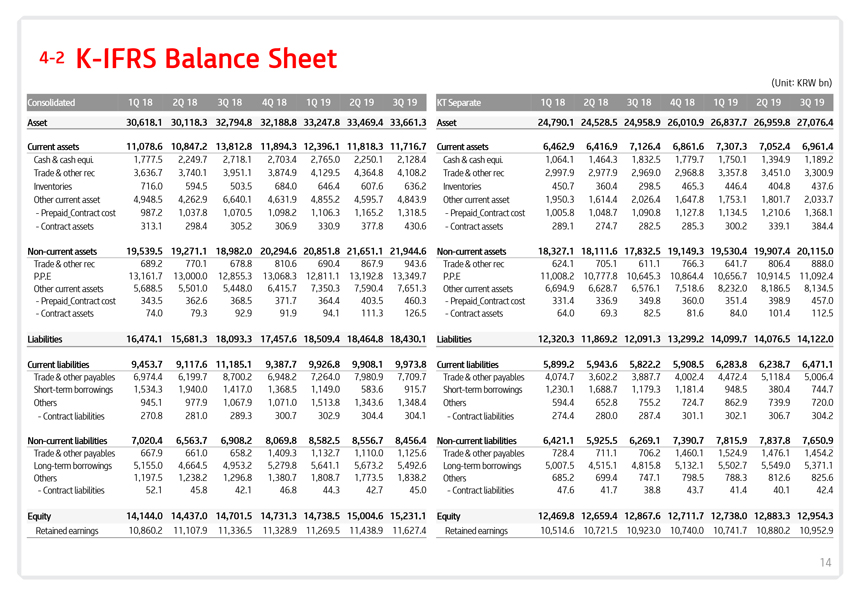 |
4-2 K-IFRS Balance Sheet (Unit: KRW bn) Consolidated 1Q 18 2Q 18 3Q 18 4Q 18 1Q 19 2Q 19 3Q 19 KT Separate 1Q 18 2Q 18 3Q 18 4Q 18 1Q 19 2Q 19 3Q 19 Asset 30,618.1 30,118.3 32,794.8 32,188.8 33,247.8 33,469.4 33,661.3 Asset 24,790.1 24,528.5 24,958.9 26,010.9 26,837.7 26,959.8 27,076.4 Current assets 11,078.6 10,847.2 13,812.8 11,894.3 12,396.1 11,818.3 11,716.7 Current assets 6,462.9 6,416.9 7,126.4 6,861.6 7,307.3 7,052.4 6,961.4 Cash & cash equi. 1,777.5 2,249.7 2,718.1 2,703.4 2,765.0 2,250.1 2,128.4 Cash & cash equi. 1,064.1 1,464.3 1,832.5 1,779.7 1,750.1 1,394.9 1,189.2 Trade & other rec 3,636.7 3,740.1 3,951.1 3,874.9 4,129.5 4,364.8 4,108.2 Trade & other rec 2,997.9 2,977.9 2,969.0 2,968.8 3,357.8 3,451.0 3,300.9 Inventories 716.0 594.5 503.5 684.0 646.4 607.6 636.2 Inventories 450.7 360.4 298.5 465.3 446.4 404.8 437.6 Other current asset 4,948.5 4,262.9 6,640.1 4,631.9 4,855.2 4,595.7 4,843.9 Other current asset 1,950.3 1,614.4 2,026.4 1,647.8 1,753.1 1,801.7 2,033.7 -Prepaid_Contract cost 987.2 1,037.8 1,070.5 1,098.2 1,106.3 1,165.2 1,318.5 -Prepaid_Contract cost 1,005.8 1,048.7 1,090.8 1,127.8 1,134.5 1,210.6 1,368.1 -Contract assets 313.1 298.4 305.2 306.9 330.9 377.8 430.6 -Contract assets 289.1 274.7 282.5 285.3 300.2 339.1 384.4Non-current assets 19,539.5 19,271.1 18,982.0 20,294.6 20,851.8 21,651.1 21,944.6Non-current assets 18,327.1 18,111.6 17,832.5 19,149.3 19,530.4 19,907.4 20,115.0 Trade & other rec 689.2 770.1 678.8 810.6 690.4 867.9 943.6 Trade & other rec 624.1 705.1 611.1 766.3 641.7 806.4 888.0 P.P.E 13,161.7 13,000.0 12,855.3 13,068.3 12,811.1 13,192.8 13,349.7 P.P.E 11,008.2 10,777.8 10,645.3 10,864.4 10,656.7 10,914.5 11,092.4 Other current assets 5,688.5 5,501.0 5,448.0 6,415.7 7,350.3 7,590.4 7,651.3 Other current assets 6,694.9 6,628.7 6,576.1 7,518.6 8,232.0 8,186.5 8,134.5 -Prepaid_Contract cost 343.5 362.6 368.5 371.7 364.4 403.5 460.3 -Prepaid_Contract cost 331.4 336.9 349.8 360.0 351.4 398.9 457.0 -Contract assets 74.0 79.3 92.9 91.9 94.1 111.3 126.5 -Contract assets 64.0 69.3 82.5 81.6 84.0 101.4 112.5 Liabilities 16,474.1 15,681.3 18,093.3 17,457.6 18,509.4 18,464.8 18,430.1 Liabilities 12,320.3 11,869.2 12,091.3 13,299.2 14,099.7 14,076.5 14,122.0 Current liabilities 9,453.7 9,117.6 11,185.1 9,387.7 9,926.8 9,908.1 9,973.8 Current liabilities 5,899.2 5,943.6 5,822.2 5,908.5 6,283.8 6,238.7 6,471.1 Trade & other payables 6,974.4 6,199.7 8,700.2 6,948.2 7,264.0 7,980.9 7,709.7 Trade & other payables 4,074.7 3,602.2 3,887.7 4,002.4 4,472.4 5,118.4 5,006.4 Short-term borrowings 1,534.3 1,940.0 1,417.0 1,368.5 1,149.0 583.6 915.7 Short-term borrowings 1,230.1 1,688.7 1,179.3 1,181.4 948.5 380.4 744.7 Others 945.1 977.9 1,067.9 1,071.0 1,513.8 1,343.6 1,348.4 Others 594.4 652.8 755.2 724.7 862.9 739.9 720.0 -Contract liabilities 270.8 281.0 289.3 300.7 302.9 304.4 304.1 -Contract liabilities 274.4 280.0 287.4 301.1 302.1 306.7 304.2Non-current liabilities 7,020.4 6,563.7 6,908.2 8,069.8 8,582.5 8,556.7 8,456.4Non-current liabilities 6,421.1 5,925.5 6,269.1 7,390.7 7,815.9 7,837.8 7,650.9 Trade & other payables 667.9 661.0 658.2 1,409.3 1,132.7 1,110.0 1,125.6 Trade & other payables 728.4 711.1 706.2 1,460.1 1,524.9 1,476.1 1,454.2 Long-term borrowings 5,155.0 4,664.5 4,953.2 5,279.8 5,641.1 5,673.2 5,492.6 Long-term borrowings 5,007.5 4,515.1 4,815.8 5,132.1 5,502.7 5,549.0 5,371.1 Others 1,197.5 1,238.2 1,296.8 1,380.7 1,808.7 1,773.5 1,838.2 Others 685.2 699.4 747.1 798.5 788.3 812.6 825.6 -Contract liabilities 52.1 45.8 42.1 46.8 44.3 42.7 45.0 -Contract liabilities 47.6 41.7 38.8 43.7 41.4 40.1 42.4 Equity 14,144.0 14,437.0 14,701.5 14,731.3 14,738.5 15,004.6 15,231.1 Equity 12,469.8 12,659.4 12,867.6 12,711.7 12,738.0 12,883.3 12,954.3 Retained earnings 10,860.2 11,107.9 11,336.5 11,328.9 11,269.5 11,438.9 11,627.4 Retained earnings 10,514.6 10,721.5 10,923.0 10,740.0 10,741.7 10,880.2 10,952.9 14
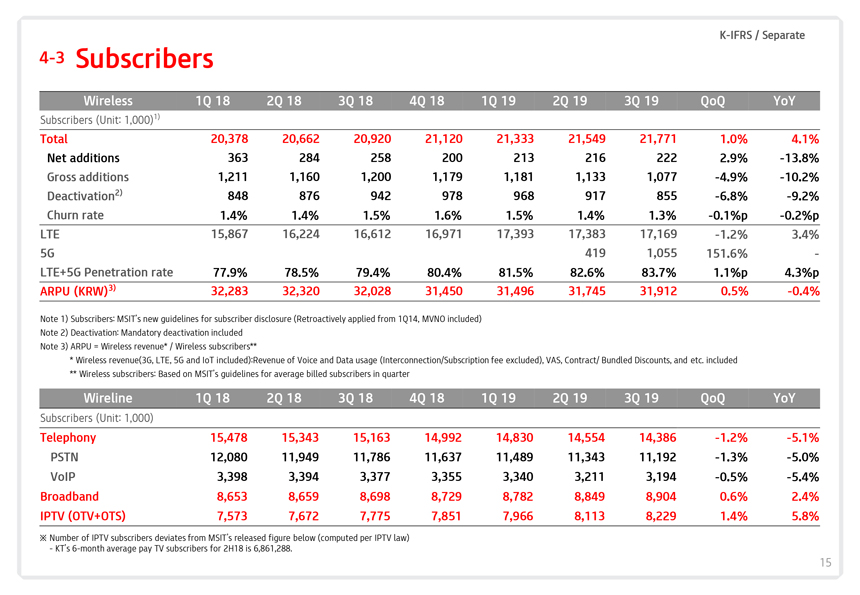 |
K-IFRS / Separate4-3 Subscribers Wireless 1Q 18 2Q 18 3Q 18 4Q 18 1Q 19 2Q 19 3Q 19 QoQ YoY Subscribers (Unit: 1,000)1) Total 20,378 20,662 20,920 21,120 21,333 21,549 21,771 1.0% 4.1% Net additions 363 284 258 200 213 216 222 2.9%-13.8% Gross additions 1,211 1,160 1,200 1,179 1,181 1,133 1,077-4.9%-10.2% Deactivation2) 848 876 942 978 968 917 855-6.8%-9.2% Churn rate 1.4% 1.4% 1.5% 1.6% 1.5% 1.4% 1.3%-0.1%p-0.2%p LTE 15,867 16,224 16,612 16,971 17,393 17,383 17,169-1.2% 3.4% 5G 419 1,055 151.6%- LTE+5G Penetration rate 77.9% 78.5% 79.4% 80.4% 81.5% 82.6% 83.7% 1.1%p 4.3%p ARPU (KRW)3) 32,283 32,320 32,028 31,450 31,496 31,745 31,912 0.5%-0.4% Note 1) Subscribers: MSIT’s new guidelines for subscriber disclosure (Retroactively applied from 1Q14, MVNO included) Note 2) Deactivation: Mandatory deactivation included Note 3) ARPU = Wireless revenue* / Wireless subscribers** * Wireless revenue(3G, LTE, 5G and IoT included):Revenue of Voice and Data usage (Interconnection/Subscription fee excluded), VAS, Contract/ Bundled Discounts, and etc. included ** Wireless subscribers: Based on MSIT’s guidelines for average billed subscribers in quarter Wireline 1Q 18 2Q 18 3Q 18 4Q 18 1Q 19 2Q 19 3Q 19 QoQ YoY Subscribers (Unit: 1,000) Telephony 15,478 15,343 15,163 14,992 14,830 14,554 14,386-1.2%-5.1% PSTN 12,080 11,949 11,786 11,637 11,489 11,343 11,192-1.3%-5.0% VoIP 3,398 3,394 3,377 3,355 3,340 3,211 3,194-0.5%-5.4% Broadband 8,653 8,659 8,698 8,729 8,782 8,849 8,904 0.6% 2.4% IPTV (OTV+OTS) 7,573 7,672 7,775 7,851 7,966 8,113 8,229 1.4% 5.8% Number of IPTV subscribers deviates from MSIT’s released figure below (computed per IPTV law) - KT’s6-month average pay TV subscribers for 2H18 is 6,861,288. 15