SECURITIES AND EXCHANGE COMMISSION
Washington, D.C. 20549
Form 6-K
REPORT OF FOREIGN PRIVATE ISSUER
PURSUANT TO RULE 13a-16 OR 15d-16 OF
THE SECURITIES EXCHANGE ACT OF 1934
For the month of November 2022
Commission File Number 1-14926
KT Corporation
(Translation of registrant’s name into English)
90, Buljeong-ro,
Bundang-gu, Seongnam-si,
Gyeonggi-do,
Korea
(Address of principal executive offices)
Indicate by check mark whether the registrant files or will file annual reports under cover of Form 20-F or Form 40-F:
Form 20-F ☒ Form 40-F ☐
Indicate by check mark if the registrant is submitting the Form 6-K in paper as permitted by Regulation S-T Rule 101(b)(1): ☐
Indicate by check mark if the registrant is submitting the Form 6-K in paper as permitted by Regulation S-T Rule 101(b)(7): ☐
Indicate by check mark whether by furnishing the information contained in this Form, the registrant is also thereby furnishing the information to the Commission pursuant to Rule 12g3-2(b) under the Securities Exchange Act of 1934.
Yes ☐ No ☒
If “Yes” is marked, indicate below the file number assigned to the registrant in connection with Rule 12g3-2(b): 82-
SIGNATURES
Pursuant to the requirements of the Securities Exchange Act of 1934, the registrant has duly caused this report to be signed on its behalf by the undersigned, thereunto duly authorized.
| Dated: November 8 2022 | ||
| KT Corporation | ||
| By: | /s/ Seunghoon Chi | |
| Name: Seunghoon Chi | ||
| Title: Vice President | ||
| By: | /s/ Sanghyun Cho | |
| Name: Sanghyun Cho | ||
| Title: Director | ||

KT 3Q22 Earning Release
Disclaimer This presentation has been prepared by KT Corp.(the “Company”) in accordance with K-IFRS. This presentation contains forward-looking statements, which are subject to risks, uncertainties, and assumptions. This presentation is being presented solely for your information and is subject to change without notice. No presentation or warranty, expressed or implied, is made and no reliance should be placed on the accuracy, actuality, fairness, or completeness of the information presented. st The Company has applied new accounting standard of K-IFRS 1115 as of Jan 1 , 2018 and K-IFRS 1116 ‘Leases’ as of Jan st 1 , 2019. There are no obligation to apply the new standard to previous financial statements. The Company, its affiliates or representatives accept no liability whatsoever for any losses arising from any information contained in the presentation. This presentation does not constitute an offer or invitation to purchase or subscribe for any shares of the Company, and no part of this presentation shall form the Basis of or be relied upon in connection with any contract or commitment. Any decision to purchase shares of the Company could be made solely on the Basis of information, which has been publicly filed with the Securities and Exchange Commission or the Korea Stock Exchange and distributed to all investors. The contents of this presentation may not be reproduced, redistributed or passed on, directly or indirectly, to any other person or published, in whole or in part, for any purpose. If you have any related questions to this material, please contact IR department. Tel : +82-2-3495-3557, 3254, 3564, 5344 Fax : +82-2-3495-5917 2

2 Financial Highlights 3 Business Overview 4 Appendix 3
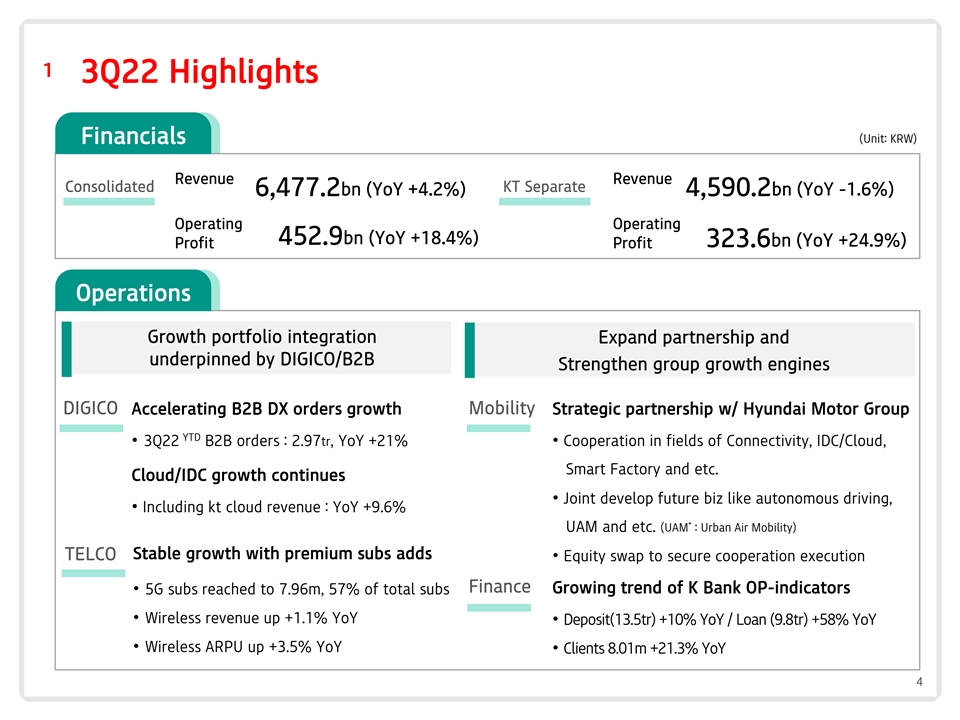
1 3Q22 Highlights Financials (Unit: KRW) Revenue Revenue Consolidated KT Separate 6,477.2bn (YoY +4.2%) 4,590.2bn (YoY -1.6%) Operating Operating 452.9bn (YoY +18.4%) 323.6bn (YoY +24.9%) Profit Profit Operations Growth portfolio integration Expand partnership and underpinned by DIGICO/B2B Strengthen group growth engines DIGICO Accelerating B2B DX orders growth Mobility Strategic partnership w/ Hyundai Motor Group YTD • 3Q22 B2B orders : 2.97tr, YoY +21% • Cooperation in fields of Connectivity, IDC/Cloud, Smart Factory and etc. Cloud/IDC growth continues • Joint develop future biz like autonomous driving, • Including kt cloud revenue : YoY +9.6% * UAM and etc. (UAM : Urban Air Mobility) TELCO Stable growth with premium subs adds • Equity swap to secure cooperation execution Finance Growing trend of K Bank OP-indicators • 5G subs reached to 7.96m, 57% of total subs • Wireless revenue up +1.1% YoY • Deposit(13.5tr) +10% YoY / Loan (9.8tr) +58% YoY • Wireless ARPU up +3.5% YoY • Clients 8.01m +21.3% YoY 4
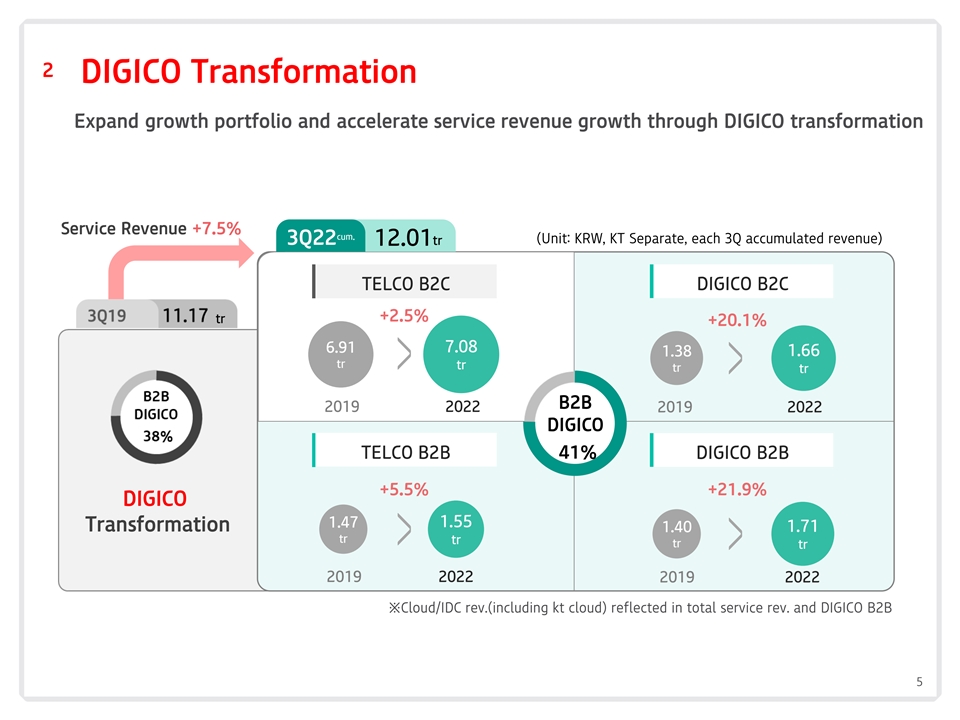
2 DIGICO Transformation Expand growth portfolio and accelerate service revenue growth through DIGICO transformation Service Revenue +7.5% cum. 3Q22 (Unit: KRW, KT Separate, each 3Q accumulated revenue) 12.01tr TELCO B2C DIGICO B2C +2.5% tr +20.1% 7.08 6.91 1.66 1.38 tr tr tr tr B2B 2019 2022 2019 2022 DIGICO TELCO B2B 41% DIGICO B2B +5.5% +21.9% DIGICO 1.47 1.55 Transformation 1.40 1.71 tr tr tr tr 2019 2022 2019 2022 ※Cloud/IDC rev.(including kt cloud) reflected in total service rev. and DIGICO B2B 5
1 3Q22 Highlights 2 Financial Highlights 3 Business Overview 4 Appendix 6

K-IFRS / Consolidated 1 Income Statement • Revenue increased +4.2% YoY solidifying growth portfolio and leading DX • Operating income increased +18.4% YoY based on DIGICO revenue growth (Unit: KRW bn) 3Q21 2Q22 3Q22 QoQ YoY Operating Revenue 6,217.4 6,312.2 6,477.2 2.6% 4.2% Service Revenue 5,402.4 5,670.5 5,744.8 1.3% 6.3% 815.0 641.7 732.4 14.1% -10.1% Handset Revenue Operating Expense 5,835.0 5,853.0 6,024.3 2.9% 3.2% 382.4 459.2 452.9 -1.4% 18.4% Operating Income Margin 6.2% 7.3% 7.0% -0.3%p 0.8%p Margin* 7.1% 8.1% 7.9% -0.2%p 0.8%p 97.9 80.5 -13.9 Turn Red Turn Red Non-op. Income/Loss Income before taxes 480.3 539.7 439.0 -18.7% -8.6% 337.7 363.4 326.2 -10.2% -3.4% Net Income Margin 5.4% 5.8% 5.0% -0.8%p -0.4%p 1,277.5 1,387.2 1,359.7 -2.0% 6.4% EBITDA Margin 20.5% 22.0% 21.0% -1.0%p 0.5%p ※ OP Margin* = Operating Income/Service Revenue 7

K-IFRS / Consolidated 2 Operating Expenses (Unit: KRW bn) 3Q21 2Q22 3Q22 QoQ YoY 5,835.0 6,024.3 2.9% 3.2% Operating Expenses 5,853.0 Labor Cost 1,090.0 1,120.9 1,075.3 -4.1% -1.3% 2,447.7 2,586.0 1.0% 5.7% General Expense 2,560.2 - Depreciation 895.1 928.0 906.8 -2.3% 1.3% 835.8 887.6 2.9% 6.2% Cost of Service Provided 863.0 Selling Expense 582.0 606.0 648.4 7.0% 11.4% 879.4 827.0 17.6% -6.0% Cost of Handset sold 703.0 § Selling Expense (KT Separate) (Unit: KRW bn) 3Q21 2Q22 3Q22 QoQ YoY Selling Expense 622.1 657.4 650.3 -1.1% 4.5% 8
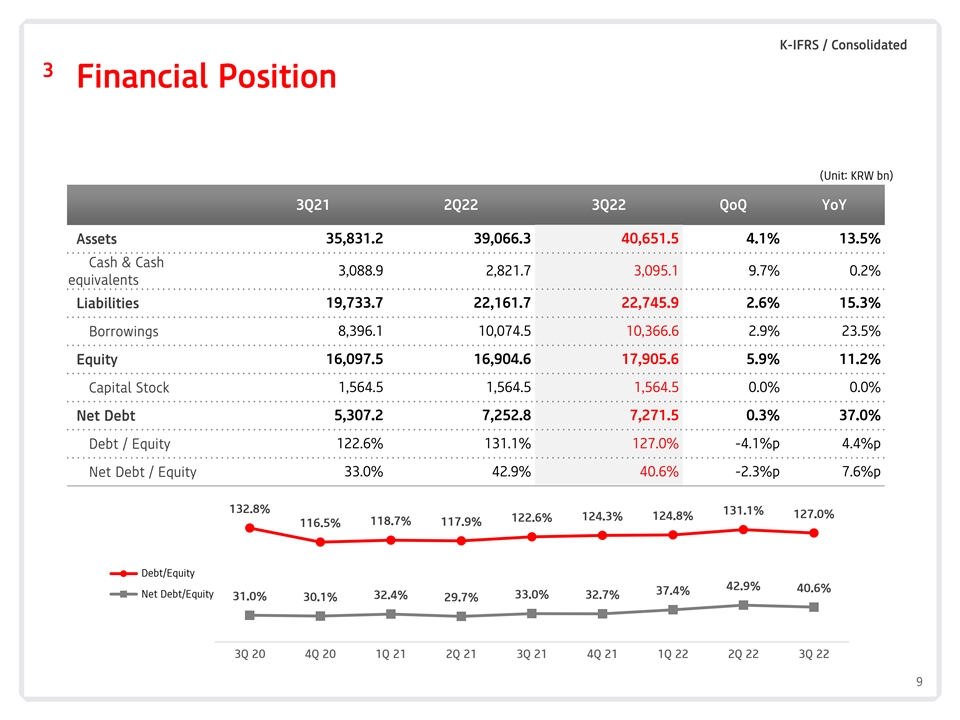
K-IFRS / Consolidated 3 Financial Position (Unit: KRW bn) 3Q21 2Q22 3Q22 QoQ YoY Assets 35,831.2 39,066.3 40,651.5 4.1% 13.5% Cash & Cash 3,088.9 2,821.7 3,095.1 9.7% 0.2% equivalents Liabilities 19,733.7 22,161.7 22,745.9 2.6% 15.3% 8,396.1 10,074.5 10,366.6 2.9% 23.5% Borrowings 16,097.5 16,904.6 17,905.6 5.9% 11.2% Equity 1,564.5 1,564.5 1,564.5 0.0% 0.0% Capital Stock 5,307.2 7,252.8 7,271.5 0.3% 37.0% Net Debt Debt / Equity 122.6% 131.1% 127.0% -4.1%p 4.4%p Net Debt / Equity 33.0% 42.9% 40.6% -2.3%p 7.6%p 132.8% 131.1% 127.0% 124.8% 124.3% 122.6% 118.7% 117.9% 116.5% Deb부채비율 t/Equity 42.9% 40.6% 37.4% Net순부채비율 Debt/Equity 33.0% 32.4% 32.7% 31.0% 30.1% 29.7% 3Q 20 4Q 20 1Q 21 2Q 21 3Q 21 4Q 21 1Q 22 2Q 22 3Q 22 9

K-IFRS / Separate and major subsidiaries 4 CAPEX • 3Q22 YTD CAPEX execution : KRW 1,864.0 bn(KT separate), KRW 522.3bn(major subsidiaries) (Unit: KRW bn) 3,452 3,127 692 462 2,386 ■ Major subsidiaries CAPEX 522 Finance, Media·Content, Cloud/IDC, Real Estate and etc. 2,760 2,666 ■ KT separate CAPEX 1,864 Access network, Backbone Network, B2B and etc. 2020 2021 3Q22 누적 cumulated ※ Cloud/IDC related investment in 2020 and 2021 are retroactively reflected in subsidiaries CAPEX 10

1 3Q22 Highlights 2 Financial Highlights 3 Business Overview 4 Appendix 11
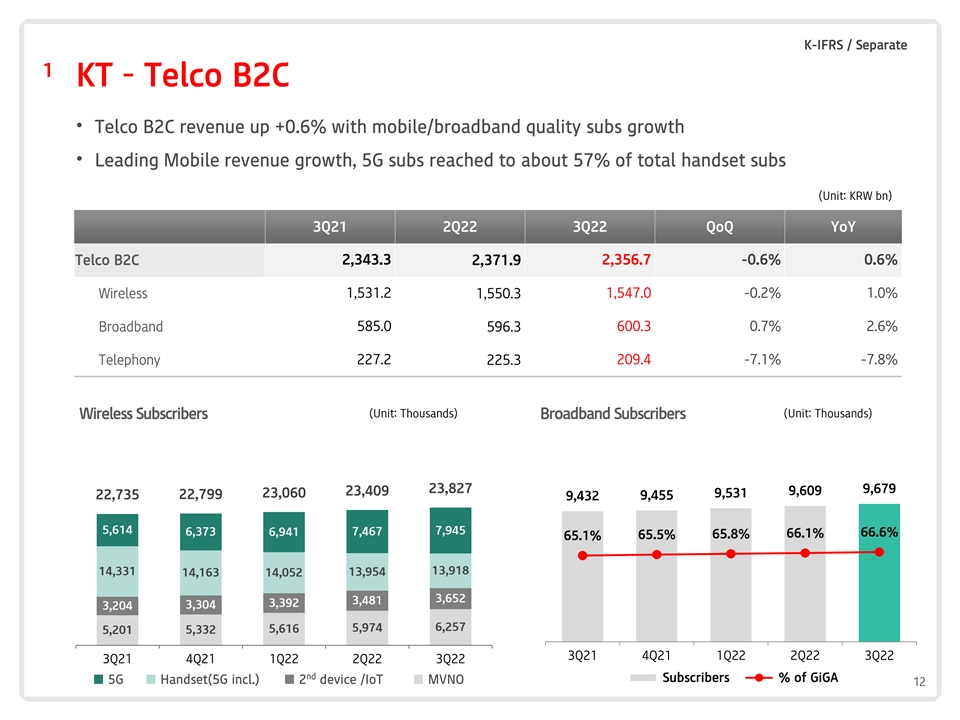
K-IFRS / Separate 1 KT – Telco B2C • Telco B2C revenue up +0.6% with mobile/broadband quality subs growth • Leading Mobile revenue growth, 5G subs reached to about 57% of total handset subs (Unit: KRW bn) 3Q21 2Q22 3Q22 QoQ YoY Telco B2C 2,343.3 2,371.9 2,356.7 -0.6% 0.6% Wireless 1,531.2 1,550.3 1,547.0 -0.2% 1.0% Broadband 585.0 596.3 600.3 0.7% 2.6% Telephony 227.2 225.3 209.4 -7.1% -7.8% Wireless Subscribers (Unit: Thousands) Broadband Subscribers (Unit: Thousands) 23,827 9,679 23,409 9,609 23,060 9,531 22,735 22,799 9,455 9,432 5,614 7,945 6,373 6,941 7,467 66.6% 65.8% 66.1% 65.1% 65.5% 13,918 14,331 13,954 14,163 14,052 3,652 3,481 3,392 3,304 3,204 5,974 6,257 5,616 5,201 5,332 3Q21 4Q21 1Q22 2Q22 3Q22 3Q21 4Q21 1Q22 2Q22 3Q22 nd Subscribers % of GiGA ■ 5G■ Handset(5G incl.)■ 2 device /IoT■ MVNO 12
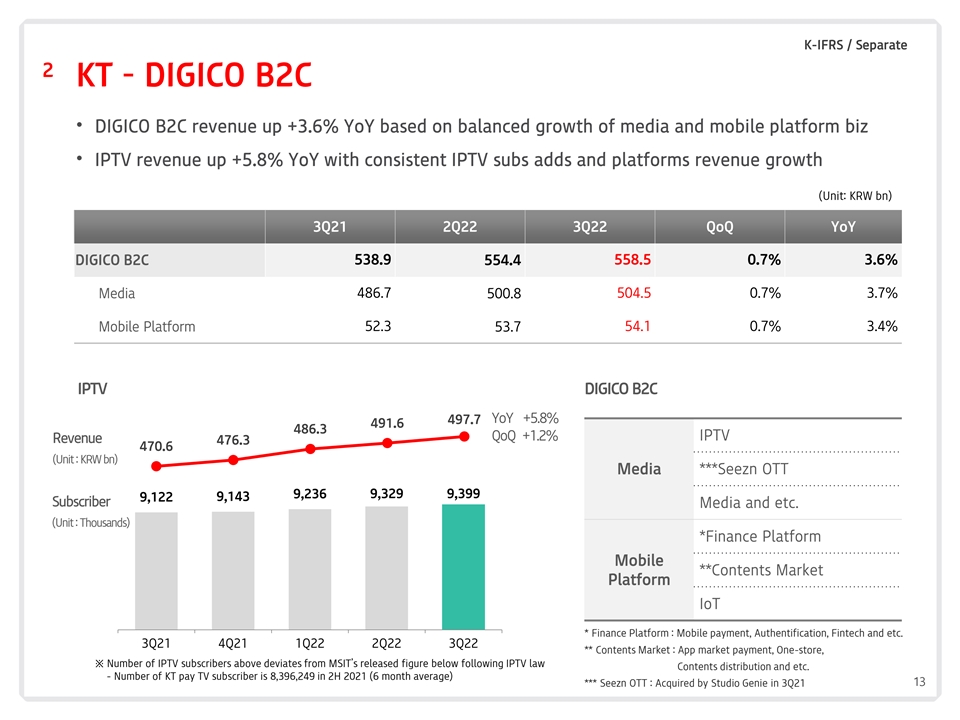
K-IFRS / Separate 2 KT – DIGICO B2C • DIGICO B2C revenue up +3.6% YoY based on balanced growth of media and mobile platform biz • IPTV revenue up +5.8% YoY with consistent IPTV subs adds and platforms revenue growth (Unit: KRW bn) 3Q21 2Q22 3Q22 QoQ YoY DIGICO B2C 538.9 554.4 558.5 0.7% 3.6% Media 486.7 500.8 504.5 0.7% 3.7% Mobile Platform 52.3 53.7 54.1 0.7% 3.4% IPTV DIGICO B2C 497.7 YoY +5.8% 491.6 486.3 QoQ +1.2% IPTV Revenue 476.3 470.6 (Unit: KRW bn) Media ***Seezn OTT 9,236 9,329 9,399 9,143 9,122 Subscriber Media and etc. (Unit: Thousands) *Finance Platform Mobile **Contents Market Platform IoT * Finance Platform : Mobile payment, Authentification, Fintech and etc. 3Q21 4Q21 1Q22 2Q22 3Q22 ** Contents Market : App market payment, One-store, ※ Number of IPTV subscribers above deviates from MSIT’s released figure below following IPTV law Contents distribution and etc. - Number of KT pay TV subscriber is 8,396,249 in 2H 2021 (6 month average) *** Seezn OTT : Acquired by Studio Genie in 3Q21 13

K-IFRS / Separate 3 KT – TELCO B2B • Corporate broadband/data revenue up +10.9% YoY based on data traffic and premium service growth • Corporate telephony revenue up +6.8% with growth of Communication DX and MVNO subscribers (Unit: KRW bn) 3Q21 2Q22 3Q22 QoQ YoY Telco B2B 498.9 529.9 546.4 3.1% 9.5% Corp. BB/data 333.3 356.4 369.6 3.7% 10.9% Corp. telephony 165.6 173.5 176.8 1.9% 6.8% MVNO Subscriber TELCO B2B (Unit: Thousands) Leased Line, KORNET, VPN 6,257 5,974 5,616 Corp. 5,332 Global Data, Wholesale 5,201 Broadband/Data Internet Exchange MVNO Corp. Corporate Telephony Telephony Corporate Intelligent 3Q21 4Q21 1Q22 2Q22 3Q22 Network 14

K-IFRS / 별도기준 4 KT – DIGICO B2B • DIGICO B2B rev. down -10.4% YoY due to kt cloud despite growth from AICC, Smart mobility and etc. • Including kt cloud revenue, DIGICO B2B revenue up +9.9% YoY to KRW 592.4bn (Unit: KRW bn) 3Q21 2Q22 3Q22 QoQ YoY • kt cloud를포함한 DIGICO B2B 매출은 5,924억원으로 YoY +9.9% 증가 DIGICO B2B 538.9 481.0 482.9 0.4% -10.4% Enterprise DX 272.1 304.3 294.6 -3.2% 8.3% Cloud/IDC 121.4 23.5 23.5 0.0% -80.6% AI/New Biz 103.3 108.5 117.8 8.6% 14.1% 42.1 46.9 4.9% 11.2% Real Estate 44.7 ※ Cloud/IDC revenue including kt cloud 3Q21 2Q22 3Q22 QoQ YoY Cloud/IDC 9.9% 9.6% 121.4 121.1 133.1 DIGICO B2B Enterprise Messaging AICC, AI Robot Managed, Enterprise IoT Smart Mobility Enterprise DX Global ICT AI/ New Biz Smart Space solution ICT and etc. Blockchain, Energy, Video Security Cloud New Biz and etc. Cloud/IDC IDC Real Estate 15
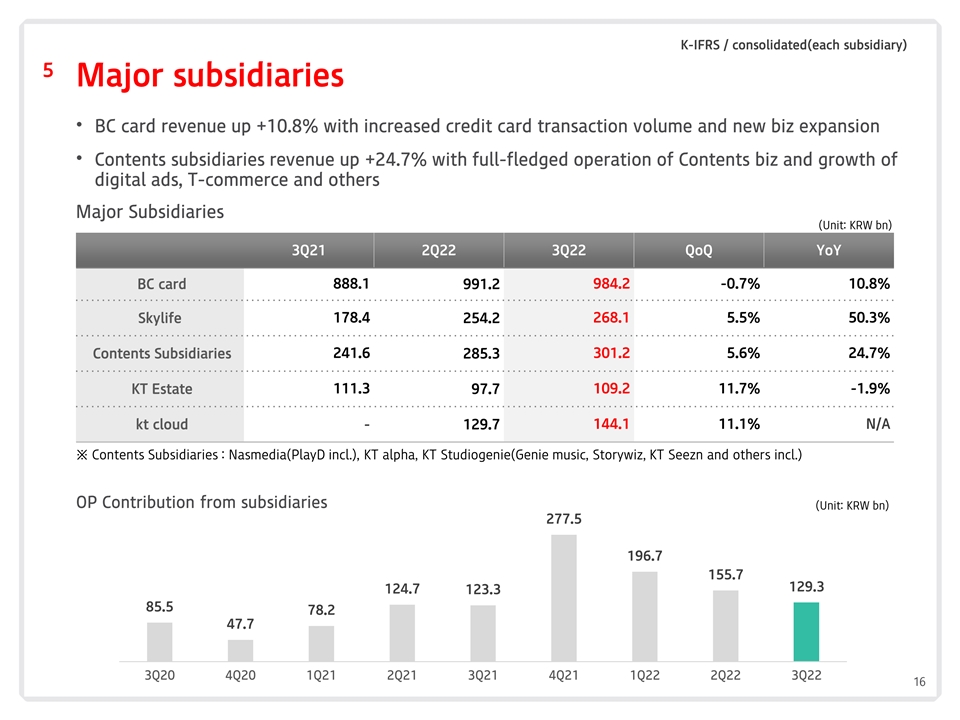
K-IFRS / consolidated(each subsidiary) 5 Major subsidiaries • BC card revenue up +10.8% with increased credit card transaction volume and new biz expansion • Contents subsidiaries revenue up +24.7% with full-fledged operation of Contents biz and growth of digital ads, T-commerce and others Major Subsidiaries (Unit: KRW bn) 3Q21 2Q22 3Q22 QoQ YoY BC card 888.1 991.2 984.2 -0.7% 10.8% 178.4 268.1 5.5% 50.3% Skylife 254.2 Contents Subsidiaries 241.6 285.3 301.2 5.6% 24.7% 111.3 109.2 11.7% -1.9% KT Estate 97.7 kt cloud - 129.7 144.1 11.1% N/A ※ Contents Subsidiaries : Nasmedia(PlayD incl.), KT alpha, KT Studiogenie(Genie music, Storywiz, KT Seezn and others incl.) OP Contribution from subsidiaries (Unit: KRW bn) 277.5 196.7 155.7 129.3 124.7 123.3 85.5 78.2 47.7 3Q20 4Q20 1Q21 2Q21 3Q21 4Q21 1Q22 2Q22 3Q22 16

1 3Q22 Highlights 2 Financial Highlights 3 Business Overview 4 Appendix 17
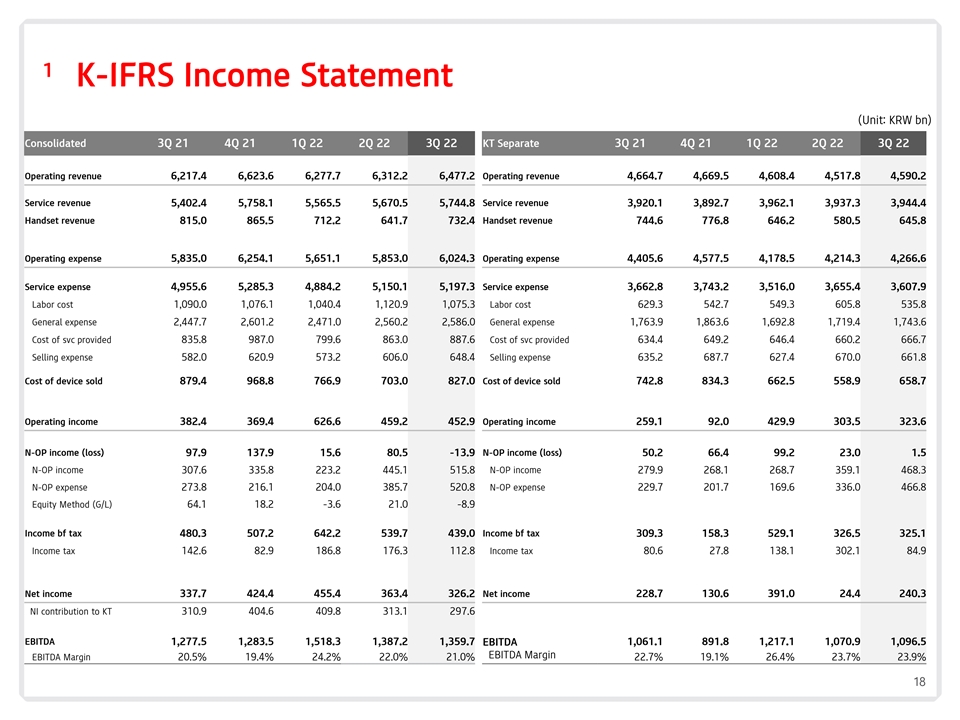
1 K-IFRS Income Statement (Unit: KRW bn) Consolidated 3Q 21 4Q 21 1Q 22 2Q 22 3Q 22 KT Separate 3Q 21 4Q 21 1Q 22 2Q 22 3Q 22 Operating revenue 6,217.4 6,623.6 6,277.7 6,312.2 6,477.2 Operating revenue 4,664.7 4,669.5 4,608.4 4,517.8 4,590.2 Service revenue 5,402.4 5,758.1 5,565.5 5,670.5 5,744.8 Service revenue 3,920.1 3,892.7 3,962.1 3,937.3 3,944.4 Handset revenue 815.0 865.5 712.2 641.7 732.4 Handset revenue 744.6 776.8 646.2 580.5 645.8 Operating expense 5,835.0 6,254.1 5,651.1 5,853.0 6,024.3 Operating expense 4,405.6 4,577.5 4,178.5 4,214.3 4,266.6 Service expense 4,955.6 5,285.3 4,884.2 5,150.1 5,197.3 Service expense 3,662.8 3,743.2 3,516.0 3,655.4 3,607.9 Labor cost 1,090.0 1,076.1 1,040.4 1,120.9 1,075.3 Labor cost 629.3 542.7 549.3 605.8 535.8 General expense 2,447.7 2,601.2 2,471.0 2,560.2 2,586.0 General expense 1,763.9 1,863.6 1,692.8 1,719.4 1,743.6 Cost of svc provided 835.8 987.0 799.6 863.0 887.6 Cost of svc provided 634.4 649.2 646.4 660.2 666.7 Selling expense 582.0 620.9 573.2 606.0 648.4 Selling expense 635.2 687.7 627.4 670.0 661.8 Cost of device sold 879.4 968.8 766.9 703.0 827.0 Cost of device sold 742.8 834.3 662.5 558.9 658.7 Operating income 382.4 369.4 626.6 459.2 452.9 Operating income 259.1 92.0 429.9 303.5 323.6 N-OP income (loss) 97.9 137.9 15.6 80.5 -13.9 N-OP income (loss) 50.2 66.4 99.2 23.0 1.5 N-OP income 307.6 335.8 223.2 445.1 515.8 N-OP income 279.9 268.1 268.7 359.1 468.3 N-OP expense 273.8 216.1 204.0 385.7 520.8 N-OP expense 229.7 201.7 169.6 336.0 466.8 Equity Method (G/L) 64.1 18.2 -3.6 21.0 -8.9 Income bf tax 480.3 507.2 642.2 539.7 439.0 Income bf tax 309.3 158.3 529.1 326.5 325.1 Income tax 142.6 82.9 186.8 176.3 112.8 Income tax 80.6 27.8 138.1 302.1 84.9 Net income 337.7 424.4 455.4 363.4 326.2 Net income 228.7 130.6 391.0 24.4 240.3 NI contribution to KT 310.9 404.6 409.8 313.1 297.6 EBITDA 1,277.5 1,283.5 1,518.3 1,387.2 1,359.7 1,061.1 891.8 1,217.1 1,070.9 1,096.5 EBITDA EBITDA Margin EBITDA Margin 20.5% 19.4% 24.2% 22.0% 21.0% 22.7% 19.1% 26.4% 23.7% 23.9% 18
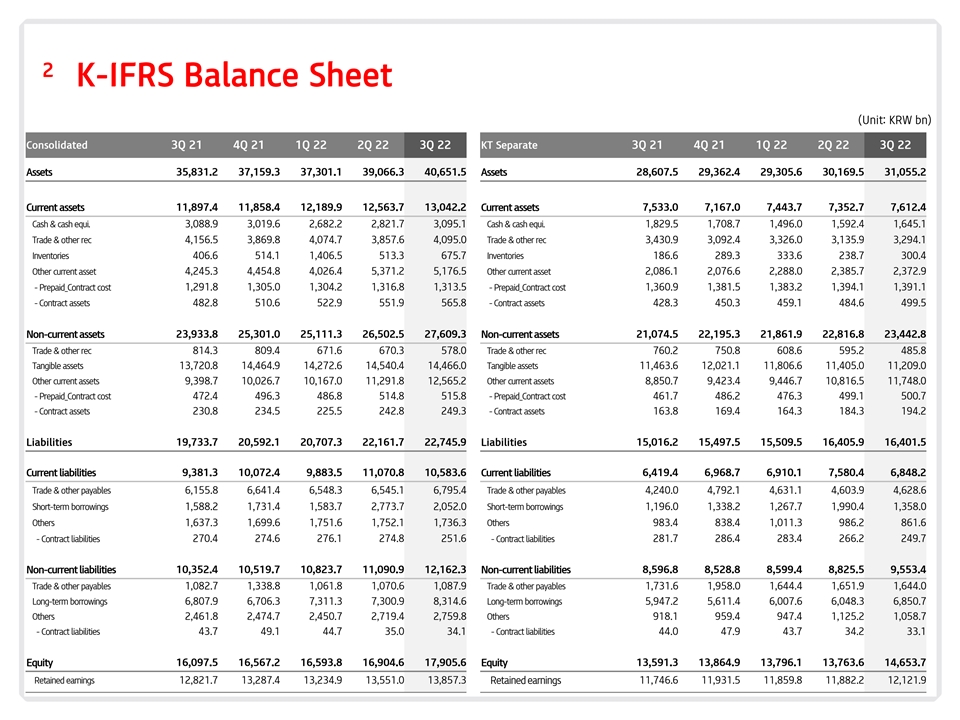
2 K-IFRS Balance Sheet (Unit: KRW bn) Consolidated 3Q 21 4Q 21 1Q 22 2Q 22 3Q 22 KT Separate 3Q 21 4Q 21 1Q 22 2Q 22 3Q 22 35,831.2 37,159.3 37,301.1 39,066.3 40,651.5 28,607.5 29,362.4 29,305.6 30,169.5 31,055.2 Assets Assets Current assets 11,897.4 11,858.4 12,189.9 12,563.7 13,042.2 Current assets 7,533.0 7,167.0 7,443.7 7,352.7 7,612.4 Cash & cash equi. 3,088.9 3,019.6 2,682.2 2,821.7 3,095.1 Cash & cash equi. 1,829.5 1,708.7 1,496.0 1,592.4 1,645.1 Trade & other rec 4,156.5 3,869.8 4,074.7 3,857.6 4,095.0 Trade & other rec 3,430.9 3,092.4 3,326.0 3,135.9 3,294.1 Inventories 406.6 514.1 1,406.5 513.3 675.7 Inventories 186.6 289.3 333.6 238.7 300.4 Other current asset 4,245.3 4,454.8 4,026.4 5,371.2 5,176.5 Other current asset 2,086.1 2,076.6 2,288.0 2,385.7 2,372.9 -Prepaid_Contract cost 1,291.8 1,305.0 1,304.2 1,316.8 1,313.5 -Prepaid_Contract cost 1,360.9 1,381.5 1,383.2 1,394.1 1,391.1 -Contract assets 482.8 510.6 522.9 551.9 565.8 -Contract assets 428.3 450.3 459.1 484.6 499.5 Non-current assets 23,933.8 25,301.0 25,111.3 26,502.5 27,609.3 Non-current assets 21,074.5 22,195.3 21,861.9 22,816.8 23,442.8 Trade & other rec 814.3 809.4 671.6 670.3 578.0 Trade & other rec 760.2 750.8 608.6 595.2 485.8 13,720.8 14,464.9 14,272.6 14,540.4 14,466.0 11,463.6 12,021.1 11,806.6 11,405.0 11,209.0 Tangible assets Tangible assets Other current assets 9,398.7 10,026.7 10,167.0 11,291.8 12,565.2 Other current assets 8,850.7 9,423.4 9,446.7 10,816.5 11,748.0 -Prepaid_Contract cost 472.4 496.3 486.8 514.8 515.8 -Prepaid_Contract cost 461.7 486.2 476.3 499.1 500.7 -Contract assets 230.8 234.5 225.5 242.8 249.3 -Contract assets 163.8 169.4 164.3 184.3 194.2 Liabilities 19,733.7 20,592.1 20,707.3 22,161.7 22,745.9 Liabilities 15,016.2 15,497.5 15,509.5 16,405.9 16,401.5 Current liabilities 9,381.3 10,072.4 9,883.5 11,070.8 10,583.6 Current liabilities 6,419.4 6,968.7 6,910.1 7,580.4 6,848.2 Trade & other payables 6,155.8 6,641.4 6,548.3 6,545.1 6,795.4 Trade & other payables 4,240.0 4,792.1 4,631.1 4,603.9 4,628.6 Short-term borrowings 1,588.2 1,731.4 1,583.7 2,773.7 2,052.0 Short-term borrowings 1,196.0 1,338.2 1,267.7 1,990.4 1,358.0 Others 1,637.3 1,699.6 1,751.6 1,752.1 1,736.3 Others 983.4 838.4 1,011.3 986.2 861.6 - Contract liabilities 270.4 274.6 276.1 274.8 251.6 - Contract liabilities 281.7 286.4 283.4 266.2 249.7 10,352.4 10,519.7 10,823.7 11,090.9 12,162.3 8,596.8 8,528.8 8,599.4 8,825.5 9,553.4 Non-current liabilities Non-current liabilities Trade & other payables 1,082.7 1,338.8 1,061.8 1,070.6 1,087.9 Trade & other payables 1,731.6 1,958.0 1,644.4 1,651.9 1,644.0 Long-term borrowings 6,807.9 6,706.3 7,311.3 7,300.9 8,314.6 Long-term borrowings 5,947.2 5,611.4 6,007.6 6,048.3 6,850.7 Others 2,461.8 2,474.7 2,450.7 2,719.4 2,759.8 Others 918.1 959.4 947.4 1,125.2 1,058.7 - Contract liabilities 43.7 49.1 44.7 35.0 34.1 - Contract liabilities 44.0 47.9 43.7 34.2 33.1 Equity 16,097.5 16,567.2 16,593.8 16,904.6 17,905.6 Equity 13,591.3 13,864.9 13,796.1 13,763.6 14,653.7 Retained earnings 12,821.7 13,287.4 13,234.9 13,551.0 13,857.3 11,746.6 11,931.5 11,859.8 11,882.2 12,121.9 Retained earnings 19

K-IFRS / Separate 3 Subscribers Wireless 3Q 21 4Q 21 1Q 22 2Q 22 3Q 22 QoQ YoY 1) Subscribers (Unit: Thousands) Total 22,735 22,799 23,060 23,409 23,827 1.8% 4.8% Net additions 114 64 261 349 418 19.8% 265.5% Gross additions 986 1,064 1,039 1,010 984 -2.6% -0.2% 2) Deactivation 871 1,000 778 661 566 -14.4% -35.1% Churn rate 1.3% 1.5% 1.1% 0.9% 0.8% -0.1%p -0.5%p LTE 15,161 14,662 14,454 14,357 14,392 0.2% -5.1% 5G 5,617 6,378 6,949 7,479 7,962 6.5% 41.8% LTE+5G Penetration rate 91.4% 92.3% 92.8% 93.3% 93.8% 0.5%p 2.4%p 3) ARPU (KRW) 31,815 31,825 32,308 32,446 32,917 1.5% 3.5% Note 1) Subscribers: MSIT’s new guidelines for subscriber disclosure (Retroactively applied from 1Q14, MVNO included) Note 2) Deactivation: Mandatory deactivation included Note 3) ARPU = Wireless revenue* / Wireless subscribers** * Wireless revenue(3G, LTE, 5G included): Revenue of Voice and Data usage (Interconnection/Subscription fee excluded), VAS, Contract/ Bundled Discounts, and etc. included ** Wireless subscribers: Based on MSIT’s guidelines for average billed subscribers in quarter (IoT/M2M excluded) Fixed Line/IPTV 3Q 21 4Q 21 1Q 22 2Q 22 3Q 22 QoQ YoY Subscribers (Unit: Thousands) Telephony 13,218 13,096 12,969 12,842 12,709 -1.0% -3.8% PSTN 10,037 9,905 9,768 9,634 9,500 -1.4% -5.4% VoIP 3,180 3,191 3,201 3,208 3,209 0.0% 0.9% Broadband 9,432 9,455 9,531 9,609 9,679 0.7% 2.6% IPTV (OTV+OTS) 9,122 9,143 9,236 9,329 9,399 0.8% 3.0% ※ Number of IPTV subscribers above deviates from MSIT’s released figure below following IPTV law - Number of KT pay TV subscriber is 8,396,249 in 2H 2021 (6 month average) 20
