Table of Contents
UNITED STATES
SECURITIES AND EXCHANGE COMMISSION
Washington, D.C. 20549
FORM N-CSR
CERTIFIED SHAREHOLDER REPORT OF REGISTERED
MANAGEMENT INVESTMENT COMPANIES
Investment Company Act file number 811-07238
SUNAMERICA SERIES TRUST
(Exact name of registrant as specified in charter)
21650 Oxnard Street, 10th Floor, Woodlands Hills, CA 91367
(Address of principal executive offices) (Zip code)
John T. Genoy
Senior Vice President
SunAmerica Asset Management, LLC
Harborside 5, 185 Hudson Street, Suite 3300
Jersey City, NJ 07311
(Name and address of agent for service)
Registrant’s telephone number, including area code: (201) 324-6414
Date of fiscal year end: December 31
Date of reporting period: December 31, 2017
Table of Contents
Item 1. Reports to Stockholders
This filing is on behalf of five of the fifty-five Investment Company Series of SunAmerica Series Trust. Also, attached to this filing are the financial statements with regard to the five Master Funds of the American Funds Insurance Series®.
Table of Contents
SUNAMERICA SERIES TRUST
ANNUAL REPORT
DECEMBER 31, 2017
Table of Contents
Table of Contents
SUNAMERICA SERIES TRUST
Dear SunAmerica Series Trust Investor
We are pleased to present the SunAmerica Series Trust annual report, which contains the investment portfolio information and the financial statements of the Trust portfolios that invest exclusively in shares of corresponding funds (“Master Funds”) of the American Funds Insurance Series (“AFIS”).
If you have any questions, please contact your investment representative, or you may contact us directly at 1-800-445-7862.
Thank you for the confidence you place in us with your financial future, and we look forward to reporting to you once again in six months.
Sincerely,

John T. Genoy
President
SunAmerica Series Trust
Note: All performance figures quoted are for the SunAmerica Series Trust. They do not reflect fees and charges associated with the variable annuity. Past performance is no guarantee of future results. Annuities are long-term investment vehicles designed for retirement purposes. Early withdrawal may be subject to withdrawal charges and if taken prior to age 59 1/2, a 10% federal tax penalty may apply. An investment in a variable annuity involves investment risk, including possible loss of principal. The contract, when redeemed, may be worth more or less than the total amount invested.
Investments in stocks and bonds are subject to risks. The Portfolios are indirectly exposed to these risks through their investments in the master funds. Investments in growth stocks may be subject to volatile price swings and therefore present a greater potential for loss than other investments. Income seeking investment strategies may not be realized due to changes in dividend policies or the availability of capital resources. Investments in non-U.S. stocks and bonds may be subject to additional risks such as fluctuations in foreign currencies, political and economic instability, differences in securities regulation and accounting standards, foreign tax laws, and limited availability of public information. Investments in lower rated bonds and “junk bonds” are considered speculative due to the heightened risk of default and are subject to unpredictable losses as a result of changes in the issuer’s creditworthiness.
There can be no assurance that the Portfolios will meet their investment objectives. The master funds’ asset allocation may result in underperformance relative to benchmarks and other funds with similar objectives.
A full description of the investment goals, principal strategies, and risks for each Portfolio are provided in the prospectus.
For a full description of the master funds, please consult the prospectus for the relevant underlying master fund.
Investments are not guaranteed or endorsed by any bank, is not a deposit or obligation of any bank, and is not federally insured by Federal Deposit Corporation (FDIC), the Federal Reserve Board or any other federal government agency.
• Not FDIC or NCUA/NCUSIF Insured
• May Lose Value • No Bank or Credit Union Guarantee
• Not a Deposit • Not insured by any Federal Government Agency
| ||
| 1 |
Table of Contents
SUNAMERICA SERIES TRUST
December 31, 2017 |
(unaudited)
Disclosure of Portfolio Expenses in Shareholder Reports
As a shareholder of a seperate series (a “Portfolio”) in the SunAmerica Series Trust (the “Trust”), you incur ongoing costs, including management fees; service (12b-1) fees; and other Portfolio expenses. This Example is intended to help you understand your ongoing costs (in dollars) of investing in the Portfolios and to compare these costs with the ongoing costs of investing in other mutual funds. The Example is based on an investment of $1,000 invested at July 1, 2017 and held until December 31, 2017. Shares of the Trust are not offered directly to the public. Instead, shares are currently issued and redeemed only in connection with investments in and payments under variable annuity contracts and variable life insurance policies (“Variable Contracts”) offered by life insurance companies affiliated with SunAmerica Asset Management, LLC, the Trust‘s investment adviser and manager. The fees and expenses associated with the Variable Contracts are not included in these Examples, and had such fees and expenses been included your costs would have been higher. Please see your variable contract prospectus for more details on the fees associated with the variable contract.
Actual Expenses
The “Actual” section of the table provides information about your actual account values and actual expenses. You may use the information in these columns, together with the amount you invested, to estimate the expenses that you paid over the period. Simply divide your account value by $1,000 (for example, an $8,600 account value divided by $1,000 = 8.6), then multiply the result by the number in the column under the heading entitled “Expenses Paid During the Six Months Ended December 31, 2017”, to estimate the expenses you paid on your account during this period. The “Expenses Paid During the Six Months Ended December 31, 2017” column and the “Annualized Expense Ratio” column do not include fees and expenses that may be charged by the Variable Contracts, in which the Portfolios are offered. Had these fees and expenses been included, the “Expenses Paid During the Six Months Ended December 31, 2017” column would have been higher and the “Ending Account Value” column would have been lower.
Hypothetical Example for Comparison Purposes
The “Hypothetical” section of the table provides information about hypothetical account values and hypothetical expenses based on the Portfolio‘s actual expense ratio and an annual rate of return of 5% before expenses, which is not the Portfolio‘s actual return. The hypothetical account values and expenses may not be used to estimate the actual ending account balance or expenses you paid for the period. You may use this information to compare the ongoing costs of investing in the Portfolios and other funds. To do so, compare this 5% hypothetical example with the 5% hypothetical examples that appear in the shareholder reports of other funds. The “Expenses Paid During the Six Months Ended December 31, 2017” column and the “Annualized Expense Ratio” column do not include fees and expenses that may be charged by the Variable Contracts, in which the Portfolios are offered. Had these fees and expenses been included, the “Expenses Paid During the Six Months Ended December 31, 2017” would have been higher and the “Ending Account Value” would have been lower.
Please note that the expenses shown in the table are meant to highlight your ongoing costs only and do not reflect any fees and expenses that may be charged by the Variable Contracts. Please refer to your variable contract prospectus for more information. Therefore the “Hypothetical” example is useful in comparing ongoing costs and will not help you determine the relative total costs of owning different funds. In addition, if these fees and expenses were included, your costs would have been higher.
| ||
| 2 |
Table of Contents
SUNAMERICA SERIES TRUST
EXPENSE EXAMPLE (continued) December 31, 2017 |
(unaudited)
| Actual | Hypothetical | |||||||||||||||||||||||||||
| Portfolio | Beginning Account Value at July 1, 2017 | Ending Account Value Using Actual Return at December 31, 2017 | Expenses Paid During the Six Months Ended December 31, 2017* | Beginning Account Value at July 1, 2017 | Ending Account Value Using a Hypothetical 5% Assumed Return at December 31, 2017 | Expenses Paid During the Six Months Ended December 31, 2017* | Annualized Expense Ratio* | |||||||||||||||||||||
SA American Funds® Asset Allocation† | ||||||||||||||||||||||||||||
Class 1#@ | $ | 1,000.00 | $ | 1,074.15 | $ | 1.46 | $ | 1,000.00 | $ | 1,023.79 | $ | 1.43 | 0.28 | % | ||||||||||||||
Class 3#@ | $ | 1,000.00 | $ | 1,073.20 | $ | 2.77 | $ | 1,000.00 | $ | 1,022.53 | $ | 2.70 | 0.53 | % | ||||||||||||||
SA American Funds® Global Growth† | ||||||||||||||||||||||||||||
Class 1#@ | $ | 1,000.00 | $ | 1,108.36 | $ | 1.49 | $ | 1,000.00 | $ | 1,023.79 | $ | 1.43 | 0.28 | % | ||||||||||||||
Class 3#@ | $ | 1,000.00 | $ | 1,107.01 | $ | 2.81 | $ | 1,000.00 | $ | 1,022.53 | $ | 2.70 | 0.53 | % | ||||||||||||||
SA American Funds® Growth† | ||||||||||||||||||||||||||||
Class 1#@ | $ | 1,000.00 | $ | 1,115.34 | $ | 1.49 | $ | 1,000.00 | $ | 1,023.79 | $ | 1.43 | 0.28 | % | ||||||||||||||
Class 3#@ | $ | 1,000.00 | $ | 1,114.10 | $ | 2.82 | $ | 1,000.00 | $ | 1,022.53 | $ | 2.70 | 0.53 | % | ||||||||||||||
SA American Funds® Growth-Income† | ||||||||||||||||||||||||||||
Class 1#@ | $ | 1,000.00 | $ | 1,114.68 | $ | 1.55 | $ | 1,000.00 | $ | 1,023.74 | $ | 1.48 | 0.29 | % | ||||||||||||||
Class 3#@ | $ | 1,000.00 | $ | 1,113.42 | $ | 2.88 | $ | 1,000.00 | $ | 1,022.48 | $ | 2.75 | 0.54 | % | ||||||||||||||
SA America Funds® VCP Managed Asset Allocation† | ||||||||||||||||||||||||||||
Class 1#@ | $ | 1,000.00 | $ | 1,068.92 | $ | 1.36 | $ | 1,000.00 | $ | 1,023.89 | $ | 1.33 | 0.26 | % | ||||||||||||||
Class 3#@ | $ | 1,000.00 | $ | 1,067.03 | $ | 2.71 | $ | 1,000.00 | $ | 1,022.58 | $ | 2.65 | 0.52 | % | ||||||||||||||
| † | See Note 1 |
| * | Expenses are equal to the Portfolio’s annualized expense ratio multiplied by the average account value over the period, multiplied by 184 days divided by 365 (to reflect the one-half year period). These ratios do not reflect expenses associated with the Variable Contracts. If such fees and expenses had been included, the expenses would have been higher. Please refer to your Variable Contract prospectus for details on the expenses that apply to the Variable Contracts of the insurance companies. |
| # | During the stated period, the investment adviser either waived fees and assumed expenses for the Portfolios or through recoupment provisions, recovered a portion of or all fees and expenses waived or reimbursed in the previous two fiscal years. As a result, if these fees and expenses had not been waived, the “Actual/Hypothetical Ending Account Value” would have been lower and the “Actual/Hypothetical Expenses Paid During the Six Months Ended December 31, 2017” and “Annualized Expense Ratios” would have been higher. If these fees and expenses had not been recouped, the “Actual/Hypothetical Ending Account Value” would have been higher and the “Actual/Hypothetical Expenses Paid During the Six Months Ended December 31, 2017” and the “Annualized Expense Ratio” would have been lower. |
| @ | Does not include the expenses of the underlying Funds of the American Funds Insurance Series (“Master Funds”) that the Portfolios bear indirectly. If these indirect expenses had been included, the “Actual/Hypothetical Expenses Paid During the Six Months Ended December 31, 2017” and the “Annualized Expense Ratios” would have been higher and the “Actual/Hypothetical Ending Account Value” would have been lower. |
| ||
| 3 |
Table of Contents
SunAmerica Series Trust SA American Funds® Asset Allocation Portfolio
PORTFOLIO PROFILE — December 31, 2017 — (unaudited)
Industry Allocation*
Asset Allocation Investment Companies | 100.1 | % | ||
|
|
| * | Calculated as a percentage of net assets. |
| ||
| 4 |
Table of Contents
SunAmerica Series Trust SA American Funds® Asset Allocation Portfolio
PORTFOLIO OF INVESTMENTS — December 31, 2017
| Shares | Value (Note 2) | |||||||
REGISTERED INVESTMENT COMPANIES — 100.1% | ||||||||
Asset Allocation Investment Companies —100.1% | ||||||||
American Funds Insurance Series® — Asset Allocation Fund, Class 1 | 23,147,557 | $ | 548,828,572 | |||||
|
| |||||||
TOTAL INVESTMENTS | 100.1 | % | 548,828,572 | |||||
Liabilities in excess of other assets | (0.1 | ) | (292,295 | ) | ||||
|
|
|
| |||||
NET ASSETS | 100.0 | % | $ | 548,536,277 | ||||
|
|
|
| |||||
| @ | See Note 3 for cost of investments on a tax basis. |
The following is a summary of the inputs used to value the Portfolio’s net assets as of December 31, 2017 (see Note 2):
| Level 1 - Unadjusted Quoted Prices | Level 2 - Other Observable Inputs | Level 3 - Significant Unobservable Inputs | Total | |||||||||||||
ASSETS: | ||||||||||||||||
Investments at Value:* | ||||||||||||||||
| Registered Investment Companies | $ | 548,828,572 | $ | — | $ | — | $ | 548,828,572 | ||||||||
|
|
|
|
|
|
|
| |||||||||
| * | For a detailed presentation of investments, please refer to the Portfolio of Investments. |
The Portfolio’s policy is to recognize transfers between Levels as of the end of the reporting period. There were no transfers between Levels during the reporting period.
See Notes to Financial Statements
| ||
| 5 |
Table of Contents
SunAmerica Series Trust SA American Funds® Global Growth Portfolio
PORTFOLIO PROFILE — December 31, 2017 — (unaudited)
Industry Allocation*
International Equity Investment Companies | 100.1 | % | ||
|
|
| * | Calculated as a percentage of net assets. |
| ||
| 6 |
Table of Contents
SunAmerica Series Trust SA American Funds® Global Growth Portfolio
PORTFOLIO OF INVESTMENTS — December 31, 2017
| Shares | Value (Note 2) | |||||||
REGISTERED INVESTMENT COMPANIES — 100.1% | ||||||||
International Equity Investment Companies — 100.1% | ||||||||
American Funds Insurance Series® — Global Growth Fund, Class 1 | 14,414,883 | $ | 439,798,078 | |||||
|
| |||||||
TOTAL INVESTMENTS | 100.1 | % | 439,798,078 | |||||
Liabilities in excess of other assets | (0.1 | ) | (258,303 | ) | ||||
|
|
|
| |||||
NET ASSETS | 100.0 | % | $ | 439,539,775 | ||||
|
|
|
| |||||
| @ | See Note 3 for cost of investments on a tax basis. |
The following is a summary of the inputs used to value the Portfolio’s net assets as of December 31, 2017 (see Note 2):
| Level 1 - Unadjusted Quoted Prices | Level 2 - Other Observable Inputs | Level 3 - Significant Unobservable Inputs | Total | |||||||||||||
ASSETS: | ||||||||||||||||
Investments at Value:* | ||||||||||||||||
| Registered Investment Companies | $ | 439,798,078 | $ | — | $ | — | $ | 439,798,078 | ||||||||
|
|
|
|
|
|
|
| |||||||||
| * | For a detailed presentation of investments, please refer to the Portfolio of Investments. |
The Portfolio’s policy is to recognize transfers between Levels as of the end of the reporting period. There were no transfers between Levels during the reporting period.
See Notes to Financial Statements
| ||
| 7 |
Table of Contents
SunAmerica Series Trust SA American Funds® Growth Portfolio
PORTFOLIO PROFILE — December 31, 2017 — (unaudited)
Industry Allocation*
Domestic Equity Investment Companies | 100.1 | % | ||
|
|
| * | Calculated as a percentage of net assets. |
| ||
| 8 |
Table of Contents
SunAmerica Series Trust SA American Funds® Growth Portfolio
PORTFOLIO OF INVESTMENTS — December 31, 2017
| Shares | Value (Note 2) | |||||||
REGISTERED INVESTMENT COMPANIES — 100.1% | ||||||||
Domestic Equity Investment Companies — 100.1% | ||||||||
American Funds Insurance Series ® — Growth Fund, Class 1 | 4,509,651 | $ | 351,076,368 | |||||
|
| |||||||
TOTAL INVESTMENTS | 100.1 | % | 351,076,368 | |||||
Liabilities in excess of other assets | (0.1 | ) | (218,116 | ) | ||||
|
|
|
| |||||
NET ASSETS | 100.0 | % | $ | 350,858,252 | ||||
|
|
|
| |||||
| @ | See Note 3 for cost of investments on a tax basis. |
The following is a summary of the inputs used to value the Portfolio’s net assets as of December 31, 2017 (see Note 2):
| Level 1 - Unadjusted Quoted Prices | Level 2 - Other Observable Inputs | Level 3 - Significant Unobservable Inputs | Total | |||||||||||||
ASSETS: | ||||||||||||||||
Investments at Value:* | ||||||||||||||||
| Registered Investment Companies | $ | 351,076,368 | $ | — | $ | — | $ | 351,076,368 | ||||||||
|
|
|
|
|
|
|
| |||||||||
| * | For a detailed presentation of investments, please refer to the Portfolio of Investments. |
The Portfolio’s policy is to recognize transfers between Levels as of the end of the reporting period. There were no transfers between Levels during the reporting period.
See Notes to Financial Statements
| ||
| 9 |
Table of Contents
SunAmerica Series Trust SA American Funds® Growth-Income Portfolio
PORTFOLIO PROFILE — December 31, 2017 — (unaudited)
Industry Allocation*
Domestic Equity Investment Companies | 100.1 | % | ||
|
|
| * | Calculated as a percentage of net assets. |
| ||
| 10 |
Table of Contents
SunAmerica Series Trust SA American Funds® Growth-Income Portfolio
PORTFOLIO OF INVESTMENTS — December 31, 2017
| Shares | Value (Note 2) | |||||||
REGISTERED INVESTMENT COMPANIES — 100.1% | ||||||||
Domestic Equity Investment Companies — 100.1% | ||||||||
American Funds Insurance Series® — Growth-Income Fund, Class 1 | 5,605,238 | $ | 281,495,053 | |||||
|
| |||||||
TOTAL INVESTMENTS | 100.1 | % | 281,495,053 | |||||
Liabilities in excess of other assets | (0.1 | ) | (179,241 | ) | ||||
|
|
|
| |||||
NET ASSETS | 100.0 | % | $ | 281,315,812 | ||||
|
|
|
| |||||
| @ | See Note 3 for cost of investments on a tax basis. |
The following is a summary of the inputs used to value the Portfolio’s net assets as of December 31, 2017 (see Note 2):
| Level 1 - Unadjusted Quoted Prices | Level 2 - Other Observable Inputs | Level 3 - Significant Unobservable Inputs | Total | |||||||||||||
ASSETS: | ||||||||||||||||
Investments at Value:* | ||||||||||||||||
| Registered Investment Companies | $ | 281,495,053 | $ | — | $ | — | $ | 281,495,053 | ||||||||
|
|
|
|
|
|
|
| |||||||||
| * | For a detailed presentation of investments, please refer to the Portfolio of Investments. |
The Portfolio’s policy is to recognize transfers between Levels as of the end of the reporting period. There were no transfers between Levels during the reporting period.
See Notes to Financial Statements
| ||
| 11 |
Table of Contents
SunAmerica Series Trust SA American Funds® VCP Managed Asset Allocation Portfolio
PORTFOLIO PROFILE — December 31, 2017 — (unaudited)
Industry Allocation*
Asset Allocation Investment Companies | 100.0 | % | ||
|
|
| * | Calculated as a percentage of net assets. |
| ||
| 12 |
Table of Contents
SunAmerica Series Trust SA American Funds® VCP Managed Asset Allocation Portfolio
PORTFOLIO OF INVESTMENTS — December 31, 2017
| Shares | Value (Note 2) | |||||||
REGISTERED INVESTMENT COMPANIES — 100.0% | ||||||||
Asset Allocation Investment Companies — 100.0% | ||||||||
American Funds Insurance Series® — Managed Risk Asset Allocation FundSM, Class P1 | 121,813,924 | $ | 1,655,451,221 | |||||
|
| |||||||
TOTAL INVESTMENTS | 100.0 | % | 1,655,451,221 | |||||
Liabilities in excess of other assets | (0.0 | ) | (815,439 | ) | ||||
|
|
|
| |||||
NET ASSETS | 100.0 | % | $ | 1,654,635,782 | ||||
|
|
|
| |||||
| @ | See Note 3 for cost of investments on a tax basis. |
The following is a summary of the inputs used to value the Portfolio’s net assets as of December 31, 2017 (see Note 2):
| Level 1 - Unadjusted Quoted Prices | Level 2 - Other Observable Inputs | Level 3 - Significant Unobservable Inputs | Total | |||||||||||||
ASSETS: | ||||||||||||||||
Investments at Value:* | ||||||||||||||||
| Registered Investment Companies | $ | 1,655,451,221 | $ | — | $ | — | $ | 1,655,451,221 | ||||||||
|
|
|
|
|
|
|
| |||||||||
| * | For a detailed presentation of investments, please refer to the Portfolio of Investments. |
The Portfolio’s policy is to recognize transfers between Levels as of the end of the reporting period. There were no transfers between Levels during the reporting period.
See Notes to Financial Statements
| ||
| 13 |
Table of Contents
SUNAMERICA SERIES TRUST
STATEMENT OF ASSETS AND LIABILITIES
December 31, 2017
| SA American Funds® Asset Allocation Portfolio† | SA American Funds® Global Growth Portfolio† | SA American Funds® Growth Portfolio† | SA American Funds® Growth- Income Portfolio† | SA American Funds® VCP Managed Asset Allocation Portfolio† | ||||||||||||||||
ASSETS: | ||||||||||||||||||||
Investment at value (unaffiliated)* | $ | 548,828,572 | $ | 439,798,078 | $ | 351,076,368 | $ | 281,495,053 | $ | 1,655,451,221 | ||||||||||
Cash | 246,787 | 257,211 | 175,239 | 138,409 | 914,583 | |||||||||||||||
Receivable for: | ||||||||||||||||||||
Fund shares sold | 1,512,738 | 12,806 | — | 33,807 | 18,661,055 | |||||||||||||||
Investments sold | — | 3,531,198 | 5,148,221 | 2,789,031 | — | |||||||||||||||
Prepaid expenses and other assets | 4,682 | 4,691 | 4,680 | 4,674 | 4,510 | |||||||||||||||
Due from investment adviser for expense reimbursements/fee waivers | 270,521 | 263,134 | 181,293 | 144,647 | 962,853 | |||||||||||||||
|
|
|
|
|
|
|
|
|
| |||||||||||
Total assets | 550,863,300 | 443,867,118 | 356,585,801 | 284,605,621 | 1,675,994,222 | |||||||||||||||
|
|
|
|
|
|
|
|
|
| |||||||||||
LIABILITIES: | ||||||||||||||||||||
Payable for: | ||||||||||||||||||||
Fund shares redeemed | 106,198 | 3,801,215 | 5,323,460 | 2,961,247 | 39 | |||||||||||||||
Investments purchased | 1,653,327 | — | — | — | 19,575,599 | |||||||||||||||
Investment advisory and management fees | 383,240 | 357,111 | 256,831 | 204,916 | 1,306,727 | |||||||||||||||
Service fees | 112,683 | 93,950 | 75,511 | 60,243 | 343,850 | |||||||||||||||
Transfer agent fees | 144 | 174 | 174 | 174 | 131 | |||||||||||||||
Trustees' fees and expenses | 791 | 734 | 582 | 464 | 2,599 | |||||||||||||||
Other accrued expenses | 70,640 | 74,159 | 70,991 | 62,765 | 129,495 | |||||||||||||||
|
|
|
|
|
|
|
|
|
| |||||||||||
Total liabilities | 2,327,023 | 4,327,343 | 5,727,549 | 3,289,809 | 21,358,440 | |||||||||||||||
|
|
|
|
|
|
|
|
|
| |||||||||||
NET ASSETS | $ | 548,536,277 | $ | 439,539,775 | $ | 350,858,252 | $ | 281,315,812 | $ | 1,654,635,782 | ||||||||||
|
|
|
|
|
|
|
|
|
| |||||||||||
NET ASSETS REPRESENTED BY: | ||||||||||||||||||||
Paid-in capital | 471,815,517 | 312,806,763 | 246,853,290 | 203,808,489 | 1,445,921,147 | |||||||||||||||
Accumulated undistributed net investment income (loss) | 6,733,360 | 1,438,313 | 1,486,855 | 3,124,249 | 3,813,360 | |||||||||||||||
Accumulated undistributed net realized gain (loss) on investments and capital gain distributions from underlying funds | 15,411,632 | 30,196,732 | 43,801,003 | 23,067,752 | 17,296,853 | |||||||||||||||
Unrealized appreciation (depreciation) on investments | 54,575,768 | 95,097,967 | 58,717,104 | 51,315,322 | 187,604,422 | |||||||||||||||
|
|
|
|
|
|
|
|
|
| |||||||||||
NET ASSETS | $ | 548,536,277 | $ | 439,539,775 | $ | 350,858,252 | $ | 281,315,812 | $ | 1,654,635,782 | ||||||||||
|
|
|
|
|
|
|
|
|
| |||||||||||
Class 1 (unlimited shares authorized): | ||||||||||||||||||||
Net assets | $ | 201,142 | $ | 125,956 | $ | 131,794 | $ | 126,712 | $ | 122,810 | ||||||||||
Shares of beneficial interest issued and outstanding | 13,541 | 9,596 | 10,020 | 9,756 | 8,546 | |||||||||||||||
Net asset value, offering and redemption price per share | $ | 14.85 | $ | 13.13 | $ | 13.15 | $ | 12.99 | $ | 14.37 | ||||||||||
|
|
|
|
|
|
|
|
|
| |||||||||||
Class 3 (unlimited shares authorized): | ||||||||||||||||||||
Net assets | $ | 548,335,135 | $ | 439,413,819 | $ | 350,726,458 | $ | 281,189,100 | $ | 1,654,512,972 | ||||||||||
Shares of beneficial interest issued and outstanding | 37,018,180 | 33,569,778 | 26,740,019 | 21,713,642 | 115,448,564 | |||||||||||||||
Net asset value, offering and redemption price per share | $ | 14.81 | $ | 13.09 | $ | 13.12 | $ | 12.95 | $ | 14.33 | ||||||||||
|
|
|
|
|
|
|
|
|
| |||||||||||
| ||||||||||||||||||||
* Cost | ||||||||||||||||||||
Investment securities (unaffiliated) | $ | 494,252,804 | $ | 344,700,111 | $ | 292,359,264 | $ | 230,179,731 | $ | 1,467,846,799 | ||||||||||
|
|
|
|
|
|
|
|
|
| |||||||||||
| † | See Note 1 |
See Notes To Financial Statements
| ||
| 14 |
Table of Contents
SUNAMERICA SERIES TRUST
For the Year Ended December 31, 2017
| SA American Funds® Asset Allocation Portfolio† | SA American Funds® Global Growth Portfolio† | SA American Funds® Growth Portfolio† | SA American Funds® Growth- Income Portfolio† | SA American Funds® VCP Managed Asset Allocation Portfolio† | ||||||||||||||||
INVESTMENT INCOME: | ||||||||||||||||||||
Dividends (unaffiliated) | $ | 8,555,703 | $ | 3,755,215 | $ | 2,509,755 | $ | 4,385,556 | $ | 11,452,205 | ||||||||||
|
|
|
|
|
|
|
|
|
| |||||||||||
Total investment income | 8,555,703 | 3,755,215 | 2,509,755 | 4,385,556 | 11,452,205 | |||||||||||||||
|
|
|
|
|
|
|
|
|
| |||||||||||
EXPENSES: | ||||||||||||||||||||
Investment advisory and management fees | 3,281,213 | 4,153,579 | 2,930,620 | 2,334,152 | 13,827,513 | |||||||||||||||
Service fees — Class 3 | 964,775 | 1,092,764 | 861,650 | 686,228 | 3,638,543 | |||||||||||||||
Transfer agent fees | 816 | 1,045 | 1,045 | 1,045 | 818 | |||||||||||||||
Custodian and accounting fees | 11,022 | 11,050 | 11,053 | 11,038 | 11,020 | |||||||||||||||
Reports to shareholders | 52,659 | 55,310 | 40,718 | 35,895 | 201,201 | |||||||||||||||
Audit and tax fees | 25,372 | 25,372 | 25,372 | 25,372 | 25,370 | |||||||||||||||
Legal fees | 8,570 | 9,667 | 8,949 | 8,453 | 15,384 | |||||||||||||||
Trustees' fees and expenses | 9,001 | 10,394 | 8,301 | 6,649 | 34,476 | |||||||||||||||
Interest expense | 30 | 116 | 69 | 46 | 250 | |||||||||||||||
Other expenses | 12,921 | 18,137 | 25,903 | 18,636 | 19,720 | |||||||||||||||
|
|
|
|
|
|
|
|
|
| |||||||||||
Total expenses before fee waivers and expense reimbursements | 4,366,379 | 5,377,434 | 3,913,680 | 3,127,514 | 17,774,295 | |||||||||||||||
|
|
|
|
|
|
|
|
|
| |||||||||||
Net (fees waived and expenses reimbursed)/recouped by investment adviser (Note 4) | (2,316,150 | ) | (3,060,532 | ) | (2,068,673 | ) | (1,647,637 | ) | (10,135,451 | ) | ||||||||||
|
|
|
|
|
|
|
|
|
| |||||||||||
Net expenses | 2,050,229 | 2,316,902 | 1,845,007 | 1,479,877 | 7,638,844 | |||||||||||||||
|
|
|
|
|
|
|
|
|
| |||||||||||
Net investment income (loss) | 6,505,474 | 1,438,313 | 664,748 | 2,905,679 | 3,813,361 | |||||||||||||||
|
|
|
|
|
|
|
|
|
| |||||||||||
REALIZED AND UNREALIZED GAIN (LOSS) ON INVESTMENTS: | ||||||||||||||||||||
Net realized gain (loss) on investments (unaffiliated) | 1,170,265 | 19,050,338 | 21,505,230 | 19,028,360 | 3,486,842 | |||||||||||||||
Net realized gain (loss) from capital gain distributions received from underlying funds (unaffiliated) | 16,058,354 | 13,141,564 | 32,759,157 | 17,451,941 | 13,810,011 | |||||||||||||||
|
|
|
|
|
|
|
|
|
| |||||||||||
Net realized gain (loss) on investments | 17,228,619 | 32,191,902 | 54,264,387 | 36,480,301 | 17,296,853 | |||||||||||||||
|
|
|
|
|
|
|
|
|
| |||||||||||
Net change in unrealized appreciation (depreciation) on investments (unaffiliated) | 30,861,936 | 83,958,038 | 29,387,966 | 15,106,865 | 171,521,312 | |||||||||||||||
|
|
|
|
|
|
|
|
|
| |||||||||||
Net realized and unrealized gain (loss) on investments | 48,090,555 | 116,149,940 | 83,652,353 | 51,587,166 | 188,818,165 | |||||||||||||||
|
|
|
|
|
|
|
|
|
| |||||||||||
NET INCREASE (DECREASE) IN NET ASSETS RESULTING FROM OPERATIONS | $ | 54,596,029 | $ | 117,588,253 | $ | 84,317,101 | $ | 54,492,845 | $ | 192,631,526 | ||||||||||
|
|
|
|
|
|
|
|
|
| |||||||||||
| † | See Note 1 |
See Notes To Financial Statements
| ||
| 15 |
Table of Contents
SUNAMERICA SERIES TRUST
STATEMENT OF CHANGES IN NET ASSETS
| SA American Funds® Asset Allocation Portfolio†† | SA American Funds® Global Growth Portfolio†† | SA American Funds® Growth Portfolio†† | ||||||||||||||||||||||
| For the year ended December 31, 2017 | For the year ended December 31, 2016 | For the year ended December 31, 2017 | For the year ended December 31, 2016 | For the year ended December 31, 2017 | For the year ended December 31, 2016 | |||||||||||||||||||
INCREASE (DECREASE) IN NET ASSETS | ||||||||||||||||||||||||
OPERATIONS: | ||||||||||||||||||||||||
Net investment income (loss) | $ | 6,505,474 | $ | 3,414,898 | $ | 1,438,313 | $ | 2,515,754 | $ | 664,748 | $ | 1,522,081 | ||||||||||||
Net realized gain (loss) on investments | 17,228,619 | 7,715,548 | 32,191,902 | 44,902,002 | 54,264,387 | 42,276,793 | ||||||||||||||||||
Net unrealized gain (loss) on investments | 30,861,936 | 8,768,716 | 83,958,038 | (45,414,998 | ) | 29,387,966 | (15,991,735 | ) | ||||||||||||||||
|
|
|
|
|
|
|
|
|
|
|
| |||||||||||||
Net increase (decrease) in net assets resulting from operations | 54,596,029 | 19,899,162 | 117,588,253 | 2,002,758 | 84,317,101 | 27,807,139 | ||||||||||||||||||
|
|
|
|
|
|
|
|
|
|
|
| |||||||||||||
DISTRIBUTIONS TO SHAREHOLDERS FROM: | ||||||||||||||||||||||||
Net investment income — Class 1 | (900 | ) | — | (1,158 | ) | — | (621 | ) | — | |||||||||||||||
Net investment income — Class 3 | (3,444,387 | ) | (4,078,481 | ) | (3,932,655 | ) | (7,069,789 | ) | (1,521,460 | ) | (1,016,942 | ) | ||||||||||||
Net realized gain on securities — Class 1 | (1,913 | ) | — | (11,538 | ) | — | (13,408 | ) | — | |||||||||||||||
Net realized gain on securities — Class 3 | (7,683,246 | ) | (14,909,260 | ) | (41,847,096 | ) | (62,319,507 | ) | (37,409,023 | ) | (83,163,468 | ) | ||||||||||||
|
|
|
|
|
|
|
|
|
|
|
| |||||||||||||
Total distributions to shareholders | (11,130,446 | ) | (18,987,741 | ) | (45,792,447 | ) | (69,389,296 | ) | (38,944,512 | ) | (84,180,410 | ) | ||||||||||||
|
|
|
|
|
|
|
|
|
|
|
| |||||||||||||
Net increase (decrease) in net assets resulting from capital share transactions (Note 6) | 232,963,007 | 74,651,559 | (44,098,574 | ) | 56,954,103 | (16,304,257 | ) | 67,813,379 | ||||||||||||||||
|
|
|
|
|
|
|
|
|
|
|
| |||||||||||||
TOTAL INCREASE (DECREASE) IN NET ASSETS | 276,428,590 | 75,562,980 | 27,697,232 | (10,432,435 | ) | 29,068,332 | 11,440,108 | |||||||||||||||||
NET ASSETS: | ||||||||||||||||||||||||
Beginning of period | 272,107,687 | 196,544,707 | 411,842,543 | 422,274,978 | 321,789,920 | 310,349,812 | ||||||||||||||||||
|
|
|
|
|
|
|
|
|
|
|
| |||||||||||||
End of period† | $ | 548,536,277 | $ | 272,107,687 | $ | 439,539,775 | $ | 411,842,543 | $ | 350,858,252 | $ | 321,789,920 | ||||||||||||
|
|
|
|
|
|
|
|
|
|
|
| |||||||||||||
† Includes accumulated undistributed net investment income (loss) | $ | 6,733,360 | $ | 3,445,287 | $ | 1,438,313 | $ | 3,933,813 | $ | 1,486,855 | $ | 1,522,082 | ||||||||||||
|
|
|
|
|
|
|
|
|
|
|
| |||||||||||||
| †† | See Note 1 |
See Notes to Financial Statements
| ||
| 16 |
Table of Contents
SUNAMERICA SERIES TRUST
STATEMENT OF CHANGES IN NET ASSETS
| SA American Funds® Growth-Income Portfolio†† | SA American Funds® VCP Managed Asset Allocation Portfolio†† | |||||||||||||||
| For the year ended December 31, 2017 | For the year ended December 31, 2016 | For the year ended December 31, 2017 | For the year ended December 31, 2016 | |||||||||||||
INCREASE (DECREASE) IN NET ASSETS | ||||||||||||||||
OPERATIONS: | ||||||||||||||||
Net investment income (loss) | $ | 2,905,679 | $ | 2,944,465 | $ | 3,813,361 | $ | 11,201,004 | ||||||||
Net realized gain (loss) on investments | 36,480,301 | 34,946,693 | 17,296,853 | 30,435,149 | ||||||||||||
Net unrealized gain (loss) on investments | 15,106,865 | (11,275,491 | ) | 171,521,312 | 29,733,181 | |||||||||||
|
|
|
|
|
|
|
| |||||||||
Net increase (decrease) in net assets resulting from operations | 54,492,845 | 26,615,667 | 192,631,526 | 71,369,334 | ||||||||||||
|
|
|
|
|
|
|
| |||||||||
DISTRIBUTIONS TO SHAREHOLDERS FROM: | ||||||||||||||||
Net investment income — Class 1 | (1,915 | ) | — | (877 | ) | — | ||||||||||
Net investment income — Class 3 | (4,254,146 | ) | (3,568,907 | ) | (11,200,128 | ) | (7,206,779 | ) | ||||||||
Net realized gain on securities — Class 1 | (14,218 | ) | — | (2,230 | ) | — | ||||||||||
Net realized gain on securities — Class 3 | (32,846,126 | ) | (44,599,886 | ) | (30,432,919 | ) | (10,153,955 | ) | ||||||||
|
|
|
|
|
|
|
| |||||||||
Total distributions to shareholders | (37,116,405 | ) | (48,168,793 | ) | (41,636,154 | ) | (17,360,734 | ) | ||||||||
|
|
|
|
|
|
|
| |||||||||
Net increase (decrease) in net assets resulting from capital share transactions (Note 6) | 5,166,595 | 33,684,263 | 287,949,004 | 451,230,605 | ||||||||||||
|
|
|
|
|
|
|
| |||||||||
TOTAL INCREASE (DECREASE) IN NET ASSETS | 22,543,035 | 12,131,137 | 438,944,376 | 505,239,205 | ||||||||||||
NET ASSETS: | ||||||||||||||||
Beginning of period | 258,772,777 | 246,641,640 | 1,215,691,406 | 710,452,201 | ||||||||||||
|
|
|
|
|
|
|
| |||||||||
End of period† | $ | 281,315,812 | $ | 258,772,777 | $ | 1,654,635,782 | $ | 1,215,691,406 | ||||||||
|
|
|
|
|
|
|
| |||||||||
† Includes accumulated undistributed net investment income (loss) | $ | 3,124,249 | $ | 4,256,061 | $ | 3,813,360 | $ | 11,201,004 | ||||||||
|
|
|
|
|
|
|
| |||||||||
| †† | See Note 1 |
See Notes to Financial Statements
| ||
| 17 |
Table of Contents
SUNAMERICA SERIES TRUST
December 31, 2017
Note 1. Description of Business and Basis of Presentation
SunAmerica Series Trust (the “Trust”), organized as a Massachusetts business trust on September 11, 1992, is an open-end management investment company. The Trust is comprised of fifty-five separate investment series, five of which are included in this report: SA American Funds® Asset Allocation Portfolio, SA American Funds® Global Growth Portfolio, SA American Funds® Growth Portfolio, SA American Funds® Growth-Income Portfolio and SA American Funds® VCP Managed Asset Allocation Portfolio, (collectively, the “Portfolios”). SunAmerica Asset Management, LLC (“SAAMCO” or the “Adviser”), an indirect wholly-owned subsidiary of American International Group, Inc., a Delaware corporation (“AIG”), serves as investment adviser for all Portfolios of the Trust.
Effective October 9, 2017, the names of the American Funds® Asset Allocation SAST Portfolio, American Funds® Global Growth SAST Portfolio, American Funds® Growth SAST Portfolio, American Funds® Growth-Income SAST Portfolio and VCP Managed Asset Allocation SAST Portfolio were changed to SA American Funds® Asset Allocation Portfolio, SA American Funds® Global Growth Portfolio, SA American Funds® Growth Portfolio, SA American Funds® Growth-Income Portfolio and SA American Funds® VCP Managed Asset Allocation Portfolio, respectively.
Shares of the Trust are issued and redeemed only in connection with investments in and payments under variable annuity contracts and variable life policies. Shares of the Portfolios are held by separate accounts of American General Life Insurance Company, a Texas life insurer (“AGL”), The United States Life Insurance Company in The City of New York, a New York life insurer (“USL”) and The Variable Annuity Life Insurance Company, a Texas life insurer (“VALIC”). AGL and USL and VALIC are indirect wholly-owned subsidiaries of AIG. The life insurance companies listed above are collectively referred to as the “Life Companies.” All shares may be purchased or redeemed at net asset value without any sales or redemption charges.
SA American Funds® Asset Allocation Portfolio, SA American Funds® Global Growth Portfolio, SA American Funds® Growth Portfolio, SA American Funds® Growth-Income Portfolio and SA American Funds® VCP Managed Asset Allocation Portfolio operate as “Feeder Funds,” and invest all or substantially all of their assets in shares of an underlying mutual fund (“underlying fund” and/or “Master Fund”).
Class 1 shares of each Portfolio commenced operations effective September 26, 2016. Class 1 shares and Class 3 shares of each Portfolio may be offered only in connection with certain variable contracts. Class 3 shares of a given Portfolio are identical in all respects to Class 1 shares of the same Portfolio, except that (i) each class may bear differing amounts of certain class-specific expenses; (ii) Class 3 shares are subject to service fees while Class 1 shares are not; and (iii) Class 3 shares have voting rights on matters that pertain to the Rule 12b-1 plan adopted with respect to Class 3 shares. Class 3 shares of each Portfolio pay service fees at an annual rate of 0.25% of each class’s average daily net assets. The Board of Trustees may establish additional portfolios or classes in the future.
Each Master Fund is a portfolio offered by American Funds Insurance Series® (“AFIS” or “American Funds”), a registered open-end management investment company. Each Portfolio’s corresponding Master Fund is listed below:
Trust Feeder Funds | American Funds Master Funds | |
SA American Funds® Asset Allocation Portfolio | SA American Funds® Asset Allocation Fund | |
SA American Funds® Global Growth Portfolio | SA American Funds® Global Growth Fund | |
SA American Funds® Growth Portfolio | SA American Funds® Growth Fund | |
SA American Funds® Growth-Income Portfolio | SA American Funds® Growth-Income Fund | |
SA American Funds® VCP Managed Asset Allocation Portfolio | SA American Funds® Managed Risk Asset Allocation FundSM |
The underlying fund’s accounting policies are outlined in the underlying funds’ financial statements, available at U.S. Securities and Exchange Commission (“SEC”) Internet website at www.sec.gov, and should be read in conjunction with these financial statements.
The investment goals for the Portfolios included in this report are as follows:
The SA American Funds® Asset Allocation Portfolio seeks high total return (including income and capital gains) consistent with the preservation of capital over the long term. Its strategy is to invest all or substantially all of its assets in Class 1 shares of the Master Fund, the American Funds Insurance Series® Asset Allocation Fund (“the Master Asset Allocation Fund”), a portfolio offered by AFIS, a registered open-end investment company. In turn, the Master Asset Allocation Fund invests in a diversified portfolio of common stocks and other equity securities, bonds and other intermediate and long-term debt securities and money market instruments.
The SA American Funds® Global Growth Portfolio seeks growth. Its strategy is to invest all or substantially all of its assets in Class 1 shares of the Master Fund, the American Funds Insurance Series® Global Growth Fund (“the Master Global Growth Fund”), a portfolio offered by AFIS, a registered open-end investment company. In turn, the Master Global Growth Fund invests primarily in common stocks and other securities of companies around the world that have the potential for growth.
| ||
| 18 |
Table of Contents
The SA American Funds® Growth Portfolio seeks growth. Its strategy is to invest all or substantially all of its assets in Class 1 shares of the Master Fund, the American Funds Insurance Series® Growth Fund (“the Master Growth Fund”), a portfolio offered by AFIS, a registered open-end investment company. In turn, the Master Growth Fund invests primarily in common stocks of companies that appear to offer superior opportunities for growth of capital.
The SA American Funds® Growth-Income Portfolio seeks growth and income. Its strategy is to invest all or substantially all of its assets in Class 1 shares of the Master Fund, the American Funds Insurance Series® Growth-Income Fund (“the Master Growth-Income Fund”), a portfolio offered by AFIS, a registered open-end investment company. In turn, the Master Growth-Income Fund invests primarily in common stocks or other securities that demonstrate the potential for appreciation and/or dividends.
The SA American Funds® VCP Managed Asset Allocation Portfolio seeks high total return (including income and capital gains) consistent with the preservation of capital over the long term while seeking to manage volatility and provide downside protection by investing all or substantially all of its assets in Class P1 shares of the Master Fund, the American Funds Insurance Series® Managed Risk Asset Allocation FundSM (“the Master Managed Risk Allocation Fund”), a portfolio offered by AFIS, a registered open-end investment company. In turn, the Master Managed Risk Allocation Fund invests in the shares of an underlying fund, the American Funds Asset Allocation Fund (the “Underlying Fund”). The Underlying Fund invests in a diversified portfolio of common stocks and other equity securities, bonds and other intermediate and long term debt securities and money market instruments.
Indemnifications: The Trust’s organizational documents provide current and former officers and trustees with a limited indemnification against liabilities arising out of the performance of their duties to the Trust. In addition, pursuant to Indemnification Agreements between the Trust and each of the current (and certain former) trustees who is not an “interested person,” as defined in Section 2(a)(19) of the Investment Company Act of 1940, as amended (the “1940 Act”), of the Trust (collectively, the “Disinterested Trustees”), the Trust provides the Disinterested Trustees with a limited indemnification against liabilities arising out of the performance of their duties to the Trust, whether such liabilities are asserted during or after their service as trustees. In addition, in the normal course of business the Trust enters into contracts that contain the obligation to indemnify others. The Trust’s maximum exposure under these arrangements is unknown. Currently, however, the Trust expects the risk of loss to be remote.
Note 2. Significant Accounting Policies
The preparation of financial statements in accordance with U.S. generally accepted accounting principles (“GAAP”) requires management to make estimates and assumptions that affect the reported amounts and disclosures in the financial statements. Actual results could differ from those estimates and those differences could be significant. The following is a summary of significant accounting policies consistently followed by the Trust and the Master Funds, in the preparation of their respective financial statements:
Security Valuation
In accordance with the authoritative guidance on fair value measurements and disclosures under GAAP, the Portfolios disclose the fair value of their investments in a hierarchy that prioritizes the inputs to valuation techniques used to measure the fair value. In accordance with GAAP, fair value is defined as the price that the Portfolios would receive upon selling an asset or transferring a liability in a timely transaction to an independent third party in the principal or most advantageous market. GAAP establishes a three-tier hierarchy to provide more transparency around the inputs used to measure fair value and to establish classification of fair value measurements for disclosure purposes. Inputs refer broadly to the assumptions that market participants would use in pricing the asset or liability, including assumptions about risk. Inputs may be observable or unobservable. Observable inputs are inputs that reflect the assumptions market participants would use in pricing the asset or liability developed based on market data obtained from sources independent of the reporting entity. Unobservable inputs are inputs that reflect the reporting entity’s own assumptions about the assumptions market participants would use in pricing the asset or liability developed based on the best information available in the circumstances. The three-tiers are as follows:
Level 1 — Unadjusted quoted prices in active markets for identical securities
Level 2 — Other significant observable inputs (including quoted prices for similar securities, interest rates, prepayment speeds, credit risk, referenced indices, quoted prices in inactive markets, adjusted quoted prices in active markets, adjusted quoted prices on foreign equity securities that were adjusted in accordance with pricing procedures approved by the Board of Trustees (the “Board”), etc.)
Level 3 — Significant unobservable inputs (includes inputs that reflect the Portfolios’ own assumptions about the assumptions market participants would use in pricing the security, developed based on the best information available under the circumstances)
Changes in valuation techniques may result in transfers in or out of an investment’s assigned Level within the hierarchy. The methodology used for valuing investments is not necessarily an indication of the risk associated with investing in those investments and the determination of the significance of a particular input to the fair value measurement in its entirety requires judgment and consideration of factors specific to each security.
The availability of observable inputs can vary from security to security and is affected by a wide variety of factors, including, for example, the type of security, whether the security is recently issued and not yet established in the marketplace, the liquidity of markets, and other characteristics particular to the security. To the extent that valuation is based on models or inputs that are less observable or unobservable in the market, the determination of fair value requires more judgment. Accordingly, the degree of judgment exercised in determining fair value is greatest for instruments categorized in Level 3.
| ||
| 19 |
Table of Contents
The summary of the Portfolios’ assets and liabilities classified in the fair value hierarchy as of December 31, 2017, is reported on a schedule following the portfolio of investments.
The net asset value (“NAV”) of each Portfolio is determined based upon the NAV of its corresponding Master Fund.
Master Funds
Each Master Fund is a series of AFIS. All portfolio securities of funds managed by Capital Research and Management Company (“Capital Research”) are valued, and the NAV per share for each share class are determined, as follows:
The AFIS investment adviser values the AFIS investments at fair value as defined by U.S. GAAP. The net asset value of each share class of each AFIS fund is generally determined as of approximately 4:00 p.m. New York time each day the New York Stock Exchange is open.
Methods and inputs — The AFIS investment adviser uses the following methods and inputs to establish the fair value of each fund’s assets and liabilities. Use of particular methods and inputs may vary over time based on availability and relevance as market and economic conditions evolve.
Equity securities are generally valued at the official closing price of, or the last reported sale price on, the exchange or market on which such securities are traded, as of the close of business on the day the securities are being valued or, lacking any sales, at the last available bid price. Prices for each security are taken from the principal exchange or market in which the security trades. The value of an underlying fund is based on its reported net asset value.
Fixed-income securities, including short-term securities, are generally valued at prices obtained from one or more pricing vendors. Vendors value such securities based on one or more of the inputs described in the following table. The table provides examples of inputs that are commonly relevant for valuing particular classes of fixed-income securities in which the funds are authorized to invest. However, these classifications are not exclusive and any of the inputs may be used to value any other class of fixed-income security.
| Fixed-income class | Examples of standard inputs | |
| All | Benchmark yields, transactions, bids, offers, quotations from dealers and trading systems, new issues, spreads and other relationships observed in the markets among comparable securities; and proprietary pricing models such as yield measures calculated using factors such as cash flows, financial or collateral performance and other reference data (collectively referred to as “standard inputs”) | |
| Corporate bonds & notes; convertible securities | Standard inputs and underlying equity of the issuer | |
| Bonds & notes of governments & government agencies | Standard inputs and interest rate volatilities | |
| Mortgage-backed; asset-backed obligations | Standard inputs and cash flows, prepayment information, default rates, delinquency and loss assumptions, collateral characteristics, credit enhancements and specific deal information | |
| Municipal securities | Standard inputs and, for certain distressed securities, cash flows or liquidation values using a net present value calculation based on inputs that include, but are not limited to, financial statements and debt contracts | |
When the AFIS investment adviser deems it appropriate to do so (such as when vendor prices are unavailable or not deemed to be representative), fixed-income securities will be valued in good faith at the mean quoted bid and ask prices that are reasonably and timely available (or bid prices, if ask prices are not available) or at prices for securities of comparable maturity, quality and type.
Securities with both fixed-income and equity characteristics, or equity securities traded principally among fixed-income dealers, are generally valued in the manner described for either equity or fixed-income securities, depending on which method is deemed most appropriate by the AFIS investment adviser. The Government Cash Management Fund held by the managed risk funds is managed to maintain a $1.00 net asset value per share. The net asset value of each share class of each managed risk fund is calculated based on the reported net asset values of the underlying funds in which each fund invests.
Exchange-traded futures are generally valued at the official settlement price of, or the last reported sale price on, the exchange or market on which such instruments are traded, as of the close of business on the day the futures are being valued or, lacking any sales, at the last available bid price. Prices for each future are taken from the exchange or market on which the security trades. Forward currency contracts are valued at the mean of representative quoted bid and ask prices, generally based on prices supplied by one or more pricing vendors. Interest rate swaps and credit default swaps are generally valued by pricing vendors based on market inputs that include the index and term of index, reset frequency, payer/receiver, currency and pay frequency.
Securities and other assets for which representative market quotations are not readily available or are considered unreliable by the AFIS investment adviser are fair valued as determined in good faith under fair value guidelines adopted by authority of the AFIS
| ||
| 20 |
Table of Contents
board of trustees as further described. The AFIS investment adviser follows fair valuation guidelines, consistent with U.S. Securities and Exchange Commission rules and guidance, to consider relevant principles and factors when making fair value determinations. The AFIS investment adviser considers relevant indications of value that are reasonably and timely available to it in determining the fair value to be assigned to a particular security, such as the type and cost of the security; contractual or legal restrictions on resale of the security; relevant financial or business developments of the issuer; actively traded similar or related securities; conversion or exchange rights on the security; related corporate actions; significant events occurring after the close of trading in the security; and changes in overall market conditions. In addition, the closing prices of equity securities and futures that trade in markets outside U.S. time zones may be adjusted to reflect significant events that occur after the close of local trading but before the net asset value of each share class of each fund is determined. Fair valuations and valuations of investments and futures that are not actively trading involve judgment and may differ materially from valuations that would have been used had greater market activity occurred.
Processes and structure — The AFIS board of trustees has delegated authority to the AFIS investment adviser to make fair value determinations, subject to board oversight. The AFIS investment adviser has established a Joint Fair Valuation Committee (the “Fair Valuation Committee”) to administer, implement and oversee the fair valuation process, and to make fair value decisions. The Fair Valuation Committee regularly reviews its own fair value decisions, as well as decisions made under its standing instructions to the AFIS investment adviser’s valuation teams. The Fair Valuation Committee reviews changes in fair value measurements from period to period and may, as deemed appropriate, update the fair valuation guidelines to better reflect the results of back testing and address new or evolving issues. The Fair Valuation Committee reports any changes to the fair valuation guidelines to the board of trustees with supplemental information to support the changes. The AFIS board and audit committee also regularly review reports that describe fair value determinations and methods.
The AFIS investment adviser has also established a Fixed-Income Pricing Review Group to administer and oversee the fixed-income valuation process, including the use of fixed-income pricing vendors. This group regularly reviews pricing vendor information and market data. Pricing decisions, processes and controls over security valuation are also subject to additional internal reviews, including an annual control self-evaluation program facilitated by the investment adviser’s compliance group.
Securities Transactions, Investment Income, Expenses, Dividends and Distributions to Shareholders: Security transactions are recorded on a trade date basis. Interest income is accrued daily from settlement date except when collection is not expected. Realized gains and losses on the sale of investments are calculated on the identified cost basis. Dividend income is recorded on the ex-dividend date.
The Portfolios invest in Master Fund portfolios offered by American Funds including funds investing in fixed income securities. Distributions from income from the Master Funds, if any, are recorded to income on ex-dividend date. Distributions from net realized capital gains from the Master Funds, if any are recorded to realized gains on ex-dividend date.
Expenses common to all Portfolios, not directly related to individual Portfolios are allocated among the Portfolios based upon relative net assets or other appropriate allocation methods. In all other respects, expenses are charged to each Portfolio as incurred on a specific identification basis.
The expenses included in the accompanying financial statements reflect the expenses of the Portfolios and do not include indirect expenses borne by each underlying Portfolio in connection with its investment in the underlying Portfolio.
Dividends from net investment income and capital gain distributions, if any, are paid annually. The Portfolios record dividends and distributions to their shareholders on the ex-dividend date.
The amount of dividends and distributions from net investment income and net realized capital gains are determined in accordance with federal income tax regulations, which may differ from GAAP. These “book/tax” differences are either considered temporary or permanent in nature. To the extent these differences are permanent in nature, such amounts are reclassified within the capital accounts at fiscal year end based on their federal tax-basis treatment; temporary differences do not require reclassification. Net assets are not affected by these reclassifications.
Each Portfolio is considered a separate entity for tax purposes and intends to comply with the requirements of the Internal Revenue Code, as amended, applicable to regulated investment companies and distribute all of its taxable income, including any net capital gains on investments, to its shareholders. Each Portfolio also intends to distribute sufficient net investment income and net capital gains, if any, so that it will not be subject to excise tax on undistributed income and gains. Therefore, no federal income tax or excise tax provision is required.
The Portfolios recognize the tax benefits of uncertain tax positions only when the position is more likely than not to be sustained, assuming examination by tax authorities. Management has analyzed each Portfolio’s tax positions and concluded that no liability for unrecognized tax benefits should be recorded related to uncertain tax positions taken on returns filed for open tax years 2014 – 2016 or expected to be taken in each Portfolio’s 2017 tax return. The Portfolios are not aware of any tax provisions for which it is reasonably possible that the total amounts of unrecognized tax benefits will change materially in the next twelve months. The Portfolios file U.S. federal and certain state income tax returns. With few exceptions, the Portfolios are no longer subject to U.S. federal and state tax examinations by tax authorities for tax returns ending before 2014.
New Accounting Pronouncement: In October 2016, the SEC adopted amendments to rules under the 1940 Act (“final rules”) intended to modernize the reporting and disclosure of information by registered investment companies. The final rules amend
| ||
| 21 |
Table of Contents
Regulation S-X and require funds to provide standardized, enhanced derivative disclosure in fund financial statements in a format designed for individual investors. The amendments to Regulation S-X also update the disclosures for other investments and investments in and advances to affiliates and amend the rules regarding the general form and content of fund financial statements. The compliance date for the amendments to Regulation S-X was August 1, 2017. All required changes have been made in accordance with Regulation S-X.
Note 3. Federal Income Taxes
The following details the tax basis of distributions as well as the components of distributable earnings. The tax basis components of distributable earnings differ from the amounts reflected in the Statement of Assets and Liabilities by temporary book/tax differences primarily arising from wash sales.
| For the year ended December 31, 2017 | ||||||||||||||||||||
| Distributable Earnings | Tax Distributions | |||||||||||||||||||
Portfolio | Ordinary Income | Long-term Gains/ Capital and Other Losses | Unrealized Appreciation (Depreciation) | Ordinary Income | Long-Term Capital Gains | |||||||||||||||
SA American Funds® Asset Allocation | $ | 6,733,360 | $ | 16,979,586 | $ | 53,007,814 | $ | 3,445,287 | $ | 7,685,159 | ||||||||||
SA American Funds® Global Growth | 1,438,313 | 32,175,734 | 93,118,968 | 3,933,813 | 41,858,634 | |||||||||||||||
SA American Funds® Growth | 1,486,854 | 48,632,217 | 53,885,890 | 1,522,081 | 37,422,431 | |||||||||||||||
SA American Funds® Growth-Income | 3,124,249 | 33,182,546 | 41,200,529 | 4,256,061 | 32,860,344 | |||||||||||||||
SA American Funds® VCP Managed Asset Allocation | 3,813,360 | 17,296,853 | 187,604,422 | 11,201,005 | 30,435,149 | |||||||||||||||
| For the year ended December 31, 2016 | ||||||||
| Tax Distributions | ||||||||
| Ordinary Income | Long-Term Capital Gains | |||||||
SA American Funds® Asset Allocation | $ | 4,078,481 | $ | 14,909,260 | ||||
SA American Funds® Global Growth | 7,069,789 | 62,319,507 | ||||||
SA American Funds® Growth | 1,016,942 | 83,163,468 | ||||||
SA American Funds® Growth-Income | 3,568,907 | 44,599,886 | ||||||
SA American Funds® VCP Managed Asset Allocation | 7,206,779 | 10,153,955 | ||||||
For the year ended December 31, 2017, the reclassifications arising from book/tax differences resulted in increases (decreases) that were primarily due to short-term capital gain distributions from underlying funds were as follows:
Portfolio | Accumulated Undistributed Net Investment Income (Loss) | Accumulated Undistributed Net Realized Gain (Loss) | Capital Paid-in | |||||||||
SA American Funds® Asset Allocation | $ | 227,886 | $ | (227,886 | ) | $ | — | |||||
SA American Funds® Global Growth | — | — | — | |||||||||
SA American Funds® Growth | 822,106 | (822,106 | ) | — | ||||||||
SA American Funds® Growth-Income | 218,570 | (218,570 | ) | — | ||||||||
SA American Funds® VCP Managed Asset Allocation | — | — | — | |||||||||
The amounts of aggregate unrealized gain (loss) and the cost of investment securities for Federal tax purposes, including short-term securities and repurchase agreements, were as follows:
Portfolio | Aggregate Unrealized Gain | Aggregate Unrealized Loss | Net Unrealized Gain / (Loss) | Cost of Investments | ||||||||||||
SA American Funds® Asset Allocation | $ | 54,575,768 | $ | (1,567,954 | ) | $ | 53,007,814 | $ | 495,820,758 | |||||||
SA American Funds® Global Growth | 95,097,967 | (1,978,999 | ) | 93,118,968 | 346,679,110 | |||||||||||
SA American Funds® Growth | 58,717,104 | (4,831,214 | ) | 53,885,890 | 297,190,478 | |||||||||||
SA American Funds® Growth-Income | 51,315,322 | (10,114,793 | ) | 41,200,529 | 240,294,524 | |||||||||||
SA American Funds® VCP Managed Asset Allocation | 187,604,422 | — | 187,604,422 | 1,467,846,799 | ||||||||||||
On December 22, 2017, the Tax Cuts and Jobs Act (the “Act”) was signed into law. Certain provisions of the Act were effective upon enactment with the remainder becoming effective for tax years beginning after December 31, 2017. Management is currently evaluating the impact, if any, on the financial statements and the accompanying notes to financial statements.
Note 4. Investment Advisory and Management Agreement, and Service Plan (12b-1 Plan)
Capital Research serves as investment adviser to the Master Funds. Capital Research, a wholly owned subsidiary of The Capital Group Companies, Inc., manages the investment fund and business affairs of the Master Funds. The Trust, on behalf of each Portfolio, entered into an Investment Advisory and Management Agreement (the “Agreement”) with SAAMCo to handle the Trust’s day-to-day affairs. The Agreement provides that SAAMCo shall manage the Trust’s investments and administer its business affairs; furnish offices, necessary facilities and equipment; provide clerical, bookkeeping and administrative services; and permit any of its officers or employees to serve, without compensation, as trustees or officers of the Trust, if duly elected to such positions. SAAMCo performs all investment advisory services for these Portfolios with the exception of portfolio management. The term “Assets,” as used in the following table, means the average daily net assets of the Portfolios.
| ||
| 22 |
Table of Contents
The Trust pays SAAMCo a monthly fee calculated daily at the following annual percentages of each Portfolio’s Assets:
Portfolio | Management Fees | |||
SA American Funds® Asset Allocation | 0.85 | % | ||
SA American Funds® Global Growth | 0.95 | % | ||
SA American Funds® Growth | 0.85 | % | ||
SA American Funds® Growth-Income | 0.85 | % | ||
SA American Funds® VCP Managed Asset Allocation | 0.95 | % | ||
The Trust has entered into a contractual agreement with SAAMCo under which SAAMCo will waive 0.60%, 0.70%, 0.60%, 0.60%, and 0.70% for SA American Funds® Asset Allocation Portfolio, SA American Funds® Global Growth Portfolio, SA American Funds® Growth Portfolio, SA American Funds® Growth-Income Portfolio and SA American Funds® VCP Managed Asset Allocation Portfolio, respectively, of its advisory fee for such time as the Portfolios are operated as feeder funds, because during that time it will not be providing the portfolio management portion of the advisory and management services to be provided under its investment advisory and management agreement with the Trust. This fee waiver will continue as long as the Portfolios are part of a master-feeder fund structure unless the Board approves a change in or elimination of the waiver.
For the year ended December 31, 2017, SAAMCo has agreed to waive advisory fees as follows:
Portfolio | Amount | |||
SA American Funds® Asset Allocation | $ | 2,316,150 | ||
SA American Funds® Global Growth | 3,060,532 | |||
SA American Funds® Growth | 2,068,673 | |||
SA American Funds® Growth-Income | 1,647,637 | |||
SA American Funds® VCP Managed Asset Allocation | 10,188,694 | |||
SAAMCo has contractually agreed to waive fees and/or reimburse expenses of the following Portfolio until April 30, 2018; so that the annual operating expenses do not exceed the following percentage of the Portfolio’s average net assets. For purposes of the waived fees and/or reimbursed expense calculations, annual operating expenses shall not include extraordinary expenses (i.e. expenses that are unusual in nature and/or infrequent in occurrence such as litigation), or acquired fund fees and expenses, brokerage commissions and other transactional expenses relating to the purchase and sale of portfolio securities, interest, taxes and governmental fees, and other expenses not incurred in the ordinary course of the Portfolio’s business. This agreement may be modified or discontinued prior to April 30, 2018 only with the approval of the Board of Trustees of the Portfolio, including a majority of the Independent Trustees. This agreement will be renewed in terms of one year only if the Adviser agrees to extend the expense limitation.
Portfolio | Class 1 | Class 3 | ||||||
SA American Funds® VCP Managed Asset Allocation | 0.28 | % | 0.53 | % | ||||
Further, SAAMCo has voluntarily agreed to waive fees and/or reimburse expenses, if necessary, to keep annual operating expenses at or below the following percentages of each of the following Portfolios’ Class 3 shares’ average daily net assets. For purposes of the waived fees and/or reimbursed expense calculations, annual operating expenses shall not include extraordinary expenses (i.e. expenses that are unusual in nature and/or infrequent in occurrence such as litigation), or acquired fund fees and expenses, brokerage commissions and other transactional expenses relating to the purchase and sale of portfolio securities, interest, taxes and governmental fees, and other expenses not incurred in the ordinary course of the Portfolio’s business. The Adviser also may voluntarily reimburse additional amounts to increase the investment return to a Portfolio’s investors. The Adviser may terminate voluntary waivers and/or reimbursements at any time.
Portfolio | Class 3 | |||
SA American Funds® Asset Allocation | 0.70 | % | ||
SA American Funds® Global Growth | 0.70 | % | ||
SA American Funds® Growth | 0.70 | % | ||
SA American Funds® Growth-Income | 0.70 | % | ||
For the year ended December 31, 2017, pursuant to the voluntary and contractual expense referred to above, SAAMCo has waived or reimbursed expenses as follows:
Portfolio | Amount | |||
SA American Funds® VCP Managed Asset Allocation | $ | 7,618 | ||
Both voluntary and contractual waivers or reimbursements, with the exception of advisory fee waivers, made by the Adviser are subject to recoupment from that Portfolio within the following two years after the occurrence of the waivers and/or reimbursements provided that the Portfolio is able to effect such payment to the Adviser and remain in compliance with the expense limitations in effect at the time the waivers and/or reimbursements were made.
For the year ended December 31, 2017, the amounts repaid to the Adviser, which are included in the Statement of Operations, along with the remaining balance subject to recoupment are as follows:
| Amount Recouped | Balance Subject to Recoupment | |||||||||||
Portfolio | December 31, 2017 | December 31, 2018 | December 31, 2019 | |||||||||
SA American Funds® VCP Managed Asset Allocation | $ | 60,861 | $ | — | $ | — | ||||||
| ||
| 23 |
Table of Contents
The Trust has entered into a master Transfer Agency and Service Agreement with VALIC Retirement Services Company (VRSCO), a wholly-owned subsidiary of VALIC, which is an affiliate of the Adviser. Under the agreement, VRSCO provides services, which include the issuance and redemption of shares, payment of dividends between the Trust and their “institutional” shareholders and certain shareholder reporting services including confirmation of transactions, statements of account and tax reporting. The Trust, and certain other mutual funds advised by SAAMCo pay VRSCO on an annual basis, a fee in the aggregate amount of $150,000 for transfer agency services provided, pursuant to the agreement. Accordingly, for the year ended December 31, 2017, transfer agent fees were paid (see Statement of Operations) based on the aforementioned agreement.
Class 3 shares of each Portfolio are subject to Rule 12b-1 plans that provide for service fees payable at the annual rate 0.25% of the average daily net assets of Class 3 shares. The service fees are used to compensate the Life Companies for costs associated with the servicing of Class 3 shares, including the cost of reimbursing the Life Companies for expenditures made to financial intermediaries for providing services to contract holders who are the indirect beneficial owners of the Portfolios’ Class 3 shares. Accordingly, for the year ended December 31, 2017, service fees were paid (see Statement of Operations) based on the aforementioned rate.
Note 5. Purchases and Sales of Investment Securities
The cost of purchases and proceeds from sales and maturities of long-term investments during the year ended December 31, 2017 were as follows:
Portfolio | Purchases of Portfolio Securities (excluding U.S. Government Securities) | Sales of Portfolio Securities (excluding U.S. Government Securities) | Purchases of U.S. Government Securities | Sales of U.S. Government Securities | ||||||||||||
SA American Funds® Asset Allocation | $ | 223,362,020 | $ | 3,324,223 | $ | — | $ | — | ||||||||
SA American Funds® Global Growth | 4,182,747 | 96,135,981 | — | — | ||||||||||||
SA American Funds® Growth | 4,035,502 | 60,949,350 | — | — | ||||||||||||
SA American Funds® Growth-Income | 5,418,124 | 38,702,675 | — | — | ||||||||||||
SA American Funds® VCP Managed Asset Allocation | 263,798,295 | 24,262,384 | — | — | ||||||||||||
Note 6. Capital Share Transactions
Transactions in capital shares of each class of each Portfolio were as follows:
| SA American Funds® Asset Allocation Portfolio | ||||||||||||||||||||||||||||||||
| Class 1 | Class 3 | |||||||||||||||||||||||||||||||
| For the year ended December 31, 2017 | For the period September 26, 2016* to December 31, 2016 | For the year ended December 31, 2017 | For the year ended December 31, 2016 | |||||||||||||||||||||||||||||
| Shares | Amount | Shares | Amount | Shares | Amount | Shares | Amount | |||||||||||||||||||||||||
Shares sold | 5,574 | $ | 82,324 | 7,776 | $ | 100,000 | 18,442,623 | $ | 263,715,938 | 6,099,027 | $ | 80,410,993 | ||||||||||||||||||||
Reinvested dividends | 194 | 2,813 | — | — | 769,720 | 11,127,633 | 1,497,333 | 18,987,741 | ||||||||||||||||||||||||
Shares redeemed | (3 | ) | (56 | ) | — | — | (2,962,605 | ) | (41,965,645 | ) | (1,893,331 | ) | (24,847,175 | ) | ||||||||||||||||||
|
|
|
|
|
|
|
|
|
|
|
|
|
|
|
| |||||||||||||||||
Net increase (decrease) | 5,765 | $ | 85,081 | 7,776 | $ | 100,000 | 16,249,738 | $ | 232,877,926 | 5,703,029 | $ | 74,551,559 | ||||||||||||||||||||
|
|
|
|
|
|
|
|
|
|
|
|
|
|
|
| |||||||||||||||||
| SA American Funds® Global Growth Portfolio | ||||||||||||||||||||||||||||||||
| Class 1 | Class 3 | |||||||||||||||||||||||||||||||
| For the year ended December 31, 2017 | For the period September 26, 2016* to December 31, 2016 | For the year ended December 31, 2017 | For the year ended December 31, 2016 | |||||||||||||||||||||||||||||
| Shares | Amount | Shares | Amount | Shares | Amount | Shares | Amount | |||||||||||||||||||||||||
Shares sold | — | $ | — | 8,593 | $ | 100,000 | 1,300,899 | $ | 16,561,311 | 3,905,587 | $ | 46,770,912 | ||||||||||||||||||||
Reinvested dividends | 1,003 | 12,696 | — | — | 3,625,447 | 45,779,751 | 6,131,053 | 69,389,296 | ||||||||||||||||||||||||
Shares redeemed | — | — | — | — | (8,297,188 | ) | (106,452,332 | ) | (4,871,825 | ) | (59,306,105 | ) | ||||||||||||||||||||
|
|
|
|
|
|
|
|
|
|
|
|
|
|
|
| |||||||||||||||||
Net increase (decrease) | 1,003 | $ | 12,696 | 8,593 | $ | 100,000 | (3,370,842 | ) | $ | (44,111,270 | ) | 5,164,815 | $ | 56,854,103 | ||||||||||||||||||
|
|
|
|
|
|
|
|
|
|
|
|
|
|
|
| |||||||||||||||||
| SA American Funds® Growth Portfolio | ||||||||||||||||||||||||||||||||
| Class 1 | Class 3 | |||||||||||||||||||||||||||||||
| For the year ended December 31, 2017 | For the period September 26, 2016* to December 31, 2016 | For the year ended December 31, 2017 | For the year ended December 31, 2016 | |||||||||||||||||||||||||||||
| Shares | Amount | Shares | Amount | Shares | Amount | Shares | Amount | |||||||||||||||||||||||||
Shares sold | — | $ | — | 8,896 | $ | 100,000 | 1,678,023 | $ | 21,538,241 | 2,106,328 | $ | 27,573,600 | ||||||||||||||||||||
Reinvested dividends | 1,124 | 14,029 | — | — | 3,127,346 | 38,930,483 | 7,658,989 | 84,180,410 | ||||||||||||||||||||||||
Shares redeemed | — | — | — | — | (5,931,545 | ) | (76,787,010 | ) | (3,402,033 | ) | (44,040,631 | ) | ||||||||||||||||||||
|
|
|
|
|
|
|
|
|
|
|
|
|
|
|
| |||||||||||||||||
Net increase (decrease) | 1,124 | $ | 14,029 | 8,896 | $ | 100,000 | (1,126,176 | ) | $ | (16,318,286 | ) | 6,363,284 | $ | 67,713,379 | ||||||||||||||||||
|
|
|
|
|
|
|
|
|
|
|
|
|
|
|
| |||||||||||||||||
| * | Commencement of operations. |
| ||
| 24 |
Table of Contents
| SA American Funds® Growth-Income Portfolio | ||||||||||||||||||||||||||||||||
| Class 1 | Class 3 | |||||||||||||||||||||||||||||||
| For the year ended December 31, 2017 | For the period September 26, 2016* to December 31, 2016 | For the year ended December 31, 2017 | For the year ended December 31, 2016 | |||||||||||||||||||||||||||||
| Shares | Amount | Shares | Amount | Shares | Amount | Shares | Amount | |||||||||||||||||||||||||
Shares sold | — | $ | — | 8,453 | $ | 100,000 | 1,567,938 | $ | 20,491,708 | 1,596,674 | $ | 20,714,955 | ||||||||||||||||||||
Reinvested dividends | 1,303 | 16,133 | — | — | 3,004,175 | 37,100,272 | 4,152,493 | 48,168,793 | ||||||||||||||||||||||||
Shares redeemed | — | — | — | — | (3,983,027 | ) | (52,441,518 | ) | (2,720,100 | ) | (35,299,485 | ) | ||||||||||||||||||||
|
|
|
|
|
|
|
|
|
|
|
|
|
|
|
| |||||||||||||||||
Net increase (decrease) | 1,303 | $ | 16,133 | 8,453 | $ | 100,000 | 589,086 | $ | 5,150,462 | 3,029,067 | $ | 33,584,263 | ||||||||||||||||||||
|
|
|
|
|
|
|
|
|
|
|
|
|
|
|
| |||||||||||||||||
| SA American Funds® VCP Managed Asset Allocation Portfolio | ||||||||||||||||||||||||||||||||
| Class 1 | Class 3 | |||||||||||||||||||||||||||||||
| For the year ended December 31, 2017 | For the period September 26, 2016* to December 31, 2016 | For the year ended December 31, 2017 | For the year ended December 31, 2016 | |||||||||||||||||||||||||||||
| Shares | Amount | Shares | Amount | Shares | Amount | Shares | Amount | |||||||||||||||||||||||||
Shares sold | 424 | $ | 6,044 | 7,901 | $ | 100,000 | 21,295,344 | $ | 292,102,492 | 36,972,400 | $ | 458,594,480 | ||||||||||||||||||||
Reinvested dividends | 221 | 3,107 | — | — | 2,971,397 | 41,633,047 | 1,388,923 | 17,360,734 | ||||||||||||||||||||||||
Shares redeemed | — | — | — | — | (3,296,948 | ) | (45,795,686 | ) | (2,000,330 | ) | (24,824,609 | ) | ||||||||||||||||||||
|
|
|
|
|
|
|
|
|
|
|
|
|
|
|
| |||||||||||||||||
Net increase (decrease) | 645 | $ | 9,151 | 7,901 | $ | 100,000 | 20,969,793 | $ | 287,939,853 | 36,360,993 | $ | 451,130,605 | ||||||||||||||||||||
|
|
|
|
|
|
|
|
|
|
|
|
|
|
|
| |||||||||||||||||
| * | Commencement of operations. |
Note 7. Line of Credit
The Trust has access to a $75 million committed unsecured line of credit and, along with certain other funds managed by the Adviser, a $50 million uncommitted unsecured line of credit. The committed and uncommitted lines of credit are renewable on an annual basis with State Street Bank and Trust Company (“State Street”), the Trust’s custodian. Interest is currently payable on the committed line of credit at the higher of the Federal Funds Rate (but not less than zero) plus 125 basis points or the One-Month London Interbank Offered Rate (but not less than zero) plus 125 basis points and State Street’s discretionary bid rate on the uncommitted line of credit. The Trust, on behalf of each of the Portfolios, has paid State Street for its own account, such Portfolio’s ratable portion of an upfront fee in an amount equal to $25,000 in the aggregate for the uncommitted line of credit made available by State Street to certain other funds managed by the Adviser, which are also party to the uncommitted line of credit. There is also a commitment fee of 25 basis points per annum on the daily unused portion of the committed line of credit. Borrowings under the line of credit will commence when the respective Portfolio’s cash shortfall exceeds $100,000. For the year ended December 31, 2017, the following Portfolios had borrowings:
Portfolio | Days Outstanding | Interest Charges | Average Debt Utilized | Weighted Average Interest | ||||||||||||
SA American Funds® Asset Allocation | 1 | $ | 30 | $ | 440,126 | 2.49 | % | |||||||||
SA American Funds® Global Growth | 5 | 116 | 344,603 | 2.30 | ||||||||||||
SA American Funds® Growth | 3 | 69 | 332,639 | 2.49 | ||||||||||||
SA American Funds® Growth-Income | 2 | 46 | 332,951 | 2.49 | ||||||||||||
SA American Funds® VCP Managed Asset Allocation | 3 | 250 | 1,215,954 | 2.33 | ||||||||||||
At December 31, 2017, there were no borrowings outstanding.
Note 8. Transactions with Affiliates
At December 31, 2017, the following affiliates owned outstanding shares of the following Portfolios:
| Holder | ||||||||||||
Portfolio | USL | AGL | VALIC | |||||||||
SA American Funds® Asset Allocation | 4.86 | % | 92.97 | % | 2.17 | % | ||||||
SA American Funds® Global Growth . | 4.93 | 94.86 | 0.21 | |||||||||
SA American Funds® Growth | 4.80 | 94.94 | 0.26 | |||||||||
SA American Funds® Global-Income | 5.58 | 93.80 | 0.62 | |||||||||
SA American Funds® VCP Managed Asset Allocation | 9.25 | 88.56 | 2.19 | |||||||||
| ||
| 25 |
Table of Contents
SUNAMERICA SERIES TRUST
Selected data for a share of beneficial interest outstanding throughout each period
| Period ended | Net Asset Value, beginning of period | Net investment income (loss)* | Net gain (loss) on investments (both realized and unrealized) | Total from investment operations | Dividends from net investment income | Dividend from net realized gain on investments | Total Distributions | Net Asset Value, end of period | Total Return** | Net Assets, end of period (000’s) | Ratio of expenses to average net assets(1)(2) | Ratio of net investment income (loss) to average net assets(1)(2)(3) | Portfolio turnover | |||||||||||||||||||||||||||||||||||||||
| SA American Funds® Asset Allocation Portfolio Class 1@ | ||||||||||||||||||||||||||||||||||||||||||||||||||||
| 09/26/16#-12/31/16 | $ | 12.86 | $ | 0.18 | $ | 0.07 | $ | 0.25 | $ | — | $ | — | $ | — | $ | 13.11 | 1.94 | % | $ | 102 | 0.29 | %† | 5.35 | %† | 4 | % | ||||||||||||||||||||||||||
| 12/31/17 | 13.11 | 0.23 | 1.88 | 2.11 | (0.12 | ) | (0.25 | ) | (0.37 | ) | 14.85 | 16.10 | 201 | 0.28 | 1.64 | 1 | ||||||||||||||||||||||||||||||||||||
| SA American Funds® Asset Allocation Portfolio Class 3@ | ||||||||||||||||||||||||||||||||||||||||||||||||||||
| 12/31/13 | 11.47 | 0.15 | 2.51 | 2.66 | (0.18 | ) | (0.02 | ) | (0.20 | ) | 13.93 | 23.32 | 157,685 | 0.56 | 1.18 | 13 | ||||||||||||||||||||||||||||||||||||
| 12/31/14 | 13.93 | 0.17 | 0.54 | 0.71 | (0.15 | ) | (0.27 | ) | (0.42 | ) | 14.22 | 5.05 | 168,828 | 0.55 | 1.20 | 11 | ||||||||||||||||||||||||||||||||||||
| 12/31/15 | 14.22 | 0.20 | (0.09 | ) | 0.11 | (0.20 | ) | (1.08 | ) | (1.28 | ) | 13.05 | 1.16 | 196,545 | 0.55 | 1.44 | 8 | |||||||||||||||||||||||||||||||||||
| 12/31/16 | 13.05 | 0.20 | 0.95 | 1.15 | (0.24 | ) | (0.86 | ) | (1.10 | ) | 13.10 | 9.09 | 272,006 | 0.54 | 1.52 | 4 | ||||||||||||||||||||||||||||||||||||
| 12/31/17 | 13.10 | 0.23 | 1.84 | 2.07 | (0.11 | ) | (0.25 | ) | (0.36 | ) | 14.81 | 15.84 | 548,335 | 0.53 | 1.69 | 1 | ||||||||||||||||||||||||||||||||||||
| SA American Funds® Global Growth Portfolio Class 1@ | ||||||||||||||||||||||||||||||||||||||||||||||||||||
| 09/26/16#-12/31/16 | $ | 11.64 | $ | 0.09 | $ | (0.58 | ) | $ | (0.49 | ) | $ | — | $ | — | $ | — | $ | 11.15 | (4.21 | )% | $ | 96 | 0.29 | %† | 2.92 | %† | 10 | % | ||||||||||||||||||||||||
| 12/31/17 | 11.15 | 0.08 | 3.37 | 3.45 | (0.13 | ) | (1.34 | ) | (1.47 | ) | 13.13 | 31.51 | 126 | 0.28 | 0.64 | 1 | ||||||||||||||||||||||||||||||||||||
| SA American Funds® Global Growth Portfolio Class 3@ | ||||||||||||||||||||||||||||||||||||||||||||||||||||
| 12/31/13 | 12.01 | 0.12 | 3.34 | 3.46 | (0.08 | ) | — | (0.08 | ) | 15.39 | 28.85 | 487,025 | 0.53 | 0.92 | 3 | |||||||||||||||||||||||||||||||||||||
| 12/31/14 | 15.39 | 0.13 | 0.17 | 0.30 | (0.14 | ) | (0.51 | ) | (0.65 | ) | 15.04 | 1.97 | 458,076 | 0.53 | 0.84 | 12 | ||||||||||||||||||||||||||||||||||||
| 12/31/15 | 15.04 | 0.11 | 0.81 | 0.92 | (0.15 | ) | (2.52 | ) | (2.67 | ) | 13.29 | 6.68 | 422,275 | 0.53 | 0.70 | 12 | ||||||||||||||||||||||||||||||||||||
| 12/31/16 | 13.29 | 0.08 | 0.01 | 0.09 | (0.23 | ) | (2.00 | ) | (2.23 | ) | 11.15 | 0.37 | 411,747 | 0.53 | 0.62 | 10 | ||||||||||||||||||||||||||||||||||||
| 12/31/17 | 11.15 | 0.04 | 3.37 | 3.41 | (0.13 | ) | (1.34 | ) | (1.47 | ) | 13.09 | 31.05 | 439,414 | 0.53 | 0.33 | 1 | ||||||||||||||||||||||||||||||||||||
| @ | See Note 1 |
| * | Calculated based on average shares outstanding. |
| ** | Total return is not annualized and does not reflect expenses that apply to the separate accounts of the Life Companies. If such expenses had been included, the total return would have been lower for each period presented. Total return does include expense reimbursements (recoupment). |
| † | Annualized |
| # | Commencement of operations. |
| (1) | During the below stated periods, the investment adviser either waived fees or reimbursed expenses for the Portfolios or through recoupment provisions, recovered a portion of or all fees and expenses waived or reimbursed in the previous two fiscal years. If all fees and expenses had been incurred by the Portfolios, the ratio of expenses to average net assets and the ratio of net investment income (loss) to average net assets would have been as follows: |
| Expenses | Net Investment Income ( Loss) | |||||||||||||||||||||||||||||||||||||||
Portfolio | 12/13 | 12/14 | 12/15 | 12/16 | 12/17 | 12/13 | 12/14 | 12/15 | 12/16 | 12/17 | ||||||||||||||||||||||||||||||
SA American Funds® Asset Allocation Class 1 | — | % | — | % | — | % | 0.89 | %† | 0.88 | % | — | % | — | % | — | % | 4.75 | %† | 1.04 | % | ||||||||||||||||||||
SA American Funds® Asset Allocation Class 3 | 1.16 | 1.15 | 1.15 | 1.14 | 1.13 | 0.58 | 0.60 | 0.84 | 0.92 | 1.09 | ||||||||||||||||||||||||||||||
SA American Funds® Global Growth Class 1 | — | — | — | 0.99 | † | 0.98 | — | — | — | 2.22 | † | (0.06 | ) | |||||||||||||||||||||||||||
SA American Funds® Global Growth Class 3 | 1.23 | 1.23 | 1.23 | 1.23 | 1.23 | 0.22 | 0.14 | 0.00 | (0.08 | ) | (0.37 | ) | ||||||||||||||||||||||||||||
| (2) | Does not include underlying fund expenses that the Portfolios bear indirectly. |
| (3) | Recognition of net investment income by the Portfolios is affected by the timing of the declaration of dividends by the underlying investment companies in which the Portfolios invest. |
See Notes to Financial Statements
| ||
| 26 |
Table of Contents
SUNAMERICA SERIES TRUST
FINANCIAL HIGHLIGHTS
Selected data for a share of beneficial interest outstanding throughout each period
| Period ended | Net Asset Value, beginning of period | Net investment income (loss)* | Net gain (loss) on investments (both realized and unrealized) | Total from investment operations | Dividends from net investment income | Dividend from net realized gain on investments | Total Distributions | Net Asset Value, end of period | Total Return** | Net Assets, end of period (000’s) | Ratio of expenses to average net assets(1)(2) | Ratio of net investment income (loss) to average net assets(1)(2)(3) | Portfolio turnover | |||||||||||||||||||||||||||||||||||||||
| SA American Funds® Growth Portfolio Class 1@ | ||||||||||||||||||||||||||||||||||||||||||||||||||||
| 09/26/16#-12/31/16 | $ | 11.24 | $ | 0.08 | $ | 0.23 | $ | 0.31 | $ | — | $ | — | $ | — | $ | 11.55 | 2.76 | % | $ | 103 | 0.30 | %† | 2.63 | %† | 4 | % | ||||||||||||||||||||||||||
| 12/31/17 | 11.55 | 0.06 | 3.12 | 3.18 | (0.07 | ) | (1.51 | ) | (1.58 | ) | 13.15 | 28.24 | 132 | 0.28 | 0.48 | 1 | ||||||||||||||||||||||||||||||||||||
| SA American Funds® Growth Portfolio Class 3@ | ||||||||||||||||||||||||||||||||||||||||||||||||||||
| 12/31/13 | 10.87 | 0.08 | 3.15 | 3.23 | (0.06 | ) | — | (0.06 | ) | 14.04 | 29.76 | 318,922 | 0.54 | 0.63 | 3 | |||||||||||||||||||||||||||||||||||||
| 12/31/14 | 14.04 | 0.13 | 1.02 | 1.15 | (0.09 | ) | (0.08 | ) | (0.17 | ) | 15.02 | 8.19 | 314,384 | 0.54 | 0.90 | 10 | ||||||||||||||||||||||||||||||||||||
| 12/31/15 | 15.02 | 0.05 | 0.86 | 0.91 | (0.14 | ) | (1.36 | ) | (1.50 | ) | 14.43 | 6.52 | 310,350 | 0.54 | 0.32 | 13 | ||||||||||||||||||||||||||||||||||||
| 12/31/16 | 14.43 | 0.06 | 1.06 | 1.12 | (0.05 | ) | (3.96 | ) | (4.01 | ) | 11.54 | 9.17 | 321,687 | 0.53 | 0.49 | 4 | ||||||||||||||||||||||||||||||||||||
| 12/31/17 | 11.54 | 0.03 | 3.12 | 3.15 | (0.06 | ) | (1.51 | ) | (1.57 | ) | 13.12 | 28.02 | 350,726 | 0.54 | 0.19 | 1 | ||||||||||||||||||||||||||||||||||||
| SA American Funds® Growth-Income Portfolio Class 1@ | ||||||||||||||||||||||||||||||||||||||||||||||||||||
| 09/26/16#-12/31/16 | $ | 11.83 | $ | 0.16 | $ | 0.26 | $ | 0.42 | $ | — | $ | — | $ | — | $ | 12.25 | 3.55 | % | $ | 104 | 0.29 | %† | 4.89 | %† | 3 | % | ||||||||||||||||||||||||||
| 12/31/17 | 12.25 | 0.18 | 2.47 | 2.65 | (0.23 | ) | (1.68 | ) | (1.91 | ) | 12.99 | 22.39 | 127 | 0.29 | 1.38 | 2 | ||||||||||||||||||||||||||||||||||||
| SA American Funds® Growth-Income Portfolio Class 3@ | ||||||||||||||||||||||||||||||||||||||||||||||||||||
| 12/31/13 | 10.40 | 0.12 | 3.31 | 3.43 | (0.15 | ) | — | (0.15 | ) | 13.68 | 33.12 | 258,358 | 0.54 | 1.03 | 3 | |||||||||||||||||||||||||||||||||||||
| 12/31/14 | 13.68 | 0.14 | 1.26 | 1.40 | (0.14 | ) | (0.12 | ) | (0.26 | ) | 14.82 | 10.28 | 263,319 | 0.54 | 0.99 | 10 | ||||||||||||||||||||||||||||||||||||
| 12/31/15 | 14.82 | 0.15 | (0.03 | ) | 0.12 | (0.15 | ) | (1.16 | ) | (1.31 | ) | 13.63 | 1.17 | 246,642 | 0.54 | 1.00 | 13 | |||||||||||||||||||||||||||||||||||
| 12/31/16 | 13.63 | 0.16 | 1.20 | 1.36 | (0.20 | ) | (2.55 | ) | (2.75 | ) | 12.24 | 11.16 | 258,669 | 0.54 | 1.19 | 3 | ||||||||||||||||||||||||||||||||||||
| 12/31/17 | 12.24 | 0.14 | 2.47 | 2.61 | (0.22 | ) | (1.68 | ) | (1.90 | ) | 12.95 | 22.08 | 281,189 | 0.54 | 1.06 | 2 | ||||||||||||||||||||||||||||||||||||
| @ | See Note 1 |
| * | Calculated based on average shares outstanding. |
| ** | Total return is not annualized and does not reflect expenses that apply to the separate accounts of the Life Companies. If such expenses had been included, the total return would have been lower for each period presented. Total return does include expense reimbursements (recoupment). |
| † | Annualized |
| # | Commencement of operations. |
| (1) | During the below stated periods, the investment adviser either waived fees or reimbursed expenses for the Portfolios or through recoupment provisions, recovered a portion of or all fees and expenses waived or reimbursed in the previous two fiscal years. If all fees and expenses had been incurred by the Portfolios, the ratio of expenses to average net assets and the ratio of net investment income (loss) to average net assets would have been as follows: |
| Expenses | Net Investment Income ( Loss) | |||||||||||||||||||||||||||||||||||||||
Portfolio | 12/13 | 12/14 | 12/15 | 12/16 | 12/17 | 12/13 | 12/14 | 12/15 | 12/16 | 12/17 | ||||||||||||||||||||||||||||||
SA American Funds® Growth Class 1 | — | % | — | % | — | % | 0.90 | %† | 0.88 | % | — | % | — | % | — | % | 2.03 | %† | (0.12 | )% | ||||||||||||||||||||
SA American Funds® Growth Class 3 | 1.14 | 1.14 | 1.14 | 1.13 | 1.14 | 0.03 | 0.30 | (0.28 | ) | (0.11 | ) | (0.41 | ) | |||||||||||||||||||||||||||
SA American Funds® Growth-Income Class 1 | — | — | — | 0.89 | † | 0.89 | — | — | — | 4.29 | † | 0.78 | ||||||||||||||||||||||||||||
SA American Funds® Growth-Income Class 3 | 1.14 | 1.14 | 1.14 | 1.14 | 1.14 | 0.43 | 0.39 | 0.40 | 0.59 | 0.46 | ||||||||||||||||||||||||||||||
| (2) | Does not include underlying fund expenses that the Portfolios bear indirectly. |
| (3) | Recognition of net investment income by the Portfolios is affected by the timing of the declaration of dividends by the underlying investment companies in which the Portfolios invest. |
See Notes to Financial Statements
| ||
| 27 |
Table of Contents
SUNAMERICA SERIES TRUST
FINANCIAL HIGHLIGHTS
Selected data for a share of beneficial interest outstanding throughout each period
| Period ended | Net Asset Value, beginning of period | Net investment income (loss)* | Net gain (loss) on investments (both realized and unrealized) | Total from investment operations | Dividends from net investment income | Dividend from net realized gain on investments | Total Distributions | Net Asset Value, end of period | Total Return** | Net Assets, end of period (000’s) | Ratio of expenses to average net assets(1)(2) | Ratio of net investment income (loss) to average net assets(1)(2)(3) | Portfolio turnover | |||||||||||||||||||||||||||||||||||||||
| SA American Funds® VCP Managed Asset Allocation Portfolio Class 1@ | ||||||||||||||||||||||||||||||||||||||||||||||||||||
| 09/26/16#-12/31/16 | $ | 12.66 | $ | 0.05 | $ | 0.16 | $ | 0.21 | $ | — | $ | — | $ | — | $ | 12.87 | 1.66 | % | $ | 102 | 0.28 | %† | 1.40 | %† | 2 | % | ||||||||||||||||||||||||||
| 12/31/17 | 12.87 | 0.07 | 1.82 | 1.89 | (0.11 | ) | (0.28 | ) | (0.39 | ) | 14.37 | 14.78 | 123 | 0.27 | 0.51 | 2 | ||||||||||||||||||||||||||||||||||||
| SA American Funds® VCP Managed Asset Allocation Portfolio Class 3@ | ||||||||||||||||||||||||||||||||||||||||||||||||||||
| 12/31/13 | 10.09 | 0.21 | 1.82 | 2.03 | (0.01 | ) | — | (0.01 | ) | 12.11 | 20.11 | 111,529 | 0.53 | 1.98 | 0 | |||||||||||||||||||||||||||||||||||||
| 12/31/14 | 12.11 | (0.03 | ) | 0.36 | 0.33 | (0.05 | ) | (0.00 | ) | (0.05 | ) | 12.39 | 2.72 | 275,987 | 0.53 | (0.22 | ) | 0 | ||||||||||||||||||||||||||||||||||
| 12/31/15 | 12.39 | 0.19 | (0.36 | ) | (0.17 | ) | — | — | — | 12.22 | (1.37 | ) | 710,452 | 0.53 | 1.59 | 2 | ||||||||||||||||||||||||||||||||||||
| 12/31/16 | 12.22 | 0.14 | 0.72 | 0.86 | (0.09 | ) | (0.12 | ) | (0.21 | ) | 12.87 | 7.07 | 1,215,590 | 0.53 | 1.16 | 2 | ||||||||||||||||||||||||||||||||||||
| 12/31/17 | 12.87 | 0.04 | 1.80 | 1.84 | (0.10 | ) | (0.28 | ) | (0.38 | ) | 14.33 | 14.41 | 1,654,513 | 0.52 | 0.26 | 2 | ||||||||||||||||||||||||||||||||||||
| @ | See Note 1 |
| * | Calculated based on average shares outstanding. |
| ** | Total return is not annualized and does not reflect expenses that apply to the separate accounts of the Life Companies. If such expenses had been included, the total return would have been lower for each period presented. Total return does include expense reimbursements (recoupment). |
| † | Annualized |
| # | Commencement of operations. |
| (1) | During the below stated periods, the investment adviser either waived fees or reimbursed expenses for the Portfolios or through recoupment provisions, recovered a portion of or all fees and expenses waived or reimbursed in the previous two fiscal years. If all fees and expenses had been incurred by the Portfolios, the ratio of expenses to average net assets and the ratio of net investment income (loss) to average net assets would have been as follows: |
| Expenses | Net Investment Income ( Loss) | |||||||||||||||||||||||||||||||||||||||
Portfolio | 12/13 | 12/14 | 12/15 | 12/16 | 12/17 | 12/13 | 12/14 | 12/15 | 12/16 | 12/17 | ||||||||||||||||||||||||||||||
SA American Funds® VCP Managed Asset Allocation Class 1 | — | % | — | % | — | % | 0.98 | %† | 0.97 | % | — | % | — | % | — | % | 0.70 | %† | (0.19 | )% | ||||||||||||||||||||
SA American Funds® VCP Managed Asset Allocation Class 3 | 1.45 | 1.25 | 1.23 | 1.23 | 1.22 | 1.06 | (0.94 | ) | 0.88 | 0.46 | (0.44 | ) | ||||||||||||||||||||||||||||
| (2) | Does not include underlying fund expenses that the Portfolios bear indirectly. |
| (3) | Recognition of net investment income by the Portfolios is affected by the timing of the declaration of dividends by the underlying investment companies in which the Portfolios invest. |
See Notes to Financial Statements
| ||
| 28 |
Table of Contents
SUNAMERICA SERIES TRUST
REPORT OF INDEPENDENT REGISTERED PUBLIC ACCOUNTING FIRM
To the Board of Trustees of SunAmerica Series Trust and Shareholders of the SA American Funds® Asset Allocation Portfolio, SA American Funds® Global Growth Portfolio, SA American Funds® Growth-Income Portfolio, SA American Funds® Growth Portfolio and SA American Funds® VCP Managed Asset Allocation Portfolio
Opinions on the Financial Statements
We have audited the accompanying statements of assets and liabilities, including the portfolios of investments, of SA American Funds® Asset Allocation Portfolio (formerly American Funds Asset Allocation SAST Portfolio), SA American Funds® Global Growth Portfolio (formerly American Funds Global Growth SAST Portfolio), SA American Funds® Growth-Income Portfolio (formerly American Funds Growth-Income SAST Portfolio), SA American Funds® Growth Portfolio (formerly American Funds Growth SAST Portfolio) and SA American Funds® VCP Managed Asset Allocation Portfolio (formerly VCP Managed Asset Allocation SAST Portfolio) (five of the portfolios constituting SunAmerica Series Trust, hereafter collectively referred to as the “Trust”) as of December 31, 2017, the related statements of operations for the year ended December 31, 2017, the statements of changes in net assets for each of the two years in the period ended December 31, 2017, including the related notes, and the financial highlights for each of the periods indicated therein (collectively referred to as the “financial statements”). In our opinion, the financial statements present fairly, in all material respects, the financial position of each of the Portfolios as of December 31, 2017, the results of each of their operations for the year then ended, the changes in each of their net assets for each of the two years in the period ended December 31, 2017 and each of the financial highlights for each of the periods indicated therein in conformity with accounting principles generally accepted in the United States of America.
Basis for Opinions
These financial statements are the responsibility of the Portfolios’ management. Our responsibility is to express an opinion on the Portfolios’ financial statements based on our audits. We are a public accounting firm registered with the Public Company Accounting Oversight Board (United States) (“PCAOB”) and are required to be independent with respect to the Portfolios in accordance with the U.S. federal securities laws and the applicable rules and regulations of the Securities and Exchange Commission and the PCAOB.
We conducted our audits of these financial statements in accordance with the standards of the PCAOB. Those standards require that we plan and perform the audit to obtain reasonable assurance about whether the financial statements are free of material misstatement, whether due to error or fraud.
Our audits included performing procedures to assess the risks of material misstatement of the financial statements, whether due to error or fraud, and performing procedures that respond to those risks. Such procedures included examining, on a test basis, evidence regarding the amounts and disclosures in the financial statements. Our audits also included evaluating the accounting principles used and significant estimates made by management, as well as evaluating the overall presentation of the financial statements. Our procedures included confirmation of securities owned as of December 31, 2017 by correspondence with the transfer agent. We believe that our audits provide a reasonable basis for our opinions.
/s/ PricewaterhouseCoopers LLP
Houston, Texas
February 27, 2018
We have served as the auditor of one or more investment companies in the SunAmerica annuity family of funds (consisting of SunAmerica Series Trust, Seasons Series Trust and Anchor Series Trust) since at least 1986.
| ||
| 29 |
Table of Contents
SUNAMERICA SERIES TRUST
APPROVAL OF ADVISORY AGREEMENT
December 31, 2017 (unaudited)
At a meeting held on October 11, 2017, the Board of Trustees (the “Board”), including the Trustees that are not interested persons of SunAmerica Series Trust (the “Trust”), as defined in the Investment Company Act of 1940, as amended (the “Independent Trustees”), approved with respect to the American Funds Asset Allocation SAST Portfolio, American Funds Growth SAST Portfolio, American Funds Global Growth SAST Portfolio, American Funds Growth-Income SAST Portfolio and VCP Managed Asset Allocation Portfolio (collectively, the “Portfolios”) the continuation of the Investment Management and Advisory Agreement between SunAmerica Asset Management, LLC (“SAAMCo” or the “Adviser”) and the Trust (the “Advisory Agreement”).
In connection with the approval of the Advisory Agreement, the Board received materials related to certain factors used in its consideration whether to renew or approve the Advisory Agreement. Those factors included:
| (1) | the requirements of the Trust in the areas of investment supervisory and administrative services; |
| (2) | the nature, extent and quality of the investment advisory, administrative, operational and compliance services provided by SAAMCo, including a review of the investment performance of the Portfolios; |
| (3) | the size and structure of the investment advisory fee and any other material payments to the Adviser and, in connection therewith, a review of the costs of services provided and the profits realized by the Adviser and its affiliates from the relationship with the Trust; |
| (4) | the expenses paid by each of the Portfolios, including their total operating expenses and any applicable expense limitation; |
| (5) | the extent to which the Adviser realizes economies of scale and shares them with the Trust; and |
| (6) | the organizational capability, resources, personnel and financial condition of the Adviser and its affiliates. |
In addition, the Board considered (a) the historical relationship between the Trust and SAAMCo; (b) the possibility that services of the type required by the Trust might be better obtained from other organizations; and (c) the conditions and trends prevailing in the economy, the securities markets and the investment company industry
The Independent Trustees were separately represented by counsel that is independent of SAAMCo in connection with their consideration of approval of the Advisory Agreement. The matters discussed below were also considered separately by the Independent Trustees in executive sessions during which their independent counsel provided guidance to the Independent Trustees.
The Board received information regarding the Trust’s advisory fees compared to advisory fee rates of a group of funds with similar investment strategies and/or objectives, as applicable, (the “Expense Group/Universe”), as selected and prepared by an independent third-party provider of investment company data. The Board also received performance data and expense information prepared by management.
Nature, Extent and Quality of Services.
The Board, including the Independent Trustees, considered the nature, quality and extent of services provided by SAAMCo. In making its evaluation, the Board considered that SAAMCo acts as adviser for each Portfolio and manages the daily business affairs of the Trust, subject to the Trustees’ oversight and control. It was also noted that SAAMCo’s advisory fees compensate SAAMCo for services such as monitoring Portfolio performance and other administrative, compliance and legal services.
The Board noted that SAAMCo is responsible for overseeing the performance of services by the Trust’s custodian, transfer agent and dividend disbursing agent. The Board also noted that SAAMCo is responsible for the financial, legal and accounting records required to be maintained by each Portfolio and for the administration of the Trust’s business affairs, including providing such office space, bookkeeping, accounting, clerical, secretarial and administrative services (exclusive of, and in addition to, any such service provided by any others retained by the Trust or any Portfolio) and such executive and other personnel as may be necessary for the operations of each Portfolio. The Board considered that SAAMCo monitors and reviews the activities of third-party service providers that may provide additional administrative services.
In addition, the Board considered the key personnel of SAAMCo that are involved in the investment management, administration, compliance and risk management activities with respect to the Portfolios. The Board also considered the compensation program for SAAMCo’s investment professionals.
The Board reviewed the qualifications, background and responsibilities of SAAMCo’s staff who is responsible for providing investment management services to the Portfolios and other key personnel of SAAMCo in addition to current and projected staffing levels and compensation practices.
| ||
| 30 |
Table of Contents
SUNAMERICA SERIES TRUST
APPROVAL OF ADVISORY AGREEMENT
December 31, 2017 (unaudited) (continued)
The Board considered SAAMCo’s reputation and long-standing relationship with the Portfolios and considered the benefit to shareholders of investing in funds that are part of a family of funds offering a variety of types of mutual funds and shareholder services. The Board also considered the Trust’s relationship with affiliated life insurance companies that offer the Portfolios through variable annuity and variable life insurance products. The Board considered SAAMCo’s experience in providing management and investment advisory and administrative services to advisory clients. The Board also considered SAAMCo’s code of ethics and its risk management process, and that SAAMCo has developed internal procedures, adopted by the Board, for monitoring compliance with the investment objectives, policies and restrictions of the Portfolios as set forth in the Portfolios’ registration statement.
The Board also reviewed and considered SAAMCo’s compliance and regulatory history, including information about any litigation, regulatory actions or investigations that could impair its ability to serve as an adviser to the Portfolios. The Board considered SAAMCo’s risk assessment and risk management processes. The Board concluded that there was no information provided that would have a material adverse effect on SAAMCo’s ability to provide services to the Trust.
The Board concluded that it was satisfied with the nature, quality and extent of the services provided by or to be provided by SAAMCo and that there was a reasonable basis on which to conclude that they would provide high quality services to the Trust.
Portfolio Fees and Expenses; Investment Performance.
The Board, including the Independent Trustees, received and reviewed information regarding the Portfolios’ fees (actual or contractual management fees, non-management fees, and 12b-1 fees, if applicable), and expense ratios compared against such fees and expense ratios of the Expense Group/Universe for each Portfolio. Such fees and expense ratios were compared both before and after expense waivers, caps and reimbursements, if any.
To assist in analyzing the reasonableness of the advisory fee, the Board received a report prepared independently by Broadridge Financial Solutions, Inc. (“Broadridge”) as well as information provided by management. The Board also considered advisory fees received by the Adviser with respect to other mutual funds and accounts with similar investment strategies to the Portfolios. Based on the information from Broadridge, the Board reviewed detailed information about peer groups of comparable mutual funds based on various factors such as the type of fund (those underlying variable insurance products), comparable investment objectives and strategies, among other factors. Referred to herein are “Expense Groups” and “Performance Groups” that represent those peer groups of funds used to compare expenses and performance, respectively.
The performance information included annualized returns for the period since inception and the one-, three-, five-and ten-year periods, as applicable, ended June 30, 2017 from Broadridge and performance information as of June 30, 2017 from management. On a quarterly basis, the Board monitors and reviews various materials presented and prepared by management, including but not limited to each Portfolio’s overall performance, performance relative to each Portfolio’s relevant benchmark and Morningstar and/or Broadridge peer groups, as applicable. The Board considered that management makes particular note of Portfolios that may require closer monitoring or potential corrective action by the Board.
As part of its review of the Portfolios’ fees and expenses and performance, the Board considered information, including but not limited to the following expense and performance information, provided by Broadridge and management in making its determinations. It was noted that actual advisory fees and total expenses were calculated as of each Portfolio’s most recent fiscal year end, which may vary among the Portfolio’s Expense Group/Universe.
The Boards considered that certain Portfolios pay advisory fees indirectly to Capital Research & Management Company (“Capital Research”) through their investment in the master funds. The Boards further considered the amount of such fees and the amount of the management fees paid to SAAMCo and determined that the amounts paid to SAAMCo by such Portfolios were reasonable in light of the services performed by SAAMCo.
| • | SA American Funds® Asset Allocation Portfolio (master-feeder fund advised by Capital Research/SAAMCo). The Board noted that both actual management fees and total expenses were below the medians of its Expense Group. The Board considered that SAAMCo has contractually agreed to waive 0.60% of its investment advisory fee. The Board also noted that the voluntary expense limitation of 0.70% for Class 3 Shares would continue for another year. |
The Board considered that the Portfolio performed slightly under its benchmark index for the one-year period but outperformed that index for the three-, five- and ten-year periods. The Board further considered that the Portfolio performed above the medians of its Performance Group for the one-, three- and five- year periods and below the median for the ten-year period. The Board took into account management’s discussion of the Master Fund’s performance.
| ||
| 31 |
Table of Contents
SUNAMERICA SERIES TRUST
APPROVAL OF ADVISORY AGREEMENT
December 31, 2017 (unaudited) (continued)
| • | SA American Funds® Global Growth Portfolio (master-feeder fund advised by Capital Research/SAAMCo). The Board considered that actual management fees were slightly above the median of its Expense Group. The Board also considered the total expenses were below the median of its Expense Group. The Board considered that SAAMCo has contractually agreed to waive 0.70% of its investment advisory fee. The Board also noted that the voluntary expense limitation of 0.70% for Class 3 Shares would continue for another year. |
The Board considered that the Portfolio outperformed its benchmark index for the one-, three- and five-year periods. The Board further considered that the Portfolio performed above the medians of its Performance Group for the one-, three-, five- and ten-year periods. The Board took into account management’s discussion of the Master Fund’s performance.
| • | SA American Funds® Growth Portfolio (master-feeder fund advised by Capital Research/SAAMCo). The Board noted that both actual management fees and total expenses were below the medians of its Expense Group. The Board considered that SAAMCo has contractually agreed to waive 0.60% of its investment advisory fee. The Board also noted that the voluntary expense limitation of 0.70% for Class 3 Shares would continue for another year. |
The Board considered that the Portfolio performed above its benchmark index for the one-, three- and five-year periods but below that index for the ten-year period. The Board further considered that the Portfolio performed above the medians of its Performance Group for the one-, three- and five-year periods but below the median for the ten-year period. The Board took into account management’s discussion of the Master Fund’s performance.
| • | SA American Funds® Growth-Income Portfolio (master-feeder fund advised by Capital Research/SAAMCo). The Board noted that both actual management fees and actual total expenses were below the medians of its Expense Group. The Board considered that SAAMCo has contractually agreed to waive 0.60% of its investment advisory fee. The Board also noted that the voluntary expense limitation of 0.70% for Class 3 Shares would continue for another year. |
The Board considered that the Portfolio outperformed its benchmark index for the one- and five-year periods but performed below that index for the three- and ten-year periods. The Board also noted that the Portfolio performed above the medians of its Performance Group for the one-, three- and five-year periods but below the median for the ten-year period. The Board took into account management’s discussion of the Master Fund’s performance.
| • | SA American Funds® VCP Managed Asset Allocation Portfolio (master-feeder fund advised by Capital Research/SAAMCo). The Board noted that actual management fees were below the median of its Expense Group. The Board also noted that total expenses were slightly above the median of its Expense Group. The Board further noted that SAAMCo has contractually agreed to waive 0.70% of its advisory fee and that there is an expense limitation of 0.28% and 0.53% on Class 1 and Class 3 shares, respectively. |
The Board considered that the Portfolio outperformed its benchmark index for the one- and three-year periods and the period since inception. The Board also considered that the Portfolio performed above the medians of its Performance Group for the same periods.
Cost of Services & Benefits Derived.
With respect to indirect costs and benefits, the Board was informed, based on management’s judgment, that any indirect costs incurred by SAAMCo in connection with rendering investment advisory services to the Trust were inconsequential to the analysis of the adequacy of the advisory fees, and that any collateral benefits derived as a result of providing advisory services to the Trust did not impact the reasonableness of the advisory fee. The Board considered that SAAMCo is paid an administrative services fee of up to 0.04% of the average daily net asset value of the Trust’s Portfolios pursuant to an arrangement between SAAMCo and certain affiliated life insurance companies (the “Life Companies”). The Board considered that the Trust also pays VALIC Retirement Services Company, an affiliate of SAAMCo, a fee for the provision of recordkeeping and shareholder services to contract owners and participants.
In connection with benefits derived from the Trust, the Board considered that the Life Companies may benefit as a result of their direct ownership of the Portfolios’ shares, which amounts may be significant. It was noted that in calculating their corporate income tax liability as insurance companies, the Life Companies, as corporate mutual fund shareholders, may exclude a portion of the ordinary dividends paid by underlying U.S. equities in the Portfolios to the same extent the Portfolios receive certain dividends with respect to shares of stock issued by domestic corporations, subject to applicable tax laws and regulations. In addition, the Life Companies may also rely on foreign tax credits with respect to certain foreign securities held by applicable Portfolios. The Board considered that the Life Companies receive financial support from SAAMCo for distribution-related activities, including administrative, marketing and other servicing activities, including payments to help offset costs for marketing activities and training (including training of registered representatives of AIG Capital Services, Inc., an affiliate of SAAMCo) to support sales of the Portfolios, as well as occasional gifts,
| ||
| 32 |
Table of Contents
SUNAMERICA SERIES TRUST
APPROVAL OF ADVISORY AGREEMENT
December 31, 2017 (unaudited) (continued)
entertainment or other compensation as incentives. It was noted that such payments may be derived from 12b-1 (service) fees that are deducted directly from the assets of the Portfolios or from investment management fees received by SAAMCo. In addition, the Board considered that, because shares of the Portfolios are offered as investment options through variable annuity or life contracts issued by the Life Companies (the “Variable Contracts”), the investment objectives, strategies and performance of the Portfolios may positively or negatively impact a Life Company’s ability to hedge and the related hedging costs associated with guarantees that the Life Company may provide as the issuer of the Variable Contracts.
The Board concluded that any benefits that SAAMCo and its affiliates could be expected to receive with regard to providing investment advisory and other services to the Portfolios were reasonable.
Profitability and Economies of Scale.
The Board received information related to SAAMCo’s profitability as well as the profitability of certain affiliates with respect to the services they provide to the Trust’s Portfolios. The profitability analysis reflected the relationship between SAAMCo and American General Life Insurance Company (“AGL”) that provides that SAAMCo contributes the profits earned through its management of the Portfolios of the Trust to AGL. The Board also considered that SAAMCo has entered into an agreement with The United States Life Insurance Company in the City of New York (“U.S. Life”) wherein SAAMCo pays U.S. Life a fee to perform certain administrative services for the benefit of certain variable annuity contract owners. Pursuant to additional Administrative Services Agreements between SAAMCo and each of AGL and U.S. Life, SAAMCo pays a fee to each insurer and in return each insurer provides certain administrative, recordkeeping, accounting and similar such services to the Portfolios as they relate to the insurer’s participants owning interest in shares of the Trust. The Board further considered that certain SAAMCo affiliates (i.e., AGL, U.S. Life and The Variable Annuity Life Insurance Company) provide services pursuant to certain agreements with the Trust and the Portfolios’ Rule 12b-1 Plans. The Board determined that the profitability to SAAMCo in connection with its relationship to the Trust was reasonable.
The Board also received and considered information regarding the ability of the Portfolios to achieve economies of scale. It was noted that the advisory fees of nearly all Portfolios contain breakpoints that will reduce the fees paid by a Portfolio as its assets increase. The Board also considered that SAAMCo has voluntarily agreed to waive fees in certain instances, which was noted earlier in the discussion of fees. It was noted that as a result of being part of a complex of mutual funds advised or administered by SAAMCo, the Trust is able to share common resources and may share certain expenses, which could result in a Portfolio experiencing lower expenses than it otherwise would achieve if the Trust were a stand-alone entity. The Board considered that management believed that the Portfolios’ existing fee schedules and the fee schedules for those Portfolios for which management proposed reductions or waivers reflect the economies of scale inherent in providing investment advice to a Portfolio in its particular asset category and asset size. The Board concluded that any potential economies of scale are currently being shared between the Trust and SAAMCo in an appropriate manner.
Terms of Advisory Agreement.
The Board, including the Independent Trustees, reviewed the terms of the Advisory Agreement including the duties and responsibilities undertaken by SAAMCo as discussed above. The Board considered that SAAMCo pays all of its own expenses in connection with the performance of its duties, as well as the salaries, fees and expenses of the officers of the Trust who are employees of SAAMCo.
Conclusions.
In reaching its decision to recommend the renewal of the Advisory Agreement, the Board did not identify any single factor as being controlling, but based its recommendation on each of the factors it considered and each Trustee attributes different weight to the various factors. Based upon the materials it reviewed, the representations made to it and the considerations described above, and as part of their deliberations, the Board, including the Independent Trustees, concluded that SAAMCo possesses the capability and resources to perform the duties required of it under the Advisory Agreement.
Further, based upon its review of the Advisory Agreement, the materials provided, and the considerations described above, the Board, including the Independent Trustees, concluded that: (1) the terms of the Advisory Agreement are reasonable, fair and in the best interest of the Portfolios and their shareholders, and (2) the advisory fee rates are fair and reasonable in light of the usual and customary charges made for services of the same nature and quality and the other factors considered.
| ||
| 33 |
Table of Contents
SUNAMERICA SERIES TRUST
TRUSTEES AND OFFICERS INFORMATION (unaudited)
The following table contains information regarding the Trustees and Officers that oversee operations of the Portfolios and other investment companies within the Fund complex.
Name, Address and Age† | Position Held | Term of | Principal Occupation(s) | Number of Portfolios in Fund Complex Overseen by Trustee(1) | Other Directorships | |||||||
Disinterested Trustee | ||||||||||||
| Garrett Bouton Age: 73 | Trustee | 2007 – Present | Retired (2003-Present); Managing Director and CEO, Barclays Global Investors (1996-2003). | 75 | Chairman/Director, The LECG Group (consulting services) (2006-2010). | |||||||
| Carl D. Covitz Age: 78 | Trustee | 2001 – Present | Owner and President, Landmark Capital, Inc. (1973-Present). | 75 | Director, Arden Realty, Inc. (real estate) (1995-2006). | |||||||
| Jane Jelenko Age: 69 | Trustee | 2006 – Present | Retired Partner KPMG, LLP and Managing Director Bearingpoint, Inc. (formerly KPMG Consulting). (2003-Present). | 75 | Director, Countrywide Bank (2003-2008) and Director, Cathay General Bancorp and CathayBank (banking) (2012-Present). | |||||||
| Gilbert T. Ray Age: 73 | Trustee | 2001 – Present | Retired Partner, O’Melveny & Myers LLP (law firm) (2000-Present). | 75 | Director, Advanced Auto Parts, Inc. (retail, auto and home supply stores) (2002-Present); Director, Watson, Wyatt Worldwide (services — management consulting services) (2000-2009); Director Dine Equity (services — restaurant) (2004-Present); Director Diamond Rock Hospitality (financial — real estate) (2005-Present); Director, Towers Watson & Co. (services — management consulting services) (2010-Present). | |||||||
| Allan L. Sher Age: 86 | Trustee | 1997 – Present | Retired Brokerage Executive (1992-Present). | 75 | Director, Bowl America Inc. (1997-Present). | |||||||
| Bruce G. Willison Age: 69 | Trustee and Chairman | 2001 – Present | Professor of Management, Anderson School at UCLA (1999-2011); Dean, Anderson School at UCLA (1999-2005); co-founder, Grandpoint Capital, Inc. (2009-2010). | 75 | Director, GrandPoint Capital Inc (banking). (2011-Present); Director, Indy Mac Bancorp (banking) (2003-2008); Director, Move, Inc. (internet real estate site) (2003-Present); Director, Healthnet International, Inc. (business services) (2000-2016). | |||||||
Interested Trustee | ||||||||||||
| Peter Harbeck (2) Age: 63 | Trustee | 2014 – Present | President CEO and Director, SAAMCo (1995-Present); Director, AIG Capital Services, Inc. (“ACS”) (1993-Present). | 152 | None | |||||||
| ||
| 34 |
Table of Contents
SUNAMERICA SERIES TRUST
TRUSTEES AND OFFICERS INFORMATION (unaudited) — (continued)
Name, Address and Age† | Position Held | Term of Office and Time Served(4) | Principal Occupation(s) During Past 5 Years | Number of Portfolios in Fund Complex Overseen by Trustee(1) | Other Directorships Held by Trustee(3) | |||||
Officers | ||||||||||
| John T. Genoy Age: 49 | President | 2007 – Present | Chief Financial Officer, SAAMCo (2002-Present); Senior Vice President, SAAMCo (2003-Present); Chief Operating Officer, SAAMCo (2006-Present). | N/A | N/A | |||||
| Kathleen D. Fuentes Age: 48 | Chief Legal Officer, Vice President, and Secretary | 2015 – Present | Vice President and Deputy General Counsel, SAAMCo (2006-Present). | N/A | N/A | |||||
Christopher C. Joe | Chief Compliance Officer | 2017-Present | Funds, Seasons Series Trust, Chief Compliance Officer, AIG SunAmerica Series Trust, VALIC Company I and VALIC Company II (2017-Present); Chief Compliance Officer, VALIC Retirement Services Company (2017-Present); Chief Compliance Officer, Invesco Powershares (2012-2017); Chief Compliance Officer, Invesco Investment Advisers, LLC (2010- 2013); U.S. Compliance Director, Invesco, Ltd (2006-2014); Deputy Chief Compliance Officer, Invesco Advisers, Inc. (2014-2015). | N/A | N/A | |||||
Gregory N. Bressler Age: 51 | Vice President and Assistant Secretary | 2005 – Present | Senior Vice President and General Counsel, SAAMCo (2005-Present). | N/A | N/A | |||||
Gregory R. Kingston Age 51 | Treasurer | 2014 – Present | Vice President, SAAMCo (2001-Present); Head of Mutual Fund Administration (2014-Present). | N/A | N/A | |||||
Shawn Parry Age: 45 | Vice President and Assistant Treasurer | 2014 – Present | Assistant Vice President, SAAMCo (2005-2014); Vice President, SAAMCo (2014-Present). | N/A | N/A | |||||
Donna McManus Age: 57 | Vice President and Assistant Treasurer | 2014 – Present | Vice President, SAAMCo (2014-Present); Managing Director, BNY Mellon (2009-2014). | N/A | N/A | |||||
Matthew J. Hackethal Age: 46 | Anti-Money Laundering Compliance Officer | 2006 – Present | Acting Chief Compliance Officer (2016-2017); Chief Compliance Officer, SAAMCo (2007-Present) and Vice President, SAAMCo (2011 to Present). | N/A | N/A | |||||
| † | The business address for each Trustee and Officer is 21650 Oxnard Street, 10th Floor, Woodland Hills, CA 91367. |
| (1) | The “Fund Complex” consists of all registered investment company portfolios for which SAAMCo serves as investment adviser or administrator. The “Fund Complex” includes the Trust (55 portfolios), the SunAmerica Equity Funds (2 funds), SunAmerica Income Funds (3 funds), SunAmerica Money Market Funds, Inc. (1 fund), SunAmerica Senior Floating Rate Fund, Inc. (1 fund), SunAmerica Series, Inc. (6 portfolios), Anchor Series Trust (8 portfolios), Seasons Series Trust (20 portfolios), SunAmerica Specialty Series (7 funds), VALIC Company I (34 portfolios), and VALIC Company II (15 funds). |
| (2) | Interested Trustee, as defined within the 1940 Act, because he serves as President, CEO and Director of SAAMCo and Director of ACS. |
| (3) | Directorships of companies required to report to the Securities and Exchange Commission under the Securities Exchange Act of 1934 (i.e. “Public Company”) registered under the 1940 Act. |
| (4) | Trustees serve until their successors are duly elected and qualified. Each officer will hold office for an indefinite term until the date he or she resigns or retires or until his/her successor is duly elected and qualifies. |
Additional information concerning the Trustees and Officers is contained in the Statement of Additional Information and is available without charge by calling (800) 445-7862.
| ||
| 35 |
Table of Contents
SUNAMERICA SERIES TRUST
SHAREHOLDERS TAX INFORMATION (unaudited)
Certain tax information regarding the SunAmerica Series Trust is required to be provided to the shareholders based upon each Portfolio’s income and capital gain distributions for the taxable year ended December 31, 2017. During the year ended December 31, 2017 the Portfolios paid the following dividends per share along with the percentage of ordinary income dividends that qualified for the 70% dividends received deductions for corporations.
| Total Dividends | Net Investment Income | Net Short-Term Capital Gains* | Net Long-Term Capital Gains* | Qualifying% for the 70% Dividends Received Deduction | ||||||||||||||||
SA American Funds® Asset Allocation Portfolio Class 1 | $ | 0.37 | $ | 0.12 | $ | — | $ | 0.25 | 82.47 | % | ||||||||||
SA American Funds® Asset Allocation Portfolio Class 3 | 0.36 | 0.11 | — | 0.25 | 82.47 | |||||||||||||||
SA American Funds® Global Growth Portfolio Class 1 | 1.47 | 0.13 | — | 1.34 | 58.79 | |||||||||||||||
SA American Funds® Global Growth Portfolio Class 3 | 1.47 | 0.13 | — | 1.34 | 58.79 | |||||||||||||||
SA American Funds® Growth Portfolio Class 1 | 1.58 | 0.07 | — | 1.51 | 100.00 | |||||||||||||||
SA American Funds® Growth Portfolio Class 3 | 1.57 | 0.06 | — | 1.51 | 100.00 | |||||||||||||||
SA American Funds® Growth-Income Portfolio Class 1 | 1.91 | 0.23 | — | 1.68 | 100.00 | |||||||||||||||
SA American Funds® Growth-Income Portfolio Class 3 | 1.90 | 0.22 | — | 1.68 | 100.00 | |||||||||||||||
SA American Funds® VCP Managed Asset Allocation Portfolio Class 1 | 0.39 | 0.11 | — | 0.28 | 83.25 | |||||||||||||||
SA American Funds® VCP Managed Asset Allocation Portfolio Class 3 | 0.38 | 0.10 | — | 0.28 | 83.25 | |||||||||||||||
| * | Short-term capital gains are treated as ordinary income for tax purposes |
| ||
| 36 |
Table of Contents
COMPARISONS: PORTFOLIOS VS. INDEXES (unaudited)
As required by the Securities and Exchange Commission, the following graphs compare the performance of a $10,000 investment in the presented Feeder Portfolios of SunAmerica Series Trust (the “Trust”) to a $10,000 investment in a comparable securities index benchmark since the portfolio’s inception. Importantly, such indices represent “paper” portfolios and do not reflect the costs and expenses of actual investing. Following each graph is a discussion of portfolio performance and factors affecting performance over the year ended December 31, 2017.
The following graphs and tables show the performance of the Portfolios at the SunAmerica Series Trust Feeder Funds level and include all trust expenses but no insurance company expenses associated with the variable annuity or variable life policy and no insurance company contingent deferred sales charge. All dividends are assumed to be reinvested. No expenses are deducted from the performance of the indexes.
The SA American Funds portfolios (“Feeder Funds”) are a part of the Trust and currently do not buy individual securities directly, but instead invest all of their assets in the underlying funds (“Master Funds”) of the American Funds Insurance Series. Each Feeder Fund has the same investment goal and limitations as the underlying Master Fund. Investing in a Feeder Fund may result in higher fees and expenses than investing directly in a Master Fund as the Feeder Funds will bear their own portfolio expenses as well as their pro rata share of each Feeder Fund’s underlying Master Fund fees and expenses. Please see the product prospectus for more information regarding the master-feeder fund structure.
Market indices referenced are unmanaged. You cannot invest directly in an index.
Note: The performance data quoted represents past performance; past performance does not guarantee future results; the investment return and principal value of an investment will fluctuate so that an investor’s shares, when redeemed, may be worth more or less than their original cost; current performance may be lower or higher than the performance data quoted. Please visit www.aig.com/Annuities for performance data current to the most recent month-end.
| ||
| 37 |
Table of Contents
American Funds
SA American Funds® Asset Allocation Portfolio — Class 3
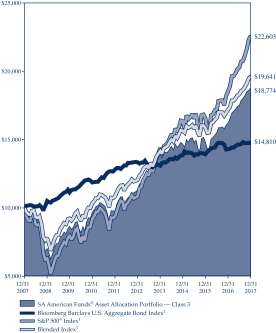
| SA American Funds® Asset Allocation Portfolio | ||||||||
| Average Annual Total Returns as of 12/31/2017 | ||||||||
| Class 1* | Class 3* | |||||||
1-year | 16.10% | 15.84% | ||||||
5-Year | N/A | 10.61% | ||||||
10-Year | N/A | 6.50% | ||||||
Since Inception | 14.24% | 6.79% | ||||||
| * | Inception date for Class I: 09/26/16; Class 3: 09/01/06. |
| 1 | The S&P 500® Index tracks the performance of 500 stocks representing a sampling of the largest domestic stocks traded publicly in the United States. Because it is market-weighted, the index will reflect the changes in larger companies more heavily than those in smaller companies. |
| 2 | The Bloomberg Barclays U.S. Aggregate Bond Index is a broad, unmanaged index generally representative of intermediate-term government bonds, investment grade corporate debt securities and mortgage-backed securities. |
| 3 | The Blended Index is comprised of 60% S&P 500 Index and 40% Bloomberg Barclays U.S. Aggregate Bond Index. |
Note: The performance data quoted represents past performance; past performance does not guarantee future results; the investment return and principal value of an investment will fluctuate so that an investor’s shares, when redeemed, may be worth more or less than their original cost; current performance may be lower or higher than the performance data quoted. Please visit aig.com/annuities for performance data current to the most recent month-end.
The SA American Funds® Asset Allocation Portfolio — Class 3 (Feeder Fund), which is a mix of stocks and bonds, gained 15.84% for the twelve months ended December 31, 2017. The S&P 500® Index gained 21.83% over the same period, while the Bloomberg Barclays U.S. Aggregate Bond Index rose 3.54%. The Blended Index (60% S&P 500® Index and 40% Bloomberg Barclays U.S. Aggregate Bond Index) advanced 14.21%. The American Funds Asset Allocation Fund — Class 1 (Master Fund), which is a mix of stocks and bonds, gained 16.51% for the annual period.
U.S. equity markets continued to stage an impressive rally as consumer optimism, healthy corporate earnings and an improving jobs market provided a boost to the economy. Repeating a common theme, information technology companies advanced, supported by better than expected corporate earnings in the sector. Bonds also advanced, led by high-yield corporates.
Investments in the industrials and information technology sectors contributed the most to the Master Fund’s relative returns. Boeing was additive to the Master Fund’s returns as the company’s strong earnings beat third-quarter analyst estimates. TSMC, a chip contract manufacturer for Apple, was also additive, as the company beat third-quarter sales and earnings estimates.
Investments in the energy sector detracted from the Master Fund’s absolute and relative returns. Within the sector, energy exploration and production company Noble Energy, as well as oil and natural gas services company Weatherford International, detracted from the Master Fund’s returns as both companies reported third-quarter losses. The Master Fund’s fixed income holdings advanced due to an overweight position in high-yield corporate bonds. Exposure to short interest duration, or the Master Fund’s relatively low sensitivity to interest rates compared with the benchmark, also helped.
Past performance is no guarantee of future results.
Securities listed may or may not be a part of current Portfolio construction.
| ||
| 38 |
Table of Contents
American Funds
SA American Funds® Global Growth Portfolio — Class 3
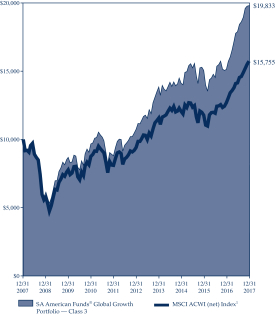
| SA American Funds® Global Growth Portfolio | ||||||||
| Average Annual Total Returns as of 12/31/2017 | ||||||||
| Class 1* | Class 3* | |||||||
1-Year | 31.51% | 31.05% | ||||||
5-Year | N/A | 13.01% | ||||||
10-Year | N/A | 7.09% | ||||||
Since Inception | 20.01% | 8.33% | ||||||
| * | Inception date for Class I: 09/26/16; Class 3: 09/01/06. |
| 1 | The MSCI ACWI (net) Index captures large and mid cap representation across 23 developed and 23 emerging markets countries. With 2,400 constituents, the index covers approximately 85% of the global investable equity opportunity set. The net index approximates the minimum possible dividend reinvestment and assumes that the dividend is reinvested after the deduction of withholding tax, applying the rate to nonresident individuals who do not benefit from double taxation treaties. |
Note: The performance data quoted represents past performance; past performance does not guarantee future results; the investment return and principal value of an investment will fluctuate so that an investor’s shares, when redeemed, may be worth more or less than their original cost; current performance may be lower or higher than the performance data quoted. Please visit aig.com/annuities for performance data current to the most recent month-end.
The SA American Funds® Global Growth Portfolio — Class 3 (Feeder Fund) rose 31.05% for the twelve months ended December 31, 2017, compared with a 23.97% increase for the MSCI ACWI (net) Index. The American Funds Global Growth Fund — Class 1 (Master Fund) gained 31.80% for the annual period.
U.S. equity markets continued to stage an impressive rally as consumer optimism, healthy corporate earnings and an improving job market provided a boost to the economy. European stocks rose, driven by a powerful combination of central bank stimulus and accelerating corporate earnings. Emerging markets advanced as well, led by rising prices for most commodities and robust profits from leading technology companies.
Larger-than-index investments and strong stock selection in information technology and consumer discretionary benefited Master Fund results. An eclectic mix of stocks boosted the Master Fund’s returns. Nintendo soared as the company’s second-quarter revenues and earnings topped estimates, led by strong sales of the Nintendo Switch console. Amazon reported strong third-quarter earnings and acquired Whole Foods, which helped strengthen its retail platform and contributed to its stock price appreciation.
Investments in energy companies detracted from the Master Fund’s results. OPEC’s production cuts aimed at propping up oil prices had done little for Canadian energy stocks as Seven Generations declined. On a geographic basis, stocks of companies domiciled in the U.S., China and the Netherlands were additive to relative results, while stocks of companies based in Canada, Spain and Denmark lagged.
Past performance is no guarantee of future results.
Securities listed may or may not be a part of current Portfolio construction.
| ||
| 39 |
Table of Contents
American Funds
SA American Funds® Growth Portfolio — Class 3
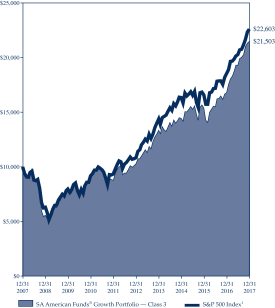
| SA American Funds® Growth Portfolio | ||||||||
| Average Annual Total Returns as of 12/31/2017 | ||||||||
| Class 1* | Class 3* | |||||||
1-year | 28.24% | 28.02% | ||||||
5-Year | N/A | 15.88% | ||||||
10-Year | N/A | 7.96% | ||||||
Since Inception | 24.36% | 8.67% | ||||||
| * | Inception date for Class I: 09/26/16; Class 3: 09/01/06. |
| 1 | The S&P 500® Index tracks the performance of 500 stocks representing a sampling of the largest domestic stocks traded publicly in the United States. Because it is market-weighted, the index will reflect the changes in larger companies more heavily than those in smaller companies. |
Note: The performance data quoted represents past performance; past performance does not guarantee future results; the investment return and principal value of an investment will fluctuate so that an investor’s shares, when redeemed, may be worth more or less than their original cost; current performance may be lower or higher than the performance data quoted. Please visit aig.com/annuities for performance data current to the most recent month-end.
The SA American Funds® Growth Portfolio — Class 3 (Feeder Fund) gained 28.02% for the twelve months ended December 31, 2017, compared with a 21.83% increase for the S&P 500® Index. The American Funds Growth Fund — Class 1 (Master Fund) rose 28.62% for the annual period.
U.S. equity markets continued to stage an impressive rally as consumer optimism, healthy corporate earnings and an improving job market provided a boost to the economy. Strong consumer demand and rising optimism fueled the information technology sector higher. European stocks rose, driven by a powerful combination of central bank stimulus and accelerating corporate earnings. Emerging markets also advanced, led by rising prices for most commodities and robust profits from leading technology companies.
Larger-than-index investments and stock selection in information technology and consumer discretionary boosted the Master Fund’s returns. Master Fund’s top contributors to returns (posting double-digit gains) was consumer discretionary company Amazon and information technology company Facebook. Exposure to the energy sector detracted from Master Fund results, despite OPEC’s decision to extend production cuts into 2018. Energy exploration and production company Noble Energy and oil-field services company Schlumberger detracted from returns.
Past performance is no guarantee of future results.
Securities listed may or may not be a part of current Portfolio construction.
| ||
| 40 |
Table of Contents
American Funds
SA American Funds® Growth-Income Portfolio — Class 3
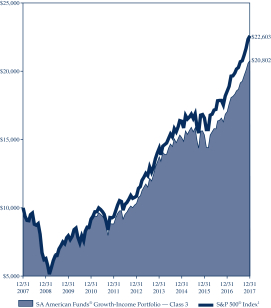
| SA American Funds® Growth-Income Portfolio | ||||||||
| Average Annual Total Returns as of 12/31/2017 | ||||||||
| Class 1* | Class 3* | |||||||
1-Year | 22.39% | 22.08% | ||||||
5-Year | N/A | 15.05% | ||||||
10-Year | N/A | 7.60% | ||||||
Since Inception | 20.58% | 7.81% | ||||||
| * | Inception date for Class I: 09/26/16; Class 3: 09/01/06. |
| 1 | The S&P 500® Index tracks the performance of 500 stocks representing a sampling of the largest domestic stocks traded publicly in the United States. Because it is market-weighted, the index will reflect the changes in larger companies more heavily than those in smaller companies. |
Note: The performance data quoted represents past performance; past performance does not guarantee future results; the investment return and principal value of an investment will fluctuate so that an investor’s shares, when redeemed, may be worth more or less than their original cost; current performance may be lower or higher than the performance data quoted. Please visit aig.com/annuities for performance data current to the most recent month-end.
The SA American Funds® Growth-Income Portfolio — Class 3 (Feeder Fund) gained 22.08% for the twelve months ended December 31, 2017. The S&P 500® Index rose 21.83%. The American Funds Growth-Income Fund — Class 1 (Master Fund) gained 22.68% for the annual period.
U.S. stocks staged an impressive rally as the economic picture remained bright. GDP grew an annualized 3.2% in the third quarter. Repeating a common theme, information technology companies advanced, supported by better-than-expected corporate earnings in the sector. Outside the U.S., European stocks rose, driven by a powerful combination of central bank stimulus and accelerating corporate earnings. Emerging markets also advanced, led by rising prices for most commodities and robust profits from leading technology companies.
Master Fund investments in the consumer discretionary and health care sectors contributed the most to relative returns. Among consumer discretionary companies, Amazon reported strong third-quarter earnings and acquired Whole Foods, which helped strengthen its retail platform and contributed to an increase in its stock price. Health care company AbbVie reported third-quarter earnings above analyst estimates due in part to sales of its flagship drug, Humira. Despite OPEC’s production cuts aimed at propping up oil prices, investments in the energy sector hindered absolute results. Energy exploration and production company Noble Energy and oil-field services company Schlumberger detracted from returns.
Past performance is no guarantee of future results.
Securities listed may or may not be a part of current Portfolio construction.
| ||
| 41 |
Table of Contents
SA American Funds® VCP Managed Asset Allocation Portfolio — Class 3
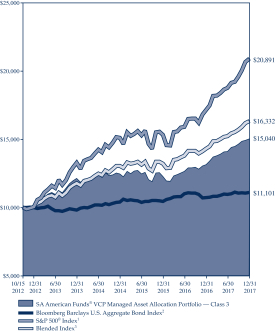
| SA American Funds® VCP Managed Asset Allocation Portfolio | ||||||||
| Average Annual Total Returns as of 12/31/2017 | ||||||||
| Class 1* | Class 3* | |||||||
1-year | 14.78% | 14.41% | ||||||
5-Year | N/A | 8.31% | ||||||
Since Inception | 12.97% | 8.15% | ||||||
| * | Inception date for Class I: 09/26/16; Class 3: 10/15/12. |
| 1 | The S&P 500® Index tracks the performance of 500 stocks representing a sampling of the largest domestic stocks traded publicly in the United States. Because it is market-weighted, the index will reflect the changes in larger companies more heavily than those in smaller companies. |
| 2 | The Bloomberg Barclays U.S. Aggregate Bond Index is a broad, unmanaged index generally representative of intermediate-term government bonds, investment grade corporate debt securities and mortgage-backed securities. |
| 3 | The Blended Index is comprised of 60% S&P 500 Index and 40% Bloomberg Barclays U.S. Aggregate Bond Index. |
Note: The performance data quoted represents past performance; past performance does not guarantee future results; the investment return and principal value of an investment will fluctuate so that an investor’s shares, when redeemed, may be worth more or less than their original cost; current performance may be lower or higher than the performance data quoted. Please visit aig.com/annuities for performance data current to the most recent month-end.
The SA American Funds® VCP Managed Asset Allocation Portfolio — Class 3 gained 14.41% for the twelve months ended December 31, 2017. The S&P 500 Index gained 21.83% over the same period, while the Bloomberg Barclays U.S. Aggregate Bond Index rose 3.54%. The Blended Index (60% S&P 500® Index and 40% Bloomberg Barclays U.S. Aggregate Bond Index) returned 14.21% for the annual period. The American Funds Managed Risk Asset Allocation Fund — Class P1 (Master Fund) gained 15.06% for the annual period.
The SA American Funds® VCP Managed Asset Allocation Portfolio is a Feeder Fund investing in shares of American Funds Insurance Series Managed Risk Asset Allocation Fund (Master Fund). The Master Fund pursues its objective by investing in shares of American Funds Insurance Series Asset Allocation Fund while seeking to manage portfolio volatility and provide downside protection, primarily through the use of exchange-traded futures. The benefit of the Master Fund’s managed risk strategy should be most apparent during periods of high volatility and in down markets. In steady or rising markets, the fund’s results can be expected to lag those of the Master Fund’s underlying fund.
The underlying American Funds Insurance Series Asset Allocation Fund’s investments in the industrials and information technology sectors contributed the most to relative returns. Holdings in the energy sector hindered absolute and relative returns as oil prices slumped on concerns of oversupply.
Past performance is no guarantee of future results.
Securities listed may or may not be a part of current Portfolio construction.
| ||
| 42 |
Table of Contents
SUNAMERICA SERIES TRUST
VOTING PROXIES ON TRUST PORTFOLIO SECURITIES
A description of the policies and procedures that the Trust uses to determine how to vote proxies related to securities held in the Trust‘s Portfolios which is available in the Trust‘s Statement of Additional Information, may be obtained without charge upon request, by calling (800) 445-SUN2. This information is also available from the EDGAR database on the U.S. Securities and Exchange Commission‘s website at http://www.sec.gov.
PROXY VOTING RECORD ON TRUST PORTFOLIO SECURITIES
Information regarding how the SunAmerica Series Trust Portfolios voted proxies relating to securities held in the Trust‘s Portfolios during the most recent twelve month period ended June 30 is available, once filed with the U.S. Securities and Exchange Commission, without charge, upon request, by calling (800) 445-SUN2 or on the U.S. Securities and Exchange Commission‘s website at http://www.sec.gov.
DISCLOSURE OF QUARTERLY PORTFOLIO HOLDINGS
The Trust is required to file its complete schedule of portfolio holdings with the U.S. Securities and Exchange Commission for its first and third fiscal quarters on Form N-Q. The Trust‘s Forms N-Q are available on the U.S. Securities and Exchange Commission‘s website at http://www.sec.gov. You can also review and obtain copies of the Forms N-Q at the U.S. Securities and Exchange Commission‘s Public Reference Room in Washington, DC (information on the operation of the Public Reference Room may be obtained by calling 1-800-SEC-0330).
This report is submitted solely for the general information of shareholders of the Trust. Distribution of this report to persons other than shareholders of the Trust is authorized only in connection with a currently effective prospectus, setting forth details of the Trust, which must precede or accompany this report.
| ||
| 43 |
Table of Contents
Annuity Service Center P.O. Box 15570 Amarillo, TX 79105-5570
CHANGE SERVICE REQUESTED |

THISREPORTISNOTAUTHORIZEDFORDISTRIBUTIONTOPROSPECTIVEPURCHASERSUNLESSACCOMPANIEDORPRECEDEDBYACURRENTPROSPECTUS.
R4397AR.11 (2/18)
Table of Contents

Table of Contents
American Funds Insurance Series, from Capital Group, is the underlying investment vehicle for many variable annuities and insurance products. For more than 85 years, Capital has invested with a long-term focus based on thorough research and attention to risk.
Investing for short periods makes losses more likely. For current information and month-end results, visit americanfunds.com/afis. For information about your insurance contract and month-end results, go to the website of the company that issued your contract.
Investing outside the United States involves risks, such as currency fluctuations, periods of illiquidity and price volatility, as more fully described in the prospectus. These risks may be heightened in connection with investments in developing countries. Investing in small-capitalization stocks can involve greater risk than is customarily associated with investing in stocks of larger, more established companies. The return of principal for bond funds and for funds with significant underlying bond holdings is not guaranteed. Fund shares are subject to the same interest rate, inflation and credit risks associated with the underlying bond holdings. High-yield bonds are subject to greater fluctuations in value and risk of loss of income and principal than investment-grade bonds. Bond ratings, which typically range from AAA/Aaa (highest) to D (lowest), are assigned by credit rating agencies such as Standard & Poor’s, Moody’s and/or Fitch as an indication of an issuer’s creditworthiness. Futures contracts may not provide an effective hedge of the underlying securities because changes in the prices of futures contracts may not track those of the securities they are intended to hedge. In addition, the managed risk strategy may not effectively protect the funds from market declines and will limit the funds’ participation in market gains. The use of the managed risk strategy could cause the funds’ returns to lag those of the applicable underlying funds in certain rising market conditions. Refer to the funds’ prospectuses and the Risk Factors section of this report for more information on these and other risks associated with investing in the funds.
Investments are not FDIC-insured, nor are they deposits of or guaranteed by a bank or any other entity, so they may lose value.
Table of Contents
Equity markets rallied in 2017, with the MSCI ACWI (All Country World Index)1 advancing 23.97%. Against a backdrop of widespread macroeconomic stability, a majority of countries benefited from strong corporate earnings and accommodative monetary policy. Financial markets remained resilient despite challenges stemming from volatile politics in Western democracies, uncertainty in the Middle East, and tensions between the U.S. and North Korea.
The MSCI USA Index1 rose 21.90%, with Gross Domestic Product (GDP) growing an annualized 3.2% in the third quarter. On the whole, the picture remained bright, reflecting an improving jobs market, rising consumer confidence, a surge in retail sales and healthy corporate profits. On the policy front, the Trump administration followed through on its pledge of delivering tax reforms as Congress approved a $1.5 trillion tax bill. Meanwhile, the Federal Reserve raised the benchmark federal funds rate by a quarter percentage point three times over the 12 months and announced it would begin to reduce the size of its balance sheet as the economy continues to strengthen.
European markets improved, diminishing investor concerns about political risk as election victories for Emmanuel Macron in France and Angela Merkel in Germany helped restore a degree of stability. The MSCI Europe Index1 climbed 25.51%, reversing last year’s weakness, with France (+28.75%), Italy (+28.43%), Germany (+27.70%) and the U.K.
See page 2 for footnotes.
(+22.30%) all registering double-digit gains. Central bank stimulus measures helped lift Europe’s markets, as officials from the European Central Bank announced they would extend quantitative easing until at least September 2018 to help keep the economy on track. Ultra-low or negative interest rates and a broad-based recovery across the continent, particularly in countries that have engaged in fiscal reform in the past several years, facilitated Europe’s growth trajectory while helping combat deflationary pressures. GDP climbed at an annualized rate of 2.6% in the euro zone as the unemployment rate fell to 8.9%, its lowest level since 2009.
Elsewhere among developed markets, Japanese equities rose 23.99%, buoyed by the country’s longest streak of economic expansion in more than a decade and a weaker yen. On the political front, Prime Minister Shinzo Abe won a majority for his party in a parliamentary election held a year earlier than expected.
Emerging markets recorded some of the most impressive gains with the MSCI EM (Emerging Markets) Index1 up 37.28%. Chinese equities advanced 54.07%, allaying fears about the nation’s debt load. Higher commodity prices, an uptick in industrial activity and government policy measures designed to stimulate the economy boosted the country’s growth. President Xi Jinping’s re-election confirmed support for his policies aimed at hastening development and improving international relations. China continues to build a rich digital ecosystem around e-commerce as it strengthens its position
American Funds Insurance Series 1
Table of Contents
as a global competitor. Elsewhere, government leaders in Brazil (+24.11%) and India (+38.76%) unveiled additional plans designed to stoke their respective economies, which expanded at an improving tempo. Russian stocks climbed a more modest 5.20% as oil prices rebounded. OPEC and Russia agreed to extend oil production cuts until the end of 2018 to accelerate rebalancing of inventories around the world.
In bond markets, U.S. investment-grade (as measured by the Bloomberg Barclays U.S. Corporate Investment Grade Index2) and high-yield corporates (as measured by the Bloomberg Barclays U.S. Corporate High Yield 2% Issuer Capped Index2) advanced 6.42% and 7.50%, respectively, as investors sought higher yields than those offered by U.S. Treasuries amid tightening monetary policy. The Bloomberg Barclays Global Aggregate Index2 , a measure of global investment-grade bonds (rated BBB/Baa and above), was up 7.39%, while the Bloomberg Barclays U.S. Aggregate Index2 (which measures U.S. investment-grade bonds) improved 3.54%. The 10-year Treasury yield, which stood at 2.45% on December 31, 2016, was little changed by year-end finishing at 2.40%. U.S. dollar–denominated emerging markets bonds, as measured by the J.P. Morgan EMBI (Emerging Markets Bond Index) Global3, rose 9.32% as their higher yields were popular in a low-rate environment.
In currency markets, the U.S. dollar depreciated against most currencies. The euro (+13.85%), British pound (+9.48%) and Canadian dollar (+7.03%)
all benefited from a weaker U.S. dollar. Gainers among developing markets included the Chinese renminbi (+6.72%), Indian rupee (+6.33%) and Russian ruble (+6.03%). The Brazilian real declined 1.88%.
Looking ahead
As the global economy continues to gather momentum, we remain optimistic about the long-term outlook. Lower corporate taxes combined with the prospects of greater infrastructure spending and regulatory reform could help the U.S. set the pace for expansion.
While Europe and Japan are in the midst of a recovery, many emerging markets are enjoying even faster growth amid rising commodities prices, a weakening U.S. dollar and increased consumer spending as the standard of living improves in a number of developing countries. We closely monitor key indicators such as inflation and wage growth, while evaluating the potential impact of a return to more normalized monetary policy from central banks in the future. All these factors are likely to cause interest rates to edge higher. A backdrop of good growth and modestly increasing rates should be positive for equities.
In the short term, we develop some caution whenever the market stages an impressive rally, as it has recently. It would not be uncommon to see a correction or pause after such gains. At these higher levels of valuation, we believe it is particularly important to conduct fundamental research and remain confident in our investment approach.
After a period of record low volatility, we are not surprised to see it pick up again recently. As stock pickers, we believe volatile share prices may present an opportunity to invest in individual companies with sound fundamentals that can ride out short-term turbulence.
Our time-tested approach — based on extensive research, a long-term outlook and close attention to valuation — has served investors well over time. We continue to have confidence this will remain the case. We thank you for your support and look forward to reporting to you again in six months’ time.
Sincerely,

Donald D. O’Neal
Vice Chairman of the Board

Alan N. Berro
President
February 9, 2018
All market indexes referenced in this report are unmanaged and, therefore, have no expenses. Investors cannot invest directly in an index.
| 1 | Country returns are based on MSCI indexes, which reflect reinvestment of distributions and dividends net of withholding taxes, except for the MSCI USA Index, which reflects dividends gross of withholding taxes. Source: MSCI. |
| 2 | Source: Bloomberg Index Services Ltd. |
| 3 | This report, and any product, index or fund referred to herein, is not sponsored, endorsed or promoted in any way by J.P. Morgan or any of its affiliates who provide no warranties whatsoever, express or implied, and shall have no liability to any prospective investor in connection with this report. J.P. Morgan disclaimer: http://www.jpmorgan.com/pages/jpmorgan/ib/girg. |
2 American Funds Insurance Series
Table of Contents
Summary investment portfolios
Summary investment portfolios are designed to streamline this report and help investors better focus on the funds’ principal holdings. Ultra-Short Bond Fund, Managed Risk Growth Fund, Managed Risk International Fund, Managed Risk Blue Chip Income and Growth Fund, Managed Risk Growth-Income Fund and Managed Risk Asset Allocation Fund show a complete listing of portfolio holdings. See the inside back cover for details on how to obtain a complete schedule of portfolio holdings for each fund in the series.
Unless otherwise indicated, American Funds Insurance Series investment results are for Class 2 shares (Class P2 shares for managed risk funds). Class 1A shares began operations on January 6, 2017. Class 2 shares began operations on April 30, 1997. Class 3 shares began operations on January 16, 2004. Class 4 shares began operations on December 14, 2012. Results encompassing periods prior to those dates assume a hypothetical investment in Class 1 shares and include the deduction of additional annual expenses (0.25% for Class 1A shares, 0.25% for Class 2 shares, 0.18% for Class 3 shares and 0.50% for Class 4 shares).
The variable annuities and life insurance contracts that use the series funds contain certain fees and expenses not reflected in this report. Investment results assume all distributions are reinvested and reflect applicable fees and expenses. The series investment adviser waived a portion of its management fees for all existing funds from September 1, 2004, through December 31, 2008, for U.S. Government/AAA-Rated Securities Fund from July 1, 2010, through December 31, 2010, and for Blue Chip Income and Growth Fund from February 1, 2014, through January 31, 2015.
For the managed risk funds, the investment adviser is currently waiving a portion of its management fee equal to 0.05% of the funds’ net assets. In addition, the investment adviser is currently reimbursing a portion of miscellaneous expenses for all managed risk funds except Managed Risk Asset Allocation Fund. The funds’ investment results and net expense ratios shown reflect the waivers and reimbursements, without which the results would have been lower and the expenses would have been higher. The waivers and reimbursements will be in effect through at least May 1, 2019, unless modified or terminated by the series board. See the Financial Highlights tables in the report for details.
The Managed Risk Growth Fund pursues its objective by investing in shares of American Funds Insurance Series — Growth FundSM and American Funds Insurance Series — Bond FundSM. The Managed Risk International Fund pursues its objective by investing in shares of American Funds Insurance Series — International FundSM and American Funds Insurance Series — Bond FundSM. The Managed Risk Blue Chip Income and Growth Fund pursues its objective by investing in shares of American Funds Insurance Series — Blue Chip Income and Growth FundSM and American Funds Insurance Series — U.S. Government/AAA-Rated Securities FundSM. The Managed Risk Growth-Income Fund pursues its objective by investing in shares of American Funds Insurance Series — Growth-Income FundSM and American Funds Insurance Series — Bond FundSM. The Managed Risk Asset Allocation Fund pursues its objective by investing in shares of American Funds Insurance Series — Asset Allocation FundSM. The funds seek to manage portfolio volatility and provide downside protection, primarily through the use of exchange-traded futures. The benefit of the funds’ managed risk strategy should be most apparent during periods of high volatility and in down markets. In steady or rising markets, the funds’ results can be expected to lag those of the underlying fund.
Funds are listed in the report as follows: equity, balanced, fixed income and managed risk.
American Funds Insurance Series 3
Table of Contents
Fund results shown are for past periods and are not predictive of results for future periods. Current and future results may be lower or higher than those shown. Unit prices and returns will vary, so investors may lose money. For current information and month-end results, visit americanfunds.com/afis. For information about your insurance contract and month-end results, go to the website of the company that issued your contract.
Global Growth Fund rose 31.47% for the 12 months ended December 31, 2017, compared with a 23.97% increase for the MSCI ACWI (All Country World Index)1, a free float-adjusted market capitalization-weighted index that is designed to measure equity market results in the global developed and emerging markets, consisting of more than 40 developed and emerging market country indexes.
U.S. equity markets continued to stage an impressive rally as consumer optimism, healthy corporate earnings and an improving job market provided a boost to the economy. European stocks rose, driven by a powerful combination of central bank stimulus and accelerating corporate earnings. Emerging markets advanced as well, led by rising prices for most commodities and robust profits from leading technology companies.
Larger-than-index investments and strong stock selection in information technology and consumer discretionary benefited fund results. An eclectic mix of stocks boosted the fund’s returns. Nintendo soared as the company’s second-quarter revenues and earnings topped estimates, led by strong sales of the Nintendo Switch console. Amazon reported strong third-quarter earnings and acquired Whole Foods, which helped strengthen its retail platform and contributed to its stock price appreciation.
Investments in energy companies detracted from the fund’s results. OPEC’s production cuts aimed at propping up oil prices had done little for Canadian energy stocks as Seven Generations declined.
On a geographic basis, stocks of companies domiciled in the U.S., China and the Netherlands were additive to relative results, while stocks of companies based in Canada, Spain and Denmark lagged.
Despite soaring valuations, the fund’s portfolio managers are optimistic they will continue to find good companies globally that offer high-quality products, and whose values are not yet fully reflected in their share prices.
| Country diversification | Percent of net assets | |||||
The Americas | ||||
United States | 38.2 | % | ||
Other | 2.0 | |||
|
| |||
| 40.2 | ||||
|
| |||
Europe | ||||
United Kingdom | 7.0 | |||
France | 6.2 | |||
Netherlands | 4.4 | |||
Switzerland | 3.7 | |||
Germany | 1.5 | |||
Spain | 1.5 | |||
Russian Federation | 1.3 | |||
Finland | 1.0 | |||
Italy | 1.0 | % | ||
Other | 2.2 | |||
|
| |||
| 29.8 | ||||
|
| |||
Asia/Pacific Basin | ||||
Japan | 6.6 | |||
China | 6.0 | |||
Taiwan | 4.0 | |||
Hong Kong | 3.3 | |||
India | 2.9 | |||
South Korea | 1.1 | |||
Other | 1.5 | |||
|
| |||
| 25.4 | ||||
|
| |||
Other regions | ||||
South Africa | 1.3 | % | ||
|
| |||
Short-term securities & other assets less liabilities | 3.3 | |||
|
| |||
Total | 100.0 | % | ||
|
| |||
| Largest equity securities | Percent of net assets |
Amazon | 5.47 | % | ||
ASML | 3.60 | |||
TSMC | 3.53 | |||
Alphabet | 3.39 | |||
Nintendo | 2.88 |
| 2.54 | % | |||
British American Tobacco | 2.17 | |||
AIA Group | 2.05 | |||
Microsoft | 1.86 | |||
Alibaba Group | 1.86 |
4 American Funds Insurance Series
Table of Contents
Global Growth Fund
How a $10,000 investment has grown
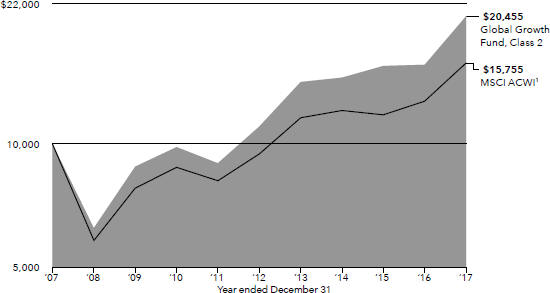
Average annual total returns based on a $1,000 investment for periods ended December 31, 2017
| 1 year | 5 years | 10 years | Lifetime (since April 30, 1997) | Expense ratio | ||||||||||||||||
Class 1 | 31.80 | % | 13.61 | % | 7.68 | % | 10.12 | % | .55 | % | ||||||||||
Class 1A | 31.54 | 13.34 | 7.42 | 9.85 | .80 | 2 | ||||||||||||||
Class 2 | 31.47 | 13.33 | 7.42 | 9.84 | .80 | |||||||||||||||
Class 4 | 31.11 | 13.13 | 7.19 | 9.59 | 1.05 | |||||||||||||||
Investment results assume all distributions are reinvested and reflect applicable fees and expenses. The fund’s investment adviser waived a portion of its management fees from September 1, 2004, through December 31, 2008. Applicable fund results shown reflect the waiver, without which they would have been lower. Expense ratios are as of the fund’s prospectus dated May 1, 2018 (unaudited). See the Financial Highlights table in this report for details.
Any market index shown is unmanaged and, therefore, has no expenses. Investors cannot invest directly in an index.
| 1 | Source: MSCI. The MSCI index result reflects dividends net of withholding taxes and reinvestment of distributions. |
| 2 | Based on estimated amounts for the current fiscal year. |
| Where the fund’s assets were invested as of December 31, 2017 | Percent of net assets |
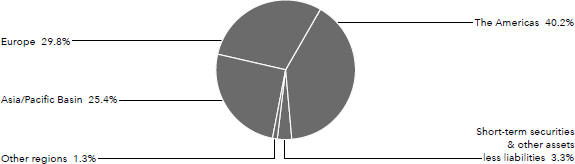
American Funds Insurance Series 5
Table of Contents
Global Small Capitalization Fund
Fund results shown are for past periods and are not predictive of results for future periods. Current and future results may be lower or higher than those shown. Unit prices and returns will vary, so investors may lose money. For current information and month-end results, visit americanfunds.com/afis. For information about your insurance contract and month-end results, go to the website of the company that issued your contract.
Global Small Capitalization Fund increased 25.89% for the 12 months ended December 31, 2017. Its benchmark, the MSCI All Country World Small Cap Index¹, a free float-adjusted market capitalization-weighted index that is designed to measure equity market results of smaller capitalization companies in both developed and emerging markets, gained 23.81%.
Global stocks advanced on the back of strong corporate earnings, accommodative monetary policy and macroeconomic stability across most regions. Numerous equity market indexes achieved or neared multiyear highs in 2017. European and emerging market equities outpaced U.S. stock markets, as investors set aside concerns about politics and focused on the global economic recovery.
Holdings in the information technology, consumer discretionary and health care sectors — the fund’s largest sectors by concentration — aided returns. Kite Pharma rose as the company was acquired by Gilead for $11.9 billion in an all-cash deal. Sunny surged to all-time highs led by robust demand for technology-related components that helped contribute to earnings growth. Investments in energy stocks, such as Laredo Petroleum and Carrizo, hurt results.
While investments in U.S. companies were additive to relative returns, larger-than-index investments in U.K.–domiciled companies detracted from relative results.
We continue to think powerful long-term investments can be found among companies with innovative products and services that are changing the way people live around the globe. We also continue to believe there are better values outside the U.S. stock market that grow more compelling every day.
While geopolitical uncertainties may result in volatility, the fund’s portfolio managers are optimistic that our investment process can help identify companies outside the U.S. with innovative products and services that are changing the way people live around the globe.
| Country diversification | Percent of net assets | |||||
The Americas | ||||
United States | 40.3 | % | ||
Canada | 2.7 | |||
Brazil | 1.0 | |||
Other | .2 | |||
|
| |||
| 44.2 | ||||
|
| |||
Asia/Pacific Basin | ||||
Japan | 7.2 | |||
China | 4.6 | |||
India | 4.4 | |||
Hong Kong | 3.2 | |||
Taiwan | 2.4 | % | ||
Philippines | 1.8 | |||
Thailand | 1.7 | |||
South Korea | 1.4 | |||
Other | 1.6 | |||
|
| |||
| 28.3 | ||||
|
| |||
Europe | ||||
United Kingdom | 12.3 | |||
Germany | 2.6 | |||
France | 1.1 | |||
Switzerland | 1.0 | % | ||
Other | 4.1 | |||
|
| |||
| 21.1 | ||||
|
| |||
Short-term securities & other assets less liabilities | 6.4 | |||
|
| |||
Total | 100.0 | % | ||
|
|
| Largest equity securities | Percent of net assets |
GW Pharmaceuticals | 2.28 | % | ||
Insulet | 1.83 | |||
Qorvo | 1.73 | |||
WIN Semiconductors | 1.43 | |||
Kotak Mahindra Bank | 1.20 |
Hilton Grand Vacations | 1.19 | % | ||
Melco International Development | 1.18 | |||
GVC Holdings | 1.17 | |||
Illumina | 1.17 | |||
Integra LifeSciences Holdings | 1.14 |
6 American Funds Insurance Series
Table of Contents
Global Small Capitalization Fund
How a $10,000 investment has grown
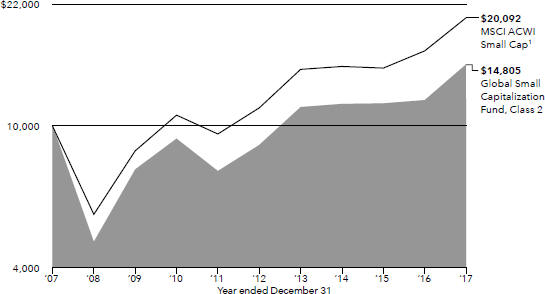
Average annual total returns based on a $1,000 investment for periods ended December 31, 2017
| 1 year | 5 years | 10 years | Lifetime (since April 30, 1998) | Expense ratio | ||||||||||||||||
Class 1 | 26.22 | % | 11.31 | % | 4.26 | % | 9.80 | % | .74 | % | ||||||||||
Class 1A | 25.99 | 11.05 | 4.01 | 9.53 | .99 | 2 | ||||||||||||||
Class 2 | 25.89 | 11.04 | 4.00 | 9.53 | .99 | |||||||||||||||
Class 4 | 25.62 | 10.78 | 3.76 | 9.26 | 1.24 | |||||||||||||||
Investment results assume all distributions are reinvested and reflect applicable fees and expenses. The fund’s investment adviser waived a portion of its management fees from September 1, 2004, through December 31, 2008. Applicable fund results shown reflect the waiver, without which they would have been lower. Expense ratios are as of the fund’s prospectus dated May 1, 2018 (unaudited). See the Financial Highlights table in this report for details.
Any market index shown is unmanaged and, therefore, has no expenses. Investors cannot invest directly in an index.
| 1 | Source: MSCI. The MSCI index result reflects dividends net of withholding taxes and reinvestment of distributions. |
| 2 | Based on estimated amounts for the current fiscal year. |
| Where the fund’s assets were invested as of December 31, 2017 | Percent of net assets |
American Funds Insurance Series 7
Table of Contents
Growth Fund
Fund results shown are for past periods and are not predictive of results for future periods. Current and future results may be lower or higher than those shown. Unit prices and returns will vary, so investors may lose money. For current information and month-end results, visit americanfunds.com/afis. For information about your insurance contract and month-end results, go to the website of the company that issued your contract.
Growth Fund gained 28.28% for the 12 months ended December 31, 2017, compared with a 21.83% increase in its benchmark, the Standard & Poor’s 500 Composite Index,1 a market capitalization-weighted index based on the results of approximately 500 widely held common stocks.
U.S. equity markets continued to stage an impressive rally as consumer optimism, healthy corporate earnings and an improving job market provided a boost to the economy. Strong consumer demand and rising optimism fueled the information technology sector higher. European stocks rose, driven by a powerful combination of central bank stimulus and accelerating corporate earnings. Emerging markets also advanced, led by rising prices for most commodities and robust profits from leading technology companies.
Larger-than-index investments and stock selection in information technology and consumer discretionary boosted the fund’s returns. Among the fund’s top contributors to returns (posting double-digit gains) was consumer discretionary company Amazon and information technology company Facebook. Exposure to the energy sector detracted from fund results, despite OPEC’s decision to extend production cuts into 2018. Energy exploration and production company Noble Energy and oil-field services company Schlumberger detracted from returns.
Although U.S. economic growth remained strong with GDP growing at an annualized pace of 3.2% in the third quarter, the fund’s portfolio managers are keeping a close watch on economic indicators, such as wage growth and fiscal policy, including outcomes of the recent U.S. tax bill. Portfolio managers continue to favor well-positioned, growth-oriented companies that are capable of generating free cash flow in myriad economic environments, and remain optimistic that our global research will help us identify attractive long-term investment opportunities.
| Largest equity securities | Percent of net assets |
Amazon | 6.39 | % | ||
| 5.89 | ||||
Microsoft | 4.00 | |||
Alphabet | 3.71 | |||
UnitedHealth Group | 3.10 |
Broadcom | 2.92 | % | ||
ASML | 2.49 | |||
Apple | 2.18 | |||
Netflix | 1.96 | |||
Tesla | 1.88 |
8 American Funds Insurance Series
Table of Contents
Growth Fund
How a $10,000 investment has grown
Average annual total returns based on a $1,000 investment for periods ended December 31, 2017
| 1 year | 5 years | 10 years | Lifetime (since February 8, 1984) | Expense ratio | ||||||||||||||||
Class 1 | 28.62 | % | 16.50 | % | 8.56 | % | 12.83 | % | .35 | % | ||||||||||
Class 1A | 28.36 | 16.22 | 8.29 | 12.55 | .60 | 2 | ||||||||||||||
Class 2 | 28.28 | 16.21 | 8.29 | 12.55 | .60 | |||||||||||||||
Class 3 | 28.39 | 16.29 | 8.36 | 12.63 | .53 | |||||||||||||||
Class 4 | 27.99 | 15.95 | 8.03 | 12.27 | .85 | |||||||||||||||
Investment results assume all distributions are reinvested and reflect applicable fees and expenses. The fund’s investment adviser waived a portion of its management fees from September 1, 2004, through December 31, 2008. Applicable fund results shown reflect the waiver, without which they would have been lower. Expense ratios are as of the fund’s prospectus dated May 1, 2018 (unaudited). See the Financial Highlights table in this report for details.
Any market index shown is unmanaged and, therefore, has no expenses. Investors cannot invest directly in an index.
| 1 | Source: S&P Dow Jones Indices LLC. |
| 2 | Based on estimated amounts for the current fiscal year. |
| Where the fund’s assets were invested as of December 31, 2017 | Percent of net assets |
American Funds Insurance Series 9
Table of Contents
International Fund
Fund results shown are for past periods and are not predictive of results for future periods. Current and future results may be lower or higher than those shown. Unit prices and returns will vary, so investors may lose money. For current information and month-end results, visit americanfunds.com/afis. For information about your insurance contract and month-end results, go to the website of the company that issued your contract.
International Fund gained 32.14% for the 12 months ended December 31, 2017. Its benchmark, the MSCI ACWI (All Country World Index) ex USA1, a free float-adjusted market capitalization-weighted index that is designed to measure equity market results in the global developed and emerging markets, consisting of more than 40 developed and emerging market country indexes excluding the U.S., rose 27.19%.
Global stocks rallied, led by strong corporate earnings growth and accommodative monetary policy amid a backdrop of macroeconomic stability across most regions. A broad-based recovery and ultra-low interest rates across Europe, particularly in countries that have engaged in fiscal reform over the past few years, facilitated the continent’s growth trajectory while helping combat deflationary pressures. Political fighting in the U.S. and elsewhere was essentially ignored by resilient financial markets.
Investments in the information technology sector contributed most to absolute and relative returns. The fund took advantage of the rally in the information technology sector, helped by investments in Tencent and Alibaba Group. Accelerated revenue growth and strong Chinese consumption promoted an increase in both companies’ stock prices, respectively. Investments in the financials sector were also among the top contributors to the fund’s returns. HDFC Bank surged after the company reported healthy second-quarter profits as the bank continued to gain market share from state-owned banks. Investments in the health care sector hindered the fund’s returns the most on a relative basis. Teva Pharmaceutical was among the top detractors to relative returns, as the company’s share price declined due to worse-than-expected results for the second quarter.
The fund’s portfolio managers continue to monitor key indicators in advanced countries — from wage growth and inflation dynamics to the impact of technology and demographics on productivity — as they seek the flexibility to pivot to areas of opportunity. That is why we take a multilayered approach to research, and invest in different geographies, industries and companies that can control their own destiny through efficiencies or innovative products.
| Country diversification | Percent of net assets | |||||||
Asia/Pacific Basin | ||||
Japan | 14.1 | % | ||
Hong Kong | 10.0 | |||
India | 7.4 | |||
China | 7.3 | |||
South Korea | 7.1 | |||
Australia | 1.6 | |||
Thailand | 1.1 | |||
Philippines | 1.1 | |||
|
| |||
| 49.7 | ||||
|
| |||
Europe | ||||
United Kingdom | 12.6 | |||
France | 7.3 | |||
Switzerland | 4.5 | |||
Germany | 2.8 | % | ||
Netherlands | 2.2 | |||
Spain | 1.9 | |||
Italy | 1.6 | |||
Denmark | .9 | |||
Other | 1.4 | |||
|
| |||
| 35.2 | ||||
|
| |||
The Americas | ||||
Canada | 2.8 | |||
Brazil | 1.6 | |||
United States | .5 | |||
|
| |||
| 4.9 | ||||
|
| |||
Other regions | ||||
South Africa | 1.0 | % | ||
Israel | .8 | |||
|
| |||
| 1.8 | ||||
|
| |||
Short-term securities & other assets less liabilities | 8.4 | |||
|
| |||
Total | 100.0 | % | ||
|
| |||
Largest equity securities | Percent of net assets | |||||||
AIA Group | 3.50 | % | ||
Samsung Electronics | 3.12 | |||
Airbus Group | 2.98 | |||
HDFC Bank | 2.69 | |||
Tencent | 2.46 |
Alibaba Group | 2.41 | % | ||
Royal Dutch Shell | 1.92 | |||
Novartis | 1.70 | |||
Galaxy Entertainment Group | 1.37 | |||
Prudential | 1.36 |
10 American Funds Insurance Series
Table of Contents
International Fund
How a $10,000 investment has grown
Average annual total returns based on a $1,000 investment for periods ended December 31, 2017
| 1 year | 5 years | 10 years | Lifetime (since May 1, 1990) | Expense ratio | ||||||||||||||||
Class 1 | 32.46 | % | 9.38 | % | 3.63 | % | 8.55 | % | .54 | % | ||||||||||
Class 1A | 32.15 | 9.11 | 3.37 | 8.28 | .792 | |||||||||||||||
Class 2 | 32.14 | 9.11 | 3.37 | 8.28 | .79 | |||||||||||||||
Class 3 | 32.23 | 9.18 | 3.44 | 8.36 | .72 | |||||||||||||||
Class 4 | 31.89 | 8.88 | 3.13 | 8.02 | 1.04 | |||||||||||||||
Investment results assume all distributions are reinvested and reflect applicable fees and expenses. The fund’s investment adviser waived a portion of its management fees from September 1, 2004, through December 31, 2008. Applicable fund results shown reflect the waiver, without which they would have been lower. Expense ratios are as of the fund’s prospectus dated May 1, 2018 (unaudited). See the Financial Highlights table in this report for details.
Any market index shown is unmanaged and, therefore, has no expenses. Investors cannot invest directly in an index.
| 1 | Source: MSCI. The MSCI index result reflects dividends net of withholding taxes and reinvestment of distributions. |
| 2 | Based on estimated amounts for the current fiscal year. |
| Where the fund’s assets were invested as of December 31, 2017 | Percent of net assets |
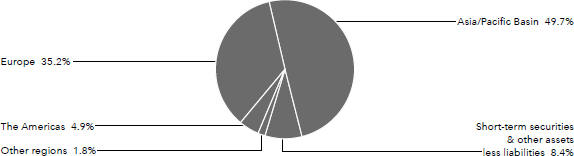
American Funds Insurance Series 11
Table of Contents
New World Fund®
Fund results shown are for past periods and are not predictive of results for future periods. Current and future results may be lower or higher than those shown. Unit prices and returns will vary, so investors may lose money. For current information and month-end results, visit americanfunds.com/afis. For information about your insurance contract and month-end results, go to the website of the company that issued your contract.
New World Fund gained 29.44% for the 12 months ended December 31, 2017. Its benchmark indexes are the MSCI ACWI (All Country World Index),1 a free float-adjusted market capitalization-weighted index that is designed to measure equity market results in the global developed and emerging markets, consisting of more than 40 developed and emerging market country indexes, and the MSCI Emerging Markets Index,1 a free float-adjusted market capitalization-weighted index that is designed to measure equity market results in the global emerging markets, consisting of more than 20 emerging market country indexes. They rose 23.97% and 37.28%, respectively.
Global stocks rallied, led by strong corporate earnings growth and accommodative monetary policy amid a backdrop of macroeconomic stability across most regions. A broad-based recovery and ultra-low interest rates across Europe, particularly in countries that have engaged in fiscal reform over the past few years, facilitated the continent’s growth trajectory while helping combat deflationary pressures. Political fighting in the U.S. and elsewhere was essentially ignored by resilient financial markets. Numerous indexes achieved or neared multiyear highs during the year, led in part by information technology stocks.
Select holdings in the financials and information technology sectors were beneficial to the fund. HDFC Bank surged after the company reported healthy second-quarter profits as the bank continued to gain market share from state-owned banks, while AAC Technologies Holdings jumped to a record high on strong third-quarter earnings. Among detractors, technology company Murata Manufacturing hindered relative returns, hurt by high costs of mass production for a key iPhone component.
While the broad stock market has rallied amid a global economic recovery, new populist policies and tax reform, how it responds to the U.S. presidential administration on matters including trade and spending is worth monitoring. As the fund invests in many different geographies, the fund’s managers continue to carefully monitor the portfolio while searching for undervalued companies with solid foundations around the world.
| Country diversification | Percent of net assets |
Asia/Pacific Basin | ||||
India | 13.2 | % | ||
China | 11.9 | |||
Japan | 6.8 | |||
Taiwan | 5.9 | |||
Australia | 1.7 | |||
South Korea | 1.7 | |||
Hong Kong | 1.4 | |||
Thailand | 1.2 | |||
Other | .7 | |||
|
| |||
| 44.5 | ||||
|
| |||
The Americas | ||||
United States | 15.0 | |||
Brazil | 6.7 | |||
Argentina | 3.8 | % | ||
Mexico | 2.7 | |||
Canada | 1.0 | |||
Other | .6 | |||
|
| |||
| 29.8 | ||||
|
| |||
Europe | ||||
United Kingdom | 8.1 | |||
France | 3.6 | |||
Russian Federation | 3.4 | |||
Switzerland | 1.8 | |||
Other | 2.3 | |||
|
| |||
| 19.2 | ||||
|
| |||
Other regions | ||||
South Africa | 1.5 | % | ||
Other | .6 | |||
|
| |||
| 2.1 | ||||
|
| |||
Short-term securities & other assets less liabilities | 4.4 | |||
|
| |||
Total | 100.0 | % | ||
|
| |||
| Largest equity securities | Percent of net assets | |||||
Reliance Industries | 5.40 | % | ||
TSMC | 2.94 | |||
British American Tobacco | 2.85 | |||
United Microelectronics | 2.79 | |||
Alphabet | 2.69 |
HDFC Bank | 2.24 | % | ||
Murata Manufacturing | 2.21 | |||
Baidu | 2.21 | |||
Grupo Financiero Galicia | 2.09 | |||
Foshan Haitian Flavouring and Food | 1.77 |
12 American Funds Insurance Series
Table of Contents
New World Fund
How a $10,000 investment has grown
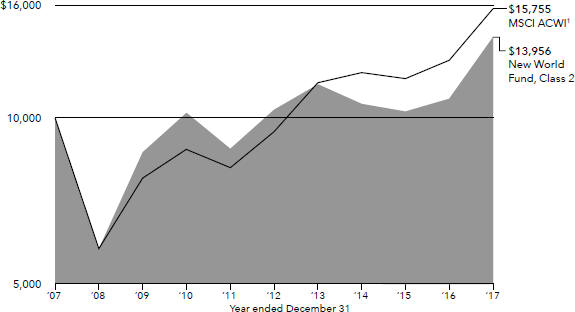
Average annual total returns based on a $1,000 investment for periods ended December 31, 2017
| 1 year | 5 years | 10 years | Lifetime (since June 17, 1999) | Expense ratio | ||||||||||||||||
Class 1 | 29.73 | % | 6.52 | % | 3.65 | % | 8.80 | % | .76 | % | ||||||||||
Class 1A | 29.42 | 6.25 | 3.39 | 8.53 | 1.01 | 2 | ||||||||||||||
Class 2 | 29.44 | 6.25 | 3.39 | 8.53 | 1.01 | |||||||||||||||
Class 4 | 29.06 | 6.00 | 3.14 | 8.26 | 1.26 | |||||||||||||||
Investment results assume all distributions are reinvested and reflect applicable fees and expenses. The fund’s investment adviser waived a portion of its management fees from September 1, 2004, through December 31, 2008. Applicable fund results shown reflect the waiver, without which they would have been lower. Expense ratios are as of the fund’s prospectus dated May 1, 2018 (unaudited). See the Financial Highlights table in this report for details.
Any market index shown is unmanaged and, therefore, has no expenses. Investors cannot invest directly in an index.
| 1 | Source: MSCI. Results for MSCI indexes reflect dividends net of withholding taxes and reinvestment of distributions. |
| 2 | Based on estimated amounts for the current fiscal year. |
| Where the fund’s assets were invested as of December 31, 2017 | Percent of net assets |
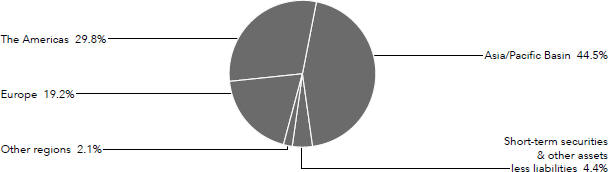
American Funds Insurance Series 13
Table of Contents
Blue Chip Income and Growth Fund
Fund results shown are for past periods and are not predictive of results for future periods. Current and future results may be lower or higher than those shown. Unit prices and returns will vary, so investors may lose money. For current information and month-end results, visit americanfunds.com/afis. For information about your insurance contract and month-end results, go to the website of the company that issued your contract.
Blue Chip Income and Growth Fund gained 17.04% for the 12 months ended December 31, 2017, trailing its benchmark, the Standard & Poor’s 500 Composite Index (a market capitalization-weighted index based on the results of approximately 500 widely held common stocks),1 which rose 21.83%.
U.S. equity markets continued to stage an impressive rally as consumer optimism, healthy corporate earnings and an improving job market provided a boost to the economy. Strong consumer demand and rising optimism pushed the information technology sector higher. Outside the U.S., European stocks rose, driven by a powerful combination of central bank stimulus and accelerating corporate earnings. Emerging markets also advanced, led by rising prices for most raw materials and robust profits from leading technology companies.
Investments in information technology and health care companies boosted the fund’s returns. Among the fund’s top contributors to returns (posting double-digit gains) was health care company AbbVie, which reported third-quarter earnings above analyst estimates due in part to sales of its flagship drug, Humira. Intel’s stock price also rose as the company reported better-than-expected third-quarter earnings and revenue from its data center.
Investments in the energy sector hindered returns, despite OPEC’s production cuts aimed at bolstering oil prices. Energy exploration and production company Halliburton hindered results. Telecommunication services company CenturyLink was also a drag, as the company missed third-quarter earnings and revenue estimates.
Given the fund’s focus on investing in dividend-paying stocks, a lack of investments in certain growth stocks in the information technology sector, such as Facebook, hampered relative returns. On a country basis, lower-than-index investments in U.S. domiciled companies also detracted from the fund’s relative returns.
The fund’s portfolio managers are keeping a close watch on the U.S. economy. Portfolio managers continue to favor well-managed, high-quality companies that are capable of generating positive cash flow in myriad economic environments, and remain optimistic that our global research will help us identify attractive long-term investment opportunities.
| Largest equity securities | Percent of net assets |
AbbVie | 6.97 | % | ||
Verizon Communications | 5.42 | |||
JPMorgan Chase | 4.43 | |||
Amgen | 4.39 | |||
Intel | 4.15 |
Wells Fargo | 3.89 | % | ||
Prudential Financial | 3.25 | |||
Texas Instruments | 2.93 | |||
CSX | 2.71 | |||
Canadian Natural Resources | 2.39 |
14 American Funds Insurance Series
Table of Contents
Blue Chip Income and Growth Fund
How a $10,000 investment has grown
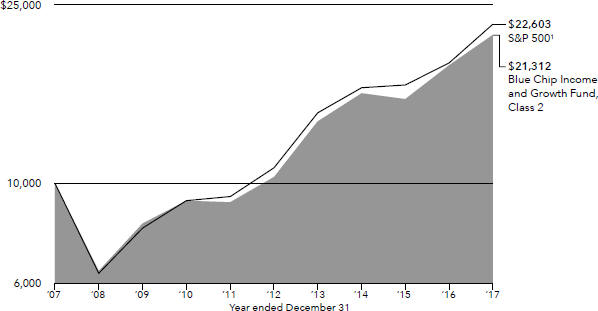
Average annual total returns based on a $1,000 investment for periods ended December 31, 2017
| 1 year | 5 years | 10 years | Lifetime (since July 5, 2001) | Expense ratio | ||||||||||||||||
Class 1 | 17.30 | % | 15.93 | % | 8.13 | % | 6.85 | % | .41 | % | ||||||||||
Class 1A | 17.08 | 15.66 | 7.87 | 6.59 | .66 | 2 | ||||||||||||||
Class 2 | 17.04 | 15.65 | 7.86 | 6.58 | .66 | |||||||||||||||
Class 4 | 16.70 | 15.48 | 7.65 | 6.35 | .91 | |||||||||||||||
Investment results assume all distributions are reinvested and reflect applicable fees and expenses. The fund’s investment adviser waived a portion of its management fees from September 1, 2004, through December 31, 2008, and from February 1, 2014, through January 31, 2015. Applicable fund results shown reflect the waiver, without which they would have been lower. Expense ratios are as of the fund’s prospectus dated May 1, 2018 (unaudited). See the Financial Highlights table in this report for details.
Any market index shown is unmanaged and, therefore, has no expenses. Investors cannot invest directly in an index.
| 1 | Source: S&P Dow Jones Indices LLC. |
| 2 | Based on estimated amounts for the current fiscal year. |
| Where the fund’s assets were invested as of December 31, 2017 | Percent of net assets |
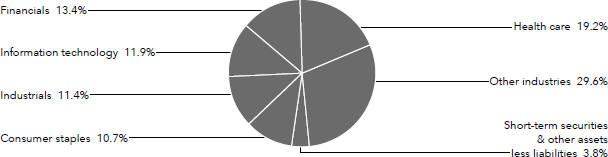
American Funds Insurance Series 15
Table of Contents
Global Growth and Income Fund
Fund results shown are for past periods and are not predictive of results for future periods. Current and future results may be lower or higher than those shown. Unit prices and returns will vary, so investors may lose money. For current information and month-end results, visit americanfunds.com/afis. For information about your insurance contract and month-end results, go to the website of the company that issued your contract.
Global Growth and Income Fund gained 26.06% for the 12 months ended December 31, 2017, compared with a 23.97% increase in its benchmark, the MSCI ACWI (All Country World Index),1 a free float-adjusted market capitalization-weighted index that is designed to measure equity market results in the global developed and emerging markets, consisting of more than 40 developed and emerging market country indexes.
Global stocks advanced on the back of strong corporate earnings, accommodative monetary policy and macroeconomic stability across most regions. Numerous indexes achieved or neared multiyear highs in 2017. European and emerging market equities outpaced U.S. stock markets, as investors set aside concerns about politics and focused on the global economic recovery.
Information technology was one of several sectors that contributed to the fund’s absolute returns. The fund’s holdings in Nintendo and Broadcom were among the top contributors to absolute results. Nintendo shares soared as the company’s second-quarter revenues and earnings beat market expectations, led by strong sales of the Nintendo Switch console. Semiconductor manufacturer Broadcom also rose as the company’s fiscal fourth-quarter earnings topped analyst estimates. On the downside, stock selection in materials and financials hindered relative returns.
On a country basis, holdings in the U.S., Japan and India contributed to relative returns, and holdings in Canada, the U.K. and Italy were a drag on relative returns.
The fund’s cash position enables portfolio managers to better navigate a challenging environment by focusing on opportunities when stock prices are favorable. The fund’s portfolio managers are also optimistic they can uncover promising long-term investment opportunities and companies with sustainable dividends and income.
| Country diversification | Percent of net assets | |||||
The Americas | ||||
United States | 34.4 | % | ||
Brazil | 3.0 | |||
Mexico | 2.9 | |||
Other | .8 | |||
|
| |||
| 41.1 | ||||
|
| |||
Europe | ||||
United Kingdom | 12.2 | |||
France | 5.8 | |||
Switzerland | 4.4 | |||
Germany | 3.5 | |||
Denmark | 1.6 | |||
Ireland | 1.2 | |||
Netherlands | 1.0 | % | ||
Other | 1.1 | |||
|
| |||
| 30.8 | ||||
|
|
Asia/Pacific Basin | ||||
Japan | 7.0 | |||
Taiwan | 6.0 | |||
India | 4.3 | |||
China | 2.4 | |||
Hong Kong | 1.2 | |||
Australia | 1.1 | |||
Other | 1.8 | |||
|
| |||
| 23.8 | ||||
|
| |||
Other regions | ||||
Israel | .3 | % | ||
|
| |||
Short-term securities & other assets less liabilities | 4.0 | |||
|
| |||
Total | 100.0 | % | ||
|
|
| Largest equity securities | Percent of net assets |
Nintendo | 4.31 | % | ||
British American Tobacco | 4.13 | |||
TSMC | 3.37 | |||
Microsoft | 3.28 | |||
Airbus Group | 2.38 |
Nestlé | 2.28 | % | ||
UnitedHealth Group | 2.25 | |||
Reliance Industries | 2.00 | |||
Broadcom | 1.67 | |||
United Microelectronics | 1.55 |
16 American Funds Insurance Series
Table of Contents
Global Growth and Income Fund
How a $10,000 investment has grown
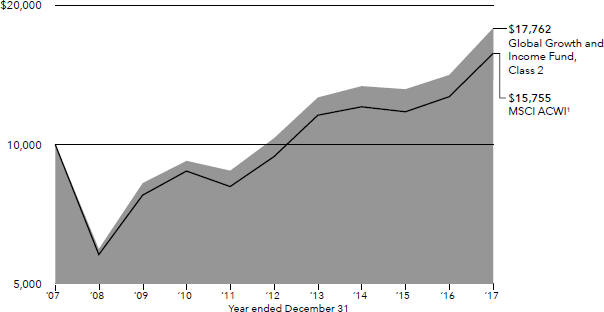
Average annual total returns based on a $1,000 investment for periods ended December 31, 2017
| 1 year | 5 years | 10 years | Lifetime (since May 1, 2006) | Expense ratio | ||||||||||||||||
Class 1 | 26.40 | % | 11.85 | % | 6.17 | % | 7.29 | % | .63 | % | ||||||||||
Class 1A | 26.35 | 11.61 | 5.93 | 7.04 | .88 | 2 | ||||||||||||||
Class 2 | 26.06 | 11.56 | 5.91 | 7.02 | .88 | |||||||||||||||
| Class 4 | 25.83 | 11.36 | 5.67 | 6.78 | 1.13 | |||||||||||||||
Investment results assume all distributions are reinvested and reflect applicable fees and expenses. The fund’s investment adviser waived a portion of its management fees from May 1, 2006, through December 31, 2008. Applicable fund results shown reflect the waiver, without which they would have been lower. Expense ratios are as of the fund’s prospectus dated May 1, 2018 (unaudited). See the Financial Highlights table in this report for details.
Any market index shown is unmanaged and, therefore, has no expenses. Investors cannot invest directly in an index.
| 1 | Source MSCI. The MSCI index result reflects dividends net of withholding taxes and reinvestment of distributions. |
| 2 | Based on estimated amounts for the current fiscal year. |
| Where the fund’s assets were invested as of December 31, 2017 | Percent of net assets |
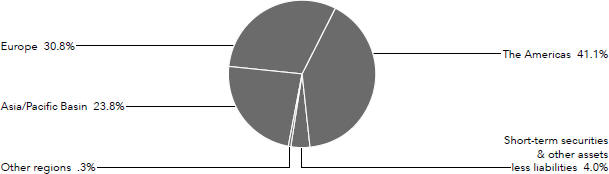
American Funds Insurance Series 17
Table of Contents
Growth-Income Fund
Fund results shown are for past periods and are not predictive of results for future periods. Current and future results may be lower or higher than those shown. Unit prices and returns will vary, so investors may lose money. For current information and month-end results, visit americanfunds.com/afis. For information about your insurance contract and month-end results, go to the website of the company that issued your contract.
Growth-Income Fund gained 22.38% for the 12 months ended December 31, 2017. The Standard & Poor’s 500 Composite Index,1 a market capitalization-weighted index based on the results of approximately 500 widely held common stocks, rose 21.83%.
U.S. stocks staged an impressive rally as the economic picture remained bright. GDP grew an annualized 3.2% in the third quarter. Repeating a common theme, information technology companies advanced, supported by better-than-expected corporate earnings in the sector. Outside the U.S., European stocks rose, driven by a powerful combination of central bank stimulus and accelerating corporate earnings. Emerging markets also advanced, led by rising prices for most commodities and robust profits from leading technology companies.
Fund investments in the consumer discretionary and health care sectors contributed the most to relative returns. Among consumer discretionary companies, Amazon reported strong third-quarter earnings and acquired Whole Foods, which helped strengthen its retail platform and contributed to an increase in its stock price. Health care company AbbVie reported third-quarter earnings above analyst estimates due in part to sales of its flagship drug, Humira. Despite OPEC’s production cuts aimed at propping up oil prices, investments in the energy sector hindered absolute results. Energy exploration and production company Noble Energy and oil-field services company Schlumberger detracted from returns.
As equity markets continue to advance, valuations for many companies are up — calling into question the sustainability of this remarkable bull market. The fund’s portfolio managers exercise caution and continue to conduct global research and fundamental analysis to identify companies that are reasonably valued for their growth prospects, while maintaining a long-term perspective on investing.
| Largest equity securities | Percent of net assets | |||||
Amazon | 3.98 | % | ||
AbbVie | 2.64 | |||
Microsoft | 2.48 | |||
Alphabet | 2.34 | |||
Netflix | 2.21 |
Verizon Communications | 1.88 | % | ||
JPMorgan Chase | 1.62 | |||
Texas Instruments | 1.61 | |||
Amgen | 1.56 | |||
Broadcom | 1.44 |
18 American Funds Insurance Series
Table of Contents
Growth-Income Fund
How a $10,000 investment has grown
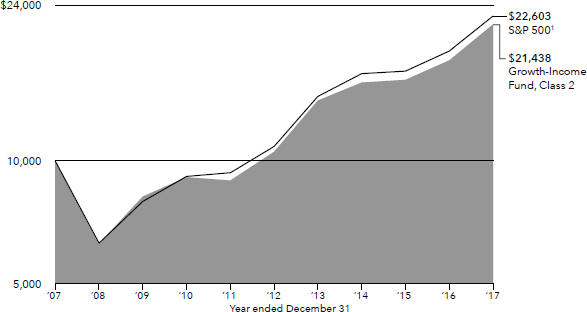
Average annual total returns based on a $1,000 investment for periods ended December 31, 2017
| 1 year | 5 years | 10 years | Lifetime (since February 8, 1984) | Expense ratio | ||||||||||||||||
Class 1 | 22.68 | % | 15.67 | % | 8.19 | % | 11.45 | % | .28 | % | ||||||||||
Class 1A | 22.47 | 15.40 | 7.93 | 11.18 | .53 | 2 | ||||||||||||||
Class 2 | 22.38 | 15.38 | 7.92 | 11.17 | .53 | |||||||||||||||
Class 3 | 22.47 | 15.46 | 8.00 | 11.25 | .46 | |||||||||||||||
| Class 4 | 22.08 | 15.12 | 7.67 | 10.90 | .78 | |||||||||||||||
Investment results assume all distributions are reinvested and reflect applicable fees and expenses. The fund’s investment adviser waived a portion of its management fees from September 1, 2004, through December 31, 2008. Applicable fund results shown reflect the waiver, without which they would have been lower. Expense ratios are as of the fund’s prospectus dated May 1, 2018 (unaudited). See the Financial Highlights table in this report for details.
Any market index shown is unmanaged and, therefore, has no expenses. Investors cannot invest directly in an index.
| 1 | Source: S&P Dow Jones Indices LLC. |
| 2 | Based on estimated amounts for the current fiscal year. |
| Where the fund’s assets were invested as of December 31, 2017 | Percent of net assets |
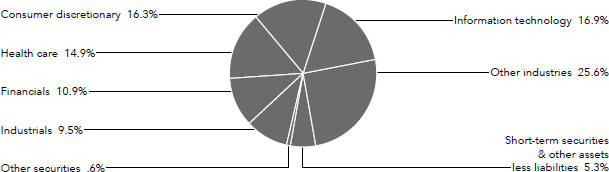
American Funds Insurance Series 19
Table of Contents
International Growth and Income Fund
Fund results shown are for past periods and are not predictive of results for future periods. Current and future results may be lower or higher than those shown. Unit prices and returns will vary, so investors may lose money. For current information and month-end results, visit americanfunds.com/afis. For information about your insurance contract and month-end results, go to the website of the company that issued your contract.
International Growth and Income Fund rose 25.03% for the 12 months ended December 31, 2017, slightly trailing its benchmark, the MSCI ACWI (All Country World Index) ex USA,1 a free float-adjusted market capitalization-weighted index that is designed to measure equity market results in the global developed and emerging markets, consisting of more than 40 developed and emerging market country indexes excluding the U.S., which rose 27.19%
U.S. equity markets continued to stage an impressive rally as consumer optimism, healthy corporate earnings and an improving job market provided a boost to the economy. European stocks also rose, driven by a powerful combination of central bank stimulus and accelerating corporate earnings. Rising prices for most commodities and robust profits from leading technology companies lifted emerging markets.
The best contributors to the fund’s relative returns were the financials and industrials sectors, due in part to good stock selection. Among financials, HDFC Bank surged after the company reported healthy second-quarter profits as the bank continued to gain market share from state-owned banks.
On the downside, investment selection in the health care sector hindered relative returns. Teva Pharmaceutical was among the top detractors, as the company’s share price declined due to worse-than-expected results for the second quarter.
The fund’s portfolio managers continue to monitor global geopolitics that may derail economic growth, but are optimistic that global research combined with the fund’s flexible mandate will help us identify attractive investment opportunit
| Country diversification | Percent of net assets | |||||
Europe | ||||
United Kingdom | 18.9 | % | ||
France | 7.8 | |||
Switzerland | 4.9 | |||
Spain | 3.8 | |||
Italy | 2.5 | |||
Portugal | 2.2 | |||
Germany | 2.1 | |||
Russian Federation | 2.0 | |||
Netherlands | 2.0 | |||
Denmark | 1.9 | |||
Norway | 1.4 | |||
Sweden | 1.0 | |||
Other | 1.5 | |||
|
| |||
| 52.0 | ||||
|
| |||
Asia/Pacific Basin | ||||
Hong Kong | 8.2 | % | ||
Japan | 8.0 | |||
South Korea | 5.4 | |||
China | 4.5 | |||
India | 2.8 | |||
Taiwan | 2.0 | |||
Thailand | 1.6 | |||
Other | 1.1 | |||
|
| |||
| 33.6 | ||||
|
|
The Americas | ||||
Brazil | 2.2 | |||
United States | 1.9 | |||
Other | 1.6 | |||
|
| |||
| 5.7 | ||||
|
| |||
Other regions | ||||
Israel | 1.0 | % | ||
Other | 1.2 | |||
|
| |||
| 2.2 | ||||
|
| |||
Short-term securities & other assets less liabilities | 6.5 | |||
|
| |||
Total | 100.0 | % | ||
|
|
| Largest equity securities | Percent of net assets |
Royal Dutch Shell | 4.08 | % | ||
HDFC Bank | 2.49 | |||
Samsung Electronics | 2.44 | |||
Shanghai International Airport | 2.43 | |||
CK Asset Holdings | 2.29 |
British American Tobacco | 2.02 | % | ||
TSMC | 2.02 | |||
Banco Santander | 2.01 | |||
Sun Hung Kai Properties | 2.01 | |||
Novartis | 1.97 |
20 American Funds Insurance Series
Table of Contents
International Growth and Income Fund
How a $10,000 investment has grown
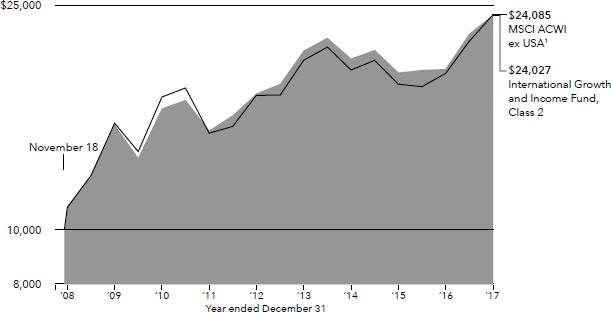
Average annual total returns based on a $1,000 investment for periods ended December 31, 2017
| 1 year | 5 years | Lifetime (since November 18, 2008) | Expense ratio | |||||||||||||
Class 1 | 25.31 | % | 6.93 | % | 10.37 | % | .65 | % | ||||||||
Class 1A | 25.14 | 6.69 | 10.11 | .90 | 2 | |||||||||||
Class 2 | 25.03 | 6.67 | 10.09 | .90 | ||||||||||||
Class 4 | 24.72 | 6.47 | 9.86 | 1.15 | ||||||||||||
Investment results assume all distributions are reinvested and reflect applicable fees and expenses. The fund’s investment adviser waived a portion of its management fees from November 18, 2008, through December 31, 2008. Applicable fund results shown reflect the waiver, without which they would have been lower. Expense ratios are as of the fund’s prospectus dated May 1, 2018 (unaudited). See the Financial Highlights table in this report for details.
Any market index shown is unmanaged and, therefore, has no expenses. Investors cannot invest directly in an index.
| 1 | Source: MSCI. The MSCI index result reflects dividends net of withholding taxes and reinvestment of distributions. |
| 2 | Based on estimated amounts for the current fiscal year. |
| Where the fund’s assets were invested as of December 31, 2017 | Percent of net assets |
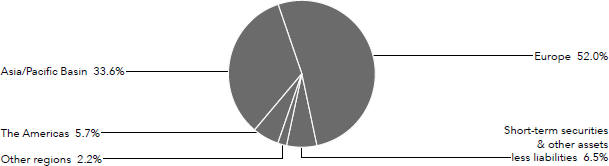
American Funds Insurance Series 21
Table of Contents
Capital Income Builder®
Fund results shown are for past periods and are not predictive of results for future periods. Current and future results may be lower or higher than those shown. Unit prices and returns will vary, so investors may lose money. For current information and month-end results, visit americanfunds.com/afis. For information about your insurance contract and month-end results, go to the website of the company that issued your contract.
Capital Income Builder, a mix of stocks and bonds, rose 13.04% for the 12 months ended December 31, 2017. During the same period, the MSCI ACWI (All Country World Index),1 a free float-adjusted market capitalization-weighted index that is designed to measure equity market results in the global developed and emerging markets, consisting of more than 40 developed and emerging market country indexes, rose 23.97%. The Bloomberg Barclays U.S. Aggregate Index,2 which measures investment-grade U.S. bonds (rated BBB/Baa and above), gained 3.54%. The index blend of 70%/30% MSCI ACWI/Bloomberg Barclays U.S. Aggregate Index3 rose 17.50%. The Lipper Global Equity Income Funds Average,4 a measure of similar funds, increased 17.29%.
U.S. equity markets continued to stage an impressive rally as consumer optimism, healthy corporate earnings and an improving jobs market provided a boost to the economy. European stocks also rose, driven by a powerful combination of central bank stimulus and accelerating corporate earnings. Emerging markets advanced, led by rising prices for most commodities and robust profits from leading technology companies.
The strongest contributors to the equity portfolio’s relative returns were the industrials and real estate sectors due to good stock selection. Boeing boosted returns and registered double-digit gains as the company beat third-quarter earnings.
On the downside, the energy sector detracted from the fund’s returns. Contract drilling services provider Helmerich & Payne hindered returns as the company reported a loss for the fourth quarter. While the fixed income portfolio detracted from relative returns, investments in bonds continue to provide the opportunity for downside protection.
Portfolio managers expect the current administration to reduce regulation, which should boost companies’ return on equity and result in higher dividends. Greater demand and signs of ebbing U.S. product are expected to help energy prices, which in turn will improve dividend prospects for holdings in the energy sector. While portfolio managers do not expect the new administration to affect legislation that will impact drug pricing, drug prices are a potential headline risk for health care stocks. The portfolio managers are optimistic that our global research will help us identify attractive long-term investment opportunities.
| Country diversification | Percent of net assets | |||||
The Americas | ||||
United States | 56.0 | % | ||
Canada | 2.7 | |||
|
| |||
| 58.7 | ||||
|
| |||
Europe | ||||
United Kingdom | 15.1 | |||
France | 3.6 | |||
Switzerland | 2.9 | |||
Netherlands | 1.7 | |||
Italy | 1.3 | |||
Sweden | 1.1 | |||
Other | 2.4 | |||
|
| |||
| 28.1 | ||||
|
|
Asia/Pacific Basin | ||||
Hong Kong | 3.4 | % | ||
Taiwan | 2.4 | |||
Other | 2.4 | |||
|
| |||
| 8.2 | ||||
|
| |||
Other regions | ||||
Other | .1 | % | ||
|
| |||
Short-term securities & other assets less liabilities | 4.9 | |||
|
| |||
Total | 100.0 | % | ||
|
|
22 American Funds Insurance Series
Table of Contents
Capital Income Builder
How a $10,000 investment has grown
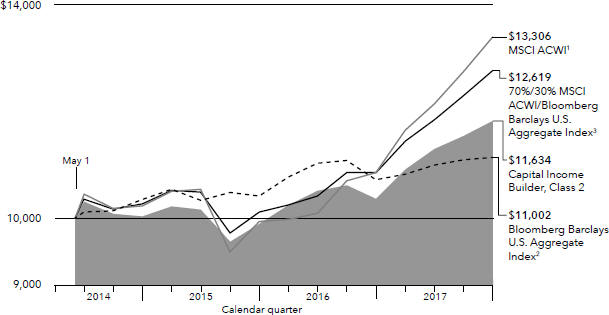
Average annual total returns based on a $1,000 investment for periods ended December 31, 2017
| 1 year | Lifetime (since May 1, 2014) | Expense ratio | ||||||||||
Class 1 | 13.29 | % | 4.30 | % | .54 | % | ||||||
Class 1A | 13.02 | 4.04 | .79 | 5 | ||||||||
Class 2 | 13.04 | 4.21 | .79 | |||||||||
Class 4 | 12.65 | 3.78 | 1.04 | |||||||||
Investment results assume all distributions are reinvested and reflect applicable fees and expenses. Expense ratios are as of the fund’s prospectus dated May 1, 2018 (unaudited). See the Financial Highlights table in this report for details.
Any market index shown is unmanaged and, therefore, has no expenses. Investors cannot invest directly in an index.
| ¹ | Source: MSCI. The MSCI index result reflects dividends net of withholding taxes and reinvestment of distributions. |
| 2 | Source: Bloomberg Index Services Ltd. |
| 3 | Data sources: MSCI and Bloomberg Index Services Ltd. The 70%/30% MSCI ACWI/Bloomberg Barclays U.S. Aggregate Index blends the MSCI ACWI (All Country World Index) with the Bloomberg Barclays U.S. Aggregate Index by weighting their total returns at 70% and 30%, respectively. Its result assumes the blend is rebalanced monthly. |
| 4 | Source: Thomson Reuters Lipper. Lipper averages reflect the current composition of all eligible mutual funds (all share classes) within a given category. Lipper categories are dynamic and averages may have few funds, especially over longer periods. To see the number of funds included in the Lipper category for each fund’s lifetime, please see the Quarterly Statistical Update, available on our website. |
| 5 | Based on estimated amounts for the current fiscal year. |
| Where the fund’s assets were invested as of December 31, 2017 | Percent of net assets |
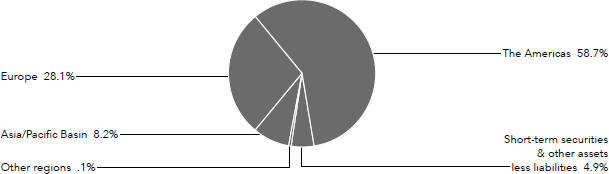
American Funds Insurance Series 23
Table of Contents
Asset Allocation Fund
Fund results shown are for past periods and are not predictive of results for future periods. Current and future results may be lower or higher than those shown. Unit prices and returns will vary, so investors may lose money. For current information and month-end results, visit americanfunds.com/afis. For information about your insurance contract and month-end results, go to the website of the company that issued your contract.
Asset Allocation Fund, which is a mix of stocks and bonds, rose 16.23% for the 12 months ended December 31, 2017. In comparison, the Standard & Poor’s 500 Composite Index,1 a market capitalization-weighted index based on the results of approximately 500 widely held common stocks and the fund’s benchmark for equity holdings, gained 21.83% over the same period. The Bloomberg Barclays U.S. Aggregate Index,2 which measures investment-grade U.S. bonds (rated BBB/Baa and above), rose 3.54%. A blend of the two indexes, the 60%/40% S&P 500/Bloomberg Barclays U.S. Aggregate Index,3 advanced 14.21%.
U.S. equity markets continued to stage an impressive rally as consumer optimism, healthy corporate earnings and an improving jobs market provided a boost to the economy. Repeating a common theme, information technology companies advanced, supported by better than expected corporate earnings in the sector. Bonds also advanced, led by high-yield corporates.
Investments in the industrials and information technology sectors contributed the most to the fund’s relative returns. Boeing was additive to the fund’s returns as the company’s strong earnings beat third-quarter analyst estimates. TSMC, a chip contract manufacturer for Apple, was also additive, as the company beat third-quarter sales and earnings estimates.
Investments in the energy sector detracted from the fund’s absolute and relative returns. Within the sector, energy exploration and production company Noble Energy, as well as oil and natural gas services company Weatherford International, detracted from the fund’s returns as both companies reported third-quarter losses.
The fund’s fixed income holdings advanced due to an overweight position in high-yield corporate bonds. The fund’s exposure to short interest duration, or the fund’s relatively low sensitivity to interest rates compared with the benchmark, also helped.
The fund’s portfolio managers continue to evaluate the economic and market sector implications of the Trump administration’s policy decisions regarding health care, infrastructure, fiscal policy, taxes and trade. The fund’s cash position allows portfolio managers to remain flexible and better navigate uncertainty by focusing on opportunities when stock prices are favorable.
| Largest equity securities | Percent of net assets |
Microsoft | 3.51 | % | ||
TSMC | 2.58 | |||
UnitedHealth Group | 2.18 | |||
ASML | 1.69 | |||
DowDuPont | 1.63 |
Lockheed Martin | 1.58 | % | ||
Johnson & Johnson | 1.55 | |||
Comcast | 1.46 | |||
Boeing | 1.42 | |||
VeriSign | 1.40 |
24 American Funds Insurance Series
Table of Contents
Asset Allocation Fund
How a $10,000 investment has grown
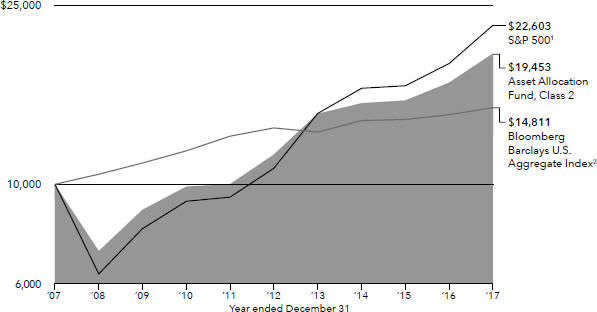
Average annual total returns based on a $1,000 investment for periods ended December 31, 2017
| 1 year | 5 years | 10 years | Lifetime (since August 1,1989) | Expense ratio | ||||||||||||||||
Class 1 | 16.51 | % | 11.23 | % | 7.15 | % | 8.69 | % | .29 | % | ||||||||||
Class 1A | 16.31 | 10.97 | 6.89 | 8.42 | .54 | 4 | ||||||||||||||
Class 2 | 16.23 | 10.95 | 6.88 | 8.42 | .54 | |||||||||||||||
Class 3 | 16.29 | 11.02 | 6.96 | 8.50 | .47 | |||||||||||||||
Class 4 | 15.91 | 10.76 | 6.66 | 8.17 | .79 | |||||||||||||||
Investment results assume all distributions are reinvested and reflect applicable fees and expenses. The fund’s investment adviser waived a portion of its management fees from September 1, 2004, through December 31, 2008. Applicable fund results shown reflect the waiver, without which they would have been lower. Expense ratios are as of the fund’s prospectus dated May 1, 2018 (unaudited). See the Financial Highlights table in this report for details.
Any market index shown is unmanaged and, therefore, has no expenses. Investors cannot invest directly in an index.
| 1 | Source: S&P Dow Jones Indices LLC. |
| 2 | Source: Bloomberg Index Services Ltd. |
| 3 | Data sources: S&P Dow Jones Indices LLC and Bloomberg Index Services Ltd. The 60%/40% S&P 500/Bloomberg Barclays U.S. Aggregate Index blends the S&P 500 with the Bloomberg Barclays U.S. Aggregate Index by weighting their total returns at 60% and 40%, respectively. Its result assumes the blend is rebalanced monthly. |
| 4 | Based on estimated amounts for the current fiscal year. |
| Where the fund’s assets were invested as of December 31, 2017 | Percent of net assets |
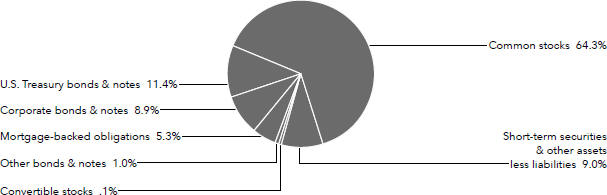
American Funds Insurance Series 25
Table of Contents
Global Balanced Fund
Fund results shown are for past periods and are not predictive of results for future periods. Current and future results may be lower or higher than those shown. Unit prices and returns will vary, so investors may lose money. For current information and month-end results, visit americanfunds.com/afis. For information about your insurance contract and month-end results, go to the website of the company that issued your contract.
Global Balanced Fund rose 19.57% for the 12 months ended December 31, 2017. The MSCI ACWI (All Country World Index),1 a free float-adjusted market capitalization-weighted index that is designed to measure equity market results in the global developed and emerging markets, consisting of more than 40 developed and emerging market country indexes, gained 23.97%, while the Bloomberg Barclays Global Aggregate Index,2 a measure of investment-grade bonds (rated BBB/Baa and above), increased 7.39%. The 60%/40% MSCI ACWI/ Bloomberg Barclays Global Aggregate Index3 rose 17.09%.
U.S. equity markets continued to stage an impressive rally as consumer optimism, healthy corporate earnings and an improving job market provided a boost to the economy. The U.S. has been the pacesetter for growth, and it looks likely that it will continue in that role. As such, the Federal Reserve continued to raise rates and additional hikes are anticipated if the economy continues its positive trajectory.
Overseas, emerging markets advanced led by rising prices for most commodities and robust profits from leading technology companies. In Europe, stocks also rose, driven by a powerful combination of central bank stimulus and accelerating corporate earnings.
Investments in the information technology sector boosted the fund’s returns, with Nintendo among the top contributors. Nintendo soared as the company’s second-quarter revenues and earnings topped estimates, led by strong sales of the Nintendo Switch console. Investments in the telecommunications services sector hindered returns, led by Inmarsat. The company indicated market conditions remain challenging and provided a narrower revenue guidance for the year. Holdings in the fixed income portfolio were additive to results.
The fund’s portfolio managers exercise caution and continue to monitor geopolitics that may derail the global economic recovery. Portfolio managers continue to stay the course of focusing on global research and bottom-up analysis.
| Largest sectors in common stock holdings | Percent of net assets |
Information technology | 11.2 | % | ||
Industrials | 8.3 | |||
Financials | 8.0 | |||
Consumer staples | 7.2 | |||
Health care | 5.0 | |||
| Largest fixed income holdings (by issuer) | Percent of net assets |
U.S. Treasury | 9.6 | % | ||
Japanese Government | 2.6 | |||
Polish Government | 1.1 | |||
Mexican Government | 1.0 | |||
Italian Government | .8 | |||
| Currency diversification | Percent of net assets |
| Equity securities | Bonds & notes | Forward currency contracts | Short-term securities & other assets less liabilities | Total | ||||||||||||||||
U.S. dollars | 28.9 | % | 17.9 | % | .8 | % | 6.8 | % | 54.4 | % | ||||||||||
Euros | 9.0 | 3.8 | .5 | — | 13.3 | |||||||||||||||
Japanese yen | 4.7 | 2.7 | 1.3 | — | 8.7 | |||||||||||||||
British pounds | 6.7 | .7 | (.7 | ) | — | 6.7 | ||||||||||||||
Swedish krona | 2.0 | — | .3 | — | 2.3 | |||||||||||||||
Swiss francs | 2.1 | — | .1 | — | 2.2 | |||||||||||||||
Hong Kong dollars | 2.1 | — | — | — | 2.1 | |||||||||||||||
New Taiwan dollars | 1.4 | — | — | — | 1.4 | |||||||||||||||
Other currencies | 4.6 | 6.6 | (2.3 | ) | — | 8.9 | ||||||||||||||
|
| |||||||||||||||||||
| 100.0 | % | |||||||||||||||||||
|
| |||||||||||||||||||
| Largest equity securities | Percent of net assets |
British American Tobacco | 2.42 | % | ||
Nintendo | 2.04 | |||
Microsoft | 1.72 | |||
ASML | 1.67 | |||
HSBC | 1.57 |
Humana | 1.46 | % | ||
TSMC | 1.44 | |||
Boeing | 1.40 | |||
JPMorgan Chase | 1.29 | |||
DowDuPont | 1.27 |
26 American Funds Insurance Series
Table of Contents
Global Balanced Fund
How a $10,000 investment has grown
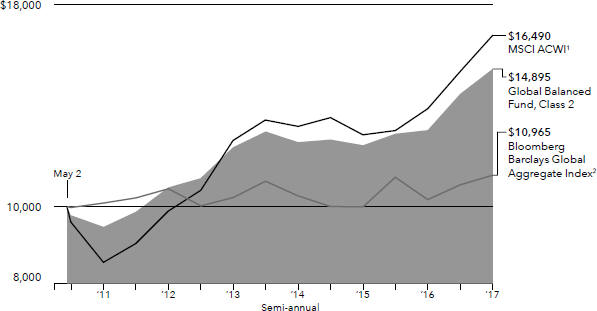
Average annual total returns based on a $1,000 investment for periods ended December 31, 2017
| 1 year | 5 years | Lifetime (since May 2, 2011) | Expense ratio | |||||||||||||
Class 1 | 19.91 | % | 7.42 | % | 6.43 | % | .71 | % | ||||||||
Class 1A | 19.78 | 7.18 | 6.19 | .96 | 4 | |||||||||||
Class 2 | 19.57 | 7.13 | 6.16 | .96 | ||||||||||||
Class 4 | 19.38 | 7.14 | 6.08 | 1.21 | ||||||||||||
Investment results assume all distributions are reinvested and reflect applicable fees and expenses. Expense ratios are as of the fund’s prospectus dated May 1, 2018 (unaudited). See the Financial Highlights table in this report for details.
Any market index shown is unmanaged and, therefore, has no expenses. Investors cannot invest directly in an index.
| 1 | Source: MSCI. The MSCI index result reflects dividends net of withholding taxes and reinvestment of distributions. |
| 2 | Source: Bloomberg Index Services Ltd. |
| 3 | Data sources: MSCI and Bloomberg Index Services Ltd. The 60%/40% MSCI ACWI/Bloomberg Barclays Global Aggregate Index blends the MSCI ACWI (All Country World Index) with the Bloomberg Barclays Global Aggregate Index by weighting their cumulative total returns at 60% and 40%, respectively. Its result assumes the blend is rebalanced monthly. |
| 4 | Based on estimated amounts for the current fiscal year. |
| Where the fund’s assets were invested as of December 31, 2017 | Percent of net assets |
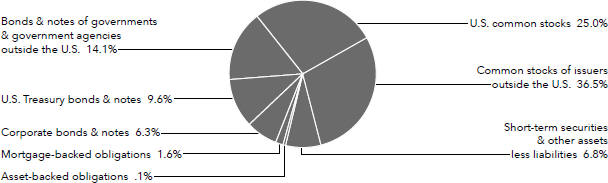
American Funds Insurance Series 27
Table of Contents
Bond Fund
Fund results shown are for past periods and are not predictive of results for future periods. Current and future results may be lower or higher than those shown. Unit prices and returns will vary, so investors may lose money. For current information and month-end results, visit americanfunds.com/afis. For information about your insurance contract and month-end results, go to the website of the company that issued your contract.
Bond Fund gained 3.67% for the 12 months ended December 31, 2017. In comparison, the fund’s benchmark, the Bloomberg Barclays U.S. Aggregate Index,1 which measures investment-grade U.S. bonds (rated BBB/Baa and above), rose 3.54%.
Bond returns were strong across most sectors. The U.S. Treasury yield curve flattened, as shorter term rates rose and longer term rates fell. This could be attributed in part to the Federal Reserve hiking short-term interest rates by 75 basis points over the course of the year as well as strong demand for longer dated Treasuries. Credit flourished as corporate bond spreads also tightened 30 basis points to 93 basis points, nearing the lowest levels of the recovery. High-yield bonds returned 7.50% and investment-grade bonds rose 6.42%.
Duration management throughout the year contributed significantly to the fund’s relative returns. The fund also benefited from sector allocation, with U.S. Treasuries contributing most to the fund’s relative returns.
On the whole, the U.S. economy appears to be in good shape and is expected to grow at a moderate pace. As U.S. interest rates increase, investors have the opportunity of reinvesting at higher yields. The fund’s portfolio managers expect continued demand for relatively safe, income-producing securities.
| Largest holdings (by issuer) | Percent of net assets |
U.S. Treasury | 27.2 | % | ||
Fannie Mae | 15.5 | |||
Freddie Mac | 6.7 | |||
Ginnie Mae | 3.4 | |||
Mexican Government | 1.8 |
Teva Pharmaceutical | 1.6 | % | ||
Portuguese Government | 1.6 | |||
State of Illinois | 1.5 | |||
Japanese Government | 1.5 | |||
AT&T | 1.1 |
28 American Funds Insurance Series
Table of Contents
Bond Fund
How a $10,000 investment has grown
Average annual total returns based on a $1,000 investment for periods ended December 31, 2017
| 1 year | 5 years | 10 years | Lifetime (since January 2, 1996) | Expense ratio | ||||||||||||||||
Class 1 | 3.88 | % | 2.22 | % | 3.21 | % | 4.74 | % | .38 | % | ||||||||||
Class 1A | 3.64 | 1.97 | 2.96 | 4.48 | .63 | 2 | ||||||||||||||
Class 2 | 3.67 | 1.97 | 2.96 | 4.48 | .63 | |||||||||||||||
Class 4 | 3.29 | 1.73 | 2.71 | 4.23 | .88 | |||||||||||||||
Investment results assume all distributions are reinvested and reflect applicable fees and expenses. The fund’s investment adviser waived a portion of its management fees from September 1, 2004, through December 31, 2008. Applicable fund results shown reflect the waiver, without which they would have been lower. Expense ratios are as of the fund’s prospectus dated May 1, 2018 (unaudited). See the Financial Highlights table in this report for details.
Any market index shown is unmanaged and, therefore, has no expenses. Investors cannot invest directly in an index.
| 1 | Source: Bloomberg Index Services Ltd. |
| 2 | Based on estimated amounts for the current fiscal year. |
| Where the fund’s assets were invested as of December 31, 2017 | Percent of net assets |
American Funds Insurance Series 29
Table of Contents
Global Bond Fund
Fund results shown are for past periods and are not predictive of results for future periods. Current and future results may be lower or higher than those shown. Unit prices and returns will vary, so investors may lose money. For current information and month-end results, visit americanfunds.com/afis. For information about your insurance contract and month-end results, go to the website of the company that issued your contract.
Global Bond Fund rose 6.86% for the 12 months ended December 31, 2017, while the Bloomberg Barclays Global Aggregate Index,1 which measures global investment-grade bonds (rated BBB/Baa and above), rose 7.39%.
Bonds generated solid returns across the board, including developed and emerging markets debt. The U.S. Federal Reserve raised interest rates three times during the year, boosting short-term rates. Long-term rates generally declined amid strong investor demand and massive bond-buying stimulus programs in Europe and Japan. Outside the U.S., the European Central Bank and the Bank of Japan left interest rates unchanged, despite signs of improving economic growth and higher inflation. The euro, the yen and most other currencies appreciated relative to the U.S. dollar.
Low exposure to euro-zone denominated debt combined with above-benchmark investments in Mexican and Polish debt contributed notably to relative returns. On the downside, currency exposure hampered results with the euro hindering relative returns the most.
The fund’s portfolio managers maintain a cautious approach to investing in global bond markets and believe that our global research can help identify attractive long-term investments around the world. Having the flexibility to diversify and adjust exposure by country, sector and currency continues to serve as a hallmark of the fund’s approach to global investing.
| Percent of net assets |
| Currency weighting (after hedging) by country | Non-U.S. government bonds by country |
United States2 | 45.7 | % | ||
Japan | 17.3 | |||
Euro zone3 | 16.4 | |||
Poland | 3.5 | |||
Mexico | 3.4 | |||
Malaysia | 2.3 | |||
Norway | 2.0 | |||
India | 1.3 | |||
United Kingdom | 1.2 | |||
Thailand | 1.2 | |||
Other | 5.7 | |||
|
| |||
Total | 100.0 | % | ||
|
|
Euro zone3: | ||||
Germany | 3.4 | % | ||
Italy | 3.4 | |||
Portugal | 2.3 | |||
Other | 3.1 | |||
|
| |||
| 12.2 | % | |||
Japan | 8.1 | |||
Poland | 4.1 | |||
Mexico | 3.9 | |||
India | 2.5 | |||
Malaysia | 2.3 | |||
Norway | 1.6 | |||
Australia | 1.4 | |||
United Kingdom | 1.2 | |||
Thailand | 1.2 | |||
Other | 8.0 | |||
|
| |||
Total | 46.5 | % | ||
|
|
| Largest holdings (by issuer) | Percent of net assets |
U.S. Treasury | 18.9 | % | ||
Japanese Government | 8.1 | |||
Polish Government | 4.1 | |||
Mexican Government | 3.9 | |||
Italian Government | 3.4 |
German Government | 3.2 | % | ||
Indian Government | 2.4 | |||
Portuguese Government | 2.3 | |||
Malaysian Government | 2.3 | |||
Norwegian Government | 1.6 |
30 American Funds Insurance Series
Table of Contents
Global Bond Fund
How a $10,000 investment has grown
Average annual total returns based on a $1,000 investment for periods ended December 31, 2017
| 1 year | 5 years | 10 years | Lifetime (since October 4, 2006) | Expense ratio | ||||||||||||||||
Class 1 | 7.11 | % | 1.05 | % | 3.52 | % | 4.19 | % | .56 | % | ||||||||||
Class 1A | 7.00 | .82 | 3.28 | 3.95 | .81 | 4 | ||||||||||||||
Class 25 | 6.86 | .79 | 3.27 | 3.93 | .81 | |||||||||||||||
Class 4 | 6.63 | .63 | 3.05 | 3.71 | 1.06 | |||||||||||||||
Investment results assume all distributions are reinvested and reflect applicable fees and expenses. The fund’s investment adviser waived a portion of its management fees from October 4, 2006, through December 31, 2008. Applicable fund results shown reflect the waiver, without which they would have been lower. Expense ratios are as of the fund’s prospectus dated May 1, 2018 (unaudited). See the Financial Highlights table in this report for details.
Any market index shown is unmanaged and, therefore, has no expenses. Investors cannot invest directly in an index.
| 1 | Source: Bloomberg Index Services Ltd. |
| 2 | Includes U.S. dollar-denominated debt of other countries, totaling 14.4%. |
| 3 | Countries using the euro as a common currency; those represented in the fund’s portfolio are Belgium, France, Germany, Greece, Ireland, Italy, Latvia, Lithuania, Luxembourg, the Netherlands, Portugal and Spain. |
| 4 | Based on estimated amounts for the current fiscal year. |
| 5 | Global Bond Fund Class 2 shares were first sold on November 6, 2006. Results prior to that date are hypothetical based on Class 1 share results adjusted for estimated additional annual expenses of 0.25%. |
| Where the fund’s assets were invested as of December 31, 2017 | Percent of net assets |
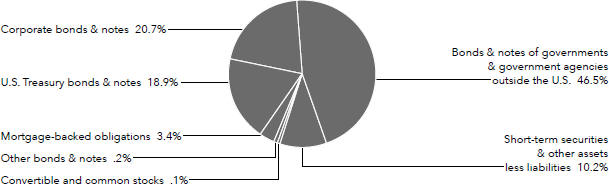
American Funds Insurance Series 31
Table of Contents
High-Income Bond Fund
Fund results shown are for past periods and are not predictive of results for future periods. Current and future results may be lower or higher than those shown. Unit prices and returns will vary, so investors may lose money. For current information and month-end results, visit americanfunds.com/afis. For information about your insurance contract and month-end results, go to the website of the company that issued your contract.
High-Income Bond Fund gained 6.89% for the 12 months ended December 31, 2017. In comparison, the fund’s benchmark, the Bloomberg Barclays U.S. Corporate High Yield 2% Issuer Capped Index,1 which measures non-investment-grade bonds and limits the exposure of an issuer to 2%, rose 7.50%.
Renewed investor expectations of more rapid economic growth led to higher short-term interest rates as the Federal Reserve increased the benchmark federal funds rate by 75 basis points over the course of the year. Bond returns were strong across most credit sectors as corporate bond spreads declined to nearly the lowest levels of the recovery.
Sector allocation and debt exposure across a mix of credit ratings were beneficial to the fund’s relative returns. The fund’s allocation to non-U.S. high-yield debt was also additive on a relative basis. Among individual issuers, Valeant Pharmaceuticals International and First Quantum Minerals boosted results, while Argos Merger Sub Inc detracted from returns. Although exposure to U.S. Treasuries and agency debt detracted from relative returns, it is important to note these investments provide an important source of liquidity and are generally not expected to outperform the market.
The fund’s portfolio managers continue to believe current fundamentals support a constructive high-yield market environment. While we are monitoring the Federal Reserve’s tightening monetary policy, maturities in the high-yield market have tended to be relatively shorter than those in some other markets, which should help dampen the effect of rising rates.
| Largest holdings (by issuer) | Percent of net assets |
Valeant Pharmaceuticals International | 2.8 | % | ||
First Quantum Minerals | 1.8 | |||
Charter Communications | 1.8 | |||
Tenet Healthcare | 1.7 | |||
Chesapeake Energy | 1.6 |
Sprint Nextel | 1.6 | % | ||
Blackstone | 1.6 | |||
AES | 1.5 | |||
Weatherford International | 1.2 | |||
Frontier Communications | 1.2 |
32 American Funds Insurance Series
Table of Contents
High-Income Bond Fund
How a $10,000 investment has grown
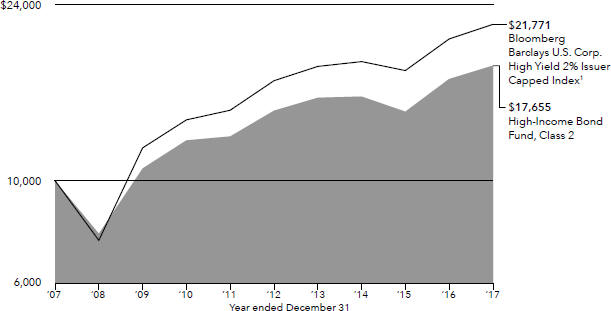
Average annual total returns based on a $1,000 investment for periods ended December 31, 2017
| 1 year | 5 years | 10 years | Lifetime (since February 8, 1984) | Expense ratio | ||||||||||||||||
Class 1 | 7.25 | % | 4.85 | % | 6.11 | % | 8.88 | % | .49 | % | ||||||||||
Class 1A | 7.05 | 4.60 | 5.85 | 8.61 | .74 | 2 | ||||||||||||||
Class 2 | 6.89 | 4.58 | 5.85 | 8.61 | .74 | |||||||||||||||
Class 3 | 7.02 | 4.67 | 5.93 | 8.69 | .67 | |||||||||||||||
Class 4 | 6.63 | 4.41 | 5.63 | 8.35 | .99 | |||||||||||||||
Investment results assume all distributions are reinvested and reflect applicable fees and expenses. The fund’s investment adviser waived a portion of its management fees from September 1, 2004, through December 31, 2008. Applicable fund results shown reflect the waiver, without which they would have been lower. Expense ratios are as of the fund’s prospectus dated May 1, 2018 (unaudited). See the Financial Highlights table in this report for details.
Any market index shown is unmanaged and, therefore, has no expenses. Investors cannot invest directly in an index.
| 1 | Source: Bloomberg Index Services Ltd. |
| 2 | Based on estimated amounts for the current fiscal year. |
| Where the fund’s assets were invested as of December 31, 2017 | Percent of net assets |
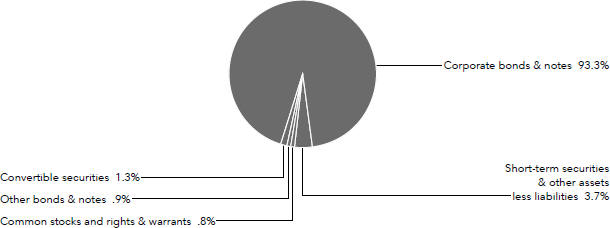
American Funds Insurance Series 33
Table of Contents
Mortgage Fund
Fund results shown are for past periods and are not predictive of results for future periods. Current and future results may be lower or higher than those shown. Unit prices and returns will vary, so investors may lose money. For current information and month-end results, visit americanfunds.com/afis. For information about your insurance contract and month-end results, go to the website of the company that issued your contract.
Mortgage Fund gained 1.22% for the 12 months ended December 31, 2017, while the Bloomberg Barclays U.S. Mortgage-Backed Securities Index,1 which covers the mortgage-backed pass-through securities of Ginnie Mae, Fannie Mae and Freddie Mac, rose 2.47%.
The Federal Reserve increased the benchmark federal funds overnight lending rate by 75 basis points over the course of the year. Long maturity U.S. Treasury yields modestly declined, pushing their prices higher. The housing market had a relatively strong year as housing starts continued to pick up. Home prices in most major housing markets rose, supported by low inventories and increasing sales.
The fund’s investments in the agency mortgage-backed securities sector and investment grade securities detracted from relative returns. As the yield curve flattened, the fund’s curve positioning also hampered results.
The fund’s portfolio managers seek to identify high-quality mortgage-backed securities based on our bottom-up approach to investing. In the current environment, demand for flight-to-safety assets and the fund’s low correlation to equities should help investors navigate macroeconomic and geopolitical uncertainty and remain well diversified.
| Breakdown of mortgage-backed obligations | Percent of net assets |
30-year pass-throughs: | ||||
Freddie Mac | 20.2 | % | ||
Ginnie Mae | 13.3 | |||
Fannie Mae | 10.7 | |||
|
| |||
| 44.2 | % | |||
Other | 19.3 | |||
|
| |||
Total | 63.5 | % | ||
|
|
34 American Funds Insurance Series
Table of Contents
Mortgage Fund
How a $10,000 investment has grown
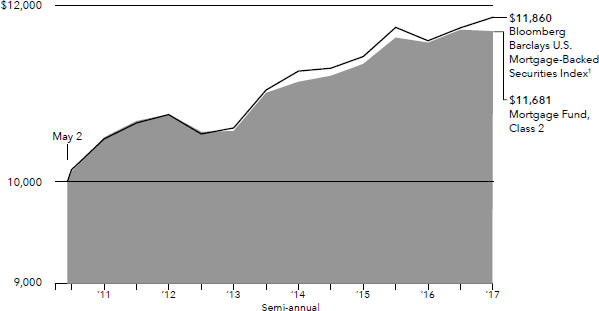
Average annual total returns based on a $1,000 investment for periods ended December 31, 2017
| 1 year | 5 years | Lifetime (since May 2, 2011) | Expense ratio | |||||||||||||
Class 1 | 1.47 | % | 2.01 | % | 2.61 | % | .47 | % | ||||||||
Class 1A | 1.21 | 1.76 | 2.35 | .72 | 2 | |||||||||||
Class 2 | 1.22 | 1.75 | 2.36 | .72 | ||||||||||||
Class 4 | .97 | 1.62 | 2.19 | .97 | ||||||||||||
Investment results assume all distributions are reinvested and reflect applicable fees and expenses. Expense ratios are as of the fund’s prospectus dated May 1, 2018 (unaudited). See the Financial Highlights table in this report for details.
Any market index shown is unmanaged and, therefore, has no expenses. Investors cannot invest directly in an index.
| 1 | Source: Bloomberg Index Services Ltd. |
| 2 | Based on estimated amounts for the current fiscal year. |
| Where the fund’s assets were invested as of December 31, 2017 | Percent of net assets |
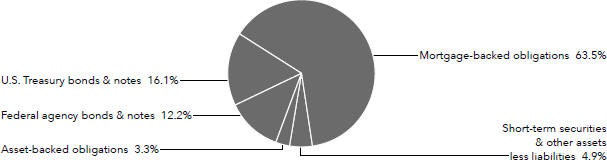
American Funds Insurance Series 35
Table of Contents
Ultra-Short Bond Fund
Fund results shown are for past periods and are not predictive of results for future periods. Current and future results may be lower or higher than those shown. Unit prices and returns will vary, so investors may lose money. For current information and month-end results, visit americanfunds.com/afis. For information about your insurance contract and month-end results, go to the website of the company that issued your contract.
Ultra-Short Bond Fund gained 0.46% for the 12 months ended December 31, 2017, while the Bloomberg Barclays Short-Term Government/Corporate Index,1 which consists of government and corporate sector securities with remaining maturity from one to 12 months, gained 0.98%.
The fund’s returns were higher over the course of 2017 than last year. During the same period, yields on three-month Treasury bills were up by more than 80 basis points since the end of last year.
The Federal Reserve raised the benchmark federal funds rate by a quarter percentage point three times this year, reassuring investors of persistent U.S. economic strength. Given these increases in interest rates, the fund’s portfolio managers believe the fund has the potential to provide current income.
36 American Funds Insurance Series
Table of Contents
Ultra-Short Bond Fund
Average annual total returns based on a $1,000 investment for periods ended December 31, 2017
| 1 year | 5 years | 10 years | Lifetime (since February 8, 1984) | Expense ratio | ||||||||||||||||
Class 1 | .66 | % | .01 | % | .15 | % | 3.49 | % | .35 | % | ||||||||||
Class 1A | .67 | –.19 | –.07 | 3.24 | .60 | 2 | ||||||||||||||
Class 2 | .46 | –.23 | –.10 | 3.24 | .60 | |||||||||||||||
| Class 3 | .54 | –.18 | –.03 | 3.31 | .53 | |||||||||||||||
| Class 4 | .16 | –.36 | –.28 | 3.00 | .85 | |||||||||||||||
Investment results assume all distributions are reinvested and reflect applicable fees and expenses. The fund’s investment adviser waived a portion of its management fees from September 1, 2004, through December 31, 2008. Applicable fund results shown reflect the waiver, without which they would have been lower. Expense ratios are as of the fund’s prospectus dated May 1, 2018 (unaudited). See the Financial Highlights table in this report for details.
Any market index shown is unmanaged and, therefore, has no expenses. Investors cannot invest directly in an index.
| 1 | Source: Bloomberg Index Services Ltd. |
| 2 | Based on estimated amounts for the current fiscal year. |
| Where the fund’s assets were invested as of December 31, 2017 | Percent of net assets |
Commercial paper | 82.9 | % | ||
Federal agency discount notes | 17.4 | |||
Other assets less liabilities | (.3 | ) | ||
|
| |||
Total | 100.0 | % | ||
|
|
American Funds Insurance Series 37
Table of Contents
U.S. Government/AAA-Rated Securities Fund
Fund results shown are for past periods and are not predictive of results for future periods. Current and future results may be lower or higher than those shown. Unit prices and returns will vary, so investors may lose money. For current information and month-end results, visit americanfunds.com/afis. For information about your insurance contract and month-end results, go to the website of the company that issued your contract.
U.S. Government/AAA-Rated Securities Fund gained 1.59% for the 12 months ended December 31, 2017, while the Bloomberg Barclays U.S. Government/Mortgage-Backed Securities Index,1 which covers obligations issued by the U.S. Treasury and U.S. government agencies, rose 2.37%.
Bond returns were strong across most sectors, including U.S. government debt. The U.S. Treasury yield curve flattened, as shorter term rates rose and longer term rates fell. This occurred in part through the Federal Reserve hiking short-term interest rates by 75 basis points over the course of the year and strong demand persisting for longer dated Treasuries.
During the period, the fund’s duration contributed to relative returns. As the yield curve flattened, yield curve positioning detracted from relative returns. A lower-than-index allocation to agency mortgage-backed securities dampened returns as well.
The fund strives to meet its objective of providing a high level of current income consistent with the preservation of capital. The fund’s portfolio managers have positioned the fund with the expectation that rate hikes over the next two to three years will be at a slower pace than is currently priced into the market. They believe this can lead to a steepening yield curve and higher inflation expectations.
| Breakdown of mortgage-backed obligations | Percent of net assets |
30-year pass-throughs: | ||||
Fannie Mae | 9.5 | % | ||
Freddie Mac | 5.7 | |||
Ginnie Mac | 4.6 | |||
|
| |||
| 19.8 | % | |||
15-year pass-throughs | 1.0 | |||
Other | 4.5 | |||
|
| |||
Total | 25.3 | % | ||
|
|
38 American Funds Insurance Series
Table of Contents
U.S. Government/AAA-Rated Securities Fund
How a $10,000 investment has grown
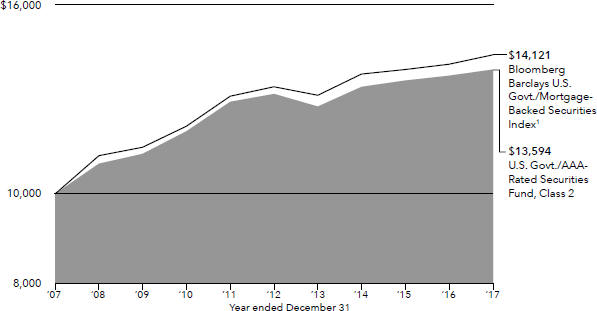
Average annual total returns based on a $1,000 investment for periods ended December 31, 2017
| 1 year | 5 years | 10 years | Lifetime (since December 2, 1985) | Expense ratio | ||||||||||||||||
Class 1 | 1.83 | % | 1.48 | % | 3.37 | % | 5.86 | % | .36 | % | ||||||||||
Class 1A | 1.72 | 1.26 | 3.13 | 5.61 | .61 | 2 | ||||||||||||||
Class 2 | 1.59 | 1.23 | 3.12 | 5.60 | .61 | |||||||||||||||
Class 3 | 1.72 | 1.31 | 3.19 | 5.67 | .54 | |||||||||||||||
Class 4 | 1.28 | 1.04 | 2.90 | 5.35 | .86 | |||||||||||||||
Investment results assume all distributions are reinvested and reflect applicable fees and expenses. The fund’s investment adviser waived a portion of its management fees from September 1, 2004, through December 31, 2008, and from July 1, 2010, through December 31, 2010. Applicable fund results shown reflect the waiver, without which they would have been lower. Expense ratios are as of the fund’s prospectus dated May 1, 2018 (unaudited). See the Financial Highlights table in this report for details.
Any market index shown is unmanaged and, therefore, has no expenses. Investors cannot invest directly in an index.
| 1 | Source: Bloomberg Index Services Ltd. |
| 2 | Based on estimated amounts for the current fiscal year. |
| Where the fund’s assets were invested as of December 31, 2017 | Percent of net assets |
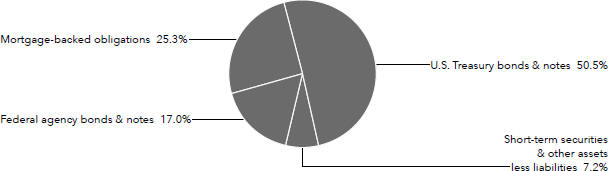
American Funds Insurance Series 39
Table of Contents
Managed Risk Growth Fund1
Fund results shown are for past periods and are not predictive of results for future periods. Current and future results may be lower or higher than those shown. Unit prices and returns will vary, so investors may lose money. For current information and month-end results, visit americanfunds.com/afis. For information about your insurance contract and month-end results, go to the website of the company that issued your contract.
The fund gained 25.99% for the 12 months ended December 31, 2017, outpacing the Standard & Poor’s 500 Managed Risk Index — Moderate Aggressive,2 which rose 17.94%. In comparison, the Standard & Poor’s 500 Composite Index,3 a market capitalization-weighted index based on the results of approximately 500 widely held common stocks, gained 21.83%. The Bloomberg Barclays U.S. Aggregate Index,4 which measures investment-grade U.S. bonds (rated BBB/Baa and above), rose 3.54%.
The fund pursues its objective by investing in shares of American Funds Insurance Series — Growth FundSM while seeking to manage portfolio volatility and provide downside protection, primarily through the use of exchange-traded futures. The benefit of the fund’s managed risk strategy should be most apparent during periods of high volatility and in down markets. In steady or rising markets, the fund’s results can be expected to lag those of the underlying fund.
The underlying American Funds Insurance Series — Growth Fund’s larger-than-index investments and strong stock selection in information technology and consumer discretionary added to returns, while energy stocks detracted from the fund’s results.
How a $10,000 investment has grown
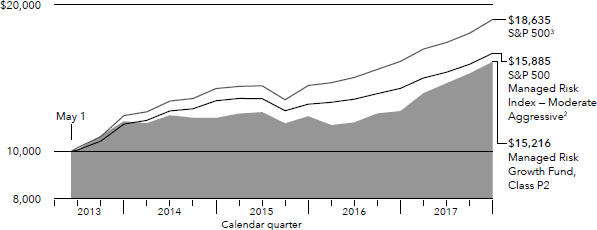
Average annual total returns based on a $1,000 investment for periods ended December 31, 2017
1 year | Lifetime (since May 1, 2013) | Gross expense ratio | Net expense ratio | |||||||||||||
Class P1 | 26.23 | % | 9.73 | % | .88 | % | .72 | % | ||||||||
Class P2 | 25.99 | 9.41 | 1.13 | .97 | ||||||||||||
Any market index shown is unmanaged and, therefore, has no expenses. Investors cannot invest directly in an index.
| 1 | Effective November 30, 2017, the Managed Risk Growth Fund also invests in shares of the Bond Fund. |
| 2 | Source: S&P Dow Jones Indices LLC. Standard & Poor’s Managed Risk Index Series is designed to simulate a dynamic protective portfolio that allocates between the underlying equity index and cash, based on realized volatilities of the underlying equity and bond indexes, while maintaining a fixed allocation to the underlying bond index. These indexes are generated and published under agreements between Standard & Poor’s Dow Jones Indices and Milliman Financial Risk Management LLC. |
| 3 | Source: S&P Dow Jones Indices LLC. |
| 4 | Source: Bloomberg Index Services Ltd. |
Milliman Financial Risk Management LLC serves as the subadviser with respect to the management of the fund’s managed risk strategy.
40 American Funds Insurance Series
Table of Contents
Managed Risk International Fund1
Fund results shown are for past periods and are not predictive of results for future periods. Current and future results may be lower or higher than those shown. Unit prices and returns will vary, so investors may lose money. For current information and month-end results, visit americanfunds.com/afis. For information about your insurance contract and month-end results, go to the website of the company that issued your contract.
The fund advanced 28.69% for the 12 months ended December 31, 2017, outpacing the Standard & Poor’s EPAC Ex. Korea LargeMidCap Managed Risk Index — Moderate Aggressive,2 which rose 20.74%. In comparison, the MSCI ACWI (All Country World Index) ex USA,3 a free float-adjusted market capitalization-weighted index that is designed to measure equity market results in the global developed and emerging markets, consisting of more than 40 developed and emerging market country indexes excluding the U.S., rose 27.19%. The Bloomberg Barclays U.S. Aggregate Index,4 which measures investment-grade U.S. bonds (rated BBB/Baa and above), rose 3.54%.
The fund pursues its objective by investing in shares of American Funds Insurance Series — International FundSM while seeking to manage portfolio volatility and provide downside protection, primarily through the use of exchange-traded futures. The benefit of the fund’s managed risk strategy should be most apparent during periods of high volatility and in down markets. In steady or rising markets, the fund’s results can be expected to lag those of the underlying fund.
The underlying American Funds Insurance Series — International Fund’s investments in the information technology sector added to returns, while health care stocks hindered the fund’s relative results.
How a $10,000 investment has grown
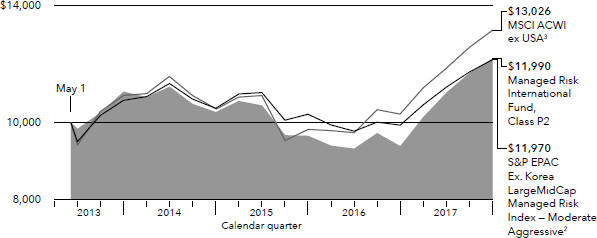
Average annual total returns based on a $1,000 investment for periods ended December 31, 2017
| 1 year | Lifetime (since May 1, 2013) | Gross expense ratio | Net expense ratio | |||||||||||||
Class P1 | 29.28 | % | 4.37 | % | 1.03 | % | .87 | % | ||||||||
Class P2 | 28.69 | 3.96 | 1.28 | 1.12 | ||||||||||||
Any market index shown is unmanaged and, therefore, has no expenses. Investors cannot invest directly in an index.
| 1 | Effective November 30, 2017, the Managed Risk International Fund also invests in shares of the Bond Fund. |
| 2 | Source: S&P Dow Jones Indices LLC. Standard & Poor’s Managed Risk Index Series is designed to simulate a dynamic protective portfolio that allocates between the underlying equity index and cash, based on realized volatilities of the underlying equity and bond indexes, while maintaining a fixed allocation to the underlying bond index. These indexes are generated and published under agreements between Standard & Poor’s Dow Jones Indices and Milliman Financial Risk Management LLC. |
| 3 | Source: MSCI. The MSCI index result reflects reinvestment of distributions and dividends net of withholding taxes. |
| 4 | Source: Bloomberg Index Services Ltd. |
Milliman Financial Risk Management LLC serves as the subadviser with respect to the management of the fund’s managed risk strategy.
American Funds Insurance Series 41
Table of Contents
Managed Risk Blue Chip Income and Growth Fund1
Fund results shown are for past periods and are not predictive of results for future periods. Current and future results may be lower or higher than those shown. Unit prices and returns will vary, so investors may lose money. For current information and month-end results, visit americanfunds.com/afis. For information about your insurance contract and month-end results, go to the website of the company that issued your contract.
The fund gained 15.03% for the 12 months ended December 31, 2017, trailing the Standard & Poor’s 500 Managed Risk Index — Moderate Aggressive,2 which rose 17.94%. In comparison, the Standard & Poor’s 500 Composite Index,3 a market capitalization-weighted index based on the results of approximately 500 widely held common stocks, gained 21.83%. The Bloomberg Barclays U.S. Government/Mortgage-Backed Securities Index,4 which covers obligations issued by the U.S. Treasury and U.S. government agencies, rose 2.37%.
The fund pursues its objective by investing in shares of American Funds Insurance Series — Blue Chip Income and Growth FundSM while seeking to manage portfolio volatility and provide downside protection, primarily through the use of exchange-traded futures. The benefit of the fund’s managed risk strategy should be most apparent during periods of high volatility and in down markets. In steady or rising markets, the fund’s results can be expected to lag those of the underlying fund.
The underlying American Funds Insurance Series — Blue Chip Income and Growth Fund’s investments in the health care sector added to returns, while energy stocks hindered the fund’s results.
How a $10,000 investment has grown
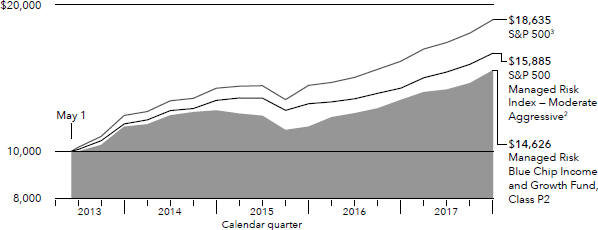
Average annual total returns based on a $1,000 investment for periods ended December 31, 2017
| 1 year | Lifetime (since May 1, 2013) | Gross expense ratio | Net expense ratio | |||||||||||||
Class P1 | 15.48 | % | 8.87 | % | .93 | % | .77 | % | ||||||||
Class P2 | 15.03 | 8.48 | 1.18 | 1.02 | ||||||||||||
Any market index shown is unmanaged and, therefore, has no expenses. Investors cannot invest directly in an index.
| 1 | Effective November 30, 2017, the Managed Risk Blue Chip Income and Growth Fund also invests in shares of the U.S. Government/ AAA-Rated Securities Fund. |
| 2 | Source: S&P Dow Jones Indices LLC. Standard & Poor’s Managed Risk Index Series is designed to simulate a dynamic protective portfolio that allocates between the underlying equity index and cash, based on realized volatilities of the underlying equity and bond indexes, while maintaining a fixed allocation to the underlying bond index. These indexes are generated and published under agreements between Standard & Poor’s Dow Jones Indices and Milliman Financial Risk Management LLC. |
| 3 | Source: S&P Dow Jones Indices LLC. |
| 4 | Source: Bloomberg Index Services Ltd. |
Milliman Financial Risk Management LLC serves as the subadviser with respect to the management of the fund’s managed risk strategy.
42 American Funds Insurance Series
Table of Contents
Managed Risk Growth-Income Fund1
Fund results shown are for past periods and are not predictive of results for future periods. Current and future results may be lower or higher than those shown. Unit prices and returns will vary, so investors may lose money. For current information and month-end results, visit americanfunds.com/afis. For information about your insurance contract and month-end results, go to the website of the company that issued your contract.
The fund gained 20.40% for the 12 months ended December 31, 2017, outpacing the Standard & Poor’s 500 Managed Risk Index — Moderate Aggressive,2 which rose 17.94%. In comparison, the Standard & Poor’s 500 Composite Index,3 a market capitalization-weighted index based on the results of approximately 500 widely held common stocks, gained 21.83%. The Bloomberg Barclays U.S. Aggregate Index,4 which measures investment-grade U.S. bonds (rated BBB/Baa and above), rose 3.54%.
The fund pursues its objective by investing in shares of American Funds Insurance Series — Growth-Income FundSM while seeking to manage portfolio volatility and provide downside protection, primarily through the use of exchange-traded futures. The benefit of the fund’s managed risk strategy should be most apparent during periods of high volatility and in down markets. In steady or rising markets, the fund’s results can be expected to lag those of the underlying fund.
The underlying American Funds Insurance Series — Growth-Income Fund’s investments in the consumer discretionary and health care sectors added the most to relative returns, while energy stocks detracted from the fund’s absolute results.
How a $10,000 investment has grown
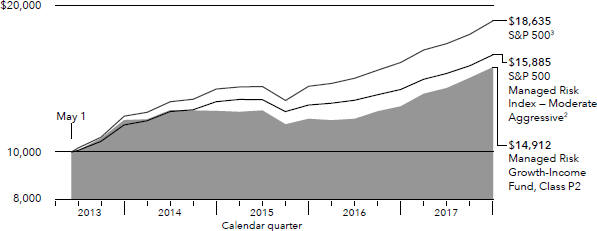
Average annual total returns based on a $1,000 investment for periods ended December 31, 2017
| 1 year | Lifetime (since May 1, 2013) | Gross expense ratio | Net expense ratio | |||||||||||||
Class P1 | 20.64 | % | 9.28 | % | .33 | % | .67 | % | ||||||||
Class P2 | 20.40 | 8.94 | 1.08 | .92 | ||||||||||||
Any market index shown is unmanaged and, therefore, has no expenses. Investors cannot invest directly in an index.
| 1 | Effective November 30, 2017, the Managed Risk Growth-Income Fund also invests in shares of the Bond Fund. |
| 2 | Source: S&P Dow Jones Indices LLC. Standard & Poor’s Managed Risk Index Series is designed to simulate a dynamic protective portfolio that allocates between the underlying equity index and cash, based on realized volatilities of the underlying equity and bond indexes, while maintaining a fixed allocation to the underlying bond index. These indexes are generated and published under agreements between Standard & Poor’s Dow Jones Indices and Milliman Financial Risk Management LLC. |
| 3 | Source: S&P Dow Jones Indices LLC. |
| 4 | Source: Bloomberg Index Services Ltd. |
Milliman Financial Risk Management LLC serves as the subadviser with respect to the management of the fund’s managed risk strategy.
American Funds Insurance Series 43
Table of Contents
Managed Risk Asset Allocation Fund
Fund results shown are for past periods and are not predictive of results for future periods. Current and future results may be lower or higher than those shown. Unit prices and returns will vary, so investors may lose money. For current information and month-end results, visit americanfunds.com/afis. For information about your insurance contract and month-end results, go to the website of the company that issued your contract.
The fund rose 14.80% for the 12 months ended December 31, 2017, trailing the Standard & Poor’s 500 Managed Risk Index — Moderate,1 which rose 16.02%. In comparison, the Standard & Poor’s 500 Composite Index,2 a market capitalization-weighted index based on the results of approximately 500 widely held common stocks, gained 21.83%, while the Bloomberg Barclays U.S. Aggregate Index,3 which measures investment-grade U.S. bonds (rated BBB/Baa and above), rose 3.54%.
The fund pursues its objective by investing in shares of American Funds Insurance Series — Asset Allocation FundSM while seeking to manage portfolio volatility and provide downside protection, primarily through the use of exchange-traded futures. The benefit of the fund’s managed risk strategy should be most apparent during periods of high volatility and in down markets. In steady or rising markets, the fund’s results can be expected to lag those of the underlying fund.
The underlying American Funds Insurance Series — Asset Allocation Fund’s investments in the industrials and information technology sectors contributed the most to relative returns. Holdings in the energy sector hindered absolute and relative returns as oil prices slumped on concerns of oversupply.
44 American Funds Insurance Series
Table of Contents
Managed Risk Asset Allocation Fund
How a $10,000 investment has grown
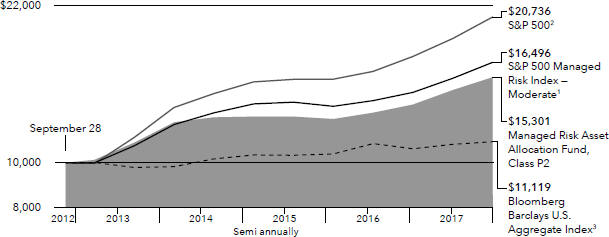
Average annual total returns based on a $1,000 investment for periods ended December 31, 2017
| 1 year | 5 years | Lifetime (since September 28, 2012) | Gross expense ratio | Net expense ratio | ||||||||||||||||
Class P1 | 15.06 | % | 8.89 | % | 8.69 | % | .71 | % | .66 | % | ||||||||||
Class P2 | 14.80 | 8.62 | 8.43 | .96 | .91 | |||||||||||||||
Any market index shown is unmanaged and, therefore, has no expenses. Investors cannot invest directly in an index.
| 1 | Source: S&P Dow Jones Indices LLC. Standard & Poor’s Managed Risk Index Series is designed to simulate a dynamic protective portfolio that allocates between the underlying equity index and cash, based on realized volatilities of the underlying equity and bond indexes, while maintaining a fixed allocation to the underlying bond index. These indexes are generated and published under agreements between Standard & Poor’s Dow Jones Indices and Milliman Financial Risk Management LLC. |
| 2 | Source: S&P Dow Jones Indices LLC. |
| 3 | Source: Bloomberg Index Services Ltd. |
Milliman Financial Risk Management LLC serves as the subadviser with respect to the management of the fund’s managed risk strategy.
American Funds Insurance Series 45
Table of Contents
Summary investment portfolio December 31, 2017
Common stocks 96.68%
| Shares | Value (000) | |||||||
Information technology 32.07% |
| |||||||
| ASML Holding NV1 | 648,442 | $112,497 | ||||||
| ASML Holding NV (New York registered) | 643,900 | 111,923 | ||||||
| Taiwan Semiconductor Manufacturing Co., Ltd.1 | 26,955,000 | 207,124 | ||||||
| Taiwan Semiconductor Manufacturing Co., Ltd. (ADR) | 335,000 | 13,283 | ||||||
| Alphabet Inc., Class A2 | 130,000 | 136,942 | ||||||
| Alphabet Inc., Class C2 | 71,052 | 74,349 | ||||||
| Nintendo Co., Ltd.1 | 492,400 | 179,259 | ||||||
| Facebook, Inc., Class A2 | 898,500 | 158,549 | ||||||
| Microsoft Corp. | 1,355,900 | 115,984 | ||||||
| Alibaba Group Holding Ltd. (ADR)2 | 671,050 | 115,709 | ||||||
| Visa Inc., Class A | 998,800 | 113,883 | ||||||
| Broadcom Ltd. | 373,700 | 96,003 | ||||||
| Tencent Holdings Ltd.1 | 1,800,000 | 93,051 | ||||||
| Samsung Electronics Co., Ltd.1 | 15,740 | 37,396 | ||||||
| Samsung Electronics Co., Ltd., nonvoting preferred1 | 15,845 | 30,888 | ||||||
| AAC Technologies Holdings Inc.1 | 3,806,540 | 67,697 | ||||||
| Just Eat PLC1,2 | 5,292,000 | 55,515 | ||||||
| Murata Manufacturing Co., Ltd.1 | 409,000 | 54,665 | ||||||
| Intel Corp. | 1,000,000 | 46,160 | ||||||
| TEMENOS Group AG (Switzerland)1 | 318,000 | 40,696 | ||||||
| Other securities | 137,838 | |||||||
|
| |||||||
| 1,999,411 | ||||||||
|
| |||||||
Consumer discretionary 18.17% |
| |||||||
| Amazon.com, Inc.2 | 291,900 | 341,368 | ||||||
| Priceline Group Inc.2 | 39,000 | 67,772 | ||||||
| Home Depot, Inc. | 350,000 | 66,335 | ||||||
| Peugeot SA1 | 3,180,000 | 64,597 | ||||||
| Industria de Diseño Textil, SA1 | 1,723,000 | 59,929 | ||||||
| Naspers Ltd., Class N1 | 190,820 | 53,168 | ||||||
| McDonald’s Corp. | 293,000 | 50,431 | ||||||
| NIKE, Inc., Class B | 671,000 | 41,971 | ||||||
| Other securities | 387,314 | |||||||
|
| |||||||
| 1,132,885 | ||||||||
|
| |||||||
Health care 11.96% |
| |||||||
| Regeneron Pharmaceuticals, Inc.2 | 214,000 | 80,455 | ||||||
| UnitedHealth Group Inc. | 324,200 | 71,473 | ||||||
| Express Scripts Holding Co.2 | 768,500 | 57,361 | ||||||
| Bayer AG1 | 421,600 | 52,436 | ||||||
| Straumann Holding AG1 | 67,500 | 47,644 | ||||||
| AstraZeneca PLC1 | 652,300 | 44,763 | ||||||
| Sartorius AG, non-registered shares, nonvoting preferred1 | 444,000 | 42,371 | ||||||
| Eurofins Scientific SE, non-registered shares1 | 68,145 | 41,492 | ||||||
| Boston Scientific Corp.2 | 1,638,200 | 40,611 | ||||||
| Mettler-Toledo International Inc.2 | 65,000 | 40,269 | ||||||
| Other securities | 227,014 | |||||||
|
| |||||||
| 745,889 | ||||||||
|
| |||||||
Financials 10.44% |
| |||||||
| AIA Group Ltd.1 | 15,004,900 | 127,967 | ||||||
| JPMorgan Chase & Co. | 853,600 | 91,284 | ||||||
| Kotak Mahindra Bank Ltd.1 | 3,471,000 | 54,891 | ||||||
| Prudential PLC1 | 1,906,884 | 49,026 | ||||||
| Société Générale1 | 923,000 | 47,588 | ||||||
| MarketAxess Holdings Inc. | 188,000 | 37,929 | ||||||
| Other securities | 242,198 | |||||||
|
| |||||||
| 650,883 | ||||||||
|
| |||||||
46 American Funds Insurance Series
Table of Contents
Global Growth Fund
Common stocks
| Shares | Value (000) | |||||||
Consumer staples 7.46% | ||||||||
| British American Tobacco PLC1 | 2,002,000 | $135,116 | ||||||
| Nestlé SA1 | 739,650 | 63,560 | ||||||
| Altria Group, Inc. | 770,000 | 54,986 | ||||||
| Other securities | 211,752 | |||||||
|
| |||||||
| 465,414 | ||||||||
|
| |||||||
Industrials 6.17% | ||||||||
| Airbus SE, non-registered shares1 | 1,109,500 | 110,180 | ||||||
| KONE Oyj, Class B1 | 880,000 | 47,222 | ||||||
| Caterpillar Inc. | 287,000 | 45,226 | ||||||
| Other securities | 181,998 | |||||||
|
| |||||||
| 384,626 | ||||||||
|
| |||||||
Materials 2.24% | ||||||||
| Sherwin-Williams Co. | 116,000 | 47,565 | ||||||
| Other securities | 92,334 | |||||||
|
| |||||||
| 139,899 | ||||||||
|
| |||||||
Telecommunication services 1.12% | ||||||||
| SoftBank Group Corp.1 | 776,000 | 61,307 | ||||||
| Other securities | 8,238 | |||||||
|
| |||||||
| 69,545 | ||||||||
|
| |||||||
Other 2.09% | ||||||||
| Other securities | 130,519 | |||||||
|
| |||||||
Miscellaneous 4.96% | ||||||||
| Other common stocks in initial period of acquisition | 309,116 | |||||||
|
| |||||||
| Total common stocks (cost: $3,842,087,000) | 6,028,187 | |||||||
|
| |||||||
Bonds, notes & other debt instruments 0.03%
Principal (000) | ||||||||
U.S. Treasury bonds & notes 0.03% | ||||||||
U.S. Treasury 0.03% | ||||||||
| Other securities | 1,998 | |||||||
|
| |||||||
| Total bonds, notes & other debt instruments (cost: $1,998,000) | 1,998 | |||||||
|
| |||||||
Short-term securities 3.57% | ||||||||
Federal Home Loan Bank 1.14%–1.31% due 1/17/2018–3/28/2018 | $ | 97,500 | 97,371 | |||||
Prudential Funding, LLC 1.35% due 1/12/2018 | 39,500 | 39,478 | ||||||
Other securities | 85,475 | |||||||
|
| |||||||
Total short-term securities (cost: $222,335,000) | 222,324 | |||||||
|
| |||||||
Total investment securities 100.28% (cost: $4,066,420,000) | 6,252,509 | |||||||
Other assets less liabilities (0.28)% | (17,433 | ) | ||||||
|
| |||||||
Net assets 100.00% | $ | 6,235,076 | ||||||
|
| |||||||
American Funds Insurance Series 47
Table of Contents
Global Growth Fund
This summary investment portfolio is designed to streamline the report and help investors better focus on the fund’s principal holdings. See the inside back cover for details on how to obtain a complete schedule of portfolio holdings.
As permitted by U.S. Securities and Exchange Commission regulations, “Miscellaneous” securities include holdings in their first year of acquisition that have not previously been publicly disclosed.
“Other securities” includes all issues that are not disclosed separately in the summary investment portfolio. “Other securities“ also includes securities (with an aggregate value of $80,835,000, which represented 1.30% of the net assets of the fund) which were acquired in transactions exempt from registration under Rule 144A or Section 4(2) of the Securities Act of 1933 and may be resold in the U.S. in transactions exempt from registration, normally to qualified institutional buyers.
Forward currency contracts
| Contract amount | Unrealized appreciation | |||||||||||||||
| Purchases (000) | Sales (000) | Counterparty | Settlement date | at 12/31/2017 (000) | ||||||||||||
| USD | 5,180 | JPY | 581,294 | Bank of America, N.A. | 1/22/2018 | $ | 15 | |||||||||
| 1 | Valued under fair value procedures adopted by authority of the board of trustees. The total value of all such securities, including those in “Miscellaneous“ and “Other securities,“ was $3,140,563,000, which represented 50.37% of the net assets of the fund. This amount includes $3,130,602,000 related to certain securities trading outside the U.S. whose values were adjusted as a result of significant market movements following the close of local trading. |
| 2 | Security did not produce income during the last 12 months. |
Key to abbreviations and symbol
ADR = American Depositary Receipts
JPY = Japanese yen
USD/$ = U.S. dollars
See Notes to Financial Statements
48 American Funds Insurance Series
Table of Contents
Global Small Capitalization Fund
Summary investment portfolio December 31, 2017
Common stocks 93.34%
| Shares | Value (000) | |||||||
Consumer discretionary 20.64% | ||||||||
| Hilton Grand Vacations Inc.1 | 1,219,200 | $51,145 | ||||||
| Melco International Development Ltd.2 | 17,379,000 | 50,976 | ||||||
| GVC Holdings PLC2 | 4,048,748 | 50,555 | ||||||
| Five Below, Inc.1 | 684,000 | 45,363 | ||||||
| Cedar Fair, LP | 531,000 | 34,510 | ||||||
| Domino’s Pizza, Inc. | 181,100 | 34,221 | ||||||
| Entertainment One Ltd.2 | 7,563,697 | 33,123 | ||||||
| Hostelworld Group PLC2,3 | 6,212,000 | 32,175 | ||||||
| Tele Columbus AG1,2 | 2,743,000 | 30,384 | ||||||
| Caesars Entertainment Corp.1 | 2,375,836 | 30,054 | ||||||
| Ladbrokes Coral Group PLC2 | 11,120,100 | 27,199 | ||||||
| Ted Baker PLC2 | 686,500 | 25,026 | ||||||
| Other securities | 445,813 | |||||||
|
| |||||||
| 890,544 | ||||||||
|
| |||||||
Health care 16.56% | ||||||||
| GW Pharmaceuticals PLC (ADR)1 | 746,460 | 98,540 | ||||||
| Insulet Corp.1 | 1,145,900 | 79,067 | ||||||
| Illumina, Inc.1 | 230,200 | 50,296 | ||||||
| Integra LifeSciences Holdings Corp.1 | 1,025,423 | 49,077 | ||||||
| Bluebird Bio, Inc.1 | 267,765 | 47,689 | ||||||
| iRhythm Technologies, Inc.1 | 807,980 | 45,287 | ||||||
| China Biologic Products Holdings, Inc.1 | 503,000 | 39,621 | ||||||
| athenahealth, Inc.1 | 236,000 | 31,397 | ||||||
| WuXi Biologics (Cayman) Inc.1,2 | 4,926,300 | 27,591 | ||||||
| Other securities | 245,806 | |||||||
|
| |||||||
| 714,371 | ||||||||
|
| |||||||
Information technology 16.55% | ||||||||
| Qorvo, Inc.1 | 1,118,753 | 74,509 | ||||||
| WIN Semiconductors Corp.2 | 6,538,400 | 61,796 | ||||||
| Mellanox Technologies, Ltd.1 | 653,000 | 42,249 | ||||||
| Topcon Corp.2 | 1,707,510 | 36,888 | ||||||
| Paycom Software, Inc.1 | 428,885 | 34,452 | ||||||
| AAC Technologies Holdings Inc.2 | 1,786,561 | 31,773 | ||||||
| VTech Holdings Ltd.2 | 2,189,000 | 28,687 | ||||||
| ZPG PLC2 | 6,260,620 | 27,928 | ||||||
| Hamamatsu Photonics KK2 | 785,753 | 26,323 | ||||||
| Other securities | 349,647 | |||||||
|
| |||||||
| 714,252 | ||||||||
|
| |||||||
Industrials 10.33% | ||||||||
| International Container Terminal Services, Inc.2 | 20,180,000 | 42,610 | ||||||
| Nabtesco Corp.2 | 728,500 | 27,943 | ||||||
| Welbilt Inc.1 | 1,050,000 | 24,685 | ||||||
| Other securities | 350,602 | |||||||
|
| |||||||
| 445,840 | ||||||||
|
| |||||||
Financials 9.38% | ||||||||
| Kotak Mahindra Bank Ltd.2 | 3,282,732 | 51,914 | ||||||
| Essent Group Ltd.1 | 1,058,841 | 45,975 | ||||||
| Texas Capital Bancshares, Inc.1 | 496,623 | 44,150 | ||||||
| Webster Financial Corp. | 553,000 | 31,056 | ||||||
| Other securities | 231,813 | |||||||
|
| |||||||
| 404,908 | ||||||||
|
| |||||||
Materials 4.09% | ||||||||
| Lundin Mining Corp. | 6,172,000 | 41,048 | ||||||
| Other securities | 135,256 | |||||||
|
| |||||||
| 176,304 | ||||||||
|
| |||||||
American Funds Insurance Series 49
Table of Contents
Global Small Capitalization Fund
Common stocks (continued)
| Shares | Value (000) | |||||||
Consumer staples 3.40% | ||||||||
COSMOS Pharmaceutical Corp.2 | 148,500 | $ | 31,014 | |||||
Varun Beverages Ltd.2 | 2,504,974 | 25,528 | ||||||
| Other securities | 90,249 | |||||||
|
| |||||||
| 146,791 | ||||||||
|
| |||||||
Energy 2.77% | ||||||||
Whitecap Resources Inc. | 3,404,880 | 24,243 | ||||||
Whitecap Resources Inc.2,4 | 270,000 | 1,865 | ||||||
| SM Energy Co. | 1,111,000 | 24,531 | ||||||
| Other securities | 68,876 | |||||||
|
| |||||||
| 119,515 | ||||||||
|
| |||||||
Real estate 2.56% | ||||||||
WHA Corp. PCL2 | 372,370,250 | 45,697 | ||||||
MGM Growth Properties LLC REIT, Class A | 1,323,600 | 38,583 | ||||||
| Other securities | 26,059 | |||||||
|
| |||||||
| 110,339 | ||||||||
|
| |||||||
Utilities 1.74% | ||||||||
ENN Energy Holdings Ltd.2 | 4,991,400 | 35,414 | ||||||
Other securities | 39,704 | |||||||
|
| |||||||
| 75,118 | ||||||||
|
| |||||||
Telecommunication services 0.43% | ||||||||
Other securities | 18,660 | |||||||
|
| |||||||
Miscellaneous 4.89% | ||||||||
Other common stocks in initial period of acquisition | 210,986 | |||||||
|
| |||||||
Total common stocks (cost: $3,076,327,000) | 4,027,628 | |||||||
|
| |||||||
Rights & warrants 0.01% | ||||||||
Real estate 0.01% | ||||||||
WHA Corp. PCL, warrants, expire 20201 | 1,075,182 | 376 | ||||||
|
| |||||||
Total rights & warrants (cost: $0) | 376 | |||||||
|
| |||||||
Convertible bonds 0.20% | ||||||||
Principal (000) | ||||||||
Consumer discretionary 0.20% | ||||||||
Other securities | 8,667 | |||||||
Total convertible bonds (cost: $8,541,000) | ||||||||
|
| |||||||
| 8,667 | ||||||||
|
| |||||||
Bonds, notes & other debt instruments 0.09% | ||||||||
U.S. Treasury bonds & notes 0.09% | ||||||||
U.S. Treasury 0.09% | ||||||||
U.S. Treasury 0.875% 20185 | $ | 4,125 | 4,110 | |||||
|
| |||||||
Total bonds, notes & other debt instruments (cost: $4,110,000) | 4,110 | |||||||
|
| |||||||
50 American Funds Insurance Series
Table of Contents
Global Small Capitalization Fund
Short-term securities 6.36%
| Principal amount (000) | Value (000) | |||||||
Bank of Montreal 1.70% due 3/15/2018 | $ | 50,000 | $ | 50,004 | ||||
Federal Home Loan Bank 1.05%–1.21% due 1/2/2018–1/16/2018 | 75,100 | 75,078 | ||||||
Mizuho Bank, Ltd. 1.37%–1.38% due 1/19/2018–1/22/20184 | 49,000 | 48,953 | ||||||
U.S. Treasury Bills 1.41%–1.50% due 5/31/2018–6/28/2018 | 101,100 | 100,436 | ||||||
|
| |||||||
Total short-term securities (cost: $274,490,000) | 274,471 | |||||||
|
| |||||||
Total investment securities 100.00% (cost: $3,363,468,000) | 4,315,252 | |||||||
Other assets less liabilities (0.00)% | (214 | ) | ||||||
|
| |||||||
Net assets 100.00% | $ | 4,315,038 | ||||||
|
| |||||||
This summary investment portfolio is designed to streamline the report and help investors better focus on the fund’s principal holdings. See the inside back cover for details on how to obtain a complete schedule of portfolio holdings.
As permitted by U.S. Securities and Exchange Commission regulations, “Miscellaneous” securities include holdings in their first year of acquisition that have not previously been publicly disclosed.
“Other securities” includes all issues that are not disclosed separately in the summary investment portfolio. One security in “Other securities” (with a value of $10,408,000, an aggregate cost of $8,280,000, and which represented .24% of the net assets of the fund) was acquired on 5/1/2015 through private placement transactions exempt from registration under the Securities Act of 1933, which may subject it to legal or contractual restrictions on resale.
Forward currency contracts
| Contract amount | Unrealized (depreciation) appreciation | |||||||||||
| Purchases (000) | Sales (000) | Counterparty | Settlement date | at 12/31/2017 (000) | ||||||||
| USD | 45,066 | GBP | 34,000 | HSBC Bank | 1/22/2018 | $(878) | ||||||
| USD | 15,775 | JPY | 1,765,175 | JPMorgan Chase | 1/23/2018 | 89 | ||||||
| USD | 16,375 | GBP | 12,190 | Citibank | 2/23/2018 | (113) | ||||||
| USD | 10,114 | INR | 663,163 | Citibank | 2/26/2018 | (201) | ||||||
| ||||||||||||
| $(1,103) | ||||||||||||
| ||||||||||||
American Funds Insurance Series 51
Table of Contents
Global Small Capitalization Fund
Investments in affiliates
A company is an affiliate of the fund under the Investment Company Act of 1940 if the fund’s holdings in that company represent 5% or more of the outstanding voting shares. The value of the fund’s affiliated-company holdings is shown in the summary investment portfolio. Further details on such holdings and related transactions during the year ended December 31, 2017, appear below.
| Beginning shares | Additions | Reductions | Ending shares | Net realized gain (loss) (000) | Net unrealized appreciation (000) | Dividend income (000) | Value of affiliates at 12/31/2017 (000) | |||||||||||||||||||||||||
Common stocks 0.75% | ||||||||||||||||||||||||||||||||
Consumer discretionary 0.75% |
| |||||||||||||||||||||||||||||||
Hostelworld Group PLC2 | — | 6,212,000 | — | 6,212,000 | $ | — | $ | 6,656 | $ | 1,346 | $ | 32,175 | ||||||||||||||||||||
Materials 0.00% | ||||||||||||||||||||||||||||||||
Time Technoplast Ltd.6 | 11,888,000 | — | 11,888,000 | — | 5,933 | 107 | — | — | ||||||||||||||||||||||||
Indochine Mining Ltd.1,2,6 | 182,998 | — | 182,998 | — | (8,032 | ) | 8,032 | — | — | |||||||||||||||||||||||
|
| |||||||||||||||||||||||||||||||
| — | ||||||||||||||||||||||||||||||||
|
| |||||||||||||||||||||||||||||||
Energy 0.00% | ||||||||||||||||||||||||||||||||
Victoria Oil & Gas PLC1,2,6 | 6,966,560 | — | 6,966,560 | — | (1,438 | ) | 3,759 | — | — | |||||||||||||||||||||||
|
|
|
|
|
|
|
| |||||||||||||||||||||||||
Total 0.75% | $ | (3,537 | ) | $ | 18,554 | $ | 1,346 | $ | 32,175 | |||||||||||||||||||||||
|
|
|
|
|
|
|
| |||||||||||||||||||||||||
The following footnotes apply to either the individual securities noted or one or more of the securities aggregated and listed as a single line item.
| 1 | Security did not produce income during the last 12 months. |
| 2 | Valued under fair value procedures adopted by authority of the board of trustees. The total value of all such securities, including those in “Miscellaneous“ and “Other securities,“ was $1,969,093,000, which represented 45.63% of the net assets of the fund. This amount includes $1,942,046,000 related to certain securities trading outside the U.S. whose values were adjusted as a result of significant market movements following the close of local trading. |
| 3 | Represents an affiliated company as defined under the Investment Company Act of 1940. |
| 4 | Acquired in a transaction exempt from registration under Rule 144A or Section 4(2) of the Securities Act of 1933. May be resold in the U.S. in transactions exempt from registration, normally to qualified institutional buyers. The total value of all such securities, including those in “Other securities,“ was $66,572,000, which represented 1.54% of the net assets of the fund. |
| 5 | A portion of this security was pledged as collateral. The total value of pledged collateral was $677,000, which represented .02% of the net assets of the fund. |
| 6 | Unaffiliated issuer at 12/31/2017. |
Key to abbreviations and symbol
ADR = American Depositary Receipts
GBP = British pounds
INR = Indian rupees
JPY = Japanese yen
USD/$ = U.S. dollars
See Notes to Financial Statements
52 American Funds Insurance Series
Table of Contents
Summary investment portfolio December 31, 2017
Common stocks 93.87%
| Shares | Value (000) | |||||||
Information technology 31.06% | ||||||||
Facebook, Inc., Class A1 | 8,340,500 | $ | 1,471,765 | |||||
Microsoft Corp. | 11,676,000 | 998,765 | ||||||
Alphabet Inc., Class C1 | 613,000 | 641,443 | ||||||
| Alphabet Inc., Class A1 | 271,500 | 285,998 | ||||||
| Broadcom Ltd. | 2,838,300 | 729,159 | ||||||
| ASML Holding NV (New York registered) | 2,382,000 | 414,039 | ||||||
| ASML Holding NV2 | 1,199,568 | 208,111 | ||||||
| Apple Inc. | 3,224,000 | 545,598 | ||||||
| Taiwan Semiconductor Manufacturing Co., Ltd.2 | 41,360,000 | 317,813 | ||||||
| Taiwan Semiconductor Manufacturing Co., Ltd. (ADR) | 2,975,392 | 117,974 | ||||||
| Visa Inc., Class A | 2,955,000 | 336,929 | ||||||
| Intel Corp. | 4,790,000 | 221,106 | ||||||
| ServiceNow, Inc.1 | 1,583,263 | 206,442 | ||||||
| Paycom Software, Inc.1 | 1,855,600 | 149,060 | ||||||
| Other securities | 1,116,674 | |||||||
|
| |||||||
| 7,760,876 | ||||||||
|
| |||||||
Consumer discretionary 19.34% | ||||||||
Amazon.com, Inc.1 | 1,364,416 | 1,595,644 | ||||||
Netflix, Inc.1 | 2,546,000 | 488,730 | ||||||
Tesla, Inc.1 | 1,506,200 | 468,955 | ||||||
| Home Depot, Inc. | 2,300,000 | 435,919 | ||||||
| Comcast Corp., Class A | 7,525,000 | 301,376 | ||||||
| NIKE, Inc., Class B | 4,255,000 | 266,150 | ||||||
| Ulta Beauty, Inc.1 | 1,120,000 | 250,499 | ||||||
| Charter Communications, Inc., Class A1 | 698,680 | 234,729 | ||||||
| Priceline Group Inc.1 | 131,531 | 228,567 | ||||||
| Starbucks Corp. | 2,895,000 | 166,260 | ||||||
| Other securities | 395,829 | |||||||
|
| |||||||
| 4,832,658 | ||||||||
|
| |||||||
Health care 13.05% | ||||||||
UnitedHealth Group Inc. | 3,517,500 | 775,468 | ||||||
Intuitive Surgical, Inc.1 | 940,500 | 343,226 | ||||||
| Humana Inc. | 993,200 | 246,383 | ||||||
| Hologic, Inc.1 | 5,413,398 | 231,423 | ||||||
| Regeneron Pharmaceuticals, Inc.1 | 609,500 | 229,148 | ||||||
| Centene Corp.1 | 2,243,000 | 226,274 | ||||||
| Thermo Fisher Scientific Inc. | 995,000 | 188,931 | ||||||
| Aetna Inc. | 1,024,600 | 184,828 | ||||||
| Boston Scientific Corp.1 | 7,255,000 | 179,851 | ||||||
| Illumina, Inc.1 | 775,000 | 169,330 | ||||||
| Other securities | 484,614 | |||||||
|
| |||||||
| 3,259,476 | ||||||||
|
| |||||||
Financials 9.34% | ||||||||
Wells Fargo & Co. | 7,150,000 | 433,790 | ||||||
Goldman Sachs Group, Inc. | 922,400 | 234,991 | ||||||
| JPMorgan Chase & Co. | 1,947,000 | 208,212 | ||||||
| PNC Financial Services Group, Inc. | 1,083,600 | 156,353 | ||||||
| BlackRock, Inc. | 289,000 | 148,462 | ||||||
| Legal & General Group PLC2 | 40,158,246 | 147,823 | ||||||
| Other securities | 1,004,043 | |||||||
|
| |||||||
| 2,333,674 | ||||||||
|
| |||||||
American Funds Insurance Series 53
Table of Contents
Growth Fund
Common stocks (continued)
| Shares | Value (000) | |||||||
Energy 7.37% | ||||||||
Concho Resources Inc.1 | 1,870,000 | $ | 280,911 | |||||
EOG Resources, Inc. | 2,402,400 | 259,243 | ||||||
| Suncor Energy Inc. | 4,588,116 | 168,450 | ||||||
| Noble Energy, Inc. | 5,663,000 | 165,020 | ||||||
| Chevron Corp. | 1,200,000 | 150,228 | ||||||
| Other securities | 818,012 | |||||||
|
| |||||||
| 1,841,864 | ||||||||
|
| |||||||
Industrials 6.62% | ||||||||
Boeing Co. | 1,035,000 | 305,232 | ||||||
MTU Aero Engines AG2 | 941,034 | 168,310 | ||||||
| Other securities | 1,180,463 | |||||||
|
| |||||||
| 1,654,005 | ||||||||
|
| |||||||
Consumer staples 2.26% | ||||||||
Constellation Brands, Inc., Class A | 815,000 | 186,285 | ||||||
Kerry Group PLC, Class A2 | 1,300,000 | 145,792 | ||||||
| Other securities | 231,411 | |||||||
|
| |||||||
| 563,488 | ||||||||
|
| |||||||
Other 2.30% | ||||||||
Other securities | 574,854 | |||||||
|
| |||||||
Miscellaneous 2.53% | ||||||||
Other common stocks in initial period of acquisition | 632,462 | |||||||
|
| |||||||
Total common stocks (cost: $13,998,793,000) | 23,453,357 | |||||||
|
| |||||||
Convertible stocks 0.04% | ||||||||
Consumer discretionary 0.04% | ||||||||
Other securities | 9,173 | |||||||
|
| |||||||
Total convertible stocks (cost: $10,650,000) | 9,173 | |||||||
|
| |||||||
Short-term securities 6.31%
| Principal amount (000) | ||||||||
| Federal Home Loan Bank 1.10%–1.30% due 1/12/2018–2/28/2018 | $ | 477,100 | 476,535 | |||||
| Procter & Gamble Co. 1.20%–1.30% due 1/2/2018–2/13/20183 | 196,000 | 195,793 | ||||||
| U.S. Treasury Bills 1.17%–1.56% due 2/1/2018–11/8/2018 | 253,200 | 252,016 | ||||||
| Other securities | 652,388 | |||||||
|
| |||||||
| Total short-term securities (cost: $1,576,948,000) | 1,576,732 | |||||||
|
| |||||||
Total investment securities 100.22% (cost: $15,586,391,000) | 25,039,262 | |||||||
Other assets less liabilities (0.22)% | (53,804 | ) | ||||||
|
| |||||||
Net assets 100.00% | $ | 24,985,458 | ||||||
|
| |||||||
This summary investment portfolio is designed to streamline the report and help investors better focus on the fund’s principal holdings. See the inside back cover for details on how to obtain a complete schedule of portfolio holdings.
As permitted by U.S. Securities and Exchange Commission regulations, “Miscellaneous” securities include holdings in their first year of acquisition that have not previously been publicly disclosed.
“Other securities” includes all issues that are not disclosed separately in the summary investment portfolio. One security in “Other securities” (with a value of $9,173,000, an aggregate cost of $10,650,000, and which represented .04% of the net assets of the fund) was acquired on 5/22/2015 through private placement transactions exempt from registration under the Securities Act of 1933, which may subject it to legal or contractual restrictions on resale.
54 American Funds Insurance Series
Table of Contents
Growth Fund
The following footnotes apply to either the individual securities noted or one or more of the securities aggregated and listed as a single line item.
| 1 | Security did not produce income during the last 12 months. |
| 2 | Valued under fair value procedures adopted by authority of the board of trustees. The total value of all such securities, including those in “Miscellaneous“ and “Other securities,“ was $1,648,959,000, which represented 6.60% of the net assets of the fund. This amount includes $1,614,318,000 related to certain securities trading outside the U.S. whose values were adjusted as a result of significant market movements following the close of local trading. |
| 3 | Acquired in a transaction exempt from registration under Section 4(2) of the Securities Act of 1933. May be resold in the U.S. in transactions exempt from registration, normally to qualified institutional buyers. The total value of all such securities, including those in “Other securities,“ was $720,144,000, which represented 2.88% of the net assets of the fund. |
Key to abbreviation
ADR = American Depositary Receipts
See Notes to Financial Statements
American Funds Insurance Series 55
Table of Contents
Summary investment portfolio December 31, 2017
Common stocks 90.84%
| Shares | Value (000) | |||||||
Financials 17.81% | ||||||||
| AIA Group Ltd.1 | 40,078,700 | $ | 341,804 | |||||
| HDFC Bank Ltd.1 | 8,416,569 | 248,893 | ||||||
| HDFC Bank Ltd. (ADR) | 130,800 | 13,298 | ||||||
| Prudential PLC1 | 5,142,265 | 132,208 | ||||||
| UniCredit SpA1,2 | 6,989,092 | 130,202 | ||||||
| Kotak Mahindra Bank Ltd.1 | 6,186,048 | 97,828 | ||||||
| Barclays PLC1 | 34,317,708 | 93,571 | ||||||
| Credit Suisse Group AG1 | 4,798,789 | 85,420 | ||||||
| BNP Paribas SA1 | 1,002,776 | 74,781 | ||||||
| Sberbank of Russia PJSC (ADR)1 | 4,290,850 | 72,627 | ||||||
| Axis Bank Ltd.1,3,4 | 8,530,055 | 68,289 | ||||||
| Other securities | 379,123 | |||||||
|
| |||||||
| 1,738,044 | ||||||||
|
| |||||||
Information technology 12.06% | ||||||||
| Samsung Electronics Co., Ltd.1 | 128,338 | 304,909 | ||||||
| Tencent Holdings Ltd.1 | 4,644,687 | 240,107 | ||||||
| Alibaba Group Holding Ltd. (ADR)2 | 1,361,800 | 234,815 | ||||||
| ASML Holding NV1 | 628,834 | 109,095 | ||||||
| Other securities | 287,922 | |||||||
|
| |||||||
| 1,176,848 | ||||||||
|
| |||||||
Consumer discretionary 11.34% | ||||||||
| Galaxy Entertainment Group Ltd.1 | 16,681,000 | 133,389 | ||||||
| Techtronic Industries Co. Ltd.1 | 15,689,500 | 102,262 | ||||||
| Kering SA1 | 208,638 | 98,357 | ||||||
| Hyundai Motor Co.1 | 672,100 | 97,915 | ||||||
| Naspers Ltd., Class N1 | 334,100 | 93,090 | ||||||
| Altice NV, Class A1,2 | 7,541,269 | 78,890 | ||||||
| Other securities | 503,026 | |||||||
|
| |||||||
| 1,106,929 | ||||||||
|
| |||||||
Health care 9.80% | ||||||||
| Novartis AG1 | 1,967,000 | 166,294 | ||||||
| Grifols, SA, Class B, preferred nonvoting, non-registered shares1 | 3,304,730 | 75,819 | ||||||
| Grifols, SA, Class A, non-registered shares1 | 881,000 | 25,761 | ||||||
| Grifols, SA, Class B (ADR) | 793,690 | 18,191 | ||||||
| Takeda Pharmaceutical Co. Ltd.1 | 1,704,000 | 96,475 | ||||||
| Sysmex Corp.1 | 1,055,000 | 83,074 | ||||||
| Fresenius SE & Co. KGaA1 | 1,040,000 | 80,975 | ||||||
| Teva Pharmaceutical Industries Ltd. (ADR) | 4,217,300 | 79,918 | ||||||
| Other securities | 329,344 | |||||||
|
| |||||||
| 955,851 | ||||||||
|
| |||||||
Industrials 9.17% | ||||||||
| Airbus SE, non-registered shares1 | 2,926,849 | 290,653 | ||||||
| Komatsu Ltd.1 | 3,339,000 | 120,950 | ||||||
| Rolls-Royce Holdings PLC1,2 | 10,478,900 | 119,259 | ||||||
| Nidec Corp.1 | 503,200 | 70,636 | ||||||
| Other securities | 292,827 | |||||||
|
| |||||||
| 894,325 | ||||||||
|
| |||||||
Consumer staples 8.15% | ||||||||
| Pernod Ricard SA1 | 717,437 | 113,564 | ||||||
| Nestlé SA1 | 1,317,700 | 113,233 | ||||||
| AMOREPACIFIC Corp.1 | 349,892 | 99,376 | ||||||
| British American Tobacco PLC1 | 1,401,000 | 94,554 | ||||||
| Associated British Foods PLC1 | 2,250,488 | 85,555 | ||||||
| Treasury Wine Estates Ltd.1 | 6,529,100 | 81,210 | ||||||
| Other securities | 207,476 | |||||||
|
| |||||||
| 794,968 | ||||||||
|
| |||||||
56 American Funds Insurance Series
Table of Contents
International Fund
Common stocks
| Shares | Value (000) | |||||||
Materials 5.72% | ||||||||
| Asahi Kasei Corp.1 | 7,293,000 | $ | 93,949 | |||||
| Nitto Denko Corp.1 | 893,000 | 79,374 | ||||||
| First Quantum Minerals Ltd. | 5,407,000 | 75,750 | ||||||
| Vale SA, ordinary nominative (ADR) | 6,023,339 | 73,665 | ||||||
| Vale SA, ordinary nominative | 102,481 | 1,244 | ||||||
| Other securities | 233,697 | |||||||
|
| |||||||
| 557,679 | ||||||||
|
| |||||||
Utilities 5.28% | ||||||||
| Power Grid Corp. of India Ltd.1 | 33,878,213 | 106,142 | ||||||
| Ørsted AS1 | 1,580,324 | 86,097 | ||||||
| ENN Energy Holdings Ltd.1 | 10,716,000 | 76,029 | ||||||
| Other securities | 247,089 | |||||||
|
| |||||||
| 515,357 | ||||||||
|
| |||||||
Energy 4.71% | ||||||||
| Royal Dutch Shell PLC, Class B1 | 3,359,624 | 113,310 | ||||||
| Royal Dutch Shell PLC, Class A1 | 2,219,608 | 74,305 | ||||||
| Other securities | 272,062 | |||||||
|
| |||||||
| 459,677 | ||||||||
|
| |||||||
Telecommunication services 2.50% | ||||||||
| Nippon Telegraph and Telephone Corp.1 | 2,323,000 | 109,310 | ||||||
| SoftBank Group Corp.1 | 911,900 | 72,043 | ||||||
| Other securities | 62,916 | |||||||
|
| |||||||
| 244,269 | ||||||||
|
| |||||||
Real estate 1.95% | ||||||||
| CK Asset Holdings Ltd.1 | 12,918,528 | 112,920 | ||||||
| Other securities | 77,784 | |||||||
|
| |||||||
| 190,704 | ||||||||
|
| |||||||
Miscellaneous 2.35% | ||||||||
| Other common stocks in initial period of acquisition | 229,314 | |||||||
|
| |||||||
| Total common stocks (cost: $6,662,362,000) | 8,863,965 | |||||||
|
| |||||||
| Rights & warrants 0.07% | ||||||||
Miscellaneous 0.07% | ||||||||
| Other rights & warrants in initial period of acquisition | 6,390 | |||||||
|
| |||||||
Total rights & warrants (cost: $5,434,000) | 6,390 | |||||||
|
| |||||||
Bonds, notes & other debt instruments 0.73%
Principal amount (000) | ||||||||
Corporate bonds & notes 0.40% | ||||||||
Materials 0.39% | ||||||||
| First Quantum Minerals Ltd. 7.00%–7.25% 2021–20224 | $29,445 | 30,965 | ||||||
| Other securities | 7,014 | |||||||
|
| |||||||
| 37,979 | ||||||||
|
| |||||||
Energy 0.01% | ||||||||
| Other securities | 991 | |||||||
|
| |||||||
| Total corporate bonds & notes | 38,970 | |||||||
|
| |||||||
| U.S. Treasury bonds & notes 0.20% | ||||||||
U.S. Treasury 0.20% | ||||||||
| Other securities | 19,983 | |||||||
|
| |||||||
American Funds Insurance Series 57
Table of Contents
International Fund
Bonds, notes & other debt instruments (continued)
Principal amount (000) | Value (000) | |||||||
Bonds & notes of governments & government agencies outside the U.S. 0.13% | ||||||||
Other securities | $ | 12,485 | ||||||
|
| |||||||
Total bonds, notes & other debt instruments (cost: $60,483,000) | 71,438 | |||||||
|
| |||||||
Short-term securities 8.34% | ||||||||
BNP Paribas Finance Inc. 1.72% due 2/22/20184 | $ | 50,000 | 49,875 | |||||
Federal Home Loan Bank 1.19%–1.29% due 1/9/2018–2/9/2018 | 170,000 | 169,813 | ||||||
Toronto-Dominion Bank 1.45% due 3/16/20184 | 71,200 | 70,941 | ||||||
Other securities | 523,191 | |||||||
|
| |||||||
Total short-term securities (cost: $813,936,000) | 813,820 | |||||||
|
| |||||||
Total investment securities 99.98% (cost: $7,542,215,000) | 9,755,613 | |||||||
Other assets less liabilities 0.02% | 2,209 | |||||||
|
| |||||||
Net assets 100.00% | $ | 9,757,822 | ||||||
|
| |||||||
This summary investment portfolio is designed to streamline the report and help investors better focus on the fund’s principal holdings. See the inside back cover for details on how to obtain a complete schedule of portfolio holdings.
As permitted by U.S. Securities and Exchange Commission regulations, “Miscellaneous” securities include holdings in their first year of acquisition that have not previously been publicly disclosed.
“Other securities” includes all issues that are not disclosed separately in the summary investment portfolio.
Forward currency contracts
| Contract amount | Unrealized depreciation | |||||||||||||
| Purchases (000) | Sales (000) | Counterparty | Settlement date | at 12/31/2017 (000) | ||||||||||
| USD 26,911 | INR 1,744,071 | Bank of America, N.A. | 1/16/2018 | $ | (355 | ) | ||||||||
The following footnotes apply to either the individual securities noted or one or more of the securities aggregated and listed as a single line item.
| 1 | Valued under fair value procedures adopted by authority of the board of trustees. The total value of all such securities, including those in “Miscellaneous“ and “Other securities,“ was $7,999,131,000, which represented 81.98% of the net assets of the fund. This amount includes $7,669,394,000 related to certain securities trading outside the U.S. whose values were adjusted as a result of significant market movements following the close of local trading. |
| 2 | Security did not produce income during the last 12 months. |
| 3 | Acquired through a private placement transaction exempt from registration under the Securities Act of 1933. May be subject to legal or contractual restrictions on resale. Further details on this holding appear below. |
| 4 | Acquired in a transaction exempt from registration under Rule 144A or Section 4(2) of the Securities Act of 1933. May be resold in the U.S. in transactions exempt from registration, normally to qualified institutional buyers. The total value of all such securities, including those in “Other securities,“ was $604,006,000, which represented 6.19% of the net assets of the fund. |
Private placement security | Acquisition dates | Cost (000) | Value (000) | Percent of net assets | ||||||||
Axis Bank Ltd. | 11/14/2017-12/18/2017 | $ | 60,701 | $ | 68,289 | .70% | ||||||
Key to abbreviations and symbol
ADR = American Depositary Receipts
INR = Indian rupees
USD/$ = U.S. dollars
See Notes to Financial Statements
58 American Funds Insurance Series
Table of Contents
Summary investment portfolio December 31, 2017
Common stocks 91.02%
| Shares | Value (000) | |||||||
Information technology 25.59% | ||||||||
Taiwan Semiconductor Manufacturing Co., Ltd.1 | 9,887,000 | $ | 75,972 | |||||
Taiwan Semiconductor Manufacturing Co., Ltd. (ADR) | 700,000 | 27,755 | ||||||
United Microelectronics Corp.1 | 207,154,634 | 98,512 | ||||||
| Alphabet Inc., Class C2 | 73,700 | 77,120 | ||||||
| Alphabet Inc., Class A2 | 16,900 | 17,802 | ||||||
| Murata Manufacturing Co., Ltd.1 | 584,000 | 78,054 | ||||||
| Baidu, Inc., Class A (ADR)2 | 332,600 | 77,898 | ||||||
| Samsung Electronics Co., Ltd.1 | 18,500 | 43,953 | ||||||
| Samsung Electronics Co., Ltd., nonvoting preferred1 | 7,750 | 15,108 | ||||||
| Intel Corp. | 1,279,460 | 59,060 | ||||||
| Alibaba Group Holding Ltd. (ADR)2 | 336,537 | 58,029 | ||||||
| Broadcom Ltd. | 159,750 | 41,040 | ||||||
| Microsoft Corp. | 369,000 | 31,564 | ||||||
| Renesas Electronics Corp.1,2 | 2,461,800 | 28,496 | ||||||
| AAC Technologies Holdings Inc.1 | 1,316,563 | 23,415 | ||||||
| TravelSky Technology Ltd., Class H1 | 7,580,456 | 22,717 | ||||||
| Other securities | 127,658 | |||||||
|
| |||||||
| 904,153 | ||||||||
|
| |||||||
Financials 11.18% | ||||||||
HDFC Bank Ltd.1 | 1,964,100 | 58,082 | ||||||
HDFC Bank Ltd. (ADR) | 208,400 | 21,188 | ||||||
| Grupo Financiero Galicia SA, Class B (ADR) | 1,123,355 | 73,973 | ||||||
| BM&FBOVESPA SA - Bolsa de Valores, Mercadorias e Futuros, ordinary nominative | 7,928,300 | 54,447 | ||||||
| AIA Group Ltd.1 | 4,611,600 | 39,329 | ||||||
| Sberbank of Russia PJSC (ADR)1 | 1,150,000 | 19,465 | ||||||
| Sberbank of Russia PJSC (ADR) | 682,500 | 11,623 | ||||||
| Industrial and Commercial Bank of China Ltd., Class H1 | 27,600,000 | 22,133 | ||||||
| Other securities | 94,647 | |||||||
|
| |||||||
| 394,887 | ||||||||
|
| |||||||
Consumer discretionary 9.02% | ||||||||
Maruti Suzuki India Ltd.1 | 244,640 | 37,232 | ||||||
Kroton Educacional SA, ordinary nominative | 6,457,000 | 35,817 | ||||||
Sony Corp.1 | 700,000 | 31,443 | ||||||
| Naspers Ltd., Class N1 | 111,519 | 31,073 | ||||||
| MakeMyTrip Ltd., non-registered shares2 | 871,500 | 26,014 | ||||||
| Other securities | 157,138 | |||||||
|
| |||||||
| 318,717 | ||||||||
|
| |||||||
Energy 8.62% | ||||||||
Reliance Industries Ltd.1 | 13,230,790 | 190,875 | ||||||
Royal Dutch Shell PLC, Class B1 | 1,050,000 | 35,413 | ||||||
| Royal Dutch Shell PLC, Class A1 | 21,628 | 724 | ||||||
| Other securities | 77,508 | |||||||
|
| |||||||
| 304,520 | ||||||||
|
| |||||||
Consumer staples 8.07% | ||||||||
British American Tobacco PLC1 | 1,494,000 | 100,831 | ||||||
CP ALL PCL1 | 17,121,500 | 40,421 | ||||||
| Nestlé SA1 | 312,196 | 26,828 | ||||||
| Lenta Ltd. (GDR)1,2 | 4,126,200 | 24,008 | ||||||
| Lenta Ltd. (GDR)1,2,3 | 244,500 | 1,423 | ||||||
| Foshan Haitian Flavouring and Food Co. Ltd., Class A1 | 2,250,000 | 18,584 | ||||||
| Other securities | 73,058 | |||||||
|
| |||||||
| 285,153 | ||||||||
|
| |||||||
American Funds Insurance Series 59
Table of Contents
New World Fund
Common stocks (continued)
| Shares | Value (000) | |||||||
Materials 7.77% | ||||||||
Randgold Resources Ltd.1 | 529,600 | $ | 52,539 | |||||
Vale SA, ordinary nominative | 4,093,786 | 49,687 | ||||||
| First Quantum Minerals Ltd. | 2,580,100 | 36,146 | ||||||
| En+ Group PLC (GDR)1,3 | 1,886,800 | 26,038 | ||||||
| Glencore PLC1 | 4,840,000 | 25,465 | ||||||
| Klabin SA, units | 4,219,400 | 22,387 | ||||||
| Other securities | 62,187 | |||||||
|
| |||||||
| 274,449 | ||||||||
|
| |||||||
Industrials 6.22% | ||||||||
Airbus SE, non-registered shares1 | 612,229 | 60,798 | ||||||
Eicher Motors Ltd.1 | 118,200 | 56,103 | ||||||
| Grupo Aeroportuario del Sureste, SA de CV, Series B | 1,315,200 | 23,951 | ||||||
| Other securities | 78,759 | |||||||
|
| |||||||
| 219,611 | ||||||||
|
| |||||||
Health care 4.44% | ||||||||
Hypermarcas SA, ordinary nominative | 4,168,700 | 45,242 | ||||||
CSL Ltd.1 | 268,500 | 29,552 | ||||||
| Other securities | 82,021 | |||||||
|
| |||||||
| 156,815 | ||||||||
|
| |||||||
Telecommunication services 2.49% | ||||||||
SoftBank Group Corp.1 | 738,000 | 58,304 | ||||||
Other securities | 29,559 | |||||||
|
| |||||||
| 87,863 | ||||||||
|
| |||||||
Utilities 1.88% | ||||||||
Infraestructura Energética Nova, SAB de CV | 6,831,495 | 33,510 | ||||||
Other securities | 32,956 | |||||||
|
| |||||||
| 66,466 | ||||||||
|
| |||||||
Real estate 1.08% | ||||||||
American Tower Corp. REIT | 236,800 | 33,784 | ||||||
Other securities | 4,281 | |||||||
|
| |||||||
| 38,065 | ||||||||
|
| |||||||
Miscellaneous 4.66% | ||||||||
Other common stocks in initial period of acquisition | 164,831 | |||||||
|
| |||||||
Total common stocks (cost: $2,398,030,000) | 3,215,530 | |||||||
|
| |||||||
Preferred securities 0.04% | ||||||||
Miscellaneous 0.04% | ||||||||
Meituan Corp., Series C, 8.00% noncumulative1,2,4 | 239,754 | 1,340 | ||||||
|
| |||||||
Total preferred securities (cost: $1,340,000) | 1,340 | |||||||
|
| |||||||
Rights & warrants 1.78% | ||||||||
Consumer staples 1.58% | ||||||||
Hypermarcas SA, ordinary nominative1,3 | 5,330,000 | 44,024 | ||||||
Other securities | 11,891 | |||||||
|
| |||||||
| 55,915 | ||||||||
|
| |||||||
Consumer discretionary 0.20% | ||||||||
Other securities | 6,895 | |||||||
|
| |||||||
Total rights & warrants (cost: $40,814,000) | 62,810 | |||||||
|
| |||||||
60 American Funds Insurance Series
Table of Contents
New World Fund
Bonds, notes & other debt instruments 2.75%
Principal (000) | Value (000) | |||||||
Bonds & notes of governments & government agencies outside the U.S. 2.27% | ||||||||
| Other securities | $ | 80,078 | ||||||
|
| |||||||
Corporate bonds & notes 0.45% | ||||||||
Materials 0.01% | ||||||||
Vale SA 6.25% 2026 | $ | 405 | 470 | |||||
|
| |||||||
Other 0.44% | ||||||||
Other securities | 15,552 | |||||||
|
| |||||||
U.S. Treasury bonds & notes 0.03% | ||||||||
U.S. Treasury 0.03% | ||||||||
Other securities | 999 | |||||||
|
| |||||||
Total bonds, notes & other debt instruments (cost: $93,990,000) | 97,099 | |||||||
|
| |||||||
Short-term securities 4.85% | ||||||||
| Bank of Montreal 1.70% due 3/15/2018 | 25,000 | 25,002 | ||||||
| Federal Home Loan Bank 1.25%–1.31% due 2/5/2018–3/28/2018 | 76,900 | 76,758 | ||||||
| Liberty Street Funding Corp. 1.78% due 3/21/20183 | 25,000 | 24,901 | ||||||
| Other securities | 44,711 | |||||||
|
| |||||||
| Total short-term securities (cost: $171,305,000) | 171,372 | |||||||
|
| |||||||
| Total investment securities 100.44% (cost: $2,705,479,000) | 3,548,151 | |||||||
| Other assets less liabilities (0.44)% | (15,438 | ) | ||||||
|
| |||||||
Net assets 100.00% | $ | 3,532,713 | ||||||
|
| |||||||
This summary investment portfolio is designed to streamline the report and help investors better focus on the fund’s principal holdings. See the inside back cover for details on how to obtain a complete schedule of portfolio holdings.
As permitted by U.S. Securities and Exchange Commission regulations, “Miscellaneous” securities include holdings in their first year of acquisition that have not previously been publicly disclosed.
“Other securities” includes all issues that are not disclosed separately in the summary investment portfolio.
American Funds Insurance Series 61
Table of Contents
New World Fund
Forward currency contracts
| Contract amount | Unrealized appreciation (depreciation) | |||||||||||||||
| Purchases (000) | Sales (000) | Counterparty | Settlement date | at 12/31/2017 (000) | ||||||||||||
| USD | 116 | MXN | 2,100 | JPMorgan Chase | 1/4/2018 | $ | 9 | |||||||||
| USD | 910 | BRL | 3,000 | JPMorgan Chase | 1/5/2018 | 6 | ||||||||||
| USD | 4,477 | INR | 289,525 | JPMorgan Chase | 1/5/2018 | (55 | ) | |||||||||
| USD | 1,426 | BRL | 4,600 | JPMorgan Chase | 1/11/2018 | 42 | ||||||||||
| USD | 514 | BRL | 1,700 | JPMorgan Chase | 1/16/2018 | 3 | ||||||||||
| USD | 687 | INR | 44,350 | Citibank | 1/16/2018 | (7 | ) | |||||||||
| USD | 1,224 | ZAR | 16,605 | Goldman Sachs | 1/17/2018 | (115 | ) | |||||||||
| USD | 314 | EUR | 265 | HSBC Bank | 1/18/2018 | (4 | ) | |||||||||
| USD | 450 | TRY | 1,775 | Bank of America, N.A. | 1/18/2018 | (15 | ) | |||||||||
| USD | 1,452 | ZAR | 19,250 | Barclays Bank PLC | 1/24/2018 | (97 | ) | |||||||||
| USD | 1,369 | JPY | 153,000 | Bank of America, N.A. | 2/15/2018 | 8 | ||||||||||
| USD | 562 | JPY | 63,000 | UBS AG | 2/23/2018 | 1 | ||||||||||
| USD | 633 | EUR | 530 | HSBC Bank | 2/23/2018 | (5 | ) | |||||||||
| USD | 1,807 | INR | 120,000 | Citibank | 3/26/2018 | (52 | ) | |||||||||
| USD | 151 | EUR | 125 | Bank of America, N.A. | 12/13/2018 | (2 | ) | |||||||||
| USD | 1,828 | EUR | 1,520 | Bank of America, N.A. | 12/13/2018 | (40 | ) | |||||||||
|
| |||||||||||||||
| $ | (323 | ) | ||||||||||||||
|
| |||||||||||||||
| 1 | Valued under fair value procedures adopted by authority of the board of trustees. The total value of all such securities, including those in “Miscellaneous“ and “Other securities,“ was $2,022,785,000, which represented 57.26% of the net assets of the fund. This amount includes $1,899,212,000 related to certain securities trading outside the U.S. whose values were adjusted as a result of significant market movements following the close of local trading. |
| 2 | Security did not produce income during the last 12 months. |
| 3 | Acquired in a transaction exempt from registration under Rule 144A or Section 4(2) of the Securities Act of 1933. May be resold in the U.S. in transactions exempt from registration, normally to qualified institutional buyers. The total value of all such securities, including those in “Other securities,“ was $160,176,000, which represented 4.53% of the net assets of the fund. |
| 4 | Value determined using significant unobservable inputs. |
Key to abbreviations and symbol
ADR = American Depositary Receipts
BRL = Brazilian reais
EUR = Euros
GDR = Global Depositary Receipts
INR = Indian rupees
JPY = Japanese yen
MXN = Mexican pesos
TRY = Turkish lira
USD/$ = U.S. dollars
ZAR = South African rand
See Notes to Financial Statements
62 American Funds Insurance Series
Table of Contents
Blue Chip Income and Growth Fund
Summary investment portfolio December 31, 2017
Common stocks 96.25%
| Shares | Value (000) | |||||||
Health care 19.17% | ||||||||
AbbVie Inc. | 6,761,500 | $ | 653,905 | |||||
Amgen Inc. | 2,366,500 | 411,534 | ||||||
Teva Pharmaceutical Industries Ltd. (ADR) | 10,833,800 | 205,300 | ||||||
Abbott Laboratories | 2,945,000 | 168,071 | ||||||
Gilead Sciences, Inc. | 1,808,012 | 129,526 | ||||||
Medtronic PLC | 900,000 | 72,675 | ||||||
Bristol-Myers Squibb Co. | 1,125,000 | 68,940 | ||||||
Other securities | 87,621 | |||||||
|
| |||||||
| 1,797,572 | ||||||||
|
| |||||||
Financials 13.44% | ||||||||
JPMorgan Chase & Co. | 3,884,900 | 415,451 | ||||||
Wells Fargo & Co. | 6,013,000 | 364,809 | ||||||
Prudential Financial, Inc. | 2,649,000 | 304,582 | ||||||
American International Group, Inc. | 1,506,300 | 89,745 | ||||||
Other securities | 85,952 | |||||||
|
| |||||||
| 1,260,539 | ||||||||
|
| |||||||
Information technology 11.95% | ||||||||
Intel Corp. | 8,432,200 | 389,230 | ||||||
Texas Instruments Inc. | 2,630,000 | 274,677 | ||||||
Microsoft Corp. | 2,184,000 | 186,819 | ||||||
Apple Inc. | 694,180 | 117,476 | ||||||
Western Union Co. | 5,375,000 | 102,179 | ||||||
Other securities | 50,629 | |||||||
|
| |||||||
| 1,121,010 | ||||||||
|
| |||||||
Industrials 11.36% | ||||||||
CSX Corp. | 4,616,500 | 253,954 | ||||||
General Electric Co. | 10,209,000 | 178,147 | ||||||
General Dynamics Corp. | 861,000 | 175,170 | ||||||
Illinois Tool Works Inc. | 650,000 | 108,453 | ||||||
Union Pacific Corp. | 750,000 | 100,575 | ||||||
Boeing Co. | 329,000 | 97,025 | ||||||
Rockwell Automation | 450,000 | 88,358 | ||||||
United Technologies Corp. | 500,000 | 63,785 | ||||||
|
| |||||||
| 1,065,467 | ||||||||
|
| |||||||
Consumer staples 10.68% | ||||||||
Altria Group, Inc. | 2,754,000 | 196,663 | ||||||
Kimberly-Clark Corp. | 1,395,800 | 168,417 | ||||||
Kellogg Co. | 2,152,800 | 146,347 | ||||||
Philip Morris International Inc. | 1,250,000 | 132,063 | ||||||
Mondelez International, Inc. | 1,580,000 | 67,624 | ||||||
Kraft Heinz Co. | 776,666 | 60,394 | ||||||
Other securities | 229,727 | |||||||
|
| |||||||
| 1,001,235 | ||||||||
|
| |||||||
Telecommunication services 8.47% | ||||||||
Verizon Communications Inc. | 9,609,171 | 508,614 | ||||||
AT&T Inc. | 4,181,000 | 162,557 | ||||||
CenturyLink, Inc. | 7,398,800 | 123,412 | ||||||
|
| |||||||
| 794,583 | ||||||||
|
| |||||||
Energy 7.82% | ||||||||
Canadian Natural Resources, Ltd. | 6,284,000 | 224,464 | ||||||
Exxon Mobil Corp. | 2,054,000 | 171,797 | ||||||
EOG Resources, Inc. | 1,555,000 | 167,800 | ||||||
Halliburton Co. | 2,419,700 | 118,251 | ||||||
Other securities | 51,217 | |||||||
|
| |||||||
| 733,529 | ||||||||
|
| |||||||
American Funds Insurance Series 63
Table of Contents
Blue Chip Income and Growth Fund
Common stocks (continued)
| Shares | Value (000) | |||||||
Consumer discretionary 5.55% | ||||||||
Twenty-First Century Fox, Inc., Class A | 3,955,900 | $ | 136,597 | |||||
Marriott International, Inc., Class A | 671,000 | 91,075 | ||||||
McDonald’s Corp. | 500,000 | 86,060 | ||||||
General Motors Co. | 2,000,000 | 81,980 | ||||||
Viacom Inc., Class B | 2,112,850 | 65,097 | ||||||
Royal Caribbean Cruises Ltd. | 500,000 | 59,640 | ||||||
|
| |||||||
| 520,449 | ||||||||
|
| |||||||
Materials 2.77% | ||||||||
Freeport-McMoRan Inc.1 | 6,163,000 | 116,851 | ||||||
Other securities | 142,876 | |||||||
|
| |||||||
| 259,727 | ||||||||
|
| |||||||
Other 1.19% | ||||||||
Other securities | 112,331 | |||||||
|
| |||||||
Miscellaneous 3.85% | ||||||||
Other common stocks in initial period of acquisition | 361,132 | |||||||
|
| |||||||
Total common stocks (cost: $6,732,682,000) | 9,027,574 | |||||||
|
| |||||||
Short-term securities 3.72% | ||||||||
Principal amount (000) | ||||||||
Cisco Systems, Inc. 1.23%-1.60% due 1/10/2018-3/6/20182 | $ | 104,400 | 104,238 | |||||
Federal Home Loan Bank 1.09%-1.24% due 1/10/2018-1/26/2018 | 75,800 | 75,772 | ||||||
General Electric Co. 1.42% due 1/2/2018 | 21,200 | 21,197 | ||||||
Microsoft Corp. 1.41% due 2/14/20182 | 25,300 | 25,252 | ||||||
Other securities | 122,735 | |||||||
|
| |||||||
Total short-term securities (cost: $349,269,000) | 349,194 | |||||||
|
| |||||||
Total investment securities 99.97% (cost: $7,081,951,000) | 9,376,768 | |||||||
Other assets less liabilities 0.03% | 3,081 | |||||||
|
| |||||||
Net assets 100.00% | $ | 9,379,849 | ||||||
|
| |||||||
This summary investment portfolio is designed to streamline the report and help investors better focus on the fund’s principal holdings. See the inside back cover for details on how to obtain a complete schedule of portfolio holdings.
As permitted by U.S. Securities and Exchange Commission regulations, “Miscellaneous” securities include holdings in their first year of acquisition that have not previously been publicly disclosed.
“Other securities” includes all issues that are not disclosed separately in the summary investment portfolio.
The following footnotes apply to either the individual securities noted or one or more of the securities aggregated and listed as a single line item.
| 1 | Security did not produce income during the last 12 months. |
| 2 | Acquired in a transaction exempt from registration under Section 4(2) of the Securities Act of 1933. May be resold in the U.S. in transactions exempt from registration, normally to qualified institutional buyers. The total value of all such securities, including those in “Other securities,“ was $166,417,000, which represented 1.77% of the net assets of the fund. |
Key to abbreviation
ADR = American Depositary Receipts
See Notes to Financial Statements
64 American Funds Insurance Series
Table of Contents
Summary investment portfolio December 31, 2017
Common stocks 93.68%
| Shares | Value (000) | |||||||
Information technology 23.74% | ||||||||
Nintendo Co., Ltd.1 | 249,000 | $ | 90,649 | |||||
Taiwan Semiconductor Manufacturing Co., Ltd.1 | 9,226,800 | 70,899 | ||||||
Microsoft Corp. | 807,000 | 69,031 | ||||||
Broadcom Ltd. | 137,000 | 35,195 | ||||||
United Microelectronics Corp.1 | 68,320,000 | 32,489 | ||||||
AAC Technologies Holdings Inc.1 | 1,503,500 | 26,739 | ||||||
Murata Manufacturing Co., Ltd.1 | 190,000 | 25,395 | ||||||
Facebook, Inc., Class A2 | 120,000 | 21,175 | ||||||
Apple Inc. | 118,000 | 19,969 | ||||||
TE Connectivity Ltd. | 200,000 | 19,008 | ||||||
Alibaba Group Holding Ltd. (ADR)2 | 104,000 | 17,933 | ||||||
TEMENOS Group AG (Switzerland)1 | 128,000 | 16,381 | ||||||
Alphabet Inc., Class C2 | 9,000 | 9,418 | ||||||
Alphabet Inc., Class A2 | 6,000 | 6,320 | ||||||
MediaTek Inc.1 | 1,465,000 | 14,442 | ||||||
Other securities | 24,047 | |||||||
|
| |||||||
| 499,090 | ||||||||
|
| |||||||
Financials 10.79% | ||||||||
Prudential PLC1 | 765,000 | 19,668 | ||||||
Wells Fargo & Co. | 272,000 | 16,502 | ||||||
Blackstone Group LP | 453,250 | 14,513 | ||||||
Other securities | 176,199 | |||||||
|
| |||||||
| 226,882 | ||||||||
|
| |||||||
Industrials 10.63% | ||||||||
Airbus SE, non-registered shares1 | 503,000 | 49,951 | ||||||
Grupo Aeroportuario del Pacífico SAB de CV | 2,930,000 | 30,114 | ||||||
Lockheed Martin Corp. | 82,300 | 26,422 | ||||||
Boeing Co. | 87,000 | 25,657 | ||||||
Deutsche Post AG1 | 523,000 | 24,845 | ||||||
Aeroflot - Russian Airlines PJSC1 | 6,632,000 | 15,914 | ||||||
Ryanair Holdings PLC (ADR)2 | 141,375 | 14,730 | ||||||
Other securities | 35,956 | |||||||
|
| |||||||
| 223,589 | ||||||||
|
| |||||||
Consumer staples 8.80% | ||||||||
British American Tobacco PLC1 | 1,285,000 | 86,725 | ||||||
Nestlé SA1 | 558,700 | 48,010 | ||||||
Other securities | 50,309 | |||||||
|
| |||||||
| 185,044 | ||||||||
|
| |||||||
Consumer discretionary 8.45% | ||||||||
Home Depot, Inc. | 122,000 | 23,123 | ||||||
Vivendi SA1 | 715,200 | 19,232 | ||||||
Amazon.com, Inc.2 | 16,000 | 18,711 | ||||||
Sony Corp.1 | 375,000 | 16,845 | ||||||
Nitori Holdings Co., Ltd.1 | 105,000 | 14,972 | ||||||
Other securities | 84,714 | |||||||
|
| |||||||
| 177,597 | ||||||||
|
| |||||||
Health care 7.15% | ||||||||
UnitedHealth Group Inc. | 215,100 | 47,421 | ||||||
Centene Corp.2 | 212,000 | 21,387 | ||||||
Hypermarcas SA, ordinary nominative | 1,662,000 | 18,037 | ||||||
Other securities | 63,489 | |||||||
|
| |||||||
| 150,334 | ||||||||
|
| |||||||
American Funds Insurance Series 65
Table of Contents
Global Growth and Income Fund
Common stocks (continued)
| Shares | Value (000) | |||||||
Energy 6.18% | ||||||||
Reliance Industries Ltd.1 | 2,915,148 | $ | 42,056 | |||||
BP PLC1 | 4,570,206 | 32,231 | ||||||
Royal Dutch Shell PLC, Class B (ADR) | 242,000 | 16,526 | ||||||
Royal Dutch Shell PLC, Class B1 | 325,000 | 10,961 | ||||||
Royal Dutch Shell PLC, Class A (ADR) | 7,395 | 494 | ||||||
Coal India Ltd.1 | 4,310,000 | 17,756 | ||||||
Other securities | 9,987 | |||||||
|
| |||||||
| 130,011 | ||||||||
|
| |||||||
Materials 5.87% | ||||||||
Century Aluminum Co.2 | 1,650,000 | 32,406 | ||||||
Randgold Resources Ltd.1 | 271,100 | 26,895 | ||||||
James Hardie Industries PLC (CDI)1 | 850,000 | 14,963 | ||||||
Other securities | 49,157 | |||||||
|
| |||||||
| 123,421 | ||||||||
|
| |||||||
Real estate 3.48% | ||||||||
Gaming and Leisure Properties, Inc. REIT | 604,000 | 22,348 | ||||||
MGM Growth Properties LLC REIT, Class A | 676,200 | 19,711 | ||||||
Other securities | 31,028 | |||||||
|
| |||||||
| 73,087 | ||||||||
|
| |||||||
Utilities 2.24% | ||||||||
Ørsted AS1 | 491,552 | 26,780 | ||||||
Other securities | 20,311 | |||||||
|
| |||||||
| 47,091 | ||||||||
|
| |||||||
Telecommunication services 1.74% | ||||||||
Verizon Communications Inc. | 415,000 | 21,966 | ||||||
Other securities | 14,635 | |||||||
|
| |||||||
| 36,601 | ||||||||
|
| |||||||
Miscellaneous 4.61% | ||||||||
Other common stocks in initial period of acquisition | 96,833 | |||||||
|
| |||||||
Total common stocks (cost: $1,460,247,000) | 1,969,580 | |||||||
|
| |||||||
| Convertible bonds 0.31% | ||||||||
| Principal amount (000) | ||||||||
Miscellaneous 0.31% | ||||||||
Other convertible bonds in initial period of acquisition | 6,622 | |||||||
|
| |||||||
Total convertible bonds (cost: $6,003,000) | 6,622 | |||||||
|
| |||||||
| Bonds, notes & other debt instruments 2.00% | ||||||||
Corporate bonds & notes 1.95% | ||||||||
Telecommunication services 1.67% | ||||||||
Sprint Corp. 7.25% 2021 | $ | 33,000 | 35,021 | |||||
|
| |||||||
Health care 0.28% | ||||||||
Other securities | 5,975 | |||||||
|
| |||||||
U.S. Treasury bonds & notes 0.05% | ||||||||
U.S. Treasury 0.05% | ||||||||
Other securities | 999 | |||||||
|
| |||||||
Total bonds, notes & other debt instruments (cost: $38,839,000) | 41,995 | |||||||
|
| |||||||
66 American Funds Insurance Series
Table of Contents
Global Growth and Income Fund
Short-term securities 4.19%
| Principal amount (000) | Value (000) | |||||||
Caisse d’Amortissement de la Dette Sociale 1.35% due 1/4/20183 | $ | 15,000 | $ | 14,997 | ||||
Canadian Imperial Holdings Inc. 1.52% due 3/8/2018 | 25,000 | 24,926 | ||||||
Federal Home Loan Bank 1.28% due 2/5/2018 | 34,700 | 34,660 | ||||||
Other securities | 13,546 | |||||||
|
| |||||||
Total short-term securities (cost: $88,134,000) | 88,129 | |||||||
|
| |||||||
Total investment securities 100.18% (cost: $1,593,223,000) | 2,106,326 | |||||||
Other assets less liabilities (0.18)% | (3,880 | ) | ||||||
|
| |||||||
Net assets 100.00% | $ | 2,102,446 | ||||||
|
| |||||||
This summary investment portfolio is designed to streamline the report and help investors better focus on the fund’s principal holdings. See the inside back cover for details on how to obtain a complete schedule of portfolio holdings.
As permitted by U.S. Securities and Exchange Commission regulations, “Miscellaneous” securities include holdings in their first year of acquisition that have not previously been publicly disclosed.
“Other securities” includes all issues that are not disclosed separately in the summary investment portfolio.
| 1 | Valued under fair value procedures adopted by authority of the board of trustees. The total value of all such securities, including those in “Miscellaneous“ and “Other securities,“ was $1,083,748,000, which represented 51.55% of the net assets of the fund. This entire amount relates to certain securities trading outside the U.S. whose values were adjusted as a result of significant market movements following the close of local trading. |
| 2 | Security did not produce income during the last 12 months. |
| 3 | Acquired in a transaction exempt from registration under Section 4(2) of the Securities Act of 1933. May be resold in the U.S. in transactions exempt from registration, normally to qualified institutional buyers. The total value of all such securities, including those in “Other securities,“ was $18,995,000, which represented .90% of the net assets of the fund. |
Key to abbreviations
ADR = American Depositary Receipts
CDI = CREST Depository Interest
See Notes to Financial Statements
American Funds Insurance Series 67
Table of Contents
Summary investment portfolio December 31, 2017
Common stocks 94.11%
| Shares | Value (000) | |||||||
Information technology 16.93% | ||||||||
Microsoft Corp. | 8,905,427 | $ | 761,770 | |||||
Alphabet Inc., Class A1 | 373,700 | 393,655 | ||||||
Alphabet Inc., Class C1 | 309,284 | 323,635 | ||||||
Texas Instruments Inc. | 4,723,259 | 493,297 | ||||||
Broadcom Ltd. | 1,715,390 | 440,684 | ||||||
Intel Corp. | 9,418,000 | 434,735 | ||||||
Apple Inc. | 1,793,300 | 303,480 | ||||||
Accenture PLC, Class A | 1,654,500 | 253,287 | ||||||
QUALCOMM Inc. | 3,519,175 | 225,298 | ||||||
Other securities | 1,566,268 | |||||||
|
| |||||||
| 5,196,109 | ||||||||
|
| |||||||
Consumer discretionary 16.28% | ||||||||
Amazon.com, Inc.1 | 1,044,100 | 1,221,044 | ||||||
Netflix, Inc.1 | 3,533,077 | 678,209 | ||||||
Twenty-First Century Fox, Inc., Class A | 8,541,000 | 294,921 | ||||||
Twenty-First Century Fox, Inc., Class B | 595,000 | 20,301 | ||||||
Comcast Corp., Class A | 6,346,200 | 254,165 | ||||||
Home Depot, Inc. | 1,243,000 | 235,586 | ||||||
NIKE, Inc., Class B | 2,954,200 | 184,785 | ||||||
Other securities | 2,107,272 | |||||||
|
| |||||||
| 4,996,283 | ||||||||
|
| |||||||
Health care 14.86% | ||||||||
AbbVie Inc. | 8,376,600 | 810,101 | ||||||
Amgen Inc. | 2,761,983 | 480,309 | ||||||
UnitedHealth Group Inc. | 1,513,596 | 333,687 | ||||||
Stryker Corp. | 2,006,441 | 310,677 | ||||||
Gilead Sciences, Inc. | 4,284,100 | 306,913 | ||||||
Express Scripts Holding Co.1 | 3,627,500 | 270,757 | ||||||
Humana Inc. | 938,500 | 232,814 | ||||||
Abbott Laboratories | 3,808,000 | 217,323 | ||||||
Merck & Co., Inc. | 3,714,380 | 209,008 | ||||||
Illumina, Inc.1 | 867,550 | 189,551 | ||||||
Other securities | 1,198,546 | |||||||
|
| |||||||
| 4,559,686 | ||||||||
|
| |||||||
Financials 10.94% | ||||||||
JPMorgan Chase & Co. | 4,639,300 | 496,127 | ||||||
Wells Fargo & Co. | 4,306,000 | 261,245 | ||||||
Bank of New York Mellon Corp. | 4,599,400 | 247,724 | ||||||
Intercontinental Exchange, Inc. | 2,541,065 | 179,298 | ||||||
Other securities | 2,172,144 | |||||||
|
| |||||||
| 3,356,538 | ||||||||
|
| |||||||
Industrials 9.48% | ||||||||
CSX Corp. | 5,387,000 | 296,339 | ||||||
BWX Technologies, Inc. | 4,772,174 | 288,669 | ||||||
General Dynamics Corp. | 1,342,100 | 273,050 | ||||||
Airbus SE, non-registered shares2 | 2,117,764 | 210,306 | ||||||
Textron Inc. | 3,456,100 | 195,581 | ||||||
Union Pacific Corp. | 1,404,933 | 188,402 | ||||||
General Electric Co. | 10,538,000 | 183,888 | ||||||
Other securities | 1,274,657 | |||||||
|
| |||||||
| 2,910,892 | ||||||||
|
| |||||||
68 American Funds Insurance Series
Table of Contents
Growth-Income Fund
Common stocks
| Shares | Value (000) | |||||||
Consumer staples 7.51% | ||||||||
British American Tobacco PLC2 | 3,746,100 | $ | 252,826 | |||||
British American Tobacco PLC (ADR) | 494,440 | 33,122 | ||||||
| Philip Morris International Inc. | 2,702,430 | 285,512 | ||||||
| Coca-Cola Co. | 5,964,900 | 273,670 | ||||||
| Other securities | 1,459,289 | |||||||
|
| |||||||
| 2,304,419 | ||||||||
|
| |||||||
Energy 6.38% | ||||||||
TOTAL SA2 | 4,561,625 | 251,689 | ||||||
EOG Resources, Inc. | 2,277,300 | 245,743 | ||||||
| Chevron Corp. | 1,646,900 | 206,175 | ||||||
| Other securities | 1,254,386 | |||||||
|
| |||||||
| 1,957,993 | ||||||||
|
| |||||||
Materials 4.46% | ||||||||
Celanese Corp., Series A | 2,573,233 | 275,542 | ||||||
Vale SA, ordinary nominative (ADR) | 17,367,884 | 212,409 | ||||||
| Vale SA, ordinary nominative | 4,147,848 | 50,343 | ||||||
| DowDuPont Inc. | 3,554,100 | 253,123 | ||||||
| Freeport-McMoRan Inc.1 | 9,055,000 | 171,683 | ||||||
| Other securities | 405,702 | |||||||
|
| |||||||
| 1,368,802 | ||||||||
|
| |||||||
Telecommunication services 1.96% | ||||||||
Verizon Communications Inc. | 10,912,400 | 577,593 | ||||||
Other securities | 23,231 | |||||||
|
| |||||||
| 600,824 | ||||||||
|
| |||||||
Real estate 1.74% | ||||||||
Other securities | 535,421 | |||||||
|
| |||||||
Utilities 0.82% | ||||||||
Sempra Energy | 1,824,600 | 195,086 | ||||||
Other securities | 56,171 | |||||||
|
| |||||||
| 251,257 | ||||||||
|
| |||||||
Mutual funds 0.18% | ||||||||
Other securities | 55,129 | |||||||
|
| |||||||
Miscellaneous 2.57% | ||||||||
Other common stocks in initial period of acquisition | 789,777 | |||||||
|
| |||||||
Total common stocks (cost: $20,214,067,000) | 28,883,130 | |||||||
|
| |||||||
Convertible stocks 0.04% | ||||||||
Financials 0.02% | ||||||||
Other securities | 5,450 | |||||||
|
| |||||||
Miscellaneous 0.02% | ||||||||
Other convertible stocks in initial period of acquisition | 6,192 | |||||||
|
| |||||||
Total convertible stocks (cost: $11,900,000) | 11,642 | |||||||
|
| |||||||
Convertible bonds 0.35% | ||||||||
Principal (000) | ||||||||
Other 0.35% | ||||||||
Other securities | 107,354 | |||||||
|
| |||||||
Total convertible bonds (cost: $71,028,000) | 107,354 | |||||||
|
| |||||||
American Funds Insurance Series 69
Table of Contents
Growth-Income Fund
Bonds, notes & other debt instruments 0.18%
Principal amount (000) | Value (000) | |||||||
U.S. Treasury bonds & notes 0.18% | ||||||||
U.S. Treasury 0.18% | ||||||||
Other securities | $ | 56,489 | ||||||
|
| |||||||
Total bonds, notes & other debt instruments (cost: $60,201,000) | 56,489 | |||||||
|
| |||||||
Short-term securities 5.38% | ||||||||
Apple Inc. 1.50% due 2/20/20183 | $ | 50,000 | 49,892 | |||||
Chariot Funding, LLC 1.45%-1.50% due 3/14/2018-3/19/20183 | 48,000 | 47,822 | ||||||
Coca-Cola Co. 1.26% due 1/31/20183 | 50,000 | 49,932 | ||||||
Federal Home Loan Bank 1.12%-1.31% due 1/3/2018-3/2/2018 | 323,700 | 323,272 | ||||||
Freddie Mac 1.08%-1.28% due 1/26/2018-4/6/2018 | 223,948 | 223,415 | ||||||
Microsoft Corp. 1.30% due 1/23/20183 | 59,300 | 59,241 | ||||||
Other securities | 897,684 | |||||||
|
| |||||||
Total short-term securities (cost: $1,651,541,000) | 1,651,258 | |||||||
|
| |||||||
Total investment securities 100.06% (cost: $22,008,737,000) | 30,709,873 | |||||||
Other assets less liabilities (0.06)% | (17,511 | ) | ||||||
|
| |||||||
Net assets 100.00% | $ | 30,692,362 | ||||||
|
| |||||||
This summary investment portfolio is designed to streamline the report and help investors better focus on the fund’s principal holdings. See the inside back cover for details on how to obtain a complete schedule of portfolio holdings.
As permitted by U.S. Securities and Exchange Commission regulations, “Miscellaneous” securities include holdings in their first year of acquisition that have not previously been publicly disclosed.
“Other securities” includes all issues that are not disclosed separately in the summary investment portfolio. One security in “Other securities” (with a value of $5,450,000, an aggregate cost of $6,000,000, and which represented .02% of the net assets of the fund) was acquired on 6/28/2012 through private placement transactions exempt from registration under the Securities Act of 1933, which may subject it to legal or contractual restrictions on resale.
The following footnotes apply to either the individual securities noted or one or more of the securities aggregated and listed as a single line item.
| 1 | Security did not produce income during the last 12 months. |
| 2 | Valued under fair value procedures adopted by authority of the board of trustees. The total value of all such securities, including those in “Miscellaneous“ and “Other securities,“ was $2,958,273,000, which represented 9.64% of the net assets of the fund. This amount includes $2,749,134,000 related to certain securities trading outside the U.S. whose values were adjusted as a result of significant market movements following the close of local trading. |
| 3 | Acquired in a transaction exempt from registration under Rule 144A or Section 4(2) of the Securities Act of 1933. May be resold in the U.S. in transactions exempt from registration, normally to qualified institutional buyers. The total value of all such securities, including those in “Other securities,“ was $1,049,318,000, which represented 3.42% of the net assets of the fund. |
Key to abbreviation
ADR = American Depositary Receipts
See Notes to Financial Statements
70 American Funds Insurance Series
Table of Contents
International Growth and Income Fund
Summary investment portfolio December 31, 2017
Common stocks 90.99%
| Shares | Value (000) | |||||||
Financials 22.93% | ||||||||
HDFC Bank Ltd.1 | 1,228,800 | $ | 36,338 | |||||
Banco Santander, SA1 | 4,488,061 | 29,430 | ||||||
Zurich Insurance Group AG1 | 92,200 | 28,041 | ||||||
KB Financial Group Inc.1 | 356,500 | 21,078 | ||||||
Intesa Sanpaolo SpA1 | 5,900,000 | 19,568 | ||||||
Sberbank of Russia PJSC (ADR)1 | 1,141,660 | 19,324 | ||||||
Prudential PLC1 | 738,000 | 18,974 | ||||||
St. James’s Place PLC1 | 1,048,000 | 17,323 | ||||||
UniCredit SpA1,2 | 914,400 | 17,035 | ||||||
AIA Group Ltd.1 | 1,833,000 | 15,632 | ||||||
Sumitomo Mitsui Financial Group, Inc.1 | 308,000 | 13,302 | ||||||
Itaú Unibanco Holding SA, preferred nominative (ADR) | 991,300 | 12,887 | ||||||
Sampo Oyj, Class A1 | 203,000 | 11,152 | ||||||
Lloyds Banking Group PLC1 | 11,968,000 | 10,959 | ||||||
Other securities | 64,168 | |||||||
|
| |||||||
| 335,211 | ||||||||
|
| |||||||
Consumer staples 9.11% | ||||||||
British American Tobacco PLC1 | 437,600 | 29,534 | ||||||
Pernod Ricard SA1 | 128,650 | 20,364 | ||||||
Philip Morris International Inc. | 153,475 | 16,215 | ||||||
Imperial Brands PLC1 | 316,016 | 13,505 | ||||||
Other securities | 53,616 | |||||||
|
| |||||||
| 133,234 | ||||||||
|
| |||||||
Industrials 8.38% | ||||||||
Shanghai International Airport Co., Ltd., Class A1 | 5,134,562 | 35,457 | ||||||
Airbus SE, non-registered shares1 | 253,960 | 25,220 | ||||||
ASSA ABLOY AB, Class B1 | 681,100 | 14,133 | ||||||
Other securities | 47,672 | |||||||
|
| |||||||
| 122,482 | ||||||||
|
| |||||||
Utilities 8.02% | ||||||||
Ørsted AS1 | 497,000 | 27,077 | ||||||
EDP - Energias de Portugal, SA1 | 6,947,820 | 24,049 | ||||||
Korea Electric Power Corp.1 | 346,800 | 12,358 | ||||||
Power Assets Holdings Ltd.1 | 1,313,000 | 11,081 | ||||||
CK Infrastructure Holdings Ltd.1 | 1,282,000 | 11,006 | ||||||
Other securities | 31,740 | |||||||
|
| |||||||
| 117,311 | ||||||||
|
| |||||||
Information technology 7.86% | ||||||||
Samsung Electronics Co., Ltd.1 | 14,996 | 35,628 | ||||||
Taiwan Semiconductor Manufacturing Co., Ltd.1 | 3,840,000 | 29,507 | ||||||
ASML Holding NV1 | 68,600 | 11,901 | ||||||
Flex Ltd.2 | 647,500 | 11,648 | ||||||
Other securities | 26,180 | |||||||
|
| |||||||
| 114,864 | ||||||||
|
| |||||||
Health care 7.72% | ||||||||
Novartis AG1 | 341,145 | 28,841 | ||||||
Hikma Pharmaceuticals PLC1 | 1,317,700 | 20,164 | ||||||
Fresenius SE & Co. KGaA1 | 165,000 | 12,847 | ||||||
Teva Pharmaceutical Industries Ltd. (ADR) | 662,000 | 12,545 | ||||||
Daiichi Sankyo Co., Ltd.1 | 451,900 | 11,770 | ||||||
Other securities | 26,718 | |||||||
|
| |||||||
| 112,885 | ||||||||
|
| |||||||
American Funds Insurance Series 71
Table of Contents
International Growth and Income Fund
Common stocks (continued)
| Shares | Value (000) | |||||||
Consumer discretionary 7.36% | ||||||||
Toyota Motor Corp.1 | 226,000 | $ | 14,472 | |||||
LVMH Moët Hennessy-Louis Vuitton SE1 | 48,000 | 14,100 | ||||||
Naspers Ltd., Class N1 | 41,000 | 11,424 | ||||||
Other securities | 67,608 | |||||||
|
| |||||||
| 107,604 | ||||||||
|
| |||||||
Real estate 6.09% | ||||||||
CK Asset Holdings Ltd.1 | 3,833,348 | 33,507 | ||||||
Sun Hung Kai Properties Ltd.1 | 1,760,000 | 29,318 | ||||||
Daito Trust Construction Co., Ltd.1 | 95,500 | 19,453 | ||||||
Other securities | 6,799 | |||||||
|
| |||||||
| 89,077 | ||||||||
|
| |||||||
Energy 5.53% | ||||||||
Royal Dutch Shell PLC, Class A1 | 1,780,359 | 59,601 | ||||||
TOTAL SA1 | 297,739 | 16,428 | ||||||
Other securities | 4,763 | |||||||
|
| |||||||
| 80,792 | ||||||||
|
| |||||||
Materials 5.03% | ||||||||
Rio Tinto PLC1 | 475,800 | 25,111 | ||||||
Yara International ASA1 | 343,000 | 15,700 | ||||||
Other securities | 32,641 | |||||||
|
| |||||||
| 73,452 | ||||||||
|
| |||||||
Telecommunication services 2.96% | ||||||||
BT Group PLC1 | 5,623,761 | 20,591 | ||||||
Nippon Telegraph and Telephone Corp.1 | 409,800 | 19,283 | ||||||
Other securities | 3,419 | |||||||
|
| |||||||
| 43,293 | ||||||||
|
| |||||||
Total common stocks (cost: $1,140,729,000) | 1,330,205 | |||||||
|
| |||||||
Bonds, notes & other debt instruments 2.52% | ||||||||
Principal amount (000) | ||||||||
Corporate bonds & notes 1.26% | ||||||||
Other 1.26% | ||||||||
Other securities | 18,499 | |||||||
|
| |||||||
Total corporate bonds & notes | 18,499 | |||||||
|
| |||||||
Bonds & notes of governments & government agencies outside the U.S. 1.23% | ||||||||
Other securities | 17,993 | |||||||
|
| |||||||
U.S. Treasury bonds & notes 0.03% | ||||||||
U.S. Treasury 0.03% | ||||||||
U.S. Treasury 0.875% 2018 | $ | 420 | 419 | |||||
|
| |||||||
Total bonds, notes & other debt instruments (cost: $33,615,000) | 36,911 | |||||||
|
| |||||||
72 American Funds Insurance Series
Table of Contents
International Growth and Income Fund
Short-term securities 6.39%
Principal amount (000) | Value (000) | |||||||
Bank of Tokyo-Mitsubishi UFJ, Ltd. 1.53% due 1/18/2018 | $ | 21,000 | $ | 20,982 | ||||
U.S. Treasury Bills 1.50% due 6/28/2018 | 26,300 | 26,105 | ||||||
United Parcel Service Inc. 1.62% due 3/19/20183 | 20,000 | 19,933 | ||||||
Victory Receivables Corp. 1.43% due 1/16/20183 | 20,900 | 20,884 | ||||||
Other securities | 5,493 | |||||||
|
| |||||||
Total short-term securities (cost: $93,402,000) | 93,397 | |||||||
|
| |||||||
Total investment securities 99.90% (cost: $1,267,746,000) | 1,460,513 | |||||||
Other assets less liabilities 0.10% | 1,454 | |||||||
|
| |||||||
Net assets 100.00% | $ | 1,461,967 | ||||||
|
| |||||||
This summary investment portfolio is designed to streamline the report and help investors better focus on the fund’s principal holdings. See the inside back cover for details on how to obtain a complete schedule of portfolio holdings.
“Other securities” includes all issues that are not disclosed separately in the summary investment portfolio. One security in “Other securities” (with a value of $4,549,000, an aggregate cost of $4,634,000, and which represented .31% of the net assets of the fund) was acquired on 12/18/2017 through private placement transactions exempt from registration under the Securities Act of 1933, which may subject it to legal or contractual restrictions on resale.
The following footnotes apply to either the individual securities noted or one or more of the securities aggregated and listed as a single line item.
| 1 | Valued under fair value procedures adopted by authority of the board of trustees. The total value of all such securities, including those in “Other securities,“ was $1,229,130,000, which represented 84.07% of the net assets of the fund. This amount includes $1,188,243,000 related to certain securities trading outside the U.S. whose values were adjusted as a result of significant market movements following the close of local trading. |
| 2 | Security did not produce income during the last 12 months. |
| 3 | Acquired in a transaction exempt from registration under Rule 144A or Section 4(2) of the Securities Act of 1933. May be resold in the U.S. in transactions exempt from registration, normally to qualified institutional buyers. The total value of all such securities, including those in “Other securities,“ was $61,360,000, which represented 4.20% of the net assets of the fund. |
Key to abbreviation
ADR = American Depositary Receipts
See Notes to Financial Statements
American Funds Insurance Series 73
Table of Contents
Summary investment portfolio December 31, 2017
Common stocks 68.87%
| Shares | Value (000) | |||||||
Energy 10.19% | ||||||||
Occidental Petroleum Corp. | 146,900 | $ | 10,820 | |||||
Schlumberger Ltd. | 119,800 | 8,073 | ||||||
Royal Dutch Shell PLC, Class B1 | 213,240 | 7,192 | ||||||
Royal Dutch Shell PLC, Class B (ADR) | 8,500 | 581 | ||||||
Royal Dutch Shell PLC, Class A1 | 101 | 3 | ||||||
Enbridge Inc. (CAD denominated) | 174,970 | 6,843 | ||||||
Enbridge Inc. (CAD denominated)1,2 | 12,969 | 497 | ||||||
Williams Companies, Inc. | 215,800 | 6,580 | ||||||
Kinder Morgan, Inc. | 359,000 | 6,487 | ||||||
Inter Pipeline Ltd. | 260,000 | 5,384 | ||||||
Helmerich & Payne, Inc. | 76,300 | 4,932 | ||||||
Other securities | 3,170 | |||||||
|
| |||||||
| 60,562 | ||||||||
|
| |||||||
Financials 10.13% | ||||||||
Wells Fargo & Co. | 124,600 | 7,559 | ||||||
CME Group Inc., Class A | 39,416 | 5,757 | ||||||
Sampo Oyj, Class A1 | 95,858 | 5,266 | ||||||
Zurich Insurance Group AG1 | 16,306 | 4,959 | ||||||
Other securities | 36,663 | |||||||
|
| |||||||
| 60,204 | ||||||||
|
| |||||||
Consumer staples 8.82% | ||||||||
Diageo PLC1 | 259,500 | 9,497 | ||||||
Philip Morris International Inc. | 86,020 | 9,088 | ||||||
Coca-Cola Co. | 129,500 | 5,942 | ||||||
British American Tobacco PLC1 | 79,700 | 5,379 | ||||||
Imperial Brands PLC1 | 123,800 | 5,291 | ||||||
Other securities | 17,225 | |||||||
|
| |||||||
| 52,422 | ||||||||
|
| |||||||
Information technology 8.46% | ||||||||
Microsoft Corp. | 132,120 | 11,302 | ||||||
QUALCOMM Inc. | 172,400 | 11,037 | ||||||
Taiwan Semiconductor Manufacturing Co., Ltd.1 | 1,005,800 | 7,729 | ||||||
Intel Corp. | 151,900 | 7,012 | ||||||
Other securities | 13,193 | |||||||
|
| |||||||
| 50,273 | ||||||||
|
| |||||||
Consumer discretionary 6.27% | ||||||||
Las Vegas Sands Corp. | 176,600 | 12,272 | ||||||
Greene King PLC1 | 948,000 | 7,101 | ||||||
Sands China Ltd.1 | 944,000 | 4,859 | ||||||
Other securities | 13,041 | |||||||
|
| |||||||
| 37,273 | ||||||||
|
| |||||||
Telecommunication services 5.93% | ||||||||
Vodafone Group PLC1 | 4,255,100 | 13,442 | ||||||
HKT Trust and HKT Ltd., units1 | 4,775,340 | 6,090 | ||||||
Koninklijke KPN NV1 | 1,553,475 | 5,420 | ||||||
Other securities | 10,311 | |||||||
|
| |||||||
| 35,263 | ||||||||
|
| |||||||
Real estate 4.88% | ||||||||
Crown Castle International Corp. REIT | 76,900 | 8,537 | ||||||
Link REIT1 | 690,500 | 6,398 | ||||||
Digital Realty Trust, Inc. REIT | 51,200 | 5,832 | ||||||
Other securities | 8,255 | |||||||
|
| |||||||
| 29,022 | ||||||||
|
| |||||||
74 American Funds Insurance Series
Table of Contents
Capital Income Builder
Common stocks
| Shares | Value (000) | |||||||
Utilities 4.44% | ||||||||
SSE PLC1 | 397,689 | $ | 7,085 | |||||
PG&E Corp. | 115,756 | 5,189 | ||||||
Other securities | 14,125 | |||||||
|
| |||||||
| 26,399 | ||||||||
|
| |||||||
Health care 3.93% | ||||||||
AstraZeneca PLC (ADR) | 113,500 | 3,939 | ||||||
AstraZeneca PLC1 | 39,300 | 2,697 | ||||||
Roche Holding AG, non-registered shares, nonvoting1 | 23,575 | 5,963 | ||||||
Other securities | 10,752 | |||||||
|
| |||||||
| 23,351 | ||||||||
|
| |||||||
Industrials 3.54% | ||||||||
Airbus SE, non-registered shares1 | 82,392 | 8,182 | ||||||
Boeing Co. | 17,600 | 5,190 | ||||||
Other securities | 7,680 | |||||||
|
| |||||||
| 21,052 | ||||||||
|
| |||||||
Materials 2.06% | ||||||||
DowDuPont Inc. | 84,800 | 6,040 | ||||||
Other securities | 6,231 | |||||||
|
| |||||||
| 12,271 | ||||||||
|
| |||||||
Miscellaneous 0.22% | ||||||||
Other common stocks in initial period of acquisition | 1,290 | |||||||
|
| |||||||
Total common stocks (cost: $377,538,000) | 409,382 | |||||||
|
| |||||||
Convertible stocks 2.52% | ||||||||
Real estate 2.52% | ||||||||
American Tower Corp., Series B, 5.50% depository share, convertible preferred 2018 | 100,400 | 12,625 | ||||||
Crown Castle International Corp., Series A, 7.00% convertible preferred 2020 | 2,231 | 2,342 | ||||||
|
| |||||||
| 14,967 | ||||||||
|
| |||||||
Total convertible stocks (cost: $14,048,000) | 14,967 | |||||||
|
| |||||||
Bonds, notes & other debt instruments 23.70%
Principal amount (000) | ||||||||
U.S. Treasury bonds & notes 14.63% | ||||||||
U.S. Treasury 13.42% | ||||||||
U.S. Treasury 8.00% 2021 | $ | 5,500 | 6,704 | |||||
U.S. Treasury 8.125% 2021 | 8,200 | 9,933 | ||||||
U.S. Treasury 1.625% 2022 | 6,050 | 5,901 | ||||||
U.S. Treasury 1.75% 2022 | 5,015 | 4,925 | ||||||
U.S. Treasury 1.875% 2022 | 9,000 | 8,879 | ||||||
U.S. Treasury 2.00% 2022 | 15,000 | 14,872 | ||||||
U.S. Treasury 2.00% 2025 | 9,400 | 9,175 | ||||||
U.S. Treasury 0%-2.88% 2020-2047 | 24,078 | 19,350 | ||||||
|
| |||||||
| 79,739 | ||||||||
|
| |||||||
U.S. Treasury inflation-protected securities 1.21% | ||||||||
U.S. Treasury Inflation-Protected Securities 0.38%-0.63% 2025-20273 | 7,202 | 7,206 | ||||||
|
| |||||||
Total U.S. Treasury bonds & notes | 86,945 | |||||||
|
| |||||||
American Funds Insurance Series 75
Table of Contents
Capital Income Builder
Bonds, notes & other debt instruments (continued)
| Principal amount (000) | Value (000) | |||||||
Mortgage-backed obligations 4.78% | ||||||||
Federal agency mortgage-backed obligations 4.70% | ||||||||
Fannie Mae 4.00% 20474 | $ | 13,899 | $ | 14,559 | ||||
Fannie Mae 4.50% 20484,5 | 6,270 | 6,664 | ||||||
Fannie Mae 4.00% 2046-20474 | 2,043 | 2,140 | ||||||
Other securities | 4,609 | |||||||
|
| |||||||
| 27,972 | ||||||||
|
| |||||||
Other 0.08% | ||||||||
Other securities | 461 | |||||||
|
| |||||||
Total mortgage-backed obligations | 28,433 | |||||||
|
| |||||||
Corporate bonds & notes 3.62% | ||||||||
Financials 1.19% | ||||||||
Wells Fargo & Co. 3.58%-4.60% 2021-2028 | 385 | 406 | ||||||
Other securities | 6,647 | |||||||
|
| |||||||
| 7,053 | ||||||||
|
| |||||||
Energy 0.52% | ||||||||
Kinder Morgan, Inc. 5.55% 2045 | 200 | 219 | ||||||
Schlumberger BV 3.625% 20222 | 200 | 206 | ||||||
Other securities | 2,653 | |||||||
|
| |||||||
| 3,078 | ||||||||
|
| |||||||
Consumer staples 0.35% | ||||||||
British American Tobacco PLC 3.557% 20272 | 600 | 602 | ||||||
Reynolds American Inc. 6.875% 2020 | 300 | 329 | ||||||
Other securities | 1,161 | |||||||
|
| |||||||
| 2,092 | ||||||||
|
| |||||||
Industrials 0.09% | ||||||||
General Electric Capital Corp. 5.50% 2020 | 150 | 160 | ||||||
Other securities | 395 | |||||||
|
| |||||||
| 555 | ||||||||
|
| |||||||
Information technology 0.09% | ||||||||
Microsoft Corp. 4.00% 2021 | 500 | 525 | ||||||
|
| |||||||
Other 1.38% | ||||||||
Other securities | 8,211 | |||||||
|
| |||||||
Total corporate bonds & notes | 21,514 | |||||||
|
| |||||||
Asset-backed obligations 0.67% | ||||||||
Other securities | 3,981 | |||||||
|
| |||||||
Total bonds, notes & other debt instruments (cost: $141,713,000) | 140,873 | |||||||
|
| |||||||
Short-term securities 5.71% | ||||||||
Cisco Systems, Inc. 1.23%-1.60% due 1/10/2018-3/6/20182 | 13,100 | 13,081 | ||||||
Federal Home Loan Bank 1.14% due 1/26/2018 | 8,500 | 8,493 | ||||||
General Electric Co. 1.42% due 1/2/2018 | 12,400 | 12,398 | ||||||
|
| |||||||
Total short-term securities (cost: $33,975,000) | 33,972 | |||||||
|
| |||||||
Total investment securities 100.80% (cost: $567,274,000) | 599,194 | |||||||
Other assets less liabilities (0.80)% | (4,737 | ) | ||||||
|
| |||||||
Net assets 100.00% | $ | 594,457 | ||||||
|
| |||||||
76 American Funds Insurance Series
Table of Contents
Capital Income Builder
This summary investment portfolio is designed to streamline the report and help investors better focus on the fund’s principal holdings. See the inside back cover for details on how to obtain a complete schedule of portfolio holdings.
As permitted by U.S. Securities and Exchange Commission regulations, “Miscellaneous” securities include holdings in their first year of acquisition that have not previously been publicly disclosed.
“Other securities” includes all issues that are not disclosed separately in the summary investment portfolio.
The following footnotes apply to either the individual securities noted or one or more of the securities aggregated and listed as a single line item.
| 1 | Valued under fair value procedures adopted by authority of the board of trustees. The total value of all such securities, including those in “Miscellaneous“ and “Other securities,“ was $207,660,000, which represented 34.93% of the net assets of the fund. This amount includes $207,107,000 related to certain securities trading outside the U.S. whose values were adjusted as a result of significant market movements following the close of local trading. |
| 2 | Acquired in a transaction exempt from registration under Rule 144A or Section 4(2) of the Securities Act of 1933. May be resold in the U.S. in transactions exempt from registration, normally to qualified institutional buyers. The total value of all such securities, including those in “Other securities,“ was $18,622,000, which represented 3.13% of the net assets of the fund. |
| 3 | Index-linked bond whose principal amount moves with a government price index. |
| 4 | Principal payments may be made periodically. Therefore, the effective maturity date may be earlier than the stated maturity date. |
| 5 | Purchased on a TBA basis. |
Key to abbreviations
ADR = American Depositary Receipts
CAD = Canadian dollars
TBA = To-be-announced
See Notes to Financial Statements
American Funds Insurance Series 77
Table of Contents
Summary investment portfolio December 31, 2017
Common stocks 64.31%
| Shares | Value (000) | |||||||
Information technology 17.88% | ||||||||
Microsoft Corp. | 10,520,000 | $ | 899,881 | |||||
Taiwan Semiconductor Manufacturing Co., Ltd. (ADR) | 15,001,000 | 594,790 | ||||||
Taiwan Semiconductor Manufacturing Co., Ltd.1 | 8,600,000 | 66,083 | ||||||
ASML Holding NV (New York registered) | 2,502,100 | 434,915 | ||||||
VeriSign, Inc.2 | 3,140,000 | 359,342 | ||||||
Intel Corp. | 6,945,000 | 320,581 | ||||||
Broadcom Ltd. | 1,245,000 | 319,840 | ||||||
Facebook, Inc., Class A2 | 1,385,000 | 244,397 | ||||||
Intuit Inc. | 1,100,000 | 173,558 | ||||||
Western Digital Corp. | 2,100,000 | 167,013 | ||||||
Other securities | 1,008,412 | |||||||
|
| |||||||
| 4,588,812 | ||||||||
|
| |||||||
Health care 9.26% | ||||||||
UnitedHealth Group Inc. | 2,542,000 | 560,409 | ||||||
Johnson & Johnson | 2,850,000 | 398,202 | ||||||
Aetna Inc. | 1,600,000 | 288,624 | ||||||
Humana Inc. | 965,000 | 239,388 | ||||||
Express Scripts Holding Co.2 | 3,100,000 | 231,384 | ||||||
Other securities | 659,219 | |||||||
|
| |||||||
| 2,377,226 | ||||||||
|
| |||||||
Financials 9.12% | ||||||||
Chubb Ltd. | 2,410,000 | 352,173 | ||||||
JPMorgan Chase & Co. | 2,600,000 | 278,044 | ||||||
Arch Capital Group Ltd.2 | 2,632,000 | 238,907 | ||||||
First Republic Bank | 2,480,000 | 214,867 | ||||||
Wells Fargo & Co. | 3,406,400 | 206,666 | ||||||
Bank of America Corp. | 7,000,000 | 206,640 | ||||||
Citigroup Inc. | 2,750,000 | 204,628 | ||||||
Other securities | 638,415 | |||||||
|
| |||||||
| 2,340,340 | ||||||||
|
| |||||||
Consumer discretionary 6.76% | ||||||||
Comcast Corp., Class A | 9,350,000 | 374,467 | ||||||
Home Depot, Inc. | 1,500,000 | 284,295 | ||||||
Newell Brands Inc. | 7,168,500 | 221,507 | ||||||
Amazon.com, Inc.2 | 160,225 | 187,378 | ||||||
VF Corp. | 2,250,000 | 166,500 | ||||||
General Motors Co. | 3,500,000 | 143,465 | ||||||
Other securities | 357,289 | |||||||
|
| |||||||
| 1,734,901 | ||||||||
|
| |||||||
Energy 5.61% | ||||||||
Noble Energy, Inc. | 10,500,000 | 305,970 | ||||||
Weatherford International PLC2,3 | 56,000,000 | 233,520 | ||||||
Royal Dutch Shell PLC, Class B (ADR) | 2,412,000 | 164,716 | ||||||
Chevron Corp. | 1,279,750 | 160,212 | ||||||
Suncor Energy Inc. | 4,000,000 | 146,858 | ||||||
Other securities | 427,574 | |||||||
|
| |||||||
| 1,438,850 | ||||||||
|
| |||||||
Consumer staples 4.47% | ||||||||
Nestlé SA1 | 2,908,230 | 249,910 | ||||||
Nestlé SA (ADR) | 900,000 | 77,373 | ||||||
Philip Morris International Inc. | 2,375,000 | 250,919 | ||||||
Associated British Foods PLC1 | 4,600,000 | 174,876 | ||||||
British American Tobacco PLC1 | 2,357,400 | 159,102 | ||||||
Other securities | 233,411 | |||||||
|
| |||||||
| 1,145,591 | ||||||||
|
| |||||||
78 American Funds Insurance Series
Table of Contents
Asset Allocation Fund
Common stocks
| Shares | Value (000) | |||||||
Materials 3.59% | ||||||||
DowDuPont Inc. | 5,877,000 | $ | 418,560 | |||||
LyondellBasell Industries NV | 2,200,000 | 242,704 | ||||||
| Other securities | 260,758 | |||||||
|
| |||||||
| 922,022 | ||||||||
|
| |||||||
Industrials 3.38% | ||||||||
Lockheed Martin Corp. | 1,262,000 | 405,165 | ||||||
Boeing Co. | 1,239,000 | 365,393 | ||||||
| Other securities | 95,622 | |||||||
|
| |||||||
| 866,180 | ||||||||
|
| |||||||
Real estate 1.28% | ||||||||
Other securities | 329,533 | |||||||
|
| |||||||
Telecommunication services 0.39% | ||||||||
Other securities | 99,225 | |||||||
|
| |||||||
Miscellaneous 2.57% | ||||||||
Other common stocks in initial period of acquisition | 660,297 | |||||||
|
| |||||||
Total common stocks (cost: $11,282,199,000) | 16,502,977 | |||||||
|
| |||||||
Convertible stocks 0.05% | ||||||||
Industrials 0.05% | ||||||||
Other securities | 12,787 | |||||||
|
| |||||||
Total convertible stocks (cost: $19,828,000) | 12,787 | |||||||
|
| |||||||
Bonds, notes & other debt instruments 26.66% | ||||||||
Principal (000) | ||||||||
U.S. Treasury bonds & notes 11.42% | ||||||||
U.S. Treasury 9.31% | ||||||||
U.S. Treasury 1.50% 2019 | $ | 400,000 | 398,592 | |||||
U.S. Treasury 1.25% 20204 | 318,117 | 313,985 | ||||||
| U.S. Treasury 2.875% 2046 | 147,158 | 150,997 | ||||||
| U.S. Treasury 0.63%-4.75% 2018-2047 | 1,531,262 | 1,524,916 | ||||||
|
| |||||||
| 2,388,490 | ||||||||
|
| |||||||
U.S. Treasury inflation-protected securities 2.11% | ||||||||
U.S. Treasury Inflation-Protected Security 0.625% 20245 | 215,862 | 219,605 | ||||||
U.S. Treasury Inflation-Protected Security 1.375% 20445 | 135,765 | 156,816 | ||||||
U.S. Treasury Inflation-Protected Securities 0.13%-2.38% 2021-20475 | 163,593 | 164,355 | ||||||
|
| |||||||
| 540,776 | ||||||||
|
| |||||||
| Total U.S. Treasury bonds & notes | 2,929,266 | |||||||
|
| |||||||
Corporate bonds & notes 8.93% | ||||||||
Energy 1.77% | ||||||||
Noble Energy, Inc. 3.85%-4.95% 2028-2047 | 11,535 | 11,662 | ||||||
Other securities | 441,692 | |||||||
|
| |||||||
| 453,354 | ||||||||
|
| |||||||
Financials 1.37% | ||||||||
ACE INA Holdings Inc. 2.30%-4.35% 2020-2045 | 6,905 | 7,082 | ||||||
Citigroup Inc. 1.70%-3.20% 2018-2026 | 15,011 | 14,938 | ||||||
| JPMorgan Chase & Co. 2.55%-5.30% 2020-2049 | 12,277 | 12,517 | ||||||
| Other securities | 316,261 | |||||||
|
| |||||||
| 350,798 | ||||||||
|
| |||||||
American Funds Insurance Series 79
Table of Contents
Asset Allocation Fund
Bonds, notes & other debt instruments (continued)
Principal amount (000) | Value (000) | |||||||
Corporate bonds & notes (continued) | ||||||||
Health care 1.23% | ||||||||
Aetna Inc. 1.70% 2018 | $ | 855 | $ | 854 | ||||
Johnson & Johnson 2.25%-3.75% 2022-2047 | 6,785 | 6,861 | ||||||
Other securities | 307,172 | |||||||
|
| |||||||
| 314,887 | ||||||||
|
| |||||||
Consumer discretionary 0.79% | ||||||||
Comcast Corp. 1.63%-5.88% 2018-2036 | 9,285 | 8,908 | ||||||
Home Depot, Inc. 1.80%-4.25% 2020-2046 | 6,915 | 7,304 | ||||||
Other securities | 187,027 | |||||||
|
| |||||||
| 203,239 | ||||||||
|
| |||||||
Consumer staples 0.52% | ||||||||
Philip Morris International Inc. 1.88%-4.25% 2020-2044 | 19,155 | 19,258 | ||||||
Other securities | 113,383 | |||||||
|
| |||||||
| 132,641 | ||||||||
|
| |||||||
Industrials 0.45% | ||||||||
Lockheed Martin Corp. 2.50%-3.55% 2020-2026 | 15,050 | 15,440 | ||||||
Other securities | 100,152 | |||||||
|
| |||||||
| 115,592 | ||||||||
|
| |||||||
Information technology 0.41% | ||||||||
Broadcom Ltd. 2.38%-3.88% 2020-20276 | 10,300 | 10,188 | ||||||
Microsoft Corp. 4.10%-4.20% 2035-2037 | 7,000 | 7,934 | ||||||
Other securities | 86,459 | |||||||
|
| |||||||
| 104,581 | ||||||||
|
| |||||||
Other 2.39% | ||||||||
Other securities | 615,194 | |||||||
|
| |||||||
Total corporate bonds & notes | 2,290,286 | |||||||
|
| |||||||
Mortgage-backed obligations 5.29% | ||||||||
Federal agency mortgage-backed obligations 5.14% | ||||||||
Fannie Mae 0%-7.50% 2021-20487,8,9 | 600,155 | 624,707 | ||||||
Freddie Mac 1.69%-6.50% 2022-20487,8,9 | 497,009 | 513,878 | ||||||
Other securities | 178,667 | |||||||
|
| |||||||
| 1,317,252 | ||||||||
|
| |||||||
Other 0.15% | ||||||||
Other securities | 40,640 | |||||||
|
| |||||||
Total mortgage-backed obligations | 1,357,892 | |||||||
|
| |||||||
Federal agency bonds & notes 0.20% | ||||||||
Fannie Mae 1.88%-2.00% 2022-2026 | 16,000 | 15,269 | ||||||
Federal Home Loan Bank 0.875% 2018 | 17,140 | 17,084 | ||||||
Freddie Mac 0.75% 2018 | 18,768 | 18,741 | ||||||
|
| |||||||
Total federal agency bonds & notes | 51,094 | |||||||
|
| |||||||
Other 0.82% | ||||||||
Other securities | 211,780 | |||||||
|
| |||||||
Total bonds, notes & other debt instruments (cost: $6,788,125,000) | 6,840,318 | |||||||
|
| |||||||
80 American Funds Insurance Series
Table of Contents
Asset Allocation Fund
Short-term securities 10.93%
Principal (000) | Value (000) | |||||||
CAFCO, LLC 1.52% due 2/27/20186 | $ | 50,000 | $ | 49,863 | ||||
Chariot Funding, LLC 1.50%-1.85% due 3/14/2018-6/19/20186 | 137,300 | 136,335 | ||||||
Fannie Mae 1.30% due 3/28/2018 | 25,000 | 24,917 | ||||||
Federal Home Loan Bank 1.08%-1.36% due 1/10/2018-3/28/2018 | 1,089,945 | 1,088,477 | ||||||
Freddie Mac 1.06%-1.28% due 2/7/2018-4/6/2018 | 375,000 | 374,036 | ||||||
Procter & Gamble Co. 1.21%-1.30% due 1/12/2018-2/13/20186 | 151,000 | 150,819 | ||||||
U.S. Treasury Bills 1.02%-1.44% due 1/2/2018-6/14/2018 | 360,000 | 359,419 | ||||||
Other securities | 619,433 | |||||||
|
| |||||||
Total short-term securities (cost: $2,803,685,000) | 2,803,299 | |||||||
|
| |||||||
Total investment securities 101.95% (cost: $20,893,837,000) | 26,159,381 | |||||||
Other assets less liabilities (1.95)% | (499,287 | ) | ||||||
|
| |||||||
Net assets 100.00% | $ | 25,660,094 | ||||||
|
| |||||||
This summary investment portfolio is designed to streamline the report and help investors better focus on the fund’s principal holdings. See the inside back cover for details on how to obtain a complete schedule of portfolio holdings.
As permitted by U.S. Securities and Exchange Commission regulations, “Miscellaneous” securities include holdings in their first year of acquisition that have not previously been publicly disclosed.
“Other securities” includes all issues that are not disclosed separately in the summary investment portfolio. “Other securities“ also includes loan participations and assignments, which may be subject to legal or contractual restrictions on resale. The total value of all such loans was $49,647,000, which represented .19% of the net assets of the fund. Some securities in “Other securities” (with an aggregate value of $40,857,000, an aggregate cost of $62,607,000, and which represented .15% of the net assets of the fund) were acquired from 3/10/2010 to 8/9/2017 through private placement transactions exempt from registration under the Securities Act of 1933, which may subject them to legal or contractual restrictions on resale.
Futures contracts
Contracts | Type | Number of contracts | Expiration | Notional amount10 (000) | Value at 12/31/201711 (000) | Unrealized (depreciation) appreciation at 12/31/2017 (000) | ||||||||||||||
10 Year Ultra U.S. Treasury Note Futures | Short | 250 | March 2018 | $ | (25,000 | ) | $ | (33,391 | ) | $ | (235 | ) | ||||||||
30 Year Ultra U.S. Treasury Bond Futures | Short | 250 | March 2018 | (25,000 | ) | (41,914 | ) | (278 | ) | |||||||||||
5 Year U.S. Treasury Note Futures | Long | 614 | April 2018 | 61,400 | 71,325 | (313 | ) | |||||||||||||
2 Year U.S. Treasury Note Futures | Short | 179 | April 2018 | (35,800 | ) | (38,325 | ) | 73 | ||||||||||||
|
| |||||||||||||||||||
| $ | (753 | ) | ||||||||||||||||||
|
| |||||||||||||||||||
Swap contracts
Interest rate swaps
Receive | Pay | Expiration date | Notional (000) | Value at 12/31/2017 (000) | Upfront payments/ receipts (000) | Unrealized appreciation (depreciation) at 12/31/2017 (000) | ||||||||||||||||
3-month USD-LIBOR | 1.501% | 6/8/2019 | $ | 100,000 | $ | 658 | $ | — | $ | 658 | ||||||||||||
1.336% | U.S. EFFR | 6/8/2019 | 100,000 | (605 | ) | — | (605 | ) | ||||||||||||||
1.6365% | 3-month USD-LIBOR | 10/16/2019 | 124,000 | (866 | ) | — | (866 | ) | ||||||||||||||
3-month USD-LIBOR | 3.402% | 6/23/2044 | 18,000 | (3,124 | ) | — | (3,124 | ) | ||||||||||||||
3-month USD-LIBOR | 2.945% | 10/16/2044 | 28,000 | (2,311 | ) | — | (2,311 | ) | ||||||||||||||
|
|
|
| |||||||||||||||||||
| $ | — | $ | (6,248 | ) | ||||||||||||||||||
|
|
|
| |||||||||||||||||||
American Funds Insurance Series 81
Table of Contents
Asset Allocation Fund
Investments in affiliates
A company is an affiliate of the fund under the Investment Company Act of 1940 if the fund’s holdings in that company represent 5% or more of the outstanding voting shares. The value of the fund’s affiliated-company holdings is shown in the summary investment portfolio. Further details on such holdings and related transactions during the year ended December 31, 2017, appear below.
| Beginning shares | Additions | Reductions | Ending shares | Net realized gain (000) | Net unrealized depreciation (000) | Dividend income (000) | Value of affiliate at 12/31/2017 (000) | |||||||||||||||||||||||||
Common stocks 0.91% | ||||||||||||||||||||||||||||||||
Energy 0.91% | ||||||||||||||||||||||||||||||||
Weatherford International PLC2 | 42,200,000 | 13,800,000 | — | 56,000,000 | $ | — | $ | (35,533 | ) | $ | — | $ | 233,520 | |||||||||||||||||||
The following footnotes apply to either the individual securities noted or one or more of the securities aggregated and listed as a single line item.
| 1 | Valued under fair value procedures adopted by authority of the board of trustees. The total value of all such securities, including those in “Miscellaneous“ and “Other securities,“ was $1,001,357,000, which represented 3.90% of the net assets of the fund. This amount includes $957,800,000 related to certain securities trading outside the U.S. whose values were adjusted as a result of significant market movements following the close of local trading. |
| 2 | Security did not produce income during the last 12 months. |
| 3 | Represents an affiliated company as defined under the Investment Company Act of 1940. |
| 4 | A portion of this security was pledged as collateral. The total value of pledged collateral was $8,119,000, which represented .03% of the net assets of the fund. 5Index-linked bond whose principal amount moves with a government price index. |
| 6 | Acquired in a transaction exempt from registration under Rule 144A or Section 4(2) of the Securities Act of 1933. May be resold in the U.S. in transactions exempt from registration, normally to qualified institutional buyers. The total value of all such securities, including those in “Other securities,“ was $1,510,770,000, which represented 5.89% of the net assets of the fund. |
| 7 | Principal payments may be made periodically. Therefore, the effective maturity date may be earlier than the stated maturity date. |
| 8 | Coupon rate may change periodically. |
| 9 | Purchased on a TBA basis. |
| 10 | Notional amount is calculated based on the number of contracts and notional contract size. |
| 11 | Value is calculated based on the notional amount and current market price. |
Key to abbreviations and symbol
ADR = American Depositary Receipts
EFFR = Federal Funds Effective Rate
LIBOR = London Interbank Offered Rate
TBA = To-be-announced
USD/$ = U.S. dollars
See Notes to Financial Statements
82 American Funds Insurance Series
Table of Contents
Summary investment portfolio December 31, 2017
Common stocks 61.54%
| Shares | Value (000) | |||||||
Information technology 11.18% | ||||||||
Nintendo Co., Ltd.1 | 19,800 | $ | 7,208 | |||||
Microsoft Corp. | 71,100 | 6,082 | ||||||
ASML Holding NV1 | 34,000 | 5,899 | ||||||
Taiwan Semiconductor Manufacturing Co., Ltd.1 | 664,000 | 5,102 | ||||||
Keyence Corp.1 | 4,400 | 2,457 | ||||||
Amphenol Corp., Class A | 24,000 | 2,107 | ||||||
Alphabet Inc., Class C2 | 2,005 | 2,098 | ||||||
Other securities | 8,623 | |||||||
|
| |||||||
| 39,576 | ||||||||
|
| |||||||
Industrials 8.31% | ||||||||
Boeing Co. | 16,750 | 4,940 | ||||||
Harmonic Drive Systems Inc.1 | 50,300 | 2,935 | ||||||
Flughafen Zürich AG1 | 12,235 | 2,798 | ||||||
ASSA ABLOY AB, Class B1 | 118,000 | 2,448 | ||||||
BAE Systems PLC1 | 303,000 | 2,330 | ||||||
AB Volvo, Class B1 | 102,000 | 1,898 | ||||||
Other securities | 12,055 | |||||||
|
| |||||||
| 29,404 | ||||||||
|
| |||||||
Financials 8.04% | ||||||||
HSBC Holdings PLC (GBP denominated)1 | 539,633 | 5,565 | ||||||
JPMorgan Chase & Co. | 42,700 | 4,567 | ||||||
BM&FBOVESPA SA - Bolsa de Valores, Mercadorias e Futuros, ordinary nominative | 376,000 | 2,582 | ||||||
Wells Fargo & Co. | 40,200 | 2,439 | ||||||
HDFC Bank Ltd. (ADR) | 21,605 | 2,197 | ||||||
AIA Group Ltd.1 | 250,000 | 2,132 | ||||||
Sberbank of Russia PJSC (ADR)1 | 123,000 | 2,082 | ||||||
Other securities | 6,876 | |||||||
|
| |||||||
| 28,440 | ||||||||
|
| |||||||
Consumer staples 7.20% | ||||||||
British American Tobacco PLC1 | 104,700 | 7,066 | ||||||
British American Tobacco PLC (ADR) | 22,146 | 1,484 | ||||||
Philip Morris International Inc. | 36,700 | 3,877 | ||||||
Nestlé SA1 | 43,800 | 3,764 | ||||||
Altria Group, Inc. | 51,000 | 3,642 | ||||||
Coca-Cola European Partners PLC | 48,000 | 1,913 | ||||||
Other securities | 3,734 | |||||||
|
| |||||||
| 25,480 | ||||||||
|
| |||||||
Health care 5.01% | ||||||||
Humana Inc. | 20,830 | 5,167 | ||||||
Merck & Co., Inc. | 56,120 | 3,158 | ||||||
Mettler-Toledo International Inc.2 | 3,500 | 2,168 | ||||||
Fisher & Paykel Healthcare Corp. Ltd.1 | 204,000 | 2,069 | ||||||
Other securities | 5,186 | |||||||
|
| |||||||
| 17,748 | ||||||||
|
| |||||||
Materials 4.42% | ||||||||
DowDuPont Inc. | 63,075 | 4,492 | ||||||
Linde AG, non-registered shares1,2 | 8,900 | 2,082 | ||||||
Croda International PLC1 | 31,900 | 1,905 | ||||||
Other securities | 7,149 | |||||||
|
| |||||||
| 15,628 | ||||||||
|
| |||||||
Energy 4.37% | ||||||||
Royal Dutch Shell PLC, Class B1 | 109,200 | 3,683 | ||||||
Royal Dutch Shell PLC, Class A1 | 585 | 20 | ||||||
ConocoPhillips | 49,506 | 2,717 | ||||||
Enbridge Inc. (CAD denominated) | 50,594 | 1,979 | ||||||
American Funds Insurance Series 83
Table of Contents
Global Balanced Fund
Common stocks (continued)
| Shares | Value (000) | |||||||
Energy (continued) | ||||||||
Enbridge Inc. (CAD denominated)1,3 | 16,157 | $ | 619 | |||||
LUKOIL Oil Co. PJSC (ADR)1 | 39,800 | 2,277 | ||||||
Other securities | 4,156 | |||||||
|
| |||||||
| 15,451 | ||||||||
|
| |||||||
Consumer discretionary 4.31% | ||||||||
Amazon.com, Inc.2 | 3,400 | 3,976 | ||||||
Peugeot SA1 | 136,500 | 2,773 | ||||||
Nokian Renkaat Oyj1 | 50,634 | 2,294 | ||||||
Home Depot, Inc. | 10,000 | 1,895 | ||||||
Other securities | 4,333 | |||||||
|
| |||||||
| 15,271 | ||||||||
|
| |||||||
Utilities 2.11% | ||||||||
Enel Américas SA (ADR) | 197,000 | 2,201 | ||||||
Other securities | 5,269 | |||||||
|
| |||||||
| 7,470 | ||||||||
|
| |||||||
Real estate 1.73% | ||||||||
Daito Trust Construction Co., Ltd.1 | 11,000 | 2,241 | ||||||
Link REIT1 | 211,697 | 1,962 | ||||||
Equinix, Inc. REIT | 4,240 | 1,921 | ||||||
|
| |||||||
| 6,124 | ||||||||
|
| |||||||
Miscellaneous 4.86% | ||||||||
Other common stocks in initial period of acquisition | 17,202 | |||||||
|
| |||||||
Total common stocks (cost: $160,781,000) | 217,794 | |||||||
|
| |||||||
Bonds, notes & other debt instruments 31.65% | ||||||||
Principal (000) | ||||||||
Bonds & notes of governments & government agencies outside the U.S. 14.13% | ||||||||
Japan 0.10%-2.30% 2018-20464 | ¥ | 1,000,339 | 9,538 | |||||
Poland (Republic of) 3.25%-5.75% 2020-2025 | PLN | 12,590 | 3,930 | |||||
Other securities | 36,549 | |||||||
|
| |||||||
| 50,017 | ||||||||
|
| |||||||
U.S. Treasury bonds & notes 9.59% | ||||||||
U.S. Treasury 7.38% | ||||||||
U.S. Treasury 1.625% 2022 | $ | 3,850 | 3,755 | |||||
U.S. Treasury 2.125% 2024 | 2,025 | 2,001 | ||||||
U.S. Treasury 2.25% 2027 | 2,800 | 2,762 | ||||||
U.S. Treasury 0.75%-3.13% 2018-2046 | 17,788 | 17,587 | ||||||
|
| |||||||
| 26,105 | ||||||||
|
| |||||||
U.S. Treasury inflation-protected securities 2.21% | ||||||||
U.S. Treasury Inflation-Protected Securities 0.13%-2.38% 2021-20444 | 7,731 | 7,837 | ||||||
|
| |||||||
Total U.S. Treasury bonds & notes | 33,942 | |||||||
|
| |||||||
Corporate bonds & notes 6.33% | ||||||||
Financials 1.43% | ||||||||
HSBC Holdings PLC 3.375% 2024 | € | 100 | 124 | |||||
HSBC Holdings PLC 3.90%-4.30% 2026 | $ | 400 | 421 | |||||
JPMorgan Chase & Co. 2.55%-6.75% 2021-2049 | 389 | 407 | ||||||
Other securities | 4,100 | |||||||
|
| |||||||
| 5,052 | ||||||||
|
| |||||||
84 American Funds Insurance Series
Table of Contents
Global Balanced Fund
Bonds, notes & other debt instruments
| Principal amount (000) | Value (000) | |||||||
Utilities 1.05% | ||||||||
Other securities | $ | 3,704 | ||||||
|
| |||||||
Consumer discretionary 0.79% | ||||||||
Amazon.com, Inc. 2.80%-3.15% 2024-20273 | $ | 265 | 265 | |||||
Other securities | 2,516 | |||||||
|
| |||||||
| 2,781 | ||||||||
|
| |||||||
Health care 0.67% | ||||||||
Humana Inc. 3.15% 2022 | 100 | 101 | ||||||
Other securities | 2,275 | |||||||
|
| |||||||
| 2,376 | ||||||||
|
| |||||||
Consumer staples 0.40% | ||||||||
Altria Group, Inc. 2.63%-4.75% 2020-2042 | 400 | 420 | ||||||
British American Tobacco PLC 3.56%-4.39% 2027-20373 | 185 | 189 | ||||||
Philip Morris International Inc. 2.00%-4.25% 2020-2044 | 195 | 197 | ||||||
Reynolds American Inc. 4.00%-4.45% 2022-2025 | 120 | 128 | ||||||
Other securities | 478 | |||||||
|
| |||||||
| 1,412 | ||||||||
|
| |||||||
Information technology 0.34% | ||||||||
Microsoft Corp. 2.40%-3.30% 2026-2027 | 640 | 653 | ||||||
Other securities | 543 | |||||||
|
| |||||||
| 1,196 | ||||||||
|
| |||||||
Other 1.65% | ||||||||
Other securities | 5,862 | |||||||
|
| |||||||
Total corporate bonds & notes | 22,383 | |||||||
|
| |||||||
Mortgage-backed obligations 1.54% | ||||||||
Other 1.54% | ||||||||
Other securities | 5,463 | |||||||
|
| |||||||
Total mortgage-backed obligations | 5,463 | |||||||
|
| |||||||
Asset-backed obligations 0.06% | ||||||||
Other securities | 200 | |||||||
|
| |||||||
Total bonds, notes & other debt instruments (cost: $111,365,000) | 112,005 | |||||||
|
| |||||||
Short-term securities 7.47% | ||||||||
Mitsubishi UFJ Trust and Banking Corp. 1.52% due 1/19/20183 | 5,000 | 4,996 | ||||||
Mizuho Bank, Ltd. 1.59% due 1/25/20183 | 8,300 | 8,290 | ||||||
Royal Bank of Canada 1.34%-1.53% due 1/8/2018-1/16/2018 | 7,500 | 7,494 | ||||||
Thunder Bay Funding, LLC 1.70% due 3/6/20183 | 475 | 473 | ||||||
Victory Receivables Corp. 1.42% due 1/17/20183 | 4,200 | 4,197 | ||||||
Other securities | 998 | |||||||
|
| |||||||
Total short-term securities (cost: $26,451,000) | ||||||||
| 26,448 | ||||||||
|
| |||||||
Total investment securities 100.66% (cost: $298,597,000) | 356,247 | |||||||
Other assets less liabilities (0.66)% | (2,348 | ) | ||||||
|
| |||||||
Net assets 100.00% | $ | 353,899 | ||||||
|
| |||||||
American Funds Insurance Series 85
Table of Contents
Global Balanced Fund
This summary investment portfolio is designed to streamline the report and help investors better focus on the fund’s principal holdings. See the inside back cover for details on how to obtain a complete schedule of portfolio holdings.
As permitted by U.S. Securities and Exchange Commission regulations, “Miscellaneous” securities include holdings in their first year of acquisition that have not previously been publicly disclosed.
“Other securities” includes all issues that are not disclosed separately in the summary investment portfolio.
Forward currency contracts
| Contract amount | Unrealized appreciation (depreciation) | |||||||||||||||
| Purchases (000) | Sales (000) | Counterparty | Settlement date | at 12/31/2017 (000) | ||||||||||||
| USD | 419 | MXN | 7,600 | JPMorgan Chase | 1/4/2018 | $ | 33 | |||||||||
| JPY | 21,922 | AUD | 250 | UBS AG | 1/5/2018 | — | 5 | |||||||||
| USD | 207 | INR | 13,400 | Citibank | 1/5/2018 | (3 | ) | |||||||||
| USD | 274 | CAD | 350 | Bank of America, N.A. | 1/5/2018 | (4 | ) | |||||||||
| USD | 571 | INR | 36,900 | JPMorgan Chase | 1/5/2018 | (7 | ) | |||||||||
| USD | 205 | ZAR | 2,900 | UBS AG | 1/5/2018 | (29 | ) | |||||||||
| EUR | 266 | USD | 312 | Goldman Sachs | 1/8/2018 | 8 | ||||||||||
| USD | 428 | ILS | 1,500 | Bank of America, N.A. | 1/9/2018 | (3 | ) | |||||||||
| USD | 651 | EUR | 550 | HSBC Bank | 1/9/2018 | (10 | ) | |||||||||
| EUR | 502 | USD | 600 | Bank of America, N.A. | 1/10/2018 | 3 | ||||||||||
| USD | 234 | CAD | 300 | Bank of America, N.A. | 1/10/2018 | (5 | ) | |||||||||
| JPY | 96,672 | USD | 863 | JPMorgan Chase | 1/10/2018 | (5 | ) | |||||||||
| USD | 228 | AUD | 300 | Goldman Sachs | 1/10/2018 | (6 | ) | |||||||||
| USD | 327 | PLN | 1,158 | JPMorgan Chase | 1/10/2018 | (6 | ) | |||||||||
| USD | 251 | AUD | 330 | JPMorgan Chase | 1/10/2018 | (7 | ) | |||||||||
| USD | 1,103 | JPY | 125,000 | JPMorgan Chase | 1/10/2018 | (7 | ) | |||||||||
| JPY | 63,535 | USD | 573 | JPMorgan Chase | 1/10/2018 | (8 | ) | |||||||||
| USD | 468 | CAD | 600 | Goldman Sachs | 1/10/2018 | (9 | ) | |||||||||
| JPY | 90,073 | USD | 811 | Barclays Bank PLC | 1/10/2018 | (11 | ) | |||||||||
| JPY | 40,289 | USD | 357 | Bank of America, N.A. | 1/11/2018 | 1 | ||||||||||
| USD | 730 | AUD | 970 | Citibank | 1/12/2018 | (27 | ) | |||||||||
| USD | 478 | INR | 31,000 | Bank of America, N.A. | 1/16/2018 | (6 | ) | |||||||||
| JPY | 134,232 | USD | 1,190 | JPMorgan Chase | 1/17/2018 | 2 | ||||||||||
| USD | 297 | EUR | 250 | Bank of America, N.A. | 1/17/2018 | (3 | ) | |||||||||
| USD | 550 | CAD | 700 | Bank of America, N.A. | 1/17/2018 | (7 | ) | |||||||||
| USD | 361 | AUD | 475 | JPMorgan Chase | 1/17/2018 | (9 | ) | |||||||||
| USD | 399 | MXN | 7,700 | Bank of America, N.A. | 1/18/2018 | 9 | ||||||||||
| CHF | 385 | USD | 391 | Goldman Sachs | 1/18/2018 | 5 | ||||||||||
| JPY | 22,275 | USD | 198 | Goldman Sachs | 1/18/2018 | — | 5 | |||||||||
| NOK | 2,700 | USD | 322 | Bank of America, N.A. | 1/19/2018 | 7 | ||||||||||
| USD | 766 | EUR | 650 | Bank of America, N.A. | 1/19/2018 | (14 | ) | |||||||||
| EUR | 645 | USD | 760 | Citibank | 1/22/2018 | 15 | ||||||||||
| EUR | 349 | USD | 413 | UBS AG | 1/22/2018 | 6 | ||||||||||
| EUR | 227 | GBP | 200 | Goldman Sachs | 1/22/2018 | 2 | ||||||||||
| JPY | 31,929 | USD | 284 | Citibank | 1/22/2018 | (1 | ) | |||||||||
| JPY | 69,685 | USD | 623 | Barclays Bank PLC | 1/22/2018 | (4 | ) | |||||||||
| USD | 2,253 | GBP | 1,700 | Barclays Bank PLC | 1/22/2018 | (44 | ) | |||||||||
| SEK | 3,609 | USD | 430 | Citibank | 1/23/2018 | 11 | ||||||||||
| EUR | 357 | USD | 422 | Citibank | 1/23/2018 | 6 | ||||||||||
| JPY | 57,092 | USD | 506 | UBS AG | 1/23/2018 | 1 | ||||||||||
| USD | 171 | ILS | 600 | JPMorgan Chase | 1/23/2018 | (2 | ) | |||||||||
| USD | 448 | PLN | 1,600 | Citibank | 1/23/2018 | (12 | ) | |||||||||
| SEK | 1,625 | USD | 192 | Barclays Bank PLC | 1/24/2018 | 7 | ||||||||||
| USD | 216 | MXN | 4,250 | JPMorgan Chase | 1/31/2018 | 1 | ||||||||||
| EUR | 482 | USD | 573 | Bank of America, N.A. | 2/6/2018 | 6 | ||||||||||
| USD | 421 | PLN | 1,500 | Bank of America, N.A. | 2/7/2018 | (9 | ) | |||||||||
| SEK | 1,270 | USD | 151 | Bank of America, N.A. | 2/15/2018 | 4 | ||||||||||
| USD | 250 | JPY | 28,000 | Bank of New York Mellon | 2/15/2018 | 1 | ||||||||||
| JPY | 22,250 | USD | 198 | HSBC Bank | 2/15/2018 | — | 5 | |||||||||
86 American Funds Insurance Series
Table of Contents
Global Balanced Fund
| Contract amount | Unrealized appreciation | |||||||||||
| Purchases (000) | Sales (000) | Counterparty | Settlement date | at 12/31/2017 (000) | ||||||||
| SEK | 1,613 | USD | 191 | UBS AG | 2/23/2018 | $7 | ||||||
| JPY | 34,577 | USD | 306 | HSBC Bank | 2/23/2018 | 1 | ||||||
| USD | 375 | INR | 24,900 | Citibank | 3/26/2018 | (11) | ||||||
| USD | 371 | BRL | 1,250 | Citibank | 11/29/2018 | 8 | ||||||
| ||||||||||||
| $(125) | ||||||||||||
| ||||||||||||
The following footnotes apply to either the individual securities noted or one or more of the securities aggregated and listed as a single line item.
| 1 | Valued under fair value procedures adopted by authority of the board of trustees. The total value of all such securities, including those in “Miscellaneous“ and “Other securities,“ was $114,391,000, which represented 32.32% of the net assets of the fund. This amount includes $112,907,000 related to certain securities trading outside the U.S. whose values were adjusted as a result of significant market movements following the close of local trading. |
| 2 | Security did not produce income during the last 12 months. |
| 3 | Acquired in a transaction exempt from registration under Rule 144A or Section 4(2) of the Securities Act of 1933. May be resold in the U.S. in transactions exempt from registration, normally to qualified institutional buyers. The total value of all such securities, including those in “Other securities,“ was $28,319,000, which represented 8.00% of the net assets of the fund. |
| 4 | Index-linked bond whose principal amount moves with a government price index. |
| 5 | Amount less than one thousand. |
Key to abbreviations and symbols
ADR = American Depositary Receipts
AUD = Australian dollars
BRL = Brazilian reais
CAD = Canadian dollars
CHF = Swiss francs
EUR/€ = Euros
GBP = British pounds
ILS = Israeli shekels
INR = Indian rupees
JPY/¥ = Japanese yen
MXN = Mexican pesos
NOK = Norwegian kroner
PLN = Polish zloty
SEK = Swedish kronor
USD/$ = U.S. dollars
ZAR = South African rand
See Notes to Financial Statements
American Funds Insurance Series 87
Table of Contents
Summary investment portfolio December 31, 2017
Bonds, notes & other debt instruments 96.91%
| Principal amount (000) | Value (000) | |||||||||
Corporate bonds & notes 32.37% | ||||||||||
Financials 7.60% | ||||||||||
Bank of America Corp. 2.33%-3.59% 2021-20281 | $ | 107,869 | $ | 108,473 | ||||||
Intesa Sanpaolo SpA 5.017% 20241 | 54,615 | 55,987 | ||||||||
Other securities | 648,915 | |||||||||
|
| |||||||||
| 813,375 | ||||||||||
|
| |||||||||
Health care 5.06% | ||||||||||
Teva Pharmaceutical Finance Company BV 2.80% 2023 | 72,471 | 63,178 | ||||||||
Teva Pharmaceutical Finance Company BV 3.15% 2026 | 73,918 | 61,126 | ||||||||
Teva Pharmaceutical Finance Company BV 2.20%-4.10% 2021-2046 | 64,348 | 50,104 | ||||||||
Other securities | 366,891 | |||||||||
|
| |||||||||
| 541,299 | ||||||||||
|
| |||||||||
Energy 4.94% | ||||||||||
Other securities | 528,887 | |||||||||
|
| |||||||||
Consumer discretionary 3.64% | ||||||||||
Other securities | 389,447 | |||||||||
|
| |||||||||
Utilities 3.43% | ||||||||||
Other securities | 366,875 | |||||||||
|
| |||||||||
Consumer staples 2.65% | ||||||||||
Procter & Gamble Co. 3.50% 2047 | 750 | 759 | ||||||||
Other securities | 282,353 | |||||||||
|
| |||||||||
| 283,112 | ||||||||||
|
| |||||||||
Telecommunication services 1.78% | ||||||||||
AT&T Inc. 3.40%-5.30% 2024-2058 | 114,118 | 114,697 | ||||||||
Other securities | 76,288 | |||||||||
|
| |||||||||
| 190,985 | ||||||||||
|
| |||||||||
Information technology 1.07% | ||||||||||
Apple Inc. 1.55%-3.35% 2021-2027 | 27,562 | 27,092 | ||||||||
Other securities | 87,012 | |||||||||
|
| |||||||||
| 114,104 | ||||||||||
|
| |||||||||
Other 2.20% | ||||||||||
Other securities | 235,072 | |||||||||
|
| |||||||||
Total corporate bonds & notes | 3,463,156 | |||||||||
|
| |||||||||
U.S. Treasury bonds & notes 27.17% | ||||||||||
U.S. Treasury 24.87% | ||||||||||
U.S. Treasury 2.125% 2022 | 172,737 | 172,069 | ||||||||
U.S. Treasury 2.125% 2022 | 150,000 | 149,736 | ||||||||
U.S. Treasury 2.25% 2023 | 115,000 | 114,802 | ||||||||
U.S. Treasury 2.125% 2024 | 260,000 | 257,452 | ||||||||
U.S. Treasury 2.125% 2024 | 200,000 | 197,500 | ||||||||
U.S. Treasury 2.125% 2024 | 159,445 | 157,576 | ||||||||
U.S. Treasury 2.25% 2024 | 80,000 | 79,831 | ||||||||
U.S. Treasury 2.25% 2024 | 77,542 | 77,148 | ||||||||
U.S. Treasury 2.25% 2027 | 266,623 | 262,999 | ||||||||
U.S. Treasury 2.25% 2027 | 226,075 | 223,315 | ||||||||
U.S. Treasury 2.25% 2027 | 150,000 | 147,993 | ||||||||
U.S. Treasury 2.375% 2027 | 200,000 | 199,582 | ||||||||
88 American Funds Insurance Series
Table of Contents
Bond Fund
Bonds, notes & other debt instruments
Principal amount (000) | Value (000) | |||||||||
| U.S. Treasury 2.75% 2047 | $ | 304,179 | $ | 304,608 | ||||||
| U.S. Treasury 2.75% 2047 | 71,680 | 71,820 | ||||||||
| U.S. Treasury 0.75%-8.75% 2019-2046 | 230,631 | 244,662 | ||||||||
|
| |||||||||
| 2,661,093 | ||||||||||
|
| |||||||||
U.S. Treasury inflation-protected securities 2.30% | ||||||||||
U.S. Treasury Inflation-Protected Security 0.375% 20272 | 151,257 | 150,475 | ||||||||
U.S. Treasury Inflation-Protected Securities 0.38%-2.00% 2025-20262 | 90,669 | 95,441 | ||||||||
| 245,916 | ||||||||||
|
| |||||||||
Total U.S. Treasury bonds & notes | 2,907,009 | |||||||||
|
| |||||||||
Mortgage-backed obligations 25.85% | ||||||||||
Federal agency mortgage-backed obligations 25.54% | ||||||||||
Fannie Mae 3.50% 20333,4 | 59,300 | 61,169 | ||||||||
Fannie Mae 3.00% 20463 | 75,036 | 75,112 | ||||||||
Fannie Mae 3.50% 20473 | 80,119 | 82,381 | ||||||||
Fannie Mae 4.00% 20473 | 88,762 | 93,005 | ||||||||
| Fannie Mae 3.50% 20483,4 | 100,000 | 102,574 | ||||||||
| Fannie Mae 3.50% 20483,4 | 77,040 | 79,149 | ||||||||
| Fannie Mae 4.00% 20483,4 | 275,000 | 287,754 | ||||||||
| Fannie Mae 4.00% 20483,4 | 171,162 | 178,860 | ||||||||
| Fannie Mae 4.50% 20483,4 | 300,000 | 319,217 | ||||||||
| Fannie Mae 4.50% 20483,4 | 148,375 | 157,694 | ||||||||
| Fannie Mae 2.89%-9.25% 2023-20483,4,5 | 203,834 | 213,825 | ||||||||
| Freddie Mac 3.50% 20473 | 74,888 | 77,080 | ||||||||
| Freddie Mac 4.00% 20483,4 | 275,000 | 287,699 | ||||||||
| Freddie Mac 4.00% 20483,4 | 76,000 | 79,403 | ||||||||
| Freddie Mac 0%-5.50% 2021-20483,4 | 268,392 | 276,461 | ||||||||
| Government National Mortgage Assn. 4.00% 20483,4 | 125,150 | 130,541 | ||||||||
| Government National Mortgage Assn. 4.00% 20483,4 | 51,450 | 53,648 | ||||||||
| Government National Mortgage Assn. 4.50% 20483,4 | 75,550 | 79,256 | ||||||||
| Government National Mortgage Assn. 4.00%-4.50% 2040-20483,4 | 92,971 | 97,490 | ||||||||
|
| |||||||||
| 2,732,318 | ||||||||||
|
| |||||||||
Other 0.31% | ||||||||||
Other securities | 32,614 | |||||||||
|
| |||||||||
Total mortgage-backed obligations | 2,764,932 | |||||||||
|
| |||||||||
Bonds & notes of governments & government agencies outside the U.S. 6.38% | ||||||||||
| Japan, Series 19, 0.10% 20242 | ¥ | 5,366,380 | 50,151 | |||||||
| Japan, Series 20, 0.10% 20252 | 11,317,500 | 106,018 | ||||||||
| Portuguese Republic 5.125% 2024 | $ | 101,050 | 108,779 | |||||||
| Portuguese Republic 5.65% 2024 | € | 20,000 | 30,550 | |||||||
| Portuguese Republic 2.88%-4.10% 2025-2045 | 24,375 | 32,318 | ||||||||
| United Mexican States, Series M, 6.50% 2021 | MXN | 3,132,700 | 154,042 | |||||||
| United Mexican States, Series M, 5.75% 2026 | 527,500 | 23,742 | ||||||||
| United Mexican States 3.60%-4.35% 2025-2047 | $ | 17,000 | 16,980 | |||||||
| Other securities | 159,400 | |||||||||
|
| |||||||||
| 681,980 | ||||||||||
|
| |||||||||
Asset-backed obligations 2.78% | ||||||||||
| Other securities | 297,847 | |||||||||
|
| |||||||||
Municipals 2.25% | ||||||||||
Illinois 1.82% | ||||||||||
G.O. Bonds, Pension Funding Series 2003, 4.95% 2023 | 24,805 | 25,903 | ||||||||
G.O. Bonds, Pension Funding Series 2003, 5.10% 20333 | 93,475 | 93,483 | ||||||||
G.O. Bonds, Pension Funding Series 2013, 5.877% 2019 | 400 | 413 | ||||||||
G.O. Bonds, Series 2013-B, 3.65% 2020 | 1,000 | 1,001 | ||||||||
G.O. Bonds, Series 2013-B, 4.11% 2022 | 750 | 758 | ||||||||
American Funds Insurance Series 89
Table of Contents
Bond Fund
Bonds, notes & other debt instruments (continued)
| Principal amount (000) | Value (000) | |||||||||
Municipals (continued) | ||||||||||
| G.O. Bonds, Series 2013-B, 4.31% 2023 | $ | 2,125 | $ | 2,140 | ||||||
| G.O. Bonds, Series 2013-B, 4.91% 2027 | 1,450 | 1,447 | ||||||||
| G.O. Bonds, Taxable Build America Bonds, Series 2010-1, 6.63% 2035 | 13,780 | 15,316 | ||||||||
| G.O. Bonds, Taxable Build America Bonds, Series 2010-2, 5.65% 2020 | 250 | 260 | ||||||||
| G.O. Bonds, Taxable Build America Bonds, Series 2010-2, 5.85% 2022 | 2,370 | 2,544 | ||||||||
| G.O. Bonds, Taxable Build America Bonds, Series 2010-2, 5.95% 2023 | 2,950 | 3,181 | ||||||||
| G.O. Bonds, Taxable Build America Bonds, Series 2010-2, 6.15% 2025 | 3,955 | 4,274 | ||||||||
| G.O. Bonds, Taxable Build America Bonds, Series 2010-3, 5.547% 2019 | 335 | 344 | ||||||||
| G.O. Bonds, Taxable Build America Bonds, Series 2010-3, 5.727% 2020 | 2,400 | 2,503 | ||||||||
| G.O. Bonds, Taxable Build America Bonds, Series 2010-5, 6.20% 20213 | 7,784 | 8,148 | ||||||||
| Other securities | 32,912 | |||||||||
|
| |||||||||
| 194,627 | ||||||||||
|
| |||||||||
Other 0.43% | ||||||||||
Other securities | 45,699 | |||||||||
|
| |||||||||
| Total municipals | 240,326 | |||||||||
|
| |||||||||
Federal agency bonds & notes 0.11% | ||||||||||
| Fannie Mae 2.125% 2026 | 12,410 | 12,036 | ||||||||
|
| |||||||||
| Total bonds, notes & other debt instruments (cost: $10,316,353,000) | 10,367,286 | |||||||||
|
| |||||||||
Common stocks 0.01% | ||||||||||
| Shares | ||||||||||
Other 0.01% | ||||||||||
Other securities | 1,242 | |||||||||
|
| |||||||||
Total common stocks (cost: $956,000) | 1,242 | |||||||||
|
| |||||||||
Rights & warrants 0.00% | ||||||||||
Utilities 0.00% | ||||||||||
Other securities | 55 | |||||||||
|
| |||||||||
Total rights & warrants (cost: $96,000) | 55 | |||||||||
|
| |||||||||
Short-term securities 22.13% | ||||||||||
| Principal amount (000) | ||||||||||
Apple Inc. 1.21%-1.50% due 1/4/2018-2/20/20181 | $ | 131,000 | 130,833 | |||||||
Bank of Tokyo-Mitsubishi UFJ, Ltd. 1.36%-1.49% due 1/5/2018-1/10/2018 | 61,100 | 61,071 | ||||||||
Cisco Systems, Inc. 1.43%-1.52% due 2/15/2018-2/20/20181 | 100,000 | 99,794 | ||||||||
Coca-Cola Co. 1.24%-1.27% due 1/12/2018-1/30/20181 | 101,400 | 101,292 | ||||||||
Federal Home Loan Bank 1.07%-1.32% due 1/8/2018-3/16/2018 | 620,350 | 619,459 | ||||||||
Freddie Mac 1.16%-1.28% due 4/3/2018-4/6/2018 | 141,900 | 141,388 | ||||||||
IBM Credit LLC 1.50% due 3/13/20181 | 80,000 | 79,752 | ||||||||
Microsoft Corp. 1.26% due 1/16/20181 | 67,500 | 67,452 | ||||||||
Pfizer Inc. 1.30%-1.50% due 2/20/2018-3/12/20181 | 100,000 | 99,741 | ||||||||
Procter & Gamble Co. 1.21%-1.30% due 1/12/2018-2/22/20181 | 125,000 | 124,848 | ||||||||
U.S. Treasury Bills 1.09%-1.44% due 1/2/2018-6/14/2018 | 237,300 | 236,407 | ||||||||
Walt Disney Co. 1.29%-1.42% due 1/25/2018-1/26/20181 | 100,000 | 99,888 | ||||||||
Other securities | 504,869 | |||||||||
|
| |||||||||
Total short-term securities (cost: $2,367,157,000) | 2,366,794 | |||||||||
|
| |||||||||
Total investment securities 119.05% (cost: $12,684,562,000) | 12,735,377 | |||||||||
Other assets less liabilities (19.05)% | (2,037,683 | ) | ||||||||
|
| |||||||||
Net assets 100.00% | $ | 10,697,694 | ||||||||
|
| |||||||||
90 American Funds Insurance Series
Table of Contents
Bond Fund
This summary investment portfolio is designed to streamline the report and help investors better focus on the fund’s principal holdings. See the inside back cover for details on how to obtain a complete schedule of portfolio holdings.
“Other securities” includes all issues that are not disclosed separately in the summary investment portfolio. “Other securities” includes securities which were valued under fair value procedures adopted by authority of the board of trustees. The total value of securities which were valued under fair value procedures was $4,276,000, which represented .04% of the net assets of the fund. “Other securities“ also includes loan participations and assignments, which may be subject to legal or contractual restrictions on resale. The total value of all such loans was $21,361,000, which represented .20% of the net assets of the fund. Some securities in “Other securities” (with an aggregate value of $1,241,000, an aggregate cost of $780,000, and which represented .01% of the net assets of the fund) were acquired on 8/31/2015 through private placement transactions exempt from registration under the Securities Act of 1933, which may subject them to legal or contractual restrictions on resale.
Futures contracts
Contracts | Type | Number of contracts | Expiration | Notional amount6 (000) | Value at 12/31/20177 (000) | Unrealized (depreciation) appreciation at 12/31/2017 (000) | ||||||||||||||||
10 Year Euro-Bund Futures | Short | 128 | March 2018 | $ | (12,800 | ) | $ | (24,831 | ) | $ | (16 | ) | ||||||||||
10 Year U.S. Treasury Note Futures | Long | 3,256 | March 2018 | 325,600 | 403,897 | (2,045 | ) | |||||||||||||||
30 Year Ultra U.S. Treasury Bond Futures | Short | 51 | March 2018 | (5,100 | ) | (8,551 | ) | (59 | ) | |||||||||||||
10 Year Ultra U.S. Treasury Note Futures | Short | 53 | March 2018 | (5,300 | ) | (7,079 | ) | 25 | ||||||||||||||
5 Year U.S. Treasury Note Futures | Long | 6,048 | April 2018 | 604,800 | 702,560 | (1,350 | ) | |||||||||||||||
2 Year U.S. Treasury Note Futures | Long | 2,099 | April 2018 | 419,800 | 449,416 | (711 | ) | |||||||||||||||
| �� |
|
| ||||||||||||||||||||
| $ | (4,156 | ) | ||||||||||||||||||||
|
| |||||||||||||||||||||
Forward currency contracts
| Contract amount | Counterparty | Settlement date | Unrealized appreciation (depreciation) | |||||||||||||
| Purchases (000) | Sales (000) | at 12/31/2017 (000) | ||||||||||||||
| USD | 64,742 | MXN | 1,220,000 | Bank of America, N.A. | 1/9/2018 | $ | 2,829 | |||||||||
| USD | 13,016 | JPY | 1,445,000 | Bank of America, N.A. | 1/10/2018 | 183 | ||||||||||
| USD | 455 | EUR | 385 | Citibank | 1/10/2018 | (7 | ) | |||||||||
| USD | 30,924 | JPY | 3,430,000 | UBS AG | 1/11/2018 | 462 | ||||||||||
| USD | 43,780 | JPY | 4,925,000 | JPMorgan Chase | 1/11/2018 | 41 | ||||||||||
| USD | 128,051 | MXN | 2,400,000 | JPMorgan Chase | 1/12/2018 | 6,331 | ||||||||||
| USD | 13,141 | MXN | 252,000 | Citibank | 1/17/2018 | 374 | ||||||||||
| USD | 19,850 | EUR | 16,750 | Citibank | 1/17/2018 | (272 | ) | |||||||||
| USD | 64,745 | JPY | 7,300,000 | HSBC Bank | 1/22/2018 | (121 | ) | |||||||||
| USD | 4,767 | EUR | 4,000 | JPMorgan Chase | 1/23/2018 | (40 | ) | |||||||||
| USD | 26,460 | EUR | 22,350 | JPMorgan Chase | 1/23/2018 | (399 | ) | |||||||||
| USD | 57,793 | EUR | 48,800 | Citibank | 1/23/2018 | (852 | ) | |||||||||
| USD | 57,533 | AUD | 75,000 | JPMorgan Chase | 1/23/2018 | (987 | ) | |||||||||
|
| |||||||||||||||
| $ | 7,542 | |||||||||||||||
|
| |||||||||||||||
American Funds Insurance Series 91
Table of Contents
Bond Fund
Swap contracts
Interest rate swaps
Receive | Pay | Expiration date | Notional (000) | Value at 12/31/2017 (000) | Upfront payments/ receipts (000) | Unrealized (depreciation) appreciation at 12/31/2017 (000) | ||||||||||||||||
1.39% | 3-month Canada BA | 7/13/2018 | C$ | 1,460,000 | $ | (1,637 | ) | $ | — | $ | (1,637 | ) | ||||||||||
1.77% | 3-month Canada BA | 9/26/2018 | 975,000 | 186 | — | 186 | ||||||||||||||||
1.669% | 3-month USD-LIBOR | 10/28/2019 | $ | 112,000 | (729 | ) | — | (729 | ) | |||||||||||||
1.6915% | 3-month USD-LIBOR | 6/3/2020 | 1,600 | (15 | ) | — | (15 | ) | ||||||||||||||
1.7345% | 3-month USD-LIBOR | 12/31/2020 | 120,000 | (1,496 | ) | — | (1,496 | ) | ||||||||||||||
3-month USD-LIBOR | 1.975% | 4/27/2022 | 15,000 | 148 | — | 148 | ||||||||||||||||
3-month USD-LIBOR | 2.1305% | 7/17/2022 | 100,000 | 400 | — | 400 | ||||||||||||||||
1.9375% | 3-month USD-LIBOR | 12/18/2022 | 150,000 | (2,128 | ) | — | (2,128 | ) | ||||||||||||||
3-month USD-LIBOR | 2.701% | 6/9/2024 | 60,000 | (1,498 | ) | — | (1,498 | ) | ||||||||||||||
3-month USD-LIBOR | 2.6815% | 9/24/2024 | 1,600 | (38 | ) | — | (38 | ) | ||||||||||||||
3-month USD-LIBOR | 2.54% | 10/3/2024 | 400 | (6 | ) | — | (6 | ) | ||||||||||||||
6-month EURIBOR | 0.9852% | 10/17/2024 | € | 25,000 | (914 | ) | — | (914 | ) | |||||||||||||
3-month USD-LIBOR | 2.342% | 10/21/2024 | $ | 290 | (1 | ) | — | (1 | ) | |||||||||||||
3-month USD-LIBOR | 2.326% | 10/22/2024 | 800 | (1 | ) | — | (1 | ) | ||||||||||||||
3-month USD-LIBOR | 2.372% | 10/24/2024 | 1,150 | (5 | ) | — | (5 | ) | ||||||||||||||
3-month USD-LIBOR | 2.438% | 11/19/2024 | 2,750 | (24 | ) | — | (24 | ) | ||||||||||||||
3-month USD-LIBOR | 2.4585% | 11/24/2024 | 23,000 | (233 | ) | — | (233 | ) | ||||||||||||||
3-month USD-LIBOR | 2.4295% | 11/25/2024 | 800 | (7 | ) | — | (7 | ) | ||||||||||||||
3-month USD-LIBOR | 2.353% | 12/8/2024 | 700 | (2 | ) | — | (2 | ) | ||||||||||||||
3-month USD-LIBOR | 2.2845% | 12/12/2024 | 330 | — | 8 | — | — | 8 | ||||||||||||||
3-month USD-LIBOR | 1.8185% | 1/20/2025 | 900 | 29 | — | 29 | ||||||||||||||||
3-month USD-LIBOR | 1.9365% | 1/22/2025 | 1,500 | 37 | — | 37 | ||||||||||||||||
3-month USD-LIBOR | 2.192% | 3/18/2025 | 1,850 | 15 | — | 15 | ||||||||||||||||
3-month USD-LIBOR | 2.0475% | 3/23/2025 | 450 | 8 | — | 8 | ||||||||||||||||
3-month USD-LIBOR | 2.3175% | 5/8/2025 | 1,500 | — | 8 | — | — | 8 | ||||||||||||||
3-month USD-LIBOR | 2.339% | 5/13/2025 | 375 | (1 | ) | — | (1 | ) | ||||||||||||||
3-month USD-LIBOR | 2.351% | 5/15/2025 | 590 | (2 | ) | — | (2 | ) | ||||||||||||||
3-month USD-LIBOR | 2.287% | 5/20/2025 | 500 | 1 | — | 1 | ||||||||||||||||
3-month USD-LIBOR | 2.227% | 5/28/2025 | 260 | 2 | — | 2 | ||||||||||||||||
3-month USD-LIBOR | 2.2125% | 5/29/2025 | 465 | 3 | — | 3 | ||||||||||||||||
3-month USD-LIBOR | 2.451% | 6/5/2025 | 650 | (6 | ) | — | (6 | ) | ||||||||||||||
3-month USD-LIBOR | 2.46% | 6/10/2025 | 2,536 | (25 | ) | — | (25 | ) | ||||||||||||||
3-month USD-LIBOR | 2.455% | 6/24/2025 | 235 | (2 | ) | — | (2 | ) | ||||||||||||||
3-month USD-LIBOR | 2.428% | 7/2/2025 | 2,000 | (15 | ) | — | (15 | ) | ||||||||||||||
3-month USD-LIBOR | 2.397% | 7/13/2025 | 900 | (5 | ) | — | (5 | ) | ||||||||||||||
3-month USD-LIBOR | 2.535% | 7/15/2025 | 800 | (12 | ) | — | (12 | ) | ||||||||||||||
3-month USD-LIBOR | 2.4615% | 7/22/2025 | 1,300 | (13 | ) | — | (13 | ) | ||||||||||||||
3-month USD-LIBOR | 2.312% | 7/29/2025 | 1,000 | 1 | — | 1 | ||||||||||||||||
3-month USD-LIBOR | 2.331% | 7/30/2025 | 435 | — | 8 | — | — | 8 | ||||||||||||||
3-month USD-LIBOR | 2.228% | 9/4/2025 | 12,000 | 82 | — | 82 | ||||||||||||||||
3-month USD-LIBOR | 2.2135% | 9/4/2025 | 5,000 | 39 | — | 39 | ||||||||||||||||
6-month JPY-LIBOR | 0.282% | 2/2/2026 | ¥ | 5,500,000 | (175 | ) | — | (175 | ) | |||||||||||||
3-month USD-LIBOR | 1.6705% | 3/4/2026 | $ | 248,000 | 12,454 | — | 12,454 | |||||||||||||||
6-month JPY-LIBOR | 0.0875% | 3/10/2026 | ¥ | 11,100,000 | 1,242 | — | 1,242 | |||||||||||||||
3-month USD-LIBOR | 1.5925% | 5/9/2026 | $ | 1,000 | 58 | — | 58 | |||||||||||||||
3-month USD-LIBOR | 1.595% | 5/12/2026 | 8,500 | 489 | — | 489 | ||||||||||||||||
3-month USD-LIBOR | 1.592% | 5/12/2026 | 4,000 | 231 | — | 231 | ||||||||||||||||
3.0865% | 3-month USD-LIBOR | 8/18/2034 | 2,250 | 184 | — | 184 | ||||||||||||||||
2.913% | 3-month USD-LIBOR | 11/24/2034 | 10,000 | 579 | — | 579 | ||||||||||||||||
2.844% | 3-month USD-LIBOR | 6/11/2035 | 3,250 | 158 | — | 158 | ||||||||||||||||
2.9535% | 3-month USD-LIBOR | 6/30/2035 | 2,500 | 161 | — | 161 | ||||||||||||||||
2.773% | 3-month USD-LIBOR | 7/13/2035 | 500 | 19 | — | 19 | ||||||||||||||||
2.589% | 3-month USD-LIBOR | 9/4/2035 | 3,100 | 35 | — | 35 | ||||||||||||||||
3-month USD-LIBOR | 3.0515% | 11/14/2044 | 1,000 | (105 | ) | — | (105 | ) | ||||||||||||||
3-month USD-LIBOR | 2.925% | 12/3/2044 | 1,230 | (97 | ) | — | (97 | ) | ||||||||||||||
92 American Funds Insurance Series
Table of Contents
Bond Fund
Receive | Pay | Expiration date | Notional (000) | Value at 12/31/2017 (000) | Upfront payments/ receipts (000) | Unrealized (depreciation) appreciation at 12/31/2017 (000) | ||||||||||||||||||
3-month USD-LIBOR | 2.6695% | 12/19/2044 | $ | 200 | $ | (5 | ) | $ | — | $ | (5 | ) | ||||||||||||
3-month USD-LIBOR | 2.5755% | 3/5/2045 | 1,470 | (12 | ) | — | (12 | ) | ||||||||||||||||
2.377% | 3-month USD-LIBOR | 4/29/2045 | 1,910 | (63 | ) | — | (63 | ) | ||||||||||||||||
3-month USD-LIBOR | 2.757% | 5/8/2045 | 1,500 | (68 | ) | — | (68 | ) | ||||||||||||||||
6-month JPY-LIBOR | 0.58295% | 3/23/2046 | ¥ | 2,000,000 | 1,673 | — | 1,673 | |||||||||||||||||
0.64355% | 6-month JPY-LIBOR | 4/27/2046 | 2,000,000 | (1,396 | ) | — | (1,396 | ) | ||||||||||||||||
3-month USD-LIBOR | 2.1155% | 5/13/2046 | $ | 2,400 | 214 | — | 214 | |||||||||||||||||
|
|
|
| |||||||||||||||||||||
| $ | — | $ | 7,712 | |||||||||||||||||||||
|
|
|
| |||||||||||||||||||||
Credit default swaps
Centrally cleared credit default swaps on credit indices — buy protection
| Receive | Pay/ Payment frequency | Expiration date | Notional (000) | Value at 12/31/2017 (000) | Upfront payments (000) | Unrealized depreciation at 12/31/2017 (000) | ||||||||||||||||
CDX.NA.IG.29 | 1.00%/Quarterly | 12/20/2022 | $ | 65,000 | $ | (1,550 | ) | $ | (1,366 | ) | $ | (184 | ) | |||||||||
The following footnotes apply to either the individual securities noted or one or more of the securities aggregated and listed as a single line item.
| 1 | Acquired in a transaction exempt from registration under Rule 144A or Section 4(2) of the Securities Act of 1933. May be resold in the U.S. in transactions exempt from registration, normally to qualified institutional buyers. The total value of all such securities, including those in “Other securities,“ was $2,046,793,000, which represented 19.13% of the net assets of the fund. |
| 2 | Index-linked bond whose principal amount moves with a government price index. |
| 3 | Principal payments may be made periodically. Therefore, the effective maturity date may be earlier than the stated maturity date. |
| 4 | Purchased on a TBA basis. |
| 5 | Coupon rate may change periodically. |
| 6 | Notional amount is calculated based on the number of contracts and notional contract size. |
| 7 | Value is calculated based on the notional amount and current market price. |
| 8 | Amount less than one thousand. |
Key to abbreviations and symbols
AUD = Australian dollars
C$ = Canadian dollars
EUR/€ = Euros
EURIBOR = Euro Interbank Offered Rate
G.O. = General Obligation
JPY/¥ = Japanese yen
LIBOR = London Interbank Offered Rate
MXN = Mexican pesos
TBA = To-be-announced
USD/$ = U.S. dollars
See Notes to Financial Statements
American Funds Insurance Series 93
Table of Contents
Summary investment portfolio December 31, 2017
Bonds, notes & other debt instruments 89.68%
Principal amount (000) | Value (000) | |||||||
Euros 14.40% | ||||||||
French Republic O.A.T. 1.85% 20271 | € | 8,228 | $ | 12,539 | ||||
Germany (Federal Republic of) 0.10% 20261 | 31,541 | 41,791 | ||||||
| Germany (Federal Republic of) 2.50% 2046 | 10,770 | 16,972 | ||||||
| Germany (Federal Republic of) 0.10%-6.25% 2023-20481 | 15,925 | 21,065 | ||||||
| Italy (Republic of) 0.90% 2022 | 10,900 | 13,181 | ||||||
| Italy (Republic of) 1.45% 2022 | 10,575 | 13,100 | ||||||
| Italy (Republic of) 0.95% 2023 | 36,575 | 43,972 | ||||||
| Italy (Republic of) 1.50%-4.75% 2023-2025 | 9,750 | 12,975 | ||||||
| Portuguese Republic 2.875% 2025 | 12,500 | 16,556 | ||||||
| Portuguese Republic 2.875% 2026 | 4,200 | 5,502 | ||||||
| Portuguese Republic 4.125% 2027 | 25,015 | 35,655 | ||||||
| Spain (Kingdom of) 1.30% 2026 | 10,400 | 12,465 | ||||||
| Other securities | 109,670 | |||||||
|
| |||||||
| 355,443 | ||||||||
|
| |||||||
Japanese yen 8.11% | ||||||||
Japan, Series 18, 0.10% 20241 | ¥ | 4,731,720 | 44,073 | |||||
Japan, Series 19, 0.10% 20241 | 2,685,700 | 25,099 | ||||||
| Japan, Series 344, 0.10% 2026 | 1,355,000 | 12,125 | ||||||
| Japan, Series 346, 0.10% 2027 | 2,335,000 | 20,877 | ||||||
| Japan, Series 116, 2.20% 2030 | 1,735,000 | 19,191 | ||||||
| Japan, Series 145, 1.70% 2033 | 2,465,000 | 26,412 | ||||||
| Japan 0.10%–2.30% 2022-20441 | 5,353,885 | 52,321 | ||||||
|
| |||||||
| 200,098 | ||||||||
|
| |||||||
Polish zloty 3.94% | ||||||||
Poland (Republic of), Series 0420, 1.50% 2020 | PLN | 60,575 | 17,268 | |||||
Poland (Republic of), Series 1021, 5.75% 2021 | 128,830 | 41,721 | ||||||
| Poland (Republic of), Series 0922, 5.75% 2022 | 46,600 | 15,295 | ||||||
| Poland (Republic of) 3.25%-5.25% 2020-2025 | 75,440 | 22,885 | ||||||
|
| |||||||
| 97,169 | ||||||||
|
| |||||||
Mexican pesos 3.91% | ||||||||
United Mexican States, Series M, 6.50% 2021 | MXN | 660,800 | 32,493 | |||||
United Mexican States, Series M20, 10.00% 2024 | 209,500 | 12,021 | ||||||
| United Mexican States, Series M, 5.75% 2026 | 717,000 | 32,270 | ||||||
| United Mexican States 4.00%-10.00% 2019-20421 | 379,751 | 19,716 | ||||||
|
| |||||||
| 96,500 | ||||||||
|
| |||||||
Indian rupees 2.54% | ||||||||
India (Republic of) 7.80% 2021 | INR | 1,117,600 | 17,937 | |||||
India (Republic of) 8.83% 2023 | 1,284,200 | 21,441 | ||||||
| India (Republic of) 6.97%-7.88% 2023-2030 | 1,223,470 | 19,105 | ||||||
| Other securities | 4,181 | |||||||
|
| |||||||
| 62,664 | ||||||||
|
| |||||||
Malaysian ringgits 2.25% | ||||||||
Malaysia (Federation of), Series 0116, 3.80% 2023 | MYR | 47,413 | 11,729 | |||||
Malaysia (Federation of) 3.58%-4.50% 2018-2030 | 177,177 | 43,917 | ||||||
|
| |||||||
| 55,646 | ||||||||
|
| |||||||
Norwegian kroner 1.62% | ||||||||
Norway (Kingdom of) 3.75% 2021 | NKr | 299,750 | 39,988 | |||||
|
| |||||||
Australian dollars 1.39% | ||||||||
Australia (Commonwealth of), Series 124, 5.75% 2021 | A$ | 22,900 | 19,929 | |||||
Australia (Commonwealth of), Series 128, 5.75% 2022 | 16,150 | 14,465 | ||||||
|
| |||||||
| 34,394 | ||||||||
|
| |||||||
94 American Funds Insurance Series
Table of Contents
Global Bond Fund
Bonds, notes & other debt instruments
Principal amount (000) | Value (000) | |||||||
British pounds 1.33% | ||||||||
United Kingdom 3.25% 2044 | £ | 6,500 | $ | 11,432 | ||||
United Kingdom 1.75%-4.25% 2022-2045 | 10,590 | 18,004 | ||||||
| Other securities | 3,319 | |||||||
|
| |||||||
| 32,755 | ||||||||
|
| |||||||
Thai baht 1.16% | ||||||||
Thailand (Kingdom of) 1.49% 2019 | THB | 491,100 | 15,073 | |||||
Thailand (Kingdom of) 1.88%-3.85% 2022-2026 | 433,200 | 13,516 | ||||||
|
| |||||||
| 28,589 | ||||||||
|
| |||||||
Danish kroner 1.05% | ||||||||
Nykredit Realkredit AS, Series 01E, 2.00% 20372 | DKr | 69,099 | 11,607 | |||||
Realkredit Danmark AS, Series 22S, 2.00% 20372 | 68,140 | 11,451 | ||||||
| Other securities | 2,748 | |||||||
|
| |||||||
| 25,806 | ||||||||
|
| |||||||
Chilean pesos 0.89% | ||||||||
Chile (Banco Central de) 4.50% 2021 | CLP | 13,200,000 | 21,977 | |||||
|
| |||||||
Israeli shekels 0.85% | ||||||||
Israel (State of) 5.50% 2042 | ILS | 29,300 | 12,512 | |||||
Other securities | 8,381 | |||||||
|
| |||||||
| 20,893 | ||||||||
|
| |||||||
Canadian dollars 0.77% | ||||||||
Canada 2.25% 2025 | C$ | 19,600 | 15,870 | |||||
Other securities | 3,097 | |||||||
|
| |||||||
| 18,967 | ||||||||
|
| |||||||
U.S. dollars 43.07% | ||||||||
Fannie Mae 4.00% 20482,3 | $ | 24,800 | 25,915 | |||||
Fannie Mae 2.18%-4.50% 2022-20482,3 | 12,330 | 12,682 | ||||||
| Poland (Republic of) 3.25% 2026 | 4,100 | 4,195 | ||||||
| U.S. Treasury 1.375% 2020 | 41,900 | 41,300 | ||||||
| U.S. Treasury 1.625% 2020 | 38,900 | 38,560 | ||||||
| U.S. Treasury 1.125% 20214 | 43,160 | 41,977 | ||||||
| U.S. Treasury 2.00% 2021 | 23,450 | 23,374 | ||||||
| U.S. Treasury 2.00% 2026 | 46,785 | 45,312 | ||||||
| U.S. Treasury 2.25% 2027 | 18,700 | 18,446 | ||||||
| U.S. Treasury 1.38%-2.13% 2021-2024 | 29,650 | 29,098 | ||||||
| U.S. Treasury Inflation-Protected Security 0.125% 20221 | 122,652 | 121,800 | ||||||
| U.S. Treasury Inflation-Protected Security 0.625% 20241 | 33,010 | 33,582 | ||||||
| U.S. Treasury Inflation-Protected Security 0.25% 20251 | 11,560 | 11,457 | ||||||
| U.S. Treasury Inflation-Protected Security 1.00% 20461 | 21,550 | 23,018 | ||||||
| U.S. Treasury Inflation-Protected Securities 0.13%-2.38% 2024-20451 | 36,940 | 38,151 | ||||||
| Other securities | 554,003 | |||||||
|
| |||||||
| 1,062,870 | ||||||||
|
| |||||||
Other 2.40% | ||||||||
Other securities | 59,260 | |||||||
|
| |||||||
Total bonds, notes & other debt instruments (cost: $2,173,424,000) | 2,213,019 | |||||||
|
| |||||||
Convertible stocks 0.05% | ||||||||
| Shares | ||||||||
U.S. dollars 0.05% | ||||||||
Other securities | 1,210 | |||||||
|
| |||||||
Total convertible stocks (cost: $1,202,000) | 1,210 | |||||||
|
| |||||||
American Funds Insurance Series 95
Table of Contents
Global Bond Fund
Common stocks 0.03%
| Shares | Value (000) | |||||||
U.S. dollars 0.03% | ||||||||
Other securities | ||||||||
Total common stocks (cost: $2,528,000) | $ | 696 | ||||||
|
| |||||||
| 696 | ||||||||
|
| |||||||
Short-term securities 11.25% | ||||||||
Principal amount (000) | ||||||||
| American Honda Finance Corp. 1.43% due 1/24/2018 | $ | 36,000 | 35,962 | |||||
| Japanese Treasury Discount Bills (0.16)% due 5/21/2018 | ¥ | 15,300,000 | 135,869 | |||||
| Liberty Street Funding Corp. 1.78% due 3/21/20185 | $ | 25,000 | 24,901 | |||||
| Mitsubishi UFJ Trust and Banking Corp. 1.52% due 1/19/20185 | 35,400 | 35,369 | ||||||
| Royal Bank of Canada 1.53% due 1/16/2018 | 16,000 | 15,988 | ||||||
| Victory Receivables Corp. 1.43% due 1/16/20185 | 12,200 | 12,191 | ||||||
| Other securities | 17,268 | |||||||
|
| |||||||
Total short-term securities (cost: $276,867,000) | 277,548 | |||||||
|
| |||||||
Total investment securities 101.01% (cost: $2,454,021,000) | 2,492,473 | |||||||
| Other assets less liabilities (1.01)% | (24,895 | ) | ||||||
|
| |||||||
Net assets 100.00% | $ | 2,467,578 | ||||||
|
| |||||||
This summary investment portfolio is designed to streamline the report and help investors better focus on the fund’s principal holdings. See the inside back cover for details on how to obtain a complete schedule of portfolio holdings.
“Other securities” includes all issues that are not disclosed separately in the summary investment portfolio. “Other securities” includes securities which were valued under fair value procedures adopted by authority of the board of trustees. The total value of securities which were valued under fair value procedures was $2,478,000, which represented .10% of the net assets of the fund. “Other securities“ also includes loan participations and assignments, which may be subject to legal or contractual restrictions on resale. The total value of all such loans was $5,582,000, which represented .23% of the net assets of the fund. Some securities in “Other securities” (with an aggregate value of $4,647,000, an aggregate cost of $5,346,000, and which represented .19% of the net assets of the fund) were acquired from 3/10/2010 to 8/9/2017 through private placement transactions exempt from registration under the Securities Act of 1933, which may subject them to legal or contractual restrictions on resale.
Futures contracts
Contracts | Type | Number of contracts | Expiration | Notional amount6 (000) | Value at 12/31/20177 (000) | Unrealized (depreciation) appreciation at 12/31/2017 (000) | ||||||||||||||||||
10 Year Ultra U.S. Treasury Note Futures | Long | 101 | March 2018 | $ | 10,100 | $ | 13,490 | $ | (78 | ) | ||||||||||||||
10 Year U.S. Treasury Note Futures | Long | 77 | March 2018 | 7,700 | 9,552 | (48 | ) | |||||||||||||||||
30 Year Ultra U.S. Treasury Bond Futures | Long | 13 | March 2018 | 1,300 | 2,179 | 25 | ||||||||||||||||||
5 Year U.S. Treasury Note Futures | Long | 1,524 | April 2018 | 152,400 | 177,034 | (428 | ) | |||||||||||||||||
90 Day Euro Dollar Futures | Short | 366 | September 2018 | (91,500 | ) | (89,634 | ) | 170 | ||||||||||||||||
|
| |||||||||||||||||||||||
| $ | (359 | ) | ||||||||||||||||||||||
|
| |||||||||||||||||||||||
Forward currency contracts
| Contract amount | Unrealized appreciation (depreciation) | |||||||||||||||
| Purchases (000) | Sales (000) | Counterparty | Settlement date | at 12/31/2017 (000) | ||||||||||||
| USD | 7,771 | MXN | 140,900 | JPMorgan Chase | 1/4/2018 | $ | 613 | |||||||||
| USD | 3,058 | CAD | 3,900 | Bank of America, N.A. | 1/5/2018 | (45 | ) | |||||||||
| USD | 4,126 | INR | 267,100 | Citibank | 1/5/2018 | (55 | ) | |||||||||
| USD | 7,869 | AUD | 10,200 | UBS AG | 1/5/2018 | (90 | ) | |||||||||
| USD | 14,560 | INR | 941,650 | JPMorgan Chase | 1/5/2018 | (180 | ) | |||||||||
96 American Funds Insurance Series
Table of Contents
Global Bond Fund
| Contract amount | Unrealized appreciation (depreciation) | |||||||||||||||
| Purchases (000) | Sales (000) | Counterparty | Settlement date | at 12/31/2017 (000) | ||||||||||||
| USD | 2,774 | ZAR | 39,200 | UBS AG | 1/5/2018 | $ | (391 | ) | ||||||||
| EUR | 5,084 | USD | 5,951 | Goldman Sachs | 1/8/2018 | 153 | ||||||||||
| USD | 4,970 | ILS | 17,400 | Bank of America, N.A. | 1/9/2018 | (32 | ) | |||||||||
| USD | 13,666 | EUR | 11,550 | HSBC Bank | 1/9/2018 | (202 | ) | |||||||||
| EUR | 10,463 | USD | 12,500 | Bank of America, N.A. | 1/10/2018 | 63 | ||||||||||
| USD | 3,153 | CAD | 4,050 | Bank of America, N.A. | 1/10/2018 | (70 | ) | |||||||||
| JPY | 1,392,273 | USD | 12,434 | JPMorgan Chase | 1/10/2018 | (70 | ) | |||||||||
| USD | 5,035 | PLN | 17,827 | JPMorgan Chase | 1/10/2018 | (86 | ) | |||||||||
| USD | 4,029 | AUD | 5,300 | Goldman Sachs | 1/10/2018 | (106 | ) | |||||||||
| JPY | 2,265,955 | USD | 20,240 | Bank of America, N.A. | 1/10/2018 | (117 | ) | |||||||||
| USD | 5,171 | AUD | 6,800 | Bank of America, N.A. | 1/10/2018 | (135 | ) | |||||||||
| USD | 7,691 | CAD | 9,850 | Goldman Sachs | 1/10/2018 | (147 | ) | |||||||||
| JPY | 1,346,098 | USD | 12,121 | Barclays Bank PLC | 1/10/2018 | (167 | ) | |||||||||
| JPY | 3,321,365 | USD | 29,938 | JPMorgan Chase | 1/10/2018 | (442 | ) | |||||||||
| JPY | 835,989 | USD | 7,411 | Bank of America, N.A. | 1/11/2018 | 13 | ||||||||||
| USD | 1,710 | AUD | 2,250 | Bank of America, N.A. | 1/11/2018 | (46 | ) | |||||||||
| JPY | 2,218,752 | USD | 20,004 | UBS AG | 1/11/2018 | (299 | ) | |||||||||
| EUR | 17,250 | USD | 20,075 | UBS AG | 1/12/2018 | 640 | ||||||||||
| USD | 3,762 | MXN | 72,500 | HSBC Bank | 1/12/2018 | 85 | ||||||||||
| USD | 12,610 | AUD | 16,760 | Citibank | 1/12/2018 | (467 | ) | |||||||||
| USD | 5,694 | INR | 369,000 | Bank of America, N.A. | 1/16/2018 | (75 | ) | |||||||||
| EUR | 14,702 | USD | 17,356 | JPMorgan Chase | 1/17/2018 | 305 | ||||||||||
| JPY | 2,756,764 | USD | 24,449 | JPMorgan Chase | 1/17/2018 | 41 | ||||||||||
| JPY | 1,698,519 | USD | 15,121 | Citibank | 1/17/2018 | (32 | ) | |||||||||
| USD | 3,568 | EUR | 3,000 | Bank of America, N.A. | 1/17/2018 | (36 | ) | |||||||||
| JPY | 3,324,831 | USD | 29,698 | HSBC Bank | 1/17/2018 | (162 | ) | |||||||||
| CHF | 5,774 | USD | 5,864 | Goldman Sachs | 1/18/2018 | 70 | ||||||||||
| JPY | 445,496 | USD | 3,951 | Goldman Sachs | 1/18/2018 | 7 | ||||||||||
| NOK | 37,200 | USD | 4,441 | Bank of America, N.A. | 1/19/2018 | 92 | ||||||||||
| EUR | 2,833 | GBP | 2,500 | HSBC Bank | 1/19/2018 | 26 | ||||||||||
| USD | 9,255 | EUR | 7,850 | Bank of America, N.A. | 1/19/2018 | (176 | ) | |||||||||
| EUR | 6,645 | USD | 7,833 | Bank of America, N.A. | 1/22/2018 | 153 | ||||||||||
| JPY | 351,002 | USD | 3,128 | Citibank | 1/22/2018 | (9 | ) | |||||||||
| JPY | 995,097 | USD | 8,894 | Barclays Bank PLC | 1/22/2018 | (52 | ) | |||||||||
| SEK | 51,198 | USD | 6,101 | Citibank | 1/23/2018 | 151 | ||||||||||
| EUR | 5,439 | USD | 6,441 | Citibank | 1/23/2018 | 95 | ||||||||||
| JPY | 1,655,674 | USD | 14,688 | UBS AG | 1/23/2018 | 25 | ||||||||||
| USD | 9,075 | ILS | 31,900 | JPMorgan Chase | 1/23/2018 | (101 | ) | |||||||||
| USD | 6,140 | PLN | 21,950 | Citibank | 1/23/2018 | (166 | ) | |||||||||
| SEK | 60,114 | USD | 7,094 | Barclays Bank PLC | 1/24/2018 | 247 | ||||||||||
| JPY | 933,211 | USD | 8,249 | Goldman Sachs | 1/24/2018 | 45 | ||||||||||
| EUR | 2,082 | USD | 2,500 | Citibank | 2/5/2018 | 4 | ||||||||||
| USD | 6,121 | ILS | 21,303 | Bank of America, N.A. | 2/6/2018 | (11 | ) | |||||||||
| JPY | 1,310,000 | USD | 11,635 | HSBC Bank | 2/15/2018 | 19 | ||||||||||
| NOK | 32,573 | DKK | 24,600 | Citibank | 2/15/2018 | (4 | ) | |||||||||
| JPY | 392,473 | USD | 3,499 | Citibank | 2/15/2018 | (8 | ) | |||||||||
| SEK | 30,059 | USD | 3,588 | Barclays Bank PLC | 2/22/2018 | 88 | ||||||||||
| JPY | 376,335 | USD | 3,336 | HSBC Bank | 2/23/2018 | 13 | ||||||||||
| USD | 7,605 | INR | 504,900 | Citibank | 3/26/2018 | (221 | ) | |||||||||
| USD | 5,942 | BRL | 19,300 | Citibank | 4/23/2018 | 196 | ||||||||||
| USD | 138,524 | JPY | 15,300,000 | Citibank | 5/21/2018 | 1,645 | ||||||||||
| USD | 5,348 | BRL | 18,000 | Citibank | 11/29/2018 | 117 | ||||||||||
| USD | 169 | EUR | 140 | Bank of America, N.A. | 12/13/2018 | (3 | ) | |||||||||
| USD | 2,008 | EUR | 1,670 | Bank of America, N.A. | 12/13/2018 | (43 | ) | |||||||||
|
| |||||||||||||||
| $ | 660 | |||||||||||||||
|
| |||||||||||||||
American Funds Insurance Series 97
Table of Contents
Global Bond Fund
Swap contracts
Interest rate swaps
Receive | Pay | Expiration date | Notional (000) | Value at 12/31/2017 (000) | Upfront payments/ receipts (000) | Unrealized (depreciation) appreciation at 12/31/2017 (000) | ||||||||||||||||
7.46% | 28-day MXN-TIIE | 11/6/2018 | MXN | 1,356,000 | $ | (335 | ) | $ | — | $ | (335 | ) | ||||||||||
7.455% | 28-day MXN-TIIE | 11/7/2018 | 1,099,000 | (274 | ) | — | (274 | ) | ||||||||||||||
7.44% | 28-day MXN-TIIE | 11/7/2018 | 3,045,000 | (779 | ) | — | (779 | ) | ||||||||||||||
1.6505% | 3-month USD-LIBOR | 3/21/2019 | $ | 85,000 | (290 | ) | — | (290 | ) | |||||||||||||
3-month USD-LIBOR | 2.0335% | 12/19/2019 | 35,000 | 18 | — | 18 | ||||||||||||||||
9.145% | DI-OVER-EXTRA Grupo | 1/4/2021 | BRL | 108,000 | 244 | — | 244 | |||||||||||||||
6.775% | 28-day MXN-TIIE | 6/20/2022 | MXN | 280,000 | (590 | ) | — | (590 | ) | |||||||||||||
3-month SEK-STIBOR | 0.425% | 8/4/2022 | SKr | 140,000 | (16 | ) | — | (16 | ) | |||||||||||||
3-month USD-LIBOR | 2.4275% | 10/31/2027 | $ | 7,050 | (27 | ) | — | (27 | ) | |||||||||||||
3-month USD-LIBOR | 2.556% | 11/27/2045 | 10,000 | (40 | ) | — | (40 | ) | ||||||||||||||
3-month USD-LIBOR | 1.909% | 10/11/2046 | 5,750 | 772 | — | 772 | ||||||||||||||||
3-month USD-LIBOR | 2.659% | 2/8/2047 | 6,000 | (159 | ) | — | (159 | ) | ||||||||||||||
1.4898% | 6-month EURIBOR | 11/24/2047 | € | 2,150 | (3 | ) | — | (3 | ) | |||||||||||||
|
|
|
| |||||||||||||||||||
| $ | — | $ | (1,479 | ) | ||||||||||||||||||
|
|
|
| |||||||||||||||||||
The following footnotes apply to either the individual securities noted or one or more of the securities aggregated and listed as a single line item.
| 1 | Index-linked bond whose principal amount moves with a government price index. |
| 2 | Principal payments may be made periodically. Therefore, the effective maturity date may be earlier than the stated maturity date. |
| 3 | Purchased on a TBA basis. |
| 4 | A portion of this security was pledged as collateral. The total value of pledged collateral was $8,305,000, which represented .34% of the net assets of the fund. |
| 5 | Acquired in a transaction exempt from registration under Rule 144A or Section 4(2) of the Securities Act of 1933. May be resold in the U.S. in transactions exempt from registration, normally to qualified institutional buyers. The total value of all such securities, including those in “Other securities,“ was $259,235,000, which represented 10.51% of the net assets of the fund. |
| 6 | Notional amount is calculated based on the number of contracts and notional contract size. |
| 7 | Value is calculated based on the notional amount and current market price. |
Key to abbreviations and symbols
AUD/A$ = Australian dollars
BRL = Brazilian reais
CAD/C$ = Canadian dollars
CHF = Swiss francs
CLP = Chilean pesos
DI-OVER-EXTRA Grupo = Overnight Brazilian Interbank Deposit Rate
DKK/DKr = Danish kroner
EUR/€ = Euros
EURIBOR = Euro Interbank Offered Rate
GBP/£ = British pounds
ILS = Israeli shekels
INR = Indian rupees
JPY/¥ = Japanese yen
LIBOR = London Interbank Offered Rate
MXN = Mexican pesos
MYR = Malaysian ringgits
NKr = Norwegian kroner
PLN = Polish zloty
SEK/SKr = Swedish kronor
STIBOR = Stockholm Interbank Offered Rate
TBA = To-be-announced
THB = Thai baht
TIIE = Equilibrium Interbank Interest Rate
USD/$ = U.S. dollars
ZAR = South African rand
See Notes to Financial Statements
98 American Funds Insurance Series
Table of Contents
Summary investment portfolio December 31, 2017
Bonds, notes & other debt instruments 94.25%
| Principal amount (000) | Value (000) | |||||||
Corporate bonds & notes 93.34% | ||||||||
Energy 19.39% | ||||||||
American Energy (Marcellus), Term Loan B, (3-month USD-LIBOR + 4.25%) 5.710% 20201,2,3,4 | $ | 7,533 | $ | 5,574 | ||||
American Energy (Permian Basin) 7.125% 20205 | 7,445 | 6,068 | ||||||
American Energy (Permian Basin) 7.375% 20215 | 6,770 | 5,484 | ||||||
Blackstone CQP Holdco LP, 6.00% 20215,6 | 1,600 | 1,612 | ||||||
Blackstone CQP Holdco LP, 6.50% 20215,6 | 20,685 | 21,099 | ||||||
Chesapeake Energy Corp. 8.00% 20255 | 10,025 | 10,138 | ||||||
Chesapeake Energy Corp. 4.61%-8.00% 2019-20274,5 | 13,838 | 13,716 | ||||||
CONSOL Energy Inc. 5.875% 2022 | 11,299 | 11,596 | ||||||
NGL Energy Partners LP 6.875% 2021 | 6,415 | 6,575 | ||||||
Southwestern Energy Co. 4.10% 2022 | 8,915 | 8,804 | ||||||
Teekay Corp. 8.50% 2020 | 11,168 | 11,419 | ||||||
Weatherford International PLC 6.75% 2040 | 7,755 | 6,398 | ||||||
Weatherford International PLC 4.50%-9.88% 2021-2042 | 12,680 | 11,458 | ||||||
Other securities | 161,929 | |||||||
|
| |||||||
| 281,870 | ||||||||
|
| |||||||
Health care 12.43% | ||||||||
Centene Corp. 4.75% 2022 | 6,515 | 6,792 | ||||||
Molina Healthcare, Inc. 5.375% 2022 | 10,285 | 10,774 | ||||||
Molina Healthcare, Inc. 4.875% 20255 | 3,975 | 3,985 | ||||||
Rotech Healthcare Inc., Term Loan, (3-month USD-LIBOR + 11.00%) 13.00% 2020 | 6,709 | 6,343 | ||||||
Tenet Healthcare Corp. 4.38%-8.13% 2021-20255 | 12,272 | 12,161 | ||||||
Tenet Healthcare Corp., First Lien, 6.00% 2020 | 6,490 | 6,886 | ||||||
Tenet Healthcare Corp., First Lien 4.50%-4.75% 2020-2021 | 5,405 | 5,510 | ||||||
Valeant Pharmaceuticals International, Inc. 5.875% 20235 | 8,860 | 8,229 | ||||||
Valeant Pharmaceuticals International, Inc. 6.125% 20255 | 17,245 | 15,844 | ||||||
Valeant Pharmaceuticals International, Inc. 5.38%-9.00% 2020-20255 | 15,503 | 15,897 | ||||||
Other securities | 88,292 | |||||||
|
| |||||||
| 180,713 | ||||||||
|
| |||||||
Consumer discretionary 12.12% | ||||||||
CCO Holdings LLC and CCO Holdings Capital Corp. 5.75% 20265 | 10,320 | 10,746 | ||||||
CCO Holdings LLC and CCO Holdings Capital Corp. 5.00% 20285 | 6,025 | 5,889 | ||||||
CCO Holdings LLC and CCO Holdings Capital Corp. 4.00%-5.88% 2023-20275 | 9,450 | 9,547 | ||||||
Clear Channel Worldwide Holdings, Inc. 7.625% 2020 | 12,563 | 12,359 | ||||||
iHeartCommunications, Inc. 9.00% 2019 | 10,385 | 7,763 | ||||||
Petsmart, Inc. 5.875% 20255 | 11,175 | 8,633 | ||||||
Petsmart, Inc. 7.13%-8.88% 2023-20255 | 7,785 | 4,702 | ||||||
Petsmart, Inc., Term Loan B-2, (3-month USD-LIBOR + 3.00%) 4.57% 20222,3,4 | 1,952 | 1,573 | ||||||
Sotheby’s 4.875% 20255 | 6,870 | 6,793 | ||||||
Wynn Las Vegas, LLC and Wynn Capital Corp. 5.50% 20255 | 6,525 | 6,737 | ||||||
Other securities | 101,530 | |||||||
|
| |||||||
| 176,272 | ||||||||
|
| |||||||
Materials 12.00% | ||||||||
Cleveland-Cliffs Inc. 4.875% 20245 | 1,800 | 1,800 | ||||||
Cliffs Natural Resources Inc. 5.75% 20255 | 14,550 | 13,932 | ||||||
Cliffs Natural Resources Inc. 6.25% 2040 | 1,735 | 1,366 | ||||||
First Quantum Minerals Ltd. 7.00% 20215 | 8,505 | 8,845 | ||||||
First Quantum Minerals Ltd. 7.50% 20255 | 12,400 | 13,500 | ||||||
First Quantum Minerals Ltd. 7.25% 2022-20235 | 3,900 | 4,141 | ||||||
Freeport-McMoRan Inc. 3.55% 2022 | 6,715 | 6,656 | ||||||
Ryerson Inc. 11.00% 20225 | 6,336 | 7,104 | ||||||
Other securities | 117,113 | |||||||
|
| |||||||
| 174,457 | ||||||||
|
| |||||||
American Funds Insurance Series 99
Table of Contents
High-Income Bond Fund
Bonds, notes & other debt instruments (continued)
| Principal amount (000) | Value (000) | |||||||
Corporate bonds & notes (continued) | ||||||||
Telecommunication services 9.34% | ||||||||
Cequel Communications Holdings I, LLC and Cequel Capital Corp. 6.375% 20205 | $ | 5,367 | $ | 5,461 | ||||
Frontier Communications Corp. 11.00% 2025 | 11,850 | 8,769 | ||||||
Frontier Communications Corp. 8.50%-10.50% 2020-2022 | 11,405 | 9,156 | ||||||
Ligado Networks, Term Loan, | ||||||||
(3-month USD-LIBOR + 8.75%) 10.07% 2020 (100% PIK)2,3,4,7 | 8,690 | 8,082 | ||||||
SoftBank Group Corp. 4.50% 20205 | 8,550 | 8,755 | ||||||
Sprint Capital Corp. 8.75% 2032 | 1,025 | 1,166 | ||||||
Sprint Corp. 11.50% 2021 | 5,880 | 7,130 | ||||||
Sprint Nextel Corp. 6.88%-7.88% 2021-2028 | 14,295 | 14,861 | ||||||
Wind Tre SpA 5.00% 20265 | 6,675 | 6,381 | ||||||
Other securities | 65,969 | |||||||
|
| |||||||
| 135,730 | ||||||||
|
| |||||||
Industrials 8.54% | ||||||||
Associated Materials, LLC 9.00% 20245 | 7,125 | 7,713 | ||||||
Brand Energy 8.5% 20255 | 6,005 | 6,320 | ||||||
Corporate Risk Holdings LLC 9.50% 20195 | 12,782 | 13,373 | ||||||
Corporate Risk Holdings LLC 13.50% 2020 (100% PIK)5,7,8,9 | 1,112 | 1,190 | ||||||
DAE Aviation Holdings, Inc. 10.00% 20235 | 7,065 | 7,771 | ||||||
Other securities | 87,784 | |||||||
|
| |||||||
| 124,151 | ||||||||
|
| |||||||
Information technology 8.03% | ||||||||
Camelot Finance SA 7.875% 20245 | 5,630 | 6,024 | ||||||
Gogo Inc. 12.50% 20225 | 11,050 | 12,500 | ||||||
Infor Software 7.125% 20215,7 | 5,785 | 5,944 | ||||||
Kronos Inc., Term Loan B, (3-month USD-LIBOR + 8.25%) 9.627% 20242,3,4 | 7,870 | 8,187 | ||||||
Unisys Corp. 10.75% 20225 | 7,275 | 8,166 | ||||||
Other securities | 75,875 | |||||||
|
| |||||||
| 116,696 | ||||||||
|
| |||||||
Utilities 4.10% | ||||||||
AES Corp. 7.375% 2021 | 5,925 | 6,680 | ||||||
AES Corp. 4.88%-8.00% 2020-20275 | 13,506 | 14,412 | ||||||
Other securities | 38,456 | |||||||
|
| |||||||
| 59,548 | ||||||||
|
| |||||||
Financials 3.23% | ||||||||
CIT Group Inc. 3.875% 2019 | 6,835 | 6,921 | ||||||
Other securities | 40,079 | |||||||
|
| |||||||
| 47,000 | ||||||||
|
| |||||||
Real estate 2.11% | ||||||||
Iron Mountain Inc. 5.75% 2024 | 5,975 | 6,080 | ||||||
Other securities | 24,604 | |||||||
|
| |||||||
| 30,684 | ||||||||
|
| |||||||
Consumer staples 2.05% | ||||||||
Other securities | 29,872 | |||||||
|
| |||||||
Total corporate bonds & notes | 1,356,993 | |||||||
|
| |||||||
Other bonds & notes 0.91% | ||||||||
U.S. Treasury 1.25% 2019 | 10,000 | 9,921 | ||||||
Other securities | 3,417 | |||||||
|
| |||||||
| 13,338 | ||||||||
|
| |||||||
Total bonds, notes & other debt instruments (cost: $1,356,968,000) | 1,370,331 | |||||||
|
| |||||||
100 American Funds Insurance Series
Table of Contents
High-Income Bond Fund
Convertible bonds 0.40%
| Principal amount (000) | Value (000) | |||||
Energy 0.08% | ||||||
Weatherford International PLC 5.875% 2021 | $527 | $ | 572 | |||
Other securities | 585 | |||||
|
| |||||
| 1,157 | ||||||
|
| |||||
Other 0.15% | ||||||
Other securities | 2,159 | |||||
|
| |||||
Miscellaneous 0.17% | ||||||
Other convertible bonds in initial period of acquisition | 2,544 | |||||
|
| |||||
Total convertible bonds (cost: $5,582,000) | ||||||
| 5,860 | ||||||
|
| |||||
Convertible stocks 0.91% | ||||||
| Shares | ||||||
Industrials 0.68% | ||||||
Associated Materials, LLC, 14.00% convertible preferred 20208,9 | 4,850 | 5,553 | ||||
Other securities | 4,257 | |||||
|
| |||||
| 9,810 | ||||||
|
| |||||
Information technology 0.04% | ||||||
Other securities | 643 | |||||
|
| |||||
Telecommunication services 0.01% | ||||||
Frontier Communications Corp., Series A, convertible preferred | 10,000 | 108 | ||||
|
| |||||
Miscellaneous 0.18% | ||||||
Other convertible stocks in initial period of acquisition | 2,619 | |||||
|
| |||||
Total convertible stocks (cost: $15,788,000) | 13,180 | |||||
|
| |||||
| Common stocks 0.75% | ||||||
Information technology 0.26% | ||||||
Corporate Risk Holdings I, Inc.6,8,9,10 | 218,504 | 3,863 | ||||
Other securities | — | |||||
|
| |||||
| 3,863 | ||||||
|
| |||||
Other 0.32% | ||||||
Other securities | 4,531 | |||||
|
| |||||
Miscellaneous 0.17% | ||||||
Other common stocks in initial period of acquisition | 2,462 | |||||
|
| |||||
Total common stocks (cost: $26,386,000) | 10,856 | |||||
|
| |||||
Rights & warrants 0.00% | ||||||
Utilities 0.00% | ||||||
Other securities | 36 | |||||
|
| |||||
Total rights & warrants (cost: $63,000) | 36 | |||||
|
| |||||
American Funds Insurance Series 101
Table of Contents
High-Income Bond Fund
Short-term securities 1.68%
| Principal amount (000) | Value (000) | |||||||
General Electric Co. 1.42% due 1/2/2018 | $ | 13,600 | $ | 13,598 | ||||
U.S. Treasury Bills 1.11% due 1/11/2018 | 10,800 | 10,796 | ||||||
|
| |||||||
Total short-term securities (cost: $24,396,000) | 24,394 | |||||||
|
| |||||||
Total investment securities 97.99% (cost: $1,429,183,000) | 1,424,657 | |||||||
Other assets less liabilities 2.01% | 29,223 | |||||||
|
| |||||||
Net assets 100.00% | $ | 1,453,880 | ||||||
|
| |||||||
This summary investment portfolio is designed to streamline the report and help investors better focus on the fund’s principal holdings. See the inside back cover for details on how to obtain a complete schedule of portfolio holdings.
As permitted by U.S. Securities and Exchange Commission regulations, “Miscellaneous” securities include holdings in their first year of acquisition that have not previously been publicly disclosed.
“Other securities” includes all issues that are not disclosed separately in the summary investment portfolio.
Swap contracts
Interest rate swaps
Receive | Pay | Expiration date | Notional (000) | Value at 12/31/2017 (000) | Upfront payments/ receipts (000) | Unrealized appreciation (depreciation) at 12/31/2017 (000) | ||||||||||||||||
3-month USD-LIBOR | 2.0745% | 11/21/2026 | $ | 18,600 | $ | 431 | $ | — | $ | 431 | ||||||||||||
3-month USD-LIBOR | 2.2825% | 4/13/2027 | 10,700 | 81 | — | 81 | ||||||||||||||||
2.2865% | 3-month USD-LIBOR | 10/2/2027 | 10,100 | (90 | ) | — | (90 | ) | ||||||||||||||
|
|
|
| |||||||||||||||||||
| $ | — | $ | 422 | |||||||||||||||||||
|
|
|
| |||||||||||||||||||
| Credit default swaps | ||||||||||||||||||||||
| Centrally cleared credit default swaps on credit indices — buy protection | ||||||||||||||||||||||
Receive | Pay/ Payment frequency | Expiration date | Notional (000) | Value at 12/31/2017 (000) | Upfront payments (000) | Unrealized depreciation at 12/31/2017 (000) | ||||||||||||||||
CDX.NA.HY.29 | 5.00%/Quarterly | 12/20/2022 | $ | 108,000 | $ | (8,915 | ) | $ | (8,496 | ) | $ | (419 | ) | |||||||||
The following footnotes apply to either the individual securities noted or one or more of the securities aggregated and listed as a single line item.
| 1 | Scheduled interest and/or principal payment was not received. |
| 2 | Loan participations and assignments; may be subject to legal or contractual restrictions on resale. The total value of all such loans, including those in “Other securities,” was $89,280,000, which represented 6.14% of the net assets of the fund. |
| 3 | Principal payments may be made periodically. Therefore, the effective maturity date may be earlier than the stated maturity date. |
| 4 | Coupon rate may change periodically. |
| 5 | Acquired in a transaction exempt from registration under Rule 144A or Section 4(2) of the Securities Act of 1933. May be resold in the U.S. in transactions exempt from registration, normally to qualified institutional buyers. The total value of all such securities, including those in “Other securities,“ was $745,292,000, which represented 51.26% of the net assets of the fund. |
| 6 | Acquired through a private placement transaction exempt from registration under the Securities Act of 1933. May be subject to legal or contractual restrictions on resale. Further details on these holdings appear on the next page. |
| 7 | Payment in kind; the issuer has the option of paying additional securities in lieu of cash. Most recent payment was 100% cash unless otherwise noted. |
| 8 | Valued under fair value procedures adopted by authority of the board of trustees. The total value of all such securities, including those in “Miscellaneous“ and “Other securities,“ was $32,234,000, which represented 2.22% of the net assets of the fund. |
| 9 | Value determined using significant unobservable inputs. |
| 10 | Security did not produce income during the last 12 months. |
102 American Funds Insurance Series
Table of Contents
High-Income Bond Fund
Private placement securities | Acquisition date(s) | Cost (000) | Value (000) | Percent of net assets | ||||||||||||
Blackstone CQP Holdco LP, 6.50% 2021 | 3/6/2017 | $ | 20,695 | $ | 21,099 | 1.45 | % | |||||||||
Blackstone CQP Holdco LP, 6.00% 2021 | 8/9/2017 | 1,600 | 1,612 | .11 | ||||||||||||
Corporate Risk Holdings I, Inc. | 8/31/2015 | 2,428 | 3,863 | .27 | ||||||||||||
Corporate Risk Holdings Corp. | 8/31/2015 | — | — | .00 | ||||||||||||
Other securities | 12/13/2012-11/15/2016 | 17,830 | 8,493 | .58 | ||||||||||||
|
|
|
|
|
| |||||||||||
Total private placement securities | $ | 42,553 | $ | 35,067 | 2.41 | % | ||||||||||
|
|
|
|
|
| |||||||||||
Key to abbreviations and symbol
LIBOR = London Interbank Offered Rate
USD/$ = U.S. dollars
See Notes to Financial Statements
American Funds Insurance Series 103
Table of Contents
Summary investment portfolio December 31, 2017
Bonds, notes & other debt instruments 95.14%
Principal amount (000) | Value (000) | |||||||
Mortgage-backed obligations 63.46% | ||||||||
Federal agency mortgage-backed obligations 60.15% | ||||||||
Fannie Mae 4.00% 20471 | $ | 7,816 | $ | 8,189 | ||||
Fannie Mae 4.00% 20471 | 4,844 | 5,075 | ||||||
Fannie Mae 4.00% 20481,2 | 17,250 | 18,026 | ||||||
Fannie Mae 4.50% 20481,2 | 3,700 | 3,932 | ||||||
Fannie Mae 4.00%-5.00% 20361 | 1,133 | 1,196 | ||||||
Freddie Mac 4.00% 20361 | 5,848 | 6,186 | ||||||
Freddie Mac 4.00% 20471 | 9,510 | 9,960 | ||||||
Freddie Mac 4.00% 20481,2 | 25,000 | 26,154 | ||||||
Freddie Mac 4.00% 20481,2 | 22,854 | 23,877 | ||||||
Freddie Mac Pool #760014 2.969% 20451,3 | 2,989 | 3,001 | ||||||
Freddie Mac, Series KJ02, Class A2, Multi Family 2.597% 20201 | 3,704 | 3,722 | ||||||
Freddie Mac, Series K031, Class A2, Multi Family 3.30% 20231,3 | 4,722 | 4,914 | ||||||
Freddie Mac 3.31%-5.00% 2023-20361,3 | 3,696 | 3,916 | ||||||
Freddie Mac Seasoned Credit Risk Transfer Trust, Series 2017-2, Class HA, 2.00% 20561 | 1,814 | 1,803 | ||||||
Freddie Mac Seasoned Credit Risk Transfer Trust, Series 2017-2, Class MA, 3.00% 20561 | 1,675 | 1,675 | ||||||
Freddie Mac Seasoned Credit Risk Transfer Trust, Series 2017-4, Class HT, 2.25% 20571 | 13,810 | 13,780 | ||||||
Freddie Mac Seasoned Credit Risk Transfer Trust, Series 2017-4, Class MT, 3.50% 20571 | 8,325 | 8,518 | ||||||
Government National Mortgage Assn. 5.50% 20401 | 2,246 | 2,499 | ||||||
Government National Mortgage Assn. 3.50% 20431 | 2,453 | 2,558 | ||||||
Government National Mortgage Assn. 3.50% 20431 | 1,754 | 1,816 | ||||||
Government National Mortgage Assn. 3.50% 20431 | 1,714 | 1,783 | ||||||
Government National Mortgage Assn. 4.25% 20441 | 1,764 | 1,867 | ||||||
Government National Mortgage Assn. 4.00% 20471 | 17,763 | 18,613 | ||||||
Government National Mortgage Assn. 4.50% 20481,2 | 4,950 | 5,193 | ||||||
Government National Mortgage Assn. 4.737% 20651 | 1,697 | 1,769 | ||||||
Government National Mortgage Assn. 4.62% 20661 | 1,792 | 1,900 | ||||||
Government National Mortgage Assn. 3.50%-6.50% 2034-20661 | 15,339 | 15,981 | ||||||
Vendee Mortgage Trust, Series 2011-2, Class V, 3.75% 20281 | 4,544 | 4,557 | ||||||
Vendee Mortgage Trust, Series 2010-1, Class DA, 4.25% 20351 | 680 | 700 | ||||||
Other securities | 1,473 | |||||||
|
| |||||||
| 204,633 | ||||||||
|
| |||||||
Collateralized mortgage-backed (privately originated) 3.28% | ||||||||
Towd Point Mortgage Trust, Series 2015-2, Class 2A11, 3.00% 20571,3,4 | 2,160 | 2,175 | ||||||
Other securities | 8,985 | |||||||
|
| |||||||
| 11,160 | ||||||||
|
| |||||||
Commercial mortgage-backed securities 0.03% | ||||||||
Other securities | 91 | |||||||
|
| |||||||
Total mortgage-backed obligations | 215,884 | |||||||
|
| |||||||
U.S. Treasury bonds & notes 16.09% | ||||||||
U.S. Treasury 10.57% | ||||||||
U.S. Treasury 1.875% 2022 | 19,800 | 19,515 | ||||||
U.S. Treasury 1.875% 20225 | 5,000 | 4,941 | ||||||
U.S. Treasury 2.00% 2022 | 7,300 | 7,238 | ||||||
U.S. Treasury 2.50% 2024 | 2,500 | 2,528 | ||||||
U.S. Treasury 1.50%-2.13% 2020-2022 | 1,744 | 1,735 | ||||||
|
| |||||||
| 35,957 | ||||||||
|
| |||||||
104 American Funds Insurance Series
Table of Contents
Mortgage Fund
Bonds, notes & other debt instruments
Principal amount (000) | Value (000) | |||||||
U.S. Treasury inflation-protected securities 5.52% | ||||||||
U.S. Treasury Inflation-Protected Security 0.375% 20255,6 | $ | 7,489 | $ | 7,501 | ||||
U.S. Treasury Inflation-Protected Security 2.125% 20416 | 124 | 163 | ||||||
U.S. Treasury Inflation-Protected Security 0.75% 20426 | 7,025 | 7,095 | ||||||
U.S. Treasury Inflation-Protected Security 1.375% 20446 | 3,466 | 4,004 | ||||||
|
| |||||||
| 18,763 | ||||||||
|
| |||||||
Total U.S. Treasury bonds & notes | 54,720 | |||||||
|
| |||||||
Federal agency bonds & notes 12.22% | ||||||||
Fannie Mae 1.88%-2.00% 2022 | 21,800 | 21,617 | ||||||
Federal Home Loan Bank 1.38%-1.88% 2021 | 13,000 | 12,852 | ||||||
United States Agency for International Development, Jordan (Kingdom of) 2.503% 2020 | 7,000 | 7,087 | ||||||
|
| |||||||
| 41,556 | ||||||||
|
| |||||||
Asset-backed obligations 3.32% | ||||||||
Hertz Vehicle Financing LLC, Rental Car Asset-backed Notes, Series 2015-1, Class A, 2.73% 20211,4 | 1,823 | 1,829 | ||||||
Other securities | 9,456 | |||||||
|
| |||||||
| 11,285 | ||||||||
|
| |||||||
Corporate bonds & notes 0.05% | ||||||||
Financials 0.05% | ||||||||
Other securities | 187 | |||||||
|
| |||||||
Total bonds, notes & other debt instruments (cost: $322,647,000) | 323,632 | |||||||
|
| |||||||
Short-term securities 27.27% | ||||||||
Apple Inc. 1.22% due 1/12/20184 | 4,000 | 3,998 | ||||||
Bank of Tokyo-Mitsubishi UFJ, Ltd. 1.49% due 1/10/2018 | 7,000 | 6,996 | ||||||
CAFCO, LLC 1.39% due 2/2/20184 | 3,900 | 3,894 | ||||||
Eli Lilly and Co. 1.28% due 1/8/20184 | 9,000 | 8,996 | ||||||
Emerson Electric Co. 1.27% due 1/29/20184 | 5,500 | 5,493 | ||||||
Federal Farm Credit Banks 1.32% due 4/19/2018 | 5,000 | 4,978 | ||||||
Federal Home Loan Bank 1.15%-1.30% due 1/5/2018-2/14/2018 | 25,750 | 25,731 | ||||||
General Electric Co. 1.42% due 1/2/2018 | 6,000 | 5,999 | ||||||
National Rural Utilities Cooperative Finance Corp. 1.51% due 1/17/2018 | 5,000 | 4,996 | ||||||
Paccar Financial Corp. 1.26% due 1/12/2018 | 5,500 | 5,497 | ||||||
Private Export Funding Corp. 1.25% due 1/4/20184 | 8,210 | 8,208 | ||||||
Toronto-Dominion Bank 1.45% due 3/16/20184 | 8,000 | 7,971 | ||||||
|
| |||||||
Total short-term securities (cost: $92,772,000) | 92,757 | |||||||
|
| |||||||
Total investment securities 122.41% (cost: $415,419,000) | 416,389 | |||||||
Other assets less liabilities (22.41)% | (76,219 | ) | ||||||
|
| |||||||
Net assets 100.00% | $ | 340,170 | ||||||
|
| |||||||
This summary investment portfolio is designed to streamline the report and help investors better focus on the fund’s principal holdings. See the inside back cover for details on how to obtain a complete schedule of portfolio holdings.
“Other securities” includes all issues that are not disclosed separately in the summary investment portfolio. “Other securities” includes securities which were valued under fair value procedures adopted by authority of the board of trustees. The total value of securities which were valued under fair value procedures was $1,579,000, which represented .46% of the net assets of the fund.
American Funds Insurance Series 105
Table of Contents
Mortgage Fund
Futures contracts
| Contracts | Type | Number of contracts | Expiration | Notional amount7 (000) | Value at 12/31/20178 (000) | Unrealized (depreciation) appreciation at 12/31/2017 (000) | ||||||||||||||||||
10 Year Ultra U.S. Treasury Note Futures | Long | 95 | March 2018 | $ | 9,500 | $ | 12,689 | $ | (73 | ) | ||||||||||||||
20 Year U.S. Treasury Bond Futures | Long | 48 | March 2018 | 4,800 | 7,344 | 8 | ||||||||||||||||||
30 Year Ultra U.S. Treasury Bond Futures | Long | 11 | March 2018 | 1,100 | 1,844 | 13 | ||||||||||||||||||
5 Year U.S. Treasury Note Futures | Long | 1,136 | April 2018 | 113,600 | 131,962 | (580 | ) | |||||||||||||||||
|
| |||||||||||||||||||||||
| $ | (632 | ) | ||||||||||||||||||||||
|
| |||||||||||||||||||||||
Swap contracts
Interest rate swaps
Receive | Pay | Expiration date | Notional (000) | Value at 12/31/2017 (000) | Upfront payments/ receipts (000) | Unrealized appreciation (depreciation) at 12/31/2017 (000) | ||||||||||||||||||
3-month USD-LIBOR | 1.217% | 9/22/2021 | $ | 11,500 | $ | 406 | $ | — | $ | 406 | ||||||||||||||
3-month USD-LIBOR | 1.225% | 9/22/2021 | 11,500 | 402 | — | 402 | ||||||||||||||||||
3-month USD-LIBOR | 1.2796% | 10/11/2021 | 14,500 | 485 | — | 485 | ||||||||||||||||||
2.0135% | 3-month USD-LIBOR | 10/20/2021 | 30,000 | (202 | ) | — | (202 | ) | ||||||||||||||||
2.012% | 3-month USD-LIBOR | 10/4/2022 | 9,000 | (91 | ) | — | (91 | ) | ||||||||||||||||
2.00% | 3-month USD-LIBOR | 10/5/2022 | 41,500 | (441 | ) | — | (441 | ) | ||||||||||||||||
2.1045% | 3-month USD-LIBOR | 10/31/2022 | 4,000 | (23 | ) | — | (23 | ) | ||||||||||||||||
3-month USD-LIBOR | 2.24% | 12/5/2026 | 10,500 | 104 | — | 104 | ||||||||||||||||||
3-month USD-LIBOR | 2.27% | 12/5/2026 | 8,500 | 63 | — | 63 | ||||||||||||||||||
3-month USD-LIBOR | 3.34% | 6/27/2044 | 3,500 | (564 | ) | — | (564 | ) | ||||||||||||||||
3-month USD-LIBOR | 3.206% | 7/31/2044 | 2,000 | (270 | ) | — | (270 | ) | ||||||||||||||||
3-month USD-LIBOR | 3.238% | 8/8/2044 | 2,000 | (283 | ) | — | (283 | ) | ||||||||||||||||
3-month USD-LIBOR | 3.2265% | 9/25/2044 | 3,000 | (418 | ) | — | (418 | ) | ||||||||||||||||
3-month USD-LIBOR | 2.5055% | 1/9/2045 | 2,000 | 14 | — | 14 | ||||||||||||||||||
3-month USD-LIBOR | 2.454% | 1/15/2045 | 3,200 | 55 | — | 55 | ||||||||||||||||||
3-month USD-LIBOR | 2.52822% | 11/23/2045 | 3,560 | 6 | — | 6 | ||||||||||||||||||
3-month USD-LIBOR | 2.59125% | 12/16/2045 | 2,250 | (25 | ) | — | (25 | ) | ||||||||||||||||
U.S. EFFR | 2.145% | 11/9/2047 | 2,200 | 4 | — | 4 | ||||||||||||||||||
U.S. EFFR | 2.153% | 11/10/2047 | 2,200 | — | 9 | — | — | 9 | ||||||||||||||||
U.S. EFFR | 2.155% | 11/10/2047 | 1,280 | — | 9 | — | — | 9 | ||||||||||||||||
U.S. EFFR | 2.17% | 11/13/2047 | 2,320 | (8 | ) | — | (8 | ) | ||||||||||||||||
|
|
|
| |||||||||||||||||||||
| $ | — | $ | (786 | ) | ||||||||||||||||||||
|
|
|
| |||||||||||||||||||||
106 American Funds Insurance Series
Table of Contents
Mortgage Fund
The following footnotes apply to either the individual securities noted or one or more of the securities aggregated and listed as a single line item.
| 1 | Principal payments may be made periodically. Therefore, the effective maturity date may be earlier than the stated maturity date. |
| 2 | Purchased on a TBA basis. |
| 3 | Coupon rate may change periodically. |
| 4 | Acquired in a transaction exempt from registration under Rule 144A or Section 4(2) of the Securities Act of 1933. May be resold in the U.S. in transactions exempt from registration, normally to qualified institutional buyers. The total value of all such securities, including those in “Other securities,“ was $57,740,000, which represented 16.97% of the net assets of the fund. |
| 5 | A portion of this security was pledged as collateral. The total value of pledged collateral was $7,383,000, which represented 2.17% of the net assets of the fund. |
| 6 | Index-linked bond whose principal amount moves with a government price index. |
| 7 | Notional amount is calculated based on the number of contracts and notional contract size. |
| 8 | Value is calculated based on the notional amount and current market price. |
| 9 | Amount less than one thousand. |
Key to abbreviations and symbol
EFFR = Federal Funds Effective Rate
LIBOR = London Interbank Offered Rate
TBA = To-be-announced
USD/$ = U.S. dollars
See Notes to Financial Statements
American Funds Insurance Series 107
Table of Contents
Investment portfolio December 31, 2017
Short-term securities 100.30%
Principal amount (000) | Value (000) | |||||||
Commercial paper 82.90% | ||||||||
American Honda Finance Corp. 1.43% due 1/24/2018 | $ | 8,100 | $ | 8,092 | ||||
Bank of Tokyo-Mitsubishi UFJ, Ltd. 1.56% due 2/14/20181 | 9,000 | 8,980 | ||||||
BMW U.S. Capital LLC 1.59% due 3/19/20181 | 5,000 | 4,983 | ||||||
British Columbia (Province of) 1.27% due 1/16/2018 | 11,000 | 10,992 | ||||||
CAFCO, LLC 1.41% due 2/13/20181 | 10,500 | 10,479 | ||||||
Cisco Systems, Inc. 1.50% due 2/15/20181 | 8,000 | 7,984 | ||||||
DBS Bank Ltd. 1.42%-1.46% due 2/2/2018-2/15/20181 | 10,600 | 10,581 | ||||||
Estée Lauder Companies Inc. 1.49% due 1/22/20181 | 5,000 | 4,995 | ||||||
ExxonMobil Corp. 1.40% due 1/23/2018 | 6,300 | 6,294 | ||||||
General Electric Co. 1.42% due 1/2/2018 | 11,000 | 10,998 | ||||||
IBM Credit LLC 1.62% due 3/13/20181 | 8,600 | 8,573 | ||||||
John Deere Canada ULC 1.32% due 1/5/20181 | 2,200 | 2,199 | ||||||
KfW 1.32% due 1/12/20181 | 12,000 | 11,994 | ||||||
Liberty Street Funding Corp. 1.40% due 2/1/20181 | 10,000 | 9,985 | ||||||
Mizuho Bank, Ltd. 1.40% due 2/15/20181 | 10,000 | 9,978 | ||||||
National Australia Bank Ltd. 1.65% due 4/4/20181 | 8,900 | 8,860 | ||||||
Nordea Bank AB 1.37% due 2/14/20181 | 10,500 | 10,480 | ||||||
Old Line Funding, LLC 1.36% due 1/22/20181 | 4,400 | 4,395 | ||||||
Paccar Financial Corp. 1.28% due 1/9/2018 | 5,100 | 5,098 | ||||||
Province of Alberta 1.45% due 1/10/20181 | 3,700 | 3,698 | ||||||
Prudential Funding, LLC 1.35% due 1/12/2018 | 10,500 | 10,494 | ||||||
Qualcomm Inc. 1.32% due 2/6/20181 | 7,800 | 7,787 | ||||||
Québec (Province of) 1.49% due 1/18/20181 | 11,000 | 10,991 | ||||||
Royal Bank of Canada 1.34% due 1/8/2018 | 6,000 | 5,998 | ||||||
Simon Property Group, L.P. 1.54% due 3/15/20181 | 6,100 | 6,080 | ||||||
Société Générale 1.41% due 1/31/20181 | 10,400 | 10,385 | ||||||
Swedbank AB 1.51% due 3/21/2018 | 5,000 | 4,984 | ||||||
Total Capital Canada Ltd. 1.66% due 3/16/20181 | 10,100 | 10,066 | ||||||
Toyota Industries Commercial Finance, Inc. 1.37% due 1/22/20181 | 6,200 | 6,194 | ||||||
Unilever Capital Corp. 1.43% due 2/26/20181 | 9,600 | 9,577 | ||||||
Walt Disney Co. 1.45% due 1/29/20181 | 10,500 | 10,487 | ||||||
|
| |||||||
| 252,681 | ||||||||
|
| |||||||
Federal agency discount notes 17.40% | ||||||||
Federal Home Loan Bank 1.08%-1.32% due 1/5/2018-2/28/2018 | 53,100 | 53,046 | ||||||
|
| |||||||
Total short-term securities (cost: $305,768,000) | 305,727 | |||||||
|
| |||||||
Total investment securities 100.30% (cost: $305,768,000) | 305,727 | |||||||
Other assets less liabilities (0.30)% | (922 | ) | ||||||
|
| |||||||
Net assets 100.00% | $ | 304,805 | ||||||
|
| |||||||
| 1 | Acquired in a transaction exempt from registration under Section 4(2) of the Securities Act of 1933. May be resold in the U.S. in transactions exempt from registration, normally to qualified institutional buyers. The total value of all such securities was $189,731,000, which represented 62.25% of the net assets of the fund. |
See Notes to Financial Statements
108 American Funds Insurance Series
Table of Contents
U.S. Government/AAA-Rated Securities Fund
Summary investment portfolio December 31, 2017
Bonds, notes & other debt instruments 92.82%
| Principal amount (000) | Value (000) | |||||||
U.S. Treasury bonds & notes 50.54% | ||||||||
U.S. Treasury 40.71% | ||||||||
U.S. Treasury 1.125% 2021 | $ | 31,950 | $ | 30,869 | ||||
U.S. Treasury 1.75% 20211 | 40,540 | 39,981 | ||||||
| U.S. Treasury 2.00% 2021 | 46,300 | 46,077 | ||||||
| U.S. Treasury 2.00% 2021 | 44,350 | 44,207 | ||||||
| U.S. Treasury 2.00% 2021 | 26,500 | 26,461 | ||||||
| U.S. Treasury 2.125% 2021 | 23,450 | 23,475 | ||||||
| U.S. Treasury 2.25% 2021 | 64,745 | 65,141 | ||||||
| U.S. Treasury 2.25% 2021 | 38,000 | 38,258 | ||||||
| U.S. Treasury 1.75% 2022 | 198,300 | 194,846 | ||||||
| U.S. Treasury 1.875% 2022 | 63,000 | 62,254 | ||||||
| U.S. Treasury 1.875% 2022 | 45,000 | 44,395 | ||||||
| U.S. Treasury 2.00% 2022 | 80,000 | 79,316 | ||||||
| U.S. Treasury 2.00% 2022 | 43,510 | 43,121 | ||||||
| U.S. Treasury 1.50% 2023 | 26,020 | 25,111 | ||||||
| U.S. Treasury 1.625% 2023 | 38,150 | 36,961 | ||||||
| U.S. Treasury 2.125% 2023 | 64,095 | 63,582 | ||||||
| U.S. Treasury 2.125% 2024 | 115,975 | 114,525 | ||||||
| U.S. Treasury 2.25% 2024 | 40,550 | 40,365 | ||||||
| U.S. Treasury 2.50% 2024 | 44,000 | 44,502 | ||||||
| U.S. Treasury 2.75% 2047 | 50,501 | 50,572 | ||||||
| U.S. Treasury 1.13%-6.25% 2021-2047 | 148,817 | 149,234 | ||||||
|
| |||||||
| 1,263,253 | ||||||||
|
| |||||||
U.S. Treasury inflation-protected securities 9.83% | ||||||||
U.S. Treasury Inflation-Protected Security 0.25% 20252 | 27,223 | 26,981 | ||||||
U.S. Treasury Inflation-Protected Security 0.375% 20252 | 86,645 | 86,784 | ||||||
U.S. Treasury Inflation-Protected Security 2.375% 20252 | 24,864 | 28,333 | ||||||
U.S. Treasury Inflation-Protected Security 0.375% 20272 | 68,267 | 67,914 | ||||||
| U.S. Treasury Inflation-Protected Security 1.375% 20441,2 | 45,728 | 52,818 | ||||||
| U.S. Treasury Inflation-Protected Securities 0.13%-2.13% 2020-20472 | 41,535 | 42,269 | ||||||
|
| |||||||
| 305,099 | ||||||||
|
| |||||||
Total U.S. Treasury bonds & notes | 1,568,352 | |||||||
|
| |||||||
Mortgage-backed obligations 25.34% | ||||||||
Federal agency mortgage-backed obligations 25.34% | ||||||||
Fannie Mae 3.50% 20333,4 | 30,000 | 30,946 | ||||||
Fannie Mae 3.00% 20363 | 29,057 | 29,534 | ||||||
Fannie Mae 4.00% 20473 | 34,100 | 35,730 | ||||||
Fannie Mae 4.00% 20473 | 23,761 | 24,893 | ||||||
| Fannie Mae 4.50% 20473 | 25,443 | 27,113 | ||||||
| Fannie Mae 4.50% 20483,4 | 75,000 | 79,804 | ||||||
| Fannie Mae 0%-9.50% 2022-20483,4,5 | 105,743 | 110,011 | ||||||
| Freddie Mac 4.00% 20473 | 23,965 | 25,098 | ||||||
| Freddie Mac 4.00% 20483,4 | 50,000 | 52,309 | ||||||
| Freddie Mac 0%-5.50% 2020-20483,4,5 | 113,700 | 117,766 | ||||||
| Government National Mortgage Assn. 4.00% 20473 | 63,961 | 67,023 | ||||||
| Government National Mortgage Assn. 4.50% 20483,4 | 30,525 | 32,022 | ||||||
| Government National Mortgage Assn. 1.99%-6.64% 2034-20653,5 | 90,528 | 94,637 | ||||||
| Other securities | 59,617 | |||||||
|
| |||||||
| 786,503 | ||||||||
|
| |||||||
Federal agency bonds & notes 16.94% | ||||||||
| Fannie Mae 1.25%-7.13% 2019-2030 | 31,400 | 32,762 | ||||||
| Federal Home Loan Bank 1.75%-5.50% 2018-2036 | 91,315 | 92,402 | ||||||
| Freddie Mac 3.75% 2019 | 12,750 | 13,040 | ||||||
| Tennessee Valley Authority 2.88%-5.88% 2021-2060 | 47,305 | 50,606 | ||||||
| TVA Southaven 3.846% 20333 | 1,418 | 1,444 | ||||||
| U.S. Department of Housing and Urban Development 1.33%-3.70% 2018-2034 | 83,632 | 84,747 | ||||||
| United States Agency for International Development, Iraq (Republic of), 2.149% 2022 | 6,670 | 6,634 | ||||||
American Funds Insurance Series 109
Table of Contents
U.S. Government/AAA-Rated Securities Fund
Bonds, notes & other debt instruments (continued)
Principal amount (000) | Value (000) | |||||||
Federal agency bonds & notes (continued) | ||||||||
United States Agency for International Development, Jordan (Kingdom of) 1.95%-3.00% 2019-2025 | $ | 194,000 | $ | 196,981 | ||||
United States Agency for International Development, Morocco (Kingdom of) 7.55% 20263 | 3,621 | 4,311 | ||||||
United States Agency for International Development, Tunisia (Kingdom of) 1.416% 2021 | 3,000 | 2,904 | ||||||
United States Agency for International Development, Ukraine 1.47%-1.84% 2019-2021 | 5,855 | 5,742 | ||||||
Other securities | 34,007 | |||||||
|
| |||||||
| 525,580 | ||||||||
|
| |||||||
Total bonds, notes & other debt instruments (cost: $2,881,337,000) | 2,880,435 | |||||||
|
| |||||||
Short-term securities 14.77% | ||||||||
Apple Inc. 1.24% due 1/30/20186 | 35,000 | 34,955 | ||||||
Ciesco LLC 1.87% due 6/25/20186 | 50,000 | 49,544 | ||||||
Cisco Systems, Inc. 1.36% due 3/8/20186 | 45,000 | 44,872 | ||||||
ExxonMobil Corp. 1.40% due 1/23/2018 | 31,400 | 31,370 | ||||||
Federal Home Loan Bank 1.16% due 2/2/2018 | 25,000 | 24,974 | ||||||
Kimberly-Clark Corp. 1.48% due 1/16/20186 | 25,000 | 24,981 | ||||||
Microsoft Corp. 1.27%-1.30% due 1/16/2018-1/23/20186 | 70,000 | 69,945 | ||||||
Paccar Financial Corp. 1.22%-1.28% due 1/8/2018-1/16/2018 | 42,400 | 42,375 | ||||||
Sumitomo Mitsui Banking Corp. 1.44% due 1/11/20186 | 40,000 | 39,979 | ||||||
Walt Disney Co. 1.25% due 1/19/20186 | 35,000 | 34,970 | ||||||
Other securities | 60,315 | |||||||
|
| |||||||
Total short-term securities (cost: $458,355,000) | 458,280 | |||||||
|
| |||||||
Total investment securities 107.59% (cost: $3,339,692,000) | 3,338,715 | |||||||
Other assets less liabilities (7.59)% | (235,400 | ) | ||||||
|
| |||||||
Net assets 100.00% | $ | 3,103,315 | ||||||
|
| |||||||
This summary investment portfolio is designed to streamline the report and help investors better focus on the fund’s principal holdings. See the inside back cover for details on how to obtain a complete schedule of portfolio holdings.
“Other securities” includes all issues that are not disclosed separately in the summary investment portfolio.
Futures contracts
Contracts | Type | Number of contracts | Expiration | Notional amount7 (000) | Value at 12/31/20178 (000) | Unrealized (depreciation) appreciation at 12/31/2017 (000) | ||||||||||||||||||
10 Year U.S. Treasury Note Futures | Long | 2,734 | March 2018 | $ | 273,400 | $ | 339,144 | $ | (813 | ) | ||||||||||||||
20 Year U.S. Treasury Bond Futures | Long | 195 | March 2018 | 19,500 | 29,835 | 31 | ||||||||||||||||||
10 Year Ultra U.S. Treasury Note Futures | Short | 175 | March 2018 | (17,500 | ) | (23,373 | ) | 110 | ||||||||||||||||
30 Year Ultra U.S. Treasury Bond Futures | Short | 219 | March 2018 | (21,900 | ) | (36,717 | ) | (23 | ) | |||||||||||||||
5 Year U.S. Treasury Note Futures | Long | 14,014 | April 2018 | 1,401,400 | 1,627,923 | (6,730 | ) | |||||||||||||||||
2 Year U.S. Treasury Note Futures | Long | 2,111 | April 2018 | 422,200 | 451,985 | (380 | ) | |||||||||||||||||
90 Day Euro Dollar Futures | Short | 905 | September 2018 | (226,250 | ) | (221,635 | ) | 245 | ||||||||||||||||
90 Day Euro Dollar Futures | Long | 1,595 | December 2018 | 398,750 | 390,197 | (242 | ) | |||||||||||||||||
90 Day Euro Dollar Futures | Short | 1,920 | December 2019 | (480,000 | ) | (468,816 | ) | 357 | ||||||||||||||||
|
| |||||||||||||||||||||||
| $ | (7,445 | ) | ||||||||||||||||||||||
|
| |||||||||||||||||||||||
110 American Funds Insurance Series
Table of Contents
U.S. Government/AAA-Rated Securities Fund
Swap contracts
Interest rate swaps
Receive | Pay | Expiration date | Notional (000) | Value at 12/31/2017 (000) | Upfront payments/ receipts (000) | Unrealized (depreciation) appreciation at 12/31/2017 (000) | ||||||||||||||||
1.345% | U.S. EFFR | 1/31/2018 | $ | 1,078,000 | $ | (56 | ) | $ | — | $ | (56 | ) | ||||||||||
1.3475% | U.S. EFFR | 1/31/2018 | 1,747,000 | (86 | ) | — | (86 | ) | ||||||||||||||
1.329% | U.S. EFFR | 3/27/2019 | 131,000 | (632 | ) | — | (632 | ) | ||||||||||||||
1.32625% | U.S. EFFR | 4/5/2019 | 68,800 | (345 | ) | — | (345 | ) | ||||||||||||||
1.34875% | U.S. EFFR | 4/5/2019 | 120,000 | (568 | ) | — | (568 | ) | ||||||||||||||
1.337% | U.S. EFFR | 6/8/2019 | 121,000 | (730 | ) | — | (730 | ) | ||||||||||||||
1.367% | U.S. EFFR | 6/12/2019 | 60,500 | (341 | ) | — | (341 | ) | ||||||||||||||
1.37% | U.S. EFFR | 6/14/2019 | 60,500 | (341 | ) | — | (341 | ) | ||||||||||||||
1.362% | U.S. EFFR | 6/21/2019 | 60,500 | (355 | ) | — | (355 | ) | ||||||||||||||
1.351% | U.S. EFFR | 6/28/2019 | 60,500 | (372 | ) | — | (372 | ) | ||||||||||||||
1.9425% | 3-month USD-LIBOR | 3/17/2020 | 165,000 | (526 | ) | — | (526 | ) | ||||||||||||||
1.8005% | 3-month USD-LIBOR | 9/28/2020 | 48,000 | (444 | ) | — | (444 | ) | ||||||||||||||
3-month USD-LIBOR | 1.217% | 9/22/2021 | 60,000 | 2,116 | — | 2,116 | ||||||||||||||||
3-month USD-LIBOR | 1.225% | 9/22/2021 | 60,000 | 2,099 | — | 2,099 | ||||||||||||||||
3-month USD-LIBOR | 1.2255% | 9/23/2021 | 5,000 | 175 | — | 175 | ||||||||||||||||
3-month USD-LIBOR | �� | 2.01215% | 2/2/2022 | 119,000 | 915 | — | 915 | |||||||||||||||
3-month USD-LIBOR | 1.9665% | 2/2/2022 | 50,000 | 474 | — | 474 | ||||||||||||||||
3-month USD-LIBOR | 2.0025% | 2/7/2022 | 59,000 | 477 | — | 477 | ||||||||||||||||
3-month USD-LIBOR | 2.2175% | 3/17/2022 | 52,000 | (10 | ) | — | (10 | ) | ||||||||||||||
3-month USD-LIBOR | 1.8675% | 4/19/2022 | 70,000 | 1,002 | — | 1,002 | ||||||||||||||||
3-month USD-LIBOR | 1.75918% | 4/29/2022 | 58,000 | 1,092 | — | 1,092 | ||||||||||||||||
3-month USD-LIBOR | 1.948% | 7/28/2022 | 20,000 | 239 | — | 239 | ||||||||||||||||
2.80% | 3-month USD-LIBOR | 9/2/2022 | 280,000 | 2,280 | — | 2,280 | ||||||||||||||||
2.75% | 3-month USD-LIBOR | 9/2/2022 | 280,000 | 2,020 | — | 2,020 | ||||||||||||||||
2.009% | 3-month USD-LIBOR | 10/4/2022 | 50,000 | (511 | ) | — | (511 | ) | ||||||||||||||
2.00965% | 3-month USD-LIBOR | 10/6/2022 | 49,000 | (498 | ) | — | (498 | ) | ||||||||||||||
1.9855% | 3-month USD-LIBOR | 10/17/2022 | 29,500 | (331 | ) | — | (331 | ) | ||||||||||||||
1.98% | 3-month USD-LIBOR | 10/17/2022 | 29,500 | (339 | ) | — | (339 | ) | ||||||||||||||
2.08613% | 3-month USD-LIBOR | 11/17/2022 | 38,300 | (257 | ) | — | (257 | ) | ||||||||||||||
2.08934% | 3-month USD-LIBOR | 11/17/2022 | 40,700 | (267 | ) | — | (267 | ) | ||||||||||||||
2.2025% | 3-month USD-LIBOR | 12/4/2022 | 20,000 | (28 | ) | — | (28 | ) | ||||||||||||||
3-month USD-LIBOR | 2.2455% | 12/21/2022 | 25,000 | (6 | ) | — | (6 | ) | ||||||||||||||
2.27403% | 3-month USD-LIBOR | 12/29/2022 | 60,000 | 92 | — | 92 | ||||||||||||||||
3-month USD-LIBOR | 2.0815% | 2/10/2024 | 28,700 | 321 | — | 321 | ||||||||||||||||
3-month USD-LIBOR | 2.0955% | 2/10/2024 | 14,300 | 148 | — | 148 | ||||||||||||||||
3-month USD-LIBOR | 2.3875% | 3/17/2024 | 160,700 | (998 | ) | — | (998 | ) | ||||||||||||||
3-month USD-LIBOR | 2.12813% | 10/3/2024 | 65,000 | 712 | — | 712 | ||||||||||||||||
3-month USD-LIBOR | 1.798% | 2/2/2026 | 35,000 | 1,408 | — | 1,408 | ||||||||||||||||
3-month USD-LIBOR | 2.24% | 12/5/2026 | 55,100 | 545 | — | 545 | ||||||||||||||||
3-month USD-LIBOR | 2.27% | 12/5/2026 | 44,900 | 335 | — | 335 | ||||||||||||||||
2.579% | 3-month USD-LIBOR | 3/14/2027 | 53,000 | 929 | — | 929 | ||||||||||||||||
2.333% | 3-month USD-LIBOR | 3/29/2027 | 42,000 | (144 | ) | — | (144 | ) | ||||||||||||||
3-month USD-LIBOR | 2.31934% | 11/17/2027 | 21,200 | 127 | — | 127 | ||||||||||||||||
3-month USD-LIBOR | 2.31613% | 11/17/2027 | 19,800 | 124 | — | 124 | ||||||||||||||||
3-month USD-LIBOR | 2.97125% | 9/2/2030 | 62,000 | (2,240 | ) | — | (2,240 | ) | ||||||||||||||
3-month USD-LIBOR | 3.005% | 9/2/2030 | 62,000 | (2,418 | ) | — | (2,418 | ) | ||||||||||||||
3-month USD-LIBOR | 3.34% | 6/27/2044 | 45,000 | (7,252 | ) | — | (7,252 | ) | ||||||||||||||
3-month USD-LIBOR | 3.206% | 7/31/2044 | 16,000 | (2,160 | ) | — | (2,160 | ) | ||||||||||||||
3-month USD-LIBOR | 3.238% | 8/8/2044 | 16,000 | (2,262 | ) | — | (2,262 | ) | ||||||||||||||
3-month USD-LIBOR | 2.7045% | 1/2/2045 | 12,000 | (404 | ) | — | (404 | ) | ||||||||||||||
3-month USD-LIBOR | 2.5055% | 1/9/2045 | 11,000 | 75 | — | 75 | ||||||||||||||||
3-month USD-LIBOR | 2.4945% | 1/9/2045 | 2,000 | 18 | — | 18 | ||||||||||||||||
3-month USD-LIBOR | 2.7025% | 9/10/2045 | 30,000 | (1,030 | ) | — | (1,030 | ) | ||||||||||||||
3-month USD-LIBOR | 2.52822% | 11/23/2045 | 13,350 | 24 | — | 24 | ||||||||||||||||
2.44345% | 3-month USD-LIBOR | 6/29/2047 | 21,000 | (422 | ) | — | (422 | ) | ||||||||||||||
American Funds Insurance Series 111
Table of Contents
U.S. Government/AAA-Rated Securities Fund
Swap contracts (continued)
Interest rate swaps (continued)
Receive | Pay | Expiration date | Notional (000) | Value at 12/31/2017 (000) | Upfront payments/ receipts (000) | Unrealized (depreciation) appreciation at 12/31/2017 (000) | ||||||||||||||||
3-month USD-LIBOR | 2.5015% | 8/17/2047 | $ | 4,600 | $ | 33 | $ | — | $ | 33 | ||||||||||||
3-month USD-LIBOR | 2.5095% | 8/17/2047 | 4,400 | 24 | — | 24 | ||||||||||||||||
3-month USD-LIBOR | 2.436% | 9/19/2047 | 10,500 | 230 | — | 230 | ||||||||||||||||
2.53563% | 3-month USD-LIBOR | 10/3/2047 | 20,000 | (4 | ) | — | (4 | ) | ||||||||||||||
3-month USD-LIBOR | 2.56315% | 10/6/2047 | 11,000 | (65 | ) | — | (65 | ) | ||||||||||||||
3-month USD-LIBOR | 2.495% | 10/17/2047 | 6,300 | 56 | — | 56 | ||||||||||||||||
3-month USD-LIBOR | 2.4975% | 10/17/2047 | 6,300 | 52 | — | 52 | ||||||||||||||||
U.S. EFFR | 2.166% | 10/23/2047 | 10,000 | (28 | ) | — | (28 | ) | ||||||||||||||
U.S. EFFR | 2.145% | 11/9/2047 | 15,400 | 29 | — | 29 | ||||||||||||||||
U.S. EFFR | 2.153% | 11/10/2047 | 15,300 | 1 | — | 1 | ||||||||||||||||
U.S. EFFR | 2.155% | 11/10/2047 | 8,640 | (3 | ) | — | (3 | ) | ||||||||||||||
U.S. EFFR | 2.17% | 11/13/2047 | 15,660 | (57 | ) | — | (57 | ) | ||||||||||||||
2.5735% | 3-month USD-LIBOR | 12/21/2047 | 5,400 | 45 | — | 45 | ||||||||||||||||
3-month USD-LIBOR | 2.57553% | 12/29/2047 | 13,000 | (115 | ) | — | (115 | ) | ||||||||||||||
|
|
|
| |||||||||||||||||||
| $ | — | $ | (8,428 | ) | ||||||||||||||||||
|
|
|
| |||||||||||||||||||
The following footnotes apply to either the individual securities noted or one or more of the securities aggregated and listed as a single line item.
| 1 | A portion of this security was pledged as collateral. The total value of pledged collateral was $61,762,000, which represented 1.99% of the net assets of the fund. |
| 2 | Index-linked bond whose principal amount moves with a government price index. |
| 3 | Principal payments may be made periodically. Therefore, the effective maturity date may be earlier than the stated maturity date. |
| 4 | Purchased on a TBA basis. |
| 5 | Coupon rate may change periodically. |
| 6 | Acquired in a transaction exempt from registration under Section 4(2) of the Securities Act of 1933. May be resold in the U.S. in transactions exempt from registration, normally to qualified institutional buyers. The total value of all such securities, including those in “Other securities,“ was $339,563,000, which represented 10.94% of the net assets of the fund. |
| 7 | Notional amount is calculated based on the number of contracts and notional contract size. |
| 8 | Value is calculated based on the notional amount and current market price. |
Key to abbreviations and symbol
EFFR = Federal Funds Effective Rate
LIBOR = London Interbank Offered Rate
TBA = To-be-announced
USD/$ = U.S. dollars
See Notes to Financial Statements
112 American Funds Insurance Series
Table of Contents
Investment portfolio December 31, 2017
| Shares | Value (000) | |||||||
Growth funds 80.05% | ||||||||
American Funds Insurance Series – Growth Fund, Class 1 | 2,960,791 | $ | 230,498 | |||||
Total growth funds (cost: $200,842,000) | 230,498 | |||||||
Fixed income funds 15.11% | ||||||||
American Funds Insurance Series – Bond Fund, Class 1 | 4,022,202 | 43,520 | ||||||
Total fixed income funds (cost: $44,022,000) | 43,520 | |||||||
Short-term securities 4.89% | ||||||||
Government Cash Management Fund | 14,078,452 | 14,078 | ||||||
Total short-term securities (cost: $14,078,000) | 14,078 | |||||||
Total investment securities 100.05% (cost: $258,942,000) | 288,096 | |||||||
Other assets less liabilities (0.05)% | (137 | ) | ||||||
Net assets 100.00% | $ | 287,959 | ||||||
Futures contracts | ||||||||
Contracts | Type | Number of contracts | Expiration | Notional amount1 (000) | Value at 12/31/20172 (000) | Unrealized depreciation at 12/31/2017 (000) | ||||||||||||||||||
5 Year U.S. Treasury Note Futures | Long | 130 | March 2018 | $ | 13,000 | $ | 15,101 | $ | (38 | ) | ||||||||||||||
Investments in affiliates
These holdings are affiliates of the fund under the Investment Company Act of 1940 since they are controlled by the same board of trustees as the series. Further details on these holdings and related transactions during the year ended December 31, 2017, appear below.
| Beginning shares | Additions | Reductions | Ending shares | Net realized loss (000) | Net unrealized appreciation (depreciation) (000) | Dividend income (000) | Value of affiliates at 12/31/2017 (000) | |||||||||||||||||||||||||
Growth funds 80.05% | ||||||||||||||||||||||||||||||||
American Funds Insurance Series - Growth Fund, Class 1 | 2,821,842 | 902,012 | 763,063 | 2,960,791 | $ | (2,465 | ) | $ | 35,900 | $ | 1,621 | $ | 230,498 | |||||||||||||||||||
Fixed income funds 15.11% | ||||||||||||||||||||||||||||||||
American Funds Insurance Series - Bond Fund, Class 1 | — | 4,068,037 | 45,835 | 4,022,202 | (5 | ) | (502 | ) | 674 | 43,520 | ||||||||||||||||||||||
|
|
|
|
|
|
|
| |||||||||||||||||||||||||
Total 95.16% | $ | (2,470 | ) | $ | 35,398 | $ | 2,295 | $ | 274,018 | |||||||||||||||||||||||
|
|
|
|
|
|
|
| |||||||||||||||||||||||||
| 1 | Notional amount is calculated based on the number of contracts and notional contract size. |
| 2 | Value is calculated based on the notional amount and current market price. |
See Notes to Financial Statements
American Funds Insurance Series 113
Table of Contents
Managed Risk International Fund
Investment portfolio December 31, 2017
| Shares | Value (000) | |||||||
Growth funds 80.15% | ||||||||
American Funds Insurance Series – International Fund, Class 1 | 5,479,657 | $ | 118,964 | |||||
|
| |||||||
Total growth funds (cost: $99,690,000) | 118,964 | |||||||
|
| |||||||
Fixed income funds 15.04% | ||||||||
American Funds Insurance Series – Bond Fund, Class 1 | 2,063,150 | 22,323 | ||||||
|
| |||||||
Total fixed income funds (cost: $22,581,000) | 22,323 | |||||||
|
| |||||||
Short-term securities 4.85% | ||||||||
Government Cash Management Fund | 7,200,311 | 7,200 | ||||||
|
| |||||||
Total short-term securities (cost: $7,200,000) | 7,200 | |||||||
|
| |||||||
Total investment securities 100.04% (cost: $129,471,000) | 148,487 | |||||||
Other assets less liabilities (0.04)% | (64 | ) | ||||||
|
| |||||||
Net assets 100.00% | $ | 148,423 | ||||||
|
| |||||||
Futures contracts
Contracts | Type | Number of contracts | Expiration | Notional amount1 (000) | Value at 12/31/20172 (000) | Unrealized depreciation at 12/31/2017 (000) | ||||||||||||||||
5 Year U.S. Treasury Note Futures | Long | 66 | March 2018 | $ | 6,600 | $ | 7,667 | $ | (19 | ) | ||||||||||||
Investments in affiliates
These holdings are affiliates of the fund under the Investment Company Act of 1940 since they are controlled by the same board of trustees as the series. Further details on these holdings and related transactions during the year ended December 31, 2017, appear below.
| Beginning shares | Additions | Reductions | Ending shares | Net realized loss (000) | Net unrealized appreciation (depreciation) (000) | Dividend income (000) | Value of affiliates at 12/31/2017 (000) | |||||||||||||||||||||||||
Growth funds 80.15% | ||||||||||||||||||||||||||||||||
American Funds Insurance Series - International Fund, Class 1 | 5,381,857 | 1,475,679 | 1,377,879 | 5,479,657 | $ | (584 | ) | $ | 29,000 | $ | 1,667 | $ | 118,964 | |||||||||||||||||||
Fixed income funds 15.04% | ||||||||||||||||||||||||||||||||
American Funds Insurance Series - Bond Fund, Class 1 | — | 2,098,231 | 35,081 | 2,063,150 | (2 | ) | (258 | ) | 345 | 22,323 | ||||||||||||||||||||||
|
|
|
|
|
|
|
| |||||||||||||||||||||||||
Total 95.19% | $ | (586 | ) | $ | 28,742 | $ | 2,012 | $ | 141,287 | |||||||||||||||||||||||
|
|
|
|
|
|
|
| |||||||||||||||||||||||||
| 1 | Notional amount is calculated based on the number of contracts and notional contract size. |
| 2 | Value is calculated based on the notional amount and current market price. |
See Notes to Financial Statements
114 American Funds Insurance Series
Table of Contents
Managed Risk Blue Chip Income and Growth Fund
Investment portfolio December 31, 2017
| Value | ||||||||
| Shares | (000) | |||||||
Growth-and-income funds 80.32% | ||||||||
American Funds Insurance Series – Blue Chip Income and Growth Fund, Class 1 | 19,699,331 | $ | 294,702 | |||||
|
| |||||||
Total growth-and-income funds (cost: $263,402,000) | 294,702 | |||||||
|
| |||||||
Fixed income funds 14.92% | ||||||||
American Funds Insurance Series – U.S. Government/AAA-Rated Securities Fund, Class 1 | 4,530,491 | 54,729 | ||||||
|
| |||||||
Total fixed income funds (cost: $55,397,000) | 54,729 | |||||||
|
| |||||||
Short-term securities 4.82% | ||||||||
Government Cash Management Fund | 17,696,252 | 17,696 | ||||||
|
| |||||||
Total short-term securities (cost: $17,696,000) | 17,696 | |||||||
|
| |||||||
Total investment securities 100.06% (cost: $336,495,000) | 367,127 | |||||||
Other assets less liabilities (0.06)% | (223 | ) | ||||||
|
| |||||||
Net assets 100.00% | $ | 366,904 | ||||||
|
| |||||||
Futures contracts
Contracts | Type | Number of contracts | Expiration | Notional amount1 (000) | Value at 12/31/20172 (000) | Unrealized depreciation at 12/31/2017 (000) | ||||||||||||||||
5 Year U.S. Treasury Note Futures | Long | 167 | March 2018 | $ | 16,700 | $ | 19,399 | $ | (49 | ) | ||||||||||||
Investments in affiliates
These holdings are affiliates of the fund under the Investment Company Act of 1940 since they are controlled by the same board of trustees as the series. Further details on these holdings and related transactions during the year ended December 31, 2017, appear below.
| Beginning shares | Additions | Reductions | Ending shares | Net realized gain (000) | Net unrealized appreciation (depreciation) (000) | Dividend income (000) | Value of affiliates at 12/31/2017 (000) | |||||||||||||||||||||||||
Growth-and-income funds 80.32% | ||||||||||||||||||||||||||||||||
American Funds Insurance Series - Blue Chip Income and Growth Fund, Class 1 | 20,295,700 | 6,791,546 | 7,387,915 | 19,699,331 | $ | 228 | $ | 31,593 | $ | 6,425 | $ | 294,702 | ||||||||||||||||||||
Fixed income funds 14.92% | ||||||||||||||||||||||||||||||||
American Funds Insurance Series - U.S. Government/AAA-Rated Securities Fund, Class 1 | — | 4,549,444 | 18,953 | 4,530,491 | 1 | (668 | ) | 690 | 54,729 | |||||||||||||||||||||||
|
|
|
|
|
|
|
| |||||||||||||||||||||||||
Total 95.24% | $ | 229 | $ | 30,925 | $ | 7,115 | $ | 349,431 | ||||||||||||||||||||||||
|
|
|
|
|
|
|
| |||||||||||||||||||||||||
| 1 | Notional amount is calculated based on the number of contracts and notional contract size. |
| 2 | Value is calculated based on the notional amount and current market price. |
See Notes to Financial Statements
American Funds Insurance Series 115
Table of Contents
Managed Risk Growth-Income Fund
Investment portfolio December 31, 2017
| Shares | Value (000) | |||||||
Growth-and-income funds 80.07% | ||||||||
American Funds Insurance Series – Growth-Income Fund, Class 1 | 3,331,787 | $ | 167,322 | |||||
|
| |||||||
Total growth-and-income funds (cost: $153,163,000) | 167,322 | |||||||
|
| |||||||
Fixed income funds 15.10% | ||||||||
American Funds Insurance Series – Bond Fund, Class 1 | 2,916,097 | 31,552 | ||||||
|
| |||||||
Total fixed income funds (cost: $31,921,000) | 31,552 | |||||||
|
| |||||||
Short-term securities 4.88% | ||||||||
Government Cash Management Fund | 10,195,681 | 10,196 | ||||||
|
| |||||||
Total short-term securities (cost: $10,196,000) | 10,196 | |||||||
|
| |||||||
Total investment securities 100.05% (cost: $195,280,000) | 209,070 | |||||||
Other assets less liabilities (0.05)% | (102 | ) | ||||||
|
| |||||||
Net assets 100.00% | $ | 208,968 | ||||||
|
| |||||||
Contracts | Type | Number of contracts | Expiration | Notional amount1 (000) | Value at 12/31/20172 (000) | Unrealized depreciation at 12/31/2017 (000) | ||||||||||||||||||
5 Year U.S. Treasury Note Futures | Long | 95 | March 2018 | $ | 9,500 | $ | 11,036 | $ | (28 | ) | ||||||||||||||
Investments in affiliates
These holdings are affiliates of the fund under the Investment Company Act of 1940 since they are controlled by the same board of trustees as the series. Further details on these holdings and related transactions during the year ended December 31, 2017, appear below.
| Beginning shares | Additions | Reductions | Ending shares | Net realized loss (000) | Net unrealized appreciation (depreciation) (000) | Dividend income (000) | Value of affiliates at 12/31/2017 (000) | |||||||||||||||||||||||||
Growth-and-income funds 80.07% | ||||||||||||||||||||||||||||||||
American Funds Insurance Series - Growth- Income Fund, Class 1 | 3,415,529 | 831,566 | 915,308 | 3,331,787 | $ | (2,960 | ) | $ | 24,457 | $ | 2,622 | $ | 167,322 | |||||||||||||||||||
Fixed income funds 15.10% | ||||||||||||||||||||||||||||||||
American Funds Insurance Series - Bond Fund, Class 1 | — | 2,928,337 | 12,240 | 2,916,097 | (1 | ) | (369 | ) | 492 | 31,552 | ||||||||||||||||||||||
|
|
|
|
|
|
|
| |||||||||||||||||||||||||
Total 95.17% | $ | (2,961 | ) | $ | 24,088 | $ | 3,114 | $ | 198,874 | |||||||||||||||||||||||
|
|
|
|
|
|
|
| |||||||||||||||||||||||||
| 1 | Notional amount is calculated based on the number of contracts and notional contract size. |
| 2 | Value is calculated based on the notional amount and current market price. |
See Notes to Financial Statements
116 American Funds Insurance Series
Table of Contents
Managed Risk Asset Allocation Fund
Investment portfolio December 31, 2017
| Shares | Value (000) | |||||||
Asset allocation funds 95.19% | ||||||||
American Funds Insurance Series – Asset Allocation Fund, Class 1 | 178,833,494 | $ | 4,240,142 | |||||
|
| |||||||
Total asset allocation funds (cost: $3,901,495,000) | 4,240,142 | |||||||
|
| |||||||
Short-term securities 4.87% | ||||||||
Government Cash Management Fund | 217,109,926 | 217,110 | ||||||
|
| |||||||
Total short-term securities (cost: $217,110,000) | 217,110 | |||||||
|
| |||||||
Total investment securities 100.06% (cost: $4,118,605,000) | 4,457,252 | |||||||
Other assets less liabilities (0.06)% | (2,842 | ) | ||||||
|
| |||||||
Net assets 100.00% | $ | 4,454,410 | ||||||
|
| |||||||
Futures contracts
Contracts | Type | Number of contracts | Expiration | Notional amount1 (000) | Value at 12/31/20172 (000) | Unrealized depreciation at 12/31/2017 (000) | ||||||||||||||||
5 Year U.S. Treasury Note Futures | Long | 2,033 | March 2018 | $ | 203,300 | $ | 236,162 | $ | (592 | ) | ||||||||||||
Investment in affiliates
This holding is an affiliate of the fund under the Investment Company Act of 1940 since it is controlled by the same board of trustees as the series. Further details on this holding and related transactions during the year ended December 31, 2017, appear below.
| Beginning shares | Additions | Reductions | Ending shares | Net realized gain (000) | Net unrealized appreciation (000) | Dividend income (000) | Value of affiliate at 12/31/2017 (000) | |||||||||||||||||||||||||
Asset allocation funds 95.19% | ||||||||||||||||||||||||||||||||
American Funds Insurance Series - Asset Allocation Fund, Class 1 | 153,453,622 | 27,323,215 | 1,943,343 | 178,833,494 | $ | 4,957 | $ | 329,625 | $ | 70,949 | $ | 4,240,142 | ||||||||||||||||||||
| 1 | Notional amount is calculated based on the number of contracts and notional contract size. |
| 2 | Value is calculated based on the notional amount and current market price. |
See Notes to Financial Statements
American Funds Insurance Series 117
Table of Contents
Statements of assets and liabilities at December 31, 2017
| Global Growth Fund | Global Small Capitalization Fund | Growth Fund | International Fund | New World Fund | ||||||||||||||||
Assets: | ||||||||||||||||||||
Investment securities, at value: | ||||||||||||||||||||
Unaffiliated issuers | $ | 6,252,509 | $ | 4,283,077 | $ | 25,039,262 | $ | 9,755,613 | $ | 3,548,151 | ||||||||||
Affiliated issuers | — | 32,175 | — | — | — | |||||||||||||||
Cash | 826 | 285 | 5,966 | 224 | 267 | |||||||||||||||
Cash denominated in currencies other than U.S. dollars | 77 | — | * | — | * | 1,557 | 17 | |||||||||||||
Unrealized appreciation on open forward currency contracts | 15 | 89 | — | — | 69 | |||||||||||||||
Receivables for: | ||||||||||||||||||||
Sales of investments | 244 | 6,683 | — | 10,136 | 4,948 | |||||||||||||||
Sales of fund’s shares | 2,175 | 780 | 5,686 | 2,305 | 1,438 | |||||||||||||||
Dividends and interest | 6,980 | 4,576 | 9,570 | 18,169 | 5,876 | |||||||||||||||
Closed forward currency contracts | — | 44 | — | — | — | |||||||||||||||
Variation margin on futures contracts | — | — | — | — | — | |||||||||||||||
Variation margin on swap contracts | — | — | — | — | — | |||||||||||||||
Other | 91 | 77 | 40 | 325 | 10 | |||||||||||||||
|
|
|
|
|
|
|
|
|
| |||||||||||
| 6,262,917 | 4,327,786 | 25,060,524 | 9,788,329 | 3,560,776 | ||||||||||||||||
|
|
|
|
|
|
|
|
|
| |||||||||||
Liabilities: | ||||||||||||||||||||
Unrealized depreciation on open forward currency contracts | — | 1,192 | — | 355 | 392 | |||||||||||||||
Payables for: | ||||||||||||||||||||
Purchases of investments | 5,023 | 4,588 | 19,283 | 9,764 | 7,084 | |||||||||||||||
Repurchases of fund’s shares | 14,501 | 2,894 | 43,820 | 10,041 | 1,590 | |||||||||||||||
Investment advisory services | 2,734 | 2,529 | 6,875 | 4,021 | 2,064 | |||||||||||||||
Services provided by related parties | 943 | 599 | 3,764 | 1,069 | 337 | |||||||||||||||
Trustees’ deferred compensation | 71 | 48 | 517 | 220 | 31 | |||||||||||||||
Closed forward currency contracts | — | — | — | — | — | |||||||||||||||
Variation margin on futures contracts | — | — | — | — | — | |||||||||||||||
Variation margin on swap contracts | — | — | — | — | — | |||||||||||||||
Non-U.S. taxes | 4,352 | 754 | 219 | 4,753 | 16,164 | |||||||||||||||
Other | 217 | 144 | 588 | 284 | 401 | |||||||||||||||
|
|
|
|
|
|
|
|
|
| |||||||||||
| 27,841 | 12,748 | 75,066 | 30,507 | 28,063 | ||||||||||||||||
|
|
|
|
|
|
|
|
|
| |||||||||||
Net assets at December 31, 2017 | $ | 6,235,076 | $ | 4,315,038 | $ | 24,985,458 | $ | 9,757,822 | $ | 3,532,713 | ||||||||||
|
|
|
|
|
|
|
|
|
| |||||||||||
Net assets consist of: | ||||||||||||||||||||
Capital paid in on shares of beneficial interest | $ | 3,621,863 | $ | 3,116,123 | $ | 13,105,139 | $ | 7,085,727 | $ | 2,609,444 | ||||||||||
Undistributed (distributions in excess of) net investment income | 3,242 | 10,507 | 41,109 | 2,852 | 4,643 | |||||||||||||||
Undistributed (accumulated) net realized gain (loss) | 427,988 | 238,153 | 2,386,299 | 458,991 | 92,357 | |||||||||||||||
Net unrealized appreciation (depreciation) | 2,181,983 | 950,255 | 9,452,911 | 2,210,252 | 826,269 | |||||||||||||||
|
|
|
|
|
|
|
|
|
| |||||||||||
Net assets at December 31, 2017 | $ | 6,235,076 | $ | 4,315,038 | $ | 24,985,458 | $ | 9,757,822 | $ | 3,532,713 | ||||||||||
|
|
|
|
|
|
|
|
|
| |||||||||||
Investment securities, at cost: | ||||||||||||||||||||
Unaffiliated issuers | $ | 4,066,420 | $ | 3,337,949 | $ | 15,586,391 | $ | 7,542,215 | $ | 2,705,479 | ||||||||||
Affiliated issuers | — | 25,519 | — | — | — | |||||||||||||||
Cash denominated in currencies other than U.S. dollars, at cost | 77 | — | * | — | * | 1,552 | 17 | |||||||||||||
See end of statements of assets and liabilities for footnote.
See Notes to Financial Statements
118 American Funds Insurance Series
Table of Contents
| (dollars in thousands) | ||||||||||||||||||||||||||||||||||
| Blue Chip Income and Growth Fund | Global Growth and Income Fund | Growth- Income Fund | International Growth and Income Fund | Capital Income Builder | Asset Allocation Fund | Global Balanced Fund | Bond Fund | Global Bond Fund | ||||||||||||||||||||||||||
| $ | 9,376,768 | $ | 2,106,326 | $ | 30,709,873 | $ | 1,460,513 | $ | 599,194 | $ | 25,925,861 | $ | 356,247 | $ | 12,735,377 | $ | 2,492,473 | |||||||||||||||||
| — | — | — | — | — | 233,520 | — | — | — | ||||||||||||||||||||||||||
| 74 | 327 | 2,827 | 190 | 387 | 13,225 | 88 | 6,703 | 48 | ||||||||||||||||||||||||||
| — | — | * | 82 | 305 | 99 | 575 | 32 | 8,467 | 1,392 | |||||||||||||||||||||||||
| — | — | — | — | — | — | 144 | 10,220 | 4,906 | ||||||||||||||||||||||||||
| — | 9,418 | 14 | 420 | 14,350 | 242,667 | 3,300 | 901,567 | 48,509 | ||||||||||||||||||||||||||
| 1,782 | 665 | 8,715 | 339 | 760 | 30,699 | 621 | 5,401 | 1,723 | ||||||||||||||||||||||||||
| 11,389 | 4,262 | 38,831 | 4,986 | 2,318 | 60,752 | 1,283 | 66,255 | 18,888 | ||||||||||||||||||||||||||
| — | — | — | — | — | — | 11 | — | 253 | ||||||||||||||||||||||||||
| — | — | — | — | — | 58 | — | 1,377 | 192 | ||||||||||||||||||||||||||
| — | — | — | — | — | 68 | — | 651 | 367 | ||||||||||||||||||||||||||
| 30 | 113 | 225 | 60 | 12 | 365 | 21 | 335 | 286 | ||||||||||||||||||||||||||
|
|
|
|
|
|
|
|
|
|
|
|
|
|
|
|
|
| |||||||||||||||||
| 9,390,043 | 2,121,111 | 30,760,567 | 1,466,813 | 617,120 | 26,507,790 | 361,747 | 13,736,353 | 2,569,037 | ||||||||||||||||||||||||||
|
|
|
|
|
|
|
|
|
|
|
|
|
|
|
|
|
| |||||||||||||||||
| — | — | — | — | — | — | 269 | 2,678 | 4,246 | ||||||||||||||||||||||||||
| — | 13,327 | 20,032 | 204 | 22,077 | 827,715 | 7,055 | 3,028,664 | 94,178 | ||||||||||||||||||||||||||
| 5,780 | 1,249 | 34,294 | 2,188 | 8 | 9,032 | 54 | 1,676 | 162 | ||||||||||||||||||||||||||
| 3,073 | 1,048 | 6,737 | 740 | 248 | 5,754 | 195 | 3,275 | 1,101 | ||||||||||||||||||||||||||
| 877 | 358 | 3,401 | 82 | 75 | 2,124 | 57 | 992 | 274 | ||||||||||||||||||||||||||
| 78 | 22 | 591 | 9 | 2 | 253 | 2 | 115 | 24 | ||||||||||||||||||||||||||
| — | — | — | — | — | — | 2 | — | 899 | ||||||||||||||||||||||||||
| — | — | — | — | — | 191 | — | 37 | 9 | ||||||||||||||||||||||||||
| — | — | — | — | — | 181 | — | 1,058 | 282 | ||||||||||||||||||||||||||
| 220 | 2,563 | 2,618 | 1,528 | 11 | 131 | 150 | — | 235 | ||||||||||||||||||||||||||
| 166 | 98 | 532 | 95 | 242 | 2,315 | 64 | 164 | 49 | ||||||||||||||||||||||||||
|
|
|
|
|
|
|
|
|
|
|
|
|
|
|
| |||||||||||||||||||
| 10,194 | 18,665 | 68,205 | 4,846 | 22,663 | 847,696 | 7,848 | 3,038,659 | 101,459 | ||||||||||||||||||||||||||
|
|
|
|
|
|
|
|
|
|
|
|
|
|
|
|
|
| |||||||||||||||||
| $ | 9,379,849 | $ | 2,102,446 | $ | 30,692,362 | $ | 1,461,967 | $ | 594,457 | $ | 25,660,094 | $ | 353,899 | $ | 10,697,694 | $ | 2,467,578 | |||||||||||||||||
|
|
|
|
|
|
|
|
|
|
|
|
|
|
|
|
|
| |||||||||||||||||
| $ | 6,329,001 | $ | 1,433,416 | $ | 19,750,659 | $ | 1,270,668 | $ | 560,897 | $ | 19,078,377 | $ | 295,581 | $ | 10,588,572 | $ | 2,421,281 | |||||||||||||||||
| 37,271 | 6,666 | 88,048 | 4,347 | 261 | 92,516 | (671 | ) | 35,376 | 2,784 | |||||||||||||||||||||||||
| 718,730 | 151,697 | 2,154,031 | (4,704 | ) | 1,369 | 1,230,620 | 1,590 | 11,921 | 6,180 | |||||||||||||||||||||||||
| 2,294,847 | 510,667 | 8,699,624 | 191,656 | 31,930 | 5,258,581 | 57,399 | 61,825 | 37,333 | ||||||||||||||||||||||||||
|
|
|
|
|
|
|
|
|
|
|
|
|
|
|
| |||||||||||||||||||
| $ | 9,379,849 | $ | 2,102,446 | $ | 30,692,362 | $ | 1,461,967 | $ | 594,457 | $ | 25,660,094 | $ | 353,899 | $ | 10,697,694 | $ | 2,467,578 | |||||||||||||||||
|
|
|
|
|
|
|
|
|
|
|
|
|
|
|
|
|
| |||||||||||||||||
| $ | 7,081,951 | $ | 1,593,223 | $ | 22,008,737 | $ | 1,267,746 | $ | 567,274 | $ | 20,455,210 | $ | 298,597 | $ | 12,684,562 | $ | 2,454,021 | |||||||||||||||||
| — | — | — | — | — | 438,627 | — | — | — | ||||||||||||||||||||||||||
| — | — | * | 82 | 305 | 99 | 575 | 32 | 8,384 | 1,371 | |||||||||||||||||||||||||
American Funds Insurance Series 119
Table of Contents
Statements of assets and liabilities at December 31, 2017
| High- Income Bond Fund | Mortgage Fund | Ultra-Short Bond Fund | U.S. Government/ AAA-Rated Securities Fund | Managed Risk Growth Fund | ||||||||||||||||
Assets: | ||||||||||||||||||||
Investment securities, at value: | ||||||||||||||||||||
Unaffiliated issuers | $ | 1,424,657 | $ | 416,389 | $ | 305,727 | $ | 3,338,715 | $ | 14,078 | ||||||||||
Affiliated issuers | — | — | — | — | 274,018 | |||||||||||||||
Cash | 7,789 | 184 | 78 | 1,154 | — | |||||||||||||||
Cash denominated in currencies other than U.S. dollars | — | * | — | — | — | — | ||||||||||||||
Receivables for: | ||||||||||||||||||||
Sales of investments | 5,688 | 69,814 | — | 93,294 | — | |||||||||||||||
Sales of fund’s shares | 231 | 159 | 129 | 791 | 424 | |||||||||||||||
Dividends and interest | 22,421 | 1,001 | — | 13,174 | 14 | |||||||||||||||
Deposits at brokers for futures contracts | — | — | — | — | 81 | |||||||||||||||
Variation margin on futures contracts | — | 152 | — | 2,137 | 12 | |||||||||||||||
Variation margin on swap contracts | 23 | 86 | — | 1,629 | — | |||||||||||||||
Other | 168 | 1 | — | 21 | — | |||||||||||||||
|
|
|
|
|
|
|
|
|
| |||||||||||
| 1,460,977 | 487,786 | 305,934 | 3,450,915 | 288,627 | ||||||||||||||||
|
|
|
|
|
|
|
|
|
| |||||||||||
Liabilities: | ||||||||||||||||||||
Payables for: | ||||||||||||||||||||
Purchases of investments | 5,131 | 147,041 | — | 342,862 | 396 | |||||||||||||||
Repurchases of fund’s shares | 499 | 240 | 924 | 488 | 7 | |||||||||||||||
Investment advisory services | 581 | 121 | 84 | 886 | 24 | |||||||||||||||
Services provided by related parties | 186 | 19 | 60 | 353 | 233 | |||||||||||||||
Trustees’ deferred compensation | 53 | 2 | 19 | 61 | 1 | |||||||||||||||
Variation margin on futures contracts | — | — | — | 264 | — | |||||||||||||||
Variation margin on swap contracts | 184 | 153 | — | 2,614 | — | |||||||||||||||
Bank overdraft | — | — | — | — | 5 | |||||||||||||||
Other | 463 | 40 | 42 | 72 | 2 | |||||||||||||||
|
|
|
|
|
|
|
|
|
| |||||||||||
| 7,097 | 147,616 | 1,129 | 347,600 | 668 | ||||||||||||||||
|
|
|
|
|
|
|
|
|
| |||||||||||
Net assets at December 31, 2017 | $ | 1,453,880 | $ | 340,170 | $ | 304,805 | $ | 3,103,315 | $ | 287,959 | ||||||||||
|
|
|
|
|
|
|
|
|
| |||||||||||
Net assets consist of: | ||||||||||||||||||||
Capital paid in on shares of beneficial interest | $ | 1,608,594 | $ | 339,464 | $ | 304,384 | $ | 3,108,660 | $ | 245,388 | ||||||||||
Undistributed (distributions in excess of) net investment income | 13,377 | 1,052 | 462 | 9,726 | 1,399 | |||||||||||||||
Undistributed (accumulated) net realized gain (loss) | (163,565 | ) | 101 | — | 1,780 | 12,056 | ||||||||||||||
Net unrealized appreciation (depreciation) | (4,526 | ) | (447 | ) | (41 | ) | (16,851 | ) | 29,116 | |||||||||||
|
|
|
|
|
|
|
|
|
| |||||||||||
Net assets at December 31, 2017 | $ | 1,453,880 | $ | 340,170 | $ | 304,805 | $ | 3,103,315 | $ | 287,959 | ||||||||||
|
|
|
|
|
|
|
|
|
| |||||||||||
Investment securities, at cost: | ||||||||||||||||||||
Unaffiliated issuers | $ | 1,429,183 | $ | 415,419 | $ | 305,768 | $ | 3,339,692 | $ | 14,078 | ||||||||||
Affiliated issuers | — | — | — | — | 244,864 | |||||||||||||||
Cash denominated in currencies other than U.S. dollars, at cost | — | * | — | — | — | — | ||||||||||||||
See end of statements of assets and liabilities for footnote.
See Notes to Financial Statements
120 American Funds Insurance Series
Table of Contents
| (dollars in thousands) | ||||||||||||||||
| Managed Risk International Fund | Managed Risk Blue Chip Income and Growth Fund | Managed Risk Growth- Income Fund | Managed Risk Asset Allocation Fund | |||||||||||||
| $ | 7,200 | $ | 17,696 | $ | 10,196 | $ | 217,110 | |||||||||
| 141,287 | 349,431 | 198,874 | 4,240,142 | |||||||||||||
| — | — | — | — | |||||||||||||
| — | — | — | — | |||||||||||||
| — | 233 | 12 | 347 | |||||||||||||
| 390 | 19 | 276 | 20,891 | |||||||||||||
| 7 | 17 | 10 | 206 | |||||||||||||
| 41 | 104 | 59 | 1,271 | |||||||||||||
| 6 | 16 | 9 | 191 | |||||||||||||
| — | — | — | — | |||||||||||||
| — | — | — | — | |||||||||||||
|
|
|
|
|
|
|
| |||||||||
| 148,931 | 367,516 | 209,436 | 4,480,158 | |||||||||||||
|
|
|
|
|
|
|
| |||||||||
| 367 | 13 | 258 | 19,185 | |||||||||||||
| 3 | 250 | 16 | 1,062 | |||||||||||||
| 12 | 31 | 18 | 374 | |||||||||||||
| 120 | 301 | 171 | 3,317 | |||||||||||||
| 1 | 1 | 1 | 20 | |||||||||||||
| — | — | — | — | |||||||||||||
| — | — | — | — | |||||||||||||
| 5 | 6 | 3 | 72 | |||||||||||||
| — | * | 10 | 1 | 1,718 | ||||||||||||
|
|
|
|
|
|
|
| |||||||||
| 508 | 612 | 468 | 25,748 | |||||||||||||
|
|
|
|
|
|
|
| |||||||||
| $ | 148,423 | $ | 366,904 | $ | 208,968 | $ | 4,454,410 | |||||||||
|
|
|
|
|
|
|
| |||||||||
| $ | 134,213 | $ | 320,903 | $ | 188,490 | $ | 3,888,542 | |||||||||
| 1,323 | 5,669 | 2,167 | 53,091 | |||||||||||||
| (6,110 | ) | 9,749 | 4,549 | 174,722 | ||||||||||||
| 18,997 | 30,583 | 13,762 | 338,055 | |||||||||||||
|
|
|
|
|
|
|
| |||||||||
| $ | 148,423 | $ | 366,904 | $ | 208,968 | $ | 4,454,410 | |||||||||
|
|
|
|
|
|
|
| |||||||||
| $ | 7,200 | $ | 17,696 | $ | 10,196 | $ | 217,110 | |||||||||
| 122,271 | 318,799 | 185,084 | 3,901,495 | |||||||||||||
| — | — | — | — | |||||||||||||
American Funds Insurance Series 121
Table of Contents
Statements of assets and liabilities at December 31, 2017
| Global Growth Fund | Global Small Capitalization Fund | Growth Fund | International Fund | New World Fund | ||||||||||||||||
Shares of beneficial interest issued and outstanding (no stated par value) — unlimited shares authorized | ||||||||||||||||||||
Class 1: | ||||||||||||||||||||
Net assets | $ | 2,009,765 | $ | 1,639,002 | $ | 8,100,634 | $ | 5,013,606 | $ | 2,049,765 | ||||||||||
Shares outstanding | 65,876 | 64,573 | 104,059 | 230,943 | 81,020 | |||||||||||||||
Net asset value per share | $ | 30.51 | $ | 25.38 | $ | 77.85 | $ | 21.71 | $ | 25.30 | ||||||||||
Class 1A: | ||||||||||||||||||||
Net assets | $ | 2,331 | $ | 194 | $ | 2,815 | $ | 1,637 | $ | 662 | ||||||||||
Shares outstanding | 77 | 8 | 36 | 76 | 26 | |||||||||||||||
Net asset value per share | $ | 30.46 | $ | 25.36 | $ | 77.74 | $ | 21.67 | $ | 25.25 | ||||||||||
Class 2: | ||||||||||||||||||||
Net assets | $ | 4,012,273 | $ | 2,550,887 | $ | 15,716,541 | $ | 4,422,688 | $ | 1,055,043 | ||||||||||
Shares outstanding | 132,692 | 103,187 | 203,181 | 204,479 | 42,082 | |||||||||||||||
Net asset value per share | $ | 30.24 | $ | 24.72 | $ | 77.35 | $ | 21.63 | $ | 25.07 | ||||||||||
Class 3: | ||||||||||||||||||||
Net assets | $ | 211,654 | $ | 31,264 | ||||||||||||||||
Shares outstanding | 2,702 | 1,437 | ||||||||||||||||||
Net asset value per share | $ | 78.32 | $ | 21.75 | ||||||||||||||||
Class 4: | ||||||||||||||||||||
Net assets | $ | 210,707 | $ | 124,955 | $ | 953,814 | $ | 288,627 | $ | 427,243 | ||||||||||
Shares outstanding | 6,993 | 5,017 | 12,459 | 13,478 | 17,094 | |||||||||||||||
Net asset value per share | $ | 30.13 | $ | 24.91 | $ | 76.56 | $ | 21.42 | $ | 24.99 | ||||||||||
| High- Income Bond Fund | Mortgage Fund | Ultra-Short Bond Fund | U.S. Government/ AAA-Rated Securities Fund | Managed Risk Growth Fund | ||||||||||||||||
Shares of beneficial interest issued and outstanding (no stated par value) — unlimited shares authorized | ||||||||||||||||||||
Class 1: | ||||||||||||||||||||
Net assets | $ | 631,391 | $ | 265,116 | $ | 37,092 | $ | 1,557,932 | ||||||||||||
Shares outstanding | 61,972 | 25,328 | 3,286 | 128,979 | ||||||||||||||||
Net asset value per share | $ | 10.19 | $ | 10.47 | $ | 11.29 | $ | 12.08 | ||||||||||||
Class 1A: | ||||||||||||||||||||
Net assets | $ | 398 | $ | 104 | $ | 10 | $ | 303 | ||||||||||||
Shares outstanding | 39 | 10 | 1 | 25 | ||||||||||||||||
Net asset value per share | $ | 10.18 | $ | 10.46 | $ | 11.29 | $ | 12.08 | ||||||||||||
Class 2: | ||||||||||||||||||||
Net assets | $ | 775,849 | $ | 62,581 | $ | 248,306 | $ | 1,472,985 | ||||||||||||
Shares outstanding | 77,355 | 5,990 | 22,562 | 123,162 | ||||||||||||||||
Net asset value per share | $ | 10.03 | $ | 10.45 | $ | 11.01 | $ | 11.96 | ||||||||||||
Class 3: | ||||||||||||||||||||
Net assets | $ | 12,095 | $ | 4,180 | $ | 10,219 | ||||||||||||||
Shares outstanding | 1,182 | 376 | 844 | |||||||||||||||||
Net asset value per share | $ | 10.23 | $ | 11.12 | $ | 12.11 | ||||||||||||||
Class 4: | ||||||||||||||||||||
Net assets | $ | 34,147 | $ | 12,369 | $ | 15,217 | $ | 61,876 | ||||||||||||
Shares outstanding | 3,156 | 1,192 | 1,367 | 5,163 | ||||||||||||||||
Net asset value per share | $ | 10.82 | $ | 10.38 | $ | 11.13 | $ | 11.98 | ||||||||||||
Class P1: | ||||||||||||||||||||
Net assets | $ | 1,672 | ||||||||||||||||||
Shares outstanding | 126 | |||||||||||||||||||
Net asset value per share | $ | 13.22 | ||||||||||||||||||
Class P2: | ||||||||||||||||||||
Net assets | $ | 286,287 | ||||||||||||||||||
Shares outstanding | 21,794 | |||||||||||||||||||
Net asset value per share | $ | 13.14 | ||||||||||||||||||
| * | Amount less than one thousand. |
See Notes to Financial Statements
122 American Funds Insurance Series
Table of Contents
| (dollars and shares in thousands, except per-share amounts) | ||||||||||||||||||||||||||||||||||
| Blue Chip | Global | International | ||||||||||||||||||||||||||||||||
| Income and | Growth | Growth- | Growth | Capital | Asset | Global | Global | |||||||||||||||||||||||||||
| Growth | and Income | Income | and Income | Income | Allocation | Balanced | Bond | Bond | ||||||||||||||||||||||||||
| Fund | Fund | Fund | Fund | Builder | Fund | Fund | Fund | Fund | ||||||||||||||||||||||||||
| $ | 5,580,689 | $ | 485,159 | $ | 15,765,468 | $ | 1,120,622 | $ | 254,064 | $ | 16,556,359 | $ | 93,180 | $ | 6,434,289 | $ | 1,272,735 | |||||||||||||||||
| 373,041 | 30,679 | 313,948 | 63,244 | 24,427 | 698,250 | 7,310 | 594,607 | 107,164 | ||||||||||||||||||||||||||
| $ | 14.96 | $ | 15.81 | $ | 50.22 | $ | 17.72 | $ | 10.40 | $ | 23.71 | $ | 12.75 | $ | 10.82 | $ | 11.88 | |||||||||||||||||
| $ | 630 | $ | 132 | $ | 2,169 | $ | 2,151 | $ | 906 | $ | 4,226 | $ | 251 | $ | 1,072 | $ | 75 | |||||||||||||||||
| 42 | 8 | 43 | 122 | 87 | 178 | 20 | 99 | 6 | ||||||||||||||||||||||||||
| $ | 14.94 | $ | 15.81 | $ | 50.15 | $ | 17.70 | $ | 10.39 | $ | 23.69 | $ | 12.74 | $ | 10.80 | $ | 11.87 | |||||||||||||||||
| $ | 3,551,426 | $ | 1,537,698 | $ | 13,930,265 | $ | 275,757 | $ | 1,470 | $ | 5,479,790 | $ | 209,277 | $ | 3,965,674 | $ | 1,164,070 | |||||||||||||||||
| 240,001 | 97,416 | 280,230 | 15,612 | 141 | 233,306 | 16,448 | 371,033 | 98,747 | ||||||||||||||||||||||||||
| $ | 14.80 | $ | 15.78 | $ | 49.71 | $ | 17.66 | $ | 10.40 | $ | 23.49 | $ | 12.72 | $ | 10.69 | $ | 11.79 | |||||||||||||||||
| $ | 167,461 | $ | 37,683 | |||||||||||||||||||||||||||||||
| 3,330 | 1,588 | |||||||||||||||||||||||||||||||||
| $ | 50.29 | $ | 23.73 | |||||||||||||||||||||||||||||||
| $ | 247,104 | $ | 79,457 | $ | 826,999 | $ | 63,437 | $ | 338,017 | $ | 3,582,036 | $ | 51,191 | $ | 296,659 | $ | 30,698 | |||||||||||||||||
| 16,735 | 5,094 | 16,773 | 3,609 | 32,558 | 153,077 | 4,055 | 27,773 | 2,624 | ||||||||||||||||||||||||||
| $ | 14.77 | $ | 15.60 | $ | 49.31 | $ | 17.58 | $ | 10.38 | $ | 23.40 | $ | 12.63 | $ | 10.68 | $ | 11.70 | |||||||||||||||||
| Managed | Managed | Managed | ||||||||||||||||||||||||||||||||
| Managed | Risk Blue | Risk | Risk | |||||||||||||||||||||||||||||||
| Risk | Chip Income | Growth- | Asset | |||||||||||||||||||||||||||||||
| International | and Growth | Income | Allocation | |||||||||||||||||||||||||||||||
| Fund | Fund | Fund | Fund | |||||||||||||||||||||||||||||||
| $ | 138 | $ | 217 | $ | 2,485 | $ | 1,655,955 | |||||||||||||||||||||||||||
| 12 | 17 | 196 | 121,880 | |||||||||||||||||||||||||||||||
| $ | 11.25 | $ | 13.04 | $ | 12.66 | $ | 13.59 | |||||||||||||||||||||||||||
| $ | 148,285 | $ | 366,687 | $ | 206,483 | $ | 2,798,455 | |||||||||||||||||||||||||||
| 13,298 | 28,293 | 16,411 | 206,542 | |||||||||||||||||||||||||||||||
| $ | 11.15 | $ | 12.96 | $ | 12.58 | $ | 13.55 | |||||||||||||||||||||||||||
American Funds Insurance Series 123
Table of Contents
Statements of operations for the year ended December 31, 2017
| Global Growth Fund | Global Small Capitalization Fund | Growth Fund | International Fund | New World Fund | ||||||||||||||||
Investment income: | ||||||||||||||||||||
Income (net of non-U.S. taxes*): | ||||||||||||||||||||
Dividends | $ | 85,149 | $ | 48,804 | $ | 246,805 | $ | 150,915 | $ | 51,286 | ||||||||||
Interest | 2,573 | 3,295 | 13,115 | 12,542 | 10,886 | |||||||||||||||
|
|
|
|
|
|
|
|
|
| |||||||||||
| 87,722 | 52,099 | 259,920 | 163,457 | 62,172 | ||||||||||||||||
|
|
|
|
|
|
|
|
|
| |||||||||||
Fees and expenses*: | ||||||||||||||||||||
Investment advisory services | 30,510 | 28,827 | 77,148 | 43,433 | 23,033 | |||||||||||||||
Distribution services | 9,963 | 6,320 | 39,735 | 10,764 | 3,328 | |||||||||||||||
Insurance administrative services | 354 | 171 | 1,544 | 305 | 821 | |||||||||||||||
Transfer agent services | 1 | — | † | 3 | 1 | — | † | |||||||||||||
Administrative services | 587 | 413 | 2,369 | 877 | 327 | |||||||||||||||
Reports to shareholders | 284 | 191 | 1,195 | 426 | 157 | |||||||||||||||
Registration statement and prospectus | 68 | 87 | 341 | 67 | 43 | |||||||||||||||
Trustees’ compensation | 50 | 36 | 203 | 73 | 28 | |||||||||||||||
Auditing and legal | 68 | 64 | 60 | 63 | 193 | |||||||||||||||
Custodian | 888 | 596 | 531 | 1,552 | 1,271 | |||||||||||||||
Other | 37 | 82 | 17 | 28 | 53 | |||||||||||||||
|
|
|
|
|
|
|
|
|
| |||||||||||
Total fees and expenses before waivers/reimbursements | 42,810 | 36,787 | 123,146 | 57,589 | 29,254 | |||||||||||||||
Less waivers/reimbursements of fees and expenses: | ||||||||||||||||||||
Investment advisory services waivers | — | — | — | — | — | |||||||||||||||
Miscellaneous fee reimbursements | — | — | — | — | — | |||||||||||||||
|
|
|
|
|
|
|
|
|
| |||||||||||
Total waivers/reimbursements of fees and expenses | — | — | — | — | — | |||||||||||||||
|
|
|
|
|
|
|
|
|
| |||||||||||
Total fees and expenses after waivers/reimbursements | 42,810 | 36,787 | 123,146 | 57,589 | 29,254 | |||||||||||||||
|
|
|
|
|
|
|
|
|
| |||||||||||
Net investment income | 44,912 | 15,312 | 136,774 | 105,868 | 32,918 | |||||||||||||||
|
|
|
|
|
|
|
|
|
| |||||||||||
Net realized gain (loss) and unrealized appreciation (depreciation): | ||||||||||||||||||||
Net realized gain (loss) on: | ||||||||||||||||||||
Investments | ||||||||||||||||||||
Unaffiliated issuers | 434,542 | 215,857 | 2,561,326 | 449,195 | 239,723 | |||||||||||||||
Affiliated issuers* | — | (3,537 | ) | — | — | — | ||||||||||||||
Futures contracts | — | — | — | — | — | |||||||||||||||
Forward currency contracts | 241 | (4,263 | ) | — | (9,021 | ) | (881 | ) | ||||||||||||
Swap contracts | — | — | — | — | — | |||||||||||||||
Currency transactions | (1,592 | ) | (154 | ) | (253 | ) | (1,490 | ) | (1,852 | ) | ||||||||||
|
|
|
|
|
|
|
|
|
| |||||||||||
| 433,191 | 207,903 | 2,561,073 | 438,684 | 236,990 | ||||||||||||||||
|
|
|
|
|
|
|
|
|
| |||||||||||
Net unrealized appreciation (depreciation) on: | ||||||||||||||||||||
Investments | ||||||||||||||||||||
Unaffiliated issuers | 1,102,369 | 714,910 | 3,159,720 | 1,848,284 | 568,118 | |||||||||||||||
Affiliated issuers | — | 18,554 | — | — | — | |||||||||||||||
Futures contracts | — | — | — | — | — | |||||||||||||||
Forward currency contracts | (344 | ) | (2,489 | ) | — | 1,789 | (333 | ) | ||||||||||||
Swap contracts | — | — | — | — | — | |||||||||||||||
Currency translations | 491 | 111 | 77 | 463 | (197 | ) | ||||||||||||||
|
|
|
|
|
|
|
|
|
| |||||||||||
| 1,102,516 | 731,086 | 3,159,797 | 1,850,536 | 567,588 | ||||||||||||||||
|
|
|
|
|
|
|
|
|
| |||||||||||
Net realized gain (loss) and unrealized appreciation (depreciation) | 1,535,707 | 938,989 | 5,720,870 | 2,289,220 | 804,578 | |||||||||||||||
|
|
|
|
|
|
|
|
|
| |||||||||||
Net increase in net assets resulting from operations | $ | 1,580,619 | $ | 954,301 | $ | 5,857,644 | $ | 2,395,088 | $ | 837,496 | ||||||||||
|
|
|
|
|
|
|
|
|
| |||||||||||
See end of statements of operations for footnotes.
See Notes to Financial Statements
124 American Funds Insurance Series
Table of Contents
| (dollars in thousands) | ||||||||||||||||||||||||||||||||||
| Blue Chip Income and Growth Fund | Global Growth and Income Fund | Growth- Income Fund | International Growth and Income Fund | Capital Income Builder | Asset Allocation Fund | Global Balanced Fund | Bond Fund | Global Bond Fund | ||||||||||||||||||||||||||
| $ | 237,559 | $ | 56,575 | $ | 539,680 | $ | 41,062 | $ | 16,366 | $ | 306,873 | $ | 4,463 | $ | 1 | $ | 86 | |||||||||||||||||
| 3,900 | 4,539 | 22,816 | 3,660 | 2,435 | 210,080 | 2,617 | 279,063 | 69,977 | ||||||||||||||||||||||||||
|
|
|
|
|
|
|
|
|
|
|
|
|
|
|
|
|
| |||||||||||||||||
| 241,459 | 61,114 | 562,496 | 44,722 | 18,801 | 516,953 | 7,080 | 279,064 | 70,063 | ||||||||||||||||||||||||||
|
|
|
|
|
|
|
|
|
|
|
|
|
|
|
|
|
| |||||||||||||||||
| 35,032 | 12,085 | 74,641 | 8,016 | 2,505 | 63,395 | 1,958 | 39,232 | 12,626 | ||||||||||||||||||||||||||
| 9,060 | 3,813 | 35,480 | 779 | 748 | 21,595 | 552 | 10,290 | 2,929 | ||||||||||||||||||||||||||
| 440 | 79 | 1,515 | 123 | 747 | 8,084 | 65 | 360 | 42 | ||||||||||||||||||||||||||
| 1 | — | † | 3 | — | † | — | † | 3 | — | † | 1 | — | † | |||||||||||||||||||||
| 901 | 203 | 2,848 | 131 | 50 | 2,366 | 30 | 1,085 | 238 | ||||||||||||||||||||||||||
| 345 | 64 | 1,221 | 29 | 11 | 1,108 | 6 | 456 | 87 | ||||||||||||||||||||||||||
| 205 | 16 | 269 | 27 | 28 | 407 | 8 | 211 | 20 | ||||||||||||||||||||||||||
| 78 | 18 | 243 | 11 | 4 | 200 | 3 | 96 | 21 | ||||||||||||||||||||||||||
| 40 | 112 | 54 | 53 | 51 | 47 | 55 | 46 | 47 | ||||||||||||||||||||||||||
| 80 | 346 | 534 | 279 | 43 | 310 | 35 | 268 | 353 | ||||||||||||||||||||||||||
| 7 | 9 | 22 | 15 | 7 | 146 | 25 | 91 | 54 | ||||||||||||||||||||||||||
|
|
|
|
|
|
|
|
|
|
|
|
|
|
|
|
|
| |||||||||||||||||
| 46,189 | 16,745 | 116,830 | 9,463 | 4,194 | 97,661 | 2,737 | 52,136 | 16,417 | ||||||||||||||||||||||||||
| — | — | — | — | — | — | — | — | — | ||||||||||||||||||||||||||
| — | — | — | — | — | — | — | — | — | ||||||||||||||||||||||||||
|
|
|
|
|
|
|
|
|
|
|
|
|
|
|
|
|
| |||||||||||||||||
| — | — | — | — | — | — | — | — | — | ||||||||||||||||||||||||||
|
|
|
|
|
|
|
|
|
|
|
|
|
|
|
|
|
| |||||||||||||||||
| 46,189 | 16,745 | 116,830 | 9,463 | 4,194 | 97,661 | 2,737 | 52,136 | 16,417 | ||||||||||||||||||||||||||
|
|
|
|
|
|
|
|
|
|
|
|
|
|
|
|
|
| |||||||||||||||||
| 195,270 | 44,369 | 445,666 | 35,259 | 14,607 | 419,292 | 4,343 | 226,928 | 53,646 | ||||||||||||||||||||||||||
|
|
|
|
|
|
|
|
|
|
|
|
|
|
|
|
|
| |||||||||||||||||
| 686,740 | 151,815 | 2,103,780 | 6,272 | 9,027 | 1,240,250 | 9,394 | 17,539 | (633 | ) | |||||||||||||||||||||||||
| — | — | — | — | — | — | — | — | — | ||||||||||||||||||||||||||
| — | — | — | — | — | 376 | — | 17,742 | 349 | ||||||||||||||||||||||||||
| — | (157 | ) | — | (143 | ) | (16 | ) | — | (136 | ) | (46,710 | ) | (18,259 | ) | ||||||||||||||||||||
| — | — | — | — �� | — | 3,089 | — | 627 | (5,432 | ) | |||||||||||||||||||||||||
| (20 | ) | (372 | ) | (1,163 | ) | (493 | ) | (47 | ) | (251 | ) | 18 | 292 | (2,850 | ) | |||||||||||||||||||
|
|
|
|
|
|
|
|
|
|
|
|
|
|
|
|
|
| |||||||||||||||||
| 686,720 | 151,286 | 2,102,617 | 5,636 | 8,964 | 1,243,464 | 9,276 | (10,510 | ) | (26,825 | ) | ||||||||||||||||||||||||
|
|
|
|
|
|
|
|
|
|
|
|
|
|
|
|
|
| |||||||||||||||||
| 550,418 | 281,665 | 3,222,476 | 242,530 | 35,686 | 1,919,245 | 38,441 | 191,050 | 128,539 | ||||||||||||||||||||||||||
| — | — | — | — | — | (35,533 | ) | — | — | — | |||||||||||||||||||||||||
| — | — | — | — | — | (995 | ) | — | (3,048 | ) | (359 | ) | |||||||||||||||||||||||
| — | (147 | ) | — | 105 | 5 | — | (227 | ) | 5,615 | 6,025 | ||||||||||||||||||||||||
| — | — | — | — | — | (2,619 | ) | — | (933 | ) | (2,601 | ) | |||||||||||||||||||||||
| 43 | 120 | 170 | 133 | 18 | 133 | 25 | 357 | 583 | ||||||||||||||||||||||||||
|
|
|
|
|
|
|
|
|
|
|
|
|
|
|
|
|
| |||||||||||||||||
| 550,461 | 281,638 | 3,222,646 | 242,768 | 35,709 | 1,880,231 | 38,239 | 193,041 | 132,187 | ||||||||||||||||||||||||||
|
|
|
|
|
|
|
|
|
|
|
|
|
|
|
|
|
| |||||||||||||||||
| 1,237,181 | 432,924 | 5,325,263 | 248,404 | 44,673 | 3,123,695 | 47,515 | 182,531 | 105,362 | ||||||||||||||||||||||||||
|
|
|
|
|
|
|
|
|
|
|
|
|
|
|
|
|
| |||||||||||||||||
| $ | 1,432,451 | $ | 477,293 | $ | 5,770,929 | $ | 283,663 | $ | 59,280 | $ | 3,542,987 | $ | 51,858 | $ | 409,459 | $ | 159,008 | |||||||||||||||||
|
|
|
|
|
|
|
|
|
|
|
|
|
|
|
|
|
| |||||||||||||||||
American Funds Insurance Series 125
Table of Contents
Statements of operations for the year ended December 31, 2017
| High- Income Bond Fund | Mortgage Fund | Ultra-Short Bond Fund | U.S. Government/ AAA-Rated Securities Fund | Managed Risk Growth Fund | ||||||||||||||||
Investment income: | ||||||||||||||||||||
Income (net of non-U.S. taxes*): | ||||||||||||||||||||
Dividends | $ | 1,001 | $ | — | $ | — | $ | — | $ | 2,295 | ||||||||||
Interest | 105,683 | 6,820 | 3,240 | 61,344 | 120 | |||||||||||||||
|
|
|
|
|
|
|
|
|
| |||||||||||
| 106,684 | 6,820 | 3,240 | 61,344 | 2,415 | ||||||||||||||||
|
|
|
|
|
|
|
|
|
| |||||||||||
Fees and expenses*: | ||||||||||||||||||||
Investment advisory services | 7,701 | 1,436 | 1,017 | 10,190 | 371 | |||||||||||||||
Distribution services | 2,084 | 180 | 704 | 3,883 | 616 | |||||||||||||||
Insurance administrative services | 67 | 25 | 38 | 144 | 619 | |||||||||||||||
Transfer agent services | — | — | † | — | † | — | † | — | † | |||||||||||
Administrative services | 165 | 34 | 32 | 301 | — | |||||||||||||||
Accounting and administrative services | — | — | — | — | 56 | |||||||||||||||
Reports to shareholders | 58 | 6 | 10 | 97 | 4 | |||||||||||||||
Registration statement and prospectus | 15 | 4 | 5 | 26 | 10 | |||||||||||||||
Trustees’ compensation | 15 | 3 | 3 | 26 | 2 | |||||||||||||||
Auditing and legal | 56 | 44 | 42 | 43 | 6 | |||||||||||||||
Custodian | 27 | 43 | 1 | 67 | 12 | |||||||||||||||
Other | 38 | 42 | — | † | 64 | 4 | ||||||||||||||
|
|
|
|
|
|
|
|
|
| |||||||||||
Total fees and expenses before waivers/reimbursements | 10,226 | 1,817 | 1,852 | 14,841 | 1,700 | |||||||||||||||
Less waivers/reimbursements of fees and expenses: | ||||||||||||||||||||
Investment advisory services waivers | — | — | — | — | 124 | |||||||||||||||
Miscellaneous fee reimbursements | — | — | — | — | 20 | |||||||||||||||
|
|
|
|
|
|
|
|
|
| |||||||||||
Total waivers/reimbursements of fees and expenses | — | — | — | — | 144 | |||||||||||||||
|
|
|
|
|
|
|
|
|
| |||||||||||
Total fees and expenses after waivers/reimbursements | 10,226 | 1,817 | 1,852 | 14,841 | 1,556 | |||||||||||||||
|
|
|
|
|
|
|
|
|
| |||||||||||
Net investment income | 96,458 | 5,003 | 1,388 | 46,503 | 859 | |||||||||||||||
|
|
|
|
|
|
|
|
|
| |||||||||||
Net realized gain (loss) and unrealized appreciation (depreciation): | ||||||||||||||||||||
Net realized gain (loss) on: | ||||||||||||||||||||
Investments | ||||||||||||||||||||
Unaffiliated issuers | 27,103 | (460 | ) | 9 | (2,118 | ) | — | |||||||||||||
Affiliated issuers* | — | — | — | — | (2,470 | ) | ||||||||||||||
Futures contracts | — | 587 | — | (2,897 | ) | — | ||||||||||||||
Swap contracts | (2,615 | ) | 281 | — | 16,684 | — | ||||||||||||||
Currency transactions | (46 | ) | — | — | — | — | ||||||||||||||
Capital gain distributions received from affiliated issuers | — | — | — | — | 21,738 | |||||||||||||||
|
|
|
|
|
|
|
|
|
| |||||||||||
| 24,442 | 408 | 9 | 11,669 | 19,268 | ||||||||||||||||
|
|
|
|
|
|
|
|
|
| |||||||||||
Net unrealized appreciation (depreciation) on: | ||||||||||||||||||||
Investments | ||||||||||||||||||||
Unaffiliated issuers | (2,755 | ) | 1,326 | (64 | ) | 12,612 | — | |||||||||||||
Affiliated issuers | — | — | — | — | 35,398 | |||||||||||||||
Futures contracts | — | (315 | ) | — | (1,030 | ) | (38 | ) | ||||||||||||
Swap contracts | (1,068 | ) | (1,442 | ) | — | (18,456 | ) | — | ||||||||||||
|
|
|
|
|
|
|
|
|
| |||||||||||
| (3,823 | ) | (431 | ) | (64 | ) | (6,874 | ) | 35,360 | ||||||||||||
|
|
|
|
|
|
|
|
|
| |||||||||||
Net realized gain (loss) and unrealized appreciation (depreciation) | 20,619 | (23 | ) | (55 | ) | 4,795 | 54,628 | |||||||||||||
|
|
|
|
|
|
|
|
|
| |||||||||||
Net increase in net assets resulting from operations | $ | 117,077 | $ | 4,980 | $ | 1,333 | $ | 51,298 | $ | 55,487 | ||||||||||
|
|
|
|
|
|
|
|
|
| |||||||||||
|
|
|
|
|
|
|
|
|
| |||||||||||
| * | Additional information related to non-U.S. taxes, class-specific fees and expenses and affiliated transactions is included in the Notes to Financial Statements. |
| † | Amount less than one thousand. |
See Notes to Financial Statements
126 American Funds Insurance Series
Table of Contents
| (dollars in thousands) | ||||||||||||||
| Managed Risk International Fund | Managed Risk Blue Chip Income and Growth Fund | Managed Risk Growth- Income Fund | Managed Risk Asset Allocation Fund | |||||||||||
| $ | 2,012 | $ | 7,115 | $ | 3,114 | $ | 70,949 | |||||||
| 55 | 159 | 88 | 1,887 | |||||||||||
|
|
|
|
|
|
|
| |||||||
| 2,067 | 7,274 | 3,202 | 72,836 | |||||||||||
|
|
|
|
|
|
|
| |||||||
| 187 | 530 | 281 | 6,118 | |||||||||||
| 311 | 883 | 463 | 6,556 | |||||||||||
| 311 | 883 | 467 | 10,196 | |||||||||||
| — | † | — | † | — | † | — | † | |||||||
| — | — | — | — | |||||||||||
| 53 | 58 | 54 | 142 | |||||||||||
| 2 | 6 | 4 | 86 | |||||||||||
| 4 | 19 | 6 | 124 | |||||||||||
| 1 | 3 | 2 | 34 | |||||||||||
| 6 | 6 | 6 | 7 | |||||||||||
| 12 | 12 | 12 | 12 | |||||||||||
| 2 | 11 | 3 | 818 | |||||||||||
|
|
|
|
|
|
|
| |||||||
| 889 | 2,411 | 1,298 | 24,093 | |||||||||||
| 62 | 177 | 94 | 2,039 | |||||||||||
| 43 | 9 | 30 | — | |||||||||||
|
|
|
|
|
|
|
| |||||||
| 105 | 186 | 124 | 2,039 | |||||||||||
|
|
|
|
|
|
|
| |||||||
| 784 | 2,225 | 1,174 | 22,054 | |||||||||||
|
|
|
|
|
|
|
| |||||||
| 1,283 | 5,049 | 2,028 | 50,782 | |||||||||||
|
|
|
|
|
|
|
| |||||||
| — | — | — | — | |||||||||||
| (586 | ) | 229 | (2,961 | ) | 4,957 | |||||||||
| (506 | ) | — | † | — | † | — | ||||||||
| — | — | — | — | |||||||||||
| 7 | — | † | — | — | ||||||||||
| 1,333 | 12,606 | 11,244 | 172,372 | |||||||||||
|
|
|
|
|
|
|
| |||||||
| 248 | 12,835 | 8,283 | 177,329 | |||||||||||
|
|
|
|
|
|
|
| |||||||
| — | — | — | — | |||||||||||
| 28,742 | 30,925 | 24,088 | 329,625 | |||||||||||
| (1 | ) | (49 | ) | (28 | ) | (592 | ) | |||||||
| — | — | — | — | |||||||||||
|
|
|
|
|
|
|
| |||||||
| 28,741 | 30,876 | 24,060 | 329,033 | |||||||||||
|
|
|
|
|
|
|
| |||||||
| 28,989 | 43,711 | 32,343 | 506,362 | |||||||||||
|
|
|
|
|
|
|
| |||||||
| $ | 30,272 | $ | 48,760 | $ | 34,371 | $ | 557,144 | |||||||
|
|
|
|
|
|
|
| |||||||
American Funds Insurance Series 127
Table of Contents
Statements of changes in net assets
| Global Growth Fund | Global Small Capitalization Fund | Growth Fund | ||||||||||||||||||||||
| Year ended December 31 | Year ended December 31 | Year ended December 31 | ||||||||||||||||||||||
| 2017 | 2016 | 2017 | 2016 | 2017 | 2016 | |||||||||||||||||||
Operations: | ||||||||||||||||||||||||
Net investment income (loss) | $ | 44,912 | $ | 43,253 | $ | 15,312 | $ | 16,207 | $ | 136,774 | $ | 179,970 | ||||||||||||
Net realized gain (loss) | 433,191 | 182,760 | 207,903 | (26,426 | ) | 2,561,073 | 2,252,045 | |||||||||||||||||
Net unrealized appreciation (depreciation) | 1,102,516 | (192,438 | ) | 731,086 | 93,893 | 3,159,797 | (489,479 | ) | ||||||||||||||||
|
|
|
|
|
|
|
|
|
|
|
| |||||||||||||
Net increase (decrease) in net assets resulting from operations | 1,580,619 | 33,575 | 954,301 | 83,674 | 5,857,644 | 1,942,536 | ||||||||||||||||||
|
|
|
|
|
|
|
|
|
|
|
| |||||||||||||
Dividends and distributions paid to shareholders: | ||||||||||||||||||||||||
Dividends from net investment income | (42,742 | ) | (51,522 | ) | (21,019 | ) | (13,487 | ) | (136,164 | ) | (177,667 | ) | ||||||||||||
Distributions from net realized gain on investments | (174,096 | ) | (443,911 | ) | — | (724,863 | ) | (2,251,429 | ) | (1,900,853 | ) | |||||||||||||
|
|
|
|
|
|
|
|
|
|
|
| |||||||||||||
Total dividends and distributions paid to shareholders | (216,838 | ) | (495,433 | ) | (21,019 | ) | (738,350 | ) | (2,387,593 | ) | (2,078,520 | ) | ||||||||||||
|
|
|
|
|
|
|
|
|
|
|
| |||||||||||||
Net capital share transactions | (335,425 | ) | 134,946 | (495,098 | ) | 300,027 | (34,343 | ) | (111,950 | ) | ||||||||||||||
|
|
|
|
|
|
|
|
|
|
|
| |||||||||||||
Total increase (decrease) in net assets | 1,028,356 | (326,912 | ) | 438,184 | (354,649 | ) | 3,435,708 | (247,934 | ) | |||||||||||||||
Net assets: | ||||||||||||||||||||||||
Beginning of year | 5,206,720 | 5,533,632 | 3,876,854 | 4,231,503 | 21,549,750 | 21,797,684 | ||||||||||||||||||
|
|
|
|
|
|
|
|
|
|
|
| |||||||||||||
End of year | $ | 6,235,076 | $ | 5,206,720 | $ | 4,315,038 | $ | 3,876,854 | $ | 24,985,458 | $ | 21,549,750 | ||||||||||||
|
|
|
|
|
|
|
|
|
|
|
| |||||||||||||
Undistributed (distributions in excess of) net investment income | $ | 3,242 | $ | (4,119 | ) | $ | 10,507 | $ | 14,387 | $ | 41,109 | $ | 41,075 | |||||||||||
|
|
|
|
|
|
|
|
|
|
|
| |||||||||||||
| International Growth | ||||||||||||||||||||||||
| and Income Fund | Capital Income Builder | Asset Allocation Fund | ||||||||||||||||||||||
| Year ended December 31 | Year ended December 31 | Year ended December 31 | ||||||||||||||||||||||
| 2017 | 2016 | 2017 | 2016 | 2017 | 2016 | |||||||||||||||||||
Operations: | ||||||||||||||||||||||||
Net investment income (loss) | $ | 35,259 | $ | 30,357 | $ | 14,607 | $ | 10,171 | $ | 419,292 | $ | 356,748 | ||||||||||||
Net realized gain (loss) | 5,636 | (11,768 | ) | 8,964 | (5,074 | ) | 1,243,464 | 1,072,096 | ||||||||||||||||
Net unrealized appreciation (depreciation) | 242,768 | (534 | ) | 35,709 | 5,120 | 1,880,231 | 360,724 | |||||||||||||||||
|
|
|
|
|
|
|
|
|
|
|
| |||||||||||||
Net increase (decrease) in net assets resulting from operations | 283,663 | 18,055 | 59,280 | 10,217 | 3,542,987 | 1,789,568 | ||||||||||||||||||
|
|
|
|
|
|
|
|
|
|
|
| |||||||||||||
Dividends and distributions paid to shareholders: | ||||||||||||||||||||||||
Dividends from net investment income | (32,772 | ) | (30,394 | ) | (14,010 | ) | (11,031 | ) | (405,124 | ) | (347,205 | ) | ||||||||||||
Distributions from net realized gain on investments | — | (4,687 | ) | — | — | (1,069,604 | ) | (465,866 | ) | |||||||||||||||
|
|
|
|
|
|
|
|
|
|
|
| |||||||||||||
Total dividends and distributions paid to shareholders | (32,772 | ) | (35,081 | ) | (14,010 | ) | (11,031 | ) | (1,474,728 | ) | (813,071 | ) | ||||||||||||
|
|
|
|
|
|
|
|
|
|
|
| |||||||||||||
Net capital share transactions | 109,624 | 125,599 | 137,152 | 175,844 | 2,543,934 | 1,700,837 | ||||||||||||||||||
|
|
|
|
|
|
|
|
|
|
|
| |||||||||||||
Total increase (decrease) in net assets | 360,515 | 108,573 | 182,422 | 175,030 | 4,612,193 | 2,677,334 | ||||||||||||||||||
Net assets: | ||||||||||||||||||||||||
Beginning of year | 1,101,452 | 992,879 | 412,035 | 237,005 | 21,047,901 | 18,370,567 | ||||||||||||||||||
|
|
|
|
|
|
|
|
|
|
|
| |||||||||||||
End of year | $ | 1,461,967 | $ | 1,101,452 | $ | 594,457 | $ | 412,035 | $ | 25,660,094 | $ | 21,047,901 | ||||||||||||
|
|
|
|
|
|
|
|
|
|
|
| |||||||||||||
Undistributed (distributions in excess of) net investment income | $ | 4,347 | $ | 1,519 | $ | 261 | $ | (948 | ) | $ | 92,516 | $ | 71,334 | |||||||||||
|
|
|
|
|
|
|
|
|
|
|
| |||||||||||||
128 American Funds Insurance Series
Table of Contents
| (dollars in thousands) | ||||||||||||||||||||||||||||||||||||||
| International Fund | New World Fund | Blue Chip Income and Growth Fund | Global Growth and Income Fund | Growth-Income Fund | ||||||||||||||||||||||||||||||||||
| Year ended December 31 | Year ended December 31 | Year ended December 31 | Year ended December 31 | Year ended December 31 | ||||||||||||||||||||||||||||||||||
| 2017 | 2016 | 2017 | 2016 | 2017 | 2016 | 2017 | 2016 | 2017 | 2016 | |||||||||||||||||||||||||||||
| $ | 105,868 | $ | 107,613 | $ | 32,918 | $ | 30,850 | $ | 195,270 | $ | 173,682 | $ | 44,369 | $ | 37,944 | $ | 445,666 | $ | 406,211 | |||||||||||||||||||
| 438,684 | 174,210 | 236,990 | (49,262 | ) | 686,720 | 340,410 | 151,286 | 63,152 | 2,102,617 | 1,870,618 | ||||||||||||||||||||||||||||
| 1,850,536 | 486 | 567,588 | 165,410 | 550,461 | 803,943 | 281,638 | 36,088 | 3,222,646 | 478,434 | |||||||||||||||||||||||||||||
|
|
|
|
|
|
|
|
|
|
|
|
|
|
|
|
|
|
|
| |||||||||||||||||||
| 2,395,088 | 282,309 | 837,496 | 146,998 | 1,432,451 | 1,318,035 | 477,293 | 137,184 | 5,770,929 | 2,755,263 | |||||||||||||||||||||||||||||
|
|
|
|
|
|
|
|
|
|
|
|
|
|
|
|
|
|
|
| |||||||||||||||||||
| (124,236 | ) | (112,086 | ) | (34,131 | ) | (26,290 | ) | (188,626 | ) | (170,997 | ) | (42,795 | ) | (36,671 | ) | (435,451 | ) | (395,167 | ) | |||||||||||||||||||
| (100,924 | ) | (637,485 | ) | — | — | (328,660 | ) | (595,206 | ) | (33,692 | ) | — | (1,807,557 | ) | (2,694,334 | ) | ||||||||||||||||||||||
|
|
|
|
|
|
|
|
|
|
|
|
|
|
|
|
|
|
|
| |||||||||||||||||||
| (225,160 | ) | (749,571 | ) | (34,131 | ) | (26,290 | ) | (517,286 | ) | (766,203 | ) | (76,487 | ) | (36,671 | ) | (2,243,008 | ) | (3,089,501 | ) | |||||||||||||||||||
|
|
|
|
|
|
|
|
|
|
|
|
|
|
|
|
|
|
|
| |||||||||||||||||||
| 133,019 | 439,487 | (164,517 | ) | 79,376 | (178,554 | ) | 1,193,132 | (289,969 | ) | 114,314 | 1,071,251 | 2,214,035 | ||||||||||||||||||||||||||
|
|
|
|
|
|
|
|
|
|
|
|
|
|
|
|
|
|
|
| |||||||||||||||||||
| 2,302,947 | (27,775 | ) | 638,848 | 200,084 | 736,611 | 1,744,964 | 110,837 | 214,827 | 4,599,172 | 1,879,797 | ||||||||||||||||||||||||||||
| 7,454,875 | 7,482,650 | 2,893,865 | 2,693,781 | 8,643,238 | 6,898,274 | 1,991,609 | 1,776,782 | 26,093,190 | 24,213,393 | |||||||||||||||||||||||||||||
|
|
|
|
|
|
|
|
|
|
|
|
|
|
|
|
|
|
|
| |||||||||||||||||||
| $ | 9,757,822 | $ | 7,454,875 | $ | 3,532,713 | $ | 2,893,865 | $ | 9,379,849 | $ | 8,643,238 | $ | 2,102,446 | $ | 1,991,609 | $ | 30,692,362 | $ | 26,093,190 | |||||||||||||||||||
|
|
|
|
|
|
|
|
|
|
|
|
|
|
|
|
|
|
|
| |||||||||||||||||||
| $ | 2,852 | $ | 29,116 | $ | 4,643 | $ | (14,553 | ) | $ | 37,271 | $ | 30,648 | $ | 6,666 | $ | 6,361 | $ | 88,048 | $ | 79,383 | ||||||||||||||||||
|
|
|
|
|
|
|
|
|
|
|
|
|
|
|
|
|
|
|
| |||||||||||||||||||
| Global Balanced Fund | Bond Fund | Global Bond Fund | High-Income Bond Fund | Mortgage Fund | ||||||||||||||||||||||||||||||||||
| Year ended December 31 | Year ended December 31 | Year ended December 31 | Year ended December 31 | Year ended December 31 | ||||||||||||||||||||||||||||||||||
| 2017 | 2016 | 2017 | 2016 | 2017 | 2016 | 2017 | 2016 | 2017 | 2016 | |||||||||||||||||||||||||||||
| $ | 4,343 | $ | 3,667 | $ | 226,928 | $ | 188,699 | $ | 53,646 | $ | 49,208 | $ | 96,458 | $ | 106,342 | $ | 5,003 | $ | 4,590 | |||||||||||||||||||
| 9,276 | 1,518 | (10,510 | ) | 163,219 | (26,825 | ) | (11,548 | ) | 24,442 | (82,614 | ) | 408 | 4,966 | |||||||||||||||||||||||||
| 38,239 | 5,219 | 193,041 | (52,479 | ) | 132,187 | 25,290 | (3,823 | ) | 262,380 | (431 | ) | (1,322 | ) | |||||||||||||||||||||||||
|
|
|
|
|
|
|
|
|
|
|
|
|
|
|
|
|
|
|
| |||||||||||||||||||
| 51,858 | 10,404 | 409,459 | 299,439 | 159,008 | 62,950 | 117,077 | 286,108 | 4,980 | 8,234 | |||||||||||||||||||||||||||||
|
|
|
|
|
|
|
|
|
|
|
|
|
|
|
|
|
|
|
| |||||||||||||||||||
| (3,252 | ) | (3,285 | ) | (220,546 | ) | (197,417 | ) | (11,164 | ) | (15,576 | ) | (98,414 | ) | (106,140 | ) | (5,571 | ) | (6,310 | ) | |||||||||||||||||||
| (10,070 | ) | — | (157,395 | ) | (35,948 | ) | (14,449 | ) | (4,207 | ) | — | — | (2,214 | ) | (3,532 | ) | ||||||||||||||||||||||
|
|
|
|
|
|
|
|
|
|
|
|
|
|
|
|
|
|
|
| |||||||||||||||||||
| (13,322 | ) | (3,285 | ) | (377,941 | ) | (233,365 | ) | (25,613 | ) | (19,783 | ) | (98,414 | ) | (106,140 | ) | (7,785 | ) | (9,842 | ) | |||||||||||||||||||
|
|
|
|
|
|
|
|
|
|
|
|
|
|
|
|
|
|
|
| |||||||||||||||||||
| 63,483 | 25,497 | (223,341 | ) | 898,544 | 85,999 | (40,534 | ) | (346,424 | ) | (193,559 | ) | 2,570 | (117 | ) | ||||||||||||||||||||||||
|
|
|
|
|
|
|
|
|
|
|
|
|
|
|
|
|
|
|
| |||||||||||||||||||
| 102,019 | 32,616 | (191,823 | ) | 964,618 | 219,394 | 2,633 | (327,761 | ) | (13,591 | ) | (235 | ) | (1,725 | ) | ||||||||||||||||||||||||
| 251,880 | 219,264 | 10,889,517 | 9,924,899 | 2,248,184 | 2,245,551 | 1,781,641 | 1,795,232 | 340,405 | 342,130 | |||||||||||||||||||||||||||||
|
|
|
|
|
|
|
|
|
|
|
|
|
|
|
|
|
|
|
| |||||||||||||||||||
| $ | 353,899 | $ | 251,880 | $ | 10,697,694 | $ | 10,889,517 | $ | 2,467,578 | $ | 2,248,184 | $ | 1,453,880 | $ | 1,781,641 | $ | 340,170 | $ | 340,405 | |||||||||||||||||||
|
|
|
|
|
|
|
|
|
|
|
|
|
|
|
|
|
|
|
| |||||||||||||||||||
| $ | (671 | ) | $ | (1,060 | ) | $ | 35,376 | $ | 59,835 | $ | 2,784 | $ | (5,646 | ) | $ | 13,377 | $ | 17,830 | $ | 1,052 | $ | 1,033 | ||||||||||||||||
|
|
|
|
|
|
|
|
|
|
|
|
|
|
|
|
|
|
|
| |||||||||||||||||||
American Funds Insurance Series 129
Table of Contents
Statements of changes in net assets
| Ultra-Short Bond Fund | U.S. Government/ AAA-Rated Securities Fund | Managed Risk Growth Fund | ||||||||||||||||||||||
| Year ended December 31 | Year ended December 31 | Year ended December 31 | ||||||||||||||||||||||
| 2017 | 2016 | 2017 | 2016 | 2017 | 2016 | |||||||||||||||||||
Operations: | ||||||||||||||||||||||||
Net investment income (loss) | $ | 1,388 | $ | (452 | ) | $ | 46,503 | $ | 36,028 | $ | 859 | $ | 731 | |||||||||||
Net realized gain (loss) | 9 | — | 11,669 | 9,371 | 19,268 | (560 | ) | |||||||||||||||||
Net unrealized appreciation (depreciation) | (64 | ) | (3 | ) | (6,874 | ) | (5,718 | ) | 35,360 | 6,120 | ||||||||||||||
|
|
|
|
|
|
|
|
|
|
|
| |||||||||||||
Net increase (decrease) in net assets resulting from operations | 1,333 | (455 | ) | 51,298 | 39,681 | 55,487 | 6,291 | |||||||||||||||||
|
|
|
|
|
|
|
|
|
|
|
| |||||||||||||
Dividends and distributions paid to shareholders: | ||||||||||||||||||||||||
Dividends from net investment income | (906 | ) | — | (43,993 | ) | (46,049 | ) | (734 | ) | (330 | ) | |||||||||||||
Distributions from net realized gain on investments | — | — | — | (60,973 | ) | (4,142 | ) | (15,012 | ) | |||||||||||||||
|
|
|
|
|
|
|
|
|
|
|
| |||||||||||||
Total dividends and distributions paid to shareholders | (906 | ) | — | (43,993 | ) | (107,022 | ) | (4,876 | ) | (15,342 | ) | |||||||||||||
|
|
|
|
|
|
|
|
|
|
|
| |||||||||||||
Net capital share transactions | (46,638 | ) | (11,965 | ) | 58,286 | 43,179 | 36,220 | 64,347 | ||||||||||||||||
|
|
|
|
|
|
|
|
|
|
|
| |||||||||||||
Total increase (decrease) in net assets | (46,211 | ) | (12,420 | ) | 65,591 | (24,162 | ) | 86,831 | 55,296 | |||||||||||||||
Net assets: | ||||||||||||||||||||||||
Beginning of year | 351,016 | 363,436 | 3,037,724 | 3,061,886 | 201,128 | 145,832 | ||||||||||||||||||
|
|
|
|
|
|
|
|
|
|
|
| |||||||||||||
End of year | $ | 304,805 | $ | 351,016 | $ | 3,103,315 | $ | 3,037,724 | $ | 287,959 | $ | 201,128 | ||||||||||||
|
|
|
|
|
|
|
|
|
|
|
| |||||||||||||
Undistributed (distributions in excess of) net investment income | $ | 462 | $ | (20 | ) | $ | 9,726 | $ | 7,697 | $ | 1,399 | $ | 729 | |||||||||||
|
|
|
|
|
|
|
|
|
|
|
| |||||||||||||
See Notes to Financial Statements
130 American Funds Insurance Series
Table of Contents
| (dollars in thousands) | ||||||||||||||||||||||||||||||
| Managed Risk International Fund | Managed Risk Blue Chip Income and Growth Fund | Managed Risk Growth-Income Fund | Managed Risk Asset Allocation Fund | |||||||||||||||||||||||||||
| Year ended December 31 | Year ended December 31 | Year ended December 31 | Year ended December 31 | |||||||||||||||||||||||||||
| 2017 | 2016 | 2017 | 2016 | 2017 | 2016 | 2017 | 2016 | |||||||||||||||||||||||
| $ | 1,283 | $ | 884 | $ | 5,049 | $ | 4,012 | $ | 2,028 | $ | 1,562 | $ | 50,782 | $ | 41,207 | |||||||||||||||
| 248 | (4,433 | ) | 12,835 | 5,539 | 8,283 | 5,070 | 177,329 | 37,559 | ||||||||||||||||||||||
| 28,741 | 1,071 | 30,876 | 15,029 | 24,060 | 2,438 | 329,033 | 148,316 | |||||||||||||||||||||||
|
|
|
|
|
|
|
|
|
|
|
|
|
|
|
| |||||||||||||||
| 30,272 | (2,478 | ) | 48,760 | 24,580 | 34,371 | 9,070 | 557,144 | 227,082 | ||||||||||||||||||||||
|
|
|
|
|
|
|
|
|
|
|
|
|
|
|
| |||||||||||||||
| (900 | ) | (843 | ) | (5,161 | ) | (3,375 | ) | (1,867 | ) | (1,707 | ) | (31,722 | ) | (44,188 | ) | |||||||||||||||
| (1,403 | ) | (2,185 | ) | (5,568 | ) | (5,923 | ) | (7,726 | ) | (8,465 | ) | (38,742 | ) | (93,578 | ) | |||||||||||||||
|
|
|
|
|
|
|
|
|
|
|
|
|
|
|
| |||||||||||||||
| (2,303 | ) | (3,028 | ) | (10,729 | ) | (9,298 | ) | (9,593 | ) | (10,172 | ) | (70,464 | ) | (137,766 | ) | |||||||||||||||
|
|
|
|
|
|
|
|
|
|
|
|
|
|
|
| |||||||||||||||
| 22,849 | 19,951 | 37,657 | 138,529 | 23,434 | 39,189 | 408,750 | 804,645 | |||||||||||||||||||||||
|
|
|
|
|
|
|
|
|
|
|
|
|
|
|
| |||||||||||||||
| 50,818 | 14,445 | 75,688 | 153,811 | 48,212 | 38,087 | 895,430 | 893,961 | |||||||||||||||||||||||
| 97,605 | 83,160 | 291,216 | 137,405 | 160,756 | 122,669 | 3,558,980 | 2,665,019 | |||||||||||||||||||||||
|
|
|
|
|
|
|
|
|
|
|
|
|
|
|
| |||||||||||||||
| $ | 148,423 | $ | 97,605 | $ | 366,904 | $ | 291,216 | $ | 208,968 | $ | 160,756 | $ | 4,454,410 | $ | 3,558,980 | |||||||||||||||
|
|
|
|
|
|
|
|
|
|
|
|
|
|
|
| |||||||||||||||
| $ | 1,323 | $ | 891 | $ | 5,669 | $ | 4,274 | $ | 2,167 | $ | 1,865 | $ | 53,091 | $ | 31,585 | |||||||||||||||
|
|
|
|
|
|
|
|
|
|
|
|
|
|
|
| |||||||||||||||
American Funds Insurance Series 131
Table of Contents
Notes to financial statements
1. Organization
American Funds Insurance Series (the “series”) is registered under the Investment Company Act of 1940 as an open-end, diversified management investment company with 28 different funds (the “funds”). Twenty-three funds in the series are covered in this report. The other five funds in the series, American Funds Insurance Series - Portfolio Series, are covered in a separate report. The assets of each fund are segregated, with each fund accounted for separately. Capital Research and Management Company (“CRMC”) is the series’ investment adviser. Milliman Financial Risk Management LLC (“Milliman FRM”) is the subadviser for the risk management strategy for eight of the funds (the “managed risk funds”), five of which are covered in this report.
The managed risk funds covered in this report are Managed Risk Growth Fund, Managed Risk International Fund, Managed Risk Blue Chip Income and Growth Fund, Managed Risk Growth-Income Fund and Managed Risk Asset Allocation Fund. The managed risk funds invest in other funds within the series (the “underlying funds”) and employ Milliman FRM to implement the risk management strategy, which consists of using hedging instruments — primarily short positions on exchange-traded futures contracts — to attempt to stabilize the volatility of the funds around target volatility levels and reduce the downside exposure of the funds during periods of significant market declines.
Shareholders approved a proposal to reorganize the series from a Massachusetts business trust to a Delaware statutory trust. The reorganization may be completed in the next 12 months; however, the series reserves the right to delay the implementation.
The investment objectives for each fund covered in this report are as follows:
Global Growth Fund — Seeks to provide long-term growth of capital.
Global Small Capitalization Fund — Seeks to provide long-term growth of capital.
Growth Fund — Seeks to provide growth of capital.
International Fund — Seeks to provide long-term growth of capital.
New World Fund — Seeks long-term capital appreciation.
Blue Chip Income and Growth Fund — Seeks to produce income exceeding the average yield on U.S. stocks generally and to provide an opportunity for growth of principal consistent with sound common stock investing.
Global Growth and Income Fund — Seeks to provide long-term growth of capital while providing current income.
Growth-Income Fund — Seeks to achieve long-term growth of capital and income.
International Growth and Income Fund — Seeks to provide long-term growth of capital while providing current income.
Capital Income Builder — Seeks to provide a level of current income that exceeds the average yield on U.S. stocks generally and to provide a growing stream of income over the years. Secondarily, seeks to provide growth of capital.
Asset Allocation Fund — Seeks to provide high total return consistent with preservation of capital over the long term.
Global Balanced Fund — Seeks the balanced accomplishment of three objectives: long-term growth of capital, conservation of principal and current income.
Bond Fund — Seeks to provide as high a level of current income as is consistent with the preservation of capital.
Global Bond Fund — Seeks to provide, over the long term, a high level of total return consistent with prudent investment management.
High-Income Bond Fund — Seeks to provide a high level of current income and, secondarily, capital appreciation.
Mortgage Fund — Seeks to provide current income and preservation of capital.
132 American Funds Insurance Series
Table of Contents
Ultra-Short Bond Fund — Seeks to provide current income, consistent with the maturity and quality standards applicable to the fund, and preservation of capital and liquidity.
U.S. Government/AAA-Rated Securities Fund — Seeks to provide a high level of current income consistent with preservation of capital.
Managed Risk Growth Fund — Seeks to provide growth of capital while seeking to manage volatility and provide downside protection.
Managed Risk International Fund — Seeks to provide long-term growth of capital while seeking to manage volatility and provide downside protection.
Managed Risk Blue Chip Income and Growth Fund — Seeks to produce income exceeding the average yield on U.S. stocks generally and to provide an opportunity for growth of principal consistent with sound common stock investing, in each case while seeking to manage volatility and provide downside protection.
Managed Risk Growth-Income Fund — Seeks to achieve long-term growth of capital and income while seeking to manage volatility and provide downside protection.
Managed Risk Asset Allocation Fund — Seeks to provide high total return consistent with preservation of capital over the long term while seeking to manage volatility and provide downside protection.
Each fund in the series, except the managed risk funds, offers either four or five share classes (Classes 1, 1A, 2, 3 or 4); the managed risk funds offer two share classes (Classes P1 and P2). Holders of all share classes of each fund have equal pro rata rights to assets, dividends and liquidation proceeds of each fund held. Each share class of each fund has identical voting rights, except for the exclusive right to vote on matters affecting only its class. Share classes have different fees and expenses (“class-specific fees and expenses”), primarily due to different arrangements for certain distribution expenses. Differences in class-specific fees and expenses will result in differences in net investment income and, therefore, the payment of different per-share dividends by each class of each fund.
2. Significant accounting policies
Each fund is an investment company that applies the accounting and reporting guidance issued in Topic 946 by the U.S. Financial Accounting Standards Board. Each fund’s financial statements have been prepared to comply with U.S. generally accepted accounting principles (“U.S. GAAP”). These principles require the series’ investment adviser to make estimates and assumptions that affect reported amounts and disclosures. Actual results could differ from those estimates. Subsequent events, if any, have been evaluated through the date of issuance in the preparation of the financial statements. The funds follow the significant accounting policies described in this section, as well as the valuation policies described in the next section on valuation.
Security transactions and related investment income — Security transactions are recorded by the funds as of the date the trades are executed with brokers. Realized gains and losses from security transactions are determined based on the specific identified cost of the securities. In the event a security is purchased with a delayed payment date, the funds will segregate liquid assets sufficient to meet their payment obligations. Dividend income is recognized on the ex-dividend date and interest income is recognized on an accrual basis. Market discounts, premiums and original issue discounts on fixed-income securities are amortized daily over the expected life of the security.
Fees and expenses — The fees and expenses of the underlying funds held by the managed risk funds are not included in the fees and expenses reported for each of the managed risk funds; however, they are indirectly reflected in the valuation of each of the underlying funds. These fees are included in the net effective expense ratios that are provided as supplementary information in the financial highlights tables.
Class allocations — Income, fees and expenses (other than class-specific fees and expenses) and realized and unrealized gains and losses are allocated daily among the various share classes of each fund based on their relative net assets. Class-specific fees and expenses, such as distribution expenses, are accrued daily and charged directly to the respective share class of each fund.
Dividends and distributions to shareholders — Dividends and distributions to shareholders are recorded on each fund’s ex-dividend date.
American Funds Insurance Series 133
Table of Contents
Currency translation — Assets and liabilities, including investment securities, denominated in currencies other than U.S. dollars are translated into U.S. dollars at the exchange rates supplied by one or more pricing vendors on the valuation date. Purchases and sales of investment securities and income and expenses are translated into U.S. dollars at the exchange rates on the dates of such transactions. The effects of changes in exchange rates on investment securities are included with the net realized gain or loss and net unrealized appreciation or depreciation on investments in the funds’ statements of operations. The realized gain or loss and unrealized appreciation or depreciation resulting from all other transactions denominated in currencies other than U.S. dollars are disclosed separately.
3. Valuation
CRMC, the series’ investment adviser, values the funds’ investments at fair value as defined by U.S. GAAP. The net asset value of each share class of each fund is generally determined as of approximately 4:00 p.m. New York time each day the New York Stock Exchange is open.
Methods and inputs — The series’ investment adviser uses the following methods and inputs to establish the fair value of each fund’s assets and liabilities. Use of particular methods and inputs may vary over time based on availability and relevance as market and economic conditions evolve.
Equity securities are generally valued at the official closing price of, or the last reported sale price on, the exchange or market on which such securities are traded, as of the close of business on the day the securities are being valued or, lacking any sales, at the last available bid price. Prices for each security are taken from the principal exchange or market on which the security trades. The value of an underlying fund is based on its reported net asset value.
Fixed-income securities, including short-term securities, are generally valued at prices obtained from one or more pricing vendors. Vendors value such securities based on one or more of the inputs described in the following table. The table provides examples of inputs that are commonly relevant for valuing particular classes of fixed-income securities in which the funds are authorized to invest. However, these classifications are not exclusive and any of the inputs may be used to value any other class of fixed-income security.
Fixed-income class | Examples of standard inputs | |
| All | Benchmark yields, transactions, bids, offers, quotations from dealers and trading systems, new issues, spreads and other relationships observed in the markets among comparable securities; and proprietary pricing models such as yield measures calculated using factors such as cash flows, financial or collateral performance and other reference data (collectively referred to as “standard inputs”) | |
| Corporate bonds & notes; convertible securities | Standard inputs and underlying equity of the issuer | |
| Bonds & notes of governments & government agencies | Standard inputs and interest rate volatilities | |
| Mortgage-backed; asset-backed obligations | Standard inputs and cash flows, prepayment information, default rates, delinquency and loss assumptions, collateral characteristics, credit enhancements and specific deal information | |
| Municipal securities | Standard inputs and, for certain distressed securities, cash flows or liquidation values using a net present value calculation based on inputs that include, but are not limited to, financial statements and debt contracts | |
When the series’ investment adviser deems it appropriate to do so (such as when vendor prices are unavailable or not deemed to be representative), fixed-income securities will be valued in good faith at the mean quoted bid and ask prices that are reasonably and timely available (or bid prices, if ask prices are not available) or at prices for securities of comparable maturity, quality and type.
134 American Funds Insurance Series
Table of Contents
Securities with both fixed-income and equity characteristics, or equity securities traded principally among fixed-income dealers, are generally valued in the manner described for either equity or fixed-income securities, depending on which method is deemed most appropriate by the series’ investment adviser. The Government Cash Management Fund held by the managed risk funds is managed to maintain a $1.00 net asset value per share. The net asset value of each share class of each managed risk fund is calculated based on the reported net asset values of the underlying funds in which each fund invests.
Exchange-traded futures are generally valued at the official settlement price of, or the last reported sale price on, the exchange or market on which such instruments are traded, as of the close of business on the day the futures are being valued or, lacking any sales, at the last available bid price. Prices for each future are taken from the exchange or market on which the security trades. Forward currency contracts are valued at the mean of representative quoted bid and ask prices, generally based on prices supplied by one or more pricing vendors. Interest rate swaps and credit default swaps are generally valued by pricing vendors based on market inputs that include the index and term of index, reset frequency, payer/receiver, currency and pay frequency.
Securities and other assets for which representative market quotations are not readily available or are considered unreliable by the series’ investment adviser are fair valued as determined in good faith under fair value guidelines adopted by authority of the series’ board of trustees as further described. The investment adviser follows fair valuation guidelines, consistent with U.S. Securities and Exchange Commission rules and guidance, to consider relevant principles and factors when making fair value determinations. The investment adviser considers relevant indications of value that are reasonably and timely available to it in determining the fair value to be assigned to a particular security, such as the type and cost of the security; contractual or legal restrictions on resale of the security; relevant financial or business developments of the issuer; actively traded similar or related securities; conversion or exchange rights on the security; related corporate actions; significant events occurring after the close of trading in the security; and changes in overall market conditions. In addition, the closing prices of equity securities and futures that trade in markets outside U.S. time zones may be adjusted to reflect significant events that occur after the close of local trading but before the net asset value of each share class of each fund is determined. Fair valuations and valuations of investments and futures that are not actively trading involve judgment and may differ materially from valuations that would have been used had greater market activity occurred.
Processes and structure — The series’ board of trustees has delegated authority to the series’ investment adviser to make fair value determinations, subject to board oversight. The investment adviser has established a Joint Fair Valuation Committee (the “Fair Valuation Committee”) to administer, implement and oversee the fair valuation process, and to make fair value decisions. The Fair Valuation Committee regularly reviews its own fair value decisions, as well as decisions made under its standing instructions to the investment adviser’s valuation teams. The Fair Valuation Committee reviews changes in fair value measurements from period to period and may, as deemed appropriate, update the fair valuation guidelines to better reflect the results of back testing and address new or evolving issues. The Fair Valuation Committee reports any changes to the fair valuation guidelines to the board of trustees with supplemental information to support the changes. The series’ board and audit committee also regularly review reports that describe fair value determinations and methods.
The series’ investment adviser has also established a Fixed-Income Pricing Review Group to administer and oversee the fixed-income valuation process, including the use of fixed-income pricing vendors. This group regularly reviews pricing vendor information and market data. Pricing decisions, processes and controls over security valuation are also subject to additional internal reviews, including an annual control self-evaluation program facilitated by the investment adviser’s compliance group.
Classifications — The series’ investment adviser classifies the funds’ assets and liabilities into three levels based on the inputs used to value the assets or liabilities. Level 1 values are based on quoted prices in active markets for identical securities. Level 2 values are based on significant observable market inputs, such as quoted prices for similar securities and quoted prices in inactive markets. Certain securities trading outside the U.S. may transfer between Level 1 and Level 2 due to valuation adjustments resulting from significant market movements following the close of local trading. Level 3 values are based on significant unobservable inputs that reflect the investment adviser’s determination of assumptions that market participants might reasonably use in valuing the securities.
American Funds Insurance Series 135
Table of Contents
The valuation levels are not necessarily an indication of the risk or liquidity associated with the underlying investment. For example, U.S. government securities are reflected as Level 2 because the inputs used to determine fair value may not always be quoted prices in an active market. The following tables present the funds’ valuation levels as of December 31, 2017 (dollars in thousands):
Global Growth Fund
| Investment securities | ||||||||||||||||
| Level 1 | Level 2* | Level 3 | Total | |||||||||||||
Assets: | ||||||||||||||||
Common stocks: | ||||||||||||||||
Information technology | $ | 1,081,264 | $ | 918,147 | $ | — | $ | 1,999,411 | ||||||||
Consumer discretionary | 694,629 | 438,256 | — | 1,132,885 | ||||||||||||
Health care | 382,457 | 363,432 | — | 745,889 | ||||||||||||
Financials | 218,654 | 432,229 | — | 650,883 | ||||||||||||
Consumer staples | 145,849 | 319,565 | — | 465,414 | ||||||||||||
Industrials | 130,560 | 254,066 | — | 384,626 | ||||||||||||
Materials | 79,260 | 60,639 | — | 139,899 | ||||||||||||
Telecommunication services | — | 69,545 | — | 69,545 | ||||||||||||
Other | 54,064 | 76,455 | — | 130,519 | ||||||||||||
Miscellaneous | 100,887 | 208,229 | — | 309,116 | ||||||||||||
Bonds, notes & other debt instruments | — | 1,998 | — | 1,998 | ||||||||||||
Short-term securities | — | 222,324 | — | 222,324 | ||||||||||||
|
|
|
|
|
|
|
| |||||||||
Total | $ | 2,887,624 | $ | 3,364,885 | $ | — | $ | 6,252,509 | ||||||||
|
|
|
|
|
|
|
| |||||||||
| Other investments† | ||||||||||||||||
| Level 1 | Level 2 | Level 3 | Total | |||||||||||||
Assets: | ||||||||||||||||
Unrealized appreciation on open forward currency contracts | $ | — | $ | 15 | $ | — | $ | 15 | ||||||||
|
|
|
|
|
|
|
| |||||||||
| * | Securities with a value of $3,130,602,000, which represented 50.21% of the net assets of the fund, were classified as Level 2 due to significant market movements following the close of local trading. |
| † | Forward currency contracts are not included in the investment portfolio. |
Global Small Capitalization Fund
| Investment securities | ||||||||||||||||
| Level 1 | Level 2* | Level 3 | Total | |||||||||||||
Assets: | ||||||||||||||||
Common stocks: | ||||||||||||||||
Consumer discretionary | $ | 329,356 | $ | 551,760 | $ | 9,428 | $ | 890,544 | ||||||||
Health care | 603,611 | 110,760 | — | 714,371 | ||||||||||||
Information technology | 412,279 | 301,973 | — | 714,252 | ||||||||||||
Industrials | 151,501 | 294,339 | — | 445,840 | ||||||||||||
Financials | 214,438 | 190,470 | — | 404,908 | ||||||||||||
Materials | 104,305 | 71,999 | — | 176,304 | ||||||||||||
Consumer staples | 3,788 | 143,003 | — | 146,791 | ||||||||||||
Energy | 84,263 | 24,844 | 10,408 | 119,515 | ||||||||||||
Real estate | 41,034 | 69,305 | — | 110,339 | ||||||||||||
Utilities | 11,606 | 63,512 | — | 75,118 | ||||||||||||
Telecommunication services | — | 18,660 | — | 18,660 | ||||||||||||
Miscellaneous | 102,354 | 108,632 | — | 210,986 | ||||||||||||
Rights & warrants | 376 | — | — | 376 | ||||||||||||
Convertible bonds | — | 8,667 | — | 8,667 | ||||||||||||
Bonds, notes & other debt instruments | — | 4,110 | — | 4,110 | ||||||||||||
Short-term securities | — | 274,471 | — | 274,471 | ||||||||||||
|
|
|
|
|
|
|
| |||||||||
Total | $ | 2,058,911 | $ | 2,236,505 | $ | 19,836 | $ | 4,315,252 | ||||||||
|
|
|
|
|
|
|
| |||||||||
136 American Funds Insurance Series
Table of Contents
| Other investments† | ||||||||||||||||
| Level 1 | Level 2 | Level 3 | Total | |||||||||||||
Assets: | ||||||||||||||||
Unrealized appreciation on open forward currency contracts | $ | — | $ | 89 | $ | — | $ | 89 | ||||||||
Liabilities: | ||||||||||||||||
Unrealized depreciation on open forward currency contracts | — | (1,192 | ) | — | (1,192 | ) | ||||||||||
|
|
|
|
|
|
|
| |||||||||
Total | $ | — | $ | (1,103 | ) | $ | — | $ | (1,103 | ) | ||||||
|
|
|
|
|
|
|
| |||||||||
| * | Securities with a value of $1,942,046,000, which represented 45.01% of the net assets of the fund, were classified as Level 2 due to significant market movements following the close of local trading. |
| † | Forward currency contracts are not included in the investment portfolio. |
Growth Fund
| Investment securities | ||||||||||||||||
| Level 1 | Level 2* | Level 3 | Total | |||||||||||||
Assets: | ||||||||||||||||
Common stocks: | ||||||||||||||||
Information technology | $ | 6,845,509 | $ | 915,367 | $ | — | $ | 7,760,876 | ||||||||
Consumer discretionary | 4,738,236 | 94,422 | — | 4,832,658 | ||||||||||||
Health care | 3,259,476 | — | — | 3,259,476 | ||||||||||||
Financials | 2,185,851 | 147,823 | — | 2,333,674 | ||||||||||||
Energy | 1,816,396 | 25,468 | — | 1,841,864 | ||||||||||||
Industrials | 1,358,459 | 295,546 | — | 1,654,005 | ||||||||||||
Consumer staples | 417,696 | 145,792 | — | 563,488 | ||||||||||||
Other | 574,854 | — | — | 574,854 | ||||||||||||
Miscellaneous | 617,094 | 15,368 | — | 632,462 | ||||||||||||
Convertible stocks | — | — | 9,173 | 9,173 | ||||||||||||
Short-term securities | — | 1,576,732 | — | 1,576,732 | ||||||||||||
|
|
|
|
|
|
|
| |||||||||
Total | $ | 21,813,571 | $ | 3,216,518 | $ | 9,173 | $ | 25,039,262 | ||||||||
|
|
|
|
|
|
|
| |||||||||
| * | Securities with a value of $1,614,318,000, which represented 6.46% of the net assets of the fund, were classified as Level 2 due to significant market movements following the close of local trading. |
International Fund
| Investment securities | ||||||||||||||||
| Level 1 | Level 2* | Level 3 | Total | |||||||||||||
Assets: | ||||||||||||||||
Common stocks: | ||||||||||||||||
Financials | $ | 41,115 | $ | 1,696,929 | $ | — | $ | 1,738,044 | ||||||||
Information technology | 234,815 | 942,033 | — | 1,176,848 | ||||||||||||
Consumer discretionary | 93,697 | 1,013,232 | — | 1,106,929 | ||||||||||||
Health care | 98,109 | 857,742 | — | 955,851 | ||||||||||||
Industrials | 32,143 | 862,182 | — | 894,325 | ||||||||||||
Consumer staples | 25,429 | 769,539 | — | 794,968 | ||||||||||||
Materials | 195,900 | 361,779 | — | 557,679 | ||||||||||||
Utilities | — | 515,357 | — | 515,357 | ||||||||||||
Energy | 143,691 | 315,986 | — | 459,677 | ||||||||||||
Telecommunication services | — | 244,269 | — | 244,269 | ||||||||||||
Real estate | — | 190,704 | — | 190,704 | ||||||||||||
Miscellaneous | 6,325 | 222,989 | — | 229,314 | ||||||||||||
Rights & warrants | — | 6,390 | — | 6,390 | ||||||||||||
Bonds, notes & other debt instruments | — | 71,438 | — | 71,438 | ||||||||||||
Short-term securities | — | 813,820 | — | 813,820 | ||||||||||||
|
|
|
|
|
|
|
| |||||||||
Total | $ | 871,224 | $ | 8,884,389 | $ | — | $ | 9,755,613 | ||||||||
|
|
|
|
|
|
|
| |||||||||
See next page for footnote.
American Funds Insurance Series 137
Table of Contents
| Other investments† | ||||||||||||||||
| Level 1 | Level 2 | Level 3 | Total | |||||||||||||
Liabilities: | ||||||||||||||||
Unrealized depreciation on open forward currency contracts | $ | — | $ | (355 | ) | $ | — | $ | (355 | ) | ||||||
|
|
|
|
|
|
|
| |||||||||
| * | Securities with a value of $7,669,394,000, which represented 78.60% of the net assets of the fund, were classified as Level 2 due to significant market movements following the close of local trading. |
| † | Forward currency contracts are not included in the investment portfolio. |
New World Fund
| Investment securities | ||||||||||||||||
| Level 1 | Level 2* | Level 3 | Total | |||||||||||||
Assets: | ||||||||||||||||
Common stocks: | ||||||||||||||||
Information technology | $ | 456,159 | $ | 447,994 | $ | — | $ | 904,153 | ||||||||
Financials | 161,231 | 233,656 | — | 394,887 | ||||||||||||
Consumer discretionary | 147,598 | 171,119 | — | 318,717 | ||||||||||||
Energy | 44,789 | 259,731 | — | 304,520 | ||||||||||||
Consumer staples | 37,317 | 247,836 | — | 285,153 | ||||||||||||
Materials | 133,930 | 140,519 | — | 274,449 | ||||||||||||
Industrials | 53,846 | 165,765 | — | 219,611 | ||||||||||||
Health care | 77,782 | 79,033 | — | 156,815 | ||||||||||||
Telecommunication services | 4,339 | 83,524 | — | 87,863 | ||||||||||||
Utilities | 54,367 | 12,099 | — | 66,466 | ||||||||||||
Real estate | 38,038 | — | 27 | 38,065 | ||||||||||||
Miscellaneous | 47,500 | 117,331 | — | 164,831 | ||||||||||||
Preferred securities | — | — | 1,340 | 1,340 | ||||||||||||
Rights & warrants | — | 62,810 | — | 62,810 | ||||||||||||
Bonds, notes & other debt instruments | — | 97,099 | — | 97,099 | ||||||||||||
Short-term securities | — | 171,372 | — | 171,372 | ||||||||||||
|
|
|
|
|
|
|
| |||||||||
Total | $ | 1,256,896 | $ | 2,289,888 | $ | 1,367 | $ | 3,548,151 | ||||||||
|
|
|
|
|
|
|
| |||||||||
| Other investments† | ||||||||||||||||
| Level 1 | Level 2 | Level 3 | Total | |||||||||||||
Assets: | ||||||||||||||||
Unrealized appreciation on open forward currency contracts | $ | — | $ | 69 | $ | — | $ | 69 | ||||||||
Liabilities: | ||||||||||||||||
Unrealized depreciation on open forward currency contracts | — | (392 | ) | — | (392 | ) | ||||||||||
|
|
|
|
|
|
|
| |||||||||
Total | $ | — | $ | (323 | ) | $ | — | $ | (323 | ) | ||||||
|
|
|
|
|
|
|
| |||||||||
| * | Securities with a value of $1,899,212,000, which represented 53.76% of the net assets of the fund, were classified as Level 2 due to significant market movements following the close of local trading. |
| † | Forward currency contracts are not included in the investment portfolio. |
138 American Funds Insurance Series
Table of Contents
Blue Chip Income and Growth Fund
| Investment securities | ||||||||||||||||
| Level 1 | Level 2 | Level 3 | Total | |||||||||||||
Assets: | ||||||||||||||||
Common stocks: | ||||||||||||||||
Health care | $ | 1,797,572 | $ | — | $ | — | $ | 1,797,572 | ||||||||
Financials | 1,260,539 | — | — | 1,260,539 | ||||||||||||
Information technology | 1,121,010 | — | — | 1,121,010 | ||||||||||||
Industrials | 1,065,467 | — | — | 1,065,467 | ||||||||||||
Consumer staples | 1,001,235 | — | — | 1,001,235 | ||||||||||||
Telecommunication services | 794,583 | — | — | 794,583 | ||||||||||||
Energy | 733,529 | — | — | 733,529 | ||||||||||||
Consumer discretionary | 520,449 | — | — | 520,449 | ||||||||||||
Materials | 259,727 | — | — | 259,727 | ||||||||||||
Other | 112,331 | — | — | 112,331 | ||||||||||||
Miscellaneous | 361,132 | — | — | 361,132 | ||||||||||||
Short-term securities | — | 349,194 | — | 349,194 | ||||||||||||
|
|
|
|
|
|
|
| |||||||||
Total | $ | 9,027,574 | $ | 349,194 | $ | — | $ | 9,376,768 | ||||||||
|
|
|
|
|
|
|
| |||||||||
Global Growth and Income Fund
| Investment securities | ||||||||||||||||
| Level 1 | Level 2* | Level 3 | Total | |||||||||||||
Assets: | ||||||||||||||||
Common stocks: | ||||||||||||||||
Information technology | $ | 203,616 | $ | 295,474 | $ | — | $ | 499,090 | ||||||||
Financials | 120,856 | 106,026 | — | 226,882 | ||||||||||||
Industrials | 96,923 | 126,666 | — | 223,589 | ||||||||||||
Consumer staples | 46,060 | 138,984 | — | 185,044 | ||||||||||||
Consumer discretionary | 77,851 | 99,746 | — | 177,597 | ||||||||||||
Health care | 131,217 | 19,117 | — | 150,334 | ||||||||||||
Energy | 23,032 | 106,979 | — | 130,011 | ||||||||||||
Materials | 53,553 | 69,868 | — | 123,421 | ||||||||||||
Real estate | 61,482 | 11,605 | — | 73,087 | ||||||||||||
Utilities | 11,028 | 36,063 | — | 47,091 | ||||||||||||
Telecommunication services | 21,966 | 14,635 | — | 36,601 | ||||||||||||
Miscellaneous | 38,248 | 58,585 | — | 96,833 | ||||||||||||
Convertible bonds | — | 6,622 | — | 6,622 | ||||||||||||
Bonds, notes & other debt instruments | — | 41,995 | — | 41,995 | ||||||||||||
Short-term securities | — | 88,129 | — | 88,129 | ||||||||||||
|
|
|
|
|
|
|
| |||||||||
Total | $ | 885,832 | $ | 1,220,494 | $ | — | $ | 2,106,326 | ||||||||
|
|
|
|
|
|
|
| |||||||||
| * | Securities with a value of $1,083,748,000, which represented 51.55% of the net assets of the fund, were classified as Level 2 due to significant market movements following the close of local trading. |
American Funds Insurance Series 139
Table of Contents
Growth-Income Fund
| Investment securities | ||||||||||||||||
| Level 1 | Level 2* | Level 3 | Total | |||||||||||||
Assets: | ||||||||||||||||
Common stocks: | ||||||||||||||||
Information technology | $ | 5,040,128 | $ | 155,981 | $ | — | $ | 5,196,109 | ||||||||
Consumer discretionary | 4,770,317 | 225,966 | — | 4,996,283 | ||||||||||||
Health care | 4,376,528 | 183,158 | — | 4,559,686 | ||||||||||||
Financials | 2,910,454 | 446,084 | — | 3,356,538 | ||||||||||||
Industrials | 2,578,432 | 332,460 | — | 2,910,892 | ||||||||||||
Consumer staples | 1,489,742 | 814,677 | — | 2,304,419 | ||||||||||||
Energy | 1,559,365 | 398,628 | — | 1,957,993 | ||||||||||||
Materials | 1,277,722 | 91,080 | — | 1,368,802 | ||||||||||||
Telecommunication services | 600,824 | — | — | 600,824 | ||||||||||||
Real estate | 535,421 | — | — | 535,421 | ||||||||||||
Utilities | 250,402 | 855 | — | 251,257 | ||||||||||||
Mutual funds | 55,129 | — | — | 55,129 | ||||||||||||
Miscellaneous | 480,393 | 309,384 | — | 789,777 | ||||||||||||
Convertible stocks | 6,192 | 5,450 | — | 11,642 | ||||||||||||
Convertible bonds | — | 107,354 | — | 107,354 | ||||||||||||
Bonds, notes & other debt instruments | — | 56,489 | — | 56,489 | ||||||||||||
Short-term securities | — | 1,651,258 | — | 1,651,258 | ||||||||||||
|
|
|
|
|
|
|
| |||||||||
Total | $ | 25,931,049 | $ | 4,778,824 | $ | — | $ | 30,709,873 | ||||||||
|
|
|
|
|
|
|
| |||||||||
| * | Securities with a value of $2,749,134,000, which represented 8.96% of the net assets of the fund, were classified as Level 2 due to significant market movements following the close of local trading. |
International Growth and Income Fund
| Investment securities | ||||||||||||||||
| Level 1 | Level 2* | Level 3 | Total | |||||||||||||
Assets: | ||||||||||||||||
Common stocks: | ||||||||||||||||
Financials | $ | 21,988 | $ | 313,223 | $ | — | $ | 335,211 | ||||||||
Consumer staples | 16,215 | 117,019 | — | 133,234 | ||||||||||||
Industrials | — | 122,482 | — | 122,482 | ||||||||||||
Utilities | — | 117,311 | — | 117,311 | ||||||||||||
Information technology | 25,969 | 88,895 | — | 114,864 | ||||||||||||
Health care | 12,545 | 100,340 | — | 112,885 | ||||||||||||
Consumer discretionary | 8,917 | 98,687 | — | 107,604 | ||||||||||||
Real estate | — | 89,077 | — | 89,077 | ||||||||||||
Energy | 4,763 | 76,029 | — | 80,792 | ||||||||||||
Materials | 10,678 | 62,774 | — | 73,452 | ||||||||||||
Telecommunication services | — | 43,293 | — | 43,293 | ||||||||||||
Bonds, notes & other debt instruments | — | 36,911 | — | 36,911 | ||||||||||||
Short-term securities | — | 93,397 | — | 93,397 | ||||||||||||
|
|
|
|
|
|
|
| |||||||||
Total | $ | 101,075 | $ | 1,359,438 | $ | — | $ | 1,460,513 | ||||||||
|
|
|
|
|
|
|
| |||||||||
| * | Securities with a value of $1,188,243,000, which represented 81.28% of the net assets of the fund, were classified as Level 2 due to significant market movements following the close of local trading. |
140 American Funds Insurance Series
Table of Contents
Capital Income Builder
| Investment securities | ||||||||||||||||
| Level 1 | Level 2* | Level 3 | Total | |||||||||||||
Assets: | ||||||||||||||||
Common stocks: | ||||||||||||||||
Energy | $ | 52,870 | $ | 7,692 | $ | — | $ | 60,562 | ||||||||
Financials | 18,600 | 41,604 | — | 60,204 | ||||||||||||
Consumer staples | 19,698 | 32,724 | — | 52,422 | ||||||||||||
Information technology | 33,208 | 17,065 | — | 50,273 | ||||||||||||
Consumer discretionary | 16,007 | 21,266 | — | 37,273 | ||||||||||||
Telecommunication services | 5,072 | 30,191 | — | 35,263 | ||||||||||||
Real estate | 18,738 | 10,284 | — | 29,022 | ||||||||||||
Utilities | 5,189 | 21,210 | — | 26,399 | ||||||||||||
Health care | 14,691 | 8,660 | — | 23,351 | ||||||||||||
Industrials | 8,324 | 12,728 | — | 21,052 | ||||||||||||
Materials | 9,381 | 2,890 | — | 12,271 | ||||||||||||
Miscellaneous | — | 1,290 | — | 1,290 | ||||||||||||
Convertible stocks | 14,967 | — | — | 14,967 | ||||||||||||
Bonds, notes & other debt instruments: | ||||||||||||||||
U.S. Treasury bonds & notes | — | 86,945 | — | 86,945 | ||||||||||||
Mortgage-backed obligations | — | 28,433 | — | 28,433 | ||||||||||||
Corporate bonds & notes | — | 21,514 | — | 21,514 | ||||||||||||
Asset-backed obligations | — | 3,981 | — | 3,981 | ||||||||||||
Short-term securities | — | 33,972 | — | 33,972 | ||||||||||||
|
|
|
|
|
|
|
| |||||||||
Total | $ | 216,745 | $ | 382,449 | $ | — | $ | 599,194 | ||||||||
|
|
|
|
|
|
|
| |||||||||
| * | Securities with a value of $207,107,000, which represented 34.84% of the net assets of the fund, were classified as Level 2 due to significant market movements following the close of local trading. |
Asset Allocation Fund
| Investment securities | ||||||||||||||||
| Level 1 | Level 2* | Level 3 | Total | |||||||||||||
Assets: | ||||||||||||||||
Common stocks: | ||||||||||||||||
Information technology | $ | 4,377,468 | $ | 208,359 | $ | 2,985 | $ | 4,588,812 | ||||||||
Health care | 2,376,858 | — | 368 | 2,377,226 | ||||||||||||
Financials | 2,219,696 | 120,644 | — | 2,340,340 | ||||||||||||
Consumer discretionary | 1,734,901 | — | — | 1,734,901 | ||||||||||||
Energy | 1,436,851 | 1,999 | — | 1,438,850 | ||||||||||||
Consumer staples | 561,703 | 583,888 | — | 1,145,591 | ||||||||||||
Materials | 922,022 | — | — | 922,022 | ||||||||||||
Industrials | 863,216 | 2,948 | 16 | 866,180 | ||||||||||||
Real estate | 329,533 | — | — | 329,533 | ||||||||||||
Telecommunication services | 99,225 | — | — | 99,225 | ||||||||||||
Miscellaneous | 606,605 | 53,692 | — | 660,297 | ||||||||||||
Convertible stocks | — | 7,062 | 5,725 | 12,787 | ||||||||||||
Bonds, notes & other debt instruments: | ||||||||||||||||
U.S. Treasury bonds & notes | — | 2,929,266 | — | 2,929,266 | ||||||||||||
Corporate bonds & notes | — | 2,277,205 | 13,081 | 2,290,286 | ||||||||||||
Mortgage-backed obligations | — | 1,357,892 | — | 1,357,892 | ||||||||||||
Federal agency bonds & notes | — | 51,094 | — | 51,094 | ||||||||||||
Other | — | 211,780 | — | 211,780 | ||||||||||||
Short-term securities | — | 2,803,299 | — | 2,803,299 | ||||||||||||
|
|
|
|
|
|
|
| |||||||||
Total | $ | 15,528,078 | $ | 10,609,128 | $ | 22,175 | $ | 26,159,381 | ||||||||
|
|
|
|
|
|
|
| |||||||||
See next page for footnote.
American Funds Insurance Series 141
Table of Contents
| Other investments† | ||||||||||||||||
| Level 1 | Level 2 | Level 3 | Total | |||||||||||||
Assets: | ||||||||||||||||
Unrealized appreciation on futures contracts | $ | 73 | $ | — | $ | — | $ | 73 | ||||||||
Unrealized appreciation on interest rate swaps | — | 658 | — | 658 | ||||||||||||
Liabilities: | ||||||||||||||||
Unrealized depreciation on futures contracts | (826 | ) | — | — | (826 | ) | ||||||||||
Unrealized depreciation on interest rate swaps | — | (6,906 | ) | — | (6,906 | ) | ||||||||||
|
|
|
|
|
|
|
| |||||||||
Total | $ | (753 | ) | $ | (6,248 | ) | $ | — | $ | (7,001 | ) | |||||
|
|
|
|
|
|
|
| |||||||||
| * | Securities with a value of $957,800,000, which represented 3.73% of the net assets of the fund, were classified as Level 2 due to significant market movements following the close of local trading. |
| † | Futures contracts and interest rate swaps are not included in the investment portfolio. |
Global Balanced Fund
| Investment securities | ||||||||||||||||
| Level 1 | Level 2* | Level 3 | Total | |||||||||||||
Assets: | ||||||||||||||||
Common stocks: | ||||||||||||||||
Information technology | $ | 16,700 | $ | 22,876 | $ | — | $ | 39,576 | ||||||||
Industrials | 11,393 | 18,011 | — | 29,404 | ||||||||||||
Financials | 15,563 | 12,877 | — | 28,440 | ||||||||||||
Consumer staples | 13,257 | 12,223 | — | 25,480 | ||||||||||||
Health care | 13,467 | 4,281 | — | 17,748 | ||||||||||||
Materials | 7,529 | 8,099 | — | 15,628 | ||||||||||||
Energy | 7,323 | 8,128 | — | 15,451 | ||||||||||||
Consumer discretionary | 7,808 | 7,463 | — | 15,271 | ||||||||||||
Utilities | 2,201 | 5,269 | — | 7,470 | ||||||||||||
Real estate | 1,921 | 4,203 | — | 6,124 | ||||||||||||
Miscellaneous | 6,241 | 10,961 | — | 17,202 | ||||||||||||
Bonds, notes & other debt instruments: | ||||||||||||||||
Bonds & notes of governments & government agencies outside the U.S. | — | 50,017 | — | 50,017 | ||||||||||||
U.S. Treasury bonds & notes | — | 33,942 | — | 33,942 | ||||||||||||
Corporate bonds & notes | — | 22,383 | — | 22,383 | ||||||||||||
Mortgage-backed obligations | — | 5,463 | — | 5,463 | ||||||||||||
Asset-backed obligations | — | 200 | — | 200 | ||||||||||||
Short-term securities | — | 26,448 | — | 26,448 | ||||||||||||
|
|
|
|
|
|
|
| |||||||||
Total | $ | 103,403 | $ | 252,844 | $ | — | $ | 356,247 | ||||||||
|
|
|
|
|
|
|
| |||||||||
| Other investments† | ||||||||||||||||
| Level 1 | Level 2 | Level 3 | Total | |||||||||||||
Assets: | ||||||||||||||||
Unrealized appreciation on open forward currency contracts | $ | — | $ | 144 | $ | — | $ | 144 | ||||||||
Liabilities: | ||||||||||||||||
Unrealized depreciation on open forward currency contracts | — | (269 | ) | — | (269 | ) | ||||||||||
|
|
|
|
|
|
|
| |||||||||
Total | $ | — | $ | (125 | ) | $ | — | $ | (125 | ) | ||||||
|
|
|
|
|
|
|
| |||||||||
| * | Securities with a value of $112,907,000, which represented 31.90% of the net assets of the fund, were classified as Level 2 due to significant market movements following the close of local trading. |
| † | Forward currency contracts are not included in the investment portfolio. |
142 American Funds Insurance Series
Table of Contents
Bond Fund
| Investment securities | ||||||||||||||||
| Level 1 | Level 2 | Level 3 | Total | |||||||||||||
Assets: | ||||||||||||||||
Bonds, notes & other debt instruments: | ||||||||||||||||
Corporate bonds & notes | $ | — | $ | 3,460,122 | $ | 3,034 | $ | 3,463,156 | ||||||||
U.S. Treasury bonds & notes | — | 2,907,009 | — | 2,907,009 | ||||||||||||
Mortgage-backed obligations | — | 2,764,932 | — | 2,764,932 | ||||||||||||
Bonds & notes of governments & government agencies outside the U.S. | — | 681,980 | — | 681,980 | ||||||||||||
Asset-backed obligations | — | 297,847 | — | 297,847 | ||||||||||||
Municipals | — | 240,326 | — | 240,326 | ||||||||||||
Federal agency bonds & notes | — | 12,036 | — | 12,036 | ||||||||||||
Common stocks | — | — | 1,242 | 1,242 | ||||||||||||
Rights & warrants | — | 55 | — | 55 | ||||||||||||
Short-term securities | — | 2,366,794 | — | 2,366,794 | ||||||||||||
|
|
|
|
|
|
|
| |||||||||
Total | $ | — | $ | 12,731,101 | $ | 4,276 | $ | 12,735,377 | ||||||||
|
|
|
|
|
|
|
| |||||||||
| Other investments* | ||||||||||||||||
| Level 1 | Level 2 | Level 3 | Total | |||||||||||||
Assets: | ||||||||||||||||
Unrealized appreciation on futures contracts | $ | 25 | $ | — | $ | — | $ | 25 | ||||||||
Unrealized appreciation on open forward currency contracts | — | 10,220 | — | 10,220 | ||||||||||||
Unrealized appreciation on interest rate swaps | — | 18,448 | — | 18,448 | ||||||||||||
Liabilities: | ||||||||||||||||
Unrealized depreciation on futures contracts | (4,181 | ) | — | — | (4,181 | ) | ||||||||||
Unrealized depreciation on open forward currency contracts | — | (2,678 | ) | — | (2,678 | ) | ||||||||||
Unrealized depreciation on interest rate swaps | — | (10,736 | ) | — | (10,736 | ) | ||||||||||
Unrealized depreciation on credit default swaps | — | (184 | ) | — | (184 | ) | ||||||||||
|
|
|
|
|
|
|
| |||||||||
Total | $ | (4,156 | ) | $ | 15,070 | $ | — | $ | 10,914 | |||||||
|
|
|
|
|
|
|
| |||||||||
| * | Futures contracts, forward currency contracts, interest rate swaps and credit default swaps are not included in the investment portfolio. |
Global Bond Fund
| Investment securities | ||||||||||||||||
| Level 1 | Level 2 | Level 3 | Total | |||||||||||||
Assets: | ||||||||||||||||
Bonds, notes & other debt instruments: | ||||||||||||||||
Euros | $ | — | $ | 355,443 | $ | — | $ | 355,443 | ||||||||
Japanese yen | — | 200,098 | — | 200,098 | ||||||||||||
Polish zloty | — | 97,169 | — | 97,169 | ||||||||||||
Mexican pesos | — | 96,500 | — | 96,500 | ||||||||||||
Indian rupees | — | 62,664 | — | 62,664 | ||||||||||||
Malaysian ringgits | — | 55,646 | — | 55,646 | ||||||||||||
Norwegian kroner | — | 39,988 | — | 39,988 | ||||||||||||
Australian dollars | — | 34,394 | — | 34,394 | ||||||||||||
British pounds | — | 32,755 | — | 32,755 | ||||||||||||
Thai baht | — | 28,589 | — | 28,589 | ||||||||||||
Danish kroner | — | 25,806 | — | 25,806 | ||||||||||||
Chilean pesos | — | 21,977 | — | 21,977 | ||||||||||||
Israeli shekels | — | 20,893 | — | 20,893 | ||||||||||||
Canadian dollars | — | 18,967 | — | 18,967 | ||||||||||||
U.S. dollars | — | 1,062,266 | 604 | 1,062,870 | ||||||||||||
Other | — | 59,260 | — | 59,260 | ||||||||||||
Convertible stocks | — | 237 | 973 | 1,210 | ||||||||||||
Common stocks | 32 | 207 | 457 | 696 | ||||||||||||
Short-term securities | — | 277,548 | — | 277,548 | ||||||||||||
|
|
|
|
|
|
|
| |||||||||
Total | $ | 32 | $ | 2,490,407 | $ | 2,034 | $ | 2,492,473 | ||||||||
|
|
|
|
|
|
|
| |||||||||
American Funds Insurance Series 143
Table of Contents
| Other investments* | ||||||||||||||||
| Level 1 | Level 2 | Level 3 | Total | |||||||||||||
Assets: | ||||||||||||||||
Unrealized appreciation on futures contracts | $ | 195 | $ | — | $ | — | $ | 195 | ||||||||
Unrealized appreciation on open forward currency contracts | — | 4,906 | — | 4,906 | ||||||||||||
Unrealized appreciation on interest rate swaps | — | 1,034 | — | 1,034 | ||||||||||||
Liabilities: | ||||||||||||||||
Unrealized depreciation on futures contracts | (554 | ) | — | — | (554 | ) | ||||||||||
Unrealized depreciation on open forward currency contracts | — | (4,246 | ) | — | (4,246 | ) | ||||||||||
Unrealized depreciation on interest rate swaps | — | (2,513 | ) | — | (2,513 | ) | ||||||||||
|
|
|
|
|
|
|
| |||||||||
Total | $ | (359 | ) | $ | (819 | ) | $ | — | $ | (1,178 | ) | |||||
|
|
|
|
|
|
|
| |||||||||
| * | Futures contracts, forward currency contracts and interest rate swaps are not included in the investment portfolio. |
High-Income Bond Fund
| Investment securities | ||||||||||||||||
| Level 1 | Level 2 | Level 3 | Total | |||||||||||||
Assets: | ||||||||||||||||
Bonds, notes & other debt instruments: | ||||||||||||||||
Corporate bonds & notes | $ | — | $ | 1,344,219 | $ | 12,774 | $ | 1,356,993 | ||||||||
Other | — | 13,338 | — | 13,338 | ||||||||||||
Convertible bonds | — | 5,860 | — | 5,860 | ||||||||||||
Convertible stocks | 2,727 | 4,900 | 5,553 | 13,180 | ||||||||||||
Common stocks | 2,744 | 2,698 | 5,414 | 10,856 | ||||||||||||
Rights & warrants | — | 36 | — | 36 | ||||||||||||
Short-term securities | — | 24,394 | — | 24,394 | ||||||||||||
|
|
|
|
|
|
|
| |||||||||
Total | $ | 5,471 | $ | 1,395,445 | $ | 23,741 | $ | 1,424,657 | ||||||||
|
|
|
|
|
|
|
| |||||||||
| Other investments1 | ||||||||||||||||
| Level 1 | Level 2 | Level 3 | Total | |||||||||||||
Assets: | ||||||||||||||||
Unrealized appreciation on interest rate swaps | $ | — | $ | 512 | $ | — | $ | 512 | ||||||||
Liabilities: | ||||||||||||||||
Unrealized depreciation on interest rate swaps | — | (90 | ) | — | (90 | ) | ||||||||||
Unrealized depreciation on credit default swaps | — | (419 | ) | — | (419 | ) | ||||||||||
|
|
|
|
|
|
|
| |||||||||
Total | $ | — | $ | 3 | $ | — | $ | 3 | ||||||||
|
|
|
|
|
|
|
| |||||||||
| 1 | Interest rate swaps and credit default swaps are not included in the investment portfolio. |
The following table reconciles the valuation of the fund’s Level 3 investment securities and related transactions for the year ended December 31, 2017 (dollars in thousands):
| Beginning value at 1/1/2017 | Transfers into Level 32 | Purchases | Sales | Net realized gain3 | Unrealized appreciation3 | Transfers out of Level 32 | Ending value at 12/31/2017 | |||||||||||||||||||||||||
Investment securities | $ | 22,631 | $ | 47 | $ | 859 | $ | (340 | ) | $ | 5 | $ | 585 | $ | (46 | ) | $ | 23,741 | ||||||||||||||
Net unrealized appreciation during the period on Level 3 investment securities held at December 31, 2017 |
| $ | 585 | |||||||||||||||||||||||||||||
| 2 | Transfers into or out of Level 3 are based on the beginning market value of the quarter in which they occurred. |
| 3 | Net realized gain and unrealized appreciation are included in the related amounts on investments in the statement of operations. |
144 American Funds Insurance Series
Table of Contents
Unobservable inputs — Valuation of the fund’s Level 3 securities is based on significant unobservable inputs that reflect the investment adviser’s determination of assumptions that market participants might reasonably use in valuing the securities. The following table provides additional information used by the fund’s investment adviser to fair value the fund’s Level 3 securities (dollars in thousands):
| Value at 12/31/2017 | Valuation techniques | Unobservable inputs | Range | Impact to valuation from an increase in input* | ||||||||
Bonds, notes & other debt instruments | $ | 12,774 | Yield analysis | Yield risk premium | 75 - 700 bps | Decrease | ||||||
Convertible stocks | 5,553 | Market comparable companies | EBITDA multiple | 13.3x | Increase | |||||||
Common stocks | 5,414 | Market comparable companies | EBITDA multiple | 5.3x - 10.6x | Increase | |||||||
| DLOM | 24% - 35% | Decrease | ||||||||||
| Weight ascribed to market comparables | 50% | N/A | ||||||||||
| Inputs to market comparables and transaction price | Weight ascribed to transaction price | 50% | N/A | |||||||||
|
| |||||||||||
| $ | 23,741 | |||||||||||
|
| |||||||||||
| * | This column represents the directional change in fair value of the Level 3 securities that would result in an increase from the corresponding input. A decrease to the unobservable input would have the opposite effect. Significant increases and decreases in these inputs in isolation could result in significantly higher or lower fair value measurements. |
Key to abbreviations
EBITDA = Earnings before income taxes, depreciation and amortization
DLOM = Discount for lack of marketability
Mortgage Fund
| Investment securities | ||||||||||||||||
| Level 1 | Level 2 | Level 3 | Total | |||||||||||||
Assets: | ||||||||||||||||
Bonds, notes & other debt instruments: | ||||||||||||||||
Mortgage-backed obligations | $ | — | $ | 215,884 | $ | — | $ | 215,884 | ||||||||
U.S. Treasury bonds & notes | — | 54,720 | — | 54,720 | ||||||||||||
Federal agency bonds & notes | — | 41,556 | — | 41,556 | ||||||||||||
Asset-backed obligations | — | 11,285 | — | 11,285 | ||||||||||||
Corporate bonds & notes | — | — | 187 | 187 | ||||||||||||
Short-term securities | — | 92,757 | — | 92,757 | ||||||||||||
|
|
|
|
|
|
|
| |||||||||
Total | $ | — | $ | 416,202 | $ | 187 | $ | 416,389 | ||||||||
|
|
|
|
|
|
|
| |||||||||
| Other investments* | ||||||||||||||||
| Level 1 | Level 2 | Level 3 | Total | |||||||||||||
Assets: | ||||||||||||||||
Unrealized appreciation on futures contracts | $ | 21 | $ | — | $ | — | $ | 21 | ||||||||
Unrealized appreciation on interest rate swaps | — | 1,539 | — | 1,539 | ||||||||||||
Liabilities: | ||||||||||||||||
Unrealized depreciation on futures contracts | (653 | ) | — | — | (653 | ) | ||||||||||
Unrealized depreciation on interest rate swaps | — | (2,325 | ) | — | (2,325 | ) | ||||||||||
|
|
|
|
|
|
|
| |||||||||
Total | $ | (632 | ) | $ | (786 | ) | $ | — | $ | (1,418 | ) | |||||
|
|
|
|
|
|
|
| |||||||||
| * | Futures contracts and interest rate swaps are not included in the investment portfolio. |
Ultra-Short Bond Fund
At December 31, 2017, all of the fund’s investment securities were classified as Level 2.
American Funds Insurance Series 145
Table of Contents
U.S. Government/AAA-Rated Securities Fund
| Investment securities | ||||||||||||||||
| Level 1 | Level 2 | Level 3 | Total | |||||||||||||
Assets: | ||||||||||||||||
Bonds, notes & other debt instruments: | ||||||||||||||||
U.S. Treasury bonds & notes | $ | — | $ | 1,568,352 | $ | — | $ | 1,568,352 | ||||||||
Mortgage-backed obligations | — | 786,503 | — | 786,503 | ||||||||||||
Federal agency bonds & notes | — | 525,580 | — | 525,580 | ||||||||||||
Short-term securities | — | 458,280 | — | 458,280 | ||||||||||||
|
|
|
|
|
|
|
| |||||||||
Total | $ | — | $ | 3,338,715 | $ | — | $ | 3,338,715 | ||||||||
|
|
|
|
|
|
|
| |||||||||
| Other investments* | ||||||||||||||||
| Level 1 | Level 2 | Level 3 | Total | |||||||||||||
Assets: | ||||||||||||||||
Unrealized appreciation on futures contracts | $ | 743 | $ | — | $ | — | $ | 743 | ||||||||
Unrealized appreciation on interest rate swaps | — | 18,217 | — | 18,217 | ||||||||||||
Liabilities: | ||||||||||||||||
Unrealized depreciation on futures contracts | (8,188 | ) | — | — | (8,188 | ) | ||||||||||
Unrealized depreciation on interest rate swaps | — | (26,645 | ) | — | (26,645 | ) | ||||||||||
|
|
|
|
|
|
|
| |||||||||
Total | $ | (7,445 | ) | $ | (8,428 | ) | $ | — | $ | (15,873 | ) | |||||
|
|
|
|
|
|
|
| |||||||||
| * | Futures contracts and interest rate swaps are not included in the investment portfolio. |
Managed Risk Growth Fund
At December 31, 2017, all of the fund’s investments were classified as Level 1.
Managed Risk International Fund
At December 31, 2017, all of the fund’s investments were classified as Level 1.
Managed Risk Blue Chip Income and Growth Fund
At December 31, 2017, all of the fund’s investments were classified as Level 1.
Managed Risk Growth-Income Fund
At December 31, 2017, all of the fund’s investments were classified as Level 1.
Managed Risk Asset Allocation Fund
At December 31, 2017, all of the fund’s investments were classified as Level 1.
4. Risk factors
Investing in the funds may involve certain risks including, but not limited to, those described below.
Market conditions — The prices of, and the income generated by, the common stocks, bonds and other securities held by a fund may decline — sometimes rapidly or unpredictably — due to various factors, including events or conditions affecting the general economy or particular industries; overall market changes; local, regional or global political, social or economic instability; governmental or governmental agency responses to economic conditions; and currency exchange rate, interest rate and commodity price fluctuations.
Issuer risks — The prices of, and the income generated by, securities held by a fund may decline in response to various factors directly related to the issuers of such securities, including reduced demand for an issuer’s goods or services, poor management performance and strategic initiatives such as mergers, acquisitions or dispositions and the market response to any such initiatives.
Investing in growth-oriented stocks — Growth-oriented common stocks and other equity-type securities (such as preferred stocks, convertible preferred stocks and convertible bonds) may involve larger price swings and greater potential for loss than other types of investments. These risks may be even greater in the case of smaller capitalization stocks.
Investing in income-oriented stocks — Income provided by a fund may be reduced by changes in the dividend policies of, and the capital resources available for dividend payments at, the companies in which the fund invests.
146 American Funds Insurance Series
Table of Contents
Investing in small companies — Investing in smaller companies may pose additional risks. For example, it is often more difficult to value or dispose of small company stocks and more difficult to obtain information about smaller companies than about larger companies. Furthermore, smaller companies often have limited product lines, operating histories, markets and/or financial resources, may be dependent on one or a few key persons for management, and can be more susceptible to losses. Moreover, the prices of their stocks may be more volatile than stocks of larger, more established companies.
Investing outside the U.S. — Securities of issuers domiciled outside the U.S., or with significant operations or revenues outside the U.S., may lose value because of adverse political, social, economic or market developments (including social instability, regional conflicts, terrorism and war) in the countries or regions in which the issuers operate or generate revenue. These securities may also lose value due to changes in foreign currency exchange rates against the U.S. dollar and/or currencies of other countries. Issuers of these securities may be more susceptible to actions of foreign governments, such as the imposition of price controls or punitive taxes, that could adversely impact the value of these securities. Securities markets in certain countries may be more volatile and/or less liquid than those in the U.S. Investments outside the U.S. may also be subject to different accounting practices and different regulatory, legal and reporting standards and practices, and may be more difficult to value, than those in the U.S. In addition, the value of investments outside the U.S. may be reduced by foreign taxes, including foreign withholding taxes on interest and dividends. Further, there may be increased risks of delayed settlement of securities purchased or sold by the fund. The risks of investing outside the U.S. may be heightened in connection with investments in emerging markets.
Investing in developing countries — Investing in countries with developing economies and/or markets may involve risks in addition to and greater than those generally associated with investing in developed countries. For instance, developing countries may have less developed legal and accounting systems than those in developed countries. The governments of these countries may be less stable and more likely to impose capital controls, nationalize a company or industry, place restrictions on foreign ownership and on withdrawing sale proceeds of securities from the country, and/or impose punitive taxes that could adversely affect the prices of securities. In addition, the economies of these countries may be dependent on relatively few industries that are more susceptible to local and global changes. Securities markets in these countries can also be relatively small and have substantially lower trading volumes. As a result, securities issued in these countries may be more volatile and less liquid, and may be more difficult to value, than securities issued in countries with more developed economies and/or markets. Less certainty with respect to security valuations may lead to additional challenges and risks in calculating the fund’s net asset value. Additionally, there may be increased settlement risks for transactions in local securities.
Investing in emerging markets — Investing in emerging markets may involve risks in addition to and greater than those generally associated with investing in the securities markets of developed countries. For instance, developing countries may have less developed legal and accounting systems than those in developed countries. The governments of these countries may be less stable and more likely to impose capital controls, nationalize a company or industry, place restrictions on foreign ownership and on withdrawing sale proceeds of securities from the country, and/or impose punitive taxes that could adversely affect the prices of securities. In addition, the economies of these countries may be dependent on relatively few industries that are more susceptible to local and global changes. Securities markets in these countries can also be relatively small and have substantially lower trading volumes. As a result, securities issued in these countries may be more volatile and less liquid, and may be more difficult to value, than securities issued in countries with more developed economies and/or markets. Less certainty with respect to security valuations may lead to additional challenges and risks in calculating a fund’s net asset value. Additionally, there may be increased settlement risks for transactions in local securities.
Investing in debt instruments — The prices of, and the income generated by, bonds and other debt securities held by a fund may be affected by changing interest rates and by changes in the effective maturities and credit ratings of these securities.
Rising interest rates will generally cause the prices of bonds and other debt securities to fall. Falling interest rates may cause an issuer to redeem, call or refinance a debt security before its stated maturity, which may result in a fund having to reinvest the proceeds in lower yielding securities. Longer maturity debt securities generally have greater sensitivity to changes in interest rates and may be subject to greater price fluctuations than shorter maturity debt securities.
Bonds and other debt securities are also subject to credit risk, which is the possibility that the credit strength of an issuer will weaken and/or an issuer of a debt security will fail to make timely payments of principal or interest and the security will go into default. Lower quality debt securities generally have higher rates of interest and may be subject to greater price fluctuations than higher quality debt securities. Credit risk is gauged, in part, by the credit ratings of the debt securities in which a fund invests. However, ratings are only the opinions of the rating agencies issuing them and are not guarantees as to credit quality or an evaluation of market risk. The funds’ investment adviser relies on its own credit analysts to research issuers and issues in seeking to mitigate various credit and default risks.
American Funds Insurance Series 147
Table of Contents
Investing in lower rated debt instruments — Lower rated bonds and other lower rated debt securities generally have higher rates of interest and involve greater risk of default or price declines due to changes in the issuer’s creditworthiness than those of higher quality debt securities. The market prices of these securities may fluctuate more than the prices of higher quality debt securities and may decline significantly in periods of general economic difficulty. These risks may be increased with respect to investments in junk bonds.
Investing in derivatives — The use of derivatives involves a variety of risks, which may be different from, or greater than, the risks associated with investing in traditional cash securities, such as stocks and bonds. Changes in the value of a derivative may not correlate perfectly with, and may be more sensitive to market events than, the underlying asset, rate or index, and a derivative instrument may expose a fund to losses in excess of its initial investment. Derivatives may be difficult for a fund to buy or sell at an opportune time or price and may be difficult to terminate or otherwise offset. A fund’s use of derivatives may result in losses to the fund, and investing in derivatives may reduce a fund’s returns and increase a fund’s price volatility. A fund’s counterparty to a derivative transaction (including, if applicable, the fund’s clearing broker, the derivatives exchange or the clearinghouse) may be unable or unwilling to honor its financial obligations in respect of the transaction.
Currency — The prices of, and the income generated by, most debt securities held by a fund may also be affected by changes in relative currency values. If the U.S. dollar appreciates against foreign currencies, the value in U.S. dollars of a fund’s securities denominated in such currencies would generally fall and vice versa. U.S. dollar-denominated securities of foreign issuers may also be affected by changes in relative currency values.
Investing in mortgage-related and other asset-backed securities — Mortgage-related securities, such as mortgage-backed securities, and other asset-backed securities, include debt obligations that represent interests in pools of mortgages or other income-bearing assets, such as consumer loans or receivables. Such securities often involve risks that are different from or more acute than the risks associated with investing in other types of debt securities. Mortgage-backed and other asset-backed securities are subject to changes in the payment patterns of borrowers of the underlying debt. When interest rates fall, borrowers are more likely to refinance or prepay their debt before its stated maturity. This may result in a fund having to reinvest the proceeds in lower yielding securities, effectively reducing a fund’s income. Conversely, if interest rates rise and borrowers repay their debt more slowly than expected, the time in which the mortgage-backed and other asset-backed securities are paid off could be extended, reducing a fund’s cash available for reinvestment in higher yielding securities.
Investing in future delivery contracts — A fund may enter into contracts, such as to-be-announced contracts and mortgage dollar rolls, that involve a fund selling mortgage-related securities and simultaneously contracting to repurchase similar securities for delivery at a future date at a predetermined price. This can increase a fund’s market exposure, and the market price of the securities that the fund contracts to repurchase could drop below their purchase price. While a fund can preserve and generate capital through the use of such contracts by, for example, realizing the difference between the sale price and the future purchase price, the income generated by the fund may be reduced by engaging in such transactions. In addition, these transactions may increase the turnover rate of a fund.
Investing in inflation linked bonds — The values of inflation linked bonds generally fluctuate in response to changes in real interest rates — i.e., rates of interest after factoring in inflation. A rise in real interest rates may cause the prices of inflation linked securities to fall, while a decline in real interest rates may cause the prices to increase. Inflation linked bonds may experience greater losses than other debt securities with similar durations when real interest rates rise faster than nominal interest rates. There can be no assurance that the value of an inflation linked security will be directly correlated to changes in interest rates; for example, if interest rates rise for reasons other than inflation, the increase may not be reflected in the security’s inflation measure.
Investing in inflation linked bonds may also reduce a fund’s distributable income during periods of extreme deflation. If prices for goods and services decline throughout the economy, the principal and income on inflation linked securities may decline and result in losses to a fund.
Investing in securities backed by the U.S. government — Securities backed by the U.S. Treasury or the full faith and credit of the U.S. government are guaranteed only as to the timely payment of interest and principal when held to maturity. Accordingly, the current market values for these securities will fluctuate with changes in interest rates. Securities issued by government-sponsored entities and federal agencies and instrumentalities that are not backed by the full faith and credit of the U.S. government are neither issued nor guaranteed by the U.S. government.
Investing in repurchase agreements — Upon entering into a repurchase agreement, a fund purchases a security from a bank or broker-dealer, which simultaneously commits to repurchase the security within a specified time at the fund’s cost with interest. The security purchased by the fund constitutes collateral for the seller’s repurchase obligation. If the party agreeing to repurchase should default, the fund may seek to sell the security it holds as collateral. The fund may incur a loss if the value of the collateral securing the repurchase obligation falls below the repurchase price. The fund may also incur disposition costs and encounter procedural delays in connection with liquidating the collateral.
148 American Funds Insurance Series
Table of Contents
Interest rate risk — The values and liquidity of the securities held by a fund may be affected by changing interest rates. For example, the values of these securities may decline when interest rates rise and increase when interest rates fall. Longer maturity debt securities generally have greater sensitivity to changes in interest rates and may be subject to greater price fluctuations than shorter maturity debt securities. A fund may invest in variable and floating rate securities. Although the values of such securities are generally less sensitive to interest rate changes than those of other debt securities, the value of variable and floating rate securities may decline if their interest rates do not rise as quickly, or as much, as general interest rates. Conversely, floating rate securities will not generally increase in value if interest rates decline. During periods of extremely low short-term interest rates, a fund may not be able to maintain a positive yield and, given the current historically low interest rate environment, risks associated with rising rates are currently heightened.
Credit and liquidity support — Changes in the credit quality of banks and financial institutions providing credit and liquidity support features with respect to securities held by a fund could cause the values of these securities to decline.
Asset allocation — A fund’s percentage allocation to equity securities, debt securities and money market instruments could cause the fund to underperform relative to relevant benchmarks and other funds with similar investment objectives.
Nondiversification risk — As nondiversified funds, certain funds have the ability to invest a larger percentage of their assets in the securities of a smaller number of issuers than diversified funds. Although the funds do not intend to limit their investments to the securities of a small number of issuers, if they were to do so, poor performance by a single large holding could adversely impact the funds’ investment results more than if the funds were invested in a larger number of issuers.
Liquidity risk — Certain fund holdings may be deemed to be less liquid or illiquid because they cannot be readily sold without significantly impacting the value of the holdings. Liquidity risk may result from the lack of an active market for a holding, legal or contractual restrictions on resale, or the reduced number and capacity of market participants to make a market in such holding. Market prices for less liquid or illiquid holdings may be volatile, and reduced liquidity may have an adverse impact on the market price of such holdings. Additionally, the sale of less liquid or illiquid holdings may involve substantial delays (including delays in settlement) and additional costs and the fund may be unable to sell such holdings when necessary to meet its liquidity needs.
Management — The investment adviser to the funds actively manages the funds’ investments. Consequently, the funds are subject to the risk that the methods and analyses employed by the investment adviser in this process may not produce the desired results. This could cause the funds to lose value or their investment results to lag relevant benchmarks or other funds with similar objectives.
Investing in the managed risk funds may involve additional risks including, but not limited to, those described below.
Fund structure — The managed risk funds invest in underlying funds and incur expenses related to those underlying funds. In addition, investors in the managed risk funds will incur fees to pay for certain expenses related to the operations of the managed risk funds. An investor holding the underlying fund directly would incur lower overall expenses but would not receive the benefit of the managed risk strategy.
Management — The managed risk funds are subject to the risk that the managed risk strategy or the methods employed by the subadviser in implementing the managed risk strategy may not produce the desired results. This could cause the managed risk funds to lose value or their investment results to lag relevant benchmarks or other funds with similar objectives.
Underlying fund risks — Because the managed risk funds’ investments consist of investments in underlying funds, the managed risk funds’ risks are directly related to the risks of the respective underlying fund in which each managed fund invests. For this reason, it is important to understand the risks associated with investing both in the managed risk fund and in each of the underlying funds.
Investing in futures contracts — In addition to the risks generally associated with investing in derivative instruments, futures contracts are subject to the creditworthiness of the clearing organizations, exchanges and futures commission merchants with which a fund transacts. Additionally, although futures require only a small initial investment in the form of a deposit of initial margin, the amount of a potential loss on a futures contract could greatly exceed the initial amount invested. While futures contracts are generally liquid instruments, under certain market conditions, futures may be deemed to be illiquid. For example, a fund may be temporarily prohibited from closing out its position in a futures contract if intraday price change limits or limits on trading volume imposed by the applicable futures exchange are triggered. If a fund is unable to close out a position on a futures contract, the fund would remain subject to the risk of adverse price movements until the fund is able to close out the futures position. The ability of a fund to successfully utilize futures contracts may depend in part upon the ability of the fund’s investment adviser or subadviser to accurately forecast interest rates and other economic factors and to assess and predict the impact of such economic factors on the futures in which the fund invests. If the investment adviser or subadviser incorrectly forecasts economic developments or incorrectly predicts the impact of such developments on the futures in which it invests, a fund could be exposed to the risk of loss.
American Funds Insurance Series 149
Table of Contents
Hedging — There may be imperfect or even negative correlation between the prices of the futures contracts and the prices of the underlying securities. For example, futures contracts may not provide an effective hedge because changes in futures contract prices may not track those of the underlying securities or indexes they are intended to hedge. In addition, there are significant differences between the securities and futures markets that could result in an imperfect correlation between the markets, causing a given hedge not to achieve its objectives. The degree of imperfection of correlation depends on circumstances such as variations in speculative market demand for futures, including technical influences in futures trading, and differences between the financial instruments being hedged and the instruments underlying the standard contracts available for trading. A decision as to whether, when and how to hedge involves the exercise of skill and judgment, and even a well-conceived hedge may be unsuccessful to some degree because of market behavior or unexpected interest rate trends. In addition, the fund’s investment in exchange-traded futures and their resulting costs could limit the fund’s gains in rising markets relative to those of the underlying funds, or to those of unhedged funds in general.
Short positions — Losses from short positions in futures contracts occur when the underlying index increases in value. As the underlying index increases in value, the holder of the short position in the corresponding futures contract is required to pay the difference in value of the futures contract resulting from the increase in the index on a daily basis. Losses from a short position in an index futures contract could potentially be very large if the value of the underlying index rises dramatically in a short period of time.
5. Certain investment techniques
Index-linked bonds — Some of the funds have invested in index-linked bonds, which are fixed-income securities whose principal value is periodically adjusted to a government price index. Over the life of an index-linked bond, interest is paid on the adjusted principal value. Increases or decreases in the principal value of index-linked bonds are recorded as interest income in the fund’s statement of operations.
Mortgage dollar rolls — Some of the funds have entered into mortgage dollar roll transactions in which the fund sells a mortgage-backed security to a counterparty and simultaneously enters into an agreement with the same counterparty to buy back a similar security on a specific future date at a predetermined price. Mortgage dollar rolls are accounted for as purchase and sale transactions, which may increase the funds’ portfolio turnover rates.
Loan transactions — Some of the funds have entered into loan transactions in which the fund acquires a loan either through an agent, by assignment from another holder, or as a participation interest in another holder’s portion of a loan. The loan is often administered by a financial institution that acts as agent for the holders of the loan, and the fund may be required to receive approval from the agent and/or borrower prior to the sale of the investment. The loan’s interest rate and maturity date may change based on the terms of the loan, including potential early payments of principal.
Short-term securities — The managed risk funds hold shares of the Government Cash Management Fund, a cash management vehicle offered by the Bank of New York Mellon (“BNY Mellon”), the funds’ custodian bank. The Government Cash Management Fund is managed by the Dreyfus Corporation.
Futures contracts — Some of the funds have entered into futures contracts, which provide for the future sale by one party and purchase by another party of a specified amount of a specific financial instrument for a specified price, date, time and place designated at the time the contract is made. Futures contracts are used to strategically manage portfolio volatility and downside equity risk.
Upon entering into futures contracts, and to maintain the fund’s open positions in futures contracts, the fund is required to deposit with a futures broker, or FCM, in a segregated account in the name of the FCM an amount of cash, U.S. government securities, suitable money market instruments, or other liquid securities, known as “initial margin.” The margin required for a particular futures contract is set by the exchange on which the contract is traded to serve as collateral, and may be significantly modified from time to time by the exchange during the term of the contract. When initial margin is deposited with brokers, a receivable is recorded in the fund’s statement of assets and liabilities.
On a daily basis, each fund pays or receives variation margin based on the increase or decrease in the value of the futures contracts and records variation margin on futures contracts in each fund’s statement of assets and liabilities. In addition, each fund segregates liquid assets equivalent to the fund’s outstanding obligations under the contract in excess of the initial margin and variation margin, if any. Futures contracts may involve a risk of loss in excess of the variation margin shown on each fund’s statement of assets and liabilities.
150 American Funds Insurance Series
Table of Contents
Each fund records realized gains or losses at the time the futures contract is closed or expires. Net realized gains or losses and net unrealized appreciation or depreciation from futures contracts are recorded in each fund’s statement of operations.
Forward currency contracts — Some of the funds have entered into forward currency contracts, which represent agreements to exchange currencies on specific future dates at predetermined rates. The series’ investment adviser uses forward currency contracts to manage the fund’s exposure to changes in exchange rates. Upon entering into these contracts, risks may arise from the potential inability of counterparties to meet the terms of their contracts and from possible movements in exchange rates.
On a daily basis, the series’ investment adviser values forward currency contracts based on the applicable exchange rates and records unrealized appreciation or depreciation for open forward currency contracts in each fund’s statement of assets and liabilities. Realized gains or losses are recorded at the time the forward contract is closed or offset by another contract with the same broker for the same settlement date and currency. Closed forward currency contracts that have not reached their settlement date are included in the respective receivables or payables for closed forward currency contracts in each fund’s statement of assets and liabilities. Net realized gains or losses from closed forward currency contracts and net unrealized appreciation or depreciation from open forward currency contracts are recorded in each fund’s statement of operations.
Interest rate swaps — Some of the funds have entered into interest rate swaps, which are agreements to exchange one stream of future interest payments for another based on a specified notional amount. Typically, interest rate swaps exchange a fixed interest rate for a payment that floats relative to a benchmark or vice versa. The series’ investment adviser uses interest rate swaps to manage the interest rate sensitivity of the fund by increasing or decreasing the duration of the fund or a portion of the fund’s portfolio. Risks may arise as a result of the series’ investment adviser incorrectly anticipating changes in interest rates, increased volatility, reduced liquidity and the potential inability of counterparties to meet the terms of their agreements.
Upon entering into an interest rate swap contract, the fund is required to deposit cash, U.S. government securities or other liquid securities, which is known as “initial margin.” Generally, the initial margin required for a particular interest rate swap is set and held as collateral by the clearinghouse on which the contract is cleared. The amount of initial margin required may be significantly modified from time to time by the clearinghouse during the term of the contract.
On a daily basis, the series’ investment adviser records daily interest accruals related to the exchange of future payments as a receivable and payable in each fund’s statement of assets and liabilities. Each fund also pays or receives a “variation margin” based on the increase or decrease in the value of the interest rate swaps, including accrued interest, and records variation margin on interest rate swaps in each fund’s statement of assets and liabilities. Each fund records realized gains and losses on both the net accrued interest and any gain or loss recognized at the time the interest rate swap is closed or expires. Net realized gains or losses, as well as any net unrealized appreciation or depreciation, from interest rate swaps are recorded in each fund’s statement of operations.
Credit default swap indices — Some of the funds have entered into centrally cleared credit default swap agreements on credit indices (“CDSI”) that involve one party (the protection buyer) making a stream of payments to another party (the protection seller) in exchange for the right to receive a specified return upon the occurrence of a credit event, such as a default or restructuring, with respect to any of the underlying issuers (reference obligations) in the referenced index. The series’ investment adviser uses credit default swaps to assume exposure to a diversified portfolio of credits or to hedge against existing credit risks.
CDSI are portfolios of credit instruments or exposures designed to be representative of some part of the credit market, such as the high-yield or investment-grade credit market. CDSI are generally traded using standardized terms, including a fixed spread and standard maturity dates, and reference all the names in the index. If there is a credit event, it is settled based on that name’s weight in the index. The composition of the underlying issuers or obligations within a particular index may change periodically, usually every six months. A specified credit event may affect all or individual underlying reference obligations included in the index, and will be settled based upon the relative weighting of the affected obligation(s) within the index. The value of each CDSI can be used as a measure of the current payment/performance risk of the CDSI and represents the likelihood of an expected liability or profit should the notional amount of the CDSI be closed or sold as of the period end. An increasing value, as compared to the notional amount of the CDSI, represents a deterioration of the referenced indices’ credit soundness and a greater likelihood of risk of default or other credit event occurring as defined under the terms of the agreement. When a fund provides sell protection, its maximum exposure is the notional amount of the credit default swap agreement.
Upon entering into a centrally cleared CDSI contract, the fund is required to deposit with a derivatives clearing member (“DCM”) in a segregated account in the name of the DCM an amount of cash, U.S. government securities or other liquid securities, which is known as initial margin. Generally, the initial margin required for a particular credit default swap is set and held as collateral by the clearinghouse on which the contract is cleared. The amount of initial margin required may be significantly modified from time to time by the clearinghouse during the term of the contract. Securities deposited as initial margin are designated on the investment portfolio.
American Funds Insurance Series 151
Table of Contents
On a daily basis, interest accruals related to the exchange of future payments are recorded as a receivable and payable in each fund’s statement of assets and liabilities. Each fund also pays or receives a variation margin based on the increase or decrease in the value of the centrally cleared swaps, and records variation margin in each fund’s statement of assets and liabilities. Each fund records realized gains and losses on both the net accrued interest and any gain or loss recognized at the time the swap is closed or expires. Net realized gains or losses, as well as any net unrealized appreciation or depreciation, from credit default swaps are recorded in each fund’s statement of operations.
The following table presents the average month-end notional amounts of futures contracts, forward currency contracts, interest rate swaps and credit default swaps while held for each fund (dollars in thousands):
| Interest | Credit | |||||||||||||||
| rate | default | |||||||||||||||
| Futures | Forwards | swaps | swaps | |||||||||||||
Global Growth Fund | Not applicable | $ | 5,216 | Not applicable | Not applicable | |||||||||||
Global Small Capitalization Fund | Not applicable | 92,699 | Not applicable | Not applicable | ||||||||||||
International Fund | Not applicable | 75,210 | Not applicable | Not applicable | ||||||||||||
New World Fund | Not applicable | 16,057 | Not applicable | Not applicable | ||||||||||||
Global Growth and Income Fund | Not applicable | 4,243 | * | Not applicable | Not applicable | |||||||||||
International Growth and Income Fund | Not applicable | 14,332 | * | Not applicable | Not applicable | |||||||||||
Capital Income Builder Fund | Not applicable | 382 | * | Not applicable | Not applicable | |||||||||||
Asset Allocation Fund | $ | 258,722 | Not applicable | $ | 2,104,283 | Not applicable | ||||||||||
Global Balanced Fund | Not applicable | 20,573 | Not applicable | Not applicable | ||||||||||||
Bond Fund | 1,981,823 | 500,381 | 2,184,779 | $ | 65,000 | |||||||||||
Global Bond Fund | 139,311 | 655,462 | 508,390 | Not applicable | ||||||||||||
High-Income Bond Fund | Not applicable | Not applicable | 30,592 | 74,354 | ||||||||||||
Mortgage Fund | 252,976 | Not applicable | 1,144,902 | Not applicable | ||||||||||||
U.S. Government/AAA-Rated Securities Fund | 2,770,411 | Not applicable | 12,472,783 | Not applicable | ||||||||||||
Managed Risk Growth Fund | 13,000 | Not applicable | Not applicable | Not applicable | ||||||||||||
Managed Risk International Fund | 6,600 | Not applicable | Not applicable | Not applicable | ||||||||||||
Managed Risk Blue Chip Income and Growth Fund | 16,700 | Not applicable | Not applicable | Not applicable | ||||||||||||
Managed Risk Growth-Income Fund | 9,500 | Not applicable | Not applicable | Not applicable | ||||||||||||
Managed Risk Asset Allocation Fund | 203,300 | Not applicable | Not applicable | Not applicable | ||||||||||||
| * | No contracts were held at the end of the reporting period; amount represents the average month-end notional amount of contracts while they were held. |
152 American Funds Insurance Series
Table of Contents
The following tables present the financial statement impacts resulting from the funds’ use of futures contracts, forward currency contracts, interest rate swaps and/or credit default swaps as of, or for the year ended, December 31, 2017 (dollars in thousands):
| Global Growth Fund | Global Small Capitalization Fund | International Fund | ||||||||||||||
Assets | Risk type | Location on statements of assets and liabilities | ||||||||||||||
Futures contracts | Interest | Net unrealized appreciation* | $ | — | $ | — | $ | — | ||||||||
Futures contracts | Equity | Net unrealized appreciation* | — | — | — | |||||||||||
Futures contracts | Currency | Net unrealized appreciation* | — | — | — | |||||||||||
Forward currency | Currency | Unrealized appreciation on open forward currency contracts | 15 | 89 | — | |||||||||||
Forward currency | Currency | Receivables for closed forward currency contracts | — | 44 | — | |||||||||||
Swap contracts | Interest | Net unrealized appreciation* | — | — | — | |||||||||||
Swap contracts | Credit | Net unrealized appreciation* | — | — | — | |||||||||||
|
|
|
|
|
| |||||||||||
| $ | 15 | $ | 133 | $ | — | |||||||||||
|
|
|
|
|
| |||||||||||
Liabilities | Risk type | Location on statements of assets and liabilities | ||||||||||||||
Futures contracts | Interest | Net unrealized depreciation* | $ | — | $ | — | $ | — | ||||||||
Futures contracts | Equity | Net unrealized depreciation* | — | — | — | |||||||||||
Futures contracts | Currency | Net unrealized depreciation* | — | — | — | |||||||||||
Forward currency | Currency | Unrealized depreciation on open forward currency contracts | — | 1,192 | 355 | |||||||||||
Forward currency | Currency | Payables for closed forward currency contracts | — | — | — | |||||||||||
Swap contracts | Interest | Net unrealized depreciation* | — | — | — | |||||||||||
Swap contracts | Credit | Net unrealized depreciation* | — | — | — | |||||||||||
|
|
|
|
|
| |||||||||||
| $ | — | $ | 1,192 | $ | 355 | |||||||||||
|
|
|
|
|
| |||||||||||
Net realized gain (loss) | Risk type | Location on statements of operations | ||||||||||||||
Futures contracts | Interest | Net realized gain on futures contracts | $ | — | $ | — | $ | — | ||||||||
Futures contracts | Equity | Net realized gain on futures contracts | — | — | — | |||||||||||
Futures contracts | Currency | Net realized gain on futures contracts | — | — | — | |||||||||||
Forward currency | Currency | Net realized gain (loss) on forward currency contracts | 241 | (4,263 | ) | (9,021 | ) | |||||||||
Swap contracts | Interest | Net realized gain on swap contracts | — | — | — | |||||||||||
Swap contracts | Credit | Net realized gain on swap contracts | — | — | — | |||||||||||
|
|
|
|
|
| |||||||||||
| $ | 241 | $ | (4,263 | ) | $ | (9,021 | ) | |||||||||
|
|
|
|
|
| |||||||||||
Net unrealized (depreciation) appreciation | Risk type | Location on statements of operations | ||||||||||||||
Futures contracts | Interest | Net unrealized appreciation on futures contracts | $ | — | $ | — | $ | — | ||||||||
Futures contracts | Equity | Net unrealized appreciation on futures contracts | — | — | — | |||||||||||
Futures contracts | Currency | Net unrealized appreciation on futures contracts | — | — | — | |||||||||||
Forward currency | Currency | Net unrealized (depreciation) appreciation on forward currency contracts | (344 | ) | (2,489 | ) | �� | 1,789 | ||||||||
Swap contracts | Interest | Net unrealized appreciation on swap contracts | — | — | — | |||||||||||
Swap contracts | Credit | Net unrealized appreciation on swap contracts | — | — | — | |||||||||||
|
|
|
|
|
| |||||||||||
| $ | (344 | ) | $ | (2,489 | ) | $ | 1,789 | |||||||||
|
|
|
|
|
| |||||||||||
See end of tables for footnotes.
American Funds Insurance Series 153
Table of Contents
| New World Fund | Global Growth and Income Fund | International Growth and Income Fund | ||||||||||||||
Assets | Risk type | Location on statements of assets and liabilities | ||||||||||||||
Futures contracts | Interest | Net unrealized appreciation* | $ | — | $ | — | $ | — | ||||||||
Futures contracts | Equity | Net unrealized appreciation* | — | — | — | |||||||||||
Futures contracts | Currency | Net unrealized appreciation* | — | — | — | |||||||||||
Forward currency | Currency | Unrealized appreciation on open forward currency contracts | 69 | — | — | |||||||||||
Forward currency | Currency | Receivables for closed forward currency contracts | — | — | — | |||||||||||
Swap contracts | Interest | Net unrealized appreciation* | — | — | — | |||||||||||
Swap contracts | Credit | Net unrealized appreciation* | — | — | — | |||||||||||
|
|
|
|
|
| |||||||||||
| $ | 69 | $ | — | $ | — | |||||||||||
|
|
|
|
|
| |||||||||||
Liabilities | Risk type | Location on statements of assets and liabilities | ||||||||||||||
Futures contracts | Interest | Net unrealized depreciation* | $ | — | $ | — | $ | — | ||||||||
Futures contracts | Equity | Net unrealized depreciation* | — | — | — | |||||||||||
Futures contracts | Currency | Net unrealized depreciation* | — | — | — | |||||||||||
Forward currency | Currency | Unrealized depreciation on open forward currency contracts | 392 | — | — | |||||||||||
Forward currency | Currency | Payables for closed forward currency contracts | — | — | — | |||||||||||
Swap contracts | Interest | Net unrealized depreciation* | — | — | — | |||||||||||
Swap contracts | Credit | Net unrealized depreciation* | — | — | — | |||||||||||
|
|
|
|
|
| |||||||||||
| $ | 392 | $ | — | $ | — | |||||||||||
|
|
|
|
|
| |||||||||||
Net realized loss | Risk type | Location on statements of operations | ||||||||||||||
Futures contracts | Interest | Net realized gain on futures contracts | $ | — | $ | — | $ | — | ||||||||
Futures contracts | Equity | Net realized gain on futures contracts | — | — | — | �� | ||||||||||
Futures contracts | Currency | Net realized gain on futures contracts | — | — | — | |||||||||||
Forward currency | Currency | Net realized loss on forward currency contracts | (881 | ) | (157 | ) | (143 | ) | ||||||||
Swap contracts | Interest | Net realized gain on swap contracts | — | — | — | |||||||||||
Swap contracts | Credit | Net realized gain on swap contracts | — | — | — | |||||||||||
|
|
|
|
|
| |||||||||||
| $ | (881 | ) | $ | (157 | ) | $ | (143 | ) | ||||||||
|
|
|
|
|
| |||||||||||
Net unrealized (depreciation) appreciation | Risk type | Location on statements of operations | ||||||||||||||
Futures contracts | Interest | Net unrealized appreciation on futures contracts | $ | — | $ | — | $ | — | ||||||||
Futures contracts | Equity | Net unrealized appreciation on futures contracts | — | — | — | |||||||||||
Futures contracts | Currency | Net unrealized appreciation on futures contracts | — | — | — | |||||||||||
Forward currency | Currency | Net unrealized (depreciation) appreciation on forward currency contracts | (333 | ) | (147 | ) | 105 | |||||||||
Swap contracts | Interest | Net unrealized appreciation on swap contracts | — | — | — | |||||||||||
Swap contracts | Credit | Net unrealized appreciation on swap contracts | — | — | — | |||||||||||
|
|
|
|
|
| |||||||||||
| $ | (333 | ) | $ | (147 | ) | $ | 105 | |||||||||
|
|
|
|
|
| |||||||||||
154 American Funds Insurance Series
Table of Contents
| Capital Income Builder | Asset Allocation Fund | Global Balanced Fund | ||||||||||||||
Assets | Risk type | Location on statements of assets and liabilities | ||||||||||||||
Futures contracts | Interest | Net unrealized appreciation* | $ | — | $ | 73 | $ | — | ||||||||
Futures contracts | Equity | Net unrealized appreciation* | — | — | — | |||||||||||
Futures contracts | Currency | Net unrealized appreciation* | — | — | — | |||||||||||
Forward currency | Currency | Unrealized appreciation on open forward currency contracts | — | — | 144 | |||||||||||
Forward currency | Currency | Receivables for closed forward currency contracts | — | — | 11 | |||||||||||
Swap contracts | Interest | Net unrealized appreciation* | — | 658 | — | |||||||||||
Swap contracts | Credit | Net unrealized appreciation* | — | — | — | |||||||||||
|
|
|
|
|
| |||||||||||
| $ | — | $ | 731 | $ | 155 | |||||||||||
|
|
|
|
|
| |||||||||||
Liabilities | Risk type | Location on statements of assets and liabilities | ||||||||||||||
Futures contracts | Interest | Net unrealized depreciation* | $ | — | $ | 826 | $ | — | ||||||||
Futures contracts | Equity | Net unrealized depreciation* | — | — | — | |||||||||||
Futures contracts | Currency | Net unrealized depreciation* | — | — | — | |||||||||||
Forward currency | Currency | Unrealized depreciation on open forward currency contracts | — | — | 269 | |||||||||||
Forward currency | Currency | Payables for closed forward currency contracts | — | — | 2 | |||||||||||
Swap contracts | Interest | Net unrealized depreciation* | — | 6,906 | — | |||||||||||
Swap contracts | Credit | Net unrealized depreciation* | — | — | — | |||||||||||
|
|
|
|
|
| |||||||||||
| $ | — | $ | 7,732 | $ | 271 | |||||||||||
|
|
|
|
|
| |||||||||||
Net realized gain (loss) | Risk type | Location on statements of operations | ||||||||||||||
Futures contracts | Interest | Net realized gain on futures contracts | $ | — | $ | 376 | $ | — | ||||||||
Futures contracts | Equity | Net realized gain on futures contracts | — | — | — | |||||||||||
Futures contracts | Currency | Net realized gain on futures contracts | — | — | — | |||||||||||
Forward currency | Currency | Net realized loss on forward currency contracts | (16 | ) | — | (136 | ) | |||||||||
Swap contracts | Interest | Net realized gain on swap contracts | — | 3,089 | — | |||||||||||
Swap contracts | Credit | Net realized gain on swap contracts | — | — | — | |||||||||||
|
|
|
|
|
| |||||||||||
| $ | (16 | ) | $ | 3,465 | $ | (136 | ) | |||||||||
|
|
|
|
|
| |||||||||||
Net unrealized (depreciation) appreciation | Risk type | Location on statements of operations | ||||||||||||||
Futures contracts | Interest | Net unrealized depreciation on futures contracts | $ | — | $ | (995 | ) | $ | — | |||||||
Futures contracts | Equity | Net unrealized appreciation on futures contracts | — | — | — | |||||||||||
Futures contracts | Currency | Net unrealized appreciation on futures contracts | — | — | — | |||||||||||
Forward currency | Currency | Net unrealized appreciation (depreciation) on forward currency contracts | 5 | — | (227 | ) | ||||||||||
Swap contracts | Interest | Net unrealized depreciation on swap contracts | — | (2,619 | ) | — | ||||||||||
Swap contracts | Credit | Net unrealized appreciation on swap contracts | — | — | — | |||||||||||
|
|
|
|
|
| |||||||||||
| $ | 5 | $ | (3,614 | ) | $ | (227 | ) | |||||||||
|
|
|
|
|
| |||||||||||
See end of tables for footnotes.
American Funds Insurance Series 155
Table of Contents
| Bond Fund | Global Bond Fund | High- Income Bond Fund | ||||||||||||||
Assets | Risk type | Location on statements of assets and liabilities | ||||||||||||||
Futures contracts | Interest | Net unrealized appreciation* | $ | 25 | $ | 195 | $ | — | ||||||||
Futures contracts | Equity | Net unrealized appreciation* | — | — | — | |||||||||||
Futures contracts | Currency | Net unrealized appreciation* | — | — | — | |||||||||||
Forward currency | Currency | Unrealized appreciation on open forward currency contracts | 10,220 | 4,906 | — | |||||||||||
Forward currency | Currency | Receivables for closed forward currency contracts | — | 253 | — | |||||||||||
Swap contracts | Interest | Net unrealized appreciation* | 18,448 | 1,034 | 512 | |||||||||||
Swap contracts | Credit | Net unrealized appreciation* | — | — | — | |||||||||||
|
|
|
|
|
| |||||||||||
| $ | 28,693 | $ | 6,388 | $ | 512 | |||||||||||
|
|
|
|
|
| |||||||||||
Liabilities | Risk type | Location on statements of assets and liabilities | ||||||||||||||
Futures contracts | Interest | Net unrealized depreciation* | $ | 4,181 | $ | 554 | $ | — | ||||||||
Futures contracts | Equity | Net unrealized depreciation* | — | — | — | |||||||||||
Futures contracts | Currency | Net unrealized depreciation* | — | — | — | |||||||||||
Forward currency | Currency | Unrealized depreciation on open forward currency contracts | 2,678 | 4,246 | — | |||||||||||
Forward currency | Currency | Payables for closed forward currency contracts | — | 899 | — | |||||||||||
Swap contracts | Interest | Net unrealized depreciation* | 10,736 | 2,513 | 90 | |||||||||||
Swap contracts | Credit | Net unrealized depreciation* | 184 | — | 419 | |||||||||||
|
|
|
|
|
| |||||||||||
| $ | 17,779 | $ | 8,212 | $ | 509 | |||||||||||
|
|
|
|
|
| |||||||||||
Net realized gain (loss) | Risk type | Location on statements of operations | ||||||||||||||
Futures contracts | Interest | Net realized gain on futures contracts | $ | 17,742 | $ | 349 | $ | — | ||||||||
Futures contracts | Equity | Net realized gain on futures contracts | — | — | — | |||||||||||
Futures contracts | Currency | Net realized gain on futures contracts | — | — | — | |||||||||||
Forward currency | Currency | Net realized loss on forward currency contracts | (46,710 | ) | (18,259 | ) | — | |||||||||
Swap contracts | Interest | Net realized gain (loss) on swap contracts | 30,366 | (5,432 | ) | (349 | ) | |||||||||
Swap contracts | Credit | Net realized loss on swap contracts | (29,739 | ) | — | (2,266 | ) | |||||||||
|
|
|
|
|
| |||||||||||
| $ | (28,341 | ) | $ | (23,342 | ) | $ | (2,615 | ) | ||||||||
|
|
|
|
|
| |||||||||||
Net unrealized (depreciation) appreciation | Risk type | Location on statements of operations | ||||||||||||||
Futures contracts | Interest | Net unrealized (depreciation) on futures contracts | $ | (3,048 | ) | $ | (359 | ) | $ | — | ||||||
Futures contracts | Equity | Net unrealized appreciation on futures contracts | — | — | — | |||||||||||
Futures contracts | Currency | Net unrealized appreciation on futures contracts | — | — | — | |||||||||||
Forward currency | Currency | Net unrealized appreciation on forward currency contracts | 5,615 | 6,025 | — | |||||||||||
Swap contracts | Interest | Net unrealized depreciation on swap contracts | (749 | ) | (2,601 | ) | (5 | ) | ||||||||
Swap contracts | Credit | Net unrealized depreciation on swap contracts | (184 | ) | — | (1,063 | ) | |||||||||
|
|
|
|
|
| |||||||||||
| $ | 1,634 | $ | 3,065 | $ | (1,068 | ) | ||||||||||
|
|
|
|
|
| |||||||||||
156 American Funds Insurance Series
Table of Contents
| Mortgage Fund | U.S. Government/AAA- Rated Securities Fund | Managed Risk Growth Fund | ||||||||||||||
Assets | Risk type | Location on statements of assets and liabilities | ||||||||||||||
Futures contracts | Interest | Net unrealized appreciation* | $ | 21 | $ | 743 | $ | — | ||||||||
Futures contracts | Equity | Net unrealized appreciation* | — | — | — | |||||||||||
Futures contracts | Currency | Net unrealized appreciation* | — | — | — | |||||||||||
Forward currency | Currency | Unrealized appreciation on open forward currency contracts | — | — | — | |||||||||||
Forward currency | Currency | Receivables for closed forward currency contracts | — | — | — | |||||||||||
Swap contracts | Interest | Net unrealized appreciation* | 1,539 | 18,217 | — | |||||||||||
Swap contracts | Credit | Net unrealized appreciation* | — | — | — | |||||||||||
|
|
|
|
|
| |||||||||||
| $ | 1,560 | $ | 18,960 | $ | — | |||||||||||
|
|
|
|
|
| |||||||||||
Liabilities | Risk type | Location on statements of assets and liabilities | ||||||||||||||
Futures contracts | Interest | Net unrealized depreciation* | $ | 653 | $ | 8,188 | $ | 38 | ||||||||
Futures contracts | Equity | Net unrealized depreciation* | — | — | — | |||||||||||
Futures contracts | Currency | Net unrealized depreciation* | — | — | — | |||||||||||
Forward currency | Currency | Unrealized depreciation on open forward currency contracts | — | — | — | |||||||||||
Forward currency | Currency | Payables for closed forward currency contracts | — | — | — | |||||||||||
Swap contracts | Interest | Net unrealized depreciation* | 2,325 | 26,645 | — | |||||||||||
Swap contracts | Credit | Net unrealized depreciation* | — | — | — | |||||||||||
|
|
|
|
|
| |||||||||||
| $ | 2,978 | $ | 34,833 | $ | 38 | |||||||||||
|
|
|
|
|
| |||||||||||
Net realized gain (loss) | Risk type | Location on statements of operations | ||||||||||||||
Futures contracts | Interest | Net realized gain (loss) on futures contracts | $ | 587 | $ | (2,897 | ) | $ | — | |||||||
Futures contracts | Equity | Net realized gain on futures contracts | — | — | — | |||||||||||
Futures contracts | Currency | Net realized loss on futures contracts | — | — | — | |||||||||||
Forward currency | Currency | Net realized gain on forward currency contracts | — | — | — | |||||||||||
Swap contracts | Interest | Net realized gain on swap contracts | 281 | 16,684 | — | |||||||||||
Swap contracts | Credit | Net realized gain on swap contracts | — | — | — | |||||||||||
|
|
|
|
|
| |||||||||||
| $ | 868 | $ | 13,787 | $ | — | |||||||||||
|
|
|
|
|
| |||||||||||
Net unrealized depreciation | Risk type | Location on statements of operations | ||||||||||||||
Futures contracts | Interest | Net unrealized depreciation on futures contracts | $ | (315 | ) | $ | (1,030 | ) | $ | (38 | ) | |||||
Futures contracts | Equity | Net unrealized depreciation on futures contracts | — | — | — | |||||||||||
Futures contracts | Currency | Net unrealized appreciation on futures contracts | — | — | — | |||||||||||
Forward currency | Currency | Net unrealized appreciation on forward currency contracts | — | — | — | |||||||||||
Swap contracts | Interest | Net unrealized depreciation on swap contracts | (1,442 | ) | (18,456 | ) | — | |||||||||
Swap contracts | Credit | Net unrealized appreciation on swap contracts | — | — | — | |||||||||||
|
|
|
|
|
| |||||||||||
| $ | (1,757 | ) | $ | (19,486 | ) | $ | (38 | ) | ||||||||
|
|
|
|
|
| |||||||||||
See end of tables for footnotes.
American Funds Insurance Series 157
Table of Contents
| Managed Risk International Fund | Managed Risk Blue Chip Income and Growth Fund | Managed Risk Growth- Income Fund | ||||||||||||||
Assets | Risk type | Location on statements of assets and liabilities | ||||||||||||||
Futures contracts | Interest | Net unrealized appreciation* | $ | — | $ | — | $ | — | ||||||||
Futures contracts | Equity | Net unrealized appreciation* | — | — | — | |||||||||||
Futures contracts | Currency | Net unrealized appreciation* | — | — | — | |||||||||||
Forward currency | Currency | Unrealized appreciation on open forward currency contracts | — | — | — | |||||||||||
Forward currency | Currency | Receivables for closed forward currency contracts | — | — | — | |||||||||||
Swap contracts | Interest | Net unrealized appreciation* | — | — | — | |||||||||||
Swap contracts | Credit | Net unrealized appreciation* | — | — | — | |||||||||||
|
|
|
|
|
| |||||||||||
| $ | — | $ | — | $ | — | |||||||||||
|
|
|
|
|
| |||||||||||
Liabilities | Risk type | Location on statements of assets and liabilities | ||||||||||||||
Futures contracts | Interest | Net unrealized depreciation* | $ | 19 | $ | 49 | $ | 28 | ||||||||
Futures contracts | Equity | Net unrealized depreciation* | — | — | — | |||||||||||
Futures contracts | Currency | Net unrealized depreciation* | — | — | — | |||||||||||
Forward currency | Currency | Unrealized depreciation on open forward currency contracts | — | — | — | |||||||||||
Forward currency | Currency | Payables for closed forward currency contracts | — | — | — | |||||||||||
Swap contracts | Interest | Net unrealized depreciation* | — | — | — | |||||||||||
Swap contracts | Credit | Net unrealized depreciation* | — | — | — | |||||||||||
|
|
|
|
|
| |||||||||||
| $ | 19 | $ | 49 | $ | 28 | |||||||||||
|
|
|
|
|
| |||||||||||
Net realized loss | Risk type | Location on statements of operations | ||||||||||||||
Futures contracts | Interest | Net realized loss on futures contracts | $ | (506 | ) | $ | — | † | $ | — | † | |||||
Futures contracts | Equity | Net realized gain on futures contracts | — | — | — | |||||||||||
Futures contracts | Currency | Net realized gain on futures contracts | — | — | — | |||||||||||
Forward currency | Currency | Net realized gain on forward currency contracts | — | — | — | |||||||||||
Swap contracts | Interest | Net realized gain on swap contracts | — | — | — | |||||||||||
Swap contracts | Credit | Net realized gain on swap contracts | — | — | — | |||||||||||
|
|
|
|
|
| |||||||||||
| $ | (506 | ) | $ | — | † | $ | — | † | ||||||||
|
|
|
|
|
| |||||||||||
Net unrealized depreciation | Risk type | Location on statements of operations | ||||||||||||||
Futures contracts | Interest | Net unrealized depreciation on futures contracts | $ | (1 | ) | $ | (49 | ) | $ | (28 | ) | |||||
Futures contracts | Equity | Net unrealized appreciation on futures contracts | — | — | — | |||||||||||
Futures contracts | Currency | Net unrealized appreciation (depreciation) on futures contracts | — | — | — | |||||||||||
Forward currency | Currency | Net unrealized appreciation on forward currency contracts | — | — | — | |||||||||||
Swap contracts | Interest | Net unrealized appreciation on swap contracts | — | — | — | |||||||||||
Swap contracts | Credit | Net unrealized appreciation on swap contracts | — | — | — | |||||||||||
|
|
|
|
|
| |||||||||||
| $ | (1 | ) | $ | (49 | ) | $ | (28 | ) | ||||||||
|
|
|
|
|
| |||||||||||
158 American Funds Insurance Series
Table of Contents
| Managed Risk Asset Allocation Fund | ||||||||
Assets | Risk type | Location on statements of assets and liabilities | ||||||
Futures contracts | Interest | Net unrealized appreciation* | $ | — | ||||
Futures contracts | Equity | Net unrealized appreciation* | — | |||||
Futures contracts | Currency | Net unrealized appreciation* | — | |||||
Forward currency | Currency | Unrealized appreciation on open forward currency contracts | — | |||||
Forward currency | Currency | Receivables for closed forward currency contracts | — | |||||
Swap contracts | Interest | Net unrealized appreciation* | — | |||||
Swap contracts | Credit | Net unrealized appreciation* | — | |||||
|
| |||||||
| $ | — | |||||||
|
| |||||||
Liabilities | Risk type | Location on statements of assets and liabilities | ||||||
Futures contracts | Interest | Net unrealized depreciation* | $ | 592 | ||||
Futures contracts | Equity | Net unrealized depreciation* | — | |||||
Futures contracts | Currency | Net unrealized depreciation* | — | |||||
Forward currency | Currency | Unrealized depreciation on open forward currency contracts | — | |||||
Forward currency | Currency | Payables for closed forward currency contracts | — | |||||
Swap contracts | Interest | Net unrealized depreciation* | — | |||||
Swap contracts | Credit | Net unrealized depreciation* | — | |||||
|
| |||||||
| $ | 592 | |||||||
|
| |||||||
Net realized gain | Risk type | Location on statements of operations | ||||||
Futures contracts | Interest | Net realized gain on futures contracts | $ | — | ||||
Futures contracts | Equity | Net realized gain on futures contracts | — | |||||
Futures contracts | Currency | Net realized loss on futures contracts | — | |||||
Forward currency | Currency | Net realized gain on forward currency contracts | — | |||||
Swap contracts | Interest | Net realized gain on swap contracts | — | |||||
Swap contracts | Credit | Net realized gain on swap contracts | — | |||||
|
| |||||||
| $ | — | |||||||
|
| |||||||
Net unrealized depreciation | Risk type | Location on statements of operations | ||||||
Futures contracts | Interest | Net unrealized depreciation on futures contracts | $ | (592 | ) | |||
Futures contracts | Equity | Net unrealized appreciation on futures contracts | — | |||||
Futures contracts | Currency | Net unrealized depreciation on futures contracts | — | |||||
Forward currency | Currency | Net unrealized appreciation on forward currency contracts | — | |||||
Swap contracts | Interest | Net unrealized appreciation on swap contracts | — | |||||
Swap contracts | Credit | Net unrealized appreciation on swap contracts | — | |||||
|
| |||||||
| $ | (592 | ) | ||||||
|
| |||||||
| * | Includes cumulative appreciation/depreciation on futures contracts, interest rate swaps and/or credit default swaps as reported in the applicable table(s) following each fund’s investment portfolio. Only current day’s variation margin is reported within the statements of assets and liabilities. |
| † | Amount less than one thousand. |
American Funds Insurance Series 159
Table of Contents
Collateral — Funds that invest in futures contracts, forward currency contracts, interest rate swaps, credit default swaps and/or future delivery contracts participate in a collateral program. For futures contracts, interest rate swaps and credit default swaps, the program calls for the fund to pledge highly liquid assets, such as cash or U.S. Treasury bills, as collateral for initial and variation margin by contract. For forward currency contracts, the program calls for the fund to either receive or pledge collateral based on the net gain or loss on unsettled forward currency contracts by counterparty. For future delivery contracts, the program calls for the fund to either receive or pledge collateral based on the net gain or loss on unsettled contracts by certain counterparties. The purpose of the collateral is to cover potential losses that could occur in the event that either party cannot meet its contractual obligations.
Rights of offset — Funds that hold forward currency contracts have enforceable master netting agreements with certain counterparties, where amounts payable by each party to the other in the same currency (with the same settlement date and with the same counter-party) are settled net of each party’s payment obligation. If an early termination date occurs under these agreements following an event of default or termination event, all obligations of each party to its counterparty are settled net through a single payment in a single currency (“close-out netting“). For financial reporting purposes, the funds do not offset financial assets and financial liabilities that are subject to these master netting arrangements in the statements of assets and liabilities.
The following tables present each fund’s forward currency contracts by counterparty that are subject to master netting agreements but that are not offset in the funds’ statements of assets and liabilities. The net amount column shows the impact of offsetting on the funds’ statement of assets and liabilities as of December 31, 2017, if close-out netting was exercised (dollars in thousands):
Global Growth Fund
| Gross amounts not offset in the statement of assets and liabilities and subject to a master netting agreement | ||||||||||||||||||||
Counterparty | Gross amounts recognized in the statement of assets and liabilities | Available to offset | Non-cash collateral* | Cash collateral | Net amount | |||||||||||||||
Assets: | ||||||||||||||||||||
Bank of America, N.A. | $ | 15 | $ | — | $ | — | $ | — | $ | 15 | ||||||||||
Global Small Capitalization Fund
| Gross amounts not offset in the statement of assets and liabilities and subject to a master netting agreement | ||||||||||||||||||||
Counterparty | Gross amounts recognized in the statement of assets and liabilities | Available to offset | Non-cash collateral* | Cash collateral | Net amount | |||||||||||||||
Assets: | ||||||||||||||||||||
JPMorgan Chase | $ | 89 | $ | — | $ | — | $ | — | $ | 89 | ||||||||||
UBS AG | 44 | — | — | — | 44 | |||||||||||||||
|
|
|
|
|
|
|
|
|
| |||||||||||
Total | $ | 133 | $ | — | $ | — | $ | — | $ | 133 | ||||||||||
|
|
|
|
|
|
|
|
|
| |||||||||||
Liabilities: | ||||||||||||||||||||
Citibank | $ | 314 | $ | — | $ | (152 | ) | $ | — | $ | 162 | |||||||||
HSBC Bank | 878 | — | (521 | ) | — | 357 | ||||||||||||||
|
|
|
|
|
|
|
|
|
| |||||||||||
Total | $ | 1,192 | $ | — | $ | (673 | ) | $ | — | $ | 519 | |||||||||
|
|
|
|
|
|
|
|
|
| |||||||||||
International Fund
| Gross amounts not offset in the statement of assets and liabilities and subject to a master netting agreement | ||||||||||||||||||||
Counterparty | Gross amounts recognized in the statement of assets and liabilities | Available to offset | Non-cash collateral* | Cash collateral | Net amount | |||||||||||||||
Liabilities: | ||||||||||||||||||||
Bank of America, N.A. | $ | 355 | $ | — | $ | (228 | ) | $ | — | $ | 127 | |||||||||
160 American Funds Insurance Series
Table of Contents
New World Fund
| Gross amounts not offset in the statement of assets and liabilities and subject to a master netting agreement | ||||||||||||||||||||
Counterparty | Gross amounts recognized in the statement of assets and liabilities | Available to offset | Non-cash collateral* | Cash collateral | Net amount | |||||||||||||||
Assets: | ||||||||||||||||||||
Bank of America, N.A. | $ | 8 | $ | (8 | ) | $ | — | $ | — | $ | — | |||||||||
JPMorgan Chase | 60 | (55 | ) | — | — | 5 | ||||||||||||||
UBS AG | 1 | — | — | — | 1 | |||||||||||||||
|
|
|
|
|
|
|
|
|
| |||||||||||
Total | $ | 69 | $ | (63 | ) | $ | — | $ | — | $ | 6 | |||||||||
|
|
|
|
|
|
|
|
|
| |||||||||||
Liabilities: | ||||||||||||||||||||
Bank of America, N.A. | $ | 57 | $ | (8 | ) | $ | — | $ | — | $ | 49 | |||||||||
Barclays Bank PLC | 97 | — | — | — | 97 | |||||||||||||||
Citibank | 59 | — | — | — | 59 | |||||||||||||||
Goldman Sachs | 115 | — | — | — | 115 | |||||||||||||||
HSBC Bank | 9 | — | — | — | 9 | |||||||||||||||
JPMorgan Chase | 55 | (55 | ) | — | — | — | ||||||||||||||
|
|
|
|
|
|
|
|
|
| |||||||||||
Total | $ | 392 | $ | (63 | ) | $ | — | $ | — | $ | 329 | |||||||||
|
|
|
|
|
|
|
|
|
| |||||||||||
Global Balanced Fund
| Gross amounts not offset in the statement of assets and liabilities and subject to a master netting agreement | ||||||||||||||||||||
Counterparty | Gross amounts recognized in the statement of assets and liabilities | Available to offset | Non-cash collateral* | Cash collateral | Net amount | |||||||||||||||
Assets: | ||||||||||||||||||||
Bank of America, N.A. | $ | 30 | $ | (30 | ) | $ | — | $ | — | $ | — | |||||||||
Bank of New York Mellon | 1 | — | — | — | 1 | |||||||||||||||
Barclays Bank PLC | 7 | (7 | ) | — | — | — | ||||||||||||||
Citibank | 40 | (40 | ) | — | — | — | ||||||||||||||
Goldman Sachs | 15 | (15 | ) | — | — | — | ||||||||||||||
HSBC Bank | 2 | (2 | ) | — | — | — | ||||||||||||||
JPMorgan Chase | 46 | (46 | ) | — | — | — | ||||||||||||||
UBS AG | 14 | (14 | ) | — | — | — | ||||||||||||||
|
|
|
|
|
|
|
|
|
| |||||||||||
Total | $ | 155 | $ | (154 | ) | $ | — | $ | — | $ | 1 | |||||||||
|
|
|
|
|
|
|
|
|
| |||||||||||
Liabilities: | ||||||||||||||||||||
Bank of America, N.A. | $ | 52 | $ | (30 | ) | $ | — | $ | — | $ | 22 | |||||||||
Barclays Bank PLC | 59 | (7 | ) | — | — | 52 | ||||||||||||||
Citibank | 54 | (40 | ) | — | — | 14 | ||||||||||||||
Goldman Sachs | 15 | (15 | ) | — | — | — | ||||||||||||||
HSBC Bank | 10 | (2 | ) | — | — | 8 | ||||||||||||||
JPMorgan Chase | 52 | (46 | ) | — | — | 6 | ||||||||||||||
UBS AG | 29 | (14 | ) | — | — | 15 | ||||||||||||||
|
|
|
|
|
|
|
|
|
| |||||||||||
Total | $ | 271 | $ | (154 | ) | $ | — | $ | — | $ | 117 | |||||||||
|
|
|
|
|
|
|
|
|
| |||||||||||
See end of tables for footnote.
American Funds Insurance Series 161
Table of Contents
Bond Fund
| Gross amounts not offset in the statement of assets and liabilities and subject to a master netting agreement | ||||||||||||||||||||
Counterparty | Gross amounts recognized in the statement of assets and liabilities | Available to offset | Non-cash collateral* | Cash collateral | Net amount | |||||||||||||||
Assets: | ||||||||||||||||||||
Bank of America, N.A. | $ | 3,012 | $ | — | $ | (2,182 | ) | $ | (830 | ) | $ | — | ||||||||
Citibank | 374 | (374 | ) | — | — | — | ||||||||||||||
JPMorgan Chase | 6,372 | (1,426 | ) | (4,946 | ) | — | — | |||||||||||||
UBS AG | 462 | — | (382 | ) | — | 80 | ||||||||||||||
|
|
|
|
|
|
|
|
|
| |||||||||||
Total | $ | 10,220 | $ | (1,800 | ) | $ | (7,510 | ) | $ | (830 | ) | $ | 80 | |||||||
|
|
|
|
|
|
|
|
|
| |||||||||||
Liabilities: | ||||||||||||||||||||
Citibank | $ | 1,131 | $ | (374 | ) | $ | (280 | ) | $ | — | $ | 477 | ||||||||
HSBC Bank | 121 | — | — | — | 121 | |||||||||||||||
JPMorgan Chase | 1,426 | (1,426 | ) | — | — | — | ||||||||||||||
|
|
|
|
|
|
|
|
|
| |||||||||||
Total | $ | 2,678 | $ | (1,800 | ) | $ | (280 | ) | $ | — | $ | 598 | ||||||||
|
|
|
|
|
|
|
|
|
| |||||||||||
Global Bond Fund
| Gross amounts not offset in the statement of assets and liabilities and subject to a master netting agreement | ||||||||||||||||||||
Counterparty | Gross amounts recognized in the statement of assets and liabilities | Available to offset | Non-cash collateral* | Cash collateral | Net amount | |||||||||||||||
Assets: | ||||||||||||||||||||
Bank of America, N.A. | $ | 321 | $ | (321 | ) | $ | — | $ | — | $ | — | |||||||||
Barclays Bank PLC | 335 | (219 | ) | — | — | 116 | ||||||||||||||
Citibank | 2,208 | (1,250 | ) | — | (958 | ) | — | |||||||||||||
Goldman Sachs | 275 | (275 | ) | — | — | — | ||||||||||||||
HSBC Bank | 143 | (143 | ) | — | — | — | ||||||||||||||
JPMorgan Chase | 1,212 | (1,130 | ) | — | — | 82 | ||||||||||||||
UBS AG | 665 | (665 | ) | — | — | — | ||||||||||||||
|
|
|
|
|
|
|
|
|
| |||||||||||
Total | $ | 5,159 | $ | (4,003 | ) | $ | — | $ | (958 | ) | $ | 198 | ||||||||
|
|
|
|
|
|
|
|
|
| |||||||||||
Liabilities: | ||||||||||||||||||||
Bank of America, N.A. | $ | 789 | $ | (321 | ) | $ | (468 | ) | $ | — | $ | — | ||||||||
Barclays Bank PLC | 219 | (219 | ) | — | — | — | ||||||||||||||
Citibank | 1,250 | (1,250 | ) | — | — | — | ||||||||||||||
Goldman Sachs | 569 | (275 | ) | (260 | ) | — | 34 | |||||||||||||
HSBC Bank | 408 | (143 | ) | (250 | ) | — | 15 | |||||||||||||
JPMorgan Chase | 1,130 | (1,130 | ) | — | — | — | ||||||||||||||
UBS AG | 780 | (665 | ) | (115 | ) | — | — | |||||||||||||
|
|
|
|
|
|
|
|
|
| |||||||||||
Total | $ | 5,145 | $ | (4,003 | ) | $ | (1,093 | ) | $ | — | $ | 49 | ||||||||
|
|
|
|
|
|
|
|
|
| |||||||||||
| * | Non-cash collateral is shown on a settlement basis. |
6. Taxation and distributions
Federal income taxation — Each fund complies with the requirements under Subchapter M of the Internal Revenue Code applicable to mutual funds and each intends to distribute substantially all of its net taxable income and net capital gains each year. The funds are not subject to income taxes to the extent such distributions are made. Therefore, no federal income tax provision is required.
As of and during the period ended December 31, 2017, none of the funds had a liability for any unrecognized tax benefits. Each fund recognizes interest and penalties, if any, related to unrecognized tax benefits as income tax expense in the statements of operations. During the period, none of the funds incurred any significant interest or penalties.
Each fund’s tax returns are not subject to examination by federal, state and, if applicable, non-U.S. tax authorities after the expiration of each jurisdiction’s statute of limitations, which is generally three years after the date of filing but can be extended in certain jurisdictions.
162 American Funds Insurance Series
Table of Contents
Non-U.S. taxation — Dividend and interest income, if any, are recorded net of non-U.S. taxes paid. The funds may file withholding tax reclaims in certain jurisdictions to recover a portion of amounts previously withheld. As a result of rulings from European courts, the funds filed for additional reclaims related to prior years. These reclaims are recorded when the amount is known and there are no significant uncertainties on collectability. Gains realized by the funds on the sale of securities in certain countries, if any, may be subject to non-U.S. taxes. If applicable, the funds record an estimated deferred tax liability based on unrealized gains to provide for potential non-U.S. taxes payable upon the sale of these securities.
Distributions — Distributions paid to shareholders are based on net investment income and net realized gains determined on a tax basis, which may differ from net investment income and net realized gains for financial reporting purposes. These differences are due primarily to different treatment for items such as currency gains and losses; short-term capital gains and losses; capital losses related to sales of certain securities within 30 days of purchase; unrealized appreciation of certain investments in securities outside the U.S.; deferred expenses; cost of investments sold; paydowns on fixed-income securities; net capital losses; non-U.S. taxes on capital gains and income on certain investments. The fiscal year in which amounts are distributed may differ from the year in which the net investment income and net realized gains are recorded by the funds for financial reporting purposes. The funds may also designate a portion of the amount paid to redeeming shareholders as a distribution for tax purposes.
Additional tax basis disclosures for each fund as of December 31, 2017, were as follows (dollars in thousands):
| Global Growth Fund | Global Small Capitalization Fund | Growth Fund | International Fund | New World Fund | Blue Chip Income and Growth Fund | |||||||||||||||||||
Undistributed ordinary income | $ | 31,444 | $ | 44,103 | $ | 112,122 | $ | 158,459 | $ | 8,129 | $ | 233,361 | ||||||||||||
Undistributed long-term capital gain | 402,492 | 147,040 | 2,434,009 | 324,550 | 93,323 | 502,967 | ||||||||||||||||||
|
|
|
|
|
|
|
|
|
|
|
| |||||||||||||
Capital loss carryforward utilized | — | 55,253 | — | — | 123,342 | — | ||||||||||||||||||
|
|
|
|
|
|
|
|
|
|
|
| |||||||||||||
Gross unrealized appreciation on investments | 2,228,168 | 1,203,855 | 9,792,218 | 2,530,645 | 890,201 | 2,526,460 | ||||||||||||||||||
Gross unrealized depreciation on investments | (44,698 | ) | (195,609 | ) | (457,553 | ) | (338,548 | ) | (52,274 | ) | (211,893 | ) | ||||||||||||
Net unrealized appreciation (depreciation) on investments | 2,183,470 | 1,008,246 | 9,334,665 | 2,192,097 | 837,927 | 2,314,567 | ||||||||||||||||||
|
|
|
|
|
|
|
|
|
|
|
| |||||||||||||
Cost of investments | 4,069,054 | 3,305,903 | 15,704,597 | 7,563,161 | 2,709,901 | 7,062,201 | ||||||||||||||||||
|
|
|
|
|
|
|
|
|
|
|
| |||||||||||||
Reclassification to (from) undistributed/distributions in excess of net investment income from (to) undistributed net realized gain/accumulated net realized loss | 5,191 | 1,827 | (576 | ) | (7,896 | ) | 20,408 | (21 | ) | |||||||||||||||
Reclassification to (from) undistributed/distributions in excess of net investment income from (to) capital paid in on shares of beneficial interest | — | — | — | — | 1 | — | ||||||||||||||||||
|
|
|
|
|
|
|
|
|
|
|
| |||||||||||||
American Funds Insurance Series 163
Table of Contents
| Global Growth and Income Fund | Growth- Income Fund | International Growth and Income Fund | Capital Income Builder | Asset Allocation Fund | Global Balanced Fund | |||||||||||||||||||
Undistributed ordinary income | $ | 30,483 | $ | 199,924 | $ | 4,856 | $ | 2,111 | $ | 180,609 | $ | — | ||||||||||||
Late year ordinary loss deferral* | — | — | — | — | — | (316 | ) | |||||||||||||||||
Undistributed long-term capital gain | 127,553 | 2,005,758 | — | 1,388 | 1,027,497 | — | ||||||||||||||||||
Post-October capital loss deferral* | — | — | — | — | — | (158 | ) | |||||||||||||||||
Capital loss carryforward† | — | — | (4,708 | ) | — | — | — | |||||||||||||||||
|
|
|
|
|
|
|
|
|
|
|
| |||||||||||||
Capital loss carryforward utilized | — | — | 7,616 | 6,972 | — | — | ||||||||||||||||||
|
|
|
|
|
|
|
|
|
|
|
| |||||||||||||
Gross unrealized appreciation on investments | 537,511 | 9,497,980 | 226,556 | 44,448 | 5,969,515 | 63,652 | ||||||||||||||||||
Gross unrealized depreciation on investments | (24,059 | ) | (759,857 | ) | (34,284 | ) | (14,396 | ) | (591,767 | ) | (4,747 | ) | ||||||||||||
Net unrealized appreciation (depreciation) on investments | 513,452 | 8,738,123 | 192,272 | 30,052 | 5,377,748 | 58,905 | ||||||||||||||||||
|
|
|
|
|
|
|
|
|
|
|
| |||||||||||||
Cost of investments | 1,592,874 | 21,971,750 | 1,268,241 | 569,142 | 20,774,632 | 297,217 | ||||||||||||||||||
|
|
|
|
|
|
|
|
|
|
|
| |||||||||||||
Reclassification to (from) undistributed/distributions in excess of net investment income from (to) undistributed net realized gain/accumulated net realized loss | (1,269 | ) | (1,550 | ) | 341 | 611 | 7,014 | (702 | ) | |||||||||||||||
Reclassification to (from) undistributed/distributions in excess of net investment income from (to) capital paid in on shares of beneficial interest | — | — | — | 1 | — | — | ||||||||||||||||||
|
|
|
|
|
|
|
|
|
|
|
| |||||||||||||
| Bond Fund | Global Bond Fund | High-Income Bond Fund | Mortgage Fund | Ultra-Short Bond Fund | U.S. Government/ AAA-Rated Securities Fund | |||||||||||||||||||
Undistributed ordinary income | $ | 43,324 | $ | 5,555 | $ | 14,711 | $ | 1,055 | $ | 481 | $ | 9,342 | ||||||||||||
Undistributed long-term capital gain | 14,531 | 6,778 | — | — | — | — | ||||||||||||||||||
Capital loss carryforward† | — | — | (146,596 | ) | (490 | ) | — | (1,300 | ) | |||||||||||||||
|
|
|
|
|
|
|
|
|
|
|
| |||||||||||||
Capital loss carryforward utilized | — | — | 23,967 | — | — | 4,995 | ||||||||||||||||||
Capital loss carryforward expired | — | — | 45,026 | — | — | — | ||||||||||||||||||
|
|
|
|
|
|
|
|
|
|
|
| |||||||||||||
Gross unrealized appreciation on investments | 162,798 | 81,621 | 32,856 | 4,807 | 4 | 47,238 | ||||||||||||||||||
Gross unrealized depreciation on investments | (107,507 | ) | (47,515 | ) | (54,535 | ) | (4,665 | ) | (45 | ) | (58,565 | ) | ||||||||||||
Net unrealized appreciation (depreciation) on investments | 55,291 | 34,106 | (21,679 | ) | 142 | (41 | ) | (11,327 | ) | |||||||||||||||
|
|
|
|
|
|
|
|
|
|
|
| |||||||||||||
Cost of investments | 12,692,366 | 2,457,189 | 1,454,834 | 414,829 | 305,768 | 3,334,169 | ||||||||||||||||||
|
|
|
|
|
|
|
|
|
|
|
| |||||||||||||
Reclassification to (from) undistributed/distributions in excess of net investment income from (to) undistributed net realized gain/accumulated net realized loss | (30,841 | ) | (34,052 | ) | (2,497 | ) | 585 | — | (481 | ) | ||||||||||||||
Reclassification to (from) undistributed/distributions in excess of net investment income from (to) capital paid in on shares of beneficial interest | — | — | — | 2 | — | — | ||||||||||||||||||
Reclassification to (from) capital paid in on shares of beneficial interest from (to) accumulated net realized loss/distribution in excess of net realized gain | — | — | (45,026 | ) | — | 9 | — | |||||||||||||||||
|
|
|
|
|
|
|
|
|
|
|
| |||||||||||||
164 American Funds Insurance Series
Table of Contents
| Managed Risk Growth Fund | Managed Risk International Fund | Managed Risk Blue Chip Income and Growth Fund | Managed Risk Growth- Income Fund | Managed Risk Asset Allocation Fund | ||||||||||||||||
Undistributed ordinary income | $ | 1,399 | $ | 1,323 | $ | 5,669 | $ | 2,167 | $ | 53,091 | ||||||||||
Undistributed long-term capital gain | 20,518 | 732 | 12,104 | 9,926 | 174,185 | |||||||||||||||
|
|
|
|
|
|
|
|
|
| |||||||||||
Gross unrealized appreciation on investments | 29,694 | 19,293 | 31,349 | 14,187 | 339,240 | |||||||||||||||
Gross unrealized depreciation on investments | (9,040 | ) | (7,137 | ) | (3,121 | ) | (5,803 | ) | (648 | ) | ||||||||||
Net unrealized appreciation (depreciation) on investments | 20,654 | 12,156 | 28,228 | 8,384 | 338,592 | |||||||||||||||
|
|
|
|
|
|
|
|
|
| |||||||||||
Cost of investments | 267,404 | 136,312 | 338,850 | 200,658 | 4,118,068 | |||||||||||||||
|
|
|
|
|
|
|
|
|
| |||||||||||
Reclassification to (from) undistributed/distributions in excess of net investment income from (to) undistributed net realized gain/accumulated net realized loss | 545 | 49 | 1,507 | 141 | 2,446 | |||||||||||||||
|
|
|
|
|
|
|
|
|
| |||||||||||
| * | These deferrals are considered incurred in the subsequent year. |
| † | Capital loss carryforwards will be used to offset any capital gains realized by the funds in future years. Funds with capital loss carryforwards will not make distributions from capital gains while a capital loss carryforwards remains. |
Distributions paid by each fund were characterized for tax purposes as follows (dollars in thousands):
Global Growth Fund
| Year ended December 31, 2017 | Year ended December 31, 2016 | |||||||||||||||||||||||
Share class | Ordinary income | Long-term capital gains | Total dividends and distributions paid | Ordinary income | Long-term capital gains | Total dividends and distributions paid | ||||||||||||||||||
Class 1 | $ | 16,830 | $ | 55,298 | $ | 72,128 | $ | 24,109 | $ | 126,735 | $ | 150,844 | ||||||||||||
Class 1A* | 15 | 16 | 31 | |||||||||||||||||||||
Class 2 | 24,835 | 114,893 | 139,728 | 44,725 | 291,772 | 336,497 | ||||||||||||||||||
Class 4 | 1,062 | 3,889 | 4,951 | 945 | 7,147 | 8,092 | ||||||||||||||||||
|
|
|
|
|
|
|
|
|
|
|
| |||||||||||||
Total | $ | 42,742 | $ | 174,096 | $ | 216,838 | $ | 69,779 | $ | 425,654 | $ | 495,433 | ||||||||||||
|
|
|
|
|
|
|
|
|
|
|
| |||||||||||||
Global Small Capitalization Fund
| Year ended December 31, 2017 | Year ended December 31, 2016 | |||||||||||||||||||||||
Share class | Ordinary income | Long-term capital gains | Total dividends paid | Ordinary income | Long-term capital gains | Total dividends and distributions paid | ||||||||||||||||||
Class 1 | $ | 10,151 | $ | — | $ | 10,151 | $ | 11,807 | $ | 273,687 | $ | 285,494 | ||||||||||||
Class 1A* | 1 | — | 1 | |||||||||||||||||||||
Class 2 | 10,597 | — | 10,597 | 12,193 | 433,806 | 445,999 | ||||||||||||||||||
Class 4 | 270 | — | 270 | 142 | 6,715 | 6,857 | ||||||||||||||||||
|
|
|
|
|
|
|
|
|
|
|
| |||||||||||||
Total | $ | 21,019 | $ | — | $ | 21,019 | $ | 24,142 | $ | 714,208 | $ | 738,350 | ||||||||||||
|
|
|
|
|
|
|
|
|
|
|
| |||||||||||||
See end of tables for footnotes.
American Funds Insurance Series 165
Table of Contents
Growth Fund
| Year ended December 31, 2017 | Year ended December 31, 2016 | |||||||||||||||||||||||
Share class | Ordinary income | Long-term capital gains | Total dividends and distributions paid | Ordinary income | Long-term capital gains | Total dividends and distributions paid | ||||||||||||||||||
Class 1 | $ | 75,247 | $ | 713,987 | $ | 789,234 | $ | 68,458 | $ | 603,135 | $ | 671,593 | ||||||||||||
Class 1A* | 15 | 63 | 78 | |||||||||||||||||||||
Class 2 | 110,909 | 1,409,266 | 1,520,175 | 105,243 | 1,244,603 | 1,349,846 | ||||||||||||||||||
Class 3 | 1,601 | 18,484 | 20,085 | 1,482 | 16,336 | 17,818 | ||||||||||||||||||
Class 4 | 4,893 | 53,128 | 58,021 | 2,484 | 36,779 | 39,263 | ||||||||||||||||||
|
|
|
|
|
|
|
|
|
|
|
| |||||||||||||
Total | $ | 192,665 | $ | 2,194,928 | $ | 2,387,593 | $ | 177,667 | $ | 1,900,853 | $ | 2,078,520 | ||||||||||||
|
|
|
|
|
|
|
|
|
|
|
| |||||||||||||
International Fund
| Year ended December 31, 2017 | Year ended December 31, 2016 | |||||||||||||||||||||||
Share class | Ordinary income | Long-term capital gains | Total dividends and distributions paid | Ordinary income | Long-term capital gains | Total dividends and distributions paid | ||||||||||||||||||
Class 1 | $ | 70,384 | $ | 49,783 | $ | 120,167 | $ | 59,237 | $ | 296,124 | $ | 355,361 | ||||||||||||
Class 1A* | 17 | 3 | 20 | |||||||||||||||||||||
Class 2 | 53,513 | 46,642 | 100,155 | 51,666 | 334,251 | 385,917 | ||||||||||||||||||
Class 3 | 396 | 331 | 727 | 389 | 2,445 | 2,834 | ||||||||||||||||||
Class 4 | 3,025 | 1,066 | 4,091 | 794 | 4,665 | 5,459 | ||||||||||||||||||
|
|
|
|
|
|
|
|
|
|
|
| |||||||||||||
Total | $ | 127,335 | $ | 97,825 | $ | 225,160 | $ | 112,086 | $ | 637,485 | $ | 749,571 | ||||||||||||
|
|
|
|
|
|
|
|
|
|
|
| |||||||||||||
New World Fund
| Year ended December 31, 2017 | Year ended December 31, 2016 | |||||||||||||||||||||||
Share class | Ordinary income | Long-term capital gains | Total dividends paid | Ordinary income | Long-term capital gains | Total dividends paid | ||||||||||||||||||
Class 1 | $ | 21,960 | $ | — | $ | 21,960 | $ | 17,725 | $ | — | $ | 17,725 | ||||||||||||
Class 1A* | 6 | — | 6 | |||||||||||||||||||||
Class 2 | 9,149 | — | 9,149 | 7,100 | — | 7,100 | ||||||||||||||||||
Class 4 | 3,016 | — | 3,016 | 1,465 | — | 1,465 | ||||||||||||||||||
|
|
|
|
|
|
|
|
|
|
|
| |||||||||||||
Total | $ | 34,131 | $ | — | $ | 34,131 | $ | 26,290 | $ | — | $ | 26,290 | ||||||||||||
|
|
|
|
|
|
|
|
|
|
|
| |||||||||||||
Blue Chip Income and Growth Fund
| Year ended December 31, 2017 | Year ended December 31, 2016 | |||||||||||||||||||||||
Share class | Ordinary income | Long-term capital gains | Total dividends and distributions paid | Ordinary income | Long-term capital gains | Total dividends and distributions paid | ||||||||||||||||||
Class 1 | $ | 140,306 | $ | 170,748 | $ | 311,054 | $ | 137,434 | $ | 292,079 | $ | 429,513 | ||||||||||||
Class 1A* | 12 | 5 | 17 | |||||||||||||||||||||
Class 2 | 82,680 | 113,013 | 195,693 | 92,301 | 236,696 | 328,997 | ||||||||||||||||||
Class 4 | 4,917 | 5,605 | 10,522 | 2,759 | 4,934 | 7,693 | ||||||||||||||||||
|
|
|
|
|
|
|
|
|
|
|
| |||||||||||||
Total | $ | 227,915 | $ | 289,371 | $ | 517,286 | $ | 232,494 | $ | 533,709 | $ | 766,203 | ||||||||||||
|
|
|
|
|
|
|
|
|
|
|
| |||||||||||||
166 American Funds Insurance Series
Table of Contents
Global Growth and Income Fund
| Year ended December 31, 2017 | Year ended December 31, 2016 | |||||||||||||||||||||||
Share class | Ordinary income | Long-term capital gains | Total dividends and distributions paid | Ordinary income | Long-term capital gains | Total dividends paid | ||||||||||||||||||
Class 1 | $ | 10,516 | $ | 7,109 | $ | 17,625 | $ | 11,131 | $ | — | $ | 11,131 | ||||||||||||
Class 1A* | 2 | — | * | 2 | ||||||||||||||||||||
Class 2 | 30,799 | 26,178 | 56,977 | 25,283 | — | | 25,283 | | ||||||||||||||||
Class 4 | 1,478 | 405 | 1,883 | 257 | — |
| 257
|
| ||||||||||||||||
|
|
|
|
|
|
|
|
|
|
|
| |||||||||||||
Total | $ | 42,795 | $ | 33,692 | $ | 76,487 | $ | 36,671 | $ | — | $ | 36,671 | ||||||||||||
|
|
|
|
|
|
|
|
|
|
|
| |||||||||||||
Growth-Income Fund
| Year ended December 31, 2017 | Year ended December 31, 2016 | |||||||||||||||||||||||
Share class | Ordinary income | Long-term capital gains | Total dividends and distributions paid | Ordinary income | Long-term capital gains | Total dividends and distributions paid | ||||||||||||||||||
Class 1 | $ | 250,221 | $ | 884,958 | $ | 1,135,179 | $ | 263,296 | $ | 1,172,060 | $ | 1,435,356 | ||||||||||||
Class 1A* | 24 | 16 | 40 | |||||||||||||||||||||
Class 2 | 195,450 | 853,292 | 1,048,742 | 250,881 | 1,329,722 | 1,580,603 | ||||||||||||||||||
Class 3 | 2,421 | 10,140 | 12,561 | 3,141 | | 16,262 | | 19,403 | ||||||||||||||||
Class 4 | 9,973 | 36,513 | 46,486 | 8,305 | 45,834 | 54,139 | ||||||||||||||||||
|
|
|
|
|
|
|
|
|
|
|
| |||||||||||||
Total | $ | 458,089 | $ | 1,784,919 | $ | 2,243,008 | $ | 525,623 | $ | 2,563,878 | $ | 3,089,501 | ||||||||||||
|
|
|
|
|
|
|
|
|
|
|
| |||||||||||||
International Growth and Income Fund
| Year ended December 31, 2017 | Year ended December 31, 2016 | |||||||||||||||||||||||
Share class | Ordinary income | Long-term capital gains | Total dividends paid | Ordinary income | Long-term capital gains | Total dividends and distributions paid | ||||||||||||||||||
Class 1 | $ | 25,860 | $ | — | $ | 25,860 | $ | 23,268 | $ | 3,458 | $ | 26,726 | ||||||||||||
Class 1A* | 14 | — | 14 | |||||||||||||||||||||
Class 2 | 5,714 | — | 5,714 | 6,231 | 1,080 | 7,311 | ||||||||||||||||||
Class 4 | 1,184 | — | 1,184 | 895 | 149 | 1,044 | ||||||||||||||||||
|
|
|
|
|
|
|
|
|
|
|
| |||||||||||||
Total | $ | 32,772 | $ | — | $ | 32,772 | $30,394 | $ | 4,687 | $ | 35,081 | |||||||||||||
|
|
|
|
|
|
|
|
|
|
|
| |||||||||||||
Capital Income Builder
| Year ended December 31, 2017 | Year ended December 31, 2016 | |||||||||||||||||||||||
Share class | Ordinary income | Long-term capital gains | Total dividends paid | Ordinary income | Long-term capital gains | Total dividends and distributions paid | ||||||||||||||||||
Class 1 | $ | 6,303 | $ | — | $ | 6,303 | $ | 4,372 | $ | — | $ | 4,372 | ||||||||||||
Class 1A* | 8 | — | 8 | |||||||||||||||||||||
Class 2 | 23 | — | 23 | 2 | — | 2 | ||||||||||||||||||
Class 4 | 7,676 | — | 7,676 | 6,657 | — | 6,657 | ||||||||||||||||||
|
|
|
|
|
|
|
|
|
|
|
| |||||||||||||
Total | $ | 14,010 | $ | — | $ | 14,010 | $ | 11,031 | $ | — | $ | 11,031 | ||||||||||||
|
|
|
|
|
|
|
|
|
|
|
| |||||||||||||
See end of tables for footnotes.
American Funds Insurance Series 167
Table of Contents
Asset Allocation Fund
| Year ended December 31, 2017 | Year ended December 31, 2016 | |||||||||||||||||||||||
Share class | Ordinary income | Long-term capital gains | Total dividends and distributions paid | Ordinary income | Long-term capital gains | Total dividends and distributions paid | ||||||||||||||||||
Class 1 | $ | 287,347 | $ | 666,425 | $ | 953,772 | $ | 229,739 | $ | 280,306 | $ | 510,045 | ||||||||||||
Class 1A* | 50 | 70 | 120 | |||||||||||||||||||||
Class 2 | 84,847 | 241,077 | 325,924 | 81,019 | 120,303 | 201,322 | ||||||||||||||||||
Class 3 | 601 | 1,646 | 2,247 | 580 | 860 | 1,440 | ||||||||||||||||||
Class 4 | 47,458 | 145,207 | 192,665 | 38,591 | 61,673 | 100,264 | ||||||||||||||||||
|
|
|
|
|
|
|
|
|
|
|
| |||||||||||||
Total | $ | 420,303 | $ | 1,054,425 | $ | 1,474,728 | $ | 349,929 | $ | 463,142 | $ | 813,071 | ||||||||||||
|
|
|
|
|
|
|
|
|
|
|
| |||||||||||||
Global Balanced Fund
| Year ended December 31, 2017 | Year ended December 31, 2016 | |||||||||||||||||||||||
Share class | Ordinary income | Long-term capital gains | Total dividends and distributions paid | Ordinary income | Long-term capital gains | Total dividends paid | ||||||||||||||||||
Class 1 | $ | 1,298 | $ | 2,309 | $ | 3,607 | $ | 939 | $ | — | $ | 939 | ||||||||||||
Class 1A* | 3 | 5 | 8 | |||||||||||||||||||||
Class 2 | 2,516 | 5,414 | 7,930 | 2,225 | — | 2,225 | ||||||||||||||||||
Class 4 | 582 | 1,195 | 1,777 | 121 | — | 121 | ||||||||||||||||||
|
|
|
|
|
|
|
|
|
|
|
| |||||||||||||
Total | $ | 4,399 | $ | 8,923 | $ | 13,322 | $ | 3,285 | $ | — | $ | 3,285 | ||||||||||||
|
|
|
|
|
|
|
|
|
|
|
| |||||||||||||
Bond Fund
| Year ended December 31, 2017 | Year ended December 31, 2016 | |||||||||||||||||||||||
Share class | Ordinary income | Long-term capital gains | Total dividends and distributions paid | Ordinary income | Long-term capital gains | Total dividends and distributions paid | ||||||||||||||||||
Class 1 | $ | 211,473 | $ | 25,594 | $ | 237,067 | $ | 138,255 | $ | 11,305 | $ | 149,560 | ||||||||||||
Class 1A* | 19 | 1 | 20 | |||||||||||||||||||||
Class 2 | 119,175 | 15,280 | 134,455 | 74,576 | 7,465 | 82,041 | ||||||||||||||||||
Class 4 | 5,958 | 441 | 6,399 | 1,614 | 150 | 1,764 | ||||||||||||||||||
|
|
|
|
|
|
|
|
|
|
|
| |||||||||||||
Total | $ | 336,625 | $ | 41,316 | $ | 377,941 | $ | 214,445 | $ | 18,920 | $ | 233,365 | ||||||||||||
|
|
|
|
|
|
|
|
|
|
|
| |||||||||||||
Global Bond Fund
| Year ended December 31, 2017 | Year ended December 31, 2016 | |||||||||||||||||||||||
Share class | Ordinary income | Long-term capital gains | Total dividends and distributions paid | Ordinary income | Long-term capital gains | Total dividends and distributions paid | ||||||||||||||||||
Class 1 | $ | 14,181 | $ | 103 | $ | 14,284 | $ | 10,101 | $ | 872 | $ | 10,973 | ||||||||||||
Class 1A* | — | † | — | † | — | † | ||||||||||||||||||
Class 2 | 11,033 | 99 | 11,132 | 7,811 | 923 | 8,734 | ||||||||||||||||||
Class 4 | 196 | 1 | 197 | 68 | 8 | 76 | ||||||||||||||||||
|
|
|
|
|
|
|
|
|
|
|
| |||||||||||||
Total | $ | 25,410 | $ | 203 | $ | 25,613 | $ | 17,980 | $ | 1,803 | $ | 19,783 | ||||||||||||
|
|
|
|
|
|
|
|
|
|
|
| |||||||||||||
168 American Funds Insurance Series
Table of Contents
High-Income Bond Fund
| Year ended December 31, 2017 | Year ended December 31, 2016 | |||||||||||||||||||||||
Share class | Ordinary income | Long-term capital gains | Total dividends paid | Ordinary income | Long-term capital gains | Total dividends and distributions paid | ||||||||||||||||||
Class 1 | $ | 43,976 | $ | — | $ | 43,976 | $ | 57,104 | $ | — | $ | 57,104 | ||||||||||||
Class 1A* | 12 | — | 12 | |||||||||||||||||||||
Class 2 | 51,640 | — | 51,640 | 47,007 | — | 47,007 | ||||||||||||||||||
Class 3 | 805 | — | 805 | 746 | — | 746 | ||||||||||||||||||
Class 4 | 1,981 | — | 1,981 | 1,283 | — | 1,283 | ||||||||||||||||||
|
|
|
|
|
|
|
|
|
|
|
| |||||||||||||
Total | $ | 98,414 | $ | — | $ | 98,414 | $ | 106,140 | $ | — | $ | 106,140 | ||||||||||||
|
|
|
|
|
|
|
|
|
|
|
| |||||||||||||
Mortgage Fund
| Year ended December 31, 2017 | Year ended December 31, 2016 | |||||||||||||||||||||||
Share class | Ordinary income | Long-term capital gains | Total dividends and distributions paid | Ordinary income | Long-term capital gains | Total dividends and distributions paid | ||||||||||||||||||
Class 1 | $ | 5,106 | $ | 1,186 | $ | 6,292 | $ | 7,780 | $ | 152 | $ | 7,932 | ||||||||||||
Class 1A* | 2 | — | † | 2 | ||||||||||||||||||||
Class 2 | 1,025 | 262 | 1,287 | 1,648 | 35 | 1,683 | ||||||||||||||||||
Class 4 | 165 | 39 | 204 | 222 | 5 | 227 | ||||||||||||||||||
|
|
|
|
|
|
|
|
|
|
|
| |||||||||||||
Total | $ | 6,298 | �� | $ | 1,487 | $ | 7,785 | $ | 9,650 | $ | 192 | $ | 9,842 | |||||||||||
|
|
|
|
|
|
|
|
|
|
|
| |||||||||||||
Ultra-Short Bond Fund
| Year ended December 31, 2017 | Year ended December 31, 2016 | |||||||||||||||||||||||
Share class | Ordinary income | Long-term capital gains | Total dividends paid | Ordinary income | Long-term capital gains | Total dividends paid | ||||||||||||||||||
Class 1 | $ | 184 | $ | — | $ | 184 | $ | — | $ | — | $ | — | ||||||||||||
Class 1A* | — | † | — | — | † | |||||||||||||||||||
Class 2 | 697 | — | 697 | — | — | — | ||||||||||||||||||
Class 3 | 15 | — | 15 | — | — | — | ||||||||||||||||||
Class 4 | 10 | — | 10 | — | — | — | ||||||||||||||||||
|
|
|
|
|
|
|
|
|
|
|
| |||||||||||||
Total | $ | 906 | $ | — | $ | 906 | $ | — | $ | — | $ | — | ||||||||||||
|
|
|
|
|
|
|
|
|
|
|
| |||||||||||||
U.S. Government/AAA-Rated Securities Fund
| Year ended December 31, 2017 | Year ended December 31, 2016 | |||||||||||||||||||||||
Share class | Ordinary income | Long-term capital gains | Total dividends paid | Ordinary income | Long-term capital gains | Total dividends and distributions paid | ||||||||||||||||||
Class 1 | $ | 23,690 | $ | — | $ | 23,690 | $ | 44,429 | $ | 7,982 | $ | 52,411 | ||||||||||||
Class 1A* | 1 | — | 1 | |||||||||||||||||||||
Class 2 | 19,498 | — | 19,498 | 43,530 | 8,728 | 52,258 | ||||||||||||||||||
Class 3 | 141 | — | 141 | 307 | 60 | 367 | ||||||||||||||||||
Class 4 | 663 | — | 663 | 1,615 | 371 | 1,986 | ||||||||||||||||||
|
|
|
|
|
|
|
|
|
|
|
| |||||||||||||
Total | $ | 43,993 | $ | — | $ | 43,993 | $ | 89,881 | $ | 17,141 | $ | 107,022 | ||||||||||||
|
|
|
|
|
|
|
|
|
|
|
| |||||||||||||
See end of tables for footnotes.
American Funds Insurance Series 169
Table of Contents
Managed Risk Growth Fund
| Year ended December 31, 2017 | Year ended December 31, 2016 | |||||||||||||||||||||||
Share class | Ordinary income | Long-term capital gains | Total dividends and distributions paid | Ordinary income | Long-term capital gains | Total dividends and distributions paid | ||||||||||||||||||
Class P1 | $ | 7 | $ | 22 | $ | 29 | $ | 3 | $ | 57 | $ | 60 | ||||||||||||
Class P2 | 727 | 4,120 | 4,847 | 327 | 14,955 | 15,282 | ||||||||||||||||||
|
|
|
|
|
|
|
|
|
|
|
| |||||||||||||
Total | $ | 734 | $ | 4,142 | $ | 4,876 | $ | 330 | $ | 15,012 | $ | 15,342 | ||||||||||||
|
|
|
|
|
|
|
|
|
|
|
| |||||||||||||
Managed Risk International Fund
| Year ended December 31, 2017 | Year ended December 31, 2016 | |||||||||||||||||||||||
Share class | Ordinary income | Long-term capital gains | Total dividends and distributions paid | Ordinary income | Long-term capital gains | Total dividends and distributions paid | ||||||||||||||||||
Class P1 | $ | 1 | $ | 1 | $ | 2 | $ | 2 | $ | 4 | $ | 6 | ||||||||||||
Class P2 | 899 | 1,402 | 2,301 | 841 | 2,181 | 3,022 | ||||||||||||||||||
|
|
|
|
|
|
|
|
|
|
|
| |||||||||||||
Total | $ | 900 | $ | 1,403 | $ | 2,303 | $ | 843 | $ | 2,185 | $ | 3,028 | ||||||||||||
|
|
|
|
|
|
|
|
|
|
|
| |||||||||||||
Managed Risk Blue Chip Income and Growth Fund
| Year ended December 31, 2017 | Year ended December 31, 2016 | |||||||||||||||||||||||
Share class | Ordinary income | Long-term capital gains | Total dividends and distributions paid | Ordinary income | Long-term capital gains | Total dividends and distributions paid | ||||||||||||||||||
Class P1 | $ | 4 | $ | 3 | $ | 7 | $ | 5 | $ | 8 | $ | 13 | ||||||||||||
Class P2 | 5,157 | 5,565 | 10,722 | 3,370 | 5,915 | 9,285 | ||||||||||||||||||
|
|
|
|
|
|
|
|
|
|
|
| |||||||||||||
Total | $ | 5,161 | $ | 5,568 | $ | 10,729 | $ | 3,375 | $ | 5,923 | $ | 9,298 | ||||||||||||
|
|
|
|
|
|
|
|
|
|
|
| |||||||||||||
Managed Risk Growth-Income Fund
| Year ended December 31, 2017 | Year ended December 31, 2016 | |||||||||||||||||||||||
Share class | Ordinary income | Long-term capital gains | Total dividends and distributions paid | Ordinary income | Long-term capital gains | Total dividends and distributions paid | ||||||||||||||||||
Class P1 | $ | 19 | $ | 73 | $ | 92 | $ | 15 | $ | 64 | $ | 79 | ||||||||||||
Class P2 | 1,848 | 7,653 | 9,501 | 1,692 | 8,401 | 10,093 | ||||||||||||||||||
|
|
|
|
|
|
|
|
|
|
|
| |||||||||||||
Total | $ | 1,867 | $ | 7,726 | $ | 9,593 | $ | 1,707 | $ | 8,465 | $ | 10,172 | ||||||||||||
|
|
|
|
|
|
|
|
|
|
|
| |||||||||||||
Managed Risk Asset Allocation Fund
| Year ended December 31, 2017 | Year ended December 31, 2016 | |||||||||||||||||||||||
Share class | Ordinary income | Long-term capital gains | Total dividends and distributions paid | Ordinary income | Long-term capital gains | Total dividends and distributions paid | ||||||||||||||||||
Class P1 | $ | 11,453 | $ | 13,811 | $ | 25,264 | $ | 16,330 | $ | 29,417 | $ | 45,747 | ||||||||||||
Class P2 | 20,269 | 24,931 | 45,200 | 27,858 | 64,161 | 92,019 | ||||||||||||||||||
|
|
|
|
|
|
|
|
|
|
|
| |||||||||||||
Total | $ | 31,722 | $ | 38,742 | $ | 70,464 | $ | 44,188 | $ | 93,578 | $ | 137,766 | ||||||||||||
|
|
|
|
|
|
|
|
|
|
|
| |||||||||||||
| * | Class 1A shares began investment operations on January 6, 2017. |
| † | Amount less than one thousand. |
170 American Funds Insurance Series
Table of Contents
7. Fees and transactions
CRMC, the series’ investment adviser, is the parent company of American Funds Distributors,® Inc. (“AFD”), the distributor of the series’ shares, and American Funds Service Company® (“AFS”), the series’ transfer agent. CRMC, AFD and AFS are considered related parties to the series.
Investment advisory services — The series has an investment advisory and service agreement with CRMC that provides for monthly fees accrued daily. These fees are based on annual rates that generally decrease as average net asset levels increase. CRMC receives investment advisory fees from the underlying funds held by the managed risk funds. These fees are included in the net effective expense ratios that are provided as supplementary information in the financial highlights tables. Subadvisory fees for the managed risk funds are paid by CRMC to Milliman FRM. The managed risk funds are not responsible for paying any subadvisory fees.
Investment advisory services waivers — On December 4, 2017, the series’ board of trustees approved amended agreements effective February 1, 2018, decreasing the annual rate to 0.580% on average daily net assets in excess of $4 billion for New World Fund, decreasing the annual rate to 0.350% on average daily net assets in excess of $10.5 billion for Blue Chip Income and Growth Fund, and decreasing the annual rate to 0.320% on average daily net assets in excess of $13 billion for Bond Fund. CRMC is waiving a portion of its investment advisory services fees for each of the managed risk funds. Investment advisory services fees are presented in each fund’s statement of operations gross of the waivers from CRMC. For the year ended December 31, 2017, total investment advisory services fees waived by CRMC were $2,496,000.
The range of rates, net asset levels and the current annualized rates of average net assets for each fund before and after any investment advisory services waivers (if applicable), are as follows:
| Rates | Net asset level (in billions) | For the year ended December 31, 2017, | For the year ended 2017, | |||||||||||||||||||||
Fund | Beginning with | Ending with | Up to | In excess of | before waiver | after waiver | ||||||||||||||||||
Global Growth Fund | .690 | % | .460 | % | $ | .6 | $ | 5.0 | .520 | % | .520 | % | ||||||||||||
Global Small Capitalization Fund | .800 | .635 | .6 | 5.0 | .697 | .697 | ||||||||||||||||||
Growth Fund | .500 | .280 | .6 | 34.0 | .326 | .326 | ||||||||||||||||||
International Fund | .690 | .430 | .5 | 21.0 | .495 | .495 | ||||||||||||||||||
New World Fund | .850 | .620 | .5 | 2.5 | .704 | .704 | ||||||||||||||||||
Blue Chip Income and Growth Fund | .500 | .360 | .6 | 6.5 | .389 | .389 | ||||||||||||||||||
Global Growth and Income Fund | .690 | .480 | .6 | 3.0 | .594 | .594 | ||||||||||||||||||
Growth-Income Fund | .500 | .219 | .6 | 34.0 | .262 | .262 | ||||||||||||||||||
International Growth and Income Fund | .690 | .530 | .5 | 1.0 | .614 | .614 | ||||||||||||||||||
Capital Income Builder Fund | .500 | all | .500 | .500 | ||||||||||||||||||||
Asset Allocation Fund | .500 | .240 | .6 | 21.0 | .268 | .268 | ||||||||||||||||||
Global Balanced Fund | .660 | .510 | .5 | 1.0 | .660 | .660 | ||||||||||||||||||
Bond Fund | .480 | .330 | .6 | 8.0 | .362 | .362 | ||||||||||||||||||
Global Bond Fund | .570 | .450 | 1.0 | 3.0 | .529 | .529 | ||||||||||||||||||
High-Income Bond Fund | .500 | .420 | .6 | 2.0 | .467 | .467 | ||||||||||||||||||
Mortgage Fund | .420 | .290 | .6 | 3.0 | .420 | .420 | ||||||||||||||||||
Ultra-Short Bond Fund | .320 | .270 | 1.0 | 2.0 | .320 | .320 | ||||||||||||||||||
U.S. Government/AAA-Rated Securities Fund | .420 | .290 | .6 | 3.0 | .338 | .338 | ||||||||||||||||||
Managed Risk Growth Fund | .150 | all | .150 | .100 | ||||||||||||||||||||
Managed Risk International Fund | .150 | all | .150 | .100 | ||||||||||||||||||||
Managed Risk Blue Chip Income and Growth Fund | .150 | all | .150 | .100 | ||||||||||||||||||||
Managed Risk Growth-Income Fund | .150 | all | .150 | .100 | ||||||||||||||||||||
Managed Risk Asset Allocation Fund | .150 | all | .150 | .100 | ||||||||||||||||||||
American Funds Insurance Series 171
Table of Contents
Distribution services — The series has plans of distribution for all share classes except Class 1. Under the plans, the board of trustees approves certain categories of expenses that are used to finance activities primarily intended to sell fund shares. The plans provide for payments to pay service fees to firms that have entered into agreements with the series. These payments, based on an annualized percentage of average daily net assets, range from 0.18% to 0.50% as noted in the table below. In some cases, the board of trustees has limited the amounts that may be paid to less than the maximum allowed by the plans.
Share class | Currently approved limits | Plan limits | ||||||
Class 1A | 0.00 | % | 0.25 | % | ||||
Class 2 | 0.25 | 0.25 | ||||||
Class 3 | 0.18 | 0.18 | ||||||
Class 4 | 0.25 | 0.25 | ||||||
Class P1 | 0.00 | 0.25 | ||||||
Class P2 | 0.25 | 0.50 | ||||||
Insurance administrative services — The series has an insurance administrative services plan for Class 1A, 4, P1 and P2 shares. Under the plan, these share classes pay 0.25% of each insurance company’s respective average daily net assets in each share class to compensate the insurance companies for services provided to their separate accounts and contractholders for which the shares of the fund are beneficially owned as underlying investments of such contractholders’ annuities. These services include, but are not limited to, maintenance, shareholder communications and transactional services. The insurance companies are not related parties to the series.
Transfer agent services — The series has a shareholder services agreement with AFS under which the funds compensate AFS for providing transfer agent services to all of the funds’ share classes. These services include recordkeeping, shareholder communications and transaction processing. In addition, the managed risk funds reimburse AFS for amounts paid to third parties for performing transfer agent services on behalf of fund shareholders.
Administrative services — The series has an administrative services agreement with CRMC to provide administrative services to all of the funds’ share classes. The services include, but are not limited to, coordinating, monitoring, assisting and overseeing third parties that provide services to fund shareholders. Under the agreement, each share class of each fund, except the managed risk funds, pays an annual fee of 0.01% based on its respective average daily net assets to compensate CRMC for providing administrative services. For the managed risk funds, CRMC receives administrative services fees of 0.01% of average daily net assets from Class 1 shares of the underlying funds for administrative services provided to the series.
Accounting and administrative services — The managed risk funds have a subadministration agreement with BNY Mellon under which the fund compensates BNY Mellon for providing accounting and administrative services to each of the managed risk funds’ share classes. These services include, but are not limited to, fund accounting (including calculation of net asset value), financial reporting and tax services. BNY Mellon is not a related party to the managed risk funds.
Miscellaneous fee reimbursements — CRMC is currently reimbursing a portion of miscellaneous fees and expenses for Managed Risk Growth Fund, Managed Risk International Fund, Managed Risk Blue Chip Income and Growth Fund and Managed Risk Growth-Income Fund. Miscellaneous expenses exclude investment advisory services and distribution services fees. For the year ended December 31, 2017, total expenses reimbursed by CRMC were $102,000.
Class-specific expenses under the agreements described above were as follows (dollars in thousands):
| Global Growth Fund | ||||||||||||
Share class | Distribution services | Insurance administrative services | Administrative services | |||||||||
Class 1 | Not applicable | Not applicable | $ | 188 | ||||||||
Class 1A* | $ | — | $ | 2 | — | † | ||||||
Class 2 | 9,611 | Not applicable | 385 | |||||||||
Class 4 | 352 | 352 | 14 | |||||||||
|
|
|
|
|
| |||||||
Total class-specific expenses | $ | 9,963 | $ | 354 | $ | 587 | ||||||
|
|
|
|
|
| |||||||
| Global Small Capitalization Fund | ||||||||||||
Share class | Distribution services | Insurance administrative services | Administrative services | |||||||||
Class 1 | Not applicable | Not applicable | $ | 160 | ||||||||
Class 1A* | $ | — | $ | — | † | — | † | |||||
Class 2 | 6,149 | Not applicable | 246 | |||||||||
Class 4 | 171 | 171 | 7 | |||||||||
|
|
|
|
|
| |||||||
Total class-specific expenses | $ | 6,320 | $ | 171 | $ | 413 | ||||||
|
|
|
|
|
| |||||||
172 American Funds Insurance Series
Table of Contents
Growth Fund
Share class | Distribution services | Insurance administrative services | Administrative services | |||||||||
Class 1 | Not applicable | Not applicable | $ | 774 | ||||||||
Class 1A* | $ | — | $ | 2 | — | † | ||||||
Class 2 | 37,831 | Not applicable | 1,513 | |||||||||
Class 3 | 362 | Not applicable | 20 | |||||||||
Class 4 | 1,542 | 1,542 | 62 | |||||||||
|
|
|
|
|
| |||||||
Total class-specific expenses | $ | 39,735 | $ | 1,544 | $ | 2,369 | ||||||
|
|
|
|
|
| |||||||
International Fund
Share class | Distribution services | Insurance administrative services | Administrative services | |||||||||
Class 1 | Not applicable | Not applicable | $ | 446 | ||||||||
Class 1A* | $ | — | $ | 1 | — | † | ||||||
Class 2 | 10,407 | Not applicable | 416 | |||||||||
Class 3 | 53 | Not applicable | 3 | |||||||||
Class 4 | 304 | 304 | 12 | |||||||||
|
|
|
|
|
| |||||||
Total class-specific expenses | $ | 10,764 | $ | 305 | $ | 877 | ||||||
|
|
|
|
|
| |||||||
New World Fund
Share class | Distribution services | Insurance administrative services | Administrative services | |||||||||
Class 1 | Not applicable | Not applicable | $ | 194 | ||||||||
Class 1A* | $ | — | $ | 1 | — | † | ||||||
Class 2 | 2,507 | Not applicable | 100 | |||||||||
Class 4 | 821 | 820 | 33 | |||||||||
|
|
|
|
|
| |||||||
Total class-specific expenses | $ | 3,328 | $ | 821 | $ | 327 | ||||||
|
|
|
|
|
| |||||||
Blue Chip Income and Growth Fund
Share class | Distribution services | Insurance administrative services | Administrative services | |||||||||
Class 1 | Not applicable | Not applicable | $ | 538 | ||||||||
Class 1A* | $ | — | $ | — | † | — | † | |||||
Class 2 | 8,620 | Not applicable | 345 | |||||||||
Class 4 | 440 | 440 | 18 | |||||||||
|
|
|
|
|
| |||||||
Total class-specific expenses | $ | 9,060 | $ | 440 | $ | 901 | ||||||
|
|
|
|
|
| |||||||
Global Growth and Income Fund
Share class | Distribution services | Insurance administrative services | Administrative services | |||||||||
Class 1 | Not applicable | Not applicable | $ | 51 | ||||||||
Class 1A* | $ | — | $ | — | † | — | † | |||||
Class 2 | 3,734 | Not applicable | 149 | |||||||||
Class 4 | 79 | 79 | 3 | |||||||||
|
|
|
|
|
| |||||||
Total class-specific expenses | $ | 3,813 | $ | 79 | $ | 203 | ||||||
|
|
|
|
|
| |||||||
Growth-Income Fund
Share class | Distribution services | Insurance administrative services | Administrative services | |||||||||
Class 1 | Not applicable | Not applicable | $ | 1,424 | ||||||||
Class 1A* | $ | — | $ | 2 | — | † | ||||||
Class 2 | 33,675 | Not applicable | 1,347 | |||||||||
Class 3 | 292 | Not applicable | 16 | |||||||||
Class 4 | 1,513 | 1,513 | 61 | |||||||||
|
|
|
|
|
| |||||||
Total class-specific expenses | $ | 35,480 | $ | 1,515 | $ | 2,848 | ||||||
|
|
|
|
|
| |||||||
International Growth and Income Fund
Share class | Distribution services | Insurance administrative services | Administrative services | |||||||||
Class 1 | Not applicable | Not applicable | $ | 100 | ||||||||
Class 1A* | $ | — | $ | 1 | — | † | ||||||
Class 2 | 656 | Not applicable | 26 | |||||||||
Class 4 | 123 | 122 | 5 | |||||||||
|
|
|
|
|
| |||||||
Total class-specific expenses | $ | 779 | $ | 123 | $ | 131 | ||||||
|
|
|
|
|
| |||||||
Capital Income Builder
Share class | Distribution services | Insurance administrative services | Administrative services | |||||||||
Class 1 | Not applicable | Not applicable | $ | 20 | ||||||||
Class 1A* | $ | — | $ | 1 | — | † | ||||||
Class 2 | 2 | Not applicable | — | † | ||||||||
Class 4 | 746 | 746 | 30 | |||||||||
|
|
|
|
|
| |||||||
Total class-specific expenses | $ | 748 | $ | 747 | $ | 50 | ||||||
|
|
|
|
|
| |||||||
See end of tables for footnotes.
American Funds Insurance Series 173
Table of Contents
Asset Allocation Fund
Share class | Distribution services | Insurance administrative services | Administrative services | |||||||||
Class 1 | Not applicable | Not applicable | $ | 1,501 | ||||||||
Class 1A* | $ | — | $ | 4 | — | † | ||||||
Class 2 | 13,450 | Not applicable | 538 | |||||||||
Class 3 | 66 | Not applicable | 4 | |||||||||
Class 4 | 8,079 | 8,080 | 323 | |||||||||
|
|
|
|
|
| |||||||
Total class-specific expenses | $ | 21,595 | $ | 8,084 | $ | 2,366 | ||||||
|
|
|
|
|
| |||||||
Global Balanced Fund
Share class | Distribution services | Insurance administrative services | Administrative services | |||||||||
Class 1 | Not applicable | Not applicable | $ | 8 | ||||||||
Class 1A* | $ | — | $ | — | — | † | ||||||
Class 2 | 487 | Not applicable | 19 | |||||||||
Class 4 | 65 | 65 | 3 | |||||||||
|
|
|
|
|
| |||||||
Total class-specific expenses | $ | 552 | $ | 65 | $ | 30 | ||||||
|
|
|
|
|
| |||||||
Bond Fund
Share class | Distribution services | Insurance administrative services | Administrative services | |||||||||
Class 1 | Not applicable | Not applicable | $ | 673 | ||||||||
Class 1A* | $ | — | $ | 1 | — | † | ||||||
Class 2 | 9,931 | Not applicable | 397 | |||||||||
Class 4 | 359 | 359 | 15 | |||||||||
|
|
|
|
|
| |||||||
Total class-specific expenses | $ | 10,290 | $ | 360 | $ | 1,085 | ||||||
|
|
|
|
|
| |||||||
Global Bond Fund
Share class | Distribution services | Insurance administrative services | Administrative services | |||||||||
Class 1 | Not applicable | Not applicable | $ | 121 | ||||||||
Class 1A* | $ | — | $ | — | † | — | † | |||||
Class 2 | 2,887 | Not applicable | 115 | |||||||||
Class 4 | 42 | 42 | 2 | |||||||||
|
|
|
|
|
| |||||||
Total class-specific expenses | $ | 2,929 | $ | 42 | $ | 238 | ||||||
|
|
|
|
|
| |||||||
High-Income Bond Fund
Share class | Distribution services | Insurance administrative services | Administrative services | |||||||||
Class 1 | Not applicable | Not applicable | $ | 81 | ||||||||
Class 1A* | $ | — | $ | — | † | — | † | |||||
Class 2 | 1,994 | Not applicable | 80 | |||||||||
Class 3 | 23 | Not applicable | 1 | |||||||||
Class 4 | 67 | 67 | 3 | |||||||||
|
|
|
|
|
| |||||||
Total class-specific expenses | $ | 2,084 | $ | 67 | $ | 165 | ||||||
|
|
|
|
|
| |||||||
Mortgage Fund
Share class | Distribution services | Insurance administrative services | Administrative services | |||||||||
Class 1 | Not applicable | Not applicable | $ | 27 | ||||||||
Class 1A* | $ | — | $ | — | † | — | † | |||||
Class 2 | 156 | Not applicable | 6 | |||||||||
Class 4 | 24 | 25 | 1 | |||||||||
|
|
|
|
|
| |||||||
Total class-specific expenses | $ | 180 | $ | 25 | $ | 34 | ||||||
|
|
|
|
|
| |||||||
Ultra-Short Bond Fund
Share class | Distribution services | Insurance administrative services | Administrative services | |||||||||
Class 1 | Not applicable | Not applicable | $ | 4 | ||||||||
Class 1A* | $ | — | $ | — | — | |||||||
Class 2 | 659 | Not applicable | 26 | |||||||||
Class 3 | 7 | Not applicable | — | † | ||||||||
Class 4 | 38 | 38 | 2 | |||||||||
|
|
|
|
|
| |||||||
Total class-specific expenses | $ | 704 | $ | 38 | $ | 32 | ||||||
|
|
|
|
|
| |||||||
U.S. Government/AAA-Rated Securities Fund
Share class | Distribution services | Insurance administrative services | Administrative services | |||||||||
Class 1 | Not applicable | Not applicable | $ | 145 | ||||||||
Class 1A* | $ | — | $ | — | † | — | † | |||||
Class 2 | 3,721 | Not applicable | 149 | |||||||||
Class 3 | 19 | Not applicable | 1 | |||||||||
Class 4 | 143 | 144 | 6 | |||||||||
|
|
|
|
|
| |||||||
Total class-specific expenses | $ | 3,883 | $ | 144 | $ | 301 | ||||||
|
|
|
|
|
| |||||||
174 American Funds Insurance Series
Table of Contents
| Managed Risk Growth Fund | ||||||||
Share class | Distribution services | Insurance administrative services | ||||||
Class P1 | Not applicable | $ | 3 | |||||
Class P2 | $ | 616 | 616 | |||||
|
|
|
| |||||
Total class-specific expenses | $ | 616 | $ | 619 | ||||
|
|
|
| |||||
| Managed Risk International Fund | ||||||||
Share class | Distribution services | Insurance administrative services | ||||||
Class P1 | Not applicable | $ | — | † | ||||
Class P2 | $ | 311 | 311 | |||||
|
|
|
| |||||
Total class-specific expenses | $ | 311 | $ | 311 | ||||
|
|
|
| |||||
| Managed Risk Blue Chip Income and Growth Fund | ||||||||
Share class | Distribution services | Insurance administrative services | ||||||
Class P1 | Not applicable | $ | — | † | ||||
Class P2 | $ | 883 | 883 | |||||
|
|
|
| |||||
Total class-specific expenses | $ | 883 | $ | 883 | ||||
|
|
|
| |||||
| Managed Risk Growth-Income Fund | ||||||||
Share class | Distribution services | Insurance administrative services | ||||||
Class P1 | Not applicable | $ | 5 | |||||
Class P2 | $ | 463 | 463 | |||||
|
|
|
| |||||
Total class-specific expenses | $ | 463 | $ | 468 | ||||
|
|
|
| |||||
| Managed Risk Asset Allocation Fund | ||||||||
Share class | Distribution services | Insurance administrative services | ||||||
Class P1 | Not applicable | $ | 3,640 | |||||
Class P2 | $ | 6,556 | 6,556 | |||||
|
|
|
| |||||
Total class-specific expenses | $ | 6,556 | $ | 10,196 | ||||
|
|
|
| |||||
| * | Class 1A shares began investment operations on January 6, 2017. |
| † | Amount less than one thousand. |
American Funds Insurance Series 175
Table of Contents
Trustees’ deferred compensation — Trustees who are unaffiliated with CRMC may elect to defer the cash payment of part or all of their compensation. These deferred amounts, which remain as liabilities of the funds, are treated as if invested in one or more of the American Funds. These amounts represent general, unsecured liabilities of the funds and vary according to the total returns of the selected funds. Trustees’ compensation, shown on the accompanying financial statements, reflects current fees (either paid in cash or deferred) and a net increase in the value of the deferred amounts as follows (dollars in thousands):
| Current fees | Increase in value of deferred amounts | Total trustees’ compensation | ||||||||||
Global Growth Fund | $ | 36 | $ | 14 | $ | 50 | ||||||
Global Small Capitalization Fund | 26 | 10 | 36 | |||||||||
Growth Fund | 146 | 57 | 203 | |||||||||
International Fund | 52 | 21 | 73 | |||||||||
New World Fund | 20 | 8 | 28 | |||||||||
Blue Chip Income and Growth Fund | 56 | 22 | 78 | |||||||||
Global Growth and Income Fund | 13 | 5 | 18 | |||||||||
Growth-Income Fund | 175 | 68 | 243 | |||||||||
International Growth and Income Fund | 8 | 3 | 11 | |||||||||
Capital Income Builder | 3 | 1 | 4 | |||||||||
Asset Allocation Fund | 144 | 56 | 200 | |||||||||
Global Balanced Fund | 2 | 1 | 3 | |||||||||
Bond Fund | 70 | 26 | 96 | |||||||||
Global Bond Fund | 15 | 6 | 21 | |||||||||
High-Income Bond Fund | 11 | 4 | 15 | |||||||||
Mortgage Fund | 2 | 1 | 3 | |||||||||
Ultra-Short Bond Fund | 2 | 1 | 3 | |||||||||
U.S. Government/AAA-Rated Securities Fund | 19 | 7 | 26 | |||||||||
Managed Risk Growth Fund | 1 | 1 | 2 | |||||||||
Managed Risk International Fund | 1 | — | * | 1 | ||||||||
Managed Risk Blue Chip Income and Growth Fund | 2 | 1 | 3 | |||||||||
Managed Risk Growth-Income Fund | 2 | — | * | 2 | ||||||||
Managed Risk Asset Allocation Fund | 24 | 10 | 34 | |||||||||
| * | Amount less than one thousand. |
Affiliated officers and trustees — Officers and certain trustees of the series are or may be considered to be affiliated with CRMC, AFD and AFS. No affiliated officers or trustees received any compensation directly from any fund in the series.
Security transactions with related funds — The funds may purchase from, or sell securities to, other CRMC-managed funds (or funds managed by certain affiliates of CRMC) under procedures adopted by the fund’s board of trustees. The funds involved in such transactions are considered related by virtue of having a common investment adviser (or affiliated investment advisers), common trustees and/or common officers. When such transactions occur, each transaction is executed at the current market price of the security and no brokerage commissions or fees are paid in accordance with Rule 17a-7 of the 1940 Act.
The following table presents purchase and sales transactions between each fund and related funds as of December 31, 2017 (dollars in thousands):
| Purchases | Sales | |||||||
Global Small Capitalization Fund | $ | 15,273 | $ | 109,018 | ||||
Blue Chip Income and Growth Fund | 80,277 | 170,978 | ||||||
8. Committed line of credit
Global Small Capitalization Fund, New World Fund and High-Income Bond Fund participate with other funds managed by CRMC in a $1 billion credit facility (the “line of credit”) to be utilized for temporary purposes to fund shareholder redemptions. Each fund has agreed to pay commitment fees on its pro-rata portion of the line of credit, which are reflected in other expenses in each fund’s statement of operations. None of the funds borrowed on this line of credit at any time during the year ended December 31, 2017.
176 American Funds Insurance Series
Table of Contents
9. Capital share transactions
Capital share transactions in the funds were as follows (dollars and shares in thousands):
Global Growth Fund
| Sales1 | Reinvestments of dividends and distributions | Repurchases1 | Net (decrease) increase | |||||||||||||||||||||||||||||
Share class | Amount | Shares | Amount | Shares | Amount | Shares | Amount | Shares | ||||||||||||||||||||||||
Year ended December 31, 2017 | ||||||||||||||||||||||||||||||||
Class 1 | $ | 202,598 | 7,210 | $ | 72,128 | 2,554 | $ | (331,323 | ) | (11,655 | ) | $ | (56,597 | ) | (1,891 | ) | ||||||||||||||||
Class 1A2 | 2,333 | 80 | 31 | 1 | (125 | ) | (4 | ) | 2,239 | 77 | ||||||||||||||||||||||
Class 2 | 55,435 | 2,042 | 139,728 | 5,015 | (563,057 | ) | (20,391 | ) | (367,894 | ) | (13,334 | ) | ||||||||||||||||||||
Class 4 | 92,931 | 3,271 | 4,951 | 178 | (11,055 | ) | (400 | ) | 86,827 | 3,049 | ||||||||||||||||||||||
|
|
|
|
|
|
|
|
|
|
|
|
|
|
|
| |||||||||||||||||
Total net increase (decrease) | $ | 353,297 | 12,603 | $ | 216,838 | 7,748 | $ | (905,560 | ) | (32,450 | ) | $ | (335,425 | ) | (12,099 | ) | ||||||||||||||||
|
|
|
|
|
|
|
|
|
|
|
|
|
|
|
| |||||||||||||||||
Year ended December 31, 2016 | ||||||||||||||||||||||||||||||||
Class 1 | $ | 214,321 | 8,771 | $ | 150,842 | 6,520 | $ | (225,629 | ) | (9,136 | ) | $ | 139,534 | 6,155 | ||||||||||||||||||
Class 2 | 98,924 | 4,087 | 336,499 | 14,694 | (451,495 | ) | (18,489 | ) | (16,072 | ) | 292 | |||||||||||||||||||||
Class 4 | 31,776 | 1,313 | 8,092 | 354 | (28,384 | ) | (1,172 | ) | 11,484 | 495 | ||||||||||||||||||||||
|
|
|
|
|
|
|
|
|
|
|
|
|
|
|
| |||||||||||||||||
Total net increase (decrease) | $ | 345,021 | 14,171 | $ | 495,433 | 21,568 | $ | (705,508 | ) | (28,797 | ) | $ | 134,946 | 6,942 | ||||||||||||||||||
|
|
|
|
|
|
|
|
|
|
|
|
|
|
|
| |||||||||||||||||
Global Small Capitalization Fund | ||||||||||||||||||||||||||||||||
| Sales1 | Reinvestments of dividends and distributions | Repurchases1 | Net (decrease) increase | |||||||||||||||||||||||||||||
Share class | Amount | Shares | Amount | Shares | Amount | Shares | Amount | Shares | ||||||||||||||||||||||||
Year ended December 31, 2017 | ||||||||||||||||||||||||||||||||
Class 1 | $ | 128,448 | 5,651 | $ | 10,108 | 429 | $ | (396,272 | ) | (17,174 | ) | $ | (257,716 | ) | (11,094 | ) | ||||||||||||||||
Class 1A2 | 169 | 8 | 1 | — | 3 | — | 3 | — | 3 | 170 | 8 | |||||||||||||||||||||
Class 2 | 27,876 | 1,267 | 10,597 | 472 | (343,593 | ) | (15,314 | ) | (305,120 | ) | (13,575 | ) | ||||||||||||||||||||
Class 4 | 73,197 | 3,126 | 270 | 12 | (5,899 | ) | (258 | ) | 67,568 | 2,880 | ||||||||||||||||||||||
|
|
|
|
|
|
|
|
|
|
|
|
|
|
|
| |||||||||||||||||
Total net increase (decrease) | $ | 229,690 | 10,052 | $ | 20,976 | 913 | $ | (745,764 | ) | (32,746 | ) | $ | (495,098 | ) | (21,781 | ) | ||||||||||||||||
|
|
|
|
|
|
|
|
|
|
|
|
|
|
|
| |||||||||||||||||
Year ended December 31, 2016 | ||||||||||||||||||||||||||||||||
Class 1 | $ | 161,105 | 7,595 | $ | 285,447 | 14,932 | $ | (368,707 | ) | (16,753 | ) | $ | 77,845 | 5,774 | ||||||||||||||||||
Class 2 | 54,521 | 2,619 | 445,999 | 23,986 | (293,447 | ) | (14,137 | ) | 207,073 | 12,468 | ||||||||||||||||||||||
Class 4 | 16,563 | 792 | 6,857 | 365 | (8,311 | ) | (402 | ) | 15,109 | 755 | ||||||||||||||||||||||
|
|
|
|
|
|
|
|
|
|
|
|
|
|
|
| |||||||||||||||||
Total net increase (decrease) | $ | 232,189 | 11,006 | $ | 738,303 | 39,283 | $ | (670,465 | ) | (31,292 | ) | $ | 300,027 | 18,997 | ||||||||||||||||||
|
|
|
|
|
|
|
|
|
|
|
|
|
|
|
| |||||||||||||||||
See end of tables for footnotes.
American Funds Insurance Series 177
Table of Contents
Growth Fund
| Sales1 | Reinvestments of dividends and distributions | Repurchases1 | Net increase (decrease) | |||||||||||||||||||||||||||||
Share class | Amount | Shares | Amount | Shares | Amount | Shares | Amount | Shares | ||||||||||||||||||||||||
Year ended December 31, 2017 | ||||||||||||||||||||||||||||||||
Class 1 | $ | 505,734 | 6,906 | $ | 786,807 | 11,094 | $ | (1,258,545 | ) | (16,930 | ) | $ | 33,996 | 1,070 | ||||||||||||||||||
Class 1A2 | 2,708 | 36 | 78 | 1 | (94 | ) | (1 | ) | 2,692 | 36 | ||||||||||||||||||||||
Class 2 | 206,092 | 2,819 | 1,520,175 | 21,621 | (2,205,078 | ) | (30,135 | ) | (478,811 | ) | (5,695 | ) | ||||||||||||||||||||
Class 3 | 468 | 6 | 20,085 | 282 | (21,851 | ) | (295 | ) | (1,298 | ) | (7 | ) | ||||||||||||||||||||
Class 4 | 407,312 | 5,509 | 58,020 | 832 | (56,254 | ) | (776 | ) | 409,078 | 5,565 | ||||||||||||||||||||||
|
|
|
|
|
|
|
|
|
|
|
|
|
|
|
| |||||||||||||||||
Total net increase (decrease) | $ | 1,122,314 | 15,276 | $ | 2,385,165 | 33,830 | $ | (3,541,822 | ) | (48,137 | ) | $ | (34,343 | ) | 969 | |||||||||||||||||
|
|
|
|
|
|
|
|
|
|
|
|
|
|
|
| |||||||||||||||||
Year ended December 31, 2016 | ||||||||||||||||||||||||||||||||
Class 1 | $ | 458,166 | 7,079 | $ | 669,418 | 10,693 | $ | (964,251 | ) | (14,691 | ) | $ | 163,333 | 3,081 | ||||||||||||||||||
Class 2 | 177,712 | 2,745 | 1,349,846 | 21,732 | (1,859,064 | ) | (28,538 | ) | (331,506 | ) | (4,061 | ) | ||||||||||||||||||||
Class 3 | 1,102 | 18 | 17,818 | 284 | (27,723 | ) | (425 | ) | (8,803 | ) | (123 | ) | ||||||||||||||||||||
Class 4 | 75,062 | 1,167 | 39,264 | 638 | (49,300 | ) | (768 | ) | 65,026 | 1,037 | ||||||||||||||||||||||
|
|
|
|
|
|
|
|
|
|
|
|
|
|
|
| |||||||||||||||||
Total net increase (decrease) | $ | 712,042 | 11,009 | $ | 2,076,346 | 33,347 | $ | (2,900,338 | ) | (44,422 | ) | $ | (111,950 | ) | (66 | ) | ||||||||||||||||
|
|
|
|
|
|
|
|
|
|
|
|
|
|
|
| |||||||||||||||||
International Fund |
| |||||||||||||||||||||||||||||||
| Sales1 | Reinvestments of dividends and distributions | Repurchases1 | Net increase (decrease) | |||||||||||||||||||||||||||||
Share class | Amount | Shares | Amount | Shares | Amount | Shares | Amount | Shares | ||||||||||||||||||||||||
Year ended December 31, 2017 | ||||||||||||||||||||||||||||||||
Class 1 | $ | 760,186 | 38,348 | $ | 119,937 | 5,881 | $ | (613,463 | ) | (30,471 | ) | $ | 266,660 | 13,758 | ||||||||||||||||||
Class 1A2 | 1,638 | 80 | 20 | 1 | (119 | ) | (5 | ) | 1,539 | 76 | ||||||||||||||||||||||
Class 2 | 174,876 | 8,941 | 100,155 | 4,954 | (605,647 | ) | (30,845 | ) | (330,616 | ) | (16,950 | ) | ||||||||||||||||||||
Class 3 | 274 | 13 | 726 | 36 | (3,886 | ) | (197 | ) | (2,886 | ) | (148 | ) | ||||||||||||||||||||
Class 4 | 209,217 | 10,089 | 4,092 | 200 | (14,987 | ) | (752 | ) | 198,322 | 9,537 | ||||||||||||||||||||||
|
|
|
|
|
|
|
|
|
|
|
|
|
|
|
| |||||||||||||||||
Total net increase (decrease) | $ | 1,146,191 | 57,471 | $ | 224,930 | 11,072 | $ | (1,238,102 | ) | (62,270 | ) | $ | 133,019 | 6,273 | ||||||||||||||||||
|
|
|
|
|
|
|
|
|
|
|
|
|
|
|
| |||||||||||||||||
Year ended December 31, 2016 | ||||||||||||||||||||||||||||||||
Class 1 | $ | 502,624 | 29,474 | $ | 355,240 | 22,171 | $ | (416,969 | ) | (24,055 | ) | $ | 440,895 | 27,590 | ||||||||||||||||||
Class 2 | 190,542 | 11,247 | 385,917 | 24,231 | (598,017 | ) | (34,790 | ) | (21,558 | ) | 688 | |||||||||||||||||||||
Class 3 | 122 | 7 | 2,834 | 177 | (5,902 | ) | (343 | ) | (2,946 | ) | (159 | ) | ||||||||||||||||||||
Class 4 | 25,077 | 1,477 | 5,458 | 345 | (7,439 | ) | (436 | ) | 23,096 | 1,386 | ||||||||||||||||||||||
|
|
|
|
|
|
|
|
|
|
|
|
|
|
|
| |||||||||||||||||
Total net increase (decrease) | $ | 718,365 | 42,205 | $ | 749,449 | 46,924 | $ | (1,028,327 | ) | (59,624 | ) | $ | 439,487 | 29,505 | ||||||||||||||||||
|
|
|
|
|
|
|
|
|
|
|
|
|
|
|
| |||||||||||||||||
New World Fund |
| |||||||||||||||||||||||||||||||
| Sales1 | Reinvestments of dividends | Repurchases1 | Net (decrease) increase | |||||||||||||||||||||||||||||
Share class | Amount | Shares | Amount | Shares | Amount | Shares | Amount | Shares | ||||||||||||||||||||||||
Year ended December 31, 2017 | ||||||||||||||||||||||||||||||||
Class 1 | $ | 280,518 | 12,105 | $ | 21,909 | 893 | $ | (475,480 | ) | (20,394 | ) | $ | (173,053 | ) | (7,396 | ) | ||||||||||||||||
Class 1A2 | 629 | 27 | 6 | — | 3 | (13 | ) | (1 | ) | 622 | 26 | |||||||||||||||||||||
Class 2 | 143,361 | 6,559 | 9,149 | 376 | (254,737 | ) | (11,445 | ) | (102,227 | ) | (4,510 | ) | ||||||||||||||||||||
Class 4 | 127,556 | 5,560 | 3,016 | 124 | (20,431 | ) | (895 | ) | 110,141 | 4,789 | ||||||||||||||||||||||
|
|
|
|
|
|
|
|
|
|
|
|
|
|
|
| |||||||||||||||||
Total net increase (decrease) | $ | 552,064 | 24,251 | $ | 34,080 | 1,393 | $ | (750,661 | ) | (32,735 | ) | $ | (164,517 | ) | (7,091 | ) | ||||||||||||||||
|
|
|
|
|
|
|
|
|
|
|
|
|
|
|
| |||||||||||||||||
Year ended December 31, 2016 | ||||||||||||||||||||||||||||||||
Class 1 | $ | 343,390 | 17,604 | $ | 17,686 | 901 | $ | (250,303 | ) | (12,858 | ) | $ | 110,773 | 5,647 | ||||||||||||||||||
Class 2 | 51,238 | 2,661 | 7,100 | 365 | (149,682 | ) | (7,790 | ) | (91,344 | ) | (4,764 | ) | ||||||||||||||||||||
Class 4 | 71,177 | 3,754 | 1,465 | 75 | (12,695 | ) | (670 | ) | 59,947 | 3,159 | ||||||||||||||||||||||
|
|
|
|
|
|
|
|
|
|
|
|
|
|
|
| |||||||||||||||||
Total net increase (decrease) | $ | 465,805 | 24,019 | $ | 26,251 | 1,341 | $ | (412,680 | ) | (21,318 | ) | $ | 79,376 | 4,042 | ||||||||||||||||||
|
|
|
|
|
|
|
|
|
|
|
|
|
|
|
| |||||||||||||||||
178 American Funds Insurance Series
Table of Contents
Blue Chip Income and Growth Fund
| Sales1 | Reinvestments of dividends and distributions | Repurchases1 | Net (decrease) increase | |||||||||||||||||||||||||||||
Share class | Amount | Shares | Amount | Shares | Amount | Shares | Amount | Shares | ||||||||||||||||||||||||
Year ended December 31, 2017 | ||||||||||||||||||||||||||||||||
Class 1 | $ | 458,480 | 32,688 | $ | 309,238 | 21,989 | $ | (834,928 | ) | (58,499 | ) | $ | (67,210 | ) | (3,822 | ) | ||||||||||||||||
Class 1A2 | 593 | 42 | 17 | 1 | (15 | ) | (1 | ) | 595 | 42 | ||||||||||||||||||||||
Class 2 | 34,639 | 2,502 | 195,693 | 14,095 | (439,009 | ) | (31,376 | ) | (208,677 | ) | (14,779 | ) | ||||||||||||||||||||
Class 4 | 129,429 | 9,259 | 10,522 | 756 | (43,213 | ) | (3,132 | ) | 96,738 | 6,883 | ||||||||||||||||||||||
|
|
|
|
|
|
|
|
|
|
|
|
|
|
|
| |||||||||||||||||
Total net increase (decrease) | $ | 623,141 | 44,491 | $ | 515,470 | 36,841 | $ | (1,317,165 | ) | (93,008 | ) | $ | (178,554 | ) | (11,676 | ) | ||||||||||||||||
|
|
|
|
|
|
|
|
|
|
|
|
|
|
|
| |||||||||||||||||
Year ended December 31, 2016 | ||||||||||||||||||||||||||||||||
Class 1 | $ | 986,168 | 74,990 | $ | 426,031 | 33,628 | $ | (260,962 | ) | (20,029 | ) | $ | 1,151,237 | 88,589 | ||||||||||||||||||
Class 2 | 42,572 | 3,274 | 328,996 | 26,334 | (424,524 | ) | (32,897 | ) | (52,956 | ) | (3,289 | ) | ||||||||||||||||||||
Class 4 | 105,759 | 8,137 | 7,693 | 611 | (18,601 | ) | (1,441 | ) | 94,851 | 7,307 | ||||||||||||||||||||||
|
|
|
|
|
|
|
|
|
|
|
|
|
|
|
| |||||||||||||||||
Total net increase (decrease) | $ | 1,134,499 | 86,401 | $ | 762,720 | 60,573 | $ | (704,087 | ) | (54,367 | ) | $ | 1,193,132 | 92,607 | ||||||||||||||||||
|
|
|
|
|
|
|
|
|
|
|
|
|
|
|
| |||||||||||||||||
Global Growth and Income Fund
| Sales1 | Reinvestments of dividends and distributions | Repurchases1 | Net (decrease) increase | |||||||||||||||||||||||||||||
Share class | Amount | Shares | Amount | Shares | Amount | Shares | Amount | Shares | ||||||||||||||||||||||||
Year ended December 31, 2017 | ||||||||||||||||||||||||||||||||
Class 1 | $ | 133,943 | 8,899 | $ | 16,607 | 1,095 | $ | (345,498 | ) | (23,190 | ) | $ | (194,948 | ) | (13,196 | ) | ||||||||||||||||
Class 1A2 | 125 | 8 | 3 | — | 3 | (3 | ) | — | 3 | 125 | 8 | |||||||||||||||||||||
Class 2 | 25,134 | 1,709 | 56,976 | 3,780 | (236,596 | ) | (16,119 | ) | (154,486 | ) | (10,630 | ) | ||||||||||||||||||||
Class 4 | 63,660 | 4,175 | 1,883 | 123 | (6,203 | ) | (417 | ) | 59,340 | 3,881 | ||||||||||||||||||||||
|
|
|
|
|
|
|
|
|
|
|
|
|
|
|
| |||||||||||||||||
Total net increase (decrease) | $ | 222,862 | 14,791 | $ | 75,469 | 4,998 | $ | (588,300 | ) | (39,726 | ) | $ | (289,969 | ) | (19,937 | ) | ||||||||||||||||
|
|
|
|
|
|
|
|
|
|
|
|
|
|
|
| |||||||||||||||||
Year ended December 31, 2016 | ||||||||||||||||||||||||||||||||
Class 1 | $ | 292,208 | 23,201 | $ | 10,481 | 808 | $ | (49,576 | ) | (3,887 | ) | $ | 253,113 | 20,122 | ||||||||||||||||||
Class 2 | 25,520 | 2,043 | 25,283 | 1,955 | (199,986 | ) | (15,865 | ) | (149,183 | ) | (11,867 | ) | ||||||||||||||||||||
Class 4 | 12,357 | 989 | 257 | 20 | (2,230 | ) | (180 | ) | 10,384 | 829 | ||||||||||||||||||||||
|
|
|
|
|
|
|
|
|
|
|
|
|
|
|
| |||||||||||||||||
Total net increase (decrease) | $ | 330,085 | 26,233 | $ | 36,021 | 2,783 | $ | (251,792 | ) | (19,932 | ) | $ | 114,314 | 9,084 | ||||||||||||||||||
|
|
|
|
|
|
|
|
|
|
|
|
|
|
|
| |||||||||||||||||
Growth-Income Fund |
| |||||||||||||||||||||||||||||||
| Sales1 | Reinvestments of dividends and distributions | Repurchases1 | Net increase (decrease) | |||||||||||||||||||||||||||||
Share class | Amount | Shares | Amount | Shares | Amount | Shares | Amount | Shares | ||||||||||||||||||||||||
Year ended December 31, 2017 | ||||||||||||||||||||||||||||||||
Class 1 | $ | 1,521,886 | 32,100 | $ | 1,132,034 | 24,392 | $ | (1,241,004 | ) | (26,012 | ) | $ | 1,412,916 | 30,480 | ||||||||||||||||||
Class 1A2 | 2,070 | 43 | 40 | 1 | (24 | ) | (1 | ) | 2,086 | 43 | ||||||||||||||||||||||
Class 2 | 120,223 | 2,558 | 1,048,742 | 22,899 | (1,761,342 | ) | (37,375 | ) | (592,377 | ) | (11,918 | ) | ||||||||||||||||||||
Class 3 | 473 | 10 | 12,561 | 271 | (21,746 | ) | (457 | ) | (8,712 | ) | (176 | ) | ||||||||||||||||||||
Class 4 | 267,835 | 5,641 | 46,486 | 1,020 | (56,983 | ) | (1,217 | ) | 257,338 | 5,444 | ||||||||||||||||||||||
|
|
|
|
|
|
|
|
|
|
|
|
|
|
|
| |||||||||||||||||
Total net increase (decrease) | $ | 1,912,487 | 40,352 | $ | 2,239,863 | 48,583 | $ | (3,081,099 | ) | (65,062 | ) | $ | 1,071,251 | 23,873 | ||||||||||||||||||
|
|
|
|
|
|
|
|
|
|
|
|
|
|
|
| |||||||||||||||||
Year ended December 31, 2016 | ||||||||||||||||||||||||||||||||
Class 1 | $ | 1,364,357 | 31,261 | $ | 1,429,866 | 34,358 | $ | (830,642 | ) | (18,888 | ) | $ | 1,963,581 | 46,731 | ||||||||||||||||||
Class 2 | 142,903 | 3,288 | 1,580,603 | 38,422 | (1,561,195 | ) | (35,880 | ) | 162,311 | 5,830 | ||||||||||||||||||||||
Class 3 | 1,293 | 30 | 19,402 | 467 | (23,792 | ) | (543 | ) | (3,097 | ) | (46 | ) | ||||||||||||||||||||
Class 4 | 72,892 | 1,695 | 54,139 | 1,325 | (35,791 | ) | (829 | ) | 91,240 | 2,191 | ||||||||||||||||||||||
|
|
|
|
|
|
|
|
|
|
|
|
|
|
|
| |||||||||||||||||
Total net increase (decrease) | $ | 1,581,445 | 36,274 | $ | 3,084,010 | 74,572 | $ | (2,451,420 | ) | (56,140 | ) | $ | 2,214,035 | 54,706 | ||||||||||||||||||
|
|
|
|
|
|
|
|
|
|
|
|
|
|
|
| |||||||||||||||||
See end of tables for footnotes.
American Funds Insurance Series 179
Table of Contents
International Growth and Income Fund
| Sales1 | Reinvestments of dividends and distributions | Repurchases1 | Net increase (decrease) | |||||||||||||||||||||||||||||
Share class | Amount | Shares | Amount | Shares | Amount | Shares | Amount | Shares | ||||||||||||||||||||||||
Year ended December 31, 2017 | ||||||||||||||||||||||||||||||||
Class 1 | $ | 186,307 | 11,140 | $ | 25,860 | 1,487 | $ | (101,536 | ) | (6,072 | ) | $ | 110,631 | 6,555 | ||||||||||||||||||
Class 1A2 | 2,100 | 121 | 14 | 1 | (1 | ) | — | 3 | 2,113 | 122 | ||||||||||||||||||||||
Class 2 | 8,391 | 510 | 5,714 | 329 | (34,542 | ) | (2,118 | ) | (20,437 | ) | (1,279 | ) | ||||||||||||||||||||
Class 4 | 19,465 | 1,164 | 1,184 | 69 | (3,332 | ) | (202 | ) | 17,317 | 1,031 | ||||||||||||||||||||||
|
|
|
|
|
|
|
|
|
|
|
|
|
|
|
| |||||||||||||||||
Total net increase (decrease) | $ | 216,263 | 12,935 | $ | 32,772 | 1,886 | $ | (139,411 | ) | (8,392 | ) | $ | 109,624 | 6,429 | ||||||||||||||||||
|
|
|
|
|
|
|
|
|
|
|
|
|
|
|
| |||||||||||||||||
Year ended December 31, 2016 | ||||||||||||||||||||||||||||||||
Class 1 | $ | 105,994 | 7,226 | $ | 26,726 | 1,853 | $ | (5,982 | ) | (396 | ) | $ | 126,738 | 8,683 | ||||||||||||||||||
Class 2 | 17,101 | 1,182 | 7,312 | 508 | (30,910 | ) | (2,088 | ) | (6,497 | ) | (398 | ) | ||||||||||||||||||||
Class 4 | 8,076 | 551 | 1,044 | 73 | (3,762 | ) | (258 | ) | 5,358 | 366 | ||||||||||||||||||||||
|
|
|
|
|
|
|
|
|
|
|
|
|
|
|
| |||||||||||||||||
Total net increase (decrease) | $ | 131,171 | 8,959 | $ | 35,082 | 2,434 | $ | (40,654 | ) | (2,742 | ) | $ | 125,599 | 8,651 | ||||||||||||||||||
|
|
|
|
|
|
|
|
|
|
|
|
|
|
|
| |||||||||||||||||
Capital Income Builder |
| |||||||||||||||||||||||||||||||
| Sales1 | Reinvestments of dividends | Repurchases1 | Net increase | |||||||||||||||||||||||||||||
Share class | Amount | Shares | Amount | Shares | Amount | Shares | Amount | Shares | ||||||||||||||||||||||||
Year ended December 31, 2017 | ||||||||||||||||||||||||||||||||
Class 1 | $ | 84,130 | 8,355 | $ | 6,303 | 622 | $ | (9,923 | ) | (984 | ) | $ | 80,510 | 7,993 | ||||||||||||||||||
Class 1A2 | 1,245 | 122 | 8 | 1 | (365 | ) | (36 | ) | 888 | 87 | ||||||||||||||||||||||
Class 2 | 1,371 | 136 | 23 | 2 | (122 | ) | (12 | ) | 1,272 | 126 | ||||||||||||||||||||||
Class 4 | 66,028 | 6,590 | 7,676 | 760 | (19,222 | ) | (1,922 | ) | 54,482 | 5,428 | ||||||||||||||||||||||
|
|
|
|
|
|
|
|
|
|
|
|
|
|
|
| |||||||||||||||||
Total net increase (decrease) | $ | 152,774 | 15,203 | $ | 14,010 | 1,385 | $ | (29,632 | ) | (2,954 | ) | $ | 137,152 | 13,634 | ||||||||||||||||||
|
|
|
|
|
|
|
|
|
|
|
|
|
|
|
| |||||||||||||||||
Year ended December 31, 2016 | ||||||||||||||||||||||||||||||||
Class 1 | $ | 95,122 | 9,946 | $ | 4,372 | 458 | $ | (23,129 | ) | (2,439 | ) | $ | 76,365 | 7,965 | ||||||||||||||||||
Class 2 | 144 | 15 | 2 | — | (2 | ) | — | 144 | 15 | |||||||||||||||||||||||
Class 4 | 113,152 | 11,813 | 6,657 | 699 | (20,474 | ) | (2,162 | ) | 99,335 | 10,350 | ||||||||||||||||||||||
|
|
|
|
|
|
|
|
|
|
|
|
|
|
|
| |||||||||||||||||
Total net increase (decrease) | $ | 208,418 | 21,774 | $ | 11,031 | 1,157 | $ | (43,605 | ) | (4,601 | ) | $ | 175,844 | 18,330 | ||||||||||||||||||
|
|
|
|
|
|
|
|
|
|
|
|
|
|
|
| |||||||||||||||||
| Asset Allocation Fund | ||||||||||||||||||||||||||||||||
| Sales1 | Reinvestments of dividends and distributions | Repurchases1 | Net increase (decrease) | |||||||||||||||||||||||||||||
Share class | Amount | Shares | Amount | Shares | Amount | Shares | Amount | Shares | ||||||||||||||||||||||||
Year ended December 31, 2017 | ||||||||||||||||||||||||||||||||
Class 1 | $ | 1,929,702 | 84,102 | $ | 953,771 | 41,982 | $ | (641,572 | ) | (27,828 | ) | $ | 2,241,901 | 98,256 | ||||||||||||||||||
Class 1A2 | 4,261 | 184 | 121 | 5 | (253 | ) | (11 | ) | 4,129 | 178 | ||||||||||||||||||||||
Class 2 | 109,962 | 4,876 | 325,924 | 14,513 | (579,020 | ) | (25,433 | ) | (143,134 | ) | (6,044 | ) | ||||||||||||||||||||
Class 3 | 1,400 | 61 | 2,246 | 99 | (4,469 | ) | (195 | ) | (823 | ) | (35 | ) | ||||||||||||||||||||
Class 4 | 408,549 | 18,017 | 192,666 | 8,617 | (159,354 | ) | (7,104 | ) | 441,861 | 19,530 | ||||||||||||||||||||||
|
|
|
|
|
|
|
|
|
|
|
|
|
|
|
| |||||||||||||||||
Total net increase (decrease) | $ | 2,453,874 | 107,240 | $ | 1,474,728 | 65,216 | $ | (1,384,668 | ) | (60,571 | ) | $ | 2,543,934 | 111,885 | ||||||||||||||||||
|
|
|
|
|
|
|
|
|
|
|
|
|
|
|
| |||||||||||||||||
Year ended December 31, 2016 | ||||||||||||||||||||||||||||||||
Class 1 | $ | 1,419,998 | 67,404 | $ | 510,045 | 24,119 | $ | (436,287 | ) | (20,771 | ) | $ | 1,493,756 | 70,752 | ||||||||||||||||||
Class 2 | 190,550 | 9,074 | 201,323 | 9,626 | (504,479 | ) | (24,294 | ) | (112,606 | ) | (5,594 | ) | ||||||||||||||||||||
Class 3 | 672 | 32 | 1,439 | 68 | (4,926 | ) | (233 | ) | (2,815 | ) | (133 | ) | ||||||||||||||||||||
Class 4 | 385,933 | 18,332 | 100,264 | 4,812 | (163,695 | ) | (7,917 | ) | 322,502 | 15,227 | ||||||||||||||||||||||
|
|
|
|
|
|
|
|
|
|
|
|
|
|
|
| |||||||||||||||||
Total net increase (decrease) | $ | 1,997,153 | 94,842 | $ | 813,071 | 38,625 | $ | (1,109,387 | ) | (53,215 | ) | $ | 1,700,837 | 80,252 | ||||||||||||||||||
|
|
|
|
|
|
|
|
|
|
|
|
|
|
|
| |||||||||||||||||
180 American Funds Insurance Series
Table of Contents
Global Balanced Fund
| Sales1 | Reinvestments of dividends and distributions | Repurchases1 | Net increase | |||||||||||||||||||||||||||||
Share class | Amount | Shares | Amount | Shares | Amount | Shares | Amount | Shares | ||||||||||||||||||||||||
Year ended December 31, 2017 | ||||||||||||||||||||||||||||||||
Class 1 | $ | 22,241 | 1,783 | $ | 3,607 | 285 | $ | (6,039 | ) | (501 | ) | $ | 19,809 | 1,567 | ||||||||||||||||||
Class 1A2 | 244 | 19 | 9 | 1 | — | 3 | — | 3 | 253 | 20 | ||||||||||||||||||||||
Class 2 | 16,382 | 1,346 | 7,928 | 628 | (20,169 | ) | (1,671 | ) | 4,141 | 303 | ||||||||||||||||||||||
Class 4 | 39,763 | 3,218 | 1,778 | 142 | (2,261 | ) | (182 | ) | 39,280 | 3,178 | ||||||||||||||||||||||
|
|
|
|
|
|
|
|
|
|
|
|
|
|
|
| |||||||||||||||||
Total net increase (decrease) | $ | 78,630 | 6,366 | $ | 13,322 | 1,056 | $ | (28,469 | ) | (2,354 | ) | $ | 63,483 | 5,068 | ||||||||||||||||||
|
|
|
|
|
|
|
|
|
|
|
|
|
|
|
| |||||||||||||||||
Year ended December 31, 2016 | ||||||||||||||||||||||||||||||||
Class 1 | $ | 20,046 | 1,826 | $ | 939 | 85 | $ | (6,690 | ) | (590 | ) | $ | 14,295 | 1,321 | ||||||||||||||||||
Class 2 | 22,939 | 2,066 | 2,226 | 201 | (22,938 | ) | (2,086 | ) | 2,227 | 181 | ||||||||||||||||||||||
Class 4 | 9,506 | 864 | 121 | 11 | (652 | ) | (59 | ) | 8,975 | 816 | ||||||||||||||||||||||
|
|
|
|
|
|
|
|
|
|
|
|
|
|
|
| |||||||||||||||||
Total net increase (decrease) | $ | 52,491 | 4,756 | $ | 3,286 | 297 | $ | (30,280 | ) | (2,735 | ) | $ | 25,497 | 2,318 | ||||||||||||||||||
|
|
|
|
|
|
|
|
|
|
|
|
|
|
|
| |||||||||||||||||
Bond Fund
| Sales1 | Reinvestments of dividends and distributions | Repurchases1 | Net (decrease) increase | |||||||||||||||||||||||||||||
Share class | Amount | Shares | Amount | Shares | Amount | Shares | Amount | Shares | ||||||||||||||||||||||||
Year ended December 31, 2017 | ||||||||||||||||||||||||||||||||
Class 1 | $ | 967,669 | 88,718 | $ | 235,240 | 21,678 | $ | (1,624,503 | ) | (147,887 | ) | $ | (421,594 | ) | (37,491 | ) | ||||||||||||||||
Class 1A2 | 1,338 | 122 | 21 | 2 | (272 | ) | (25 | ) | 1,087 | 99 | ||||||||||||||||||||||
Class 2 | 138,965 | 12,898 | 134,455 | 12,545 | (273,010 | ) | (25,301 | ) | 410 | 142 | ||||||||||||||||||||||
Class 4 | 212,848 | 19,725 | 6,398 | 597 | (22,490 | ) | (2,080 | ) | 196,756 | 18,242 | ||||||||||||||||||||||
|
|
|
|
|
|
|
|
|
|
|
|
|
|
|
| |||||||||||||||||
Total net increase (decrease) | $ | 1,320,820 | 121,463 | $ | 376,114 | 34,822 | $ | (1,920,275 | ) | (175,293 | ) | $ | (223,341 | ) | (19,008 | ) | ||||||||||||||||
|
|
|
|
|
|
|
|
|
|
|
|
|
|
|
| |||||||||||||||||
Year ended December 31, 2016 | ||||||||||||||||||||||||||||||||
Class 1 | $ | 1,345,167 | 121,199 | $ | 148,075 | 13,631 | $ | (420,052 | ) | (38,234 | ) | $ | 1,073,190 | 96,596 | ||||||||||||||||||
Class 2 | 144,585 | 13,214 | 82,041 | 7,631 | (444,145 | ) | (40,888 | ) | (217,519 | ) | (20,043 | ) | ||||||||||||||||||||
Class 4 | 57,784 | 5,273 | 1,763 | 164 | (16,674 | ) | (1,523 | ) | 42,873 | 3,914 | ||||||||||||||||||||||
|
|
|
|
|
|
|
|
|
|
|
|
|
|
|
| |||||||||||||||||
Total net increase (decrease) | $ | 1,547,536 | 139,686 | $ | 231,879 | 21,426 | $ | (880,871 | ) | (80,645 | ) | $ | 898,544 | 80,467 | ||||||||||||||||||
|
|
|
|
|
|
|
|
|
|
|
|
|
|
|
| |||||||||||||||||
Global Bond Fund
| Sales1 | Reinvestments of dividends and distributions | Repurchases1 | Net increase (decrease) | |||||||||||||||||||||||||||||
Share class | Amount | Shares | Amount | Shares | Amount | Shares | Amount | Shares | ||||||||||||||||||||||||
Year ended December 31, 2017 | ||||||||||||||||||||||||||||||||
Class 1 | $ | 177,200 | 15,155 | $ | 14,284 | 1,210 | $ | (100,697 | ) | (8,588 | ) | $ | 90,787 | 7,777 | ||||||||||||||||||
Class 1A2 | 74 | 6 | — | 3 | — | 3 | — | 3 | — | 3 | 74 | 6 | ||||||||||||||||||||
Class 2 | 45,841 | 3,978 | 11,132 | 952 | (79,734 | ) | (6,868 | ) | (22,761 | ) | (1,938 | ) | ||||||||||||||||||||
Class 4 | 20,651 | 1,777 | 197 | 17 | (2,949 | ) | (255 | ) | 17,899 | 1,539 | ||||||||||||||||||||||
|
|
|
|
|
|
|
|
|
|
|
|
|
|
|
| |||||||||||||||||
Total net increase (decrease) | $ | 243,766 | 20,916 | $ | 25,613 | 2,179 | $ | (183,380 | ) | (15,711 | ) | $ | 85,999 | 7,384 | ||||||||||||||||||
|
|
|
|
|
|
|
|
|
|
|
|
|
|
|
| |||||||||||||||||
Year ended December 31, 2016 | ||||||||||||||||||||||||||||||||
Class 1 | $ | 213,129 | 18,309 | $ | 10,956 | 974 | $ | (159,412 | ) | (13,652 | ) | $ | 64,673 | 5,631 | ||||||||||||||||||
Class 2 | 36,347 | 3,158 | 8,734 | 780 | (156,676 | ) | (13,741 | ) | (111,595 | ) | (9,803 | ) | ||||||||||||||||||||
Class 4 | 10,946 | 954 | 76 | 7 | (4,634 | ) | (404 | ) | 6,388 | 557 | ||||||||||||||||||||||
|
|
|
|
|
|
|
|
|
|
|
|
|
|
|
| |||||||||||||||||
Total net increase (decrease) | $ | 260,422 | 22,421 | $ | 19,766 | 1,761 | $ | (320,722 | ) | (27,797 | ) | $ | (40,534 | ) | (3,615 | ) | ||||||||||||||||
|
|
|
|
|
|
|
|
|
|
|
|
|
|
|
| |||||||||||||||||
See end of tables for footnotes.
American Funds Insurance Series 181
Table of Contents
High-Income Bond Fund
| Sales1 | Reinvestments of dividends | Repurchases1 | Net (decrease) increase | |||||||||||||||||||||||||||||
Share class | Amount | Shares | Amount | Shares | Amount | Shares | Amount | Shares | ||||||||||||||||||||||||
Year ended December 31, 2017 | ||||||||||||||||||||||||||||||||
Class 1 | $ | 43,584 | 4,162 | $ | 43,816 | 4,273 | $ | (422,269 | ) | (39,685 | ) | $ | (334,869 | ) | (31,250 | ) | ||||||||||||||||
Class 1A2 | 400 | 39 | 12 | 1 | (7 | ) | (1 | ) | 405 | 39 | ||||||||||||||||||||||
Class 2 | 15,931 | 1,540 | 51,640 | 5,121 | (92,969 | ) | (8,946 | ) | (25,398 | ) | (2,285 | ) | ||||||||||||||||||||
Class 3 | 397 | 38 | 805 | 78 | (1,921 | ) | (181 | ) | (719 | ) | (65 | ) | ||||||||||||||||||||
Class 4 | 84,996 | 7,657 | 1,981 | 182 | (72,820 | ) | (6,577 | ) | 14,157 | 1,262 | ||||||||||||||||||||||
|
|
|
|
|
|
|
|
|
|
|
|
|
|
|
| |||||||||||||||||
Total net increase (decrease) | $ | 145,308 | 13,436 | $ | 98,254 | 9,655 | $ | (589,986 | ) | (55,390 | ) | $ | (346,424 | ) | (32,299 | ) | ||||||||||||||||
|
|
|
|
|
|
|
|
|
|
|
|
|
|
|
| |||||||||||||||||
Year ended December 31, 2016 | ||||||||||||||||||||||||||||||||
Class 1 | $ | 69,042 | 6,945 | $ | 56,592 | 5,626 | $ | (291,328 | ) | (30,021 | ) | $ | (165,694 | ) | (17,450 | ) | ||||||||||||||||
Class 2 | 22,831 | 2,394 | 47,007 | 4,738 | (116,168 | ) | (11,943 | ) | (46,330 | ) | (4,811 | ) | ||||||||||||||||||||
Class 3 | 2,650 | 279 | 746 | 74 | (3,553 | ) | (365 | ) | (157 | ) | (12 | ) | ||||||||||||||||||||
Class 4 | 90,979 | 8,413 | 1,283 | 120 | (73,640 | ) | (6,754 | ) | 18,622 | 1,779 | ||||||||||||||||||||||
|
|
|
|
|
|
|
|
|
|
|
|
|
|
|
| |||||||||||||||||
Total net increase (decrease) | $ | 185,502 | 18,031 | $ | 105,628 | 10,558 | $ | (484,689 | ) | (49,083 | ) | $ | (193,559 | ) | (20,494 | ) | ||||||||||||||||
|
|
|
|
|
|
|
|
|
|
|
|
|
|
|
| |||||||||||||||||
Mortgage Fund
|
| |||||||||||||||||||||||||||||||
| Sales1 | Reinvestments of dividends and distributions | Repurchases1 | Net (decrease) increase | |||||||||||||||||||||||||||||
Share class | Amount | Shares | Amount | Shares | Amount | Shares | Amount | Shares | ||||||||||||||||||||||||
Year ended December 31, 2017 | ||||||||||||||||||||||||||||||||
Class 1 | $ | 52,151 | 4,904 | $ | 5,982 | 566 | $ | (59,926 | ) | (5,621 | ) | $ | (1,793 | ) | (151 | ) | ||||||||||||||||
Class 1A2 | 109 | 10 | 2 | — | 3 | (6 | ) | — | 3 | 105 | 10 | |||||||||||||||||||||
Class 2 | 7,132 | 672 | 1,287 | 122 | (8,011 | ) | (755 | ) | 408 | 39 | ||||||||||||||||||||||
Class 4 | 8,522 | 808 | 204 | 20 | (4,876 | ) | (462 | ) | 3,850 | 366 | ||||||||||||||||||||||
|
|
|
|
|
|
|
|
|
|
|
|
|
|
|
| |||||||||||||||||
Total net increase (decrease) | $ | 67,914 | 6,394 | $ | 7,475 | 708 | $ | (72,819 | ) | (6,838 | ) | $ | 2,570 | 264 | ||||||||||||||||||
|
|
|
|
|
|
|
|
|
|
|
|
|
|
|
| |||||||||||||||||
Year ended December 31, 2016 | ||||||||||||||||||||||||||||||||
Class 1 | $ | 28,827 | 2,669 | $ | 7,933 | 749 | $ | (38,385 | ) | (3,569 | ) | $ | (1,625 | ) | (151 | ) | ||||||||||||||||
Class 2 | 18,388 | 1,714 | 1,683 | 159 | (15,825 | ) | (1,473 | ) | 4,246 | 400 | ||||||||||||||||||||||
Class 4 | 14,879 | 1,395 | 227 | 22 | (17,844 | ) | (1,676 | ) | (2,738 | ) | (259 | ) | ||||||||||||||||||||
|
|
|
|
|
|
|
|
|
|
|
|
|
|
|
| |||||||||||||||||
Total net increase (decrease) | $ | 62,094 | 5,778 | $ | 9,843 | 930 | $ | (72,054 | ) | (6,718 | ) | $ | (117 | ) | (10 | ) | ||||||||||||||||
|
|
|
|
|
|
|
|
|
|
|
|
|
|
|
| |||||||||||||||||
Ultra-Short Bond Fund
|
| |||||||||||||||||||||||||||||||
| Sales1 | Reinvestments of dividends | Repurchases1 | Net (decrease) increase | |||||||||||||||||||||||||||||
Share class | Amount | Shares | Amount | Shares | Amount | Shares | Amount | Shares | ||||||||||||||||||||||||
Year ended December 31, 2017 | ||||||||||||||||||||||||||||||||
Class 1 | $ | 14,832 | 1,312 | $ | 184 | 16 | $ | (15,478 | ) | (1,371 | ) | $ | (462 | ) | (43 | ) | ||||||||||||||||
Class 1A2 | 10 | 1 | — | 3 | — | 3 | — | — | 10 | 1 | ||||||||||||||||||||||
Class 2 | 62,145 | 5,646 | 697 | 63 | (111,628 | ) | (10,146 | ) | (48,786 | ) | (4,437 | ) | ||||||||||||||||||||
Class 3 | 1,448 | 130 | 15 | 2 | (1,233 | ) | (111 | ) | 230 | 21 | ||||||||||||||||||||||
Class 4 | 16,767 | 1,507 | 10 | 1 | (14,407 | ) | (1,294 | ) | 2,370 | 214 | ||||||||||||||||||||||
|
|
|
|
|
|
|
|
|
|
|
|
|
|
|
| |||||||||||||||||
Total net increase (decrease) | $ | 95,202 | 8,596 | $ | 906 | 82 | $ | (142,746 | ) | (12,922 | ) | $ | (46,638 | ) | (4,244 | ) | ||||||||||||||||
|
|
|
|
|
|
|
|
|
|
|
|
|
|
|
| |||||||||||||||||
Year ended December 31, 2016 | ||||||||||||||||||||||||||||||||
Class 1 | $ | 15,562 | 1,382 | $ | — | — | $ | (17,527 | ) | (1,556 | ) | $ | (1,965 | ) | (174 | ) | ||||||||||||||||
Class 2 | 128,178 | 11,656 | — | — | (133,142 | ) | (12,108 | ) | (4,964 | ) | (452 | ) | ||||||||||||||||||||
Class 3 | 2,647 | 238 | — | — | (4,768 | ) | (429 | ) | (2,121 | ) | (191 | ) | ||||||||||||||||||||
Class 4 | 18,372 | 1,649 | — | — | (21,287 | ) | (1,911 | ) | (2,915 | ) | (262 | ) | ||||||||||||||||||||
|
|
|
|
|
|
|
|
|
|
|
|
|
|
|
| |||||||||||||||||
Total net increase (decrease) | $ | 164,759 | 14,925 | $ | — | — | $ | (176,724 | ) | (16,004 | ) | $ | (11,965 | ) | (1,079 | ) | ||||||||||||||||
|
|
|
|
|
|
|
|
|
|
|
|
|
|
|
| |||||||||||||||||
182 American Funds Insurance Series
Table of Contents
U.S. Government/AAA-Rated Securities Fund
| Sales1 | Reinvestments of dividends and distributions | Repurchases1 | Net increase (decrease) | |||||||||||||||||||||||||||||
Share class | Amount | Shares | Amount | Shares | Amount | Shares | Amount | Shares | ||||||||||||||||||||||||
Year ended December 31, 2017 | ||||||||||||||||||||||||||||||||
Class 1 | $ | 291,253 | 23,702 | $ | 23,401 | 1,927 | $ | (226,514 | ) | (18,425 | ) | $ | 88,140 | 7,204 | ||||||||||||||||||
Class 1A2 | 1,016 | 83 | 2 | — | 3 | (714 | ) | (58 | ) | 304 | 25 | |||||||||||||||||||||
Class 2 | 49,410 | 4,091 | 19,498 | 1,621 | (103,407 | ) | (8,550 | ) | (34,499 | ) | (2,838 | ) | ||||||||||||||||||||
Class 3 | 1,050 | 86 | 141 | 12 | (1,501 | ) | (123 | ) | (310 | ) | (25 | ) | ||||||||||||||||||||
Class 4 | 27,872 | 2,299 | 663 | 55 | (23,884 | ) | (1,976 | ) | 4,651 | 378 | ||||||||||||||||||||||
|
|
|
|
|
|
|
|
|
|
|
|
|
|
|
| |||||||||||||||||
Total net increase (decrease) | $ | 370,601 | 30,261 | $ | 43,705 | 3,615 | $ | (356,020 | ) | (29,132 | ) | $ | 58,286 | 4,744 | ||||||||||||||||||
|
|
|
|
|
|
|
|
|
|
|
|
|
|
|
| |||||||||||||||||
Year ended December 31, 2016 | ||||||||||||||||||||||||||||||||
Class 1 | $ | 111,564 | 8,949 | $ | 52,411 | 4,280 | $ | (89,943 | ) | (7,217 | ) | $ | 74,032 | 6,012 | ||||||||||||||||||
Class 2 | 65,544 | 5,287 | 52,257 | 4,303 | (160,525 | ) | (13,019 | ) | (42,724 | ) | (3,429 | ) | ||||||||||||||||||||
Class 3 | 1,568 | 125 | 368 | 30 | (2,199 | ) | (176 | ) | (263 | ) | (21 | ) | ||||||||||||||||||||
Class 4 | 58,794 | 4,745 | 1,986 | 163 | (48,646 | ) | (3,930 | ) | 12,134 | 978 | ||||||||||||||||||||||
|
|
|
|
|
|
|
|
|
|
|
|
|
|
|
| |||||||||||||||||
Total net increase (decrease) | $ | 237,470 | 19,106 | $ | 107,022 | 8,776 | $ | (301,313 | ) | (24,342 | ) | $ | 43,179 | 3,540 | ||||||||||||||||||
|
|
|
|
|
|
|
|
|
|
|
|
|
|
|
| |||||||||||||||||
Managed Risk Growth Fund |
| |||||||||||||||||||||||||||||||
| Sales1 | Reinvestments of dividends and distributions | Repurchases1 | Net increase | |||||||||||||||||||||||||||||
Share class | Amount | Shares | Amount | Shares | Amount | Shares | Amount | Shares | ||||||||||||||||||||||||
Year ended December 31, 2017 | ||||||||||||||||||||||||||||||||
Class P1 | $ | 836 | 70 | $ | 29 | 2 | $ | (230 | ) | (19 | ) | $ | 635 | 53 | ||||||||||||||||||
Class P2 | 46,748 | 3,893 | 4,847 | 408 | (16,010 | ) | (1,330 | ) | 35,585 | 2,971 | ||||||||||||||||||||||
|
|
|
|
|
|
|
|
|
|
|
|
|
|
|
| |||||||||||||||||
Total net increase (decrease) | $ | 47,584 | 3,963 | $ | 4,876 | 410 | $ | (16,240 | ) | (1,349 | ) | $ | 36,220 | 3,024 | ||||||||||||||||||
|
|
|
|
|
|
|
|
|
|
|
|
|
|
|
| |||||||||||||||||
Year ended December 31, 2016 | ||||||||||||||||||||||||||||||||
Class P1 | $ | 492 | 46 | $ | 60 | 6 | $ | (168 | ) | (16 | ) | $ | 384 | 36 | ||||||||||||||||||
Class P2 | 63,452 | 5,983 | 15,282 | 1,507 | (14,771 | ) | (1,388 | ) | 63,963 | 6,102 | ||||||||||||||||||||||
|
|
|
|
|
|
|
|
|
|
|
|
|
|
|
| |||||||||||||||||
Total net increase (decrease) | $ | 63,944 | 6,029 | $ | 15,342 | 1,513 | $ | (14,939 | ) | (1,404 | ) | $ | 64,347 | 6,138 | ||||||||||||||||||
|
|
|
|
|
|
|
|
|
|
|
|
|
|
|
| |||||||||||||||||
Managed Risk International Fund |
| |||||||||||||||||||||||||||||||
| Sales1 | Reinvestments of dividends and distributions | Repurchases1 | Net (decrease) increase | |||||||||||||||||||||||||||||
Share class | Amount | Shares | Amount | Shares | Amount | Shares | Amount | Shares | ||||||||||||||||||||||||
Year ended December 31, 2017 | ||||||||||||||||||||||||||||||||
Class P1 | $ | 130 | 14 | $ | 2 | — | 3 | $ | (166 | ) | (17 | ) | $ | (34 | ) | (3 | ) | |||||||||||||||
Class P2 | 30,462 | 3,002 | 2,301 | 230 | (9,880 | ) | (967 | ) | 22,883 | 2,265 | ||||||||||||||||||||||
|
|
|
|
|
|
|
|
|
|
|
|
|
|
|
| |||||||||||||||||
Total net increase (decrease) | $ | 30,592 | 3,016 | $ | 2,303 | 230 | $ | (10,046 | ) | (984 | ) | $ | 22,849 | 2,262 | ||||||||||||||||||
|
|
|
|
|
|
|
|
|
|
|
|
|
|
|
| |||||||||||||||||
Year ended December 31, 2016 | ||||||||||||||||||||||||||||||||
Class P1 | $ | 41 | 4 | $ | 6 | 1 | $ | (53 | ) | (6 | ) | $ | (6 | ) | (1 | ) | ||||||||||||||||
Class P2 | 25,545 | 2,830 | 3,022 | 346 | (8,610 | ) | (948 | ) | 19,957 | 2,228 | ||||||||||||||||||||||
|
|
|
|
|
|
|
|
|
|
|
|
|
|
|
| |||||||||||||||||
Total net increase (decrease) | $ | 25,586 | 2,834 | $ | 3,028 | 347 | $ | (8,663 | ) | (954 | ) | $ | 19,951 | 2,227 | ||||||||||||||||||
|
|
|
|
|
|
|
|
|
|
|
|
|
|
|
| |||||||||||||||||
See end of tables for footnotes.
American Funds Insurance Series 183
Table of Contents
Managed Risk Blue Chip Income and Growth Fund
Reinvestments of dividends and | Net (decrease) | |||||||||||||||||||||||||||||||
| Sales1 | distributions | Repurchases1 | increase | |||||||||||||||||||||||||||||
Share class | Amount | Shares | Amount | Shares | Amount | Shares | Amount | Shares | ||||||||||||||||||||||||
Year ended December 31, 2017 | ||||||||||||||||||||||||||||||||
Class P1 | $ | 59 | 5 | $ | 7 | 1 | $ | (136 | ) | (11 | ) | $ | (70 | ) | (5 | ) | ||||||||||||||||
Class P2 | 83,072 | 6,949 | 10,722 | 898 | (56,067 | ) | (4,624 | ) | 37,727 | 3,223 | ||||||||||||||||||||||
|
|
|
|
|
|
|
|
|
|
|
|
|
|
|
| |||||||||||||||||
Total net increase (decrease) | $ | 83,131 | 6,954 | $ | 10,729 | 899 | $ | (56,203 | ) | (4,635 | ) | $ | 37,657 | 3,218 | ||||||||||||||||||
|
|
|
|
|
|
|
|
|
|
|
|
|
|
|
| |||||||||||||||||
Year ended December 31, 2016 | ||||||||||||||||||||||||||||||||
Class P1 | $ | 60 | 6 | $ | 13 | 1 | $ | (20 | ) | (2 | ) | $ | 53 | 5 | ||||||||||||||||||
Class P2 | 139,800 | 12,424 | 9,285 | 848 | (10,609 | ) | (952 | ) | 138,476 | 12,320 | ||||||||||||||||||||||
|
|
|
|
|
|
|
|
|
|
|
|
|
|
|
| |||||||||||||||||
Total net increase (decrease) | $ | 139,860 | 12,430 | $ | 9,298 | 849 | $ | (10,629 | ) | (954 | ) | $ | 138,529 | 12,325 | ||||||||||||||||||
|
|
|
|
|
|
|
|
|
|
|
|
|
|
|
| |||||||||||||||||
Managed Risk Growth-Income Fund
|
| |||||||||||||||||||||||||||||||
Reinvestments of dividends and | ||||||||||||||||||||||||||||||||
| Sales1 | distributions | Repurchases1 | Net increase | |||||||||||||||||||||||||||||
Share class | Amount | Shares | Amount | Shares | Amount | Shares | Amount | Shares | ||||||||||||||||||||||||
Year ended December 31, 2017 | ||||||||||||||||||||||||||||||||
Class P1 | $ | 1,093 | 92 | $ | 92 | 8 | $ | (154 | ) | (13 | ) | $ | 1,031 | 87 | ||||||||||||||||||
Class P2 | 27,997 | 2,382 | 9,501 | 835 | (15,095 | ) | (1,278 | ) | 22,403 | 1,939 | ||||||||||||||||||||||
|
|
|
|
|
|
|
|
|
|
|
|
|
|
|
| |||||||||||||||||
Total net increase (decrease) | $ | 29,090 | 2,474 | $ | 9,593 | 843 | $ | (15,249 | ) | (1,291 | ) | $ | 23,434 | 2,026 | ||||||||||||||||||
|
|
|
|
|
|
|
|
|
|
|
|
|
|
|
| |||||||||||||||||
Year ended December 31, 2016 | ||||||||||||||||||||||||||||||||
Class P1 | $ | 746 | 68 | $ | 79 | 7 | $ | (343 | ) | (31 | ) | $ | 482 | 44 | ||||||||||||||||||
Class P2 | 41,955 | 3,864 | 10,093 | 964 | (13,341 | ) | (1,227 | ) | 38,707 | 3,601 | ||||||||||||||||||||||
|
|
|
|
|
|
|
|
|
|
|
|
|
|
|
| |||||||||||||||||
Total net increase (decrease) | $ | 42,701 | 3,932 | $ | 10,172 | 971 | $ | (13,684 | ) | (1,258 | ) | $ | 39,189 | 3,645 | ||||||||||||||||||
|
|
|
|
|
|
|
|
|
|
|
|
|
|
|
| |||||||||||||||||
| Managed Risk Asset Allocation Fund | ||||||||||||||||||||||||||||||||
Reinvestments of dividends and | ||||||||||||||||||||||||||||||||
| Sales1 | distributions | Repurchases1 | Net increase | |||||||||||||||||||||||||||||
Share class | Amount | Shares | Amount | Shares | Amount | Shares | Amount | Shares | ||||||||||||||||||||||||
Year ended December 31, 2017 | ||||||||||||||||||||||||||||||||
Class P1 | $ | 264,545 | 20,631 | $ | 25,264 | 1,986 | $ | (25,397 | ) | (1,973 | ) | $ | 264,412 | 20,644 | ||||||||||||||||||
Class P2 | 253,137 | 19,936 | 45,200 | 3,559 | (153,999 | ) | (11,957 | ) | 144,338 | 11,538 | ||||||||||||||||||||||
|
|
|
|
|
|
|
|
|
|
|
|
|
|
|
| |||||||||||||||||
Total net increase (decrease) | $ | 517,682 | 40,567 | $ | 70,464 | 5,545 | $ | (179,396 | ) | (13,930 | ) | $ | 408,750 | 32,182 | ||||||||||||||||||
|
|
|
|
|
|
|
|
|
|
|
|
|
|
|
| |||||||||||||||||
Year ended December 31, 2016 | ||||||||||||||||||||||||||||||||
Class P1 | $ | 443,537 | 37,855 | $ | 45,747 | 3,957 | $ | (14,583 | ) | (1,270 | ) | $ | 474,701 | 40,542 | ||||||||||||||||||
Class P2 | 369,887 | 31,502 | 92,019 | 7,990 | (131,962 | ) | (11,243 | ) | 329,944 | 28,249 | ||||||||||||||||||||||
|
|
|
|
|
|
|
|
|
|
|
|
|
|
|
| |||||||||||||||||
Total net increase (decrease) | $ | 813,424 | 69,357 | $ | 137,766 | 11,947 | $ | (146,545 | ) | (12,513 | ) | $ | 804,645 | 68,791 | ||||||||||||||||||
|
|
|
|
|
|
|
|
|
|
|
|
|
|
|
| |||||||||||||||||
| 1 | Includes exchanges between share classes of the fund. |
| 2 | Class 1A shares began investment operations on January 6, 2017. |
| 3 | Amount less than one thousand. |
184 American Funds Insurance Series
Table of Contents
10. Investment transactions and other disclosures
The following tables present additional information for each of the funds for the year ended December 31, 2017 (dollars in thousands):
| Global Growth Fund | Global Small Capitalization Fund | Growth Fund | International Fund | New World Fund | Blue Chip Income and Growth Fund | |||||||||||||||||||
Purchases of investment securities* | $ | 1,709,869 | $ | 1,284,211 | $ | 5,381,976 | $ | 2,353,764 | $ | 1,716,759 | $ | 2,884,969 | ||||||||||||
Sales of investment securities* | 2,095,865 | 1,778,593 | 8,015,869 | 2,597,007 | 1,716,842 | 2,992,025 | ||||||||||||||||||
Non-U.S. taxes paid on interest income | — | — | — | (11 | ) | 37 | — | |||||||||||||||||
Non-U.S. taxes paid on realized gains | 903 | 5 | — | 527 | 13 | — | ||||||||||||||||||
Non-U.S. taxes provided on unrealized gains | 4,211 | 502 | — | 3,115 | 16,043 | — | ||||||||||||||||||
Dividends from affiliated issuers | — | 1,346 | — | — | — | — | ||||||||||||||||||
Net realized (loss) gain from affiliated issuers | — | (3,537 | ) | — | — | — | — | |||||||||||||||||
| Global Growth and Income Fund | Growth- Income Fund | International Growth and Income Fund | Capital Income Builder | Asset Allocation Fund | Global Balanced Fund | |||||||||||||||||||
Purchases of investment securities* | $ | 801,855 | $ | 7,282,680 | $ | 737,253 | $ | 448,150 | $ | 17,391,526 | $ | 152,879 | ||||||||||||
Sales of investment securities* | 1,084,942 | 7,556,491 | 619,618 | 379,687 | 16,903,042 | 107,452 | ||||||||||||||||||
Non-U.S. taxes paid on interest income | — | — | 3 | — | — | 14 | ||||||||||||||||||
Non-U.S. taxes paid on realized gains | 763 | 10 | 99 | — | 102 | 41 | ||||||||||||||||||
Non-U.S. taxes provided on unrealized gains | 2,538 | 1,737 | 1,168 | — | 108 | 140 | ||||||||||||||||||
| Bond Fund | Global Bond Fund | High- Income Bond Fund | Mortgage Fund | Ultra-Short Bond Fund | U.S. Government/ AAA-Rated Securities Fund | |||||||||||||||||||
Purchases of investment securities* | $ | 41,383,822 | $ | 1,826,715 | $ | 1,183,191 | $ | 2,202,832 | $ | — | $ | 13,557,389 | ||||||||||||
Sales of investment securities* | 40,443,825 | 1,968,533 | 1,483,385 | 2,197,044 | — | 13,732,439 | ||||||||||||||||||
Non-U.S. taxes paid on interest income | 1 | 390 | (2 | ) | — | — | — | |||||||||||||||||
Non-U.S. taxes paid on realized gains | — | 564 | — | — | — | — | ||||||||||||||||||
Non-U.S. taxes provided on unrealized gains | 10 | 188 | 5 | — | — | — | ||||||||||||||||||
| Managed Risk Growth Fund | Managed Risk International Fund | Managed Risk Blue Chip Income and Growth Fund | Managed Risk Growth- Income Fund | Managed Risk Asset Allocation Fund |
| |||||||||||||||||||
Purchases of investment securities* | $ | 110,122 | $ | 52,041 | $ | 150,702 | $ | 71,239 | $ | 623,590 | ||||||||||||||
Sales of investment securities* | 58,914 | 29,432 | 107,026 | 45,175 | 44,905 | |||||||||||||||||||
Dividends from affiliated issuers | 2,295 | 2,012 | 7,115 | 3,114 | 70,949 | |||||||||||||||||||
Net realized (loss) gain from affiliated issuers | (2,470 | ) | (586 | ) | 229 | (2,961 | ) | 4,957 | ||||||||||||||||
| * | Excludes short-term securities and U.S. government obligations, if any. |
American Funds Insurance Series 185
Table of Contents
11. Ownership concentration
At December 31, 2017, American Funds Insurance Series — Managed Risk Growth and Income Portfolio, American Funds Insurance Series — Managed Risk Global Allocation Portfolio and Managed Risk Asset Allocation Fund held 36%, 18% and 16% of the outstanding shares of Capital Income Builder, Global Balanced Fund and Asset Allocation Fund, respectively.
186 American Funds Insurance Series
Table of Contents
Financial highlights
| Income (loss) from investment operations1 | Dividends and distributions | |||||||||||||||||||||||||||||||||||||||||||||||
| Period ended | Net asset value, beginning of period | Net investment income (loss) | Net gains (losses) on securities (both realized and unrealized) | Total from investment operations | Dividends (from net investment income) | Distributions (from capital gains) | Total dividends and distributions | Net asset value, end of period | Total return | Net assets, end of period (in millions) | Ratio of expenses to average net assets | Ratio of net income (loss) to average net assets | ||||||||||||||||||||||||||||||||||||
Global Growth Fund | ||||||||||||||||||||||||||||||||||||||||||||||||
Class 1: | ||||||||||||||||||||||||||||||||||||||||||||||||
12/31/17 | $ | 24.05 | $ | .26 | $ | 7.30 | $ | 7.56 | $ | (.26 | ) | $ | (.84 | ) | $ | (1.10 | ) | $ | 30.51 | 31.80 | % | $ | 2,010 | .55 | % | .94 | % | |||||||||||||||||||||
12/31/16 | 26.39 | .25 | (.14 | ) | .11 | (.29 | ) | (2.16 | ) | (2.45 | ) | 24.05 | .87 | 1,630 | .56 | 1.00 | ||||||||||||||||||||||||||||||||
12/31/15 | 27.48 | .25 | 1.80 | 2.05 | (.35 | ) | (2.79 | ) | (3.14 | ) | 26.39 | 7.24 | 1,626 | .55 | .90 | |||||||||||||||||||||||||||||||||
12/31/14 | 30.11 | .31 | 2 | .40 | .71 | (.40 | ) | (2.94 | ) | (3.34 | ) | 27.48 | 2.52 | 1,558 | .55 | 1.08 | 2 | |||||||||||||||||||||||||||||||
12/31/13 | 23.58 | .31 | 6.62 | 6.93 | (.40 | ) | — | (.40 | ) | 30.11 | 29.51 | 1,508 | .55 | 1.17 | ||||||||||||||||||||||||||||||||||
Class 1A: | ||||||||||||||||||||||||||||||||||||||||||||||||
12/31/173,4 | 24.50 | .11 | 6.94 | 7.05 | (.25 | ) | (.84 | ) | (1.09 | ) | 30.46 | 29.13 | 5 | 2 | .80 | 6 | .39 | 6 | ||||||||||||||||||||||||||||||
Class 2: | ||||||||||||||||||||||||||||||||||||||||||||||||
12/31/17 | 23.85 | .19 | 7.23 | 7.42 | (.19 | ) | (.84 | ) | (1.03 | ) | 30.24 | 31.47 | 4,012 | .80 | .69 | |||||||||||||||||||||||||||||||||
12/31/16 | 26.19 | .18 | (.14 | ) | .04 | (.22 | ) | (2.16 | ) | (2.38 | ) | 23.85 | .62 | 3,483 | .81 | .76 | ||||||||||||||||||||||||||||||||
12/31/15 | 27.30 | .18 | 1.78 | 1.96 | (.28 | ) | (2.79 | ) | (3.07 | ) | 26.19 | 6.94 | 3,817 | .80 | .66 | |||||||||||||||||||||||||||||||||
12/31/14 | 29.92 | .24 | 2 | .41 | .65 | (.33 | ) | (2.94 | ) | (3.27 | ) | 27.30 | 2.31 | 3,992 | .80 | .85 | 2 | |||||||||||||||||||||||||||||||
12/31/13 | 23.44 | .24 | 6.58 | 6.82 | (.34 | ) | — | (.34 | ) | 29.92 | 29.18 | 4,379 | .80 | .91 | ||||||||||||||||||||||||||||||||||
Class 4: | ||||||||||||||||||||||||||||||||||||||||||||||||
12/31/17 | 23.81 | .10 | 7.22 | 7.32 | (.16 | ) | (.84 | ) | (1.00 | ) | 30.13 | 31.11 | 211 | 1.05 | .37 | |||||||||||||||||||||||||||||||||
12/31/16 | 26.16 | .12 | (.14 | ) | (.02 | ) | (.17 | ) | (2.16 | ) | (2.33 | ) | 23.81 | .37 | 94 | 1.06 | .50 | |||||||||||||||||||||||||||||||
12/31/15 | 27.34 | .09 | 1.81 | 1.90 | (.29 | ) | (2.79 | ) | (3.08 | ) | 26.16 | 6.69 | 91 | 1.05 | .34 | |||||||||||||||||||||||||||||||||
12/31/14 | 30.07 | .07 | 2 | .50 | .57 | (.36 | ) | (2.94 | ) | (3.30 | ) | 27.34 | 2.01 | 19 | 1.05 | .26 | 2 | |||||||||||||||||||||||||||||||
12/31/13 | 23.58 | .13 | 6.77 | 6.90 | (.41 | ) | — | (.41 | ) | 30.07 | 29.36 | 1 | 1.06 | .43 | ||||||||||||||||||||||||||||||||||
Global Small Capitalization Fund |
| |||||||||||||||||||||||||||||||||||||||||||||||
Class 1: | ||||||||||||||||||||||||||||||||||||||||||||||||
12/31/17 | $ | 20.24 | $ | .12 | $ | 5.17 | $ | 5.29 | $ | (.15 | ) | $ | — | $ | (.15 | ) | $ | 25.38 | 26.22 | % | $ | 1,639 | .73 | % | .54 | % | ||||||||||||||||||||||
12/31/16 | 24.41 | .12 | .17 | .29 | (.11 | ) | (4.35 | ) | (4.46 | ) | 20.24 | 2.35 | 1,532 | .74 | .57 | |||||||||||||||||||||||||||||||||
12/31/15 | 26.09 | .04 | .36 | .40 | — | (2.08 | ) | (2.08 | ) | 24.41 | .50 | 1,706 | .73 | .15 | ||||||||||||||||||||||||||||||||||
12/31/14 | 25.69 | .09 | .52 | .61 | (.09 | ) | (.12 | ) | (.21 | ) | 26.09 | 2.36 | 1,411 | .74 | .34 | |||||||||||||||||||||||||||||||||
12/31/13 | 20.16 | .04 | 5.70 | 5.74 | (.21 | ) | — | (.21 | ) | 25.69 | 28.60 | 1,241 | .74 | .17 | ||||||||||||||||||||||||||||||||||
Class 1A: | ||||||||||||||||||||||||||||||||||||||||||||||||
12/31/173,4 | 20.70 | .08 | 4.71 | 4.79 | (.13 | ) | — | (.13 | ) | 25.36 | 23.19 | 5 | — | 7 | .96 | 6 | .35 | 6 | ||||||||||||||||||||||||||||||
Class 2: | ||||||||||||||||||||||||||||||||||||||||||||||||
12/31/17 | 19.72 | .06 | 5.04 | 5.10 | (.10 | ) | — | (.10 | ) | 24.72 | 25.89 | 2,551 | .98 | .27 | ||||||||||||||||||||||||||||||||||
12/31/16 | 23.90 | .07 | .15 | .22 | (.05 | ) | (4.35 | ) | (4.40 | ) | 19.72 | 2.10 | 2,303 | .99 | .31 | |||||||||||||||||||||||||||||||||
12/31/15 | 25.64 | (.03 | ) | .37 | .34 | — | (2.08 | ) | (2.08 | ) | 23.90 | .27 | 2,492 | .98 | (.10 | ) | ||||||||||||||||||||||||||||||||
12/31/14 | 25.25 | .03 | .51 | .54 | (.03 | ) | (.12 | ) | (.15 | ) | 25.64 | 2.12 | 2,738 | .99 | .10 | |||||||||||||||||||||||||||||||||
12/31/13 | 19.86 | (.01 | ) | 5.60 | 5.59 | (.20 | ) | — | (.20 | ) | 25.25 | 28.28 | 2,955 | .99 | (.05 | ) | ||||||||||||||||||||||||||||||||
Class 4: | ||||||||||||||||||||||||||||||||||||||||||||||||
12/31/17 | 19.91 | — | 8 | 5.09 | 5.09 | (.09 | ) | — | (.09 | ) | 24.91 | 25.62 | 125 | 1.23 | — | 9 | ||||||||||||||||||||||||||||||||
12/31/16 | 24.11 | .01 | .16 | .17 | (.02 | ) | (4.35 | ) | (4.37 | ) | 19.91 | 1.85 | 42 | 1.24 | .03 | |||||||||||||||||||||||||||||||||
12/31/15 | 25.92 | (.10 | ) | .37 | .27 | — | (2.08 | ) | (2.08 | ) | 24.11 | (.02 | ) | 34 | 1.23 | (.37 | ) | |||||||||||||||||||||||||||||||
12/31/14 | 25.57 | (.05 | ) | .54 | .49 | (.02 | ) | (.12 | ) | (.14 | ) | 25.92 | 1.88 | 12 | 1.24 | (.17 | ) | |||||||||||||||||||||||||||||||
12/31/13 | 20.16 | (.12 | ) | 5.74 | 5.62 | (.21 | ) | — | (.21 | ) | 25.57 | 28.01 | 4 | 1.24 | (.50 | ) | ||||||||||||||||||||||||||||||||
See end of tables for footnotes.
American Funds Insurance Series 187
Table of Contents
Financial highlights (continued)
| Income (loss) from investment operations1 | Dividends and distributions | |||||||||||||||||||||||||||||||||||||||||||||||
| Period ended | Net asset value, beginning of period | Net investment income (loss) | Net gains (losses) on securities (both realized and unrealized) | Total from investment operations | Dividends (from net investment income) | Distributions (from capital gains) | Total dividends and distributions | Net asset value, end of period | Total return | Net assets, end of period (in millions) | Ratio of expenses to average net assets | Ratio of net income (loss) to average net assets | ||||||||||||||||||||||||||||||||||||
Growth Fund |
| |||||||||||||||||||||||||||||||||||||||||||||||
Class 1: | ||||||||||||||||||||||||||||||||||||||||||||||||
12/31/17 | $ | 67.29 | $ | .55 | $ | 17.89 | $ | 18.44 | $ | (.55 | ) | $ | (7.33 | ) | $ | (7.88 | ) | $ | 77.85 | 28.62 | % | $ | 8,100 | .35 | % | .75 | % | |||||||||||||||||||||
12/31/16 | 68.02 | .67 | 5.40 | 6.07 | (.67 | ) | (6.13 | ) | (6.80 | ) | 67.29 | 9.77 | 6,931 | .35 | 1.03 | |||||||||||||||||||||||||||||||||
12/31/15 | 80.15 | .64 | 5.08 | 5.72 | (.61 | ) | (17.24 | ) | (17.85 | ) | 68.02 | 7.12 | 6,796 | .35 | .87 | |||||||||||||||||||||||||||||||||
12/31/14 | 78.54 | .88 | 2 | 5.79 | 6.67 | (1.16 | ) | (3.90 | ) | (5.06 | ) | 80.15 | 8.78 | 7,118 | .35 | 1.12 | 2 | |||||||||||||||||||||||||||||||
12/31/13 | 60.90 | .64 | 17.84 | 18.48 | (.84 | ) | — | (.84 | ) | 78.54 | 30.43 | 7,003 | .35 | .93 | ||||||||||||||||||||||||||||||||||
Class 1A: | ||||||||||||||||||||||||||||||||||||||||||||||||
12/31/173,4 | 68.84 | .35 | 16.38 | 16.73 | (.50 | ) | (7.33 | ) | (7.83 | ) | 77.74 | 25.47 | 5 | 3 | .59 | 6 | .47 | 6 | ||||||||||||||||||||||||||||||
Class 2: | ||||||||||||||||||||||||||||||||||||||||||||||||
12/31/17 | 66.92 | .37 | 17.76 | 18.13 | (.37 | ) | (7.33 | ) | (7.70 | ) | 77.35 | 28.28 | 15,716 | .60 | .50 | |||||||||||||||||||||||||||||||||
12/31/16 | 67.69 | .51 | 5.36 | 5.87 | (.51 | ) | (6.13 | ) | (6.64 | ) | 66.92 | 9.49 | 13,978 | .60 | .78 | |||||||||||||||||||||||||||||||||
12/31/15 | 79.84 | .46 | 5.06 | 5.52 | (.43 | ) | (17.24 | ) | (17.67 | ) | 67.69 | 6.86 | 14,414 | .60 | .62 | |||||||||||||||||||||||||||||||||
12/31/14 | 77.94 | .68 | 2 | 5.75 | 6.43 | (.63 | ) | (3.90 | ) | (4.53 | ) | 79.84 | 8.51 | 15,413 | .60 | .87 | 2 | |||||||||||||||||||||||||||||||
12/31/13 | 60.45 | .47 | 17.68 | 18.15 | (.66 | ) | — | (.66 | ) | 77.94 | 30.11 | 16,334 | .60 | .68 | ||||||||||||||||||||||||||||||||||
Class 3: | ||||||||||||||||||||||||||||||||||||||||||||||||
12/31/17 | 67.67 | .42 | 17.98 | 18.40 | (.42 | ) | (7.33 | ) | (7.75 | ) | 78.32 | 28.39 | 212 | .53 | .57 | |||||||||||||||||||||||||||||||||
12/31/16 | 68.37 | .56 | 5.42 | 5.98 | (.55 | ) | (6.13 | ) | (6.68 | ) | 67.67 | 9.56 | 183 | .53 | .85 | |||||||||||||||||||||||||||||||||
12/31/15 | 80.47 | .51 | 5.11 | 5.62 | (.48 | ) | (17.24 | ) | (17.72 | ) | 68.37 | 6.92 | 194 | .53 | .69 | |||||||||||||||||||||||||||||||||
12/31/14 | 78.62 | .74 | 2 | 5.79 | 6.53 | (.78 | ) | (3.90 | ) | (4.68 | ) | 80.47 | 8.58 | 208 | .53 | .94 | 2 | |||||||||||||||||||||||||||||||
12/31/13 | 60.97 | .52 | 17.84 | 18.36 | (.71 | ) | — | (.71 | ) | 78.62 | 30.20 | 216 | .53 | .75 | ||||||||||||||||||||||||||||||||||
Class 4: | ||||||||||||||||||||||||||||||||||||||||||||||||
12/31/17 | 66.41 | .18 | 17.61 | 17.79 | (.31 | ) | (7.33 | ) | (7.64 | ) | 76.56 | 27.99 | 954 | .85 | .25 | |||||||||||||||||||||||||||||||||
12/31/16 | 67.26 | .34 | 5.32 | 5.66 | (.38 | ) | (6.13 | ) | (6.51 | ) | 66.41 | 9.22 | 458 | .85 | .53 | |||||||||||||||||||||||||||||||||
12/31/15 | 79.74 | .29 | 5.02 | 5.31 | (.55 | ) | (17.24 | ) | (17.79 | ) | 67.26 | 6.59 | 394 | .85 | .42 | |||||||||||||||||||||||||||||||||
12/31/14 | 78.32 | .37 | 2 | 5.87 | 6.24 | (.92 | ) | (3.90 | ) | (4.82 | ) | 79.74 | 8.25 | 24 | .85 | .47 | 2 | |||||||||||||||||||||||||||||||
12/31/13 | 60.90 | .29 | 17.90 | 18.19 | (.77 | ) | — | (.77 | ) | 78.32 | 29.96 | 5 | .85 | .40 | ||||||||||||||||||||||||||||||||||
International Fund |
| |||||||||||||||||||||||||||||||||||||||||||||||
Class 1: | ||||||||||||||||||||||||||||||||||||||||||||||||
12/31/17 | $ | 16.82 | $ | .26 | $ | 5.16 | $ | 5.42 | $ | (.30 | ) | $ | (.23 | ) | $ | (.53 | ) | $ | 21.71 | 32.46 | % | $ | 5,014 | .53 | % | 1.33 | % | |||||||||||||||||||||
12/31/16 | 18.08 | .27 | .30 | .57 | (.28 | ) | (1.55 | ) | (1.83 | ) | 16.82 | 3.78 | 3,652 | .54 | 1.57 | |||||||||||||||||||||||||||||||||
12/31/15 | 20.35 | .29 | (1.03 | ) | (.74 | ) | (.35 | ) | (1.18 | ) | (1.53 | ) | 18.08 | (4.25 | ) | 3,427 | .54 | 1.41 | ||||||||||||||||||||||||||||||
12/31/14 | 21.22 | .30 | (.81 | ) | (.51 | ) | (.36 | ) | — | (.36 | ) | 20.35 | (2.41 | ) | 3,282 | .54 | 1.43 | |||||||||||||||||||||||||||||||
12/31/13 | 17.68 | .27 | 3.59 | 3.86 | (.32 | ) | — | (.32 | ) | 21.22 | 21.91 | 3,324 | .54 | 1.41 | ||||||||||||||||||||||||||||||||||
Class 1A: | ||||||||||||||||||||||||||||||||||||||||||||||||
12/31/173,4 | 17.17 | .09 | 4.93 | 5.02 | (.29 | ) | (.23 | ) | (.52 | ) | 21.67 | 29.46 | 5 | 2 | .77 | 6 | .43 | 6 | ||||||||||||||||||||||||||||||
Class 2: | ||||||||||||||||||||||||||||||||||||||||||||||||
12/31/17 | 16.76 | .22 | 5.13 | 5.35 | (.25 | ) | (.23 | ) | (.48 | ) | 21.63 | 32.14 | 4,422 | .78 | 1.10 | |||||||||||||||||||||||||||||||||
12/31/16 | 18.02 | .23 | .30 | .53 | (.24 | ) | (1.55 | ) | (1.79 | ) | 16.76 | 3.53 | 3,710 | .79 | 1.35 | |||||||||||||||||||||||||||||||||
12/31/15 | 20.29 | .24 | (1.03 | ) | (.79 | ) | (.30 | ) | (1.18 | ) | (1.48 | ) | 18.02 | (4.53 | ) | 3,978 | .79 | 1.17 | ||||||||||||||||||||||||||||||
12/31/14 | 21.15 | .25 | (.81 | ) | (.56 | ) | (.30 | ) | — | (.30 | ) | 20.29 | (2.65 | ) | 4,374 | .79 | 1.19 | |||||||||||||||||||||||||||||||
12/31/13 | 17.62 | .22 | 3.58 | 3.80 | (.27 | ) | — | (.27 | ) | 21.15 | 21.64 | 5,916 | .79 | 1.15 | ||||||||||||||||||||||||||||||||||
Class 3: | ||||||||||||||||||||||||||||||||||||||||||||||||
12/31/17 | 16.85 | .23 | 5.17 | 5.40 | (.27 | ) | (.23 | ) | (.50 | ) | 21.75 | 32.23 | 31 | .71 | 1.17 | |||||||||||||||||||||||||||||||||
12/31/16 | 18.11 | .24 | .30 | .54 | (.25 | ) | (1.55 | ) | (1.80 | ) | 16.85 | 3.57 | 27 | .72 | 1.42 | |||||||||||||||||||||||||||||||||
12/31/15 | 20.38 | .25 | (1.03 | ) | (.78 | ) | (.31 | ) | (1.18 | ) | (1.49 | ) | 18.11 | (4.44 | ) | 32 | .72 | 1.24 | ||||||||||||||||||||||||||||||
12/31/14 | 21.24 | .27 | (.82 | ) | (.55 | ) | (.31 | ) | — | (.31 | ) | 20.38 | (2.56 | ) | 38 | .72 | 1.28 | |||||||||||||||||||||||||||||||
12/31/13 | 17.70 | .23 | 3.59 | 3.82 | (.28 | ) | — | (.28 | ) | 21.24 | 21.67 | 46 | .72 | 1.22 | ||||||||||||||||||||||||||||||||||
Class 4: | ||||||||||||||||||||||||||||||||||||||||||||||||
12/31/17 | 16.64 | .11 | 5.16 | 5.27 | (.26 | ) | (.23 | ) | (.49 | ) | 21.42 | 31.89 | 289 | 1.03 | .55 | |||||||||||||||||||||||||||||||||
12/31/16 | 17.93 | .18 | .29 | .47 | (.21 | ) | (1.55 | ) | (1.76 | ) | 16.64 | 3.21 | 66 | 1.04 | 1.03 | |||||||||||||||||||||||||||||||||
12/31/15 | 20.23 | .17 | (1.00 | ) | (.83 | ) | (.29 | ) | (1.18 | ) | (1.47 | ) | 17.93 | (4.75 | ) | 46 | 1.04 | .88 | ||||||||||||||||||||||||||||||
12/31/14 | 21.16 | .07 | (.68 | ) | (.61 | ) | (.32 | ) | — | (.32 | ) | 20.23 | (2.88 | ) | 18 | 1.04 | .31 | |||||||||||||||||||||||||||||||
12/31/13 | 17.68 | (.01 | ) | 3.79 | 3.78 | (.30 | ) | — | (.30 | ) | 21.16 | 21.48 | 2 | 1.04 | (.07 | ) | ||||||||||||||||||||||||||||||||
188 American Funds Insurance Series
Table of Contents
| Income (loss) from investment operations1 | Dividends and distributions | |||||||||||||||||||||||||||||||||||||||||||||||
| Period ended | Net asset value, beginning of period | Net investment income (loss) | Net gains (losses) on securities (both realized and unrealized) | Total from investment operations | Dividends (from net investment income) | Distributions (from capital gains) | Total dividends and distributions | Net asset value, end of period | Total return | Net assets, end of period (in millions) | Ratio of expenses to average net assets | Ratio of net income (loss) to average net assets | ||||||||||||||||||||||||||||||||||||
New World Fund |
| |||||||||||||||||||||||||||||||||||||||||||||||
Class 1: | ||||||||||||||||||||||||||||||||||||||||||||||||
12/31/17 | $ | 19.72 | $ | .26 | $ | 5.59 | $ | 5.85 | $ | (.27 | ) | $ | — | $ | (.27 | ) | $ | 25.30 | 29.73 | % | $ | 2,050 | .77 | % | 1.14 | % | ||||||||||||||||||||||
12/31/16 | 18.87 | .24 | .81 | 1.05 | (.20 | ) | — | (.20 | ) | 19.72 | 5.59 | 1,743 | .78 | 1.25 | ||||||||||||||||||||||||||||||||||
12/31/15 | 20.72 | .19 | (.71 | ) | (.52 | ) | (.17 | ) | (1.16 | ) | (1.33 | ) | 18.87 | (2.96 | ) | 1,562 | .79 | .92 | ||||||||||||||||||||||||||||||
12/31/14 | 25.08 | .29 | 2 | (1.92 | ) | (1.63 | ) | (.29 | ) | (2.44 | ) | (2.73 | ) | 20.72 | (7.63 | ) | 1,433 | .78 | 1.23 | 2 | ||||||||||||||||||||||||||||
12/31/13 | 22.93 | .34 | 2.31 | 2.65 | (.39 | ) | (.11 | ) | (.50 | ) | 25.08 | 11.66 | 1,388 | .78 | 1.45 | |||||||||||||||||||||||||||||||||
Class 1A: | ||||||||||||||||||||||||||||||||||||||||||||||||
12/31/173,4 | 20.14 | .13 | 5.24 | 5.37 | (.26 | ) | — | (.26 | ) | 25.25 | 26.72 | 5 | 1 | 1.00 | 6 | .53 | 6 | |||||||||||||||||||||||||||||||
Class 2: | ||||||||||||||||||||||||||||||||||||||||||||||||
12/31/17 | 19.54 | .20 | 5.55 | 5.75 | (.22 | ) | — | (.22 | ) | 25.07 | 29.44 | 1,055 | 1.02 | .89 | ||||||||||||||||||||||||||||||||||
12/31/16 | 18.71 | .19 | .79 | .98 | (.15 | ) | — | (.15 | ) | 19.54 | 5.26 | 911 | 1.03 | 1.00 | ||||||||||||||||||||||||||||||||||
12/31/15 | 20.54 | .14 | (.69 | ) | (.55 | ) | (.12 | ) | (1.16 | ) | (1.28 | ) | 18.71 | (3.14 | ) | 961 | 1.04 | .68 | ||||||||||||||||||||||||||||||
12/31/14 | 24.88 | .24 | 2 | (1.91 | ) | (1.67 | ) | (.23 | ) | (2.44 | ) | (2.67 | ) | 20.54 | (7.87 | ) | 1,084 | 1.03 | 1.01 | 2 | ||||||||||||||||||||||||||||
12/31/13 | 22.75 | .28 | 2.29 | 2.57 | (.33 | ) | (.11 | ) | (.44 | ) | 24.88 | 11.38 | 1,307 | 1.03 | 1.22 | |||||||||||||||||||||||||||||||||
Class 4: | ||||||||||||||||||||||||||||||||||||||||||||||||
12/31/17 | 19.51 | .14 | 5.52 | 5.66 | (.18 | ) | — | (.18 | ) | 24.99 | 29.06 | 427 | 1.27 | .61 | ||||||||||||||||||||||||||||||||||
12/31/16 | 18.69 | .14 | .80 | .94 | (.12 | ) | — | (.12 | ) | 19.51 | 5.04 | 240 | 1.28 | .75 | ||||||||||||||||||||||||||||||||||
12/31/15 | 20.56 | .08 | (.68 | ) | (.60 | ) | (.11 | ) | (1.16 | ) | (1.27 | ) | 18.69 | (3.37 | ) | 171 | 1.29 | .39 | ||||||||||||||||||||||||||||||
12/31/14 | 24.99 | .09 | 2 | (1.83 | ) | (1.74 | ) | (.25 | ) | (2.44 | ) | (2.69 | ) | 20.56 | (8.13 | ) | 64 | 1.28 | .40 | 2 | ||||||||||||||||||||||||||||
12/31/13 | 22.93 | .14 | 2.41 | 2.55 | (.38 | ) | (.11 | ) | (.49 | ) | 24.99 | 11.20 | 8 | 1.29 | .56 | |||||||||||||||||||||||||||||||||
Blue Chip Income and Growth Fund |
| |||||||||||||||||||||||||||||||||||||||||||||||
Class 1: | ||||||||||||||||||||||||||||||||||||||||||||||||
12/31/17 | $ | 13.53 | $ | .32 | $ | 1.96 | $ | 2.28 | $ | (.32 | ) | $ | (.53 | ) | $ | (.85 | ) | $ | 14.96 | 17.30 | % | $ | 5,581 | .41 | % | 2.27 | % | |||||||||||||||||||||
12/31/16 | 12.62 | .31 | 1.97 | 2.28 | (.29 | ) | (1.08 | ) | (1.37 | ) | 13.53 | 19.06 | 5,099 | .41 | 2.39 | |||||||||||||||||||||||||||||||||
12/31/15 | 14.69 | .31 | (.64 | ) | (.33 | ) | (.29 | ) | (1.45 | ) | (1.74 | ) | 12.62 | (2.72 | ) | 3,638 | .41 | 2.23 | ||||||||||||||||||||||||||||||
12/31/14 | 13.12 | .46 | 2 | 1.59 | 2.05 | (.48 | ) | — | (.48 | ) | 14.69 | 15.69 | 3,542 | .42 | | 3.31 | 2 | |||||||||||||||||||||||||||||||
12/31/13 | 10.05 | .27 | 3.06 | 3.33 | (.26 | ) | — | (.26 | ) | 13.12 | 33.26 | 2,814 | .42 | 2.27 | ||||||||||||||||||||||||||||||||||
Class 1A: | ||||||||||||||||||||||||||||||||||||||||||||||||
12/31/173,4 | 13.75 | .28 | 1.75 | 2.03 | (.31 | ) | (.53 | ) | (.84 | ) | 14.94 | 15.21 | 5 | 1 | .65 | 6 | 2.01 | 6 | ||||||||||||||||||||||||||||||
Class 2: | ||||||||||||||||||||||||||||||||||||||||||||||||
12/31/17 | 13.39 | .28 | 1.94 | 2.22 | (.28 | ) | (.53 | ) | (.81 | ) | 14.80 | 17.04 | 3,551 | .66 | 2.02 | |||||||||||||||||||||||||||||||||
12/31/16 | 12.51 | .28 | 1.94 | 2.22 | (.26 | ) | (1.08 | ) | (1.34 | ) | 13.39 | 18.70 | 3,412 | .66 | 2.16 | |||||||||||||||||||||||||||||||||
12/31/15 | 14.57 | .27 | (.62 | ) | (.35 | ) | (.26 | ) | (1.45 | ) | (1.71 | ) | 12.51 | (2.93 | ) | 3,228 | .66 | 1.97 | ||||||||||||||||||||||||||||||
12/31/14 | 13.02 | .44 | 2 | 1.55 | 1.99 | (.44 | ) | — | (.44 | ) | 14.57 | 15.36 | 3,722 | .67 | 3.14 | 2 | ||||||||||||||||||||||||||||||||
12/31/13 | 9.97 | .23 | 3.05 | 3.28 | (.23 | ) | — | (.23 | ) | 13.02 | 33.00 | 3,755 | .67 | 2.03 | ||||||||||||||||||||||||||||||||||
Class 4: | ||||||||||||||||||||||||||||||||||||||||||||||||
12/31/17 | 13.39 | .25 | 1.93 | 2.18 | (.27 | ) | (.53 | ) | (.80 | ) | 14.77 | 16.70 | 247 | .91 | 1.76 | |||||||||||||||||||||||||||||||||
12/31/16 | 12.53 | .24 | 1.96 | 2.20 | (.26 | ) | (1.08 | ) | (1.34 | ) | 13.39 | 18.49 | 132 | .91 | 1.81 | |||||||||||||||||||||||||||||||||
12/31/15 | 14.63 | .24 | (.63 | ) | (.39 | ) | (.26 | ) | (1.45 | ) | (1.71 | ) | 12.53 | (3.21 | ) | 32 | .91 | 1.75 | ||||||||||||||||||||||||||||||
12/31/14 | 13.12 | .34 | 2 | 1.63 | 1.97 | (.46 | ) | — | (.46 | ) | 14.63 | 15.13 | 9 | .92 | 2.33 | 2 | ||||||||||||||||||||||||||||||||
12/31/13 | 10.05 | .18 | 3.15 | 3.33 | (.26 | ) | — | (.26 | ) | 13.12 | 33.27 | — | 7 | .86 | 1.39 | |||||||||||||||||||||||||||||||||
See end of tables for footnotes.
American Funds Insurance Series 189
Table of Contents
Financial highlights (continued)
| Income (loss) from investment operations1 | Dividends and distributions | |||||||||||||||||||||||||||||||||||||||||||||||
| Period ended | Net asset value, beginning of period | Net investment income (loss) | Net gains (losses) on securities (both realized and unrealized) | Total from investment operations | Dividends (from net investment income) | Distributions (from capital gains) | Total dividends and distributions | Net asset value, end of period | Total return | Net assets, end of period (in millions) | Ratio of expenses to average net assets | Ratio of net income (loss) to average net assets | ||||||||||||||||||||||||||||||||||||
Global Growth and Income Fund |
| |||||||||||||||||||||||||||||||||||||||||||||||
Class 1: | ||||||||||||||||||||||||||||||||||||||||||||||||
12/31/17 | $ | 13.02 | $ | .35 | $ | 3.06 | $ | 3.41 | $ | (.36 | ) | $ | (.26 | ) | $ | (.62 | ) | $ | 15.81 | 26.40 | % | $ | 485 | .63 | % | 2.43 | % | |||||||||||||||||||||
12/31/16 | 12.35 | .28 | .66 | .94 | (.27 | ) | — | (.27 | ) | 13.02 | 7.61 | 571 | .63 | 2.18 | ||||||||||||||||||||||||||||||||||
12/31/15 | 12.78 | .36 | (.50 | ) | (.14 | ) | (.29 | ) | — | (.29 | ) | 12.35 | (1.14 | ) | 293 | .64 | 2.79 | |||||||||||||||||||||||||||||||
12/31/14 | 12.53 | .43 | 2 | .31 | .74 | (.49 | ) | — | (.49 | ) | 12.78 | 6.00 | 200 | .63 | 3.34 | 2 | ||||||||||||||||||||||||||||||||
12/31/13 | 10.56 | .39 | 2.00 | 2.39 | (.42 | ) | — | (.42 | ) | 12.53 | 22.81 | 206 | .62 | 3.35 | ||||||||||||||||||||||||||||||||||
Class 1A: | ||||||||||||||||||||||||||||||||||||||||||||||||
12/31/173,4 | 13.21 | .18 | 3.03 | 3.21 | (.35 | ) | (.26 | ) | (.61 | ) | 15.81 | 24.54 | 5 | — | 7 | .84 | 6 | 1.20 | 6 | |||||||||||||||||||||||||||||
Class 2: | ||||||||||||||||||||||||||||||||||||||||||||||||
12/31/17 | 13.00 | .31 | 3.05 | 3.36 | (.32 | ) | (.26 | ) | (.58 | ) | 15.78 | 26.06 | 1,538 | .88 | 2.11 | |||||||||||||||||||||||||||||||||
12/31/16 | 12.33 | .25 | .65 | .90 | (.23 | ) | — | (.23 | ) | 13.00 | 7.34 | 1,405 | .88 | 1.98 | ||||||||||||||||||||||||||||||||||
12/31/15 | 12.75 | .22 | (.39 | ) | (.17 | ) | (.25 | ) | — | (.25 | ) | 12.33 | (1.34 | ) | 1,479 | .89 | 1.73 | |||||||||||||||||||||||||||||||
12/31/14 | 12.51 | .41 | 2 | .29 | .70 | (.46 | ) | — | (.46 | ) | 12.75 | 5.64 | 1,685 | .88 | 3.22 | 2 | ||||||||||||||||||||||||||||||||
12/31/13 | 10.54 | .36 | 2.00 | 2.36 | (.39 | ) | — | (.39 | ) | 12.51 | 22.54 | 1,822 | .87 | 3.09 | ||||||||||||||||||||||||||||||||||
Class 4: | ||||||||||||||||||||||||||||||||||||||||||||||||
12/31/17 | 12.89 | .22 | 3.08 | 3.30 | (.33 | ) | (.26 | ) | (.59 | ) | 15.60 | 25.83 | 79 | 1.14 | 1.49 | |||||||||||||||||||||||||||||||||
12/31/16 | 12.26 | .21 | .65 | .86 | (.23 | ) | — | (.23 | ) | 12.89 | 7.04 | 16 | 1.13 | 1.63 | ||||||||||||||||||||||||||||||||||
12/31/15 | 12.71 | .17 | (.37 | ) | (.20 | ) | (.25 | ) | — | (.25 | ) | 12.26 | (1.60 | ) | 5 | 1.14 | 1.32 | |||||||||||||||||||||||||||||||
12/31/14 | 12.50 | .30 | 2 | .37 | .67 | (.46 | ) | — | (.46 | ) | 12.71 | 5.41 | 1 | 1.13 | 2.30 | 2 | ||||||||||||||||||||||||||||||||
12/31/13 | 10.55 | .28 | 2.09 | 2.37 | (.42 | ) | — | (.42 | ) | 12.50 | 22.60 | 1 | 1.12 | 2.27 | ||||||||||||||||||||||||||||||||||
Growth-Income Fund |
| |||||||||||||||||||||||||||||||||||||||||||||||
Class 1: | ||||||||||||||||||||||||||||||||||||||||||||||||
12/31/17 | $ | 44.41 | $ | .81 | $ | 8.89 | $ | 9.70 | $ | (.78 | ) | $ | (3.11 | ) | $ | (3.89 | ) | $ | 50.22 | 22.68 | % | $ | 15,765 | .28 | % | 1.69 | % | |||||||||||||||||||||
12/31/16 | 45.40 | .79 | 4.09 | 4.88 | (.75 | ) | (5.12 | ) | (5.87 | ) | 44.41 | 11.80 | 12,588 | .29 | 1.79 | |||||||||||||||||||||||||||||||||
12/31/15 | 52.76 | .79 | .37 | 1.16 | (.75 | ) | (7.77 | ) | (8.52 | ) | 45.40 | 1.72 | 10,747 | .29 | 1.59 | |||||||||||||||||||||||||||||||||
12/31/14 | 50.72 | .81 | 4.57 | 5.38 | (.80 | ) | (2.54 | ) | (3.34 | ) | 52.76 | 10.91 | 10,812 | .29 | 1.56 | |||||||||||||||||||||||||||||||||
12/31/13 | 38.48 | .66 | 12.31 | 12.97 | (.73 | ) | — | (.73 | ) | 50.72 | 33.82 | 9,857 | .29 | 1.49 | ||||||||||||||||||||||||||||||||||
Class 1A: | ||||||||||||||||||||||||||||||||||||||||||||||||
12/31/173,4 | 45.39 | .67 | 7.96 | 8.63 | (.76 | ) | (3.11 | ) | (3.87 | ) | 50.15 | 19.83 | 5 | 2 | .52 | 6 | 1.41 | 6 | ||||||||||||||||||||||||||||||
Class 2: | ||||||||||||||||||||||||||||||||||||||||||||||||
12/31/17 | 44.00 | .68 | 8.80 | 9.48 | (.66 | ) | (3.11 | ) | (3.77 | ) | 49.71 | 22.38 | 13,930 | .53 | 1.45 | |||||||||||||||||||||||||||||||||
12/31/16 | 45.04 | .67 | 4.05 | 4.72 | (.64 | ) | (5.12 | ) | (5.76 | ) | 44.00 | 11.51 | 12,854 | .54 | 1.54 | |||||||||||||||||||||||||||||||||
12/31/15 | 52.41 | .66 | .37 | 1.03 | (.63 | ) | (7.77 | ) | (8.40 | ) | 45.04 | 1.45 | 12,895 | .54 | 1.34 | |||||||||||||||||||||||||||||||||
12/31/14 | 50.40 | .67 | 4.55 | 5.22 | (.67 | ) | (2.54 | ) | (3.21 | ) | 52.41 | 10.63 | 14,337 | .54 | 1.31 | |||||||||||||||||||||||||||||||||
12/31/13 | 38.24 | .55 | 12.23 | 12.78 | (.62 | ) | — | (.62 | ) | 50.40 | 33.50 | 14,980 | .54 | 1.25 | ||||||||||||||||||||||||||||||||||
Class 3: | ||||||||||||||||||||||||||||||||||||||||||||||||
12/31/17 | 44.47 | .72 | 8.90 | 9.62 | (.69 | ) | (3.11 | ) | (3.80 | ) | 50.29 | 22.47 | 168 | .46 | 1.52 | |||||||||||||||||||||||||||||||||
12/31/16 | 45.46 | .71 | 4.09 | 4.80 | (.67 | ) | (5.12 | ) | (5.79 | ) | 44.47 | 11.59 | 156 | .47 | 1.61 | |||||||||||||||||||||||||||||||||
12/31/15 | 52.82 | .70 | .37 | 1.07 | (.66 | ) | (7.77 | ) | (8.43 | ) | 45.46 | 1.53 | 161 | .47 | 1.41 | |||||||||||||||||||||||||||||||||
12/31/14 | 50.77 | .71 | 4.59 | 5.30 | (.71 | ) | (2.54 | ) | (3.25 | ) | 52.82 | 10.71 | 185 | .47 | 1.38 | |||||||||||||||||||||||||||||||||
12/31/13 | 38.52 | .58 | 12.32 | 12.90 | (.65 | ) | — | (.65 | ) | 50.77 | 33.58 | 193 | .47 | 1.32 | ||||||||||||||||||||||||||||||||||
Class 4: | ||||||||||||||||||||||||||||||||||||||||||||||||
12/31/17 | 43.73 | .56 | 8.73 | 9.29 | (.60 | ) | (3.11 | ) | (3.71 | ) | 49.31 | 22.08 | 827 | .78 | 1.19 | |||||||||||||||||||||||||||||||||
12/31/16 | 44.82 | .56 | 4.02 | 4.58 | (.55 | ) | (5.12 | ) | (5.67 | ) | 43.73 | 11.25 | 495 | .79 | 1.29 | |||||||||||||||||||||||||||||||||
12/31/15 | 52.39 | .58 | .33 | .91 | (.71 | ) | (7.77 | ) | (8.48 | ) | 44.82 | 1.21 | 410 | .79 | 1.25 | |||||||||||||||||||||||||||||||||
12/31/14 | 50.56 | .58 | 4.51 | 5.09 | (.72 | ) | (2.54 | ) | (3.26 | ) | 52.39 | 10.34 | 30 | .79 | 1.11 | |||||||||||||||||||||||||||||||||
12/31/13 | 38.47 | .45 | 12.33 | 12.78 | (.69 | ) | — | (.69 | ) | 50.56 | 33.32 | 3 | .79 | .96 | ||||||||||||||||||||||||||||||||||
190 American Funds Insurance Series
Table of Contents
| Income (loss) from investment operations1 | Dividends and distributions | |||||||||||||||||||||||||||||||||||||||||||||||
| Period ended | Net asset value, beginning of period | Net investment income (loss) | Net gains (losses) on securities (both realized and unrealized) | Total from investment operations | Dividends (from net investment income) | Distributions (from capital gains) | Total dividends and distributions | Net asset value, end of period | Total return | Net assets, end of period (in millions) | Ratio of expenses to average net assets | Ratio of net income (loss) to average net assets | ||||||||||||||||||||||||||||||||||||
International Growth and Income Fund |
| |||||||||||||||||||||||||||||||||||||||||||||||
Class 1: | ||||||||||||||||||||||||||||||||||||||||||||||||
12/31/17 | $ | 14.48 | $ | .46 | $ | 3.20 | $ | 3.66 | $ | (.42 | ) | $ | — | $ | (.42 | ) | $ | 17.72 | 25.31 | % | $ | 1,121 | .66 | % | 2.75 | % | ||||||||||||||||||||||
12/31/16 | 14.72 | .43 | (.19 | ) | .24 | (.42 | ) | (.06 | ) | (.48 | ) | 14.48 | 1.71 | 820 | .68 | 2.93 | ||||||||||||||||||||||||||||||||
12/31/15 | 16.27 | .42 | (1.25 | ) | (.83 | ) | (.38 | ) | (.34 | ) | (.72 | ) | 14.72 | (5.34 | ) | 707 | .68 | 2.60 | ||||||||||||||||||||||||||||||
12/31/14 | 17.48 | .58 | 2 | (1.09 | ) | (.51 | ) | (.53 | ) | (.17 | ) | (.70 | ) | 16.27 | (2.93 | ) | 740 | .68 | 3.32 | 2 | ||||||||||||||||||||||||||||
12/31/13 | 15.29 | .44 | 2.50 | 2.94 | (.47 | ) | (.28 | ) | (.75 | ) | 17.48 | 19.39 | 696 | .69 | 2.63 | |||||||||||||||||||||||||||||||||
Class 1A: | ||||||||||||||||||||||||||||||||||||||||||||||||
12/31/173,4 | 14.69 | .34 | 3.08 | 3.42 | (.41 | ) | — | (.41 | ) | 17.70 | 23.36 | 5 | 2 | .91 | 6 | 1.99 | 6 | |||||||||||||||||||||||||||||||
Class 2: | ||||||||||||||||||||||||||||||||||||||||||||||||
12/31/17 | 14.43 | .43 | 3.17 | 3.60 | (.37 | ) | — | (.37 | ) | 17.66 | 25.03 | 276 | .91 | 2.60 | ||||||||||||||||||||||||||||||||||
12/31/16 | 14.68 | .40 | (.21 | ) | .19 | (.38 | ) | (.06 | ) | (.44 | ) | 14.43 | 1.44 | 244 | .93 | 2.72 | ||||||||||||||||||||||||||||||||
12/31/15 | 16.22 | .38 | (1.24 | ) | (.86 | ) | (.34 | ) | (.34 | ) | (.68 | ) | 14.68 | (5.60 | ) | 254 | .93 | 2.32 | ||||||||||||||||||||||||||||||
12/31/14 | 17.43 | .56 | 2 | (1.10 | ) | (.54 | ) | (.50 | ) | (.17 | ) | (.67 | ) | 16.22 | (3.15 | ) | 248 | .93 | 3.21 | 2 | ||||||||||||||||||||||||||||
12/31/13 | 15.25 | .38 | 2.51 | 2.89 | (.43 | ) | (.28 | ) | (.71 | ) | 17.43 | 19.09 | 257 | .94 | 2.28 | |||||||||||||||||||||||||||||||||
Class 4: | ||||||||||||||||||||||||||||||||||||||||||||||||
12/31/17 | 14.38 | .37 | 3.18 | 3.55 | (.35 | ) | — | (.35 | ) | 17.58 | 24.72 | 63 | 1.16 | 2.24 | ||||||||||||||||||||||||||||||||||
12/31/16 | 14.63 | .36 | (.19 | ) | .17 | (.36 | ) | (.06 | ) | (.42 | ) | 14.38 | 1.18 | 37 | 1.18 | 2.43 | ||||||||||||||||||||||||||||||||
12/31/15 | 16.19 | .33 | (1.23 | ) | (.90 | ) | (.32 | ) | (.34 | ) | (.66 | ) | 14.63 | (5.82 | ) | 32 | 1.18 | 2.02 | ||||||||||||||||||||||||||||||
12/31/14 | 17.45 | .26 | 2 | (.85 | ) | (.59 | ) | (.50 | ) | (.17 | ) | (.67 | ) | 16.19 | (3.39 | ) | 20 | 1.18 | 1.52 | 2 | ||||||||||||||||||||||||||||
12/31/13 | 15.29 | .03 | 2.87 | 2.90 | (.46 | ) | (.28 | ) | (.74 | ) | 17.45 | 19.16 | 1 | 1.19 | .18 | |||||||||||||||||||||||||||||||||
Capital Income Builder |
| |||||||||||||||||||||||||||||||||||||||||||||||
Class 1: | ||||||||||||||||||||||||||||||||||||||||||||||||
12/31/17 | $ | 9.46 | $ | .32 | $ | .93 | $ | 1.25 | $ | (.31 | ) | $ | — | $ | (.31 | ) | $ | 10.40 | 13.29 | % | $ | 254 | .54 | % | 3.21 | % | ||||||||||||||||||||||
12/31/16 | 9.40 | .32 | .07 | .39 | (.33 | ) | — | (.33 | ) | 9.46 | 4.17 | 156 | .54 | 3.39 | ||||||||||||||||||||||||||||||||||
12/31/15 | 9.81 | .28 | (.40 | ) | (.12 | ) | (.29 | ) | — | (.29 | ) | 9.40 | (1.23 | ) | 80 | .56 | 2.88 | |||||||||||||||||||||||||||||||
12/31/143,10 | 10.00 | .19 | (.18 | ) | .01 | (.19 | ) | (.01 | ) | (.20 | ) | 9.81 | .12 | 5 | 20 | .56 | 6 | 2.87 | 6 | |||||||||||||||||||||||||||||
Class 1A: | ||||||||||||||||||||||||||||||||||||||||||||||||
12/31/173,4 | 9.57 | .27 | .84 | 1.11 | (.29 | ) | — | (.29 | ) | 10.39 | 11.72 | 5 | 1 | .79 | 6 | 2.63 | 6 | |||||||||||||||||||||||||||||||
Class 2: | ||||||||||||||||||||||||||||||||||||||||||||||||
12/31/17 | 9.46 | .29 | .93 | 1.22 | (.28 | ) | — | (.28 | ) | 10.40 | 13.04 | 1 | .79 | 2.82 | ||||||||||||||||||||||||||||||||||
12/31/16 | 9.40 | .27 | .11 | .38 | (.32 | ) | — | (.32 | ) | 9.46 | 4.08 | — | 7 | .80 | 2.82 | |||||||||||||||||||||||||||||||||
12/31/15 | 9.81 | .31 | (.43 | ) | (.12 | ) | (.29 | ) | — | (.29 | ) | 9.40 | (1.23 | )11 | — | 7 | .46 | 11 | 3.12 | 11 | ||||||||||||||||||||||||||||
12/31/143,10 | 10.00 | .20 | (.19 | ) | .01 | (.19 | ) | (.01 | ) | (.20 | ) | 9.81 | .12 | 5,11 | — | 7 | .47 | 6,11 | 2.94 | 6,11 | ||||||||||||||||||||||||||||
Class 4: | ||||||||||||||||||||||||||||||||||||||||||||||||
12/31/17 | 9.45 | .27 | .92 | 1.19 | (.26 | ) | — | (.26 | ) | 10.38 | 12.65 | 338 | 1.04 | 2.72 | ||||||||||||||||||||||||||||||||||
12/31/16 | 9.38 | .27 | .08 | .35 | (.28 | ) | — | (.28 | ) | 9.45 | 3.78 | 256 | 1.04 | 2.88 | ||||||||||||||||||||||||||||||||||
12/31/15 | 9.80 | .25 | (.42 | ) | (.17 | ) | (.25 | ) | — | (.25 | ) | 9.38 | (1.79 | ) | 157 | 1.05 | 2.55 | |||||||||||||||||||||||||||||||
12/31/143,10 | 10.00 | .14 | (.16 | ) | (.02 | ) | (.17 | ) | (.01 | ) | (.18 | ) | 9.80 | (.21 | )5 | 55 | 1.06 | 6 | 2.08 | 6 | ||||||||||||||||||||||||||||
See end of tables for footnotes.
American Funds Insurance Series 191
Table of Contents
Financial highlights (continued)
| Income (loss) from investment operations1 | Dividends and distributions | |||||||||||||||||||||||||||||||||||||||||||||||
| Period ended | Net asset value, beginning of period | Net (loss) | Net gains (losses) on | Total from investment operations | Dividends (from net investment income) | Distributions (from capital gains) | Total dividends and distributions | Net asset of period | Total return | Net assets, end of period (in millions) | Ratio of expenses to average net assets | Ratio of net income (loss) to average net assets | ||||||||||||||||||||||||||||||||||||
| Asset Allocation Fund | ||||||||||||||||||||||||||||||||||||||||||||||||
Class 1: | ||||||||||||||||||||||||||||||||||||||||||||||||
12/31/17 | $ | 21.68 | $ | .44 | $ | 3.06 | $ | 3.50 | $ | (.41 | ) | $ | (1.06 | ) | $ | (1.47 | ) | $ | 23.71 | 16.51 | % | $ | 16,556 | .29 | % | 1.90 | % | |||||||||||||||||||||
12/31/16 | 20.62 | .42 | 1.54 | 1.96 | (.39 | ) | (.51 | ) | (.90 | ) | 21.68 | 9.69 | 13,008 | .29 | 1.97 | |||||||||||||||||||||||||||||||||
12/31/15 | 22.23 | .40 | (.02 | ) | .38 | (.40 | ) | (1.59 | ) | (1.99 | ) | 20.62 | 1.64 | 10,913 | .29 | 1.85 | ||||||||||||||||||||||||||||||||
12/31/14 | 22.49 | .44 | .81 | 1.25 | (.39 | ) | (1.12 | ) | (1.51 | ) | 22.23 | 5.66 | 11,997 | .30 | 1.95 | |||||||||||||||||||||||||||||||||
12/31/13 | 18.43 | .35 | 4.07 | 4.42 | (.36 | ) | — | (.36 | ) | 22.49 | 24.04 | 10,515 | .31 | 1.71 | ||||||||||||||||||||||||||||||||||
Class 1A: | ||||||||||||||||||||||||||||||||||||||||||||||||
12/31/173,4 | 21.97 | .39 | 2.78 | 3.17 | (.39 | ) | (1.06 | ) | (1.45 | ) | 23.69 | 14.78 | 5 | 4 | .53 | 6 | 1.69 | 6 | ||||||||||||||||||||||||||||||
Class 2: | ||||||||||||||||||||||||||||||||||||||||||||||||
12/31/17 | 21.49 | .37 | 3.04 | 3.41 | (.35 | ) | (1.06 | ) | (1.41 | ) | 23.49 | 16.23 | 5,480 | .54 | 1.64 | |||||||||||||||||||||||||||||||||
12/31/16 | 20.45 | .36 | 1.53 | 1.89 | (.34 | ) | (.51 | ) | (.85 | ) | 21.49 | 9.41 | 5,144 | .54 | 1.72 | |||||||||||||||||||||||||||||||||
12/31/15 | 22.06 | .34 | (.01 | ) | .33 | (.35 | ) | (1.59 | ) | (1.94 | ) | 20.45 | 1.40 | 5,008 | .54 | 1.60 | ||||||||||||||||||||||||||||||||
12/31/14 | 22.33 | .37 | .81 | 1.18 | (.33 | ) | (1.12 | ) | (1.45 | ) | 22.06 | 5.40 | 5,494 | .55 | 1.69 | |||||||||||||||||||||||||||||||||
12/31/13 | 18.31 | .30 | 4.03 | 4.33 | (.31 | ) | — | (.31 | ) | 22.33 | 23.69 | 5,760 | .56 | 1.47 | ||||||||||||||||||||||||||||||||||
Class 3: | ||||||||||||||||||||||||||||||||||||||||||||||||
12/31/17 | 21.70 | .39 | 3.07 | 3.46 | (.37 | ) | (1.06 | ) | (1.43 | ) | 23.73 | 16.29 | 38 | .47 | 1.72 | |||||||||||||||||||||||||||||||||
12/31/16 | 20.64 | .38 | 1.54 | 1.92 | (.35 | ) | (.51 | ) | (.86 | ) | 21.70 | 9.49 | 35 | .47 | 1.79 | |||||||||||||||||||||||||||||||||
12/31/15 | 22.25 | .36 | (.02 | ) | .34 | (.36 | ) | (1.59 | ) | (1.95 | ) | 20.64 | 1.46 | 36 | .47 | 1.67 | ||||||||||||||||||||||||||||||||
12/31/14 | 22.51 | .39 | .81 | 1.20 | (.34 | ) | (1.12 | ) | (1.46 | ) | 22.25 | 5.47 | 40 | .48 | 1.76 | |||||||||||||||||||||||||||||||||
12/31/13 | 18.45 | .32 | 4.06 | 4.38 | (.32 | ) | — | (.32 | ) | 22.51 | 23.81 | 42 | .49 | 1.54 | ||||||||||||||||||||||||||||||||||
Class 4: | ||||||||||||||||||||||||||||||||||||||||||||||||
12/31/17 | 21.43 | .32 | 3.02 | 3.34 | (.31 | ) | (1.06 | ) | (1.37 | ) | 23.40 | 15.91 | 3,582 | .79 | 1.40 | |||||||||||||||||||||||||||||||||
12/31/16 | 20.40 | .31 | 1.53 | 1.84 | (.30 | ) | (.51 | ) | (.81 | ) | 21.43 | 9.16 | 2,861 | .79 | 1.47 | |||||||||||||||||||||||||||||||||
12/31/15 | 22.11 | .30 | (.02 | ) | .28 | (.40 | ) | (1.59 | ) | (1.99 | ) | 20.40 | 1.14 | 2,414 | .79 | 1.45 | ||||||||||||||||||||||||||||||||
12/31/14 | 22.46 | .34 | .79 | 1.13 | (.36 | ) | (1.12 | ) | (1.48 | ) | 22.11 | 5.16 | 32 | .80 | 1.55 | |||||||||||||||||||||||||||||||||
12/31/13 | 18.43 | .27 | 4.12 | 4.39 | (.36 | ) | — | (.36 | ) | 22.46 | 23.89 | 1 | .79 | 1.22 | ||||||||||||||||||||||||||||||||||
Global Balanced Fund |
| |||||||||||||||||||||||||||||||||||||||||||||||
Class 1: | ||||||||||||||||||||||||||||||||||||||||||||||||
12/31/17 | $ | 11.08 | $ | .21 | $ | 1.99 | $ | 2.20 | $ | (.15 | ) | $ | (.38 | ) | $ | (.53 | ) | $ | 12.75 | 19.91 | % | $ | 93 | .72 | % | 1.68 | % | |||||||||||||||||||||
12/31/16 | 10.74 | .19 | .32 | .51 | (.17 | ) | — | (.17 | ) | 11.08 | 4.73 | 64 | .72 | 1.73 | ||||||||||||||||||||||||||||||||||
12/31/15 | 11.11 | .20 | (.28 | ) | (.08 | ) | (.14 | ) | (.15 | ) | (.29 | ) | 10.74 | (.69 | ) | 47 | .72 | 1.80 | ||||||||||||||||||||||||||||||
12/31/14 | 11.37 | .25 | 2 | (.03 | ) | .22 | (.18 | ) | (.30 | ) | (.48 | ) | 11.11 | 1.87 | 37 | .71 | 2.14 | 2 | ||||||||||||||||||||||||||||||
12/31/13 | 10.34 | .22 | 1.07 | 1.29 | (.18 | ) | (.08 | ) | (.26 | ) | 11.37 | 12.56 | 36 | .70 | 2.05 | |||||||||||||||||||||||||||||||||
Class 1A: | ||||||||||||||||||||||||||||||||||||||||||||||||
12/31/173,4 | 11.18 | .16 | 1.92 | 2.08 | (.14 | ) | (.38 | ) | (.52 | ) | 12.74 | 18.71 | 5 | — | 7 | .94 | 6 | 1.27 | 6 | |||||||||||||||||||||||||||||
Class 2: | ||||||||||||||||||||||||||||||||||||||||||||||||
12/31/17 | 11.06 | .18 | 1.98 | 2.16 | (.12 | ) | (.38 | ) | (.50 | ) | 12.72 | 19.57 | 210 | .96 | 1.43 | |||||||||||||||||||||||||||||||||
12/31/16 | 10.72 | .16 | .32 | .48 | (.14 | ) | — | (.14 | ) | 11.06 | 4.48 | 178 | .97 | 1.48 | ||||||||||||||||||||||||||||||||||
12/31/15 | 11.09 | .18 | (.28 | ) | (.10 | ) | (.12 | ) | (.15 | ) | (.27 | ) | 10.72 | (.95 | ) | 171 | .97 | 1.60 | ||||||||||||||||||||||||||||||
12/31/14 | 11.35 | .22 | 2 | (.03 | ) | .19 | (.15 | ) | (.30 | ) | (.45 | ) | 11.09 | 1.63 | 179 | .96 | 1.88 | 2 | ||||||||||||||||||||||||||||||
12/31/13 | 10.33 | .20 | 1.06 | 1.26 | (.16 | ) | (.08 | ) | (.24 | ) | 11.35 | 12.23 | 156 | .95 | 1.79 | |||||||||||||||||||||||||||||||||
Class 4: | ||||||||||||||||||||||||||||||||||||||||||||||||
12/31/17 | 11.00 | .13 | 1.99 | 2.12 | (.11 | ) | (.38 | ) | (.49 | ) | 12.63 | 19.38 | 51 | 1.22 | 1.07 | |||||||||||||||||||||||||||||||||
12/31/16 | 10.69 | .12 | .33 | .45 | (.14 | ) | — | (.14 | ) | 11.00 | 4.21 | 10 | 1.24 | 1.12 | ||||||||||||||||||||||||||||||||||
12/31/15 | 11.09 | .06 | (.17 | ) | (.11 | ) | (.14 | ) | (.15 | ) | (.29 | ) | 10.69 | (1.00 | ) | 1 | 1.34 | .58 | ||||||||||||||||||||||||||||||
12/31/14 | 11.35 | .24 | 2 | (.02 | ) | .22 | (.18 | ) | (.30 | ) | (.48 | ) | 11.09 | 1.88 | 11 | — | 7 | .67 | 11 | 2.07 | 2,11 | |||||||||||||||||||||||||||
12/31/13 | 10.33 | .22 | 1.06 | 1.28 | (.18 | ) | (.08 | ) | (.26 | ) | 11.35 | 12.49 | 11 | — | 7 | .71 | 11 | 1.98 | 11 | |||||||||||||||||||||||||||||
192 American Funds Insurance Series
Table of Contents
| Income (loss) from investment operations1 | Dividends and distributions | |||||||||||||||||||||||||||||||||||||||||||||||
| Period ended | Net asset value, beginning of period | Net investment income (loss) | Net gains (losses) on | Total from investment operations | Dividends (from net investment income) | Distributions (from capital gains) | Total dividends and distributions | Net asset value, end of period | Total return | Net assets, end of period (in millions) | Ratio of expenses to average net assets | Ratio of net income (loss) to average net assets | ||||||||||||||||||||||||||||||||||||
Bond Fund |
| |||||||||||||||||||||||||||||||||||||||||||||||
Class 1: | ||||||||||||||||||||||||||||||||||||||||||||||||
12/31/17 | $ | 10.80 | $ | .24 | $ | .18 | $ | .42 | $ | (.24 | ) | $ | (.16 | ) | $ | (.40 | ) | $ | 10.82 | 3.88 | % | $ | 6,434 | .38 | % | 2.19 | % | |||||||||||||||||||||
12/31/16 | 10.70 | .21 | .14 | .35 | (.21 | ) | (.04 | ) | (.25 | ) | 10.80 | 3.27 | 6,829 | .38 | 1.91 | |||||||||||||||||||||||||||||||||
12/31/15 | 11.08 | .22 | (.17 | ) | .05 | (.21 | ) | (.22 | ) | (.43 | ) | 10.70 | .45 | 5,731 | .38 | 1.95 | ||||||||||||||||||||||||||||||||
12/31/14 | 10.73 | .23 | .37 | .60 | (.25 | ) | — | 8 | (.25 | ) | 11.08 | 5.59 | 4,977 | .39 | 2.03 | |||||||||||||||||||||||||||||||||
12/31/13 | 11.29 | .22 | (.43 | ) | (.21 | ) | (.23 | ) | (.12 | ) | (.35 | ) | 10.73 | (1.89 | ) | 4,506 | .39 | 2.01 | ||||||||||||||||||||||||||||||
Class 1A: | ||||||||||||||||||||||||||||||||||||||||||||||||
12/31/173,4 | 10.82 | .22 | .15 | .37 | (.23 | ) | (.16 | ) | (.39 | ) | 10.80 | 3.46 | 5 | 1 | .62 | 6 | 2.01 | 6 | ||||||||||||||||||||||||||||||
Class 2: | ||||||||||||||||||||||||||||||||||||||||||||||||
12/31/17 | 10.67 | .21 | .18 | .39 | (.21 | ) | (.16 | ) | (.37 | ) | 10.69 | 3.67 | 3,966 | .63 | 1.94 | |||||||||||||||||||||||||||||||||
12/31/16 | 10.58 | .18 | .13 | .31 | (.18 | ) | (.04 | ) | (.22 | ) | 10.67 | 2.95 | 3,959 | .63 | 1.65 | |||||||||||||||||||||||||||||||||
12/31/15 | 10.95 | .18 | (.15 | ) | .03 | (.18 | ) | (.22 | ) | (.40 | ) | 10.58 | .28 | 4,135 | .63 | 1.69 | ||||||||||||||||||||||||||||||||
12/31/14 | 10.61 | .20 | .36 | .56 | (.22 | ) | — | 8 | (.22 | ) | 10.95 | 5.28 | 4,565 | .64 | 1.79 | |||||||||||||||||||||||||||||||||
12/31/13 | 11.17 | .19 | (.43 | ) | (.24 | ) | (.20 | ) | (.12 | ) | (.32 | ) | 10.61 | (2.16 | ) | 4,763 | .64 | 1.76 | ||||||||||||||||||||||||||||||
Class 4: | ||||||||||||||||||||||||||||||||||||||||||||||||
12/31/17 | 10.70 | .19 | .16 | .35 | (.21 | ) | (.16 | ) | (.37 | ) | 10.68 | 3.29 | 297 | .88 | 1.72 | |||||||||||||||||||||||||||||||||
12/31/16 | 10.61 | .15 | .15 | .30 | (.17 | ) | (.04 | ) | (.21 | ) | 10.70 | 2.80 | 102 | .88 | 1.41 | |||||||||||||||||||||||||||||||||
12/31/15 | 11.01 | .16 | (.16 | ) | — | (.18 | ) | (.22 | ) | (.40 | ) | 10.61 | (.08 | ) | 59 | .88 | 1.47 | |||||||||||||||||||||||||||||||
12/31/14 | 10.69 | .16 | .39 | .55 | (.23 | ) | — | 8 | (.23 | ) | 11.01 | 5.15 | 29 | .89 | 1.43 | |||||||||||||||||||||||||||||||||
12/31/13 | 11.29 | .17 | (.43 | ) | (.26 | ) | (.22 | ) | (.12 | ) | (.34 | ) | 10.69 | (2.34 | ) | 3 | .89 | 1.58 | ||||||||||||||||||||||||||||||
Global Bond Fund |
| |||||||||||||||||||||||||||||||||||||||||||||||
Class 1: | ||||||||||||||||||||||||||||||||||||||||||||||||
12/31/17 | $ | 11.22 | $ | .28 | $ | .52 | $ | .80 | $ | (.07 | ) | $ | (.07 | ) | $ | (.14 | ) | $ | 11.88 | 7.11 | % | $ | 1,273 | .56 | % | 2.37 | % | |||||||||||||||||||||
12/31/16 | 11.01 | .26 | .06 | .32 | (.09 | ) | (.02 | ) | (.11 | ) | 11.22 | 2.92 | 1,115 | .57 | 2.26 | |||||||||||||||||||||||||||||||||
12/31/15 | 11.77 | .27 | (.71 | ) | (.44 | ) | (.01 | ) | (.31 | ) | (.32 | ) | 11.01 | (3.75 | ) | 1,032 | .57 | 2.34 | ||||||||||||||||||||||||||||||
12/31/14 | 11.88 | .29 | (.08 | ) | .21 | (.21 | ) | (.11 | ) | (.32 | ) | 11.77 | 1.71 | 1,194 | .57 | 2.35 | ||||||||||||||||||||||||||||||||
12/31/13 | 12.32 | .28 | (.58 | ) | (.30 | ) | — | (.14 | ) | (.14 | ) | 11.88 | (2.40 | ) | 1,093 | .56 | 2.37 | |||||||||||||||||||||||||||||||
Class 1A: | ||||||||||||||||||||||||||||||||||||||||||||||||
12/31/173,4 | 11.22 | .26 | .52 | .78 | (.06 | ) | (.07 | ) | (.13 | ) | 11.87 | 7.00 | 5 | — | 7 | .72 | 6 | 2.27 | 6 | |||||||||||||||||||||||||||||
Class 2: | ||||||||||||||||||||||||||||||||||||||||||||||||
12/31/17 | 11.14 | .25 | .51 | .76 | (.04 | ) | (.07 | ) | (.11 | ) | 11.79 | 6.86 | 1,164 | .81 | 2.12 | |||||||||||||||||||||||||||||||||
12/31/16 | 10.93 | .23 | .07 | .30 | (.07 | ) | (.02 | ) | (.09 | ) | 11.14 | 2.71 | 1,121 | .82 | 2.01 | |||||||||||||||||||||||||||||||||
12/31/15 | 11.72 | .24 | (.71 | ) | (.47 | ) | (.01 | ) | (.31 | ) | (.32 | ) | 10.93 | (4.07 | ) | 1,208 | .82 | 2.09 | ||||||||||||||||||||||||||||||
12/31/14 | 11.81 | .26 | (.09 | ) | .17 | (.15 | ) | (.11 | ) | (.26 | ) | 11.72 | 1.39 | 1,386 | .82 | 2.11 | ||||||||||||||||||||||||||||||||
12/31/13 | 12.27 | .25 | (.57 | ) | (.32 | ) | — | (.14 | ) | (.14 | ) | 11.81 | (2.58 | ) | 1,496 | .81 | 2.11 | |||||||||||||||||||||||||||||||
Class 4: | ||||||||||||||||||||||||||||||||||||||||||||||||
12/31/17 | 11.08 | .22 | .51 | .73 | (.04 | ) | (.07 | ) | (.11 | ) | 11.70 | 6.63 | 31 | 1.06 | 1.89 | |||||||||||||||||||||||||||||||||
12/31/16 | 10.89 | .20 | .06 | .26 | (.05 | ) | (.02 | ) | (.07 | ) | 11.08 | 2.42 | 12 | 1.07 | 1.76 | |||||||||||||||||||||||||||||||||
12/31/15 | 11.70 | .21 | (.71 | ) | (.50 | ) | — | 8 | (.31 | ) | (.31 | ) | 10.89 | (4.27 | ) | 6 | 1.07 | 1.86 | ||||||||||||||||||||||||||||||
12/31/14 | 11.87 | .20 | (.05 | ) | .15 | (.21 | ) | (.11 | ) | (.32 | ) | 11.70 | 1.16 | 4 | 1.09 | 1.66 | ||||||||||||||||||||||||||||||||
12/31/13 | 12.31 | .27 | (.57 | ) | (.30 | ) | — | (.14 | ) | (.14 | ) | 11.87 | (2.41 | ) | — | 7 | .79 | 2.25 | ||||||||||||||||||||||||||||||
See end of tables for footnotes.
American Funds Insurance Series 193
Table of Contents
Financial highlights (continued)
| Income (loss) from investment operations1 | Dividends and distributions | |||||||||||||||||||||||||||||||||||||||||||||||
| Period ended | Net asset value, beginning of period | Net investment income (loss) | Net gains (losses) on securities (both realized and unrealized) | Total from investment operations | Dividends (from net investment income) | Distributions (from capital gains) | Total dividends and distributions | Net asset value, end of period | Total return | Net assets, end of period (in millions) | Ratio of expenses to average net assets | Ratio of to average | ||||||||||||||||||||||||||||||||||||
High-Income Bond Fund |
| |||||||||||||||||||||||||||||||||||||||||||||||
Class 1: | ||||||||||||||||||||||||||||||||||||||||||||||||
12/31/17 | $ | 10.18 | $ | .63 | $ | .10 | $ | .73 | $ | (.72 | ) | $ | — | $ | (.72 | ) | $ | 10.19 | 7.25 | % | $ | 632 | .49 | % | 5.98 | % | ||||||||||||||||||||||
12/31/16 | 9.19 | .61 | 1.02 | 1.63 | (.64 | ) | — | (.64 | ) | 10.18 | 17.83 | 949 | .49 | 6.18 | ||||||||||||||||||||||||||||||||||
12/31/15 | 10.54 | .64 | (1.36 | ) | (.72 | ) | (.63 | ) | — | (.63 | ) | 9.19 | (6.94 | ) | 1,017 | .48 | 6.12 | |||||||||||||||||||||||||||||||
12/31/14 | 11.13 | .67 | (.59 | ) | .08 | (.67 | ) | — | (.67 | ) | 10.54 | .80 | 1,017 | .48 | 5.90 | |||||||||||||||||||||||||||||||||
12/31/13 | 11.16 | .75 | .01 | .76 | (.79 | ) | — | (.79 | ) | 11.13 | 6.89 | 856 | .48 | 6.54 | ||||||||||||||||||||||||||||||||||
Class 1A: | ||||||||||||||||||||||||||||||||||||||||||||||||
12/31/173,4 | 10.28 | .60 | .02 | .62 | (.72 | ) | — | (.72 | ) | 10.18 | 6.02 | 5 | — | 7 | .72 | 6 | 5.74 | 6 | ||||||||||||||||||||||||||||||
Class 2: | ||||||||||||||||||||||||||||||||||||||||||||||||
12/31/17 | 10.04 | .59 | .10 | .69 | (.70 | ) | — | (.70 | ) | 10.03 | 6.89 | 776 | .74 | 5.72 | ||||||||||||||||||||||||||||||||||
12/31/16 | 9.06 | .58 | 1.01 | 1.59 | (.61 | ) | — | (.61 | ) | 10.04 | 17.69 | 799 | .74 | 5.92 | ||||||||||||||||||||||||||||||||||
12/31/15 | 10.41 | .60 | (1.35 | ) | (.75 | ) | (.60 | ) | — | (.60 | ) | 9.06 | (7.30 | ) | 765 | .73 | 5.85 | |||||||||||||||||||||||||||||||
12/31/14 | 10.99 | .63 | (.57 | ) | .06 | (.64 | ) | — | (.64 | ) | 10.41 | .63 | 929 | .73 | 5.67 | |||||||||||||||||||||||||||||||||
12/31/13 | 11.03 | .71 | .01 | .72 | (.76 | ) | — | (.76 | ) | 10.99 | 6.60 | 1,061 | .73 | 6.29 | ||||||||||||||||||||||||||||||||||
Class 3: | ||||||||||||||||||||||||||||||||||||||||||||||||
12/31/17 | 10.22 | .61 | .10 | .71 | (.70 | ) | — | (.70 | ) | 10.23 | 7.02 | 12 | .67 | 5.79 | ||||||||||||||||||||||||||||||||||
12/31/16 | 9.22 | .59 | 1.03 | 1.62 | (.62 | ) | — | (.62 | ) | 10.22 | 17.68 | 13 | .67 | 5.99 | ||||||||||||||||||||||||||||||||||
12/31/15 | 10.57 | .62 | (1.37 | ) | (.75 | ) | (.60 | ) | — | (.60 | ) | 9.22 | (7.13 | ) | 12 | .66 | 5.91 | |||||||||||||||||||||||||||||||
12/31/14 | 11.16 | .65 | (.59 | ) | .06 | (.65 | ) | — | (.65 | ) | 10.57 | .59 | 16 | .66 | 5.74 | |||||||||||||||||||||||||||||||||
12/31/13 | 11.18 | .73 | .02 | .75 | (.77 | ) | — | (.77 | ) | 11.16 | 6.77 | 19 | .66 | 6.36 | ||||||||||||||||||||||||||||||||||
Class 4: | ||||||||||||||||||||||||||||||||||||||||||||||||
12/31/17 | 10.79 | .61 | .10 | .71 | (.68 | ) | — | (.68 | ) | 10.82 | 6.63 | 34 | .99 | 5.46 | ||||||||||||||||||||||||||||||||||
12/31/16 | 9.73 | .60 | 1.07 | 1.67 | (.61 | ) | — | (.61 | ) | 10.79 | 17.29 | 21 | .99 | 5.55 | ||||||||||||||||||||||||||||||||||
12/31/15 | 11.05 | .62 | (1.43 | ) | (.81 | ) | (.51 | ) | — | (.51 | ) | 9.73 | (7.42 | ) | 1 | .98 | 5.51 | |||||||||||||||||||||||||||||||
12/31/14 | 11.12 | .63 | (.59 | ) | .04 | (.11 | ) | — | (.11 | ) | 11.05 | .35 | — | 7 | .98 | 5.49 | ||||||||||||||||||||||||||||||||
12/31/13 | 11.16 | .67 | .08 | .75 | (.79 | ) | — | (.79 | ) | 11.12 | 6.81 | — | 7 | .93 | 5.82 | |||||||||||||||||||||||||||||||||
Mortgage Fund |
| |||||||||||||||||||||||||||||||||||||||||||||||
Class 1: | ||||||||||||||||||||||||||||||||||||||||||||||||
12/31/17 | $ | 10.56 | $ | .16 | $ | — | 8 | $ | .16 | $ | (.18 | ) | $ | (.07 | ) | $ | (.25 | ) | $ | 10.47 | 1.47 | % | $ | 265 | .47 | % | 1.52 | % | ||||||||||||||||||||
12/31/16 | 10.61 | .15 | .11 | .26 | (.20 | ) | (.11 | ) | (.31 | ) | 10.56 | 2.50 | 269 | .46 | 1.39 | |||||||||||||||||||||||||||||||||
12/31/15 | 10.70 | .10 | .13 | .23 | (.18 | ) | (.14 | ) | (.32 | ) | 10.61 | 2.09 | 272 | .45 | .89 | |||||||||||||||||||||||||||||||||
12/31/14 | 10.23 | .12 | .45 | .57 | (.10 | ) | — | (.10 | ) | 10.70 | 5.54 | 292 | .45 | 1.12 | ||||||||||||||||||||||||||||||||||
12/31/13 | 10.47 | .04 | (.18 | ) | (.14 | ) | (.08 | ) | (.02 | ) | (.10 | ) | 10.23 | (1.41 | ) | 198 | .44 | .35 | ||||||||||||||||||||||||||||||
Class 1A: | ||||||||||||||||||||||||||||||||||||||||||||||||
12/31/173,4 | 10.55 | .14 | — | 8 | .14 | (.16 | ) | (.07 | ) | (.23 | ) | 10.46 | 1.31 | 5 | — | 7 | .70 | 6 | 1.38 | 6 | ||||||||||||||||||||||||||||
Class 2: | ||||||||||||||||||||||||||||||||||||||||||||||||
12/31/17 | 10.54 | .14 | (.01 | ) | .13 | (.15 | ) | (.07 | ) | (.22 | ) | 10.45 | 1.22 | 63 | .72 | 1.27 | ||||||||||||||||||||||||||||||||
12/31/16 | 10.59 | .12 | .12 | .24 | (.18 | ) | (.11 | ) | (.29 | ) | 10.54 | 2.25 | 63 | .71 | 1.14 | |||||||||||||||||||||||||||||||||
12/31/15 | 10.68 | .07 | .13 | .20 | (.15 | ) | (.14 | ) | (.29 | ) | 10.59 | 1.86 | 59 | .70 | .65 | |||||||||||||||||||||||||||||||||
12/31/14 | 10.22 | .10 | .44 | .54 | (.08 | ) | — | (.08 | ) | 10.68 | 5.23 | 52 | .70 | .91 | ||||||||||||||||||||||||||||||||||
12/31/13 | 10.46 | — | 8 | (.17 | ) | (.17 | ) | (.05 | ) | (.02 | ) | (.07 | ) | 10.22 | (1.68 | ) | 49 | .69 | (.02 | ) | ||||||||||||||||||||||||||||
Class 4: | ||||||||||||||||||||||||||||||||||||||||||||||||
12/31/17 | 10.48 | .11 | — | 8 | .11 | (.14 | ) | (.07 | ) | (.21 | ) | 10.38 | .97 | 12 | .97 | 1.03 | ||||||||||||||||||||||||||||||||
12/31/16 | 10.52 | .09 | .12 | .21 | (.14 | ) | (.11 | ) | (.25 | ) | 10.48 | 2.01 | 8 | .96 | .86 | |||||||||||||||||||||||||||||||||
12/31/15 | 10.65 | .04 | .14 | .18 | (.17 | ) | (.14 | ) | (.31 | ) | 10.52 | 1.62 | 11 | .97 | .37 | |||||||||||||||||||||||||||||||||
12/31/14 | 10.23 | .05 | .46 | .51 | (.09 | ) | — | (.09 | ) | 10.65 | 4.98 | 1 | .94 | .47 | ||||||||||||||||||||||||||||||||||
12/31/13 | 10.47 | .02 | (.16 | ) | (.14 | ) | (.08 | ) | (.02 | ) | (.10 | ) | 10.23 | (1.41 | )11 | — | 7 | .38 | 11 | .23 | 11 | |||||||||||||||||||||||||||
194 American Funds Insurance Series
Table of Contents
| Income (loss) from investment operations1 | Dividends and distributions | |||||||||||||||||||||||||||||||||||||||||||||||
| Period ended | Net asset value, beginning of period | Net investment income (loss) | Net gains (losses) on securities (both realized and unrealized) | Total from investment operations | Dividends (from net investment income) | Distributions (from capital gains) | Total dividends and distributions | Net asset value, end of period | Total return | Net assets, end of period (in millions) | Ratio of expenses to average net assets | Ratio of net income (loss) to average net assets | ||||||||||||||||||||||||||||||||||||
Ultra-Short Bond Fund |
| |||||||||||||||||||||||||||||||||||||||||||||||
Class 1: | ||||||||||||||||||||||||||||||||||||||||||||||||
12/31/17 | $ | 11.27 | $ | .08 | $ | (.01 | ) | $ | .07 | $ | (.05 | ) | $ | — | $ | (.05 | ) | $ | 11.29 | .66 | % | $ | 37 | .35 | % | .68 | % | |||||||||||||||||||||
12/31/1612 | 11.26 | .01 | — | 8 | .01 | — | — | — | 11.27 | .09 | 37 | .35 | .11 | |||||||||||||||||||||||||||||||||||
12/31/15 | 11.28 | (.03 | ) | .01 | (.02 | ) | — | — | — | 11.26 | (.18 | ) | 39 | .34 | (.24 | ) | ||||||||||||||||||||||||||||||||
12/31/14 | 11.31 | (.03 | ) | — | (.03 | ) | — | — | — | 11.28 | (.27 | ) | 49 | .34 | (.26 | ) | ||||||||||||||||||||||||||||||||
12/31/13 | 11.34 | (.03 | ) | — | 8 | (.03 | ) | — | — | — | 11.31 | (.27 | ) | 57 | .34 | (.24 | ) | |||||||||||||||||||||||||||||||
Class 1A: | ||||||||||||||||||||||||||||||||||||||||||||||||
12/31/173,4 | 11.27 | .08 | — | 8 | .08 | (.06 | ) | — | (.06 | ) | 11.29 | .67 | 5 | — | 7 | .34 | 6 | .69 | 6 | |||||||||||||||||||||||||||||
Class 2: | ||||||||||||||||||||||||||||||||||||||||||||||||
12/31/17 | 10.99 | .05 | — | 8 | .05 | (.03 | ) | — | (.03 | ) | 11.01 | .46 | 249 | .60 | .42 | |||||||||||||||||||||||||||||||||
12/31/1612 | 11.01 | (.02 | ) | — | 8 | (.02 | ) | — | — | — | 10.99 | (.18 | ) | 297 | .60 | (.14 | ) | |||||||||||||||||||||||||||||||
12/31/15 | 11.06 | (.05 | ) | — | 8 | (.05 | ) | — | — | — | 11.01 | (.45 | ) | 302 | .59 | (.49 | ) | |||||||||||||||||||||||||||||||
12/31/14 | 11.12 | (.06 | ) | — | (.06 | ) | — | — | — | 11.06 | (.54 | ) | 331 | .59 | (.51 | ) | ||||||||||||||||||||||||||||||||
12/31/13 | 11.17 | (.05 | ) | — | 8 | (.05 | ) | — | — | — | 11.12 | (.45 | ) | 395 | .59 | (.49 | ) | |||||||||||||||||||||||||||||||
Class 3: | ||||||||||||||||||||||||||||||||||||||||||||||||
12/31/17 | 11.10 | .06 | — | 8 | .06 | (.04 | ) | — | (.04 | ) | 11.12 | .54 | 4 | .53 | .50 | |||||||||||||||||||||||||||||||||
12/31/1612 | 11.11 | (.01 | ) | — | 8 | (.01 | ) | — | — | — | 11.10 | (.09 | ) | 4 | .53 | (.08 | ) | |||||||||||||||||||||||||||||||
12/31/15 | 11.16 | (.05 | ) | — | 8 | (.05 | ) | — | — | — | 11.11 | (.45 | ) | 6 | .52 | (.42 | ) | |||||||||||||||||||||||||||||||
12/31/14 | 11.21 | (.05 | ) | — | (.05 | ) | — | — | — | 11.16 | (.45 | ) | 8 | .52 | (.44 | ) | ||||||||||||||||||||||||||||||||
12/31/13 | 11.26 | (.05 | ) | — | 8 | (.05 | ) | — | — | — | 11.21 | (.44 | ) | 8 | .52 | (.42 | ) | |||||||||||||||||||||||||||||||
Class 4: | ||||||||||||||||||||||||||||||||||||||||||||||||
12/31/17 | 11.12 | .02 | — | 8 | .02 | (.01 | ) | — | (.01 | ) | 11.13 | .16 | 15 | .85 | .19 | |||||||||||||||||||||||||||||||||
12/31/1612 | 11.17 | (.04 | ) | (.01 | ) | (.05 | ) | — | — | — | 11.12 | (.45 | ) | 13 | .85 | (.40 | ) | |||||||||||||||||||||||||||||||
12/31/15 | 11.25 | (.08 | ) | — | 8 | (.08 | ) | — | — | — | 11.17 | (.71 | ) | 16 | .85 | (.74 | ) | |||||||||||||||||||||||||||||||
12/31/14 | 11.30 | (.09 | ) | .04 | (.05 | ) | — | — | — | 11.25 | (.44 | ) | 7 | .84 | (.77 | ) | ||||||||||||||||||||||||||||||||
12/31/13 | 11.34 | (.04 | ) | — | 8 | (.04 | ) | — | — | — | 11.30 | (.35 | )11 | — | 7 | .37 | 11 | (.32 | )11 | |||||||||||||||||||||||||||||
See end of tables for footnotes.
American Funds Insurance Series 195
Table of Contents
Financial highlights (continued)
| Income (loss) from investment operations1 | Dividends and distributions | |||||||||||||||||||||||||||||||||||||||||||||||
| Period ended | Net asset value, beginning of period | Net investment income (loss) | Net gains (losses) on securities (both realized and unrealized) | Total from investment operations | Dividends (from net investment income) | Distributions (from capital gains) | Total dividends and distributions | Net asset value, end of period | Total return | Net assets, end of period (in millions) | Ratio of expenses to average net assets | Ratio of net income (loss) to average net assets | ||||||||||||||||||||||||||||||||||||
| U.S. Government/AAA-Rated Securities Fund | ||||||||||||||||||||||||||||||||||||||||||||||||
| Class 1: | ||||||||||||||||||||||||||||||||||||||||||||||||
12/31/17 | $ | 12.05 | $ | .21 | $ | .01 | $ | .22 | $ | (.19 | ) | $ | — | $ | (.19 | ) | $ | 12.08 | 1.83 | % | $ | 1,558 | .36 | % | 1.68 | % | ||||||||||||||||||||||
12/31/16 | 12.31 | .16 | .03 | .19 | (.20 | ) | (.25 | ) | (.45 | ) | 12.05 | 1.44 | 1,467 | .36 | 1.31 | |||||||||||||||||||||||||||||||||
12/31/15 | 12.40 | .13 | .09 | .22 | (.21 | ) | (.10 | ) | (.31 | ) | 12.31 | 1.93 | 1,426 | .35 | 1.02 | |||||||||||||||||||||||||||||||||
12/31/14 | 11.94 | .15 | .48 | .63 | (.17 | ) | — | (.17 | ) | 12.40 | 5.24 | 1,723 | .35 | 1.24 | ||||||||||||||||||||||||||||||||||
12/31/13 | 12.75 | .08 | (.44 | ) | (.36 | ) | (.11 | ) | (.34 | ) | (.45 | ) | 11.94 | (2.87 | ) | 1,584 | .35 | .67 | ||||||||||||||||||||||||||||||
Class 1A: | ||||||||||||||||||||||||||||||||||||||||||||||||
12/31/173,4 | 12.05 | .18 | .03 | .21 | (.18 | ) | — | (.18 | ) | 12.08 | 1.73 | 5 | — | 7 | .58 | 6 | 1.53 | 6 | ||||||||||||||||||||||||||||||
Class 2: | ||||||||||||||||||||||||||||||||||||||||||||||||
12/31/17 | 11.93 | .17 | .02 | .19 | (.16 | ) | — | (.16 | ) | 11.96 | 1.59 | 1,473 | .61 | 1.43 | ||||||||||||||||||||||||||||||||||
12/31/16 | 12.20 | .13 | .02 | .15 | (.17 | ) | (.25 | ) | (.42 | ) | 11.93 | 1.19 | 1,503 | .61 | 1.05 | |||||||||||||||||||||||||||||||||
12/31/15 | 12.29 | .10 | .09 | .19 | (.18 | ) | (.10 | ) | (.28 | ) | 12.20 | 1.59 | 1,579 | .60 | .79 | |||||||||||||||||||||||||||||||||
12/31/14 | 11.83 | .12 | .47 | .59 | (.13 | ) | — | (.13 | ) | 12.29 | 5.01 | 1,717 | .60 | 1.00 | ||||||||||||||||||||||||||||||||||
12/31/13 | 12.63 | .05 | (.43 | ) | (.38 | ) | (.08 | ) | (.34 | ) | (.42 | ) | 11.83 | (3.08 | ) | 1,801 | .60 | .42 | ||||||||||||||||||||||||||||||
Class 3: | ||||||||||||||||||||||||||||||||||||||||||||||||
12/31/17 | 12.07 | .18 | .03 | .21 | (.17 | ) | — | (.17 | ) | 12.11 | 1.72 | 10 | .54 | 1.50 | ||||||||||||||||||||||||||||||||||
12/31/16 | 12.34 | .14 | .02 | .16 | (.18 | ) | (.25 | ) | (.43 | ) | 12.07 | 1.24 | 11 | .54 | 1.12 | |||||||||||||||||||||||||||||||||
12/31/15 | 12.43 | .11 | .09 | .20 | (.19 | ) | (.10 | ) | (.29 | ) | 12.34 | 1.64 | 11 | .53 | .85 | |||||||||||||||||||||||||||||||||
12/31/14 | 11.96 | .13 | .48 | .61 | (.14 | ) | — | (.14 | ) | 12.43 | 5.11 | 13 | .53 | 1.08 | ||||||||||||||||||||||||||||||||||
12/31/13 | 12.76 | .06 | (.43 | ) | (.37 | ) | (.09 | ) | (.34 | ) | (.43 | ) | 11.96 | (3.00 | ) | 14 | .53 | .47 | ||||||||||||||||||||||||||||||
Class 4: | ||||||||||||||||||||||||||||||||||||||||||||||||
12/31/17 | 11.96 | .14 | .01 | .15 | (.13 | ) | — | (.13 | ) | 11.98 | 1.28 | 62 | .86 | 1.18 | ||||||||||||||||||||||||||||||||||
12/31/16 | 12.22 | .10 | .03 | .13 | (.14 | ) | (.25 | ) | (.39 | ) | 11.96 | .99 | 57 | .86 | .82 | |||||||||||||||||||||||||||||||||
12/31/15 | 12.34 | .07 | .08 | .15 | (.17 | ) | (.10 | ) | (.27 | ) | 12.22 | 1.29 | 46 | .85 | .56 | |||||||||||||||||||||||||||||||||
12/31/14 | 11.93 | .06 | .51 | .57 | (.16 | ) | — | (.16 | ) | 12.34 | 4.76 | 21 | .85 | .50 | ||||||||||||||||||||||||||||||||||
12/31/13 | 12.75 | .08 | (.44 | ) | (.36 | ) | (.12 | ) | (.34 | ) | (.46 | ) | 11.93 | (2.95 | ) | — | 7 | .84 | .68 | |||||||||||||||||||||||||||||
| Income (loss) from investment operations1 | Dividends and distributions | |||||||||||||||||||||||||||||||||||||||||||||||||||||||
| Period ended | Net asset value, beginning of period | Net investment income | Net gains (losses) on securities (both realized and unrealized) | Total from investment operations | Dividends (from net investment income) | Distributions (from capital gains) | Total dividends and distributions | Net asset value, end of period | Total return13 | Net assets, end of period (in millions) | Ratio of expenses to average net assets before waivers/ reimbursements | Ratio of expenses to average net assets after waivers/ reimbursements13 | Net effective expense ratio13,14 | Ratio of net income to average net assets13 | ||||||||||||||||||||||||||||||||||||||||||
Managed Risk Growth Fund |
| |||||||||||||||||||||||||||||||||||||||||||||||||||||||
Class P1: | ||||||||||||||||||||||||||||||||||||||||||||||||||||||||
12/31/17 | $ | 10.71 | $ | .08 | $ | 2.70 | $ | 2.78 | $ | (.07 | ) | $ | (.20 | ) | $ | (.27 | ) | $ | 13.22 | 26.23 | %11 | $ | 2 | .42 | %11 | .36 | %11 | .70 | %11 | .69 | %11 | |||||||||||||||||||||||||
12/31/16 | 11.49 | .08 | .20 | .28 | (.05 | ) | (1.01 | ) | (1.06 | ) | 10.71 | 2.89 | 11 | 1 | .50 | 11 | .34 | 11 | .68 | 11 | .79 | 11 | ||||||||||||||||||||||||||||||||||
12/31/15 | 11.37 | .09 | .03 | .12 | — | — | — | 11.49 | 1.06 | 11 | — | 7 | .53 | 11 | .29 | 11 | .63 | 11 | .80 | 11 | ||||||||||||||||||||||||||||||||||||
12/31/14 | 11.43 | .31 | (.06 | ) | .25 | (.12 | ) | (.19 | ) | (.31 | ) | 11.37 | 2.18 | 11 | — | 7 | .50 | 11 | .32 | 11 | .65 | 11 | 2.71 | 11 | ||||||||||||||||||||||||||||||||
12/31/133,15 | 10.00 | .12 | 1.38 | 1.50 | (.07 | ) | — | (.07 | ) | 11.43 | 15.05 | 5,11 | — | 7 | .88 | 6,11 | .25 | 6,11 | .58 | 6,11 | 1.64 | 6,11 | ||||||||||||||||||||||||||||||||||
Class P2: | ||||||||||||||||||||||||||||||||||||||||||||||||||||||||
12/31/17 | 10.64 | .04 | 2.70 | 2.74 | (.04 | ) | (.20 | ) | (.24 | ) | 13.14 | 25.99 | 286 | .69 | .63 | .97 | .34 | |||||||||||||||||||||||||||||||||||||||
12/31/16 | 11.43 | .05 | .19 | .24 | (.02 | ) | (1.01 | ) | (1.03 | ) | 10.64 | 2.52 | 200 | .79 | .63 | .97 | .43 | |||||||||||||||||||||||||||||||||||||||
12/31/15 | 11.35 | .04 | .04 | .08 | — | — | — | 11.43 | .71 | 146 | .89 | .66 | 1.00 | .31 | ||||||||||||||||||||||||||||||||||||||||||
12/31/14 | 11.43 | .12 | .08 | .20 | (.09 | ) | (.19 | ) | (.28 | ) | 11.35 | 1.77 | 79 | .87 | .69 | 1.02 | 1.01 | |||||||||||||||||||||||||||||||||||||||
12/31/133,15 | 10.00 | .12 | 1.37 | 1.49 | (.06 | ) | — | (.06 | ) | 11.43 | 14.94 | 5,11 | 28 | 1.05 | 6,11 | .52 | 6,11 | .85 | 6,11 | 1.69 | 6,11 | |||||||||||||||||||||||||||||||||||
196 American Funds Insurance Series
Table of Contents
| Income (loss) from investment operations1 | Dividends and distributions | |||||||||||||||||||||||||||||||||||||||||||||||||||||||
| Period ended | Net asset value, beginning of period | Net investment income | Net gains (losses) on securities (both realized and unrealized) | Total from investment operations | Dividends (from net investment income) | Distributions (from capital gains) | Total dividends and distributions | Net asset value, end of period | Total | Net assets, end of period (in millions) | Ratio of expenses to average net assets before waivers/ reimbursements | Ratio of expenses to average net assets after waivers/ reimbursements13 | Net effective expense ratio13,14 | Ratio of net income to average net assets13 | ||||||||||||||||||||||||||||||||||||||||||
Managed Risk International Fund |
| |||||||||||||||||||||||||||||||||||||||||||||||||||||||
Class P1: | ||||||||||||||||||||||||||||||||||||||||||||||||||||||||
12/31/17 | $ | 8.89 | $ | .11 | $ | 2.47 | $ | 2.58 | $ | (.10 | ) | $ | (.12 | ) | $ | (.22 | ) | $ | 11.25 | 29.28 | %11 | $ | — | 7 | .28 | %11 | .20 | %11 | .69 | %11 | 1.13 | %11 | ||||||||||||||||||||||||
12/31/16 | 9.48 | .10 | (.35 | ) | (.25 | ) | (.12 | ) | (.22 | ) | (.34 | ) | 8.89 | (2.59 | )11 | — | 7 | .39 | 11 | .23 | 11 | .74 | 11 | 1.15 | 11 | |||||||||||||||||||||||||||||||
12/31/15 | 10.10 | .18 | (.80 | ) | (.62 | ) | — | 8 | — | — | 8 | 9.48 | (6.12 | )11 | — | 7 | .45 | 11 | .21 | 11 | .72 | 11 | 1.75 | 11 | ||||||||||||||||||||||||||||||||
12/31/14 | 10.82 | .14 | (.71 | ) | (.57 | ) | (.15 | ) | — | (.15 | ) | 10.10 | (5.31 | )11 | — | 7 | .50 | 11 | .25 | 11 | .76 | 11 | 1.33 | 11 | ||||||||||||||||||||||||||||||||
12/31/133,15 | 10.00 | .13 | .78 | .91 | (.09 | ) | — | (.09 | ) | 10.82 | 9.08 | 5,11 | — | 7 | 1.05 | 6,11 | .23 | 6,11 | .73 | 6,11 | 1.92 | 6,11 | ||||||||||||||||||||||||||||||||||
Class P2: | ||||||||||||||||||||||||||||||||||||||||||||||||||||||||
12/31/17 | 8.83 | .11 | 2.41 | 2.52 | (.08 | ) | (.12 | ) | (.20 | ) | 11.15 | 28.69 | 148 | .71 | .63 | 1.12 | 1.03 | |||||||||||||||||||||||||||||||||||||||
12/31/16 | 9.43 | .09 | (.38 | ) | (.29 | ) | (.09 | ) | (.22 | ) | (.31 | ) | 8.83 | (3.05 | ) | 97 | .79 | .63 | 1.14 | .97 | ||||||||||||||||||||||||||||||||||||
12/31/15 | 10.09 | .13 | (.79 | ) | (.66 | ) | — | 8 | — | — | 8 | 9.43 | (6.52 | ) | 83 | .90 | .66 | 1.17 | 1.30 | |||||||||||||||||||||||||||||||||||||
12/31/14 | 10.82 | .16 | (.77 | ) | (.61 | ) | (.12 | ) | — | (.12 | ) | 10.09 | (5.68 | ) | 46 | .91 | .67 | 1.18 | 1.51 | |||||||||||||||||||||||||||||||||||||
12/31/133,15 | 10.00 | .18 | .72 | .90 | (.08 | ) | — | (.08 | ) | 10.82 | 8.99 | 5,11 | 17 | 1.19 | 6,11 | .44 | 6,11 | .94 | 6,11 | 2.66 | 6,11 | |||||||||||||||||||||||||||||||||||
| Managed Risk Blue Chip Income and Growth Fund | ||||||||||||||||||||||||||||||||||||||||||||||||||||||||
Class P1: | ||||||||||||||||||||||||||||||||||||||||||||||||||||||||
12/31/17 | $ | 11.67 | $ | .19 | $ | 1.59 | $ | 1.78 | $ | (.22 | ) | $ | (.19 | ) | $ | (.41 | ) | $ | 13.04 | 15.48 | %11 | $ | — | 7 | .30 | %11 | .25 | %11 | .64 | %11 | 1.59 | %11 | ||||||||||||||||||||||||
12/31/16 | 10.80 | .20 | 1.25 | 1.45 | (.21 | ) | (.37 | ) | (.58 | ) | 11.67 | 13.77 | 11 | — | 7 | .43 | 11 | .27 | 11 | .67 | 11 | 1.83 | 11 | |||||||||||||||||||||||||||||||||
12/31/15 | 11.70 | .19 | (1.02 | ) | (.83 | ) | (.07 | ) | — | (.07 | ) | 10.80 | (7.07 | )11 | — | 7 | .50 | 11 | .27 | 11 | .66 | 11 | 1.64 | 11 | ||||||||||||||||||||||||||||||||
12/31/14 | 11.05 | .40 | .55 | .95 | (.30 | ) | — | (.30 | ) | 11.70 | 8.58 | 11 | — | 7 | .50 | 11 | .31 | 11 | .70 | 11 | 3.43 | 11 | ||||||||||||||||||||||||||||||||||
12/31/133,15 | 10.00 | .20 | 1.01 | 1.21 | (.16 | ) | — | (.16 | ) | 11.05 | 12.16 | 5,11 | — | 7 | .84 | 6,11 | .24 | 6,11 | .64 | 6,11 | 2.80 | 6,11 | ||||||||||||||||||||||||||||||||||
Class P2: | ||||||||||||||||||||||||||||||||||||||||||||||||||||||||
12/31/17 | 11.61 | .17 | 1.55 | 1.72 | (.18 | ) | (.19 | ) | (.37 | ) | 12.96 | 15.03 | 367 | .68 | .63 | 1.02 | 1.43 | |||||||||||||||||||||||||||||||||||||||
12/31/16 | 10.76 | .23 | 1.18 | 1.41 | (.19 | ) | (.37 | ) | (.56 | ) | 11.61 | 13.39 | 291 | .79 | .63 | 1.03 | 2.04 | |||||||||||||||||||||||||||||||||||||||
12/31/15 | 11.67 | .18 | (1.05 | ) | (.87 | ) | (.04 | ) | — | (.04 | ) | 10.76 | (7.43 | ) | 137 | .89 | .66 | 1.05 | 1.57 | |||||||||||||||||||||||||||||||||||||
12/31/14 | 11.05 | .50 | .40 | .90 | (.28 | ) | — | (.28 | ) | 11.67 | 8.10 | 98 | .88 | .69 | 1.08 | 4.27 | ||||||||||||||||||||||||||||||||||||||||
12/31/133,15 | 10.00 | .28 | .92 | 1.20 | (.15 | ) | — | (.15 | ) | 11.05 | 12.05 | 5,11 | 26 | 1.04 | 6,11 | .54 | 6,11 | .94 | 6,11 | 3.91 | 6,11 | |||||||||||||||||||||||||||||||||||
| Managed Risk Growth-Income Fund | ||||||||||||||||||||||||||||||||||||||||||||||||||||||||
| Class P1: | ||||||||||||||||||||||||||||||||||||||||||||||||||||||||
12/31/17 | $ | 11.07 | $ | .19 | $ | 2.03 | $ | 2.22 | $ | (.13 | ) | $ | (.50 | ) | $ | (.63 | ) | $ | 12.66 | 20.64 | %11 | $ | 2 | .44 | %11 | .37 | %11 | .66 | %11 | 1.61 | %11 | |||||||||||||||||||||||||
12/31/16 | 11.25 | .16 | .52 | .68 | (.16 | ) | (.70 | ) | (.86 | ) | 11.07 | 6.49 | 11 | 1 | .52 | 11 | .36 | 11 | .64 | 11 | 1.46 | 11 | ||||||||||||||||||||||||||||||||||
12/31/15 | 11.67 | .25 | (.63 | ) | (.38 | ) | (.04 | ) | — | (.04 | ) | 11.25 | (3.27 | )11 | 1 | .56 | 11 | .31 | 11 | .59 | 11 | 2.17 | 11 | |||||||||||||||||||||||||||||||||
12/31/14 | 11.50 | .35 | .21 | .56 | (.14 | ) | (.25 | ) | (.39 | ) | 11.67 | 4.85 | 11 | — | 7 | .45 | 11 | .25 | 11 | .52 | 11 | 2.94 | 11 | |||||||||||||||||||||||||||||||||
12/31/133,15 | 10.00 | .14 | 1.47 | 1.61 | (.11 | ) | — | (.11 | ) | 11.50 | 16.15 | 5,11 | — | 7 | .92 | 6,11 | .23 | 6,11 | .50 | 6,11 | 2.01 | 6,11 | ||||||||||||||||||||||||||||||||||
Class P2: | ||||||||||||||||||||||||||||||||||||||||||||||||||||||||
12/31/17 | 11.02 | .13 | 2.05 | 2.18 | (.12 | ) | (.50 | ) | (.62 | ) | 12.58 | 20.40 | 206 | .70 | .63 | .92 | 1.08 | |||||||||||||||||||||||||||||||||||||||
12/31/16 | 11.22 | .12 | .52 | .64 | (.14 | ) | (.70 | ) | (.84 | ) | 11.02 | 6.08 | 160 | .79 | .63 | .91 | 1.13 | |||||||||||||||||||||||||||||||||||||||
12/31/15 | 11.65 | .12 | (.54 | ) | (.42 | ) | (.01 | ) | — | (.01 | ) | 11.22 | (3.64 | ) | 122 | .89 | .66 | .94 | 1.04 | |||||||||||||||||||||||||||||||||||||
12/31/14 | 11.50 | .16 | .35 | .51 | (.11 | ) | (.25 | ) | (.36 | ) | 11.65 | 4.42 | 76 | .87 | .69 | .96 | 1.38 | |||||||||||||||||||||||||||||||||||||||
12/31/133,15 | 10.00 | .20 | 1.40 | 1.60 | (.10 | ) | — | (.10 | ) | 11.50 | 16.04 | 5,11 | 24 | 1.09 | 6,11 | .50 | 6,11 | .77 | 6,11 | 2.73 | 6,11 | |||||||||||||||||||||||||||||||||||
See end of tables for footnotes.
American Funds Insurance Series 197
Table of Contents
Financial highlights (continued)
| Income (loss) from investment operations1 | Dividends and distributions | |||||||||||||||||||||||||||||||||||||||||||||||||||||||
| Period ended | Net asset value, beginning of period | Net investment income | Net gains (losses) on securities (both realized and unrealized) | Total from investment operations | Dividends (from net investment income) | Distributions (from capital gains) | Total dividends and distributions | Net asset value, end of period | Total return13 | Net assets, end of period (in millions) | Ratio of expenses to average net assets before waivers/ reimbursements | Ratio of expenses to average net assets after waivers/ reimbursements13 | Net effective expense ratio13,14 | Ratio of net income to average net assets13 | ||||||||||||||||||||||||||||||||||||||||||
Managed Risk Asset Allocation Fund |
| |||||||||||||||||||||||||||||||||||||||||||||||||||||||
Class P1: | ||||||||||||||||||||||||||||||||||||||||||||||||||||||||
12/31/17 | $ | 12.02 | $ | .19 | $ | 1.60 | $ | 1.79 | $ | (.10 | ) | $ | (.12 | ) | $ | (.22 | ) | $ | 13.59 | 15.06 | % | $ | 1,656 | .43 | % | .38 | % | .66 | % | 1.45 | % | |||||||||||||||||||||||||
12/31/16 | 11.72 | .19 | .67 | .86 | (.19 | ) | (.37 | ) | (.56 | ) | 12.02 | 7.57 | 1,217 | .43 | .38 | .66 | 1.65 | |||||||||||||||||||||||||||||||||||||||
12/31/15 | 12.29 | .25 | (.34 | ) | (.09 | ) | (.22 | ) | (.26 | ) | (.48 | ) | 11.72 | (.83 | ) | 712 | .54 | .40 | .68 | 2.06 | ||||||||||||||||||||||||||||||||||||
12/31/14 | 11.93 | .13 | .26 | .39 | (.03 | ) | — | (.03 | ) | 12.29 | 3.24 | 277 | .53 | .48 | .76 | 1.04 | ||||||||||||||||||||||||||||||||||||||||
12/31/13 | 9.99 | .27 | 1.81 | 2.08 | (.14 | ) | — | (.14 | ) | 11.93 | 20.82 | 11 | 112 | .55 | 11 | .47 | 11 | .75 | 11 | 2.37 | 11 | |||||||||||||||||||||||||||||||||||
Class P2: | ||||||||||||||||||||||||||||||||||||||||||||||||||||||||
12/31/17 | 12.01 | .15 | 1.61 | 1.76 | (.10 | ) | (.12 | ) | (.22 | ) | 13.55 | 14.80 | 2,798 | .68 | .63 | .91 | 1.13 | |||||||||||||||||||||||||||||||||||||||
12/31/16 | 11.71 | .14 | .69 | .83 | (.16 | ) | (.37 | ) | (.53 | ) | 12.01 | 7.27 | 2,342 | .68 | .63 | .91 | 1.20 | |||||||||||||||||||||||||||||||||||||||
12/31/15 | 12.27 | .14 | (.26 | ) | (.12 | ) | (.18 | ) | (.26 | ) | (.44 | ) | 11.71 | (1.07 | ) | 1,953 | .79 | .66 | .94 | 1.16 | ||||||||||||||||||||||||||||||||||||
12/31/14 | 11.93 | .16 | .19 | .35 | (.01 | ) | — | (.01 | ) | 12.27 | 2.91 | 1,780 | .79 | .73 | 1.01 | 1.33 | ||||||||||||||||||||||||||||||||||||||||
12/31/13 | 9.99 | .28 | 1.77 | 2.05 | (.11 | ) | — | (.11 | ) | 11.93 | 20.58 | 11 | 795 | .80 | 11 | .73 | 11 | 1.01 | 11 | 2.43 | 11 | |||||||||||||||||||||||||||||||||||
198 American Funds Insurance Series
Table of Contents
Portfolio turnover rate for all share classes excluding mortgage dollar roll transactions16 | Period ended December 31 | |||||||||||||||||||
| 2017 | 2016 | 2015 | 2014 | 2013 | ||||||||||||||||
Capital Income Builder | 59 | % | 41 | % | 38 | % | 24 | %5,10 | ||||||||||||
Asset Allocation Fund | 39 | 43 | 28 | 42 | ||||||||||||||||
Global Balanced Fund | 28 | 43 | 36 | 40 | ||||||||||||||||
Bond Fund | 153 | 108 | 141 | 121 | Not available | |||||||||||||||
Global Bond Fund | 74 | 70 | 88 | 134 | ||||||||||||||||
Mortgage Fund | 98 | 113 | 138 | 108 | ||||||||||||||||
U.S. Government/AAA-Rated Securities Fund | 120 | 273 | 352 | 88 | ||||||||||||||||
Portfolio turnover rate for all share classes including mortgage dollar roll transactions, if applicable16 | Period ended December 31 | |||||||||||||||||||
| 2017 | 2016 | 2015 | 2014 | 2013 | ||||||||||||||||
Global Growth Fund | 31 | % | 27 | % | 29 | % | 22 | % | 39 | % | ||||||||||
Global Small Capitalization Fund | 33 | 40 | 36 | 28 | 36 | |||||||||||||||
Growth Fund | 24 | 26 | 20 | 29 | 19 | |||||||||||||||
International Fund | 29 | 31 | 37 | 18 | 21 | |||||||||||||||
New World Fund | 56 | 32 | 39 | 36 | 43 | |||||||||||||||
Blue Chip Income and Growth Fund | 34 | 30 | 26 | 37 | 30 | |||||||||||||||
Global Growth and Income Fund | 41 | 57 | 37 | 28 | 31 | |||||||||||||||
Growth-Income Fund | 27 | 27 | 25 | 25 | 19 | |||||||||||||||
International Growth and Income Fund | 51 | 32 | 35 | 34 | 34 | |||||||||||||||
Capital Income Builder Fund | 88 | 53 | 128 | 35 | 5,10 | |||||||||||||||
Asset Allocation Fund | 85 | 83 | 76 | 88 | 74 | |||||||||||||||
Global Balanced Fund | 41 | 65 | 76 | 73 | 81 | |||||||||||||||
Bond Fund | 502 | 375 | 434 | 365 | 354 | |||||||||||||||
Global Bond Fund | 105 | 154 | 159 | 200 | 213 | |||||||||||||||
High-Income Bond Fund | 78 | 89 | 66 | 54 | 64 | |||||||||||||||
Mortgage Fund | 680 | 713 | 1103 | 790 | 715 | |||||||||||||||
Ultra-Short Bond Fund | — | 17 | — | 12,17 | N/A | N/A | N/A | |||||||||||||
U.S. Government/AAA-Rated Securities Fund | 551 | 539 | 901 | 387 | 621 | |||||||||||||||
Managed Risk Growth Fund | 25 | 15 | 16 | 22 | 10 | 3,5,15 | ||||||||||||||
Managed Risk International Fund | 25 | 26 | 15 | 22 | 6 | 3,5,15 | ||||||||||||||
Managed Risk Blue Chip Income and Growth Fund | 32 | 9 | 20 | 22 | 3 | 3,5,15 | ||||||||||||||
Managed Risk Growth-Income Fund | 26 | 14 | 11 | 28 | 2 | 3,5,15 | ||||||||||||||
Managed Risk Asset Allocation Fund | 1 | 3 | 3 | 3 | 3 | |||||||||||||||
| 1 | Based on average shares outstanding. |
| 2 | For the year ended December 31, 2014, reflects the impact of a corporate action event that resulted in a one-time increase to net investment income. If the corporate action event had not occurred, the net investment income per share and ratio of net income to average net assets would have been lower for all share classes. |
| 3 | Based on operations for a period that is less than a full year. |
| 4 | Class 1A shares began investment operations on January 6, 2017. |
| 5 | Not annualized. |
| 6 | Annualized. |
| 7 | Amount less than $1 million. |
| 8 | Amount less than $.01. |
| 9 | Amount less than .01%. |
| 10 | For the period May 1, 2014, commencement of operations, through December 31, 2014. |
| 11 | All or a significant portion of assets in this class consisted of seed capital invested by CRMC and/or its affiliates. Certain fees (including, where applicable, fees for distribution services) are not charged or accrued on these seed capital assets. If such fees were paid by the fund on seed capital assets, fund expenses would have been higher and net income and total return would have been lower. |
| 12 | On May 1, 2016, the fund converted from a cash fund to an ultra-short-term bond fund and changed its name from Cash Management Fund to Ultra-Short Bond Fund. |
| 13 | This column reflects the impact of certain waivers/reimbursements by CRMC. CRMC waived a portion of investment advisory services fees for all of the managed risk funds. CRMC also reimbursed a portion of miscellaneous fees and expenses during some of the periods shown for some of the managed risk funds. |
| 14 | Ratio reflects weighted average net expense ratio of the underlying fund for the period presented. See Expense Example for further information regarding fees and expenses. |
| 15 | For the period May 1, 2013, commencement of operations, through December 31, 2013. |
| 16 | Refer to Note 5 for further information on mortgage dollar rolls. |
| 17 | Amount is either less than 1% or there is no turnover. |
See Notes to Financial Statements
American Funds Insurance Series 199
Table of Contents
Report of Independent Registered Public Accounting Firm
Opinions on the Financial Statements
We have audited the accompanying statements of assets and liabilities, including summary investment portfolios of Global Growth Fund, Global Small Capitalization Fund, Growth Fund, International Fund, New World Fund®, Blue Chip Income and Growth Fund, Global Growth and Income Fund, Growth-Income Fund, International Growth and Income Fund, Capital Income Builder®, Asset Allocation Fund, Global Balanced Fund, Bond Fund, Global Bond Fund, High-Income Bond Fund, Mortgage Fund, Ultra-Short Bond Fund, U.S. Government/AAA-Rated Securities Fund and investment portfolios for Ultra-Short Bond Fund, Managed Risk Growth Fund, Managed Risk International Fund, Managed Risk Blue Chip Income and Growth Fund, Managed Risk Growth-Income Fund and Managed Risk Asset Allocation Fund, Managed Risk Growth Fund, Managed Risk International Fund, Managed Risk Blue Chip Income and Growth Fund, Managed Risk Growth-Income Fund and Managed Risk Asset Allocation Fund (twenty-three of the funds constituting American Funds Insurance Series, hereafter collectively referred to as the “Funds”) as of December 31, 2017, the related statements of operations for the year ended December 31, 2017, the statements of changes in net assets for each of the two years in the period ended December 31, 2017, including the related notes, and the financial highlights for each of the periods indicated herein (collectively referred to as the “financial statements”). In our opinion, the financial statements present fairly, in all material respects, the financial position of each of the Funds as of December 31, 2017, the results of each of their operations for the year then ended, the changes in each of their net assets for each of the two years in the period ended December 31, 2017 and each of the financial highlights for each of the periods indicated herein in conformity with accounting principles generally accepted in the United States of America.
Basis for Opinions
These financial statements are the responsibility of the Funds’ management. Our responsibility is to express an opinion on the Funds’ financial statements based on our audits. We are a public accounting firm registered with the Public Company Accounting Oversight Board (United States) (“PCAOB”) and are required to be independent with respect to the Funds in accordance with the U.S. federal securities laws and the applicable rules and regulations of the Securities and Exchange Commission and the PCAOB.
We conducted our audits of these financial statements in accordance with the standards of the PCAOB. Those standards require that we plan and perform the audit to obtain reasonable assurance about whether the financial statements are free of material misstate-ment, whether due to error or fraud.
Our audits included performing procedures to assess the risks of material misstatement of the financial statements, whether due to error or fraud, and performing procedures that respond to those risks. Such procedures included examining, on a test basis, evidence regarding the amounts and disclosures in the financial statements. Our audits also included evaluating the accounting principles used and significant estimates made by management, as well as evaluating the overall presentation of the financial statements. Our procedures included confirmation of securities owned as of December 31, 2017 by correspondence with the custodians, transfer agents and brokers. We believe that our audits provide a reasonable basis for our opinions.
PricewaterhouseCoopers LLP
Los Angeles, California
February 9, 2018
We have served as the auditor of one or more investment companies in The Capital Group Companies Investment Company Complex since 1934.
200 American Funds Insurance Series
Table of Contents
| Expense example | unaudited |
The funds in American Funds Insurance Series serve as the underlying investment vehicle for various insurance products. As an owner of an insurance contract that invests in one of the funds in the series, you incur two types of costs: (1) transaction costs, such as initial sales charges on purchase payments and contingent deferred sales charges on redemptions (loads), and (2) ongoing costs, including management fees, distribution and service (12b-1) fees, and other expenses. Additional fees are charged by the insurance companies related to the various benefits they provide. This example is intended to help you understand your ongoing costs (in dollars) of investing in the underlying funds so you can compare these costs with the ongoing costs of investing in other mutual funds that serve a similar function in other annuity products. The example is based on an investment of $1,000 invested at the beginning of the period and held for the entire six-month period (July 1, 2017, through December 31, 2017).
Actual expenses:
The first line of each share class in the table on the following pages provides information about actual account values and actual expenses. You may use the information in this line, together with the amount you invested, to estimate the expenses that you paid over the period. Simply divide your account value by $1,000 (for example, an $8,600 account value divided by $1,000 = 8.6), then multiply the result by the number in the first line under the heading titled “Expenses paid during period” to estimate the expenses you paid on your account during this period.
Hypothetical example for comparison purposes:
The second line of each share class in the table on the following pages provides information about hypothetical account values and hypothetical expenses based on the actual expense ratio for the share class and an assumed rate of return of 5.00% per year before expenses, which is not the actual return of the share class. The hypothetical account values and expenses may not be used to estimate the actual ending account balance or expenses you paid for the period. You may use this information to compare the ongoing costs of investing in the fund and other funds. To do so, compare this 5.00% hypothetical example with the 5.00% hypothetical examples that appear in the shareholder reports of the other funds.
Notes:
Additional fees are charged by the insurance companies related to the various benefits they provide. You can estimate the impact of these fees by adding the amount of the fees to the total estimated expenses you paid on your account during the period as calculated above. In addition, your ending account value would be lower by the amount of these fees.
Note that the expenses shown in the table on the following pages are meant to highlight your ongoing costs only and do not reflect any transactional costs. Therefore, the second line of each share class in the table is useful in comparing ongoing costs only and will not help you determine the relative total costs of owning different funds. In addition, if these transactional costs were included, your costs would have been higher.
American Funds Insurance Series 201
Table of Contents
| Beginning account value 7/1/2017 | Ending account value 12/31/2017 | Expenses paid during period1 | Annualized expense ratio | |||||||||||||
Global Growth Fund | ||||||||||||||||
Class 1 — actual return | $ | 1,000.00 | $ | 1,109.92 | $ | 2.98 | .56 | % | ||||||||
Class 1 — assumed 5% return | 1,000.00 | 1,022.38 | 2.85 | .56 | ||||||||||||
Class 1A — actual return | 1,000.00 | 1,108.56 | 4.25 | .80 | ||||||||||||
Class 1A — assumed 5% return | 1,000.00 | 1,021.17 | 4.08 | .80 | ||||||||||||
Class 2 — actual return | 1,000.00 | 1,108.84 | 4.31 | .81 | ||||||||||||
Class 2 — assumed 5% return | 1,000.00 | 1,021.12 | 4.13 | .81 | ||||||||||||
Class 4 — actual return | 1,000.00 | 1,106.95 | 5.63 | 1.06 | ||||||||||||
Class 4 — assumed 5% return | 1,000.00 | 1,019.86 | 5.40 | 1.06 | ||||||||||||
Global Small Capitalization Fund | ||||||||||||||||
Class 1 — actual return | $ | 1,000.00 | $ | 1,118.73 | $ | 3.95 | .74 | % | ||||||||
Class 1 — assumed 5% return | 1,000.00 | 1,021.48 | 3.77 | .74 | ||||||||||||
Class 1A — actual return | 1,000.00 | 1,117.26 | 5.18 | .97 | ||||||||||||
Class 1A — assumed 5% return | 1,000.00 | 1,020.32 | 4.94 | .97 | ||||||||||||
Class 2 — actual return | 1,000.00 | 1,117.00 | 5.28 | .99 | ||||||||||||
Class 2 — assumed 5% return | 1,000.00 | 1,020.21 | 5.04 | .99 | ||||||||||||
Class 4 — actual return | 1,000.00 | 1,116.02 | 6.61 | 1.24 | ||||||||||||
Class 4 — assumed 5% return | 1,000.00 | 1,018.95 | 6.31 | 1.24 | ||||||||||||
Growth Fund | ||||||||||||||||
Class 1 — actual return | $ | 1,000.00 | $ | 1,116.99 | $ | 1.87 | .35 | % | ||||||||
Class 1 — assumed 5% return | 1,000.00 | 1,023.44 | 1.79 | .35 | ||||||||||||
Class 1A — actual return | 1,000.00 | 1,115.57 | 3.15 | .59 | ||||||||||||
Class 1A — assumed 5% return | 1,000.00 | 1,022.23 | 3.01 | .59 | ||||||||||||
Class 2 — actual return | 1,000.00 | 1,115.54 | 3.20 | .60 | ||||||||||||
Class 2 — assumed 5% return | 1,000.00 | 1,022.18 | 3.06 | .60 | ||||||||||||
Class 3 — actual return | 1,000.00 | 1,115.90 | 2.83 | .53 | ||||||||||||
Class 3 — assumed 5% return | 1,000.00 | 1,022.53 | 2.70 | .53 | ||||||||||||
Class 4 — actual return | 1,000.00 | 1,114.18 | 4.53 | .85 | ||||||||||||
Class 4 — assumed 5% return | 1,000.00 | 1,020.92 | 4.33 | .85 | ||||||||||||
International Fund | ||||||||||||||||
Class 1 — actual return | $ | 1,000.00 | $ | 1,115.85 | $ | 2.83 | .53 | % | ||||||||
Class 1 — assumed 5% return | 1,000.00 | 1,022.53 | 2.70 | .53 | ||||||||||||
Class 1A — actual return | 1,000.00 | 1,114.40 | 4.16 | .78 | ||||||||||||
Class 1A — assumed 5% return | 1,000.00 | 1,021.27 | 3.97 | .78 | ||||||||||||
Class 2 — actual return | 1,000.00 | 1,114.72 | 4.16 | .78 | ||||||||||||
Class 2 — assumed 5% return | 1,000.00 | 1,021.27 | 3.97 | .78 | ||||||||||||
Class 3 — actual return | 1,000.00 | 1,114.58 | 3.78 | .71 | ||||||||||||
Class 3 — assumed 5% return | 1,000.00 | 1,021.63 | 3.62 | .71 | ||||||||||||
Class 4 — actual return | 1,000.00 | 1,113.20 | 5.49 | 1.03 | ||||||||||||
Class 4 — assumed 5% return | 1,000.00 | 1,020.01 | 5.24 | 1.03 | ||||||||||||
New World Fund | ||||||||||||||||
Class 1 — actual return | $ | 1,000.00 | $ | 1,132.10 | $ | 4.19 | .78 | % | ||||||||
Class 1 — assumed 5% return | 1,000.00 | 1,021.27 | 3.97 | .78 | ||||||||||||
Class 1A — actual return | 1,000.00 | 1,130.42 | 5.42 | 1.01 | ||||||||||||
Class 1A — assumed 5% return | 1,000.00 | 1,020.11 | 5.14 | 1.01 | ||||||||||||
Class 2 — actual return | 1,000.00 | 1,130.73 | 5.53 | 1.03 | ||||||||||||
Class 2 — assumed 5% return | 1,000.00 | 1,020.01 | 5.24 | 1.03 | ||||||||||||
Class 4 — actual return | 1,000.00 | 1,128.90 | 6.87 | 1.28 | ||||||||||||
Class 4 — assumed 5% return | 1,000.00 | 1,018.75 | 6.51 | 1.28 | ||||||||||||
202 American Funds Insurance Series
Table of Contents
| Beginning account value 7/1/2017 | Ending account value 12/31/2017 | Expenses paid during period1 | Annualized expense ratio | |||||||||||||
Blue Chip Income and Growth Fund | ||||||||||||||||
Class 1 — actual return | $ | 1,000.00 | $ | 1,108.43 | $ | 2.18 | .41 | % | ||||||||
Class 1 — assumed 5% return | 1,000.00 | 1,023.14 | 2.09 | .41 | ||||||||||||
Class 1A — actual return | 1,000.00 | 1,107.22 | 3.45 | .65 | ||||||||||||
Class 1A — assumed 5% return | 1,000.00 | 1,021.93 | 3.31 | .65 | ||||||||||||
Class 2 — actual return | 1,000.00 | 1,106.66 | 3.50 | .66 | ||||||||||||
Class 2 — assumed 5% return | 1,000.00 | 1,021.88 | 3.36 | .66 | ||||||||||||
Class 4 — actual return | 1,000.00 | 1,105.98 | 4.83 | .91 | ||||||||||||
Class 4 — assumed 5% return | 1,000.00 | 1,020.62 | 4.63 | .91 | ||||||||||||
Global Growth and Income Fund | ||||||||||||||||
Class 1 — actual return | $ | 1,000.00 | $ | 1,100.31 | $ | 3.39 | .64 | % | ||||||||
Class 1 — assumed 5% return | 1,000.00 | 1,021.98 | 3.26 | .64 | ||||||||||||
Class 1A — actual return | 1,000.00 | 1,099.92 | 4.55 | .86 | ||||||||||||
Class 1A — assumed 5% return | 1,000.00 | 1,020.87 | 4.38 | .86 | ||||||||||||
Class 2 — actual return | 1,000.00 | 1,099.08 | 4.71 | .89 | ||||||||||||
Class 2 — assumed 5% return | 1,000.00 | 1,020.72 | 4.53 | .89 | ||||||||||||
Class 4 — actual return | 1,000.00 | 1,098.18 | 6.03 | 1.14 | ||||||||||||
Class 4 — assumed 5% return | 1,000.00 | 1,019.46 | 5.80 | 1.14 | ||||||||||||
Growth-Income Fund | ||||||||||||||||
Class 1 — actual return | $ | 1,000.00 | $ | 1,116.34 | $ | 1.49 | .28 | % | ||||||||
Class 1 — assumed 5% return | 1,000.00 | 1,023.79 | 1.43 | .28 | ||||||||||||
Class 1A — actual return | 1,000.00 | 1,114.88 | 2.83 | .53 | ||||||||||||
Class 1A — assumed 5% return | 1,000.00 | 1,022.53 | 2.70 | .53 | ||||||||||||
Class 2 — actual return | 1,000.00 | 1,114.95 | 2.83 | .53 | ||||||||||||
Class 2 — assumed 5% return | 1,000.00 | 1,022.53 | 2.70 | .53 | ||||||||||||
Class 3 — actual return | 1,000.00 | 1,114.98 | 2.45 | .46 | ||||||||||||
Class 3 — assumed 5% return | 1,000.00 | 1,022.89 | 2.35 | .46 | ||||||||||||
Class 4 — actual return | 1,000.00 | 1,113.47 | 4.16 | .78 | ||||||||||||
Class 4 — assumed 5% return | 1,000.00 | 1,021.27 | 3.97 | .78 | ||||||||||||
International Growth and Income Fund | ||||||||||||||||
Class 1 — actual return | $ | 1,000.00 | $ | 1,084.53 | $ | 3.42 | .65 | % | ||||||||
Class 1 — assumed 5% return | 1,000.00 | 1,021.93 | 3.31 | .65 | ||||||||||||
Class 1A — actual return | 1,000.00 | 1,083.17 | 4.83 | .92 | ||||||||||||
Class 1A — assumed 5% return | 1,000.00 | 1,020.57 | 4.69 | .92 | ||||||||||||
Class 2 — actual return | 1,000.00 | 1,082.65 | 4.72 | .90 | ||||||||||||
Class 2 — assumed 5% return | 1,000.00 | 1,020.67 | 4.58 | .90 | ||||||||||||
Class 4 — actual return | 1,000.00 | 1,081.77 | 6.03 | 1.15 | ||||||||||||
Class 4 — assumed 5% return | 1,000.00 | 1,019.41 | 5.85 | 1.15 | ||||||||||||
Capital Income Builder | ||||||||||||||||
Class 1 — actual return | $ | 1,000.00 | $ | 1,046.34 | $ | 2.84 | .55 | % | ||||||||
Class 1 — assumed 5% return | 1,000.00 | 1,022.43 | 2.80 | .55 | ||||||||||||
Class 1A — actual return | 1,000.00 | 1,045.28 | 4.12 | .80 | ||||||||||||
Class 1A — assumed 5% return | 1,000.00 | 1,021.17 | 4.08 | .80 | ||||||||||||
Class 2 — actual return | 1,000.00 | 1,045.17 | 4.12 | .80 | ||||||||||||
Class 2 — assumed 5% return | 1,000.00 | 1,021.17 | 4.08 | .80 | ||||||||||||
Class 4 — actual return | 1,000.00 | 1,043.83 | 5.41 | 1.05 | ||||||||||||
Class 4 — assumed 5% return | 1,000.00 | 1,019.91 | 5.35 | 1.05 | ||||||||||||
See end of tables for footnotes.
American Funds Insurance Series 203
Table of Contents
| Beginning account value 7/1/2017 | Ending account value 12/31/2017 | Expenses paid during period1 | Annualized expense ratio | |||||||||||||
Asset Allocation Fund | ||||||||||||||||
Class 1 — actual return | $ | 1,000.00 | $ | 1,075.96 | $ | 1.52 | .29 | % | ||||||||
Class 1 — assumed 5% return | 1,000.00 | 1,023.74 | 1.48 | .29 | ||||||||||||
Class 1A — actual return | 1,000.00 | 1,074.67 | 2.77 | .53 | ||||||||||||
Class 1A — assumed 5% return | 1,000.00 | 1,022.53 | 2.70 | .53 | ||||||||||||
Class 2 — actual return | 1,000.00 | 1,074.53 | 2.82 | .54 | ||||||||||||
Class 2 — assumed 5% return | 1,000.00 | 1,022.48 | 2.75 | .54 | ||||||||||||
Class 3 — actual return | 1,000.00 | 1,074.80 | 2.46 | .47 | ||||||||||||
Class 3 — assumed 5% return | 1,000.00 | 1,022.84 | 2.40 | .47 | ||||||||||||
Class 4 — actual return | 1,000.00 | 1,073.03 | 4.13 | .79 | ||||||||||||
Class 4 — assumed 5% return | 1,000.00 | 1,021.22 | 4.02 | .79 | ||||||||||||
Global Balanced Fund | ||||||||||||||||
Class 1 — actual return | $ | 1,000.00 | $ | 1,078.42 | $ | 3.82 | .73 | % | ||||||||
Class 1 — assumed 5% return | 1,000.00 | 1,021.53 | 3.72 | .73 | ||||||||||||
Class 1A — actual return | 1,000.00 | 1,077.23 | 5.08 | .97 | ||||||||||||
Class 1A — assumed 5% return | 1,000.00 | 1,020.32 | 4.94 | .97 | ||||||||||||
Class 2 — actual return | 1,000.00 | 1,076.06 | 5.13 | .98 | ||||||||||||
Class 2 — assumed 5% return | 1,000.00 | 1,020.27 | 4.99 | .98 | ||||||||||||
Class 4 — actual return | 1,000.00 | 1,075.47 | 6.43 | 1.23 | ||||||||||||
Class 4 — assumed 5% return | 1,000.00 | 1,019.00 | 6.26 | 1.23 | ||||||||||||
Bond Fund | ||||||||||||||||
Class 1 — actual return | $ | 1,000.00 | $ | 1,012.27 | $ | 1.93 | .38 | % | ||||||||
Class 1 — assumed 5% return | 1,000.00 | 1,023.29 | 1.94 | .38 | ||||||||||||
Class 1A — actual return | 1,000.00 | 1,010.94 | 3.19 | .63 | ||||||||||||
Class 1A — assumed 5% return | 1,000.00 | 1,022.03 | 3.21 | .63 | ||||||||||||
Class 2 — actual return | 1,000.00 | 1,011.27 | 3.19 | .63 | ||||||||||||
Class 2 — assumed 5% return | 1,000.00 | 1,022.03 | 3.21 | .63 | ||||||||||||
Class 4 — actual return | 1,000.00 | 1,009.80 | 4.46 | .88 | ||||||||||||
Class 4 — assumed 5% return | 1,000.00 | 1,020.77 | 4.48 | .88 | ||||||||||||
Global Bond Fund | ||||||||||||||||
Class 1 — actual return | $ | 1,000.00 | $ | 1,019.28 | $ | 2.85 | .56 | % | ||||||||
Class 1 — assumed 5% return | 1,000.00 | 1,022.38 | 2.85 | .56 | ||||||||||||
Class 1A — actual return | 1,000.00 | 1,018.24 | 3.82 | .75 | ||||||||||||
Class 1A — assumed 5% return | 1,000.00 | 1,021.42 | 3.82 | .75 | ||||||||||||
Class 2 — actual return | 1,000.00 | 1,018.21 | 4.12 | .81 | ||||||||||||
Class 2 — assumed 5% return | 1,000.00 | 1,021.12 | 4.13 | .81 | ||||||||||||
Class 4 — actual return | 1,000.00 | 1,016.69 | 5.39 | 1.06 | ||||||||||||
Class 4 — assumed 5% return | 1,000.00 | 1,019.86 | 5.40 | 1.06 | ||||||||||||
High-Income Bond Fund | ||||||||||||||||
Class 1 — actual return | $ | 1,000.00 | $ | 1,025.31 | $ | 2.55 | .50 | % | ||||||||
Class 1 — assumed 5% return | 1,000.00 | 1,022.68 | 2.55 | .50 | ||||||||||||
Class 1A — actual return | 1,000.00 | 1,023.44 | 3.72 | .73 | ||||||||||||
Class 1A — assumed 5% return | 1,000.00 | 1,021.53 | 3.72 | .73 | ||||||||||||
Class 2 — actual return | 1,000.00 | 1,023.54 | 3.83 | .75 | ||||||||||||
Class 2 — assumed 5% return | 1,000.00 | 1,021.42 | 3.82 | .75 | ||||||||||||
Class 3 — actual return | 1,000.00 | 1,024.55 | 3.47 | .68 | ||||||||||||
Class 3 — assumed 5% return | 1,000.00 | 1,021.78 | 3.47 | .68 | ||||||||||||
Class 4 — actual return | 1,000.00 | 1,022.46 | 5.10 | 1.00 | ||||||||||||
Class 4 — assumed 5% return | 1,000.00 | 1,020.16 | 5.09 | 1.00 | ||||||||||||
204 American Funds Insurance Series
Table of Contents
| Beginning account value 7/1/2017 | Ending account value 12/31/2017 | Expenses paid during period1 | Annualized expense ratio | |||||||||||||
Mortgage Fund | ||||||||||||||||
Class 1 — actual return | $ | 1,000.00 | $ | 999.60 | $ | 2.52 | .50 | % | ||||||||
Class 1 — assumed 5% return | 1,000.00 | 1,022.68 | 2.55 | .50 | ||||||||||||
Class 1A — actual return | 1,000.00 | 998.01 | 3.63 | .72 | ||||||||||||
Class 1A — assumed 5% return | 1,000.00 | 1,021.58 | 3.67 | .72 | ||||||||||||
Class 2 — actual return | 1,000.00 | 998.48 | 3.78 | .75 | ||||||||||||
Class 2 — assumed 5% return | 1,000.00 | 1,021.42 | 3.82 | .75 | ||||||||||||
Class 4 — actual return | 1,000.00 | 997.26 | 5.03 | 1.00 | ||||||||||||
Class 4 — assumed 5% return | 1,000.00 | 1,020.16 | 5.09 | 1.00 | ||||||||||||
Ultra-Short Bond Fund | ||||||||||||||||
Class 1 — actual return | $ | 1,000.00 | $ | 1,003.97 | $ | 1.87 | .37 | % | ||||||||
Class 1 — assumed 5% return | 1,000.00 | 1,023.34 | 1.89 | .37 | ||||||||||||
Class 1A — actual return | 1,000.00 | 1,004.05 | 1.77 | .35 | ||||||||||||
Class 1A — assumed 5% return | 1,000.00 | 1,023.44 | 1.79 | .35 | ||||||||||||
Class 2 — actual return | 1,000.00 | 1,003.68 | 3.08 | .61 | ||||||||||||
Class 2 — assumed 5% return | 1,000.00 | 1,022.13 | 3.11 | .61 | ||||||||||||
Class 3 — actual return | 1,000.00 | 1,003.57 | 2.73 | .54 | ||||||||||||
Class 3 — assumed 5% return | 1,000.00 | 1,022.48 | 2.75 | .54 | ||||||||||||
Class 4 — actual return | 1,000.00 | 1,001.58 | 4.34 | .86 | ||||||||||||
Class 4 — assumed 5% return | 1,000.00 | 1,020.87 | 4.38 | .86 | ||||||||||||
U.S. Government/AAA-Rated Securities Fund | ||||||||||||||||
Class 1 — actual return | $ | 1,000.00 | $ | 999.63 | $ | 1.81 | .36 | % | ||||||||
Class 1 — assumed 5% return | 1,000.00 | 1,023.39 | 1.84 | .36 | ||||||||||||
Class 1A — actual return | 1,000.00 | 998.61 | 2.97 | .59 | ||||||||||||
Class 1A — assumed 5% return | 1,000.00 | 1,022.23 | 3.01 | .59 | ||||||||||||
Class 2 — actual return | 1,000.00 | 998.34 | 3.07 | .61 | ||||||||||||
Class 2 — assumed 5% return | 1,000.00 | 1,022.13 | 3.11 | .61 | ||||||||||||
Class 3 — actual return | 1,000.00 | 998.91 | 2.72 | .54 | ||||||||||||
Class 3 — assumed 5% return | 1,000.00 | 1,022.48 | 2.75 | .54 | ||||||||||||
Class 4 — actual return | 1,000.00 | 996.62 | 4.33 | .86 | ||||||||||||
Class 4 — assumed 5% return | 1,000.00 | 1,020.87 | 4.38 | .86 | ||||||||||||
See end of tables for footnotes.
American Funds Insurance Series 205
Table of Contents
Beginning account value 7/1/2017 | Ending account value 12/31/2017 | Expenses paid during period1,2 | Annualized expense ratio2 | Effective expenses paid during period3 | Effective annualized expense ratio4 | |||||||||||||||||||
Managed Risk Growth Fund |
| |||||||||||||||||||||||
Class P1 — actual return | $ | 1,000.00 | $ | 1,106.28 | $ | 1.91 | .36 | % | $ | 3.72 | .70 | % | ||||||||||||
Class P1 — assumed 5% return | 1,000.00 | 1,023.39 | 1.84 | .36 | 3.57 | .70 | ||||||||||||||||||
Class P2 — actual return | 1,000.00 | 1,106.06 | 3.34 | .63 | 5.15 | .97 | ||||||||||||||||||
Class P2 — assumed 5% return | 1,000.00 | 1,022.03 | 3.21 | .63 | 4.94 | .97 | ||||||||||||||||||
Managed Risk International Fund |
| |||||||||||||||||||||||
Class P1 — actual return | $ | 1,000.00 | $ | 1,106.19 | $ | .90 | .17 | % | $ | 3.66 | .69 | % | ||||||||||||
Class P1 — assumed 5% return | 1,000.00 | 1,024.35 | .87 | .17 | 3.52 | .69 | ||||||||||||||||||
Class P2 — actual return | 1,000.00 | 1,103.96 | 3.34 | .63 | 5.94 | 1.12 | ||||||||||||||||||
Class P2 — assumed 5% return | 1,000.00 | 1,022.03 | 3.21 | .63 | 5.70 | 1.12 | ||||||||||||||||||
Managed Risk Blue Chip Income and Growth Fund |
| |||||||||||||||||||||||
Class P1 — actual return | $ | 1,000.00 | $ | 1,096.01 | $ | 1.22 | .23 | % | $ | 3.38 | .64 | % | ||||||||||||
Class P1 — assumed 5% return | 1,000.00 | 1,024.05 | 1.17 | .23 | 3.26 | .64 | ||||||||||||||||||
Class P2 — actual return | 1,000.00 | 1,094.42 | 3.33 | .63 | 5.38 | 1.02 | ||||||||||||||||||
Class P2 — assumed 5% return | 1,000.00 | 1,022.03 | 3.21 | .63 | 5.19 | 1.02 | ||||||||||||||||||
Managed Risk Growth-Income Fund |
| |||||||||||||||||||||||
Class P1 — actual return | $ | 1,000.00 | $ | 1,105.67 | $ | 1.96 | .37 | % | $ | 3.50 | .66 | % | ||||||||||||
Class P1 — assumed 5% return | 1,000.00 | 1,023.34 | 1.89 | .37 | 3.36 | .66 | ||||||||||||||||||
Class P2 — actual return | 1,000.00 | 1,103.51 | 3.34 | .63 | 4.88 | .92 | ||||||||||||||||||
Class P2 — assumed 5% return | 1,000.00 | 1,022.03 | 3.21 | .63 | 4.69 | .92 | ||||||||||||||||||
Managed Risk Asset Allocation Fund |
| |||||||||||||||||||||||
Class P1 — actual return | $ | 1,000.00 | $ | 1,070.08 | $ | 1.98 | .38 | % | $ | 3.44 | .66 | % | ||||||||||||
Class P1 — assumed 5% return | 1,000.00 | 1,023.29 | 1.94 | .38 | 3.36 | .66 | ||||||||||||||||||
Class P2 — actual return | 1,000.00 | 1,068.61 | 3.28 | .63 | 4.74 | .91 | ||||||||||||||||||
Class P2 — assumed 5% return | 1,000.00 | 1,022.03 | 3.21 | .63 | 4.63 | .91 | ||||||||||||||||||
| 1 | The “expenses paid during period” are equal to the “annualized expense ratio,” multiplied by the average account value over the period, multiplied by the number of days in the period, and divided by 365 (to reflect the one-half year period). |
| 2 | The “expenses paid during period” and “annualized expense ratio” do not include the expenses of the underlying funds in which each fund invests. |
| 3 | The “effective expenses paid during period” are equal to the “effective annualized expense ratio,” multiplied by the average account value over the period, multiplied by the number of days in the period, and divided by 365 (to reflect the period). |
| 4 | The “effective annualized expense ratio” reflects the net annualized expense ratio of the class plus the class’s pro-rata share of the weighted average expense ratio of the underlying funds in which it invests. |
206 American Funds Insurance Series
Table of Contents
Approval of Investment Advisory and Service Agreement — American Funds Insurance Series
American Funds Insurance Series’ board has approved the series’ Investment Advisory and Service Agreement (the “agreement”) with Capital Research and Management Company (“CRMC”) for an additional one-year term through January 31, 2019. The agreement was amended to add an additional advisory fee breakpoint for New World Fund when the fund’s net assets exceed $4 billion, for Blue Chip Income and Growth Fund when the fund’s net assets exceed $10.5 billion, and for Bond Fund when the fund’s net assets exceed $13 billion. The board approved the agreement following the recommendation of the series’ Contracts Committee (the “committee”), which is composed of all of the series’ independent board members. The board and the committee determined in the exercise of their business judgment that each fund’s advisory fee structure was fair and reasonable in relation to the services provided, and that approving the agreement was in the best interests of each fund and its shareholders.
In reaching this decision, the board and the committee took into account information furnished to them throughout the year and otherwise provided to them, as well as information prepared specifically in connection with their review of the agreement, and were advised by their independent counsel. They considered the following factors, among others, but did not identify any single issue or particular piece of information that, in isolation, was the controlling factor, and each board and committee member did not necessarily attribute the same weight to each factor.
1. Nature, extent and quality of services
The board and the committee considered the depth and quality of CRMC’s investment management process, including its global research capabilities; the experience, capability and integrity of its senior management and other personnel; the low turnover rates of its key personnel; the overall financial strength and stability of CRMC and the Capital Group organization; the resources and systems CRMC devotes to investment management, compliance, trading, portfolio accounting and other services; and the ongoing evolution of CRMC’s organizational structure designed to maintain and strengthen these qualities. The board and the committee also considered the nature, extent and quality of administrative, compliance and shareholder services provided by CRMC to the funds under each fund’s agreement and other agreements, as well as the benefits to each fund’s shareholders from investing in a fund that is part of a large family of funds. The board and the committee concluded that the nature, extent and quality of the services provided by CRMC have benefited and should continue to benefit each fund and its shareholders.
2. Investment results
The board and the committee considered the investment results of each fund in light of its objectives. They compared each fund’s investment results with relevant benchmarks, such as market indexes and fund averages, over various periods through June 30, 2017. This report, including the letter to shareholders and related disclosures, contains certain information about each fund’s investment results.
Global Growth Fund seeks to provide long-term growth of capital by investing primarily in common stocks of companies located around the world. The board and the committee reviewed the fund’s investment results measured against (i) the Lipper Global Funds Average and (ii) the MSCI All Country World Index. They noted that the fund’s investment results were higher than all of the comparisons.
Global Small Capitalization Fund seeks to provide long-term growth of capital by investing primarily in stocks of smaller companies located around the world. The board and the committee reviewed the fund’s investment results measured against (i) the Lipper Global Small/Mid-Cap Funds Average and (ii) the MSCI All Country World Small Cap Index. They noted that the fund’s investment results were higher than the benchmarks for the six-month period and over the lifetime of the fund since April 30, 1998, below the benchmarks for the one-year, three-year, five-year and 10-year periods, and were mixed for the 15-year period.
American Funds Insurance Series 207
Table of Contents
Growth Fund seeks to provide growth of capital by investing primarily in common stocks of companies that appear to offer superior opportunities for growth of capital. The board and the committee reviewed the fund’s investment results measured against (i) the Lipper Capital Appreciation Funds Average, (ii) the Lipper Growth Funds Average and (iii) the Standard & Poor’s 500 Composite Index. They noted that the fund’s investment results were higher than all of the comparisons.
International Fund seeks to provide long-term growth of capital by investing primarily in common stocks of companies domiciled outside the United States. The board and the committee reviewed the fund’s investment results measured against (i) the Lipper International Funds Average and (ii) the MSCI All Country World Index ex USA. They noted that the fund’s investment results were higher than all of the comparisons.
New World Fund seeks long-term capital appreciation by investing primarily in stocks of companies with significant exposure to countries with developing economies and/or markets. The board and the committee reviewed the fund’s investment results measured against (i) the Lipper Emerging Markets Funds Average, (ii) the MSCI All Country World Index and (iii) the MSCI Emerging Markets Index. They noted that the fund’s investment results were higher than the benchmarks over the 10-year period and lifetime of the fund since June 17, 1999, below the benchmarks for the one-year period, and mixed for the six-month, three-year, five-year and 15-year periods.
Blue Chip Income and Growth Fund seeks to produce income exceeding the average yield on U.S. stocks generally and to provide an opportunity for growth of principal by investing primarily in dividend-paying common stocks of larger, more established companies domiciled in the United States, with market capitalizations of $4 billion and above. The board and the committee reviewed the fund’s investment results measured against (i) the Lipper Growth and Income Funds Average and (ii) the Standard & Poor’s 500 Composite Index. They noted that the fund’s investment results were above both benchmarks over the five-year period, below the benchmarks for the six-month period, and mixed for the one-year, three-year and 10-year periods and lifetime of the fund since July 5, 2001.
Global Growth and Income Fund seeks to provide long-term growth of capital while providing current income by investing primarily in well-established companies located around the world. The board and the committee reviewed the fund’s investment results measured against (i) the Lipper Global Funds Average and (ii) the MSCI All Country World Index. They noted that the fund’s investment results were higher than all of the comparisons.
Growth-Income Fund seeks to provide long-term growth of capital and income by investing primarily in common stocks or other securities that demonstrate the potential for appreciation and/or dividends. The board and the committee reviewed the fund’s investment results measured against (i) the Lipper Growth and Income Funds Average and (ii) the Standard & Poor’s 500 Composite Index. They noted that the fund’s investment results were higher than both benchmarks over the six-month, one-year, five-year and 20-year periods and lifetime of the fund since February 8, 1984, and were mixed for the three-year, 10-year and 15-year periods.
International Growth and Income Fund seeks to provide long-term growth of capital while providing current income by investing primarily in stocks of larger, well-established companies domiciled outside the United States, including in developing countries. The board and the committee reviewed the fund’s investment results measured against (i) the Lipper International Funds Average and (ii) the MSCI All Country World Index ex USA. They noted that the fund’s investment results were higher than both benchmarks over the six-month period and lifetime of the fund since November 18, 2008, and were below the benchmarks for the one-year and three-year periods.
208 American Funds Insurance Series
Table of Contents
Capital Income Builder seeks to provide a level of current income that exceeds the average yield on U.S. stocks generally and to provide a growing stream of income over the years. The board and the committee reviewed the fund’s investment results measured against (i) the Lipper Global Equity Income Funds Average, (ii) the MSCI All Country World Index, (iii) the Bloomberg Barclays U.S. Aggregate Index and (iv) a customized index composed of 70% MSCI index and 30% Bloomberg Barclays index. They noted that for all periods, the fund’s investment results were above the Bloomberg Barclays index and below all other benchmarks.
Asset Allocation Fund seeks to provide high total return (including income and capital gains) consistent with preservation of capital over the long term by investing in a diversified portfolio of stocks and other equity securities, bonds and other intermediate and long-term debt securities, and money market instruments (debt securities maturing in one year or less). The board and the committee reviewed the fund’s investment results measured against (i) the Lipper Balanced Funds Average, (ii) the Bloomberg Barclays U.S. Aggregate Index, (iii) the Standard & Poor’s 500 Composite Index and (iv) a customized index composed of 60% S&P 500 index and 40% Bloomberg Barclays index. They noted that for the 20-year period, the fund’s investment results were above all benchmarks, and for the six-month, one-year, three-year, five-year and 15-year periods, the fund’s investment results were above all benchmarks except the S&P 500 index. They also noted that for the 10-year period and lifetime of the fund since August 1, 1989, the fund’s investment results were mixed.
Global Balanced Fund seeks the balanced accomplishment of three objectives — long-term growth of capital, conservation of principal and current income — by investing in equity and debt securities of companies around the world that offer the opportunity for growth and/or provide dividend income, while also constructing its portfolio to protect principal and limit volatility. The board and the committee reviewed the fund’s investment results measured against (i) the Lipper Flexible Portfolio Funds Average, (ii) the Bloomberg Barclays Global Aggregate Bond Index, (iii) the MSCI All Country World Index and (iv) a customized index composed of 60% MSCI index and 40% Bloomberg Barclays index. They noted that the fund’s results were above all benchmarks except the MSCI index for all periods.
Bond Fund seeks to maximize current income and preserve capital by investing primarily in bonds. The board and the committee reviewed the fund’s investment results measured against (i) the Lipper Core Bond Funds Average and (ii) the Bloomberg Barclays U.S. Aggregate Index. They noted that the fund’s investment results were above the Lipper average and the Bloomberg Barclays index for the six-month, three-year, five-year and 15-year periods, but below both benchmarks for the 10-year and 20-year periods, and mixed for the one-year period and for the lifetime of the fund since January 2, 1996.
American Funds Insurance Series 209
Table of Contents
Global Bond Fund seeks to provide a high level of total return by investing primarily in debt securities of governmental, supranational and corporate issuers domiciled in various countries and denominated in various currencies, including U.S. dollars. The board and the committee reviewed the fund’s investment results measured against (i) the Lipper Global Income Funds Index and (ii) the Bloomberg Barclays Global Aggregate Bond Index. They noted that the fund’s results were higher than both benchmarks for the six-month and 10-year periods and for the lifetime of the fund since October 4, 2006. They also noted that the fund’s investment results were mixed for the one-year, three-year and five-year periods.
High-Income Bond Fund seeks to provide a high level of current income and, secondarily, capital appreciation by investing primarily in higher yielding and generally lower quality debt securities. The board and the committee reviewed the fund’s investment results measured against (i) the Lipper High Yield Funds Average and (ii) the Bloomberg Barclays U.S. Corporate High Yield 2% Issuer Capped Index. They noted that the fund’s investment results were higher than both benchmarks for the one-year period, higher than the Lipper average over the lifetime of the fund since February 8, 1984 (data for the Bloomberg Barclays index was not available for the period), below both benchmarks for the 10-year period, and were mixed for the six-month, three-year, five-year, 15-year and 20-year periods.
Mortgage Fund seeks to provide current income and preservation of capital by investing in mortgage-related securities, including securities collateralized by mortgage loans and contracts for future delivery of such securities. The board and the committee reviewed the fund’s investment results measured against (i) the Lipper GNMA Funds Average, (ii) the Lipper Intermediate U.S. Government Funds Average and (iii) the Bloomberg Barclays U.S. Mortgage-Backed Securities Index. They noted that the fund’s investment results were higher than all of the comparisons.
Ultra-Short Bond Fund seeks to provide an opportunity to earn income on cash reserves while preserving the value of investment and maintaining liquidity. The board and the committee reviewed the fund’s investment results measured against (i) the Lipper Ultra-Short Obligation Funds Average, (ii) the Lipper Money Market Funds Average and (iii) the Bloomberg Barclays Short-Term Government/Corporate Index. They noted that the fund’s investment results were lower than all the benchmarks for the three-year, five-year, 10-year and 20-year periods, and were mixed for the six-month period and lifetime of the fund since February 8, 1984.
U.S. Government/AAA-Rated Securities Fund seeks to provide a high level of current income, as well as to preserve investment. The board and the committee reviewed the fund’s investment results measured against (i) the Lipper General U.S. Government Funds Average and (ii) the Bloomberg Barclays U.S. Government/Mortgage-Backed Securities Index. They noted that the fund’s investment results were above both benchmarks for the six-month, one-year, three-year and five-year periods. They also noted that the fund’s results were above the Lipper average but below the Bloomberg Barclays index for the 10-year, 15-year and 20-year periods, as well as over the lifetime of the fund since December 2, 1985.
210 American Funds Insurance Series
Table of Contents
The board and the committee concluded that each fund’s investment results have been satisfactory for renewal of the agreement, and that CRMC’s record in managing the funds indicated that its continued management should benefit each fund and its shareholders.
3. Advisory fees and total expenses
The board and the committee compared the advisory fees and total expense levels of each fund to those of other relevant funds. They observed that the expenses of each fund were less than the median fees and expenses of the other funds included in its Lipper category described above. They also observed that each fund’s advisory fees were at or less than the median fees of the other funds included in its Lipper category, other than the Mortgage Fund, Bond Fund and Ultra-Short Bond Fund.
The board and the committee also considered the breakpoint discounts in each fund’s advisory fee structure that reduce the level of fees charged by CRMC to the fund as fund assets increase. The board and the committee noted that CRMC had agreed to additional breakpoints for the advisory fee schedules of AFIS — New World Fund, AFIS — Blue Chip Income and Growth Fund and AFIS — Bond Fund. In addition, they reviewed information regarding advisory fees charged to clients of an affiliate of CRMC. They noted that, to the extent there were differences between the advisory fees paid by each fund and the advisory fees paid by those clients, the differences appropriately reflected the investment, operational and regulatory differences between advising the fund and the other clients. The board and the committee concluded that each fund’s cost structure was fair and reasonable in relation to the services provided, and that each fund’s shareholders receive reasonable value in return for the advisory fees and other amounts paid to CRMC by the funds.
4. Ancillary benefits
The board and the committee considered a variety of other benefits that CRMC and its affiliates receive as a result of CRMC’s relationship with the series and the other American Funds, including fees for administrative services provided to certain share classes; fees paid to CRMC’s affiliated transfer agent; sales charges and distribution fees received and retained by the series’ principal underwriter, an affiliate of CRMC; and possible ancillary benefits to CRMC and its institutional management affiliates in managing other investment vehicles. The board and the committee reviewed CRMC’s portfolio trading practices, noting the benefits CRMC receives from the research obtained with commissions from portfolio transactions made on behalf of the funds. The board and the committee took these ancillary benefits into account in evaluating the reasonableness of the advisory fees and other amounts paid to CRMC by each fund.
5. Adviser financial information
The board and the committee reviewed information regarding CRMC’s costs of providing services to the American Funds, including personnel, systems and resources of investment, compliance, trading, accounting and other administrative operations. They considered CRMC’s costs and related cost allocation methodology as well as its willingness to invest in technology, infrastructure and staff to maintain and expand services and capabilities, respond to industry and regulatory developments, and attract and retain qualified personnel. They also considered CRMC’s sharing of any economies of scale, or efficiencies, through breakpoints and other fee reductions and costs voluntarily absorbed. They noted information regarding the compensation structure for CRMC’s investment professionals. The board and the committee also compared CRMC’s profitability and compensation data to the reported results and data of several large, publicly held investment management companies. The board and the committee noted the competitiveness and cyclicality of both the mutual fund industry and the capital markets, and the importance in that environment of CRMC’s long-term profitability for maintaining its independence, company culture and management continuity. They further considered the breakpoint discounts in the fund’s advisory fee structure. The board and the committee concluded that each fund’s advisory fee structure reflected a reasonable sharing of benefits between CRMC and each fund’s shareholders. The board and the committee concluded that each fund’s investment results have been satisfactory for renewal of the agreement, and that CRMC’s record in managing the funds indicated that its continued management should benefit each fund and its shareholders.
American Funds Insurance Series 211
Table of Contents
Approval of Investment Advisory and Service Agreement and Subadvisory Agreement — American Funds Insurance Series Managed Risk Funds
American Funds Insurance Series’ board has approved the series’ Investment Advisory and Service Agreement (the “advisory agree-ment”) with Capital Research and Management Company (“CRMC”) with respect to the Managed Risk Funds for an additional one-year term through January 31, 2019. The board has also approved the series’ Subadvisory Agreement (the “subadvisory agreement”) with CRMC and Milliman Financial Risk Management LLC (“Milliman FRM”) with respect to these funds for the same term. The advisory and subadvisory agreements are jointly referred to below as the “agreements.” The board approved the agreements following the recommendation of the series’ Contracts Committee (the “committee”), which is composed of all of the series’ independent board members. The board and the committee determined in the exercise of their business judgment that each fund’s advisory fee structure was fair and reasonable in relation to the services provided, and that approving the agreements was in the best interests of each fund and its shareholders.
In reaching this decision, the board and the committee took into account information furnished to them throughout the year and otherwise provided to them, as well as information prepared specifically in connection with their review of the agreements, and were advised by their independent counsel. They considered the following factors, among others, but did not identify any single issue or particular piece of information that, in isolation, was the controlling factor, and each board and committee member did not necessar-ily attribute the same weight to each factor.
1. Nature, extent and quality of services
The board and the committee considered the depth and quality of CRMC’s investment management process, including its global research capabilities; the experience, capability and integrity of its senior management and other personnel; the low turnover rates of its key personnel; the overall financial strength and stability of CRMC and the Capital Group organization; the resources and systems CRMC devotes to investment management, compliance, trading, portfolio accounting and other services; and the ongoing evolution of CRMC’s organizational structure designed to maintain and strengthen these qualities. The board and the committee also consid-ered the nature, extent and quality of the oversight of Milliman FRM’s services provided by CRMC, the administrative, compliance and shareholder services provided by CRMC to the funds under the agreements and other agreements, as well as the benefits to each fund’s shareholders from investing in a fund that is part of a large family of funds. The board and the committee concluded that the nature, extent and quality of the services provided by CRMC have benefited and should continue to benefit each fund and its share-holders.
The board and the committee also considered the depth and quality of Milliman FRM’s investment management process, including its experience in applying the Milliman Managed Risk Strategy to other funds of the series and risk management services for other clients; the experience, capability and integrity of its senior management and other personnel; and the services provided to each fund under the subadvisory agreement. The board and the committee concluded that the nature, extent and quality of the services provided by Milliman FRM have benefited and should continue to benefit each fund and its shareholders.
2. Investment results
The board and the committee considered the investment results of each fund in light of its objectives. They compared each fund’s investment results with relevant benchmarks, such as market indexes and fund averages, over various periods through June 30, 2017. This report, including the letter to shareholders and related disclosures, contains certain information about each fund’s investment results.
Managed Risk Growth Fund seeks to provide growth of capital while seeking to manage volatility and provide downside protection. The board and the committee reviewed the fund’s investment results measured against the investment results of (i) the Standard & Poor’s 500 Composite Index and (ii) the Standard & Poor’s 500 Managed Risk Index — Moderate Aggressive. They noted that the fund’s investment results were above both benchmarks for the three-month, six-month and one-year periods, and below both bench-marks for the three-year period and lifetime of the fund since May 1, 2013.
212 American Funds Insurance Series
Table of Contents
Managed Risk International Fund seeks to provide long-term growth of capital while seeking to manage volatility and provide downside protection. The board and the committee reviewed the fund’s investment results measured against the investment results of (i) the MSCI All Country World Index ex USA and (ii) the Standard & Poor’s EPAC Ex. Korea LargeMidCap Managed Risk Index — Moderate Aggressive. They noted that the fund’s investment results were above both benchmarks for the three-month and six-month periods. They also noted that for the one-year and three-year periods, the fund’s investment results were above the S&P EPAC index and below the MSCI index, and for the lifetime of the fund since May 1, 2013, the fund’s results were below both the MSCI index and the S&P EPAC index.
Managed Risk Blue Chip Income and Growth Fund seeks to produce income exceeding the average yield on U.S. stocks generally and to provide an opportunity for growth of principal consistent with sound common stock investing, in each case while seeking to manage volatility and provide downside protection. The board and the committee reviewed the fund’s investment results measured against the investment results of (i) the Standard & Poor’s 500 Composite Index and (ii) the Standard & Poor’s 500 Managed Risk Index — Moderate Aggressive. They noted that the fund’s investment results were lower than all of the comparisons.
Managed Risk Growth-Income Fund seeks to achieve long-term growth of capital and income while seeking to manage volatility and provide downside protection. The board and the committee reviewed the fund’s investment results measured against the invest-ment results of (i) the Standard & Poor’s 500 Composite Index and (ii) the Standard & Poor’s 500 Managed Risk Index — Moderate Aggressive. They noted that the fund’s investment results were below all benchmarks for the three-month and three-year periods and for the lifetime of the fund since May 1, 2015, and were mixed for the six-month and one-year periods.
Managed Risk Asset Allocation Fund seeks to provide high total return (including income and capital gains) consistent with preserva-tion of capital over the long term while seeking to manage volatility and provide downside protection. The board and the committee reviewed the fund’s investment results measured against the investment results of (i) the Bloomberg Barclays U.S. Aggregate Index, (ii) the Standard & Poor’s 500 Composite Index and (iii) the Standard & Poor’s 500 Managed Risk Index — Moderate. They noted that the fund’s investment results were higher than the Bloomberg Barclays index for all periods, but below both S&P 500 indexes for the three-month and three-year periods and for the lifetime of the fund since October 1, 2012. They also noted the fund’s investment results were mixed for the six-month and one-year periods.
The board and the committee also considered the volatility of the funds compared with the Standard & Poor’s 500 Managed Risk indexes noted above, and those of a group of funds with volatility management strategies identified by management for the three-month, six-month, one-year and three-year periods and lifetime of the fund, through June 30, 2017. They noted that the volatility of Managed Risk Growth Fund, Managed Risk Blue Chip Income and Growth Fund, and Managed Risk Growth-Income Fund was greater than that of the S&P 500 Managed Risk indexes and most of the selected funds for all periods. They also noted that the volatility of Managed Risk International Fund was lower than all comparisons, except for the S&P 500 Managed Risk index for the six-month period. In addition, they noted that the volatility of Managed Risk Asset Allocation Fund was lower than that of the S&P 500 Managed Risk index for all periods, and lower than most of the selected funds for all periods, except for the three-year period and lifetime of the fund through June 30, 2017. The board and the committee also noted, however, that for those periods the equity markets did not sustain large market declines of the type that Milliman FRM’s volatility management program was designed to protect against. The board and the committee concluded that each fund’s investment results, and the results of the services provided by Milliman FRM, have been satisfactory for renewal of the agreement, and that CRMC’s and Milliman FRM’s record in managing the funds indicated that their continued management should benefit each fund and its shareholders.
American Funds Insurance Series 213
Table of Contents
3. Advisory fees and total expenses
The board and the committee compared the advisory fees and total expense levels of each fund to those of other relevant funds. The board and the committee noted CRMC’s waiver of a portion of the advisory fee payable by each fund under the advisory agree-ment, CRMC’s commitment not to remove the waiver without board approval and CRMC’s agreement to pay the fees due Milliman FRM under the subadvisory agreement. They observed that the total advisory fees and expenses for Managed Risk Growth Fund were lower than the median and average for the Lipper Growth Funds Average (variable insurance), and that the total advisory fees and expenses for Managed Risk International Fund were lower than the median and average for the Lipper International Funds Average (variable insurance), and that the total advisory fees and expenses for Managed Risk Blue Chip Income and Growth Fund were at or slightly above the median of the Lipper Growth and Income Funds Average (variable insurance). They also noted that the total advi-sory fees and expenses for Managed Risk Growth-Income Fund were lower than the median and average for the Lipper Growth and Income Funds Average (variable insurance), and that the total advisory fees and expenses for Managed Risk Asset Allocation Fund were lower than the Lipper Flexible Portfolio Funds Average (variable insurance).
The board and the committee also considered the breakpoint discounts in each underlying fund’s advisory fee structure that reduce the level of fees charged by CRMC to the underlying fund as its assets increase. In addition, they reviewed information regarding advisory fees paid by clients of an affiliate of CRMC. They noted that, to the extent there were differences between the advisory fee schedule for the funds and the advisory fees paid by those clients, the differences appropriately reflected the investment, operational, regulatory and marketing differences between advising the funds and the other clients. They also reviewed the fees paid to Milliman FRM by other funds which it advised or subadvised. The board and the committee concluded that each fund’s cost structure was fair and reasonable in relation to the services that CRMC provided, directly and through Milliman FRM, and that each fund’s shareholders receive reasonable value in return for the advisory fees and other amounts paid to CRMC (and indirectly to Milliman FRM) by the funds.
4. Ancillary benefits
The board and the committee considered a variety of other benefits that CRMC and its affiliates receive as a result of CRMC’s relation-ship with the series and the other American Funds, including fees for administrative services provided to certain share classes; fees paid to CRMC’s affiliated transfer agent; sales charges and distribution fees received and retained by the series’ principal underwriter, an affiliate of CRMC; and possible ancillary benefits to CRMC and its institutional management affiliates in managing other invest-ment vehicles. The board and the committee reviewed CRMC’s portfolio trading practices, noting the benefits CRMC receives from the research obtained with commissions from portfolio transactions made on behalf of the funds. The board and the committee also reviewed similar ancillary benefits received by Milliman FRM as a result of its relationship with the series. The board and the commit-tee took these ancillary benefits into account in evaluating the reasonableness of the advisory fees and other amounts paid to CRMC (and indirectly to Milliman FRM) by the funds.
5. Adviser financial information
The board and the committee reviewed information regarding CRMC’s costs of providing services to the American Funds, including personnel, systems and resources of investment, compliance, trading, accounting and other administrative operations. They consid-ered CRMC’s costs and related cost allocation methodology as well as its willingness to invest in technology, infrastructure and staff to maintain and expand services and capabilities, respond to industry and regulatory developments, and attract and retain qualified per-sonnel. They also considered CRMC’s sharing of any economies of scale, or efficiencies, through breakpoints and other fee reductions and costs voluntarily absorbed. They noted information regarding the compensation structure for CRMC’s investment professionals. The board and the committee also compared CRMC’s profitability and compensation data to the reported results and data of several large, publicly held investment management companies. The board and the committee noted the competitiveness and cyclicality of both the mutual fund industry and the capital markets, and the importance in that environment of CRMC’s long-term profitability for maintaining its independence, company culture and management continuity. The board and the committee concluded that each fund’s advisory fee structure reflected a reasonable sharing of benefits between CRMC and each fund’s shareholders.
214 American Funds Insurance Series
Table of Contents
Board of trustees and other officers
Independent trustees1
Name and year of birth | Year first elected a trustee of the series2 | Principal occupation(s) during past five years | Number of portfolios in fund complex overseen by trustee | Other directorships3 held by trustee | ||||
William H. Baribault, 1945 | 2009 | CEO and President, Richard Nixon Foundation; Chairman of the Board and CEO, Oakwood Enterprises (private investment and consulting) | 80 | General Finance Corporation | ||||
James G. Ellis, 1947 | 2010 | Dean and Professor of Marketing, Marshall School of Business, University of Southern California | 80 | Mercury General Corporation | ||||
Nariman Farvardin, PhD, 1956 | 2018 | President, Stevens Institute of Technology | 77 | None | ||||
Leonard R. Fuller, 1946 | 1999 | Private investor; former President and CEO, Fuller Consulting (financial management consulting) | 80 | None | ||||
Mary Davis Holt, 1950 | 2015–2016 2017 | Principal, Mary Davis Holt Enterprises, LLC (leadership development consulting); former Partner, Flynn Heath Holt Leadership, LLC (leadership consulting); former COO, Time Life Inc. (1993–2003) | 77 | None | ||||
| R. Clark Hooper, 1946 Chairman of the Board (Independent and Non-Executive) | 2010 | Private investor | 80 | None | ||||
Merit E. Janow, 1958 | 2007 | Dean and Professor, Columbia University, School of International and Public Affairs | 79 | Mastercard Incorporated; Trimble Inc. | ||||
Laurel B. Mitchell, PhD, 1955 | 2010 | Chair, California Jump$tart Coalition for Personal Financial Literacy; Part-time faculty, Pomona College; former Distinguished Professor of Accounting, University of Redlands; former Director, Accounting Program, University of Redlands | 76 | None | ||||
Frank M. Sanchez, 1943 | 2010 | Principal, The Sanchez Family Corporation dba McDonald’s Restaurants (McDonald’s licensee) | 76 | None | ||||
Margaret Spellings, 1957 | 2010 | President, The University of North Carolina; former President, George W. Bush Foundation; former President and CEO, Margaret Spellings & Company (public policy and strategic consulting); former President, U.S. Chamber Foundation and Senior Advisor to the President and CEO, U.S. Chamber of Commerce | 81 | None | ||||
Alexandra Trower, 1964 | 2018 | Executive Vice President, Global Communications and Corporate Officer, The Estée Lauder Companies | 67 | None | ||||
We are deeply saddened by the loss of Dr. Steadman Upham, who passed away on July 30, 2017. Dr. Upham served as an independent trustee on the boards of several American Funds since 2001. His wise counsel and friendship will be missed.
Interested trustee4,5
Name, year of birth and position with series | Year first elected a trustee or officer of the series2 | Principal occupation(s) during past five years and positions held with affiliated entities or the principal underwriter of the series | Number of portfolios in fund complex overseen by trustee | Other directorships3 held by trustee | ||||
Donald D. O’Neal, 1960 Vice Chairman of the Board | 1998 | Partner — Capital Research Global Investors, Capital Research and Management Company; Director, Capital Research and Management Company | 31 | None | ||||
The series statement of additional information includes further details about the series trustees and is available without charge upon request by calling American Funds Service Company at (800) 421-4225 or by visiting the American Funds website at americanfunds.com. The address for all trustees and officers of the series is 333 South Hope Street, Los Angeles, CA 90071, Attention: Secretary.
American Funds Insurance Series 215
Table of Contents
Other officers5
Name, year of birth and position with series | Year first elected an officer of the series2 | Principal occupation(s) during past five years and positions held with affiliated entities or the principal | ||
Alan N. Berro, 1960 President | 1998 | Partner — Capital World Investors, Capital Research and Management Company; Director, Capital Research and Management Company | ||
Michael J. Downer, 1955 Executive Vice President | 1991 | Director, Senior Vice President and Secretary, Capital Research and Management Company; Chairman of the Board, Capital Bank and Trust Company6 | ||
John H. Smet, 1956 Senior Vice President | 1994 | Partner — Capital Fixed Income Investors, Capital Research and Management Company; Director, Capital Research and Management Company | ||
Martin Jacobs, 1962 Vice President | 2016 | Partner — Capital World Investors, Capital Research and Management Company | ||
Carl M. Kawaja, 1964 Vice President | 2008 | Partner — Capital World Investors, Capital Research and Management Company; Director, The Capital Group Companies, Inc.6 | ||
Sung Lee, 1966 Vice President | 2008 | Partner — Capital Research Global Investors, Capital International, Inc.6 | ||
S. Keiko McKibben, 1969 Vice President | 2010 | Partner — Capital Research Global Investors, Capital Research and Management Company | ||
Maria T. Manotok Pathria, 1974 Vice President | 2012 | Senior Vice President and Senior Counsel — Fund Business Management Group, Capital Research and Management Company; Director, Capital Guardian Trust Company6 | ||
Renaud H. Samyn, 1974 Vice President | 2010 | Partner — Capital Research Global Investors, Capital International, Inc.6 | ||
Dylan Yolles, 1969 Vice President | 2012 | Partner — Capital International Investors, Capital Research and Management Company | ||
Steven I. Koszalka, 1964 Secretary | 2003 | Vice President — Fund Business Management Group, Capital Research and Management Company | ||
Gregory F. Niland, 1971 Treasurer | 2008 | Vice President — Investment Operations, Capital Research and Management Company | ||
Susan K. Countess, 1966 Assistant Secretary | 2014 | Associate — Fund Business Management Group, Capital Research and Management Company | ||
Brian C. Janssen, 1972 Assistant Treasurer | 2015 | Vice President — Investment Operations, Capital Research and Management Company | ||
Dori Laskin, 1951 Assistant Treasurer | 2010 | Vice President — Investment Operations, Capital Research and Management Company | ||
| 1 | The term independent trustee refers to a trustee who is not an “interested person” of the series within the meaning of the Investment Company Act of 1940. |
| 2 | Trustees and officers of the series serve until their resignation, removal or retirement. |
| 3 | This includes all directorships/trusteeships (other than those in the American Funds or other funds managed by Capital Research and Management Company or its affiliates) that are held by each trustee as a trustee or director of a public company or a registered investment company. |
| 4 | The term interested trustee refers to a trustee who is an “interested person” within the meaning of the Investment Company Act of 1940, on the basis of their affiliation with the series investment adviser, Capital Research and Management Company, or affiliated entities (including the series principal underwriter). |
| 5 | All of the trustees and/or officers listed, with the exception of Martin Jacobs, S. Keiko McKibben and Renaud H. Samyn, are officers and/or directors/trustees of one or more of the other funds for which Capital Research and Management Company serves as investment adviser. |
| 6 | Company affiliated with Capital Research and Management Company. |
| Offices of the series and of the | Custodians of assets | Counsel | ||
| investment adviser | State Street Bank and Trust Company | Morgan, Lewis & Bockius LLP | ||
| Capital Research and Management Company | One Lincoln Street | 300 South Grand Avenue, 22nd Floor | ||
| 333 South Hope Street | Boston, MA 02111 | Los Angeles, CA 90071-3132 | ||
| Los Angeles, CA 90071-1406 | ||||
| Bank of New York Mellon | Independent registered | |||
| 6455 Irvine Center Drive | (Managed Risk Funds only) | public accounting firm | ||
| Irvine, CA 92618-4518 | One Wall Street | PricewaterhouseCoopers LLP | ||
| New York, NY 10286 | 601 South Figueroa Street | |||
| Investment subadviser | Los Angeles, CA 90017-3874 | |||
| Milliman Financial Risk Management LLC | ||||
(Managed Risk Funds only) 71 South Wacker Drive, 31st Floor | ||||
| Chicago, IL 60606 |
216 American Funds Insurance Series
Table of Contents
Investors should carefully consider investment objectives, risks, charges and expenses. This and other important information is contained in the series prospectuses and summary prospectuses, which can be obtained from your financial professional and should be read carefully before investing. You may also call American Funds Service Company (AFS) at (800) 421-4225 or visit the American Funds website at americanfunds.com. Fund shares offered through American Funds Distributors, Inc.
“American Funds Proxy Voting Procedures and Principles” — which describes how we vote proxies relating to portfolio securities — is available on the American Funds website or upon request by calling AFS. The series files its proxy voting record with the U.S. Securities and Exchange Commission (SEC) for the 12 months ended June 30 by August 31. The proxy voting record is available free of charge on the SEC website at sec.gov and on the American Funds website.
Complete December 31, 2017, portfolios of American Funds Insurance Series investments are available free of charge by calling AFS or visiting the SEC website (where they are part of Form N-CSR).
American Funds Insurance Series files a complete list of its portfolio holdings with the SEC for the first and third quarters of each fiscal year on Form N-Q. This filing is available free of charge on the SEC website. You may also review or, for a fee, copy this filing at the SEC’s Public Reference Room in Washington, D.C. Additional information regarding the operation of the Public Reference Room may be obtained by calling the SEC’s Office of Investor Education and Advocacy at (800) SEC-0330. Additionally, the list of portfolio holdings is available by calling AFS.
This report is for the information of American Funds Insurance Series investors, but it also may be used as sales literature when preceded or accompanied by the current prospectuses or summary prospectuses for American Funds Insurance Series and the prospectus for the applicable insurance contract, which give details about charges, expenses, investment objectives and operating policies of the series. If used as sales material after March 31, 2018, this report must be accompanied by a statistical update for the most recently completed calendar quarter.
Fund attribution data was produced using FactSet, a third-party software system, based on daily portfolios. Securities in their initial period of acquisition may not be included in this analysis. The analysis includes equity investments only and excludes forward contracts and fixed income investments, if applicable. It does not account for buy-and-sell transactions that might have occurred intraday. As a result, average portfolio weight percentages are approximate, and the actual average portfolio weight percentages might be higher or lower. Data elements, such as pricing, income, market cap, etc., were provided by FactSet. The indexes provided for attribution are based on FactSet’s methodology. The indexes are broad-based market benchmarks and may not be used by Capital Group® as the sole comparative index for the funds. Capital Group believes the software and information from FactSet to be reliable. However, Capital Group cannot be responsible for inaccuracies, incomplete information or updating of information by FactSet.
Futures contracts may not provide an effective hedge of the underlying securities because changes in the prices of futures contracts may not track those of the securities they are intended to hedge. In addition, the managed risk strategy may not effectively protect the fund from market declines and will limit the fund’s participation in market gains. The use of the managed risk strategy could cause the fund’s return to lag that of the underlying fund in certain rising market conditions.
Bloomberg® is a trademark and service mark of Bloomberg Finance L.P. (collectively with its affiliates, “Bloomberg”). Barclays® is a trademark and service mark of Barclays Bank Plc (collectively with its affiliates, “Barclays”), used under license. Neither Bloomberg nor Barclays approve or endorse this material, or guarantees the accuracy or completeness of any information herein, or makes any warranty, express or implied, as to the results to be obtained therefrom and, to the maximum extent allowed by law, neither shall have any liability or responsibility for injury or damages arising in connection therewith. MSCI has not approved, reviewed or produced this report, makes no express or implied warranties or representations and is not liable whatsoever for any data in the report. You may not redistribute the MSCI data or use it as a basis for other indices or investment products. The S&P 500 is a product of S&P Dow Jones Indices LLC and/or its affiliates and has been licensed for use by Capital Group. Copyright © 2018 S&P Dow Jones Indices LLC, a division of S&P Global, and/or its affiliates. All rights reserved. Redistribution or reproduction in whole or in part is prohibited without written permission of S&P Dow Jones Indices LLC.
Table of Contents
American Funds from Capital Group
The Capital Advantage®
Since 1931, American Funds, part of Capital Group, has helped investors pursue long-term investment success. Our consistent approach — in combination with The Capital SystemSM — has resulted in a superior long-term track record for American Funds Insurance Series®.
| Aligned with investor success | The Capital System | Superior long-term track record | ||
| We base our decisions on a long-term perspective, which we believe aligns our goals with the interests of our clients. American Funds Insurance Series (AFIS) portfolio managers average 27 years of investment experience, including 22 years at our company, reflecting a career commitment to our long-term approach.1 | The Capital System combines individual accountability with teamwork. Funds using The Capital System are divided into portions that are managed independently by investment professionals with diverse backgrounds, ages and investment approaches. An extensive global research effort is the backbone of our system. | AFIS equity funds have beaten their comparable Lipper indexes in 93% of 10-year periods and 100% of 20-year periods. AFIS fixed income funds have beaten comparable Lipper indexes in 69% of 10-year periods and 84% of 20-year periods.2 We strive to keep management fees competitive. Over the past 20 years, most funds’ fees have been below industry averages.3 | ||
| 1 | Portfolio manager experience as of the American Funds Insurance Series prospectus dated May 1, 2017. |
| 2 | Based on Class 1 share results for rolling periods through December 31, 2017. Periods covered are the shorter of the fund’s lifetime or since the inception date of the comparable Lipper index. The comparable Lipper indexes are: Global Funds Index (Global Growth Fund, Global Growth and Income Fund), Growth Funds Index (Growth Fund), International Funds Index (International Fund), Emerging Markets Funds Index (New World Fund), Growth & Income Funds Index (Blue Chip Income and Growth Fund, Growth-Income Fund), Balanced Funds Index (Asset Allocation Fund), Core Bond Funds Index (Bond Fund), Global Income Funds Index (Global Bond Fund), High Yield Funds Index (High-Income Bond Fund), Ultra-Short Obligation Funds Index (Ultra-Short Bond Fund) and General U.S. Government Funds Index (U.S. Government/AAA-Rated Securities Fund). The Lipper Global Small-/Mid-Cap Funds Average was used for Global Small Capitalization Fund. |
| 3 | Based on management fees for the 20-year period ended December 31, 2017, versus comparable Lipper categories, excluding funds of funds. |
Lit. No. INGEARX-998-0218P
Table of Contents
Item 2. Code of Ethics.
SunAmerica Series Trust (“the registrant”) has adopted a Code of Ethics applicable to its Principal Executive and Principal Accounting Officers pursuant to Section 406 of the Sarbanes-Oxley Act of 2002 (the “Code”). During the fiscal year ended December 31, 2017, there were no reportable waivers or implicit waivers to a provision of the Code that applies to the registrant’s Principal Executive and Principal Accounting Officers (the “Covered Officers”). During the fiscal year ended December 31, 2017, however, there were reportable amendments to the Code that apply to the Covered Officers, and that relate to one or more of the items set forth in paragraph (b) of Item 2 of Form N-CSR. In particular, the Code has been amended to provide an enhanced description of the Covered Officers’ responsibilities, which include a responsibility to observe the ethical principles contained in the Code.
Item 3. Audit Committee Financial Expert.
The registrant’s Board of Trustees has determined that Allan Sher, Garrett Bouton and Jane Jelenko each qualify as audit committee financial experts, as defined in Item 3(b) of Form N-CSR. Mr. Sher, Mr. Bouton and Ms. Jelenko are considered “independent” for purposes of Item 3(a)(2) of Form N-CSR.
Item 4. Principal Accountant Fees and Services.
| (a)-(d) | Aggregate fees billed to the registrant for the last two fiscal years for services rendered by the registrant’s principal accountant were as follows: |
| 2016 | 2017 | |||||||
(a) Audit Fees | $ | 98,993 | $ | 101,963 | ||||
(b) Audit-Related Fees | $ | 0 | $ | 0 | ||||
(c) Tax Fees | $ | 29,490 | $ | 34,365 | ||||
(d) All Other Fees | $ | 0 | $ | 0 | ||||
Audit Fees include amounts related to the audit of the registrant’s annual financial statements and services normally provided by the principal accountant in connection with statutory and regulatory filings. Tax Fees principally include tax compliance, tax advice, tax planning and preparation of tax returns.
Aggregate fees billed to the investment adviser and Adviser Affiliates (as defined below in Item 4 (e)) that are required to be pre-approved pursuant to paragraph (c)(7)(ii) of Rule 2-01 of Regulation S-X for the last two fiscal years for services rendered by the registrant’s principal accountant were as follows:
| 2016 | 2017 | |||||||
(b) Audit-Related Fees | $ | 0 | $ | 0 | ||||
(c) Tax Fees | $ | 0 | $ | 0 | ||||
(d) All Other Fees | $ | 217,596 | $ | 390,644 | ||||
| (e) | (1) The registrant’s audit committee pre-approves all audit services provided by the registrant’s principal accountant for the registrant and all non-audit services provided by the registrant’s principal accountant for the registrant, its investment adviser and any entity controlling, controlled by, or under common control with the investment adviser (“Adviser Affiliates”) that provides ongoing services to the registrant, if the engagement by the investment adviser or Adviser Affiliates relates directly to the operations and financial reporting of the registrant. The audit committee has not presently established any pre-approval policies and procedures that permit the pre-approval of the above services other than by the full audit committee. Certain de minimis exceptions are allowed for non-audit services in accordance with Rule 2-01(c)(7)(i)(C) of Regulation S-X as set forth in the registrant’s audit committee minutes. |
(2) No services included in (b)-(d) above in connection with fees billed to the registrant or the investment adviser or Adviser Affiliates were approved pursuant to paragraph (c)(7)(i)(C) of Rule 2-01 of Regulation S-X.
| (f) | Not applicable. |
| (g) | The aggregate fees billed for the most recent fiscal year and the preceding fiscal year by the registrant’s principal accountant for non-audit services rendered to the registrant, its investment adviser, and Adviser Affiliates that provides ongoing services to the registrant for 2016 and 2017 were $330,886 and $889,023, respectively. |
| (h) | Non-audit services rendered to the registrant’s investment adviser and any Adviser Affiliates that provides ongoing services to the registrant that were not pre-approved pursuant to paragraph (c)(7)(ii) of Rule 2-01 of Regulation S-X were considered by the registrant’s audit committee as to whether they were compatible with maintaining the principal accountant’s independence. |
Item 5. Audit Committee of Listed Registrants.
Not applicable.
Item 6. Investments.
Included in Item 1 to the Form.
Table of Contents
Item 7. Disclosure of Proxy Voting Policies and Procedures for Closed-End Management Investment Companies.
Not applicable.
Item 8. Portfolio Managers of Closed-End Management Investment Companies.
Not applicable.
Item 9. Purchases of Equity Securities by Closed-End Management Investment Company and Affiliated Purchasers.
Not applicable.
Item 10. Submission of Matters to a Vote of Security Holders.
There were no material changes to the procedures by which shareholders may recommend nominees to the registrant’s Board of Trustees that were implemented after the registrant last provided disclosure in response to the requirements of Item 407(c)(2)(iv) of Regulation S-K (17 CFR 229.407) (as required by item 22(b)(15)) of Schedule 14A (17 CFR 240.14a-101), or this Item 10.
Item 11. Controls and Procedures.
(a) An evaluation was performed within 90 days of the filing of this report, under the supervision and with the participation of the registrant’s management, including the President and Treasurer, of the effectiveness of the design and operation of the registrant’s disclosure controls and procedures (as defined under Rule 30a-3(c) under the Investment Company Act of 1940 (17 CFR 270.30a-3(c))). Based on that evaluation, the registrant’s management, including the President and Treasurer, concluded that the registrant’s disclosure controls and procedures are effective.
(b) There was no change in the registrant’s internal control over financial reporting (as defined in Rule 30a-3(d) under the Investment Company Act of 1940 (17 CFR 270.30a-3(d))) that occurred during the registrant’s last fiscal quarter of the period covered by this report that has materially affected, or is reasonably likely to materially affect, the registrant’s internal control over financial reporting.
Table of Contents
Item 12. Disclosure of Securities Lending Activities for Closed-End Management Investment Companies.
| Not applicable. |
Item 13. Exhibits.
| (a) | (1) Code of Ethics applicable to its Principal Executive and Principal Accounting Officers pursuant to Section 406 of the Sarbanes-Oxley Act of 2002 attached hereto as Exhibit 99.406.Code of Ethics. |
(2) Certification pursuant to Rule 30a-2(a) under the Investment Company Act of 1940 (17 CFR 270.30a-2(a)) attached hereto as Exhibit 99.CERT.
(3) Not applicable.
| (b) | Certification pursuant to Rule 30a-2(b) under the Investment Company Act of 1940 (17 CFR 270.30a-2(a)) and Section 906 of the Sarbanes-Oxley Act of 2002 attached hereto as Exhibit 99.906.CERT. |
SIGNATURES
Pursuant to the requirements of the Securities Exchange Act of 1934 and the Investment Company Act of 1940, the registrant has duly caused this report to be signed on its behalf by the undersigned, thereunto duly authorized.
| SunAmerica Series Trust | ||
| By: | /s/ John T. Genoy | |
| John T. Genoy | ||
| President | ||
Date: March 9, 2018
Pursuant to the requirements of the Securities Exchange Act of 1934 and the Investment Company Act of 1940, this report has been signed below by the following persons on behalf of the registrant and in the capacities and on the dates indicated.
| By: | /s/ John T. Genoy | |
| John T. Genoy | ||
| President | ||
Date: March 9, 2018
| By: | /s/ Gregory R. Kingston | |
Gregory R. Kingston | ||
| Treasurer | ||
Date: March 9, 2018