
Exhibit 99.1 Chart Industries, Inc. Investor Presentation February 2019 © 2019 Chart Industries, Inc. Confidential and Proprietary © 2019 Chart Industries, Inc. Confidential and Proprietary

Forward Looking Statements Certain statements made in this news release are forward-looking statements within the meaning of the Private Securities Litigation Reform Act of 1995. Forward-looking statements include statements concerning the Company’s business plans, including statements regarding the recent VRV acquisition, cost synergies and efficiency savings, objectives, future orders, revenues, margins, earnings or performance, liquidity and cash flow, capital expenditures, business trends, and other information that is not historical in nature. Forward- looking statements may be identified by terminology such as "may," "will," "should," "could," "expects," "anticipates," "believes," "projects," "forecasts," “outlook,” “guidance,” "continue," or the negative of such terms or comparable terminology. Forward-looking statements contained in this presentation or in other statements made by the Company are made based on management's expectations and beliefs concerning future events impacting the Company and are subject to uncertainties and factors relating to the Company's operations and business environment, all of which are difficult to predict and many of which are beyond the Company's control, that could cause the Company's actual results to differ materially from those matters expressed or implied by forward-looking statements. Factors that could cause the Company’s actual results to differ materially from those described in the forward-looking statements include: those found in Item 1A (Risk Factors) in the Company’s most recent Annual Report on Form 10-K filed with the SEC, which should be reviewed carefully; and Chart’s ability to successfully integrate VRV, and achieve anticipated revenue, earnings and accretion. The Company undertakes no obligation to update or revise any forward-looking statement. Chart is a leading diversified global manufacturer of highly engineered equipment for the industrial gas, energy, and biomedical industries. The majority of Chart's products are used throughout the liquid gas supply chain for purification, liquefaction, distribution, storage and end-use applications, a large portion of which are energy- related. Chart has domestic operations located across the United States and an international presence in Asia, Australia, Europe and Latin America. For more information, visit: http://www.chartindustries.com. 1 © 2019 Chart Industries, Inc. Confidential and Proprietary

Leading Supplier of Mission Critical Equipment 1 Energy & Chemical 2 Distribution & Storage ▪ ▪ Supply Brazed Aluminum Heat Exchangers (BAHX), Offer a complete portfolio of cryogenic distribution and Air Cooled Heat Exchangers (ACHX) and Cold storage equipment Boxes ▪ Spearhead innovation in cryogenic packaged gas and ▪ Provide integrated systems and aftermarket services MicroBulk systems for gas processing, LNG and petrochemical ▪ Excel with over 20 years of experience in LNG applications applications ▪ Lead in technological advancements ▪ Set the standard for storage of biological materials at low temperatures 2 © 2019 Chart Industries, Inc. Confidential and Proprietary
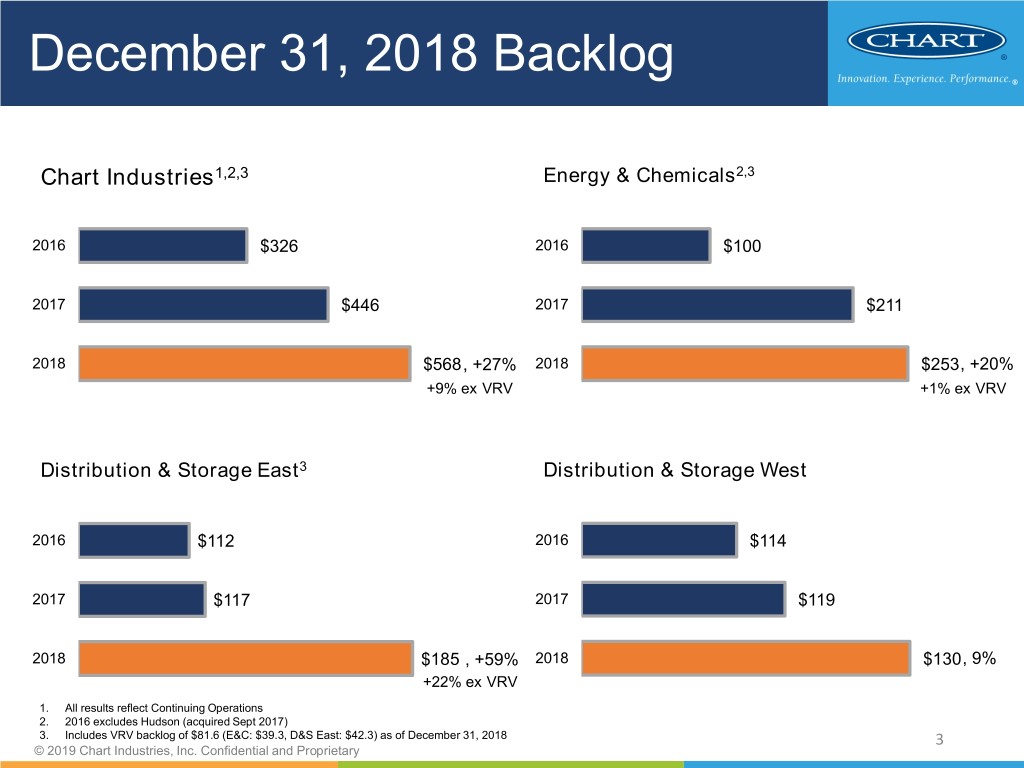
December 31, 2018 Backlog Chart Industries1,2,3 Energy & Chemicals2,3 2016 $326 2016 $100 2017 $446 2017 $211 2018 $568 , +27% 2018 $253 , +20% +9% ex VRV +1% ex VRV Distribution & Storage East3 Distribution & Storage West 2016 $112 2016 $114 2017 $117 2017 $119 2018 $185 , +59% 2018 $130 , 9% +22% ex VRV 1. All results reflect Continuing Operations 2. 2016 excludes Hudson (acquired Sept 2017) 3. Includes VRV backlog of $81.6 (E&C: $39.3, D&S East: $42.3) as of December 31, 2018 3 © 2019 Chart Industries, Inc. Confidential and Proprietary

Base Business Growth Levers 2018 by Segment Growth Areas 2019 Expectation • Big LNG (+$500M) E&C • Petrochemical E&C 2018 Sales: $390M • Fans Organic Sales + 8 - 12% 2018 Gross Margin: 22.8% • ACHX Gross Margin +50 - 100 bps • Repair and Service • IMO 2020 / Marine D&S East • Leveraging VRV D&S East 2018 Sales: $246M • Over the road LNG trucking / LNG Organic Sales + 5 - 7% fueling systems 2018 Gross Margin: 21.3% Gross Margin +100 - 150 bps • China growth in LNG and IG • Industrial gas core customers / LTAs D&S West • Specialty markets D&S West 2018 Sales: $456M • Food & beverage Organic Sales + 5 - 7% 2018 Gross Margin: 34.4% • Cannabis Gross Margin +100 - 125 bps • Space launch 4 © 2019 Chart Industries, Inc. Confidential and Proprietary

Where do we play in LNG? *Source: Scotia Howard Weil 5 © 2019 Chart Industries, Inc. Confidential and Proprietary

LNG Supply / Demand Demand forecast to 2025 Supply/Demand Deficit Forecast Source: Wood Mackenzie; 2018 World LNG Report, published by IGU and HIS Market; Scotia Howard Weil estimates. • Current buildout cycle serving upcoming 2022-2023 supply-demand deficit • Expect ~100 MTPA of related orders in 2019 into the market Source: Evercore 6 © 2019 Chart Industries, Inc. Confidential and Proprietary
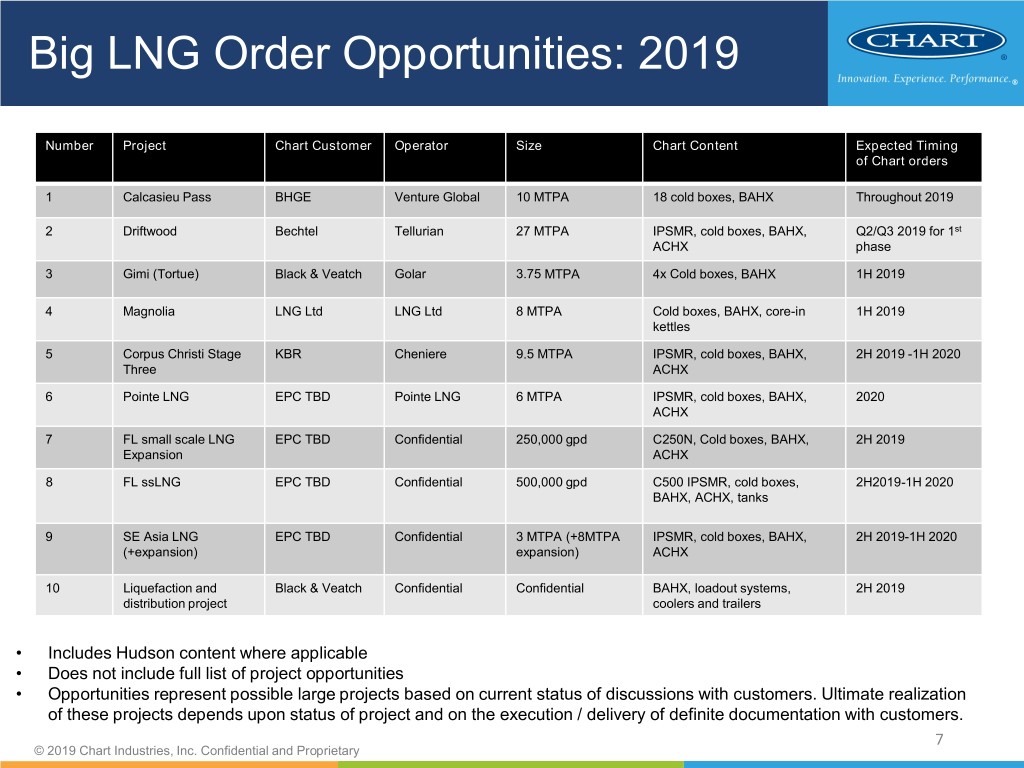
Big LNG Order Opportunities: 2019 Number Project Chart Customer Operator Size Chart Content Expected Timing of Chart orders 1 Calcasieu Pass BHGE Venture Global 10 MTPA 18 cold boxes, BAHX Throughout 2019 2 Driftwood Bechtel Tellurian 27 MTPA IPSMR, cold boxes, BAHX, Q2/Q3 2019 for 1st ACHX phase 3 Gimi (Tortue) Black & Veatch Golar 3.75 MTPA 4x Cold boxes, BAHX 1H 2019 4 Magnolia LNG Ltd LNG Ltd 8 MTPA Cold boxes, BAHX, core-in 1H 2019 kettles 5 Corpus Christi Stage KBR Cheniere 9.5 MTPA IPSMR, cold boxes, BAHX, 2H 2019 -1H 2020 Three ACHX 6 Pointe LNG EPC TBD Pointe LNG 6 MTPA IPSMR, cold boxes, BAHX, 2020 ACHX 7 FL small scale LNG EPC TBD Confidential 250,000 gpd C250N, Cold boxes, BAHX, 2H 2019 Expansion ACHX 8 FL ssLNG EPC TBD Confidential 500,000 gpd C500 IPSMR, cold boxes, 2H2019-1H 2020 BAHX, ACHX, tanks 9 SE Asia LNG EPC TBD Confidential 3 MTPA (+8MTPA IPSMR, cold boxes, BAHX, 2H 2019-1H 2020 (+expansion) expansion) ACHX 10 Liquefaction and Black & Veatch Confidential Confidential BAHX, loadout systems, 2H 2019 distribution project coolers and trailers • Includes Hudson content where applicable • Does not include full list of project opportunities • Opportunities represent possible large projects based on current status of discussions with customers. Ultimate realization of these projects depends upon status of project and on the execution / delivery of definite documentation with customers. 7 © 2019 Chart Industries, Inc. Confidential and Proprietary

M&A: A Way to Accelerate Growth Acquisition Criteria: Prioritize Key Market Opportunities: ▪ Strong level of strategic fit SERVICE & ▪ TEMPERATURE High degree of leveragability REPAIR EXPANSION (specific and attainable BUILDOUT synergies) ▪ Proven growth and profitability ▪ Reasonable price expectations CRYOGENIC ▪ Management bench strength PUMPS / FANS MARINE ▪ Ownership that’s willing TECH to assist in the transition EXPANSION 8 © 2019 Chart Industries, Inc. Confidential and Proprietary
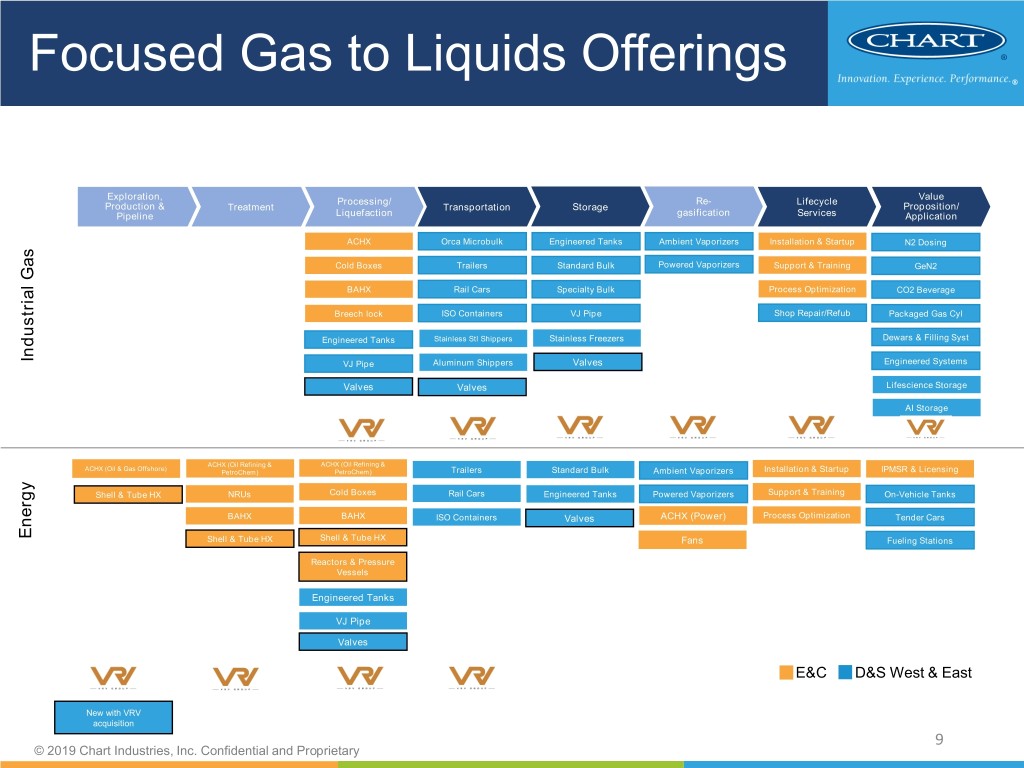
Focused Gas to Liquids Offerings Exploration, Value Processing/ Re- Lifecycle Production & Treatment Transportation Storage Proposition/ Pipeline Liquefaction gasification Services Application ACHX Orca Microbulk Engineered Tanks Ambient Vaporizers Installation & Startup N2 Dosing Cold Boxes Trailers Standard Bulk Powered Vaporizers Support & Training GeN2 BAHX Rail Cars Specialty Bulk Process Optimization CO2 Beverage Breech lock ISO Containers VJ Pipe Shop Repair/Refub Packaged Gas Cyl Engineered Tanks Stainless Stl Shippers Stainless Freezers Dewars & Filling Syst Industrial Gas VJ Pipe Aluminum Shippers Valves Engineered Systems Valves Valves Lifescience Storage AI Storage ACHX (Oil Refining & ACHX (Oil Refining & ACHX (Oil & Gas Offshore) PetroChem) PetroChem) Trailers Standard Bulk Ambient Vaporizers Installation & Startup IPMSR & Licensing Shell & Tube HX NRUs Cold Boxes Rail Cars Engineered Tanks Powered Vaporizers Support & Training On-Vehicle Tanks BAHX BAHX ISO Containers Valves ACHX (Power) Process Optimization Tender Cars Energy Shell & Tube HX Shell & Tube HX Fans Fueling Stations Reactors & Pressure Vessels Engineered Tanks VJ Pipe Valves E&C D&S West & East New with VRV acquisition 9 © 2019 Chart Industries, Inc. Confidential and Proprietary
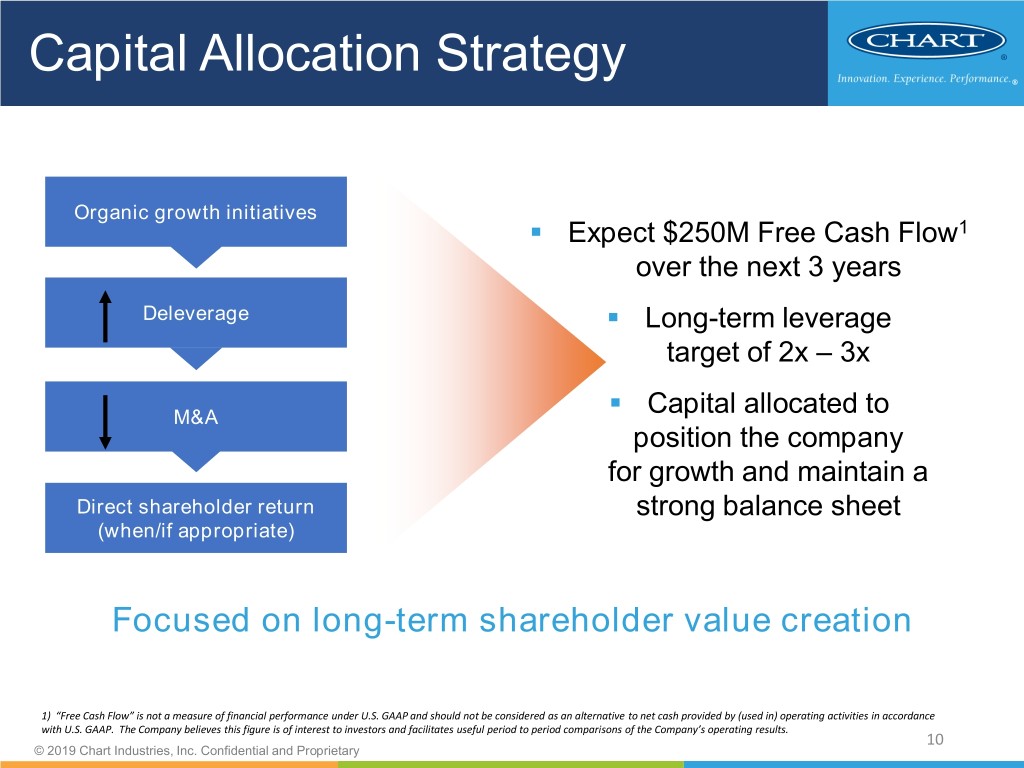
Capital Allocation Strategy Organic growth initiatives ▪ Expect $250M Free Cash Flow1 over the next 3 years Deleverage ▪ Long-term leverage target of 2x – 3x ▪ M&A Capital allocated to position the company for growth and maintain a Direct shareholder return strong balance sheet (when/if appropriate) Focused on long-term shareholder value creation 1) “Free Cash Flow” is not a measure of financial performance under U.S. GAAP and should not be considered as an alternative to net cash provided by (used in) operating activities in accordance with U.S. GAAP. The Company believes this figure is of interest to investors and facilitates useful period to period comparisons of the Company’s operating results. 10 © 2019 Chart Industries, Inc. Confidential and Proprietary
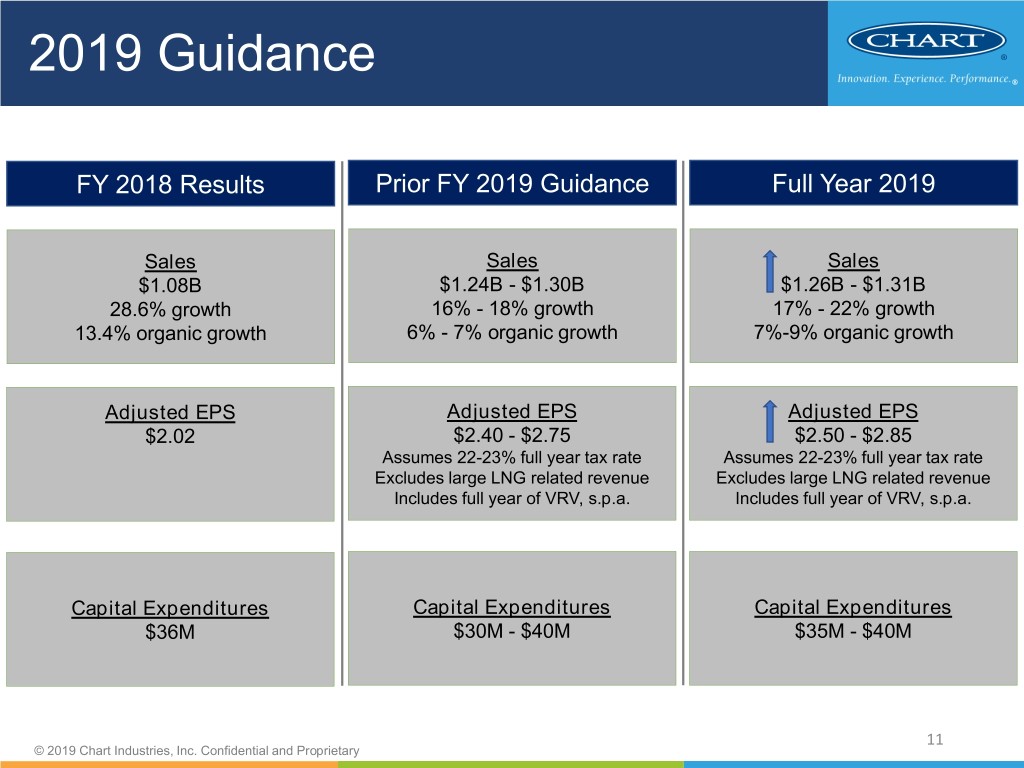
2019 Guidance FY 2018 Results Prior FY 2019 Guidance Full Year 2019 Sales Sales Sales $1.08B $1.24B - $1.30B $1.26B - $1.31B 28.6% growth 16% - 18% growth 17% - 22% growth 13.4% organic growth 6% - 7% organic growth 7%-9% organic growth Adjusted EPS Adjusted EPS Adjusted EPS $2.02 $2.40 - $2.75 $2.50 - $2.85 Assumes 22-23% full year tax rate Assumes 22-23% full year tax rate Excludes large LNG related revenue Excludes large LNG related revenue Includes full year of VRV, s.p.a. Includes full year of VRV, s.p.a. Capital Expenditures Capital Expenditures Capital Expenditures $36M $30M - $40M $35M - $40M 11 © 2019 Chart Industries, Inc. Confidential and Proprietary
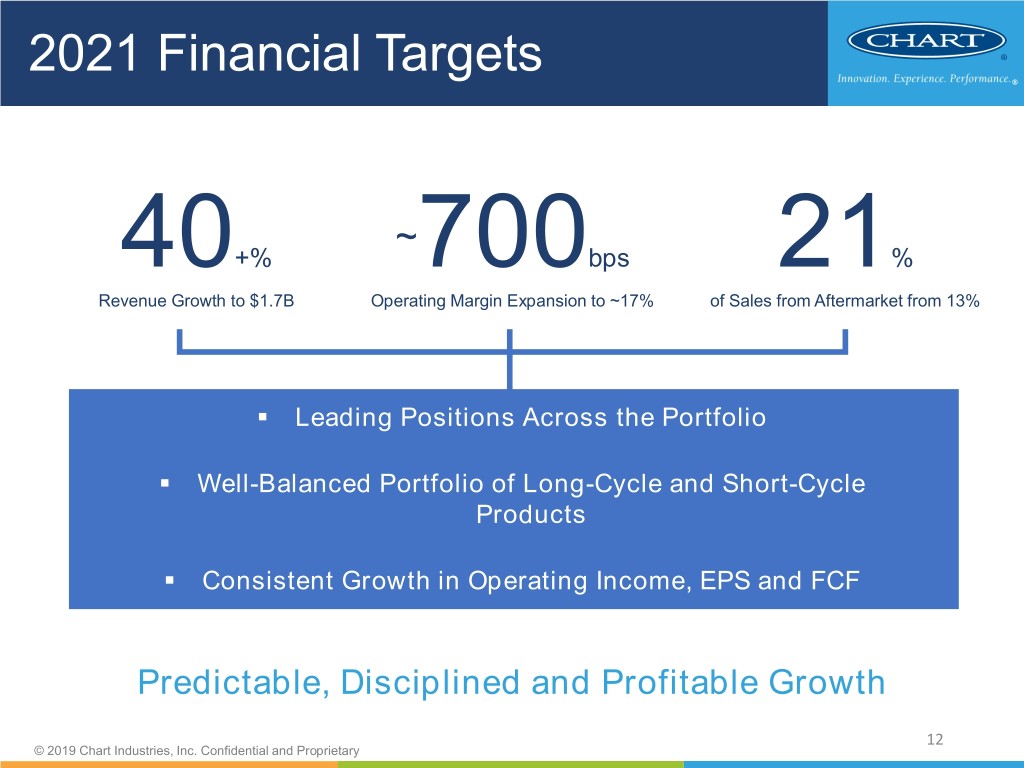
2021 Financial Targets ~ 40+% 700bps 21% Revenue Growth to $1.7B Operating Margin Expansion to ~17% of Sales from Aftermarket from 13% ▪ Leading Positions Across the Portfolio ▪ Well-Balanced Portfolio of Long-Cycle and Short-Cycle Products ▪ Consistent Growth in Operating Income, EPS and FCF Predictable, Disciplined and Profitable Growth 12 © 2019 Chart Industries, Inc. Confidential and Proprietary

Chart Investment Highlights Leading diversified industrial global manufacturer with diverse Operate in attractive, growing and broad product offering markets Innovative technical expertise Cross-operating segment scale and and reputation collaboration Longstanding relationships with Industry leading global industry leading and global manufacturing capability customers 13 © 2019 Chart Industries, Inc. Confidential and Proprietary

Appendix © 2019 Chart Industries, Inc. Confidential and Proprietary © 2019 Chart Industries, Inc. Confidential and Proprietary

Financial Results by Segment Energy & Chemicals Q1 2017 Q2 2017 Q3 2017 Q4 2017 FY 2017 Q1 2018 Q2 2018 Q3 2018 Q4 2018 FY 2018 $M Sales $39.9 $40.0 $46.6 $99.1 $225.6 $89.9 $100.8 $98.1 $101.7 $390.5 Gross Margin 8.4 5.4 8.6 22.7 45.1 19.4 21.3 26.9 21.6 89.2 GM % 21.1% 13.5% 18.5% 22.9% 20.0% 21.6% 21.1% 27.4% 21.2% 22.8% SG&A 7.8 7.4 7.4 11.7 34.3 12.6 11.7 11.3 12.5 48.1 % / Sales 19.5% 18.5% 15.9% 11.8% 15.2% 14.0% 11.6% 11.5% 12.3% 12.3% Operating Income $(0.2) $(2.5) $0.3 $7.5 $5.1 $2.8 $5.9 $12.1 $4.7 $25.5 % / Sales -0.5% -6.3% 0.6% 7.6% 2.3% 3.1% 5.9% 12.3% 4.6% 6.5% Distribution & Storage Western Hemisphere Q1 2017 Q2 2017 Q3 2017 Q4 2017 FY 2017 Q1 2018 Q2 2018 Q3 2018 Q4 2018 FY 2018 $M Sales $91.1 $104.9 $99.6 $105.0 $400.6 $100.6 $117.6 $119.0 $118.3 $455.5 Gross Margin 32.2 36.1 37.0 36.5 141.8 36.1 38.2 44.7 37.8 156.8 GM % 35.3% 34.4% 37.1% 34.9% 35.4% 35.9% 32.5% 37.6% 32.0% 34.4% SG&A 13.9 12.5 13.0 12.6 52.0 12.7 13.4 11.6 13.3 51.0 % / Sales 15.3% 11.9% 13.1% 12.0% 13.0% 12.6% 11.4% 9.7% 11.2% 11.2% Operating Income $17.0 $22.2 $23.1 $22.9 $85.2 $22.2 $23.6 $31.9 $23.5 $101.2 % / Sales 18.7% 21.2% 23.2% 21.8% 21.3% 22.1% 20.1% 26.8% 19.9% 22.2% Distribution & Storage Eastern Hemisphere Q1 2017 Q2 2017 Q3 2017 Q4 2017 FY 2017 Q1 2018 Q2 2018 Q3 2018 Q4 2018 FY 2018 $M Sales $45.2 $58.3 $63.2 $65.6 $232.3 $55.1 $62.4 $56.8 $72.0 $246.3 Gross Margin 9.1 11.6 13.7 13.9 48.3 11.8 14.1 11.2 15.3 52.4 GM % 20.1% 19.9% 21.7% 21.2% 20.8% 21.4% 22.6% 19.7% 21.3% 21.3% SG&A 6.4 7.8 7.8 11.0 33.0 7.8 7.3 7.7 8.8 31.6 % / Sales 14.2% 13.4% 12.3% 16.8% 14.2% 14.2% 11.7% 13.6% 12.2% 12.8% Operating Income $2.5 $3.7 $5.6 $2.4 $14.2 $3.6 $6.6 $3.3 $5.8 $19.3 % / Sales 5.5% 6.3% 8.9% 3.7% 6.1% 6.5% 10.6% 5.8% 8.1% 7.8% Chart Industries - Total Q1 2017 Q2 2017 Q3 2017 Q4 2017 FY 2017 Q1 2018 Q2 2018 Q3 2018 Q4 2018 FY 2018 $M Sales $171.0 $199.8 $202.7 $269.4 $842.9 $244.1 $277.9 $272.2 $290.1 $1,084.3 Gross Margin 48.3 52.3 57.9 73.1 231.6 66.9 72.8 82.3 73.9 295.9 GM % 28.2% 26.2% 28.6% 27.1% 27.5% 27.4% 26.2% 30.2% 25.5% 27.3% SG&A 44.1 41.7 48.1 47.0 180.9 46.6 48.1 45.8 41.4 181.9 % / Sales 25.8% 20.9% 23.7% 17.4% 21.5% 19.1% 17.3% 16.8% 14.3% 16.8% Operating Income $1.8 $8.6 $7.2 $20.9 $38.5 $14.7 $19.6 $31.5 $26.3 $92.1 % / Sales 1.1% 4.3% 3.6% 7.8% 4.6% 6.0% 7.1% 11.6% 9.1% 8.5% 15 © 2019 Chart Industries, Inc. Confidential and Proprietary

www.chartindustries.com © 2019 Chart Industries, Inc. Confidential and Proprietary © 2019 Chart Industries, Inc. Confidential and Proprietary


