
N Y S E : G T L S 1 Jill Evanko CEO Presented by Joe Brinkman CFO Third Quarter 2022 Earnings Call Exhibit 99.2
Forward-Looking Statements © 2022 Chart Industries, Inc. Confidential and Proprietary 2 CERTAIN STATEMENTS MADE IN THIS PRESENTATION ARE FORW ARD -LOOKING STATEMENTS W ITHIN THE MEANING OF THE PRIVATE SECURITIES LITIGAT ION REFORM ACT OF 1995. FORW ARD-LOOKING STATEMENTS INCLUDE STATEMEN TS CONCERNING THE COMPANY’S BUSINESS PLANS, INCLUDING STATEMENTS REGARDING COMPLETED DIVESTITURES, ACQUISITIONS AND INVESTMENTS, COST SYNERGIES AND EFFICIENCY SAVINGS, OBJECTIVES, FUTURE ORDERS , REVENUES, MARGINS, SEGMENT SALES MIX, EARNINGS OR PERFORMANCE, L IQUIDITY AND CASH FLOW , INVENTORY LEVELS, CAPITAL EXPENDITURES, SUPPLY CHAIN CHALLENGES, INFLATIONARY PRESSURES INCLUDING MATERI AL COST AND PRICING INCREASES, BUSINESS TRENDS, CLEAN ENERGY MAR KET OPPORTUNITIES, INCLUDING ADDRESSABLE MARKETS AND PROJECTED INDUS TRY-W IDE INVESTMENTS, GOVERNMENTAL INITIATIVES, INCLUDING EXECUT IVE ORDERS AND OTHER INFORMATION THAT IS NOT HISTORICAL IN NATURE. FORW ARD-LOOKING STATEMENTS MAY BE IDENTIFIED BY TERMINOLOGY SUCH AS "MAY," "W ILL," "SHOULD," "COULD," "EXPECTS," "ANTICIPATES," "BEL IEVES," "PROJECTS," "FORECASTS," “OUTLOOK,” “GUIDANCE,” "CONTINU E," “TARGET,” OR THE NEGATIVE OF SUCH TERMS OR COMPARABLE TERMINOLOGY. FORW ARD-LOOKING STATEMENTS CONTAINED IN THIS PRESENTATION OR IN OTHER STATEMENTS MADE BY THE COMPANY ARE MADE BASED ON MANAGEMENT'S EXPECTATIONS AND BELIEFS CONCERNING FUTURE EVENTS I MPACTING THE COMPANY AND ARE SUBJECT TO UNCERTAINTIES AND FACTOR S RELATING TO THE COMPANY'S OPERATIONS AND BUSINESS ENVIRONMENT, A LL OF W HICH ARE DIFFICULT TO PREDICT AND MANY OF W HICH ARE BEYON D THE COMPANY'S CONTROL, THAT COULD CAUSE THE COMPANY'S ACTUAL RESULTS TO DIFFER MATERIALLY FROM THOSE MATTERS EXPRESSED OR IMPLIED BY FORW ARD-LOOKING STATEMENTS. FACTORS THAT COULD CAUSE THE COMPAN Y’S ACTUAL RESULTS TO DIFFER MATERIALLY FROM THOSE DESCRIBED IN THE FORW ARD-LOOKING STATEMENTS INCLUDE: THE COMPANY’S ABILITY TO SUCCESSFULLY INTEGRATE RECENT ACQUISITIONS AND ACHIEVE THE ANTICIP ATED REVENUE, EARNINGS, ACCRETION AND OTHER BENEFITS FROM THESE ACQUI SITIONS; SLOW ER THAN ANTICIPATED GROW TH AND MARKET ACCEPTANCE OF NEW CLEAN ENERGY PRODUCT OFFERINGS; INABILITY TO ACHIEVE EXPECTE D PRICE INCREASES OR CONTINUED SUPPLY CHAIN CHALLENGES INCLUDING VOLATILITY IN RAW MATERIALS COST AND SUPPLY; RISKS RELATING TO T HE OUTBREAK AND CONTINUED UNCERTAINTY ASSOCIATED W ITH THE CORONAVIRUS (COVID-19) AND THE CONFLICT BETW EEN RUSSIA AND UKRAI NE, INCLUDING ENERGY SHORTAGES IN EUROPE AND ELSEW HERE, AND THE OTHER FACTORS DISCUSSED IN ITEM 1A (RISK FACTORS) IN THE COMPANY ’S MOST RECENT ANNUAL REPORT ON FORM 10 -K AND QUARTERLY REPORTS ON FORM 10-Q FILED W ITH THE SEC, W HICH SHOULD BE REVIEW ED CAREFULLY . THE COMPANY UNDERTAKES NO OBLIGATION TO UPDATE OR REVISE ANY FORW ARD-LOOKING STATEMENT. THIS PRESENTATION CONTAINS THIRD QUARTER 2022 NON -GAAP FINANCIAL INFORMATION, INCLUDING ADJUSTED NON-DILUTED EPS, NORMALIZED BASIC EPS, “NET INCOME, ADJUSTED”, FREE CASH FLOW , ADJUSTED FREE CASH FLOW , EBITDA, ADJUSTED EBITDA, ADJUSTED GROSS PROFIT, ADJUSTED G ROSS PROFIT MARGIN, ADJUSTED OPERATING INCOME, AND ADJUSTED OPERATING MARGIN. FOR ADDITIONAL INFORMATION REGARDING THE COMPANY'S USE OF NON-GAAP FINANCIAL INFORMATION, AS W ELL AS RECONCILIATIONS OF NO N-GAAP FINANCIAL MEASURES TO THE MOST DIRECTLY COMPARABLE FINANC IAL MEASURES CALCULATED AND PRESENTED IN ACCORDANCE W ITH ACCOUNTING PRINCIPLES GENERALLY ACCEPTED IN THE UNITED STATES ("GAAP") , PLE ASE SEE THE RECONCILIATION SLIDES TITLED “THIRD QUARTER 2022 EARNING S PER SHARE,” “THIRD QUARTER 2022 ADJUSTED EBITDA” AND “THIRD QUARTER 2022 FREE CASH FLOW ” INCLUDED IN, OR IN THE APPENDIX AT THE END OF, THIS PRESENTATION. PLEASE SEE THE RECONCILIATION TABLE AT T HE END OF THE ACCOMPANYING EARNINGS RELEASE FOR THE “ADJUSTED GROSS PROFIT ” AND “ADJUSTED OPERATING INCOME” RECONCILIATIONS, AS W ELL AS A RECONCILIATION AND ADDITIONAL DETAILS ON ADJUSTED NON -DILUTED EPS AND ADJUSTED FREE CASH FLOW . W ITH RESPECT TO THE COMPANY’S 202 2 AND 2023 FULL YEAR EARNINGS OUTLOOK, THE COMPANY IS NOT ABLE TO PROV IDE A RECONCILIATION OF THE ADJUSTED EARNINGS PER NON -DILUTED SHARE OR ADJUSTED FREE CASH FLOW , BECAUSE CERTAIN ITEMS MAY HAVE NOT YET OCCURRED OR ARE OUT OF THE COMPANY’S CONTROL AND/OR CANNOT BE REASONABLY PREDICTED. CHART INDUSTRIES, INC. IS A LEADING INDEPENDENT GLOBAL MANUFACTU RER OF HIGHLY ENGINEERED EQUIPMENT SERVICING MULTIPLE APPLICATIO NS IN THE ENERGY AND INDUSTRIAL GAS MARKETS. OUR UNIQUE PRODUCT PORTFOLIO IS USED IN EVERY PHASE OF THE LIQUID GAS SUPPLY CHAIN, INCL UDING UPFRONT ENGINEERING, SERVICE AND REPAIR. BEING AT THE FOREFRONT OF THE CLEAN ENERGY TRANSITION, CHART IS A LEADING PROVIDER OF TECHNOLOGY, EQUIPMENT AND SERVICES RELATED TO LIQUEFIED NATURAL GAS, HYDROGEN, BIOGAS AND CO2 CAPTURE AMONGST OTHER APPLICATIONS . W E ARE COMMITTED TO EXCELLENCE IN ENVIRONMENTAL, SOCIAL AND CORP ORATE GOVERNANCE (ESG) ISSUES BOTH FOR OUR COMPANY AS W ELL AS OU R CUSTOMERS. W ITH OVER 25 GLOBAL LOCATIONS FROM THE UNITED STATES TO ASIA, AUSTRALIA, INDIA, EUROPE AND SOUTH AMERICA, W E MAINTAI N ACCOUNTABILITY AND TRANSPARENCY TO OUR TEAM MEMBERS, SUPPLIERS, CUSTOMERS AND COMMUNITIES. TO LEARN MORE, VISIT WWW.CHARTINDUSTRIES.COM.

Macro Tailwinds Increasing Specialty 2030 TAM and LNG Opportunities 3
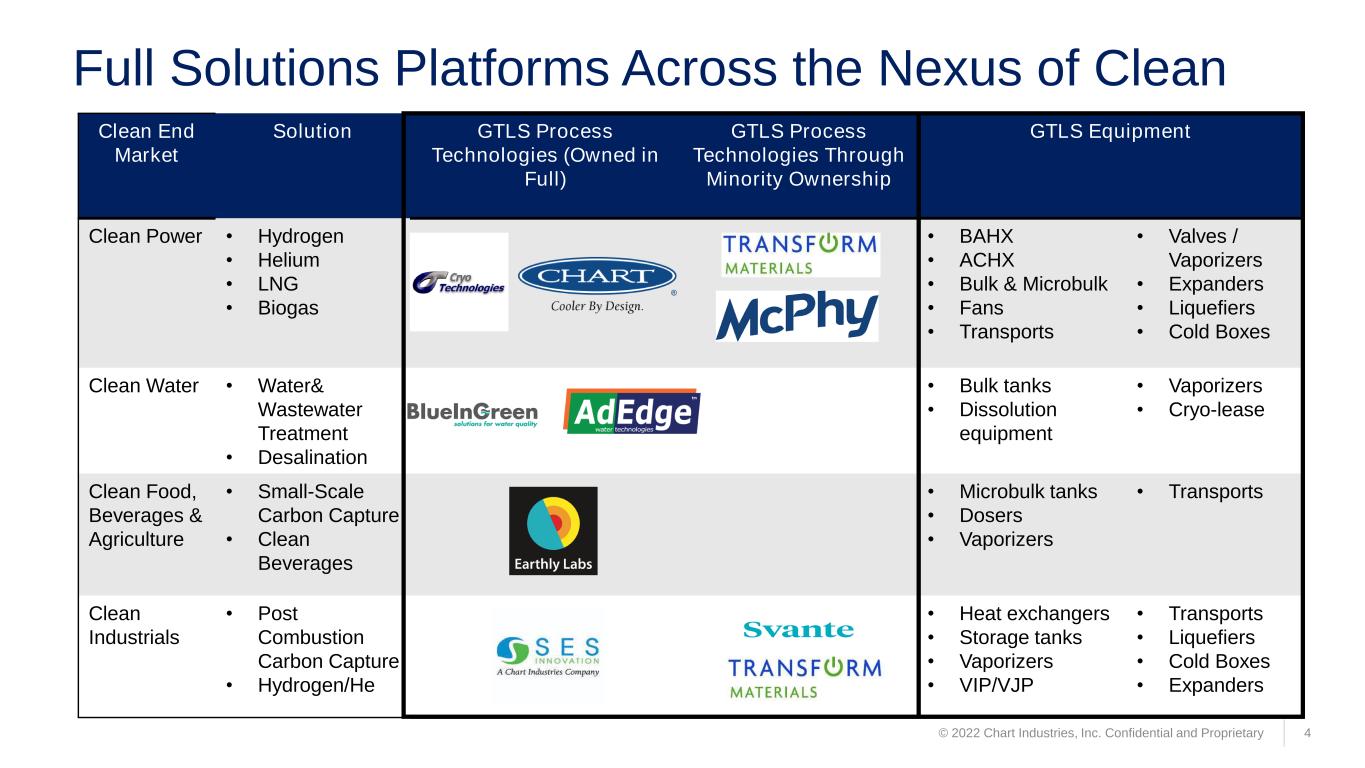
© 2022 Chart Industries, Inc. Confidential and Proprietary 4 Full Solutions Platforms Across the Nexus of Clean Clean End Market Solution GTLS Process Technologies (Owned in Full) GTLS Process Technologies Through Minority Ownership GTLS Equipment Clean Power • Hydrogen • Helium • LNG • Biogas • BAHX • ACHX • Bulk & Microbulk • Fans • Transports • Valves / Vaporizers • Expanders • Liquefiers • Cold Boxes Clean Water • Water& Wastewater Treatment • Desalination • Bulk tanks • Dissolution equipment • Vaporizers • Cryo-lease Clean Food, Beverages & Agriculture • Small-Scale Carbon Capture • Clean Beverages • Microbulk tanks • Dosers • Vaporizers • Transports Clean Industrials • Post Combustion Carbon Capture • Hydrogen/He • Heat exchangers • Storage tanks • Vaporizers • VIP/VJP • Transports • Liquefiers • Cold Boxes • Expanders
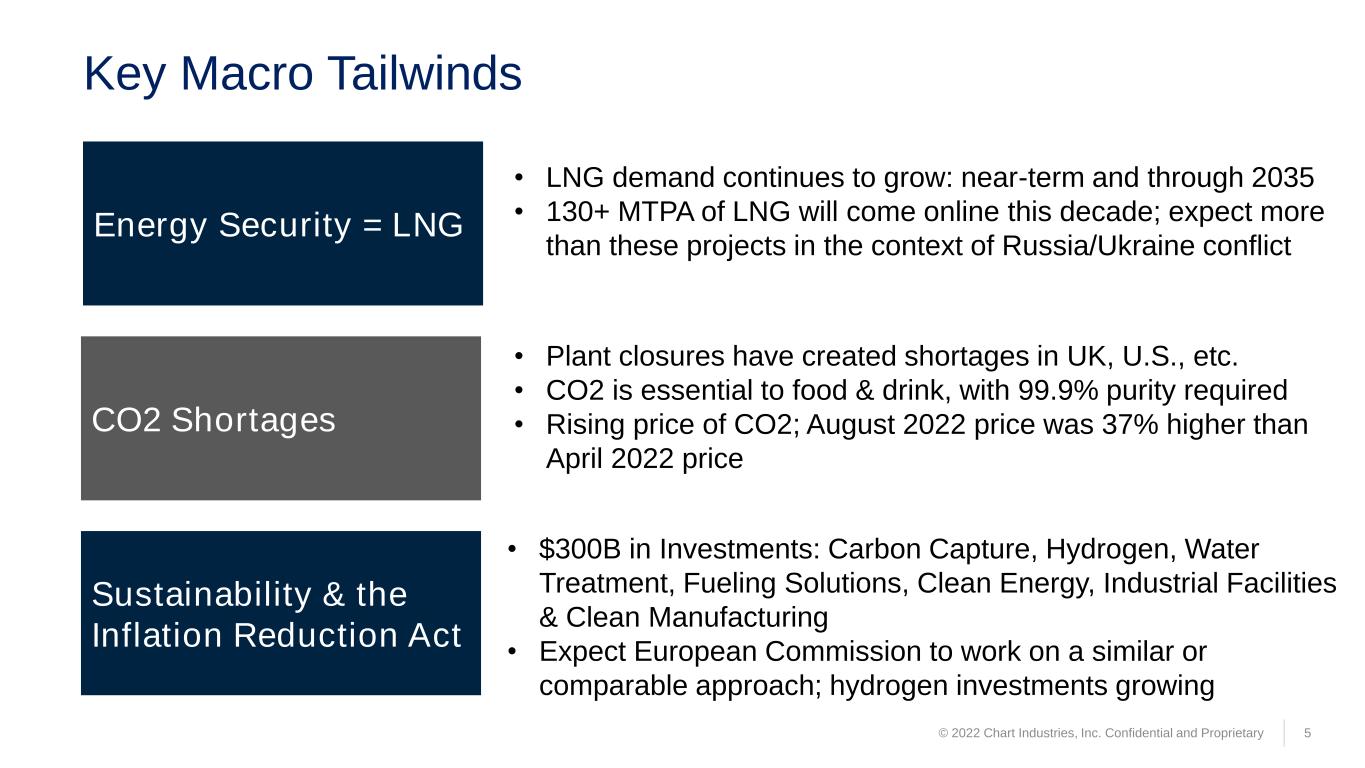
© 2022 Chart Industries, Inc. Confidential and Proprietary 5 Key Macro Tailwinds Energy Security = LNG CO2 Shortages Sustainability & the Inflation Reduction Act • LNG demand continues to grow: near-term and through 2035 • 130+ MTPA of LNG will come online this decade; expect more than these projects in the context of Russia/Ukraine conflict • Plant closures have created shortages in UK, U.S., etc. • CO2 is essential to food & drink, with 99.9% purity required • Rising price of CO2; August 2022 price was 37% higher than April 2022 price • $300B in Investments: Carbon Capture, Hydrogen, Water Treatment, Fueling Solutions, Clean Energy, Industrial Facilities & Clean Manufacturing • Expect European Commission to work on a similar or comparable approach; hydrogen investments growing

© 2022 Chart Industries, Inc. Confidential and Proprietary 6 Hydrogen Investments This Decade are Increasing Mid-2021 Mid-2022 (One Year Later) Hydrogen Projects under development globally through 2030 Direct investment through 2030 announced Increase in announced clean hydrogen production capacity compared to 2019 Countries with “net zero” targets % Change $160 billion $240 billion +50% 75 131 +75 228 534 +134% 3X 11.4X +280% Announced clean hydrogen production capacity 6.7 MTPA 26.2 MTPA +290%
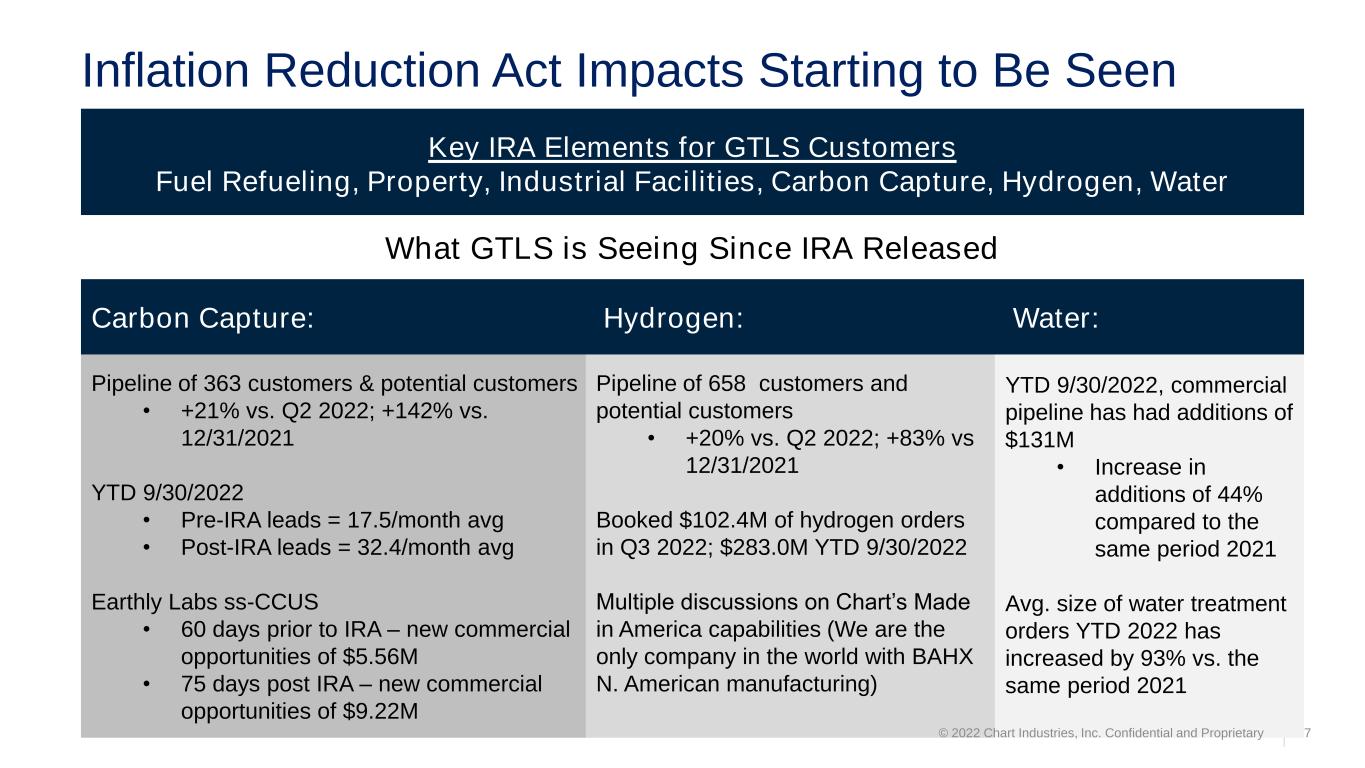
Pipeline of 363 customers & potential customers • +21% vs. Q2 2022; +142% vs. 12/31/2021 YTD 9/30/2022 • Pre-IRA leads = 17.5/month avg • Post-IRA leads = 32.4/month avg Earthly Labs ss-CCUS • 60 days prior to IRA – new commercial opportunities of $5.56M • 75 days post IRA – new commercial opportunities of $9.22M Pipeline of 658 customers and potential customers • +20% vs. Q2 2022; +83% vs 12/31/2021 Booked $102.4M of hydrogen orders in Q3 2022; $283.0M YTD 9/30/2022 Multiple discussions on Chart’s Made in America capabilities (We are the only company in the world with BAHX N. American manufacturing) YTD 9/30/2022, commercial pipeline has had additions of $131M • Increase in additions of 44% compared to the same period 2021 Avg. size of water treatment orders YTD 2022 has increased by 93% vs. the same period 2021 © 2022 Chart Industries, Inc. Confidential and Proprietary 7 Inflation Reduction Act Impacts Starting to Be Seen Key IRA Elements for GTLS Customers Fuel Refueling, Property, Industrial Facilities, Carbon Capture, Hydrogen, Water Carbon Capture: Hydrogen: Water: What GTLS is Seeing Since IRA Released

© 2022 Chart Industries, Inc. Confidential and Proprietary 8 Specialty Products Total Addressable Market Increase Prior TAM TAM as of 10/28/2022 Market End-use of Products Near-term TAM(1) 2030 TAM Near-term TAM(1) 2030 TAM Drivers of Expanded Opportunity Hydrogen & Helium • H2/He Liquefaction • Transports and storage, stations, etc. $3,100M $25,000M $4,500M $30,000M • Faster pace of liquid adoption • National hydrogen strategies • U.S. IRA / GTLS bookings Carbon Capture • Industrial scale & small-scale CCUS • Distribution and storage $850M $6,000M $950M $6,500 • U.S. IRA • CO2 shortages Over-Road Trucking • LNG for heavy duty vehicles, mine trucks (lower emissions, engine noise, etc.) $750M $2,000M $750M $2,000M Water Treatment • Wastewater treatment technology for removal of contaminants (arsenic, PFAS and PFOS) • Related storage equipment $1,500M $6,000M $2,000M $7,400 • U.S. IRA • Earlier than expected traction in India signals intl expectations to continue Food & Beverage • Food preservation equipment • Nitrogen dosing equipment $500M $1,000M $500M $1,000M Cannabis • Liquid CO2 storage • Used in grow houses, CBD oil extraction and packaging $250M $500M $250M $500M Molecules By Rail • Gas by rail tender cars approved for use $250M $500M $250M $750M • Increasing interest in alternative fuels by rail Lasers • High purity liquid nitrogen (gas assist) for a faster cut, superior edge, free of impurities $200M $500M $200M $500M Space • Cryogenic liquid propellants are used as fuel for rocket propulsion $250M $500M $250M $600M • Supersize tank adoption, with Teddy expanded facility Total $7,650M $42,000M $9,650M $49,250M Source: Potential Market Size are Chart Management estimates. (1) Reflects Total Addressable Market (TAM) for current and potential application of Chart technology and products.
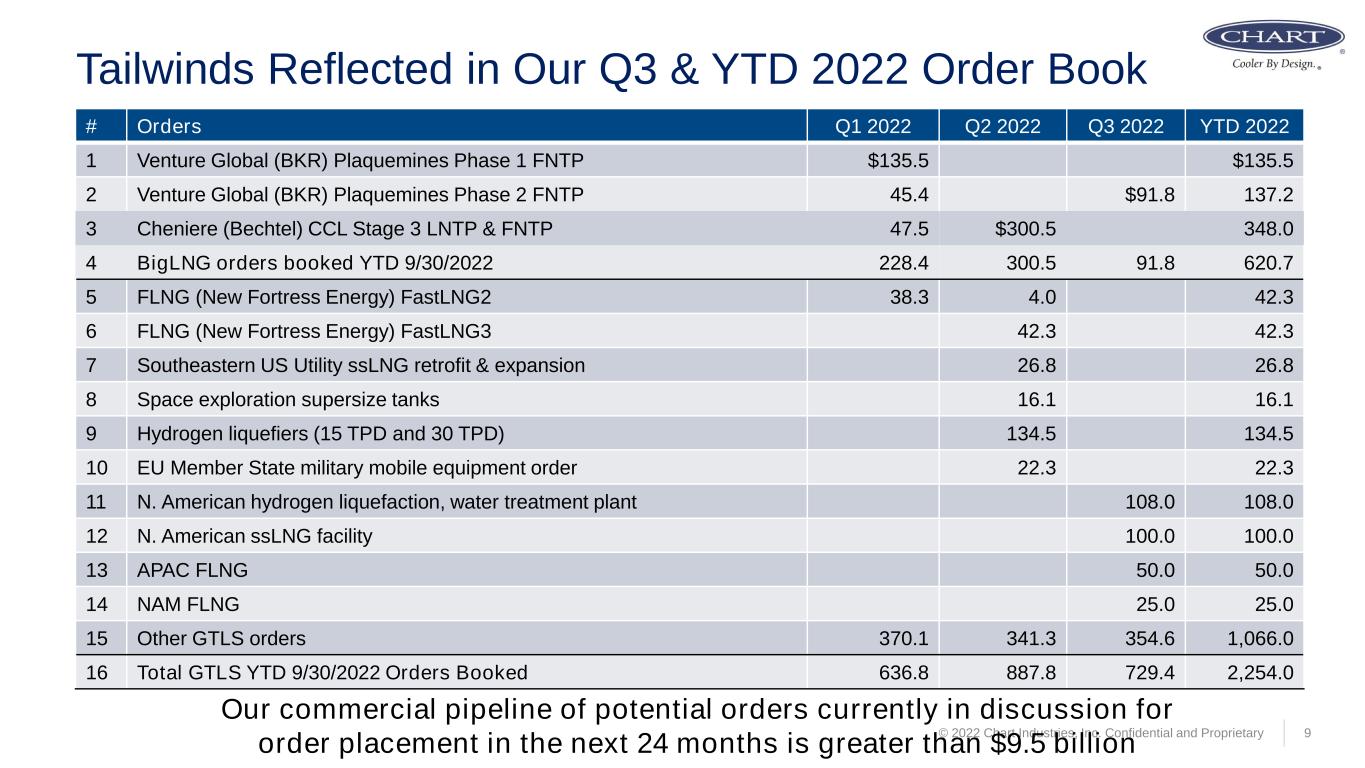
© 2022 Chart Industries, Inc. Confidential and Proprietary 9 Tailwinds Reflected in Our Q3 & YTD 2022 Order Book # Orders Q1 2022 Q2 2022 Q3 2022 YTD 2022 1 Venture Global (BKR) Plaquemines Phase 1 FNTP $135.5 $135.5 2 Venture Global (BKR) Plaquemines Phase 2 FNTP 45.4 $91.8 137.2 3 Cheniere (Bechtel) CCL Stage 3 LNTP & FNTP 47.5 $300.5 348.0 4 BigLNG orders booked YTD 9/30/2022 228.4 300.5 91.8 620.7 5 FLNG (New Fortress Energy) FastLNG2 38.3 4.0 42.3 6 FLNG (New Fortress Energy) FastLNG3 42.3 42.3 7 Southeastern US Utility ssLNG retrofit & expansion 26.8 26.8 8 Space exploration supersize tanks 16.1 16.1 9 Hydrogen liquefiers (15 TPD and 30 TPD) 134.5 134.5 10 EU Member State military mobile equipment order 22.3 22.3 11 N. American hydrogen liquefaction, water treatment plant 108.0 108.0 12 N. American ssLNG facility 100.0 100.0 13 APAC FLNG 50.0 50.0 14 NAM FLNG 25.0 25.0 15 Other GTLS orders 370.1 341.3 354.6 1,066.0 16 Total GTLS YTD 9/30/2022 Orders Booked 636.8 887.8 729.4 2,254.0 Our commercial pipeline of potential orders currently in discussion for order placement in the next 24 months is greater than $9.5 billion

© 2022 Chart Industries, Inc. Confidential and Proprietary 10 Average Orders Per Quarter, ex Big LNG (2016-YTD 2022) $177.0 $215.0 $265.0 $296.0 $302.2 $419.0 $544.4 2016 2017 2018 2019 2020 2021 2022 Big LNG Orders, not shown on column graph Year $ millions 2018 $2.9 2019 133.9 2020 1.1 2021 2.9 2022 YTD 9/30/22 620.7 Average 2021-2022 GTLS orders per quarter $472.8M Average 2016-2020 GTLS orders per quarter $251.0 million All years normalized to exclude divested businesses. $684.9 $1,102.2 2,254.1 2020 2021 2022 Chart Industries Backlog as of September 30th +100%

Q3 2022 Results 11
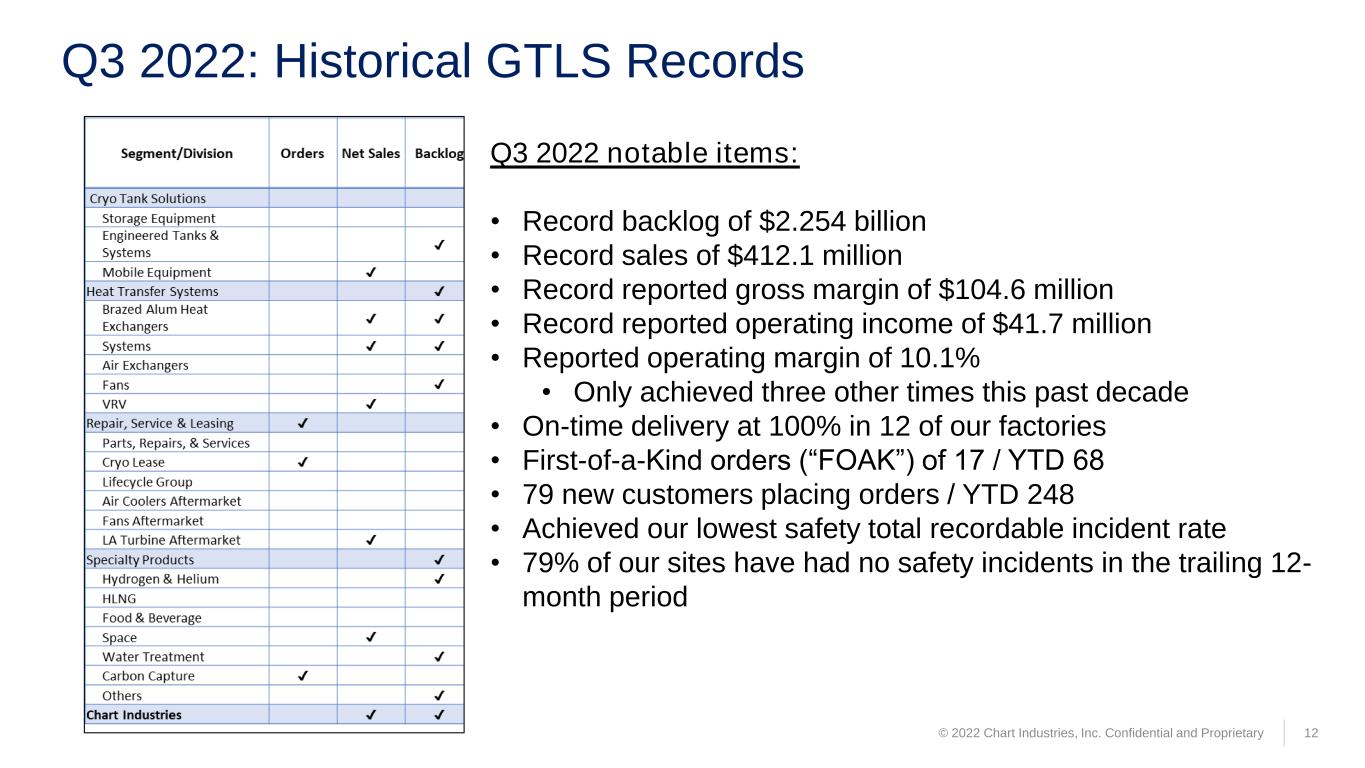
Q3 2022: Historical GTLS Records © 2022 Chart Industries, Inc. Confidential and Proprietary 12 Q3 2022 notable items: • Record backlog of $2.254 billion • Record sales of $412.1 million • Record reported gross margin of $104.6 million • Record reported operating income of $41.7 million • Reported operating margin of 10.1% • Only achieved three other times this past decade • On-time delivery at 100% in 12 of our factories • First-of-a-Kind orders (“FOAK”) of 17 / YTD 68 • 79 new customers placing orders / YTD 248 • Achieved our lowest safety total recordable incident rate • 79% of our sites have had no safety incidents in the trailing 12- month period
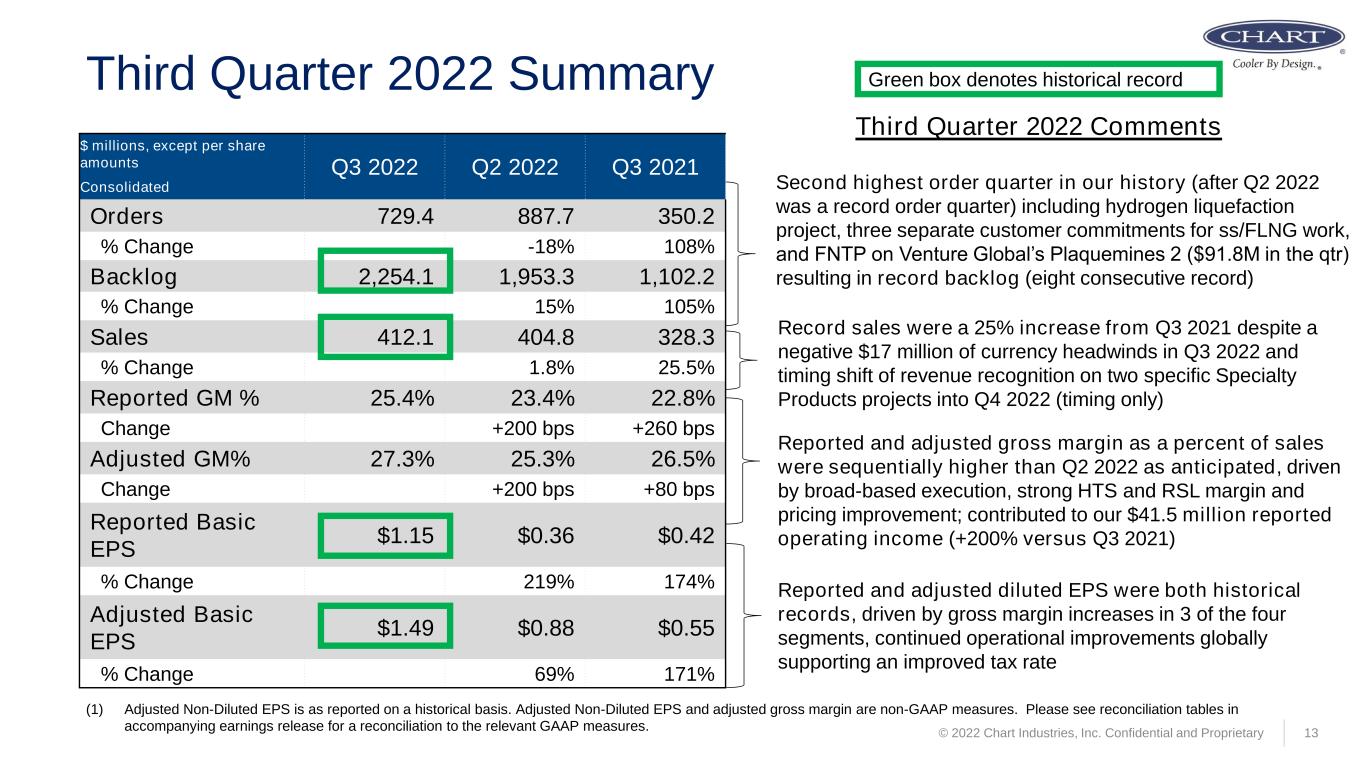
Third Quarter 2022 Summary Second highest order quarter in our history (after Q2 2022 was a record order quarter) including hydrogen liquefaction project, three separate customer commitments for ss/FLNG work, and FNTP on Venture Global’s Plaquemines 2 ($91.8M in the qtr) resulting in record backlog (eight consecutive record) Record sales were a 25% increase from Q3 2021 despite a negative $17 million of currency headwinds in Q3 2022 and timing shift of revenue recognition on two specific Specialty Products projects into Q4 2022 (timing only) Reported and adjusted gross margin as a percent of sales were sequentially higher than Q2 2022 as anticipated, driven by broad-based execution, strong HTS and RSL margin and pricing improvement; contributed to our $41.5 million reported operating income (+200% versus Q3 2021) Reported and adjusted diluted EPS were both historical records, driven by gross margin increases in 3 of the four segments, continued operational improvements globally supporting an improved tax rate Third Quarter 2022 Comments 13 Green box denotes historical record (1) Adjusted Non-Diluted EPS is as reported on a historical basis. Adjusted Non-Diluted EPS and adjusted gross margin are non-GAAP measures. Please see reconciliation tables in accompanying earnings release for a reconciliation to the relevant GAAP measures. $ millions, except per share amounts Q3 2022 Q2 2022 Q3 2021 Consolidated Orders 729.4 887.7 350.2 % Change -18% 108% Backlog 2,254.1 1,953.3 1,102.2 % Change 15% 105% Sales 412.1 404.8 328.3 % Change 1.8% 25.5% Reported GM % 25.4% 23.4% 22.8% Change +200 bps +260 bps Adjusted GM% 27.3% 25.3% 26.5% Change +200 bps +80 bps Reported Basic EPS $1.15 $0.36 $0.42 % Change 219% 174% Adjusted Basic EPS $1.49 $0.88 $0.55 % Change 69% 171% © 2022 Chart Industries, Inc. Confidential and Proprietary
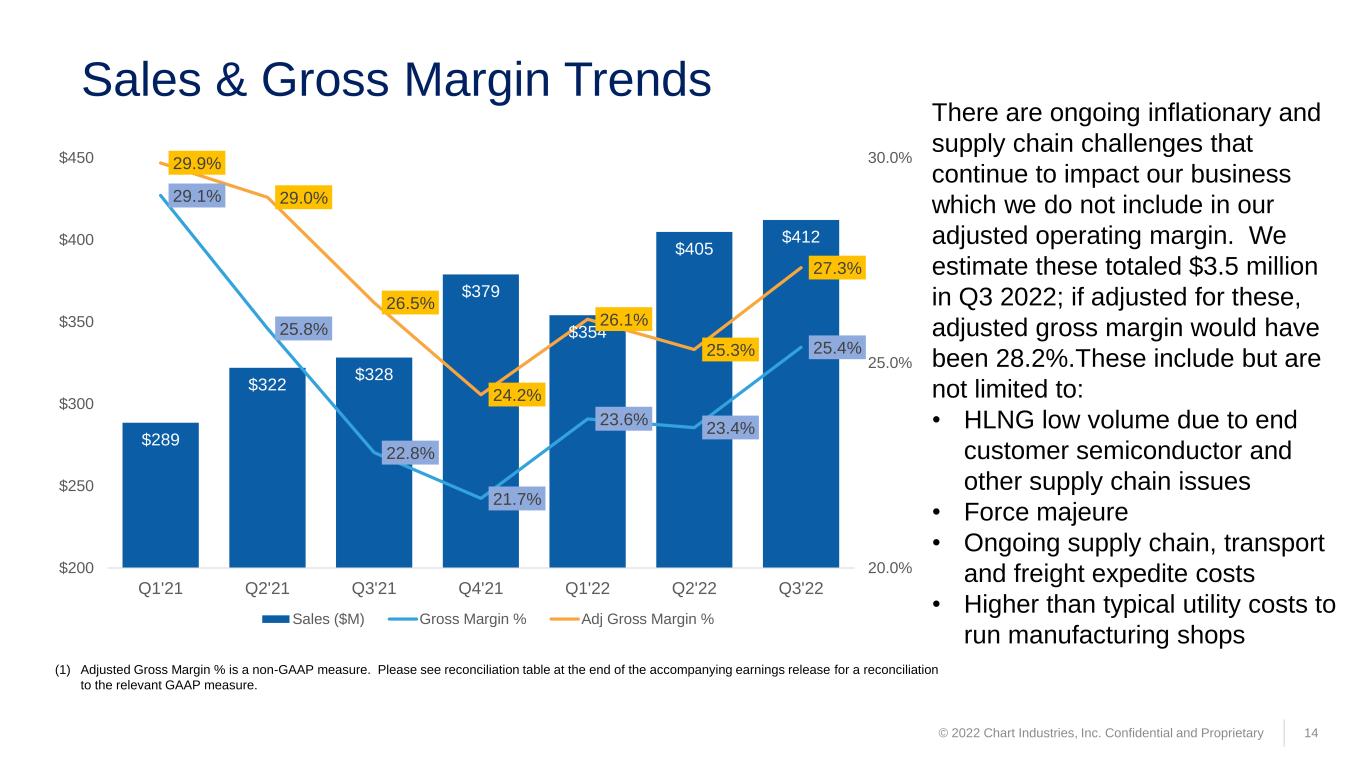
© 2022 Chart Industries, Inc. Confidential and Proprietary 14 Sales & Gross Margin Trends There are ongoing inflationary and supply chain challenges that continue to impact our business which we do not include in our adjusted operating margin. We estimate these totaled $3.5 million in Q3 2022; if adjusted for these, adjusted gross margin would have been 28.2%.These include but are not limited to: • HLNG low volume due to end customer semiconductor and other supply chain issues • Force majeure • Ongoing supply chain, transport and freight expedite costs • Higher than typical utility costs to run manufacturing shops (1) Adjusted Gross Margin % is a non-GAAP measure. Please see reconciliation table at the end of the accompanying earnings release for a reconciliation to the relevant GAAP measure. $289 $322 $328 $379 $354 $405 $412 29.1% 25.8% 22.8% 21.7% 23.6% 23.4% 25.4% 29.9% 29.0% 26.5% 24.2% 26.1% 25.3% 27.3% 20.0% 25.0% 30.0% $200 $250 $300 $350 $400 $450 Q1'21 Q2'21 Q3'21 Q4'21 Q1'22 Q2'22 Q3'22 Sales ($M) Gross Margin % Adj Gross Margin %
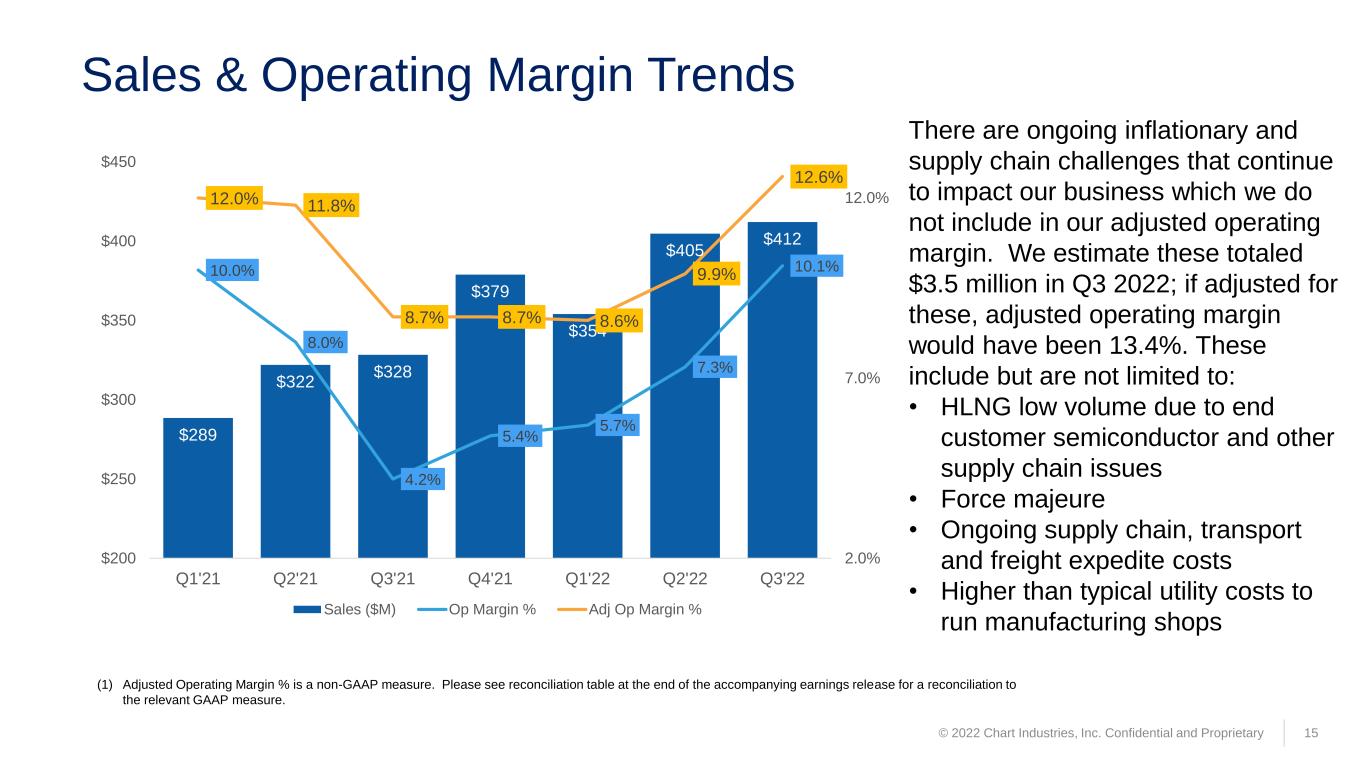
© 2022 Chart Industries, Inc. Confidential and Proprietary 15 Sales & Operating Margin Trends (1) Adjusted Operating Margin % is a non-GAAP measure. Please see reconciliation table at the end of the accompanying earnings release for a reconciliation to the relevant GAAP measure. There are ongoing inflationary and supply chain challenges that continue to impact our business which we do not include in our adjusted operating margin. We estimate these totaled $3.5 million in Q3 2022; if adjusted for these, adjusted operating margin would have been 13.4%. These include but are not limited to: • HLNG low volume due to end customer semiconductor and other supply chain issues • Force majeure • Ongoing supply chain, transport and freight expedite costs • Higher than typical utility costs to run manufacturing shops $289 $322 $328 $379 $354 $405 $412 10.0% 8.0% 4.2% 5.4% 5.7% 7.3% 10.1% 12.0% 11.8% 8.7% 8.7% 8.6% 9.9% 12.6% 2.0% 7.0% 12.0% $200 $250 $300 $350 $400 $450 Q1'21 Q2'21 Q3'21 Q4'21 Q1'22 Q2'22 Q3'22 Sales ($M) Op Margin % Adj Op Margin %
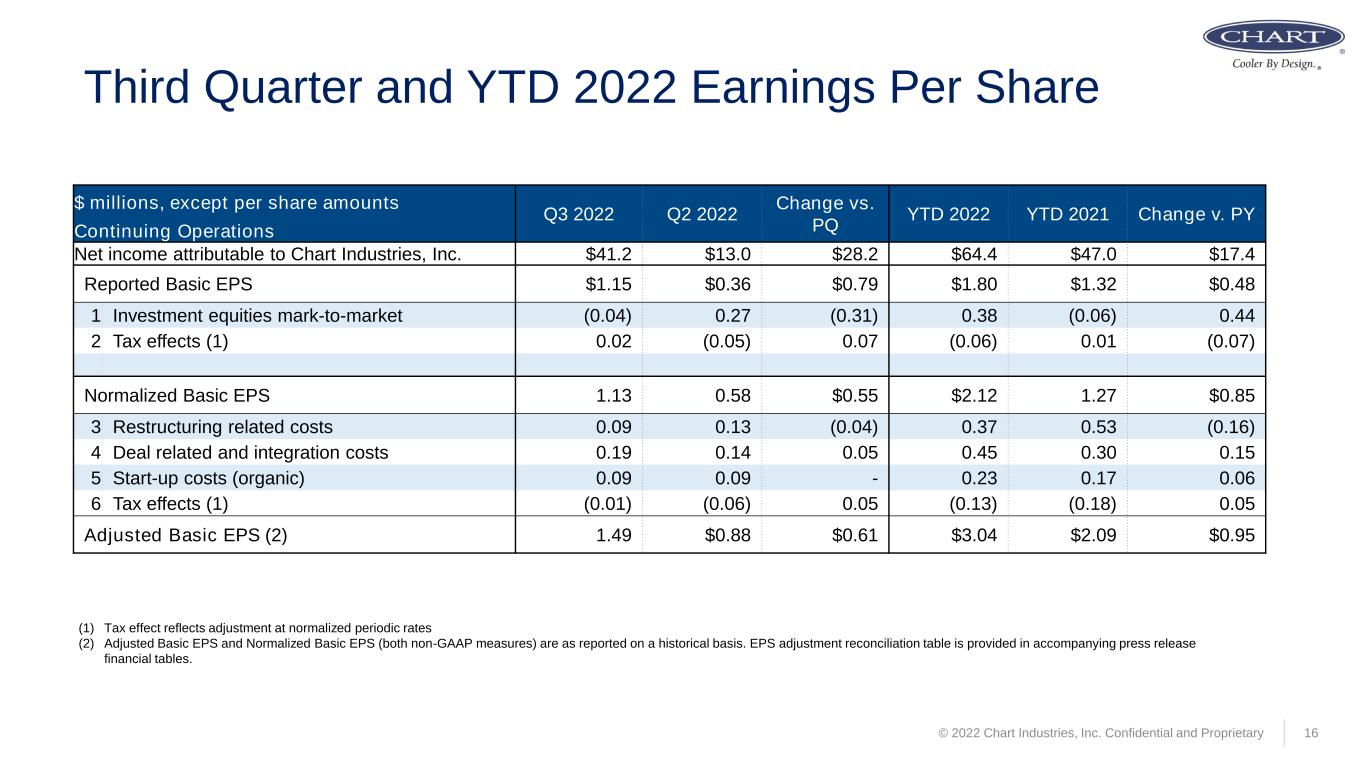
© 2022 Chart Industries, Inc. Confidential and Proprietary 16 Third Quarter and YTD 2022 Earnings Per Share (1) Tax effect reflects adjustment at normalized periodic rates (2) Adjusted Basic EPS and Normalized Basic EPS (both non-GAAP measures) are as reported on a historical basis. EPS adjustment reconciliation table is provided in accompanying press release financial tables. $ millions, except per share amounts Q3 2022 Q2 2022 Change vs. PQ YTD 2022 YTD 2021 Change v. PY Continuing Operations Net income attributable to Chart Industries, Inc. $41.2 $13.0 $28.2 $64.4 $47.0 $17.4 Reported Basic EPS $1.15 $0.36 $0.79 $1.80 $1.32 $0.48 1 Investment equities mark-to-market (0.04) 0.27 (0.31) 0.38 (0.06) 0.44 2 Tax effects (1) 0.02 (0.05) 0.07 (0.06) 0.01 (0.07) Normalized Basic EPS 1.13 0.58 $0.55 $2.12 1.27 $0.85 3 Restructuring related costs 0.09 0.13 (0.04) 0.37 0.53 (0.16) 4 Deal related and integration costs 0.19 0.14 0.05 0.45 0.30 0.15 5 Start-up costs (organic) 0.09 0.09 - 0.23 0.17 0.06 6 Tax effects (1) (0.01) (0.06) 0.05 (0.13) (0.18) 0.05 Adjusted Basic EPS (2) 1.49 $0.88 $0.61 $3.04 $2.09 $0.95

Q3 2021 to Q3 2022 EPS and Adjusted EPS Walk © 2022 Chart Industries, Inc. Confidential and Proprietary 17 Reported non-diluted EPS Bridge Q3 2021 to Q3 2022 Adjusted non-diluted EPS Bridge Q3 2021 to Q3 2022
Chart’s Differentiation 18
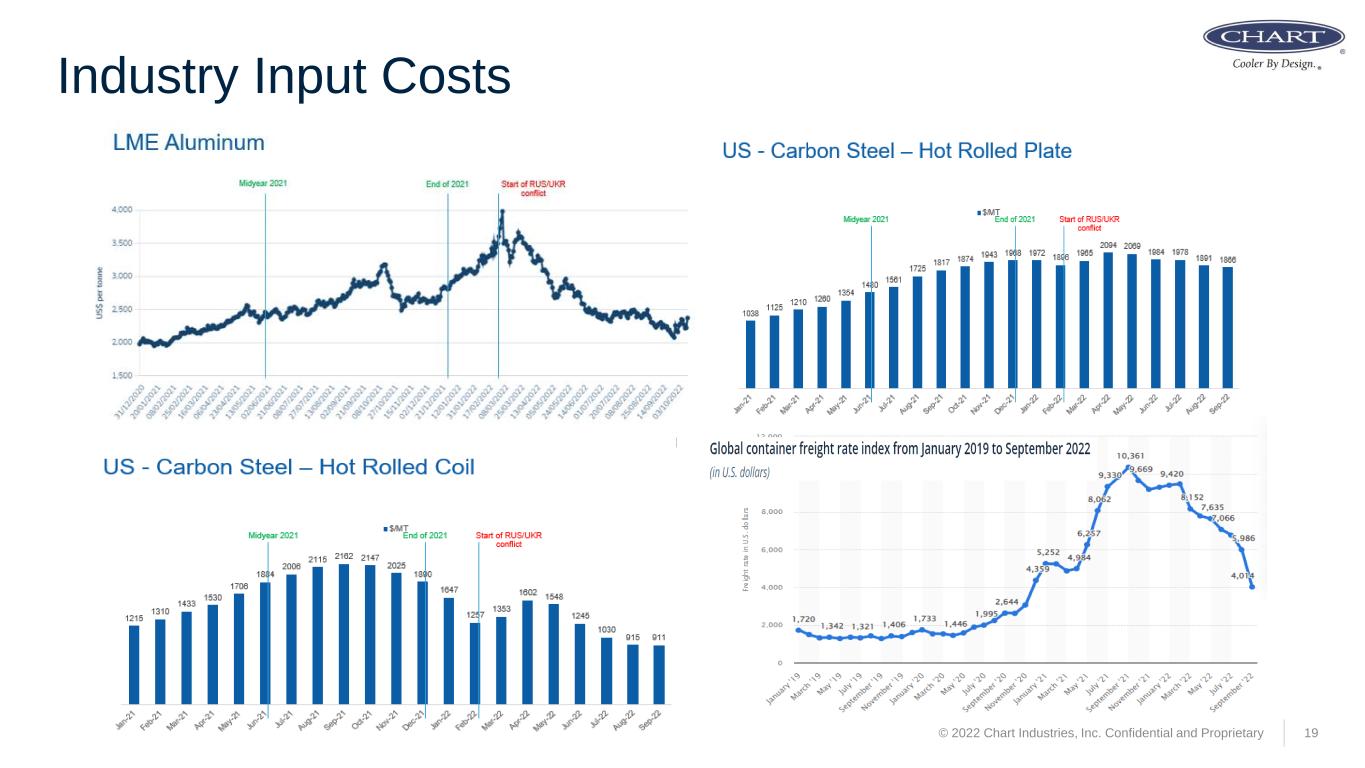
19 Industry Input Costs © 2022 Chart Industries, Inc. Confidential and Proprietary

© 2022 Chart Industries, Inc. Confidential and Proprietary 20 Continued Actions Taken by Chart Team in Q3 2022 Pricing Cost Control Partnerships with Focus Building on Specific Differentiators • Specific long-term agreement index price adjustments occurred • Surcharges remain in place • Continued with updated three-prong pricing (project, LTA, standard) • Eight MOUs signed with 2 having Master Services Agreements (“MSA”) • Focus on core expertise and work with suppliers on sourcing (pump) • Productivity and continuous improvement projects • One Chart flexible manufacturing strategy • Adjusting cost structure based on demand trends (i.e. HLNG) • Leading certifications globally • Proactively organically expanding capacity • Getting sticky with customers via First-of-a-Kind orders A B C D
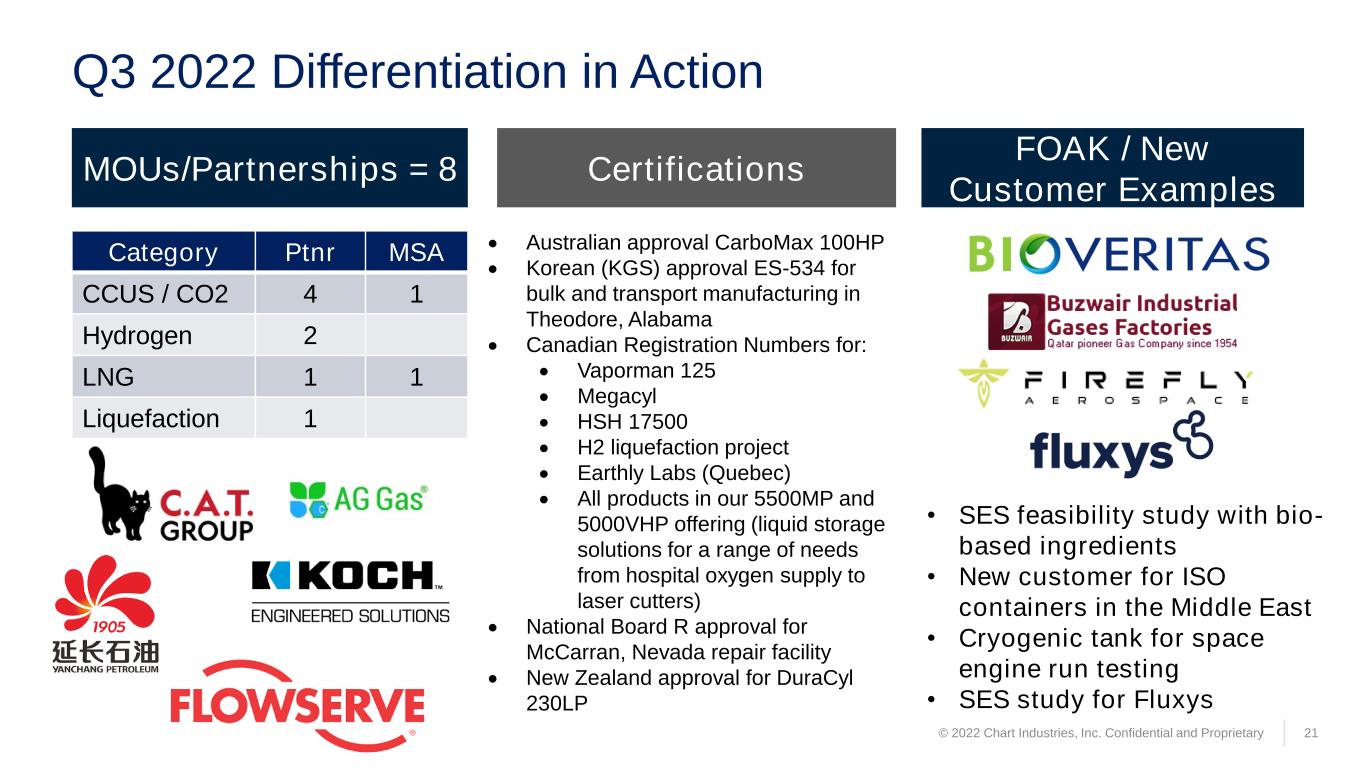
Q3 2022 Differentiation in Action © 2022 Chart Industries, Inc. Confidential and Proprietary 21 MOUs/Partnerships = 8 Certifications FOAK / New Customer Examples Category Ptnr MSA CCUS / CO2 4 1 Hydrogen 2 LNG 1 1 Liquefaction 1 • Australian approval CarboMax 100HP • Korean (KGS) approval ES-534 for bulk and transport manufacturing in Theodore, Alabama • Canadian Registration Numbers for: • Vaporman 125 • Megacyl • HSH 17500 • H2 liquefaction project • Earthly Labs (Quebec) • All products in our 5500MP and 5000VHP offering (liquid storage solutions for a range of needs from hospital oxygen supply to laser cutters) • National Board R approval for McCarran, Nevada repair facility • New Zealand approval for DuraCyl 230LP • SES feasibility study with bio- based ingredients • New customer for ISO containers in the Middle East • Cryogenic tank for space engine run testing • SES study for Fluxys

Organic Automation & Productivity Activities 22 Ornago, Italy Automated Perliting System Tulsa, Oklahoma (USA) VIP Bellows Machine Richburg, SC (RSL) East Liquid Cylinder Repair Line Beasley, Texas Order to Mfg Paper Free New Iberia, LA (USA) Remote Laser Guided Welding Changzhou, China Welding Machine Integration © 2022 Chart Industries, Inc. Confidential and Proprietary

Brazed Aluminum Heat Exchanger Line Tulsa, Oklahoma USA • Fin presses, saws, machining equipment are operational • Fin, bar washers, sheet handling system, drying oven installed • Furnace delivered and in place • Planned start of validation core November 2022 • Will utilize post braze production in Q4 2022
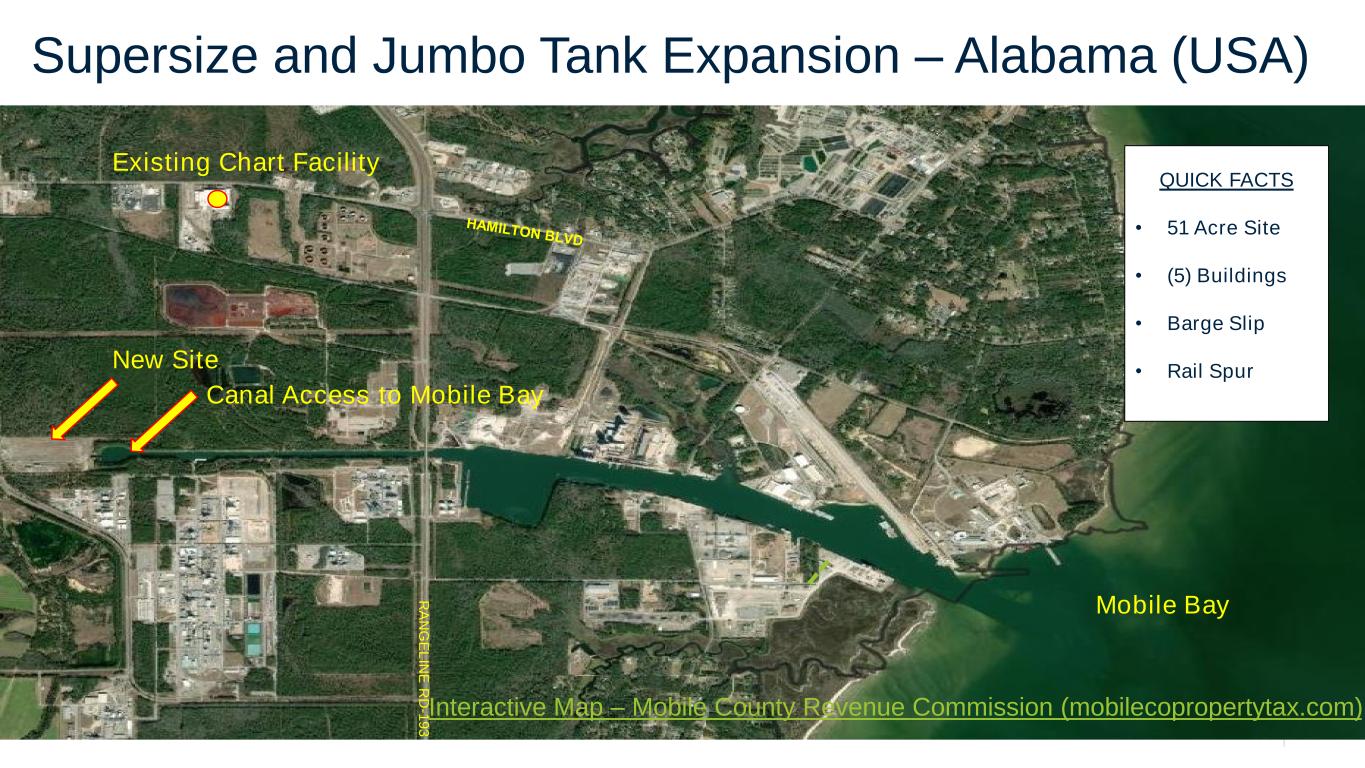
Supersize and Jumbo Tank Expansion – Alabama (USA) 24 Mobile Bay Existing Chart Facility Interactive Map – Mobile County Revenue Commission (mobilecopropertytax.com) R A N G E L IN E R D -1 9 3 New Site Canal Access to Mobile Bay QUICK FACTS • 51 Acre Site • (5) Buildings • Barge Slip • Rail Spur

GOFA Trailer Facility Expansion Goch, Germany • Groundwork started Q3/2022 • Production start at beginning of Q4 2023 • ESG point: Heat pump with low energy consumption & highly insulated building • ESG point: Planting numerous trees to lower our CO2 emissions

Q3 2022 Segment Information 26
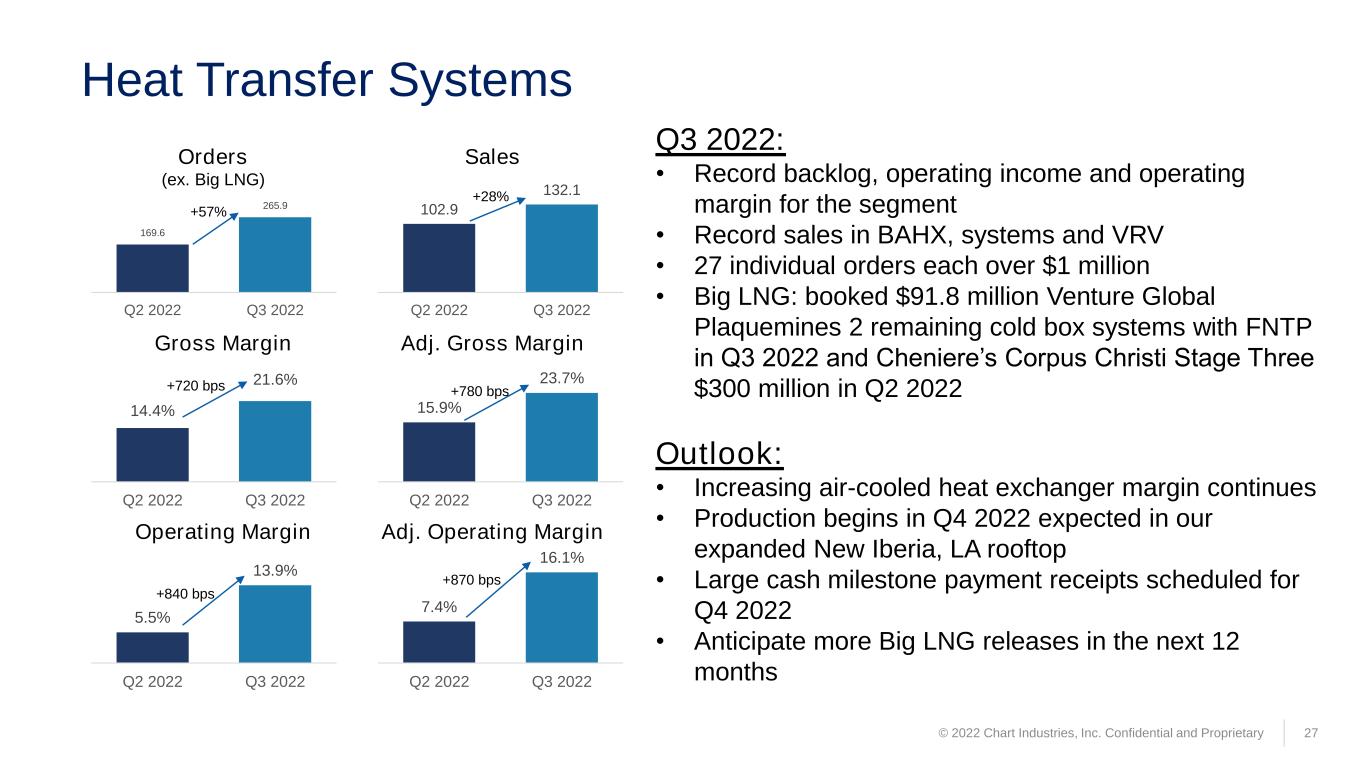
Heat Transfer Systems © 2022 Chart Industries, Inc. Confidential and Proprietary 27 Q3 2022: • Record backlog, operating income and operating margin for the segment • Record sales in BAHX, systems and VRV • 27 individual orders each over $1 million • Big LNG: booked $91.8 million Venture Global Plaquemines 2 remaining cold box systems with FNTP in Q3 2022 and Cheniere’s Corpus Christi Stage Three $300 million in Q2 2022 Outlook: • Increasing air-cooled heat exchanger margin continues • Production begins in Q4 2022 expected in our expanded New Iberia, LA rooftop • Large cash milestone payment receipts scheduled for Q4 2022 • Anticipate more Big LNG releases in the next 12 months 5.5% 13.9% Q2 2022 Q3 2022 14.4% 21.6% Q2 2022 Q3 2022 Sales Gross Margin 102.9 132.1 Q2 2022 Q3 2022 +28% +720 bps 169.6 265.9 Q2 2022 Q3 2022 Orders (ex. Big LNG) +57% 15.9% 23.7% Q2 2022 Q3 2022 Adj. Gross Margin +780 bps Operating Margin Adj. Operating Margin 7.4% 16.1% Q2 2022 Q3 2022 +840 bps +870 bps
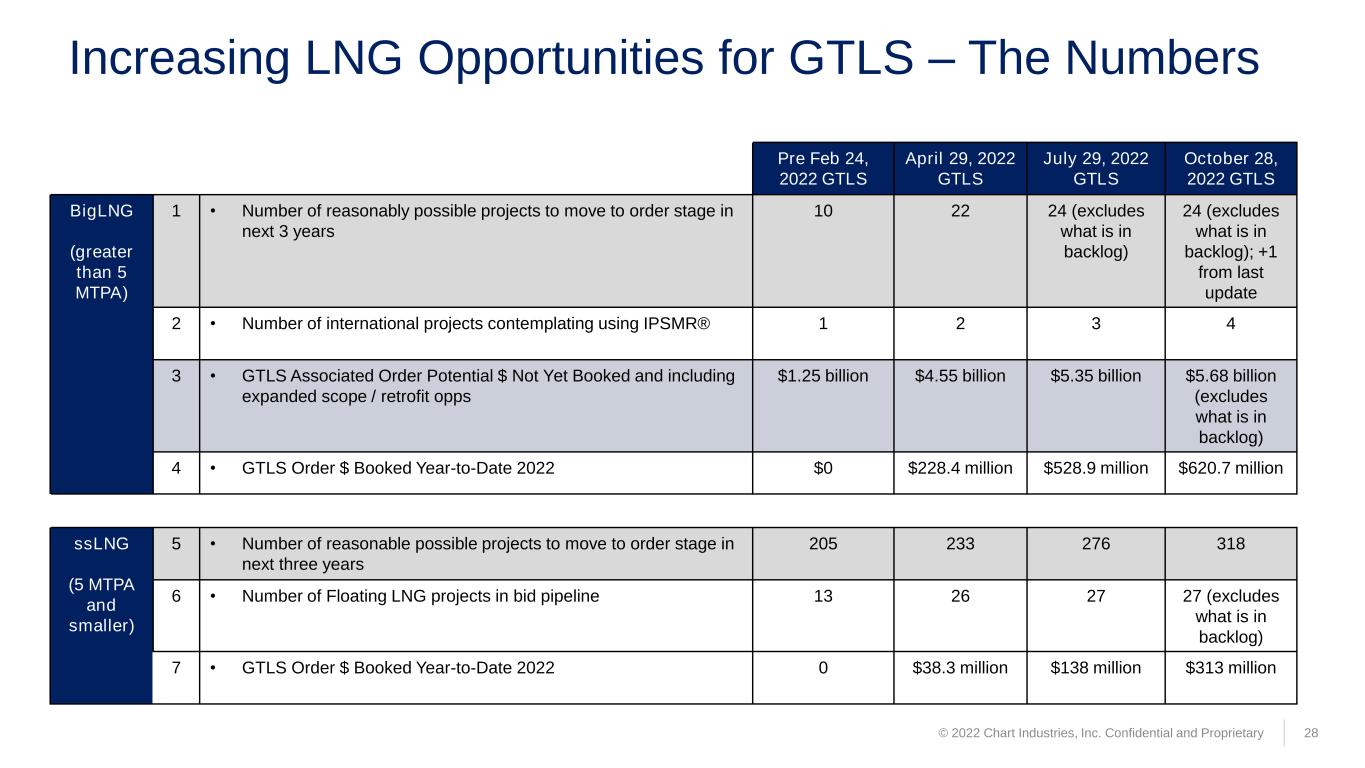
© 2022 Chart Industries, Inc. Confidential and Proprietary 28 Increasing LNG Opportunities for GTLS – The Numbers Pre Feb 24, 2022 GTLS April 29, 2022 GTLS July 29, 2022 GTLS October 28, 2022 GTLS BigLNG (greater than 5 MTPA) 1 • Number of reasonably possible projects to move to order stage in next 3 years 10 22 24 (excludes what is in backlog) 24 (excludes what is in backlog); +1 from last update 2 • Number of international projects contemplating using IPSMR® 1 2 3 4 3 • GTLS Associated Order Potential $ Not Yet Booked and including expanded scope / retrofit opps $1.25 billion $4.55 billion $5.35 billion $5.68 billion (excludes what is in backlog) 4 • GTLS Order $ Booked Year-to-Date 2022 $0 $228.4 million $528.9 million $620.7 million ssLNG (5 MTPA and smaller) 5 • Number of reasonable possible projects to move to order stage in next three years 205 233 276 318 6 • Number of Floating LNG projects in bid pipeline 13 26 27 27 (excludes what is in backlog) 7 • GTLS Order $ Booked Year-to-Date 2022 0 $38.3 million $138 million $313 million
© 2022 Chart Industries, Inc. Confidential and Proprietary 29 Market Move to Modular and/or Mid-Scale Liquefaction & Our IPSMR® Process Technology • Benefits of IPSMR® include: • Saves power cost or increases LNG production for a given gas turbine power available • Uses BAHX which are compact with significantly lower cold box heights for less expensive installation • BAHX cold boxes are designed with the cold end of the heat exchanger down; can easily and quickly be restarted • Typically uses significantly less air cooler space than other technologies • Reduces construction cost, plot space required and is particularly beneficial for FLNG with air cooling • Train sizes are easily matched to drivers, allowing for standard pipe, fitting, valve sizes without custom designs • Multiple trains matched to the driver power increases total plant availability • Designed for modular production, investment, construction and startup • Can be staged with first trains producing LNG product before total plant production is realized • ISPMR® modules can be smaller and easier to construct, transport, etc. • Benefits of Chart’s Heavy Hydrocarbon Removal Unit (HHC) • Designed to maximize LNG BTU content while effectively removing freezing components from the feed gas. • Maximizes pressure to the liquefaction system which reduces power consumption or increases LNG production • We supply nitrogen rejection technology (NRU) for feed gas compositions with excess nitrogen • Can either retrofit existing facilities or design into the plant at the start
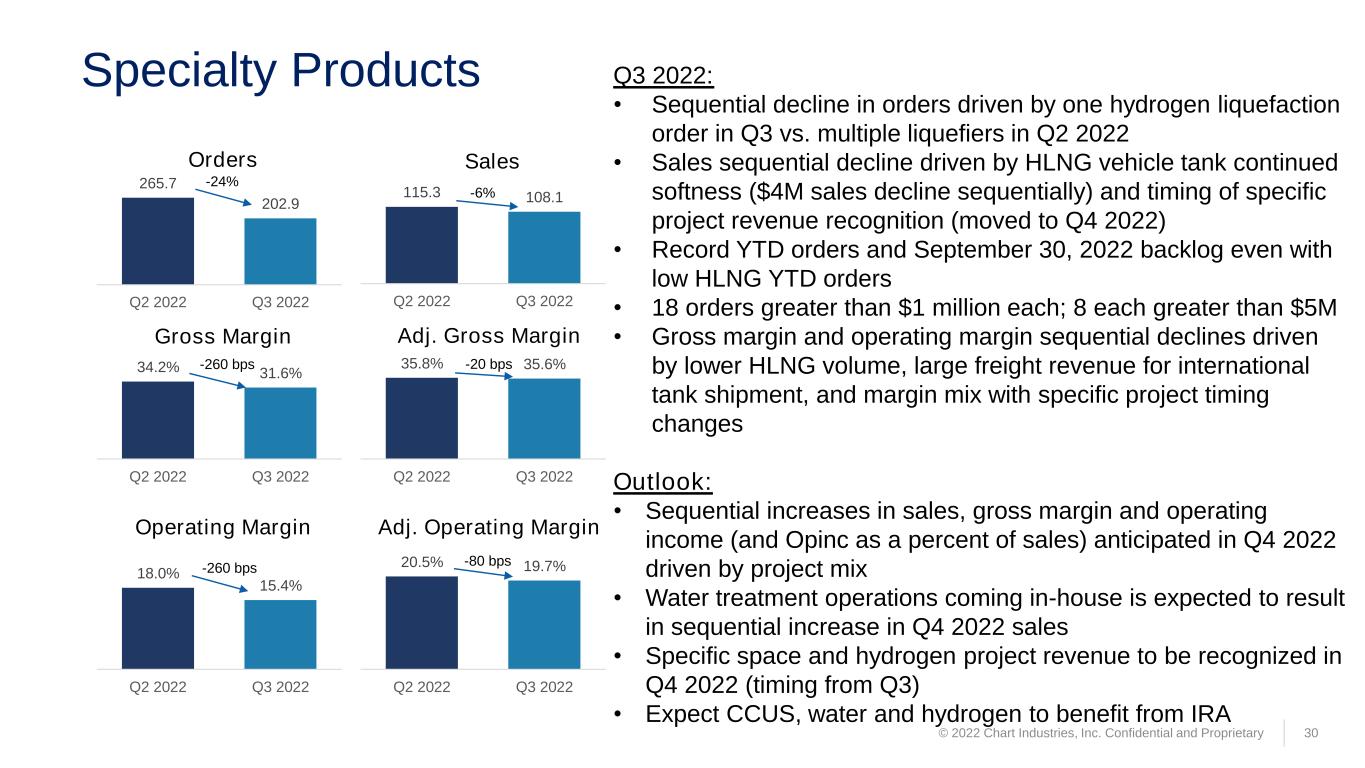
Specialty Products 30 Q3 2022: • Sequential decline in orders driven by one hydrogen liquefaction order in Q3 vs. multiple liquefiers in Q2 2022 • Sales sequential decline driven by HLNG vehicle tank continued softness ($4M sales decline sequentially) and timing of specific project revenue recognition (moved to Q4 2022) • Record YTD orders and September 30, 2022 backlog even with low HLNG YTD orders • 18 orders greater than $1 million each; 8 each greater than $5M • Gross margin and operating margin sequential declines driven by lower HLNG volume, large freight revenue for international tank shipment, and margin mix with specific project timing changes Outlook: • Sequential increases in sales, gross margin and operating income (and Opinc as a percent of sales) anticipated in Q4 2022 driven by project mix • Water treatment operations coming in-house is expected to result in sequential increase in Q4 2022 sales • Specific space and hydrogen project revenue to be recognized in Q4 2022 (timing from Q3) • Expect CCUS, water and hydrogen to benefit from IRA 20.5% 19.7% Q2 2022 Q3 2022 -80 bps 35.8% 35.6% Q2 2022 Q3 2022 115.3 108.1 Q2 2022 Q3 2022 34.2% 31.6% Q2 2022 Q3 2022 Orders Sales Gross Margin Operating Margin 18.0% 15.4% Q2 2022 Q3 2022 -24% -6% -260 bps -20 bps -260 bps 265.7 202.9 Q2 2022 Q3 2022 Adj. Gross Margin Adj. Operating Margin © 2022 Chart Industries, Inc. Confidential and Proprietary
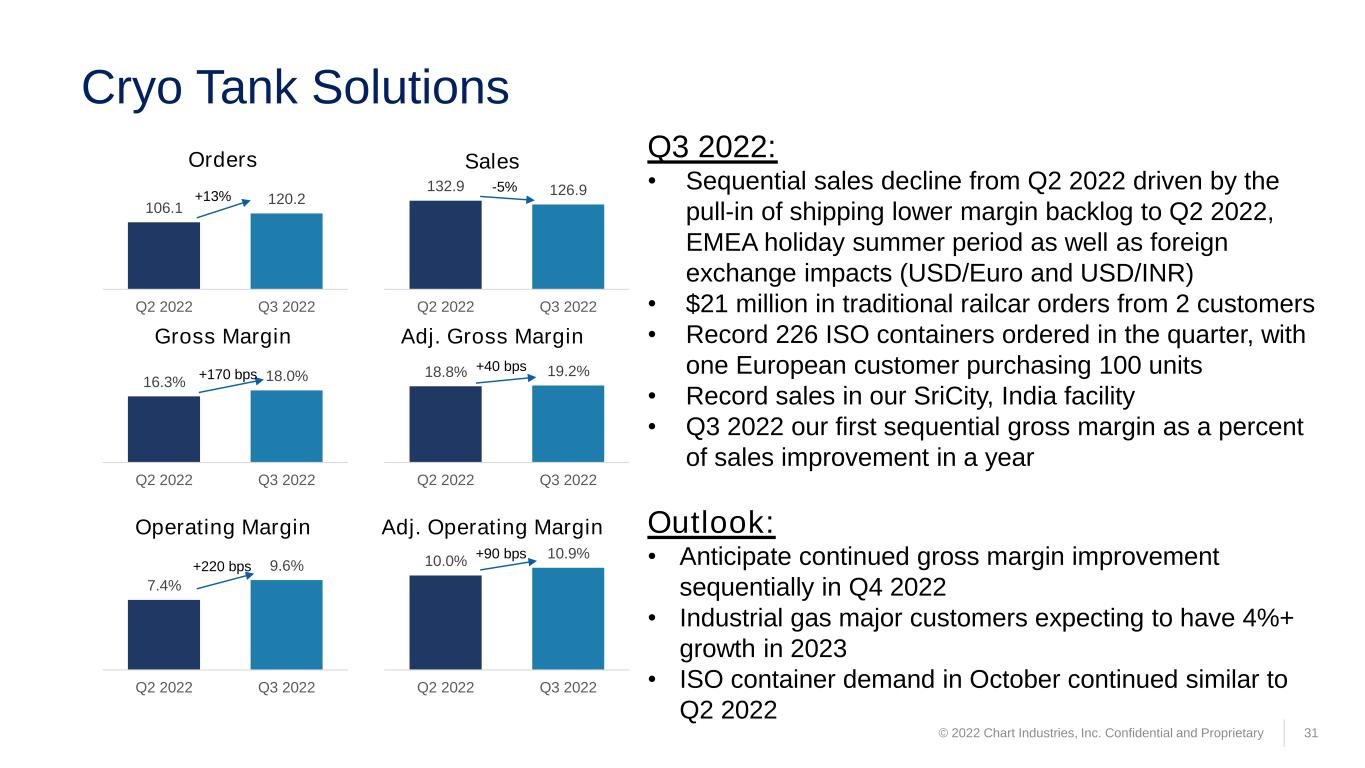
Cryo Tank Solutions 31 Q3 2022: • Sequential sales decline from Q2 2022 driven by the pull-in of shipping lower margin backlog to Q2 2022, EMEA holiday summer period as well as foreign exchange impacts (USD/Euro and USD/INR) • $21 million in traditional railcar orders from 2 customers • Record 226 ISO containers ordered in the quarter, with one European customer purchasing 100 units • Record sales in our SriCity, India facility • Q3 2022 our first sequential gross margin as a percent of sales improvement in a year Outlook: • Anticipate continued gross margin improvement sequentially in Q4 2022 • Industrial gas major customers expecting to have 4%+ growth in 2023 • ISO container demand in October continued similar to Q2 2022 18.8% 19.2% Q2 2022 Q3 2022 132.9 126.9 Q2 2022 Q3 2022 7.4% 9.6% Q2 2022 Q3 2022 +40 bps 106.1 120.2 Q2 2022 Q3 2022 Orders Sales Gross Margin Adj. Gross Margin Operating Margin Adj. Operating Margin 16.3% 18.0% Q2 2022 Q3 2022 10.0% 10.9% Q2 2022 Q3 2022 +13% -5% +170 bps +220 bps +90 bps © 2022 Chart Industries, Inc. Confidential and Proprietary

© 2022 Chart Industries, Inc. Confidential and Proprietary 32 Repair, Service & Leasing Q3 2022: • Record orders, gross profit, operating income • L.A.Turbine record aftermarket sales • Sales sequential decline was driven by timing of international field service work in Q3 that moved to Q4 2022 due to visa requirements and a large fan aftermarket sale in Q2 2022 Outlook: • Anticipate a strong fourth quarter 2022 with winter temperature changes yielding more field service work • Expect to see an uptick in leases for trailers in the EU • Strong order start to Q4 2022 with further fast turn work anticipated later in Q4 2022 and into Q1 2023 • Anticipate Q4 2022 additional sales from liquid cylinder repairs • Repair and refurbishment work from long-term agreement customers is increasing 35.6% 37.0% Q2 2022 Q3 2022 22.9% 22.9% Q2 2022 Q3 2022 +140 bps Orders Sales Gross Margin Adj. Gross Margin Operating Margin Adj. Operating Margin 47.4 61.7 Q2 2022 Q3 2022 55.4 49.7 Q2 2022 Q3 2022 34.3% 38.4% Q2 2022 Q3 2022 21.7% 24.1% Q2 2022 Q3 2022 +30% -10% +410 bps +240 bps

2022 Outlook and Preliminary 2023 Outlook 33
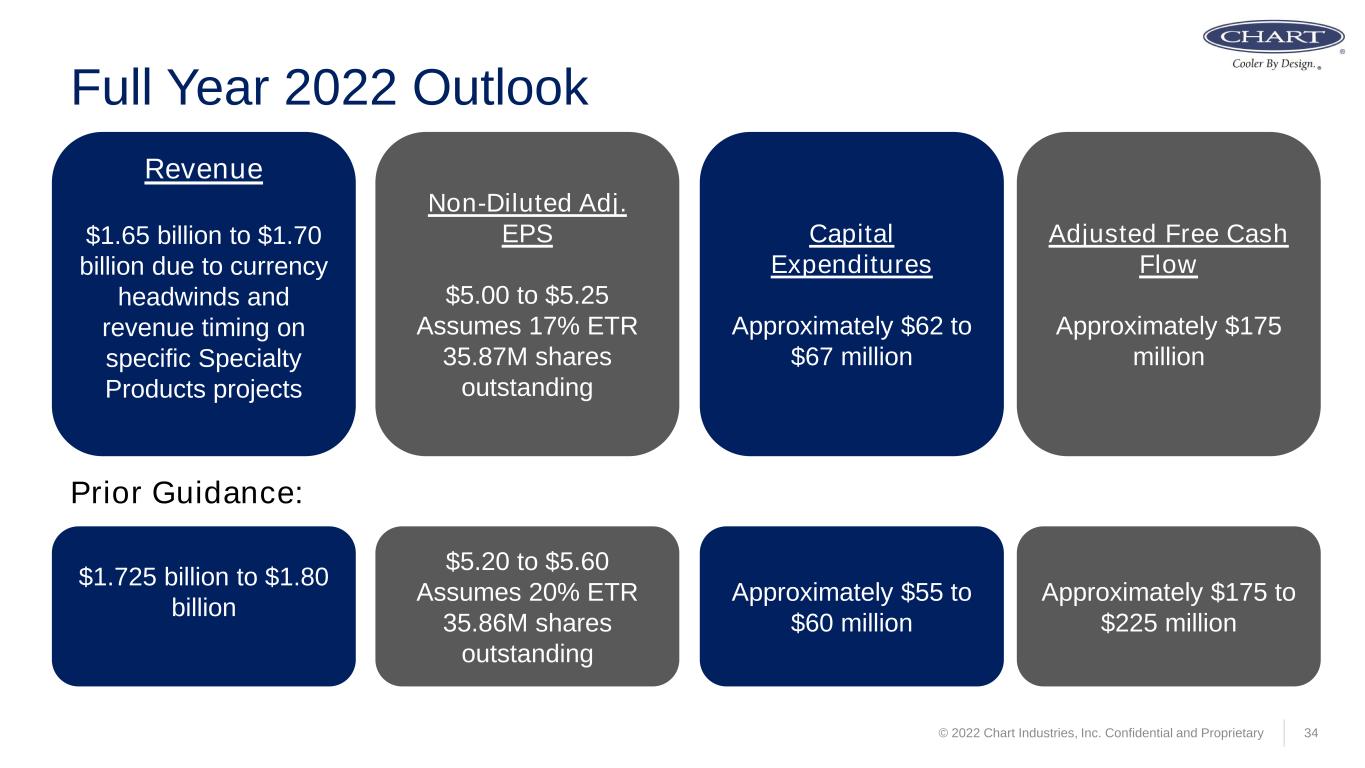
© 2022 Chart Industries, Inc. Confidential and Proprietary 34 Full Year 2022 Outlook Revenue $1.65 billion to $1.70 billion due to currency headwinds and revenue timing on specific Specialty Products projects Non-Diluted Adj. EPS $5.00 to $5.25 Assumes 17% ETR 35.87M shares outstanding Capital Expenditures Approximately $62 to $67 million Adjusted Free Cash Flow Approximately $175 million $1.725 billion to $1.80 billion $5.20 to $5.60 Assumes 20% ETR 35.86M shares outstanding Approximately $55 to $60 million Approximately $175 to $225 million Prior Guidance:

© 2022 Chart Industries, Inc. Confidential and Proprietary 35 Full Year 2023 Preliminary Outlook Revenue $2.10 to $2.20 billion Non-Diluted Adj. EPS $7.50 to $8.50 Assumes 19% ETR and 35.87M shares outstanding Capital Expenditures Approximately $60 to $65 million Adjusted Free Cash Flow Approximately $250 to $300 million # Description $ millions 1 2023 Shippable Backlog as of 9/30/2022 $1,230 to 1,300 2 Repair, service, leasing book & bill business (not backlog) 220 to 225 3 Book & Ship drop-in standard product businesses 650 to 675 4 Initial revenue outlook range 2023 $2,100 to $2,200 5 Potential for one mid-size project between now and end of Q1 2023 with associated revenue into 2H 2023 (not included in the range) ~50-75 6 Potential scenario with additional mi-size project into backlog $2,150 to $2,275

Giving Back and Making a Difference 36
© 2022 Chart Industries, Inc. Confidential and Proprietary 37 Women’s Business Collaborative Company of Purpose

© 2022 Chart Industries, Inc. Confidential and Proprietary 38 Finalists in the 2022 S&P Global Energy Awards Energy Transition - LNG • Recognizes a company for operational excellence, exemplary corporate innovation, leadership, and company performance in liquefied natural gas (LNG) Deal of the Year – Strategic • Recognizes a deal that creates combined strengths, better optimizations, and profitability • Considers strategic elements of our Chart, Cryo Technologies, and Fronti combination Chief Executive of the Year - Trailblazer • Recognizes an individual, or a CEO of a small-mid cap company, who has consistently demonstrated clarity of vision, judgment, and motivational skills that transform and empower their organization
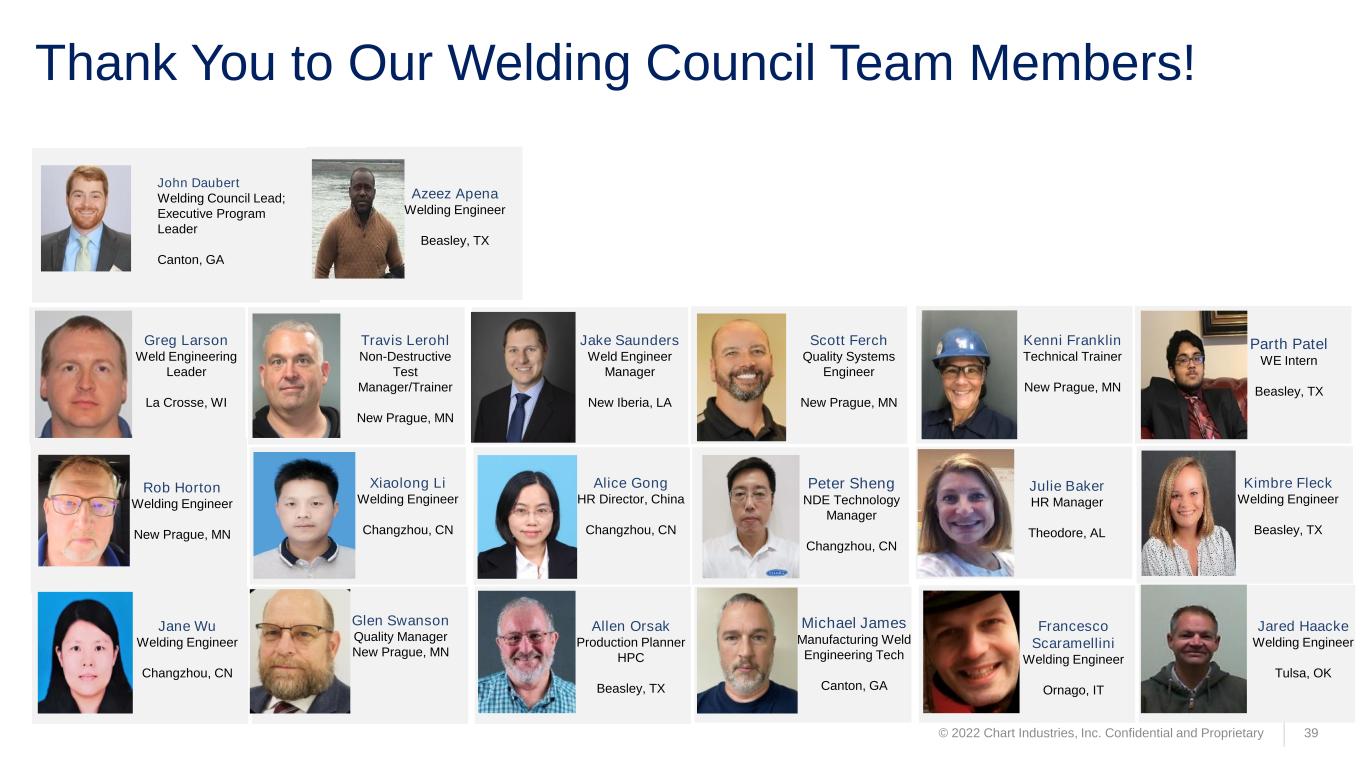
© 2022 Chart Industries, Inc. Confidential and Proprietary 39 Thank You to Our Welding Council Team Members! Greg Larson Weld Engineering Leader La Crosse, WI Jane Wu Welding Engineer Changzhou, CN Travis Lerohl Non-Destructive Test Manager/Trainer New Prague, MN Xiaolong Li Welding Engineer Changzhou, CN Jake Saunders Weld Engineer Manager New Iberia, LA Alice Gong HR Director, China Changzhou, CN Allen Orsak Production Planner HPC Beasley, TX Scott Ferch Quality Systems Engineer New Prague, MN Peter Sheng NDE Technology Manager Changzhou, CN Kenni Franklin Technical Trainer New Prague, MN Francesco Scaramellini Welding Engineer Ornago, IT John Daubert Welding Council Lead; Executive Program Leader Canton, GA Glen Swanson Quality Manager New Prague, MN Michael James Manufacturing Weld Engineering Tech Canton, GA Parth Patel WE Intern Beasley, TX Kimbre Fleck Welding Engineer Beasley, TX Jared Haacke Welding Engineer Tulsa, OK Azeez Apena Welding Engineer Beasley, TX Rob Horton Welding Engineer New Prague, MN Julie Baker HR Manager Theodore, AL

Appendix 40
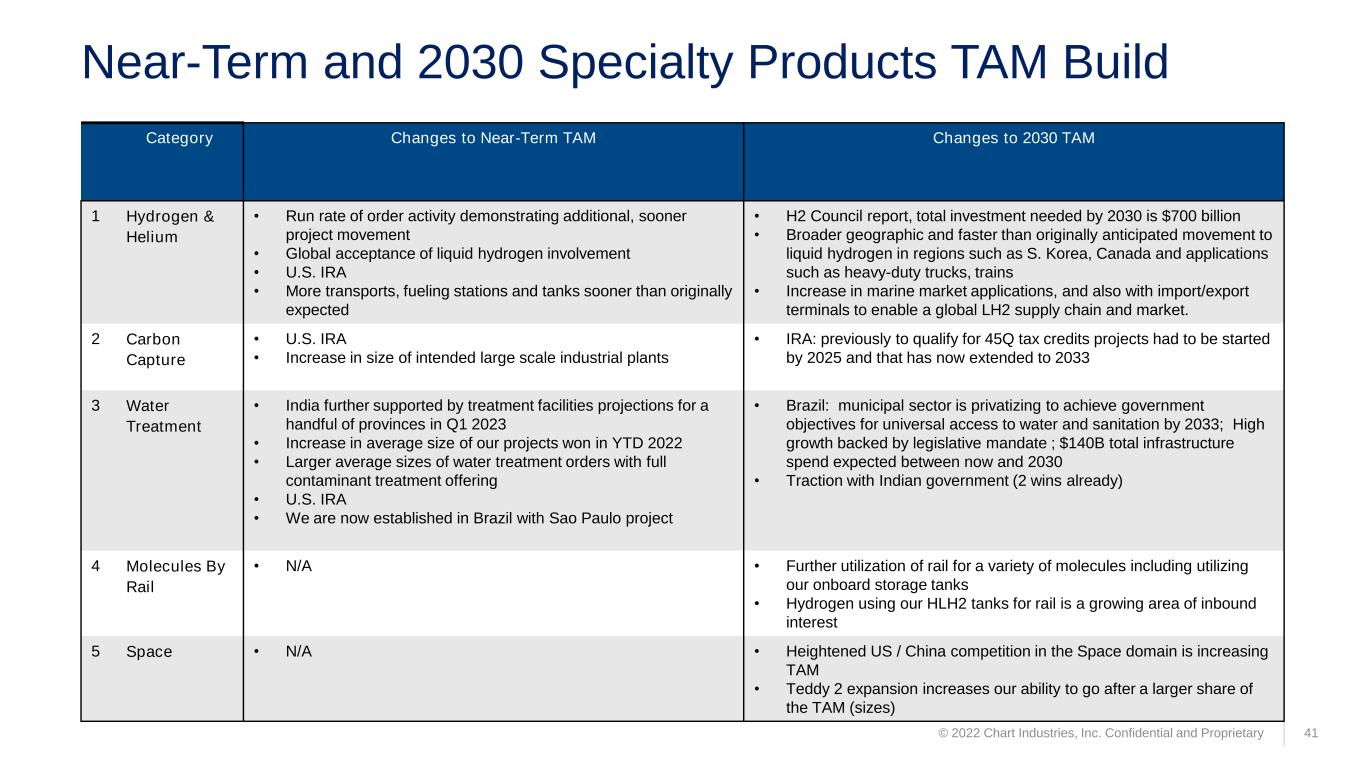
Near-Term and 2030 Specialty Products TAM Build © 2022 Chart Industries, Inc. Confidential and Proprietary 41 Category Changes to Near-Term TAM Changes to 2030 TAM 1 Hydrogen & Helium • Run rate of order activity demonstrating additional, sooner project movement • Global acceptance of liquid hydrogen involvement • U.S. IRA • More transports, fueling stations and tanks sooner than originally expected • H2 Council report, total investment needed by 2030 is $700 billion • Broader geographic and faster than originally anticipated movement to liquid hydrogen in regions such as S. Korea, Canada and applications such as heavy-duty trucks, trains • Increase in marine market applications, and also with import/export terminals to enable a global LH2 supply chain and market. 2 Carbon Capture • U.S. IRA • Increase in size of intended large scale industrial plants • IRA: previously to qualify for 45Q tax credits projects had to be started by 2025 and that has now extended to 2033 3 Water Treatment • India further supported by treatment facilities projections for a handful of provinces in Q1 2023 • Increase in average size of our projects won in YTD 2022 • Larger average sizes of water treatment orders with full contaminant treatment offering • U.S. IRA • We are now established in Brazil with Sao Paulo project • Brazil: municipal sector is privatizing to achieve government objectives for universal access to water and sanitation by 2033; High growth backed by legislative mandate ; $140B total infrastructure spend expected between now and 2030 • Traction with Indian government (2 wins already) 4 Molecules By Rail • N/A • Further utilization of rail for a variety of molecules including utilizing our onboard storage tanks • Hydrogen using our HLH2 tanks for rail is a growing area of inbound interest 5 Space • N/A • Heightened US / China competition in the Space domain is increasing TAM • Teddy 2 expansion increases our ability to go after a larger share of the TAM (sizes)
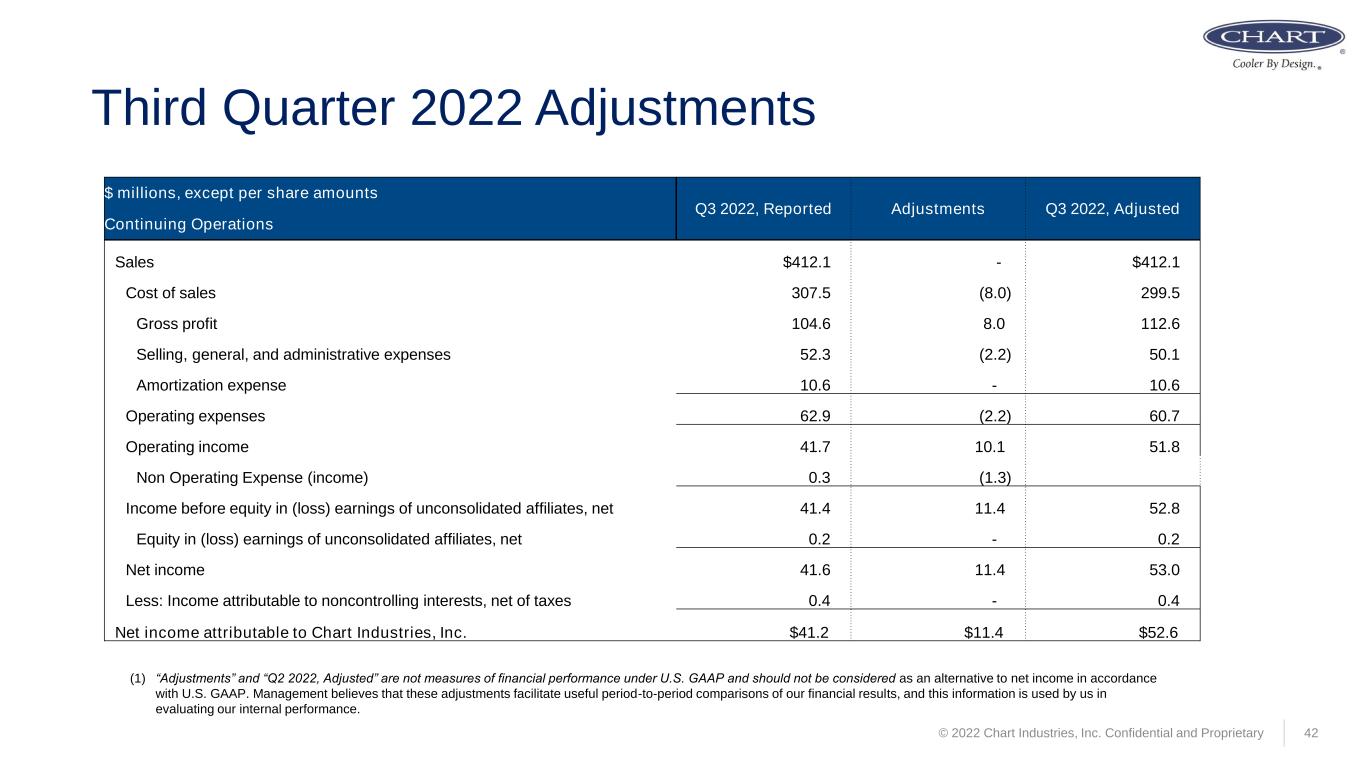
© 2022 Chart Industries, Inc. Confidential and Proprietary 42 Third Quarter 2022 Adjustments (1) “Adjustments” and “Q2 2022, Adjusted” are not measures of financial performance under U.S. GAAP and should not be considered as an alternative to net income in accordance with U.S. GAAP. Management believes that these adjustments facilitate useful period-to-period comparisons of our financial results, and this information is used by us in evaluating our internal performance. $ millions, except per share amounts Q3 2022, Reported Adjustments Q3 2022, Adjusted Continuing Operations Sales $412.1 - $412.1 Cost of sales 307.5 (8.0) 299.5 Gross profit 104.6 8.0 112.6 Selling, general, and administrative expenses 52.3 (2.2) 50.1 Amortization expense 10.6 - 10.6 Operating expenses 62.9 (2.2) 60.7 Operating income 41.7 10.1 51.8 Non Operating Expense (income) 0.3 (1.3) Income before equity in (loss) earnings of unconsolidated affiliates, net 41.4 11.4 52.8 Equity in (loss) earnings of unconsolidated affiliates, net 0.2 - 0.2 Net income 41.6 11.4 53.0 Less: Income attributable to noncontrolling interests, net of taxes 0.4 - 0.4 Net income attributable to Chart Industries, Inc. $41.2 $11.4 $52.6

Addback Specifics by Category (Q2 2022/Q3 2022) 2020 Chart Industries Investor Day 43 Category Q2 2022 Addback Items Net of Tax Q2 2022 $M Q2 2022 Addback Items Net of Tax Q3 2022 $M 1 Restructuring and Severance • Severance / restructuring costs • Completion of Tulsa ACHX consolidation to Texas • Completion of SriCity, India expansion 3.6 • Severance and other associated fees with restructuring headcount • Accrual release (reduces addbacks) net of qtr costs to close RSL restructuring to completion 3.2 2 Deal-related & integration costs • Pre-closing / acquisition DD costs • Integration costs (year 1 only) • Legal costs for the one specific pre- closing liability from cryobio divestiture • Doesn’t include any amortization addback 4.2 • Pre-closing / acquisition DD costs • Integration costs (year 1 only) • Earnout release net of assoc. costs • Legal costs for the one specific pre- closing liability from cryobio divestiture • Completed AdEdge and LAT year one integrations • We do not addback amortization 6.5 3 Organic startup costs • Startup costs for Teddy expansion • Startup costs for Tulsa, OK flex mfg • Training costs on new product lines 2.7 • Startup costs for BAHX Tulsa line • Startup costs for Germany trailers • Startup costs for vaporizer line • Training costs on new product lines 3.0 4 MTM of investments net of FX • MTM of investments in McPhy and Stabilis and unconsolidated affiliates, HTEC and Cryomotive, • We do not addback FX impact 8.0 • MTM of investments in McPhy and Stabilis and unconsolidated affiliates, HTEC and Cryomotive, • We do not addback negative FX impact (0.5)

© 2022 Chart Industries, Inc. Confidential and Proprietary 44 Segment Sales and Operating Margin Information (1) Adjusted Operating Margin % is a non-GAAP measure. Please see reconciliation table at the end of the accompanying earnings release for a reconciliation to the relevant GAAP measure. Sales ($M, except %) Q3 ‘22 Q2 ‘22 % Chg PQ Q3 ‘21 % Chg PY Specialty Products 108.1 115.3 -6.2% 116.9 -7.5% Cryo Tank Solutions 126.9 132.9 -4.5% 112.2 13.1% Repair, Service, Leasing 49.7 55.4 -10.3% 46.3 7.3% Heat Transfer Systems 132.1 102.9 28.4% 56.4 134.2% Reported Op Income ($M, except %) Q3 ‘22 Q2 ‘22 % Chg PQ Q3 ‘21 % Chg PY Specialty Products 16.7 20.8 -19.7% 26.4 -36.7% Cryo Tank Solutions 12.2 9.9 23.2% 13.0 -6.2% Repair, Service, Leasing 12.0 12.0 0.0% 2.2 445.5% Heat Transfer Systems 18.3 5.7 221.1% -10.0 n.a. Adjusted Op Income ($M, except %) Q3 ‘22 Q2 ‘22 % Chg PQ Q3 ‘21 % Chg PY Specialty Products 21.3 23.6 -9.7% 29.4 -27.6% Cryo Tank Solutions 13.8 13.3 3.8% 16.3 -15.3% Repair, Service, Leasing 11.4 12.7 -10.2% 6.2 83.9% Heat Transfer Systems 21.3 7.6 180.3% -7.5 n.a. Adjusted Op Margin ($M, except %) Q3 ‘22 Q2 ‘22 Bps Chg PQ Q3 ‘21 Bps Chg PY Specialty Products 19.7% 20.5% -80 bps 25.1% -540 bps Cryo Tank Solutions 10.9% 10.0% 90 bps 14.5% -360 bps Repair, Service, Leasing 22.9% 22.9% 0 bps 13.4% 950 bps Heat Transfer Systems 16.1% 7.4% 870 bps -13.3% 2940 bps
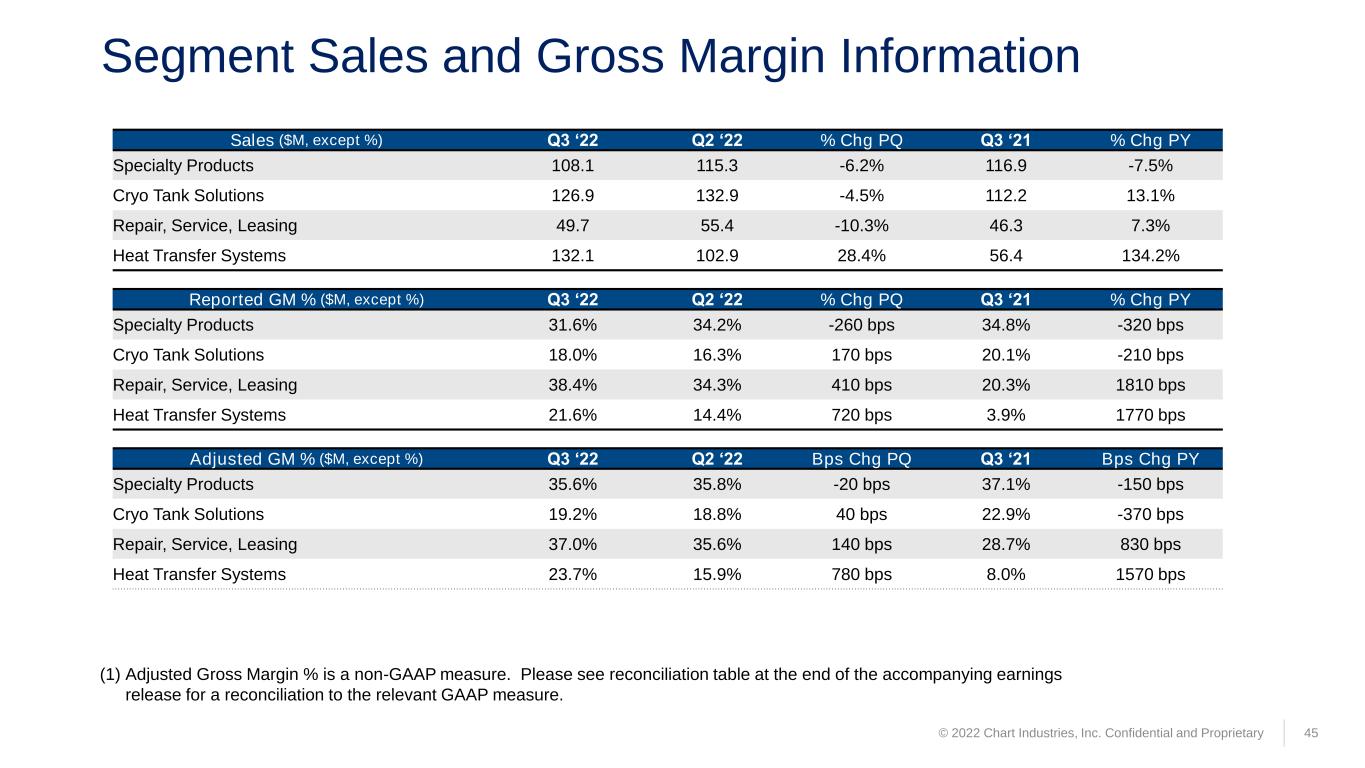
Segment Sales and Gross Margin Information 45 (1) Adjusted Gross Margin % is a non-GAAP measure. Please see reconciliation table at the end of the accompanying earnings release for a reconciliation to the relevant GAAP measure. Sales ($M, except %) Q3 ‘22 Q2 ‘22 % Chg PQ Q3 ‘21 % Chg PY Specialty Products 108.1 115.3 -6.2% 116.9 -7.5% Cryo Tank Solutions 126.9 132.9 -4.5% 112.2 13.1% Repair, Service, Leasing 49.7 55.4 -10.3% 46.3 7.3% Heat Transfer Systems 132.1 102.9 28.4% 56.4 134.2% Reported GM % ($M, except %) Q3 ‘22 Q2 ‘22 % Chg PQ Q3 ‘21 % Chg PY Specialty Products 31.6% 34.2% -260 bps 34.8% -320 bps Cryo Tank Solutions 18.0% 16.3% 170 bps 20.1% -210 bps Repair, Service, Leasing 38.4% 34.3% 410 bps 20.3% 1810 bps Heat Transfer Systems 21.6% 14.4% 720 bps 3.9% 1770 bps Adjusted GM % ($M, except %) Q3 ‘22 Q2 ‘22 Bps Chg PQ Q3 ‘21 Bps Chg PY Specialty Products 35.6% 35.8% -20 bps 37.1% -150 bps Cryo Tank Solutions 19.2% 18.8% 40 bps 22.9% -370 bps Repair, Service, Leasing 37.0% 35.6% 140 bps 28.7% 830 bps Heat Transfer Systems 23.7% 15.9% 780 bps 8.0% 1570 bps © 2022 Chart Industries, Inc. Confidential and Proprietary
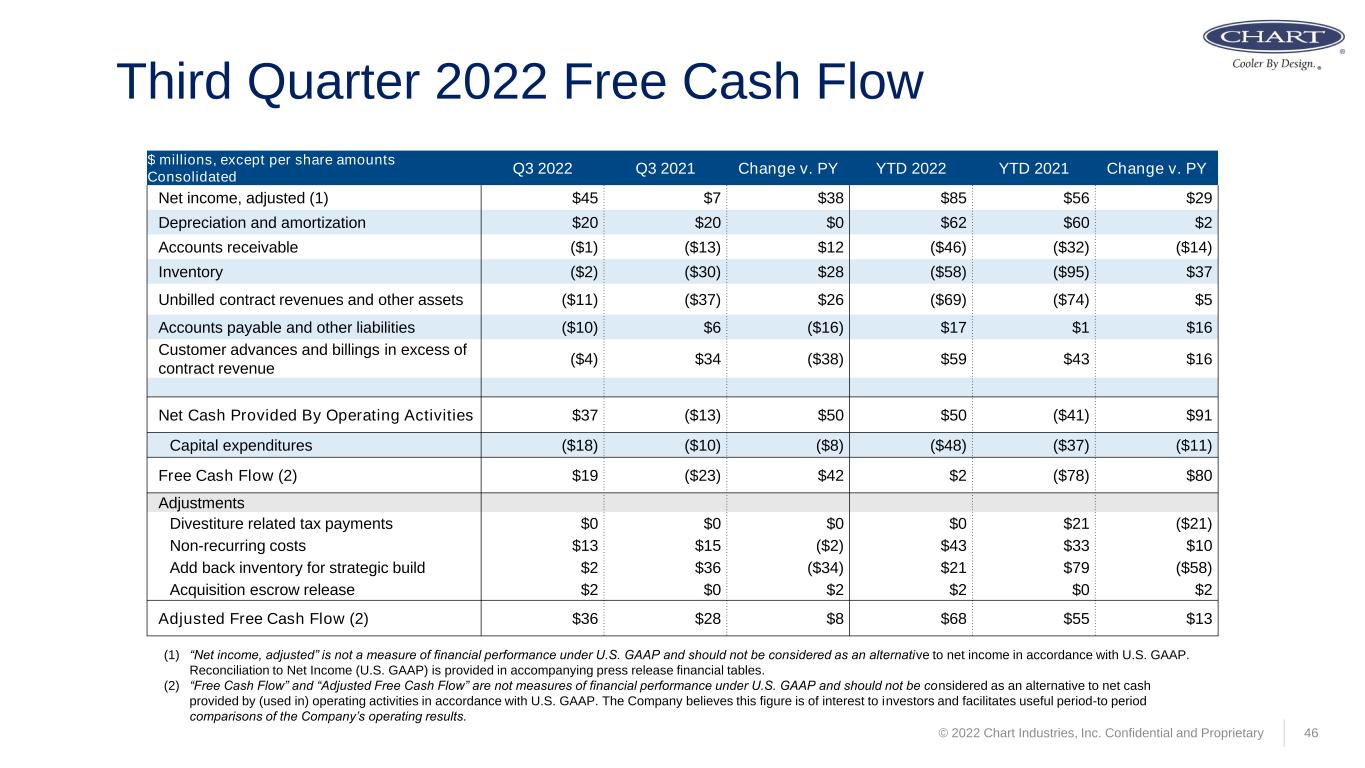
46 Third Quarter 2022 Free Cash Flow (1) “Net income, adjusted” is not a measure of financial performance under U.S. GAAP and should not be considered as an alternative to net income in accordance with U.S. GAAP. Reconciliation to Net Income (U.S. GAAP) is provided in accompanying press release financial tables. (2) “Free Cash Flow” and “Adjusted Free Cash Flow” are not measures of financial performance under U.S. GAAP and should not be considered as an alternative to net cash provided by (used in) operating activities in accordance with U.S. GAAP. The Company believes this figure is of interest to investors and facilitates useful period-to period comparisons of the Company’s operating results. $ millions, except per share amounts Consolidated Q3 2022 Q3 2021 Change v. PY YTD 2022 YTD 2021 Change v. PY Net income, adjusted (1) $45 $7 $38 $85 $56 $29 Depreciation and amortization $20 $20 $0 $62 $60 $2 Accounts receivable ($1) ($13) $12 ($46) ($32) ($14) Inventory ($2) ($30) $28 ($58) ($95) $37 Unbilled contract revenues and other assets ($11) ($37) $26 ($69) ($74) $5 Accounts payable and other liabilities ($10) $6 ($16) $17 $1 $16 Customer advances and billings in excess of contract revenue ($4) $34 ($38) $59 $43 $16 Net Cash Provided By Operating Activities $37 ($13) $50 $50 ($41) $91 Capital expenditures ($18) ($10) ($8) ($48) ($37) ($11) Free Cash Flow (2) $19 ($23) $42 $2 ($78) $80 Adjustments Divestiture related tax payments $0 $0 $0 $0 $21 ($21) Non-recurring costs $13 $15 ($2) $43 $33 $10 Add back inventory for strategic build $2 $36 ($34) $21 $79 ($58) Acquisition escrow release $2 $0 $2 $2 $0 $2 Adjusted Free Cash Flow (2) $36 $28 $8 $68 $55 $13 © 2022 Chart Industries, Inc. Confidential and Proprietary
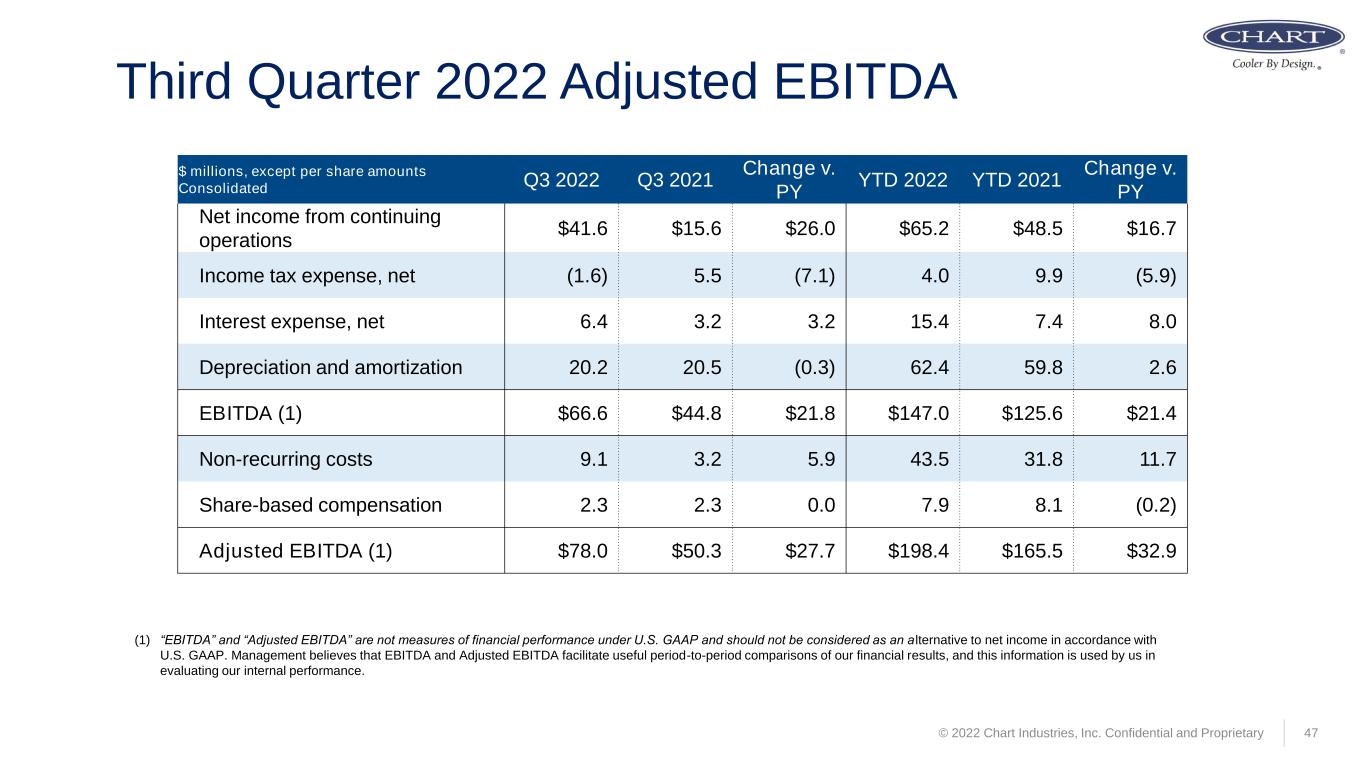
© 2022 Chart Industries, Inc. Confidential and Proprietary 47 Third Quarter 2022 Adjusted EBITDA (1) “EBITDA” and “Adjusted EBITDA” are not measures of financial performance under U.S. GAAP and should not be considered as an a lternative to net income in accordance with U.S. GAAP. Management believes that EBITDA and Adjusted EBITDA facilitate useful period-to-period comparisons of our financial results, and this information is used by us in evaluating our internal performance. $ millions, except per share amounts Consolidated Q3 2022 Q3 2021 Change v. PY YTD 2022 YTD 2021 Change v. PY Net income from continuing operations $41.6 $15.6 $26.0 $65.2 $48.5 $16.7 Income tax expense, net (1.6) 5.5 (7.1) 4.0 9.9 (5.9) Interest expense, net 6.4 3.2 3.2 15.4 7.4 8.0 Depreciation and amortization 20.2 20.5 (0.3) 62.4 59.8 2.6 EBITDA (1) $66.6 $44.8 $21.8 $147.0 $125.6 $21.4 Non-recurring costs 9.1 3.2 5.9 43.5 31.8 11.7 Share-based compensation 2.3 2.3 0.0 7.9 8.1 (0.2) Adjusted EBITDA (1) $78.0 $50.3 $27.7 $198.4 $165.5 $32.9


