
© 2024 Chart Industries, Inc. Confidential and Proprietary Third Quarter 2024 Earnings Call November 1, 2024
© 2024 Chart Industries, Inc. Confidential and Proprietary 2 Forward Looking Statements (1/2) CERTAIN STATEMENTS MADE IN THIS INVESTOR PRESENTATION ARE FORWARD-LOOKING STATEMENTS WITHIN THE MEANING OF THE PRIVATE SECURITIES LITIGATION REFORM ACT OF 1995. FORWARD-LOOKING STATEMENTS INCLUDE STATEMENTS CONCERNING CHART’S BUSINESS PLANS, INCLUDING STATEMENTS REGARDING OBJECTIVES, FUTURE ORDERS, REVENUES, MARGINS, EARNINGS, PERFORMANCE OR OUTLOOK, BUSINESS OR INDUSTRY TRENDS AND OTHER INFORMATION THAT IS NOT HISTORICAL IN NATURE. FORWARD-LOOKING STATEMENTS MAY BE IDENTIFIED BY TERMINOLOGY SUCH AS “MAY,” “WILL,” “SHOULD,” “COULD,” “EXPECTS,” “ANTICIPATES,” “BELIEVES,” “PROJECTS,” “FORECASTS,” “INDICATORS”, “OUTLOOK,” “GUIDANCE,” “CONTINUE,” “TARGET,” OR THE NEGATIVE OF SUCH TERMS OR COMPARABLE TERMINOLOGY. FORWARD-LOOKING STATEMENTS CONTAINED IN THIS PRESENTATION OR IN OTHER STATEMENTS MADE BY CHART ARE MADE BASED ON MANAGEMENT’S EXPECTATIONS AND BELIEFS CONCERNING FUTURE EVENTS IMPACTING CHART AND ARE SUBJECT TO UNCERTAINTIES AND FACTORS RELATING TO CHART’S OPERATIONS AND BUSINESS ENVIRONMENT, ALL OF WHICH ARE DIFFICULT TO PREDICT AND MANY OF WHICH ARE BEYOND CHART’S CONTROL, THAT COULD CAUSE CHART’S ACTUAL RESULTS TO DIFFER MATERIALLY FROM THOSE MATTERS EXPRESSED OR IMPLIED BY FORWARD-LOOKING STATEMENTS. FACTORS THAT COULD CAUSE CHART’S ACTUAL RESULTS TO DIFFER MATERIALLY FROM THOSE DESCRIBED IN THE FORWARD-LOOKING STATEMENTS INCLUDE: CHART MAY BE UNABLE TO ACHIEVE THE ANTICIPATED BENEFITS OF RECENT ACQUISITIONS, INCLUDING THE ACQUISITION OF HOWDEN (THE “ACQUISITION”) (INCLUDING WITH RESPECT TO ESTIMATED FUTURE COST AND COMMERCIAL SYNERGIES); REVENUES FOLLOWING THE ACQUISITION MAY BE LOWER THAN EXPECTED; OPERATING COSTS, CUSTOMER LOSSES, AND BUSINESS DISRUPTION (INCLUDING, WITHOUT LIMITATION, DIFFICULTIES IN MAINTAINING RELATIONSHIPS WITH EMPLOYEES, CUSTOMERS AND SUPPLIERS) RESULTING FROM THE ACQUISITION MAY BE GREATER THAN EXPECTED; SLOWER THAN ANTICIPATED GROWTH AND MARKET ACCEPTANCE OF NEW CLEAN ENERGY PRODUCT OFFERINGS; INABILITY TO ACHIEVE EXPECTED PRICING INCREASES OR CONTINUED SUPPLY CHAIN CHALLENGES INCLUDING VOLATILITY IN RAW MATERIALS AND SUPPLY; RISKS RELATING TO REGIONAL CONFLICTS AND UNREST, INCLUDING THE RECENT UNREST IN THE MIDDLE EAST AND THE CONFLICT BETWEEN RUSSIA AND UKRAINE, INCLUDING POTENTIAL ENERGY SHORTAGES IN EUROPE AND ELSEWHERE AND THE OTHER FACTORS DISCUSSED IN ITEM 1A (RISK FACTORS) IN CHART’S MOST RECENT ANNUAL REPORT ON FORM 10-K FILED WITH THE SEC, WHICH SHOULD BE REVIEWED CAREFULLY. CHART UNDERTAKES NO OBLIGATION TO UPDATE OR REVISE ANY FORWARD- LOOKING STATEMENT.
© 2024 Chart Industries, Inc. Confidential and Proprietary 3 Forward Looking Statements (2/2) THIS PRESENTATION CONTAINS NON-GAAP FINANCIAL INFORMATION, INCLUDING ADJUSTED DILUTED EPS, “NET INCOME, ADJUSTED”, FREE CASH FLOW, EBITDA, ADJUSTED EBITDA, ADJUSTED OPERATING INCOME, AND ADJUSTED OPERATING MARGIN. FOR ADDITIONAL INFORMATION REGARDING THE COMPANY'S USE OF NON-GAAP FINANCIAL INFORMATION, AS WELL AS RECONCILIATIONS OF NON-GAAP FINANCIAL MEASURES TO THE MOST DIRECTLY COMPARABLE FINANCIAL MEASURES CALCULATED AND PRESENTED IN ACCORDANCE WITH ACCOUNTING PRINCIPLES GENERALLY ACCEPTED IN THE UNITED STATES ("GAAP"), PLEASE SEE THE RECONCILIATION SLIDES TITLED “ADJUSTED DILUTED EPS RECONCILIATION”, “PRO FORMA ADJUSTED DILUTED EPS RECONCILIATION”, “THIRD QUARTER 2024 ADJUSTED EBITDA”, “FREE CASH FLOW AND PRO FORMA FREE CASH FLOW RECONCILATION TABLE”,”SEGMENT PRO FORMA RECONCILATION”, “OPERATING INCOME TO ADJUSTED OPERATING INCOME”, AND “Q3 2023 PRO FORMA ADJUSTED EBITDA AND ADJUSTED OPERATING INCOME”, INCLUDED IN, OR IN THE APPENDIX AT THE END OF, THIS PRESENTATION. WITH RESPECT TO THE COMPANY’S 2024 AND 2025 FULL YEAR EARNINGS OUTLOOK, THE COMPANY IS NOT ABLE TO PROVIDE A RECONCILIATION OF THE ADJUSTED EBITDA, ADJUSTED DILUTED EARNINGS PER SHARE, AND FREE CASH FLOW OUTLOOKS BECAUSE CERTAIN ITEMS MAY HAVE NOT YET OCCURRED OR ARE OUT OF THE COMPANY’S CONTROL AND/OR CANNOT BE REASONABLY PREDICTED. CHART INDUSTRIES, INC. IS A LEADING INDEPENDENT GLOBAL LEADER IN THE DESIGN, ENGINEERING, AND MANUFACTURING OF PROCESS TECHNOLOGIES AND EQUIPMENT FOR GAS AND LIQUID MOLECULE HANDING FOR THE NEXUS OF CLEAN - CLEAN POWER, CLEAN WATER, CLEAN FOOD, AND CLEAN INDUSTRIALS, REGARDLESS OF MOLECULE. THE COMPANY’S UNIQUE PRODUCT AND SOLUTION PORTFOLIO ACROSS STATIONARY AND ROTATING EQUIPMENT IS USED IN EVERY PHASE OF THE LIQUID GAS SUPPLY CHAIN, INCLUDING ENGINEERING, SERVICE AND REPAIR FROM INSTALLATION TO PREVENTIVE MAINTENANCE AND DIGITAL MONITORING. CHART IS A LEADING PROVIDER OF TECHNOLOGY, EQUIPMENT AND SERVICES RELATED TO LIQUEFIED NATURAL GAS, HYDROGEN, BIOGAS AND CO2 CAPTURE AMONGST OTHER APPLICATIONS. CHART IS COMMITTED TO EXCELLENCE IN ENVIRONMENTAL, SOCIAL AND CORPORATE GOVERNANCE (ESG) ISSUES BOTH FOR ITS COMPANY AS WELL AS ITS CUSTOMERS. WITH OVER 48 GLOBAL MANUFACTURING LOCATIONS AND 41 SERVICE CENTERS FROM THE UNITED STATES TO ASIA, AUSTRALIA, INDIA, EUROPE AND SOUTH AMERICA, THE COMPANY MAINTAINS ACCOUNTABILITY AND TRANSPARENCY TO ITS TEAM MEMBERS, SUPPLIERS, CUSTOMERS AND COMMUNITIES. TO LEARN MORE, VISIT WWW.CHARTINDUSTRIES.COM.
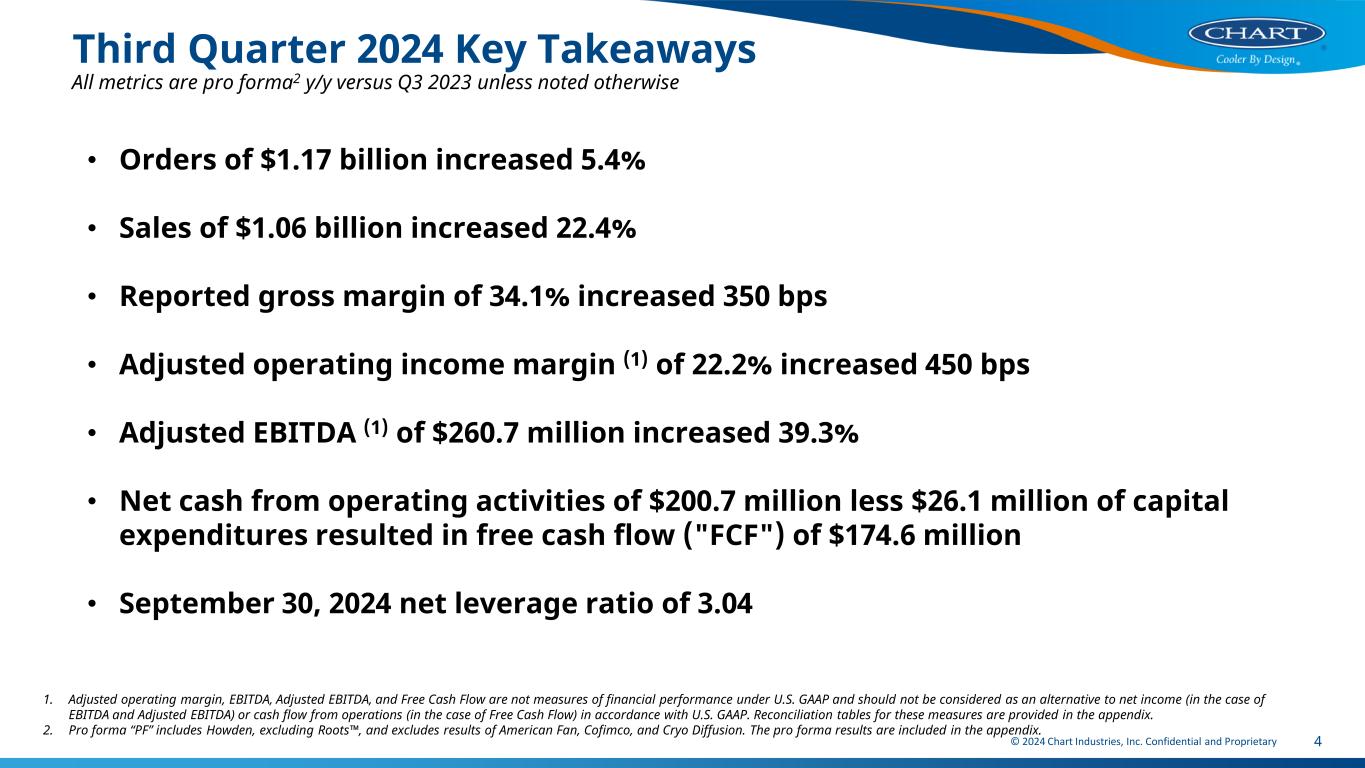
© 2024 Chart Industries, Inc. Confidential and Proprietary 4 Third Quarter 2024 Key Takeaways 1. Adjusted operating margin, EBITDA, Adjusted EBITDA, and Free Cash Flow are not measures of financial performance under U.S. GAAP and should not be considered as an alternative to net income (in the case of EBITDA and Adjusted EBITDA) or cash flow from operations (in the case of Free Cash Flow) in accordance with U.S. GAAP. Reconciliation tables for these measures are provided in the appendix. 2. Pro forma “PF” includes Howden, excluding Roots , and excludes results of American Fan, Cofimco, and Cryo Diffusion. The pro forma results are included in the appendix. All metrics are pro forma2 y/y versus Q3 2023 unless noted otherwise • Orders of $1.17 billion increased 5.4% • Sales of $1.06 billion increased 22.4% • Reported gross margin of 34.1% increased 350 bps • Adjusted operating income margin (1) of 22.2% increased 450 bps • Adjusted EBITDA (1) of $260.7 million increased 39.3% • Net cash from operating activities of $200.7 million less $26.1 million of capital expenditures resulted in free cash flow ("FCF") of $174.6 million • September 30, 2024 net leverage ratio of 3.04
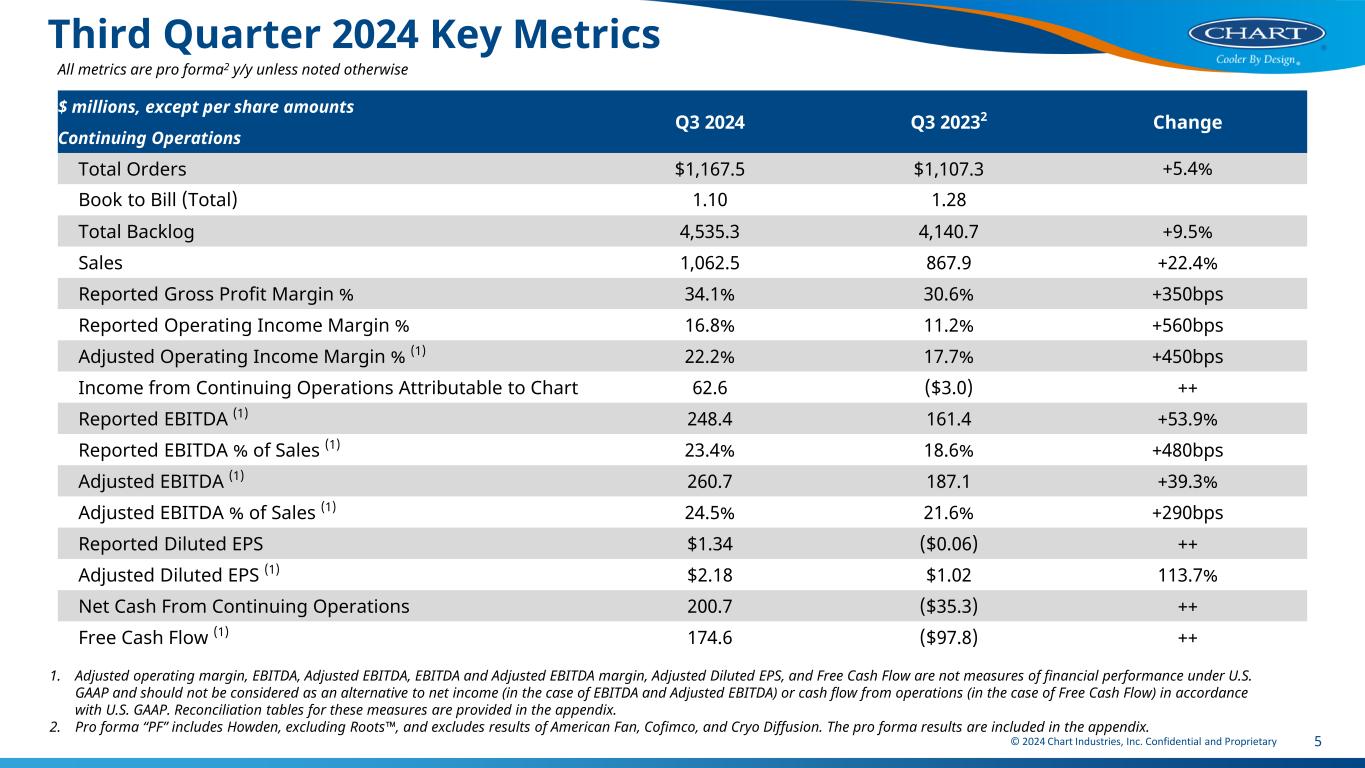
© 2024 Chart Industries, Inc. Confidential and Proprietary 5 Third Quarter 2024 Key Metrics All metrics are pro forma2 y/y unless noted otherwise 1. Adjusted operating margin, EBITDA, Adjusted EBITDA, EBITDA and Adjusted EBITDA margin, Adjusted Diluted EPS, and Free Cash Flow are not measures of financial performance under U.S. GAAP and should not be considered as an alternative to net income (in the case of EBITDA and Adjusted EBITDA) or cash flow from operations (in the case of Free Cash Flow) in accordance with U.S. GAAP. Reconciliation tables for these measures are provided in the appendix. 2. Pro forma “PF” includes Howden, excluding Roots , and excludes results of American Fan, Cofimco, and Cryo Diffusion. The pro forma results are included in the appendix. $ millions, except per share amounts Q3 2024 Q3 20232 Change Continuing Operations Total Orders $1,167.5 $1,107.3 +5.4% Book to Bill (Total) 1.10 1.28 Total Backlog 4,535.3 4,140.7 +9.5% Sales 1,062.5 867.9 +22.4% Reported Gross Profit Margin % 34.1% 30.6% +350bps Reported Operating Income Margin % 16.8% 11.2% +560bps Adjusted Operating Income Margin % (1) 22.2% 17.7% +450bps Income from Continuing Operations Attributable to Chart 62.6 ($3.0) ++ Reported EBITDA (1) 248.4 161.4 +53.9% Reported EBITDA % of Sales (1) 23.4% 18.6% +480bps Adjusted EBITDA (1) 260.7 187.1 +39.3% Adjusted EBITDA % of Sales (1) 24.5% 21.6% +290bps Reported Diluted EPS $1.34 ($0.06) ++ Adjusted Diluted EPS (1) $2.18 $1.02 113.7% Net Cash From Continuing Operations 200.7 ($35.3) ++ Free Cash Flow (1) 174.6 ($97.8) ++
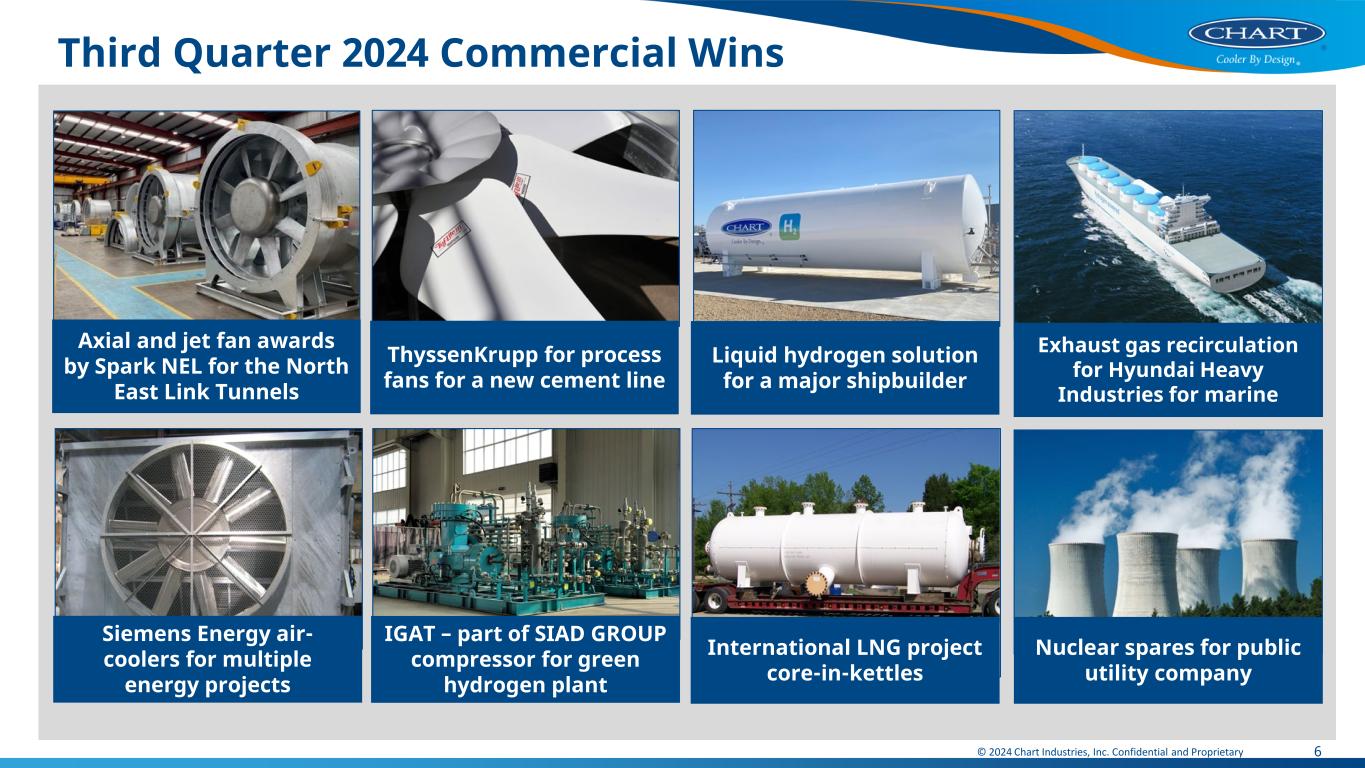
Third Quarter 2024 Commercial Wins © 2024 Chart Industries, Inc. Confidential and Proprietary 6 Liquid hydrogen solution for a major shipbuilder Siemens Energy air- coolers for multiple energy projects IGAT – part of SIAD GROUP compressor for green hydrogen plant Exhaust gas recirculation for Hyundai Heavy Industries for marine International LNG project core-in-kettles Nuclear spares for public utility company ThyssenKrupp for process fans for a new cement line Axial and jet fan awards by Spark NEL for the North East Link Tunnels

© 2024 Chart Industries, Inc. Confidential and Proprietary 7 Third Quarter 2024 Key Metrics All metrics are pro forma2 y/y unless noted otherwise $868 $1,063 Q3'23 Q3'24 Sales (2) +22% Adjusted Operating Profit(1,2) Adjusted EBITDA(1,2) Three of our segments had record sales Profit growth driven by volume leverage, full solution project mix, and synergy realization Excluding the foreign exchange headwind, would have been $270 million $187 $261 Q3'23 Q3'24 +40% $154 $236 Q3'23 Q3'24 +53% 1. Adjusted operating profit, EBITDA, and Adjusted EBITDA are not measures of financial performance under U.S. GAAP and should not be considered as an alternative to net income (in the case of Adjusted EBITDA) in accordance with U.S. GAAP. Reconciliation tables for these measures are provided in the appendix. 2. Pro forma “PF” includes Howden, excluding Roots , and excludes results of American Fan, Cofimco, and Cryo Diffusion. The pro forma results are included in the appendix.
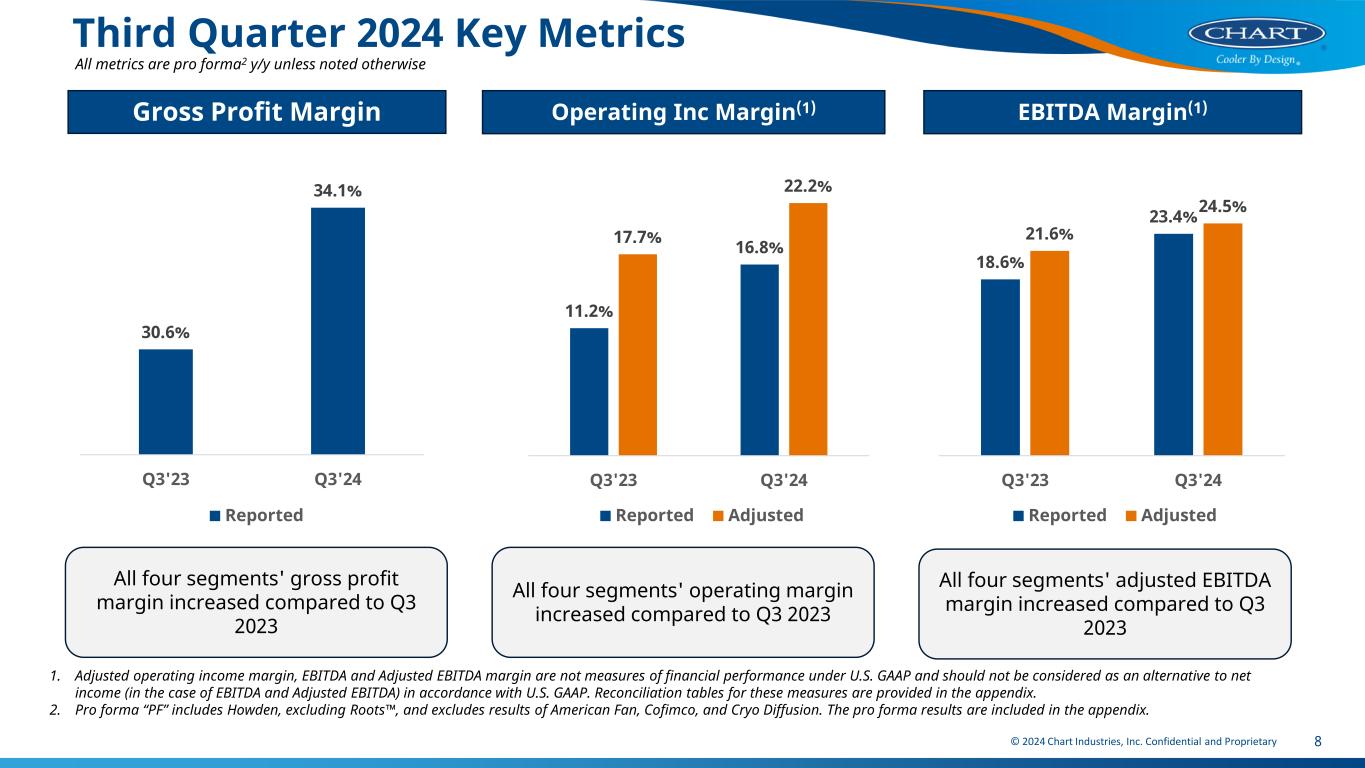
© 2024 Chart Industries, Inc. Confidential and Proprietary 8 Third Quarter 2024 Key Metrics All metrics are pro forma2 y/y unless noted otherwise Gross Profit Margin Operating Inc Margin(1) EBITDA Margin(1) All four segments' gross profit margin increased compared to Q3 2023 All four segments' operating margin increased compared to Q3 2023 All four segments' adjusted EBITDA margin increased compared to Q3 2023 1. Adjusted operating income margin, EBITDA and Adjusted EBITDA margin are not measures of financial performance under U.S. GAAP and should not be considered as an alternative to net income (in the case of EBITDA and Adjusted EBITDA) in accordance with U.S. GAAP. Reconciliation tables for these measures are provided in the appendix. 2. Pro forma “PF” includes Howden, excluding Roots , and excludes results of American Fan, Cofimco, and Cryo Diffusion. The pro forma results are included in the appendix. 30.6% 34.1% Q3'23 Q3'24 Reported 11.2% 16.8%17.7% 22.2% Q3'23 Q3'24 Reported Adjusted 18.6% 23.4% 21.6% 24.5% Q3'23 Q3'24 Reported Adjusted
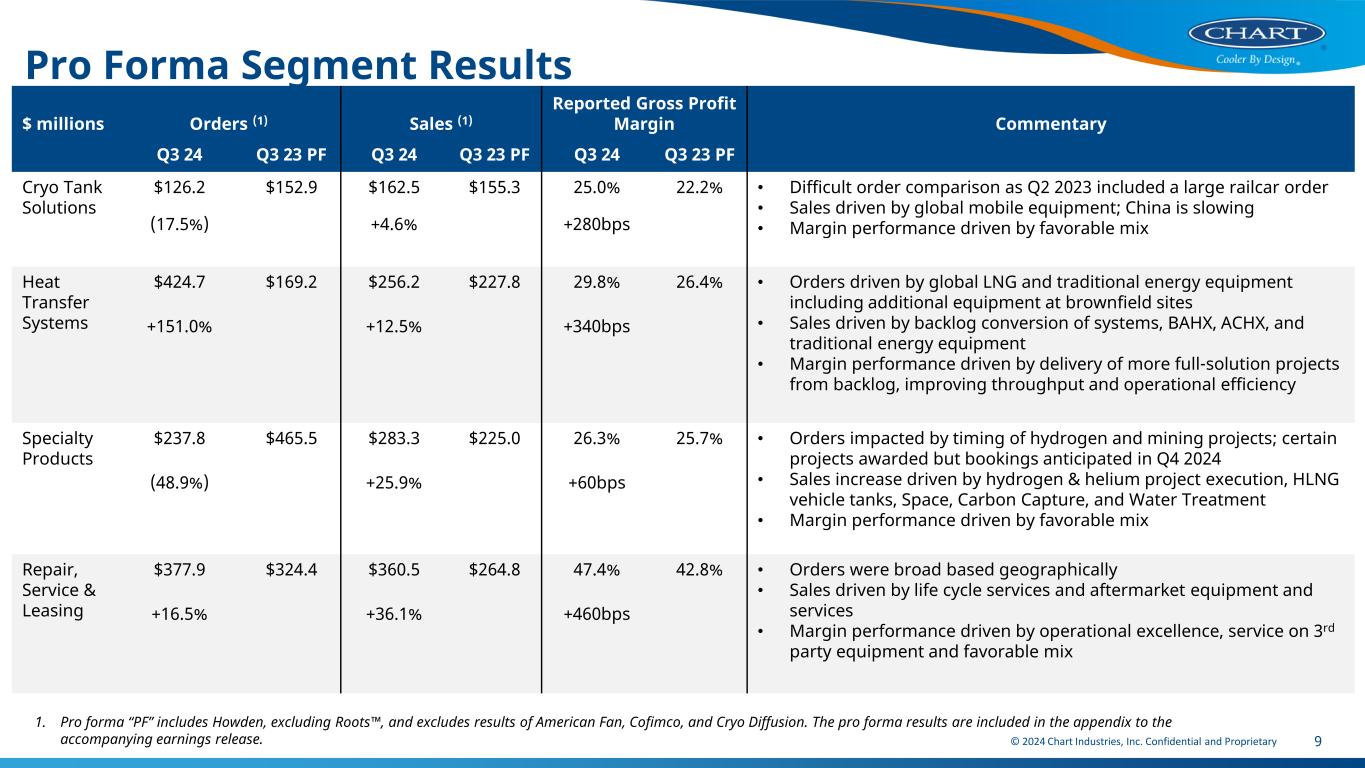
© 2024 Chart Industries, Inc. Confidential and Proprietary 9 Pro Forma Segment Results $ millions Orders (1) Sales (1) Reported Gross Profit Margin Commentary Q3 24 Q3 23 PF Q3 24 Q3 23 PF Q3 24 Q3 23 PF Cryo Tank Solutions $126.2 $152.9 $162.5 $155.3 25.0% 22.2% • Difficult order comparison as Q2 2023 included a large railcar order • Sales driven by global mobile equipment; China is slowing • Margin performance driven by favorable mix (17.5%) +4.6% +280bps Heat Transfer Systems $424.7 $169.2 $256.2 $227.8 29.8% 26.4% • Orders driven by global LNG and traditional energy equipment including additional equipment at brownfield sites • Sales driven by backlog conversion of systems, BAHX, ACHX, and traditional energy equipment • Margin performance driven by delivery of more full-solution projects from backlog, improving throughput and operational efficiency +151.0% +12.5% +340bps Specialty Products $237.8 $465.5 $283.3 $225.0 26.3% 25.7% • Orders impacted by timing of hydrogen and mining projects; certain projects awarded but bookings anticipated in Q4 2024 • Sales increase driven by hydrogen & helium project execution, HLNG vehicle tanks, Space, Carbon Capture, and Water Treatment • Margin performance driven by favorable mix (48.9%) +25.9% +60bps Repair, Service & Leasing $377.9 $324.4 $360.5 $264.8 47.4% 42.8% • Orders were broad based geographically • Sales driven by life cycle services and aftermarket equipment and services • Margin performance driven by operational excellence, service on 3rd party equipment and favorable mix +16.5% +36.1% +460bps 1. Pro forma “PF” includes Howden, excluding Roots , and excludes results of American Fan, Cofimco, and Cryo Diffusion. The pro forma results are included in the appendix to the accompanying earnings release.
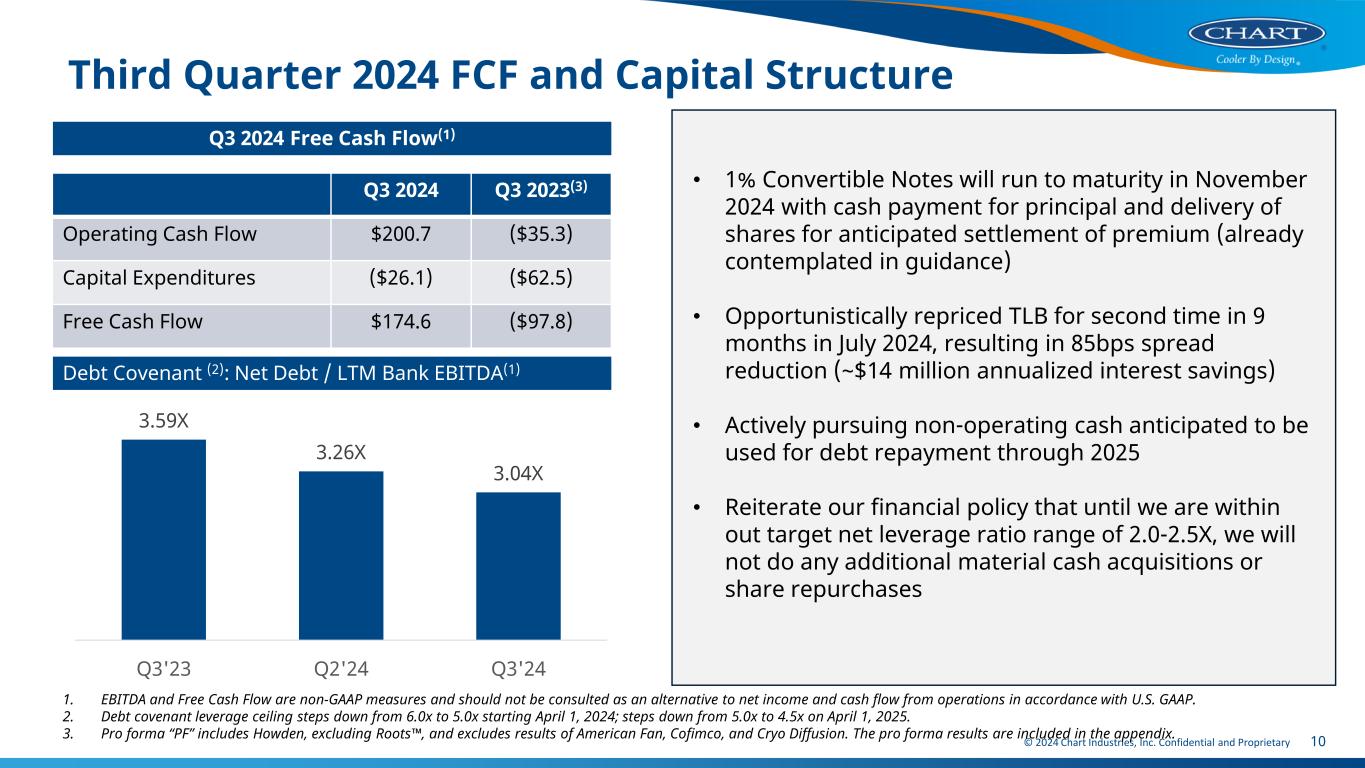
© 2024 Chart Industries, Inc. Confidential and Proprietary Third Quarter 2024 FCF and Capital Structure Debt Covenant (2): Net Debt / LTM Bank EBITDA(1) 3.59X 3.26X 3.04X Q3'23 Q2'24 Q3'24 1. EBITDA and Free Cash Flow are non-GAAP measures and should not be consulted as an alternative to net income and cash flow from operations in accordance with U.S. GAAP. 2. Debt covenant leverage ceiling steps down from 6.0x to 5.0x starting April 1, 2024; steps down from 5.0x to 4.5x on April 1, 2025. 3. Pro forma “PF” includes Howden, excluding Roots , and excludes results of American Fan, Cofimco, and Cryo Diffusion. The pro forma results are included in the appendix. • 1% Convertible Notes will run to maturity in November 2024 with cash payment for principal and delivery of shares for anticipated settlement of premium (already contemplated in guidance) • Opportunistically repriced TLB for second time in 9 months in July 2024, resulting in 85bps spread reduction (~$14 million annualized interest savings) • Actively pursuing non-operating cash anticipated to be used for debt repayment through 2025 • Reiterate our financial policy that until we are within out target net leverage ratio range of 2.0-2.5X, we will not do any additional material cash acquisitions or share repurchases 10 Q3 2024 Free Cash Flow(1) Q3 2024 Q3 2023(3) Operating Cash Flow $200.7 ($35.3) Capital Expenditures ($26.1) ($62.5) Free Cash Flow $174.6 ($97.8)
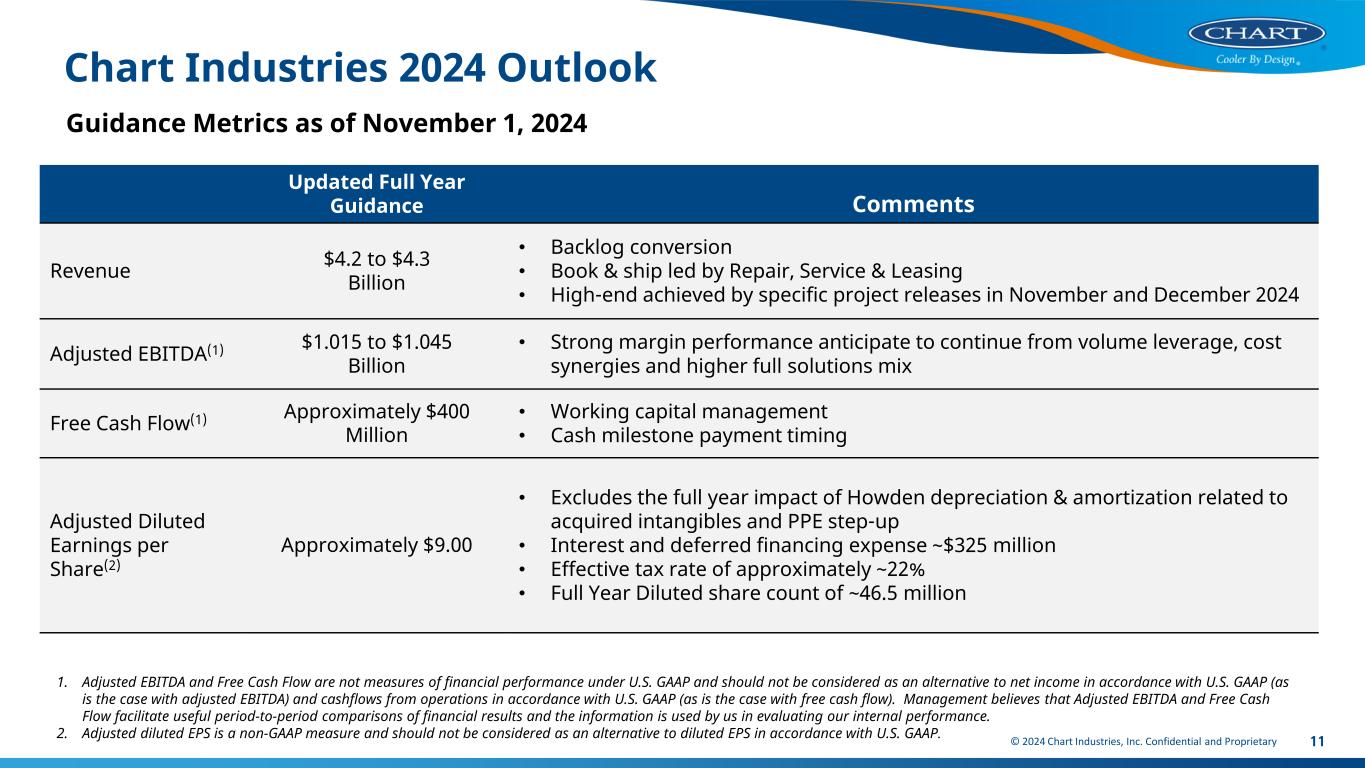
© 2024 Chart Industries, Inc. Confidential and Proprietary Chart Industries 2024 Outlook 11 Guidance Metrics as of November 1, 2024 1. Adjusted EBITDA and Free Cash Flow are not measures of financial performance under U.S. GAAP and should not be considered as an alternative to net income in accordance with U.S. GAAP (as is the case with adjusted EBITDA) and cashflows from operations in accordance with U.S. GAAP (as is the case with free cash flow). Management believes that Adjusted EBITDA and Free Cash Flow facilitate useful period-to-period comparisons of financial results and the information is used by us in evaluating our internal performance. 2. Adjusted diluted EPS is a non-GAAP measure and should not be considered as an alternative to diluted EPS in accordance with U.S. GAAP. Updated Full Year Guidance Comments Revenue $4.2 to $4.3 Billion • Backlog conversion • Book & ship led by Repair, Service & Leasing • High-end achieved by specific project releases in November and December 2024 Adjusted EBITDA(1) $1.015 to $1.045 Billion • Strong margin performance anticipate to continue from volume leverage, cost synergies and higher full solutions mix Free Cash Flow(1) Approximately $400 Million • Working capital management • Cash milestone payment timing Adjusted Diluted Earnings per Share(2) Approximately $9.00 • Excludes the full year impact of Howden depreciation & amortization related to acquired intangibles and PPE step-up • Interest and deferred financing expense ~$325 million • Effective tax rate of approximately ~22% • Full Year Diluted share count of ~46.5 million

© 2024 Chart Industries, Inc. Confidential and Proprietary Chart Industries Initial 2025 Outlook 12 Guidance Metrics as of November 1, 2024 1. Adjusted EBITDA, Adjusted Diluted Earnings per share, and Free Cash Flow are not measures of financial performance under U.S. GAAP and should not be considered as an alternative to net income in accordance with U.S. GAAP (as is the case with adjusted EBITDA) and cashflows from operations in accordance with U.S. GAAP (as is the case with free cash flow). Management believes that Adjusted EBITDA, Adjusted Diluted Earnings Per Share, and Free Cash Flow facilitate useful period-to-period comparisons of financial results and the information is used by us in evaluating our internal performance. Full Year Guidance Revenue $4.65 to $4.85 Billion Adjusted EBITDA(1) $1.175 to $1.225 Billion Adjusted Diluted Earnings per share(1) $12.00 to $13.00 Free Cash Flow(1) $550 to $600 Million Tax Rate Approximately 22% Details to be provided at our Capital Markets Day on November 12, 2024
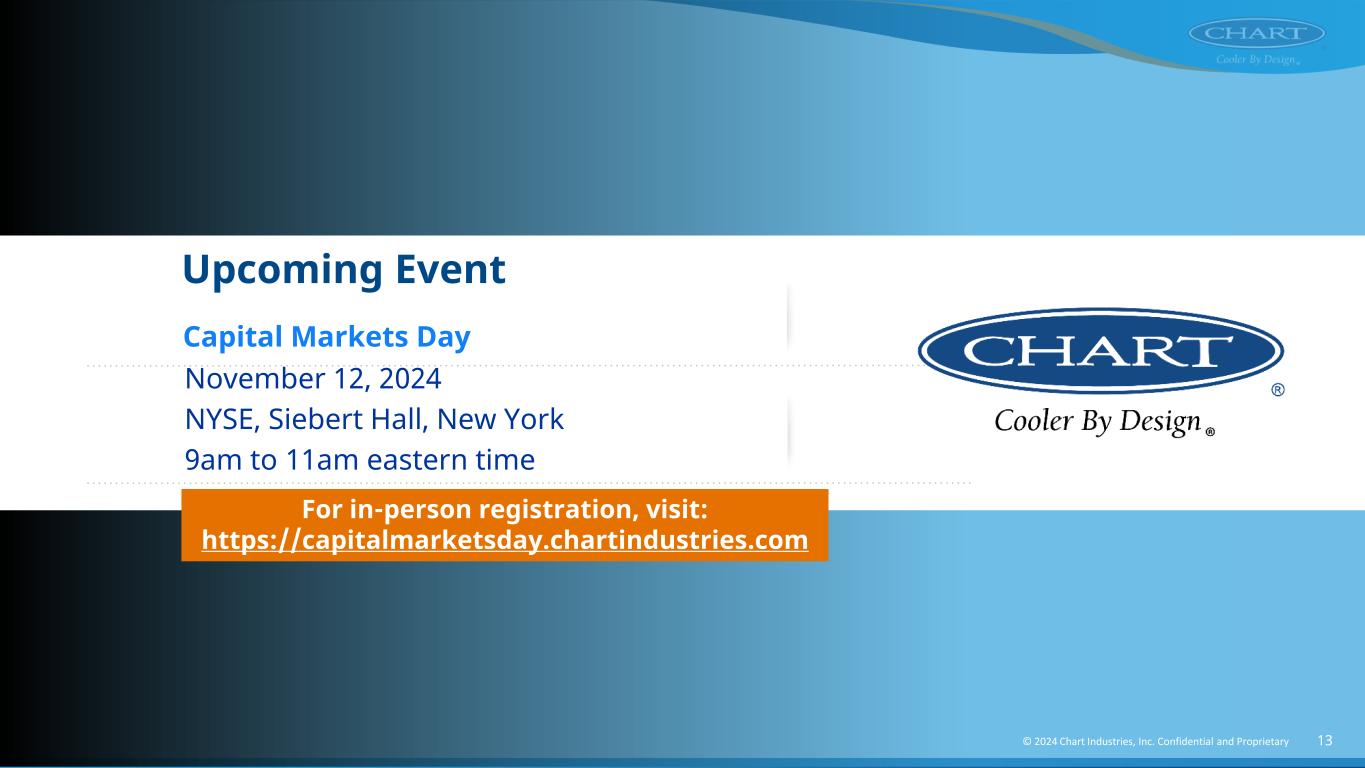
November 12, 2024 NYSE, Siebert Hall, New York 9am to 11am eastern time Capital Markets Day For in-person registration, visit: https://capitalmarketsday.chartindustries.com © 2024 Chart Industries, Inc. Confidential and Proprietary 13 Upcoming Event

Appendix 14© 2024 Chart Industries, Inc. Confidential and Proprietary
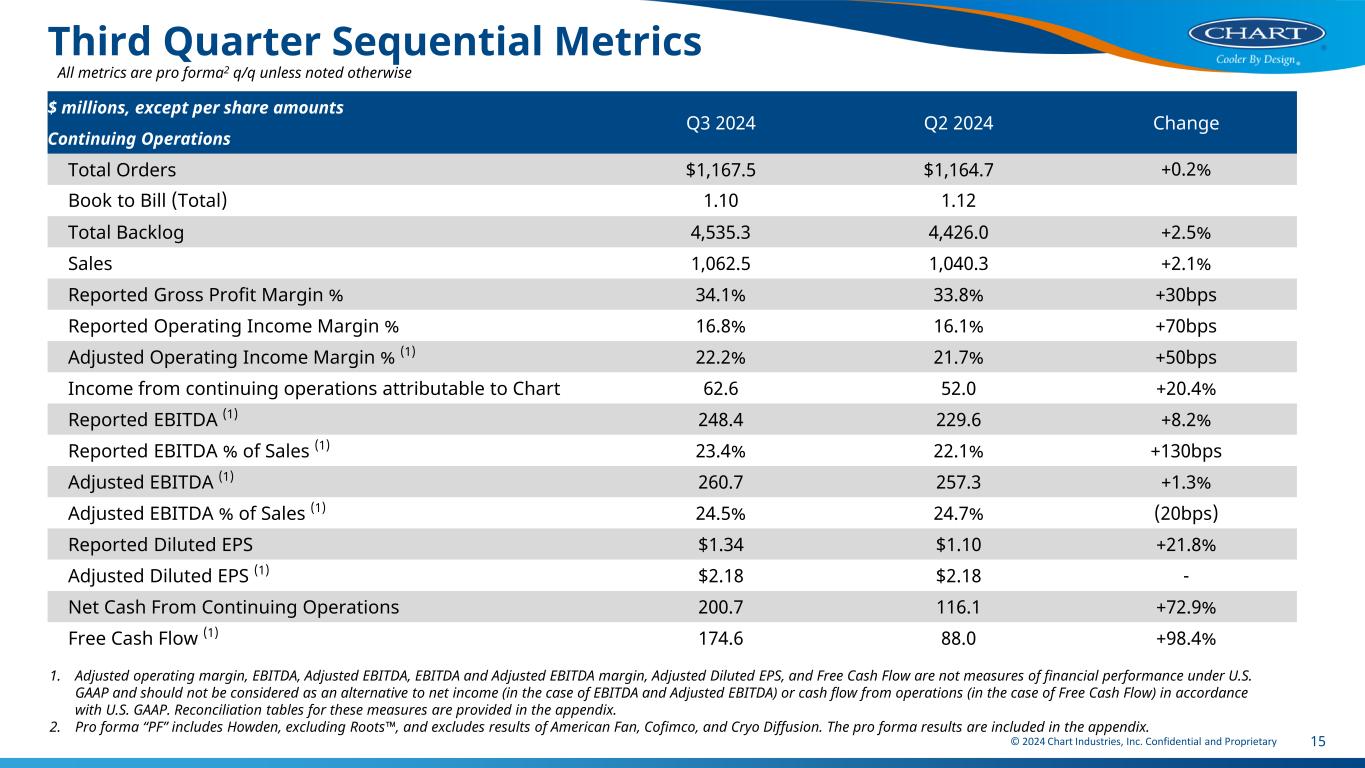
© 2024 Chart Industries, Inc. Confidential and Proprietary 15 Third Quarter Sequential Metrics All metrics are pro forma2 q/q unless noted otherwise 1. Adjusted operating margin, EBITDA, Adjusted EBITDA, EBITDA and Adjusted EBITDA margin, Adjusted Diluted EPS, and Free Cash Flow are not measures of financial performance under U.S. GAAP and should not be considered as an alternative to net income (in the case of EBITDA and Adjusted EBITDA) or cash flow from operations (in the case of Free Cash Flow) in accordance with U.S. GAAP. Reconciliation tables for these measures are provided in the appendix. 2. Pro forma “PF” includes Howden, excluding Roots , and excludes results of American Fan, Cofimco, and Cryo Diffusion. The pro forma results are included in the appendix. $ millions, except per share amounts Q3 2024 Q2 2024 Change Continuing Operations Total Orders $1,167.5 $1,164.7 +0.2% Book to Bill (Total) 1.10 1.12 Total Backlog 4,535.3 4,426.0 +2.5% Sales 1,062.5 1,040.3 +2.1% Reported Gross Profit Margin % 34.1% 33.8% +30bps Reported Operating Income Margin % 16.8% 16.1% +70bps Adjusted Operating Income Margin % (1) 22.2% 21.7% +50bps Income from continuing operations attributable to Chart 62.6 52.0 +20.4% Reported EBITDA (1) 248.4 229.6 +8.2% Reported EBITDA % of Sales (1) 23.4% 22.1% +130bps Adjusted EBITDA (1) 260.7 257.3 +1.3% Adjusted EBITDA % of Sales (1) 24.5% 24.7% (20bps) Reported Diluted EPS $1.34 $1.10 +21.8% Adjusted Diluted EPS (1) $2.18 $2.18 - Net Cash From Continuing Operations 200.7 116.1 +72.9% Free Cash Flow (1) 174.6 88.0 +98.4%

© 2024 Chart Industries, Inc. Confidential and Proprietary Chart Industries Prior 2024 Outlook 16 From August 2, 2024 1. Adjusted EBITDA and Free Cash Flow are not measures of financial performance under U.S. GAAP and should not be considered as an alternative to net income in accordance with U.S. GAAP (as is the case with adjusted EBITDA) and cashflows from operations in accordance with U.S. GAAP (as is the case with free cash flow). Management believes that Adjusted EBITDA and Free Cash Flow facilitate useful period-to-period comparisons of financial results and the information is used by us in evaluating our internal performance. 2. Adjusted diluted EPS is a non-GAAP measure and should not be considered as an alternative to diluted EPS in accordance with U.S. GAAP. Prior Full Year Guidance Revenue $4.45 to $4.60 Billion Adjusted EBITDA(1) $1.08 to $1.15 Billion Free Cash Flow(1) $400 to $475 Million Adjusted Diluted Earnings per Share(2) $10.75 to $11.75 Tax Rate 20% to 21%
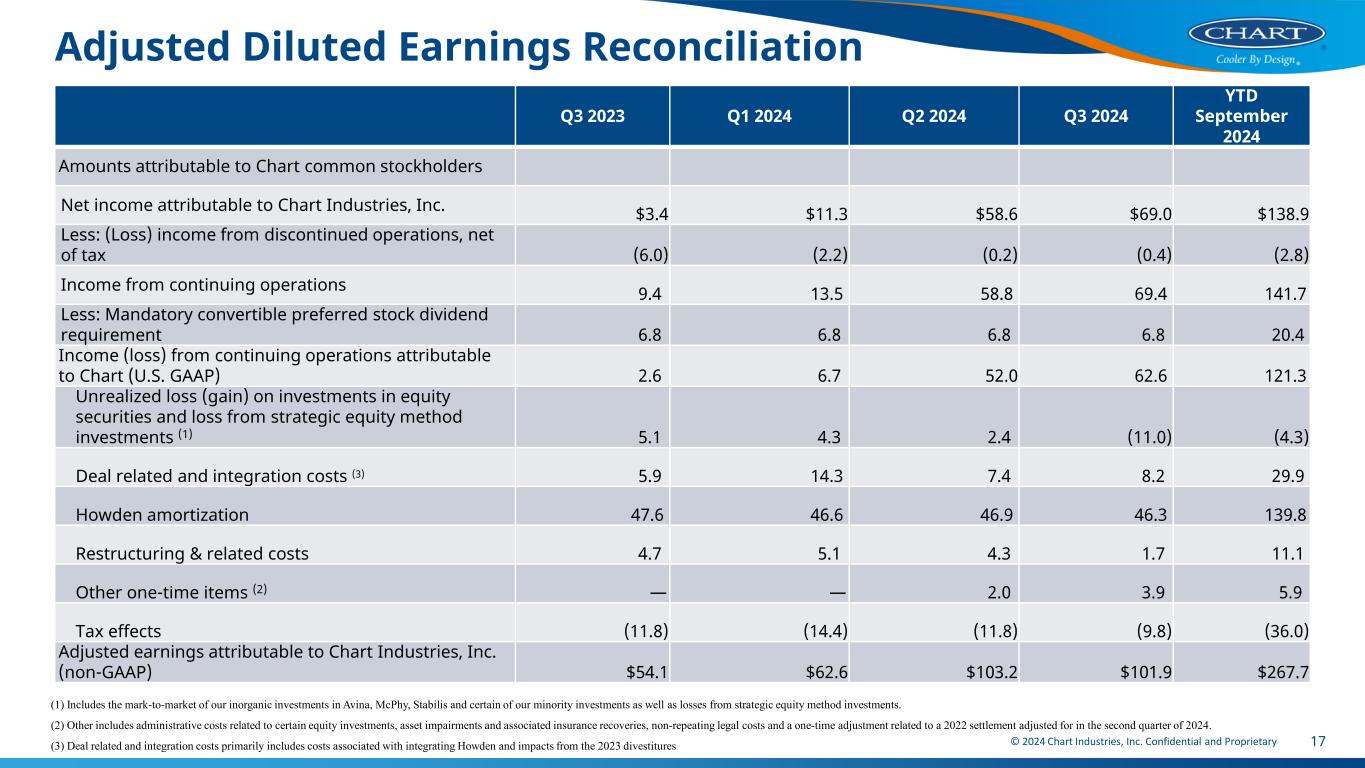
© 2024 Chart Industries, Inc. Confidential and Proprietary 17 Adjusted Diluted Earnings Reconciliation Q3 2023 Q1 2024 Q2 2024 Q3 2024 YTD September 2024 Amounts attributable to Chart common stockholders Net income attributable to Chart Industries, Inc. $3.4 $11.3 $58.6 $69.0 $138.9 Less: (Loss) income from discontinued operations, net of tax (6.0) (2.2) (0.2) (0.4) (2.8) Income from continuing operations 9.4 13.5 58.8 69.4 141.7 Less: Mandatory convertible preferred stock dividend requirement 6.8 6.8 6.8 6.8 20.4 Income (loss) from continuing operations attributable to Chart (U.S. GAAP) 2.6 6.7 52.0 62.6 121.3 Unrealized loss (gain) on investments in equity securities and loss from strategic equity method investments (1) 5.1 4.3 2.4 (11.0) (4.3) Deal related and integration costs (3) 5.9 14.3 7.4 8.2 29.9 Howden amortization 47.6 46.6 46.9 46.3 139.8 Restructuring & related costs 4.7 5.1 4.3 1.7 11.1 Other one-time items (2) — — 2.0 3.9 5.9 Tax effects (11.8) (14.4) (11.8) (9.8) (36.0) Adjusted earnings attributable to Chart Industries, Inc. (non-GAAP) $54.1 $62.6 $103.2 $101.9 $267.7 (1) Includes the mark-to-market of our inorganic investments in Avina, McPhy, Stabilis and certain of our minority investments as well as losses from strategic equity method investments. (2) Other includes administrative costs related to certain equity investments, asset impairments and associated insurance recoveries, non-repeating legal costs and a one-time adjustment related to a 2022 settlement adjusted for in the second quarter of 2024. (3) Deal related and integration costs primarily includes costs associated with integrating Howden and impacts from the 2023 divestitures
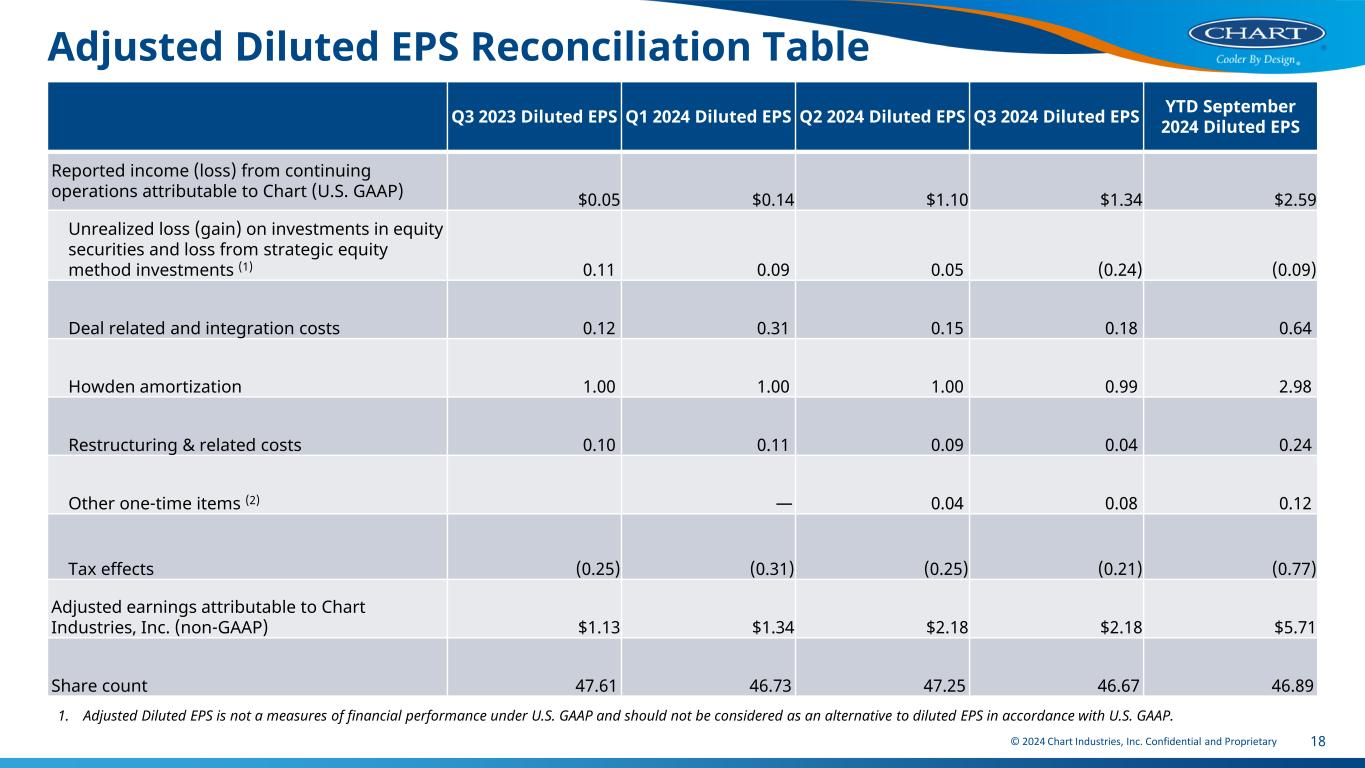
© 2024 Chart Industries, Inc. Confidential and Proprietary 18 Adjusted Diluted EPS Reconciliation Table Q3 2023 Diluted EPS Q1 2024 Diluted EPS Q2 2024 Diluted EPS Q3 2024 Diluted EPS YTD September 2024 Diluted EPS Reported income (loss) from continuing operations attributable to Chart (U.S. GAAP) $0.05 $0.14 $1.10 $1.34 $2.59 Unrealized loss (gain) on investments in equity securities and loss from strategic equity method investments (1) 0.11 0.09 0.05 (0.24) (0.09) Deal related and integration costs 0.12 0.31 0.15 0.18 0.64 Howden amortization 1.00 1.00 1.00 0.99 2.98 Restructuring & related costs 0.10 0.11 0.09 0.04 0.24 Other one-time items (2) — 0.04 0.08 0.12 Tax effects (0.25) (0.31) (0.25) (0.21) (0.77) Adjusted earnings attributable to Chart Industries, Inc. (non-GAAP) $1.13 $1.34 $2.18 $2.18 $5.71 Share count 47.61 46.73 47.25 46.67 46.89 1. Adjusted Diluted EPS is not a measures of financial performance under U.S. GAAP and should not be considered as an alternative to diluted EPS in accordance with U.S. GAAP.

© 2024 Chart Industries, Inc. Confidential and Proprietary 19 Pro Forma Adjusted Dilute EPS Reconciliation Table $ millions, except per share Q3 2024 Q3 2023 Net income (loss) attributable to Chart Industries, Inc. $69.0 $3.4 Less: (Loss) income from discontinued operations, net of tax (0.4) 6.0 Income from continuing operations 69.4 9.4 Less: Mandatory convertible preferred stock dividend 6.8 6.8 Income (loss) from continuing operations attributable to Chart 62.6 2.6 Less: Net Income from American Fan, Cofimco and Cryo Diffusion (divested in fourth quarter 2023) _ 5.6 Pro forma Income (loss) from continuing operations attributable to Chart 62.6 (3.0) Pro forma earnings (loss) per common share attributable to Chart Industries, Inc. cont. operations 1.34 (0.06) Unrealized (gain)/loss on investments in equity securities and loss from strategic equity method investments (0.24) 0.11 Deal related and integration costs 0.18 0.12 Howden amortization 0.99 1.00 Restructuring & related costs 0.04 0.10 Other one-time items 0.08 - Tax effects (0.21) (0.25) Adjusted earnings per common share attributable to Chart Industries, Inc. (non-GAAP) $2.18 $1.02 Share Count 46.67 47.61 1. Adjusted Diluted EPS is not a measures of financial performance under U.S. GAAP and should not be considered as an alternative to diluted EPS in accordance with U.S. GAAP. 2. Pro forma “PF” includes Howden, excluding Roots , and excludes results of American Fan, Cofimco, and Cryo Diffusion
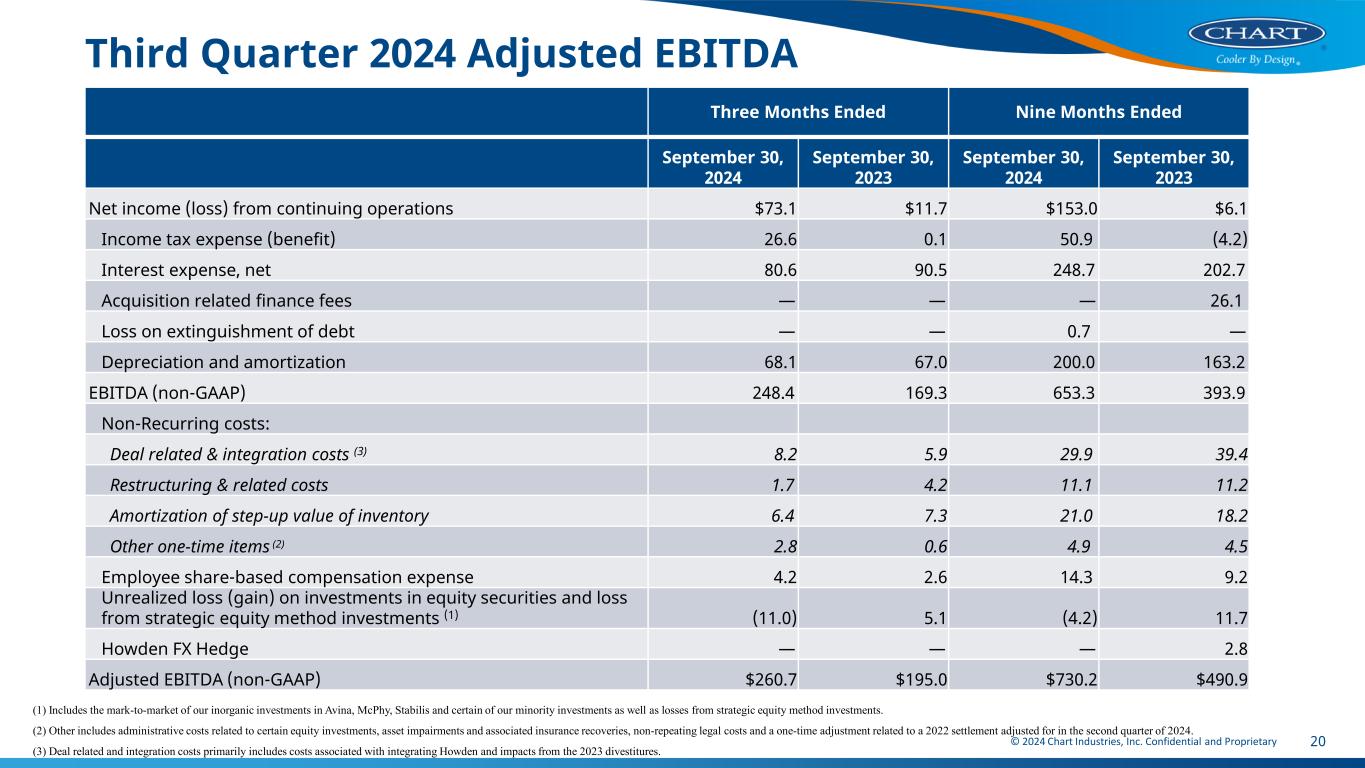
© 2024 Chart Industries, Inc. Confidential and Proprietary 20 Third Quarter 2024 Adjusted EBITDA Three Months Ended Nine Months Ended September 30, 2024 September 30, 2023 September 30, 2024 September 30, 2023 Net income (loss) from continuing operations $73.1 $11.7 $153.0 $6.1 Income tax expense (benefit) 26.6 0.1 50.9 (4.2) Interest expense, net 80.6 90.5 248.7 202.7 Acquisition related finance fees — — — 26.1 Loss on extinguishment of debt — — 0.7 — Depreciation and amortization 68.1 67.0 200.0 163.2 EBITDA (non-GAAP) 248.4 169.3 653.3 393.9 Non-Recurring costs: Deal related & integration costs (3) 8.2 5.9 29.9 39.4 Restructuring & related costs 1.7 4.2 11.1 11.2 Amortization of step-up value of inventory 6.4 7.3 21.0 18.2 Other one-time items (2) 2.8 0.6 4.9 4.5 Employee share-based compensation expense 4.2 2.6 14.3 9.2 Unrealized loss (gain) on investments in equity securities and loss from strategic equity method investments (1) (11.0) 5.1 (4.2) 11.7 Howden FX Hedge — — — 2.8 Adjusted EBITDA (non-GAAP) $260.7 $195.0 $730.2 $490.9 (1) Includes the mark-to-market of our inorganic investments in Avina, McPhy, Stabilis and certain of our minority investments as well as losses from strategic equity method investments. (2) Other includes administrative costs related to certain equity investments, asset impairments and associated insurance recoveries, non-repeating legal costs and a one-time adjustment related to a 2022 settlement adjusted for in the second quarter of 2024. (3) Deal related and integration costs primarily includes costs associated with integrating Howden and impacts from the 2023 divestitures.
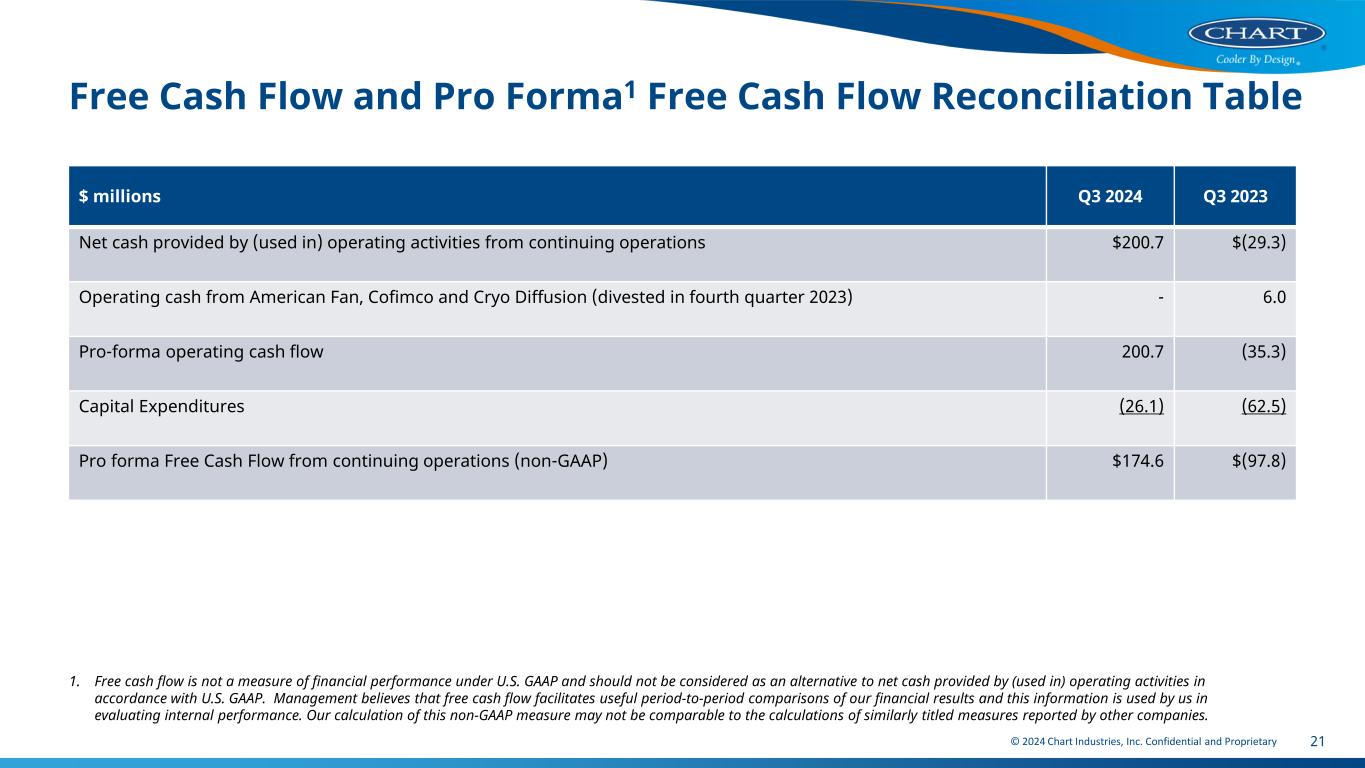
© 2024 Chart Industries, Inc. Confidential and Proprietary 21 Free Cash Flow and Pro Forma1 Free Cash Flow Reconciliation Table 1. Free cash flow is not a measure of financial performance under U.S. GAAP and should not be considered as an alternative to net cash provided by (used in) operating activities in accordance with U.S. GAAP. Management believes that free cash flow facilitates useful period-to-period comparisons of our financial results and this information is used by us in evaluating internal performance. Our calculation of this non-GAAP measure may not be comparable to the calculations of similarly titled measures reported by other companies. $ millions Q3 2024 Q3 2023 Net cash provided by (used in) operating activities from continuing operations $200.7 $(29.3) Operating cash from American Fan, Cofimco and Cryo Diffusion (divested in fourth quarter 2023) - 6.0 Pro-forma operating cash flow 200.7 (35.3) Capital Expenditures (26.1) (62.5) Pro forma Free Cash Flow from continuing operations (non-GAAP) $174.6 $(97.8)

© 2024 Chart Industries, Inc. Confidential and Proprietary 22 Segment Pro Forma1 Reconciliation 1. Pro forma “PF” includes Howden, excluding Roots , and excludes results of American Fan, Cofimco, and Cryo Diffusion. The pro forma results are included in the appendix. Three Months Ended September 30, 2023 Cryo Tank Solutions Heat Transfer Systems Specialty Products Repair, Service & Leasing Intersegment Eliminations Corporate Consolidated Orders $155.6 $176.1 $469.1 $331.2 $(4.7) — $ 1,127.3 Less: Orders from businesses divested in the fourth quarter 2023 2.7 6.9 3.6 6.8 — — 20.0 Pro forma orders (non-GAAP) 152.9 169.2 465.5 324.4 (4.7) — 1,107.3 Sales 159.0 232.5 240.0 271.3 (4.9) — 897.9 Less: Sales from businesses divested in the fourth quarter 2023 3.7 4.7 15.0 6.5 0.1 — 30.0 Pro forma sales (non-GAAP) 155.3 227.8 225.0 264.8 (5.0) — 867.9 Gross Profit 35.2 61.5 62.0 117.5 — — 276.2 Less: Gross profit from businesses divested in the fourth quarter 2023 0.7 1.3 4.1 4.1 0.1 — 10.3 Pro forma gross profit (non-GAAP) $34.5 $60.2 $57.9 $113.4 $(0.1) — $265.9 Pro forma gross profit margin (non-GAAP) 22.2 % 26.4 % 25.7 % 42.8 % 2.0 % — 30.6 %
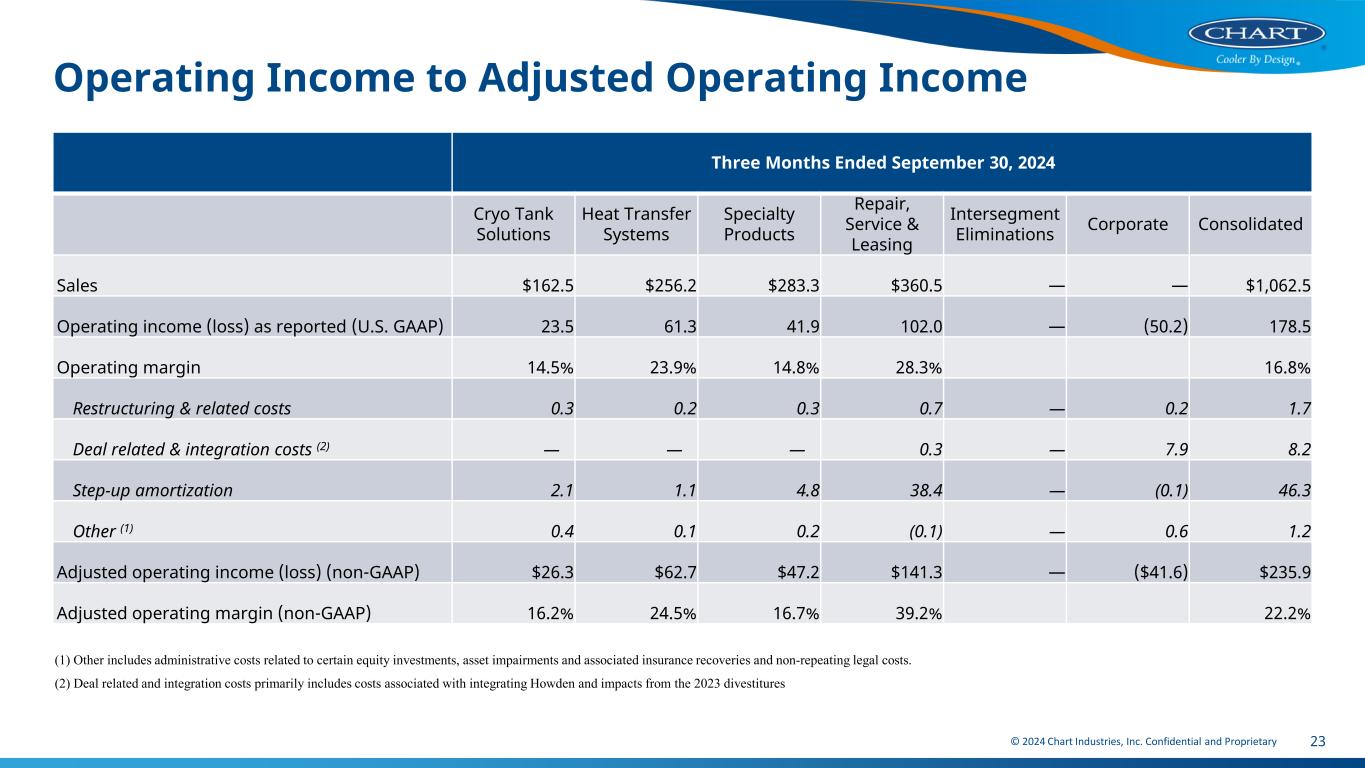
© 2024 Chart Industries, Inc. Confidential and Proprietary 23 Operating Income to Adjusted Operating Income Three Months Ended September 30, 2024 Cryo Tank Solutions Heat Transfer Systems Specialty Products Repair, Service & Leasing Intersegment Eliminations Corporate Consolidated Sales $162.5 $256.2 $283.3 $360.5 — — $1,062.5 Operating income (loss) as reported (U.S. GAAP) 23.5 61.3 41.9 102.0 — (50.2) 178.5 Operating margin 14.5% 23.9% 14.8% 28.3% 16.8% Restructuring & related costs 0.3 0.2 0.3 0.7 — 0.2 1.7 Deal related & integration costs (2) — — — 0.3 — 7.9 8.2 Step-up amortization 2.1 1.1 4.8 38.4 — (0.1) 46.3 Other (1) 0.4 0.1 0.2 (0.1) — 0.6 1.2 Adjusted operating income (loss) (non-GAAP) $26.3 $62.7 $47.2 $141.3 — ($41.6) $235.9 Adjusted operating margin (non-GAAP) 16.2% 24.5% 16.7% 39.2% 22.2% (1) Other includes administrative costs related to certain equity investments, asset impairments and associated insurance recoveries and non-repeating legal costs. (2) Deal related and integration costs primarily includes costs associated with integrating Howden and impacts from the 2023 divestitures

© 2024 Chart Industries, Inc. Confidential and Proprietary 24 Q3 2023 Pro Forma Adjusted EBITDA & Adjusted Operating Income 1. EBITDA and Adjusted EBITDA, pro forma EBITDA, pro forma adjusted EBITDA, pro forma adjusted EBITDA margin, pro forma operating income, pro forma operating income margin, pro forma adjusted operating income and pro forma adjusted operating income margin are not measures of financial performance under U.S. GAAP and should not be considered as an alternative to net income in accordance with U.S. GAAP (as is the case with EBITDA and adjusted EBITDA) and cashflows from operations in accordance with U.S. GAAP (as is the case with free cash flow). Management believes these non-GAAP measures facilitate useful period-to-period comparisons of financial results and the information is used by us in evaluating our internal performance. EBITDA (non-GAAP) $169.3 Less: Adjusted EBITDA from businesses divested in the fourth quarter 2023 7.9 Pro forma EBITDA (non-GAAP) 161.4 Non-Recurring costs: Deal related & Integration Costs 5.9 Restructuring & related Costs 4.2 Amortization of step up value of inventory 7.3 Other one-time items 0.6 Employee share-based compensation expense 2.6 Unrealized loss on investments in equity securities and loss from strategic equity method investments 5.1 Pro forma adjusted EBITDA (non-GAAP) 187.1 Pro forma adjusted EBITDA margin (non-GAAP) 21.6 % Operating income 104.4 Less: Operating income from businesses divested in the fourth quarter 2023 7.4 Pro forma operating income (non-GAAP) 97.0 Pro forma operating income margin (non-GAAP) 11.2 % Restructuring related, deal-related, integration and other one time costs 57.0 Pro forma adjusted operating income (non-GAAP) $154.0 Pro forma adjusted operating income margin (non-GAAP) 17.7 %


