 CHART INDUSTRIES, INC. Exhibit 99.1 INVESTOR PRESENTATION 2012 SEPTEMBER |
Disclosure 1 Forward-Looking Statements: This presentation includes “forward-looking statements” within the meaning of the Private Securities Litigation Reform Act of 1995. The use of words such as “may”, “might”, “should”, “will”, “expect”, “plan”, “anticipate”, “believe”, “estimate”, “project”, “forecast”, “outlook”, “intend”, “future”, “potential” or “continue”, and other similar expressions are intended to identify forward-looking statements. All of these forward-looking statements are based on estimates and assumptions by our management as of the date of this presentation that, although we believe to be reasonable, are inherently uncertain. Forward-looking statements involve risks and uncertainties that could cause the Company’s actual results or circumstances to differ materially from those expressed or implied by forward-looking statements. These risks and uncertainties include, among others, the following: the cyclicality of the markets that the Company serves; a delay, significant reduction in or loss of purchases by large customers; fluctuations in energy prices; changes in government energy policy or failure of expected changes in policy to materialize; the potential for negative developments in the natural gas industry related to hydraulic fracturing; competition; economic downturns and deteriorating financial conditions; our ability to manage our fixed-price contract exposure; our reliance on key suppliers and potential supplier failures or defects; the modification or cancellation of orders in our backlog; the Company’s ability to successfully manage its costs and growth, including its ability to successfully manage operational expansions and the challenges associated with efforts to acquire and integrate new product lines or businesses; including the ability to successfully integrate AirSep’s business and achieve anticipated revenue, earnings and accretion related to AirSep; changes in government healthcare regulations and reimbursement policies; general economic, political, business and market risks associated with the Company’s global operations and transactions; fluctuations in foreign currency exchange and interest rates; the financial distress of third parties; the loss of key employees and deterioration of employee or labor relations; the pricing and availability of raw materials; the regulation of our products by the U.S. Food & Drug Administration and other governmental authorities; potential future impairment of the Company’s significant goodwill and other intangibles; the cost of compliance with environmental, health and safety laws; additional liabilities related to taxes; the impact of severe weather; litigation and disputes involving the Company, including product liability, contract, warranty, employment and environmental claims; technological security threats; risks associated with our indebtedness, leverage, debt service and liquidity; and volatility and fluctuations in the price of the Company’s stock. For a discussion of these and additional risks that could cause actual results to differ from those described in the forward-looking statements, see disclosure under Item 1A. “Risk Factors” in the Company’s most recent Annual Report on Form 10-K and other recent filings with the Securities and Exchange Commission, which should be reviewed carefully. Please consider the Company’s forward-looking statements in light of these risks. Any forward-looking statement speaks only as of its date. We undertake no obligation to publicly update or revise any forward-looking statement, whether as a result of new information, future events or otherwise, except as required by law. |
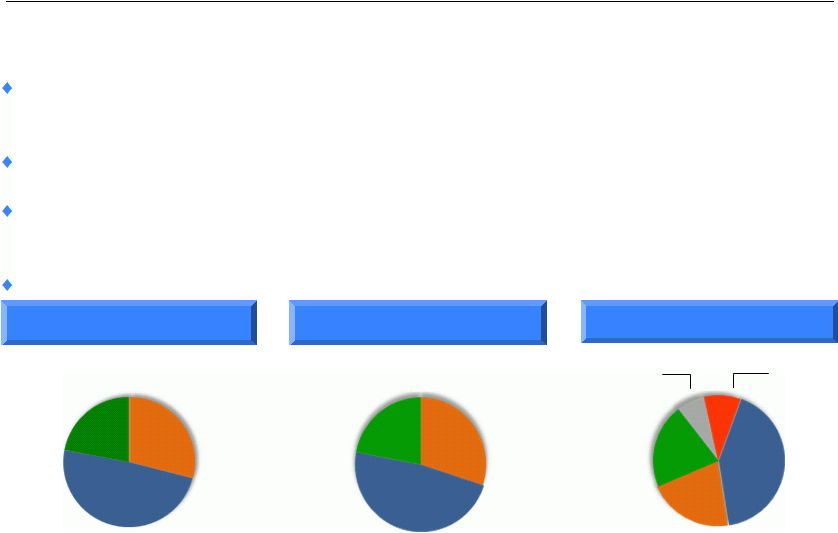 GTLS: GAS TO LIQUID SYSTEMS Technology leader that provides high-end equipment to the energy industry, which is the largest end-user of Chart’s products One of the leading suppliers in all primary markets served Global footprint for our operations on four continents with approximately 4,600 employees Worldwide earnings with approximately 60% of sales derived from outside the U.S. Company Overview Chart Industries is a leading provider of highly engineered cryogenic equipment for the hydrocarbon, industrial gas, and biomedical markets Asia 21% U.S. 42% Americas (Non-US) 7% RoW 9% Europe 21% LTM June 2012 Sales by Segment Energy 48% BioMedical 22% General Industrial 30% LTM June 2012 Sales by Region LTM June 2012 Sales by End-User Energy & Chemicals 29% Distribution & Storage 49% BioMedical 22% 2 |
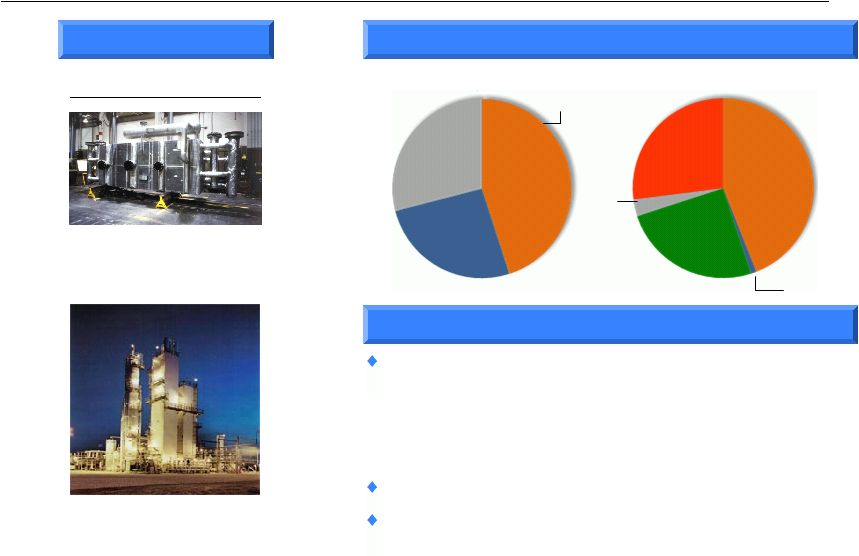 GTLS: GAS TO LIQUID SYSTEMS Energy & Chemicals (E&C) Segment Overview Heat Exchanger Cold Box Production Brazed Aluminium Heat Exchangers 45% Cold Boxes and LNG VIP 29% LTM June 2012 Sales by Product / Region Highlights Technology leader – providing heat exchangers and cold boxes critical to LNG, Olefin petrochemicals, natural gas processing and industrial gas markets – Separation, liquefaction and purification of hydrocarbon and industrial gases Market leader – leading industry positions worldwide Manufacturing leader – one of three global suppliers of mission-critical LNG and LNG liquefaction equipment Selected Products Americas (Non-US) 3% Middle East & RoW 27% Asia 25% U.S. 44% Europe 1% 3 Air Cooled Heat Exchangers 26% |
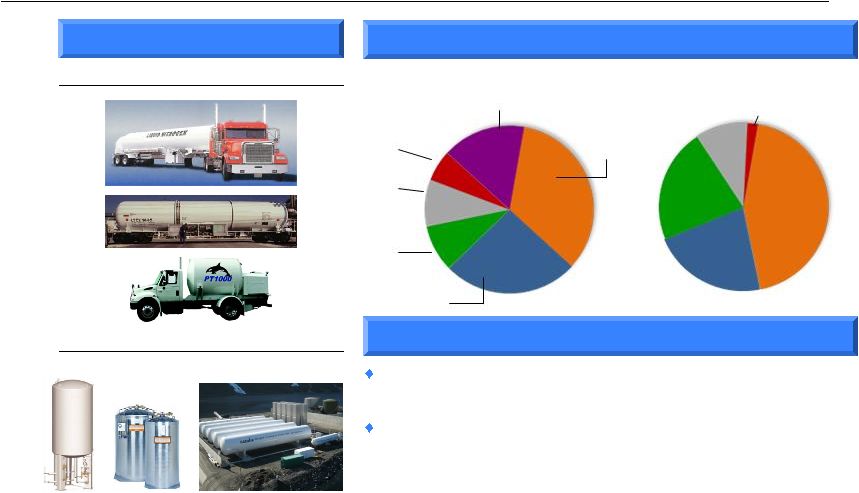 GTLS: GAS TO LIQUID SYSTEMS Distribution & Storage (D&S) Segment Overview LTM June 2012 Sales by Product / Region Highlights Balanced customer base – 46% of segment sales derived from products used in energy applications Strategic footprint – manufacturing located near growing end markets and lower-cost countries – Positioned to capitalize on strong expected growth in Asia and North America – Continued investment in key global manufacturing facilities Bulk MicroBulk Distribution Storage Selected Products Satellite LNG Storage Bulk Storage Systems 34% Packaged Gas Systems 26% VIP, Systems and Components 9% Parts, Repair and On- Site Service 9% Beverage Liquid CO Systems 6% LNG Terminals and Vehicle Fuel Systems 16% Americas (Non-US) 10% RoW 2% Asia 22% U.S. 44% Europe 22% 4 2 |
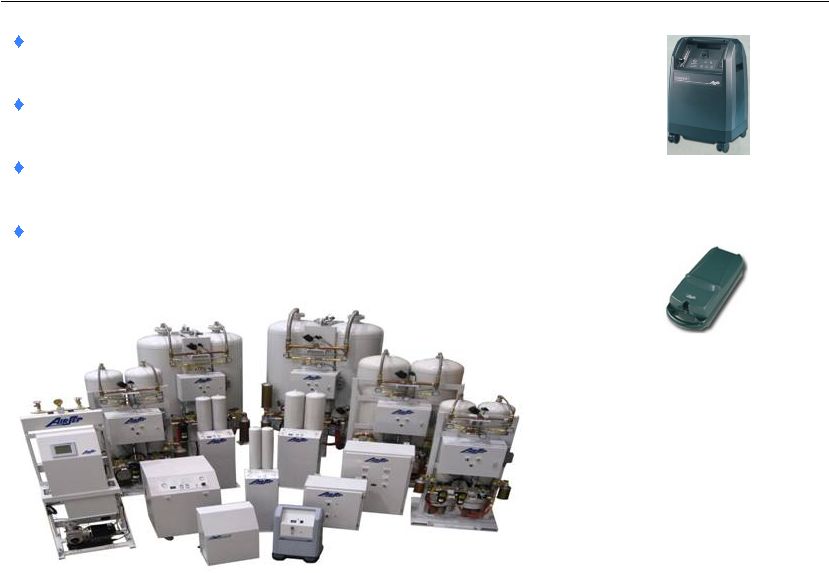
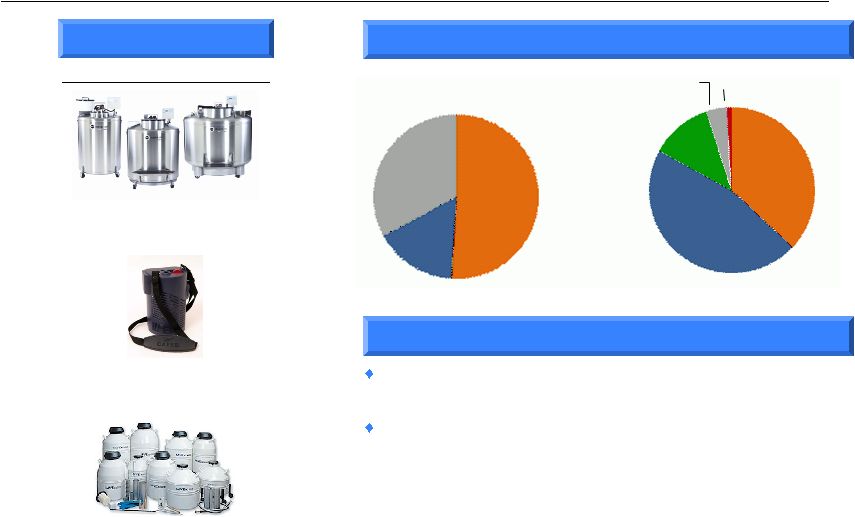 GTLS: GAS TO LIQUID SYSTEMS BioMedical Segment Overview LTM June 2012 Sales by Product / Region Highlights Strong growth – increase in oxygen respiratory therapy and biomedical research, led by international markets, expected Robust end markets include: – Home healthcare and nursing homes – Hospitals and long-term care – Biomedical and pharmaceutical research – Animal breeding Portable Oxygen Lab Storage Stainless Steel Freezer End-Use Consumption Liquid Oxygen (LOX) Therapy Systems 51% Biological Storage Systems 33% Selected Products Americas (Non-US) 4% U.S. 37% Europe 46% Asia 12% RoW 1% 5 Non-LOX Respiratory Therapy Systems 16% |
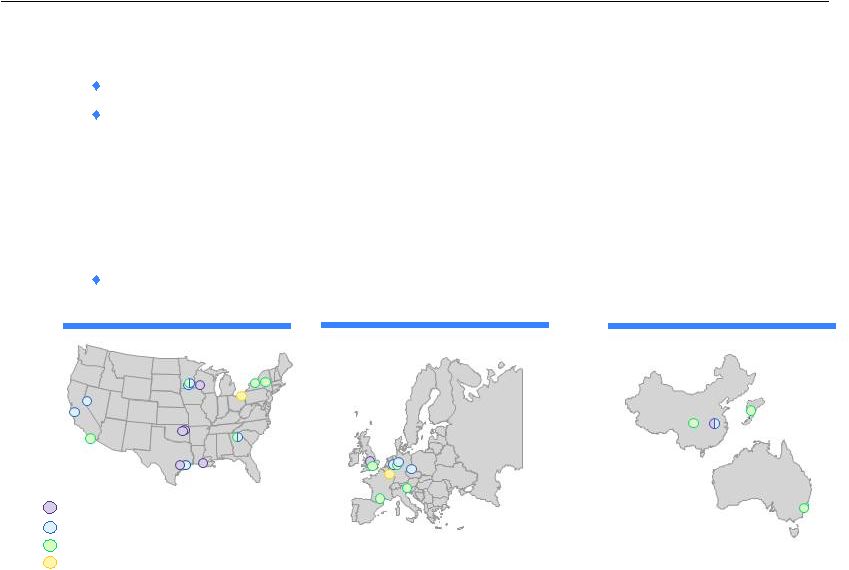 GTLS: GAS TO LIQUID SYSTEMS Global Manufacturing and Distribution Platform Operating leverage provides the flexibility to expand and reduce capacity as needed Major manufacturing locations include: China, Changzhou (D&S and E&C) and Chengdu (BioMedical) Czech Republic, Decin (D&S) Georgia, Canton, Minnesota, New Prague/Owatonna and New York, Buffalo (D&S and BioMedical) Wisconsin, La Crosse, Louisiana, New Iberia and Oklahoma, Tulsa (E&C) Expansion of facilities in China, Louisiana and Minnesota is currently in process Manufacturing facilities are strategically located in lower-cost countries and near centers of demand Corporate Energy & Chemicals Distribution & Storage BioMedical Asia-Pacific North America Europe 6 |
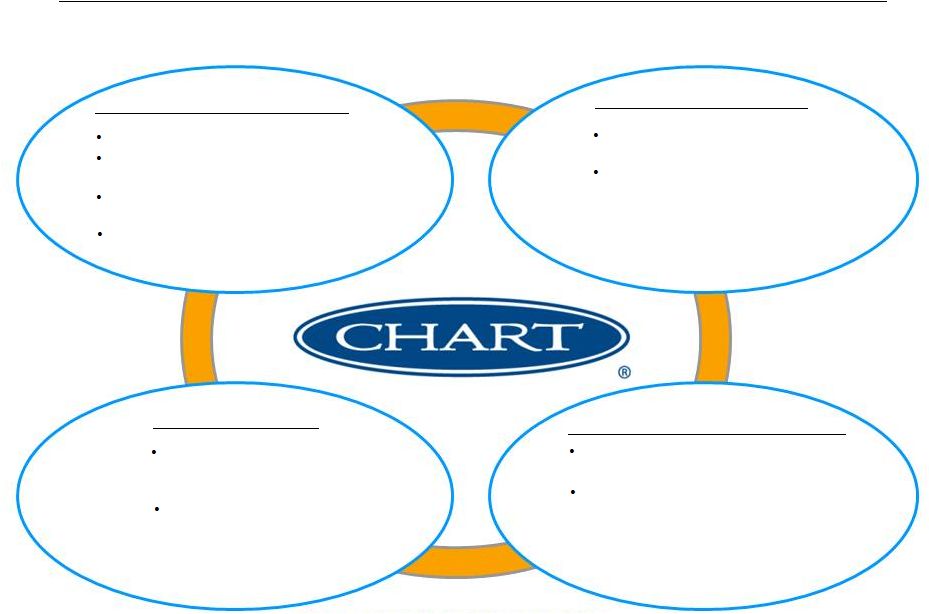
 GTLS: GAS TO LIQUID SYSTEMS Growth Opportunities 7 E&C •Global base load LNG projects • Growth in natural gas processing • Emerging market opportunities D&S •Global LNG opportunity • Strong relationships with Industrial Gas customers • Demand for Industrial Gas projected to increase 8% per year BioMedical •Aging demographics • Product expansion • Increasing biological research |
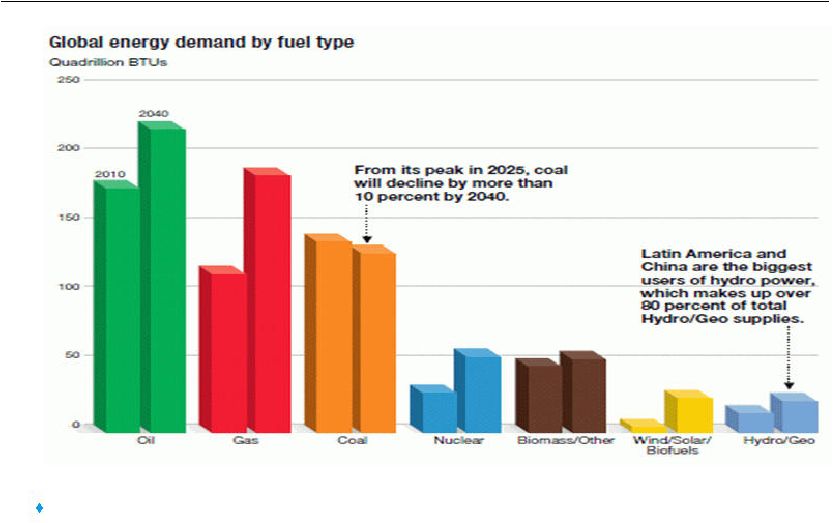 GTLS: GAS TO LIQUID SYSTEMS Global Appetite For Energy 8 Source: ExxonMobil 2012 – The Outlook for Energy, A View to 2040 Natural gas expansion – Natural gas demand is expected to continue to grow at a pace faster than coal and oil, and will be heavily weighted towards emerging economies, which is expected to drive demand for Chart’s products |
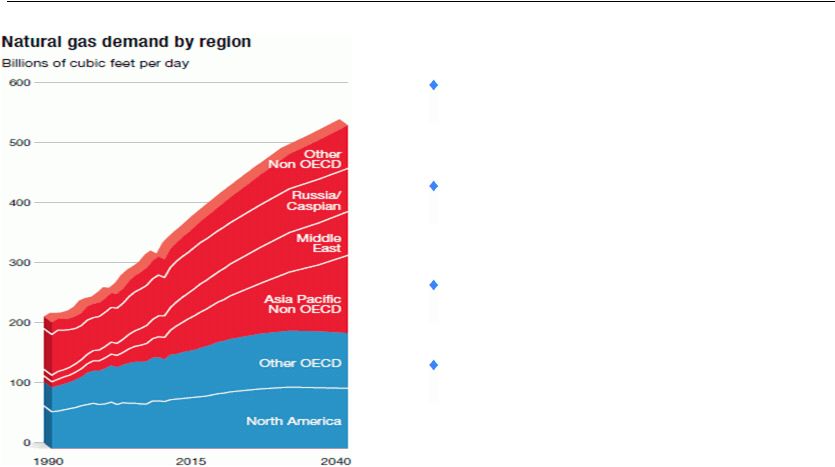 GTLS: GAS TO LIQUID SYSTEMS Natural Gas Expected To Grow Globally 9 Source: ExxonMobil 2012 – The Outlook for Energy, A View to 2040 Efforts to reduce emissions will help gas become the world’s #2 fuel overtaking coal Many applications are suited to natural gas hence it can displace oil, coal and LPG By 2040 it is estimated that 15% of global gas demand will be met by LNG Shale gas and coal mine methane are examples of unconventional gas production that is forecast to account for 30% of total gas production by 2040 |
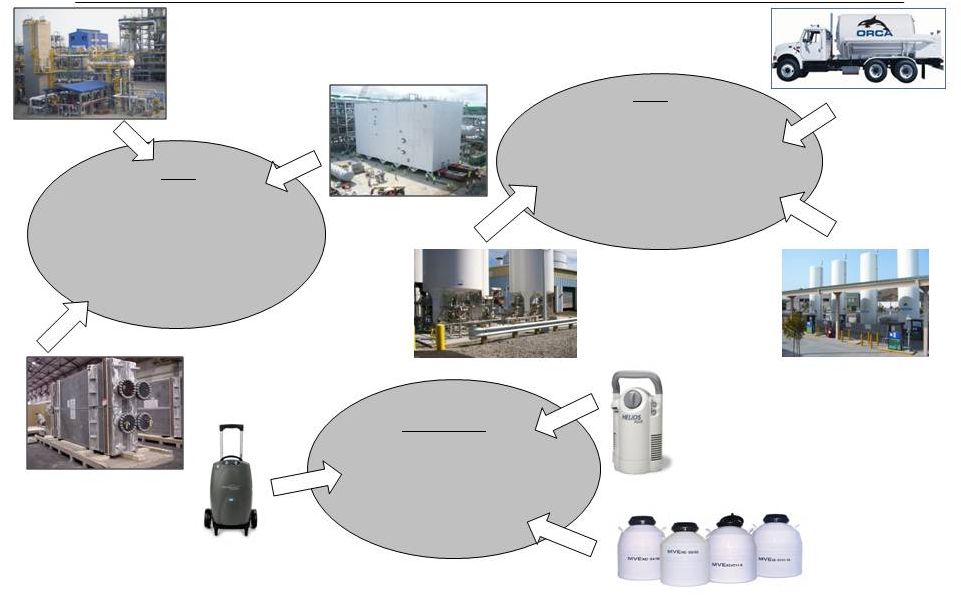
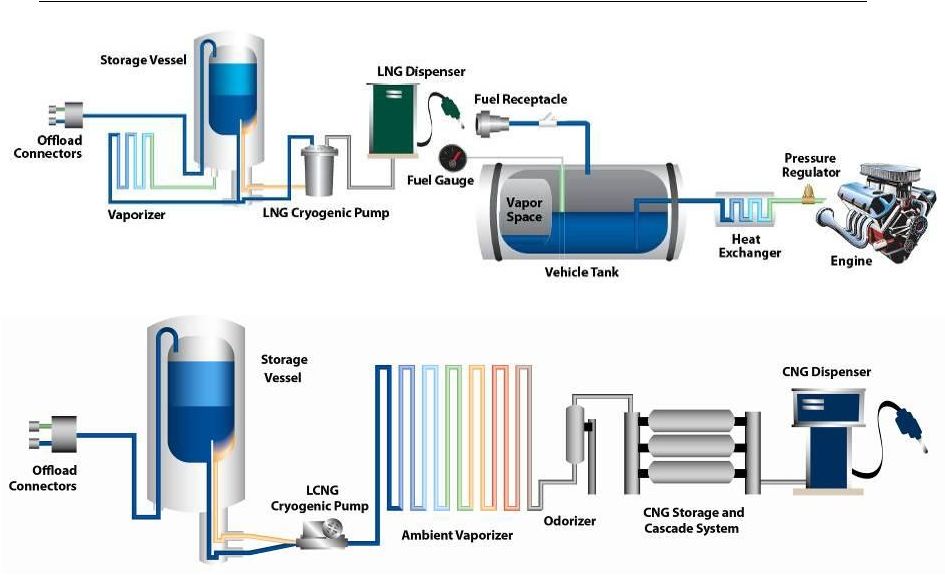
 GTLS: GAS TO LIQUID SYSTEMS LNG Value Chain Opportunities 10 Chart provides a broad offering of products and solutions for the full LNG value chain: LNG liquefiers, transportation equipment, terminal storage equipment and vehicle tanks for both on-road and off-road heavy duty vehicles and marine applications |
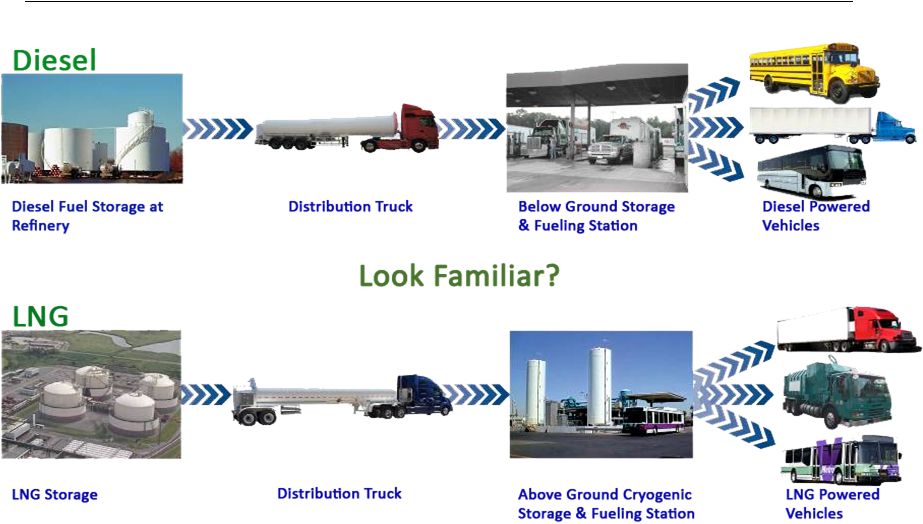 GTLS: GAS TO LIQUID SYSTEMS LNG Storage, Transportation & Delivery 11 |
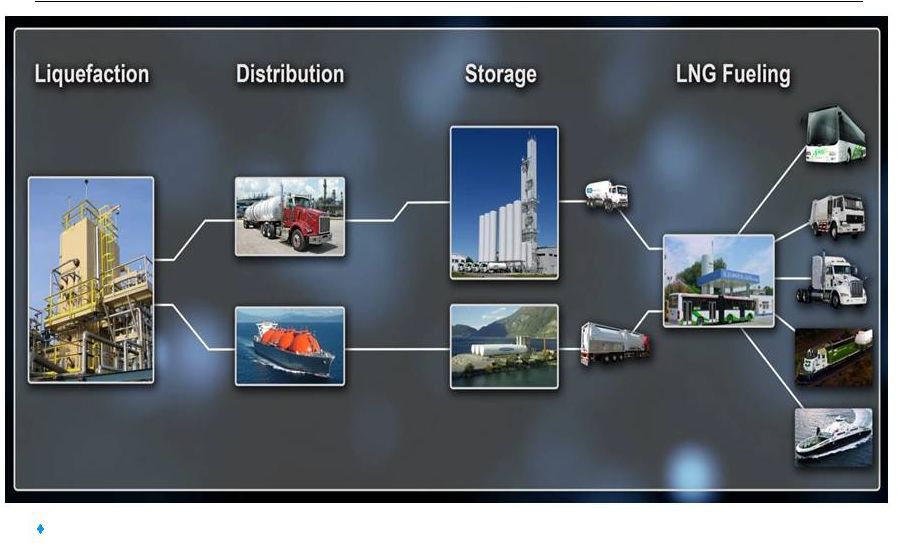
 GTLS: GAS TO LIQUID SYSTEMS LNG Fueling 12 |
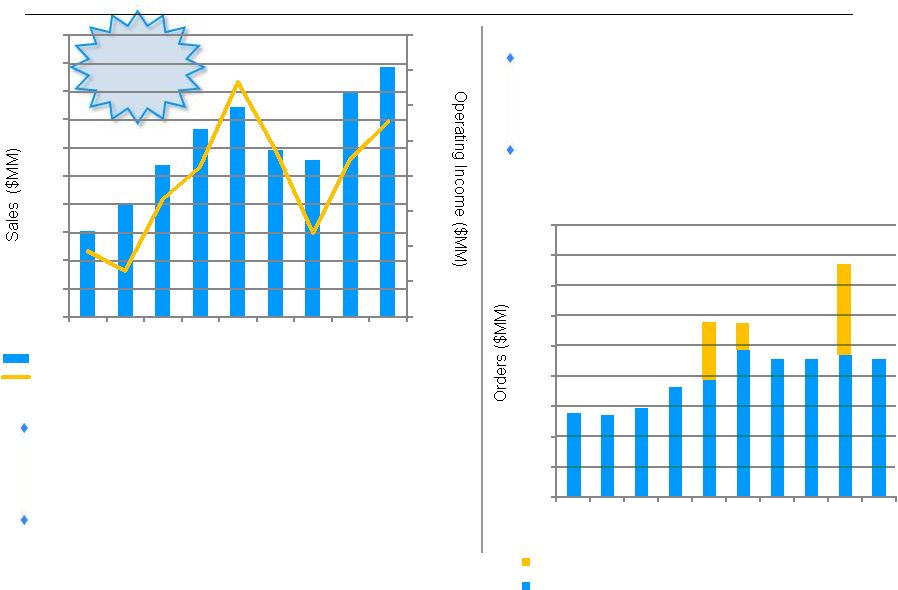 GTLS: GAS TO LIQUID SYSTEMS Strong Track Record of Successful Execution ¹Included in 2005 are non-recurring costs of $26.5 million for the acquisition of Chart Industries by First Reserve During last growth cycle Company leveraged its flexible manufacturing platform resulting in operating income growth that outpaced sales Flexible cost structure and good execution allowed for aggressive response to economic downturn resulting in higher operating income level than last cycle low point 13 Similar or higher growth, leveraged by acquisitions, expected to occur again during the current growth cycle The return of large contract orders and the improvement in base order levels have confirmed a new growth cycle 1 0 50 100 150 200 250 300 350 400 450 Q1 2010 Q2 2010 Q3 2010 Q4 2010 Q1 2011 Q2 2011 Q3 2011 Q4 2011 Q1 2012 Q2 2012 Large Contract Orders Base Orders 0 20 40 60 80 100 120 140 160 0 100 200 300 400 500 600 700 800 900 1000 2004 2005 2006 2007 2008 2009 2010 2011 LTM Jun 2012 Sales Operating Income Last Growth Cycle CAGR (2004-2008) Sales 25% Oper. Inc. 38% |
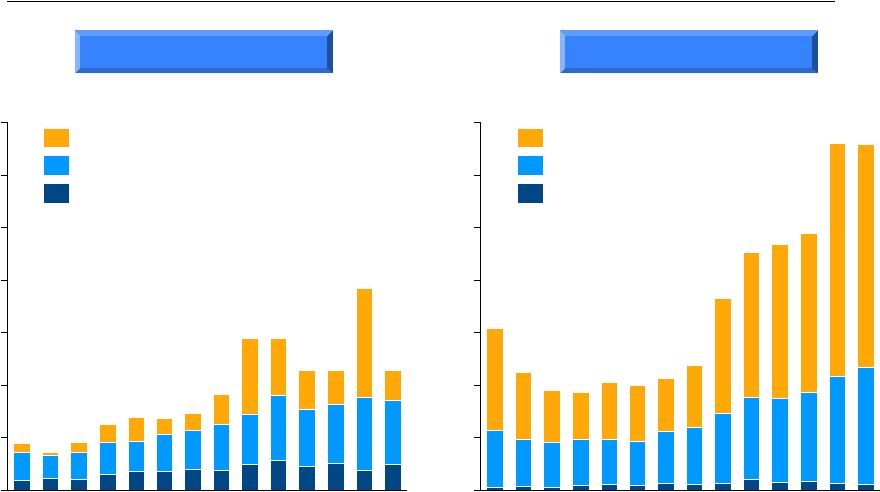 GTLS: GAS TO LIQUID SYSTEMS Historical Orders and Backlog Quarter-end Backlog ($MM) 14 Quarterly Orders ($MM) 0 100 200 300 400 500 600 700 Q3 2009 Q1 2009 Q2 2009 Q3 2010 Q4 2010 Q1 2011 Q2 2011 Q3 2011 Q4 2011 Q1 2012 Q4 2009 Q1 2010 Q2 2010 E&C D&S BioMed 0 100 200 300 400 500 600 700 Q1 2012 Q4 2011 Q3 2011 Q2 2011 Q1 2011 Q4 2010 Q3 2010 Q2 2010 Q1 2010 Q4 2009 Q3 2009 Q2 2009 Q1 2009 D&S E&C BioMed Q2 2012 Q2 2012 |
 GTLS: GAS TO LIQUID SYSTEMS AirSep Acquisition 15 Closed acquisition of AirSep Corporation in August 2012 for $170 million in cash and $10 million payoff of debt Extends Chart’s BioMedical product offerings and distribution network Adds approximately $130 million in annual revenues and will be accretive to earnings after acquisition related costs Represents an attractive and stable complement to Chart’s large and rapidly growing energy business |
 GTLS: GAS TO LIQUID SYSTEMS Summary of Investment Highlights 16 Chart continues to represent a unique investment opportunity to capitalize on global energy demand, growth in natural gas and LNG use, and a growing biomedical business Positioned for Significant Growth Exploit LNG and NG growth Opportunities with global infrastructure build-out New product development and innovation Expanded new business and inorganic pipeline Very Stable Business Model Attractive industry with long-term customer relationships Solid platform with worldwide presence and leading industry positions in all segments Strong Balance Sheet Strong organic earnings should provide substantial free cash flow and liquidity Permit continued accretive organic and inorganic growth Flexible / Low Cost Capital Structure 7 yr. $250 million convertible notes - 2% cash interest cost Increased senior credit facility, which includes $300 million revolving credit facility, adding significant liquidity |