united states
securities and exchange commission
washington, d.c. 20549
form n-csr
certified shareholder report of registered management
investment companies
Investment Company Act file number 811-07254
Johnson Mutual Funds Trust
(Exact name of registrant as specified in charter)
3777 West Fork Road, Cincinnati, Ohio 45247
(Address of principal executive offices) (Zip code)
Jennifer Kelhoffer, Treasurer, 3777 West Fork Road, Cincinnati, Ohio 45247
(Name and address of agent for service)
Registrant’s telephone number, including area code (513) 661-3100
Date of fiscal year end: December 31
Date of reporting period: June 30, 2024
Form N-CSR is to be used by management investment companies to file reports with the Commission not later than 10 days after the transmission to stockholders of any report that is required to be transmitted to stockholders under Rule 30e-1 under the Investment Company Act of 1940 (17 CFR 270.30e-1). The Commission may use the information provided on Form N-CSR in its regulatory, disclosure review, inspection and policymaking roles.
A registrant is required to disclose the information specified by Form N-CSR, and the Commission will make this information public. A registrant is not required to respond to the collection of information contained in Form N-CSR unless the Form displays a currently valid Office of Management and Budget (“OMB”) control number. Please direct comments concerning the accuracy of the information collection burden estimate and any suggestions for reducing the burden to Secretary, Securities and Exchange Commission, 450 Fifth Street, NW, Washington, DC 20549-0609. The OMB has reviewed this collection of information under the clearance requirements of 44 U.S.C. § 3507.
| Item 1. | Reports to Stockholders. |
Johnson Equity Income Fund
Semi-Annual Shareholder Report - June 30, 2024
This semi-annual shareholder report contains important information about Johnson Equity Income Fund for the period of January 1, 2024 to June 30, 2024. You can find additional information about the Fund at www.johnsoninv.com/mutualfunds. You can also request this information by contacting us at (800) 541-0170.
What were the Fund’s costs for the last six months?
(based on a hypothetical $10,000 investment)
| Class Name | Costs of a $10,000 investment | Costs paid as a percentage of a $10,000 investment |
|---|
| Class I | $37 | 0.75% |
How did the Fund perform during the reporting period?
The Johnson Equity Income Fund’s 2024 under performance relative to its benchmark, the S&P 500 Index, thus far reflects a continuation of the mega-cap, growth-oriented themes the stock market exhibited in 2023.
Both sector allocation and stock selection contributed to the Fund’s underperformance. The Fund was meaningfully underweight in both Technology and Communication Services sectors, which were the only two sectors to outperform the Index through the first six months of 2024. This was partially offset by underweight positions in Materials and Consumer Discretionary, which underperformed the Index.
Given the historic concentration of the current S&P 500 Index, the Fund’s relative returns were driven as much by what we did not own as what we owned versus the Index. NVIDIA and Meta, which we do not own, represented meaningful detractors for the Index. Also, avoiding names such as Tesla was beneficial to the Fund’s performance as the stock had negative returns for the first six months of the year. The Fund also benefited from a few standout performers. Taiwan Semiconductor provided the largest positive contribution among the Fund’s holdings following a strong start for the semiconductor industry in the first half of 2024. Amphenol also performed strongly on expectations of a robust ramp in the IT and Datacom business from increased datacenter connections.
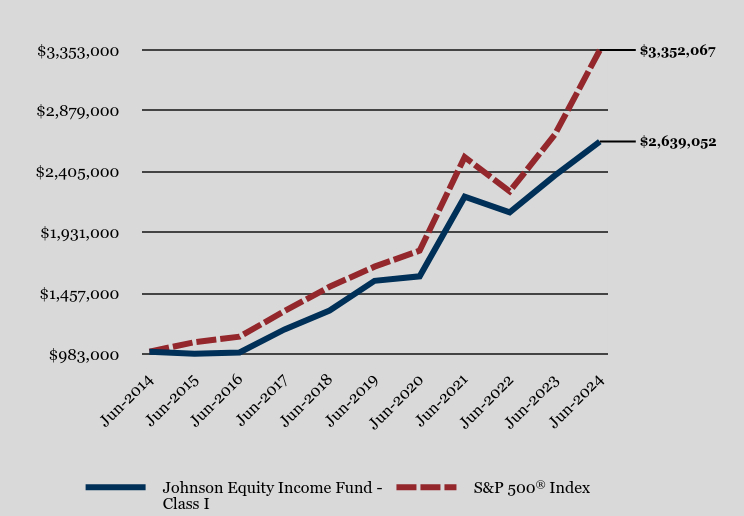
How has the Fund performed over the last ten years?
Total Return Based on $1,000,000 Investment
| Johnson Equity Income Fund - Class I | S&P 500® Index |
|---|
| Jun-2014 | $1,000,000 | $1,000,000 |
| Jun-2015 | $983,679 | $1,074,228 |
| Jun-2016 | $993,992 | $1,117,118 |
| Jun-2017 | $1,173,772 | $1,317,038 |
| Jun-2018 | $1,320,787 | $1,506,351 |
| Jun-2019 | $1,552,552 | $1,663,274 |
| Jun-2020 | $1,587,615 | $1,788,103 |
| Jun-2021 | $2,208,602 | $2,517,545 |
| Jun-2022 | $2,086,837 | $2,250,288 |
| Jun-2023 | $2,372,922 | $2,691,210 |
| Jun-2024 | $2,639,052 | $3,352,067 |
Average Annual Total Returns
| 1 Year | 5 Years | 10 Years |
|---|
| Johnson Equity Income Fund - Class I | 11.22% | 11.19% | 10.19% |
S&P 500® Index | 24.56% | 15.05% | 12.86% |
The Fund's past performance is not a good predictor of how the Fund will perform in the future. The graph and table do not reflect the deduction of taxes that a shareholder would pay on fund distributions or redemption of fund shares.
- Net Assets$640,493,260
- Number of Portfolio Holdings51
- Advisory Fee $2,353,548
- Portfolio Turnover7%
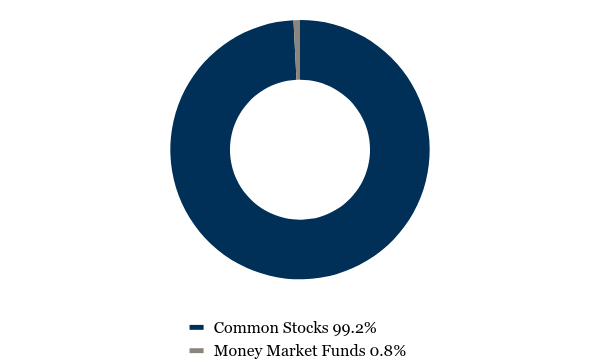
Asset Weighting (% of total investments)
| Value | Value |
|---|
| Common Stocks | 99.2% |
| Money Market Funds | 0.8% |
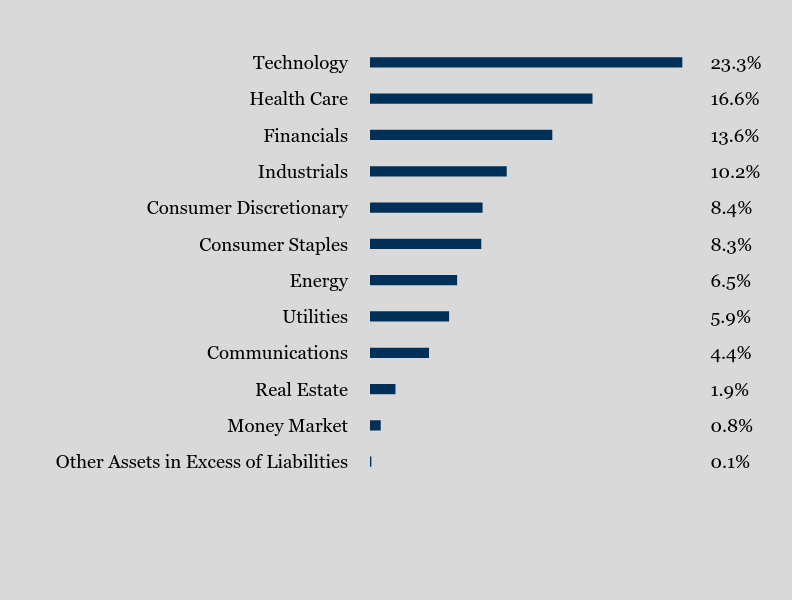
What did the Fund invest in?
Sector Weighting (% of net assets)
| Value | Value |
|---|
| Other Assets in Excess of Liabilities | 0.1% |
| Money Market | 0.8% |
| Real Estate | 1.9% |
| Communications | 4.4% |
| Utilities | 5.9% |
| Energy | 6.5% |
| Consumer Staples | 8.3% |
| Consumer Discretionary | 8.4% |
| Industrials | 10.2% |
| Financials | 13.6% |
| Health Care | 16.6% |
| Technology | 23.3% |
Top 10 Holdings (% of net assets)
| Holding Name | % of Net Assets |
| Microsoft Corp. | 4.2% |
| Williams Cos., Inc. (The) | 3.4% |
| Alphabet, Inc. - Class A | 3.4% |
| Nasdaq, Inc. | 3.3% |
| American Electric Power Co., Inc. | 3.1% |
| Chevron Corp. | 3.1% |
| UnitedHealth Group, Inc. | 3.1% |
| Danaher Corp. | 2.9% |
| Alliant Energy Corp. | 2.8% |
| Cencora, Inc. | 2.8% |
No material changes occurred during the period ended June 30, 2024.
Johnson Equity Income Fund - Class I (JEQIX)
Semi-Annual Shareholder Report - June 30, 2024
Where can I find additional information about the Fund?
Additional information is available on the Fund's website (www.johnsoninv.com/mutualfunds), including its:
Prospectus
Financial information
Holdings
Proxy voting information
Johnson Equity Income Fund
Semi-Annual Shareholder Report - June 30, 2024
This semi-annual shareholder report contains important information about Johnson Equity Income Fund for the period of January 1, 2024 to June 30, 2024. You can find additional information about the Fund at www.johnsoninv.com/mutualfunds. You can also request this information by contacting us at (800) 541-0170.
What were the Fund’s costs for the last six months?
(based on a hypothetical $10,000 investment)
| Class Name | Costs of a $10,000 investment | Costs paid as a percentage of a $10,000 investment |
|---|
| Class S | $50 | 1.00% |
How did the Fund perform during the reporting period?
The Johnson Equity Income Fund’s 2024 under performance relative to its benchmark, the S&P 500 Index, thus far reflects a continuation of the mega-cap, growth-oriented themes the stock market exhibited in 2023.
Both sector allocation and stock selection contributed to the Fund’s underperformance. The Fund was meaningfully underweight in both Technology and Communication Services sectors, which were the only two sectors to outperform the Index through the first six months of 2024. This was partially offset by underweight positions in Materials and Consumer Discretionary, which underperformed the Index.
Given the historic concentration of the current S&P 500 Index, the Fund’s relative returns were driven as much by what we did not own as what we owned versus the Index. NVIDIA and Meta, which we do not own, represented meaningful detractors for the Index. Also, avoiding names such as Tesla was beneficial to the Fund’s performance as the stock had negative returns for the first six months of the year. The Fund also benefited from a few standout performers. Taiwan Semiconductor provided the largest positive contribution among the Fund’s holdings following a strong start for the semiconductor industry in the first half of 2024. Amphenol also performed strongly on expectations of a robust ramp in the IT and Datacom business from increased datacenter connections.
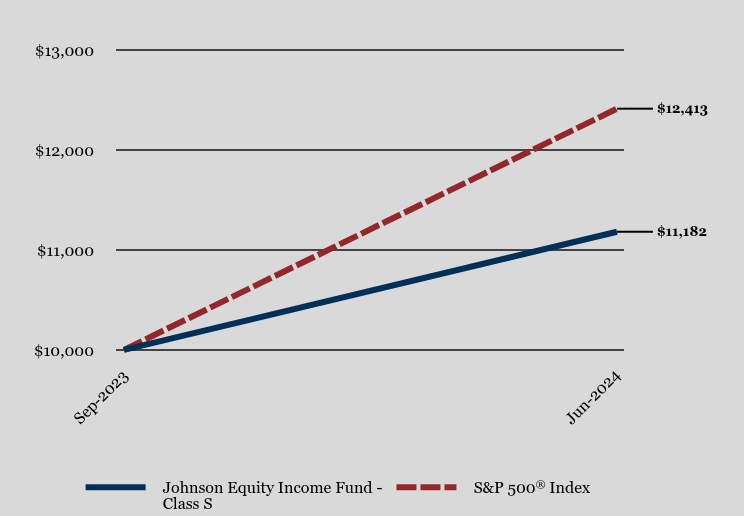
How has the Fund performed since inception?
Total Return Based on $10,000 Investment
| Johnson Equity Income Fund - Class S | S&P 500® Index |
|---|
| Sep-2023 | $10,000 | $10,000 |
| Jun-2024 | $11,182 | $12,413 |
Average Annual Total Returns
| Since Inception (September 15, 2023) |
|---|
| Johnson Equity Income Fund - Class S | 11.82% |
S&P 500® Index | 24.13% |
The Fund's past performance is not a good predictor of how the Fund will perform in the future. The graph and table do not reflect the deduction of taxes that a shareholder would pay on fund distributions or redemption of fund shares.
- Net Assets$640,493,260
- Number of Portfolio Holdings51
- Advisory Fee $2,353,548
- Portfolio Turnover7%
Asset Weighting (% of total investments)
| Value | Value |
|---|
| Common Stocks | 99.2% |
| Money Market Funds | 0.8% |
What did the Fund invest in?
Sector Weighting (% of net assets)
| Value | Value |
|---|
| Other Assets in Excess of Liabilities | 0.1% |
| Money Market | 0.8% |
| Real Estate | 1.9% |
| Communications | 4.4% |
| Utilities | 5.9% |
| Energy | 6.5% |
| Consumer Staples | 8.3% |
| Consumer Discretionary | 8.4% |
| Industrials | 10.2% |
| Financials | 13.6% |
| Health Care | 16.6% |
| Technology | 23.3% |
Top 10 Holdings (% of net assets)
| Holding Name | % of Net Assets |
| Microsoft Corp. | 4.2% |
| Williams Cos., Inc. (The) | 3.4% |
| Alphabet, Inc. - Class A | 3.4% |
| Nasdaq, Inc. | 3.3% |
| American Electric Power Co., Inc. | 3.1% |
| Chevron Corp. | 3.1% |
| UnitedHealth Group, Inc. | 3.1% |
| Danaher Corp. | 2.9% |
| Alliant Energy Corp. | 2.8% |
| Cencora, Inc. | 2.8% |
No material changes occurred during the period ended June 30, 2024.
Johnson Equity Income Fund - Class S (JEQSX)
Semi-Annual Shareholder Report - June 30, 2024
Where can I find additional information about the Fund?
Additional information is available on the Fund's website (www.johnsoninv.com/mutualfunds), including its:
Prospectus
Financial information
Holdings
Proxy voting information
Semi-Annual Shareholder Report - June 30, 2024
This semi-annual shareholder report contains important information about Johnson Opportunity Fund for the period of January 1, 2024 to June 30, 2024. You can find additional information about the Fund at www.johnsoninv.com/mutualfunds. You can also request this information by contacting us at (800) 541-0170.
What were the Fund’s costs for the last six months?
(based on a hypothetical $10,000 investment)
| Class Name | Costs of a $10,000 investment | Costs paid as a percentage of a $10,000 investment |
|---|
| Class I | $45 | 0.90% |
How did the Fund perform during the reporting period?
The Johnson Opportunity Fund outperformed its benchmark, the Russell 2500 Index, in the first 6 months of 2024. Large cap indexes, which are highly concentrated in technology stocks, reached all-time highs, but most small and midcap stocks sputtered as the first half progressed. Worsening economic data and a delay in the Federal Reserve’s plan to cut interest rates contributed to SMID cap stocks weakening in the second quarter of 2024 after a positive gain in the first quarter.
The top two performing sectors in the six-month period for the SMID Cap market were Utilities and Energy, with optimism for a growth opportunity in meeting the massive power needs of data centers as artificial intelligence technology growth booms. Due to high valuations for AI-related growth stocks, the Fund’s exposure to that theme has been more limited. Nevertheless, overall performance did benefit from both sector allocation and security selection, with each having a positive impact in seven of the eleven sectors.
It was a diverse group of winners, with six different sectors represented within the top ten positive contributors. Williams-Sonoma and LeMaitre Vascular, which both had total returns greater than 40%, were the biggest gainers. Security selection within Consumer Discretionary and Financials was also additive to performance.
Economic cycle concerns or missed growth expectations contributed to weakness in the Fund’s bottom performers. Technology was the most challenging sector for security selection and DoubleVerify Holdings was the Fund’s worst performer as the company reset growth forecasts lower. Four of the ten most negative contributors were in Health Care as the sector continued to work through a bumpy growth path following the COVID pandemic disruption.
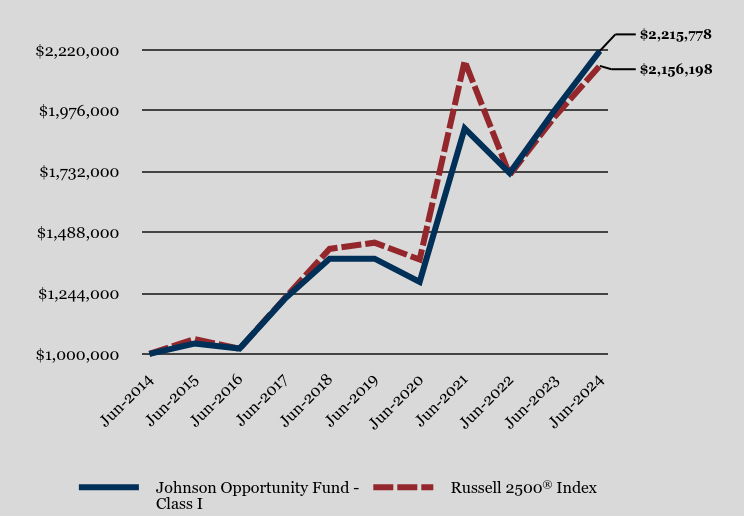
How has the Fund performed over the last ten years?
Total Return Based on $1,000,000 Investment
| Johnson Opportunity Fund - Class I | Russell 2500® Index |
|---|
| Jun-2014 | $1,000,000 | $1,000,000 |
| Jun-2015 | $1,041,286 | $1,059,194 |
| Jun-2016 | $1,021,475 | $1,020,323 |
| Jun-2017 | $1,219,739 | $1,222,767 |
| Jun-2018 | $1,382,216 | $1,421,379 |
| Jun-2019 | $1,382,262 | $1,446,503 |
| Jun-2020 | $1,288,681 | $1,378,547 |
| Jun-2021 | $1,905,196 | $2,175,226 |
| Jun-2022 | $1,725,890 | $1,718,487 |
| Jun-2023 | $1,977,998 | $1,951,863 |
| Jun-2024 | $2,215,778 | $2,156,198 |
Average Annual Total Returns
| 1 Year | 5 Years | 10 Years |
|---|
| Johnson Opportunity Fund - Class I | 12.02% | 9.90% | 8.28% |
Russell 2500® Index | 10.47% | 8.31% | 7.99% |
The Fund's past performance is not a good predictor of how the Fund will perform in the future. The graph and table do not reflect the deduction of taxes that a shareholder would pay on fund distributions or redemption of fund shares.
- Net Assets$153,815,721
- Number of Portfolio Holdings81
- Advisory Fee $654,224
- Portfolio Turnover7%
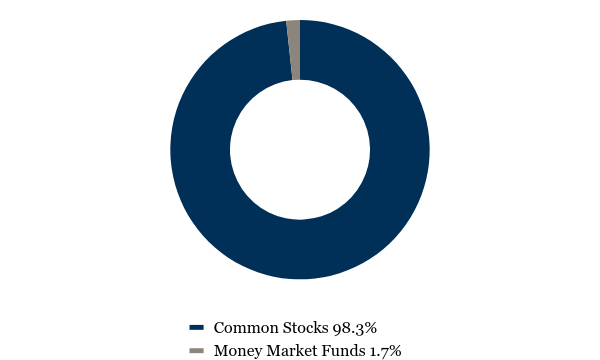
Asset Weighting (% of total investments)
| Value | Value |
|---|
| Common Stocks | 98.3% |
| Money Market Funds | 1.7% |
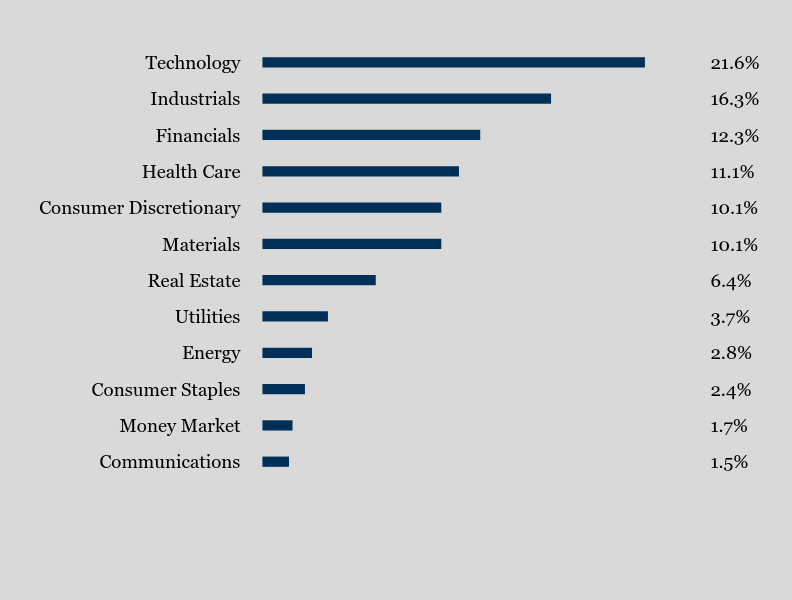
What did the Fund invest in?
Sector Weighting (% of net assets)
| Value | Value |
|---|
| Communications | 1.5% |
| Money Market | 1.7% |
| Consumer Staples | 2.4% |
| Energy | 2.8% |
| Utilities | 3.7% |
| Real Estate | 6.4% |
| Materials | 10.1% |
| Consumer Discretionary | 10.1% |
| Health Care | 11.1% |
| Financials | 12.3% |
| Industrials | 16.3% |
| Technology | 21.6% |
Top 10 Holdings (% of net assets)
| Holding Name | % of Net Assets |
| Hawkins, Inc. | 2.0% |
| Axis Capital Holdings Ltd. | 2.0% |
| Wintrust Financial Corp. | 1.9% |
| Leidos Holdings, Inc. | 1.9% |
| Applied Industrial Technologies, Inc. | 1.9% |
| H.B. Fuller Co. | 1.8% |
| Tyler Technologies, Inc. | 1.7% |
| American Financial Group, Inc. | 1.7% |
| Unitil Corp. | 1.7% |
| Everest Group Ltd. | 1.7% |
No material changes occurred during the period ended June 30, 2024.
Johnson Opportunity Fund - Class I (JOPPX)
Semi-Annual Shareholder Report - June 30, 2024
Where can I find additional information about the Fund?
Additional information is available on the Fund's website (www.johnsoninv.com/mutualfunds), including its:
Prospectus
Financial information
Holdings
Proxy voting information
Semi-Annual Shareholder Report - June 30, 2024
This semi-annual shareholder report contains important information about Johnson Opportunity Fund for the period of January 1, 2024 to June 30, 2024. You can find additional information about the Fund at www.johnsoninv.com/mutualfunds. You can also request this information by contacting us at (800) 541-0170.
What were the Fund’s costs for the last six months?
(based on a hypothetical $10,000 investment)
| Class Name | Costs of a $10,000 investment | Costs paid as a percentage of a $10,000 investment |
|---|
| Class S | $57 | 1.15% |
How did the Fund perform during the reporting period?
The Johnson Opportunity Fund outperformed its benchmark, the Russell 2500 Index, in the first 6 months of 2024. Large cap indexes, which are highly concentrated in technology stocks, reached all-time highs, but most small and midcap stocks sputtered as the first half progressed. Worsening economic data and a delay in the Federal Reserve’s plan to cut interest rates contributed to SMID cap stocks weakening in the second quarter of 2024 after a positive gain in the first quarter.
The top two performing sectors in the six-month period for the SMID Cap market were Utilities and Energy, with optimism for a growth opportunity in meeting the massive power needs of data centers as artificial intelligence technology growth booms. Due to high valuations for AI-related growth stocks, the Fund’s exposure to that theme has been more limited. Nevertheless, overall performance did benefit from both sector allocation and security selection, with each having a positive impact in seven of the eleven sectors.
It was a diverse group of winners, with six different sectors represented within the top ten positive contributors. Williams-Sonoma and LeMaitre Vascular, which both had total returns greater than 40%, were the biggest gainers. Security selection within Consumer Discretionary and Financials was also additive to performance.
Economic cycle concerns or missed growth expectations contributed to weakness in the Fund’s bottom performers. Technology was the most challenging sector for security selection and DoubleVerify Holdings was the Fund’s worst performer as the company reset growth forecasts lower. Four of the ten most negative contributors were in Health Care as the sector continued to work through a bumpy growth path following the COVID pandemic disruption.
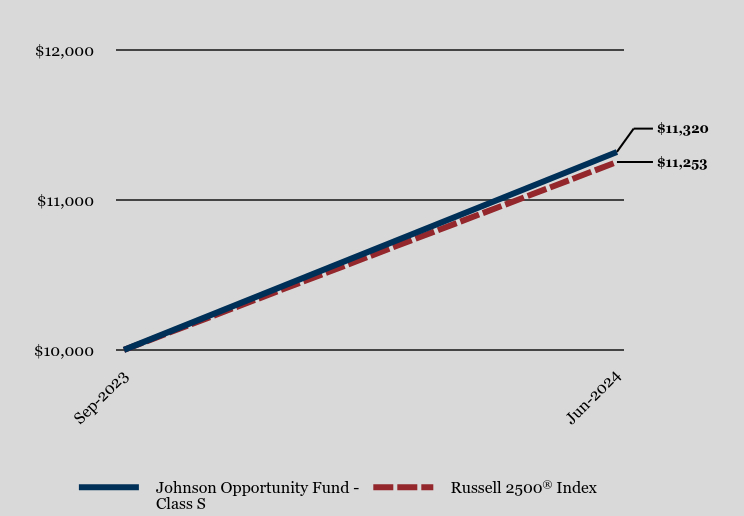
How has the Fund performed since inception?
Total Return Based on $10,000 Investment
| Johnson Opportunity Fund - Class S | Russell 2500® Index |
|---|
| Sep-2023 | $10,000 | $10,000 |
| Jun-2024 | $11,320 | $11,253 |
Average Annual Total Returns
| Since Inception (September 15, 2023) |
|---|
| Johnson Opportunity Fund - Class S | 13.20% |
Russell 2500® Index | 12.53% |
The Fund's past performance is not a good predictor of how the Fund will perform in the future. The graph and table do not reflect the deduction of taxes that a shareholder would pay on fund distributions or redemption of fund shares.
- Net Assets$153,815,721
- Number of Portfolio Holdings81
- Advisory Fee $654,224
- Portfolio Turnover7%
Asset Weighting (% of total investments)
| Value | Value |
|---|
| Common Stocks | 98.3% |
| Money Market Funds | 1.7% |
What did the Fund invest in?
Sector Weighting (% of net assets)
| Value | Value |
|---|
| Communications | 1.5% |
| Money Market | 1.7% |
| Consumer Staples | 2.4% |
| Energy | 2.8% |
| Utilities | 3.7% |
| Real Estate | 6.4% |
| Materials | 10.1% |
| Consumer Discretionary | 10.1% |
| Health Care | 11.1% |
| Financials | 12.3% |
| Industrials | 16.3% |
| Technology | 21.6% |
Top 10 Holdings (% of net assets)
| Holding Name | % of Net Assets |
| Hawkins, Inc. | 2.0% |
| Axis Capital Holdings Ltd. | 2.0% |
| Wintrust Financial Corp. | 1.9% |
| Leidos Holdings, Inc. | 1.9% |
| Applied Industrial Technologies, Inc. | 1.9% |
| H.B. Fuller Co. | 1.8% |
| Tyler Technologies, Inc. | 1.7% |
| American Financial Group, Inc. | 1.7% |
| Unitil Corp. | 1.7% |
| Everest Group Ltd. | 1.7% |
No material changes occurred during the period ended June 30, 2024.
Johnson Opportunity Fund - Class S (JOSSX)
Semi-Annual Shareholder Report - June 30, 2024
Where can I find additional information about the Fund?
Additional information is available on the Fund's website (www.johnsoninv.com/mutualfunds), including its:
Prospectus
Financial information
Holdings
Proxy voting information
Johnson International Fund
Semi-Annual Shareholder Report - June 30, 2024
This semi-annual shareholder report contains important information about Johnson International Fund for the period of January 1, 2024 to June 30, 2024. You can find additional information about the Fund at www.johnsoninv.com/mutualfunds. You can also request this information by contacting us at (800) 541-0170.
What were the Fund’s costs for the last six months?
(based on a hypothetical $10,000 investment)
| Fund Name | Costs of a $10,000 investment | Costs paid as a percentage of a $10,000 investment |
|---|
| Johnson International Fund | $50 | 1.00% |
How did the Fund perform during the reporting period?
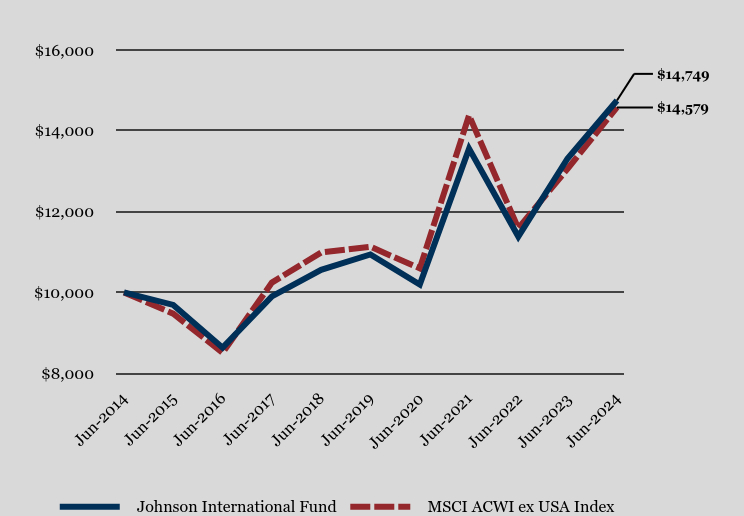
The Johnson International Fund underperformed its benchmark, the MSCI ACWI ex-US Index through the first 6 months of 2024. Local currency returns were better, but a strong U.S. Dollar weakened returns for a US investor by five percentage points. Sector and and country allocations were both slight positive effects, thus the Fund’s relative underperformance can be attributed to security selection.
Emerging markets were stronger than developed markets, driven by very strong returns in Southeast Asian countries. This geographic area is a key supplier of semiconductors and technology equipment, important to booming secular growth in artificial intelligence and other advanced technologies. The Technology sector was the top performer in the first half, and Taiwan Semiconductor, up 68%, was the Fund’s highest return stock. An overweight position in the outperforming Asia Pacific region was beneficial, and six of the Fund’s ten best performers were in that area.
The Fund was less exposed to the risk factors driving the market, including momentum, liquidity, and growth. Five of its best performers were in the Financials sector, but every other sector had a negative security selection effect. Three of the Fund’s worst performers were Materials companies: Companhia Siderurgica Nacional, POSCO Holdings, and Vale. After ending last year at cycle highs, steel prices declined as inflation pressures eased, reducing forward earnings estimates.
How has the Fund performed over the last ten years?
Total Return Based on $10,000 Investment
| Johnson International Fund | MSCI ACWI ex USA Index |
|---|
| Jun-2014 | $10,000 | $10,000 |
| Jun-2015 | $9,690 | $9,474 |
| Jun-2016 | $8,632 | $8,504 |
| Jun-2017 | $9,900 | $10,243 |
| Jun-2018 | $10,559 | $10,988 |
| Jun-2019 | $10,938 | $11,130 |
| Jun-2020 | $10,194 | $10,595 |
| Jun-2021 | $13,559 | $14,380 |
| Jun-2022 | $11,383 | $11,587 |
| Jun-2023 | $13,315 | $13,061 |
| Jun-2024 | $14,749 | $14,579 |
Average Annual Total Returns
| 1 Year | 5 Years | 10 Years |
|---|
| Johnson International Fund | 10.77% | 6.16% | 3.96% |
| MSCI ACWI ex USA Index | 11.62% | 5.55% | 3.84% |
The Fund's past performance is not a good predictor of how the Fund will perform in the future. The graph and table do not reflect the deduction of taxes that a shareholder would pay on fund distributions or redemption of fund shares.
- Net Assets$23,812,817
- Number of Portfolio Holdings94
- Advisory Fee $120,529
- Portfolio Turnover5%
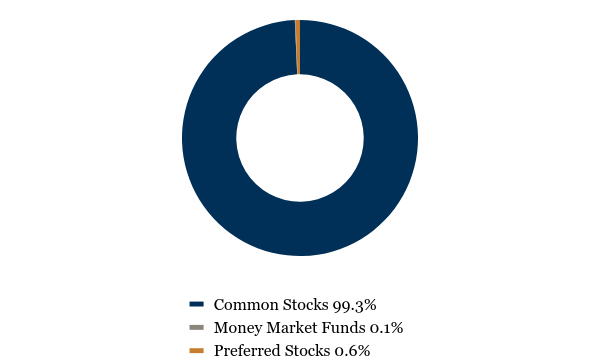
Asset Weighting (% of total investments)
| Value | Value |
|---|
| Common Stocks | 99.3% |
| Money Market Funds | 0.1% |
| Preferred Stocks | 0.6% |
What did the Fund invest in?
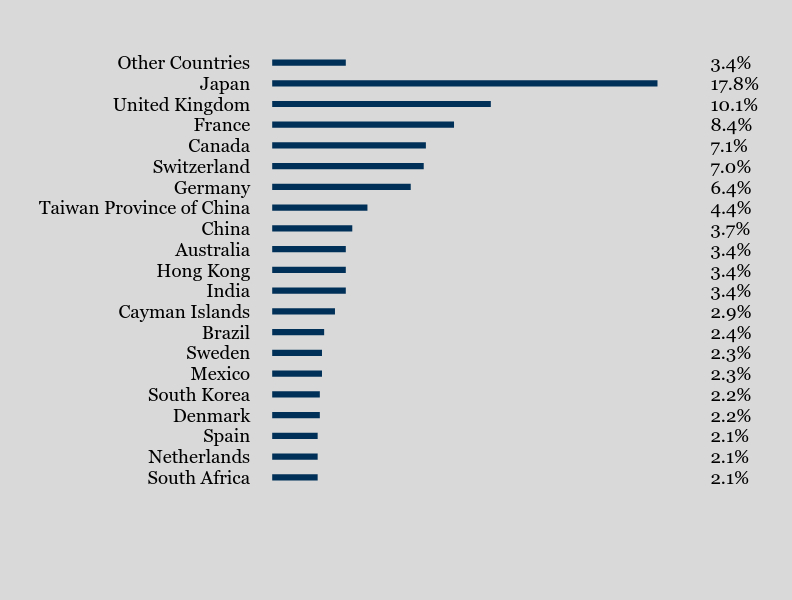
Country Weighting (% of net assets)
| Value | Value |
|---|
| South Africa | 2.1% |
| Netherlands | 2.1% |
| Spain | 2.1% |
| Denmark | 2.2% |
| South Korea | 2.2% |
| Mexico | 2.3% |
| Sweden | 2.3% |
| Brazil | 2.4% |
| Cayman Islands | 2.9% |
| India | 3.4% |
| Hong Kong | 3.4% |
| Australia | 3.4% |
| China | 3.7% |
| Taiwan Province of China | 4.4% |
| Germany | 6.4% |
| Switzerland | 7.0% |
| Canada | 7.1% |
| France | 8.4% |
| United Kingdom | 10.1% |
| Japan | 17.8% |
| Other Countries | 3.4% |
Top 10 Holdings (% of net assets)
| Holding Name | % of Net Assets |
| Tokio Marine Holdings, Inc. - ADR | 2.5% |
| Taiwan Semiconductor Manufacturing Co. Ltd. - ADR | 2.3% |
| Sumitomo Mitsui Financial Group, Inc. - ADR | 2.3% |
| Atlas Copco AB - ADR | 2.3% |
| Novo Nordisk A/S - ADR | 2.2% |
| Roche Holding AG - ADR | 2.2% |
| ASML Holding N.V. | 2.1% |
| Lenovo Group Ltd. - ADR | 2.1% |
| Shoprite Holdings Ltd. - ADR | 2.1% |
| Tencent Holdings Ltd. - ADR | 2.1% |
No material changes occurred during the period ended June 30, 2024.
Johnson International Fund (JINTX)
Semi-Annual Shareholder Report - June 30, 2024
Where can I find additional information about the Fund?
Additional information is available on the Fund's website (www.johnsoninv.com/mutualfunds), including its:
Prospectus
Financial information
Holdings
Proxy voting information
Johnson Enhanced Return Fund
Semi-Annual Shareholder Report - June 30, 2024
This semi-annual shareholder report contains important information about Johnson Enhanced Return Fund for the period of January 1, 2024 to June 30, 2024. You can find additional information about the Fund at www.johnsoninv.com/mutualfunds. You can also request this information by contacting us at (800) 541-0170.
What were the Fund’s costs for the last six months?
(based on a hypothetical $10,000 investment)
| Fund Name | Costs of a $10,000 investment | Costs paid as a percentage of a $10,000 investment |
|---|
| Johnson Enhanced Return Fund | $17 | 0.35% |
How did the Fund perform during the reporting period?
Familiar themes dominated the US large cap equity market to start 2024. The S&P 500, the Fund’s benchmark, hit another all-time high and has now posted returns well into the double-digits year-to-date. While the Fund has experienced strong positive returns year-to-date, it has been unable to keep pace with the benchmark. The primary driver of underperformance during the first half of the year were returns in the bond portion of the portfolio that failed to keep pace with the embedded cost-of-carry within its equity futures contract positions. Within the bond portfolio, elevated levels of income led to positive returns, however cost-of-carry also remains elevated, with the Federal Reserve likely at their peak policy rate for the cycle. In particular, the strategy’s focus on higher-yielding investment grade corporate bonds was additive to performance. Curve positioning detracted modestly from performance as rates rose and the curve steepened, which pressured prices of the strategy’s three-to-five-year maturities.
How has the Fund performed over the last ten years?
Total Return Based on $1,000,000 Investment
| Johnson Enhanced Return Fund | S&P 500® Index |
|---|
| Jun-2014 | $1,000,000 | $1,000,000 |
| Jun-2015 | $1,073,410 | $1,074,228 |
| Jun-2016 | $1,128,985 | $1,117,118 |
| Jun-2017 | $1,324,940 | $1,317,038 |
| Jun-2018 | $1,487,642 | $1,506,351 |
| Jun-2019 | $1,664,273 | $1,663,274 |
| Jun-2020 | $1,803,545 | $1,788,103 |
| Jun-2021 | $2,523,180 | $2,517,545 |
| Jun-2022 | $2,132,052 | $2,250,288 |
| Jun-2023 | $2,454,945 | $2,691,210 |
| Jun-2024 | $3,016,849 | $3,352,067 |
Average Annual Total Returns
| 1 Year | 5 Years | 10 Years |
|---|
| Johnson Enhanced Return Fund | 22.89% | 12.63% | 11.67% |
S&P 500® Index | 24.56% | 15.05% | 12.86% |
The Fund's past performance is not a good predictor of how the Fund will perform in the future. The graph and table do not reflect the deduction of taxes that a shareholder would pay on fund distributions or redemption of fund shares.
- Net Assets$274,938,155
- Number of Portfolio Holdings109
- Advisory Fee $457,017
- Portfolio Turnover17%
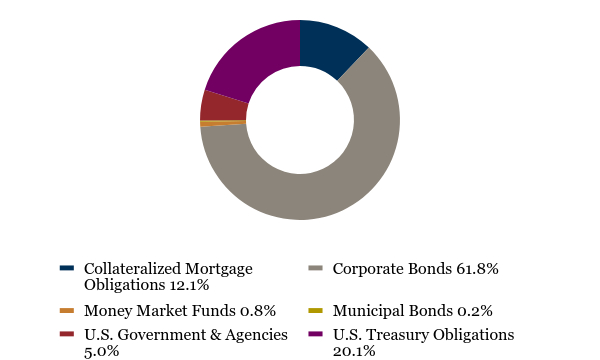
Asset Weighting (% of total investments)
| Value | Value |
|---|
| Collateralized Mortgage Obligations | 12.1% |
| Corporate Bonds | 61.8% |
| Money Market Funds | 0.8% |
| Municipal Bonds | 0.2% |
| U.S. Government & Agencies | 5.0% |
| U.S. Treasury Obligations | 20.1% |
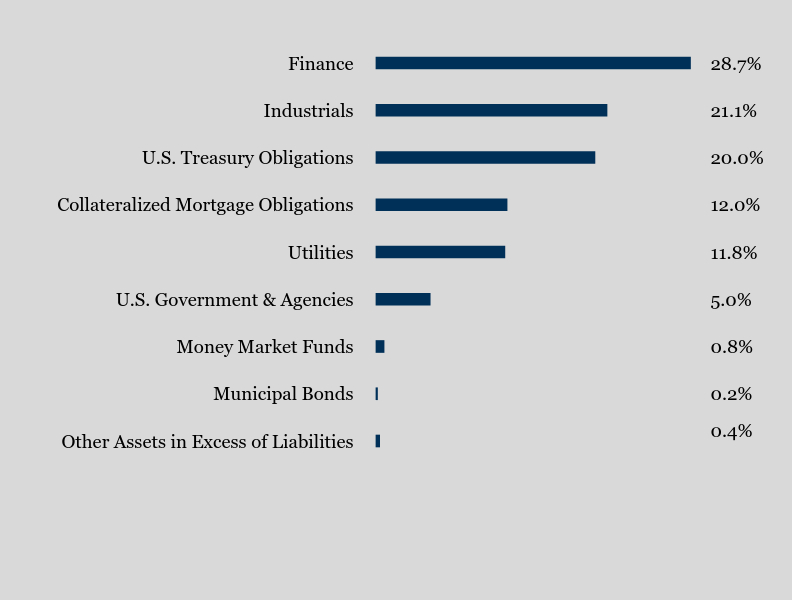
What did the Fund invest in?
Sector Weighting (% of net assets)
| Value | Value |
|---|
| Other Assets in Excess of Liabilities | 0.4% |
| Municipal Bonds | 0.2% |
| Money Market Funds | 0.8% |
| U.S. Government & Agencies | 5.0% |
| Utilities | 11.8% |
| Collateralized Mortgage Obligations | 12.0% |
| U.S. Treasury Obligations | 20.0% |
| Industrials | 21.1% |
| Finance | 28.7% |
Top 10 Holdings (% of net assets)
| Holding Name | % of Net Assets |
| U.S. Treasury Notes, 3.125%, due 11/15/28 | 4.7% |
| U.S. Treasury Notes, 2.750%, due 02/15/28 | 4.2% |
| U.S. Treasury Notes, 2.875%, due 05/15/28 | 3.6% |
| U.S. Treasury Notes, 2.750%, due 07/31/27 | 2.5% |
| U.S. Treasury Notes, 2.000%, due 08/15/25 | 2.0% |
| Home Depot, Inc. (The), 5.150%, due 06/25/26 | 2.0% |
| U.S. Treasury Notes, 2.625%, due 02/15/29 | 2.0% |
| Chubb INA Holdings, Inc., 3.350%, due 05/3/26 | 2.0% |
| FHLMC, 5.000%, due 04/1/53 - Class ED - Series 5301 | 1.9% |
| Cisco Systems, Inc., 4.800%, due 02/26/27 | 1.9% |
No material changes occurred during the period ended June 30, 2024.
Johnson Enhanced Return Fund (JENHX)
Semi-Annual Shareholder Report - June 30, 2024
Where can I find additional information about the Fund?
Additional information is available on the Fund's website (www.johnsoninv.com/mutualfunds), including its:
Prospectus
Financial information
Holdings
Proxy voting information
Johnson Institutional Core Bond Fund
Semi-Annual Shareholder Report - June 30, 2024
This semi-annual shareholder report contains important information about Johnson Institutional Core Bond Fund for the period of January 1, 2024 to June 30, 2024. You can find additional information about the Fund at www.johnsoninv.com/mutualfunds. You can also request this information by contacting us at (800) 541-0170.
What were the Fund’s costs for the last six months?
(based on a hypothetical $10,000 investment)
| Class Name | Costs of a $10,000 investment | Costs paid as a percentage of a $10,000 investment |
|---|
| Class I | $12 | 0.25% |
How did the Fund perform during the reporting period?
Bond markets ended 2023 on a high note as investors’ expectations for meaningful rate cuts in 2024 sent rates lower, fueling strong positive returns. Surprisingly strong economic data to begin 2024 tempered those expectations and sent rates back to near cycle highs. The 10-year treasury ultimately finished the first half of the year modestly higher, once again resulting in negative returns. The Fund maintained a modest long duration position relative to the Bloomberg Aggregate Index, the Fund’s benchmark, resulting in a slight drag to performance in the first half of the year. As interest rates rose on the better-than-expected economic data, corporate credit spreads continued to tighten. As a result, the Fund’s overweight position to corporate bonds was the largest contributor to performance, more than offsetting the headwind from duration. Within corporate bonds the Fund’s emphasis on intermediate maturity bonds was an additional tailwind to performance as bonds in the intermediate part of the curve outperformed longer maturity bonds. Finally, sector allocation was additive to performance as the Fund maintains an overweight to financials, which outperformed their industrial and utility sector peers. We remain underweight Agency MBS, which continued to underperform during the first half of the year providing an additional tailwind to relative performance.
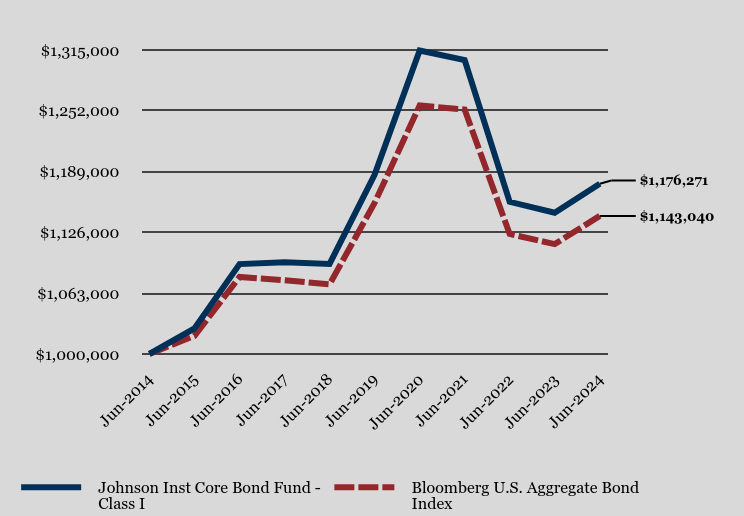
How has the Fund performed over the last ten years?
Total Return Based on $1,000,000 Investment
| Johnson Inst Core Bond Fund - Class I | Bloomberg U.S. Aggregate Bond Index |
|---|
| Jun-2014 | $1,000,000 | $1,000,000 |
| Jun-2015 | $1,026,438 | $1,018,578 |
| Jun-2016 | $1,093,069 | $1,079,707 |
| Jun-2017 | $1,095,094 | $1,076,310 |
| Jun-2018 | $1,093,261 | $1,072,034 |
| Jun-2019 | $1,185,655 | $1,156,395 |
| Jun-2020 | $1,314,389 | $1,257,460 |
| Jun-2021 | $1,304,629 | $1,253,269 |
| Jun-2022 | $1,157,613 | $1,124,281 |
| Jun-2023 | $1,146,309 | $1,113,738 |
| Jun-2024 | $1,176,271 | $1,143,040 |
Average Annual Total Returns
| 1 Year | 5 Years | 10 Years |
|---|
| Johnson Inst Core Bond Fund - Class I | 2.61% | | 1.64% |
| Bloomberg U.S. Aggregate Bond Index | 2.63% | | 1.35% |
The Fund's past performance is not a good predictor of how the Fund will perform in the future. The graph and table do not reflect the deduction of taxes that a shareholder would pay on fund distributions or redemption of fund shares.
- Net Assets$1,737,112,667
- Number of Portfolio Holdings212
- Advisory Fee (net of waivers)$2,088,502
- Portfolio Turnover13%
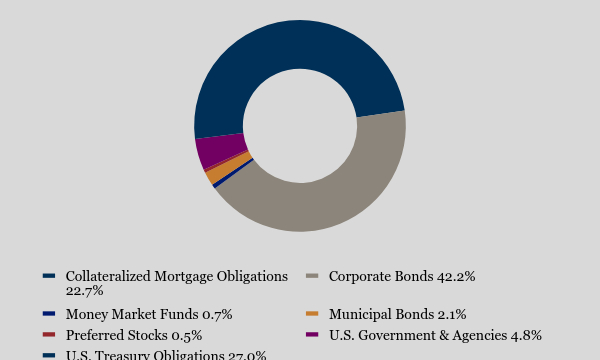
Asset Weighting (% of total investments)
| Value | Value |
|---|
| Collateralized Mortgage Obligations | 22.7% |
| Corporate Bonds | 42.2% |
| Money Market Funds | 0.7% |
| Municipal Bonds | 2.1% |
| Preferred Stocks | 0.5% |
| U.S. Government & Agencies | 4.8% |
| U.S. Treasury Obligations | 27.0% |
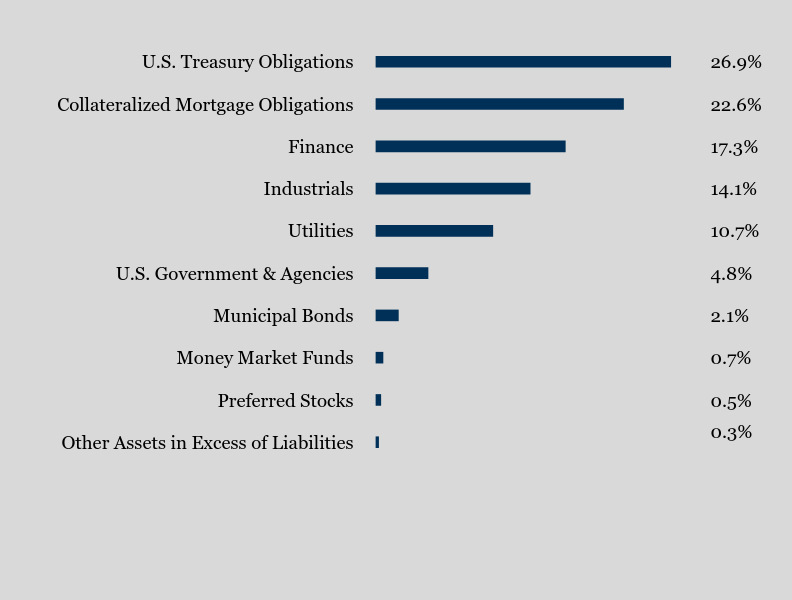
What did the Fund invest in?
Sector Weighting (% of net assets)
| Value | Value |
|---|
| Other Assets in Excess of Liabilities | 0.3% |
| Preferred Stocks | 0.5% |
| Money Market Funds | 0.7% |
| Municipal Bonds | 2.1% |
| U.S. Government & Agencies | 4.8% |
| Utilities | 10.7% |
| Industrials | 14.1% |
| Finance | 17.3% |
| Collateralized Mortgage Obligations | 22.6% |
| U.S. Treasury Obligations | 26.9% |
Top 10 Holdings (% of net assets)
| Holding Name | % of Net Assets |
| U.S. Treasury Notes, 3.375%, due 05/15/33 | 4.9% |
| U.S. Treasury Bonds, 2.375%, due 02/15/42 | 4.2% |
| U.S. Treasury Bonds, 2.500%, due 02/15/45 | 4.1% |
| U.S. Treasury Notes, 3.500%, due 02/15/33 | 3.5% |
| FNMA, 1.520%, due 08/21/35 - Class KA - Series 2022-25 | 2.4% |
| U.S. Treasury Notes, 3.875%, due 08/15/33 | 2.1% |
| FHLMC, 3.000%, due 08/1/52 | 2.1% |
| U.S. Treasury Bonds, 2.750%, due 08/15/47 | 1.9% |
| U.S. Treasury Bonds, 2.250%, due 05/15/41 | 1.9% |
| U.S. Treasury Bonds, 2.500%, due 05/15/46 | 1.8% |
No material changes occurred during the period ended June 30, 2024.
Johnson Institutional Core Bond Fund - Class I (JIBFX)
Semi-Annual Shareholder Report - June 30, 2024
Where can I find additional information about the Fund?
Additional information is available on the Fund's website (www.johnsoninv.com/mutualfunds), including its:
Prospectus
Financial information
Holdings
Proxy voting information
Johnson Institutional Core Bond Fund
Semi-Annual Shareholder Report - June 30, 2024
This semi-annual shareholder report contains important information about Johnson Institutional Core Bond Fund for the period of January 1, 2024 to June 30, 2024. You can find additional information about the Fund at www.johnsoninv.com/mutualfunds. You can also request this information by contacting us at (800) 541-0170.
What were the Fund’s costs for the last six months?
(based on a hypothetical $10,000 investment)
| Class Name | Costs of a $10,000 investment | Costs paid as a percentage of a $10,000 investment |
|---|
| Class F | $20 | 0.40% |
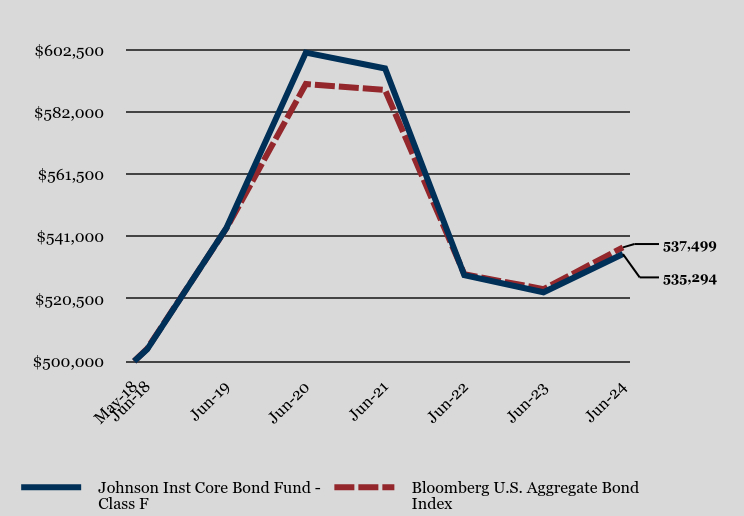
How did the Fund perform during the reporting period?
Bond markets ended 2023 on a high note as investors’ expectations for meaningful rate cuts in 2024 sent rates lower, fueling strong positive returns. Surprisingly strong economic data to begin 2024 tempered those expectations and sent rates back to near cycle highs. The 10-year treasury ultimately finished the first half of the year modestly higher, once again resulting in negative returns. The Fund maintained a modest long duration position relative to the Bloomberg Aggregate Index, the Fund’s benchmark, resulting in a slight drag to performance in the first half of the year. As interest rates rose on the better-than-expected economic data, corporate credit spreads continued to tighten. As a result, the Fund’s overweight position to corporate bonds was the largest contributor to performance, more than offsetting the headwind from duration. Within corporate bonds the Fund’s emphasis on intermediate maturity bonds was an additional tailwind to performance as bonds in the intermediate part of the curve outperformed longer maturity bonds. Finally, sector allocation was additive to performance as the Fund maintains an overweight to financials, which outperformed their industrial and utility sector peers. We remain underweight Agency MBS, which continued to underperform during the first half of the year providing an additional tailwind to relative performance.
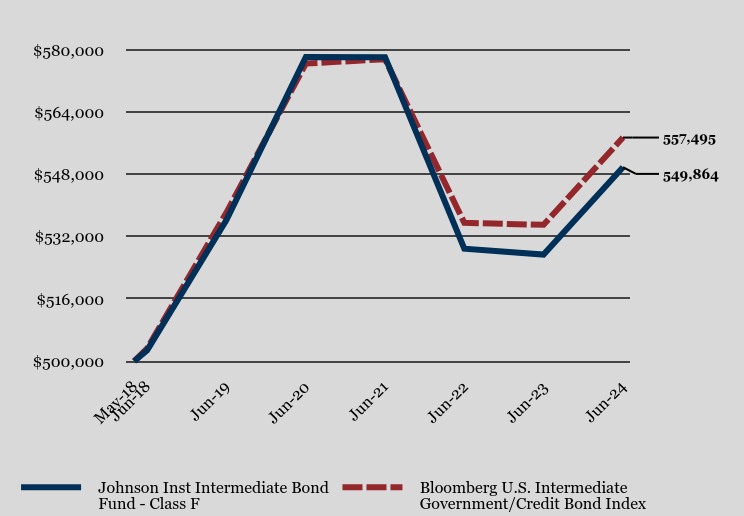
How has the Fund performed since inception?
Total Return Based on $500,000 Investment
| Johnson Inst Core Bond Fund - Class F | Bloomberg U.S. Aggregate Bond Index |
|---|
| May-18 | $500,000 | $500,000 |
| Jun-18 | 503,920 | 504,109 |
| Jun-19 | 543,879 | 543,779 |
| Jun-20 | 601,637 | 591,303 |
| Jun-21 | 596,429 | 589,332 |
| Jun-22 | 528,307 | 528,677 |
| Jun-23 | 522,701 | 523,720 |
| Jun-24 | 535,294 | 537,499 |
Average Annual Total Returns
| 1 Year | 5 Years | Since Inception (May 1, 2018) |
|---|
| Johnson Inst Core Bond Fund - Class F | 2.41% | | 1.11% |
| Bloomberg U.S. Aggregate Bond Index | 2.63% | | 1.18% |
The Fund's past performance is not a good predictor of how the Fund will perform in the future. The graph and table do not reflect the deduction of taxes that a shareholder would pay on fund distributions or redemption of fund shares.
- Net Assets$1,737,112,667
- Number of Portfolio Holdings212
- Advisory Fee (net of waivers)$2,088,502
- Portfolio Turnover13%
Asset Weighting (% of total investments)
| Value | Value |
|---|
| Collateralized Mortgage Obligations | 22.7% |
| Corporate Bonds | 42.2% |
| Money Market Funds | 0.7% |
| Municipal Bonds | 2.1% |
| Preferred Stocks | 0.5% |
| U.S. Government & Agencies | 4.8% |
| U.S. Treasury Obligations | 27.0% |
What did the Fund invest in?
Sector Weighting (% of net assets)
| Value | Value |
|---|
| Other Assets in Excess of Liabilities | 0.3% |
| Preferred Stocks | 0.5% |
| Money Market Funds | 0.7% |
| Municipal Bonds | 2.1% |
| U.S. Government & Agencies | 4.8% |
| Utilities | 10.7% |
| Industrials | 14.1% |
| Finance | 17.3% |
| Collateralized Mortgage Obligations | 22.6% |
| U.S. Treasury Obligations | 26.9% |
Top 10 Holdings (% of net assets)
| Holding Name | % of Net Assets |
| U.S. Treasury Notes, 3.375%, due 05/15/33 | 4.9% |
| U.S. Treasury Bonds, 2.375%, due 02/15/42 | 4.2% |
| U.S. Treasury Bonds, 2.500%, due 02/15/45 | 4.1% |
| U.S. Treasury Notes, 3.500%, due 02/15/33 | 3.5% |
| FNMA, 1.520%, due 08/21/35 - Class KA - Series 2022-25 | 2.4% |
| U.S. Treasury Notes, 3.875%, due 08/15/33 | 2.1% |
| FHLMC, 3.000%, due 08/1/52 | 2.1% |
| U.S. Treasury Bonds, 2.750%, due 08/15/47 | 1.9% |
| U.S. Treasury Bonds, 2.250%, due 05/15/41 | 1.9% |
| U.S. Treasury Bonds, 2.500%, due 05/15/46 | 1.8% |
No material changes occurred during the period ended June 30, 2024.
Johnson Institutional Core Bond Fund - Class F (JIMFX)
Semi-Annual Shareholder Report - June 30, 2024
Where can I find additional information about the Fund?
Additional information is available on the Fund's website (www.johnsoninv.com/mutualfunds), including its:
Prospectus
Financial information
Holdings
Proxy voting information
Johnson Institutional Core Bond Fund
Semi-Annual Shareholder Report - June 30, 2024
This semi-annual shareholder report contains important information about Johnson Institutional Core Bond Fund for the period of January 1, 2024 to June 30, 2024. You can find additional information about the Fund at www.johnsoninv.com/mutualfunds. You can also request this information by contacting us at (800) 541-0170.
What were the Fund’s costs for the last six months?
(based on a hypothetical $10,000 investment)
| Class Name | Costs of a $10,000 investment | Costs paid as a percentage of a $10,000 investment |
|---|
| Class S | $25 | 0.50% |
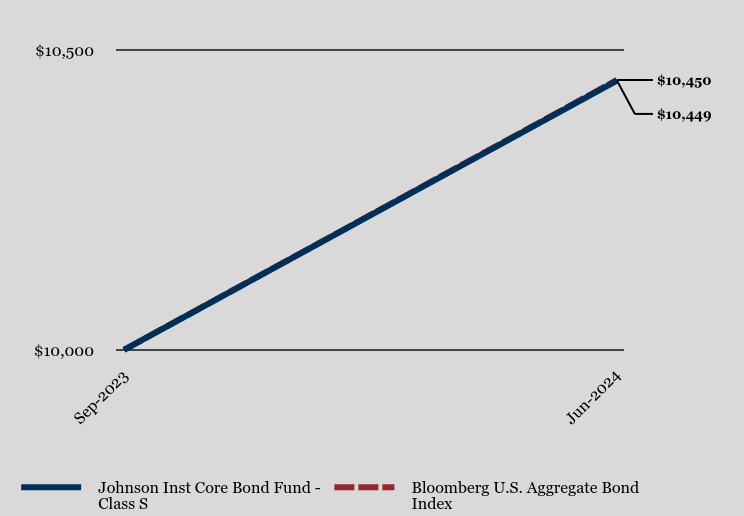
How did the Fund perform during the reporting period?
Bond markets ended 2023 on a high note as investors’ expectations for meaningful rate cuts in 2024 sent rates lower, fueling strong positive returns. Surprisingly strong economic data to begin 2024 tempered those expectations and sent rates back to near cycle highs. The 10-year treasury ultimately finished the first half of the year modestly higher, once again resulting in negative returns. The Fund maintained a modest long duration position relative to the Bloomberg Aggregate Index, the Fund’s benchmark, resulting in a slight drag to performance in the first half of the year. As interest rates rose on the better-than-expected economic data, corporate credit spreads continued to tighten. As a result, the Fund’s overweight position to corporate bonds was the largest contributor to performance, more than offsetting the headwind from duration. Within corporate bonds the Fund’s emphasis on intermediate maturity bonds was an additional tailwind to performance as bonds in the intermediate part of the curve outperformed longer maturity bonds. Finally, sector allocation was additive to performance as the Fund maintains an overweight to financials, which outperformed their industrial and utility sector peers. We remain underweight Agency MBS, which continued to underperform during the first half of the year providing an additional tailwind to relative performance.
How has the Fund performed since inception?
Total Return Based on $10,000 Investment
| Johnson Inst Core Bond Fund - Class S | Bloomberg U.S. Aggregate Bond Index |
|---|
| Sep-2023 | $10,000 | $10,000 |
| Jun-2024 | $10,449 | $10,450 |
Average Annual Total Returns
| Since Inception (September 15, 2023) |
|---|
| Johnson Inst Core Bond Fund - Class S | 4.49% |
| Bloomberg U.S. Aggregate Bond Index | 4.50% |
The Fund's past performance is not a good predictor of how the Fund will perform in the future. The graph and table do not reflect the deduction of taxes that a shareholder would pay on fund distributions or redemption of fund shares.
- Net Assets$1,737,112,667
- Number of Portfolio Holdings212
- Advisory Fee (net of waivers)$2,088,502
- Portfolio Turnover13%
Asset Weighting (% of total investments)
| Value | Value |
|---|
| Collateralized Mortgage Obligations | 22.7% |
| Corporate Bonds | 42.2% |
| Money Market Funds | 0.7% |
| Municipal Bonds | 2.1% |
| Preferred Stocks | 0.5% |
| U.S. Government & Agencies | 4.8% |
| U.S. Treasury Obligations | 27.0% |
What did the Fund invest in?
Sector Weighting (% of net assets)
| Value | Value |
|---|
| Other Assets in Excess of Liabilities | 0.3% |
| Preferred Stocks | 0.5% |
| Money Market Funds | 0.7% |
| Municipal Bonds | 2.1% |
| U.S. Government & Agencies | 4.8% |
| Utilities | 10.7% |
| Industrials | 14.1% |
| Finance | 17.3% |
| Collateralized Mortgage Obligations | 22.6% |
| U.S. Treasury Obligations | 26.9% |
Top 10 Holdings (% of net assets)
| Holding Name | % of Net Assets |
| U.S. Treasury Notes, 3.375%, due 05/15/33 | 4.9% |
| U.S. Treasury Bonds, 2.375%, due 02/15/42 | 4.2% |
| U.S. Treasury Bonds, 2.500%, due 02/15/45 | 4.1% |
| U.S. Treasury Notes, 3.500%, due 02/15/33 | 3.5% |
| FNMA, 1.520%, due 08/21/35 - Class KA - Series 2022-25 | 2.4% |
| U.S. Treasury Notes, 3.875%, due 08/15/33 | 2.1% |
| FHLMC, 3.000%, due 08/1/52 | 2.1% |
| U.S. Treasury Bonds, 2.750%, due 08/15/47 | 1.9% |
| U.S. Treasury Bonds, 2.250%, due 05/15/41 | 1.9% |
| U.S. Treasury Bonds, 2.500%, due 05/15/46 | 1.8% |
No material changes occurred during the period ended June 30, 2024.
Johnson Institutional Core Bond Fund - Class S (JIBSX)
Semi-Annual Shareholder Report - June 30, 2024
Where can I find additional information about the Fund?
Additional information is available on the Fund's website (www.johnsoninv.com/mutualfunds), including its:
Prospectus
Financial information
Holdings
Proxy voting information
Johnson Institutional Intermediate Bond Fund
Semi-Annual Shareholder Report - June 30, 2024
This semi-annual shareholder report contains important information about Johnson Institutional Intermediate Bond Fund for the period of January 1, 2024 to June 30, 2024. You can find additional information about the Fund at www.johnsoninv.com/mutualfunds. You can also request this information by contacting us at (800) 541-0170.
What were the Fund’s costs for the last six months?
(based on a hypothetical $10,000 investment)
| Class Name | Costs of a $10,000 investment | Costs paid as a percentage of a $10,000 investment |
|---|
| Class I | $12 | 0.25% |
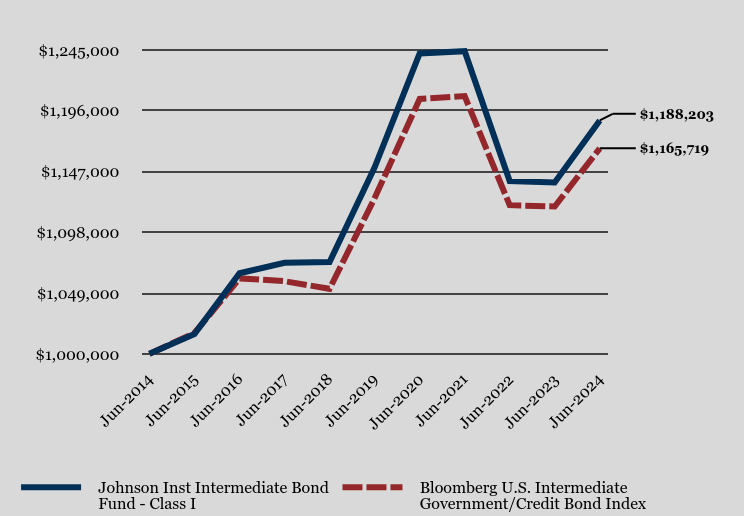
How did the Fund perform during the reporting period?
Bond markets ended 2023 on a high note as investors’ expectations for meaningful rate cuts in 2024 sent rates lower, fueling strong positive returns. Surprisingly strong economic data to begin 2024 tempered those expectations and sent rates back to near cycle highs. The 10-year treasury ultimately finished the first half of the year modestly higher, once again resulting in negative returns. The Fund maintained a modest long duration position relative to the Bloomberg Aggregate Index, the Fund’s benchmark, resulting in a slight drag to performance in the first half of the year. As interest rates rose on the better-than-expected economic data, corporate credit spreads continued to tighten. Our corporate overweight position, combined with a shorter corporate duration structure, contributed to our yield advantage against the benchmark. As a result, the Fund’s overweight to corporate bonds was the largest contributor to performance, more than offsetting the headwind from duration. Finally, sector allocation was additive to performance as the Fund maintains an overweight to financials, which outperformed their industrial and utility sector peers. We continue to maintain a modest non-benchmark allocation to Agency MBS, which continued to underperform during the first half of the year providing an additional headwind to relative performance.
How has the Fund performed over the last ten years?
Total Return Based on $1,000,000 Investment
| Johnson Inst Intermediate Bond Fund - Class I | Bloomberg U.S. Intermediate Government/Credit Bond Index |
|---|
| Jun-2014 | $1,000,000 | $1,000,000 |
| Jun-2015 | $1,015,976 | $1,016,798 |
| Jun-2016 | $1,065,014 | $1,060,846 |
| Jun-2017 | $1,073,391 | $1,058,592 |
| Jun-2018 | $1,074,036 | $1,052,457 |
| Jun-2019 | $1,150,252 | $1,125,415 |
| Jun-2020 | $1,242,253 | $1,205,496 |
| Jun-2021 | $1,244,033 | $1,207,811 |
| Jun-2022 | $1,139,323 | $1,119,879 |
| Jun-2023 | $1,138,154 | $1,118,814 |
| Jun-2024 | $1,188,203 | $1,165,719 |
Average Annual Total Returns
| 1 Year | 5 Years | 10 Years |
|---|
| Johnson Inst Intermediate Bond Fund - Class I | 4.40% | 0.65% | 1.74% |
| Bloomberg U.S. Intermediate Government/Credit Bond Index | 4.19% | 0.71% | 1.55% |
The Fund's past performance is not a good predictor of how the Fund will perform in the future. The graph and table do not reflect the deduction of taxes that a shareholder would pay on fund distributions or redemption of fund shares.
- Net Assets$302,719,571
- Number of Portfolio Holdings102
- Advisory Fee (net of waivers)$342,845
- Portfolio Turnover15%
Asset Weighting (% of total investments)
| Value | Value |
|---|
| Collateralized Mortgage Obligations | 7.5% |
| Corporate Bonds | 49.5% |
| Money Market Funds | 0.1% |
| Municipal Bonds | 1.6% |
| Preferred Stocks | 0.5% |
| U.S. Government & Agencies | 5.1% |
| U.S. Treasury Obligations | 35.7% |
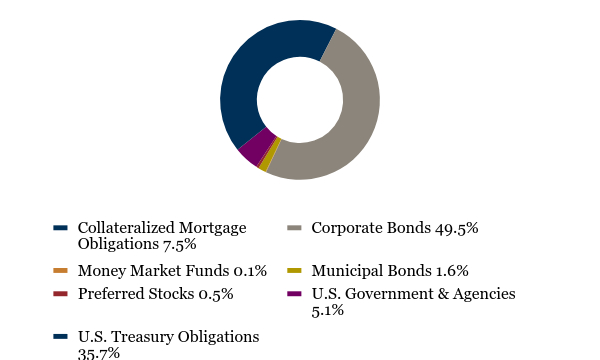
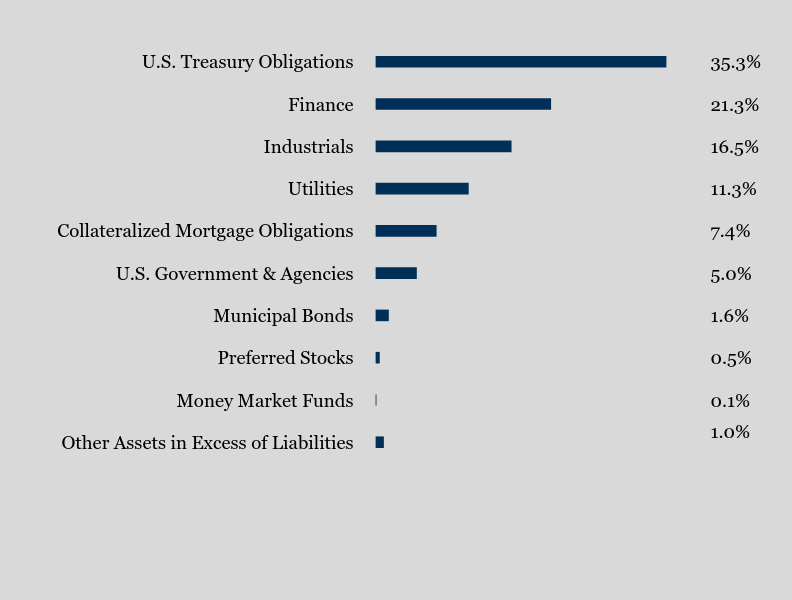
What did the Fund invest in?
Sector Weighting (% of net assets)
| Value | Value |
|---|
| Other Assets in Excess of Liabilities | 1.0% |
| Money Market Funds | 0.1% |
| Preferred Stocks | 0.5% |
| Municipal Bonds | 1.6% |
| U.S. Government & Agencies | 5.0% |
| Collateralized Mortgage Obligations | 7.4% |
| Utilities | 11.3% |
| Industrials | 16.5% |
| Finance | 21.3% |
| U.S. Treasury Obligations | 35.3% |
Top 10 Holdings (% of net assets)
| Holding Name | % of Net Assets |
| U.S. Treasury Notes, 3.500%, due 01/31/30 | 4.5% |
| U.S. Treasury Notes, 1.375%, due 11/15/31 | 4.3% |
| U.S. Treasury Notes, 2.625%, due 02/15/29 | 4.3% |
| U.S. Treasury Notes, 0.875%, due 11/15/30 | 4.2% |
| U.S. Treasury Notes, 1.375%, due 10/31/28 | 4.1% |
| U.S. Treasury Notes, 4.625%, due 04/30/29 | 4.0% |
| U.S. Treasury Notes, 2.875%, due 05/15/32 | 3.9% |
| FHLB, 4.750%, due 12/10/32 - Series HQ-2032 | 3.0% |
| U.S. Treasury Notes, 4.000%, due 02/15/34 | 2.5% |
| U.S. Treasury Notes, 1.500%, due 02/15/30 | 2.1% |
No material changes occurred during the period ended June 30, 2024.
Johnson Institutional Intermediate Bond Fund - Class I (JIBEX)
Semi-Annual Shareholder Report - June 30, 2024
Where can I find additional information about the Fund?
Additional information is available on the Fund's website (www.johnsoninv.com/mutualfunds), including its:
Prospectus
Financial information
Holdings
Proxy voting information
Johnson Institutional Intermediate Bond Fund
Semi-Annual Shareholder Report - June 30, 2024
This semi-annual shareholder report contains important information about Johnson Institutional Intermediate Bond Fund for the period of January 1, 2024 to June 30, 2024. You can find additional information about the Fund at www.johnsoninv.com/mutualfunds. You can also request this information by contacting us at (800) 541-0170.
What were the Fund’s costs for the last six months?
(based on a hypothetical $10,000 investment)
| Class Name | Costs of a $10,000 investment | Costs paid as a percentage of a $10,000 investment |
|---|
| Class F | $20 | 0.40% |
How did the Fund perform during the reporting period?
Bond markets ended 2023 on a high note as investors’ expectations for meaningful rate cuts in 2024 sent rates lower, fueling strong positive returns. Surprisingly strong economic data to begin 2024 tempered those expectations and sent rates back to near cycle highs. The 10-year treasury ultimately finished the first half of the year modestly higher, once again resulting in negative returns. The Fund maintained a modest long duration position relative to the Bloomberg Aggregate Index, the Fund’s benchmark, resulting in a slight drag to performance in the first half of the year. As interest rates rose on the better-than-expected economic data, corporate credit spreads continued to tighten. Our corporate overweight position, combined with a shorter corporate duration structure, contributed to our yield advantage against the benchmark. As a result, the Fund’s overweight to corporate bonds was the largest contributor to performance, more than offsetting the headwind from duration. Finally, sector allocation was additive to performance as the Fund maintains an overweight to financials, which outperformed their industrial and utility sector peers. We continue to maintain a modest non-benchmark allocation to Agency MBS, which continued to underperform during the first half of the year providing an additional headwind to relative performance.
How has the Fund performed since inception?
Total Return Based on $500,000 Investment
| Johnson Inst Intermediate Bond Fund - Class F | Bloomberg U.S. Intermediate Government/Credit Bond Index |
|---|
| May-18 | $500,000 | $500,000 |
| Jun-18 | 502,847 | 503,328 |
| Jun-19 | 536,313 | 538,220 |
| Jun-20 | 578,223 | 576,518 |
| Jun-21 | 578,161 | 577,625 |
| Jun-22 | 528,919 | 535,572 |
| Jun-23 | 527,424 | 535,063 |
| Jun-24 | 549,864 | 557,495 |
Average Annual Total Returns
| 1 Year | 5 Years | Since Inception (May 1, 2018) |
|---|
| Johnson Inst Intermediate Bond Fund - Class F | 4.25% | 0.50% | 1.55% |
| Bloomberg U.S. Intermediate Government/Credit Bond Index | 4.19% | 0.71% | 1.78% |
The Fund's past performance is not a good predictor of how the Fund will perform in the future. The graph and table do not reflect the deduction of taxes that a shareholder would pay on fund distributions or redemption of fund shares.
- Net Assets$302,719,571
- Number of Portfolio Holdings102
- Advisory Fee (net of waivers)$342,845
- Portfolio Turnover15%
Asset Weighting (% of total investments)
| Value | Value |
|---|
| Collateralized Mortgage Obligations | 7.5% |
| Corporate Bonds | 49.5% |
| Money Market Funds | 0.1% |
| Municipal Bonds | 1.6% |
| Preferred Stocks | 0.5% |
| U.S. Government & Agencies | 5.1% |
| U.S. Treasury Obligations | 35.7% |
What did the Fund invest in?
Sector Weighting (% of net assets)
| Value | Value |
|---|
| Other Assets in Excess of Liabilities | 1.0% |
| Money Market Funds | 0.1% |
| Preferred Stocks | 0.5% |
| Municipal Bonds | 1.6% |
| U.S. Government & Agencies | 5.0% |
| Collateralized Mortgage Obligations | 7.4% |
| Utilities | 11.3% |
| Industrials | 16.5% |
| Finance | 21.3% |
| U.S. Treasury Obligations | 35.3% |
Top 10 Holdings (% of net assets)
| Holding Name | % of Net Assets |
| U.S. Treasury Notes, 3.500%, due 01/31/30 | 4.5% |
| U.S. Treasury Notes, 1.375%, due 11/15/31 | 4.3% |
| U.S. Treasury Notes, 2.625%, due 02/15/29 | 4.3% |
| U.S. Treasury Notes, 0.875%, due 11/15/30 | 4.2% |
| U.S. Treasury Notes, 1.375%, due 10/31/28 | 4.1% |
| U.S. Treasury Notes, 4.625%, due 04/30/29 | 4.0% |
| U.S. Treasury Notes, 2.875%, due 05/15/32 | 3.9% |
| FHLB, 4.750%, due 12/10/32 - Series HQ-2032 | 3.0% |
| U.S. Treasury Notes, 4.000%, due 02/15/34 | 2.5% |
| U.S. Treasury Notes, 1.500%, due 02/15/30 | 2.1% |
No material changes occurred during the period ended June 30, 2024.
Johnson Institutional Intermediate Bond Fund - Class F (JIMEX)
Semi-Annual Shareholder Report - June 30, 2024
Where can I find additional information about the Fund?
Additional information is available on the Fund's website (www.johnsoninv.com/mutualfunds), including its:
Prospectus
Financial information
Holdings
Proxy voting information
Johnson Institutional Short Duration Bond Fund
Semi-Annual Shareholder Report - June 30, 2024
This semi-annual shareholder report contains important information about Johnson Institutional Short Duration Bond Fund for the period of January 1, 2024 to June 30, 2024. You can find additional information about the Fund at www.johnsoninv.com/mutualfunds. You can also request this information by contacting us at (800) 541-0170.
What were the Fund’s costs for the last six months?
(based on a hypothetical $10,000 investment)
| Class Name | Costs of a $10,000 investment | Costs paid as a percentage of a $10,000 investment |
|---|
| Class I | $12 | 0.25% |
How did the Fund perform during the reporting period?
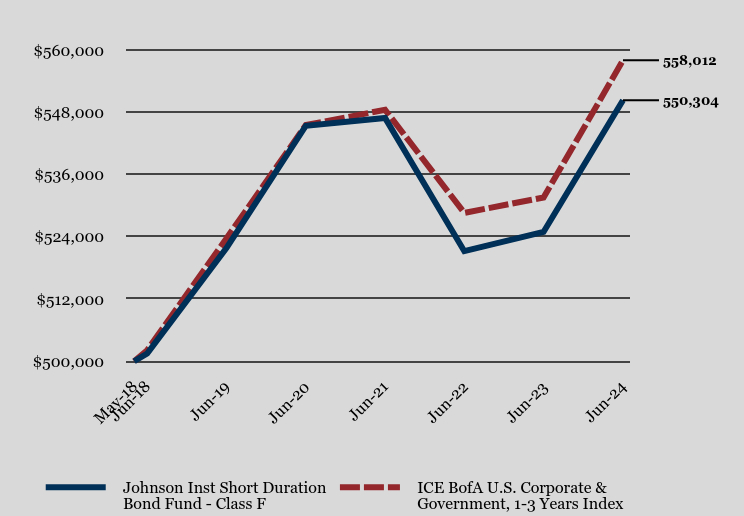
Bond markets ended 2023 on a high note as investors’ expectations for meaningful rate cuts in 2024 sent rates lower, fueling strong positive returns. Surprisingly strong economic data to begin 2024 tempered those expectations and sent rates back to near cycle highs. Interest rates rose, with the front end of the yield curve re-steepening. The Fund’s positive total returns were largely driven by its income generation, which was also additive to performance relative to the ICE BofA U.S. Corporate and Government, 1-3 Years Index, the Fund's benchmark. Offsetting the Fund’s income advantage in the first half of the year was a modest long duration position and overweight to the 3-5 year maturities relative to the Index resulting in a slight drag to performance. As interest rates rose on the better-than-expected economic data, corporate credit spreads continued to tighten, providing positive relative performance from the Fund’s overweight position to corporate bonds. Finally, sector allocation was additive to performance as the Fund maintains an overweight to financials, which outperformed their industrial and utility sector peers. We continue to maintain a modest non-benchmark allocation to Agency MBS, which continued to underperform during the first half of the year providing an additional headwind to relative performance.
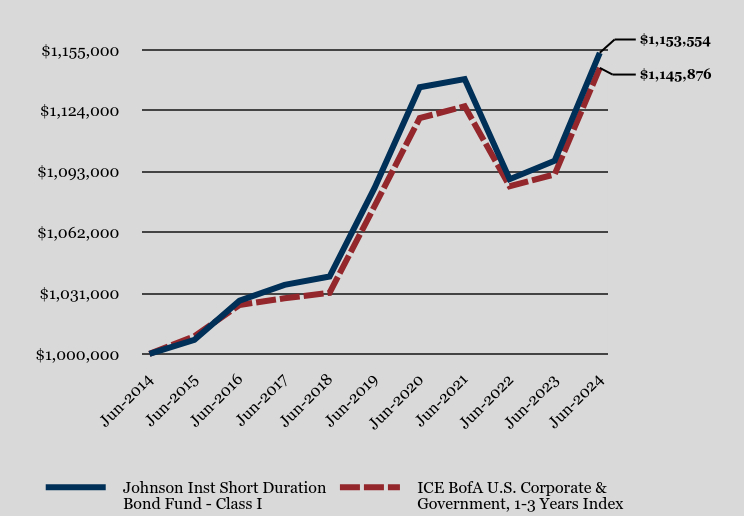
How has the Fund performed over the last ten years?
Total Return Based on $1,000,000 Investment
| Johnson Inst Short Duration Bond Fund - Class I | ICE BofA U.S. Corporate & Government, 1-3 Years Index |
|---|
| Jun-2014 | $1,000,000 | $1,000,000 |
| Jun-2015 | $1,007,156 | $1,008,993 |
| Jun-2016 | $1,027,137 | $1,024,945 |
| Jun-2017 | $1,035,177 | $1,028,389 |
| Jun-2018 | $1,039,465 | $1,031,117 |
| Jun-2019 | $1,084,654 | $1,075,342 |
| Jun-2020 | $1,135,997 | $1,120,238 |
| Jun-2021 | $1,140,144 | $1,126,271 |
| Jun-2022 | $1,089,084 | $1,085,491 |
| Jun-2023 | $1,098,538 | $1,091,571 |
| Jun-2024 | $1,153,554 | $1,145,876 |
Average Annual Total Returns
| 1 Year | 5 Years | 10 Years |
|---|
| Johnson Inst Short Duration Bond Fund - Class I | 5.01% | 1.24% | 1.44% |
| ICE BofA U.S. Corporate & Government, 1-3 Years Index | 4.97% | 1.28% | 1.37% |
The Fund's past performance is not a good predictor of how the Fund will perform in the future. The graph and table do not reflect the deduction of taxes that a shareholder would pay on fund distributions or redemption of fund shares.
- Net Assets$244,305,268
- Number of Portfolio Holdings111
- Advisory Fee (net of waivers)$264,732
- Portfolio Turnover19%
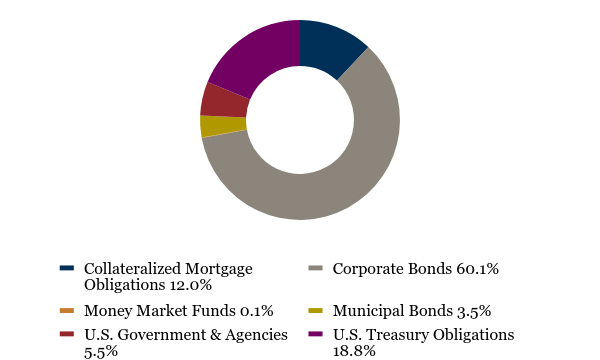
Asset Weighting (% of total investments)
| Value | Value |
|---|
| Collateralized Mortgage Obligations | 12.0% |
| Corporate Bonds | 60.1% |
| Money Market Funds | 0.1% |
| Municipal Bonds | 3.5% |
| U.S. Government & Agencies | 5.5% |
| U.S. Treasury Obligations | 18.8% |
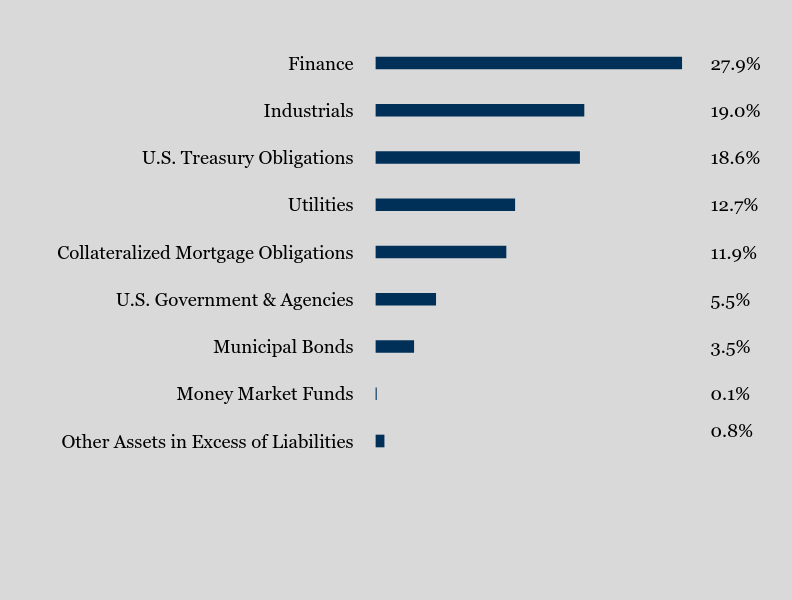
What did the Fund invest in?
Sector Weighting (% of net assets)
| Value | Value |
|---|
| Other Assets in Excess of Liabilities | 0.8% |
| Money Market Funds | 0.1% |
| Municipal Bonds | 3.5% |
| U.S. Government & Agencies | 5.5% |
| Collateralized Mortgage Obligations | 11.9% |
| Utilities | 12.7% |
| U.S. Treasury Obligations | 18.6% |
| Industrials | 19.0% |
| Finance | 27.9% |
Top 10 Holdings (% of net assets)
| Holding Name | % of Net Assets |
| U.S. Treasury Notes, 2.750%, due 02/15/28 | 4.1% |
| U.S. Treasury Notes, 2.875%, due 05/15/28 | 4.0% |
| U.S. Treasury Notes, 2.750%, due 07/31/27 | 4.0% |
| U.S. Treasury Notes, 1.625%, due 05/15/26 | 2.2% |
| Huntington Bancshares, Inc., 2.625%, due 08/6/24 | 1.8% |
| Home Depot, Inc. (The), 5.150%, due 06/25/26 | 1.8% |
| Dover Corp., 3.150%, due 11/15/25 | 1.8% |
| Interstate Power & Light Co., 3.400%, due 08/15/25 | 1.8% |
| FNMA, 1.500%, due 09/1/31 | 1.8% |
| Florida Power & Light Co., 4.400%, due 05/15/28 | 1.8% |
No material changes occurred during the period ended June 30, 2024.
Johnson Institutional Short Duration Bond Fund - Class I (JIBDX)
Semi-Annual Shareholder Report - June 30, 2024
Where can I find additional information about the Fund?
Additional information is available on the Fund's website (www.johnsoninv.com/mutualfunds), including its:
Prospectus
Financial information
Holdings
Proxy voting information
Johnson Institutional Short Duration Bond Fund
Semi-Annual Shareholder Report - June 30, 2024
This semi-annual shareholder report contains important information about Johnson Institutional Short Duration Bond Fund for the period of January 1, 2024 to June 30, 2024. You can find additional information about the Fund at www.johnsoninv.com/mutualfunds. You can also request this information by contacting us at (800) 541-0170.
What were the Fund’s costs for the last six months?
(based on a hypothetical $10,000 investment)
| Class Name | Costs of a $10,000 investment | Costs paid as a percentage of a $10,000 investment |
|---|
| Class F | $20 | 0.40% |
How did the Fund perform during the reporting period?
Bond markets ended 2023 on a high note as investors’ expectations for meaningful rate cuts in 2024 sent rates lower, fueling strong positive returns. Surprisingly strong economic data to begin 2024 tempered those expectations and sent rates back to near cycle highs. Interest rates rose, with the front end of the yield curve re-steepening. The Fund’s positive total returns were largely driven by its income generation, which was also additive to performance relative to the ICE BofA U.S. Corporate and Government, 1-3 Years Index, the Fund's benchmark. Offsetting the Fund’s income advantage in the first half of the year was a modest long duration position and overweight to the 3-5 year maturities relative to the Index resulting in a slight drag to performance. As interest rates rose on the better-than-expected economic data, corporate credit spreads continued to tighten, providing positive relative performance from the Fund’s overweight position to corporate bonds. Finally, sector allocation was additive to performance as the Fund maintains an overweight to financials, which outperformed their industrial and utility sector peers. We continue to maintain a modest non-benchmark allocation to Agency MBS, which continued to underperform during the first half of the year providing an additional headwind to relative performance.
How has the Fund performed since inception?
Total Return Based on $500,000 Investment
| Johnson Inst Short Duration Bond Fund - Class F | ICE BofA U.S. Corporate & Government, 1-3 Years Index |
|---|
| May-18 | $500,000 | $500,000 |
| Jun-18 | 501,485 | 502,128 |
| Jun-19 | 521,814 | 523,664 |
| Jun-20 | 545,399 | 545,527 |
| Jun-21 | 546,904 | 548,466 |
| Jun-22 | 521,216 | 528,606 |
| Jun-23 | 524,928 | 531,567 |
| Jun-24 | 550,304 | 558,012 |
Average Annual Total Returns
| 1 Year | 5 Years | Since Inception (May 1, 2018) |
|---|
| Johnson Inst Short Duration Bond Fund - Class F | 4.83% | 1.07% | 1.57% |
| ICE BofA U.S. Corporate & Government, 1-3 Years Index | 4.97% | 1.28% | 1.80% |
The Fund's past performance is not a good predictor of how the Fund will perform in the future. The graph and table do not reflect the deduction of taxes that a shareholder would pay on fund distributions or redemption of fund shares.
- Net Assets$244,305,268
- Number of Portfolio Holdings111
- Advisory Fee (net of waivers)$264,732
- Portfolio Turnover19%
Asset Weighting (% of total investments)
| Value | Value |
|---|
| Collateralized Mortgage Obligations | 12.0% |
| Corporate Bonds | 60.1% |
| Money Market Funds | 0.1% |
| Municipal Bonds | 3.5% |
| U.S. Government & Agencies | 5.5% |
| U.S. Treasury Obligations | 18.8% |
What did the Fund invest in?
Sector Weighting (% of net assets)
| Value | Value |
|---|
| Other Assets in Excess of Liabilities | 0.8% |
| Money Market Funds | 0.1% |
| Municipal Bonds | 3.5% |
| U.S. Government & Agencies | 5.5% |
| Collateralized Mortgage Obligations | 11.9% |
| Utilities | 12.7% |
| U.S. Treasury Obligations | 18.6% |
| Industrials | 19.0% |
| Finance | 27.9% |
Top 10 Holdings (% of net assets)
| Holding Name | % of Net Assets |
| U.S. Treasury Notes, 2.750%, due 02/15/28 | 4.1% |
| U.S. Treasury Notes, 2.875%, due 05/15/28 | 4.0% |
| U.S. Treasury Notes, 2.750%, due 07/31/27 | 4.0% |
| U.S. Treasury Notes, 1.625%, due 05/15/26 | 2.2% |
| Huntington Bancshares, Inc., 2.625%, due 08/6/24 | 1.8% |
| Home Depot, Inc. (The), 5.150%, due 06/25/26 | 1.8% |
| Dover Corp., 3.150%, due 11/15/25 | 1.8% |
| Interstate Power & Light Co., 3.400%, due 08/15/25 | 1.8% |
| FNMA, 1.500%, due 09/1/31 | 1.8% |
| Florida Power & Light Co., 4.400%, due 05/15/28 | 1.8% |
No material changes occurred during the period ended June 30, 2024.
Johnson Institutional Short Duration Bond Fund - Class F (JIMDX)
Semi-Annual Shareholder Report - June 30, 2024
Where can I find additional information about the Fund?
Additional information is available on the Fund's website (www.johnsoninv.com/mutualfunds), including its:
Prospectus
Financial information
Holdings
Proxy voting information
Johnson Core Plus Bond Fund
Semi-Annual Shareholder Report - June 30, 2024
This semi-annual shareholder report contains important information about Johnson Core Plus Bond Fund for the period of January 1, 2024 to June 30, 2024. You can find additional information about the Fund at www.johnsoninv.com/mutualfunds. You can also request this information by contacting us at (800) 541-0170.
What were the Fund’s costs for the last six months?
(based on a hypothetical $10,000 investment)
| Fund Name | Costs of a $10,000 investment | Costs paid as a percentage of a $10,000 investment |
|---|
| Johnson Core Plus Bond Fund | $22 | 0.45% |
How did the Fund perform during the reporting period?
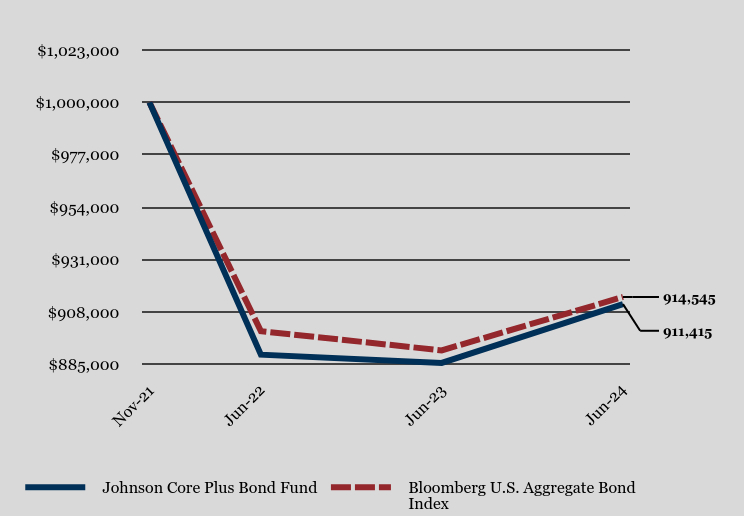
Bond markets ended 2023 on a high note as investors’ expectations for meaningful rate cuts in 2024 sent rates lower, fueling strong positive returns. Surprisingly strong economic data to begin 2024 tempered those expectations and sent rates back to near cycle highs. The 10-year treasury ultimately finished the first half of the year modestly higher, once again resulting in negative returns. The Fund maintained a modest long duration position relative to the Bloomberg Aggregate Index, the Fund’s benchmark, resulting in a slight drag to performance in the first half of the year. The Fund does seek to use Treasury Futures to adjust duration. While the use of futures amplified the negative impact of duration, overall, the impact was negligible. As interest rates rose on the better-than-expected economic data, corporate credit spreads continued to tighten. The Fund benefited from its income advantage over the Index, due in large part to its allocation to select high-quality high yield offerings. As a result, the Fund’s overweight to corporate bonds was the largest contributor to performance, more than offsetting the headwind from duration. Within corporate bonds the Fund’s emphasis on intermediate maturity bonds was an additional tailwind to performance as bonds in the intermediate part of the curve outperformed longer maturity bonds. Finally, sector allocation was additive to performance as the Fund maintains an overweight to financials, which outperformed their industrial and utility sector peers. We remain underweight Agency MBS, which continued to underperform during the first half of the year providing an additional tailwind to relative performance.
How has the Fund performed since inception?
Total Return Based on $1,000,000 Investment
| Johnson Core Plus Bond Fund | Bloomberg U.S. Aggregate Bond Index |
|---|
| Nov-21 | $1,000,000 | $1,000,000 |
| Jun-22 | 889,226 | 899,536 |
| Jun-23 | 885,599 | 891,100 |
| Jun-24 | 911,415 | 914,545 |
Average Annual Total Returns
| 1 Year | Since Inception (November 17, 2021) |
|---|
| Johnson Core Plus Bond Fund | 2.91% | |
| Bloomberg U.S. Aggregate Bond Index | 2.63% | |
The Fund's past performance is not a good predictor of how the Fund will perform in the future. The graph and table do not reflect the deduction of taxes that a shareholder would pay on fund distributions or redemption of fund shares.
- Net Assets$39,744,413
- Number of Portfolio Holdings95
- Advisory Fee (net of waivers)$0
- Portfolio Turnover26%
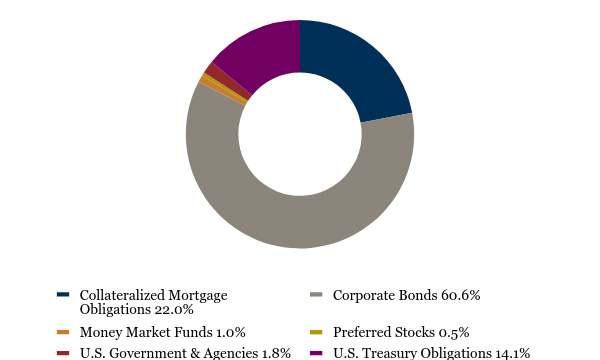
Asset Weighting (% of total investments)
| Value | Value |
|---|
| Collateralized Mortgage Obligations | 22.0% |
| Corporate Bonds | 60.6% |
| Money Market Funds | 1.0% |
| Preferred Stocks | 0.5% |
| U.S. Government & Agencies | 1.8% |
| U.S. Treasury Obligations | 14.1% |
What did the Fund invest in?
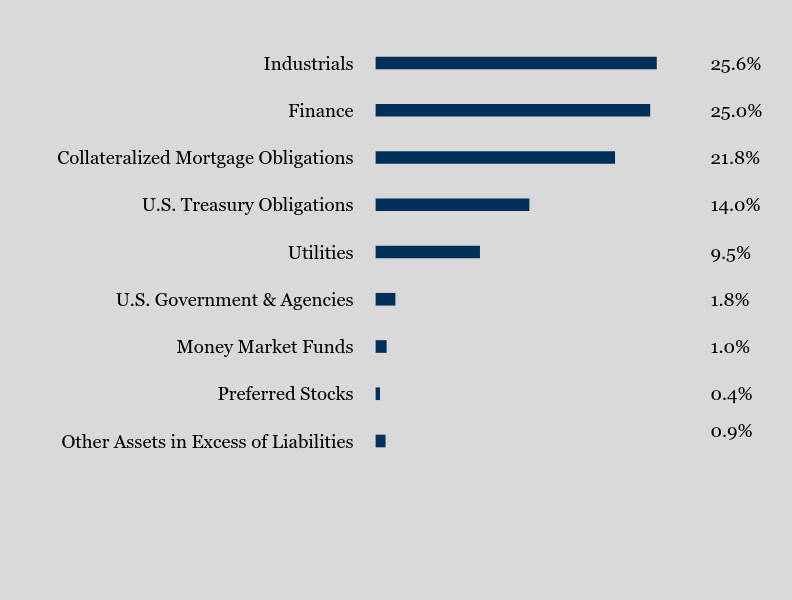
Sector Weighting (% of net assets)
| Value | Value |
|---|
| Other Assets in Excess of Liabilities | 0.9% |
| Preferred Stocks | 0.4% |
| Money Market Funds | 1.0% |
| U.S. Government & Agencies | 1.8% |
| Utilities | 9.5% |
| U.S. Treasury Obligations | 14.0% |
| Collateralized Mortgage Obligations | 21.8% |
| Finance | 25.0% |
| Industrials | 25.6% |
Top 10 Holdings (% of net assets)
| Holding Name | % of Net Assets |
FHLMC, 4.000%, due 12/1/49 | 2.5% |
| U.S. Treasury Notes, 3.875%, due 08/15/33 | 2.4% |
| U.S. Treasury Bonds, 2.375%, due 02/15/42 | 2.4% |
| FNMA, 4.500%, due 10/1/48 | 2.3% |
| FNMA, 4.000%, due 10/1/49 | 2.2% |
| U.S. Treasury Bonds, 2.500%, due 02/15/45 | 2.2% |
| U.S. Bancorp, 4.967%, due 07/22/33 - Series BB | 2.0% |
| Florida Power & Light Co., 5.100%, due 04/1/33 | 1.9% |
| U.S. Treasury Bonds, 2.250%, due 05/15/41 | 1.9% |
| Morgan Stanley, 3.591%, due 07/22/28 | 1.9% |
Effective May 1, 2024, the Adviser has contractually agreed to change the expense arrangement to a unitary fee arrangement, with a limit of 0.45% per year. The Adviser will cover all expenses in excess of the management fee.
Johnson Core Plus Bond Fund (JCPLX)
Semi-Annual Shareholder Report - June 30, 2024
Where can I find additional information about the Fund?
Additional information is available on the Fund's website (www.johnsoninv.com/mutualfunds), including its:
Prospectus
Financial information
Holdings
Proxy voting information
Johnson Municipal Income Fund
Semi-Annual Shareholder Report - June 30, 2024
This semi-annual shareholder report contains important information about Johnson Municipal Income Fund for the period of January 1, 2024 to June 30, 2024. You can find additional information about the Fund at www.johnsoninv.com/mutualfunds. You can also request this information by contacting us at (800) 541-0170.
What were the Fund’s costs for the last six months?
(based on a hypothetical $10,000 investment)
| Fund Name | Costs of a $10,000 investment | Costs paid as a percentage of a $10,000 investment |
|---|
| Johnson Municipal Income Fund | $15 | 0.30% |
How did the Fund perform during the reporting period?
After falling throughout 2023, municipal bond yields rose across every tenor of the curve in the first half of 2024 but most prominently for intermediate maturities. The Municipal Income Bond Fund’s overweight position to longer maturity securities contributed to relative performance as they outperformed intermediate tenors. New municipal bond issuance was elevated relative to recent history as issuers worked to get ahead of any potential presidential-election related market volatility. The Fund’s focus on higher-quality securities detracted from relative performance throughout the first half of the year as higher-quality spreads widened due to heightened new issue activity, and lower-quality securities significantly outperformed.
The Fund maintains a high-quality focus with about 71% of assets rated AA or higher as downgrade activity in economically sensitive sectors has continued. Cooling labor markets, restrictive monetary policy, and weakening leading economic indicators continue to send warning signs and further support a defensive positioning. Higher quality municipal credit health remains strong as many enjoyed boosts to tax-revenue collections, expanding savings funds to historically high levels. The Fund is diversified by issuer and sector to protect against idiosyncratic risks while approximately 24% of its assets are invested in states other than Ohio. The Fund’s duration will be longer versus its benchmark as longer maturity securities provide the greatest relative value at current levels. Finally, the current levels of rates are likely to offer attractive opportunities for long-term returns going forward.
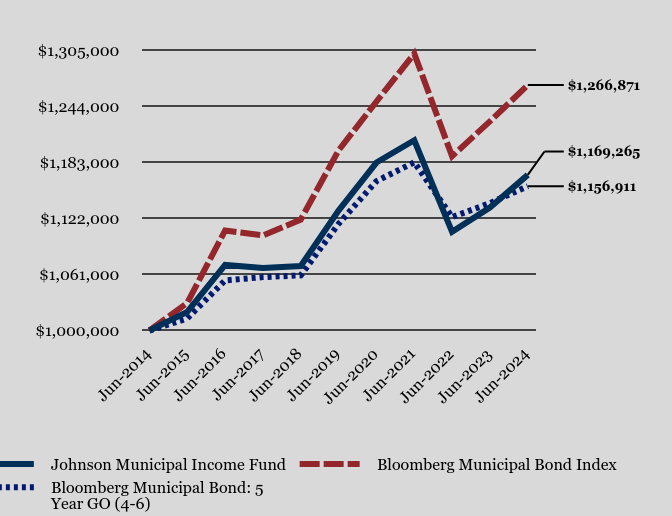
How has the Fund performed over the last ten years?
Total Return Based on $1,000,000 Investment
| Johnson Municipal Income Fund | Bloomberg Municipal Bond Index | Bloomberg Municipal Bond: 5 Year GO (4-6) |
|---|
| Jun-2014 | $1,000,000 | $1,000,000 | $1,000,000 |
| Jun-2015 | $1,020,338 | $1,029,995 | $1,013,131 |
| Jun-2016 | $1,071,321 | $1,108,816 | $1,054,541 |
| Jun-2017 | $1,068,045 | $1,103,407 | $1,058,096 |
| Jun-2018 | $1,070,120 | $1,120,671 | $1,059,966 |
| Jun-2019 | $1,130,422 | $1,195,826 | $1,116,005 |
| Jun-2020 | $1,182,664 | $1,249,021 | $1,162,402 |
| Jun-2021 | $1,206,853 | $1,301,052 | $1,182,882 |
| Jun-2022 | $1,107,364 | $1,189,532 | $1,123,340 |
| Jun-2023 | $1,133,802 | $1,227,437 | $1,138,501 |
| Jun-2024 | $1,169,265 | $1,266,871 | $1,156,911 |
Average Annual Total Returns
| 1 Year | 5 Years | 10 Years |
|---|
| Johnson Municipal Income Fund | 3.13% | 0.68% | 1.58% |
| Bloomberg Municipal Bond Index | 3.21% | 1.16% | 2.39% |
| Bloomberg Municipal Bond: 5 Year GO (4-6) | 1.62% | 0.72% | 1.47% |
The Fund's past performance is not a good predictor of how the Fund will perform in the future. The graph and table do not reflect the deduction of taxes that a shareholder would pay on fund distributions or redemption of fund shares.
What did the Fund invest in?
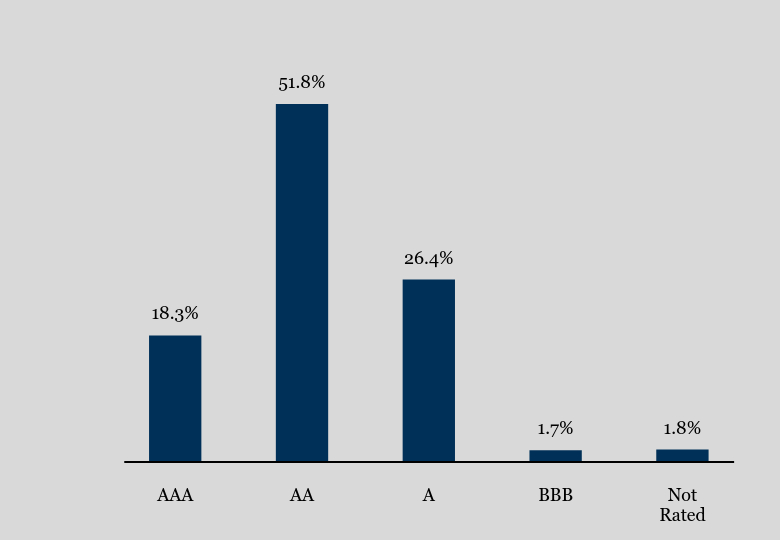
Quality Allocation (as a percentage of total assets)*
| Value | Value |
|---|
| AAA | 18.3% |
| AA | 51.8% |
| A | 26.4% |
| BBB | 1.7% |
| Not Rated | 1.8% |
* As rated by either Standard & Poor's or Moody's Rating Agencies.
(If rated by both, the lower rating is represented.)
- Net Assets$171,927,654
- Number of Portfolio Holdings153
- Advisory Fee $263,055
- Portfolio Turnover9%
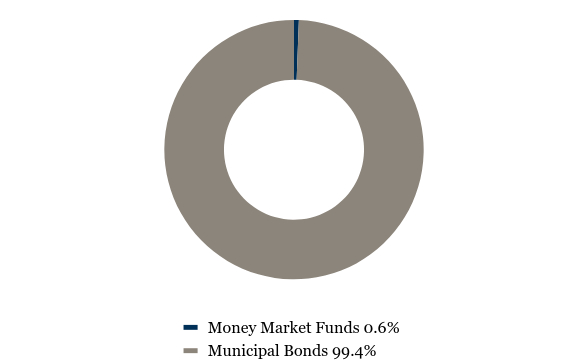
Asset Weighting (% of total investments)
| Value | Value |
|---|
| Money Market Funds | 0.6% |
| Municipal Bonds | 99.4% |
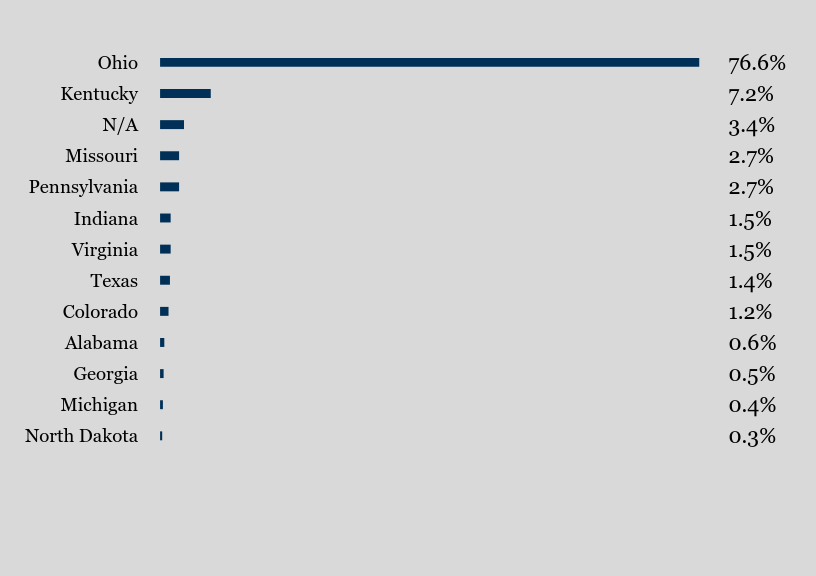
Holdings by State of Issuance (% of total investments)
| Value | Value |
|---|
| North Dakota | 0.3% |
| Michigan | 0.4% |
| Georgia | 0.5% |
| Alabama | 0.6% |
| Colorado | 1.2% |
| Texas | 1.4% |
| Virginia | 1.5% |
| Indiana | 1.5% |
| Pennsylvania | 2.7% |
| Missouri | 2.7% |
| N/A | 3.4% |
| Kentucky | 7.2% |
| Ohio | 76.6% |
Top 10 Holdings (% of net assets)
| Holding Name | % of Net Assets |
| Ohio Higher Education Facilities Revenue - Denison University, 5.000%, due 11/1/53 | 9.3% |
| Ohio State Water Development Authority Revenue, 5.000%, due 06/1/46 - Series 2021 | 8.0% |
| Ohio State Water Development Authority Revenue, 4.000%, due 12/1/46 - Series 2021-A | 6.8% |
| Franklin County Ohio Hospital Revenue Nationwide Childrens, 5.000%, due 11/1/48 - Series 2019-A | 6.0% |
| Columbus Ohio GO Unlimited, 5.000%, due 04/1/41 - Series 2022-A | 6.0% |
| Ohio Hospital Facility Revenue Refunding Cleveland Clinic Health, 4.000%, due 01/1/36 - Series 2017-A | 5.4% |
| Miami University Ohio General Receipts Revenue, 4.000%, due 09/1/45 - Series 2020-A | 5.4% |
| FHLMC, 2.550%, due 06/15/35 - Class A - Series M-053 | 5.3% |
| Grandview Heights Ohio Municipal Facilities Construction and Improvement, 4.000%, due 12/1/46 - Series 2023 | 5.2% |
| Bowling Green State University Ohio Revenue, 4.000%, due 06/1/45 - Series 2020-A | 4.9% |
No material changes occurred during the period ended June 30, 2024.
Where can I find additional information about the Fund?
Additional information is available on the Fund's website (www.johnsoninv.com/mutualfunds), including its:
Prospectus
Financial information
Holdings
Proxy voting information
Johnson Municipal Income Fund (JMUNX)
Semi-Annual Shareholder Report - June 30, 2024
Not required
| Item 3. | Audit Committee Financial Expert. |
Not required
| Item 4. | Principal Accountant Fees and Services. |
Not required
| Item 5. | Audit Committee of Listed Registrants. |
Not applicable
| (a) | The Registrant(s) schedule(s) of investments is included in the Financial Statements under Item 7 of this form. |
| Item 7. | Financial Statements and Financial Highlights for Open-End Management Investment Companies |
|
| |
| |
 |
| |
| |
| FINANCIAL STATEMENTS |
| |
JOHNSON EQUITY INCOME FUND – JEQIX, JEQSX JOHNSON OPPORTUNITY FUND – JOPPX, JOSSX JOHNSON INTERNATIONAL FUND – JINTX JOHNSON ENHANCED RETURN FUND – JENHX JOHNSON INSTITUTIONAL CORE BOND FUND – JIBFX, JIMFX, JIBSX JOHNSON INSTITUTIONAL INTERMEDIATE BOND FUND – JIBEX, JIMEX JOHNSON INSTITUTIONAL SHORT DURATION BOND FUND – JIBDX, JIMDX JOHNSON CORE PLUS BOND FUND – JCPLX JOHNSON MUNICIPAL INCOME FUND – JMUNX |
| |
| |
| JUNE 30, 2024 (UNAUDITED) |
| |
| |
| |
| |
| |
| |
| |
| |
| |
| |
| |
| |
| |
| |
| |
Johnson Mutual Funds Trust 3777 West Fork Road | Cincinnati, Ohio 45247 513.661.3100 | 800.541.0170 | Fax 513.661.4901 | | WWW.JOHNSONMUTUALFUNDS.COM |
| JOHNSON MUTUAL FUNDS | JUNE 30, 2024 |
Table of Contents
| Portfolio of Investments | | |
| Equity Income Fund | | 1 |
| Opportunity Fund | | 2 |
| International Fund | | 4 |
| Enhanced Return Fund | | 6 |
| Institutional Core Bond Fund | | 10 |
| Institutional Intermediate Bond Fund | | 16 |
| Institutional Short Duration Bond Fund | | 19 |
| Core Plus Bond Fund | | 23 |
| Municipal Income Fund | | 27 |
| Statements of Assets and Liabilities | | 32 |
| Statements of Operations | | 36 |
| Statements of Changes in Net Assets | | 40 |
| Financial Highlights | | |
| Equity Income Fund | | 47 |
| Opportunity Fund | | 49 |
| International Fund | | 51 |
| Enhanced Return Fund | | 52 |
| Institutional Core Bond Fund | | 53 |
| Institutional Intermediate Bond Fund | | 56 |
| Institutional Short Duration Bond Fund | | 58 |
| Core Plus Bond Fund | | 60 |
| Municipal Income Fund | | 61 |
| Notes to the Financial Statements | | 62 |
| Additional Information | | 77 |
| Review and Renewal of Management Agreements | | 78 |
| Trustees and Officers, Transfer Agent and Fund Accountant, Custodian, Independent Registered Public Accounting Firm, Legal Counsel | | Back Page |
| EQUITY INCOME FUND | PORTFOLIO OF INVESTMENTS AS OF JUNE 30, 2024 – UNAUDITED |
| COMMON STOCKS — 99.1% | | Shares | | | Value | |
| Communications — 4.4% | | | | | | | | |
| Alphabet, Inc. - Class A | | | 117,812 | | | $ | 21,459,456 | |
| Comcast Corp. - Class A | | | 177,800 | | | | 6,962,648 | |
| | | | | | | | 28,422,104 | |
| Consumer Discretionary — 8.4% | | | | | | | | |
| Amazon.com, Inc. (a) | | | 67,000 | | | | 12,947,750 | |
| Genuine Parts Co. | | | 72,000 | | | | 9,959,040 | |
| Lowe’s Cos., Inc. | | | 57,000 | | | | 12,566,220 | |
| McDonald’s Corp. | | | 42,500 | | | | 10,830,700 | |
| TJX Cos., Inc. (The) | | | 65,485 | | | | 7,209,899 | |
| | | | | | | | 53,513,609 | |
| Consumer Staples — 8.3% | | | | | | | | |
| Coca-Cola Co. (The) | | | 215,320 | | | | 13,705,118 | |
| Estee Lauder Cos., Inc. (The) - Class A | | | 80,000 | | | | 8,512,000 | |
| Hershey Co. (The) | | | 65,600 | | | | 12,059,248 | |
| PepsiCo, Inc. | | | 35,900 | | | | 5,920,987 | |
| Procter & Gamble Co. (The) | | | 36,690 | | | | 6,050,915 | |
| Walmart, Inc. | | | 104,665 | | | | 7,086,867 | |
| | | | | | | | 53,335,135 | |
| Energy — 6.5% | | | | | | | | |
| Chevron Corp. | | | 125,760 | | | | 19,671,379 | |
| Williams Cos., Inc. (The) | | | 514,300 | | | | 21,857,750 | |
| | | | | | | | 41,529,129 | |
| Financials — 13.6% | | | | | | | | |
| American Financial Group, Inc. | | | 103,400 | | | | 12,720,268 | |
| Axis Capital Holdings Ltd. | | | 223,550 | | | | 15,793,807 | |
| Everest Group Ltd. | | | 34,200 | | | | 13,030,884 | |
| Marsh & McLennan Cos., Inc. | | | 61,600 | | | | 12,980,352 | |
| Nasdaq, Inc. | | | 349,300 | | | | 21,048,818 | |
| Willis Towers Watson plc | | | 44,870 | | | | 11,762,222 | |
| | | | | | | | 87,336,351 | |
| Health Care — 16.6% | | | | | | | | |
| Abbott Laboratories | | | 117,218 | | | | 12,180,122 | |
| Cencora, Inc. | | | 79,000 | | | | 17,798,700 | |
| Danaher Corp. | | | 75,343 | | | | 18,824,449 | |
| Medtronic plc | | | 108,836 | | | | 8,566,482 | |
| Stryker Corp. | | | 37,000 | | | | 12,589,250 | |
| UnitedHealth Group, Inc. | | | 38,550 | | | | 19,631,973 | |
| Zimmer Biomet Holdings, Inc. | | | 103,900 | | | | 11,276,267 | |
| Zoetis, Inc. | | | 32,892 | | | | 5,702,157 | |
| | | | | | | | 106,569,400 | |
| Industrials — 10.2% | | | | | | | | |
| Amphenol Corp. - Class A | | | 94,000 | | | | 6,332,780 | |
| Honeywell International, Inc. | | | 53,350 | | | | 11,392,359 | |
| Illinois Tool Works, Inc. | | | 52,000 | | | | 12,321,920 | |
| Nordson Corp. | | | 46,300 | | | | 10,738,822 | |
| Northrop Grumman Corp. | | | 27,000 | | | | 11,770,650 | |
| Waste Management, Inc. | | | 60,500 | | | | 12,907,070 | |
| | | | | | | | 65,463,601 | |
| COMMON STOCKS — 99.1% | | Shares | | | Value | |
| Real Estate — 1.9% | | | | | | | | |
| American Tower Corp. | | | 61,187 | | | $ | 11,893,529 | |
| | | | | | | | | |
| Technology — 23.3% | | | | | | | | |
| Accenture plc - Class A | | | 33,190 | | | | 10,070,178 | |
| Adobe, Inc. (a) | | | 26,260 | | | | 14,588,480 | |
| Analog Devices, Inc. | | | 59,200 | | | | 13,512,992 | |
| Apple, Inc. | | | 61,760 | | | | 13,007,891 | |
| ASML Holding N.V. | | | 7,100 | | | | 7,261,383 | |
| Intuit, Inc. | | | 10,250 | | | | 6,736,403 | |
| Mastercard, Inc. - Class A | | | 26,450 | | | | 11,668,682 | |
| Microsoft Corp. | | | 60,260 | | | | 26,933,207 | |
| Roper Technologies, Inc. | | | 26,000 | | | | 14,655,160 | |
| S&P Global, Inc. | | | 14,057 | | | | 6,269,422 | |
| Taiwan Semiconductor Manufacturing Co. Ltd. - ADR | | | 63,000 | | | | 10,950,030 | |
| Visa, Inc. - Class A | | | 50,600 | | | | 13,280,982 | |
| | | | | | | | 148,934,810 | |
| Utilities — 5.9% | | | | | | | | |
| Alliant Energy Corp. | | | 352,910 | | | | 17,963,119 | |
| American Electric Power Co., Inc. | | | 227,600 | | | | 19,969,624 | |
| | | | | | | | 37,932,743 | |
Total Common Stocks
(Cost $442,157,609) | | | | | | $ | 634,930,411 | |
| | | | | | | | | |
| MONEY MARKET FUNDS — 0.8% | | | | | | | | |
| First American Government Obligations Fund - Class Z, 5.19% (b) (Cost $5,238,390) | | | 5,238,390 | | | $ | 5,238,390 | |
| | | | | | | | | |
Investments at Value — 99.9%
(Cost $447,395,999) | | | | | | $ | 640,168,801 | |
| | | | | | | | | |
| Other Assets in Excess of Liabilities — 0.1% | | | | | | | 324,459 | |
| | | | | | | | | |
| Net Assets — 100.0% | | | | | | $ | 640,493,260 | |
| (a) | Non-income producing security. |
| (b) | The rate shown is the 7-day effective yield as of June 30, 2024. |
ADR - American Depositary Receipt
N.V. - Naamloze Vennootschap
plc - Public Limited Company
The accompanying notes are an integral part of these financial statements.
| OPPORTUNITY FUND | PORTFOLIO OF INVESTMENTS AS OF JUNE 30, 2024 – UNAUDITED |
| COMMON STOCKS — 98.3% | | Shares | | | Value | |
| Communications — 1.5% | | | | | | | | |
| New York Times Co. (The) - Class A | | | 44,300 | | | $ | 2,268,603 | |
| | | | | | | | | |
| Consumer Discretionary — 10.1% | | | | | | | | |
| Beacon Roofing Supply, Inc. (a) | | | 15,500 | | | | 1,402,750 | |
| Floor & Decor Holdings, Inc. - Class A (a) | | | 18,100 | | | | 1,799,321 | |
| LKQ Corp. | | | 49,100 | | | | 2,042,069 | |
| NVR, Inc. (a) | | | 195 | | | | 1,479,769 | |
| Ralph Lauren Corp. | | | 9,500 | | | | 1,663,070 | |
| Rush Enterprises, Inc. - Class A | | | 38,100 | | | | 1,595,247 | |
| Steven Madden Ltd. | | | 42,300 | | | | 1,789,290 | |
| Texas Roadhouse, Inc. | | | 11,900 | | | | 2,043,349 | |
| Williams-Sonoma, Inc. | | | 6,300 | | | | 1,778,931 | |
| | | | | | | | 15,593,796 | |
| Consumer Staples — 2.4% | | | | | | | | |
| BJ’s Wholesale Club Holdings, Inc. (a) | | | 22,400 | | | | 1,967,616 | |
| Coca-Cola Consolidated, Inc. | | | 1,600 | | | | 1,736,000 | |
| | | | | | | | 3,703,616 | |
| Energy — 2.8% | | | | | | | | |
| DT Midstream, Inc. | | | 25,000 | | | | 1,775,750 | |
| World Kinect Corp. | | | 99,200 | | | | 2,559,360 | |
| | | | | | | | 4,335,110 | |
| Financials — 12.3% | | | | | | | | |
| American Financial Group, Inc. | | | 21,400 | | | | 2,632,628 | |
| Arrow Financial Corp. | | | 35,597 | | | | 927,302 | |
| Axis Capital Holdings Ltd. | | | 43,700 | | | | 3,087,405 | |
| Diamond Hill Investment Group, Inc. | | | 7,900 | | | | 1,111,925 | |
| East West Bancorp, Inc. | | | 28,700 | | | | 2,101,701 | |
| Everest Group Ltd. | | | 6,800 | | | | 2,590,936 | |
| SEI Investments Co. | | | 26,000 | | | | 1,681,940 | |
| Webster Financial Corp. | | | 41,000 | | | | 1,787,190 | |
| Wintrust Financial Corp. | | | 30,300 | | | | 2,986,368 | |
| | | | | | | | 18,907,395 | |
| Health Care — 11.1% | | | | | | | | |
| Charles River Laboratories International, Inc. (a) | | | 11,400 | | | | 2,355,012 | |
| Chemed Corp. | | | 4,300 | | | | 2,333,094 | |
| Jazz Pharmaceuticals plc (a) | | | 18,900 | | | | 2,017,197 | |
| LeMaitre Vascular, Inc. | | | 25,900 | | | | 2,131,052 | |
| Option Care Health, Inc. (a) | | | 68,300 | | | | 1,891,910 | |
| Quest Diagnostics, Inc. | | | 10,600 | | | | 1,450,928 | |
| Repligen Corp. (a) | | | 9,900 | | | | 1,247,994 | |
| U.S. Physical Therapy, Inc. | | | 19,400 | | | | 1,792,948 | |
| Universal Health Services, Inc. - Class B | | | 10,200 | | | | 1,886,286 | |
| | | | | | | | 17,106,421 | |
| COMMON STOCKS — 98.3% | | Shares | | | Value | |
| Industrials — 16.3% | | | | | | | | |
| A.O. Smith Corp. | | | 30,900 | | | $ | 2,527,002 | |
| AMN Healthcare Services, Inc. (a) | | | 19,700 | | | | 1,009,231 | |
| Applied Industrial Technologies, Inc. | | | 14,700 | | | | 2,851,800 | |
| Comfort Systems USA, Inc. | | | 3,700 | | | | 1,125,244 | |
| Core & Main, Inc. - Class A (a) | | | 31,900 | | | | 1,561,186 | |
| Donaldson Co., Inc. | | | 29,100 | | | | 2,082,396 | |
| Gorman-Rupp Co. (The) | | | 50,500 | | | | 1,853,855 | |
| Hubbell, Inc. | | | 5,200 | | | | 1,900,496 | |
| IDEX Corp. | | | 8,500 | | | | 1,710,200 | |
| Littelfuse, Inc. | | | 8,900 | | | | 2,274,751 | |
| LSI Industries, Inc. | | | 105,300 | | | | 1,523,691 | |
| Nordson Corp. | | | 9,300 | | | | 2,157,042 | |
| SiteOne Landscape Supply, Inc. (a) | | | 8,200 | | | | 995,562 | |
| Watts Water Technologies, Inc. - Class A | | | 8,400 | | | | 1,540,308 | |
| | | | | | | | 25,112,764 | |
| Materials — 10.1% | | | | | | | | |
| Avery Dennison Corp. | | | 11,600 | | | | 2,536,340 | |
| H.B. Fuller Co. | | | 36,600 | | | | 2,816,736 | |
| Hawkins, Inc. | | | 34,000 | | | | 3,094,000 | |
| Reliance, Inc. | | | 8,000 | | | | 2,284,800 | |
| RPM International, Inc. | | | 15,600 | | | | 1,679,808 | |
| Sonoco Products Co. | | | 34,500 | | | | 1,749,840 | |
| UFP Industries, Inc. | | | 11,700 | | | | 1,310,400 | |
| | | | | | | | 15,471,924 | |
| Real Estate — 6.4% | | | | | | | | |
| Americold Realty Trust, Inc. | | | 88,200 | | | | 2,252,628 | |
| Community Healthcare Trust, Inc. | | | 49,300 | | | | 1,153,127 | |
| Equity LifeStyle Properties, Inc. | | | 13,000 | | | | 846,690 | |
| Jones Lang LaSalle, Inc. (a) | | | 11,200 | | | | 2,299,136 | |
| NNN REIT, Inc. | | | 46,900 | | | | 1,997,940 | |
| STAG Industrial, Inc. | | | 37,400 | | | | 1,348,644 | |
| | | | | | | | 9,898,165 | |
| Technology — 21.6% | | | | | | | | |
| Amdocs Ltd. | | | 23,600 | | | | 1,862,512 | |
| Bentley Systems, Inc. - Class B | | | 44,200 | | | | 2,181,712 | |
| Blackbaud, Inc. (a) | | | 23,800 | | | | 1,812,846 | |
| CACI International, Inc. - Class A (a) | | | 5,400 | | | | 2,322,702 | |
| DoubleVerify Holdings, Inc. (a) | | | 62,600 | | | | 1,218,822 | |
| Dynatrace, Inc. (a) | | | 57,800 | | | | 2,585,972 | |
| Genpact Ltd. | | | 59,500 | | | | 1,915,305 | |
| Globant S.A. (a) | | | 11,500 | | | | 2,049,990 | |
| ICF International, Inc. | | | 8,700 | | | | 1,291,602 | |
| Jack Henry & Associates, Inc. | | | 8,400 | | | | 1,394,568 | |
| Leidos Holdings, Inc. | | | 19,700 | | | | 2,873,836 | |
| MAXIMUS, Inc. | | | 28,100 | | | | 2,408,170 | |
| Paylocity Holding Corp. (a) | | | 6,900 | | | | 909,765 | |
| PTC, Inc. (a) | | | 9,200 | | | | 1,671,364 | |
The accompanying notes are an integral part of these financial statements.
| OPPORTUNITY FUND | PORTFOLIO OF INVESTMENTS AS OF JUNE 30, 2024 – UNAUDITED |
| COMMON STOCKS — 98.3% | | Shares | | | Value | |
| Sapiens International Corp. N.V. | | | 57,300 | | | $ | 1,944,189 | |
| Tyler Technologies, Inc. (a) | | | 5,350 | | | | 2,689,873 | |
| WEX, Inc. (a) | | | 4,900 | | | | 867,986 | |
| Zebra Technologies Corp. - Class A (a) | | | 3,700 | | | | 1,143,041 | |
| | | | | | | | 33,144,255 | |
| Utilities — 3.7% | | | | | | | | |
| Atmos Energy Corp. | | | 14,500 | | | | 1,691,425 | |
| Portland General Electric Co. | | | 32,200 | | | | 1,392,328 | |
| Unitil Corp. | | | 50,600 | | | | 2,620,574 | |
| | | | | | | | 5,704,327 | |
Total Common Stocks
(Cost $123,355,885) | | | | | | $ | 151,246,376 | |
| | | | | | | | | |
| MONEY MARKET FUNDS — 1.7% | | | | | | | | |
| First American Government Obligations Fund - Class Z, 5.19% (b) (Cost $2,538,428) | | | 2,538,428 | | | $ | 2,538,428 | |
| | | | | | | | | |
Investments at Value — 100.0%
(Cost $125,894,313) | | | | | | $ | 153,784,804 | |
| | | | | | | | | |
| Other Assets in Excess of Liabilities — 0.0% (c) | | | | | | | 30,917 | |
| | | | | | | | | |
| Net Assets — 100.0% | | | | | | $ | 153,815,721 | |
| (a) | Non-income producing security. |
| (b) | The rate shown is the 7-day effective yield as of June 30, 2024. |
| (c) | Percentage rounds to less than 0.1%. |
N.V. - Naamloze Vennootschap
plc - Public Limited Company
S.A. - Societe Anonyme
The accompanying notes are an integral part of these financial statements.
| INTERNATIONAL FUND | PORTFOLIO OF INVESTMENTS AS OF JUNE 30, 2024 – UNAUDITED |
| COMMON STOCKS — 98.4% | | Shares | | | Value | |
| Communications — 9.0% | | | | | | | | |
| Baidu, Inc. - ADR (a) | | | 1,800 | | | $ | 155,664 | |
| Deutsche Telekom AG - ADR | | | 7,100 | | | | 178,849 | |
| KDDI Corp. - ADR | | | 22,600 | | | | 298,546 | |
| Orange S.A. - ADR | | | 7,500 | | | | 74,925 | |
| PDLT, Inc. - ADR | | | 14,100 | | | | 346,296 | |
| Publicis Groupe S.A. - ADR | | | 16,400 | | | | 427,220 | |
| SK Telecom Co. Ltd. - ADR | | | 4,600 | | | | 96,278 | |
| Tencent Holdings Ltd. - ADR | | | 10,400 | | | | 492,544 | |
| WPP plc - ADR | | | 1,800 | | | | 82,404 | |
| | | | | | | | 2,152,726 | |
| Consumer Discretionary — 7.9% | | | | | | | | |
| Alibaba Group Holding Ltd. - ADR | | | 2,000 | | | | 144,000 | |
| Bridgestone Corp. - ADR | | | 8,200 | | | | 161,622 | |
| Bunzl plc - ADR | | | 7,700 | | | | 292,831 | |
| CIE Financiere Richemont S.A. - ADR | | | 22,000 | | | | 343,200 | |
| Honda Motor Co. Ltd. - ADR | | | 5,500 | | | | 177,320 | |
| JD.com, Inc. - ADR | | | 1,700 | | | | 43,928 | |
| Magna International, Inc. | | | 6,000 | | | | 251,400 | |
| Mercedes-Benz Group AG | | | 3,600 | | | | 248,666 | |
| Toyota Motor Corp. - ADR | | | 1,100 | | | | 225,467 | |
| | | | | | | | 1,888,434 | |
| Consumer Staples — 8.2% | | | | | | | | |
| ITOCHU Corp. - ADR | | | 3,700 | | | | 363,895 | |
| L’Oreal S.A. - ADR | | | 2,800 | | | | 245,924 | |
| Nestlé S.A. - ADR | | | 2,800 | | | | 286,860 | |
| Reckitt Benckiser Group plc - ADR | | | 5,900 | | | | 64,546 | |
| Shoprite Holdings Ltd. - ADR | | | 32,100 | | | | 500,118 | |
| Unilever plc - ADR | | | 2,200 | | | | 120,978 | |
| Wal-Mart de Mexico S.A.B. de C.V. - ADR | | | 10,600 | | | | 360,612 | |
| | | | | | | | 1,942,933 | |
| Energy — 3.3% | | | | | | | | |
| BP plc - ADR | | | 4,000 | | | | 144,400 | |
| Gazprom PJSC - ADR (a)(b) | | | 14,000 | | | | 140 | |
| Shell plc - ADR | | | 4,600 | | | | 332,029 | |
| TotalEnergies SE - ADR | | | 2,352 | | | | 156,831 | |
| Woodside Energy Group Ltd. - ADR | | | 7,599 | | | | 142,937 | |
| | | | | | | | 776,337 | |
| Financials — 21.4% | | | | | | | | |
| Admiral Group plc - ADR | | | 8,200 | | | | 270,436 | |
| Allianz SE - ADR | | | 10,700 | | | | 296,604 | |
| Banco Santander S.A. - ADR | | | 37,155 | | | | 172,028 | |
| Bank of Montreal | | | 1,240 | | | | 103,974 | |
| Barclays plc - ADR | | | 15,000 | | | | 160,650 | |
| BNP Paribas S.A. - ADR | | | 6,100 | | | | 196,054 | |
| China Construction Bank Corp. - ADR | | | 23,000 | | | | 339,480 | |
| COMMON STOCKS — 98.4% | | Shares | | | Value | |
| Commonwealth Bank of Australia - ADR | | | 1,700 | | | $ | 143,786 | |
| Deutsche Boerse AG - ADR | | | 7,000 | | | | 143,010 | |
| Industrial & Commercial Bank of China Ltd. - ADR | | | 33,800 | | | | 399,178 | |
| KB Financial Group, Inc. - ADR | | | 2,400 | | | | 135,864 | |
| Legal & General Group plc - ADR | | | 15,700 | | | | 225,452 | |
| Manulife Financial Corp. | | | 7,720 | | | | 205,506 | |
| Mitsubishi UFJ Financial Group, Inc. - ADR | | | 40,000 | | | | 432,000 | |
| ORIX Corp. - ADR | | | 1,650 | | | | 183,645 | |
| Royal Bank of Canada | | | 1,900 | | | | 202,122 | |
| Sumitomo Mitsui Financial Group, Inc. - ADR | | | 40,000 | | | | 536,400 | |
| Tokio Marine Holdings, Inc. - ADR | | | 15,800 | | | | 595,186 | |
| Toronto-Dominion Bank (The) | | | 2,700 | | | | 148,392 | |
| United Overseas Bank Ltd. - ADR | | | 2,500 | | | | 114,875 | |
| Zurich Insurance Group AG - ADR | | | 1,940 | | | | 103,538 | |
| | | | | | | | 5,108,180 | |
| Health Care — 8.6% | | | | | | | | |
| Astellas Pharma, Inc. - ADR | | | 10,300 | | | | 101,558 | |
| Bayer AG - ADR | | | 10,700 | | | | 75,328 | |
| Dr. Reddy’s Laboratories Ltd. - ADR | | | 4,500 | | | | 342,855 | |
| Novartis AG - ADR | | | 2,480 | | | | 264,021 | |
| Novo Nordisk A/S - ADR | | | 3,700 | | | | 528,137 | |
| Roche Holding AG - ADR | | | 15,100 | | | | 523,517 | |
| Sanofi S.A. - ADR | | | 2,000 | | | | 97,040 | |
| Takeda Pharmaceutical Co. Ltd. - ADR | | | 9,340 | | | | 120,860 | |
| | | | | | | | 2,053,316 | |
| Industrials — 7.5% | | | | | | | | |
| ABB Ltd. - ADR | | | 2,900 | | | | 161,559 | |
| Atlas Copco AB - ADR | | | 28,400 | | | | 535,908 | |
| BAE Systems plc - ADR | | | 3,800 | | | | 254,030 | |
| Schneider Electric SE - ADR | | | 9,900 | | | | 476,586 | |
| Sensata Technologies Holding plc | | | 2,200 | | | | 82,258 | |
| Siemens AG - ADR | | | 2,900 | | | | 270,425 | |
| | | | | | | | 1,780,766 | |
| Materials — 9.1% | | | | | | | | |
| Air Liquide S.A. - ADR | | | 5,528 | | | | 191,473 | |
| BASF SE - ADR | | | 7,400 | | | | 89,392 | |
| BHP Group Ltd. - ADR | | | 7,400 | | | | 422,466 | |
| Cemex S.A.B. de C.V. - ADR | | | 30,300 | | | | 193,617 | |
| Companhia Siderurgica Nacional S.A. - ADR | | | 57,100 | | | | 131,330 | |
| Fortescue Ltd. - ADR | | | 3,300 | | | | 94,545 | |
| Nitto Denko Corp. - ADR | | | 9,000 | | | | 357,030 | |
| POSCO Holdings, Inc. - ADR | | | 4,200 | | | | 276,108 | |
| Rio Tinto plc - ADR | | | 1,570 | | | | 103,510 | |
The accompanying notes are an integral part of these financial statements.
| INTERNATIONAL FUND | PORTFOLIO OF INVESTMENTS AS OF JUNE 30, 2024 – UNAUDITED |
| COMMON STOCKS — 98.4% | | Shares | | | Value | |
| Vale S.A. - ADR | | | 27,800 | | | $ | 310,526 | |
| | | | | | | | 2,169,997 | |
| Real Estate — 1.3% | | | | | | | | |
| Sun Hung Kai Properties Ltd. - ADR | | | 34,700 | | | | 300,502 | |
| | | | | | | | | |
| Technology — 18.7% | | | | | | | | |
| ASML Holding N.V. | | | 500 | | | | 511,365 | |
| Capgemini SE - ADR | | | 4,000 | | | | 159,200 | |
| CGI, Inc. (a) | | | 4,300 | | | | 429,183 | |
| Infosys Ltd. - ADR | | | 24,100 | | | | 448,742 | |
| Lenovo Group Ltd. - ADR | | | 17,900 | | | | 506,749 | |
| Open Text Corp. | | | 11,500 | | | | 345,460 | |
| PDD Holdings, Inc. (a) | | | 1,900 | | | | 252,605 | |
| RELX plc - ADR | | | 2,500 | | | | 114,700 | |
| SAP SE - ADR | | | 1,300 | | | | 262,223 | |
| Sony Group Corp. - ADR | | | 4,500 | | | | 382,275 | |
| Taiwan Semiconductor Manufacturing Co. Ltd. - ADR | | | 3,200 | | | | 556,192 | |
| United Microelectronics Corp. - ADR (a) | | | 55,700 | | | | 487,932 | |
| | | | | | | | 4,456,626 | |
| Utilities — 3.4% | | | | | | | | |
| Enel S.p.A. - ADR | | | 33,700 | | | | 232,193 | |
| Iberdrola S.A. - ADR | | | 6,300 | | | | 329,616 | |
| National Grid plc - ADR | | | 1,629 | | | | 92,527 | |
| SSE plc - ADR | | | 6,900 | | | | 158,631 | |
| | | | | | | | 812,967 | |
Total Common Stocks
(Cost $16,283,444) | | | | | | $ | 23,442,784 | |
| PREFERRED STOCKS — 0.6% | | Shares | | | Value | |
| Financials — 0.6% | | | | | | | | |
| Itau Unibanco Holding S.A. - ADR (Cost $129,573) | | | 24,800 | | | $ | 144,832 | |
| | | | | | | | | |
| MONEY MARKET FUNDS — 0.1% | | | | | | | | |
| First American Government Obligations Fund - Class Z, 5.19% (c) (Cost $12,897) | | | 12,897 | | | $ | 12,897 | |
| | | | | | | | | |
Investments at Value — 99.1%
(Cost $16,425,914) | | | | | | $ | 23,600,513 | |
| | | | | | | | | |
| Other Assets in Excess of Liabilities — 0.9% | | | | | | | 212,304 | |
| | | | | | | | | |
| Net Assets — 100.0% | | | | | | $ | 23,812,817 | |
| (a) | Non-income producing security. |
| (b) | This security is currently restricted from trading and is valued using Level 3 inputs as of June 30, 2024. The total fair value of Level 3 securities as of June 30, 2024 is $140. |
| (c) | The rate shown is the 7-day effective yield as of June 30, 2024. |
A/S - Aktieselskab
AB - Aktiebolag
ADR - American Depositary Receipt
AG - Aktiengesellschaft
N.V. - Naamloze Vennootschap
PJSC - Public Joint-Stock Company
plc - Public Limited Company
S.A. - Societe Anonyme
S.A.B. de C.V. - Sociedad Anónima Bursátil de Capital Variable
SE - Societe Europaea
S.P.A. - Societa per azioni
The accompanying notes are an integral part of these financial statements.
| ENHANCED RETURN FUND | PORTFOLIO OF INVESTMENTS AS OF JUNE 30, 2024 – UNAUDITED |
| CORPORATE BONDS — 61.6% | | Coupon | | | Maturity | | | Par Value | | | Value | |
| Finance — 28.7% | | | | | | | | | | | | | | |
| Allstate Corp. | | 0.750% | | | 12/15/25 | | | $ | 4,102,000 | | | $ | 3,835,842 | |
| American Express Co. | | 2.500% | | | 07/30/24 | | | | 3,647,000 | | | | 3,647,000 | |
| AON plc | | 3.875% | | | 12/15/25 | | | | 3,999,000 | | | | 3,908,071 | |
| Bank of America Corp., Series L | | 3.875% | | | 08/01/25 | | | | 4,599,000 | | | | 4,528,062 | |
| Branch Banking & Trust Co. | | 3.625% | | | 09/16/25 | | | | 4,540,000 | | | | 4,421,636 | |
| Chubb INA Holdings, Inc. | | 3.350% | | | 05/03/26 | | | | 5,559,000 | | | | 5,378,572 | |
| Essex Portfolio, L.P. | | 3.500% | | | 04/01/25 | | | | 3,435,000 | | | | 3,376,793 | |
| Essex Portfolio, L.P. | | 3.375% | | | 04/15/26 | | | | 565,000 | | | | 545,044 | |
| Fifth Third Bancorp (SOFR + 234) (a) | | 6.339% | | | 07/27/29 | | | | 3,895,000 | | | | 3,993,908 | |
| Goldman Sachs Group, Inc. (The) | | 3.500% | | | 01/23/25 | | | | 4,050,000 | | | | 4,000,306 | |
| Huntington Bancshares, Inc. | | 2.625% | | | 08/06/24 | | | | 3,840,000 | | | | 3,826,753 | |
| JPMorgan Chase & Co. | | 3.875% | | | 09/10/24 | | | | 2,704,000 | | | | 2,693,140 | |
| JPMorgan Chase & Co. | | 2.182% | | | 06/01/28 | | | | 2,935,000 | | | | 2,694,314 | |
| KeyCorp, Series O | | 4.150% | | | 10/29/25 | | | | 4,562,000 | | | | 4,459,651 | |
| Marsh & McLennan Co., Inc. | | 3.500% | | | 03/10/25 | | | | 765,000 | | | | 753,860 | |
| Morgan Stanley, Series F | | 3.700% | | | 10/23/24 | | | | 200,000 | | | | 198,732 | |
| Morgan Stanley, Series F | | 4.000% | | | 07/23/25 | | | | 4,200,000 | | | | 4,137,037 | |
| Morgan Stanley | | 3.591% | | | 07/22/28 | | | | 1,100,000 | | | | 1,045,907 | |
| National Retail Properties, Inc. | | 4.000% | | | 11/15/25 | | | | 4,120,000 | | | | 4,035,094 | |
| PNC Financial Services Group, Inc. (The) | | 5.300% | | | 01/21/28 | | | | 4,010,000 | | | | 4,003,974 | |
| PNC Financial Services Group, Inc. (The) | | 4.050% | | | 07/26/28 | | | | 1,195,000 | | | | 1,135,397 | |
| Private Export Funding Corp., 144A | | 5.500% | | | 03/14/25 | | | | 2,000,000 | | | | 2,000,200 | |
| Truist Financial Corp., Series H | | 3.875% | | | 03/19/29 | | | | 1,000,000 | | | | 932,559 | |
| U.S. Bancorp, Series MTN | | 3.100% | | | 04/27/26 | | | | 4,790,000 | | | | 4,592,725 | |
| U.S. Bancorp, Series Y | | 3.000% | | | 07/30/29 | | | | 900,000 | | | | 805,312 | |
| Wells Fargo & Co., Series N | | 3.550% | | | 09/29/25 | | | | 830,000 | | | | 810,321 | |
| Wells Fargo & Co., Series M | | 4.100% | | | 06/03/26 | | | | 3,290,000 | | | | 3,206,238 | |
| | | | | | | | | | | | | | 78,966,448 | |
| Industrials — 21.1% | | | | | | | | | | | | | | |
| Becton Dickinson and Co. | | 3.734% | | | 12/15/24 | | | | 2,269,000 | | | | 2,247,574 | |
| Burlington Northern Santa Fe | | 3.650% | | | 09/01/25 | | | | 3,970,000 | | | | 3,892,155 | |
| Cisco Systems, Inc. | | 4.800% | | | 02/26/27 | | | | 5,140,000 | | | | 5,125,702 | |
| CVS Health Corp. | | 3.875% | | | 07/20/25 | | | | 4,100,000 | | | | 4,026,060 | |
| Dover Corp. | | 3.150% | | | 11/15/25 | | | | 4,515,000 | | | | 4,374,638 | |
| Enterprise Products Operating, LLC | | 3.750% | | | 02/15/25 | | | | 500,000 | | | | 494,018 | |
| Home Depot, Inc. (The) | | 5.150% | | | 06/25/26 | | | | 5,500,000 | | | | 5,505,222 | |
| Johnson Controls International plc | | 3.625% | | | 07/02/24 | | | | 4,252,000 | | | | 4,252,000 | |
| MPLX, L.P. | | 4.875% | | | 12/01/24 | | | | 3,505,000 | | | | 3,489,862 | |
| Norfolk Southern Corp. | | 5.590% | | | 05/17/25 | | | | 1,280,000 | | | | 1,277,936 | |
| Norfolk Southern Corp. | | 3.650% | | | 08/01/25 | | | | 3,300,000 | | | | 3,238,233 | |
| Parker-Hannifin Corp. | | 4.250% | | | 09/15/27 | | | | 4,105,000 | | | | 4,001,095 | |
| Roper Technologies, Inc. | | 1.000% | | | 09/15/25 | | | | 4,083,000 | | | | 3,866,655 | |
| Starbucks Corp. | | 4.850% | | | 02/08/27 | | | | 3,870,000 | | | | 3,850,017 | |
| Verizon Communications, Inc. | | 2.100% | | | 03/22/28 | | | | 1,000,000 | | | | 899,477 | |
| Walt Disney Co. (The) | | 1.750% | | | 01/13/26 | | | | 3,429,000 | | | | 3,252,997 | |
| Xylem, Inc. | | 3.250% | | | 11/01/26 | | | | 3,075,000 | | | | 2,939,861 | |
| Xylem, Inc. | | 1.950% | | | 01/30/28 | | | | 1,200,000 | | | | 1,077,789 | |
| | | | | | | | | | | | | | 57,811,291 | |
| Utilities — 11.8% | | | | | | | | | | | | | | |
| Berkshire Hathaway, Inc. | | 3.500% | | | 02/01/25 | | | | 1,300,000 | | | | 1,283,688 | |
The accompanying notes are an integral part of these financial statements.
| ENHANCED RETURN FUND | PORTFOLIO OF INVESTMENTS AS OF JUNE 30, 2024 – UNAUDITED |
| CORPORATE BONDS — 61.6% | | Coupon | | | Maturity | | | Par Value | | | Value | |
| Berkshire Hathaway, Inc. | | 3.250% | | | 04/15/28 | | | $ | 743,000 | | | $ | 697,294 | |
| Duke Energy Corp. | | 2.650% | | | 09/01/26 | | | | 4,610,000 | | | | 4,359,553 | |
| Eversource Energy, Series H | | 3.150% | | | 01/15/25 | | | | 1,495,000 | | | | 1,473,412 | |
| Eversource Energy, Series AA | | 4.750% | | | 05/15/26 | | | | 1,225,000 | | | | 1,209,725 | |
| Eversource Energy, Series U | | 1.400% | | | 08/15/26 | | | | 1,260,000 | | | | 1,156,393 | |
| Florida Power & Light Co. | | 4.400% | | | 05/15/28 | | | | 4,370,000 | | | | 4,291,710 | |
| Georgia Power Co., Series 2019-A | | 2.200% | | | 09/15/24 | | | | 3,450,000 | | | | 3,423,749 | |
| Interstate Power & Light Co. | | 3.250% | | | 12/01/24 | | | | 1,910,000 | | | | 1,890,892 | |
| Interstate Power & Light Co. | | 3.400% | | | 08/15/25 | | | | 2,895,000 | | | | 2,825,068 | |
| National Rural Utilities Cooperative Finance Corp. (The) | | 2.850% | | | 01/27/25 | | | | 1,875,000 | | | | 1,845,829 | |
| Virginia Electric & Power Co., Series A | | 3.800% | | | 04/01/28 | | | | 3,585,000 | | | | 3,430,016 | |
| Xcel Energy, Inc. | | 3.300% | | | 06/01/25 | | | | 4,610,000 | | | | 4,508,367 | |
| | | | | | | | | | | | | | 32,395,696 | |
| | | | | | | | | | | | | | | |
| Total Corporate Bonds (Cost $172,137,930) | | | | | | | | | | | | $ | 169,173,435 | |
| | | | | | | | | | | | | | | |
| COLLATERALIZED MORTGAGE OBLIGATIONS — 12.0% | | | | | | | | | | | | | | |
| Federal Home Loan Mortgage Corporation — 4.4% | | | | | | | | | | | | | | |
| FHLMC, Pool #J1-2635 | | 4.000% | | | 07/01/25 | | | $ | 6,224 | | | $ | 6,160 | |
| FHLMC, Series 4287, Class AB | | 2.000% | | | 12/15/26 | | | | 137,655 | | | | 131,334 | |
| FHLMC, Pool #J3-2364 | | 2.500% | | | 11/01/28 | | | | 594,544 | | | | 570,222 | |
| FHLMC, Pool #ZS-7207 | | 3.500% | | | 07/01/30 | | | | 564,254 | | | | 545,568 | |
| FHLMC, Pool #G1-8642 | | 3.500% | | | 04/01/32 | | | | 584,409 | | | | 559,696 | |
| FHLMC, Pool #ZT-1964 | | 3.500% | | | 06/01/32 | | | | 1,283,038 | | | | 1,227,951 | |
| FHLMC, Pool #G1-6330 | | 3.500% | | | 08/01/32 | | | | 614,689 | | | | 591,406 | |
| FHLMC, Pool #SB-0380 | | 3.500% | | | 02/01/34 | | | | 662,313 | | | | 633,823 | |
| FHLMC, Series 4198, Class BE | | 2.000% | | | 10/15/40 | | | | 28,558 | | | | 28,412 | |
| FHLMC, Series 5050, Class BG | | 1.000% | | | 01/15/41 | | | | 685,719 | | | | 607,208 | |
| FHLMC, Series 5902, Class XC | | 1.500% | | | 01/15/41 | | | | 1,665,555 | | | | 1,414,615 | |
| FHLMC, Series 4009, Class PA | | 2.000% | | | 06/15/41 | | | | 197,119 | | | | 186,462 | |
| FHLMC, Series 4709, Class EA | | 3.000% | | | 01/15/46 | | | | 645,276 | | | | 605,984 | |
| FHLMC, Series 5301, Class ED | | 5.000% | | | 04/01/53 | | | | 5,245,199 | | | | 5,148,613 | |
| | | | | | | | | | | | | | 12,257,454 | |
| Federal National Mortgage Association — 7.6% | | | | | | | | | | | | | | |
| FNMA, Pool #AN2351 | | 2.150% | | | 09/01/26 | | | | 2,000,000 | | | | 1,881,227 | |
| FNMA, Pool #AT2060 | | 2.500% | | | 04/01/28 | | | | 547,257 | | | | 525,224 | |
| FNMA, Pool #AL9230 | | 3.500% | | | 12/01/29 | | | | 507,681 | | | | 492,893 | |
| FNMA, Pool #FM1536 | | 2.500% | | | 11/01/30 | | | | 209,227 | | | | 201,271 | |
| FNMA, Pool #MA4424 | | 1.500% | | | 09/01/31 | | | | 956,107 | | | | 859,253 | |
| FNMA, Pool #MA1106 | | 3.000% | | | 07/01/32 | | | | 1,611,446 | | | | 1,521,110 | |
| FNMA, Series 2013-3, Class DK | | 1.750% | | | 02/25/33 | | | | 444,327 | | | | 403,559 | |
| FNMA, Pool #FM2287 | | 4.500% | | | 03/01/34 | | | | 520,341 | | | | 512,845 | |
| FNMA, Pool #FM2989 | | 3.000% | | | 09/01/34 | | | | 778,081 | | | | 735,622 | |
| FNMA, Pool #AL7077 | | 4.000% | | | 07/01/35 | | | | 859,731 | | | | 829,369 | |
| FNMA, Pool #833200 | | 5.500% | | | 09/01/35 | | | | 199,572 | | | | 202,073 | |
| FNMA, Pool #CA7891 | | 1.500% | | | 11/01/35 | | | | 4,486,610 | | | | 3,910,239 | |
| FNMA, Series 2020-044, Class TE | | 2.000% | | | 12/25/35 | | | | 1,704,310 | | | | 1,557,906 | |
| FNMA, Series FM8444 | | 2.000% | | | 06/01/36 | | | | 2,188,302 | | | | 1,939,527 | |
| FNMA, Pool #FM2293 | | 4.000% | | | 09/01/36 | | | | 1,559,088 | | | | 1,501,383 | |
| FNMA, Pool #FM7224 | | 4.500% | | | 11/01/38 | | | | 767,349 | | | | 755,407 | |
The accompanying notes are an integral part of these financial statements.
| ENHANCED RETURN FUND | PORTFOLIO OF INVESTMENTS AS OF JUNE 30, 2024 – UNAUDITED |
| COLLATERALIZED MORTGAGE OBLIGATIONS — 12.0% | | Coupon | | | Maturity | | | Par Value | | | Value | |
| FNMA, Pool #AJ7509 (RFUCCT1Y + 178) (a) | | 6.030% | | | 12/01/41 | | | $ | 14,815 | | | $ | 14,864 | |
| FNMA, Series 2013-6, Class BC | | 1.500% | | | 12/25/42 | | | | 45,539 | | | | 43,807 | |
| FNMA, Series 2015-28, Class P | | 2.500% | | | 05/25/45 | | | | 1,956,280 | | | | 1,772,197 | |
| FNMA, Series 2020-95, Class GA | | 1.000% | | | 01/25/51 | | | | 1,498,921 | | | | 1,110,787 | |
| | | | | | | | | | | | | | 20,770,563 | |
| Government National Mortgage Association — 0.0% (b) | | | | | | | | | | | | | | |
| GNMA, Pool #726475X | | 4.000% | | | 11/15/24 | | | | 2,533 | | | | 2,521 | |
| GNMA, Pool #728920 | | 4.000% | | | 12/15/24 | | | | 3,819 | | | | 3,797 | |
| | | | | | | | | | | | | | 6,318 | |
| | | | | | | | | | | | | | | |
| Total Collateralized Mortgage Obligations (Cost $35,687,889) | | | | | | | | | | | | $ | 33,034,335 | |
| | | | | | | | | | | | | | | |
| MUNICIPAL BONDS — 0.2% | | | | | | | | | | | | | | |
| Franklin County Ohio Convention Facilities, Series 2020 B (Cost $550,000) | | 1.155% | | | 12/01/24 | | | $ | 550,000 | | | $ | 539,195 | |
| | | | | | | | | | | | | | | |
| U.S. GOVERNMENT & AGENCIES — 5.0% | | | | | | | | | | | | | | |
| Federal Farm Credit Bank — 0.7% | | | | | | | | | | | | | | |
| FFCB | | 4.750% | | | 10/13/27 | | | $ | 2,000,000 | | | $ | 2,010,804 | |
| | | | | | | | | | | | | | | |
| Federal Home Loan Bank — 1.9% | | | | | | | | | | | | | | |
| FHLB | | 1.375% | | | 08/26/26 | | | | 4,100,000 | | | | 3,803,598 | |
| FHLB | | 1.375% | | | 09/29/26 | | | | 1,600,000 | | | | 1,481,659 | |
| | | | | | | | | | | | | | 5,285,257 | |
| Federal National Mortgage Association — 0.9% | | | | | | | | | | | | | | |
| FNMA | | 4.800% | | | 05/08/29 | | | | 2,550,000 | | | | 2,525,536 | |
| | | | | | | | | | | | | | | |
| Federal Home Loan Mortgage Corporation — 1.5% | | | | | | | | | | | | | | |
| FHLMC | | 0.450% | | | 07/22/24 | | | | 4,000,000 | | | | 3,988,341 | |
| | | | | | | | | | | | | | | |
| Total U.S. Government & Agencies (Cost $14,220,434) | | | | | | | | | | | | $ | 13,809,938 | |
| | | | | | | | | | | | | | | |
| U.S. TREASURY OBLIGATIONS — 20.0% | | | | | | | | | | | | | | |
| U.S. Treasury Notes — 20.0% | | | | | | | | | | | | | | |
| U.S. Treasury Notes (d) | | 2.000% | | | 08/15/25 | | | $ | 5,800,000 | | | $ | 5,607,422 | |
| U.S. Treasury Notes | | 5.465% | | | 04/30/26 | | | | 2,720,000 | | | | 2,719,618 | |
| U.S. Treasury Notes | | 2.750% | | | 07/31/27 | | | | 7,285,000 | | | | 6,917,335 | |
| U.S. Treasury Notes (d) | | 2.750% | | | 02/15/28 | | | | 12,210,000 | | | | 11,510,787 | |
| U.S. Treasury Notes | | 2.875% | | | 05/15/28 | | | | 10,535,000 | | | | 9,952,283 | |
| U.S. Treasury Notes | | 3.125% | | | 11/15/28 | | | | 13,590,000 | | | | 12,904,130 | |
| U.S. Treasury Notes | | 2.625% | | | 02/15/29 | | | | 5,875,000 | | | | 5,446,308 | |
| Total U.S. Treasury Obligations (Cost $55,649,439) | | | | | | | | | | | | $ | 55,057,883 | |
The accompanying notes are an integral part of these financial statements.
| ENHANCED RETURN FUND | PORTFOLIO OF INVESTMENTS AS OF JUNE 30, 2024 – UNAUDITED |
| MONEY MARKET FUNDS — 0.8% | | Shares | | | Value | |
| First American Government Obligations Fund - Class Z, 5.19% (c) (Cost $2,286,568) | | | 2,286,568 | | | $ | 2,286,568 | |
| | | | | | | | | |
Investments at Value — 99.6%
(Cost $280,532,260) | | | | | | $ | 273,901,354 | |
| | | | | | | | | |
| Other Assets in Excess of Liabilities — 0.4% | | | | | | | 1,036,801 | |
| | | | | | | | | |
| Net Assets — 100.0% | | | | | | $ | 274,938,155 | |
| (a) | Variable rate security. Interest rate resets periodically. The rate shown is the effective interest rate as of June 30, 2024. For securities based on a published reference rate and spread, the reference rate and spread (in basis points) are indicated parenthetically. |
| (b) | Percentage rounds to less than 0.1%. |
| (c) | The rate shown is the 7-day effective yield as of June 30, 2024. |
| (d) | All or a portion of the security is segregated as collateral on futures contracts. The total fair value of collateral as of June 30, 2024 is $17,118,209. |
144A - Security was purchased in a transaction exempt from registration in compliance with Rule 144A of the Securities Act of 1933. This security may be resold in transactions exempt from registration, normally to qualified institutional buyers. The total value of such securities is $2,000,200 as of June 30, 2024, representing 0.7% of net assets.
plc - Public Limited Company
RFUCCT - Refinitiv USD IBOR Cash Fallbacks.
SOFR - Secured Overnight Financing Rate.
| ENHANCED RETURN FUND | SCHEDULE OF FUTURES CONTRACTS AS OF JUNE 30, 2024 (UNAUDITED) |
| FUTURES CONTRACTS | | Contracts | | | Expiration
Date | | | Notional
Value
at Purchase | | | Notional
Value | | | Value/
Unrealized
Appreciation | |
| Index Futures | | | | | | | | | | | | | | | | | | |
| E-MINI S&P 500 Future | | 993 | | | 9/20/2024 | | | $ | 275,095,863 | | | $ | 274,142,475 | | | $ | 2,046,612 | |
The average monthly notional value of futures contracts during the six months ended June 30, 2024 was $262,035,295.
The accompanying notes are an integral part of these financial statements.
| INSTITUTIONAL CORE BOND FUND | PORTFOLIO OF INVESTMENTS AS OF JUNE 30, 2024 – UNAUDITED |
| CORPORATE BONDS — 42.1% | | Coupon | | | Maturity | | | Par Value | | | Value | |
| Finance — 17.3% | | | | | | | | | | | | | | |
| Allstate Corp. (The) | | 5.250% | | | 03/30/33 | | | $ | 27,850,000 | | | $ | 27,738,193 | |
| American Express Co. | | 1.650% | | | 11/04/26 | | | | 2,870,000 | | | | 2,641,167 | |
| American Express Co. | | 2.550% | | | 03/04/27 | | | | 4,211,000 | | | | 3,936,143 | |
| American Express Co. | | 5.532% | | | 04/25/30 | | | | 19,760,000 | | | | 19,985,800 | |
| AON Corp. | | 3.750% | | | 05/02/29 | | | | 10,646,000 | | | | 9,992,407 | |
| AON Corp. | | 2.800% | | | 05/15/30 | | | | 1,650,000 | | | | 1,446,913 | |
| Bank of America Corp. | | 5.202% | | | 04/25/29 | | | | 29,890,000 | | | | 29,837,141 | |
| Essex Portfolio, L.P. | | 3.000% | | | 01/15/30 | | | | 9,666,000 | | | | 8,567,034 | |
| Essex Property Trust, Inc. | | 3.625% | | | 05/01/27 | | | | 2,298,000 | | | | 2,198,045 | |
| Fifth Third Bancorp (SOFR + 234) (a) | | 6.339% | | | 07/27/29 | | | | 24,200,000 | | | | 24,814,523 | |
| Huntington Bancshares, Inc. | | 4.443% | | | 08/04/28 | | | | 6,655,000 | | | | 6,447,291 | |
| Huntington Bancshares, Inc. | | 6.208% | | | 08/21/29 | | | | 2,830,000 | | | | 2,888,605 | |
| Huntington Bancshares, Inc. | | 2.550% | | | 02/04/30 | | | | 10,628,000 | | | | 9,090,013 | |
| JPMorgan Chase & Co. (SOFR + 379) (a) | | 4.493% | | | 03/24/31 | | | | 6,660,000 | | | | 6,421,424 | |
| KeyCorp, Series O | | 4.100% | | | 04/30/28 | | | | 3,810,000 | | | | 3,604,463 | |
| KeyCorp | | 2.550% | | | 10/01/29 | | | | 9,755,000 | | | | 8,276,436 | |
| Marsh & McLennan Cos., Inc. | | 4.375% | | | 03/15/29 | | | | 1,482,000 | | | | 1,448,626 | |
| PNC Financial Services | | 5.939% | | | 08/18/34 | | | | 12,605,000 | | | | 12,915,048 | |
| PNC Financial Services Group, Inc. (The) | | 3.450% | | | 04/23/29 | | | | 9,850,000 | | | | 9,133,612 | |
| Prologis, Inc. | | 3.875% | | | 09/15/28 | | | | 3,470,000 | | | | 3,321,923 | |
| Prologis, Inc. | | 5.125% | | | 01/15/34 | | | | 9,060,000 | | | | 8,940,090 | |
| Truist Financial Corp., Series H | | 3.875% | | | 03/19/29 | | | | 2,315,000 | | | | 2,158,873 | |
| Truist Financial Corp. | | 2.250% | | | 03/11/30 | | | | 22,716,000 | | | | 18,942,135 | |
| Truist Financial Corp., Series G | | 6.123% | | | 10/28/33 | | | | 3,285,000 | | | | 3,358,297 | |
| Truist Financial Corp. | | 5.122% | | | 01/26/34 | | | | 10,305,000 | | | | 9,864,175 | |
| U.S. Bancorp, Series Y | | 3.000% | | | 07/30/29 | | | | 22,755,000 | | | | 20,360,969 | |
| U.S. Bancorp, Series BB | | 4.967% | | | 07/22/33 | | | | 11,985,000 | | | | 11,358,315 | |
| Wells Fargo & Co., Series M | | 4.100% | | | 06/03/26 | | | | 17,315,000 | | | | 16,874,167 | |
| Wells Fargo & Co., Series O | | 4.300% | | | 07/22/27 | | | | 14,199,000 | | | | 13,826,392 | |
| | | | | | | | | | | | | | 300,388,220 | |
| Industrials — 14.1% | | | | | | | | | | | | | | |
| Air Products and Chemicals, Inc. | | 4.750% | | | 02/08/31 | | | | 18,690,000 | | | | 18,495,818 | |
| Air Products and Chemicals, Inc. | | 4.850% | | | 02/08/34 | | | | 15,235,000 | | | | 14,953,390 | |
| Becton Dickinson & Co. | | 3.700% | | | 06/06/27 | | | | 9,500,000 | | | | 9,143,105 | |
| Becton Dickinson & Co. | | 2.823% | | | 05/20/30 | | | | 11,250,000 | | | | 9,941,255 | |
| Cincinnati Children’s Hospital Medical Center, Series 2016Y | | 2.853% | | | 11/15/26 | | | | 1,835,000 | | | | 1,725,919 | |
| Cisco Systems, Inc. | | 4.950% | | | 02/26/31 | | | | 3,230,000 | | | | 3,227,767 | |
| Cisco Systems, Inc. | | 5.050% | | | 02/26/34 | | | | 18,625,000 | | | | 18,607,085 | |
| CVS Health Corp. | | 4.300% | | | 03/25/28 | | | | 20,133,000 | | | | 19,437,461 | |
| CVS Health Corp. | | 3.750% | | | 04/01/30 | | | | 5,000,000 | | | | 4,601,208 | |
| Dover Corp. | | 3.150% | | | 11/15/25 | | | | 4,302,000 | | | | 4,168,260 | |
| Dover Corp. | | 2.950% | | | 11/04/29 | | | | 24,695,000 | | | | 22,314,126 | |
| Duke Energy Corp. | | 2.450% | | | 06/01/30 | | | | 18,000,000 | | | | 15,471,366 | |
| Enterprise Products Operating, LLC | | 4.150% | | | 10/16/28 | | | | 4,497,000 | | | | 4,347,548 | |
| Home Depot, Inc. (The) | | 4.850% | | | 06/25/31 | | | | 2,000,000 | | | | 1,983,928 | |
| Honeywell International, Inc. | | 5.000% | | | 03/01/35 | | | | 12,680,000 | | | | 12,569,821 | |
| Johnson Controls International plc | | 3.900% | | | 02/14/26 | | | | 6,430,000 | | | | 6,272,648 | |
| Lowes Cos., Inc. | | 4.500% | | | 04/15/30 | | | | 19,722,000 | | | | 19,143,734 | |
| Parker-Hannifin Corp. | | 3.250% | | | 03/01/27 | | | | 9,710,000 | | | | 9,264,570 | |
The accompanying notes are an integral part of these financial statements.
| INSTITUTIONAL CORE BOND FUND | PORTFOLIO OF INVESTMENTS AS OF JUNE 30, 2024 – UNAUDITED |
| CORPORATE BONDS — 42.1% | | Coupon | | | Maturity | | | Par Value | | | Value | |
| Parker-Hannifin Corp. | | 4.250% | | | 09/15/27 | | | $ | 14,431,000 | | | $ | 14,065,725 | |
| Roper Technologies, Inc. | | 2.950% | | | 09/15/29 | | | | 1,150,000 | | | | 1,034,296 | |
| Verizon Communications, Inc. | | 4.329% | | | 09/21/28 | | | | 1,675,000 | | | | 1,628,521 | |
| Verizon Communications, Inc. | | 4.016% | | | 12/03/29 | | | | 28,496,000 | | | | 26,926,940 | |
| Xylem, Inc. | | 1.950% | | | 01/30/28 | | | | 5,250,000 | | | | 4,715,326 | |
| | | | | | | | | | | | | | 244,039,817 | |
| Utilities — 10.7% | | | | | | | | | | | | | | |
| Berkshire Hathaway, Inc. | | 3.700% | | | 07/15/30 | | | | 11,767,000 | | | | 10,946,178 | |
| Duke Energy Corp. | | 2.650% | | | 09/01/26 | | | | 10,575,000 | | | | 10,000,494 | |
| Eversource Energy, Series M | | 3.300% | | | 01/15/28 | | | | 9,140,000 | | | | 8,529,966 | |
| Eversource Energy, Series O | | 4.250% | | | 04/01/29 | | | | 17,808,000 | | | | 16,961,689 | |
| Eversource Energy, Series R | | 1.650% | | | 08/15/30 | | | | 232,000 | | | | 187,252 | |
| Florida Power & Light Co. | | 5.100% | | | 04/01/33 | | | | 31,020,000 | | | | 30,882,353 | |
| Georgia Power Co., Series 2019B | | 2.650% | | | 09/15/29 | | | | 28,141,000 | | | | 25,075,016 | |
| Interstate Power & Light Co. | | 3.400% | | | 08/15/25 | | | | 2,525,000 | | | | 2,464,006 | |
| Interstate Power & Light Co. | | 4.100% | | | 09/26/28 | | | | 20,965,000 | | | | 20,105,466 | |
| Interstate Power & Light Co. | | 2.300% | | | 06/01/30 | | | | 6,410,000 | | | | 5,470,167 | |
| National Rural Utilities Cooperative Finance Corp. (The) | | 3.400% | | | 02/07/28 | | | | 660,000 | | | | 625,608 | |
| National Rural Utilities Cooperative Finance Corp. (The) | | 3.700% | | | 03/15/29 | | | | 5,558,000 | | | | 5,239,230 | |
| National Rural Utilities Cooperative Finance Corp. (The) | | 2.400% | | | 03/15/30 | | | | 15,950,000 | | | | 13,787,458 | |
| Virginia Electric & Power Co., Series B | | 2.950% | | | 11/15/26 | | | | 695,000 | | | | 660,882 | |
| Virginia Electric & Power Co., Series A | | 3.500% | | | 03/15/27 | | | | 4,777,000 | | | | 4,586,161 | |
| Xcel Energy, Inc. | | 4.000% | | | 06/15/28 | | | | 19,857,000 | | | | 18,924,469 | |
| Xcel Energy, Inc. | | 3.400% | | | 06/01/30 | | | | 13,365,000 | | | | 12,003,496 | |
| | | | | | | | | | | | | | 186,449,891 | |
| | | | | | | | | | | | | | | |
| Total Corporate Bonds (Cost $786,847,801) | | | | | | | | | | | | $ | 730,877,928 | |
| | | | | | | | | | | | | | | |
| COLLATERALIZED MORTGAGE OBLIGATIONS — 22.6% | | | | | | | | | | | | | | |
| Federal Home Loan Mortgage Corporation — 8.0% | | | | | | | | | | | | | | |
| FHLMC, Series 2985, Class GE | | 5.500% | | | 06/15/25 | | | $ | 10,920 | | | $ | 10,875 | |
| FHLMC, Series 4287, Class AB | | 2.000% | | | 12/15/26 | | | | 258,103 | | | | 246,251 | |
| FHLMC, Pool #ZA-3721 | | 3.000% | | | 06/01/29 | | | | 3,254,556 | | | | 3,125,335 | |
| FHLMC, Pool #ZK-6713 | | 3.000% | | | 06/01/29 | | | | 2,078,155 | | | | 1,995,047 | |
| FHLMC, Pool #C0-1005 | | 8.000% | | | 06/01/30 | | | | 452 | | | | 481 | |
| FHLMC, Pool #V6-1479, Series V6-1479 | | 2.500% | | | 01/01/32 | | | | 2,152,470 | | | | 2,008,185 | |
| FHLMC, Pool #G1-8642 | | 3.500% | | | 04/01/32 | | | | 1,849,360 | | | | 1,771,157 | |
| FHLMC, Pool #ZT-1964 | | 3.500% | | | 06/01/32 | | | | 2,668,718 | | | | 2,554,138 | |
| FHLMC, Pool #G1-8667 | | 3.500% | | | 11/01/32 | | | | 1,157,813 | | | | 1,107,609 | |
| FHLMC, Series 4151, Class PA | | 2.000% | | | 01/15/33 | | | | 1,293,274 | | | | 1,188,690 | |
| FHLMC, Pool #78-0439 (H15T1Y + 222.3) | | 7.098% | | | 04/01/33 | | | | 7,835 | | | | 7,863 | |
| FHLMC, Pool #G0-8068 | | 5.500% | | | 07/01/35 | | | | 498,624 | | | | 505,526 | |
| FHLMC, Pool #G0-1880 | | 5.000% | | | 08/01/35 | | | | 25,792 | | | | 25,598 | |
| FHLMC, Pool #G0-6616 | | 4.500% | | | 12/01/35 | | | | 228,563 | | | | 223,091 | |
| FHLMC, Pool #G3-0933 | | 4.000% | | | 01/01/36 | | | | 9,144,464 | | | | 8,819,571 | |
| FHLMC, Series 3109, Class ZN | | 5.500% | | | 02/15/36 | | | | 525,935 | | | | 530,849 | |
| FHLMC, Pool #G3-1087 | | 4.000% | | | 07/01/38 | | | | 1,595,103 | | | | 1,518,546 | |
| FHLMC, Series 4887, Class A | | 3.250% | | | 09/15/38 | | | | 486,948 | | | | 458,401 | |
| FHLMC, Pool #SC-0066 | | 4.500% | | | 01/01/39 | | | | 5,416,354 | | | | 5,289,428 | |
| FHLMC, Series 4346, NL | | 3.500% | | | 07/15/39 | | | | 76,534 | | | | 73,142 | |
| FHLMC, Pool #GO-5659 | | 4.500% | | | 10/01/39 | | | | 56,186 | | | | 54,674 | |
The accompanying notes are an integral part of these financial statements.
| INSTITUTIONAL CORE BOND FUND | PORTFOLIO OF INVESTMENTS AS OF JUNE 30, 2024 – UNAUDITED |
| COLLATERALIZED MORTGAGE OBLIGATIONS — 22.6% | | Coupon | | | Maturity | | | Par Value | | | Value | |
| FHLMC, Pool #A8-9335 | | 5.000% | | | 10/01/39 | | | $ | 121,067 | | | $ | 120,378 | |
| FHLMC, Series 3592, Class BZ | | 5.000% | | | 10/15/39 | | | | 336,319 | | | | 335,036 | |
| FHLMC, Pool #SC-0047 | | 3.000% | | | 01/01/40 | | | | 20,613,856 | | | | 18,441,399 | |
| FHLMC, Series 3946, Class LN | | 3.500% | | | 04/15/41 | | | | 303,236 | | | | 293,588 | |
| FHLMC, Series 4105, Class PJ | | 3.500% | | | 06/15/41 | | | | 285,413 | | | | 275,931 | |
| FHLMC, Pool #2B-0350 (RFUCCT1Y + 186) (a) | | 6.610% | | | 04/01/42 | | | | 61,826 | | | | 62,228 | |
| FHLMC, Series 4087, Class PT | | 3.000% | | | 07/15/42 | | | | 328,105 | | | | 305,712 | |
| FHLMC, Series 4180, Class ME | | 2.500% | | | 10/15/42 | | | | 741,658 | | | | 686,558 | |
| FHLMC, Series 4161, Class QA | | 3.000% | | | 02/15/43 | | | | 83,145 | | | | 77,377 | |
| FHLMC, Series 4471, GA | | 3.000% | | | 02/15/44 | | | | 9,278,434 | | | | 8,591,929 | |
| FHLMC, Series 4517, Class PC | | 2.500% | | | 05/15/44 | | | | 542,034 | | | | 506,567 | |
| FHLMC, Series 4689, Class DA | | 3.000% | | | 07/15/44 | | | | 474,236 | | | | 456,222 | |
| FHLMC, Series 4831, Class BA | | 3.500% | | | 10/15/44 | | | | 233,046 | | | | 228,504 | |
| FHLMC, Series 4567, Class LA | | 3.000% | | | 08/15/45 | | | | 106,213 | | | | 97,838 | |
| FHLMC, Series 4582, Class PA | | 3.000% | | | 11/15/45 | | | | 1,492,027 | | | | 1,359,931 | |
| FHLMC, Series 4709, Class EA | | 3.000% | | | 01/15/46 | | | | 761,425 | | | | 715,061 | |
| FHLMC, Pool #SD-1069 | | 3.500% | | | 06/01/49 | | | | 5,323,609 | | | | 4,797,147 | |
| FHLMC, Series 4906, Class DE | | 2.500% | | | 09/25/49 | | | | 3,407,818 | | | | 2,943,634 | |
| FHLMC, Pool #SD-0695 | | 4.000% | | | 12/01/49 | | | | 462,562 | | | | 430,899 | |
| FHLMC, Pool #SD-2170 | | 3.000% | | | 07/01/51 | | | | 22,184,344 | | | | 19,155,978 | |
| FHLMC, Pool #SD-7556 | | 3.000% | | | 08/01/52 | | | | 42,769,826 | | | | 36,826,067 | |
| FHLMC, Series 5301, Class ED | | 5.000% | | | 04/01/53 | | | | 10,982,991 | | | | 10,780,748 | |
| | | | | | | | | | | | | | 139,003,189 | |
| Federal National Mortgage Association — 13.5% | | | | | | | | | | | | | | |
| FNMA, Pool #AS4320 | | 3.000% | | | 01/01/30 | | | | 56,514 | | | | 54,053 | |
| FNMA, Pool #MA0384 | | 5.000% | | | 04/01/30 | | | | 259,194 | | | | 257,757 | |
| FNMA, Pool #AL6923 | | 3.000% | | | 05/01/30 | | | | 3,637,420 | | | | 3,484,444 | |
| FNMA, Pool #AS5794 | | 3.000% | | | 09/01/30 | | | | 726,527 | | | | 691,448 | |
| FNMA, Pool #AS6548, Series 2016 | | 2.500% | | | 01/01/31 | | | | 1,654,391 | | | | 1,554,490 | |
| FNMA, Pool #MA4424 | | 1.500% | | | 09/01/31 | | | | 29,058,282 | | | | 26,114,645 | |
| FNMA, Pool #AL9309 | | 3.500% | | | 10/01/31 | | | | 604,423 | | | | 579,564 | |
| FNMA, Pool #MA1107 | | 3.500% | | | 07/01/32 | | | | 245,009 | | | | 234,481 | |
| FNMA, Pool #MA1237 | | 3.000% | | | 11/01/32 | | | | 158,878 | | | | 149,598 | |
| FNMA, Pool #725027 | | 5.000% | | | 11/01/33 | | | | 115,338 | | | | 114,326 | |
| FNMA, Pool #FM5394 | | 3.000% | | | 03/01/34 | | | | 4,184,466 | | | | 3,925,823 | |
| FNMA, Pool #FM3388 | | 4.000% | | | 03/01/34 | | | | 398,702 | | | | 392,574 | |
| FNMA, Pool #725704 | | 6.000% | | | 08/01/34 | | | | 46,096 | | | | 47,309 | |
| FNMA, Pool #FM5050 | | 2.500% | | | 02/01/35 | | | | 905,132 | | | | 857,778 | |
| FNMA, Pool #AL7077 | | 4.000% | | | 07/01/35 | | | | 1,709,747 | | | | 1,649,367 | |
| FNMA, Series 2005-64, Class PL | | 5.500% | | | 07/25/35 | | | | 19,180 | | | | 19,354 | |
| FNMA, Pool #BM1971 | | 3.500% | | | 12/01/35 | | | | 1,086,833 | | | | 1,031,562 | |
| FNMA, Pool #888223 | | 5.500% | | | 01/01/36 | | | | 161,510 | | | | 163,535 | |
| FNMA, Series 2016-99, Class TA | | 3.500% | | | 03/25/36 | | | | 165,175 | | | | 159,375 | |
| FNMA, Pool #995112 | | 5.500% | | | 07/01/36 | | | | 172,073 | | | | 173,891 | |
| FNMA, Series 2014-20, Class AC | | 3.000% | | | 08/25/36 | | | | 55,432 | | | | 54,336 | |
| FNMA, Pool #FM2293 | | 4.000% | | | 09/01/36 | | | | 223,849 | | | | 215,564 | |
| FNMA, Pool #MA2773 | | 3.000% | | | 10/01/36 | | | | 3,886,358 | | | | 3,581,935 | |
| FNMA, Pool #AL9623 | | 4.000% | | | 12/01/36 | | | | 1,395,046 | | | | 1,344,206 | |
| FNMA, Pool #889050 | | 6.000% | | | 05/01/37 | | | | 90,019 | | | | 92,777 | |
| FNMA, Pool #MA3186 | | 4.000% | | | 11/01/37 | | | | 4,825,297 | | | | 4,624,935 | |
| FNMA, Pool #MA3337 | | 4.000% | | | 04/01/38 | | | | 1,777,629 | | | | 1,687,890 | |
The accompanying notes are an integral part of these financial statements.
| INSTITUTIONAL CORE BOND FUND | PORTFOLIO OF INVESTMENTS AS OF JUNE 30, 2024 – UNAUDITED |
| COLLATERALIZED MORTGAGE OBLIGATIONS — 22.6% | | Coupon | | | Maturity | | | Par Value | | | Value | |
| FNMA, Pool #AA4392 | | 4.000% | | | 04/01/39 | | | $ | 372,396 | | | $ | 351,833 | |
| FNMA, Pool #FM9469 | | 4.000% | | | 08/01/39 | | | | 5,548,638 | | | | 5,289,156 | |
| FNMA, Pool #CB0114 | | 2.500% | | | 04/01/41 | | | | 15,416,772 | | | | 13,365,263 | |
| FNMA, Series 2011-53, Class DT | | 4.500% | | | 06/25/41 | | | | 88,776 | | | | 87,128 | |
| FNMA, Pool #AJ7509 (RFUCCT1Y + 178) (a) | | 6.030% | | | 12/01/41 | | | | 14,815 | | | | 14,864 | |
| FNMA, Series 2012-128, Class TP | | 2.000% | | | 11/25/42 | | | | 497,615 | | | | 458,669 | |
| FNMA, Series 2013-6, Class BC | | 1.500% | | | 12/25/42 | | | | 101,097 | | | | 97,252 | |
| FNMA, Series 2015-72, Class GB | | 2.500% | | | 12/25/42 | | | | 1,152,461 | | | | 1,091,699 | |
| FNMA, Series 2013-75, Class EG | | 3.000% | | | 02/25/43 | | | | 218,043 | | | | 201,881 | |
| FNMA, Series 2014-28, Class PA | | 3.500% | | | 02/25/43 | | | | 169,517 | | | | 163,895 | |
| FNMA, Series 2013-83, Class MH | | 4.000% | | | 08/25/43 | | | | 120,205 | | | | 113,926 | |
| FNMA, Pool #AU7025 | | 3.000% | | | 11/01/43 | | | | 9,274,901 | | | | 8,217,966 | |
| FNMA, Series 2014-4, Class PC | | 3.000% | | | 02/25/44 | | | | 761,994 | | | | 720,799 | |
| FNMA, Series 2016-79, Class L | | 2.500% | | | 10/25/44 | | | | 903,280 | | | | 835,498 | |
| FNMA, Series 2016-39, Class LA | | 2.500% | | | 03/25/45 | | | | 1,501,759 | | | | 1,373,282 | |
| FNMA, Series 2016-64, Class PG | | 3.000% | | | 05/25/45 | | | | 1,751,299 | | | | 1,612,334 | |
| FNMA, Series 2016-40, Class PA | | 3.000% | | | 07/25/45 | | | | 95,684 | | | | 88,297 | |
| FNMA, Series 4768, Class GA | | 3.500% | | | 09/15/45 | | | | 1,791,202 | | | | 1,724,130 | |
| FNMA, Series 2016-49, Class PA | | 3.000% | | | 09/25/45 | | | | 726,004 | | | | 668,135 | |
| FNMA, Series 2016-99, Class PH | | 3.000% | | | 01/25/46 | | | | 1,346,398 | | | | 1,243,991 | |
| FNMA, Series 2016-02, Class PB | | 2.000% | | | 02/25/46 | | | | 181,437 | | | | 165,162 | |
| FNMA, Series 2018-67, Class BA | | 4.500% | | | 03/25/46 | | | | 1,263,392 | | | | 1,246,177 | |
| FNMA, Series 2018-25, Class P | | 3.500% | | | 03/25/46 | | | | 2,080,556 | | | | 1,967,207 | |
| FNMA, Pool #BM5003 | | 4.000% | | | 03/01/47 | | | | 1,106,198 | | | | 1,033,045 | |
| FNMA, Series 2022-25, Class KA | | 4.000% | | | 09/25/48 | | | | 8,213,963 | | | | 7,852,280 | |
| FNMA, Series 2019-60, Class DA | | 2.500% | | | 03/25/49 | | | | 1,607,238 | | | | 1,376,937 | |
| FNMA, Pool #CA3967 | | 3.500% | | | 08/01/49 | | | | 366,556 | | | | 330,350 | |
| FNMA, Series 2019-57, KJ | | 2.500% | | | 08/25/49 | | | | 116,154 | | | | 100,076 | |
| FNMA, Pool #FS4218 | | 4.000% | | | 10/01/49 | | | | 9,341,315 | | | | 8,738,198 | |
| FNMA, Pool #CA4860 | | 3.000% | | | 12/01/49 | | | | 26,239,577 | | | | 22,710,405 | |
| FNMA, Series 2020-95, Class GA | | 1.000% | | | 01/25/51 | | | | 6,674,882 | | | | 4,946,473 | |
| FNMA, Pool #FM9631 | | 3.000% | | | 11/01/51 | | | | 7,591,592 | | | | 6,551,602 | |
| FNMA, Pool #FS3678 | | 3.000% | | | 12/01/51 | | | | 12,585,961 | | | | 10,898,262 | |
| FNMA, Pool #CB3051 | | 3.000% | | | 03/01/52 | | | | 7,034,352 | | | | 6,084,299 | |
| FNMA, Pool #FS4520 | | 3.000% | | | 04/01/52 | | | | 33,908,851 | | | | 29,308,150 | |
| FNMA, Pool #FS4608 | | 3.000% | | | 05/01/52 | | | | 9,433,091 | | | | 8,158,167 | |
| FNMA, Pool #FS7972 | | 3.000% | | | 05/01/52 | | | | 12,011,780 | | | | 10,376,099 | |
| FNMA, Pool #FS2724 | | 3.000% | | | 07/01/52 | | | | 15,059,742 | | | | 12,940,422 | |
| FNMA, Pool #FS8070 | | 3.000% | | | 07/01/52 | | | | 11,256,057 | | | | 9,706,900 | |
| | | | | | | | | | | | | | 235,467,226 | |
| Government National Mortgage Association — 1.1% | | | | | | | | | | | | | | |
| GNMA, Pool #004847M | | 4.000% | | | 11/01/25 | | | | 17,316 | | | | 17,101 | |
| GNMA, Pool #780400X | | 7.000% | | | 12/01/25 | | | | 180 | | | | 181 | |
| GNMA, Pool #780420X | | 7.500% | | | 08/01/26 | | | | 149 | | | | 150 | |
| GNMA, Pool #002658M | | 6.500% | | | 10/01/28 | | | | 3,866 | | | | 3,934 | |
| GNMA, Pool #002945M | | 7.500% | | | 07/01/30 | | | | 359 | | | | 371 | |
| GNMA, Pool #004187M | | 5.500% | | | 07/01/38 | | | | 6,960 | | | | 7,057 | |
| GNMA, Series 2021-175, Class DG | | 2.000% | | | 10/20/51 | | | | 22,248,303 | | | | 18,375,524 | |
| | | | | | | | | | | | | | 18,404,318 | |
| | | | | | | | | | | | | | | |
| Total Collateralized Mortgage Obligations (Cost $418,214,242) | | | | | | | | | | | | $ | 392,874,733 | |
The accompanying notes are an integral part of these financial statements.
| INSTITUTIONAL CORE BOND FUND | PORTFOLIO OF INVESTMENTS AS OF JUNE 30, 2024 – UNAUDITED |
| MUNICIPAL BONDS — 2.1% | | Coupon | | | Maturity | | | Par Value | | | Value | |
| Hamilton County Ohio Health Care FACS Revenue, Series 2019 | | 3.374% | | | 06/01/34 | | | $ | 5,000,000 | | | $ | 4,338,573 | |
| Kansas Development Finance Authority, Series 2015 H | | 3.741% | | | 04/15/25 | | | | 3,705,000 | | | | 3,659,133 | |
| Kansas Development Finance Authority, Series 2015 H | | 4.091% | | | 04/15/27 | | | | 410,000 | | | | 401,396 | |
| Kansas Development Finance Authority Revenue, Series 2015 H | | 3.941% | | | 04/15/26 | | | | 8,000,000 | | | | 7,849,747 | |
| Ohio University General Receipts, Series 2020 | | 1.766% | | | 12/01/26 | | | | 2,000,000 | | | | 1,855,301 | |
| Pennsylvania State University, Series 2020 D | | 1.893% | | | 09/01/26 | | | | 4,635,000 | | | | 4,348,841 | |
| Texas Natural Gas Securitization Finance Corp. Revenue, Series 2023 A-1 | | 5.102% | | | 04/01/35 | | | | 9,700,402 | | | | 9,723,895 | |
| University of Cincinnati Ohio General Receipts Revenue, Series 2019 B | | 2.162% | | | 06/01/25 | | | | 2,185,000 | | | | 2,122,891 | |
| University of Washington Revenue, Series 2009B | | 5.400% | | | 06/01/36 | | | | 3,000,000 | | | | 3,007,927 | |
| Total Municipal Bonds (Cost $38,688,336) | | | | | | | | | | | | $ | 37,307,704 | |
| | | | | | | | | | | | | | | |
| U.S. GOVERNMENT & AGENCIES — 4.8% | | | | | | | | | | | | | | |
| Federal National Mortgage Association — 4.8% | | | | | | | | | | | | | | |
| FNMA | | 3.320% | | | 04/01/28 | | | $ | 9,260,000 | | | $ | 8,752,241 | |
| FNMA | | 3.740% | | | 07/01/28 | | | | 8,938,000 | | | | 8,558,347 | |
| FNMA | | 3.650% | | | 01/01/29 | | | | 5,000,000 | | | | 4,771,753 | |
| FNMA | | 3.150% | | | 06/01/29 | | | | 8,000,000 | | | | 7,430,568 | |
| FNMA | | 1.520% | | | 08/21/35 | | | | 59,440,000 | | | | 41,798,782 | |
| FNMA | | 3.500% | | | 11/01/46 | | | | 12,443,026 | | | | 11,268,747 | |
| Total U.S. Government & Agencies (Cost $84,209,678) | | | | | | | | | | | | $ | 82,580,438 | |
| | | | | | | | | | | | | | | |
| U.S. TREASURY OBLIGATIONS — 26.9% | | | | | | | | | | | | | | |
| U.S. Treasury Bonds — 13.9% | | | | | | | | | | | | | | |
| U.S. Treasury Bonds | | 2.250% | | | 05/15/41 | | | $ | 44,500,000 | | | $ | 32,192,969 | |
| U.S. Treasury Bonds | | 2.375% | | | 02/15/42 | | | | 100,975,000 | | | | 73,490,867 | |
| U.S. Treasury Bonds | | 2.500% | | | 02/15/45 | | | | 100,600,000 | | | | 71,740,375 | |
| U.S. Treasury Bonds | | 2.500% | | | 05/15/46 | | | | 44,545,000 | | | | 31,299,823 | |
| U.S. Treasury Bonds | | 2.750% | | | 08/15/47 | | | | 44,990,000 | | | | 32,772,403 | |
| | | | | | | | | | | | | | 241,496,437 | |
| U.S. Treasury Notes — 13.0% | | | | | | | | | | | | | | |
| U.S. Treasury Notes | | 4.125% | | | 11/15/32 | | | | 30,460,000 | | | | 29,950,747 | |
| U.S. Treasury Notes | | 3.500% | | | 02/15/33 | | | | 65,700,000 | | | | 61,573,219 | |
| U.S. Treasury Notes | | 3.375% | | | 05/15/33 | | | | 92,530,000 | | | | 85,763,744 | |
| U.S. Treasury Notes | | 3.875% | | | 08/15/33 | | | | 38,590,000 | | | | 37,130,815 | |
| U.S. Treasury Notes | | 4.500% | | | 11/15/33 | | | | 12,000,000 | | | | 12,112,500 | |
| | | | | | | | | | | | | | 226,531,025 | |
| | | | | | | | | | | | | | | |
| Total U.S. Treasury Obligations (Cost $510,246,578) | | | | | | | | | | | | $ | 468,027,462 | |
The accompanying notes are an integral part of these financial statements.
| INSTITUTIONAL CORE BOND FUND | PORTFOLIO OF INVESTMENTS AS OF JUNE 30, 2024 – UNAUDITED |
| PREFERRED STOCKS — 0.5% | | Shares | | | Value | |
| Financials — 0.5% | | | | | | | | |
| Allstate Corp. (The), 5.10%, 01/15/53 (Cost $8,697,107) | | | 354,596 | | | $ | 9,162,761 | |
| | | | | | | | | |
| MONEY MARKET FUNDS — 0.7% | | | | | | | | |
| First American Government Obligations Fund - Class Z, 5.19% (b) (Cost $11,523,813) | | | 11,523,813 | | | $ | 11,523,813 | |
| | | | | | | | | |
Investments at Value — 99.7%
(Cost $1,858,427,555) | | | | | | $ | 1,732,354,839 | |
| | | | | | | | | |
| Other Assets in Excess of Liabilities — 0.3% | | | | | | | 4,757,828 | |
| | | | | | | | | |
| Net Assets — 100.0% | | | | | | $ | 1,737,112,667 | |
| (a) | Variable rate security. Interest rate resets periodically. The rate shown is the effective interest rate as of June 30, 2024. For securities based on a published reference rate and spread, the reference rate and spread (in basis points) are indicated parenthetically. |
| (b) | The rate shown is the 7-day effective yield as of June 30, 2024. |
H15T1Y - U.S. Treasury yield curve rate for U.S. Treasury Note with a constant maturity of 1 year.
plc - Public Limited Company
RFUCCT - Refinitiv USD IBOR Cash Fallbacks.
SOFR - Secured Overnight Financing Rate.
The accompanying notes are an integral part of these financial statements.
| INSTITUTIONAL INTERMEDIATE BOND FUND | PORTFOLIO OF INVESTMENTS AS OF JUNE 30, 2024 – UNAUDITED |
| CORPORATE BONDS — 49.1% | | Coupon | | | Maturity | | | Par Value | | | Value | |
| Finance — 21.3% | | | | | | | | | | | | | | |
| Allstate Corp. (The) | | 5.250% | | | 03/30/33 | | | $ | 1,000,000 | | | $ | 995,985 | |
| American Express Co. | | 3.950% | | | 08/01/25 | | | | 4,250,000 | | | | 4,179,680 | |
| AON Corp. | | 3.750% | | | 05/02/29 | | | | 615,000 | | | | 577,243 | |
| Bank of America Corp. | | 5.202% | | | 04/25/29 | | | | 5,370,000 | | | | 5,360,503 | |
| Branch Banking & Trust Co. | | 3.625% | | | 09/16/25 | | | | 1,145,000 | | | | 1,115,148 | |
| Essex Portfolio, L.P. | | 4.000% | | | 03/01/29 | | | | 1,716,000 | | | | 1,621,367 | |
| Essex Portfolio, L.P. | | 3.000% | | | 01/15/30 | | | | 3,120,000 | | | | 2,765,275 | |
| Fifth Third Bancorp (SOFR + 234) (a) | | 6.339% | | | 07/27/29 | | | | 4,279,000 | | | | 4,387,659 | |
| Huntington Bancshares, Inc. | | 4.000% | | | 05/15/25 | | | | 1,225,000 | | | | 1,204,686 | |
| Huntington Bancshares, Inc. | | 6.208% | | | 08/21/29 | | | | 3,300,000 | | | | 3,368,337 | |
| JPMorgan Chase & Co. | | 3.875% | | | 09/10/24 | | | | 3,065,000 | | | | 3,052,690 | |
| JPMorgan Chase & Co. (SOFR + 379) (a) | | 4.493% | | | 03/24/31 | | | | 2,500,000 | | | | 2,410,444 | |
| KeyCorp, Series O | | 4.150% | | | 10/29/25 | | | | 1,500,000 | | | | 1,466,347 | |
| KeyCorp | | 2.550% | | | 10/01/29 | | | | 3,465,000 | | | | 2,939,811 | |
| Morgan Stanley, Series F | | 3.700% | | | 10/23/24 | | | | 4,135,000 | | | | 4,108,780 | |
| Morgan Stanley, Series I (SOFR + 166.9) (a) | | 4.679% | | | 07/17/26 | | | | 1,674,000 | | | | 1,657,647 | |
| PNC Financial Services Group, Inc. (The) (SOFR + 173) (a) | | 6.615% | | | 10/20/27 | | | | 3,000,000 | | | | 3,072,302 | |
| PNC Financial Services Group, Inc. (The) | | 3.450% | | | 04/23/29 | | | | 1,000,000 | | | | 927,270 | |
| Prologis, Inc. | | 5.125% | | | 01/15/34 | | | | 3,100,000 | | | | 3,058,971 | |
| Truist Financial Corp | | 7.161% | | | 10/30/29 | | | | 1,510,000 | | | | 1,603,305 | |
| Truist Financial Corp. | | 2.250% | | | 03/11/30 | | | | 3,900,000 | | | | 3,252,084 | |
| U.S. Bancorp, Series BB | | 4.967% | | | 07/22/33 | | | | 6,225,000 | | | | 5,899,501 | |
| Wells Fargo & Co., Series M | | 4.100% | | | 06/03/26 | | | | 2,050,000 | | | | 1,997,808 | |
| Wells Fargo & Co., Series Q | | 3.196% | | | 06/17/27 | | | | 1,000,000 | | | | 957,676 | |
| Wells Fargo & Co., Series O | | 4.300% | | | 07/22/27 | | | | 2,600,000 | | | | 2,531,771 | |
| | | | | | | | | | | | | | 64,512,290 | |
| Industrials — 16.5% | | | | | | | | | | | | | | |
| Air Products and Chemicals, Inc. | | 4.750% | | | 02/08/31 | | | | 5,200,000 | | | | 5,145,974 | |
| Becton Dickinson & Co. | | 3.700% | | | 06/06/27 | | | | 4,000,000 | | | | 3,849,728 | |
| Burlington Northern Santa Fe | | 3.650% | | | 09/01/25 | | | | 485,000 | | | | 475,490 | |
| Cisco Systems, Inc. | | 4.850% | | | 02/26/29 | | | | 3,500,000 | | | | 3,498,899 | |
| CVS Health Corp. | | 4.300% | | | 03/25/28 | | | | 3,200,000 | | | | 3,089,449 | |
| CVS Health Corp. | | 5.400% | | | 06/01/29 | | | | 1,300,000 | | | | 1,301,425 | |
| Dover Corp. | | 3.150% | | | 11/15/25 | | | | 2,650,000 | | | | 2,567,617 | |
| Dover Corp. | | 2.950% | | | 11/04/29 | | | | 1,995,000 | | | | 1,802,660 | |
| Home Depot, Inc. (The) | | 2.950% | | | 06/15/29 | | | | 1,000,000 | | | | 916,543 | |
| Honeywell International, Inc. | | 4.875% | | | 09/01/29 | | | | 3,700,000 | | | | 3,704,641 | |
| Johnson Controls International plc | | 3.900% | | | 02/14/26 | | | | 2,282,000 | | | | 2,226,156 | |
| Kroger Co. (The) | | 3.500% | | | 02/01/26 | | | | 2,100,000 | | | | 2,038,432 | |
| Norfolk Southern Corp. | | 2.900% | | | 06/15/26 | | | | 4,690,000 | | | | 4,480,651 | |
| Parker-Hannifin Corp. | | 3.300% | | | 11/21/24 | | | | 1,410,000 | | | | 1,397,198 | |
| Parker-Hannifin Corp. | | 4.250% | | | 09/15/27 | | | | 3,000,000 | | | | 2,924,065 | |
| Starbucks Corp. | | 4.850% | | | 02/08/27 | | | | 2,500,000 | | | | 2,487,091 | |
| Union Pacific Corp. | | 3.750% | | | 07/15/25 | | | | 535,000 | | | | 527,113 | |
| Verizon Communications, Inc. | | 4.016% | | | 12/03/29 | | | | 3,935,000 | | | | 3,718,329 | |
| Xylem, Inc. | | 3.250% | | | 11/01/26 | | | | 4,000,000 | | | | 3,824,209 | |
| | | | | | | | | | | | | | 49,975,670 | |
| Utilities — 11.3% | | | | | | | | | | | | | | |
| Berkshire Hathaway, Inc. | | 3.250% | | | 04/15/28 | | | | 3,500,000 | | | | 3,284,696 | |
| Duke Energy Corp. | | 2.650% | | | 09/01/26 | | | | 4,750,000 | | | | 4,491,948 | |
The accompanying notes are an integral part of these financial statements.
| INSTITUTIONAL INTERMEDIATE BOND FUND | PORTFOLIO OF INVESTMENTS AS OF JUNE 30, 2024 – UNAUDITED |
| CORPORATE BONDS — 49.1% | | Coupon | | | Maturity | | | Par Value | | | Value | |
| Eversource Energy, Series AA | | 4.750% | | | 05/15/26 | | | $ | 3,028,000 | | | $ | 2,990,244 | |
| Eversource Energy, Series BB | | 5.125% | | | 05/15/33 | | | | 1,200,000 | | | | 1,150,520 | |
| Florida Power & Light Co. | | 4.400% | | | 05/15/28 | | | | 1,315,000 | | | | 1,291,441 | |
| Florida Power & Light Co. | | 5.100% | | | 04/01/33 | | | | 5,500,000 | | | | 5,475,595 | |
| Georgia Power Co., Series 2019-A | | 2.200% | | | 09/15/24 | | | | 975,000 | | | | 967,581 | |
| Interstate Power & Light Co. | | 3.400% | | | 08/15/25 | | | | 1,035,000 | | | | 1,009,998 | |
| Interstate Power & Light Co. | | 4.100% | | | 09/26/28 | | | | 2,367,000 | | | | 2,269,956 | |
| Interstate Power & Light Co. | | 2.300% | | | 06/01/30 | | | | 1,067,000 | | | | 910,557 | |
| National Rural Utilities Cooperative Finance Corp. (The) | | 3.400% | | | 02/07/28 | | | | 3,090,000 | | | | 2,928,982 | |
| Virginia Electric & Power Co., Series 2015A | | 3.100% | | | 05/15/25 | | | | 394,000 | | | | 385,818 | |
| Virginia Electric & Power Co., Series A | | 3.800% | | | 04/01/28 | | | | 2,250,000 | | | | 2,152,730 | |
| Xcel Energy, Inc. | | 3.300% | | | 06/01/25 | | | | 4,050,000 | | | | 3,960,713 | |
| Xcel Energy, Inc. | | 4.000% | | | 06/15/28 | | | | 500,000 | | | | 476,519 | |
| Xcel Energy, Inc. | | 3.400% | | | 06/01/30 | | | | 290,000 | | | | 260,457 | |
| | | | | | | | | | | | | | 34,007,755 | |
| | | | | | | | | | | | | | | |
| Total Corporate Bonds (Cost $152,562,446) | | | | | | | | | | | | $ | 148,495,715 | |
| | | | | | | | | | | | | | | |
| COLLATERALIZED MORTGAGE OBLIGATIONS — 7.4% | | | | | | | | | | | | | | |
| Federal Home Loan Mortgage Corporation — 3.8% | | | | | | | | | | | | | | |
| FHLMC, Series 2985, Class GE | | 5.500% | | | 06/15/25 | | | $ | 5,139 | | | $ | 5,118 | |
| FHLMC, Pool #J1-2635 | | 4.000% | | | 07/01/25 | | | | 19,804 | | | | 19,601 | |
| FHLMC, Pool #G1-8642 | | 3.500% | | | 04/01/32 | | | | 417,435 | | | | 399,783 | |
| FHLMC, Series 4151, Class PA | | 2.000% | | | 01/15/33 | | | | 738,716 | | | | 678,978 | |
| FHLMC, Pool #SB-0297 | | 3.000% | | | 03/01/35 | | | | 1,675,651 | | | | 1,563,988 | |
| FHLMC, Pool #G0-8068 | | 5.500% | | | 07/01/35 | | | | 64,045 | | | | 64,931 | |
| FHLMC, Pool #SC-0047 | | 3.000% | | | 01/01/40 | | | | 2,738,161 | | | | 2,449,591 | |
| FHLMC, Series 3946, Class LN | | 3.500% | | | 04/15/41 | | | | 172,792 | | | | 167,294 | |
| FHLMC, Pool #2B-0350 (RFUCCT1Y + 186) (a) | | 6.610% | | | 04/01/42 | | | | 11,792 | | | | 11,868 | |
| FHLMC, Series 5189, Class PG | | 2.500% | | | 09/25/51 | | | | 2,644,638 | | | | 2,347,409 | |
| FHLMC, Series 5301, Class ED | | 5.000% | | | 04/01/53 | | | | 4,013,718 | | | | 3,939,808 | |
| | | | | | | | | | | | | | 11,648,369 | |
| Federal National Mortgage Association — 2.8% | | | | | | | | | | | | | | |
| FNMA, Pool #MA0384 | | 5.000% | | | 04/01/30 | | | | 54,711 | | | | 54,408 | |
| FNMA, Pool #MA1237 | | 3.000% | | | 11/01/32 | | | | 680,364 | | | | 640,627 | |
| FNMA, Pool #FM5050 | | 2.500% | | | 02/01/35 | | | | 1,701,376 | | | | 1,612,365 | |
| FNMA, Series 2016-99, Class TA | | 3.500% | | | 03/25/36 | | | | 153,377 | | | | 147,991 | |
| FNMA, Pool #FS0140 | | 4.000% | | | 11/01/37 | | | | 3,046,004 | | | | 2,927,781 | |
| FNMA, Pool #AA4392 | | 4.000% | | | 04/01/39 | | | | 74,109 | | | | 70,016 | |
| FNMA, Series 2011-52, Class PC | | 3.000% | | | 03/25/41 | | | | 195,927 | | | | 188,831 | |
| FNMA, Pool #AJ7509 (RFUCCT1Y + 178) (a) | | 6.030% | | | 12/01/41 | | | | 14,815 | | | | 14,864 | |
| FNMA, Series 2012-128, Class TP | | 2.000% | | | 11/25/42 | | | | 397,425 | | | | 366,320 | |
| FNMA, Series 2015-37, Class BA | | 3.000% | | | 08/25/44 | | | | 549,487 | | | | 510,655 | |
| FNMA, Pool #AY0089 (RFUCCT1Y + 160) (a) | | 5.850% | | | 12/01/44 | | | | 96,669 | | | | 98,520 | |
| FNMA, Series 2016-39, Class LA | | 2.500% | | | 03/25/45 | | | | 425,026 | | | | 388,665 | |
| FNMA, Pool #CA5539 | | 3.000% | | | 04/01/50 | | | | 1,551,342 | | | | 1,348,478 | |
| | | | | | | | | | | | | | 8,369,521 | |
| Government National Mortgage Association — 0.8% | | | | | | | | | | | | | | |
| GNMA, Pool #MA7852M | | 2.000% | | | 02/20/37 | | | | 2,691,129 | | | | 2,363,751 | |
| | | | | | | | | | | | | | | |
| Total Collateralized Mortgage Obligations (Cost $24,072,441) | | | | | | | | | | | | $ | 22,381,641 | |
The accompanying notes are an integral part of these financial statements.
| INSTITUTIONAL INTERMEDIATE BOND FUND | PORTFOLIO OF INVESTMENTS AS OF JUNE 30, 2024 – UNAUDITED |
| MUNICIPAL BONDS — 1.6% | | Coupon | | | Maturity | | | Par Value | | | Value | |
| Kansas Development Finance Authority, Series 2015 H | | 4.091% | | | 04/15/27 | | | $ | 3,000,000 | | | $ | 2,937,042 | |
| Pennsylvania State University, Series 2020 D | | 1.893% | | | 09/01/26 | | | | 2,000,000 | | | | 1,876,522 | |
| Total Municipal Bonds (Cost $5,069,886) | | | | | | | | | | | | $ | 4,813,564 | |
| | | | | | | | | | | | | | | |
| U.S. GOVERNMENT & AGENCIES — 5.0% | | | | | | | | | | | | | | |
| Federal National Mortgage Association — 0.8% | | | | | | | | | | | | | | |
| FNMA | | 3.320% | | | 04/01/28 | | | $ | 2,500,000 | | | $ | 2,362,916 | |
| | | | | | | | | | | | | | | |
| Federal Home Loan Bank — 4.2% | | | | | | | | | | | | | | |
| FHLB | | 1.950% | | | 09/10/25 | | | | 4,000,000 | | | | 3,850,227 | |
| FHLB | | 4.750% | | | 12/10/32 | | | | 9,000,000 | | | | 9,070,339 | |
| | | | | | | | | | | | | | 12,920,566 | |
| | | | | | | | | | | | | | | |
| Total U.S. Government & Agencies (Cost $15,866,762) | | | | | | | | | | | | $ | 15,283,482 | |
| | | | | | | | | | | | | | | |
| U.S. TREASURY OBLIGATIONS — 35.3% | | | | | | | | | | | | | | |
| U.S. Treasury Notes — 35.3% | | | | | | | | | | | | | | |
| U.S. Treasury Notes | | 4.125% | | | 10/31/27 | | | $ | 4,250,000 | | | $ | 4,202,520 | |
| U.S. Treasury Notes | | 1.375% | | | 10/31/28 | | | | 13,935,000 | | | | 12,287,840 | |
| U.S. Treasury Notes | | 2.625% | | | 02/15/29 | | | | 14,000,000 | | | | 12,978,437 | |
| U.S. Treasury Notes | | 4.625% | | | 04/30/29 | | | | 12,000,000 | | | | 12,138,750 | |
| U.S. Treasury Notes | | 3.500% | | | 01/31/30 | | | | 14,250,000 | | | | 13,648,828 | |
| U.S. Treasury Notes | | 1.500% | | | 02/15/30 | | | | 7,300,000 | | | | 6,267,164 | |
| U.S. Treasury Notes | | 0.875% | | | 11/15/30 | | | | 15,900,000 | | | | 12,861,609 | |
| U.S. Treasury Notes | | 1.375% | | | 11/15/31 | | | | 16,000,000 | | | | 13,015,000 | |
| U.S. Treasury Notes | | 2.875% | | | 05/15/32 | | | | 13,150,000 | | | | 11,847,328 | |
| U.S. Treasury Notes | | 4.000% | | | 02/15/34 | | | | 7,950,000 | | | | 7,718,953 | |
| Total U.S. Treasury Obligations (Cost $108,898,971) | | | | | | | | | | | | $ | 106,966,429 | |
| PREFERRED STOCKS — 0.5% | | Shares | | | Value | |
| Financials — 0.5% | | | | | | | | |
| Allstate Corp. (The), 5.10%, 01/15/53 (Cost $1,446,031) | | | 59,890 | | | $ | 1,547,558 | |
| | | | | | | | | |
| MONEY MARKET FUNDS — 0.1% | | | | | | | | |
| First American Government Obligations Fund - Class Z, 5.19% (b) (Cost $291,546) | | | 291,546 | | | $ | 291,546 | |
| | | | | | | | | |
Investments at Value — 99.0%
(Cost $308,208,083) | | | | | | $ | 299,779,935 | |
| | | | | | | | | |
| Other Assets in Excess of Liabilities — 1.0% | | | | | | | 2,939,636 | |
| | | | | | | | | |
| Net Assets — 100.0% | | | | | | $ | 302,719,571 | |
| (a) | Variable rate security. Interest rate resets periodically. The rate shown is the effective interest rate as of June 30, 2024. For securities based on a published reference rate and spread, the reference rate and spread (in basis points) are indicated parenthetically. |
| (b) | The rate shown is the 7-day effective yield as of June 30, 2024. |
plc - Public Limited Company
RFUCCT - Refinitiv USD IBOR Cash Fallbacks.
SOFR - Secured Overnight Financing Rate.
The accompanying notes are an integral part of these financial statements.
| INSTITUTIONAL SHORT DURATION BOND FUND | PORTFOLIO OF INVESTMENTS AS OF JUNE 30, 2024 – UNAUDITED |
| CORPORATE BONDS — 59.6% | | Coupon | | | Maturity | | | Par Value | | | Value | |
| Finance — 27.9% | | | | | | | | | | | | | | |
| Allstate Corp. | | 0.750% | | | 12/15/25 | | | $ | 3,000,000 | | | $ | 2,805,346 | |
| American Express Co. | | 2.500% | | | 07/30/24 | | | | 2,900,000 | | | | 2,900,000 | |
| American Express Co. | | 2.550% | | | 03/04/27 | | | | 1,000,000 | | | | 934,729 | |
| AON plc | | 3.875% | | | 12/15/25 | | | | 3,700,000 | | | | 3,615,870 | |
| Bank of America Corp., Series L | | 3.875% | | | 08/01/25 | | | | 2,765,000 | | | | 2,722,351 | |
| Bank of America Corp. | | 5.202% | | | 04/25/29 | | | | 2,100,000 | | | | 2,096,286 | |
| Branch Banking & Trust Co. | | 3.625% | | | 09/16/25 | | | | 1,500,000 | | | | 1,460,893 | |
| Essex Portfolio, L.P. | | 3.375% | | | 04/15/26 | | | | 3,773,000 | | | | 3,639,737 | |
| Fifth Third Bancorp (SOFR + 234) (a) | | 6.339% | | | 07/27/29 | | | | 3,565,000 | | | | 3,655,528 | |
| Goldman Sachs Group, Inc. (The) | | 3.500% | | | 01/23/25 | | | | 3,705,000 | | | | 3,659,539 | |
| Huntington Bancshares, Inc. | | 2.625% | | | 08/06/24 | | | | 4,500,000 | | | | 4,484,476 | |
| JPMorgan Chase & Co. | | 3.875% | | | 09/10/24 | | | | 1,745,000 | | | | 1,737,992 | |
| JPMorgan Chase & Co. | | 3.540% | | | 05/01/28 | | | | 3,255,000 | | | | 3,106,221 | |
| KeyCorp, Series O | | 4.150% | | | 10/29/25 | | | | 4,200,000 | | | | 4,105,772 | |
| Marsh & McLennan Co., Inc. | | 3.500% | | | 03/10/25 | | | | 1,000,000 | | | | 985,438 | |
| Morgan Stanley, Series F | | 4.000% | | | 07/23/25 | | | | 2,750,000 | | | | 2,708,774 | |
| Morgan Stanley | | 3.591% | | | 07/22/28 | | | | 2,200,000 | | | | 2,091,815 | |
| National Retail Properties, Inc. | | 4.000% | | | 11/15/25 | | | | 2,965,000 | | | | 2,903,896 | |
| NNN REIT, Inc. | | 3.600% | | | 12/15/26 | | | | 760,000 | | | | 729,093 | |
| PNC Financial Services Group, Inc. (The) | | 4.200% | | | 11/01/25 | | | | 2,385,000 | | | | 2,338,734 | |
| PNC Financial Services Group, Inc. (The) | | 4.050% | | | 07/26/28 | | | | 2,640,000 | | | | 2,508,325 | |
| Private Export Funding Corp., 144A | | 5.500% | | | 03/14/25 | | | | 2,000,000 | | | | 2,000,200 | |
| Suntrust Bank, Inc. | | 4.000% | | | 05/01/25 | | | | 3,002,000 | | | | 2,960,345 | |
| U.S. Bancorp, Series W | | 3.600% | | | 09/11/24 | | | | 1,594,000 | | | | 1,586,432 | |
| U.S. Bancorp, Series MTN | | 3.100% | | | 04/27/26 | | | | 2,655,000 | | | | 2,545,655 | |
| Wells Fargo & Co., Series N | | 3.550% | | | 09/29/25 | | | | 600,000 | | | | 585,774 | |
| Wells Fargo & Co., Series M | | 4.100% | | | 06/03/26 | | | | 3,215,000 | | | | 3,133,147 | |
| | | | | | | | | | | | | | 68,002,368 | |
| Industrials — 19.0% | | | | | | | | | | | | | | |
| Becton Dickinson & Co. | | 3.700% | | | 06/06/27 | | | | 2,000,000 | | | | 1,924,864 | |
| Cisco Systems, Inc. | | 4.800% | | | 02/26/27 | | | | 4,025,000 | | | | 4,013,804 | |
| CVS Health Corp. | | 3.875% | | | 07/20/25 | | | | 3,700,000 | | | | 3,633,274 | |
| Dover Corp. | | 3.150% | | | 11/15/25 | | | | 4,548,000 | | | | 4,406,613 | |
| Enterprise Products Operating, LLC | | 3.750% | | | 02/15/25 | | | | 1,500,000 | | | | 1,482,055 | |
| Home Depot, Inc. (The) | | 5.150% | | | 06/25/26 | | | | 4,430,000 | | | | 4,434,206 | |
| Johnson Controls International plc | | 3.625% | | | 07/02/24 | | | | 2,936,000 | | | | 2,936,000 | |
| Johnson Controls International plc | | 3.900% | | | 02/14/26 | | | | 1,240,000 | | | | 1,209,655 | |
| MPLX, L.P. | | 4.875% | | | 12/01/24 | | | | 2,800,000 | | | | 2,787,907 | |
| Norfolk Southern Corp. | | 5.590% | | | 05/17/25 | | | | 1,000,000 | | | | 998,388 | |
| Parker-Hannifin Corp. | | 3.250% | | | 03/01/27 | | | | 3,235,000 | | | | 3,086,600 | |
| Parker-Hannifin Corp. | | 4.250% | | | 09/15/27 | | | | 640,000 | | | | 623,800 | |
| Roper Technologies, Inc. | | 1.000% | | | 09/15/25 | | | | 3,845,000 | | | | 3,641,266 | |
| Shell International | | 3.250% | | | 05/11/25 | | | | 3,115,000 | | | | 3,059,300 | |
| Starbucks Corp. | | 4.850% | | | 02/08/27 | | | | 3,675,000 | | | | 3,656,024 | |
| Verizon Communications, Inc. | | 2.100% | | | 03/22/28 | | | | 1,000,000 | | | | 899,477 | |
| Xylem, Inc. | | 3.250% | | | 11/01/26 | | | | 2,406,000 | | | | 2,300,262 | |
| Xylem, Inc. | | 1.950% | | | 01/30/28 | | | | 1,542,000 | | | | 1,384,958 | |
| | | | | | | | | | | | | | 46,478,453 | |
The accompanying notes are an integral part of these financial statements.
| INSTITUTIONAL SHORT DURATION BOND FUND | PORTFOLIO OF INVESTMENTS AS OF JUNE 30, 2024 – UNAUDITED |
| CORPORATE BONDS — 59.6% | | Coupon | | | Maturity | | | Par Value | | | Value | |
| Utilities — 12.7% | | | | | | | | | | | | | | |
| Duke Energy Corp. | | 0.900% | | | 09/15/25 | | | $ | 3,877,000 | | | $ | 3,670,405 | |
| Emerson Electric Co. | | 2.000% | | | 12/21/28 | | | | 2,500,000 | | | | 2,217,699 | |
| Eversource Energy, Series H | | 3.150% | | | 01/15/25 | | | | 1,900,000 | | | | 1,872,564 | |
| Eversource Energy, Series U | | 1.400% | | | 08/15/26 | | | | 1,985,000 | | | | 1,821,777 | |
| Florida Power & Light Co. | | 4.400% | | | 05/15/28 | | | | 4,390,000 | | | | 4,311,352 | |
| Georgia Power Co., Series 2019-A | | 2.200% | | | 09/15/24 | | | | 3,043,000 | | | | 3,019,846 | |
| Interstate Power & Light Co. | | 3.400% | | | 08/15/25 | | | | 4,472,000 | | | | 4,363,974 | |
| National Rural Utilities Cooperative Finance Corp. (The) | | 2.850% | | | 01/27/25 | | | | 1,705,000 | | | | 1,678,473 | |
| National Rural Utilities Cooperative Finance Corp. (The) | | 3.250% | | | 11/01/25 | | | | 900,000 | | | | 874,826 | |
| Virginia Electric & Power Co., Series B | | 2.950% | | | 11/15/26 | | | | 2,805,000 | | | | 2,667,299 | |
| Virginia Electric & Power Co., Series A | | 3.500% | | | 03/15/27 | | | | 1,000,000 | | | | 960,051 | |
| Xcel Energy, Inc. | | 3.300% | | | 06/01/25 | | | | 3,720,000 | | | | 3,637,988 | |
| | | | | | | | | | | | | | 31,096,254 | |
| | | | | | | | | | | | | | | |
| Total Corporate Bonds (Cost $148,093,205) | | | | | | | | | | | | $ | 145,577,075 | |
| | | | | | | | | | | | | | | |
| COLLATERALIZED MORTGAGE OBLIGATIONS — 11.9% | | | | | | | | | | | | | | |
| Federal Home Loan Mortgage Corporation — 4.2% | | | | | | | | | | | | | | |
| FHLMC, Series 2989, Class TG | | 5.000% | | | 06/01/25 | | | $ | 8,882 | | | $ | 8,847 | |
| FHLMC, Pool #SB-0037 | | 2.500% | | | 12/01/27 | | | | 289,202 | | | | 279,423 | |
| FHLMC, Pool #G1-5973 | | 3.000% | | | 07/01/31 | | | | 654,946 | | | | 622,302 | |
| FHLMC, Pool #V6-1479, Series V6-1479 | | 2.500% | | | 01/01/32 | | | | 2,404,572 | | | | 2,243,387 | |
| FHLMC, Pool #G1-8642 | | 3.500% | | | 04/01/32 | | | | 783,247 | | | | 750,126 | |
| FHLMC, Pool #ZT-1964 | | 3.500% | | | 06/01/32 | | | | 659,856 | | | | 631,526 | |
| FHLMC, Pool #G1-6330 | | 3.500% | | | 08/01/32 | | | | 649,814 | | | | 625,200 | |
| FHLMC, Series 4980, Class DB | | 1.250% | | | 10/25/34 | | | | 2,018,632 | | | | 1,788,803 | |
| FHLMC, Pool #ZS-9286 | | 4.500% | | | 04/01/35 | | | | 650,317 | | | | 637,544 | |
| FHLMC, Series 4198, Class BE | | 2.000% | | | 10/15/40 | | | | 10,349 | | | | 10,296 | |
| FHLMC, Series 4125, Class KP | | 2.500% | | | 05/15/41 | | | | 370,186 | | | | 346,339 | |
| FHLMC, Series 4009, Class PA | | 2.000% | | | 06/15/41 | | | | 56,946 | | | | 53,867 | |
| FHLMC, Pool #2B-0350 (RFUCCT1Y + 186) (a) | | 6.610% | | | 04/01/42 | | | | 11,006 | | | | 11,078 | |
| FHLMC, Series 5301, Class ED | | 5.000% | | | 04/01/53 | | | | 2,280,521 | | | | 2,238,527 | |
| | | | | | | | | | | | | | 10,247,265 | |
| Federal National Mortgage Association — 7.7% | | | | | | | | | | | | | | |
| FNMA, Series 2013-1, Class LA | | 1.250% | | | 02/25/28 | | | | 456,519 | | | | 430,201 | |
| FNMA, Pool #AL9230 | | 3.500% | | | 12/01/29 | | | | 304,609 | | | | 295,736 | |
| FNMA, Pool #MA0384 | | 5.000% | | | 04/01/30 | | | | 136,778 | | | | 136,020 | |
| FNMA, Pool #MA4424 | | 1.500% | | | 09/01/31 | | | | 4,835,874 | | | | 4,345,994 | |
| FNMA, Pool #FM1926 | | 3.000% | | | 09/01/32 | | | | 661,827 | | | | 630,930 | |
| FNMA, Series 2013-3, Class DK | | 1.750% | | | 02/25/33 | | | | 444,327 | | | | 403,559 | |
| FNMA, Pool #FM2287 | | 4.500% | | | 03/01/34 | | | | 691,151 | | | | 681,195 | |
| FNMA, Series 2020 B | | 4.500% | | | 07/01/34 | | | | 902,537 | | | | 888,569 | |
| FNMA, Pool #FM2989 | | 3.000% | | | 09/01/34 | | | | 676,592 | | | | 639,671 | |
| FNMA, Pool #AL7077 | | 4.000% | | | 07/01/35 | | | | 427,650 | | | | 412,548 | |
| FNMA, Pool #FM4481 | | 1.500% | | | 10/01/35 | | | | 4,701,885 | | | | 4,037,418 | |
| FNMA, Pool #CA7891 | | 1.500% | | | 11/01/35 | | | | 1,037,250 | | | | 904,000 | |
| FNMA, Series 2020-044, Class TE | | 2.000% | | | 12/25/35 | | | | 1,392,085 | | | | 1,272,502 | |
| FNMA, Series 2013-6, Class BC | | 1.500% | | | 12/25/42 | | | | 67,398 | | | | 64,835 | |
| FNMA, Pool #AY0089 (RFUCCT1Y + 160) (a) | | 5.850% | | | 12/01/44 | | | | 94,116 | | | | 95,917 | |
The accompanying notes are an integral part of these financial statements.
| INSTITUTIONAL SHORT DURATION BOND FUND | PORTFOLIO OF INVESTMENTS AS OF JUNE 30, 2024 – UNAUDITED |
| COLLATERALIZED MORTGAGE OBLIGATIONS — 11.9% | | Coupon | | | Maturity | | | Par Value | | | Value | |
| FNMA, Pool #AL8183 (RFUCCT1Y + 160) (a) | | 7.148% | | | 02/01/46 | | | $ | 71,116 | | | $ | 71,900 | |
| FNMA, Series 2020-95, Class GA | | 1.000% | | | 01/25/51 | | | | 4,590,445 | | | | 3,401,785 | |
| | | | | | | | | | | | | | 18,712,780 | |
| Government National Mortgage Association — 0.0% (b) | | | | | | | | | | | | | | |
| GNMA, Pool #726475X | | 4.000% | | | 11/15/24 | | | | 2,533 | | | | 2,521 | |
| | | | | | | | | | | | | | | |
| Total Collateralized Mortgage Obligations (Cost $31,762,553) | | | | | | | | | | | | $ | 28,962,566 | |
| | | | | | | | | | | | | | | |
| MUNICIPAL BONDS — 3.5% | | | | | | | | | | | | | | |
| Allegheny County Pennsylvania, Series C-79 | | 0.843% | | | 11/01/24 | | | $ | 600,000 | | | $ | 590,579 | |
| Allegheny County Pennsylvania, Series C-79 | | 0.973% | | | 11/01/25 | | | | 1,835,000 | | | | 1,733,413 | |
| Commonwealth Financing Authority Pennsylvania Revenue, Series 2006-C | | 5.197% | | | 06/01/26 | | | | 705,000 | | | | 704,193 | |
| Franklin County Ohio Convention Facilities Authority, Series 2020-B | | 1.255% | | | 12/01/25 | | | | 500,000 | | | | 470,372 | |
| Pennsylvania State University, Series D | | 1.545% | | | 09/01/24 | | | | 1,145,000 | | | | 1,137,507 | |
| Pennsylvania State University, Series D | | 1.645% | | | 09/01/25 | | | | 2,000,000 | | | | 1,920,338 | |
| Wisconsin State General Fund Annual Appropriation Revenue, Series 2023-A | | 4.330% | | | 05/01/27 | | | | 1,460,000 | | | | 1,443,986 | |
| Wisconsin State General Fund Annual Appropriation Revenue, Series 2023-A | | 4.330% | | | 05/01/27 | | | | 540,000 | | | | 531,330 | |
| Total Municipal Bonds (Cost $8,804,634) | | | | | | | | | | | | $ | 8,531,718 | |
| | | | | | | | | | | | | | | |
| U.S. GOVERNMENT & AGENCIES — 5.5% | | | | | | | | | | | | | | |
| Federal Home Loan Bank — 2.0% | | | | | | | | | | | | | | |
| FHLB | | 1.375% | | | 08/26/26 | | | $ | 3,700,000 | | | $ | 3,432,516 | |
| FHLB | | 1.375% | | | 09/29/26 | | | | 1,585,000 | | | | 1,467,769 | |
| | | | | | | | | | | | | | 4,900,285 | |
| Federal National Mortgage Association — 1.8% | | | | | | | | | | | | | | |
| FNMA | | 5.200% | | | 05/25/27 | | | | 2,500,000 | | | | 2,493,913 | |
| FNMA | | 4.800% | | | 05/08/29 | | | | 2,000,000 | | | | 1,980,812 | |
| | | | | | | | | | | | | | 4,474,725 | |
| Federal Home Loan Mortgage Corporation — 1.7% | | | | | | | | | | | | | | |
| FHLMC | | 0.450% | | | 07/22/24 | | | | 4,000,000 | | | | 3,988,341 | |
| | | | | | | | | | | | | | | |
| Total U.S. Government & Agencies (Cost $13,765,265) | | | | | | | | | | | | $ | 13,363,351 | |
| | | | | | | | | | | | | | | |
| U.S. TREASURY OBLIGATIONS — 18.6% | | | | | | | | | | | | | | |
| U.S. Treasury Notes — 18.6% | | | | | | | | | | | | | | |
| U.S. Treasury Notes (13WKTBILL + 24.5) (a) | | 5.550% | | | 01/31/26 | | | $ | 1,800,000 | | | $ | 1,802,581 | |
| U.S. Treasury Notes | | 5.465% | | | 04/30/26 | | | | 3,000,000 | | | | 2,999,579 | |
| U.S. Treasury Notes | | 1.625% | | | 05/15/26 | | | | 5,600,000 | | | | 5,286,969 | |
| U.S. Treasury Notes | | 2.750% | | | 07/31/27 | | | | 10,310,000 | | | | 9,789,667 | |
| U.S. Treasury Notes | | 2.750% | | | 02/15/28 | | | | 10,700,000 | | | | 10,087,258 | |
| U.S. Treasury Notes | | 2.875% | | | 05/15/28 | | | | 10,420,000 | | | | 9,843,644 | |
| U.S. Treasury Notes | | 3.125% | | | 11/15/28 | | | | 2,110,000 | | | | 2,003,511 | |
| U.S. Treasury Notes | | 2.625% | | | 02/15/29 | | | | 4,000,000 | | | | 3,708,125 | |
| Total U.S. Treasury Obligations (Cost $45,785,539) | | | | | | | | | | | | $ | 45,521,334 | |
The accompanying notes are an integral part of these financial statements.
| INSTITUTIONAL SHORT DURATION BOND FUND | PORTFOLIO OF INVESTMENTS AS OF JUNE 30, 2024 – UNAUDITED |
| MONEY MARKET FUNDS — 0.1% | | Shares | | | Value | |
| First American Government Obligations Fund - Class Z, 5.19% (c) (Cost $294,264) | | 294,264 | | | $ | 294,264 | |
| | | | | | | | |
Investments at Value — 99.2%
(Cost $248,505,460) | | | | | $ | 242,250,308 | |
| | | | | | | | |
| Other Assets in Excess of Liabilities — 0.8% | | | | | | 2,054,960 | |
| | | | | | | | |
| Net Assets — 100.0% | | | | | $ | 244,305,268 | |
| (a) | Variable rate security. Interest rate resets periodically. The rate shown is the effective interest rate as of June 30, 2024. For securities based on a published reference rate and spread, the reference rate and spread (in basis points) are indicated parenthetically. |
| (b) | Percentage rounds to less than 0.1%. |
| (c) | The rate shown is the 7-day effective yield as of June 30, 2024. |
13WKTBILL - 13 Week Treasury Bill.
144A - Security was purchased in a transaction exempt from registration in compliance with Rule 144A of the Securities Act of 1933. This security may be resold in transactions exempt from registration, normally to qualified institutional buyers. The total value of such securities is $2,000,200 as of June 30, 2024, representing 0.8% of net assets.
plc - Public Limited Company
RFUCCT - Refinitiv USD IBOR Cash Fallbacks.
SOFR - Secured Overnight Financing Rate.
The accompanying notes are an integral part of these financial statements.
| CORE PLUS BOND FUND | PORTFOLIO OF INVESTMENTS AS OF JUNE 30, 2024 – UNAUDITED |
| CORPORATE BONDS — 60.1% | | Coupon | | | Maturity | | | Par Value | | | Value | |
| Finance — 25.0% | | | | | | | | | | | | | | |
| Allstate Corp. (The) | | 5.250% | | | 03/30/33 | | | $ | 300,000 | | | $ | 298,796 | |
| American Express Co. | | 1.650% | | | 11/04/26 | | | | 630,000 | | | | 579,768 | |
| AON plc | | 3.875% | | | 12/15/25 | | | | 220,000 | | | | 214,998 | |
| Bank of America Corp. | | 5.202% | | | 04/25/29 | | | | 555,000 | | | | 554,019 | |
| Essex Portfolio, L.P. | | 3.000% | | | 01/15/30 | | | | 670,000 | | | | 593,825 | |
| Fifth Third Bancorp (SOFR + 234) (a) | | 6.339% | | | 07/27/29 | | | | 580,000 | | | | 594,728 | |
| Huntington Bancshares, Inc. | | 4.443% | | | 08/04/28 | | | | 335,000 | | | | 324,544 | |
| Huntington Bancshares, Inc. | | 2.550% | | | 02/04/30 | | | | 300,000 | | | | 256,587 | |
| Iron Mountain, Inc. | | 4.875% | | | 09/15/27 | | | | 195,000 | | | | 189,192 | |
| JPMorgan Chase & Co. (SOFR + 379) (a) | | 4.493% | | | 03/24/31 | | | | 775,000 | | | | 747,238 | |
| Keycorp | | 6.401% | | | 03/06/35 | | | | 585,000 | | | | 593,321 | |
| Morgan Stanley | | 3.591% | | | 07/22/28 | | | | 800,000 | | | | 760,660 | |
| MSCI, Inc., 144A | | 4.000% | | | 11/15/29 | | | | 415,000 | | | | 386,950 | |
| National Retail Properties, Inc. | | 4.300% | | | 10/15/28 | | | | 580,000 | | | | 558,870 | |
| PNC Financial Services Group, Inc. (The) | | 3.450% | | | 04/23/29 | | | | 675,000 | | | | 625,907 | |
| Prologis, Inc. | | 5.125% | | | 01/15/34 | | | | 485,000 | | | | 478,581 | |
| SBA Communications Corp. | | 3.875% | | | 02/15/27 | | | | 160,000 | | | | 152,487 | |
| Truist Financial Corp. | | 2.250% | | | 03/11/30 | | | | 815,000 | | | | 679,602 | |
| U.S. Bancorp, Series BB | | 4.967% | | | 07/22/33 | | | | 845,000 | | | | 800,816 | |
| Wells Fargo & Co., Series O | | 4.300% | | �� | 07/22/27 | | | | 575,000 | | | | 559,911 | |
| | | | | | | | | | | | | | 9,950,800 | |
| Industrials — 25.6% | | | | | | | | | | | | | | |
| Air Products and Chemicals, Inc. | | 4.750% | | | 02/08/31 | | | | 555,000 | | | | 549,234 | |
| Ball Corp. | | 6.875% | | | 03/15/28 | | | | 365,000 | | | | 374,585 | |
| Becton Dickinson & Co. | | 3.700% | | | 06/06/27 | | | | 110,000 | | | | 105,867 | |
| Becton Dickinson & Co. | | 2.823% | | | 05/20/30 | | | | 230,000 | | | | 203,243 | |
| CCO Holdings, LLC/CCO Holdings Capital Corp., 144A | | 5.375% | | | 06/01/29 | | | | 220,000 | | | | 200,118 | |
| Charles River Laboratories International, Inc., 144A | | 4.250% | | | 05/01/28 | | | | 230,000 | | | | 217,277 | |
| Cisco Systems, Inc. | | 4.850% | | | 02/26/29 | | | | 650,000 | | | | 649,795 | |
| CVS Health Corp. | | 3.875% | | | 07/20/25 | | | | 255,000 | | | | 250,401 | |
| CVS Health Corp. | | 4.300% | | | 03/25/28 | | | | 295,000 | | | | 284,809 | |
| Dover Corp. | | 3.150% | | | 11/15/25 | | | | 100,000 | | | | 96,891 | |
| Dover Corp. | | 2.950% | | | 11/04/29 | | | | 545,000 | | | | 492,456 | |
| Duke Energy Corp. | | 2.450% | | | 06/01/30 | | | | 670,000 | | | | 575,879 | |
| Edgewell Personal Care Co., 144A | | 5.500% | | | 06/01/28 | | | | 200,000 | | | | 195,370 | |
| Enterprise Products Operating, LLC | | 3.750% | | | 02/15/25 | | | | 290,000 | | | | 286,531 | |
| HCA Healthcare, Inc. | | 5.600% | | | 04/01/34 | | | | 370,000 | | | | 367,606 | |
| Hologic, Inc., 144A | | 3.250% | | | 02/15/29 | | | | 290,000 | | | | 260,221 | |
| Johnson Controls International plc | | 3.900% | | | 02/14/26 | | | | 550,000 | | | | 536,541 | |
| Mattel, Inc., 144A | | 3.750% | | | 04/01/29 | | | | 365,000 | | | | 336,608 | |
| Parker-Hannifin Corp. | | 3.250% | | | 03/01/27 | | | | 385,000 | | | | 367,339 | |
| Roper Technologies, Inc. | | 1.000% | | | 09/15/25 | | | | 355,000 | | | | 336,190 | |
| Sealed Air Corp., 144A | | 6.500% | | | 07/15/32 | | | | 400,000 | | | | 398,116 | |
| SS&C Technologies, Inc., 144A | | 5.500% | | | 09/30/27 | | | | 330,000 | | | | 325,100 | |
| Starbucks Corp. | | 3.800% | | | 08/15/25 | | | | 175,000 | | | | 172,051 | |
| Starbucks Corp. | | 4.850% | | | 02/08/27 | | | | 390,000 | | | | 387,986 | |
| T-Mobile U.S., Inc. | | 2.625% | | | 04/15/26 | | | | 350,000 | | | | 333,103 | |
| TransDigm, Inc., 144A | | 6.375% | | | 03/01/29 | | | | 385,000 | | | | 387,385 | |
| United Rentals North America, Inc. | | 4.875% | | | 01/15/28 | | | | 400,000 | | | | 387,383 | |
| Verizon Communications, Inc. | | 4.016% | | | 12/03/29 | | | | 280,000 | | | | 264,582 | |
The accompanying notes are an integral part of these financial statements.
| CORE PLUS BOND FUND | PORTFOLIO OF INVESTMENTS AS OF JUNE 30, 2024 – UNAUDITED |
| CORPORATE BONDS — 60.1% | | Coupon | | | Maturity | | | Par Value | | | Value | |
| Xylem, Inc. | | 3.250% | | | 11/01/26 | | | $ | 620,000 | | | $ | 592,752 | |
| Yum Brands, Inc., 144A | | 4.750% | | | 01/15/30 | | | | 230,000 | | | | 218,975 | |
| | | | | | | | | | | | | | 10,154,394 | |
| Utilities — 9.5% | | | | | | | | | | | | | | |
| Berkshire Hathaway, Inc. | | 3.250% | | | 04/15/28 | | | | 220,000 | | | | 206,467 | |
| Eversource Energy, Series R | | 1.650% | | | 08/15/30 | | | | 740,000 | | | | 597,268 | |
| Florida Power & Light Co. | | 5.100% | | | 04/01/33 | | | | 775,000 | | | | 771,561 | |
| Georgia Power Co., Series 2019B | | 2.650% | | | 09/15/29 | | | | 230,000 | | | | 204,941 | |
| Interstate Power & Light Co. | | 4.100% | | | 09/26/28 | | | | 555,000 | | | | 532,246 | |
| MPLX L.P. | | 5.500% | | | 06/01/34 | | | | 400,000 | | | | 393,893 | |
| National Rural Utilities Cooperative Finance Corp. (The) | | 3.400% | | | 02/07/28 | | | | 290,000 | | | | 274,888 | |
| Virginia Electric & Power Co., Series A | | 3.500% | | | 03/15/27 | | | | 215,000 | | | | 206,411 | |
| Xcel Energy, Inc. | | 3.400% | | | 06/01/30 | | | | 650,000 | | | | 583,784 | |
| | | | | | | | | | | | | | 3,771,459 | |
| | | | | | | | | | | | | | | |
| Total Corporate Bonds (Cost $24,343,206) | | | | | | | | | | | | $ | 23,876,653 | |
| | | | | | | | | | | | | | | |
| COLLATERALIZED MORTGAGE OBLIGATIONS — 21.8% | | | | | | | | | | | | | | |
| Federal Home Loan Mortgage Corporation — 7.9% | | | | | | | | | | | | | | |
| FHLMC, Pool #ZS-9278 | | 4.000% | | | 05/01/37 | | | $ | 312,595 | | | $ | 300,684 | |
| FHLMC, Series 4709, Class EA | | 3.000% | | | 01/15/46 | | | | 655,203 | | | | 615,306 | |
| FHLMC, Series 5220, Class KC | | 3.500% | | | 01/25/46 | | | | 318,620 | | | | 304,955 | |
| FHLMC, Pool #SD-0695 | | 4.000% | | | 12/01/49 | | | | 1,069,870 | | | | 996,638 | |
| FHLMC, Series 5189, Class PG | | 2.500% | | | 09/25/51 | | | | 292,205 | | | | 259,364 | |
| FHLMC, Pool #SD-0767 | | 3.000% | | | 11/01/51 | | | | 422,502 | | | | 364,968 | |
| FHLMC, Series 5301, Class ED | | 5.000% | | | 04/01/53 | | | | 319,273 | | | | 313,394 | |
| | | | | | | | | | | | | | 3,155,309 | |
| Federal National Mortgage Association — 12.5% | | | | | | | | | | | | | | |
| FNMA, Pool #MA4424 | | 1.500% | | | 09/01/31 | | | | 344,322 | | | | 309,441 | |
| FNMA, Pool #MA1222 | | 4.000% | | | 10/01/32 | | | | 290,525 | | | | 281,759 | |
| FNMA, Pool #AL5491 | | 4.000% | | | 06/01/34 | | | | 262,952 | | | | 253,744 | |
| FNMA, Pool #MA3071 | | 4.000% | | | 07/01/37 | | | | 333,361 | | | | 319,623 | |
| FNMA, Pool #FM9469 | | 4.000% | | | 08/01/39 | | | | 200,514 | | | | 191,137 | |
| FNMA, Pool #AU7025 | | 3.000% | | | 11/01/43 | | | | 334,383 | | | | 296,278 | |
| FNMA, Pool #MA2895 | | 3.000% | | | 02/01/47 | | | | 406,776 | | | | 355,344 | |
| FNMA, Pool #CA2479 | | 4.500% | | | 10/01/48 | | | | 944,152 | | | | 909,950 | |
| FNMA, Pool #FS4218 | | 4.000% | | | 10/01/49 | | | | 945,738 | | | | 884,677 | |
| FNMA, Pool #CB0734 | | 3.000% | | | 06/01/51 | | | | 569,062 | | | | 492,231 | |
| FNMA, Pool #FS4520 | | 3.000% | | | 04/01/52 | | | | 421,650 | | | | 364,442 | |
| FNMA, Pool #FS4608 | | 3.000% | | | 05/01/52 | | | | 356,138 | | | | 308,005 | |
| | | | | | | | | | | | | | 4,966,631 | |
| Government National Mortgage Association — 1.4% | | | | | | | | | | | | | | |
| GNMA, Pool #MA7852M | | 2.000% | | | 02/20/37 | | | | 624,726 | | | | 548,728 | |
| | | | | | | | | | | | | | | |
| Total Collateralized Mortgage Obligations (Cost $8,942,255) | | | | | | | | | | | | $ | 8,670,668 | |
| | | | | | | | | | | | | | | |
| U.S. GOVERNMENT & AGENCIES — 1.8% | | | | | | | | | | | | | | |
| Federal National Mortgage Association — 1.8% | | | | | | | | | | | | | | |
| FNMA | | 1.520% | | | 08/21/35 | | | $ | 1,000,000 | | | $ | 703,210 | |
The accompanying notes are an integral part of these financial statements.
| CORE PLUS BOND FUND | PORTFOLIO OF INVESTMENTS AS OF JUNE 30, 2024 – UNAUDITED |
| U.S. TREASURY OBLIGATIONS — 14.0% | | Coupon | | | Maturity | | | Par Value | | | Value | |
| U.S. Treasury Bonds — 9.0% | | | | | | | | | | | | | | |
| U.S. Treasury Bonds | | 2.250% | | | 05/15/41 | | | $ | 1,055,000 | | | $ | 763,227 | |
| U.S. Treasury Bonds | | 2.375% | | | 02/15/42 | | | | 1,310,000 | | | | 953,434 | |
| U.S. Treasury Bonds | | 2.500% | | | 02/15/45 | | | | 1,200,000 | | | | 855,750 | |
| U.S. Treasury Bonds | | 2.750% | | | 08/15/47 | | | | 300,000 | | | | 218,531 | |
| U.S. Treasury Bonds | | 2.000% | | | 02/15/50 | | | | 260,000 | | | | 157,910 | |
| U.S. Treasury Bonds | | 2.000% | | | 08/15/51 | | | | 1,025,000 | | | | 615,801 | |
| | | | | | | | | | | | | | 3,564,653 | |
| U.S. Treasury Notes — 5.0% | | | | | | | | | | | | | | |
| U.S. Treasury Notes (b) | | 1.500% | | | 11/30/24 | | | | 140,000 | | | | 137,796 | |
| U.S. Treasury Notes | | 2.625% | | | 02/15/29 | | | | 190,000 | | | | 176,136 | |
| U.S. Treasury Notes | | 3.500% | | | 02/15/33 | | | | 760,000 | | | | 712,263 | |
| U.S. Treasury Notes | | 3.875% | | | 08/15/33 | | | | 1,000,000 | | | | 962,187 | |
| | | | | | | | | | | | | | 1,988,382 | |
| | | | | | | | | | | | | | | |
| Total U.S. Treasury Obligations (Cost $6,020,129) | | | | | | | | | | | | $ | 5,553,035 | |
| | | | | | | | | | | | | | | |
| PREFERRED STOCKS — 0.4% | | | | | | | | Shares | | | Value | |
| Financials — 0.4% | | | | | | | | | | | | | | |
| Allstate Corp. (The), 5.10%, 01/15/53 (Cost $170,387) | | | | | | | | | 6,500 | | | $ | 167,960 | |
| | | | | | | | | | | | | | | |
| MONEY MARKET FUNDS — 1.0% | | | | | | | | | | | | | | |
| First American Government Obligations Fund - Class Z, 5.19% (c) (Cost $412,402) | | | | 412,402 | | | $ | 412,402 | |
| | | | | | | | | | | | | | | |
Investments at Value — 99.1%
(Cost $40,602,331) | | | | | | | | | | | | $ | 39,383,928 | |
| | | | | | | | | | | | | | | |
| Other Assets in Excess of Liabilities — 0.9% | | | | | | | | | | | | | 360,485 | |
| | | | | | | | | | | | | | | |
| Net Assets — 100.0% | | | | | | | | | | | | $ | 39,744,413 | |
| (a) | Variable rate security. Interest rate resets periodically. The rate shown is the effective interest rate as of June 30, 2024. For securities based on a published reference rate and spread, the reference rate and spread (in basis points) are indicated parenthetically. |
| (b) | All or a portion of the security is segregated as collateral on futures contracts. Total fair value of collateral as of June 30, 2024 is $137,796. |
| (c) | The rate shown is the 7-day effective yield as of June 30, 2024. |
144A - Security was purchased in a transaction exempt from registration in compliance with Rule 144A of the Securities Act of 1933. This security may be resold in transactions exempt from registration, normally to qualified institutional buyers. The total value of such securities is $2,926,120 as of June 30, 2024, representing 7.4% of net assets.
plc - Public Limited Company
SOFR - Secured Overnight Financing Rate.
The accompanying notes are an integral part of these financial statements.
| CORE PLUS BOND FUND | SCHEDULE OF FUTURES CONTRACTS AS OF JUNE 30, 2024 – UNAUDITED |
FUTURES CONTRACTS | |
Contracts | | |
Expiration
Date | | | Notional
Value
at Purchase | | |
Notional
Value | | | Value/
Unrealized
Appreciation | |
| Treasury Futures | | | | | | | | | | | | | | | | | | |
| U.S. Treasury Long Bond Future | | 10 | | | 9/20/2024 | | | $ | 1,052,719 | | | $ | 1,183,125 | | | $ | 12,775 | |
| Ultra 10-Year U.S. Treasury Note Future | | 7 | | | 9/20/2024 | | | | 867,344 | | | | 877,406 | | | | 9,993 | |
| Ultra U.S. Treasury Bond Future | | 11 | | | 9/20/2024 | | | | 1,348,875 | | | | 1,248,844 | | | | 14,070 | |
| Total Futures Contracts | | | | | | | | $ | 3,268,938 | | | $ | 3,309,375 | | | $ | 36,838 | |
The average monthly notional value of futures contracts during the six months ended June 30, 2024 was $2,893,641.
The accompanying notes are an integral part of these financial statements.
| MUNICIPAL INCOME FUND | PORTFOLIO OF INVESTMENTS AS OF JUNE 30, 2024 – UNAUDITED |
| MUNICIPAL BONDS — 98.7% | | Coupon | | | Maturity | | | Par Value | | | Value | |
| Anticipation Notes - City — 0.6% | | | | | | | | | | | | | | |
| Kirtland Ohio Bond Anticipation Notes Various Purpose, Series 2024 | | 4.500% | | | 04/17/25 | | | $ | 570,000 | | | $ | 574,657 | |
| Seven Hills Ohio Bond Anticipation Notes, Series 2024 | | 4.375% | | | 04/03/25 | | | | 500,000 | | | | 503,251 | |
| | | | | | | | | | | | | | 1,077,908 | |
| General Obligation - City — 6.2% | | | | | | | | | | | | | | |
| Cincinnati Ohio GO Unlimited, Series 2017-A | | 4.000% | | | 12/01/32 | | | | 1,000,000 | | | | 1,014,813 | |
| Columbus Ohio GO Unlimited, Series 2015-A | | 3.000% | | | 07/01/27 | | | | 2,565,000 | | | | 2,494,646 | |
| Columbus Ohio GO Unlimited, Series 2022-A | | 5.000% | | | 04/01/38 | | | | 750,000 | | | | 841,538 | |
| Columbus Ohio GO Unlimited, Series 2022-A | | 5.000% | | | 04/01/41 | | | | 3,120,000 | | | | 3,434,862 | |
| Copley Township Ohio Safety Facilities Improvement, Series 2023 | | 4.000% | | | 12/01/36 | | | | 775,000 | | | | 786,392 | |
| Copley Township Ohio Safety Facilities Improvement, Series 2023 | | 4.000% | | | 12/01/37 | | | | 810,000 | | | | 819,692 | |
| Lakewood Ohio GO Limited, Series A | | 4.000% | | | 12/01/28 | | | | 840,000 | | | | 850,152 | |
| Strongsville Ohio GO Limited, Series 2016 | | 4.000% | | | 12/01/30 | | | | 350,000 | | | | 350,400 | |
| | | | | | | | | | | | | | 10,592,495 | |
| General Obligation - County — 1.5% | | | | | | | | | | | | | | |
| Lorain County Ohio GO Unlimited, Series 2017 | | 4.000% | | | 12/01/30 | | | | 450,000 | | | | 450,267 | |
| Lucas County Ohio GO Limited, Series 2017 | | 4.000% | | | 10/01/28 | | | | 1,000,000 | | | | 1,005,951 | |
| Lucas County Ohio GO Limited, Series 2018 | | 4.000% | | | 10/01/29 | | | | 605,000 | | | | 609,108 | |
| Summit County Ohio GO Limited, Series 2016 | | 4.000% | | | 12/01/31 | | | | 500,000 | | | | 500,283 | |
| | | | | | | | | | | | | | 2,565,609 | |
| General Obligation - State — 1.8% | | | | | | | | | | | | | | |
| Pennsylvania GO Unlimited, Series 2018 | | 4.000% | | | 03/01/37 | | | | 1,000,000 | | | | 1,012,738 | |
| Washington GO Unlimited, Series 2022-A | | 5.000% | | | 08/01/44 | | | | 2,000,000 | | | | 2,160,074 | |
| | | | | | | | | | | | | | 3,172,812 | |
| Higher Education — 26.5% | | | | | | | | | | | | | | |
| Bowling Green State University Ohio Revenue, Series 2017-B | | 5.000% | | | 06/01/30 | | | | 750,000 | | | | 780,964 | |
| Bowling Green State University Ohio Revenue, Series 2020-A | | 5.000% | | | 06/01/37 | | | | 1,000,000 | | | | 1,089,607 | |
| Bowling Green State University Ohio Revenue, Series 2020-A | | 4.000% | | | 06/01/45 | | | | 2,830,000 | | | | 2,829,900 | |
| Cuyahoga County Ohio Community College GO Unlimited, Series 2018 | | 4.000% | | | 12/01/33 | | | | 1,275,000 | | | | 1,283,999 | |
| Indiana Financial Authorities Educational Facilities Revenue, Series 2024 | | 5.000% | | | 02/01/28 | | | | 500,000 | | | | 522,010 | |
| Indiana Financial Authorities Educational Facilities Revenue, Series 2021 | | 4.000% | | | 02/01/29 | | | | 940,000 | | | | 951,753 | |
| Indiana Financial Authorities Educational Facilities Revenue, Series 2021 | | 5.000% | | | 02/01/32 | | | | 1,065,000 | | | | 1,145,916 | |
| Kent State University Ohio Revenue, Series 2020-A | | 5.000% | | | 05/01/45 | | | | 950,000 | | | | 1,008,994 | |
| Miami University Ohio General Receipts Revenue, Series 2017 | | 5.000% | | | 09/01/31 | | | | 735,000 | | | | 758,907 | |
| Miami University Ohio General Receipts Revenue, Series 2020-A | | 4.000% | | | 09/01/36 | | | | 1,000,000 | | | | 1,022,815 | |
| Miami University Ohio General Receipts Revenue, Series 2020-A | | 4.000% | | | 09/01/45 | | | | 3,110,000 | | | | 3,091,647 | |
| Ohio Higher Education Facilities Revenue - Case Western Reserve University, Series 2021-A | | 4.000% | | | 12/01/44 | | | | 1,250,000 | | | | 1,246,635 | |
| Ohio Higher Education Facilities Revenue - Denison University, Series 2017-A | | 5.000% | | | 11/01/42 | | | | 1,700,000 | | | | 1,750,880 | |
| Ohio Higher Education Facilities Revenue - Denison University | | 5.000% | | | 11/01/53 | | | | 5,000,000 | | | | 5,339,876 | |
| Ohio Higher Education Facilities Revenue - Oberlin College, Series A | | 5.250% | | | 10/01/53 | | | | 1,000,000 | | | | 1,089,926 | |
| Ohio Higher Education Facilities Revenue - University of Dayton, Series 2018-B | | 4.000% | | | 12/01/33 | | | | 620,000 | | | | 622,265 | |
| Ohio Higher Education Facilities Revenue - University of Dayton, Series 2018-A | | 5.000% | | | 02/01/35 | | | | 1,350,000 | | | | 1,451,364 | |
| Ohio Higher Education Facilities Revenue - University of Dayton | | 4.000% | | | 02/01/36 | | | | 1,050,000 | | | | 1,064,035 | |
| Ohio Higher Education Facilities Revenue - University of Dayton, Series 2018-A | | 5.000% | | | 12/01/36 | | | | 2,010,000 | | | | 2,107,016 | |
| Ohio Higher Education Facilities Revenue - University of Dayton, Series 2018-B | | 5.000% | | | 12/01/36 | | | | 470,000 | | | | 492,686 | |
The accompanying notes are an integral part of these financial statements.
| MUNICIPAL INCOME FUND | PORTFOLIO OF INVESTMENTS AS OF JUNE 30, 2024 – UNAUDITED |
| MUNICIPAL BONDS — 98.7% | | Coupon | | | Maturity | | | Par Value | | | Value | |
| Ohio Higher Education Facilities Revenue - Xavier University, Series 2020 | | 5.000% | | | 05/01/29 | | | $ | 540,000 | | | $ | 576,956 | |
| Ohio Higher Education Facilities Revenue - Xavier University, Series 2020 | | 5.000% | | | 05/01/30 | | | | 570,000 | | | | 614,539 | |
| Ohio Higher Education Facilities Revenue - Xavier University, Series 2020 | | 5.000% | | | 05/01/32 | | | | 630,000 | | | | 675,275 | |
| Ohio Higher Education Facilities Revenue - Xavier University, Series 2015-C | | 5.000% | | | 05/01/32 | | | | 1,000,000 | | | | 1,008,101 | |
| Ohio Higher Education Facilities Revenue - Xavier University | | 4.500% | | | 05/01/36 | | | | 1,000,000 | | | | 1,003,319 | |
| Ohio Higher Education Facilities Revenue - Xavier University, Series 2020 | | 4.000% | | | 05/01/38 | | | | 600,000 | | | | 592,890 | |
| Ohio State University General Receipts, Series 2021-A | | 4.000% | | | 12/01/48 | | | | 2,270,000 | | | | 2,203,833 | |
| University of Akron Ohio General Receipts Revenue, Series 2015-A | | 5.000% | | | 01/01/28 | | | | 410,000 | | | | 411,570 | |
| University of Akron Ohio General Receipts Revenue, Series 2016-A | | 5.000% | | | 01/01/29 | | | | 435,000 | | | | 442,904 | |
| University of Akron Ohio General Receipts Revenue, Series 2014-A | | 5.000% | | | 01/01/29 | | | | 650,000 | | | | 650,307 | |
| University of Akron Ohio General Receipts Revenue, Series 2015-A | | 5.000% | | | 01/01/30 | | | | 720,000 | | | | 722,515 | |
| University of Akron Ohio General Receipts Revenue, Series 2016-A | | 5.000% | | | 01/01/33 | | | | 1,000,000 | | | | 1,019,626 | |
| University of Akron Ohio General Receipts Revenue, Series 2018-A | | 5.000% | | | 01/01/34 | | | | 400,000 | | | | 420,455 | |
| University of Cincinnati General Receipts Revenue, Series C | | 5.000% | | | 06/01/39 | | | | 1,250,000 | | | | 1,255,164 | |
| University of Cincinnati General Receipts Revenue, Series A | | 5.250% | | | 06/01/54 | | | | 1,000,000 | | | | 1,094,954 | |
| University of North Dakota Certificate of Participation, Series 2021-A | | 4.000% | | | 06/01/37 | | | | 555,000 | | | | 561,942 | |
| University of Toledo Revenue, Series B | | 5.000% | | | 06/01/27 | | | | 1,590,000 | | | | 1,646,693 | |
| University of Toledo Revenue, Series 2017-A | | 5.000% | | | 06/01/34 | | | | 1,000,000 | | | | 1,031,131 | |
| | | | | | | | | | | | | | 45,583,369 | |
| Hospital/Health Bonds — 8.3% | | | | | | | | | | | | | | |
| Franklin County Ohio Hospital Revenue Nationwide Childrens, Series 2016-C | | 4.000% | | | 11/01/36 | | | | 800,000 | | | | 803,829 | |
| Franklin County Ohio Hospital Revenue Nationwide Childrens, Series 2016-C | | 4.000% | | | 11/01/40 | | | | 1,340,000 | | | | 1,326,383 | |
| Franklin County Ohio Hospital Revenue Nationwide Childrens, Series 2019-A | | 5.000% | | | 11/01/48 | | | | 3,100,000 | | | | 3,459,062 | |
| Hamilton County Ohio Hospital Facilities Revenue Cincinnati Children’s, Series 2019-CC | | 5.000% | | | 11/15/41 | | | | 2,410,000 | | | | 2,744,447 | |
| Hamilton County Ohio Hospital Facilities Revenue Cincinnati Children’s Hospital, Series 2019-CC | | 5.000% | | | 11/15/49 | | | | 1,300,000 | | | | 1,460,963 | |
| Ohio Hospital Facility Revenue Refunding Cleveland Clinic Health, Series 2017-A | | 4.000% | | | 01/01/36 | | | | 3,100,000 | | | | 3,123,228 | |
| Ohio Hospital Facility Revenue Refunding Cleveland Clinic Health, Series 2019-B | | 4.000% | | | 01/01/42 | | | | 1,320,000 | | | | 1,313,209 | |
| | | | | | | | | | | | | | 14,231,121 | |
| Housing — 8.4% | | | | | | | | | | | | | | |
| Colorado State Certificate of Participation, Series 2020-A | | 4.000% | | | 12/15/39 | | | | 2,000,000 | | | | 2,004,586 | |
| FHLMC, Series M-053 | | 2.550% | | | 06/15/35 | | | | 3,770,000 | | | | 3,013,164 | |
| FHLMC Multifamily ML Certificates (Freddie Mac Guaranty Agreement), Series A-US | | 3.400% | | | 01/25/36 | | | | 1,836,811 | | | | 1,730,708 | |
| Kentucky Certificates of Participation, Series 2018-A | | 4.000% | | | 04/15/28 | | | | 695,000 | | | | 711,991 | |
| Kentucky Certificates of Participation, Series A | | 4.000% | | | 04/15/31 | | | | 500,000 | | | | 504,142 | |
| Kentucky Property and Buildings Commission Revenue, Series A | | 5.000% | | | 05/01/34 | | | | 2,340,000 | | | | 2,608,181 | |
| Missouri State Housing Development Commission Single Family Mortgage Revenue, Series 2019 SER C | | 3.875% | | | 05/01/50 | | | | 1,020,000 | | | | 1,011,176 | |
| Missouri State Housing Development Commission Single Family Mortgage Revenue, Series 2020-C | | 3.500% | | | 11/01/50 | | | | 1,820,000 | | | | 1,786,586 | |
The accompanying notes are an integral part of these financial statements.
| MUNICIPAL INCOME FUND | PORTFOLIO OF INVESTMENTS AS OF JUNE 30, 2024 – UNAUDITED |
| MUNICIPAL BONDS — 98.7% | | Coupon | | | Maturity | | | Par Value | | | Value | |
| Missouri State Housing Development Commission Single Family Mortgage Revenue, Series 2020-A | | 3.500% | | | 11/01/50 | | | $ | 570,000 | | | $ | 559,603 | |
| Ohio Housing Finance Agency Residential Mortgage Revenue, Series 2017-A | | 3.700% | | | 03/01/32 | | | | 520,000 | | | | 499,757 | |
| | | | | | | | | | | | | | 14,429,894 | |
| Other Revenue — 7.8% | | | | | | | | | | | | | | |
| Akron Ohio Income Tax Revenue, Series 2019 | | 4.000% | | | 12/01/31 | | | | 870,000 | | | | 884,169 | |
| Cincinnati Ohio Economic Development Revenue (Baldwin 300 Project), Series D | | 4.750% | | | 11/01/30 | | | | 500,000 | | | | 510,444 | |
| Cincinnati Ohio Economic Development Revenue (Baldwin 300 Project), Series D | | 5.000% | | | 11/01/32 | | | | 525,000 | | | | 537,785 | |
| Hamilton County Ohio Economic Development King Highland Community Urban Redevelopment Corp. Revenue, Series 2015 | | 5.000% | | | 06/01/30 | | | | 655,000 | | | | 661,388 | |
| Mobile Alabama Industrial Development Board Pollution Control Revenue, Series 2008-B | | 3.650% | | | 07/15/34 | | | | 1,000,000 | | | | 999,885 | |
| Monroe County Georgia Development Authority Pollution Control Revenue, Series 2009 | | 1.000% | | | 07/01/49 | | | | 1,000,000 | | | | 920,644 | |
| Ohio Special Obligation Revenue, Series 2020-B | | 5.000% | | | 04/01/39 | | | | 1,000,000 | | | | 1,083,447 | |
| Ohio Turnpike Revenue, Series 2021-A | | 5.000% | | | 02/15/46 | | | | 1,990,000 | | | | 2,119,232 | |
| Riversouth Ohio Authority Revenue, Series 2016 | | 4.000% | | | 12/01/31 | | | | 700,000 | | | | 704,194 | |
| St. Xavier High School, Inc. Ohio Revenue, Series 2020-A | | 4.000% | | | 04/01/36 | | | | 400,000 | | | | 405,518 | |
| St. Xavier High School, Inc. Ohio Revenue, Series 2020-A | | 4.000% | | | 04/01/37 | | | | 575,000 | | | | 582,702 | |
| St. Xavier High School, Inc. Ohio Revenue, Series 2020-A | | 4.000% | | | 04/01/38 | | | | 400,000 | | | | 404,240 | |
| St. Xavier High School, Inc. Ohio Revenue, Series 2020-A | | 4.000% | | | 04/01/39 | | | | 400,000 | | | | 403,305 | |
| Summit County Ohio Development Finance Authority, Series 2018 | | 4.000% | | | 12/01/27 | | | | 220,000 | | | | 221,256 | |
| Summit County Ohio Development Finance Authority, Series 2018 | | 4.000% | | | 12/01/28 | | | | 435,000 | | | | 437,133 | |
| Wise County Virginia Industrial Development Authority Solid Waste and Disposal Revenue - Virginia Electric and Power Co. Project, Series A | | 3.800% | | | 11/01/40 | | | | 2,500,000 | | | | 2,501,256 | |
| | | | | | | | | | | | | | 13,376,598 | |
| Revenue Bonds - Facility — 0.7% | | | | | | | | | | | | | | |
| Franklin County Convention Facilities Authority, Series 2019 | | 5.000% | | | 12/01/30 | | | | 600,000 | | | | 656,260 | |
| Franklin County Convention Facilities Authority, Series 2019 | | 5.000% | | | 12/01/32 | | | | 505,000 | | | | 552,421 | |
| | | | | | | | | | | | | | 1,208,681 | |
| Revenue Bonds - Water & Sewer — 6.5% | | | | | | | | | | | | | | |
| Ohio State Water Development Authority Revenue, Series 2020-A | | 5.000% | | | 12/01/39 | | | | 1,165,000 | | | | 1,270,624 | |
| Ohio State Water Development Authority Revenue, Series 2021 | | 5.000% | | | 06/01/46 | | | | 4,215,000 | | | | 4,570,428 | |
| Ohio State Water Development Authority Revenue, Series 2021-A | | 4.000% | | | 12/01/46 | | | | 3,880,000 | | | | 3,883,479 | |
| Ohio Water Development Authority Revenue Pollution Control, Series 2021-A | | 5.000% | | | 12/01/40 | | | | 1,000,000 | | | | 1,104,889 | |
| St. Charles County Missouri Public Water Supply Dist. 2 Certificates of Participation, Series 2016-C | | 4.000% | | | 12/01/31 | | | | 400,000 | | | | 401,549 | |
| | | | | | | | | | | | | | 11,230,969 | |
| School District — 24.9% | | | | | | | | | | | | | | |
| Arcanum-Butler Ohio LSD GO, Series 2016 | | 4.000% | | | 12/01/29 | | | | 675,000 | | | | 675,654 | |
| Arcanum-Butler Ohio LSD GO, Series 2016 | | 4.000% | | | 12/01/30 | | | | 650,000 | | | | 650,498 | |
| Athens City School District, Series 2019-A | | 4.000% | | | 12/01/33 | | | | 750,000 | | | | 767,367 | |
| Athens City School District, Series 2024 | | 4.000% | | | 12/01/53 | | | | 1,595,000 | | | | 1,522,792 | |
| Baytown Texas Certificates Obligation, Series 2022 | | 4.250% | | | 02/01/40 | | | | 1,045,000 | | | | 1,074,146 | |
| Bellbrook-Sugarcreek Ohio LSD GO Unlimited, Series 2016 | | 4.000% | | | 12/01/31 | | | | 325,000 | | | | 326,790 | |
The accompanying notes are an integral part of these financial statements.
| MUNICIPAL INCOME FUND | PORTFOLIO OF INVESTMENTS AS OF JUNE 30, 2024 – UNAUDITED |
| MUNICIPAL BONDS — 98.7% | | Coupon | | | Maturity | | | Par Value | | | Value | |
| Bellefontaine Ohio SCD GO Unlimited (National RE Insured), Series 2005 | | 5.500% | | | 12/01/26 | | | $ | 615,000 | | | $ | 630,884 | |
| Berea Ohio CSD GO Unlimited, Series 2017 | | 4.000% | | | 12/01/31 | | | | 500,000 | | | | 501,126 | |
| Bexar Texas Refunding Limited, Series 2019 | | 4.000% | | | 06/15/37 | | | | 1,360,000 | | | | 1,381,806 | |
| Brecksville Ohio GO Limited, Series 2022 | | 4.000% | | | 12/01/51 | | | | 1,885,000 | | | | 1,873,502 | |
| Bullit Kentucky School District Finance Corp., Series 2023-A | | 4.000% | | | 03/01/37 | | | | 1,255,000 | | | | 1,271,963 | |
| Chillicothe Ohio SD GO Unlimited (AGM Insured), Series 2016 | | 4.000% | | | 12/01/29 | | | | 400,000 | | | | 398,588 | |
| Cleveland Heights and University Heights Ohio CSD GO Unlimited, Series 2017 | | 4.000% | | | 12/01/32 | | | | 1,000,000 | | | | 1,011,732 | |
| Columbus Ohio CSD GO Unlimited, Series 2016-B | | 4.000% | | | 12/01/29 | | | | 400,000 | | | | 403,830 | |
| Dexter Michigan CSD GO Unlimited, Series 2017 | | 4.000% | | | 05/01/31 | | | | 670,000 | | | | 677,714 | |
| Dublin Ohio CSD School Facilities, Series 2024 | | 5.000% | | | 12/01/26 | | | | 1,645,000 | | | | 1,714,200 | |
| Elyria Ohio SCD GO Unlimited (SDCP), Series A | | 4.000% | | | 12/01/30 | | | | 1,000,000 | | | | 1,011,425 | |
| Grandview Heights Ohio Municipal Facilities Construction and Improvement, Series 2023 | | 4.000% | | | 12/01/46 | | | | 3,000,000 | | | | 2,955,990 | |
| Green County Ohio Vocational SD GO Unlimited, Series 2019 | | 4.000% | | | 12/01/35 | | | | 1,000,000 | | | | 1,017,907 | |
| Hudson Ohio CSD GO Unlimited, Series 2018 | | 4.000% | | | 12/01/33 | | | | 800,000 | | | | 805,647 | |
| Johnstown-Monroe Ohio LSD GO Unlimited, Series 2016 | | 4.000% | | | 12/01/29 | | | | 800,000 | | | | 809,078 | |
| Kettering Ohio CSD GO Unlimited, Series 2016 | | 4.000% | | | 12/01/30 | | | | 400,000 | | | | 403,182 | |
| Kettering Ohio CSD GO Unlimited, Series 2007 | | 5.250% | | | 12/01/31 | | | | 500,000 | | | | 537,380 | |
| Lakewood Ohio GO Limited, Series A | | 5.000% | | | 12/01/36 | | | | 500,000 | | | | 517,073 | |
| Logan Hocking Ohio LSD Certificates of Participation, Series 2018 | | 4.000% | | | 12/01/32 | | | | 420,000 | | | | 422,697 | |
| Mario Ohio LSD School Improvement, Series 2024 | | 4.000% | | | 12/01/49 | | | | 1,295,000 | | | | 1,246,244 | |
| McCracken County Kentucky SD Finance Corp., Series 2022 | | 5.000% | | | 08/01/32 | | | | 580,000 | | | | 641,515 | |
| McCreary County Kentucky SD Finance Corp., Series 2022 | | 4.000% | | | 12/01/35 | | | | 560,000 | | | | 572,287 | |
| Menifee County Kentucky SD Financial Corp. Revenue, Series 2019 | | 3.000% | | | 08/01/27 | | | | 615,000 | | | | 595,681 | |
| Milford Ohio Exempt Village SD Go Unlimited (AGM Insured), Series 2007 | | 5.500% | | | 12/01/30 | | | | 1,260,000 | | | | 1,377,865 | |
| Olentangy LSD Ohio Go Unlimited, Series 2016 | | 4.000% | | | 12/01/31 | | | | 1,000,000 | | | | 1,008,632 | |
| Owen County Kentucky SD Revenue, Series 2017 | | 4.000% | | | 04/01/27 | | | | 1,320,000 | | | | 1,338,535 | |
| Owensboro Kentucky Independent SD School Building Revenue, Series 2024 | | 4.000% | | | 04/01/44 | | | | 575,000 | | | | 558,398 | |
| Palm Beach Florida SD Certificate of Participation, Series 2021-A | | 5.000% | | | 08/01/39 | | | | 1,000,000 | | | | 1,089,702 | |
| Pickerington Ohio LSD Capital Appreciation Refunding, Series 2023 | | 4.375% | | | 12/01/49 | | | | 1,000,000 | | | | 1,004,157 | |
| Popular Bluff Missouri R-I School District Lease Certificates of Participation, Series 2023 | | 5.000% | | | 03/01/30 | | | | 500,000 | | | | 541,180 | |
| Powell County Kentucky SD Finance Corp. School Building Revenue, Series 2024 | | 4.000% | | | 02/01/45 | | | | 855,000 | | | | 820,727 | |
| Princeton Ohio CSD GO Unlimited (National RE Insured), Series 2006 | | 5.250% | | | 12/01/30 | | | | 1,735,000 | | | | 1,907,188 | |
| Pulaski County Kentucky SD Finance Corp. School Building Revenue, Series 2023 | | 4.250% | | | 06/01/40 | | | | 1,000,000 | | | | 1,018,423 | |
| Shaker Heights Ohio CSD Certificates Program | | 5.000% | | | 12/15/49 | | | | 875,000 | | | | 926,636 | |
| Teays Valley Ohio LSD Refunding, Series 2016 | | 4.000% | | | 12/01/32 | | | | 580,000 | | | | 584,725 | |
| Toledo Ohio CSD GO Unlimited, Series 2015 | | 5.000% | | | 12/01/29 | | | | 660,000 | | | | 672,811 | |
| Trotwood-Madison Ohio CSD GO Unlimited (SDCP), Series 2016 | | 4.000% | | | 12/01/28 | | | | 410,000 | | | | 415,391 | |
| Trotwood-Madison Ohio CSD GO Unlimited (SDCP), Series 2016 | | 4.000% | | | 12/01/29 | | | | 500,000 | | | | 506,322 | |
| Trotwood-Madison Ohio CSD GO Unlimited (SDCP), Series 2016 | | 4.000% | | | 12/01/30 | | | | 350,000 | | | | 353,999 | |
| Upper Arlington Ohio Special Obligation Income Tax Revenue Community Center, Series 2023 | | 4.000% | | | 12/01/37 | | | | 500,000 | | | | 513,579 | |
| Wentzville R-IV SD Of Saint Charles County Missouri Certificates of Participation, Series 2016 | | 4.000% | | | 04/01/30 | | | | 395,000 | | | | 395,951 | |
The accompanying notes are an integral part of these financial statements.
| MUNICIPAL INCOME FUND | PORTFOLIO OF INVESTMENTS AS OF JUNE 30, 2024 – UNAUDITED |
| MUNICIPAL BONDS — 98.7% | | Coupon | | | Maturity | | | Par Value | | | Value | |
| Westerville Ohio SCD Certificate of Participation, Series 2018 | | 5.000% | | | 12/01/32 | | | $ | 555,000 | | | $ | 585,536 | |
| Willoughby-Eastlake Ohio CSD Certificates of Participation (BAM Insured), Series 2017 | | 4.000% | | | 03/01/30 | | | | 810,000 | | | | 810,123 | |
| | | | | | | | | | | | | | 42,848,578 | |
| State Agency — 5.5% | | | | | | | | | | | | | | |
| Kentucky Association of Counties Finance Corp. Revenue, Series 2018-E | | 4.000% | | | 02/01/29 | | | | 575,000 | | | | 579,856 | |
| Kentucky Property and Buildings Commission Revenue, Series A | | 5.000% | | | 08/01/29 | | | | 600,000 | | | | 608,125 | |
| Kentucky Property and Buildings Commission Revenue | | 5.000% | | | 08/01/30 | | | | 600,000 | | | | 608,139 | |
| Ohio Common Schools, Series 2019-A | | 5.000% | | | 06/15/39 | | | | 2,000,000 | | | | 2,158,097 | |
| Ohio Higher Education, Series 2017-A | | 5.000% | | | 05/01/31 | | | | 850,000 | | | | 859,418 | |
| Ohio Housing Finance Agency Residential Mortgage Revenue, Series 2021-A | | 3.000% | | | 03/01/52 | | | | 1,585,000 | | | | 1,529,070 | |
| Ohio Infrastructure Improvement, Series 2021-A | | 5.000% | | | 03/01/41 | | | | 1,500,000 | | | | 1,660,609 | |
| Pennsylvania State Refunding, Series 2017 | | 4.000% | | | 01/01/30 | | | | 645,000 | | | | 653,542 | |
| Washington Certificates of Participation, Series 2022-A | | 5.000% | | | 01/01/41 | | | | 675,000 | | | | 745,480 | |
| | | | | | | | | | | | | | 9,402,336 | |
| | | | | | | | | | | | | | | |
| Total Municipal Bonds (Cost $181,217,114) | | | | | | | | | | | | $ | 169,720,370 | |
| MONEY MARKET FUNDS — 0.6% | | Shares | | | Value | |
| Dreyfus AMT-Free Tax Cash Management Fund - Institutional Class, 3.46% (a) (Cost $1,000,458) | | | 1,000,645 | | | $ | 1,000,545 | |
| | | | | | | | | |
Investments at Value — 99.3%
(Cost $182,217,572) | | | | | | $ | 170,720,915 | |
| | | | | | | | | |
| Other Assets in Excess of Liabilities — 0.7% | | | | | | | 1,206,739 | |
| | | | | | | | | |
| Net Assets — 100.0% | | | | | | $ | 171,927,654 | |
| (a) | The rate shown is the 7-day effective yield as of June 30, 2024. |
The accompanying notes are an integral part of these financial statements.
| JOHNSON MUTUAL FUNDS | JUNE 30, 2024 – UNAUDITED |
Statements of Assets and Liabilities
| | | Equity Income
Fund | | | Opportunity
Fund | |
| Assets: | | | | | | | | |
| Investment Securities at Value* | | $ | 640,168,801 | | | $ | 153,784,804 | |
| Dividends Receivable | | | 691,739 | | | | 135,822 | |
| Fund Shares Sold Receivable | | | 82,751 | | | | 21,000 | |
| Total Assets | | $ | 640,943,291 | | | $ | 153,941,626 | |
| | | | | | | | | |
| Liabilities: | | | | | | | | |
| Accrued Management Fees | | $ | 391,475 | | | $ | 113,935 | |
| Accrued Shareholder Servicing Fees — Class S | | | 26,802 | | | | 3,969 | |
| Fund Shares Redeemed Payable | | | 31,754 | | | | 8,001 | |
| Total Liabilities | | $ | 450,031 | | | $ | 125,905 | |
| | | | | | | | | |
| Net Assets | | $ | 640,493,260 | | | $ | 153,815,721 | |
| | | | | | | | | |
| Net Assets Consist of: | | | | | | | | |
| Paid-In Capital | | $ | 419,189,284 | | | $ | 122,287,084 | |
| Accumulated Earnings | | | 221,303,976 | | | | 31,528,637 | |
| | | | | | | | | |
| Net Assets | | $ | 640,493,260 | | | $ | 153,815,721 | |
| | | | | | | | | |
| Pricing of Class I Shares | | | | | | | | |
| Net Assets applicable to Class I Shares | | $ | 509,902,038 | | | $ | 134,664,097 | |
| Shares Outstanding (Unlimited Amount Authorized) | | | 14,067,457 | | | | 2,627,943 | |
| Offering, Redemption and Net Asset Value Per Share | | $ | 36.25 | | | $ | 51.24 | |
| | | | | | | | | |
| Pricing of Class S Shares | | | | | | | | |
| Net Assets applicable to Class S Shares | | $ | 130,591,222 | | | $ | 19,151,624 | |
| Shares Outstanding (Unlimited Amount Authorized) | | | 3,607,809 | | | | 374,212 | |
| Offering, Redemption and Net Asset Value Per Share | | $ | 36.20 | | | $ | 51.18 | |
| | | | | | | | | |
| * | Identified Cost of Investment Securities | | $ | 447,395,999 | | | $ | 125,894,313 | |
The accompanying notes are an integral part of these financial statements.
| JOHNSON MUTUAL FUNDS | JUNE 30, 2024 – UNAUDITED |
Statements of Assets and Liabilities – Continued
| | | International
Fund | | | Enhanced Return
Fund | |
| Assets: | | | | | | | | |
| Investment Securities at Value* | | $ | 23,600,513 | | | $ | 273,901,354 | |
| Cash | | | 98,202 | | | | — | |
| Dividends and Interest Receivable | | | 74,790 | | | | 2,311,658 | |
| Reclaims Receivable | | | 58,991 | | | | — | |
| Fund Shares Sold Receivable | | | — | | | | 20,000 | |
| Total Assets | | $ | 23,832,496 | | | $ | 276,233,012 | |
| | | | | | | | | |
| Liabilities: | | | | | | | | |
| Accrued Management Fees | | $ | 19,679 | | | $ | 78,432 | |
| Variation Margin Payable | | | — | | | | 1,216,425 | |
| Total Liabilities | | $ | 19,679 | | | $ | 1,294,857 | |
| | | | | | | | | |
| Net Assets | | $ | 23,812,817 | | | $ | 274,938,155 | |
| | | | | | | | | |
| Net Assets Consist of: | | | | | | | | |
| Paid-In Capital | | $ | 16,060,589 | | | $ | 278,288,603 | |
| Accumulated Earnings (Deficit) | | | 7,752,228 | | | | (3,350,448 | ) |
| | | | | | | | | |
| Net Assets | | $ | 23,812,817 | | | $ | 274,938,155 | |
| Shares Outstanding (Unlimited Amount Authorized) | | | 743,328 | | | | 16,349,673 | |
| | | | | | | | | |
| Offering, Redemption and Net Asset Value Per Share | | $ | 32.04 | | | $ | 16.82 | |
| | | | | | | | | |
| * | Identified Cost of Investment Securities | | $ | 16,425,914 | | | $ | 280,532,260 | |
The accompanying notes are an integral part of these financial statements.
| JOHNSON MUTUAL FUNDS | JUNE 30, 2024 – UNAUDITED |
Statements of Assets and Liabilities – Continued
| | | Institutional
Core
Bond Fund | | | Institutional
Intermediate
Bond Fund | | | Institutional
Short Duration
Bond Fund | |
| Assets: | | | | | | | | | | | | |
| Investment Securities at Value* | | $ | 1,732,354,839 | | | $ | 299,779,935 | | | $ | 242,250,308 | |
| Dividends and Interest Receivable | | | 14,996,388 | | | | 2,655,923 | | | | 1,901,147 | |
| Fund Shares Sold Receivable | | | 980,970 | | | | 460,847 | | | | 259,513 | |
| Paydowns Receivable | | | 196 | | | | 28 | | | | 26 | |
| Total Assets | | $ | 1,748,332,393 | | | $ | 302,896,733 | | | $ | 244,410,994 | |
| | | | | | | | | | | | | |
| Liabilities: | | | | | | | | | | | | |
| Accrued Management Fee | | $ | 356,105 | | | $ | 61,889 | | | $ | 50,102 | |
| Accrued Distribution Fee - Class F | | | 1,034 | | | | 1 | | | | 1 | |
| Accrued Shareholder Servicing Fee - Class S | | | 7,209 | | | | — | | | | — | |
| Fund Shares Redeemed Payable | | | 230,215 | | | | 115,272 | | | | 55,623 | |
| Securities Sold Payable | | | 10,625,163 | | | | — | | | | — | |
| Total Liabilities | | $ | 11,219,726 | | | $ | 177,162 | | | $ | 105,726 | |
| | | | | | | | | | | | | |
| Net Assets | | $ | 1,737,112,667 | | | $ | 302,719,571 | | | $ | 244,305,268 | |
| | | | | | | | | | | | | |
| Net Assets Consist of: | | | | | | | | | | | | |
| Paid-in Capital | | $ | 1,982,166,036 | | | $ | 330,377,068 | | | $ | 257,535,834 | |
| Accumulated Deficit | | | (245,053,369 | ) | | | (27,657,497 | ) | | | (13,230,566 | ) |
| | | | | | | | | | | | | |
| Net Assets | | $ | 1,737,112,667 | | | $ | 302,719,571 | | | $ | 244,305,268 | |
| | | | | | | | | | | | | |
| Pricing of Class I Shares | | | | | | | | | | | | |
| Net assets applicable to Class I Shares | | $ | 1,693,795,997 | | | $ | 302,712,493 | | | $ | 244,297,917 | |
| Shares of beneficial interest outstanding (unlimited number of shares authorized, no par value) | | | 119,705,892 | | | | 21,017,420 | | | | 16,631,993 | |
| Net Asset Value, offering price and redemption price | | $ | 14.15 | | | $ | 14.40 | | | $ | 14.69 | |
| | | | | | | | | | | | | |
| Pricing of Class F Shares | | | | | | | | | | | | |
| Net assets applicable to Class F Shares | | $ | 8,595,214 | | | $ | 7,078 | | | $ | 7,351 | |
| Shares of beneficial interest outstanding (unlimited number of shares authorized, no par value) | | | 598,208 | | | | 481 | | | | 495 | |
| Net Asset Value, offering price and redemption price | | $ | 14.37 | | | $ | 14.71 | ^ | | $ | 14.86 | ^ |
| | | | | | | | | | | | | |
| Pricing of Class S Shares | | | | | | | | | | | | |
| Net assets applicable to Class S Shares | | $ | 34,721,456 | | | | N/A | | | | N/A | |
| Shares of beneficial interest outstanding (unlimited number of shares authorized, no par value) | | | 2,455,165 | | | | N/A | | | | N/A | |
| Net Asset Value, offering price and redemption price | | $ | 14.14 | | | | N/A | | | | N/A | |
| | | | | | | | | | | | | |
| * | Identified Cost of Investment Securities | | $ | 1,858,427,555 | | | $ | 308,208,083 | | | $ | 248,505,460 | |
| ^ | Net Assets divided by Shares do not calculate to the stated Net Asset Value because Net Assets and Shares shown are rounded. |
The accompanying notes are an integral part of these financial statements.
| JOHNSON MUTUAL FUNDS | JUNE 30, 2024 – UNAUDITED |
Statements of Assets and Liabilities – Continued
| | | Core Plus
Bond Fund | | | Municipal
Income Fund | |
| Assets: | | | | | | | | |
| Investment Securities at Value* | | $ | 39,383,928 | | | $ | 170,720,915 | |
| Dividends and Interest Receivable | | | 402,140 | | | | 1,372,556 | |
| Total Assets | | $ | 39,786,068 | | | $ | 172,093,471 | |
| | | | | | | | | |
| Liabilities: | | | | | | | | |
| Accrued Management Fees | | $ | 14,733 | | | $ | 42,604 | |
| Fund Shares Redeemed Payable | | | — | | | | 123,213 | |
| Variation Margin Payable | | | 26,922 | | | | — | |
| Total Liabilities | | $ | 41,655 | | | $ | 165,817 | |
| | | | | | | | | |
| Net Assets | | $ | 39,744,413 | | | $ | 171,927,654 | |
| | | | | | | | | |
| Net Assets Consist of: | | | | | | | | |
| Paid-In Capital | | $ | 42,488,233 | | | $ | 190,338,456 | |
| Accumulated Deficit | | | (2,743,820 | ) | | | (18,410,802 | ) |
| | | | | | | | | |
| Net Assets | | $ | 39,744,413 | | | $ | 171,927,654 | |
| Shares Outstanding (Unlimited Amount Authorized) | | | 3,149,927 | | | | 10,583,540 | |
| | | | | | | | | |
| Offering, Redemption and Net Asset Value Per Share | | $ | 12.62 | | | $ | 16.24 | |
| | | | | | | | | |
| * | Identified Cost of Investment Securities | | $ | 40,602,331 | | | $ | 182,217,572 | |
The accompanying notes are an integral part of these financial statements.
| JOHNSON MUTUAL FUNDS | JUNE 30, 2024 – UNAUDITED |
Statements of Operations
| | Equity Income
Fund | | Opportunity
Fund | |
| | Six Months Ended
6/30/2024
(Unaudited) | | Six Months Ended
6/30/2024
(Unaudited) | |
| Investment Income: | | | | | | |
| Dividends | | $ | 6,290,407 | | | $ | 1,232,126 | |
| Less: Foreign withholding taxes on dividends | | | (18,598 | ) | | | (3,665 | ) |
| Total Investment Income | | | 6,271,809 | | | | 1,228,461 | |
| | | | | | | | | |
| Expenses: | | | | | | | | |
| Management Fee | | $ | 2,353,548 | | | $ | 654,224 | |
| Shareholder Servicing Fees - Class S | | | 167,201 | | | | 24,850 | |
| Other | | | 434 | | | | 434 | |
| Net Expenses | | $ | 2,521,183 | | | $ | 679,508 | |
| | | | | | | | | |
| Net Investment Income | | $ | 3,750,626 | | | $ | 548,953 | |
| | | | | | | | | |
| Realized and Unrealized Gains (Losses): | | | | | | | | |
| Net Realized Gains from Investments | | $ | 18,226,292 | | | $ | 3,089,157 | |
| Net Change in Unrealized Appreciation (Depreciation) on Investments | | | 15,621,247 | | | | (312,520 | ) |
| | | | | | | | | |
| Net Gains on Investments | | $ | 33,847,539 | | | $ | 2,776,637 | |
| | | | | | | | | |
| Net Change in Net Assets from Operations | | $ | 37,598,165 | | | $ | 3,325,590 | |
The accompanying notes are an integral part of these financial statements.
| JOHNSON MUTUAL FUNDS | JUNE 30, 2024 – UNAUDITED |
Statements of Operations – Continued
| | | International
Fund | | | Enhanced
Return Fund | |
| | | Six Months
Ended
6/30/2024
(Unaudited) | | | Six Months
Ended
6/30/2024
(Unaudited) | |
| Investment Income: | | | | | | | | |
| Dividends | | $ | 471,020 | | | $ | 155,015 | |
| Less: Foreign withholding taxes on dividends | | | (83,345 | ) | | | — | |
| Interest | | | — | | | | 4,200,349 | |
| Total Investment Income | | | 387,675 | | | | 4,355,364 | |
| | | | | | | | | |
| Expenses: | | | | | | | | |
| Management Fee | | $ | 120,529 | | | $ | 457,017 | |
| Interest Expense | | | 52 | | | | — | |
| Other | | | 434 | | | | 434 | |
| Net Expenses | | $ | 121,015 | | | $ | 457,451 | |
| | | | | | | | | |
| Net Investment Income | | $ | 266,660 | | | $ | 3,897,913 | |
| | | | | | | | | |
| Realized and Unrealized Gains (Losses): | | | | | | | | |
| Net Realized Gains (Losses) from Security Transactions and Foreign Currency Transactions | | $ | 774,401 | | | $ | (174,471 | ) |
| Net Realized Gains from Futures Contracts | | | — | | | | 32,813,103 | |
| Net Change in Unrealized Appreciation (Depreciation) on Investments and Foreign Currency Translations | | | (111,842 | ) | | | (132,075 | ) |
| Net Change in Unrealized Appreciation (Depreciation) on Futures Contracts | | | — | | | | (3,706,115 | ) |
| | | | | | | | | |
| Net Gains on Investments, Foreign Currencies and Futures Contracts | | $ | 662,559 | | | $ | 28,800,442 | |
| | | | | | | | | |
| Net Change in Net Assets from Operations | | $ | 929,219 | | | $ | 32,698,355 | |
The accompanying notes are an integral part of these financial statements.
| JOHNSON MUTUAL FUNDS | JUNE 30, 2024 – UNAUDITED |
Statements of Operations – Continued
| | Institutional
Core
Bond Fund | | Institutional
Intermediate
Bond Fund | | Institutional
Short Duration
Bond Fund | |
| | Six Months Ended
6/30/2024
(Unaudited) | | Six Months Ended
6/30/2024
(Unaudited) | | Six Months Ended
6/30/2024
(Unaudited) | |
| Investment Income: | | | | | | | | | | | | |
| Dividends | | $ | 504,131 | | | $ | 84,073 | | | $ | 81,088 | |
| Interest | | | 30,979,452 | | | | 5,064,129 | | | | 3,201,754 | |
| Total Investment Income | | $ | 31,483,583 | | | $ | 5,199,195 | | | $ | 3,282,842 | |
| | | | | | | | | | | | | |
| Expenses: | | | | | | | | | | | | |
| Gross Management Fee | | | 2,506,196 | | | | 411,413 | | | | 317,677 | |
| Shareholder Servicing Fees - Class S | | | 46,221 | | | | — | | | | — | |
| Distribution Fee - Class F | | | 9,275 | | | | 9 | | | | 9 | |
| Other | | | 434 | | | | 434 | | | | 434 | |
| Total Expenses | | $ | 2,562,126 | | | $ | 411,856 | | | $ | 318,120 | |
| Management Fee Waiver (Note 5) | | | (417,694 | ) | | | (68,568 | ) | | | (52,945 | ) |
| Distribution Fee Waiver (Note 5) | | | (3,710 | ) | | | (3 | ) | | | (4 | ) |
| Net Expenses | | $ | 2,140,722 | | | $ | 343,285 | | | $ | 265,171 | |
| | | | | | | | | | | | | |
| Net Investment Income | | $ | 29,342,861 | | | $ | 4,855,910 | | | $ | 3,017,671 | |
| | | | | | | | | | | | | |
| Realized and Unrealized Gains (Losses): | | | | | | | | | | | | |
| Net Realized Losses from Investments | | $ | (12,678,420 | ) | | $ | (1,424,100 | ) | | $ | (372,170 | ) |
| Net Change in Unrealized Appreciation (Depreciation) on Investments | | | (27,180,939 | ) | | | (1,681,988 | ) | | | 555,268 | |
| | | | | | | | | | | | | |
| Net Gains (Losses) on Investments | | $ | (39,859,359 | ) | | $ | (3,106,088 | ) | | $ | 183,098 | |
| | | | | | | | | | | | | |
| Net Change in Net Assets from Operations | | $ | (10,516,498 | ) | | $ | 1,749,822 | | | $ | 3,200,769 | |
The accompanying notes are an integral part of these financial statements.
| JOHNSON MUTUAL FUNDS | JUNE 30, 2024 – UNAUDITED |
Statements of Operations – Continued
| | | Core Plus
Bond Fund | | | Municipal
Income Fund | |
| | | Six Months
Ended
6/30/2024
(Unaudited) | | | Six Months
Ended
6/30/2024
(Unaudited) | |
| Investment Income: | | | | | | | | |
| Dividends | | $ | 16,688 | | | $ | 34,067 | |
| Interest | | | 777,640 | | | | 3,031,731 | |
| Total Investment Income | | | 794,328 | | | | 3,065,798 | |
| | | | | | | | | |
| Expenses: | | | | | | | | |
| Management Fee | | $ | 76,422 | | | $ | 263,055 | |
| Fund Administration | | | 42,451 | | | | — | |
| Audit & Tax Fees | | | 13,611 | | | | — | |
| Shareholder Servicing Fees | | | 6,938 | | | | — | |
| Trustee Fees | | | 5,500 | | | | — | |
| Registration | | | 3,384 | | | | — | |
| Pricing | | | 2,690 | | | | — | |
| Filing | | | 1,352 | | | | — | |
| Other | | | 1,101 | | | | 434 | |
| Total Expenses | | $ | 153,449 | | | $ | 263,489 | |
| Fee Waiver (Note 5) | | | (76,593 | ) | | | — | |
| Net Expenses | | $ | 76,856 | | | $ | 263,489 | |
| | | | | | | | | |
| Net Investment Income | | $ | 717,472 | | | $ | 2,802,309 | |
| | | | | | | | | |
| Realized and Unrealized Losses: | | | | | | | | |
| Net Realized Losses from Investments | | $ | (140,008 | ) | | $ | (350,177 | ) |
| Net Realized Losses from Futures Contracts | | | (64,666 | ) | | | — | |
| Net Change in Unrealized Appreciation (Depreciation) on Investments | | | (425,547 | ) | | | (3,501,015 | ) |
| Net Change in Unrealized Appreciation (Depreciation) on Futures Contracts | | | (33,340 | ) | | | — | |
| | | | | | | | | |
| Net Losses on Investments and Futures Contracts | | $ | (663,561 | ) | | $ | (3,851,192 | ) |
| | | | | | | | | |
| Net Change in Net Assets from Operations | | $ | 53,911 | | | $ | (1,048,883 | ) |
The accompanying notes are an integral part of these financial statements.
Statements of Changes in Net Assets
| | | Equity Income Fund | | | Opportunity Fund | |
| | | Six Months
Ended
6/30/2024
(Unaudited) | | | Year/Period
Ended
12/31/2023* | | | Six Months
Ended
6/30/2024
(Unaudited) | | | Year/Period
Ended
12/31/2023* | |
| Operations: | | | | | | | | | | | | | | | | |
| Net Investment Income | | $ | 3,750,626 | | | $ | 5,837,878 | | | $ | 548,953 | | | $ | 781,417 | |
| Net Realized Gains from Investments | | | 18,226,292 | | | | 11,095,008 | | | | 3,089,157 | | | | 3,951,347 | |
| Net Change in Unrealized Appreciation (Depreciation) on Investments | | | 15,621,247 | | | | 56,843,463 | | | | (312,520 | ) | | | 14,933,265 | |
| Net Change in Net Assets from Operations | | $ | 37,598,165 | | | $ | 73,776,349 | | | $ | 3,325,590 | | | $ | 19,666,029 | |
| | | | | | | | | | | | | | | | | |
| Distributions to Shareholders (see Note 2) | | | | | | | | | | | | | | | | |
| From Class I | | $ | — | | | $ | (12,642,180 | ) | | $ | — | | | $ | (4,032,219 | ) |
| From Class S | | | — | | | | (3,415,845 | ) | | | — | | | | (704,024 | ) |
| Total Distributions to Shareholders | | $ | — | | | $ | (16,058,025 | ) | | $ | — | | | $ | (4,736,243 | ) |
| | | | | | | | | | | | | | | | | |
| Capital Share Transactions: | | | | | | | | | | | | | | | | |
| From Class I | | | | | | | | | | | | | | | | |
| Proceeds from Sale of Shares | | $ | 35,982,577 | | | $ | 73,001,239 | | | $ | 24,741,532 | | | $ | 13,471,424 | |
| Shares Issued on Reinvestment of Distributions | | | — | | | | 12,608,501 | | | | — | | | | 4,023,813 | |
| Cost of Shares Redeemed | | | (40,574,772 | ) | | | (72,780,277 | ) | | | (5,760,901 | ) | | | (14,417,459 | ) |
| Net Assets in Conjunction with Transfer to Class S | | | — | | | | (133,449,635 | ) | | | — | | | | (19,032,778 | ) |
| Net Change in Net Assets from Class I Capital Share Transactions | | $ | (4,592,195 | ) | | $ | (120,620,172 | ) | | $ | 18,980,631 | | | $ | (15,955,000 | ) |
| | | | | | | | | | | | | | | | | |
| From Class S | | | | | | | | | | | | | | | | |
| Proceeds from Sale of Shares | | $ | 2,539,437 | | | $ | 1,462,885 | | | $ | 645,501 | | | $ | 222,296 | |
| Shares Issued on Reinvestment of Distributions | | | — | | | | 3,405,891 | | | | — | | | | 703,374 | |
| Cost of Shares Redeemed | | | (15,208,556 | ) | | | (6,530,448 | ) | | | (2,261,533 | ) | | | (899,418 | ) |
| Net Assets in Conjunction with Transfer from Class I | | | — | | | | 133,449,635 | | | | — | | | | 19,032,778 | |
| Net Change in Net Assets from Class S Capital Share Transactions | | $ | (12,669,119 | ) | | $ | 131,787,963 | | | $ | (1,616,032 | ) | | $ | 19,059,030 | |
| | | | | | | | | | | | | | | | | |
| Net Change in Net Assets | | $ | 20,336,851 | | | $ | 68,886,115 | | | $ | 20,690,189 | | | $ | 18,033,816 | |
| | | | | | | | | | | | | | | | | |
| Net Assets at Beginning of Period | | $ | 620,156,409 | | | $ | 551,270,294 | | | $ | 133,125,532 | | | $ | 115,091,716 | |
| Net Assets at End of Period | | $ | 640,493,260 | | | $ | 620,156,409 | | | $ | 153,815,721 | | | $ | 133,125,532 | |
| * | Equity Income Fund Class S and Opportunity Fund Class S began operations on September 15, 2023. |
The accompanying notes are an integral part of these financial statements.
Statements of Changes in Net Assets – Continued
| | | Equity Income Fund | | | Opportunity Fund | |
| | | Six Months
Ended
6/30/2024
(Unaudited) | | | Year/Period
Ended
12/31/2023* | | | Six Months
Ended
6/30/2024
(Unaudited) | | | Year/Period
Ended
12/31/2023* | |
| Capital Share Activity (a) | | | | | | | | | | | | | | | | |
| Class I | | | | | | | | | | | | | | | | |
| Shares Sold | | | 1,017,662 | | | | 2,248,347 | | | | 477,958 | | | | 288,812 | |
| Share Reinvested | | | — | | | | 368,993 | | | | — | | | | 80,188 | |
| Shares Redeemed | | | (1,148,663 | ) | | | (2,233,847 | ) | | | (112,863 | ) | | | (306,555 | ) |
| Shares in Conjunction with Transfer to Class S | | | — | | | | (4,018,357 | ) | | | — | | | | (406,423 | ) |
| Net Increase (Decrease) in Shares Outstanding | | | (131,001 | ) | | | (3,634,864 | ) | | | 365,095 | | | | (343,978 | ) |
| | | | | | | | | | | | | | | | | |
| Shares Outstanding, beginning of Period | | | 14,198,458 | | | | 17,833,322 | | | | 2,262,848 | | | | 2,606,826 | |
| Shares Outstanding, end of Period | | | 14,067,457 | | | | 14,198,458 | | | | 2,627,943 | | | | 2,262,848 | |
| | | | | | | | | | | | | | | | | |
| Class S | | | | | | | | | | | | | | | | |
| Shares Sold | | | 72,135 | | | | 43,665 | | | | 12,443 | | | | 4,648 | |
| Share Reinvested | | | — | | | | 99,675 | | | | — | | | | 14,017 | |
| Shares Redeemed | | | (428,392 | ) | | | (197,631 | ) | | | (43,988 | ) | | | (19,331 | ) |
| Shares in Conjunction with Transfer from Class I | | | — | | | | 4,018,357 | | | | — | | | | 406,423 | |
| Net Increase (Decrease) in Shares Outstanding | | | (356,257 | ) | | | 3,964,066 | | | | (31,545 | ) | | | 405,757 | |
| | | | | | | | | | | | | | | | | |
| Shares Outstanding, beginning of Period | | | 3,964,066 | | | | — | | | | 405,757 | | | | — | |
| Shares Outstanding, end of Period | | | 3,607,809 | | | | 3,964,066 | | | | 374,212 | | | | 405,757 | |
| * | Equity Income Fund Class S and Opportunity Fund Class S began operations on September 15, 2023. |
| (a) | There were an unlimited number of shares of beneficial interest authorized for each Fund. Each Fund records purchases of its capital shares at the daily net asset value determined after receipt of a shareholder’s order in proper form. Redemptions are recorded at the net asset value determined following receipt of a shareholder’s written or telephone request in proper form. |
The accompanying notes are an integral part of these financial statements.
Statements of Changes in Net Assets – Continued
| | | International Fund | | | Enhanced Return Fund | |
| | | Six Months
Ended
6/30/2024
(Unaudited) | | | Year Ended
12/31/2023 | | | Six Months
Ended
6/30/2024
(Unaudited) | | | Year Ended
12/31/2023 | |
| Operations: | | | | | | | | | | | | | | | | |
| Net Investment Income | | $ | 266,660 | | | $ | 507,559 | | | $ | 3,897,913 | | | $ | 4,905,052 | |
| Net Realized Gains (Losses) from Investments and Foreign Currencies | | | 774,401 | | | | 247,799 | | | | (174,471 | ) | | | (958,032 | ) |
| Net Realized Gains from Futures Contracts | | | — | | | | — | | | | 32,813,103 | | | | 26,171,644 | |
| Net Change in Unrealized Appreciation (Depreciation) on Investments and Foreign Currencies | | | (111,842 | ) | | | 3,470,002 | | | | (132,075 | ) | | | 6,025,642 | |
| Net Change in Unrealized Appreciation (Depreciation) on Futures Contracts | | | — | | | | — | | | | (3,706,115 | ) | | | 14,522,830 | |
| Net Change in Net Assets from Operations | | $ | 929,219 | | | $ | 4,225,360 | | | $ | 32,698,355 | | | $ | 50,667,136 | |
| | | | | | | | | | | | | | | | | |
| Distributions to Shareholders (see Note 2) | | $ | — | | | $ | (501,175 | ) | | $ | (4,101,456 | ) | | $ | (5,197,873 | ) |
| | | | | | | | | | | | | | | | | |
| Capital Share Transactions: | | | | | | | | | | | | | | | | |
| Proceeds from Sale of Shares | | $ | 559,950 | | | $ | 1,707,346 | | | $ | 3,708,209 | | | $ | 15,630,493 | |
| Shares Issued on Reinvestment of Distributions | | | — | | | | 500,514 | | | | 4,098,396 | | | | 5,193,594 | |
| Cost of Shares Redeemed | | | (2,127,221 | ) | | | (2,955,541 | ) | | | (12,983,418 | ) | | | (21,257,319 | ) |
| Net Change in Net Assets from Capital Share Transactions | | $ | (1,567,271 | ) | | $ | (747,681 | ) | | $ | (5,176,813 | ) | | $ | (433,232 | ) |
| | | | | | | | | | | | | | | | | |
| Net Change in Net Assets | | $ | (638,052 | ) | | $ | 2,976,504 | | | $ | 23,420,086 | | | $ | 45,036,031 | |
| | | | | | | | | | | | | | | | | |
| Net Assets at Beginning of Period | | $ | 24,450,869 | | | $ | 21,474,365 | | | $ | 251,518,069 | | | $ | 206,482,038 | |
| Net Assets at End of Period | | $ | 23,812,817 | | | $ | 24,450,869 | | | $ | 274,938,155 | | | $ | 251,518,069 | |
| | | | | | | | | | | | | | | | | |
| Capital Share Activity (a) | | | | | | | | | | | | | | | | |
| Shares Sold | | | 17,930 | | | | 59,753 | | | | 234,126 | | | | 1,134,130 | |
| Share Reinvested | | | — | | | | 16,229 | | | | 246,596 | | | | 374,315 | |
| Shares Redeemed | | | (67,494 | ) | | | (101,896 | ) | | | (814,045 | ) | | | (1,550,460 | ) |
| Net Decrease in Shares Outstanding | | | (49,564 | ) | | | (25,914 | ) | | | (333,323 | ) | | | (42,015 | ) |
| | | | | | | | | | | | | | | | | |
| Shares Outstanding, beginning of Period | | | 792,892 | | | | 818,806 | | | | 16,682,996 | | | | 16,725,011 | |
| Shares Outstanding, end of Period | | | 743,328 | | | | 792,892 | | | | 16,349,673 | | | | 16,682,996 | |
| (a) | There were an unlimited number of shares of beneficial interest authorized for each Fund. Each Fund records purchases of its capital shares at the daily net asset value determined after receipt of a shareholder’s order in proper form. Redemptions are recorded at the net asset value determined following receipt of a shareholder’s written or telephone request in proper form. |
The accompanying notes are an integral part of these financial statements.
Statements of Changes in Net Assets – Continued
| | | Institutional Core Bond Fund | | | Institutional Intermediate Bond Fund | | | Institutional Short Duration Bond Fund | |
| | | Six Months
Ended
6/30/2024
(Unaudited) | | | Year Ended
12/31/2023* | | | Six Months
Ended
6/30/2024
(Unaudited) | | | Year Ended
12/31/2023 | | | Six Months
Ended
6/30/2024
(Unaudited) | | | Year Ended
12/31/2023 | |
| Operations: | | | | | | | | | | | | | | | | | | | | | | | | |
| Net Investment Income | | $ | 29,342,861 | | | $ | 26,755,051 | | | $ | 4,855,910 | | | $ | 7,079,880 | | | $ | 3,017,671 | | | $ | 4,224,569 | |
| Net Realized Losses from Investments | | | (12,678,420 | ) | | | (32,829,121 | ) | | | (1,424,100 | ) | | | (7,577,720 | ) | | | (372,170 | ) | | | (2,008,772 | ) |
| Net Change in Unrealized Appreciation (Depreciation) on Investments | | | (27,180,939 | ) | | | 89,663,016 | | | | (1,681,988 | ) | | | 13,066,509 | | | | 555,268 | | | | 7,529,742 | |
| Net Change in Net Assets from Operations | | $ | (10,516,498 | ) | | $ | 83,588,946 | | | $ | 1,749,822 | | | $ | 12,568,669 | | | $ | 3,200,769 | | | $ | 9,745,539 | |
| | | | | | | | | | | | | | | | | | | | | | | | | |
| Distributions to Shareholders (see Note 2): | | | | | | | | | | | | | | | | | | | | | | | | |
| From Class I | | | (29,156,877 | ) | | | (26,833,431 | ) | | | (4,989,506 | ) | | | (7,258,613 | ) | | | (3,172,400 | ) | | | (4,447,438 | ) |
| From Class F | | | (130,413 | ) | | | (114,381 | ) | | | (120 | ) | | | (188 | ) | | | (100 | ) | | | (140 | ) |
| From Class S | | | (621,592 | ) | | | (383,192 | ) | | | N/A | | | | N/A | | | | N/A | | | | N/A | |
| Total Distributions to Shareholders | | $ | (29,908,882 | ) | | $ | (27,331,004 | ) | | $ | (4,989,626 | ) | | $ | (7,258,801 | ) | | $ | (3,172,500 | ) | | $ | (4,447,578 | ) |
| | | | | | | | | | | | | | | | | | | | | | | | | |
| Capital Share Transactions: | | | | | | | | | | | | | | | | | | | | | | | | |
| From Class I | | | | | | | | | | | | | | | | | | | | | | | | |
| Proceeds from Shares Sold | | $ | 254,226,508 | | | $ | 207,049,177 | | | $ | 72,045,835 | | | $ | 67,404,621 | | | $ | 59,594,798 | | | $ | 28,856,430 | |
| Proceeds from Subscriptions-in-Kind (Note 11) | | | 14,591,969 | | | | — | | | | — | | | | — | | | | — | | | | — | |
| Net Asset Value of Shares Issued on Reinvestment of Dividends | | | 26,386,604 | | | | 23,303,871 | | | | 2,178,109 | | | | 3,216,130 | | | | 1,196,850 | | | | 1,383,952 | |
| Payments for Shares Redeemed | | | (134,147,857 | ) | | | (253,627,523 | ) | | | (16,392,851 | ) | | | (61,466,557 | ) | | | (17,967,272 | ) | | | (63,563,323 | ) |
| Net Assets Received in Conjunction with Fund Merger (Note 1) | | | — | | | | 971,030,502 | | | | — | | | | — | | | | — | | | | — | |
| Change in Net Assets from Class I Capital Share Transactions | | $ | 161,057,224 | | | $ | 947,756,027 | | | $ | 57,831,093 | | | $ | 9,154,194 | | | $ | 42,824,376 | | | $ | (33,322,941 | ) |
| | | | | | | | | | | | | | | | | | | | | | | | | |
| From Class F | | | | | | | | | | | | | | | | | | | | | | | | |
| Proceeds from Shares Sold | | $ | 2,569,787 | | | $ | 3,490,784 | | | $ | — | | | $ | — | | | $ | — | | | $ | — | |
| Net Asset Value of Shares Issued on Reinvestment of Dividends | | | 130,413 | | | | 114,381 | | | | 120 | | | | 188 | | | | 100 | | | | 140 | |
| Payments for Shares Redeemed | | | (233,563 | ) | | | (549,255 | ) | | | — | | | | — | | | | — | | | | — | |
| Net Increase from Class F share capital transactions | | $ | 2,466,637 | | | $ | 3,055,910 | | | $ | 120 | | | $ | 188 | | | $ | 100 | | | $ | 140 | |
| * | Johnson Institutional Core Bond Fund Class S began operations on September 15, 2023. |
The accompanying notes are an integral part of these financial statements.
Statements of Changes in Net Assets – Continued
| | | Institutional Core Bond Fund | | | Institutional Intermediate Bond Fund | | | Institutional Short Duration Bond Fund | |
| | | Six Months
Ended
6/30/2024
(Unaudited) | | | Year Ended
12/31/2023* | | | Six Months
Ended
6/30/2024
(Unaudited) | | | Year Ended
12/31/2023 | | | Six Months
Ended
6/30/2024
(Unaudited) | | | Year Ended
12/31/2023 | |
| From Class S | | | | | | | | | | | | | | | | | | | | | | | | |
| Proceeds from Shares Sold | | $ | 1,181,871 | | | $ | 943,495 | | | | N/A | | | | N/A | | | | N/A | | | | N/A | |
| Net Asset Value of Shares Issued on Reinvestment of Dividends | | | 618,772 | | | | 380,070 | | | | N/A | | | | N/A | | | | N/A | | | | N/A | |
| Payments for Shares Redeemed | | | (5,809,298 | ) | | | (2,783,995 | ) | | | N/A | | | | N/A | | | | N/A | | | | N/A | |
| Net Assets Received in Conjunction with Fund Merger (Note 1) | | | — | | | | 39,530,597 | | | | N/A | | | | N/A | | | | N/A | | | | N/A | |
| Change in Net Assets from Class S Capital Share Transactions | | $ | (4,008,655 | ) | | $ | 38,070,167 | | | $ | N/A | | | $ | N/A | | | $ | N/A | | | $ | N/A | |
| | | | | | | | | | | | | | | | | | | | | | | | | |
| Net Change in Net Assets | | $ | 119,089,826 | | | $ | 1,045,140,046 | | | $ | 54,591,409 | | | $ | 14,464,250 | | | $ | 42,852,745 | | | $ | (28,024,840 | ) |
| | | | | | | | | | | | | | | | | | | | | | | | | |
| Net Assets at Beginning of Period | | $ | 1,618,022,841 | | | $ | 572,882,795 | | | $ | 248,128,162 | | | $ | 233,663,912 | | | $ | 201,452,523 | | | $ | 229,477,363 | |
| Net Assets at End of Period | | $ | 1,737,112,667 | | | $ | 1,618,022,841 | | | $ | 302,719,571 | | | $ | 248,128,162 | | | $ | 244,305,268 | | | $ | 201,452,523 | |
| | | | | | | | | | | | | | | | | | | | | | | | | |
| Capital Share Activity (a) | | | | | | | | | | | | | | | | | | | | | | | | |
| Class I | | | | | | | | | | | | | | | | | | | | | | | | |
| Shares Sold | | | 17,859,954 | | | | 14,700,775 | | | | 4,993,356 | | | | 4,703,902 | | | | 4,064,668 | | | | 1,997,902 | |
| Shares Issued for Subscriptions-in-Kind (Note 11) | | | 1,035,626 | | | | — | | | | — | | | | — | | | | — | | | | — | |
| Share Reinvested | | | 1,869,876 | | | | 1,657,989 | | | | 151,722 | | | | 225,129 | | | | 81,726 | | | | 95,943 | |
| Shares Redeemed | | | (9,466,854 | ) | | | (18,030,739 | ) | | | (1,137,638 | ) | | | (4,309,323 | ) | | | (1,225,422 | ) | | | (4,410,956 | ) |
| Shares in Conjunction with Transfer to Class S | | | — | | | | 69,867,357 | | | | — | | | | — | | | | — | | | | — | |
| Net Increase (Decrease) in Shares Outstanding | | | 11,298,602 | | | | 68,195,382 | | | | 4,007,440 | | | | 619,708 | | | | 2,920,972 | | | | (2,317,111 | ) |
| | | | | | | | | | | | | | | | | | | | | | | | | |
| Shares Outstanding, beginning of Period | | | 108,407,290 | | | | 40,211,908 | | | | 17,009,980 | | | | 16,390,272 | | | | 13,711,021 | | | | 16,028,132 | |
| Shares Outstanding, end of Period | | | 119,705,892 | | | | 108,407,290 | | | | 21,017,420 | | | | 17,009,980 | | | | 16,631,993 | | | | 13,711,021 | |
| | | | | | | | | | | | | | | | | | | | | | | | | |
| Class F | | | | | | | | | | | | | | | | | | | | | | | | |
| Shares Sold | | | 178,336 | | | | 247,178 | | | | — | | | | — | | | | — | | | | — | |
| Share Reinvested | | | 9,105 | | | | 7,949 | | | | 8 | | | | 13 | | | | 7 | | | | 10 | |
| Shares Redeemed | | | (16,157 | ) | | | (38,375 | ) | | | — | | | | — | | | | — | | | | — | |
| Net Increase in Shares Outstanding | | | 171,284 | | | | 216,752 | | | | 8 | | | | 13 | | | | 7 | | | | 10 | |
| | | | | | | | | | | | | | | | | | | | | | | | | |
| Shares Outstanding, beginning of Period | | | 426,924 | | | | 210,172 | | | | 473 | | | | 460 | | | | 488 | | | | 478 | |
| Shares Outstanding, end of Period | | | 598,208 | | | | 426,924 | | | | 481 | | | | 473 | | | | 495 | | | | 488 | |
| * | Johnson Institutional Core Bond Fund Class S began operations on September 15, 2023. |
The accompanying notes are an integral part of these financial statements.
Statements of Changes in Net Assets – Continued
| | | Institutional Core Bond Fund | | | Institutional Intermediate Bond Fund | | | Institutional Short Duration Bond Fund | |
| | | Six Months
Ended
6/30/2024
(Unaudited) | | | Year Ended
12/31/2023* | | | Six Months
Ended
6/30/2024
(Unaudited) | | | Year Ended
12/31/2023 | | | Six Months
Ended
6/30/2024
(Unaudited) | | | Year Ended
12/31/2023 | |
| Class S | | | | | | | | | | | | | | | | | | | | | | | | |
| Shares Sold | | | 83,966 | | | | 68,245 | | | | N/A | | | | N/A | | | | N/A | | | | N/A | |
| Share Reinvested | | | 43,860 | | | | 27,316 | | | | N/A | | | | N/A | | | | N/A | | | | N/A | |
| Shares Redeemed | | | (410,565 | ) | | | (201,953 | ) | | | N/A | | | | N/A | | | | N/A | | | | N/A | |
| Shares in Conjunction with Transfer from Class I | | | — | | | | 2,844,296 | | | | N/A | | | | N/A | | | | N/A | | | | N/A | |
| Net Increase (Decrease) in Shares Outstanding | | | (282,739 | ) | | | 2,737,904 | | | | N/A | | | | N/A | | | | N/A | | | | N/A | |
| | | | | | | | | | | | | | | | | | | | | | | | | |
| Shares Outstanding, beginning of Period | | | 2,737,904 | | | | — | | | | N/A | | | | N/A | | | | N/A | | | | N/A | |
| Shares Outstanding, end of Period | | | 2,455,165 | | | | 2,737,904 | | | | N/A | | | | N/A | | | | N/A | | | | N/A | |
| * | Johnson Institutional Core Bond Fund Class S began operations on September 15, 2023. |
The accompanying notes are an integral part of these financial statements.
Statements of Changes in Net Assets – Continued
| | | Core Plus Bond Fund | | | Municipal Income Fund | |
| | | Six Months
Ended
6/30/2024
(Unaudited) | | | Year Ended
12/31/2023 | | | Six Months
Ended
6/30/2024
(Unaudited) | | | Year Ended
12/31/2023 | |
| Operations: | | | | | | | | | | | | | | | | |
| Net Investment Income | | $ | 717,472 | | | $ | 577,246 | | | $ | 2,802,309 | | | $ | 5,524,264 | |
| Net Realized Losses from Investments | | | (140,008 | ) | | | (664,005 | ) | | | (350,177 | ) | | | (3,138,283 | ) |
| Net Realized Losses from Futures Contracts | | | (64,666 | ) | | | (42,001 | ) | | | — | | | | — | |
| Net Change in Unrealized Appreciation (Depreciation) on Investments | | | (425,547 | ) | | | 1,180,535 | | | | (3,501,015 | ) | | | 6,601,639 | |
| Net Change in Unrealized Appreciation (Depreciation) on Futures Contracts | | | (33,340 | ) | | | 73,392 | | | | — | | | | — | |
| Net Change in Net Assets from Operations | | $ | 53,911 | | | $ | 1,125,167 | | | $ | (1,048,883 | ) | | $ | 8,987,620 | |
| | | | | | | | | | | | | | | | | |
| Distributions to Shareholders (see Note 2) | | $ | (727,674 | ) | | $ | (592,529 | ) | | $ | (2,802,200 | ) | | $ | (5,541,344 | ) |
| | | | | | | | | | | | | | | | | |
| Capital Share Transactions: | | | | | | | | | | | | | | | | |
| Proceeds from Sale of Shares | | $ | 18,758,812 | | | $ | 12,528,321 | | | $ | 17,192,614 | | | $ | 73,610,081 | |
| Shares Issued on Reinvestment of Distributions | | | 629,050 | | | | 488,450 | | | | 2,754,918 | | | | 5,449,190 | |
| Cost of Shares Redeemed | | | (1,572,497 | ) | | | (5,305,005 | ) | | | (18,712,543 | ) | | | (98,462,347 | ) |
| Net Change in Net Assets from Capital Share Transactions | | $ | 17,815,365 | | | $ | 7,711,766 | | | $ | 1,234,989 | | | $ | (19,403,076 | ) |
| | | | | | | | | | | | | | | | | |
| Net Change in Net Assets | | $ | 17,141,602 | | | $ | 8,244,404 | | | $ | (2,616,094 | ) | | $ | (15,956,800 | ) |
| | | | | | | | | | | | | | | | | |
| Net Assets at Beginning of Period | | $ | 22,602,811 | | | $ | 14,358,407 | | | $ | 174,543,748 | | | $ | 190,500,548 | |
| Net Assets at End of Period | | $ | 39,744,413 | | | $ | 22,602,811 | | | $ | 171,927,654 | | | $ | 174,543,748 | |
| | | | | | | | | | | | | | | | | |
| Capital Share Activity (a) | | | | | | | | | | | | | | | | |
| Shares Sold | | | 1,480,332 | | | | 986,949 | | | | 1,044,955 | | | | 4,534,312 | |
| Share Reinvested | | | 49,970 | | | | 38,606 | | | | 168,744 | | | | 336,777 | |
| Shares Redeemed | | | (124,723 | ) | | | (415,472 | ) | | | (1,144,340 | ) | | | (6,155,140 | ) |
| Net Increase (Decrease) in Shares Outstanding | | | 1,405,579 | | | | 610,083 | | | | 69,359 | | | | (1,284,051 | ) |
| | | | | | | | | | | | | | | | | |
| Shares Outstanding, beginning of Period | | | 1,744,348 | | | | 1,134,265 | | | | 10,514,181 | | | | 11,798,232 | |
| Shares Outstanding, end of Period | | | 3,149,927 | | | | 1,744,348 | | | | 10,583,540 | | | | 10,514,181 | |
| (a) | There were an unlimited number of shares of beneficial interest authorized for each Fund. Each Fund records purchases of its capital shares at the daily net asset value determined after receipt of a shareholder’s order in proper form. Redemptions are recorded at the net asset value determined following receipt of a shareholder’s written or telephone request in proper form. |
The accompanying notes are an integral part of these financial statements.
| FINANCIAL HIGHLIGHTS | EQUITY INCOME FUND - CLASS I SHARES |
Selected Data for a Share Outstanding Throughout each Period:
| | | Six Months | | | | | | | | | | | | | | | | |
| | | Ended | | | | | | | | | | | | | | | | |
| | | 6/30/2024 | | | Year Ended December 31, | |
| | | (Unaudited) | | | 2023 | | | 2022 | | | 2021 | | | 2020 | | | 2019 | |
| Net Asset Value, beginning of period | | $ | 34.15 | | | $ | 30.91 | | | $ | 36.44 | | | $ | 31.35 | | | $ | 28.50 | | | $ | 22.48 | |
| | | | | | | | | | | | | | | | | | | | | | | | | |
| Operations: | | | | | | | | | | | | | | | | | | | | | | | | |
| Net Investment Income | | | 0.22 | (a) | | | 0.33 | (a) | | | 0.28 | | | | 0.21 | | | | 0.25 | | | | 0.29 | |
| Net Realized and Unrealized Gains (Losses) on Investments | | | 1.88 | | | | 3.81 | | | | (3.82 | ) | | | 7.92 | | | | 3.24 | | | | 7.37 | |
| Total Operations | | $ | 2.10 | | | $ | 4.14 | | | $ | (3.54 | ) | | $ | 8.13 | | | $ | 3.49 | | | $ | 7.66 | |
| | | | | | | | | | | | | | | | | | | | | | | | | |
| Distributions: | | | | | | | | | | | | | | | | | | | | | | | | |
| Net Investment Income | | | — | | | | (0.30 | ) | | | (0.30 | ) | | | (0.21 | ) | | | (0.25 | ) | | | (0.29 | ) |
| Net Realized Capital Gains | | | — | | | | (0.60 | ) | | | (1.69 | ) | | | (2.83 | ) | | | (0.39 | ) | | | (1.35 | ) |
| Total Distributions | | $ | — | | | $ | (0.90 | ) | | $ | (1.99 | ) | | $ | (3.04 | ) | | $ | (0.64 | ) | | $ | (1.64 | ) |
| | | | | | | | | | | | | | | | | | | | | | | | | |
| Net Asset Value, end of period | | $ | 36.25 | | | $ | 34.15 | | | $ | 30.91 | | | $ | 36.44 | | | $ | 31.35 | | | $ | 28.50 | |
| | | | | | | | | | | | | | | | | | | | | | | | | |
| Total Return (b) | | | 6.15 | %(c) | | | 13.42 | % | | | (9.74 | )% | | | 25.96 | % | | | 12.24 | % | | | 34.07 | % |
| | | | | | | | | | | | | | | | | | | | | | | | | |
| Net Assets, end of period (millions) | | $ | 509.90 | | | $ | 484.82 | | | $ | 551.27 | | | $ | 609.71 | | | $ | 464.81 | | | $ | 400.82 | |
| | | | | | | | | | | | | | | | | | | | | | | | | |
| Ratios/supplemental data | | | | | | | | | | | | | | | | | | | | | | | | |
| Ratio of expenses to average net assets | | | 0.75 | %(d) | | | 0.94 | %(e) | | | 1.00 | % | | | 1.00 | % | | | 1.00 | % | | | 1.00 | % |
| Ratio of Net Investment Income to average net assets | | | 1.25 | %(d) | | | 1.00 | % | | | 0.84 | % | | | 0.62 | % | | | 0.91 | % | | | 1.11 | % |
| Portfolio turnover rate (f) | | | 7.45 | %(c) | | | 32.38 | % | | | 22.66 | % | | | 29.91 | % | | | 27.55 | % | | | 31.91 | % |
| (a) | Per share net investment income has been determined on the basis of average number of shares outstanding during the period. |
| (b) | Total return is a measure of the change in value of an investment in the Fund over the periods covered. The returns shown do not reflect the deduction of taxes a shareholder would pay on Fund distributions, if any, or the redemption of Fund shares. The total return would have been lower if the Adviser had not reduced fees. |
| (c) | Not Annualized. |
| (d) | Annualized |
| (e) | Effective September 15, 2023, the Management Fee reduced from 1.00% to 0.75%. (Note 5) |
| (f) | Portfolio turnover is calculated on the basis on the Fund as a whole without distinguishing among the classes of shares. |
The accompanying notes are an integral part of these financial statements.
| FINANCIAL HIGHLIGHTS | EQUITY INCOME FUND - CLASS S SHARES |
Selected Data for a Share Outstanding Throughout each Period:
| | | Six Months
Ended
6/30/2024
(Unaudited) | | | Period
Ended
12/31/2023* | |
| Net Asset Value, beginning of period | | $ | 34.14 | | | $ | 33.21 | |
| | | | | | | | | |
| Operations: | | | | | | | | |
| Net Investment Income (a) | | | 0.17 | | | | 0.10 | |
| Net Realized and Unrealized Gains on Investments | | | 1.89 | | | | 1.71 | |
| Total Operations | | $ | 2.06 | | | $ | 1.81 | |
| | | | | | | | | |
| Distributions: | | | | | | | | |
| Net Investment Income | | | — | | | | (0.28 | ) |
| Net Realized Capital Gains | | | — | | | | (0.60 | ) |
| Total Distributions | | $ | — | | | $ | (0.88 | ) |
| | | | | | | | | |
| Net Asset Value, end of period | | $ | 36.20 | | | $ | 34.14 | |
| | | | | | | | | |
| Total Return (b) | | | 6.03 | %(c) | | | 5.46 | %(c) |
| | | | | | | | | |
| Net Assets, end of period (millions) | | $ | 130.59 | | | $ | 135.34 | |
| | | | | | | | | |
| Ratios/supplemental data | | | | | | | | |
| Ratio of expenses to average net assets | | | 1.00 | %(d) | | | 1.00 | %(d) |
| Ratio of Net Investment Income to average net assets | | | 1.00 | %(d) | | | 1.00 | %(d) |
| Portfolio turnover rate (e) | | | 7.45 | %(c) | | | 32.38 | %(c) |
| * | Class S began operations on September 15, 2023. |
| (a) | Per share net investment income has been determined on the basis of average number of shares outstanding during each period. |
| (b) | Total return is a measure of the change in value of an investment in the Fund over the periods covered. The returns shown do not reflect the deduction of taxes a shareholder would pay on Fund distributions, if any, or the redemption of Fund shares. The total return would have been lower if the Adviser had not reduced fees. |
| (c) | Not annualized. |
| (d) | Annualized. |
| (e) | Portfolio turnover is calculated on the basis on the Fund as a whole without distinguishing among the classes of shares. |
The accompanying notes are an integral part of these financial statements.
| FINANCIAL HIGHLIGHTS | OPPORTUNITY FUND - CLASS I SHARES |
Selected Data for a Share Outstanding Throughout each Period:
| | | Six Months | | | | | | | | | | | | | | | | |
| | | Ended | | | | | | | | | | | | | | | | |
| | | 6/30/2024 | | | Year Ended December 31, | |
| | | (Unaudited) | | | 2023 | | | 2022 | | | 2021 | | | 2020 | | | 2019 | |
| Net Asset Value, beginning of period | | $ | 49.89 | | | $ | 44.15 | | | $ | 52.62 | | | $ | 45.55 | | | $ | 42.48 | | | $ | 34.47 | |
| | | | | | | | | | | | | | | | | | | | | | | | | |
| Operations: | | | | | | | | | | | | | | | | | | | | | | | | |
| Net Investment Income | | | 0.20 | (a) | | | 0.31 | (a) | | | 0.29 | | | | 0.38 | | | | 0.25 | | | | 0.28 | |
| Net Realized and Unrealized Gains (Losses) on Investments | | | 1.15 | | | | 7.26 | | | | (6.83 | ) | | | 13.55 | | | | 3.08 | | | | 9.58 | |
| Total Operations | | $ | 1.35 | | | $ | 7.57 | | | $ | (6.54 | ) | | $ | 13.93 | | | $ | 3.33 | | | $ | 9.86 | |
| | | | | | | | | | | | | | | | | | | | | | | | | |
| Distributions: | | | | | | | | | | | | | | | | | | | | | | | | |
| Net Investment Income | | | — | | | | (0.31 | ) | | | (0.29 | ) | | | (0.39 | ) | | | (0.26 | ) | | | (0.30 | ) |
| Net Realized Capital Gains | | | — | | | | (1.52 | ) | | | (1.64 | ) | | | (6.47 | ) | | | — | | | | (1.39 | ) |
| Return of Capital | | | — | | | | — | | | | — | | | | — | | | | — | | | | (0.16 | ) |
| Total Distributions | | $ | — | | | $ | (1.83 | ) | | $ | (1.93 | ) | | $ | (6.86 | ) | | $ | (0.26 | ) | | $ | (1.85 | ) |
| | | | | | | | | | | | | | | | | | | | | | | | | |
| Net Asset Value, end of period | | $ | 51.24 | | | $ | 49.89 | | | $ | 44.15 | | | $ | 52.62 | | | $ | 45.55 | | | $ | 42.48 | |
| | | | | | | | | | | | | | | | | | | | | | | | | |
| Total Return (b) | | | 2.71 | %(c) | | | 17.12 | % | | | (12.46 | )% | | | 30.59 | % | | | 7.84 | % | | | 28.63 | % |
| | | | | | | | | | | | | | | | | | | | | | | | | |
| Net Assets, end of period (millions) | | $ | 134.66 | | | $ | 112.88 | | | $ | 115.09 | | | $ | 126.09 | | | $ | 93.29 | | | $ | 76.50 | |
| | | | | | | | | | | | | | | | | | | | | | | | | |
| Ratios/supplemental data | | | | | | | | | | | | | | | | | | | | | | | | |
| Ratio of expenses to average net assets | | | 0.90 | %(d) | | | 0.97 | %(e) | | | 1.00 | % | | | 1.00 | % | | | 1.00 | % | | | 1.00 | % |
| Ratio of Net Investment Income to average net assets | | | 0.79 | %(d) | | | 0.66 | % | | | 0.63 | % | | | 0.84 | % | | | 0.67 | % | | | 0.67 | % |
| Portfolio turnover rate (f) | | | 7.40 | %(c) | | | 22.66 | % | | | 26.51 | % | | | 38.97 | % | | | 32.89 | % | | | 36.19 | % |
| (a) | Per share net investment income has been determined on the basis of average number of shares outstanding during the period. |
| (b) | Total return is a measure of the change in value of an investment in the Fund over the periods covered. The returns shown do not reflect the deduction of taxes a shareholder would pay on Fund distributions, if any, or the redemption of Fund shares. The total return would have been lower if the Adviser had not reduced fees. |
| (c) | Not annualized. |
| (d) | Annualized. |
| (e) | Effective September 15, 2023, the Management Fee reduced from 1.00% to 0.90%. (Note 5) |
| (f) | Portfolio turnover is calculated on the basis on the Fund as a whole without distinguishing among the classes of shares. |
The accompanying notes are an integral part of these financial statements.
| FINANCIAL HIGHLIGHTS | OPPORTUNITY FUND - CLASS S SHARES |
Selected Data for a Share Outstanding Throughout each Period:
| | | Six Months
Ended
6/30/2024
(Unaudited) | | | Period
Ended
12/31/2023* | |
| Net Asset Value, beginning of period | | $ | 49.89 | | | $ | 46.83 | |
| | | | | | | | | |
| Operations: | | | | | | | | |
| Net Investment Income (a) | | | 0.14 | | | | 0.06 | |
| Net Realized and Unrealized Gains on Investments | | | 1.15 | | | | 4.79 | |
| Total Operations | | $ | 1.29 | | | $ | 4.85 | |
| | | | | | | | | |
| Distributions: | | | | | | | | |
| Net Investment Income | | | — | | | | (0.27 | ) |
| Net Realized Capital Gains | | | — | | | | (1.52 | ) |
| Total Distributions | | $ | — | | | $ | (1.79 | ) |
| | | | | | | | | |
| Net Asset Value, end of period | | $ | 51.18 | | | $ | 49.89 | |
| | | | | | | | | |
| Total Return (b) | | | 2.59 | %(c) | | | 10.35 | %(c) |
| | | | | | | | | |
| Net Assets, end of period (millions) | | $ | 19.15 | | | $ | 20.24 | |
| | | | | | | | | |
| Ratios/supplemental data | | | | | | | | |
| Ratio of expenses to average net assets | | | 1.15 | %(d) | | | 1.15 | %(d) |
| Ratio of Net Investment Income to average net assets | | | 0.54 | %(d) | | | 0.44 | %(d) |
| Portfolio turnover rate (e) | | | 7.40 | %(c) | | | 22.66 | % |
| * | Class S began operations on September 15, 2023. |
| (a) | Per share net investment income has been determined on the basis of average number of shares outstanding during each period. |
| (b) | Total return is a measure of the change in value of an investment in the Fund over the periods covered. The returns shown do not reflect the deduction of taxes a shareholder would pay on Fund distributions, if any, or the redemption of Fund shares. The total return would have been lower if the Adviser had not reduced fees. |
| (c) | Not annualized. |
| (d) | Annualized. |
| (e) | Portfolio turnover is calculated on the basis on the Fund as a whole without distinguishing among the classes of shares. |
The accompanying notes are an integral part of these financial statements.
| FINANCIAL HIGHLIGHTS | INTERNATIONAL FUND |
Selected Data for a Share Outstanding Throughout each Period:
| | | Six Months | | | | | | | | | | | | | | | | |
| | | Ended | | | | | | | | | | | | | | | | |
| | | 6/30/2024 | | | Year Ended December 31, | |
| | | (Unaudited) | | | 2023* | | | 2022 | | | 2021 | | | 2020 | | | 2019 | |
| Net Asset Value, beginning of period | | $ | 30.84 | | | $ | 26.23 | | | $ | 30.62 | | | $ | 28.60 | | | $ | 27.13 | | | $ | 23.17 | |
| | | | | | | | | | | | | | | | | | | | | | | | | |
| Operations: | | | | | | | | | | | | | | | | | | | | | | | | |
| Net Investment Income | | | 0.36 | | | | 0.65 | | | | 0.53 | | | | 0.64 | | | | 0.43 | | | | 0.53 | |
| Net Realized and Unrealized Gains (Losses) on Investments and Foreign Currencies | | | 0.84 | | | | 4.60 | | | | (4.60 | ) | | | 2.22 | | | | 1.36 | | | | 4.03 | |
| Total Operations | | $ | 1.20 | | | $ | 5.25 | | | $ | (4.07 | ) | | $ | 2.86 | | | $ | 1.79 | | | $ | 4.56 | |
| | | | | | | | | | | | | | | | | | | | | | | | | |
| Distributions: | | | | | | | | | | | | | | | | | | | | | | | | |
| Net Investment Income | | | — | | | | (0.64 | ) | | | (0.32 | ) | | | (0.77 | ) | | | (0.32 | ) | | | (0.60 | ) |
| Return of Capital | | | — | | | | — | | | | — | | | | (0.07 | ) | | | — | | | | — | |
| Total Distributions | | $ | — | | | $ | (0.64 | ) | | $ | (0.32 | ) | | $ | (0.84 | ) | | $ | (0.32 | ) | | $ | (0.60 | ) |
| | | | | | | | | | | | | | | | | | | | | | | | | |
| Net Asset Value, end of period | | $ | 32.04 | | | $ | 30.84 | | | $ | 26.23 | | | $ | 30.62 | | | $ | 28.60 | | | $ | 27.13 | |
| | | | | | | | | | | | | | | | | | | | | | | | | |
| Total Return (a) | | | 3.89 | %(b) | | | 20.03 | % | | | (13.30 | )% | | | 10.00 | % | | | 6.59 | % | | | 19.69 | % |
| | | | | | | | | | | | | | | | | | | | | | | | | |
| Net Assets, end of period (millions) | | $ | 23.81 | | | $ | 24.45 | | | $ | 21.47 | | | $ | 24.91 | | | $ | 21.10 | | | $ | 21.08 | |
| | | | | | | | | | | | | | | | | | | | | | | | | |
| Ratios/supplemental data | | | | | | | | | | | | | | | | | | | | | | | | |
| Ratio of expenses to average net assets | | | 1.00 | %(c) | | | 1.00 | % | | | 1.00 | % | | | 1.00 | % | | | 1.00 | % | | | 1.00 | % |
| Ratio of Net Investment Income to average net assets | | | 2.21 | %(c) | | | 2.17 | % | | | 2.02 | % | | | 2.09 | % | | | 1.77 | % | | | 2.02 | % |
| Portfolio turnover rate | | | 4.76 | %(b) | | | 8.31 | % | | | 6.63 | % | | | 6.62 | % | | | 7.85 | % | | | 4.33 | % |
| (a) | Total return is a measure of the change in value of an investment in the Fund over the periods covered. The returns shown do not reflect the deduction of taxes a shareholder would pay on Fund distributions, if any, or the redemption of Fund shares. The total return would have been lower if the Adviser had not reduced fees. |
| (b) | Not Annualized |
| (c) | Annualized. |
| * | Includes adjustments in accordance with accounting principles generally accepted in the United States and, consequently, the net asset values for financial reporting purposes and the returns based upon those net asset values may differ from the net asset values and returns for shareholder transactions. |
The accompanying notes are an integral part of these financial statements.
| FINANCIAL HIGHLIGHTS | ENHANCED RETURN FUND |
Selected Data for a Share Outstanding Throughout each Period:
| | | Six Months | | | | | | | | | | | | | | | | |
| | | Ended | | | | | | | | | | | | | | | | |
| | | 6/30/2024 | | | Year Ended December 31, | |
| | | (Unaudited) | | | 2023 | | | 2022 | | | 2021 | | | 2020 | | | 2019 | |
| Net Asset Value, beginning of period | | $ | 15.08 | | | $ | 12.35 | | | $ | 17.41 | | | $ | 19.12 | | | $ | 16.97 | | | $ | 14.21 | |
| | | | | | | | | | | | | | | | | | | | | | | | | |
| Operations: | | | | | | | | | | | | | | | | | | | | | | | | |
| Net Investment Income | | | 0.24 | | | | 0.30 | | | | 0.14 | | | | 0.16 | | | | 0.21 | | | | 0.37 | |
| Net Realized and Unrealized Gains (Losses) on Investments and Futures | | | 1.75 | | | | 2.75 | | | | (4.25 | ) | | | 4.92 | | | | 3.00 | | | | 4.40 | |
| Total Operations | | $ | 1.99 | | | $ | 3.05 | | | $ | (4.11 | ) | | $ | 5.08 | | | $ | 3.21 | | | $ | 4.77 | |
| | | | | | | | | | | | | | | | | | | | | | | | | |
| Distributions: | | | | | | | | | | | | | | | | | | | | | | | | |
| Net Investment income | | | (0.25 | ) | | | (0.32 | ) | | | (0.17 | ) | | | (0.18 | ) | | | (0.23 | ) | | | (0.38 | ) |
| Net Realized Capital Gains | | | — | | | | — | | | | (0.78 | ) | | | (6.61 | ) | | | (0.83 | ) | | | (1.63 | ) |
| Total Distributions | | $ | (0.25 | ) | | $ | (0.32 | ) | | $ | (0.95 | ) | | $ | (6.79 | ) | | $ | (1.06 | ) | | $ | (2.01 | ) |
| | | | | | | | | | | | | | | | | | | | | | | | | |
| Net Asset Value, end of period | | $ | 16.82 | | | $ | 15.08 | | | $ | 12.35 | | | $ | 17.41 | | | $ | 19.12 | | | $ | 16.97 | |
| | | | | | | | | | | | | | | | | | | | | | | | | |
| Total Return (a) | | | 13.24 | %(b) | | | 24.91 | % | | | (23.56 | )% | | | 26.51 | % | | | 19.38 | % | | | 33.80 | % |
| | | | | | | | | | | | | | | | | | | | | | | | | |
| Net Assets, end of period (millions) | | $ | 274.94 | | | $ | 251.52 | | | $ | 206.48 | | | $ | 322.89 | | | $ | 261.29 | | | $ | 183.93 | |
| | | | | | | | | | | | | | | | | | | | | | | | | |
| Ratios/supplemental data | | | | | | | | | | | | | | | | | | | | | | | | |
| Ratio of expenses to average net assets | | | 0.35 | %(c) | | | 0.35 | % | | | 0.35 | % | | | 0.35 | % | | | 0.35 | % | | | 0.35 | % |
| Ratio of Net Investment Income to average net assets | | | 2.98 | %(c) | | | 2.18 | % | | | 0.96 | % | | | 0.65 | % | | | 1.27 | % | | | 2.21 | % |
| Portfolio Turnover Rate | | | 17.17 | %(b) | | | 36.66 | % | | | 42.99 | % | | | 40.89 | % | | | 96.76 | % | | | 46.04 | % |
| (a) | Total return is a measure of the change in value of an investment in the Fund over the periods covered. The returns shown do not reflect the deduction of taxes a shareholder would pay on Fund distributions, if any, or the redemption of Fund shares. The total return would have been lower if the Adviser had not reduced fees. |
| (b) | Not annualized. |
| (c) | Annualized. |
The accompanying notes are an integral part of these financial statements.
| FINANCIAL HIGHLIGHTS | INSTITUTIONAL CORE BOND - CLASS I SHARES |
Selected Data for a Share Outstanding Throughout each Period:
| | | Six Months | | | | | | | | | | | | | | | | |
| | | Ended | | | | | | | | | | | | | | | | |
| | | 6/30/2024 | | | Year Ended December 31, | |
| | | (Unaudited) | | | 2023 | | | 2022 | | | 2021 | | | 2020 | | | 2019 | |
| Net Asset Value, beginning of period | | $ | 14.50 | | | $ | 14.17 | | | $ | 16.80 | | | $ | 17.45 | | | $ | 16.41 | | | $ | 15.49 | |
| | | | | | | | | | | | | | | | | | | | | | | | | |
| Operations: | | | | | | | | | | | | | | | | | | | | | | | | |
| Net Investment Income | | | 0.25 | (a) | | | 0.44 | (a) | | | 0.32 | | | | 0.26 | | | | 0.34 | | | | 0.43 | |
| Net Realized and Unrealized Gains (Losses) on Investments | | | (0.35 | ) | | | 0.31 | | | | (2.61 | ) | | | (0.62 | ) | | | 1.24 | | | | 0.94 | |
| Total Operations | | $ | (0.10 | ) | | $ | 0.75 | | | $ | (2.29 | ) | | $ | (0.36 | ) | | $ | 1.58 | | | $ | 1.37 | |
| | | | | | | | | | | | | | | | | | | | | | | | | |
| Distributions: | | | | | | | | | | | | | | | | | | | | | | | | |
| Net Investment Income | | | (0.25 | ) | | | (0.42 | ) | | | (0.34 | ) | | | (0.29 | ) | | | (0.36 | ) | | | (0.44 | ) |
| Net Realized Capital Gains | | | — | | | | — | | | | — | | | | — | | | | (0.18 | ) | | | (0.01 | ) |
| Total Distributions | | $ | (0.25 | ) | | $ | (0.42 | ) | | $ | (0.34 | ) | | $ | (0.29 | ) | | $ | (0.54 | ) | | $ | (0.45 | ) |
| | | | | | | | | | | | | | | | | | | | | | | | | |
| Net Asset Value, end of period | | $ | 14.15 | | | $ | 14.50 | | | $ | 14.17 | | | $ | 16.80 | | | $ | 17.45 | | | $ | 16.41 | |
| | | | | | | | | | | | | | | | | | | | | | | | | |
| Total Return (b) | | | (0.67 | )%(c) | | | 5.43 | % | | | (13.70 | )% | | | (2.04 | )% | | | 9.71 | % | | | 8.94 | % |
| | | | | | | | | | | | | | | | | | | | | | | | | |
| Net Assets, end of period (millions) | | $ | 1,693.80 | | | $ | 1,572.04 | | | $ | 569.86 | | | $ | 640.68 | | | $ | 559.67 | | | $ | 261.28 | |
| | | | | | | | | | | | | | | | | | | | | | | | | |
| Ratios/supplemental data (d)(e) | | | | | | | | | | | | | | | | | | | | | | | | |
| Ratio of expenses to average net assets before Waiver | | | 0.30 | %(f) | | | 0.30 | % | | | 0.30 | % | | | 0.30 | % | | | 0.30 | % | | | 0.30 | % |
| Ratio of expenses to average net assets after Waiver | | | 0.25 | %(f) | | | 0.25 | % | | | 0.25 | % | | | 0.25 | % | | | 0.25 | % | | | 0.25 | % |
| Ratio of Net Investment Income to average net assets before Waiver | | | 3.47 | %(f) | | | 3.08 | % | | | 2.04 | % | | | 1.46 | % | | | 1.83 | % | | | 2.59 | % |
| Ratio of Net Investment Income to average net assets after Waiver | | | 3.52 | %(f) | | | 3.13 | % | | | 2.09 | % | | | 1.51 | % | | | 1.88 | % | | | 2.64 | % |
| Portfolio Turnover Rate (g) | | | 12.76 | %(c) | | | 31.63 | % | | | 33.21 | % | | | 42.67 | % | | | 30.08 | % | | | 28.83 | % |
| (a) | Per share net investment income has been determined on the basis of average number of shares outstanding during the period. |
| (b) | Total return is a measure of the change in value of an investment in the Fund over the periods covered. The returns shown do not reflect the deduction of taxes a shareholder would pay on Fund distributions, if any, or the redemption of Fund shares. The total return would have been lower if the Adviser had not reduced fees. |
| (c) | Not annualized. |
| (d) | The Adviser waived a portion of the 0.30% management fee to sustain a net fee of 0.25%. The Adviser intends this fee waiver to be permanent, although the Adviser retains the right to remove the waiver after April 30, 2025. (Note #5) |
| (e) | Interest Expense had less than a 0.01% impact on the ratios of net investment income and expenses to average net assets. |
| (f) | Annualized. |
| (g) | Portfolio turnover is calculated on the basis on the Fund as a whole without distinguishing among the classes of shares. |
The accompanying notes are an integral part of these financial statements.
| FINANCIAL HIGHLIGHTS | INSTITUTIONAL CORE BOND FUND - CLASS F SHARES |
Selected Data for a Share Outstanding Throughout each Period:
| | | Six Months | | | | | | | | | | | | | | | | |
| | | Ended | | | | | | | | | | | | | | | | |
| | | 6/30/2024 | | | Year Ended December 31, | |
| | | (Unaudited) | | | 2023 | | | 2022 | | | 2021 | | | 2020 | | | 2019 | |
| Net Asset Value, beginning of period | | $ | 14.73 | | | $ | 14.39 | | | $ | 17.06 | | | $ | 17.61 | | | $ | 16.49 | | | $ | 15.61 | |
| | | | | | | | | | | | | | | | | | | | | | | | | |
| Operations: | | | | | | | | | | | | | | | | | | | | | | | | |
| Net Investment Income | | | 0.24 | (a) | | | 0.42 | (a) | | | 0.32 | | | | 0.33 | | | | 0.26 | | | | 0.40 | |
| Net Realized and Unrealized Gains (Losses) on Investments | | | (0.35 | ) | | | 0.33 | | | | (2.66 | ) | | | (0.71 | ) | | | 1.31 | | | | 0.92 | |
| Total Operations | | $ | (0.11 | ) | | $ | 0.75 | | | $ | (2.34 | ) | | $ | (0.38 | ) | | $ | 1.57 | | | $ | 1.32 | |
| | | | | | | | | | | | | | | | | | | | | | | | | |
| Distributions: | | | | | | | | | | | | | | | | | | | | | | | | |
| Net Investment Income | | | (0.25 | ) | | | (0.41 | ) | | | (0.33 | ) | | | (0.17 | ) | | | (0.27 | ) | | | (0.43 | ) |
| Net Realized Capital Gains | | | — | | | | — | | | | — | | | | — | | | | (0.18 | ) | | | (0.01 | ) |
| Total Distributions | | $ | (0.25 | ) | | $ | (0.41 | ) | | $ | (0.33 | ) | | $ | (0.17 | ) | | $ | (0.45 | ) | | $ | (0.44 | ) |
| | | | | | | | | | | | | | | | | | | | | | | | | |
| Net Asset Value, end of period | | $ | 14.37 | | | $ | 14.73 | | | $ | 14.39 | | | $ | 17.06 | | | $ | 17.61 | | | $ | 16.49 | |
| | | | | | | | | | | | | | | | | | | | | | | | | |
| Total Return (b) | | | (0.76 | )%(c) | | | 5.29 | % | | | (13.81 | )% | | | (2.15 | )% | | | 9.57 | % | | | 8.56 | % |
| | | | | | | | | | | | | | | | | | | | | | | | | |
| Net Assets, end of period (millions) | | $ | 8.60 | | | $ | 6.29 | | | $ | 3.02 | | | $ | 4.22 | | | $ | 6.87 | | | $ | 0.15 | |
| | | | | | | | | | | | | | | | | | | | | | | | | |
| Ratios/supplemental data (d)(e) | | | | | | | | | | | | | | | | | | | | | | | | |
| Ratio of expenses to average net assets before Waiver | | | 0.55 | %(d) | | | 0.55 | % | | | 0.55 | % | | | 0.55 | % | | | 0.55 | % | | | 0.55 | % |
| Ratio of expenses to average net assets after Waiver | | | 0.40 | %(d) | | | 0.40 | % | | | 0.40 | % | | | 0.40 | % | | | 0.40 | % | | | 0.40 | % |
| Ratio of Net Investment Income to average net assets before Waiver | | | 3.22 | %(d) | | | 2.79 | % | | | 1.76 | % | | | 1.19 | % | | | 1.33 | % | | | 2.18 | % |
| Ratio of Net Investment Income to average net assets after Waiver | | | 3.37 | %(d) | | | 2.89 | % | | | 1.91 | % | | | 1.34 | % | | | 1.48 | % | | | 2.33 | % |
| Portfolio Turnover Rate (g) | | | 12.76 | %(c) | | | 31.63 | % | | | 33.21 | % | | | 42.67 | % | | | 30.08 | % | | | 28.83 | % |
| (a) | Per share net investment income has been determined on the basis of average number of shares outstanding during the period. |
| (b) | Total return is a measure of the change in value of an investment in the Fund over the periods covered. The returns shown do not reflect the deduction of taxes a shareholder would pay on Fund distributions, if any, or the redemption of Fund shares. The total return would have been lower if the Adviser had not reduced fees. |
| (c) | Not annualized. |
| (d) | The Adviser waived a portion of the 0.30% management fee to sustain a net fee of 0.25%. The Adviser intends this fee waiver to be permanent, although the Adviser retains the right to remove the waiver after April 30, 2025. (Note #5) |
| (e) | Interest Expense had less than a 0.01% impact on the ratios of net investment income and expenses to average net assets. |
| (f) | Annualized. |
| (g) | Portfolio turnover is calculated on the basis on the Fund as a whole without distinguishing among the classes of shares. |
The accompanying notes are an integral part of these financial statements.
| FINANCIAL HIGHLIGHTS | INSTITUTIONAL CORE BOND FUND - CLASS S SHARES |
Selected Data for a Share Outstanding Throughout each Period:
| | | Six Months
Ended
6/30/2024
(Unaudited) | | | Period
Ended
12/31/2023* | |
| Net Asset Value, beginning of period | | $ | 14.50 | | | $ | 13.90 | |
| | | | | | | | | |
| Operations: | | | | | | | | |
| Net Investment Income (a) | | | 0.23 | | | | 0.13 | |
| Net Realized and Unrealized Gains on Investments | | | (0.35 | ) | | | 0.61 | |
| Total Operations | | $ | (0.12 | ) | | $ | 0.74 | |
| | | | | | | | | |
| Distributions: | | | | | | | | |
| Net Investment Income | | | (0.24 | ) | | | (0.14 | ) |
| | | | | | | | | |
| Net Asset Value, end of period | | $ | 14.14 | | | $ | 14.50 | |
| | | | | | | | | |
| Total Return (b) | | | (0.82 | )%(c) | | | 5.35 | %(c) |
| | | | | | | | | |
| Net Assets, end of period (millions) | | $ | 34.72 | | | $ | 39.70 | |
| | | | | | | | | |
| Ratios/supplemental data (d)(e) | | | | | | | | |
| Ratio of expenses to average net assets before Waiver | | | 0.55 | %(f) | | | 0.55 | %(f) |
| Ratio of expenses to average net assets after Waiver | | | 0.50 | %(f) | | | 0.50 | %(f) |
| Ratio of Net Investment Income to average net assets before Waiver | | | 3.21 | %(f) | | | 3.10 | %(f) |
| Ratio of Net Investment Income to average net assets after Waiver | | | 3.26 | %(f) | | | 3.15 | %(f) |
| Portfolio Turnover Rate (g) | | | 12.76 | %(c) | | | 31.63 | % |
| * | Fund began operations on September 15, 2023. |
| (a) | Per share net investment income has been determined on the basis of average number of shares outstanding during the period. |
| (b) | Total return is a measure of the change in value of an investment in the Fund over the periods covered. The returns shown do not reflect the deduction of taxes a shareholder would pay on Fund distributions, if any, or the redemption of Fund shares. The total return would have been lower if the Adviser had not reduced fees. |
| (c) | Not annualized. |
| (d) | The Adviser waived a portion of the 0.30% management fee to sustain a net fee of 0.25%. The Adviser intends this fee waiver to be permanent, although the Adviser retains the right to remove the waiver after April 30, 2025. (Note #5) |
| (e) | Interest Expense had less than a 0.01% impact on the ratios of net investment income and expenses to average net assets. |
| (f) | Annualized. |
| (g) | Portfolio turnover is calculated on the basis on the Fund as a whole without distinguishing among the classes of shares. |
The accompanying notes are an integral part of these financial statements.
| FINANCIAL HIGHLIGHTS | INSTITUTIONAL INTERMEDIATE BOND FUND - CLASS I SHARES |
Selected Data for a Share Outstanding Throughout each Period:
| | | Six Months | | | | | | | | | | | | | | | | |
| | | Ended | | | | | | | | | | | | | | | | |
| | | 6/30/2024 | | | Year Ended December 31, | |
| | | (Unaudited) | | | 2023 | | | 2022 | | | 2021 | | | 2020 | | | 2019 | |
| Net Asset Value, beginning of period | | $ | 14.59 | | | $ | 14.26 | | | $ | 16.03 | | | $ | 16.60 | | | $ | 15.98 | | | $ | 15.27 | |
| | | | | | | | | | | | | | | | | | | | | | | | | |
| Operations: | | | | | | | | | | | | | | | | | | | | | | | | |
| Net Investment Income | | | 0.25 | (a) | | | 0.41 | (a) | | | 0.30 | | | | 0.25 | | | | 0.34 | | | | 0.41 | |
| Net Realized and Unrealized Gains (Losses) on Investments | | | (0.18 | ) | | | 0.34 | | | | (1.77 | ) | | | (0.52 | ) | | | 0.80 | | | | 0.73 | |
| Total Operations | | $ | 0.07 | | | $ | 0.75 | | | $ | (1.47 | ) | | $ | (0.27 | ) | | $ | 1.14 | | | $ | 1.14 | |
| | | | | | | | | | | | | | | | | | | | | | | | | |
| Distributions: | | | | | | | | | | | | | | | | | | | | | | | | |
| Net Investment Income | | | (0.26 | ) | | | (0.42 | ) | | | (0.30 | ) | | | (0.26 | ) | | | (0.35 | ) | | | (0.42 | ) |
| Net Realized Capital Gains | | | — | | | | — | | | | — | | | | (0.04 | ) | | | (0.17 | ) | | | (0.01 | ) |
| Total Distributions | | $ | (0.26 | ) | | $ | (0.42 | ) | | $ | (0.30 | ) | | $ | (0.30 | ) | | $ | (0.52 | ) | | $ | (0.43 | ) |
| | | | | | | | | | | | | | | | | | | | | | | | | |
| Net Asset Value, end of period | | $ | 14.40 | | | $ | 14.59 | | | $ | 14.26 | | | $ | 16.03 | | | $ | 16.60 | | | $ | 15.98 | |
| | | | | | | | | | | | | | | | | | | | | | | | | |
| Total Return (b) | | | 0.48 | %(c) | | | 5.38 | % | | | (9.18 | )% | | | (1.66 | )% | | | 7.20 | % | | | 7.53 | % |
| | | | | | | | | | | | | | | | | | | | | | | | | |
| Net Assets, end of period (millions) | | $ | 302.71 | | | $ | 248.12 | | | $ | 233.65 | | | $ | 254.72 | | | $ | 219.62 | | | $ | 153.73 | |
| | | | | | | | | | | | | | | | | | | | | | | | | |
| Ratios/supplemental data (d)(e) | | | | | | | | | | | | | | | | | | | | | | | | |
| Ratio of expenses to average net assets before Waiver | | | 0.30 | %(f) | | | 0.30 | % | | | 0.30 | % | | | 0.30 | % | | | 0.30 | % | | | 0.30 | % |
| Ratio of expenses to average net assets after Waiver | | | 0.25 | %(f) | | | 0.25 | % | | | 0.25 | % | | | 0.25 | % | | | 0.25 | % | | | 0.25 | % |
| Ratio of Net Investment Income to average net assets before Waiver | | | 3.49 | %(f) | | | 2.85 | % | | | 1.93 | % | | | 1.45 | % | | | 1.99 | % | | | 2.57 | % |
| Ratio of Net Investment Income to average net assets after Waiver | | | 3.54 | %(f) | | | 2.90 | % | | | 1.98 | % | | | 1.50 | % | | | 2.04 | % | | | 2.62 | % |
| Portfolio Turnover Rate (g) | | | 14.72 | %(c) | | | 46.33 | % | | | 46.94 | % | | | 32.34 | % | | | 41.17 | % | | | 32.83 | % |
| (a) | Per share net investment income has been determined on the basis of average number of shares outstanding during the period. |
| (b) | Total return is a measure of the change in value of an investment in the Fund over the periods covered. The returns shown do not reflect the deduction of taxes a shareholder would pay on Fund distributions, if any, or the redemption of Fund shares. The total return would have been lower if the Adviser had not reduced fees. |
| (c) | Not annualized. |
| (d) | The Adviser waived a portion of the 0.30% management fee to sustain a net fee of 0.25%. The Adviser intends this fee waiver to be permanent, although the Adviser retains the right to remove the waiver after April 30, 2025. (Note #5) |
| (e) | Interest Expense had less than a 0.01% impact on the ratios of net investment income and expenses to average net assets. |
| (f) | Annualized. |
| (g) | Portfolio turnover is calculated on the basis on the Fund as a whole without distinguishing among the classes of shares. |
The accompanying notes are an integral part of these financial statements.
| FINANCIAL HIGHLIGHTS | INSTITUTIONAL INTERMEDIATE BOND FUND - CLASS F SHARES |
Selected Data for a Share Outstanding Throughout each Period:
| | | Six Months | | | | | | | | | | | | | | | | |
| | | Ended | | | | | | | | | | | | | | | | |
| | | 6/30/2024 | | | Year Ended December 31, | |
| | | (Unaudited) | | | 2023 | | | 2022 | | | 2021 | | | 2020 | | | 2019 | |
| Net Asset Value, beginning of period | | $ | 14.89 | | | $ | 14.55 | | | $ | 16.37 | | | $ | 16.84 | | | $ | 16.09 | | | $ | 15.39 | |
| | | | | | | | | | | | | | | | | | | | | | | | | |
| Operations: | | | | | | | | | | | | | | | | | | | | | | | | |
| Net Investment Income | | | 0.25 | (a) | | | 0.40 | (a) | | | 0.27 | | | | 0.22 | | | | 0.26 | | | | 0.37 | |
| Net Realized and Unrealized Gains (Losses) on Investments | | | (0.18 | ) | | | 0.34 | | | | (1.80 | ) | | | (0.53 | ) | | | 0.87 | | | | 0.75 | |
| Total Operations | | $ | 0.07 | | | $ | 0.74 | | | $ | (1.53 | ) | | $ | (0.31 | ) | | $ | 1.13 | | | $ | 1.12 | |
| | | | | | | | | | | | | | | | | | | | | | | | | |
| Distributions: | | | | | | | | | | | | | | | | | | | | | | | | |
| Net Investment Income | | | (0.25 | ) | | | (0.40 | ) | | | (0.29 | ) | | | (0.12 | ) | | | (0.21 | ) | | | (0.41 | ) |
| Net Realized Capital Gains | | | — | | | | — | | | | — | | | | (0.04 | ) | | | (0.17 | ) | | | (0.01 | ) |
| Total Distributions | | $ | (0.25 | ) | | $ | (0.40 | ) | | $ | (0.29 | ) | | $ | (0.16 | ) | | $ | (0.38 | ) | | $ | (0.42 | ) |
| | | | | | | | | | | | | | | | | | | | | | | | | |
| Net Asset Value, end of period | | $ | 14.71 | | | $ | 14.89 | | | $ | 14.55 | | | $ | 16.37 | | | $ | 16.84 | | | $ | 16.09 | |
| | | | | | | | | | | | | | | | | | | | | | | | | |
| Total Return (b) | | | 0.49 | %(c) | | | 5.20 | % | | | (9.32 | )% | | | (1.83 | )% | | | 7.07 | % | | | 7.35 | % |
| | | | | | | | | | | | | | | | | | | | | | | | | |
| Net Assets, end of period (millions) | | $ | 0.007 | | | $ | 0.007 | | | $ | 0.007 | | | $ | 0.007 | | | $ | 0.008 | | | $ | 0.003 | |
| | | | | | | | | | | | | | | | | | | | | | | | | |
| Ratios/supplemental data (d)(e) | | | | | | | | | | | | | | | | | | | | | | | | |
| Ratio of expenses to average net assets before Waiver | | | 0.55 | %(f) | | | 0.55 | % | | | 0.55 | % | | | 0.55 | % | | | 0.55 | % | | | 0.55 | % |
| Ratio of expenses to average net assets after Waiver | | | 0.40 | %(f) | | | 0.40 | % | | | 0.40 | % | | | 0.40 | % | | | 0.40 | % | | | 0.40 | % |
| Ratio of Net Investment Income to average net assets before Waiver | | | 3.20 | %(f) | | | 2.59 | % | | | 1.66 | % | | | 1.20 | % | | | 1.75 | % | | | 2.26 | % |
| Ratio of Net Investment Income to average net assets after Waiver | | | 3.35 | %(f) | | | 2.74 | % | | | 1.81 | % | | | 1.35 | % | | | 1.90 | % | | | 2.41 | % |
| Portfolio Turnover Rate (g) | | | 14.72 | %(c) | | | 46.33 | % | | | 46.94 | % | | | 32.34 | % | | | 41.17 | % | | | 32.83 | % |
| (a) | Per share net investment income has been determined on the basis of average number of shares outstanding during the period. |
| (b) | Total return is a measure of the change in value of an investment in the Fund over the periods covered. The returns shown do not reflect the deduction of taxes a shareholder would pay on Fund distributions, if any, or the redemption of Fund shares. The total return would have been lower if the Adviser had not reduced fees. |
| (c) | Not annualized. |
| (d) | The Adviser waived a portion of the 0.30% management fee to sustain a net fee of 0.25%, and a portion of the 0.25% 12b-1 fee to sustain a new distribution fee of 0.15%. The Adviser intends this fee waiver to be permanent, although the Adviser retains the rights to remove the waiver after April 30, 2025 (Note 5) |
| (e) | Interest Expense had less than a 0.01% impact on the ratios of net investment income and expenses to average net assets. |
| (f) | Annualized. |
| (g) | Portfolio turnover is calculated on the basis on the Fund as a whole without distinguishing among the classes of shares. |
The accompanying notes are an integral part of these financial statements.
| FINANCIAL HIGHLIGHTS | INSTITUTIONAL SHORT DURATION BOND FUND - CLASS I SHARES |
Selected Data for a Share Outstanding Throughout each Period:
| | | Six Months | | | | | | | | | | | | | | | | |
| | | Ended | | | | | | | | | | | | | | | | |
| | | 6/30/2024 | | | Year Ended December 31, | |
| | | (Unaudited) | | | 2023 | | | 2022 | | | 2021 | | | 2020 | | | 2019 | |
| Net Asset Value, beginning of period | | $ | 14.69 | | | $ | 14.32 | | | $ | 15.15 | | | $ | 15.44 | | | $ | 15.12 | | | $ | 14.80 | |
| | | | | | | | | | | | | | | | | | | | | | | | | |
| Operations: | | | | | | | | | | | | | | | | | | | | | | | | |
| Net Investment Income | | | 0.21 | (a) | | | 0.29 | (a) | | | 0.14 | | | | 0.13 | | | | 0.26 | | | | 0.35 | |
| Net Realized and Unrealized Gains (Losses) on Investments | | | (0.00 | )(b) | | | 0.39 | | | | (0.79 | ) | | | (0.27 | ) | | | 0.33 | | | | 0.33 | |
| Total Operations | | $ | 0.21 | | | $ | 0.68 | | | $ | (0.65 | ) | | $ | (0.14 | ) | | $ | 0.59 | | | $ | 0.68 | |
| | | | | | | | | | | | | | | | | | | | | | | | | |
| Distributions: | | | | | | | | | | | | | | | | | | | | | | | | |
| Net Investment Income | | | (0.21 | ) | | | (0.31 | ) | | | (0.18 | ) | | | (0.15 | ) | | | (0.27 | ) | | | (0.36 | ) |
| Return of Capital | | | — | | | | — | | | | — | | | | — | | | | — | | | | (0.00 | )(b) |
| Total Distributions | | $ | (0.21 | ) | | $ | (0.31 | ) | | $ | (0.18 | ) | | $ | (0.15 | ) | | $ | (0.27 | ) | | $ | (0.36 | ) |
| | | | | | | | | | | | | | | | | | | | | | | | | |
| Net Asset Value, end of period | | $ | 14.69 | | | $ | 14.69 | | | $ | 14.32 | | | $ | 15.15 | | | $ | 15.44 | | | $ | 15.12 | |
| | | | | | | | | | | | | | | | | | | | | | | | | |
| Total Return (c) | | | 1.46 | %(d) | | | 4.78 | % | | | (4.29 | )% | | | (0.91 | )% | | | 3.91 | % | | | 4.65 | % |
| | | | | | | | | | | | | | | | | | | | | | | | | |
| Net Assets, end of period (millions) | | $ | 244.30 | | | $ | 201.45 | | | $ | 229.47 | | | $ | 347.32 | | | $ | 327.10 | | | $ | 164.80 | |
| | | | | | | | | | | | | | | | | | | | | | | | | |
| Ratios/supplemental data (e) | | | | | | | | | | | | | | | | | | | | | | | | |
| Ratio of expenses to average net assets before Waiver | | | 0.30 | %(f) | | | 0.30 | % | | | 0.30 | % | | | 0.30 | % | | | 0.30 | % | | | 0.30 | % |
| Ratio of expenses to average net assets after Waiver | | | 0.25 | %(f) | | | 0.25 | % | | | 0.25 | % | | | 0.25 | % | | | 0.25 | % | | | 0.25 | % |
| Ratio of Net Investment Income to average net assets before Waiver | | | 2.80 | %(f) | | | 1.94 | % | | | 1.00 | % | | | 0.76 | % | | | 1.54 | % | | | 2.30 | % |
| Ratio of Net Investment Income to average net assets after Waiver | | | 2.85 | %(f) | | | 1.99 | % | | | 1.05 | % | | | 0.81 | % | | | 1.59 | % | | | 2.35 | % |
| Portfolio Turnover Rate (g) | | | 18.94 | %(d) | | | 36.84 | % | | | 21.53 | % | | | 58.31 | % | | | 37.11 | % | | | 48.01 | % |
| (a) | Per share net investment income has been determined on the basis of average number of shares outstanding during the period. |
| (b) | Amount is less than $0.005 per share. |
| (c) | Total return is a measure of the change in value of an investment in the Fund over the periods covered. The returns shown do not reflect the deduction of taxes a shareholder would pay on Fund distributions, if any, or the redemption of Fund shares. The total return would have been lower if the Adviser had not reduced fees. |
| (d) | Not annualized. |
| (e) | The Adviser waived a portion of the 0.30% management fee to sustain a net fee of 0.25%. The Adviser intends this fee waiver to be permanent, although the Adviser retains the right to remove the waiver after April 30, 2025. (Note #5) |
| (f) | Annualized. |
| (g) | Portfolio turnover is calculated on the basis on the Fund as a whole without distinguishing among the classes of shares. |
The accompanying notes are an integral part of these financial statements.
| FINANCIAL HIGHLIGHTS | INSTITUTIONAL SHORT DURATION BOND FUND - CLASS F SHARES |
Selected Data for a Share Outstanding Throughout each Period:
| | | Six Months | | | | | | | | | | | | | | | | |
| | | Ended | | | | | | | | | | | | | | | | |
| | | 6/30/2024 | | | Year Ended December 31, | |
| | | (Unaudited) | | | 2023 | | | 2022 | | | 2021 | | | 2020 | | | 2019 | |
| Net Asset Value, beginning of period | | $ | 14.87 | | | $ | 14.49 | | | $ | 15.33 | | | $ | 15.63 | | | $ | 15.20 | | | $ | 14.91 | |
| | | | | | | | | | | | | | | | | | | | | | | | | |
| Operations: | | | | | | | | | | | | | | | | | | | | | | | | |
| Net Investment Income | | | 0.20 | (a) | | | 0.27 | (a) | | | 0.14 | | | | 0.10 | | | | 0.16 | | | | 0.32 | |
| Net Realized and Unrealized Gains (Losses) on Investments | | | (0.01 | )(b) | | | 0.40 | | | | (0.82 | ) | | | (0.27 | ) | | | 0.42 | | | | 0.33 | |
| Total Operations | | $ | 0.19 | | | $ | 0.67 | | | $ | (0.68 | ) | | $ | (0.17 | ) | | $ | 0.58 | | | $ | 0.65 | |
| | | | | | | | | | | | | | | | | | | | | | | | | |
| Distributions: | | | | | | | | | | | | | | | | | | | | | | | | |
| Net Investment Income | | | (0.20 | ) | | | (0.29 | ) | | | (0.16 | ) | | | (0.13 | ) | | | (0.15 | ) | | | (0.36 | ) |
| | | | | | | | | | | | | | | | | | | | | | | | | |
| Net Asset Value, end of period | | $ | 14.86 | | | $ | 14.87 | | | $ | 14.49 | | | $ | 15.33 | | | $ | 15.63 | | | $ | 15.20 | |
| | | | | | | | | | | | | | | | | | | | | | | | | |
| Total Return (c) | | | 1.31 | %(d) | | | 4.68 | % | | | (4.47 | )% | | | (1.09 | )% | | | 3.82 | % | | | 4.36 | % |
| | | | | | | | | | | | | | | | | | | | | | | | | |
| Net Assets, end of period (millions) | | $ | 0.007 | | | $ | 0.007 | | | $ | 0.007 | | | $ | 0.007 | | | $ | 0.007 | | | $ | 0.003 | |
| | | | | | | | | | | | | | | | | | | | | | | | | |
| Ratios/supplemental data (e) | | | | | | | | | | | | | | | | | | | | | | | | |
| Ratio of expenses to average net assets before Waiver | | | 0.55 | %(f) | | | 0.55 | % | | | 0.55 | % | | | 0.55 | % | | | 0.55 | % | | | 0.55 | % |
| Ratio of expenses to average net assets after Waiver | | | 0.40 | %(f) | | | 0.40 | % | | | 0.40 | % | | | 0.40 | % | | | 0.40 | % | | | 0.40 | % |
| Ratio of Net Investment Income to average net assets before Waiver | | | 2.50 | %(f) | | | 1.70 | % | | | 0.75 | % | | | 0.51 | % | | | 1.33 | % | | | 1.98 | % |
| Ratio of Net Investment Income to average net assets after Waiver | | | 2.65 | %(f) | | | 1.85 | % | | | 0.90 | % | | | 0.66 | % | | | 1.48 | % | | | 2.13 | % |
| Portfolio Turnover Rate (g) | | | 18.94 | %(d) | | | 36.84 | % | | | 21.53 | % | | | 58.31 | % | | | 37.11 | % | | | 48.01 | % |
| (a) | Per share net investment income has been determined on the basis of average number of shares outstanding during the period. |
| (b) | Represents a balancing figure derived from other amounts in the financial highlights table that captures all other changes affecting net asset value per share. This per share amount does not correlate to the aggregate of the net realized and unrealized losses on the Statements of Operations for the same period. |
| (c) | Total return is a measure of the change in value of an investment in the Fund over the periods covered. The returns shown do not reflect the deduction of taxes a shareholder would pay on Fund distributions, if any, or the redemption of Fund shares. The total return would have been lower if the Adviser had not reduced fees. |
| (d) | Not annualized. |
| (e) | The Adviser waived a portion of the 0.30% management fee to sustain a net fee of 0.25%, and a portion of the 0.25% 12b-1 fee to sustain a new distribution fee of 0.15%. The Adviser intends this fee waiver to be permanent, although the Adviser retains the rights to remove the waiver after April 30, 2025. (Note #5) |
| (f) | Annualized. |
| (g) | Portfolio turnover is calculated on the basis on the Fund as a whole without distinguishing among the classes of shares. |
The accompanying notes are an integral part of these financial statements.
| FINANCIAL HIGHLIGHTS | CORE PLUS BOND FUND |
Selected Data for a Share Outstanding Throughout each Period:
| | | Six Months | | | | | | | | | | |
| | | Ended | | | Year | | | Year | | | Period | |
| | | 6/30/2024 | | | Ended | | | Ended | | | Ended | |
| | | (Unaudited) | | | 12/31/2023 | | | 12/31/2022 | | | 12/31/2021* | |
| Net Asset Value, beginning of period | | $ | 12.96 | | | $ | 12.66 | | | $ | 15.04 | | | $ | 15.00 | |
| | | | | | | | | | | | | | | | | |
| Operations: | | | | | | | | | | | | | | | | |
| Net Investment Income | | | 0.25 | | | | 0.41 | | | | 0.29 | | | | 0.03 | |
| Net Realized and Unrealized Gains (Losses) on Investments and Futures | | | (0.33 | ) | | | 0.31 | | | | (2.34 | ) | | | 0.04 | |
| Total Operations | | $ | (0.08 | ) | | $ | 0.72 | | | $ | (2.05 | ) | | $ | 0.07 | |
| | | | | | | | | | | | | | | | | |
| Distributions: | | | | | | | | | | | | | | | | |
| Net Investment Income | | | (0.26 | ) | | | (0.42 | ) | | | (0.33 | ) | | | (0.03 | ) |
| | | | | | | | | | | | | | | | | |
| Net Asset Value, end of period | | $ | 12.62 | | | $ | 12.96 | | | $ | 12.66 | | | $ | 15.04 | |
| | | | | | | | | | | | | | | | | |
| Total Return (a) | | | (0.61 | )%(b) | | | 5.81 | % | | | (13.71 | )% | | | 0.44 | %(b) |
| | | | | | | | | | | | | | | | | |
| Net Assets, end of period (millions) | | $ | 39.74 | | | $ | 22.60 | | | $ | 14.36 | | | $ | 16.42 | |
| | | | | | | | | | | | | | | | | |
| Ratios/supplemental data (c) | | | | | | | | | | | | | | | | |
| Ratio of expenses to average net assets before Waiver | | | 0.91 | %(d) | | | 1.34 | % | | | 1.14 | % | | | 0.55 | %(d) |
| Ratio of expenses to average net assets after Waiver | | | 0.45 | %(d) | | | 0.45 | % | | | 0.45 | % | | | 0.45 | %(d) |
| Ratio of Net Investment Income to average net assets before Waiver | | | 3.75 | %(d) | | | 2.41 | % | | | 1.43 | % | | | 1.55 | %(d) |
| Ratio of Net Investment Income to average net assets after Waiver | | | 4.21 | %(d) | | | 3.30 | % | | | 2.12 | % | | | 1.65 | %(d) |
| Portfolio Turnover Rate | | | 26.35 | %(b) | | | 45.24 | % | | | 42.09 | % | | | 69.02 | %(b) |
| * | Fund began operations on November 17,2021. |
| (a) | Total return is a measure of the change in value of an investment in the Fund over the periods covered. The returns shown do not reflect the deduction of taxes a shareholder would pay on Fund distributions, if any, or the redemption of Fund shares. The total return would have been lower if the Adviser had not reduced fees. |
| (b) | Not annualized. |
| (c) | The Adviser waived a portion of the 0.45% management fee to sustain a net fee of 0.45%. (Note #5) |
| (d) | Annualized. |
The accompanying notes are an integral part of these financial statements.
| FINANCIAL HIGHLIGHTS | MUNICIPAL INCOME FUND |
Selected Data for a Share Outstanding Throughout each Period:
| | | Six Months | | | | | | | | | | | | | | | | |
| | | Ended | | | | | | | | | | | | | | | | |
| | | 6/30/2024 | | | Year Ended December 31, | |
| | | (Unaudited) | | | 2023 | | | 2022 | | | 2021 | | | 2020 | | | 2019 | |
| Net Asset Value, beginning of period | | $ | 16.60 | | | $ | 16.15 | | | $ | 17.98 | | | $ | 18.28 | | | $ | 17.73 | | | $ | 17.12 | |
| | | | | | | | | | | | | | | | | | | | | | | | | |
| Operations: | | | | | | | | | | | | | | | | | | | | | | | | |
| Net Investment Income | | | 0.26 | | | | 0.46 | | | | 0.37 | | | | 0.32 | | | | 0.33 | | | | 0.32 | |
| Net Realized and Unrealized Gains (Losses) on Investments | | | (0.36 | ) | | | 0.45 | | | | (1.83 | ) | | | (0.27 | ) | | | 0.57 | | | | 0.64 | |
| Total Operations | | $ | (0.10 | ) | | $ | 0.91 | | | $ | (1.46 | ) | | $ | 0.05 | | | $ | 0.90 | | | $ | 0.96 | |
| | | | | | | | | | | | | | | | | | | | | | | | | |
| Distributions: | | | | | | | | | | | | | | | | | | | | | | | | |
| Net Investment Income | | | (0.26 | ) | | | (0.46 | ) | | | (0.37 | ) | | | (0.32 | ) | | | (0.33 | ) | | | (0.32 | ) |
| Net Realized Capital Gains | | | — | | | | — | | | | — | | | | (0.03 | ) | | | (0.02 | ) | | | (0.03 | ) |
| Return of Capital | | | — | | | | — | | | | — | | | | (0.00 | )(a) | | | — | | | | — | |
| Total Distributions | | $ | (0.26 | ) | | $ | (0.46 | ) | | $ | (0.37 | ) | | $ | (0.35 | ) | | $ | (0.35 | ) | | $ | (0.35 | ) |
| | | | | | | | | | | | | | | | | | | | | | | | | |
| Net Asset Value, end of period | | $ | 16.24 | | | $ | 16.60 | | | $ | 16.15 | | | $ | 17.98 | | | $ | 18.28 | | | $ | 17.73 | |
| | | | | | | | | | | | | | | | | | | | | | | | | |
| Total Return (b) | | | (0.60 | )%(c) | | | 5.76 | % | | | (8.10 | )% | | | 0.30 | % | | | 5.12 | % | | | 5.66 | % |
| | | | | | | | | | | | | | | | | | | | | | | | | |
| Net Assets, end of period (millions) | | $ | 171.93 | | | $ | 174.54 | | | $ | 190.50 | | | $ | 274.98 | | | $ | 259.73 | | | $ | 225.13 | |
| | | | | | | | | | | | | | | | | | | | | | | | | |
| Ratios/supplemental data | | | | | | | | | | | | | | | | | | | | | | | | |
| Ratio of expenses to average net assets | | | 0.30 | %(d) | | | 0.56 | %(e) | | | 0.65 | % | | | 0.65 | % | | | 0.65 | % | | | 0.65 | % |
| Ratio of Net Investment Income to average net assets | | | 3.20 | %(d) | | | 2.78 | % | | | 2.14 | % | | | 1.78 | % | | | 1.86 | % | | | 1.90 | % |
| Portfolio turnover rate | | | 9.01 | %(c) | | | 17.28 | % | | | 21.30 | % | | | 9.11 | % | | | 5.98 | % | | | 10.54 | % |
| (a) | Amount rounds to less than $0.005 per share. |
| (b) | Total return is a measure of the change in value of an investment in the Fund over the periods covered. The returns shown do not reflect the deduction of taxes a shareholder would pay on Fund distributions, if any, or the redemption of Fund shares. The total return would have been lower if the Adviser had not reduced fees. |
| (c) | Not annualized. |
| (d) | Annualized. |
| (e) | Effective September 15, 2023, the Management Fee was reduced from 0.65% to 0.30%. (Note 5) |
The accompanying notes are an integral part of these financial statements.
JOHNSON MUTUAL FUNDS
| NOTES TO THE FINANCIAL STATEMENTS | JUNE 30, 2024 (UNAUDITED) |
The Johnson Equity Income Fund, Johnson Opportunity Fund, Johnson International Fund, Johnson Enhanced Return Fund, Johnson Core Plus Bond Fund, Johnson Municipal Income Fund (each individually a “Fund” and collectively the “Funds”), Johnson Institutional Short Duration Bond Fund, Johnson Institutional Intermediate Bond Fund, Johnson Institutional Core Bond Fund (the “Bond Funds,”) are each a series of the Johnson Mutual Funds Trust (the “Trust”), and are registered under the Investment Company Act of 1940, as amended, as no-load, open-end investment companies. The Johnson Mutual Funds Trust was established as an Ohio business trust under an Agreement and Declaration of Trust dated September 30, 1992. The Opportunity Fund and Municipal Income Fund began offering their shares publicly on May 16, 1994. The Bond Funds began offering their shares publicly on August 31, 2000. The Equity Income Fund and Enhanced Return Fund began offering its shares publicly on December 30, 2005. The International Fund began offering its shares publicly on December 8, 2008. The Johnson Core Plus Bond Fund began offering shares publicly on November 17, 2021. All the Funds are managed by Johnson Investment Counsel, Inc. (the “Adviser”).
The Equity Income Fund and Opportunity Fund both have an additional share class, Class S shares. Each class of shares for each Fund has identical rights and privileges except with respect to shareholder servicing fees fees and voting rights on matters affecting a single class of shares. Class S shares have a maximum shareholder servicing fee of 0.25%.
The Bond Funds also have an additional share class, Class F shares. Each class of shares for each Fund has identical rights and privileges except with respect to distribution (12b-1) fees, shareholder servicing fees, and voting rights on matters affecting a single class of shares. Class F shares have a maximum distribution (12b-1) fee of 0.25%, currently waived by the Adviser to 0.15% (see Note 5). The Institutional Core Bond Fund also has an additional share class, Class S shares. Class S shares have a maximum shareholder servicing fee of 0.25%.
The investment objective of the Equity Income Fund is above average dividend income and long-term capital growth. The investment objective of the Opportunity Fund and International Fund is long-term capital growth. The investment objective of the Johnson Enhanced Return Fund is to outperform the Fund’s benchmark, the S&P 500 Index, over a full market cycle. The investment objective of the Bond Funds is a high level of income over the long term consistent with preservation of capital. The investment objective of the Johnson Core Plus Bond Fund is to maximize total return over the long term consistent with the preservation of capital. The investment objective of the Municipal Income Fund is a high level of federally tax-free income over the long-term consistent with preservation of capital.
The shareholders of the Johnson Fixed Income Fund (Target Fund) approved an Agreement and Plan of Reorganization providing for the transfer of all assets and liabilities of the Target Fund to the Core Bond Fund (Survivor Fund). The tax-free reorganization took place on September 15, 2023.
NOTES TO THE FINANCIAL STATEMENTS | JUNE 30, 2024 (UNAUDITED) |
| 1) | Organization, continued |
The following is a summary of shares outstanding, net assets, NAV per share, and unrealized depreciation immediately before and after the reorganization:
| | | Total Net Assets | | | Shares | | | Net Asset Value
Per Share | |
| Before Reorganization | | | | | | | | | | | | |
| Target Fund | | $ | 1,010,561,099 | | | | 70,231,503 | | | $ | 14.39 | |
| | | | | | | | | | | | | |
| Survivor Fund Class I | | $ | 566,121,196 | | | | 40,733,372 | | | $ | 13.90 | |
| Survivor Fund Class F | | $ | 3,609,156 | | | | 255,739 | | | $ | 14.11 | |
| Survivor Fund Class S | | | — | | | | — | | | | | |
| | | | | | | | | | | | | |
| Pro Forma Adjustment* | | | | | | | | | | | | |
| Class I | | $ | 971,030,502 | | | | 69,867,357 | | | $ | 13.90 | |
| Class F | | | — | | | | — | | | | | |
| Class S | | $ | 39,530,597 | | | | 2,844,269 | | | $ | 13.90 | |
| | | | | | | | | | | | | |
| After Reorganization | | | | | | | | | | | | |
| Pro Forma - Survivor Fund | | | | | | | | | | | | |
| Survivor Fund Class I | | $ | 1,537,151,698 | | | | 110,600,729 | | | $ | 13.90 | |
| Survivor Fund Class F | | $ | 3,609,156 | | | | 255,739 | | | $ | 14.11 | |
| Survivor Fund Class S** | | $ | 39,530,597 | | | | 2,844,269 | | | $ | 13.90 | |
| * | Shareholders of the Target Fund who had a minimum account balance of $1,000,000 will receive Class I shares of the Survivor Fund. All other shareholders of the Target Fund will receive Class S shares of the Survivor Fund. For every 1 share of the Target Fund, shareholders received 1.0353 shares of the Survivor Fund. |
| ** | Class S is a newly-created share class of the Survivor Fund. The initial NAV per share of the Class S shares will be set at the NAV per share of the Class I shares of the Survivor Fund. |
| | | | | | | | | After | |
| | | Before Reorganization | | | Reorganization | |
| | | Target Fund | | | Survivor Fund | | | Survivor Fund | |
| Unrealized Depreciation | | $ | (111,762,383 | ) | | $ | (66,380,154 | ) | | $ | (178,142,537 | ) |
Assuming the reorganization had been completed on January 1, 2023, the beginning of the annual reporting period of the Core Bond Fund, the Core Bond Fund’s pro forma results of operations for the year ended December 31, 2023 would have been as follows:
| Net Investment Income | | | Net Realized Gains and Net
Change in Unrealized Appreciation
(Depreciation) on Investments | | | Change in Net Assets from Operations |
| $43,684,246 | | | $(78,670,410) | | | $(34,986,164) |
NOTES TO THE FINANCIAL STATEMENTS | JUNE 30, 2024 (UNAUDITED) |
| 2) | Summary of Significant Accounting Policies: |
BASIS OF ACCOUNTING:
The financial statements are prepared in accordance with accounting principles generally accepted in the United State of Americas (GAAP). The Funds are investment companies and accordingly follow the investment company guidance of Financial Accounting Standards Board (FASB) Accounting Standards Codification Topic 946, “Financial Services — Investment Companies”.
Regulatory update:
Tailored Shareholder Reports for Mutual Funds and Exchange-Traded Funds (“ETFs”) – Effective January 24, 2023, the Securities and Exchange Commission (the “SEC”) adopted rule and form amendments to require mutual funds and ETFs to transmit concise and visually engaging streamlined annual and semiannual reports to shareholders that highlight key information. Other information, including financial statements, will no longer appear in a streamlined shareholder report but must be available online, delivered free of charge upon request, and filed on a semiannual basis on Form N-CSR. The rule and form amendments have a compliance date of July 24, 2024. The Funds have implemented the rule and form requirement as applicable and are currently adhering to the requirement.
FINANCIAL FUTURES CONTRACTS:
The Enhanced Return Fund invests in stock index futures (equity risk) in an attempt to replicate the returns of the leading large capitalization companies in the leading industries in the U.S. economy. The Fund enters into S&P 500 E-Mini contracts four times a year generally near the time the contracts would expire (contracts expire the third Friday of March, June, September and December). The contracts are generally held until it is time to roll into the next contracts. Upon entering into a financial futures contract, the Fund is required to pledge to the broker an amount of cash, U.S. government securities, or other assets, equal to a certain percentage of the contract amount (initial margin deposit). Subsequent payments, known as “variation margin,” are made or received by the Fund each day, depending on the daily fluctuations in the fair value of the futures contract. The Fund recognizes an unrealized gain or loss equal to the daily variation margin. The amount of the daily variation margin is reflected as an asset or liability within the Statements of Assets and Liabilities, while the cumulative change in unrealized gains (losses) on futures contracts is reported separately within the Statements of Operations. The Net Unrealized Gains on futures contracts, as of June 30, 2024, was $2,046,612. Should market conditions move unexpectedly, the Fund may not achieve the anticipated benefits of the financial futures contracts and may realize a loss at the contract settlement date. A realized gain or loss is recognized when a contract is sold and is the difference between the fair value of the contract at purchase and the fair value of the contract when sold. Realized gains (losses) on futures contracts are reported separately within the Statements of Operations. The use of futures transactions involves the risk of imperfect correlation in movements in the price of futures contracts, interest rates, and the underlying hedged asset, as well as the risk that the counterparty will fail to perform its obligations. The net variation margin payable on futures contracts as of June 30, 2024 was $1,216,425.
The Core Plus Bond Fund may enter into various exchange-traded and over-the-counter derivative transactions for both hedging and non-hedging purposes, including for purposes of enhancing returns. These derivative transactions may include futures, options, swaps, foreign currency futures and forwards. In particular, the Fund may use interest rate swaps, credit default swaps (including buying and selling credit default swaps on individual securities and/or baskets of securities), options (including options on credit default swaps and options on futures) and futures contracts to a significant extent, although the amounts invested in these instruments may change from time to time. Upon entering into a financial futures contract, the Fund is required to pledge to the broker an amount of cash, U.S. government securities, or other assets, equal to a certain percentage of the contract amount (initial margin deposit). Subsequent payments, known as “variation margin,” are made or received by the Fund each day, depending on the daily fluctuations in the fair value of the futures contract. The Fund recognizes an unrealized gain or loss equal to the daily variation margin. The amount of the daily variation margin is reflected as an asset or liability within the Statements of Assets and Liabilities, while the cumulative change in unrealized gain/loss on futures contracts is reported separately within the Statements of Operations. The Net Unrealized Gains on futures contracts, as of June 30, 2024, was $36,837. As of June 30, 2024, Wells Fargo Services holds U.S. Treasury Notes with the custodian, which serves as collateral for future contracts, with a value of $137,389. The net variation margin payable on these futures contracts as of June 30, 2024 was $26,922.
NOTES TO THE FINANCIAL STATEMENTS | JUNE 30, 2024 (UNAUDITED) |
| 2) | Summary of Significant Accounting Policies, continued |
OFFSETTING ASSETS AND LIABILITIES:
The Enhanced Return Fund and the Core Plus Bond Fund have adopted financial reporting rules regarding offsetting assets and liabilities and related arrangements to enable users of its financial statements to understand the effect of those arrangements on its financial position. The Fund’s policy is to recognize a net asset/liability equal to the net variation margin for the futures contracts. As of June 30, 2024, the Funds each have only one position and the variation margin applicable to each of those positions is presented in the Statement of Assets and Liabilities.
The following table presents the Enhanced Return Fund and Core Plus Bond Fund’s liability derivatives available for offset under a master netting agreement, net of collateral pledged as of June 30, 2024.
Enhanced Return Fund
Liabilities
| | | | | | | | | | | | Gross Amounts Not
Offset in the Statement
of Assets and Liabilities | | | |
| Description | | Gross
Amounts of
Recognized
Liabilities | | | Gross
Amounts
Offset in the
Statement of
Assets and
Liabilities | | | Net Amounts
Presented in
the Statement
of Assets and
Liabilities | | | Financial
Instruments* | | Cash
Collateral
Pledged/
Received | | | Net Amount | |
| Futures Contracts | | $ | (1,216,425 | ) | | $ | — | | | $ | (1,216,425 | ) | | $ | 1,216,425 | | $ | — | | | $ | — | |
| * | The Amount is limited to the derivative balance, and accordingly, does not include excess collateral pledged. |
Core Plus Bond Fund
Liabilities
| | | | | | | | | | | | Gross Amounts Not
Offset in the Statement
of Assets and Liabilities | | | |
| Description | | Gross
Amounts of
Recognized
Liabilities | | | Gross
Amounts
Offset in the
Statement of
Assets and
Liabilities | | | Net Amounts
Presented in
the Statement
of Assets and
Liabilities | | | Financial
Instruments* | | Cash
Collateral
Pledged/
Received | | | Net Amount | |
| Futures Contracts | | $ | (26,922 | ) | | $ | — | | | $ | (26,922 | ) | | $ | 26,922 | | $ | — | | | $ | — | |
| * | The Amount is limited to the derivative balance, and accordingly, does not include excess collateral pledged. |
INVESTMENT INCOME AND REALIZED CAPITAL GAINS AND LOSSES ON INVESTMENT SECURITIES:
Dividend income is recorded on the ex-dividend date and interest income is recorded on an accrual basis. Dividend and interest income are recorded net of foreign taxes. Withholding taxes and reclaims on foreign dividends have been recorded in accordance with the Funds’ understanding of the applicable country’s tax rules and rates. Gains and losses on sales of investments are calculated using the specific identification method, mainly using high-cost lots. Discounts and premiums on securities purchased are amortized over the lives or to the earliest call date of the respective securities in accordance with GAAP. Distributions received from investments in securities that represent a return of capital or capital gains are recorded as a reduction of the cost of investment or as a realized gain, respectively. The calendar year-end amounts of ordinary income, capital gains, and return of capital included in distributions received
NOTES TO THE FINANCIAL STATEMENTS | JUNE 30, 2024 (UNAUDITED) |
| 2) | Summary of Significant Accounting Policies, continued |
from the Funds’ investments in real estate investment trusts (“REITs”) are reported to the Funds after the end of the calendar year; accordingly, the Funds estimate these amounts for accounting purposes until the characterization of REIT distributions is reported. Estimates are based on the most recent REIT distributions information available. Gains and losses on paydowns of mortgage-backed securities are reflected in interest income on the Statements of Operations. The ability of issuers of debt securities held by the Funds to meet their obligations may be affected by economic and political developments in a specific country or region.
FOREIGN CURRENCY TRANSLATION:
Securities and other assets and liabilities denominated in or expected to settle in foreign currencies, if any, are translated into U.S. dollars based on exchange rates on the following basis:
| A. | The fair values of investment securities and other assets and liabilities are translated as of the close of the NYSE each day. |
| B. | Purchases and sales of investment securities and income and expenses are translated at the rate of exchange prevailing as of 4:00 p.m. Eastern time on the respective date of such transactions. |
| C. | The Fund does not isolate that portion of the results of operations caused by changes in foreign exchange rates on investments from those caused by changes in market prices of securities held. Such fluctuations are included with the net realized and unrealized gains or losses on investments. |
Reported net realized foreign exchange gains or losses arise from 1) purchases and sales of foreign currencies, 2) currency gains or losses realized between trade and settlement dates on securities transactions, and 3) the difference between the amounts of dividends and foreign withholding taxes recorded on the Fund’s books and the U.S. dollar equivalent of the amounts actually received or paid. Reported net unrealized foreign exchange gains and losses arise from changes in the value of assets and liabilities, other than investments in securities, that result from changes in exchange rates.
FEDERAL INCOME TAX:
The Funds have qualified and intend to continue to qualify as a regulated investment company under the Internal Revenue Code of 1986, as amended (the “Code”). Qualification generally will relieve the Fund of liability for federal income taxes to the extent is net investment income and net realized capital gains are distributed in accordance with the Code.
In order to avoid imposition of a federal excise tax applicable to regulated investment companies, it is also the Funds’ intention to declare and pay as dividends in each calendar year at least 98% of its net investment income (earned during the calendar year) and 98.2% of its net realized capital gains (earned during the 12 months ended December 31 for the Opportunity Fund, Bond Funds, and Municipal Income Fund, and October 31 for the Equity Income, International, Enhanced Return and Core Plus Bond Fund) plus undistributed amounts from prior years.
The following information is computed for each item as of December 31, 2023:
| | | Equity Income | | | Opportunity | | | International | | | Enhanced
Return | | | Core | |
| Cost of Investments | | $ | 442,517,389 | | | $ | 105,058,052 | | | $ | 17,281,741 | | | $ | 257,213,489 | | | $ | 1,704,486,993 | |
| Gross unrealized appreciation | | | 182,206,343 | | | | 31,911,002 | | | | 8,844,676 | | | | 816,592 | | | | 10,935,416 | |
| Gross unrealized depreciation | | | (5,069,350 | ) | | | (3,707,991 | ) | | | (1,730,553 | ) | | | (7,809,752 | ) | | | (110,020,202 | ) |
| Net unrealized appreciation (depreciation) | | | 177,136,993 | | | | 28,203,011 | | | | 7,114,123 | | | | (6,993,160 | ) | | | (99,084,786 | ) |
| Net unrealized depreciation on foreign currency | | | — | | | | — | | | | (12 | ) | | | — | | | | — | |
| Undistributed ordinary income | | | 535,930 | | | | — | | | | 134,858 | | | | 108,424 | | | | 181,013 | |
| Undistributed long-term gains | | | 6,032,888 | | | | 36 | | | | — | | | | — | | | | — | |
| Accumulated capital and other losses | | | — | | | | — | | | | (425,960 | ) | | | (25,062,611 | ) | | | (105,724,216 | ) |
| Distributable earnings (accumulated deficit) | | $ | 183,705,811 | | | $ | 28,203,047 | | | $ | 6,823,009 | | | $ | (31,947,347 | ) | | $ | (204,627,989 | ) |
NOTES TO THE FINANCIAL STATEMENTS | JUNE 30, 2024 (UNAUDITED) |
| 2) | Summary of Significant Accounting Policies, continued |
| | | Interemediate | | | Short Duration | | | Core Plus | | | Municipal
Income | |
| Cost of Investments | | $ | 252,149,663 | | | $ | 206,973,291 | | | $ | 23,227,403 | | | $ | 181,631,626 | |
| Gross unrealized appreciation | | | 2,483,379 | | | | 574,715 | | | | 303,075 | | | | 1,543,316 | |
| Gross unrealized depreciation | | | (9,334,389 | ) | | | (7,513,340 | ) | | | (1,095,931 | ) | | | (9,539,791 | ) |
| Net unrealized depreciation | | | (6,851,010 | ) | | | (6,938,625 | ) | | | (792,856 | ) | | | (7,996,475 | ) |
| Undistributed ordinary income | | | 76,069 | | | | 77,460 | | | | 4,038 | | | | — | |
| Accumulated capital and other losses | | | (17,642,752 | ) | | | (6,397,670 | ) | | | (1,281,239 | ) | | | (6,563,244 | ) |
| Accumulated deficit | | $ | (24,417,693 | ) | | $ | (13,258,835 | ) | | $ | (2,070,057 | ) | | $ | (14,559,719 | ) |
As of December 31, 2023, the following Funds had capital loss carryovers which will reduce each Fund’s taxable income arising from future net realized gains on investments, if any, to the extent permitted by the Code and thus will reduce the amount of distributions to shareholders which would otherwise be necessary to relieve the Fund of any liability for federal income tax. The capital loss carryovers which may be carried forward for an indefinite period are as follows:
| | | Long-term | | | Short-term | | | Total | |
| International | | $ | 147,347 | | | $ | 278,613 | | | $ | 425,960 | |
| Core | | | 69,071,385 | | | | 36,652,831 | | | | 105,724,216 | |
| Intermediate | | | 12,622,755 | | | | 5,019,997 | | | | 17,642,752 | |
| Short Duration | | | 4,209,631 | | | | 2,188,039 | | | | 6,397,670 | |
| Core Plus | | | 774,721 | | | | 506,517 | | | | 1,281,238 | |
| Municipal Income | | | 6,300,775 | | | | 262,469 | | | | 6,563,244 | |
As a result of the reorganization of the Fixed Income Fund into the Core Fund, the Core Fund acquired $39,996,550 of long-term capital loss carryover and $10,326,215 of short-term capital loss carryover, which are available to offset future capital gains. In addition, as a result of a change in control due to the merger, $21,904,287 of the Core Fund’s capital loss carryovers are subject to an annual limitation of $18,057,023 (prorated in the initial year) under IRC Section 382.
The following information is computed as of June 30, 2024:
| | | Equity Income | | | Opportunity | | | International | | | Enhanced
Return | | | Core | |
| Cost of Investments | | $ | 447,410,561 | | | $ | 125,894,313 | | | $ | 16,598,227 | | | $ | 280,706,146 | | | $ | 1,858,427,555 | |
| Gross unrealized appreciation | | | 200,842,366 | | | | 36,365,054 | | | | 8,905,014 | | | | 936,691 | | | | 3,426,644 | |
| Gross unrealized depreciation | | | (8,084,126 | ) | | | (8,474,563 | ) | | | (1,902,728 | ) | | | (7,741,483 | ) | | | (129,499,360 | ) |
| Net unrealized appreciation (depreciation) | | $ | 192,758,240 | | | $ | 27,890,491 | | | $ | 7,002,286 | | | $ | (6,804,792 | ) | | $ | (126,072,716 | ) |
| Net unrealized depreciation on foreign currency | | $ | — | | | $ | — | | | $ | (17 | ) | | $ | — | | | $ | — | |
| | | Interemediate | | | Short Duration | | | Core Plus | | | Municipal
Income | |
| Cost of Investments | | $ | 308,219,549 | | | $ | 248,505,460 | | | $ | 40,602,331 | | | $ | 182,217,572 | |
| Gross unrealized appreciation | | | 1,229,205 | | | | 187,864 | | | | 140,767 | | | | 376,953 | |
| Gross unrealized depreciation | | | (9,668,819 | ) | | | (6,443,016 | ) | | | (1,359,170 | ) | | | (11,873,610 | ) |
| Net unrealized depreciation | | $ | (8,439,614 | ) | | $ | (6,255,152 | ) | | $ | (1,218,403 | ) | | $ | (11,496,657 | ) |
The difference between the federal income tax cost and the financial statement cost of Funds’ investments is due to certain timing differences in the recognition of capital gains and losses under income tax regulations and GAAP. The timing differences are temporary in nature and are due to the tax deferral of losses on amortization of bonds, mark to market on futures contracts and wash sales.
NOTES TO THE FINANCIAL STATEMENTS | JUNE 30, 2024 (UNAUDITED) |
| 2) | Summary of Significant Accounting Policies, continued |
The Funds recognize the tax benefits or expenses of uncertain tax positions only where the position is “more likely than not” to be sustained assuming examination by tax authorities. Management has reviewed the tax positions taken on Federal income tax returns for the current and all open tax years (generally three years) and has concluded that no provision for unrecognized tax benefits or expenses is required in these financial statements. The Funds identify its major tax jurisdictions as U.S. Federal and certain State tax authorities. The Funds are not aware of any tax positions for which it is reasonably likely that the total amounts of unrecognized tax benefits or expenses will change materially in the next twelve months. The Funds recognize interest and penalties, if any, related to unrecognized tax expenses as income tax expense in the Statements of Operations. During the six months ended June 30, 2024, the Funds did not incur any interest or penalties.
ALLOCATIONS BETWEEN CLASSES:
Investment income earned, realized capital gains and losses, and unrealized appreciation and depreciation are allocated daily to each class of shares based upon its proportionate share of total net assets of the Fund. Class specific expenses are charged directly to the class incurring the expense. Common expenses which are not attributable to a specific class are allocated daily to each class of shares based upon its proportionate share of total net assets of the Fund.
DISTRIBUTIONS:
Distributions to shareholders, which are determined in accordance with income tax regulations, are recorded on the ex-dividend date. The Funds intend to distribute net investment income on a monthly basis for the Bond Funds and Core Plus Fund, and on a calendar quarter basis for the Enhanced Return Fund and Municipal Income Fund. The Equity Income, Opportunity and International Funds intend to distribute net investment income, if any, at least once a year. The Funds intend to distribute their net realized long-term capital gains and their net realized short-term capital gains, if any, at least once a year. The treatment for financial reporting purposes of distributions made to shareholders during the year from net investment income or net realized capital gains may differ from their ultimate treatment for federal income tax purposes. These differences are caused primarily by differences in the timing of the recognition of certain components of income, expense or realized capital gain for federal income tax purposes. Where such differences are permanent in nature, they are reclassified in the components of net assets based on their ultimate characterization for federal income tax purposes. Any such reclassifications will have no effect on net assets, results of operations, or net asset values per share of the Funds.
The tax character of the distributions paid for the periods ended June 30, 2024 and December 31, 2023 are as follows:
| | | | | Ordinary
Income* | | | Tax Exempt
Income | | | Net Realized
Long-Term
Capital Gain | | | Total Taxable
Distributions
Paid | | | Total
Distributions
Paid | |
| Equity Income | | 12/31/2023 | | $ | 6,120,765 | | | | — | | | $ | 9,937,260 | | | $ | 16,058,025 | | | $ | 16,058,025 | |
| | | 6/30/2024 | | | — | | | | — | | | | — | | | | — | | | | — | |
| Opportunity | | 12/31/2023 | | | 781,417 | | | | — | | | | 3,954,826 | | | | 4,736,243 | | | | 4,736,243 | |
| | | 6/30/2024 | | | — | | | | — | | | | — | | | | — | | | | — | |
| International | | 12/31/2023 | | | 501,175 | | | | — | | | | — | | | | 501,175 | | | | 501,175 | |
| | | 6/30/2024 | | | — | | | | — | | | | — | | | | — | | | | — | |
| Enhanced Return | | 12/31/2023 | | | 5,197,873 | | | | — | | | | — | | | | 5,197,873 | | | | 5,197,873 | |
| | | 6/30/2024 | | | 4,101,456 | | | | — | | | | — | | | | 4,101,456 | | | | 4,101,456 | |
| Core | | 12/31/2023 | | | 27,331,004 | | | | — | | | | — | | | | 27,331,004 | | | | 27,331,004 | |
| | | 6/30/2024 | | | 29,908,882 | | | | — | | | | — | | | | 29,908,882 | | | | 29,908,882 | |
| Interemediate | | 12/31/2023 | | | 7,258,801 | | | | — | | | | — | | | | 7,258,801 | | | | 7,258,801 | |
| | | 6/30/2024 | | | 4,989,626 | | | | — | | | | — | | | | 4,989,626 | | | | 4,989,626 | |
| Short Duration | | 12/31/2023 | | | 4,447,578 | | | | — | | | | — | | | | 4,447,578 | | | | 4,447,578 | |
| | | 6/30/2024 | | | 3,172,500 | | | | — | | | | — | | | | 3,172,500 | | | | 3,172,500 | |
NOTES TO THE FINANCIAL STATEMENTS | JUNE 30, 2024 (UNAUDITED) |
| 2) | Summary of Significant Accounting Policies, continued |
| | | | | Ordinary
Income* | | | Tax Exempt
Income | | | Net Realized
Long-Term
Capital Gain | | | Total Taxable
Distributions
Paid | | | Total
Distributions
Paid | |
| Core Plus | | 12/31/2023 | | $ | 592,529 | | | $ | — | | | $ | — | | | $ | 592,529 | | | $ | 592,529 | |
| | | 6/30/2024 | | | 727,674 | | | | — | | | | — | | | | 727,674 | | | | 727,674 | |
| Municipal Income | | 12/31/2023 | | | 161,996 | | | | 5,379,348 | | | | — | | | | 5,541,344 | | | | 5,541,344 | |
| | | 6/30/2024 | | | 2,802,200 | | | | — | | | | — | | | | 2,802,200 | | | | 2,802,200 | |
| * | Short-Term Capital Gains were combined with Ordinary Income, as they are taxed at the Ordinary Income tax rate. |
| 3) | Security Valuation and Transactions: |
The Funds’ portfolio securities are valued as of the close of business of the regular session of the New York Stock Exchange (normally 4:00 p.m., Eastern time). The Board has assigned the Adviser as their Valuation Designee to consider all appropriate factors relevant to the value of securities, in accordance with the Trust’s valuation policies and fair value determinations. Fixed income securities typically are valued on the basis of prices furnished by a pricing service when the Adviser believes such prices accurately reflect the market value of such securities. A pricing service utilizes electronic data processing techniques based on yield spreads relating to securities with similar characteristics to determine prices for normal institutional-size trading units of debt securities without regard to sale or bid prices. When the Adviser decides that a price provided by the pricing service does not accurately reflect the market value of the securities, when prices are not readily available from the pricing service, or when restricted or illiquid securities are being valued, securities are valued at fair value as determined in good faith by the Adviser, in conformity with guidelines adopted by and subject to review of the Board of Trustees. Various inputs may be reviewed in order to make a good faith determination of a security’s fair value. These inputs include, but are not limited to, the type and cost of the security; contractual or legal restrictions on resale of the security; relevant financial or business developments of the issuer; actively traded similar or related securities; conversion or exchange rights on the security; related corporate actions; significant events occurring after the close of trading in the security; and changes in overall market conditions. Fair valuations and valuations of investments that are not actively trading involve judgment and may differ materially from valuations of investments that would have been used had greater market activity occurred.
The Funds utilizes various methods to measure the fair value of its investments on a recurring basis. GAAP establishes a single authoritative definition of fair value, sets out a framework for measuring fair value and requires additional disclosures about fair value measurements.
GAAP established a hierarchy that prioritizes inputs to valuation methods. The three levels of inputs are:
| ● | Level 1 — Unadjusted quoted prices in active markets for identical assets or liabilities that the Funds have the ability to access. |
| ● | Level 2 — Observable inputs other than quoted prices included in Level 1 that are observable for the asset or liability, either directly or indirectly. These inputs may include quoted prices for the identical instrument on an inactive market, prices for similar instruments, interest rates, prepayment speeds, credit risk, yield curves, default rates and similar data. |
| ● | Level 3 — Unobservable inputs for the asset or liability, to the extent relevant observable inputs are not available, representing the Fund’s own assumptions about the assumptions a market participant would use in valuing the asset or liability, and would be based on the best information available. |
The availability of observable inputs can vary from security to security and is affected by a wide variety of factors, including, for example, the type of security, whether the security is new and not yet established in the marketplace, the liquidity of markets, and other characteristics particular to the security. To the extent that valuation is based on models or inputs that are less observable or unobservable in the market, the determination of fair value requires more judgment. Accordingly, the degree of judgment exercised in determining fair value is greatest for instruments categorized in Level 3.
NOTES TO THE FINANCIAL STATEMENTS | JUNE 30, 2024 (UNAUDITED) |
| 3) | Security Valuation and Transactions, continued |
The inputs or methodology used for valuing securities are not necessarily an indication of the risks associated with investing in those securities. The inputs used to measure fair value may fall into different levels of the fair value hierarchy. In such cases, for disclosure purposes, the level of the fair value hierarchy within which the fair value measurement falls in its entirety, is determined based on the lowest level input that is significant to the fair value measurement in its entirety.
FAIR VALUE MEASUREMENTS:
A description of the valuation techniques applied to the Funds’ major categories of assets and liabilities measured at fair value on a recurring basis follows.
Equity Securities (Common Stock, Real Estate Investment Trusts). Securities traded on a national securities exchange (or reported on the NASDAQ national market) are stated at the last reported sales price on the day of valuation. To the extent these securities are actively traded and valuation adjustments are not applied, they are categorized in Level 1 of the fair value hierarchy. When adjustments to observable prices are applied or when the market is considered inactive, securities will be categorized in Level 2 of the fair value hierarchy.
Corporate Bonds. Corporate bonds are generally valued at prices obtained from pricing vendors. The fair value of corporate bonds is estimated using market approach valuation techniques, which may consider recently executed transactions in securities of the issuer or comparable issuers, market price quotations for similar securities (where observable), bond spreads, fundamental data relating to the issuer, and credit default swap spreads adjusted for any basis difference between cash and derivative instruments. While most corporate bonds are categorized in Level 2 of the fair value hierarchy, in instances where lower relative weight is placed on transaction prices, quotations, or similar observable inputs, they will be categorized in Level 3.
Certificates of Deposit. Certificates of Deposit are generally valued at prices obtained from pricing vendors. Certificates of Deposit which are traded on the open market are normally valued using a market approach valuation technique that incorporates observable market data such as reported sales of similar securities, broker quotes, yields, bids, offers, and reference data. Certain securities are valued principally using dealer quotations. Certificates of Deposit are categorized in Level 2 of the fair value hierarchy.
U.S. Government Securities. U.S. government securities are generally valued at prices obtained from pricing vendors. U.S. government securities, including U.S. Treasury Obligations, are normally valued using market approach valuation techniques that incorporate observable market data such as reported sales of similar securities, broker quotes, yields, bids, offers, and reference data. Certain securities are valued principally using dealer quotations. U.S. government securities are categorized in Level 2 of the fair value hierarchy.
U.S. Agency Securities. U.S. agency securities are generally valued at prices obtained from pricing vendors. U.S. agency securities are comprised of two main categories consisting of agency issued debt and mortgage-backed securities. Agency issued debt securities are generally valued in a manner similar to U.S. government securities. Mortgage-backed securities are generally valued based on models that consider the estimated cash flows of each tranche of the entity, establish a benchmark yield, and develop an estimated tranche-specific spread to the benchmark yield based on the unique attributes of the tranche. Depending on market activity levels and whether quotations or other data are used, these securities are typically categorized in Level 2 of the fair value hierarchy.
Municipal Bonds. Municipal bonds are generally valued at prices obtained from pricing vendors. Municipal Bonds are normally valued using a market approach valuation technique that incorporates observable market data such as reported sales of similar securities, broker quotes, yields, bids, offers, and reference data. Certain securities are valued principally using dealer quotations. Municipal Bonds are categorized in Level 2 of the fair value hierarchy.
Preferred Stocks. Securities traded on a national securities exchange (or reported on the NASDAQ national market) are stated at the last reported sales price on the day of valuation. To the extent these securities are actively traded and valuation adjustments are not applied, they are categorized in Level 1 of the fair value hierarchy.
NOTES TO THE FINANCIAL STATEMENTS | JUNE 30, 2024 (UNAUDITED) |
| 3) | Security Valuation and Transactions, continued |
Money Market. Investments in mutual funds, including money market mutual funds (notated throughout these financial statements as cash equivalents), are generally priced at the ending net asset value (“NAV”) provided by the service agent of the funds. These securities will be categorized as Level 1 securities.
Derivative Instruments. Listed derivatives, including futures contracts that are actively traded, are valued based on quoted prices from the exchange and are categorized in Level 1 of the fair value hierarchy.
The following is a summary of the inputs used to value each Fund’s investments as of June 30, 2024:
| Equity Income Fund | | Level 1 | | | Level 2 | | | Level 3 | | | Totals | |
| Common Stocks* | | $ | 634,930,411 | | | $ | — | | | $ | — | | | $ | 634,930,411 | |
| Money Market Funds | | | 5,238,390 | | | | — | | | | — | | | | 5,238,390 | |
| Total | | $ | 640,168,801 | | | $ | — | | | $ | — | | | $ | 640,168,801 | |
| Opportunity Fund | | Level 1 | | | Level 2 | | | Level 3 | | | Totals | |
| Common Stocks* | | $ | 151,246,376 | | | $ | — | | | $ | — | | | $ | 151,246,376 | |
| Cash Equivalents | | | 2,538,428 | | | | — | | | | — | | | | 2,538,428 | |
| Total | | $ | 153,784,804 | | | $ | — | | | $ | — | | | $ | 153,784,804 | |
| International Fund | | Level 1 | | | Level 2 | | | Level 3 | | | Totals | |
| Common Stocks* | | $ | 23,442,644 | | | $ | — | | | $ | 140 | ** | | $ | 23,442,784 | |
| Preferred Stocks | | | 144,832 | | | | — | | | | — | | | | 144,832 | |
| Money Market Funds | | | 12,897 | | | | — | | | | — | | | | 12,897 | |
| Total | | $ | 23,600,373 | | | $ | — | | | $ | 140 | | | $ | 23,600,513 | |
| Enhanced Return Fund | | Level 1 | | | Level 2 | | | Level 3 | | | Totals | |
| Corporate Bonds* | | $ | — | | | $ | 169,173,435 | | | $ | — | | | $ | 169,173,435 | |
| Collateralized Mortgage Obligations | | | — | | | | 33,034,335 | | | | — | | | | 33,034,335 | |
| Municipal Bonds | | | — | | | | 539,195 | | | | — | | | | 539,195 | |
| U.S. Government & Agencies | | | — | | | | 13,809,938 | | | | — | | | | 13,809,938 | |
| U.S. Treasury Obligations | | | — | | | | 55,057,883 | | | | — | | | | 55,057,883 | |
| Money Market Funds | | | 2,286,568 | | | | — | | | | — | | | | 2,286,568 | |
| Sub-total | | $ | 2,286,568 | | | $ | 271,614,786 | | | $ | — | | | $ | 273,901,354 | |
| Other Financial Instruments*** | | | — | | | | — | | | | 2,046,612 | | | | 2,046,612 | |
| Total | | $ | 2,286,568 | | | $ | 271,614,786 | | | $ | 2,046,612 | | | $ | 275,947,966 | |
| Institutional Core Bond Fund | | Level 1 | | | Level 2 | | | Level 3 | | | Totals | |
| Corporate Bonds* | | $ | — | | | $ | 730,877,928 | | | $ | — | | | $ | 730,877,928 | |
| Collateralized Mortgage Obligations | | | — | | | | 392,874,733 | | | | — | | | | 392,874,733 | |
| Municipal Bonds | | | — | | | | 37,307,704 | | | | — | | | | 37,307,704 | |
| U.S. Government & Agencies | | | — | | | | 82,580,438 | | | | — | | | | 82,580,438 | |
| U.S. Treasury Obligations | | | — | | | | 468,027,462 | | | | — | | | | 468,027,462 | |
| Preferred Stocks | | | 9,162,761 | | | | — | | | | — | | | | 9,162,761 | |
| Money Market Funds | | | 11,523,813 | | | | — | | | | — | | | | 11,523,813 | |
| Total | | $ | 20,686,574 | | | $ | 1,711,668,265 | | | $ | — | | | $ | 1,732,354,839 | |
NOTES TO THE FINANCIAL STATEMENTS | JUNE 30, 2024 (UNAUDITED) |
| 3) | Security Valuation and Transactions, continued |
| Intermediate Bond Fund | | Level 1 | | | Level 2 | | | Level 3 | | | Totals | |
| Corporate Bonds* | | $ | — | | | $ | 148,495,715 | | | $ | — | | | $ | 148,495,715 | |
| Collateralized Mortgage Obligations | | | — | | | | 22,381,641 | | | | — | | | | 22,381,641 | |
| Municipal Bonds | | | — | | | | 4,813,564 | | | | — | | | | 4,813,564 | |
| U.S. Government & Agencies | | | — | | | | 15,283,482 | | | | — | | | | 15,283,482 | |
| U.S. Treasury Obligations | | | — | | | | 106,966,429 | | | | — | | | | 106,966,429 | |
| Preferred Stocks | | | 1,547,558 | | | | — | | | | — | | | | 1,547,558 | |
| Money Market Funds | | | 291,546 | | | | — | | | | — | | | | 291,546 | |
| Total | | $ | 1,839,104 | | | $ | 297,940,831 | | | $ | — | | | $ | 299,779,935 | |
| Short Duration Bond Fund | | Level 1 | | | Level 2 | | | Level 3 | | | Totals | |
| Corporate Bonds* | | $ | — | | | $ | 145,577,075 | | | $ | — | | | $ | 145,577,075 | |
| Collateralized Mortgage Obligations | | | — | | | | 28,962,566 | | | | — | | | | 28,962,566 | |
| Municipal Bonds | | | — | | | | 8,531,718 | | | | — | | | | 8,531,718 | |
| U.S. Government & Agencies | | | — | | | | 13,363,351 | | | | — | | | | 13,363,351 | |
| U.S. Treasury Obligations | | | — | | | | 45,521,334 | | | | — | | | | 45,521,334 | |
| Money Market Funds | | | 294,264 | | | | — | | | | — | | | | 294,264 | |
| Total | | $ | 294,264 | | | $ | 241,956,044 | | | $ | — | | | $ | 242,250,308 | |
| Core Plus Bond Fund | | Level 1 | | | Level 2 | | | Level 3 | | | Totals | |
| Corporate Bonds* | | $ | — | | | $ | 23,876,653 | | | $ | — | | | $ | 23,876,653 | |
| Collateralized Mortgage Obligations | | | — | | | | 8,670,668 | | | | — | | | | 8,670,668 | |
| U.S. Government & Agencies | | | — | | | | 703,210 | | | | — | | | | 703,210 | |
| U.S. Treasury Obligations | | | — | | | | 5,553,035 | | | | — | | | | 5,553,035 | |
| Preferred Stocks | | | 167,960 | | | | — | | | | — | | | | 167,960 | |
| Money Market Funds | | | 412,402 | | | | — | | | | — | | | | 412,402 | |
| Sub-total | | $ | 580,362 | | | $ | 38,803,566 | | | $ | — | | | $ | 39,383,928 | |
| Other Financial Instruments*** | | | 36,838 | | | | — | | | | — | | | | 36,838 | |
| Total | | $ | 617,200 | | | $ | 38,803,566 | | | $ | — | | | $ | 39,420,766 | |
| Municipal Income Fund | | Level 1 | | | Level 2 | | | Level 3 | | | Totals | |
| Municipal Bonds* | | $ | — | | | $ | 169,720,370 | | | $ | — | | | $ | 169,720,370 | |
| Money Market Funds | | | 1,000,545 | | | | — | | | | — | | | | 1,000,545 | |
| Total | | $ | 1,000,545 | | | $ | 169,720,370 | | | $ | — | | | $ | 170,720,915 | |
| * | See Portfolio of Investments for sector classifications. |
| ** | Includes a Russian ADR valued at $0.01 per share by management, given the halting of foreign investors’ ability to sell Russian securities and ADRs. The change in unrealized appreciation (depreciation) of this security that is reflected in the Statement of Operations is $0. Given the insignificance of Level 3 securities, a rollforward of Level 3 activity is not presented. |
| *** | Other financial instruments are futures contracts reflected separately in the Portfolio of Investments, and are reflected at the net unrealized appreciation (depreciation) on futures contracts. |
Other than the Johnson International Fund, no other Fund held Level 3 securities during the period.
NOTES TO THE FINANCIAL STATEMENTS | JUNE 30, 2024 (UNAUDITED) |
Pandemics and other wide-spread public health events can result in significant disruptions to economies and markets, adversely impacting individual companies, sectors, industries, currencies, interest and inflation rates, credit ratings, and investor sentiment. The duration and extent of such events cannot be reasonably estimated. Governmental responses to these events may negatively impact the capabilities of the Funds’ service providers and disrupt the Funds’ operations. These events may result in substantial market volatility and may adversely impact the prices and liquidity of a Fund’s investments.
| 5) | Investment Advisory Agreement, 12b-1 Fees and Shareholder Servicing Fees: |
The Funds incurred management fees for the six months ended June 30, 2024, as indicated below:
| Fund | | Fee | | | Management
Fee | | | Payable as of
June 30,
2024 | |
| Equity Income Fund | | 0.75% | | | $ | 2,353,548 | | | $ | 391,475 | |
| Opportunity Fund | | 0.90% | | | | 654,224 | | | | 113,935 | |
| International Fund | | 1.00% | | | | 120,529 | | | | 19,679 | |
| Enhanced Return Fund | | 0.35% | | | | 457,017 | | | | 78,432 | |
| Core Bond Fund | | 0.30% | | | | 2,506,196 | | | | 356,105 | |
| Intermediate Fund | | 0.30% | | | | 411,413 | | | | 61,889 | |
| Short Duration Bond Fund | | 0.30% | | | | 317,677 | | | | 50,102 | |
| Core Plus Bond Fund | | 0.45% | | | | 76,422 | | | | 14,733 | |
| Municipal Income Fund | | 0.30% | | | | 263,055 | | | | 42,604 | |
The Short Duration, Intermediate and Core Bond Funds F share classes also incur 12b-1 fee at the annual rate of 0.25% (before the contractual waiver described below) of the Fund’s average daily net assets, which is accrued daily and paid monthly.
The Adviser has agreed to waive a part of the management fee for the Short Duration, Intermediate and Core Bond Funds from a maximum of 0.30% to an effective fee ratio of 0.25%, unchanged from the prior period. In addition, the Adviser has agreed to waive a part of the 12b-1 fee from a maximum of 0.25% to an effective annual rate of 0.15%. The Adviser has the right to remove this fee waiver any time after April 30, 2025. These waivers are not subject to recoupment.
For the Core Plus Bond Fund, the Adviser had contractually agreed to waive management fees and/or to reimburse expenses to limit Fund expenses, at least until April 30, 2024, so that the total annual operating expenses (exclusive of any front-end or contingent deferred loads; brokerage fees and commissions, acquired fund fees and expenses; fees and expenses associated with investments in other collective investment vehicles or derivative instruments (including for example option and swap fees and expenses); borrowing costs (such as interest and dividend expense on securities sold short); taxes; and extraordinary expenses, such as litigation expenses (which may include indemnification of Fund officers and Trustees, contractual indemnification of Fund service providers (other than the adviser)) of the Fund did not exceed 0.45% of the Fund’s average daily net assets. Fee waivers and expense reimbursements were subject to possible recoupment from the Fund in future years on a rolling three-year basis (within the three years from the date in which the fees were waived or reimbursed) if such recoupment could be achieved within the foregoing expense limit and any expense limitation in place at the time of recoupment. The Adviser did not intend to recoup these waived amounts. Effective May 1, 2024, the Adviser has contractually agreed to change the expense arrangement to a unitary fee arrangement, with a limit of 0.45% per year. The Adviser will cover all expenses in excess of the management fee.
The Equity Income, Opportunity and Core Bond Funds S Shares classes also incur shareholder servicing fees at the annual rate of 0.25% of each Fund’s average daily net assets, attributable to the Class, which is accrued daily.
NOTES TO THE FINANCIAL STATEMENTS | JUNE 30, 2024 (UNAUDITED) |
| 5) | Investment Advisory Agreement, 12b-1 Fees and Shareholder Servicing Fees, continued |
As of June 30, 2024, the remaining cumulative unreimbursed amount paid and/or waived by the Adviser on behalf of the Core Plus Fund was $348,176. The Adviser may recapture a portion of the above amount no later than the dates as stated below:
| | | Expires | | | Expires | | | Expires | | | Expires | | | | |
| Fund | | 12/31/24 | | | 12/31/25 | | | 12/31/26 | | | 6/30/2027 | | | Total | |
| Core Plus Bond Fund | | $ | 12,347 | | | $ | 104,225 | | | $ | 155,011 | | | $ | 76,593 | | | $ | 348,176 | |
| 6) | Related Party Transactions: |
All officers and one Trustee of the Trust are employees of the Adviser. Total compensation for the Independent Trustees as a group was $75,000 for the six months ended June 30, 2024, which was paid by the Adviser, and as a group they received no additional compensation from the Trust. The Trust consists of nine Funds: Johnson Equity Income Fund, Johnson Opportunity Fund, Johnson International Fund, Johnson Enhanced Return Fund, Johnson Institutional Core Bond Fund, Johnson Institutional Intermediate Bond Fund, Johnson Institutional Short Duration Bond Fund, Johnson Core Plus Bond Fund, and Johnson Municipal Income Fund. The Adviser is not a registered broker-dealer of securities and thus does not receive commissions on trades made on behalf of the Funds. The beneficial ownership, either directly or indirectly, of more than 25% of the voting securities of a fund creates a presumption of control of the Fund, under Section 2(a)(9) of the Investment Company Act of 1940. As of June 30, 2024, the following are identified as having an ownership of more than 25%:
| Equity Income Fund | | | | |
| Client accounts managed by the Adviser and held by Charles Schwab & Co. | | | 76.96 | % |
| Opportunity Fund | | | | |
| Client accounts managed by the Adviser and held by Charles Schwab & Co. | | | 72.07 | % |
| International Fund | | | | |
| Client accounts managed by the Adviser and held by Charles Schwab & Co. | | | 34.05 | % |
| Enhanced Return Fund: | | | | |
| Client accounts managed by the Adviser and held by Charles Schwab & Co. | | | 98.25 | % |
| Intermediate Bond Fund: | | | | |
| Covenant Trust Company | | | 33.01 | % |
| Client accounts managed by the Adviser and held by Charles Schwab & Co. | | | 26.45 | % |
| Short Duration Bond Fund: | | | | |
| Covenant Trust Company | | | 43.26 | % |
| Core Plus Bond Fund: | | | | |
| Client accounts managed by the Adviser and held by Charles Schwab & Co. | | | 70.25 | % |
| Saxon & Co. (for the benefit of its customers) | | | 29.74 | % |
| Municipal Income Fund | | | | |
| Client accounts managed by the Adviser and held by Charles Schwab & Co. | | | 97.67 | % |
Johnson Financial, Inc. is a wholly-owned subsidiary of Johnson Investment Counsel, Inc., the Adviser. Johnson Financial, Inc. provided transfer agency and administration services to the Funds until March 31, 2023. These services were paid for by the Adviser.
Ultimus Fund Solutions, LLC (“Ultimus”) provides fund accounting services, administration services, and transfer agency services to the Funds. All services are paid for by the Adviser, except as relates to the Core Plue Bond Fund.
NOTES TO THE FINANCIAL STATEMENTS | JUNE 30, 2024 (UNAUDITED) |
| 7) | Purchases and Sales of Securities: |
For the six months ended June 30, 2024, purchases and sales of investment securities aggregated (excluding in-kind subscriptions):
| | | Investment Securities Other Than
Short-Term Investments and
U.S. Government Obligations | | | U.S. Government Obligations | |
| Fund | | Purchases | | | Sales | | | Purchases | | | Sales | |
| Equity Income Fund | | $ | 46,208,269 | | | $ | 59,260,773 | | | $ | — | | | $ | — | |
| Opportunity Fund | | | 27,638,336 | | | | 10,562,873 | | | | — | | | | — | |
| International Fund | | | 1,135,390 | | | | 2,542,444 | | | | — | | | | — | |
| Enhanced Return Fund | | | 42,758,946 | | | | 30,183,795 | | | | 23,551,053 | | | | 12,499,023 | |
| Core Bond Fund | | | 187,413,634 | | | | 72,046,644 | | | | 186,973,769 | | | | 139,712,378 | |
| Intermediate Bond Fund | | | 52,035,060 | | | | 17,278,454 | | | | 45,090,760 | | | | 22,416,552 | |
| Short Duration Bond Fund | | | 50,087,424 | | | | 26,735,723 | | | | 30,186,192 | | | | 13,130,422 | |
| Core Plus Bond Fund | | | 15,666,831 | | | | 1,961,872 | | | | 11,400,040 | | | | 6,634,482 | |
| Municipal Income Fund | | | 17,038,773 | | | | 15,572,277 | | | | — | | | | — | |
The Equity Income Fund, Opportunity Fund, International Fund, Enhanced Return Fund, Short Duration Bond Fund, Intermediate Bond Fund, Core Bond Fund, Core Plus Bond Fund, and Municipal Income Fund each has an unsecured line of credit through April 27, 2025 with U.S. Bank National Association, up to 33.3% of its net assets, with a total maximum borrowing limit of $60,000,000 for the Trust.
Borrowings under the agreement bear interest at the Prime lending rate which was 8.5% as of June 30, 2024. During the six months ended June 30, 2024, the International Fund borrowed from the line for two (2) calendar days in the amount of $110,000. During the six months ended June 30, 2024, the Core Bond Fund incurred $52 of interest expense and fees related to the borrowings. The average debt outstanding and average interest rate for the days with borrowings during the six months ended June 30, 2024 were $110,000 and 8.50%. There were no borrowings for any of the other Funds at any time during the six month period.
The preparation of financial statements in conformity with accounting principles generally accepted in the United States of America requires management to make estimates and assumptions that affect the reported amounts of assets and liabilities and disclosure of contingent assets and liabilities at the date of the financial statements and the reported amounts of revenues and expenses during the reporting period. Actual results could differ from those estimates.
In the normal course of business, the Trust, on behalf of the Funds, enters into contracts that provide general indemnifications. The Funds’ maximum exposure under these arrangements is dependent on claims that may be made against the Funds in the future and, therefore, cannot be estimated; however, based on experience, the risk of material loss from such claims is considered remote.
| 11) | In-Kind Subscription Transactions |
During the six-months ended June 30, 2024, the Core Bond Fund, Class I received securities in lieu of cash for a shareholder purchase. The purchase was as follows:
| Fund | | Date | | | Amount
Purchased | | | Securities
Received | | | Shares Issued | |
| Core Plus Bond Fund | | 06/10/24 | | | $ | 14,591,696 | | | $ | 14,591,696 | | | | 1,035,626 | |
NOTES TO THE FINANCIAL STATEMENTS | JUNE 30, 2024 (UNAUDITED) |
Subsequent events after the date of the Statements of Assets and Liabilities have been evaluated through the date the financial statements were issued. Management has concluded that there is no impact requiring adjustment to or disclosure in the financial statements except for the following:
| | | | | | | | Per Share | |
| | | Record Date | | Ex-Date | | | Ordinary Income | |
| Core Bond Fund | | | | | | | | | |
| Class I | | 7/26/24 | | 7/29/24 | | | $ | 0.0470 | |
| Class F | | 7/26/24 | | 7/29/24 | | | $ | 0.0460 | |
| Class S | | 7/26/24 | | 7/29/24 | | | $ | 0.0440 | |
| Intermediate Bond Fund | | | | | | | | | |
| Class I | | 7/26/24 | | 7/29/24 | | | $ | 0.0470 | |
| Class F | | 7/26/24 | | 7/29/24 | | | $ | 0.0460 | |
| Short Duration Bond Fund | | | | | | | | | |
| Class I | | 7/26/24 | | 7/29/24 | | | $ | 0.0420 | |
| Class F | | 7/26/24 | | 7/29/24 | | | $ | 0.0410 | |
| Core Plus Bond Fund | | 7/26/24 | | 7/29/24 | | | $ | 0.0480 | |
ADDITIONAL INFORMATION | JUNE 30, 2024 (UNAUDITED) |
PROXY DISCLOSURE
A description of the policies and procedures that the Funds use to determine how to vote proxies relating to portfolio securities and information regarding how the Funds voted those proxies during the most recent 12-month period ended December 31 are available without charge: (1) upon request by calling the Funds at 513-661-3100 or toll free at 1-800-541-0170; or (2) from the Fund’s documents filed with the Securities and Exchange Commission (“SEC”) on the SEC’s website at www.sec.gov.
AVAILABILITY OF SCHEDULES OF PORTFOLIO INVESTMENTS:
The Funds file their complete schedules of portfolio holdings with the SEC for the first and third quarters of each fiscal year at www.johnsonmutualfunds.com or on Form N-PORT. The Funds’ holdings are available, without charge, (1) upon request by calling the Funds at 513-661-3100 or toll free at 1-800-541-0170; (2) by visiting www.johnsonmutualfunds.com; or (3) from the Fund’s documents filed with the Securities and Exchange Commission (“SEC”) on the SEC’s website at www.sec.gov.
CODE OF ETHICS
The Trust’s Code of Ethics is available on request without charge; please call for your copy at 513-661-3100 or 1-800-541-0170 or write us at:
Johnson Mutual Funds
3777 West Fork Road
Cincinnati OH 45247
| MANAGEMENT AGREEMENT BETWEEN JOHNSON MUTUAL FUNDS AND JOHNSON INVESTMENT COUNSEL, INC. |
The Trustees, including the Trustees who are not “interested persons” of the Trust (the “Independent Trustees”), then considered the renewal of the Management Agreements between the Trust and the Adviser. The Trustees were assisted by experienced independent legal counsel throughout the contract review process. The Independent Trustees discussed the proposed continuance in executive session with such counsel at which no representatives of the Adviser were present. The Independent Trustees relied upon the advice of independent legal counsel and their own business judgment in determining the material factors to be considered in evaluating the Management Agreements and the weight to be given to each such factor. Among other factors, the Trustees considered (i) the investment performance of each Fund and the Adviser; (ii) the nature, extent and quality of the services provided by the Adviser; (iii) the cost of services provided and the profits to be realized by the Adviser and its affiliates from the relationship with the Funds; and (iv) economies of scale. The conclusions reached by the Independent Trustees were based on a comprehensive evaluation of all the information provided and were not the result of any one factor. Additionally, each Independent Trustee may have afforded different weight to the various factors in reaching his or her conclusions with respect to the Management Agreements.
The Trustees evaluated the Adviser’s responses and information prepared by the Adviser in the board materials, noting the Adviser’s financial resources, its personnel and operations, advisory, administrative and compliance services provided by the Adviser to the Funds, and the overall compensation received for management services. The Board considered and discussed each Fund’s performance for various periods, the profitability of the Adviser with respect to each of the Funds and economies of scale.
With respect to the nature, extent and quality of services provided by the Adviser, the Trustees reviewed the information describing the Adviser’s business and personnel and discussed the Adviser’s extensive experience and resources. The Board noted that the Adviser has been providing services to the Trust since 1992. The Trustees and representatives of the Adviser noted the continuance of their cooperative working relationship on Fund matters. The Board reviewed the individuals who serve as portfolio managers for the Funds and indicated that they continued to be satisfied with the portfolio management being provided to the Funds. The Trustees then discussed the Adviser’s and Trust’s compliance programs with the Trust’s chief compliance officer. A representative of the Adviser discussed the Adviser’s financial status and reviewed the Adviser’s resources in providing services to the Funds. The Trustees, including the Independent Trustees, concluded that the nature and extent of services provided by the Adviser was satisfactory, and that the overall quality of services was excellent. The Trustees also concluded that the Adviser had the appropriate level of resources to continue to provide quality advisory services to the Funds.
Next, the Trustees discussed the performance information provided by the Adviser for each of the Funds. The Trustees considered performance data showing each Fund’s performance for various periods ended March 31, 2024 and year-to-date as compared to each Fund’s benchmark index. The Board noted the Adviser’s expectations as to each Fund’s risk/return profile.
The Trustees considered and discussed the performance of the Equity Income, Opportunity, International, and Municipal Income Funds. The Trustees noted that the Equity Income Fund had trailed the S&P 500 Index for the 1-year period and was trailing the Index for the 3 and 5-year periods. With respect to the Opportunity Fund, the Trustees noted that the Fund had outperformed the Russell 2500 Total Return Index for the 1, 3 and 5-year periods. The Trustees next reviewed the International Fund’s performance, which slightly trailed its benchmark, the MSCI All Country World Index excluding the USA, for the 1-year period, and was outperforming with each of the 3 and 5-year periods. The Trustees then discussed the Municipal Income Fund’s returns, noting that the Fund had underperformed the Bloomberg Municipal Bond Index for the 1-year, 3-year and 5-year periods. After discussion, the Trustees agreed that the performance of each of these Funds was satisfactory.
The Trustees considered the performance of each of the Institutional Funds. They noted that the Short Duration Bond Fund had generally performed in line with its benchmark, the ICE BofA U.S. Corporate & Government 1-3 Year Index, for 3 and 5-year periods and outperformed for the 1-year period. Next, the Trustees discussed the performance of the Intermediate Bond Fund, noting that it has outperformed the Bloomberg Intermediate Government/Credit Index for the 1-year period and was generally in line for the 3 and 5-year periods. With respect to the Core Bond Fund, the Board noted that the Fund had underperformed the Bloomberg U.S. Aggregate Bond Index for the 1 and 3-year periods but had slightly outperformed for the 5-year period. The Trustees next evaluated the performance for the Enhanced Return Fund. The Board reviewed its performance, noting that the Enhanced Return Fund had underperformed the S&P 500 Index for the 1, 3 and 5-year periods. Finally, the Board reviewed the performance for the Core Plus
| MANAGEMENT AGREEMENT BETWEEN JOHNSON MUTUAL FUNDS AND JOHNSON INVESTMENT COUNSEL, INC. |
Bond Fund, noting that it underperformed its benchmark, the Bloomberg Aggregate Bond index, for the 1-year period, the only period available for this Fund. After discussion, the Trustees indicated that it was their consensus all five Institutional Funds continued to have reasonable performance given their respective investment objectives, risks and strategies.
As to the cost of the services provided and the profits realized by the Adviser from the relationship with the Funds, the Trustees reviewed the fees paid to the Adviser for the year ended December 31, 2023 by each of the Funds. As in past years, the Board and counsel discussed that the total expense ratio for each Fund (with the exception of Core Plus) was a more meaningful comparison than the actual advisory fee because the Management Agreements for the Funds have a unitary fee structure which requires the Adviser to pay substantially all of the operating expenses of each Fund and is compensated with a single fee (noting that most of the funds in the Peer Group comparisons do not share this structure). The expense ratios for Municipal Income Fund, Short Duration Bond Fund, Intermediate Bond Fund, Opportunity Fund, Core Bond Fund, Equity Income Fund, International Fund, and Enhanced Return Fund were below the mean of each Fund’s respective category. The Trustees noted the contractual fee waivers which were in effect during the period for the Short Duration Bond Fund, the Intermediate Bond Fund and the Core Bond Fund, as well as the overall fees paid to the Adviser by each Fund for the period. The Trustees also discussed the profitability of each of the Funds to the Adviser and the profitability of the Adviser with respect to the Funds in the aggregate. Representatives of the Adviser reported on the Adviser’s profitability on a fund-by-fund basis and discussed their methodologies in determining the profitability of the Adviser. The Trustees, including the Independent Trustees, concluded that the Management Fee payable by each Fund was reasonable and that the Adviser’s level of profitability from its relationship with the Funds is not excessive.
The Trustees then considered economies of scale. The Trustees noted that they concluded that the Funds’ expense ratios were not unreasonable and that there were no excessive profits being derived from any of the Funds by the Adviser as a result of its management of each of the Funds. The Board further noted that they would continue to evaluate the Funds’ expense ratios with the Adviser. The Board also noted that the Adviser had agreed to extend its contractual fee waiver with respect to the Core Bond, Short Duration and Intermediate Bond Funds for another year. The Trustees and representatives from the Adviser again agreed to discuss the possibility of fee breakpoints in the future, depending on the asset level of a Fund. After a discussion, the Trustees agreed that they would continue to evaluate the potential for establishing breakpoints with the Adviser, but that no breakpoints are necessary at this time.
After a discussion, the Trustees concluded and agreed, including all Independent Trustees, that renewal of each Management Agreement was in the best interests of each Fund and its shareholders.
[THIS PAGE INTENTIONALLY LEFT BLANK]
[THIS PAGE INTENTIONALLY LEFT BLANK]
| Trustees and Officers |
| | | |
| Dale Coates | | Independent Trustee, Chairman |
| Timothy E. Johnson | | Interested Trustee |
| Jonathan Adams | | Independent Trustee |
| James J. Berrens | | Independent Trustee |
| John R. Green | | Independent Trustee |
| Julie Murphy | | Independent Trustee |
| Jeri B. Ricketts | | Independent Trustee |
| Gregory Simpson | | Independent Trustee |
| | | |
| Jason Jackman | | President |
| Marc E. Figgins | | Vice President |
| Scott J. Bischoff | | Chief Compliance Officer |
| Jennifer J. Kelhoffer | | Secretary/Treasurer |
| Transfer Agent and Fund Accountant |
| |
| Ultimus Fund Solutions, LLC |
| 225 Pictoria Drive, Suite 450 |
| Cincinnati, Ohio 45246 |
| |
| Custodian |
| |
| US Bank |
| 425 Walnut Street |
| Cincinnati, OH 45202 |
| |
| Independent Registered Public Accounting Firm |
| |
| Cohen & Company, Ltd. |
| 1350 Euclid Avenue, Suite 800 |
| Cleveland, Ohio 44115 |
| |
| Legal Counsel |
| |
| Thompson Hine LLP |
| 312 Walnut Street, 14th Floor |
| Cincinnati, Ohio 45202 |
This report is authorized for distribution to prospective investors only when accompanied or preceded
by the Funds’ prospectus, which illustrates each Fund’s objectives, policies, management fees,
and other information that may be helpful in making an investment decision.
Investment Company Act #811-7254
| Item 8. | Changes in and Disagreements with Accountants for Open-End Management Investment Companies. |
Not applicable
| Item 9. | Proxy Disclosures for Open-End Management Investment Companies. |
Not applicable [filed under item 7]
| Item 10. | Remuneration Paid to Directors, Officers, and Others of Open-End Management Investment Companies. |
Included under Item 7
| Item 11. | Statement Regarding Basis for Approval of Investment Advisory Contract. |
Not applicable [included under Item 7 if applicable]
| Item 12. | Disclosure of Proxy Voting Policies and Procedures for Closed-End Management Investment Companies. |
Not applicable
| Item 13. | Portfolio Managers of Closed-End Management Investment Companies. |
Not applicable
| Item 14. | Purchases of Equity Securities by Closed-End Management Investment Company and Affiliated Purchasers. |
Not applicable
| Item 15. | Submission of Matters to a Vote of Security Holders. |
The registrant has not adopted procedures by which shareholders may recommend nominees to the registrant’s board of trustees.
| Item 16. | Controls and Procedures. |
| (a) | Based on their evaluation of the registrant’s disclosure controls and procedures (as defined in Rule 30a-3(c) under the Investment Company Act of 1940) as of a date within 90 days of the filing date of this report, the registrant’s principal executive officer and principal financial officer have concluded that such disclosure controls and procedures are reasonably designed and are operating effectively to ensure that material information relating to the registrant, including its consolidated subsidiaries, is made known to them by others within those entities, particularly during the period in which this report is being prepared, and that the information required in filings on Form N-CSR is recorded, processed, summarized, and reported on a timely basis. |
| (b) | There were no changes in the registrant’s internal control over financial reporting (as defined in Rule 30a-3(d) under the Investment Company Act of 1940) that occurred during the period covered by this report that have materially affected, or are reasonably likely to materially affect, the registrant’s internal control over financial reporting. |
| Item 17. | Disclosure of Securities Lending Activities for Closed-End Management Investment Companies. |
Not applicable
| Item 18. | Recovery of Erroneously Awarded Compensation. |
File the exhibits listed below as part of this Form. Letter or number the exhibits in the sequence indicated.
| (a)(1) | Any code of ethics, or amendment thereto, that is the subject of the disclosure required by Item 2, to the extent that the registrant intends to satisfy the Item 2 requirements through filing of an exhibit: Not required |
| (2) | Change in the registrant’s independent public accountant: Not applicable |
SIGNATURES
Pursuant to the requirements of the Securities Exchange Act of 1934 and the Investment Company Act of 1940, the registrant has duly caused this report to be signed on its behalf by the undersigned, thereunto duly authorized.
| Johnson Mutual Funds Trust | |
| | | |
| By: | /s/ Jason O. Jackman | |
| | Jason O. Jackman, President and Chief Executive Officer | |
| Date | September 4, 2024 | | |
Pursuant to the requirements of the Securities Exchange Act of 1934 and the Investment Company Act of 1940, this report has been signed below by the following persons on behalf of the registrant and in the capacities and on the dates indicated.
| By: | /s/ Jason O. Jackman | |
| | Jason O. Jackman, President and Chief Executive Officer | |
| Date | September 4, 2024 | | |
| By: | /s/ Jennifer J. Kelhoffer | |
| | Jennifer J. Kelhoffer, Treasurer and Chief Financial Officer | |
| Date | September 4, 2024 | | |
| * | Print the name and title of each signing officer under his or her signature. |