Searchable text section of graphics shown above
Investor Update
Warren Resources, Inc.
[LOGO]
AUGUST 17, 2005
Forward-Looking Statements | [LOGO] |
Cautionary Note to U.S. Investors: This presentation includes “forward- looking statements” within the meaning of Section 27A of the Securities Act of 1933, as amended, and Section 21E of the Securities Exchange Act of 1934, as amended. The opinions, forecasts, projections or other statements, other than statements of historical fact, are forward-looking statements. Although Warren believes that the expectations reflected in such forward-looking statements are reasonable, they can give no assurance that such expectations will prove to have been correct. Additionally, in its filings with the SEC Warren is permitted to disclose only proved reserves, which are reserve estimates that geological and engineering data demonstrate with reasonable certainty to be recoverable in future years from known reservoirs under existing economic and operating conditions. Warren uses certain terms in this presentation, such as “potential”, “possible” and “recoverable” in relation to reserves, which SEC guidelines strictly prohibit from being included in filings with the SEC. Estimates of “potential”, “possible” and “recoverable” reserves which may potentially be recoverable through additional drilling or recovery techniques are by their nature more uncertain than estimates of proved reserves and accordingly are subject to substantially greater risk of not actually being realized by the Company. Investors are urged to consider closely Warren’s disclosure of its proved reserves, along with certain risk factors and uncertainties inherent in its business set forth in its Form 10K for 2004 and other filings with the SEC.
WRES undertakes no obligation, and expressly disclaims any duty, to publicly update any forward looking statements made herein, whether as a result of new information or future events.
2
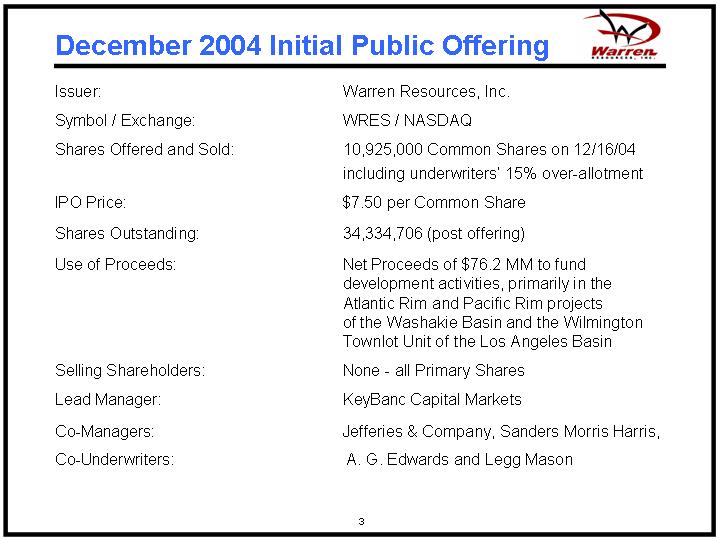
December 2004 Initial Public Offering
Issuer: | | Warren Resources, Inc. |
| | |
Symbol / Exchange: | | WRES / NASDAQ |
| | |
Shares Offered and Sold: | | 10,925,000 Common Shares on 12/16/04 including underwriters’ 15% over-allotment |
| | |
IPO Price: | | $7.50 per Common Share |
| | |
Shares Outstanding: | | 34,334,706 (post offering) |
| | |
Use of Proceeds: | | Net Proceeds of $76.2 MM to fund development activities, primarily in the Atlantic Rim and Pacific Rim projects of the Washakie Basin and the Wilmington Townlot Unit of the
Los Angeles Basin |
| | |
Selling Shareholders: | | None - all Primary Shares |
| | |
Lead Manager: | | KeyBanc Capital Markets |
| | |
Co-Managers: | | Jefferies & Company, Sanders Morris Harris, |
| | |
Co-Underwriters: | | A. G. Edwards and Legg Mason |
3
Key Management
Norman F. Swanton
Chief Executive Officer
Kenneth A. Gobble
Chief Operating Officer
Timothy A. Larkin
Chief Financial Officer
David E. Fleming
Chief Legal and Compliance Officer
Lloyd G. Davies
Chief Executive-Warren E&P
4
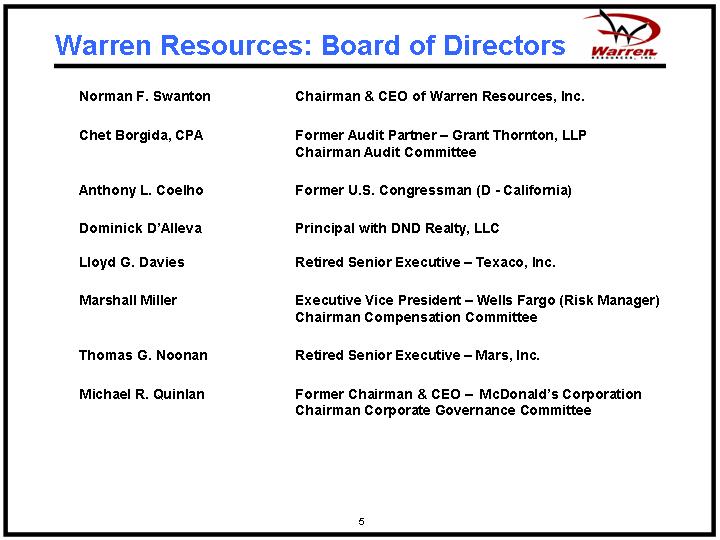
Warren Resources: Board of Directors
Norman F. Swanton | | Chairman & CEO of Warren Resources, Inc. |
| | |
Chet Borgida, CPA | | Former Audit Partner – Grant Thornton, LLP Chairman Audit Committee |
| | |
Anthony L. Coelho | | Former U.S. Congressman (D - California) |
| | |
Dominick D’Alleva | | Principal with DND Realty, LLC |
| | |
Lloyd G. Davies | | Retired Senior Executive – Texaco, Inc. |
| | |
Marshall Miller | | Executive Vice President – Wells Fargo (Risk Manager) Chairman Compensation Committee |
| | |
Thomas G. Noonan | | Retired Senior Executive – Mars, Inc. |
| | |
Michael R. Quinlan | | Former Chairman & CEO – McDonald’s Corporation Chairman Corporate Governance Committee |
5
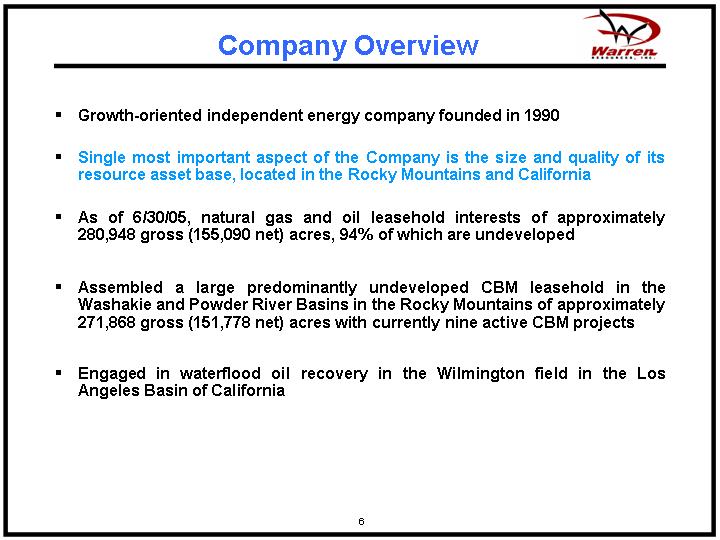
Company Overview
• Growth-oriented independent energy company founded in 1990
• Single most important aspect of the Company is the size and quality of its resource asset base, located in the
Rocky Mountains and California
• As of 6/30/05, natural gas and oil leasehold interests of approximately 280,948 gross (155,090 net) acres, 94% of which are undeveloped
• Assembled a large predominantly undeveloped CBM leasehold in the Washakie and Powder River Basins in the Rocky Mountains of approximately 271,868 gross (151,778 net) acres with currently nine active CBM projects
• Engaged in waterflood oil recovery in the Wilmington field in the Los Angeles Basin of California
6
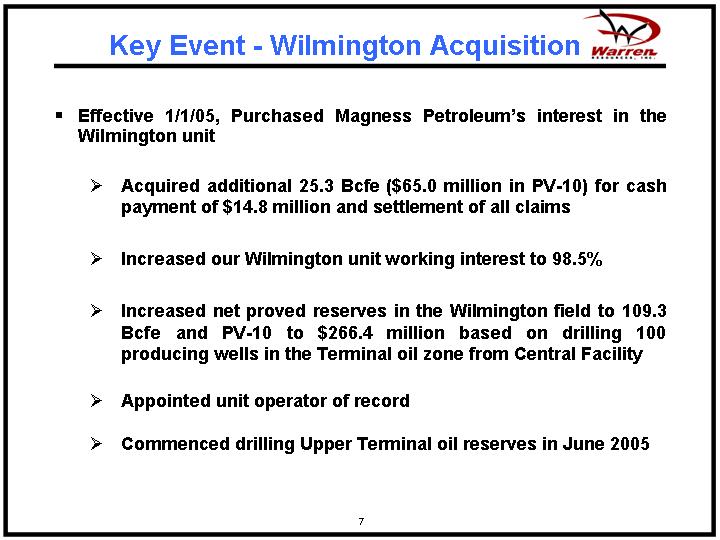
Key Event - Wilmington Acquisition
• Effective 1/1/05, Purchased Magness Petroleum’s interest in the Wilmington unit
• Acquired additional 25.3 Bcfe ($65.0 million in PV-10) for cash payment of $14.8 million and settlement of all claims
• Increased our Wilmington unit working interest to 98.5%
• Increased net proved reserves in the Wilmington field to 109.3 Bcfe and PV-10 to $266.4 million based on drilling 100 producing wells in the Terminal oil zone from Central Facility
• Appointed unit operator of record
• Commenced drilling Upper Terminal oil reserves in June 2005
7
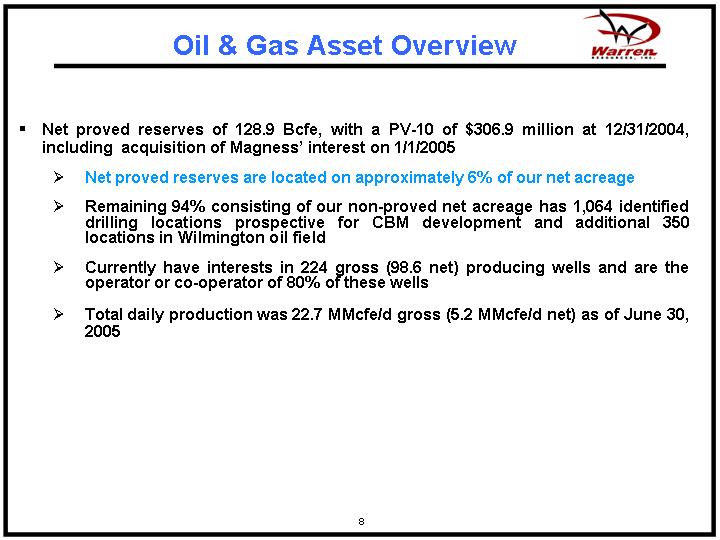
Oil & Gas Asset Overview
• Net proved reserves of 128.9 Bcfe, with a PV-10 of $306.9 million at 12/31/2004, including acquisition of Magness’ interest on 1/1/2005
• Net proved reserves are located on approximately 6% of our net acreage
• Remaining 94% consisting of our non-proved net acreage has 1,064 identified drilling locations prospective for CBM development and additional 350 locations in Wilmington oil field
• Currently have interests in 224 gross (98.6 net) producing wells and are the operator or co-operator of 80% of these wells
• Total daily production was 22.7 MMcfe/d gross (5.2 MMcfe/d net) as of June 30, 2005
8
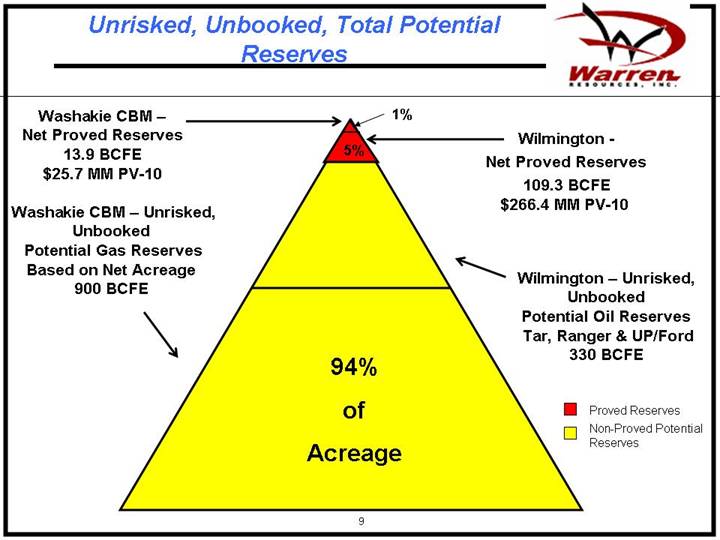
Unrisked, Unbooked, Total Potential Reserves
[CHART]
9
Business Strategy
• Increase proved producing reserves by drilling identified Rocky Mountain CBM and Wilmington locations
• Increase Our Working Interests in Future Wells
• Pursue Selective Acquisitions and Joint Ventures
• Reduce Costs Through Economies of Scale and Efficient Operations
10
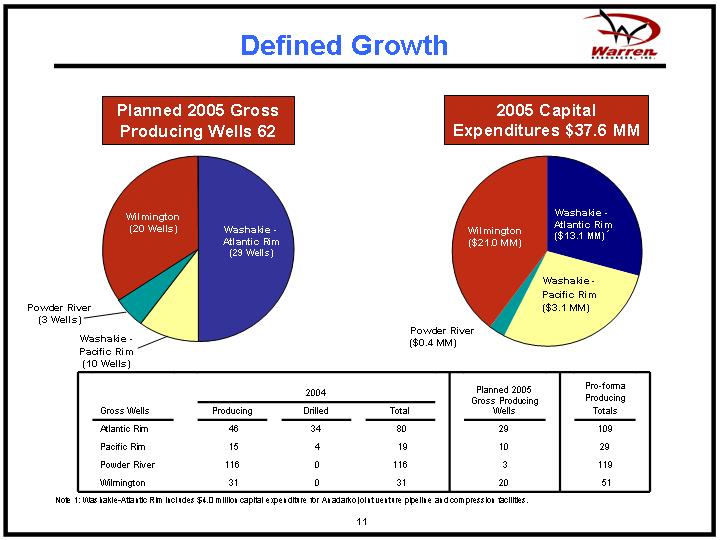
Defined Growth
Planned 2005 Gross
Producing Wells 62 | | 2005 Capital
Expenditures $37.6 MM |
| | |
[CHART] | | [CHART] |
| | 2004 | | Planned 2005
Gross Producing | | Pro-forma
Producing | |
Gross Wells | | Producing | | Drilled | | Total | | Wells | | Totals | |
Atlantic Rim | | 46 | | 34 | | 80 | | 29 | | 109 | |
Pacific Rim | | 15 | | 4 | | 19 | | 10 | | 29 | |
Powder River | | 116 | | 0 | | 116 | | 3 | | 119 | |
Wilmington | | 31 | | 0 | | 31 | | 20 | | 51 | |
Note 1: Washakie-Atlantic Rim includes $4.0 million capital expenditure for Anadarko joint venture pipeline and compression facilities.
11
Operations and Property Overview
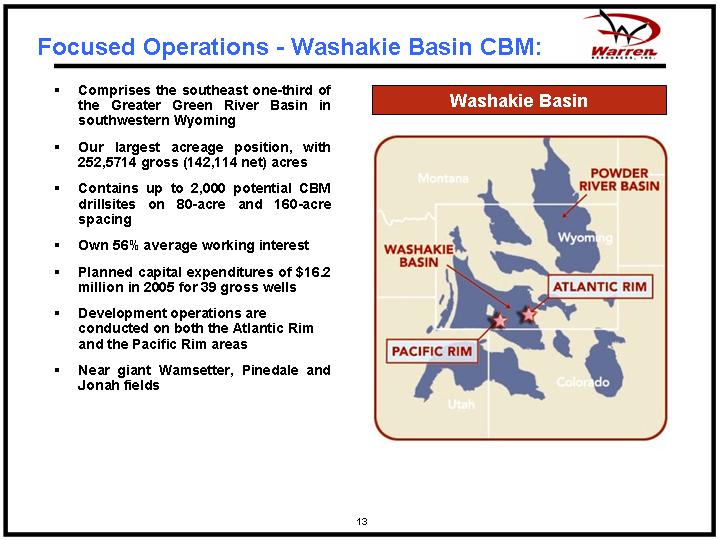
Focused Operations - Washakie Basin CBM:
• Comprises the southeast one-third of the Greater Green River Basin in southwestern Wyoming
• Our largest acreage position, with 252,5714 gross (142,114 net) acres
• Contains up to 2,000 potential CBM drillsites on 80-acre and 160-acre spacing
• Own 56% average working interest
• Planned capital expenditures of $16.2 million in 2005 for 39 gross wells
• Development operations are conducted on both the Atlantic Rim and the Pacific Rim areas
• Near giant Wamsetter, Pinedale and Jonah fields
Washakie Basin
[GRAPHIC]
12
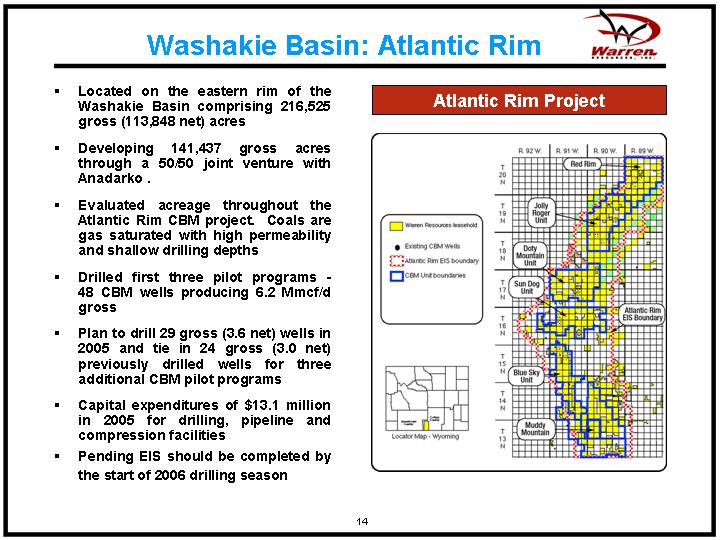
Washakie Basin: Atlantic Rim
• Located on the eastern rim of the Washakie Basin comprising 216,525 gross (113,848 net) acres
• Developing 141,437 gross acres through a 50/50 joint venture with Anadarko .
• Evaluated acreage throughout the Atlantic Rim CBM project. Coals are gas saturated with high permeability and shallow drilling depths
• Drilled first three pilot programs - 48 CBM wells producing 6.2 Mmcf/d gross
• Plan to drill 29 gross (3.6 net) wells in 2005 and tie in 24 gross (3.0 net) previously drilled wells for three additional CBM pilot programs
• Capital expenditures of $13.1 million in 2005 for drilling, pipeline and compression facilities
• Pending EIS should be completed by the start of 2006 drilling season
Atlantic Rim Project
[GRAPHIC]
13
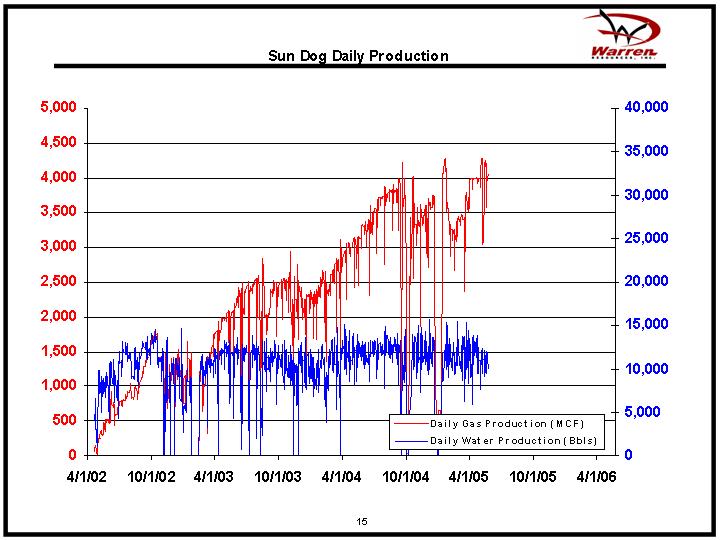
Sun Dog Daily Production
[CHART]
14
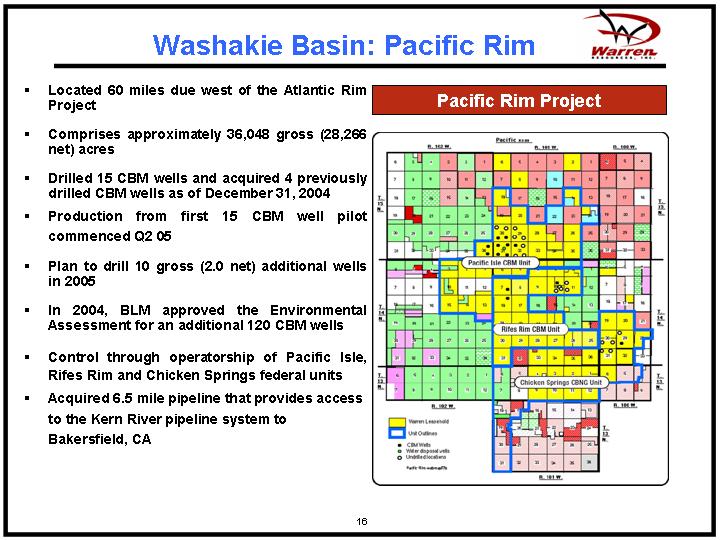
Washakie Basin: Pacific Rim
• Located 60 miles due west of the Atlantic Rim Project
• Comprises approximately 36,048 gross (28,266 net) acres
• Drilled 15 CBM wells and acquired 4 previously drilled CBM wells as of December 31, 2004
• Production from first 15 CBM well pilot commenced Q2 05
• Plan to drill 10 gross (2.0 net) additional wells in 2005
• In 2004, BLM approved the Environmental Assessment for an additional 120 CBM wells
• Control through operatorship of Pacific Isle, Rifes Rim and Chicken Springs federal units
• Acquired 6.5 mile pipeline that provides access to the Kern River pipeline system to Bakersfield, CA
Pacific Rim Project
[GRAPHIC]
15
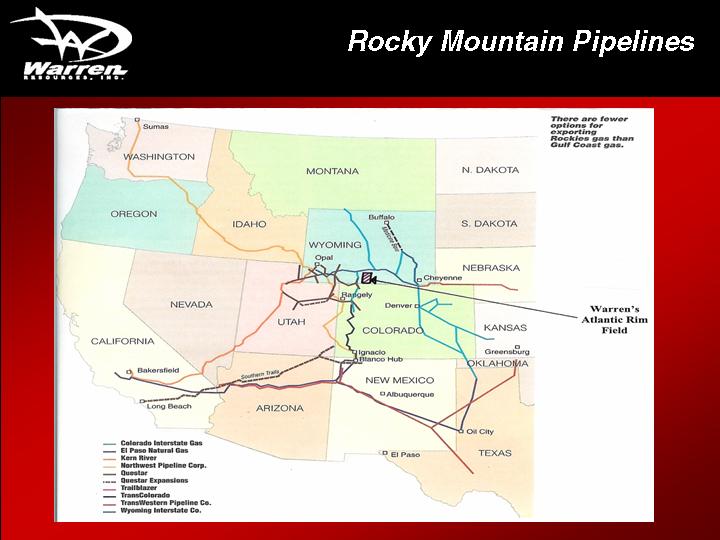
Rocky Mountain Pipelines
[GRAPHIC]
Wilmington Townlot Unit: Oil
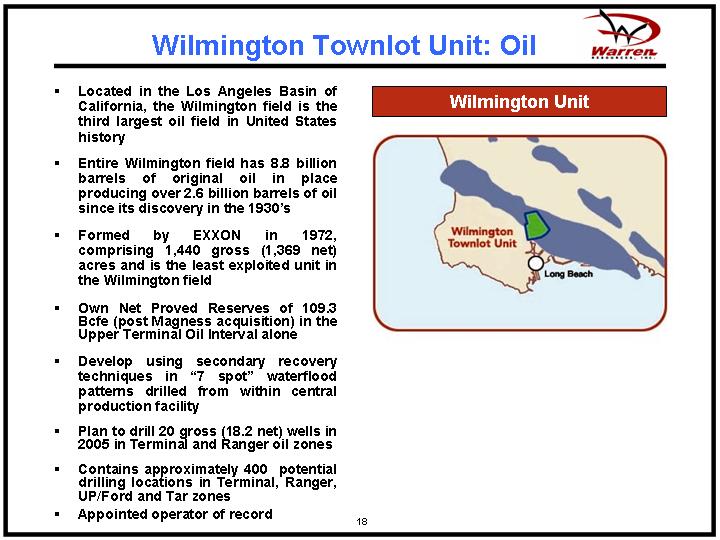
• Located in the Los Angeles Basin of California, the Wilmington field is the third largest oil field in United States history
• Entire Wilmington field has 8.8 billion barrels of original oil in place producing over 2.6 billion barrels of oil since its discovery in the 1930’s
• Formed by EXXON in 1972, comprising 1,440 gross (1,369 net) acres and is the least exploited unit in the Wilmington field
• Own Net Proved Reserves of 109.3 Bcfe (post Magness acquisition) in the Upper Terminal Oil Interval alone
• Develop using secondary recovery techniques in “7 spot” waterflood patterns drilled from within central production facility
• Plan to drill 20 gross (18.2 net) wells in 2005 in Terminal and Ranger oil zones
• Contains approximately 400 potential drilling locations in Terminal, Ranger, UP/Ford and Tar zones
• Appointed operator of record
Wilmington Unit
[GRAPHIC]
16
Pay Zones in the WTU
• | | Tar Interval- Potentially up to 10 million barrels recoverable low gravity oil with steam injection. |
| | |
• | | Ranger Interval - Potentially up to 42 million barrels recoverable medium (17 degree) gravity oil with “7 spot” pattern waterflood. |
| | |
• | | Terminal Interval - Proved undeveloped net reserves of 23 million barrels of medium gravity oil recoverable with 7 spot pattern waterflood. Potential for additional 7 million barrels of oil. |
| | |
• | | Ford Interval - Potentially up to 10 million barrels of 28 gravity oil recoverable with pattern waterflood. |
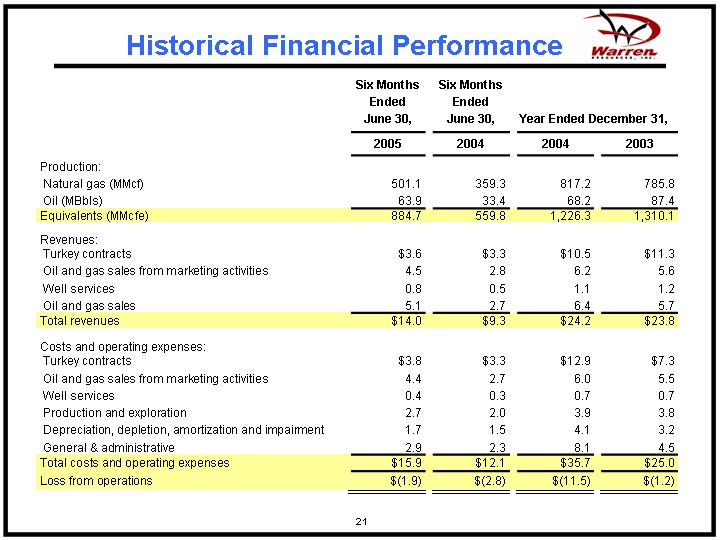
Historical Financial Performance
| | Six Months
Ended
June 30, | | Six Months
Ended
June 30, | | Year Ended December 31, | |
| | 2005 | | 2004 | | 2004 | | 2003 | |
Production: | | | | | | | | | |
Natural gas (MMcf) | | 501.1 | | 359.3 | | 817.2 | | 785.8 | |
Oil (MBbls) | | 63.9 | | 33.4 | | 68.2 | | 87.4 | |
Equivalents (MMcfe) | | 884.7 | | 559.8 | | 1,226.3 | | 1,310.1 | |
| | | | | | | | | |
Revenues: | | | | | | | | | |
Turkey contracts | | $ | 3.6 | | $ | 3.3 | | $ | 10.5 | | $ | 11.3 | |
Oil and gas sales from marketing activities | | 4.5 | | 2.8 | | 6.2 | | 5.6 | |
Well services | | 0.8 | | 0.5 | | 1.1 | | 1.2 | |
Oil and gas sales | | 5.1 | | 2.7 | | 6.4 | | 5.7 | |
Total revenues | | $ | 14.0 | | $ | 9.3 | | $ | 24.2 | | $ | 23.8 | |
| | | | | | | | | |
Costs and operating expenses: | | | | | | | | | |
Turkey contracts | | $ | 3.8 | | $ | 3.3 | | $ | 12.9 | | $ | 7.3 | |
Oil and gas sales from marketing activities | | 4.4 | | 2.7 | | 6.0 | | 5.5 | |
Well services | | 0.4 | | 0.3 | | 0.7 | | 0.7 | |
Production and exploration | | 2.7 | | 2.0 | | 3.9 | | 3.8 | |
Depreciation, depletion, amortization and impairment | | 1.7 | | 1.5 | | 4.1 | | 3.2 | |
General & administrative | | 2.9 | | 2.3 | | 8.1 | | 4.5 | |
Total costs and operating expenses | | $ | 15.9 | | $ | 12.1 | | $ | 35.7 | | $ | 25.0 | |
Loss from operations | | $ | (1.9 | ) | $ | (2.8 | ) | $ | (11.5 | ) | $ | (1.2 | ) |
21
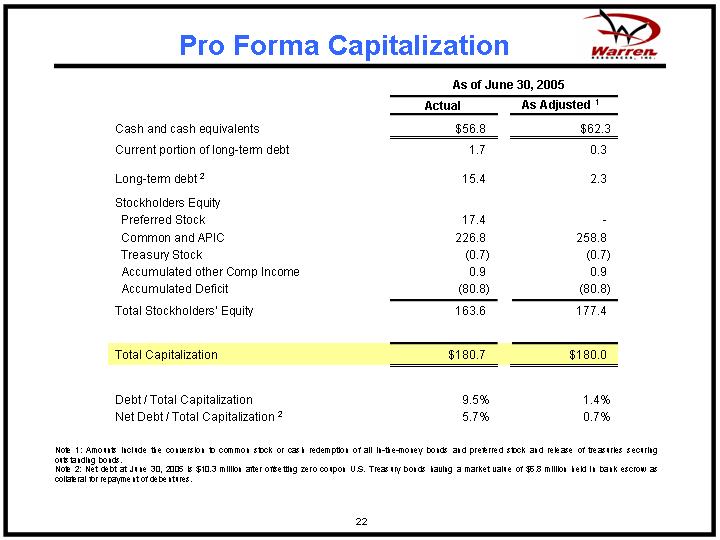
Pro Forma Capitalization
| | As of June 30, 2005 | |
| | Actual | | As Adjusted (1) | |
Cash and cash equivalents | | $ | 56.8 | | $ | 62.3 | |
Current portion of long-term debt | | 1.7 | | 0.3 | |
| | | | | |
Long-term debt (2) | | 15.4 | | 2.3 | |
Stockholders Equity | | | | | |
Preferred Stock | | 17.4 | | — | |
Common and APIC | | 226.8 | | 258.8 | |
Treasury Stock | | (0.7 | ) | (0.7 | ) |
Accumulated other Comp Income | | 0.9 | | 0.9 | |
Accumulated Deficit | | (80.8 | ) | (80.8 | ) |
Total Stockholders’ Equity | | 163.6 | | 177.4 | ) |
| | | | | |
Total Capitalization | | $ | 180.7 | | $ | 180.0 | |
| | | | | |
Debt / Total Capitalization | | 9.5 | % | 1.4 | % |
Net Debt / Total Capitalization (2) | | 5.7 | % | 0.7 | % |
Note 1: Amounts include the conversion to common stock or cash redemption of all in-the-money bonds and preferred stock and release of treasuries securing outstanding bonds.
Note 2: Net debt at June 30, 2005 is $10.3 million after offsetting zero coupon U.S. Treasury bonds having a market value of $6.8 million held in bank escrow as collateral for repayment of debentures.
22
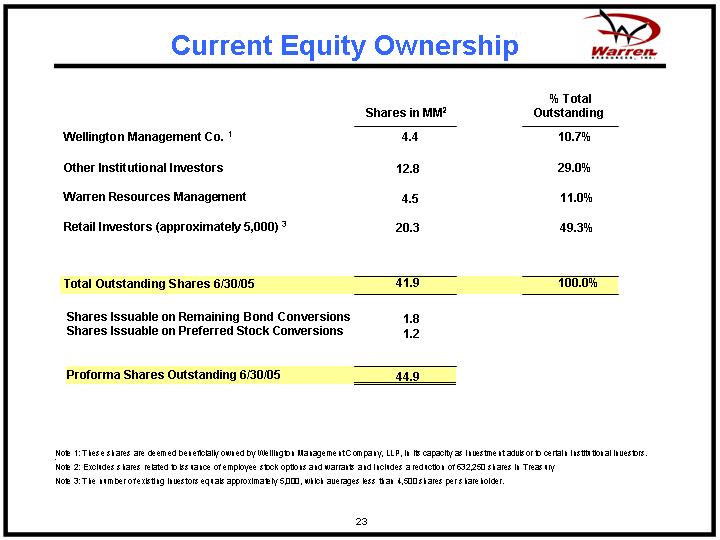
Current Equity Ownership
| | | | % Total | |
| | Shares in MM(2) | | Outstanding | |
Wellington Management Co. (1) | | 4.4 | | 10.7 | % |
| | | | | |
Other Institutional Investors | | 12.8 | | 29.0 | % |
| | | | | |
Warren Resources Management | | 4.5 | | 11.0 | % |
| | | | | |
Retail Investors (approximately 5,000) (3) | | 20.3 | | 49.3 | % |
| | | | | |
Total Outstanding Shares 6/30/05 | | 41.9 | | 100.0 | % |
| | | | | |
Shares Issuable on Remaining Bond Conversions | | 1.8 | | | |
Shares Issuable on Preferred Stock Conversions | | 1.2 | | | |
| | | | | |
Proforma Shares Outstanding 6/30/05 | | 44.9 | | | |
Note 1: These shares are deemed beneficially owned by Wellington Management Company, LLP, in its capacity as investment advisor to certain Institutional investors.
Note 2: Excludes shares related to issuance of employee stock options and warrants and includes a reduction of 632,250 shares in Treasury
Note 3: The number of existing investors equals approximately 5,000, which averages less than 4,500 shares per shareholder.
23
Investment Recap
• Large, High Quality Asset Base
• Substantial Rocky Mountain Undeveloped CBM Acreage Position
• Net proved reserves of 13.9 Bcfe with net PV-10 of $25.7 million on 6,766 net acres in Washakie Basin
• Undeveloped position of 260,212 gross, 145,130 net, acres containing over 1,049 identified (2,000 potential) CBM drilling locations with large potential gas reserves
• Wilmington Townlot Unit Post Acquisition
• Net proved reserves of 109.3 Bcfe with net PV-10 value of $266.4 million plus 3 zones <6,000 feet with additional potential oil reserves
• Ownership of 98.5% of the Wilmington Unit with potential for additional 400 wells - 20 new development wells planned in 2005
• Total pro-forma PV-10 of $306.9 million based on 6% of net acreage
• Experienced Technical Team to Execute Plan
• Incentivized Management - Stock Ownership
24