Exhibit 99.1
Link to searchable text of slide shown above

Link to searchable text of slide shown above

Link to searchable text of slide shown above
Link to searchable text of slide shown above
Link to searchable text of slide shown above
Link to searchable text of slide shown above

Link to searchable text of slide shown above
Link to searchable text of slide shown above

Link to searchable text of slide shown above
Link to searchable text of slide shown above
Link to searchable text of slide shown above
Link to searchable text of slide shown above

Link to searchable text of slide shown above
Link to searchable text of slide shown above
Link to searchable text of slide shown above
Link to searchable text of slide shown above
Link to searchable text of slide shown above
Link to searchable text of slide shown above
Link to searchable text of slide shown above
Link to searchable text of slide shown above

Link to searchable text of slide shown above
Link to searchable text of slide shown above
Link to searchable text of slide shown above
Link to searchable text of slide shown above
Link to searchable text of slide shown above

Link to searchable text of slide shown above
Searchable text section of graphics shown above
IPAA SMALL CAP OGIS
Warren Resources, Inc.
[LOGO]
February 7, 2006
Cautionary Note to U.S. Investors: This presentation includes “forward-looking statements” within the meaning of Section 27A of the Securities Act of 1933, as amended, and Section 21E of the Securities Exchange Act of 1934, as amended. The opinions, forecasts, projections or other statements, other than statements of historical fact, are forward-looking statements. Although Warren believes that the expectations reflected in such forward-looking statements are reasonable, they can give no assurance that such expectations will prove to have been correct. Additionally, in its filings with the SEC Warren is permitted to disclose only proved reserves, which are reserve estimates that geological and engineering data demonstrate with reasonable certainty to be recoverable in future years from known reservoirs under existing economic and operating conditions. Warren uses certain terms in this presentation, such as “potential”, “possible” and “recoverable” in relation to reserves, which SEC guidelines strictly prohibit from being included in filings with the SEC. Estimates of “potential”, “possible” and “recoverable” reserves which may potentially be recoverable through additional drilling or recovery techniques are by their nature more uncertain than estimates of proved reserves and accordingly are subject to substantially greater risk of not actually being realized by the Company. Investors are urged to consider closely Warren’s disclosure of its proved reserves, along with certain risk factors and uncertainties inherent in its business set forth in its Form 10K and other filings with the SEC.
WRES undertakes no obligation, and expressly disclaims any duty, to publicly update any forward looking statements made herein, whether as a result of new information or future events.
ii
Introduction
i
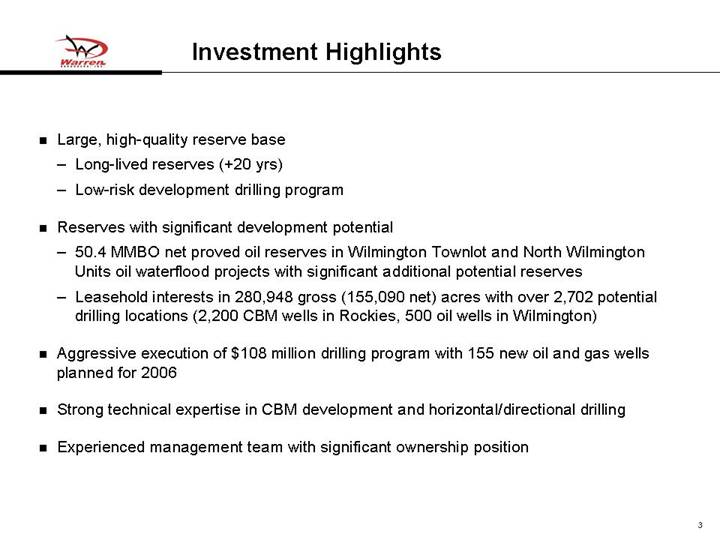
• Large, high-quality reserve base
• Long-lived reserves (+20 yrs)
• Low-risk development drilling program
• Reserves with significant development potential
• 50.4 MMBO net proved oil reserves in Wilmington Townlot and North Wilmington Units oil waterflood projects with significant additional potential reserves
• Leasehold interests in 280,948 gross (155,090 net) acres with over 2,702 potential drilling locations (2,200 CBM wells in Rockies, 500 oil wells in Wilmington)
• Aggressive execution of $108 million drilling program with 155 new oil and gas wells planned for 2006
• Strong technical expertise in CBM development and horizontal/directional drilling
• Experienced management team with significant ownership position
3
| Warren Resources Overview |
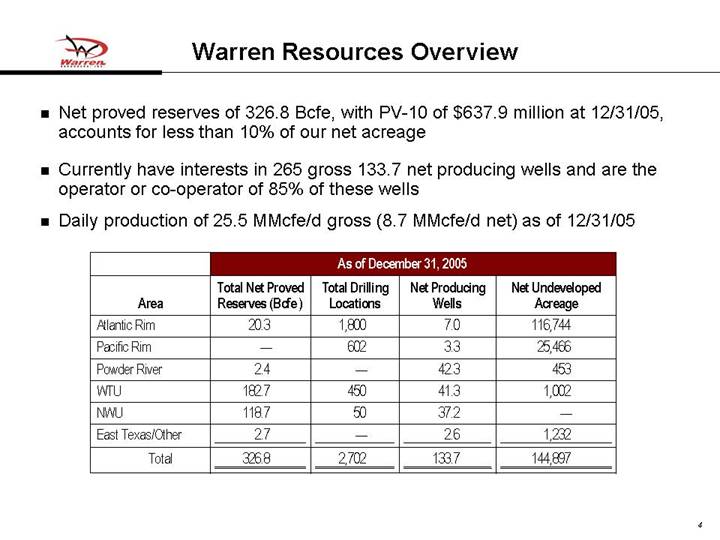
• Net proved reserves of 326.8 Bcfe, with PV-10 of $637.9 million at 12/31/05, accounts for less than 10% of our net acreage
• Currently have interests in 265 gross 133.7 net producing wells and are the operator or co-operator of 85% of these wells
• Daily production of 25.5 MMcfe/d gross (8.7 MMcfe/d net) as of 12/31/05
| | As of December 31, 2005 | |
Area | | Total Net Proved
Reserves (Bcfe) | | Total Drilling
Locations | | Net Producing
Wells | | Net Undeveloped
Acreage | |
Atlantic Rim | | 20.3 | | 1,800 | | 7.0 | | 116,744 | |
Pacific Rim | | — | | 602 | | 3.3 | | 25,466 | |
Powder River | | 2.4 | | — | | 42.3 | | 453 | |
WTU | | 182.7 | | 450 | | 41.3 | | 1,002 | |
NWU | | 118.7 | | 50 | | 37.2 | | — | |
East Texas/Other | | 2.7 | | — | | 2.6 | | 1,232 | |
Total | | 326.8 | | 2,702 | | 133.7 | | 144,897 | |
4
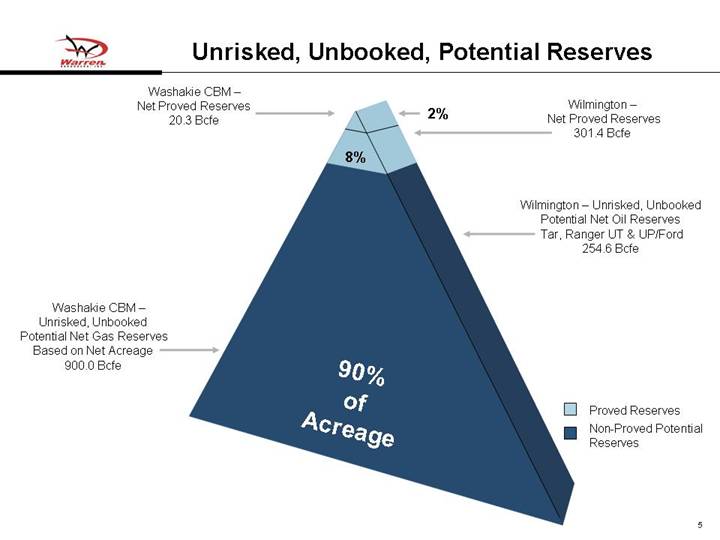
| Unrisked, Unbooked, Potential Reserves |
[CHART]
5
| One Year Results – 2005 Compared to 2004 |
[CHART]
• Exploit existing properties through the drillbit
• Increase proved reserves by drilling identified Rocky Mountain CBM and Wilmington locations
• Increase our working interests in future wells
• Utilize $100 million from recent equity offering proceeds to increase level of participation in drilling activities in high growth areas
• Pursue selective acquisitions and joint ventures
• Leverage technical knowledge and experience in core areas
• Increase high-quality CBM and secondary recovery oil projects
• Reduce unit costs through economies of scale and efficient operations
• Increase production
• Leverage growing infrastructure
6
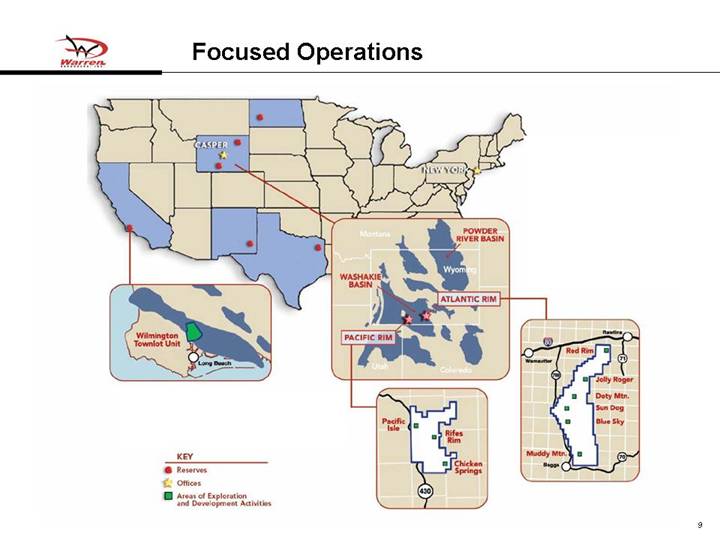
Operations and Property Overview
8
[GRAPHIC]
9
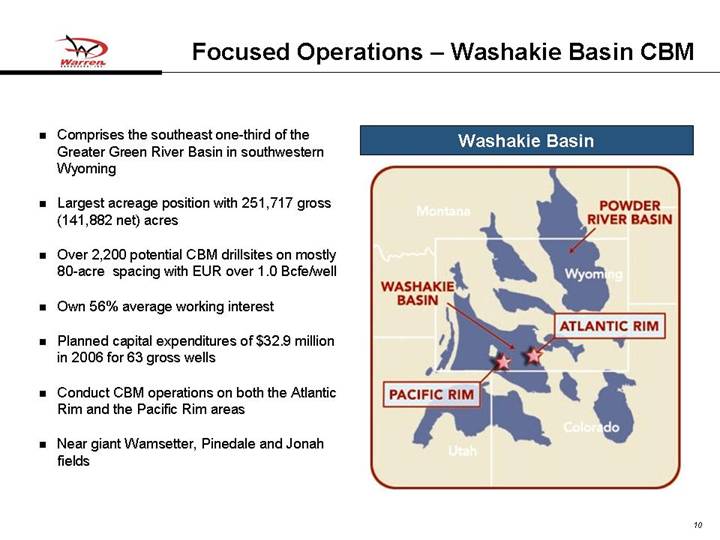
| Focused Operations – Washakie Basin CBM |
• Comprises the southeast one-third of the Greater Green River Basin in southwestern Wyoming
• Largest acreage position with 251,717 gross (141,882 net) acres
• Over 2,200 potential CBM drillsites on mostly 80-acre spacing with EUR over 1.0 Bcfe/well
• Own 56% average working interest
• Planned capital expenditures of $32.9 million in 2006 for 63 gross wells
• Conduct CBM operations on both the Atlantic Rim and the Pacific Rim areas
• Near giant Wamsetter, Pinedale and Jonah fields
Washakie Basin
[GRAPHIC]
10
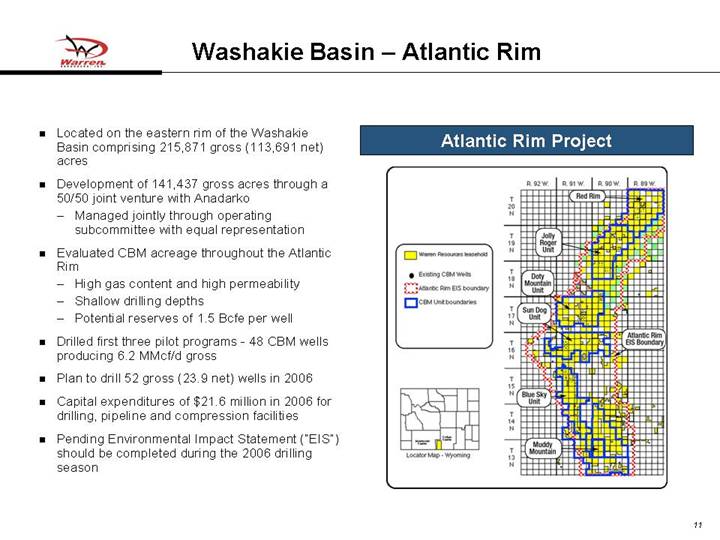
| Washakie Basin – Atlantic Rim |
• Located on the eastern rim of the Washakie Basin comprising 215,871 gross (113,691 net) acres
• Development of 141,437 gross acres through a 50/50 joint venture with Anadarko
• Managed jointly through operating subcommittee with equal representation
• Evaluated CBM acreage throughout the Atlantic Rim
• High gas content and high permeability
• Shallow drilling depths
• Potential reserves of 1.5 Bcfe per well
• Drilled first three pilot programs - 48 CBM wells producing 6.2 MMcf/d gross
• Plan to drill 52 gross (23.9 net) wells in 2006
• Capital expenditures of $21.6 million in 2006 for drilling, pipeline and compression facilities
• Pending Environmental Impact Statement (“EIS”) should be completed during the 2006 drilling season
Atlantic Rim Project
[GRAPHIC]
11
| Washakie Basin – Atlantic Rim – Sun Dog Unit |
• Pilot test with 31/2-year history
• Still in de-watering phase with inclining production
• First 10 pilot wells averaging 500 Mcf/d per well
• Two new wells averaging 150 Mcf/d (rather than zero gas production) due to benefits of pilot wells previous de-watering
[CHART]
Note: Production includes ten producing wells since inception and two additional wells from 4/1/05.
12
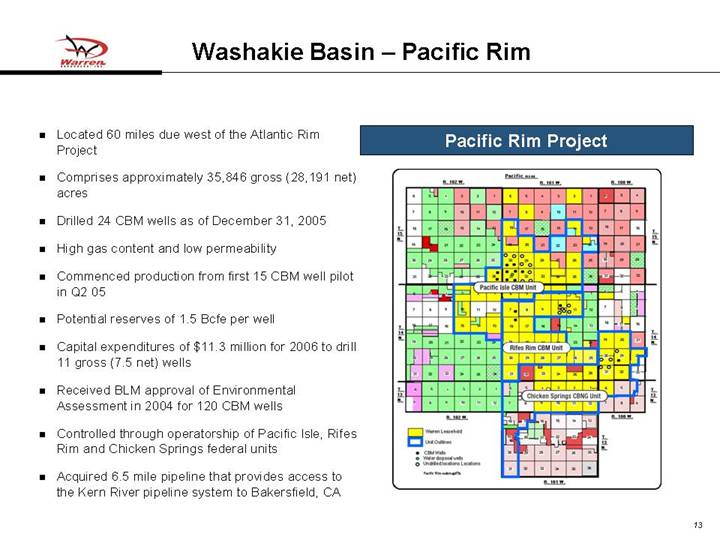
| Washakie Basin – Pacific Rim |
• Located 60 miles due west of the Atlantic Rim Project
• Comprises approximately 35,846 gross (28,191 net) acres
• Drilled 24 CBM wells as of December 31, 2005
• High gas content and low permeability
• Commenced production from first 15 CBM well pilot in Q2 05
• Potential reserves of 1.5 Bcfe per well
• Capital expenditures of $11.3 million for 2006 to drill 11 gross (7.5 net) wells
• Received BLM approval of Environmental Assessment in 2004 for 120 CBM wells
• Controlled through operatorship of Pacific Isle, Rifes Rim and Chicken Springs federal units
• Acquired 6.5 mile pipeline that provides access to the Kern River pipeline system to Bakersfield, CA
Pacific Rim Project
[GRAPHIC]
13
[GRAPHIC]
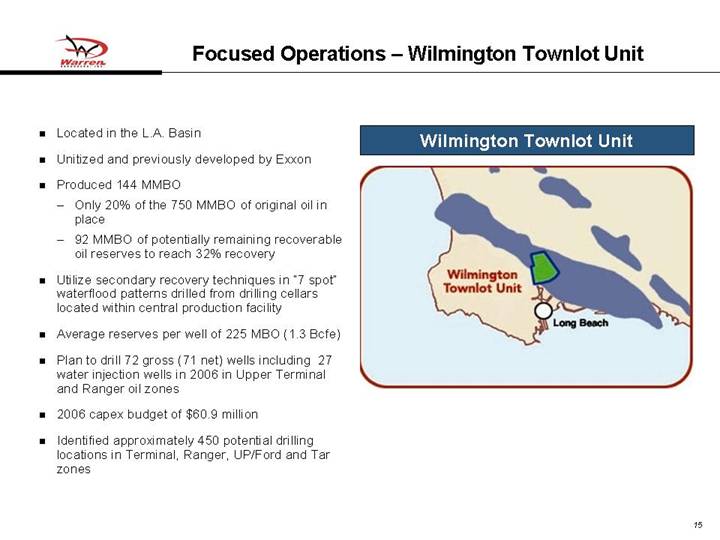
| Focused Operations – Wilmington Townlot Unit |
• Located in the L.A. Basin
• Unitized and previously developed by Exxon
• Produced 144 MMBO
• Only 20% of the 750 MMBO of original oil in place
• 92 MMBO of potentially remaining recoverable oil reserves to reach 32% recovery
• Utilize secondary recovery techniques in “7 spot” waterflood patterns drilled from drilling cellars located within central production facility
• Average reserves per well of 225 MBO (1.3 Bcfe)
• Plan to drill 72 gross (71 net) wells including 27 water injection wells in 2006 in Upper Terminal and Ranger oil zones
• 2006 capex budget of $60.9 million
• Identified approximately 450 potential drilling locations in Terminal, Ranger, UP/Ford and Tar zones
Wilmington Townlot Unit
[GRAPHIC]
15
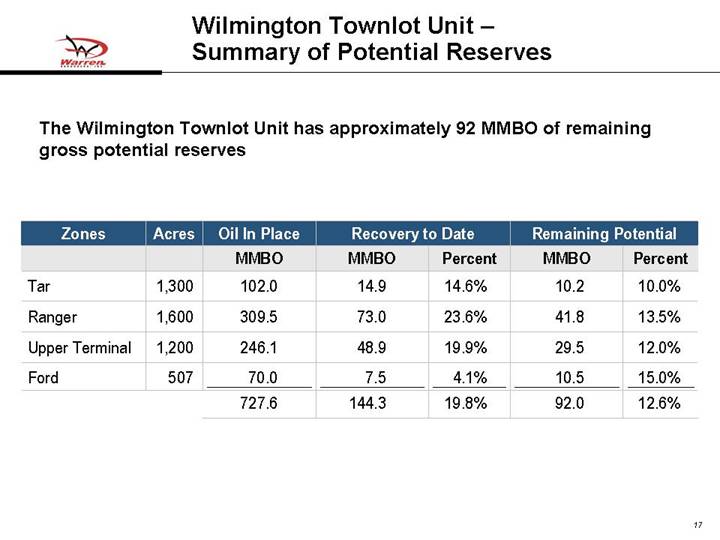
| Wilmington Townlot Unit – Summary of Potential Reserves |
The Wilmington Townlot Unit has approximately 92 MMBO of remaining gross potential reserves
Zones | | Acres | | Oil In Place | | Recovery to Date | | Remaining Potential | |
| | | | MMBO | | MMBO | | Percent | | MMBO | | Percent | |
Tar | | 1,300 | | 102.0 | | 14.9 | | 14.6 | % | 10.2 | | 10.0 | % |
Ranger | | 1,600 | | 309.5 | | 73.0 | | 23.6 | % | 41.8 | | 13.5 | % |
Upper Terminal | | 1,200 | | 246.1 | | 48.9 | | 19.9 | % | 29.5 | | 12.0 | % |
Ford | | 507 | | 70.0 | | 7.5 | | 4.1 | % | 10.5 | | 15.0 | % |
| | | | 727.6 | | 144.3 | | 19.8 | % | 92.0 | | 12.6 | % |
17
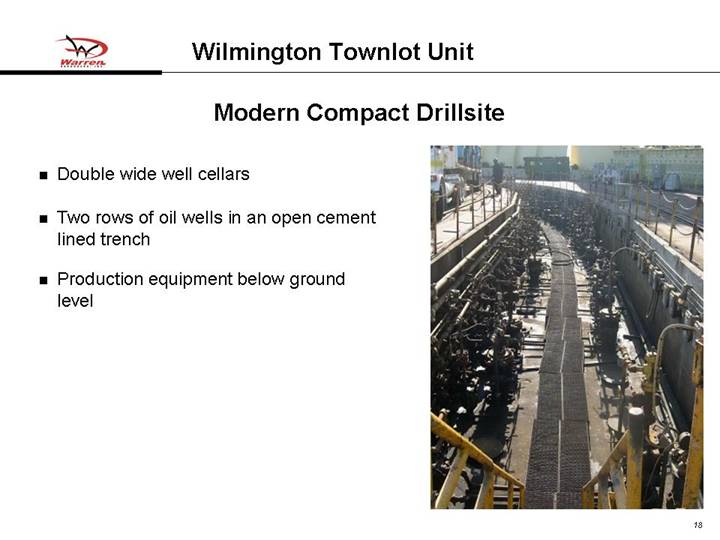
Modern Compact Drillsite
• Double wide well cellars
• Two rows of oil wells in an open cement lined trench
• Production equipment below ground level
[GRAPHIC]
18
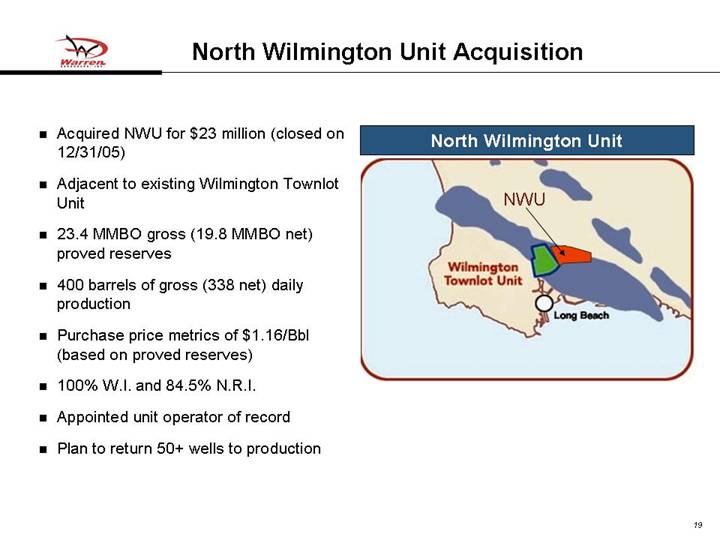
| North Wilmington Unit Acquisition |
• Acquired NWU for $23 million (closed on 12/31/05)
• Adjacent to existing Wilmington Townlot Unit
• 23.4 MMBO gross (19.8 MMBO net) proved reserves
• 400 barrels of gross (338 net) daily production
• Purchase price metrics of $1.16/Bbl (based on proved reserves)
• 100% W.I. and 84.5% N.R.I.
• Appointed unit operator of record
• Plan to return 50+ wells to production
North Wilmington Unit
[GRAPHIC]
19
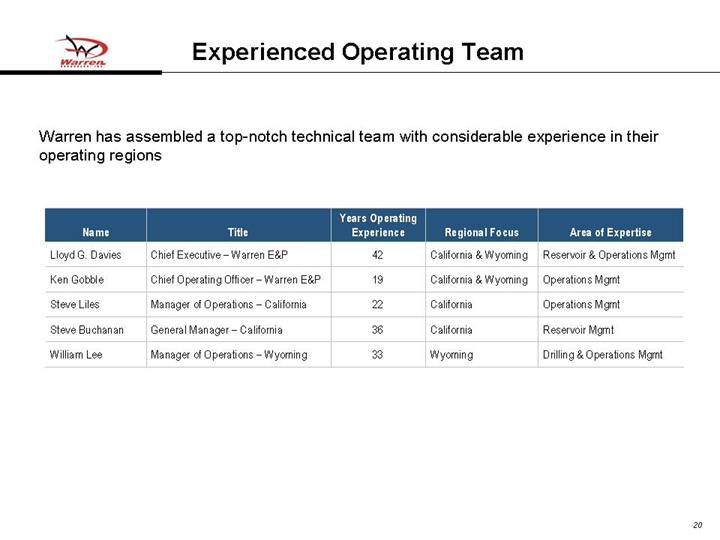
| Experienced Operating Team |
Warren has assembled a top-notch technical team with considerable experience in their operating regions
Name | | Title | | Years Operating
Experience | | Regional Focus | | Area of Expertise |
Lloyd G. Davies | | Chief Executive – Warren E&P | | 42 | | California & Wyoming | | Reservoir & Operations Mgmt |
Ken Gobble | | Chief Operating Officer – Warren E&P | | 19 | | California & Wyoming | | Operations Mgmt |
Steve Liles | | Manager of Operations – California | | 22 | | California | | Operations Mgmt |
Steve Buchanan | | General Manager – California | | 36 | | California | | Reservoir Mgmt |
William Lee | | Manager of Operations – Wyoming | | 33 | | Wyoming | | Drilling & Operations Mgmt |
20
Financial Overview
21
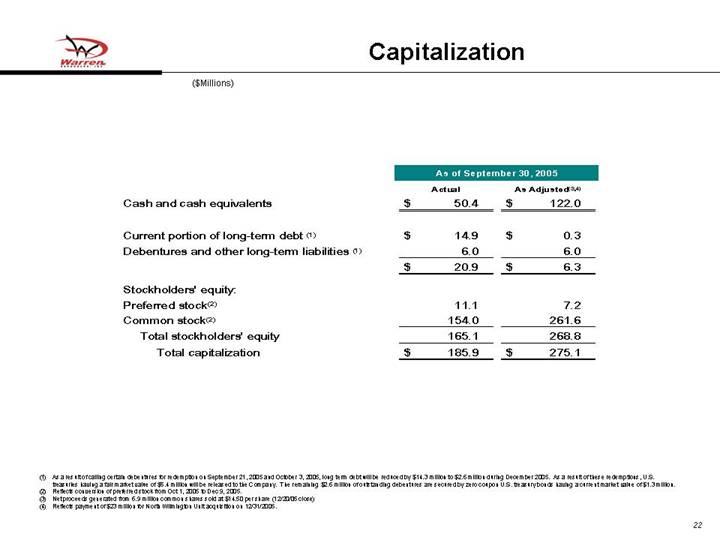
($Millions)
| | As of September 30, 2005 | |
| | Actual | | As Adjusted(3),(4) | |
Cash and cash equivalents | | $ | 50.4 | | $ | 122.0 | |
| | | | | |
Current portion of long-term debt (1) | | $ | 14.9 | | $ | 0.3 | |
Debentures and other long-term liabilities (1) | | 6.0 | | 6.0 | |
| | $ | 20.9 | | $ | 6.3 | |
Stockholders’ equity: | | | | | |
Preferred stock(2) | | 11.1 | | 7.2 | |
Common stock(2) | | 154.0 | | 261.6 | |
Total stockholders’ equity | | 165.1 | | 268.8 | |
Total capitalization | | $ | 185.9 | | $ | 275.1 | |
(1) As a result of calling certain debentures for redemption on September 21, 2005 and October 3, 2005, long term debt will be reduced by $14.3 million to $2.6 million during December 2005. As a result of these redemptions, U.S. treasuries having a fair market value of $5.4 million will be released to the Company. The remaining $2.6 million of outstanding debentures are secured by zero coupon U.S. treasury bonds having a current market value of $1.3 million.
(2) Reflects conversion of preferred stock from Oct 1, 2005 to Dec 9, 2005.
(3) Net proceeds generated from 6.9 million common shares sold at $14.50 per share (12/20/05 close)
(4) Reflects payment of $23 million for North Wilmington Unit acquisition on 12/31/2005.
22
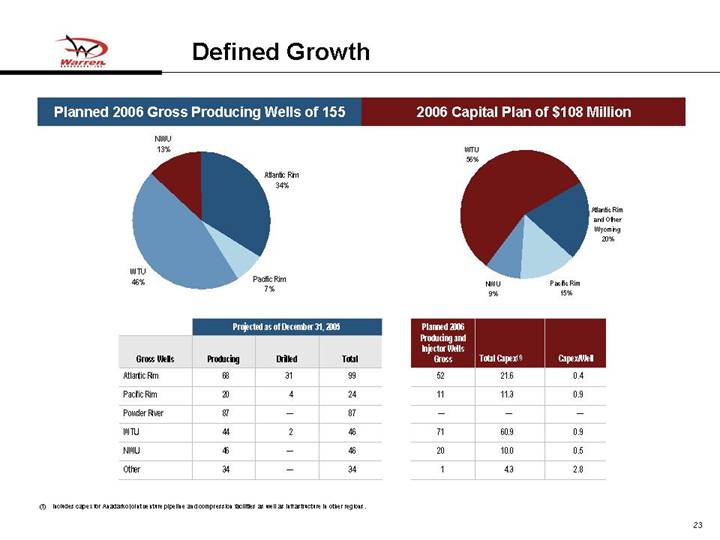
Planned 2006 Gross Producing Wells of 155 | | 2006 Capital Plan of $108 Million |
| | |
[CHART] | | [CHART] |
| | Projected as of December 31, 2005 | | Planned 2006
Producing and
Injector Wells | | | | | |
Gross Wells | | Producing | | Drilled | | Total | | Gross | | Total Capex(1) | | Capex/Well | |
Atlantic Rim | | 68 | | 31 | | 99 | | 52 | | 21.6 | | 0.4 | |
Pacific Rim | | 20 | | 4 | | 24 | | 11 | | 11.3 | | 0.9 | |
Powder River | | 87 | | — | | 87 | | — | | — | | — | |
WTU | | 44 | | 2 | | 46 | | 71 | | 60.9 | | 0.9 | |
NWU | | 46 | | — | | 46 | | 20 | | 10.0 | | 0.5 | |
Other | | 34 | | — | | 34 | | 1 | | 4.3 | | 2.8 | |
(1) Includes capex for Anadarko joint venture pipeline and compression facilities as well as infrastructure in other regions.
23
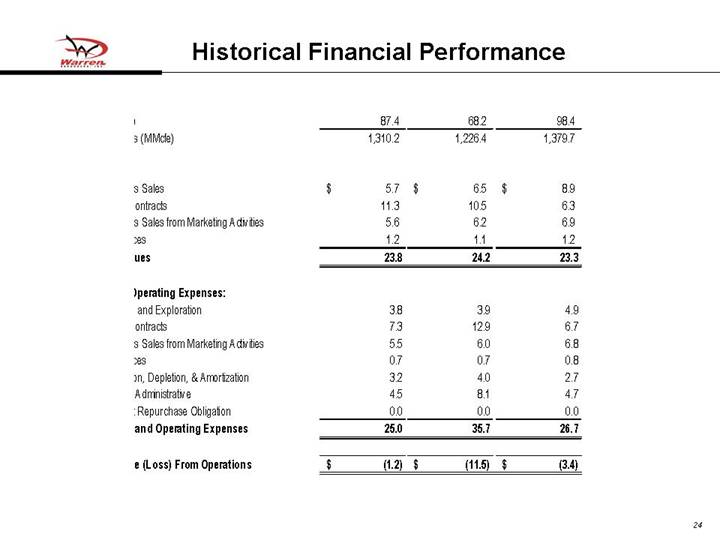
| Historical Financial Performance |
| | | | | | Nine Months | |
| | | | | | Ended | |
| | Year Ended December 31 | | Sept. 30, | |
| | 2003 | | 2004 | | 2005 | |
Net Production: | | | | | | | |
Natural Gas (MMcf) | | 785.8 | | 817.2 | | 789.3 | |
Oil (MBbls) | | 87.4 | | 68.2 | | 98.4 | |
Equivalents (MMcfe) | | 1,310.2 | | 1,226.4 | | 1,379.7 | |
| | | | | | | |
Revenues: | | | | | | | |
Oil and Gas Sales | | $ | 5.7 | | $ | 6.5 | | $ | 8.9 | |
Turnkey Contracts | | 11.3 | | 10.5 | | 6.3 | |
Oil and Gas Sales from Marketing Activities | | 5.6 | | 6.2 | | 6.9 | |
Well Services | | 1.2 | | 1.1 | | 1.2 | |
Total Revenues | | 23.8 | | 24.2 | | 23.3 | |
| | | | | | | |
Costs and Operating Expenses: | | | | | | | |
Production and Exploration | | 3.8 | | 3.9 | | 4.9 | |
Turnkey Contracts | | 7.3 | | 12.9 | | 6.7 | |
Oil and Gas Sales from Marketing Activities | | 5.5 | | 6.0 | | 6.8 | |
Well Services | | 0.7 | | 0.7 | | 0.8 | |
Depreciation, Depletion, & Amortization | | 3.2 | | 4.0 | | 2.7 | |
General & Administrative | | 4.5 | | 8.1 | | 4.7 | |
Contingent Repurchase Obligation | | 0.0 | | 0.0 | | 0.0 | |
Total Costs and Operating Expenses | | 25.0 | | 35.7 | | 26.7 | |
| | | | | | | |
Total Income (Loss) From Operations | | $ | (1.2 | ) | $ | (11.5 | ) | $ | (3.4 | ) |
24
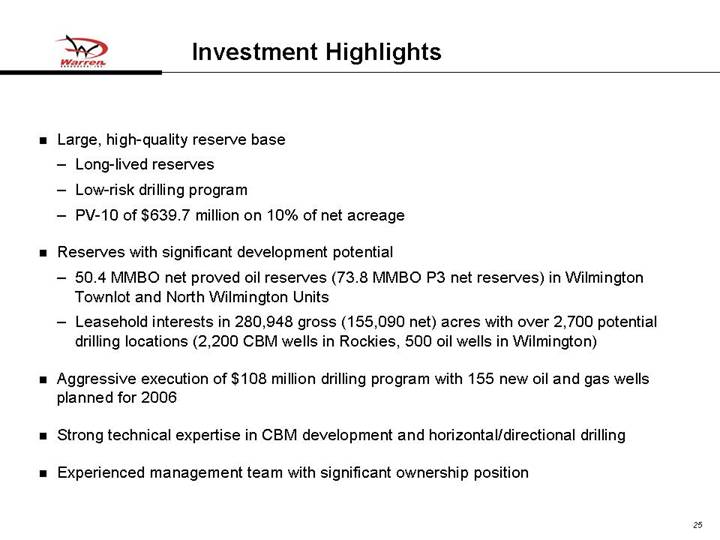
• Large, high-quality reserve base
• Long-lived reserves
• Low-risk drilling program
• PV-10 of $639.7 million on 10% of net acreage
• Reserves with significant development potential
• 50.4 MMBO net proved oil reserves (73.8 MMBO P3 net reserves) in Wilmington Townlot and North Wilmington Units
• Leasehold interests in 280,948 gross (155,090 net) acres with over 2,700 potential drilling locations (2,200 CBM wells in Rockies, 500 oil wells in Wilmington)
• Aggressive execution of $108 million drilling program with 155 new oil and gas wells planned for 2006
• Strong technical expertise in CBM development and horizontal/directional drilling
• Experienced management team with significant ownership position
25
[LOGO]