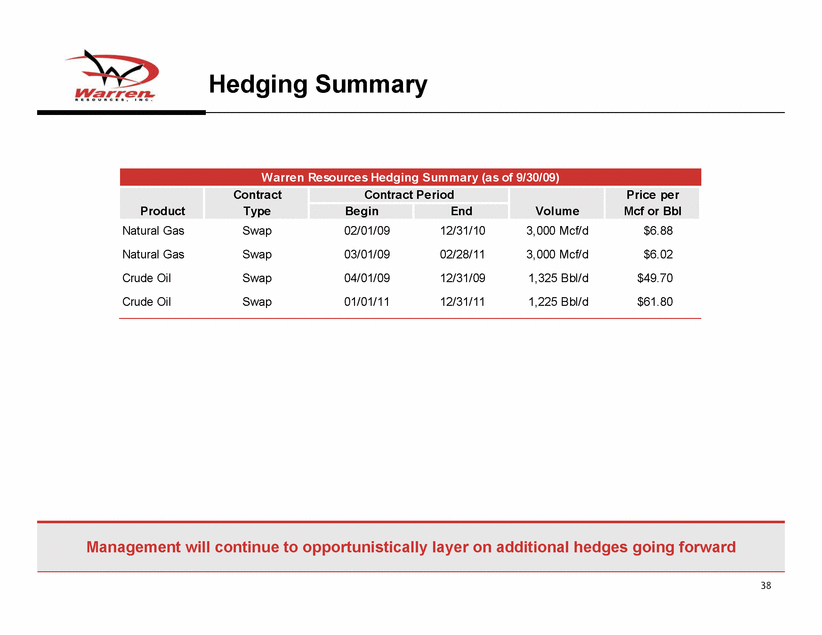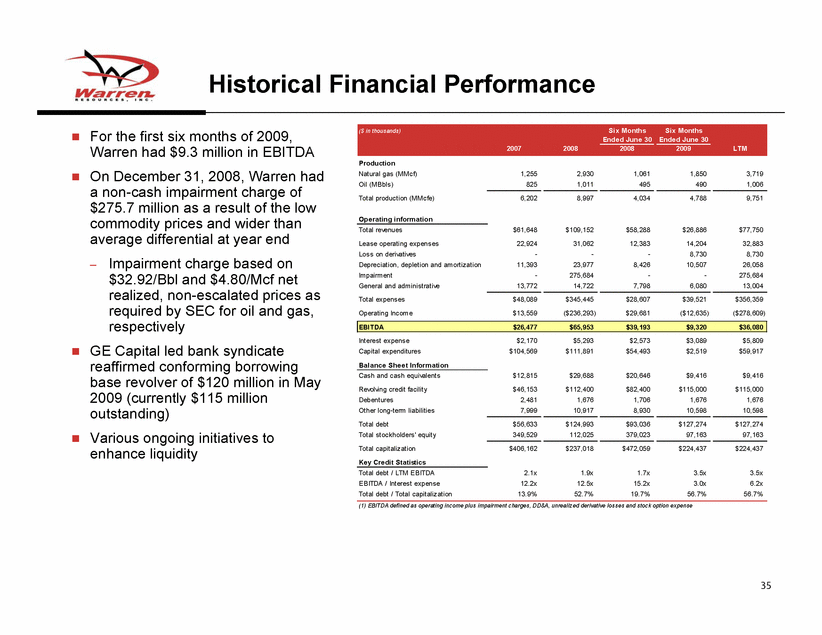
| 35 Historical Financial Performance For the first six months of 2009, Warren had $9.3 million in EBITDA On December 31, 2008, Warren had a non-cash impairment charge of $275.7 million as a result of the low commodity prices and wider than average differential at year end – Impairment charge based on $32.92/Bbl and $4.80/Mcf net realized, non-escalated prices as required by SEC for oil and gas, respectively GE Capital led bank syndicate reaffirmed conforming borrowing base revolver of $120 million in May 2009 (currently $115 million outstanding) Various ongoing initiatives to enhance liquidity ($ in thousands) Six Months Six Months Ended June 30 Ended June 30 2007 2008 2008 2009 LTM Production Natural gas (MMcf) 1,255 2,930 1,061 1,850 3,719 Oil (MBbls) 825 1,011 495 490 1,006 Total production (MMcfe) 6,202 8,997 4,034 4,788 9,751 Operating information Total revenues $61,648 $109,152 $58,288 $26,886 $77,750 Lease operating expenses 22,924 31,062 12,383 14,204 32,883 Loss on derivatives - - - 8,730 8,730 Depreciation, depletion and amortization 11,393 23,977 8,426 10,507 26,058 Impairment - 275,684 - - 275,684 General and administrative 13,772 14,722 7,798 6,080 13,004 Total expenses $48,089 $345,445 $28,607 $39,521 $356,359 Operating Income $13,559 ($236,293) $29,681 ($12,635) ($278,609) EBITDA $26,477 $65,953 $39,193 $9,320 $36,080 Interest expense $2,170 $5,293 $2,573 $3,089 $5,809 Capital expenditures $104,569 $111,891 $54,493 $2,519 $59,917 Balance Sheet Information Cash and cash equivalents $12,815 $29,688 $20,646 $9,416 $9,416 Revolving credit facility $46,153 $112,400 $82,400 $115,000 $115,000 Debentures 2,481 1,676 1,706 1,676 1,676 Other long-term liabilities 7,999 10,917 8,930 10,598 10,598 Total debt $56,633 $124,993 $93,036 $127,274 $127,274 Total stockholders' equity 349,529 112,025 379,023 97,163 97,163 Total capitalization $406,162 $237,018 $472,059 $224,437 $224,437 Key Credit Statistics Total debt / LTM EBITDA 2.1x 1.9x 1.7x 3.5x 3.5x EBITDA / Interest expense 12.2x 12.5x 15.2x 3.0x 6.2x Total debt / Total capitalization 13.9% 52.7% 19.7% 56.7% 56.7% (1) EBITDA defined as operating income plus impairment charges, DD&A, unrealized derivative losses and stock option expense |

