
Shareholder Rights Common Stock Offering
Investor Presentation
Northwest Bancorporation, Inc.

2
Legal Disclaimer
In the course of our presentation, we may discuss matters that are deemed to be forward-
looking statements, which are intended to be covered by the safe harbor for “forward-looking
statements” provided by the Private Securities Litigation Reform Act of 1995 (the “Reform
Act”)(1). Forward-looking statements, including those relating to our position and strategy
following completion of the transaction discussed herein, involve substantial risks and
uncertainties, many of which are difficult to predict and are generally beyond our control and
actual results may differ from management’s view. Additional information about risks of the
company achieving results suggested by any forward-looking statements may be found in
Company’s registration statement on Form S-3 under the heading “Risk Factors” as well as the
Company’s 10-K and other SEC filings incorporated by reference therein under the headings
“Risk Factors” and “Management’s Discussion and Analysis of Financial Condition and Results of
Operations.” Unless legally required, the Company disclaims any obligation to update any
forward-looking statements, whether as a result of new information, future events or otherwise.
(1) The Reform Act defines the term "forward-looking statements" to include: statements of management plans and objectives, statements regarding the future economic performance, and
projections of revenues and other financial data, among others. The Reform Act precludes liability for oral or written forward-looking statements if the statement is identified as such and
accompanied by "meaningful cautionary statements identifying important factors that could cause actual results to differ materially from those made in the forward-looking statements."

3
Offering Summary
Issuer: Northwest Bancorporation, Inc.
Ticker: (OTCBB: NBCT)
Closing Stock Price (5/25/2010): $6.00
Tangible Book Value Per Share: $9.83
Type of Security: Common Stock
Offering Type: Non-Transferable Shareholder Rights
Transaction Size: $4,000,000
Upsize Option: 20% (up to $4,800,000)
Offer Price Per Share: $4.00
Shares Issued in Offering(1): 1,000,000
Pre-Offering Shares Outstanding(2): 2,385,693
Use of Proceeds: Improve capital position at the Bank and general
corporate purposes
corporate purposes
Expected Closing: July 1, 2010
(1) Shares issued based on a $4.0 million offering before the potential upsize option
(2) Shares outstanding as of 5/3/2010 per the Company S-3

4
Offering Rationale
Further strengthen balance sheet
• Increase tangible common equity and enhance capital ratios
• Proactive approach to uncertain economic and regulatory environment
Better positions the Company to take advantage of
opportunities resulting from market dislocation
opportunities resulting from market dislocation
• Favorable competitive landscape (big and small competitors struggling)
• Grow core deposits and attract new customers
• Attract and retain talented personnel
Shareholder rights offering is the least dilutive option for
shareholders to raise capital
shareholders to raise capital
• Current shareholders have the opportunity to purchase newly issued shares direct from the
Company without any fees

5
Company Profile
Company Name: Northwest Bancorporation, Inc.
Bank Name: Inland Northwest Bank
Year Established: 1989
Headquarters: Spokane, WA
Branch Network: 11 Branches (7 in WA and 4 in ID)
Assets: $398.2 million
Gross Loans: $315.4 million
Deposits: $343.3 million
Common Equity: $23.6 million
Net Income (Q1 2010): $586 thousand
Net Interest Margin (Q1 2010): 4.04%
Loan / Deposit Ratio: 91.9%
Regional Focus: Eastern Washington and Northern Idaho
Customer Focus: Small to medium-sized businesses
headquartered in our markets as well
as the owners and employees of these
businesses
Insider Ownership: 21.70%
NBCT branch location
Source: Financial data from Company 10-Q, as of 3/31/2010.
Ownership data from Internal Company Reports, as of 5/3/2010
Ownership data from Internal Company Reports, as of 5/3/2010

6
Investment Highlights
Returned to profitability in 1st Quarter 2010
Experienced and disciplined management team
Attractive and growing core deposit base
Growing net interest margin, operating revenue and core earnings
Largely avoided the major credit quality problems that have
plagued peers in the region
Competitor dislocation in our market area
Attractive valuation

7
1st Quarter Update
Earnings
Margin
Core Deposits
Credit Quality
Capital
• Profit of $586 thousand during Q1 2010
• Core earnings of $1.7 million during Q1 2010
• Operating revenue of $4.6 million during Q1 2010
• Net interest margin expanded to 4.04% during Q1 2010 compared to 3.40% for Q1 2009
• Core deposits increased by 10.08%, or $16.6 million compared to 12/31/2009
• Core deposits increased by 20.77%, or $31.2 million compared to 3/31/2009
• Non-accrual loans of $9.0 million, compared to $11.7 million at 12/31/2009
• Loan loss reserve of $7.2 million, compared to $7.1 million at 12/31/2009
Update on the financial results for the Company for the fiscal quarter ended 3/31/2010
• Risk based capital ratio increased to 12.57%
Source: Company 10-Q, as of 3/31/2010
Note: Core earnings excludes taxes, provision expense, expenses related to OREO and depreciation expense
Note: Operating revenue includes net interest income and non-interest income
Note: Core deposits exclude all CDs

8
Executive Management Team and Ownership
Executive Management Team and Current Insider Ownership
Source: Internal Company Reports, as of 5/3/2010
Name
Title
Age
Years With
Company
Ownership
%
Randall L. Fewel
Chief Executive Officer
61
16
2.05%
Holly A. Poquette, CPA
Chief Financial Officer
39
13
0.35%
Douglas J. Beaudoin
Manager of Mortgage Department
58
12
0.23%
Mark V. Dresback
Commercial Team Leader
50
9
0.22%
Elizabeth A. Herndon
Chief Retail Banking Officer
55
15
0.26%
Ronald G. Jacobson
Commercial Team Leader
54
9
0.38%
Scott W. Southwick
Chief Credit Officer
59
3
0.33%
All Executive Management and Directors as a Group (18 Persons)
21.70%
9
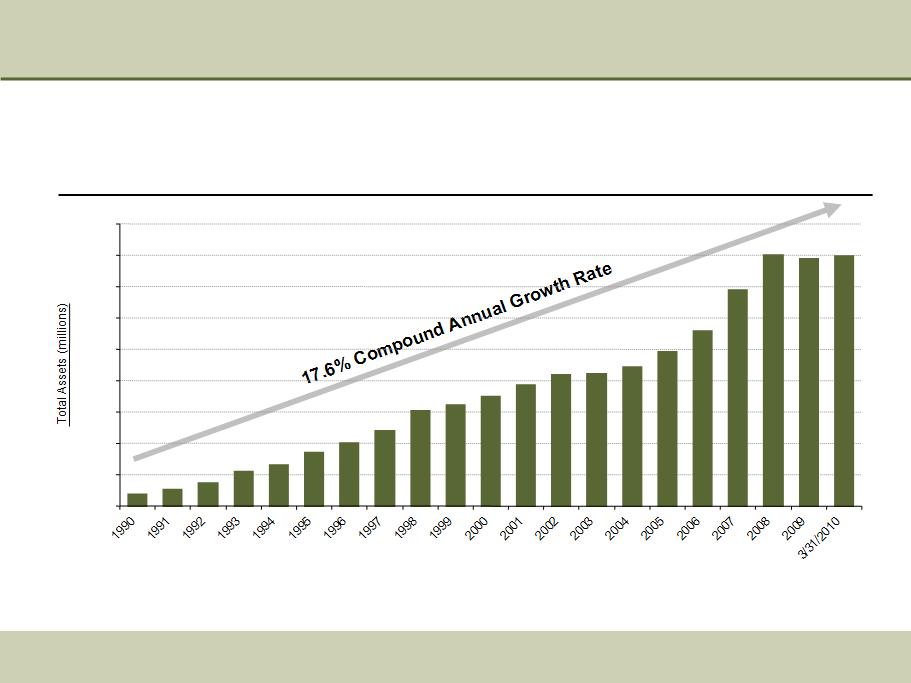
Conservative and Steady Growth
Total Assets (From 1990-Present)
Source: SNL Financial and Internal Company Reports
$17.6
$25.6
$36.5
$54.7
$65.6
$84.5
$99.5
$220.5
$245.5
$278.9
$343.7
$400.2
$398.2
$393.7
$151.9
$120.4
$161.2
$209.1
$192.9
$173.7
$210.5
$-
$50
$100
$150
$200
$250
$300
$350
$400
$450
10
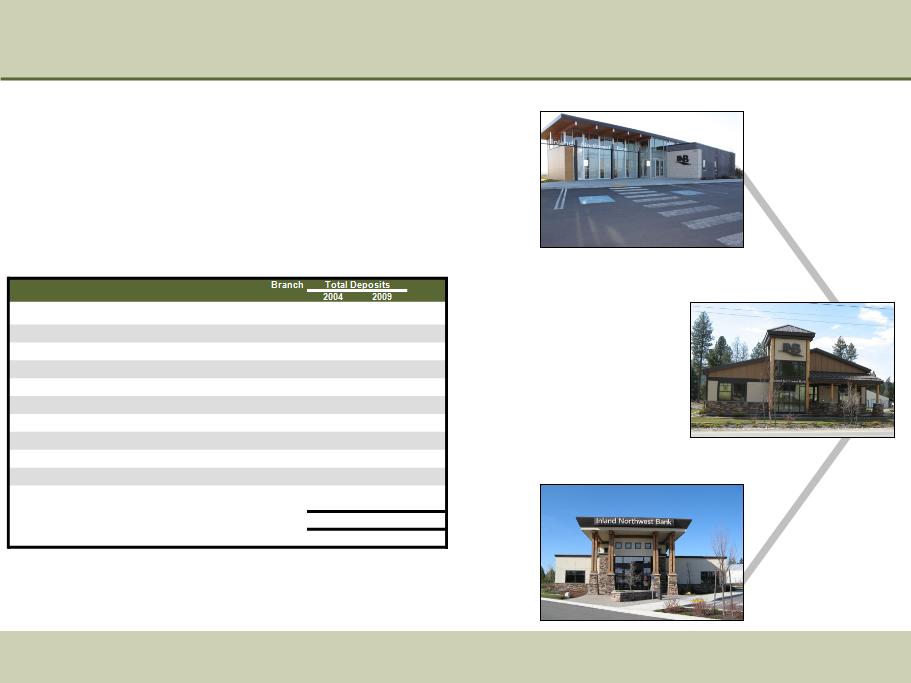
Attractive Branch Network
Regional concentration in Eastern Washington and Northern Idaho
• 11 branches across Spokane County and Kootenai County
• High quality full-service banking facilities
• 2 new branch locations opened since 2007 and 4 branch relocations since 2006
Source: SNL Financial and Internal Company Reports.
Deposit data as of 6/30 for the respective year
Deposit data as of 6/30 for the respective year
Branch Locations
Spirit Lake, ID
Airway Heights, WA
Coeur d’Alene (Hayden), ID
Address
City
County, State
Opened
CAGR
421 W Riverside Ave
Spokane
Spokane, WA
1989
$77,123
$133,519
11.6%
1021 E Hawthorne Rd
Spokane
Spokane, WA
1995
$15,324
$29,510
14.0%
1729 E Seltice Way
Post Falls
Kootenai, ID
1995
$4,884
$12,155
20.0%
15015 E Sprague Ave
Spokane Valley
Spokane, WA
1992
$17,454
$26,438
8.7%
11917 W Sunset Hwy
Airway Heights
Spokane, WA
1993
$11,385
$17,359
8.8%
518 W Francis Ave
Spokane
Spokane, WA
1996
$8,429
$23,483
22.7%
2905 E 57th Ave
Spokane
Spokane, WA
1997
$17,336
$32,875
13.7%
955 Ironwood Dr
Coeur d'Alene
Kootenai, ID
1998
$12,395
$23,273
13.4%
2110 N Ruby St
Spokane
Spokane, WA
1994
$15,738
$19,776
4.7%
30 W Prairie Ave
Coeur d'Alene
Kootenai, ID
2007
NA
$6,972
50.5%
31845 N 5th Ave
Spirit Lake
Kootenai, ID
2007
NA
$5,690
17.2%
Total Deposits
$180,068
$331,050
13.0%
Average Deposits
$20,008
$30,095
11
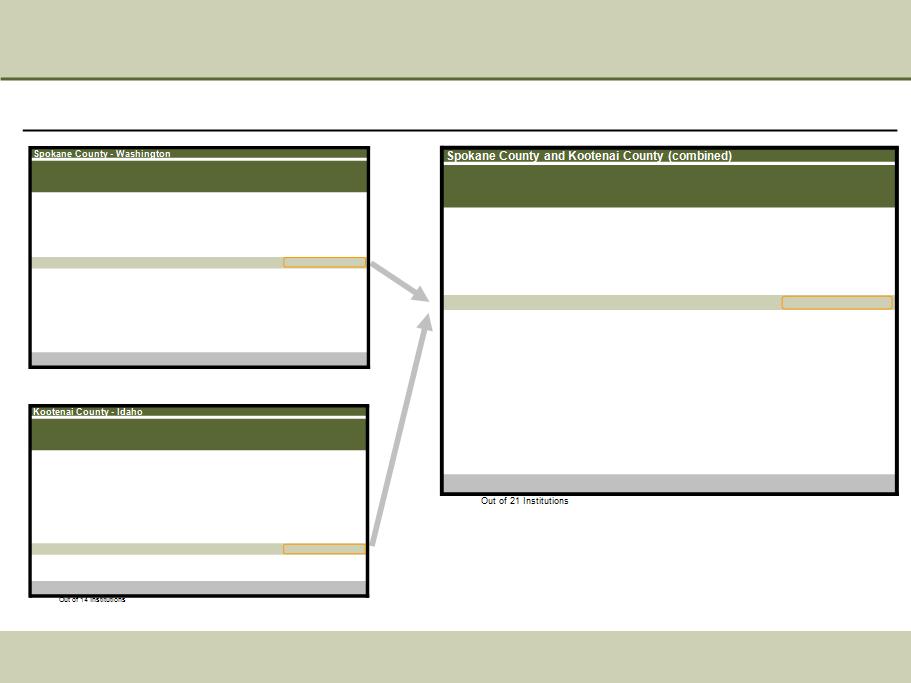
Established Market Share Position
Deposit Market Share
Source: Deposit market share data provided by SNL Financial, as of 6/30/2009.
Rank
Institution (State)
Number of
Branches
Deposits
in Market
Deposit
Growth
(1-Year)
Market
Share %
1
Sterling Financial Corp. (WA)
8
1,969,138
$
+12.8%
26.97%
2
W.T.B. Financial Corp. (WA)
16
1,746,867
$
+7.5%
23.93%
3
Bank of America Corp. (NC)
12
729,590
$
+17.7%
9.99%
4
JPMorgan Chase & Co. (NY)
13
578,672
$
-22.9%
7.93%
5
U.S. Bancorp (MN)
16
537,325
$
+2.3%
7.36%
6
Banner Corp. (WA)
16
440,592
$
-3.7%
6.04%
7
Wells Fargo & Co. (CA)
8
406,969
$
+19.0%
5.57%
8
Northwest Bancorporation, Inc. (WA)
7
282,960
$
+15.5%
3.88%
9
AmericanWest Bancorp. (WA)
7
175,843
$
-60.6%
2.41%
10
Riverbank Holding Co. (WA)
3
128,647
$
+17.0%
1.76%
11
Fairfield Financial Holdings (WA)
6
106,272
$
+5.8%
1.46%
12
State Bancorp Northwest (WA)
2
80,911
$
+7.6%
1.11%
13
Community Financial Group Inc (WA)
3
38,606
$
+22.4%
0.53%
14
Intermountain Community Bancorp (ID)
2
35,223
$
+13.7%
0.48%
15
Whitman Bancorporation Inc. (WA)
3
30,369
$
+21.5%
0.42%
16
Glacier Bancorp Inc. (MT)
1
9,579
$
+201.2%
0.13%
17
Dickinson Financial Corp. II (MO)
1
2,693
$
-15.8%
0.04%
Total For Institutions In Market
124
$ 7,300,256
+2.3%
Out of 17 Institutions
Rank
Institution (State)
Number of
Branches
Deposits
in Market
Deposit
Growth
(1-Year)
Market
Share %
1
Wells Fargo & Co. (CA)
8
325,244
$
+1.8%
19.74%
2
Glacier Bancorp Inc. (MT)
5
227,327
$
-3.7%
13.79%
3
Bank of America Corp. (NC)
5
206,031
$
+15.8%
12.50%
4
U.S. Bancorp (MN)
5
182,072
$
+18.3%
11.05%
5
W.T.B. Financial Corp. (WA)
4
156,560
$
-8.4%
9.50%
6
Idaho Independent Bank (ID)
2
129,539
$
-11.0%
7.86%
7
Intermountain Community Bancorp (ID)
4
104,727
$
+13.5%
6.36%
8
Coeur d'Alene Bancorp (ID)
3
76,729
$
-10.0%
4.66%
9
Sterling Financial Corp. (WA)
3
63,406
$
-6.4%
3.85%
10
JPMorgan Chase & Co. (NY)
2
56,225
$
-25.6%
3.41%
11
Northwest Bancorporation, Inc. (WA)
4
48,090
$
+3.9%
2.92%
12
AmericanWest Bancorp. (WA)
2
39,508
$
+61.2%
2.40%
13
Community 1st Bank (ID)
1
26,023
$
+86.9%
1.58%
14
Idaho Trust Bancorp (ID)
1
6,451
$
+98.1%
0.39%
Total For Institutions In Market
49
$ 1,647,932
+2.2%
Rank
Institution (State)
Number of
Branches
Deposits
in Market
Deposit
Growth
(1-Year)
Market
Share %
1
Sterling Financial Corp. (WA)
11
2,032,544
$
+12.1%
22.71%
2
W.T.B. Financial Corp. (WA)
20
1,903,427
$
+6.0%
21.27%
3
Bank of America Corp. (NC)
17
935,621
$
+17.3%
10.46%
4
Wells Fargo & Co. (CA)
16
732,213
$
+10.7%
8.18%
5
U.S. Bancorp (MN)
21
719,397
$
+5.9%
8.04%
6
JPMorgan Chase & Co. (NY)
15
634,897
$
-23.1%
7.10%
7
Banner Corp. (WA)
16
440,592
$
-3.7%
4.92%
8
Northwest Bancorporation, Inc. (WA)
11
331,050
$
+13.7%
3.70%
9
Glacier Bancorp Inc. (MT)
6
236,906
$
-0.9%
2.65%
10
AmericanWest Bancorp. (WA)
9
215,351
$
-54.2%
2.41%
11
Intermountain Community Bancorp (ID)
6
139,950
$
+13.6%
1.56%
12
Idaho Independent Bank (ID)
2
129,539
$
-11.0%
1.45%
13
Riverbank Holding Co. (WA)
3
128,647
$
+17.0%
1.44%
14
Fairfield Financial Holdings (WA)
6
106,272
$
+5.8%
1.19%
15
State Bancorp Northwest (WA)
2
80,911
$
+7.6%
0.90%
16
Coeur d'Alene Bancorp (ID)
3
76,729
$
-10.0%
0.86%
17
Community Financial Group Inc (WA)
3
38,606
$
+22.4%
0.43%
18
Whitman Bancorporation Inc. (WA)
3
30,369
$
+21.5%
0.34%
19
Community 1st Bank (ID)
1
26,023
$
+86.9%
0.29%
20
Idaho Trust Bancorp (ID)
1
6,451
$
+98.1%
0.07%
21
Dickinson Financial Corp. II (MO)
1
2,693
$
-15.8%
0.03%
Total For Institutions In Market
173
$ 8,948,188
+2.3%
12
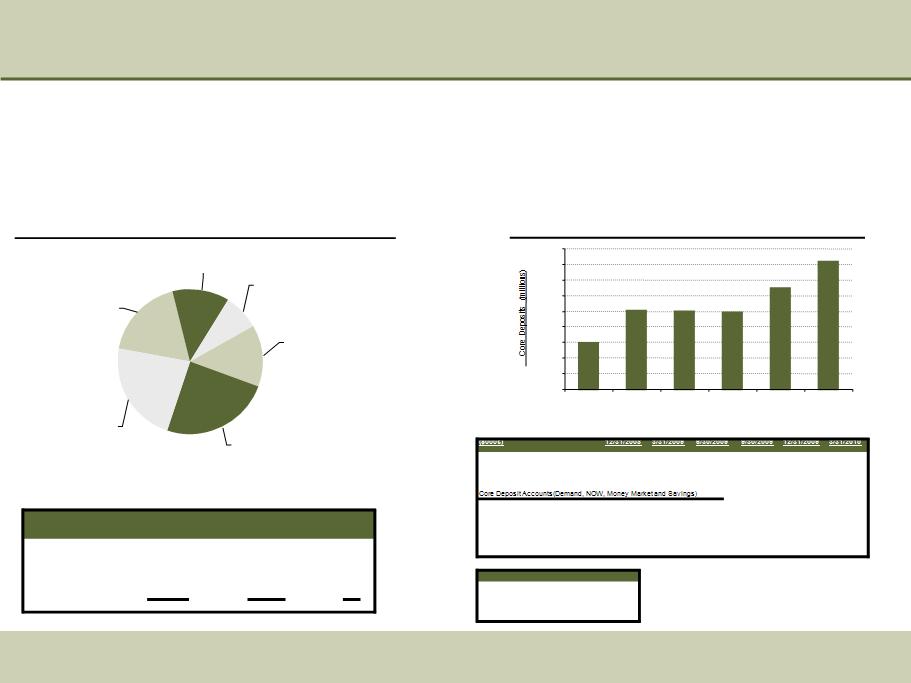
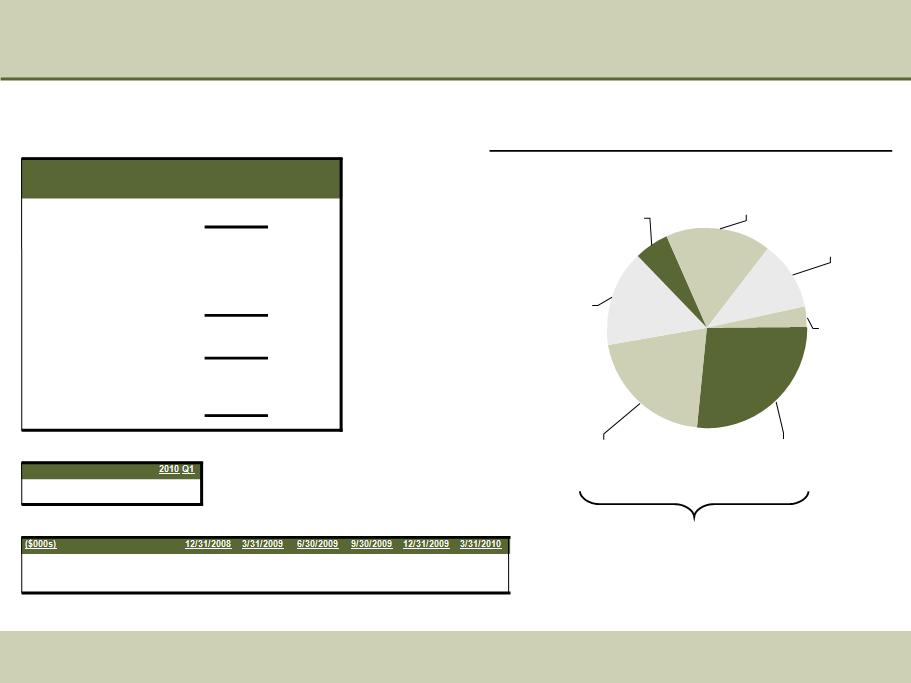
Deposit Composition
Core Deposits
Attractive and Growing Deposit Base
Source: Company 10-Q and Internal Company Reports, as of 3/31/2010
Note: Core deposits exclude all CDs
• Non-interest bearing deposits represent 18.4% of total deposit balances
• Core deposits increased $16.6 million, or 10.08% since 12/31/2009
• Non-core deposits decreased $11.0 million, or 6.38% since 12/31/2009
• Significant new account growth during 1st quarter 2010 with 656 net new core accounts, or a 4.45% increase in core accounts since 12/31/2009 (19.0%
annualized growth)
annualized growth)
Deposit Detail By Category
Money Market Accounts
8.1%
Savings Accounts
13.5%
CDs Under $100,000
24.3%
CDs $100,000 and Over
22.9%
Non-Interest Bearing
Demand
18.4%
NOW Accounts
12.8%
Balance
($000s)
% of
Total Bal.
# of
Accounts
% of Total
Accts.
Avg.
Cost
Non-Interest Bearing Demand
63,276
$
18.4%
8,783
44.1%
0.00%
NOW Accounts
43,826
12.8%
1,837
9.2%
1.28%
Money Market Accounts
27,735
8.1%
693
3.5%
1.03%
Savings Accounts
46,448
13.5%
4,105
20.6%
1.19%
CDs Under $100,000
83,552
24.3%
4,066
20.4%
2.96%
CDs $100,000 and Over
78,506
22.9%
442
2.2%
2.93%
Total Deposits
343,343
$
19,926
1.84%
$129.5
$150.1
$149.6
$149.2
$164.7
$181.3
$100
$110
$120
$130
$140
$150
$160
$170
$180
$190
12/31/2008
3/31/2009
6/30/2009
9/30/2009
12/31/2009
3/31/2010
Balances
Total Deposits
316,055
$
331,435
$
330,069
$
326,062
$
337,777
$
343,343
$
Core Deposits
129,466
$
150,107
$
149,623
$
149,193
$
164,683
$
181,285
$
Total Number of Accounts
14,029
14,333
14,431
14,546
14,749
15,405
Net New Accounts During Period
33
191
108
115
112
656
Core Deposit Trends
% of Total
41.0%
45.3%
45.3%
45.8%
48.8%
52.8%
% Growth From Prior Quarter-End
-5.08%
15.94%
-0.32%
-0.29%
10.38%
10.08%
2010 Q1
Cost of Core Deposits
0.76%
Cost of Interest Bearing Deposits
2.24%
Cost of Total Deposits
1.84%
Cost of Funds
1.97%
13
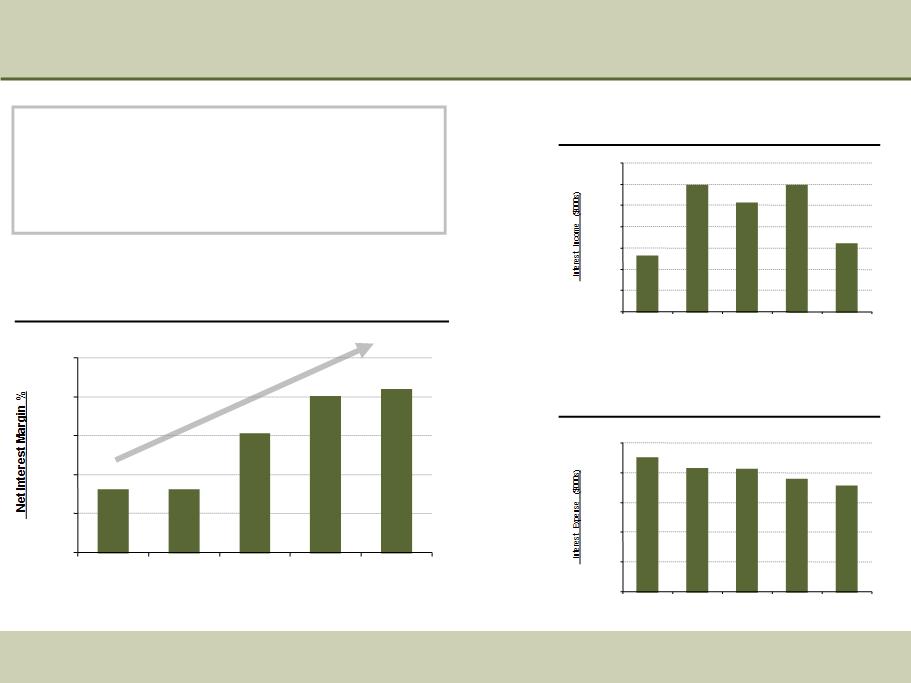
Net Interest Margin
• The Company’s net interest margin has expanded 64 basis
points since 1st quarter 2009
points since 1st quarter 2009
• Margin expansion is largely attributed to decreasing interest
expense and stable interest income
expense and stable interest income
• Interest expense of $1.8 million compared to $2.2 million in
Q1 2009, a decrease of $476 thousand or 21.3%
Q1 2009, a decrease of $476 thousand or 21.3%
Net Interest Margin
Interest Expense
Interest Income
Source: Company 10-Q, as of 3/31/2010
+ 64 basis
points
points
3.40%
3.40%
3.76%
4.00%
4.04%
3.00%
3.25%
3.50%
3.75%
4.00%
4.25%
2009 Q1
2009 Q2
2009 Q3
2009 Q4
2010 Q1
$5,379
$5,545
$5,505
$5,545
$5,408
$5,250
$5,300
$5,350
$5,400
$5,450
$5,500
$5,550
$5,600
2009 Q1
2009 Q2
2009 Q3
2009 Q4
2010 Q1
$2,236
$2,068
$2,043
$1,879
$1,760
$-
$500
$1,000
$1,500
$2,000
$2,500
2009 Q1
2009 Q2
2009 Q3
2009 Q4
2010 Q1
14
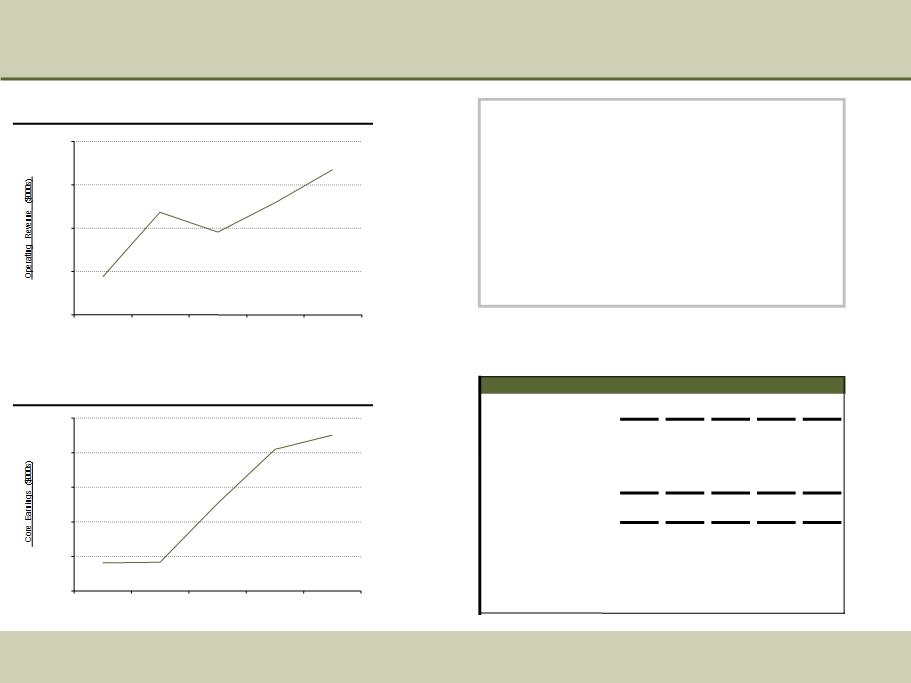
Earnings Power
Operating Revenue
Core Earnings
Source: Company 10-Q and Internal Company Reports, as of 3/31/2010
Note: Core earnings excludes taxes, provision expense, expenses related to OREO and depreciation expense
Note: Pre-tax pre-provision income excludes income tax expense and provision expense
Note: Operating revenue includes net interest income and non-interest income
Returned to Profitability During 1st Quarter 2010
Results from 1st Quarter 2010
• Net interest income of $3.6 million
• Net income of $586 thousand (before preferred dividends)
• Net income for common shareholders of $417 thousand
• Operating revenue of $4.6 million
• Pre-tax pre-provision income of $1.3 million
• Core earnings of $1.7 million
Income Statement
$4,589
$4,341
$3,968
$4,226
$4,396
$3,750
$4,000
$4,250
$4,500
$4,750
2009 Q1
2009 Q2
2009 Q3
2009 Q4
2010 Q1
$1,703
$965
$964
$1,307
$1,618
$800
$1,000
$1,200
$1,400
$1,600
$1,800
2009 Q1
2009 Q2
2009 Q3
2009 Q4
2010 Q1
($000s)
2009 Q1
2009 Q2
2009 Q3
2009 Q4
2010 Q1
Interest Income
5,379
$
5,545
$
5,505
$
5,545
$
5,408
$
Interest Expense
2,236
2,068
2,043
1,879
1,760
Net Interest Income
3,143
3,477
3,462
3,666
3,648
Provision Expense
1,180
1,800
2,400
1,967
500
Non-Interest Income
825
864
764
730
941
Non-Interest Expense
3,228
3,891
3,163
3,627
3,241
Income Tax Expense
(184)
(504)
(706)
346
262
Net Income
(256)
(846)
(631)
(1,544)
586
Preferred Dividends
87
171
173
165
169
Net Income For Common
(343)
$
(1,017)
$
(804)
$
(1,708)
$
417
$
Non-GAAP Measurements
Operating Revenue
3,968
$
4,341
$
4,226
$
4,396
$
4,589
$
Pre-Tax Pre-Provision Income
740
$
450
$
1,063
$
769
$
1,348
$
Core Earnings
964
$
965
$
1,307
$
1,618
$
1,703
$
15
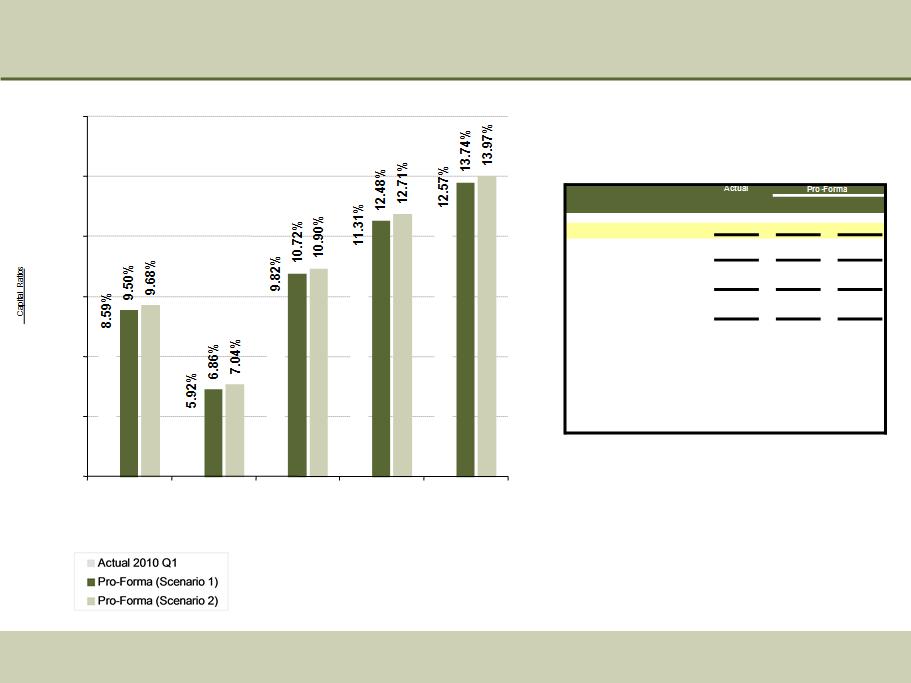
Capital Ratio Snapshot
Capital Snapshot
Northwest Bancorporation, Inc.
Source: Regulatory data from FR-Y9
Note: Pro-forma scenarios with gross offerings of $4.0 million and $4.8
million (respectively) and risk weighting of 0.0% on new capital
million (respectively) and risk weighting of 0.0% on new capital
Tangible Common
Equity Ratio
Equity Ratio
Leverage
Ratio
Ratio
Tier-1
Ratio
Ratio
Risk Based
Capital Ratio
Capital Ratio
Total Equity
Ratio
Ratio
4.00%
6.00%
8.00%
10.00%
12.00%
14.00%
16.00%
($000s)
Scen. 1
Scen. 2
Common Equity (Actual)
23,587
$
23,587
$
23,587
$
Additional Capital From Offering
-
4,000
4,800
Common Equity
23,587
27,587
28,387
TARP Preferred Equity
10,618
10,618
10,618
Total Equity
34,205
38,205
39,005
Trust Preferred Securities
5,000
5,000
5,000
Total Tier-1 Capital
38,871
42,871
43,671
LLR Includable in Tier-2
4,333
4,333
4,333
Total Tier-2 Capital
4,333
4,333
4,333
Total Risk Based Capital
43,204
$
47,204
$
48,004
$
Capital Ratios
Total Equity Ratio
8.59%
9.50%
9.68%
Tangible Common Equity Ratio
5.92%
6.86%
7.04%
Leverage Ratio
9.82%
10.72%
10.90%
Tier-1 Ratio
11.31%
12.48%
12.71%
Risk Based Capital Ratio
12.57%
13.74%
13.97%
2010 Q1
16
Diversified Loan Portfolio
Loan Composition
Loan Detail By Category
Total Commercial Real Estate of 47.1%
Source: Company data from 10-Q and Internal Company Reports, as of 3/31/2010
* Gross loans excluding loans held for sale
Balance
($000s)
% of
Gross Loans
Owner-Occupied CRE
83,381
$
26.4%
Non Owner-Occupied CRE
65,132
20.7%
Commercial Real Estate
148,513
47.1%
1-4 Family and Multi-Family
49,534
15.7%
Commercial Construction
17,668
5.6%
Commercial Non-Real Estate
54,486
17.3%
Land and Land Development
35,091
11.1%
Consumer
10,091
3.2%
Gross Loans*
315,383
Less: Net Deferred Loan Fees
603
Gross Loans*, Net of Deferred Fees
314,780
Plus: Loans Held For Sale
1,466
Less: Loan Loss Reserve
7,175
Net Loans
309,071
$
Yield on Loans
6.37%
Yield on Earning Assets
5.99%
Gross Loans*
339,752
$
338,360
$
337,163
$
324,983
$
321,811
$
315,383
$
Loan / Deposit Ratio
107.5%
102.1%
102.1%
99.7%
95.3%
91.9%
Consumer
3.2%
Non Owner-Occupied
CRE
20.7%
1-4 Family and Multi-
Family
15.7%
Commercial Construction
5.6%
Commercial Non-Real
Estate
17.3%
Land and Land
Development
11.1%
Owner-Occupied CRE
26.4%
17
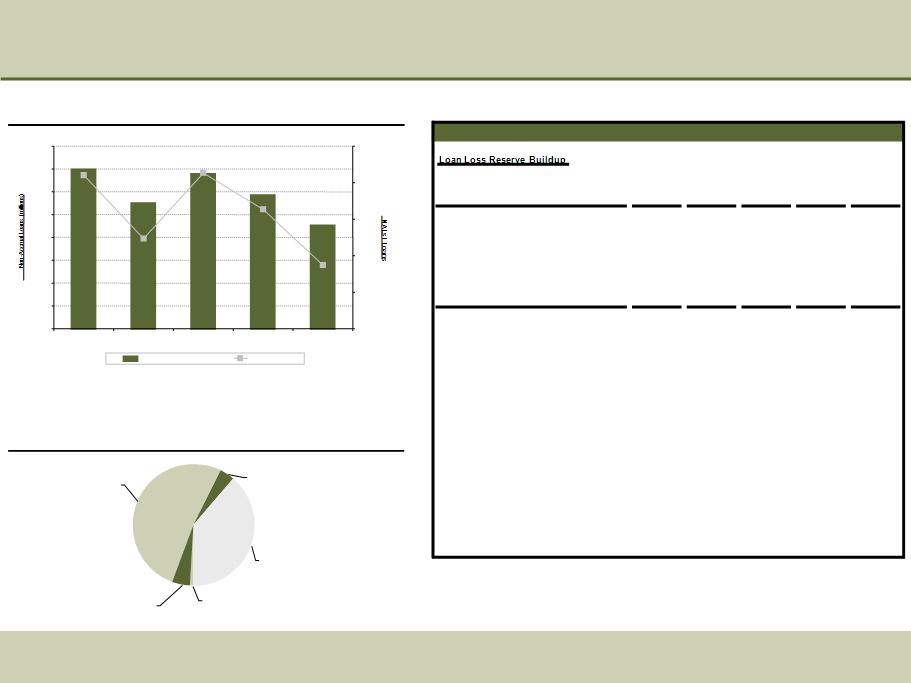
Credit Quality Snapshot
Non-Accrual Loan Composition (3/31/2010)
Credit Quality Statistics
Non-Accrual Loan Trends
Source: Company data from 10-Q and Internal Company Reports
Note: Non-performing assets excludes restructured loans
Note: Texas ratio = (non-performing assets + loans 90 days or greater past
due) / (tangible equity + loan loss reserve)
due) / (tangible equity + loan loss reserve)
$14.0
$11.0
$13.6
$11.7
$9.0
2.87%
3.63%
4.13%
4.10%
3.23%
$-
$2.0
$4.0
$6.0
$8.0
$10.0
$12.0
$14.0
$16.0
3/31/2009
6/30/2009
9/30/2009
12/31/2009
3/31/2010
2.00%
2.50%
3.00%
3.50%
4.00%
4.50%
Non-Accrual Loans
NAL / Loans
Consumer
0.6%
Commercial Non-
Real Estate
4.8%
Commercial Real
Estate
38.8%
1-4 Family
4.0%
Construction &
Development
51.8%
($000s)
3/31/2009
6/30/2009
9/30/2009
12/31/2009
3/31/2010
Beginning Reserve Balance
4,737
$
5,453
$
4,425
$
6,334
$
7,082
$
Plus: Loan Loss Provisions
1,180
1,800
2,400
2,047
500
Less: Net Charge-offs
464
2,843
496
1,199
407
Ending Reserve Balance
5,453
4,425
6,334
7,082
7,175
Credit Quality
Loans 30-89 Days Past Due
10,467
7,695
9,997
4,528
8,583
Loans 90+ Days Past Due
-
-
-
-
-
Non-Accrual Loans (NALs)
13,956
11,014
13,555
11,676
9,045
Other Real Estate Owned
2,635
4,134
3,880
3,672
3,401
Non-Performing Assets (NPAs)
16,591
15,148
17,435
15,348
12,446
Portion of NALs from Participation Loans
6,386
4,331
6,786
6,526
4,057
% of Total Non-Accrual Loans
45.8%
39.3%
50.1%
55.9%
44.9%
Credit Ratios
Reserves / Loans
1.60%
1.30%
1.93%
2.20%
2.28%
Reserves / NALs
39.1%
40.2%
46.7%
60.7%
79.3%
Reserves / NPAs
32.9%
29.2%
36.3%
46.1%
57.6%
NALs / Loans
4.10%
3.23%
4.13%
3.63%
2.87%
NPAs / Assets
4.16%
3.80%
4.43%
3.90%
3.13%
Net Charge-Offs / Avg. Loans
0.54%
3.34%
0.59%
1.47%
0.51%
Texas Ratio
39.0%
37.4%
41.5%
37.5%
30.1%
Non-Accrual Balances By Loan Type
Construction & Development
9,502
$
9,631
$
9,077
$
7,957
$
4,687
$
1-4 Family
195
202
511
190
360
Commercial Real Estate
2,222
428
3,310
3,191
3,507
Consumer
43
80
-
16
56
Commercial Non-Real Estate
1,993
896
658
434
436

18
Appendix

19
Historical Key Financials
Source: Company data from 10-Q and 10-K filings
Note: Operating revenue includes net interest income and non-interest income
Note: Pre-tax pre-provision income excludes income tax expense and provision expense
2005
2006
2007
2008
2009
3/31/2010
Balance Sheet ($000s)
Cash and Equivalents
10,570
$
12,369
$
12,271
$
11,414
$
18,119
$
21,522
$
Investment Securities
36,935
35,955
37,206
27,339
26,069
36,131
Net Loans
186,465
216,693
276,452
335,207
317,198
309,071
Loan Loss Reserve
2,252
2,586
2,711
4,737
7,082
7,175
Total Assets
245,465
278,947
343,716
400,231
393,702
398,238
Deposits
192,043
210,567
272,540
316,055
337,777
343,343
Borrowings
30,324
41,574
41,000
54,701
19,222
18,063
Tangible Common Equity
21,686
24,521
27,346
26,919
23,214
23,587
Total Equity
21,686
24,521
27,346
26,919
33,806
34,205
Income Statement ($000s)
Interest Income
13,687
$
17,884
$
21,768
$
23,124
$
21,974
$
5,408
$
Interest Expense
4,347
6,640
9,282
10,250
8,226
1,760
Net Interest Income
9,340
11,244
12,485
12,874
13,748
3,648
Loan Loss Provisions
324
360
420
3,955
7,347
500
Non-Interest Income
2,196
2,207
2,167
2,473
3,183
941
Non-Interest Expense
8,031
8,961
10,398
11,942
13,909
3,241
Net Income
2,160
2,780
2,638
(275)
(3,277)
586
Net Income Available to Common
2,160
2,780
2,638
(275)
(3,872)
417
Operating Revenue
11,536
13,451
14,652
15,347
16,931
4,589
Pre-Tax Pre-Provision
3,505
4,490
4,254
3,405
3,022
1,348

20
Historical Key Ratios
Source: Company data from 10-Q and 10-K filings
Note: Non-performing assets excludes restructured loans
Note: Texas ratio = (non-performing assets + loans 90 days or greater past
due) / (tangible equity + loan loss reserve)
due) / (tangible equity + loan loss reserve)
2005
2006
2007
2008
2009
3/31/2010
Performance Ratios
Net Interest Margin
4.39%
4.57%
4.35%
3.71%
3.67%
4.04%
Yield on Interest Earning Assets
6.39%
7.26%
7.58%
6.66%
5.87%
5.99%
Cost of Funds
2.04%
2.77%
3.31%
3.00%
2.28%
1.97%
Efficiency Ratio
69.6%
66.6%
71.0%
77.9%
82.2%
70.6%
Non-Interest Income / Avg. Assets
0.93%
0.83%
0.70%
0.66%
0.80%
0.95%
Non-Interest Expense / Avg. Assets
3.42%
3.39%
3.36%
3.21%
3.49%
3.27%
Return on Avg. Assets
0.92%
1.05%
0.85%
-0.07%
-0.97%
0.42%
Return on Avg. Equity
10.31%
11.94%
10.24%
-0.98%
-11.42%
4.91%
Loans / Deposits
98.3%
103.6%
102.0%
107.6%
95.3%
91.9%
Capitalization
Tang. Common Equity / Tang. Assets
8.83%
8.79%
7.96%
6.73%
5.90%
5.92%
Leverage Ratio
10.97%
10.82%
9.46%
8.03%
9.76%
9.82%
Tier 1 Ratio
13.48%
12.76%
10.95%
8.77%
10.94%
11.31%
Total Capital Ratio
14.70%
13.95%
11.96%
10.03%
12.20%
12.57%
Credit Quality
Non-Performing Assets / Assets
0.17%
0.11%
0.16%
4.70%
3.90%
3.13%
Non-Accrual Loans / Loans
0.21%
0.15%
0.20%
4.71%
3.63%
2.87%
Net Charge-Offs / Avg. Loans
0.03%
0.00%
0.09%
0.61%
1.49%
0.51%
Reserves / Loans
1.19%
1.19%
0.97%
1.39%
2.20%
2.28%
Reserves / Non-Performing Assets
533.6%
808.1%
490.2%
25.2%
46.1%
57.6%
Reserves / Non-Accrual Loans
556.0%
808.1%
495.6%
29.6%
60.7%
79.3%
Texas Ratio
1.8%
1.2%
1.8%
62.8%
37.5%
30.1%