| |  | |
| | | |
| | | |
| | | |
| | | |
| | | |
| | | |
| | | |
| | | |
| | | |
| | | |
| | Semi-Annual Report | |
| | | |
| | April 30, 2014 | |
| | | |
| | (Unaudited) | |
| |
| |
| | | |
| | Total Return U.S. Treasury Fund, Inc. | |
| | | |
| | Managed Municipal Fund, Inc. | |
| | | |
| | North American Government Bond Fund, Inc. | |
| | | |
| | ISI Strategy Fund, Inc. | |
| | | |
| |
| |
| | | |
| | | |
| | | |
| | | |
| | | |
| | | |
| | | |
| | | |
| | | |
| | | |
| | | |
| ISI Funds Semi-Annual Report – Table of Contents |
| Investment Advisor’s Message | 1 |
| Performance Comparisons | 2 |
| Shareholder Expense Examples | 10 |
| Portfolio Profiles | 13 |
| Schedules of Investments | 14 |
| Statements of Assets and Liabilities | 30 |
| Statements of Operations | 34 |
| Statements of Changes in Net Assets | 36 |
| Financial Highlights | 42 |
| Notes to Financial Statements | 49 |
| Notice to Shareholders | 60 |
| Investment Advisor’s Message | 4/30/2014 |
Dear Shareholder:
I am pleased to present the semi-annual report to shareholders for the ISI Funds. This report covers the six-month reporting period ended April 30, 2014. For this period, the Total Return US Treasury Fund, Inc. (‘Total Return’) produced a -0.71% return; Managed Municipal Fund, Inc. (‘Managed Municipal’) produced a +2.38% return in its Class A Shares and a +1.94% return in its Class I Shares; North American Government Bond Fund, Inc. (‘North American’) produced a -1.31% return in its Class A Shares, a -1.38% return in its Class C Shares, and a -1.03% return in its Class I Shares; and ISI Strategy Fund (‘Strategy’) produced a +6.20% return. These figures assume the reinvestment of dividends and capital gain distributions, and exclude the impact of any sales charges.
Performance data quoted represents past performance and is no guarantee of future results. Current performance may be lower or higher than the performance data quoted. Investment return and principal value will fluctuate so that an investor’s shares, when redeemed, may be worth more or less than original cost. For the most recent month-end performance of a Fund, please call (800) 882-8585.
Description of Fund Objectives
Total Return, Managed Municipal, North American and Strategy, (each a ‘Fund’ and collectively, the ‘Funds’) are registered under the Investment Company Act of 1940, as amended, as open-end management investment companies. The Funds are organized as corporations under the laws of the state of Maryland.
International Strategy & Investment, Inc. (‘ISI’) manages all four Funds. Total Return’s investment objective is to achieve a high level of total return with relative stability of principal and, secondarily, high current income consistent with an investment in securities issued by the United States Treasury. Managed Municipal’s investment objective is designed to provide a high level of total return with relative stability of principal and, secondarily, high current income exempt from federal income tax through investment in a portfolio consisting primarily of tax-free municipal obligations. North American’s investment objective is designed to provide a high level of current income, consistent with prudent investment risk. Strategy’s investment objective is designed to maximize total return through a combination of long-term growth of capital and current income.
We would like to welcome new investors to the ISI Funds and thank those who have been with us for some time. We appreciate your confidence.
Sincerely,
R. Alan Medaugh
President
May 13, 2014
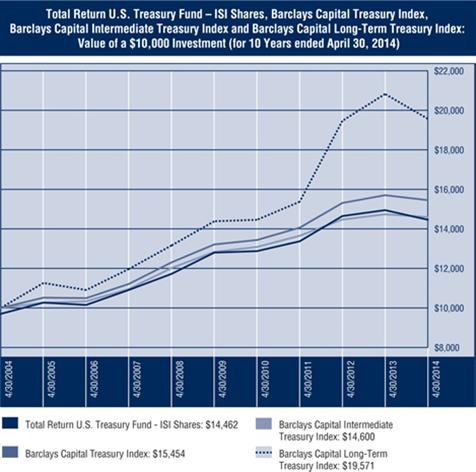
Total Return U.S. Treasury Fund, Inc. – Performance Comparison1 (Unaudited) |
Total Return U.S. Treasury Fund, Inc. – Performance Comparison1 (Unaudited) (continued) |
| Cumulative Total Returns (With Sales Charge) | Average Annual Total Returns (With Sales Charge) |
Periods Ended
April 30, 2014 | 1 Year | 3 Years | 5 Years | 10 Years | Since Inception2 | 1 Year | 3 Years | 5 Years | 10 Years | Since Inception2 |
| Total Return U.S. Treasury Fund | -6.11% | 4.93% | 9.58% | 44.59% | 356.91% | -6.11% | 1.62% | 1.85% | 3.76% | 6.08% |
Barclays Capital Treasury Index3 | -1.59% | 9.90% | 16.97% | 54.54% | 416.33% | -1.59% | 3.20% | 3.19% | 4.45% | 6.60% |
Barclays Capital Intermediate Treasury Index3 | -0.93% | 6.96% | 13.73% | 46.00% | 343.86% | -0.93% | 2.26% | 2.60% | 3.86% | 5.98% |
Barclays Capital Long-Term Treasury Index3 | -6.02% | 27.31% | 36.05% | 95.71% | 549.63% | -6.02% | 8.38% | 6.35% | 6.94% | 7.56% |
| 1 | Past performance is not indicative of future results. Investment return and principal value will fluctuate so that an investor’s shares, when redeemed, may be worth more or less than their original cost. The performance information presented in the graph and table above does not reflect the deduction of taxes that a shareholder would pay on Fund distributions or the redemption of Fund shares. All performance assumes the reinvestment of dividends and capital gain distributions and includes the Fund’s maximum 3.00% sales charge. Distributions of the Fund’s capital gains and any non-US Treasury income may be subject to state and local taxes. Management is not aware of any single index that is truly representative of the Fund since its active maturity management policy allows the manager to adjust the weighted average maturity throughout each US Treasury sector. Currently, the Fund’s weighted average maturity is approximately 4.16 years. |
| 2 | The Fund’s inception date is August 10, 1988. Benchmark returns are for the periods beginning August 31, 1988. |
| 3 | The Barclays Capital Treasury Index is an unmanaged index reflecting the performance of all public Treasury obligations and does not focus on one particular segment of the Treasury market. The Barclays Capital Intermediate Treasury Index is an unmanaged index reflecting the performance of US Treasury securities in the intermediate-term Treasury sector. The Barclays Capital Long-Term Treasury Index is an unmanaged index reflecting the performance of US Treasury securities in the long-term Treasury sector. Benchmark returns do not reflect expenses or sales charges that have been deducted from the Fund’s returns. |
| October 31, 2013 |
| Expense Ratio Information as of: | (As disclosed in March 1, 2014 Summary Prospectus) |
| Gross Expense Ratio | 0.89% |
Managed Municipal Fund, Inc. – Performance Comparison1 (Unaudited) |
Managed Municipal Fund, Inc. – Performance Comparison1 (Unaudited) (continued) |
| Cumulative Total Returns (With Sales Charge) | Average Annual Total Returns (With Sales Charge) |
Periods Ended
April 30, 2014 | 1 Year | 3 Years | 5 Years | 10 Years | Since Inception | 1 Year | 3 Years | 5 Years | 10 Years | Since Inception |
Managed Municipal Fund –
ISI Class A Shares2 | -4.33% | 6.71% | 12.34% | 36.04% | 210.41% | -4.33% | 2.19% | 2.35% | 3.13% | 4.80% |
Managed Municipal Fund –
ISI Class I Shares3 | -1.78% | 10.07% | ─ | ─ | 8.22% | -1.78% | 3.25% | ─ | ─ | 2.24% |
Barclays Capital General Obligation Index4 | 0.62% | 15.72% | 27.62% | 60.17% | 175.27% | 0.62% | 4.99% | 5.00% | 4.82% | 4.28% |
Barclays Capital Prerefunded Municipal Bond Index4 | 0.75% | 5.87% | 11.82% | 38.88% | 71.71% | 0.75% | 1.92% | 2.26% | 3.34% | 2.26% |
Consumer Price Index5 | 2.00% | 5.49% | 11.26% | 26.17% | 92.85% | 2.00% | 1.80% | 2.16% | 2.35% | 2.75% |
| 1 | Past performance is not indicative of future results. Investment return and principal value will fluctuate so that an investor’s shares, when redeemed, may be worth more or less than their original cost. The performance information presented in the graph and table above does not reflect the deduction of taxes that a shareholder would pay on Fund distributions or the redemption of Fund shares. All performance assumes the reinvestment of dividends and capital gain distributions and includes the sales charge, if applicable. ISI Class A Shares have a maximum 3.00% sales charge. Distributions of the Fund’s income and capital gains may be subject to state and local taxes. |
| 2 | The ISI Class A Shares inception date is February 26, 1990. Benchmark returns are for the periods beginning February 28, 1990. |
| 3 | The ISI Class I Shares inception date is October 7, 2010. Benchmark returns are for the period beginning October 31, 2010. Cumulative and annualized returns for the Barclays Capital General Obligation Index from October 31, 2010 through April 30, 2014 were 14.90% and 4.05%, respectively. Cumulative and annualized returns for the Barclays Capital Prerefunded Municipal Bond Index from October 31, 2010 through April 30, 2014 were 6.26% and 1.75%, respectively. |
| 4 | The Barclays Capital General Obligation Index is an unmanaged index reflecting general municipal bond market performance. The Barclays Capital Prerefunded Municipal Bond Index, an unmanaged index, is a subcomponent of the general Barclays Capital Municipal Bond Index, and contains only bonds from that index that have been prerefunded or escrowed to maturity. Benchmark returns do not reflect expenses or sales charges that have been deducted from the Fund’s returns. |
| 5 | The Consumer Price Index is a widely used measure of inflation. |
| October 31, 2013 |
| Expense Ratio Information as of: | (As disclosed in March 1, 2014 Summary Prospectus) |
| Gross Expense Ratio – Class A | 1.04% |
| Gross Expense Ratio – Class I | 0.79% |
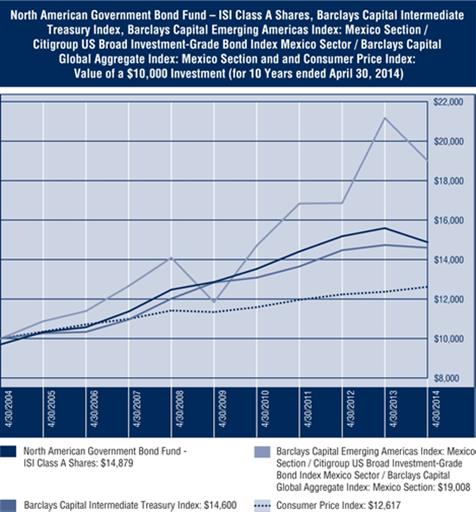
North American Government Bond Fund, Inc. – Performance Comparison1 (Unaudited) |
North American Government Bond Fund, Inc. – Performance Comparison1 (Unaudited) (continued) |
| Cumulative Total Returns (With Sales Charge) | Average Annual Total Returns (With Sales Charge) |
Periods Ended
April 30, 2014 | 1 Year | 3 Years | 5 Years | 10 Years | Since Inception | 1 Year | 3 Years | 5 Years | 10 Years | Since Inception |
North American Government Bond Fund - ISI Class A Shares2 | -7.47% | 0.17% | 12.27% | 48.74% | 186.88% | -7.47% | 0.06% | 2.34% | 4.05% | 5.07% |
North American Government Bond Fund - ISI Class C Shares3 | -5.94% | 1.65% | 12.39% | 44.32% | 39.32% | -5.94% | 0.55% | 2.36% | 3.74% | 3.07% |
North American Government Bond Fund - ISI Class I Shares4 | -4.39% | 4.33% | ─ | ─ | 6.31% | -4.39% | 1.42% | ─ | ─ | 1.70% |
Barclays Capital Intermediate Treasury Index5 | -0.93% | 6.96% | 13.73% | 46.00% | 182.85% | -0.93% | 2.26% | 2.60% | 3.86% | 5.01% |
Barclays Capital Emerging Americas Index: Mexico Section / Citigroup US Broad Investment-Grade Bond Index Mexico Sector / Barclays Capital Global Aggregate Index: Mexico Section6 | -10.21% | 12.89% | 60.47% | 90.08% | 542.22% | -10.21% | 4.12% | 9.92% | 6.63% | 9.14% |
Consumer Price Index7 | 2.00% | 5.49% | 11.26% | 26.17% | 70.15% | 2.00% | 1.80% | 2.16% | 2.35% | 2.53% |
| 1 | Past performance is not indicative of future results. Investment return and principal value will fluctuate so that an investor’s shares, when redeemed, may be worth more or less than their original cost. The performance information presented in the graph and table above does not reflect the deduction of taxes that a shareholder would pay on Fund distributions or the redemption of Fund shares. All performance assumes the reinvestment of dividends and capital gain distributions and includes sales charges, if applicable. ISI Class A shares have a maximum 3.00% sales charge. ISI Class C Shares have a maximum 1.00% contingent deferred sales charge in the first year, which is eliminated thereafter. |
| 2 | ISI Class A Shares inception date is January 15, 1993. Benchmark returns are for the periods beginning January 31, 1993. |
| 3 | ISI Class C Shares inception date is May 16, 2003. Cumulative and annualized returns for the Barclays Capital Intermediate Treasury Index from May 31, 2003 through April 30, 2014 were 45.12% and 3.47%, respectively. |
| 4 | ISI Class I Shares inception date is September 16, 2010. Benchmark returns are for the periods beginning September 30, 2010. Cumulative and annualized returns for the Barclays Capital Intermediate Treasury Index from September 30, 2010 through April 30, 2014 were 6.12% and 1.67%, respectively. |
| 5 | The Barclays Capital Intermediate Treasury Index is an unmanaged index reflecting the performance of US Treasury securities in the intermediate-term Treasury sector. Benchmark returns do not reflect expenses or sales charges that have been deducted from the Fund’s returns. |
| 6 | Reflects the performance of the Barclays Capital Emerging Americas Index: Mexico Section through October 31, 2004 and the Citigroup US Broad Investment-Grade Bond Index Mexico Sector from that date through October 31, 2006 and the Barclays Capital Global Aggregate Index: Mexico from October 31, 2006 through April 30, 2014. The Barclays Capital Emerging Americas Index: Mexico Section has been discontinued. Barclays Capital Emerging Americas Index: Mexico Section was an unmanaged sub-index of the Barclays Capital Emerging Americas Index reflecting the performance of selected Mexican debt instruments with maturities of one year or more. The Citigroup US Broad Investment-Grade Bond Index Mexico Sector is an unmanaged sub-index of the Citigroup US Broad Investment-Grade Bond Index reflecting the performance of selected Mexican debt instruments with maturities of one year or more. The Barclays Capital Global Aggregate Index: Mexico Section is an unmanaged sub-index of Barclays Capital Global Aggregate Index which provides broad-based measure of global investment-grade fixed income markets. The Mexico Section reflects the US dollar performance of selected Mexican government peso-denominated debt instruments with maturities of one year or more. Benchmark returns do not reflect expenses or sales charges that have been deducted from the Fund’s returns. |
| 7 | The Consumer Price Index is a widely used measure of inflation. |
| October 31, 2013 |
| Expense Ratio Information as of: | (As disclosed in March 1, 2014 Summary Prospectus) |
| Gross Expense Ratio – Class A | 1.25% |
| Gross Expense Ratio – Class C | 1.85% |
| Gross Expense Ratio – Class I | 0.85% |
ISI Strategy Fund, Inc. – Performance Comparison1 (Unaudited) |
ISI Strategy Fund, Inc. – Performance Comparison1 (Unaudited) (continued) |
| Cumulative Total Returns (With Sales Charge) | Average Annual Total Returns (With Sales Charge) |
Periods Ended
April 30, 2014 | 1 Year | 3 Years | 5 Years | 10 Years | Since Inception2 | 1 Year | 3 Years | 5 Years | 10 Years | Since Inception2 |
| ISI Strategy Fund | 12.02% | 30.41% | 100.32% | 96.13% | 158.62% | 12.02% | 9.25% | 14.91% | 6.97% | 5.88% |
DJ Wilshire 5000 (Full Cap) Index3 | 20.66% | 46.20% | 144.60% | 122.71% | 186.59% | 20.66% | 13.50% | 19.59% | 8.34% | 6.55% |
Consumer Price Index4 | 2.00% | 5.49% | 11.26% | 26.17% | 48.06% | 2.00% | 1.80% | 2.16% | 2.35% | 2.39% |
Lipper Flexible Portfolio Funds’ Average5 | 11.00% | 22.84% | 87.44% | 94.49% | 142.79% | 11.00% | 7.09% | 13.38% | 6.87% | 5.49% |
| 1 | Past performance is not indicative of future results. Investment return and principal value will fluctuate so that an investor’s shares, when redeemed, may be worth more or less than their original cost. The performance information presented in the graph and table above does not reflect the deduction of taxes that a shareholder would pay on Fund distributions or the redemption of Fund shares. All performance assumes the reinvestment of dividends and capital gain distributions and includes the Fund’s maximum 3.00% sales charge. |
| 2 | The Fund’s inception date is September 16, 1997. Benchmark returns are for the periods beginning September 30, 1997. |
| 3 | The DJ Wilshire 5000 (Full Cap) Index is an unmanaged index that represents the broadest measure of the US equity market. Benchmark returns do not reflect expenses or sales charges that have been deducted from the Fund’s returns. |
| 4 | The Consumer Price Index is a widely used measure of inflation. |
| 5 | Lipper figures represent the average total returns by all mutual funds designated by Lipper as falling into the category indicated. The Lipper Flexible Portfolio Funds’ Average category includes funds that allocate their investments across various asset classes, including domestic common stocks, bonds and money market instruments with a focus on total return. |
| October 31, 2013 |
| Expense Ratio Information as of: | (As disclosed in March 1, 2014 Summary Prospectus) |
| Gross Expense Ratio | 1.08% |
| Shareholder Expense Examples (Unaudited) |
As a shareholder of the Funds, you incur two types of cost: (1) transaction costs, including sales charges (loads); and (2) ongoing costs, including management fees, Rule 12b-1 distribution/shareholder service fees and other Fund expenses. This example is intended to help you understand your ongoing costs (in dollars) of investing in each Fund and to compare these costs with the ongoing costs of investing in other mutual funds.
A mutual fund’s ongoing costs are expressed as a percentage of its average net assets. This figure is known as the expense ratio. The expenses in the tables below are based on an investment of $1,000 made at the beginning of the period (November 1, 2013) shown and held for the entire period (April 30, 2014).
Actual Expenses – “Actual Return” in the following table provides information about actual account values and actual expenses. You may use the information here, together with the amount you invested, to estimate the expenses that you paid over the period. Simply divide your account value by $1,000 (for example, an $8,600 account value divided by $1,000 = 8.6), then multiply the result by the number in the “Expenses Paid During Period” column to estimate the expenses you paid on your account during this period.
Hypothetical Example for Comparison Purposes – “Hypothetical Returns” in the following table provides information about hypothetical account values and hypothetical expenses based on each Fund’s actual expense ratio and an assumed rate of return of 5% per year before expenses, which is not the actual return of each Fund. The hypothetical account values and expenses may not be used to estimate the actual ending account balance or expenses you paid for the period. You may use this information to compare the ongoing cost of investing in a Fund and other funds. To do so, compare this 5% hypothetical example with the 5% hypothetical examples that appear in the shareholder reports of other funds.
Expenses shown in the tables are meant to highlight your ongoing costs only and do not reflect any transactional costs, such as sales charges (loads). Therefore, “Hypothetical Returns” in the table are useful in comparing ongoing costs only, and will not help you determine the relative total costs of owning different funds. If these transactional costs were included, your costs would have been higher.
| Shareholder Expense Examples (Unaudited) (continued) |
Total Return U.S. Treasury Fund, Inc.
| | Beginning
Account Value
November 1, 2013 | Ending
Account Value
April 30, 2014 | Expenses Paid
During Period(1) | Annualized
Expense Ratio |
| Based on Actual Fund Return | $1,000.00 | $992.90 | $4.79 | 0.97% |
| Based on Hypothetical 5% Return | $1,000.00 | $1,019.98 | $4.86 | 0.97% |
Managed Municipal Fund, Inc. – Class A
| | Beginning
Account Value
November 1, 2013 | Ending
Account Value
April 30, 2014 | Expenses Paid
During Period(1) | Annualized
Expense Ratio |
| Based on Actual Fund Return | $1,000.00 | $1,023.80 | $5.82 | 1.16% |
| Based on Hypothetical 5% Return | $1,000.00 | $1,019.04 | $5.81 | 1.16% |
Managed Municipal Fund, Inc. – Class I
| | Beginning
Account Value
November 1, 2013 | Ending
Account Value
April 30, 2014 | Expenses Paid
During Period(1) | Annualized
Expense Ratio |
| Based on Actual Fund Return | $1,000.00 | $1,019.40 | $4.61 | 0.92% |
| Based on Hypothetical 5% Return | $1,000.00 | $1,020.23 | $4.61 | 0.92% |
North American Government Bond Fund, Inc. – Class A
| | Beginning
Account Value
November 1, 2013 | Ending
Account Value
April 30, 2014 | Expenses Paid
During Period(1) | Annualized
Expense Ratio |
| Based on Actual Fund Return | $1,000.00 | $986.90 | $6.85 | 1.39% |
| Based on Hypothetical 5% Return | $1,000.00 | $1,017.90 | $6.95 | 1.39% |
North American Government Bond Fund, Inc. – Class C
| | Beginning
Account Value
November 1, 2013 | Ending
Account Value
April 30, 2014 | Expenses Paid
During Period(1) | Annualized
Expense Ratio |
| Based on Actual Fund Return | $1,000.00 | $986.20 | $9.11 | 1.85% |
| Based on Hypothetical 5% Return | $1,000.00 | $1,015.62 | $9.25 | 1.85% |
(1) | Expenses are equal to the Fund’s annualized expense ratio for the period, multiplied by the average account value over the period, multiplied by 181/365 (to reflect the one-half year period). |
| Shareholder Expense Examples (Unaudited) (continued) |
North American Government Bond Fund, Inc. – Class I
| | Beginning
Account Value
November 1, 2013 | Ending
Account Value
April 30, 2014 | Expenses Paid
During Period(1) | Annualized
Expense Ratio |
| Based on Actual Fund Return | $1,000.00 | $989.70 | $4.88 | 0.99% |
| Based on Hypothetical 5% Return | $1,000.00 | $1,019.89 | $4.96 | 0.99% |
ISI Strategy Fund, Inc.
| | Beginning
Account Value
November 1, 2013 | Ending
Account Value
April 30, 2014 | Expenses Paid
During Period(1) | Annualized
Expense Ratio |
| Based on Actual Fund Return | $1,000.00 | $1,062.00 | $5.73 | 1.12% |
| Based on Hypothetical 5% Return | $1,000.00 | $1,019.24 | $5.61 | 1.12% |
(1) | Expenses are equal to the Fund’s annualized expense ratio for the period, multiplied by the average account value over the period, multiplied by 181/365 (to reflect the one-half year period). |
| Portfolio Profiles (Unaudited) |
| Portfolio Profiles (as a % of Net Assets) | April 30, 2014 |
| Total Return U.S. Treasury Fund, Inc. |
| U.S. Treasury Obligations | 79.91% |
| U.S. Treasury Bills | 19.48% |
| Other Assets and Liabilities | 0.61% |
| 100.00% |
| Managed Municipal Fund, Inc. |
| Aaa Municipal Obligations* | 82.88% |
| Aa Municipal Obligations* | 5.85% |
| NR Municipal Obligations* | 0.55% |
| U.S. Treasury Bills | 9.83% |
| Other Assets and Liabilities | 0.89% |
| 100.00% |
| * Ratings are based on Moody’s Investors Service, Inc. |
| North American Government Bond Fund, Inc. |
| Canadian Securities | 18.89% |
| Mexican Securities | 16.71% |
| U.S. Treasury Obligations | 57.86% |
| U.S. Treasury Bills | 5.20% |
| Other Assets and Liabilities | 1.34% |
| 100.00% |
| ISI Strategy Fund, Inc. |
| Consumer Discretionary | 12.21% |
| Consumer Staples | 5.80% |
| Energy | 9.00% |
| Financials | 13.57% |
| Health Care | 11.34% |
| Industrials | 9.36% |
| Information Technology | 16.91% |
| Materials | 3.17% |
| Telecommunication Services | 2.93% |
| Utilities | 2.77% |
| U.S. Treasury Obligations | 10.39% |
| U.S. Treasury Bills | 2.34% |
| Other Assets and Liabilities | 0.21% |
| 100.00% |
| Total Return U.S. Treasury Fund, Inc. |
| Schedule of Investments | April 30, 2014 (Unaudited) |
| Security | | Interest Rate | Maturity
Date | | Principal
Amount | | | Value | |
| U.S. TREASURY OBLIGATIONS - 79.91% | | | | | | | | |
| U.S. Treasury Notes | | | 3.750 | % | 11/15/18 | | $ | 360,000 | | | $ | 395,592 | |
| U.S. Treasury Notes | | | 1.250 | % | 01/31/19 | | | 16,000,000 | | | | 15,733,120 | |
| U.S. Treasury Notes | | | 1.500 | % | 01/31/19 | | | 750,000 | | | | 746,016 | |
| U.S. Treasury Notes | | | 2.625 | % | 08/15/20 | | | 280,000 | | | | 289,450 | |
| U.S. Treasury Bonds | | | 8.125 | % | 08/15/19 | | | 10,000,000 | | | | 13,239,060 | |
| U.S. Treasury Bonds | | | 8.750 | % | 08/15/20 | | | 11,000,000 | | | | 15,396,128 | |
| | | | | | | | | | | | | |
| Total U.S. Treasury Obligations (Cost $43,978,801) | | | $ | 45,799,366 | |
| | | | | | | | | | | | | |
| U.S. TREASURY BILLS - 19.48% | | | | | | | | | | | | | |
U.S. Treasury Bills1 | | | 0.014 | % | 05/08/14 | | $ | 6,155,000 | | | $ | 6,154,982 | |
U.S. Treasury Bills1 | | | 0.006 | % | 06/05/14 | | | 1,915,000 | | | | 1,914,988 | |
U.S. Treasury Bills1 | | | 0.011 | % | 08/07/14 | | | 3,095,000 | | | | 3,094,904 | |
| | | | | | | | | | | | | |
| Total U.S. Treasury Bills (Cost $11,164,611) | | | $ | 11,164,874 | |
| | | | | | | | | | | | | |
| Total Investments - 99.39% (Cost $55,143,412)* | | | $ | 56,964,240 | |
| Other Assets in Excess of Liabilities - 0.61% | | | | 349,974 | |
| Net Assets - 100.00% | | | $ | 57,314,214 | |
1 | Interest rate presented is yield to maturity. |
| * | Cost for Federal income tax purposes is $55,143,412 and net unrealized appreciation on a tax basis consists of: |
| Gross Unrealized Appreciation | | $ | 2,089,893 | |
| Gross Unrealized Depreciation | | | (269,065 | ) |
| Net Unrealized Appreciation | | $ | 1,820,828 | |
See Notes to Financial Statements.
| Managed Municipal Fund, Inc. |
| Schedule of Investments | April 30, 2014 (Unaudited) |
| Security | | Interest Rate | Maturity
Date | Ratings
(Moody’s/
S&P)1 | | Principal
Amount | | | Value | |
| MUNICIPAL BONDS - 89.28% | | | | | | | | | | | |
| General Obligation - 44.70% | | | | | | | | | | | |
| Baltimore County, MD | | | 4.000 | % | 08/01/22 | Aaa/AAA | | $ | 1,665,000 | | | $ | 1,856,841 | |
| City of Columbus, OH, Series 1 | | | 4.000 | % | 07/01/29 | Aaa/AAA | | | 500,000 | | | | 532,985 | |
| Delaware State | | | 4.000 | % | 03/01/31 | Aaa/AAA | | | 2,000,000 | | | | 2,122,160 | |
| Delaware State, Series A | | | 3.000 | % | 08/01/26 | Aaa/AAA | | | 1,500,000 | | | | 1,525,815 | |
| Delaware State, Series B | | | 3.000 | % | 07/01/19 | Aaa/AAA | | | 1,400,000 | | | | 1,521,898 | |
| Georgia State, Series A | | | 3.000 | % | 07/01/29 | Aaa/AAA | | | 3,000,000 | | | | 2,907,450 | |
| Georgia State, Series B | | | 4.250 | % | 04/01/25 | Aaa/AAA | | | 1,120,000 | | | | 1,179,528 | |
| Mecklenburg County, NC | | | 3.500 | % | 02/01/26 | Aaa/AAA | | | 2,000,000 | | | | 2,163,780 | |
Oregon State, State Property,
ODOT Building, Series K | | | 5.000 | % | 05/01/30 | Aa1/AA+ | | | 1,915,000 | | | | 2,162,380 | |
Prince Georges County, MD,
Public Improvements | | | 4.125 | % | 07/15/26 | Aaa/AAA | | | 2,000,000 | | | | 2,119,700 | |
| Texas State, Water Financial Assistance, Series C-1 | | | 5.000 | % | 08/01/39 | Aaa/AAA | | | 3,515,000 | | | | 3,901,931 | |
| Utah State, Series A | | | 5.000 | % | 07/01/23 | Aaa/AAA | | | 2,785,000 | | | | 3,341,499 | |
| Wake County, NC, Series A | | | 3.000 | % | 05/01/29 | Aaa/AAA | | | 2,525,000 | | | | 2,487,453 | |
| Washington State, Motor Vehicle Fuel Tax, Series E | | | 4.000 | % | 02/01/36 | Aa1/AA+ | | | 2,000,000 | | | | 2,012,500 | |
| Washington, MD, Suburban Sanitation District, Public Improvements | | | 3.000 | % | 06/01/26 | Aaa/AAA | | | 2,000,000 | | | | 2,026,940 | |
| | | | | | | | | | | | $ | 31,862,860 | |
Prerefunded2 Issues - 33.85% | | | | | | | | | | | | | | |
| Fairfax County, VA, Water Authority Water Revenue, 04/01/2017 @ 100 | | | 4.500 | % | 04/01/27 | NR/NR | | $ | 355,000 | | | $ | 394,792 | |
Georgia State, Series G,
10/01/16 @ 100 | | | 4.125 | % | 10/01/23 | Aaa/AA+ | | | 2,000,000 | | | | 2,166,080 | |
| Henrico County, VA, Public Improvements, 07/15/15 @ 100 | | | 4.250 | % | 07/15/24 | Aaa/AAA | | | 2,830,000 | | | | 2,968,217 | |
Kansas State, Development Finance Authority, Series DW-1,
04/01/17 @ 100 | | | 3.000 | % | 04/01/20 | Aaa/AAA | | | 2,865,000 | | | | 2,976,248 | |
Kansas State, Development Finance Authority, Series DW-1,
04/01/17 @ 100 | | | 3.125 | % | 04/01/22 | Aaa/AAA | | | 2,975,000 | | | | 3,188,516 | |
Maryland State, Capital Improvements, Series A,
02/15/15 @ 100 | | | 4.000 | % | 02/15/20 | Aaa/AAA | | | 4,000,000 | | | | 4,121,800 | |
Tennessee State, Series A,
05/01/17 @ 100 | | | 5.000 | % | 05/01/26 | Aaa/AA+ | | | 500,000 | | | | 565,405 | |
See Notes to Financial Statements.
| Managed Municipal Fund, Inc. |
| Schedule of Investments (continued) | April 30, 2014 (Unaudited) |
| Security | | Interest Rate | Maturity
Date | Ratings
(Moody’s/
S&P)1 | | Principal
Amount | | | Value | |
| MUNICIPAL BONDS - 89.28% (continued) | | | | | | | | | |
Prerefunded2 Issues - 33.85% (continued) | | | | | | | | | |
Tennessee State, Series A,
05/01/17 @ 100 | | | 5.000 | % | 05/01/27 | Aaa/AA+ | | $ | 2,075,000 | | | $ | 2,346,431 | |
Virginia State, Series B,
06/01/16 @ 100 | | | 4.250 | % | 06/01/26 | Aaa/AAA | | | 2,500,000 | | | | 2,700,550 | |
| Washington, MD, Suburban Sanitation District, Water Supply, 06/01/16 @ 100 | | | 4.250 | % | 06/01/26 | Aaa/AAA | | | 2,500,000 | | | | 2,705,825 | |
| | | | | | | | | | | | $ | 24,133,864 | |
| Revenue Bonds - 10.73% | | | | | | | | | | | | | | |
| Fairfax County, VA, Water Authority Water Revenue | | | 4.500 | % | 04/01/27 | Aaa/AAA | | $ | 2,145,000 | | | $ | 2,253,430 | |
| Gwinnett County, GA, Water & Sewerage Authority, Series A | | | 4.000 | % | 08/01/28 | Aaa/AAA | | | 2,000,000 | | | | 2,111,320 | |
| Virginia State, Resources Authority Clean Water Revenue | | | 4.500 | % | 10/01/28 | Aaa/AAA | | | 3,000,000 | | | | 3,281,190 | |
| | | | | | | | | | | | $ | 7,645,940 | |
| | | | | | | | | | | | | | |
| Total Municipal Bonds (Cost $60,304,786) | | | $ | 63,642,664 | |
| | | | | | | | | | | | | | |
| U.S. TREASURY BILLS - 9.83% | | | | | | | | | | | |
U.S. Treasury Bills3 | | | 0.000 | % | 05/01/14 | | — | | $ | 3,810,000 | | | $ | 3,810,000 | |
U.S. Treasury Bills4 | | | 0.006 | % | 06/05/14 | | — | | | 2,850,000 | | | | 2,849,983 | |
U.S. Treasury Bills4 | | | 0.011 | % | 08/07/14 | | — | | | 350,000 | | | | 349,989 | |
| | | | | | | | | | | | | | | |
| Total U.S. Treasury Bills (Cost $7,009,852) | | | $ | 7,009,972 | |
| | | | | | | | | | | | | | | |
| Total Investments - 99.11% (Cost $67,314,638)* | | | $ | 70,652,636 | |
| Other Assets in Excess of Liabilities - 0.89% | | | | 630,925 | |
| Net Assets - 100.00% | | | $ | 71,283,561 | |
See Notes to Financial Statements.
| Managed Municipal Fund, Inc. |
| Schedule of Investments (continued) | April 30, 2014 (Unaudited) |
1 | Moody’s Municipal Bond Ratings: |
| | |
| | Aaa | Judged to be of the best quality. |
| | | | |
| | Aa | Judged to be of high quality by all standards. Issues are sometimes denoted with a 1, 2 or 3, which denote a high, medium or low ranking within the rating. |
| | | | |
| | NR | Bond is not rated by this rating organization. |
| | | | |
| S&P Municipal Bond Ratings: |
| | |
| | AAA | Of the highest quality. |
| | | | |
| | AA | The second strongest capacity of payment of debt services. Those issues determined to possess very strong safety characteristics are denoted with a plus (+) sign. |
| | | | |
| | NR | Bond is not rated by this rating organization. |
| | | | |
2 | Prerefunded: Bonds which are prerefunded are collateralized by U.S. Treasury securities which are held in escrow and are used to pay principal and interest on tax-exempt issues and to retire the bonds in full at the earliest refunding date. |
| | |
3 | Zero coupon bond. |
| | |
4 | Interest rate presented is yield to maturity. |
| | |
| * | Cost for Federal income tax purposes is $67,314,638 and net unrealized appreciation on a tax basis consists of: |
| Gross Unrealized Appreciation | | $ | 3,559,419 | |
| Gross Unrealized Depreciation | | | (221,421 | ) |
| Net Unrealized Appreciation | | $ | 3,337,998 | |
See Notes to Financial Statements.
| North American Government Bond Fund, Inc. |
| Schedule of Investments | April 30, 2014 (Unaudited) |
| Security | | Interest Rate | Maturity
Date | Principal
Amount1 | | | Value | |
| CANADIAN SECURITIES - 18.89% | | | | | | | | | | |
| Canadian Government Bonds | | | 0.750 | % | 05/01/14 | CAD | 5,000,000 | | | $ | 4,562,018 | |
| Canadian Government Bonds | | | 2.250 | % | 08/01/14 | | | 3,150,000 | | | | 2,883,585 | |
| Canadian Government Bonds | | | 1.000 | % | 05/01/15 | | | 3,100,000 | | | | 2,828,536 | |
| Canadian Government Bonds | | | 4.000 | % | 06/01/17 | | | 5,075,000 | | | | 5,019,622 | |
| | | | | | | | | | | | | |
| Total Canadian Securities (Cost $16,308,107) | | | $ | 15,293,761 | |
| | | | | | | | | | | | | |
| MEXICAN SECURITIES - 16.71% | | | | | | | | | | | | | |
Mexican Bono2 | | | 8.000 | % | 12/17/15 | MXN | 47,407,000 | | | $ | 3,853,498 | |
Mexican Bono2 | | | 7.250 | % | 12/15/16 | | | 79,860,000 | | | | 6,561,446 | |
Mexican Bono2 | | | 7.750 | % | 12/14/17 | | | 37,057,500 | | | | 3,118,365 | |
| | | | | | | | | | | | | |
| Total Mexican Securities (Cost $14,370,181) | | | $ | 13,533,309 | |
| | | | | | | | | | | | | |
| U.S. TREASURY OBLIGATIONS - 57.86% | | | | | | | | | | |
| U.S. Treasury Notes | | | 1.500 | % | 01/31/19 | | $ | 2,050,000 | | | $ | 2,039,110 | |
| U.S. Treasury Notes | | | 2.625 | % | 08/15/20 | | | 1,000,000 | | | | 1,033,750 | |
| U.S. Treasury Notes | | | 2.000 | % | 11/15/21 | | | 4,025,000 | | | | 3,929,249 | |
| U.S. Treasury Bonds | | | 8.750 | % | 05/15/17 | | | 11,300,000 | | | | 13,967,862 | |
| U.S. Treasury Bonds | | | 8.875 | % | 08/15/17 | | | 7,550,000 | | | | 9,477,606 | |
| U.S. Treasury Bonds | | | 8.125 | % | 08/15/19 | | | 3,775,000 | | | | 4,997,745 | |
| U.S. Treasury Bonds | | | 8.500 | % | 02/15/20 | | | 6,000,000 | | | | 8,191,872 | |
| U.S. Treasury Bonds | | | 8.750 | % | 08/15/20 | | | 2,300,000 | | | | 3,219,191 | |
| | | | | | | | | | | | | |
| Total U.S. Treasury Obligations (Cost $44,646,458) | | | $ | 46,856,385 | |
| | | | | | | | | | | | | |
| U.S. TREASURY BILLS - 5.20% | | | | | | | | | | | | | |
U.S. Treasury Bills3 | | | 0.014 | % | 05/08/14 | | $ | 1,730,000 | | | $ | 1,729,995 | |
U.S. Treasury Bills3 | | | 0.006 | % | 06/05/14 | | | 880,000 | | | | 879,995 | |
U.S. Treasury Bills3 | | | 0.011 | % | 08/07/14 | | | 1,600,000 | | | | 1,599,950 | |
| | | | | | | | | | | | | |
| Total U.S. Treasury Bills (Cost $4,209,921) | | | $ | 4,209,940 | |
| | | | | | | | | | | | | |
| Total Investments - 98.66% (Cost $79,534,667)* | | | $ | 79,893,395 | |
| Other Assets in Excess of Liabilities - 1.34% | | | | 1,086,300 | |
| Net Assets - 100.00% | | | $ | 80,979,695 | |
See Notes to Financial Statements.
| North American Government Bond Fund, Inc. |
| Schedule of Investments (continued) | April 30, 2014 (Unaudited) |
| CAD | Canadian Dollar |
| MXN | Mexican Peso |
1 | Principal Amount is shown in U.S. dollars unless otherwise noted. |
| | |
2 | Bonos are fixed rate, local currency-denominated coupon bonds issued by the Mexican government. |
| | |
3 | Interest rate presented is yield to maturity. |
| | |
| * | Cost for Federal income tax purposes is $79,534,667 and net unrealized appreciation on a tax basis consists of: |
| Gross Unrealized Appreciation | | $ | 2,440,034 | |
| Gross Unrealized Depreciation | | | (2,081,306 | ) |
| Net Unrealized Appreciation | | $ | 358,728 | |
See Notes to Financial Statements.
| Schedule of Investments | April 30, 2014 (Unaudited) |
| Security | | Shares | | | Value | |
| COMMON STOCKS - 87.06% | | | | |
| Consumer Discretionary - 12.21% | | | | |
| Auto Components - 0.63% | | | | | | |
| Allison Transmission Holdings, Inc. | | | 1,750 | | | $ | 52,220 | |
| American Axle & Manufacturing Holdings, Inc.* | | | 690 | | | | 12,178 | |
| Federal-Mogul Holdings Corp.* | | | 3,535 | | | | 60,873 | |
| Goodyear Tire & Rubber Co. (The) | | | 7,215 | | | | 181,818 | |
| Lear Corp. | | | 3,250 | | | | 269,945 | |
| | | | | | | 577,034 | |
| Automobiles - 0.78% | | | | | | | | |
| Ford Motor Co. | | | 17,115 | | | | 276,407 | |
| General Motors Co. | | | 11,735 | | | | 404,623 | |
| Winnebago Industries, Inc.* | | | 1,640 | | | | 39,196 | |
| | | | | | | 720,226 | |
| Diversified Consumer Services - 0.26% | | | | | |
| Apollo Education Group, Inc.* | | | 2,220 | | | | 64,069 | |
| H&R Block, Inc. | | | 1,220 | | | | 34,673 | |
| Hillenbrand, Inc. | | | 2,200 | | | | 66,880 | |
| Regis Corp. | | | 1,140 | | | | 14,980 | |
| Service Corp. International | | | 2,490 | | | | 46,737 | |
| Weight Watchers International, Inc. | | | 650 | | | | 12,870 | |
| | | | | | | 240,209 | |
| Hotels, Restaurants & Leisure - 1.68% | | | | | |
| Brinker International, Inc. | | | 900 | | | | 44,226 | |
| Darden Restaurants, Inc. | | | 1,130 | | | | 56,172 | |
| Denny's Corp.* | | | 4,730 | | | | 31,880 | |
| Diamond Resorts International, Inc.* | | | 1,000 | | | | 18,710 | |
| Dunkin' Brands Group, Inc. | | | 2,480 | | | | 112,865 | |
| Hyatt Hotels Corp. - Class A* | | | 2,905 | | | | 163,493 | |
| International Game Technology | | | 4,430 | | | | 55,596 | |
| Jack in the Box, Inc.* | | | 1,010 | | | | 54,075 | |
| Marriott International, Inc. - Class A | | | 2,606 | | | | 150,966 | |
| | | | | | | | | |
| Hotels, Restaurants & Leisure - 1.68% (continued) | |
| McDonald's Corp. | | | 1,862 | | | $ | 188,770 | |
| MGM Resorts International* | | | 3,878 | | | | 97,842 | |
| Scientific Games Corp. - Class A* | | | 5,300 | | | | 63,494 | |
| Six Flags Entertainment Corp. | | | 3,900 | | | | 156,546 | |
| Wyndham Worldwide Corp. | | | 3,355 | | | | 239,346 | |
| Yum! Brands, Inc. | | | 1,440 | | | | 110,866 | |
| | | | | | | 1,544,847 | |
| Household Durables - 0.82% | | | | | | | | |
| DR Horton, Inc. | | | 4,020 | | | | 89,566 | |
| Hovnanian Enterprises, Inc. - Class A* | | | 2,130 | | | | 9,500 | |
| Jarden Corp.* | | | 6,205 | | | | 354,616 | |
| Libbey, Inc.* | | | 1,310 | | | | 34,938 | |
| Newell Rubbermaid, Inc. | | | 5,265 | | | | 158,529 | |
| PulteGroup, Inc. | | | 5,950 | | | | 109,420 | |
| | | | | | | 756,569 | |
| Internet & Catalog Retail - 0.84% | | | | | |
| Amazon.com, Inc.* | | | 1,280 | | | | 389,286 | |
| Groupon, Inc.* | | | 3,990 | | | | 27,890 | |
| Liberty Interactive Corp. - Class A* | | | 12,115 | | | | 352,062 | |
| | | | | | | 769,238 | |
| Leisure Products - 0.10% | |
| Mattel, Inc. | | | 2,220 | | | | 87,057 | |
| | | | | | | | |
| Media - 3.98% | | | | | | | | |
| Cablevision Systems Corp. - New York Group - Class A | | | 17,608 | | | | 294,054 | |
| Charter Communications, Inc. - Class A* | | | 2,072 | | | | 280,818 | |
| Comcast Corp. - Class A | | | 7,400 | | | | 383,024 | |
| DIRECTV* | | | 7,855 | | | | 609,548 | |
| DISH Network Corp. - Class A* | | | 835 | | | | 47,478 | |
| Interpublic Group of Cos., Inc. (The) | | | 7,100 | | | | 123,682 | |
| John Wiley & Sons, Inc. - Class A | | | 2,575 | | | | 147,959 | |
| Journal Communications, Inc. - Class A* | | | 2,680 | | | | 21,494 | |
See Notes to Financial Statements.
| Schedule of Investments (continued) | April 30, 2014 (Unaudited) |
| Security | | Shares | | | Value | |
| COMMON STOCKS - 87.06% (continued) | |
| Consumer Discretionary - 12.21% (continued) | |
| Media - 3.98% (continued) | | | | | | |
| Liberty Global PLC - Class A* | | | 3,998 | | | $ | 159,200 | |
| News Corp. - Class A* | | | 2,468 | | | | 42,005 | |
| Omnicom Group, Inc. | | | 2,210 | | | | 149,573 | |
| Scholastic Corp. | | | 850 | | | | 27,974 | |
| Thomson Reuters Corp. | | | 3,540 | | | | 128,077 | |
| Time Warner Cable, Inc. | | | 3,730 | | | | 527,646 | |
| Time Warner, Inc. | | | 2,655 | | | | 176,451 | |
| Viacom, Inc. - Class B | | | 1,230 | | | | 104,525 | |
| Walt Disney Co. (The) | | | 5,378 | | | | 426,691 | |
| | | | | | | 3,650,199 | |
| Multi-Line Retail - 0.65% | | | | | | | | |
| Big Lots, Inc.* | | | 130 | | | | 5,135 | |
| Dollar General Corp.* | | | 1,490 | | | | 84,096 | |
| Kohl's Corp. | | | 3,950 | | | | 216,420 | |
| Nordstrom, Inc. | | | 2,415 | | | | 147,991 | |
| Target Corp. | | | 2,266 | | | | 139,926 | |
| | | | | | | 593,568 | |
| Specialty Retail - 2.15% | | | | | | | | |
| AutoNation, Inc.* | | | 1,000 | | | | 52,990 | |
| AutoZone, Inc.* | | | 230 | | | | 122,795 | |
| Best Buy Co., Inc. | | | 10,993 | | | | 285,048 | |
| Chico's FAS, Inc. | | | 2,460 | | | | 39,065 | |
| Express, Inc.* | | | 1,482 | | | | 21,593 | |
| GameStop Corp. - Class A | | | 4,450 | | | | 176,576 | |
| Gap, Inc. (The) | | | 579 | | | | 22,755 | |
| Home Depot, Inc. (The) | | | 2,257 | | | | 179,454 | |
| Lowe's Cos., Inc. | | | 3,525 | | | | 161,833 | |
| Sally Beauty Holdings, Inc.* | | | 2,260 | | | | 61,947 | |
| Staples, Inc. | | | 25,490 | | | | 318,625 | |
| Stein Mart, Inc. | | | 1,000 | | | | 12,500 | |
| Systemax, Inc.* | | | 1,031 | | | | 17,826 | |
| TJX Cos., Inc. | | | 1,240 | | | | 72,143 | |
| Ulta Salon, Cosmetics & Fragrance, Inc.* | | | 4,460 | | | | 391,186 | |
| Wet Seal, Inc. (The) - Class A* | | | 5,200 | | | | 5,876 | |
| Zumiez, Inc.* | | | 1,370 | | | | 33,496 | |
| | | | | | | 1,975,708 | |
| Textiles, Apparel & Luxury Goods - 0.32% | |
| NIKE, Inc. - Class B | | | 2,205 | | | $ | 160,855 | |
| Unifi, Inc.* | | | 1,120 | | | | 24,797 | |
| Wolverine World Wide, Inc. | | | 3,860 | | | | 108,466 | |
| | | | | | | 294,118 | |
| Consumer Staples - 5.80% | | | | | |
| Beverages - 1.48% | | | | | | | | |
| Coca-Cola Bottling Co. Consolidated | | | 580 | | | | 47,693 | |
| Coca-Cola Co. (The) | | | 13,860 | | | | 565,350 | |
| Coca-Cola Enterprises, Inc. | | | 5,555 | | | | 252,419 | |
| Dr Pepper Snapple Group, Inc. | | | 3,743 | | | | 207,437 | |
| PepsiCo, Inc. | | | 3,309 | | | | 284,210 | |
| | | | | | | 1,357,109 | |
| Food & Staples Retailing - 1.80% | | | | | |
| Costco Wholesale Corp. | | | 1,170 | | | | 135,345 | |
| CVS Caremark Corp. | | | 5,015 | | | | 364,691 | |
| Kroger Co. (The) | | | 2,120 | | | | 97,605 | |
| Safeway, Inc. | | | 2,960 | | | | 100,818 | |
| SUPERVALU, Inc.* | | | 15,100 | | | | 105,549 | |
| Wal-Mart Stores, Inc. | | | 10,637 | | | | 847,875 | |
| | | | | | | 1,651,883 | |
| Food Products - 1.30% | | | | | | | | |
| Boulder Brands, Inc.* | | | 680 | | | | 10,037 | |
| Bunge Ltd. | | | 1,630 | | | | 129,829 | |
| Campbell Soup Co. | | | 1,420 | | | | 64,596 | |
| Chiquita Brands International, Inc.* | | | 2,900 | | | | 33,292 | |
| ConAgra Foods, Inc. | | | 450 | | | | 13,729 | |
| Darling International, Inc.* | | | 1,480 | | | | 29,615 | |
| Dean Foods Co. | | | 2,225 | | | | 35,244 | |
| General Mills, Inc. | | | 3,091 | | | | 163,885 | |
| Kraft Foods Group, Inc. | | | 1,076 | | | | 61,181 | |
| McCormick & Co., Inc. - Non-Voting Shares | | | 1,118 | | | | 79,602 | |
| Mondelez International, Inc. - Class A | | | 11,775 | | | | 419,779 | |
| Pinnacle Foods, Inc. | | | 1,490 | | | | 45,296 | |
| TreeHouse Foods, Inc.* | | | 1,390 | | | | 104,028 | |
| | | | | | | 1,190,113 | |
See Notes to Financial Statements.
| Schedule of Investments (continued) | April 30, 2014 (Unaudited) |
| Security | | Shares | | | Value | |
| COMMON STOCKS - 87.06% (continued) | |
| Consumer Staples - 5.80% (continued) | |
| Household Products - 0.80% | | | | | | |
| Colgate-Palmolive Co. | | | 105 | | | $ | 7,066 | |
| Harbinger Group, Inc.* | | | 5,210 | | | | 60,749 | |
| Kimberly-Clark Corp. | | | 250 | | | | 28,062 | |
| Procter & Gamble Co. (The) | | | 7,758 | | | | 640,423 | |
| | | | | | | 736,300 | |
| Personal Products - 0.22% | | | | | | | | |
| Avon Products, Inc. | | | 10,250 | | | | 156,620 | |
| Nu Skin Enterprises, Inc. | | | 260 | | | | 22,620 | |
| Revlon, Inc. - Class A* | | | 930 | | | | 28,030 | |
| | | | | | | 207,270 | |
| Tobacco - 0.20% | | | | | | | | |
| Philip Morris International, Inc. | | | 902 | | | | 77,058 | |
| Reynolds American, Inc. | | | 1,851 | | | | 104,452 | |
| | | | | | | 181,510 | |
| Energy - 9.00% | | | | | | | | |
| Energy Equipment & Services - 1.31% | | | | | |
| Cameron International Corp.* | | | 2,270 | | | | 147,459 | |
| Dresser-Rand Group, Inc.* | | | 2,865 | | | | 173,161 | |
| Halliburton Co. | | | 5,440 | | | | 343,101 | |
| ION Geophysical Corp.* | | | 1,000 | | | | 4,400 | |
| Nabors Industries Ltd. | | | 1,000 | | | | 25,520 | |
| Newpark Resources, Inc.* | | | 2,390 | | | | 28,776 | |
| Schlumberger Ltd. | | | 4,102 | | | | 416,558 | |
| Unit Corp.* | | | 930 | | | | 61,333 | |
| | | | | | | 1,200,308 | |
| Oil, Gas & Consumable Fuels - 7.69% | | | | | |
| Anadarko Petroleum Corp. | | | 586 | | | | 58,026 | |
| Apache Corp. | | | 6,220 | | | | 539,896 | |
| Chesapeake Energy Corp. | | | 7,610 | | | | 218,787 | |
| Chevron Corp. | | | 6,871 | | | | 862,448 | |
| Cimarex Energy Co. | | | 996 | | | | 118,643 | |
| ConocoPhillips | | | 6,370 | | | | 473,355 | |
| CONSOL Energy, Inc. | | | 2,570 | | | | 114,391 | |
| Contango Oil & Gas Co.* | | | 850 | | | | 40,834 | |
| Denbury Resources, Inc. | | | 5,770 | | | | 97,051 | |
| Devon Energy Corp. | | | 6,718 | | | | 470,260 | |
| Emerald Oil, Inc.* | | | 1,140 | | | | 8,060 | |
| | |
| Oil, Gas & Consumable Fuels - 7.69% (continued) | |
| Exxon Mobil Corp. | | | 15,363 | | | $ | 1,573,325 | |
| Forest Oil Corp.* | | | 8,350 | | | | 15,531 | |
| Hess Corp. | | | 2,610 | | | | 232,708 | |
| Kinder Morgan, Inc. | | | 9,715 | | | | 317,292 | |
| Marathon Oil Corp. | | | 5,840 | | | | 211,116 | |
| Marathon Petroleum Corp. | | | 1,945 | | | | 180,788 | |
| Murphy Oil Corp. | | | 4,490 | | | | 284,801 | |
| Newfield Exploration Co.* | | | 3,110 | | | | 105,273 | |
| Occidental Petroleum Corp. | | | 2,300 | | | | 220,225 | |
| Peabody Energy Corp. | | | 10,790 | | | | 205,118 | |
| SM Energy Co. | | | 2,740 | | | | 203,116 | |
| Southwestern Energy Co.* | | | 8,105 | | | | 388,067 | |
| Tesoro Corp. | | | 1,080 | | | | 60,793 | |
| W&T Offshore, Inc. | | | 2,030 | | | | 38,976 | |
| WPX Energy, Inc.* | | | 1,000 | | | | 21,280 | |
| | | | | | | 7,060,160 | |
| Financials - 13.57% | | | | | | | | |
| Banks - 2.67% | | | | | | | | |
| BB&T Corp. | | | 6,065 | | | | 226,407 | |
| Cullen/Frost Bankers, Inc. | | | 2,588 | | | | 197,749 | |
| CVB Financial Corp. | | | 4,920 | | | | 71,143 | |
| Enterprise Financial Services Corp. | | | 1,010 | | | | 18,049 | |
| Fifth Third Bancorp | | | 4,255 | | | | 87,696 | |
| FirstMerit Corp. | | | 5,455 | | | | 105,773 | |
| MB Financial, Inc. | | | 2,160 | | | | 57,974 | |
| Pinnacle Financial Partners, Inc. | | | 1,760 | | | | 60,843 | |
| PNC Financial Services Group, Inc. (The) | | | 1,200 | | | | 100,848 | |
| Popular, Inc.* | | | 2,830 | | | | 87,447 | |
| Susquehanna Bancshares, Inc. | | | 4,012 | | | | 41,564 | |
| SVB Financial Group* | | | 1,160 | | | | 123,760 | |
| Trico Bancshares | | | 900 | | | | 21,825 | |
| Union Bankshares Corp. | | | 1,457 | | | | 37,285 | |
| United Community Banks, Inc.* | | | 3,040 | | | | 49,096 | |
| United Financial Bancorp, Inc. | | | 1,590 | | | | 20,924 | |
| US Bancorp | | | 5,760 | �� | | | 234,893 | |
See Notes to Financial Statements.
| Schedule of Investments (continued) | April 30, 2014 (Unaudited) |
| Security | | Shares | | | Value | |
| COMMON STOCKS - 87.06% (continued) | |
| Financials - 13.57% (continued) | |
| Banks - 2.67% (continued) | |
| Washington Trust Bancorp, Inc. | | | 700 | | | $ | 23,940 | |
| Webster Financial Corp. | | | 2,460 | | | | 74,144 | |
| Wells Fargo & Co. | | | 16,328 | | | | 810,522 | |
| | | | | | | 2,451,882 | |
| Capital Markets - 1.47% | | | | | | | | |
| Bank of New York Mellon Corp. (The) | | | 7,535 | | | | 255,210 | |
| Charles Schwab Corp. (The) | | | 2,325 | | | | 61,729 | |
| E*TRADE Financial Corp.* | | | 4,080 | | | | 91,596 | |
| Franklin Resources, Inc. | | | 1,000 | | | | 52,350 | |
| Goldman Sachs Group, Inc. (The) | | | 1,000 | | | | 159,820 | |
| Investment Technology Group, Inc.* | | | 2,130 | | | | 43,963 | |
| Legg Mason, Inc. | | | 5,040 | | | | 236,326 | |
| Morgan Stanley | | | 6,955 | | | | 215,118 | |
| Raymond James Financial, Inc. | | | 1,620 | | | | 80,514 | |
| State Street Corp. | | | 2,305 | | | | 148,811 | |
| | | | | | | 1,345,437 | |
| Consumer Finance - 0.96% | | | | | | | | |
| American Express Co. | | | 4,955 | | | | 433,216 | |
| Capital One Financial Corp. | | | 1,700 | | | | 125,630 | |
| DFC Global Corp.* | | | 2,700 | | | | 25,164 | |
| Discover Financial Services | | | 5,165 | | | | 288,723 | |
| Ezcorp, Inc. - Class A* | | | 1,000 | | | | 10,430 | |
| | | | | | | 883,163 | |
| Diversified Financial Services - 1.84% | | | | | |
| Bank of America Corp. | | | 30,281 | | | | 458,455 | |
| Citigroup, Inc. | | | 7,175 | | | | 343,754 | |
| JPMorgan Chase & Co. | | | 10,036 | | | | 561,815 | |
| MSCI, Inc.* | | | 3,945 | | | | 159,930 | |
| NASDAQ OMX Group, Inc. (The) | | | 4,085 | | | | 150,737 | |
| Resource America, Inc. - Class A | | | 1,110 | | | | 9,446 | |
| | | | | | | 1,684,137 | |
| Insurance - 4.59% | | | | | | | | |
| Aflac, Inc. | | | 2,515 | | | $ | 157,741 | |
| Allstate Corp. (The) | | | 2,195 | | | | 125,005 | |
| American International Group, Inc. | | | 6,155 | | | | 327,015 | |
| American National Insurance Co. | | | 240 | | | | 26,978 | |
| Assured Guaranty Ltd. | | | 1,000 | | | | 23,910 | |
| Berkshire Hathaway, Inc. - Class B* | | | 6,986 | | | | 900,146 | |
| Brown & Brown, Inc. | | | 3,360 | | | | 100,061 | |
| Chubb Corp. (The) | | | 1,150 | | | | 105,892 | |
| Cincinnati Financial Corp. | | | 362 | | | | 17,644 | |
| Employers Holdings, Inc. | | | 1,818 | | | | 36,996 | |
| Erie Indemnity Co. - Class A | | | 3,236 | | | | 231,860 | |
| FBL Financial Group, Inc. - Class A | | | 900 | | | | 40,239 | |
| First American Financial Corp. | | | 3,380 | | | | 89,908 | |
| Genworth Financial, Inc. - Class A* | | | 3,370 | | | | 60,155 | |
| Loews Corp. | | | 3,025 | | | | 133,009 | |
| Montpelier Re Holdings Ltd. | | | 2,550 | | | | 77,979 | |
| PartnerRe Ltd. | | | 2,993 | | | | 315,462 | |
| Platinum Underwriters Holdings Ltd. | | | 1,430 | | | | 89,675 | |
| Principal Financial Group, Inc. | | | 5,195 | | | | 243,334 | |
| Progressive Corp. (The) | | | 3,910 | | | | 94,818 | |
| Protective Life Corp. | | | 2,870 | | | | 146,801 | |
| RenaissanceRe Holdings Ltd. | | | 2,895 | | | | 293,003 | |
| RLI Corp. | | | 2,040 | | | | 87,842 | |
| Unum Group | | | 7,523 | | | | 249,914 | |
| Validus Holdings Ltd. | | | 6,500 | | | | 240,955 | |
| | | | | | | 4,216,342 | |
| Real Estate Investment Trusts - 1.15% | | | | | |
| American Capital Agency Corp. | | | 4,040 | | | | 91,748 | |
| American Homes 4 Rent - REIT | | | 3,240 | | | | 52,002 | |
| American Tower Corp. | | | 1,640 | | | | 136,973 | |
| Annaly Capital Management, Inc. | | | 15,040 | | | | 173,712 | |
See Notes to Financial Statements.
| Schedule of Investments (continued) | April 30, 2014 (Unaudited) |
| Security | | Shares | | | Value | |
| COMMON STOCKS - 87.06% (continued) | |
| Financials - 13.57% (continued) | |
| Real Estate Investment Trusts - 1.15% (continued) | |
| Ashford Hospitality Prime, Inc. - REIT | | | 1,000 | | | $ | 15,340 | |
| Capstead Mortgage Corp. - REIT | | | 6,670 | | | | 85,243 | |
| Cousins Properties, Inc. - REIT | | | 1,000 | | | | 11,630 | |
| CYS Investments, Inc. - REIT | | | 11,210 | | | | 96,406 | |
| FelCor Lodging Trust, Inc. | | | 1,806 | | | | 16,669 | |
| Healthcare Trust of America, Inc. - Class A, REIT | | | 4,110 | | | | 48,046 | |
| iStar Financial, Inc.* | | | 4,770 | | | | 70,882 | |
| Parkway Properties Inc. | | | 1,000 | | | | 18,860 | |
| Potlatch Corp. - REIT | | | 1,410 | | | | 53,904 | |
| Public Storage | | | 510 | | | | 89,510 | |
| Strategic Hotels & Resorts, Inc.* | | | 2,870 | | | | 30,967 | |
| Ventas, Inc. | | | 410 | | | | 27,093 | |
| Weyerhaeuser Co. | | | 1,310 | | | | 39,104 | |
| | | | | | | 1,058,089 | |
| Real Estate Management & Development - 0.40% | |
| CBRE Group, Inc. - Class A* | | | 4,890 | | | | 130,270 | |
| Jones Lang LaSalle, Inc. | | | 2,070 | | | | 239,892 | |
| | | | | | | 370,162 | |
| Thrifts & Mortgage Finance - 0.49% | | | | | |
| Capitol Federal Financial, Inc. | | | 7,400 | | | | 89,096 | |
| MGIC Investment Corp.* | | | 2,930 | | | | 25,198 | |
| Ocwen Financial Corp.* | | | 8,790 | | | | 333,141 | |
| | | | | | | 447,435 | |
| Health Care - 11.34% | | | | | | | | |
| Biotechnology - 1.86% | | | | | | | | |
| Amgen, Inc. | | | 3,473 | | | | 388,108 | |
| Biogen Idec, Inc.* | | | 1,000 | | | | 287,120 | |
| Celgene Corp.* | | | 1,020 | | | | 149,950 | |
| Gilead Sciences, Inc.* | | | 7,195 | | | | 564,735 | |
| Quintiles Transnational Holdings, Inc.* | | | 1,000 | | | | 47,130 | |
| Targacept, Inc.* | | | 2,190 | | | | 9,724 | |
| United Therapeutics Corp.* | | | 2,600 | | | | 260,026 | |
| | | | | | | 1,706,793 | |
| Health Care Equipment & Supplies - 1.69% | |
| Alere, Inc.* | | | 3,340 | | | $ | 111,556 | |
| Baxter International, Inc. | | | 422 | | | | 30,717 | |
| Boston Scientific Corp.* | | | 46,589 | | | | 587,487 | |
| Edwards Lifesciences Corp.* | | | 1,650 | | | | 134,426 | |
| Hologic, Inc.* | | | 18,365 | | | | 385,390 | |
| Medtronic, Inc. | | | 2,555 | | | | 150,285 | |
| Neogen Corp.* | | | 1,000 | | | | 41,775 | |
| STERIS Corp. | | | 1,388 | | | | 66,693 | |
| West Pharmaceutical Services, Inc. | | | 1,010 | | | | 43,814 | |
| | | | | | | 1,552,143 | |
| Health Care Providers & Services - 3.53% | |
| AmerisourceBergen Corp. | | | 2,535 | | | | 165,231 | |
| Cigna Corp. | | | 2,910 | | | | 232,916 | |
| Community Health Systems, Inc.* | | | 2,100 | | | | 79,569 | |
| DaVita HealthCare Partners, Inc.* | | | 3,200 | | | | 221,760 | |
| Express Scripts Holding Co.* | | | 4,181 | | | | 278,371 | |
| Gentiva Health Services, Inc.* | | | 2,530 | | | | 19,051 | |
| HCA Holdings, Inc.* | | | 6,615 | | | | 343,980 | |
| Health Net, Inc.* | | | 1,440 | | | | 49,435 | |
| HealthSouth Corp. | | | 2,260 | | | | 78,286 | |
| Humana, Inc. | | | 1,840 | | | | 201,940 | |
| Laboratory Corp. of America Holdings* | | | 2,605 | | | | 257,114 | |
| LifePoint Hospitals, Inc.* | | | 1,610 | | | | 90,031 | |
| Magellan Health Services, Inc.* | | | 1,780 | | | | 102,742 | |
| McKesson Corp. | | | 1,040 | | | | 175,958 | |
| Quest Diagnostics, Inc. | | | 2,815 | | | | 157,443 | |
| Select Medical Holdings Corp. | | | 8,070 | | | | 112,657 | |
| Team Health Holdings, Inc.* | | | 2,080 | | | | 100,838 | |
| Tenet Healthcare Corp.* | | | 5,573 | | | | 251,231 | |
| UnitedHealth Group, Inc. | | | 1,600 | | | | 120,064 | |
| WellPoint, Inc. | | | 2,011 | | | | 202,468 | |
| | | | | | | 3,241,085 | |
See Notes to Financial Statements.
| Schedule of Investments (continued) | April 30, 2014 (Unaudited) |
| Security | | Shares | | | Value | |
| COMMON STOCKS - 87.06% (continued) | |
| Health Care - 11.34% (continued) | |
| Health Care Technology - 0.07% | | | | |
| MedAssets, Inc.* | | | 1,190 | | | $ | 27,168 | |
| Omnicell, Inc.* | | | 1,270 | | | | 33,630 | |
| | | | | | | 60,798 | |
| Life Sciences Tools & Services - 0.15% | |
| Thermo Fisher Scientific, Inc. | | | 1,220 | | | | 139,080 | |
| | | | | | | | |
| Pharmaceuticals - 4.04% | | | | | | | | |
| Abbott Laboratories | | | 8,881 | | | | 344,050 | |
| AbbVie, Inc. | | | 4,431 | | | | 230,767 | |
| Allergan, Inc. | | | 811 | | | | 134,496 | |
| Bristol-Myers Squibb Co. | | | 4,038 | | | | 202,263 | |
| Eli Lilly & Co. | | | 2,190 | | | | 129,429 | |
| Hospira, Inc.* | | | 4,120 | | | | 188,696 | |
| Johnson & Johnson | | | 8,720 | | | | 883,249 | |
| Merck & Co., Inc. | | | 11,047 | | | | 646,912 | |
| Mylan, Inc.* | | | 5,515 | | | | 280,052 | |
| Pfizer, Inc. | | | 20,765 | | | | 649,529 | |
| Salix Pharmaceuticals Ltd.* | | | 210 | | | | 23,100 | |
| | | | | | | 3,712,543 | |
| Industrials - 9.36% | | | | | | | | |
| Aerospace & Defense - 2.34% | | | | | |
| AAR Corp. | | | 1,652 | | | | 42,787 | |
| Boeing Co. (The) | | | 1,120 | | | | 144,502 | |
| Curtiss-Wright Corp. | | | 1,736 | | | | 111,000 | |
| Exelis, Inc. | | | 4,570 | | | | 84,728 | |
| General Dynamics Corp. | | | 2,770 | | | | 303,176 | |
| Honeywell International, Inc. | | | 3,025 | | | | 281,023 | |
| Huntington Ingalls Industries, Inc. | | | 598 | | | | 61,594 | |
| Lockheed Martin Corp. | | | 1,210 | | | | 198,609 | |
| Northrop Grumman Corp. | | | 1,000 | | | | 121,510 | |
| Precision Castparts Corp. | | | 1,000 | | | | 253,090 | |
| Raytheon Co. | | | 1,422 | | | | 135,773 | |
| Spirit Aerosystems Holdings, Inc. - Class A* | | | 3,125 | | | | 93,844 | |
| United Technologies Corp. | | | 2,679 | | | | 317,006 | |
| | | | | | | 2,148,642 | |
| Air Freight & Logistics - 0.17% | | | | | |
| FedEx Corp. | | | 1,050 | | | $ | 143,062 | |
| UTi Worldwide, Inc. | | | 1,110 | | | | 10,867 | |
| | | | | | | 153,929 | |
| Airlines - 0.86% | | | | | | | | |
| Alaska Air Group, Inc. | | | 400 | | | | 37,632 | |
| Delta Air Lines, Inc. | | | 8,065 | | | | 297,034 | |
| Republic Airways Holdings, Inc.* | | | 2,740 | | | | 22,769 | |
| United Continental Holdings, Inc.* | | | 10,489 | | | | 428,686 | |
| | | | | | | 786,121 | |
| Building Products - 0.15% | | | | | | | | |
| AO Smith Corp. | | | 1,550 | | | | 72,478 | |
| Griffon Corp. | | | 3,900 | | | | 41,496 | |
| Masco Corp. | | | 1,000 | | | | 20,090 | |
| | | | | | | 134,064 | |
| Commercial Services & Supplies - 0.49% | |
| Brink's Co. (The) | | | 1,780 | | | | 45,283 | |
| Republic Services, Inc. | | | 1,130 | | | | 39,652 | |
| Rollins, Inc. | | | 4,810 | | | | 144,685 | |
| United Stationers, Inc. | | | 1,950 | �� | | | 73,183 | |
| Waste Management, Inc. | | | 3,325 | | | | 147,796 | |
| | | | | | | 450,599 | |
| Construction & Engineering - 0.33% | | | | | |
| AECOM Technology Corp.* | | | 1,990 | | | | 64,516 | |
| KBR, Inc. | | | 4,540 | | | | 115,180 | |
| Tutor Perini Corp.* | | | 2,150 | | | | 63,640 | |
| URS Corp. | | | 1,260 | | | | 59,371 | |
| | | | | | | 302,707 | |
| Electrical Equipment - 0.44% | | | | | |
| Babcock & Wilcox Co. (The) | | | 2,470 | | | | 85,931 | |
| Emerson Electric Co. | | | 3,965 | | | | 270,334 | |
| General Cable Corp. | | | 1,880 | | | | 48,165 | |
| | | | | | | 404,430 | |
| Industrial Conglomerates - 1.04% | | | | | |
| 3M Co. | | | 1,118 | | | | 155,503 | |
| Danaher Corp. | | | 2,835 | | | | 208,032 | |
| General Electric Co. | | | 22,155 | | | | 595,748 | |
| | | | | | | 959,283 | |
See Notes to Financial Statements.
| Schedule of Investments (continued) | April 30, 2014 (Unaudited) |
| Security | | Shares | | | Value | |
| COMMON STOCKS - 87.06% (continued) | |
| Industrials - 9.36% (continued) | |
| Machinery - 1.90% | | | | | | |
| AGCO Corp. | | | 2,460 | | | $ | 137,022 | |
| Blount International, Inc.* | | | 2,750 | | | | 30,718 | |
| Caterpillar, Inc. | | | 3,074 | | | | 324,000 | |
| Deere & Co. | | | 1,172 | | | | 109,394 | |
| Graco, Inc. | | | 1,360 | | | | 98,600 | |
| ITT Corp. | | | 3,395 | | | | 146,460 | |
| Joy Global, Inc. | | | 2,710 | | | | 163,630 | |
| Mueller Industries, Inc. | | | 580 | | | | 16,785 | |
| Rexnord Corp.* | | | 2,230 | | | | 59,630 | |
| SPX Corp. | | | 2,951 | | | | 300,530 | |
| Stanley Black & Decker, Inc. | | | 1,000 | | | | 85,890 | |
| Timken Co. (The) | | | 1,000 | | | | 63,080 | |
| Toro Co. (The) | | | 1,850 | | | | 117,549 | |
| Trinity Industries, Inc. | | | 1,230 | | | | 92,324 | |
| | | | | | | 1,745,612 | |
| Professional Services - 0.46% | | | | | |
| Dun & Bradstreet Corp. (The) | | | 2,020 | | | | 223,735 | |
| Manpowergroup, Inc. | | | 2,000 | | | | 162,680 | |
| Verisk Analytics, Inc. - Class A* | | | 560 | | | | 33,650 | |
| | | | | | | 420,065 | |
| Road & Rail - 0.67% | | | | | | | | |
| Hertz Global Holdings, Inc.* | | | 8,850 | | | | 251,960 | |
| Union Pacific Corp. | | | 1,919 | | | | 365,435 | |
| | | | | | | 617,395 | |
| Trading Companies & Distributors - 0.51% | |
| GATX Corp. | | | 1,400 | | | | 91,882 | |
| United Rentals, Inc.* | | | 1,000 | | | | 93,830 | |
| Watsco, Inc. | | | 1,050 | | | | 108,056 | |
| WESCO International, Inc.* | | | 1,980 | | | | 173,804 | |
| | | | | | | 467,572 | |
| Information Technology - 16.91% | | | | | |
| Communications Equipment - 0.87% | | | | | |
| Aruba Networks, Inc.* | | | 1,000 | | | | 19,770 | |
| Black Box Corp. | | | 1,010 | | | | 21,473 | |
| Brocade Communications Systems, Inc.* | | | 5,120 | | | | 47,667 | |
| Ciena Corp.* | | | 2,030 | | | | 40,133 | |
| | |
| Communications Equipment - 0.87% (continued) | |
| Cisco Systems, Inc. | | | 13,730 | | | $ | 317,300 | |
| Comtech Telecommunications Corp. | | | 810 | | | | 25,718 | |
| Harris Corp. | | | 1,010 | | | | 74,255 | |
| Juniper Networks, Inc.* | | | 3,580 | | | | 88,390 | |
| Motorola Solutions, Inc. | | | 1,700 | | | | 108,086 | |
| NETGEAR, Inc.* | | | 570 | | | | 18,411 | |
| QUALCOMM, Inc. | | | 485 | | | | 38,174 | |
| | | | | | | 799,377 | |
| Electronic Equipment, Instruments & Components - 0.91% | |
| Arrow Electronics, Inc.* | | | 1,000 | | | | 56,750 | |
| Avnet, Inc. | | | 3,470 | | | | 149,661 | |
| Corning, Inc. | | | 4,954 | | | | 103,588 | |
| CTS Corp. | | | 1,403 | | | | 24,959 | |
| Ingram Micro, Inc. - Class A* | | | 3,570 | | | | 96,247 | |
| Insight Enterprises, Inc.* | | | 2,030 | | | | 53,024 | |
| Itron, Inc.* | | | 490 | | | | 18,620 | |
| Jabil Circuit, Inc. | | | 2,160 | | | | 37,282 | |
| Plexus Corp.* | | | 850 | | | | 35,632 | |
| ScanSource, Inc.* | | | 1,334 | | | | 51,239 | |
| Tech Data Corp.* | | | 2,179 | | | | 136,166 | |
| TTM Technologies, Inc.* | | | 4,010 | | | | 31,639 | |
| Vishay Intertechnology, Inc. | | | 2,800 | | | | 39,816 | |
| | | | | | | 834,623 | |
| Internet Software & Services - 1.90% | | | | | |
| Akamai Technologies, Inc.* | | | 1,110 | | | | 58,908 | |
| Brightcove, Inc.* | | | 1,770 | | | | 15,257 | |
| Digital River, Inc.* | | | 2,030 | | | | 31,039 | |
| EarthLink Holdings Corp. | | | 5,930 | | | | 20,221 | |
| Equinix, Inc.* | | | 1,000 | | | | 187,810 | |
| Facebook, Inc. - Class A* | | | 4,220 | | | | 252,271 | |
| Google, Inc. - Class C* | | | 986 | | | | 519,287 | |
| LinkedIn Corp.* | | | 1,000 | | | | 153,470 | |
| Rackspace Hosting, Inc.* | | | 980 | | | | 28,440 | |
| VeriSign, Inc.* | | | 1,650 | | | | 77,847 | |
| Web.com Group, Inc.* | | | 1,430 | | | | 43,915 | |
| Yahoo!, Inc.* | | | 10,000 | | | | 359,500 | |
| | | | | | | 1,747,965 | |
See Notes to Financial Statements.
| Schedule of Investments (continued) | April 30, 2014 (Unaudited) |
| Security | | Shares | | | Value | |
| COMMON STOCKS - 87.06% (continued) | |
| Information Technology - 16.91% (continued) | |
| IT Services - 3.82% | | | | | | |
| Automatic Data Processing, Inc. | | | 1,000 | | | $ | 77,960 | |
| Blackhawk Network Holdings, Inc.* | | | 486 | | | | 11,192 | |
| CACI International, Inc. - Class A* | | | 840 | | | | 58,506 | |
| Cardtronics, Inc.* | | | 1,530 | | | | 51,224 | |
| Computer Sciences Corp. | | | 3,265 | | | | 193,223 | |
| Convergys Corp. | | | 3,340 | | | | 71,943 | |
| DST Systems, Inc. | | | 740 | | | | 68,221 | |
| Fidelity National Information Services, Inc. | | | 1,790 | | | | 95,640 | |
| Fiserv, Inc.* | | | 2,200 | | | | 133,716 | |
| Global Payments, Inc. | | | 4,307 | | | | 287,837 | |
| iGATE Corp.* | | | 1,280 | | | | 46,848 | |
| International Business Machines Corp. | | | 3,792 | | | | 745,014 | |
| MasterCard, Inc. - Class A | | | 1,960 | | | | 144,158 | |
| MoneyGram International, Inc.* | | | 2,560 | | | | 33,792 | |
| Teradata Corp.* | | | 11,250 | | | | 511,425 | |
| Unisys Corp.* | | | 2,770 | | | | 67,505 | |
| Vantiv, Inc. - Class A* | | | 11,280 | | | | 346,860 | |
| Visa, Inc. - Class A | | | 1,710 | | | | 346,463 | |
| Western Union Co. (The) | | | 13,464 | | | | 213,674 | |
| | | | | | | 3,505,201 | |
| Office Electronics - 0.41% | | | | | | | | |
| Xerox Corp. | | | 31,265 | | | | 377,994 | |
| | | | | | | | |
| Semiconductors & Semiconductor Equipment - 2.16% | |
| Atmel Corp.* | | | 2,550 | | | | 19,814 | |
| Broadcom Corp. - Class A | | | 8,050 | | | | 248,020 | |
| Cree, Inc.* | | | 1,210 | | | | 57,076 | |
| Diodes, Inc.* | | | 2,280 | | | | 60,124 | |
| First Solar, Inc.* | | | 1,580 | | | | 106,634 | |
| Intel Corp. | | | 10,249 | | | | 273,546 | |
| Lam Research Corp.* | | | 4,200 | | | | 241,962 | |
| Marvell Technology Group Ltd. | | | 8,960 | | | | 142,106 | |
| | |
| Semiconductors & Semiconductor Equipment - 2.16% (continued) | |
| Micron Technology, Inc.* | | | 14,807 | | | $ | 386,759 | |
| ON Semiconductor Corp.* | | | 15,535 | | | | 146,184 | |
| PMC-Sierra, Inc.* | | | 10,760 | | | | 73,598 | |
| Spansion, Inc. - Class A* | | | 1,930 | | | | 34,412 | |
| Texas Instruments, Inc. | | | 4,250 | | | | 193,162 | |
| | | | | | | 1,983,397 | |
| Software - 3.12% | | | | | | | | |
| Activision Blizzard, Inc. | | | 5,300 | | | | 106,053 | |
| CA, Inc. | | | 3,489 | | | | 105,158 | |
| Citrix Systems, Inc.* | | | 2,960 | | | | 175,558 | |
| Comverse, Inc.* | | | 1,070 | | | | 26,686 | |
| Intuit, Inc. | | | 2,055 | | | | 155,666 | |
| Microsoft Corp. | | | 25,497 | | | | 1,030,079 | |
| Nuance Communications, Inc.* | | | 14,822 | | | | 238,486 | |
| Oracle Corp. | | | 16,799 | | | | 686,743 | |
| Pegasystems, Inc. | | | 1,360 | | | | 22,535 | |
| Rovi Corp.* | | | 1,000 | | | | 22,290 | |
| Solera Holdings, Inc. | | | 2,751 | | | | 178,210 | |
| Symantec Corp. | | | 5,945 | | | | 120,565 | |
| | | | | | | 2,868,029 | |
| Technology Hardware, Storage & Peripherals - 3.72% | |
| Apple, Inc. | | | 3,664 | | | | 2,162,090 | |
| Diebold, Inc. | | | 3,730 | | | | 140,285 | |
| EMC Corp. | | | 2,010 | | | | 51,858 | |
| Hewlett-Packard Co. | | | 16,840 | | | | 556,731 | |
| Lexmark International, Inc. - Class A | | | 1,350 | | | | 58,050 | |
| NCR Corp.* | | | 10,440 | | | | 318,524 | |
| Western Digital Corp. | | | 1,400 | | | | 123,382 | |
| | | | | | | 3,410,920 | |
| Materials - 3.17% | | | | | | | | |
| Chemicals - 1.31% | | | | | | | | |
| Ashland, Inc. | | | 1,150 | | | | 111,090 | |
| Cytec Industries, Inc. | | | 1,364 | | | | 130,016 | |
| Dow Chemical Co. (The) | | | 5,544 | | | | 276,646 | |
| EI du Pont de Nemours & Co. | | | 2,645 | | | | 178,061 | |
| Mosaic Co. (The) | | | 2,865 | | | | 143,365 | |
| OMNOVA Solutions, Inc.* | | | 840 | | | | 7,661 | |
See Notes to Financial Statements.
| Schedule of Investments (continued) | April 30, 2014 (Unaudited) |
| Security | | Shares | | | Value | |
| COMMON STOCKS - 87.06% (continued) | |
| Materials - 3.17% (continued) | |
| Chemicals - 1.31% (continued) | | | | |
| Rockwood Holdings, Inc. | | | 1,000 | | | $ | 71,050 | |
| RPM International, Inc. | | | 3,923 | | | | 167,355 | |
| W.R. Grace & Co.* | | | 1,281 | | | | 117,980 | |
| | | | | | | 1,203,224 | |
| Construction Materials - 0.07% | | | | | |
| Vulcan Materials Co. | | | 1,070 | | | | 69,047 | |
| | | | | | | | |
| Containers & Packaging - 1.31% | | | | | |
| Ball Corp. | | | 1,888 | | | | 106,087 | |
| Berry Plastics Group, Inc.* | | | 2,040 | | | | 45,880 | |
| Crown Holdings, Inc.* | | | 8,585 | | | | 404,954 | |
| Myers Industries, Inc. | | | 1,900 | | | | 35,530 | |
| Owens-Illinois, Inc.* | | | 7,704 | | | | 244,833 | |
| Sealed Air Corp. | | | 5,575 | | | | 191,278 | |
| Silgan Holdings, Inc. | | | 3,575 | | | | 177,856 | |
| | | | | | | 1,206,418 | |
| Metals & Mining - 0.44% | | | | | | | | |
| Alcoa, Inc. | | | 7,330 | | | | 98,735 | |
| Freeport-McMoRan Copper & Gold, Inc. | | | 2,151 | | | | 73,930 | |
| Newmont Mining Corp. | | | 6,730 | | | | 167,106 | |
| Southern Copper Corp. | | | 2,066 | | | | 62,269 | |
| | | | | | | 402,040 | |
| Paper & Forest Products - 0.04% | | | | | |
| Wausau Paper Corp. | | | 2,760 | | | | 33,010 | |
| | | | | | | | |
| Telecommunication Services - 2.93% | |
| Diversified Telecommunication Services - 2.59% | |
| AT&T, Inc. | | | 21,255 | | | | 758,803 | |
| CenturyLink, Inc. | | | 22,424 | | | | 782,822 | |
| Cincinnati Bell, Inc.* | | | 12,815 | | | | 42,930 | |
| General Communication, Inc. - Class A* | | | 2,420 | | | | 25,265 | |
| Level 3 Communications, Inc.* | | | 2,500 | | | | 107,575 | |
| tw telecom, Inc.* | | | 2,410 | | | | 73,963 | |
| Verizon Communications, Inc. | | | 12,400 | | | | 579,452 | |
| | | | | | | 2,370,810 | |
| | |
| Wireless Telecommunication Services - 0.34% | |
| Crown Castle International Corp. | | | 570 | | | $ | 41,456 | |
| NTELOS Holdings Corp. | | | 1,340 | | | | 18,479 | |
| SBA Communications Corp. - Class A* | | | 1,580 | | | | 141,821 | |
| Sprint Corp.* | | | 13,145 | | | | 111,732 | |
| | | | | | | 313,488 | |
| Utilities - 2.77% | | | | | | | | |
| Electric Utilities - 1.06% | | | | | | | | |
| American Electric Power Co., Inc. | | | 730 | | | | 39,281 | |
| Duke Energy Corp. | | | 1,310 | | | | 97,582 | |
| Exelon Corp. | | | 14,170 | | | | 496,375 | |
| FirstEnergy Corp. | | | 1,970 | | | | 66,488 | |
| NextEra Energy, Inc. | | | 1,100 | | | | 109,835 | |
| Southern Co. (The) | | | 1,765 | | | | 80,890 | |
| Xcel Energy, Inc. | | | 2,600 | | | | 82,862 | |
| | | | | | | 973,313 | |
| Gas Utilities - 0.20% | | | | | | | | |
| AGL Resources, Inc. | | | 1,000 | | | | 54,000 | |
| ONE Gas, Inc. | | | 425 | | | | 15,547 | |
| UGI Corp. | | | 2,480 | | | | 115,791 | |
| | | | | | | 185,338 | |
| Independent Power and Renewable Energy Producers- 0.67% | |
| AES Corp. | | | 42,270 | | | | 610,801 | |
| | | | | | | | |
| Multi-Utilities - 0.76% | | | | | | | | |
| Ameren Corp. | | | 8,840 | | | | 365,180 | |
| CenterPoint Energy, Inc. | | | 3,380 | | | | 83,689 | |
| Consolidated Edison, Inc. | | | 700 | | | | 40,621 | |
| Dominion Resources, Inc. | | | 2,080 | | | | 150,883 | |
| Sempra Energy | | | 310 | | | | 30,569 | |
| Wisconsin Energy Corp. | | | 620 | | | | 30,058 | |
| | | | | | | 701,000 | |
| Water Utilities - 0.08% | | | | | | | | |
| American Water Works Co., Inc. | | | 1,540 | | | | 70,116 | |
| | | | | | | | |
| Total Common Stocks (Cost $60,819,722) | | | | | | $ | 79,919,045 | |
See Notes to Financial Statements.
| Schedule of Investments (continued) | April 30, 2014 (Unaudited) |
| Security | | Interest Rate | Maturity
Date | | Principal
Amount | | | Value | |
| U.S. TREASURY OBLIGATIONS - 10.39% | | | | | | | | | | |
| U.S. Treasury Notes | | | 2.000 | % | 01/31/16 | | $ | 1,000,000 | | | $ | 1,029,590 | |
| U.S. Treasury Notes | | | 1.000 | % | 03/31/17 | | | 2,000,000 | | | | 2,009,062 | |
| U.S. Treasury Notes | | | 2.625 | % | 08/15/20 | | | 1,600,000 | | | | 1,654,000 | |
| U.S. Treasury Notes | | | 1.750 | % | 05/15/22 | | | 3,500,000 | | | | 3,325,819 | |
| U.S. Treasury Bonds | | | 8.125 | % | 08/15/19 | | | 1,150,000 | | | | 1,522,492 | |
| | | | | | | | | | | | | |
| Total U.S. Treasury Obligations (Cost $9,694,605) | | | $ | 9,540,963 | |
| | | | | | | | | | | | | |
| U.S. TREASURY BILLS - 2.34% | | | | | | | | | | | | | |
U.S. Treasury Bills1 | | | 0.000 | % | 05/01/14 | | $ | 2,010,000 | | | $ | 2,010,000 | |
U.S. Treasury Bills2 | | | 0.027 | % | 09/11/14 | | | 140,000 | | | | 139,986 | |
| | | | | | | | | | | | | |
| Total U.S. Treasury Bills (Cost $2,149,988) | | | $ | 2,149,986 | |
| | | | | | | | | | | | | |
| Total Investments - 99.79% (Cost $72,664,315)** | | | $ | 91,609,994 | |
| Other Assets in Excess of Liabilities - 0.21% | | | | 195,075 | |
| Net Assets - 100.00% | | | $ | 91,805,069 | |
| * | Non-income producing security. |
| | |
1 | Zero coupon bond. |
| | |
2 | Interest rate presented is yield to maturity. |
| | |
| ** | Cost for Federal income tax purposes is $72,664,315 and net unrealized appreciation on a tax basis consists of: |
| Gross Unrealized Appreciation | | $ | 20,276,632 | |
| Gross Unrealized Depreciation | | | (1,330,953 | ) |
| Net Unrealized Appreciation | | $ | 18,945,679 | |
| The difference between the federal tax cost of portfolio investments and the Schedule of Investments is due to certain timing differences in the recognition of capital gains and losses under income tax regulations and accounting principles generally accepted in the United States. These timing differences are temporary in nature and are due to the tax deferral of losses on wash sales. |
See Notes to Financial Statements.
| Statements of Assets and Liabilities | April 30, 2014 (Unaudited) |
| | | Total Return U.S. Treasury Fund, Inc. | | | Managed Municipal Fund, Inc. | |
| ASSETS | | | | | | |
| Investments in securities: | | | | | | |
| At cost | | $ | 55,143,412 | | | $ | 67,314,638 | |
| At value (Note 1) | | $ | 56,964,240 | | | $ | 70,652,636 | |
| Cash | | | 39,870 | | | | 121,707 | |
| Interest receivable | | | 428,020 | | | | 642,170 | |
| Receivable for capital shares sold | | | 536 | | | | 199 | |
| Other assets | | | 4,968 | | | | 24,602 | |
| TOTAL ASSETS | | | 57,437,634 | | | | 71,441,314 | |
| | | | | | | | |
| LIABILITIES | | | | | | | | |
| Distributions payable | | | 28,150 | | | | 48,928 | |
| Payable for capital shares redeemed | | | 31,865 | | | | 8,163 | |
| Accrued investment advisory fees (Note 2) | | | 10,858 | | | | 23,411 | |
| Accrued distribution fees (Note 2) | | | 11,811 | | | | 13,024 | |
| Accrued administration fees (Note 2) | | | 8,010 | | | | 14,904 | |
| Accrued transfer agent fees (Note 2) | | | 7,845 | | | | 10,335 | |
| Accrued directors' fees (Note 2) | | | 3,153 | | | | 5,675 | |
| Other accrued expenses and liabilities | | | 21,728 | | | | 33,313 | |
| TOTAL LIABILITIES | | | 123,420 | | | | 157,753 | |
| | | | | | | | |
| NET ASSETS | | $ | 57,314,214 | | | $ | 71,283,561 | |
| | | | | | | | |
| NET ASSETS CONSIST OF: | | | | | | | | |
| Paid-in capital | | $ | 55,756,113 | | | $ | 68,593,357 | |
| Distributions in excess of net investment income | | | (298,682 | ) | | | (662 | ) |
| Accumulated net realized gains (losses) from security transactions | | | 35,955 | | | | (647,132 | ) |
| Net unrealized appreciation on investments | | | 1,820,828 | | | | 3,337,998 | |
| Net assets | | $ | 57,314,214 | | | $ | 71,283,561 | |
See Notes to Financial Statements.
| Statements of Assets and Liabilities (continued) | April 30, 2014 (Unaudited) |
| | | Total Return U.S. Treasury Fund, Inc. | | | Managed Municipal Fund, Inc. | |
| SHARES OF CAPITAL STOCK OUTSTANDING OF $0.001 PAR VALUE | | | | | | |
| ISI Class A Shares (50,000,000 shares authorized) | | | — | | | | 5,968,275 | |
| ISI Class I Shares (5,000,000 shares authorized) | | | — | | | | 742,260 | |
| ISI Shares (115,000,000 shares authorized) | | | 5,931,447 | | | | — | |
| | | | | | | | |
| NET ASSET VALUE AND REDEMPTION PRICE PER SHARE | | | | | | | | |
| ISI Class A Shares (based on net assets of $63,436,851) | | $ | — | | | $ | 10.63 | |
| ISI Class I Shares (based on net assets of $7,846,710) | | $ | — | | | $ | 10.57 | |
| ISI Shares (based on net assets of $57,314,214) | | $ | 9.66 | | | $ | — | |
| | | �� | | | | | |
| MAXIMUM OFFERING PRICE VALUE PER SHARE (100/97) X NET ASSET VALUE PER SHARE | | | | | | | | |
| ISI Class A Shares | | $ | — | | | $ | 10.96 | |
| ISI Shares | | $ | 9.96 | | | $ | — | |
See Notes to Financial Statements.
| Statements of Assets and Liabilities | April 30, 2014 (Unaudited) |
| | | North American Government Bond Fund, Inc. | | | ISI Strategy Fund, Inc. | |
| ASSETS | | | | | | |
| Investments in securities: | | | | | | |
| At cost | | $ | 79,534,667 | | | $ | 72,664,315 | |
| At value (Note 1) | | $ | 79,893,395 | | | $ | 91,609,994 | |
| Cash | | | 111,066 | | | | 119,718 | |
| Dividends and interest receivable, at value | | | 1,331,423 | | | | 118,056 | |
| Receivable for investment securities sold | | | — | | | | 678,317 | |
| Receivable for capital shares sold | | | 3,608 | | | | 36,196 | |
| Other assets | | | 41,002 | | | | 6,058 | |
| TOTAL ASSETS | | | 81,380,494 | | | | 92,568,339 | |
| | | | | | | | |
| LIABILITIES | | | | | | | | |
| Payable for investments purchased | | | — | | | | 682,789 | |
| Distributions payable | | | 57,869 | | | | — | |
| Payable for capital shares redeemed | | | 173,603 | | | | 9,876 | |
| Accrued investment advisory fees (Note 2) | | | 24,648 | | | | 30,021 | |
| Accrued distribution fees (Note 2) | | | 29,027 | | | | 18,762 | |
| Accrued transfer agent fees (Note 2) | | | 26,998 | | | | 5,523 | |
| Accrued administration fees (Note 2) | | | 20,295 | | | | 5,557 | |
| Accrued directors' fees (Note 2) | | | 9,556 | | | | — | |
| Accrued shareholder servicing fees (Note 2) | | | 2,682 | | | | — | |
| Other accrued expenses and liabilities | | | 56,121 | | | | 10,742 | |
| TOTAL LIABILITIES | | | 400,799 | | | | 763,270 | |
| | | | | | | | |
| NET ASSETS | | $ | 80,979,695 | | | $ | 91,805,069 | |
| | | | | | | | |
| NET ASSETS CONSIST OF: | | | | | | | | |
| Paid-in capital | | $ | 81,854,214 | | | $ | 69,291,508 | |
| Undistributed (distributions in excess of) net investment income | | | (643,971 | ) | | | 8,592 | |
| Accumulated net realized gains (losses) from security and foreign currency transactions | | | (591,442 | ) | | | 3,559,290 | |
| Net unrealized appreciation on investments and foreign currency translation | | | 360,894 | | | | 18,945,679 | |
| Net assets | | $ | 80,979,695 | | | $ | 91,805,069 | |
See Notes to Financial Statements.
| Statements of Assets and Liabilities (continued) | April 30, 2014 (Unaudited) |
| | | North American Government Bond Fund, Inc. | | | ISI Strategy Fund, Inc. | |
| SHARES OF CAPITAL STOCK OUTSTANDING OF $0.001 PAR VALUE | | | | | | |
| ISI Class A Shares (50,000,000 shares authorized) | | | 8,555,963 | | | | — | |
| ISI Class C Shares (5,000,000 shares authorized) | | | 1,764,425 | | | | — | |
| ISI Class I Shares (5,000,000 shares authorized) | | | 612,325 | | | | — | |
| ISI Shares (25,000,000 shares authorized) | | | — | | | | 5,641,225 | |
| | | | | | | | |
| NET ASSET VALUE AND REDEMPTION PRICE PER SHARE | | | | | | | | |
| ISI Class A Shares (based on net assets of $63,514,891) | | $ | 7.42 | | | $ | — | |
| ISI Class C Shares (based on net assets of $12,960,624)* | | $ | 7.35 | | | $ | — | |
| ISI Class I Shares (based on net assets of $4,504,180) | | $ | 7.36 | | | $ | — | |
| ISI Shares (based on net assets of $91,805,069) | | $ | — | | | $ | 16.27 | |
| | | | | | | | |
| MAXIMUM OFFERING PRICE VALUE PER SHARE (100/97) X NET ASSET VALUE PER SHARE | | | | | | | | |
| ISI Class A Shares | | $ | 7.65 | | | $ | — | |
| ISI Shares | | $ | — | | | $ | 16.77 | |
| * | Contingent deferred sales charge of 1.00% is imposed on the sale of shares if redeemed within the first year of purchase. |
See Notes to Financial Statements.
| Statements of Operations | Six Months Ended April 30, 2014 (Unaudited) |
| | | Total Return U.S. Treasury Fund, Inc. | | | Managed Municipal Fund, Inc. | |
| INVESTMENT INCOME | | | | | | |
| Interest | | $ | 570,363 | | | $ | 1,225,429 | |
| | | | | | | | |
| EXPENSES | | | | | | | | |
| Investment advisory fees (Note 2) | | | 67,710 | | | | 150,223 | |
| Distribution fees (Note 2): | | | | | | | | |
| ISI Class A Shares | | | — | | | | 88,413 | |
| ISI Shares | | | 73,946 | | | | — | |
| Transfer agent fees (Note 2): | | | | | | | | |
| ISI Class A Shares | | | — | | | | 25,814 | |
| ISI Class I Shares | | | — | | | | 1,628 | |
| ISI Shares | | | 27,811 | | | | — | |
| Administration fees (Note 2) | | | 28,269 | | | | 38,631 | |
| Custody fees | | | 21,540 | | | | 33,543 | |
| Professional fees | | | 21,507 | | | | 26,578 | |
| Registration fees | | | 18,305 | | | | 29,833 | |
| Compliance consulting fees (Note 2) | | | 7,517 | | | | 10,797 | |
| Directors' fees and expenses | | | 7,347 | | | | 11,236 | |
| Other expenses | | | 11,890 | | | | 13,846 | |
| TOTAL EXPENSES | | | 285,842 | | | | 430,542 | |
| | | | | | | | |
| NET INVESTMENT INCOME | | | 284,521 | | | | 794,887 | |
| | | | | | | | |
| REALIZED AND UNREALIZED GAINS (LOSSES) ON INVESTMENTS | | | | | | | | |
| Net realized gains (losses) from security transactions | | | 35,956 | | | | (645,297 | ) |
| Net change in unrealized appreciation/(depreciation) on investments | | | (733,545 | ) | | | 1,480,696 | |
| | | | | | | | |
| NET REALIZED AND UNREALIZED GAINS (LOSSES) ON INVESTMENTS | | | (697,589 | ) | | | 835,399 | |
| | | | | | | | |
| NET INCREASE (DECREASE) IN NET ASSETS RESULTING FROM OPERATIONS | | $ | (413,068 | ) | | $ | 1,630,286 | |
See Notes to Financial Statements.
| Statements of Operations | Six Months Ended April 30, 2014 (Unaudited) |
| | | North American Government Bond Fund, Inc. | | | ISI Strategy Fund, Inc. | |
| INVESTMENT INCOME | | | | | | |
| Interest | | $ | 1,251,027 | | | $ | 77,550 | |
| Dividends | | | — | | | | 651,364 | |
| Foreign taxes withheld | | | — | | | | (348 | ) |
| TOTAL INVESTMENT INCOME | | | 1,251,027 | | | | 728,566 | |
| | | | | | | | |
| EXPENSES | | | | | | | | |
| Investment advisory fees (Note 2) | | | 174,754 | | | | 178,212 | |
| Distribution fees (Note 2): | | | | | | | | |
| ISI Class A Shares | | | 139,338 | | | | — | |
| ISI Class C Shares | | | 50,848 | | | | — | |
| ISI Shares | | | — | | | | 111,382 | |
| Transfer agent fees (Note 2): | | | | | | | | |
| ISI Class A Shares | | | 40,404 | | | | — | |
| ISI Class C Shares | | | 7,879 | | | | — | |
| ISI Class I Shares | | | 2,425 | | | | — | |
| ISI Shares | | | — | | | | 30,828 | |
| Registration fees | | | 48,377 | | | | 29,480 | |
| Administration fees (Note 2) | | | 41,105 | | | | 40,762 | |
| Custody fees | | | 40,901 | | | | 51,225 | |
| Professional fees | | | 29,000 | | | | 22,193 | |
| Shareholder servicing fees (Note 2): | | | | | | | | |
| ISI Class C Shares | | | 16,949 | | | | — | |
| Directors' fees and expenses | | | 13,328 | | | | 8,454 | |
| Compliance consulting fees (Note 2) | | | 11,798 | | | | 10,412 | |
| Other expenses | | | 22,640 | | | | 14,271 | |
| TOTAL EXPENSES | | | 639,746 | | | | 497,219 | |
| Less expense reimbursement (Note 2) | | | (9,533 | ) | | | — | |
| Net expenses | | | 630,213 | | | | 497,219 | |
| NET INVESTMENT INCOME | | | 620,814 | | | | 231,347 | |
| | | | | | | | |
| REALIZED AND UNREALIZED GAINS (LOSSES) ON INVESTMENTS AND FOREIGN CURRENCIES | | | | | | | | |
| Net realized gains (losses) from security transactions | | | (565,644 | ) | | | 3,636,155 | |
| Foreign currency transactions | | | (25,706 | ) | | | — | |
| Net change in unrealized appreciation/depreciation on: | | | | | | | | |
| Investments | | | (1,277,768 | ) | | | 1,482,521 | |
| Foreign currency translations | | | 6,393 | | | | — | |
| | | | | | | | |
| NET REALIZED AND UNREALIZED GAINS (LOSSES) ON INVESTMENTS AND FOREIGN CURRENCIES | | | (1,862,725 | ) | | | 5,118,676 | |
| | | | | | | | |
| NET INCREASE (DECREASE) IN NET ASSETS RESULTING FROM OPERATIONS | | $ | (1,241,911 | ) | | $ | 5,350,023 | |
See Notes to Financial Statements.
| Total Return U.S. Treasury Fund, Inc. |
| Statements of Changes in Net Assets | |
| | | Six Months Ended
April 30, 2014 (Unaudited) | | | Year Ended
October 31,
2013 | |
| FROM OPERATIONS | | | | | | |
| Net investment income | | $ | 284,521 | | | $ | 672,516 | |
| Net realized gains from security transactions | | | 35,956 | | | | 350,551 | |
| Net change in net unrealized appreciation/(depreciation) on investments | | | (733,545 | ) | | | (2,429,015 | ) |
| Net decrease in net assets resulting from operations | | | (413,068 | ) | | | (1,405,948 | ) |
| | | | | | | | |
| DISTRIBUTIONS TO SHAREHOLDERS | | | | | | | | |
| From net investment income | | | (284,521 | ) | | | (666,200 | ) |
| From net realized gains from security transactions | | | — | | | | (1,742,186 | ) |
| From return of capital | | | — | | | | (246,880 | ) |
| In excess of net investment income | | | (268,825 | ) | | | — | |
| Decrease in net assets resulting from distributions to shareholders | | | (553,346 | ) | | | (2,655,266 | ) |
| | | | | | | | |
| FROM CAPITAL SHARE TRANSACTIONS | | | | | | | | |
| Proceeds from shares sold | | | 1,614,433 | | | | 847,213 | |
| Reinvestment of distributions to shareholders | | | 378,517 | | | | 1,918,696 | |
| Payments for shares redeemed | | | (5,885,964 | ) | | | (14,364,990 | ) |
| Net decrease in net assets resulting from capital share transactions | | | (3,893,014 | ) | | | (11,599,081 | ) |
| | | | | | | | |
| TOTAL DECREASE IN NET ASSETS | | | (4,859,428 | ) | | | (15,660,295 | ) |
| | | | | | | | |
| NET ASSETS | | | | | | | | |
| Beginning of period | | | 62,173,642 | | | | 77,833,937 | |
| End of period | | $ | 57,314,214 | | | $ | 62,173,642 | |
| | | | | | | | |
| DISTRIBUTIONS IN EXCESS OF NET INVESTMENT INCOME | | $ | (298,682 | ) | | $ | (29,857 | ) |
| | | | | | | | |
| CAPITAL SHARE ACTIVITY | | | | | | | | |
| Shares sold | | | 166,283 | | | | 83,453 | |
| Shares reinvested | | | 39,020 | | | | 190,073 | |
| Shares redeemed | | | (605,803 | ) | | | (1,437,502 | ) |
| Net decrease in shares outstanding | | | (400,500 | ) | | | (1,163,976 | ) |
| Shares outstanding, beginning of period | | | 6,331,947 | | | | 7,495,923 | |
| Shares outstanding, end of period | | | 5,931,447 | | | | 6,331,947 | |
See Notes to Financial Statements.
| Managed Municipal Fund, Inc. |
| Statements of Changes in Net Assets | |
| | | Six Months Ended
April 30, 2014 (Unaudited) | | | Year Ended
October 31,
2013 | |
| FROM OPERATIONS | | | | | | |
| Net investment income | | $ | 794,887 | | | $ | 2,362,641 | |
| Net realized gains (losses) from security transactions | | | (645,297 | ) | | | 525,005 | |
| Net change in net unrealized appreciation/(depreciation) on investments | | | 1,480,696 | | | | (6,288,934 | ) |
| Net increase (decrease) in net assets resulting from operations | | | 1,630,286 | | | | (3,401,288 | ) |
| | | | | | | | |
| DISTRIBUTIONS TO SHAREHOLDERS | | | | | | | | |
| From net investment income | | | | | | | | |
| ISI Class A Shares | | | (744,706 | ) | | | (2,186,601 | ) |
| ISI Class I Shares | | | (50,818 | ) | | | (175,691 | ) |
| From net realized gains from security transactions | | | | | | | | |
| ISI Class A Shares | | | (515,643 | ) | | | (464,062 | ) |
| ISI Class I Shares | | | (9,915 | ) | | | (28,892 | ) |
| Decrease in net assets resulting from distributions to shareholders | | | (1,321,082 | ) | | | (2,855,246 | ) |
| | | | | | | | |
| FROM CAPITAL SHARE TRANSACTIONS | | | | | | | | |
| Proceeds from shares sold | | | | | | | | |
| ISI Class A Shares | | | 3,717,422 | | | | 8,226,840 | |
| ISI Class I Shares | | | 7,633,307 | | | | 2,930,854 | |
| Net asset value of shares issued in reinvestment of distributions to shareholders | | | | | | | | |
| ISI Class A Shares | | | 815,375 | | | | 1,493,696 | |
| ISI Class I Shares | | | 49,547 | | | | 13,566 | |
| Payments for shares redeemed | | | | | | | | |
| ISI Class A Shares | | | (24,741,227 | ) | | | (30,559,542 | ) |
| ISI Class I Shares | | | (7,098,936 | ) | | | (1,833,115 | ) |
| Net decrease in net assets resulting from capital share transactions | | | (19,624,512 | ) | | | (19,727,701 | ) |
| | | | | | | | |
| TOTAL DECREASE IN NET ASSETS | | | (19,315,308 | ) | | | (25,984,235 | ) |
| | | | | | | | |
| NET ASSETS | | | | | | | | |
| Beginning of period | | | 90,598,869 | | | | 116,583,104 | |
| End of period | | $ | 71,283,561 | | | $ | 90,598,869 | |
| | | | | | | | |
| DISTRIBUTIONS IN EXCESS OF NET INVESTMENT INCOME | | $ | (662 | ) | | $ | (25 | ) |
See Notes to Financial Statements.
| Managed Municipal Fund, Inc. |
| Statements of Changes in Net Assets (continued) | |
| | | Six Months Ended
April 30, 2014 (Unaudited) | | | Year Ended
October 31,
2013 | |
| CAPITAL SHARE ACTIVITY | | | | | | |
| Shares sold | | | | | | |
| ISI Class A Shares | | | 353,199 | | | | 744,950 | |
| ISI Class I Shares | | | 727,594 | | | | 270,632 | |
| Shares reinvested | | | | | | | | |
| ISI Class A Shares | | | 77,961 | | | | 137,047 | |
| ISI Class I Shares | | | 4,730 | | | | 1,251 | |
| Shares redeemed | | | | | | | | |
| ISI Class A Shares | | | (2,353,510 | ) | | | (2,833,029 | ) |
| ISI Class I Shares | | | (673,620 | ) | | | (171,268 | ) |
| | | | | | | | |
| Net increase (decrease) in shares outstanding | | | | | | | | |
| ISI Class A Shares | | | (1,922,350 | ) | | | (1,951,032 | ) |
| ISI Class I Shares | | | 58,704 | | | | 100,615 | |
| | | | | | | | |
| Shares outstanding, beginning of period | | | | | | | | |
| ISI Class A Shares | | | 7,890,625 | | | | 9,841,657 | |
| ISI Class I Shares | | | 683,556 | | | | 582,941 | |
| Shares outstanding, end of period | | | | | | | | |
| ISI Class A Shares | | | 5,968,275 | | | | 7,890,625 | |
| ISI Class I Shares | | | 742,260 | | | | 683,556 | |
See Notes to Financial Statements.
| North American Government Bond Fund, Inc. |
| Statements of Changes in Net Assets | |
| | | Six Months Ended
April 30, 2014 (Unaudited) | | | Year Ended
October 31,
2013 | |
| FROM OPERATIONS | | | | | | |
| Net investment income | | $ | 620,814 | | | $ | 1,810,305 | |
| Net realized gains (losses) from security and foreign currency transactions | | | (591,350 | ) | | | 1,495,974 | |
| Net change in net unrealized appreciation/(depreciation) on investments and foreign currency translations | | | (1,271,375 | ) | | | (5,257,279 | ) |
| Net decrease in net assets resulting from operations | | | (1,241,911 | ) | | | (1,951,000 | ) |
| | | | | | | | |
| DISTRIBUTIONS TO SHAREHOLDERS | | | | | | | | |
| From net investment income | | | | | | | | |
| ISI Class A Shares | | | (511,836 | ) | | | (1,242,273 | ) |
| ISI Class C Shares | | | (69,375 | ) | | | (162,289 | ) |
| ISI Class I Shares | | | (39,603 | ) | | | (251,435 | ) |
| From net realized gains from security transactions | | | | | | | | |
| ISI Class A Shares | | | — | | | | (1,184,021 | ) |
| ISI Class C Shares | | | — | | | | (154,678 | ) |
| ISI Class I Shares | | | — | | | | (239,645 | ) |
| From return of capital | | | | | | | | |
| ISI Class A Shares | | | — | | | | (28,772 | ) |
| ISI Class C Shares | | | — | | | | (3,759 | ) |
| ISI Class I Shares | | | — | | | | (5,823 | ) |
| In excess of net investment income | | | | | | | | |
| ISI Class A Shares | | | (402,385 | ) | | | — | |
| ISI Class C Shares | | | (106,885 | ) | | | — | |
| ISI Class I Shares | | | (70,376 | ) | | | — | |
| Decrease in net assets resulting from distributions to shareholders | | | (1,200,460 | ) | | | (3,272,695 | ) |
| | | | | | | | |
| FROM CAPITAL SHARE TRANSACTIONS | | | | | | | | |
| Proceeds from shares sold | | | | | | | | |
| ISI Class A Shares | | | 5,402,961 | | | | 17,302,209 | |
| ISI Class C Shares | | | 175,706 | | | | 1,255,273 | |
| ISI Class I Shares | | | 2,796,063 | | | | 8,272,561 | |
| Net asset value of shares issued in reinvestment of distributions to shareholders | | | | | | | | |
| ISI Class A Shares | | | 618,157 | | | | 1,671,239 | |
| ISI Class C Shares | | | 103,602 | | | | 191,253 | |
| ISI Class I Shares | | | 69,633 | | | | 138,441 | |
| Payments for shares redeemed | | | | | | | | |
| ISI Class A Shares | | | (25,028,652 | ) | | | (46,968,168 | ) |
| ISI Class C Shares | | | (1,546,398 | ) | | | (3,615,208 | ) |
| ISI Class I Shares | | | (380,235 | ) | | | (37,524,003 | ) |
| Net decrease in net assets resulting from capital share transactions | | | (17,789,163 | ) | | | (59,276,403 | ) |
| | | | | | | | |
| TOTAL DECREASE IN NET ASSETS | | | (20,231,534 | ) | | | (64,500,098 | ) |
See Notes to Financial Statements.
| North American Government Bond Fund, Inc. |
| Statements of Changes in Net Assets (continued) | |
| | | Six Months Ended
April 30, 2014 (Unaudited) | | | Year Ended
October 31,
2013 | |
| NET ASSETS | | | | | | |
| Beginning of period | | $ | 101,211,229 | | | $ | 165,711,327 | |
| End of period | | $ | 80,979,695 | | | $ | 101,211,229 | |
| | | | | | | | |
| DISTRIBUTIONS IN EXCESS OF NET INVESTMENT INCOME | | $ | (643,971 | ) | | $ | (64,325 | ) |
| | | | | | | | |
| CAPITAL SHARE ACTIVITY | | | | | | | | |
| Shares sold | | | | | | | | |
| ISI Class A Shares | | | 723,768 | | | | 2,210,246 | |
| ISI Class C Shares | | | 23,852 | | | | 161,225 | |
| ISI Class I Shares | | | 370,080 | | | | 1,042,288 | |
| Shares reinvested | | | | | | | | |
| ISI Class A Shares | | | 82,812 | | | | 214,513 | |
| ISI Class C Shares | | | 14,021 | | | | 24,757 | |
| ISI Class I Shares | | | 9,391 | | | | 17,489 | |
| Shares redeemed | | | | | | | | |
| ISI Class A Shares | | | (3,331,205 | ) | | | (6,042,659 | ) |
| ISI Class C Shares | | | (208,425 | ) | | | (466,830 | ) |
| ISI Class I Shares | | | (51,035 | ) | | | (4,755,861 | ) |
| | | | | | | | |
| Net increase (decrease) in shares outstanding | | | | | | | | |
| ISI Class A Shares | | | (2,524,625 | ) | | | (3,617,900 | ) |
| ISI Class C Shares | | | (170,552 | ) | | | (280,848 | ) |
| ISI Class I Shares | | | 328,436 | | | | (3,696,084 | ) |
| | | | | | | | |
| Shares outstanding, beginning of period | | | | | | | | |
| ISI Class A Shares | | | 11,080,588 | | | | 14,698,488 | |
| ISI Class C Shares | | | 1,934,977 | | | | 2,215,825 | |
| ISI Class I Shares | | | 283,889 | | | | 3,979,973 | |
| Shares outstanding, end of period | | | | | | | | |
| ISI Class A Shares | | | 8,555,963 | | | | 11,080,588 | |
| ISI Class C Shares | | | 1,764,425 | | | | 1,934,977 | |
| ISI Class I Shares | | | 612,325 | | | | 283,889 | |
See Notes to Financial Statements.
| Statements of Changes in Net Assets | |
| | | Six Months Ended
April 30, 2014 (Unaudited) | | | Year Ended
October 31,
2013 | |
| FROM OPERATIONS | | | | | | |
| Net investment income | | $ | 231,347 | | | $ | 696,997 | |
| Net realized gains from security transactions | | | 3,636,155 | | | | 5,618,548 | |
| Net change in net unrealized appreciation/(depreciation) on investments | | | 1,482,521 | | | | 7,560,061 | |
| Net increase in net assets resulting from operations | | | 5,350,023 | | | | 13,875,606 | |
| | | | | | | | |
| DISTRIBUTIONS TO SHAREHOLDERS | | | | | | | | |
| From net investment income | | | (224,809 | ) | | | (686,465 | ) |
| From net realized gains from security transactions | | | (5,615,550 | ) | | | (2,720,495 | ) |
| Decrease in net assets resulting from distributions to shareholders | | | (5,840,359 | ) | | | (3,406,960 | ) |
| | | | | | | | |
| FROM CAPITAL SHARE TRANSACTIONS | | | | | | | | |
| Proceeds from shares sold | | | 8,169,596 | | | | 17,784,145 | |
| Reinvestment of distributions to shareholders | | | 5,258,262 | | | | 3,015,066 | |
| Payments for shares redeemed | | | (7,130,335 | ) | | | (8,781,704 | ) |
| Net increase in net assets resulting from capital share transactions | | | 6,297,523 | | | | 12,017,507 | |
| | | | | | | | |
| TOTAL INCREASE IN NET ASSETS | | | 5,807,187 | | | | 22,486,153 | |
| | | | | | | | |
| NET ASSETS | | | | | | | | |
| Beginning of period | | | 85,997,882 | | | | 63,511,729 | |
| End of period | | $ | 91,805,069 | | | $ | 85,997,882 | |
| | | | | | | | |
| UNDISTRIBUTED NET INVESTMENT INCOME | | $ | 8,592 | | | $ | 2,054 | |
| | | | | | | | |
| CAPITAL SHARE ACTIVITY | | | | | | | | |
| Shares sold | | | 506,166 | | | | 1,152,539 | |
| Shares reinvested | | | 325,953 | | | | 217,792 | |
| Shares redeemed | | | (441,249 | ) | | | (588,442 | ) |
| Net increase in shares outstanding | | | 390,870 | | | | 781,889 | |
| Shares outstanding, beginning of period | | | 5,250,355 | | | | 4,468,466 | |
| Shares outstanding, end of period | | | 5,641,225 | | | | 5,250,355 | |
See Notes to Financial Statements.
| Total Return U.S. Treasury Fund, Inc. |
Selected Per Share Data and Ratios for a Share Outstanding Throughout Each Period
| | Six Months Ended
April 30,
2014 | | | Years Ended October 31, | |
| | (Unaudited) | | | 2013 | | | 2012 | | | 2011 | | | 2010 | | | 2009 | |
Net asset value at
beginning of period | | $ | 9.82 | | | $ | 10.38 | | | $ | 10.38 | | | $ | 10.09 | | | $ | 10.11 | | | $ | 9.59 | |
| | | | | | | | | | | | | | | | | | | | | | | | |
Income (loss) from
investment operations: | | | | | | | | | | | | | | | | | | | | | | | | |
Net investment income(a) | | | 0.05 | | | | 0.10 | | | | 0.11 | | | | 0.15 | | | | 0.15 | | | | 0.17 | |
| Net realized and unrealized gains (losses) on investments | | | (0.12 | ) | | | (0.29 | ) | | | 0.23 | | | | 0.33 | | | | 0.50 | | | | 0.70 | |
| Total from investment operations | | | (0.07 | ) | | | (0.19 | ) | | | 0.34 | | | | 0.48 | | | | 0.65 | | | | 0.87 | |
| | | | | | | | | | | | | | | | | | | | | | | | |
| Less distributions: | | | | | | | | | | | | | | | | | | | | | | | | |
Distributions from
net investment income | | | (0.09 | ) | | | (0.10 | ) | | | (0.11 | ) | | | (0.15 | ) | | | (0.15 | ) | | | (0.17 | ) |
Distributions from
net realized gains | | | — | | | | (0.23 | ) | | | (0.23 | ) | | | (0.04 | ) | | | (0.52 | ) | | | (0.18 | ) |
| Return of capital | | | — | | | | (0.04 | ) | | | — | | | | — | | | | — | | | | — | |
| Total distributions | | | (0.09 | ) | | | (0.37 | ) | | | (0.34 | ) | | | (0.19 | ) | | | (0.67 | ) | | | (0.35 | ) |
| | | | | | | | | | | | | | | | | | | | | | | | |
| Net asset value at end of period | | $ | 9.66 | | | $ | 9.82 | | | $ | 10.38 | | | $ | 10.38 | | | $ | 10.09 | | | $ | 10.11 | |
| | | | | | | | | | | | | | | | | | | | | | | | |
TOTAL RETURN(b) | | | (0.71 | %)(c) | | | (1.89 | )% | | | 3.28 | % | | | 4.87 | % | | | 6.85 | % | | | 9.05 | % |
| | | | | | | | | | | | | | | | | | | | | | | | |
| Net assets at end of period (000's) | $ | 57,314 | | | $ | 62,174 | | | $ | 77,834 | | | $ | 85,494 | | | $ | 97,793 | | | $ | 112,295 | |
| | | | | | | | | | | | | | | | | | | | | | | | |
Ratio of expenses to
average net assets | | | 0.97 | %(d) | | | 0.89 | % | | | 0.83 | % | | | 0.84 | % | | | 0.82 | % | | | 0.80 | % |
| | | | | | | | | | | | | | | | | | | | | | | | |
Ratio of net investment income
to average net assets | | | 0.96 | %(d) | | | 0.96 | % | | | 1.05 | % | | | 1.50 | % | | | 1.49 | % | | | 1.68 | % |
| | | | | | | | | | | | | | | | | | | | | | | | |
| Portfolio turnover rate | | | 2 | %(c) | | | 0 | % | | | 52 | % | | | 51 | % | | | 44 | % | | | 109 | % |
(a) | Calculated using the average shares outstanding for the period. |
(b) | Total return is a measure of the change in value of an investment in the Fund over the period covered, which assumes any dividends or capital gains distributions are reinvested in shares of the Fund. Returns shown do not reflect initial sales charges, the deduction of taxes a shareholder would pay on Fund distributions or the redemption of Fund shares. |
(c) | Not annualized. |
(d) | Annualized. |
See Notes to Financial Statements.
| Managed Municipal Fund, Inc. - Class A |
Selected Per Share Data and Ratios for a Share Outstanding Throughout Each Period
| | Six Months Ended
April 30,
2014 | | | Years Ended October 31, | |
| | (Unaudited) | | | 2013 | | | 2012 | | | 2011 | | | 2010 | | | 2009 | |
Net asset value at
beginning of period | | $ | 10.57 | | | $ | 11.18 | | | $ | 10.77 | | | $ | 10.82 | | | $ | 10.68 | | | $ | 9.96 | |
| | | | | | | | | | | | | | | | | | | | | | | | |
Income (loss) from
investment operations: | | | | | | | | | | | | | | | | | | | | | | | | |
Net investment income(a) | | | 0.11 | | | | 0.24 | | | | 0.27 | | | | 0.28 | | | | 0.31 | | | | 0.32 | |
| Net realized and unrealized gains (losses) on investments | | | 0.14 | | | | (0.56 | ) | | | 0.41 | | | | 0.02 | | | | 0.18 | | | | 0.74 | |
| Total from investment operations | | | 0.25 | | | | (0.32 | ) | | | 0.68 | | | | 0.30 | | | | 0.49 | | | | 1.06 | |
| | | | | | | | | | | | | | | | | | | | | | | | |
| Less distributions: | | | | | | | | | | | | | | | | | | | | | | | | |
Distributions from
net investment income | | | (0.11 | ) | | | (0.24 | ) | | | (0.27 | ) | | | (0.28 | ) | | | (0.31 | ) | | | (0.32 | ) |
Distributions from
net realized gains | | | (0.08 | ) | | | (0.05 | ) | | | — | | | | (0.07 | ) | | | (0.04 | ) | | | (0.02 | ) |
| Total distributions | | | (0.19 | ) | | | (0.29 | ) | | | (0.27 | ) | | | (0.35 | ) | | | (0.35 | ) | | | (0.34 | ) |
| | | | | | | | | | | | | | | | | | | | | | | | |
| Net asset value at end of period | | $ | 10.63 | | | $ | 10.57 | | | $ | 11.18 | | | $ | 10.77 | | | $ | 10.82 | | | $ | 10.68 | |
| | | | | | | | | | | | | | | | | | | | | | | | |
TOTAL RETURN(b) | | | 2.38 | %(c) | | | (2.90 | )% | | | 6.34 | % | | | 2.93 | % | | | 4.62 | % | | | 10.68 | % |
| | | | | | | | | | | | | | | | | | | | | | | | |
| Net assets at end of period (000's) | $ | 63,437 | | | $ | 83,371 | | | $ | 110,060 | | | $ | 104,342 | | | $ | 112,203 | | | $ | 100,923 | |
| | | | | | | | | | | | | | | | | | | | | | | | |
Ratio of expenses to
average net assets | | | 1.16 | %(d) | | | 1.04 | % | | | 0.99 | % | | | 1.01 | % | | | 0.97 | % | | | 0.97 | % |
| | | | | | | | | | | | | | | | | | | | | | | | |
Ratio of net investment income
to average net assets | | | 2.11 | %(d) | | | 2.20 | % | | | 2.42 | % | | | 2.65 | % | | | 2.89 | % | | | 3.02 | % |
| | | | | | | | | | | | | | | | | | | | | | | | |
| Portfolio turnover rate | | | 3 | %(c) | | | 14 | % | | | 17 | % | | | 10 | % | | | 22 | % | | | 10 | % |
(a) | Calculated using the average shares outstanding for the period. |
(b) | Total return is a measure of the change in value of an investment in the Fund over the period covered, which assumes any dividends or capital gains distributions are reinvested in shares of the Fund. Returns shown do not reflect initial sales charges, the deduction of taxes a shareholder would pay on Fund distributions or the redemption of Fund shares. |
(c) | Not annualized. |
(d) | Annualized. |
See Notes to Financial Statements.
| Managed Municipal Fund, Inc. - Class I |
Selected Per Share Data and Ratios for a Share Outstanding Throughout Each Period
| | Six Months Ended
April 30,
2014 | | | Years Ended October 31, | |
| | (Unaudited) | | | 2013 | | | 2012 | | | 2011 | | | 2010(a) | |
| Net asset value at beginning of period | | $ | 10.57 | | | $ | 11.19 | | | $ | 10.78 | | | $ | 10.82 | | | $ | 10.94 | |
| | | | | | | | | | | | | | | | | | | | |
| Income (loss) from investment operations: | | | | | | | | | | | | | | | | | | | | |
Net investment income(b) | | | 0.12 | | | | 0.27 | | | | 0.30 | | | | 0.31 | | | | 0.02 | |
| Net realized and unrealized gains (losses) on investments | | | 0.09 | | | | (0.57 | ) | | | 0.41 | | | | 0.03 | | | | (0.11 | ) |
| Total from investment operations | | | 0.21 | | | | (0.30 | ) | | | 0.71 | | | | 0.34 | | | | (0.09 | ) |
| | | | | | | | | | | | | | | | | | | | |
| Less distributions: | | | | | | | | | | | | | | | | | | | | |
| Distributions from net investment income | | | (0.13 | ) | | | (0.27 | ) | | | (0.30 | ) | | | (0.31 | ) | | | (0.03 | ) |
| Distributions from net realized gains | | | (0.08 | ) | | | (0.05 | ) | | | — | | | | (0.07 | ) | | | — | |
| Total distributions | | | (0.21 | ) | | | (0.32 | ) | | | (0.30 | ) | | | (0.38 | ) | | | (0.03 | ) |
| | | | | | | | | | | | | | | | | | | | |
| Net asset value at end of period | | $ | 10.57 | | | $ | 10.57 | | | $ | 11.19 | | | $ | 10.78 | | | $ | 10.82 | |
| | | | | | | | | | | | | | | | | | | | |
TOTAL RETURN(c) | | | 1.94 | %(d) | | | (2.75 | )% | | | 6.60 | % | | | 3.28 | % | | | (0.86 | %)(d) |
| | | | | | | | | | | | | | | | | | | | |
| Net assets at end of period (000's) | | $ | 7,847 | | | $ | 7,228 | | | $ | 6,523 | | | $ | 3,605 | | | $ | 76 | |
| | | | | | | | | | | | | | | | | | | | |
| Ratio of expenses to average net assets | | | 0.92 | %(e) | | | 0.79 | % | | | 0.74 | % | | | 0.76 | % | | | 0.70 | %(e) |
| | | | | | | | | | | | | | | | | | | | |
Ratio of net investment income to
average net assets | | | 2.30 | %(e) | | | 2.46 | % | | | 2.66 | % | | | 2.92 | % | | | 2.83 | %(e) |
| | | | | | | | | | | | | | | | | | | | |
| Portfolio turnover rate | | | 3 | %(d) | | | 14 | % | | | 17 | % | | | 10 | % | | | 22 | % |
(a) | Class I commenced operations on October 7, 2010. |
(b) | Calculated using the average shares outstanding for the period. |
(c) | Total return is a measure of the change in value of an investment in the Fund over the period covered, which assumes any dividends or capital gains distributions are reinvested in shares of the Fund. Returns shown do not reflect the deduction of taxes a shareholder would pay on Fund distributions or the redemption of Fund shares. |
(d) | Not annualized. |
(e) | Annualized. |
See Notes to Financial Statements.
| North American Government Bond Fund, Inc. - Class A |
Financial Highlights
Selected Per Share Data and Ratios for a Share Outstanding Throughout Each Period
| | Six Months Ended
April 30,
2014 | | | Years Ended October 31, | |
| | (Unaudited) | | | 2013 | | | 2012 | | | 2011 | | | 2010 | | | 2009 | |
Net asset value at
beginning of period | | $ | 7.62 | | | $ | 7.93 | | | $ | 7.93 | | | $ | 7.89 | | | $ | 7.56 | | | $ | 7.22 | |
| | | | | | | | | | | | | | | | | | | | | | | | |
Income (loss) from
investment operations: | | | | | | | | | | | | | | | | | | | | | | | | |
Net investment income(a) | | | 0.05 | | | | 0.10 | | | | 0.11 | | | | 0.14 | | | | 0.14 | | | | 0.14 | |
| Net realized and unrealized gains (losses) on investments and foreign currencies | | | (0.15 | ) | | | (0.22 | ) | | | 0.10 | | | | 0.12 | | | | 0.56 | | | | 0.56 | |
| Total from investment operations | | | (0.10 | ) | | | (0.12 | ) | | | 0.21 | | | | 0.26 | | | | 0.70 | | | | 0.70 | |
| | | | | | | | | | | | | | | | | | | | | | | | |
| Less distributions: | | | | | | | | | | | | | | | | | | | | | | | | |
| Distributions from net investment income | | | (0.10 | ) | | | (0.10 | ) | | | (0.12 | ) | | | (0.16 | ) | | | (0.14 | ) | | | (0.08 | ) |
Distributions from net
realized gains | | | — | | | | (0.09 | ) | | | (0.09 | ) | | | (0.06 | ) | | | (0.23 | ) | | | (0.28 | ) |
| Return of capital | | | — | | | | (0.00 | )* | | | (0.00 | )* | | | — | | | | — | | | | — | |
| Total distributions | | | (0.10 | ) | | | (0.19 | ) | | | (0.21 | ) | | | (0.22 | ) | | | (0.37 | ) | | | (0.36 | ) |
| | | | | | | | | | | | | | | | | | | | | | | | |
| Net asset value at end of period | | $ | 7.42 | | | $ | 7.62 | | | $ | 7.93 | | | $ | 7.93 | | | $ | 7.89 | | | $ | 7.56 | |
| | | | | | | | | | | | | | | | | | | | | | | | |
TOTAL RETURN(b) | | | (1.31 | %)(c) | | | (1.51 | )% | | | 2.71 | % | | | 3.30 | % | | | 9.53 | % | | | 9.80 | % |
| | | | | | | | | | | | | | | | | | | | | | | | |
| Net assets at end of period (000's) | $ | 63,515 | | | $ | 84,430 | | | $ | 116,599 | | | $ | 112,407 | | | $ | 134,383 | | | $ | 132,814 | |
| | | | | | | | | | | | | | | | | | | | | | | | |
Ratio of expenses to
average net assets | | | 1.39 | %(d) | | | 1.25 | % | | | 1.18 | % | | | 1.18 | % | | | 1.15 | % | | | 1.13 | % |
| | | | | | | | | | | | | | | | | | | | | | | | |
Ratio of net investment income
to average net assets | | | 1.47 | %(d) | | | 1.34 | % | | | 1.40 | % | | | 1.83 | % | | | 1.85 | % | | | 1.87 | % |
| | | | | | | | | | | | | | | | | | | | | | | | |
| Portfolio turnover rate | | | 7 | %(c) | | | 10 | % | | | 57 | % | | | 46 | % | | | 48 | % | | | 131 | % |
| * | Amount less than $0.005 per share. |
(a) | Calculated using the average shares outstanding for the period. |
(b) | Total return is a measure of the change in value of an investment in the Fund over the period covered, which assumes any dividends, capital gains distributions or return of capital distributions are reinvested in shares of the Fund. Returns shown do not reflect initial sales charges, the deduction of taxes a shareholder would pay on Fund distributions or the redemption of Fund shares. |
(c) | Not annualized. |
(d) | Annualized. |
See Notes to Financial Statements.
| North American Government Bond Fund, Inc. - Class C |
Selected Per Share Data and Ratios for a Share Outstanding Throughout Each Period
| | Six Months Ended
April 30,
2014 | | | Years Ended October 31, | |
| | (Unaudited) | | | 2013 | | | 2012 | | | 2011 | | | 2010 | | | 2009 | |
Net asset value at
beginning of period | | $ | 7.55 | | | $ | 7.88 | | | $ | 7.89 | | | $ | 7.85 | | | $ | 7.54 | | | $ | 7.21 | |
| | | | | | | | | | | | | | | | | | | | | | | | |
Income (loss) from
investment operations: | | | | | | | | | | | | | | | | | | | | | | | | |
Net investment income(a) | | | 0.04 | | | | 0.06 | | | | 0.06 | | | | 0.10 | | | | 0.09 | | | | 0.09 | |
| Net realized and unrealized gains (losses) on investments and foreign currencies | | | (0.14 | ) | | | (0.23 | ) | | | 0.11 | | | | 0.12 | | | | 0.56 | | | | 0.55 | |
| Total from investment operations | | | (0.10 | ) | | | (0.17 | ) | | | 0.17 | | | | 0.22 | | | | 0.65 | | | | 0.64 | |
| | | | | | | | | | | | | | | | | | | | | | | | |
| Less distributions: | | | | | | | | | | | | | | | | | | | | | | | | |
| Distributions from net investment income | | | (0.10 | ) | | | (0.07 | ) | | | (0.09 | ) | | | (0.12 | ) | | | (0.11 | ) | | | (0.03 | ) |
Distributions from net
realized gains | | | — | | | | (0.09 | ) | | | (0.09 | ) | | | (0.06 | ) | | | (0.23 | ) | | | (0.28 | ) |
| Return of capital | | | — | | | | (0.00 | )* | | | (0.00 | )* | | | — | | | | — | | | | — | |
| Total distributions | | | (0.10 | ) | | | (0.16 | ) | | | (0.18 | ) | | | (0.18 | ) | | | (0.34 | ) | | | (0.31 | ) |
| | | | | | | | | | | | | | | | | | | | | | | | |
| Net asset value at end of period | | $ | 7.35 | | | $ | 7.55 | | | $ | 7.88 | | | $ | 7.89 | | | $ | 7.85 | | | $ | 7.54 | |
| | | | | | | | | | | | | | | | | | | | | | | | |
TOTAL RETURN(b) | | | (1.38 | %)(c) | | | (2.23 | )% | | | 2.13 | % | | | 2.84 | % | | | 8.85 | % | | | 8.97 | % |
| | | | | | | | | | | | | | | | | | | | | | | | |
| Net assets at end of period (000's) | $ | 12,961 | | | $ | 14,615 | | | $ | 17,451 | | | $ | 17,248 | | | $ | 22,963 | | | $ | 24,659 | |
| | | | | | | | | | | | | | | | | | | | | | | | |
Ratio of expenses to
average net assets | | | 1.85%(d | )(e) | | | 1.85 | % | | | 1.78 | % | | | 1.78 | % | | | 1.78 | % | | | 1.76 | % |
| | | | | | | | | | | | | | | | | | | | | | | | |
Ratio of expenses (before reimbursements) to
average net assets | | | 1.99 | %(d) | | | 1.85 | % | | | 1.78 | % | | | 1.78 | % | | | 1.78 | % | | | 1.76 | % |
| | | | | | | | | | | | | | | | | | | | | | | | |
Ratio of net investment income
to average net assets | | | 1.02 | %(d) | | | 0.73 | % | | | 0.80 | % | | | 1.23 | % | | | 1.23 | % | | | 1.22 | % |
| | | | | | | | | | | | | | | | | | | | | | | | |
| Portfolio turnover rate | | | 7 | %(c) | | | 10 | % | | | 57 | % | | | 46 | % | | | 48 | % | | | 131 | % |
| * | Amount less than $0.005 per share. |
(a) | Calculated using the average shares outstanding for the period. |
(b) | Total return is a measure of the change in value of an investment in the Fund over the period covered, which assumes any dividends, capital gains distributions or return of capital distributions are reinvested in shares of the Fund. Returns shown do not reflect contingent deferred sales charges, the deduction of taxes a shareholder would pay on Fund distributions or the redemption of Fund shares. |
(c) | Not annualized. |
(d) | Annualized. |
(e) | Ratio of expenses to average net assets includes the effect of expense reimbursements as detailed in Note 2 of the Notes to Financial Statements. |
See Notes to Financial Statements.
| North American Government Bond Fund, Inc. - Class I |
Selected Per Share Data and Ratios for a Share Outstanding Throughout Each Period
| | Six Months Ended
April 30,
2014 | | | Years Ended October 31, | |
| | (Unaudited) | | | 2013 | | | 2012 | | | 2011 | | | 2010(a) | |
| Net asset value at beginning of period | | $ | 7.63 | | | $ | 7.96 | | | $ | 7.95 | | | $ | 7.89 | | | $ | 7.80 | |
| | | | | | | | | | | | | | | | | | | | |
| Income (loss) from investment operations: | | | | | | | | | | | | | | | | | | | | |
Net investment income(b) | | | 0.07 | | | | 0.13 | | | | 0.14 | | | | 0.18 | | | | 0.02 | |
| Net realized and unrealized gains (losses) on investments and foreign currencies | | | (0.15 | ) | | | (0.24 | ) | | | 0.11 | | | | 0.12 | | | | 0.12 | |
| Total from investment operations | | | (0.08 | ) | | | (0.11 | ) | | | 0.25 | | | | 0.30 | | | | 0.14 | |
| | | | | | | | | | | | | | | | | | | | |
| Less distributions: | | | | | | | | | | | | | | | | | | | | |
| Distributions from net investment income | | | (0.19 | ) | | | (0.13 | ) | | | (0.15 | ) | | | (0.18 | ) | | | (0.02 | ) |
| Distributions from net realized gains | | | — | | | | (0.09 | ) | | | (0.09 | ) | | | (0.06 | ) | | | (0.03 | ) |
| Return of capital | | | — | | | | (0.00 | )* | | | (0.00 | )* | | | — | | | | — | |
| Total distributions | | | (0.19 | ) | | | (0.22 | ) | | | (0.24 | ) | | | (0.24 | ) | | | (0.05 | ) |
| | | | | | | | | | | | | | | | | | | | |
| Net asset value at end of period | | $ | 7.36 | | | $ | 7.63 | | | $ | 7.96 | | | $ | 7.95 | | | $ | 7.89 | |
| | | | | | | | | | | | | | | | | | | | |
TOTAL RETURN(c) | | | (1.03 | %)(d) | | | (1.46 | )% | | | 3.14 | % | | | 3.88 | % | | | 1.74 | %(d) |
| | | | | | | | | | | | | | | | | | | | |
| Net assets at end of period (000's) | | $ | 4,504 | | | $ | 2,165 | | | $ | 31,661 | | | $ | 18,056 | | | $ | 197 | |
| | | | | | | | | | | | | | | | | | | | �� |
| Ratio of expenses to average net assets | | | 0.99 | %(e) | | | 0.85 | % | | | 0.78 | % | | | 0.78 | % | | | 0.69 | %(e) |
| | | | | | | | | | | | | | | | | | | | |
| Ratio of net investment income to average net assets | | | 1.91 | %(e) | | | 1.69 | % | | | 1.78 | % | | | 2.25 | % | | | 2.25 | %(e) |
| | | | | | | | | | | | | | | | | | | | |
| Portfolio turnover rate | | | 7 | %(d) | | | 10 | % | | | 57 | % | | | 46 | % | | | 48 | % |
| * | Amount less than $0.005 per share. |
(a) | Class I commenced operations on September 16, 2010. |
(b) | Calculated using the average shares outstanding for the period. |
(c) | Total return is a measure of the change in value of an investment in the Fund over the period covered, which assumes any dividends, capital gains distributions or return of capital distributions are reinvested in shares of the Fund. Returns shown do not reflect the deduction of taxes a shareholder would pay on Fund distributions or the redemption of Fund shares. |
(d) | Not annualized. |
(e) | Annualized. |
See Notes to Financial Statements.
Selected Per Share Data and Ratios for a Share Outstanding Throughout Each Period
| | Six Months Ended
April 30,
2014 | | | Years Ended October 31, | |
| | (Unaudited) | | | 2013 | | | 2012 | | | 2011 | | | 2010 | | | 2009 | |
Net asset value at
beginning of period | | $ | 16.38 | | | $ | 14.21 | | | $ | 12.63 | | | $ | 12.28 | | | $ | 10.64 | | | $ | 9.63 | |
| | | | | | | | | | | | | | | | | | | | | | | | |
Income (loss) from
investment operations: | | | | | | | | | | | | | | | | | | | | | | | | |
Net investment income(a) | | | 0.04 | | | | 0.15 | | | | 0.14 | | | | 0.15 | | | | 0.16 | | | | 0.11 | |
| Net realized and unrealized gains on investments | | | 0.96 | | | | 2.79 | | | | 1.58 | | | | 0.35 | | | | 1.64 | | | | 1.02 | |
| Total from investment operations | | | 1.00 | | | | 2.94 | | | | 1.72 | | | | 0.50 | | | | 1.80 | | | | 1.13 | |
| | | | | | | | | | | | | | | | | | | | | | | | |
| Less distributions: | | | | | | | | | | | | | | | | | | | | | | | | |
| Distributions from net investment income | | | (0.04 | ) | | | (0.15 | ) | | | (0.14 | ) | | | (0.15 | ) | | | (0.16 | ) | | | (0.12 | ) |
Distributions from net
realized gains | | | (1.07 | ) | | | (0.62 | ) | | | — | | | | — | | | | — | | | | — | |
| Total distributions | | | (1.11 | ) | | | (0.77 | ) | | | (0.14 | ) | | | (0.15 | ) | | | (0.16 | ) | | | (0.12 | ) |
| | | | | | | | | | | | | | | | | | | | | | | | |
| Net asset value at end of period | | $ | 16.27 | | | $ | 16.38 | | | $ | 14.21 | | | $ | 12.63 | | | $ | 12.28 | | | $ | 10.64 | |
| | | | | | | | | | | | | | | | | | | | | | | | |
TOTAL RETURN(b) | | | 6.20 | %(c) | | | 21.72 | % | | | 13.69 | % | | | 4.03 | % | | | 17.05 | % | | | 11.84 | % |
| | | | | | | | | | | | | | | | | | | | | | | | |
| Net assets at end of period (000's) | | $ | 91,805 | | | $ | 85,998 | | | $ | 63,512 | | | $ | 57,261 | | | $ | 60,445 | | | $ | 53,731 | |
| | | | | | | | | | | | | | | | | | | | | | | | |
Ratio of expenses to average
net assets | | | 1.12 | %(d) | | | 1.08 | % | | | 1.11 | % | | | 1.04 | % | | | 1.06 | % | | | 1.10 | % |
| | | | | | | | | | | | | | | | | | | | | | | | |
Ratio of net investment income
to average net assets | | | 0.52 | %(d) | | | 0.97 | % | | | 1.03 | % | | | 1.12 | % | | | 1.40 | % | | | 1.19 | % |
| | | | | | | | | | | | | | | | | | | | | | | | |
| Portfolio turnover rate | | | 17 | %(c) | | | 38 | % | | | 55 | % | | | 50 | % | | | 38 | % | | | 55 | % |
(a) | Calculated using the average shares outstanding for the period. |
(b) | Total return is a measure of the change in value of an investment in the Fund over the period covered, which assumes any dividends or capital gains distributions are reinvested in shares of the Fund. Returns shown do not reflect initial sales charges, the deduction of taxes a shareholder would pay on Fund distributions or the redemption of Fund shares. |
(c) | Not annualized. |
(d) | Annualized. |
See Notes to Financial Statements.
Notes to Financial Statements
April 30, 2014 (Unaudited)
Note 1 – Organization and Significant Accounting Policies
Total Return US Treasury Fund, Inc. (“Total Return”), Managed Municipal Fund, Inc. (“Managed Municipal”), North American Government Bond Fund, Inc. (“North American”) and ISI Strategy Fund, Inc. (“Strategy”) (each a “Fund” and collectively, the “Funds”) are registered under the Investment Company Act of 1940, as amended, as open-end management investment companies. The Funds are organized as corporations under the laws of the State of Maryland.
Total Return’s investment objectives are to provide a high level of total return with relative stability of principal and, secondarily, high current income. Managed Municipal’s investment objectives are to provide a high level of total return with relative stability of principal and, secondarily, high current income exempt from Federal income tax. North American’s investment objective is to provide a high level of current income, consistent with prudent investment risk. Strategy’s investment objective is to maximize total return through a combination of long-term growth of capital and current income.
Total Return and Strategy each currently offer a single class of shares (ISI Shares) to investors. Managed Municipal offers two classes of shares – ISI Class A Shares and ISI Class I Shares. North American offers three classes of shares – ISI Class A Shares, ISI Class C Shares and ISI Class I Shares. ISI Shares and ISI Class A Shares are subject to a maximum front-end sales charge equal to 3.00%. A contingent deferred sales charge of 1.00% is imposed on the sale of ISI Class C Shares if redeemed within the first year of purchase.
Total Return and Strategy are authorized to issue 115,000,000 and 25,000,000 shares, respectively, of ISI Shares at $0.001 par value. Managed Municipal is authorized to issue 50,000,000 ISI Class A Shares and 5,000,000 ISI Class I Shares at $0.001 par value. North American is authorized to issue 50,000,000 ISI Class A Shares, 5,000,000 ISI Class C Shares and 5,000,000 ISI Class I Shares at $0.001 par value.
| B. | Valuation of Securities |
Exchange traded securities and over-the-counter securities listed on the NASDAQ National Market System for which market quotations are readily available are valued each Fund business day using the last reported sales price or the NASDAQ Official Closing Price (“NOCP”) provided by independent pricing services as of the close of trading on the New York Stock Exchange (normally 4:00 p.m. Eastern Time). In the absence of a sale price or NOCP, such securities are valued at the mean of the last bid and the last asked prices. Non-exchange traded securities for which quotations are readily
Notes to Financial Statements (continued)
available are generally valued at the mean between the last bid and the last asked prices. Debt securities may be valued at prices supplied by a Fund’s pricing agent based on broker or dealer supplied valuations or matrix pricing, a method of valuing securities by reference to the value of other securities with similar characteristics such as rating, interest rate, and maturity. Money market instruments that mature in 60 days or less may be valued at amortized cost unless the Fund’s investment advisor believes another valuation is more appropriate.
When valuing securities for which market quotations are not readily available or for which the market quotations that are readily available are considered unreliable, the Funds determine a fair value in good faith under procedures established by and under the general supervision of the Funds’ Boards of Directors (the “Board”). The Funds may use these procedures to establish the fair value of securities when, for example, a significant event occurs between the time the market closes and the calculation of the net asset value per share, and the event is likely to affect the Fund’s net asset value per share. Fair valuation may also be used for securities that are subject to legal or contractual restrictions on resale, securities for which no or limited trading activity has occurred for a period of time, or securities that are otherwise deemed to be illiquid (i.e., securities that cannot be disposed of within seven days at approximately the price at which the security is currently priced by the Funds).
If a fair value is required, the investment advisor, or the sub-advisor in the case of Strategy, determines the value of the security until the Board meets to establish the fair value of the security.
As of April 30, 2014, there were no fair valued securities.
Accounting principles generally accepted in the United States (“GAAP”) establish a single authoritative definition of fair value, set out a frame work for measuring fair value and require additional disclosures about fair value measurements.
Various inputs are used in determining the value of each Fund’s investments. These inputs are summarized in the three broad levels listed below:
Level 1 – quoted prices in active markets for identical securities
Level 2 – other significant observable inputs
Level 3 – significant unobservable inputs
The inputs or methodology used for valuing securities are not necessarily an indication of the risks associated with investing in those securities.
| Notes to Financial Statements (continued) | |
The following is a summary of the inputs used to value each Fund’s investments as of April 30, 2014:
| Total Return | | | | | | | | |
| | Level 1 | | Level 2 | | Level 3 | | Total | |
| U.S. Treasury Obligations | | $ | — | | | $ | 45,799,366 | | | $ | — | | | $ | 45,799,366 | |
| U.S. Treasury Bills | | | — | | | | 11,164,874 | | | | — | | | | 11,164,874 | |
| Total | | $ | — | | | $ | 56,964,240 | | | $ | — | | | $ | 56,964,240 | |
| Managed Municipal | | | | | | | | |
| | Level 1 | | Level 2 | | Level 3 | | Total | |
| Municipal Bonds | | $ | — | | | $ | 63,642,664 | | | $ | — | | | $ | 63,642,664 | |
| U.S. Treasury Bills | | | — | | | | 7,009,972 | | | | — | | | | 7,009,972 | |
| Total | | $ | — | | | $ | 70,652,636 | | | $ | — | | | $ | 70,652,636 | |
| North American | | | | | | | | | | | | |
| | | Level 1 | | | Level 2 | | | Level 3 | | | Total | |
| Canadian Securities | | $ | — | | | $ | 15,293,761 | | | $ | — | | | $ | 15,293,761 | |
| Mexican Securities | | | — | | | | 13,533,309 | | | | — | | | | 13,533,309 | |
| U.S. Treasury Obligations | | | — | | | | 46,856,385 | | | | — | | | | 46,856,385 | |
| U.S. Treasury Bills | | | — | | | | 4,209,940 | | | | — | | | | 4,209,940 | |
| Total | | $ | — | | | $ | 79,893,395 | | | $ | — | | | $ | 79,893,395 | |
| Strategy | | | | | | | | | | | | |
| | | Level 1 | | | Level 2 | | | Level 3 | | | Total | |
| Common Stocks | | $ | 79,919,045 | | | $ | — | | | $ | — | | | $ | 79,919,045 | |
| U.S. Treasury Obligations | | | — | | | | 9,540,963 | | | | — | | | | 9,540,963 | |
| U.S. Treasury Bills | | | — | | | | 2,149,986 | | | | — | | | | 2,149,986 | |
| Total | | $ | 79,919,045 | | | $ | 11,690,949 | | | $ | — | | | $ | 91,609,994 | |
See Strategy’s Schedule of Investments for a listing of the common stocks valued using Level 1 inputs by industry type.
The Funds’ policy is to disclose significant transfers between Levels based on valuations at the end of the reporting period. The Funds may hold securities which are periodically fair valued in accordance with the Funds’ Fair Value Procedures. This may result in movements between Level 1 and Level 2 throughout the period. There were no transfers between Level 1, 2, or 3 as of April 30, 2014, based on the valuation input Levels on October 31, 2013 for the Funds.
| Notes to Financial Statements (continued) | |
| C. | Securities Transactions and Investment Income |
Securities transactions are recorded on trade date. Realized gains and losses are determined by comparing the proceeds of a sale or the cost of a purchase with a specific offsetting transaction. Dividend income is recorded on the ex-dividend date. Interest income, including amortization of premiums and accretion of discounts, is accrued daily. Estimated expenses are also accrued daily. With respect to North American and Managed Municipal, income, gains (losses) and common expenses are allocated to each class based on its respective net assets. Class specific expenses are charged directly to each class.
Total Return declares distributions daily, and North American declares monthly distributions at fixed rates approved by the Board. These distributions are paid monthly. To the extent that a Fund’s net investment income is less than an approved fixed rate, some of its distributions may be designated as a return of capital. Managed Municipal declares and pays dividends monthly from its net investment income. Strategy declares and pays dividends quarterly from its net investment income. Net realized capital gains, if any, are distributed at least annually. The Funds record dividends and distributions on the ex-dividend date.
Each Fund intends to continue to qualify as a regulated investment company under Subchapter M of the Internal Revenue Code of 1986, as amended, and distribute substantially all of its taxable income to shareholders. Therefore, no provison for Federal Income tax or excise tax is required.
| F. | Foreign Currency Translation |
The Funds maintain their accounting records in U.S. dollars. North American determines the U.S. dollar value of foreign currency-denominated assets, liabilities and transactions by using prevailing exchange rates. In valuing security transactions, the receipt of income and the payment of expenses, North American uses the prevailing exchange rate on the transaction date.
| Notes to Financial Statements (continued) | |
Net realized gains and losses on foreign currency transactions shown on North American’s financial statements result from the sale of foreign currencies, currency gains or losses realized between the trade and settlement dates on securities transactions, and from the difference between the amounts of interest recorded on North American’s books and the U.S. dollar equivalent of the amounts actually received or paid. That portion of realized gains (losses) from security transactions that results from fluctuation in foreign currency exchange rates relating to the sale of foreign securities is not separately disclosed but is included in net realized gains (losses) from security transactions. That portion of unrealized gains and losses on investments that results from fluctuations in foreign currency exchange rates is not separately disclosed but is included in the net change in unrealized appreciation/depreciation on investments.
| G. | Forward Foreign Currency Contracts |
North American may use forward foreign currency contracts to manage foreign exchange rate risk. The Fund may use these contracts to fix the U.S. dollar value of securities transactions for the period between the date of the transaction and the date the security is received or delivered or to hedge the U.S. dollar value of securities that it already owns. The use of forward foreign currency contracts does not eliminate fluctuations in the prices of the underlying securities, but does establish a rate of exchange that can be achieved in the future. North American determines the net U.S. dollar value of the forward foreign currency contracts using prevailing exchange rates.
In preparing the Funds’ financial statements in conformity with GAAP, management makes estimates and assumptions that affect the reported amounts of assets and liabilities and disclosure of contingent assets and liabilities at the date of the financial statements and the reported amounts of revenues and expenses during the period. Actual results may be different.
Note 2 – Fees and Transactions with Affiliates
International Strategy & Investment, Inc. (“ISI”) is the Funds’ investment advisor. As compensation for ISI’s advisory services, Total Return pays ISI an annual fee based on the Fund’s average daily net assets, which is calculated daily and paid monthly at the following annual rates: 0.20% of the first $100 million, 0.18% of the next $100 million, 0.16% of the next $100 million, 0.14% of the next $200 million and 0.12% of the amount over $500 million. In addition, Total Return pays ISI 1.50% of the Fund’s gross interest income. As compensation for ISI’s advisory services, Managed Municipal, North American and Strategy each pay ISI a fee, which is calculated daily and paid monthly, at the annual rate of 0.40% of such Fund’s average daily net assets.
| Notes to Financial Statements (continued) | |
ISI has contractually agreed to reimburse expenses with respect to Class C Shares of North American through March 1, 2015 to the extent necessary to limit the annual ordinary operating expenses of ISI Class C Shares to 1.85% of the average daily net assets attributable to such shares. During the period ended April 30, 2014, $9,533 of expenses were reimbursed by ISI under the expense limitation agreement.
Los Angeles Capital Management and Equity Research, Inc. is Strategy’s Sub-Advisor and is responsible for managing the common stocks in Strategy’s portfolio. The Sub-Advisor is paid by ISI, not Strategy.
International Strategy & Investment Group LLC (“ISI Group”), an affiliate of ISI, is the distributor for the Funds. Total Return, Managed Municipal (ISI Class A Shares, only) and Strategy each pay ISI Group a distribution/shareholder service fee, pursuant to Rule 12b-1, that is calculated daily and paid monthly at the annual rate of 0.25% of average daily net assets. North American’s ISI Class A Shares and ISI Class C Shares pay ISI Group a distribution/shareholder service fee, pursuant to Rule 12b-1, that is calculated daily and paid monthly at the annual rates of 0.40% and 1.00% (which may include up to 0.25% for shareholder servicing fees for each class) of their average daily net assets, respectively.
During the period ended April 30, 2014, ISI Group earned commissions on sales of ISI Shares of Total Return, Managed Municipal and Strategy of $151, $527 and $3,094, respectively, and earned commissions of $355 on sales of ISI Class A Shares of North American. ISI Group retained $781 of contingent deferred sales charges on redemptions of ISI Class C Shares of North American during the period ended April 30, 2014.
State Street Bank and Trust Company (“State Street”) is the administrator of the Funds. State Street is responsible for providing certain administrative services to the Funds, and assists in managing and supervising all aspects of the general day-to-day business activities and operations of the Funds other than investment advisory activities, including maintaining the books and records of the Funds, and preparing certain reports and other documents required by federal and/or state laws and regulations. For the performance of these services, the Funds pay State Street an annual fee of $300,000. This fee is allocated among the Funds based on the relative net assets of each Fund.
State Street is the fund accountant and fund custodian, and State Street is responsible for safeguarding and controlling the Funds’ cash and securities, handling the delivery of securities and collecting interest and dividends on the Funds’ investments. State Street as fund accounting agent is responsible for maintaining the books and records and calculating the daily net asset value of each Fund. For fund accounting services, the Funds pay State Street an annual base fee of $180,000. This fee is allocated among the Funds based on the relative net assets for each Fund. For fund custodian services, the
| Notes to Financial Statements (continued) | |
Funds pay State Street an annual base fee of 1 (one) basis point on net assets, plus other asset-based fees that vary according to the number of positions and transactions, plus out-of-pocket fees.
State Street also serves as transfer agent for the Funds and is responsible for the issuance, transfer and redemption of shares and the opening, maintenance and servicing of shareholder accounts. For these services State Street receives an annual amount of $130,000, allocated among the Funds based on the relative net assets of each Fund and a monthly fee from each Fund at an annual rate of $20 for each direct account and $15 for certain accounts established through financial intermediaries. In addition, the Funds reimburse State Street for its out-of-pocket expenses including, but not limited to, postage and supplies.
EJV Financial Services, LLC (“EJV”) provides certain compliance services to the Funds. Edward J. Veilleux, Vice President and Chief Compliance Officer (“CCO”) of the Funds, is also a principal of EJV. The Funds pay EJV $20,000 quarterly for providing CCO services. This fee is allocated among the Funds based on the relative net assets of each Fund. In addition, the Funds reimburse EJV for any reasonable out-of-pocket expenses relating to these compliance services.
Effective January 1, 2014, the Funds pay each independent Director an annual fee of $23,000. The Audit Committee Chairman and Chairman of the Board receive an additional annual fee of $4,000 and $5,000, respectively. The Funds also reimburse each of the Directors for out-of-pocket expenses incurred in connection with attending the Board of Directors’ meetings. Certain officers of the Funds are also officers or employees of the above named service providers, and during their terms of office, receive no compensation from the Funds.
Note 3 – Federal Income Tax
The Funds may periodically make reclassifications among certain capital accounts as a result of differences in the characterization and allocation of certain income and capital gain distributions determined annually in accordance with Federal tax regulations, which may differ from GAAP. These book/tax differences may be either temporary or permanent in nature. To the extent they are permanent, they are charged or credited to paid-in-capital, undistributed net investment income or accumulated net realized gains, as appropriate, in the period that the differences arose. The reclassifications have no impact on the net assets or net asset value per share of the Funds.
The Funds determine their net investment income and capital gain distributions in accordance with income tax regulations, which may differ from GAAP.
| Notes to Financial Statements (continued) | |
During the periods ended April 30, 2014 and October 31, 2013, the tax character of distributions paid by each of the Funds was as follows:
| | Ordinary Income | | | Tax-Exempt Income | |
| | | April 30,
2014 | | | October 31, 2013 | | | April 30,
2014 | | | October 31, 2013 | |
| Total Return | | $ | 553,346 | * | | $ | 1,000,452 | * | | $ | — | | | $ | — | |
| Managed Municipal | | | 2,110 | | | | 20,586 | | | | 793,415 | | | | 2,341,706 | |
| North American | | | 1,220,460 | * | | | 1,766,138 | * | | | — | | | | — | |
| Strategy | | | 224,809 | | | | 703,061 | * | | | — | | | | — | |
| | Long-Term Capital Gains | | | Return of Capital | |
| | | April 30,
2014 | | | October 31, 2013 | | | April 30,
2014 | | | October 31, 2013 | |
| Total Return | | $ | — | | | $ | 1,407,934 | | | $ | — | | | $ | 246,880 | |
| Managed Municipal | | | 525,558 | | | | 492,954 | | | | — | | | | — | |
| North American | | | — | | | | 1,468,203 | | | | — | | | | 38,354 | |
| Strategy | | | 5,615,550 | | | | 2,703,899 | | | | — | | | | — | |
| * | A portion of the ordinary income is short-term gains that are taxed as ordinary income for tax purposes. However, these short-term gains may be offset by losses incurred through October 31, 2013 and therefore could be treated as return of capital. |
The Funds recognize the tax benefits or expenses of uncertain tax positions only when the position is “more likely than not” to be sustained assuming examination by tax authorities. Management has reviewed each Fund’s tax positions taken on Federal and state income tax returns for all open tax years (tax years ended October 31, 2010 through October 31, 2013) and concluded that no provision for unrecognized tax benefits or expenses is required in these financial statements.
| Notes to Financial Statements (continued) | |
As of October 31, 2013, the components of distributable earnings (accumulated deficit) on a tax basis were as follows:
| | Total Return | | | Managed Municipal | | | North American | | | Strategy | |
| Undistributed ordinary income | | $ | — | | | $ | 33,551 | | | $ | — | | | $ | 905,921 | |
| Undistributed tax-exempt income | | | — | | | | 80,916 | | | | — | | | | — | |
| Accumulated undistributed long-term capital gains (losses) | | | (1 | ) | | | 490,843 | | | | — | | | | 4,708,975 | |
| Capital loss carryforwards | | | — | | | | — | | | | — | | | | — | |
| Net unrealized appreciation (depreciation) | | | 2,554,373 | | | | 1,857,256 | | | | 1,632,178 | | | | 17,386,948 | |
| Other temporary differences | | | (29,857 | ) | | | (81,566 | ) | | | (64,326 | ) | | | 2,053 | |
| Total | | $ | 2,524,515 | | | $ | 2,381,000 | | | $ | 1,567,852 | | | $ | 23,003,897 | |
As of October 31, 2013, the Funds recorded the following reclassifications primarily due to foreign exchange gains/losses, REIT adjustments to increase (decrease) the accounts listed below:
| Fund | | Undistributed Net Investment Income/(Loss) | | | Accumulated Net Realized Gain/(Loss) | | | Paid-in Capital | |
| Total Return | | $ | — | | | $ | — | | | $ | — | |
| Managed Municipal | | | — | | | | — | | | | — | |
| North American | | | (82,278 | ) | | | 82,278 | | | | — | |
| Strategy | | | (28,941 | ) | | | 28,941 | | | | — | |
The difference between the federal income tax cost of portfolio investments and the financial statement cost for Strategy is due to certain timing differences in the recognition of capital gains or losses under income tax reporting regulations and GAAP. These “book/tax” differences are temporary in nature and are primarily due to the tax deferral of losses on wash sales.
| Notes to Financial Statements (continued) | |
Note 4 – Investment Transactions
The aggregate cost of purchases and proceeds from sales of investments, other than short-term obligations, for the six months ended April 30, 2014 were as follows:
| | Non-U.S. Government Obligations | | | U.S. Government Obligations | |
| | | Purchases | | | Sales | | | Purchases | | | Sales | |
| Total Return | | $ | — | | | $ | — | | | $ | 750,586 | | | $ | 1,835,625 | |
| Managed Municipal | | | 2,088,980 | | | | 19,812,188 | | | | — | | | | — | |
| North American | | | 3,164,179 | | | | 7,028,662 | | | | 2,047,678 | | | | 6,083,164 | |
| Strategy | | | 19,154,646 | | | | 15,049,134 | | | | — | | | | — | |
Note 5 – Market and Credit Risk
North American invests in Canadian and Mexican government securities. Investing in Canadian and Mexican government securities may have different risks than investing in U.S. government securities. An investment in Canada or Mexico may be affected by developments unique to those countries. These developments may not affect the U.S. economy or the prices of U.S. government securities in the same manner. In addition, the value of bonds issued by non-U.S. governments may be affected by adverse international political and economic developments that may not impact the value of U.S. government securities.
Note 6 – Contractual Obligations
In the ordinary course of business, the Funds enter into contracts that contain a variety of indemnifications. Each Fund’s maximum exposure under these arrangements is unknown. However, the Funds have not had prior claims or losses pursuant to these indemnification provisions and believe the risk of loss thereunder to be remote.
Note 7 – Subsequent Events
GAAP requires the Funds to recognize in the financial statements the effects of all subsequent events that provide additional evidence about conditions that existed as of the date of the Statements of Assets and Liabilities. For non-recognized subsequent events that must be disclosed to keep the financial statements from being misleading, the Funds are required to disclose the nature of the event as well as an estimate of its financial effect, or a statement that such an estimate cannot be made. Management has evaluated subsequent events through the issuance of these financial statements and has determined no disclosure is necessary other than as noted below.
| Notes to Financial Statements (continued) | |
On May 30, 2014, the Funds paid the following per share net investment income distributions related to the period ended May 31, 2014:
| | | Net Investment Income per share May 31, 2014 | |
| Total Return US Treasury | | $ | — | |
| Managed Municipal Fund - Class A | | | — | |
| Managed Municipal Fund - Class I | | | — | |
| North American Government Bond Fund - Class A | | | — | |
| North American Government Bond Fund - Class C | | | — | |
| North American Government Bond Fund - Class I | | | — | |
| ISI Strategy Fund | | | — | |