Exhibit 99.1

Investor Day Program
September 20, 2005

Agenda
Safe Harbor Agenda Overview
Steve Walsh, Senior VP, Capital Markets
Forward-Looking Statements
Certain statements in this package may constitute “forward-looking statements” within the meaning of the Private Securities Litigation Reform Act of 1995. Such forward-looking statements involve known and unknown risks, uncertainties and other factors that may cause the actual results, performance, achievements or transactions of the Company and its affiliates or industry results to be materially different from any future results, performance, achievements or transactions expressed or implied by such forward-looking statements. Such risks, uncertainties and other factors relate to, among others: the Company’s ability to lease vacant space and to renew or relet space under expiring leases at expected levels, the potential loss of major tenants, interest rate levels, the availability of debt and equity financing, competition with other real estate companies for tenants and acquisitions, risks of real estate acquisitions and developments, dependence upon certain geographic markets, and general economic, business and real estate conditions. Additional information on factors which could impact the Company and the forward-looking statements contained herein are included in the Company’s Form 10-K filed with the Securities and Exchange Commission.
Agenda
Operating Strategy
Presented by:
Phil Hawkins, President & COO
Agenda
Washington, DC Market Review
Presented by: Phillip Thomas, Managing Director
Agenda
Chicago Market Review
Presented by: Jerry O’Malley, Managing Director

Agenda
Texas and Denver/Salt Lake Market Review
Presented by: Jeff Pace, Managing Director

BREAK
Agenda
Seattle Market Review
Presented by: Clete Casper, Managing Director
Agenda
Southern California Market Review
Presented by:
Malcolm O’Donnell, Managing Director

Agenda
San Francisco Bay Area Market Review
Presented by:
Christopher Peatross, Managing Director

Agenda
The Future Wrap Up and Q&A
Presented by: Tom Carr, CEO

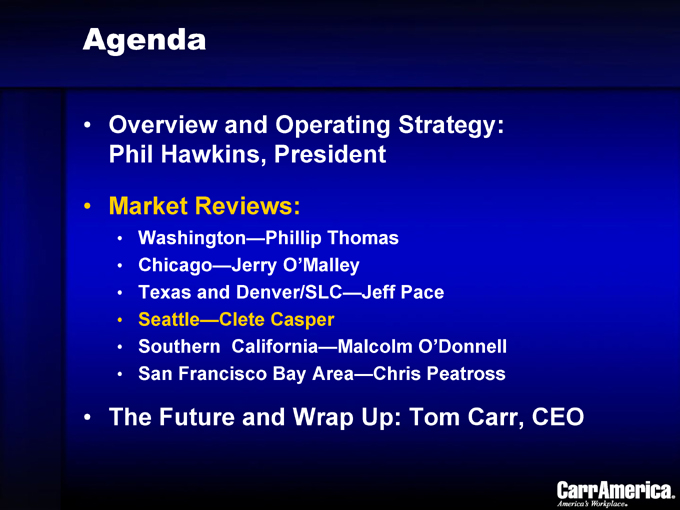
Agenda
Overview and Operating Strategy: Phil Hawkins, President
Market Reviews:
Washington—Phillip Thomas Chicago—Jerry O’Malley Texas and Denver/SLC—Jeff Pace Seattle—Clete Casper Southern California—Malcolm O’Donnell San Francisco Bay Area—Chris Peatross
The Future and Wrap Up: Tom Carr, CEO
National Real Estate Company
Today
National company; strong market focus A high-quality office portfolio 43 years of real estate experience 27 million SF in 290 operating properties $4.2 billion enterprise value
CarrAmerica Investor Conference
Key Messages
Strong execution through the market downturn
Market improvement is accelerating
CarrAmerica is very well positioned to benefit from the recovery
Operating Strategy
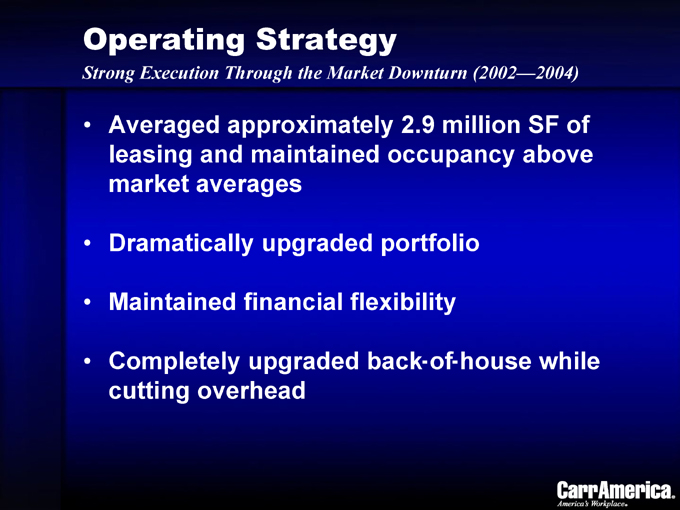
Strong Execution Through the Market Downturn (2002—2004)
Averaged approximately 2.9 million SF of leasing and maintained occupancy above market averages
Dramatically upgraded portfolio
Maintained financial flexibility
Completely upgraded back-of-house while cutting overhead
Operating Strategy
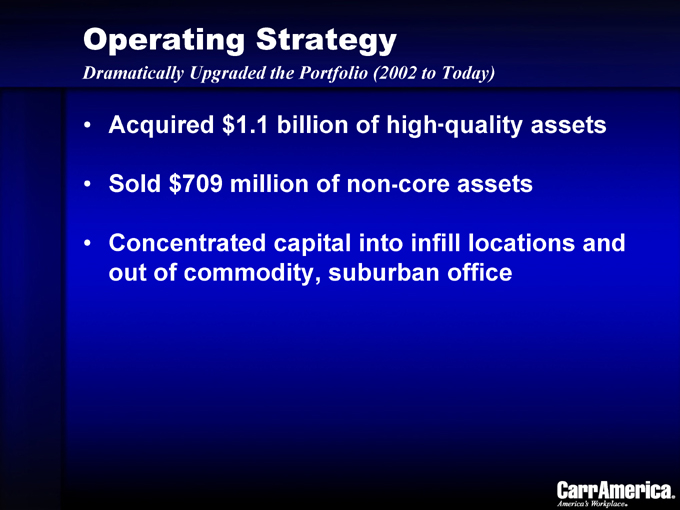
Dramatically Upgraded the Portfolio (2002 to Today)
Acquired $1.1 billion of high-quality assets
Sold $709 million of non-core assets
Concentrated capital into infill locations and out of commodity, suburban office
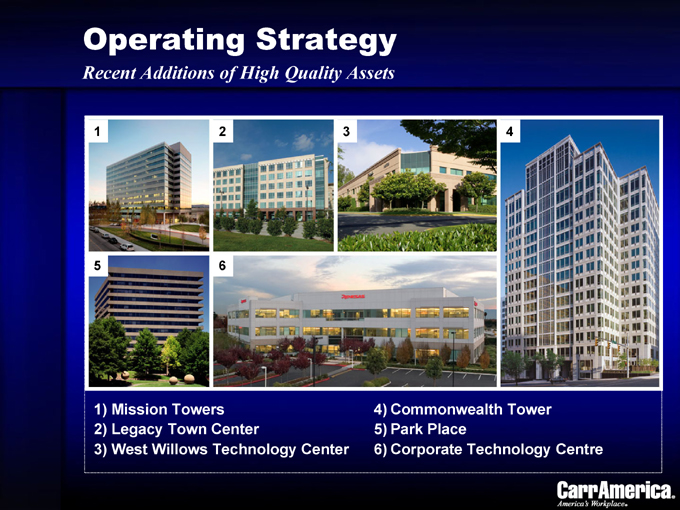
Operating Strategy
Recent Additions of High Quality Assets
1 2 3 4 5 6
1) Mission Towers
2) Legacy Town Center
3) West Willows Technology Center
4) Commonwealth Tower
5) Park Place
6) Corporate Technology Centre
Operating Strategy
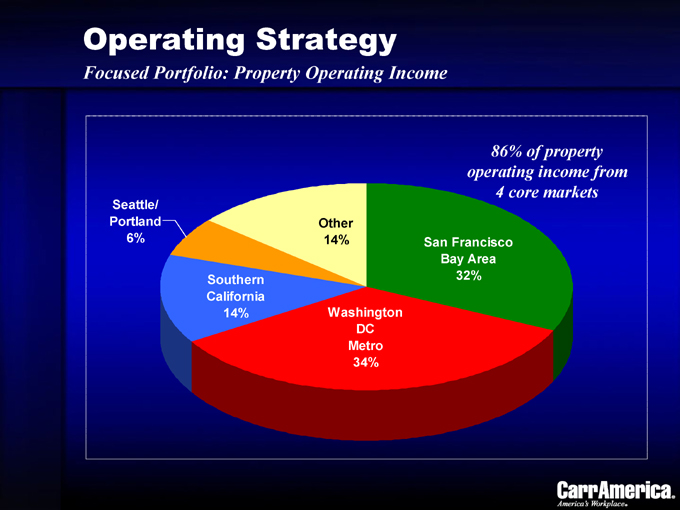
Focused Portfolio: Property Operating Income
86% of property operating income from 4 core markets
Seattle/Portland 6%
Other 14%
San Francisco Bay Area 32%
Washington DC
Metro 34%
Southern California 14%
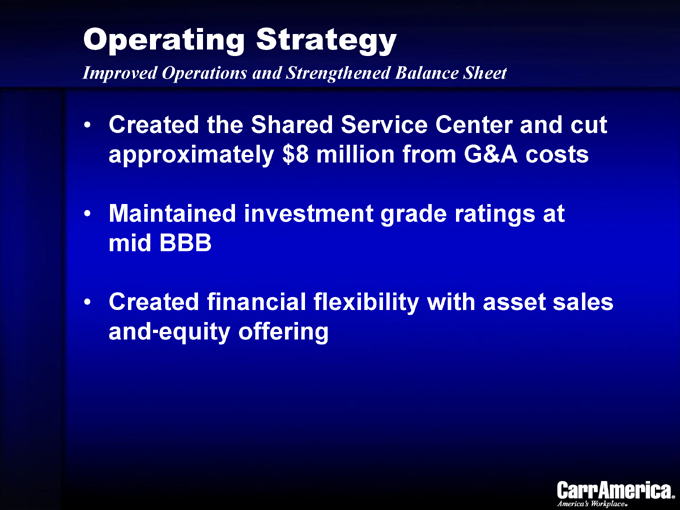
Operating Strategy
Improved Operations and Strengthened Balance Sheet
Created the Shared Service Center and cut approximately $8 million from G&A costs
Maintained investment grade ratings at mid BBB
Created financial flexibility with asset sales and equity offering
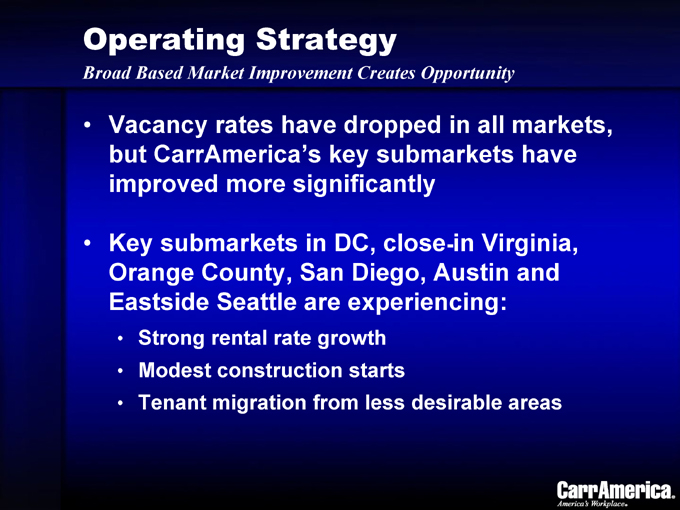
Operating Strategy
Broad Based Market Improvement Creates Opportunity
Vacancy rates have dropped in all markets, but CarrAmerica’s key submarkets have improved more significantly
Key submarkets in DC, close-in Virginia, Orange County, San Diego, Austin and Eastside Seattle are experiencing:
Strong rental rate growth Modest construction starts
Tenant migration from less desirable areas
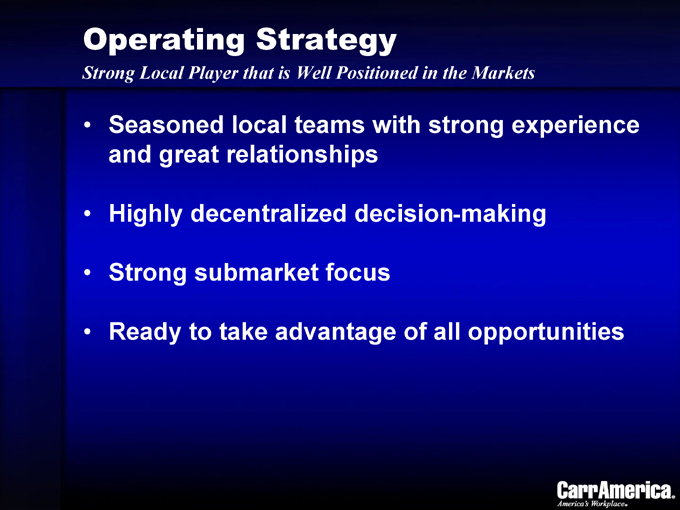
Operating Strategy
Strong Local Player that is Well Positioned in the Markets
Seasoned local teams with strong experience and great relationships
Highly decentralized decision making Strong submarket focus Ready to take advantage of all opportunities
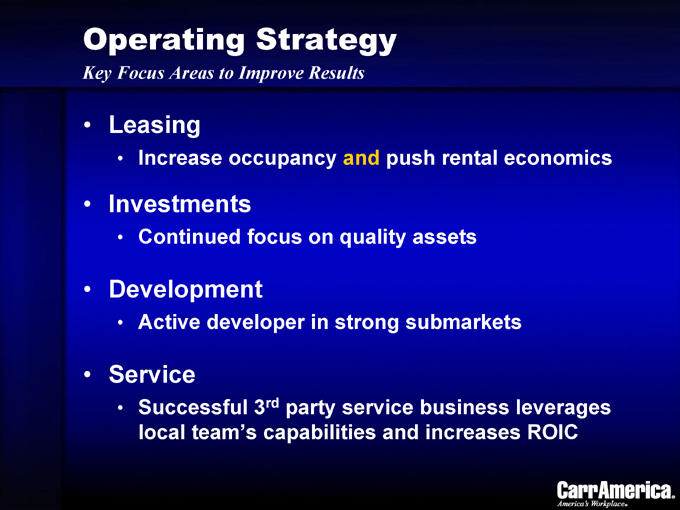
Operating Strategy
Key Focus Areas to Improve Results
Leasing
Increase occupancy and push rental economics
Investments
Continued focus on quality assets
Development
Active developer in strong submarkets
Service
Successful 3rd party service business leverages local team’s capabilities and increases ROIC
Operating Strategy
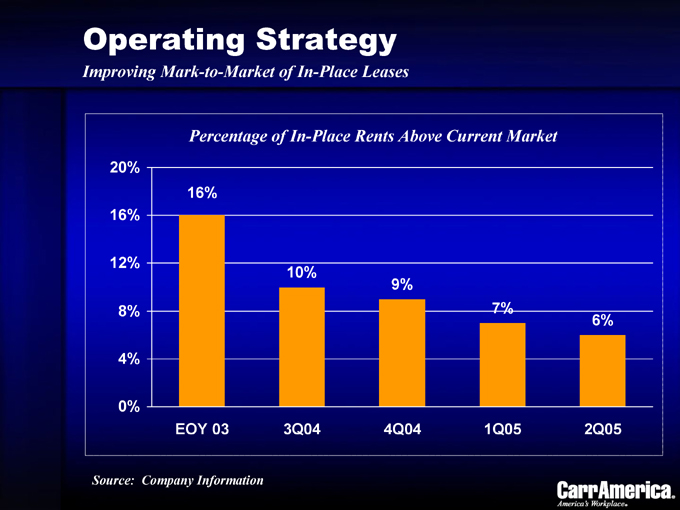
Improving Mark-to-Market of In-Place Leases
Percentage of In-Place Rents Above Current Market
20% 16% 12% 8% 4% 0%
16% 10% 9% 7% 6%
EOY 03 3Q04 4Q04 1Q05 2Q05
Source: Company Information
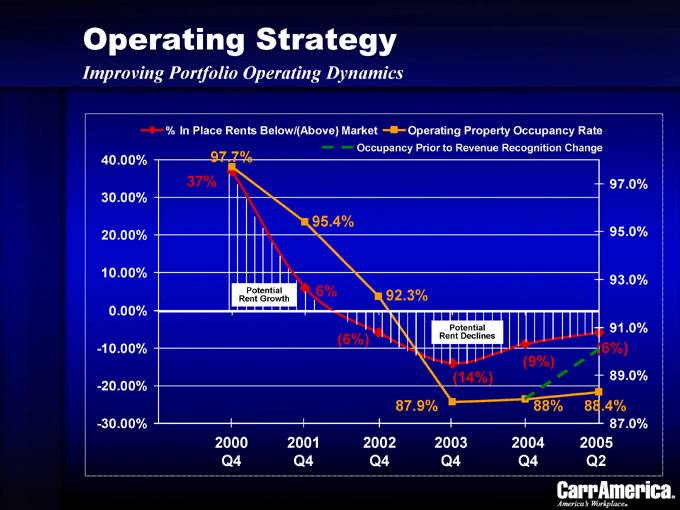
Operating Strategy
Improving Portfolio Operating Dynamics
% In Place Rents Below/(Above) Market Operating Property Occupancy Rate
Occupancy Prior to Revenue Recognition Change
40.00% 30.00% 20.00% 10.00% 0.00% -10.00% -20.00% -30.00%
97.7% 37% 95.4% 6%
Potential Rent Growth
(6%) 92.3%
Potential Rent Declines
(14%) 87.9% (9%) (6%) 88% 88.4% 97.0% 95.0% 93.0%
91.0% 89.0% 87.0%
2000 Q4 2001 Q4 2002 Q4 2003 Q4 2004 Q4 2005 Q2
Operating Strategy
Acquisitions and Dispositions – Recycling has Improved our Position
Reduced exposure to underperforming markets, submarkets and assets
Provided reinvestment dollars to upgrade the portfolio and improve submarket presence
Generated significant gains
Agenda
Overview and Operating Strategy: Phil Hawkins, President
Market Reviews:
Washington—Phillip Thomas Chicago—Jerry O’Malley Texas and Denver/SLC—Jeff Pace Seattle—Clete Casper Southern California—Malcolm O’Donnell San Francisco Bay Area—Chris Peatross
The Future and Wrap Up: Tom Carr, CEO
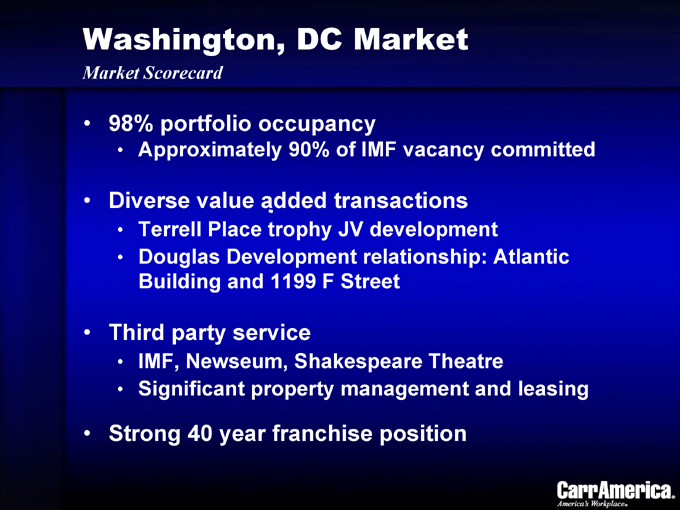
Washington, DC Market
Market Scorecard
98% portfolio occupancy
Approximately 90% of IMF vacancy committed
Diverse value added transactions
Terrell Place trophy JV development
Douglas Development relationship: Atlantic Building and 1199 F Street
Third party service
IMF, Newseum, Shakespeare Theatre
Significant property management and leasing
Strong 40 year franchise position
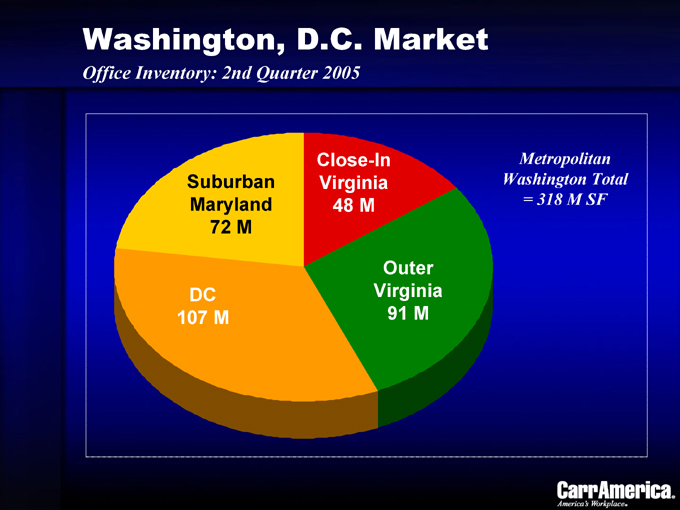
Washington, D.C. Market
Office Inventory: 2nd Quarter 2005
Metropolitan Washington Total = 318 M SF
Close-In Virginia 48 M
Outer Virginia 91 M
DC 107 M
Suburban Maryland 72 M
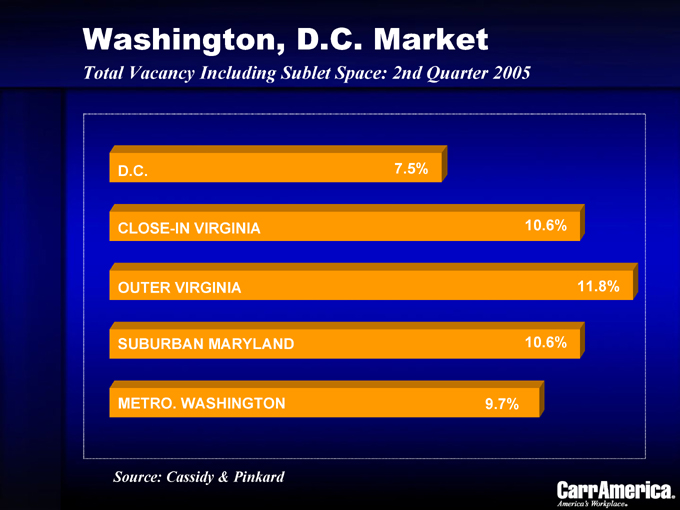
Washington, D.C. Market
Total Vacancy Including Sublet Space: 2nd Quarter 2005
D.C. 7.5%
CLOSE-IN VIRGINIA 10.6%
OUTER VIRGINIA 11.8%
SUBURBAN MARYLAND 10.6%
METRO. WASHINGTON 9.7%
Source: Cassidy & Pinkard
Washington, D.C. Market
Market Dynamics
Top investment market
Positive net absorption in all markets
Continued strength of market demand
Small vs. large tenant conundrum
Expansion of the U.S. government
Barriers to entry to many submarkets
BRAC
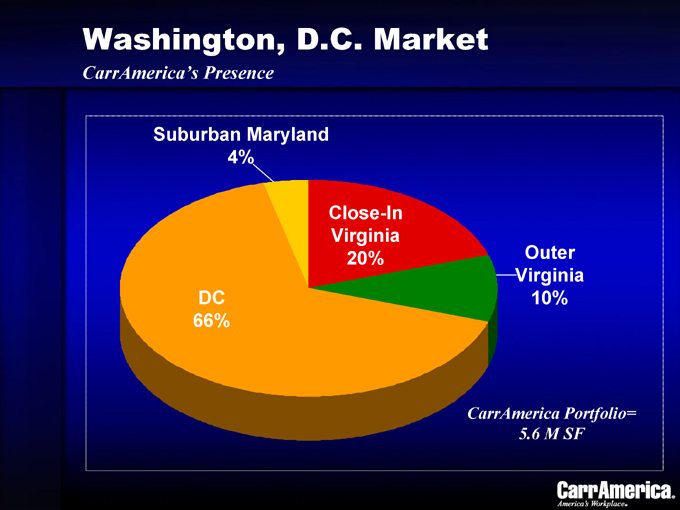
Washington, D.C. Market
CarrAmerica’s Presence
Suburban Maryland 4%
Close-In Virginia 20%
Outer Virginia 10%
DC 66%
CarrAmerica Portfolio= 5.6 M SF
Washington, D.C. Market
Current Market Strategy
Leverage strong market presence into new transactions
Opportunistically invest to outperform market returns
Invested $481 million from 1/1/02 to present
Increase control of land sites in downtown Washington and key suburban submarkets
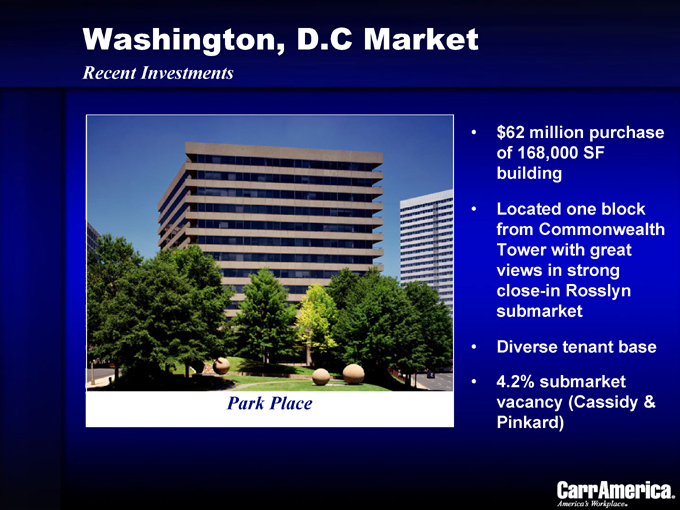
Washington, D.C Market
Recent Investments $62 million purchase of 168,000 SF building
Located one block from Commonwealth Tower with great views in strong close-in Rosslyn submarket
Diverse tenant base
4.2% submarket vacancy (Cassidy & Pinkard)
Park Place
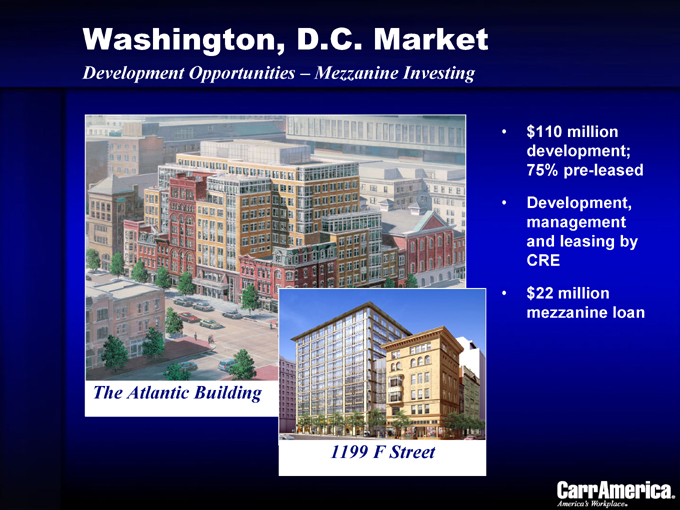
Washington, D.C. Market
Development Opportunities – Mezzanine Investing $110 million development; 75% pre-leased Development, management and leasing by CRE $22 million mezzanine loan
The Atlantic Building
1199 F Street
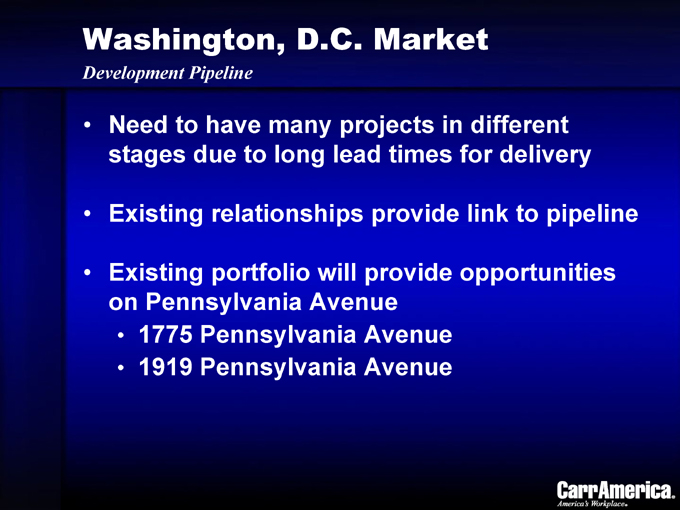
Washington, D.C. Market
Development Pipeline
Need to have many projects in different stages due to long lead times for delivery
Existing relationships provide link to pipeline
Existing portfolio will provide opportunities on Pennsylvania Avenue
1775 Pennsylvania Avenue
1919 Pennsylvania Avenue
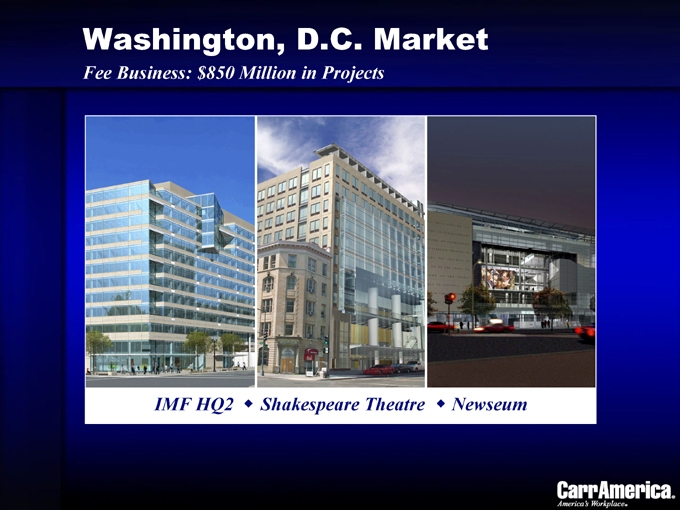
Washington, D.C. Market
Fee Business: $850 Million in Projects
IMF HQ2 Shakespeare Theatre Newseum
Agenda
Overview and Operating Strategy: Phil Hawkins, President
Market Reviews:
Washington—Phillip Thomas Chicago—Jerry O’Malley Texas and Denver/SLC—Jeff Pace Seattle—Clete Casper Southern California—Malcolm O’Donnell San Francisco Bay Area—Chris Peatross
The Future and Wrap Up: Tom Carr, CEO
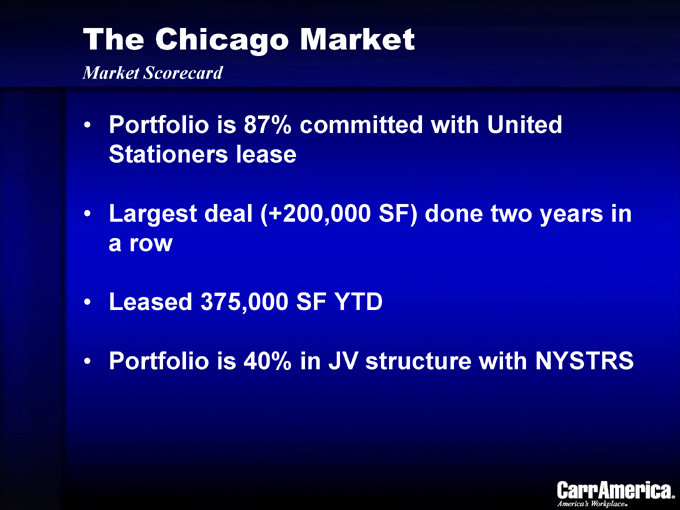
The Chicago Market
Market Scorecard
Portfolio is 87% committed with United Stationers lease
Largest deal (+200,000 SF) done two years in a row
Leased 375,000 SF YTD
Portfolio is 40% in JV structure with NYSTRS

Chicago Metro Market
By Million of RSF
East-West 35 RSF
.75 M *
O’Hare 14 RSF
CBD 119 RSF
Northwest 25 RSF
North 21 RSF 1.3 M *
* CarrAmerica’s Portion of Market
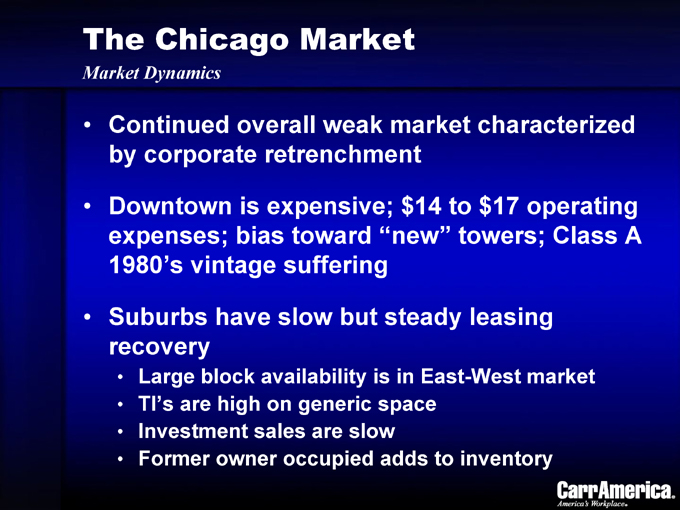
The Chicago Market
Market Dynamics
Continued overall weak market characterized by corporate retrenchment
Downtown is expensive; $14 to $17 operating expenses; bias toward “new” towers; Class A 1980’s vintage suffering
Suburbs have slow but steady leasing recovery
Large block availability is in East-West market TI’s are high on generic space Investment sales are slow Former owner occupied adds to inventory
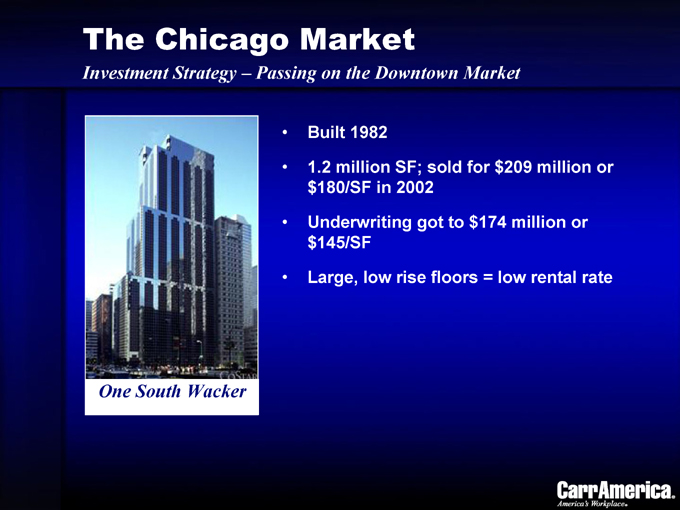
The Chicago Market
Investment Strategy – Passing on the Downtown Market
Built 1982
1.2 million SF; sold for $209 million or $180/SF in 2002
Underwriting got to $174 million or $145/SF
Large, low rise floors = low rental rate
One South Wacker
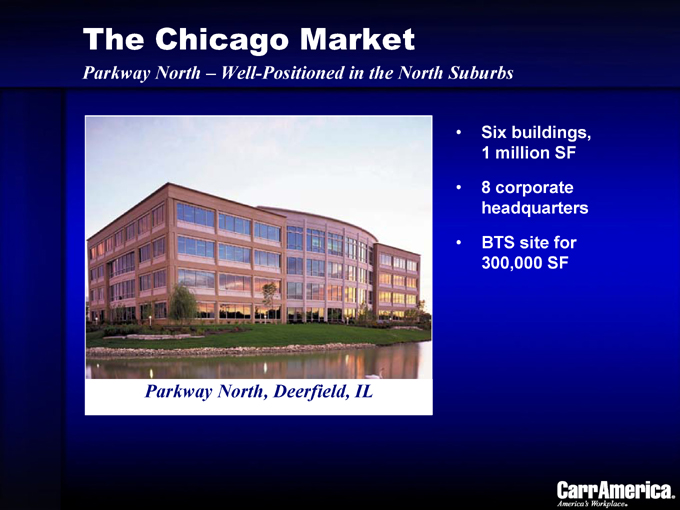
The Chicago Market
Parkway North – Well-Positioned in the North Suburbs
Six buildings, 1 million SF
8 corporate headquarters
BTS site for 300,000 SF
Parkway North, Deerfield, IL
Agenda
Overview and Operating Strategy: Phil Hawkins, President
Market Reviews:
Washington—Phillip Thomas Chicago—Jerry O’Malley Texas and Denver/SLC—Jeff Pace Seattle—Clete Casper Southern California—Malcolm O’Donnell San Francisco Bay Area—Chris Peatross
The Future and Wrap Up: Tom Carr, CEO
Texas and Denver/Salt Lake Markets
Market Strategy
Opportunistic strategy reflecting low barrier markets
Extensive use of joint ventures to leverage equity capital and spread risk
Significant fee revenue increases returns
The Dallas Market
Market Scorecard
90+% portfolio occupancy
70% of portfolio is in JV structure
$50 million in BTS deals over the last three years
Capital recycling will result in ownership of only “A” properties
The Dallas Market
Market Dynamics
Strong submarket recoveries in Preston Center, Legacy and Uptown
Traditionally high job growth with concentration of corporate offices
Liquid capital market; rewards for having a nimble investment strategy
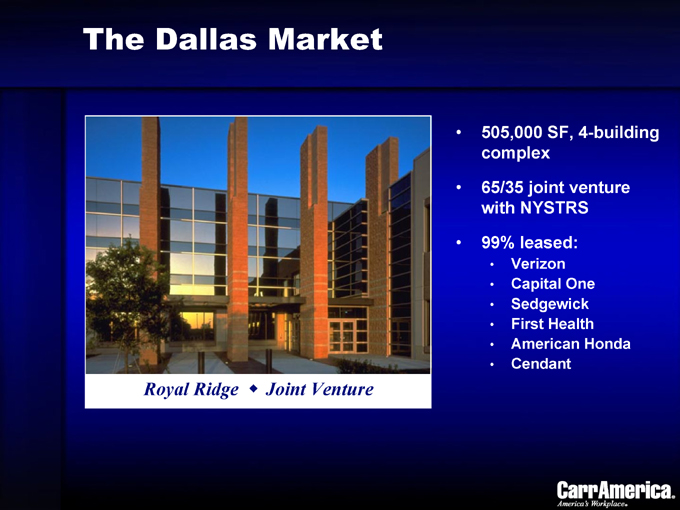
The Dallas Market
505,000 SF, 4-building complex
65/35 joint venture with NYSTRS
99% leased:
Verizon Capital One Sedgewick First Health American Honda Cendant
Royal Ridge Joint Venture
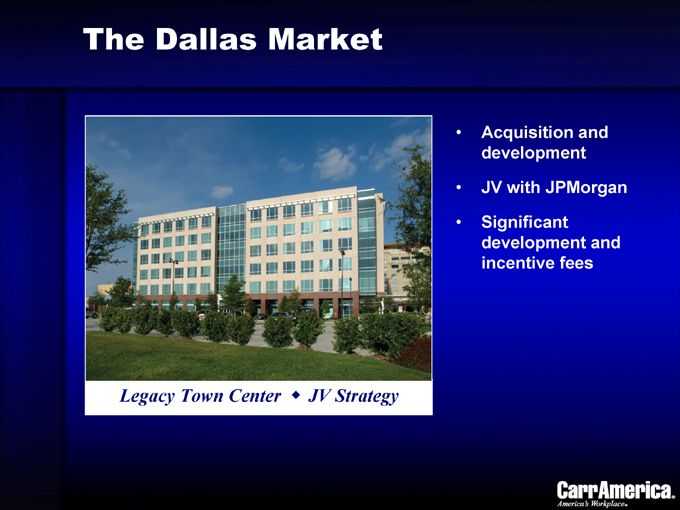
The Dallas Market
Acquisition and development
JV with JPMorgan
Significant development and incentive fees
Legacy Town Center JV Strategy
The Austin Market
Current Market Strategy
1.7 million SF – mostly CarrAmerica development
85% of portfolio is in JV structure
Recycled out of 1 million SF
Stay in the deal flow for acquisitions and development
Additional opportunity to develop positions in Riata
The Austin Market
Market Dynamics
Suburban recovery well underway
Leasing velocity is high in many submarkets and rents are beginning to push upward
Limited development opportunities in the strongest submarkets
Due to its smaller size, the market moves directionally very quickly
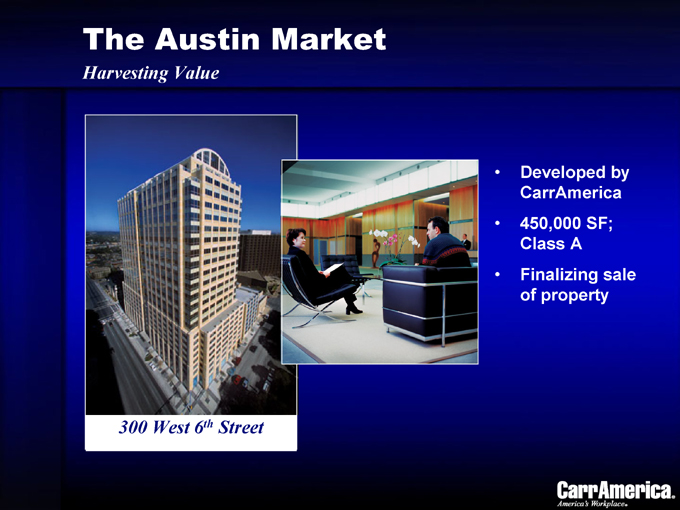
The Austin Market
Harvesting Value
Developed by CarrAmerica 450,000 SF; Class A Finalizing sale of property
300 West 6th Street
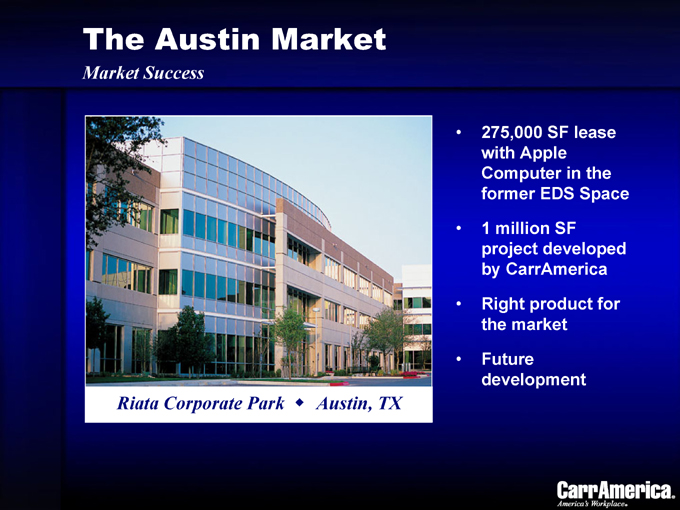
The Austin Market
Market Success
275,000 SF lease with Apple Computer in the former EDS Space
1 million SF project developed by CarrAmerica
Right product for the market
Future development
Riata Corporate Park Austin, TX
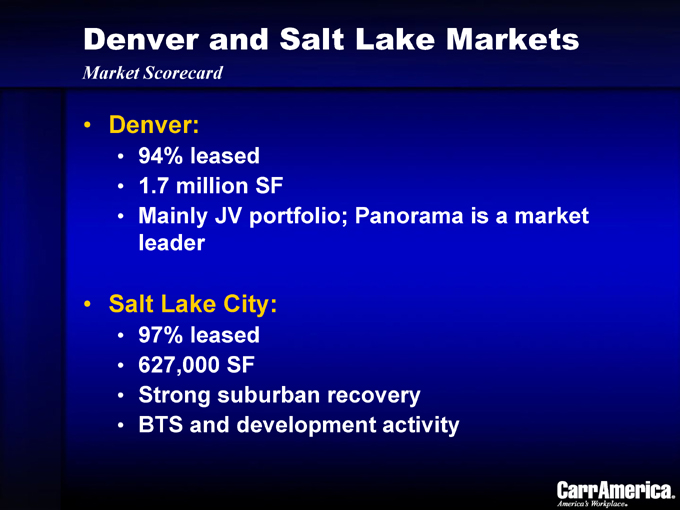
Denver and Salt Lake Markets
Market Scorecard
Denver:
94% leased 1.7 million SF
Mainly JV portfolio; Panorama is a market leader
Salt Lake City:
97% leased 627,000 SF
Strong suburban recovery BTS and development activity

BREAK
Agenda
Overview and Operating Strategy: Phil Hawkins, President
Market Reviews:
Washington—Phillip Thomas Chicago—Jerry O’Malley Texas and Denver/SLC—Jeff Pace Seattle—Clete Casper Southern California—Malcolm O’Donnell San Francisco Bay Area—Chris Peatross
The Future and Wrap Up: Tom Carr, CEO
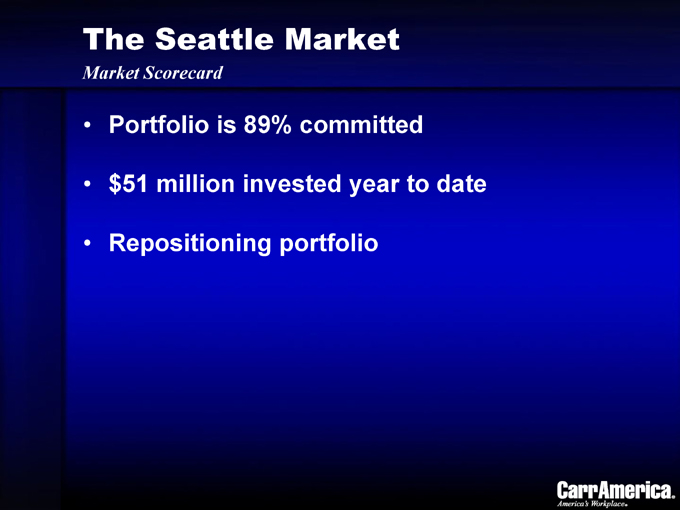
The Seattle Market
Market Scorecard
Portfolio is 89% committed $51 million invested year to date Repositioning portfolio
The Seattle Market
Market Dynamics
Dynamic market with good barriers to entry Microsoft, Boeing, Nordstrom and WAMU –strong local companies headquartered in the market Bellevue submarket has leased up –development and spillover to the other East End markets
The Seattle Market
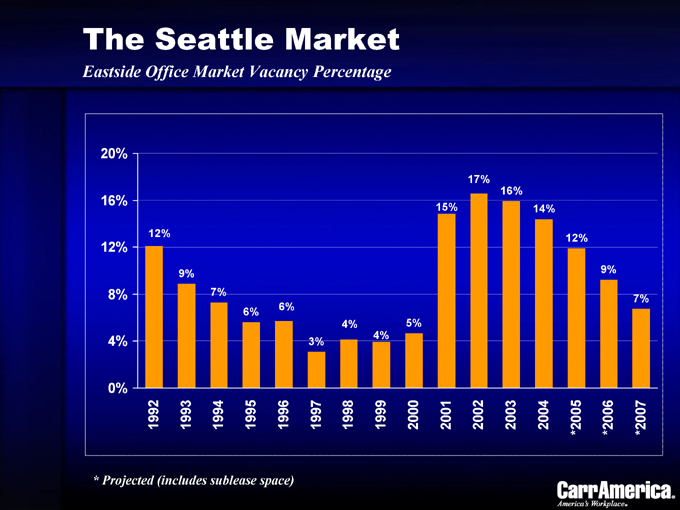
Eastside Office Market Vacancy Percentage
20% 16% 12% 8% 4% 0%
1992 1993 1994 1995 1996 1997 1998 1999 2000 2001 2002 2003 2004 *2005 *2006 *2007
12% 9% 7% 6% 6% 3% 4% 4% 5% 15% 17% 16% 14% 12% 9% 7%
* Projected (includes sublease space)
The Seattle Market
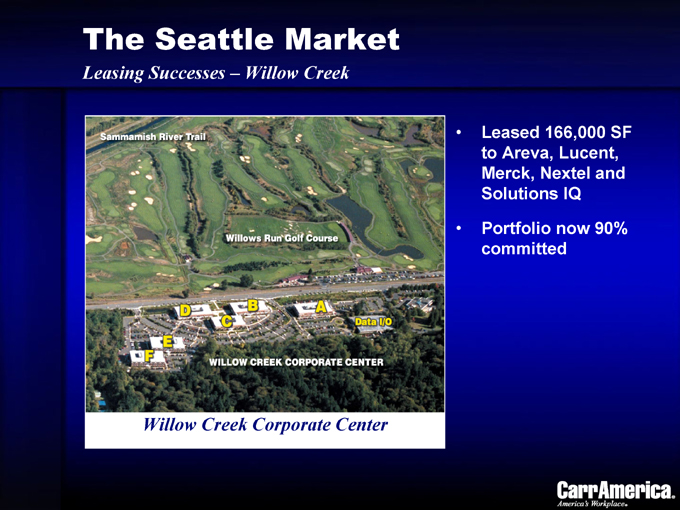
Leasing Successes – Willow Creek
Leased 166,000 SF to Areva, Lucent, Merck, Nextel and Solutions IQ
Portfolio now 90% committed
Willow Creek Corporate Center
The Seattle Market
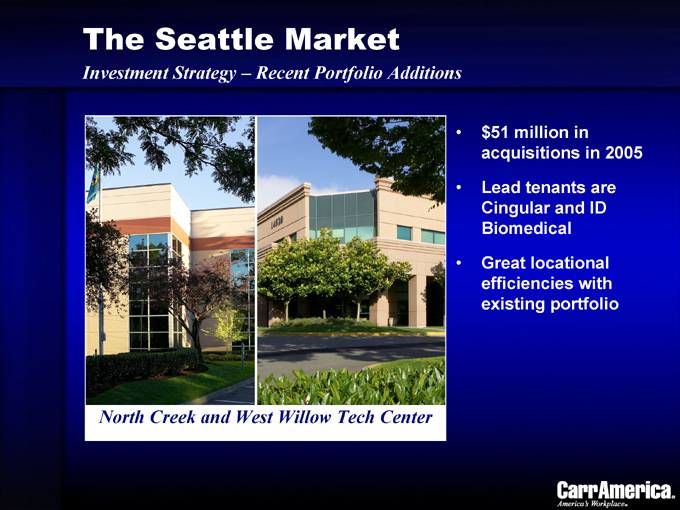
Investment Strategy – Recent Portfolio Additions $51 million in acquisitions in 2005
Lead tenants are Cingular and ID Biomedical
Great locational efficiencies with existing portfolio
North Creek and West Willow Tech Center
The Seattle Market
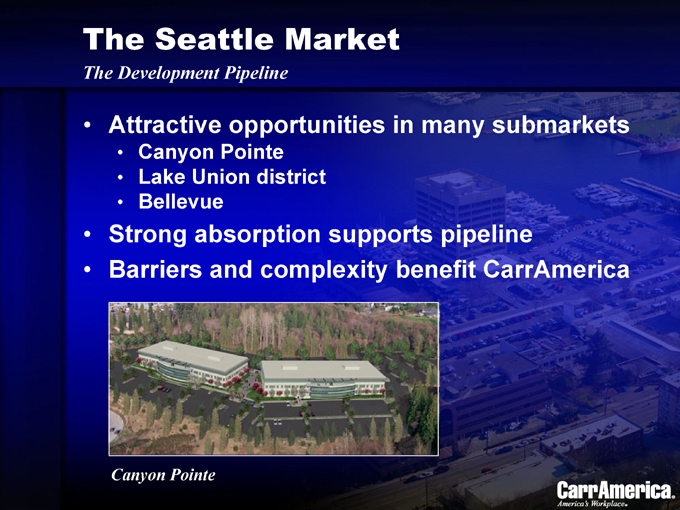
The Development Pipeline
Attractive opportunities in many submarkets
Canyon Pointe
Lake Union district
Bellevue
Strong absorption supports pipeline
Barriers and complexity benefit CarrAmerica
Canyon Pointe
Agenda
Overview and Operating Strategy: Phil Hawkins, President
Market Reviews:
Washington—Phillip Thomas Chicago—Jerry O’Malley Texas and Denver/SLC—Jeff Pace Seattle—Clete Casper Southern California—Malcolm O’Donnell San Francisco Bay Area—Chris Peatross
The Future and Wrap Up: Tom Carr, CEO
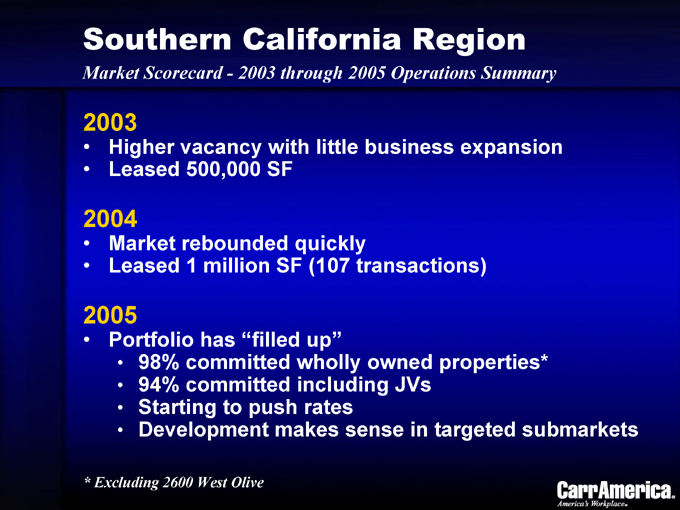
Southern California Region
Market Scorecard - 2003 through 2005 Operations Summary
2003
Higher vacancy with little business expansion Leased 500,000 SF
2004
Market rebounded quickly
Leased 1 million SF (107 transactions)
2005
Portfolio has “filled up”
98% committed wholly owned properties* 94% committed including JVs Starting to push rates
Development makes sense in targeted submarkets
* Excluding 2600 West Olive
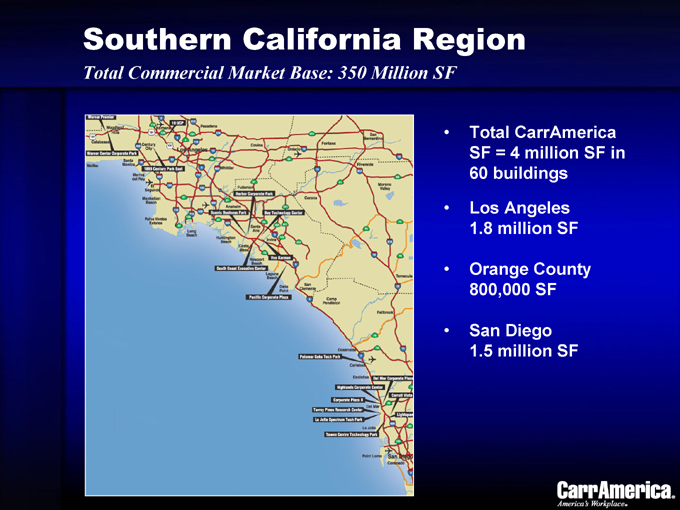
Southern California Region
Total Commercial Market Base: 350 Million SF
Total CarrAmerica SF = 4 million SF in 60 buildings
Los Angeles 1.8 million SF
Orange County 800,000 SF
San Diego 1.5 million SF

Southern California Region
Market Dynamics
Large and dynamic market with good barriers to entry
Large concentration of entertainment/media/ defense/technology
Highly skilled workforce
Strong life science cluster in San Diego
Southern California Region
Market Strategy
Pushing rates
Focus on development opportunities
Start San Diego biotech building early 2006
Opportunistic acquisitions
Southern California Region
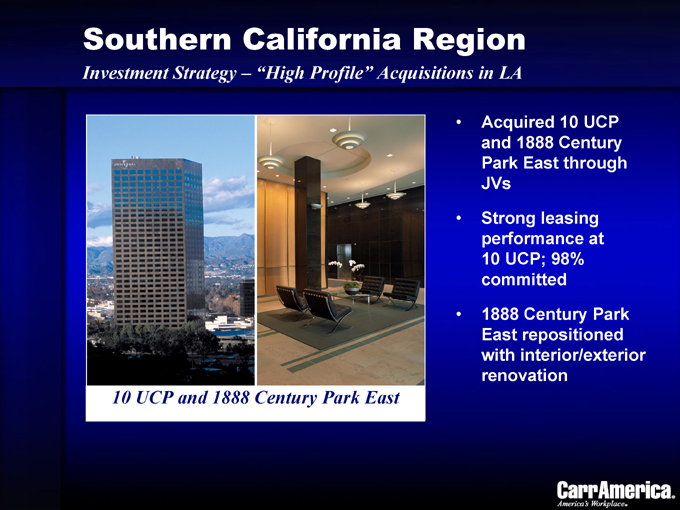
Investment Strategy – “High Profile” Acquisitions in LA
Acquired 10 UCP and 1888 Century Park East through JVs
Strong leasing performance at 10 UCP; 98% committed
1888 Century Park East repositioned with interior/exterior renovation
10 UCP and 1888 Century Park East
Southern California Region
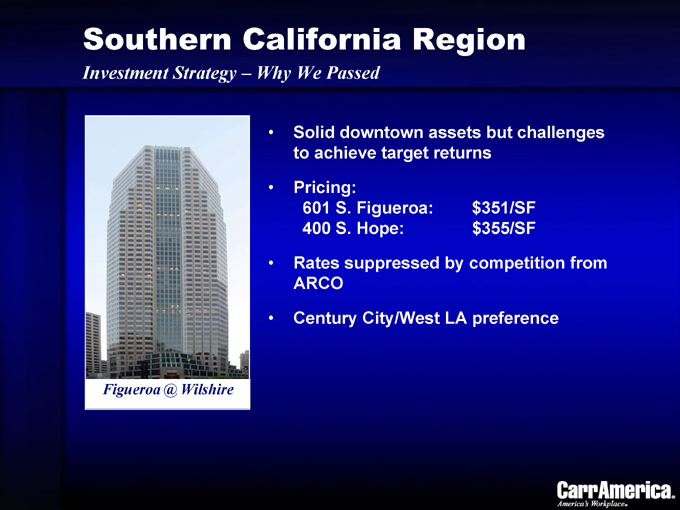
Investment Strategy – Why We Passed
Solid downtown assets but challenges to achieve target returns
Pricing:
601 S. Figueroa: $351/SF
400 S. Hope: $355/SF
Rates suppressed by competition from ARCO
Century City/West LA preference
Figueroa @ Wilshire
Southern California Region
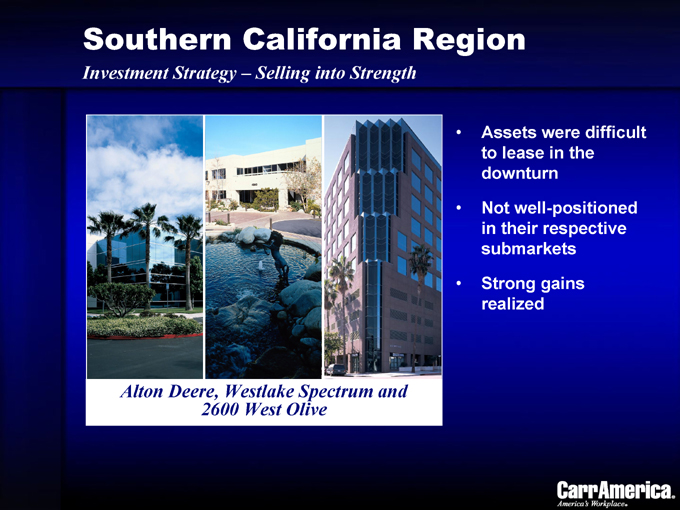
Investment Strategy – Selling into Strength
Assets were difficult to lease in the downturn
Not well-positioned in their respective submarkets
Strong gains realized
Alton Deere, Westlake Spectrum and 2600 West Olive
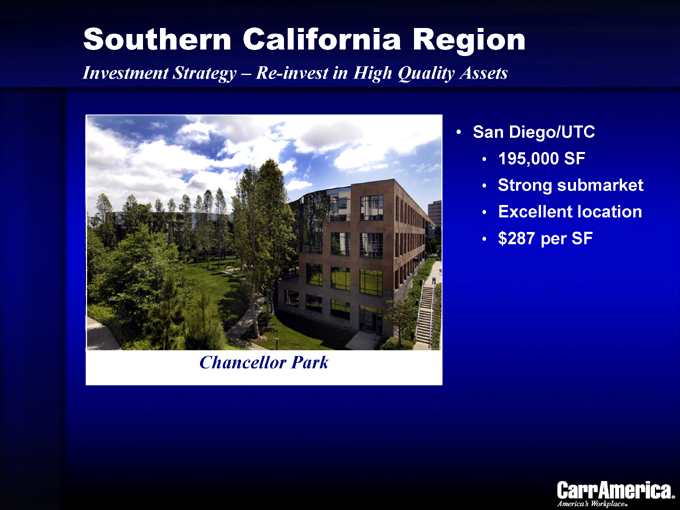
Southern California Region
Investment Strategy – Re-invest in High Quality Assets
San Diego/UTC
195,000 SF Strong submarket Excellent location $287 per SF
Chancellor Park
Agenda
Overview and Operating Strategy: Phil Hawkins, President
Market Reviews:
Washington—Phillip Thomas Chicago—Jerry O’Malley Texas and Denver/SLC—Jeff Pace Seattle—Clete Casper Southern California—Malcolm O’Donnell San Francisco Bay Area—Chris Peatross
The Future and Wrap Up: Tom Carr, CEO
San Francisco Bay Area Market
Market Scorecard
90% committed
Approximately 750,000 SF of leases completed YTD 2005 (72 transactions)
Strategically acquiring buildings and sites for future development opportunities
San Francisco Bay Area Market
Market Dynamics
Large and dynamic market with good barriers to entry
Large concentration of Fortune 500 companies
Highly skilled workforce
Easy access to capital for industry and technology = venture capital firms
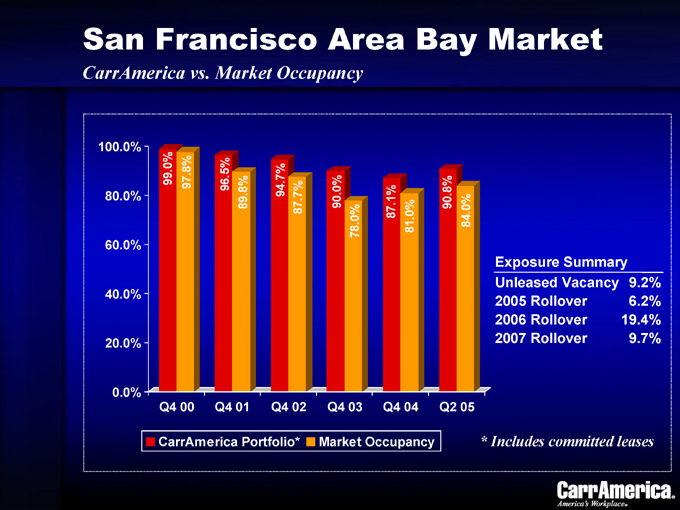
San Francisco Area Bay Market
CarrAmerica vs. Market Occupancy
100.0% 80.0% 60.0% 40.0% 20.0% 0.0%
99.0% 97.8%
96.5% 89.8%
94.7% 87.7%
90.0% 78.0%
87.1% 81.0%
90.8% 84.0%
Q4 00 Q4 01 Q4 02 Q4 03 Q4 04 Q2 05
Exposure Summary
Unleased Vacancy 9.2%
2005 Rollover 6.2%
2006 Rollover 19.4%
2007 Rollover 9.7%
CarrAmerica Portfolio* Market Occupancy
* Includes committed leases
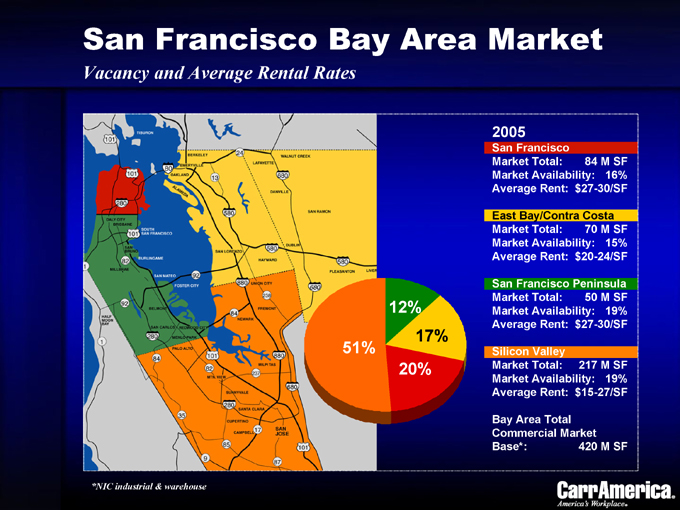
San Francisco Bay Area Market
Vacancy and Average Rental Rates
12% 17% 20% 51%
2005
San Francisco
Market Total: 84 M SF
Market Availability: 16%
Average Rent: $27-30/SF
East Bay/Contra Costa
Market Total: 70 M SF
Market Availability: 15%
Average Rent: $20-24/SF
San Francisco Peninsula
Market Total: 50 M SF
Market Availability: 19%
Average Rent: $27-30/SF
Silicon Valley
Market Total: 217 M SF
Market Availability: 19%
Average Rent: $15-27/SF
Bay Area Total
Commercial Market
Base*: 420 M SF
*NIC industrial & warehouse
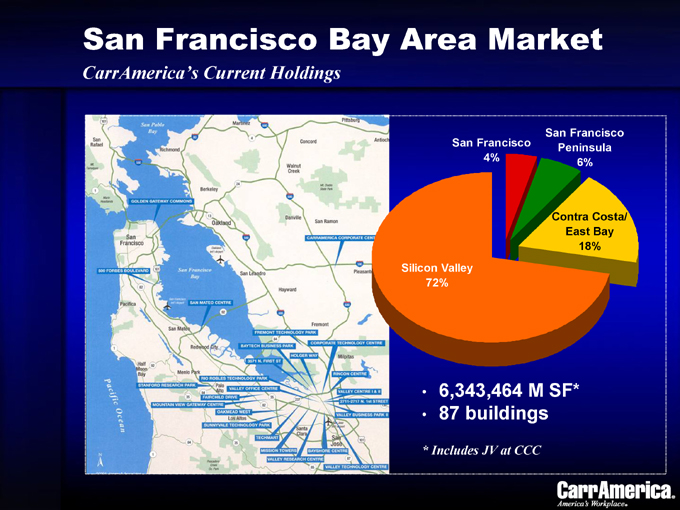
San Francisco Bay Area Market
CarrAmerica’s Current Holdings
San Francisco 4%
San Francisco Peninsula 6%
Contra Costa/ East Bay 18%
Silicon Valley 72%
6,343,464 M SF* 87 buildings
* Includes JV at CCC
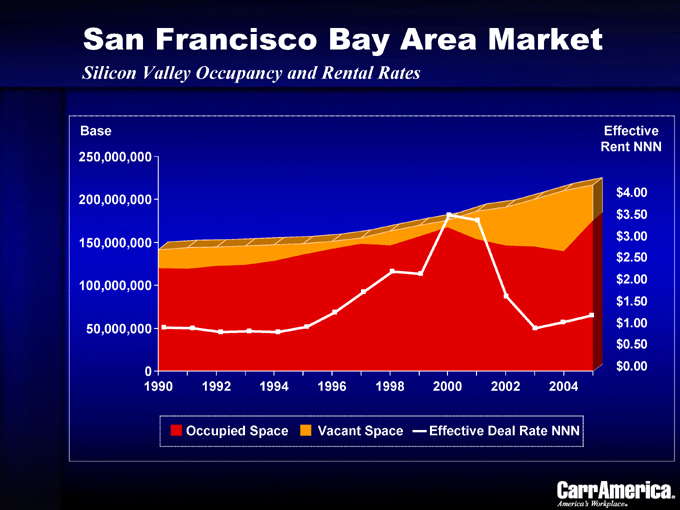
San Francisco Bay Area Market
Silicon Valley Occupancy and Rental Rates
Base 250,000,000
200,000,000 150,000,000 100,000,000 50,000,000 0
Effective Rent NNN
$4.00 $3.50 $3.00 $2.50 $2.00 $1.50 $1.00 $0.50 $0.00
1990 1992 1994 1996 1998 2000 2002 2004
Occupied Space Vacant Space Effective Deal Rate NNN
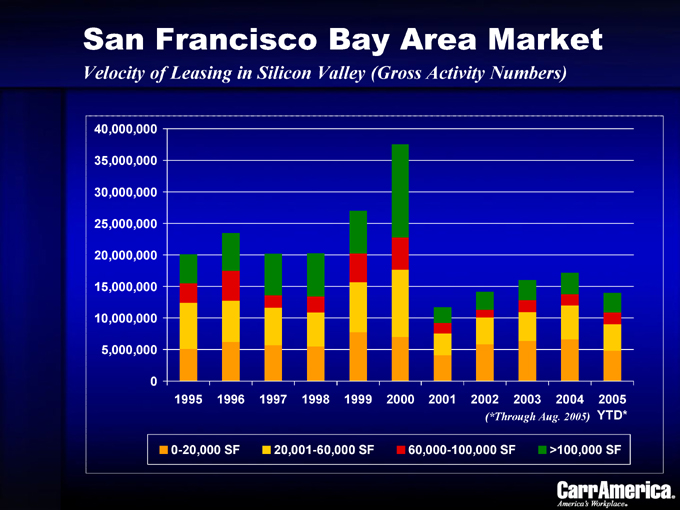
San Francisco Bay Area Market
Velocity of Leasing in Silicon Valley (Gross Activity Numbers)
40,000,000 35,000,000 30,000,000 25,000,000 20,000,000 15,000,000 10,000,000 5,000,000 0
1995 1996 1997 1998 1999 2000 2001 2002 2003 2004 2005
(*Through Aug. 2005) YTD*
0-20,000 SF 20,001-60,000 SF 60,000-100,000 SF >100,000 SF
San Francisco Bay Area Market
Market Strategy: Responding to Rapidly Changing Market Conditions
Lease strategy
Push rental rates for Class A assets Occupancy-driven for lower quality assets Focus on tenant’s credit and expansion capability Less emphasis on early renewal
Investment strategy
Acquire Class A product to upgrade portfolio Value-add opportunities through repositioning or new development Sell non-strategic product
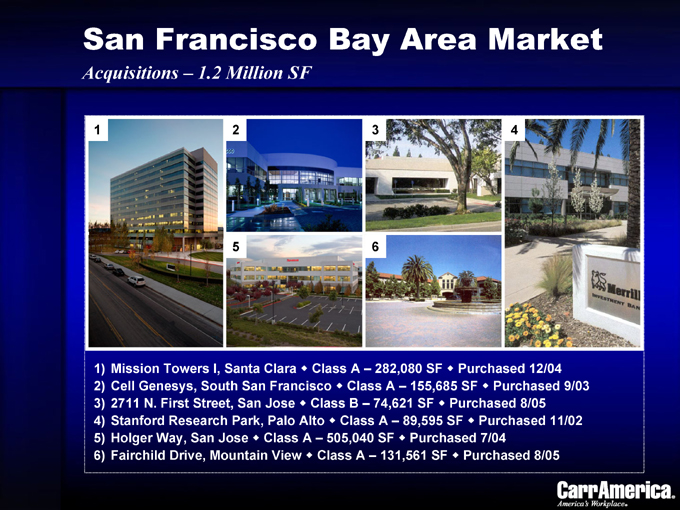
San Francisco Bay Area Market
Acquisitions – 1.2 Million SF
1 2 3 4 5 6
1) Mission Towers I, Santa Clara Class A – 282,080 SF Purchased 12/04
2) Cell Genesys, South San Francisco Class A – 155,685 SF Purchased 9/03
3) 2711 N. First Street, San Jose Class B – 74,621 SF Purchased 8/05
4) Stanford Research Park, Palo Alto Class A – 89,595 SF Purchased 11/02
5) Holger Way, San Jose Class A – 505,040 SF Purchased 7/04
6) Fairchild Drive, Mountain View Class A – 131,561 SF Purchased 8/05
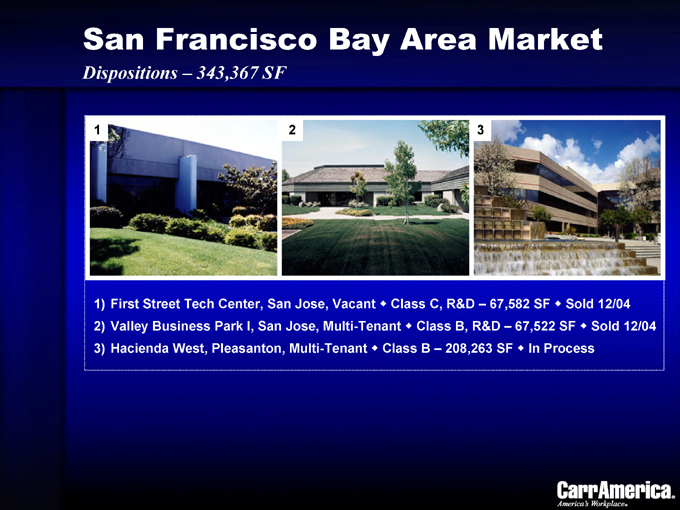
San Francisco Bay Area Market
Dispositions – 343,367 SF
1 2 3
1) First Street Tech Center, San Jose, Vacant Class C, R&D – 67,582 SF Sold 12/04
2) Valley Business Park I, San Jose, Multi-Tenant Class B, R&D – 67,522 SF Sold 12/04
3) Hacienda West, Pleasanton, Multi-Tenant Class B – 208,263 SF In Process
Agenda
Overview and Operating Strategy: Phil Hawkins, President
Market Reviews:
Washington—Phillip Thomas Chicago—Jerry O’Malley Texas and Denver/SLC—Jeff Pace Seattle—Clete Casper Southern California—Malcolm O’Donnell San Francisco Bay Area—Chris Peatross
The Future and Wrap Up: Tom Carr, CEO
CarrAmerica is Well Positioned
The Future
Improving portfolio dynamics
A strong balance sheet
Shifting external growth opportunities
The right operating model
CarrAmerica is Well Positioned
Improving Portfolio Dynamics
Improving mark-to-market from leasing, dispositions and acquisitions
Improving occupancy to date
More submarkets experiencing rent increases
CarrAmerica is Well Positioned
A Strong Balance Sheet
Moderate leverage Strong line capacity Investment grade rating
CarrAmerica is Well Positioned
Shifting External Growth Opportunities
Opportunistic purchases and/or investments in completed buildings
Development window is open or fast approaching in good submarkets
CarrAmerica is Well Positioned
The Right Operating Model
The right assets in the right submarkets Quality cash flow
Strong people on the ground Relationships, information, execution
Speed and capital access Credibility
Full service Opportunism

CarrAmerica Investor Conference
Key Messages
Strong execution through the market downturn
Market improvement is accelerating
CarrAmerica is very well positioned to benefit from the recovery

Q & A
Investor Day Program
September 20, 2005