Table of Contents
As filed with the Securities and Exchange Commission on July 7, 2003
UNITED STATES
SECURITIES AND EXCHANGE COMMISSION
WASHINGTON, D.C. 20549
FORM N-CSR
CERTIFIED SHAREHOLDER REPORT OF REGISTERED MANAGEMENT
INVESTMENT COMPANIES
Investment Company Act file number 811-7310
ARK FUNDS
Two Portland Square
Portland, Maine 04101
(207) 879-1900
Rick A. Gold, President
Two Portland Square
Portland, Maine 04101
(207) 879-1900
Date of fiscal year end: APRIL 30, 2003
Date of reporting period: APRIL 30, 2003
Form N-CSR is to be used by management investment companies to file reports with the Commission not later than 10 days after the transmission to stockholders of any report that is required to be transmitted to stockholders under Rule 30e-1 under the Investment Company Act of 1940 (17 CFR 270.30e-1). The Commission may use the information provided on Form N-CSR in its regulatory, disclosure review, inspection, and policymaking roles.
A registrant is required to disclose the information specified by Form N-CSR, and the Commission will make this information public. A registrant is not required to respond to the collection of information contained in Form N-CSR unless the Form displays a currently valid Office of Management and Budget (“OMB”) control number. Please direct comments concerning the accuracy of the information collection burden estimate and any suggestions for reducing the burden to Secretary, Securities and Exchange Commission, 450 Fifth Street, NW, Washington, DC 20549-0609. The OMB has reviewed this collection of information under the clearance requirements of 44 U.S.C. ss. 3507.
Table of Contents
ITEM 1. REPORTS TO STOCKHOLDERS.
Table of Contents
 Clear-cut strategies for confident investing.
April 30, 2003 | Corporate Classes Annual Report |
U.S. Treasury Cash Management Portfolio
U.S. Government Cash Management Portfolio
Prime Cash Management Portfolio
Tax-Free Cash Management Portfolio
Managed by Allied Investment Advisors, Inc.
Table of Contents
[GRAPHIC]
| 1 | ||
| 4 | ||
| 6 | ||
| 12 | ||
| 13 | ||
| 14 | ||
| 15 | ||
| 16 | ||
| 19 | ||
| 20 | ||
This report and the financial statements contained herein are submitted for the general information of shareholders of the ARK Funds and do not constitute investment advice. The report is not authorized for distribution to prospective investors unless preceded or accompanied by an effective prospectus for each of the portfolios included. Shares of the portfolios are not deposits of any bank, and are not insured by the Federal Deposit Insurance Corporation, the Federal Reserve Board, or any other government agency. Investing in the shares involves investment risks including the possible loss of principal amount invested. The views in this report are those of the portfolio manager as of April 30, 2003, and may not reflect his views as of the date this report was first published or anytime thereafter. An investment in a money market fund is not insured or guaranteed by the Federal Deposit Insurance Corporation or any other government agency. Although money market funds seek to preserve the value of your investment at $1.00 per share, it is possible to lose money by investing in these funds. For information about ARK Funds Portfolios, please call 1-800-ARK-FUND (1-800-275-3863).
Table of Contents
JUNE 2003
Dear Shareholder,
With this Annual Report, we will update you on the progress of the ARK Cash Management Portfolios as of April 30, 2003. We are proud to have been able to grow assets to over $991 million as of April 30, 2003 and pleased to have been able to provide competitive returns during the continuing difficult economic conditions that have impacted us all during the past fiscal year.
In addition to providing you with information about the Portfolios’ performance, diversification, and holdings, the portfolio manager’s Management Discussion and Analysis provides information about economic factors affecting the Portfolios.
The past six months have been full of activity for ARK Funds. In our Semi Annual Report dated October 31, 2002, we told you about the pending acquisition of Allfirst Financial, Inc. by M&T Bank Corporation of Buffalo, New York. That acquisition was completed on April 1, 2003.
Earlier this year, the respective boards of trustees of ARK Funds and the VISION Group of Funds (the proprietary mutual fund company of M&T Bank Corporation) each met and authorized a tax-free reorganization of certain ARK and VISION portfolios, subject to shareholder approval. A Special Meeting of Shareholders of each of the affected portfolios will be scheduled, and a proxy/prospectus containing additional information will be sent to shareholders soon.
We thank you for investing in the ARK Funds, and we look forward to continuing to help you meet your financial goals.
Sincerely,

William H. Cowie, Jr.
Chairman
ANNUAL REPORT / APRIL 30, 2003
1
Table of Contents
This page intentionally left blank.
Table of Contents
CASH MANAGEMENT PORTFOLIOS
Cash Management
Portfolios
Our investment management philosophy is defined by three objectives: to preserve principal, to maintain daily liquidity, and to maximize current income. To achieve these objectives, we actively manage the Cash Management Portfolios, utilizing our conservative and highly disciplined relative value approach, which is constantly monitored and reviewed seeking to ensure that the Portfolios’ goals are realized.
To preserve principal, we consider only those issuers that pass our stringent credit evaluation process. The goal of the credit evaluation process is to select high-quality issuers that present minimal credit risk. The evaluation process is based on both quantitative and qualitative factors that highlight the issuer’s ability to maintain its credit rating and leading industry position. Issuers are monitored and reviewed by the Allied Investment Advisors Investment Policy Committee, which is comprised of senior personnel from Allied Investment Advisors, Inc. (AIA).
To provide daily liquidity, we manage our maturities and engage in overnight repurchase agreements seeking to obtain the highest short-term credit ratings. Each repurchase agreement is collateralized by U.S. Treasury or U.S. government agency securities.
To maximize current income, we actively manage the Portfolios. We seek to take advantage of short-lived trading opportunities and market inefficiencies by employing a relative-value approach that emphasizes security selection.
Each Portfolio’s strategy starts with an average maturity decision. This decision is determined by a number of factors, such as analysis of our shareholders’ liquidity needs, expected Federal Reserve monetary policy and yield curve, and implied forward interest-rate analysis.
Upon determining a Portfolio’s average maturity, we analyze each market sector to determine which sectors we believe are cheap, thus providing value, and which sectors are expensive. Individual securities are then selected. This in-depth analysis allows us to identify perceived market inefficiencies and trading opportunities.
3
Table of Contents
CASH MANAGEMENT PORTFOLIOS
CASH MANAGEMENT PORTFOLIOS

James M. Hannan
PORTFOLIO MANAGER
James M. Hannan is manager of the Cash Management Portfolios, and is manager or co-manager of other ARK Funds Portfolios. He is also responsible for several separately managed institutional portfolios. Mr. Hannan has been a Portfolio Manager of Allied Investment Advisers, Inc. (“AIA”) since 1996, a Vice President of Allfirst Bank from 1987 to 2003 and a Vice President of Manufacturers and Traders Trust Company (“M&T Trust”) since 2003. He has more than 15 years of experience in the investment industry.
U.S. Treasury Cash Management
U.S. Government Cash Management
Prime Cash Management
Tax-Free Cash Management
Management Discussion and Analysis
Interest rates fell over the past fiscal year, as economic growth remained elusive. The 2-year Treasury note’s yield declined from a fiscal-year high of 3.37% on May 17, 2002 to 1.49% on April 30, 2003. The Federal Reserve lowered short-term interest rates once during the period in November 2002 to 1.25% from 1.75%.
During the past fiscal year we continued to invest in high-quality, short-term securities that present minimal credit risk. We maintained the average maturity of the Portfolios by selectively purchasing securities maturing in either the latter part of 2003 or early 2004.
Given the tepid economic growth and low inflation environment, we believe the Federal Reserve may either lower interest rates during the summer or maintain the current rate of 1.25% for the foreseeable future. Because of our expectations for economic growth and Federal Reserve policy, we may choose to maintain a barbelled portfolio structure, attempting to maintain principal preservation and daily liquidity, while also seeking to provide a competitive rate of return. As always, we will continue to consistently utilize our conservative and disciplined relative value investment process.
APRIL 30, 2003 / ANNUAL REPORT
4
Table of Contents
CASH MANAGEMENT PORTFOLIOS
Performance as of April 30, 2003*
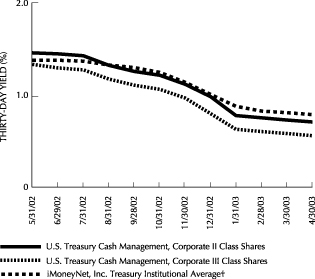
U.S. Treasury Cash Management Portfolio
| Corporate II Class Shares | Corporate III Class Shares | iMoneyNet, Inc. Treasury Institutional Average† | ||||
Seven Day Simple Yield | 0.69% | 0.54% | 0.79% | |||
THIRTY-DAY YIELD COMPARISON
Prime Cash Management Portfolio
| Corporate Class Shares | Corporate II Class Shares | Corporate III Class Shares | iMoneyNet, Inc. First Tier Institutional Average† | |||||
| Seven Day Simple Yield | 1.07% | 0.82% | 0.67% | 0.92% | ||||
THIRTY-DAY YIELD COMPARISON
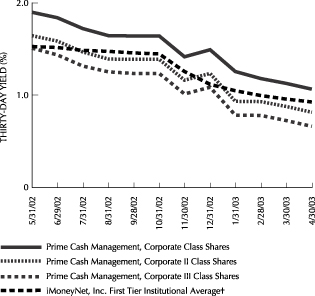
| * | Past performance is not predictive of future performance. |
| † | The performance of the iMoneyNet, Inc. averages do not include operating expenses that are incurred by each Portfolio. |
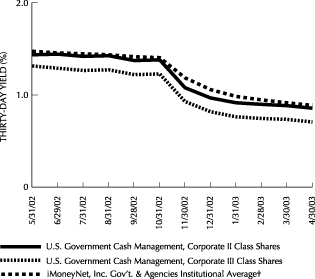
U.S. Government Cash Management Portfolio
| Corporate II Class Shares | Corporate III Class Shares | iMoneyNet, Inc. Gov’t & Agencies Institutional Average† | ||||
Seven Day Simple Yield | 0.84% | 0.69% | 0.88% | |||
THIRTY-DAY YIELD COMPARISON
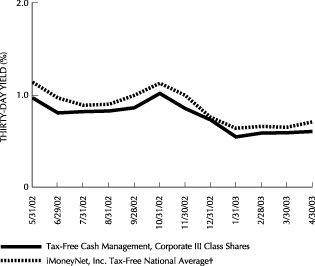
Tax-Free Cash Management Portfolio
| Corporate III Class Shares | iMoneyNet, Inc Tax-Free National Average† | |||
| Seven Day Simple Yield | 0.72% | 0.79% | ||
THIRTY-DAY YIELD COMPARISON
ANNUAL REPORT / APRIL 30, 2003
5
Table of Contents
U.S. TREASURY CASH MANAGEMENT PORTFOLIO

| Description | Principal Amount (000) | Market Value (000) | |||||
| U.S. Treasury Obligations — 100.1% | |||||||
U.S. Treasury Bills ^ | |||||||
1.250%, 05/22/03 | $ | 294 | $ | 294 | |||
1.234%, 06/05/03 | 2,389 | 2,386 | |||||
1.217%, 07/10/03 | 48 | 48 | |||||
1.210%, 05/01/03 | 4,448 | 4,448 | |||||
1.209%, 05/15/03 | 562 | 562 | |||||
1.182%, 08/21/03 | 113 | 113 | |||||
1.176%, 09/18/03 | 2,528 | 2,516 | |||||
1.171%, 08/07/03 | 1,148 | 1,144 | |||||
1.166%, 10/02/03 | 108 | 107 | |||||
1.155%, 07/03/03 | 1,788 | 1,784 | |||||
1.154%, 07/17/03 | 16,954 | 16,912 | |||||
1.145%, 08/28/03 | 2 | 2 | |||||
1.142%, 05/29/03 | 5,650 | 5,645 | |||||
1.142%, 07/24/03 | 1,219 | 1,216 | |||||
1.131%, 10/16/03 | 138 | 137 | |||||
1.129%, 09/25/03 | 4,864 | 4,842 | |||||
1.110%, 06/12/03 | 358 | 358 | |||||
| TOTAL U.S. TREASURY OBLIGATIONS (COST $42,514) | $ | 42,514 | |||||
TOTAL INVESTMENTS — 100.1% (COST $42,514) | $ | 42,514 | |||||
| OTHER ASSETS & LIABILITIES, NET — (0.1)% | $ | (33 | ) | ||||
| TOTAL NET ASSETS — 100.0% | $ | 42,481 | |||||
| ^ | The effective yield at time of purchase is shown as the rate on the Schedule of Investments. |
The accompanying notes are an integral part of the financial statements.
APRIL 30, 2003 / ANNUAL REPORT
6
Table of Contents
U.S. GOVERNMENT CASH MANAGEMENT PORTFOLIO

Schedule of Investments
| Description | Principal Amount (000) | Market Value (000) | ||||
| U.S. Government Agency Obligations — 50.6% | ||||||
FFCB ^ | ||||||
1.616%, 05/15/03 | $ | 6,000 | $ | 5,996 | ||
1.576%, 05/28/03 | 15,000 | 14,983 | ||||
FHLB | ||||||
6.875%, 08/15/03 | 35,100 | 35,652 | ||||
5.250%, 02/13/04 | 10,000 | 10,304 | ||||
5.125%, 09/15/03 | 7,500 | 7,603 | ||||
2.500%, 11/14/03 | 5,000 | 5,029 | ||||
2.060%, 07/02/03 | 5,000 | 5,000 | ||||
1.500%, 03/08/04 | 4,000 | 4,000 | ||||
1.450%, 05/14/04 | 5,000 | 5,000 | ||||
1.400%, 03/29/04 | 12,000 | 12,000 | ||||
1.300%, 04/07/04 | 10,000 | 10,000 | ||||
FHLB ^ | ||||||
1.250%, 05/01/03 | 50,000 | 50,000 | ||||
FHLB ‡ | ||||||
1.210%, 09/27/04 | 5,000 | 4,998 | ||||
1.190%, 05/27/04 | 15,000 | 14,993 | ||||
1.089%, 06/17/03 | 9,200 | 9,200 | ||||
FHLMC | ||||||
7.375%, 05/15/03 | 30,000 | 30,059 | ||||
FHLMC ^ | ||||||
1.760%, 07/17/03 | 20,000 | 19,926 | ||||
FNMA | ||||||
5.500%, 09/29/03 | 9,000 | 9,153 | ||||
5.125%, 02/13/04 | 25,000 | 25,747 | ||||
4.000%, 08/15/03 | 68,903 | 69,440 | ||||
FNMA ^ | ||||||
1.250%, 05/01/03 | 100,000 | 100,000 | ||||
| TOTAL U.S. GOVERNMENT AGENCY OBLIGATIONS (COST $449,083) | $ | 449,083 | ||||
| Description | Principal Amount (000) | Market Value (000) | ||||
| Repurchase Agreements — 49.2% | ||||||
Deutsche Bank, 1.280%, dated 04/30/03, matures 05/01/03, repurchase price $125,004,444 (102% collateralized by various U.S. Treasury Obligations) | $ | 125,000 | $ | 125,000 | ||
First Boston, 1.270%, dated 04/30/03, matures 05/01/03, repurchase price $50,001,764 (102% collateralized by various U.S. Treasury Obligations) | 50,000 | 50,000 | ||||
Goldman Sachs, 1.250%, dated 04/30/03, matures 05/01/03, repurchase price $125,004,340 (102% collateralized by various U.S. Treasury Obligations) | 125,000 | 125,000 | ||||
Goldman Sachs, 1.100%, dated 04/30/03, matures 05/01/03, repurchase price $11,431,395 (102% collateralized by various U.S. Treasury Obligations) | 11,431 | 11,431 | ||||
Salomon Brothers, 1.250%, dated 04/30/03, matures 05/01/03, repurchase price $125,004,340 (102% collateralized by various U.S. Treasury Obligations) | 125,000 | 125,000 | ||||
| TOTAL REPURCHASE AGREEMENTS (COST $436,431) | $ | 436,431 | ||||
| TOTAL INVESTMENTS — 99.8% (COST $885,514) | $ | 885,514 | ||||
| OTHER ASSETS & LIABILITIES, NET — 0.2% | $ | 1,796 | ||||
| TOTAL NET ASSETS — 100.0% | $ | 887,310 | ||||
| ^ | The effective yield at time of purchase is shown as the rate on the Schedule of Investments. |
| ‡ | Variable Rate Security. The rate reported on the Schedule of Investments is the rate in effect on 4/30/03. The date shown is the stated maturity. |
FFCB — Federal Farm Credit Bureau
FHLB — Federal Home Loan Bank
FHLMC — Federal Home Loan Mortgage Corporation
FNMA — Federal National Mortgage Association
The accompanying notes are an integral part of the financial statements.
ANNUAL REPORT / APRIL 30, 2003
7
Table of Contents
PRIME CASH MANAGEMENT PORTFOLIO

Schedule of Investments
| Description | Principal Amount (000) | Market Value (000) | ||||
| Corporate Obligations — 22.9% | ||||||
Banks — 9.5% | ||||||
Bank of New York | ||||||
6.625%, 06/15/03 | $ | 1,000 | $ | 1,006 | ||
Canadian Imperial Bank NY ‡ | ||||||
1.420%, 04/12/04 | 1,000 | 1,000 | ||||
Deutsche Bank NY | ||||||
1.685%, 03/10/04 | 1,000 | 1,000 | ||||
U.S. Bancorp | ||||||
6.000%, 05/15/04 | 1,500 | 1,571 | ||||
TOTAL BANKS | $ | 4,577 | ||||
Financials — 4.4% | ||||||
Associates N.A. | ||||||
5.750%, 11/01/03 | 1,000 | 1,021 | ||||
Heller Financial | ||||||
6.000%, 03/19/04 | 1,050 | 1,093 | ||||
TOTAL FINANCIALS | $ | 2,114 | ||||
Security Dealers & Brokers — 9.0% | ||||||
Bear Stearns | ||||||
6.150%, 03/02/04 | 1,000 | 1,037 | ||||
Goldman Sachs Group + | ||||||
6.650%, 08/01/03 | 250 | 253 | ||||
Goldman Sachs Group ‡ | ||||||
1.590%, 04/26/04 | 1,000 | 1,002 | ||||
Morgan Stanley ‡ | ||||||
1.810%, 03/09/04 | 1,000 | 1,004 | ||||
1.579%, 08/18/03 | 1,000 | 1,001 | ||||
TOTAL SECURITY DEALERS & BROKERS | $ | 4,297 | ||||
| TOTAL CORPORATE OBLIGATIONS (COST $10,988) | $ | 10,988 | ||||
| Description | Principal Amount (000) | Market Value (000) | ||||
| Asset-Backed Securities — 1.9% | ||||||
Ford Credit Auto Owner Trust, | ||||||
1.363%, 10/15/03 | $ | 485 | $ | 485 | ||
Honda Auto Receivables Owner Trust, Ser 2002-3, Cl A1 | ||||||
1.823%, 08/18/03 | —† | —† | ||||
Whole Auto Loan Trust, | ||||||
1.420%, 12/15/03 | 416 | 416 | ||||
| TOTAL ASSET-BACKED SECURITIES (COST $901) | $ | 901 | ||||
| Asset-Backed Commercial Paper — 30.2% | ||||||
Bavaria ^ | ||||||
1.281%, 05/23/03 | 1,500 | 1,499 | ||||
Ciesco ^ | ||||||
1.242%, 06/17/03 | 2,000 | 1,997 | ||||
Citibank ^ | ||||||
1.253%, 05/09/03 | 1,000 | 1,000 | ||||
Corporate Asset Receivables ^ | ||||||
1.253%, 06/26/03 | 2,000 | 1,996 | ||||
Delaware Funding ^ | ||||||
1.252%, 05/28/03 | 2,000 | 1,998 | ||||
Edison Asset Securitization ^ | ||||||
1.253%, 06/10/03 | 1,000 | 998 | ||||
Falcon Asset Securitization ^ | ||||||
1.271%, 06/02/03 | 2,000 | 1,998 | ||||
General Electric Capital | ||||||
1.268%, 11/07/03 | 1,000 | 1,000 | ||||
Sigma Finance | ||||||
1.280%, 05/27/03 | 2,000 | 2,000 | ||||
| TOTAL ASSET-BACKED COMMERCIAL PAPER (COST $14,486) | $ | 14,486 | ||||
| Commercial Paper — 8.3% | ||||||
Financials — 8.3% | ||||||
Societe Generale NY ^ | ||||||
1.248%, 07/07/03 | 2,000 | 1,995 | ||||
UBS Finance Delaware LLC ^ | ||||||
1.260%, 05/07/03 | 2,000 | 2,000 | ||||
TOTAL FINANCIALS | $ | 3,995 | ||||
| TOTAL COMMERCIAL PAPER (COST $3,995) | $ | 3,995 | ||||
APRIL 30, 2003 / ANNUAL REPORT
8
Table of Contents
PRIME CASH MANAGEMENT PORTFOLIO (concluded)
| Description | Principal Amount (000) | Market Value (000) | |||||
| Taxable Municipal Bonds — 2.1% | |||||||
New York — 2.1% | |||||||
New York City, FGIC | |||||||
1.290%, 06/04/03 | $ | 1,000 | $ | 1,000 | |||
TOTAL NEW YORK | $ | 1,000 | |||||
| TOTAL TAXABLE MUNICIPAL BONDS (COST $1,000) | $ | 1,000 | |||||
| Repurchase Agreements — 37.8% | |||||||
Credit Suisse First Boston, 1.270%, dated 04/30/03, matures 05/01/03, repurchase price $5,000,176 (102% collateralized by various U.S. Treasury Obligations) | 5,000 | 5,000 | |||||
Deutsche Bank, 1.280%, dated 04/30/03, matures 05/01/03, repurchase price $5,000,178 (102% collateralized by various U.S. Treasury Obligations) | 5,000 | 5,000 | |||||
Goldman Sachs, 1.250%, dated 04/30/03, matures 05/01/03, repurchase price $5,000,174 (102% collateralized by various U.S. Treasury Obligations) | 5,000 | 5,000 | |||||
Goldman Sachs, 1.100%, dated 04/30/03, matures 05/01/03, repurchase price $3,119,704 (102% collateralized by various U.S. Treasury Obligations) | 3,120 | 3,120 | |||||
| TOTAL REPURCHASE AGREEMENTS (COST $18,120) | $ | 18,120 | |||||
| TOTAL INVESTMENTS — 103.2% (COST $49,490) | $ | 49,490 | |||||
| OTHER ASSETS & LIABILITIES, NET — (3.2)% | $ | (1,555 | ) | ||||
| TOTAL NET ASSETS — 100.0% | $ | 47,935 | |||||
| + | Security exempt from registration under Rule 144A of the Securities Act of 1933. These securities may be resold in transactions exempt from registration normally qualified to institutional investors. |
| ^ | The effective yield at time of purchase is shown as the rate on the Schedule of Investments. |
| † | Amount held rounds to less than 1,000. |
| ‡ | Variable Rate Security. The rate reported on the Schedule of Investments is the rate in effect on 4/30/03. The date shown is the stated maturity. |
| Cl — Class |
| Ser — Series |
These organizations have provided underlying credit support for securities as listed above, as indicated.
| FGIC — Financial Guaranty Insurance Corporation |
The accompanying notes are an integral part of the financial statements.
ANNUAL REPORT / APRIL 30, 2003
9
Table of Contents
TAX-FREE CASH MANAGEMENT PORTFOLIO

Schedule of Investments
| Description | Principal Amount (000) | Market Value (000) | ||||
| Municipal Bonds & Notes — 94.7% | ||||||
California — 9.1% | ||||||
California State, RAN | ||||||
2.500%, 06/20/03 | $ | 700 | $ | 701 | ||
Oakland, JT Powers Financing Authority, Ser A-1, FSA § | 600 | 600 | ||||
TOTAL CALIFORNIA | $ | 1,301 | ||||
Colorado — 5.6% | ||||||
Jefferson County, School District R-001, GO, TRAN | ||||||
2.500%, 06/30/03 | 800 | 802 | ||||
TOTAL COLORADO | $ | 802 | ||||
Florida — 4.2% | ||||||
Florida State, Housing Finance Agency RB, Ser AA, Remarketed 07/31/95, FNMA § | ||||||
1.330%, 06/15/25 | 100 | 100 | ||||
Lee County, Housing Finance Authority RB, Forestwood Apartments Project, Ser A, FNMA § | ||||||
1.330%, 06/15/25 | 500 | 500 | ||||
TOTAL FLORIDA | $ | 600 | ||||
Illinois — 0.7% | ||||||
Illinois State, Development Finance Authority RB, Pollution Control, Amoco Oil Project § | ||||||
1.350%, 11/01/12 | 100 | 100 | ||||
TOTAL ILLINOIS | $ | 100 | ||||
| Description | Principal Amount (000) | Market Value (000) | ||||
Indiana — 4.9% | ||||||
Columbus, Industrial RB, Quinco Consulting Center Project, Fifth Third Bank LOC § | ||||||
1.390%, 12/01/21 | $ | 600 | $ | 600 | ||
Elkhart County, Industrial RB, Hubbard Hill Estates Project, Fifth Third Bank | ||||||
1.390%, 11/01/21 | 100 | 100 | ||||
TOTAL INDIANA | $ | 700 | ||||
Kentucky — 4.4% | ||||||
Kenton County, Industrial Building RB, Baptist Convalescent Center Project, Fifth Third Bank LOC § | ||||||
1.400%, 07/01/18 | 625 | 625 | ||||
TOTAL KENTUCKY | $ | 625 | ||||
Maryland — 14.2% | ||||||
Baltimore County, Consolidated Public Improvements Project, GO | ||||||
3.000%, 09/01/03 | 220 | 221 | ||||
Gaithersburg, Economic Development RB, Asbury Methodist Project, Ser A, MBIA § | ||||||
1.350%, 07/01/27 | 400 | 400 | ||||
Maryland State, Health & Higher Education Facilities Authority RB, Pooled Loan Program, Ser A, Bank One LOC § | ||||||
1.320%, 04/01/35 | 800 | 800 | ||||
Maryland State, Health & Higher Education Facilities Authority RB, Pooled Loan Program, Ser B, Bank One LOC § | ||||||
1.300%, 04/01/35 | 600 | 600 | ||||
TOTAL MARYLAND | $ | 2,021 | ||||
Massachusetts — 2.1% | ||||||
Massachusetts State, Health & Education § | ||||||
1.300%, 07/01/10 | 300 | 300 | ||||
TOTAL MASSACHUSETTS | $ | 300 | ||||
Michigan — 5.6% | ||||||
Detroit, Water Supply Systems RB, Ser C, FGIC § | ||||||
1.350%, 07/01/29 | 800 | 800 | ||||
TOTAL MICHIGAN | $ | 800 | ||||
APRIL 30, 2003 / ANNUAL REPORT
10
Table of Contents
TAX-FREE CASH MANAGEMENT PORTFOLIO (concluded)
| Description | Principal Amount (000) | Market Value (000) | ||||
Missouri — 0.7% | ||||||
Missouri State, Health & Educational Facilities Authority RB, Washington University Project, Ser A § | ||||||
1.300%, 09/01/30 | $ | 100 | $ | 100 | ||
TOTAL MISSOURI | $ | 100 | ||||
New Hampshire — 3.5% | ||||||
New Hampshire State, Housing Finance Authority RB, Equity Residential Property—Bond Partnership—Manchester Project, FNMA § | ||||||
1.350%, 09/15/26 | 500 | 500 | ||||
TOTAL NEW HAMPSHIRE | $ | 500 | ||||
New Jersey — 4.2% | ||||||
New Jersey State, Municipal Securities Trust Receipts RB, Ser CB1 § | ||||||
1.400%, 02/15/11 | 600 | 600 | ||||
TOTAL NEW JERSEY | $ | 600 | ||||
Pennsylvania — 15.8% | ||||||
Chester County, Industrial Development Authority RB, The Woods Project, PNC Bank N.A. LOC § | ||||||
1.400%, 03/31/15 | 40 | 40 | ||||
Delaware County, Industrial Development Authority RB, Resource Recovery Facility Project, Ser G § | ||||||
1.280%, 12/01/31 | 550 | 550 | ||||
1.280%, 12/01/31 | 10 | 10 | ||||
Delaware Valley, Regulatory Finance Authority RB, Ser D, Toronto-Dominion Bank LOC § | ||||||
1.350%, 12/01/20 | 600 | 600 | ||||
Emmaus, General Authority RB, Ser G, Remarketed 12/01/97 § | ||||||
1.400%, 03/01/24 | 800 | 800 | ||||
Moon, Industrial Development Authority RB, Executive Office Association Project, PNC Bank N.A. LOC § | ||||||
1.400%, 11/01/10 | 250 | 250 | ||||
TOTAL PENNSYLVANIA | $ | 2,250 | ||||
South Carolina — 4.2% | ||||||
South Carolina State, Jobs Economic Development Authority RB, Catholic Diocese of South Carolina Project, Bank of America N.A. LOC § | ||||||
1.400%, 09/01/18 | 600 | 600 | ||||
TOTAL SOUTH CAROLINA | $ | 600 | ||||
| Description | Principal Amount (000) | Market Value (000) | ||||
Texas — 5.3% | ||||||
Gulf Coast, Waste Disposal Authority Texas Pollution Control RB, Exxon | ||||||
1.300%, 06/01/20 | $ | 60 | $ | 60 | ||
Texas State, GO, TRAN | ||||||
2.750%, 08/29/03 | 700 | 703 | ||||
TOTAL TEXAS | $ | 763 | ||||
Washington — 4.9% | ||||||
Washington State, Municipal Security Trust Receipts RB, Public Power Supply Systems Nuclear Project Number One, Ser CMC2 § | ||||||
1.420%, 01/01/05 | 700 | 700 | ||||
TOTAL WASHINGTON | $ | 700 | ||||
Wyoming — 5.3% | ||||||
Lincoln County, Pollution Control Authority RB, Exxon Project § | ||||||
1.300%, 08/01/15 | 500 | 500 | ||||
Sublette County, Pollution Control RB, Exxon Project § | ||||||
1.300%, 11/01/14 | 250 | 250 | ||||
TOTAL WYOMING | $ | 750 | ||||
| TOTAL MUNICIPAL BONDS & NOTES (COST $13,512) | $ | 13,512 | ||||
Commercial Paper — 4.9% | ||||||
Howard County Maryland | ||||||
1.100%, 06/02/03 | 700 | 700 | ||||
| TOTAL COMMERCIAL PAPER (COST $700) | $ | 700 | ||||
| TOTAL INVESTMENTS — 99.6% (COST $14,212) | $ | 14,212 | ||||
| OTHER ASSETS & LIABILITIES, NET — 0.4% | $ | 59 | ||||
| TOTAL NET ASSETS — 100.0% | $ | 14,271 | ||||
| § | These variable rate securities are subject to a put and demand feature. The date reported is the stated maturity. |
GO — General Obligation
LOC — Securities are held in connection with a letter of credit support for securities listed above, as indicated.
RAN — Revenue Anticipation Note
RB — Revenue Bond
Ser — Series
TRAN — Tax and Revenue Anticipation Note
These organizations have provided underlying credit support for securities as listed above, as indicated.
FGIC — Financial Guaranty Insurance Corporation
FNMA — Federal National Mortgage Corporation
FSA — Financial Security Assistance
MBIA — Municipal Bond Insurance Association
The accompanying notes are an integral part of the financial statements.
ANNUAL REPORT / APRIL 30, 2003
11
Table of Contents
STATEMENTS OF ASSETS AND LIABILITIES
| As of April 30, 2003 (000, except per share amounts) | U.S. Treasury Cash Management Portfolio | U.S. Government Cash Management Portfolio | Prime Cash Management Portfolio | Tax-Free Cash Management Portfolio | |||||||||||
Assets: | |||||||||||||||
Investments at Amortized Cost | $ | 42,514 | $ | 885,514 | $ | 49,490 | $ | 14,212 | |||||||
Cash | 1 | — | — | 20 | |||||||||||
Interest Receivable | — | 2,779 | 128 | 52 | |||||||||||
Expense Reimbursement from Advisor | 2 | 1 | 5 | 1 | |||||||||||
Prepaid Expenses | 1 | 23 | 2 | — | † | ||||||||||
Other Assets | — | 1 | — | — | |||||||||||
TOTAL ASSETS | 42,518 | 888,318 | 49,625 | 14,285 | |||||||||||
Liabilities: | |||||||||||||||
Distribution Payable | 23 | 633 | 47 | 7 | |||||||||||
Payable for Investment Securities Purchased | — | — | 1,613 | — | |||||||||||
Accrued Expenses: | |||||||||||||||
Investment Advisory Fees | — | 102 | — | — | |||||||||||
Administrator Fees | — | † | 7 | 2 | — | † | |||||||||
Distributor Fees | 9 | 186 | 13 | 5 | |||||||||||
Custody Fees | 1 | 21 | 5 | — | † | ||||||||||
Transfer Agency Fees | 1 | — | 3 | 1 | |||||||||||
Other Expense Payables | 3 | 59 | 7 | 1 | |||||||||||
TOTAL LIABILITIES | 37 | 1,008 | 1,690 | 14 | |||||||||||
Net Assets: | |||||||||||||||
Paid in Capital | 42,473 | 887,306 | 47,929 | 14,260 | |||||||||||
Undistributed Net Investment Income | 9 | 4 | 6 | 11 | |||||||||||
Accumulated Net Realized Gain (Loss) on Investments | (1 | ) | — | † | — | — | |||||||||
TOTAL NET ASSETS | $ | 42,481 | $ | 887,310 | $ | 47,935 | $ | 14,271 | |||||||
Outstanding Shares of Beneficial Interest | |||||||||||||||
Corporate Class Shares | — | — | 10,632 | — | |||||||||||
Corporate II Class Shares | 41,443 | 879,686 | 28,836 | — | |||||||||||
Corporate III Class Shares | 1,029 | 7,620 | 8,461 | 14,260 | |||||||||||
NET ASSET VALUE, OFFERING AND | — | — | $1.00 | — | |||||||||||
NET ASSET VALUE, OFFERING AND | $1.00 | $1.00 | $1.00 | — | |||||||||||
NET ASSET VALUE, OFFERING AND | $1.00 | $1.00 | $1.00 | $1.00 | |||||||||||
| † | Amount rounds to less than one thousand. |
The accompanying notes are an integral part of the financial statements.
APRIL 30, 2003 / ANNUAL REPORT
12
Table of Contents
| For the Fiscal Year Ended April 30, 2003 (000) | U.S. Treasury Cash Management Portfolio | U.S. Government Cash Management Portfolio | Prime Cash Management Portfolio | Tax-Free Cash Management Portfolio | ||||||||||||
Investment Income: | ||||||||||||||||
Interest | $ | 692 | $ | 14,608 | $ | 834 | $ | 286 | ||||||||
TOTAL INVESTMENT INCOME | 692 | 14,608 | 834 | 286 | ||||||||||||
Expenses: | ||||||||||||||||
Investment Advisory Fees | 65 | 1,326 | 75 | 30 | ||||||||||||
Administrator Fees | 62 | 784 | 68 | 42 | ||||||||||||
Distribution Fees — Corporate II Class Shares | 107 | 2,192 | 96 | — | ||||||||||||
Distribution Fees — Corporate III Class Shares | 3 | 29 | 27 | 80 | ||||||||||||
Transfer Agency Fees | 11 | — | 16 | 5 | ||||||||||||
Custodian Fees | 12 | 172 | 40 | 5 | ||||||||||||
Accounting Fees | 49 | 133 | 55 | 38 | ||||||||||||
Professional Fees | 5 | 107 | 5 | 2 | ||||||||||||
Registration Fees | 2 | 35 | 3 | 1 | ||||||||||||
Printing | 3 | 65 | 4 | 1 | ||||||||||||
Trustee Fees and Expenses | 2 | 31 | 2 | 1 | ||||||||||||
Miscellaneous Fees | 3 | 83 | 21 | 2 | ||||||||||||
TOTAL EXPENSES | 324 | 4,957 | 412 | 207 | ||||||||||||
Less Waivers: | ||||||||||||||||
Investment Advisory Fees | (64 | ) | (20 | ) | (75 | ) | (30 | ) | ||||||||
Administrator Fees | (33 | ) | (587 | ) | (37 | ) | (15 | ) | ||||||||
TOTAL WAIVERS | (97 | ) | (607 | ) | (112 | ) | (45 | ) | ||||||||
Less Expense Reimbursement by Advisor | (14 | ) | (7 | ) | (58 | ) | (35 | ) | ||||||||
TOTAL NET EXPENSES | 213 | 4,343 | 242 | 127 | ||||||||||||
NET INVESTMENT INCOME | 479 | 10,265 | 592 | 159 | ||||||||||||
Net Realized Gain on Investments | 1 | — | † | 1 | 1 | |||||||||||
NET REALIZED GAIN ON INVESTMENTS | 1 | — | † | 1 | 1 | |||||||||||
NET INCREASE IN NET ASSETS RESULTING FROM OPERATIONS | $ | 480 | $ | 10,265 | $ | 593 | $ | 160 | ||||||||
| † | Amount rounds to less than one thousand. |
The accompanying notes are an integral part of the financial statements.
ANNUAL REPORT / APRIL 30, 2003
13
Table of Contents
STATEMENTS OF CHANGES IN NET ASSETS
| For the Fiscal Years Ended April 30, 2003 and 2002 (000) | U.S. Treasury Cash Management Portfolio | U.S. Government Cash Management Portfolio | Prime Cash Management Portfolio | Tax-Free Cash Management Portfolio | ||||||||||||||||||||||||||||
| 05/01/02 to 04/30/03 | 05/01/01 to 04/30/02 | 05/01/02 to 04/30/03 | 05/01/01 to 04/30/02 | 05/01/02 to 04/30/03 | 05/01/01 to 04/30/02 | 05/01/02 to 04/30/03 | 05/01/01 to 04/30/02 | |||||||||||||||||||||||||
Operations: | ||||||||||||||||||||||||||||||||
Net Investment Income | $ | 479 | $ | 678 | $ | 10,265 | $ | 16,172 | $ | 592 | $ | 1,102 | $ | 159 | $ | 391 | ||||||||||||||||
Net Realized Gain on Investments | 1 | 6 | — | † | 1 | 1 | 8 | 1 | 1 | |||||||||||||||||||||||
NET INCREASE IN NET ASSETS FROM OPERATIONS | 480 | 684 | 10,265 | 16,173 | 593 | 1,110 | 160 | 392 | ||||||||||||||||||||||||
Distributions to Shareholders: | ||||||||||||||||||||||||||||||||
Net Investment Income | ||||||||||||||||||||||||||||||||
Corporate Class Shares | — | — | † | — | — | † | (70 | ) | (45 | ) | — | — | ||||||||||||||||||||
Corporate II Class Shares | (473 | ) | (674 | ) | (10,192 | ) | (16,046 | ) | (455 | ) | (890 | ) | — | — | ||||||||||||||||||
Corporate III Class Shares | (6 | ) | (4 | ) | (73 | ) | (126 | ) | (73 | ) | (167 | ) | (159 | ) | (391 | ) | ||||||||||||||||
TOTAL DISTRIBUTIONS | (479 | ) | (678 | ) | (10,265 | ) | (16,172 | ) | (598 | ) | (1,102 | ) | (159 | ) | (391 | ) | ||||||||||||||||
Capital Share Transactions(1): | ||||||||||||||||||||||||||||||||
Corporate Class Shares | ||||||||||||||||||||||||||||||||
Shares Issued | — | 279 | — | — | 69,896 | 9,558 | — | — | ||||||||||||||||||||||||
Shares Issued in Lieu of | — | — | † | — | † | — | † | — | † | — | † | — | — | |||||||||||||||||||
Shares Redeemed | — | † | (279 | ) | — | † | — | (59,461 | ) | (14,773 | ) | — | — | |||||||||||||||||||
TOTAL CORPORATE CLASS SHARE TRANSACTIONS | — | †** | — | † | — | †** | — | † | 10,435 | (5,215 | ) | — | — | |||||||||||||||||||
Corporate II Class Shares | ||||||||||||||||||||||||||||||||
Shares Issued | 45,078 | 177,397 | 1,706,797 | 3,357,870 | 1,956,938 | 288,250 | — | — | ||||||||||||||||||||||||
Shares Issued in Lieu of | 28 | 5 | 15 | 47 | 1 | 6 | — | — | ||||||||||||||||||||||||
Shares Redeemed | (45,342 | ) | (161,213 | ) | (1,532,072 | ) | (3,189,630 | ) | (1,966,560 | ) | (261,562 | ) | — | — | ||||||||||||||||||
TOTAL CORPORATE II CLASS SHARE TRANSACTIONS | (236 | ) | 16,189 | 174,740 | 168,287 | (9,621 | ) | 26,694 | — | — | ||||||||||||||||||||||
Corporate III Class Shares | ||||||||||||||||||||||||||||||||
Shares Issued | 586 | 443 | 20,870 | 29,818 | 13,936 | 12,643 | 35,614 | 25,875 | ||||||||||||||||||||||||
Shares Issued in Lieu of | — | — | † | 1 | 3 | — | 21 | 5 | 53 | |||||||||||||||||||||||
Shares Redeemed | — | † | — | (18,451 | ) | (27,716 | ) | (14,207 | ) | (11,422 | ) | (35,769 | ) | (44,171 | ) | |||||||||||||||||
TOTAL CORPORATE III CLASS SHARE TRANSACTIONS | 586 | 443 | 2,420 | 2,105 | (271 | ) | 1,242 | (150 | ) | (18,243 | ) | |||||||||||||||||||||
NET INCREASE (DECREASE) IN NET ASSETS FROM CAPITAL SHARE TRANSACTIONS | 350 | 16,632 | 177,160 | 170,392 | 543 | 22,721 | (150 | ) | (18,243 | ) | ||||||||||||||||||||||
NET INCREASE (DECREASE) IN NET ASSETS | 351 | 16,638 | 177,160 | 170,393 | 538 | 22,729 | (149 | ) | (18,242 | ) | ||||||||||||||||||||||
Net Assets: | ||||||||||||||||||||||||||||||||
Beginning of period | 42,130 | 25,492 | 710,150 | 539,757 | 47,397 | 24,668 | 14,420 | 32,662 | ||||||||||||||||||||||||
END OF PERIOD | $ | 42,481 | $ | 42,130 | $ | 887,310 | $ | 710,150 | $ | 47,935 | $ | 47,397 | $ | 14,271 | $ | 14,420 | ||||||||||||||||
ACCUMULATED UNDISTRIBUTED NET INVESTMENT INCOME | $ | 9 | $ | — | † | $ | 4 | $ | — | $ | 6 | $ | — | † | $ | 11 | $ | — | † | |||||||||||||
| † | Amount rounds to less than one thousand. |
| ** | Ended operations August 30, 2002. |
| (1) | At $1.00 per share. |
The accompanying notes are an integral part of the financial statements.
APRIL 30, 2003 / ANNUAL REPORT
14
Table of Contents
| For a Share Outstanding Throughout the Fiscal Years Ended April 30, | |||||||||||||||||||||||||||||
| Net Asset Value Beginning of Period | Net Investment Income | Realized and | Distributions from Net Investment Income | Distributions from Capital Gains | Net Asset Value End of Period | Total Return | Net Assets End of Period (000) | Ratio of Expenses to Average Net Assets* | Ratio of Net Investment Income to Average Net Assets* | Ratio of Expenses to Average Net Assets (Excluding Waivers and Reimbursements)* | |||||||||||||||||||
| U.S. Treasury Cash Management Portfolio | |||||||||||||||||||||||||||||
| CORPORATE II CLASS SHARES | |||||||||||||||||||||||||||||
2003 | $1.00 | 0.01 | — | (0.01 | ) | — | $1.00 | 1.11 | % | $ | 41,451 | 0.49 | % | 1.11 | % | 0.73 | % | ||||||||||||
2002 | 1.00 | 0.02 | — | (0.02 | ) | — | 1.00 | 2.46 | 41,686 | 0.49 | 2.37 | 0.69 | |||||||||||||||||
2001(1) | 1.00 | 0.04 | — | (0.04 | ) | — | 1.00 | 4.22 | + | 25,492 | 0.49 | 4.90 | 0.61 | ||||||||||||||||
| CORPORATE III CLASS SHARES | |||||||||||||||||||||||||||||
2003 | $1.00 | 0.01 | — | (0.01 | ) | — | $1.00 | 0.96 | % | $ | 1,030 | 0.64 | % | 0.89 | % | 1.60 | % | ||||||||||||
2002 | 1.00 | 0.02 | — | (0.02 | ) | — | 1.00 | 2.38 | 444 | 0.64 | 1.67 | 0.84 | |||||||||||||||||
2001(2) | 1.00 | 0.04 | — | (0.04 | ) | — | 1.00 | 3.63 | + | — | † | 0.64 | 5.90 | 0.79 | |||||||||||||||
| U.S. Government Cash Management Portfolio | |||||||||||||||||||||||||||||
| CORPORATE II CLASS SHARES | |||||||||||||||||||||||||||||
2003 | $1.00 | 0.01 | — | (0.01 | ) | — | $1.00 | 1.18 | % | $ | 879,690 | 0.49 | % | 1.16 | % | 0.56 | % | ||||||||||||
2002 | 1.00 | 0.02 | — | (0.02 | ) | — | 1.00 | 2.50 | 704,950 | 0.49 | 2.39 | 0.60 | |||||||||||||||||
2001(3) | 1.00 | 0.05 | — | (0.05 | ) | — | 1.00 | 5.39 | + | 536,662 | 0.49 | 5.63 | 0.63 | ||||||||||||||||
| CORPORATE III CLASS SHARES | |||||||||||||||||||||||||||||
2003 | $1.00 | 0.01 | — | (0.01 | ) | — | $1.00 | 1.03 | % | $ | 7,620 | 0.64 | % | 1.01 | % | 0.79 | % | ||||||||||||
2002 | 1.00 | 0.02 | — | (0.02 | ) | — | 1.00 | 2.35 | 5,200 | 0.64 | 2.33 | 0.75 | |||||||||||||||||
2001(4) | 1.00 | 0.05 | — | (0.05 | ) | — | 1.00 | 5.16 | + | 3,095 | 0.64 | 5.60 | 0.78 | ||||||||||||||||
| U.S. Prime Cash Management Portfolio | |||||||||||||||||||||||||||||
| CORPORATE CLASS SHARES | |||||||||||||||||||||||||||||
2003 | $1.00 | 0.01 | — | (0.01 | ) | — | $1.00 | 1.50 | % | $ | 10,632 | 0.24 | % | 1.50 | % | 0.64 | % | ||||||||||||
2002 | 1.00 | 0.03 | — | (0.03 | ) | — | 1.00 | 2.74 | 197 | 0.24 | 3.34 | 0.49 | |||||||||||||||||
2001(5) | 1.00 | 0.05 | — | (0.05 | ) | — | 1.00 | 4.61 | + | 5,412 | 0.24 | 6.05 | 0.42 | ||||||||||||||||
| CORPORATE II CLASS SHARES | |||||||||||||||||||||||||||||
2003 | $1.00 | 0.01 | — | (0.01 | ) | — | $1.00 | 1.24 | % | $ | 28,840 | 0.49 | % | 1.18 | % | 0.82 | % | ||||||||||||
2002 | 1.00 | 0.02 | — | (0.02 | ) | — | 1.00 | 2.48 | 38,465 | 0.49 | 2.19 | 0.74 | |||||||||||||||||
2001(6) | 1.00 | 0.05 | — | (0.05 | ) | — | 1.00 | 5.14 | + | 11,764 | 0.49 | 4.89 | 0.71 | ||||||||||||||||
| CORPORATE III CLASS SHARES | |||||||||||||||||||||||||||||
2003 | $1.00 | 0.01 | — | (0.01 | ) | — | $1.00 | 1.09 | % | $ | 8,463 | 0.64 | % | 1.07 | % | 1.03 | % | ||||||||||||
2002 | 1.00 | 0.02 | — | (0.02 | ) | — | 1.00 | 2.33 | 8,735 | 0.64 | 2.27 | 0.89 | |||||||||||||||||
2001(7) | 1.00 | 0.04 | — | (0.04 | ) | — | 1.00 | 3.97 | + | 7,492 | 0.64 | 5.79 | 0.82 | ||||||||||||||||
| Tax-Free Cash Management Portfolio | |||||||||||||||||||||||||||||
| CORPORATE III CLASS SHARES | |||||||||||||||||||||||||||||
2003 | $1.00 | 0.01 | — | (0.01 | ) | — | $1.00 | 0.78 | % | $ | 14,271 | 0.64 | % | 0.79 | % | 1.04 | % | ||||||||||||
2002 | 1.00 | 0.01 | — | (0.01 | ) | — | 1.00 | 1.47 | 14,420 | 0.64 | 1.57 | 0.80 | |||||||||||||||||
2001(8) | 1.00 | 0.03 | — | (0.03 | ) | — | 1.00 | 2.82 | + | 32,662 | 0.64 | 3.26 | 0.81 | ||||||||||||||||
| + | Total return is for the period indicated and has not been annualized. |
| † | Amount rounds to less than one thousand. |
| * | Periods of less than one year have been annualized. |
| (1) | Commenced operations on July 21, 2000. |
| (2) | Commenced operations on October 6, 2000. |
| (3) | Commenced operations on June 1, 2000. |
| (4) | Commenced operations on June 6, 2000. |
| (5) | Commenced operations on July 28, 2000. |
| (6) | Commenced operations on June 5, 2000. |
| (7) | Commenced operations on August 16, 2000. |
| (8) | Commenced operations on June 23, 2000. |
The accompanying notes are an integral part of the financial statements.
ANNUAL REPORT / APRIL 30, 2003
15
Table of Contents
| 1. | ORGANIZATION |
ARK Funds (the “Fund”) is registered under the Investment Company Act of 1940, as amended (the “1940 Act”), as an open-end management investment company organized as a Massachusetts business trust pursuant to a Declaration of Trust dated October 22, 1992, amended and restated on March 19, 1993, and further amended on December 10, 1999.
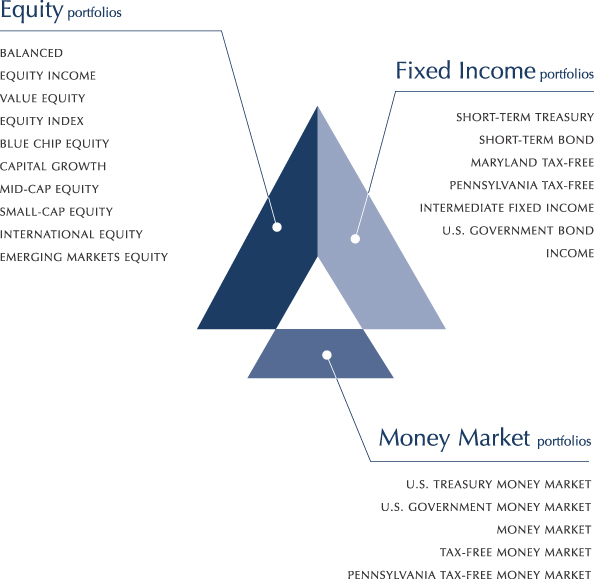
The Fund offers thirty separate investment portfolios as of April 30, 2003:
U.S. Treasury Cash Management Portfolio (“TCMP”)
U.S. Government Cash Management Portfolio (“GCMP”)
Prime Cash Management Portfolio (“PCMP”)
Tax-Free Cash Management Portfolio (“TFCMP”)
(individually a “Portfolio” and collectively, the “Portfolios”)
Social Issues Intermediate Fixed Income Portfolio
Social Issues Blue Chip Equity Portfolio
Social Issues Capital Growth Portfolio
Social Issues Small-Cap Equity Portfolio
U.S. Treasury Money Market Portfolio
U.S. Government Money Market Portfolio
Money Market Portfolio
Tax-Free Money Market Portfolio
Pennsylvania Tax-Free Money Market Portfolio
Short-Term Treasury Portfolio
Short-Term Bond Portfolio
Maryland Tax-Free Portfolio
Pennsylvania Tax-Free Portfolio
Intermediate Fixed Income Portfolio
U.S. Government Bond Portfolio
Income Portfolio
Balanced Portfolio
Equity Income Portfolio
Value Equity Portfolio
Equity Index Portfolio
Blue Chip Equity Portfolio
Capital Growth Portfolio
Mid-Cap Equity Portfolio
Small-Cap Equity Portfolio
International Equity Portfolio
Emerging Markets Equity Portfolio
The financial statements and notes presented herein are those of TCMP, GCMP, PCMP, and TFCMP. The financial statements of the other portfolios listed above are not presented herein, but are presented separately. The Fund may issue an unlimited number of shares of each of the Portfolios and may issue shares of one or more classes of each Portfolio.
| 2. | SIGNIFICANT ACCOUNTING POLICIES |
The preparation of financial statements in conformity with accounting principles generally accepted in the United States of America requires management to make estimates and assumptions that affect amounts reported therein. Although actual results could differ from these estimates, any such differences are expected to be immaterial to the net assets of the Portfolios.
The following is a summary of significant accounting policies followed by the Portfolios.
Security Valuation — Investment securities held by the Portfolios are stated at their amortized cost, which approximates market value. Under the amortized cost method, any discount or premium is amortized ratably to the maturity of the security and is included in interest income. The Portfolios’ use of amortized cost is subject to compliance with certain conditions specified in Rule 2a-7 under the 1940 Act.
Income Taxes — It is the intention of each Portfolio to comply with the requirements of the Internal Revenue Code, to qualify as a regulated investment company and to distribute all of its taxable income. Accordingly, no provision for federal income taxes is considered necessary.
Net Asset Value Per Share — The net asset value per share (“NAV”) of each class of each Portfolio is calculated every business day (i.e., any day that both the New York Stock Exchange and the Federal Reserve Bank are open for business). A business day will be any weekday, other than a federal holiday, unless the fund determines that being open for business is not in the best interest of shareholders. The NAV is computed by dividing the total assets of each class of the Portfolio, less the liabilities of the class, by the number of outstanding shares of the Portfolio.
Classes — Each class of shares has equal rights to earnings, assets and voting privileges, except that each class bears different distribution and shareholder services expenses. Each class of shares has exclusive voting rights with respect to matters that affect just that class. Class-specific expenses are borne by the applicable class. Other expenses, income and realized and unrealized gains/losses are allocated to the respective classes on the basis of relative daily net assets.
Repurchase Agreements — Securities pledged as collateral for repurchase agreements are held by the custodian bank until maturity of the repurchase agreements. Provisions of the repurchase agreements and procedures adopted by the Board of Trustees require that market value of collateral, including accrued interest thereon, be sufficient in the event of default by the counterparty. If the counterparty defaults and the value of the collateral declines or if the counterparty enters an
APRIL 30, 2003 / ANNUAL REPORT
16
Table of Contents
NOTES TO FINANCIAL STATEMENTS
insolvency proceeding, realization of the collateral by the Portfolio may be delayed or limited.
Distributions — Dividends from net investment income are declared daily and paid monthly for the Portfolios. Distributions from net realized capital gains, if any, are declared and paid at least annually by each Portfolio.
Distributions from net investment income and net realized capital gains are determined in accordance with U.S. federal income tax regulations, and may differ from those amounts determined under generally accepted accounting principles. These book/tax differences are either temporary or permanent in nature. To the extent these differences are permanent, they are charged or credited to paid-in capital in the period that the difference arises.
The Portfolios have a tax year end of October 31.
On the Statements of Assets and Liabilities, the following adjustments were made:
| Portfolio | Undistributed Net Investment Income (000) | Accumulated Net Realized Loss (000) | ||||
| TCMP | $10 | $ | (10 | ) | ||
| GCMP | 4 | (4 | ) | |||
| PCMP | 12 | (12 | ) | |||
| TFCMP | 11 | (11 | ) | |||
The tax character of distributions paid during the year ended October 31, 2002 and year ended October 31, 2001 was as follows:
| Tax-Exempt Income (000) | Ordinary Income (000) | Total (000) | ||||||||||||||||
| Portfolio | 2002 | 2001 | 2002 | 2001 | 2002 | 2001 | ||||||||||||
TCMP | $ | — | $ | — | $ | 525 | $ | 780 | $ | 525 | $ | 780 | ||||||
GCMP | — | — | 11,940 | 22,815 | 11,940 | 22,815 | ||||||||||||
PCMP | — | — | 833 | 1,255 | 833 | 1,255 | ||||||||||||
TFCMP | 186 | 724 | 10 | — | 196 | 724 | ||||||||||||
At October 31, 2002 the components of net assets (excluding paid-in capital) on a tax basis were as follows:
| Portfolio | Undistributed Tax-Exempt Income (000) | Undistributed Ordinary Income (000) | Capital and Other Losses (000) | Total (000) | ||||||
TCMP | $— | $ 60 | $ | (2) | $ | 58 | ||||
GCMP | — | 993 | — | 993 | ||||||
PCMP | — | 72 | — | 72 | ||||||
TFCMP | 26 | 1 | — | 27 | ||||||
The following Portfolio has estimated capital loss carryforwards at October 31, 2002, which are available to offset future net realized capital gains:
| Portfolio | Accumulated Capital Loss Carryforward (000) | Year Expires | ||
TCMP | $2 | 2010 | ||
Other — Security transactions are accounted for on the date the security is purchased or sold (trade date). Net realized capital gains and losses on the sale of investment securities are determined using the identified cost method. Interest income is recognized using the accrual method. Discounts and premiums on securities purchased are amortized over the lives of the respective securities.
| 3. | INVESTMENT ADVISORY AND ADMINISTRATIVE FEES AND OTHER TRANSACTIONS WITH AFFILIATES |
Allied Investment Advisors, Inc. (“AIA”) is the investment advisor to each Portfolio. Pursuant to an investment advisory contract on behalf of each Portfolio, AIA is entitled to receive fees for its advisory services at the annual rates shown in the following table based on the daily average net assets of the Portfolio.
| Portfolio | Annual Rate | ||
TCMP | 0.15 | % | |
GCMP | 0.15 | % | |
PCMP | 0.15 | % | |
TFCMP | 0.15 | % | |
AIA has contractually agreed to waive a portion of its fees or reimburse expenses for all of the Portfolios in order to limit total operating expenses of such Portfolios.
Effective April 1, 2003, AIA became a wholly-owned subsidiary of Manufacturers and Traders Trust Company (“M&T Trust”), the principal financial services operating subsidiary of M&T Bank Corporation (“M&T”), a publicly-traded holding company based in Buffalo, New York. M&T’s ownership of AIA is a result of an agreement entered into on September 26, 2002, among M&T, Allfirst Financial, Inc. and Allied Irish Banks, p.l.c., under which M&T was to acquire Allfirst Financial Inc. the indirect parent corporation of AIA, and parent corporation of Allfirst Bank, the direct parent of AIA (the “Acquisition”). At a special meeting of shareholders held on January 31, 2003, shareholders of each Portfolio approved a new investment advisory agreement between AIA and the Fund with respect to each Portfolio. The 1940 Act, which regulates investment companies such as the Fund,
ANNUAL REPORT / APRIL 30, 2003
17
Table of Contents
NOTES TO FINANCIAL STATEMENTS
requires a shareholder vote to approve a new advisory agreement in connection with business transactions such as the Acquisition. The new advisory agreement is substantially identical to the former advisory agreement, except for the dates of execution and termination. The new advisory agreement became effective upon consummation of the Acquisition on April 1, 2003.
Also as a result of the Acquisition, M&T Trust acquired Allfirst Trust Company, N.A., (“Allfirst Trust”), which as of April 30, 2003, served as the Portfolios’ administrator, transfer agent and custodian pursuant to administration, transfer agency and custodian agreements with the Fund. (See Note 5 for additional information concerning the administrator and transfer agent subsequent to the Portfolios’ fiscal year end.)
Allfirst Trust serves as administrator and transfer agent for the Fund pursuant to an administration agreement. For its services, Allfirst Trust is entitled to receive an administration fee from the Fund at the annual rate of $24,000 per Portfolio, plus 0.085% of the annual average daily net assets of the Portfolios. Allfirst Trust receives annually a $60,000 base fee that is allocated to each portfolio of the Fund based on respective average daily net assets. Under a separate agreement, Allfirst Trust has subcontracted the services to be provided by it under the administration agreement to Forum Administrative Services, LLC (the “Sub-administrator”). Allfirst Trust is responsible for paying a portion of the administration fee it receives from the Fund to the Sub-administrator for the services it provides.
Pursuant to an agreement between the Fund and Allfirst Trust, Allfirst Trust performs transfer agency services. Pursuant to an agreement between Boston Financial Data Services, Inc. (“Boston Financial”) and Allfirst Trust, Boston Financial performs sub-transfer agency services. For the services provided under the agreement with Allfirst Trust, the Fund pays an annual fee of up to $16 per Portfolio account and activity based fees ranging from $0.50 to $12.50 per item and reimbursements for out-of-pocket expenses. Allfirst Trust pays the transfer agency fees and expense reimbursements that it receives from the Fund to Boston Financial.
Pursuant to a custody agreement between the Fund and Allfirst Trust, Allfirst Trust was appointed and serves as the custodian of the assets of the Portfolios. Pursuant to an agreement between Bankers Trust Company (“BTC”) and Allfirst Trust, BTC performs sub-custodial services. For the services provided under the agreement with Allfirst Trust, the Fund pays 0.015% of the market value of the assets of the Portfolios, plus transaction fees ranging from $5 to $75 per item and reimbursement for out-of-pocket expenses. Allfirst Trust is responsible for paying a portion of the custody fees it receives from the Fund to BTC for the custody services it provides.
| 4. | DISTRIBUTION AND SERVICE PLANS |
The Fund’s Board of Trustees has adopted Distribution and Service Plans on behalf of the Corporate II Class Shares and Corporate III Class Shares of each Portfolio pursuant to Rule 12b-1 under the 1940 Act. Distribution and/or service fees under the plans are paid to ARK Funds Distributors, LLC (the “Distributor”), which acts as distributor for the Fund pursuant to a distribution agreement on behalf of each Portfolio. The plans allow the Portfolios to pay the Distributor a fee at the annual rate of up to 0.25% and 0.40%, respectively, of the average daily net assets of the Corporate II Class Shares and Corporate III Class Shares. The Distributor may voluntarily waive all or a portion of their fees for certain Portfolios. These waivers are voluntary and may be discontinued at any time.
| 5. | SIGNIFICANT EVENTS AFTER APRIL 30, 2003 |
As a result of the Acquisition described in Note 3, effective June 13, 2003, Allfirst Trust, the administrator, transfer agent and custodian to the Fund was merged into M&T Trust and no longer maintains a separate corporate existence. In connection with that merger, effective June 16, 2003, M&T Trust serves as the administrator, transfer agent and custodian to the Fund as a result of the assignment of the Fund’s administration and transfer agency agreements with Allfirst Trust to M&T Trust. The compensation provisions under the agreements are unchanged.
Effective June 1, 2003, State Street Bank and Trust Company (“State Street Bank”) serves as custodian of the assets of the Portfolios pursuant to a custodian agreement between State Street and the Fund.
M&T Trust also serves as the administrator to the VISION Group of Funds (“VISION Funds”), a mutual fund family that offers different classes of shares in separate investment portfolios for which M&T Asset Management, a department of M&T Trust, serves as investment adviser. In connection with the Acquisition described above, the Board of Trustees of the Fund has authorized the reorganization of each Portfolio into a newly created or existing portfolio of the VISION Funds. On May 16, 2003, the VISION Funds filed a preliminary proxy statement/prospectus on Form N-14, which sets forth the reorganization proposals to be submitted to shareholders of each Portfolio, who will vote separately on the proposal to reorganize their respective Portfolio. The VISION Funds filed an amendment to the Form N-14 filing on May 23, 2003 with a proposed effective date for the preliminary proxy statement/prospectus of June 23, 2003. According to the preliminary proxy statement/prospectus, only shareholders of record of the Fund at the close of business on June 16, 2003 will be entitled to notice of and to vote at the shareholder meeting scheduled for August 14, 2003, and any postponement or adjournment thereof. Under the proposed agreement and plan of reorganization, if approved by shareholders of a Portfolio, the shareholders of that Portfolio will receive shares of a comparable VISION Fund. According to the preliminary proxy statement/prospectus, the reorganization is currently anticipated to occur in August, assuming shareholder approval is obtained.
APRIL 30, 2003 / ANNUAL REPORT
18
Table of Contents
The Board of Trustees and Shareholders
ARK Funds:
We have audited the accompanying statements of assets and liabilities, including the schedules of investments, of U.S. Treasury Cash Management Portfolio, U.S. Government Cash Management Portfolio, Prime Cash Management Portfolio, and Tax-Free Cash Management Portfolio, portfolios of ARK Funds (the “Portfolios”), as of April 30, 2003, and the related statements of operations for the year then ended, statements of changes in net assets for each of the years in the two-year period then ended, and financial highlights for each of the years or periods in the three-year period then ended. These financial statements and financial highlights are the responsibility of the Portfolios’ management. Our responsibility is to express an opinion on these financial statements and financial highlights based on our audits.
We conducted our audits in accordance with auditing standards generally accepted in the United States of America. Those standards require that we plan and perform our audit to obtain reasonable assurance about whether the financial statements and financial highlights are free of material misstatement. An audit includes examining, on a test basis, evidence supporting the amounts and disclosures in the financial statements. Our procedures included confirmation of securities owned as of April 30, 2003 by correspondence with the custodian and brokers. As to securities purchased or sold but not yet received or delivered, we performed other appropriate auditing procedures. An audit also includes assessing the accounting principles used and significant estimates made by management, as well as evaluating the overall financial statement presentation. We believe that our audits provide a reasonable basis for our opinion.
In our opinion, the financial statements and financial highlights referred to above present fairly, in all material respects, the financial position of U.S. Treasury Cash Management Portfolio, U.S. Government Cash Management Portfolio, Prime Cash Management Portfolio, and Tax-Free Cash Management Portfolio as of April 30, 2003, the results of their operations, the changes in their net assets and their financial highlights for each of the years or periods specified above in conformity with accounting principles generally accepted in the United States of America.

Boston, Massachusetts
June 16, 2003
ANNUAL REPORT / APRIL 30, 2003
19
Table of Contents
TRUSTEES OF THE FUND (Unaudited)
Name, Age and Contact Address | Position with the Trust | Length of Time Served | Principal Occupation(s) During Past 5 Years | Number of Fund | Other Trusteeships or Held by Trustees outside ARK Funds | |||||
| Interested Trustee | ||||||||||
Rick A Gold1 Born: August 4, 1949 c/o ARK Funds 100 East Pratt Street, 15th Floor, M/C 104-410, Baltimore, MD 21202 | President and Trustee | since 2000 | Senior Vice President of M&T Trust the parent company of AIA (since 2003); Executive Vice President of Asset Management Group of Allfirst Financial, Inc. the former parent company to Allfirst Trust and AIA (1999-2003); Chief Executive Officer and Director of AIA and Allfirst Trust (1997-2003). | 30 | None | |||||
| Disinterested Trustees | ||||||||||
William H. Cowie, Jr. Born: January 24, 1931 c/o ARK Funds 100 East Pratt Street, 15th Floor, M/C 104-410, Baltimore, MD 21202 | Trustee and Chairman | since 1993 | Retired. | 30 | None | |||||
David D. Downes Born: July 16, 1935 c/o ARK Funds 100 East Pratt Street, 15th Floor, M/C 104-410, Baltimore, MD 21202 | Trustee | since 1995 | Attorney in private practice (since October 1996). | 30 | None | |||||
Sir Victor Garland Born: May 5, 1934 c/o ARK Funds 100 East Pratt Street, 15th Floor, M/C 104-410, Baltimore, MD 21202 | Trustee | since 2000 | Private Investor (since 1994). | 30 | Director and Chairman: Henderson Far East Income Trust plc (Chairman since 1990). Director: The Throgmorton Trust plc. Director: Framington Income and Capital Trust plc. Director: Govett Asian Income and Growth Trust Ltd. | |||||
Charlotte R. Kerr Born: September 26, 1946 c/o ARK Funds 100 East Pratt Street, 15th Floor, M/C 104-410, Baltimore, MD 21202 | Trustee | since 1993 | Practitioner and faculty member of Traditional Acupuncture Institute. | 30 | None | |||||
Richard B. Seidel Born: April 20, 1941 c/o ARK Funds 100 East Pratt Street, 15th Floor, M/C 104-410, Baltimore, MD 21202 | Trustee | since 1998 | Director and President (since 1994) of Girard Partners (a registered broker-dealer). | 30 | None | |||||
| 1 | Mr. Gold is deemed to be an “interested person” due to his affiliation with AIA and M&T Trust. See Note 5 of Notes to the Financial Statements. |
Additional information concerning the Trustees is contained in the Statement of Additional Information (“SAI”) and is available by contacting the Fund at 1-800-275-3863.
APRIL 30, 2003 / ANNUAL REPORT
20
Table of Contents
OFFICERS OF THE FUND (Unaudited)
Name, Age and Contact Address | Position with the Trust | Length of Time Served | Principal Occupation(s) During | |||||||
| Officers | ||||||||||
Stacey E. Hong Born: May 10, 1966 Two Portland Square, Portland, ME 04101 | Treasurer | since 2002 | Director of Forum Accounting Services, LLC (since 1998). | |||||||
Michele L. Dalton Born: February 16, 1959 100 East Pratt Street, 15th Floor, Baltimore, MD 21202 | Vice President and Assistant Secretary | since 2000 | Vice President of M&T Trust (since 2003); Senior Vice President of Allfirst Financial, Inc. (1994-2003). | |||||||
Thomas R. Rus Born: October 11, 1959 100 East Pratt Street, 17th Floor, Baltimore, MD 21202 | Secretary | since 2000 | Vice President of M&T Trust (since 2003); Vice President and Counsel of Allfirst Trust and Allfirst Bank, and Compliance Officer of Allfirst Trust (1995-2003). | |||||||
D. Blaine Riggle Born: November 12, 1966 Two Portland Square, Portland, ME 04101 | Vice President and Assistant Secretary | since 2002 | Relationship Manager and Counsel for Forum Financial Group, LLC (associated since 1998). | |||||||
Cheryl O. Tumlin Born: June 30, 1966 Two Portland Square, Portland, ME 04101 | Vice President and Assistant Secretary | since 2002 | Counsel for Forum Financial Group, LLC (associated from 1996-1999 and again since 2001); former Counsel at I-many, Inc. (1999-2001); Staff Attorney at the United States Securities and Exchange Commission (1995-1996). | |||||||
Dawn L. Taylor Born: May 14, 1964 Two Portland Square, Portland, ME 04101 | Assistant Treasurer | since 2002 | Tax Manager at Forum Financial Group, LLC (since 1997). | |||||||
Nathan V. Gemmiti Born: August 6, 1970 Two Portland Square, Portland, ME 04101 | Assistant Secretary | since 2002 | Staff Attorney, Forum Financial Group, LLC (since 2001); Associate, Pierce Atwood (a law firm) (1998-2001). | |||||||
ANNUAL REPORT / APRIL 30, 2003
21
Table of Contents
INVESTMENT ADVISOR
Allied Investment Advisors, Inc.
Baltimore, Maryland
TRUSTEES
William H. Cowie, Jr.
David D. Downes
Sir Victor Garland
Rick A. Gold
Charlotte R. Kerr
Richard B. Seidel
ADMINISTRATOR
Allfirst Trust Company, N.A.
Baltimore, Maryland
DISTRIBUTOR
ARK Funds Distributors, LLC
Portland, Maine
LEGAL COUNSEL
Kirkpatrick & Lockhart LLP
Washington, D.C.
INDEPENDENT AUDITORS
KPMG LLP
Boston, Massachusetts
CUSTODIAN
Allfirst Trust Company, N.A.
Baltimore, Maryland
Table of Contents

100 EAST PRATT STREET, 15TH FLOOR | MAIL CODE 104-410 | BALTIMORE, MD 21202
We are pleased to send you our Annual Report for the fiscal year ended April 30, 2003. This report contains important information about your investments in ARK Funds. Because we are sending a report to each person listed as shareholder, you (or your household) may receive more than one report.
This material must be preceded or accompanied by a current prospectus. ARK-AR-002-0603 |
recycled content |

Table of Contents
 Clear-cut strategies for confident investing.
April 30, 2003 | Annual Report |
U.S. Treasury Money Market Portfolio
U.S. Government Money Market Portfolio
Money Market Portfolio
Tax-Free Money Market Portfolio
Pennsylvania Tax-Free Money Market Portfolio
Short-Term Treasury Portfolio
Short-Term Bond Portfolio
Maryland Tax-Free Portfolio
Pennsylvania Tax-Free Portfolio
Intermediate Fixed Income Portfolio
U.S. Government Bond Portfolio
Income Portfolio
Balanced Portfolio
Equity Income Portfolio
Value Equity Portfolio
Equity Index Portfolio
Blue Chip Equity Portfolio
Capital Growth Portfolio
Mid-Cap Equity Portfolio
Small-Cap Equity Portfolio
International Equity Portfolio
Emerging Markets Equity Portfolio
Managed by Allied Investment Advisors, Inc.
Table of Contents
[GRAPHIC]
CONTENTS
| 1 | ||
Management Discussion and Analysis / Schedules of Investments | 4 | |
Management Discussion and Analysis / Schedules of Investments | 20 | |
Management Discussion and Analysis / Schedules of Investments | 52 | |
| 100 | ||
| 104 | ||
| 108 | ||
| 114 | ||
| 122 | ||
| 138 | ||
| 139 | ||
| 140 | ||
| 143 | ||
This report and the financial statements contained herein are submitted for the general information of the shareholders of the ARK Funds and do not constitute investment advice. The report is not authorized for distribution to prospective investors unless preceded or accompanied by an effective prospectus for each of the portfolios included. Shares of the portfolios are not deposits of any bank, and are not insured by the Federal Deposit Insurance Corporation, the Federal Reserve Board, or any other government agency. Investing in the shares involves investment risks including the possible loss of principal amount invested. The views in this report are those of the respective portfolio manager as of April 30, 2003, and may not reflect the managers’ views as of the date this report was first published or anytime thereafter. For information about ARK Funds Portfolios, please call 1-800-ARK-FUND (1-800-275-3863).
Table of Contents
JUNE 2003
Dear Shareholder,
With this Annual Report, we are pleased to give you updated performance, holdings, and diversification information for the ARK Funds Money Market, Fixed Income, Balanced, and Equity Portfolios as of April 30, 2003, as well as the Portfolios’ Management Discussion and Analysis.
The past six months have been full of activity for ARK Funds. In our Semi Annual report dated October 31, 2002, we told you about the pending acquisition of Allfirst Financial, Inc. by M&T Bank Corporation of Buffalo, New York. That acquisition was completed on April 1, 2003.
Earlier this year, the respective boards of trustees of ARK Funds and the VISION Group of Funds (the proprietary mutual fund company of M&T Bank Corporation) each met and authorized a tax-free reorganization of certain ARK and VISION portfolios, subject to shareholder approval. A Special Meeting of Shareholders of each of the affected portfolios will be scheduled, and a proxy/prospectus containing additional information will be sent to shareholders soon.
Thank you for investing with ARK Funds. We look forward to continuing to help you meet your financial goals.
Sincerely,

William H. Cowie, Jr.
Chairman
ANNUAL REPORT / APRIL 30, 2003
1
Table of Contents
The ARK Funds Family
The ARK Funds Family offers a comprehensive range of money market, fixed income, and equity portfolios designed to meet both short- and long-term needs. Whether you’re looking to enhance short-term income, gain tax advantages, or achieve long-term growth, ARK Funds offers a variety of mutual fund solutions.
As a rule, investments, such as stocks, with greater perceived risks also have the potential for greater returns than fixed income investments. Keep in mind stocks also have greater price fluctuations (“volatility”) and risks than fixed income investments, which may not make them appropriate for the short-term investor or those whose primary concern is preservation of principal amount invested. If you are investing for the long-term and will not need your investment for several years in the future, then investing in an equity-based mutual fund may be appropriate. An investment in a money market fund is not insured or guaranteed by the Federal Deposit Insurance Corporation or any other government agency. Although money market funds seek to preserve the value of your investment at $1.00 per share, it is possible to lose money by investing in these funds.
Table of Contents
MONEY MARKET PORTFOLIOS
Money Market Portfolios
Our money market investment management philosophy is defined by three objectives: to preserve principal, to maintain daily liquidity, and to maximize current income. To achieve these objectives, we actively manage the Money Market Portfolios utilizing our conservative and highly disciplined relative-value approach, which is constantly monitored and reviewed to ensure that our shareholders’ goals are realized.
To preserve principal, we consider only those issuers that pass our stringent credit evaluation process. The goal of the credit evaluation process is to select high-quality issuers that present minimal credit risk. The evaluation process is based on both quantitative and qualitative factors that highlight the issuer’s ability to maintain its credit rating and leading industry position. Issuers are monitored and reviewed by the Allied Investment Advisors Investment Policy Committee, which is comprised of senior personnel from Allied Investment Advisors Inc. (AIA).
To provide daily liquidity, we manage our maturities and engage in overnight repurchase agreements seeking to obtain the highest short-term credit ratings. Each repurchase agreement is collateralized by U.S. Treasury or U.S. government agency collateral.
To maximize current income, we actively manage the Portfolios. We seek to take advantage of short-lived trading opportunities and market inefficiencies by employing a relative-value approach that emphasizes security selection.
Each Portfolio’s strategy starts with an average maturity decision. The decision is determined by a number of factors, such as analysis of our shareholders’ liquidity needs, expected Federal Reserve monetary policy and yield curve, and implied forward interest-rate analysis.
Upon determining a Portfolio’s average maturity, we analyze each market sector to determine which sectors are cheap, thus providing value, and which sectors are expensive. Individual securities are then selected. This in-depth analysis allows us to identify market inefficiencies and trading opportunities.
3
Table of Contents
MONEY MARKET PORTFOLIOS

James M. Hannan
PORTFOLIO MANAGER
James M. Hannan is manager of the Money Market Portfolios, and is manager or co-manager of other ARK Funds Portfolios. He is also responsible for several separately managed institutional portfolios. Mr. Hannan has been a Portfolio Manager of Allied Investment Advisors, Inc. (“AIA”) since 1996, a Vice President of Allfirst Bank from 1987 to 2003 and a Vice President of Manufacturers and Traders Trust Company (“M&T Trust”) since 2003. He has more than 15 years of experience in the investment industry.
U.S. Treasury Money Market Portfolio
U.S. Government Money Market Portfolio
Money Market Portfolio
Tax-Free Money Market Portfolio
Pennsylvania Tax-Free Money Market Portfolio
Management Discussion and Analysis
Interest rates fell over the past fiscal year, as economic growth remained elusive. The 2-year Treasury note’s yield declined from a fiscal-year high of 3.37% on May 17, 2002 to 1.49% on April 30, 2003. The Federal Reserve lowered short-term interest rates once during the period in November 2002 to 1.25% from 1.75%.
During the past fiscal year we continued to invest in high-quality, short-term securities that present minimal credit risk. We maintained the average maturity of the Portfolios by selectively purchasing securities maturing in either the latter part of 2003 or early 2004.
Given the tepid economic growth and low inflation environment, we believe the Federal Reserve may either lower interest rates during the summer or maintain the current rate of 1.25% for the foreseeable future. Because of our expectations for economic growth and Federal Reserve policy, we may choose to maintain a barbelled portfolio structure, attempting to maintain principal preservation and daily liquidity, while also seeking to provide a competitive rate of return. As always, we will continue to consistently utilize our conservative and disciplined relative value investment process.
APRIL 30, 2003 / ANNUAL REPORT
4
Table of Contents
MONEY MARKET PORTFOLIOS
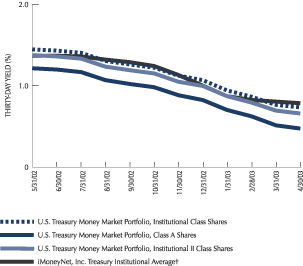
Performance as of April 30, 2003
U.S. Treasury Money Market Portfolio
| Inst’l Class Shares | Class A Shares | Inst’l II Class Shares | iMoneyNet, Inc. Treasury Institutional Average† | |||||
Seven Day Simple Yield | 0.70% | 0.45% | 0.63% | 0.79% | ||||
THIRTY DAY YIELD COMPARISON
Money Market Portfolio
| Inst’l Class Shares | Class A Shares | Class B Shares | Inst’l II Class Shares | iMoneyNet, Inc. First Tier Institutional Average† | iMoneyNet, Inc. First Tier Retail Average† | |||||||
| Seven Day Simple Yield | 1.01% | 0.78% | 0.09% | 0.94% | 0.92% | 0.55% | ||||||
THIRTY DAY YIELD COMPARISON
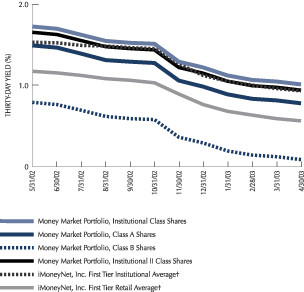
Past performance is not predictive of future performance.
†The performance of the iMoneyNet, Inc. averages does not include operating expenses that are incurred by each Portfolio.
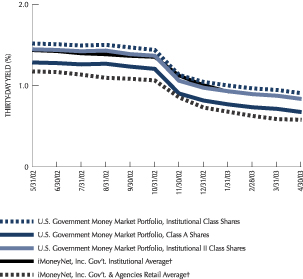
U.S. Government Money Market Portfolio
| Inst’l Class Shares | Class A Shares | Inst’l II Class Shares | iMoneyNet, Inc. Gov’t. Institutional Average† | iMoneyNet, Inc. Gov’t & Agencies Retail Average† | ||||||
Seven Day Simple Yield | 0.89% | 0.66% | 0.82% | 0.83% | 0.56% | |||||
THIRTY DAY YIELD COMPARISON
ANNUAL REPORT / APRIL 30, 2003
5
Table of Contents
MONEY MARKET PORTFOLIOS
Performance as of April 30, 2003
Tax-Free Money Market Portfolio
| Inst’l Class Shares | Class A Shares | Inst’l II Class Shares | iMoneyNet, Inc. Tax-Free National Institutional Average† | iMoneyNet, Inc. Tax-Free National Retail Average† | ||||||
Seven Day Simple Yield | 0.98% | 0.75% | 0.91% | 0.94% | 0.67% | |||||
THIRTY DAY YIELD COMPARISON
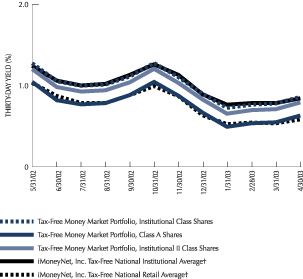
Past performance is not predictive of future performance.
†The performance of the iMoneyNet, Inc. averages does not include operating expenses that are incurred by each Portfolio.
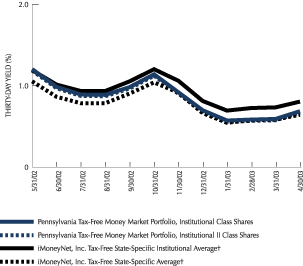
Pennsylvania Tax-Free Money Market Portfolio
| Inst’l Class Shares | Inst’I II Class Shares | iMoneyNet, Inc. Tax-Free State-Specific Institutional Average† | iMoneyNet, Inc. Tax-Free State-Specific Average† | |||||
Seven Day Simple Yield | 0.80% | 0.80% | 0.90% | 0.75% | ||||
THIRTY DAY YIELD COMPARISON
APRIL 30, 2003 / ANNUAL REPORT
6
Table of Contents
U.S. TREASURY MONEY MARKET PORTFOLIO

Schedule of Investments
| Description | Principal Amount (000) | Market Value (000) | |||||
| U.S. Treasury Obligations — 100.1% | |||||||
U.S. Treasury Bills ^ | |||||||
1.400%, 05/01/03 | $ | 9,383 | $ | 9,383 | |||
1.290%, 05/29/03 | 5,794 | 5,788 | |||||
1.229%, 06/26/03 | 29,281 | 29,225 | |||||
1.201%, 05/15/03 | 15,202 | 15,195 | |||||
1.200%, 07/03/03 | 34,506 | 34,434 | |||||
1.182%, 06/19/03 | 48,210 | 48,133 | |||||
1.180%, 07/31/03 | 10,438 | 10,407 | |||||
1.180%, 08/21/03 | 7,854 | 7,825 | |||||
1.178%, 07/17/03 | 24,561 | 24,499 | |||||
1.173%, 07/10/03 | 26,105 | 26,046 | |||||
1.170%, 05/22/03 | 11,945 | 11,937 | |||||
1.166%, 09/18/03 | 47,967 | 47,751 | |||||
1.162%, 08/07/03 | 35,220 | 35,109 | |||||
1.123%, 07/24/03 | 79,142 | 78,936 | |||||
1.121%, 06/12/03 | 49,974 | 49,909 | |||||
1.112%, 06/05/03 | 34,421 | 34,384 | |||||
U.S. Treasury Note | |||||||
3.000%, 01/31/04 | 10,000 | 10,137 | |||||
| TOTAL U.S. TREASURY OBLIGATIONS (COST $479,098) | $ | 479,098 | |||||
TOTAL INVESTMENTS — 100.1% (COST $479,098) | $ | 479,098 | |||||
| OTHER ASSETS & LIABILITIES, NET — (0.01)% | $ | (392 | ) | ||||
| TOTAL NET ASSETS — 100.0% | $ | 478,706 | |||||
| ^ | The effective yield at time of purchase is shown as the rate on the Schedule of Investments. |
The accompanying notes are an integral part of the financial statements.
ANNUAL REPORT / APRIL 30, 2003
7
Table of Contents
U.S. GOVERNMENT MONEY MARKET PORTFOLIO

Schedule of Investments
| Description | Principal Amount (000) | Market Value (000) | ||||
| U.S. Government Agency Obligations — 51.9% | ||||||
FFCB ^ | ||||||
1.616%, 05/15/03 | $ | 11,400 | $ | 11,393 | ||
1.576%, 05/28/03 | 25,000 | 24,971 | ||||
FHLB | ||||||
6.875%, 08/15/03 | 49,000 | 49,754 | ||||
6.375%, 11/14/03 | 12,950 | 13,295 | ||||
5.250%, 02/13/04 | 15,000 | 15,456 | ||||
5.125%, 09/15/03 | 42,000 | 42,588 | ||||
4.500%, 07/07/03 | 6,000 | 6,035 | ||||
3.750%, 02/13/04 | 5,000 | 5,093 | ||||
2.060%, 07/02/03 | 15,000 | 15,000 | ||||
1.500%, 03/08/04 | 6,000 | 6,000 | ||||
1.450%, 02/27/04 | 15,000 | 15,000 | ||||
1.450%, 05/14/04 | 10,000 | 10,000 | ||||
1.400%, 03/29/04 | 18,000 | 18,000 | ||||
1.300%, 04/07/04 | 15,000 | 15,000 | ||||
FHLB ^ | ||||||
1.250%, 05/01/03 | 100,000 | 100,000 | ||||
FHLB ‡ | ||||||
1.210%, 09/27/04 | 10,000 | 9,996 | ||||
1.190%, 05/27/04 | 25,000 | 24,989 | ||||
1.089%, 06/17/03 | 15,000 | 15,000 | ||||
FHLMC | ||||||
7.375%, 05/15/03 | 30,000 | 30,062 | ||||
6.375%, 11/15/03 | 5,100 | 5,240 | ||||
5.000%, 01/15/04 | 28,350 | 29,083 | ||||
FHLMC ^ | ||||||
1.760%, 07/17/03 | 39,899 | 39,751 | ||||
FNMA | ||||||
5.125%, 02/13/04 | 15,000 | 15,458 | ||||
4.750%, 11/14/03 | 7,000 | 7,119 | ||||
4.000%, 08/15/03 | 85,000 | 85,666 | ||||
| Description | Principal Amount (000) | Market Value (000) | ||||
FNMA ^ | ||||||
1.250%, 05/01/03 | $ | 200,000 | $ | 200,000 | ||
| TOTAL U.S. GOVERNMENT AGENCY OBLIGATIONS (COST $809,949) | $ | 809,949 | ||||
| Repurchase Agreements — 48.0% | ||||||
Credit Suisse First Boston 1.270%, dated 04/30/03, matures 05/01/03, repurchase price $55,001,940 (102% collateralized by various U.S. Treasury Obligations) | 55,000 | 55,000 | ||||
Deutsche Bank 1.280%, dated 04/30/03, matures 05/01/03, repurchase price $275,009,778 (102% collateralized by various U.S. Treasury Obligations) | 275,000 | 275,000 | ||||
Goldman Sachs 1.250%, dated 04/30/03, matures 05/01/03, repurchase price $235,008,160 (102% collateralized by various U.S. Treasury Obligations) | 235,000 | 235,000 | ||||
Goldman Sachs 1.100%, dated 04/30/03, matures 05/01/03, repurchase price $9,309,329 (102% collateralized by various U.S. Treasury Obligations) | 9,309 | 9,309 | ||||
Salomon Brothers 1.250%, dated 04/30/03, matures 05/01/03, repurchase price $175,006,076 (102% collateralized by various U.S. Treasury Obligations) | 175,000 | 175,000 | ||||
TOTAL REPURCHASE AGREEMENTS (COST $749,309) | $ | 749,309 | ||||
TOTAL INVESTMENTS — 99.9% (COST $1,559,258) | $ | 1,559,258 | ||||
| OTHER ASSETS & LIABILITIES, NET — 0.1% | $ | 2,833 | ||||
| TOTAL NET ASSETS — 100.0% | $ | 1,562,091 | ||||
| ^ | The effective yield at time of purchase is shown as the rate on the Schedule of Investments. |
| ‡ | Variable Rate Security. The rate reported on the Schedule of Investments is the rate in effect on 4/30/03. The date shown is the stated maturity. |
| FFCB — Federal Farm Credit Bureau |
| FHLB — Federal Home Loan Bank |
| FHLMC — Federal Home Loan Mortgage Corporation |
| FNMA — Federal National Mortgage Association |
The accompanying notes are an integral part of the financial statements.
APRIL 30, 2003 / ANNUAL REPORT
8
Table of Contents
MONEY MARKET PORTFOLIO

Schedule of Investments
| Description | Principal Amount (000) | Market Value (000) | ||||
| Corporate Obligations — 41.9% | ||||||
Banks — 11.6% | ||||||
Bank One | ||||||
8.740%, 09/15/03 | $ | 5,500 | $ | 5,635 | ||
6.875%, 06/15/03 | 3,000 | 3,018 | ||||
Bank of America | ||||||
6.500%, 08/15/03 | 20,000 | 20,262 | ||||
Bank of America ‡ | ||||||
1.584%, 03/12/04 | 25,000 | 25,074 | ||||
Bank of New York | ||||||
6.625%, 06/15/03 | 11,588 | 11,653 | ||||
Bank of Nova Scotia | ||||||
6.875%, 05/01/03 | 2,000 | 2,000 | ||||
Canadian Imperial Bank NY ‡ | ||||||
1.420%, 04/12/04 | 24,000 | 24,016 | ||||
Deutsche Bank NY | ||||||
1.685%, 03/10/04 | 23,000 | 23,000 | ||||
First Fidelity | ||||||
6.800%, 06/15/03 | 6,000 | 6,033 | ||||
Fleet Boston Financial | ||||||
6.625%, 02/01/04 | 5,110 | 5,308 | ||||
U.S. Bank N.A. ‡ | ||||||
1.243%, 05/29/03 | 6,500 | 6,500 | ||||
Wells Fargo | ||||||
9.125%, 02/01/04 | 5,000 | 5,290 | ||||
7.200%, 05/01/03 | 5,000 | 5,000 | ||||
TOTAL BANKS | $ | 142,789 | ||||
Financials — 11.0% | ||||||
Associates N.A | ||||||
5.750%, 11/01/03 | 37,800 | 38,586 | ||||
Beta Finance, MTN + | ||||||
2.700%, 05/22/03 | 22,000 | 22,000 | ||||
1.850%, 09/15/03 | 25,000 | 25,000 | ||||
| Description | Principal Amount (000) | Market Value (000) | ||||
Capital One Funding, Ser 1995-C ‡ | ||||||
1.350%, 10/01/15 | $ | 1,000 | $ | 1,000 | ||
Capital One Funding, Ser 1996-H ‡ | ||||||
1.350%, 10/01/21 | 1,000 | 1,000 | ||||
CIT Group ‡ | ||||||
2.027%, 04/08/04 | 5,000 | 5,009 | ||||
General Electric Capital | ||||||
6.750%, 09/11/03 | 2,194 | 2,235 | ||||
General Electric Capital ‡ | ||||||
1.390%, 07/28/03 | 10,000 | 10,001 | ||||
1.320%, 05/28/03 | 16,000 | 16,000 | ||||
Household Finance, MTN | ||||||
3.000%, 05/30/03 | 4,650 | 4,650 | ||||
Mellon Financial | ||||||
5.750%, 11/15/03 | 9,990 | 10,231 | ||||
TOTAL FINANCIALS | $ | 135,712 | ||||
Financials | ||||||
(Miscellaneous Business Services) — 1.3% | ||||||
Bob Sumerel Tire, Ser 1999 ‡ | ||||||
1.360%, 04/01/19 | 4,725 | 4,725 | ||||
Elsinore Properties, Ser 1999 ‡ | ||||||
1.360%, 01/01/29 | 9,600 | 9,600 | ||||
Trap Rock Industry, Ser 1997 ‡ | ||||||
1.370%, 10/01/12 | 1,000 | 1,000 | ||||
TOTAL FINANCIALS | $ | 15,325 | ||||
Security Brokers & Dealers — 16.0% | ||||||
Bear Stearns | ||||||
6.625%, 01/15/04 | 2,000 | 2,071 | ||||
6.150%, 03/02/04 | 21,502 | 22,326 | ||||
Bear Stearns ‡ | ||||||
1.665%, 05/16/03 | 500 | 500 | ||||
Goldman Sachs Group ‡ | ||||||
1.590%, 04/26/04 | 39,000 | 39,089 | ||||
Goldman Sachs Group ‡ + | ||||||
1.539%, 05/12/04 | 10,000 | 10,000 | ||||
Lehman Brothers Holdings | ||||||
7.360%, 12/15/03 | 7,000 | 7,239 | ||||
7.250%, 10/15/03 | 9,023 | 9,261 | ||||
6.625%, 04/01/04 | 1,065 | 1,115 | ||||
Lehman Brothers Holdings, Ser F, MTN | ||||||
7.000%, 05/15/03 | 14,130 | 14,154 | ||||
Merrill Lynch ‡ | ||||||
1.480%, 12/02/03 | 9,000 | 9,008 | ||||
1.440%, 10/01/03 | 18,000 | 18,004 | ||||
1.358%, 05/11/04 | 9,000 | 9,000 | ||||
ANNUAL REPORT / APRIL 30, 2003
9
Table of Contents
MONEY MARKET PORTFOLIO (continued)
| Description | Principal Amount (000) | Market Value (000) | ||||
Merrill Lynch, Ser B, MTN | ||||||
7.850%, 05/30/03 | $ | 7,700 | $ | 7,737 | ||
Morgan Stanley | ||||||
5.625%, 01/20/04 | 2,000 | 2,061 | ||||
Morgan Stanley ‡ | ||||||
1.810%, 03/09/04 | 22,000 | 22,086 | ||||
1.579%, 08/18/03 | 24,000 | 24,016 | ||||
TOTAL SECURITY BROKERS & DEALERS | $ | 197,667 | ||||
Telecommunications — 2.0% | ||||||
Verizon Global | ||||||
1.319%, 10/15/03 | 25,000 | 24,999 | ||||
TOTAL TELECOMMUNICATIONS | $ | 24,999 | ||||
| TOTAL CORPORATE OBLIGATIONS (COST $516,492) | $ | 516,492 | ||||
| Asset-Backed Commercial Paper — 28.7% | ||||||
Atlantis One Funding ^ | ||||||
1.274%, 05/08/03 | 50,000 | 49,988 | ||||
Bavaria ^ | ||||||
1.291%, 05/23/03 | 25,000 | 24,980 | ||||
1.291%, 05/27/03 | 25,000 | 24,977 | ||||
CXC ^ | ||||||
1.253%, 06/23/03 | 40,000 | 39,926 | ||||
Citibank Credit Card Issuance ^ | ||||||
1.253%, 05/09/03 | 50,000 | 49,986 | ||||
Corporate Asset Funding ^ | ||||||
1.253%, 06/24/03 | 14,374 | 14,347 | ||||
Corporate Asset Receivables ^ | ||||||
1.254%, 07/11/03 | 50,000 | 49,877 | ||||
Edison Asset Securitization ^ | ||||||
1.254%, 07/16/03 | 25,000 | 24,934 | ||||
1.253%, 06/10/03 | 25,000 | 24,965 | ||||
Falcon Asset Securitization ^ | ||||||
1.271%, 06/02/03 | 50,000 | 49,944 | ||||
| TOTAL ASSET-BACKED COMMERCIAL PAPER (COST $353,924) | $ | 353,924 | ||||
| Commercial Paper — 7.8% | ||||||
Financials — 7.4% | ||||||
CIT Group ^ | ||||||
1.345%, 05/12/03 | 20,000 | 19,992 | ||||
General Electric Capital | ||||||
1.268%, 11/07/03 | 21,000 | 21,000 | ||||
UBS Finance Delaware ^ | ||||||
1.360%, 05/01/03 | 50,000 | 50,000 | ||||
TOTAL FINANCIALS | $ | 90,992 | ||||
| Description | Principal Amount (000) | Market Value (000) | ||||
Financials | ||||||
(Miscellaneous Business Services) — 0.4% | ||||||
Reynolds Road Fitness, Ser 1998 ‡ | ||||||
1.360%, 01/01/19 | $ | 5,455 | $ | 5,455 | ||
TOTAL FINANCIALS | $ | 5,455 | ||||
| TOTAL COMMERCIAL PAPER (COST $96,447) | $ | 96,447 | ||||
| Municipal Bonds & Notes — 6.5% | ||||||
California — 0.6% | ||||||
Riverside County COP, Bankruptcy | ||||||
1.600%, 11/01/27 | 7,500 | 7,500 | ||||
TOTAL CALIFORNIA | $ | 7,500 | ||||
Illinois — 0.7% | ||||||
Illinois State, Health Facilities Authority RB, Loyola University Health Facilities Project, Ser C, MBIA § | ||||||
1.300%, 07/01/24 | 8,500 | 8,500 | ||||
TOTAL ILLINOIS | $ | 8,500 | ||||
Maryland — 0.4% | ||||||
Maryland State, Health & Higher Education Facilities RB, Charlestown, Ser B, First Union National Bank LOC § | ||||||
1.350%, 01/01/28 | 4,700 | 4,700 | ||||
TOTAL MARYLAND | $ | 4,700 | ||||
New Jersey — 0.3% | ||||||
New Jersey Economic Development Authority RB, The Morey Organization Project, First Union National Bank LOC § | ||||||
1.400%, 10/01/15 | 3,600 | 3,600 | ||||
TOTAL NEW JERSEY | $ | 3,600 | ||||
New York — 2.5% | ||||||
New York City, FGIC | ||||||
1.290%, 06/04/03 | 31,000 | 31,000 | ||||
TOTAL NEW YORK | $ | 31,000 | ||||
North Carolina — 0.5% | ||||||
Durham COP, Ser B § | ||||||
1.340%, 07/01/03 | 1,500 | 1,500 | ||||
Winston-Salem | ||||||
1.380%, 05/09/03 | 5,000 | 5,000 | ||||
TOTAL NORTH CAROLINA | $ | 6,500 | ||||
APRIL 30, 2003 / ANNUAL REPORT
10
Table of Contents
MONEY MARKET PORTFOLIO (concluded)
| Description | Principal Amount (000) | Market Value (000) | ||||
Texas — 1.5% | ||||||
Texas State GO, Veterans Housing Assistance Program, Ser A-2 § | ||||||
1.320%, 12/01/29 | $ | 10,000 | $ | 10,000 | ||
Texas State GO, Veterans Land Refunding Program, Ser B § | ||||||
1.320%, 12/01/09 | 8,920 | 8,920 | ||||
TOTAL TEXAS | $ | 18,920 | ||||
| TOTAL MUNICIPAL BONDS & NOTES (COST $80,720) | $ | 80,720 | ||||
| Asset-Backed Securities — 2.0% | ||||||
Ford Credit Auto Owner Trust, | ||||||
1.363%, 10/15/03 | 14,543 | 14,543 | ||||
Honda Auto Receivables Owner Trust, Ser 2002-3, Cl A1 | ||||||
1.823%, 08/18/03 | 2 | 2 | ||||
Whole Auto Loan Trust, Ser 2002-1, | ||||||
1.420%, 12/15/03 | 10,132 | 10,132 | ||||
| TOTAL ASSET-BACKED SECURITIES (COST $24,677) | $ | 24,677 | ||||
| Certificates of Deposit — 0.5% | ||||||
Financials — 0.5% | ||||||
Abbey National N.A. | ||||||
2.105%, 07/01/03 | 2,000 | 2,003 | ||||
Societe Generale NY | ||||||
9.875%, 07/15/03 | 4,100 | 4,172 | ||||
TOTAL FINANCIALS | $ | 6,175 | ||||
| TOTAL CERTIFICATES OF DEPOSIT (COST $6,175) | $ | 6,175 | ||||
| Repurchase Agreements — 12.7% | ||||||
Deutsche Bank, 1.280%, dated 04/30/03, matures 05/01/03, repurchase price $100,003,556 (102% collateralized by various U.S. Treasury Obligations) | 100,000 | 100,000 | ||||
Goldman Sachs, 1.250%, dated 04/30/03, matures 05/01/03, repurchase price $35,001,215 (102% collateralized by various U.S. Treasury Obligations) | 35,000 | 35,000 | ||||
Goldman Sachs, 1.100%, dated 04/30/03, matures 05/01/03, repurchase price $20,941,494 (102% collateralized by various U.S. Treasury Obligations) | 20,941 | 20,941 | ||||
| TOTAL REPURCHASE AGREEMENTS (COST $155,941) | $ | 155,941 | ||||
| Description | Principal Amount (000) | Market Value (000) | ||||
| TOTAL INVESTMENTS — 100.1% (COST $1,234,376) | $ | 1,234,376 | ||||
| OTHER ASSETS & LIABILITIES, NET — (0.1)% | $ | (853 | ) | |||
| TOTAL NET ASSETS — 100.0% | $ | 1,233,523 | ||||
| ‡ | Variable Rate Security. The rate reported on the Schedule of Investments is the rate in effect on 4/30/03. The date shown is the stated maturity. |
| § | These variable rate securities are subject to a put and demand feature. The date shown is the stated maturity. |
| ^ | The effective yield at time of purchase is shown as the rate on the Schedule of Investments. |
| + | Security exempt from registration under Rule 144A of the Securities Act of 1933. These securities may be resold in transactions exempt from registration normally qualified to institutional investors. |
Cl — Class
COP — Certificate of Participation
GO — General Obligation
LOC — Securities are held in connection with a letter of credit support for securities, as indicated.
MTN — Medium Term Note
RB — Revenue Bond
Ser — Series
These organizations have provided underlying credit support for securities listed above, as indicated.
FGIC — Financial Guaranty Insurance Corporation
MBIA — Municipal Bond Insurance Association
The accompanying notes are an integral part of the financial statements.
ANNUAL REPORT / APRIL 30, 2003
11
Table of Contents
TAX-FREE MONEY MARKET PORTFOLIO

Schedule of Investments
| Description | Principal Amount (000) | Market Value (000) | ||||
| Municipal Bonds & Notes — 96.4% | ||||||
Alabama — 0.5% | ||||||
Mobile, Industrial Development Board RB, Dock & Wharf, Holnam Project, | ||||||
1.350%, 06/01/32 | $ | 900 | $ | 900 | ||
TOTAL ALABAMA | $ | 900 | ||||
Alaska — 1.0% | ||||||
Valdez, Marine Terminal RB, BP Amoco Pipelines Project § | ||||||
1.350%, 07/01/37 | 1,850 | 1,850 | ||||
TOTAL ALASKA | $ | 1,850 | ||||
California — 5.1% | ||||||
Berkeley County, Pollution Control RB, BP Amoco Chemical Project § | ||||||
1.350%, 07/01/12 | 320 | 320 | ||||
California State, RAN | ||||||
2.500%, 06/20/03 | 5,300 | 5,307 | ||||
Oakland, JT Powers Financing Authority, Ser A-1, FSA § | ||||||
1.600%, 08/01/21 | 3,900 | 3,900 | ||||
TOTAL CALIFORNIA | $ | 9,527 | ||||
Colorado — 3.1% | ||||||
Colorado State, Postsecondary Educational Facilities Authority RB, Pro Rodeo Hall of Fame Project, Bank One Colorado N.A. LOC § | ||||||
1.500%, 10/01/10 | 645 | 645 | ||||
Jefferson County, School District R-001, GO, TRAN | ||||||
2.500%, 06/30/03 | 5,200 | 5,209 | ||||
TOTAL COLORADO | $ | 5,854 | ||||
District of Columbia — 0.8% | ||||||
District of Columbia, General Fund Recovery Project GO, Ser B-3, Morgan Guaranty Trust LOC § | ||||||
1.350%, 06/01/03 | 1,500 | 1,500 | ||||
TOTAL DISTRICT OF COLUMBIA | $ | 1,500 | ||||
| Description | Principal Amount (000) | Market Value (000) | ||||
Florida—3.6% | ||||||
Florida State, Housing Finance Agency RB, Ser AA, Remarketed 07/31/95, FNMA § | ||||||
1.330%, 06/15/25 | $ | 2,800 | $ | 2,800 | ||
Lee County, Housing Finance Authority RB, Forestwood Apartments Project, | ||||||
1.330%, 06/15/25 | 1,900 | 1,900 | ||||
Pinellas County, Housing Finance Authority RB, Foxbridge Apartments Project, Ser A, FNMA § | ||||||
1.330%, 06/15/25 | 2,000 | 2,000 | ||||
TOTAL FLORIDA | $ | 6,700 | ||||
Georgia — 0.9% | ||||||
De Kalb County, Housing Authority RB, | ||||||
1.350%, 06/15/25 | 1,600 | 1,600 | ||||
TOTAL GEORGIA | $ | 1,600 | ||||
Illinois — 2.2% | ||||||
Illinois State, Development Finance Authority RB, Pollution Control, | ||||||
1.350%, 11/01/12 | 600 | 600 | ||||
Illinois State, Health Facilities Authority RB, St. Luke’s Medical Center Project, | ||||||
1.350%, 11/15/23 | 3,500 | 3,500 | ||||
TOTAL ILLINOIS | $ | 4,100 | ||||
Indiana — 3.1% | ||||||
Columbus, Industrial RB, Quinco Consulting Center Project, Fifth Third Bank LOC § | ||||||
1.390%, 12/01/21 | 2,500 | 2,500 | ||||
Elkhart County, Industrial RB, Hubbard Hill Estates Project, Fifth Third Bank LOC § | ||||||
1.390%, 11/01/21 | 1,200 | 1,200 | ||||
Indiana State, Educational Facilities Authority RB, University of Notre Dame Du Lac Project § | ||||||
1.280%, 03/01/25 | 2,000 | 2,000 | ||||
TOTAL INDIANA | $ | 5,700 | ||||
Iowa — 1.2% | ||||||
Iowa State, Higher Educational Facilities Authority RB, Ambrose Project, Wells Fargo Bank N.A. LOC § | ||||||
1.350%, 10/01/09 | 400 | 400 | ||||
Iowa State, School Cash Anticipation Program, Ser B, FSA | ||||||
2.250%, 01/30/04 | 1,800 | 1,816 | ||||
TOTAL IOWA | $ | 2,216 | ||||
APRIL 30, 2003 / ANNUAL REPORT
12
Table of Contents
TAX-FREE MONEY MARKET PORTFOLIO (continued)
| Description | Principal Amount (000) | Market Value (000) | ||||
Kentucky — 1.0% | ||||||
Kenton County, Industrial Building RB, Baptist Convalescent Center Project, | ||||||
1.400%, 07/01/18 | $ | 1,875 | $ | 1,875 | ||
TOTAL KENTUCKY | $ | 1,875 | ||||
Louisiana — 1.6% | ||||||
Lake Charles, Harbor & Revenue | ||||||
1.350%, 09/01/29 | 3,000 | 3,000 | ||||
TOTAL LOUISIANA | $ | 3,000 | ||||
Maryland — 18.8% | ||||||
Baltimore County, Consolidated Public Improvements Project, GO | ||||||
3.000%, 09/01/03 | 2,700 | 2,715 | ||||
Gaithersburg, Economic | ||||||
1.350%, 07/01/27 | 5,250 | 5,250 | ||||
Howard County, Housing RB, Avalon Meadows Project, FNMA § | ||||||
1.300%, 06/15/26 | 2,000 | 2,000 | ||||
Maryland State, Health & Higher Education Facilities Authority RB, Charlestown Community Project, Ser A, First Union National Bank LOC § | ||||||
1.350%, 01/01/28 | 6,445 | 6,445 | ||||
Maryland State, Health & Higher Education Facilities Authority RB, Pooled Loan Program, Ser A, Bank One LOC § | ||||||
1.320%, 04/01/35 | 5,600 | 5,600 | ||||
Maryland State, Health & Higher Education Facilities Authority RB, Pooled Loan Program, Ser B, Bank One LOC § | ||||||
1.300%, 04/01/35 | 700 | 700 | ||||
Maryland State, Health & Higher Education Facilities Authority RB, Pooled Loan Program, Ser D, Bank of America N.A. LOC § | ||||||
1.350%, 01/01/29 | 5,233 | 5,233 | ||||
Maryland State, University of Maryland Authority RB, Equipment Loan Program, Ser A § | ||||||
1.300%, 07/01/15 | 500 | 500 | ||||
Maryland State, University of Maryland Authority RB, Revolving Equipment Loan Program, Ser B § | ||||||
1.300%, 07/01/15 | 400 | 400 | ||||
| Description | Principal Amount (000) | Market Value (000) | ||||
Montgomery County, Housing Opportunities RB, Barclay Apartments Project, Issue I, MBIA § | ||||||
1.250%, 07/01/29 | $ | 2,800 | $ | 2,800 | ||
Washington County, Economic Development Authority RB, St. James School Project, PNC Bank N.A. LOC § | ||||||
2.000%, 11/01/29 | 1,500 | 1,500 | ||||
Westminster, Educational Facilities RB, Western Maryland College Project, Wachovia Bank N.A. LOC § | ||||||
1.350%, 04/01/30 | 1,700 | 1,700 | ||||
TOTAL MARYLAND | $ | 34,843 | ||||
Massachusetts — 1.4% | ||||||
Massachusetts State, Health & Higher Educational Facilities RB, Capital Asset Program, Ser B, MBIA § | ||||||
1.300%, 07/01/10 | 700 | 700 | ||||
Massachusetts State, Water Resources Authority RB, Ser A, AMBAC § | ||||||
1.280%, 08/01/28 | 1,965 | 1,965 | ||||
TOTAL MASSACHUSETTS | $ | 2,665 | ||||
Michigan — 1.1% | ||||||
Detroit, Water Supply Systems RB, FGIC § | ||||||
1.350%, 07/01/13 | 2,100 | 2,100 | ||||
TOTAL MICHIGAN | $ | 2,100 | ||||
Mississippi — 1.7% | ||||||
Jackson County, Port Facility Authority RB, Chevron USA Project § | ||||||
1.350%, 06/01/23 | 3,100 | 3,100 | ||||
TOTAL MISSISSIPPI | $ | 3,100 | ||||
Missouri — 0.4% | ||||||
Missouri State, Health & Educational Facilities Authority RB, Washington University Project, Ser A § | ||||||
1.300%, 09/01/30 | 700 | 700 | ||||
TOTAL MISSOURI | $ | 700 | ||||
Montana — 0.5% | ||||||
Montana State, Health Facilities Authority RB, Healthcare Pooled Loan Program, | ||||||
1.350%, 12/01/15 | 1,000 | 1,000 | ||||
TOTAL MONTANA | $ | 1,000 | ||||
ANNUAL REPORT / APRIL 30, 2003
13
Table of Contents
TAX-FREE MONEY MARKET PORTFOLIO (continued)
| Description | Principal Amount (000) | Market Value (000) | ||||
Nevada — 0.4% | ||||||
Clark County, Airport Improvement Authority RB, Ser A, MBIA, Bayerische Vereinsbank LOC § | ||||||
1.300%, 07/01/12 | $ | 800 | $ | 800 | ||
TOTAL NEVADA | $ | 800 | ||||
New Hampshire — 0.8% | ||||||
New Hampshire State, Housing Finance Authority RB, Equity Residential Property—Bond Partnership—Manchester Project, FNMA § | ||||||
1.350%, 09/15/26 | 1,500 | 1,500 | ||||
TOTAL NEW HAMPSHIRE | $ | 1,500 | ||||
New Jersey — 1.0% | ||||||
New Jersey State, Municipal Securities Trust Receipts RB, Ser CB1 § | ||||||
1.400%, 02/15/11 | 1,800 | 1,800 | ||||
TOTAL NEW JERSEY | $ | 1,800 | ||||
New York — 0.7% | ||||||
New York, GO, Sub-Ser A-8, Morgan Guaranty Trust LOC § | ||||||
1.400%, 08/01/18 | 1,300 | 1,300 | ||||
TOTAL NEW YORK | $ | 1,300 | ||||
North Carolina — 3.5% | ||||||
Charlotte, Airport Development | ||||||
1.600%, 07/01/16 | 1,540 | 1,540 | ||||
Durham, Water & Sewer | ||||||
1.400%, 12/01/15 | 2,000 | 2,000 | ||||
Greensboro, Public Improvements Project, GO, Ser B § | ||||||
1.300%, 04/01/14 | 1,000 | 1,000 | ||||
North Carolina State, Educational Facilities Financing Authority RB, | ||||||
1.350%, 01/01/21 | 1,900 | 1,900 | ||||
TOTAL NORTH CAROLINA | $ | 6,440 | ||||
Ohio — 1.4% | ||||||
Allen County, GO, AMBAC | ||||||
1.500%, 12/01/03 | 525 | 525 | ||||
Butler County, Healthcare Facilities Authority RB, UC Physicians Project, | ||||||
1.390%, 09/01/22 | 2,000 | 2,000 | ||||
TOTAL OHIO | $ | 2,525 | ||||
| Description | Principal Amount (000) | Market Value (000) | ||||
Pennsylvania — 24.7% | ||||||
Allegheny County, Hospital Development Authority RB, Health Center—South Hills Project, Ser A, PNC Bank N.A. LOC § | ||||||
1.950%, 06/01/30 | $ | 1,150 | $ | 1,150 | ||
Allentown, Commercial & Industrial Development Authority RB, Diocese of Allentown Project, First Union National Bank LOC § | ||||||
1.350%, 12/01/29 | 2,430 | 2,430 | ||||
Bucks County, Industrial Development Authority RB, Christian Life Center Project, First Union National Bank LOC § | ||||||
1.450%, 09/01/19 | 600 | 600 | ||||
Chester County, Health & Educational Facilities Authority RB, Barclay Friends Project, Ser A, First Union National | ||||||
1.350%, 08/01/25 | 945 | 945 | ||||
Chester County, Industrial Development Authority RB, Archdiocese of Philadelphia Project, Wachovia Bank N.A. LOC § | ||||||
1.350%, 07/01/31 | 600 | 600 | ||||
Chester County, Industrial Development Authority RB, The Woods Project, | ||||||
1.400%, 03/31/15 | 140 | 140 | ||||
Dallastown, Area School District Authority, GO, FGIC § | ||||||
1.420%, 02/01/18 | 350 | 350 | ||||
Delaware County, Industrial Development Authority RB, Resource Recovery Facility Project, Ser G § | ||||||
1.280%, 12/01/31 | 2,055 | 2,055 | ||||
1.280%, 12/01/31 | 2,860 | 2,860 | ||||
Delaware Valley, Regional Finance Authority RB, Mode 1, Toronto-Dominion Bank LOC § | ||||||
1.350%, 08/01/16 | 5,700 | 5,700 | ||||
Emmaus, General Authority RB, Loan Program, Ser A, FSA § | ||||||
1.400%, 03/01/30 | 2,600 | 2,600 | ||||
Emmaus, General Authority RB, Remarketed 03/03/97 § | ||||||
1.400%, 03/01/24 | 2,800 | 2,800 | ||||
Emmaus, General Authority RB, Ser E, Remarketed 07/01/97 § | ||||||
1.400%, 03/01/24 | 3,000 | 3,000 | ||||
Erie County, Higher Education Building Authority RB, Gannon University Project, Ser F, PNC Bank N.A. LOC § | ||||||
1.400%, 07/01/13 | 1,000 | 1,000 | ||||
APRIL 30, 2003 / ANNUAL REPORT
14
Table of Contents
TAX-FREE MONEY MARKET PORTFOLIO (continued)
| Description | Principal Amount (000) | Market Value (000) | ||||
Erie County, Hospital Authority RB, Hamot Health Foundation Project, AMBAC § | ||||||
1.350%, 05/15/20 | $ | 650 | $ | 650 | ||
Huntingdon County, General Authority RB, Juniata College Project, Ser A, | ||||||
2.050%, 05/01/26 | 850 | 850 | ||||
Lancaster County, Hospital Authority RB, Health Center — Masonic Homes Project, AMBAC § | ||||||
1.350%, 07/01/34 | 1,585 | 1,585 | ||||
Lehigh County, Industrial Development Authority RB, Allegheny Electric Cooperative Project, Ser A, Rabobank Nederland LOC § | ||||||
1.300%, 12/01/15 | 1,500 | 1,500 | ||||
Lehigh County, Industrial Development Authority RB, Allentown Airport Project, First Union National Bank LOC § | ||||||
1.450%, 12/01/05 | 900 | 900 | ||||
Luzerne County, Convention Center Authority RB, Ser A, Wachovia | ||||||
1.350%, 09/01/28 | 1,550 | 1,550 | ||||
Montgomery County, Redevelopment Authority RB, Forge Gate Apartments Project, Ser A § | ||||||
1.300%, 08/15/31 | 600 | 600 | ||||
Pennsylvania State, Economic Development Financing Authority RB, Glade Run Lutheran Services Project, | ||||||
1.400%, 09/01/15 | 475 | 475 | ||||
Pennsylvania State, GO, 1st Ser, MBIA | ||||||
5.000%, 06/01/03 | 740 | 742 | ||||
Pennsylvania State University, Higher Educational Facilities Authority RB, | ||||||
1.330%, 04/01/31 | 450 | 450 | ||||
1.330%, 03/01/32 | 1,400 | 1,400 | ||||
Pennsylvania State, Intergovernmental Special Tax Authority, GO, City of Philadelphia Funding Program, MBIA, Prerefunded 06/15/03 @ 100 | ||||||
5.600%, 06/15/15 | 1,000 | 1,005 | ||||
Pennsylvania Turnpike RB, Ser Q § | ||||||
1.350%, 06/01/28 | 1,750 | 1,750 | ||||
Philadelphia, Water & Wastewater Authority RB, Ser B, AMBAC § | ||||||
1.300%, 08/01/27 | 3,000 | 3,000 | ||||
| Description | Principal Amount (000) | Market Value (000) | ||||
Schuylkill County, GO, AMBAC § | ||||||
1.440%, 09/01/15 | $ | 400 | $ | 400 | ||
University of Pittsburgh, University Capital Project RB, Ser A § | ||||||
1.350%, 09/15/04 | 400 | 400 | ||||
1.350%, 09/15/29 | 500 | 500 | ||||
University of Pittsburgh, University Capital Project RB, Ser B § | ||||||
1.350%, 09/15/29 | 1,500 | 1,500 | ||||
York, General Authority Pooled Finance RB, Sub-Ser A, Remarketed 05/07/98, AMBAC § | ||||||
1.350%, 09/01/26 | 375 | 375 | ||||
TOTAL PENNSYLVANIA | $ | 45,862 | ||||
Texas — 10.5% | ||||||
City of Midlothian, Industrial Development Authority RB, Box-Crow Cement Project, UBS AG Bank LOC § | ||||||
1.370%, 12/01/09 | 1,900 | 1,900 | ||||
Georgetown, Higher Education Financing RB, Southwestern University Project, Chase Manhattan Bank LOC § | ||||||
1.350%, 10/01/14 | 3,000 | 3,000 | ||||
Gulf Coast, Waste Disposal Authority Texas Pollution Control RB, Exxon | ||||||
1.300%, 06/01/20 | 600 | 600 | ||||
Splendora, Higher Education Financing Authority RB, Fort Bend Baptist Project, Ser A, Wells Fargo Bank N.A. LOC § | ||||||
1.350%, 12/01/26 | 3,600 | 3,600 | ||||
Texas State, GO, TRAN | ||||||
2.750%, 08/29/03 | 5,300 | 5,323 | ||||
Texas State, Gas Utility RB, FSA § | ||||||
1.350%, 01/15/23 | 3,500 | 3,500 | ||||
Texas State, Higher Education | ||||||
1.350%, 12/01/25 | 1,580 | 1,580 | ||||
TOTAL TEXAS | $ | 19,503 | ||||
Utah — 1.0% | ||||||
Emery County, Pollution Control RB, Pacificorp Project, AMBAC § | ||||||
1.350%, 11/01/24 | 40 | 40 | ||||
Emery County, Pollution Control RB, Pacificorp Project, Bank One N.A. LOC § | ||||||
1.400%, 07/01/15 | 1,800 | 1,800 | ||||
TOTAL UTAH | $ | 1,840 | ||||
ANNUAL REPORT / APRIL 30, 2003
15
Table of Contents
TAX-FREE MONEY MARKET PORTFOLIO (concluded)
| Description | Principal Amount (000) | Market Value (000) | ||||
Vermont — 3.0% | ||||||
Vermont State, Educational & Health Buildings Financing Authority RB, Capital Asset Financing Program, Ser 1, Chittenden Trust / First Union National Bank LOC § | ||||||
1.450%, 06/01/22 | $ | 1,500 | $ | 1,500 | ||
Vermont State, Educational & Health Buildings Financing Authority RB, VHA New England Project, Ser C, AMBAC § | ||||||
1.400%, 12/01/25 | 1,000 | 1,000 | ||||
Vermont State, Educational & Health Buildings Financing Authority RB, VHA New England Project, Ser E, AMBAC § | ||||||
1.400%, 12/01/25 | 3,100 | 3,100 | ||||
TOTAL VERMONT | $ | 5,600 | ||||
Wyoming — 1.4% | ||||||
Lincoln County, Pollution Control Authority RB, Exxon Project § | ||||||
1.300%, 08/01/15 | 730 | 730 | ||||
Sublette County, Pollution Control RB, Exxon Project § | ||||||
1.300%, 11/01/14 | 1,850 | 1,850 | ||||
TOTAL WYOMING | $ | 2,580 | ||||
| TOTAL MUNICIPAL BONDS & NOTES (COST $178,980) | $ | 178,980 | ||||
| Commercial Paper — 3.4% | ||||||
District of Columbia, National Academy of Science Project | ||||||
1.050%, 05/27/03 | 1,000 | 1,000 | ||||
Howard County Maryland | ||||||
1.100%, 06/02/03 | 5,300 | 5,300 | ||||
TOTAL COMMERCIAL PAPER (COST $6,300) | $ | 6,300 | ||||
TOTAL INVESTMENTS — 99.8% (COST $185,280) | $ | 185,280 | ||||
| OTHER ASSETS & LIABILITIES, NET — 0.2% | $ | 373 | ||||
| TOTAL NET ASSETS — 100.0% | $ | 185,653 | ||||
| § | These variable rate securities are subject to a put and demand feature. The date shown is the stated maturity. |
GO — General Obligation
LOC — Securities are held in connection with a letter of credit support for securities as listed above, as indicated.
RAN — Revenue Anticipation Note
RB — Revenue Bond
Ser — Series
TRAN — Tax & Revenue Anticipation Note
These organizations have provided underlying credit support for securities, as indicated.
AMBAC — American Municipal Bond Assurance Corporation
FGIC — Financial Guaranty Insurance Corporation
FNMA — Federal National Mortgage Association
FSA — Financial Security Assistance
MBIA — Municipal Bond Insurance Association
The accompanying notes are an integral part of the financial statements.
APRIL 30, 2003 / ANNUAL REPORT
16
Table of Contents
PENNSYLVANIA TAX-FREE MONEY MARKET PORTFOLIO

Schedule of Investments
| Description | Principal Amount (000) | Market Value (000) | ||||
| Municipal Bonds & Notes — 99.7% | ||||||
Pennsylvania — 99.7% | ||||||
Beaver County, Industrial Development Authority RB, Atlantic Richfield Project § | ||||||
1.350%, 12/01/20 | $ | 700 | $ | 700 | ||
Berks County, GO, MBIA § | ||||||
1.320%, 11/01/23 | 500 | 500 | ||||
Bucks County, Industrial Development Authority RB, SHV Real Estate Project, ABN Amro Bank N.V. LOC § | ||||||
1.300%, 07/01/15 | 800 | 800 | ||||
Chester County, Health & Educational Facilities Authority RB, Barclay Friends Project, Ser A, First Union National | ||||||
1.350%, 08/01/25 | 315 | 315 | ||||
Chester County, Industrial Development Authority RB, Archdiocese of Philadelphia Project, Wachovia Bank N.A. LOC § | ||||||
1.350%, 07/01/31 | 600 | 600 | ||||
Chester County, Industrial Development Authority RB, The Woods Project, PNC Bank N.A. LOC § | ||||||
1.400%, 03/31/15 | 180 | 180 | ||||
Dallastown, Area School District Authority, GO, FGIC § | ||||||
1.420%, 02/01/18 | 150 | 150 | ||||
Delaware County, Industrial Development Authority RB, Resource Recovery Facility Project, Ser G § | ||||||
1.280%, 12/01/31 | 700 | 700 | ||||
1.280%, 12/01/31 | 130 | 130 | ||||
Delaware County, Industrial Development Authority RB, Scott | ||||||
1.350%, 12/01/18 | 800 | 800 | ||||
Delaware Valley, Regional Finance Authority RB, Ser A, Toronto-Dominion Bank N.A. LOC § | ||||||
1.350%, 12/01/20 | 500 | 500 | ||||
East Hempfield Township, Industrial Development Authority RB, Menonite Home Project, Northern Trust | ||||||
1.420%, 06/01/25 | 785 | 785 | ||||
| Description | Principal Amount (000) | Market Value (000) | ||||
Emmaus, General Authority RB, Ser E, Remarketed 07/01/97 § | ||||||
1.400%, 03/01/24 | $ | 400 | $ | 400 | ||
Emmaus, General Authority RB, Ser G, Remarketed 12/01/97 § | ||||||
1.400%, 03/01/24 | 200 | 200 | ||||
Erie County, Higher Education Building Authority RB, Gannon University Project, Ser F, PNC Bank N.A. LOC § | ||||||
1.400%, 07/01/13 | 700 | 700 | ||||
Huntingdon County, General Authority RB, Juniata College Project, Ser A, | ||||||
2.050%, 05/01/26 | 500 | 500 | ||||
Lancaster County, Hospital Authority RB, Health Center — Masonic Homes Project, AMBAC § | ||||||
1.350%, 07/01/34 | 200 | 200 | ||||
Lancaster, Higher Education Authority RB, Franklin & Marshall College Project § | ||||||
1.450%, 04/15/27 | 395 | 395 | ||||
Lehigh County, Industrial Development Authority RB, Allegheny Electric Cooperative Project, Ser A, Rabobank Nederland LOC § | ||||||
1.300%, 12/01/15 | 500 | 500 | ||||
Lehigh County, Industrial Development Authority RB, Allentown Airport Project, First Union National Bank LOC § | ||||||
1.450%, 12/01/05 | 600 | 600 | ||||
Montgomery County, Redevelopment Authority RB, Forge Gate Apartments Project, Ser A § | ||||||
1.300%, 08/15/31 | 800 | 800 | ||||
Moon, Industrial Development Authority RB, Executive Office Association Project, PNC Bank N.A. LOC § | ||||||
1.400%, 11/01/10 | 300 | 300 | ||||
Pennsylvania State, GO, 1st Ser, MBIA | ||||||
5.000%, 06/01/03 | 500 | 502 | ||||
Pennsylvania State, GO, AMBAC | ||||||
5.125%, 09/15/03 | 500 | 507 | ||||
Pennsylvania State, Intergovernmental Special Tax Authority, GO, City of Philadelphia Funding Program, MBIA, Prerefunded 06/15/03 @ 100 | ||||||
5.600%, 06/15/15 | 400 | 402 | ||||
Pennsylvania Turnpike RB, Ser Q § | ||||||
1.350%, 06/01/28 | 150 | 150 | ||||
Philadelphia, Gas Works RB, | ||||||
1.390%, 07/01/28 | 760 | 760 | ||||
ANNUAL REPORT / APRIL 30, 2003
17
Table of Contents
PENNSYLVANIA TAX-FREE MONEY MARKET PORTFOLIO (concluded)
| Description | Principal Amount (000) | Market Value (000) | ||||
Philadelphia, Industrial Development Authority RB, Newcourtland Elder Services Project, PNC Bank N.A. LOC § | ||||||
1.350%, 03/01/27 | $ | 300 | $ | 300 | ||
Philadelphia, Water & Wastewater Authority RB, Ser B, AMBAC § | ||||||
1.300%, 08/01/27 | 1,000 | 1,000 | ||||
Pittsburgh, GO, AMBAC | ||||||
4.750%, 09/01/03 | 500 | 505 | ||||
Schuylkill County, GO, AMBAC § | ||||||
1.440%, 09/01/15 | 100 | 100 | ||||
University of Pittsburgh, University Capital Project RB, Ser A § | ||||||
1.350%, 09/15/29 | 100 | 100 | ||||
University of Pittsburgh, University Capital Project RB, Ser B § | ||||||
1.350%, 09/15/29 | 400 | 400 | ||||
York, General Authority Pooled Finance RB, Harrisburg Parking Project, | ||||||
1.350%, 09/01/26 | 545 | 545 | ||||
York, General Authority Pooled Finance RB, Sub-Ser 96B, Remarketed 04/29/99, AMBAC § | ||||||
1.350%, 09/01/26 | 520 | 520 | ||||
York, General Authority Pooled Finance RB, Sub-Ser A, Remarketed 05/07/98, AMBAC § | ||||||
1.350%, 09/01/26 | 300 | 300 | ||||
TOTAL PENNSYLVANIA | $ | 16,846 | ||||
| TOTAL MUNICIPAL BONDS & NOTES (COST $16,846) | $ | 16,846 | ||||
TOTAL INVESTMENTS — 99.7% (COST $16,846) | $ | 16,846 | ||||
| OTHER ASSETS & LIABILITIES, NET — 0.3% | $ | 46 | ||||
| TOTAL NET ASSETS — 100.0% | $ | 16,892 | ||||
| § | These variable rate securities are subject to a put and demand feature. The date shown is the stated maturity. |
GO — General Obligation
| LOC — | Securities are held in connection with a letter of credit support for securities listed above, as indicated. |
RB — Revenue Bond
Ser — Series
These organizations have provided underlying credit support for securities as indicated
AMBAC — American Municipal Bond Assurance Corporation
FGIC — Financial Guaranty Insurance Corporation
FSA — Financial Security Assistance
MBIA — Municipal Bond Insurance Association
The accompanying notes are an integral part of the financial statements.
APRIL 30, 2003 / ANNUAL REPORT
18
Table of Contents
FIXED INCOME PORTFOLIOS
Fixed Income
Portfolios
Our fixed income investment management philosophy centers on four core beliefs. We believe that over a full interest-rate cycle, a portfolio of fixed income investments should provide real returns that exceed any loss of purchasing power due to inflation, be competitive with the specified portfolio benchmark return, be competitive versus portfolios of similar risk, and maintain low-to-moderate principal volatility.
With the understanding of each Portfolio’s constraints and tolerance for risk, we employ a value approach to fixed income investing involving over- or under-weighting market sectors, industries, or yield curve segments deemed to be relatively undervalued or expensive. We undertake rigorous analysis utilizing the following components to construct a portfolio: sector selection, duration management, credit analysis, industry and issue selection, and yield curve management.
The fixed income process is an actively managed, bottom-up sector selection approach, wherein risk containment is paramount. Our objective is to position the Portfolios in such a way that our sector, interest rate, yield curve, and credit analysis can add value without assuming an inordinate risk of underperformance. As part of the construction and management process, we continually test the Portfolios to assess and control risk. This disciplined fixed income philosophy has been in place within our organization for more than 15 years, has been consistently applied, and has generated historically strong results.
19
Table of Contents
SHORT-TERM TREASURY PORTFOLIO
James M. Hannan
PORTFOLIO MANAGER
James M. Hannan is manager of the Short-Term Treasury Portfolio, and is manager or co-manager of other ARK Funds Portfolios. He is also responsible for several separately managed institutional portfolios. Mr. Hannan has been a Portfolio Manager of AIA since 1996, a Vice President of Allfirst Bank from 1987 to 2003 and a Vice President of M&T Trust since 2003. He has more than 15 years of experience in the investment industry.
Management Discussion and Analysis
As economic growth remained elusive over the past fiscal year, interest rates fell. The 2-year Treasury note declined from a high yield for the fiscal year of 3.37% on May 17, 2002 to a yield of 1.49% on April 30, 2003. The Federal Reserve lowered short-term interest rates once during the period in November 2002 to 1.25% from 1.75%. We were challenged to seek out investments that would provide competitive short-term returns, even as falling rates negatively impacted Portfolio performance.
Working within this declining interest rate environment, we continued to invest in U.S. Treasury securities maturing in less than 3 years. Portfolio strategy was to maintain an average maturity of between 1 1/2 and 1 3/4 years, which positively impacted Portfolio performance. Had duration been shorter, our performance would have suffered.
As always we will continue to consistently utilize our conservative and disciplined relative value investment process.
APRIL 30, 2003 / ANNUAL REPORT
20
Table of Contents
SHORT-TERM TREASURY PORTFOLIO
Performance as of April 30, 2003
INSTITUTIONAL CLASS SHARES: VALUE OF A $100,000 INVESTMENT
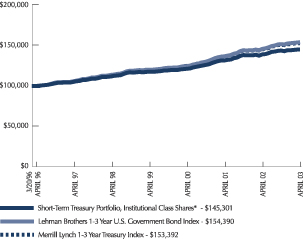
CLASS A SHARES: VALUE OF A $10,000 INVESTMENT
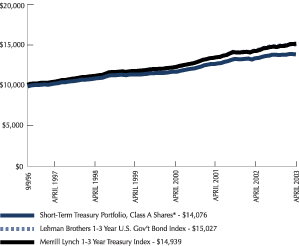
| Inst’l Class Shares* | Class A Shares* | Merrill Lynch 1-3 Year Treasury Index | Lehman Brothers 1-3 Year U.S. Gov’t Bond Index | |||||
| One year total return | 4.18% | 3.93% | 5.39% | 5.63% | ||||
| Annualized three year total return | 6.10% | 5.88% | 7.08% | 7.34% | ||||
| Annualized five year total return | 5.32% | 5.09% | 6.16% | 6.29% | ||||
| Annualized total return inception to date | 5.39% | 5.29% | — | — | ||||
Past performance is no guarantee of future results. Investment return and principal value will fluctuate so that an investor’s shares, when redeemed, may be worth more or less than original cost. Total return figures include the reinvestment of dividends and capital gains. During the period, certain fees may have been waived or expenses reimbursed; otherwise total return would have been lower.
| * | Institutional Class Shares were offered beginning March 20, 1996. Class A Shares were offered beginning September 9, 1996. Class A Shares are not subject to a sales charge. |
The performance of the Lehman Brothers 1-3 Year U.S. Government Bond Index and the Merrill Lynch 1-3 Year Treasury Index do not include operating expenses that are incurred by the Portfolio. Index performance for the Institutional Class Shares is for the period March 31, 1996 to April 30, 2003. Index performance for the Class A Shares is for the period September 30, 1996 to April 30, 2003.
The performance information presented in the graphs and table above do not reflect the deduction of taxes that a shareholder would pay on Portfolio distributions or the redemption of Portfolio shares.

Schedule of Investments
| Description | Principal Amount (000) | Market Value (000) | ||||
| U.S. Treasury Obligations — 98.5% | ||||||
U.S. Treasury Bills ^ | ||||||
1.241%, 05/22/2003 | $ | 48 | $ | 48 | ||
1.233%, 06/05/2003 | 33 | 33 | ||||
1.187%, 07/03/2003 | 611 | 610 | ||||
1.186%, 06/19/2003 | 787 | 786 | ||||
1.176%, 09/18/2003 | 288 | 287 | ||||
1.172%, 08/07/2003 | 418 | 417 | ||||
1.163%, 07/10/2003 | 2,255 | 2,250 | ||||
1.158%, 05/15/2003 | 570 | 570 | ||||
1.157%, 07/17/2003 | 186 | 186 | ||||
1.145%, 08/28/2003 | 35 | 35 | ||||
1.132%, 07/24/2003 | 519 | 518 | ||||
1.131%, 10/16/2003 | 36 | 36 | ||||
1.120%, 09/25/2003 | 216 | 215 | ||||
1.118%, 06/26/2003 | 1,487 | 1,484 | ||||
1.110%, 06/12/2003 | 101 | 101 | ||||
U.S. Treasury Bonds | ||||||
10.750%, 05/15/2003 | 2,000 | 2,007 | ||||
U.S. Treasury Notes | ||||||
7.500%, 02/15/2005 | 9,000 | 9,969 | ||||
6.750%, 05/15/2005 | 5,000 | 5,523 | ||||
6.500%, 08/15/2005 | 4,000 | 4,438 | ||||
6.000%, 08/15/2004 | 500 | 531 | ||||
5.875%, 02/15/2004 | 2,000 | 2,075 | ||||
5.875%, 11/15/2004 | 9,000 | 9,621 | ||||
5.875%, 11/15/2005 | 3,000 | 3,305 | ||||
4.250%, 11/15/2003 | 3,000 | 3,049 | ||||
3.250%, 05/31/2004 | 4,500 | 4,600 | ||||
1.625%, 01/31/2005 | 5,000 | 5,019 | ||||
| TOTAL U.S. TREASURY OBLIGATIONS (COST $56,698) | $ | 57,713 | ||||
| TOTAL INVESTMENTS — 98.5% (COST $56,698) | $ | 57,713 | ||||
| OTHER ASSETS & LIABILITIES, NET — 1.5% | $ | 881 | ||||
| TOTAL NET ASSETS — 100.0% | $ | 58,594 | ||||
| ^ | The effective yield at time of purchase is shown as the rate on the Schedule of Investments. |
The accompanying notes are an integral part of the financial statements.
APRIL 30, 2003 / ANNUAL REPORT
21
Table of Contents
FIXED INCOME PORTFOLIOS
SHORT-TERM BOND PORTFOLIO

Wilmer C. Stith III, CFA
PORTFOLIO MANAGER
Wilmer C. Stith III, CFA is manager of the Short-Term Bond Portfolio, and is manager or co-manager of other ARK Funds Portfolios. He has been a Vice President of AIA and Portfolio Manager since 1996. He manages separate accounts, assists in the management of the money market portfolios, and is responsible for analyzing and trading various fixed income securities. Mr. Stith has more than 10 years of experience in the investment industry, and is a Chartered Financial Analyst.
Management Discussion and Analysis
The Portfolio reduced its exposure to U.S. Treasury securities to 4%, its lowest allocation in over 5 years. We took this action, anticipating that as the Federal government finances its budget deficit for 2003, Treasuries will be issued at a much greater volume as compared to last year. The potential result of this action may cause Treasuries to underperform other sectors. Conversely, as corporate profit margins continued to compress amidst global competition and little to no pricing power, we increased our exposure to select corporate securities. For example, Portfolio performance was positively impacted as we added yield with the purchase of approximately one-year CIT Group corporate bonds.
We will continue our investment approach of seeking to invest in higher-yielding corporate and asset-backed securities.
APRIL 30, 2003 / ANNUAL REPORT
22
Table of Contents
SHORT-TERM BOND PORTFOLIO
Performance as of April 30, 2003
INSTITUTIONAL CLASS SHARES: VALUE OF A $100,000 INVESTMENT
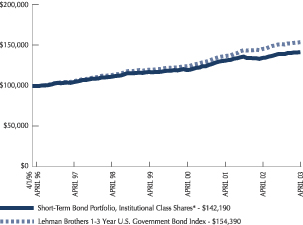
| Inst’l Class Shares* | Lehman Brothers 1-3 Year U.S. Gov’t Bond Index | |||
| One year total return | 5.44% | 5.63% | ||
| Annualized three year total return | 5.89% | 7.34% | ||
| Annualized five year total return | 4.95% | 6.29% | ||
| Annualized total return inception to date* | 5.09% | — | ||
| Past performance is no guarantee of future results. Investment return and principal value will fluctuate so that an investor’s shares, when redeemed, may be worth more or less than original cost. Total return figures include the reinvestment of dividends and capital gains. During the period, certain fees may have been waived or expenses reimbursed; otherwise total return would have been lower. |
| * | Institutional Class Shares were offered beginning March 22, 1998. Performance prior to that date reflects performance of the Marketvest Short-Term Bond Fund from its inception date of April 1, 1996. |
| The performance of the Lehman Brothers 1-3 Year U.S. Government Bond Index does not include operating expenses that are incurred by the Portfolio. Index performance is for the period March 31, 1996 to April 30, 2003. |
| The performance information presented in the graph and table above do not reflect the deduction of taxes that a shareholder would pay on Portfolio distributions or the redemption of Portfolio shares. |

Schedule of Investments
| Description | Principal Amount (000) | Market Value (000) | ||||
| U.S. Treasury Obligations — 4.0% | ||||||
Treasury Inflation Index Bonds | ||||||
3.500%, 01/15/11 | $ | 1,400 | $ | 1,630 | ||
U.S. Treasury Notes | ||||||
6.000%, 08/15/04 | 200 | 212 | ||||
3.250%, 08/15/07 | 215 | 221 | ||||
3.000%, 11/15/07 | 350 | 355 | ||||
| TOTAL U.S. TREASURY OBLIGATIONS (COST $2,259) | $ | 2,418 | ||||
| U.S. Government Agency Obligations — 6.0% | ||||||
FHLMC | ||||||
7.000%, 07/15/05 | 500 | 556 | ||||
4.500%, 01/15/13 | 1,000 | 1,021 | ||||
FNMA | ||||||
3.780%, 08/09/04 | 1,000 | 1,001 | ||||
3.600%, 05/14/04 | 1,000 | 1,001 | ||||
| TOTAL U.S. GOVERNMENT AGENCY OBLIGATIONS (COST $3,562) | $ | 3,579 | ||||
U.S. Government Agency | ||||||
FHLMC | ||||||
6.250%, 11/15/22 | 1,220 | 1,277 | ||||
6.000%, 07/15/21 | 816 | 824 | ||||
FNMA ‡ | ||||||
4.285%, 09/01/27 | 1 | 1 | ||||
| TOTAL U.S. GOVERNMENT AGENCY MORTGAGE-BACKED OBLIGATIONS (COST $2,085) | $ | 2,102 | ||||
| Corporate Obligations — 53.9% | ||||||
Banks — 15.5% | ||||||
Bank of America | ||||||
5.250%, 02/01/07 | 1,000 | 1,086 | ||||
First USA Bank | ||||||
7.650%, 08/01/03 | 480 | 487 | ||||
ANNUAL REPORT / APRIL 30, 2003
23
Table of Contents
SHORT-TERM BOND PORTFOLIO (continued)
| Description | Principal Amount (000) | Market Value (000) | ||||
Fleet Boston Financial | ||||||
6.625%, 12/01/05 | $ | 1,000 | $ | 1,098 | ||
Mercantile Bank-St Louis | ||||||
6.375%, 01/15/04 | 500 | 517 | ||||
National Westminster Bank | ||||||
9.375%, 11/15/03 | 1,000 | 1,042 | ||||
PNC Funding | ||||||
7.000%, 09/01/04 | 1,500 | 1,600 | ||||
Wachovia | ||||||
6.700%, 06/21/04 | 1,500 | 1,586 | ||||
Wells Fargo | ||||||
6.700%, 09/22/04 | 1,500 | 1,605 | ||||
Wells Fargo, MTN, Ser C | ||||||
4.250%, 08/15/03 | 216 | 218 | ||||
TOTAL BANKS | $ | 9,239 | ||||
Consumer Staples — 1.0% | ||||||
ConAgra Foods | ||||||
7.400%, 09/15/04 | 585 | 625 | ||||
TOTAL CONSUMER STAPLES | $ | 625 | ||||
Energy — 9.3% | ||||||
Conoco | ||||||
5.900%, 04/15/04 | 540 | 561 | ||||
Consolidated Natural Gas | ||||||
5.750%, 08/01/03 | 300 | 303 | ||||
DTE Energy | ||||||
6.000%, 06/01/04 | 1,500 | 1,565 | ||||
Husky Oil | ||||||
6.875%, 11/15/03 | 1,000 | 1,026 | ||||
Smith International ‡ + | ||||||
2.414%, 10/15/03 | 1,000 | 1,001 | ||||
Union Pacific | ||||||
6.500%, 05/15/05 | 1,000 | 1,078 | ||||
TOTAL ENERGY | $ | 5,534 | ||||
Financials — 19.8% | ||||||
American Express | ||||||
6.875%, 11/01/05 | 1,700 | 1,891 | ||||
CIT Group ‡ | ||||||
2.839%, 03/01/04 | 1,000 | 1,006 | ||||
General Electric Capital | ||||||
3.500%, 05/01/08 | 1,000 | 1,005 | ||||
General Motors Acceptance | ||||||
7.500%, 07/15/05 | 2,000 | 2,140 | ||||
Household Finance | ||||||
7.250%, 07/15/03 | 500 | 506 | ||||
| Description | Principal Amount (000) | Market Value (000) | ||||
John Deere Capital | ||||||
4.500%, 08/22/07 | $ | 1,000 | $ | 1,045 | ||
Lehman Brothers Holdings | ||||||
7.750%, 01/15/05 | 1,000 | 1,093 | ||||
MBNA, MTN | ||||||
6.150%, 10/01/03 | 1,000 | 1,017 | ||||
Morgan Stanley | ||||||
6.100%, 04/15/06 | 1,000 | 1,097 | ||||
Simon Property Group | ||||||
6.750%, 02/09/04 | 1,000 | 1,038 | ||||
TOTAL FINANCIALS | $ | 11,838 | ||||
Industrials — 4.2% | ||||||
Canadian National Railway | ||||||
7.000%, 03/15/04 | 300 | 313 | ||||
First Data | ||||||
6.750%, 07/15/05 | 1,000 | 1,101 | ||||
Rockwell International | ||||||
6.625%, 06/01/05 | 1,000 | 1,085 | ||||
TOTAL INDUSTRIALS | $ | 2,499 | ||||
Materials — 3.2% | ||||||
Westvaco | ||||||
6.850%, 11/15/04 | 1,800 | 1,910 | ||||
TOTAL MATERIALS | $ | 1,910 | ||||
Telecommunication Services — 0.9% | ||||||
Alltel | ||||||
7.500%, 03/01/06 | 475 | 542 | ||||
TOTAL TELECOMMUNICATION SERVICES | $ | 542 | ||||
TOTAL CORPORATE OBLIGATIONS (COST $31,296) | $ | 32,187 | ||||
| Asset-Backed Securities — 31.5% | ||||||
ANRC Auto Owner Trust, Ser 2001-A, | ||||||
4.320%, 06/16/08 | 900 | 934 | ||||
Capital Auto Receivables Asset, | ||||||
3.820%, 07/15/05 | 1,500 | 1,531 | ||||
Capital Auto Receivables Asset, | ||||||
3.580%, 10/16/06 | 1,000 | 1,037 | ||||
Daimler Chrysler Auto Trust, | ||||||
4.210%, 07/06/05 | 700 | 711 | ||||
EQCC Home Equity Loan Trust, | ||||||
5.915%, 11/20/24 | 330 | 334 | ||||
APRIL 30, 2003 / ANNUAL REPORT
24
Table of Contents
SHORT-TERM BOND PORTFOLIO (concluded)
| Description | Principal Amount (000) | Market Value (000) | ||||
EQCC Home Equity Loan Trust, | ||||||
6.459%, 03/15/21 | $ | 224 | $ | 225 | ||
Ford Credit Auto Owner Trust, | ||||||
7.240%, 02/15/04 | 70 | 71 | ||||
Ford Credit Auto Owner Trust, | ||||||
4.310%, 06/15/05 | 739 | 750 | ||||
Ford Credit Auto Owner Trust, | ||||||
3.790%, 09/15/06 | 1,000 | 1,041 | ||||
Green Tree Home Improvement Loan Trust, Ser 1995-F, Cl B1 | ||||||
6.750%, 01/15/21 | 301 | 302 | ||||
Green Tree Home Improvement Loan Trust, Ser 1996-F, Cl HIB1 | ||||||
7.250%, 11/15/27 | 2,000 | 2,031 | ||||
Greenpoint Manufactured Housing, | ||||||
6.010%, 08/15/15 | 126 | 127 | ||||
Honda Auto Receivables Owner Trust, Ser 2002-2, Cl A3 | ||||||
3.830%, 02/15/06 | 1,000 | 1,025 | ||||
Honda Auto Receivables Owner Trust, Ser 2002-3, Cl A3 | ||||||
3.000%, 05/18/06 | 2,000 | 2,040 | ||||
Prudential Home Mortgage Securities Trust, Ser 1994-25, Cl A7 | ||||||
7.500%, 08/15/24 | 314 | 313 | ||||
Residential Asset Securities, | ||||||
5.180%, 07/25/27 | 1,800 | 1,827 | ||||
Residential Asset Securities, | ||||||
4.040%, 01/25/22 | 1,000 | 1,021 | ||||
Residential Asset Securities, | ||||||
3.580%, 12/25/26 | 750 | 768 | ||||
| Description | Principal Amount/ Shares (000) | Market Value (000) | |||||
SLMA ‡ | |||||||
1.891%, 10/25/10 | $ | 1,742 | $ | 1,760 | |||
Whole Auto Loan Trust, Ser 2002-1, Cl A3 | |||||||
2.600%, 08/15/06 | 950 | 966 | |||||
TOTAL ASSET-BACKED SECURITIES (COST $18,463) | $ | 18,814 | |||||
| Repurchase Agreements — 1.7% | |||||||
Credit Suisse First Boston 1.270%, dated 04/30/03, matures 05/01/03 repurchase price $1,000,035 (102% collateralized by various U.S. Treasury Obligations) | 1,000 | 1,000 | |||||
TOTAL REPURCHASE AGREEMENTS (COST $1,000) | $ | 1,000 | |||||
| Related Party Money Market Portfolio — 1.3% | |||||||
ARK Money Market Portfolio Institutional Class Ú | 785 | 785 | |||||
TOTAL RELATED PARTY MONEY MARKET PORTFOLIO (COST $785) | $ | 785 | |||||
TOTAL INVESTMENTS — 101.9% (COST $59,450) | $ | 60,885 | |||||
| OTHER ASSETS & LIABILITIES, NET — (1.9)% | $ | (1,120 | ) | ||||
| TOTAL NET ASSETS — 100.0% | $ | 59,765 | |||||
| ‡ | Variable Rate Security. The rate reported on the Schedule of Investments is the rate in effect on 4/30/03. The date shown is the stated maturity. |
| + | Security exempt from registration under Rule 144A of the Securities Act of 1933. These securities may be resold in transactions exempt from registration normally qualified to institutional investors. |
| Ú | This money market portfolio is advised by Allied Investment Advisors, Inc. who also serves as advisor of this portfolio. |
Cl — Class
FHLMC — Federal Home Loan Mortgage Corporation
FNMA — Federal National Mortgage Association
MTN — Medium Term Note
Ser — Series
SLMA — Student Loan Marketing Association
The accompanying notes are an integral part of the financial statements.
ANNUAL REPORT / APRIL 30, 2003
25
Table of Contents
FIXED INCOME PORTFOLIOS
MARYLAND AND PENNSYLVANIA TAX-FREE PORTFOLIOS

Susan L. Schnaars, CFA
PORTFOLIO MANAGER
Susan L. Schnaars, CFA is manager of the Maryland Tax-Free Portfolio and Pennsylvania Tax-Free Portfolio. Ms. Schnaars is also responsible for managing several large institutional accounts. She has been a Principal of AIA and Portfolio Manager since 1996, a Vice President of Allfirst Bank from 1992 to 2003 and a Vice President M&T Trust since 2003. Ms. Schnaars is a Chartered Financial Analyst and a Certified Public Accountant, and has more than 12 years of experience in the investment industry.
Management Discussion and Analysis
During the fiscal year ended April 30, 2003, ongoing reports of lethargic economic growth and volatility in the equity markets continued to fuel demand for bonds. Yields on municipal bonds fell over 100 basis points (1.00%) in 2-5 year notes, while yields on longer-dated securities fell almost 50 basis points. Over the same period, yields on U.S. Treasury securities fell even more dramatically as the yield on shorter-maturity assets fell 175 basis points and longer-dated assets fell 75 basis points. The result was an underperformance of municipals, as well as the Portfolios, when compared to their taxable counterparts.
Early in the year, we shortened the effective duration of the Portfolios only slightly as we believed interest rates would rise in tandem with an economic recovery. We have continued to maintain duration around the 6.25 to 6.5 year range as interest rates have fallen further. We have the option to sustain this range should interest rates rise during the second half of 2003. The overall credit quality of the Portfolios has been upheld; however, we have taken opportunities to add yield to the Portfolios where appropriate.
During March we took minor positions in Tobacco Asset Securitization bonds, which are issued by states and local municipalities that capitalize the payments due to them from the major cigarette manufacturers under the Master Settlement Agreement (the agreement by 46 states to settle all claims against major cigarette manufacturers). At the end of March, the bonds were downgraded by several rating agencies citing increased litigation risk, causing volatility in these holdings. We are following the situation very closely.
APRIL 30, 2003 / ANNUAL REPORT
26
Table of Contents
MARYLAND TAX-FREE PORTFOLIO
Performance as of April 30, 2003
INSTITUTIONAL CLASS SHARES: VALUE OF A $100,000 INVESTMENT

CLASS A AND B SHARES: VALUE OF A $10,000 INVESTMENT
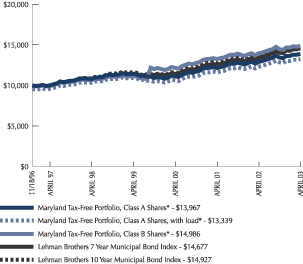
| Inst’l Class Shares | Class A Shares* | Class B Shares* | Lehman Brothers 7 yr. Muni Bond Index | Lehman Brothers 10 yr. Muni Bond Index | ||||||
| One year total return | 7.66% | 7.47% | 6.72% | 8.62% | 8.50% | |||||
| One year total return with load | — | 2.68% | 1.72% | — | — | |||||
| Annualized three year total return | 7.75% | 7.56% | 6.84% | 8.40% | 8.54% | |||||
| Annualized three year total return with load | — | 5.91% | 5.96% | — | — | |||||
| Annualized five year total return | 5.27% | 5.10% | 6.91% | 6.34% | 6.44% | |||||
| Annualized five year total return with load | — | 4.13% | 6.60% | — | — | |||||
| Annualized total return inception to date | 5.47% | 5.31% | 6.47% | — | — | |||||
| Annualized total return inception to date with load | — | 4.56% | 6.47% | — | — | |||||
| Past performance is no guarantee of future results. Investment return and principal value will fluctuate so that an investor’s shares, when redeemed, may be worth more or less than original cost. Total return figures include the reinvestment of dividends and capital gains. The Portfolio is non-diversified, which means that it may invest in the securities of relatively few issuers. As a result, the Portfolio may experience increased volatility due to its investments in fewer securities. During the period, certain fees may have been waived or expenses reimbursed; otherwise total return would have been lower. |
| Institutional Class Shares were offered beginning November 18, 1996. Class A Shares were offered beginning January 2, 1997. Performance for Class A Shares with load reflects the deduction of the maximum 4.50% sales charge. Class B Shares were offered beginning September 19, 1999. Performance for Class B Shares with load reflects the deduction of the applicable contingent deferred sales charge (CDSC). Class B Shares are subject to a maximum 5% CDSC in the first year which declines to 0% in the seventh year. |
| * | Performance shown prior to the actual inception date of the Class A and Class B Shares represents that of the Institutional Class Shares adjusted for the sales charge and total annual operating expenses applicable to Class A and Class B Shares, respectively. |
| The performance of the Lehman Brothers 7 Year Municipal Bond Index and Lehman Brothers 10 Year Municipal Bond Index does not include operating expenses that are incurred by the Portfolio. Index performance is for the period November 30, 1996 to April 30, 2003. |
| The performance information presented in the graphs and table above do not reflect the deduction of taxes that a shareholder would pay on Portfolio distributions or the redemption of Portfolio shares. |
ANNUAL REPORT / APRIL 30, 2003
27
Table of Contents
MARYLAND TAX-FREE PORTFOLIO (continued)
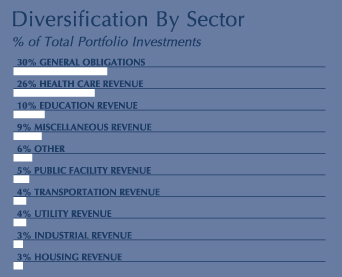
Schedule of Investments
| Description | Principal Amount (000) | Market Value (000) | ||||
| Municipal Bonds & Notes — 97.9% | ||||||
Maryland — 91.3% | ||||||
Allegany County, GO, AMBAC, | ||||||
5.300%, 03/01/12 | $ | 1,190 | $ | 1,341 | ||
Allegany County, Pollution Control Authority RB, Westvaco Project | ||||||
6.200%, 01/01/08 | 550 | 569 | ||||
Anne Arundel County, GO | ||||||
6.000%, 09/01/06 | 2,000 | 2,277 | ||||
5.000%, 03/01/19 | 2,000 | 2,132 | ||||
Baltimore County, Consolidated Public Improvements Project, GO, | ||||||
5.250%, 06/01/11 | 1,000 | 1,117 | ||||
5.500%, 06/01/16 | 1,500 | 1,687 | ||||
Baltimore, City Parking System Facilities Project RB, Ser A, FGIC | ||||||
5.250%, 07/01/17 | 1,000 | 1,150 | ||||
Baltimore, Convention Center RB, MBIA | ||||||
5.375%, 09/01/11 | 2,910 | 3,270 | ||||
Baltimore, GO, Ser B, MBIA | ||||||
7.000%, 10/15/03 | 1,000 | 1,026 | ||||
Baltimore, Port Facilities RB, Consolidated Coal Sales Project, Ser A | ||||||
6.500%, 10/01/11 | 1,000 | 1,024 | ||||
Baltimore, Water Project RB, Ser A, FSA, Prerefunded 07/01/10 @ 100 | ||||||
5.750%, 07/01/30 | 3,000 | 3,515 | ||||
| Description | Principal Amount (000) | Market Value (000) | ||||
Calvert County, GO, | ||||||
5.750%, 01/01/11 | $ | 1,900 | $ | 2,121 | ||
Calvert County, Pollution Control Authority RB, Baltimore Gas Project, MBIA-IBC | ||||||
5.550%, 07/15/14 | 2,500 | 2,662 | ||||
Carroll County, Fairhaven & Copper Ridge Project RB, Ser A, Radian Guaranty | ||||||
5.375%, 01/01/16 | 2,000 | 2,172 | ||||
Charles County, GO | ||||||
3.125%, 03/01/11 | 1,000 | 991 | ||||
Frederick County, Educational Facilities RB, Mount St. Mary’s College, Ser A | ||||||
5.750%, 09/01/25 | 1,000 | 1,029 | ||||
Frederick County, Retirement Community RB, Buckinghams Choice Facilities Project, Ser A | ||||||
5.900%, 01/01/17 | 1,000 | 954 | ||||
Harford County, GO | ||||||
5.500%, 12/01/08 | 1,895 | 2,188 | ||||
Howard County, Consolidated Public Improvements Project, GO, Ser A | ||||||
5.250%, 08/15/16 | 1,480 | 1,652 | ||||
Howard County, Metropolitan District Project, GO, Ser A | ||||||
5.250%, 08/15/15 | 1,925 | 2,161 | ||||
Maryland State, Community Development Administration RB, Multi Family Housing Development, Westfield Project, Ser C | ||||||
5.200%, 12/01/29 | 2,000 | 2,118 | ||||
Maryland State, Community Development Administration RB, Residential Housing & Community Development, Ser A, FHA | ||||||
5.600%, 03/01/17 | 940 | 985 | ||||
Maryland State, Community Development Administration RB, Single Family Housing & Community Development, | ||||||
5.050%, 04/01/08 | 1,000 | 1,073 | ||||
Maryland State, Economic Development Authority RB, Chesapeake Hills Golf Course Project | ||||||
8.250%, 11/01/26 | 1,000 | 1,019 | ||||
Maryland State, Economic Development Authority RB, Collegiate Student Housing, Salisbury Project, Ser A | ||||||
6.000%, 06/01/19 | 1,000 | 1,024 | ||||
5.600%, 06/01/10 | 1,775 | 1,871 | ||||
APRIL 30, 2003 / ANNUAL REPORT
28
Table of Contents
MARYLAND TAX-FREE PORTFOLIO (continued)
| Description | Principal Amount (000) | Market Value (000) | ||||
Maryland State, Economic Development Authority RB, Healthcare Facilities, GNMA-Crescent Cities Project, Ser A, Collateralized by GNMA | ||||||
4.650%, 12/20/08 | $ | 635 | $ | 680 | ||
Maryland State, Economic Development Authority RB, Lutheran World Relief Project, Guaranty Agreement | ||||||
7.125%, 04/01/19 | 895 | 954 | ||||
Maryland State, Health & Higher Education Facilities Authority RB, | ||||||
5.250%, 07/01/20 | 1,585 | 1,708 | ||||
Maryland State, Health & Higher Education Facilities Authority RB, Carroll County General Hospital Project | ||||||
6.000%, 07/01/37 | 2,250 | 2,346 | ||||
Maryland State, Health & Higher Education Facilities Authority RB, Catholic Health Initiatives Project, Ser A | ||||||
6.000%, 12/01/13 | 1,370 | 1,551 | ||||
Maryland State, Health & Higher Education Facilities Authority RB, Frederick Memorial Hospital Project | ||||||
5.000%, 07/01/22 | 2,500 | 2,510 | ||||
Maryland State, Health & Higher Education Facilities Authority RB, Hebrew Home of Washington Project | ||||||
5.800%, 01/01/32 | 1,135 | 1,166 | ||||
Maryland State, Health & Higher Education Facilities Authority RB, Helix Health Project, AMBAC, ETM | ||||||
5.000%, 07/01/27 | 2,500 | 2,656 | ||||
Maryland State, Health & Higher Education Facilities Authority RB, Hospital-Charity Obligation Group, Daughters of Charity Project, Ser A | ||||||
4.750%, 11/01/14 | 1,000 | 1,041 | ||||
Maryland State, Health & Higher Education Facilities Authority RB, Howard County General Hospital Project, ETM | ||||||
5.500%, 07/01/13 | 1,000 | 1,025 | ||||
Maryland State, Health & Higher Education Facilities Authority RB, Johns Hopkins Medicine Project, MBIA | ||||||
5.000%, 07/01/19 | 1,500 | 1,585 | ||||
Maryland State, Health & Higher Education Facilities Authority RB, Johns Hopkins University Project | ||||||
5.250%, 07/01/17 | 2,000 | 2,192 | ||||
5.125%, 07/01/20 | 2,000 | 2,120 | ||||
5.000%, 05/15/13 | 1,465 | 1,597 | ||||
| Description | Principal Amount (000) | Market Value (000) | ||||
Maryland State, Health & Higher Education Facilities Authority RB, Loyola College Project, Ser A, MBIA | ||||||
5.375%, 10/01/11 | $ | 950 | $ | 1,052 | ||
Maryland State, Health & Higher Education Facilities Authority RB, McLean School Project | ||||||
6.000%, 07/01/20 | 250 | 261 | ||||
6.000%, 07/01/31 | 1,500 | 1,525 | ||||
Maryland State, Health & Higher Education Facilities Authority RB, Medlantic/Helix Project, Ser A, FSA | ||||||
5.250%, 08/15/11 | 2,000 | 2,198 | ||||
5.250%, 08/15/12 | 1,175 | 1,283 | ||||
Maryland State, Health & Higher Education Facilities Authority RB, Mercy Medical Center Project | ||||||
5.625%, 07/01/31 | 2,000 | 2,029 | ||||
Maryland State, Health & Higher Education Facilities Authority RB, Mercy Medical Center Project, AMBAC | ||||||
5.750%, 07/01/15 | 2,000 | 2,053 | ||||
Maryland State, Health & Higher Education Facilities Authority RB, North Arundel Hospital Project, MBIA | ||||||
6.000%, 07/01/12 | 500 | 513 | ||||
Maryland State, Health & Higher Education Facilities Authority RB, Peninsula Regional Medical Center Project | ||||||
5.000%, 07/01/08 | 1,000 | 1,022 | ||||
Maryland State, Health & Higher Education Facilities Authority RB, Peninsula United Methodists of Maryland, Ser B ‡ | ||||||
5.250%, 10/01/28 | 1,000 | 998 | ||||
Maryland State, Health & Higher Education Facilities Authority RB, Pickersgill Project, Ser A | ||||||
6.000%, 01/01/15 | 1,500 | 1,589 | ||||
Maryland State, Health & Higher Education Facilities Authority RB, University of Maryland Medical | ||||||
5.000%, 07/01/12 | 1,000 | 1,057 | ||||
Maryland State, Industrial Development Financing Authority RB, National Aquarium Baltimore Facilities Project, | ||||||
5.100%, 11/01/22 | 1,000 | 1,042 | ||||
Maryland State, Local Facilities Authority, Capital Improvement Project, GO, Ser A | ||||||
5.500%, 03/01/13 | 2,000 | 2,324 | ||||
ANNUAL REPORT / APRIL 30, 2003
29
Table of Contents
MARYLAND TAX-FREE PORTFOLIO (continued)
| Description | Principal Amount (000) | Market Value (000) | ||||
Maryland State, National Capital Park & Planning Commission RB, Park Acquisition & Development Project, | ||||||
5.375%, 01/15/14 | $ | 1,000 | $ | 1,089 | ||
Maryland State, Stadium Authority RB, AMBAC | ||||||
5.500%, 03/01/12 | 1,000 | 1,087 | ||||
Maryland State, Transportation Authority RB | ||||||
5.750%, 07/01/15 | 1,500 | 1,507 | ||||
Maryland State, Transportation Authority RB, Baltimore/Washington International Airport Project, Ser B, FGIC | ||||||
6.000%, 07/01/07 | 1,000 | 1,067 | ||||
Maryland Water Quality Financing Administration RB, Revolving Loan Fund, Ser A | ||||||
6.550%, 09/01/14 | 945 | 959 | ||||
5.500%, 09/01/12 | 1,250 | 1,349 | ||||
Montgomery County, Consolidated Public Improvements Project, GO | ||||||
4.750%, 02/01/15 | 2,025 | 2,195 | ||||
Montgomery County, Consolidated Public Improvements Project, GO, Ser A | ||||||
5.800%, 07/01/07 | 1,000 | 1,147 | ||||
Montgomery County, Consolidated Public Improvements Project, GO, Ser A, Prerefunded 01/01/10 @ 101 | ||||||
5.600%, 01/01/16 | 2,000 | 2,327 | ||||
Montgomery County, Special Obligation, West Germantown Development District Project, GO, Ser A, Radian Guaranty | ||||||
5.375%, 07/01/20 | 250 | 267 | ||||
New Baltimore, School Board System RB | ||||||
5.000%, 11/01/13 | 1,135 | 1,238 | ||||
Northeast Maryland Waste Disposal Authority RB, Southwest Resource Recovery Facility Project, MBIA | ||||||
7.200%, 01/01/06 | 2,500 | 2,637 | ||||
Prince George’s County, Consolidated Public Improvements Project, GO, FSA | ||||||
5.500%, 10/01/10 | 2,000 | 2,295 | ||||
Queen Anne’s County, Public Facilities, GO, FGIC | ||||||
6.000%, 11/15/08 | 1,000 | 1,159 | ||||
5.400%, 11/15/11 | 1,000 | 1,117 | ||||
St. Mary’s College, Academic & Auxiliary Facilities RB, Ser A, MBIA | ||||||
5.250%, 09/01/27 | 2,000 | 2,078 | ||||
| Description | Principal Amount (000) | Market Value (000) | ||||
St. Mary’s County, Consolidated Public Improvements Project, GO | ||||||
4.450%, 07/01/14 | $ | 1,100 | $ | 1,176 | ||
St. Mary’s County, County Commissioners St. Mary’s Hospital Project, GO | ||||||
5.000%, 10/01/21 | 1,000 | 1,063 | ||||
University of Maryland, Auxiliary Facility & Tuition RB, Ser A | ||||||
5.500%, 04/01/10 | 1,000 | 1,085 | ||||
Washington County, Public Improvements Project, GO, MBIA, Prerefunded 01/01/05 @ 102 | ||||||
5.800%, 01/01/15 | 1,250 | 1,365 | ||||
Washington Suburban Sanitation District, General Construction Project, GO | ||||||
6.000%, 06/01/18 | 1,000 | 1,242 | ||||
Washington Suburban Sanitation District, Water Supply Project, GO | ||||||
4.700%, 06/01/18 | 2,000 | 2,103 | ||||
TOTAL MARYLAND | $ | 116,757 | ||||
New Jersey — 1.4% | ||||||
Tobacco Settlement Financing | ||||||
6.750%, 06/01/39 | 2,000 | 1,767 | ||||
TOTAL NEW JERSEY | $ | 1,767 | ||||
Puerto Rico — 5.2% | ||||||
Commonwealth of Puerto Rico, Highway & Transportation RB, Ser F | ||||||
5.250%, 07/01/11 | 1,000 | 1,097 | ||||
Commonwealth of Puerto Rico, Highway & Transportation RB, Ser W, FSA, Prerefunded 07/01/03 @ 101.5 | ||||||
5.400%, 07/01/06 | 2,000 | 2,043 | ||||
Commonwealth of Puerto Rico, Public Buildings Authority RB, MBIA-IBC Commonwealth Guaranty | ||||||
5.700%, 07/01/16 | 500 | 511 | ||||
Commonwealth of Puerto Rico, Public Finance Authority RB, Ser A, AMBAC | ||||||
5.375%, 06/01/19 | 1,500 | 1,722 | ||||
Commonwealth of Puerto Rico, Public Improvements Project, GO, MBIA | ||||||
6.250%, 07/01/12 | 1,000 | 1,221 | ||||
TOTAL PUERTO RICO | $ | 6,594 | ||||
| TOTAL MUNICIPAL BONDS & NOTES (COST $117,276) | $ | 125,118 | ||||
APRIL 30, 2003 / ANNUAL REPORT
30
Table of Contents
MARYLAND TAX-FREE PORTFOLIO (concluded)
| Description | Shares (000) | Market Value (000) | |||
| Related Party Money Market Portfolio — 1.0% | |||||
ARK Tax-Free Money Market Portfolio Institutional Class Ú | 1,226 | $ | 1,226 | ||
| TOTAL RELATED PARTY MONEY MARKET PORTFOLIO (COST $1,226) | $ | 1,226 | |||
| TOTAL INVESTMENTS — 98.9% (COST $118,502) | $ | 126,344 | |||
| OTHER ASSETS & LIABILITIES, NET — 1.1% | $ | 1,461 | |||
| TOTAL NET ASSETS — 100.0% | $ | 127,805 | |||
| ‡ | Variable Rate Security. The rate reported on the Schedule of Investments is the rate in effect on 4/30/03. The date shown is the stated maturity. |
| Ú | This money market portfolio is advised by Allied Investment Advisors, Inc. who also serves as advisor of this portfolio. |
ETM — Escrowed to Maturity
GO — General Obligation
RB — Revenue Bond
Ser — Series
These organizations have provided underlying credit support for securities, as indicated
AMBAC — American Municipal Bond Assurance Corporation
FGIC — Financial Guaranty Insurance Corporation
FHA — Federal Housing Authority
FSA — Financial Security Assistance
GNMA — Government National Mortgage Association
IBC — Insured Bond Certification
MBIA — Municipal Bond Insurance Association
The accompanying notes are an integral part of the financial statements.
ANNUAL REPORT / APRIL 30, 2003
31
Table of Contents
PENNSYLVANIA TAX-FREE PORTFOLIO
Performance as of April 30, 2003
INSTITUTIONAL CLASS SHARES: VALUE OF A $100,000 INVESTMENT
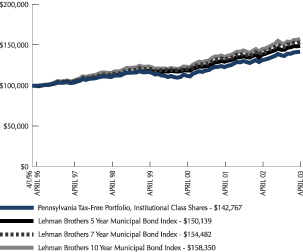
CLASS A AND B SHARES: VALUE OF A $10,000 INVESTMENT
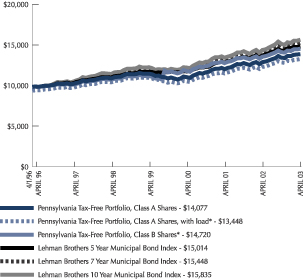
| Inst’l Class Shares | Class A Shares* | Class B Shares* | Lehman Brothers 5 yr. Muni Bond Index | Lehman Brothers 7 yr. Muni Bond Index | Lehman Brothers 10 yr. Muni Bond Index | |||||||
| One year total return | 7.96% | 7.77% | 7.03% | 7.88% | 8.62% | 8.50% | ||||||
| One year total return with load | — | 2.96% | 2.03% | — | — | — | ||||||
| Annualized three year total return | 8.13% | 7.92% | 7.19% | 7.95% | 8.40% | 8.54% | ||||||
| Annualized three year total return with load | — | 6.29% | 6.32% | — | — | — | ||||||
| Annualized five year total return | 5.10% | 4.94% | 6.25% | 6.09% | 6.34% | 6.44% | ||||||
| Annualized five year total return with load | — | 3.97% | 5.93% | — | — | — | ||||||
| Annualized total return inception to date | 5.15% | 4.94% | 5.61% | — | — | — | ||||||
| Annualized total return inception to date with load | — | 4.27% | 5.61% | — | — | — | ||||||
| Past performance is no guarantee of future results. Investment return and principal value will fluctuate so that an investor’s shares, when redeemed, may be worth more or less than original cost. Total return figures include the reinvestment of dividends and capital gains. The Portfolio is non-diversified, which means that it may invest in the securities of relatively few issuers. As a result, the Portfolio may experience increased volatility due to its investments in fewer securities. During the period, certain fees may have been waived or expenses reimbursed; otherwise total return would have been lower. |
| For each class, performance presented prior to March 23, 1998 reflects the performance of the Marketvest Pennsylvania Intermediate Municipal Bond Fund from its inception date of April 1, 1996. Class A Shares were offered beginning March 23, 1998. Performance for Class A Shares with load reflects the deduction of the maximum 4.50% sales charge. Class B Shares were offered beginning September 1, 1999. Performance for Class B Shares with load reflects the deduction of the applicable contingent deferred sales charge (CDSC). Class B Shares are subject to a maximum 5% CDSC in the first year which declines to 0% in the seventh year. |
| * | Performance shown prior to the actual inception date of the Class A and Class B Shares represents that of the Institutional Class Shares adjusted for the sales charge and total annual operating expenses applicable to Class A and Class B Shares, respectively. |
| The performance of the Lehman Brothers 5 Year Municipal Bond Index, Lehman Brothers 7 Year Municipal Bond Index, and Lehman Brothers 10 Year Municipal Bond Index does not include operating expenses that are incurred by the Portfolio. Index performance is for the period March 31, 1996 to April 30, 2003. |
| The performance information presented in the graphs and table above do not reflect the deduction of taxes that a shareholder would pay on Portfolio distributions or the redemption of Portfolio shares. |
APRIL 30, 2003 / ANNUAL REPORT
32
Table of Contents
PENNSYLVANIA TAX-FREE PORTFOLIO

Schedule of Investments
| Description | Principal Amount (000) | Market Value (000) | ||||
| Municipal Bonds & Notes — 98.1% | ||||||
New Jersey — 1.1% | ||||||
Tobacco Settlement Financing | ||||||
6.750%, 06/01/39 | $ | 2,000 | $ | 1,767 | ||
TOTAL NEW JERSEY | $ | 1,767 | ||||
Pennsylvania — 97.0% | ||||||
Adams County, GO, FGIC, | ||||||
5.500%, 11/15/26 | 2,500 | 2,883 | ||||
Allegheny County, GO, Ser C-52, FGIC | ||||||
5.250%, 05/10/11 | 4,000 | 4,236 | ||||
Allegheny County, Industrial Development Authority RB, Environmental Improvement Project, Ser A | ||||||
6.700%, 12/01/20 | 4,150 | 4,293 | ||||
Bucks County, Industrial Development Authority RB, Pennswood Village Project, Ser A | ||||||
6.000%, 10/01/27 | 1,000 | 1,033 | ||||
Bucks County, Industrial Development Authority RB, Personal Care, Ser A, ETM, Remarketed 11/15/93 | ||||||
10.000%, 05/15/19 | 4,775 | 8,041 | ||||
Burrell School District, GO, FGIC, STAID | ||||||
5.250%, 11/15/10 | 2,200 | 2,434 | ||||
Chester County, Health & Education Facilities Authority RB, Chester County Hospital Project, MBIA | ||||||
5.625%, 07/01/09 | 1,985 | 2,190 | ||||
5.625%, 07/01/10 | 1,675 | 1,847 | ||||
5.500%, 07/01/07 | 965 | 1,074 | ||||
| Description | Principal Amount (000) | Market Value (000) | ||||
Chester County, Health & Education Facilities Authority RB, Immaculata College Project, Radian — IBC Guaranty | ||||||
5.625%, 10/15/27 | $ | 2,250 | $ | 2,380 | ||
Chester County, Health & Education Facilities Authority RB, Jefferson Health Systems Project, Ser B | ||||||
5.375%, 05/15/27 | 2,000 | 2,012 | ||||
Chester County, Health & Education Facilities Authority RB, Main Line Health Systems Project, Ser A, MBIA-IBC | ||||||
5.300%, 05/15/07 | 2,045 | 2,157 | ||||
Dauphin County, General Health Authority RB, Pinnacle Health System Project, MBIA | ||||||
5.200%, 05/15/09 | 910 | 1,001 | ||||
Delaware County, Dunwoody Village Project RB | ||||||
6.250%, 04/01/30 | 1,200 | 1,250 | ||||
5.550%, 04/01/06 | 300 | 301 | ||||
Delaware County, Hospital RB, Chester Community Hospital Project | ||||||
6.000%, 12/15/20 | 4,000 | 4,021 | ||||
Downington, Area School District, GO, FSA — STAID | ||||||
4.900%, 04/01/16 | 2,130 | 2,259 | ||||
Indiana County, Industrial Development Authority RB, New York State Electric & Gas Project, Ser A, MBIA | ||||||
6.000%, 06/01/06 | 1,500 | 1,692 | ||||
Lancaster County, Solid Waste Management Authority RB, | ||||||
5.375%, 12/15/15 | 4,000 | 4,416 | ||||
Lehigh County, GO, Ser A, CNTY GTD, Prerefunded 05/15/06 @ 100 | ||||||
5.500%, 07/19/06 | 2,000 | 2,228 | ||||
Lehigh County, General Purpose Authority GOH, Muhlenberg Hospital Center Project, ETM | ||||||
5.750%, 07/15/10 | 1,270 | 1,424 | ||||
5.750%, 07/15/10 | 1,730 | 1,939 | ||||
Lehigh County, General Purpose Authority RB, Kidspeace Obligation Group Project | ||||||
5.800%, 11/01/12 | 1,435 | 1,378 | ||||
Luzerne County, Pennsylvania Flood Protection Authority RB, Ser A, | ||||||
5.250%, 01/15/12 | 2,310 | 2,597 | ||||
ANNUAL REPORT / APRIL 30, 2003
33
Table of Contents
PENNSYLVANIA TAX-FREE PORTFOLIO (continued)
| Description | Principal Amount (000) | Market Value (000) | ||||
Mercer County, GO, FGIC | ||||||
5.500%, 10/01/18 | $ | 1,155 | $ | 1,274 | ||
5.500%, 10/01/19 | 1,215 | 1,332 | ||||
Montgomery County, GO | ||||||
5.375%, 07/15/13 | 1,885 | 2,084 | ||||
Montgomery County, Health & Higher Education Facilities Authority RB, | ||||||
5.700%, 04/01/10 | 500 | 558 | ||||
Montgomery County, Health & Higher Education Facilities Authority RB, Holy Redeemer Health Project, Ser A, AMBAC | ||||||
5.500%, 10/01/08 | 1,275 | 1,439 | ||||
5.250%, 10/01/04 | 2,070 | 2,183 | ||||
Montgomery County, Health & Higher Education Facilities Authority RB, Philadelphia Geriatric Center Project, Ser A | ||||||
7.250%, 12/01/19 | 3,000 | 3,079 | ||||
Montgomery County, Industrial Development Authority RB, Acts Retirement-Life Communities Project | ||||||
5.250%, 11/15/28 | 3,000 | 2,855 | ||||
Montgomery County, Industrial Development Authority RB, Adult Communities Total Services Project, Ser B | ||||||
5.750%, 11/15/17 | 1,000 | 1,030 | ||||
North Allegheny, School District Authority, GO, FGIC, STAID | ||||||
5.500%, 11/01/10 | 1,765 | 2,032 | ||||
Northhampton County, GO | ||||||
5.125%, 08/15/19 | 2,575 | 2,731 | ||||
Pennsylvania State, Convention Center Authority RB, Ser A, FGIC, ETM | ||||||
6.000%, 09/01/19 | 5,410 | 6,620 | ||||
Pennsylvania State, Convention Center Authority RB, Ser A, FSA | ||||||
6.750%, 09/01/19 | 2,000 | 2,173 | ||||
Pennsylvania State, Convention Center Authority RB, Ser A, MBIA-IBC | ||||||
6.750%, 09/01/19 | 2,500 | 2,716 | ||||
Pennsylvania State, GO, First Ser, FGIC | ||||||
5.375%, 05/15/15 | 5,000 | 5,443 | ||||
Pennsylvania State, Higher Educational Facilities Authority RB, Drexel University Project | ||||||
6.000%, 05/01/24 | 4,075 | 4,426 | ||||
Pennsylvania State, Higher Educational Facilities Authority RB, Gwynedd-Mercy College Project, Radian Guaranty | ||||||
5.600%, 11/01/22 | 2,600 | 2,834 | ||||
| Description | Principal Amount (000) | Market Value (000) | ||||
Pennsylvania State, Higher Educational Facilities Authority RB, University of Pennsylvania Health Services Project, | ||||||
5.500%, 01/01/09 | $ | 4,000 | $ | 4,225 | ||
Pennsylvania State, Housing Finance Agency RB, Ser 50A | ||||||
6.000%, 10/01/13 | 1,500 | 1,589 | ||||
Pennsylvania State, Industrial Development Authority RB, AMBAC | ||||||
6.000%, 07/01/06 | 3,000 | 3,389 | ||||
Philadelphia, Authority For Industrial Lease RB, Ser B, FSA | ||||||
5.250%, 10/01/30 | 2,000 | 2,091 | ||||
Philadelphia, GO, FGIC | ||||||
5.125%, 05/15/14 | 5,000 | 5,379 | ||||
Philadelphia, Health & Higher Educational Facilities Authority RB, Community College of Philadelphia Project, AMBAC | ||||||
5.500%, 05/01/14 | 1,280 | 1,432 | ||||
5.500%, 05/01/15 | 1,350 | 1,507 | ||||
Philadelphia, Hospital & Higher Education Facilities Authority RB, Temple University Hospital Project, Ser A | ||||||
6.625%, 11/15/23 | 3,250 | 3,286 | ||||
Philadelphia, Industrial Development Authority RB, City of Philadelphia Project, Ser A, MBIA | ||||||
6.000%, 02/15/07 | 1,365 | 1,556 | ||||
Philadelphia, Industrial Development Authority RB, Franklin Institute Project | ||||||
5.200%, 06/15/18 | 2,100 | 2,113 | ||||
Philadelphia, Industrial Development Authority RB, Girard Estate Coal Mining Project, ETM | ||||||
5.500%, 11/15/16 | 3,590 | 3,978 | ||||
Philadelphia, Industrial Development Authority RB, Simpson House Project | ||||||
4.750%, 08/15/08 | 1,000 | 1,023 | ||||
Philadelphia, Municipal Authority RB, Justice Lease Project, Ser A, MBIA | ||||||
7.100%, 11/15/06 | 4,095 | 4,159 | ||||
Philadelphia, Water & Wastewater RB, MBIA | ||||||
6.250%, 08/01/07 | 3,000 | 3,491 | ||||
6.250%, 08/01/08 | 2,150 | 2,533 | ||||
Pittsburgh & Allegheny Counties, Regional Asset District Sales Tax, AMBAC | ||||||
5.250%, 02/01/17 | 3,000 | 3,216 | ||||
APRIL 30, 2003 / ANNUAL REPORT
34
Table of Contents
PENNSYLVANIA TAX-FREE PORTFOLIO (concluded)
| Description | Principal Amount/ Shares (000) | Market Value (000) | ||||
Ridley Park, Taylor Hospital RB, | ||||||
6.000%, 12/01/05 | $ | 400 | $ | 425 | ||
Scranton-Lackawanna, Mercy Health Hospital Facilities RB, Ser B, MBIA | ||||||
5.625%, 01/01/16 | 2,000 | 2,170 | ||||
Swarthmore, Higher Educational | ||||||
5.250%, 09/15/20 | 1,000 | 1,072 | ||||
Tredyffrin Township, GO | ||||||
5.250%, 11/15/17 | 1,750 | 1,898 | ||||
West Chester Area School District, GO | ||||||
5.000%, 04/15/16 | 1,515 | 1,631 | ||||
5.000%, 04/15/18 | 1,000 | 1,062 | ||||
TOTAL PENNSYLVANIA | $ | 157,120 | ||||
TOTAL MUNICIPAL BONDS & NOTES (COST $148,676) | $ | 158,887 | ||||
| Related Party Money Market Portfolio — 0.5% | ||||||
ARK Pennsylvania Tax-Free Money Market Portfolio Institutional Class Ú | 762 | 762 | ||||
TOTAL RELATED PARTY MONEY MARKET PORTFOLIO (COST $762) | $ | 762 | ||||
TOTAL INVESTMENTS — 98.6% (COST $149,438) | $ | 159,649 | ||||
| OTHER ASSETS & LIABILITIES, NET — 1.4% | $ | 2,300 | ||||
| TOTAL NET ASSETS — 100.0% | $ | 161,949 | ||||
| Ú | This money market portfolio is advised by Allied Investment Advisors, Inc. who also serves as advisor of this portfolio. |
ETM — Escrowed to Maturity
GO — General Obligation
GOH — General Obligation of Hospital
RB — Revenue Bond
Ser — Series
STAID — State Aid Withholding
These organizations have provided underlying credit support for securities as listed above, as indicated
AMBAC — American Municipal Bond Assurance Corporation
CNTY GTD — County Guaranteed
CONLEE — College Construction Loan Insurance Association
FGIC — Financial Guaranty Insurance Corporation
FSA — Financial Security Assistance
IBC — Insured Bond Certification
MBIA — Municipal Bond Insurance Association
The accompanying notes are an integral part of the financial statements.
ANNUAL REPORT / APRIL 30, 2003
35
Table of Contents
FIXED INCOME PORTFOLIOS
INTERMEDIATE FIXED INCOME PORTFOLIO
Wilmer C. Stith III, CFA
PORTFOLIO MANAGER
Wilmer C. Stith III, CFA is manager of the Intermediate Fixed Income Portfolio, and is manager or co-manager of other ARK Funds Portfolios. He has been a Vice President of AIA and Portfolio Manager since 1996. He manages separate accounts, assists in the management of the money market portfolios, and is responsible for analyzing and trading various fixed income securities. Mr. Stith has more than 10 years of experience in the investment industry, and is a Chartered Financial Analyst.
Management Discussion and Analysis
The Portfolio has reduced its exposure to U.S. Treasury securities to 8%, its lowest allocation in over 5 years. This strategic decision has contributed positively towards performance. Although Treasuries have served us well over the last couple of years we anticipate that powerful dynamics are in play to cause them to under perform other sectors. One such dynamic will be a much greater amount of Treasuries issued this year vs. last year, as the Federal government finances its budget deficit. While we are decreasing our allocation to Treasuries we are increasing our exposure to corporate and mortgage-backed securities. Our choices in corporate issuers have been very selective. As corporate profit margins continue to compress amidst global competition and little to no pricing power, we remain very cautious in our choice of corporate issuers. We have purchased AT&T Wireless Services in the telecom sector. AT&T Wireless Services has shown above average subscriber growth and continues to be the dominant wireless provider. We also expanded our exposure in the energy sector with Devon Financing and Valero Logistics. We anticipate, as the summer driving season picks up and the economy grows, a strong demand for refined oil products. In addition, we expect crude oil to continue to fall in price. This environment is highly favorable for an oil refiner such as Valero Logistics. We also added yield to the overall portfolio with the purchase of approximately one-year Ford Motor Credit and CIT Group corporate bonds. Finally, we have increased our exposure to mortgage backed securities. We have forecasted that the worst of prepayment risks are behind us, and that unlike last year mortgage backed securities will outperform U.S. Treasuries.
Looking forward we expect to reduce our overall level of interest rate risk in the Portfolio as economic growth resumes in earnest. Eventually, once the market anticipates the Federal Reserve to begin to tighten monetary policy, we will migrate to floating rate notes. These securities have a coupon that is set to a money market index such as three month LIBOR and is reset on a frequent basis. As interest rates move higher, the floating rate note will outperform its fixed rate counterpart. We will also continue to underweight Treasuries and continue to invest in higher yielding corporate and mortgage-backed securities.
APRIL 30, 2003 / ANNUAL REPORT
36
Table of Contents
INTERMEDIATE FIXED INCOME PORTFOLIO
Performance as of April 30, 2003
INSTITUTIONAL CLASS SHARES: VALUE OF A $100,000 INVESTMENT
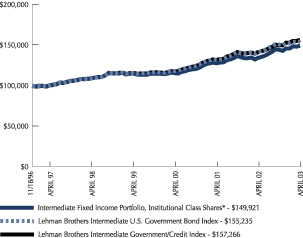
| Inst’l Class Shares* | Lehman Brothers Intermediate Gov't/Credit Index | Lehman Brothers Intermediate U.S. Government Bond Index | ||||
| One year total return | 11.20% | 10.76% | 9.22% | |||
| Annualized three year total return | 9.00% | 10.00% | 9.37% | |||
| Annualized five year total return | 6.49% | 7.53% | 7.27% | |||
| Annualized total return inception to date* | 6.47% | — | — | |||
Past performance is no guarantee of future results. Investment return and principal value will fluctuate so that an investor’s shares, when redeemed, may be worth more or less than original cost. Total return figures include the reinvestment of dividends and capital gains. During the period, certain fees may have been waived or expenses reimbursed; otherwise total return would have been lower.
| * | Institutional Class Shares were offered beginning November 18, 1996. |
The performance of the Lehman Brothers Intermediate Government/Credit Index and the Lehman Brothers Intermediate U.S. Government Bond Index do not include operating expenses incurred by the Portfolio. Index performance is for the period November 30, 1996 to April 30, 2003.
The performance information presented in the graph and table above do not reflect the deduction of taxes that a shareholder would pay on Portfolio distributions or the redemption of Portfolio shares.

Schedule of Investments
| Description | Principal Amount (000) | Market Value (000) | ||||
| U.S. Treasury Obligations — 8.3% | ||||||
Treasury Inflation Index Bonds | ||||||
3.500%, 01/15/11 | $ | 2,000 | $ | 2,329 | ||
3.375%, 01/15/12 | 1,000 | 1,139 | ||||
3.000%, 07/15/12 | 580 | 634 | ||||
U.S. Treasury Notes | ||||||
6.625%, 05/15/07 | 175 | 203 | ||||
6.500%, 08/15/05 | 1,000 | 1,110 | ||||
6.125%, 08/15/07 | 1,120 | 1,281 | ||||
5.625%, 05/15/08 | 165 | 186 | ||||
4.750%, 11/15/08 | 80 | 87 | ||||
4.625%, 05/15/06 | 690 | 743 | ||||
3.500%, 11/15/06 | 1,055 | 1,100 | ||||
3.000%, 02/15/08 | 870 | 879 | ||||
1.625%, 03/31/05 | 1,000 | 1,003 | ||||
| TOTAL U.S. TREASURY OBLIGATIONS (COST $10,246) | $ | 10,694 | ||||
| U.S. Government Agency Obligations — 16.6% | ||||||
FHLB | ||||||
6.500%, 11/13/09 | 5,000 | 5,867 | ||||
FHLMC | ||||||
5.875%, 03/21/11 | 2,500 | 2,772 | ||||
5.125%, 07/15/12 | 500 | 537 | ||||
4.000%, 10/29/07 | 2,000 | 2,053 | ||||
ANNUAL REPORT / APRIL 30, 2003
37
Table of Contents
INTERMEDIATE FIXED INCOME PORTFOLIO (continued)
| Description | Principal Amount (000) | Market Value (000) | ||||
FNMA | ||||||
6.000%, 05/15/08 | $ | 1,190 | $ | 1,350 | ||
5.500%, 05/02/06 | 1,500 | 1,633 | ||||
5.250%, 08/01/12 | 3,000 | 3,173 | ||||
2.345%, 11/26/04 | 2,250 | 2,252 | ||||
Private Export Funding, Ser UU n | ||||||
7.950%, 11/01/06 | 1,495 | 1,632 | ||||
| TOTAL U.S. GOVERNMENT AGENCY OBLIGATIONS (COST $19,743) | $ | 21,269 | ||||
U.S. Government Agency Mortgage-Backed Obligations — 17.3% | ||||||
FHLMC | ||||||
6.500%, 07/01/09 | 1,055 | 1,112 | ||||
6.250%, 11/15/22 | 1,220 | 1,277 | ||||
6.000%, 07/15/21 | 817 | 824 | ||||
FHLMC, Ser T | ||||||
4.105%, 10/27/31 | 1,000 | 1,030 | ||||
FNMA | ||||||
7.500%, 12/01/29 | 515 | 549 | ||||
7.000%, 06/01/03 | 25 | 25 | ||||
6.500%, 05/01/08 | 242 | 258 | ||||
6.500%, 10/01/08 | 666 | 710 | ||||
6.500%, 06/01/13 | 427 | 453 | ||||
6.500%, 03/01/32 | 846 | 884 | ||||
6.000%, 04/01/11 | 788 | 829 | ||||
5.500%, 11/01/17 | 4,300 | 4,476 | ||||
5.500%, 03/01/18 | 5,000 | 5,205 | ||||
FNMA, REMIC | ||||||
6.500%, 04/25/23 | 2,705 | 2,947 | ||||
6.250%, 07/25/08 | 1,193 | 1,264 | ||||
GNMA | ||||||
7.000%, 02/15/29 | 326 | 346 | ||||
| TOTAL U.S. GOVERNMENT AGENCY MORTGAGE-BACKED OBLIGATIONS (COST $21,375) | $ | 22,189 | ||||
| Corporate Obligations — 51.2% | ||||||
Banks — 10.7% | ||||||
Bank One | ||||||
7.600%, 05/01/07 | 1,000 | 1,156 | ||||
Bank of America | ||||||
7.800%, 02/15/10 | 965 | 1,174 | ||||
6.625%, 10/15/07 | 500 | 569 | ||||
Bank of New York | ||||||
5.200%, 07/01/07 | 1,000 | 1,080 | ||||
Citigroup | ||||||
4.875%, 05/07/15 | 1,000 | 1,001 | ||||
| Description | Principal Amount (000) | Market Value (000) | ||||
CitiFinancial | ||||||
7.750%, 03/01/05 | $ | 1,285 | $ | 1,420 | ||
Fleet National Bank | ||||||
5.750%, 01/15/09 | 1,320 | 1,448 | ||||
PNC Funding | ||||||
6.125%, 02/15/09 | 1,330 | 1,467 | ||||
Wachovia | ||||||
7.875%, 02/15/10 | 1,000 | 1,203 | ||||
6.625%, 06/15/04 | 970 | 1,026 | ||||
Wells Fargo | ||||||
7.125%, 08/15/06 | 1,920 | 2,200 | ||||
TOTAL BANKS | $ | 13,744 | ||||
Consumer Discretionary — 3.7% | ||||||
Comcast Cablevision Communications | ||||||
8.875%, 05/01/17 | 1,500 | 1,900 | ||||
Newell Rubbermaid | ||||||
6.350%, 07/15/08 | 1,125 | 1,266 | ||||
Wal-Mart Stores | ||||||
5.450%, 08/01/06 | 1,460 | 1,600 | ||||
TOTAL CONSUMER DISCRETIONARY | $ | 4,766 | ||||
Consumer Staples — 0.9% | ||||||
ConAgra Foods | ||||||
9.875%, 11/15/05 | 1,000 | 1,175 | ||||
TOTAL CONSUMER STAPLES | $ | 1,175 | ||||
Energy — 10.5% | ||||||
Anderson Exploration | ||||||
6.750%, 03/15/11 | 1,000 | 1,130 | ||||
BP Amoco | ||||||
10.875%, 07/15/05 | 962 | 1,142 | ||||
ChevronTexaco Capital | ||||||
3.500%, 09/17/07 | 990 | 1,013 | ||||
Devon Financing | ||||||
6.875%, 09/30/11 | 1,000 | 1,150 | ||||
DTE Energy | ||||||
7.050%, 06/01/11 | 2,305 | 2,656 | ||||
Kerr-McGee | ||||||
5.375%, 04/15/05 | 500 | 526 | ||||
Kinder Morgan | ||||||
6.650%, 03/01/05 | 2,000 | 2,161 | ||||
National Oilwell + | ||||||
5.650%, 11/15/12 | 1,000 | 1,046 | ||||
Oryx Energy | ||||||
8.125%, 10/15/05 | 580 | 650 | ||||
APRIL 30, 2003 / ANNUAL REPORT
38
Table of Contents
INTERMEDIATE FIXED INCOME PORTFOLIO (continued)
| Description | Principal Amount (000) | Market Value (000) | ||||
Smith International ‡ + | ||||||
2.414%, 10/15/03 | $ | 1,000 | $ | 1,001 | ||
Valero Logistics + | ||||||
6.050%, 03/15/13 | 1,000 | 1,048 | ||||
TOTAL ENERGY | $ | 13,523 | ||||
Financials — 12.5% | ||||||
Bear Stearns | ||||||
7.250%, 10/15/06 | 835 | 951 | ||||
4.000%, 01/31/08 | 1,000 | 1,028 | ||||
CIT Group | ||||||
5.625%, 10/15/03 | 1,000 | 1,017 | ||||
Ford Motor Credit | ||||||
6.700%, 07/16/04 | 1,000 | 1,038 | ||||
General Electric Capital | ||||||
3.500%, 05/01/08 | 1,000 | 1,005 | ||||
General Motors Acceptance | ||||||
7.000%, 02/01/12 | 1,000 | 1,024 | ||||
Goldman Sachs Group | ||||||
5.700%, 09/01/12 | 1,000 | 1,065 | ||||
JP Morgan | ||||||
7.625%, 09/15/04 | 1,000 | 1,073 | ||||
John Deere Capital | ||||||
4.500%, 08/22/07 | 1,000 | 1,045 | ||||
Kimco Realty | ||||||
6.500%, 10/01/03 | 1,084 | 1,105 | ||||
Lehman Brothers Holdings | ||||||
6.250%, 05/15/06 | 670 | 743 | ||||
Morgan Stanley | ||||||
5.800%, 04/01/07 | 500 | 545 | ||||
4.250%, 05/15/10 | 1,000 | 1,000 | ||||
National Rural Utilities | ||||||
6.500%, 03/01/07 | 1,000 | 1,111 | ||||
Nordia Bank Finland NY | ||||||
6.500%, 01/15/06 | 2,060 | 2,273 | ||||
TOTAL FINANCIALS | $ | 16,023 | ||||
Industrials — 2.9% | ||||||
Canadian National Railway ‡ | ||||||
6.450%, 07/15/06 | 2,445 | 2,683 | ||||
General Electric Capital | ||||||
5.000%, 02/01/13 | 1,000 | 1,033 | ||||
TOTAL INDUSTRIALS | $ | 3,716 | ||||
| Description | Principal Amount (000) | Market Value (000) | ||||
Insurance — 0.9% | ||||||
American General Finance | ||||||
5.375%, 10/01/12 | $ | 1,160 | $ | 1,205 | ||
TOTAL INSURANCE | $ | 1,205 | ||||
Materials — 1.1% | ||||||
MeadWestvaco | ||||||
6.850%, 04/01/12 | 1,275 | 1,442 | ||||
TOTAL MATERIALS | $ | 1,442 | ||||
Telecommunication Services — 3.7% | ||||||
Alltel | ||||||
7.500%, 03/01/06 | 1,150 | 1,312 | ||||
AT&T Wireless Services | ||||||
7.875%, 03/01/11 | 800 | 922 | ||||
Cox Communications | ||||||
6.850%, 01/15/18 | 1,310 | 1,449 | ||||
Verizon Wireless ‡ | ||||||
1.659%, 12/17/03 | 1,000 | 999 | ||||
TOTAL TELECOMMUNICATION SERVICES | $ | 4,682 | ||||
Utilities — 3.3% | ||||||
Cinergy | ||||||
6.250%, 09/01/04 | 1,000 | 1,055 | ||||
Columbus Southern Power | ||||||
6.510%, 02/01/08 | 1,250 | 1,410 | ||||
Consolidated Natural Gas | ||||||
6.850%, 04/15/11 | 1,500 | 1,724 | ||||
TOTAL UTILITIES | $ | 4,189 | ||||
Real Estate Investment Trust — 1.0% | ||||||
Boston Properties + | ||||||
6.250%, 01/15/13 | $ | 1,225 | $ | 1,313 | ||
TOTAL REAL ESTATE INVESTMENT TRUST | $ | 1,313 | ||||
TOTAL CORPORATE OBLIGATIONS (COST $62,706) | $ | 65,778 | ||||
| Asset-Backed Securities — 6.8% | ||||||
EQCC Home Equity Loan Trust, | ||||||
5.915%, 11/20/24 | 507 | 513 | ||||
Ford Credit Auto Owner Trust, | ||||||
4.750%, 08/15/06 | 1,000 | 1,058 | ||||
Household Automotive Trust, | ||||||
2.850%, 09/16/04 | 1,000 | 1,015 | ||||
ANNUAL REPORT / APRIL 30, 2003
39
Table of Contents
INTERMEDIATE FIXED INCOME PORTFOLIO (concluded)
| Description | Shares/Principal Amount (000) | Market Value (000) | |||||
Residential Asset Securities, Ser | |||||||
3.690%, 12/04/05 | $ | 1,500 | $ | 1,534 | |||
Residential Asset Securities, | |||||||
3.580%, 09/29/05 | 1,250 | 1,280 | |||||
The Money Store Home Equity Trust, | |||||||
6.555%, 09/20/03 | 1,295 | 1,326 | |||||
Whole Auto Loan Trust, | |||||||
2.600%, 12/11/04 | 1,000 | 1,017 | |||||
William Street Funding, | |||||||
1.620%, 04/23/06 | 1,000 | 1,004 | |||||
TOTAL ASSET-BACKED SECURITIES (COST $8,550) | $ | 8,747 | |||||
| Repurchase Agreements — 9.4% | |||||||
Credit Suisse First Boston 1.270%, dated 4/30/03, matures 5/1/03 repurchase price $12,000,423 (102% collateralized by various U.S. Treasury Obligations) | �� | ||||||
1.270%, 05/01/03 | 12,000 | 12,000 | |||||
TOTAL REPURCHASE AGREEMENTS (COST $12,000) | $ | 12,000 | |||||
| Related Party Money Market Portfolio — 1.6% | |||||||
ARK Money Market Portfolio Institutional Class Ú | 2,007 | 2,007 | |||||
| TOTAL RELATED PARTY MONEY MARKET PORTFOLIO (COST $2,007) | $ | 2,007 | |||||
TOTAL INVESTMENTS — 111.2% (COST $136,627) | $ | 142,684 | |||||
| OTHER ASSETS & LIABILITIES, NET — (11.2)% | $ | (14,421 | ) | ||||
| TOTAL NET ASSETS — 100.0% | $ | 128,263 | |||||
| ‡ | Variable Rate Security. The rate reported on the Schedule of Investments is the rate in effect on 4/30/03. The date shown is the stated maturity. |
| Ú | This money market portfolio is advised by Allied Investment Advisors, Inc. who also serves as advisor of this portfolio. |
| + | Security exempt from registration under Rule 144A of the Securities Act of 1933. These securities may be resold in transactions exempt from registration normally qualified to institutional investors. |
| n | Principal is guaranteed by U.S. Government and interest is guaranteed by EXIM Bank. |
Cl — Class
FHLB — Federal Home Loan Bank
FHLMC — Federal Home Loan Mortgage Corporation
FNMA — Federal National Mortgage Association
GNMA — Government National Mortgage Association
MTN — Medium Term Note
REMIC — Real Estate Mortgage Investment Conduit
Ser — Series
The accompanying notes are an integral part of the financial statements.
APRIL 30, 2003 / ANNUAL REPORT
40
Table of Contents
This page intentionally left blank.
Table of Contents
FIXED INCOME PORTFOLIOS
U.S. GOVERNMENT BOND PORTFOLIO
James M. Hannan
CO-PORTFOLIO MANAGER
James M. Hannan is co-manager of the U.S. Government Bond Portfolio, and is manager or co-manager of other ARK Funds Portfolios. He is also responsible for several separately managed institutional portfolios. Mr. Hannan has been a Portfolio Manager of AIA since 1996, a Vice President of Allfirst Bank from 1987 to 2003 and a Vice President of M&T Trust since 2003. He has more than 15 years of experience in the investment industry.
Wilmer C. Stith III, CFA
CO-PORTFOLIO MANAGER
Wilmer C. Stith III, CFA is co-manager of the U.S. Government Bond Portfolio, and is manager or co-manager of other ARK Funds Portfolios. He has been a Vice President of AIA and Portfolio Manager since 1996. He manages separate accounts, assists in the management of the money market portfolios, and is responsible for analyzing and trading various fixed income securities. Mr. Stith has more than 10 years of experience in the investment industry, and is a Chartered Financial Analyst.
Management Discussion and Analysis
Interest rates fell over the past fiscal year, as economic growth remained elusive. The 10-year Treasury yield declined from a fiscal year high of 5.27% on May 14, 2002 to a yield of 3.84% on April 30, 2003. The Federal Reserve lowered short-term interest rates once during the period in November 2002 to 1.25% from 1.75%.
Working within this declining interest rate environment during the past fiscal year, we maintained our allocation to high-quality U.S. Treasury securities and increased our allocation to higher-yielding government agency securities. In the mortgage-backed sector we reduced our allocation versus fiscal year end 2002 to minimize our prepayment risk. This reduction contributed positively to Portfolio performance as mortgage prepayments soared. During the final quarter of the fiscal year, our increased allocation to corporate securities also aided Portfolio performance as corporates generally outperformed other areas of the bond market.
At fiscal year end our duration was in line with the Lehman Government Intermediate Index at approximately 3.2 years. We believe that securities with durations between 7 and 8 years have the potential to outperform the shorter end of the yield curve, and thus have overweighting in this portion of the yield curve.
Looking forward we will continue to consistently utilize our conservative and disciplined relative value investment process.
APRIL 30, 2003 / ANNUAL REPORT
42
Table of Contents
U.S. GOVERNMENT BOND PORTFOLIO
9Performance as of April 30, 2003
INSTITUTIONAL CLASS SHARES: VALUE OF A $100,000 INVESTMENT
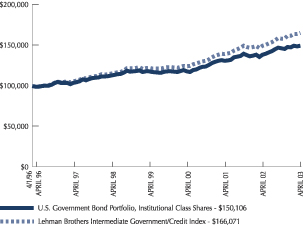
CLASS A SHARES: VALUE OF A $10,000 INVESTMENT
![]()
| Inst'l Class Shares | Class A Shares* | Lehman Brothers Intermediate Gov't/Credit Index | ||||
| One year total return | 8.11% | 8.01% | 10.76% | |||
| One year total return with load | — | 3.14% | — | |||
| Annualized three year total return | 8.19% | 8.06% | 10.00% | |||
| Annualized three year total return with load | — | 6.41% | — | |||
| Annualized five year total return | 5.84% | 5.76% | 7.53% | |||
| Annualized five year total return with load | — | 4.80% | — | |||
| Annualized total return inception to date | 5.90% | 6.77% | — | |||
| Annualized total return inception to date with load | — | 6.07% | — | |||
| Past performance is no guarantee of future results. Investment return and principal value will fluctuate so that an investor’s shares, when redeemed, may be worth more or less than original cost. Total return figures include the reinvestment of dividends and capital gains. During the period, certain fees may have been waived or expenses reimbursed; otherwise total return would have been lower. |
| For each class, performance presented prior to March 23, 1998 reflects the performance of the Marketvest Intermediate U.S. Government Bond Fund from its inception date of April 1, 1996. Class A Shares were offered beginning April 1, 1998. Performance for Class A Shares with load reflects the deduction of the maximum 4.50% sales charge. |
| * | Performance shown prior to the actual inception date of the Class A Shares represents that of the Institutional Class Shares adjusted for the sales charge and total operating expenses applicable to Class A Shares. |
| The performance of the Lehman Brothers Intermediate Government/Credit Index does not include operating expenses incurred by the Portfolio. Index performance is for the period March 31, 1996 to April 30, 2003. |
| The performance information presented in the graphs and table above do not reflect the deduction of taxes that a shareholder would pay on Portfolio distributions or the redemption of Portfolio shares. |
ANNUAL REPORT / APRIL 30, 2003
43
Table of Contents
U.S GOVERNMENT BOND PORTFOLIO (continued)

Schedule of Investments
| Description | Principal Amount (000) | Market Value (000) | ||||
| U.S. Treasury Obligations — 14.8% | ||||||
Treasury Inflation Index Bonds | ||||||
U.S. Treasury Bonds | ||||||
3.500%, 01/15/11 | $ | 2,325 | $ | 2,707 | ||
U.S. Treasury Notes | ||||||
5.375%, 02/15/31 | 750 | 818 | ||||
6.750%, 05/15/05 | 1,500 | 1,657 | ||||
6.500%, 08/15/05 | 1,000 | 1,110 | ||||
5.000%, 08/15/11 | 1,385 | 1,517 | ||||
4.750%, 11/15/08 | 825 | 897 | ||||
4.625%, 05/15/06 | 2,000 | 2,154 | ||||
4.000%, 11/15/12 | 500 | 506 | ||||
3.500%, 11/15/06 | 1,500 | 1,564 | ||||
3.250%, 08/15/07 | 720 | 740 | ||||
2.125%, 10/31/04 | 1,000 | 1,012 | ||||
| TOTAL U.S. TREASURY OBLIGATIONS (COST $13,941) | $ | 14,682 | ||||
| U.S. Government Agency Obligations — $38.6% | ||||||
FHLB | ||||||
6.625%, 11/15/10 |
| 1,435 |
| 1,697 | ||
4.500%, 11/15/12 |
| 3,000 |
| 3,068 | ||
2.000%, 03/10/05 |
| 1,500 |
| 1,501 | ||
FHLMC | ||||||
8.250%, 06/01/26 |
| 1,000 |
| 1,335 | ||
5.875%, 03/21/11 |
| 2,000 |
| 2,217 | ||
5.125%, 07/15/12 |
| 2,615 |
| 2,808 | ||
2.500%, 07/28/05 |
| 5,000 |
| 5,038 | ||
FNMA | ||||||
5.500%, 05/02/06 |
| 3,025 |
| 3,293 | ||
5.250%, 08/01/12 |
| 3,000 |
| 3,173 | ||
3.875%, 03/15/05 |
| 5,000 |
| 5,218 | ||
FNMA, MTN | ||||||
6.470%, 09/25/12 |
| 7,500 | 8,820 | |||
| TOTAL U.S. GOVERNMENT AGENCY OBLIGATIONS (COST $35,776) | $ | 38,168 | ||||
| Description | Principal Amount (000) | Market Value (000) | ||||
| U.S. Government Agency Mortgage-Backed Obligations — 27.0% | ||||||
FHLMC | ||||||
6.500%, 10/15/25 | $ | 1,500 | $ | 1,522 | ||
6.250%, 11/15/22 | 351 | 367 | ||||
6.000%, 03/01/13 | 4,498 | 4,711 | ||||
5.500%, 09/15/06 | 2,595 | 2,631 | ||||
FHLMC, REMIC | ||||||
6.250%, 09/15/23 | 5,000 | 5,306 | ||||
FNMA | ||||||
6.500%, 03/01/32 | 1,450 | 1,515 | ||||
6.500%, 08/01/28 | 723 | 756 | ||||
6.500%, 08/01/28 | 583 | 610 | ||||
6.500%, 08/01/28 | 2,104 | 2,201 | ||||
6.500%, 03/01/29 | 1,779 | 1,860 | ||||
6.500%, 03/01/29 | 1,344 | 1,406 | ||||
6.500%, 05/01/29 | 1,176 | 1,229 | ||||
FNMA, REMIC | ||||||
6.000%, 09/18/26 | 2,493 | 2,537 | ||||
| TOTAL U.S. GOVERNMENT AGENCY MORTGAGE-BACKED OBLIGATIONS (COST $25,727) | $ | 26,651 | ||||
| Corporate Obligations — 9.2% | ||||||
Banks — 2.6% | ||||||
Bank of America | ||||||
5.250%, 02/01/07 | 1,425 | 1,548 | ||||
PNC Funding | ||||||
6.125%, 09/01/03 | 1,000 | 1,016 | ||||
TOTAL BANKS | $ | 2,564 | ||||
Energy — 1.2% | ||||||
Husky Oil | ||||||
7.550%, 11/15/16 | 1,000 | 1,209 | ||||
TOTAL ENERGY | $ | 1,209 | ||||
Financials — 3.6% | ||||||
CIT Group ‡ | ||||||
2.839%, 03/01/04 | 1,500 | 1,509 | ||||
Ford Motor Credit | ||||||
6.700%, 07/16/04 | 1,000 | 1,038 | ||||
General Motors Acceptance | ||||||
7.000%, 02/01/12 | 1,000 | 1,024 | ||||
TOTAL FINANCIALS | $ | 3,571 | ||||
Industrials — 1.2% | ||||||
FedEx | ||||||
7.250%, 02/15/11 | 1,000 | 1,153 | ||||
TOTAL INDUSTRIALS | $ | 1,153 | ||||
APRIL 30, 2003 / ANNUAL REPORT
44
Table of Contents
U.S GOVERNMENT BOND PORTFOLIO (concluded)
| Description | Principal Amount/ Shares (000) | Market Value (000) | |||||
| Real Estate Investment Trust — 0.6% | |||||||
Boston Properties + | |||||||
5.625%, 04/15/15 | $ | 600 | $ | 607 | |||
TOTAL REAL ESTATE INVESTMENT TRUST | $ | 607 | |||||
| TOTAL CORPORATE OBLIGATIONS (COST $8,598) | $ | 9,104 | |||||
| Asset-Backed Securities — 1.6% | |||||||
ANRC Auto Owner Trust, | |||||||
4.320%, 06/16/08 | 850 | 883 | |||||
EQCC Home Equity Loan Trust, | |||||||
6.459%, 03/15/21 | 168 | 169 | |||||
EQCC Home Equity Loan Trust, | |||||||
6.326%, 01/15/22 | 558 | 565 | |||||
| TOTAL ASSET-BACKED SECURITIES (COST $1,582) | $ | 1,617 | |||||
| Repurchase Agreements — 7.1% | |||||||
Credit Suisse First Boston, 1.270%, dated 04/30/03, matures 05/01/03, repurchase price $7,000,247 (102% collateralized by various U.S. Treasury Obligations) | 7,000 | 7,000 | |||||
| TOTAL REPURCHASE AGREEMENTS (COST $7,000) | $ | 7,000 | |||||
| Related Party Money Market Portfolio — 3.9% | |||||||
ARK Money Market Portfolio Institutional Class Ú | 3,877 | 3,877 | |||||
| TOTAL RELATED PARTY MONEY MARKET PORTFOLIO (COST $3,877) | $ | 3,877 | |||||
| TOTAL INVESTMENTS — 102.2% (COST $96,501) | $ | 101,099 | |||||
| OTHER ASSETS & LIABILITIES, NET — (2.2)% | $ | (2,191 | ) | ||||
| TOTAL NET ASSETS — 100.0% | $ | 98,908 | |||||
| + | Security exempt from registration under Rule 144A of the Securities Act of 1933. These securities may be resold in transactions exempt from registration normally qualified to institutional investors. |
| ‡ | Variable Rate Security. The rate reported on the Schedule of Investments is the rate in effect on 4/30/03. The date shown is the stated maturity. |
| Ú | This money market portfolio is advised by Allied Investment Advisors, Inc. who also serves as advisor of this portfolio. |
| Cl — Class |
| FHLB — Federal Home Loan Bank |
| FHLMC — Federal Home Loan Mortgage Corporation |
| FNMA — Federal National Mortgage Association |
| MTN — Medium Term Note |
| REMIC — Real Estate Mortgage Investment Conduit |
| Ser — Series |
The accompanying notes are an integral part of the financial statements.
ANNUAL REPORT / APRIL 30, 2003
45
Table of Contents
FIXED INCOME PORTFOLIOS
INCOME PORTFOLIO
James M. Hannan
CO-PORTFOLIO MANAGER
James M. Hannan is co-manager of the Income Portfolio, and is manager or co-manager of other ARK Funds Portfolios. He is also responsible for several separately managed institutional portfolios. Mr. Hannan has been a Portfolio Manager of AIA since 1996, a Vice President of Allfirst Bank from 1987 to 2003 and a Vice President of M&T Trust since 2003. He has more than 15 years of experience in the investment industry.
Wilmer C. Stith III, CFA
CO-PORTFOLIO MANAGER
Wilmer C. Stith III, CFA is co-manager of the Income Portfolio, and is manager or co-manager of other ARK Funds Portfolios. He has been a Vice President of AIA and Portfolio Manager since 1996. He manages separate accounts, assists in the management of the money market portfolios, and is responsible for analyzing and trading various fixed income securities. Mr. Stith has more than 10 years of experience in the investment industry, and is a Chartered Financial Analyst.
Management Discussion and Analysis
Interest rates fell over the past fiscal year, as economic growth remained elusive. The 10-year Treasury declined from a high yield for the fiscal year of 5.27% on May 14, 2002 to a yield of 3.84% on April 30, 2003. The Federal Reserve lowered short-term interest rates once during the period in November 2002 to 1.25% from 1.75%.
Working within this declining interest rate environment, during the past fiscal year we reduced our allocation to high-quality U.S. Treasury securities in favor of higher-yielding corporate, government agency, and mortgage-backed securities. This sector shift aided the Portfolio as the credit sector outperformed the general market from November 2002 through April 2003. In particular, we added names such as AT&T Wireless Services, Boston Properties (a real estate investment trust), Goldman Sachs, and a number of energy companies. In the mortgage-backed sector we added 15-year pass-through securities versus 30-year securities to minimize our prepayment risk.
For most of the past year the duration of the Portfolio was either neutral to or longer than the Lehman Brothers U.S. Aggregate Bond Index. At fiscal year end, Portfolio duration was in line with the aforementioned index at slightly less than 4 years. Believing that securities with a duration between 6 and 9 years have the potential to outperform the shorter end of the yield curve, we have an overweighting in this portion of the yield curve.
Looking forward we will continue to consistently utilize our conservative and disciplined relative value investment process.
APRIL 30, 2003 / ANNUAL REPORT
46
Table of Contents
INCOME PORTFOLIO
Performance as of April 30, 2003
INSTITUTIONAL CLASS SHARES: VALUE OF A $100,000 INVESTMENT
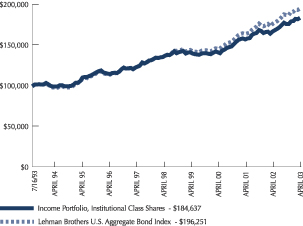
CLASS A AND B SHARES: VALUE OF A $10,000 INVESTMENT
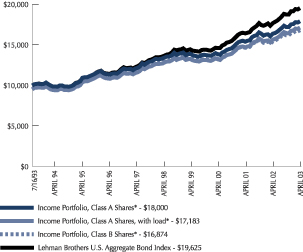
| Inst’l Class Shares | Class A Shares* | Class B Shares* | Lehman Brothers U.S. Aggregate Bond Index | |||||
| One year total return | 9.86% | 9.59% | 8.90% | 10.47% | ||||
| One year total return with load | — | 4.65% | 3.90% | — | ||||
| Annualized three year total return | 9.14% | 9.01% | 8.21% | 10.21% | ||||
| Annualized three year total return with load | — | 7.36% | 7.35% | — | ||||
| Annualized five year total return | 6.26% | 6.12% | 5.46% | 7.58% | ||||
| Annualized five year total return with load | — | 5.14% | 5.14% | — | ||||
| Annualized total return inception to date | 6.46% | 6.19% | 5.49% | — | ||||
| Annualized total return inception to date with load | — | 5.69% | 5.49% | — | ||||
| Past performance is no guarantee of future results. Investment return and principal value will fluctuate so that an investor’s shares, when redeemed, may be worth more or less than original cost. Total return figures include the reinvestment of dividends and capital gains. During the period, certain fees may have been waived or expenses reimbursed, otherwise total return would have been lower. |
| Institutional Class Shares were offered beginning July 16, 1993. Class A Shares were offered beginning April 12, 1994. Performance for Class A Shares with load reflects the deduction of the maximum 4.50% sales charge. Class B Shares were offered beginning September 14, 1998. Performance for Class B Shares with load reflects the deduction of the applicable contingent deferred sales charge (CDSC). Class B Shares are subject to a maximum 5% CDSC in the first year which declines to 0% in the seventh year. |
| * | Performance shown prior to the actual inception date of the Class A and Class B Shares represents that of the Institutional Class Shares adjusted for the sales charge and total operating expenses applicable to Class A and Class B Shares, respectively. |
| The performance of the Lehman Brothers U.S. Aggregate Bond Index does not include operating expenses incurred by the Portfolio. Index performance is for the period July 31, 1993 to April 30, 2003. |
| The performance information presented in the graphs and table above do not reflect the deduction of taxes that a shareholder would pay on Portfolio distributions or the redemption of Portfolio shares. |
ANNUAL REPORT / APRIL 30, 2003
47
Table of Contents
INCOME PORTFOLIO (continued)

Schedule of Investments
| Description | Principal Amount (000) | Market Value (000) | ||||
| U.S. Treasury Obligations — 9.1% | ||||||
Treasury Inflation Index Bonds | ||||||
3.375%, 01/15/12 | $ | 7,000 | $ | 7,972 | ||
3.000%, 07/15/12 | 2,000 | 2,188 | ||||
U.S. Treasury Bonds | ||||||
6.250%, 05/15/30 | 2,350 | 2,832 | ||||
5.375%, 02/15/31 | 1,000 | 1,091 | ||||
U.S. Treasury Notes | ||||||
6.750%, 05/15/05 | 5,000 | 5,523 | ||||
3.875%, 02/15/13 | 2,555 | 2,558 | ||||
3.500%, 11/15/06 | 1,570 | 1,636 | ||||
| TOTAL U.S. TREASURY OBLIGATIONS (COST $22,210) | $ | 23,800 | ||||
| U.S. Government Agency Obligations — 12.1% | ||||||
FHLB | ||||||
4.500%, 11/15/12 | 3,000 | 3,068 | ||||
FHLMC | ||||||
5.875%, 03/21/11 | 10,500 | 11,641 | ||||
5.250%, 01/15/06 | 3,000 | 3,253 | ||||
5.125%, 07/15/12 | 4,850 | 5,208 | ||||
FHLMC, GTD | ||||||
9.000%, 09/15/08 | 4 | 4 | ||||
FNMA | ||||||
5.250%, 08/01/12 | 8,000 | 8,461 | ||||
| TOTAL U.S. GOVERNMENT AGENCY OBLIGATIONS (COST $29,437) | $ | 31,635 | ||||
| U.S. Government Agency Mortgage-Backed Obligations — 42.6% | ||||||
FHLMC | ||||||
14.750%, 03/01/10 | 8 | 10 | ||||
8.500%, 09/01/26 | 234 | 254 | ||||
8.000%, 01/01/08 | 6 | 6 | ||||
6.250%, 11/15/22 | 1,220 | 1,277 | ||||
| Description | Principal Amount (000) | Market Value (000) | ||||
FHLMC, REMIC | ||||||
6.500%, 05/15/30 | $ | 12,000 | $ | 12,708 | ||
6.500%, 06/15/30 | 10,000 | 10,387 | ||||
FNMA | ||||||
7.000%, 02/01/26 | 850 | 903 | ||||
7.000%, 03/01/29 | 422 | 446 | ||||
5.500%, 11/01/17 | 7,075 | 7,365 | ||||
5.500%, 03/01/18 | 10,000 | 10,409 | ||||
FNMA ± | ||||||
6.000%, 05/01/33 | 43,500 | 45,330 | ||||
FNMA, REMIC | ||||||
9.750%, 09/25/18 | 95 | 108 | ||||
6.000%, 07/18/26 | 10,732 | 10,981 | ||||
6.000%, 09/18/26 | 4,156 | 4,229 | ||||
GNMA | ||||||
7.500%, 05/15/22 | 135 | 145 | ||||
7.500%, 10/15/23 | 779 | 838 | ||||
7.500%, 12/15/23 | 371 | 399 | ||||
7.500%, 05/15/24 | 699 | 750 | ||||
7.500%, 10/15/24 | 749 | 805 | ||||
7.000%, 02/15/24 | 1,111 | 1,186 | ||||
7.000%, 05/15/24 | 1,044 | 1,115 | ||||
7.000%, 05/15/24 | 1,034 | 1,103 | ||||
7.000%, 09/20/25 | 363 | 386 | ||||
| TOTAL U.S. GOVERNMENT AGENCY MORTGAGE-BACKED OBLIGATIONS (COST $108,673) | $ | 111,140 | ||||
| Corporate Obligations — 51.0% | ||||||
Banks — 7.7% | ||||||
Bank of America + | ||||||
8.070%, 12/31/26 | 2,500 | 2,927 | ||||
Bank of New York + | ||||||
7.780%, 12/01/26 | 1,500 | 1,697 | ||||
Bank One | ||||||
5.250%, 01/30/13 | 900 | 946 | ||||
Citigroup | ||||||
4.875%, 05/07/15 | 2,000 | 2,002 | ||||
Crestar Capital Trust I | ||||||
8.160%, 12/15/26 | 3,500 | 4,065 | ||||
Mellon Capital I, Ser A | ||||||
7.720%, 12/01/26 | 2,500 | 2,856 | ||||
PNC Funding | ||||||
6.125%, 09/01/03 | 1,300 | 1,320 | ||||
5.750%, 08/01/06 | 2,500 | 2,722 | ||||
Wells Fargo | ||||||
5.000%, 11/15/14 | 1,445 | 1,493 | ||||
TOTAL BANKS | $ | 20,028 | ||||
APRIL 30, 2003 / ANNUAL REPORT
48
Table of Contents
INCOME PORTFOLIO (continued)
| Description | Principal Amount (000) | Market Value (000) | ||||
Consumer Discretionary — 1.4% | ||||||
Comcast Cablevision Communications | ||||||
8.875%, 05/01/17 | $ | 2,000 | $ | 2,533 | ||
Target | ||||||
3.375%, 03/01/08 | 1,000 | 1,006 | ||||
TOTAL CONSUMER DISCRETIONARY | $ | 3,539 | ||||
Consumer Staples — 1.4% | ||||||
Archer-Daniels-Midland | ||||||
5.935%, 10/01/32 | 1,000 | 1,048 | ||||
ConAgra Foods | ||||||
9.875%, 11/15/05 | 1,000 | 1,174 | ||||
Safeway | ||||||
3.625%, 11/05/03 | 1,330 | 1,337 | ||||
TOTAL CONSUMER STAPLES | $ | 3,559 | ||||
Energy — 10.0% | ||||||
Anadarko Petroleum | ||||||
7.200%, 03/15/29 | 3,800 | 4,462 | ||||
Anderson Exploration | ||||||
6.750%, 03/15/11 | 1,000 | 1,130 | ||||
Conoco Funding | ||||||
7.250%, 10/15/31 | 1,290 | 1,564 | ||||
Devon Financing | ||||||
6.875%, 09/30/11 | 950 | 1,093 | ||||
DTE Energy | ||||||
6.000%, 06/01/04 | 2,600 | 2,713 | ||||
6.375%, 04/15/33 | 1,000 | 1,048 | ||||
Husky Oil | ||||||
7.550%, 11/15/16 | 2,100 | 2,539 | ||||
Kinder Morgan | ||||||
6.650%, 03/01/05 | 2,750 | 2,971 | ||||
National Oilwell + | ||||||
5.650%, 11/15/12 | 2,000 | 2,091 | ||||
Smith International ‡ + | ||||||
2.414%, 10/15/03 | 4,000 | 4,003 | ||||
Valero Logistics + | ||||||
6.050%, 03/15/13 | 1,500 | 1,572 | ||||
XTO Energy + | ||||||
6.250%, 04/15/13 | 1,000 | 1,042 | ||||
TOTAL ENERGY | $ | 26,228 | ||||
Financials — 23.1% | ||||||
Bear Stearns ‡ | ||||||
1.565%, 06/26/04 | 1,830 | 1,822 | ||||
| Description | Principal Amount (000) | Market Value (000) | ||||
CIT Group | ||||||
7.500%, 11/14/03 | $ | 5,000 | $ | 5,143 | ||
Countrywide Home ‡ | ||||||
1.568%, 12/10/03 | 3,000 | 3,000 | ||||
Deutsche Ausgleichsbank | ||||||
7.000%, 06/23/05 | 250 | 277 | ||||
Ford Motor Credit | ||||||
6.700%, 07/16/04 | 3,000 | 3,113 | ||||
General Electric Capital | ||||||
3.500%, 05/01/08 | 1,150 | 1,155 | ||||
General Motors Acceptance | ||||||
7.000%, 02/01/12 | 4,000 | 4,098 | ||||
General Motors Acceptance, MTN ‡ | ||||||
1.604%, 07/21/03 | 5,000 | 4,997 | ||||
Goldman Sachs Group | ||||||
5.700%, 09/01/12 | 1,000 | 1,065 | ||||
5.500%, 11/15/14 | 1,000 | 1,046 | ||||
John Deere Capital | ||||||
4.500%, 08/22/07 | 1,300 | 1,358 | ||||
JP Morgan | ||||||
7.625%, 09/15/04 | 2,497 | 2,678 | ||||
Lehman Brothers Holdings | ||||||
8.250%, 06/15/07 | 2,500 | 2,970 | ||||
7.000%, 02/01/08 | 1,107 | 1,272 | ||||
MBNA, MTN | ||||||
6.150%, 10/01/03 | 2,000 | 2,035 | ||||
Merrill Lynch | ||||||
4.000%, 11/15/07 | 1,455 | 1,492 | ||||
Merrill Lynch, MTN, Ser B ‡ | ||||||
1.710%, 06/23/03 | 5,000 | 5,001 | ||||
Morgan Stanley, MTN ‡ | ||||||
1.650%, 02/02/04 | 2,100 | 2,104 | ||||
Morgan Stanley, MTN, Ser C ‡ | ||||||
1.599%, 08/07/03 | 5,000 | 5,004 | ||||
National Rural Utilities | ||||||
6.500%, 03/01/07 | 1,180 | 1,312 | ||||
Newcourt Credit | ||||||
6.875%, 02/16/05 | 3,500 | 3,717 | ||||
SLM | ||||||
3.625%, 03/17/08 | 2,000 | 2,015 | ||||
SUSA Partnership | ||||||
7.125%, 11/01/03 | 3,600 | 3,695 | ||||
TOTAL FINANCIALS | $ | 60,369 | ||||
ANNUAL REPORT / APRIL 30, 2003
49
Table of Contents
INCOME PORTFOLIO (concluded)
| Description | Principal Amount (000) | Market Value (000) | ||||
Industrials — 3.6% | ||||||
Canadian National Railway | ||||||
6.450%, 07/15/06 | $ | 2,000 | $ | 2,194 | ||
General Electric | ||||||
5.000%, 02/01/13 | 1,000 | 1,034 | ||||
Norfolk Southern ‡ | ||||||
1.849%, 07/07/03 | 6,045 | 6,048 | ||||
TOTAL INDUSTRIALS | $ | 9,276 | ||||
Insurance — 0.4% | ||||||
ASIF Global Financing + | ||||||
4.900%, 01/17/13 | 1,175 | 1,199 | ||||
TOTAL INSURANCE | $ | 1,199 | ||||
Materials — 0.4% | ||||||
Westvaco | ||||||
6.850%, 11/15/04 | 1,000 | 1,061 | ||||
TOTAL MATERIALS | $ | 1,061 | ||||
Real Estate Investment Trust — 0.4% | ||||||
Boston Properties + | ||||||
6.250%, 01/15/13 | 1,000 | 1,072 | ||||
TOTAL REAL ESTATE INVESTMENT TRUST | $ | 1,072 | ||||
Telecommunication Services — 1.8% | ||||||
AT&T Wireless Services | ||||||
7.875%, 03/01/11 | 1,500 | 1,728 | ||||
Verizon Wireless ‡ | ||||||
1.659%, 12/17/03 | 2,865 | 2,863 | ||||
TOTAL TELECOMMUNICATION SERVICES | $ | 4,591 | ||||
Utilities — 0.8% | ||||||
Consolidated Natural Gas, Ser C | ||||||
6.250%, 11/01/11 | 2,000 | 2,229 | ||||
TOTAL UTILITIES | $ | 2,229 | ||||
| TOTAL CORPORATE OBLIGATIONS (COST $128,107) | $ | 133,151 | ||||
| Asset-Backed Securities — 5.5% | ||||||
Chase Funding Mortgage Loan, | ||||||
7.674%, 10/25/19 | 895 | 904 | ||||
Citibank Credit Card Master Trust I, | ||||||
5.300%, 01/09/06 | 2,000 | 2,054 | ||||
Countrywide Funding, Ser 1994-4, | ||||||
6.950%, 04/25/04 | 1,171 | 1,183 | ||||
| Description | Principal Amount/ Shares (000) | Market Value (000) | |||||
L.A. Arena Funding, Ser 1, Cl A + | |||||||
7.656%, 12/15/26 | $ | 1,933 | $ | 2,087 | |||
The Money Store Home Equity Trust, Ser 1997-D, Cl AF5 | |||||||
6.555%, 12/15/38 | 3,165 | 3,240 | |||||
William Street Funding, Ser 2003-1, | |||||||
1.620%, 04/23/06 | 5,000 | 5,019 | |||||
TOTAL ASSET-BACKED SECURITIES (COST $14,164) | $ | 14,487 | |||||
| Repurchase Agreements — 0.8% | |||||||
Credit Suisse First Boston 1.270%, dated 4/30/03, matures 5/1/03 repurchase price $2,000,071 (102% collateralized by various U.S. Treasury Obligations) | 2,000 | 2,000 | |||||
TOTAL REPURCHASE AGREEMENTS (COST $2,000) | $ | 2,000 | |||||
| Related Party Money Market Portfolio — 1.8% | |||||||
ARK Money Market Portfolio Institutional Class Ú | 4,634 | 4,634 | |||||
| TOTAL RELATED PARTY MONEY MARKET PORTFOLIO (COST $4,634) | $ | 4,634 | |||||
TOTAL INVESTMENTS — 122.9% (COST $309,225) | $ | 320,847 | |||||
| OTHER ASSETS & LIABILITIES, NET — (22.9)% | $ | (59,692 | ) | ||||
| TOTAL NET ASSETS — 100.0% | $ | 261,155 | |||||
| ‡ | Variable Rate Security. The rate reported on the Schedule of Investments is the rate in effect on 4/30/03. The date shown is the stated maturity. |
| Ú | This money market portfolio is advised by Allied Investment Advisors, Inc. who also serves as advisor of this portfolio. |
| ± | When Issued Security, total cost $50,666 (in thousands) |
| + | Security exempt from registration under Rule 144A of the Securities Act of 1933. These securities may be resold in transactions exempt from registration normally qualified to institutional investors. |
Cl — Class
FHLB — Federal Home Loan Bank
FHLMC — Federal Home Loan Mortgage Corporation
FNMA — Federal National Mortgage Association
GNMA — Government National Mortgage Association
GTD — Guaranteed Mortgage Certificate
MTN — Medium Term Note
REMIC — Real Estate Mortgage Investment Conduit
Ser — Series
The accompanying notes are an integral part of the financial statements.
APRIL 30, 2003 / ANNUAL REPORT
50
Table of Contents
EQUITY PORTFOLIOS
Equity
Portfolios
Simply stated, our investment management philosophy for the Equity Portfolios is quality for the long term. We look for outstanding businesses that are reasonably priced, because over the long haul, experience has shown the benefits of buying a quality company at a fair price, versus a fair business at a bargain price.
In their research, our Portfolio Managers look for businesses that demonstrate faster-than-average growth, strong cash flows, and returns on capital in excess of the cost of capital.
We look for high-quality companies and use a bottom-up stock selection process with strict criteria. We select the stocks of companies that demonstrate superior sales, cash flow, and earnings growth rates, and that operate in a dynamic market and industry. We also look for strong balance sheets and capable, shareholder-oriented management. We like companies that can earn returns on capital in excess of their cost of capital.
We believe history has become a less-than-accurate predictor of the future; thus, we place greater emphasis on meeting with management to assess each company’s future. Increasingly important is the teaming of strong financials with enlightened corporate leadership, a combination necessary to thrive in today’s highly competitive, rapidly evolving business environment. Our team of professionals, which includes all of our Portfolio Managers, searches for the best companies based on our specific screening criteria.
Next, we assess future earnings prospects seeking to identify the companies that can continue to generate superior sales and profit growth. We examine industry dynamics, the companies’ relative positions, cost structures, margin trends, and management plans. Finally, we assess each company’s current stock valuation relative to future earnings stream against history, competitors, and the S&P 500.
Typically, we review a portfolio holding for sale under the following circumstances: when the price objective is achieved, when fundamentals deteriorate and make the achievement of objectives unlikely, when the stock underperforms the S&P 500 by 20 percent or more on a relative basis, and when a more attractive opportunity presents itself.
51
Table of Contents
BALANCED PORTFOLIO
PORTFOLIO MANAGERS
The Balanced Portfolio is managed by a Portfolio Management Team under the direction of J. Eric Leo. Through the team approach, AIA seeks consistent implementation of process and continuity in investment management staff for the Portfolio. Mr. Leo has been a Portfolio Manager of AIA since 1996, a Vice President of Allfirst Bank from 1987 to 2003 and a Vice President of M&T Trust since 2003. Mr. Leo has more than 30 years of experience in the investment industry.
Management Discussion and Analysis
This year was one of the more challenging years from an investment standpoint in decades. The equity markets experienced their third consecutive year of negative returns. Equity investors shied away from equities on concerns over the health of a struggling economy, and the worries of an armed conflict with Iraq. As equities in general underperformed, this Portfolio was aided by its weighting in fixed income assets. The bond market had a superb year as interest rates fell and bond prices appreciated handsomely. Because of its positioning, the Portfolio didn’t suffer the poor returns witnessed by most equity funds over the last fiscal year.
The largest positive contributing factor to Portfolio performance this year was our exposure to the fixed income market. However, several equities that positively impacted returns were Amgen, Eli Lilly, and Best Buy. The Portfolio’s worst-performing equities were Lucent, Taiwan Semiconductor, and Honeywell.
The Portfolio’s style is to invest approximately two thirds of its capital in equities with a growth bias, while investing approximately one third in fixed income assets. This approach creates a solid combination of aggressiveness and conservatism. Aggressiveness in looking at stocks of companies that over time we feel have the potential to grow at double digit rates, and conservatism in owning quality fixed assets that seek to deliver a competitive income stream. We continue to search for investments that we believe can add value to the Portfolio with the potential to deliver strong long-term returns.
APRIL 30, 2003 / ANNUAL REPORT
52
Table of Contents
BALANCED PORTFOLIO
Performance as of April 30, 2003
INSTITUTIONAL CLASS SHARES: VALUE OF A $100,000 INVESTMENT
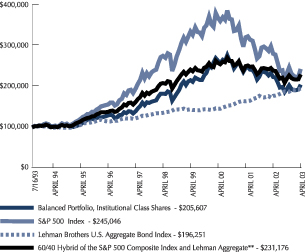
CLASS A AND B SHARES: VALUE OF A $10,000 INVESTMENT
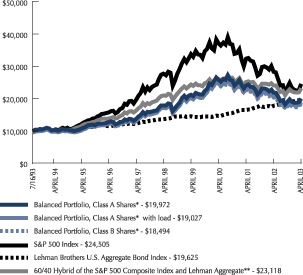
| Inst'l Class Shares | Class A Shares* | Class B Shares* | S&P 500 Index | Lehman Brothers U.S. Aggregate Bond Index | 60/40 Hybrid ** | |||||||
| One year total return | -8.52% | -8.71% | -9.31% | -13.31% | 10.47% | -3.82% | ||||||
| One year total return with load | — | -13.04% | -13.81% | — | — | — | ||||||
| Annualized three year total return | -8.15% | -8.25% | -8.92% | -12.96% | 10.21% | -3.83% | ||||||
| Annualized three year total return with load | — | -9.73% | -9.76% | — | — | — | ||||||
| Annualized five year total return | 2.31% | 2.17% | 1.23% | -2.42% | 7.58% | 1.96% | ||||||
| Annualized five year total return with load | — | 1.18% | 0.90% | — | — | — | ||||||
| Annualized total return inception to date | 7.64% | 7.32% | 6.48% | — | — | — | ||||||
| Annualized total return inception to date with load | — | 6.79% | 6.48% | — | — | — | ||||||
| Past performance is no guarantee of future results. Market volatility can significantly impact short-term performance and results of an investment made today may differ substantially from the Portfolio’s historical performance. Investment return and principal value will fluctuate so that an investor’s shares, when redeemed, may be worth more or less than original cost. Total return figures include the reinvestment of dividends and capital gains. During the period, certain fees may have been waived or expenses reimbursed; otherwise total return would have been lower. |
| Institutional Class Shares were offered beginning July 16, 1993. Class A Shares were offered beginning March 9, 1994. Performance for Class A Shares with load reflects the deduction of the maximum 4.75% sales charge. Class B Shares were offered beginning September 14, 1998. Performance for Class B Shares with load reflects the deduction of the applicable contingent deferred sales charge (CDSC). Class B Shares are subject to a maximum 5% CDSC in the first year which declines to 0% in the seventh year. |
| * | Performance shown prior to the actual inception date of the Class A and Class B Shares represents that of the Institutional Class Shares adjusted for the sales charge and total operating expenses applicable to Class A and Class B Shares, respectively. |
| The performance of the S&P 500 Index and Lehman Brothers U.S. Aggregate Bond Index does not include operating expenses that are incurred by the Portfolio. Index performance is for the period July 31, 1993 to April 30, 2003. |
| ** | Benchmark is comprised of two unmanaged indexes, weighted 60% S&P 500 Index and 40% Lehman Brothers U.S. Aggregate Bond Index. The Portfolio uses a blended index as a comparison index because it is better suited to the Portfolio’s objective. |
| The performance information presented in the graphs and table above do not reflect the deduction of taxes that a shareholder would pay on Portfolio distributions or the redemption of Portfolio shares. |
ANNUAL REPORT / APRIL 30, 2003
53
Table of Contents
BALANCED PORTFOLIO (continued)
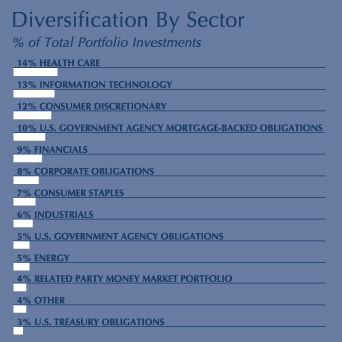
Schedule of Investments
| Description | Shares (000) | Market Value | |||
| Common Stock — 69.5% | |||||
Consumer Discretionary — 12.6% | |||||
AOL Time Warner * | 180 | $ | 2,462 | ||
Best Buy * | 45 | 1,556 | |||
Brinker International * | 60 | 1,905 | |||
Centex | 51 | 3,367 | |||
Clear Channel Communications * | 35 | 1,369 | |||
Darden Restaurants | 90 | 1,576 | |||
DR Horton | 85 | 2,015 | |||
Lear * | 45 | 1,788 | |||
Lowe’s | 55 | 2,414 | |||
Target | 62 | 2,073 | |||
TOTAL CONSUMER DISCRETIONARY | $ | 20,525 | |||
Consumer Staples — 7.1% | |||||
General Mills | 40 | 1,804 | |||
Kraft Foods, Cl A | 75 | 2,318 | |||
PepsiCo | 80 | 3,462 | |||
Procter & Gamble | 36 | 3,235 | |||
Sysco | 30 | 862 | |||
TOTAL CONSUMER STAPLES | $ | 11,681 | |||
Energy — 5.3% | |||||
Nabors Industries * | 85 | 3,332 | |||
Smith International * | 60 | 2,134 | |||
Weatherford International * | 80 | 3,218 | |||
TOTAL ENERGY | $ | 8,684 | |||
| Description | Shares (000) | Market Value | |||
Financials — 9.2% | |||||
American International Group | 75 | $ | 4,346 | ||
Freddie Mac | 35 | 2,027 | |||
JP Morgan Chase | 100 | 2,935 | |||
Morgan Stanley | 53 | 2,372 | |||
Wells Fargo | 70 | 3,378 | |||
TOTAL FINANCIALS | $ | 15,058 | |||
Health Care — 14.1% | |||||
Abbott Laboratories | 65 | 2,641 | |||
Amgen * | 45 | 2,759 | |||
Eli Lilly | 59 | 3,765 | |||
Genentech * | 60 | 2,279 | |||
Health Management Association | 80 | 1,365 | |||
Johnson & Johnson | 38 | 2,142 | |||
Pfizer | 153 | 4,705 | |||
Wyeth | 78 | 3,395 | |||
TOTAL HEALTH CARE | $ | 23,051 | |||
Industrials — 5.9% | |||||
First Data | 40 | 1,569 | |||
General Electric | 105 | 3,093 | |||
Northrop Grumman | 37 | 3,254 | |||
SPX * | 50 | 1,690 | |||
TOTAL INDUSTRIALS | $ | 9,606 | |||
Information Technology — 13.3% | |||||
Celestica * | 75 | 867 | |||
Cisco Systems * | 131 | 1,970 | |||
Corning * | 350 | 1,897 | |||
EMC-Mass * | 100 | 909 | |||
International Business Machines | 35 | 2,972 | |||
Jabil Circuit * | 121 | 2,265 | |||
Microsoft | 110 | 2,813 | |||
STMicroelectronics NV, ADR | 125 | 2,574 | |||
Taiwan Semiconductor Manufacturing, ADR * | 160 | 1,339 | |||
Texas Instruments | 80 | 1,479 | |||
Veritas Software * | 125 | 2,751 | |||
TOTAL INFORMATION TECHNOLOGY | $ | 21,836 | |||
Telecommunication Services — 2.0% | |||||
Alltel | 45 | 2,109 | |||
AT&T Wireless Services * | 175 | 1,130 | |||
TOTAL TELECOMMUNICATION SERVICES | $ | 3,239 | |||
TOTAL COMMON STOCK (COST $121,018) | $ | 113,680 | |||
APRIL 30, 2003 / ANNUAL REPORT
54
Table of Contents
BALANCED PORTFOLIO (continued)
| Description | Principal Amount (000) | Market Value | ||||
| U.S. Treasury Obligations — 3.2% | ||||||
Treasury Inflation Index Bonds | ||||||
3.500%, 01/15/11 | $ | 1,965 | $ | 2,288 | ||
U.S. Treasury Bonds | ||||||
8.000%, 11/15/21 | 1,000 | 1,403 | ||||
U.S. Treasury Notes | ||||||
6.500%, 08/15/05 | 1,000 | 1,110 | ||||
5.000%, 08/15/11 | 320 | 350 | ||||
TOTAL U.S. TREASURY OBLIGATIONS (COST $4,889) | $ | 5,151 | ||||
| U.S. Government Agency Obligations — 5.7% | ||||||
FHLMC | ||||||
5.875%, 03/21/11 | 4,000 | 4,435 | ||||
5.250%, 01/15/06 | 2,000 | 2,168 | ||||
FNMA | ||||||
5.250%, 08/01/12 | 2,500 | 2,644 | ||||
TOTAL U.S. GOVERNMENT AGENCY OBLIGATIONS (COST $8,437) | $ | 9,247 | ||||
| U.S. Government Agency Mortgage-Backed Obligations — 10.1% | ||||||
FHLMC | ||||||
8.500%, 09/01/26 | 26 | 28 | ||||
6.500%, 04/01/08 | 252 | 268 | ||||
6.500%, 05/15/30 | 1,325 | 1,398 | ||||
FNMA | ||||||
8.000%, 12/01/08 | 89 | 96 | ||||
7.500%, 01/01/30 | 190 | 202 | ||||
7.500%, 03/01/30 | 602 | 642 | ||||
7.500%, 04/01/30 | 167 | 178 | ||||
7.000%, 02/01/07 | 55 | 59 | ||||
7.000%, 12/01/25 | 125 | 133 | ||||
7.000%, 02/01/26 | 719 | 763 | ||||
5.500%, 03/01/18 | 5,000 | 5,204 | ||||
FNMA, REMIC | ||||||
9.750%, 09/25/18 | 32 | 36 | ||||
6.000%, 09/18/26 | 4,156 | 4,229 | ||||
GNMA | ||||||
7.500%, 12/15/23 | 247 | 266 | ||||
7.500%, 10/15/23 | 701 | 754 | ||||
7.000%, 09/25/25 | 273 | 289 | ||||
7.000%, 02/15/24 | 634 | 677 | ||||
7.000%, 05/15/24 | 627 | 669 | ||||
7.000%, 05/15/24 | 620 | 662 | ||||
TOTAL U.S. GOVERNMENT AGENCY (COST $16,051) | $ | 16,553 | ||||
| Description | Principal Amount (000) | Market Value | ||||
| Corporate Obligations — 8.8% | ||||||
Banks — 1.3% | ||||||
Bank of America | ||||||
5.250%, 02/01/07 | $ | 1,500 | $ | 1,629 | ||
Bank of New York + | ||||||
7.780%, 12/01/26 | 500 | 565 | ||||
TOTAL BANKS | $ | 2,194 | ||||
Consumer Discretionary — 0.4% | ||||||
Comcast Cablevision Communications | ||||||
8.875%, 05/01/17 | 500 | 633 | ||||
TOTAL CONSUMER DISCRETIONARY | $ | 633 | ||||
Energy — 1.6% | ||||||
Anadarko Petroleum | ||||||
7.200%, 03/15/29 | 500 | 587 | ||||
Husky Oil | ||||||
7.550%, 11/15/16 | 725 | 877 | ||||
Kinder Morgan | ||||||
6.650%, 03/01/05 | 500 | 540 | ||||
Valero Logistics + | ||||||
6.050%, 03/15/13 | 500 | 524 | ||||
TOTAL ENERGY | $ | 2,528 | ||||
Financials — 3.9% | ||||||
Citicorp Capital I | ||||||
7.933%, 02/15/27 | 250 | 293 | ||||
Citigroup | ||||||
6.500%, 01/18/11 | 1,300 | 1,486 | ||||
Crestar Capital Trust I | ||||||
8.160%, 12/15/26 | 800 | 929 | ||||
General Motors Acceptance | ||||||
7.000%, 02/01/12 | 750 | 768 | ||||
Household Finance | ||||||
6.375%, 10/15/11 | 1,000 | 1,095 | ||||
Mellon Capital I, Ser A | ||||||
7.720%, 12/01/26 | 600 | 686 | ||||
Mellon Capital II, Ser B | ||||||
7.995%, 01/15/27 | 500 | 587 | ||||
Newcourt Credit | ||||||
6.875%, 02/16/05 | 500 | 531 | ||||
TOTAL FINANCIALS | $ | 6,375 | ||||
Industrials — 0.7% | ||||||
Union Pacific | ||||||
7.375%, 09/15/09 | 1,000 | 1,183 | ||||
TOTAL INDUSTRIALS | $ | 1,183 | ||||
ANNUAL REPORT / APRIL 30, 2003
55
Table of Contents
BALANCED PORTFOLIO (concluded)
| Description | Principal Amount/ Shares (000) | Market Value | |||||
Utilities — 0.9% | |||||||
Consolidated Natural Gas | |||||||
6.250%, 11/01/11 | $ | 635 | $ | 708 | |||
Hydro-Quebec, Ser IO | |||||||
8.050%, 07/07/24 | 575 | 764 | |||||
TOTAL UTILITIES | $ | 1,472 | |||||
TOTAL CORPORATE OBLIGATIONS (COST $12,567) | $ | 14,385 | |||||
| Asset-Backed Securities — 1.6% | |||||||
Chase Funding Mortgage Loan, Ser 2000-1, Cl IA3 | |||||||
7.674%, 10/25/19 | 298 | 301 | |||||
Contimortgage Home Equity Loan Trust, Ser 1998-2, Cl A6 | |||||||
6.360%, 11/15/19 | 407 | 414 | |||||
Countrywide Funding, | |||||||
6.950%, 04/25/24 | 409 | 413 | |||||
Honda Auto Receivables Owner Trust, Ser 2002-1, Cl A3 | |||||||
3.500%, 10/17/05 | 1,150 | 1,167 | |||||
The Money Store Home Equity Trust, Ser 97-D, Cl AF5 | |||||||
6.555%, 12/15/38 | 291 | 298 | |||||
TOTAL ASSET-BACKED SECURITIES (COST $2,549) | $ | 2,593 | |||||
| Related Party Money Market Portfolio — 4.1% | |||||||
ARK Money Market Portfolio Institutional Class Ú | 6,710 | 6,710 | |||||
TOTAL RELATED PARTY MONEY MARKET PORTFOLIO (COST $6,710) | $ | 6,710 | |||||
TOTAL INVESTMENTS — 103.0% (COST $172,221) | $ | 168,319 | |||||
| OTHER ASSETS & LIABILITIES, NET — (3.0)% | $ | (4,827 | ) | ||||
| TOTAL NET ASSETS — 100.0% | $ | 163,492 | |||||
| * | Non-income producing security. |
| + | Security exempt from registration under Rule 144A of the Securities Act of 1933. These securities may be resold in transactions exempt from registration normally qualified to institutional investors. |
| Ú | This money market portfolio is advised by Allied Investment Advisors, Inc. who also serves as advisor of this portfolio. |
ADR —American Depositary Receipt
Cl — Class
FHLMC — Federal Home Loan Mortgage Corporation
FNMA — Federal National Mortgage Association
GNMA — Government National Mortgage Association
REMIC — Real Estate Mortgage Investment Conduit
Ser — Series
The accompanying notes are an integral part of the financial statements.
APRIL 30, 2003 / ANNUAL REPORT
56
Table of Contents
This page intentionally left blank.
Table of Contents
EQUITY PORTFOLIOS
EQUITY INCOME PORTFOLIO

Allen J. Ashcroft, Jr.
CO-PORTFOLIO MANAGER
Allen J. Ashcroft, Jr. is co-manager of the Equity Income Portfolio and is co-manager of other ARK Funds Portfolios. He has been a Principal of AIA and Portfolio Manager since 1996, a Vice President of Allfirst Bank from 1995 to 2003 and a Vice President of M&T Trust since 2003. Mr. Ashcroft has more than 20 years of experience in investment research and equity analysis.

Clyde L. Randall II, CFA
CO-PORTFOLIO MANAGER
Clyde L. Randall II, CFA is co-manager of the Equity Income Portfolio, and is co-manager of other ARK Funds Portfolios. Mr. Randall has been a Principal of AIA and Portfolio Manager since 1996, a Vice President of Allfirst Bank from 1995 to 2003 and a Vice President of M&T Trust since 2003. He has more than 14 years of experience in investment research and equity analysis and is a Chartered Financial Analyst.
Management Discussion and Analysis
Market returns were broadly down during the Portfolio’s 2003 fiscal year, turning up in early March but not recovering fully. Behind the averages, individual stocks declined significantly, many over 50%. Many were from sectors which had historically been quite stable – electric utilities, natural gas, and consumer companies.
In the context of this market, the Portfolio experienced good performance from holdings in many sectors, including real estate, technology, finance, and health care. However, these positive performances were offset by large declines in several utility, natural gas, and consumer-related stocks. Our assumptions about the level of diversification needed to moderate risk were based on historical norms of volatility, but these declines were well in excess of historical norms and so had a meaningful negative impact on Portfolio performance.
New positions in the last fiscal year included Bristol-Myers Squibb, Electronic Data Systems, Masco, Verizon Communications, Merck, General Mills, and Maytag. Sales included Telefonica, Safeco, United Parcel Service, Dover, Interpublic Group, SBC Communications, CVS, Hartford Financial Services Group, and Duke Energy. Looking forward, we will continue to seek dividend-paying stocks that we feel have the potential for competitive long-term total returns.
APRIL 30, 2003 / ANNUAL REPORT
58
Table of Contents
EQUITY INCOME PORTFOLIO
Performance as of April 30, 2003
INSTITUTIONAL CLASS: VALUE OF A $100,000 INVESTMENT
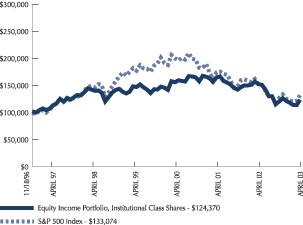
CLASS A SHARES: VALUE OF A $10,000 INVESTMENT
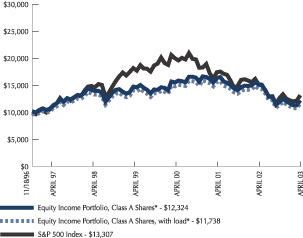
| Inst’l Class Shares | Class A Shares* | S&P 500 Index | ||||
| One year total return | -19.21% | -19.38% | -13.31% | |||
| One year total return with load | — | -23.19% | — | |||
| Annualized three year total return | -7.59% | -7.71% | -12.96% | |||
| Annualized three year total return with load | — | -9.20% | — | |||
| Annualized five year total return | -2.82% | -2.97% | -2.42% | |||
| Annualized five year total return with load | — | -3.90% | — | |||
| Annualized total return inception to date | 3.44% | 3.29% | — | |||
| Annualized total return inception to date with load | — | 2.51% | — | |||
| Past performance is no guarantee of future results. Market volatility can significantly impact short-term performance and results of an investment made today may differ substantially from the Portfolio’s historical performance. Investment return and principal value will fluctuate so that an investor’s shares, when redeemed, may be worth more or less than original cost. Total return figures include the reinvestment of dividends and capital gains. During the period, certain fees may have been waived or expenses reimbursed; otherwise total return would have been lower. |
| Institutional Class Shares were offered beginning November 18, 1996. Class A Shares were offered beginning May 9, 1997. Performance for Class A Shares with load reflects the deduction of the maximum 4.75% sales charge. |
| * | Performance shown prior to the actual inception date of the Class A Shares represents that of the Institutional Class Shares adjusted for the sales charge and total annual operating expenses applicable to Class A Shares. |
| The performance of the S&P 500 Index does not include operating expenses that are incurred by the Portfolio. Index performance is for the period November 30, 1996 to April 30, 2003. |
| The performance information presented in the graphs and table above do not reflect the deduction of taxes that a shareholder would pay on Portfolio distributions or the redemption of Portfolio shares. |
ANNUAL REPORT / APRIL 30, 2003
59
Table of Contents
EQUITY INCOME PORTFOLIO (continued)
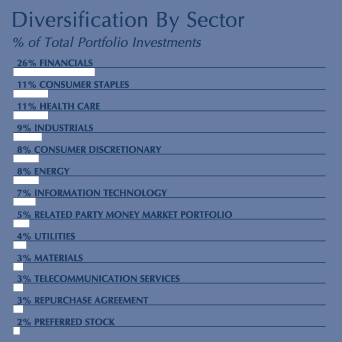
Schedule of Investments
| Description | Shares (000) | Market Value (000) | |||
| Common Stock — 89.9% | |||||
Consumer Discretionary — 7.8% | |||||
Maytag | 40 | $ | 834 | ||
New York Times, Cl A | 17 | 788 | |||
Newell Rubbermaid | 50 | 1,524 | |||
Target | 40 | 1,338 | |||
Walt Disney | 35 | 653 | |||
TOTAL CONSUMER DISCRETIONARY | $ | 5,137 | |||
Consumer Staples — 11.0% | |||||
Adolph Coors, Cl B | 10 | 535 | |||
Altria Group | 30 | 923 | |||
General Mills | 15 | 677 | |||
Kellogg | 40 | 1,309 | |||
Kraft Foods, Cl A | 35 | 1,082 | |||
PepsiCo | 35 | 1,515 | |||
Procter & Gamble | 13 | 1,168 | |||
TOTAL CONSUMER STAPLES | $ | 7,209 | |||
Energy — 8.1% | |||||
BP, ADR | 42 | 1,619 | |||
Exxon Mobil | 66 | 2,323 | |||
GlobalSantaFe | 65 | 1,375 | |||
TOTAL ENERGY | $ | 5,317 | |||
Financials — 26.1% | |||||
ACE | 28 | 926 | |||
Boston Properties | 20 | 784 | |||
| Description | Shares (000) | Market Value (000) | |||
Chubb | 24 | $ | 1,269 | ||
Citigroup | 45 | 1,766 | |||
FleetBoston Financial | 50 | 1,326 | |||
JP Morgan Chase | 25 | 734 | |||
Keycorp | 50 | 1,206 | |||
New Plan Excel Realty Trust | 40 | 799 | |||
Simon Property Group | 22 | 808 | |||
U.S. Bancorp | 80 | 1,772 | |||
Waddell & Reed Financial, Cl A | 80 | 1,600 | |||
Washington Mutual | 45 | 1,778 | |||
Wells Fargo | 50 | 2,413 | |||
TOTAL FINANCIALS | $ | 17,181 | |||
Health Care — 10.7% | |||||
Abbott Laboratories | 35 | 1,422 | |||
Bristol-Myers Squibb | 40 | 1,022 | |||
Merck | 20 | 1,164 | |||
Pfizer | 55 | 1,691 | |||
Wyeth | 40 | 1,741 | |||
TOTAL HEALTH CARE | $ | 7,040 | |||
Industrials — 9.3% | |||||
General Dynamics | 13 | 795 | |||
General Electric | 50 | 1,473 | |||
Knightsbridge Tankers | 85 | 1,040 | |||
Masco | 60 | 1,264 | |||
United Technologies | 25 | 1,545 | |||
TOTAL INDUSTRIALS | $ | 6,117 | |||
Information Technology — 6.6% | |||||
Electronic Data Systems | 50 | 907 | |||
International Business Machines | 20 | 1,698 | |||
Koninklijke Philips Electronics | 60 | 1,121 | |||
Texas Instruments | 35 | 647 | |||
TOTAL INFORMATION TECHNOLOGY | $ | 4,373 | |||
Materials — 2.8% | |||||
Alcoa | 40 | 917 | |||
Eastman Chemical | 30 | 916 | |||
TOTAL MATERIALS | $ | 1,833 | |||
Telecommunication Services — 3.3% | |||||
BellSouth | 45 | 1,147 | |||
Verizon Communications | 27 | 1,009 | |||
TOTAL TELECOMMUNICATION SERVICES | $ | 2,156 | |||
Utilities — 4.2% | |||||
Constellation Energy Group | 42 | 1,230 | |||
El Paso | 60 | 450 | |||
Exelon | 20 | 1,061 | |||
TOTAL UTILITIES | $ | 2,741 | |||
| TOTAL COMMON STOCK (COST $56,910) | $ | 59,104 | |||
APRIL 30, 2003 / ANNUAL REPORT
60
Table of Contents
EQUITY INCOME PORTFOLIO (concluded)
| Description | Shares/Principal Amount (000) | Market Value (000) | ||||
| Convertible Preferred Stock — 2.3% | ||||||
Industrials — 2.3% | ||||||
Northrop Grumman | 15 | $ | 1,533 | |||
TOTAL INDUSTRIALS | $ | 1,533 | ||||
| TOTAL CONVERTIBLE PREFERRED STOCK (COST $1,579) | $ | 1,533 | ||||
| Repurchase Agreements — 3.0% | ||||||
Credit Suisse First Boston 1.270%, dated 4/30/03, matures 5/1/03 repurchase price $2,000,071 (102% collateralized by various U.S. Treasury Obligations) | $ | 2,000 | 2,000 | |||
| TOTAL REPURCHASE AGREEMENTS (COST $2,000) | $ | 2,000 | ||||
| Related Party Money Market Portfolio — 4.7% | ||||||
ARK Money Market Portfolio Institutional Class Ú | 3,114 | 3,114 | ||||
TOTAL RELATED PARTY MONEY MARKET PORTFOLIO (COST $3,114) | $ | 3,114 | ||||
| TOTAL INVESTMENTS — 99.9% (COST $63,603) | $ | 65,751 | ||||
| OTHER ASSETS & LIABILITIES, NET — 0.1% | $ | 64 | ||||
| TOTAL NET ASSETS — 100.0% | $ | 65,815 | ||||
| Ú | This money market portfolio is advised by Allied Investment Advisors, Inc. who also serves as advisor of this portfolio. |
ADR—American Depositary Receipt
Cl—Class
The accompanying notes are an integral part of the financial statements.
ANNUAL REPORT / APRIL 30, 2003
61
Table of Contents
EQUITY PORTFOLIOS
VALUE EQUITY PORTFOLIO

J. Eric Leo
CO-PORTFOLIO MANAGER
J. Eric Leo is co-manager of the Value Equity Portfolio and heads a Portfolio Management Team that manages the Balanced Portfolio. Mr. Leo has been a Portfolio Manager of AIA since 1996, a Vice President of Allfirst Bank from 1987 to 2003 and a Vice President of M&T Trust since 2003. Mr. Leo has more than 30 years of experience in the investment industry.

Barbara L. Rishel
CO-PORTFOLIO MANAGER
Barbara L. Rishel is co-manager of the Value Equity Portfolio. Ms. Rishel has been a Principal of AIA since 2001. She is also an equity analyst. She has more than 15 years of experience in the investment industry.
Management Discussion and Analysis
For the fiscal year ended April 30, 2003, the Portfolio lagged the S&P 500/BARRA Value Index as both economically sensitive sectors and traditionally defensive sectors failed to live up to investors’ expectations. The Portfolio’s exposure to basic materials and industrials proved too early, and an overweight position in health care, particularly in Baxter International and Abbott Laboratories, hurt Portfolio performance due to greater than expected earnings disappointments. Our relative underweighted position in financials also negatively impacted Portfolio returns. Overall, the Portfolio was aided by strength in the telecommunications and technology sectors, particularly Corning and First Data, a transaction processing company. Short-term volatility inherent to turnaround situations was demonstrated by Crown Holdings, which was a significant positive contributor to Portfolio performance in the fourth quarter of 2002, but detracted from our overall returns for the year. Crown Holdings remains in the Portfolio due to its strong brands, dominant market position, and growth potential.
Positions were initiated in several financial holdings: American International Group, Lincoln National, and Capital One Financial; and increased in AT&T Wireless and Comcast, which was distributed through AT&T. Nextel Communications, which was a strong contributor to Portfolio performance over the past two quarters, was sold as it had reached our price target. Positions were also eliminated in Allstate and Tyco International, and overweighted positions were decreased in Lowe’s, Wells Fargo, and selected energy companies.
We will continue to seek undervalued or out-of-favor stocks with higher-than-average sales growth and return on equity whose management we feel has the ability to adjust to the dynamics of changing economic and business conditions.
APRIL 30, 2003 / ANNUAL REPORT
62
Table of Contents
VALUE EQUITY PORTFOLIO
Performance as of April 30, 2003
INSTITUTIONAL CLASS SHARES: VALUE OF A $100,000 INVESTMENT
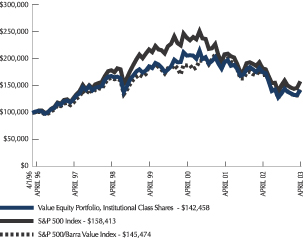
CLASS A AND B SHARES: VALUE OF A $10,000 INVESTMENT
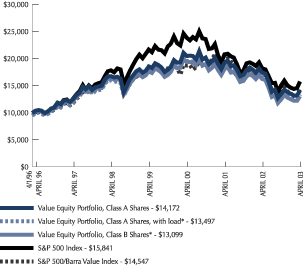
| Inst’l Class Shares | Class A Shares* | Class B Shares* | S&P 500/ Barra Value Index | S&P 500 Index | ||||||
| One year total return | -19.03% | -19.12% | -19.64% | -14.61% | -13.31% | |||||
| One year total return with load | — | -22.96% | -23.58% | — | — | |||||
| Annualized three year total return | -11.68% | -11.76% | -12.40% | -8.21% | -12.96% | |||||
| Annualized three year total return with load | — | -13.17% | -13.08% | — | — | |||||
| Annualized five year total return | -3.34% | -3.45% | -4.53% | -2.49% | -2.42% | |||||
| Annualized five year total return with load | — | -4.39% | -4.76% | — | — | |||||
| Annualized total return inception to date | 5.12% | 5.05% | 3.89% | — | — | |||||
| Annualized total return inception to date with load | — | 4.33% | 3.89% | — | — | |||||
| Past performance is no guarantee of future results. Market volatility can significantly impact short-term performance and results of an investment made today may differ substantially from the Portfolio’s historical performance. Investment return and principal value will fluctuate so that an investor’s shares, when redeemed, may be worth more or less than original cost. Total return figures include the reinvestment of dividends and capital gains. During the period, certain fees may have been waived or expenses reimbursed; otherwise total return would have been lower. |
| For each class, performance presented prior to March 29, 1998 reflects the performance of the Marketvest Equity Fund from its inception date of April 1, 1996. Class A Shares were offered beginning April 1, 1998. Performance for Class A Shares with load reflects the deduction of the maximum 4.75% sales charge. Class B Shares were offered beginning September 14, 1998. Performance for Class B Shares with load reflects the deduction of the applicable contingent deferred sales charge (CDSC). Class B Shares are subject to a maximum 5% CDSC in the first year which declines to 0% in the seventh year. |
| * | Performance shown prior to the actual inception date of the Class A and Class B Shares represents that of the Institutional Class Shares adjusted for the sales charge and total operating expenses applicable to Class A and Class B Shares, respectively. |
| The performance of the S&P 500 Index and the S&P 500/Barra Value Index does not include operating expenses incurred by the Portfolios. Index performance is for the period March 31, 1996 to April 30, 2003. |
| The performance information presented in the graphs and table above do not reflect the deduction of taxes that a shareholder would pay on Portfolio distributions or the redemption of Portfolio shares. |
ANNUAL REPORT / APRIL 30, 2003
63
Table of Contents
VALUE EQUITY PORTFOLIO (continued)
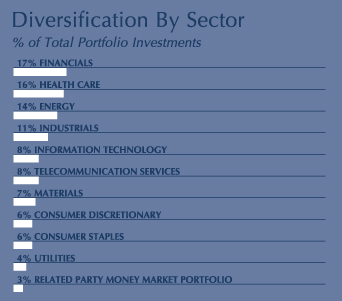
Schedule of Investments
| Description | Shares (000) | Market Value (000) | |||
| Common Stock — 97.1% | |||||
Consumer Discretionary — 5.9% | |||||
AOL Time Warner * | 130 | $ | 1,778 | ||
Comcast, Cl A * | 60 | 1,915 | |||
Lear * | 50 | 1,987 | |||
Lowe’s | 85 | 3,731 | |||
Walt Disney | 50 | 933 | |||
TOTAL CONSUMER DISCRETIONARY | $ | 10,344 | |||
Consumer Staples — 5.5% | |||||
HJ Heinz | 43 | 1,273 | |||
Kraft Foods, Cl A | 100 | 3,090 | |||
PepsiCo | 121 | 5,215 | |||
TOTAL CONSUMER STAPLES | $ | 9,578 | |||
Energy — 14.5% | |||||
BP, ADR | 195 | 7,515 | |||
ChevronTexaco | 84 | 5,301 | |||
Exxon Mobil | 245 | 8,624 | |||
Nabors Industries * | 50 | 1,960 | |||
Weatherford International * | 47 | 1,891 | |||
TOTAL ENERGY | $ | 25,291 | |||
Financials — 17.5% | |||||
American International Group | 60 | 3,477 | |||
Capital One Financial | 50 | 2,093 | |||
CIT Group | 100 | 2,037 | |||
Citigroup | 105 | 4,121 | |||
Fannie Mae | 25 | 1,810 | |||
Lincoln National | 57 | 1,822 | |||
| Description | Shares (000) | Market Value (000) | |||
Travelers Property Casualty, Cl A | 85 | $ | 1,372 | ||
U.S. Bancorp | 85 | 1,883 | |||
Waddell & Reed Financial, Cl A | 300 | 6,000 | |||
Washington Mutual | 70 | 2,765 | |||
Wells Fargo | 65 | 3,137 | |||
TOTAL FINANCIALS | $ | 30,517 | |||
Health Care — 16.4% | |||||
Abbott Laboratories | 140 | 5,688 | |||
Becton Dickinson | 175 | 6,195 | |||
Bristol-Myers Squibb | 95 | 2,426 | |||
Medtronic | 140 | 6,684 | |||
Wyeth | 175 | 7,635 | |||
TOTAL HEALTH CARE | $ | 28,628 | |||
Industrials — 10.9% | |||||
First Data | 68 | 2,648 | |||
General Electric | 55 | 1,620 | |||
Ingersoll-Rand, Cl A | 85 | 3,747 | |||
Northrop Grumman | 31 | 2,761 | |||
Parker Hannifin | 75 | 3,051 | |||
Raytheon | 125 | 3,741 | |||
United Technologies | 25 | 1,545 | |||
TOTAL INDUSTRIALS | $ | 19,113 | |||
Information Technology — 8.3% | |||||
Agere Systems, Cl B * | 1,100 | 1,881 | |||
Corning * | 700 | 3,794 | |||
International Business Machines | 45 | 3,821 | |||
Lucent Technologies * | 1,050 | 1,890 | |||
Motorola | 200 | 1,582 | |||
Solectron * | 500 | 1,595 | |||
TOTAL INFORMATION TECHNOLOGY | $ | 14,563 | |||
Materials — 6.7% | |||||
Ball | 70 | 3,931 | |||
Constar International * | 140 | 1,015 | |||
Crown Holdings * | 150 | 795 | |||
Engelhard | 200 | 4,910 | |||
Pactiv * | 50 | 1,026 | |||
TOTAL MATERIALS | $ | 11,677 | |||
Telecommunication Services — 7.5% | |||||
AT&T | 80 | 1,364 | |||
AT&T Wireless Services * | 350 | 2,261 | |||
BellSouth | 145 | 3,696 | |||
SBC Communications | 84 | 1,972 | |||
Verizon Communications | 100 | 3,751 | |||
TOTAL TELECOMMUNICATION SERVICES | $ | 13,044 | |||
APRIL 30, 2003 / ANNUAL REPORT
64
Table of Contents
VALUE EQUITY PORTFOLIO (concluded)
| Description | Shares (000) | Market Value (000) | ||||
Utilities — 3.9% | ||||||
Questar | 226 | $ | 6,813 | |||
| TOTAL UTILITIES | $ | 6,813 | ||||
| TOTAL COMMON STOCK (COST) $127,837) | $ | 169,568 | ||||
| Related Party Money Market Portfolio — 3.3% | ||||||
ARK Money Market Portfolio Institutional Class Ú | 5,762 | 5,762 | ||||
| TOTAL RELATED PARTY MONEY MARKET PORTFOLIO (COST $5,762) | $ | 5,762 | ||||
| TOTAL INVESTMENTS — 100.4% (COST $133,599) | $ | 175,330 | ||||
| OTHER ASSETS & LIABILITIES, NET — (0.4)% | $ | (615 | ) | |||
| TOTAL NET ASSETS — 100.0% | $ | 174,715 | ||||
| * | Non-income producing security |
| Ú | This money market portfolio is advised by Allied Investment Advisors, Inc. who also serves as advisor of this portfolio. |
ADR — American Depositary Receipt
Cl — Class
The accompanying notes are an integral part of the financial statements.
ANNUAL REPORT / APRIL 30, 2003
65
Table of Contents
EQUITY PORTFOLIOS
EQUITY INDEX PORTFOLIO

Clarence W. Woods, Jr.
CO-PORTFOLIO MANAGER
Clarence W. Woods, Jr. is co-manager of the Equity Index Portfolio. Mr. Woods has been a Vice President and Principal of, and Chief Equity Trader for, AIA since 1996. He heads the equity-trading unit. Mr. Woods has more than 17 years of experience in the investment industry.

Peter C. Hastings, CFA
CO-PORTFOLIO MANAGER
Peter C. Hastings, CFA is co-manager of the Equity Index Portfolio. Mr. Hastings has been a Vice President of AIA since 1997. Mr. Hastings has more than 6 years of experience in the investment industry and is a Chartered Financial Analyst.
Management Discussion and Analysis
The fiscal year ended April 30, 2003 was relatively quiet in terms of changes in composition of the S&P 500 Index via the traditional manner of through-mergers and acquisitions. During the period, Standard and Poor’s elected to remove foreign-based companies from the Index. Also, most of the airlines were removed either due to bankruptcies or the likelihood of declaring bankruptcy. In all, a total of 24 changes occurred in the S&P 500 Index, which turned out to be a smaller number than usual. In terms of contribution to performance, Amgen, Comcast, and Ebay added the most on a market capitalization basis, while Intel, Altria, and Home Depot were the three with the most negative impact to performance. We continue to manage the Portfolio with the goal of seeking to closely replicate the performance of the S&P 500 Index.
APRIL 30, 2003 / ANNUAL REPORT
66
Table of Contents
EQUITY INDEX PORTFOLIO
Performance as of April 30, 2003
INSTITUTIONAL CLASS SHARES: VALUE OF A $100,000 INVESTMENT
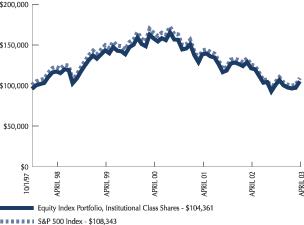
CLASS A SHARES: VALUE OF A $10,000 INVESTMENT

| Inst'l Class Shares | Class A Shares* | S&P 500 Index | ||||
| One year total return | -13.50% | -13.70% | -13.31% | |||
| One year total return with load | — | -17.81% | — | |||
| Annualized three year total return | -12.81% | -13.03% | -12.96% | |||
| Annualized three year total return with load | — | -14.43% | — | |||
| Annualized five year total return | -2.21% | -2.46% | -2.42% | |||
| Annualized five year total return with load | — | -3.41% | — | |||
| Annualized total return inception to date | 0.77% | 0.92% | — | |||
| Annualized total return inception to date with load | — | 0.02% | — | |||
| Past performance is no guarantee of future results. Market volatility can significantly impact short-term performance and results of an investment made today may differ substantially from the Portfolio’s historical performance. Investment return and principal value will fluctuate so that an investor’s shares, when redeemed, may be worth more or less than original cost. Total return figures include the reinvestment of dividends and capital gains. During the period, certain fees may have been waived or expenses reimbursed; otherwise total return would have been lower. |
| * | Institutional Class Shares were offered beginning October 1, 1997. Class A Shares were offered beginning November 3, 1997. Performance for Class A Shares with load reflects the deduction of the maximum 4.75% sales charge. |
| The performance of the S&P 500 Index does not include operating expenses that are incurred by the Portfolio. Index performance for the Institutional Class Shares is for the period October 31, 1997 to April 30, 2003. Index performance for the Class A Shares is for the period November 30, 1997 to April 30, 2003. |
| The performance information presented in the graphs and table above do not reflect the deduction of taxes that a shareholder would pay on Portfolio distributions or the redemption of Portfolio shares. |
ANNUAL REPORT / APRIL 30, 2003
67
Table of Contents
EQUITY INDEX PORTFOLIO (continued)
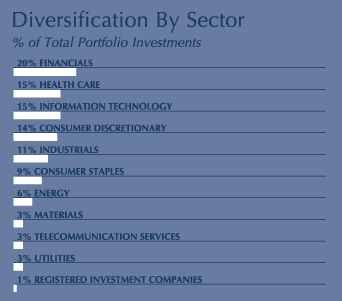
Schedule of Investments
| Description | Shares (000) | Market Value (000) | ||||
| Common Stock — 97.9% | ||||||
Consumer Discretionary — 13.9% | ||||||
American Greetings, Cl A * | — | † | $ | 5 | ||
AOL Time Warner * | 52 | 719 | ||||
Autonation * | 3 | 48 | ||||
Autozone * | 1 | 96 | ||||
Bed Bath & Beyond * | 3 | 136 | ||||
Best Buy * | 4 | 124 | ||||
Big Lots * | 1 | 16 | ||||
Black & Decker | 1 | 30 | ||||
Brunswick | 1 | 20 | ||||
Carnival | 7 | 204 | ||||
Centex | 1 | 45 | ||||
Circuit City Stores | 2 | 13 | ||||
Clear Channel Communications * | 7 | 281 | ||||
Comcast, Cl A * | 27 | 865 | ||||
Cooper Tire & Rubber | — | † | 3 | |||
Costco Wholesale * | 5 | 185 | ||||
Dana | 2 | 16 | ||||
Darden Restaurants | 2 | 29 | ||||
Delphi | 7 | 55 | ||||
Dillard’s, Cl A | 1 | 15 | ||||
Dollar General | 4 | 57 | ||||
Dow Jones | 1 | 33 | ||||
Eastman Kodak | 3 | 98 | ||||
Ebay * | 4 | 339 | ||||
Family Dollar Stores | 2 | 70 | ||||
Federated Department Stores | 2 | 61 | ||||
Ford Motor | 21 | 221 | ||||
| Description | Shares (000) | Market Value (000) | |||
Fortune Brands | 2 | $ | 80 | ||
Gannett | 3 | 238 | |||
Gap | 10 | 173 | |||
General Motors | 7 | 238 | |||
Genuine Parts | 2 | 56 | |||
Goodyear Tire & Rubber | 1 | 9 | |||
Harley-Davidson | 3 | 151 | |||
Harrah's Entertainment * | 1 | 51 | |||
Hasbro | 2 | 32 | |||
Hilton Hotels | 4 | 55 | |||
Home Depot | 27 | 770 | |||
International Game Technology * | 1 | 82 | |||
Interpublic Group | 4 | 46 | |||
JC Penney | 3 | 51 | |||
Johnson Controls | 1 | 82 | |||
Jones Apparel Group * | 1 | 41 | |||
KB Home | 1 | 26 | |||
Knight Ridder | 1 | 58 | |||
Kohl’s * | 4 | 224 | |||
Leggett & Platt | 2 | 43 | |||
Limited | 5 | 80 | |||
Liz Claiborne | 1 | 44 | |||
Lowe’s | 9 | 404 | |||
Marriott International, Cl A | 2 | 89 | |||
Mattel | 5 | 112 | |||
May Department Stores | 3 | 72 | |||
Maytag | 1 | 15 | |||
McDonald’s | 15 | 255 | |||
McGraw-Hill | 2 | 126 | |||
Meredith | 1 | 24 | |||
New York Times, Cl A | 2 | 82 | |||
Newell Rubbermaid | 3 | 85 | |||
Nike, Cl B | 3 | 159 | |||
Nordstrom | 1 | 20 | |||
Office Depot * | 3 | 42 | |||
Omnicom Group | 2 | 128 | |||
Pulte Homes | 1 | 36 | |||
RadioShack | 2 | 43 | |||
Reebok International * | 1 | 21 | |||
Sears Roebuck | 3 | 101 | |||
Sherwin-Williams | 2 | 53 | |||
Snap-On | 1 | 20 | |||
Stanley Works | 1 | 24 | |||
Staples * | 5 | 99 | |||
Starbucks * | 4 | 107 | |||
Starwood Hotels & Resorts Worldwide | 2 | 62 | |||
Target | 11 | 358 | |||
Tiffany | 2 | 44 | |||
TJX | 6 | 109 | |||
TMP Worldwide * | 1 | 13 | |||
APRIL 30, 2003 / ANNUAL REPORT
68
Table of Contents
EQUITY INDEX PORTFOLIO (continued)
| Description | Shares (000) | Market Value (000) | ||||
Toys ‘R’ US * | 2 | $ | 21 | |||
Tribune | 4 | 175 | ||||
Tupperware | — | † | 2 | |||
Univision Communications, Cl A * | 3 | 79 | ||||
VF | 1 | 42 | ||||
Viacom, Cl B * | 21 | 899 | ||||
Visteon | 1 | 9 | ||||
Wal-Mart Stores | 52 | 2,913 | ||||
Walt Disney | 24 | 448 | ||||
Wendy’s International | 1 | 36 | ||||
Whirlpool | 1 | 35 | ||||
Yum! Brands * | 3 | 76 | ||||
TOTAL CONSUMER DISCRETIONARY | $ | 13,852 | ||||
Consumer Staples — 8.6% | ||||||
Adolph Coors, Cl B | — | † | 15 | |||
Alberto-Culver Cl B | 1 | 31 | ||||
Albertson’s | 5 | 90 | ||||
Altria Group | 24 | 747 | ||||
Anheuser-Busch | 10 | 501 | ||||
Archer-Daniels-Midland | 7 | 75 | ||||
Avon Products | 3 | 151 | ||||
Brown-Forman, Cl B | 1 | 60 | ||||
Campbell Soup | 5 | 106 | ||||
Clorox | 2 | 115 | ||||
Coca-Cola | 29 | 1,177 | ||||
Coca-Cola Enterprises | 5 | 97 | ||||
Colgate-Palmolive | 6 | 362 | ||||
Conagra Foods | 6 | 126 | ||||
CVS | 5 | 112 | ||||
General Mills | 4 | 195 | ||||
Gillette | 12 | 374 | ||||
Hershey Foods | 2 | 100 | ||||
HJ Heinz | 4 | 115 | ||||
Kellogg | 4 | 147 | ||||
Kimberly-Clark | 6 | 300 | ||||
Kroger * | 9 | 125 | ||||
McCormick | 2 | 40 | ||||
Pepsi Bottling Group | 3 | 66 | ||||
PepsiCo | 20 | 879 | ||||
Procter & Gamble | 15 | 1,366 | ||||
RJ Reynolds Tobacco Holdings | 1 | 28 | ||||
Safeway * | 5 | 89 | ||||
Sara Lee | 9 | 145 | ||||
Supervalu | 1 | 19 | ||||
Sysco | 7 | 212 | ||||
UST | 2 | 59 | ||||
Walgreen | 12 | 373 | ||||
Winn-Dixie Stores | 1 | 18 | ||||
| Description | Shares (000) | Market Value (000) | |||
WM Wrigley Jr | 2 | $ | 142 | ||
TOTAL CONSUMER STAPLES | $ | 8,557 | |||
Energy — 5.7% | |||||
Amerada Hess | 1 | 44 | |||
Anadarko Petroleum | 3 | 121 | |||
Apache | 2 | 99 | |||
Ashland | 1 | 18 | |||
Baker Hughes | 4 | 104 | |||
BJ Services * | 2 | 60 | |||
Burlington Resources | 2 | 110 | |||
ChevronTexaco | 13 | 790 | |||
ConocoPhillips | 8 | 401 | |||
Devon Energy | 3 | 130 | |||
EOG Resources | 1 | 41 | |||
Exxon Mobil | 79 | 2,774 | |||
Halliburton | 5 | 105 | |||
Kerr-McGee | 1 | 50 | |||
Marathon Oil | 3 | 75 | |||
Nabors Industries * | 2 | 67 | |||
Noble * | 1 | 40 | |||
Occidental Petroleum | 4 | 123 | |||
Rowan | 1 | 22 | |||
Schlumberger | 7 | 286 | |||
Sunoco | 1 | 27 | |||
Transocean | 3 | 64 | |||
Unocal | 3 | 80 | |||
TOTAL ENERGY | $ | 5,631 | |||
Financials — 20.3% | |||||
ACE | 3 | 96 | |||
Aflac | 6 | 188 | |||
Allstate | 8 | 313 | |||
AMBAC Financial Group | 1 | 64 | |||
American Express | 15 | 583 | |||
American International Group | 31 | 1,779 | |||
AmSouth Bancorporation | 4 | 88 | |||
AON | 3 | 76 | |||
Apartment Investment & Management | 1 | 38 | |||
Bank of America | 18 | 1,309 | |||
Bank of New York | 9 | 236 | |||
Bank One | 14 | 494 | |||
BB&T | 5 | 176 | |||
Bear Stearns | 1 | 80 | |||
Capital One Financial | 3 | 108 | |||
Charles Schwab | 15 | 130 | |||
Charter One Financial | 3 | 78 | |||
Chubb | 2 | 102 | |||
Cincinnati Financial | 2 | 61 | |||
Citigroup | 60 | 2,373 | |||
ANNUAL REPORT / APRIL 30, 2003
69
Table of Contents
EQUITY INDEX PORTFOLIO (continued)
| Description | Shares (000) | Market Value (000) | |||
Comerica | 2 | $ | 84 | ||
Countrywide Financial | 1 | 102 | |||
Equity Office Properties Trust | 5 | 125 | |||
Equity Residential | 3 | 79 | |||
Fannie Mae | 12 | 847 | |||
Federated Investors, Cl B | 1 | 35 | |||
Fifth Third Bancorp | 7 | 335 | |||
First Tennessee National | 1 | 57 | |||
FleetBoston Financial | 12 | 328 | |||
Franklin Resources | 3 | 101 | |||
Freddie Mac | 8 | 473 | |||
Golden West Financial | 2 | 136 | |||
Goldman Sachs Group | 5 | 421 | |||
Hartford Financial Services Group | 3 | 112 | |||
Huntington Bancshares | 2 | 49 | |||
Janus Capital Group | 2 | 33 | |||
Jefferson-Pilot | 2 | 64 | |||
John Hancock Financial Services | 3 | 97 | |||
JP Morgan Chase | 23 | 689 | |||
Keycorp | 5 | 114 | |||
Lehman Brothers Holdings | 3 | 171 | |||
Lincoln National | 2 | 63 | |||
Loew’s | 2 | 80 | |||
Marsh & McLennan | 6 | 292 | |||
Marshall & Ilsley | 3 | 76 | |||
MBIA | 2 | 74 | |||
MBNA | 15 | 283 | |||
Mellon Financial | 5 | 126 | |||
Merrill Lynch | 10 | 418 | |||
Metlife | 8 | 236 | |||
MGIC Investment | 1 | 45 | |||
Moody’s | 2 | 79 | |||
Morgan Stanley | 13 | 571 | |||
National City | 7 | 210 | |||
North Fork Bancorporation | 2 | 55 | |||
Northern Trust | 2 | 87 | |||
Plum Creek Timber | 2 | 41 | |||
PNC Financial Services Group | 3 | 138 | |||
Principal Financial Group | 4 | 112 | |||
Progressive | 2 | 167 | |||
Providian Financial * | 3 | 21 | |||
Prudential Financial | 7 | 208 | |||
Regions Financial | 3 | 88 | |||
Safeco | 2 | 59 | |||
Simon Property Group | 2 | 70 | |||
SLM | 2 | 193 | |||
SouthTrust | 4 | 105 | |||
St Paul | 3 | 86 | |||
State Street | 4 | 126 | |||
SunTrust Banks | 3 | 180 | |||
| Description | Shares (000) | Market Value (000) | |||
Synovus Financial | 3 | $ | 63 | ||
T Rowe Price Group | 1 | 40 | |||
Torchmark | 1 | 47 | |||
Travelers Property Casualty, Cl B | 11 | 181 | |||
U.S. Bancorp | 23 | 498 | |||
Union Planters | 2 | 62 | |||
UnumProvident | 2 | 29 | |||
Wachovia | 16 | 611 | |||
Washington Mutual | 11 | 441 | |||
Wells Fargo | 20 | 961 | |||
XL Capital, Cl A | 2 | 134 | |||
Zions Bancorporation | 1 | 44 | |||
TOTAL FINANCIALS | $ | 20,224 | |||
Health Care — 14.7% | |||||
Abbott Laboratories | 18 | 747 | |||
Aetna | 2 | 88 | |||
Allergan | 1 | 104 | |||
AmerisourceBergen | 1 | 69 | |||
Amgen * | 15 | 929 | |||
Anthem * | 2 | 117 | |||
Applied Biosystems Group — Applera | 2 | 36 | |||
Bausch & Lomb | 1 | 23 | |||
Baxter International | 7 | 154 | |||
Becton Dickinson | 3 | 101 | |||
Biogen * | 2 | 66 | |||
Biomet | 3 | 90 | |||
Boston Scientific * | 5 | 207 | |||
Bristol-Myers Squibb | 23 | 579 | |||
Cardinal Health | 5 | 296 | |||
Chiron * | 2 | 86 | |||
Cigna | 1 | 80 | |||
CR Bard | 1 | 41 | |||
Eli Lilly | 13 | 842 | |||
Forest Laboratories * | 4 | 222 | |||
Genzyme * | 2 | 93 | |||
Guidant | 3 | 131 | |||
HCA | 6 | 188 | |||
Health Management Associates, Cl A | 2 | 39 | |||
Humana * | 2 | 20 | |||
Johnson & Johnson | 35 | 1,969 | |||
King Pharmaceuticals * | 3 | 34 | |||
Manor Care * | 1 | 15 | |||
McKesson | 3 | 90 | |||
Medimmune * | 3 | 93 | |||
Medtronic | 14 | 687 | |||
Merck | 26 | 1,537 | |||
Pfizer | 93 | 2,871 | |||
Quest Diagnostics * | 1 | 66 | |||
Quintiles Transnational * | 1 | 18 | |||
APRIL 30, 2003 / ANNUAL REPORT
70
Table of Contents
EQUITY INDEX PORTFOLIO (continued)
| Description | Shares (000) | Market Value (000) | ||||
Schering-Plough | 17 | $ | 313 | |||
St Jude Medical * | 2 | 101 | ||||
Stryker | 2 | 147 | ||||
Tenet Healthcare * | 5 | 76 | ||||
UnitedHealth Group | 4 | 332 | ||||
Watson Pharmaceuticals * | 1 | 35 | ||||
Wellpoint Health Networks * | 2 | 129 | ||||
Wyeth | 16 | 678 | ||||
Zimmer Holdings * | 2 | 102 | ||||
TOTAL HEALTH CARE | $ | 14,641 | ||||
Industrials — 11.3% | ||||||
3M | 5 | 581 | ||||
Allied Waste Industries * | 2 | 16 | ||||
American Power Conversion * | 3 | 39 | ||||
American Standard * | 1 | 57 | ||||
Apollo Group, Cl A * | 2 | 111 | ||||
Automatic Data Processing | 7 | 233 | ||||
Avery Dennison | 1 | 66 | ||||
Boeing | 10 | 270 | ||||
Burlington Northern Santa Fe | 4 | 124 | ||||
Caterpillar | 4 | 214 | ||||
Cendant * | 11 | 164 | ||||
Cintas | 2 | 68 | ||||
Concord EFS * | 6 | 77 | ||||
Convergys * | 2 | 28 | ||||
Cooper Industries | 1 | 34 | ||||
Crane | 1 | 15 | ||||
CSX | 3 | 82 | ||||
Cummins | — | † | 11 | |||
Danaher | 2 | 117 | ||||
Deere | 3 | 116 | ||||
Delta Air Lines | 1 | 15 | ||||
Deluxe | 1 | 28 | ||||
Dover | 2 | 61 | ||||
Eaton | 1 | 63 | ||||
Emerson Electric | 5 | 251 | ||||
Equifax | 2 | 38 | ||||
FedEx | 4 | 211 | ||||
First Data | 9 | 348 | ||||
Fiserv * | 2 | 63 | ||||
Fluor | 1 | 26 | ||||
General Dynamics | 2 | 138 | ||||
General Electric | 117 | 3,431 | ||||
Goodrich | 1 | 14 | ||||
H&R Block | 2 | 81 | ||||
Honeywell International | 10 | 237 | ||||
Illinois Tool Works | 4 | 232 | ||||
IMS Health | 3 | 48 | ||||
Ingersoll-Rand, Cl A | 2 | 84 | ||||
| Description | Shares (000) | Market Value (000) | ||||
ITT Industries | 1 | $ | 61 | |||
Lockheed Martin | 5 | 268 | ||||
Masco | 5 | 117 | ||||
McDermott International * | — | † | 1 | |||
Navistar International * | 1 | 15 | ||||
Norfolk Southern | 5 | 97 | ||||
Northrop Grumman | 2 | 179 | ||||
Paccar | 1 | 78 | ||||
Pall | 1 | 21 | ||||
Parker Hannifin | 1 | 47 | ||||
Paychex | 4 | 128 | ||||
Pitney Bowes | 3 | 94 | ||||
Power-One * | 1 | 4 | ||||
Raytheon | 5 | 137 | ||||
Robert Half International * | 2 | 28 | ||||
Rockwell Automation | 2 | 43 | ||||
Rockwell Collins | 2 | 40 | ||||
RR Donnelley & Sons | 1 | 22 | ||||
Ryder System | — | † | 9 | |||
Sabre Holdings | 1 | 25 | ||||
Southwest Airlines | 9 | 144 | ||||
Textron | 1 | 37 | ||||
Thomas & Betts * | 1 | 9 | ||||
Tyco International | 23 | 366 | ||||
Union Pacific | 3 | 166 | ||||
United Parcel Service, Cl B | 13 | 823 | ||||
United Technologies | 6 | 344 | ||||
Waste Management | 7 | 145 | ||||
WW Grainger | 1 | 51 | ||||
TOTAL INDUSTRIALS | $ | 11,291 | ||||
Information Technology — 14.5% | ||||||
ADC Telecommunications * | 8 | 18 | ||||
Adobe Systems | 3 | 90 | ||||
Advanced Micro Devices * | 3 | 25 | ||||
Agilent Technologies * | 5 | 83 | ||||
Altera * | 4 | 62 | ||||
Analog Devices * | 4 | 136 | ||||
Andrew * | — | † | 2 | |||
Apple Computer * | 4 | 51 | ||||
Applied Materials * | 19 | 282 | ||||
Applied Micro Circuits * | 3 | 13 | ||||
Autodesk | 1 | 21 | ||||
Avaya * | 3 | 11 | ||||
BMC Software * | 3 | 40 | ||||
Broadcom, Cl A * | 3 | 50 | ||||
CIENA * | 5 | 23 | ||||
Cisco Systems * | 84 | 1,259 | ||||
Citrix Systems * | 2 | 38 | ||||
Computer Associates International | 6 | 104 | ||||
ANNUAL REPORT / APRIL 30, 2003
71
Table of Contents
EQUITY INDEX PORTFOLIO (continued)
| Description | Shares (000) | Market Value (000) | |||
Computer Sciences * | 2 | $ | 63 | ||
Compuware * | 4 | 15 | |||
Comverse Technology * | 2 | 20 | |||
Corning * | 13 | 69 | |||
Dell Computer * | 30 | 876 | |||
Electronic Arts * | 2 | 101 | |||
Electronic Data Systems | 5 | 91 | |||
EMC-Mass * | 26 | 235 | |||
Gateway * | 4 | 10 | |||
Hewlett-Packard | 36 | 584 | |||
Intel | 78 | 1,432 | |||
International Business Machines | 20 | 1,687 | |||
Intuit * | 2 | 90 | |||
Jabil Circuit * | 2 | 36 | |||
JDS Uniphase * | 17 | 55 | |||
Kla-Tencor * | 2 | 86 | |||
Lexmark International * | 1 | 104 | |||
Linear Technology | 3 | 122 | |||
LSI Logic * | 3 | 18 | |||
Lucent Technologies * | 41 | 74 | |||
Maxim Integrated Products | 4 | 141 | |||
Mercury Interactive * | 1 | 31 | |||
Micron Technology * | 6 | 54 | |||
Microsoft | 125 | 3,204 | |||
Millipore * | 1 | 18 | |||
Molex | 2 | 43 | |||
Motorola | 27 | 214 | |||
National Semiconductor * | 2 | 35 | |||
NCR * | 1 | 24 | |||
Network Appliance * | 4 | 53 | |||
Novell * | 3 | 9 | |||
Novellus Systems * | 1 | 39 | |||
Nvidia * | 1 | 19 | |||
Oracle * | 61 | 724 | |||
Parametric Technology * | 3 | 9 | |||
PeopleSoft * | 3 | 53 | |||
PerkinElmer | 1 | 10 | |||
PMC-Sierra * | 1 | 11 | |||
Qlogic * | 1 | 44 | |||
Qualcomm | 9 | 287 | |||
Sanmina-SCI * | 4 | 22 | |||
Scientific-Atlanta | 2 | 26 | |||
Siebel Systems * | 5 | 43 | |||
Solectron * | 8 | 24 | |||
Sun Microsystems * | 38 | 124 | |||
SunGard Data Systems * | 3 | 62 | |||
Symantec * | 2 | 77 | |||
Symbol Technologies | 3 | 30 | |||
Tektronix * | 1 | 21 | |||
Tellabs * | 4 | 25 | |||
| Description | Shares (000) | Market Value (000) | ||||
Teradyne * | 2 | $ | 20 | |||
Texas Instruments | 20 | 376 | ||||
Thermo Electron * | 2 | 29 | ||||
Unisys * | 3 | 34 | ||||
Veritas Software * | 4 | 99 | ||||
Waters * | 1 | 30 | ||||
Xerox * | 8 | 80 | ||||
Xilinx * | 4 | 100 | ||||
Yahoo * | 7 | 161 | ||||
TOTAL INFORMATION TECHNOLOGY | $ | 14,481 | ||||
Materials — 2.6% | ||||||
Air Products & Chemicals | 3 | 109 | ||||
Alcoa | 10 | 230 | ||||
Allegheny Technologies | 1 | 3 | ||||
Ball | 1 | 33 | ||||
Bemis | 1 | 26 | ||||
Boise Cascade | 1 | 13 | ||||
Dow Chemical | 11 | 349 | ||||
Eastman Chemical | 1 | 27 | ||||
Ecolab | 1 | 74 | ||||
EI du Pont de Nemours | 12 | 495 | ||||
Engelhard | 1 | 28 | ||||
Freeport-McMoran Copper & Gold, Cl B | 2 | 32 | ||||
Georgia-Pacific | 2 | 37 | ||||
Great Lakes Chemical | 1 | 15 | ||||
Hercules * | 1 | 8 | ||||
International Flavors & Fragrances | 1 | 27 | ||||
International Paper | 5 | 193 | ||||
Louisiana-Pacific * | 1 | 7 | ||||
MeadWestvaco | 2 | 56 | ||||
Monsanto | 3 | 53 | ||||
Newmont Mining | 4 | 120 | ||||
Nucor | 1 | 32 | ||||
Pactiv * | 2 | 36 | ||||
Phelps Dodge * | 1 | 28 | ||||
PPG Industries | 2 | 92 | ||||
Praxair | 2 | 105 | ||||
Rohm & Haas | 2 | 81 | ||||
Sealed Air * | 1 | 38 | ||||
Sigma-Aldrich | 1 | 37 | ||||
Temple-Inland | — | † | 20 | |||
United States Steel | 1 | 13 | ||||
Vulcan Materials | 1 | 31 | ||||
Weyerhaeuser | 2 | 121 | ||||
Worthington Industries | 1 | 13 | ||||
TOTAL MATERIALS | $ | 2,582 | ||||
APRIL 30, 2003 / ANNUAL REPORT
72
Table of Contents
EQUITY INDEX PORTFOLIO (concluded)
| Description | Shares (000) | Market Value (000) | |||||
Telecommunication Services — 3.6% | |||||||
Alltel | 3 | $ | 161 | ||||
AT&T | 1 | 25 | |||||
AT&T Wireless Services * | 32 | 206 | |||||
BellSouth | 22 | 558 | |||||
CenturyTel | 1 | 44 | |||||
Citizens Communications * | 3 | 29 | |||||
Nextel Communications, Cl A * | 12 | 178 | |||||
Qwest Communications International * | 19 | 70 | |||||
SBC Communications | 39 | 912 | |||||
Sprint (FON Group) | 10 | 113 | |||||
Sprint (PCS Group) * | 11 | 39 | |||||
Verizon Communications | 32 | 1,202 | |||||
TOTAL TELECOMMUNICATION SERVICES | $ | 3,537 | |||||
Utilities — 2.7% | |||||||
AES * | 6 | 38 | |||||
Allegheny Energy | 1 | 8 | |||||
Ameren | 2 | 66 | |||||
American Electric Power | 4 | 113 | |||||
Calpine * | 3 | 14 | |||||
Centerpoint Energy | 3 | 23 | |||||
Cinergy | 2 | 64 | |||||
CMS Energy | 1 | 6 | |||||
Consolidated Edison | 2 | 88 | |||||
Constellation Energy Group | 2 | 48 | |||||
Dominion Resources | 4 | 213 | |||||
DTE Energy | 2 | 74 | |||||
Duke Energy | 10 | 173 | |||||
Dynegy, Cl A | 3 | 13 | |||||
Edison International * | 3 | 51 | |||||
El Paso | 6 | 49 | |||||
Entergy | 2 | 116 | |||||
Exelon | 4 | 192 | |||||
FirstEnergy | 3 | 109 | |||||
FPL Group | 2 | 125 | |||||
KeySpan | 2 | 58 | |||||
Kinder Morgan | 1 | 61 | |||||
Mirant * | 4 | 14 | |||||
Nicor | 1 | 16 | |||||
NiSource | 3 | 51 | |||||
Peoples Energy | — | † | 16 | ||||
PG&E * | 4 | 66 | |||||
Pinnacle West Capital | 1 | 30 | |||||
PPL | 2 | 66 | |||||
Progress Energy | 3 | 110 | |||||
Progress Energy, CVO * | 1 | — | † | ||||
Public Service Enterprise Group | 3 | 100 | |||||
Sempra Energy | 2 | 64 | |||||
| Description | Shares (000) | Market Value (000) | ||||
Southern | 8 | $ | 245 | |||
TECO Energy | 2 | 20 | ||||
TXU | 3 | 68 | ||||
Williams | 5 | 33 | ||||
XCEL Energy | 4 | 60 | ||||
TOTAL UTILITIES | $ | 2,661 | ||||
TOTAL COMMON STOCK (COST $123,850) | $ | 97,457 | ||||
| Rights — 0.0% | ||||||
Seagate Escrow Security + * | 2 | — | † | |||
TOTAL RIGHTS (COST $0) | $ | — | † | |||
| Registered Investment Companies — 0.9% | ||||||
SPDR Trust, Ser 128 | 10 | 920 | ||||
TOTAL REGISTERED INVESTMENT COMPANIES (COST $921) | $ | 920 | ||||
| Related Party Money Market Portfolio — 0.0% | ||||||
ARK Money Market Portfolio Institutional Class Ú | 30 | 30 | ||||
TOTAL RELATED PARTY MONEY MARKET PORTFOLIO (COST $30) | $ | 30 | ||||
TOTAL INVESTMENTS — 98.8% (COST $124,801) | $ | 98,407 | ||||
| OTHER ASSETS & LIABILITIES, NET — 1.2% | $ | 1,186 | ||||
| TOTAL NET ASSETS — 100.0% | $ | 99,593 | ||||
| * | Non-income producing security |
| + | Security is fair valued as determined under procedures established by the Board of Trustees. |
| Ú | This money market portfolio is advised by Allied Investment Advisors, Inc. who also serves as advisor of this portfolio. |
| † | Amount rounds to less than one thousand |
| Cl — Class |
| CVO — Contingent Value Obligation |
| SPDR — Standard & Poors Depositary Receipt |
The accompanying notes are an integral part of the financial statements.
ANNUAL REPORT / APRIL 30, 2003
73
Table of Contents
EQUITY PORTFOLIOS
BLUE CHIP EQUITY PORTFOLIO
Allen J. Ashcroft, Jr.
CO-PORTFOLIO MANAGER
Allen J. Ashcroft, Jr. is co-manager of the Blue Chip Equity Portfolio and is co-manager of other ARK Funds Portfolios. He has been a Principal of AIA and Portfolio Manager since 1996, a Vice President of Allfirst Bank from 1995 to 2003 and a Vice President of M&T Trust since 2003. Mr. Ashcroft has more than 20 years of experience in investment research and equity analysis.
Clyde L. Randall II, CFA
CO-PORTFOLIO MANAGER
Clyde L. Randall II, CFA is co-manager of the Blue Chip Equity Portfolio, and is co-manager of other ARK Funds Portfolios. Mr. Randall has been a Principal of AIA and Portfolio Manager since 1996, a Vice President of Allfirst Bank from 1995 to 2003 and a Vice President of M&T Trust since 2003. He has more than 14 years of experience in investment research and equity analysis and is a Chartered Financial Analyst.
Management Discussion and Analysis
This fiscal year was the most challenging to the Portfolio from an investment standpoint since its inception. The equity markets recently completed their third straight year of negative returns. This three-year span is somewhat unprecedented in that you would have to go back to the late 1930’s to witness a similar period of market contraction. Many equity investors remained on the sidelines concerned about the health of the economy, and the conflict that seemed imminent in the Middle East. Historically, in uncertain times investors have tended to seek cover by transferring assets into blue chip equities that had the perceived strength and balance sheets to weather the pending storm; however, this wasn’t the case this year. Investors questioned management and their accounting principles, among other things, and as a result capital exited even the most respected of institutions. For the most part, fixed income assets or short-term money market instruments were the only investments that delivered positive returns.
The best contributors to Portfolio performance this year were Amgen, Genentech, and Lowe’s—two health care companies and a home improvement company. Demographics certainly were a factor in this group, delivering positive returns in a tough environment. The Portfolio’s worst performers in our fiscal year were Dynegy, Interpublic Group, and Sun Microsystems. Dynegy, a merchant gas company, was impacted from the fallout over Enron. Interpublic, an advertising company, had accounting concerns, and Sun Microsystems got caught up in the technology swoon.
The Portfolio’s primary focus is to invest in established large-cap franchise companies while seeking to stay competitive with the returns of the S&P 500. We remain committed to our strategy of diversifying the Portfolio so that it has representation in each major market sector. Our investment style guides us to concentrate on those companies that we believe are well managed and have long-term investment horizons. This approach has not changed even in the tough and unpleasant market environment of the past several years.
APRIL 30, 2003 / ANNUAL REPORT
74
Table of Contents
BLUE CHIP EQUITY PORTFOLIO
Performance as of April 30, 2003
INSTITUTIONAL CLASS SHARES: VALUE OF A $100,000 INVESTMENT
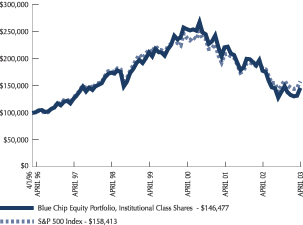
CLASS A AND B SHARES: VALUE OF A $10,000 INVESTMENT
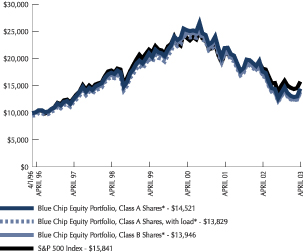
| Inst’l Class Shares | Class A Shares* | Class B Shares* | S&P 500 Index | |||||
| One year total return | -18.18% | -18.30% | -18.89% | -13.31% | ||||
| One year total return with load | — | -22.19% | -22.95% | — | ||||
| Annualized three year total return | -16.96% | -17.06% | -17.66% | -12.96% | ||||
| Annualized three year total return with load | — | -18.40% | -18.47% | — | ||||
| Annualized five year total return | -3.54% | -3.65% | -3.99% | -2.42% | ||||
| Annualized five year total return with load | — | -4.59% | -4.35% | — | ||||
| Annualized total return inception to date | 5.54% | 5.41% | 4.81% | — | ||||
| Annualized total return inception to date with load | — | 4.69% | 4.81% | — | ||||
| Past performance is no guarantee of future results. Market volatility can significantly impact short-term performance and results of an investment made today may differ substantially from the Portfolio’s historical performance. Investment return and principal value will fluctuate so that an investor’s shares, when redeemed, may be worth more or less than original cost. Total return figures include the reinvestment of dividends and capital gains. During the period, certain fees may have been waived or expenses reimbursed; otherwise total return would have been lower. |
| Institutional Class Shares were offered beginning April 1, 1996. Class A Shares were offered beginning May 16, 1996. Performance for Class A Shares with load reflects the deduction of maximum 4.75% sales charge. Class B Shares were offered beginning July 31, 1998. Performance for Class B Shares with load reflects the deduction of applicable contingent deferred sales charge (CDSC). Class B Shares are subject to a maximum 5% CDSC in the first year which declines to 0% in the seventh year. |
| * | Performance shown prior to the actual inception date of the Class A and Class B Shares represents that of the Institutional Class Shares adjusted for the sales charge and total annual operating expenses applicable to Class A and Class B Shares, respectively. |
| The performance of the S&P 500 Index does not include operating expenses that are incurred by the Portfolio. Index performance is for the period March 31, 1996 to April 30, 2003. |
| The performance information presented in the graphs and table above do not reflect the deduction of taxes that a shareholder would pay on Portfolio distributions or the redemption of Portfolio shares. |
ANNUAL REPORT / APRIL 30, 2003
75
Table of Contents
BLUE CHIP EQUITY PORTFOLIO (continued)

Schedule of Investments
| Description | Shares (000) | Market Value (000) | |||
| Common Stock — 99.0% | |||||
Consumer Discretionary — 13.1% | |||||
AOL Time Warner * | 350 | $ | 4,788 | ||
Best Buy * | 150 | 5,187 | |||
Clear Channel Communications * | 70 | 2,738 | |||
Lowe’s | 100 | 4,389 | |||
Newell Rubbermaid | 100 | 3,048 | |||
Wal-Mart Stores | 100 | 5,632 | |||
TOTAL CONSUMER DISCRETIONARY | $ | 25,782 | |||
Consumer Staples — 7.9% | |||||
Kraft Foods, Cl A | 150 | 4,635 | |||
PepsiCo | 125 | 5,410 | |||
Procter & Gamble | 60 | 5,391 | |||
TOTAL CONSUMER STAPLES | $ | 15,436 | |||
Energy — 8.2% | |||||
Exxon Mobil | 160 | 5,632 | |||
Nabors Industries * | 140 | 5,488 | |||
Weatherford International * | 125 | 5,029 | |||
TOTAL ENERGY | $ | 16,149 | |||
Financials — 21.1% | |||||
American Express | 135 | 5,111 | |||
American International Group | 107 | 6,201 | |||
Bank of America | 40 | 2,962 | |||
Citigroup | 140 | 5,495 | |||
JP Morgan Chase | 175 | 5,136 | |||
Morgan Stanley | 135 | 6,041 | |||
Northern Trust | 140 | 4,914 | |||
Wells Fargo | 115 | 5,550 | |||
TOTAL FINANCIALS | $ | 41,410 | |||
| Description | Shares (000) | Market Value (000) | |||
Health Care — 16.2% | |||||
Abbott Laboratories | 120 | $ | 4,876 | ||
Amgen * | 75 | 4,598 | |||
Eli Lilly | 90 | 5,744 | |||
Johnson & Johnson | 80 | 4,509 | |||
Pfizer | 190 | 5,842 | |||
Wyeth | 145 | 6,312 | |||
TOTAL HEALTH CARE | $ | 31,881 | |||
Industrials — 10.7% | |||||
General Electric | 250 | 7,362 | |||
Northrop Grumman | 65 | 5,716 | |||
Tyco International | 175 | 2,730 | |||
United Technologies | 85 | 5,254 | |||
TOTAL INDUSTRIALS | $ | 21,062 | |||
Information Technology — 15.2% | |||||
Celestica * | 150 | 1,734 | |||
Cisco Systems * | 250 | 3,760 | |||
International Business Machines | 50 | 4,245 | |||
Jabil Circuit * | 165 | 3,085 | |||
Koninklijke Philips Electronics | 115 | 2,148 | |||
Microsoft | 210 | 5,370 | |||
Nokia, ADR | 175 | 2,900 | |||
STMicroelectronics NV, ADR | 150 | 3,089 | |||
Veritas Software * | 165 | 3,631 | |||
TOTAL INFORMATION TECHNOLOGY | $ | 29,962 | |||
Materials — 2.9% | |||||
Alcoa | 250 | 5,733 | |||
TOTAL MATERIALS | $ | 5,733 | |||
Telecommunication Services — 3.7% | |||||
BellSouth | 220 | 5,608 | |||
SBC Communications | 75 | 1,752 | |||
TOTAL TELECOMMUNICATION SERVICES | $ | 7,360 | |||
TOTAL COMMON STOCK (COST $211,143) | $ | 194,775 | |||
APRIL 30, 2003 / ANNUAL REPORT
76
Table of Contents
BLUE CHIP EQUITY PORTFOLIO (concluded)
| Description | Shares (000) | Market Value (000) | |||
| Related Party Money Market Portfolio — 0.3% | |||||
ARK Money Market Portfolio Institutional Class Ú | 517 | $ | 517 | ||
| TOTAL RELATED PARTY MONEY MARKET PORTFOLIO (COST $517) | $ | 517 | |||
TOTAL INVESTMENTS — 99.3% (COST $211,660) | $ | 195,292 | |||
| OTHER ASSETS & LIABILITIES, NET — 0.7% | $ | 1,280 | |||
| TOTAL NET ASSETS — 100.0% | $ | 196,572 | |||
| * | Non-income producing security |
| Ú | This money market portfolio is advised by Allied Investment Advisors, Inc. who also serves as advisor of this portfolio. |
ADR — American Depositary Receipt
Cl — Class
The accompanying notes are an integral part of the financial statements.
ANNUAL REPORT / APRIL 30, 2003
77
Table of Contents
EQUITY PORTFOLIOS
CAPITAL GROWTH PORTFOLIO

Thomas D. DeHudy, CFA
PORTFOLIO MANAGER
Thomas D. DeHudy, CFA is manager of the Capital Growth Portfolio and another ARK Funds Portfolio. Mr. DeHudy has been a Principal of AIA since 2001. Mr. DeHudy is also an equity analyst and provides research coverage for the technology sector and selected consumer cyclical areas. Mr. DeHudy has more than 20 years of experience in investment research, and is a Chartered Financial Analyst.
Management Discussion and Analysis
During the first half of fiscal year 2003, the Portfolio underperformed its benchmark (the Russell 1000 Growth Index) primarily because of a premature assumption for a reaccelerating economy. Portfolio performance for the second half of the year more closely followed that of the benchmark. Generally, sector weighting helped performance as overweights in energy, financials, and consumer cyclicals/services benefited Portfolio performance (as did the underweight in consumer staples).
Among the stocks that detracted most from Portfolio performance were: Sprint PCS, Best Buy, Baxter International, Freemarkets, and Taiwan Semiconductor Manufacturing. Most of the performance detractors were either technology-related or economically-sensitive. Conversely, stocks that contributed positively to Portfolio performance were either health care-related (e.g., Forest Laboratories, Amgen, and Wyeth) or had unique industry circumstances such as radio broadcasting (Clear Channel Communications) or homebuilders (Centex).
The Portfolio remains positioned for a reacceleration of the economy, but we continue to favor: 1) consumer-related groups such as homebuilders, restaurants and radio broadcasting; 2) financials such as real estate investment trusts and Fannie Mae/Freddie Mac; and 3) energy service companies that have exposure to natural gas. Currently, the Portfolio is approximately neutrally weighted to technology and moderately underweighted to health care.
APRIL 30, 2003 / ANNUAL REPORT
78
Table of Contents
CAPITAL GROWTH PORTFOLIO
Performance as of April 30, 2003
INSTITUTIONAL CLASS SHARES: VALUE OF A $100,000 INVESTMENT
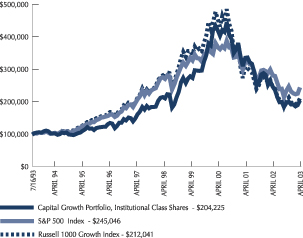
CLASS A AND B SHARES: VALUE OF A $10,000 INVESTMENT
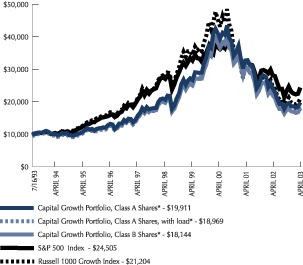
| Inst'l Class Shares | Class A Shares* | Class B Shares* | S&P 500 Index | Russell 1000 Growth Index | ||||||
| One year total return | -17.50% | -17.69% | -18.23% | -13.31% | -14.35% | |||||
| One year total return with load | — | -21.60% | -22.32% | — | — | |||||
| Annualized three year total return | -21.56% | -21.66% | -22.23% | -12.96% | -22.60% | |||||
| Annualized three year total return with load | — | -22.92% | -22.94% | — | — | |||||
| Annualized five year total return | -1.10% | -1.23% | -2.26% | -2.42% | -5.63% | |||||
| Annualized five year total return with load | — | -2.19% | -2.58% | — | — | |||||
| Annualized total return inception to date | 7.57% | 7.29% | 6.27% | — | — | |||||
| Annualized total return inception to date with load | — | 6.76% | 6.27% | — | — | |||||
| Past performance is no guarantee of future results. Market volatility can significantly impact short-term performance and results of an investment made today may differ substantially from the Portfolio’s historical performance. Investment return and principal value will fluctuate so that an investor’s shares, when redeemed, may be worth more or less than original cost. Total return figures include the reinvestment of dividends and capital gains. During the period, certain fees may have been waived or expenses reimbursed; otherwise total return would have been lower. |
| Institutional Class Shares were offered beginning July 16, 1993. Class A Shares were offered beginning March 9, 1994. Performance for Class A Shares with load reflects the deduction of the maximum 4.75% sales charge. Class B Shares were offered beginning September 14, 1998. Performance for Class B Shares with load reflects the deduction of applicable contingent deferred sales charge (CDSC). Class B Shares are subject to a maximum 5% CDSC in the first year which declines to 0% in the seventh year. |
| * | Performance shown prior to the actual inception date of the Class A and Class B Shares represents that of the Institutional Class Shares adjusted for the sales charge and total annual operating expenses applicable to Class A and Class B Shares, respectively. |
| The performance of the S&P 500 Index and the Russell 1000 Growth Index does not include operating expenses that are incurred by the Portfolio. Index performance is for the period July 31, 1993 to April 30, 2003. |
| The performance information presented in the graphs and table above do not reflect the deduction of taxes that a shareholder would pay on Portfolio distributions or the redemption of Portfolio shares. Investments in smaller and medium capitalization companies may be more vulnerable to adverse business or economic events than larger, more established companies. In particular, these companies may have limited product lines, markets and financial resources, and may depend upon a relatively small management group. |
ANNUAL REPORT / APRIL 30, 2003
79
Table of Contents
CAPITAL GROWTH PORTFOLIO (continued)

Schedule of Investments
| Description | Shares (000) | Market Value (000) | |||
| Common Stock — 99.1% | |||||
Consumer Discretionary — 25.6% | |||||
American Axle & Manufacturing * | 50 | $ | 1,246 | ||
Applebees International | 25 | 685 | |||
BorgWarner | 40 | 2,347 | |||
Brinker International * | 50 | 1,587 | |||
CBRL Group | 60 | 1,913 | |||
Centex | 45 | 2,971 | |||
Clear Channel Communications * | 90 | 3,520 | |||
Darden Restaurants | 90 | 1,576 | |||
DR Horton | 110 | 2,607 | |||
Hispanic Broadcasting * | 70 | 1,795 | |||
Lear * | 50 | 1,987 | |||
Lennar, Cl A | 40 | 2,170 | |||
Lennar, Cl B | 5 | 241 | |||
Outback Steakhouse | 40 | 1,430 | |||
Radio One, Cl D * | 125 | 1,912 | |||
Ruby Tuesday | 90 | 1,773 | |||
Staples * | 80 | 1,523 | |||
Toll Brothers * | 75 | 1,744 | |||
Viacom, Cl B * | 35 | 1,519 | |||
TOTAL CONSUMER DISCRETIONARY | $ | 34,546 | |||
Consumer Staples — 2.7% | |||||
Estee Lauder | 55 | 1,788 | |||
General Mills | 40 | 1,804 | |||
TOTAL CONSUMER STAPLES | $ | 3,592 | |||
Energy — 3.2% | |||||
Nabors Industries * | 35 | 1,372 | |||
Patterson-UTI Energy * | 40 | 1,324 | |||
Weatherford International * | 40 | 1,609 | |||
TOTAL ENERGY | $ | 4,305 | |||
| Description | Shares (000) | Market Value (000) | |||
Financials — 16.2% | |||||
American International Group | 35 | $ | 2,028 | ||
Boston Properties | 40 | 1,568 | |||
Equity Office Properties Trust | 60 | 1,558 | |||
Fannie Mae | 70 | 5,067 | |||
Freddie Mac | 90 | 5,211 | |||
General Growth Properties | 25 | 1,391 | |||
Morgan Stanley | 50 | 2,238 | |||
Rouse | 40 | 1,390 | |||
Simon Property Group | 40 | 1,469 | |||
TOTAL FINANCIALS | $ | 21,920 | |||
Health Care — 20.9% | |||||
Affymetrix * | 80 | 1,484 | |||
Amgen * | 45 | 2,759 | |||
Caremark Rx * | 125 | 2,489 | |||
Eli Lilly | 20 | 1,276 | |||
Express Scripts * | 50 | 2,948 | |||
Health Management Associates, Cl A | 110 | 1,877 | |||
ICOS * | 75 | 2,006 | |||
Johnson & Johnson | 80 | 4,509 | |||
Pfizer | 200 | 6,150 | |||
Pharmaceutical Product Development * | 50 | 1,308 | |||
Quest Diagnostics * | 25 | 1,494 | |||
TOTAL HEALTH CARE | $ | 28,300 | |||
Industrials — 6.9% | |||||
General Electric | 250 | 7,362 | |||
Ryanair Holdings, ADR * | 50 | 1,984 | |||
TOTAL INDUSTRIALS | $ | 9,346 | |||
Information Technology — 22.6% | |||||
Affiliated Computer Services, Cl A * | 60 | 2,862 | |||
Analog Devices * | 30 | 994 | |||
Applied Materials * | 40 | 584 | |||
BearingPoint * | 210 | 1,716 | |||
CACI International, Cl A * | 50 | 1,747 | |||
Cadence Design Systems * | 125 | 1,429 | |||
Celestica * | 125 | 1,445 | |||
Ceridian * | 100 | 1,395 | |||
Cisco Systems * | 100 | 1,504 | |||
Cognos * | 35 | 950 | |||
Computer Associates International | 200 | 3,248 | |||
Concord EFS * | 110 | 1,521 | |||
Cree * | 60 | 1,197 | |||
Dell Computer * | 75 | 2,168 | |||
Jabil Circuit * | 85 | 1,589 | |||
Microsoft | 30 | 767 | |||
Nokia — ADR | 30 | 497 | |||
STMicroelectronics NV, ADR | 65 | 1,338 | |||
APRIL 30, 2003 / ANNUAL REPORT
80
Table of Contents
CAPITAL GROWTH PORTFOLIO (concluded)
| Description | Shares (000) | Market Value (000) | ||||
Symantec * | 35 | $ | 1,538 | |||
Taiwan Semiconductor Manufacturing, ADR * | 100 | 837 | ||||
Yahoo * | 50 | 1,239 | ||||
TOTAL INFORMATION TECHNOLOGY | $ | 30,565 | ||||
Materials — 1.0% | ||||||
Peabody Energy | 50 | 1,405 | ||||
TOTAL MATERIALS | $ | 1,405 | ||||
TOTAL COMMON STOCK (COST $129,385) | $ | 133,979 | ||||
| Related Party Money Market Portfolio — 1.8% | ||||||
ARK Money Market Portfolio Institutional Class Ú | 2,388 | 2,388 | ||||
| TOTAL RELATED PARTY MONEY MARKET PORTFOLIO (COST $2,388) | $ | 2,388 | ||||
| TOTAL INVESTMENTS 100.9% (COST $131,773) | $ | 136,367 | ||||
| OTHER ASSETS & LIABILITIES, NET — (0.9)% | $ | (1,236 | ) | |||
| TOTAL NET ASSETS — 100.0% | $ | 135,131 | ||||
| * | Non-income producing security. |
| Ú | This money market portfolio is advised by Allied Investment Advisors, Inc. who also serves as advisor of this portfolio. |
ADR — American Depositary Receipt
Cl — Class
The accompanying notes are an integral part of the financial statements.
ANNUAL REPORT / APRIL 30, 2003
81
Table of Contents
EQUITY PORTFOLIOS
MID-CAP EQUITY PORTFOLIO

David G. Robertson, CFA
PORTFOLIO MANAGER
David G. Robertson, CFA is manager of the Mid-Cap Equity Portfolio. Mr. Robertson has been a Vice President of AIA since 2000. He is also an equity analyst. Mr. Robertson has more than 13 years of experience in the investment industry and is a Chartered Financial Analyst.
Management Discussion and Analysis
During the fiscal year ended April 30, 2003, the number of holdings in the Portfolio was reduced from about 135 to about 60, aligning the style and size composition of the Portfolio even more closely with its benchmark. As a result, although size and style continued to be important determinants of performance across the broad equity indices over the course of the year, these factors were not important factors in the relative performance of the Portfolio.
The factors that were most important to the Portfolio’s relative performance were stock selection and the positioning of the Portfolio for an economic recovery. Because the Portfolio was positioned for economic recovery for the better part of the year, the volatility and lack of direction of the equity markets hurt its performance. Encouragingly however, our ongoing search for stocks with sustainable growth, cash flow generation, solid balance sheets, and conservative accounting proved fruitful as stock selection aided Portfolio performance and partially offset other negative and (hopefully) temporary impacts such as investor sentiment ranging from ebullience to despair.
Over the course of the year, positive contributors to Portfolio performance came from a large number of stocks, many of which are related to the energy industry. XTO Energy, Maverick Tube, and Nabors Industries were all strong contributors to performance. In addition, stocks such as Protein Design Labs, Express Scripts, and Comverse Technology also helped boost Portfolio performance. Although overall contribution to performance was positively effected by stock selection, a couple of stocks materially detracted from performance. Both Enzon Pharmaceuticals and Concord EFS were penalized severely by the market when doubts arose regarding growth and profitability prospects.
APRIL 30, 2003 / ANNUAL REPORT
82
Table of Contents
MID-CAP EQUITY PORTFOLIO
Performance as of April 30, 2003
INSTITUTIONAL CLASS SHARES: VALUE OF A $100,000 INVESTMENT
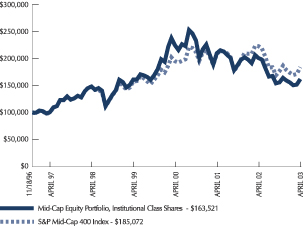
CLASS A SHARES: VALUE OF A $10,000 INVESTMENT
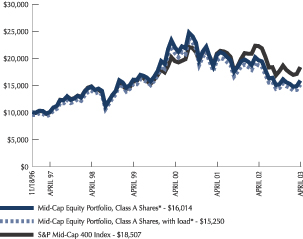
| Inst'l Class Shares | Class A Shares* | S&P Mid- Cap 400 Index | ||||
| One year total return | -19.25% | -19.32% | -17.51% | |||
| One year total return with load | — | -23.16% | — | |||
| Annualized three year total return | -10.27% | -10.36% | -2.00% | |||
| Annualized three year total return with load | — | -11.80% | — | |||
| Annualized five year total return | 1.77% | 1.44% | 4.34% | |||
| Annualized five year total return with load | — | 0.46% | — | |||
| Annualized total return inception to date | 7.92% | 7.57% | — | |||
| Annualized total return inception to date with load | — | 6.76% | — | |||
| Past performance is no guarantee of future results. Market volatility can significantly impact short-term performance and results of an investment made today may differ substantially from the Portfolio’s historical performance. Investment return and principal value will fluctuate so that an investor’s shares, when redeemed, may be worth more or less than original cost. Total return figures include the reinvestment of dividends and capital gains. During the period, certain fees may have been waived or expenses reimbursed; otherwise total return would have been lower. |
| Institutional Class Shares were offered beginning November 18, 1996. Class A Shares were offered beginning September 1, 1999. Performance for Class A Shares with load reflects the deduction of the maximum 4.75% sales charge. |
| * | Performance shown prior to the actual inception date of the Class A Shares represents that of the Institutional Class Shares adjusted for the sales charge and total annual operating expenses applicable to Class A Shares. |
| The performance of the S&P Mid-Cap 400 Index does not include operating expenses that are incurred by the Portfolio. Index performance is for the period November 30, 1996 to April 30, 2003. |
| The performance information presented in the graphs and table above do not reflect the deduction of taxes that a shareholder would pay on Portfolio distributions or the redemption of Portfolio shares. Investments in medium capitalization companies may be more vulnerable to adverse business or economic events than larger, more established companies. In particular, these companies may have limited product lines, markets and financial resources, and may depend upon a relatively small management group. |
ANNUAL REPORT / APRIL 30, 2003
83
Table of Contents
MID-CAP EQUITY PORTFOLIO (continued)
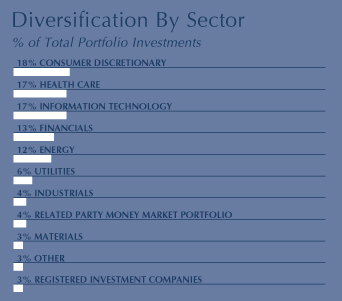
Schedule of Investments
| Description | Shares (000) | Market Value (000) | |||||
| Common Stock — 92.2% | |||||||
Consumer Discretionary — 17.8% | |||||||
Blockbuster, Cl A | 50 | $ | 894 | ||||
Dollar General | 63 | 916 | |||||
FTI Consulting * | 12 | 543 | |||||
Interpublic Group | 177 | 2,018 | |||||
Lennar, Cl A | 10 | 542 | |||||
Lennar, Cl B | 1 | 54 | |||||
Lin TV, Cl A * | 28 | 669 | |||||
Michaels Stores * | 47 | 1,468 | |||||
New York Times, Cl A | 24 | 1,113 | |||||
Sinclair Broadcast Group * | 142 | 1,505 | |||||
United Rentals * | 179 | 1,844 | |||||
Washington Post, Cl B | 1 | 948 | |||||
TOTAL CONSUMER DISCRETIONARY | $ | 12,514 | |||||
Consumer Staples — 2.2% | |||||||
Career Education * | 12 | 721 | |||||
Pepsi Bottling Group | 40 | 822 | |||||
TOTAL CONSUMER STAPLES | $ | 1,543 | |||||
Energy — 12.1% | |||||||
BJ Services * | 17 | 621 | |||||
Devon Energy | 25 | 1,181 | |||||
Ensco International | 61 | 1,537 | |||||
GlobalSantaFe | — | † | — | † | |||
Grant Prideco * | 15 | 171 | |||||
Maverick Tube * | 27 | 480 | |||||
Nabors Industries * | 40 | 1,568 | |||||
Smith International * | 8 | 285 | |||||
| Description | Shares (000) | Market Value (000) | |||
Valero Energy | 33 | $ | 1,213 | ||
Weatherford International * | 15 | 603 | |||
XTO Energy | 44 | 851 | |||
TOTAL ENERGY | $ | 8,510 | |||
Financials — 13.1% | |||||
Archstone-Smith Trust | 40 | 912 | |||
Boston Properties | 25 | 980 | |||
CarrAmerica Realty | 48 | 1,252 | |||
CIT Group | 59 | 1,202 | |||
Greater Bay Bancorp | 103 | 1,648 | |||
Northern Trust | 45 | 1,579 | |||
UCBH Holdings | 64 | 1,628 | |||
TOTAL FINANCIALS | $ | 9,201 | |||
Health Care — 16.8% | |||||
Adolor * | 25 | 350 | |||
Affymetrix * | 30 | 557 | |||
Amerigroup * | 70 | 2,038 | |||
Enzon * | 33 | 453 | |||
Express Scripts * | 25 | 1,474 | |||
Health Management Associates, Cl A | 60 | 1,024 | |||
Idec Pharmaceuticals * | 22 | 720 | |||
Protein Design Labs * | 254 | 2,522 | |||
Quest Diagnostics * | 29 | 1,733 | |||
Universal Health Services * | 24 | 928 | |||
TOTAL HEALTH CARE | $ | 11,799 | |||
Industrials — 3.9% | |||||
Harsco | 42 | 1,448 | |||
SPX * | 39 | 1,318 | |||
TOTAL INDUSTRIALS | $ | 2,766 | |||
Information Technology — 16.8% | |||||
BEA Systems * | 116 | 1,242 | |||
Cadence Design Systems * | 90 | 1,029 | |||
Cerner * | 40 | 799 | |||
Cree * | 45 | 898 | |||
Electronic Data Systems | 29 | 526 | |||
Internet Security Systems * | 82 | 1,076 | |||
Lucent Technologies * | 470 | 846 | |||
Mantech International, Cl A * | 90 | 1,404 | |||
Microchip Technology | 12 | 249 | |||
Nvidia * | 62 | 885 | |||
Skyworks Solutions * | 177 | 947 | |||
THQ * | 84 | 1,187 | |||
Vishay Intertechnology * | 55 | 688 | |||
TOTAL INFORMATION TECHNOLOGY | $ | 11,776 | |||
APRIL 30, 2003 / ANNUAL REPORT
84
Table of Contents
MID-CAP EQUITY PORTFOLIO (concluded)
| Description | Shares/Principal Amount (000) | Market Value (000) | |||||
Materials — 3.3% | |||||||
IMC Global | 125 | $ | 1,133 | ||||
Pactiv * | 39 | 800 | |||||
Peabody Energy | 13 | 365 | |||||
TOTAL MATERIALS | $ | 2,298 | |||||
Utilities — 6.2% | |||||||
Constellation Energy Group | 54 | 1,581 | |||||
PEPCO Holdings | 70 | 1,203 | |||||
Wisconsin Energy | 60 | 1,580 | |||||
TOTAL UTILITIES | $ | 4,364 | |||||
TOTAL COMMON STOCK (COST $61,268) | $ | 64,771 | |||||
| Warrants — 0.0% | |||||||
Dime Bancorp * | 9 | 1 | |||||
| TOTAL WARRANTS (COST $0) | $ | 1 | |||||
| Registered Investment Companies — 2.5% | |||||||
Midcap SPDR Trust Ser 1 | 22 | 1,764 | |||||
TOTAL REGISTERED INVESTMENT COMPANIES (COST $1,701) | $ | 1,764 | |||||
| Repurchase Agreement — 1.4% | |||||||
Credit Suisse First Boston, 1.270%, dated 04/30/03, matures 05/01/03, repurchase price $1,000,035 (102% collateralized by various U.S. Treasury Obligations) | $ | 1,000 | 1,000 | ||||
TOTAL REPURCHASE AGREEMENT (COST $1,000) | $ | 1,000 | |||||
| Related Party Money Market Portfolio — 3.9% | |||||||
ARK Money Market Portfolio Institutional Class Ú | 2,753 | 2,753 | |||||
TOTAL RELATED PARTY (COST $2,753) | $ | 2,753 | |||||
TOTAL INVESTMENTS — 100.0% (COST $66,722) | $ | 70,289 | |||||
| OTHER ASSETS & LIABILITIES, NET — (0.0)% | $ | (31 | ) | ||||
| TOTAL NET ASSETS — 100.0% | $ | 70,258 | |||||
| * | Non-income producing security. |
| † | Amount rounds to less than one thousand. |
| Ú | This money market portfolio is advised by Allied Investment Advisors, Inc. who also serves as advisor of this portfolio. |
Cl — Class
Ser — Series
SPDR — Standard & Poors Depositary Receipt
The accompanying notes are an integral part of the financial statements.
ANNUAL REPORT / APRIL 30, 2003
85
Table of Contents
EQUITY PORTFOLIOS
SMALL-CAP EQUITY PORTFOLIO

H. Giles Knight
PORTFOLIO MANAGER
H. Giles Knight is manager of the Small-Cap Equity Portfolio and is manager of another ARK Funds Portfolio. He has been a Principal of AIA and Portfolio Manager since 1996, a Senior Vice President of Allfirst Bank from 1995 to 2003 and a Senior Vice President of M&T Trust since 2003. Mr. Knight has more than 30 years of experience in the investment industry.
Management Discussion and Analysis
Small-cap stocks had a tough year as investors faced the uncertainty of war in Iraq, a very weak and unresponsive economy, and continued destructive revelations concerning the accounting practices of the likes of Enron, WorldCom, and Tyco. Small-cap stocks suffered disproportionally because of their added financial and market risks. Their lack of liquidity made for many jarring declines as a few cents earnings miss could severely diminish a stock’s value.
The Portfolio had a disappointing fiscal year due mainly to weak third and fourth quarters. The third quarter suffered from our lower technology weighting as this group rallied in late October, and the fourth quarter was hurt by earning disappointments from five stocks: Accredo Health, Hilb Rogal & Hamilton, Multimedia Games, Overture Services, and Charles River Laboratories. These companies provided earnings shortfalls or weaker forward guidance, which then triggered selling among shareholders.
It appears that the Federal Reserve’s monetary stimulus has had a positive impact on the United States economy. The Portfolio has been positioned more aggressively with overweightings in information technology, health care, and telecommunications. Standard Pacific, WCI Communities, and Brookfield Homes are home builders that we feel have the potential to continue to do well in an atmosphere of low interest rates. Semiconductor producers such as Intersil, Integrated Circuits, and Micrel have the potential to participate in anticipated “chip” capital spending increases.
APRIL 30, 2003 / ANNUAL REPORT
86
Table of Contents
SMALL-CAP EQUITY PORTFOLIO
Performance as of April 30, 2003
INSTITUTIONAL CLASS SHARES: VALUE OF A $100,000 INVESTMENT
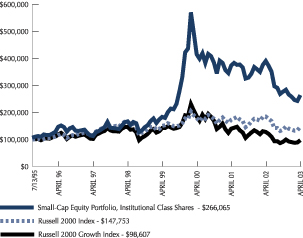
CLASS A, B AND C SHARES: VALUE OF A $10,000 INVESTMENT
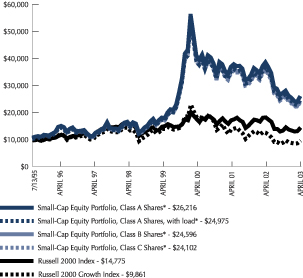
| Inst'l Class Shares | Class A Shares* | Class B Shares* | Class C Shares* | Russell 2000 Growth Index | Russell 2000 Index | |||||||
| One year total return | -32.35% | -32.49% | -33.01% | -33.01% | -23.50% | -20.76% | ||||||
One year total return with load | — | -35.71% | -36.36% | -33.68% | — | — | ||||||
Annualized three year total return | -13.98% | -14.07% | -15.16% | -14.97% | -19.28% | -6.36% | ||||||
Annualized three year total return with load | — | -15.45% | -15.86% | -14.97% | — | — | ||||||
Annualized five year total return | 9.63% | 9.49% | 8.74% | 8.35% | -7.84% | -2.47% | ||||||
| Annualized five year total return with load | — | 8.43% | 8.46% | 8.35% | — | — | ||||||
| Annualized total return inception to date | 13.37% | 13.15% | 12.23% | 11.94% | — | — | ||||||
| Annualized total return inception to date with load | — | 12.45% | 12.23% | 11.94% | — | — | ||||||
| Past performance is no guarantee of future results. Market volatility can significantly impact short-term performance and results of an investment made today may differ substantially from the Portfolio’s historical performance. Investment return and principal value will fluctuate so that an investor’s shares, when redeemed, may be worth more or less than original cost. Total return figures include the reinvestment of dividends and capital gains. During the period, certain fees may have been waived or expenses reimbursed; otherwise total return would have been lower. |
| Institutional Class Shares were offered beginning July 13, 1995. Class A Shares were offered beginning May 16, 1996. Performance for Class A Shares with load reflects the deduction of the maximum 4.75% sales charge. Class B Shares were offered beginning February 20, 2001. Performance for Class B Shares with load reflects the deduction of the applicable contingent deferred sales charge (CDSC). Class B Shares are subject to a maximum 5% CDSC in the first year which declines to 0% in the seventh year. Class C Shares were offered beginning October 1, 2002. Performance for Class C Shares with load reflects the deduction of the applicable CDSC. Class C Shares are subject to a 1% CDSC in the first year which declines to 0% in the second year. |
| * | Performance shown prior to the actual inception date of the Class A, Class B and Class C Shares represents that of the Institutional Class Shares adjusted for the sales charge and total annual operating expenses applicable to these classes. |
| The performance of the Russell 2000 Growth Index and the Russell 2000 Index does not include operating expenses that are incurred by the Portfolio. Index performance is for the period July 30, 1995 to April 30, 2003. |
| The performance information presented in the graphs and table above do not reflect the deduction of taxes that a shareholder would pay on Portfolio distributions or the redemption of Portfolio shares. Investments in smaller capitalization companies may be more vulnerable to adverse business or economic events than larger, more established companies. In particular, these companies may have limited product lines, markets and financial resources, and may depend upon a relatively small management group. |
ANNUAL REPORT / APRIL 30, 2003
87
Table of Contents
SMALL-CAP EQUITY PORTFOLIO (continued)

Schedule of Investments
| Description | Shares (000) | Market Value (000) | |||
| Common Stock — 99.8% | |||||
Consumer Discretionary — 25.9% | |||||
AC Moore Arts & Crafts * | 100 | $ | 1,723 | ||
Alliance Gaming * | 100 | 1,597 | |||
Brookfield Homes | 157 | 2,379 | |||
Central Garden & Pet * | 100 | 2,423 | |||
Emmis Communications, Cl A * | 100 | 1,897 | |||
Gevity HR | 100 | 941 | |||
HOT Topic * | 70 | 1,712 | |||
Meredith | 65 | 2,809 | |||
Multimedia Games * | 87 | 2,179 | |||
SCP Pool * | 44 | 1,443 | |||
Shuffle Master * | 100 | 2,290 | |||
Standard-Pacific | 60 | 1,815 | |||
Steven Madden * | 100 | 1,772 | |||
Strayer Education | 35 | 2,276 | |||
WCI Communities * | 110 | 1,521 | |||
TOTAL CONSUMER DISCRETIONARY | $ | 28,777 | |||
Energy — 5.6% | |||||
Grant Prideco * | 100 | 1,141 | |||
Patina Oil & Gas | 50 | 1,727 | |||
Range Resources * | 141 | 833 | |||
Tom Brown * | 100 | 2,452 | |||
TOTAL ENERGY | $ | 6,153 | |||
Financials — 8.2% | |||||
Columbia Bancorp | 56 | 1,436 | |||
East-West Bancorp | 65 | 2,200 | |||
Greater Bay Bancorp | 96 | 1,542 | |||
Sterling Bancshares | 137 | 1,634 | |||
UCBH Holdings | 90 | 2,290 | |||
TOTAL FINANCIALS | $ | 9,102 | |||
| Description | Shares (000) | Market Value (000) | |||
Health Care — 17.8% | |||||
ICOS * | 83 | $ | 2,207 | ||
Idexx Laboratories * | 75 | 2,925 | |||
Mentor | 75 | 1,388 | |||
Orthofix International * | 77 | 2,153 | |||
Pediatrix Medic Group * | 75 | 2,390 | |||
Perrigo | 100 | 1,536 | |||
Possis Medical * | 115 | 2,216 | |||
PSS World Medical * | 165 | 989 | |||
Taro Pharmaceuticals * | 41 | 1,876 | |||
Zoll Medical * | 65 | 2,100 | |||
TOTAL HEALTH CARE | $ | 19,780 | |||
Industrials — 9.5% | |||||
Chicago Bridge & Iron | 100 | 2,000 | |||
Dionex * | 60 | 2,064 | |||
Heartland Express * | 39 | 897 | |||
OMI * | 450 | 2,183 | |||
Oshkosh Truck | 30 | 1,680 | |||
Regis | 60 | 1,700 | |||
TOTAL INDUSTRIALS | $ | 10,524 | |||
Information Technology — 29.7% | |||||
ADC Telecommunications * | 401 | 957 | |||
Anixter International * | 77 | 1,762 | |||
Autodesk | 199 | 3,096 | |||
Avid Technology * | 85 | 2,335 | |||
Cognizant Technology Systems * | 125 | 2,245 | |||
Concur Technologies * | 145 | 871 | |||
Cray * | 134 | 1,012 | |||
Cypress Semiconductor * | 125 | 1,090 | |||
Exar * | 64 | 947 | |||
Integrated Circuit Systems * | 115 | 2,498 | |||
Intersil * | 142 | 2,623 | |||
Legato Systems * | 125 | 740 | |||
Marvel Technology Group * | 100 | 2,308 | |||
Micrel * | 175 | 2,049 | |||
Perot Systems, Cl A * | 100 | 1,062 | |||
Pixelworks * | 215 | 1,602 | |||
Rambus * | 100 | 1,430 | |||
RSA Security * | 100 | 959 | |||
Sandisk * | 85 | 2,057 | |||
Seachange International * | 160 | 1,288 | |||
TOTAL INFORMATION TECHNOLOGY | $ | 32,931 | |||
Telecommunication Services — 1.9% | |||||
Nextel Partner, Cl A * | 200 | 1,162 | |||
Western Wireless * | 150 | 918 | |||
TOTAL TELECOMMUNICATION SERVICES | $ | 2,080 | |||
APRIL 30, 2003 / ANNUAL REPORT
88
Table of Contents
SMALL-CAP EQUITY PORTFOLIO (concluded)
| Description | Shares (000) | Market Value (000) | ||||
Utilities — 1.2% | ||||||
AES * | 230 | $ | 1,382 | |||
TOTAL UTILITIES | $ | 1,382 | ||||
TOTAL COMMON STOCK (COST $105,311) | $ | 110,729 | ||||
| Related Party Money Market Portfolio — 3.1% | ||||||
ARK Money Market Portfolio Institutional Class Ú | 3,465 | 3,465 | ||||
| TOTAL RELATED PARTY MONEY MARKET PORTFOLIO (COST $3,465) | $ | 3,465 | ||||
TOTAL INVESTMENTS — 102.9% (COST $108,776) | $ | 114,194 | ||||
| OTHER ASSETS & LIABILITIES, NET — (2.9)% | $ | (3,273 | ) | |||
| TOTAL NET ASSETS — 100.0% | $ | 110,921 | ||||
| * | Non-income producing security. |
| Ú | This money market portfolio is advised by Allied Investment Advisors, Inc. who also serves as advisor of this portfolio. |
Cl — Class
The accompanying notes are an integral part of the financial statements.
ANNUAL REPORT / APRIL 30, 2003
89
Table of Contents
EQUITY PORTFOLIOS
INTERNATIONAL EQUITY PORTFOLIO

Louise McGuigan
PORTFOLIO MANAGER
Louise McGuigan is the manager of the International Equity Portfolio. Ms. McGuigan has been head of AIB Investment Managers Limited’s (“AIBIM”) EAFE product line since 1998. She managed AIBIM’s Far East equity book before becoming European equity manager in 1995. Ms. McGuigan has more than 9 years of experience in the investment industry.
Management Discussion and Analysis
Near the end of the period under review, global equity markets rallied in April following the swift collapse of Saddam Hussein’s regime in Iraq. The U.S. reporting season also brought some relief to equity markets as first quarter earnings figures were viewed as generally positive. On the back of these events, equity markets continued their recovery from the lows reached in mid-March.
Within this volatile economic and geopolitical environment, we increased the Portfolio’s defensive exposure in Europe ex UK, funded through a reduction in our cyclical holdings. Cap Gemini (IT consulting) was sold and we reduced our exposure in Accor (hotels) due to the slow demand in the hotel and leisure industry. We also sold out of Allianz, Infineon, and Koninklijke Ahold mainly due to balance sheet concerns and vulnerability to a slower economic environment. New stocks added included Arcelor (produces steel for manufacturers of automobiles, home appliances, and construction materials) and Schneider Electric (manufactures power distribution and automation systems, and has a strong balance sheet and pricing power over suppliers). Other new purchases included Enel (Italian utility), TPG (Dutch TNT post group) and Sanofi Synthelbo (second largest pharmaceutical company in France).
The Europe ex UK portion of the Portfolio experienced positive performance, but yet underperformed its benchmark. Most of the underperformance came from stock specific weakness. Accor, the hotel group, was a poor performer with fears over further terrorist attacks and the spread of SARS leading to a slowdown in the hotel industry. Koninklijke Ahold, the Dutch food retailer, had extremely poor performance which in turn had a negative impact on Portfolio performance. An announcement from the food retailer that income was overstated by at least $500m led to an investigation into its U.S. operation, resulting in a sharp decline in its share price. In the food, beverages, and tobacco sector, Pernod Ricard and Danone contributed to Portfolio performance.
In the UK, we saw some repositioning as we increased our exposure from an underweight to overweight position. We sold some of our cyclical/growth-oriented stocks (e.g., Granada, Hays, Invensys, Signet, and reduced holdings in IMI and Pearson) as their valuations largely reflected recovery. We increased our weighting in banks where more attractive valuations existed by increasing our holdings in HBOS and Royal Bank of Scotland and purchasing HSBC. Other purchases included Debenhams (retailing), Kingfisher (European leader in do-it-yourself), and Imperial Tobacco. Tesco’s, the supermarket chain which controls 23% of the food retail market in the UK and is rapidly growing its non-food retail business, was also added to the Portfolio. BHP Billiton (materials), Astra Zeneca and GlaxoSmithKline (pharmaceuticals), and HBOS and RBS (banks) all had good performance, and helped the UK portion of the Portfolio outperform its benchmark.
In Japan, Sony, Nintendo (consumer durables and apparel) and THK Co Ltd. (capital goods) were all weak performers, contributing to underperformance in the Japanese portion of the Portfolio. However, we did see some good performance from NTT DoCoMo (telecom services). We reduced our holdings in Ajinomoto, Nissan Motors, and Promise. New stocks added included Canon and East Japan Railways, which is focused on expanding its non-railway operations.
In the Far East, we saw some relatively strong performance in Hong Kong (non-domestic stocks mainly) with PetroChina performing well. In Emerging Markets, we saw positive performance but underperformed the benchmark. China Steel was a strong performer from Taiwan. In China, the reform process has been strongly aided by the smooth transition of power at the recent congresses.
Geographically, the Portfolio has moved to an underweight position in Europe ex UK due to a less favourable outlook in Europe. In the UK, we have taken a more positive stance moving from an underweight to overweight position. We remain overweight Emerging Markets and underweight in the Far East and Japan.
APRIL 30, 2003 / ANNUAL REPORT
90
Table of Contents
INTERNATIONAL EQUITY PORTFOLIO
Performance as of April 30, 2003
INSTITUTIONAL CLASS SHARES: VALUE OF A $100,000 INVESTMENT

CLASS A SHARES: VALUE OF A $10,000 INVESTMENT
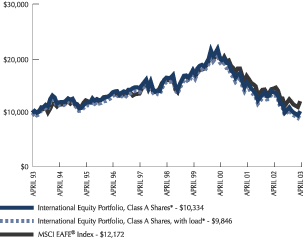
| Inst'l Class Shares | Class A Shares* | MSCI EAFE Index | ||||
| One year total return | -25.16% | -25.20% | -16.27% | |||
| One year total return with load | — | -28.75% | — | |||
| Annualized three year total return | -20.14% | -20.23% | -15.49% | |||
| Annualized three year total return with load | — | -21.51% | — | |||
| Annualized five year total return | -8.85% | -9.01% | -5.52% | |||
| Annualized five year total return with load | — | -9.89% | — | |||
| Annualized ten year total return | 0.42% | 0.33% | 1.98% | |||
| Annualized ten year total return with load | — | -0.15% | — | |||
| Annualized total return inception to date ** | 1.73% | 1.65% | — | |||
| Annualized total return inception to date with load ** | — | 1.21% | — | |||
| Past performance is no guarantee of future results. Market volatility can significantly impact short-term performance and results of an investment made today may differ substantially from the Portfolio’s historical performance. Investment return and principal value will fluctuate so that an investor’s shares, when redeemed, may be worth more or less than original cost. Total return figures include the reinvestment of dividends and capital gains. During the period, certain fees may have been waived or expenses reimbursed; otherwise total return would have been lower. |
| Performance for the Class A Shares with load reflects the deduction of the maximum 4.75% sales charge. |
| * | Performance prior to August 12, 2000 reflects the performance of the Retail Class A Shares of the Govett International Equity Fund, which were offered beginning January 7, 1992. The assets of the Govett Fund were reorganized into the Portfolio on August 12, 2000. There was no sales charge applicable to Retail Class A Shares of the Govett Fund. Performance results for Institutional Class Shares have not been adjusted for the sales charge applicable to Class A Shares of the Portfolio. |
| ** | Since January 7, 1992. |
| The performance of the MSCI EAFE® Index does not include operating expenses that are incurred by the Portfolio. |
| The performance information presented in the graphs and table above do not reflect the deduction of taxes that a shareholder would pay on Portfolio distributions or the redemption of Portfolio shares. Investments in foreign countries pose additional risks since the political and economic events unique to a country or region will affect those markets and their issues. |
ANNUAL REPORT / APRIL 30, 2003
91
Table of Contents
INTERNATIONAL EQUITY PORTFOLIO (continued)

Schedule of Investments
| Description | Shares (000) | Market Value (000) | |||
| Foreign Common Stock — 97.3% | |||||
Australia — 2.6% | |||||
AMP | 6 | $ | 31 | ||
Australia & New Zealand Banking Group | 5 | 65 | |||
BHP Billiton | 9 | 51 | |||
Coles Myer | 15 | 64 | |||
Foster's Group | 20 | 57 | |||
National Australia Bank | 4 | 87 | |||
Rio Tinto | 1 | 18 | |||
Westpac Banking | 6 | 58 | |||
Woodside Petroleum | 8 | 56 | |||
TOTAL AUSTRALIA | $ | 487 | |||
Czech Republic — 1.2% | |||||
Komercni Banka, GDR * | 10 | 239 | |||
TOTAL CZECH REPUBLIC | $ | 239 | |||
Finland — 1.5% | |||||
Nokia OYJ | 17 | 281 | |||
TOTAL FINLAND | $ | 281 | |||
France — 10.8% | |||||
Accor * | 3 | 118 | |||
Air Liquide | 1 | 97 | |||
Arcelor | 9 | 107 | |||
Aventis | 4 | 205 | |||
AXA | 11 | 165 | |||
BNP Paribas | 5 | 258 | |||
Groupe Danone | 1 | 176 | |||
Lafarge | 2 | 153 | |||
Pernod-Ricard | 1 | 105 | |||
Sanofi-Synthelabo | 1 | 80 | |||
Schneider Electric | 2 | 110 | |||
STMicroelectronics | 2 | 35 | |||
| Description | Shares (000) | Market Value (000) | ||||
TotalFina Elf | 3 | $ | 378 | |||
Valeo | 3 | 74 | ||||
TOTAL FRANCE | $ | 2,061 | ||||
Germany — 4.0% | ||||||
BASF | 3 | 139 | ||||
Deutsche Bank | 2 | 89 | ||||
E.ON | 5 | 235 | ||||
Siemens | 5 | 232 | ||||
Volkswagen | 2 | 68 | ||||
TOTAL GERMANY | $ | 763 | ||||
Hong Kong — 3.1% | ||||||
China Mobile | 48 | 96 | ||||
Fountain SET Holdings | 310 | 211 | ||||
PetroChina, Cl H | 1,284 | 293 | ||||
TOTAL HONG KONG | $ | 600 | ||||
Israel — 1.1% | ||||||
Teva Pharmaceutical Industries, ADR | 5 | 210 | ||||
TOTAL ISRAEL | $ | 210 | ||||
Italy — 1.7% | ||||||
Enel | 30 | 177 | ||||
Sanpaolo IMI | 17 | 139 | ||||
TOTAL ITALY | $ | 316 | ||||
Japan — 16.4% | ||||||
Aeon | 4 | 89 | ||||
Ajinomoto | 14 | 142 | ||||
Canon | 6 | 243 | ||||
East Japan Railway | — | † | 140 | |||
Fuji Photo Film | 3 | 77 | ||||
Hitachi | 16 | 53 | ||||
Ito-Yokado | 2 | 47 | ||||
Kao | 4 | 73 | ||||
Leopalace21 | 13 | 75 | ||||
Meitec | 5 | 132 | ||||
Mitsubishi | 23 | 137 | ||||
Mitsubishi Estate | 8 | 47 | ||||
Mitsui Sumitomo Insurance | 13 | 61 | ||||
Nissan Motor | 12 | 88 | ||||
Nomura Holdings | 17 | 168 | ||||
NTT DoCoMo | — | † | 173 | |||
OJI Paper | 26 | 98 | ||||
Rohm | 2 | 155 | ||||
Shin-Etsu Chemical | 5 | 153 | ||||
SMC | 2 | 128 | ||||
Sony | 7 | 175 | ||||
Takeda Chemical Industries | 5 | 187 | ||||
THK | 9 | 79 | ||||
APRIL 30, 2003 / ANNUAL REPORT
92
Table of Contents
INTERNATIONAL EQUITY PORTFOLIO (continued)
| Description | Shares (000) | Market Value (000) | ||||
Tokyo Gas | 29 | $ | 94 | |||
Toyota Motor | 7 | 165 | ||||
Yamaha | 12 | 140 | ||||
TOTAL JAPAN | $ | 3,119 | ||||
Mexico — 1.5% | ||||||
Telefonos de Mexico, ADR | 4 | 127 | ||||
Walmart de México, Ser C | 60 | 152 | ||||
TOTAL MEXICO | $ | 279 | ||||
Netherlands — 6.7% | ||||||
ASML Holding * | 8 | 68 | ||||
Fortis Group | 10 | 166 | ||||
ING Groep | 13 | 216 | ||||
Royal Dutch Petroleum | 9 | 362 | ||||
Royal KPN * | 20 | 134 | ||||
TPG | 5 | 77 | ||||
VNU | 8 | 242 | ||||
TOTAL NETHERLANDS | $ | 1,265 | ||||
South Africa — 0.9% | ||||||
Edgars Consolidated Stores | — | † | 2 | |||
Sappi | 14 | 168 | ||||
TOTAL SOUTH AFRICA | $ | 170 | ||||
South Korea — 2.0% | ||||||
POSCO ADR | 9 | 177 | ||||
Samsung Electronics, GDR | 2 | 212 | ||||
TOTAL SOUTH KOREA | $ | 389 | ||||
Spain — 2.9% | ||||||
Endesa | 6 | 90 | ||||
Santander | 14 | 112 | ||||
Telefonica | 32 | 351 | ||||
TOTAL SPAIN | $ | 553 | ||||
Sweden — 3.2% | ||||||
Atlas Copco, Cl A | 6 | 142 | ||||
ForeningsSparbanken | 15 | 204 | ||||
Nordea | 13 | 67 | ||||
Sandvik | 8 | 193 | ||||
TOTAL SWEDEN | $ | 606 | ||||
Switzerland — 7.6% | ||||||
Nestle, Cl B | 2 | 404 | ||||
Novartis | 9 | 343 | ||||
Roche Holding | 1 | 90 | ||||
Swisscom | 1 | 186 | ||||
UBS | 8 | 373 | ||||
Zurich Financial Services | 1 | 58 | ||||
TOTAL SWITZERLAND | $ | 1,454 | ||||
| Description | Shares (000) | Market Value (000) | ||||
Taiwan — 1.0% | ||||||
China Steel | 17 | $ | 186 | |||
TOTAL TAIWAN | $ | 186 | ||||
Thailand — 0.8% | ||||||
Bangkok Bank * | 104 | 146 | ||||
Finance One * | 3 | — | † | |||
TOTAL THAILAND | $ | 146 | ||||
United Kingdom — 28.3% | ||||||
3i Group | 8 | 63 | ||||
Aggregate Industries | 104 | 128 | ||||
AstraZeneca | 7 | 288 | ||||
Aviva | 22 | 151 | ||||
Barclays | 27 | 184 | ||||
Barratt Developments | 7 | 43 | ||||
BHP Billiton | 21 | 109 | ||||
BP | 99 | 629 | ||||
BT Group | 47 | 136 | ||||
Bunzl | 8 | 56 | ||||
Compass Group | 15 | 69 | ||||
Debenhams | 13 | 69 | ||||
Diageo | 12 | 136 | ||||
GlaxoSmithKline | 29 | 583 | ||||
HBOS | 23 | 269 | ||||
HSBC Holdings | 37 | 410 | ||||
IMI | 10 | 44 | ||||
Imperial Tobacco Group | 5 | 92 | ||||
Kier Group | 9 | 64 | ||||
Kingfisher | 26 | 101 | ||||
Lloyds TSB Group | 9 | 59 | ||||
Mitie Group | 13 | 23 | ||||
Pearson | 7 | 58 | ||||
Royal Bank of Scotland Group | 16 | 418 | ||||
Serco Group | 11 | 27 | ||||
Severn Trent | 8 | 91 | ||||
Shell Transport & Trading | 36 | 217 | ||||
South Staffordshire Group | 5 | 28 | ||||
Tesco | 28 | 90 | ||||
Unilever | 24 | 232 | ||||
Vodafone Group | 264 | 522 | ||||
TOTAL UNITED KINGDOM | $ | 5,389 | ||||
| TOTAL FOREIGN COMMON STOCK (COST $19,727) | $ | 18,513 | ||||
ANNUAL REPORT / APRIL 30, 2003
93
Table of Contents
INTERNATIONAL EQUITY PORTFOLIO (concluded)
| Description | Shares (000) | Market Value (000) | |||
| Foreign Preferred Stock — 2.1% | |||||
Brazil — 1.4% | |||||
Brasil Telecom Participacoes, ADR | 3 | $ | 117 | ||
Companhia Vale do Rio Doce, ADR | 5 | 142 | |||
TOTAL BRAZIL | $ | 259 | |||
Germany — 0.7% | |||||
Henkel | 2 | 126 | |||
TOTAL GERMANY | $ | 126 | |||
| TOTAL FOREIGN PREFERRED STOCK (COST $377) | $ | 385 | |||
TOTAL INVESTMENTS — 99.4% (COST $20,104) | $ | 18,898 | |||
| OTHER ASSETS & LIABILITIES, NET — 0.6% | $ | 118 | |||
| TOTAL NET ASSETS — 100.0% | $ | 19,016 | |||
| * | Non-income producing security |
| † | Amount rounds to less than one thousand. |
ADR — American Depositary Receipt
Cl — Class
GDR — Global Depositary Receipt
Ser — Series
The accompanying notes are an integral part of the financial statements.
APRIL 30, 2003 / ANNUAL REPORT
94
Table of Contents
This page intentionally left blank.
Table of Contents
EQUITY PORTFOLIOS
EMERGING MARKETS EQUITY PORTFOLIO

Calum Graham
PORTFOLIO MANAGER
Calum Graham is manager of the Emerging Markets Equity Portfolio. Mr. Graham is also the Director of Govett Investment Management Limited (“Govett”) where he has overall responsibility for the management of all Global Emerging Markets portfolios and the implementation of the investment process. He has more than 10 years of experience in the investment industry.
Management Discussion and Analysis
During this third torrid year for equity markets, the Portfolio maintained a defensive posture, concentrating in markets and stocks that we felt had the potential to better weather the storm of uncertainty derived from geopolitical pressures, accountancy scandals, and declining economic growth.
Two key Asian markets we focused on were Hong Kong and Thailand: Hong Kong’s economy enjoyed strong growth in 2002, and we added several smaller Hong Kong stocks to the Portfolio, such as Harbin Brewery, Fountain Set (a textile manufacturer), and Lerado (a maker of infant strollers), all of which benefited performance. The effect of this was to increase our exposure to the consumer sector. The Thai economy performed robustly, and we moved the Thai portfolio to a strong overweight by buying key benchmark stocks such as Siam Cement and several Thai banks.
Korea, the largest market component of the benchmark index, was weak over the period, and although the Portfolio was a net seller, performance was negatively impacted by exposure to the banking sector, particularly in early 2003. We also reduced exposure to Taiwan, but performance was also negatively impacted by that market’s large technology component. Overall technology exposure was underweighted throughout the period. We avoided smaller Asian markets by exiting Indonesia and having no exposure to the Philippines.
Exposure in Latin America was confined to Brazil and Mexico. We avoided Argentina—which suffered a financial crisis in 2002 but is now on the path to recovery—and other small markets. Brazil was habitually volatile, falling heavily in the run-up to October’s Presidential election, but recovering well since then. We reduced our Brazilian exposure from an overweighted to neutral position during 2002, but have returned to an overweighted position recently by adding to the telecom sector, while reducing defensive stocks such as iron ore producer Cia Vale do Rio Doce and Aracruz Celulose, a paper and pulp company. We maintained an overweighted exposure to Mexico through the period.
A positive stance was maintained to Eastern Europe, as European integration underpins the outlook for these economies. Substantial exposure was held to the Czech Republic, Hungary, and Russia (representing the bulk of the Portfolio’s oil exposure). The South African portfolio concentrated on the index-heavy commodities sector, through stocks such as Anglo American and Anglogold, which benefited performance. More recently, we broadened Portfolio holdings through purchases of Standard Bank, Nedcor, and Barloworld.
APRIL 30, 2003 / ANNUAL REPORT
96
Table of Contents
EMERGING MARKETS EQUITY PORTFOLIO
Performance as of April 30, 2003
CLASS A SHARES: VALUE OF A $10,000 INVESTMENT
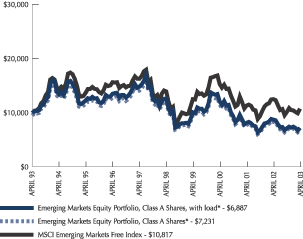
| Class A Shares* | MSCI Emerging Markets Free Index | |||
| One year total return | -17.64% | -14.06% | ||
| One year total return with load | -21.58% | — | ||
| Annualized three year total return | -15.86% | -11.04% | ||
| Annualized three year total return with load | -17.21% | — | ||
| Annualized five year total return | -10.57% | -5.04% | ||
| Annualized five year total return with load | -11.44% | — | ||
| Annualized ten year total return | -3.19% | 0.79% | ||
| Annualized ten year total return with load | -3.66% | — | ||
| Annualized total return inception to date ** | -0.82% | — | ||
| Annualized total return inception to date with load ** | -1.25% | — | ||
Past performance is no guarantee of future results. Market volatility can significantly impact short-term performance and results of an investment made today may differ substantially from the Portfolio’s historical performance. Investment return and principal value will fluctuate so that an investor’s shares, when redeemed, may be worth more or less than original cost. Total return figures include the reinvestment of dividends and capital gains. During the period, certain fees may have been waived or expenses reimbursed; otherwise total return would have been lower.
Performance for the Class A Shares with load reflects the deduction of the maximum 4.75% sales charge.
| * | Performance presented prior to August 12, 2000 reflects the performance of the Retail Class A Shares of the Govett Emerging Markets Equity Fund, which were offered beginning January 7, 1992. The assets of the Govett fund were reorganized into the Portfolio on August 12, 2000. |
| ** | Since January 7, 1992. |
The performance of the MSCI Emerging Markets Free Index does not include operating expenses that are incurred by the Portfolio.
The performance information presented in the graph and table above does not reflect the deduction of taxes that a shareholder would pay on Portfolio distributions or the redemption of Portfolio shares. Investments in foreign countries pose additional risks since the political and economic events unique to a country or region will affect those markets and their issues.

Schedule of Investments
| Description | Shares (000) | Market Value (000) | |||
| Foreign Common Stock — 93.6% | |||||
Austria — 1.2% | |||||
Erste Bank der Oesterreichisch * | 1 | $ | 55 | ||
TOTAL AUSTRIA | 55 | ||||
Brazil — 3.5% | |||||
Aracruz Celulose, ADR | 1 | 32 | |||
Cia de Saneamento Basico, ADR | 7 | 62 | |||
Petróleo Brasileiro, ADR | 2 | 37 | |||
Uniao de Bancos Brasileiros, ADR | 1 | 27 | |||
TOTAL BRAZIL | $ | 158 | |||
China — 1.2% | |||||
Sinotrans * | 22 | 5 | |||
Zhejiang Expressway | 130 | 50 | |||
TOTAL CHINA | $ | 55 | |||
Croatia — 1.0% | |||||
Pliva D.D. — Reg S, GDR | 3 | 46 | |||
TOTAL CROATIA | $ | 46 | |||
Czech Republic — 1.6% | |||||
Komercni Banka, GDR * | 3 | 70 | |||
TOTAL CZECH REPUBLIC | $ | 70 | |||
Hong Kong — 12.3% | |||||
Cosco Pacific | 27 | 23 | |||
Fong's Industries | 82 | 33 | |||
Fountain Set | 258 | 175 | |||
Harbin Brewery * | 350 | 106 | |||
Leefung-Asco Printers | 46 | 10 | |||
Lerado Group | 508 | 76 | |||
Shanghai Real Estate | 540 | 42 | |||
Victory City International | 402 | 91 | |||
TOTAL HONG KONG | $ | 556 | |||
Hungary — 3.4% | |||||
Magyar Olajes Gazip-Mol, GDR * | 2 | 48 | |||
OTP Bank, GDR | 5 | 107 | |||
TOTAL HUNGARY | $ | 155 | |||
ANNUAL REPORT / APRIL 30, 2003
97
Table of Contents
EMERGING MARKETS EQUITY PORTFOLIO (continued)
| Description | Shares (000) | Market Value (000) | |||
India — 2.1% | |||||
ICICI Bank, ADR * | 19 | $ | 97 | ||
TOTAL INDIA | $ | 97 | |||
Israel — 3.4% | |||||
Check Point Software Technology * | 3 | 45 | |||
Teva Pharmaceutical Industries, ADR | 2 | 108 | |||
TOTAL ISRAEL | $ | 153 | |||
Malaysia — 1.7% | |||||
Gamuda | 56 | 77 | |||
TOTAL MALAYSIA | $ | 77 | |||
Mexico — 11.3% | |||||
America Móvil, Ser L | 86 | 72 | |||
Cemex, ADR | 2 | 53 | |||
Fomento Económico Mexicano | 13 | 49 | |||
Grupo Financiero BBVA Bancomer, Ser B * | 105 | 91 | |||
Grupo Modelo, Ser C | 12 | 28 | |||
Grupo Televisa, ADR * | 2 | 75 | |||
Teléfonos de México, Ser L * | 55 | 83 | |||
Walmart de México, Ser C | 23 | 58 | |||
TOTAL MEXICO | $ | 509 | |||
Russia — 6.0% | |||||
Lukoil, ADR | 1 | 90 | |||
MMC Norilsk Nickel * | 3 | 67 | |||
Vimpelcom—Communications, ADR * | 1 | 59 | |||
YUKOS Oil | 5 | 54 | |||
TOTAL RUSSIA | $ | 270 | |||
South Africa — 9.6% | |||||
Anglo American | 10 | 150 | |||
Anglo American Platinum | 1 | 21 | |||
Anglogold | 1 | 28 | |||
Barloworld | 5 | 34 | |||
Nedcor | 4 | 54 | |||
SABMiller | 3 | 22 | |||
Sappi | 2 | 29 | |||
Sasol | 3 | 33 | |||
Standard Bank | 16 | 64 | |||
TOTAL SOUTH AFRICA | $ | 435 | |||
South Korea — 17.7% | |||||
Daewoo Shipbuilding & Marine * | 8 | 65 | |||
Hyundai Motor | 5 | 106 | |||
Hyundai Motor, Ser 2 | 1 | 10 | |||
Kookmin Bank | 4 | 98 | |||
KT | 2 | 64 | |||
LG Chemical | 3 | 92 | |||
| Description | Shares (000) | Market Value (000) | |||
Posco | 1 | $ | 63 | ||
Samsung Electronics | 1 | 239 | |||
Shinsegae | 1 | 61 | |||
TOTAL SOUTH KOREA | $ | 798 | |||
Taiwan — 8.6% | |||||
Askey Computer * | 52 | 31 | |||
Benq | 30 | 31 | |||
Cathay Financial | 64 | 71 | |||
Fubon Financial | 35 | 24 | |||
K Laser Technology | 20 | 16 | |||
Largan Precision | — † | 2 | |||
Nan Ya Plastic | 58 | 50 | |||
Optimax Technology * | 25 | 29 | |||
Sinopac Holdings * | 68 | 21 | |||
Taiwan Hon Chuan Enterprise | 14 | 19 | |||
Taiwan Semiconductor Manufacturing * | 71 | 97 | |||
TOTAL TAIWAN | $ | 391 | |||
Thailand — 7.5% | |||||
Asian Property Development | 48 | 42 | |||
Banpu | 29 | 26 | |||
Dynasty Ceramic | 43 | 12 | |||
Kasikornbank * | 122 | 103 | |||
Land & Houses | 493 | 85 | |||
Siam Cement | 26 | 73 | |||
TOTAL THAILAND | $ | 341 | |||
Turkey — 1.5% | |||||
Akbank | 6,700 | 24 | |||
Arcelik | 2,500 | 24 | |||
Turkcell Iletisim Hizmet * | 3,125 | 19 | |||
TOTAL TURKEY | $ | 67 | |||
| TOTAL FOREIGN COMMON STOCK (COST $4,075) | $ | 4,233 | |||
| Foreign Preferred Stock — 6.3% | |||||
Brazil — 6.3% | |||||
Cia de Bebidas das Americas, ADR | 3 | 60 | |||
Cia Vale do Rio Doce | 2 | 51 | |||
Petróleo Brasileiro | 4 | 68 | |||
Tele Norte Leste Participacoes | 9,733 | 106 | |||
TOTAL BRAZIL | $ | 285 | |||
TOTAL FOREIGN PREFERRED STOCK (COST $273) | $ | 285 | |||
APRIL 30, 2003 / ANNUAL REPORT
98
Table of Contents
EMERGING MARKETS EQUITY PORTFOLIO (concluded)
| Description | Shares (000) | Market Value (000) | ||||
| Rights — 0.0% | ||||||
Tele Norte Leste Rights * | 173 | $ | — | † | ||
Tele Norte Leste Rights * | 1 | — | † | |||
TOTAL RIGHTS (COST $0) | — | † | ||||
TOTAL INVESTMENTS 99.9% (COST $4,348) | $ | 4,518 | ||||
| OTHER ASSETS & LIABILITIES, NET — 0.1% | $ | 5 | ||||
| TOTAL NET ASSETS — 100.0% | $ | 4,523 | ||||
| * | Non-income producing security |
| † | Amount rounds to less than one thousand. |
| ADR — American Depositary Receipt |
| GDR — Global Depositary Receipt |
| Ser — Series |
The accompanying notes are an integral part of the financial statements.
ANNUAL REPORT / APRIL 30, 2003
99
Table of Contents
STATEMENTS OF ASSETS AND LIABILITIES
| As of April 30, 2003 (000, except for per share amounts) | U.S. Treasury Money Market Portfolio | U.S. Government Money Market Portfolio | Money Market Portfolio | Tax-Free Money Market Portfolio | Pennsylvania Tax-Free Money Market Portfolio | ||||||||||
Assets: | |||||||||||||||
Investments at Market Value (Cost $479,098, $1,559,258, $1,234,376, $185,280, $16,846, $56,698, $59,450, $118,502, $149,438, $136,627, $96,501 and $309,225, respectively) | $479,098 | * | $1,559,258 | * | $1,234,376 | * | $185,280 | * | $16,846 | * | |||||
Collateral for Investment Securities Loaned | — | — | — | — | — | ||||||||||
Cash | — | — | — | 8 | 7 | ||||||||||
Interest and Dividends Receivable | 74 | 4,601 | 5,517 | 529 | 49 | ||||||||||
Receivable for Investment Securities Sold | — | — | — | — | — | ||||||||||
Receivable for Capital Shares Sold | — | — | — | — | — | ||||||||||
Expense Reimbursement from Advisor | 2 | 4 | 20 | 3 | 5 | ||||||||||
Prepaid Expenses | 11 | 39 | 34 | 4 | — | † | |||||||||
Other Assets | 4 | — | 16 | — | † | — | |||||||||
TOTAL ASSETS | 479,189 | 1,563,902 | 1,239,963 | 185,824 | 16,907 | ||||||||||
Liabilities: | |||||||||||||||
Distribution Payable | 260 | 1,139 | 829 | 95 | 10 | ||||||||||
Payable for Investment Securities Loaned | — | — | — | — | — | ||||||||||
Payable for Investment Securities Purchased | — | — | 5,016 | — | — | ||||||||||
Payable for Capital Shares Redeemed | — | — | — | — | — | ||||||||||
Accrued Expenses: | |||||||||||||||
Investment Advisory Fees | 96 | 289 | 217 | 19 | — | ||||||||||
Administrator Fees | 33 | 112 | 92 | 12 | — | † | |||||||||
Shareholder Servicing Fees | 18 | 87 | 63 | 8 | 2 | ||||||||||
Distribution Fees | 28 | 48 | 81 | 15 | — | † | |||||||||
Custody Fees | 10 | 35 | 32 | 5 | 1 | ||||||||||
Transfer Agency Fees | — | — | — | 3 | 1 | ||||||||||
Other Expense Payables | 38 | 101 | 110 | 14 | 1 | ||||||||||
TOTAL LIABILITIES | 483 | 1,811 | 6,440 | 171 | 15 | ||||||||||
Net Assets: | |||||||||||||||
Paid in Capital | 478,607 | 1,562,089 | 1,233,523 | 185,655 | 16,892 | ||||||||||
Undistributed (Distributions in Excess of) Net Investment Income | 84 | 2 | — | — | † | — | |||||||||
Accumulated Net Realized Gain (Loss) on Investments | 15 | — | † | — | † | (2 | ) | — | † | ||||||
Net Unrealized Appreciation (Depreciation) on Investments | — | — | — | — | — | ||||||||||
TOTAL NET ASSETS | $478,706 | $1,562,091 | $1,233,523 | $185,653 | $16,892 | ||||||||||
Outstanding Shares of Beneficial Interest (unlimited authorization — no par value) | |||||||||||||||
Institutional Class Shares | 250,972 | 1,232,649 | 749,229 | 96,730 | 13,453 | ||||||||||
Class A Shares | 22,612 | 70,519 | 205,867 | 40,713 | — | ||||||||||
Class B Shares | — | — | 237 | — | — | ||||||||||
Institutional II Class Shares | 205,056 | 259,027 | 278,218 | 48,223 | 3,439 | ||||||||||
NET ASSET VALUE, OFFERING AND REDEMPTION PRICE PER SHARE — INSTITUTIONAL CLASS SHARES | $1.00 | $1.00 | $1.00 | $1.00 | $1.00 | ||||||||||
NET ASSET VALUE, OFFERING AND REDEMPTION PRICE PER SHARE — CLASS A SHARES | $1.00 | $1.00 | $1.00 | $1.00 | — | ||||||||||
MAXIMUM OFFERING PRICE PER SHARE — CLASS A SHARES ($10.42 ÷ 95.50%, $10.45 ÷ 95.50%, $10.13 ÷ 95.50% AND $10.70 ÷ 95.50%, RESPECTIVELY) | N/A | N/A | N/A | N/A | N/A | ||||||||||
NET ASSET VALUE, OFFERING AND REDEMPTION PRICE PER SHARE — CLASS B SHARES | — | — | $1.00 | — | — | ||||||||||
NET ASSET VALUE, OFFERING AND REDEMPTION PRICE PER SHARE — INSTITUTIONAL II CLASS SHARES | $1.00 | $1.00 | $1.00 | $1.00 | $1.00 | ||||||||||
| * | Investments are stated at their amortized cost. See Note 2 in Notes to Financial Statements. |
| † | Amount rounds to less than one thousand. |
The accompanying notes are an integral part of the financial statements.
APRIL 30, 2003 / ANNUAL REPORT
100
Table of Contents
STATEMENTS OF ASSETS AND LIABILITIES
| Short- Term Treasury Portfolio | Short- Term Bond Portfolio | Maryland Tax-Free Portfolio | Pennsylvania Tax-Free Portfolio | Intermediate Fixed Income Portfolio | U.S. Government Bond Portfolio | Income Portfolio | ||||||||||||
| $57,713 | $60,885 | $126,344 | $159,649 | $142,684 | $101,099 | $320,847 | ||||||||||||
| — | — | — | — | 2,416 | 10,851 | 25,766 | ||||||||||||
| 1 | — | — | — | — | — | — | ||||||||||||
| 945 | 704 | 1,877 | 2,895 | 1,466 | 884 | 3,087 | ||||||||||||
| — | — | — | — | 1,330 | — | 2,727 | ||||||||||||
| 128 | 269 | 49 | 44 | 81 | 39 | 870 | ||||||||||||
| 1 | — | 2 | 3 | — | 2 | 4 | ||||||||||||
| 1 | 2 | 3 | 4 | 3 | 2 | 6 | ||||||||||||
| — | † | — | † | — | † | — | † | 2 | — | † | — | † | ||||||
| 58,789 | 61,860 | 128,275 | 162,595 | 147,982 | 112,877 | 353,307 | ||||||||||||
| 74 | 88 | 314 | 488 | 344 | 214 | 393 | ||||||||||||
| — | — | — | — | 2,416 | 10,851 | 25,766 | ||||||||||||
| — | 1,947 | — | — | 16,826 | 2,638 | 65,724 | ||||||||||||
| 85 | 12 | 58 | 20 | 42 | 182 | 70 | ||||||||||||
| 18 | 34 | 56 | 88 | 56 | 54 | 120 | ||||||||||||
| 4 | 4 | 9 | 11 | 9 | 7 | 18 | ||||||||||||
| 2 | 3 | 10 | 20 | 12 | 9 | 25 | ||||||||||||
| 2 | — | 6 | — | † | — | 1 | 4 | |||||||||||
| 2 | 2 | 3 | 3 | 4 | 3 | 7 | ||||||||||||
| 3 | — | 4 | 3 | — | 2 | 4 | ||||||||||||
| 5 | 5 | 10 | 13 | 10 | 8 | 21 | ||||||||||||
| 195 | 2,095 | 470 | 646 | 19,719 | 13,969 | 92,152 | ||||||||||||
| 57,310 | 60,073 | 120,631 | 155,361 | 119,321 | 102,934 | 247,424 | ||||||||||||
| 2 | 2 | — | 21 | — | 25 | — | ||||||||||||
| 267 | (1,745 | ) | (668 | ) | (3,644 | ) | 2,885 | (8,649 | ) | 2,109 | ||||||||
| 1,015 | 1,435 | 7,842 | 10,211 | 6,057 | 4,598 | 11,622 | ||||||||||||
| $58,594 | $59,765 | $127,805 | $161,949 | $128,263 | $98,908 | $261,155 | ||||||||||||
| 4,620 | 5,986 | 9,666 | 15,161 | 12,217 | 9,291 | 23,329 | ||||||||||||
| 1,048 | — | 2,421 | 275 | — | 489 | 1,162 | ||||||||||||
| — | — | 170 | 40 | — | — | 197 | ||||||||||||
| — | — | — | — | — | — | — | ||||||||||||
| $10.34 | $9.98 | $10.43 | $10.46 | $10.50 | $10.11 | $10.57 | ||||||||||||
| $10.33 | — | $10.42 | $10.45 | — | $10.13 | $10.70 | ||||||||||||
| N/A | N/A | $10.91 | $10.94 | N/A | $10.61 | $11.20 | ||||||||||||
| — | — | $10.43 | $10.47 | — | — | $10.57 | ||||||||||||
| — | — | — | — | — | — | — | ||||||||||||
ANNUAL REPORT / APRIL 30, 2003
101
Table of Contents
STATEMENTS OF ASSETS AND LIABILITIES
| As of April 30, 2003 (000, except for per share amounts) | Balanced Portfolio | Equity Income Portfolio | Value Equity Portfolio | Equity Index Portfolio | ||||||||||||
Assets: | ||||||||||||||||
Investments at Market Value (Cost $172,221, $63,603, $133,599, $124,801, $211,660, $131,773, $66,722, $108,776, $20,104 and $4,348, respectively) | $ | 168,319 | $ | 65,751 | $ | 175,330 | $ | 98,407 | ||||||||
Foreign Currency (Cost $—, $—, $—, $—, $—, $—, $—, $—, $42 and $111, respectively) | — | — | — | — | ||||||||||||
Cash | — | — | — | — | ||||||||||||
Interest and Dividend Receivable | 564 | 197 | 297 | 104 | ||||||||||||
Receivable for Investment Securities Sold | — | — | 3,706 | 2,136 | ||||||||||||
Receivable for Capital Shares Sold | 20 | 69 | 3 | 352 | ||||||||||||
Expense Reimbursement from Advisor | 14 | 3 | 4 | 3 | ||||||||||||
Prepaid Expenses | 4 | 2 | 4 | 2 | ||||||||||||
Other Assets | — | † | — | — | † | — | ||||||||||
TOTAL ASSETS | 168,921 | 66,022 | 179,344 | 101,004 | ||||||||||||
Liabilities: | ||||||||||||||||
Payable to Custodian | — | — | — | — | ||||||||||||
Distribution Payable | — | 144 | — | — | ||||||||||||
Payable for Investment Securities Purchased | 5,186 | — | 4,303 | 1,355 | ||||||||||||
Payable for Capital Shares Redeemed | 89 | 11 | 145 | 34 | ||||||||||||
Accrued Expenses: | ||||||||||||||||
Investment Advisory Fees | 79 | 29 | 127 | — | † | |||||||||||
Administrator Fees | 11 | 4 | 12 | 5 | ||||||||||||
Shareholder Servicing Fees | 17 | 7 | 21 | 1 | ||||||||||||
Distribution Fees | 13 | 1 | 1 | 1 | ||||||||||||
Custody Fees | 5 | 2 | 4 | 3 | ||||||||||||
Transfer Agency Fees | 16 | 3 | 2 | 4 | ||||||||||||
Other Expense Payables | 13 | 6 | 14 | 8 | ||||||||||||
TOTAL LIABILITIES | 5,429 | 207 | 4,629 | 1,411 | ||||||||||||
Net Assets: | ||||||||||||||||
Paid in Capital | 231,753 | 64,292 | 133,298 | 138,664 | ||||||||||||
Undistributed (Distributions in Excess of) Net Investment Income | 153 | — | 129 | 93 | ||||||||||||
Accumulated Net Realized Loss on Investments and Options | (64,512 | ) | (625 | ) | (443 | ) | (12,770 | ) | ||||||||
Net Unrealized Appreciation (Depreciation) on Investments and Foreign Exchange Translations | (3,902 | ) | 2,148 | 41,731 | (26,394 | ) | ||||||||||
TOTAL NET ASSETS | $ | 163,492 | $ | 65,815 | $ | 174,715 | $ | 99,593 | ||||||||
Outstanding Shares of Beneficial Interest | ||||||||||||||||
Institutional Class Shares | 10,538 | 7,545 | 22,755 | 12,342 | ||||||||||||
Class A Shares | 2,618 | 537 | 567 | 604 | ||||||||||||
Class B Shares | 970 | — | 120 | — | ||||||||||||
Class C Shares | — | — | — | — | ||||||||||||
NET ASSET VALUE, OFFERING AND REDEMPTION PRICE PER SHARE — INSTITUTIONAL CLASS SHARES | $11.58 | $8.14 | $7.45 | $7.69 | ||||||||||||
NET ASSET VALUE, OFFERING AND REDEMPTION PRICE PER SHARE — CLASS A SHARES | $11.55 | $8.16 | $7.47 | $7.70 | ||||||||||||
MAXIMUM OFFERING PRICE PER SHARE — CLASS A SHARES ($11.55 ÷ 95.25%, $8.16 ÷ 95.25%, | $12.13 | $8.57 | $7.84 | $8.08 | ||||||||||||
NET ASSET VALUE, OFFERING AND REDEMPTION PRICE PER SHARE — CLASS B SHARES | $11.55 | — | $7.23 | — | ||||||||||||
NET ASSET VALUE, OFFERING AND REDEMPTION PRICE PER SHARE — CLASS C SHARES | — | — | — | — | ||||||||||||
| † | Amount rounds to less than one thousand. |
The accompanying notes are an integral part of the financial statements.
APRIL 30, 2003 / ANNUAL REPORT
102
Table of Contents
STATEMENTS OF ASSETS AND LIABILITIES
| Blue Chip Equity Portfolio | Capital Growth Portfolio | Mid-Cap Equity Portfolio | Small-Cap Equity Portfolio | International Equity Portfolio | Emerging Markets Equity Portfolio | |||||||||||
| $195,292 | $136,367 | $70,289 | $114,194 | $18,898 | $4,518 | |||||||||||
| — | — | — | — | 42 | 113 | |||||||||||
| — | — | — | — | — | — | |||||||||||
| 193 | 56 | 19 | 7 | 164 | 7 | |||||||||||
| 1,442 | — | — | 1,517 | 192 | — | |||||||||||
| 128 | 35 | 31 | 358 | 257 | — | |||||||||||
| 25 | 23 | 3 | 70 | 11 | 11 | |||||||||||
| 5 | 3 | 2 | 3 | — | † | — | † | |||||||||
| — | — | † | 1 | — | † | — | — | |||||||||
| 197,085 | 136,484 | 70,345 | 116,149 | 19,564 | 4,649 | |||||||||||
| — | — | — | — | 289 | 95 | |||||||||||
| — | — | — | — | — | — | |||||||||||
| — | 1,110 | — | 4,435 | — | — | |||||||||||
| 312 | 92 | 20 | 607 | 238 | 11 | |||||||||||
| 104 | 71 | 39 | 64 | — | — | |||||||||||
| 13 | 9 | 5 | 7 | — | † | — | † | |||||||||
| 20 | 14 | 8 | 7 | 2 | — | |||||||||||
| 13 | 10 | 2 | 11 | 1 | 1 | |||||||||||
| 4 | 5 | 3 | 5 | 11 | 6 | |||||||||||
| 31 | 31 | 4 | 83 | 7 | 12 | |||||||||||
| 16 | 11 | 6 | 9 | — | † | 1 | ||||||||||
| 513 | 1,353 | 87 | 5,228 | 548 | 126 | |||||||||||
| 268,448 | 212,107 | 81,301 | 149,496 | 41,285 | 17,685 | |||||||||||
| 122 | 97 | 7 | — | (74 | ) | — | ||||||||||
| (55,630 | ) | (81,667 | ) | (14,617 | ) | (43,993 | ) | (21,001 | ) | (13,335 | ) | |||||
| (16,368 | ) | 4,594 | 3,567 | 5,418 | (1,194 | ) | 173 | |||||||||
| $196,572 | $135,131 | $70,258 | $110,921 | $19,016 | $4,523 | |||||||||||
| 11,544 | 8,957 | 6,419 | 4,681 | 2,247 | — | |||||||||||
| 2,845 | 2,001 | 477 | 4,371 | 916 | 642 | |||||||||||
| 724 | 801 | — | 137 | — | — | |||||||||||
| — | — | — | 12 | — | — | |||||||||||
| $13.01 | $11.55 | $10.19 | $12.13 | $6.00 | — | |||||||||||
| $13.05 | $11.40 | $10.15 | $11.99 | $6.03 | $7.05 | |||||||||||
| $13.70 | $11.97 | $10.66 | $12.59 | $6.33 | $7.40 | |||||||||||
| $12.71 | $11.08 | — | $11.79 | — | — | |||||||||||
| — | — | — | $11.81 | — | — | |||||||||||
ANNUAL REPORT / APRIL 30, 2003
103
Table of Contents
| For the Fiscal Year Ended April 30, 2003 (000) | U.S. Treasury Money Market Portfolio | U.S. Government Money Market Portfolio | Money Market Portfolio | Tax-Free Money Market Portfolio | Pennsylvania Money Market | |||||||||||||||
Investment Income: | ||||||||||||||||||||
Dividends | $ | — | $ | — | $ | — | $ | — | $ | — | ||||||||||
Interest | 7,536 | 27,193 | 26,347 | 2,343 | 297 | |||||||||||||||
TOTAL INVESTMENT INCOME | 7,536 | 27,193 | 26,347 | 2,343 | 297 | |||||||||||||||
Expenses: | ||||||||||||||||||||
Investment Advisory Fees | 1,161 | 4,040 | 3,723 | 424 | 51 | |||||||||||||||
Administrator Fees | 424 | 1,414 | 1,304 | 170 | 42 | |||||||||||||||
Shareholder Servicing Fees —Institutional Class Shares | 393 | 1,880 | 1,294 | 120 | 44 | |||||||||||||||
Shareholder Servicing Fees —Class A Shares | 32 | 116 | 345 | 62 | — | |||||||||||||||
Shareholder Servicing Fees —Class B Shares | — | — | 1 | — | — | |||||||||||||||
Shareholder Servicing Fees —Institutional II Class Shares | — | — | 594 | — | 6 | |||||||||||||||
Distribution Fees — Class A Shares | 54 | 193 | 575 | 103 | — | |||||||||||||||
Distribution Fees — Class B Shares | — | — | 1 | — | — | |||||||||||||||
Distribution Fees —Institutional II Class Shares | 271 | 428 | — | 72 | 4 | |||||||||||||||
Transfer Agency Fees | 23 | — | 105 | 43 | 10 | |||||||||||||||
Custodian Fees | 53 | 283 | 268 | 33 | 10 | |||||||||||||||
Accounting Fees | 95 | 210 | 203 | 65 | 44 | |||||||||||||||
Professional Fees | 54 | 191 | 171 | 20 | 2 | |||||||||||||||
Registration Fees | 23 | 100 | 89 | 9 | 1 | |||||||||||||||
Printing | 33 | 111 | 96 | 13 | 1 | |||||||||||||||
Trustee Fees and Expenses | 18 | 63 | 59 | 6 | 1 | |||||||||||||||
Miscellaneous Fees | 44 | 171 | 147 | 16 | — | † | ||||||||||||||
TOTAL EXPENSES | 2,678 | 9,200 | 8,975 | 1,156 | 216 | |||||||||||||||
Less Waivers: | ||||||||||||||||||||
Investment Advisory Fees | — | (902 | ) | (1,125 | ) | (244 | ) | (51 | ) | |||||||||||
Administrator Fees | — | — | — | — | (12 | ) | ||||||||||||||
Shareholder Servicing Fees —Institutional Class Shares | (183 | ) | (877 | ) | (604 | ) | (56 | ) | (9 | ) | ||||||||||
Shareholder Servicing Fees —Class A Shares | (20 | ) | (70 | ) | (207 | ) | (37 | ) | — | |||||||||||
Shareholder Servicing Fees —Institutional II Class Shares | — | — | — | — | (4 | ) | ||||||||||||||
Distribution Fees — Class A Shares | — | — | — | — | — | |||||||||||||||
TOTAL WAIVERS | (203 | ) | (1,849 | ) | (1,936 | ) | (337 | ) | (76 | ) | ||||||||||
Less Expense Reimbursement by Advisor | (22 | ) | (24 | ) | (125 | ) | (30 | ) | (21 | ) | ||||||||||
TOTAL NET EXPENSES | 2,453 | 7,327 | 6,914 | 789 | 119 | |||||||||||||||
NET INVESTMENT INCOME (LOSS) | 5,083 | 19,866 | 19,433 | 1,554 | 178 | |||||||||||||||
Net Realized Gain (Loss) on Investments | 10 | — | † | 4 | (1 | ) | — | † | ||||||||||||
Net Change in Unrealized Appreciation (Depreciation) on Investments | — | — | — | — | — | |||||||||||||||
NET REALIZED AND UNREALIZED GAIN (LOSS) ON INVESTMENTS | 10 | — | † | 4 | (1 | ) | — | † | ||||||||||||
NET INCREASE (DECREASE) IN NET ASSETS RESULTING FROM OPERATIONS | $ | 5,093 | $ | 19,866 | $ | 19,437 | $ | 1,553 | $ | 178 | ||||||||||
| • | Includes income from securities lending program. See Note 6 in Notes to Financial Statements. |
| † | Amount rounds to less than one thousand. |
The accompanying notes are an integral part of the financial statements.
APRIL 30, 2003 / ANNUAL REPORT
104
Table of Contents
STATEMENTS OF OPERATIONS
| Short-Term Treasury Portfolio | Short-Term Bond Portfolio | Maryland Tax-Free Portfolio | Pennsylvania Tax-Free Portfolio | Intermediate Fixed Income Portfolio | U.S. Government Bond Portfolio | Income Portfolio | ||||||||||||||||||||
| $ | — | $ | 17 | $ | 21 | $ | 24 | $ | 93 | $ | 228 | $ | 389 | |||||||||||||
| 1,958 | 2,909 | • | 6,218 | 8,051 | 6,330 | • | 5,086 | • | 13,263 | • | ||||||||||||||||
| 1,958 | 2,926 | 6,239 | 8,075 | 6,423 | 5,314 | 13,652 | ||||||||||||||||||||
| 194 | 494 | 826 | 1,058 | 774 | 776 | 1,632 | ||||||||||||||||||||
| 72 | 81 | 133 | 164 | 135 | 113 | 258 | ||||||||||||||||||||
| 68 | 99 | 150 | 240 | 193 | 148 | 386 | ||||||||||||||||||||
| 15 | — | 38 | 3 | — | 7 | 19 | ||||||||||||||||||||
| — | — | 4 | 1 | — | — | 5 | ||||||||||||||||||||
| — | — | — | — | — | — | — | ||||||||||||||||||||
| 40 | — | 77 | 7 | — | 13 | 38 | ||||||||||||||||||||
| — | — | 12 | 2 | — | — | 14 | ||||||||||||||||||||
| — | — | — | — | — | — | — | ||||||||||||||||||||
| 23 | 6 | 36 | 32 | 3 | 22 | 46 | ||||||||||||||||||||
| 13 | 16 | 21 | 25 | 30 | 21 | 52 | ||||||||||||||||||||
| 48 | 43 | 61 | 65 | 49 | 53 | 75 | ||||||||||||||||||||
| 7 | 7 | 16 | 19 | 16 | 12 | 32 | ||||||||||||||||||||
| 3 | 4 | 7 | 9 | 7 | 6 | 15 | ||||||||||||||||||||
| 4 | 4 | 9 | 12 | 9 | 7 | 19 | ||||||||||||||||||||
| 2 | 3 | 5 | 6 | 5 | 4 | 10 | ||||||||||||||||||||
| 5 | 6 | 11 | 14 | 11 | 9 | 24 | ||||||||||||||||||||
| 494 | 763 | 1,406 | 1,657 | 1,232 | 1,191 | 2,625 | ||||||||||||||||||||
| (15 | ) | (45 | ) | (175 | ) | (4 | ) | (97 | ) | (95 | ) | (133 | ) | |||||||||||||
| — | — | — | — | — | — | — | ||||||||||||||||||||
| (41 | ) | (59 | ) | (30 | ) | — | (52 | ) | (39 | ) | (77 | ) | ||||||||||||||
| (15 | ) | — | (38 | ) | (3 | ) | — | (7 | ) | (19 | ) | |||||||||||||||
| — | — | — | — | — | — | — | ||||||||||||||||||||
| (15 | ) | — | (13 | ) | (1 | ) | — | (2 | ) | (6 | ) | |||||||||||||||
| (86 | ) | (104 | ) | (256 | ) | (8 | ) | (149 | ) | (143 | ) | (235 | ) | |||||||||||||
| (14 | ) | — | (22 | ) | (30 | ) | — | (16 | ) | (39 | ) | |||||||||||||||
| 394 | 659 | 1,128 | 1,619 | 1,083 | 1,032 | 2,351 | ||||||||||||||||||||
| 1,564 | 2,267 | 5,111 | 6,456 | 5,340 | 4,282 | 11,301 | ||||||||||||||||||||
| 326 | 745 | 495 | 583 | 4,821 | 871 | 6,724 | ||||||||||||||||||||
| 293 | 557 | 3,739 | 5,524 | 3,626 | 2,971 | 7,581 | ||||||||||||||||||||
| 619 | 1,302 | 4,234 | 6,107 | 8,447 | 3,842 | 14,305 | ||||||||||||||||||||
| $ | 2,183 | $ | 3,569 | $ | 9,345 | $ | 12,563 | $ | 13,787 | $ | 8,124 | $ | 25,606 | |||||||||||||
ANNUAL REPORT / APRIL 30, 2003
105
Table of Contents
STATEMENTS OF OPERATIONS
| For the Fiscal Year Ended April 30, 2003 (000) | Balanced Portfolio | Equity Income Portfolio | Value Equity Portfolio | Equity Index Portfolio | ||||||||||||
Investment Income: | ||||||||||||||||
Dividends | $ | 1,998 | $ | 2,077 | $ | 3,835 | $ | 1,638 | ||||||||
Less: Foreign Taxes Withheld | (6 | ) | (10 | ) | (32 | ) | (4 | ) | ||||||||
Interest | 4,263 | 8 | 5 | — | † | |||||||||||
TOTAL INVESTMENT INCOME | 6,255 | 2,075 | 3,808 | 1,634 | ||||||||||||
Expenses: | ||||||||||||||||
Investment Advisory Fees | 1,488 | 457 | 1,947 | 182 | ||||||||||||
Administrator Fees | 221 | 80 | 192 | 103 | ||||||||||||
Shareholder Servicing Fees — Institutional Class Shares | 278 | 91 | 284 | 128 | ||||||||||||
Shareholder Servicing Fees — Class A Shares | 48 | 7 | 7 | 9 | ||||||||||||
Shareholder Servicing Fees — Class B Shares | 29 | — | 2 | — | ||||||||||||
Shareholder Servicing Fees — Class C Shares | — | — | — | — | ||||||||||||
Distribution Fees — Class A Shares | 129 | 18 | 18 | 23 | ||||||||||||
Distribution Fees — Class B Shares | 88 | — | 7 | — | ||||||||||||
Distribution Fees — Class C Shares | — | — | — | — | ||||||||||||
Transfer Agency Fees | 124 | 26 | 37 | 30 | ||||||||||||
Custodian Fees | 46 | 14 | 34 | 28 | ||||||||||||
Accounting Fees | 71 | 49 | 68 | 51 | ||||||||||||
Professional Fees | 23 | 7 | 21 | 11 | ||||||||||||
Registration Fees | 15 | 4 | 13 | 6 | ||||||||||||
Printing | 13 | 4 | 11 | 6 | ||||||||||||
Trustee Fees and Expenses | 10 | 3 | 8 | 4 | ||||||||||||
Amortization of Deferred Organization Costs | — | — | — | 1 | ||||||||||||
Miscellaneous Fees | 23 | 6 | 18 | 8 | ||||||||||||
TOTAL EXPENSES | 2,606 | 766 | 2,667 | 590 | ||||||||||||
Less Waivers: | ||||||||||||||||
Investment Advisory Fees | (98 | ) | (61 | ) | (208 | ) | (141 | ) | ||||||||
Administrator Fees | — | — | — | (37 | ) | |||||||||||
Shareholder Servicing Fees — Institutional Class Shares | — | — | — | (120 | ) | |||||||||||
Shareholder Servicing Fees — Class A Shares | (48 | ) | (7 | ) | (7 | ) | (9 | ) | ||||||||
Distribution Fees — Class A Shares | (48 | ) | (7 | ) | (7 | ) | (9 | ) | ||||||||
TOTAL WAIVERS | (194 | ) | (75 | ) | (222 | ) | (316 | ) | ||||||||
Less Expense Reimbursement by Advisor | (108 | ) | (19 | ) | (35 | ) | (28 | ) | ||||||||
TOTAL NET EXPENSES | 2,304 | 672 | 2,410 | 246 | ||||||||||||
NET INVESTMENT INCOME (LOSS) | 3,951 | 1,403 | 1,398 | 1,388 | ||||||||||||
Net Realized Loss on Investments | (35,836 | ) | (3,250 | ) | (385 | ) | (5,731 | ) | ||||||||
Net Realized Gain (Loss) on Options | — | — | 104 | — | ||||||||||||
Net Realized Loss on Foreign Currency Translations | — | — | — | — | ||||||||||||
Net Change in Unrealized Appreciation (Depreciation) on Investments | 1,971 | (12,929 | ) | (49,517 | ) | (9,047 | ) | |||||||||
Net Change in Unrealized Appreciation (Depreciation) on Foreign Currency Translations | — | — | — | — | ||||||||||||
NET REALIZED AND UNREALIZED GAIN | (33,865 | ) | (16,179 | ) | (49,798 | ) | (14,778 | ) | ||||||||
NET INCREASE (DECREASE) IN NET ASSETS RESULTING | $ | (29,914 | ) | $ | (14,776 | ) | $ | (48,400 | ) | $ | (13,390 | ) | ||||
| (1) | Class C commenced operations on October 1, 2002. |
| † | Amount rounds to less than one thousand. |
The accompanying notes are an integral part of the financial statements.
APRIL 30, 2003 / ANNUAL REPORT
106
Table of Contents
STATEMENTS OF OPERATIONS
| Blue Chip Equity Portfolio | Capital Growth Portfolio | Mid-Cap Equity Portfolio | Small-Cap Equity Portfolio | International Equity Portfolio | Emerging Markets Equity Portfolio | |||||||||||||||||
| $ | 3,296 | $ | 1,411 | $ | 856 | $ | 735 | $ | 681 | $ | 113 | |||||||||||
| (16 | ) | (14 | ) | — | (1 | ) | (108 | ) | (10 | ) | ||||||||||||
| 3 | 11 | 56 | 69 | 9 | 2 | |||||||||||||||||
| 3,283 | 1,408 | 912 | 803 | 582 | 105 | |||||||||||||||||
| 1,495 | 991 | 621 | 972 | 239 | 52 | |||||||||||||||||
| 208 | 146 | 91 | 129 | 45 | 29 | |||||||||||||||||
| 246 | 161 | 109 | 96 | 27 | — | |||||||||||||||||
| 60 | 37 | 8 | 84 | 9 | 8 | |||||||||||||||||
| 24 | 23 | — | 3 | — | — | |||||||||||||||||
| — | — | — | — | †(1) | — | — | ||||||||||||||||
| 219 | 98 | 20 | 225 | 23 | 21 | |||||||||||||||||
| 72 | 70 | — | 10 | — | — | |||||||||||||||||
| — | — | — | — | †(1) | — | — | ||||||||||||||||
| 218 | 208 | 30 | 482 | 44 | 72 | |||||||||||||||||
| 36 | 40 | 26 | 38 | 69 | 65 | |||||||||||||||||
| 70 | 63 | 50 | 64 | 69 | 61 | |||||||||||||||||
| 23 | 16 | 9 | 14 | 2 | — | † | ||||||||||||||||
| 15 | 10 | 5 | 8 | 2 | — | † | ||||||||||||||||
| 12 | 8 | 5 | 8 | 1 | — | † | ||||||||||||||||
| 9 | 6 | 3 | 5 | 1 | — | † | ||||||||||||||||
| — | — | — | — | — | — | |||||||||||||||||
| 20 | 13 | 7 | 11 | 2 | — | † | ||||||||||||||||
| 2,727 | 1,890 | 984 | 2,149 | 533 | 308 | |||||||||||||||||
| (90 | ) | (50 | ) | (60 | ) | (25 | ) | (95 | ) | (52 | ) | |||||||||||
| — | — | — | — | (1 | ) | (4 | ) | |||||||||||||||
| — | — | — | — | — | — | |||||||||||||||||
| (60 | ) | (37 | ) | (8 | ) | (84 | ) | (9 | ) | (8 | ) | |||||||||||
| (119 | ) | (37 | ) | (8 | ) | (84 | ) | (9 | ) | (8 | ) | |||||||||||
| (269 | ) | (124 | ) | (76 | ) | (193 | ) | (114 | ) | (72 | ) | |||||||||||
| (202 | ) | (189 | ) | (22 | ) | (431 | ) | (38 | ) | (129 | ) | |||||||||||
| 2,256 | 1,577 | 886 | 1,525 | 381 | 107 | |||||||||||||||||
| 1,027 | (169 | ) | 26 | (722 | ) | 201 | (2 | ) | ||||||||||||||
| (46,516 | ) | (36,357 | ) | (9,011 | ) | (36,188 | ) | (10,444 | ) | (665 | ) | |||||||||||
| — | (279 | ) | — | 327 | — | — | ||||||||||||||||
| — | — | — | — | (253 | ) | (9 | ) | |||||||||||||||
| (5,851 | ) | 3,889 | (9,898 | ) | (16,378 | ) | 3,061 | (423 | ) | |||||||||||||
| — | — | — | — | 101 | 3 | |||||||||||||||||
| (52,367 | ) | (32,747 | ) | (18,909 | ) | (52,239 | ) | (7,535 | ) | (1,094 | ) | |||||||||||
| $ | (51,340 | ) | $ | (32,916 | ) | $ | (18,883 | ) | $ | (52,961 | ) | $ | (7,334 | ) | $ | (1,096 | ) | |||||
ANNUAL REPORT / APRIL 30, 2003
107
Table of Contents
STATEMENTS OF CHANGES IN NET ASSETS
| For the Fiscal Years Ended April 30, 2003 and 2002 (000) | U.S. Treasury Money Market Portfolio | U.S. Government Money Market Portfolio | Money Market Portfolio | |||||||||||||||||||||
| 05/01/02 to 04/30/03 | 05/01/01 to 04/30/02 | 05/01/02 to 04/30/03 | 05/01/01 to 04/30/02 | 05/01/02 to 04/30/03 | 05/01/01 to 04/30/02 | |||||||||||||||||||
Operations: | ||||||||||||||||||||||||
Net Investment Income | $ | 5,083 | $ | 10,518 | $ | 19,866 | $ | 41,440 | $ | 19,433 | $ | 42,845 | ||||||||||||
Net Realized Gain (Loss) on Investments | 10 | 26 | — | † | — | † | 4 | 34 | ||||||||||||||||
Net Change in Unrealized Appreciation (Depreciation) on Investments | — | — | — | — | — | — | ||||||||||||||||||
NET INCREASE (DECREASE) IN NET ASSETS FROM OPERATIONS | 5,093 | 10,544 | 19,866 | 41,440 | 19,437 | 42,879 | ||||||||||||||||||
Distributions to Shareholders: | ||||||||||||||||||||||||
Net Investment Income | ||||||||||||||||||||||||
Institutional Class Shares | (2,983 | ) | (6,670 | ) | (15,731 | ) | (33,488 | ) | (11,633 | ) | (21,712 | ) | ||||||||||||
Class A Shares | (192 | ) | (559 | ) | (798 | ) | (2,424 | ) | (2,630 | ) | (7,742 | ) | ||||||||||||
Class B Shares | — | — | — | — | (1 | ) | (2 | ) | ||||||||||||||||
Institutional II Class Shares | (1,917 | ) | (3,289 | ) | (3,337 | ) | (5,528 | ) | (5,197 | ) | (13,389 | ) | ||||||||||||
Net Capital Gains | ||||||||||||||||||||||||
Institutional Class Shares | — | — | — | — | — | — | ||||||||||||||||||
Class A Shares | — | — | — | — | — | — | ||||||||||||||||||
TOTAL DISTRIBUTIONS | (5,092 | ) | (10,518 | ) | (19,866 | ) | (41,440 | ) | (19,461 | ) | (42,845 | ) | ||||||||||||
Capital Share Transactions(1): | ||||||||||||||||||||||||
Institutional Class Shares: | ||||||||||||||||||||||||
Shares Issued | 595,456 | 466,051 | 2,455,363 | 1,809,961 | 2,016,168 | 2,527,319 | ||||||||||||||||||
Shares Issued in Lieu of Cash Distributions | 35 | 23 | 45 | — | 1,122 | 1,712 | ||||||||||||||||||
Shares Redeemed | (594,272 | ) | (475,352 | ) | (2,550,591 | ) | (1,725,723 | ) | (2,196,098 | ) | (2,184,923 | ) | ||||||||||||
TOTAL INSTITUTIONAL CLASS SHARE TRANSACTIONS | 1,219 | (9,278 | ) | (95,183 | ) | 84,238 | (178,808 | ) | 344,108 | |||||||||||||||
Class A Shares: | ||||||||||||||||||||||||
Shares Issued | 23,764 | 30,179 | 169,780 | 154,038 | 107,969 | 123,836 | ||||||||||||||||||
Shares Issued in Lieu of Cash Distributions | 140 | 447 | — | — | † | 2,585 | 7,648 | |||||||||||||||||
Shares Redeemed | (23,682 | ) | (29,821 | ) | (178,670 | ) | (194,408 | ) | (163,837 | ) | (169,143 | ) | ||||||||||||
TOTAL CLASS A SHARE TRANSACTIONS | 222 | 805 | (8,890 | ) | (40,370 | ) | (53,283 | ) | (37,659 | ) | ||||||||||||||
Class B Shares: | ||||||||||||||||||||||||
Shares Issued | — | — | — | — | 125 | 97 | ||||||||||||||||||
Shares Issued in Lieu of Cash Distributions | — | — | — | — | 1 | 3 | ||||||||||||||||||
Shares Redeemed | — | — | — | — | (46 | ) | (49 | ) | ||||||||||||||||
TOTAL CLASS B SHARE TRANSACTIONS | — | — | — | — | 80 | 51 | ||||||||||||||||||
Institutional II Class Shares: | ||||||||||||||||||||||||
Shares Issued | 488,538 | 507,157 | 1,251,005 | 1,045,057 | 1,348,148 | 2,294,308 | ||||||||||||||||||
Shares Issued in Lieu of Cash Distributions | — | — | — | — | — | — | ||||||||||||||||||
Shares Redeemed | (437,433 | ) | (463,193 | ) | (1,254,483 | ) | (948,855 | ) | (1,528,331 | ) | (2,201,705 | ) | ||||||||||||
TOTAL INSTITUTIONAL II CLASS SHARE TRANSACTIONS | 51,105 | 43,964 | (3,478 | ) | 96,202 | (180,183 | ) | 92,603 | ||||||||||||||||
NET INCREASE (DECREASE) IN NET ASSETS FROM CAPITAL SHARE TRANSACTIONS | 52,546 | 35,491 | (107,551 | ) | 140,070 | (412,194 | ) | 399,103 | ||||||||||||||||
NET INCREASE (DECREASE) IN NET ASSETS | 52,547 | 35,517 | (107,551 | ) | 140,070 | (412,218 | ) | 399,137 | ||||||||||||||||
Net Assets: | ||||||||||||||||||||||||
Beginning of period | 426,159 | 390,642 | 1,669,642 | 1,529,572 | 1,645,741 | 1,246,604 | ||||||||||||||||||
END OF PERIOD | $ | 478,706 | $ | 426,159 | $ | 1,562,091 | $ | 1,669,642 | $ | 1,233,523 | $ | 1,645,741 | ||||||||||||
UNDISTRIBUTED NET INVESTMENT INCOME | $ | 84 | $ | 18 | $ | 2 | $ | — | $ | — | $ | — | † | |||||||||||
| (1) | For share transactions, see Note 8 in Notes to Financial Statements. |
| † | Amount rounds to less than one thousand. |
The accompanying notes are an integral part of the financial statements.
APRIL 30, 2003 / ANNUAL REPORT
108
Table of Contents
STATEMENTS OF CHANGES IN NET ASSETS
| Tax-Free Money Market Portfolio | Pennsylvania Tax-Free Money Market Portfolio | Short-Term Treasury Portfolio | Short-Term Bond Portfolio | Maryland Tax-Free Portfolio | ||||||||||||||||||||||||||||||||||
| 05/01/02 to 04/30/03 | 05/01/01 to 04/30/02 | 05/01/02 to 04/30/03 | 05/01/01 to 04/30/02 | 05/01/02 to 04/30/03 | 05/01/01 to 04/30/02 | 05/01/02 to 04/30/03 | 05/01/01 to 04/30/02 | 05/01/02 to 04/30/03 | 05/01/01 to 04/30/02 | |||||||||||||||||||||||||||||
| $ | 1,554 | $ | 2,610 | $ | 178 | $ | 531 | $ | 1,564 | $ | 1,911 | $ | 2,267 | $ | 3,375 | $ | 5,111 | $ | 5,157 | |||||||||||||||||||
| (1 | ) | — | — | † | — | 326 | 672 | 745 | (1,603 | ) | 495 | 3 | ||||||||||||||||||||||||||
| — | — | — | — | 293 | (113 | ) | 557 | 171 | 3,739 | 2,137 | ||||||||||||||||||||||||||||
| 1,553 | 2,610 | 178 | 531 | 2,183 | 2,470 | 3,569 | 1,943 | 9,345 | 7,297 | |||||||||||||||||||||||||||||
| (796 | ) | (1,200 | ) | (155 | ) | (501 | ) | (1,304 | ) | (1,542 | ) | (2,299 | ) | (3,376 | ) | (4,075 | ) | (4,044 | ) | |||||||||||||||||||
| (318 | ) | (651 | ) | — | — | (260 | ) | (369 | ) | — | — | (997 | ) | (1,077 | ) | |||||||||||||||||||||||
| — | — | — | — | — | — | — | — | (49 | ) | (36 | ) | |||||||||||||||||||||||||||
| (440 | ) | (759 | ) | (23 | ) | (30 | ) | — | — | — | — | — | — | |||||||||||||||||||||||||
| — | — | — | — | (420 | ) | — | — | — | — | — | ||||||||||||||||||||||||||||
| — | — | — | — | (86 | ) | — | — | — | — | — | ||||||||||||||||||||||||||||
| (1,554 | ) | (2,610 | ) | (178 | ) | (531 | ) | (2,070 | ) | (1,911 | ) | (2,299 | ) | (3,376 | ) | (5,121 | ) | (5,157 | ) | |||||||||||||||||||
| 121,416 | 82,024 | 41,730 | 79,059 | 26,297 | 10,879 | 15,285 | 18,536 | �� | 8,352 | 13,932 | ||||||||||||||||||||||||||||
| — | — | — | — | † | 149 | 186 | 1,083 | 1,502 | 519 | 455 | ||||||||||||||||||||||||||||
| (93,962 | ) | (74,801 | ) | (52,328 | ) | (55,008 | ) | (15,176 | ) | (10,332 | ) | (29,066 | ) | (23,502 | ) | (9,100 | ) | (8,510 | ) | |||||||||||||||||||
| 27,454 | 7,223 | (10,598 | ) | 24,051 | 11,270 | 733 | (12,698 | ) | (3,464 | ) | (229 | ) | 5,877 | |||||||||||||||||||||||||
| 19,710 | 25,344 | — | — | 8,229 | 2,044 | — | — | 3,415 | 10,002 | |||||||||||||||||||||||||||||
| 319 | 651 | — | — | 240 | 347 | — | — | 696 | 822 | |||||||||||||||||||||||||||||
| (28,554 | ) | (15,121 | ) | — | — | (6,027 | ) | (2,989 | ) | — | — | (6,454 | ) | (9,286 | ) | |||||||||||||||||||||||
| (8,525 | ) | 10,874 | — | — | 2,442 | (598 | ) | — | — | (2,343 | ) | 1,538 | ||||||||||||||||||||||||||
| — | — | — | — | — | — | — | — | 523 | 606 | |||||||||||||||||||||||||||||
| — | — | — | — | — | — | — | — | 32 | 23 | |||||||||||||||||||||||||||||
| — | — | — | — | — | — | — | — | (93 | ) | (119 | ) | |||||||||||||||||||||||||||
| — | — | — | — | — | — | — | — | 462 | 510 | |||||||||||||||||||||||||||||
| 88,282 | 98,032 | 8,751 | 5,095 | — | — | — | — | — | — | |||||||||||||||||||||||||||||
| — | — | — | — | † | — | — | — | — | — | — | ||||||||||||||||||||||||||||
| (72,422 | ) | (109,667 | ) | (7,380 | ) | (3,027 | ) | — | — | — | — | — | — | |||||||||||||||||||||||||
| 15,860 | (11,635 | ) | 1,371 | 2,068 | — | — | — | — | — | — | ||||||||||||||||||||||||||||
| 34,789 | 6,462 | (9,227 | ) | 26,119 | 13,712 | 135 | (12,698 | ) | (3,464 | ) | (2,110 | ) | 7,925 | |||||||||||||||||||||||||
| 34,788 | 6,462 | (9,227 | ) | 26,119 | 13,825 | 694 | (11,428 | ) | (4,897 | ) | 2,114 | 10,065 | ||||||||||||||||||||||||||
| 150,865 | 144,403 | 26,119 | — | 44,769 | 44,075 | 71,193 | 76,090 | 125,691 | 115,626 | |||||||||||||||||||||||||||||
| $ | 185,653 | $ | 150,865 | $ | 16,892 | $ | 26,119 | $ | 58,594 | $ | 44,769 | $ | 59,765 | $ | 71,193 | $ | 127,805 | $ | 125,691 | |||||||||||||||||||
| $ | — | † | $ | — | $ | — | $ | — | $ | 2 | $ | 2 | $ | 2 | $ | 11 | $ | — | $ | — | ||||||||||||||||||
ANNUAL REPORT / APRIL 30, 2003
109
Table of Contents
STATEMENTS OF CHANGES IN NET ASSETS
| For the Fiscal Years Ended April 30, 2003 and 2002 (000) | Pennsylvania Tax-Free Portfolio | Intermediate Fixed Income Portfolio | U.S. Government Bond Portfolio | |||||||||||||||||||||
| 05/01/02 to 04/30/03 | 05/01/01 to 04/30/02 | 05/01/02 to 04/30/03 | 05/01/01 to 04/30/02 | 05/01/02 to 04/30/03 | 05/01/01 to 04/30/02 | |||||||||||||||||||
Operations: | ||||||||||||||||||||||||
Net Investment Income | $ | 6,456 | $ | 6,948 | $ | 5,340 | $ | 6,774 | $ | 4,282 | $ | 6,243 | ||||||||||||
Net Realized Gain (Loss) on Investments | 583 | 1,392 | 4,821 | (1,669 | ) | 871 | (1,898 | ) | ||||||||||||||||
Net Realized Gain on Options | — | — | — | — | — | — | ||||||||||||||||||
Net Change in Unrealized Appreciation (Depreciation) on Investments | 5,524 | 3,004 | 3,626 | 1,671 | 2,971 | 2,437 | ||||||||||||||||||
NET INCREASE (DECREASE) IN NET ASSETS FROM OPERATIONS | 12,563 | 11,344 | 13,787 | 6,776 | 8,124 | 6,782 | ||||||||||||||||||
Distributions to Shareholders: | ||||||||||||||||||||||||
Net Investment Income | ||||||||||||||||||||||||
Institutional Class Shares | (6,359 | ) | (6,850 | ) | (5,349 | ) | (6,779 | ) | (4,159 | ) | (6,074 | ) | ||||||||||||
Class A Shares | (87 | ) | (93 | ) | — | — | (173 | ) | (162 | ) | ||||||||||||||
Class B Shares | (10 | ) | (5 | ) | — | — | — | — | ||||||||||||||||
Net Capital Gains | ||||||||||||||||||||||||
Institutional Class Shares | — | — | — | (64 | ) | — | — | |||||||||||||||||
Class A Shares | — | — | — | — | — | — | ||||||||||||||||||
Class B Shares | — | — | — | — | — | — | ||||||||||||||||||
TOTAL DISTRIBUTIONS | (6,456 | ) | (6,948 | ) | (5,349 | ) | (6,843 | ) | (4,332 | ) | (6,236 | ) | ||||||||||||
Capital Share Transactions(1): | ||||||||||||||||||||||||
Institutional Class Shares | ||||||||||||||||||||||||
Shares Issued | 7,490 | 11,394 | 14,470 | 21,567 | 12,551 | 12,221 | ||||||||||||||||||
Shares Issued in Lieu of Cash Distributions | 233 | 220 | 1,015 | 1,397 | 1,010 | 1,526 | ||||||||||||||||||
Shares Redeemed | (15,423 | ) | (16,447 | ) | (25,895 | ) | (22,193 | ) | (24,542 | ) | (41,045 | ) | ||||||||||||
TOTAL INSTITUTIONAL CLASS SHARE TRANSACTIONS | (7,700 | ) | (4,833 | ) | (10,410 | ) | 771 | (10,981 | ) | (27,298 | ) | |||||||||||||
Class A Shares | ||||||||||||||||||||||||
Shares Issued | 1,213 | 336 | — | — | 5,779 | 2,263 | ||||||||||||||||||
Shares Issued in Lieu of Cash Distributions | 68 | 69 | — | — | 142 | 134 | ||||||||||||||||||
Shares Redeemed | (659 | ) | (891 | ) | — | — | (4,796 | ) | (1,247 | ) | ||||||||||||||
TOTAL CLASS A SHARE TRANSACTIONS | 622 | (486 | ) | — | — | 1,125 | 1,150 | |||||||||||||||||
Class B Shares | ||||||||||||||||||||||||
Shares Issued | 307 | 98 | — | — | — | — | ||||||||||||||||||
Shares Issued in Lieu of Cash Distributions | 5 | 5 | — | — | — | — | ||||||||||||||||||
Shares Redeemed | (78 | ) | (6 | ) | — | — | — | — | ||||||||||||||||
TOTAL CLASS B SHARE TRANSACTIONS | 234 | 97 | — | — | — | — | ||||||||||||||||||
NET INCREASE (DECREASE) IN NET ASSETS FROM CAPITAL SHARE TRANSACTIONS | (6,844 | ) | (5,222 | ) | (10,410 | ) | 771 | (9,856 | ) | (26,148 | ) | |||||||||||||
NET INCREASE (DECREASE) IN NET ASSETS | (737 | ) | (826 | ) | (1,972 | ) | 704 | (6,064 | ) | (25,602 | ) | |||||||||||||
Net Assets: | ||||||||||||||||||||||||
Beginning of period | 162,686 | 163,512 | 130,235 | 129,531 | 104,972 | 130,574 | ||||||||||||||||||
END OF PERIOD | $ | 161,949 | $ | 162,686 | $ | 128,263 | $ | 130,235 | $ | 98,908 | $ | 104,972 | ||||||||||||
UNDISTRIBUTED NET INVESTMENT INCOME | $ | 21 | $ | 21 | $ | — | $ | 9 | $ | 25 | $ | 49 | ||||||||||||
| (1) | For share transactions, see Note 8 in Notes to Financial Statements. |
The accompanying notes are an integral part of the financial statements.
APRIL 30, 2003 / ANNUAL REPORT
110
Table of Contents
STATEMENTS OF CHANGES IN NET ASSETS
| Income Portfolio | Balanced Portfolio | Equity Income Portfolio | Value Equity Portfolio | Equity Index Portfolio | ||||||||||||||||||||||||||||||||||
| 05/01/02 to 04/30/03 | 05/01/01 to 04/30/02 | 05/01/02 to 04/30/03 | 05/01/01 to 04/30/02 | 05/01/02 to 04/30/03 | 05/01/01 to 04/30/02 | 05/01/02 to 04/30/03 | 05/01/01 to 04/30/02 | 05/01/02 to 04/30/03 | 05/01/01 to 04/30/02 | |||||||||||||||||||||||||||||
| $ | 11,301 | $ | 17,964 | $ | 3,951 | $ | 6,063 | $ | 1,403 | $ | 1,178 | $ | 1,398 | $ | 961 | $ | 1,388 | $ | 1,106 | |||||||||||||||||||
| 6,724 | 595 | (35,836 | ) | (25,352 | ) | (3,250 | ) | 2,359 | (385 | ) | 6,462 | (5,731 | ) | (5,962 | ) | |||||||||||||||||||||||
| — | — | — | — | — | — | 104 | — | — | — | |||||||||||||||||||||||||||||
| 7,581 | 3,291 | 1,971 | (11,934 | ) | (12,929 | ) | (9,569 | ) | (49,517 | ) | (36,701 | ) | (9,047 | ) | (9,100 | ) | ||||||||||||||||||||||
| 25,606 | 21,850 | (29,914 | ) | (31,223 | ) | (14,776 | ) | (6,032 | ) | (48,400 | ) | (29,278 | ) | (13,390 | ) | (13,956 | ) | |||||||||||||||||||||
| (10,783 | ) | (17,378 | ) | (3,584 | ) | (5,385 | ) | (1,329 | ) | (1,115 | ) | (1,266 | ) | (1,005 | ) | (1,309 | ) | (1,034 | ) | |||||||||||||||||||
| (501 | ) | (534 | ) | (511 | ) | (785 | ) | (73 | ) | (66 | ) | (9 | ) | (17 | ) | (47 | ) | (74 | ) | |||||||||||||||||||
| (59 | ) | (47 | ) | (93 | ) | (168 | ) | — | — | — | — | — | — | |||||||||||||||||||||||||
| — | (576 | ) | — | — | — | (333 | ) | (3,324 | ) | (20,266 | ) | — | — | |||||||||||||||||||||||||
| — | (18 | ) | — | — | — | (21 | ) | (76 | ) | (483 | ) | — | — | |||||||||||||||||||||||||
| — | (2 | ) | — | — | — | — | (17 | ) | (77 | ) | — | — | ||||||||||||||||||||||||||
| (11,343 | ) | (18,555 | ) | (4,188 | ) | (6,338 | ) | (1,402 | ) | (1,535 | ) | (4,692 | ) | (21,848 | ) | (1,356 | ) | (1,108 | ) | |||||||||||||||||||
| 35,535 | 37,445 | 11,591 | 16,678 | 11,678 | 8,422 | 17,045 | 27,523 | 31,763 | 27,108 | |||||||||||||||||||||||||||||
| 5,803 | 11,581 | 3,560 | 5,354 | 66 | 351 | 2,909 | 14,913 | 905 | 785 | |||||||||||||||||||||||||||||
| (72,011 | ) | (160,519 | ) | (113,301 | ) | (42,979 | ) | (7,279 | ) | (8,272 | ) | (44,470 | ) | (57,733 | ) | (19,537 | ) | (19,095 | ) | |||||||||||||||||||
| (30,673 | ) | (111,493 | ) | (98,150 | ) | (20,947 | ) | 4,465 | 501 | (24,516 | ) | (15,297 | ) | 13,131 | 8,798 | |||||||||||||||||||||||
| 6,501 | 4,892 | 1,984 | 6,799 | 1,653 | 2,220 | 1,369 | 1,663 | 1,134 | 1,042 | |||||||||||||||||||||||||||||
| 422 | 463 | 500 | 764 | 67 | 82 | 79 | 376 | 38 | 52 | |||||||||||||||||||||||||||||
| (6,611 | ) | (2,926 | ) | (7,403 | ) | (7,181 | ) | (1,333 | ) | (954 | ) | (1,901 | ) | (1,830 | ) | (3,160 | ) | (1,387 | ) | |||||||||||||||||||
| 312 | 2,429 | (4,919 | ) | 382 | 387 | 1,348 | (453 | ) | 209 | (1,988 | ) | (293 | ) | |||||||||||||||||||||||||
| 701 | 757 | 892 | 2,445 | — | — | 165 | 456 | — | — | |||||||||||||||||||||||||||||
| 55 | 45 | 92 | 166 | — | — | 17 | 77 | — | — | |||||||||||||||||||||||||||||
| (185 | ) | (83 | ) | (2,279 | ) | (1,816 | ) | — | — | (209 | ) | (67 | ) | — | — | |||||||||||||||||||||||
| 571 | 719 | (1,295 | ) | 795 | — | — | (27 | ) | 466 | — | — | |||||||||||||||||||||||||||
| (29,790 | ) | (108,345 | ) | (104,364 | ) | (19,770 | ) | 4,852 | 1,849 | (24,996 | ) | (14,622 | ) | 11,143 | 8,505 | |||||||||||||||||||||||
| (15,527 | ) | (105,050 | ) | (138,466 | ) | (57,331 | ) | (11,326 | ) | (5,718 | ) | (78,088 | ) | (65,748 | ) | (3,603 | ) | (6,559 | ) | |||||||||||||||||||
| 276,682 | 381,732 | 301,958 | 359,289 | 77,141 | 82,859 | 252,803 | 318,551 | 103,196 | 109,755 | |||||||||||||||||||||||||||||
| $ | 261,155 | $ | 276,682 | $ | 163,492 | $ | 301,958 | $ | 65,815 | $ | 77,141 | $ | 174,715 | $ | 252,803 | $ | 99,593 | $ | 103,196 | |||||||||||||||||||
| $ | — | $ | 42 | $ | 153 | $ | 390 | $ | — | $ | — | $ | 129 | $ | 17 | $ | 93 | $ | 65 | |||||||||||||||||||
ANNUAL REPORT / APRIL 30, 2003
111
Table of Contents
STATEMENTS OF CHANGES IN NET ASSETS
| For the Fiscal Years Ended April 30, 2003 and 2002 (000) | Blue Chip Equity Portfolio | Capital Growth Portfolio | ||||||||||||||
| 05/01/02 to 04/30/03 | 05/01/01 to 04/30/02 | 05/01/02 to 04/30/03 | 05/01/01 to 04/30/02 | |||||||||||||
Operations: | ||||||||||||||||
Net Investment Income (Loss) | $ | 1,027 | $ | 489 | $ | (169 | ) | $ | (459 | ) | ||||||
Net Realized Gain (Loss) on Investments | (46,516 | ) | (7,596 | ) | (36,357 | ) | (39,485 | ) | ||||||||
Net Realized Gain (Loss) on Options | — | — | (279 | ) | — | |||||||||||
Net Realized Gain (Loss) on Foreign Currency Translations | — | — | — | — | ||||||||||||
Net Change in Unrealized Appreciation (Depreciation) on Investments | (5,851 | ) | (56,779 | ) | 3,889 | (25,288 | ) | |||||||||
Net Change in Unrealized Appreciation (Depreciation) on Foreign Currency Transactions | — | — | — | — | ||||||||||||
NET INCREASE (DECREASE) IN NET ASSETS FROM OPERATIONS | (51,340 | ) | (63,886 | ) | (32,916 | ) | (65,232 | ) | ||||||||
Distributions to Shareholders: | ||||||||||||||||
Net Investment Income | ||||||||||||||||
Institutional Class Shares | (946 | ) | (463 | ) | — | — | ||||||||||
Class A Shares | (18 | ) | (71 | ) | — | — | ||||||||||
TOTAL DISTRIBUTIONS | (964 | ) | (534 | ) | — | — | ||||||||||
Capital Share Transactions(1): | ||||||||||||||||
Institutional Class Shares | ||||||||||||||||
Shares Issued | 21,388 | 55,009 | 17,565 | 42,901 | ||||||||||||
Shares Issued in Lieu of Cash Distributions | 375 | 183 | — | — | ||||||||||||
Shares Redeemed | (39,891 | ) | (34,266 | ) | (27,797 | ) | (31,616 | ) | ||||||||
TOTAL INSTITUTIONAL CLASS SHARE TRANSACTIONS | (18,128 | ) | 20,926 | (10,232 | ) | 11,285 | ||||||||||
Class A Shares | ||||||||||||||||
Shares Issued | 2,561 | 10,240 | 1,261 | 8,628 | ||||||||||||
Shares Issued in Lieu of Cash Distributions | 17 | 68 | — | — | ||||||||||||
Shares Redeemed | (8,862 | ) | (11,620 | ) | (6,060 | ) | (7,809 | ) | ||||||||
TOTAL CLASS A SHARE TRANSACTIONS | (6,284 | ) | (1,312 | ) | (4,799 | ) | 819 | |||||||||
Class B Shares | ||||||||||||||||
Shares Issued | 707 | 2,491 | 373 | 2,055 | ||||||||||||
Shares Issued in Lieu of Cash Distributions | — | — | — | — | ||||||||||||
Shares Redeemed | (1,677 | ) | (1,251 | ) | (1,443 | ) | (1,557 | ) | ||||||||
TOTAL CLASS B SHARE TRANSACTIONS | (970 | ) | 1,240 | (1,070 | ) | 498 | ||||||||||
Class C Shares | ||||||||||||||||
Shares Issued | — | — | — | — | ||||||||||||
Shares Issued in Lieu of Cash Distributions | — | — | — | — | ||||||||||||
Shares Redeemed | — | — | — | — | ||||||||||||
TOTAL CLASS C SHARE TRANSACTIONS | — | — | — | — | ||||||||||||
NET INCREASE (DECREASE) IN NET ASSETS FROM CAPITAL SHARE TRANSACTIONS | (25,382 | ) | 20,854 | (16,101 | ) | 12,602 | ||||||||||
NET INCREASE (DECREASE) IN NET ASSETS | (77,686 | ) | (43,566 | ) | (49,017 | ) | (52,630 | ) | ||||||||
Net Assets: | ||||||||||||||||
Beginning of period | 274,258 | 317,824 | 184,148 | 236,778 | ||||||||||||
END OF PERIOD | $ | 196,572 | $ | 274,258 | $ | 135,131 | $ | 184,148 | ||||||||
UNDISTRIBUTED (DISTRIBUTIONS IN EXCESS OF) NET INVESTMENT INCOME (LOSS) | $ | 122 | $ | 59 | $ | 97 | $ | (502 | ) | |||||||
| (1) | For share transactions, see Note 8 in Notes to Financial Statements. |
| (2) | Class C Shares commenced operations on October 1, 2002. |
| † | Amount rounds to less than one thousand. |
The accompanying notes are an integral part of the financial statements.
APRIL 30, 2003 / ANNUAL REPORT
112
Table of Contents
STATEMENTS OF CHANGES IN NET ASSETS
| Mid-Cap Equity Portfolio | Small-Cap Equity Portfolio | International Equity Portfolio | Emerging Markets Equity Portfolio | |||||||||||||||||||||||||||
| 05/01/02 to 04/30/03 | 05/01/01 to 04/30/02 | 05/01/02 to 04/30/03(2) | 05/01/01 to 04/30/02 | 05/01/02 to 04/30/03 | 05/01/01 to 04/30/02 | 05/01/02 to 04/30/03 | 05/01/01 to 04/30/02 | |||||||||||||||||||||||
| $ | 26 | $ | (132 | ) | $ | (722 | ) | $ | (474 | ) | $ | 201 | $ | 104 | $ | (2 | ) | $ | 10 | |||||||||||
| (9,011 | ) | (11,910 | ) | (36,188 | ) | (3,204 | ) | (10,444 | ) | (7,434 | ) | (665 | ) | (1,042 | ) | |||||||||||||||
| — | — | 327 | — | — | — | — | — | |||||||||||||||||||||||
| — | — | — | — | (253 | ) | 485 | (9 | ) | (31 | ) | ||||||||||||||||||||
| (9,898 | ) | 7,800 | (16,378 | ) | 10,616 | 3,061 | 1,949 | (423 | ) | 1,512 | ||||||||||||||||||||
| — | — | — | 101 | (187 | ) | 3 | (7 | ) | ||||||||||||||||||||||
| (18,883 | ) | (4,242 | ) | (52,961 | ) | 6,938 | (7,334 | ) | (5,083 | ) | (1,096 | ) | 442 | |||||||||||||||||
| (56 | ) | — | — | (30 | ) | (419 | ) | (53 | ) | — | — | |||||||||||||||||||
| — | — | — | — | (103 | ) | (6 | ) | — | (26 | ) | ||||||||||||||||||||
| (56 | ) | — | — | (30 | ) | (522 | ) | (59 | ) | — | (26 | ) | ||||||||||||||||||
| 5,638 | 21,532 | 21,325 | 39,076 | 21,152 | 4,410 | — | — | |||||||||||||||||||||||
| 22 | — | — | 25 | 266 | 32 | — | — | |||||||||||||||||||||||
| (12,719 | ) | (22,602 | ) | (19,978 | ) | (44,977 | ) | (26,552 | ) | (8,715 | ) | — | — | |||||||||||||||||
| (7,059 | ) | (1,070 | ) | 1,347 | (5,876 | ) | (5,134 | ) | (4,273 | ) | — | — | ||||||||||||||||||
| 1,413 | 3,527 | 17,146 | 19,586 | 23,273 | 2,076 | 1,986 | 2,070 | |||||||||||||||||||||||
| — | — | — | — | 98 | 6 | — | 22 | |||||||||||||||||||||||
| (1,301 | ) | (1,877 | ) | (14,319 | ) | (13,415 | ) | (23,775 | ) | (3,334 | ) | (2,773 | ) | (3,348 | ) | |||||||||||||||
| 112 | 1,650 | 2,827 | 6,171 | (404 | ) | (1,252 | ) | (787 | ) | (1,256 | ) | |||||||||||||||||||
| — | — | 1,369 | 665 | — | — | — | — | |||||||||||||||||||||||
| — | — | — | — | — | — | — | — | |||||||||||||||||||||||
| — | — | (127 | ) | (14 | ) | — | — | — | — | |||||||||||||||||||||
| — | — | 1,242 | 651 | — | — | — | — | |||||||||||||||||||||||
| — | — | 139 | — | — | — | — | — | |||||||||||||||||||||||
| — | — | — | — | — | — | — | — | |||||||||||||||||||||||
| — | — | — | † | — | — | — | — | — | ||||||||||||||||||||||
| — | — | 139 | — | — | — | — | — | |||||||||||||||||||||||
| (6,947 | ) | 580 | 5,555 | 946 | (5,538 | ) | (5,525 | ) | (787 | ) | (1,256 | ) | ||||||||||||||||||
| (25,886 | ) | (3,662 | ) | (47,406 | ) | 7,854 | (13,394 | ) | (10,667 | ) | (1,883 | ) | (840 | ) | ||||||||||||||||
| 96,144 | 99,806 | 158,327 | 150,473 | 32,410 | 43,077 | 6,406 | 7,246 | |||||||||||||||||||||||
| $ | 70,258 | $ | 96,144 | $ | 110,921 | $ | 158,327 | $ | 19,016 | $ | 32,410 | $ | 4,523 | $ | 6,406 | |||||||||||||||
| $ | 7 | $ | — | $ | — | $ | — | $ | (74 | ) | $ | 432 | $ | — | $ | — | ||||||||||||||
ANNUAL REPORT / APRIL 30, 2003
113
Table of Contents
| For a Share Outstanding Throughout the Fiscal Years Ended April 30, | ||||||||||||||||||||||||||||
| Net Asset Value Beginning of Period | Net Investment Income (Loss) | Realized and Unrealized Gains (Losses) on Investments | Distributions from Net Investment Income | Distributions from Capital Gains | Net Asset Value End of Period | Total Return+ | Net Assets End of Period (000) | Ratio of Expenses to Average Net Assets | Ratio of Net Investment Income (Loss) to Average Net Assets | Ratio of Expenses to Average Net Assets (Excluding Waivers and Reimbursements) | ||||||||||||||||||
| U.S. Treasury Money Market Portfolio | ||||||||||||||||||||||||||||
| INSTITUTIONAL CLASS SHARES | ||||||||||||||||||||||||||||
2003 | $1.00 | 0.01 | — | (0.01 | ) | — | $1.00 | 1.14 | % | $251,101 | 0.49 | % | 1.14 | % | 0.56 | % | ||||||||||||
2002 | 1.00 | 0.03 | — | (0.03 | ) | — | 1.00 | 2.59 | 249,882 | 0.46 | 2.53 | 0.58 | ||||||||||||||||
2001 | 1.00 | 0.05 | — | (0.05 | ) | — | 1.00 | 5.58 | 259,145 | 0.47 | 5.44 | 0.60 | ||||||||||||||||
2000 | 1.00 | 0.05 | — | (0.05 | ) | — | 1.00 | 4.73 | 278,568 | 0.45 | 4.63 | 0.58 | ||||||||||||||||
1999 | 1.00 | 0.04 | — | (0.04 | ) | — | 1.00 | 4.58 | 289,930 | 0.45 | 4.47 | 0.59 | ||||||||||||||||
| CLASS A SHARES | ||||||||||||||||||||||||||||
2003 | $1.00 | 0.01 | — | (0.01 | ) | — | $1.00 | 0.90 | % | $22,616 | 0.73 | % | 0.89 | % | 0.92 | % | ||||||||||||
2002 | 1.00 | 0.02 | — | (0.02 | ) | — | 1.00 | 2.35 | 22,394 | 0.69 | 2.28 | 0.84 | ||||||||||||||||
2001 | 1.00 | 0.05 | — | (0.05 | ) | — | 1.00 | 5.34 | 21,587 | 0.70 | 5.19 | 0.85 | ||||||||||||||||
2000 | 1.00 | 0.04 | — | (0.04 | ) | — | 1.00 | 4.49 | 18,618 | 0.68 | 4.34 | 0.83 | ||||||||||||||||
1999 | 1.00 | 0.04 | �� | — | (0.04 | ) | — | 1.00 | 4.33 | 19,632 | 0.69 | 4.31 | 0.84 | |||||||||||||||
| INSTITUTIONAL II CLASS SHARES | ||||||||||||||||||||||||||||
2003 | $1.00 | 0.01 | — | (0.01 | ) | — | $1.00 | 1.07 | % | $204,989 | 0.56 | % | 1.06 | % | 0.56 | % | ||||||||||||
2002 | 1.00 | 0.02 | — | (0.02 | ) | — | 1.00 | 2.51 | 153,883 | 0.53 | 2.43 | 0.59 | ||||||||||||||||
2001 | 1.00 | 0.05 | — | (0.05 | ) | — | 1.00 | 5.50 | 109,910 | 0.54 | 5.34 | 0.60 | ||||||||||||||||
2000 | 1.00 | 0.05 | — | (0.05 | ) | — | 1.00 | 4.66 | 129,378 | 0.52 | 4.58 | 0.58 | ||||||||||||||||
1999 | 1.00 | 0.04 | — | (0.04 | ) | — | 1.00 | 4.53 | 139,253 | 0.50 | 4.39 | 0.56 | ||||||||||||||||
| U.S. Government Money Market Portfolio | ||||||||||||||||||||||||||||
| INSTITUTIONAL CLASS SHARES | ||||||||||||||||||||||||||||
2003 | $1.00 | 0.01 | — | (0.01 | ) | — | $1.00 | 1.25 | % | $1,232,568 | 0.43 | % | 1.26 | % | 0.56 | % | ||||||||||||
2002 | 1.00 | 0.03 | — | (0.03 | ) | — | 1.00 | 2.63 | 1,327,751 | 0.42 | 2.56 | 0.60 | ||||||||||||||||
2001 | 1.00 | 0.06 | — | (0.06 | ) | — | 1.00 | 6.00 | 1,243,512 | 0.40 | 5.82 | 0.58 | ||||||||||||||||
2000 | 1.00 | 0.05 | — | (0.05 | ) | — | 1.00 | 5.16 | 1,414,772 | 0.41 | 5.05 | 0.59 | ||||||||||||||||
1999 | 1.00 | 0.05 | — | (0.05 | ) | — | 1.00 | 5.00 | 1,428,064 | 0.40 | 4.86 | 0.59 | ||||||||||||||||
| CLASS A SHARES | ||||||||||||||||||||||||||||
2003 | $1.00 | 0.01 | — | (0.01 | ) | — | $1.00 | 1.02 | % | $70,506 | 0.66 | % | 1.03 | % | 0.83 | % | ||||||||||||
2002 | 1.00 | 0.02 | — | (0.02 | ) | — | 1.00 | 2.39 | 79,396 | 0.65 | 2.46 | 0.85 | ||||||||||||||||
2001 | 1.00 | 0.06 | — | (0.06 | ) | — | 1.00 | 5.75 | 119,725 | 0.63 | 5.62 | 0.83 | ||||||||||||||||
2000 | 1.00 | 0.05 | — | (0.05 | ) | — | 1.00 | 4.92 | 120,578 | 0.64 | 4.85 | 0.84 | ||||||||||||||||
1999 | 1.00 | 0.05 | — | (0.05 | ) | — | 1.00 | 4.75 | 104,037 | 0.64 | 4.62 | 0.84 | ||||||||||||||||
| INSTITUTIONAL II CLASS SHARES | ||||||||||||||||||||||||||||
2003 | $1.00 | 0.01 | — | (0.01 | ) | — | $1.00 | 1.18 | % | $259,017 | 0.50 | % | 1.17 | % | 0.56 | % | ||||||||||||
2002 | 1.00 | 0.02 | — | ^ | (0.02 | ) | — | 1.00 | 2.55 | 262,495 | 0.49 | 2.35 | 0.60 | |||||||||||||||
2001 | 1.00 | 0.06 | — | (0.06 | ) | — | 1.00 | 5.92 | 166,335 | 0.47 | 5.69 | 0.58 | ||||||||||||||||
2000 | 1.00 | 0.05 | — | (0.05 | ) | — | 1.00 | 5.08 | 84,503 | 0.48 | 4.91 | 0.59 | ||||||||||||||||
1999 | 1.00 | 0.05 | — | (0.05 | ) | — | 1.00 | 4.95 | 142,144 | 0.45 | 4.76 | 0.56 | ||||||||||||||||
| Money Market Portfolio | ||||||||||||||||||||||||||||
| INSTITUTIONAL CLASS SHARES | ||||||||||||||||||||||||||||
2003 | $1.00 | 0.01 | — | (0.01 | ) | — | $1.00 | 1.37 | % | $749,267 | 0.41 | % | 1.35 | % | 0.56 | % | ||||||||||||
2002 | 1.00 | 0.03 | — | (0.03 | ) | — | 1.00 | 2.78 | 928,089 | 0.40 | 2.56 | 0.60 | ||||||||||||||||
2001 | 1.00 | 0.06 | — | (0.06 | ) | — | 1.00 | 6.17 | 583,964 | 0.38 | 5.97 | 0.58 | ||||||||||||||||
2000 | 1.00 | 0.05 | — | (0.05 | ) | — | 1.00 | 5.37 | 509,229 | 0.38 | 5.25 | 0.58 | ||||||||||||||||
1999 | 1.00 | 0.05 | — | (0.05 | ) | — | 1.00 | 5.17 | 527,132 | 0.38 | 5.01 | 0.60 | ||||||||||||||||
+ | Total return does not include any front-end or deferred sales load. | (1) Commenced operations on January 22, 1999. | ||
†† | Not Annualized | (2) Commenced operations on May 1, 2001. | ||
^ | Amount rounds to less than $0.01. | (3) Commenced operations on May 11, 2001. | ||
* | Annualized. | The accompanying notes are an integral part of the financial statements. |
APRIL 30, 2003 / ANNUAL REPORT
114
Table of Contents
FINANCIAL HIGHLIGHTS
| For a Share Outstanding Throughout the Fiscal Years Ended April 30, | |||||||||||||||||||||||
| Net Asset Value Beginning of Period | Net Investment Income (Loss) | Realized and Unrealized Gains (Losses) on Investments | Distributions from Net Investment Income | Distributions from Capital Gains | Net Asset Value End of Period | Total Return+ | Net Assets End of Period (000) | Ratio of Expenses to Average Net Assets | Ratio of Net Investment Income (Loss) to Average Net Assets | Ratio of Expenses to Average Net Assets (Excluding Waivers and Reimbursements) | |||||||||||||
| Money Market Portfolio (continued) | |||||||||||||||||||||||
| CLASS A SHARES | |||||||||||||||||||||||
2003 | $1.00 | 0.01 | — | (0.01) | — | $1.00 | 1.13% | $205,808 | 0.64% | 1.14% | 0.85% | ||||||||||||
2002 | 1.00 | 0.03 | — | (0.03) | — | 1.00 | 2.55 | 259,095 | 0.62 | 2.54 | 0.85 | ||||||||||||
2001 | 1.00 | 0.06 | — | (0.06) | — | 1.00 | 5.93 | 296,748 | 0.61 | 5.75 | 0.83 | ||||||||||||
2000 | 1.00 | 0.05 | — | (0.05) | — | 1.00 | 5.13 | 251,140 | 0.61 | 5.02 | 0.83 | ||||||||||||
1999 | 1.00 | 0.05 | — | (0.05) | — | 1.00 | 4.91 | 246,496 | 0.62 | 4.79 | 0.85 | ||||||||||||
| CLASS B SHARES | |||||||||||||||||||||||
2003 | $1.00 | —^ | — | —^ | — | $1.00 | 0.44% | $237 | 1.33% | 0.41% | 9.60% | ||||||||||||
2002 | 1.00 | 0.02 | — | (0.02) | — | 1.00 | 1.85 | 156 | 1.32 | 1.64 | 1.45 | ||||||||||||
2001 | 1.00 | 0.05 | — | (0.05) | — | 1.00 | 5.21 | 105 | 1.30 | 4.80 | 1.43 | ||||||||||||
2000 | 1.00 | 0.04 | — | (0.04) | — | 1.00 | 4.41 | 23 | 1.31 | 4.39 | 1.44 | ||||||||||||
1999(1) | 1.00 | 0.01 | — | (0.01) | — | 1.00 | 3.86 | †† | 22 | 1.30* | 3.76* | 1.44* | |||||||||||
| INSTITUTIONAL II CLASS SHARES | |||||||||||||||||||||||
2003 | $1.00 | 0.01 | — | (0.01) | — | $1.00 | 1.30% | $278,211 | 0.48% | 1.31% | 0.56% | ||||||||||||
2002 | 1.00 | 0.03 | — | (0.03) | — | 1.00 | 2.71 | 458,401 | 0.46 | 2.67 | 0.60 | ||||||||||||
2001 | 1.00 | 0.06 | — | (0.06) | — | 1.00 | 6.09 | 365,787 | 0.45 | 5.86 | 0.58 | ||||||||||||
2000 | 1.00 | 0.05 | — | (0.05) | — | 1.00 | 5.30 | 300,562 | 0.45 | 5.20 | 0.58 | ||||||||||||
1999 | 1.00 | 0.05 | — | (0.05) | — | 1.00 | 5.11 | 229,046 | 0.43 | 4.97 | 0.57 | ||||||||||||
| Tax-Free Money Market Portfolio | |||||||||||||||||||||||
| INSTITUTIONAL CLASS SHARES | |||||||||||||||||||||||
2003 | $1.00 | 0.01 | — | (0.01) | — | $1.00 | 1.00% | $96,729 | 0.39% | 0.99% | 0.60% | ||||||||||||
2002 | 1.00 | 0.02 | — | (0.02) | — | 1.00 | 1.77 | 69,275 | 0.37 | 1.73 | 0.61 | ||||||||||||
2001 | 1.00 | 0.04 | — | (0.04) | — | 1.00 | 3.73 | 62,052 | 0.36 | 3.67 | 0.59 | ||||||||||||
2000 | 1.00 | 0.03 | — | (0.03) | — | 1.00 | 3.17 | 63,666 | 0.37 | 3.12 | 0.60 | ||||||||||||
1999 | 1.00 | 0.03 | — | (0.03) | — | 1.00 | 2.99 | 77,896 | 0.36 | 2.95 | 0.60 | ||||||||||||
| CLASS A SHARES | |||||||||||||||||||||||
2003 | $1.00 | 0.01 | — | (0.01) | — | $1.00 | 0.77% | $40,706 | 0.62% | 0.77% | 0.92% | ||||||||||||
2002 | 1.00 | 0.02 | — | (0.02) | — | 1.00 | 1.54 | 49,232 | 0.60 | 1.49 | 0.86 | ||||||||||||
2001 | 1.00 | 0.03 | — | (0.03) | — | 1.00 | 3.50 | 38,358 | 0.59 | 3.46 | 0.84 | ||||||||||||
2000 | 1.00 | 0.03 | — | (0.03) | — | 1.00 | 2.94 | 45,970 | 0.60 | 2.90 | 0.85 | ||||||||||||
1999 | 1.00 | 0.03 | — | (0.03) | — | 1.00 | 2.74 | 33,509 | 0.60 | 2.66 | 0.85 | ||||||||||||
| INSTITUTIONAL II CLASS SHARES | |||||||||||||||||||||||
2003 | $1.00 | 0.01 | — | (0.01) | — | $1.00 | 0.93% | $48,218 | 0.46% | 0.92% | 0.61% | ||||||||||||
2002 | 1.00 | 0.02 | — | (0.02) | — | 1.00 | 1.70 | 32,358 | 0.44 | 1.74 | 0.61 | ||||||||||||
2001 | 1.00 | 0.04 | — | (0.04) | — | 1.00 | 3.66 | 43,993 | 0.43 | 3.53 | 0.59 | ||||||||||||
2000 | 1.00 | 0.03 | — | (0.03) | — | 1.00 | 3.10 | 35,256 | 0.44 | 3.04 | 0.60 | ||||||||||||
1999 | 1.00 | 0.03 | — | (0.03) | — | 1.00 | 2.94 | 43,575 | 0.41 | 2.87 | 0.57 | ||||||||||||
| Pennsylvania Tax-Free Money Market Portfolio | |||||||||||||||||||||||
| INSTITUTIONAL CLASS SHARES | |||||||||||||||||||||||
2003 | $1.00 | 0.01 | — | (0.01) | — | $1.00 | 0.86% | $13,453 | 0.58% | 0.88% | 1.01% | ||||||||||||
2002(2) | 1.00 | 0.02 | — | (0.02) | — | 1.00 | 1.54 | †† | 24,051 | 0.57* | 1.51* | 0.76* | |||||||||||
| INSTITUTIONAL II CLASS SHARES | |||||||||||||||||||||||
2003 | $1.00 | 0.01 | — | (0.01) | — | $1.00 | 0.86% | $3,439 | 0.58% | 0.83% | 1.31% | ||||||||||||
2002(3) | 1.00 | 0.01 | — | (0.01) | — | 1.00 | 1.46 | †† | 2,068 | 0.57* | 1.45* | 0.86* | |||||||||||
ANNUAL REPORT / APRIL 30, 2003
115
Table of Contents
FINANCIAL HIGHLIGHTS
| For a Share Outstanding Throughout the Fiscal Years Ended April 30, | |||||||||||||||||||||||||||||||||
Net Asset Value Beginning of Period | Net Investment Income (Loss) | Realized and Unrealized Gains (Losses) | Distributions from Net Investment Income | Distributions from Capital Gains | Net Asset Value End of Period | Total Return+ | Net Assets End of Period (000) | Ratio of Expenses to Average Net Assets | Ratio of Net Investment Income (Loss) to Average Net Assets | Ratio of Expenses to Average Net Assets (Excluding Waivers and Reimbursements) | Portfolio Turnover Rate | ||||||||||||||||||||||
| Short-Term Treasury Portfolio | |||||||||||||||||||||||||||||||||
| INSTITUTIONAL CLASS SHARES | |||||||||||||||||||||||||||||||||
2003 | $10.31 | 0.30 | 0.12 | (0.30 | ) | (0.09 | ) | $10.34 | 4.18 | % | $47,768 | 0.67 | % | 2.87 | % | 0.79 | % | 57.22 | % | ||||||||||||||
2002 | 10.18 | 0.44 | 0.13 | (0.44 | ) | — | 10.31 | 5.71 | 36,404 | 0.63 | 4.30 | 0.75 | 65.56 | ||||||||||||||||||||
2001 | 9.86 | 0.49 | 0.32 | (0.49 | ) | — | 10.18 | 8.45 | 35,215 | 0.64 | 4.93 | 0.73 | 80.00 | ||||||||||||||||||||
2000 | 10.03 | 0.46 | (0.15 | ) | (0.46 | ) | (0.02 | ) | 9.86 | 3.11 | 34,877 | 0.64 | 4.60 | 0.73 | 80.49 | ||||||||||||||||||
1999 | 10.05 | 0.48 | 0.03 | (0.48 | ) | (0.05 | ) | 10.03 | 5.24 | 34,088 | 0.63 | 4.79 | 0.72 | 70.64 | |||||||||||||||||||
| CLASS A SHARES | |||||||||||||||||||||||||||||||||
2003 | $10.30 | 0.28 | 0.12 | (0.28 | ) | (0.09 | ) | $10.33 | 3.93 | % | $10,826 | 0.91 | % | 2.62 | % | 1.37 | % | 57.22 | % | ||||||||||||||
2002 | 10.17 | 0.42 | 0.13 | (0.42 | ) | — | 10.30 | 5.51 | 8,365 | 0.82 | 4.11 | 1.15 | 65.56 | ||||||||||||||||||||
2001 | 9.85 | 0.47 | 0.32 | (0.47 | ) | — | 10.17 | 8.24 | 8,860 | 0.83 | 4.74 | 1.13 | 80.00 | ||||||||||||||||||||
2000 | 10.03 | 0.44 | (0.16 | ) | (0.44 | ) | (0.02 | ) | 9.85 | 2.80 | 9,804 | 0.82 | 4.39 | 1.12 | 80.49 | ||||||||||||||||||
1999 | 10.05 | 0.47 | 0.03 | (0.47 | ) | (0.05 | ) | 10.03 | 5.04 | 14,006 | 0.82 | 4.61 | 1.12 | 70.64 | |||||||||||||||||||
| Short-Term Bond Portfolio | |||||||||||||||||||||||||||||||||
| INSTITUTIONAL CLASS SHARES | |||||||||||||||||||||||||||||||||
2003 | $9.80 | 0.34 | 0.19 | (0.35 | ) | — | $9.98 | 5.44 | % | $59,765 | 1.00 | % | 3.49 | % | 1.16 | % | 169.92 | % | |||||||||||||||
2002 | 9.99 | 0.45 | (0.19 | ) | (0.45 | ) | — | 9.80 | 2.65 | 71,193 | 0.97 | 4.54 | 1.13 | 79.12 | |||||||||||||||||||
2001 | 9.63 | 0.55 | 0.36 | (0.55 | ) | — | 9.99 | 9.70 | 76,090 | 0.97 | 5.52 | 1.11 | 107.45 | ||||||||||||||||||||
2000 | 9.94 | 0.50 | (0.30 | ) | (0.50 | ) | (0.01 | ) | 9.63 | 2.01 | 92,185 | 0.97 | 5.09 | 1.11 | 65.58 | ||||||||||||||||||
1999 | 9.95 | 0.51 | (0.01 | ) | (0.51 | ) | — | 9.94 | 5.15 | 111,127 | 0.97 | 5.14 | 1.11 | 91.22 | |||||||||||||||||||
| Maryland Tax-Free Portfolio | |||||||||||||||||||||||||||||||||
| INSTITUTIONAL CLASS SHARES | |||||||||||||||||||||||||||||||||
2003 | $10.09 | 0.42 | 0.34 | (0.42 | ) | — | $10.43 | 7.66 | % | $100,797 | 0.84 | % | 4.07 | % | 1.01 | % | 17.81 | % | |||||||||||||||
2002 | 9.91 | 0.43 | 0.18 | (0.43 | ) | — | 10.09 | 6.27 | 97,759 | 0.81 | 4.29 | 1.01 | 8.72 | ||||||||||||||||||||
2001 | 9.48 | 0.44 | 0.43 | (0.44 | ) | — | 9.91 | 9.34 | 90,210 | 0.81 | 4.50 | 1.00 | 28.94 | ||||||||||||||||||||
2000 | 10.21 | 0.44 | (0.69 | ) | (0.44 | ) | (0.04 | ) | 9.48 | (2.37 | ) | 87,845 | 0.81 | 4.57 | 1.00 | 24.29 | |||||||||||||||||
1999 | 10.14 | 0.45 | 0.14 | (0.45 | ) | (0.07 | ) | 10.21 | 5.86 | 95,046 | 0.76 | 4.35 | 0.99 | 30.83 | |||||||||||||||||||
| CLASS A SHARES | |||||||||||||||||||||||||||||||||
2003 | $10.08 | 0.40 | 0.34 | (0.40 | ) | — | $10.42 | 7.47 | % | $25,233 | 1.02 | % | 3.89 | % | 1.38 | % | 17.81 | % | |||||||||||||||
2002 | 9.90 | 0.42 | 0.18 | (0.42 | ) | — | 10.08 | 6.13 | 26,666 | 0.94 | 4.16 | 1.31 | 8.72 | ||||||||||||||||||||
2001 | 9.48 | 0.43 | 0.42 | (0.43 | ) | — | 9.90 | 9.09 | 24,671 | 0.94 | 4.38 | 1.30 | 28.94 | ||||||||||||||||||||
2000 | 10.21 | 0.43 | (0.69 | ) | (0.43 | ) | (0.04 | ) | 9.48 | (2.50 | ) | 25,924 | 0.94 | 4.43 | 1.30 | 24.29 | |||||||||||||||||
1999 | 10.14 | 0.43 | 0.14 | (0.43 | ) | (0.07 | ) | 10.21 | 5.69 | 32,395 | 0.93 | 4.18 | 1.29 | 30.83 | |||||||||||||||||||
| CLASS B SHARES | |||||||||||||||||||||||||||||||||
2003 | $10.09 | 0.33 | 0.34 | (0.33 | ) | — | $10.43 | 6.72 | % | $1,775 | 1.72 | % | 3.18 | % | 2.89 | % | 17.81 | % | |||||||||||||||
2002 | 9.91 | 0.35 | 0.18 | (0.35 | ) | — | 10.09 | 5.37 | 1,266 | 1.69 | 3.40 | 1.86 | 8.72 | ||||||||||||||||||||
2001 | 9.48 | 0.36 | 0.43 | (0.36 | ) | — | 9.91 | 8.47 | 745 | 1.69 | 3.57 | 1.85 | 28.94 | ||||||||||||||||||||
2000(1) | 9.75 | 1.51 | (0.23 | ) | (1.51 | ) | (0.04 | ) | 9.48 | 13.17 | †† | 50 | 1.68 | * | 3.82 | * | 1.85 | * | 24.29 | ||||||||||||||
+ Total return does not include any front-end or deferred sales load. | * Annualized. | |
†† Not Annualized. | (1) Commenced operations on September 1, 1999. | |
^ Amount rounds to less than $0.01. | The accompanying notes are an integral part of the financial statements. |
APRIL 30, 2003 / ANNUAL REPORT
116
Table of Contents
FINANCIAL HIGHLIGHTS
| For a Share Outstanding Throughout the Fiscal Years Ended April 30, | |||||||||||||||||||||||||||||||||
| Net Asset Value Beginning of Period | Net Investment Income (Loss) | Realized and Unrealized Gains (Losses) on Investments | Distributions from Net Investment Income | Distributions from Capital Gains | Net Asset Value End of Period | Total Return+ | Net Assets End of Period (000) | Ratio of Expenses to Average Net Assets | Ratio of Net Investment Income (Loss) to Average Net Assets | Ratio of Expenses to Average Net Assets (Excluding Waivers and Reimbursements) | Portfolio Turnover Rate | ||||||||||||||||||||||
| Pennsylvania Tax-Free Portfolio | |||||||||||||||||||||||||||||||||
| INSTITUTIONAL CLASS SHARES | |||||||||||||||||||||||||||||||||
2003 | $10.08 | 0.41 | 0.38 | (0.41 | ) | — | $10.46 | 7.96 | % | $158,648 | 0.99 | % | 3.97 | % | 0.99 | % | 11.78 | % | |||||||||||||||
2002 | 9.81 | 0.42 | 0.27 | (0.42 | ) | — | 10.08 | 7.18 | 160,333 | 0.95 | 4.22 | 1.00 | 16.15 | ||||||||||||||||||||
2001 | 9.38 | 0.42 | 0.43 | (0.42 | ) | — | 9.81 | 9.25 | 160,833 | 0.96 | 4.38 | 1.00 | 25.67 | ||||||||||||||||||||
2000 | 10.23 | 0.42 | (0.81 | ) | (0.42 | ) | (0.04 | ) | 9.38 | (3.88 | ) | 160,664 | 0.96 | 4.32 | 1.00 | 30.92 | |||||||||||||||||
1999 | 10.14 | 0.41 | 0.15 | (0.41 | ) | (0.06 | ) | 10.23 | 5.56 | 224,480 | 0.92 | 4.01 | 1.00 | 43.46 | |||||||||||||||||||
| CLASS A SHARES | |||||||||||||||||||||||||||||||||
2003 | $10.07 | 0.39 | 0.38 | (0.39 | ) | — | $10.45 | 7.77 | % | $2,880 | 1.17 | % | 3.79 | % | 1.99 | % | 11.78 | % | |||||||||||||||
2002 | 9.80 | 0.41 | 0.27 | (0.41 | ) | — | 10.07 | 7.03 | 2,177 | 1.09 | 4.08 | 1.30 | 16.15 | ||||||||||||||||||||
2001 | 9.38 | 0.41 | 0.42 | (0.41 | ) | — | 9.80 | 8.99 | 2,603 | 1.09 | 4.24 | 1.29 | 25.67 | ||||||||||||||||||||
2000 | 10.22 | 0.40 | (0.80 | ) | (0.40 | ) | (0.04 | ) | 9.38 | (3.95 | ) | 3,036 | 1.09 | 4.23 | 1.29 | 30.92 | |||||||||||||||||
1999 | 10.13 | 0.39 | 0.15 | (0.39 | ) | (0.06 | ) | 10.22 | 5.39 | 3,820 | 1.10 | 3.84 | 1.30 | 43.46 | |||||||||||||||||||
| CLASS B SHARES | |||||||||||||||||||||||||||||||||
2003 | $10.09 | 0.32 | 0.38 | (0.32 | ) | — | $10.47 | 7.03 | % | $421 | 1.82 | % | 3.08 | % | 6.70 | % | 11.78 | % | |||||||||||||||
2002 | 9.82 | 0.34 | 0.27 | (0.34 | ) | — | 10.09 | 6.26 | 176 | 1.84 | 3.33 | 1.85 | 16.15 | ||||||||||||||||||||
2001 | 9.39 | 0.34 | 0.43 | (0.34 | ) | — | 9.82 | 8.30 | 76 | 1.84 | 3.52 | 1.84 | 25.67 | ||||||||||||||||||||
2000(1) | 9.71 | 1.20 | (0.28 | ) | (1.20 | ) | (0.04 | ) | 9.39 | 9.37 | †† | 188 | 1.84 | * | 3.63 | * | 1.84 | * | 30.92 | ||||||||||||||
| Intermediate Fixed Income Portfolio | |||||||||||||||||||||||||||||||||
| INSTITUTIONAL CLASS SHARES | |||||||||||||||||||||||||||||||||
2003 | $9.84 | 0.42 | 0.66 | (0.42 | ) | — | $10.50 | 11.20 | % | $128,263 | 0.84 | % | 4.14 | % | 0.96 | % | 259.20 | % | |||||||||||||||
2002 | 9.85 | 0.51 | (0.01 | ) | (0.51 | ) | — | ^ | 9.84 | 5.18 | 130,235 | 0.82 | 5.11 | 0.97 | 83.47 | ||||||||||||||||||
2001 | 9.42 | 0.55 | 0.43 | (0.55 | ) | — | 9.85 | 10.72 | 129,531 | 0.80 | 5.75 | 0.95 | 36.26 | ||||||||||||||||||||
2000 | 9.93 | 0.53 | (0.50 | ) | (0.53 | ) | (0.01 | ) | 9.42 | 0.32 | 114,554 | 0.81 | 5.52 | 0.96 | 29.28 | ||||||||||||||||||
1999 | 10.00 | 0.55 | (0.02 | ) | (0.55 | ) | (0.05 | ) | 9.93 | 5.40 | 100,419 | 0.77 | 5.49 | 0.95 | 52.87 | ||||||||||||||||||
| U.S. Government Bond | |||||||||||||||||||||||||||||||||
| INSTITUTIONAL CLASS SHARES | |||||||||||||||||||||||||||||||||
2003 | $9.75 | 0.42 | 0.36 | (0.42 | ) | — | $10.11 | 8.11 | % | $93,953 | 0.99 | % | 4.16 | % | 1.12 | % | 53.04 | % | |||||||||||||||
2002 | 9.72 | 0.51 | 0.03 | (0.51 | ) | — | 9.75 | 5.65 | 101,291 | 0.96 | 5.22 | 1.10 | 36.05 | ||||||||||||||||||||
2001 | 9.27 | 0.53 | 0.45 | (0.53 | ) | — | 9.72 | 10.88 | 128,041 | 0.96 | 5.62 | 1.09 | 36.75 | ||||||||||||||||||||
2000 | 9.78 | 0.51 | (0.51 | ) | (0.51 | ) | — | 9.27 | 0.04 | 166,837 | 0.96 | 5.38 | 1.09 | 6.62 | |||||||||||||||||||
1999 | 9.85 | 0.54 | (0.07 | ) | (0.54 | ) | — | 9.78 | 4.82 | 255,329 | 0.93 | 5.43 | 1.10 | 102.27 | |||||||||||||||||||
| CLASS A SHARES | |||||||||||||||||||||||||||||||||
2003 | $9.76 | 0.40 | 0.37 | (0.40 | ) | — | $10.13 | 8.01 | % | $4,955 | 1.18 | % | 3.91 | % | 1.84 | % | 53.04 | % | |||||||||||||||
| �� | |||||||||||||||||||||||||||||||||
2002 | 9.73 | 0.50 | 0.03 | (0.50 | ) | — | 9.76 | 5.53 | 3,681 | 1.10 | 5.05 | 1.40 | 36.05 | ||||||||||||||||||||
2001 | 9.28 | 0.52 | 0.45 | (0.52 | ) | — | 9.73 | 10.72 | 2,533 | 1.10 | 5.47 | 1.40 | 36.75 | ||||||||||||||||||||
2000 | 9.79 | 0.50 | (0.51 | ) | (0.50 | ) | — | 9.28 | (0.09 | ) | 2,375 | 1.10 | 5.26 | 1.40 | 6.62 | ||||||||||||||||||
1999 | 9.85 | 0.54 | (0.06 | ) | (0.54 | ) | — | 9.79 | 4.93 | 2,240 | 1.12 | 5.11 | 1.41 | 102.27 | |||||||||||||||||||
ANNUAL REPORT / APRIL 30, 2003
117
Table of Contents
FINANCIAL HIGHLIGHTS
| For a Share Outstanding Throughout the Fiscal Years Ended April 30, | ||||||||||||||||||||||||||||||||
| Net Asset Value Beginning of Period | Net Investment Income (Loss) | Realized on Investments | Distributions from Net Investment Income | Distributions Capital | Net Asset Value of Period | Total Return+ | Net Assets End of Period (000) | Ratio of Expenses to Average Net Assets | Ratio of Net Investment Income (Loss) to Average Net Assets | Ratio of Expenses to Waivers and | Portfolio Turnover Rate | |||||||||||||||||||||
| Income Portfolio | ||||||||||||||||||||||||||||||||
| INSTITUTIONAL CLASS SHARES | ||||||||||||||||||||||||||||||||
2003 | $10.03 | 0.43 | 0.54 | (0.43 | ) | — | $10.57 | 9.86 | % | $246,639 | 0.85 | % | 4.17 | % | 0.93 | % | 275.91 | % | ||||||||||||||
2002 | 9.96 | 0.54 | 0.08 | (0.53 | ) | (0.02 | ) | 10.03 | 6.33 | 263,802 | 0.83 | 5.32 | 0.96 | 142.61 | ||||||||||||||||||
2001 | 9.51 | 0.60 | 0.45 | (0.60 | ) | — | 9.96 | 11.28 | 372,036 | 0.82 | 6.09 | 0.94 | 339.82 | |||||||||||||||||||
2000 | 10.08 | 0.56 | (0.57 | ) | (0.56 | ) | — | 9.51 | (0.01 | ) | 343,260 | 0.82 | 5.82 | 0.94 | 328.20 | |||||||||||||||||
1999 | 10.25 | 0.59 | (0.17 | ) | (0.59 | ) | — | 10.08 | 4.22 | 356,482 | 0.78 | 5.77 | 0.94 | 50.41 | ||||||||||||||||||
| CLASS A SHARES | ||||||||||||||||||||||||||||||||
2003 | $10.16 | 0.42 | 0.54 | (0.42 | ) | — | $10.70 | 9.59 | % | $12,430 | 1.03 | % | 3.97 | % | 1.45 | % | 275.91 | % | ||||||||||||||
| �� | ||||||||||||||||||||||||||||||||
2002 | 10.08 | 0.54 | 0.09 | (0.53 | ) | (0.02 | ) | 10.16 | 6.30 | 11,459 | 0.96 | 5.13 | 1.26 | 142.61 | ||||||||||||||||||
2001 | 9.62 | 0.58 | 0.47 | (0.59 | ) | — | 10.08 | 11.19 | 8,991 | 0.95 | 5.97 | 1.24 | 339.82 | |||||||||||||||||||
2000 | 10.20 | 0.56 | (0.58 | ) | (0.56 | ) | — | 9.62 | (0.18 | ) | 5,830 | 0.95 | 5.67 | 1.24 | 328.20 | |||||||||||||||||
1999 | 10.37 | 0.58 | (0.16 | ) | (0.59 | ) | — | 10.20 | 4.08 | 8,573 | 0.95 | 5.59 | 1.24 | 50.41 | ||||||||||||||||||
| CLASS B SHARES | ||||||||||||||||||||||||||||||||
2003 | $10.03 | 0.34 | 0.54 | (0.34 | ) | — | $10.57 | 8.90 | % | $2,086 | 1.73 | % | 3.25 | % | 2.72 | % | 275.91 | % | ||||||||||||||
2002 | 9.96 | 0.45 | 0.09 | (0.45 | ) | (0.02 | ) | 10.03 | 5.44 | 1,421 | 1.71 | 4.35 | 1.80 | 142.61 | ||||||||||||||||||
2001 | 9.51 | 0.51 | 0.45 | (0.51 | ) | — | 9.96 | 10.35 | 705 | 1.70 | 5.19 | 1.79 | 339.82 | |||||||||||||||||||
2000 | 10.08 | 0.48 | (0.57 | ) | (0.48 | ) | — | 9.51 | (0.85 | ) | 429 | 1.71 | 4.97 | 1.80 | 328.20 | |||||||||||||||||
1999(1) | 10.40 | 0.35 | (0.32 | ) | (0.35 | ) | — | 10.08 | 0.35 | †† | 280 | 1.70 | * | 4.71 | * | 1.79 | * | 50.41 | ||||||||||||||
| Balanced Portfolio | ||||||||||||||||||||||||||||||||
| INSTITUTIONAL CLASS SHARES | ||||||||||||||||||||||||||||||||
2003 | $12.91 | 0.21 | (1.32 | ) | (0.22 | ) | — | $11.58 | (8.52 | )% | $122,051 | 0.94 | % | 1.80 | % | 0.98 | % | 84.46 | % | |||||||||||||
2002 | 14.47 | 0.26 | (1.55 | ) | (0.27 | ) | — | 12.91 | (8.98 | ) | 248,726 | 0.91 | 1.88 | 1.01 | 50.05 | |||||||||||||||||
2001 | 16.90 | 0.35 | (1.48 | ) | (0.35 | ) | (0.95 | ) | 14.47 | (6.93 | ) | 300,818 | 0.91 | 2.18 | 1.01 | 36.26 | ||||||||||||||||
2000 | 14.64 | 0.28 | 2.90 | (0.26 | ) | (0.66 | ) | 16.90 | 22.39 | 348,332 | 0.90 | 1.95 | 1.00 | 54.46 | ||||||||||||||||||
1999 | 13.24 | 0.28 | 2.03 | (0.28 | ) | (0.63 | ) | 14.64 | 18.17 | 118,395 | 0.85 | 2.12 | 1.00 | 56.70 | ||||||||||||||||||
| CLASS A SHARES | ||||||||||||||||||||||||||||||||
2003 | $12.86 | 0.19 | (1.32 | ) | (0.18 | ) | — | $11.55 | (8.71 | )% | $30,238 | 1.10 | % | 1.61 | % | 1.64 | % | 84.46 | % | |||||||||||||
2002 | 14.40 | 0.24 | (1.52 | ) | (0.26 | ) | — | 12.86 | (8.97 | ) | 39,276 | 1.01 | 1.78 | 1.41 | 50.05 | |||||||||||||||||
2001 | 16.84 | 0.32 | (1.48 | ) | (0.33 | ) | (0.95 | ) | 14.40 | (7.06 | ) | 43,644 | 1.02 | 2.08 | 1.41 | 36.26 | ||||||||||||||||
2000 | 14.59 | 0.28 | 2.88 | (0.25 | ) | (0.66 | ) | 16.84 | 22.26 | 43,098 | 1.01 | 1.84 | 1.40 | 54.46 | ||||||||||||||||||
1999 | 13.20 | 0.26 | 2.02 | (0.26 | ) | (0.63 | ) | 14.59 | 17.97 | 26,927 | 1.01 | 1.94 | 1.40 | 56.70 | ||||||||||||||||||
| CLASS B SHARES | ||||||||||||||||||||||||||||||||
2003 | $12.84 | 0.10 | (1.30 | ) | (0.09 | ) | — | $11.55 | (9.31 | )% | $11,203 | 1.80 | % | 0.91 | % | 2.22 | % | 84.46 | % | |||||||||||||
2002 | 14.38 | 0.14 | (1.52 | ) | (0.16 | ) | — | 12.84 | (9.66 | ) | 13,956 | 1.76 | 1.03 | 1.86 | 50.05 | |||||||||||||||||
2001 | 16.82 | 0.20 | (1.47 | ) | (0.22 | ) | (0.95 | ) | 14.38 | (7.78 | ) | 14,827 | 1.77 | 1.35 | 1.86 | 36.26 | ||||||||||||||||
2000 | 14.60 | 0.16 | 2.87 | (0.15 | ) | (0.66 | ) | 16.82 | 21.32 | 10,991 | 1.77 | 1.10 | 1.86 | 54.46 | ||||||||||||||||||
1999(1) | 12.58 | 0.16 | 2.67 | (0.18 | ) | (0.63 | ) | 14.60 | 23.13 | †† | 2,479 | 1.75 | * | 0.99 | * | 1.84 | * | 56.70 | ||||||||||||||
| Equity Income Portfolio | ||||||||||||||||||||||||||||||||
| INSTITUTIONAL CLASS SHARES | ||||||||||||||||||||||||||||||||
2003 | $10.30 | 0.18 | (2.16 | ) | (0.18 | ) | — | $8.14 | (19.21 | )% | $61,427 | 1.02 | % | 2.16 | % | 1.11 | % | 28.13 | % | |||||||||||||
2002 | 11.34 | 0.16 | (0.99 | ) | (0.16 | ) | (0.05 | ) | 10.30 | (7.34 | ) | 72,005 | 1.00 | 1.52 | 1.08 | 42.83 | ||||||||||||||||
2001 | 12.00 | 0.20 | 0.42 | (0.20 | ) | (1.08 | ) | 11.34 | 5.42 | 78,666 | 0.99 | 1.70 | 1.06 | 21.41 | ||||||||||||||||||
2000 | 12.05 | 0.20 | 0.38 | (0.20 | ) | (0.43 | ) | 12.00 | 5.40 | 83,473 | 0.98 | 1.83 | 1.05 | 41.43 | ||||||||||||||||||
1999 | 12.52 | 0.25 | 0.22 | (0.25 | ) | (0.69 | ) | 12.05 | 4.17 | 101,104 | 0.91 | 2.10 | 1.04 | 56.03 | ||||||||||||||||||
+ | Total return does not include any front-end or deferred sales load. | * Annualized. | ||
†† | Not Annualized. | (1) Commenced operations on September 14, 1998. | ||
| The accompanying notes are an integral part of the financial statements. |
APRIL 30, 2003 / ANNUAL REPORT
118
Table of Contents
FINANCIAL HIGHLIGHTS
| For a Share Outstanding Throughout the Fiscal Years Ended April 30, | ||||||||||||||||||||||||||||||||||
| Net Asset Value Beginning of Period | Net Investment Income (Loss) | Realized and Unrealized Gains (Losses) on Investments | Distributions from Net Investment Income | Distributions from Capital Gains | Net Asset Value End of Period | Total Return+ | Net Assets End of Period (000) | Ratio of Expenses to Average Net Assets | Ratio of Net Investment Income (Loss) to Average Net Assets | Ratio of Expenses to Average Net Assets (Excluding Waivers and Reimbursements) | Portfolio Turnover Rate | |||||||||||||||||||||||
| Equity Income Portfolio (continued) | ||||||||||||||||||||||||||||||||||
| CLASS A SHARES | ||||||||||||||||||||||||||||||||||
2003 | $10.29 | 0.17 | (2.16 | ) | (0.14 | ) | — | $8.16 | (19.38 | )% | $4,388 | 1.18 | % | 1.99 | % | 1.99 | % | 28.13 | % | |||||||||||||||
2002 | 11.33 | 0.15 | (0.99 | ) | (0.15 | ) | (0.05 | ) | 10.29 | (7.43 | ) | 5,136 | 1.10 | 1.41 | 1.48 | 42.83 | ||||||||||||||||||
2001 | 11.99 | 0.19 | 0.42 | (0.19 | ) | (1.08 | ) | 11.33 | 5.33 | 4,193 | 1.10 | 1.62 | 1.46 | 21.41 | ||||||||||||||||||||
2000 | 12.04 | 0.22 | 0.38 | (0.22 | ) | (0.43 | ) | 11.99 | 5.29 | 3,353 | 1.09 | 1.72 | 1.45 | 41.43 | ||||||||||||||||||||
1999 | 12.52 | 0.23 | 0.21 | (0.23 | ) | (0.69 | ) | 12.04 | 3.92 | 3,659 | 1.08 | 1.93 | 1.44 | 56.03 | ||||||||||||||||||||
| Value Equity Portfolio | ||||||||||||||||||||||||||||||||||
| INSTITUTIONAL CLASS SHARES | ||||||||||||||||||||||||||||||||||
2003 | $9.44 | 0.06 | (1.86 | ) | (0.05 | ) | (0.14 | ) | $7.45 | (19.03 | )% | $169,616 | 1.23 | % | 0.73 | % | 1.34 | % | 35.74 | % | ||||||||||||||
2002 | 11.30 | 0.04 | (1.09 | ) | (0.04 | ) | (0.77 | ) | 9.44 | (9.52 | ) | 245,727 | 1.21 | 0.34 | 1.35 | 21.81 | ||||||||||||||||||
2001 | 14.11 | 0.02 | (0.86 | ) | (0.02 | ) | (1.95 | ) | 11.30 | (5.96 | ) | 310,803 | 1.20 | 0.17 | 1.33 | 9.63 | ||||||||||||||||||
2000 | 15.22 | 0.26 | 1.40 | (0.26 | ) | (2.51 | ) | 14.11 | 10.87 | 428,675 | 1.20 | 0.16 | 1.34 | 25.00 | ||||||||||||||||||||
1999 | 14.59 | 0.08 | 1.36 | (0.09 | ) | (0.72 | ) | 15.22 | 10.48 | 536,827 | 1.14 | 0.58 | 1.34 | 32.21 | ||||||||||||||||||||
| CLASS A SHARES | ||||||||||||||||||||||||||||||||||
2003 | $9.43 | 0.04 | (1.84 | ) | (0.02 | ) | (0.14 | ) | $7.47 | (19.12 | )% | $4,232 | 1.38 | % | 0.58 | % | 2.17 | % | 35.74 | % | ||||||||||||||
2002 | 11.28 | 0.02 | (1.07 | ) | (0.03 | ) | (0.77 | ) | 9.43 | (9.53 | ) | 5,935 | 1.31 | 0.24 | 1.75 | 21.81 | ||||||||||||||||||
2001 | 14.10 | 0.01 | (0.87 | ) | (0.01 | ) | (1.95 | ) | 11.28 | (6.10 | ) | 6,890 | 1.30 | 0.06 | 1.73 | 9.63 | ||||||||||||||||||
2000 | 15.22 | 0.14 | 1.40 | (0.15 | ) | (2.51 | ) | 14.10 | 10.72 | 7,516 | 1.32 | (0.01 | ) | 1.75 | 25.00 | |||||||||||||||||||
1999 | 14.60 | 0.05 | 1.36 | (0.07 | ) | (0.72 | ) | 15.22 | 10.29 | 3,553 | 1.31 | 0.29 | 1.74 | 32.21 | ||||||||||||||||||||
| CLASS B SHARES | ||||||||||||||||||||||||||||||||||
2003 | $9.17 | (0.01 | ) | (1.79 | ) | — | (0.14 | ) | $7.23 | (19.64 | )% | $867 | 2.08 | % | (0.13 | )% | 4.10 | % | 35.74 | % | ||||||||||||||
2002 | 11.05 | (0.01 | ) | (1.10 | ) | — | (0.77 | ) | 9.17 | (10.26 | ) | 1,141 | 2.06 | (0.53 | ) | 2.20 | 21.81 | |||||||||||||||||
2001 | 13.94 | (0.02 | ) | (0.92 | ) | — | (1.95 | ) | 11.05 | (6.79 | ) | 858 | 2.05 | (0.69 | ) | 2.18 | 9.63 | |||||||||||||||||
2000 | 15.16 | (0.07 | ) | 1.36 | — | (2.51 | ) | 13.94 | 9.93 | 583 | 2.07 | (0.77 | ) | 2.20 | 25.00 | |||||||||||||||||||
1999(1) | 12.93 | 0.01 | 2.97 | (0.03 | ) | (0.72 | ) | 15.16 | 23.70 | †† | 164 | 2.07 | * | (0.67 | )* | 2.20 | * | 32.21 | ||||||||||||||||
| Equity Index Portfolio | ||||||||||||||||||||||||||||||||||
| INSTITUTIONAL CLASS SHARES | ||||||||||||||||||||||||||||||||||
2003 | $9.03 | 0.12 | (1.34 | ) | (0.12 | ) | — | $7.69 | (13.50 | )% | $94,947 | 0.25 | % | 1.54 | % | 0.59 | % | 87.33 | % | |||||||||||||||
2002 | 10.45 | 0.11 | (1.42 | ) | (0.11 | ) | — | 9.03 | (12.59 | ) | 95,487 | 0.25 | 1.12 | 0.59 | 31.17 | |||||||||||||||||||
2001 | 14.83 | 0.12 | (1.77 | ) | (0.13 | ) | (2.60 | ) | 10.45 | (12.34 | ) | 100,495 | 0.25 | 0.94 | 0.56 | 44.36 | ||||||||||||||||||
2000 | 13.87 | 0.14 | 1.26 | (0.14 | ) | (0.30 | ) | 14.83 | 10.25 | 151,157 | 0.25 | 1.03 | 0.59 | 58.81 | ||||||||||||||||||||
1999 | 11.59 | 0.14 | 2.41 | (0.14 | ) | (0.13 | ) | 13.87 | 22.37 | 86,911 | 0.23 | 1.20 | 0.61 | 34.04 | ||||||||||||||||||||
| CLASS A SHARES | ||||||||||||||||||||||||||||||||||
2003 | $9.00 | 0.10 | (1.34 | ) | (0.06 | ) | — | $7.70 | (13.70 | )% | $4,646 | 0.58 | % | 1.21 | % | 1.44 | % | 87.33 | % | |||||||||||||||
2002 | 10.42 | 0.08 | (1.42 | ) | (0.08 | ) | — | 9.00 | (12.85 | ) | 7,709 | 0.50 | 0.87 | 0.99 | 31.17 | |||||||||||||||||||
2001 | 14.79 | 0.09 | (1.77 | ) | (0.09 | ) | (2.60 | ) | 10.42 | (12.51 | ) | 9,260 | 0.50 | 0.70 | 0.96 | 44.36 | ||||||||||||||||||
2000 | 13.84 | 0.11 | 1.25 | (0.11 | ) | (0.30 | ) | 14.79 | 9.95 | 7,453 | 0.50 | 0.78 | 0.99 | 58.81 | ||||||||||||||||||||
1999 | 11.57 | 0.11 | 2.40 | (0.11 | ) | (0.13 | ) | 13.84 | 22.05 | 4,974 | 0.48 | 0.92 | 1.00 | 34.04 | ||||||||||||||||||||
ANNUAL REPORT / APRIL 30, 2003
119
Table of Contents
FINANCIAL HIGHLIGHTS
| For a Share Outstanding Throughout the Fiscal Years Ended April 30, | ||||||||||||||||||||||||||||||||||
| Net Asset Value Beginning of Period | Net Investment Income (Loss) | Realized and Unrealized Gains (Losses) on Investments | Distributions from Net Investment Income | Distributions from Capital Gains | Net Asset Value End of Period | Total Return+ | Net Assets End of Period (000) | Ratio of Expenses to Average Net Assets | Ratio of Net Investment Income (Loss) to Average Net Assets | Ratio of Expenses to Average Net Assets (Excluding Waivers and Reimbursements) | Portfolio Turnover Rate | |||||||||||||||||||||||
| Blue Chip Equity Portfolio | ||||||||||||||||||||||||||||||||||
| INSTITUTIONAL CLASS SHARES | ||||||||||||||||||||||||||||||||||
2003 | $16.00 | 0.07 | (2.98 | ) | (0.08 | ) | — | $13.01 | (18.18 | )% | $150,242 | 0.99 | % | 0.55 | % | 1.03 | % | 42.56 | % | |||||||||||||||
2002 | 19.89 | 0.04 | (3.89 | ) | (0.04 | ) | — | 16.00 | (19.38 | ) | 208,327 | 0.96 | 0.23 | 1.05 | 40.45 | |||||||||||||||||||
2001 | 23.60 | 0.07 | (3.15 | ) | (0.07 | ) | (0.56 | ) | 19.89 | (13.20 | ) | 235,562 | 0.96 | 0.35 | 1.06 | 31.66 | ||||||||||||||||||
2000 | 20.00 | 0.08 | 3.97 | (0.07 | ) | (0.38 | ) | 23.60 | 20.45 | 211,534 | 0.97 | 0.39 | 1.08 | 40.58 | ||||||||||||||||||||
1999 | 17.01 | 0.10 | 3.41 | (0.12 | ) | (0.40 | ) | 20.00 | 21.07 | 129,720 | 0.91 | 0.63 | 1.07 | 38.78 | ||||||||||||||||||||
| CLASS A SHARES | ||||||||||||||||||||||||||||||||||
2003 | $15.98 | 0.06 | (2.98 | ) | (0.01 | ) | — | $13.05 | (18.30 | )% | $37,126 | 1.14 | % | 0.40 | % | 1.98 | % | 42.56 | % | |||||||||||||||
2002 | 19.87 | 0.02 | (3.89 | ) | (0.02 | ) | — | 15.98 | (19.48 | ) | 53,338 | 1.06 | 0.13 | 1.60 | 40.45 | |||||||||||||||||||
2001 | 23.57 | 0.05 | (3.14 | ) | (0.05 | ) | (0.56 | ) | 19.87 | (13.26 | ) | 67,840 | 1.06 | 0.25 | 1.61 | 31.66 | ||||||||||||||||||
2000 | 19.98 | 0.06 | 3.95 | (0.04 | ) | (0.38 | ) | 23.57 | 20.29 | 73,347 | 1.08 | 0.28 | 1.63 | 40.58 | ||||||||||||||||||||
1999 | 16.98 | 0.09 | 3.40 | (0.09 | ) | (0.40 | ) | 19.98 | 20.96 | 56,771 | 1.07 | 0.49 | 1.62 | 38.78 | ||||||||||||||||||||
| CLASS B SHARES | ||||||||||||||||||||||||||||||||||
2003 | $15.67 | (0.07 | ) | (2.89 | ) | — | — | $12.71 | (18.89 | )% | $9,204 | 1.84 | % | (0.30 | )% | 2.54 | % | 42.56 | % | |||||||||||||||
2002 | 19.60 | (0.09 | ) | (3.84 | ) | — | — | 15.67 | (20.05 | ) | 12,593 | 1.81 | (0.62 | ) | 1.90 | 40.45 | ||||||||||||||||||
2001 | 23.38 | (0.06 | ) | (3.16 | ) | — | (0.56 | ) | 19.60 | (13.92 | ) | 14,422 | 1.81 | (0.50 | ) | 1.91 | 31.66 | |||||||||||||||||
2000 | 19.93 | (0.07 | ) | 3.90 | — | (0.38 | ) | 23.38 | 19.39 | 10,710 | 1.83 | (0.49 | ) | 1.93 | 40.58 | |||||||||||||||||||
1999(1) | 17.07 | 0.01 | 3.28 | (0.03 | ) | (0.40 | ) | 19.93 | 19.62 | †† | 3,162 | 1.84 | * | (0.43 | )* | 1.94 | * | 38.78 | ||||||||||||||||
| Capital Growth Portfolio | ||||||||||||||||||||||||||||||||||
| INSTITUTIONAL CLASS SHARES | ||||||||||||||||||||||||||||||||||
2003 | $14.00 | — | (2.45 | ) | — | — | $11.55 | (17.50 | )% | $103,441 | 1.03 | % | (0.03 | )% | 1.07 | % | 193.91 | % | ||||||||||||||||
2002 | 19.07 | (0.02 | ) | (5.05 | ) | — | — | 14.00 | (26.59 | ) | 138,331 | 1.00 | (0.14 | ) | 1.05 | 201.73 | ||||||||||||||||||
2001 | 26.13 | 0.04 | (5.19 | ) | (0.02 | ) | (1.89 | ) | 19.07 | (20.32 | ) | 175,559 | 1.00 | 0.20 | 1.06 | 90.32 | ||||||||||||||||||
2000 | 18.71 | (0.03 | ) | 9.31 | — | (1.86 | ) | 26.13 | 51.36 | 193,827 | 1.00 | (0.18 | ) | 1.06 | 113.74 | |||||||||||||||||||
1999 | 14.90 | (0.01 | ) | 4.33 | — | (0.51 | ) | 18.71 | 29.51 | 90,042 | 0.94 | (0.07 | ) | 1.04 | 118.46 | |||||||||||||||||||
| CLASS A SHARES | ||||||||||||||||||||||||||||||||||
2003 | $13.85 | (0.03 | ) | (2.42 | ) | — | — | $11.40 | (17.69 | )% | $22,820 | 1.19 | % | (0.20 | )% | 2.01 | % | 193.91 | % | |||||||||||||||
2002 | 18.88 | (0.04 | ) | (4.99 | ) | — | — | 13.85 | (26.64 | ) | 33,621 | 1.10 | (0.24 | ) | 1.45 | 201.73 | ||||||||||||||||||
2001 | 25.89 | 0.03 | (5.15 | ) | — | (1.89 | ) | 18.88 | (20.37 | ) | 44,988 | 1.11 | 0.11 | 1.46 | 90.32 | |||||||||||||||||||
2000 | 18.58 | (0.05 | ) | 9.22 | — | (1.86 | ) | 25.89 | 51.12 | 52,445 | 1.11 | (0.29 | ) | 1.46 | 113.74 | |||||||||||||||||||
1999 | 14.82 | (0.03 | ) | 4.30 | — | (0.51 | ) | 18.58 | 29.34 | 23,035 | 1.09 | (0.23 | ) | 1.44 | 118.46 | |||||||||||||||||||
| CLASS B SHARES | ||||||||||||||||||||||||||||||||||
2003 | $13.55 | (0.14 | ) | (2.33 | ) | — | — | $11.08 | (18.23 | )% | $8,870 | 1.89 | % | (0.90 | )% | 2.69 | % | 193.91 | % | |||||||||||||||
2002 | 18.61 | (0.15 | ) | (4.91 | ) | — | — | 13.55 | (27.19 | ) | 12,196 | 1.85 | (0.99 | ) | 1.90 | 201.73 | ||||||||||||||||||
2001 | 25.74 | (0.08 | ) | (5.16 | ) | — | (1.89 | ) | 18.61 | (20.98 | ) | 16,231 | 1.86 | (0.66 | ) | 1.91 | 90.32 | |||||||||||||||||
2000 | 18.61 | (0.13 | ) | 9.12 | — | (1.86 | ) | 25.74 | 50.03 | 14,129 | 1.86 | (1.04 | ) | 1.91 | 113.74 | |||||||||||||||||||
1999(2) | 13.53 | (0.04 | ) | 5.63 | — | (0.51 | ) | 18.61 | 41.88 | †† | 2,162 | 1.87 | * | (1.09 | )* | 1.92 | * | 118.46 | ||||||||||||||||
| Mid-Cap Equity Portfolio | ||||||||||||||||||||||||||||||||||
| INSTITUTIONAL CLASS SHARES | ||||||||||||||||||||||||||||||||||
2003 | $12.63 | — | (2.43 | ) | (0.01 | ) | — | $10.19 | (19.25 | )% | $65,417 | 1.13 | % | 0.05 | % | 1.21 | % | 237.57 | % | |||||||||||||||
2002 | 13.19 | (0.02 | ) | (0.54 | ) | — | — | 12.63 | (4.25 | ) | 90,179 | 1.11 | (0.13 | ) | 1.18 | 105.88 | ||||||||||||||||||
2001 | 17.92 | (0.02 | ) | (1.11 | ) | — | (3.60 | ) | 13.19 | (6.55 | ) | 95,317 | 1.10 | (0.20 | ) | 1.17 | 95.51 | |||||||||||||||||
2000 | 14.70 | (0.04 | ) | 5.30 | — | (2.04 | ) | 17.92 | 38.90 | 92,253 | 1.11 | (0.26 | ) | 1.18 | 55.90 | |||||||||||||||||||
1999 | 14.11 | 0.01 | 1.16 | (0.01 | ) | (0.57 | ) | 14.70 | 8.76 | 63,648 | 1.06 | 0.04 | 1.18 | 61.81 | ||||||||||||||||||||
| CLASS A SHARES | ||||||||||||||||||||||||||||||||||
2003 | $12.58 | (0.01 | ) | (2.42 | ) | — | — | $10.15 | (19.32 | )% | $4,841 | 1.29 | % | (0.12 | )% | 2.11 | % | 237.57 | % | |||||||||||||||
2002 | 13.16 | (0.03 | ) | (0.55 | ) | — | — | 12.58 | (4.41 | ) | 5,965 | 1.21 | (0.25 | ) | 1.58 | 105.88 | ||||||||||||||||||
2001 | 17.90 | (0.01 | ) | (1.13 | ) | — | (3.60 | ) | 13.16 | (6.62 | ) | 4,489 | 1.21 | (0.27 | ) | 1.57 | 95.51 | |||||||||||||||||
2000(3) | 15.22 | (0.02 | ) | 4.74 | — | (2.04 | ) | 17.90 | 34.04 | †† | 1,161 | 1.23 | * | (0.31 | )* | 1.59 | * | 55.90 | ||||||||||||||||
+ Total return does not include any front-end or deferred sales load. | (4) Commenced operations on February 20, 2001. | |
†† Not Annualized. | (5) Commenced operations on October 1, 2002. | |
* Annualized. | (6) For the six-month period ended April 30, 2001. | |
(1) Commenced operations on July 31, 1998. | (7) Periods ended October 31, 2000. | |
(2) Commenced operations on September 14, 1998. | (8) Years ended December 31, 1999 and December 31, 1998. | |
(3) Commenced operations on September 1, 1999. | (9) Commenced operations on July 24, 1998. | |
| The accompanying notes are an integral part of the financial statements. |
APRIL 30, 2003 / ANNUAL REPORT
120
Table of Contents
FINANCIAL HIGHLIGHTS
| For a Share Outstanding Throughout the Fiscal Years Ended April 30, | |||||||||||||||||||||||||||||||||||||
Net Asset Value Beginning of Period | Net Investment Income (Loss) | Realized and Unrealized Gains (Losses) on Investments | Distributions from Net Investment Income | Distributions from Capital Gains | Return of Capital | Net Asset Value End of Period | Total Return+ | Net Assets End of Period (000) | Ratio of Net Assets | Ratio of Net Investment Income (Loss) Net Assets | Ratio of Expenses to Average Net Assets (Excluding Waivers and Reimbursements) | Portfolio Turnover Rate | |||||||||||||||||||||||||
| Small-Cap Equity Portfolio | |||||||||||||||||||||||||||||||||||||
| INSTITUTIONAL CLASS SHARES | |||||||||||||||||||||||||||||||||||||
2003 | $17.93 | (0.07 | ) | (5.73 | ) | — | — | — | $12.13 | (32.35 | )% | $56,766 | 1.17 | % | (0.51 | )% | 1.19 | % | 246.11 | % | |||||||||||||||||
2002 | 17.15 | (0.04 | ) | 0.83 | (0.01 | ) | — | — | 17.93 | 4.58 | 82,922 | 1.17 | (0.27 | ) | 1.18 | 266.74 | |||||||||||||||||||||
2001 | 23.24 | (0.01 | ) | (2.03 | ) | — | (4.03 | ) | (0.02 | ) | 17.15 | (10.05 | ) | 85,286 | 1.15 | (0.14 | ) | 1.17 | 359.60 | ||||||||||||||||||
2000 | 12.65 | (0.08 | ) | 15.39 | — | (4.72 | ) | — | 23.24 | 126.42 | �� | 81,375 | 1.19 | (0.49 | ) | 1.21 | 753.31 | ||||||||||||||||||||
1999 | 11.86 | (0.05 | ) | 1.17 | — | (0.33 | ) | — | 12.65 | 9.89 | 30,562 | 1.16 | (0.48 | ) | 1.23 | 733.14 | |||||||||||||||||||||
| CLASS A SHARES | |||||||||||||||||||||||||||||||||||||
2003 | $17.76 | (0.08 | ) | (5.69 | ) | — | — | — | $11.99 | (32.49 | )% | $52,397 | 1.33 | % | (0.67 | )% | 2.38 | % | 246.11 | % | |||||||||||||||||
2002 | 16.99 | (0.05 | ) | 0.82 | — | — | — | 17.76 | 4.53 | 74,576 | 1.27 | (0.38 | ) | 1.58 | 266.74 | ||||||||||||||||||||||
2001 | 23.07 | (0.02 | ) | (2.01 | ) | — | (4.03 | ) | (0.02 | ) | 16.99 | (10.09 | ) | 65,062 | 1.25 | (0.11 | ) | 1.56 | 359.60 | ||||||||||||||||||
2000 | 12.59 | (0.05 | ) | 15.25 | — | (4.72 | ) | — | 23.07 | 126.13 | 11,292 | 1.30 | (0.49 | ) | 1.61 | 753.31 | |||||||||||||||||||||
1999 | 11.83 | (0.07 | ) | 1.16 | — | (0.33 | ) | — | 12.59 | 9.66 | 2,248 | 1.32 | (0.64 | ) | 1.63 | 733.14 | |||||||||||||||||||||
| CLASS B SHARES | |||||||||||||||||||||||||||||||||||||
2003 | $17.60 | (0.19 | ) | (5.62 | ) | — | — | — | $11.79 | (33.01 | )% | $1,611 | 2.08 | % | (1.44 | )% | 3.47 | % | 246.11 | % | |||||||||||||||||
2002 | 16.97 | (0.14 | ) | 0.77 | — | — | — | 17.60 | 3.71 | 829 | 2.01 | (1.20 | ) | 2.03 | 266.74 | ||||||||||||||||||||||
2001(4) | 16.80 | (0.01 | ) | 0.18 | — | — | — | 16.97 | 1.01 | †† | 125 | 2.07 | * | (0.61 | )* | 2.08 | * | 359.60 | |||||||||||||||||||
| CLASS C SHARES | |||||||||||||||||||||||||||||||||||||
2003(5) | $12.27 | (0.03 | ) | (0.43 | ) | — | — | — | $11.81 | (3.75 | )%†† | $147 | 2.09 | %* | (1.42 | )%* | 11.28 | %* | 246.11 | %†† | |||||||||||||||||
| International Equity Portfolio | |||||||||||||||||||||||||||||||||||||
| INSTITUTIONAL CLASS SHARES | |||||||||||||||||||||||||||||||||||||
2003 | $8.23 | 0.09 | (2.16 | ) | (0.16 | ) | — | — | $6.00 | (25.16 | )% | $13,493 | 1.57 | % | 0.84 | % | 1.99 | % | 65.29 | % | |||||||||||||||||
2002 | 9.38 | 0.03 | (1.16 | ) | (0.02 | ) | — | — | 8.23 | (12.08 | ) | 24,793 | 1.39 | 0.32 | 1.73 | 52.80 | |||||||||||||||||||||
2001(6) | 11.02 | (0.02 | ) | (1.06 | ) | (0.04 | ) | (0.52 | ) | — | 9.38 | (10.21 | )†† | 33,101 | 1.41 | * | (0.07 | )* | 1.46 | * | 15.09 | †† | |||||||||||||||
2000(7) | 17.18 | (0.01 | ) | (2.92 | ) | — | (3.23 | ) | — | 11.02 | (18.85 | )†† | 42,058 | 1.71 | * | (0.51 | )* | 1.96 | * | 196.30 | †† | ||||||||||||||||
1999(8) | 15.05 | (0.03 | ) | 4.18 | — | (2.02 | ) | — | 17.18 | 28.25 | 8,419 | 2.00 | (0.17 | ) | 2.98 | 41.00 | |||||||||||||||||||||
1998(9) | 17.28 | (0.03 | ) | (0.17 | ) | — | (2.03 | ) | — | 15.05 | (1.15 | )†† | 6,678 | 1.75 | (0.47 | ) | 2.90 | 109.00 | |||||||||||||||||||
| CLASS A SHARES | |||||||||||||||||||||||||||||||||||||
2003 | $8.23 | 0.07 | (2.14 | ) | (0.13 | ) | — | — | $6.03 | (25.20 | )% | $5,523 | 1.67 | % | 0.88 | % | 2.99 | % | 65.29 | % | |||||||||||||||||
2002 | 9.38 | 0.01 | (1.15 | ) | (0.01 | ) | — | — | 8.23 | (12.18 | ) | 7,617 | 1.49 | 0.23 | 2.13 | 52.80 | |||||||||||||||||||||
2001(6) | 11.01 | (0.02 | ) | (1.06 | ) | (0.03 | ) | (0.52 | ) | — | 9.38 | (10.24 | )†† | 9,976 | 1.51 | * | (0.18 | )* | 1.86 | * | 15.09 | †† | |||||||||||||||
2000(7) | 17.25 | (0.08 | ) | (2.93 | ) | — | (3.23 | ) | — | 11.01 | (19.09 | )†† | 10,815 | 2.46 | * | (1.21 | )* | 3.11 | * | 196.30 | †† | ||||||||||||||||
1999(8) | 15.15 | (0.08 | ) | 4.21 | — | (2.03 | ) | — | 17.25 | 27.95 | 12,718 | 2.35 | (0.52 | ) | 3.34 | 41.00 | |||||||||||||||||||||
1998(8) | 14.78 | (0.11 | ) | 2.92 | — | (2.44 | ) | — | 15.15 | 19.12 | 12,223 | 2.45 | (0.62 | ) | 3.30 | 109.00 | |||||||||||||||||||||
| Emerging Markets Portfolio | |||||||||||||||||||||||||||||||||||||
| CLASS A SHARES | |||||||||||||||||||||||||||||||||||||
2003 | $8.56 | — | (1.51 | ) | — | — | — | $7.05 | (17.64 | )% | $4,523 | 2.10 | % | (0.05 | )% | 5.99 | % | 134.46 | % | ||||||||||||||||||
2002 | 7.98 | 0.01 | 0.60 | (0.03 | ) | — | — | 8.56 | 7.68 | 6,406 | 2.06 | 0.16 | 3.90 | 124.31 | |||||||||||||||||||||||
2001(6) | 9.23 | (0.01 | ) | (1.24 | ) | — | — | — | 7.98 | (13.54 | )†† | 7,246 | 2.16 | * | (0.25 | )* | 2.61 | * | 29.80 | †† | |||||||||||||||||
2000(7) | 13.54 | (0.20 | ) | (4.11 | ) | — | — | — | 9.23 | (31.83 | )†† | 9,124 | 1.91 | * | (0.88 | )* | 3.80 | * | 63.40 | †† | |||||||||||||||||
1999(8) | 7.96 | — | 5.58 | — | — | — | 13.54 | 70.10 | 18,059 | 1.85 | 0.08 | 4.31 | 63.00 | ||||||||||||||||||||||||
1998(8) | 12.24 | 0.02 | (4.15 | ) | (0.15 | ) | — | — | 7.96 | (34.18 | ) | 14,734 | 2.50 | 0.03 | 4.09 | 121.00 | |||||||||||||||||||||
ANNUAL REPORT / APRIL 30, 2003
121
Table of Contents
| 1. | ORGANIZATION |
ARK Funds (the “Fund”) is registered under the Investment Company Act of 1940, as amended (the “1940 Act”), as an open-end management investment company organized as a Massachusetts business trust pursuant to a Declaration of Trust dated October 22, 1992, amended and restated on March 19, 1993, and further amended on December 10, 1999.
The Fund offers thirty separate investment portfolios as of April 30, 2003:
U.S. Treasury Money Market Portfolio (“TMMP”)
U.S. Government Money Market Portfolio (“GMMP”)
Money Market Portfolio (“MMP”)
Tax-Free Money Market Portfolio (“TFMMP”)
Pennsylvania Tax-Free Money Market Portfolio (“PTFMMP”)
Short-Term Treasury Portfolio (“STTP”)
Short-Term Bond Portfolio (“STBP”)
Maryland Tax-Free Portfolio (“MTFP”)
Pennsylvania Tax-Free Portfolio (“PTFP”)
Intermediate Fixed Income Portfolio (“IFIP”)
U.S. Government Bond Portfolio (“GBP”)
Income Portfolio (“IP”)
Balanced Portfolio (“BP”)
Equity Income Portfolio (“EIP”)
Value Equity Portfolio (“VEP”)
Equity Index Portfolio (“EIDP”)
Blue Chip Equity Portfolio (“BCEP”)
Capital Growth Portfolio (“CGP”)
Mid-Cap Equity Portfolio (“MCEP”)
Small-Cap Equity Portfolio (“SCEP”)
International Equity Portfolio (“IEP”)
Emerging Markets Equity Portfolio (“EMEP”)
(individually a “Portfolio” and collectively, the “Portfolios”)
U.S. Treasury Cash Management Portfolio
U.S. Government Cash Management Portfolio
Prime Cash Management Portfolio
Tax-Free Cash Management Portfolio
Social Issues Intermediate Fixed Income Portfolio
Social Issues Blue Chip Equity Portfolio
Social Issues Capital Growth Portfolio
Social Issues Small-Cap Equity Portfolio
The financial statements and notes presented herein are those of TMMP, GMMP, MMP, TFMMP, PTFMMP, STTP, STBP, MTFP, PTFP, IFIP, GBP, IP, BP, EIP, VEP, EIDP, BCEP, CGP, MCEP, SCEP, IEP, and EMEP. The financial statements of the other portfolios listed above are not presented herein, but are presented separately. The Fund may issue an unlimited number of shares of each of the Portfolios and may issue shares of one or more classes of each Portfolio.
| 2. | SIGNIFICANT ACCOUNTING POLICIES |
The preparation of financial statements in conformity with accounting principles generally accepted in the United States of America requires management to make estimates and assumptions that affect amounts reported therein. Although actual results could differ from these estimates, any such differences are expected to be immaterial to the net assets of the Portfolios.
The following is a summary of significant accounting policies followed by the Portfolios.
Security Valuation — Securities of the Portfolios are generally valued by independent pricing services. Securities listed on a securities exchange for which market quotations are readily available are valued at the last reported sale price on the principal exchange on which they are traded on the valuation date or, if there is no such reported sale on the valuation date, at the most recently quoted bid price. Unlisted securities for which market quotations are readily available are valued at the most recently quoted bid price. Debt obligations exceeding sixty days to maturity for which market quotations are readily available are valued at the most recently quoted bid price. Debt obligations with sixty days or less to maturity are valued at their amortized cost.
When market quotations are not readily available, securities are valued at fair value as determined under procedures established by the Board of Trustees.
Investment securities held by the money market fund portfolios are stated at their amortized cost, which approximates market value. Under the amortized cost method, any discount or premium is amortized ratably to the maturity of the security and is included in net interest income. The money market fund portfolios’ use of the amortized cost method is subject to compliance with certain conditions specified in Rule 2a-7 under the 1940 Act.
Income Taxes — It is the intention of each Portfolio to qualify as a regulated investment company, to comply with the requirements of the Internal Revenue Code, and to distribute all of its taxable income. Accordingly, no provision for federal income taxes is considered necessary.
Net Asset Value Per Share — The net asset value per share (“NAV”) of each class of each Portfolio is calculated every business day (i.e., any day that both the New York Stock Exchange and the Federal Reserve Bank are open for business). For TMMP, GMMP, MMP, TFMMP, and PTFMMP, a business day will be any weekday, other than a federal holiday, unless the fund determines that being open for business is not in the best interest of shareholders. The NAV is computed by dividing the total assets of each class of the Portfolio, less the liabilities of the class, by the number of outstanding shares of the Portfolio.
APRIL 30, 2003 / ANNUAL REPORT
122
Table of Contents
NOTES TO FINANCIAL STATEMENTS
Classes — Each class of shares has equal rights to earnings, assets and voting privileges, except that each class bears different distribution and shareholder services expenses. Each class of shares has exclusive voting rights with respect to matters that affect just that class. Class-specific expenses are borne by the applicable class. Other expenses, income and realized and unrealized gains/losses are allocated to the respective classes on the basis of relative daily net assets.
Organizational Costs — All eligible organizational costs associated with the start-up of the Portfolios prior to December 15, 1998 are being amortized on a straight-line basis over a period of sixty months. If any or all of the shares representing initial capital of a Portfolio are redeemed by any holder thereof prior to the end of the amortization period, the proceeds will be reduced by the unamortized organizational cost balance in the same proportion as the number of shares redeemed bears to the initial shares outstanding immediately preceding the redemption.
Repurchase Agreements — Securities pledged as collateral for repurchase agreements are held by the custodian bank until maturity of the repurchase agreements. Provisions of the repurchase agreements and procedures adopted by the Board of Trustees require that market value of collateral, including accrued interest thereon, be sufficient in the event of default by the counterparty. If the counterparty defaults and the value of the collateral declines or if the counterparty enters an insolvency proceeding, realization of the collateral by the Portfolio may be delayed or limited.
Dollar Roll Transactions — IP engages in dollar roll transactions with respect to mortgage-related securities issued by GNMA, FNMA, and FHLMC. In a dollar roll transaction, a Portfolio sells a mortgage-related security to a financial institution, such as a bank or broker/dealer, and simultaneously agrees to repurchase a substantially similar (i.e., same type, coupon, maturity) security from the institution at a later date at an agreed-upon price. The mortgage-related securities that are repurchased will bear the same interest rate as those sold, but generally will be collateralized by different pools of mortgages with different prepayment histories. As of April 30, 2003, there were no dollar roll transactions outstanding.
When-Issued Purchases and Forward Commitments — The Portfolios may purchase securities on a “when-issued” basis and may purchase or sell securities on a “forward commitment” basis. These transactions, which involve a commitment by a Portfolio to purchase or sell particular securities with payment and delivery taking place at a future date (perhaps one or two months later), permit the Portfolio to lock in a price or yield on a security it owns or intends to purchase, regardless of future changes in interest rates. When-issued and forward commitment transactions involve the risk, however, that the yield obtained in a transaction (and therefore the value of the security) may be less favorable than the yield available in the market when the securities delivery takes place. The Portfolios maintain cash, U.S. government securities, or liquid, high-grade debt obligations in an amount sufficient to meet the purchase price in a segregated account until the settlement date. No Portfolio intends to engage in when-issued purchases and forward commitments for speculative purposes. As of April 30, 2003, there were no forward contracts outstanding.
Written Option Transactions — VEP, CGP and SCEP engage in written options transactions. An option is a right to buy or sell a particular security at a specified price within a limited period of time. The buyer of the option, in return for a premium paid to the seller, has the right to buy (in the case of a call option) or sell (in the case of a put option) the underlying security of the contract. The premium received in cash from that is adjusted to reflect the option’s value. The premium received from writing options that expire is recorded as realized gains. The premium received from writing options that are exercised or closed is offset against the proceeds or amount paid on the transaction to determine the realized gain or loss. If a put option is exercised, the premium reduces the cost basis of the security or currency purchased. Options are valued based on their quoted daily settlement prices.
Risks could arise from entering into written options transactions from the potential inability of counterparties to meet the terms of their contracts, the potential inability to enter into a closing transaction because of an illiquid secondary market, and from unexpected movements in interest or exchange rates or security values.
Foreign Currency Translations and Contracts — Investment securities and other assets and liabilities initially expressed in foreign currencies are converted daily to U.S. dollars based upon current exchange rates. Purchases and sales of foreign investment securities and income are converted to U.S. dollars based upon currency exchange rates prevailing on the respective dates of such transactions. The effect of the changes in foreign exchange rates on realized and unrealized security gains or losses is reflected as a component of such gains or losses. Forward foreign currency exchange contracts are valued daily at that day’s forward rate and are marked-to-market. The daily change in market value is recorded as an unrealized gain or loss. When the currency contract is closed, a gain or loss is recorded in the amount of the difference between value of the opening contract and that of the time of closing.
IEP and EMEP may enter into transactions to purchase or sell foreign currencies to protect the U.S. dollar value of its underlying portfolio of securities against the effect of possible adverse movements in foreign exchange rates. Principal risks associated with such transactions include the movement in value of the foreign currency relative to the U.S. dollar and the ability of the counterparty to perform. As of April 30, 2003 there were no foreign currency contracts outstanding.
ANNUAL REPORT / APRIL 30, 2003
123
Table of Contents
NOTES TO FINANCIAL STATEMENTS
For the fiscal year ended April 30, 2003, VEP, CGP, and SCEP had the following written options contracts, respectively:
| WRITTEN CALL OPTIONS CONTRACTS | ||||||||
| Principal Amount of Contracts (000) | Premiums (000) | |||||||
VEP: | ||||||||
Outstanding April 30, 2002 | $ | — | $ | — | ||||
Options written | 22 | 5,160 | ||||||
Options terminated in | (17 | ) | (3,880 | ) | ||||
Options exercised | (2 | ) | (497 | ) | ||||
Options expired | (3 | ) | (783 | ) | ||||
Outstanding April 30, 2003 | $ | — | $ | — | ||||
CGP: | ||||||||
Outstanding April 30, 2002 | $ | — | $ | — | ||||
Options written | 3 | 452 | ||||||
Options terminated in | (3 | ) | (452 | ) | ||||
Options exercised | — | — | ||||||
Options expired | — | — | ||||||
Outstanding April 30, 2003 | $ | — | $ | — | ||||
SCEP: | ||||||||
Outstanding April 30, 2002 | $ | — | $ | — | ||||
Options written | 5 | 648 | ||||||
Options terminated in | (5 | ) | (648 | ) | ||||
Options exercised | — | — | ||||||
Options expired | — | — | ||||||
Outstanding April 30, 2003 | $ | — | $ | — | ||||
Distributions — Dividends from net investment income are declared daily and paid monthly for the money market fund portfolios, STTP, STBP, MTFP, PTFP, IFIP, GBP and IP. EIP declares and pays dividends monthly. BP, VEP, EIDP, BCEP and MCEP declare and pay dividends quarterly; and CGP, SCEP, IEP, and EMEP declare and pay dividends annually from net investment income. Distributions from net capital gains, if any, are declared and paid at least annually by each Portfolio.
Distributions from net investment income and net realized capital gains are determined in accordance with U.S. federal income tax regulations, which may differ from those amounts determined under accounting principles generally accepted in the United States of America. These book/tax differences are either temporary or permanent in nature. To the extent these differences are permanent, they are charged or credited to paid-in capital in the period that the difference arises.
All Portfolios have an October 31 tax year end, except STBP, GBP, VEP and IEP, each of which has an April 30 tax year end.
On the Statements of Assets and Liabilities, the following adjustments were made:
| Portfolio | Accumulated Net Realized Gain (Loss) (000) | Undistributed Net Investment Income (Loss) (000) | Paid-in- Capital (000) | |||||||||
TMMP | $ | (75 | ) | $ | 75 | $ | — | |||||
GMMP | (2 | ) | 2 | — | ||||||||
MMP | (29 | ) | 28 | 1 | ||||||||
STBP | (34 | ) | 23 | 11 | ||||||||
MTFP | — | 10 | (10 | ) | ||||||||
IFIP | (6 | ) | — | 6 | ||||||||
GBP | (37 | ) | 26 | 11 | ||||||||
IP | 1,282 | — | (1,282 | ) | ||||||||
EIP | 34 | (1 | ) | (33 | ) | |||||||
VEP | — | (11 | ) | 11 | ||||||||
EIDP | 4 | (4 | ) | — | ||||||||
CGP | — | 266 | (266 | ) | ||||||||
MCEP | 41 | 37 | (78 | ) | ||||||||
SCEP | — | 722 | (722 | ) | ||||||||
IEP | 253 | (185 | ) | (68 | ) | |||||||
EMEP | 8 | 2 | (10 | ) | ||||||||
The tax character of distributions paid during the periods ended April 30, 2003 and April 30, 2002 was as follows:
Ordinary Income (000) | Long-Term Capital Gains | Return of Capital (000) | Total (000) | |||||||||||||||||||||
| Portfolio | 2003 | 2002 | 2003 | 2002 | 2003 | 2002 | 2003 | 2002 | ||||||||||||||||
STBP | $ | 2,299 | $ | 3,376 | $ | — | $ | — | $ | — | $ | — | $ | 2,299 | $ | 3,376 | ||||||||
GBP | 4,332 | 6,236 | — | — | — | — | 4,332 | 6,236 | ||||||||||||||||
VEP | 1,276 | 1,022 | 3,416 | 20,826 | — | — | 4,692 | 21,848 | ||||||||||||||||
IEP | 454 | 59 | — | — | 68 | — | 522 | 59 | ||||||||||||||||
The tax character of distributions paid during the tax years ended October 31, 2002 and October 31, 2001 was as follows:
Tax-Exempt Income (000) | Ordinary Income (000) | Long-Term Capital Gains | Total (000) | |||||||||||||||||||||
| Portfolio | 2002 | 2001 | 2002 | 2001 | 2002 | 2001 | 2002 | 2001 | ||||||||||||||||
TMMP | $ | — | $ | — | $ | 6,701 | $ | 18,850 | $ | — | $ | — | $ | 6,701 | $ | 18,850 | ||||||||
GMMP | — | — | 27,356 | 69,904 | — | — | 27,356 | 69,904 | ||||||||||||||||
MMP | — | — | 27,812 | 60,389 | — | — | 27,812 | 60,389 | ||||||||||||||||
TFMMP | 1,756 | 4,034 | — | — | — | — | 1,756 | 4,034 | ||||||||||||||||
PTFMMP | 296 | 348 | — | — | — | — | 296 | 348 | ||||||||||||||||
STTP | — | — | 1,757 | 2,060 | — | — | 1,757 | 2,060 | ||||||||||||||||
MTFP | 5,191 | 5,076 | 9 | 1 | — | — | 5,200 | 5,077 | ||||||||||||||||
PTFP | 6,688 | 7,012 | 51 | 22 | — | — | 6,739 | 7,034 | ||||||||||||||||
IFIP | — | — | 6,109 | 7,208 | 64 | — | 6,173 | 7,208 | ||||||||||||||||
IP | — | — | 13,747 | 22,067 | 596 | — | 14,343 | 22,607 | ||||||||||||||||
BP | — | — | 5,309 | 10,521 | — | 20,542 | 5,309 | 31,063 | ||||||||||||||||
EIP | — | — | 1,153 | 2,298 | 354 | 6,444 | 1,507 | 8,742 | ||||||||||||||||
EIDP | — | — | 1,189 | 1,953 | — | 20,777 | 1,189 | 22,730 | ||||||||||||||||
BCEP | — | — | 590 | 1,731 | — | 6,722 | 590 | 8,453 | ||||||||||||||||
CGP | — | — | — | 4,348 | — | 16,199 | — | 20,547 | ||||||||||||||||
MCEP | — | — | 46 | 6,406 | — | 13,868 | 46 | 20,274 | ||||||||||||||||
SCEP | — | — | 30 | — | — | — | 30 | — | ||||||||||||||||
EMEP | — | — | 26 | — | — | — | 26 | — | ||||||||||||||||
APRIL 30, 2003 / ANNUAL REPORT
124
Table of Contents
NOTES TO FINANCIAL STATEMENTS
At April 30, 2003 the components of net assets (excluding paid-in capital) on a tax basis were as follows:
| Portfolio | Undistributed Ordinary Income (000) | Undistributed Long-Term Gain (000) | Net Unrealized Appreciation (Depreciation) (000) | Capital and Other Losses (000) | Total (000) | ||||||||||||||
STBP | $ | 2 | $ | — | $ | 1,436 | $ | (1,746 | ) | $ | (308 | ) | |||||||
GBP | 25 | — | 4,598 | (8,650 | ) | (4,027 | ) | ||||||||||||
VEP | 129 | — | 41,570 | (281 | ) | 41,418 | |||||||||||||
IEP | (68 | ) | — | (2,861 | ) | (19,352 | ) | (22,281 | ) | ||||||||||
At October 31, 2002 the components of net assets (excluding paid-in capital) on a tax basis were as follows:
| Portfolio | Undistributed | Net Unrealized Appreciation (Depreciation) (000) | Capital and Other Losses (000) | Total (000) | |||||||||||||||||
| Tax-Exempt Income (000) | Ordinary Income (000) | Long- Term Gain (000) | |||||||||||||||||||
TMMP | $ | — | $ | 579 | $ | — | $ | (6 | ) | $ | — | $ | 573 | ||||||||
GMMP | — | 1,928 | — | — | — | 1,928 | |||||||||||||||
MMP | — | 2,006 | — | — | — | 2,006 | |||||||||||||||
TFMMP | 178 | — | — | — | (2 | ) | 176 | ||||||||||||||
PTFMMP | 20 | — | — | — | — | 20 | |||||||||||||||
STTP | — | 188 | 466 | 1,504 | — | 2,158 | |||||||||||||||
MTFP | 418 | — | — | 6,605 | (899 | ) | 6,124 | ||||||||||||||
PTFP | 567 | — | — | 8,088 | (3,780 | ) | 4,875 | ||||||||||||||
IFIP | — | 471 | — | 7,171 | (195 | ) | 7,447 | ||||||||||||||
IP | — | 1,052 | — | 9,243 | (2,549 | ) | 7,746 | ||||||||||||||
BP | — | 354 | — | (21,713 | ) | (54,799 | ) | (76,158 | ) | ||||||||||||
EIP | — | 9 | — | 940 | (118 | ) | 831 | ||||||||||||||
EIDP | — | 94 | — | (33,791 | ) | (8,919 | ) | (42,616 | ) | ||||||||||||
BCEP | — | 148 | — | (39,742 | ) | (41,044 | ) | (80,638 | ) | ||||||||||||
CGP | — | — | — | (11,187 | ) | (70,252 | ) | (81,439 | ) | ||||||||||||
MCEP | — | — | — | (1,143 | ) | (12,739 | ) | (13,882 | ) | ||||||||||||
SCEP | — | — | — | (10,229 | ) | (23,254 | ) | (33,483 | ) | ||||||||||||
EMEP | — | — | — | (112 | ) | (13,103 | ) | (13,215 | ) | ||||||||||||
The following Portfolios had estimated capital loss carryforwards at October 31, 2002, which are available to offset future net realized capital gains:
| Portfolio | Accumulated Capital Loss Carryforwards (000) | Year Expires | |||
TFMMP | $ | 1 | 2009 | ||
| 1 | 2010 | ||||
MTFP | 899 | 2008 | |||
PTFP | 874 | 2007 | |||
| 2,864 | 2008 | ||||
| 42 | 2009 | ||||
IFIP | 195 | 2010 | |||
IP | 1,412 | 2003 | |||
| 745 | 2004 | ||||
| 392 | 2006 | ||||
BP | 12,285 | 2009 | |||
| 42,514 | 2010 | ||||
EIP | 118 | 2010 | |||
EIDP | 602 | 2009 | |||
| 8,317 | 2010 | ||||
BCEP | 3,208 | 2009 | |||
| 37,836 | 2010 | ||||
CGP | 16,703 | 2009 | |||
| 53,549 | 2010 | ||||
MCEP | 1,967 | 2009 | |||
| 10,772 | 2010 | ||||
SCEP | 4,237 | 2006 | |||
| 10,031 | 2009 | ||||
| 8,986 | 2010 | ||||
EMEP | 9,841 | 2006 | |||
| 755 | 2007 | ||||
| 2,508 | 2009 | ||||
The following Portfolios had estimated capital loss carryforwards at April 30, 2003, which are available to offset future net realized capital gains:
| Portfolio | Accumulated Capital Loss Carryforwards (000) | Year Expires | |||
STBP | $ | 185 | 2008 | ||
| 555 | 2009 | ||||
| 1,006 | 2011 | ||||
GBP | 498 | 2006 | |||
| 919 | 2007 | ||||
| 1,280 | 2008 | ||||
| 4,506 | 2009 | ||||
| 1,446 | 2011 | ||||
VEP | 281 | 2011 | |||
IEP | 5,543 | 2010 | |||
| 9,479 | 2011 | ||||
ANNUAL REPORT / APRIL 30, 2003
125
Table of Contents
NOTES TO FINANCIAL STATEMENTS
The following Portfolio has incurred post-October realized losses:
| Portfolio | Short- Term (000) | Long- Term (000) | Total (000) | ||||||
IEP | $ | 1,137 | $ | 3,193 | $ | 4,330 | |||
Other — Security transactions are accounted for on the date the security is purchased or sold (trade date). Net realized capital gains and losses on the sale of investment securities are determined using the identified cost method. Dividend income is recognized on the ex-dividend date, and interest income is recognized using the accrual method. Discounts and premiums on securities purchased are amortized over the lives of the respective securities.
| 3. | INVESTMENT ADVISORY AND ADMINISTRATIVE FEES AND OTHER TRANSACTIONS WITH AFFILIATES |
Allied Investment Advisors, Inc. (“AIA”) is the investment advisor to each Portfolio. Pursuant to an investment advisory contract on behalf of each Portfolio, AIA is entitled to receive fees for its advisory services at the annual rates shown in the following table based on the daily average net assets of the Portfolio:
| Portfolio | Annual Rate | ||
TMMP | 0.25 | % | |
GMMP | 0.25 | % | |
MMP | 0.25 | % | |
TFMMP | 0.25 | % | |
PTFMMP | 0.25 | % | |
STTP | 0.35 | % | |
STBP | 0.75 | % | |
MTFP | 0.65 | % | |
PTFP | 0.65 | % | |
IFIP | 0.60 | % | |
GBP | 0.75 | % | |
IP | 0.60 | % | |
BP | 0.65 | % | |
EIP | 0.70 | % | |
VEP | 1.00 | % | |
EIDP | 0.20 | % | |
BCEP | 0.70 | % | |
CGP | 0.70 | % | |
MCEP | 0.80 | % | |
SCEP | 0.80 | % | |
IEP | 1.00 | % | |
EMEP | 1.00 | % | |
AIA has contractually agreed to waive a portion of its fees or reimburse expenses for all of the Portfolios in order to limit total operating expenses of the Portfolios.
Pursuant to an exemptive order issued by the Securities and Exchange Commission, the Portfolios may invest in affiliated money market fund Portfolios, provided that the investments in affiliated money market fund Portfolios do not exceed 25% of the investing Portfolio’s total assets.
Effective April 1, 2003, AIA became a wholly-owned subsidiary of Manufacturers and Traders Trust Company (“M&T Trust”), the principal financial services operating subsidiary of M&T Bank Corporation (“M&T”), a publicly-traded holding company based in Buffalo, New York. M&T’s ownership of AIA is a result of an agreement entered into on September 26, 2002, among M&T, Allfirst Financial, Inc. and Allied Irish Banks, p.l.c. (“AIB”), under which M&T was to acquire Allfirst Financial Inc. the indirect parent corporation of AIA, and parent corporation of Allfirst Bank, the direct parent of AIA (the “Acquisition”). At a special meeting of shareholders held on January 31, 2003, shareholders of each Portfolio approved a new investment advisory agreement between AIA and the Fund with respect to each Portfolio. The 1940 Act, which regulates investment companies such as the Fund, requires a shareholder vote to approve a new advisory agreement in connection with business transactions such as the Acquisition. The new advisory agreement is substantially identical to the former advisory agreement, except for the dates of execution and termination. The new advisory agreement became effective upon consummation of the Acquisition on April 1, 2003.
Also as a result of the Acquisition, M&T Trust acquired Allfirst Trust Company, N.A. (“Allfirst Trust”), which as of April 30, 2003, served as the Portfolios’ administrator, transfer agent and custodian pursuant to administration, transfer agency, and custodian agreements with the Fund. (See Note 8 for additional information concerning the administrator, transfer agent, and custodian subsequent to the Portfolios’ fiscal year end.)
Effective September 1, 2002, AIB Investment Managers, Ltd. and Govett Investment Management, Ltd., affiliates of AIB, serve as subadvisors for IEP and EMEP. AIB Investment Managers Limited (“AIBIM”) and Govett provide their respective Portfolios with day-to-day management services and make investment decisions on behalf of these Portfolios in accordance with their respective investment policies. In accordance with an investment subadvisory agreement, AIA pays AIBIM and Govett subadvisory fees from the fees it receives from IEP and EMEP.
APRIL 30, 2003 / ANNUAL REPORT
126
Table of Contents
NOTES TO FINANCIAL STATEMENTS
Prior to September 1, 2002, AIB Govett, Inc., an indirect majority owned subsidiary of AIB, served as the subadvisor for IEP and EMEP.
Allfirst Trust serves as administrator and transfer agent for the Fund pursuant to an administration agreement. For its services as administrator, Allfirst Trust is entitled to receive an administration fee from the Fund at the annual rate of $24,000 per Portfolio, plus 0.085% of the annual average daily net assets of the Portfolios. Allfirst Trust receives annually a $60,000 base fee that is allocated to each portfolio of the Fund based on respective average daily net assets. Under a separate agreement, Allfirst Trust has subcontracted the services to be provided by it under the administration agreement to Forum Administrative Services, LLC (the “Sub-administrator”). Allfirst Trust is responsible for paying a portion of the administration fee it receives from the Fund to the Sub-administrator for the services it provides.
Pursuant to an agreement between the Fund and Allfirst Trust, Allfirst Trust performs transfer agency services. Pursuant to an agreement between Boston Financial Data Services, Inc. (“Boston Financial”) and Allfirst Trust, Boston Financial performs sub-transfer agency services. For the services provided under the agreement with Allfirst Trust, the Fund pays an annual fee of up to $16 per Portfolio account and activity based fees ranging from $0.50 to $12.50 per item and reimbursements for out-of-pocket expenses. Allfirst Trust pays the transfer agency fees and expense reimbursements that it receives from the Fund to Boston Financial.
Pursuant to a custody agreement between the Fund and Allfirst Trust, Allfirst Trust was appointed and serves as the custodian of the Portfolios. Pursuant to an agreement between Bankers Trust Company (“BTC”) and Allfirst Trust, BTC performs sub-custodial services. For the services provided under the agreement with Allfirst Trust, the Fund pays 0.015% of the market value of assets of the Portfolios, plus transaction fees ranging from $5 to $75 per item and reimbursement for out-of-pocket expenses. Allfirst Trust is responsible for paying a portion of the custody fees it receives from the Fund to BTC for the custody services it provides.
| 4. | DISTRIBUTION AND SHAREHOLDER SERVICES PLANS |
Distribution and Services Plans — The Fund’s Board of Trustees has adopted a Distribution Plan pursuant to Rule 12b-1 under the 1940 Act on behalf of the Class A Shares of each Portfolio. The plan permits payment of distribution fees up to 0.75% of the average daily net assets of the class. The Trustees have authorized payment of the following distribution fees by Class A Shares:
| Class | Percentage of Average Net Assets | Portfolio | |||
Class A | 0.25 | % | TMMP, GMMP, MMP, TFMMP, PTFMMP | ||
| 0.30 | % | MTFP, PTFP, IFIP, GBP, IP | |||
| 0.40 | % | STTP, BP, EIP, VEP, EIDP, CGP, MCEP, SCEP, IEP, EMEP | |||
| 0.55 | % | BCEP | |||
The Fund’s Board of Trustees has also adopted a Distribution and Shareholder Services Plan pursuant to Rule 12b-1 under the 1940 Act on behalf of the Class B shares of MMP, MTFP, PTFP, IP, BP, VEP, BCEP, CGP, SCEP and the Institutional II Class Shares of TMMP, GMMP, MMP, TFMMP, and PTFMMP. Pursuant to the Class B Shares plan, distribution fees of 0.75% and shareholder services fees of 0.25% of the average daily net assets of the Class B Shares of each of the Portfolios are paid. For Institutional II Class Shares, distribution and shareholder services fees, as a percentage of average daily net assets of the class, may be up to 0.75% as authorized by the Trustees. Currently, the Trustees have set distribution and shareholder services fees at an annual rate of 0.15% of the average daily net assets of the Institutional II Class Shares.
A contingent deferred sales charge (“CDSC”) is imposed on certain redemptions of Class B Shares. The CDSC varies depending on the number of years from the time of payment for the purchase of Class B Shares until the redemption of such shares. Following the seventh year, Class B Shares automatically convert to Class A Shares.
ANNUAL REPORT / APRIL 30, 2003
127
Table of Contents
NOTES TO FINANCIAL STATEMENTS
| Years Purchases Made | Contingent Deferred Sales Charge | |
First | 5% | |
Second | 4% | |
Third | 3% | |
Fourth | 3% | |
Fifth | 2% | |
Sixth | 1% | |
Seventh and Following | None | |
A CDSC of 1% is imposed on redemptions of Class C Shares if redeemed within one year from the time of purchase.
Distribution and/or service fees under the plans are paid to ARK Funds Distributors, LLC (the “Distributor”), which acts as distributor for the Fund pursuant to a distribution agreement on behalf of each Portfolio. The Distributor may voluntarily waive all or a portion of its fees for certain Portfolios. These waivers are voluntary and may be discontinued at any time.
Shareholder Services Plans — The Fund has adopted a Shareholder Services Plan on behalf of Class A Shares and the Institutional Class Shares of each Portfolio. With the exception of the Institutional Class Shares of PTFMMP, each plan permits payment of the shareholder services fees at an annual rate of up to 0.25% of the average daily net assets of Class A Shares and 0.15% of the average daily net assets of Institutional Class Shares, respectively. PTFMMP’s plan permits payment of up to 0.25% of the average daily net assets of Institutional Class Shares. Currently, the Trustees have set shareholder services fees at an annual rate of 0.15% of the average daily net assets of Class A Shares and Institutional Class Shares of each Portfolio with the exception of the Institutional Class Shares of PTFMMP, for which the Trustees have set shareholder services fees at the annual rate of 0.20% of average daily net assets. A portion of the shareholder services fees paid by the Class A Shares and Institutional Class Shares of certain Portfolios is being waived voluntarily. All or a portion of these waivers may be discontinued at any time.
| 5. | INVESTMENT TRANSACTIONS |
The cost of securities purchased and the proceeds from the sale of securities, other than short-term investments and U.S. government securities, during the year ended April 30, 2003 were as follows:
| Portfolio | Purchases (000) | Sales (000) | ||||
STTP | $ | — | $ | — | ||
STBP | 27,599 | 25,746 | ||||
MTFP | 22,140 | 22,893 | ||||
PTFP | 18,713 | 21,295 | ||||
IFIP | 63,534 | 51,572 | ||||
GBP | 6,517 | 15,936 | ||||
IP | 80,803 | 55,463 | ||||
BP | 176,757 | 228,191 | ||||
EIP | 17,907 | 17,585 | ||||
VEP | 69,181 | 99,852 | ||||
EIDP | 90,888 | 79,675 | ||||
BCEP | 89,603 | 105,666 | ||||
CGP | 266,511 | 277,856 | ||||
MCEP | 170,877 | 174,084 | ||||
SCEP | 296,383 | 288,291 | ||||
IEP | 15,560 | 21,335 | ||||
EMEP | 6,402 | 6,507 | ||||
The purchases and sales of U.S. government securities were as follows:
| Portfolio | Purchases (000) | Sales (000) | ||||
STTP | $ | 35,187 | $ | 27,913 | ||
STBP | 78,133 | 91,003 | ||||
IFIP | 264,645 | 283,088 | ||||
GBP | 45,077 | 52,523 | ||||
IP | 730,683 | 756,410 | ||||
BP | 10,054 | 32,490 | ||||
APRIL 30, 2003 / ANNUAL REPORT
128
Table of Contents
NOTES TO FINANCIAL STATEMENTS
For federal income tax purposes, cost and aggregate gross unrealized appreciation and depreciation of securities at April 30, 2003 were not materially different from the amounts reported for financial statement purposes and for each Portfolio were as follows:
| Portfolio | Appreciated Securities (000) | Depreciated Securities (000) | Net Unrealized Appreciation (Depreciation) (000) | ||||||||
STTP | $ | 1,015 | $ | — | $ | 1,015 | |||||
STBP | 1,451 | (16 | ) | 1,435 | |||||||
MTFP | 8,129 | (287 | ) | 7,842 | |||||||
PTFP | 10,477 | (266 | ) | 10,211 | |||||||
IFIP | 6,083 | (26 | ) | 6,057 | |||||||
GBP | 4,677 | (79 | ) | 4,598 | |||||||
IP | 11,747 | (125 | ) | 11,622 | |||||||
BP | 12,596 | (16,498 | ) | (3,902 | ) | ||||||
EIP | 7,238 | (5,090 | ) | 2,148 | |||||||
VEP | 44,136 | (2,405 | ) | 41,731 | |||||||
EIDP | 5,954 | (32,348 | ) | (26,394 | ) | ||||||
BCEP | 11,540 | (27,908 | ) | (16,368 | ) | ||||||
CGP | 8,559 | (3,965 | ) | 4,594 | |||||||
MCEP | 5,452 | (1,885 | ) | 3,567 | |||||||
SCEP | 8,587 | (3,169 | ) | 5,418 | |||||||
IEP | 914 | (2,120 | ) | (1,206 | ) | ||||||
EMEP | 500 | (330 | ) | 170 | |||||||
| 6. | SECURITIES LENDING TRANSACTIONS |
In order to generate additional income, certain Portfolios may lend portfolio securities representing up to one-third of the value of total assets (which includes collateral received for securities on loan) to broker/dealers, banks or other institutional borrowers of securities. As with other extensions of credit, there may be risks of delay in recovery of the securities or even loss of rights in the collateral should the borrower of the security fail financially. The market value of the securities on loan at April 30, 2003, income generated from the program during the fiscal year ended April 30, 2003, and collateral received and held at April 30, 2003, with respect to such loans were as follows:
| Portfolio | Market Value of Loaned Securities (000) | Income Received from Securities Lending (000) | ||||
STBP | $ | — | $ | 4 | ||
IFIP | 2,127 | 29 | ||||
GBP | 10,564 | 23 | ||||
IP | 24,995 | 61 | ||||
| Collateral | |||||||||||||||
| Portfolio | Repurchase Agreements (000) | Cash and Cash Equivalents (000) | Market Value of Corporate and Fixed Income Securities (000) | Market Value of U.S. Treasury Obligations (000) | Total (000) | ||||||||||
IFIP | $ | 2,000 | $ | 166 | $ | — | $ | 250 | $ | 2,416 | |||||
GBP | 2,300 | 4,219 | 4,000 | 332 | 10,851 | ||||||||||
IP | 13,100 | 292 | 11,000 | 1,374 | 25,766 | ||||||||||
| 7. | CONCENTRATION OF RISK |
IEP and EMEP invest in securities of foreign issuers in various countries. These investments may involve certain considerations and risks not typically associated with investments in the United States as a result of, among other factors, the possibility of future political and economic developments, lack of liquidity, low market capitalizations, foreign currency fluctuations, and the level of governmental supervision and regulation of securities markets in the respective countries.
PTFMMP, MTFP and PTFP invest in debt instruments of municipal issuers. Although these Portfolios monitor investment concentration, the issuers’ ability to meet their obligations may be affected by economic developments in a specific state or region.
PTFMMP, MTFP and PTFP invest in securities that include revenue and general obligation bonds.
| 8. | SIGNIFICANT EVENTS AFTER APRIL 30, 2003 |
As a result of the Acquisition described in Note 3 above, effective June 13, 2003, Allfirst Trust, the administrator, transfer agent and custodian to the Fund was merged into M&T Trust and no longer maintains a separate corporate existence. In connection with that merger, effective June 16, 2003, M&T Trust serves as the administrator and transfer agent to the Fund as a result of the assignment of the Fund’s administration agreement and transfer agency agreement with Allfirst Trust to M&T Trust. The compensation provisions under the agreements are unchanged.
Effective June 1, 2003, State Street Bank and Trust Company (“State Street”) serves as custodian of the assets of the Portfolios pursuant to a custodian agreement between State Street and the Fund.
M&T Trust also serves as the administrator to the VISION Group of Funds (“VISION Funds”), a mutual fund family that offers different classes of shares in separate investment portfolios for which M&T Asset Management, a department of M&T Trust, serves as investment adviser. In connection with the Acquisition described above, the Board of Trustees
ANNUAL REPORT / APRIL 30, 2003
129
Table of Contents
NOTES TO FINANCIAL STATEMENTS
of the Fund has authorized the reorganization of each Portfolio into a newly created or existing portfolio of the VISION Funds. On May 16, 2003, the VISION Funds filed a preliminary proxy statement/prospectus on Form N-14, which sets forth the reorganization proposals to be submitted to shareholders of each Portfolio, who will vote separately on the proposal to reorganize their respective Portfolio. The VISION Funds filed an amendment to the Form N-14 filing on May 23, 2003 with a proposed effective date for the preliminary proxy statement/prospectus of June 23, 2003. According to the preliminary proxy statement/prospectus, only shareholders of record of the Fund at the close of business on June 16, 2003 will be entitled to notice of and to vote at the shareholder meeting scheduled for August 14, 2003, and any postponement or adjournment thereof. Under the proposed agreement and plan of reorganization, if approved by shareholders of a Portfolio, the shareholders of that Portfolio will receive shares of a comparable VISION Fund. According to the preliminary proxy statement/prospectus, the reorganization is currently anticipated to occur in August, assuming shareholder approval is obtained.
APRIL 30, 2003 / ANNUAL REPORT
130
Table of Contents
This page intentionally left blank.
Table of Contents
NOTES TO FINANCIAL STATEMENTS
| 9. | SHARES ISSUED AND REDEEMED (000): |
| For the Fiscal Years Ended April 30, 2003 and 2002 | ||||||||||||||||||||||||
| Transactions in Portfolio Shares were as follows: | TMMP | GMMP | MMP | TFMMP | ||||||||||||||||||||
| 05/01/02 to 04/30/03 | 05/01/01 to 04/30/02 | 05/01/02 to 04/30/03 | 05/01/01 to 04/30/02 | 05/01/02 to 04/30/03 | 05/01/01 to 04/30/02 | 05/01/02 to 04/30/03 | 05/01/01 to 04/30/02 | |||||||||||||||||
Shares Issued and Redeemed: | ||||||||||||||||||||||||
Institutional Class Shares | ||||||||||||||||||||||||
Shares Issued | 595,456 | 466,051 | 2,455,363 | 1,809,961 | 2,016,169 | 2,527,316 | 121,416 | 82,024 | ||||||||||||||||
Shares Issued in Lieu of Cash Distributions | 34 | 23 | 45 | — | 1,122 | 1,712 | — | — | ||||||||||||||||
Shares Redeemed | (594,272 | ) | (475,352 | ) | (2,550,591 | ) | (1,725,723 | ) | (2,196,098 | ) | (2,184,923 | ) | (93,962 | ) | (74,801 | ) | ||||||||
TOTAL INSTITUTIONAL CLASS SHARE TRANSACTIONS | 1,218 | (9,278 | ) | (95,183 | ) | 84,238 | (178,807 | ) | 344,105 | 27,454 | 7,223 | |||||||||||||
Class A Shares | ||||||||||||||||||||||||
Shares Issued | 23,764 | 30,179 | 169,780 | 154,038 | 107,969 | 123,836 | 19,710 | 25,344 | ||||||||||||||||
Shares Issued in Lieu of Cash Distributions | 140 | 447 | — | — | † | 2,585 | 7,648 | 318 | 651 | |||||||||||||||
Shares Redeemed | (23,682 | ) | (29,821 | ) | (178,670 | ) | (194,408 | ) | (163,837 | ) | (169,143 | ) | (28,554 | ) | (15,121 | ) | ||||||||
TOTAL CLASS A SHARE TRANSACTIONS | 222 | 805 | (8,890 | ) | (40,370 | ) | (53,283 | ) | (37,659 | ) | (8,526 | ) | 10,874 | |||||||||||
Class B Shares | ||||||||||||||||||||||||
Shares Issued | — | — | — | — | 125 | 96 | — | — | ||||||||||||||||
Shares Issued in Lieu of Cash Distributions | — | — | — | — | 1 | 3 | — | — | ||||||||||||||||
Shares Redeemed | — | — | — | — | (45 | ) | (48 | ) | — | — | ||||||||||||||
TOTAL CLASS B SHARE TRANSACTIONS | — | — | — | — | 81 | 51 | — | — | ||||||||||||||||
Institutional II Class Shares | ||||||||||||||||||||||||
Shares Issued | 488,538 | 507,157 | 1,251,005 | 1,045,057 | 1,348,148 | 2,294,308 | 88,282 | 98,032 | ||||||||||||||||
Shares Issued in Lieu of Cash Distributions | — | — | — | — | — | — | — | — | ||||||||||||||||
Shares Redeemed | (437,433 | ) | (463,193 | ) | (1,254,483 | ) | (948,855 | ) | (1,528,331 | ) | (2,201,705 | ) | (72,422 | ) | (109,667 | ) | ||||||||
TOTAL INSTITUTIONAL II CLASS SHARE TRANSACTIONS | 51,105 | 43,964 | (3,478 | ) | 96,202 | (180,183 | ) | 92,603 | 15,860 | (11,635 | ) | |||||||||||||
NET INCREASE (DECREASE) IN SHARE TRANSACTIONS | 52,545 | 35,491 | (107,551 | ) | 140,070 | (412,192 | ) | 399,100 | 34,788 | 6,462 | ||||||||||||||
| † | Amount rounds to less than one thousand. |
APRIL 30, 2003 / ANNUAL REPORT
132
Table of Contents
NOTES TO FINANCIAL STATEMENTS
PTFMMP | STTP | STBP | MTFP | PTFP | ||||||||||||||||||||||||
| 05/01/02 to 04/30/03 | 05/01/01 to 04/30/02 | 05/01/02 to 04/30/03 | 05/01/01 to 04/30/02 | 05/01/02 to 04/30/03 | 05/01/01 to 04/30/02 | 05/01/02 to 04/30/03 | 05/01/01 to 04/30/02 | 05/01/02 to 04/30/03 | 05/01/01 to 04/30/02 | |||||||||||||||||||
| 41,730 | 79,059 | 2,539 | 1,051 | 1,538 | 1,858 | 809 | 1,385 | 726 | 1,135 | |||||||||||||||||||
| — | — | † | 14 | 18 | 109 | 150 | 50 | 45 | 23 | 22 | ||||||||||||||||||
| (52,328 | ) | (55,008 | ) | (1,465 | ) | (996 | ) | (2,928 | ) | (2,361 | ) | (882 | ) | (845 | ) | (1,494 | ) | (1,641 | ) | |||||||||
| (10,598 | ) | 24,051 | 1,088 | 73 | (1,281 | ) | (353 | ) | (23 | ) | 585 | (745 | ) | (484 | ) | |||||||||||||
| — | — | 794 | 198 | — | — | 330 | 1,000 | 116 | 33 | |||||||||||||||||||
| — | — | 23 | 34 | — | — | 67 | 82 | 7 | 7 | |||||||||||||||||||
| — | — | (581 | ) | (291 | ) | — | — | (621 | ) | (929 | ) | (64 | ) | (90 | ) | |||||||||||||
| — | — | 236 | (59 | ) | — | — | (224 | ) | 153 | 59 | (50 | ) | ||||||||||||||||
| — | — | — | — | — | — | 51 | 60 | 30 | 9 | |||||||||||||||||||
| — | — | — | — | — | — | 3 | 2 | — | † | 1 | ||||||||||||||||||
| — | — | — | — | — | — | (9 | ) | (12 | ) | (7 | ) | (1 | ) | |||||||||||||||
| — | — | — | — | — | — | 45 | 50 | 23 | 9 | |||||||||||||||||||
| 8,751 | 5,095 | — | — | — | — | — | — | — | — | |||||||||||||||||||
| — | — | † | — | — | — | — | — | — | — | — | ||||||||||||||||||
| (7,380 | ) | (3,027 | ) | — | — | — | — | — | — | — | — | |||||||||||||||||
| 1,371 | 2,068 | — | — | — | — | — | — | — | — | |||||||||||||||||||
| (9,227 | ) | 26,119 | 1,324 | 14 | (1,281 | ) | (353 | ) | (202 | ) | 788 | (663 | ) | (525 | ) | |||||||||||||
ANNUAL REPORT / APRIL 30, 2003
133
Table of Contents
NOTES TO FINANCIAL STATEMENTS
SHARES ISSUED AND REDEEMED (000) (continued):
| For the Fiscal Years Ended April 30, 2003 and 2002 | ||||||||||||||||||
| Transactions in Portfolio Shares were as follows: | IFIP | GBP | IP | |||||||||||||||
| 05/01/02 to 04/30/03 | 05/01/01 to 04/30/02 | 05/01/02 to 04/30/03 | 05/01/01 to 04/30/02 | 05/01/02 to 04/30/03 | 05/01/01 to 04/30/02 | |||||||||||||
Shares Issued and Redeemed: | ||||||||||||||||||
Institutional Class Shares | ||||||||||||||||||
Shares Issued | 1,414 | 2,169 | 1,252 | 1,250 | 3,451 | 3,719 | ||||||||||||
Shares Issued in Lieu of Cash Distributions | 99 | 140 | 101 | 155 | 561 | 1,144 | ||||||||||||
Shares Redeemed | (2,531 | ) | (2,230 | ) | (2,448 | ) | (4,188 | ) | (6,974 | ) | (15,914 | ) | ||||||
TOTAL INSTITUTIONAL CLASS SHARE TRANSACTIONS | (1,018 | ) | 79 | (1,095 | ) | (2,783 | ) | (2,962 | ) | (11,051 | ) | |||||||
Class A Shares | ||||||||||||||||||
Shares Issued | — | — | 582 | 230 | 625 | 478 | ||||||||||||
Shares Issued in Lieu of Cash Distributions | — | — | 14 | 14 | 41 | 45 | ||||||||||||
Shares Redeemed | — | — | (484 | ) | (127 | ) | (632 | ) | (287 | ) | ||||||||
TOTAL CLASS A SHARE TRANSACTIONS | — | — | 112 | 117 | 34 | 236 | ||||||||||||
Class B Shares | ||||||||||||||||||
Shares Issued | — | — | — | — | 68 | 75 | ||||||||||||
Shares Issued in Lieu of Cash Distributions | — | — | — | — | 5 | 4 | ||||||||||||
Shares Redeemed | — | — | — | — | (18 | ) | (8 | ) | ||||||||||
TOTAL CLASS B SHARE TRANSACTIONS | — | — | — | — | 55 | 71 | ||||||||||||
NET INCREASE (DECREASE) IN SHARE TRANSACTIONS | (1,018 | ) | 79 | (983 | ) | (2,666 | ) | (2,873 | ) | (10,744 | ) | |||||||
APRIL 30, 2003 / ANNUAL REPORT
134
Table of Contents
NOTES TO FINANCIAL STATEMENTS
| BP | EIP | VEP | EIDP | BCEP | ||||||||||||||||||||||||
| 05/01/02 to 04/30/03 | 05/01/01 to 04/30/02 | 05/01/02 to 04/30/03 | 05/01/01 to 04/30/02 | 05/01/02 to 04/30/03 | 05/01/01 to 04/30/02 | 05/01/02 to 04/30/03 | 05/01/01 to 04/30/02 | 05/01/02 to 04/30/03 | 05/01/01 to 04/30/02 | |||||||||||||||||||
| 999 | 1,235 | 1,407 | 814 | 2,243 | 2,671 | 4,218 | 2,868 | 1,640 | 3,087 | |||||||||||||||||||
| 319 | 397 | 8 | 35 | 397 | 1,525 | 123 | 83 | 31 | 11 | |||||||||||||||||||
| (10,043 | ) | (3,165 | ) | (860 | ) | (793 | ) | (5,921 | ) | (5,676 | ) | (2,577 | ) | (1,987 | ) | (3,145 | ) | (1,921 | ) | |||||||||
| (8,725 | ) | (1,533 | ) | 555 | 56 | (3,281 | ) | (1,480 | ) | 1,764 | 964 | (1,474 | ) | 1,177 | ||||||||||||||
| 172 | 500 | 189 | 214 | 183 | 161 | 153 | 107 | 193 | 585 | |||||||||||||||||||
| 45 | 57 | 8 | 8 | 11 | 38 | 5 | 5 | 1 | 4 | |||||||||||||||||||
| (654 | ) | (532 | ) | (158 | ) | (93 | ) | (257 | ) | (180 | ) | (410 | ) | (144 | ) | (687 | ) | (666 | ) | |||||||||
| (437 | ) | 25 | 39 | 129 | (63 | ) | 19 | (252 | ) | (32 | ) | (493 | ) | (77 | ) | |||||||||||||
| 77 | 178 | — | — | 22 | 45 | — | — | 54 | 140 | |||||||||||||||||||
| 8 | 12 | — | — | 3 | 8 | — | — | — | — | |||||||||||||||||||
| (202 | ) | (134 | ) | — | — | (29 | ) | (7 | ) | — | — | (134 | ) | (72 | ) | |||||||||||||
| (117 | ) | 56 | — | — | (4 | ) | 46 | — | — | (80 | ) | 68 | ||||||||||||||||
| (9,279 | ) | (1,452 | ) | 594 | 185 | (3,348 | ) | (1,415 | ) | 1,512 | 932 | (2,047 | ) | 1,168 | ||||||||||||||
ANNUAL REPORT / APRIL 30, 2003
135
Table of Contents
NOTES TO FINANCIAL STATEMENTS
SHARES ISSUED AND REDEEMED (000) (continued):
| For the Fiscal Years Ended April 30, 2003 and 2002 Transactions in Portfolio Shares were as follows: | CGP | MCEP | ||||||||||
| 05/01/02 to 04/30/03 | 05/01/01 to 04/30/02 | 05/01/02 to 04/30/03 | 05/01/01 to 04/30/02 | |||||||||
Shares Issued and Redeemed: | ||||||||||||
Institutional Class Shares | ||||||||||||
Shares Issued | 1,534 | 2,647 | 533 | 1,731 | ||||||||
Shares Issued in Lieu of Cash Distributions | — | — | 2 | — | ||||||||
Shares Redeemed | (2,456 | ) | (1,972 | ) | (1,256 | ) | (1,816 | ) | ||||
TOTAL INSTITUTIONAL CLASS SHARE TRANSACTIONS | (922 | ) | 675 | (721 | ) | (85 | ) | |||||
Class A Shares | ||||||||||||
Shares Issued | 112 | 544 | 132 | 280 | ||||||||
Shares Issued in Lieu of Cash Distributions | — | — | — | — | ||||||||
Shares Redeemed | (539 | ) | (499 | ) | (129 | ) | (147 | ) | ||||
TOTAL CLASS A SHARE TRANSACTIONS | (427 | ) | 45 | 3 | 133 | |||||||
Class B Shares | ||||||||||||
Shares Issued | 34 | 128 | — | — | ||||||||
Shares Issued in Lieu of Cash Distributions | — | — | — | — | ||||||||
Shares Redeemed | (133 | ) | (100 | ) | — | — | ||||||
TOTAL CLASS B SHARE TRANSACTIONS | (99 | ) | 28 | — | — | |||||||
Class C Shares | ||||||||||||
Shares Issued | — | — | — | — | ||||||||
Shares Issued in Lieu of Cash Distributions | — | — | — | — | ||||||||
Shares Redeemed | — | — | — | — | ||||||||
TOTAL CLASS C SHARE TRANSACTIONS | — | — | — | — | ||||||||
NET INCREASE (DECREASE) IN SHARE TRANSACTIONS | (1,448 | ) | 748 | (718 | ) | 48 | ||||||
| † | Amount rounds to less than one thousand. |
| (1) | Class C Shares commenced operations on October 1, 2002. |
APRIL 30, 2003 / ANNUAL REPORT
136
Table of Contents
NOTES TO FINANCIAL STATEMENTS
| SCEP | IEP | EMEP | ||||||||||||||
05/01/02 to 04/30/03(1) | 05/01/01 to 04/30/02 | 05/01/02 to 04/30/03 | 05/01/01 to 04/30/02 | 05/01/02 to 04/30/03 | 05/01/01 to 04/30/02 | |||||||||||
| 1,581 | 2,386 | 3,396 | 527 | — | — | |||||||||||
| — | 1 | 44 | 4 | — | — | |||||||||||
| (1,524 | ) | (2,736 | ) | (4,204 | ) | (1,049 | ) | — | — | |||||||
| 57 | (349 | ) | (764 | ) | (518 | ) | — | — | ||||||||
| 1,270 | 1,171 | 3,374 | 240 | 271 | 265 | |||||||||||
| — | — | 16 | 1 | — | 3 | |||||||||||
| (1,099 | ) | (799 | ) | (3,402 | ) | (376 | ) | (377 | ) | (428 | ) | |||||
| 171 | 372 | (12 | ) | (135 | ) | (106 | ) | (160 | ) | |||||||
| 100 | 41 | — | — | — | — | |||||||||||
| — | — | — | — | — | — | |||||||||||
| (10 | ) | (1 | ) | — | — | — | — | |||||||||
| 90 | 40 | — | — | — | — | |||||||||||
| 12 | — | — | — | — | — | |||||||||||
| — | — | — | — | — | — | |||||||||||
| — | † | — | — | — | — | — | ||||||||||
| 12 | — | — | — | — | — | |||||||||||
| 330 | 63 | (776 | ) | (653 | ) | (106 | ) | (160 | ) | |||||||
ANNUAL REPORT / APRIL 30, 2003
137
Table of Contents
The Board of Trustees and Shareholders
ARK Funds:
We have audited the accompanying statements of assets and liabilities, including the schedules of investments, of U.S. Treasury Money Market Portfolio, U.S. Government Money Market Portfolio, Money Market Portfolio, Tax-Free Money Market Portfolio, Pennsylvania Tax-Free Money Market Portfolio, Short-Term Treasury Portfolio, Short-Term Bond Portfolio, Maryland Tax-Free Portfolio, Pennsylvania Tax-Free Portfolio, Intermediate Fixed Income Portfolio, U.S. Government Bond Portfolio, Income Portfolio, Balanced Portfolio, Equity Income Portfolio, Value Equity Portfolio, Equity Index Portfolio, Blue Chip Equity Portfolio, Capital Growth Portfolio, Mid-Cap Equity Portfolio, Small-Cap Equity Portfolio, Emerging Markets Equity Portfolio, and International Equity Portfolio, portfolios of ARK Funds (the “Portfolios”), as of April 30, 2003, and the related statements of operations for the year then ended, statements of changes in net assets for each of the years or periods in the two-year period then ended, and financial highlights for each of the years or periods in the five-year period then ended, except as noted below. These financial statements and financial highlights are the responsibility of the Portfolios’ management. Our responsibility is to express an opinion on these financial statements and financial highlights based on our audits. For Emerging Markets Equity Portfolio and International Equity Portfolio the financial highlights for each of the years or periods ended prior to January 1, 2000 were audited by other auditors whose report dated February 11, 2000 expressed an unqualified opinion thereon.
We conducted our audits in accordance with auditing standards generally accepted in the United States of America. Those standards require that we plan and perform our audit to obtain reasonable assurance about whether the financial statements and financial highlights are free of material misstatement. An audit includes examining, on a test basis, evidence supporting the amounts and disclosures in the financial statements. Our procedures included confirmation of securities owned as of April 30, 2003 by correspondence with the custodian and brokers. As to securities purchased or sold but not yet received or delivered, we performed other appropriate auditing procedures. An audit also includes assessing the accounting principles used and significant estimates made by management, as well as evaluating the overall financial statement presentation. We believe that our audits provide a reasonable basis for our opinion.
In our opinion, the financial statements and financial highlights referred to above present fairly, in all material respects, the financial position of Money Market Portfolio, Tax-Free Money Market Portfolio, U.S. Government Money Market Portfolio, U.S. Treasury Money Market Portfolio, Pennsylvania Tax-Free Money Market Portfolio, Short-Term Treasury Portfolio, Short-Term Bond Portfolio, Maryland Tax-Free Portfolio, Pennsylvania Tax-Free Portfolio, Intermediate Fixed Income Portfolio, U.S. Government Bond Portfolio, Income Portfolio, Balanced Portfolio, Equity Income Portfolio, Value Equity Portfolio, Equity Index Portfolio, Blue Chip Equity Portfolio, Capital Growth Portfolio, Mid-Cap Equity Portfolio, Small-Cap Equity Portfolio, Emerging Markets Equity Portfolio, and International Equity Portfolio as of April 30, 2003, the results of their operations, the changes in their net assets and their financial highlights for each of the years or periods specified above (except for the Portfolios and periods audited and reported on by other auditors as specified above), in conformity with accounting principles generally accepted in the United States of America.

Boston, Massachusetts
June 16, 2003
APRIL 30, 2003 / ANNUAL REPORT
138
Table of Contents
SUPPLEMENTARY INFORMATION (UNAUDITED)
For taxpayers filing on a calendar year basis, this notice is for informational purposes only.
For the fiscal year ended April 30, 2003, each Portfolio is designating the following items with regard to distribution paid during the year.
| Portfolio | Long-Term Capital Gain Distribution (Tax Basis) | Ordinary Income Distribution (Tax Basis) | Return of Capital (Tax Basis) | Total | Qualifying Dividends (1) | Foreign Tax Credit (2) | ||||||||||||
STBP | 0 | % | 100 | % | 0 | % | 100 | % | 0 | % | 0 | % | ||||||
GBP | 0 | % | 100 | % | 0 | % | 100 | % | 4 | % | 0 | % | ||||||
VEP | 73 | % | 27 | % | 0 | % | 100 | % | 100 | % | 0 | % | ||||||
IEP | 0 | % | 87 | % | 13 | % | 100 | % | 8 | % | 17 | % | ||||||
| (1) | Qualifying dividends represent those dividends that qualify for the corporate dividends received deduction. |
| (2) | IEP had $681,362 in gross foreign income, of which $108,322 was foreign tax credits passed through to shareholders. |
The Fund intends to elect to pass through to its shareholders the credit for taxes paid in foreign countries during its fiscal year ended April 30, 2003. In accordance with the current tax laws, the foreign income and foreign tax per share (for a share outstanding April 30, 2003) is as follows:
| Country | Dividends | Foreign Tax | ||||
Australia | $ | 0.000760 | $ | 0.000190 | ||
Brazil | 0.003923 | 0.000562 | ||||
China | 0.008256 | — | ||||
Czech Republic | 0.000512 | 0.000075 | ||||
Finland | 0.001641 | 0.000246 | ||||
France | 0.040458 | 0.012459 | ||||
Germany | 0.017594 | 0.002662 | ||||
Hong Kong | 0.002815 | — | ||||
Israel | 0.000480 | 0.000072 | ||||
Italy | 0.006439 | 0.000972 | ||||
Japan | 0.010442 | 0.001568 | ||||
Korea | 0.004943 | 0.000995 | ||||
Malaysia | 0.001562 | 0.000437 | ||||
Mexico | 0.002945 | — | ||||
Netherlands | 0.022829 | 0.003424 | ||||
South Africa | 0.001392 | — | ||||
Spain | 0.002050 | 0.000259 | ||||
Sweden | 0.009399 | 0.001407 | ||||
Switzerland | 0.011872 | 0.001780 | ||||
Taiwan | 0.001795 | 0.000746 | ||||
United Kingdom | 0.060852 | 0.005978 | ||||
United States | 0.002787 | — | ||||
ANNUAL REPORT / APRIL 30, 2003
139
Table of Contents
TRUSTEES OF THE FUND (Unaudited)
| Name, Age and Contact Address | Position Trust | Length of Time Served | Principal Occupation(s) During Past 5 Years | Number of Portfolios in Fund Complex Overseen by Trustee | Other Trusteeships or Directorships Held by Trustees outside ARK Funds Complex | |||||
| Interested Trustee | ||||||||||
Rick A Gold(1) Born: August 4, 1949 c/o ARK Funds 100 East Pratt Street, 15th Floor, M/C 104-410 Baltimore, MD 21202 | President and Trustee | since 2000 | Senior Vice President of M&T Trust, the parent company of AIA (since 2003); Executive Vice-President of Asset Management Group of Allfirst Financial, Inc., the former parent company to Allfirst Trust and AIA (1999-2003); Chief Executive Officer and Director of AIA and Allfirst Trust (1997-2003). | 30 | None | |||||
| Disinterested Trustees | ||||||||||
William H. Cowie, Jr. Born: January 24, 1931 c/o ARK Funds 100 East Pratt Street, 15th Floor, M/C 104-410 Baltimore, MD 21202 | Trustee and Chairman | since 1993 | Retired | 30 | None | |||||
David D. Downes Born: July 16, 1935 c/o ARK Funds 100 East Pratt Street, 15th Floor, M/C 104-410 Baltimore, MD 21202 | Trustee | since 1995 | Attorney in private practice (since October 1996). | 30 | None | |||||
Sir Victor Garland Born: May 5, 1934 c/o ARK Funds 100 East Pratt Street, 15th Floor, M/C 104-410 Baltimore, MD 21202 | Trustee | since 2000 | Private Investor (since 1994) | 30 | Director and Chairman: Henderson Far East Income Trust plc (Chairman since 1990). Director: The Throgmorton Trust plc. Director: Framington Income and Capital Trust plc. Director and Chairman: Fidelity Asian Values plc Director and Chairman: Govett Enhanced Income Investment Trust plc. Director: GEIIT plc. Director: Govett Asian Income and Growth Trust Ltd. | |||||
APRIL 30, 2003 / ANNUAL REPORT
140
Table of Contents
TRUSTEES OF THE FUND (Unaudited)
| Name, Age and Contact Address | Position Trust | Length of Time Served | Principal Occupation(s) During Past 5 Years | Number of Portfolios in Fund Complex Overseen by Trustee | Other Trusteeships or Directorships Held by Trustees outside ARK Funds Complex | |||||
Charlotte R. Kerr Born: September 26, 1946 c/o ARK Funds 100 East Pratt Street, 15th Floor, M/C 104-410 Baltimore, MD 21202 | Trustee | since 1993 | Practitioner and faculty member of Traditional Acupuncture Institute. | 30 | None | |||||
Richard B. Seidel Born: April 20, 1941 c/o ARK Funds 100 East Pratt Street, 15th Floor, M/C 104-410 Baltimore, MD 21202 | Trustee | since 1998 | Director and President (since 1994) of Girard Partners (a registered broker-dealer). | 30 | None | |||||
(1) Mr. Gold is deemed to be an “interested person” due to his affiliation with AIA and M&T Trust (see Note 8 of Notes to the Financial Statements).
Additional information concerning the Trustees is contained in the Statement of Additional Information (“SAI”) and is available by contacting the Fund at 1-800-275-3863.
ANNUAL REPORT / APRIL 30, 2003
141
Table of Contents
OFFICERS OF THE FUND (Unaudited)
Name, Age and Contact Address | Position with the Trust | Length of Time Served | Principal Occupation(s) During Past 5 Years | |||||
| Officers | ||||||||
Stacey E. Hong Born: May 10, 1966 Two Portland Square, Portland, ME 04101 | Treasurer | since 2002 | Director of Forum Accounting Services, LLC (since 1998). | |||||
Michele L. Dalton Born: February 16, 1959 100 East Pratt Street, 15th Floor, Baltimore, MD 21202 | Vice President and Assistant Secretary | since 2000 | Vice President of M&T Trust (since 2003); Senior Vice President of Allfirst Financial, Inc. (1994-2003). | |||||
Thomas R. Rus Born: October 11, 1959 Allfirst Bank Building 25 South Charles Street, M/C 101-621 Baltimore, MD 21201 | Secretary | since 2000 | Vice President of M&T Trust (since 2003); Vice-President and Counsel of Allfirst Trust and Allfirst Bank, and Compliance Officer of Allfirst Trust (1995-2003). | |||||
D. Blaine Riggle Born: November 12, 1966 Two Portland Square, Portland, ME 04101 | Vice President and Assistant Secretary | since 2002 | Relationship Manager and Counsel for Forum Financial Group, LLC (associated since 1998). | |||||
Cheryl O. Tumlin Born: June 30, 1966 Two Portland Square, Portland, ME 04101 | Vice President and Assistant Secretary | since 2002 | Counsel for Forum Financial Group, LLC (associated from 1996-1999 and again since 2001); Counsel for I-many, Inc. (1999-2001). | |||||
Dawn L. Taylor Born: May 14, 1964 Two Portland Square, Portland, ME 04101 | Assistant Treasurer | since 2002 | Tax Manager at Forum Financial Group, LLC (since 1997). | |||||
Nathan V. Gemmiti Born: August 6, 1970 Two Portland Square, Portland, ME 04101 | Assistant Secretary | since 2002 | Staff Attorney, Forum Financial Group, LLC (since 2001); Associate, Pierce Atwood (a law firm) (1998-2001). | |||||
APRIL 30, 2003 / ANNUAL REPORT
142
Table of Contents
GLOSSARY
The following list of indexes is provided for your reference. Investments may not be made into an index.
Lehman Brothers 1-3 Year U.S. Government Bond Index is an unmanaged aggregate of the Treasury Bond Index and the Agency Bond Index with maturities of one to three years.
Lehman Brothers 5 Year Municipal Bond Index is an unmanaged index comprised of investment-grade, fixed rate securities larger than $50 million with maturities of at least 4 years, and less than 6 years.
Lehman Brothers 7 Year Municipal Bond Index is an unmanaged index comprised of investment-grade, fixed rate securities larger than $50 million with maturities of at least 6 years, and less than 8 years.
Lehman Brothers 10 Year Municipal Bond Index is an unmanaged index comprised of investment-grade, fixed rate securities larger than $50 million with maturities of at least 8 years and less than 12 years.
Lehman Brothers Intermediate Government/Credit Index is an unmanaged index consisting of all Lehman Brothers Government and Corporate Bond Indices containing bonds with maturities of one to ten years.
Lehman Brothers Intermediate U.S. Government Bond Index is an unmanaged aggregate of the Treasury Bond Index and the Agency Bond Index with maturities of one to ten years.
Lehman Brothers U.S. Aggregate Bond Index is an unmanaged index composed of fixed income securities from the Lehman Brothers Government/Credit Index, Mortgage-Backed Securities Index, and the Asset-Backed Securities Index.
Merrill Lynch 1-3 Year Treasury Index is a widely recognized index of U.S. government obligations with maturities between one and three years.
MSCI EAFE® Index is an unmanaged index composed of more than 1,000 equities from Europe, Asia and the Far East, and is typically used to measure the performance of international stock funds.
MSCI Emerging Markets Free Index is an unmanaged index that represents the general performance of equity markets in emerging market countries.
Russell 1000® Growth Index is an unmanaged index that measures the performance of Russell 1000® companies with higher price-to-book ratios and higher forecasted growth values. The Russell 1000® Index is an unmanaged market value weighted index which is widely regarded to be representative of large company stocks in general.
Russell 2000®Index is an unmanaged market value weighted index which is widely regarded to be representative of small company stocks in general.
Russell 2000®Growth Index is an unmanaged index that measures the performance of Russell 2000® companies with higher price-to-book ratios and higher forecasted growth values.
S&P 500/Barra Value Index is an unmanaged index of stocks in the S&P 500 Index that have lower price-to-book ratios.
S&P 500 Index is a broad-based unmanaged index representing the average performance of 500 widely held, publicly traded, large capitalization stocks.
S&P Mid-Cap 400 Index is an unmanaged, capitalization weighted index that measures the performance of the mid range sector of the U.S. stock market.
ANNUAL REPORT / APRIL 30, 2003
143
Table of Contents
NOTES
Table of Contents
NOTES
Table of Contents

100 EAST PRATT STREET, 15TH FLOOR | MAIL CODE 104-410 | BALTIMORE, MD 21202
We are pleased to send you our Annual Report for the fiscal year ended April 30, 2003. This report contains important information about your investments in ARK Funds. Because we are sending a report to each person listed as shareholder, you (or your household) may receive more than one report.
INVESTMENT ADVISOR
Allied Investment Advisors, Inc.
Baltimore, Maryland
INVESTMENT SUBADVISORS
Govett Investment Management Limited
London, England
AIB Investment Managers Limited
Dublin, Ireland
TRUSTEES
William H. Cowie, Jr.
David D. Downes
Sir Victor Garland
Rick A. Gold
Charlotte R. Kerr
Richard B. Seidel
ADMINISTRATOR
Allfirst Trust Company, N.A.
Baltimore, Maryland
DISTRIBUTOR
ARK Funds Distributors, LLC
Portland, Maine
LEGAL COUNSEL
Kirkpatrick & Lockhart LLP
Washington, D.C.
INDEPENDENT AUDITORS
KPMG LLP
Boston, Massachusetts
CUSTODIAN
Allfirst Trust Company, N.A.
Baltimore, Maryland
| This material must be preceded or accompanied by a current prospectus. |
recycled content |

Table of Contents
[GRAPHIC]
[LOGO] ARK FUNDS(R)
CLEAR-CUT STRATEGIES FOR CONFIDENT INVESTING.
APRIL 30, 2003
SOCIAL ISSUES ANNUAL REPORT
Social Issues Intermediate Fixed Income Portfolio
Social Issues Blue Chip Equity Portfolio
Social Issues Capital Growth Portfolio
Social Issues Small-Cap Equity Portfolio
MANAGED BY ALLIED INVESTMENT ADVISORS, INC.
[GRAPHIC]
ARK FUNDS
ARK FUNDS
Table of Contents
[GRAPHIC]
CONTENTS
| 1 | ||
Management Discussion and Analysis / Schedule of Investments | 3 | |
Management Discussion and Analysis / Schedules of Investments | 9 | |
| 21 | ||
| 22 | ||
| 23 | ||
| 24 | ||
| 25 | ||
| 29 | ||
| 30 | ||
This report and the financial statements contained herein are submitted for the general information of shareholders of the ARK Funds and do not constitute investment advice. The report is not authorized for distribution to prospective investors unless preceded or accompanied by an effective prospectus for each of the portfolios included. Shares of the Portfolios are not deposits of any bank, and are not insured by the Federal Deposit Insurance Corporation, the Federal Reserve Board, or any other government agency. Investing in the shares involves investment risks including the possible loss of principal amount invested. The views in this report are those of the respective portfolio managers as of April 30, 2003, and may not reflect the managers’ views as of the date this report was first published or anytime thereafter. For information about ARK Funds Portfolios, please call 1-800-ARK-FUND (1-800-275-3863).
Table of Contents
JUNE 2003
Dear Shareholders,
With this Annual Report, we will update you on the progress of the ARK Social Issues Portfolios as of April 30, 2003. We are proud to have been able to grow net assets to over $4.8 million, as of April 30, 2003, during the continuing difficult economic conditions that have impacted us all during the past fiscal year.
In addition to providing you with information about the Portfolios’ performance, diversification, and holdings, the portfolio managers’ Management Discussion and Analyses provide information about economic factors affecting the Portfolios.
The past six months have been full of activity for ARK Funds. In our Semi Annual Report dated October 31, 2002, we told you about the pending acquisition of Allfirst Financial, Inc. by M&T Bank Corporation of Buffalo, New York. That acquisition was completed on April 1, 2003.
Earlier this year, the respective boards of trustees of ARK Funds and the VISION Group of Funds (the proprietary mutual fund company of M&T Bank Corporation) each met and authorized a tax-free reorganization of certain ARK and VISION portfolios, subject to shareholder approval. A Special Meeting of Shareholders of each of the affected portfolios will be scheduled, and a proxy/prospectus containing additional information will be sent to shareholders soon.
We thank you for investing in the ARK Funds, and we look forward to continuing to help you meet your financial goals.
Sincerely,

William H. Cowie, Jr.
Chairman
ANNUAL REPORT / APRIL 30, 2003
1
Table of Contents
This page intentionally left blank.
Table of Contents
SOCIAL ISSUES PORTFOLIOS
Portfolio
Our investment management philosophy for the Social Issues Fixed Income Portfolio centers on four core beliefs. We believe that over a full interest-rate cycle, a portfolio of fixed income investments should provide real returns that exceed any loss of purchasing power due to inflation, be competitive with the specified portfolio benchmark return, be competitive versus portfolios of similar risk, and maintain low-to-moderate principal volatility.
With the understanding of the Portfolio’s constraints and tolerance for risk, we employ a value approach to fixed income investing involving over- or under-weighting market sectors, industries, or yield curve segments deemed to be relatively undervalued or expensive. We undertake rigorous analysis utilizing the following components to construct a portfolio: sector selection, duration, management, credit analysis, industry and issue selection, and yield curve management.
In selecting corporate securities, we look for businesses that meet the Portfolio’s social criteria. We utilize social research and screening technology provided for investment managers by various outside research services, and have adopted social screens seeking to exclude companies that derive revenue from tobacco and alcohol, gambling, nuclear power, weapons, and abortion and contraceptives.
The fixed income process is an actively managed bottom-up sector selection approach, wherein risk containment is paramount. Our objective is to position the Portfolio in such a way that our sector, interest rate, yield curve, and credit analysis can add value without assuming an inordinate risk of underperformance. As part of the construction and management process, we continually test the Portfolio to assess and mitigate risk. This disciplined fixed income philosophy has been in place within our organization for more than 15 years, has been consistently applied, and has generated historically strong results.
3
Table of Contents
SOCIAL ISSUES PORTFOLIOS
SOCIAL ISSUES
INTERMEDIATE FIXED INCOME PORTFOLIO

Wilmer C. Stith III, CFA
PORTFOLIO MANAGER
Wilmer C. Stith III, CFA is manager of the Social Issues Intermediate Fixed Income Portfolio, and is manager or co-manager of other ARK Funds Portfolios. He has been Vice President of Allied Investment Advisors, Inc. (“AIA”), and Portfolio Manager since 1996. He manages separate accounts, assists in the management of the money market portfolios, and is responsible for analyzing and trading various fixed income securities. Mr. Stith has more than 10 years of experience in the investment industry, and is a Chartered Financial Analyst.
Management Discussion and Analysis
The Portfolio reduced its exposure to U.S. Treasury securities to roughly 30%, its lowest allocation since inception. We took this action, anticipating that as the Federal government finances its budget deficit for 2003, Treasuries will be issued at a much greater volume as compared to last year. The potential result of this action may cause Treasuries to underperform other sectors. Our strategic decision has contributed positively to Portfolio performance. Conversely, as corporate profit margins continued to compress amidst global competition and little to no pricing power, we increased our exposure to select corporate and mortgage-backed securities (‘‘MBS’’).
We purchased AT&T Wireless (above average subscriber growth and dominant wireless provider). We also expanded our exposure in the energy sector with Devon Financing. We anticipate that as the summer driving season picks up and the economy grows, the potential demand for refined oil products will be strong. Unlike last year, we believe the worst of prepayment risks are behind us, indicating that MBS are well positioned to potentially outperform U.S. Treasuries. Based on this assumption, we increased the Portfolio’s exposure to MBS.
APRIL 30, 2003 / ANNUAL REPORT
4
Table of Contents
SOCIAL ISSUES INTERMEDIATE FIXED INCOME PORTFOLIO
Performance as of April 30, 2003
INSTITUTIONAL CLASS SHARES: VALUE OF A $50,000 INVESTMENT
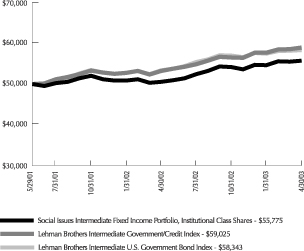
| Inst’l Class Shares | Lehman Brothers Intermediate Gov't./Credit Index | Lehman Brothers Intermediate U.S. Government Bond Index | ||||
| Three month cumulative return | 1.95% | 2.29% | 1.43% | |||
| Six month cumulative return | 2.91% | 4.43% | 2.27% | |||
| One year total return | 10.25% | 10.76% | 9.22% | |||
| Annualized total return inception to date | 5.86% | — | — | |||
Past performance is no guarantee of future results. Investment return and principal value will fluctuate so that an investor’s shares, when redeemed, may be worth more or less than original cost. Total return figures include the reinvestment of dividends and capital gains. Institutional Class Shares were offered beginning May 29, 2001.
The mountain chart illustrates the comparative performance of $50,000 invested in Institutional Class Shares of the Social Issues Intermediate Fixed Income Portfolio, the Lehman Brothers Intermediate Government/Credit Index and the Lehman Brothers Intermediate U.S. Government Bond Index from May 29, 2001, commencement of operations, to April 30, 2003. The performance of the indices reflects an initial investment at the end of the month following the Portfolios’s inception. The performance of the Portfolio assumes the reinvestment of all dividends and capital gains. The total return of the Portfolio includes expenses that reduce returns, while the total return of the benchmark comparisons do not include expenses. The Portfolio is professionally managed, while the benchmark comparisons are unmanaged and are not available for investment.
During the period certain fees were waived or expenses reimbursed, otherwise total returns would have been lower. The Portfolios’s investments are subject to social screens. Because of these screens, Portfolio management may forego opportunities to buy certain securities when it is economically advantageous to do so, or may sell certain securities for social reasons when it is otherwise disadvantageous to do so.
The performance information presented in the graph and table above does not reflect the deduction of taxes that a shareholder would pay on Portfolio distributions or the redemption of Portfolio shares.
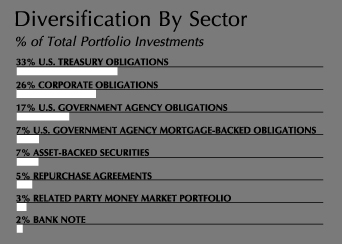
Schedule of Investments
| Description | Principal Amount | Market Value | |||
| U.S. Treasury Obligations — 34.0% | |||||
Treasury Inflation Index Bonds | |||||
3.500%, 01/15/11 | $ | 20,000 | $ 23,288 | ||
3.375%, 01/15/12 | 100,000 | 113,880 | |||
3.000%, 07/15/12 | 50,000 | 54,688 | |||
U.S. Treasury Bonds | |||||
5.375%, 02/15/31 | 5,000 | 5,456 | |||
4.375%, 05/15/07 | 200,000 | 214,602 | |||
U.S. Treasury Notes | |||||
6.125%, 08/15/07 | 100,000 | 114,387 | |||
5.750%, 11/15/05 | 200,000 | 219,805 | |||
4.750%, 11/15/08 | 110,000 | 119,612 | |||
4.375%, 08/15/12 | 190,000 | 198,379 | |||
3.875%, 02/15/13 | 20,000 | 20,026 | |||
3.250%, 08/15/07 | 25,000 | 25,682 | |||
| TOTAL U.S. TREASURY OBLIGATIONS (COST $1,054,466) | $1,109,805 | ||||
| U.S. Government Agency Obligations — 18.2% | |||||
FHLB | |||||
6.875%, 08/15/05 | 80,000 | 89,221 | |||
6.500%, 11/15/05 | 100,000 | 111,356 | |||
2.500%, 12/15/05 | 100,000 | 101,233 | |||
FHLMC | |||||
4.000%, 10/29/07 | 75,000 | 76,997 | |||
FNMA | |||||
5.500%, 05/02/06 | 100,000 | 108,859 | |||
4.250%, 07/15/07 | 100,000 | 105,901 | |||
| TOTAL U.S. GOVERNMENT AGENCY OBLIGATIONS (COST $568,099) | $ 593,567 | ||||
ANNUAL REPORT / APRIL 30, 2003
5
Table of Contents
SOCIAL ISSUES INTERMEDIATE FIXED INCOME PORTFOLIO (continued)
| Description | Principal Amount | Market Value | ||||
| U.S. Government Agency Mortgage-Backed Obligations — 7.2% | ||||||
FHLMC, Ser T | ||||||
4.105%, 10/27/31 | $ | 25,000 | $ | 25,758 | ||
FNMA | ||||||
5.500%, 11/01/17 | 200,000 | 208,196 | ||||
| TOTAL U.S. GOVERNMENT AGENCY MORTGAGE-BACKED OBLIGATIONS (COST $231,938) | $ | 233,954 | ||||
| Corporate Obligations — 27.6% | ||||||
Banks — 5.0% | ||||||
Fleet National Bank | ||||||
5.750%, 01/15/09 | 20,000 | 21,942 | ||||
Wachovia | ||||||
5.625%, 12/15/08 | 75,000 | 83,542 | ||||
Wells Fargo | ||||||
6.125%, 04/18/12 | 50,000 | 56,645 | ||||
TOTAL BANKS | $ | 162,129 | ||||
Consumer Discretionary — 3.0% | ||||||
Comcast Cablevision Communications | ||||||
8.875%, 05/01/17 | 25,000 | 31,662 | ||||
Newell Rubbermaid | ||||||
6.350%, 07/15/08 | 30,000 | 33,772 | ||||
Target | ||||||
7.500%, 02/15/05 | 30,000 | 32,938 | ||||
TOTAL CONSUMER DISCRETIONARY | $ | 98,372 | ||||
Energy — 4.2% | ||||||
Devon Financing | ||||||
6.875%, 09/30/11 | 25,000 | 28,754 | ||||
Kerr-McGee | ||||||
6.625%, 10/15/07 | 75,000 | 83,199 | ||||
Kinder Morgan | ||||||
6.650%, 03/01/05 | 25,000 | 27,008 | ||||
TOTAL ENERGY | $ | 138,961 | ||||
Financials — 9.0% | ||||||
Bear Stearns | ||||||
7.250%, 10/15/06 | 25,000 | 28,481 | ||||
Goldman Sachs Group, Ser B, MTN | ||||||
7.500%, 01/28/05 | 25,000 | 27,268 | ||||
Heller Financial | ||||||
6.375%, 03/15/06 | 25,000 | 27,649 | ||||
JP Morgan | ||||||
7.625%, 09/15/04 | 25,000 | 26,816 | ||||
John Deere Capital | ||||||
5.100%, 01/15/13 | 40,000 | 41,097 | ||||
| Description | Principal Amount | Market Value | ||||
Kimco Realty | ||||||
6.875%, 02/10/09 | $ | 100,000 | $ | 113,724 | ||
National Rural Utilities | ||||||
6.500%, 03/01/07 | 25,000 | 27,784 | ||||
TOTAL FINANCIALS | $ | 292,819 | ||||
Industrials — 0.8% | ||||||
Canadian National Railway | ||||||
7.000%, 03/15/04 | 25,000 | 26,109 | ||||
TOTAL INDUSTRIALS | $ | 26,109 | ||||
Insurance — 0.9% | ||||||
American General Finance | ||||||
5.375%, 10/01/12 | 30,000 | 31,174 | ||||
TOTAL INSURANCE | $ | 31,174 | ||||
Materials — 0.9% | ||||||
MeadWestvaco | ||||||
6.850%, 04/01/12 | 25,000 | 28,271 | ||||
TOTAL MATERIALS | $ | 28,271 | ||||
Telecommunication Services — 1.3% | ||||||
AT&T Wireless Services | ||||||
7.875%, 03/01/11 | 10,000 | 11,521 | ||||
Verizon Wireless ‡ | ||||||
1.659%, 12/17/03 | 30,000 | 29,978 | ||||
TOTAL TELECOMMUNICATION SERVICES | $ | 41,499 | ||||
Utilities — 1.7% | ||||||
Consolidated Natural Gas, Ser C | ||||||
6.250%, 11/01/11 | 50,000 | 55,724 | ||||
TOTAL UTILITIES | $ | 55,724 | ||||
Real Estate Investment Trust — 0.8% | ||||||
Boston Properties + | ||||||
6.250%, 01/15/13 | 25,000 | 26,804 | ||||
TOTAL REAL ESTATE INVESTMENT TRUST | $ | 26,804 | ||||
| TOTAL CORPORATE OBLIGATIONS (COST $853,913) | $ | 901,862 | ||||
| Asset-Backed Securities — 7.8% | ||||||
ANRC Auto Owner Trust, Ser 2001-A, Cl A-4 | ||||||
4.320%, 06/16/08 | 100,000 | 103,840 | ||||
Residential Asset Securities, Ser 2001-KS3, Cl AI3 | ||||||
5.180%, 07/25/27 | 100,000 | 101,489 | ||||
APRIL 30, 2003 / ANNUAL REPORT
6
Table of Contents
SOCIAL ISSUES INTERMEDIATE FIXED INCOME PORTFOLIO (concluded)
| Description | Principal/Share Amount | Market Value | |||||
Whole Auto Loan Trust, Ser 2002-1, Cl A3 | |||||||
2.600%, 08/15/06 | $ | 50,000 | $ | 50,830 | |||
TOTAL ASSET-BACKED SECURITIES (COST $249,978) | $ | 256,159 | |||||
| Bank Note — 1.7% | |||||||
U.S. Bank | |||||||
6.375%, 08/01/11 | 50,000 | 57,120 | |||||
| TOTAL BANK NOTE (COST $51,008) | $ | 57,120 | |||||
| Repurchase Agreements — 5.2% | |||||||
Credit Suisse First Boston, 1.270%, dated 04/30/03, matures 05/01/03, repurchase price $169,006 (102% collateralized by various U.S. Treasury Obligations) | 169,000 | 169,000 | |||||
| TOTAL REPURCHASE AGREEMENTS (COST $169,000) | $ | 169,000 | |||||
| Related Party Money Market Portfolio — 3.2% | |||||||
ARK Money Market Portfolio Institutional Class Ú | 105,299 | 105,299 | |||||
| TOTAL RELATED PARTY MONEY MARKET PORTFOLIO (COST $105,299) | $ | 105,299 | |||||
| TOTAL INVESTMENTS — 104.9% (COST $3,283,701) | $ | 3,426,766 | |||||
| OTHER ASSETS & LIABILITIES, NET — (4.9)% | $ | (160,044 | ) | ||||
| TOTAL NET ASSETS — 100.0% | $ | 3,266,722 | |||||
| ‡ | Variable Rate Security. The rate reported on the Schedule of Investments is the rate in effect on 04/30/03. The date shown is the stated maturity. |
| + | Security exempt from registration under Rule 144A of the Securities Act of 1933. These securities may be resold in transactions exempt from registration normally qualified to institutional investors. |
| Ú | This money market portfolio is advised by Allied Investment Advisors, Inc. who also serves as advisor of this portfolio. |
Cl — Class
FHLB — Federal Home Loan Bank
FHLMC — Federal Home Loan Mortgage Corporation
FNMA — Federal National Mortgage Association
MTN — Medium Term Note
Ser — Series
The accompanying notes are an integral part of the financial statements.
ANNUAL REPORT / APRIL 30, 2003
7
Table of Contents
This page intentionally left blank.
Table of Contents
SOCIAL ISSUES PORTFOLIOS
Portfolios
Simply stated, our investment management philosophy for the Social Issues Equity Portfolios is quality for the long term. We look for outstanding businesses that are reasonably priced, because over the long haul, experience has shown the benefits of buying a quality company at a fair price, versus a fair business at a bargain price. In selecting securities, we utilize social research and screening technology provided for investment managers by various outside research services, and have adopted social screens to seek to exclude companies that derive revenue from tobacco and alcohol, gambling, nuclear power, weapons, and abortion and contraceptives.
In their research, our Portfolio Managers look for businesses that meet the Portfolios’ social criteria and demonstrate faster-than-average growth, strong cash flows, and returns on capital in excess of the cost of capital.
We believe history has become a less-than-accurate predictor of the future, thus we place greater emphasis on meeting with management to assess each company’s future. Increasingly important is the teaming of strong financials with enlightened corporate leadership, a combination necessary to thrive in today’s highly competitive, rapidly evolving business environment. Our team of professionals, which includes all of our Portfolio Managers, searches for the best companies based on our specific screening criteria.
Next, we assess future earnings prospects seeking to identify the companies that can continue to generate superior sales and profit growth. We examine industry dynamics, the companies’ relative positions, cost structures, margin trends, and management plans. Finally, we assess each company’s current stock valuation relative to future earnings stream against history, competitors, and the S&P 500.
Typically, we review a portfolio holding for sale under the following circumstances: when the price objective is achieved; when fundamentals deteriorate and make the achievement of objectives unlikely; when the stock underperforms the S&P 500 by 20 percent or more on a relative basis; and when a more attractive opportunity presents itself.
9
Table of Contents
SOCIAL ISSUES PORTFOLIOS
SOCIAL ISSUES
BLUE CHIP EQUITY PORTFOLIO

Allen J. Ashcroft, Jr.
CO-PORTFOLIO MANAGER
Allen J. Ashcroft, Jr. is co-manager of the Social Issues Blue Chip Equity Portfolio and is co-manager of another ARK Funds Portfolio. He has been a Principal of AIA and Portfolio Manager since 1996, a Vice President of Allfirst Bank from 1995 to 2003 and a Vice President of Manufacturers and Traders Trust Company (“M&T Trust”) since 2003. Mr. Ashcroft has more than 20 years of experience in investment research and equity analysis.

Clyde L. Randall II, CFA
CO-PORTFOLIO MANAGER
Clyde L. Randall II, CFA is co-manager of the Social Issues Blue Chip Equity Portfolio and is co-manager of another ARK Funds Portfolio. Mr. Randall has been a Principal of AIA and Portfolio Manager since 1996, a Vice President of Allfirst Bank from 1995 to 2003 and a Vice President of M&T Trust since 2003. He has more than 14 years of experience in investment research and equity analysis, and is a Chartered Financial Analyst.
Management Discussion and Analysis
This fiscal year was challenging to the Portfolio from an investment standpoint since its inception. The equity markets recently completed their third straight year of negative returns. This three-year span is somewhat unprecedented in that you would have to go back to the late 1930’s to witness a similar period of market contraction. Many equity investors remained on the sidelines concerned about the health of the economy, and the conflict that seemed imminent in the Middle East. Historically, in uncertain times investors have tended to seek cover by transferring assets into blue chip equities that had the perceived strength and balance sheets to weather the pending storm; however, this wasn’t the case this year. Investors questioned management and their accounting principles, among other things, and as a result capital exited even the most respected of institutions. For the most part, fixed income assets or short-term money market instruments were the only investments that delivered positive returns.
The best contributors to Portfolio performance this year were Amgen and Lowe’s — a health care company and a home improvement company. Demographics certainly were a factor in this group, delivering positive returns in a tough environment. The Portfolio’s worst performers in our fiscal year were Interpublic Group and Sun Microsystems. Interpublic, an advertising company, had accounting concerns, and Sun Microsystems got caught up in the technology swoon.
The Portfolio’s primary focus is to invest in established large-cap franchise companies while seeking to stay competitive with the returns of the S&P 500. We remain committed to our strategy of diversifying the Portfolio so that it has representation in each major market sector. Our investment style guides us to concentrate on those companies that we believe are well managed and have long-term investment horizons. This approach has not changed even in the tough and unpleasant market environment of the past couple of years.
APRIL 30, 2003 / ANNUAL REPORT
10
Table of Contents
SOCIAL ISSUES BLUE CHIP EQUITY PORTFOLIO
Performance as of April 30, 2003
INSTITUTIONAL CLASS SHARES: VALUE OF A $50,000 INVESTMENT
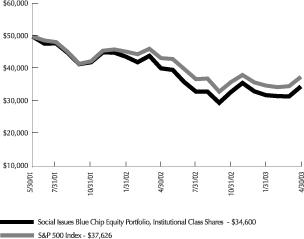
| Inst’l Class Shares | S&P 500 Index | |||
| Three month cumulative return | 8.19% | 7.64% | ||
| Six month cumulative return | 4.98% | 4.47% | ||
| One year total return | -14.05% | -13.31% | ||
| Annualized total return inception to date | -17.47% | — | ||
Past performance is no guarantee of future results. Market volatility can significantly impact short-term performance and results of an investment made today may differ substantially from the Portfolio’s historical performance. Investment return and principal value will fluctuate so that an investor’s shares, when redeemed, may be worth more or less than original cost. Total return figures include the reinvestment of dividends and capital gains. Institutional Class Shares were offered beginning May 30, 2001.
The mountain chart illustrates the comparative performance of $50,000 invested in Institutional Class Shares of the Social Issues Blue Chip Equity Portfolio and the S&P 500 Index from May 30, 2001, commencement of operations, to April 30, 2003. The performance of the index reflects an initial investment at the end of the month following the Portfolio’s inception. The performance of the Portfolio assumes the reinvestment of all dividends and capital gains. The total return of the Portfolio includes expenses that reduce returns, while the total return of the index does not include expenses. The Portfolio is professionally managed, while the index is unmanaged and is not available for investment.
During the period certain fees were waived or expenses reimbursed; otherwise total returns would have been lower. The Portfolio’s investments are subject to social screens. Because of these screens, Portfolio management may forego opportunities to buy certain securities when it is economically advantageous to do so, or may sell certain securities for social reasons when it is otherwise disadvantageous to do so. The Portfolio’s low asset level may subject the fund to greater volatility due to the potential impact of large shareholder transactions or an individual security’s performance. Such events increase the Portfolio’s volatility compared with similarly managed portfolios that have higher asset levels.
The performance information presented in the graph and table above does not reflect the deduction of taxes that a shareholder would pay on Portfolio distributions or the redemption of Portfolio shares.
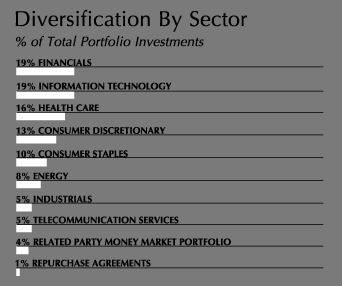
Schedule of Investments
| Description | Shares | Market Value | |||
| Common Stock — 94.0% | |||||
Consumer Discretionary — 12.8% | |||||
AOL Time Warner * | 1,100 | $ | 15,048 | ||
Best Buy * | 600 | 20,748 | |||
Clear Channel Communications * | 300 | 11,733 | |||
Lowe’s | 400 | 17,556 | |||
Newell Rubbermaid | 300 | 9,144 | |||
Target | 600 | 20,064 | |||
TOTAL CONSUMER DISCRETIONARY | $ | 94,293 | |||
Consumer Staples — 10.0% | |||||
General Mills | 300 | 13,533 | |||
Kraft Foods, Cl A | 500 | 15,450 | |||
PepsiCo | 400 | 17,312 | |||
Procter & Gamble | 300 | 26,955 | |||
TOTAL CONSUMER STAPLES | $ | 73,250 | |||
Energy — 7.9% | |||||
Exxon Mobil | 700 | 24,640 | |||
Nabors Industries * | 300 | 11,760 | |||
Smith International * | 600 | 21,336 | |||
TOTAL ENERGY | $ | 57,736 | |||
Financials — 18.4% | |||||
American Express | 500 | 18,930 | |||
American International Group | 400 | 23,180 | |||
Citigroup | 500 | 19,625 | |||
JP Morgan Chase | 500 | 14,675 | |||
Morgan Stanley | 500 | 22,375 | |||
Northern Trust | 500 | 17,550 | |||
Wells Fargo | 400 | 19,304 | |||
TOTAL FINANCIALS | $ | 135,639 | |||
ANNUAL REPORT / APRIL 30, 2003
11
Table of Contents
SOCIAL ISSUES BLUE CHIP EQUITY PORTFOLIO (concluded)
| Description | Shares | Market Value | |||
Health Care — 15.7% | |||||
Amgen * | 400 | $ | 24,524 | ||
Baxter International | 500 | 11,500 | |||
Cardinal Health | 200 | 11,056 | |||
Eli Lilly | 400 | 25,528 | |||
Medtronic | 400 | 19,096 | |||
Merck | 400 | 23,272 | |||
TOTAL HEALTH CARE | $ | 114,976 | |||
Industrials — 5.6% | |||||
Danaher | 300 | 20,694 | |||
Emerson Electric | 400 | 20,280 | |||
TOTAL INDUSTRIALS | $ | 40,974 | |||
Information Technology — 18.9% | |||||
Celestica * | 600 | 6,936 | |||
Cisco Systems * | 1,000 | 15,040 | |||
Intel | 500 | 9,200 | |||
International Business Machines | 300 | 25,470 | |||
Jabil Circuit * | 800 | 14,960 | |||
Koninklijke Philips Electronics | 700 | 13,076 | |||
Microsoft | 1,000 | 25,570 | |||
Nokia — ADR | 500 | 8,285 | |||
Texas Instruments | 500 | 9,245 | |||
Veritas Software * | 500 | 11,005 | |||
TOTAL INFORMATION TECHNOLOGY | $ | 138,787 | |||
Telecommunication Services — 4.7% | |||||
BellSouth | 700 | 17,843 | |||
SBC Communications | 700 | 16,352 | |||
TOTAL TELECOMMUNICATION SERVICES | $ | 34,195 | |||
| TOTAL COMMON STOCK (COST $737,152) | $ | 689,850 | |||
| Related Party Money Market Portfolio — 3.9% | |||||
ARK Money Market Portfolio | 28,823 | 28,823 | |||
| TOTAL RELATED PARTY MONEY MARKET PORTFOLIO (COST $28,823) | $ | 28,823 | |||
| Description | Principal Amount | Market Value | ||||
| Repurchase Agreements — 1.4% | ||||||
Credit Suisse First Boston, 1.270%, dated 04/30/03, matures 05/01/03, repurchase price $10,001 (102% collateralized by various U.S. Treasury Obligations) | $ | 10,000 | $ | 10,000 | ||
| TOTAL REPURCHASE AGREEMENTS (COST $10,000) | $ | 10,000 | ||||
| TOTAL INVESTMENTS — 99.3% (COST $775,975) | $ | 728,673 | ||||
| OTHER ASSETS & LIABILITIES, NET — 0.7% | $ | 4,825 | ||||
| TOTAL NET ASSETS — 100.0% | $ | 733,498 | ||||
| * | Non-income producing security |
| Ú | This money market portfolio is advised by Allied Investment Advisors, Inc. who also serves as advisor of this portfolio. |
Cl — Class
ADR — American Depositary Receipt
The accompanying notes are an integral part of the financial statements.
APRIL 30, 2003 / ANNUAL REPORT
12
Table of Contents
This page intentionally left blank.
Table of Contents
SOCIAL ISSUES PORTFOLIOS
SOCIAL ISSUES
CAPITAL GROWTH PORTFOLIO

Thomas D. DeHudy, CFA
PORTFOLIO MANAGER
Thomas D. DeHudy, CFA is manager of the Social Issues Capital Growth Portfolio and another ARK Funds Portfolio. Mr. DeHudy has been a Principal of AIA since 2001. Mr. DeHudy is also an equity analyst and provides research coverage for the technology sector and selected consumer cyclical areas. Mr. DeHudy has more than 20 years of experience in investment research, and is a Chartered Financial Analyst.
Management Discussion and Analysis
During the first half of fiscal year 2003, the Portfolio underperformed its benchmark (the S&P 500 Index) primarily because of a premature assumption for a reaccelerating economy. Portfolio performance for the second half of the year more closely followed that of the benchmark. Generally, sector weighting helped performance as overweights in energy, financials, and consumer cyclicals/services benefited Portfolio performance (as did the underweight in consumer staples).
Among the stocks that detracted most from Portfolio performance were: Sprint PCS, Best Buy, Baxter International, Freemarkets and Taiwan Semiconductor. Most of the performance detractors were either technology-related or economically-sensitive. Conversely, stocks that contributed positively to Portfolio performance were either health care-related (e.g., Forest Laboratories and Amgen) or had unique industry circumstances such as radio broadcasting (Clear Channel) or homebuilders (Centex).
The Portfolio remains positioned for a reacceleration of the economy, but we continue to favor: 1) consumer-related groups such as homebuilders, restaurants and radio broadcasting; 2) financials such as real estate investment trusts and Fannie Mae/Freddie Mac; and 3) energy service companies that have exposure to natural gas. Currently, the Portfolio is approximately neutrally weighted to technology and moderately underweighted to health care.
APRIL 30, 2003 / ANNUAL REPORT
14
Table of Contents
SOCIAL ISSUES CAPITAL GROWTH PORTFOLIO
Performance as of April 30, 2003
INSTITUTIONAL CLASS SHARES: VALUE OF A $50,000 INVESTMENT
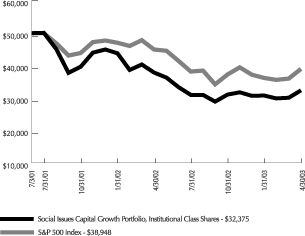
| Inst’l Class Shares | S&P 500 Index | |||
| Three month cumulative return | 5.20% | 7.64% | ||
| Six month cumulative return | 4.02% | 4.47% | ||
| One year total return | -14.52% | -13.31% | ||
| Annualized total return inception to date | -21.20% | — | ||
Past performance is no guarantee of future results. Market volatility can significantly impact short-term performance and results of an investment made today may differ substantially from the Portfolio’s historical performance. Investment return and principal value will fluctuate so that an investor’s shares, when redeemed, may be worth more or less than original cost. Total return figures include the reinvestment of dividends and capital gains. Institutional Class Shares were offered beginning July 3, 2001.
The mountain chart illustrates the comparative performance of $50,000 invested in Institutional Class Shares of the Social Issues Capital Growth Portfolio and the S&P 500 Index from July 3, 2001, commencement of operations, to April 30, 2003. The performance of the index reflects an initial investment at the end of the month following the Portfolio’s inception. The performance of the Portfolio assumes the reinvestment of all dividends and capital gains. The total return of the Portfolio includes expenses that reduce returns, while the total return of the index does not include expenses. The Portfolio is professionally managed, while the index is unmanaged and is not available for investment.
During the period certain fees were waived or expenses reimbursed; otherwise total returns would have been lower. The Portfolio invests in smaller to medium capitalization companies which may be more vulnerable to adverse business or economic events than larger, more established companies. In particular, these companies may have limited product lines, markets and financial resources, and may depend upon a relatively small management group. In addition, the Portfolio’s investments are subject to social screens. Because of these screens, Portfolio management may forego opportunities to buy certain securities when it is economically advantageous to do so, or may sell certain securities for social reasons when it is otherwise disadvantageous to do so. The Portfolio’s low asset level may subject the fund to greater volatility due to the potential impact of large shareholder transactions or an individual security’s performance. Such events increase the Portfolio’s volatility compared with similarly managed portfolios that have higher asset levels.
The performance information presented in the graph and table above does not reflect the deduction of taxes that a shareholder would pay on Portfolio distributions or the redemption of Portfolio shares.

Schedule of Investments
| Description | Shares | Market Value | |||
| Common Stock — 98.8% | |||||
Consumer Discretionary — 29.1% | |||||
BorgWarner | 40 | $ | 2,347 | ||
Brinker International * | 70 | 2,222 | |||
CBRL Group | 75 | 2,391 | |||
Centex | 60 | 3,961 | |||
Clear Channel Communications * | 100 | 3,911 | |||
Darden Restaurants | 125 | 2,189 | |||
Hispanic Broadcasting * | 100 | 2,565 | |||
Lear * | 100 | 3,974 | |||
Lennar, Cl A | 75 | 4,068 | |||
Lennar, Cl B | 7 | 375 | |||
NVR * | 10 | 3,577 | |||
Outback Steakhouse | 50 | 1,787 | |||
Radio One, Cl D * | 125 | 1,913 | |||
Ruby Tuesday | 125 | 2,463 | |||
Staples * | 100 | 1,904 | |||
Toll Brothers * | 125 | 2,906 | |||
Viacom, Cl B * | 100 | 4,341 | |||
TOTAL CONSUMER DISCRETIONARY | $ | 46,894 | |||
Consumer Staples — 2.9% | |||||
Estee Lauder | 75 | 2,437 | |||
General Mills | 50 | 2,256 | |||
TOTAL CONSUMER STAPLES | $ | 4,693 | |||
Energy — 6.0% | |||||
Nabors Industries * | 100 | 3,920 | |||
Patterson-UTI Energy * | 50 | 1,655 | |||
Weatherford International * | 100 | 4,023 | |||
TOTAL ENERGY | $ | 9,598 | |||
ANNUAL REPORT / APRIL 30, 2003
15
Table of Contents
SOCIAL ISSUES CAPITAL GROWTH PORTFOLIO (concluded)
| Description | Shares | Market Value | |||
Financials — 17.8% | |||||
American International Group | 40 | $ | 2,318 | ||
Boston Properties | 50 | 1,960 | |||
Equity Office Properties Trust | 70 | 1,818 | |||
Fannie Mae | 100 | 7,239 | |||
Freddie Mac | 100 | 5,790 | |||
General Growth Properties | 30 | 1,669 | |||
Morgan Stanley | 75 | 3,356 | |||
Rouse | 50 | 1,737 | |||
Simon Property Group | 75 | 2,754 | |||
TOTAL FINANCIALS | $ | 28,641 | |||
Health Care — 17.8% | |||||
Affymetrix * | 100 | $ | 1,855 | ||
Amgen * | 100 | 6,131 | |||
Caremark Rx * | 200 | 3,982 | |||
Eli Lilly | 50 | 3,191 | |||
Express Scripts * | 70 | 4,127 | |||
ICOS * | 100 | 2,675 | |||
Medtronic | 75 | 3,581 | |||
Pharmaceutical Product Development * | 50 | 1,309 | |||
Quest Diagnostics * | 30 | 1,792 | |||
TOTAL HEALTH CARE | $ | 28,643 | |||
Industrials — 1.8% | |||||
Ryanair Holdings, ADR * | 75 | 2,975 | |||
TOTAL INDUSTRIALS | $ | 2,975 | |||
Information Technology — 23.4% | |||||
Affiliated Computer Services, Cl A * | 80 | 3,816 | |||
Analog Devices * | 75 | 2,484 | |||
BearingPoint * | 250 | 2,042 | |||
Cadence Design Systems * | 150 | 1,715 | |||
Celestica * | 150 | 1,734 | |||
Ceridian * | 150 | 2,093 | |||
Cisco Systems * | 175 | 2,632 | |||
Cognos * | 50 | 1,357 | |||
Computer Associates International | 200 | 3,248 | |||
Concord EFS * | 135 | 1,867 | |||
Cree * | 75 | 1,496 | |||
Dell Computer * | 100 | 2,891 | |||
Jabil Circuit * | 125 | 2,337 | |||
Microsoft | 40 | 1,023 | |||
STMicroelectronics NV, ADR | 75 | 1,544 | |||
Symantec * | 50 | 2,198 | |||
Taiwan Semiconductor Manufacturing, ADR * | 150 | 1,255 | |||
Yahoo * | 75 | 1,858 | |||
TOTAL INFORMATION TECHNOLOGY | $ | 37,590 | |||
TOTAL COMMON STOCK (COST $148,998) | $ | 159,034 | |||
| Description | Shares | Market Value | ||||
| Related Party Money Market Portfolio — 4.4% | ||||||
ARK Money Market Portfolio Institutional Class Ú | 7,097 | $ | 7,097 | |||
TOTAL RELATED PARTY MONEY MARKET PORTFOLIO (COST $7,097) | $ | 7,097 | ||||
TOTAL INVESTMENTS — 103.2% (COST $156,095) | $ | 166,131 | ||||
| OTHER ASSETS & LIABILITIES, NET — (3.2)% | $ | (5,161 | ) | |||
| TOTAL NET ASSETS — 100.0% | $ | 160,970 | ||||
| * | Non-income producing security |
| Ú | This money market portfolio is advised by Allied Investment Advisors, Inc. who also serves as advisor of this portfolio. |
ADR — American Depositary Receipt
Cl — Class
The accompanying notes are an integral part of the financial statements.
APRIL 30, 2003 / ANNUAL REPORT
16
Table of Contents
This page intentionally left blank.
Table of Contents
SOCIAL ISSUES PORTFOLIOS
SOCIAL ISSUES
SMALL-CAP EQUITY PORTFOLIO

H. Giles Knight
PORTFOLIO MANAGER
H. Giles Knight is manager of the Social Issues Small-Cap Equity Portfolio and is manager of another ARK Funds Portfolio. He has been a Principal of AIA and Portfolio Manager since 1996, a Senior Vice President of Allfirst Bank from 1995 to 2003 and a Senior Vice President of M&T Trust since 2003. Mr. Knight has more than 30 years of experience in the investment industry.
Management Discussion and Analysis
Small-cap stocks had a tough year as investors faced the uncertainty of war in Iraq, a very weak and unresponsive economy, and continued destructive revelations concerning the accounting practices of the likes of Enron, WorldCom, and Tyco. Small-cap stocks suffered disproportionately because of their added financial and market risks. Their lack of liquidity made for many jarring declines as a few cents earnings miss could severely diminish a stock’s value.
The Portfolio had a disappointing fiscal year due mainly to weak third and fourth quarters. The third quarter suffered from our lower technology weighting as this group rallied in late October, and the fourth quarter was hurt by earning disappointments from three stocks: Accredo Health, Hilb Rogal & Hamilton, and Overture Services. These companies provided earnings shortfalls or weaker forward guidance, which then triggered selling among shareholders.
It appears that the Federal Reserve’s monetary stimulus has had a positive impact on the United States economy. The Portfolio has been positioned more aggressively with overweightings in information technology, health care, and telecommunications. Standard Pacific, WCI Communities, and Brookfield Homes are home builders that we feel have the potential to continue to do well in an atmosphere of low interest rates. Semiconductor producers such as Intersil, Integrated Circuits, and Micrel have the potential to participate in anticipated “chip” capital spending increases.
APRIL 30, 2003 / ANNUAL REPORT
18
Table of Contents
SOCIAL ISSUES SMALL-CAP EQUITY PORTFOLIO
Performance as of April 30, 2003
INSTITUTIONAL CLASS SHARES: VALUE OF A $50,000 INVESTMENT
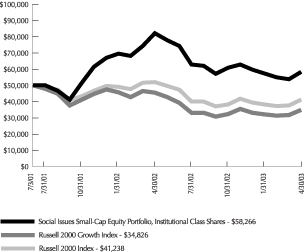
| Inst’l Class Shares | Russell 2000 Growth Index | Russell 2000 Index | ||||
| Three month cumulative return | 1.52% | 8.16% | 7.54% | |||
| Six month cumulative return | -4.34% | 7.67% | 7.55% | |||
| One year total return | -29.15% | -23.50% | -20.76% | |||
| Annualized total return inception to date | 8.75% | — | — | |||
Past performance is no guarantee of future results. Market volatility can significantly impact short-term performance and results of an investment made today may differ substantially from the Portfolio’s historical performance. Investment return and principal value will fluctuate so that an investor’s shares, when redeemed, may be worth more or less than original cost. Total return figures include the reinvestment of dividends and capital gains. Institutional Class Shares were offered beginning July 3, 2001.
The mountain chart illustrates the comparative performance of $50,000 invested in Institutional Class Shares of the Social Issues Small-Cap Equity Portfolio, the Russell 2000 Growth Index and the Russell 2000 Index from July 3, 2001, commencement of operations, to April 30, 2003. The performance of the indices reflects an initial investment at the end of the month following the Portfolio’s inception. The performance of the Portfolio assumes the reinvestment of all dividends and capital gains. The total return of the Portfolio includes expenses that reduce returns, while the total return of the benchmark comparisons do not include expenses. The Portfolio is professionally managed, while the benchmark comparisons are unmanaged and is not available for investment.
During the period certain fees were waived or expenses reimbursed; otherwise total returns would have been lower. The Portfolio invests in smaller to medium capitalization companies which may be more vulnerable to adverse business or economic events than larger, more established companies. In particular, these companies may have limited product lines, markets and financial resources, and may depend upon a relatively small management group. In addition, the Portfolio’s investments are subject to social screens. Because of these screens, Portfolio management may forego opportunities to buy certain securities when it is economically advantageous to do so, or may sell certain securities for social reasons when it is otherwise disadvantageous to do so. The Portfolio’s low asset level may subject the fund to greater volatility due to the potential impact of large shareholder transactions or an individual security’s performance. Such events increase the Portfolio’s volatility compared with similarly managed portfolios that have higher asset levels.
The performance information presented in the graph and table above does not reflect the deduction of taxes that a shareholder would pay on Portfolio distributions of the redemption of Portfolio shares.

Schedule of Investments
| Description | Shares | Market Value | |||
| Common Stock — 100.5% | |||||
Consumer Discretionary — 21.8% | |||||
AC Moore Arts & Crafts * | 600 | $ | 10,338 | ||
Brookfield Homes | 1,000 | 15,150 | |||
Central Garden & Pet * | 700 | 16,961 | |||
Emmis Communications, Cl A * | 600 | 11,382 | |||
Gevity HR | 500 | 4,705 | |||
Hot Topics * | 450 | 11,003 | |||
Meredith | 450 | 19,449 | |||
SCP Pool * | 300 | 9,903 | |||
Standard-Pacific | 250 | 7,563 | |||
Steven Madden * | 700 | 12,404 | |||
Strayer Education | 250 | 16,260 | |||
WCI Communities * | 400 | 5,532 | |||
TOTAL CONSUMER DISCRETIONARY | $ | 140,650 | |||
Energy — 6.7% | |||||
Grant Prideco * | 700 | 7,987 | |||
Patina Oil & Gas | 300 | 10,359 | |||
Range Resources * | 900 | 5,319 | |||
Tom Brown * | 800 | 19,616 | |||
TOTAL ENERGY | $ | 43,281 | |||
Financials — 10.2% | |||||
Columbia Bancorp | 500 | 12,820 | |||
East-West Bancorp | 400 | 13,540 | |||
Greater Bay Bancorp | 700 | 11,200 | |||
Max Re Capital | 200 | 2,650 | |||
Sterling Bancshares | 900 | 10,715 | |||
UCBH Holdings | 600 | 15,264 | |||
TOTAL FINANCIALS | $ | 66,189 | |||
ANNUAL REPORT / APRIL 30, 2003
19
Table of Contents
SOCIAL ISSUES SMALL-CAP EQUITY PORTFOLIO (concluded)
| Description | Shares | Market Value | |||
Health Care — 18.3% | |||||
ICOS * | 200 | $ | 5,350 | ||
Idexx Laboratories * | 450 | 17,550 | |||
Mentor | 500 | 9,255 | |||
Orthofix International * | 450 | 12,668 | |||
PSS World Medical * | 1,100 | 6,611 | |||
Pediatrix Medic Group * | 500 | 15,935 | |||
Perrigo | 700 | 10,752 | |||
Possis Medical * | 800 | 15,360 | |||
Taro Pharmaceuticals * | 250 | 11,440 | |||
Zoll Medical * | 400 | 12,920 | |||
TOTAL HEALTH CARE | $ | 117,841 | |||
Industrials — 9.7% | |||||
Chicago Bridge & Iron | 700 | 14,000 | |||
Dionex * | 400 | 13,764 | |||
OMI * | 2,800 | 13,580 | |||
Oshkosh Truck | 200 | 11,200 | |||
Regis | 350 | 9,916 | |||
TOTAL INDUSTRIALS | $ | 62,460 | |||
Information Technology — 30.4% | |||||
ADC Telecommunications * | 1,900 | 4,537 | |||
Anixter International * | 500 | 11,490 | |||
Autodesk | 900 | 14,004 | |||
Avid Technology * | 550 | 15,108 | |||
Cognizant Technology Systems * | 775 | 13,919 | |||
Concur Technologies * | 600 | 3,606 | |||
Cray * | 800 | 6,040 | |||
Cypress Semiconductor * | 800 | 6,976 | |||
Exar * | 500 | 7,375 | |||
Integrated Circuit Systems * | 900 | 19,548 | |||
Intersil, Cl A * | 1,000 | 18,500 | |||
Kopin * | 100 | 481 | |||
Legato Systems * | 125 | 740 | |||
Marvel Technology Group * | 600 | 13,847 | |||
Micrel * | 900 | 10,539 | |||
Perot Systems, Cl A * | 500 | 5,310 | |||
Pixelworks * | 1,300 | 9,685 | |||
RSA Security * | 600 | 5,754 | |||
Rambus * | 600 | 8,580 | |||
Sandisk * | 550 | 13,310 | |||
Seachange International * | 900 | 7,245 | |||
TOTAL INFORMATION TECHNOLOGY | $ | 196,594 | |||
| Description | Shares | Market Value | ||||
Telecommunication Services — 2.0% | ||||||
Nextel Partner, Cl A * | 1,200 | $ | 6,972 | |||
Western Wireless * | 1,000 | 6,120 | ||||
TOTAL TELECOMMUNICATION SERVICES | $ | 13,092 | ||||
Utilities — 1.4% | ||||||
AES * | 1,500 | 9,015 | ||||
TOTAL UTILITIES | $ | 9,015 | ||||
| TOTAL COMMON STOCK (COST $624,474) | $ | 649,122 | ||||
| Related Party Money Market Portfolio — 2.7% | ||||||
ARK Money Market Portfolio Institutional Class Ú | 17,615 | 17,615 | ||||
| TOTAL RELATED PARTY MONEY MARKET PORTFOLIO (COST $17,615) | $ | 17,615 | ||||
| TOTAL INVESTMENTS — 103.2% (COST $642,089) | $ | 666,737 | ||||
| OTHER ASSETS & LIABILITIES, NET — (3.2)% | $ | (20,964 | ) | |||
| TOTAL NET ASSETS — 100.0% | $ | 645,773 | ||||
| * | Non-income producing security |
| Ú | This money market portfolio is advised by Allied Investment Advisors, Inc. who also serves as advisor of this portfolio. |
Cl — Class
The accompanying notes are an integral part of the financial statements.
APRIL 30, 2003 / ANNUAL REPORT
20
Table of Contents
STATEMENTS OF ASSETS AND LIABILITIES
| As of April 30, 2003 | Social Issues Intermediate Fixed Income Portfolio | Social Issues Blue Chip Equity Portfolio | Social Issues Capital Growth Portfolio | Social Issues Small-Cap Equity Portfolio | ||||||||||||
Assets: | ||||||||||||||||
Investments at Market Value | $ | 3,426,766 | $ | 728,673 | $ | 166,131 | $ | 666,737 | ||||||||
Interest Receivable | 39,180 | 735 | 77 | 47 | ||||||||||||
Receivable for Investment Securities Sold | — | — | — | 31,769 | ||||||||||||
Receivable for Capital Shares Sold | 15,000 | — | — | — | ||||||||||||
Prepaid Expenses | 1,094 | 6,083 | 4 | 15 | ||||||||||||
Other Assets | — | — | 68 | 268 | ||||||||||||
TOTAL ASSETS | 3,482,040 | 735,491 | 166,280 | 698,836 | ||||||||||||
Liabilities: | ||||||||||||||||
Distribution Payable | 5,517 | — | — | — | ||||||||||||
Payable for Investment Securities Purchased | 207,488 | — | 1,934 | 30,985 | ||||||||||||
Payable to Investment Advisor | — | — | 1,246 | 19,706 | ||||||||||||
Accrued Expenses: | ||||||||||||||||
Investment Advisory Fees | 197 | — | — | — | ||||||||||||
Administrator Fees | 28 | 70 | 47 | — | ||||||||||||
Shareholder Servicing Fees | 26 | 6 | 1 | 5 | ||||||||||||
Custody Fees | 945 | 593 | 1,237 | 1,492 | ||||||||||||
Transfer Agency Fees | 852 | 1,200 | 828 | 823 | ||||||||||||
Other Expense Payables | 265 | 124 | 17 | 52 | ||||||||||||
TOTAL LIABILITIES | 215,318 | 1,993 | 5,310 | 53,063 | ||||||||||||
Net Assets: | ||||||||||||||||
Paid in Capital | 3,221,536 | 1,409,144 | 204,448 | 697,397 | ||||||||||||
Undistributed (Distributions in Excess of) Net Investment Income | (19 | ) | 469 | 1 | — | |||||||||||
Accumulated Net Realized Loss on Investments | (97,860 | ) | (628,813 | ) | (53,515 | ) | (76,272 | ) | ||||||||
Net Unrealized Appreciation (Depreciation) on Investments | 143,065 | (47,302 | ) | 10,036 | 24,648 | |||||||||||
TOTAL NET ASSETS | $ | 3,266,722 | $ | 733,498 | $ | 160,970 | $ | 645,773 | ||||||||
Outstanding Shares of Beneficial Interest | ||||||||||||||||
Institutional Class Shares | 312,970 | 106,993 | 24,863 | 64,304 | ||||||||||||
NET ASSET VALUE, OFFERING AND | $ | 10.44 | $ | 6.86 | $ | 6.47 | $ | 10.04 | ||||||||
The accompanying notes are an integral part of the financial statements.
ANNUAL REPORT / APRIL 30, 2003
21
Table of Contents
| For the Fiscal Year Ended April 30, 2003 | Social Issues Intermediate Fixed Income Portfolio | Social Issues Blue Chip Equity Portfolio | Social Issues Capital Growth Portfolio | Social Issues Small-Cap Equity Portfolio | ||||||||||||
Investment Income: | ||||||||||||||||
Dividend | $ | 1,471 | $ | 16,408 | $ | 1,152 | $ | 2,434 | ||||||||
Less: Foreign Taxes Withheld | — | (64 | ) | (8 | ) | — | ||||||||||
Interest | 109,123 | 340 | 44 | 291 | ||||||||||||
TOTAL INVESTMENT INCOME | 110,594 | 16,684 | 1,188 | 2,725 | ||||||||||||
Expenses: | ||||||||||||||||
Investment Advisory Fees | 15,976 | 7,575 | 1,012 | 2,697 | ||||||||||||
Administrator Fees | 22,420 | 25,145 | 24,318 | 24,394 | ||||||||||||
Shareholder Servicing Fees — | 3,994 | 1,623 | 217 | 506 | ||||||||||||
Transfer Agency Fees | 5,189 | 5,560 | 5,239 | 5,271 | ||||||||||||
Custodian Fees | 8,144 | 5,411 | 11,891 | 10,905 | ||||||||||||
Accounting Fees | 24,367 | 24,252 | 24,059 | 23,895 | ||||||||||||
Professional Fees | 346 | 100 | 17 | 47 | ||||||||||||
Registration Fees | 143 | 85 | 7 | 20 | ||||||||||||
Printing | 204 | 55 | 11 | 27 | ||||||||||||
Trustee Fees and Expenses | 107 | 50 | 5 | 12 | ||||||||||||
Compliance Fees | 5,487 | 3,719 | 379 | 415 | ||||||||||||
Miscellaneous Fees | 7,096 | 781 | 159 | 307 | ||||||||||||
TOTAL EXPENSES | 93,473 | 74,356 | 67,314 | 68,496 | ||||||||||||
Less Waivers: | ||||||||||||||||
Investment Advisory Fees | (15,779 | ) | (7,575 | ) | (1,012 | ) | (2,697 | ) | ||||||||
Administrator Fees | (1,997 | ) | (812 | ) | (103 | ) | (232 | ) | ||||||||
Shareholder Servicing Fees — | (3,082 | ) | (979 | ) | (164 | ) | (377 | ) | ||||||||
TOTAL WAIVERS | (20,858 | ) | (9,366 | ) | (1,279 | ) | (3,306 | ) | ||||||||
Less Expense Reimbursement by Advisor | (49,448 | ) | (53,844 | ) | (64,489 | ) | (61,077 | ) | ||||||||
TOTAL NET EXPENSES | 23,167 | 11,146 | 1,546 | 4,113 | ||||||||||||
NET INVESTMENT INCOME (LOSS) | 87,427 | 5,538 | (358 | ) | (1,388 | ) | ||||||||||
Net Realized Gain (Loss) on Investments | 14,475 | (595,669 | ) | (27,145 | ) | (110,485 | ) | |||||||||
Net Unrealized Appreciation (Depreciation) on Investments | 136,910 | 181,794 | 9,353 | 2,674 | ||||||||||||
NET REALIZED AND UNREALIZED GAIN (LOSS) | 151,385 | (413,875 | ) | (17,792 | ) | (107,811 | ) | |||||||||
NET INCREASE (DECREASE) IN NET ASSETS RESULTING FROM OPERATIONS | $ | 238,812 | $ | (408,337 | ) | $ | (18,150 | ) | $ | (109,199 | ) | |||||
The accompanying notes are an integral part of the financial statements.
APRIL 30, 2003 / ANNUAL REPORT
22
Table of Contents
STATEMENTS OF CHANGES IN NET ASSETS
| For the Fiscal Year Indicated | Social Issues Intermediate Fixed Income Portfolio | Social Issues Blue Chip Equity Portfolio | Social Issues Capital Growth Portfolio | Social Issues Small-Cap | ||||||||||||||||||||||||||||
| 05/01/02 to 04/30/03 | 05/29/01* to 04/30/02 | 05/01/02 to 04/30/03 | 05/30/01* to 04/30/02 | 05/01/02 to 04/30/03 | 07/03/01* to 04/30/02 | 05/01/02 to 04/30/03 | 07/03/01* to 04/30/02 | |||||||||||||||||||||||||
Operations: | ||||||||||||||||||||||||||||||||
Net Investment Income (Loss) | $ | 87,427 | $ | 93,655 | $ | 5,538 | $ | 5,875 | $ | (358 | ) | $ | (198 | ) | $ | (1,388 | ) | $ | (434 | ) | ||||||||||||
Net Realized Gain (Loss) on Investments | 14,475 | (110,696 | ) | (595,669 | ) | (33,144 | ) | (27,145 | ) | (26,370 | ) | (110,485 | ) | 59,261 | ||||||||||||||||||
Net Change in Unrealized Appreciation (Depreciation) on Investments | 136,910 | 6,155 | 181,794 | (229,096 | ) | 9,353 | 683 | 2,674 | 21,974 | |||||||||||||||||||||||
NET INCREASE (DECREASE) IN NET ASSETS FROM OPERATIONS | 238,812 | (10,886 | ) | (408,337 | ) | (256,365 | ) | (18,150 | ) | (25,885 | ) | (109,199 | ) | 80,801 | ||||||||||||||||||
Distributions to Shareholders: | ||||||||||||||||||||||||||||||||
Net Investment Income | ||||||||||||||||||||||||||||||||
Institutional Class Shares | (87,426 | ) | (93,655 | ) | (5,975 | ) | (4,969 | ) | (12 | ) | (90 | ) | — | — | ||||||||||||||||||
Net Capital Gains | ||||||||||||||||||||||||||||||||
Institutional Class Shares | — | (1,659 | ) | — | — | — | — | (20,601 | ) | (3,697 | ) | |||||||||||||||||||||
TOTAL DISTRIBUTIONS | (87,426 | ) | (95,314 | ) | (5,975 | ) | (4,969 | ) | (12 | ) | (90 | ) | (20,601 | ) | (3,697 | ) | ||||||||||||||||
Capital Share Transactions: | ||||||||||||||||||||||||||||||||
Institutional Class Shares | ||||||||||||||||||||||||||||||||
Shares Issued | 1,073,007 | 5,093,222 | 174,575 | 2,114,439 | 69,947 | 140,100 | 570,948 | 408,378 | ||||||||||||||||||||||||
Shares Issued in Lieu of Cash Distributions | 39,721 | 64,877 | 3,181 | 1,473 | 9 | 51 | 20,601 | 3,697 | ||||||||||||||||||||||||
Shares Redeemed | (56,511 | ) | (2,992,780 | ) | (784,524 | ) | (100,000 | ) | (5,000 | ) | — | (142,457 | ) | (162,698 | ) | |||||||||||||||||
TOTAL INSTITUTIONAL CLASS SHARE TRANSACTIONS | 1,056,217 | 2,165,319 | (606,768 | ) | 2,015,912 | 64,956 | 140,151 | 449,092 | 249,377 | |||||||||||||||||||||||
NET INCREASE (DECREASE) IN NET ASSETS FROM CAPITAL SHARE TRANSACTIONS | 1,056,217 | 2,165,319 | (606,768 | ) | 2,015,912 | 64,956 | 140,151 | 449,092 | 249,377 | |||||||||||||||||||||||
NET INCREASE (DECREASE) IN NET ASSETS | 1,207,603 | 2,059,119 | (1,021,080 | ) | 1,754,578 | 46,794 | 114,176 | 319,292 | 326,481 | |||||||||||||||||||||||
Net Assets: | ||||||||||||||||||||||||||||||||
Beginning of period | 2,059,119 | — | 1,754,578 | — | 114,176 | — | 326,481 | — | ||||||||||||||||||||||||
END OF PERIOD | $ | 3,266,722 | $ | 2,059,119 | $ | 733,498 | $ | 1,754,578 | $ | 160,970 | $ | 114,176 | $ | 645,773 | $ | 326,481 | ||||||||||||||||
Shares Issued and Redeemed: | ||||||||||||||||||||||||||||||||
Institutional Class Shares | ||||||||||||||||||||||||||||||||
Shares Issued | 104,213 | 505,545 | 25,244 | 229,838 | 10,555 | 15,071 | 53,083 | 31,922 | ||||||||||||||||||||||||
Shares Issued in Lieu of Cash Distributions | 3,886 | 6,494 | 494 | 170 | 1 | 6 | 2,032 | 295 | ||||||||||||||||||||||||
Shares Redeemed | (5,511 | ) | (301,657 | ) | (137,232 | ) | (11,521 | ) | (770 | ) | — | (11,068 | ) | (11,960 | ) | |||||||||||||||||
TOTAL INSTITUTIONAL CLASS SHARE TRANSACTIONS | 102,588 | 210,382 | (111,494 | ) | 218,487 | 9,786 | 15,077 | 44,047 | 20,257 | |||||||||||||||||||||||
UNDISTRIBUTED (DISTRIBUTIONS IN EXCESS OF) NET INVESTMENT INCOME | $ | (19 | ) | $ | — | $ | 469 | $ | 906 | $ | 1 | $ | — | $ | — | $ | — | |||||||||||||||
| * | Commencement of Operations |
The accompanying notes are an integral part of the financial statements.
ANNUAL REPORT / APRIL 30, 2003
23
Table of Contents
| For a Share Outstanding Throughout the Fiscal Years Ended April 30, | |||||||||||||||||||||||||||||||||||||
| Net Asset Value Beginning of Period | Net Investment Income (Loss) | Realized and | Distributions from Net Investment Income | Distributions Capital | Net Asset Value End of Period (000) | Total Return | Net Assets End of Period (000) | Ratio of to Average | Ratio of Net Investment to Average | Ratio of Expenses to Average Net Assets | Portfolio Turnover Rate | ||||||||||||||||||||||||||
| Social Issues Intermediate Fixed Income Portfolio | |||||||||||||||||||||||||||||||||||||
| INSTITUTIONAL CLASS SHARES | |||||||||||||||||||||||||||||||||||||
2003 | $ | 9.79 | 0.34 | 0.65 | (0.34 | ) | — | $ | 10.44 | 10.25 | % | $ | 3,267 | 0.87 | % | 3.28 | % | 3.51 | % | 82 | % | ||||||||||||||||
2002(1) | 10.00 | 0.33 | (0.21 | ) | (0.33 | ) | — | ^ | 9.79 | 1.18 | † | 2,059 | 0.83 | 3.53 | 1.39 | 260 | |||||||||||||||||||||
| Social Issues Blue Chip Equity Portfolio | |||||||||||||||||||||||||||||||||||||
| INSTITUTIONAL CLASS SHARES | |||||||||||||||||||||||||||||||||||||
2003 | $ | 8.03 | 0.04 | (1.17 | ) | (0.04 | ) | — | $ | 6.86 | (14.05 | )% | $ | 733 | 1.03 | % | 0.51 | % | 6.89 | % | 40 | %5 | |||||||||||||||
2002(2) | 10.00 | 0.03 | (1.98 | ) | (0.02 | ) | — | 8.03 | (19.49 | )† | 1,755 | 1.00 | 0.38 | 1.88 | 22 | ||||||||||||||||||||||
| Social Issues Capital Growth Portfolio | |||||||||||||||||||||||||||||||||||||
| INSTITUTIONAL CLASS SHARES | |||||||||||||||||||||||||||||||||||||
2003 | $ | 7.57 | (0.01 | ) | (1.09 | ) | — | ^ | — | $ | 6.47 | (14.52 | )% | $ | 161 | 1.07 | % | (0.25 | )% | 46.52 | % | 210 | % | ||||||||||||||
2002(3) | 10.00 | (0.01 | ) | (2.41 | ) | (0.01 | ) | — | 7.57 | (24.25 | )† | 114 | 1.05 | (0.25 | ) | 17.07 | 154 | ||||||||||||||||||||
| Social Issues Small-Cap Equity Portfolio | |||||||||||||||||||||||||||||||||||||
| INSTITUTIONAL CLASS SHARES | |||||||||||||||||||||||||||||||||||||
2003 | $ | 16.12 | (0.02 | ) | (4.66 | ) | — | (1.40 | ) | $ | 10.04 | (29.15 | )% | $ | 646 | 1.22 | % | (0.41 | )% | 20.26 | % | 279 | % | ||||||||||||||
2002(3) | 10.00 | (0.02 | ) | 6.39 | — | (0.25 | ) | 16.12 | 64.47 | † | 326 | 1.18 | (0.34 | ) | 11.13 | 600 | |||||||||||||||||||||
| �� | |||||||||||||||||||||||||||||||||||||
| † | Total return is for the period indicated and has not been annualized. |
| ^ | Amount rounds to less than $0.01. |
| * | Periods of less than one year have been annualized. |
| (1) | Commenced operations on May 29, 2001. |
| (2) | Commenced operations on May 30, 2001. |
| (3) | Commenced operations on July 3, 2001. |
The accompanying notes are an integral part of the financial statements.
APRIL 30, 2003 / ANNUAL REPORT
24
Table of Contents
| 1. | ORGANIZATION |
ARK Funds (the “Fund”) is registered under the Investment Company Act of 1940, as amended (the “1940 Act”), as an open-end management investment company organized as a Massachusetts business trust pursuant to a Declaration of Trust dated October 22, 1992, amended and restated on March 19, 1993, and further amended on December 10, 1999.
The Fund offers thirty separate investment portfolios as of April 30, 2003:
Social Issues Intermediate Fixed Income Portfolio (“SIIFIP”)
Social Issues Blue Chip Equity Portfolio (“SIBCEP”)
Social Issues Capital Growth Portfolio (“SICGP”)
Social Issues Small-Cap Equity Portfolio (“SISCEP”)
(individually a “Portfolio” and collectively, the “Portfolios”)
U.S. Treasury Cash Management Portfolio
U.S. Government Cash Management Portfolio
Prime Cash Management Portfolio
Tax-Free Cash Management Portfolio
U.S. Treasury Money Market Portfolio
U.S. Government Money Market Portfolio
Money Market Portfolio
Tax-Free Money Market Portfolio
Pennsylvania Tax-Free Money Market Portfolio
Short-Term Treasury Portfolio
Short-Term Bond Portfolio
Maryland Tax-Free Portfolio
Pennsylvania Tax-Free Portfolio
Intermediate Fixed Income Portfolio
U.S. Government Bond Portfolio
Income Portfolio
Balanced Portfolio
Equity Income Portfolio
Value Equity Portfolio
Equity Index Portfolio
Blue Chip Equity Portfolio
Capital Growth Portfolio
Mid-Cap Equity Portfolio
Small-Cap Equity Portfolio
International Equity Portfolio
Emerging Markets Equity Portfolio
The financial statements and notes presented herein are those of SIIFIP, SIBCEP, SICGP, and SISCEP. The financial statements of the other portfolios listed above are not presented herein, but are presented separately. The Fund may issue an unlimited number of shares of each of the Portfolios and may issue shares of one or more classes of each Portfolio.
| 2. | SIGNIFICANT ACCOUNTING POLICIES |
The preparation of financial statements in conformity with accounting principles generally accepted in the United States of America requires management to make estimates and assumptions that affect amounts reported therein. Although actual results could differ from these estimates, any such differences are expected to be immaterial to the net assets of the Portfolios.
The following is a summary of significant accounting policies followed by the Portfolios.
Security Valuation — Securities of the Portfolios are generally valued by independent pricing services. Securities listed on a securities exchange for which market quotations are readily available are valued at the last reported sale price on the principal exchange on which they are traded on the valuation date or, if there is no such reported sale on the valuation date, at the most recently quoted bid price. Unlisted securities for which market quotations are readily available are valued at the most recently quoted bid price. Debt obligations exceeding sixty days to maturity for which market quotations are readily available are valued at the most recently quoted bid price. Debt obligations with sixty days or less to maturity are valued at their amortized cost.
Income Taxes — It is the intention of each Portfolio to comply with the requirements of the Internal Revenue Code, qualify as a regulated investment company and to distribute all of its taxable income. Accordingly, no provision for federal income taxes is considered necessary.
Net Asset Value Per Share — The net asset value per share (“NAV”) of each class of each Portfolio is calculated every business day (i.e., any day that both the New York Stock Exchange and the Federal Reserve Bank are open for business). The NAV is computed by dividing the total assets of each class of the Portfolio, less the liabilities of the class, by the number of outstanding shares of the Portfolio.
Repurchase Agreements — Securities pledged as collateral for repurchase agreements are held by the custodian bank until maturity of the repurchase agreements. Provisions of the repurchase agreements and procedures adopted by the Board of Trustees require that market value of collateral, including accrued interest thereon, be sufficient in the event of default by the counterparty. If the counterparty defaults and the value of the collateral declines or if the counterparty enters an insolvency proceeding, realization of the collateral by the Portfolio may be delayed or limited.
When-Issued Purchases and Forward Commitments — The Portfolios may purchase securities on a “when-issued” basis and may purchase or sell securities on a “forward
ANNUAL REPORT / APRIL 30, 2003
25
Table of Contents
NOTES TO FINANCIAL STATEMENTS
commitment” basis. These transactions, which involve a commitment by a Portfolio to purchase or sell particular securities with payment and delivery taking place at a future date (perhaps one or two months later), permit the Portfolio to lock in a price or yield on a security it owns or intends to purchase, regardless of future changes in interest rates. When-issued and forward commitment transactions involve the risk, however, that the yield obtained in a transaction (and therefore the value of the security) may be less favorable than the yield available in the market when the securities delivery takes place. The Portfolios maintain cash, U.S. government securities, or liquid, high-grade debt obligations in an amount sufficient to meet the purchase price in a segregated account until the settlement date. No Portfolio intends to engage in when-issued purchases and forward commitments for speculative purposes.
Distributions — Dividends from net investment income are declared and paid according to the following table:
| Portfolio | Frequency of Declaration of Dividends | Frequency of Payment of Dividends | ||
SIIFIP | Daily | Monthly | ||
SIBCEP | Quarterly | Quarterly | ||
SICGP | Annually | Annually | ||
SISCEP | Annually | Annually | ||
Each Portfolio makes distributions of capital gains, if any, at least annually.
Distributions from net investment income and net realized capital gains are determined in accordance with U.S. federal income tax regulations, and may differ from those amounts determined under generally accepted accounting principles. These book/tax differences are either temporary or permanent in nature. To the extent these differences are permanent, they are charged or credited to paid-in capital in the period that the difference arises.
The Portfolios have a tax year end of October 31.
On the Statements of Assets and Liabilities, the following adjustments were made:
| Portfolio | Undistributed Net Investment Income (Loss) | Undistributed Net Realized Gain (Loss) | Paid-in- Capital | |||||||||
SIIFIP | $ | (20 | ) | $ | 20 | $ | — | |||||
SICGP | 371 | — | (371 | ) | ||||||||
SISCEP | 1,388 | (5,145 | ) | 3,757 | ||||||||
The tax character of distributions paid during the tax year ended October 31, 2002 and period ended October 31, 2001 was as follows:
| Ordinary Income | Total | |||||||||||
| Portfolio | 2002 | 2001 | 2002 | 2001 | ||||||||
SIIFIP | $ | 110,740 | $ | 24,043 | $ | 110,740 | $ | 24,043 | ||||
SIBCEP | 6,257 | 2,044 | 6,257 | 2,044 | ||||||||
SICGP | 102 | — | 102 | — | ||||||||
SISCEP | 3,697 | — | 3,697 | — | ||||||||
At October 31, 2002 the components of net assets (excluding paid-in capital) on a tax basis were as follows:
| Portfolio | Undistributed Ordinary Income | Undistributed Long-Term Gain | Net Unrealized Appreciation (Depreciation) | Capital and Other Losses | ||||||||||
SIIFIP | $ | 6,754 | $ | — | $ | 112,829 | $ | (111,854 | ) | |||||
SIBCEP | 1,324 | — | (166,648 | ) | (541,910 | ) | ||||||||
SICGP | — | — | (1,594 | ) | (48,205 | ) | ||||||||
SISCEP | 14,585 | 858 | (19,155 | ) | — | |||||||||
The following Portfolios have estimated capital loss carryforwards at October 31, 2002, which are available to offset future net realized capital gains:
| Portfolio | Accumulated Capital Loss Carryforward | Year Expires | |||
SIIFIP | $ | 111,854 | 2010 | ||
SIBCEP | 10,680 | 2009 | |||
| 531,230 | 2010 | ||||
SICGP | 6,772 | 2009 | |||
| 41,433 | 2010 | ||||
Other — Security transactions are accounted for on the date the security is purchased or sold (trade date). Net realized capital gains and losses on the sale of investment securities are determined using the identified cost method. Dividend income is recognized on the ex-dividend date, and interest income is recognized using the accrual method. Discounts and premiums on securities purchased are amortized over the lives of the respective securities.
APRIL 30, 2003 / ANNUAL REPORT
26
Table of Contents
NOTES TO FINANCIAL STATEMENTS
| 3. | INVESTMENT ADVISORY AND ADMINISTRATIVE FEES AND OTHER TRANSACTIONS WITH AFFILIATES |
Allied Investment Advisors, Inc. (“AIA”) is the investment advisor to each Portfolio. Pursuant to an investment advisory contract on behalf of each Portfolio, AIA is entitled to receive fees for its advisory services at the annual rates shown in the following table based on the daily average net assets of the Portfolio.
| Portfolio | Annual Rate | |
SIIFIP | 0.60% | |
SIBCEP | 0.70% | |
SICGP | 0.70% | |
SISCEP | 0.80% | |
AIA has contractually agreed to waive a portion of its fees or reimburse expenses for all of the Portfolios in order to limit total operating expenses of such Portfolios.
Pursuant to an exemptive order by the Securities and Exchange Commission, the Portfolios may invest in affiliated money market fund Portfolios, provided that the instruments in affiliated money market fund Portfolios do not exceed 25% of the investing Portfolio’s total assets.
Effective April 1, 2003, AIA became a wholly-owned subsidiary of Manufacturers and Traders Trust Company (“M&T Trust”), the principal financial services operating subsidiary of M&T Bank Corporation (“M&T”), a publicly-traded holding company based in Buffalo, New York. M&T’s ownership of AIA is a result of an agreement entered into on September 26, 2002, among M&T, Allfirst Financial, Inc. and Allied Irish Banks, p.l.c. (“AIB”), under which M&T was to acquire Allfirst Financial Inc. the indirect parent corporation of AIA, and parent corporation of Allfirst Bank, the direct parent of AIA (the “Acquisition”). At a special meeting of shareholders held on January 31, 2003, shareholders of each Portfolio approved a new investment advisory agreement between AIA and the Fund with respect to each Portfolio. The 1940 Act, which regulates investment companies such as the Fund, requires a shareholder vote to approve a new advisory agreement in connection with business transactions such as the Acquisition. The new advisory agreement is substantially identical to the former advisory agreement, except for the dates of execution and termination. The new advisory agreement became effective upon consummation of the Acquisition on April 1, 2003.
Also as a result of the Acquisition, M&T Trust acquired Allfirst Trust Company, N.A., (“Allfirst Trust”) which as of April 30, 2003, served as the Portfolios’ administrator, transfer agent and custodian pursuant to administration, transfer agency and custodian agreements with the Fund. (See Note 6 for additional information concerning the administrator, transfer agent and custodian subsequent to the Portfolios’ fiscal year end.)
Allfirst Trust serves as administrator and transfer agent for the Fund pursuant to an administration agreement. For its services, Allfirst Trust is entitled to receive an administration fee from the Fund at the annual rate of $24,000 per Portfolio, plus 0.085% of the annual average daily net assets of the Portfolios. Allfirst Trust receives annually a $60,000 base fee that is allocated to each portfolio of the Fund based on respective average daily net assets. Under a separate agreement, Allfirst Trust has subcontracted the services to be provided by it under the administration agreement to Forum Administrative Services, LLC (the “Sub-administrator”). Allfirst Trust is responsible for paying a portion of the administration fee it receives from the Fund to the Sub-administrator for the services it provides.
Pursuant to an agreement between the Fund and Allfirst Trust, Allfirst Trust performs transfer agency services. Pursuant to an agreement between Boston Financial Data Services, Inc. (“Boston Financial”) and Allfirst Trust, Boston Financial performs sub-transfer agency services. For the services provided under the agreement with Allfirst Trust, the Fund pays an annual fee of up to $16 per Portfolio account and activity based fees ranging from $0.50 to $12.50 per item and reimbursements for out-of-pocket expenses. Allfirst Trust pays the transfer agency fees and expense reimbursements that it receives from the Fund to Boston Financial.
Pursuant to a custody agreement between the Fund and Allfirst Trust, Allfirst Trust was appointed and serves as the custodian of the assets of the Portfolios. Pursuant to an agreement between Bankers Trust Company (“BTC”) and Allfirst Trust, BTC performs sub-custodial services. For the services provided under the agreement with Allfirst Trust, the Fund pays 0.015% of the market value of the assets of the Portfolios, plus transaction fees ranging from $5 to $75 per item and reimbursement for out-of-pocket expenses. Allfirst Trust is responsible for paying a portion of the custody fees it receives from the fund to BTC for the custody services it provides.
| 4. | SHAREHOLDER SERVICES PLANS |
The Fund has adopted a Shareholder Services Plan on behalf of the Institutional Class Shares of each Portfolio. Institutional Class Shares’ shareholder services fees, as a percentage of average daily net assets of the class, may be up to 0.15% as authorized by the Board.
ANNUAL REPORT / APRIL 30, 2003
27
Table of Contents
NOTES TO FINANCIAL STATEMENTS
| 5. | INVESTMENT TRANSACTIONS |
The cost of securities purchased and the proceeds from the sale of securities, other than short-term investments and U.S. government securities during the year ended April 30, 2003, were as follows:
| Portfolio | Purchases | Sales | ||||
SIIFIP | $ | 727,091 | $ | 411,402 | ||
SIBCEP | 414,803 | 1,007,760 | ||||
SICGP | 355,410 | 281,631 | ||||
SISCEP | 1,342,660 | 879,157 | ||||
The purchases and sales of U.S. government securities were as follows:
| Portfolio | Purchases | Sales | ||||
SIIFIP | $ | 2,455,188 | $ | 1,598,074 | ||
For federal income tax purposes, cost, aggregate gross unrealized appreciation and depreciation of securities at April 30, 2003 were not materially different from amounts reported for financial reporting purposes. For each Portfolio, these amounts were as follows:
| Portfolio | Appreciated Securities | Depreciated Securities | Net Unrealized Appreciation (Depreciation) | ||||||||
SIIFIP | $ | 143,191 | $ | (126 | ) | $ | 143,065 | ||||
SIBCEP | 43,463 | (90,765 | ) | (47,302 | ) | ||||||
SICGP | 12,913 | (2,877 | ) | 10,036 | |||||||
SISCEP | 44,872 | (20,224 | ) | 24,648 | |||||||
| 6. | SIGNIFICANT EVENTS AFTER APRIL 30, 2003 |
As a result of the Acquisition described in Note 3, effective June 13, 2003, Allfirst Trust, the administrator, transfer agent and custodian to the Fund was merged into M&T Trust and no longer maintains a separate corporate existence. In connection with that merger, effective June 16, 2003, M&T Trust serves as the administrator and transfer agent to the Fund as a result of the assignment of the Fund’s administration and transfer agency agreements with Allfirst Trust to M&T Trust. The compensation provisions under the agreements are unchanged.
Effective June 1, 2003, State Street Bank Corporation (“State Street”) serves as custodian of the assets of the Portfolios pursuant to a custodian agreement between State Street and the Fund.
M&T Trust also serves as the administrator to the VISION Group of Funds (“VISION Funds”), a mutual fund family that offers different classes of shares in separate investment portfolios for which M&T Asset Management, a department of M&T Trust, serves as investment adviser. In connection with the Acquisition described above, the Board of Trustees of the Fund has authorized the reorganization of each Portfolio into a newly created or existing portfolio of the VISION Funds. On May 16, 2003, the VISION Funds filed a preliminary proxy statement/prospectus on Form N-14, which sets forth the reorganization proposals to be submitted to shareholders of each Portfolio, who will vote separately on the proposal to reorganize their respective Portfolio. The VISION Funds filed an amendment to the Form N-14 filing on May 23, 2003 with a proposed effective date for the preliminary proxy statement/prospectus of June 23, 2003. According to the preliminary proxy statement/prospectus, only shareholders of record of the Fund at the close of business on June 16, 2003 will be entitled to notice of and to vote at the shareholder meeting scheduled for August 14, 2003, and any postponement or adjournment thereof. Under the proposed agreement and plan of reorganization, if approved by shareholders of a Portfolio, the shareholders of that Portfolio will receive shares of a comparable VISION Fund. According to the preliminary proxy statement/prospectus, the reorganization is currently anticipated to occur in August, assuming shareholder approval is obtained.
APRIL 30, 2003 / ANNUAL REPORT
28
Table of Contents
The Board of Trustees and Shareholders
ARK Funds:
We have audited the accompanying statements of assets and liabilities, including the schedules of investments, of Social Issues Intermediate Fixed Income Portfolio, Social Issues Blue Chip Equity Portfolio, Social Issues Capital Growth Portfolio, and Social Issues Small-Cap Equity Portfolio, portfolios of ARK Funds (the “Portfolios”), as of April 30, 2003, the related statements of operations for the year then ended, and the statements of changes in net assets and the financial highlights for each of the years or periods in the two-year period then ended. These financial statements and financial highlights are the responsibility of the Portfolios’ management. Our responsibility is to express an opinion on these financial statements and financial highlights based on our audits.
We conducted our audits in accordance with auditing standards generally accepted in the United States of America. Those standards require that we plan and perform our audit to obtain reasonable assurance about whether the financial statements and financial highlights are free of material misstatement. An audit includes examining, on a test basis, evidence supporting the amounts and disclosures in the financial statements. Our procedures included confirmation of securities owned as of April 30, 2003 by correspondence with the custodian. As to securities purchased or sold but not yet received or delivered, we performed other appropriate auditing procedures. An audit also includes assessing the accounting principles used and significant estimates made by management, as well as evaluating the overall financial statement presentation. We believe that our audit provides a reasonable basis for our opinion.
In our opinion, the financial statements and financial highlights referred to above present fairly, in all material respects, the financial position of Social Issues Intermediate Fixed Income Portfolio, Social Issues Blue Chip Equity Portfolio, Social Issues Capital Growth Portfolio, and Social Issues Small Cap Equity Portfolio as of April 30, 2003, the results of their operations, the changes in their net assets and their financial highlights for the years or periods specified above in conformity with accounting principles generally accepted in the United States of America.

Boston, Massachusetts
June 16, 2003
ANNUAL REPORT / APRIL 30, 2003
29
Table of Contents
TRUSTEES OF THE FUND (Unaudited)
| Name, Age and Contact Address | Position with the Trust | Length of Time Served | Principal Occupation(s) During Past 5 Years | Number of Portfolios in Fund Complex Overseen by Trustee | Other Trusteeships or Directorships Held by Trustees outside ARK Funds Complex | |||||
| Interested Trustee | ||||||||||
Rick A Gold1 Born: August 4, 1949 c/o ARK Funds 100 East Pratt Street, 15th Floor, M/C 104-410 Baltimore, MD 21202 | President and Trustee | since 2000 | Senior Vice President of M&T Trust, the parent company of AIA (since 2003); Executive Vice President of Asset Management Group of Allfirst Financial, Inc., the former parent company to Allfirst Trust and AIA (1999-2003); Chief Executive Officer and Director of AIA and Allfirst Trust (1997-2003). | 30 | None | |||||
| Disinterested Trustees | ||||||||||
William H. Cowie, Jr. Born: January 24, 1931 c/o ARK Funds 100 East Pratt Street, 15th Floor, M/C 104-410 Baltimore, MD 21202 | Trustee and Chairman | since 1993 | Retired | 30 | None | |||||
David D. Downes Born: July 16, 1935 c/o ARK Funds 100 East Pratt Street, 15th Floor, M/C 104-410 Baltimore, MD 21202 | Trustee | since 1995 | Attorney in private practice (since October 1996) | 30 | None | |||||
Sir Victor Garland Born: May 5, 1934 c/o ARK Funds 100 East Pratt Street, 15th Floor, M/C 104-410 Baltimore, MD 21202 | Trustee | since 2000 | Private Investor (since 1994) | 30 | Director and Chairman: Henderson Far East Income Trust plc (Chairman since 1990). Director: The Throgmorton Trust plc. Director: Framington Income and Capital Trust plc. Director and Chairman: Fidelity Asian Values plc (Chairman since 2001). Director and Chairman: Govett Enhanced Income Investment Trust plc. Director: GEIIT plc. Director: Govett Asian Income and Growth Trust Ltd. | |||||
Charlotte R. Kerr Born: September 26, 1946 c/o ARK Funds 100 East Pratt Street, 15th Floor, M/C 104-410 Baltimore, MD 21202 | Trustee | since 1993 | Practitioner and faculty member of Traditional Acupuncture Institute. | 30 | None | |||||
Richard B. Seidel Born: April 20, 1941 c/o ARK Funds 100 East Pratt Street, 15th Floor, M/C 104-410 Baltimore, MD 21202 | Trustee | since 1998 | Director and President (since 1994) of Girard Partners (a registered broker-dealer). | 30 | None | |||||
| 1 | Mr. Gold is deemed to be an “interested person” due to his affiliation with AIA and M&T Trust (See Note 6 of Notes to the Financial Statements). |
Additional information concerning the Trustees is contained in the Statement of Additional Information (“SAI”) and is available by contacting the Fund at 1-800-275-3863.
APRIL 30, 2003 / ANNUAL REPORT
30
Table of Contents
31
OFFICERS OF THE FUND (Unaudited)
| Name, Age and Contact Address | Position with the Trust | Length of Time Served | Principal Occupation(s) During Past 5 Years | |||||
| Officers | ||||||||
| Stacey E. Hong Born: May 10, 1966 Two Portland Square, Portland, ME 04101 | Treasurer | since 2002 | Director of Forum Accounting Services, LLC (since 1998). | |||||
| Michele L. Dalton Born: February 16, 1959 100 East Pratt Street, 15th Floor, Baltimore, MD 21202 | Vice President and Assistant Secretary | since 2000 | Vice President of M&T Trust (since 2003); Senior Vice President of Allfirst Financial, Inc. (1994-2003). | |||||
| Thomas R. Rus Born: October 11, 1959 100 East Pratt Street, 17th Floor, Baltimore, MD 21202 | Secretary | since 2000 | Vice President of M&T Trust (since 2003); Vice President and Counsel of Allfirst Trust and Allfirst Bank and Compliance Officer of Allfirst Trust (1995-2003). | |||||
| D. Blaine Riggle Born: November 12, 1966 Two Portland Square, Portland, ME 04101 | Vice President and Assistant Secretary | since 2002 | Relationship Manager and Counsel for Forum Financial Group, LLC (associated since 1998). | |||||
| Cheryl O. Tumlin Born: June 30, 1966 Two Portland Square, Portland, ME 04101 | Vice President and Assistant Secretary | since 2002 | Counsel for Forum Financial Group, LLC (associated from 1996-1999 and again since 2001); former Counsel at I-many, Inc. (1999-2001). | |||||
| Dawn L. Taylor Born: May 14, 1964 Two Portland Square, Portland, ME 04101 | Assistant Treasurer | since 2002 | Tax Manager at Forum Financial Group, LLC (since 1997). | |||||
| Nathan V. Gemmiti Born: August 6, 1970 Two Portland Square, Portland, ME 04101 | Assistant Secretary | since 2002 | Staff Attorney, Forum Financial Group, LLC (since 2001); Associate, Pierce Atwood (a law firm) (1998-2001). | |||||
ANNUAL REPORT / APRIL 30, 2003
Table of Contents
NOTES
Table of Contents
INVESTMENT ADVISOR
Allied Investment Advisors, Inc.
Baltimore, Maryland
TRUSTEES
William H. Cowie, Jr.
David D. Downes
Sir Victor Garland
Rick A. Gold
Charlotte R. Kerr
Richard B. Seidel
ADMINISTRATOR
Allfirst Trust Company, N.A.
Baltimore, Maryland
DISTRIBUTOR
ARK Funds Distributors, LLC
Portland, Maine
LEGAL COUNSEL
Kirkpatrick & Lockhart LLP
Washington, D.C.
INDEPENDENT AUDITORS
KPMG LLP
Boston, Massachusetts
CUSTODIAN
Allfirst Trust Company, N.A.
Baltimore, Maryland
Table of Contents

100 EAST PRATT STREET, 15TH FLOOR | MAIL CODE 104-410 | BALTIMORE, MD 21202
We are pleased to send you this Annual Report for the fiscal year ended April 30, 2003. This report contains important information about your investments in ARK Funds. Because we are sending a report to each person listed as shareholder, you (or your household) may receive more than one report.
This material must be preceded or accompanied by a current prospectus. ARK-AR-003-0603 |
recycled content |

Table of Contents
ITEM 2. CODE OF ETHICS.
Not applicable.
ITEM 3. AUDIT COMMITTEE FINANCIAL EXPERT.
Not applicable.
ITEM 4. PRINCIPAL ACCOUNTANT FEES AND SERVICES.
Not applicable.
ITEM 5. [RESERVED]
ITEM 6. [RESERVED]
ITEM 7. DISCLOSURE OF PROXY VOTING POLICIES AND PROCEDURES FOR CLOSED-END MANAGEMENT INVESTMENT COMPANIES.
Not applicable.
ITEM 8. [RESERVED]
ITEM 9. CONTROLS AND PROCEDURES
(a)—The certifying officers, whose certifications are included herewith, have evaluated the registrant’s disclosure controls and procedures within 90 days of the filing date of this report. In their opinion, based on their evaluation, the registrant’s disclosure controls and procedures are adequately designed, and are operating effectively to ensure, that material information relating to the registrant, including its consolidated subsidiaries, is made known to them by others within those entities, particularly during the period in which this report is being prepared. Further, in their opinion, the registrant’s disclosure controls and procedures are adequately designed, and are operating effectively to ensure that information required to be disclosed by the registrant in the reports it files or submits under the Securities Exchange Act of 1934 is recorded, processed, summarized and reported within the time periods specified in the Securities and Exchange Commission’s rules and forms.
(b)—There were no significant changes in the registrant’s internal controls or in other factors that could significantly affect these controls subsequent to the date of their most recent evaluation, including any corrective actions with regard to significant deficiencies and material weaknesses.
ITEM 10. EXHIBITS.
(a) Not applicable.
(b) Certifications pursuant to Section 302 of the Sarbanes-Oxley Act of 2002 (Exhibit filed herewith).
(c) Certifications pursuant to Section 906 of the Sarbanes-Oxley Act of 2002 (Exhibit filed herewith).